integrating remote sensing and gis for urban fire disaster
TRANSCRIPT
UNIVERSITY OF NEW SOUTH WALES Thesis/Project Report Sheet
Surname or Family name: Bhaskaran First name: Sunil Other name/s: -----Abbreviation for degree as given in the University calendar: PhD School: Surveying and Spatial Information Systems Faculty: Engineering Title: Integrating Remote Sensing and GIS for Urban Fire Disaster Management
Abstract 350 words maximum:
This research is aimed at developing an urban disaster management system, which will improve the existing method of hazard
assessment and dynamic resource distribution. Disaster management deals with the risk of natural disaster and managing the
events following disasters. Although prevention of disasters is an impossible task, careful risk analysis can help save lives and
reduce monetary damages. The study integrates high spatial resolution remote sensor data with GIS data for developing a
methodology to model urban disaster risk, which will assist in providing decision support systems for emergency operations
and redistribution of dynamic resources (material and human). Since a major part of the research was carried out in
collaboration with the New South Wales Fire Brigades, Sydney, it attempts to provide systems, which aim to improve their
existing methodology of risk assessment and provide decision support systems for dynamic resource distribution.
Research result demonstrates a unique methodology, that integrates appropriate remote sensor and existing GIS data to
semantically model hazard in urban areas. The use of the model will have implications for the existing distribution of dynamic
resources in geographically unique service areas, which can lead to the reassessment of hazard and redistribution of dynamic
resources.A framework for integrating remote sensing and GIS data is also demonstrated as an alternative to the existing
method of distributing dynamic resources. The research results can contribute to an overall improvement in the way urban
disasters are managed and will assist multiple users in the decision making process. Since this research was carried out using
real data and off and on-field collaboration with the Corporate Strategy Division, New South Wales Fire Brigades, Sydney it has
the potential to be implemented immediately.
Declaration relating to disposition of project report/thesis
I am fully aware of the policy of the University relating to the retention and use of higher degree project reports and theses, namely that the University retains the copies submitted for examination and is free to allow them to be consulted or borrowed. Subject to the provisions of the Copyright Act 1968, the University may issue a project report or thesis in whole or in part, in photostat or microfilm or other copying medium.
The University recognises that there may be exceptional circumstances requiring restrictions on copying or conditions on use. Requests for restriction for a period of up to 2 years must be made in writing to the Registrar. Requests for a longer period of restriction may be considered in exceptional circumstances if accompanied by a letter of support from the Supervisor or Head of School. Such requests must be submitted with the thesis/project report.
FOR OFFICE USE ONLY Date of completion of requirements for Award
1-' \· 07 !Registrar a !lid De(!u!Y Princi(!al
I


CERTIFICATE OF ORIGINALITY
I hereby declare that this ·:.ubmission is my own work and to the best of my knowledge it contains no nMerials previously published or written by another person, nor material which to a s~bstantinl extent has been accepted for the award of any other degree or diploma at UNSW or any other educational institution, except where due acknowledgement is made in the thesis. Any contribution made to the research by others, with whom I have worked at UNSW or elsewhere, b explicitly acknowledged in the thesis.
I also declare that the intellectual content of this thesis is the product of my own work, except to the extent that assistance from others in the projccrs design and conception or in style, presentation and linguistic expression is acknowledged
(Signed) L_ ____________________ ~
INT GRA T NG REMOTE E Sl G A D GIS FOR
U BAN Fl E DISASTER MANAGEME T
By
Sunil Bhaskaran
A thesis submitted to
The School of Surveying and Spatial Information Systems
University of New South Wales in partial fulfilment of the requirements for the degree of
Doctor of Philosophy
In School of Surveying and Spatial Information Systems
(Was earlier known as Geomatic Engineering)
March 2002
"I hereby declare that this submission is my own work and that, to the best of my knowledge and belief, it contains no material previously published or written by another person nor material which to a substantial extent has been accepted for the award of any other degree or diploma of a university or other institute of higher learning, except where due acknowledgment is made in the text. "

UN 8 vV
1 6 JAN 2003
LIBRARY
TABLE OF CONTENTS
Table of Contents-----------------------------------------------------------------------------------------------1
References & Append ices--------------------------------------------------------------------------------------VII
Abstract ---------------------------------------------------------------------------------------------------------IX
List of Figures------------------------------------------------------------------------------------------------------XII
List of Tables-------------------------------------------------------------------------------------------------------XV
Acknowledgments-----------------------------------------------------------------------------------------------XVI
Chapter 1: lntroduction-····························································1
1-1 Purpose of the Study--------------------------------------------------------------------- -1
1-1.1 Reasons for Undertaking Research----------------------------------------------------------3
1-1.2 Background and Justification of Study------------------------------------------------------4
1-2 Research Objectives----------------------------------------------------------------------------------------5
1-3 Research Questions----------------------------------------------------------------7
1-4 Thesis Organization -----------------------------------------------------------------------------------------7
Chapter 2: Hazard Monitoring- Review of Remote Sensing and GIS et!; lrC>C>Is.··································································-··············1~
2-1 lntroduction-----------------------------------------------------------------------------------------------------12
2-1.1 Conceptual Issues Definition of Hazard, Vulnerability, Risk and Disaster--------13
2-2 Need for Modelling Hazards-------------------------------------------------------------------------------16
2-3 Hazard Monitoring, Assessment and Analysis--------------------------------------------------------1 9
I
2-4 Remote Sensing and GIS in Disaster Management- ------------------------------------------------22
2-4.1 Weather Hazards-----------------------------------------------------------------------------25
2-4.1.1 Hurricanes, Cyclones and Storms----------------------------------------------25
2-4.2 Geologic Hazards --------------------------------------------------------------------------27
2-4.2.1 Landslide Hazard Mitigation------------------------------------------------------27
2-4 .2 .2 Earthquakes--------------------------------------------------------------------------29
2-4.2.3 Volcanoes ----------------------------------------------------------------------------30
2-4.3 Technological and lnd us trial H azards--------------------------------------------------31
2-4.4 En vi ron men tal H azard s------------------------------------------------------------------------32
2-4.5 Fire Hazards-----------------------------------------------------------------------------33
2-4.5.1 Forest and Grass Fires------------------------------------------------------------33
2-4.6 Risk Management in Urban areas----------------------------------------------------------38
2-4.7 Remote Sensing and GIS for Other Studies----------------------------------------------40
2-5 Su mmary---------------------------------------------------------------------------------------------------------42
Chapter 3: Urban Fire Hazard Categorization and Monitoring--····45
3-1 I ntrod u ctio n------------------------------------------------------------------------------------------------------45
3-2 Case studies of RS/GIS applied to Hazard Management-------------------------------------------48
3-2 .1 National-------------------------------------------------------------------------------------------51
3-3 Risk Assessment by the New South Wales Fire Srigades-------------------------------------------55
3-3.1 Issues with Current Methodology------------------------------------------------------------56
3-3.1.1 Geographicallnsensitivity---------------------------------------------------------59
3-3.1.2 Community Vulnerability-----------------------------------------------------------60
3-3.1.3 Non-Currency of Spatio-temporallnformation------------------------- --- -61
3-3.1.4 Allocation of Dynamic Resources-----------------------------------------------61
II
3-4 Sources of Data for Required Resolutions--------------------------------------------------------------62
3-4 .1 In trod u ction---------------------------------------------------------------------------------------62
3-4.2 Building/Cadastre/lnfrastructure------------------------------------------------------------63
3-4.3 Socio-Economic Variables-------------------------------------------------------------------65
3-4.4 DEMs----------------------------------------------------------------------------------------------65
3-4.5 Utility /lnfrastructure---------------------------------------------------------------------------65
3-5 Benefits and Disadvantages of Airborne Remote Sensing for Hazard Monitoring-----------67
3-6 Temporal Resolution Requirements for Risk Assessment-----------------------------------------68
3-7 Spectral Resolution----------------------------------------------------------------------------------------70
3-8 Spatial Resolution Requirements for Hazard Assessment-----------------------------------------71
3-9 Evaluation of Hazard Related Variables----------------------------------------------------------------71
3-1 0 Restrictions and other F actors-----------------------------------------------------------------------75
3-11 Other Factors------------------------------------------------------------------------------------------75
3-12 Summary --------------------------------------------------------------------------------------------------7 5
Chapter 4: Data Management and Methodology---······················-77
4-1 I ntrod u ctio n-----------------------------------------------------------------------------------------------------77
4-2 Site Requirements---------------------------------------------------------------------------------------------78
4-2.1 Bathurst City -------------------------------------------------------------------------------------79
4-2.2 Hornsby-------------------------------------------------------------------------------------------79
4-2.3 Fire Incident History--------------------------------------------------------------------------- 85
4-3 Information Management Needs---------------------------------------------------------------------------87
4-4 Data Description----------------------------------------------------------------------------------------------88
4-4 .1 Co nto u rs------------------------------------------------------------------------------------------89
4-4.2 Land-use------------------------------------------------------------------------------------------89
Ill
4-4.3 Orthorectified Aerial Photo lmages---------------------------------------------------------90
4-4.4 Digital Elevation Model--------------------------------------------------------------91
4-4.5 Population Density-----------------------------------------------------------------------------92
4-4.6 State Wide Chemical Data Base------------------------------------------------------------92
4-4.7 Special Hazard Locations---------------------------------------------------------------------96
4-4.8 Digital Topographic and Cadastral Database--------------------------------------------97
4-5 Software and Hardware Requirements------------------------------------------------------------------98
4-6 Methodology----------------------------------------------------------------------------------------------------99
4-7 Data Resolution Characteristics--------------------------------------------------------------------------1 DO
4-7.1 Temporal Resolution--------------------------------------------------------------------------1 DO
4-7.2 Spectral Resolution----------------------------------------------------------------------------1 DO
4-7.3 Spatial Resolution------------------------------------------------------------------------------1 01
4-8 Availability of Cartographic Data-----------------------------------------------------------------------1 02
4-9 Methodology in Detail--------------------------------------------------------------------------------------1 02
4-9.1 Processing of Aerial Photo Graphs--------------------------------------------------------1 02
4-9.2 Map to Image Registration-------------------------------------------------------------------1 05
4-1 0 Spatial Overlay of disparate data----------------------------------------------------------------------1 05
4-11 Selection of Spatial Units--------------------------------------------------------------------------------1 06
4-12 Mas ki ng------------------------------------------------------------------------------------------------------1 08
4-13 Geometric lntersection-----------------------------------------------------------------------------------11 0
4-13.1 Results of Geometric lntersection------------------------------------------------------111
4-13.2 Update Operation and Creation of Master Attribute Table-----------------------114
4-14 Justification for the Choice and use of Weighted Overlay---------------------------------------118
4-15 Modelling risk with Weighted Overlay----------------------------------------------------------------122
4-15.1 Data Considerations-------------------------------------------------------------------------125
IV
4-16 Assigning Influences and Biases to Layers----------------------------------------------------126
4-17 Hazard Maps and lnterpretation-----------------------------------------------------------------------127
4-18 Verification of Model Results---------------------------------------------------------------------------129
4-19 Model Capabilities--------------------------------------------------------------------------------------130
4-19.1 Advantages of using Model Builder -----------------------------------------------------134
4-19.2 Limitations of using Model Builder -------------------------------------------------------135
4-20 Summary-----------------------------------------------------------------------------------------------------137
Chapter 5: Potential of applying FRM to the Resource Planning Process ···············································································140
5-1 In trod uction-----------------------------------------------------------------------------------140
5-2 Need for Balanced Resource Allocation and Distribution-----------------------------------------141
5-3 Typical Fire (Material) Resources-----------------------------------------------------------------------142
5-3. 1 Aerial Pu m pers-----------------------------------------------------------------------------------14 2
5-3.2 Water T ankers-----------------------------------------------------------------------------------143
5-3.3 Rescue Veh icles-----------------------------------------------------------------------------143
5-3.4 Aerial Appliances-----------------------------------------------------------------------------144
5-4 New South Wales Fire Brigades -An Overview of the Resource Planning Process--------------------------------------------------------------------------------------------145
5-4.1 The Government Level-------------------------------------------------------------------------146
5-4.2 The Organisational Level-------------------------------------------------------------------146
5-4.3 The Regional Leve l------------------------------------------------------------------------------148
5-4.4 The Local Level-----------------------------------------------------------------------------148
5-5 Issues with the Existing Planning Process-----------------------------------------------------------151
5-5.1 Existing System Variables and Hazard Assessment------------------------------------152
v
5-5.2 Urban Growth Assessment--------------------------------------------------------------------153
5-5.3 Vulnerability Assessment: Population and Demographic Characteristics---------156
5-5.4 Incident Data and Council LEP lnformation-----------------------------------------------156
5-5.5 Multiple Scenario Analysis---------------------------------------------------------------------157
5-6 Summary-----------------------------------------------------------------------------------------------------157
Chapter 6: Fire Risk Model: Interpretation of Risk in Bathurst and Hornsby ·············································································160
6-1 lntroduction--------------------------------------------------------------------------------------------------160
6-2 Semantic Hazard Model of Bathurst City-------------------------------------------------------------162
6-2.1 Distribution of Hazard in Bathurst-------------------------------------------------------------164
6-2.2 Implications of Hazard Model Output--------------------------------------------------------164
6-3 Semantic Risk Model of Hornsby Shire---------------------------------------------------------------17 4
6-3.1 Interpretation of Hazard in Hornsby Shire---------------------------------------------------175
6-4 Summary-----------------------------------------------------------------------------------------------------179
Chapter 7: Results: Advantages of the proposed FRM and comparison with the Existing Methodology followed by ~~\n#F=B ·······•······································································· 180
7-1 lntroduction--------------------------------------------------------------------------------------------------180
7-2 Model capabilities------------------------------------------------------------------------------------------184
7-3 Comparative hazard analysis--------------------- -----------------------------------------------------188
7-4 Management of Resources------------------------------------------------------------------------------ 197
7-5 Summary---------------------------------------------------------------------------------------------------197'
VI
Chapter 8: Summary and Conclusions·-·································200
8-1 Summary-----------------------------------------------------------------------------------------------------200
8-2 Conclusions-------------------------------------------------------------------------------------------------202
8-2.1 Model will have applicability in the NSWFB context--------------------------------------202
8-2.2 By using more variables the model will have more universal application
to hazard analysis in general not only fire hazard-----------------------------------------203
8-2.3 Better data will become increasingly available with new satellite remote sensing
system-----------------------------------------------------------------------------------------------204
8-2.4 The current study has used a limited number of variables to show the
methodology, but in many operational applications more variables may be required---204
8-2.5 Future research should directed to new GIS and RS methods and more
rapid acquisition of data to more effectively model hazards in real time--------------------204
FtE:i=E:FtE:~CE:S~·····································································:ZtJ6
~flflE:~[)ICE:S ·······································································:!:Zt5
Appendix I
Technical report. Integrating Imaging Spectroscopy & GIS for Spatial Emergency Decision Support Systems (SEDSS). A Case of Hail Storm Damage and Post Disaster Management, Sydney, NSW, Australia----------------------------------------------------------------- -226
Appendix II
Description of layers in master table in (Bathurst And Hornsby-Shire) master attribute table Bathurst, NSW, Australia----------------------------------------------------------------- 273
Appendix Ill
Update operations, Options Available and Weighted Average Index Method--------------- 283
vn
Appendix IV
New South Wales Incident Reports----------------------------------------------------------------------288
AppendixV
USGS Classification codes------------------------------------------------------------------------------290
Appendix VI
Extract from NSW Fire Brigades 'Fire News'. Winter Edition 2001 Vol2 No 3 pp1 0 -------------292
Appendix VII
Softwares used------------------------------------------------------------------------------------------------295
vm
ABSTRACT
This research is aimed at developing an urban disaster management system, which may
improve the existing method of hazard assessment and dynamic resource distribution. Disaster
management deals with the risk of natural disaster and managing the events following disasters.
Although prevention of disasters is an impossible task, careful risk analysis can help save lives
and reduce monetary damages. The ability to forecast the probability of hazards can assist state
and local governments in identifying zones particularly susceptible to disaster. This knowledge
aids in planning for local development, and the allocation of emergency resources. Additionally,
timely data on the geography of affected regions can assist in the deployment of disaster
response.
The study integrates high spatial resolution remote sensor data with GIS data for developing a
methodology to model urban disaster risk, which may assist in providing decision support
systems for emergency operations and redistribution of dynamic resources (material and
human). Disasters occurs in all parts of the world, but statistics have shown that those which
occur in urban areas have higher incidence to loss of lives and property due to the close
proximity of manmade, natural features and dense population. Since most of the research was
carried out in collaboration with the New South Wales Fire Brigades, it attempts to provide
systems, which may improve their existing methodology of hazard assessment and analysis and
resource distribution.
Much of the focus of this research is directed towards the hazard of fire (structural, property,
vegetation fires) in urban areas. Fires in urban areas, are very random and irregular. This is
mainly due to the nature of fire hazard in urban areas, which is very unpredictable and can occur
in any place despite the best methods of precaution and protection. This character of urban fire
hazard is in sharp contrast to bush fires where it is possible to make rough predictions about the
time and occurrence of the next bush fire. This is also due to the fact that bush fires are aided by
natural factors such as topography, wind direction and other atmospheric conditions.
Urban fire hazards may have different impacts on a community, due to the uneven spatial
distribution of factors which may influence these hazards such as land-use, structural density,
type of dwelling, construction materials used, location of fire stations, hydrants, location of
IX
special hazards, natural features such as topography, location, presence of water facilities, and
population density and other related demographic characteristics. At any given time the
assessment of hazard and the provision of fire protection must depend on an overall
consideration of these spatial factors. These factors are dynamic by nature, as they undergo
changes (both physical and human), leading to an increase in the level of hazard. It is important
from a disaster management perspective that these changes in hazard be regularly monitored
and hazards reassessed, which may have implications for the existing distribution of dynamic
resources leading to their re-distribution. Fire resources are distributed to provide fire protection
to the citizens in every service areas. In many instances the distribution is based on legislative
criterion and not on an overall understanding of the hazard, which is explained by both physical
and human features. Since hazards are characterized by physical as well as human factors, the
distribution of dynamic resources (material and human) must ideally be based on a combined
assessment of these factors.
Managing disasters in urban areas therefore requires current information on the spatial
distribution of risk and their spatia-temporal changes. The factors which influence risk from fire,
are varied and related with each other in a complex manner. Since, these factors are themselves
subject to frequent irregular changes over a period of space and time there is a need to model
such relationships in near real time by using integrated remote sensing and GIS technologies.
In the first phase of this study, a methodology is demonstrated to develop a semantic Fire Risk
Model (FRM), which enables the assessment and analysis of hazard in near real time. High
spatial resolution aerial photo images are combined with available GIS data to develop a
semantic risk model. Hazard for every spatial unit is analyzed by performing the geometric
intersection operation and weighted overlay process. By a system of assigning biases and
influences, this model may be used for generating hazard profiles in near real time.
In the second phase of the study, the potential benefit of the hazard model in the resource
planning process is discussed. The resource planning process which leads to the integrated
assessment of the decision-making process, is detailed after a brief explanation of the different
hierarchies through which the spatial information is disseminated. Issues related to data
consistency, currency and collective analysis of hazard related variables is documented, and the
benefit of using the hazard model is discussed.
X
The study results are summarized in the following paragraphs
};> Research result demonstrates a unique methodology, that integrates appropriate remote
sensor and existing GIS data to semantically model hazard in urban areas. The use of
the model may have implications for the existing distribution of dynamic resources in
geographically unique service areas, which may lead to the reassessment of hazard and
redistribution of dynamic resources.
};> A framework for integrating remote sensing and GIS data is also demonstrated as an
alternative to the existing method of distributing dynamic resources.
};> The research results can contribute to an overall improvement in the way urban
disasters are managed and may assist multiple users in the decision making process.
Since this research was carried out by using real data and off and on~ field collaboration with the
Corporate Strategy Division, New South Wales Fire Brigades, Sydney it has the potential to be
implemented immediately.
XI
LIST OF FIGURES
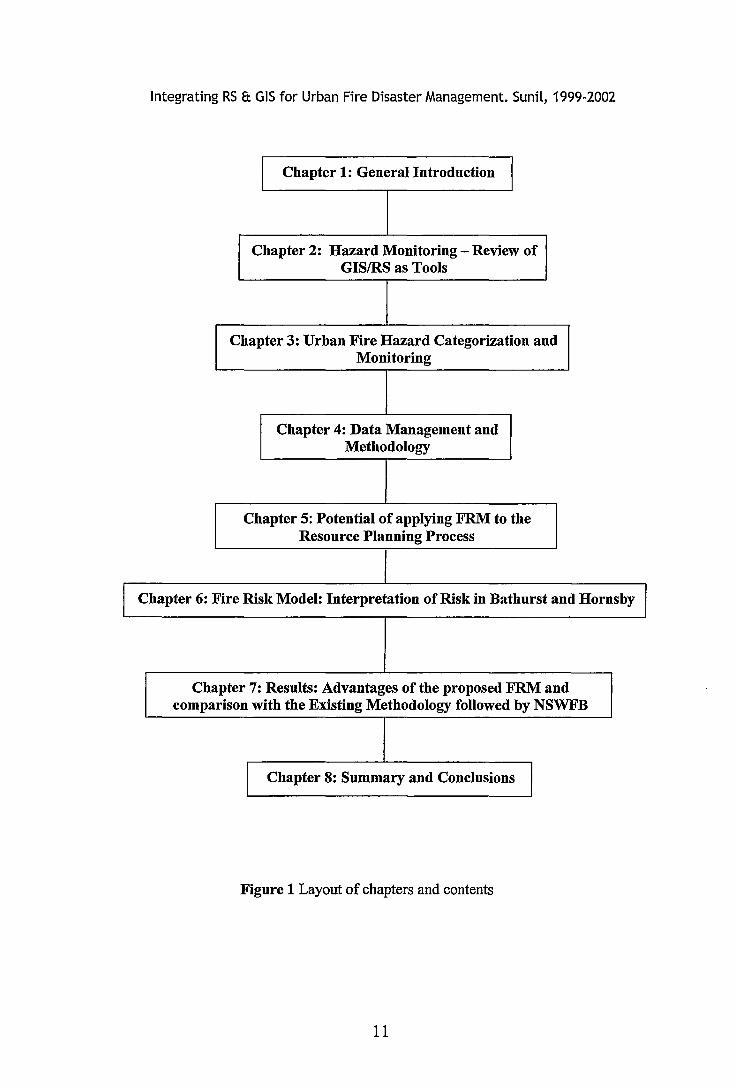
Fig 1 Layout of Chapters and Contents ........................................................................ 11
Fig 2 Hazard categorisation by NSWFB in Bathurst City, NSW ......................................... 57
Fig 3 Hazard categorisation by NSWFB in Hornsby Shire, NSW ....................................... 58
Fig 4 Property info layer (Small scale. Source LPI Bathurst, NSW) .................................... 64
Fig 5 Property information layer (Large scale map: Source LPI Bathurst, NSW) ................... 65
Fig 6 Location map of the study areas. Bathurst and Hornsby .......................................... 80
Fig 7 Ortho-rectified aerial photoimage of central business district, Bathurst. ....................... 81
Fig 8 Study area Bathurst City, NSW ........................................................................... 82
Fig 9 Study area CBD Hornsby Shire, NSW .................................................................. 83
Fig 1~ Orthorectified aerial photoimage of CBD Hornsby Shire, NSW ................................. 84
Fig 11 Spatial distribution of fire incident history in Bathurst City: Source NSWFB ................. 85
Fig 12 Spatial distribution of fire incident history in Hornsby Shire Source: NSWFB) ..................................................................................................... 86
Fig 13 Information management cycle (Granger K, 2000) ................................................. 87
Fig 14 Contours showing the general elevation in Hornsby ............................................... 91
Fig 15 Chemical storage locations within consent levels in Bathurst. .................................. 93
Fig 16 Spatial distribution of sensitive locations in Bathurst City, NSW (Source: NSWFB) .................................................................................................... 94
Fig 17 The New South Wales Feature Data Base .......................................................... 95
Fig 18 Legend: New South Wales Feature Data Base ..................................................... 95
Fig 19 Location of special hazard sites: above consent level sites, Bathurst.. ....................... 96
Fig 20 Digital topographic database: Source: Land and Property Information (LPI) Bathurst .................................................................................................................. 98
Fig 21 Methodology to semantically model hazard in urban environments ........................... 104
xn
Fig 22 Spatial unit selection (large yellow box: 500m by 500m, medium 250m by 250m and small 100m by 100m ........................................................ 107
Fig 23 Small area analysis issues: By using orthophotos the area of hazard can be precisely demarcated. Structures are shown by dots within the collector districts .............................................................................................. 1 09
Fig 24 Location of hazard within collector districts: Masking operations in GIS ................... 110
Fig 25 The Geometric intersection process ................................................................ 112
Fig 26 Graphical results of geometric intersection between land-use and spatial units .......................................................................................................... 114
Fig 27 The weighted overlay process ......................................................................... 123
Fig 28 The Weighted Overlay Process ....................................................................... 124
Fig 29 Assigning Influences and Biases ..................................................................... 127
Fig 30 Semantic Hazard Model of Bathurst City and Proximity Analysis ............................ 128
Fig 31 Spatial overlay of vector layers: model verification .............................................. 130
Fig 32 Proximity analysis ........................................................................................ 133
Fig 33 Ability of the model to provide forecast information .............................................. 134
Fig 34 The New South Wales Fire Brigades Resource Planning Process .......................... 150
Fig 35 Use of hazard model in the resource planning process for detecting urban growth ................................................................................................................. 155
Fig 36 Fire hazard model Bathurst.. ........................................................................... 163
Fig 37 Hazard level by commerciallanduse (service business and general business) in Bathurst .............................................................................................. 165
Fig 38 Hazard level by lndustriallanduse in Bathurst.. .................................................. 166
Fig 39 Hazard level by structural density in Bathurst ..................................................... 167
Fig 40 Hazard level by degree of congestion in Bathurst ............................................... 168
Fig 41 Hazard level by population density in Bathurst.. ................................................. 169
Fig 42 Hazard by residential density .......................................................................... 170
Fig 43 Hazard categories by income level ofpeople ...................................................... 171
Xlll
Fig 44 Hazard level by less mobile people ................................................................. 172
Fig 45 Fire hazard model, Bathurst. ........................................................................ 17 4
Fig 46 Hazard categorization in CBD Hornsby Shire .................................................... 175
Fig 47 Hazard categories and locations of special hazards ........................................... 176
Fig 48 Vacant Spaces for Evacuation Strategies ......................................................... 177
Fig 49 Hazard model for resource allocation: spatial distribution of high-rise structures for allocation of aerial pumpers ................................................................. 178
Fig 50 Fire districts in New South Wales (Source NSWFB) .......................................... 186
Fig 51 Model Overlay on Fire districts New South Wales ............................................. 187
Fig 52 Hazard categorization by NSWFB in Bathurst City ............................................. 189
Fig 53 Hazard categorisation by this study ................................................................ 190
Fig 54 Area serviced by existing Fire Stations in Bathurst ............................................ 192
XIV
LIST OF TABLES
1. Hazard Descriptors (Adapted from the NSWFB Project Report, 1996) .............................. 56
2. Urban/Suburban Attributes desired for hazard assessment and the minimum remote sensing resolutions required to provide such information ..................................... 69
3. Attribute Table created after the Geometric Intersection and the Update operation ............................................................................................................ 113
4. Master Attribute Table (MAT) of attributes showing the final fields and columns. For detailed description of fields ............................................................. 115
5. Master Attribute Table (MAT) of attributes showing the final fields and columns. For detailed description of fields .......................................................... 116
6. Master Attribute Table (MAT) of attributes showing the final fields and columns ...................................................................................................... 117
7. Comparison of travel distance to special hazard sites by the existing fire stations of Bathurst and Kelso (Bathurst) .................................................................. 193
8. Directions required to be taken by the fire service to a specific special hazard site 'Ampol and Mobil fuels' ................................................... 194
9. Directions required to be taken by the fire service to a specific special hazard site 'Am pol and Mobil fuels' .................................................... 194
XV
Acknowledgments
My doctoral program had all the ingredients that characterizes a PhD, therefore in the end,
it 2vas a very fit!filling and satisfying achievement. Since I decided to investigate an issue in
remote sensing and GIS, which was of an applied nature, I had to interact with many
organizations and personneL There were numerous people from different organizations and
backgrounds, 2vho were cooperative and helpful in many 2Vq)IS.
First and foremost, I would like to express my gratitude to Professor Bruce Forster 2vho
supervised my progress and guided me in a wqy on!J he can. Professor Forster, provided
ongoing encouragement and maintained prompt communication with me, be it discussing a
project, topic or planning a conference paper. Professor .Forster provided me 1vith a platform
which helped me to maintain my enthusiasm for research.
Some of the chapters in this thesis depended on input from the New South Wales Fire
Brigades (NSWFB). I am grateful to Trevor Neal from the NSW'FB, who cooperated
with me despite his busy schedule during the two mqjor projects, 1vhich I carried out for the
Corporate Strategy Division, NSWFB, Sydnry, Australia. His support and feedback
1vere an invaluable asset to me.
Other thanks are extended to Carmel Donnel!J, Director - Corporate Strategy Division,
New South Wales Fire Brigades, 2vho sanctioned scholarships for the projects, John Nee!J
who 1vas a very reassuring presence at every meeting, Mark Br02vn who cooperated in field
work and validation operations.
A special thanks to my fami!J, particular!J my brotherS uresh 1vho was a source of constant
inspiration at all times and sister Smitha, who was very understanding. Special thanks to
my friends and colleagues; Addie Mercer, Bisun Datt, Anthea Mitchell, Masashi 1vith
1vhom I shared intelligent, thoughtful and humorous moments, 1vhich were important to
keep me going during long hours of research.
XVI

Thanks are also due to Professor Ian Burnlry, Professor Colin Sutherland, Professor Totry
Milne, Professor Bill Kearslry, Professor Barry Garner, Dr Ewan Masters, Yanni
Zakaria, Chris Ryan, John Craag, , John Claque, Chris Dorman, George Antomvich,
Dr Es1varappa and all others, who have played a part in my achievements directjy or
indirectjy.
I would like to dedicate the thesis to my parents, 1vho have been a great source of strength,
inspiration and wisdom.
XVII
Integrating RS & GIS for Urban Fire Disaster Management. Sunil, 1999-2002
Chapter 1: General Introduction.
Purpose of the Study
The purpose of this research is to develop a hazard1 model in an urban environment,
which integrates remote sensing data and cartographic data (GIS) in a manner, that it
embraces the concept of hazard holistically, and provides a decision support system for
the strategic distribution of fire resources (material and human) in near real time. The
occurrence of a disaster triggers a sequence of actions by emergency organizations,
most of which are based on logical and intuitive theories. However, every disaster has
some spatial ramifications, which is embodied in the physical and or human attributes
that are distributed in space and over a period oftime. Besides, the proper management
of a disaster must take into account other factors, which may influence them. However,
this is not an easy task, since the factors which influence hazard are dynamic and need
to be constantly monitored and analysed, leading to the need for risk assessment in all
regions. The identification and assessment of hazard is vital for the distribution of
dynamic resources. Any effective strategy to manage disaster risk must begin with an
identification of the hazards and what is vulnerable to them. This involves information
on the nature and extent of risk that characterizes a particular location, including
information on the nature of particular physical hazards obtained through their risk
assessment, as well as information and data on the degree of exposure of a population
and its built environment to such hazards.
Achieving the above tasks in near real time is important since emergency operations are
based on decisions, which have to be taken immediately.
1 Fire hazard those caused by structural, property and vegetative fires
1
Integrating RS &. GIS for Urban Fire Disaster Management. Sunil, 1999-2002
Emergency services and similar organizations need to regularly assess urban hazard
and associated vulnerability, for the management of urban disasters. However,
developing management systems for urban disasters is a complex task. Remote sensing
data and GIS techniques may be used in the development of such systems, but their use
involves the systematic appraisal of sensor characteristics such as spatial, spectral and
temporal resolutions. Furthermore, GIS data availability may limit the integration of
several attributes, which are vital for developing a risk model. Modelling an urban
disaster management system is therefore a very challenging and complex task.
Existing methods pursued by many emergency services suffer from lack of conceptual
understanding of hazard, and therefore do not take into account several spatia-temporal
variables which influence hazard and are dynamic by nature. There is a need to address
some of these issues and develop an operational model that is capable of detecting,
recording and analysing urban hazards in near real time. Given the unpredictable and
frequent nature of hazards and disaster risks, and the pressure to make quick decisions
during emergency operations, the demand for improved and efficient management has
never been more acute. Since the relationship between factors which cause hazard are
many and complex, there is a need to develop a methodology to model urban hazards
which can make a positive contribution to the management of urban disasters.
The main focus of the study is to demonstrate a methodology, by integrating high
spatial resolution airborne remote sensing data with GIS data, for the purpose of
modelling urban hazard and vulnerability. The study uses an example of hazard caused
by fire to demonstrate the development of an urban disaster management system.
2
Integrating RS a GIS for Urban Fire Disaster Management. Sunil, 1999-2002
Urban disasters caused by fire and other hazards may have different impacts in a given
area due to the spatia-temporal distribution of physical and socio-economic features
such as land-use, structural density, location of hazardous facilities, population density
and demographic characteristics. These factors undergo frequent changes in space and
over a period oftime, and are interrelated in a complex manner.
Modelling these complex relationships is important in order to understand the existing
hazard and vulnerability, which is then important for managing a disaster, which in tum
hinges on an understanding of spatia-temporal factors. The development of an
operational model largely depends on current data, which in many cases can be only be
derived from remotely sensed images. The use of remote sensing data for hazard and
vulnerability assessment depends on a systematic appraisal of sensor resolution
characteristics (spatial, spectral, temporal and radiometric). This study discusses the
applications and suitability of remote sensing images that come in different spatial,
spectral and temporal resolutions, for the purpose of detecting, extracting and recording
hazard and vulnerability related variables and their integration with cartographic (GIS)
data for developing a hazard model in urban environments. The study attempts to
approach the concept of hazard holistically by studying and analysing physical
attributes of hazard such as land-use, structural density and types, with the human
component (population density, demographic and socio-economic characteristics etc).
1-1.1 Reasons for undertaking research
Managing urban disaster demands information on hazard, risk and the spatial analysis
of several factors, which influence disaster risks. Hazards are multi-dimensional, multi
disciplinary and intrinsically complex phenomena caused by a large set of factors,
3
Integrating RS B: GIS for Urban Fire Disaster Management. Sunil, 1999-2002
which have a strong spatial component (Coppock, 1995). The distribution of latent and
realized demand of fire hazards (structural, property and vegetation) clearly indicate a
spatia-temporal irregularity that needs to be understood in order to improve emergency
preparedness, redistribution of dynamic resources and overall disaster mitigation.
Managing risks arising from these hazards is a key issue. Pre-disaster management is
risk management. Disaster risks arise from combinations of hazardousness and
vulnerability that vary over seasonal to decadal time scales as well as geographically.
There is a need to model the complex relationships between factors which influence
and cause hazards and which make certain regions more vulnerable than others. The
use of remote sensing technology and GIS have the potential to provide the ingredients
for an operational model. However, the use of remote sensing data and GIS for the
management of urban hazards presents numerous challenges of which, modelling and
dynamic resource distribution, are two of the more demanding issues which have to be
dealt with in near real time.
1-1.2 Background and justification of study
The proposed research is directed to improving the existing methodology of hazard
categorization as practiced in New South Wales, Australia. It is therefore necessary to
provide a brief summary of the current methodology and related issues. The existing
method for generating hazard categories is undertaken using in-situ field survey
methods, which are time consuming, expensive and requires extensive coordination.
One of the major drawbacks of this methodology is its lack of currency. Decisions
made during emergency situations have to be taken quickly and should be based on the
most recent data. Processes such as urbanization, industrialization, often result in
4
Integrating RS a GIS for Urban Fire Disaster Management. Sunil, 1999-2002
frequent changes in the land-use resulting in a restructuring of spatial patterns. This
will alter the potential degree/scale of hazard either by increasing or decreasing it.
Current information on land-use, population density and changes in structural patterns
is vital in order to draw up appropriate plans and make appropriate decisions.
The in-situ field survey methodology consumes a lot of time in order to develop a
hazard categorization at a regional scale (in this case for the entire state ofNSW). Any
major disaster that may occur in the interim period will have to be addressed by using
existing available information and local knowledge. Besides, it is dependent on
extensive coordination amongst staff, some of who are appointed on a voluntary basis.
Record keeping and information management in this situation can give rise to an
erroneous database. There is a strong reason to use a technology that can improve this
methodology by providing accurate spatia-temporal data in real time.
The allocation of dynamic resources (staff, equipment and vehicles) is to be based on
the level of hazard present in the response area. The hazard categorization process is
yet to be completed in NSW and its completion is some time away. There is therefore
an immediate need to use a technology that acquires spatia-temporal data in real time,
which can then be analyzed in a GIS environment for hazard and vulnerability
assessment modeling. GIS/RS are twin technologies that may answer most of the above
questions.
Research Objectives
The major goal of the study is to develop a fully operational spatial fire hazard and
vulnerability assessment model by using available remotely sensed data that contributes
5
Integrating RS a: GIS for Urban Fire Disaster Management. Sunil, 1999-2002
to an enhanced conceptual understanding of hazard/disasters and attempts to bridge the
gap between physical assessment and community vulnerability.
• To evaluate the existing method adopted by the New South Wales Fire Brigades,
Australia to assess and monitor urban fire hazards and associated risks, and to
address issues arising out of their existing approach.
• To model hazard and vulnerability assessment holistically by integrating image data
With suitable resolution characteristics acquired from both airborne and space
borne sensors and to integrate available sources of cartographic data in order to
understand and map the hazard and vulnerability in a certain region.
• To attempt a systematic appraisal of spatial and temporal resolution capabilities of
available airborne and space-borne sensors with respect to their suitability for
hazard categorization and monitoring and to document the advantages and
disadvantages of each.
• To understand the rationale behind the distribution of dynamic resources (staff and
fire equipment within each fire districts) in NSW and critically evaluate their spatial
distribution by/and using the integrated hazard and vulnerability model for
addressing any imbalances in the distribution of such resources.
One of the major overall goals of the study is to develop a fully operational spatial fire
hazard and vulnerability assessment model that contributes to an enhanced conceptual
understanding of hazard/disasters and attempts to bridge the gap between physical
assessment and community vulnerability
6
Integrating RS &. GIS for Urban Fire Disaster Management. Sunil, 1999-2002
Research Questions
Some of the research questions that this research is expected to answer is as follows
.> What is the methodology for developing urban disaster management
systems by integrating remote sensing and GIS data?
.> How can the existing resource planning process be improved by using the hazard model?
.> How can the identification and assessment of hazards and development of
emergency spatial decision support systems assist in urban disaster
management?
Thesis Organisation
Chapter 1 gives a general introduction to the research and describes the background
and justification for undertaking this research. The research objectives and the research
questions are also discussed in this chapter.
Chapter 2 presents a description of some interesting attempts made in the past to
integrate remotely sensed data and GIS. It emphasizes the importance of understanding
the concepts of hazard, risk, vulnerability and disaster, and begins with a brief
explanation between apparently similar, but at times confusing terms of hazard, risk
and disaster. It also describes the importance of fire hazard categorization and the
potential role ofGIS/RS for the study of hazard. The chapter reviews some past studies,
which were carried out using remote sensing and/or GIS in the field of hazard and
disaster management. Practical models developed in this research, which are unique to
this field of risk assessment and analysis is cited along with the original contributions
made by the current research.
7
Integrating RS a: GIS for Urban Fire Disaster Management. Sunil, 1999-2002
Chapter 3 presents selected studies in urban fire hazard monitoring which includes
current national and international approaches to hazard management. The methodology
adopted by the New South Wales Fire Brigades is described, along with a discussion of
the major issues that pose a major challenge to the emergency services in the future.
Spatial and temporal resolution requirements of space borne and airborne data are
discussed with particular reference to the analysis of urban hazard. Data needs for the
research are also discussed in this chapter.
Chapter 4 deals with the management of data and the methodology adopted in this
study. The study areas of Bathurst and Hornsby are introduced along with a discussion
on the data management issues. The main content of this chapter is the methodology for
the fire risk model. The various steps and processes involved in the methodology are
explained in detail along with other important spatial operations such as geometric
intersection and update. The ability of the model to depict different risk scenarios in
different regions by using influences and biases is also explained.
Chapter 5 The potential application of the fire risk model to the existing process of
resource planning and risk assessment followed by the NSWFB, Sydney. The various
types of resources (particularly material resources) are briefly discussed and an
overview of the entire planning process is described. Issues with the existing planning
and decision-making process are discussed and the importance and benefits of applying
the fire risk model to the planning process is discussed in this chapter.
8
Integrating RS ft GIS for Urban Fire Disaster Management. Sunil, 1999-2002
Chapter 6 explains the interpretation of the type of hazards and risks as shown by
various individual hazard related indices. Different hazard maps in Bathurst and
Hornsby, which are generated by the FRM are shown and discussed in this chapter.
Chapter 7 presents the results of the various GIS operations and data analysis and
summarizes the overall achievements of the research. The performance of the models
and their potential application during emergency management is discussed in this
chapter. Advantages of the proposed model and comparisons with the existing
methodology followed by the NSWFB is the main content of this chapter.
Chapter 8 summarizes the achievements of research and describes the scope for using
the FRM, and the need to use it for distributing dynamic resources. The potential
benefits of integrating remote sensing data with GIS for assessing and modeling
hazards in urban environment, is also discussed in this chapter. Since the developed
model depends on available data and data which may be extracted from remote sensing
(airborne or spaceborne) sources, their choice and quality are crucial to the success of
model implementation. The need for further research into the extraction of socio
economic information from remote sensing data is emphasized in this chapter.
Limitations of available data and the potential of future remote sensing systems are also
discussed in this chapter.
The methodology developed in the research has been submitted for publication in
international journals and has also been presented and published in various
international conferences, which focused on GIS/RS applications. A major part of the
thesis and research was derived from two projects, which were carried out, jointly by
9
Integrating RS a GIS for Urban Fire Disaster Management. Sunil, 1999-2002
the University of New South Wales and the Corporate Strategy Division, New South
Wales Fire Brigades. Thus the research was of an applied nature where the main
emphasis was to review existing methodology, and to develop systems to improve the
existing methodology of risk assessment and resource distribution. A quick-look layout
of the thesis is illustrated in shown in Figure 1.
10
Integrating RS 8: GIS for Urban Fire Disaster Management. Sunil, 1999-2002
Chapter 1: General Introduction
Chapter 2: Hazard Monitoring- Review of GISIRS as Tools
Chapter 3: Urban Fire Hazard Categorization and Monitoring
Chapter 4: Data Management and Methodology
Chapter 5: Potential of applying FRM to the Resource Planning Process
I Chapter 6: Fire Risk Model: Interpretation of Risk in Bathurst and Hornsby I
Chapter 7: Results: Advantages of the proposed FRM and comparison with the Existing Methodology followed by NSWFB
I Chapter 8: Summary and Conclusions I
Figure 1 Layout of chapters and contents
11
lntegratfng RS 8: GIS for Urban Ffre Dfsaster Management. SunH, 1999-2002
Chapter 2: Hazard Monitoring - Review of GIS/RS as Tools.
2-1 Introduction
An important source of data, available to emergency services during the management
of disasters is remote sensing of the disaster environment. During emergencies and
disasters, detailed description of natural hazards may not exist and there may be a
limited knowledge on the susceptibility of a certain area to natural hazards. Remote
sensing provides synoptic details about the spatial relationships that exist between earth
features, and by using such information in near real time the effect and impact of a
potential disaster may be reduced. Studies (Verstappen, 1995) addressing the role of
remotely sensed geographic information in mitigating rrinstantaneousrr disasters, such as
floods, have resulted in the following list of potential applications:
)>- To establish the susceptibility ofthe land and vulnerability ofthe society.
)>- To construct maps of potential hazard areas for use in physical planning
(hazard zoning maps).
)>- To monitor potentially hazardous situations and processes, providing
advanced warning.
)>- To improve management of emergency situations following a disaster.
Remote sensing technology has often been used with GIS for many applications.
GIS/RS have over the years exhibited two principal advantages for natural hazard
mitigation and research. First, the technology allows long-term time-series studies and
storage ofthe information, which may prove invaluable in future situations. Secondly,
GIS/RS improves information accessibility. Remote sensing platforms can provide
12
Integrating RS & GIS for Urban Fire Disaster Management. Sunil, 1999-2002
large amounts of data quickly and inexpensively, relative to other means of collection,
and GIS can bring together vast amounts of information from a wide variety of sources
and make the information quickly visible and applicable in emergency situations. Their
combined use in the field of hazard and disaster management should be based on a
clear conceptual understanding of hazard and related terms. A clear and concise
understanding of hazard and related terms of risk and disaster is important before
embarking on hazard related studies and analysis.
2-1.1 Conceptual Issues: Definition of hazard, vulnerability, risk and disaster
The definition of hazard and disaster has been the subject of much debate. Hazard is
seen as a situation, that in particular circumstances, can lead to harm (Royal Society,
1983). This defmition states that hazards are omnipresent phenomena that may occur
anytime and anywhere leading to harmful consequences. Statements about the
probability of occurrence of a harmful event are usually referred to as statements about
'risk' (Handmer and Penning-Rowsell, 1990). Hewitt (1983) states that 'hazard' refers
to the potential for damage that exists only in the presence of a vulnerable human
community. This concept usefully embodies the idea the harmful events, which arise in
hazardous environments, may be reduced by altering the vulnerability of the exposed
population. Most of the above definitions have implied that hazard is a harmful event to
which humans are exposed. However, hazards may also affect the flora and fauna in a
harmful manner. For instance, the leaking of oil from a gas tanker in the ocean can pose
a great hazard to the marine life sometimes endangering near extinct species. Most of
the vulnerability assessment studies are underpinned by a poor appreciation and
understanding of the concept of hazard and disaster, resulting in serious shortcomings
in the emergency preparedness plans. Invariably the spatial context is missing in most
13
Integrating RS a GIS for Urban Fire Disaster Management. Sunil, 1999-ZOOZ
of them, since they are guided by legislative rules and are too hazard focused. This has
been highlighted in a number of articles including (Walker et al. 2000, Bull, 1991,
Farmer, 1997).
A hazard is defined as a potential or existing condition that may cause harm to people,
or damage to property or the environment (Guidelines for Hazardous Activity, 1992).
Hazards are inevitable and normal consequences of human interaction with our natural
and social environments and from our development and use oftechnology. From that
point of view, hazards and economic development go hand-in-hand. With each
progressive step taken by mankind there will be an accompanying component of hazard
and risk. For instance, a nuclear installation will carry a high hazard label due to the
inherent potential of harm that it may lead to in the event of a mishap. Similarly, a
chemical industry or dense commercial center characterized by a high density of
population and structural density will also carry an element of hazard. In other words
hazards are omnipresent phenomena that are an unavoidable part and parcel of our
lives. A hazard is any situation, condition or thing that has the potential to disrupt,
damage or bring loss to things that people value (Boughton, 1998). A 'Hazard' is seen
as a 'situation that in particular circumstances could lead to harm' (Royal Society,
1983). 'Hazard Management' embraces everything from hazard evaluation and
identification through to recovery from a disaster and post-event evaluation or
feedback, and includes emergency planning and management and disaster management.
A certain installation can be seen as a potential hazard if it were to be located in the
middle of a thickly populated town or city as was the case with the Bhopal gas disaster
in India, or Chernobyl nuclear disaster in Russia. On the other hand the same site may
not qualify to be hazardous, if it were to be located far away from habitation. (Hewitt,
14
Integrating RS a: GIS for Urban Fire Disaster Management. Sunil, 1999-2002
1983) states that hazard refers to the potential for damage that exists only in the
presence of a vulnerable human community. There is a relative shift in the intensity of
the effect a hazard can lead ranging from high to low, depending on the number of
people exposed to it.
'Disaster' is often the term given to the harmful event referred to in the definitions of
hazard. Thus, according to Whittow (1980), whereas "a hazard is a perceived natural
event which threatens both life and property - a disaster is the realization of this
hazard". However, Whittow, whose focus is on environmental hazards, excludes man
made events and those events caused by the failure of technological systems, each of
which can cause disaster. Cohen and Ahearn (1980), whose focus on the human victims
of disasters, refer to disasters as extraordinary events that cause great destruction of
property and may result in death, physical injury, and human suffering'. Once again
this defmition excludes environmental disasters. Keller et al. (1990) state that a disaster
is "an event which afflicts a community the consequences of which are beyond the
immediate fmancial, material or emotional resources of the community". Disasters
have also been defined as overwhelming events and circumstances that test the
adaptation responses of communities or individuals beyond their capability, and lead, at
least temporarily, to massive disruption of function for these communities or
individuals. This defmition is useful because it implies that communities have
differential resilience or capacity to respond to disasters. Disasters can be defmed as an
unusual natural or man-made event, including an event caused by failure of
technological systems, which temporarily overwhelms the response capacity of human
communities, groups of individuals, or natural environments, and which causes massive
damage, economic loss, disruption, injury and/or loss of life. This definition
15
Integrating RS ·& GIS for Urban Fire Disaster Management. Sunil, 1999-2002
encompasses medical accidents and disasters such as those, which have arisen from the
negative affects of whooping cough, vaccine, and HIV I AIDS haemophiliac cases.
Risk on the other hand is a concept used to give meaning to 'things, forces or
circumstances' that pose a danger, whereas 'hazard' is 'something' with the potential to
produce harm. 'Risk' is sometimes taken to be the same as 'hazard' but risk has the
additional implication of the chance of a particular hazard actually occurring. A hazard
may be defined as 'a potential threat to humans and their welfare' and risk as 'the
probability of hazard occurrence'. The distinction can be drawn by the following
example - two people are crossing an ocean, one in a liner and the other in a rowing
boat. The hazard (death by drowning) is the same in both cases but the risk (probability
of drowning) is very different. If the drowning actually occurred, it could be called a
disaster. So a disaster may be seen as 'the realization of a hazard'. Disasters results
when the interaction of a hazard and vulnerability is such that the community cannot
reasonably cope with the results using its societal and materials resources (Stenchion,
1997).
2-2 Need for Modelling Hazards
Hazards are multi-dimensional, multi-disciplinary and intrinsically complex
phenomena caused by a large set of factors, which have a strong spatial component
(Coppock, 1995). The distribution of latent and realized demand of fire hazards
(structural, property and vegetation) clearly indicate a spatio-temporal irregularity that
needs to be understood in order to improve emergency preparedness for disaster
mitigation. Fire hazard categorization is a system of measuring and recording hazards,
which leads to the understanding of these spatio-temporal variations. However, current
16
Integrating RS ft GIS for Urban Fire Disaster Management. Sunil, 1999-2002
in-situ methods, to categorize hazards, are beset with problems. Some critical issues
are, for example, being too hazard focused, lacking currency, and most importantly
lacking an adequate theoretical base. There is a need to develop a semantic model that
provides a solution to the above issues, which at first acquires spatial data in real time,
and then is input to a GIS for hazard and vulnerability assessment. A model can
simplify complex events by helping to distinguish between critical elements and noise.
This is particularly useful in a high-pressure disaster response environment, when there
is little time to think about issues or to identify critical issues. A model can lead to
better understanding of the current situation and the processes, which are responsible
for the evolution of a disaster. A model of the disaster process will enable
quantification of disaster events, which in turn is a key element in the reduction of the
complexity of disasters (Kelly, 1999).
However, a major component of such a model will be heavily reliant on data that may
not be available in digital form or have not been spatially referenced. Given the
dynamic and complex nature of hazards, modeling such a database in real time is
currently the greatest need.
The synergism of GIS/RS technology can result in faster and synoptic acquisition of
spatia-temporal data and its subsequent analysis, in order to model hazard and
vulnerability assessment, since they both involve spatially-referenced digital data. At
the wider regional scale, remote sensing can reduce the manpower requirements of
mapping projects by several orders of magnitude, with corresponding increases in the
speed of map compilation (Alexander, 1995). GIS has potential for use in emergencies,
when "real time" - generated maps can show the way to points of major impact and
17
Integrating RS ft GIS for Urban Fire Disaster Management. Sunil, 1999-2002
indicate the viability of route ways and other lifelines for relief and aid (Dymon, 1994).
It has excellent potential in modeling, or simulation (ANU, 1994), emergency planning
(Watson, 1992), and logistic research (Hodgson and Palm, 1992). Due to its versatility
and ability to integrate diverse types of information, a GIS can be a valuable tool in
development, monitoring and update of a hazard mitigation plan (USAID/OAS
Caribbean disaster mitigation project, 1993).
The current study examines the potential benefits of integrating high spatial high
resolution remotely sensed data in the form of colour aerial-photo-images and the
recently launched commercial satellite IKONOS, which has a spatial resolution of 1
metre in the visible range and 4 metres in the in the visible and near infrared (multi
spectral), with cartographic GIS data, for developing a hazard and vulnerability
assessment model. It evaluates the existing methodology of categorizing fire hazards in
NSW, Australia and argues for a better understanding of the concept of hazard and
vulnerability and disaster. Going further, the study demonstrates the construction of a
model, which integrates image data, and available cartographic GIS data, and by
employing an expert classifier approach, attempts to explain the spatio-temporal
distribution of hazard and vulnerability in diverse landscapes. The model is developed
using high spatial resolution airborne remotely sensed data with GIS leading to a
critical and systematic appraisal of both sources of data and their suitability for hazard
categorization and monitoring, as part of the model development process.
An immediate benefit from such a model is the systematic and automatic generation of
hazard categories in diverse landscapes, whereas long term benefits will assist the
18
Integrating RS a: GIS for Urban Fire Disaster Management. Sunil, 1999-2002
decision making process, particularly for improving the allocation and distribution of
dynamic resources within fire districts.
2-3 Hazard Monitoring, Assessment and Analysis
Hazards are complex and vary greatly in their frequency, speed of onset, duration and
area affected (Coppock, 1995). Throughout history, urban hazards and disasters have
included a mix of natural, technological and social events. Although scientists and
professionals might wish to classify different hazardous phenomena into one of these
categories for purposes of analysis and management, the reality is that city dwellers do
not make such fine distinctions (Mitchell, 1999). Understanding the very complex
processes that lead to hazards and disasters requires a multi-disciplinary approach, and
coping with them require access to spatially referenced data from a wide variety of
sources, at different scales, resolutions and reliability, and often over time, and analyses
of such data in four dimensions (Coppock, 1995). It is vital to model these events in
order to systematically understand and unravel the underlying complex physical and
social processes. In a joint project carried out in the Caribbean (which is a region
subject to multiple hazards), by the Organization of American States (OAS) and the US
Agency for International Development (USAID) a simple but effective approach was
demonstrated to model hazard and vulnerability. The main aim of the project was to
reduce vulnerability to natural hazards throughout the region. A planning process was
evolved through which the risk and susceptibility associated with areas hazards were
analysed and the information was used to mitigate hazard and vulnerability in the
region (USAID/OAS-Caribbean disaster mitigation project, 1993).
19
Integrating RS 8: GIS for Urban Fire Disaster Management. Sunil, 1999-2002
Another simple example of a modelling process is given by (Ahearn and Chladil,
1999). They examined the relationship between the edge of the bush and house losses
using data from two large fires: the Hobart bushfire of 1967 and the Otways in 1983.
Black and white aerial photographs were used to determine the vegetation boundary.
The photographs were first registered in the mapping package. The distance from each
destroyed house to the vegetation boundary was then measured along the appropriate
wind direction for each location. The study showed the relationships between houses
burnt in bushfires and the distance they stand from vegetation boundaries, which could
be used to reduce risk in other hazard prone areas.
A place becomes prone to hazard over a period of time mainly due to economic
progress, which alters existing spatial arrangements in a manner that adversely affects
the provision of equitable emergency service, and demands more resources, or
maximization of resources than before. In order to understand the increase in hazardous
regions it is essential to monitor these spatio-temporal changes at regular intervals. Key
observations made will provide much needed information to disaster managers and
planners who can unravel the complexities associated with the risk planning.
Monitoring the spatio-temporal changes can be achieved by several, means such as in
situ field survey methods, where trained staff examine the structures on the earth
surface and assess their relative degree of hazard. Recently due to technological
advancements made in the field of GIS/RS, it is easier and faster to detect and measure
such changes by using remotely sensed images either from space borne or airborne
sensors. This is particularly relevant to hazard categorization and its spatial distribution
which are explained as follows.
20
Integrating RS ft GIS for Urban Fire Disaster Management. Sunil, 1999-2002
At least four basic types of scientific information are necessary to construct an effective
disaster reduction program: Information about risks, exposure, vulnerability and
responses. Hazard identification is the first and most important step in any hazard
analysis and involves the identification of all possible conditions that could lead to a
hazardous incident. The comprehensive and systematic identification of all hazards is
critical to the success of the hazard analysis (Guidelines for Hazard Activity, 1992).
Hazard identification is the essential foundation upon which all risk assessment is
based. Vulnerability assessment combines the information from hazard identification
with an inventory of the existing or (planned) property and population at risk. It
provides information on who and what are vulnerable to a hazard within the
geographical areas defined by hazard identification and can estimate damages and
casualties that will result from various intensities of the hazard (Burby et al. 2000). Fire
hazard categorization helps in identifying and assessing the vulnerable and susceptible
regions that have a potential for disaster in varying degrees. Hazards differ from place
to place due to variations in the land-use, structural density patterns, population density
and demographic indices to name a few contributing factors. Land-use is one of the
fundamental indicators of this variability of fire hazards. For instance a dense
commercial region will pose a different level of hazard, when compared to a residential
or industrial region.
One of the main objectives for generating fire hazard categories is to understand this
spatia-temporal variation. Hazard categorization permits the measurement, recording
and meaningful translation of these geographic variations for each spatial unit and
enables an overall understanding of prevalent hazard in a region. Hazard categorization
enables the comparison of hazard in one region to that of another and consequently
21
Integrating RS 8: GIS for Urban Fire Disaster Management. Sunil, 1999-2002
assists in the allocation of dynamic resources. It also helps in visualizing the spatia
temporal patterns of hazards, which would otherwise be difficult to comprehend. When
combined with demographic data and other derived hazard related information, hazard
categories can be used for complex analysis, which will be a major input to disaster
management. One of the key outcomes of hazard categorization is risk assessment for
emergency management.
Hazards may be categorised into different levels according to the spatial distribution of
factors, which influence them. Since an understanding of risk includes the physical and
human attributes, therefore categories of hazard must be based on a combined analysis
of these factors/attributes. Hazard categories may also vary depending on the landscape
and region. For instance, in an urban environment major hazard categories may be
determined by variables such as land-use, structural density, population density, type of
structures and other factors whereas in a region covered by bushes and vegetation the
categorisation will be based on other factors.
2-4 Remote Sensing and GIS in Disaster Management
Remote sensing technology and geographic information systems are both tools for
managing spatially distributed information in large quantities and at a variety of scales.
Both provide a systematic view of spatial information. Both increase the capabilities of
human decision-makers and planners to grasp relationships at larger scales and in more
complex settings than was ever possible (Ehlers, 1993). The use of GIS/RS can play an
important role since they can provide information on the extent of disaster within a
relatively short period of time and they are of extreme importance in obtaining the
22
Integrating RS 8: GIS for Urban Fire Disaster Management. Sunil, 1999-2002
necessary data to make an evaluation of the hazard, vulnerability and risk, if combined
with other types of cartographic data (Westen van, 1993-4).
Remotely sensed data are inherently suited to provide information on urban land cover
characteristics related to ecological, demographic, socioeconomic, and dynamic aspects
of developed regions at various spatial and temporal scales (Ridd, 1995). Remotely
sensed data is in most cases the only data source, which may make a real time
information system possible (Zhou, 1995). Remotely sensed data, can be put to their
best use if they are incorporated to a GIS which is designed to accept large volumes of
spatial data, derived from a variety of sources, including remote sensing, and to
efficiently store, retrieve, manipulate, analyze, and display these data according to user
defined specifications. All GIS are dependent on the availability of spatially referenced
data whose use, for purposes other than those for which they were collected, will be
enhanced by the systematic appraisal of such sources in respect of both locational
precision and the characteristics of the attribute data, and by the adoption of standards
for data transfer.
Land is a dynamically changing entity. For example, rivers change course, forests are
cut, roads and houses are built. Consequently, our information stored in a GIS is only a
static model of the real world at a particular instant in time that has to be updated on a
regular basis. Satellite data, on the other hand, offer repetitive, synoptic, and accurate
information of the earth's surface, and, as such, offer the potential to monitor these
dynamic changes within a GIS. A GIS, therefore, when combined with up-to-date data
from a remote sensing system, can assist in the automation of interpretation, change
detection, map compilation, and map revision functions. One major part of a GIS is the
23
Integrating RS 8: GIS for Urban Fire Disaster Management. Sunil, 1999-2002
ability to overlay various layers of spatially referenced data. This allows the user to
determine graphically and analytically, how structures and objects (for example roads,
water distribution, community zoning) interact with one another (Ehlers, 1993).
If disaster reduction efforts are to succeed, urban leaders and managers need to have a
better understanding of the potential for these kinds of intersecting issues to emerge,
and the probability that some kind of combinations may be especially felicitous for the
adoption of innovative disaster reduction measures. The sustainability of cities in the
face of disaster is as much a function of enhancing institutional behavioral capacities to
deal with uncertainty as it is an outcome of material investment in hazard management
technologies and physical infrastructure (Mitchell, 1999).
Many applications using remote sensing imagery (airborne and space borne) have been
carried out to study different types of natural hazards, in different geographic regions.
Applications of remote sensing in natural hazard studies are characterized by different
objectives and therefore were unique to each other with respect to the resolution
characteristics required, and the scale of details. Therefore the choice of remote sensing
data was guided by the objectives and purpose of each study. Applications using
remote sensing data and GIS range from assessment of atmospheric, earth,
technological and many other types of hazards. Some selected studies which have used
remote sensing and GIS data are discussed briefly, as follows, to illustrate the benefits
of these tools, and to underpin the argument for their beneficial application in urban
and near urban fire hazard monitoring and management.
24
Integrating RS ft GIS for Urban Fire Disaster Management. Sunil, 1999-2002
2-4.1 Weather hazards
Of all the natural hazards, which threaten human society, those caused or facilitated by
weather extremes are the most common (Smith et al. 1996). On a worldwide basis,
relatively few people are directly exposed to geologic hazards (e.g. earthquakes or
mass movement ofthe earth's surface) everyone however is exposed to the variability
ofweather and climate.
2-4.1.1 Hurricanes, cyclones and storms
One of the earliest uses of satellite remote sensing was for locating and tracking
hurricanes, because of the ease by which these large systems could be observed from
space and because of the importance of providing advance warning on their potential
landfalls. A combination of Landsat Thematic Mapper, SPOT, aerial photography,
existing maps, and field surveys were incorporated to evaluate the damage to renewable
resources in Thailand by Typhoon (Hurricane) Gay in November 1989. This successful
study estimated that over 250,000 hectares of agricultural lands were damaged, and
over 38,000 homes were destroyed. The results of this damage evaluation were used in
post -disaster resource allocation (Omakupt, 1992).
In 1989 Hurricane Hugo caused extensive damage to forest cover when it came ashore
in southeastern U.S.A. A change detection analysis based on 1987 and 1989 Landsat
Thematic Mapper imagery determined that over 90,000 hectares of forest were
seriously affected near Charleston. In the entire state of South Carolina, it was
estimated, using remote sensing and field surveys, that 36% of the forested lands,
1,800,000, hectares, worth over a billion dollars, were damaged (Remion, 1990).
25
Integrating RS 8: GIS for Urban Fire Disaster Management. Sunil, 1999-2002
Zerger (1998) developed a methodology to model risk arising out of storms, by using
geographic information systems. The study examined the potential of uncertainty
modelling methodology for using digital elevation models for inundation modelling.
Results show that a relatively simple risk modelling methodology may support the
decision making process.
(Sunil et al. 2001) demonstrated the use of high spatial resolution ortho rectified broad
band aerial photo images sensors for risk assessment and vulnerability mapping in a
section of the Central Business District of Hornsby Shire, NSW, in Australia. By
performing a supervised classification and spatial analysis in a GIS environment an
ortho rectified colour RGB composite image was used to map roof types with varying
degree of resistance, which may be susceptible to future hail storm damage. A
methodology to design such a model in near real time and the potential of this database
for dynamic resource allocation was described in this paper.
In another study carried out for the New South Wales Fire Brigades and linked to the
current research, (Bhaskaran and Datt, 2000) used airborne hyper-spectral and GIS data
for developing a spatial emergency decision support system. The hyperspectral data
was found to be suitable for urban area analysis where the main emphasis was to detect
and distinguish spectrally dissimilar roof types on a large scale in an image pixel. A
spectral library from field samples as well as laboratory samples were analysed using a
FR (full range) field spectra-radiometer. A vulnerability map was generated by a
supervised classification method, which was integrated with census and available GIS
data to develop a spatial emergency decision support system (SEDSS) for the NSWFB
(see appendix I for full technical report). Such information can be used with the current
fire hazard research to develop total urban hazard models.
26
Integrating RS 8: GIS for Urban Fire Disaster Management. Sunil, 1999-2002
The post disaster problems associated with the hazard of rainstorms in 1998 were
assessed by a geo-technical team in the city of Wollongong, Australia. The team
employed Hazard-Consequence Matrix based Risk Assessment approach, in
accordance with the AS/NZS 4360:(1995) Risk Management Standard, which was
adopted for the qualitative risk assessment work (Flentje et al. 1999). A description of
urban hail damage modeling carried out at the Natural Hazards Research Centre,
Macquarie University was summarized in the paper titled 'Hailstorm risk assessment
in New South Wales' (McMaster, 1999). The NHRC hail data set for Sydney, one of
the few hail data sets in the country was used with the hailstorm climatology for the
Sydney region, to model urban hail damage. A reasonably reliable, regional risk
assessment of losses due to this natural peril was developed. The results of these
investigations created an ideal starting point for a more quantitative risk assessment and
insurance-industry-oriented, loss modeling of these phenomena Leigh and Kuhnel
(1999). In yet another study on hailstorm risk assessment in rural New South Wales
three data sets (severe thunderstorm, phenomena and crop insurance datasets) were
used to determine the relative risk of hail damage in the various weather forecasting
districts of New South Wales. However, data inconsistency posed some limitations to
this study (McMaster, 1999).
2-4.2 Geologic hazards
2-4.2.1 Landslide hazard mitigation
Landslides are mass movements of rock and unconsolidated materials such as soil,
mud, and volcanic debris. Landslides are caused by mass movement of bedrock and
unconsolidated materials, which result in different types of slides, magnitudes, and
27
Integrating RS 8: GIS for Urban Fire Disaster Management. Sunil, 1999-2002
rates of movement. Some large landslides may be detected by remote sensing imagery
but smaller landslides, which are more :frequent, cannot always be detected. Sinkholes,
which are a form of circular collapse landslide, may be detected in Karst topography by
satellite imagery such as Landsat MSS, Landsat TM, and SPOT, due to their pitted
appearance and evidence of internal drainage. The spatial resolution required for the
recognition of most landslide features is about 10m (Richards, 1986). Detection of
landslide features is more easily achieved using airborne sensors because of their better
spatial resolution. Aerial photographs can normally be used to detect both small and
large landslide features. The more recent launch of high resolution satellite remote
sensing systems (better than 1 metre spatial resolution) will now allow satellite data to
be more widely used, even for small landslides.
The rapid growth of many cities in the developing world, especially in the tropics, has
resulted in the increased incidence and severity of urban environmental hazards, such
as slope failure and flooding. This problem was investigated by Smyth and Royle
(2000) and they concluded that the use of GIS can facilitate the study of
physicaVenvironmental factors and human land-use activities, which may all, lead to
the mitigation ofurban landslide hazards.
In a paper entitled "Embedding a Geographic Information System in a Decision
Support System for Landslide Hazard Monitoring", Lazzari and Salvaneschi (1999)
presented an application that exploits a geographic information system as a :front end of
a complex information system supporting the management of landslide hazard in
Valtellina, an alpine valley in Northern Italy. (Barreda et al. 2000) carried out a GIS
based study to evaluate the mass movement hazard in Spain's Canaria Islands. This
study used two different types of knowledge driven approaches: a direct method and an
28
Integrating RS 8: GIS for Urban Fire Disaster Management. Sunil, 1999-2002
indirect method. In the direct method very detailed geomorphologic mapping was
carried out, using uniquely coded polygons, which were evaluated one-by-one by an
expert to assess the type and degree of hazard. The indirect method followed an
indexing approach. Parameters including slope angle, landslide activity, landslide
phases, material, proximity to drainage channels and reservoirs, and land use change
were combined using multi-criteria evaluation techniques.
2-4.2.2 Earthquakes
The application of remote sensing to the hazard of earthquakes is limited in the sense
that earthquakes cannot generally be predicted. However the faults associated with the
tectonic activity, which is the major cause of earthquakes, can be frequently identified
on satellite imagery. However, in order to identify earthquakes it is necessary to have
the expertise to recognize them and then determine the correct remote sensing tools to
best delimit them. Landsat imagery has been widely used for detecting faults. Airborne
radar mosaics, multispectral imagery obtained from the Landsat TM and I or MSS or
SPOT HR.V sensors have also been successfully used for delineation of fault zones.
In their article titled "Photogrammetry and geographic information systems for quick
assessment, documentation and analysis of earthquakes", (Altan et al. 2001) combined
remote sensing data with GIS data in order to carry out a quick assessment of disaster
caused by earthquakes. The aim of this study was to make an improvement, using a
combination of GIS as a management and data analysis tool, and photogrammetry as a
documentation method. It was demonstrated that by combining rapid data acquisition
and GIS a quick and holistic assessment of a post disaster situation could be made.
29
Integrating RS ft GIS for Urban Fire Disaster Management. Sunil, 1999-2002
2-4.2.3 Volcanoes
Many hazards are linked to a volcanic explosion, which may have long term as well as
short term affects. For instance, the immediate destruction of structures which may lie
in the vicinity of the eruption, the pollution caused by the smoke and soot released
during an eruption, break out of diseases, and the breakdown in infrastructure and
normal life. Predicting an earthquake is almost impossible due to the limited knowledge
of tectonic activity so that satellite imagery may have only limited application in the
identification of volcanic eruptions.
Volcanic eruptions can present unpredictable hazards to populations living within
regions containing potentially active volcanoes and for people travelling in jet aircraft
that intersect ash-laden eruption clouds. Methods of monitoring volcanic activity
include searching for variations in the thermal signal from active fumaroles, lava
domes, lava lakes, flows, and other features. Over many active volcanoes in the
Western Hemisphere, low spatial resolution ( 4 km/pixel) weather satellite data acquired
every 15 minutes are used to identify changes in eruptive activity, but are of
insufficient spatial resolution to map active volcanic features.
In a study of volcanoes by (Luke et al. 2001) used the Enhanced Thematic Mapper Plus
(ETM+) on Landsat 7 to monitor active volcanoes at a higher spatial resolution (15- to
60-m pixels). They were able to map lava flow fields, trace very high temperature lava
channels, and, at Lascar volcano, identify an arcuate feature associated with a collapsed
crater floor, a phenomenon that may precede explosive activity. With improved spatial
resolution in the thermal IR, they were able to map the bifurcation and braiding of
underground lava tubes at Kilauea. Identifying these tube locations and tracking their
30
Integrating RS ft GIS for Urban Fire Disaster Management. Sunil, 1999-2002
extension were considered important because, for a given volumetric lava production
(effusion) rate, tube-fed flows can extend a much greater distance than surface flows.
(Pareschi et al. 2000) in their paper "GIS and Volcanic Risk Management" presented a
methodology to link GIS with remote sensing technology and
telecommunications/warning systems, for a decision making process. In their paper the
role of GIS in risk management is discussed, keeping in mind the different volcanic
scenarios of effusive and explosive phenomena. The GIS data base included satellite
images, digital elevation models, volcanic hazard maps and vector data on natural and
artificial features (energy supply lines, strategic buildings, roads, railways, etc). The
GIS was planned for
a) Volcanic risk mitigation (hazard, value, vulnerability and risk mapping),
b) to provide suitable tools during an impending crisis, and
c) to provide a basis for emergency plans.
A GIS was also used to assess risk to people and property from lava flow hazard in the
Vesuvian area of Italy. Lirer and Vitelli (1998) used a lava flow hazard map overlain
on a land use map, and to extract spatial and numerical information on a land-use map
to extract spatial and numerical information on risk.
2-4.3 Technological and industrial hazards
The analysis of technological and industrial hazards has received a considerable
amount of attention during the past two decades, with researchers focusing on specific
problems such as airborne toxic releases (Cutter, 1987), the emergency, management of
chemical spills (Gould et al. 1988), regional evacuation analysis (Cova and Church,
31
Integrating RS a: GIS for Urban Fire Disaster Management. Sunil, 1999-2002
1997), and the assessment of community vulnerability to hazardous contaminants
(McMaster 1990; Chakraborty and Armstrong 1999; Lowry et al. 1995).
Weinstein et al. 1995, in a paper titled "Fire Growth Modelling in an Integrated GIS
Environment" developed a fire simulation application FIRE!, which integrates state of
the art fire behaviour modelling into the Arclnfo GIS environment. The model's user
interface was designed so that advanced computer and GIS skills are not required for
model execution. The model puts the power of comprehensive fire behaviour prediction
into the hands of qualified, on-the-ground resource managers, where it can be most
effectively applied.
2-4.4 Environmental hazards
There have been a few studies that integrated RS/GIS directly in the area of
hazard/disaster management such as that by (Tappan et al. 1991) where grasshopper
and locusts habitats were monitored in Sahelian Africa using GIS and remote sensing
technology. An environmental sensitivity index (ESI) mapping for oil spills using
remote sensing and geographic information system technology was carried out by
Ferrier (1999) who performed hyperspectral analysis to identify ferruginous materials,
which are left out after mining, These ferruginous materials often contain trace
elements that are environmentally harmful and possibly toxic. The distribution of the
ferruginous materials identified from the imaging spectrometer data supported the
results of laboratory experiments on the dependence of the formation of iron species on
their geochemical and physical situation.
32
Integrating RS 8: GIS for Urban Fire Disaster Management. Sunil, 1999-2002
2-4.5 Fire hazards
2-4.5.1 GIS/RS for forest/grass fires
The diversity of factors affecting the occurrence and spreading of wildfire necessitates
an integrated analysis approach. Some of these factors also have importance for urban
fires. Modern space technology together with Geographic Information System (GIS)
application can provide a very useful support for the fire control and analysis.
Garner (1989) demonstrated that geospatial technologies such as satellite imagery,
global positioning systems, and geographic information systems have the potential to
identify, inventory, and map the risk posed by wildfire to residences in the wildland
urban interface. In his project the following spatial models were developed which
generated: threat matrix, suppression matrix, and risk matrix. When combined, these
matrixes produced a predictive model of wildfire risk to rural residences in northwest
Arkansas. Four interim computer models for risk assessment were developed for this
study: access potential, ignition potential, fuel potential, and response potential. These
models have the potential to assist local volunteer firefighters and natural resource
managers to better assess the risks and hazards threatening rural landowner's property.
These computer models could also be quickly updated as more detailed and timely
information became available (Garner, 1989). This was also the major thrust of a paper
by De Fusco et al. (1992) which dealt with the applications of both GIS and satellite
remote sensing techniques, developed within the framework of Italian Space Agency -
Telespazio project for the implementation of a prototype system for forest fire
management.
33
Integrating RS &. GIS for Urban Fire Disaster Management. Sunil, 1999-2002
In a study carried out by Cartalis and Chrysoulakis, (2000) the potential of
NOAA/A VHRR was demonstrated in the detection of fires caused by industrial
accidents in Lyon, France and Kalohori, Greece.
Epp and Lanoville (1996) developed a method of analysing remotely sensed data, a
geographic information system, and an intelligent fire management system to provide
integrated resource data for fire and other resource management. Natural and cultural
features were digitised from 1:50,000 topographic maps using a geographic information
system (GIS) to cover the 29 communities below the tree line in the Western Canadian
Arctic. Landsat Thematic Mapper data covering the same area were classified into
landcover or fuel types. Detailed information on each fire such as location, area burned,
date of discovery, fire number, fire zone, fire class and source of ignition was obtained
and added to each map sheet as attribute data. A generalized vegetation cover map
using NOAA AVHRR data was used in this study. All these data were combined to
develop an intelligent Fire Management Information System (IFMIS) that integrates
relational data-base, geographic information display, and expert systems. (Smith et al.
1999) also demonstrated the use of NOAA-AVHRR remote sensing data for fire
management in Australia's tropical savannas. Monitoring of fires on a regional scale is
undertaken using the NOAA-A VHRR satellite data to develop sustainable management
methods. The areas burned by forest fires are launched and posted on the world-wide
web. Upon the completion of the fire season, this information is put into a GIS, which
has fire area information from regular periods. By providing near real time information
to land managers the utility of satellite data on a regional scale was highlighted.
In yet another study carried out by Siegert and Hoffi.nann (2000), which used high
resolution, multitemporal ERS-2 SAR images and NOAA-A VHRR Hotspot Data were
34
Integrating RS ft GIS for Urban Fire Disaster Management. Sunil, 1999-2002
used for a quantitative evaluation of forest fires in East Kalimantan, Indonesia; This
paper describes the results of the combined synergistic use ofNOAA-AVHRR hotspot
data and multi-temporal ERS-2 SAR images for burned scar mapping in the province of
East Kalimantan. Burned areas detected by ERS were verified using A VHRR data and
extensive field surveys during the fire season in April 1998. Furthermore, a vegetation
classification discerning five classes was derived from the ERS-2 SAR images and
compared to the mapped burned scars. The total burned area of the test site was
estimated to be 1.3 mil ha out of 1.85 mil ha (71 %).
The most common approach used in risk assessment is to classify vegetation into fuel
classes then combining this information through a GIS with collateral information such
as slope, aspect, elevation and fire history to assess hazard or fire spread . Some
examples of research using this approach can be found in Chuveico and Congalton
(1989); Cosentino et al. 1981; Burgan and Shasby, 1984; Yool et al. 1985; Chuvieco
and Salas, (1996).
Kushla and Ripple (1998) evaluated the utility of Landsat Thematic Mapper imagery to
map forest survival after a wildfire using a single-date and multi-date TM imagery.
regressions of TM band transformations were used to estimate forest survival. Single
date TM 4/5 accounted for 73% (P<0.0001). The pre-fire landscape had a matrix of
closed mature/old growth stands comprising 77% of the area. The study found that
overall habitat diversity and edge diversity increased after the bum, but interior habitat
decreased. By using Landsat TM data foresters can assess the effects of larger wildfires
more quickly and more cheaply than the interpretation of aerial photography.
35
Integrating RS 8: GIS for Urban Fire Disaster Management. Sunil, 1999-2002
The relationship between fuel conditions and fire ignition and spread can be understood
by considering meteo-climatic parameters. Weather variables, such as precipitation,
temperature, wind speed and direction, are used to determine fire risk by means of
various indices, which take into account the actual meteorological conditions as well as
recent climatic history affecting fuel moisture (Martellaci et al. 1993). The application
of satellite technology to dynamic risk evaluation is still in the pre-operational stage,
while static fire risk maps are already commonly used in fire defence activities. These
products allow the estimate of fire occurrence probability, combining natural and
human parameters, in order to classify the region of interest in terms of different fire
hazard levels (Chou et al. 1993)
Nancy et al. (1999) found that Radarsat imagery collected at incidence angles similar
to ERS-2 result in a similar, relatively bright backscatter from the fires scar, while
backscatter from Radarsat image collected at a higher incidence angle is relatively dark.
Model results confirm that incidence angle is critical in determining the relative
brightness of the backscatter from fire scars. These results have implications when
looking at broad-coverage SAR images, which span a large range of incidence angles
from near to far range.
Research was carried out by Riafio et al. (200 1) a spectral mixture analysis (SMA),
from Airborne Visible/Infrared Imaging Spectrometer (A VIRIS), was used to
understand regeneration patterns after fire in two semiarid shrub communities of the
Santa Monica Mountains, California: northern mixed chaparral and coastal sage scrub.
Two fires were analysed: the Malibu Topanga fire (3 November 1993) and the
Calabasas fire (21 October 1996). SMA was compared to the results ofthe Normalized
Difference Vegetation Index (NDVI) to assess vegetation recovery. An unburned
36
Integrating RS & GIS for Urban Fire Disaster Management. Sunil, 1999-2002
control plot (within the past 20 years), having similar environmental features, was used
to generate two relative fire regeneration indices, Regeneration Index (Rl) and
Normalized Regeneration Index (NRI). Indices were calculated using the Green
Vegetation (GV) endmember and the NDVI. These indices were determined to be
largely independent of A VIRIS radiometric calibration uncertainty, minor errors in the
atmospheric correction, topographic distortions, and differences in the phenological
state of the vegetation because of interannual or seasonal differences. The temporal
evolution of the two fires were combined to produce a longer observation period and
used to fit a logarithmic regression model for each Mediterranean shrub community.
The NRI developed from the GV endmember (NRIGv) produced the closest estimate
for the time of recovery in both communities based on recovery times in the literature.
The use of NDVI worked very well for recovery in the northern mixed chaparral, but
was less successful in the coastal sage scrub, mainly because of extensive herbaceous
cover during the first years of the regeneration process. Endmembers generated from
hyperspectral images were more accurate because they are tuned to capture the
greenness of the shrub type of vegetation. Use of matching plots having similar
environmental features, but which were burned in different years were demonstrated to
improve estimates of the recovery within each community.
In a study carried out by Giri and Shrestha (2000) Landsat Thematic Mapper TM was
found to be extremely useful for accurate delineation and demarcation of burnt areas in
the Huay Kha Kheang Wildlife Sanctuary of Thailand. A high overall accuracy was
achieved which underlines the importance of remote sensing in determining forest fire
boundaries on a large scale.
37
Integrating RS B: GIS for Urban Fire Disaster Management. Sunil, 1999-2002
2-4.6 Risk management in urban areas
Risk is the outcome of the interaction between hazard phenomena and the vulnerable
elements at risk (the people, buildings and infrastructure) within the community
(Granger et al. 1999). In this project extensive use of GIS was made to carry out
analysis and assessment. Risk GIS as it has been christened in the cities project, is a
fusion of the decision support capabilities of GIS and the philosophy of risk
management. Total risk assessments for each of the hazards, earthquake landslide,
flood, destructive cyclonic wind and storm tide, were constructed to give total risk
profiles for Cairns, taking into account the vulnerability of the whole community as
well as the suburb-by-suburb risk for that hazard.
In the paper entitled "Risk management in the Fire and Emergency Services" (Smith et
al. 1996) the responses of the County Fire Authority (CF A) are examined, and a
broader agenda for risk management within the fire and emergency services sector in
Australia is proposed. It was argued that recognizing incident response represents only
part of the process of managing community risks and combined with significant
changes to the operating environment and fire and emergency service provides, poses
considerable pressures for change and creativity within the fire and emergency services
sector.
Remotely sensed data are inherently suited to the provision of information on land
cover characteristics related to ecological, demographic, socio-economic, and dynamic
aspects of developed regions at various spatial and temporal scales (Ridd, 1995). Many
studies, which integrated GIS/RS, especially in the field of natural resource
management/urban studies (which is quite similar to the field of hazard and disaster, if
38
Integrating RS 8: GIS for Urban Fire Disaster Management. Sunil, 1999-2002
one leaves out the aspect of urgency in hazards), have been undertaken successfully
(Forster, 1980, 1983; Gong and Howarth 1990a,b; Jensen, 1993; Kam, 1995). Some
further examples are provided as follows.
Uta Hieden et al. (2001) used airborne hyperspectral sensor data for an automated
material-oriented identification of materials. A combined classification and unmixing
approach is applied which was developed for the analysis ofhyperspectral DAIS 7915
data. The result shows the great potential of hyperspectral HyMap data for automated
material-oriented identification of urban surfaces.
In his article entitled "Monitoring of hazards and urban growth in Villavicencio,
Columbia, using scanned air photos and satellite imagery" Nossin (1999) presents a
method to monitor the development of geomorphic hazard affecting urban areas by
overlaying time series of airphotos in a digital image processing system. The paper
describes a methodology where natural hazards affecting an urban area can be
identified and monitored by the use of remote sensing techniques and digitised air
photos. He also demonstrated that a quantification of the urban areas affected by
hazards, and of the growth of the urban area, is possible. Altan et al. (2001) looks at the
important problem of providing shelter and housing for the homeless. Focus on
improving the information systems using Geographic Information Systems (GIS) and
photogrammetry are described in this article.
Gao. J and Skillcom (1998) demonstrated the capability of SPOT XS data in producing
detailed land cover maps along the urban rural periphery. Two images, one recorded in
summer and another in winter, were critically evaluated for generating detailed land
cover maps. A supervised classification using the maximum likelihood classifier
39
Integrating RS 8: GIS for Urban Fire Disaster Management. Sunil, 1999-2002
approach was employed to generate 1 0 categories of land use by using the Anderson
classification. Foresman and Millete (1997) described the use of Landsat, which was
integrated to derive land-use and other spatial data for regional planning of 25 towns in
Vermont. More recently Ambrosia et al. (1998), carried out real time data transfer of
thermal line scanner data from an airborne platform via a cellular data phone
transmission, and near-real time map integration and development was demonstrated
using portable uplink/downlink systems to move data and asset information (such as
vehicle and personnel location) to a fire camp and a disaster control center. Kam (1995)
also undertook an urban land-use study in Brunei, using an image analysis filtering
spatial model to integrate image analysis with the GIS.
2-4.7 Remote Sensing and GIS for other studies
Wiesmann et al. (2001) demonstrated the potential of synthetic aperture radar (SAR)
and InSAR for forest storm, flood and avalanche mapping. In their methodology,
process models were used to describe the targets before, during or after the hazard
event. Results from the study showed good potential of multi-temporal SAR and
InSAR for hazard mapping.
The importance of suitable data and appropriate handling were highlighted in the study
by Thomson and Hardin (2000) titled Remote sensing I GIS integration to identifY
potential low-income housing sites. The study reviewed the development of remote
sensing and geographic information system (GIS) techniques for urban analysis. It then
applies these techniques to evaluate several types of planning related information in a
raster based (GIS) to identifY potential low income housing sites in the eastern portion
of Bangkok Metropolitan Area, Thailand.
40
Integrating RS 8: GIS for Urban Fire Disaster Management. Sunil, 1999-2002
Chakraborty and Armstrong (1999) developed a methodology and demonstrated an
approach for assessing the population at risk to airborne releases of extremely
hazardous substances. This methodology was based on the recent USEP A" guidelines
(USEPA, 1996) for risk assessment and modeling worst-case releases. They also
examined the relationship between potential sources of chemical hazards and the
special needs of population in a medium sized metropolitan area and determined
whether the distribution of environmental risks disproportionately impacted the special
needs population. Coulter et al. (1999) addressed aspect of currency for metropolitan
transportation planning through integration ofRS/GIS data.
In a study carried out by Ulbricht and Heckendorff (1998), satellite images from 1985,
1988 and 1996 were used for a visual interpretation of the coastal area around Joao
Pessoa, situated in the northeast Brazilian state of Paraiba. The interpretation resulted
in the recognition of several changes and geographic relationships: changes in the
course of the river Paraiba over a distance of several kilometres, coastline changes
resulting from the S-N ocean current induced by the southeastern trade winds, growth
of the city of Joao Pessoa and increase in density of the built-up areas, and constancy of
the borders between sugar-cane fields, pasture land, and the remnants of the original
coastal forests, the 'Matas Atlanticas'.
Abdullah Al-Garni (1996) demonstrated a methodology to develop a conceptual model
based prototype urban Geographic Information System (UGIS). The base maps used in
developing the system and acquiring visual attributes were obtained from aerial
photographs. A multi-purpose parcel-based system, one that can serve many urban
• U.S. Environmental Protection Agency
41
Integrating RS ft GIS for Urban Fire Disaster Management. Sunil, 1999-2002
applications such as public utilities, health centres, schools, population estimation, road
engineering and maintenance, and many others was developed. A modem region in the
capital city of Saudi Arabia is used for the study. The developed model was operational
for one urban application (population estimation) and was tested for that particular
application. The results showed that the system has a satisfactory accuracy and that it
may well be promising for other similar urban applications in countries with similar
demographic and social characteristics.
2-5 Summary
Almost all reported studies deal with the use of GIS/RS for studying hazards, but very
few addressed urban fire hazard and management. However, statistics show that urban
fires have resulted in huge losses of lives and property damage worth billions of
dollars. Unfortunately, due to many obvious reasons, one being the spatial resolution of
space borne remote sensing data, attention may not have focused on urban disaster
applications. Yet another common feature about all these studies is that remote sensing
was largely concerned with extracting generalized information and error detection,
while GIS applications tend to focus on database management issues, cartographic
modeling and presentation of data. A truly operational GIS for planning purposes
requires the integration and automation of at least some of the most routine procedures
in both approaches.
Applications of remote sensing data and GIS, to the study of natural hazards are
generally unique, to each other since different natural hazards are caused by different
phenomena and are characterized by different attributes. These studies therefore use
different types of remote sensing data with unique sensor resolution characteristics,
42
Integrating RS 8: GIS for Urban Fire Disaster Management. Sunil, 1999-2002
which are influenced by the different attributes, which have to be detected by the
sensor. However, most of the studies used broadband remote sensing. For each
phenomenon there is a unique methodology and sensor resolution characteristics, and
all studies generally are case dependent. Monitoring different types of hazards, both
natural and manmade require a systematic appraisal of sensor resolution characteristics,
an understanding of the type of hazard and the need for assessment of the hazard.
Urban hazards may have different impacts due to the distribution of spatial features,
which in turn may be found in different shapes, sizes and patterns.
Very few studies have used satellite data for assessing hazards in an urban environment
since the spatial resolution of space-borne sensors until recently was not adequate for
analysis in urban areas. Most applications of remote sensing to urban areas still fall
short of the required spatial resolution (Jensen and Cowen, 1999). Inadequacy of spatial
resolution of satellite data was one of the main reasons in the current research for
choosing high resolution aerial photo images for assessing and modeling hazards. In a
few instances, high spatial and spectral resolution is needed for the material-oriented
detection of urban surface features often found in close proximity, such as roofing
materials and their material composition, while this information may be required it
cannot be provided by broadband remote sensing data that are mainly used in the
studies of urban environment (Sunil et al. 2001). The use ofhyperspectral image data
can open up new opportunities for an area-wide inventory of urban surfaces. The high
spectral and spatial resolution of these data yields the potential for identification of
urban surface cover types based on their material-specific spectral reflectance
characteristics (Roessner et al. 1998). Although some recent advancement in the field
of remote sensing have delivered high spatial resolution data such as from IKON OS,
43
Integrating RS a GIS for Urban Fire Disaster Management. Sunil, 1999-2002
the availability of such data is currently affected by long delays attributed to their high
costs, accuracy and coverage. Comparatively, aerial photographs, which are scale
independent, offer potential benefits since they are not affected by any of the factors,
which influence the purchase, and use of high spatial resolution space-borne data.
Managing urban disasters must begin with the identification of hazard. Significant
work has been carried out in the past on disaster management, few of which have
focused on urban areas. A run down of selected attempts to study urban disaster is
described in the following chapter. These hazards and disasters provides insight into
the nature of urban fire hazards, which are different to other natural hazards such as
earthquakes, volcanoes, hail storms, and highlights the importance of identification of
hazard be it natural or manmade.
44
Integrating RS ft GIS for Urban Fire Disaster Management. Sunil, 1999-2002
Chapter 3: Urban Fire Hazard Categorization and Monitoring.
3-1 Introduction
The reasons for increasing vulnerability are many, and one of the main factors is the
accelerated growth of cities and increasing scale of urban industrial activity. They raise
the vulnerability of urban areas to both natural and technological hazards. It is
commonly recognized that the characteristics of "urban natural disasters" have become
increasingly complex because of the high density of population and the strong
concentration of social capital Elo et al. (1996). Hazards therefore are omnipresent
phenomena, which cannot be detached from urban life. To reduce the impact of
disasters a complete strategy for disaster management is required which involves the
following aspects:
Disaster prevention
:> Hazard analysis: assessing the probability of occurrence of potentially
damaging phenomena.
:> Vulnerability analysis: assessing the degree of loss expected to population,
infrastructure, economic activities, as the consequence of an event of a certain
magnitude
:> Risk assessment: assessing the numbers of lives likely to be lost, the persons
injured, damage to property and disruption of economic activities caused by a
particular natural phenomena.
:> Landuse planning and legislation: implementation of the risk map in the form of
building codes and restrictions.
Disaster preparedness
45
Integrating RS 8: GIS for Urban Fire Disaster Management. Sunil, 1999-2002
)> Forecasts/warning/prediction of disasters (for example Hail storm warning)
)> Monitoring: evaluating the development through time of disasters (for example
floods)
Disaster relief
)> Damage assessment shortly after the occurrence of a disaster
)> Defming safe areas, to indicate possible escape areas
)> Infrastructural monitoring, to ensure an undisturbed supply of aid. (OAS, 1990;
UNDRO, 1991).
Therefore identification of hazards is an important issue and is the first and the most
important step in any hazard analysis. It involves the identification of all possible
conditions that could lead to a hazardous incident. The comprehensive and systematic
identification of all hazards is critical to the success of hazard analysis. The Department
of Planning, NSW, Australia has recognized the need for an integrated approach to the
control of hazardous industry, incorporating environmental risk impact assessment.
This approach essentially requires that
a) All hazards associated with the operations of potentially hazardous installation
are identified.
b) Such hazards are analysed in terms of their consequences to people, property
and the biophysical environment and their likelihood of occurrence; and
c) Risks from the operations are quantified and assessed in terms of their location
and land use planning implications.
Fire hazard categorization helps in identifying and assessing the vulnerable and
susceptible regions that have a potential for disaster in varying degrees. Hazards differ
from place to place due to variations in land-use, structural density patterns, population
density and demographic indices, to name a few contributing factors. The areas most
46
Integrating RS ft GIS for Urban Fire Disaster Management. Sunil, 1999-2002
vulnerable to extreme natural events are those where there are concentrations of
elements at risk: people, buildings and infrastructure, i.e. human settlements. (Elo et al.
1996). In one of the technical sessions at the world conference on natural disaster
reduction in 1994, Yokohama, Japan, emphasis was laid on effects of disasters on
urban areas. The panel of experts recognized that urban areas are extremely vulnerable
to disasters and likely to become even more so, because of the concentration of
population, resources and activities. Land-use patterns often increase the level of risk.
Disaster reduction should become an integral part of the development process of human
settlements, and IDNDR"', aims to facilitate the activities associated with that. Land-use
is one of the fundamental indicators of this variability of fire hazards. For instance a
dense commercial region will pose a different level of hazard, when compared to a
residential or industrial region. One of the main objectives behind the generation of fire
hazard categories is to understand these spatial variations. Hazard categorization
measures, records and translates these geographic variations for each spatial unit and
enables an overall understanding of the prevalent hazard in a region. Hazard
categorization enables the comparison of hazard in one region to that of another, and
consequently assists in the allocation of dynamic resources. These categories help in
visualizing the spatia-temporal patterns of hazards, which would otherwise be difficult
to comprehend. When combined with demographic data and other derived hazard
related information, hazard categories can be used for complex analysis which will be a
major input to disaster management.
• International Decade for Natural Disaster Reduction (IDNDR, 1990-2000)
47
Integrating RS 8: GIS for Urban Fire Disaster Management. Sunil, 1999-2002
3-2 Case Studies of RS/GIS Applied to Hazard Management
Most studies that have used GIS/RS to study urban hazards have been carried out on
brush fires and their hazard to residential areas and local topography. Broadband
sensors were used to study the outbreak of fire and the adjacent land-use in order to
develop decision support systems. Brush fires have the potential to instigate hazard,
years after the fire has been extinguished. The removal of vegetation in these scar
regions may facilitate rapid flood run-off and soil erosion over the next several
monsoon seasons. In an effort to understand these dangers in light of the rapid increase
in urbanization and population in cities throughout the southwest USA and in similar
environments around the world, remote sensing data was analysed by group of
scientists from USA (Ramsey and Arrowsmith, 2001).
A pilot study is now underway examining historic data from the Landsat TM, SIR-C
radar, and airborne thermal infrared scanners of existing brush fire scars surrounding
Phoenix, USA. This study investigates the linkage between the fire scar age, vegetation
type/recovery, soil type and local topography. It is proposed to use this information to
model surface response to heavy rainfall and assess the potential for future flood and
fire hazards. These data will be valuable because ofthe high spatial resolution (15-90
m/pixel), the multi-spectral coverage (visible-thermal wavelengths), and the ability to
generate along-track moderate resolution digital elevation models (DEMs) critical for
urban topographic analysis. Remote sensing work will expand to surrounding cities
with different growth rates, vegetation species, and fire/flood potential. These cities
may include San Diego and Los Angeles, Albuquerque, and Las Vegas. Airborne
MASTER data have already been acquired over several of these targets, and will be
used in conjunction with aerial photography to validate detection and classification
48
Integrating RS 8: GIS for Urban Fire Disaster Management. Sunil, 1999-2002
algorithms. ASTER data from the UEM project will also be examined for similar fire
scar evidence globally.
Many studies found that the accuracy and utility of most GIS fire behaviour models
was compromised when the process of generalizing vegetation components into fuel
models takes place. Twenty-three different vegetation communities recorded in this
study were placed into three generalized fuel models, experience has shown that some
of the vegetation types lumped together have quite different flammability potential.
GIS was found to be a fast and effective link between census information and wildland
urban hazards reduction and fire prevention efforts particularly in USA. GIS lets land
and fire managers overlay rural population trends and forecast, fire behaviour factors,
and past fire occurrence records. New fire simulation models such as the National
Interagency Wildfire Laboratory's Farsite use local GIS data sets to project fire
problems years into the future.
At California's Cuyamaca Rancho State Park, GIS was used to develop long range
management plans from detailed information about climate, weather, topography,
geology, soils, vegetation, fauna, and modem cultural features. Realizing the
importance of fire's role in preserving native wildlands, prescribed burn offs becomes
an important management tool, (Wells and Mckinsey, 1991). They based their fuel
model on those described by the National Fire-Danger Rating System, National
Wildlife Coordination Group in 1981. They concluded that the GIS program was
limited by the categories of fuel, the 23 vegetation classes being placed into three
generalized fuel models.
49
Integrating RS ft GIS for Urban Fire Disaster Management. Sunil, 1999-2002
The Nicaragua Land Resources (Fire) Monitoring Project is an environmental
monitoring project carried out by the Ministerio del Ambiente y los Recursos Naturales
(MARENA) and the Natural Resources Institute (NRI). The Project was supported by
the UK Government Department For International Development (DFID) until June
1998. A PC-based NOAA satellite receiver, installed at MARENA headquarters in
Managua since its start in June 1995, has enabled daily observations to be made on
vegetation fires in Nicaragua and Central America. These observations are used
particularly to assist and support operational forest management activities in Nicaragua.
Spatial and time distributions of hot spots were examined and assessed with regard to
forest/land use type coverage and to population density and rural poverty levels.
In a study in California, related to firestorms which have devastated many acres of
land, a spatial decision support system was developed to provide planners with tools to
assist in managing disasters caused by firestorms. This paper models and assesses the
risk of frrestorms in the East Bay Hills and produces a spatial support system that could
help manage and reduce the risk of future firestorms. A GIS was used as a framework
for quantifying fire hazard in this heterogeneous landscape. Two models, one to assess
the wildland fire hazard and the other to assess the urban/residential fire hazard, are
integrated and embedded within the GIS to map both regional and neighbourhood risk.
Risk assessment maps were generated which represented the results of quantitative
multivariate analysis and clearly identified the hazardous neighbourhoods. The system
produced and provided an ideal tool for managing and reducing the risk of a firestorm.
It allowed for future adjustment of one or all of the parameters, as fire prevention
policy and techniques are implemented and hazardous conditions are mitigated. This
50
Integrating RS 8: GIS for Urban Fire Disaster Management. Sunil, 1999-2002
feature provided a mechanism for accounting and feedback, allowing for the appraisal
of the success of mitigation.
3-2.1 National
Most of the studies related to mitigation of hazards and disaster in Australia have been
carried out on bush fires, community participation and related risk management issues.
For instance, in January 1994, almost all of coastal NSW experienced an extended
period of extreme fire weather. In excess of 800 fires started between 27 December
1993 and 16 January 1994 burning approximately 800,000 hectares. The areas
primarily affected included the coastal plains and nearby ranges. Intrusion of fire into
the Sydney and nearby metropolitan area occurred on a scale never before documented.
Over two hundred houses mostly in urban areas were destroyed. Many others sustained
severe damage. Two fire fighters and two other people were killed.
Of these, many have focused on community participation and awareness for mitigation
of disasters. As such very few attempts have been made at studying fire hazards and
risk and surprisingly not many attempts have been made to study urban disaster risk by
using GIS/RS data.
The AGSO's Cities Project was established in 1996 with the objective of determining
the vulnerability of Australian urban communities to the effects of geological hazards
and to provide emergency managers and planners with information and decision
support tools that will aid in the mitigation of the hazards. The mission of this project
was to conduct research that would lead to safer, more sustainable and more prosperous
communities. This effort formed a major part of Australia's contribution to the United
51
Integrating RS & GIS for Urban Fire Disaster Management. Sunil, 1999-2002
Nations International Decade for Natural Disaster Reduction (IDNDR) and the
development of national risk mitigation strategies.
A study carried out by O'Neill et al. (1993), integrated remote sensing and spatial
analysis techniques to compare Aboriginal and pastoral fire patterns in the East
Kimberley region in the Northern Territory of Australia. Remote sensing and spatial
analysis techniques were used to compare the different uses of fire and provide some
quantitative assessment of the ecological impacts. Multi-temporal Landsat Thematic
Mapper imagery was used to delineate fire patterns over a three-year period. A
geographic information system was then used to integrate the resultant landcover maps,
land system maps and other spatial data. Cross tabulations, proximity analysis and the
production of a unique criteria map provided quantified data on the extent and spatial
distribution of different fire types, fire frequency and the relationships between fire
type, land systems and areas of most intensive Aboriginal land-use.
Ahearn and Chladil (1999) discussed effective targeting of bush fire prevention,
management and suppression activities, and argued about the distance or the limits to
which the bush fires may impact. A distance distribution was obtained for each fire
event. A combined distribution was obtained for each fire event from a base data and
tested against the 1994 data. Results showed some consistency between all fires and a
relationship between houses burnt in bushfires and the distance they stand from
vegetation boundaries.
The increased pressure on tropical cyclone risk management resulting from
demographic growth and climate change requires the best possible information,
52
Integrating RS &. GIS for Urban Fire Disaster Management. Sunil, 1999-2002
preferably quantitative, about both the hazard levels and the vulnerability of the coastal
communities. An understanding to this effect lead to the launch of the "The Tropical
Cyclone Coastal Impacts Program" (TCCIP): a collaborative Australian IDNDR, to
help focus attention and resources on this problem. The most significant achievement
of this program was the development in Australia of a significant multi-disciplinary
community, interested in cyclone hazard mitigation. An article by Falls et al. (1999)
highlighted the approach and achievements of the TCCIP. Henderson et al. (1999)
investigated the impact of cyclone Vance in Western Australia and the strength of
houses to withstand the hazard. Insurance losses in excess of 12 million dollars were
reported drawing attention to the need for addressing this hazard. Berry and King
(1999) discussed the catastrophic impact of cyclones in Northern Australia to
communities in the short term as well as long term. In the paper, community
vulnerability studies indicated that residents are increasingly vulnerable and
decreasingly resilient to the cyclone hazard. The paper highlighted the need to improve
early warning response and levels of preparation throughout the community.
The Australian International Decade for Natural Disaster Reduction (IDNDR) have
facilitated earthquake mitigation studies through earthquake zonation mapping, GIS
based approaches and disaster management aspects for several areas in Australia. The
IDNDR launched the Radius (Risk Assessment Tools for Diagnosis of Urban Areas
against Seismic Disasters) initiative with financial assistance from the Japanese
government. The aim of this program was to promote worldwide activities to reduce
seismic disasters in urban areas, particularly in developing countries, Rynn and
Okazaki (1999).
53
Integrating RS 8: GIS for Urban Fire Disaster Management. Sunil, 1999-2002
Rhodes et al. (1999) in their paper titled " A framework for understanding and
monitoring levels of preparedness for wildfire" provided a framework that could be
utilized as a basis to develop a measurement tool to assess preparedness levels to deal
with risks. This paper seeks to explore some of the issues surrounding preparedness for
wildfire. It examines how household preparedness is described both within the
community and the emergency services and how preparedness might be described.
A GIS-based assessment of landslide risk to the Cairns community has been carried out
to provide information to the Cairns City Council for planning and emergency
management purposes. These studies were undertaken in the Cairns area as a part of an
AGSO Cities Project multi-hazard risk assessment. GIS polygons were used to
delineate and characterize the areas that could be affected by landslides. The nature,
number and geographic distribution of the elements at risk were obtained by
interrogating the GIS, and their vulnerability to destruction by the two main landslide
slope processes were assessed. From this information, specific risk maps were
produced for: people living in houses and flats; for buildings (houses and flats only)
and for roads. Maps, which quantitatively depict the total risks per square kilometer,
per 100 years for residential people and buildings in each GIS polygon in the currently
developed parts of Cairns, was constructed by this study. However, the study had some
limitations with respect to mapping, which was carried out only at a reconnaissance
level. Therefore detail site specific assessments could only be confirmed by geo
technical specialists.
Most of the above studies relied on existing data and therefore had to contend with
issues related to data inconsistencies and quality. Noticeably very few studies have
54
Integrating RS 8: GIS for Urban Fire Disaster Management. Sunil, 1999-2002
applied the technologies of GIS/RS together to manage disasters in urban
environments. Some of the issues raised by these applications relate to problems
associated with data collection, which may be solved by GIS/RS.
3-3 Risk assessment by the New South Wales Fire Brigades
The New South Wales Fire Brigades are responsible for providing fire protection in
urban environments, to a major part ofNew South Wales. The rural fue services are
responsible for the brush fires and other fire hazards and disaster management in the
rural areas of Australia. The NSFWB are in the process of collecting hazard related
data by in-situ field survey based methods to manage disasters and to provide decision
support systems. A brief insight into the existing methodology and some related issues
is given in the following paragraphs below.
The New South Wales Fire Brigades are responsible for providing emergency services
to a major part of the state of New South Wales making it arguably the largest
emergency organization in the world, with respect to the area over which it has
jurisdiction. The management of any disaster demands spatial and temporal data. The
NSWFB understands the importance of collecting data pertaining to hazards, which
will enable them to carry out risk assessment and resource planning. The existing
method of collecting hazard related variables by the NSWFB involves extensive in-situ
surveying and inspection of individual sites for assessment against a predetermined
descriptive hazard summary as illustrated in (Tablel). In this methodology regions are
divided into unit survey squares (USS derived from lkm Australian Map Grid) for
enabling a systematic survey of built structures. Each USS is assessed in the field from
a vehicle by a team oftwo survey staff.
55
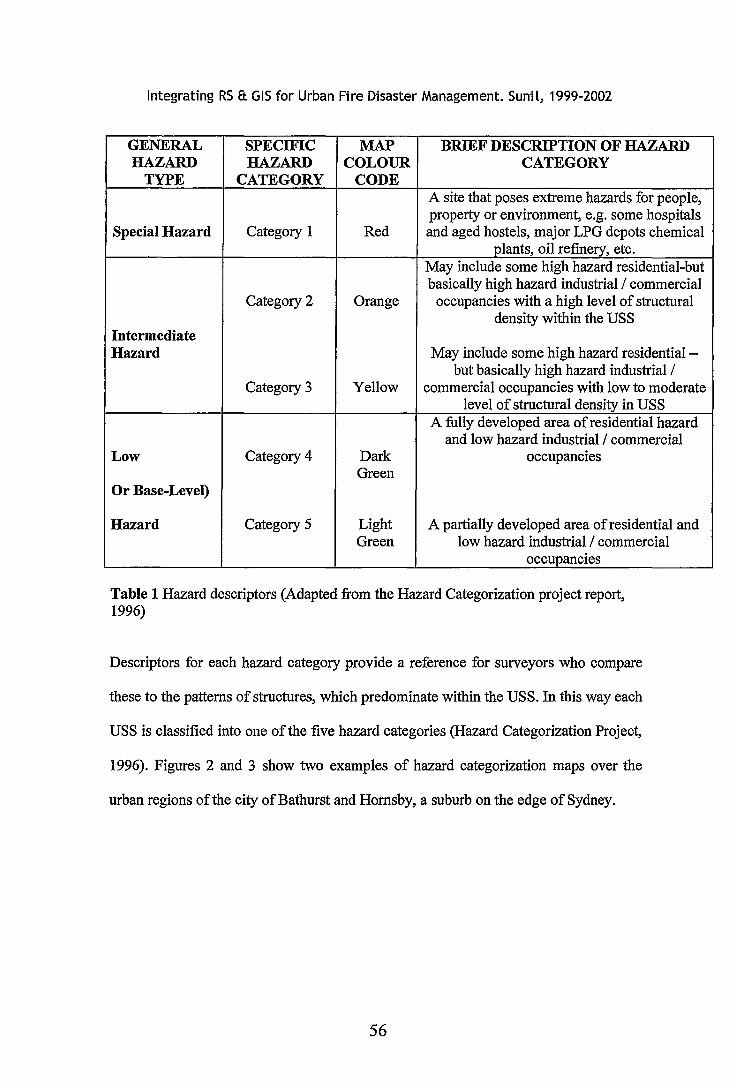
Integrating RS 8: GIS for Urban Fire Disaster Management. Sunil, 1999-2002
GENERAL SPECIFIC MAP BRIEF DESCRIPTION OF HAZARD HAZARD HAZARD COLOUR CATEGORY
TYPE CATEGORY CODE A site that poses extreme hazards for people, property or environment, e.g. some hospitals
Special Hazard Category 1 Red and aged hostels, major LPG depots chemical plants, oil refinery, etc.
May include some high hazard residential-but basically high hazard industrial I commercial
Category 2 Orange occupancies with a high level of structural density within the USS
Intermediate Hazard May include some high hazard residential-
but basically high hazard industrial I Category 3 Yellow commercial occupancies with low to moderate
level of structural density in USS A fully developed area of residential hazard
and low hazard industrial I commercial Low Category 4 Dark occupancies
Green Or Base-Level)
Hazard Category 5 Light A partially developed area of residential and Green low hazard industrial I commercial
occuR_ancies
Table 1 Hazard descriptors (Adapted from the Hazard Categorization project report, 1996)
Descriptors for each hazard category provide a reference for surveyors who compare
these to the patterns of structures, which predominate within the USS. In this way each
USS is classified into one of the five hazard categories (Hazard Categorization Project,
1996). Figures 2 and 3 show two examples of hazard categorization maps over the
urban regions ofthe city ofBathurst and Hornsby, a suburb on the edge of Sydney.
56
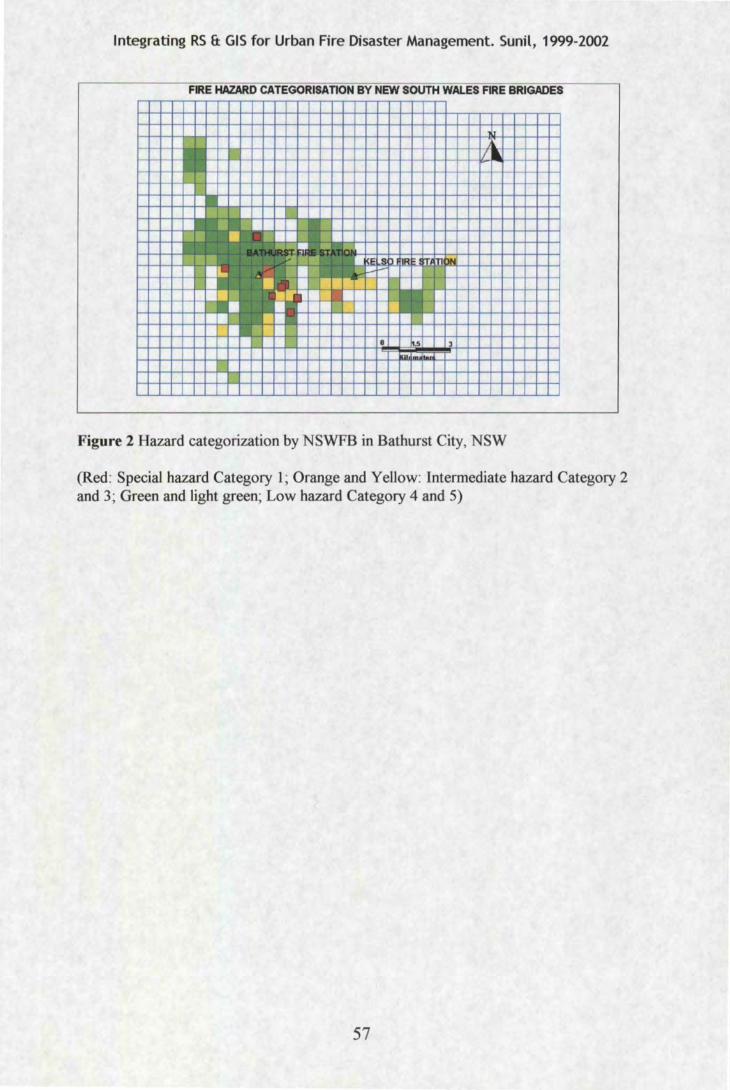
Integrating RS & GIS for Urban Fire Disaster Management. Sunil, 1999-2002
FIRE HAZARD CATEGORISATION BY NEW SOUTH WALES FIRE BRIGADES
, __ =• • .I a ---- r-- -
• I -· kE Ls, 01 IIR rr~ ITi lN
-~ ..... ,...... f-r-- -
_I ~~ ~ f- . 1-
• ,,_
l.S 3
llU"'" ... '
Figure 2 Hazard categorization by NSWFB in Bathurst City, NSW
(Red: Special hazard Category 1; Orange and Yellow: Intermediate hazard Category 2 and 3; Green and light green; Low hazard Category 4 and 5)
57
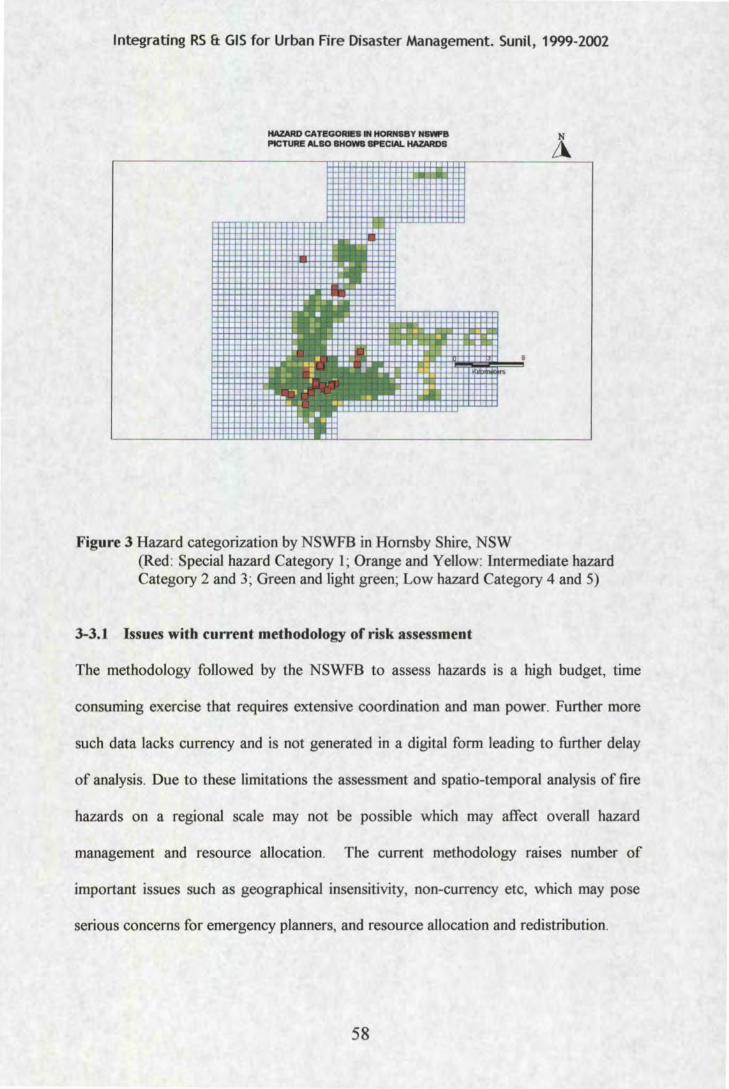
Integrating RS & GIS for Urban Fire Disaster Management. Sunil, 1999-2002
HAZARD CATI!GOReS IN HORNSBY NSWP15 PICTURE ALSO SHOWS SPECIAL HAZARDS
Figure 3 Hazard categorization by NSWFB in Hornsby Shire, NSW (Red: Special hazard Category 1; Orange and Yellow: Intermediate hazard Category 2 and 3; Green and light green; Low hazard Category 4 and 5)
3-3.1 Issues with current methodology of risk assessment
The methodology followed by the NSWFB to assess hazards is a high budget, time
consuming exercise that requires extensive coordination and man power. Further more
such data lacks currency and is not generated in a digital form leading to further delay
of analysis. Due to these limitations the assessment and spatio-temporal analysis of fire
hazards on a regional scale may not be possible which may affect overall hazard
management and resource allocation. The current methodology raises number of
important issues such as geographical insensitivity, non-currency etc, which may pose
serious concerns for emergency planners, and resource allocation and redistribution.
58
Integrating RS a: GIS for Urban Fire Disaster Management. Sunil, 1999-2002
3-3.1.1 Geographical insensitivity
Existing methodology is hazard focused and the allocation of dynamic resources (fire
fighting staff and equipment) made on the basis of a single criterion of structural
assessment alone will result in an inefficient distribution of resources, which will in
tum affect disaster mitigation efforts. A place becomes increasingly hazardous when
the forces of urbanization, industrialization, population increase and new housing,
result in changes to the existing spatial patterns. These spatial changes, more often than
not, increase the element of hazard in a harmful way leading to a disaster at some point
in time. In other words there is geographic disorder and a breakdown in the balance of
spatial arrangement. The spatial disorganization of hazards is manifest in the disasters,
in the sense that disaster is a disruption and unraveling of urban order. Harm and
survival, human impairment and adaptive response, exhibit strong spatial variations
(Hewitt, 1997). Issues that confront the fire services, or any other emergency
organization, must extend from hazard categorization to overall planning. For instance,
in the eventuality of a gas leak from a chemical plant that is located in the vicinity of a
residential area, the limits of the hazard will extend beyond the bounds of the site from
where it originated to the area where the toxic gas can spread randomly. The study of
hazard is therefore not restricted to the location of the chemical plant. Therefore it is
essential to understand the demography, relative locations of features like buildings,
hydrants, water bodies, heritage areas, population, street network, travel impedances
and so on. A single criterion for identifying major accident hazards based on inventory
level alone has, in its simplicity, a legislative attraction, which in part explains its wide
adoption (Rayner, 1992). Spatially linked data has to be understood and studied in
totality and not exclusively of each another (Walker et al. 2000).
59
Integrating RS &. GIS for Urban Fire Disaster Management. Sunil, 1999-2002
3-3.1.2 Community vulnerability
The existing method of hazard categorization does not take into account the community
vulnerability. The concept of community vulnerability has been particularly important
in understanding the physical relationship between hazards and communities at risk,
accident preparedness and mitigation and the social geography of potentially affected
populations (Blaikie et al. 1994). A hazard only becomes a disaster when it affects a
human population that is exposed and vulnerable (Ditto, 1998). This is particularly true
of developing nations where a combination of high population density and hazard
potential can lead to disasters. Hazards are important only in so far as they threaten or
harm human activities or assets or those (such as the environment) on which we place
some value. Understanding the spatial variation of population in relation to hazard
related indices is essential in order to plan for an emergency. In its strategic sense,
emergency management is not just about understanding the full range of consequences
of hazard impact, but is also about understanding the relationships of environmental,
political, social and economic forces that influence, shape and determine the frequency,
nature and location of emergencies. Comprehensive knowledge about the type of
people, age, socioeconomic indices and education are all essential prerequisites in an
emergency operation. In some cases the local knowledge of people, who are long term
residents in a certain area, may provide valuable information to emergency services.
Their local knowledge may be used in the location of high hazard sites, structures and
their use functions, and for identification of built features during scientific visualization
of remotely sensed data. The goal of emergency management is the effective delivery
of services to a target population (Buckle, 1999). To achieve effective services
emergency managers therefore need a clear understanding of the phenomena with
60
Integrating RS 8: GIS for Urban Fire Disaster Management. Sunil, 1999-2002
which they have to deal. These include the hazards themselves as well as the people at
risk from these hazards.
3-3.1.3 Non-currency of spatio-temporal information
Urbanization, industrialization, and new developments all act together to cause an
increase in population, and a change in the landscape. These create spatial disorder
bringing about variations in the distribution of existing and new hazards. In order to
make appropriate decisions in emergency planning, these spatia-temporal changes of
hazard will have to be detected and recorded regularly. These hazard changes occur in
an unplanned or unforeseen way in most urban areas, and are difficult to detect, record
and update immediately. For instance new development in the form of a built feature
representing an industrial activity or residential land-use may change the overall degree
of hazard and a pose a new level of risk. Detailed and regular monitoring and recording
of these changes will provide the emergency services with timely information which
will enable assessment and redress of issues related to planning such as resource
redistribution or allocation. Given the dynamic nature of changes in land-use in urban
areas, the existing in-situ field survey method will prove inadequate for detecting,
recording and monitoring these changes regularly.
3-3.1.4 Allocation of dynamic resources.
The allocation of dynamic resources assumes a high level of importance since it
determines the weight of attack in the event of a disaster. For instance, in a particular
fire district where there are many welfare homes and aged care facilities, rescue
operations will have to be performed by skilled staff that is adept in handling less
mobile people. Similarly in the event of an industrial disaster skilled or trained staff
61
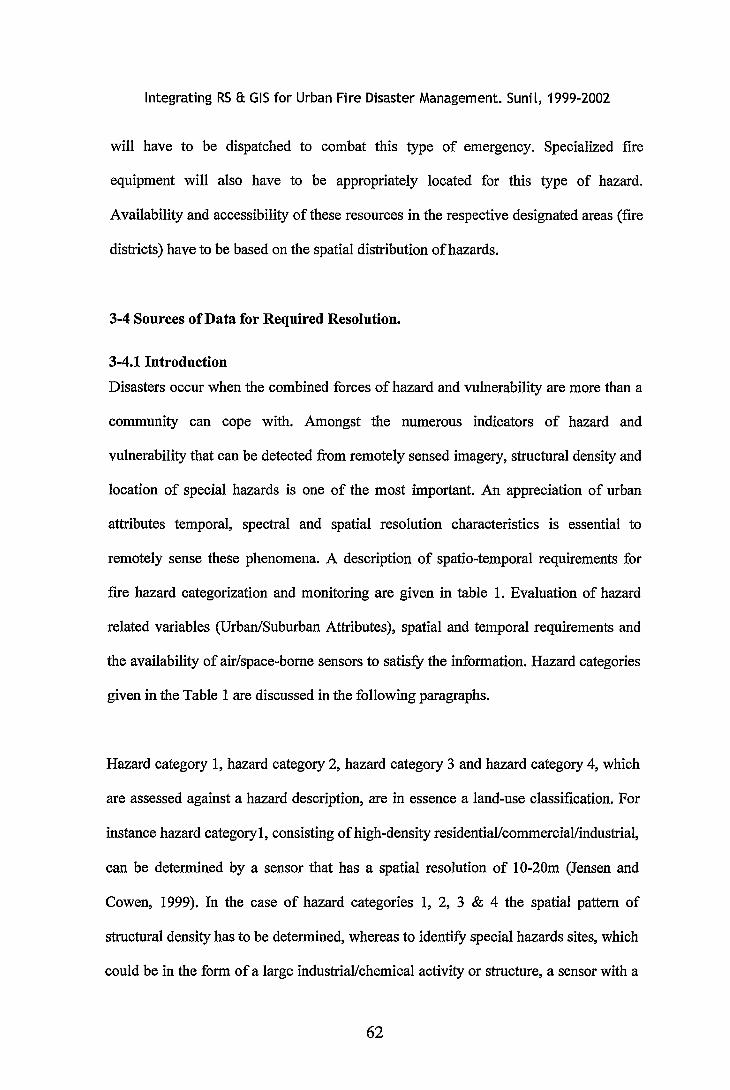
Integrating RS a GIS for Urban Fire Disaster Management. Sunil, 1999-2002
will have to be dispatched to combat this type of emergency. Specialized fire
equipment will also have to be appropriately located for this type of hazard.
Availability and accessibility of these resources in the respective designated areas (fire
districts) have to be based on the spatial distribution ofhazards.
3-4 Sources of Data for Required Resolution.
3-4.1 Introduction
Disasters occur when the combined forces of hazard and vulnerability are more than a
community can cope with. Amongst the numerous indicators of hazard and
vulnerability that can be detected from remotely sensed imagery, structural density and
location of special hazards is one of the most important. An appreciation of urban
attributes temporal, spectral and spatial resolution characteristics is essential to
remotely sense these phenomena. A description of spatia-temporal requirements for
fire hazard categorization and monitoring are given in table 1. Evaluation of hazard
related variables (Urban/Suburban Attributes), spatial and temporal requirements and
the availability of air/space-borne sensors to satisfy the information. Hazard categories
given in the Table 1 are discussed in the following paragraphs.
Hazard category 1, hazard category 2, hazard category 3 and hazard category 4, which
are assessed against a hazard description, are in essence a land-use classification. For
instance hazard category!, consisting of high-density residential/commercial/industrial,
can be determined by a sensor that has a spatial resolution of 1 0-20m (Jensen and
Cowen, 1999). In the case of hazard categories 1, 2, 3 & 4 the spatial pattern of
structural density has to be determined, whereas to identify special hazards sites, which
could be in the form of a large industrial/chemical activity or structure, a sensor with a
62
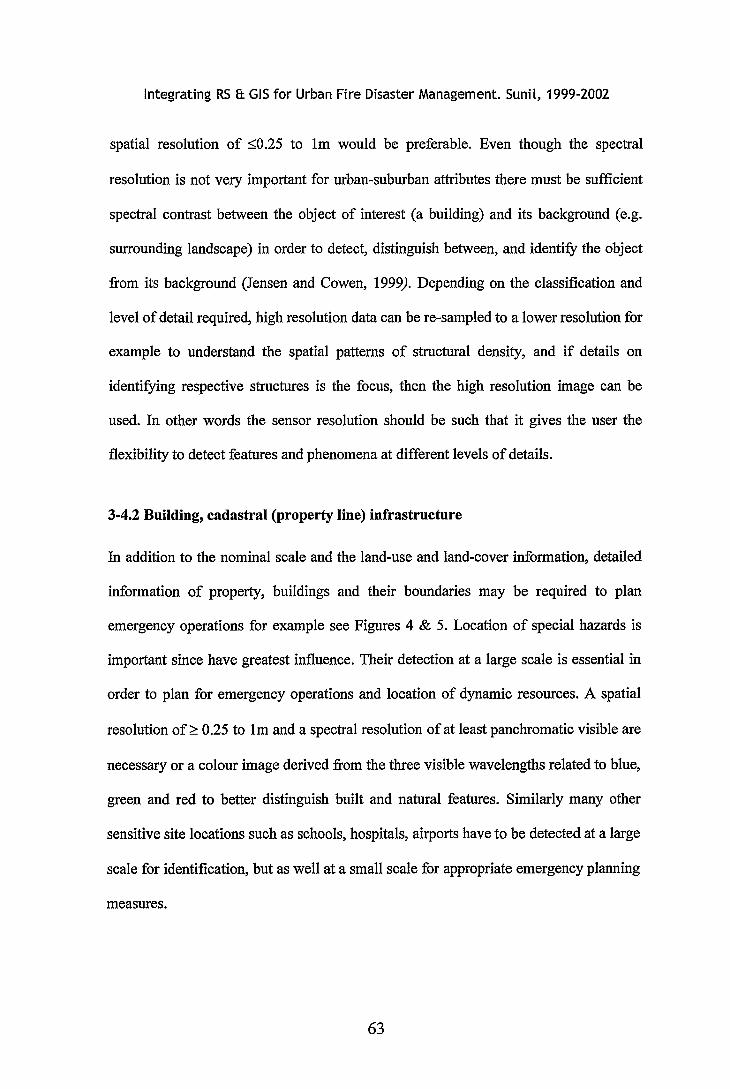
Integrating RS 8: GIS for Urban Fire Disaster Management. Sunil, 1999-2002
spatial resolution of ::::;0.25 to lm would be preferable. Even though the spectral
resolution is not very important for urban-suburban attributes there must be sufficient
spectral contrast between the object of interest (a building) and its background (e.g.
surrounding landscape) in order to detect, distinguish between, and identify the object
from its background (Jensen and Cowen, 1999). Depending on the classification and
level of detail required, high resolution data can be re-sampled to a lower resolution for
example to understand the spatial patterns of structural density, and if details on
identifying respective structures is the focus, then the high resolution image can be
used. In other words the sensor resolution should be such that it gives the user the
flexibility to detect features and phenomena at different levels of details.
3-4.2 Building, cadastral (property line) infrastructure
In addition to the nominal scale and the land-use and land-cover information, detailed
information of property, buildings and their boundaries may be required to plan
emergency operations for example see Figures 4 & 5. Location of special hazards is
important since have greatest influence. Their detection at a large scale is essential in
order to plan for emergency operations and location of dynamic resources. A spatial
resolution of;::: 0.25 to lm and a spectral resolution of at least panchromatic visible are
necessary or a colour image derived from the three visible wavelengths related to blue,
green and red to better distinguish built and natural features. Similarly many other
sensitive site locations such as schools, hospitals, airports have to be detected at a large
scale for identification, but as well at a small scale for appropriate emergency planning
measures.
63
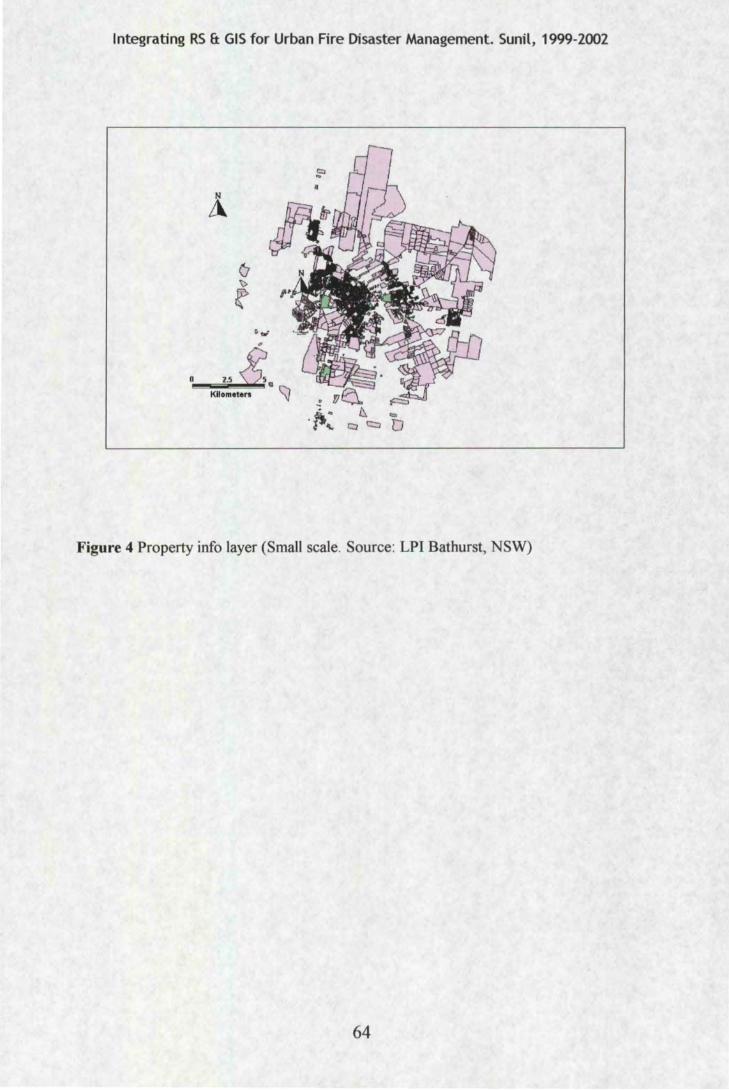
Integrating RS & GIS for Urban Fire Disaster Management. Sunil, 1999-2002
N
A.
~. Kilometers '\]
Figure 4 Property info layer (Small scale. Source: LPI Bathurst, NSW)
64
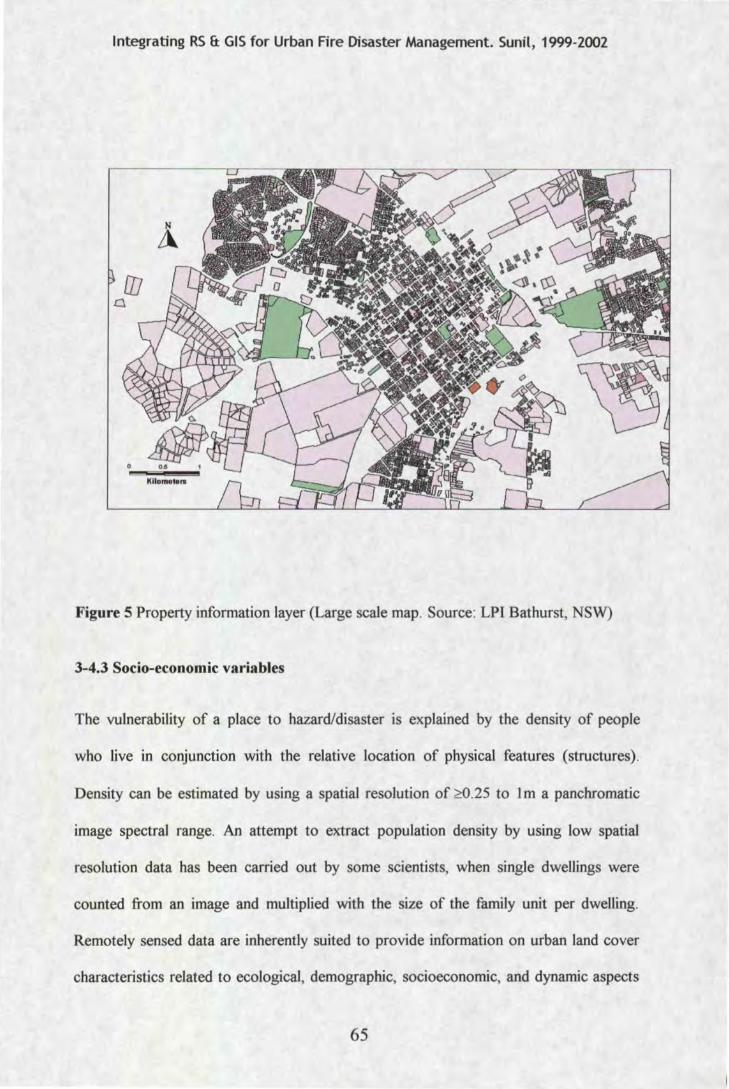
Integrating RS & GIS for Urban Fire Disaster Management. Sunil, 1999-2002
[[; c
Kllo,..lerw
Figure 5 Property information layer (Large scale map. Source: LPI Bathurst, NSW)
3-4.3 Socio-economic variables
The vulnerability of a place to hazard/disaster is explained by the density of people
who live in conjunction with the relative location of physical features (structures).
Density can be estimated by using a spatial resolution of ~0 .25 to I m a panchromatic
image spectral range. An attempt to extract population density by using low spatial
resolution data has been carried out by some scientists, when single dwellings were
counted from an image and multiplied with the size of the family unit per dwelling.
Remotely sensed data are inherently suited to provide information on urban land cover
characteristics related to ecological, demographic, socioeconomic, and dynamic aspects
65
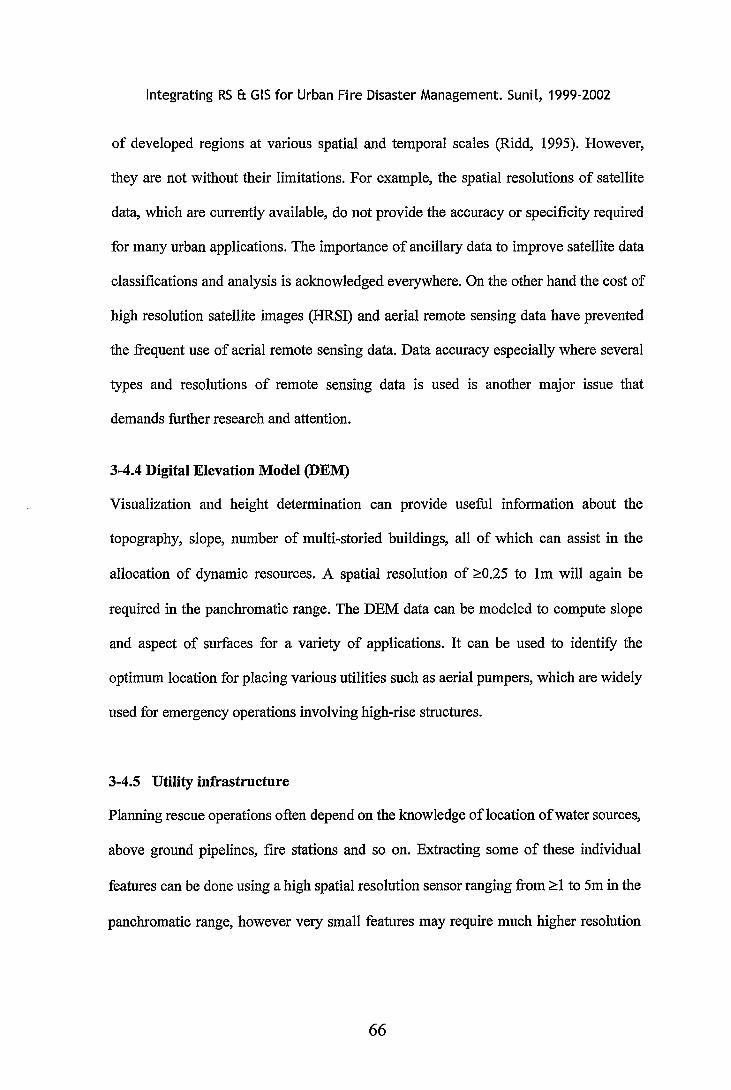
Integrating RS 8: GIS for Urban Fire Disaster Management. Sunil, 1999-2002
of developed regions at various spatial and temporal scales (Ridd, 1995). However,
they are not without their limitations. For example, the spatial resolutions of satellite
data, which are currently available, do not provide the accuracy or specificity required
for many urban applications. The importance of ancillary data to improve satellite data
classifications and analysis is acknowledged everywhere. On the other hand the cost of
high resolution satellite images (HRSI) and aerial remote sensing data have prevented
the frequent use of aerial remote sensing data. Data accuracy especially where several
types and resolutions of remote sensing data is used is another major issue that
demands further research and attention.
3-4.4 Digital Elevation Model (DEM)
Visualization and height determination can provide useful information about the
topography, slope, number of multi-storied buildings, all of which can assist in the
allocation of dynamic resources. A spatial resolution of ~0.25 to 1m will again be
required in the panchromatic range. The DEM data can be modeled to compute slope
and aspect of surfaces for a variety of applications. It can be used to identify the
optimum location for placing various utilities such as aerial pumpers, which are widely
used for emergency operations involving high-rise structures.
3-4.5 Utility infrastructure
Planning rescue operations often depend on the knowledge oflocation of water sources,
above ground pipelines, fire stations and so on. Extracting some of these individual
features can be done using a high spatial resolution sensor ranging from ~1 to 5m in the
panchromatic range, however very small features may require much higher resolution
66
Integrating RS 8: GIS for Urban Fire Disaster Management. Sunil, 1999-2002
imagery or site visits to identify and locate them. Temporal resolutions of a few days to
a few weeks can be delivered by existing and future sensors.
3-5 Benefits and Disadvantages of Airborne Remote Sensing and Spaceborne Remote Sensing Data for Hazard Categorization and Monitoring.
Both forms of remotely sensor data (airborne and spacebome) have advantages and
disadvantages for hazard and vulnerability assessment. A careful and systematic
appraisal of these data sources, and their inherent strengths and demerits will need to be
made before arriving at any decision to use them for hazard categorization and
vulnerability assessment. Fundamental aspects of spatial, spectral and temporal
resolutions required will have to be assessed prior to their use. Table 2 lists the
requirements for the hazard and vulnerability assessment and monitoring. Since most of
the factors that influence hazards in an urban-suburban spatial setting are composed of
attributes such as structural density and strategic location of sensitive structures the
spectral resolution does not play an important role compared to the spatial resolution.
However, with the advent of high spatial resolution remote sensing data the spatial
resolution is not as important an issue as in the past. Nevertheless to ensure that the
most appropriate and cost effective acquisition systems are used, resolution must still
be considered, particularly where there is a requirement for better than lm resolution.
The selection and use of remotely sensed data differs from one study to another. To
remotely sense the required urban-suburban attributes, it is first necessary to appreciate
the "temporal, spectral and spatial resolution characteristics" ofthese attributes.
67
Integrating RS ft GIS for Urban Fire Disaster Management. Sunil, 1999-2002
3-6 Temporal resolution requirements for risk assessment
Three types of temporal resolution should be considered when monitoring hazard and
vulnerability in an urban-suburban setting. These are related to cyclic change, sensor
return period, and user needs. First urban/suburban phenomena progress through an
identifiable developmental cycle much like vegetation progresses through a
phenological cycle. Urban agricultural land is subdivided into urban allotments, and
houses, shops, factories are built and gardens and trees are planted and then mature. In
older areas densification of land-use occurs or existing use is converted to a higher and
better use, as a function of the value of land. Understanding these changes additions to
the existing spatial environment is crucial because they bring in an imbalance between
available resources and demand for more or sometimes less dynamic resources for fire
service protection. It is important therefore that the image analyst understands the
temporal development cycle of the urban phenomena to detect and monitor hazards and
vulnerabilities (Jensen and Toll, 1982). The second type oftemporal resolution relates
to the revisit or potential revisit schedule of the sensor, whether on a project basis as for
most airborne systems, or on a repetitive basis for space borne sensors. Finally temporal
resolution may refer to how often land/managers/emergency planners require a specific
type of information. In the context of this study vulnerability related indices such as
structural density would need to be monitored at an interval ranging between 6-12
months, since urbanization often results in an increase or change in built features within
a relatively short time frame. However, the temporal requirements are met by most of
the available sensors as explained in Table 2.
68
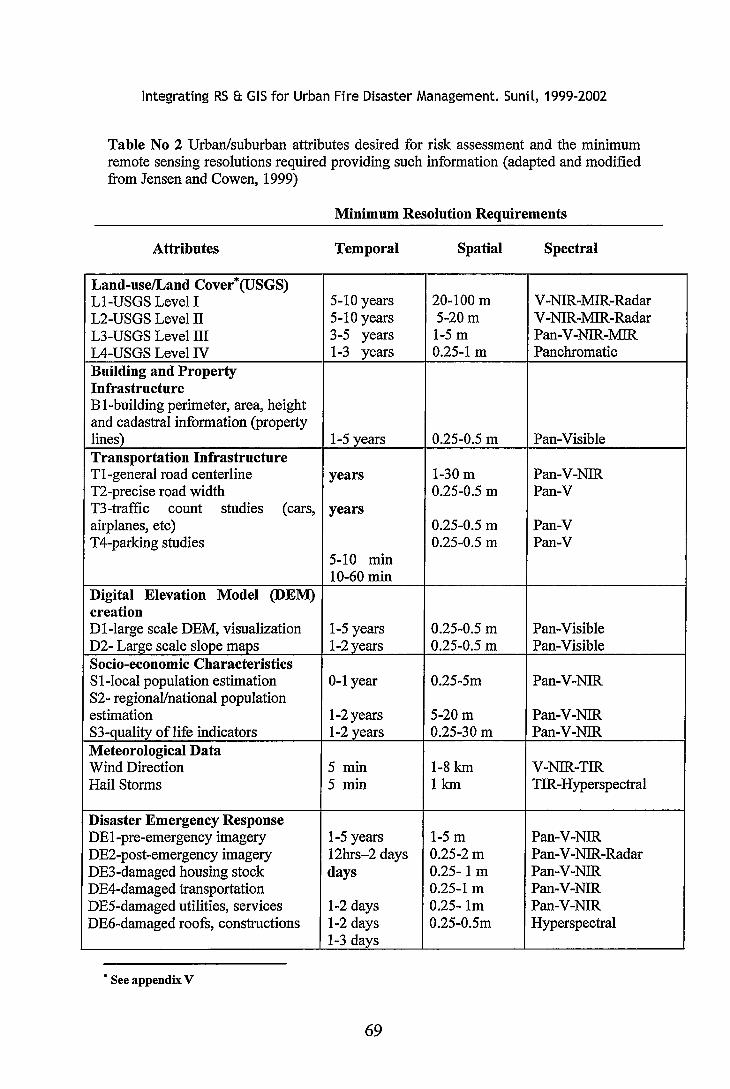
Integrating RS & GIS for Urban Fire Disaster Management. Sunil, 1999-2002
Table No 2 Urban/suburban attributes desired for risk assessment and the minimum remote sensing resolutions required providing such information (adapted and modified from Jensen and Cowen, 1999)
Attributes
Land-use/Land Cover*(USGS) L1-USGS Level I L2-USGS Level II L3-USGS Level III L4-USGS Level IV Building and Property Infrastructure B 1-building perimeter, area, height and cadastral information (property lines) Transportation Infrastructure T1-general road centerline T2-precise road width T3-traffic count studies (cars, airplanes, etc) T4-parking studies
Digital Elevation Model (DEM) creation D !-large scale DEM, visualization D2- Large scale slope maps Socio-economic Characteristics S !-local population estimation 82- regionaVnational population estimation 83-quality oflife indicators Meteorological Data Wind Direction Hail Storms
Disaster Emergency Response DE !-pre-emergency imagery DE2-post-emergency imagery DE3-damaged housing stock DE4-damaged transportation DE5-damaged utilities, services DE6-damaged roofs, constructions
• See appendix V
Minimum Resolution Requirements
Temporal
5-10 years 5-10 years 3-5 years 1-3 years
1-5 years
years
years
5-10 min 10-60 min
1-5 years 1-2 years
0-1 year
1-2 years 1-2 years
5 min 5 min
1-5 years 12hrs-2 days days
1-2 days 1-2 days 1-3 days
69
Spatial
20-100 m 5-20m 1-5m 0.25-1 m
0.25-0.5 m
1-30m 0.25-0.5 m
0.25-0.5 m 0.25-0.5 m
0.25-0.5 m 0.25-0.5 m
0.25-5m
5-20m 0.25-30 m
1-8 km 1 km
1-5m 0.25-2 m 0.25-1 m 0.25-1 m 0.25-lm 0.25-0.5m
Spectral
V -NIR-MIR-Radar V -NIR-MIR-Radar Pan-V -NIR-MIR Panchromatic
Pan-Visible
Pan-V-NIR Pan-V
Pan-V Pan-V
Pan-Visible Pan-Visible
Pan-V-NIR
Pan-V-NIR Pan-V-NIR
V-NIR-TIR TIR -Hyperspectral
Pan-V-NIR Pan-V-NIR-Radar Pan-V-NIR Pan-V-NIR Pan-V-NIR Hyperspectral
Integrating RS &. GIS for Urban Fire Disaster Management. Sunil, 1999-2002
3-7 Spectral resolution
Spatial resolution is usually more important than spectral resolution for extracting
urban-suburban information from remotely sensed data. It is more important to have
high spatial resolution (small resolution element) than high spectral resolution (a large
number of spectral bands). For example local population estimates based on building
unit counts usually require a minimum spatial resolution of from 0.25 to 5m to detect,
distinguish between and or identify the type of individual buildings. However, there
must be sufficient spectral contrast between the object of interest (e.g. a building) and
its background (e.g., the surrounding landscape) in order to distinguish the object from
its background. While this can usually be obtained with a single band covering the
visible spectrum, often smaller or different wavelengths band intervals can be used. For
example in the visible blue, green and red (for true colour) may be required for
identification or wavelengths in the visible and near infrared used for easier distinction
between built and vegetated surfaces, while microwave radar sensors may be used to
penetrate cloud where essential immediate information is required, or for urban
structural form. Furthermore, in some cases the spectral resolution is very important to
distinguish between several urban features such as roofing materials, which may be
found in close proximity. For example, in a study carried out by (Bhaskaran et al. 2001,
2001a) for the New South Wales Fire Brigades in Sydney, it was necessary to
spectrally differentiate roofing materials on the basis of their material composition.
This type of analysis is important to determine the regions having more vulnerable
roofmg materials that may be damaged by natural perils such as hail storms, which are
responsible for some of the largest disaster bills in Australia.
70
Integrating RS & GIS for Urban Fire Disaster Management. Sunil, 1999-2002
3-8 Spatial resolution requirements for hazard assessment
For the current study high spatial resolution is vital in order to distinguish between
individual buildings. Aerial photographs can be flown on request at the required height
in order to deliver the capture the data at the required resolution or aerial photos can be
secured from the archives often at appropriate scales. In spite of the successful use of
satellite data as an essential data for the appraisal of urban environments which is
shown in previous studies (Forster, 1985; Welch, 1982; Jensen, 1983; Lo and Welch,
1977, Jensen and Toll, (1982), Murai and Mustra (1988) and more recently Sutton
(1997) the urban environment continues to challenge the demands of remote sensing
users as the coarse spatial resolution of remotely sensed data has not been as suitable
for urban surface analysis as researchers had hoped (Thomson and Hardin, 2000).
While the spatial resolution of satellite products has not yet matched the very high
spatial resolution provided by airborne sensors, most of the needs of urban hazard
monitoring can be met by the recently launched high spatial resolution satellite system,
with spatial resolutions of better than 1 metre as shown in Table 2.
3-9 Evaluation of hazard related variables found in urban/suburban environments and the availability of remote sensing systems to provide such information
Some of the important factors, which influence hazard may be summarized as follows
land-use, special hazards, infrastructure, street network, population density and
demographic characteristics, structural density, topographic features (slope, elevation,
aspect), weather phenomena (wind direction, conditions).
Land-use/landcover is one of the most fundamental variables required for assessing
hazard. Landcover refers to the physical cover found in different areas and as such
71
Integrating RS & GIS for Urban Fire Disaster Management. Sunil, 1999-2002
consists of natural and built features, whereas, land-use refers to the predominant
activity carried out with in that landcover. The land-use is more important for assessing
hazards since hazard in urban environments are a function of the activity and its
potential for hazard. For instance, a tiled roof area (land cover) by itself is not a hazard,
but when it covers an activity such as a workshop or chemical factory (land-use), it
may carry a certain hazard to the people working in it or exposed nearby. However it is
important to have a landcover map before constructing a land-use map since in ideal
conditions the land cover map may provide details about the land-use. A
comprehensive land-use map may require ancillary information about the activity
found in that land cover. Such data may be integrated into the land cover map in order
to determine or confirm the land-use. A moderate resolution remote sensing data such
as Landsat and SPOT may be used to develop landcover maps but high resolution data
such as IKONOS will be required to distinguish separate urban features that aid in the
determination of land-use. In some special cases where detection of small features is
crucial for planning a very high resolution will be required, where scale independent
remote sensing data such as those exposed by airborne platforms, will be required
(Jensen and Cowen, 1999).
Mapping urban sprawl is very important component of risk assessment. Such stages of
urban phenology can be effectively studied by using moderate remote sensing data such
as SPOT and Landsat, which can monitor the urban growth. Image data from these
systems will function like a flagging mechanism, highlighting where change has taken
place but the detailed description of the structures or urban features will have to
ascertained by high spatial resolution data such as those provided by IKONOS or
airborne sensor systems, or from field visits.
72
Integrating RS &. GIS for Urban Fire Disaster Management. Sunil, 1999-2002
High spatial resolution space/airborne data will have to use for locating individual
features, transportation centres, storage locations, and special hazard locations. In many
instances even the highest resolution of satellite data may fall short of the required
resolution for detecting urban landuse. Airborne data (aerial photo images) will
therefore always be required until satellite can be provided at a very high spatial
resolution (<0.5).
Determining the height of structures is also important in assessing the hazard and
specifically for allocating materials such as aerial pumpers. High resolution DEMs may
be required to identify such structures. Ridley et al. (1998) conducted a feasibility study
and found that simulated lm by lm satellite stereoscopic data could have potential for
creating a nationwide three dimensional model if the processes were automated.
However, the use of such synthetic imagery may not provide the detailed planimetric
(perimeter area) and topographic detail and accuracy (building height and volume) that
can be extracted from aerial photography. Nevertheless such resolution may be
sufficient enough for assessing hazards and locating high-rise buildings, and for
creating a database, which can be used for visualization.
Atmospheric data from weather satellites may be used in conjunction with high spatial
resolution data in order to prepare for an emergency rescue operation. For instance in
the case of hail storms in Australia, meteorological data may be used in conjunction
with hyperspectral and airborne aerial photo images to locate vulnerable areas. Such
data-base may be linked with other available ground based spatial data, and analyzed in
a GIS environment for managing disasters.
73
Integrating RS 8: GIS for Urban Fire Disaster Management. Sunil, 1999-2002
Table 2 generally shows that high spatial resolution images would be required to
identify large features in urban areas. For the purposes of risk assessment in urban
environments a very high spatial resolution is required which is also true for most
urban/suburban areas (Jensen and Cowen, 1999). This is due to the need to identify
each structure and other relative features such as street network, drainage lines, special
hazard sites, water-hydrants, fire stations, emergency sites. At any point during a
disaster these features will have to monitored and studied in their relative locations,
which may provide valuable input to resource planning. The range and sizes of features
in urban areas can be very high, with a smallest structure measuring 15 metres to 20
metres or considerably lesser (e.g. water hydrant), therefore risk assessment generally
requires very high spatial resolution data.
However, in some instances a high spectral resolution image may also be required, by
the study as was shown by Bhaskaran and Neal (2002) in a study where there was a
need to identify roofmg materials in Sydney. The study demanded a high spatial
resolution as well as spectral resolution. Hyperspectral data may be used in urban areas
to distinguish between built features and the materials used in their construction.
Roofing materials were distinguished in an attempt to create a vulnerability assessment
map for identifying hail-storm prone areas in Sydney, Australia (Bhaskaran et al. 2001
a,b). A high spatial and spectral resolution image HyMap was used for analysis and
integration into a GIS environment for identifying exposed population for every
collector district level.
74
Integrating RS ft GIS for Urban Fire Disaster Management. Sunil, 1999-2002
3-10 Restrictions and other factors
The sourcing of aerial photographs can be hampered by political factors. For instance
in some developing countries the use of aerial photographs is restricted, while satellite
products are generally available. The policy of the government also influences the
choice of remote sensing data. Similarly low level flying can be prohibited in some
sensitive areas such as the city centres (CBD).
3-11 Other Factors
The gestation time involved in exposing a fresh scene on an airborne sensor involves
two factors. The topography of the region may be such that safe flight of the aircraft
may not be possible. These regions can be better exposed by space borne sensors.
Satellite data can be secured even in poor weather conditions provided the cloud cover
is within acceptable limits, while data acquisition from airborne sensors may not be
possible in such situations.
3-12 Summary
From the above discussion it is clear that the study of hazard cannot be based on a
single criterion, such as the hazard focused approach followed by the NSWFB, since
they are influenced by many spatia-temporal factors. On the one hand is the issue of
combining hazard and vulnerability related variables and on the other is the issue of
providing composite information on the existing hazard to assist in emergency
operations. There is a need to develop a semantic fire risk model in order to assist
emergency operations during urban fires. In order to model hazards numerous types of
data which may influence hazard in an urban environment may have to be sourced and
managed.
75
Integrating RS &. GIS for Urban Fire Disaster Management. Sunil, 1999-2002
While it can be seen from the discussion of hazard that a wide range of urban variables
can have an impact, it was decided that structural density, land-use, demographic
variables (age, income levels, education) and roof materials, could be considered as
surrogates for most other variables, thus reducing the data sets to manageable size
without compromising the integrity of the study. Management of data is one of the
main issues when developing and modeling hazards. Data management begins by
identifying the type of data required, sourcing it and finally analyzing it to derive new
additional information. The identification of data will be influenced by the objective of
the study, level of details required, and general availability of data. Data management
and choice of sites and the methodology developed for the current study are discussed
in the following chapter.
The main contribution of this study was to present a methodology which can
incorporate various types of spatial data such as remote sensing, cartographic and field
data, all of which when combined systematically and analyzed, will assist in better
decision making and improve the existing methodology of assessing risk and managing
resources. A significant portion of the following chapter explains the step by step
process involved in developing the model and the various analyses.
76
Integrating RS ft GIS for Urban Fire Disaster Management. Sunil, 1999-2002
Chapter 4: Data Management and Methodology.
4-1 Introduction
The current research is based on using data, which is extracted from remote sensing
sources and other available GIS cartographic data. The first step in developing a model
is to identify and acquire the raw data and their sources by using the latest technology
such as remote sensing and available cartographic data. The data is generally
determined by the problem to be studied, which will influence the scale, type and
details in the data. The type of details which have to be studied and analyzed will vary
from one region to another depending on the local landscape and geography. Data
management is therefore a complex aspect of hazard modeling which includes the
identification, sourcing and management of data. Once the data has been identified then
details pertaining to accuracy, content, projection and datum need to be recorded and
stored for future uses. Data management is also based on the study area, its geography
and other socio-economic characteristics. The sites chosen for this study were the
developing city of Bathurst and a section of the densely populated Shire of Hornsby, on
the edge of Sydney.
A detailed description of the data management aspects and the methodology adopted in
this research is the main content of this chapter. The methodology for developing a
semantic model is a complex and time consuming process, involving the systematic
appraisal of spatial data, which is sourced from high spatial remote sensing data and
available cartographic data, that has been validated and has or is being used by other
and different organizations. A detailed step-by-step account of the methodology will
77
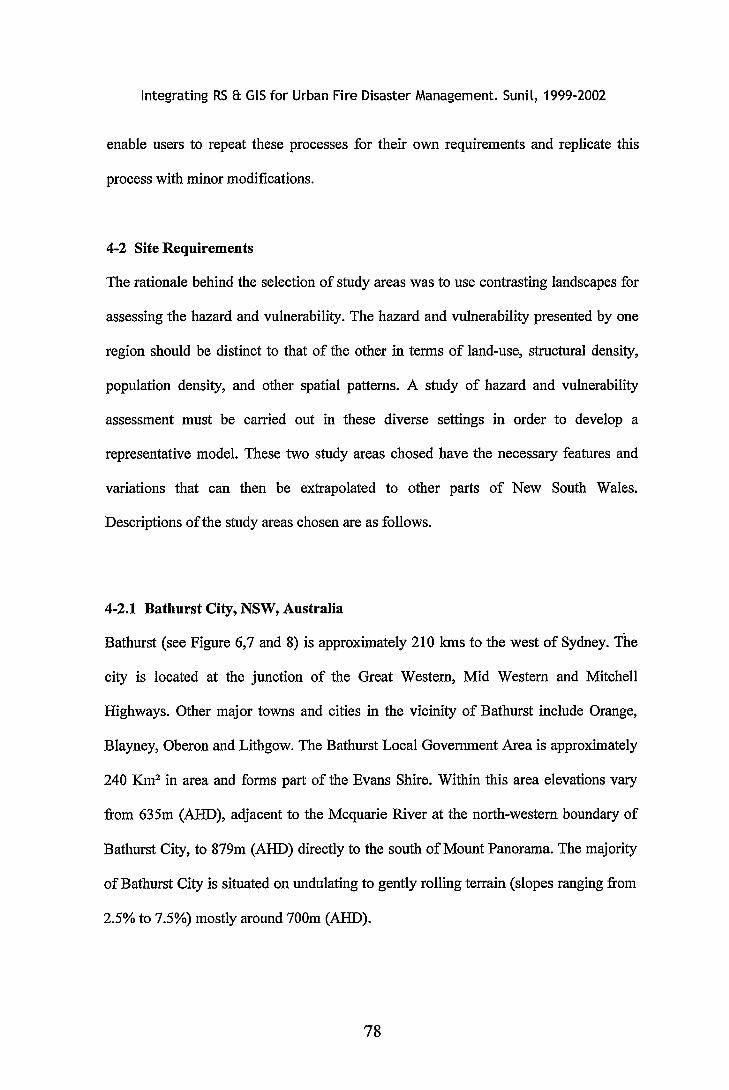
Integrating RS 8: GIS for Urban Fire Disaster Management. Sunil, 1999-2002
enable users to repeat these processes for their own requirements and replicate this
process with minor modifications.
4-2 Site Requirements
The rationale behind the selection of study areas was to use contrasting landscapes for
assessing the hazard and vulnerability. The hazard and vulnerability presented by one
region should be distinct to that of the other in terms of land-use, structural density,
population density, and other spatial patterns. A study of hazard and vulnerability
assessment must be carried out in these diverse settings in order to develop a
representative model. These two study areas chosed have the necessary features and
variations that can then be extrapolated to other parts of New South Wales.
Descriptions ofthe study areas chosen are as follows.
4-2.1 Bathurst City, NSW, Australia
Bathurst (see Figure 6,7 and 8) is approximately 210 Ians to the west of Sydney. The
city is located at the junction of the Great Western, Mid Western and Mitchell
Highways. Other major towns and cities in the vicinity of Bathurst include Orange,
Blayney, Oberon and Lithgow. The Bathurst Local Government Area is approximately
240 Km2 in area and forms part of the Evans Shire. Within this area elevations vary
from 635m (AHD), adjacent to the Mcquarie River at the north-western boundary of
Bathurst City, to 879m (AHD) directly to the south of Mount Panorama. The majority
of Bathurst City is situated on undulating to gently rolling terrain (slopes ranging from
2.5% to 7.5%) mostly around 700m (AHD).
78
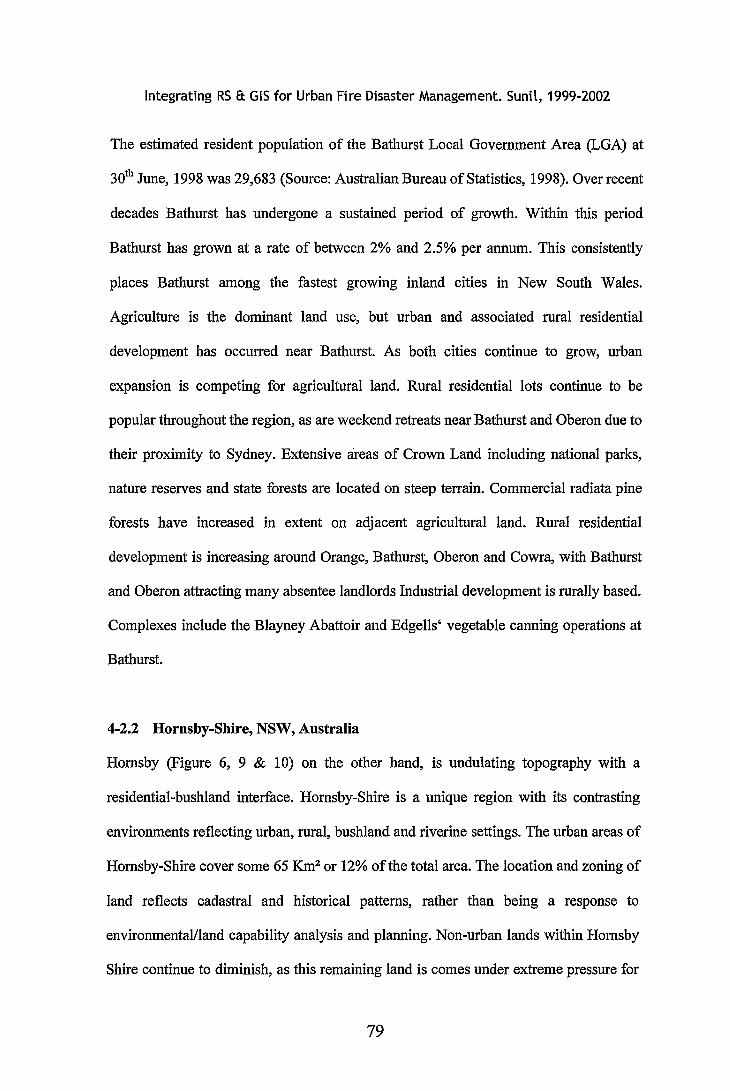
Integrating RS &. GIS for Urban Fire Disaster Management. Sunil, 1999-2002
The estimated resident population of the Bathurst Local Government Area (LOA) at
30th June, 1998 was 29,683 (Source: Australian Bureau of Statistics, 1998). Over recent
decades Bathurst has undergone a sustained period of growth. Within this period
Bathurst has grown at a rate of between 2% and 2.5% per annum. This consistently
places Bathurst among the fastest growing inland cities in New South Wales.
Agriculture is the dominant land use, but urban and associated rural residential
development has occurred near Bathurst. As both cities continue to grow, urban
expansion is competing for agricultural land. Rural residential lots continue to be
popular throughout the region, as are weekend retreats near Bathurst and Oberon due to
their proximity to Sydney. Extensive areas of Crown Land including national parks,
nature reserves and state forests are located on steep terrain. Commercial radiata pine
forests have increased in extent on adjacent agricultural land. Rural residential
development is increasing around Orange, Bathurst, Oberon and Cowra, with Bathurst
and Oberon attracting many absentee landlords Industrial development is rurally based.
Complexes include the Blayney Abattoir and Edgells' vegetable canning operations at
Bathurst.
4-2.2 Hornsby-Shire, NSW, Australia
Hornsby (Figure 6, 9 & 1 0) on the other hand, is undulating topography with a
residential-bushland interface. Hornsby-Shire is a unique region with its contrasting
environments reflecting urban, rural, bushland and riverine settings. The urban areas of
Hornsby-Shire cover some 65 Km2 or 12% of the total area. The location and zoning of
land reflects cadastral and historical patterns, rather than being a response to
environmental/land capability analysis and planning. Non-urban lands within Hornsby
Shire continue to diminish, as this remaining land is comes under extreme pressure for
79
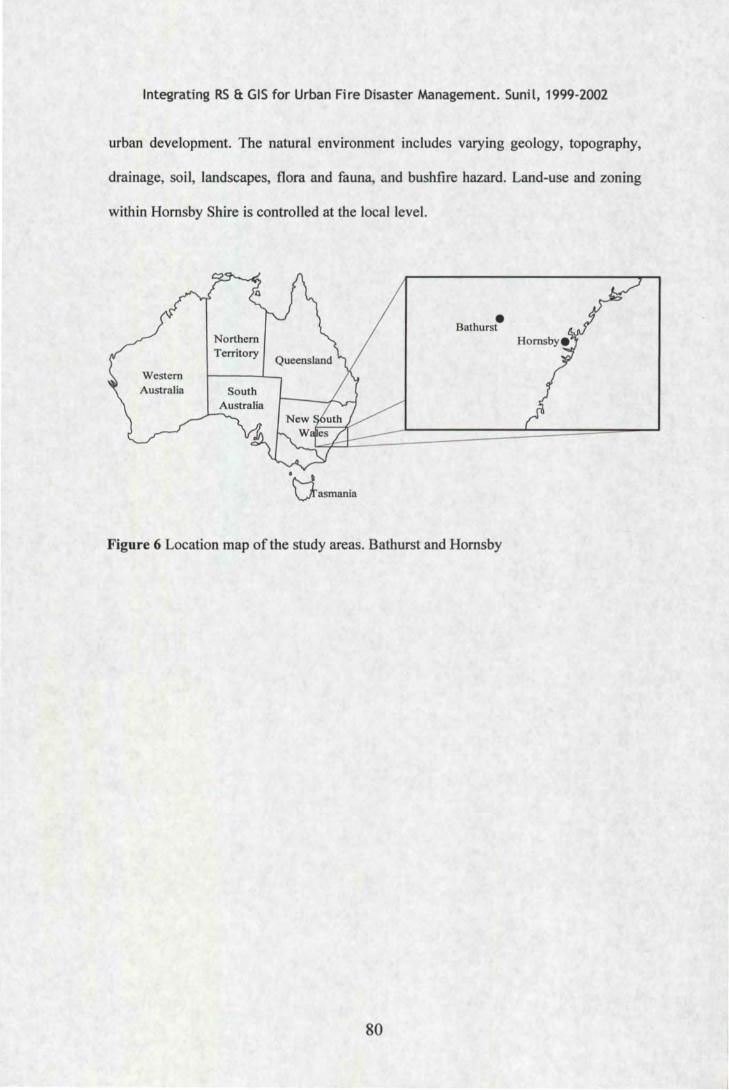
Integrating RS & GIS for Urban Fire Disaster Management. Sunil, 1999-2002
urban development. The natural environment includes varying geology, topography,
drainage, soil, landscapes, flora and fauna, and bushfire hazard. Land-use and zoning
within Hornsby Shire is controlled at the local level.
Territory
Western Australia South
• Bathurst
Figure 6 Location map of the study areas. Bathurst and Hornsby
80
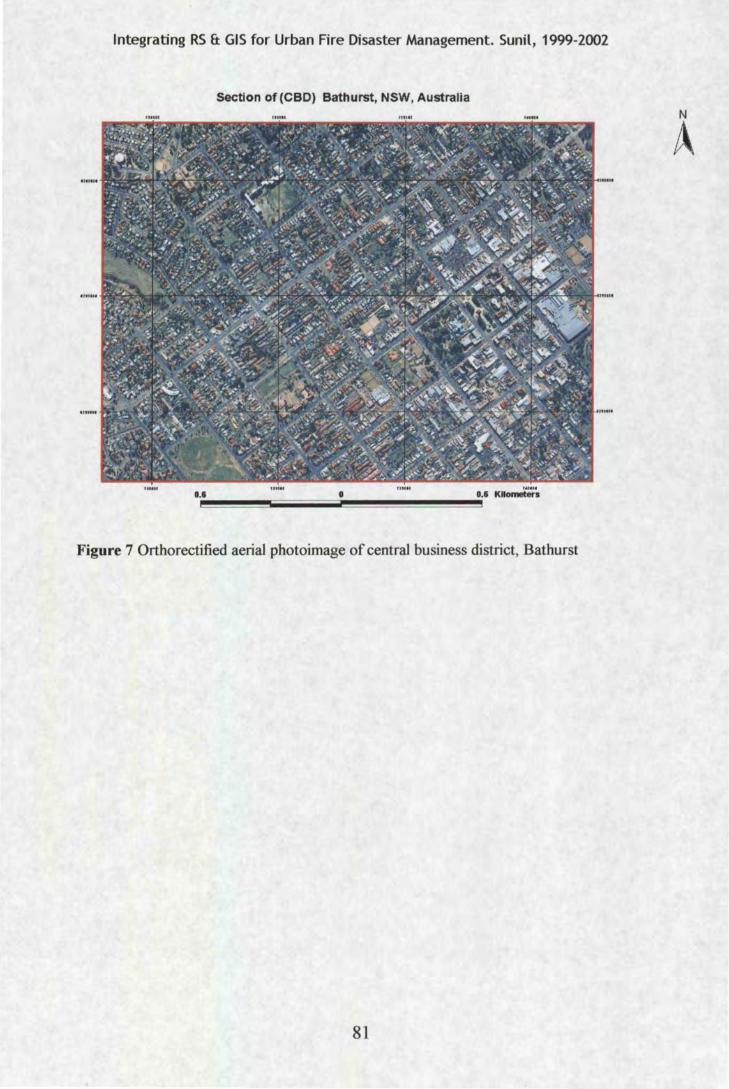
Integrating RS & GIS for Urban Fire Disaster Management. Sunil, 1999-2002
Section of(CBD) Bathurst, NSW, Australia N
A ., .....
Figure 7 Orthorectified aerial photoimage of central business district, Bathurst
81
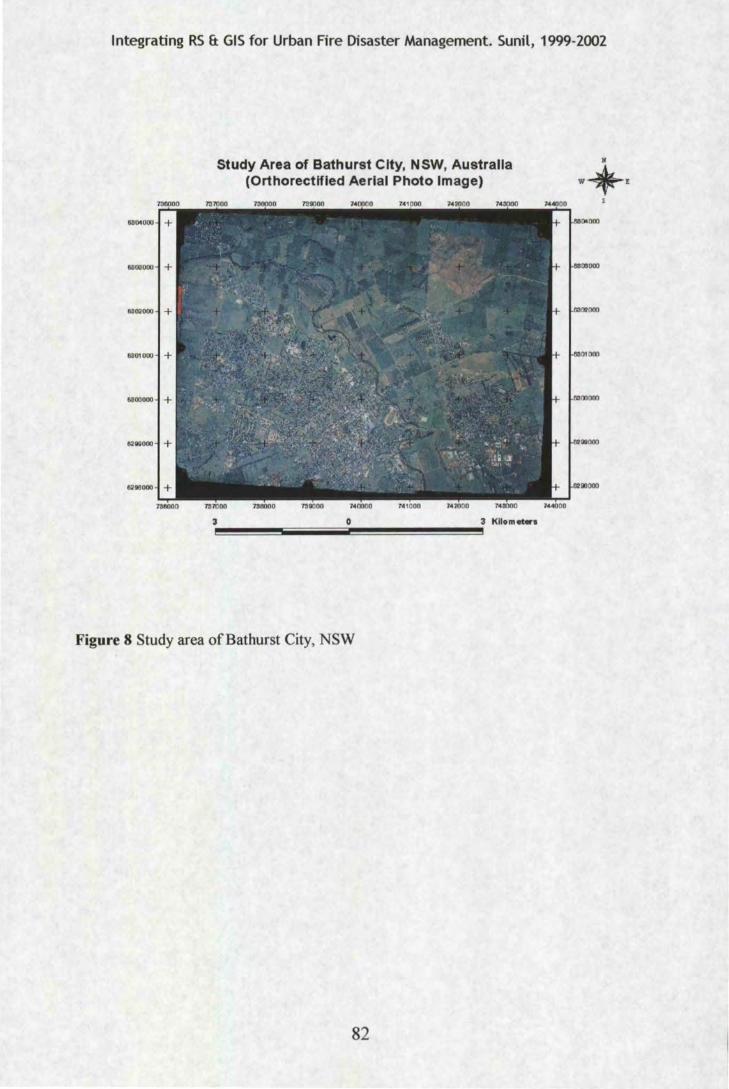
Integrating RS & GIS for Urban Fire Disaster Management. Sunil, 1999-2002
Study Area of Bathurst City, NSW, Australia (Orthorectifled Aerial Photo Image)
Figure 8 Study area ofBathurst City, NSW
82
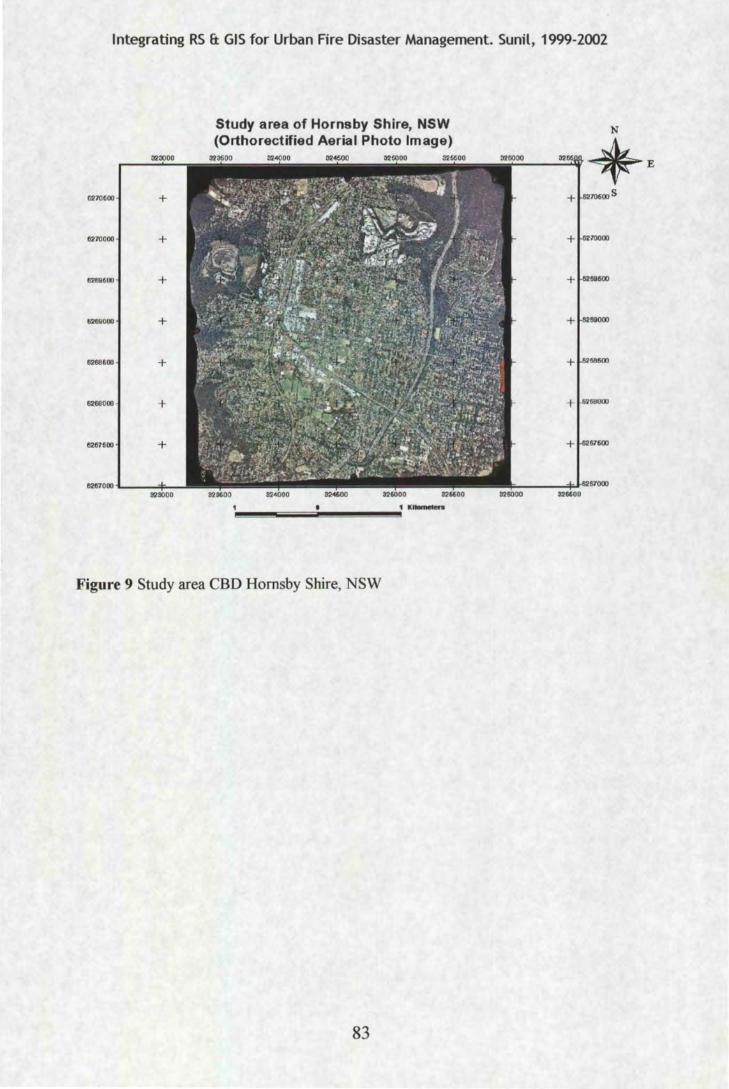
Integrating RS & GIS for Urban Fire Disaster Management. Sunil, 1999-2002
li270600 +
8270000 +
62till600 +
+
+
62E8000 +
8287600 +
8287000 "L--"'"""*'-82SOOO
Study area of Hornsby Shire, NSW (Orthorectified Aerial Photo Image)
Figure 9 Study area CBD Hornsby Shire, NSW
83
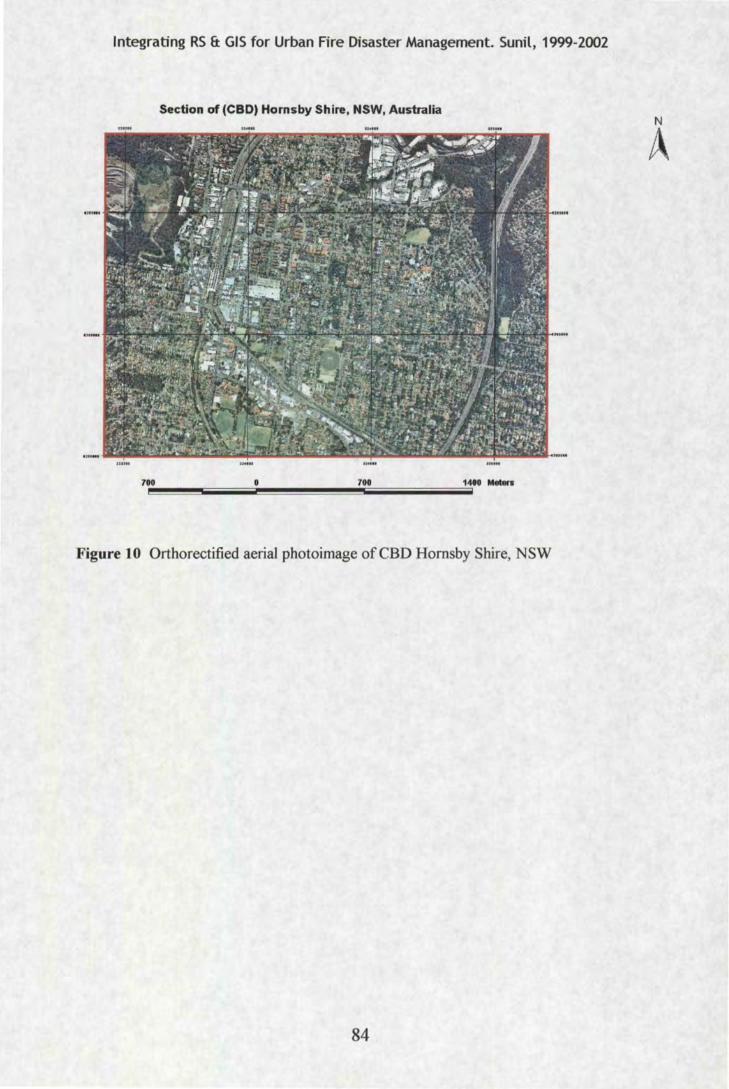
Integrating RS & GIS for Urban Fire Disaster Management. Sunil, 1999-2002
Section of (CBD) Hornsby Shire, NSW, Australia N
A
Figure 10 Orthorectified aerial photoimage ofCBD Hornsby Shire, NSW
84
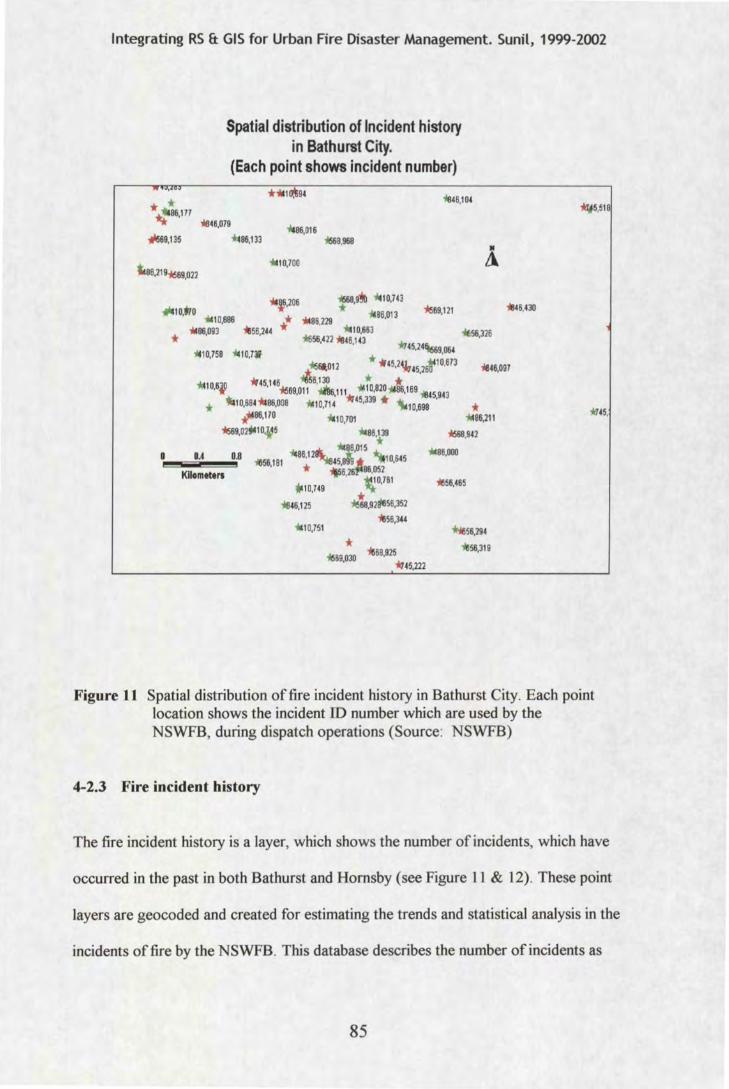
Integrating RS & GIS for Urban Fire Disaster Management. Sunil, 1999-2002
Spatial distribution of Incident history in Bathurst City.
(Each point shows incident number)
* * ~46,104
•
. 7' 86,177 .... '1111 46,079
~69,135 '*486,133 86,016
~8,968
i.86,219-f669 on 10,700 A
~69,121
*>56,326
10,WO i410,686 * . 86,093
*f·206 : 6a,sil • 10,743
l i486,229 'J\486,013 *'56,244 10,663
-Ati56,m ~46,143 '~745•24~69,064 10,758 ill10,7lf
,1846,430
ls~f:A01 2 * •45,2~45,2sr 1 0,673 -le46,097
~10 630 *45·146 6 ·1.~ 'lilt 820 * ' fr 'i669,011 11!1116,111 ' 86,169 i845943 * i.t10,684 '*-86,008 'J\410,714 *45·339 • '\10,698 '
# 86•110 .10,701 'l\569,02 :tl10,~5 86,139
*-"§!1,015 * o'i!!!!!liiioii!.4~~o.o 'i(;56,1B1 a&,12&\ec5e9'9 10,645
Kilometers * '5 26 86•052 ' il10,761
. 10,749 ~
ie46,125 'l\s!a.s2a'656,352
'J\410,751 *'56,344
* oM69,030 ~68,925 i m,222
* 86,211
'i668,942
1!186,000
-le56,465
+;e5e,2sc
*'56,319
~5,518
Figure 11 Spatial distribution of fire incident history in Bathurst City. Each point location shows the incident ID number which are used by the NSWFB, during dispatch operations (Source: NSWFB)
4-2.3 Fire incident history
The fire incident history is a layer, which shows the number of incidents, which have
occurred in the past in both Bathurst and Hornsby (see Figure 11 & 12). These point
layers are geocoded and created for estimating the trends and statistical analysis in the
incidents of fire by the NSWFB. This database describes the number of incidents as
85
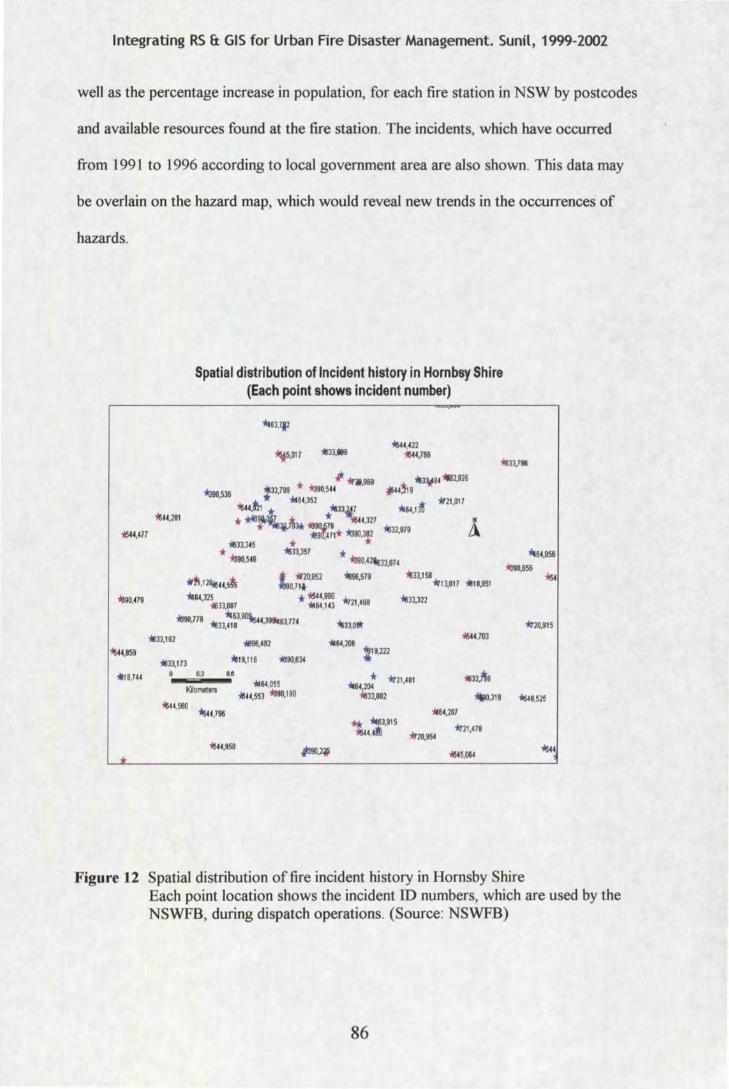
Integrating RS & GIS for Urban Fire Disaster Management. Sunil, 1999-2002
well as the percentage increase in population, for each fire station in NSW by postcodes
and available resources found at the fire station. The incidents, which have occurred
from 1991 to 1996 according to local government area are also shown. This data may
be overlain on the hazard map, which would reveal new trends in the occurrences of
hazards.
1e9o,m
Spatial distribution of Incident history in Hornbsy Shire (Each point shows incident number)
~14.281
'*!33,162
~3.113 0 0.3
I<Jiometm
~44. 560 'IIMI,796
~63,1.f
~.017
11896,492
'11119,116 '111190,634
0.0
•s..055 lieU,553 1e90,190
llJJ,
33,158
ie33,322
..... ... 63,915
*I 3,017 ... 18,951
. 64.207
• n.l\9 ~0.319
1614,1 . 20.951
111161,056
io9o,656
111720,915
'111549,525
Figure 12 Spatial distribution of fire incident history in Hornsby Shire Each point location shows the incident ID numbers, which are used by the NSWFB, during dispatch operations. (Source: NSWFB)
86
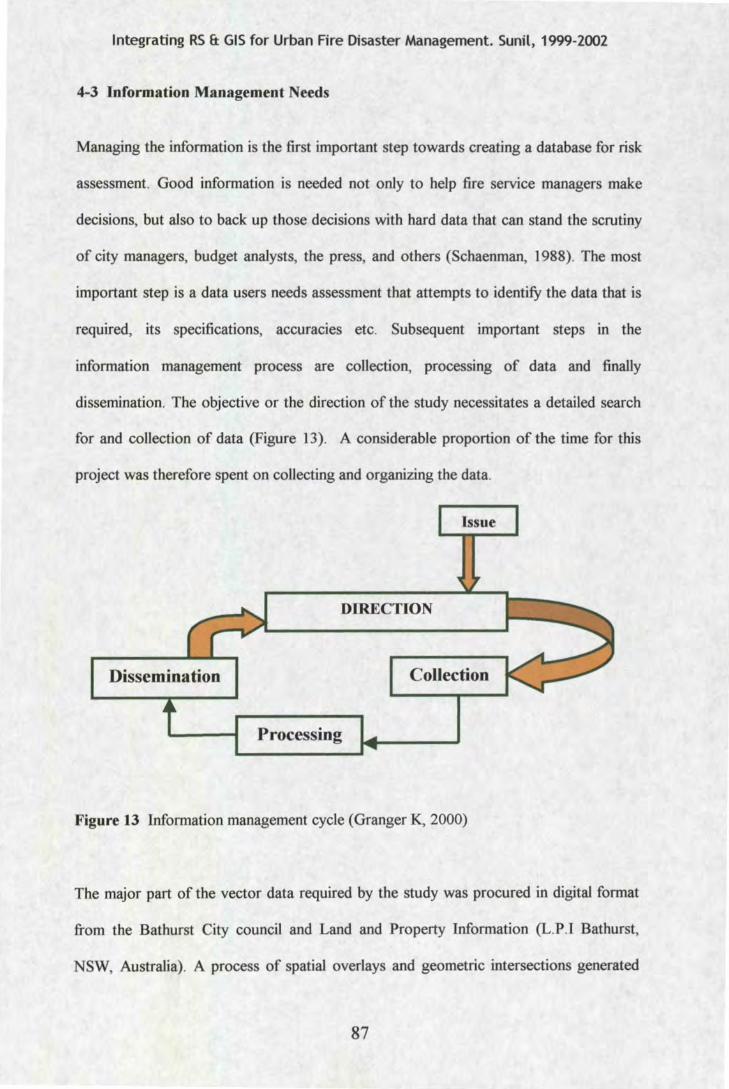
Integrating RS & GIS for Urban Fire Disaster Management. Sunil, 1999-2002
4-3 Information Management Needs
Managing the information is the first important step towards creating a database for risk
assessment. Good information is needed not only to help fire service managers make
decisions, but also to back up those decisions with hard data that can stand the scrutiny
of city managers, budget analysts, the press, and others (Schaenman, 1988). The most
important step is a data users needs assessment that attempts to identify the data that is
required, its specifications, accuracies etc. Subsequent important steps in the
information management process are collection, processing of data and finally
dissemination. The objective or the direction of the study necessitates a detailed search
for and collection of data (Figure 13). A considerable proportion of the time for this
project was therefore spent on collecting and organizing the data.
Issue
DIRECTION
Dissemioa tion Collection
Processing
Figure 13 Information management cycle (Granger K, 2000)
The major part of the vector data required by the study was procured in digital format
from the Bathurst City council and Land and Property Information (L.P.I Bathurst,
NSW, Australia). A process of spatial overlays and geometric intersections generated
87
Integrating RS 8: GIS for Urban Fire Disaster Management. Sunil, 1999-2002
the attribute data for each areal unit (250m by 250m). A contact print of an aerial
photograph (1:16,000) exposed in 1998 was scanned to a 1000 dpi and registered using
several ground control points from a digital elevation model (DEM) to accuracy of ±5
meters: This image was re-sampled to a 1 by 1m spatial resolution and saved as a tag
imported file format. These types of digital image maps (or image maps) are becoming
more common than conventional cartographic line maps for many land-related
mapping applications, especially in relation to hybrid GIS (Parent, 1991). Hybrid in this
context means the capability of a GIS to capture, manage and analyze, and present
vector and raster data efficiently (Grenzdorffer and Bill, 1994). These digital images
can be geometrically processed to achieve high accuracy, which would be comparable
to basic maps of similar scale (Thorpe et al. 1994; Doyle, 1996). Where new data is
required, remote sensing technology, on satellites or aircraft, holds great potential in a
disaster situation (Granger, 2000).
4-4 Data Description
Several types of data were sourced for this study particularly those which were related
to risk. Modelling urban fire risk requires a systematic appraisal of such varied types of
data and their utility in explaining the spread of urban hazard. The accuracy and quality
of the database varies for each study, however those used in this research were found to
be suitable with respect to accuracy and details. A brief description and utility of some
of the important datasets used for the research is explained in the following
subsections. (see appendix V for complete description of data used in current research
and Metadata.)
88
Integrating RS 8: GIS for Urban Fire Disaster Management. Sunil, 1999-2002
4~4.1 Contours (Source: Hornsby Shire Council) land and property information (LPI)
This information may be used to assess the elevation of the service area mainly for
visualization. The topography of a service area may combine with other existing factors
which influence hazard in presenting additional difficulties during emergency
operations. For instance, if the general elevation is mapped then the degree of difficulty
of routing an appliance such as the aerial pumper can be determined and strategically
located. The elevation details may be input to the fire hazard model to draw and create
picture of the existing hazard. In the current study the contours were not used due to
some technical problems with the data. However see Figure 14 for an example of
contour data over Hornsby.
4~4.2 Land~use (LEP) (Source: Bathurst city council and Hornsby Shire council)
These data were fundamental to the assessment of hazard since land~use is one of the
main factors which, influences the hazard in a particular region. The database was
secured from the Bathurst City Council who created it. New developments are updated
and validated them at regular intervals. This data therefore has high accuracy. The land~
use data consists of three major land~use types such as residential, commercial and
Industrial. Commercial land~use was further sub~divided; for example service business
and general business were combined to create the commercial land~use. The other
major categories of land~use were market gardening and general residential. The data
was provided as a polygon layers in multiple formats such as e.OO (Arcinfo Interchange
file format) and TAB (Map Info format) for the sake of software compatibility.
89
Integrating RS & GIS for Urban Fire Disaster Management. Sunil, 1999-2002
The land-use map was not available from the Hornsby council in a digital format since
they were encountering problems with the export of data from a specialized GIS
software to Map Info. The hardcopy map showing the land-use in the central business
district of Hornsby was converted from analogue to digital form using an AO size
digitizing table and Arclnfo software. Data editing was followed by the construction of
topology and the coverage was projected and transformed to the UTM Zone 56 wgs84
geodetic model. Digitizing still proves to be a very useful method of creating spatial
data especially when no other sources of acquiring such data is possible.
4-4.3 Orthorectified aerial photoimages (Source: Land and Property Information (LPI), Bathurst and Hornsby Shire)
Airborne data were preferred over space borne data mainly because of the inability of
space borne data to detect small details about some features in the urban environment.
Study areas in Bathurst and Hornsby were exposed at a scale of 1:16,000 and the
contact prints of these high resolution aerial photographs were secured from the LPI,
Bathurst and Hornsby Shire council. These were then scanned by using a digital
elevation model (DEM) and ground control points (GCPs) which had accuracies of
±5m and ±1m respectively. These products were orthorectified at the LPI, Bathurst
City. The digital images were then registered with the DCDB by a process of image to
map registration. Many types of vector data were overlain and analyzed with the aerial
photo images, to reveal many hidden patterns and spatial information which were
particularly significant in the research.
90
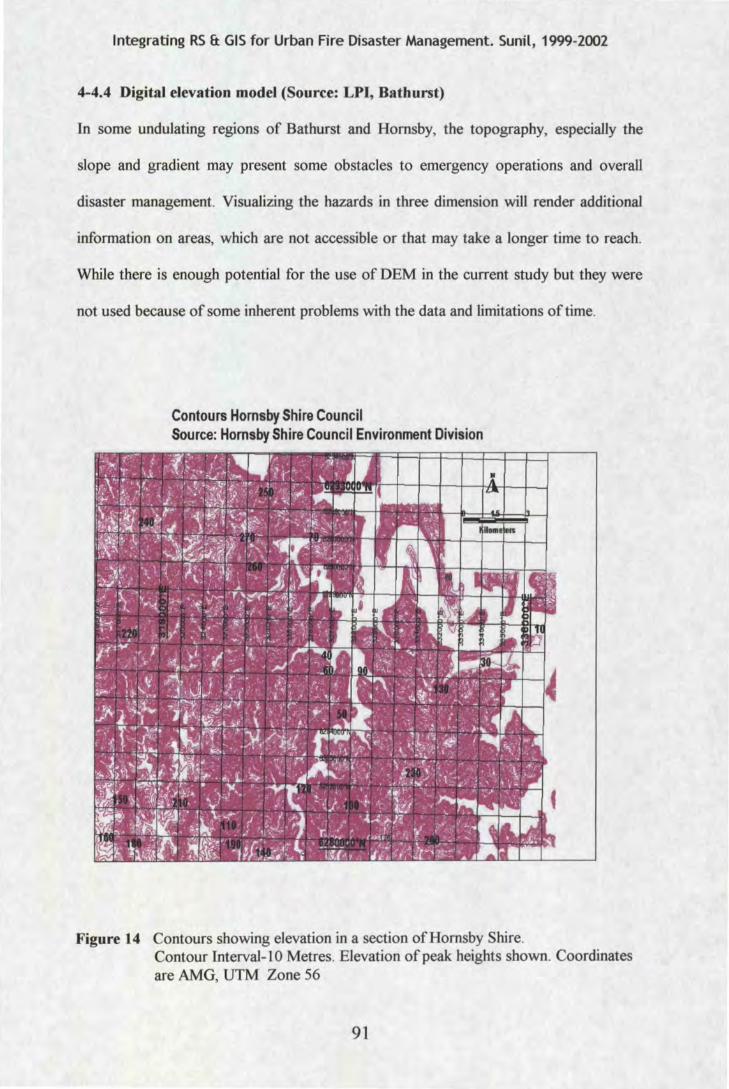
Integrating RS & GIS for Urban Fire Disaster Management. Sunil, 1999-2002
4-4.4 Digital elevation model (Source: LPI, Bathurst)
In some undulating regions of Bathurst and Hornsby, the topography, especially the
slope and gradient may present some obstacles to emergency operations and overall
disaster management. Visualizing the hazards in three dimension will render additional
information on areas, which are not accessible or that may take a longer time to reach.
While there is enough potential for the use of DEM in the current study but they were
not used because of some inherent problems with the data and limitations of time.
Contours Hornsby Shire Council Source: Hornsby Shire Council Environment Division
Figure 14 Contours showing elevation in a section ofHomsby Shire. Contour Interval-! 0 Metres. Elevation of peak heights shown. Coordinates are AMG, UTM Zone 56
91
Integrating RS & GIS for Urban Fire Disaster Management. Sunil, 1999-2002
4-4.5 Population density and demographic characteristics. Source: Australian Bureau of Statistics. (Source: Australian Bureau of Statistics)
Risk assessment must involve the assessment of the hazard (physical factor) as well as
the population who may be exposed to such hazards. Night-time population density and
demographic characteristics such as population density, the income level, distribution
of less mobile people, were extracted from the census data which was procured from
the ABS. The data from the census was inadequate in some ways. For instance, the
demographic data is a reflection of the night-time population and there is no
information to show the day-time population, and the data provided was given for the
entire collector district, whereas in reality only certain portions of the collector district
was populated. Even though this information, in many ways, is not very adequate for
the study, it was the best available data source about population and their
characteristics. The layers were provided in polygon map feature and had to be
processed before inputting them into the model. The data was secured in TAB format
and the data type was in the form of polygons. Most of the data used in this research
was extracted at the collector district level, which is the lowest level of detail provided
by the ABS.
4-4.6 Statewide chemical database
There are many sites in NSW, which present some hazard since they contain stored
chemicals. Most of these sites were under the acceptable standards of normal consent
levels stipulated by the NSWFB (Figure 15). Although most of the sites were strictly
monitored and were found to be under the permissible levels of hazardous
contaminants they had the potential to influence nearby regions and increase hazard
due to the material store and their nature and purpose of use. These sites have the
92
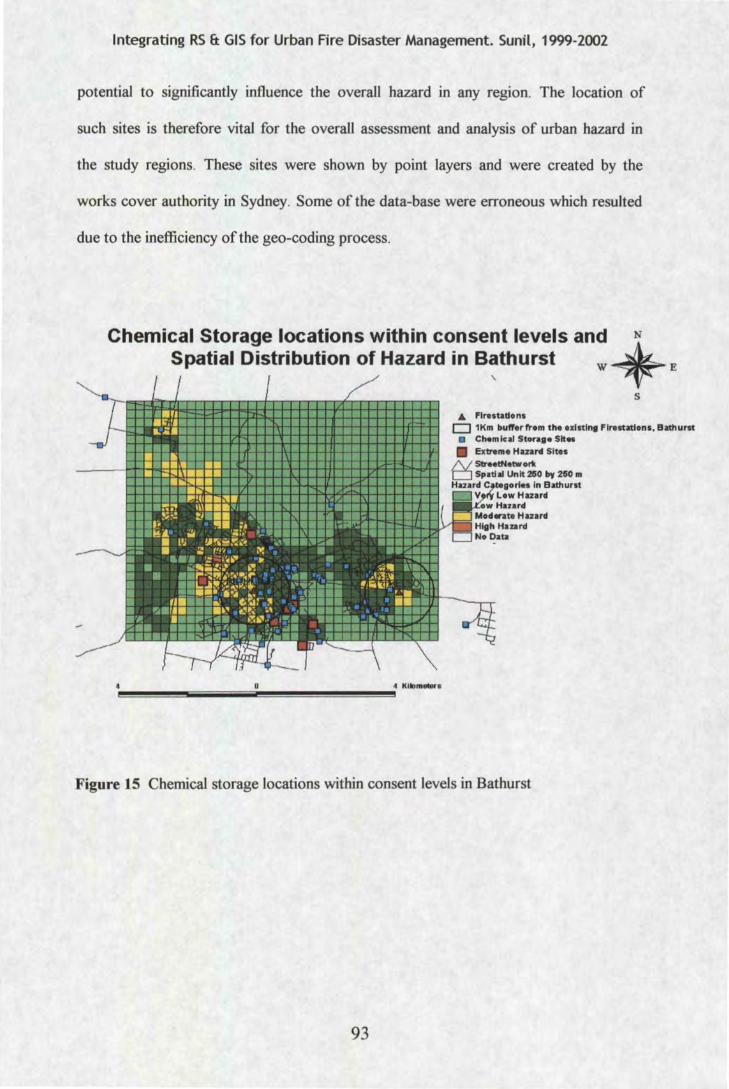
Integrating RS & GIS for Urban Fire Disaster Management. Sunil, 1999-2002
potential to significantly influence the overall hazard in any region. The location of
such sites is therefore vital for the overall assessment and analysis of urban hazard in
the study regions. These sites were shown by point layers and were created by the
works cover authority in Sydney. Some of the data-base were erroneous which resulted
due to the inefficiency of the geo-coding process.
Chemical Storage locations within consent levels and *N Spatial Distribution of Hazard in Bathurst w E
' s
A Flrutadons D 1Km butrorft"om tho exlatlnt Flrutulons, Bathurst
• Chemical Storaeo Sitos • Extreme Huard Sites
1\1 StrootNotwor11 D Spatial Unit 250 by 2GO m Huard In Bathurat
Hazard
Figure 15 Chemical storage locations within consent levels in Bathurst
93
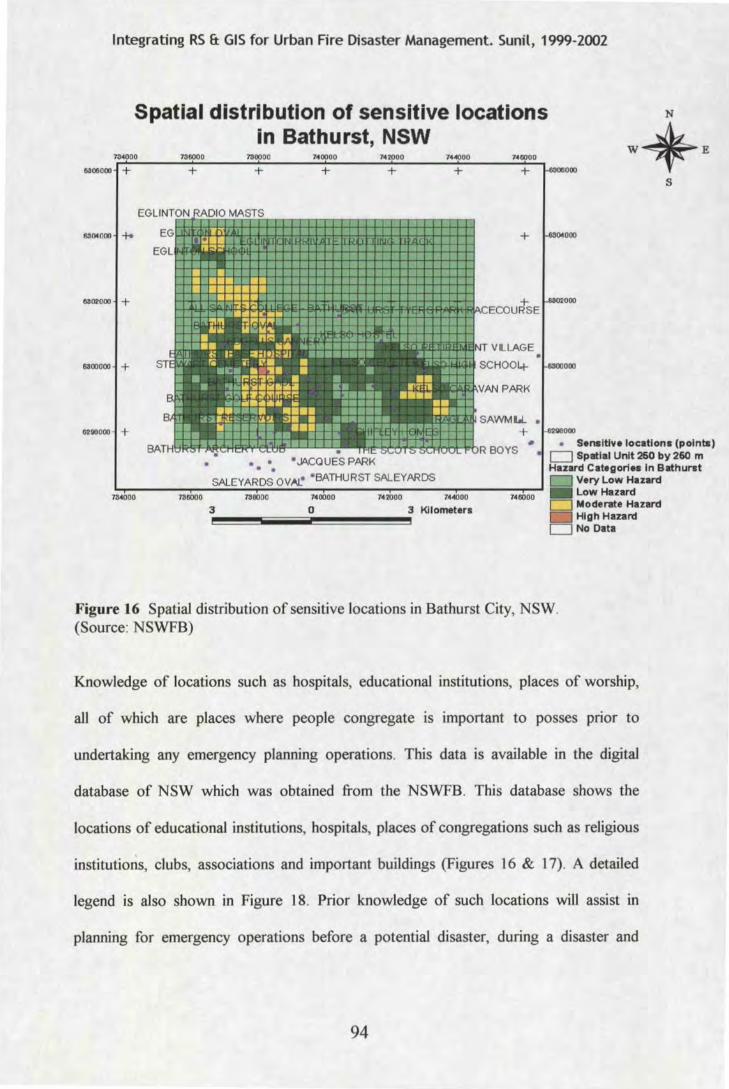
Integrating RS & GIS for Urban Fire Disaster Management. Sunil, 1999-2002
Spatial distribution of sensitive locations in Bathurst, NSW
7S4000 780000 7:10000 740000 742000 744000
118011000 + + + + + +
6!04000 +-
11:102000 +
6100000 +
62111000 + 000
s
• • . . SALEYARDS OV~ • BATHURST SALEYARDS
• Sensitive locations (points) D Spatial Unit 260 by 260 m Hazard Categories In Bathurst
Very Low Hazard
7S4000 780000 788000 74 2000 744000
3 3 Kilometers ~~--~~~~
740000
0
748000 -Low Hazard D Moderate Hazard
High Hazard c::J No Data
Figure 16 Spatial distribution of sensitive locations in Bathurst City, NSW. (Source: NSWFB)
Knowledge of locations such as hospitals, educational institutions, places of worship,
all of which are places where people congregate is important to posses prior to
undertaking any emergency planning operations. This data is available in the digital
database of NSW which was obtained from the NSWFB. This database shows the
locations of educational institutions, hospitals, places of congregations such as religious
institutions, clubs, associations and important buildings (Figures 16 & 17). A detailed
legend is also shown in Figure 18. Prior knowledge of such locations will assist in
planning for emergency operations before a potential disaster, during a disaster and
94
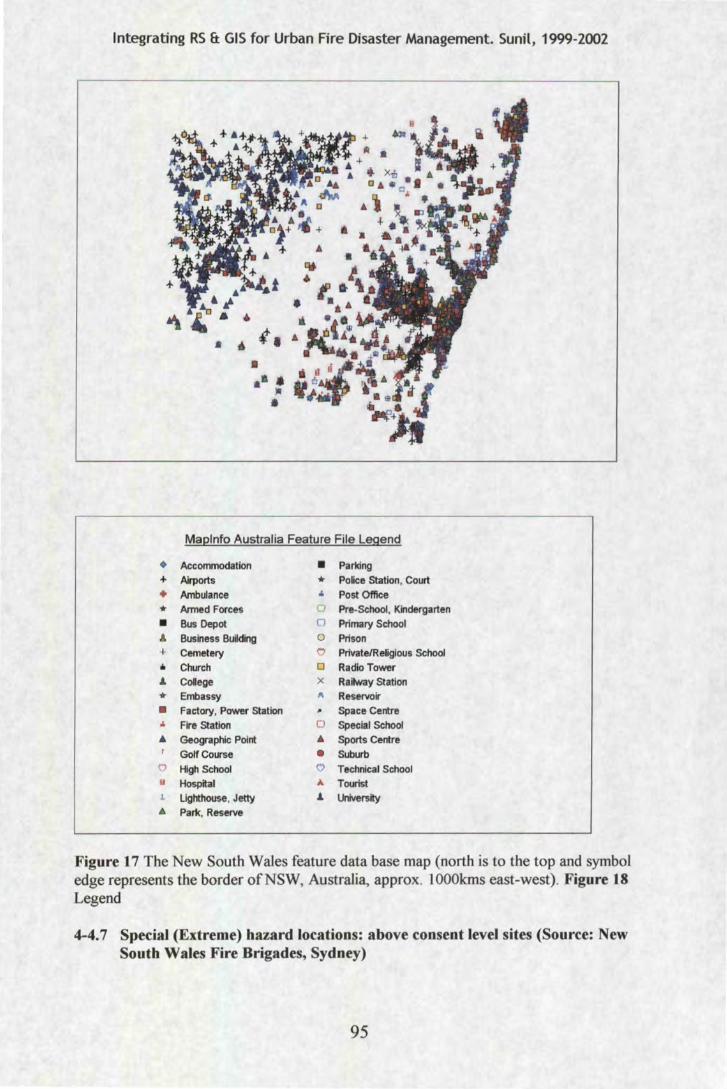
Integrating RS & GIS for Urban Fire Disaster Management. Sunil, 1999-2002
• . '· • •• • }II
•
Maplnfo Australia Feature File Legend
+ Accommodation + Airports + Ambulance
* Armed Forces • Bus Depot A Business Building + Cemetery
' Church .a. College
* Embassy • Factory, Power Station
" Fire Station • Geographic Point
Golf Course 0 High School o Hospital J. lighthouse, Jetty
• Parte:, Reserve
• Parl<ing * Po~ce Station, Court
" Post Office Pre-School, Kindergarten
0 Primary School o Prison 0 Private/Religious School 0 Radio Tower X Railway Station A Reservoir ~ Space Centre 0 Special School 6 Sports Centre
• Suburb 0 Technical School A. Tourist .&. University
Figure 17 The New South Wales feature data base map (north is to the top and symbol edge represents the border ofNSW, Australia, approx. 1 OOOkms east-west). Figure 18 Legend
4-4.7 Special (Extreme) hazard locations: above consent level sites (Source: New South Wales Fire Brigades, Sydney)
95
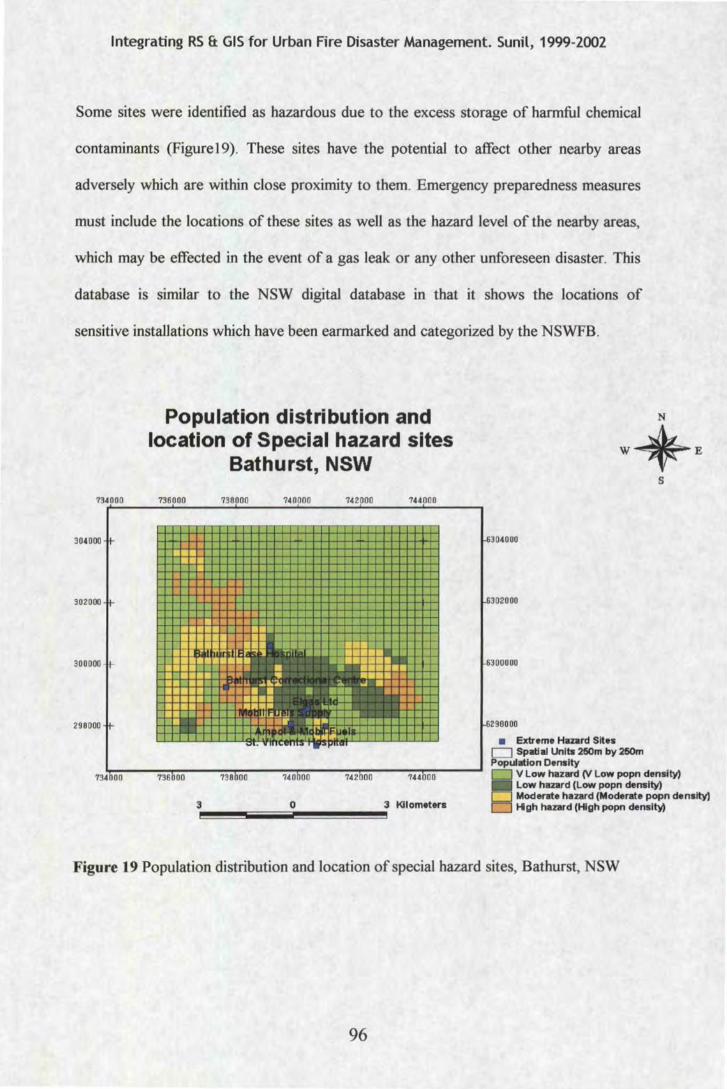
Integrating RS & GIS for Urban Fire Disaster Management. Sunil, 1999-2002
Some sites were identified as hazardous due to the excess storage of harmful chemical
contaminants (Figure19). These sites have the potential to affect other nearby areas
adversely which are within close proximity to them. Emergency preparedness measures
must include the locations of these sites as weU as the hazard level of the nearby areas,
which may be effected in the event of a gas leak or any other unforeseen disaster. This
database is similar to the NSW digital database in that it shows the locations of
sensitive installations which have been earmarked and categorized by the NSWFB.
734000
302000
300000
298000
Population distribution and location of Special hazard sites
Bathurst, NSW
736000 '738000 740000 '742000 744000
3040 00
6302000
300000
296000
• Extreme Hazard Sites
s
D Spatial Units 250m by 250m Population Density
734T00~0--73=so":":oo:---~73~B~00~--=74-:0'!":oo~o ---:7~42~0o~o--':"":74":'!:4 ~oo:---~ 0 V low hazard CV low popn density) low hazard (low popn density) Moderate hazard (Moderate popn density) Hgh hazard (High popn denslcy)
Figure 19 Population distribution and location of special hazard sites, Bathurst, NSW
96
Integrating RS ft GIS for Urban Fire Disaster Management. Sunil, 1999-2002
4-4.8 Digital topographic and cadastral database (DTDB & DCDB; Source LPI)
These data-base were secured from the LPI, Bathurst in digital form and consisted of
basic information on the street network, land parcels, locations of important sites and
most importantly is prepared for the entire state of NSW. The DTDB and DCDB
(Figure 20) are therefore consistent for the entire state ofNSW province and has been
validated. The DTDB comprises data derived from the existing hardcopy topographic
maps series. The captured data is available as natural drainage, contours 2, I 0 and 20
meter interval data, and transport/cultural data. The DTDB is designed as a state-wide
coverage suitable for the majority of users. Although the dataset is sensibly
independent of scale, and some data such as urban road centerlines are sourced from
large scale cadastral maps, the content, accuracy and representation of features is
related to the source documents from which the data is obtained. Therefore the
currency of the topographical digital data is not always maintained. The digital
topographical database shows the location of important features.
The source data for the DCDB was I: 1000, 1 :2000 and 1:4000 scale mapping over
urban areas, and 1:25,000, 1:50,000 and 1:100,000 scale mapping over rural areas. The
Sydney Water Board collected data throughout its coverage area from its I :500
cadastral sheets and selected Councils also provided data. This data was polygonised,
tagged and incorporated into the DCDB.The DCDB contains up to fourteen layers of
data depending in the occurrence of various features within any specified area. The
DCDB consists of details about the property, ownership, plot number which may
provide indirect details about the nature of land-use. The DCDB was used to register
the orthorectified image in the current research.
97
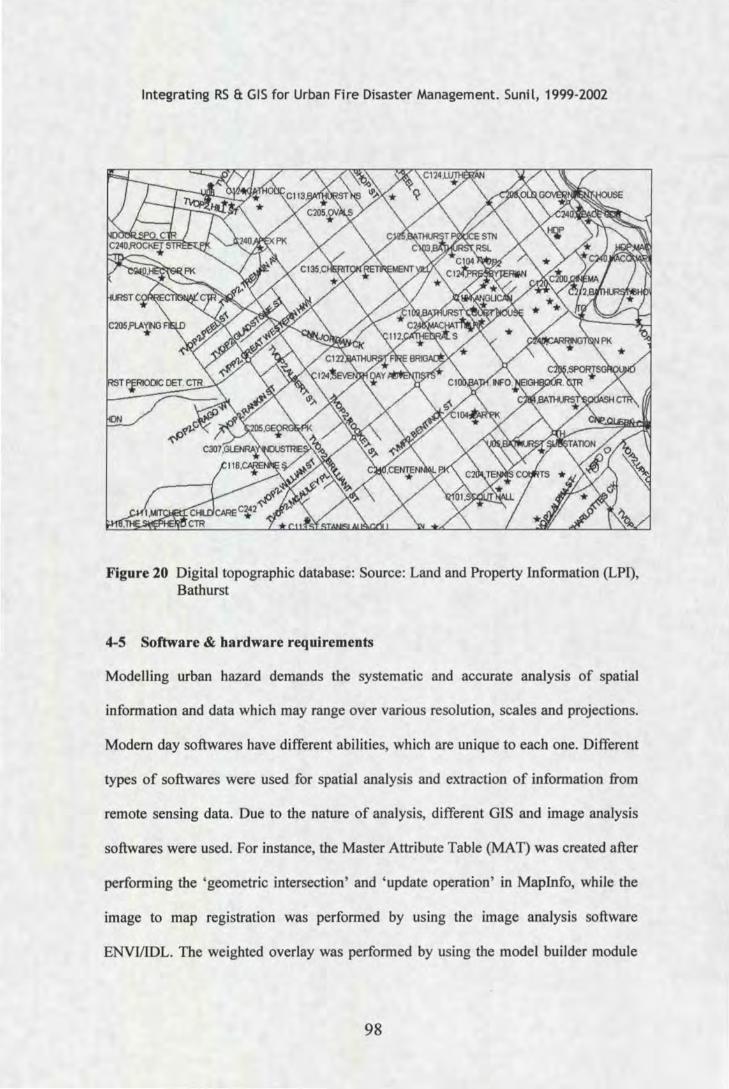
Integrating RS & GIS for Urban Fire Disaster Management. Sunil, 1999-2002
Figure 20 Digital topographic database: Source: Land and Property Information (LPI), Bathurst
4-5 Software & hardware requirements
Modelling urban hazard demands the systematic and accurate analysis of spatial
information and data which may range over various resolution, scales and projections.
Modem day softwares have different abilities, which are unique to each one. Different
types of softwares were used for spatial analysis and extraction of information from
remote sensing data. Due to the nature of analysis, different GIS and image analysis
softwares were used. For instance, the Master Attribute Table (MAT) was created after
performing the 'geometric intersection' and 'update operation' in Mapinfo, while the
image to map registration was performed by using the image analysis software
ENVIJIDL. The weighted overlay was performed by using the model builder module
98
Integrating RS ft GIS for Urban Fire Disaster Management. Sunil, 1999-2002
provided with the Arc View software. These softwares and the purposes of their use are
listed in appendix vn.
The accuracy ofthe data used is as important as the objective of the study. In this study
the relative locations of features was important for mapping the spatial distribution of
risk in urban environment. Even though some inaccuracies were detected during the use
of some of the data, it was within acceptable limits, and therefore a decision was made
to use them anyway. But this is another aspect of data integration and modeling, which
needs appraisal since GIS data deteriorates with an increased information content and
sophistication. Different data types may lead to various issues such as data
incompatibility which is attributed to the individual and self oriented attitude of
organizations, who are involved in preparing data-base to suit their own personalized
needs and softwares. This can be resolved by using multiple softwares which may
accept all commonly used data formats.
4-6 Methodology
The methodology to generate hazard categories in Bathurst involved the integration of
orthorectified aerial photo images with available cartographic data, which was sourced
from different agencies. These cartographic data were found to exist at different scales,
projections and formats which were spatially referenced to the ortho-image by a
process of map to image registration. High spatial resolution (lm by lm) remotely
sensed data :from airborne platforms were used to visualize and derive spatial data in
the study and test areas of Bathurst and a section of the central business district of
Hornsby Shire. The methodology to develop hazard categories using remotely sensed
airborne images and cartographic GIS data was designed after a careful appraisal of
99
Integrating RS 8: GIS for Urban Fire Disaster Management. Sunil, 1999-2002
spatia-temporal resolution characteristics of available sensors (both space borne and
airborne) and available cartographic data. Whilst, there were also advantages with
space borne data there were also some disadvantages. These advantages and
disadvantages were considered and the advantages optimized, depending on the hazard
related variable to be derived.
4-7 Data resolution characteristics
The following resolution characteristics were considered before deciding between
airborne and space borne sensors. Resolution (or resolving power) is a measure of the
ability of a sensor to distinguish between signals that are spatially near or spectrally
similar.
4-7.1 Temporal resolution
The temporal resolution of a sensor system refers to how often it records imagery of a
particular area. Choice of the temporal resolution will ideally depend on the phenomena
to be studied. In this study acquiring fundamental data on Urban/suburban attributes
changes was crucial, so a temporal resolution of 6-12 months was deemed appropriate
for the study. Air-borne sensors could provide this since they could be flown whenever
required subject to restrictions imposed on flying low altitude, restricted areas, weather
and unfriendly terrain.
4-7.2 Spectral resolution
Spectral resolution refers to the number and dimension of specific wavelength intervals
in the electromagnetic spectrum to which a sensor is sensitive. Since most of the study
was to be carried out in an urban/suburban setting the spectral resolution was not as
100
Integrating RS 8: GIS for Urban Fire Disaster Management. Sunil, 1999-2002
important compared to the spatial resolution, because urban features are identified more
by shape and size and not their colour. However, it is important to have sufficient
spectral resolution to make out the features to be identified from their background
setting. For example, a building from surrounding vegetation.
4-7.3 Spatial resolution
Spatial resolution is a measure of the smallest angular or linear separation between two
objects that can be resolved by the sensor. Evaluation of spatial resolutions offered by
many sensors (from both airborne and space borne platforms) were carried out before
deciding on the most appropriate option. In this study it was necessary to determine the
object being studied individually as well as in a group of objects. The spatial resolution
had to be sufficient enough to provide those details. Satellite products were not able to
provide a spatial resolution of ~lm, necessary for most urban identification, and also
high spatial resolution aerial colour photo images were used for the study. The
adequacy of satellite data with respect to the spatial resolution may be fulfilled with
improved sensors in the future, but there are other aspects related to the satellite data
that may act as an impediment. For instance the nadir/off nadir viewing angle (vantage
point from which the sensor detects the object). If the sensor detects at nadir the spatial
resolution will be much better than when the sensor detects at off nadir. Thus the
viewing ability of the sensor can offset the high spatial resolution of the satellite
product. Therefore, the adequacy of satellite data has to be systematically appraised
with respect to all of its features and characteristics spatial resolution including
temporal resolution and viewing abilities, before the decision is made to use such data
in an urban hazard context.
101
Integrating RS 8: GIS for Urban Fire Disaster Management. Sunil, 1999-2002
4-8 Availability of cartographic data
Since most of the study is data driven and would need to be extrapolated later in an
operational mode to the entire state of NSW, it was essential to identify and collect
available data that could be found in other parts of the state for e.g. the Local
Environment Plan or LEP prepared by all local authorities. Another reason to use
available and common data was to standardize the methodology over the entire state of
New South Wales in an attempt to replicate the methodology without many difficulties.
4-9 Methodology in detail (See Figure 21)
The overall methodology for data modelling is shown in Figure 21. This procedure
commences with the digitising of ortho rectified aerial photos, and ends with an output
hazard model that can be used for Impact Analysis and Forecasting. Each of the steps
will be discussed in detail as follows:
4-9.1 Processing of aerial photograph
An aerial photograph of scale 1:16,000 contact print exposed in early September, 1998
was scanned at 1000 dots per inch (DPI). An aerial photo will have distortions from a
uniform scale due to, topographic variations, and terrain and image displacement
resulting from relief and tilt, which must be corrected in order to make it planimetric
(scale correct). Spatial analysis or data derivation from these map bases will result in
erroneous calculations and analysis if they are not ortho rectified. The process of ortho
rectification requires accurate ground control points and terrain elevation. The process
of ortho-rectification is effective in undulating terrain and least effective on relatively
flat terrain due to the minimum scale distortions, which are attributed to uneven relief.
102
Integrating RS a: GIS for Urban Fire Disaster Management. Sunil, 1999-2002
The ortho-rectification process results in photos with a single scale in undulating
terrain, (region that is not flat) which is the same as a map.
The distortions and relief displacements were eliminated and the image was made
planimetric and scale correct by the process of orthorectification. A DEM with an
accuracy of ± 5m and GCPs with an accuracy of ±1m were used to orthorectify the
image using a stereoplotter. The image was formatted to the Tagg Imported File format
(Tiff). Other data parameters such as projection, scale of the ortho rectified image are
listed in the Metadata table shown in appendix V.
103
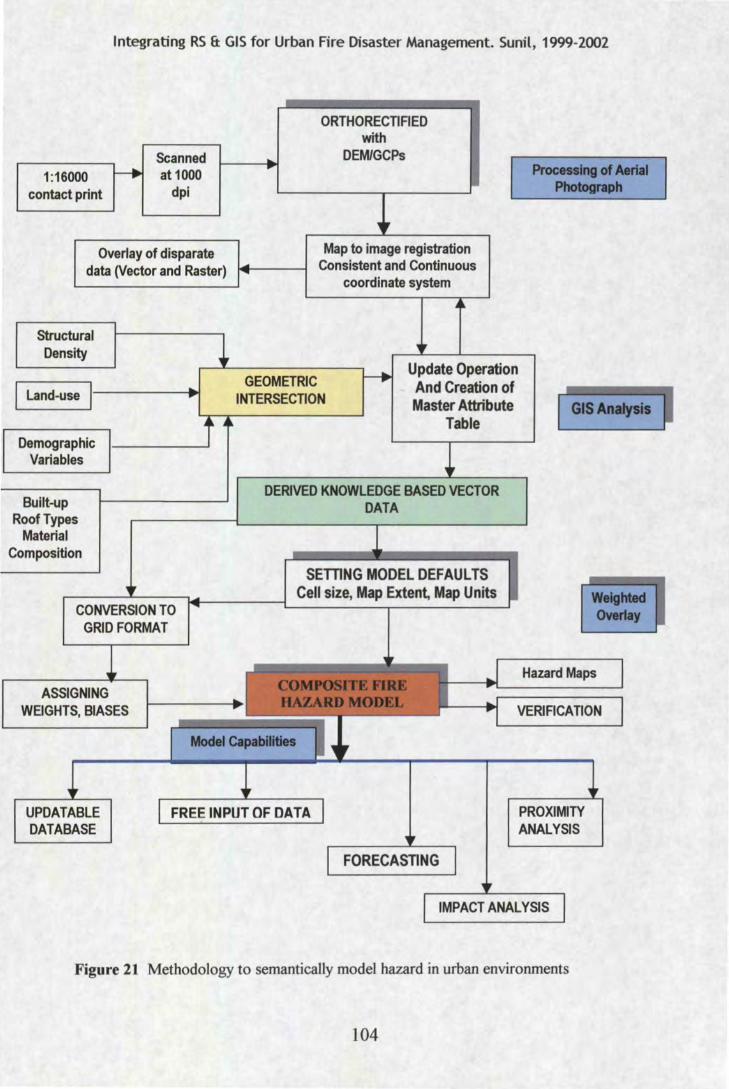
Integrating RS & GIS for Urban Fire Disaster Management. Sunil, 1999-2002
1:16000 contact print
Scanned at 1000
dpi
Overlay of disparate data (Vector and Raster)
Structural Density
Land-use j----~
Demographic Variables
Built-up Roof Types
Material Composition
ASSIGNING WEIGHTS, BIASES
UPDATABLE DATABASE
ORTHORECTIFIED with
DEMIGCPs
Map to image registration Consistent and Continuous
coordinate system
GEOMETRIC INTERSECTION
Update Operation And Creation of Master Attribute
Table
DERIVED KNOWLEDGE BASED VECTOR DATA
SETT1NG MODEL DEFAULTS Cell size, Map Extent, Map Units
Processing of Aerial Photograph
GIS Analysis
Welghtad Overlay
Hazard Maps
VERIFICATION
PROXIMITY ANALYSIS
Figure 21 Methodology to semantically model hazard in urban environments
104
Integrating RS 8: GIS for Urban Fire Disaster Management. Sunil, 1999-2002
4-9.2 Map to image registration and transformation to a common coordinate system
Data from various sources, as from digitising and field surveying, may be used together
only if they are referenced to a common coordinate system. An image to map
registration was performed where the ortho rectified source image pixels were
geometrically rectified to the coordinates of the georeferenced land-use vector map
provided by the Bathurst City Council. The two layers (image and the map) were
displayed simultaneously in the Maplnfo GIS software environment and common
GCPs were selected in order to perform the registration. The GCPs were spread out
over the entire image so that scale errors about were kept to the minimum. The Root
Mean Square Error (RMSE), which is a simple method to measure distortions, was kept
within acceptable limits of ±1m. The map was projected to the Australian Map Grid
(AMG84) projection system. Having done this the other disparate (layers with different
projections, themes, datums, scales) vector layers could now be spatially overlaid onto
the image.
4-10 Spatial overlay of disparate data
Overlay is a spatial operation in which a thematic layer containing polygons is
superimposed on another to form a new thematic layer with new polygons. This new or
derived layer will have composite information about the variables and will provide
additional knowledge of various spatial phenomena that would have been otherwise
difficult to observe. In the study several layers were observed by the spatial overlay
command. The overlay process enables the visualization of a composite of different
themes that have different purposes individually. By themselves these themes may not
hold much value, but when viewed in conjunction they form a powerful piece of value-
105
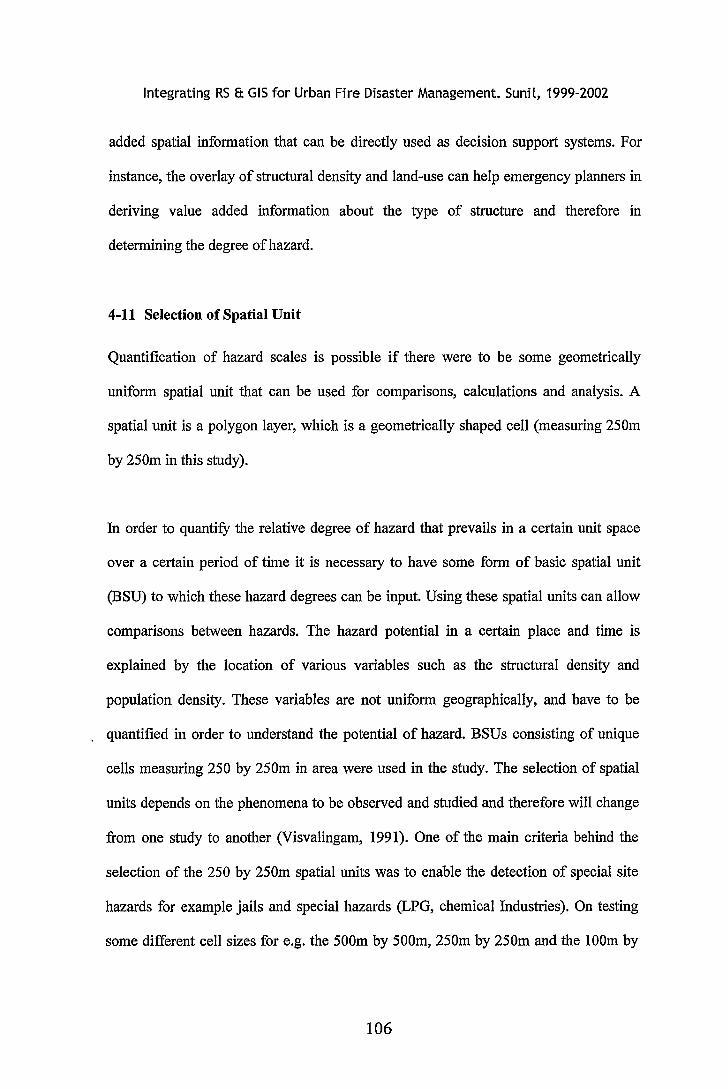
Integrating RS 8: GIS for Urban Fire Disaster Management. Sunil, 1999-2002
added spatial information that can be directly used as decision support systems. For
instance, the overlay of structural density and land-use can help emergency planners in
deriving value added information about the type of structure and therefore in
determining the degree of hazard.
4-11 Selection of Spatial Unit
Quantification of hazard scales is possible if there were to be some geometrically
uniform spatial unit that can be used for comparisons, calculations and analysis. A
spatial unit is a polygon layer, which is a geometrically shaped cell (measuring 250m
by 250m in this study).
In order to quantify the relative degree of hazard that prevails in a certain unit space
over a certain period of time it is necessary to have some form of basic spatial unit
(BSU) to which these hazard degrees can be input. Using these spatial units can allow
comparisons between hazards. The hazard potential in a certain place and time is
explained by the location of various variables such as the structural density and
population density. These variables are not uniform geographically, and have to be
quantified in order to understand the potential of hazard. BSUs consisting of unique
cells measuring 250 by 250m in area were used in the study. The selection of spatial
units depends on the phenomena to be observed and studied and therefore will change
from one study to another (Visvalingam, 1991). One of the main criteria behind the
selection of the 250 by 250m spatial units was to enable the detection of special site
hazards for example jails and special hazards (LPG, chemical Industries). On testing
some different cell sizes for e.g. the 500m by 500m, 250m by 250m and the lOOm by
106
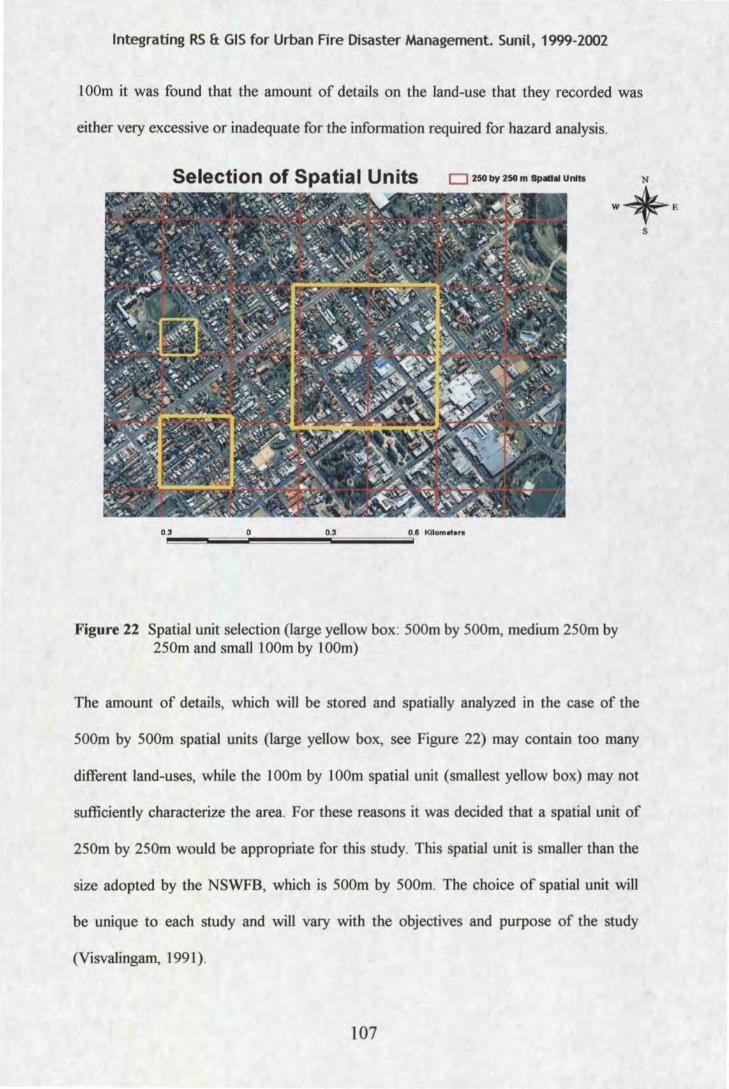
Integrating RS & GIS for Urban Fire Disaster Management. Sunil, 1999-2002
1OOm it was found that the amount of details on the land-use that they recorded was
either very excessive or inadequate for the information required for hazard analysis.
Selection of Spatial Units D 250 by 250 m Spllllll units N
W*E
0 .. 1!!3 !!ll!!!!!!!liiiiiiiiiiiiiiiiiiiiiiiii!O!!II!!!!!!II!!!!!!II!!!!!!!!!!!!i!Oiiii;.3iiiiiiiiiiiiiiiiiiiiiiiiiiiiiiiii~O. I Kllometo,..
Figure 22 Spatial unit selection (large yellow box: 500m by 500m, medium 250m by 250m and small lOOm by lOOm)
The amount of details, which will be stored and spatially analyzed in the case of the
500m by 500m spatial units (large yellow box, see Figure 22) may contain too many
different land-uses, while the lOOm by lOOm spatial unit (smallest yellow box) may not
sufficiently characterize the area. For these reasons it was decided that a spatial unit of
250m by 250m would be appropriate for this study. This spatial unit is smaller than the
size adopted by the NSWFB, which is 500m by 500m. The choice of spatial unit will
be unique to each study and will vary with the objectives and purpose of the study
(Visvalingam, 1991).
107
s
Integrating RS & GIS for Urban Fire Disaster Management. Sunil, 1999-2002
4-12 Masking Operations
The census data was used for inputting the population density and other demographic
variables. The nature of this data created an immediate problem in assessing the
hazard/vulnerability. The population density which is an estimate of the night-time
residential population is aggregated to the collector district (CD), but does not indicate
the precise location of the structure i.e. the residential dwelling. Since the information
presented is not calibrated with the location of these residential structures the database
to a large degree is generalized. From the hazard/vulnerability assessment point of view
this lack of specific location does not assist in the analysis of hazard/vulnerability
particularly in mapping and resource allocation, as certain parts of the CD can be
densely populated and others not. Therefore by a process of visualization of the high
spatial resolution airborne data, new vector polygons (shown in blue colour around the
dots) were created around these residential structures (Figure 23). The data provided by
census could then be clearly associated with the residential dwellings by a process of
geometric intersection. This process of masking improves the positional accuracy of the
census to a considerable degree, and pinpoints high population areas and therefore the
potential of hazard/vulnerability (see Figure 24). Another method of reducing the
effects of CD data aggregation is by overlaying other land-use layers such as vacant
spaces, parks, bushland and so on, but in this case the layers must be available and in
the right map projection.
108
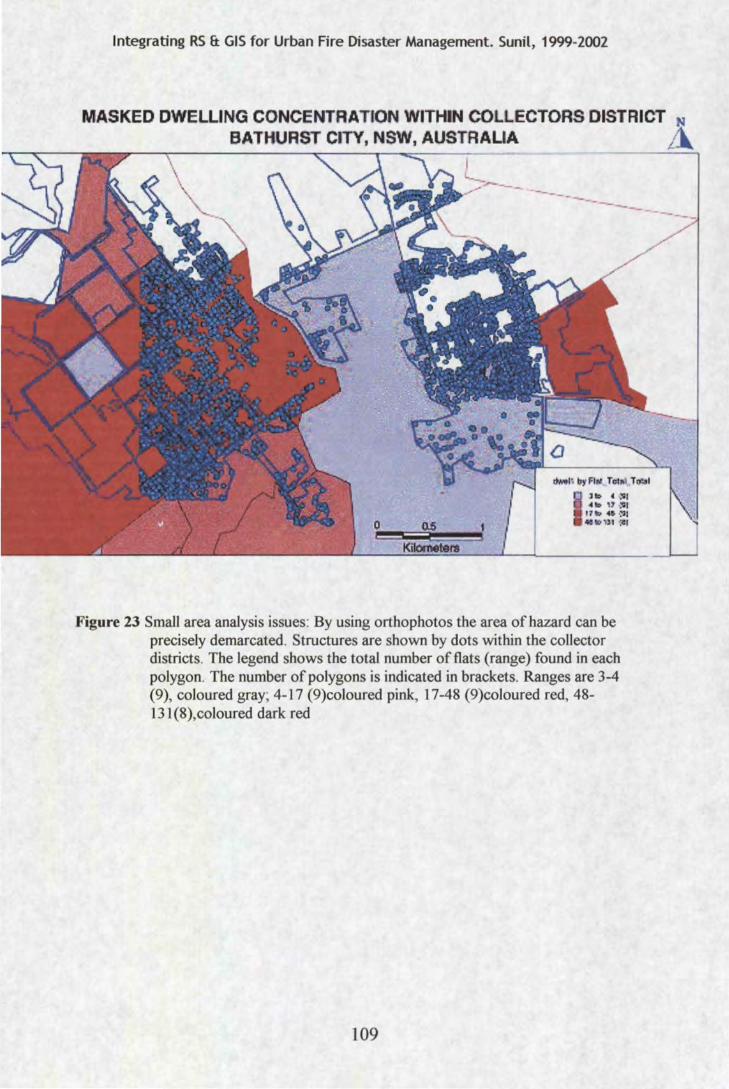
Integrating RS & GIS for Urban Fire Disaster Management. Sunil, 1999-2002
MASKED DWELLING CONCENTRATION WITHIN COllECTORS DISTRICT N
BATHURST CITY, NSW, AUS RAUA i\
------ -----
Figure 23 Small area analysis issues: By using orthophotos the area of hazard can be precisely demarcated. Structures are shown by dots within the collector districts. The legend shows the total number of flats (range) found in each polygon. The number of polygons is indicated in brackets. Ranges are 3-4 (9), coloured gray; 4-17 (9)coloured pink, 17-48 (9)coloured red, 48-131(8),coloured dark red
109
---.--. __
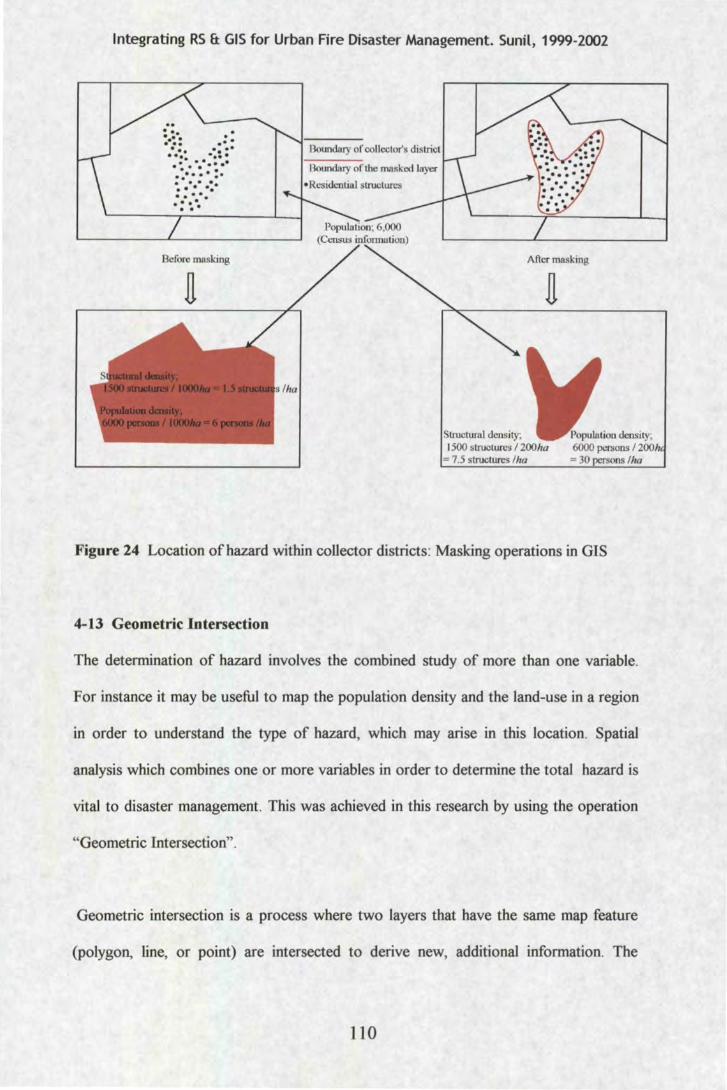
Integrating RS & GIS for Urban Fire Disaster Management. Sunil, 1999-2002
.. . .. :·:: .: . . . . . ... . . :· .. ::·.: . . . . . .. · ..... . . . . . . . . .. . . . . . . . . . . . .
Before masking
I S1nmtw-al density; 1500 struct.un:s I 200ha 7.5 structures /Ira
Figure 24 Location of hazard within collector districts: Masking operations in GIS
4-13 Geometric Intersection
The determination of hazard involves the combined study of more than one variable.
For instance it may be useful to map the population density and the land-use in a region
in order to understand the type of hazard, which may arise in this location. Spatial
analysis which combines one or more variables in order to determine the total hazard is
vital to disaster management. This was achieved in this research by using the operation
"Geometric Intersection".
Geometric intersection is a process where two layers that have the same map feature
(polygon, line, or point) are intersected to derive new, additional information. The
110
Integrating RS & GIS for Urban Fire Disaster Management. Sunil, 1999-2002
procedure adopted for the geometric intersection process is shown in Figure 25. For
instance, the geometric intersection between the spatial unit (polygon layer) and the
land-use will result in new information that will explain the type of land-use within
each spatial unit. This new layer that shows the land-use for each spatial unit can be
intersected further to derive new information depending on the need to generate
additional information.
4-13.1 Results of geometric intersection
The results of the geometric intersection operation performed in this study are
described below. The residential units were intersected with each spatial unit (250m by
250m). Advanced sequel (SQL) programs available with Map Info were used to
perform the geometric intersection and update operations. This resulted in a new layer
where the residential land-use for each spatial unit was derived. This procedure was
undertaken for the entire city as shown. Figure 26 shows the results of the geometric
intersection process and Table 3 shows the updated attribute table after the geometric
intersection process for the city of Bathurst. Similar operations were performed for
several other layers in order to generate additional knowledge based maps.
111
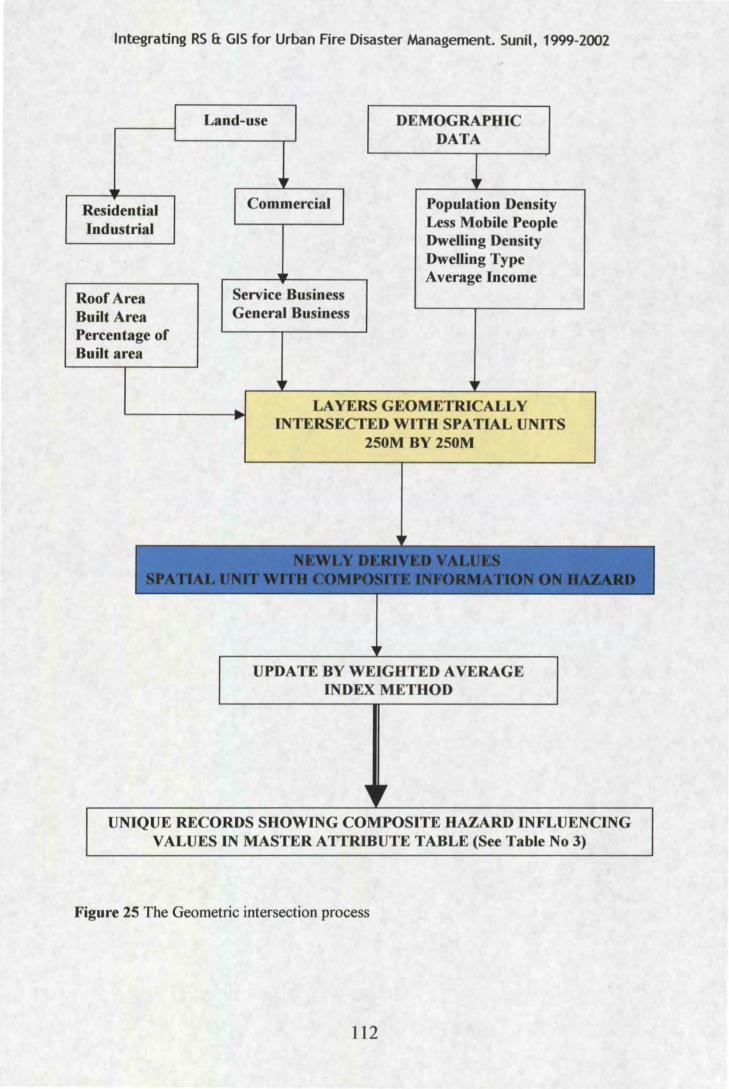
Integrating RS & GIS for Urban Fire Disaster Management. Sunil, 1999-2002
Residential hldustrial
Roof Area Built Area Percentage of Built area
Land-use DEMOGRAPHIC DATA
Population Density Less Mobile People Dwelling Density Dwelling Type Average h1come
Service Business General Business
LAYERS GEOMETRICALLY INTERSECTED WITH SPATIAL UNITS
250M BY 250M
UPDATE BY WEIGHTED AVERAGE INDEX METHOD
UNIQUE RECORDS SHOWING COMPOSITE HAZARD INFLUENCING VALUES IN MASTER ATTRIBUTE TABLE (See Table No 3)
Figure 25 The Geometric intersection process
112
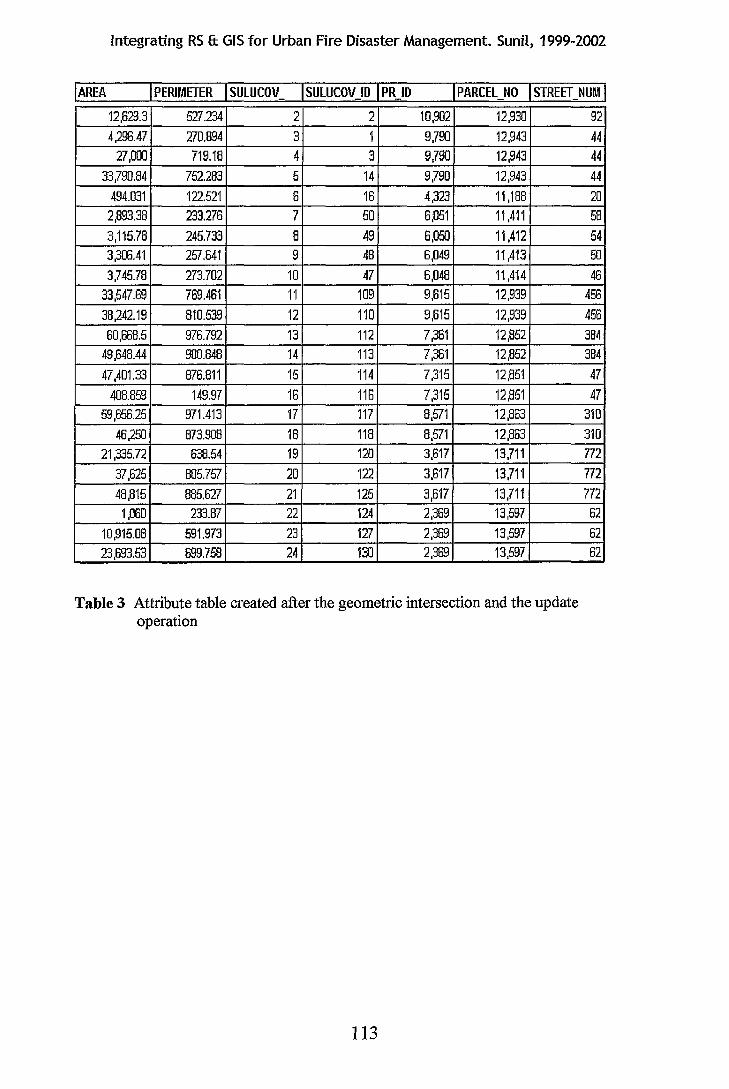
Integrating RS &: GIS for Urban Fire Disaster Management. Sunil, 1999-2002
!AREA I PERIMETER I SULUCOV I SULUCOV 10 I PR 10 - I PARCEL NO I STREET NUM I - -12,629.3 527.234 2 2 10,902 12,930
.4,296.47 270.894 3 1 9,790 12,943 27,000 719.18 4 3 9,790 12,943
33,790.84 752.283 5 14 9,790 12,943
494.031 122.521 6 16 4,323 11,188 2,893.38 233.276 7 50 6;051 11,411
3,115.78 245.733 8 49 6,050 11,412 3,306.41 257.641 9 48 6,049 11,413
3,745.78 273.702 10 47 6,048 11,414 33,547.69 769.461 11 109 9,615 12,939
38,242.19 810.539 12 110 9,615 12,939
60,668.5 976.792 13 112 7,361 12,852 49,648.44 900.848 14 113 7,361 12,852
47,401.33 876.811 15 114 7,315 12,851
408.859 149.97 16 116 7,315 12,851 59,656.25 971.413 17 117 8,571 12,863
46,250 873.908 18 118 8,571 12,863
21,335.72 638.54 19 120 3,617 13,711
37,625 805.757 20 122 3,617 13,711
48,815 885.627 21 125 3,617 13,711 1,060 233.87 22 124 2,369 13,597
10,915.08 591.973 23 127 2,369 13,597 23,693.53 699.758 24 130 2,369 13,597
Table 3 Attribute table created after the geometric intersection and the update operation
113
92
44 44
44
20 58
54 50
46 456
456 384 384
47
47 310
310 772
772 772
62
62 62
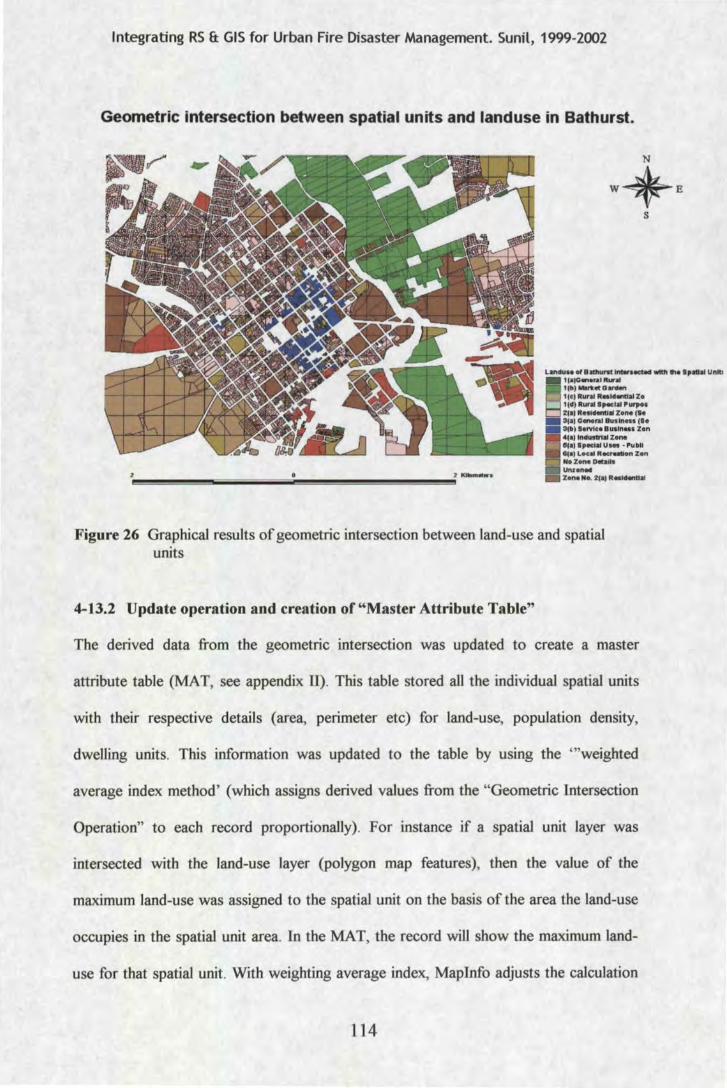
Integrating RS & GIS for Urban Fire Disaster Management. Sunil, 1999-2002
Geometric intersection between spatial units and landuse in Bathurst.
Land.uso Of B illllunt ,_._ - flo l,atlal Unitt 1 (a)Ceneralltw"al 1(b) MlttttO...., 1(c) llUnlll•l<l-aiZo 1(d) llunl ., .. ,al ,..., •• 2(a) Roll-11 Zono (lo 3(a) o-nal Business (lo 3(b) l•rvlce BUlin•• Zon 4(o) lnaullr1a1Zono G(a) lpoclal Usos - ,ubll
Loc:ll Recrution Zon DaUs
Figure 26 Graphical results of geometric intersection between land-use and spatial units
4-13.2 Update operation and creation of "Master Attribute Table"
The derived data from the geometric intersection was updated to create a master
attribute table (MAT, see appendix II). This table stored all the individual spatial units
with their respective details (area, perimeter etc) for land-use, population density,
dwelling units. This information was updated to the table by using the "'weighted
average index method' (which assigns derived values from the "Geometric Intersection
Operation" to each record proportionally). For instance if a spatial unit layer was
intersected with the land-use layer (polygon map features), then the value of the
maximum land-use was assigned to the spatial unit on the basis of the area the land-use
occupies in the spatial unit area. In the MAT, the record will show the maximum land-
use for that spatial unit. With weighting average index, Maplnfo adjusts the calculation
114
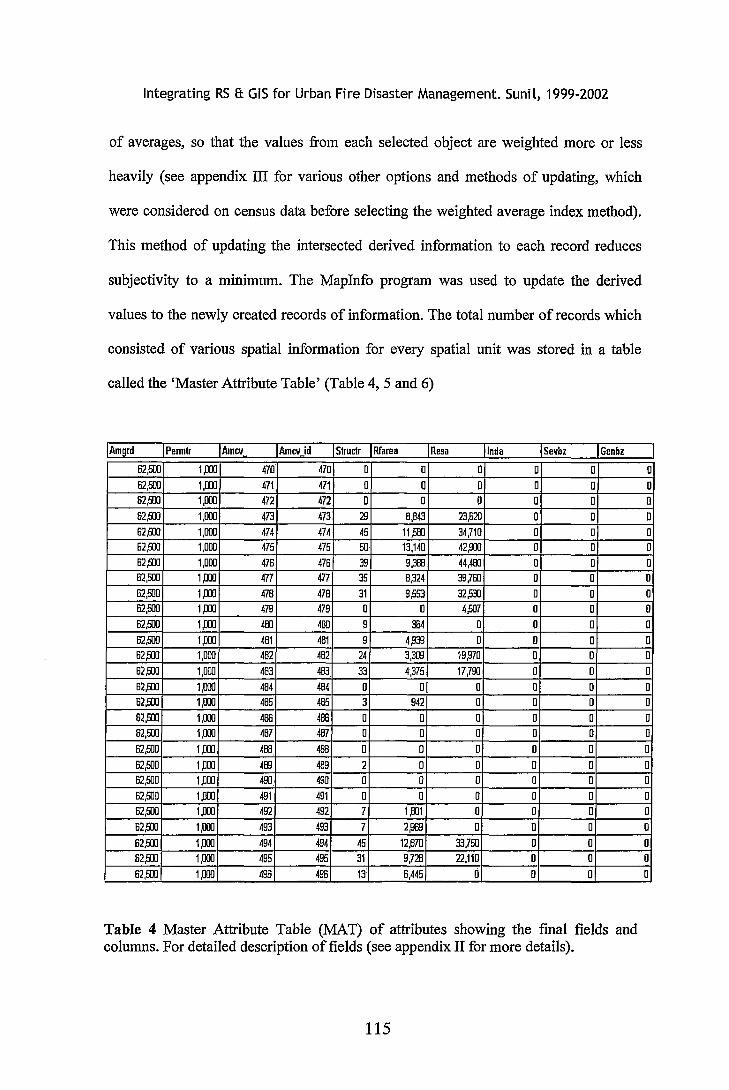
Integrating RS 8: GIS for Urban Fire Disaster Management. Sunil, 1999-2002
of averages, so that the values from each selected object are weighted more or less
heavily (see appendix ill for various other options and methods of updating, which
were considered on census data before selecting the weighted average index method).
This method of updating the intersected derived information to each record reduces
subjectivity to a minimum. The Maplnfo program was used to update the derived
values to the newly created records of information. The total number of records which
consisted of various spatial information for every spatial unit was stored in a table
called the 'Master Attribute Table' (Table 4, 5 and 6)
IAmgrd IPermtr IAmcv .. IAmcv id lstructr I Rfarea - IResa hnda lsevbz IGenbz
62,!m 1,000 470 470 D [] 0 0 0 62,!m 1,000 471 471 0 0 0 0 0 62,!m 1,000 472 472 0 0 0 0 0 62,!m 1,000 473 473 29 8,843 23,620 0 0 62,500 1,000 474 474 45 11,500 34,710 0 0 62,500 1,000 475 475 50· 13,14[] 42,900 0 0 62,500 1,000 476 476 39 9,388 44,400 0 0 62,!m 1,000 477 477 35 8,324 39,760 0 0 62,500 1,000 478 478 31 9,553 32,530 0 0 62,500 1,000 479 479 0 0 4,507 0 0 62,!m 1,000 480 480 9 384 0 0 0 62,!m 1,000 481 481 9 4,939 0 0 (]
62,500 1,000 482 482 24 3,309 19,970 0 0 62,500 1,000 483 483 33 4,375 17,700 0 0 62,500 1,000 484 484 0 0 0 D D 62,!m 1,000 485 485 3 942 0 0 0 62,!m 1,000 486 486 (] D D 0 0 62,500 1,000 487 487 0 0 0 0 0 62,500 1,000 488 468 0 0 0 0 0 62,500 1 ,DOD 489 489 2 0 0 0 0 62,500 1,000 490 490 0 0 0 0 0 62,500 1,000 491 491 D D 0 0 0 62,!m 1,000 492 492 7 1,001 0 0 0 62,500 1,000 493 493 7 2,969 0 D D 62,500 1,000 494 494 45 12,870 33,750 0 D 62,500 1,000 495 495 31 9,728 22,110 0 0
62,500 1,000 496 496 13 6,445 0 [J 0
Table 4 Master Attribute Table (MAT) of attributes showing the fmal fields and columns. For detailed description of fields (see appendix II for more details).
115
0
0 (]
0 0 0
0 0 0 0
0
0 0
0
0 0
0 0 0
0 D 0 0
0
0 0
0
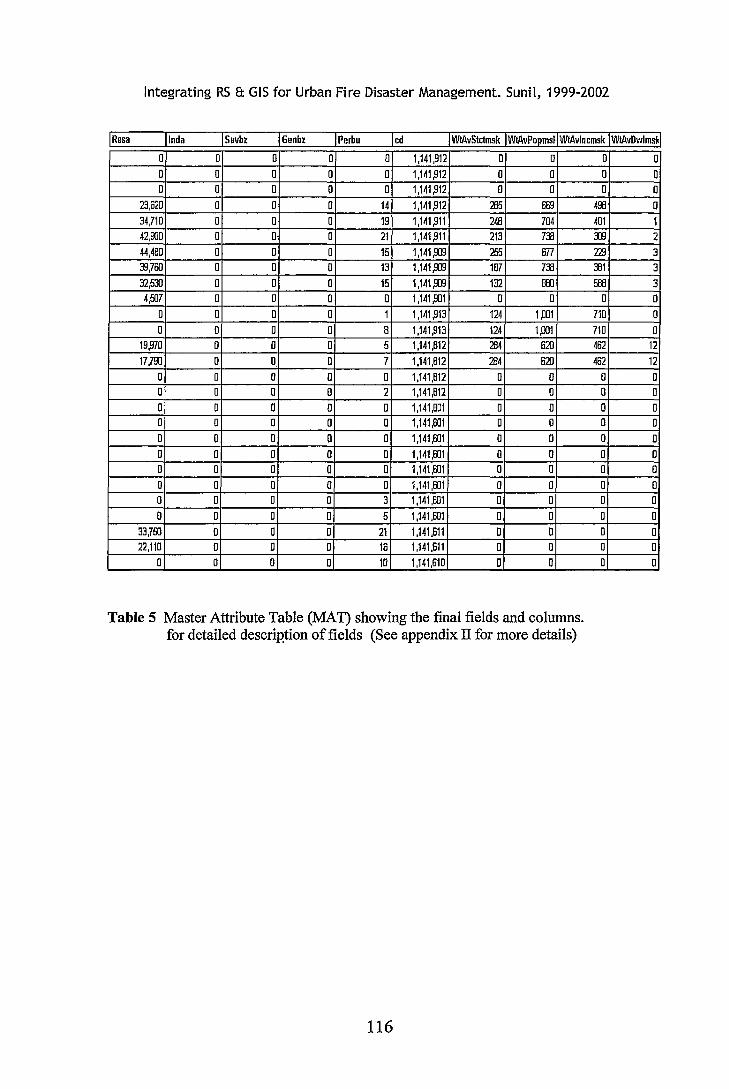
Integrating RS 8: GIS for Urban Fire Disaster Management. Sunil, 1999-2002
IResa linda lsevbz IGenbz IPerbu led IWIAvStctmsk IWIAvPopmsliWIAvlncmsk lwtAvDwlmskl
0 0 0 0 0 1,141,912 0 0 0 0 0 0 0 1,141,912 ll 0 0 0 0 0 0 1,141,912 0 0
23,620 0 0 0 14 1,141,912 285 669 34,710 0 0 0 19 1,141,911 248 704 42,000 0 0 0 21 1,141,911 213 738 44,480 0 0 0 15 1,141,009 2!i5 677 39,760 0 0 0 13 1,141,909 187 738 32,!UI 0 0 0 15 1,141,909 132 800 4,ffJ7 0 0 0 0 1,141,901 0 []
0 0 0 0 1 1,141,913 124 1,001 0 0 0 0 8 1,141,913 124 1,001
19,970 0 0 0 5 1,141,612 284 620 17,700 0 0 0 7 1,141,812 284 620
0 0 0 0 0 1,141,812 0 0 0 0 0 0 2 1,141,812 0 0 0 0 0 0 0 1,141,801 0 0 0 0 0 0 [] 1,141,601 0 0 0 0 [] [] ll 1,141,601 ll 0 0 0 0 0 0 1,141,601 0 []
0 0 0 0 0 1,141,601 0 []
0 0 0 0 0 1,141,601 0 0 0 0 0 0 3 1,141,601 0 0 0 0 0 0 5 1,141,601 0 0
33,7ffJ 0 0 0 21 1,141,611 0 0 22,110 0 0 0 16 1,141,611 0 0
0 0 0 0 10 1,141,610 ll 0
Table 5 Master Attribute Table (MAT) showing the fmal fields and columns. for detailed descriP.tion of :fields (See appendix II for more details)
116
0 0 0 0 0 0
498 [J
401 1 309 2 229 3 381 3
568 3 0 0
710 0 710 0 462 12 462 12
0 0 0 0 0 0 0 0 0 0 0 0 0 0 0 0 0 0 0 0 0 0 0 0 0 0
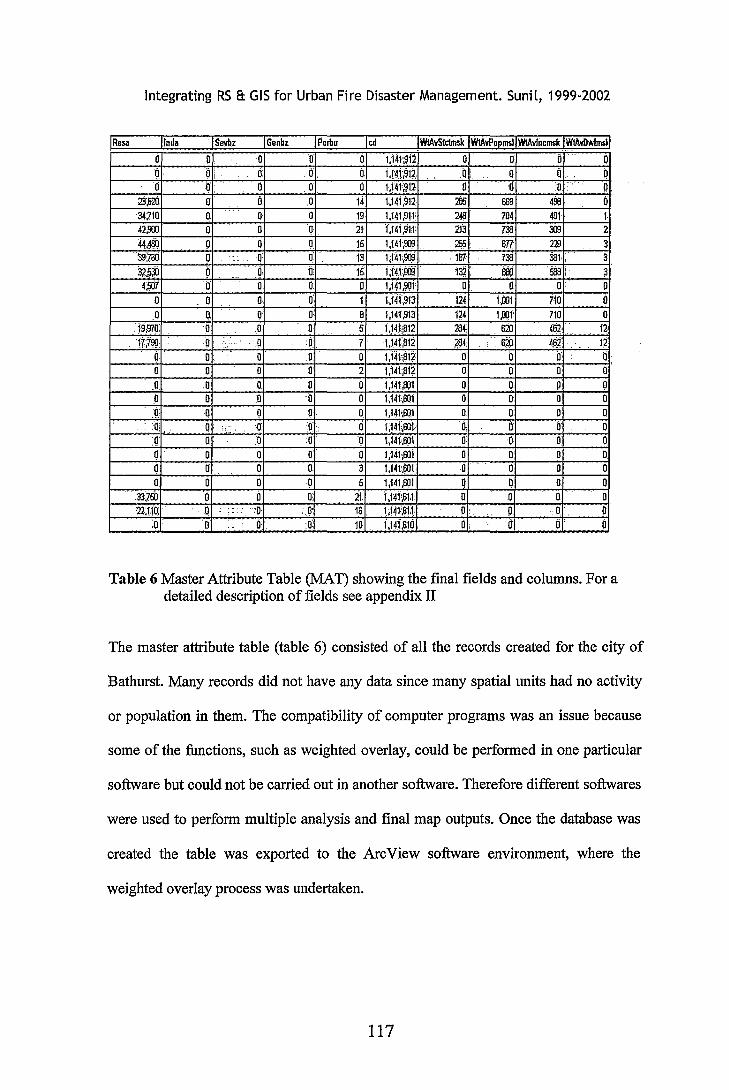
Integrating RS & GIS for Urban Fire Disaster Management. Sunil, 1999-2002
IResa linda ISilYbz IGenbz IPeibu led IWtAvStctmsk IWtAYPopms!IWIAvfncmsk IWtAvDwlnml .... 0 0, ·o ~ 0 !,141'~12 0 0: 0 0 Q Qli ,(j: 0 o. i.t~t~14 b a Q < • D. 0 0. 0 0 0 1,j41·~1~ 0 0 '0 •... p
23;620. a fi .0 14 1,141~12 m 669 400 ii 34;710 Q, 0 0 19 1,141.91t 248" 704 401 1 42)JJJ 0 0 0 21 1,141 ,911' 213 7ll l:a 2
~ p 0 0. 15 1,141.!m. .. 2!!5• str 229 3
0 ::. 0 p: 13 1,14hro9. 187; 738 sat,; 3
~~ 9 .o. jj 15 LH.i~· 137 •.. .. 800 $' ~ 4$1 il 0 0 0 t.Hi.Wr 0 0 0 il
0 0 0 o· 1 1,141:,913 1i4 iJ)OI 710 iJ 0 Q, 0 0 B 1,14(913 124 l,lllf' 710 0
19,970 0 .,0 .0 5 1,14.1;812 284 62o 462· 12 17;7~ .. 0": .. .0 :o: 7 1,141jlt~ . ·i!fl4· @ 46.7 lt
0 0 0 .0 0 1,141'.$1~ 0 0 tr (j
d 0 0 ll 2 1.141,812 0 0 0 0 .0 0 0. 0 0 1,141~1 0 Q 0 0 0 0 .n 0 0 1,14t.601 0 a 0 0 o; Q Q 0 0 1,141\601 0. 0 0 0
•(I: o: :·q .o:·· d Q4h60J, 0: fi tr 0 :o o· ·o 0 ·o 1,141-:S~il o: 0 0 0 0 0 0 0 0 1,141,601 0 0 0 0 0 0 0 0 3 1,141#)1 0 0 0 0 0 0 0 0 5 1,141.6QI 0 0 0. 0
.33;7!:1:1 r.i iJ 0 21 l,14fptl 0 0 il 0 ~22:r1o: .Q .: : :. :'_. :·o . o· 16 t.t4f.6f1· p p 0 0
:o D .. o: :o: 10 i;14l.S10 0 a o' 0
Table 6 Master Attribute Table (MAT) showing the final fields and columns. For a detailed description of fields see appendix II
The master attribute table (table 6) consisted of all the records created for the city of
Bathurst. Many records did not have any data since many spatial units had no activity
or population in them. The compatibility of computer programs was an issue because
some of the functions, such as weighted overlay, could be performed in one particular
software but could not be carried out in another software. Therefore different softwares
were used to perform multiple analysis and final map outputs. Once the database was
created the table was exported to the Arc View software environment, where the
weighted overlay process was undertaken.
117
Integrating RS & GIS for Urban Fire Disaster Management. Sunil, 1999-2002
4-14 Justification for the choice and use of Weighted Overlay and Model Builder for study.
Planning for risk mitigation involves critical decisions, which demands the use of
existing spatial data and performing multi-criteria modelling approach. Using available
data, inherent trends and patterns in data related to risk assessment could be located. By
combining a set of risk related variables and weighting these criteria in different ways,
risk assessment scenarios for different regions can be created. These alternatives can
then be visualized and used in planning the distribution of existing dynamic resources.
In the study there was a need to integrate and perform combined analysis of multiple
variables all of which influenced the risk at a certain geographical region.
Furthermore, there was a need to spatially analyse multiple variables and communicate
different scenarios to stations and between stations, which may lead to fresh demand
for requirements for resources. For instance, a local service area may undergo changes
in the land-use due to an economic boom or industrialisation resulting in increase in the
number of infrastructure, dwellings, all of which may lead to a revaluation of the
existing hazard and vulnerability. These developments can be input from each station
and provided to the head office in the planning process where appropriate measures
may be taken to redistribute the dynamic resources. After the variables are collected,
recorded and input to the model the model can be re-run using different function
parameters, thus enabling them to calibrate their models or examine how they perform
using different set of values. Users can also copy portions oftheir models and smaller
models can be used to build larger models.
118
Integrating RS ft GIS for Urban Fire Disaster Management. Sunil, 1999-2002
The new risk map will then show the increase in risk areas than before, which may
have implications to the existing distribution of resources. On the one hand there is a
need to update the records and input to the model, on the other there is a need to keep
this process simple and straightforward so that fire staff may be trained in the use of the
system and input spatial and non-spatial data to the model. There was a need for a
system, which can communicate with different operators (fire stations) produce spatial
data, manage spatial data, update spatial data. Coordinated strategy to combat hazard
demands the combined use of available spatial data. There is a need for a system which
will enable the fire brigades to perform this task, and at the same time allow the
different stations to input data which may be typical to their service area. In this
manner a well co-ordinated strategy can be devised to support the decision making
process.
The use of Model builder will allow fire stations to develop their own models and share
it with different stations that may benefit from the model. This means that
organizations can develop model "templates" for processing specific types of data and
then distribute those templates to their users. New users can then add their own data to
their model and run it using a consistent or prescribed modelling strategy. The model
builder can therefore play a very important role in the development of standard
modelling strategy and in the distribution of spatial data across the planning process. Of
the many challenges, one of the most pressing is to build an infrastructure that can
mould complex data and withstand intricate analysis from an easy-to-use readily
accessible environment (Gonzales, 2002).
119
Integrating RS & GIS for Urban Fire Disaster Management. Sunil, 1999-2002
All this could be achieved by using the weighted overlay approach provided in the
Arc View Model builder, which helps in multi-criteria analysis and generating 'What If
scenarios, which will help the emergency service in better planning strategies. Complex
relationships between variables and disasters can be designed and built into a single
model. For example, what if a fire broke out in an industrial area consisting of chemical
factories, and which lies in the proximity of landuse which had residential areas,
welfare homes, schools, petrol stations, multi-storeyed dwelling, commercial areas and
so on. In the context of the present study, this spatial analyst tool is invaluable for
simulating spatial data transfer in the NSWFB planning process. In fact the corporate
office have already started experimenting with the effectiveness of introducing the
results of the Model Builder by combining it with ArciMS (Internet Map Server) which
will enable local stations to input data from their service areas, so that such data may be
analysed in conjunction with other service areas. A common strategy plan for
distributing resources and planning can be drawn by this system. Although, the
scientific treatment of selected variables and fresh variables will be crucial, this
approach has the potential to resolve multi criteria issues such as the creation of a
system that can be used by all personnel effectively and the use of complex
programmes that may be written and read into the model, which upon running can yield
the desired results.
Using existing data sets and a multi-criteria modelling approach, hazard zones can be
mapped based on the physical properties and cultural values. Alternatives can then be
visualized which will assist emergency planners and decision-making process. Weights
rank individual elements in order of influence, for example if the number of multi
storeyed constructions are higher, then these constructions would hold more weight,
120
Integrating RS 8: GIS for Urban Fire Disaster Management. Sunil, 1999-2002
thereby having a greater bearing on the overall hazard categories. The decisions to
assign weights have to be developed after consultations, discussions and experimenting
with the local fire stations and the head office.
The weighted overlay reclassifies the cell values of two or more input themes to a
common scale, then multiplies the reclassified values by influence factors and adds the
values to produce an output grid. Model builder is a relatively new extension from
ESRI that extends the capabilities of Spatial Analyst to allow a model to be developed
ran quickly and distributed to others. This model is constructed of individual processes
from project data, spatial functions, and derived data, which are then linked together.
The creation of the model takes place in a user-friendly graphical user interface (GUI)
with the help of drag-and-drop options and I or instructional wizards. Model builder
uses several spatial analyst operations for manipulation of data.
There are two ways that the user can enter information into Model Builder - wizards
and property sheets. The wizard is an automatic method, which will suit new users or
those who are unsure of the information they wish to use. After entering the data by
either method (wizard or by using the various drag and drop methods), the check model
status button can be used to check if all the pertinent information is entered.
Determination of Weightage: of each class is the most crucial in integrated analysis,
as the output is largely dependent on the assignment of appropriate weightage. In this
study the determination of input variables was done by holding discussions with
officials from the fire brigades. However these were not subjected to any rigorous
scientific treatment, mainly because the decision to select the most appropriate
121
Integrating RS 8: GIS for Urban Fire Disaster Management. Sunil, 1999-2002
variables for assessing risk has to be done after detailed discussions with the fire
stations in the respective service areas and the Corporate Strategy Division, NSWFB
and this entails a substantial period of time, which can only be developed over a period
of time. The study used some variables to show that different variables can be input to
the model and visualized which will assist in the decision making process. If the
inclusion of fresh and existing· variables could be done according to mutual
understanding between the various fire services and liasing agencies then the concept
of risk can be better understood and implemented. Further work needs to be done in
order to refine the model particularly with respect to the selection of more types of
variables and refining the existing choices. This will consume considerable time and
collaboration between many agencies including the NSWFB.
4-15 Modelling risk with the "Weighted Overlay Process".
The "weighted overlay process" creates a discrete grid theme that combines multiple
input themes (See Figure 27 & 28). The output theme represents the weighted
influence of multiple features in a geographic area. Each of the input themes is assigned
a percent influence based on its importance. Values within the themes are reassigned to
a common evaluation scale. In order to build the composite hazard model it was
essential to extract individual themes, which had to be input uniquely to the model
builder process.
122
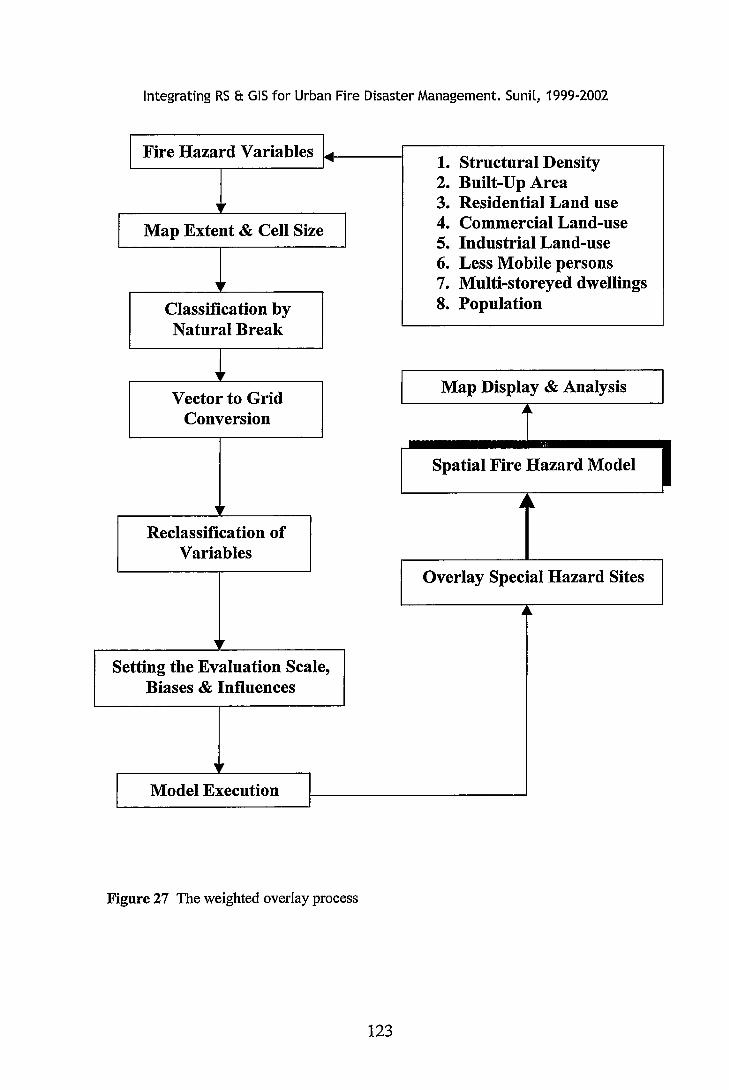
Integrating RS a GIS for Urban Fire Disaster Management. Sunil, 1999-2002
Fire Hazard Variables ... -. 1. Structural Density
2. Built-Up Area ,,. 3. Residential Land use
Map Extent & Cell Size I 4. Commercial Land-use 5. Industrial Land-use 6. Less Mobile persons
,r 7. Multi-storeyed dwellings
Classification by 8. Population
Natural Break
Vector to Grid Map Display & Analysis
Conversion .a.
Spatial Fire Hazard Model
ir ..4 ~
Reclassification of Variables
Overlay Special Hazard Sites
.4~
, Setting the Evaluation Scale,
Biases & Influences
, .. Model Execution
I
Figure 27 The weighted overlay process
123
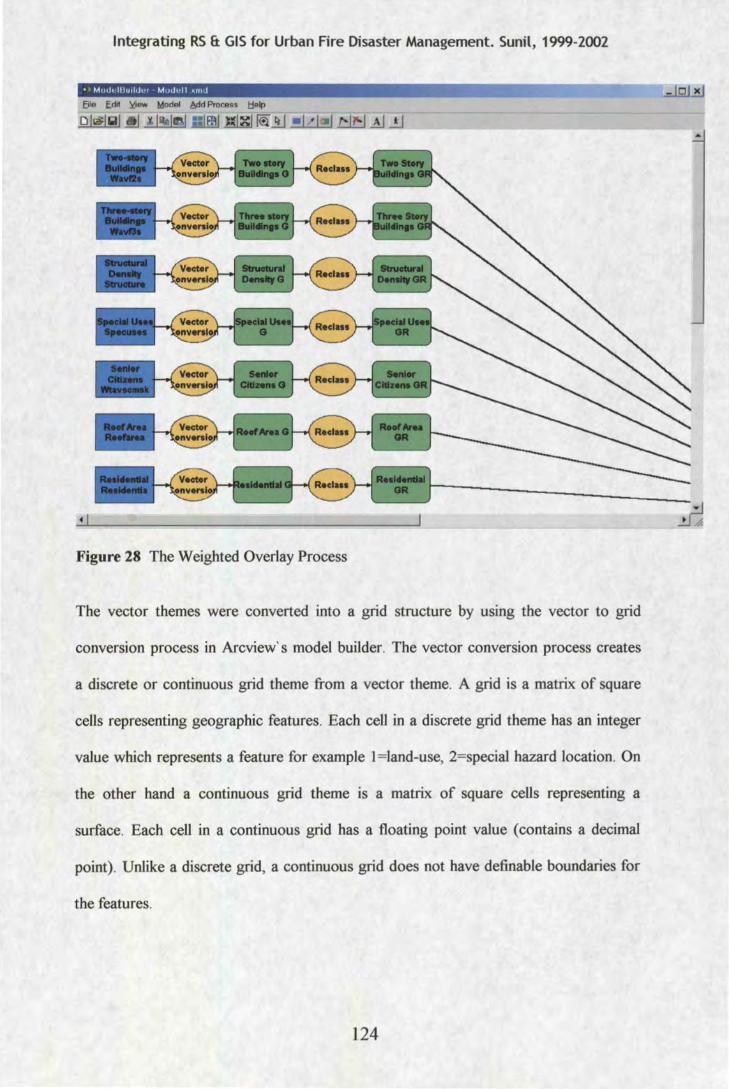
Integrating RS & GIS for Urban Fire Disaster Management. Sunil, 1999-2002
file fdot ~- Model Add Process l:felp
D l~l liil l ~ .w.l~l -1 •:IEBI ~-1~1 ~~ ..::• J..::I ...J.:J
Figure 28 The Weighted Overlay Process
The vector themes were converted into a grid structure by using the vector to grid
conversion process in Arcview' s model builder. The vector conversion process creates
a discrete or continuous grid theme from a vector theme. A grid is a matrix of square
cells representing geographic features. Each cell in a discrete grid theme has an integer
value which represents a feature for example 1 =land-use, 2=special hazard location. On
the other hand a continuous grid theme is a matrix of square cells representing a
surface. Each cell in a continuous grid has a floating point value (contains a decimal
point). Unlike a discrete grid, a continuous grid does not have definable boundaries for
the features.
124
Integrating RS 8: GIS for Urban Fire Disaster Management. Sunil, 1999-2002
All the themes, ranging from land-use, population density to, structural density, were
extracted from the master table into separate themes in order to perform the weighted
overlay operation. These themes were classified by the natural break method into 4
class intervals. Before modelling the composite hazard by the weighted overlay
process, it was necessary to ensure data transformations and set the model defaults.
4-15.1 Data considerations and image environment for the weighted overlay process
The weighted overlay process requires all input themes/layers to be a grid file.
Conversion to a grid format enables uniform calculations and analysis, unlike the
vector formats where calculations and analysis can lead to erroneous results.
)> Cell size and map units
A grid theme is composed of square cells with values. The size of the cells determines
the resolution of the grid theme. The smaller the size of the cells the more precise will
be the outline of the geographic feature but will consume more time and storage space
because of the increased number of cells. For the study a cell size corresponding to the
size of the spatial unit 250 by 250m was chosen. All the output hazard/vulnerability
categories were assessed to this cells size. The map units were set to meters.
)> Map extent
The extent of a theme is the area on the earth's surface covered by the theme. An extent
is always rectangular and it has coordinates that locate its position. The map extent for
this study was set to the extent of the structural density theme. All the output composite
hazard categories were generated to this map extent.
125
Integrating RS ft GIS for Urban Fire Disaster Management. Sunil, 1999-2002
)> Classification method
Classification methods are calculations that are applied to the data to define the class
ranges. The purpose of classification is twofold: to make the process of reading and
understanding a map easier and to show something about the area being mapped which
is not clear and self evident. The study used the natural breaks method of classification
which identifies breakpoints between classes using a statistical formula called Jenk's
optimisation. Natural breaks help in finding groupings and patterns inherent in the data.
The reclassification process is used in the study to group the values of an input grid
theme to new values in a discrete grid theme. For example, the land costs in a theme
could be grouped into high, medium and low price ranges (Using Model Builder,
2000).
4-16 Assigning influences and biases to layers
The major advantage of using the weighted overlay process for arriving at the
composite hazard categories is its flexibility in allowing the input and exclusion of
variables that may/may not be important, depending on the geographic region. For
instance, in a region dominated by dense structural density and commercial land-use
the most important influencing factor would be the variables that depict these, while
other variables such as open space might be excluded, or have little weight. Thus the
most important influence will be assigned to these variables in comparison to the others
(Figure 29). These influences will vary from region to region depending on the
geography and arrangement of spatial features. The "Evaluation Scale" is set to
weight the values of the input themes for the weighted overlay. For instance, raw
values have to be converted to a common evaluation scale in order for these to be
processed and analysed. Hazard categories are generated to 4 distinct categories (i.e.
126
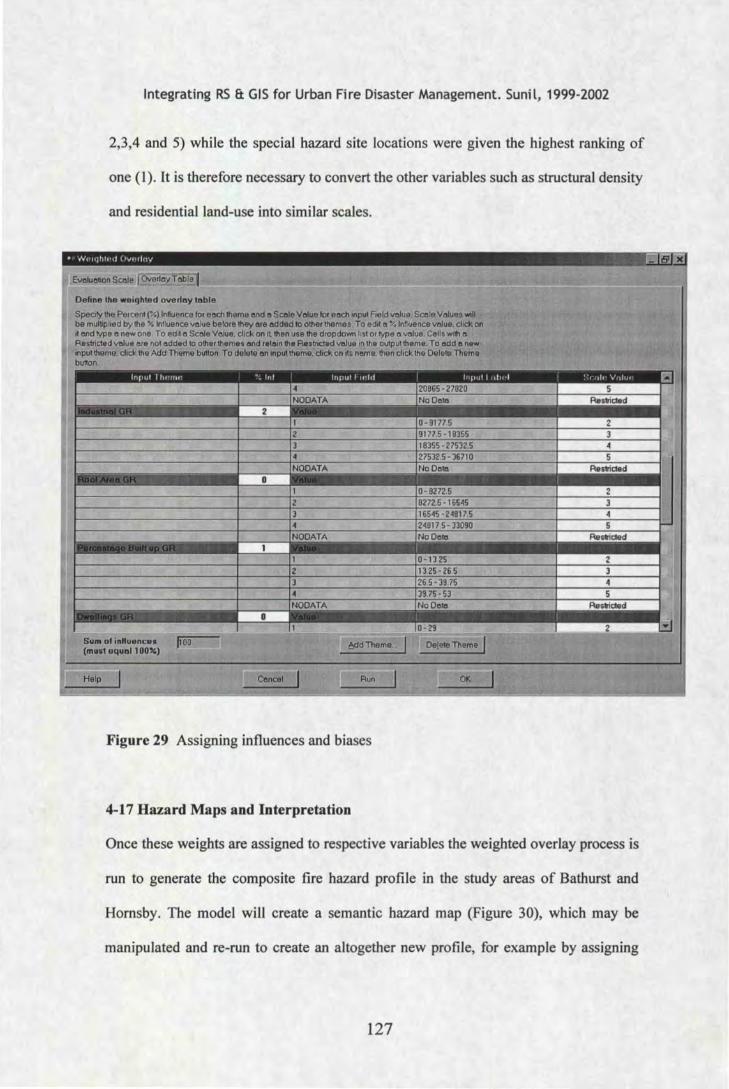
Integrating RS & GIS for Urban Fire Disaster Management. Sunil, 1999-2002
2,3,4 and 5) while the special hazard site locations were given the highest ranking of
one (1). It is therefore necessary to convert the other variables such as structural density
and residential land-use into similar scales.
Ev!WetionScele
Deline llle -ighted overlay table Specify !he Percent ("/o) lnftuence lor e8Ch theme ll!ld 11 Scele Vlllue lor e8Ch inpul Foeld Vlllue. Scele Vlllues will be multiplied by the % lntluence value before lhey are added to o1het1hemet. To edit 11% Influence Vlllue. dick on
type11 new one 11 SCilla Velue. dick on It 1hen use the dropdown list or type a velue. Cells Willa Aestrided velue are not added to olherlhemes end retain the Aeltricled lllllue in the output theme. To add 11 new input tbama. dick the Add Theme button. To dalate an lnpullhelnll. dick on its n11111e.lhan dick lhe Oehat& Th11m1 buttt:Jn.
lr,pul I twrnf' ' lrtf lrtpul t t1•ld l11ptJII tlH·I
I I INOOATA INoODia 2
11 I0-91775 12 19177.5 - 18355 13 i 18355 - 27532.5 14 i 27532.5- 36710 INOOATA -NoODia
0 11 0- 8272.6 12 8272.6 · 16545 13 16545 - 24817,5 14 24817 5- 33090
' I 1h \/oaiiJ>
.
I • 3
5 Aes1ridlld
2 3 4 5
El
I ;I
-1NOOATA No0Dia
I 1 I0-13 2' 2 113 25 - ' !6.5 3 3 126 5-3 175 4 4 139 75 - 'i3 5 NOOATA INoODia Aemaed
0 I I II ! 0-29 2
Su• ollnlluencee poo (muet equall OO"l .. I
Cencel Run
Figure 29 Assigning influences and biases
4-17 Hazard Maps and Interpretation
Once these weights are assigned to respective variables the weighted overlay process is
run to generate the composite fire hazard profile in the study areas of Bathurst and
Hornsby. The model will create a semantic hazard map (Figure 30), which may be
manipulated and re-run to create an altogether new profile, for example by assigning
127
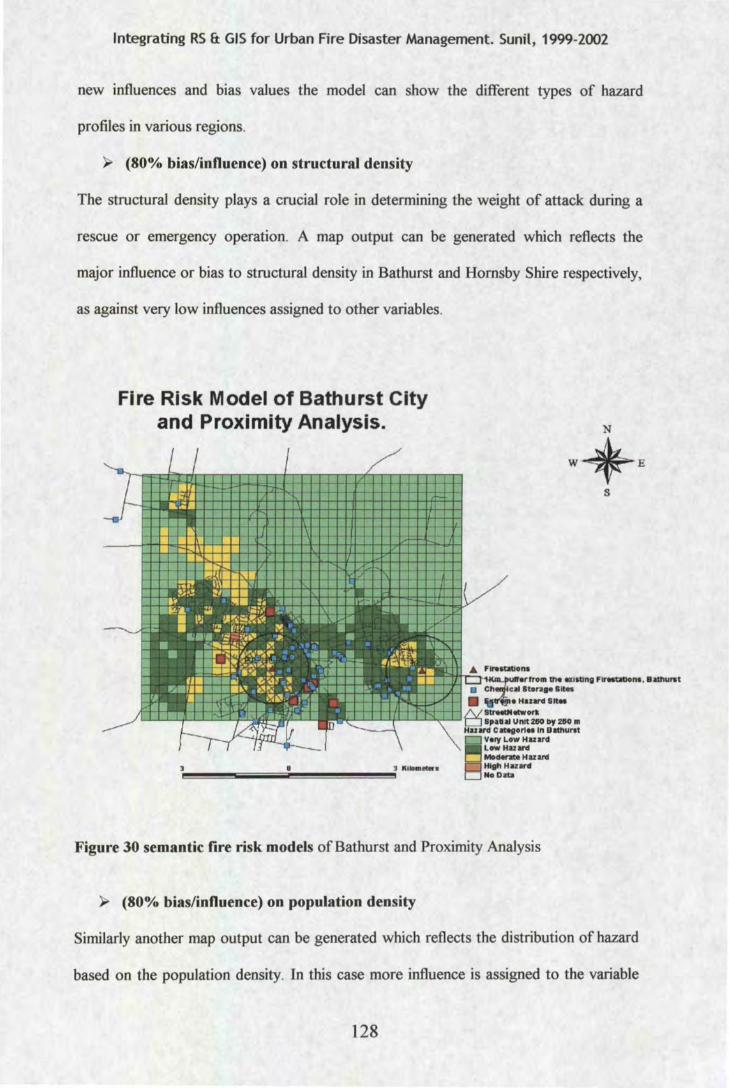
Integrating RS & GIS for Urban Fire Disaster Management. Sunil, 1999-2002
new influences and bias values the model can show the different types of hazard
profiles in various regions.
)'> (80% bias/influence) on structural density
The structural density plays a crucial role in determining the weight of attack during a
rescue or emergency operation. A map output can be generated which reflects the
major influence or bias to structural density in Bathurst and Hornsby Shire respectively,
as against very low influences assigned to other variables.
Fire Risk Model of Bathurst City and Proximity Analysis. N
W*E
Hazvclllt•
t-'--'-'-'-.Ji-1'-'-'~~-' ~ l,alal Unit zeo by :zeo m Huvcl c-.ort• In Bllltlurst
Vory Low Hazard L-Hazvcl MocMnll>l H az arc1
t ' IIIID.,tt•• lfltlh Hazaril ~~~~----~~~~~~~ ~om
Figure 30 semantic fire risk models ofBathurst and Proximity Analysis
(80% bias/influence) on population density
s
Similarly another map output can be generated which reflects the distribution of hazard
based on the population density. In this case more influence is assigned to the variable
128
Integrating RS & GIS for Urban Fire Disaster Management. Sunil, 1999-2002
population density, m other words more importance IS given to the community
vulnerability.
~ (50% bias/influence) each on population density and structural density.
This hazard profile can give an altogether different results as compared to the earlier
outputs since the biases are equally divided between population density and structural
density. The potential of the model to show the changes and simulate them indicates the
flexibility of the model with respect to the free input of hazard related variables and the
concentration of resources that may be required during emergencies. Depending on the
fire district and the geography of the region hazard categorization will vary, but the
model can be given biases and influences to give the best available option for
deploying dynamic resources and emergency management.
4-18 Verification of model results
The model was created by using several hazard related input layers. These layers were
sourced from different agencies and therefore had mixed accuracies. Some of the layers
such as the local environment plan and land-use were validated on the ground so they
had a high level of accuracy, but the same could not be said about the others. Since the
weighted overlay is a data driven process, the best way to check the reliability of the
model was to overlay the original vector layers on the model and check them visually
against the model attribute values (Figure 31) The verification process can also be
undertaken by ground truthing but would have to be carried out after updating the
vector data using more recent remotely sensed data such as Quick Bird (spatial
resolution 0.61m by 0.61m)
129
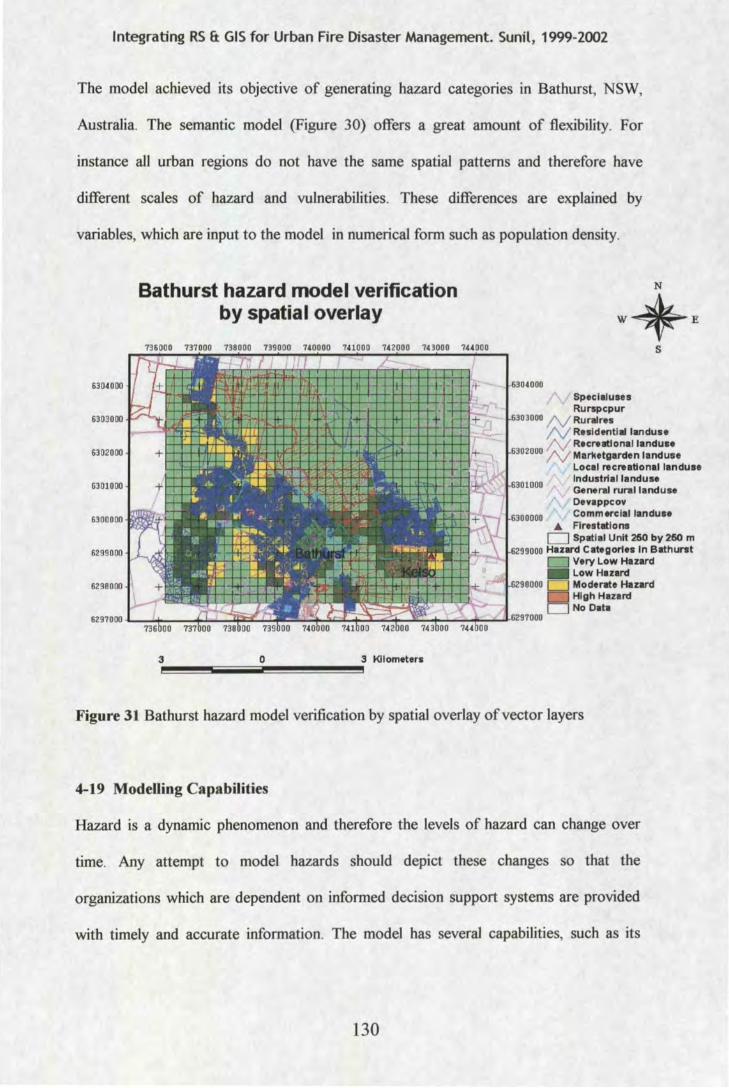
Integrating RS & GIS for Urban Fire Disaster Management. Sunil, 1999-2002
The model achieved its objective of generating hazard categories in Bathurst, NSW,
Australia. The semantic model (Figure 30) offers a great amount of flexibility. For
instance all urban regions do not have the same spatial patterns and therefore have
different scales of hazard and vulnerabilities. These differences are explained by
variables, which are input to the model in numerical form such as population density.
63 0~0 00
6303000
63 02 000
6301000
6300000
6299000
6298000
6297000
Bathurst hazard model verification by spatial overlay
3 0
s
Special uses Rurspcpur
N RuraJres N Resident!• landuse N Recrelltlonallanduse N Marketgarden land use
Local recreatlonallanduse lndustriallanduse General rurallanduse Devappcov Commerc:lallanduse
• Flrestatlons D Splltlal Unit 260 by 260 m
oo Hazard Categories in Bllthurst D Very Low Hazard -Low Hazard CJ Moderllte Hazard c:::::J High Hazard CJ No Data
Figure 31 Bathurst hazard model verification by spatial overlay of vector layers
4-19 ModeUing Capabilities
Hazard is a dynamic phenomenon and therefore the levels of hazard can change over
time. Any attempt to model hazards should depict these changes so that the
organizations which are dependent on informed decision support systems are provided
with timely and accurate information. The model has several capabilities, such as its
130
Integrating RS ft GIS for Urban Fire Disaster Management. Sunil, 1999-2002
ability to input fresh data which may be processed at regular intervals, perform impact
analysis and forecasting. Some of these capabilities are briefly described as follows
)> Updating data-base
Emergency management is heavily reliant on the most recent spatia-temporal data. For
instance in the rural urban fringe unplanned development takes place leading to
increase or decrease in the level of hazard. This is an acute problem, particularly in
developing countries. Unhindered development can be detected by new high resolution
space borne and airborne sensors. The data can then be input to the model and the risk
assessment can be undertaken by combining the new and current data with the other
variables. By exposing the study area with new space borne and airborne sensors, the
model can be updated. For instance, by using high resolution ortho rectified images and
simple methods such as 'On-screen digitising' newly developed regions can be
regularly monitored and updated before analysis and modelling. The frequency of
acquiring a new image will be influenced by an understanding of the phenological
cycles and changes that occur in an urban area.
)> Free input of data
The model can input fresh data that may explain hazard in a certain region. This would
facilitate the incorporation of spatial data that may not have been available in the initial
stages of the development of the model. For instance, in a recent study which
investigated the mapping of vulnerable areas to the hazard of hail storm in Sydney,
hyperspectral images were analysed and classified to produce end user maps. The
classified information was imported to a GIS environment (See Appendix I for a full
description of the report). The results of such analysis may be input to the hazard model
for further analysis. This ability to input data will mean that hazards can be assessed
comprehensively and information may be input as and when available, and can be
131
Integrating RS & GIS for Urban Fire Disaster Management. Sunil, 1999-2002
crucial to the derivation of the latest information for emergency management. Another
important capability of the model is the input of data in any format, which may be a an
issue since data is available in different forms, scales and resolutions.
);>- Impact Analysis
New developments in the form of a chemical industry or any other hazardous activity
can redefine the scale of hazard which may have implications for the distribution of
dynamic resources mostly leading to an increase in number of such resources. Similarly
the siting of an industrial plant may alter the degree of hazard in an undesirable
manner. For instance, if the location of these sites were in the vicinity of residential
areas, or commercial areas, then necessary precaution may have to be taken in order to
avoid major affects. The impact analysis may contribute to land-use and decision
making processes by influencing the location of these sites on the basis of the
information provided by the hazard model. These facts can be ascertained
geographically by overlaying the site (point feature) on the model.
);>- Proximity analysis (See Figure 32)
Proximity analysis is a powerful tool which may be performed around the site to assess
the number and type of people who may be affected by the location of the proposed
site. Knowledge about the number of people who live near a hazardous location is
important in order to provide fire protection. Proximity analysis not only provides a
comprehensive scenario on the area that could be affected by the hazardous location,
but can also generate a report about the number, category and type of people who may
be affected by a disaster. Proximity analysis can be carried out on the model, since the
model depicts a comprehensive picture of hazard by including two main hazard
determinants- Physical structure and Population.
132
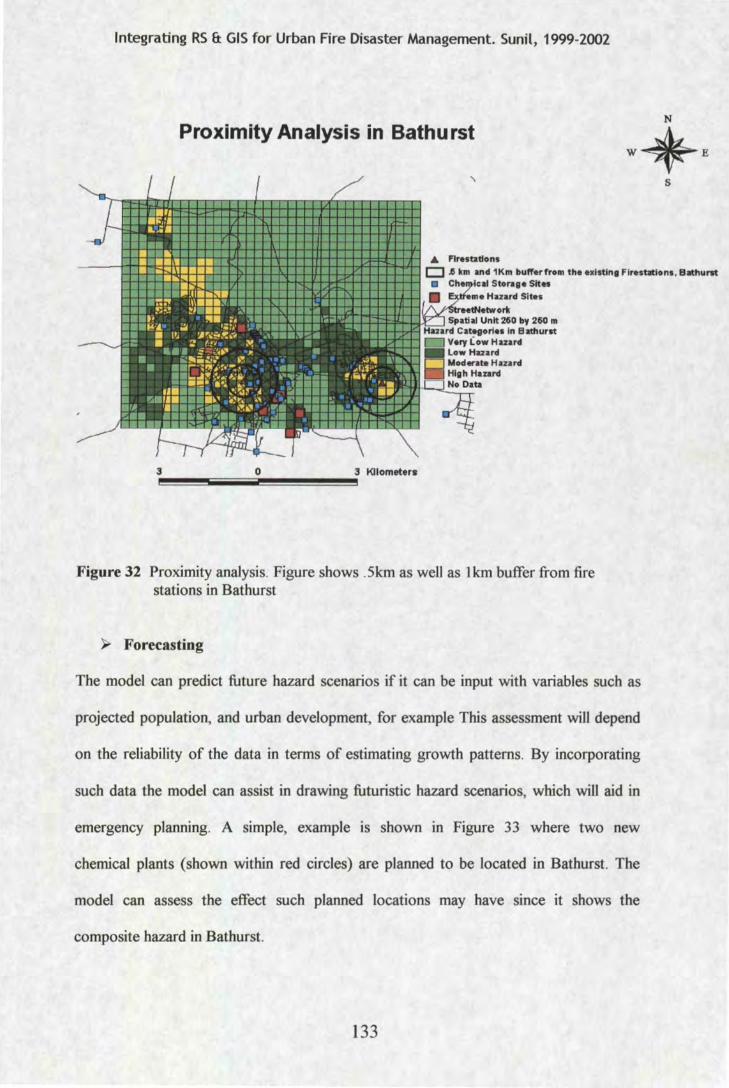
Integrating RS & GIS for Urban Fire Disaster Management. Sunil, 1999-2002
Proximity Analysis in Bathurst
A Flrestadons
• Storage Sitos
3~!!!!!'!!!!!!!!!!!1iiiiiiiiiiiiiiiiiiiiiiiilo!!!!!!!!!!!!!'!!!!!!'!!!!!!'!!!!!!'!~3 Kilometers
Figure 32 Proximity analysis. Figure shows .5km as weiJ as lkm buffer from fire stations in Bathurst
);> Forecasting
The model can predict future hazard scenarios if it can be input with variables such as
projected population, and urban development, for example This assessment will depend
on the reliability of the data in terms of estimating growth patterns. By incorporating
such data the model can assist in drawing futuristic hazard scenarios, which will aid in
emergency planning. A simple, example is shown in Figure 33 where two new
chemical plants (shown within red circles) are planned to be located in Bathurst. The
model can assess the effect such planned locations may have since it shows the
composite hazard in Bathurst.
133
s
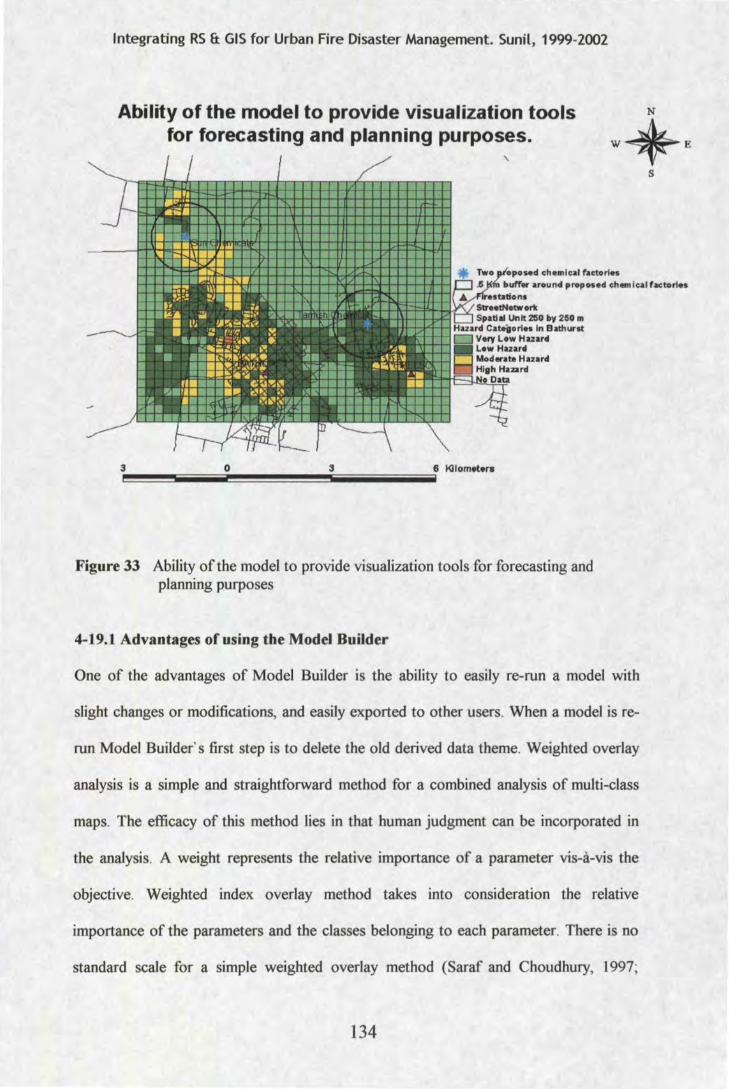
Integrating RS & GIS for Urban Fire Disaster Management. Sunil, 1999-2002
Ability of the model to provide visualization tools for forecasting and planning purposes.
5ed chemical factorie5
s
around propo5ed chemical factories
Figure 33 Ability of the model to provide visualization tools for forecasting and planning purposes
4-19.1 Advantages of using the Model Builder
One of the advantages of Model Builder is the ability to easily re-run a model with
slight changes or modifications, and easily exported to other users. When a model is re-
run Model Builder' s first step is to delete the old derived data theme. Weighted overlay
analysis is a simple and straightforward method for a combined analysis of multi-class
maps. The efficacy of this method lies in that human judgment can be incorporated in
the analysis. A weight represents the relative importance of a parameter vis-a-vis the
objective. Weighted index overlay method takes into consideration the relative
importance of the parameters and the classes belonging to each parameter. There is no
standard scale for a simple weighted overlay method (Saraf and Choudhury, 1997;
134
Integrating RS a: GIS for Urban Fire Disaster Management. Sunil, 1999-2002
Saraf and Choudhury, 1998). For larger models, which would involve many map
calculations, Model Builder would be beneficial in the creation, running and exporting
a model.
Emergency operations with agencies such as the NSWFB demand multi-criteria
analysis and visualization. Risks are dynamic by nature and planning for the mitigation
of risks require the generation of multiple scenarios and communicating the results of
the analysis between different fire stations is vital for managing resources by any
emergency service, such as the NSWFB. Currently the NSWFB is testing the model by
using ArciMS, which is a web based GIS system that assists in the graphic
dissemination and free flow of spatial data between several fire stations. The system
will promote the input of data from the fire stations which can then be sent to the
corporate office where most of this information is further integrated and analysed in
order to plan better and mobilize existing and fresh resources. The flow diagrams are
not only a convenient way to build and modify spatial models but are also an excellent
way to document your work. The program eases the process of creating and working
with multiple what-if scenarios.
4-19.2 Limitations of using the Model Builder
There are some disadvantages of using the Model Builder, but they did not have much
effect on the existing study. Evaluation scales can only be set for single digit and not
finer scales. Other limitations such as grid cell numbers can cause problems in the use
of Model Builder for risk assessment. A brief explanation about the disadvantages is
provided in the following paragraphs.
135
Integrating RS 8: GIS for Urban Fire Disaster Management. Sunil, 1999-2002
Evaluation Scale limitations: There are predefined evaluation scales in the weighted
overlay function and a particular model may require a different evaluation scale. For
instance there are set evaluation scales in the Model Builder, which prevents the user
from using their own customized evaluation scales. This aspect of Model Builder did
not pose many problems in the study since the numbers ofhazards were limited to four,
the fifth and most hazardous being the point locations, consisting of extreme hazard
sites. But in a different type of analysis where there is a need for customizing and
setting multiple evaluation scales the model builder does not have the provision, due to
the fact that the program written for Model Builder was coded to accept only single
digits.
Grid Cell Limitations: There are some limitations on the grid cells and the derived
theme being an integer theme. The Model builder allows only for 1,000,000 cells,
which may not be enough for analyzing a large area. For the study this was not a
problem, but may become a problem if a very large area may be involved and if many
areas were to be analyzed together in combination. However, this shortcoming can be
reduced or altered to some extent by manipulating the size of the cell, when the model
environment is set initially, even though this will have implications on the scale ofthe
final risk map.
The results from the weighted overlay are an integer grid. The values from the
computation are rounded to obtain integers. This generalizes the results, but the grids
load faster and the table for the theme can be viewed. This is particularly useful in a
network situation such as the planning process of the NSWFB, where information may
have to be viewed and sent quickly back and forth.
136
Integrating RS 8: GIS for Urban Fire Disaster Management. Sunil, 1999-2002
ReclassifYing 'No Data' areas: Another flaw was observed while reclassifying the
'No Data Areas'. For example, in many of the data layers there are areas with no value
or data, for e.g. vacant land areas particularly in Bathurst city posed a problem. When
the model is run the 'vacant land', which presents no hazard or risk is also reclassed,
instead of assigning a value of zero to such areas. This brings in local errors in the final
risk assessment map leading to a certain amount of subjectivity to the final risk map
results. The extent of this subjectivity in the present study was considerable which has
affected the quality of the final results to some extent. As long as these areas of 'No
Data' lie outside the study area, it will not have any implications to the hazard mapping
process, but subjectivity will increase considerably, if such areas of 'No Data' were to
lie within the study areas. The solution to resolving this problem may be to undertake
ground surveys and mask these vacant lands before the analysis.
Another minor issue with Model Builder is that when it is re-run, it deletes the old
derived data theme, therefore preventing the comparison between the new derived
theme and the older one. The solution is to rename the entire model (Save as) andre
running the model. This will ensure that the older model is not affected or overwritten
by the changes in the new model.
4-20 Summary
Modelling hazards requires the combined assessment of many factors, which influence
hazard. An attempt has been made in this study to model urban hazard where some
relevant data (surrogates) were sourced and spatially analysed. The entire list of hazard
relevant data may be much more than what is included in this chapter, but the
acquisition of relevant data is a difficult and costly process. All GIS are dependent on
137
Integrating RS 8: GIS for Urban Fire Disaster Management. Sunil, 1999-2002
the availability of spatially referenced data whose use for purposes other than those for
which they were collected will be enhanced by the systematic appraisal of such sources
in respect of both locational precision and the characteristics of the attribute data, and
by the adoption of standards for data transfer. Modelling the physical and human
processes requires not only the availability of data on the factors thought responsible,
but also an understanding ofthe processes involved (Coppock, 1995). Remote sensing
data can play a significant role with respect to the acquisition of current data. New
satellites, especially those capable of providing data of higher resolution and with
sensors that are independent of both cloud and daylight, will help to provide some of
the missing information (Coppock, 1995). Some of the information related to hazard
may be available within organizations and planning bodies whilst most of it may not
exist at all. The model discussed in this chapter integrates information from remote
sensing data as well as available GIS cartographic information. There is a need to
acquire more relevant and accurate data from wider sources. There is also a need to
establish reliable data centres, which can gather hazard relevant data and provide them
to all organizations that may have to use them. This will facilitate the modeling process
and assist in producing improved decision support systems. Assessment and analysis of
fire hazard levels is vital to plan resources such as fire equipment and human resources.
The model may be also used in the existing resource planning process to determine
urban growth, vulnerability and other hazard related indices.
The approach for modeling presented in this chapter may be relatively simple but has
scope to improve if the data acquisition process is streamlined and relevant data is
constantly acquired and analysed at regular intervals. The model uses physical
variables, as well as introduces the human component by including variables such as
138
Integrating RS 8: GIS for Urban Fire Disaster Management. Sunil, 1999-2002
density of population and demographic indicators such as distribution of senior
citizens, and income levels of people. The hazard maps produced by running the model
show that there is scope for including more data, which explains the hazard more
completely. For instance, the daytime population is important to determine the density
ofpeople who may be exposed in the event of a disaster.
The study has substantial potential to be integrated into the existing planning process of
the NSWFB. There is a need to highlight the implications and advantages the model
may have by describing the existing planning process of the NSWFB. The wide
network of the fire stations and other offices must be linked not only conceptually and
philosophically but the free flow of spatio-temporal data is one of the main ingredients
to sustain a unified approach to understanding the distribution of risk and consequently
a planned management to risk.
A thorough understanding of the existing planning process is a prerequisite to
understanding the potential advantages of the risk model developed in the study. There
are many stages in the planning process where remote sensing and GIS and a combined
analysis of spatial data can assist in the betterment of risk management, which will
result in a much improved way of assessing, analyzing and mapping spatial
information.
The following chapter describes in detail some of the dynamic resources (mainly
materials) used during emergency operations and the various stages of the NSWFB
planning process.
139
Integrating RS & GIS for Urban Fire Disaster Management. Sunil, 1999-2002
Chapter 5: Potential of applying FRM to the Resource Planning Process
5-l Introduction
Managing resources for the emergency services involves a broad spectrum of
management concepts and activities. Resource management encompasses human
resources (people doing a job), material resources (things people need to do the job),
and fiscal resources (money to pay the people and purchase the equipment). It also
involves the effective use of time (priorities and schedules for both human and material
resources). Determining the level of resources required for fire, emergency medical,
and related services is a complex task. A community must determine its needs in
relation to the existing hazards, the level of risk that is politically acceptable, and the
level of service that is financially obtainable (Managing Fire Services, 1988).
Most fire protection agencies are experiencing escalating demands for fire suppression
and fire prevention services, fire safety education, emergency medical services, and
hazardous materials control. However, the resources required to provide these services
are limited or diminishing. To adequately meet these demands, a community- with the
guidance of the fire department- must take the following steps
1. Identify the nature and extent of the risks its faces
2. Establish the levels of service desired
3. Identify the most efficient and effective use of public and private resources to
provide the established service levels
140
Integrating RS ft GIS for Urban Fire Disaster Management. Sunil, 1999-2002
4. Implement a management and evaluation system that ensures the attainment and
timely revision of service-levels standards
It is clear from the above paragraphs that the identification of the nature and extent of
risks a community may face, in the eventuality of a disaster, is one of the most
important tasks faced by emergency services. Risk identification has to be performed
by using a model, which integrates most of the variables that may influence fire risk.
Such a model may be further used for regional and local distribution of dynamic
resources.
5-2 Need for Balanced Resource Allocation and Distribution
Most fire protection agencies are experiencing escalating demands while resources
required providing these services are limited or diminishing. Planning is therefore a
basic step in fire protection management (Managing Fire Services, 1988). Dynamic
resources (fire Fighting equipment and staff) are provided to designated geographic
regions to ensure maximum protection from any hazard. The existing degree of hazard
and vulnerability may vary from one region to another depending upon the local sets of
physical and human conditions, such as land-use, economic activity, population
density, local geography, presence of hazardous installations, and many other related
factors. This means that resources cannot be distributed in a uniform manner to all
places, they have to be distributed intelligently so that maximum fire protection may be
provided. Urban landscapes may undergo rapid change, which results in a
corresponding change in the level of risk giving rise to an increase in demand for
additional dynamic resources. Therefore, these resources must be redistributed
according to the current factors.
141
Integrating RS 8: GIS for Urban Fire Disaster Management. Sunil, 1999-2002
5-3 Typical Fire Service (material) Resources
The location of material fire service resources is a key factor behind the provision of
fire protection services. Different types of fire service resources have varying functions
and capabilities, therefore their prime location is vital for planning for community fire
protection. The distribution of such resources may vary from one area to another
depending on various factors. Since these fire service resources perform different
functions it is important to describe them briefly.
5-3.1 Aerial pumpers
Modern fire engines used in urban areas are called pumpers. These are truck based
vehicles which must fulfil the following criteria:
)> Must be self propelled
)> Be capable of carrying the crew ( 4-6 people) to the incident,
)> Be equipped with an efficient pump of sufficient capacity,
)> Be equipped with a water carrying capacity (usually at least 1,800 litres), and
)> Be able to accommodate the necessary hose and equipment.
A pumper, its crew and equipment, are the primary resources available to the fire
service to extinguish structure fires and to provide fire protection during bushfires or
other emergency situations. Pumpers are often classified into a range of types, with the
main difference between them being in the pump capacity and the durability of the
vehicle chassis.
142
Integrating RS &. GIS for Urban Fire Disaster Management. Sunil, 1999-2002
5-3.2 Water tankers
Water tankers are truck based vehicles the primary role of which is to transport large
quantities of water to the scene of a fire (usually but not exclusively, a bushfire ). These
vehicles have 4WD for traversing rough roads and hilly terrain. Although carrying only
basic hose and equipment, Water tankers are fitted with a tank, which carries between
3500 and 4000 litres of water. Water tankers have a "pump and roll" capacity, which
allows water to be delivered onto the fire while the vehicle is in motion. Apart from
bushfrre situations, a Water tanker is a very useful fire fighting resource in other
situations such as structure fires where the water pressure from street mains is poor, or
for vehicle fires Hazmat (hazardous materials) incidents on freeways/highways where
mains water is unavailable.
5-3.3 Rescue vehicles
A rescue appliance may take a number of forms, for example a truck based appliance, a
van based appliance or rescue pumper where a single vehicle has multiple functions.
However it is now more common to find specialised vehicles being put into service to
carry out the role of rescue appliance. It is more usually a vehicle with storage and
transport capacity for a large quantity of equipment that may be needed at an
emergency incident. Essentially, it is a major support vehicle carrying not only bulky
equipment that cannot be carried on a pumper, but provides a range of additional
equipment such as:
~ Water-proof sheeting
~ Large range of both power and hand tools for entry purposes,
~ Generating and lighting equipment for night-time operations,
~ Mops, buckets, shovels and other clean-up equipment,
143
Integrating RS 8: GIS for Urban Fire Disaster Management. Sunil, 1999-2002
~ Hydraulic, electric and hand-held rescue equipment for entry and extrication
work,
~ Basic medical equipment, and
~ A quantity of miscellaneous equipment.
These vehicles are specifically designed to provide land based rescue services and
damage mitigation services at incidents.
5-3.4 Aerial appliances
Aerial appliances are major rescue or fire-fighting vehicles, which consist of a series of
extendable ladders, or an hydraulic cherry-picker type mechanism, mounted on an
appropriately sized and powered truck chassis. The main functions of Aerial
Appliances include:
~ Rescue from heights in conjunction with ropes, harnesses, stretchers, etc
Persons can be rescued from above or below ground level.
~ Water tower- water can be pumped through a pipe which extends or retracts in
line with the ladder/cherry-picker mechanism to be delivered down onto a fire
from an appropriate height,
~ External staircase- the extending ladder of some aerials can be positioned to
provide a means of escape for persons otherwise trapped in above-ground levels
of a building,
~ Observation tower incident commanders can use these appliances to obtain an
elevated view of the prevailing situation.
~ Gear lift transporting equipment to upper levels of a structure
Minor aerials, commonly referred to as Rescue Monitors, are usually fitted with a
large capacity pump to enable independent operations and have a ladder mechanism
144
Integrating RS 8: GIS for Urban Fire Disaster Management. Sunil, 1999-2002
that extends to about 15 metres. Major aerials, commonly referred to as turntable
ladders or hydraulic platforms, may have to rely upon water being pumped to them by a
number of Pumpers. Turntable ladders have an extendable ladder mechanism, while
hydraulic platforms are fitted with an hydraulic cherry-picker mechanism. Depending
on the model, major aerials can have a vertical reach of about 30-40 metres.
5-4 New South Wales Fire Brigades, Sydney- An overview of the resource planning process.
Application of the hazard model has some potential benefits to the existing resource
planning and management of disasters. However in order to highlight the advantages it
is vital to gain an understanding of the existing resource planning process currently
employed by the New South Wales Fire Brigades.
The New South Wales Fire Brigades have an elaborate planning process leading to
decision making and the final resource allocation (Figure 34). Planning takes place at
four major levels namely, the organizational level, regional level and local level,
through which the entire process of decision-making and information is disseminated
and exchanged. However, all plans must comply with the standards and be consistent in
its application and recommendations. The organization looks after the consistency,
expertise and methodology which contribute to the creation of a final decision making
process and plans. Each level have their responsibilities and tasks in the planning
process which may be unique or similar to what other levels perform in order to realize
an integrated and prioritized final plan. The government level lies at the top of the
hierarchy and they are responsible for making the ultimate decisions to be implemented
145
Integrating RS 8: GIS for Urban Fire Disaster Management. Sunil, 1999-2002
based on the plans outcome, costs and benefit analysis. The four different levels are
briefly described below
5-4.1 The government level
All the other levels have to adhere to the directions laid out by the government for
planning and formulating strategies for resource allocation. Policy directives for
resource allocation and planning are charted by the government and submitted to the
next level, which is the organisational level. Overall planning takes place at this level
where original plans are created and implemented. Initial plans for planning
information and data requirements for developing decision support systems are
identified at this level. The entire planning process, dealing with the type of data
required and the sources and methodology required to collect such data for resource
allocation is drafted at the organisational level. There is a high level of interdependency
between the local, regional and organisational levels due to the nature of spatial
information involved for assessing hazard and consequently resource allocation.
Therefore, information required is sourced from the local as well as the regional level
to create the plans and develop standards for decision support systems, which may
assist in resource management.
5-4.2 The organisational level
At the organisational level all plans are drafted in a manner that they adhere and
comply with the policy directives set by the government. This leads to the
standardisation of plans and consistency in the planning process and community
outcomes. Although the initial plans were created at the organisational levels, there are
instances where the planning process is decentralised and data gathering is initiated at
146
Integrating RS 8: GIS for Urban Fire Disaster Management. Sunil, 1999-2002
the regional and local levels. This leads to some autonomy with in the regions and local
levels. For instance, data on urban growth is an important determinant of resource
planning. Such data is sought from the regions and local levels by the organisational
level. Another instance is the incident data which gives details on the type and number
of incidents in the region and local service area which has to be input and generated
from the local and regional level. This is done to increase efficiency and
comprehensiveness of the plans. Due to the sheer magnitude of data pertaining to
resource allocation and the nature and forms of such data these data are secured directly
from the regional and local levels. At present information sought at this level comes
from data on urban growth and development, Australian Incident Reporting System
(AIRS), service delivery framework, population and demographic characteristics,
hazard and risk assessments. Once the information is gathered and integrated, at this
level, it is used in the assessment and decision making process.
Therefore the fmal assessment and decision-making process is determined by a
combination of spatia-temporal data which is sourced from all levels and analysed at
the organisational level. Another important function which is managed at the
organisational level is the economic appraisal of the plan for additional resource
allocation. This is achieved by carrying out cost/benefit analysis, which leads to a final
budget submission to the government. A decision is made by the government and
resources are allocated or re-distributed after due consideration of the resource
allocation. A major input is derived from the regions who actually deal with the hazard
in the field and therefore have first hand knowledge about the hazards in their
respective service areas. They have a very important role to play in the decision making
process.
147
Integrating RS 8: GIS for Urban Fire Disaster Management. Sunil, 1999-2002
5-4.3 The regional level
The regional level constitutes of 3 major regions i.e. North Region, South Region and
West Region. Each of these regions consists of seven zones, which have in total 336
stations equipped with dynamic resources, which provide fire protection to individual
service areas. One of the key functions carried out at the regional levels is the
formulation of plans for new proposals and additional resources. New development in
the form of physical and human attributes leads to the reassessment of existing hazard.
This in tum leads to a demand for additional resources which are discussed at a
management committee, where the need for additional resources by all regions are
taken and finalised by priority and finally put forward to the government for
consideration. Therefore fresh demand for resources is presented at the regional level.
The regions also interact at the local levels with respective service areas and fire
stations whose feedback forms a vital indicator of the demand for additional resources.
At the regional level plans for resource allocation and distribution are worked out after
consultations between the region and local areas under the respective regions.
Consultations and assistance are provided to the region and service areas at the local
level.
5-4.4 The local level
The local level comprise of individual service areas and the static resources (fire
stations) as well as the dynamic resources, which are stationed there. Each service area
is responsible for providing vital information on urban growth, incident data, local
environment planning land-use, population estimates and demographic characteristics
and most importantly hazard and risk assessment information. All these databases from
different service areas will be formulated into one major regional plan. Thus the request
148
Integrating RS 8: GIS for Urban Fire Disaster Management. Sunil, 1999-ZOOZ
for additional resources is indeed a reflection of the existing hazard and risk at the local
level. The station identifies specific issues related to local service delivery. These are
then forwarded to the region level, which in tum confirm the compliance ofthe service
delivery standards at the organisational level.
In essence all the information process involved in the formulation of plans for resource
management is a two-way process, often called top-down bottom-up planning, starting
from either the local level to the organisational level and from the organisational level
to the local level. The system is designed in a manner that it facilitates the distribution
of information from one level to another and the assessment of disaster risk is carried in
many ways by studying different variables, which may influence hazards. Finally the
results of each assessment are integrated to generate an integrated assessment for the
decision-making process. In this manner available GIS data, which are collected either
manually or by indirect means, are assessed together to map the spatial distribution of
hazards.
149
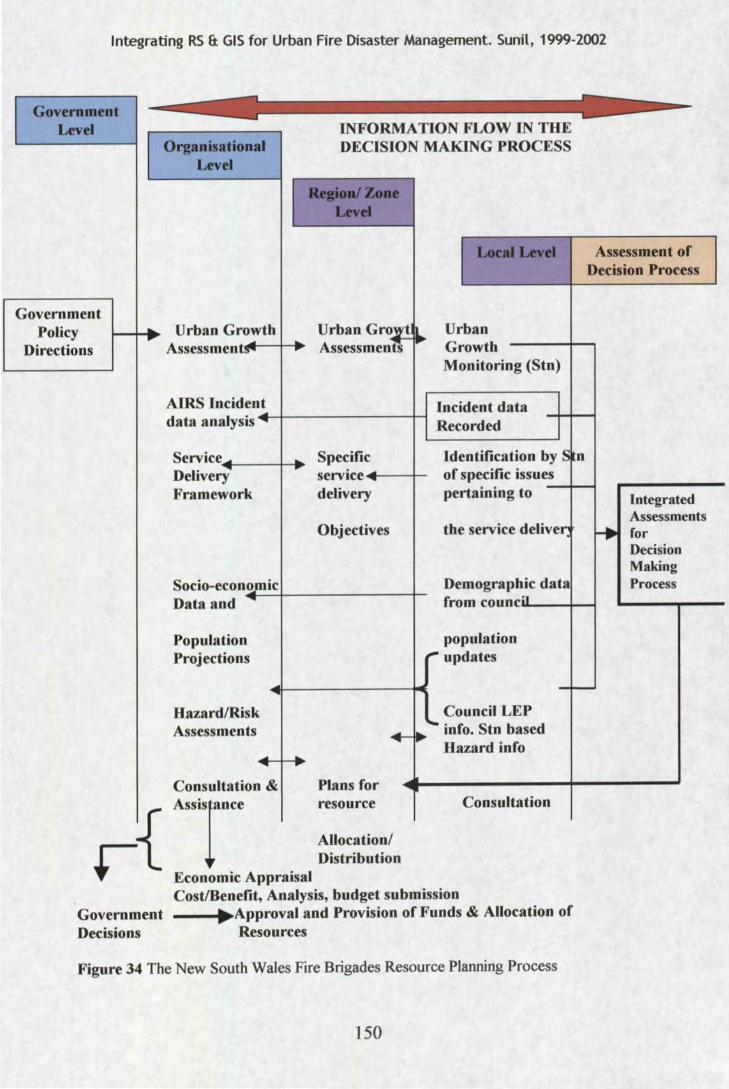
Integrating RS & GIS for Urban Fire Disaster Management. Sunil, 1999-2002
Government Level
Organisational Level
INFORMATION FLOW IN THE DECISION MAKING PROCESS
~;~ .. ·'?~.;.:;.:~~~·.~_ .;, ' Assessment of :~-'Y~ ·?~ ,:_; ·. J.·. Decision Process
Government Policy
Directions 1--~... Urban Growth ,.. Urban GrOJr!~ Urban
Assessmentlr"' .. Assessmen~ Growth Monitoring (Stn)
AIRS Incident data analysis ........ ~----+-------+-!
Incident data Recorded
Service,4....,1----4___.
Delivery • Framework
Specific service «~~....,1---+
delivery
Objectives
Identification by S n of specific issues pertaining to -+---1
the service deliver: ~
Socio-econ.,.~._i_c._ ______ -+-Data and ""
Demographic data from counciuil--+--l
Population Projections
Hazard/Risk Assessments
.....
.....
Consultation &
.. .. Plans for
population ,. updates
Council LEP info. Stn based Hazard info
Consultation
-+--
Assislance resource
~ Allocation/ I L Distribution
• Economic Appraisal Cost/Benefit, Analysis, budget submission
Government • Approval and Provision of Funds & Allocation of Decisions Resources
Figure 34 The New South Wales Fire Brigades Resource Planning Process
150
Integrated Assessments for Decision Making Process
Integrating RS 8: GIS for Urban Fire Disaster Management. Sunil, 1999-2002
5-5 Issues with the existing planning process.
Efficient and balanced distribution of dynamic fire resources is required for managing
disasters, which in turn will depend on risk assessment. Risk assessment has to be
carried out in a uniform and consistent manner at all levels across the state of NSW.
The methodology, whilst laying emphasis on current data is mostly a manual approach
with emphasis on information provided by all fire stations. This information is used at
the organization level where most of the decisions are taken in compliance with the
rules set at the government level. Some of the major drawbacks which result from the
present system may be summarized by these statements.
)- The process of collecting and gathering spatial and temporal data is carried out
by a manual process which may be inconsistent, time consuming and demands
extensive coordination amongst departments and levels.
)- The methodology process does not gather current data which may render the
risk assessment and planning process inadequate
)- The methodology is not an effective method of showing increasing hazard since
it does not show the changes visually. As such it cannot be used at meetings at
the government level, where decisions are often made more with a political
rather than scientific bias.
)- In its present state the methodology may not permit combined analysis by using
available cartographic data, since most of the data is collected manually which
prevents the modeling of hazard and vulnerability, that is an essential
prerequisite to the assessment of hazard.
On of the major drawbacks of the present methodology of planning adopted by the
NSWFB (Bhaskaran, 2001) in the planning process is its incapability to develop a
151
Integrating RS a GIS for Urban Fire Disaster Management. Sunil, 1999-2002
comprehensive spatia-temporal model for hazard and vulnerability assessment which is
required to allocated or redistribute existing resources. A detailed and critical
discussion of the present system of risk assessment in the planning process is given in
the following paragraphs.
5-5.1 Existing system variables and risk assessment
Risk assessment is performed at many service areas in an effort to create informed
understanding of the spatial distribution of the prevalent hazards. However the
methodology may be improved and made more efficient by the use of a semantic
hazard model. For instance, a major part of the spatial data, which contributes to the
overall risk assessment, is collected by the in-situ field survey method, which may take
a considerable amount of time. The level of hazards is always increasing with
increasing urban development and population increase. There is a need for rapid data
collection, so that the data may be integrated in the planning process in near real time.
The concept of hazard includes the assessment of physical as well as human attributes,
which are embodied in the form and shape of built structures, patterns of land-use and
other invisible features such as population and demographic characteristics. These
factors/variables have to be assessed in combination and not in exclusion. The hazard
model provides information on the level of existing hazard as a function of physical
and human variables. This information may be used at the local and regional level to
assess hazards and disasters risks in a consistent and uniform manner.
There must be a consistent standard of assessing disaster risks based on predetermined
spatial criteria; otherwise the planning process will be biased to some regions against
others. The organization takes care of this aspect and ensures that the initiatives taken
152
Integrating RS a: GIS for Urban Fire Disaster Management. Sunil, 1999-2002
at the regional and local level comply with policies ofthe government and standards for
risk assessment. However data still needs to be collected at these levels and there may
be instances where the data is not consistent since the entire process is based on manual
feedback and local knowledge. By using the hazard model, this approach can be made
more efficient, timely and consistent since remote sensing and other data may be
customized to the objective of the study. Risk assessment can be carried out by using a
seamless layer/s of remotely sensed data, and data can be selected and organized
consistently throughout the entire resource process. There are significant advantages in
having a resource allocation model based on consistent spatial data in order to make
appraisals and recommendations.
5-5.2 Urban growth assessments
Urban growth results in an increasing population, new housing and accompanying
community infrastructure all of which have implications to the existing level ofhazard,
most of the time leading to an increase in the degree of hazard. The data on urban
growth is sourced at the organizational level from the government, regional and local
levels. Sourcing information on such developments is based on local knowledge and
input from the local level to the regional level. Once again such input of data can be
efficiently detected and recorded automatically by using spatia-temporal remote
sensing data on an appropriate scale. The hazard model can perform the task of
monitoring the increased number of built features and analyze them collectively with
other variables. For instance, urban development leads to an increase in structural
density, which may be integrated into the model. The model may be run in order to get
a new picture of the revised hazard level (Figure 35). Since remote sensing data is
advancing with respect to sensor resolution characteristics (spatial and spectral
153
Integrating RS 8: GIS for Urban Fire Disaster Management. Sunil, 1999-2002
resolution) their suitability to study and analyze urban environments are ever growing.
It may be useful to use these new sensors and source more data pertaining to hazard.
The hazard model can incorporate new sensor data and integrate it with other spatial
data to assess hazards and risks.
154
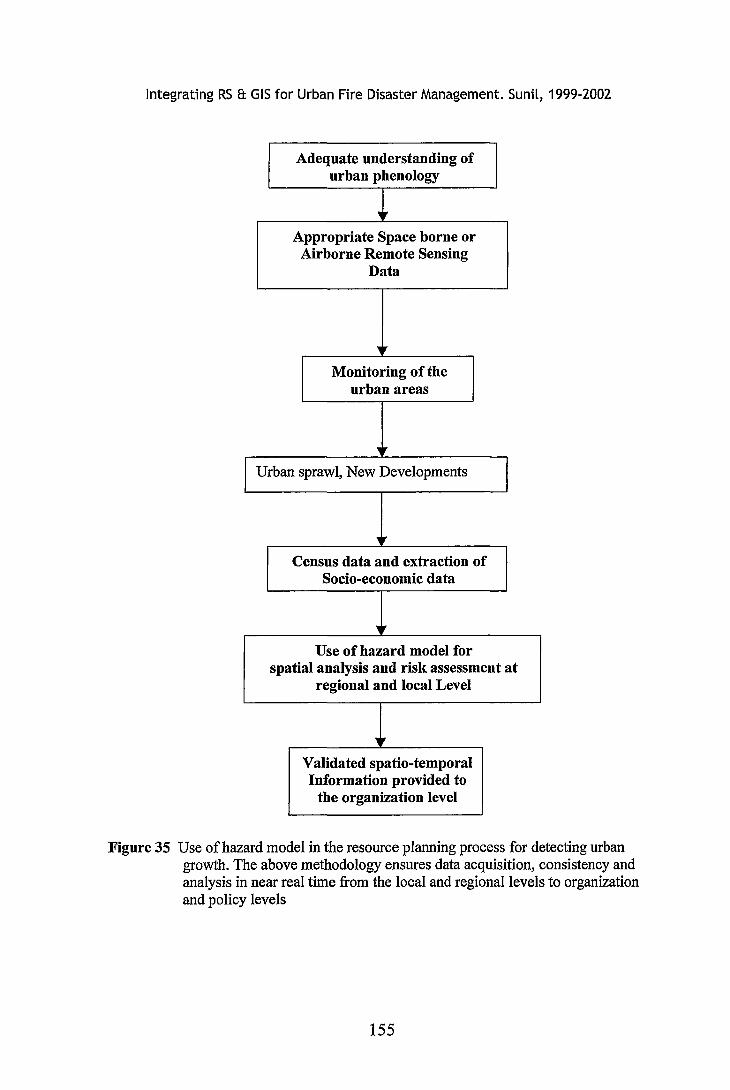
Integrating RS 8: GIS for Urban Fire Disaster Management. Sunil, 1999-2002
Adequate understanding of urban phenology
Appropriate Space borne or Airborne Remote Sensing
Data
.,,.
Monitoring of the urban areas
.,,.
Urban sprawl, New Developments
~
Census data and extraction of Socio-economic data
,, Use of hazard model for
spatial analysis and risk assessment at regional and local Level
,, Validated spatio-temporal Information provided to
the organization level
Figure 35 Use of hazard model in the resource planning process for detecting urban growth. The above methodology ensures data acquisition, consistency and analysis in near real time from the local and regional levels to organization and policy levels
155
Integrating RS a: GIS for Urban Fire Disaster Management. Sunil, 1999-2002
5-5.3 Vulnerability assessment: population and demographic characteristics
Risk assessment will be incomplete if the data on the number and type of people who
may be exposed to a hazard is not calculated and incorporated in the planning process.
Data relating to population density and other demographic characteristics such as
income level, ethnic composition are secured at a local level which is then compiled at
a regional level and provided to the organization to make plans for resource allocation.
Data from the latest census is also generated at the organization level, which may be
integrated into the model for multiple analyses.
5-5.4 Incident data and council LEP information
The incident data is extracted from an extensive database, which comprehensively
records information about all emergency incidents attended since 1987. Such data may
be used with the other spatia-temporal data in order to compile a comprehensive hazard
scenario. The ability of the hazard model to input additional data may be used here to
find out the areas with the highest call rates.
Local Environment Plans are land-use plans produced by almost all councils in
Australia. They show the boundaries of different land-uses, which are found in the
region. Land developments are restricted to those activities within the zones, except for
those activities, which have been there for a long time. The LEPs therefore are a
planning control, which prevent haphazard development and use of land. The land-use
is a critical factor which influences hazard since it shows the distribution of residential,
commercial, industrial and recreational activity in a region. The land-use information is
secured at the local level and one of the available methods of providing such
information is through the Local Environment Plans or LEPs, which are available
156
Integrating RS &. GIS for Urban Fire Disaster Management. Sunil, 1999-2002
throughout Australia with some minor inconsistencies. They may be input to the hazard
model in the form of numerical values. For instance the total area of the respective
land-use can be categorised into 4 major classes. Once this information is intersected
with the spatial unit, the total area of each land-use within each spatial unit can be
determined. In this manner the predominant land-use for each spatial unit can be
depicted visually, which will help in the assessment and distribution of existing hazard.
Once again this database can be input to the hazard model in order to assess hazard
comprehensively.
5-5.5 Multiple scenario analysis
The ability of the model to perform multi-scenario analysis may assist in the existing
planning process. Resource allocation may be done on the basis of existing hazards but
sometimes there is a need to plan for an event and find out the number of features,
which may be affected by a potential disaster. This in tum calls for the management of
multiple data from different sources and with different resolutions, scales, details, and
information. Analysis of such data has to be performed in a computer environment
since it demands complex, comprehensive analysis, rapid results and multiple outputs.
5-6 Summary
Hazard analysis is a data driven process and therefore needs flexibility in addressing
issues such as incorporation of new data, automation of data exchanges in a consistent
manner between different agencies which are involved in the emergency planning and
strategic resource allocation. For instance, urban developments redefme the level of
hazard, which calls for additional fire fighting resources. Such changes can be
represented by variables which best explain them. There is a need to incorporate new
157
Integrating RS B: GIS for Urban Fire Disaster Management. Sunil, 1999-2002
data to model these changes. The methodology developed has the potential to address
several issues, which may be required during emergency planning and operations.
Some of the advantages of using such an approach may lead to benefits, which are
described below:
> Automation of spatio-temporal information
A greater degree of automation can be injected into the existing system of resource
planning by using the hazard model. This may lead to improvements in the planning
mechanism by upgrading the comprehensiveness and complexity of the information
and finally placing a request for additional resources. Hazards are dynamic
phenomenon and therefore by using the hazard model, assessments can be carried out
in a more consistent and timely manner.
> Urban growth monitoring
Changes in the landscape are reflected in new developments, and structures and
infrastructure. The methodology can record and analyze these new structures and their
land-use. Fresh input to the model can be made from updated information which is
extracted from space borne and airborne images. In this manner urban growth can be
recorded and analyzed with the other hazard related variables in near real time. The
model can be used at the local, regional and organizational levels for recording urban
growth.
> Consistency of data collected at all levels and implementability
The organization provides the framework for the methodology of assessing hazards and
decision support, with assistance from the local and regional levels who provide them
with information on various aspects ofhazard, such as population density and changes,
land-use and so on. The implementation of any decision based on this information will
have to be validated at every level if they were manually collected and analyzed, which
158
Integrating RS 8: GIS for Urban Fire Disaster Management. Sunil, 1999-2002
may lead to inconsistency and wrong analysis of data. The use of the hazard model will
avoid data inconsistency by maintaining the methodology since it uses the same type,
format and accurate databases. Sound planning decisions must be based on spatial
information which is based on a continuous and consistent coordinate system. This will
enable the plans to be incorporated with other planning organizations on a regional and
national scale.
)- Visualization and reporting
Visualization of integrated remote sensing and GIS databases can provide additional
information on the topography, aspect and weather conditions of a region. This is
especially important in countries where fire hazard is particularly severe. Simulation of
the real world is important in the planning process.
The FRM can extract variables separately and show the different types of hazards and
vulnerabilities, which may be present in a region from time to time. Mapping these
variables to show the different types of hazards and vulnerability will show the
distribution of existing hazard and vulnerabilities and can lead to important strategic
decisions especially with respect to the allocation of dynamic resources. The
emergency services can use these risk maps to determine the extent and level of
hazard/vulnerability and plan for mobilizing their limited resources. Combining these
maps can give a composite idea about the overall risk in the region. An interpretation of
risk, which is possible by using the FRM model for both Bathurst and Hornsby, is the
main content of the next chapter.
159
Integrating RS 8: GIS for Urban Fire Disaster Management. Sunil, 1999-2002
Chapter 6: Fire Risk Model-- Interpretation of Risk in Bathurst and Hornsby.
6.1 Introduction
Any effective strategy to manage disaster risk must begin with an identification of the
hazards and what is vulnerable to them. This involves information on the nature and
extent of risk that characterizes a particular location, including information on the
nature of particular physical hazards obtained through risk assessments, as well as
information and data on the degree of exposure of a population and its built
environment to such hazards. In this way informed decisions can be made on where to
invest and how to design sustainable projects that will withstand the impacts of
potential users. This research has attempted to develop improved tools and systems for
managing an urban disaster. It has highlighted some of the drawbacks found in the
existing methodology used for assessing hazard in the state of New South Wales. The
research attempts to improve upon the existing methodology by integrating remote
sensing data with available GIS data.
The spatial distribution of risk (combination of physical attributes and human factors)
in urban areas is not uniform. The distribution of dynamic resources will have to be
based on the type and level of risk found in an urban environment. This will lead to
maximisation of the use of dynamic resources and improved management of urban
disasters. The factors which have to be taken into account are many and varied.
Modelling hazard and vulnerability in an urban environment is important to keep the
effects of any disaster to a minimum and to tackle the worst possible accident in an
efficient manner. At the same time, it is important to create information decision
160
Integrating RS 8: GIS for Urban Fire Disaster Management. Sunil, 1999-2002
support systems in near real time so that emergency services are equipped with the
latest information on risk.
The study has demonstrated the potential use of high spatial resolution remote sensing
data with GIS for assessing hazards and vulnerability. This is made possible by using
and analysing a wide range of data that come in different scales, resolutions, and
structures. Modem day space-borne and airborne sensors may be used to extract vital
risk related information. However, their use will depend on a systematic appraisal and
selection of such data sources, which consist of information that is vital for the
successful implementation of this model.
The study has also demonstrated that airborne remote sensing data are important to
assess hazards in urban areas and vital to build an information system. One of the major
outcomes of this study will be to compare and assess the disadvantages and advantages
of airborne and space borne remote sensing data with respect to the study of hazard and
vulnerability. The choice of remotely sensed data has to undergo several considerations
mainly dealing with spatial, temporal and spectral resolutions that will have to be
optimised in order to come up with the best selection of data.
The distribution of dynamic resources must be based on the gross assessment of the
physical as well as the human components that explain hazard in urban areas. The
methodology for developing a semantic model to assess risk comprehensively in near
real time is demonstrated in this research. The Fire Risk Model may be used to ensure
appropriate use of existing dynamic resources.
161
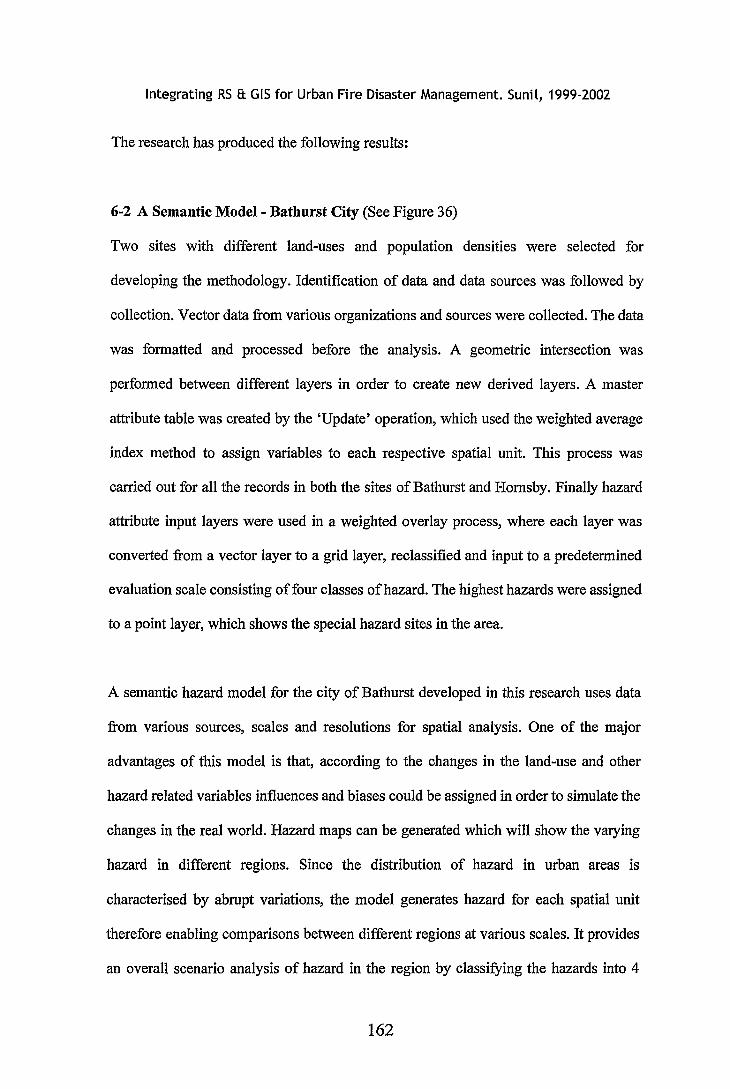
Integrating RS & GIS for Urban Fire Disaster Management. Sunil, 1999-2002
The research has produced the following results:
6-2 A Semantic Model - Bathurst City (See Figure 36)
Two sites with different land-uses and population densities were selected for
developing the methodology. Identification of data and data sources was followed by
collection. Vector data from various organizations and sources were collected. The data
was formatted and processed before the analysis. A geometric intersection was
performed between different layers in order to create new derived layers. A master
attribute table was created by the 'Update' operation, which used the weighted average
index method to assign variables to each respective spatial unit. This process was
carried out for all the records in both the sites ofBathurst and Hornsby. Finally hazard
attribute input layers were used in a weighted overlay process, where each layer was
converted from a vector layer to a grid layer, reclassified and input to a predetermined
evaluation scale consisting of four classes of hazard. The highest hazards were assigned
to a point layer, which shows the special hazard sites in the area.
A semantic hazard model for the city of Bathurst developed in this research uses data
from various sources, scales and resolutions for spatial analysis. One of the major
advantages of this model is that, according to the changes in the land-use and other
hazard related variables influences and biases could be assigned in order to simulate the
changes in the real world. Hazard maps can be generated which will show the varying
hazard in different regions. Since the distribution of hazard in urban areas is
characterised by abrupt variations, the model generates hazard for each spatial unit
therefore enabling comparisons between different regions at various scales. It provides
an overall scenario analysis of hazard in the region by classifYing the hazards into 4
162
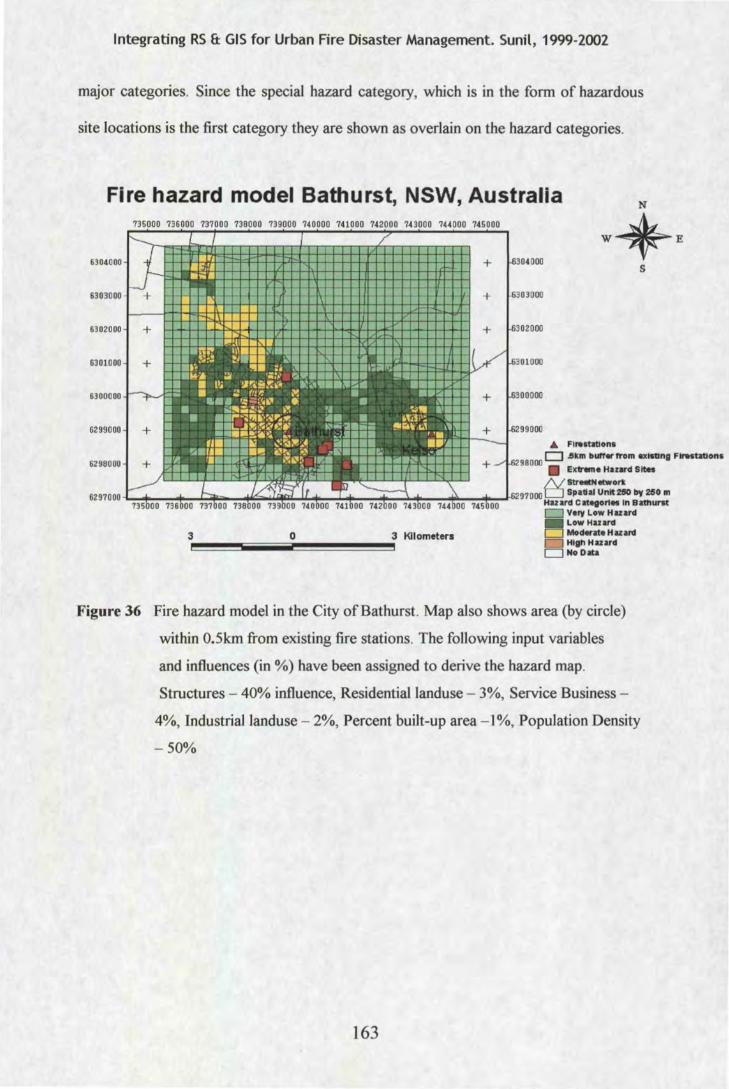
Integrating RS & GIS for Urban Fire Disaster Management. Sunil, 1999-2002
major categories. Since the special hazard category, which is in the form of hazardous
site locations is the first category they are shown as overlain on the hazard categories.
Fire hazard model Bathurst, NSW, Australia
6304000
6303000
6302000
6301000
6300000
6299000
6298000
6297000
73sooo 73&ooo 737000 738ooo 739ooo 7• oooo 741ooo 742000 7Hooo 1••ooo 7•sooo
+
+
s
A Flreatattona
000 CJ .llkm blll'rer from ulatlng Flr'Htatlona
• Eldreme Harvel SltlH
N 111:r.-N-or1t
-i,..~~+~~~~~~~'-+~~~~~~----"'~.....-.t.._.J.b<~ 000 D Bpallal Unlt2110 by 2110 m Hazard CatOfOriM In BathUnt
3 3 Kilometers ~~--~~~~
0
D Vert Low Hazard Low Hazard Moclorate Hazard High Hazard
c:::J NoDIIta
Figure 36 Fire hazard model in the City ofBathurst. Map also shows area (by circle)
within 0.5km from existing fire stations. The following input variables
and influences (in%) have been assigned to derive the hazard map.
Structures - 40% influence, Residentiallanduse - 3%, Service Business -
4%, Industriallanduse - 2%, Percent built-up area - 1%, Population Density
- 50%
163
Integrating RS & GIS for Urban Fire Disaster Management. Sunil, 1999-2002
6-2.1 Distribution of hazard in Bathurst
In the following section a number of examples will be shown and described, for both
Bathurst and Hornsby. The example results given are illustrative and do not encompass
the full range of output results.
The city of Bathurst does not show very high overall hazard. The locations of sites
which are classified as highly hazardous are also very limited and restricted to the
south. However these sites, which consist of some fuel deposits and chemical storages
are located within the proximity of residential areas towards the south of the city. In the
eventuality of a gas leak, these houses may be affected adversely, and the model
recommendation would then be that appropriate resources should be stationed to carry
out rescue operations. The model can develop reports about the number of houses,
which may be located in the vicinity of the hazardous sites (category no.l). The
characteristics of the population with respect to the age of people, their socio-economic
conditions, ethnic background etc can be mapped from the model, which will aid in
emergency preparedness measures.
6-2.2 Implications of hazard model output to the emergency preparation in Bathurst
The area serviced by fire stations is limited in the case of the hazard model prepared by
the NSWFB methodology, whereas the integrated hazard model shows more area
which is not serviced by the fire stations and which may be hazardous to the residents
in Bathurst and Hornsby. This is due to the increase in economic development and
activity and resulting increase in the number of infra-structural facilities.
164
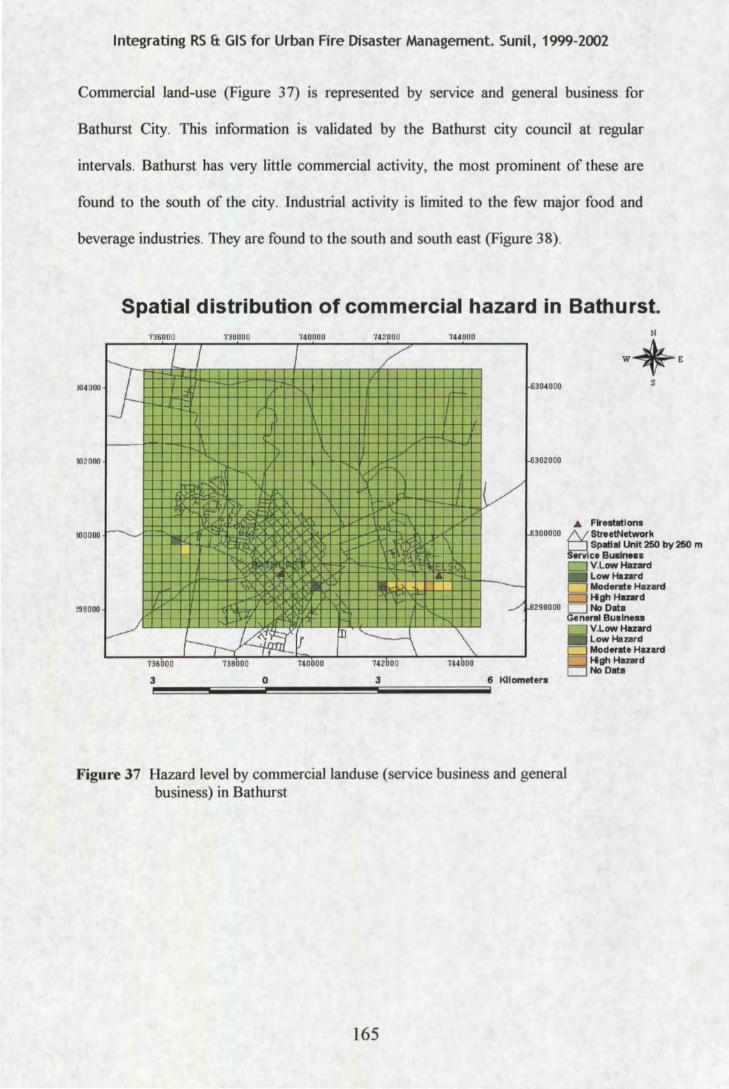
Integrating RS & GIS for Urban Fire Disaster Management. Sunil, 1999-2002
Commercial land-use (Figure 3 7) is represented by service and general business for
Bathurst City. This information is validated by the Bathurst city council at regular
intervals. Bathurst has very little commercial activity, the most prominent of these are
found to the south of the city. Industrial activity is limited to the few major food and
beverage industries. They are found to the south and south east (Figure 38).
10~ 000
102000
100000
!98000
Spatial distribution of commercial hazard in Bathurst. 7360 00 73000 0 740000 7~ 200 0
I I / 1---
lf-
--... .\ ,\
I'C'
_-I ~if ll '-------.\
\ 73600 0 738000 7~0bOO 7~ 2 bO O
74~000
\ 7~~000
~
~
1/ 1-s
---
302000
.& Flrest.tl om 300000 1\/ StreetNetwork
D Spatial Unlt260 by260 m Sfivlce BualrMn
V.Low Hazard Low Hazard
D Moder.te Hazard Hgh Hazard
~I-s 2980 00 No Data eneral Bu1lne1a
V.Low Hazard Low Hazard
c:::J Moderatt Hazard Hgh Hazard No Data
Figure 37 Hazard level by commerciallanduse (service business and general business) in Bathurst
165
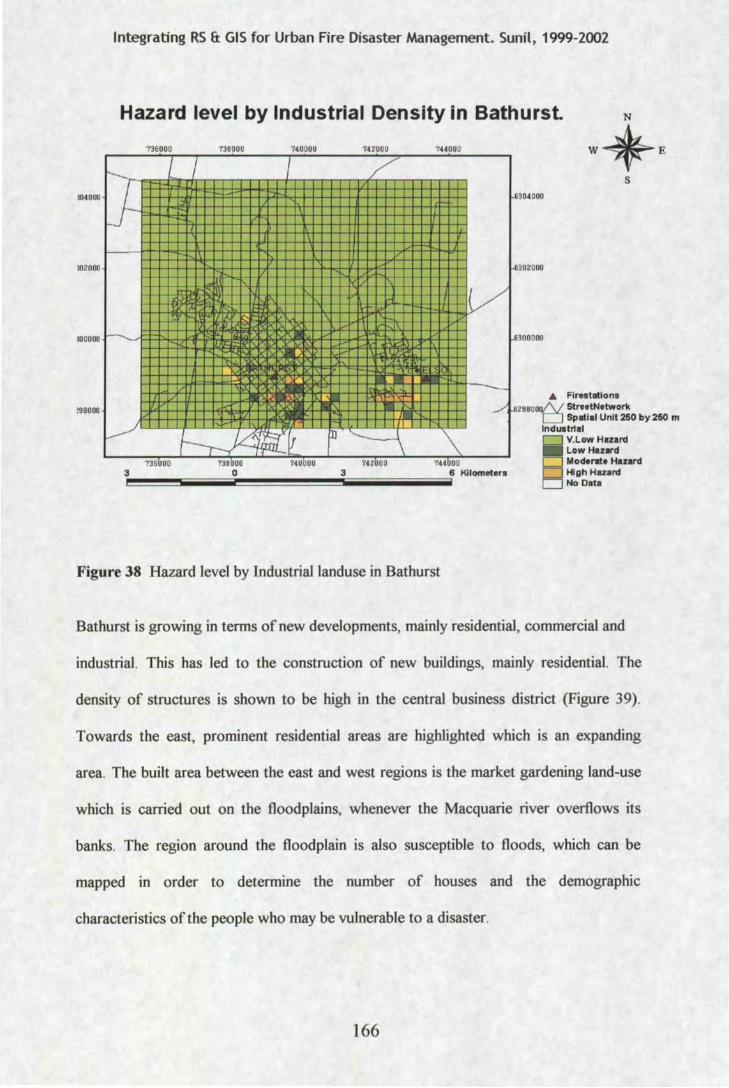
104000
102000
100000
!98000
Integrating RS & GIS for Urban Fire Disaster Management. Sunil, 1999-2002
Hazard level by Industrial Density in Bathurst.
736000 738000 740000 742000
I / r--.
lJ-
--..
v ~ :t>~l! D '--------\ flfll1-736000 738000 740000 742boo
744000
~
~
IV ~
• --___...,.,~
\_ 744000
s 304000
302000
300000
A. Firutatlons 29Boolll\/ StreetNetwork
c:J Spatial Unit 260 by 260 m indu&tr1al D V.Low Hazan:!
Low Hazard D Modtratt Hazard
3~~~§iiiiiiiiiiil0~~~~~~3iiiiiiiiiiiiiiiiiiiiiiiiiiiiii6 Kilometers D High Hann:t <= c:::J No Data
Figure 38 Hazard level by Industriallanduse in Bathurst
Bathurst is growing in terms of new developments, mainly residential, commercial and
industrial . This has led to the construction of new buildings, mainly residential. The
density of structures is shown to be high in the central business district (Figure 39).
Towards the east, prominent residential areas are highlighted which is an expanding
area. The built area between the east and west regions is the market gardening land-use
which is carried out on the floodplains, whenever the Macquarie river overflows its
banks. The region around the floodplain is also susceptible to floods, which can be
mapped in order to determine the number of houses and the demographic
characteristics of the people who may be vulnerable to a disaster.
166
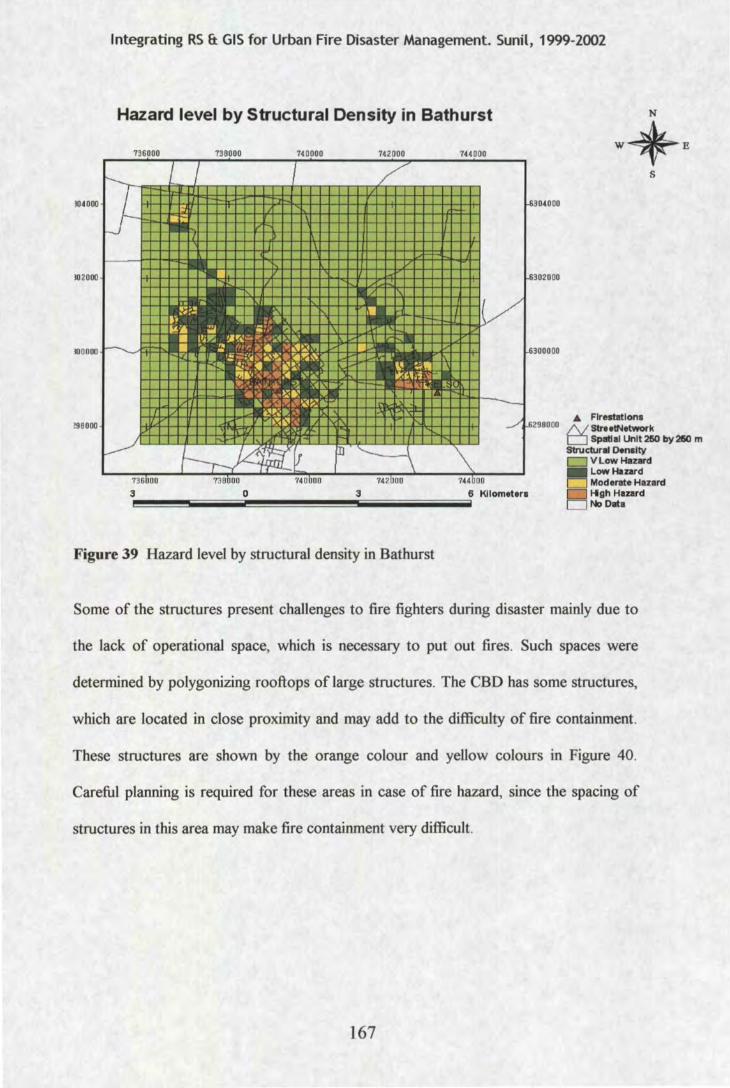
Integrating RS & GIS for Urban Fire Disaster Management. Sunil, 1999-2002
Hazard level by Structural Density in Bathurst
mpoo 73spoo 74opoo 74 2000 744 ~ 00
I I / .....___
1040 00 J 10 2000
:~ _... ~
::( ~ !--.._ qt-- • II - ~~ ~ ......._
10 0000
~ v .../ 'T
!98000
__; .....,.- ., ~v n '- - } ~
736000 738000 74 0000 74 2000 744 000
Figure 39 Hazard level by structural density in Bathurst
-S3 04 000
~302000
~300000
..6298000
s
.a. Flreltatlons /\1 stre etNetwork CJ Spatial Unlt260 by2150 m structural O.nslty c:::J V Low Hazard
Low Hazard D Moderate Hazard 0 Hgh Hazard CJ NoData
Some of the structures present challenges to fire fighters during disaster mainly due to
the lack of operational space, which is necessary to put out fires. Such spaces were
determined by polygonizing rooftops of large structures. The CBD has some structures,
which are located in close proximity and may add to the difficulty of fire containment.
These structures are shown by the orange colour and yellow colours in Figure 40.
Careful planning is required for these areas in case of fire hazard, since the spacing of
structures in this area may make fire containment very difficult.
167
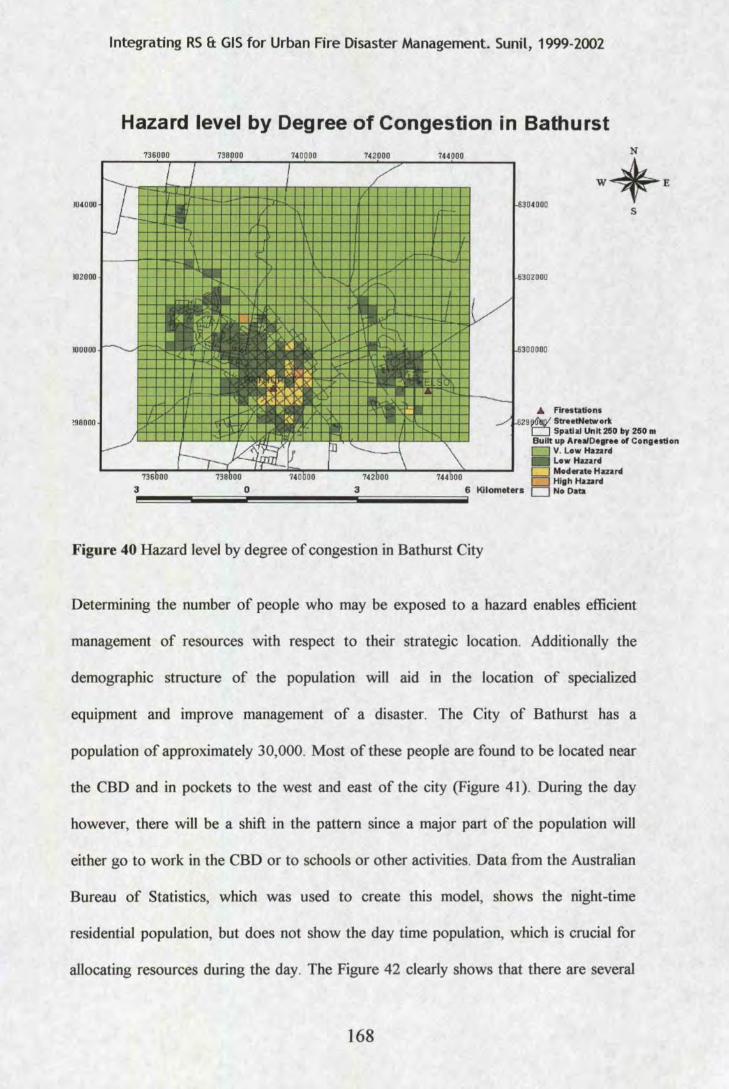
104000
102000
100000
!98000
Integrating RS & GIS for Urban Fire Disaster Management. Sunil, 1999-2002
Hazard level by Degree of Congestion in Bathurst
s
Stroo!N4ttw orlt Sp;otial Unlt2GO by 2GO 111
Built up AroiiiD•••• of Congowon 0 V. Low Hanrd
Low Huard 0 Moderato Huard 0 HllhHazanl
~!!!'!'!!!!!'!!!!'!'!!!!!'!!liiiiiiiiiiiiiiiiiiiiiiiiiiiiiiiiiiiiilo!!!'!'!!!!!'!!!!'!'!!!!!'!!!!'!'!!!!!'!!!!'!'!!!!!'!!!!'!'!!!!!'!!!!'!'!!!!!'!!lli3iiiiiiiiiiiiiiiiiiiiiiiiiiiiiiiiiiiiiiiiiiiiiiiiiiiiiiiiiiiiiiiiiiiiiiiil6 Kilometers 0 No Data
Figure 40 Hazard level by degree of congestion in Bathurst City
Determining the number of people who may be exposed to a hazard enables efficient
management of resources with respect to their strategic location. Additionally the
demographic structure of the population will aid in the location of specialized
equipment and improve management of a disaster. The City of Bathurst has a
population of approximately 30,000. Most of these people are found to be located near
the CBD and in pockets to the west and east of the city (Figure 41 ). During the day
however, there will be a shift in the pattern since a major part of the population will
either go to work in the CBD or to schools or other activities. Data from the Australian
Bureau of Statistics, which was used to create this model, shows the night-time
residential population, but does not show the day time population, which is crucial for
allocating resources during the day. The Figure 42 clearly shows that there are several
168
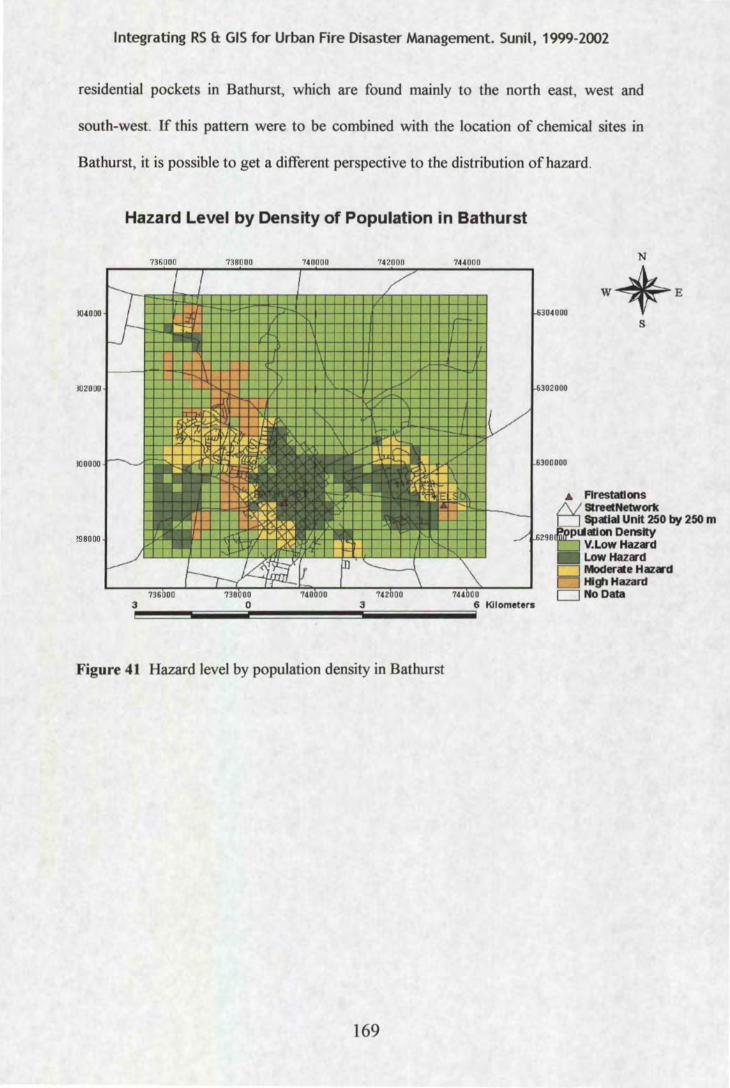
Integrating RS & GIS for Urban Fire Disaster Management. Sunil, 1999-2002
residential pockets in Bathurst, which are found mainly to the north east, west and
south-west. If this pattern were to be combined with the location of chemical sites in
Bathurst, it is possible to get a different perspective to the distribution ofhazard.
Hazard Level by Density of Population in Bathurst
736000 738000 7400 00
l040 00
102000
lOOOOO
!98000
3
Figure 41 Hazard level by population density in Bathurst
169
s
.a. Flrestatlons streetNetwor1( Spatial Unit 250 by 250 m aaon Density V.LowHazwd LowHaz.-d Moderate Hazard .. {11Hazard
c::J NoData
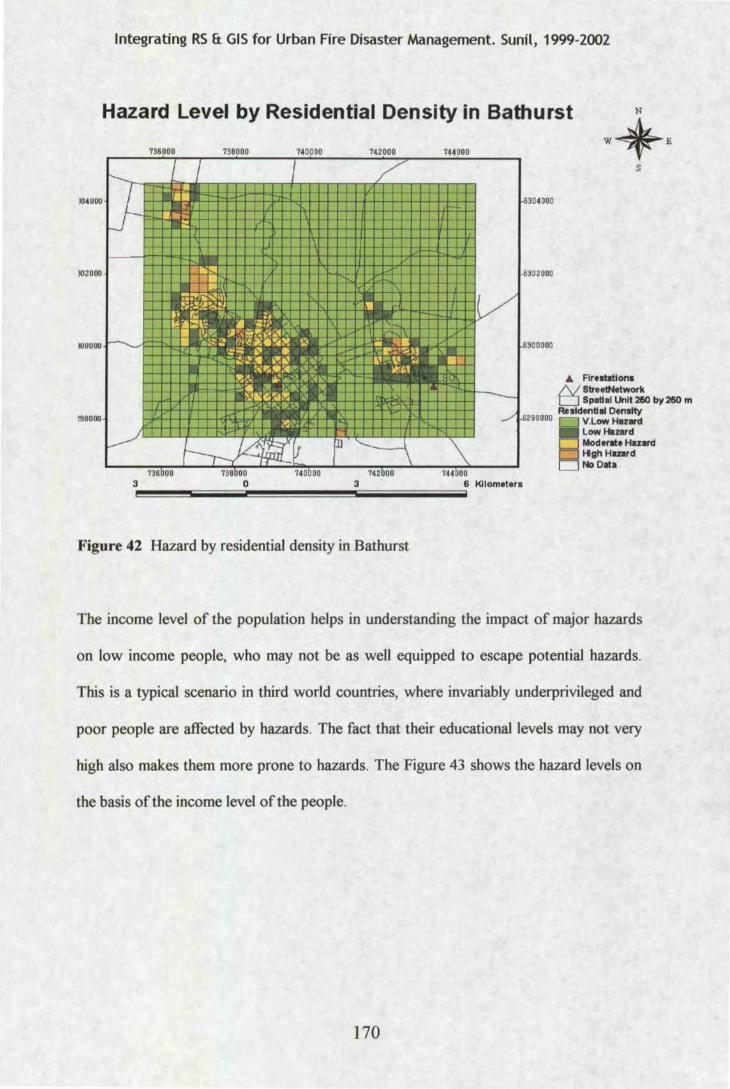
Integrating RS & GIS for Urban Fire Disaster Management. Sunil, 1999-2002
Hazard Level by Residential Density in Bathurst
m QOO 738~00 740900 742000 744 000
I / r---000 U- f-630 4000
l02 000 ~302000
v •• _.,_ _,..,_
000 c.-..... Ji300000 JOO
• -~ • I -• 000· .../ f-62980 00
_____./ ~ 0 '---- \ \
!98
73&boo 738000 7400 00 742000 744 000
3!!!!!!~~!'1iiiiiiiiiiiiiiiiiiiiiiiiiiilo~~~~~~!!i;3iiiiiiiiiiiiiiiiiiiiiiiiiiiiiiiiiiiiiiiiiiiiliiiii6 Kllometera
Figure 42 Hazard by residential density in Bathurst
s
"" Flr .. tatlons 1\/ streetNetwork 0 Spllllsl Unit 260 by260 m Resldentlll Oenllty
V.lowHaz•d low Hazard Moderllte Hazard HghHuard No Ollta
The income level of the population helps in understanding the impact of major hazards
on low income people, who may not be as weU equipped to escape potential hazards.
This is a typical scenario in third world countries, where invariably underprivileged and
poor people are affected by hazards. The fact that their educational levels may not very
high also makes them more prone to hazards. The Figure 43 shows the hazard levels on
the basis of the income level of the people.
170
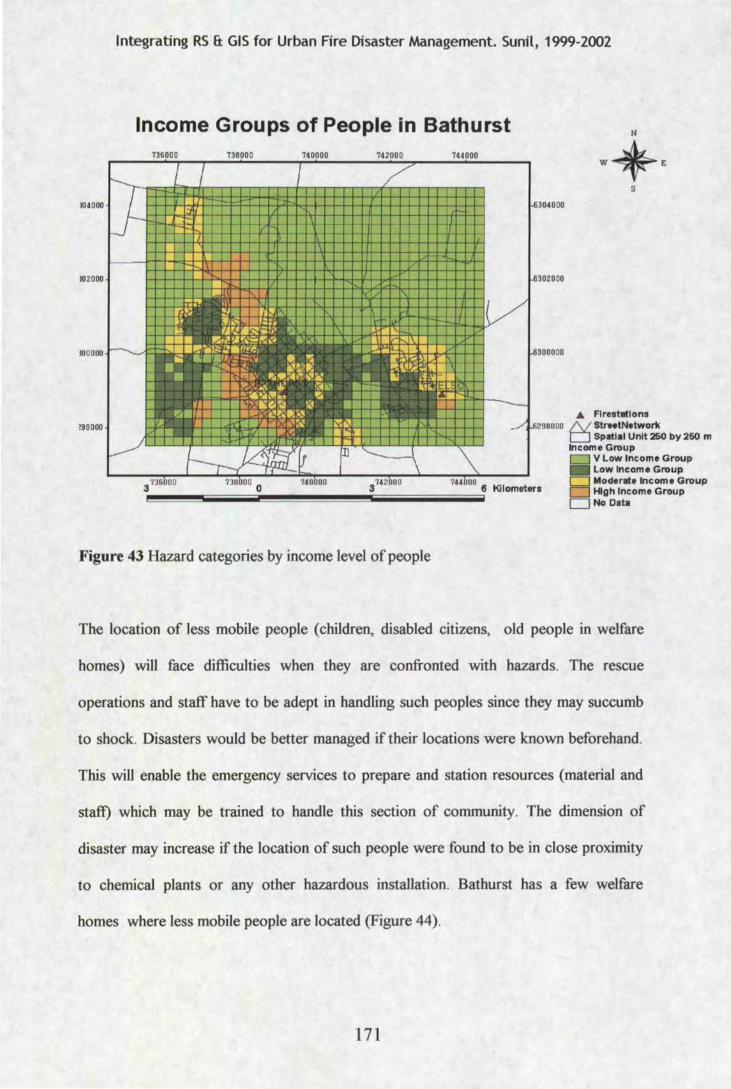
Integrating RS & GIS for Urban Fire Disaster Management. Sunil, 1999-2002
Income Groups of People in Bathurst 00
104000
10 2000
100000
!980 00
Figure 43 Hazard categories by income level of people
s
.& Flrest.tlons /\1 streetNetwori( D Spatial Unit 250 by 260 m Income Group D V low Income Group -low Income Group D Moderate Income Group D High Income Group CJNo Data
The location of less mobile people (children, disabled citizens, old people in welfare
homes) will face difficulties when they are confronted with hazards. The rescue
operations and staff have to be adept in handling such peoples since they may succumb
to shock. Disasters would be better managed if their locations were known beforehand.
This will enable the emergency services to prepare and station resources (material and
staff) which may be trained to handle this section of community. The dimension of
disaster may increase if the location of such people were found to be in close proximity
to chemical plants or any other hazardous installation. Bathurst has a few welfare
homes where less mobile people are located (Figure 44).
171
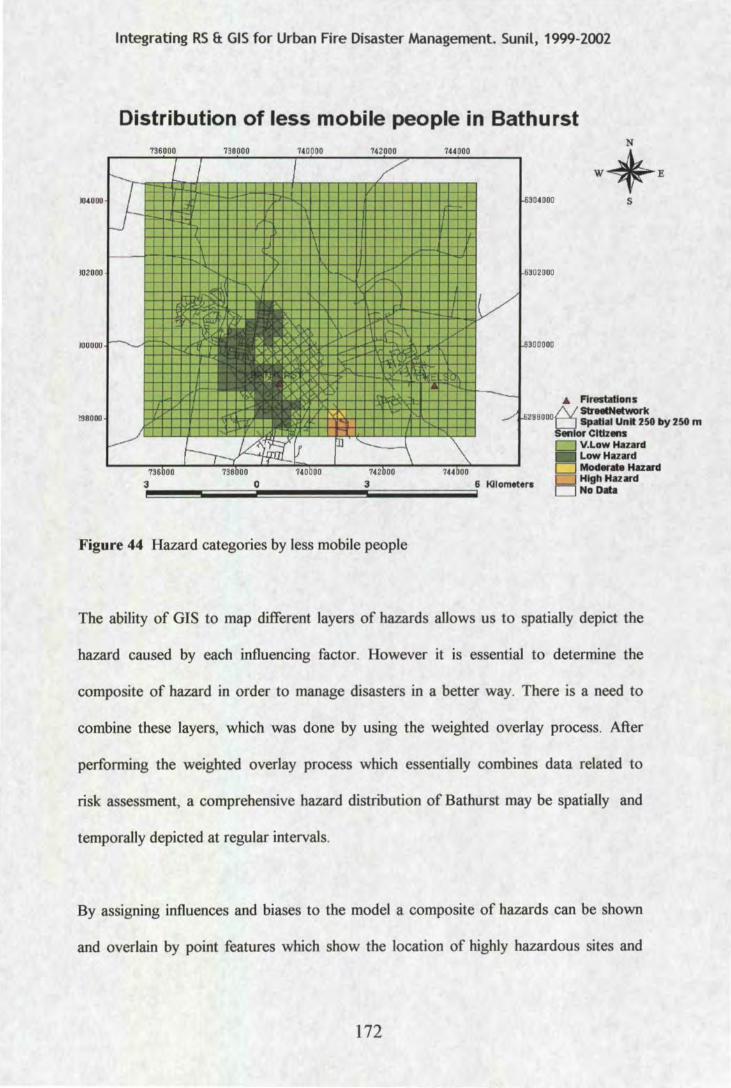
Integrating RS & GIS for Urban Fire Disaster Management. Sunil, 1999-2002
Distribution of less mobile people in Bathurst 736~00 738900 740000 742000
I I / f'-.....
lUOOO lJ l02000
1)1
-----... :X
lOOOOO
!98000 (\j
v lA
~ ~ n '-----\
736boo 738bOO 740boo 742boo
Figure 44 Hazard categories by less mobile people
744000
!V
---'\
744boo
N
i-&304000 W*E
s
i-&302000
1-&300000
.6 F I """""' • AI
lrestatlons strMINetwork Spalla! UnR 250 by 250 m
Citizens - ~0~ D V.Low Hazard
L ow Hazard D Moder.ta Hazard D High Hazard O NoDIIa
The ability of GIS to map different layers of hazards allows us to spatially depict the
hazard caused by each influencing factor. However it is essential to determine the
composite of hazard in order to manage disasters in a better way. There is a need to
combine these layers, which was done by using the weighted overlay process. After
performing the weighted overlay process which essentially combines data related to
risk assessment, a comprehensive hazard distribution of Bathurst may be spatially and
temporally depicted at regular intervals.
By assigning influences and biases to the model a composite of hazards can be shown
and overlain by point features which show the location of highly hazardous sites and
172
Integrating RS & GIS for Urban Fire Disaster Management. Sunil, 1999-2002
other chemical sites. In this way the model can give a clear picture of the existing
hazards in the city of Bathurst and any other city. By combining various hazards related
variables from remote sensing data as well as cartographic (GIS) data (Figure 45). The
hazard map of Bathurst can be used to perform proximity analysis where the number
and type of people who may be exposed to a hazardous event may be estimated. Based
on this data, disasters maybe managed better and efficiently. In the map given in Figure
45 below the residences within 500 metres of category 1 or special hazard sites are
shown. A report may be generated to determine the vulnerable population, and the
equipment required for managing disasters may be planned in the future. For instance,
by working out the proximity of the people living near a chemical factory, rescue
operations can be planned for in the event of a fire, gas leak or explosion.
173
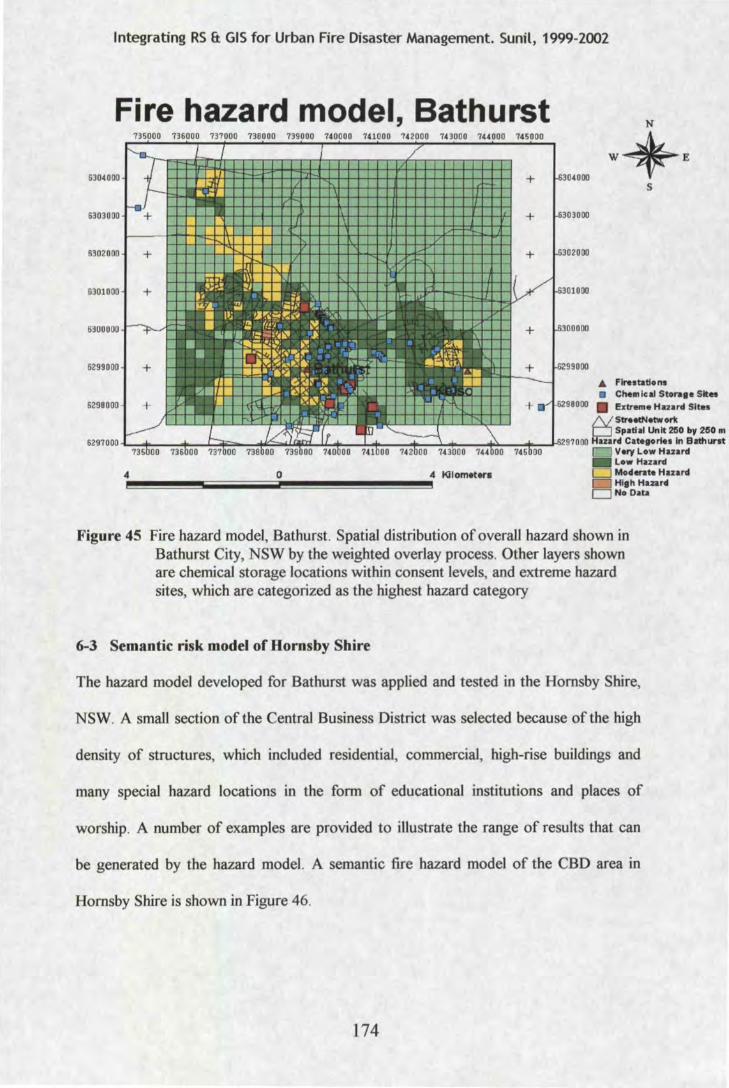
Integrating RS & GIS for Urban Fire Disaster Management. Sunil, 1999-2002
Fire hazard model, Bathurst
6304000 s
6303000
6302000 +
6301000 +
6300000
6299000 + .6. Flrestatlons
6298000 + • CIM111Ical St0f'11ga Sit ..
000 • !Extrema H112ard Situ
StreecNatwork Spatl al UnIt 2!50 by 2110 m
-1-....P..--"'-"""'-op;::=-.......,:;;;;:..l.l.lolji~.U...+---L......_-......,_..J....t---~--+-~-~>~~ ooo rd Catagorlaaln Bathurst Vary Low Huard
6297 000
4 0 - Low H112an:t D Moderate H112ard
Hllh Hazard CJ NoOata
Figure 45 Fire hazard model, Bathurst. Spatial distribution of overall hazard shown in Bathurst City, NSW by the weighted overlay process. Other layers shown are chemical storage locations within consent levels, and extreme hazard sites, which are categorized as the highest hazard category
6-3 Semantic risk model of Hornsby Shire
The hazard model developed for Bathurst was applied and tested in the Hornsby Shire,
NSW. A small section of the Central Business District was selected because of the high
density of structures, which included residential, commercial, high-rise buildings and
many special hazard locations in the form of educational institutions and places of
worship. A number of examples are provided to illustrate the range of results that can
be generated by the hazard model. A semantic fire hazard model of the CBD area in
Hornsby Shire is shown in Figure 46.
174
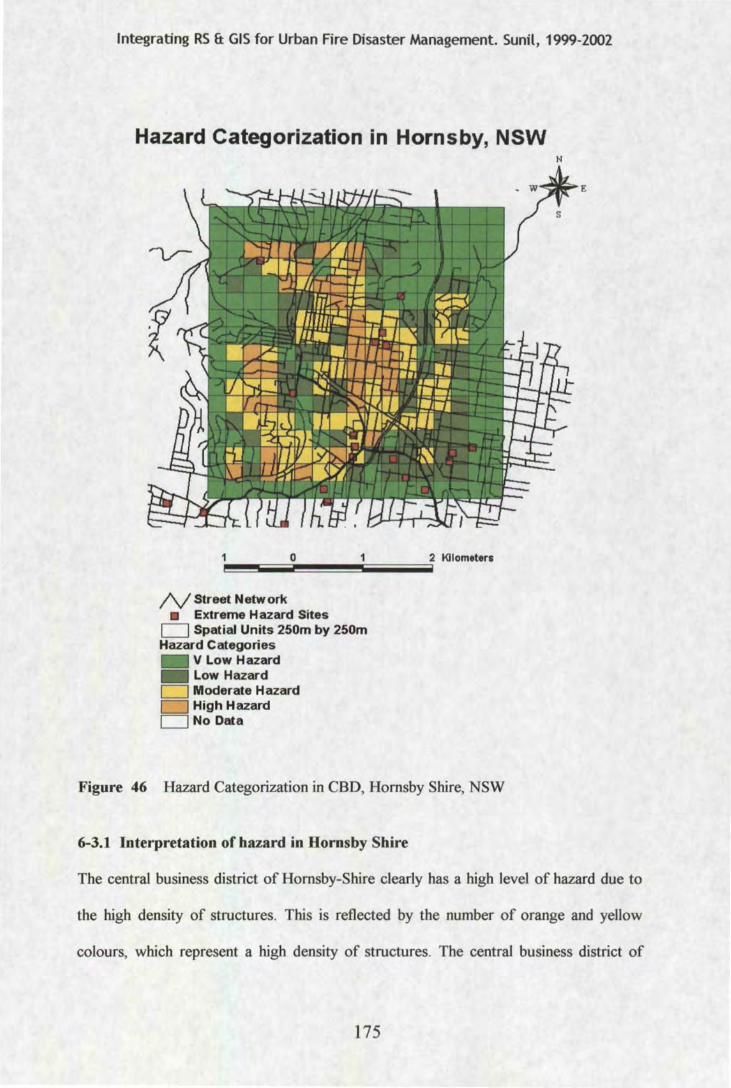
Integrating RS & GIS for Urban Fire Disaster Management. Sunil, 1999-2002
Hazard Categorization in Hornsby, NSW
1\1 Street Network • Extreme Hazard Sites
D Spatial Units 250m by 250m Hazard Categories
V Low Hazard Low Hazard Moderate Hazard High Hazard No Dma
Figure 46 Hazard Categorization in CBD, Hornsby Shire, NSW
6-3.1 Interpretation of hazard in Hornsby Shire
N
The central business district of Hornsby-Shire clearly has a high level of hazard due to
the high density of structures. This is reflected by the number of orange and yellow
colours, which represent a high density of structures. The central business district of
175
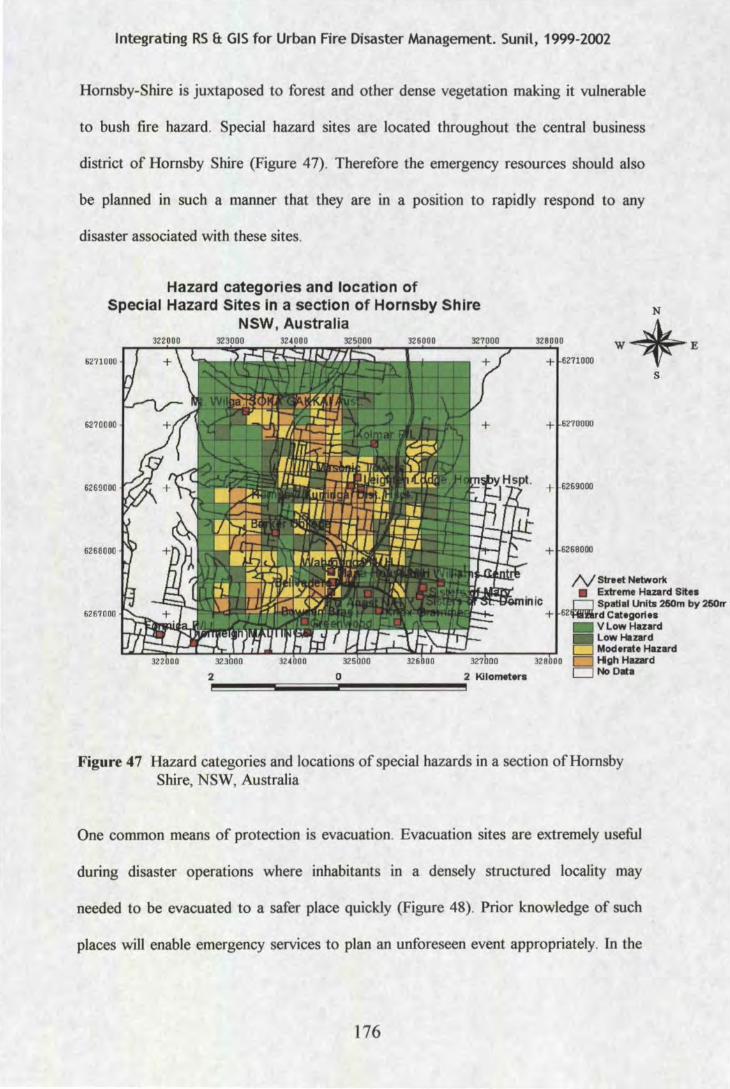
Integrating RS & GIS for Urban Fire Disaster Management. Sunil, 1999-2002
Hornsby-Shire is juxtaposed to forest and other dense vegetation making it vulnerable
to bush fire hazard. Special hazard sites are located throughout the central business
district of Hornsby Shire (Figure 4 7). Therefore the emergency resources should also
be planned in such a manner that they are in a position to rapidly respond to any
disaster associated with these sites.
Hazard categories and location of Special Hazard Sites in a section of Hornsby Shire
NSW, Australia
6271000
6270000
6269000
6268000
s
N Street Networit
6267000
• Extreme Hazard Sltea Spatial Units 260m by 260rr
Loz n.:w ....... Categories Vlow Hazard Low Hazard Moderate Hazard Hgh Hazard No Dllta
Figure 47 Hazard categories and locations of special hazards in a section of Hornsby Shire, NSW, Australia
One common means of protection is evacuation. Evacuation sites are extremely useful
during disaster operations where inhabitants in a densely structured locality may
needed to be evacuated to a safer place quickly (Figure 48). Prior knowledge of such
places will enable emergency services to plan an unforeseen event appropriately. In the
176
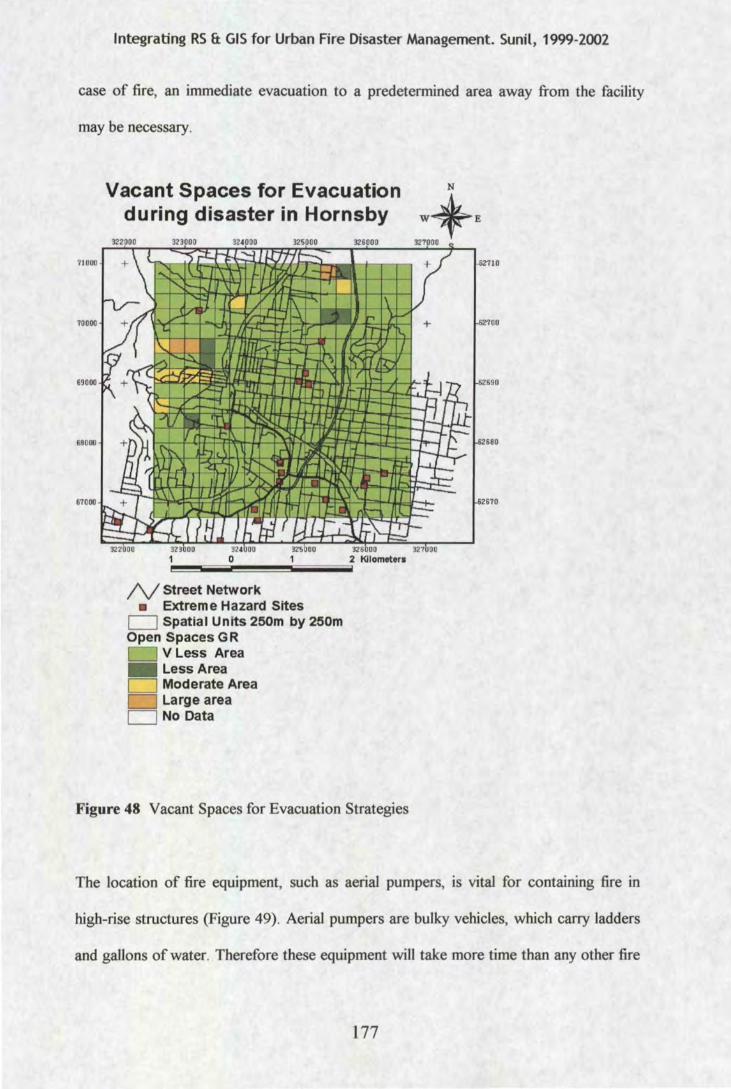
Integrating RS & GIS for Urban Fire Disaster Management. Sunil, 1999-2002
case of fire, an immediate evacuation to a predetermined area away from the facility
may be necessary.
69000
68000
67000
Vacant Spaces for Evacuation during disaster in Hornsby
1\1 Street Network • Extreme Hazard Sites
D Spatial Units 250m by 250m Open Spaces G R
V Less Area Less Area Moderate Area Large area No Data
Figure 48 Vacant Spaces for Evacuation Strategies
The location of fire equipment, such as aerial pumpers, is vital for containing fire in
high-rise structures (Figure 49). Aerial pumpers are bulky vehicles, which carry ladders
and gallons of water. Therefore these equipment will take more time than any other fire
177
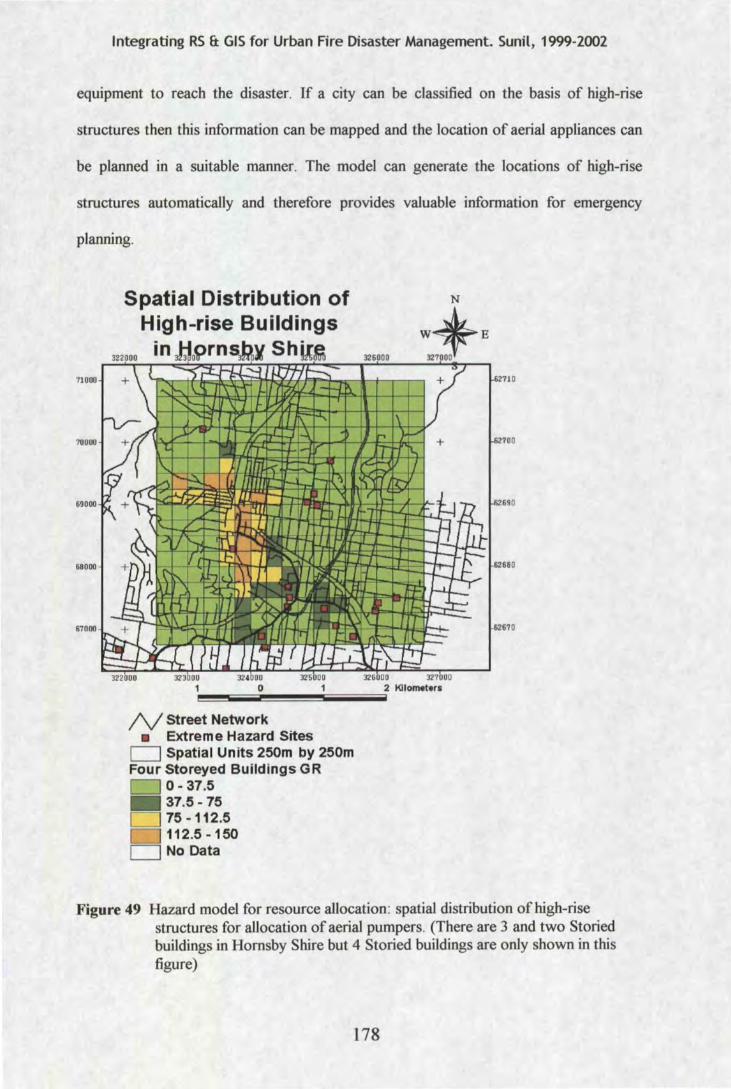
Integrating RS & GIS for Urban Fire Disaster Management. Sunil, 1999-2002
equipment to reach the disaster. If a city can be classified on the basis of high-rise
structures then this information can be mapped and the location of aerial appliances can
be planned in a suitable manner. The model can generate the locations of high-rise
structures automatically and therefore provides valuable information for emergency
planning.
71000
70000
69000
69000
67000
Spatial Distribution of High-rise Buildings
Sh
0 2 t<llometers
~!liiiiiiiiiiiii~~~iiiiiiiiiiiiiiiiiiiiiiiii
1\1 Street Network • Extreme Hazard Sites
D Spatial Units 250m by 250m Four Storeyed Buildings GR
0-37.5 - 37.5-75 D 75-112.5
112.5 -150 D No Data
Figure 49 Hazard model for resource allocation: spatial distribution of high-rise structures for allocation of aerial pumpers. (There are 3 and two Storied buildings in Hornsby Shire but 4 Storied buildings are only shown in this figure)
178
Integrating RS & GIS for Urban Fire Disaster Management. Sunil, 1999-2002
6-4 Summary
Selective attributes may be visualized together for planning purposes, for instance the
location of special hazards in relation to the distribution of population may give an idea
of the number of people who may be exposed to a gas leak or explosion. In another
example, the location of high-rise buildings and distribution of less mobile people may
assist in the location of skilled staff that is adept in handling these people. If the
allocation of resources is based on accurate spatio-temporal data then the resource
mobilization will be maximized and disaster mitigation can be achieved. In urban areas
hazards are defined by a combination of built features in their natural settings and the
number of people who may be exposed to hazard.
One of the major results of the study was to develop a methodology and finally a
model, which could assess multiple variables, all of which influence risk in a certain
place. The model has also many advantages, which can be clearly understood by
attempting a comparison of the existing model over the existing the methodology
employed by the NSWFB. A comparison of the existing methodology and the specific
advantages of the model are described in detail in the following next chapter.
179
Integrating RS 8: GIS for Urban Fire Disaster Management. Sunil, 1999-2002
Chapter 7: Results --Advantages of the proposed FRM and comparison with the Existing Methodology followed by NSWFB.
7-1 Introduction
Hazards are multi-faceted and multi-dimensional phenomena that are complex and
difficult to understand. The structural, property and other types of fires that occur in
regions that are densely populated result in human casualties and destruction of
property worth millions of dollars. It is not possible to put a stop to this hazard but it is
possible to mitigate the effects of such potential disasters by combining the various
current sources of technology, such as GIS/RS.
Patterns of hazard and disaster are likely to vary widely among cities. Although some
trends appear to be widespread (e.g., reappearance of 'extinct' hazards; marked spatial
shifts in the locus of hazards; social polarization and spatial segregation of hazard-
susceptible populations), future hazard profiles of megacities are likely to resemble a
mosiac composed of complex blends of risk, exposure, vulnerability and response. In
addition, for hazards management to be effective it can no longer remain a separate
aspect of urban management it must become a component of integrated programs that
are designed to address broader goals ofurban sustainability (Mitchell, 1999).
Monitoring spatia-temporal changes assumes crucial importance if efforts to mitigate
fire hazards are to be consistently undertaken. Vulnerability assessments have to be
carried out by strategic planning for people living in high-risk areas. Both these issues
can be addressed by using new resolution satellite data such as IKONOS, which have a
180
Integrating RS 8: GIS for Urban Fire Disaster Management. Sunil, 1999-2002
high resolution of0.81 by 0.81 m and Quick Bird 0.60 by 0.60 m, comparable to aerial
photography. Urban development has to be closely monitored at regular intervals in
order to capture the most recent additions to the spatial environment, be it people or
structures. The intensity of a potential disaster, which can occur in a certain place, is
attributed to the constant spatia-temporal build-up, which increases risk. Once the
current developments are recorded, then necessary planning can be carried out to
provide equitable service levels to all the citizens. This is a very important issue in
developing countries where there is a limited resource for addressing disasters that may
involve thousands ofhuman casualties.
There are many available databases in Australia, which can be used in a consistent
manner to generate derived knowledge based information that can assist in disaster
mitigation. However they cannot be directly used in the way they are released. The
census database explains night-time residential population for collectors district but
they do not exactly indicate the location of dwellings. Calibrating such data-base to the
residential dwellings can be a useful exercise to reduce the randomness, especially from
the point of view of hazard related studies where accurate location of people and
dwelling is important. To explain the vulnerability a thorough understanding of the
dynamics of population is important. It is also important to model the various processes
prior to the unfolding of a hazard. It is essential therefore to breakdown the links and
spatial intricacies that hazards are made up of, in order to plan for emergency services
and resource allocation. This has shown to be possible by the various examples given in
the results chapter.
181
Integrating RS 8: GIS for Urban Fire Disaster Management. Sunil, 1999-2002
~ Potential of the model to be applied in different regions
Even though the study has used local variables to assess and model hazard in an urban
environment most of these data are available or can be extracted from remote sensing
and available sources in the form of cartographic data. Whilst in developing nations
such data bases may not be available at all, developing countries may have such data
readily available. In developing countries the emphasis must be placed on using high
spatial and airborne remote sensing data for systematically extracting data about
landcover and by using the census information to begin modeling hazards and
managing resources efficiently. Intensive use of space borne and airborne data can
counter the lack of data in such nations. Once the data has been obtained it can be
managed in a GIS environment and modeled by using the approach developed in this
study.
~ A multi-sensor approach
A multi-sensor approach to model hazards inn urban areas will be very useful since an
urban area is dominated by numerous features, which are found in different sizes,
shapes and patterns. The use of remote sensing data can be used for estimating this
variety of features and patterns. Multiple remote sensing data in different spatial and
spectral resolutions may be used to determine land-use, individual features and for
differentiating different urban materials (as is shown in another study of an urban
environment in Appendix I, which uses hyperspectral data)
~ Data limitations
The study of hazard in an urban environment demands the collection of a variety of
data and must be followed by their systematic appraisal before being used in
emergency operations. This study has not taken all data which is required to
comprehensively assess and model hazards, but has attempted to demonstrate that it is
182
Integrating RS 8: GIS for Urban Fire Disaster Management. Sunil, 1999-2002
possible to incorporate a multitude of data which may come in different scales and
resolutions and from different sources over a period of time. The increasing use of
remote sensing data and the fact that remote sensing data is constantly improving in
terms of its resolution and spectral qualities augurs well for the study of urban hazards.
On the one hand remote sensing of the environment will assist in monitoring the
changes on the land surface and on the other in rapid data acquisition.
~ Extraction of socio-economic characteristics from remote sensing data
The density of population and the characteristics of the people who may be exposed to
a hazard are of considerable importance in resource planning. However, the sources of
data are limited to the Census. This means that the population during the day-time is
not accounted for which may cause serious shortcomings in resource planning. In
Australia a major drawback is that the census data is collected by collector districts
level, which is the lowest level for which data is collected. It is random by nature in the
sense that the data for a collector's district is highly generalized since it does not tag the
data to a respective structure or dwelling unit. So the population for a given collectors
district may be 6000 for the entire district, but in reality the number of dwelling units
may only occupy a certain percentage of the collector district. In this study an attempt
was made to mask the collectors district and population data by overlaying the census
district with aerial photographs and the number of structures. This resulted in a more
accurate means of depicting hazard indicators like structures and their population. It is
interesting to note that the Australian Bureau of Statistics have already embarked on a
regional study to incorporate aerial photos and to link demographic data.
The long period of time between census data collection also does not assist in
emergency planning, since the population undergoes rapid changes in numbers and
183
Integrating RS ft GIS for Urban Fire Disaster Management. Sunil, 1999-2002
demographic structure. Remote sensing data may be used for estimating population
density but these studies underlined the limitations and the manual process involved in
using remote senor data. This is attributed to the fact that remote sensing data is useful
for estimating the physical attributes of the earth and any indirect assessment will need
to make use of ancillary data.
)> Generalization of data in the hazard model
The operations and processes involved in developing the model have generalized the
spatial data to some extent. For example when the geometric intersection is performed
between the spatial unit layer and the landuse layer both of which are polygon map
features, there is some subjectivity. The landuse which has the highest landuse in terms
of the area is retained and updated to the master attribute table. The other landuses are
left out. However this has allowed data from a wide range of sources to be incorporated
into the model.
7-2 Model Capabilities
The model developed in the current research has capabilities, which are briefly
summarized below
)> Proximity analysis (See Figure 32)
The model can perform proximity analysis which is an important tool for emergency
planning. For instance a chemical factory which may be located in the vicinity of a
residential or commercial area. The proximity analysis will lead to an estimation of the
area which may be affected in the event of a gas leak, the number of residences which
may be affected, the type of population who reside within that vicinity. This
information is vital for emergency departments who have to plan and locate their
limited resources strategically (Bhaskaran, 2001).
184
Integrating RS 8: GIS for Urban Fire Disaster Management. Sunil, 1999-2002
~ Forecasting (See Figure 33)
Whilst updating takes us from past to present, forecasting is directed at examining how
changes may take place in the future. Projected population Figures can be input to the
model to arrive at the potential number of people who may be affected in the event of a
disaster. The non-availability of such information can jeopardize appropriate planning
and affect emergency operations. Planning and locating new activities and sites which
may be involved in harmful elements (chemical factories, petroleum based industries)
demands comprehensive knowledge about the existing areas. In other words an idea
about the land-use, the population type, demographic features, infrastructures and
structures is essential for planning and locating new installations. This also means
taking into account future residential, industrial and commercial plans and projections
before the location of any activity, which involves harmful elements. The model will be
able to forecast the trend and effects a future plan or investment might have on the
existing hazard and therefore will provide a basis for allocating fresh resources or
redistribute dynamic resources, or advising against the location of such installations.
~ Basis for allocation of resources
Equitable fire services can be provided to all citizens, if the allocation of limited
dynamic resources to fire districts (geographical boundaries) is done according to a
comprehensive hazard and vulnerability assessment model. Spatial distribution of key
hazard indicators of population, structural density and sensitive sites has to be
considered before allocating such resources. The model, which is a composite of
important variables that influence hazard and vulnerability, can be used as a guide for
allocating dynamic resources efficiently. If the fire districts (Figure 50) are categorised
by using the model (Figure 51) developed in the current research, it may assist in
reassessment and distribution of the existing dynamic resources in a more optimal way.
185
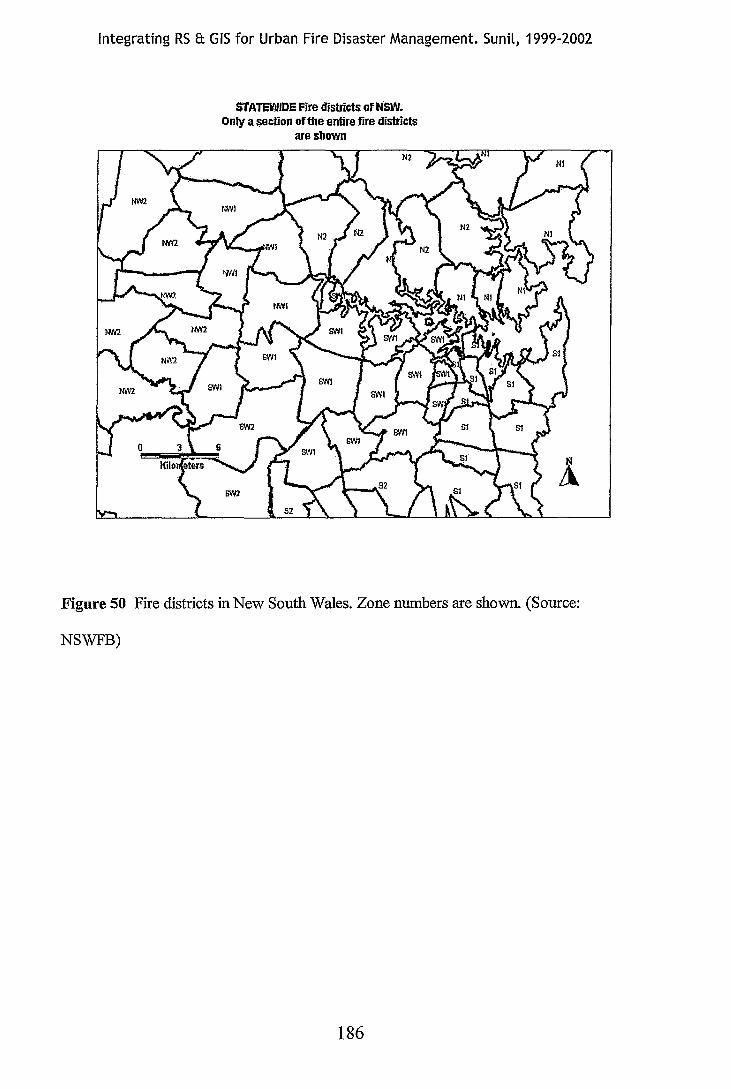
Integrating RS 8: GIS for Urban Fire Disaster Management. Sunil, 1999-2002
STATEWIDE Fire districts of NSW. Only a ~ection of the entire fire districts
are sbown
Figure 50 Fire districts in New South Wales. Zone numbers are shown. (Source:
NSWFB)
186
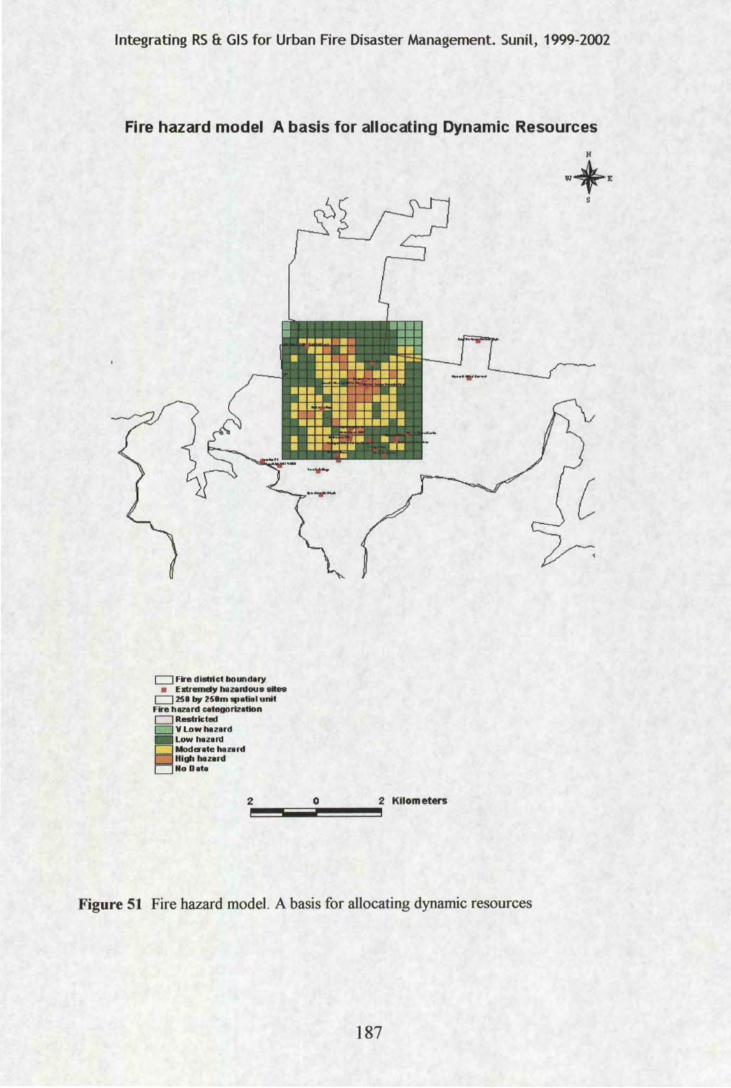
Integrating RS & GIS for Urban Fire Disaster Management. Sunil, 1999-2002
Fire hazard model A basis for allocating Dynamic Resources
0 Fire dl.crtct boundery a ElltnlnWlt)f hllz:tudoue .. _
0 251 by' 2Sim ••tiel unit Fire hazard categortzetlon CJ R...trlcted CJ V Low hllzerd
L- hnerd Modonte hllzerd High hezerd llo Oete
2 o 2 Kllom eters
~--~~
Figure 51 Fire hazard model. A basis for allocating dynamic resources
187
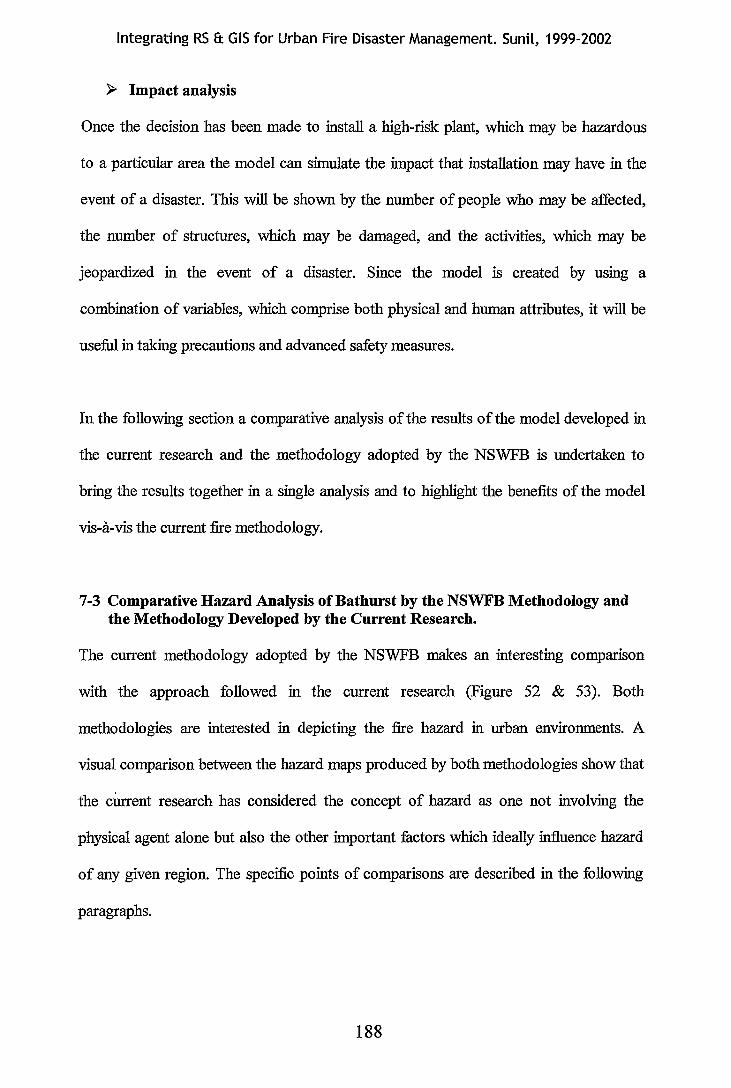
Integrating RS & GIS for Urban Fire Disaster Management. Sunil, 1999-2002
)> Impact analysis
Once the decision has been made to install a high-risk plant, which may be hazardous
to a particular area the model can simulate the impact that installation may have in the
event of a disaster. This will be shown by the number of people who may be affected,
the number of structures, which may be damaged, and the activities, which may be
jeopardized in the event of a disaster. Since the model is created by using a
combination of variables, which comprise both physical and human attributes, it will be
useful in taking precautions and advanced safety measures.
In the following section a comparative analysis of the results of the model developed in
the current research and the methodology adopted by the NSWFB is undertaken to
bring the results together in a single analysis and to highlight the benefits of the model
vis-a-vis the current fire methodology.
7-3 Comparative Hazard Analysis of Bathurst by the NSWFB Methodology and the Methodology Developed by the Current Research.
The current methodology adopted by the NSWFB makes an interesting comparison
with the approach followed in the current research (Figure 52 & 53). Both
methodologies are interested in depicting the fire hazard in urban environments. A
visual comparison between the hazard maps produced by both methodologies show that
the cl.rrrent research has considered the concept of hazard as one not involving the
physical agent alone but also the other important factors which ideally influence hazard
of any given region. The specific points of comparisons are described in the following
paragraphs.
188
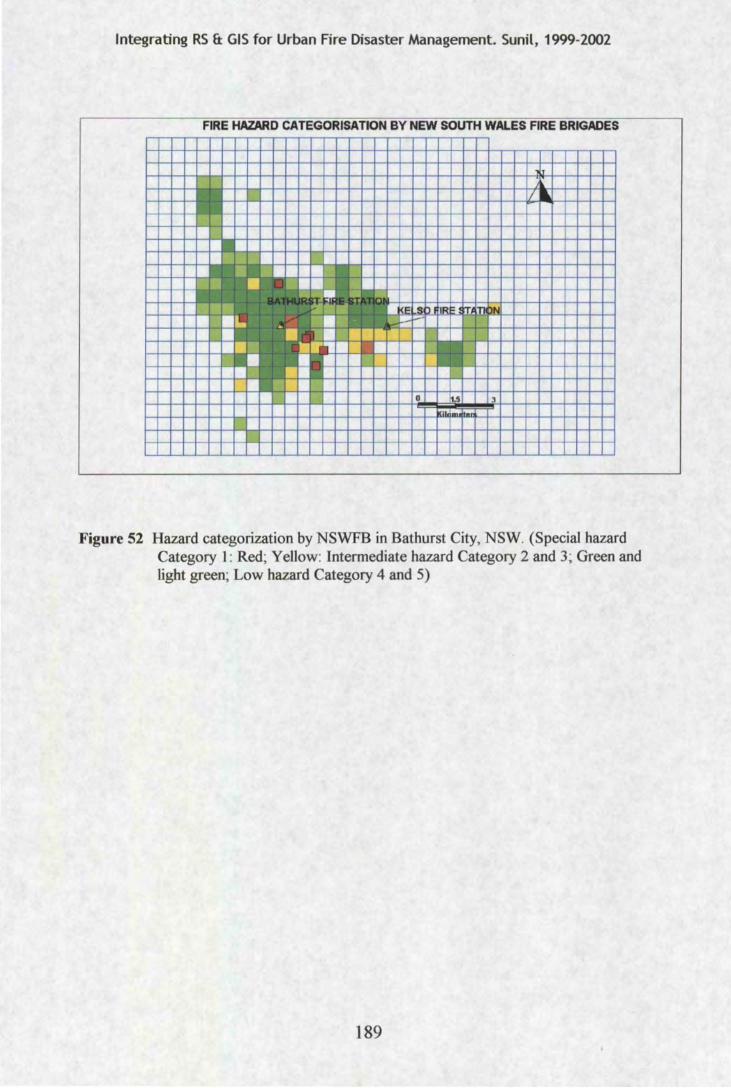
Integrating RS & GIS for Urban Fire Disaster Management. Sunil, 1999-2002
FIRE HAZARD CATEGORISATION BY NEW SOUTH WALES FIRE BRIGADES
l.l 1/ • - 1-fa~
• rtiiJ
I ,--II -<E _s :J 'IR: -f-' -
• -· • • 1- -I-1-
0 lt.5 3
·- ;- ..... - - - 1- r- 1- f-1- 1- -
Figure 52 Hazard categorization by NSWFB in Bathurst City, NSW. (Special hazard Category 1: Red; Yellow: Intermediate hazard Category 2 and 3; Green and light green; Low hazard Category 4 and 5)
189
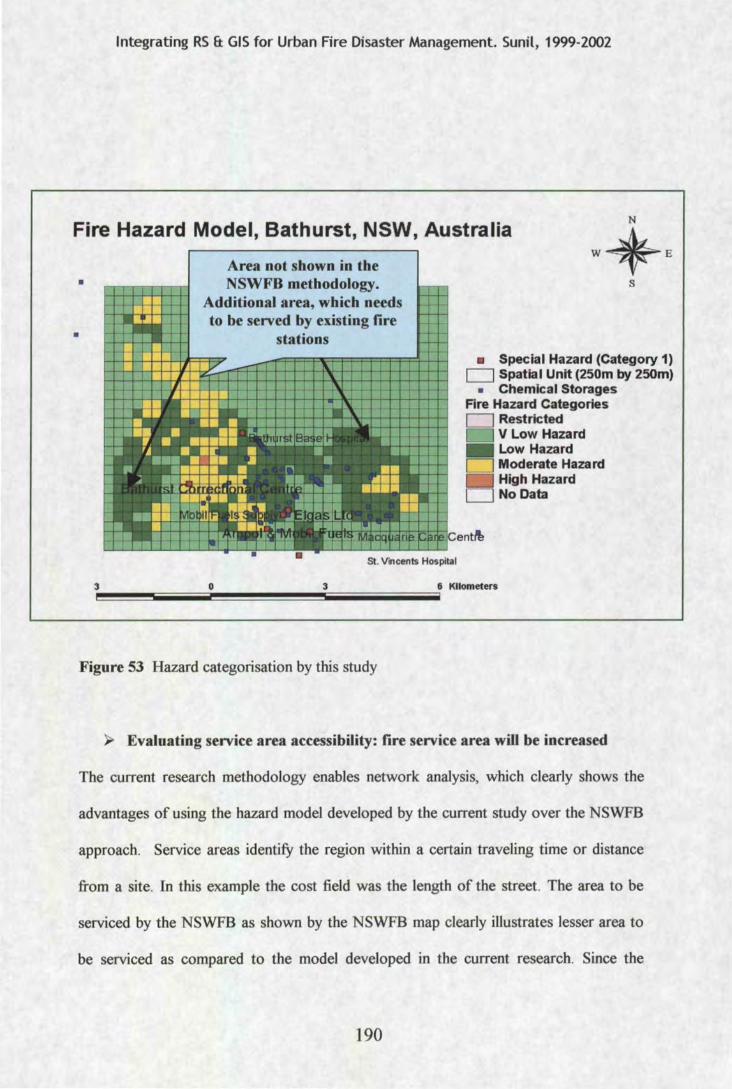
Integrating RS & GIS for Urban Fire Disaster Management. Sunil, 1999-2002
Fire Hazard Model, Bathurst, NSW, Australia
•
• Area not shown in the NSWFB methodology .
Additional area, which needs to be served by existing fire
stations
St. Vincents Hospital
s
• Special Hazard (Category 1) CJ Spatial Unit (250m by 250m)
• Chemical Storages Fire Hazard Categories CJ Restricted
V Low Hazard - Low Hazard CJ Moderate Hazard
High Hazard CJ NoData
3~~~5iiiiiiiiiiiiiiiiiiiiiiiiiiiiiiiiiiiiiiiiiiio~~~~~~~3iiiiiiiiiiiiiiiiiiiiiiiiiiiiiiiiiiiiiiiiiiiiiiiiiiiiiiiiiiiiiiiiiiiiiiiiiiiiiiliiiii6 Kilometers
Figure 53 Hazard categorisation by this study
);> Evaluating service area accessibility: fire service area will be increased
The current research methodology enables network analysis, which clearly shows the
advantages of using the hazard model developed by the current study over the NSWFB
approach. Service areas identify the region within a certain traveling time or distance
from a site. In this example the cost field was the length of the street. The area to be
serviced by the NSWFB as shown by the NSWFB map clearly illustrates lesser area to
be serviced as compared to the model developed in the current research. Since the
190
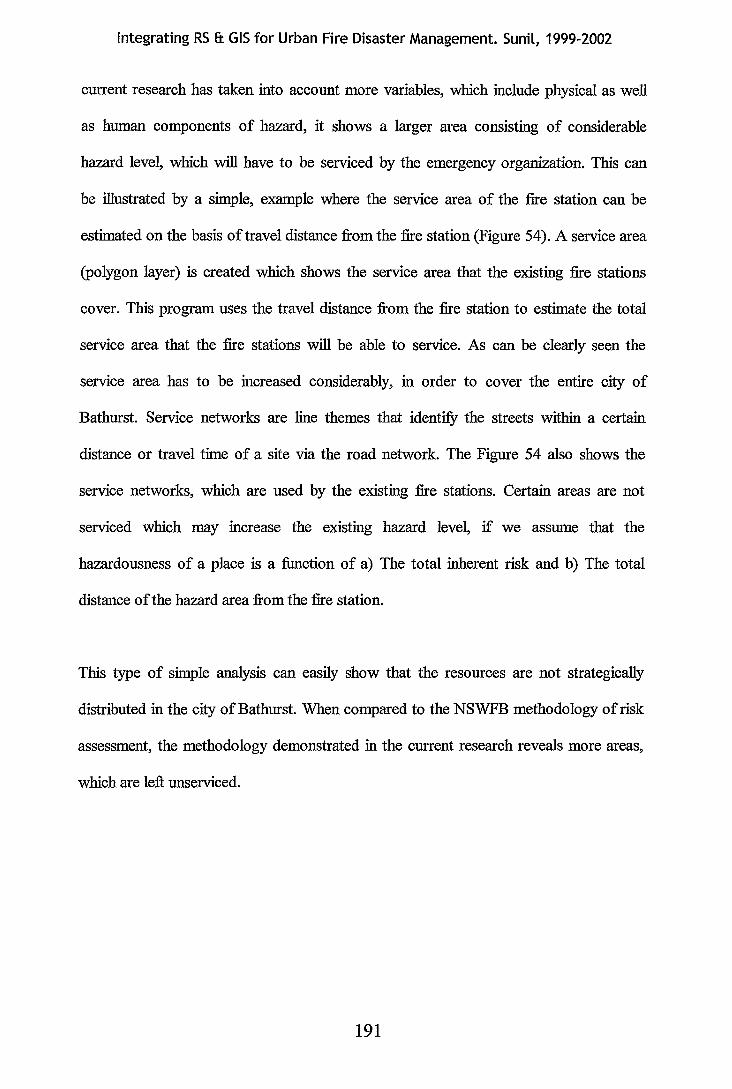
Integrating RS & GIS for Urban Fire Disaster Management. Sunil, 1999-2002
current research has taken into account more variables, which include physical as well
as human components of hazard, it shows a larger area consisting of considerable
hazard level, which will have to be serviced by the emergency organization. This can
be illustrated by a simple, example where the service area of the fire station can be
estimated on the basis of travel distance from the fire station (Figure 54). A service area
(polygon layer) is created which shows the service area that the existing fire stations
cover. This program uses the travel distance from the fire station to estimate the total
service area that the fire stations will be able to service. As can be clearly seen the
service area has to be increased considerably, in order to cover the entire city of
Bathurst. Service networks are line themes that identifY the streets within a certain
distance or travel time of a site via the road network. The Figure 54 also shows the
service networks, which are used by the existing fire stations. Certain areas are not
serviced which may increase the existing hazard level, if we assume that the
hazardousness of a place is a function of a) The total inherent risk and b) The total
distance ofthe hazard area from the fire station.
This type of simple analysis can easily show that the resources are not strategically
distributed in the city of Bathurst. When compared to the NSWFB methodology of risk
assessment, the methodology demonstrated in the current research reveals more areas,
which are left unserviced.
191
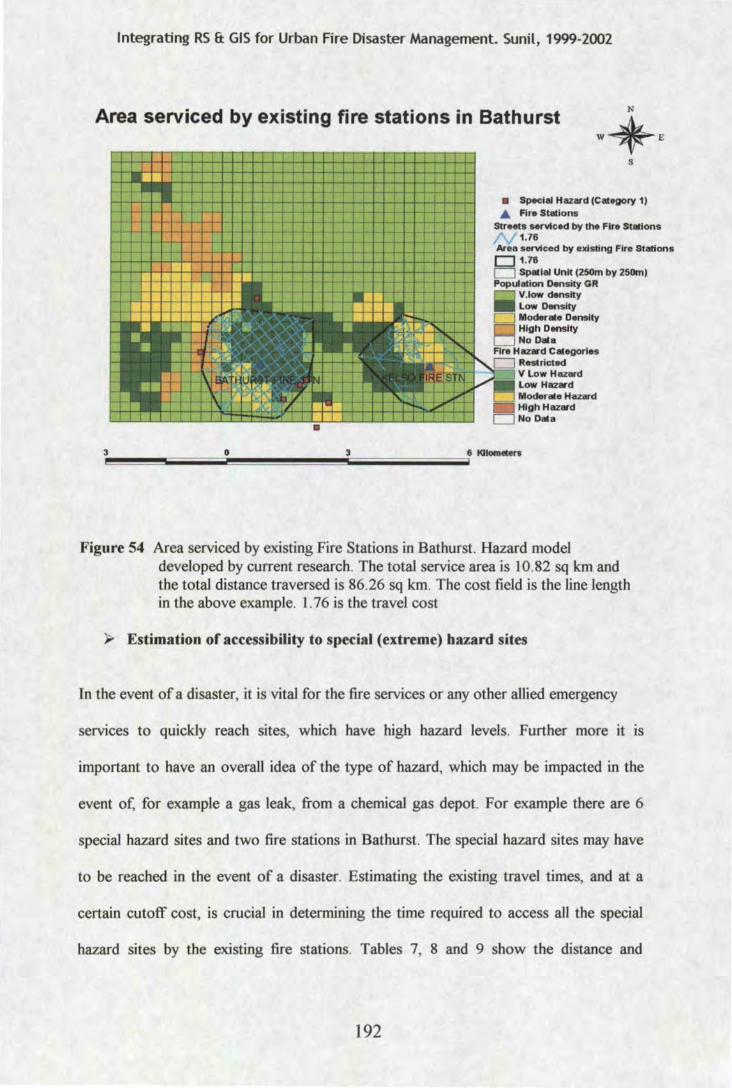
Integrating RS & GIS for Urban Fire Disaster Management. Sunil, 1999-2002
Area serviced by existing fire stations in Bathurst
s
• Special HazMd (Category 1) A. Fire Stations
Streets serviced by the Fire Staltlons / 1.76 Area serviced by existing Fire Stations 01.76 D Spalla! Unit (250m by 250m I Population Density GR
V.low density Low Density
D Moderalte Density High Density No Ollila
V Low Hazard Low Hazard Moderlllte Hazard High Hazard No Data
Figure 54 Area serviced by existing Fire Stations in Bathurst. Hazard model developed by current research. The total service area is 10.82 sq km and the total distance traversed is 86.26 sq km. The cost field is the line length in the above example. 1. 76 is the travel cost
}> Estimation of accessibility to special (extreme) hazard sites
In the event of a disaster, it is vital for the fire services or any other allied emergency
services to quickly reach sites, which have high hazard levels. Further more it ts
important to have an overall idea of the type of hazard, which may be impacted in the
event of, for example a gas leak, from a chemical gas depot. For example there are 6
special hazard sites and two fire stations in Bathurst. The special hazard sites may have
to be reached in the event of a disaster. Estimating the existing travel times, and at a
certain cutoff cost, is crucial in determining the time required to access all the special
hazard sites by the existing fire stations. Tables 7, 8 and 9 show the distance and
192
Integrating RS &. GIS for Urban Fire Disaster Management. Sunil, 1999-2002
directions required to travel from the facilities (i.e. Bathurst and Kelso) fire stations to
the special hazard sites. It can be deduced that most of the special hazard sites are
closer to the Bathurst fire station rather than the Kelso fire station. In this example the
travel distance by default is the travel cost. In the real world however there may be
impedances such as high volume of traffic at different times in a day, one-way traffic,
and other obstacles. More and more variables and values may be added to simulate the
real world conditions in order to estimate the travel distance. The research model show
more developed areas, which need fire protection and resources due to their existing
level ofhazard.
Facility #1: Bathurst fire station
Special hazard sites Travel Distance _!.Km~
Bathurst base hospital 2.28 Correctional centre 1.85 El~as 1.79 ~obilfuelsupply 1.65 ~cQuarie care centre 3.06 Ampol and mobil fuels 1.73 St Vincents hospital 2.94
Facility# 2: Kelso fire station
Special hazard sites Travel Distance (Kms)
Bathurst base hospital 5.04 Correctional centre 6.63 El~as 4.17 ~obilfuelsupply 4.03 ~cQuarie care centre 5.44 Ampol and mobil fuels 4.60 St Vincents hospital 5.32
Table 7: Comparison of travel distance to special hazard sites the existing fire stations ofBathurst and Kelso (Bathurst)
193
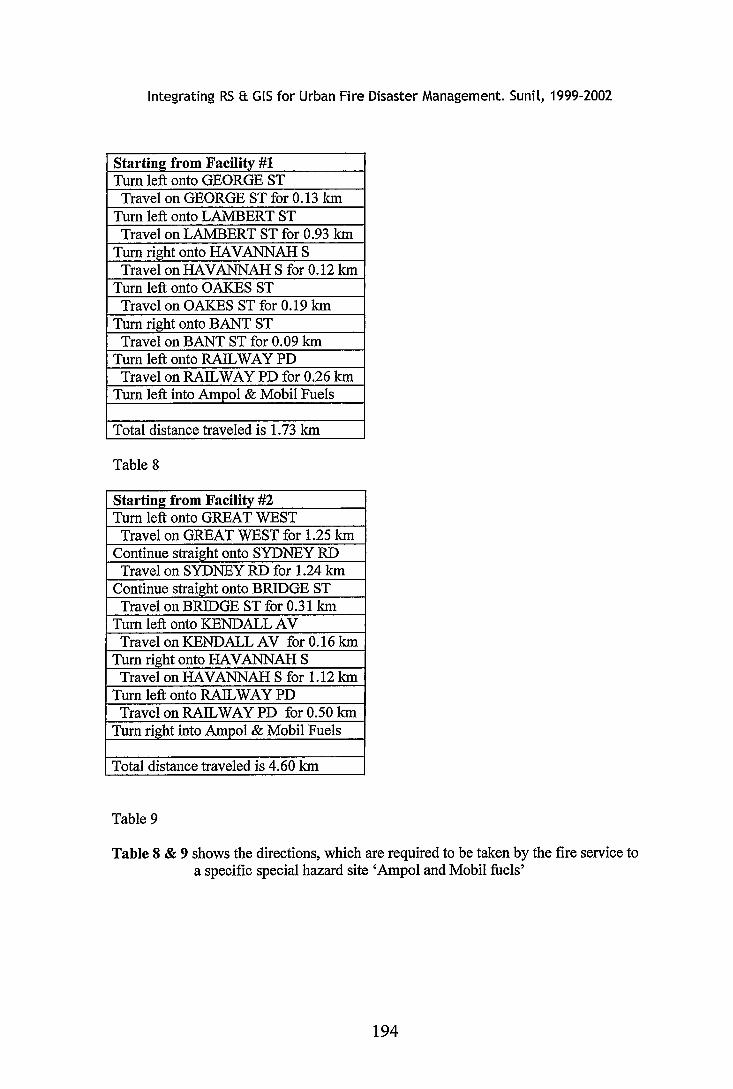
Integrating RS a GIS for Urban Fire Disaster Management. Sunil, 1999-2002
Starting from Facility #1 Turn left onto GEORGE ST
Travel on GEORGE ST for 0.13 km Turn left onto LAMBERT ST
Travel on LAMBERT ST for 0.93 km Turn right onto HA V ANNAH S
Travel on HA V ANNAH S for 0.12 km Turn left onto OAKES ST
Travel on OAKES ST for 0.19 km Turn right onto BANT ST
Travel on BANT ST for 0.09 km Turn left onto RAILWAY PD
Travel on RAILWAY PD for 0.26 km Turn left into Ampol & Mobil Fuels
Total distance traveled is 1.73 km
Table 8
Starting from Facility #2 Turn left onto GREAT WEST
Travel on GREAT WEST for 1.25 km Continue straight onto SYDNEY RD
Travel on SYDNEY RD for 1.24 km Continue straight onto BRIDGE ST
Travel on BRIDGE ST for 0.31 km Turn left onto KENDALL A V
Travel on KENDALL A V for 0.16 km Turn right onto HA V ANNAH S
Travel on HA V ANNAH S for 1.12 km Turn left onto RAILWAY PD
Travel on RAILWAY PD for 0.50 km Turn right into Ampol & Mobil Fuels
Total distance traveled is 4.60 km
Table 9
Table 8 & 9 shows the directions, which are required to be taken by the fire service to a specific special hazard site 'Ampol and Mobil fuels'
194
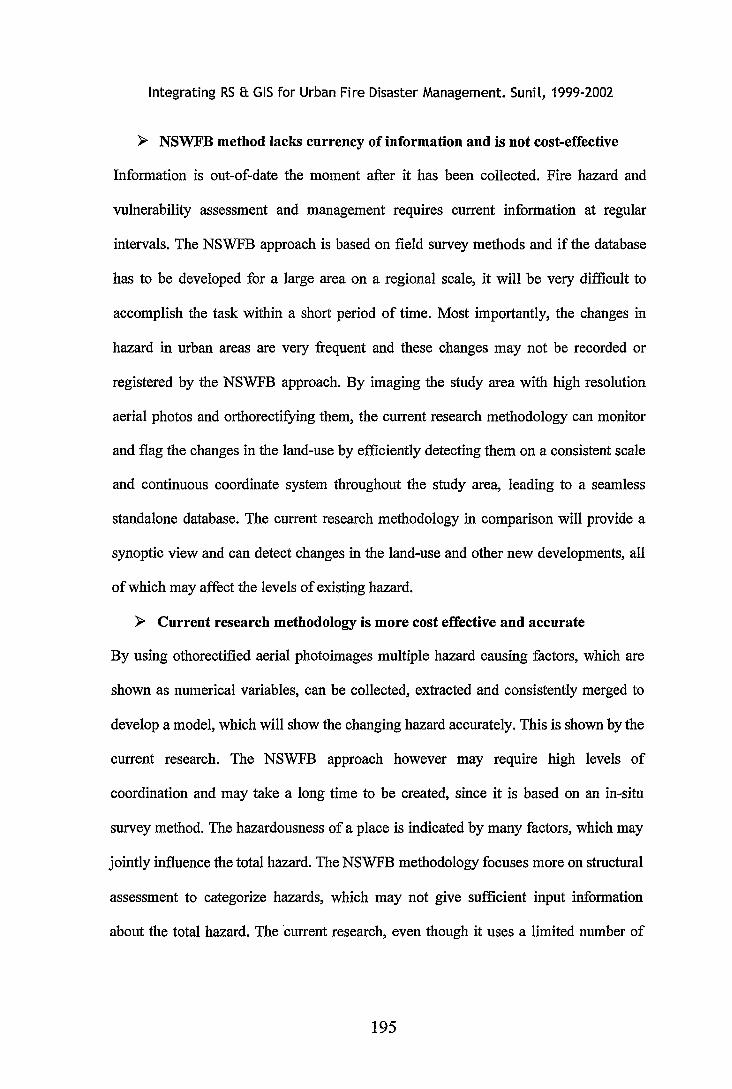
Integrating RS & GIS for Urban Fire Disaster Management. Sunil, 1999-2002
);;> NSWFB method lacks currency of information and is not cost-effective
Information is out-of-date the moment after it has been collected. Fire hazard and
vulnerability assessment and management requires current information at regular
intervals. The NSWFB approach is based on field survey methods and if the database
has to be developed for a large area on a regional scale, it will be very difficult to
accomplish the task within a short period of time. Most importantly, the changes in
hazard in urban areas are very frequent and these changes may not be recorded or
registered by the NSWFB approach. By imaging the study area with high resolution
aerial photos and orthorectifying them, the current research methodology can monitor
and flag the changes in the land-use by efficiently detecting them on a consistent scale
and continuous coordinate system throughout the study area, leading to a seamless
standalone database. The current research methodology in comparison will provide a
synoptic view and can detect changes in the land-use and other new developments, all
of which may affect the levels of existing hazard.
);;> Current research methodology is more cost effective and accurate
By using othorectified aerial photoimages multiple hazard causing factors, which are
shown as numerical variables, can be collected, extracted and consistently merged to
develop a model, which will show the changing hazard accurately. This is shown by the
current research. The NSWFB approach however may require high levels of
coordination and may take a long time to be created, since it is based on an in-situ
survey method. The hazardousness of a place is indicated by many factors, which may
jointly influence the total hazard. The NSWFB methodology focuses more on structural
assessment to categorize hazards, which may not give sufficient input information
about the total hazard. The current research, even though it uses a limited number of
195
Integrating RS & GIS for Urban Fire Disaster Management. Sunil, 1999-2002
variables, has shown a methodology that can incorporate a wide range of variables,
which may influence hazard in urban areas.
~ Current research methodology can be introduced into the 'Resource Planning Process'.
The planning process explained in chapter 5 clearly describes that there is a need for
consistent and reliable information. A manual method of collecting details and
maintaining files may not be a very efficient way of storing and disseminating spatia-
temporal information to different agencies of the organization. These shortcomings
may be avoided by using the current research methodology since it stores
spatiotemporal information on a uniform scale and can register changes in the level of
hazard very easily. By pursuing appropriate R&D (research and development)
techniques the current methodology can be used as a reliable method for assessing
hazards and preparing subsequent reports, which are essential for the management of
dynamic and static resources.
~ Need for providing spatio-temporal information for allocation of resources or redistributing existing resources
Allocation of fresh resources (Static or Dynamic) will depend on the timely
identification and assessment of fire hazards, which may not be possible using the
approach adopted by the NSWFB methodology, for reasons, which were explained in
the earlier paragraphs. The current methodology may be used on a regional basis for the
entire state of NSW to assess hazards uniformly, which will in turn provide a broad
basis for the allocation of dynamic resources in particular. The service area can also be
calculated vis-a-vis the existing location of fire stations and resources on the one hand
and the ever changing hazard on the other.
196
Integrating RS a: GIS for Urban Fire Disaster Management. Sunil, 1999-2002
7-4 Management of Resources (Distance and hazard for optimization of resource location)
Efficient management of resources is a complex task that is key to the success of an
organization. The proper use and development of people, things, and money will, to a
great extent, determine the success of a fire department in achieving its goals and
objectives (Forsman, 1988). Resources must be managed according to a number of
variables, which influence hazard and community vulnerability. The current research
has underlined the importance of data such as land-use, population density, socio-
economic data, all of which have to be jointly assessed and evaluated for each region in
a consistent and systematic manner, for the allocation of fresh resources and
redistribution of existing resources.
The hazard model developed in the study may be used to estimate hazardousness of a
place on the basis of travel distance and the level of hazard. The cells in the hazard
model which represent geometrically regular spatial units have a distance and hazard
level value attached to it, for instance each cell represents a value of 0.25 km and the
level of hazard is indicated by the hazard value. The total hazard risk of a certain
location can then be calculated as a factor of the hazard level and the travel distance
from a fire station to that location. The closer the location is to a fire station the lesser
the risk it will carry.
7-5 Summary
Hazard modeling demands spatial and temporal data, which have to be updated at
frequent intervals. Remote sensing technology and GIS can provide such information.
Hazard related variables appear on the surface of the earth in many different shapes,
197
Integrating RS 8: GIS for Urban Fire Disaster Management. Sunil, 1999-2002
sizes, scales and level of details, particularly in urban environments, which may have to
be detected by multiple sensors. For example a large industrial plant may have to be
detected at a large scale as well as a medium scale. Regular patterns such as residential
land-use may have to be detected at a medium scale. The use of different sensor
systems will speed up the process of variable data acquisition on a consistent scale.
Spatiotemporal data is vital for emergency services since their decisions are based on
systems, which provide them with up-to-date and reliable information. The currency of
spatia-temporal information may not be maintained by the present methodology
adopted by the NSWFB, while the current research provides a methodology, which can
be used to rapidly acquire, assess and analyse those spatio-temporal data, which
influence risk.
Socioeconomic data is essential for estimating the prevailing risk in different places.
However there is limited data on some aspects of risk, such as daytime population,
which is very important to estimate the number of people who may be exposed to a
hazard. The census data is based on night-time residential population estimates, which
may not be sufficient to adequately assess risk. Remote sensing data provides us with
details on the physical objects found on the earth, but are incapable of providing direct
estimates of variables, such as population, unless they are combined with ancillary data
such as dwelling size, land-use or other related data-base.
Management of fire resources (staff and equipment) is vital since it has a bearing on the
disaster operations and consequences. It may not be possible to provide one hundred
percent fire protection to all citizens since fire fighting resources are always less than
198
Integrating RS 8: GIS for Urban Fire Disaster Management. Sunil, 1999-2002
the number of people and property for which they are responsible to provide protection.
The hazard model developed in the current research is useful for providing a basis for
the allocation of resources since the model reflects the combination ofvariables, which
influence risk. By using this model over the entire state ofNSW a broad but consistent
allocation of resources, can be made. In-depth studies of certain areas with high risk
may be made by using the model with data derived from limited in-situ field survey
method.
The hazard model developed in the current research may be used by the NSWFB in
their planning process since it provides a consistent yet reliable methodology for
combining and analyzing data. With the advent ofthe World Wide Web and Internet
based GIS, such as ArciMS the NSWFB have already put this into use albeit in a slow
and steady manner. By using the model, at all the levels of the planning process, a
consistent mechanism of storing and assessing risk can be achieved. The planning
process entails a lot of discussion, reporting and critical assessment of decisions made,
particularly about acquiring new resources and other kinds of investments, all of which
have to be confirmed and supported by hardcore facts at a high level. A methodology
based on GIS/RS, supported by field surveys, will lend authenticity and reliability to
the entire process of planning and decision making.
199
Integrating RS 8: GIS for Urban Fire Disaster Management. Sunil, 1999-2002
Chapter 8: Summary and Conclusions.
8-1 Summary
At the outset the research focused on addressing the issue of urban fire hazard
modeling and attempted to base this research on the current methodology adopted by
the NSWFB to model hazards. One of the main objectives was to improve the existing
methodology of assessing and analyzing hazards particularly in urban environments by
the use of GIS/RS.
High resolution aerial photo images were exposed over the study sites of Bathurst and
Hornsby at a scale of 1:16,000 respectively. These images were then orthorectified
using digital elevation models and ground control points. Available cartographic GIS
data were identified for modeling purposes and also to study hazards as a combined
influence both physical and human agents. Data were gathered from different sources
and the digital cadastral data base was registered to the orthorectified image in order to
bring all the layers into one consistent coordinate system. The image was used for
visualization and extraction of additional layers such as roof area, and total built up
area, which assisted in explaining areas with a high degree of congestion which could
in tum lead to a high degree of difficulty in fire fighting. Many other layers were
combined and analysed by using various spatial operations such as Geometric
Intersection, Update and a master attribute table was created for both the study areas.
The weighted average index method was used for updating newly created values to the
master attribute table after the geometric intersection process was completed. By using
this method the subjectivity was kept to a minimum and the values were partitioned
according to the total area they occupied in the spatial unit. This master attribute table
200
Integrating RS 8: GIS for Urban Fire Disaster Management. Sunil, 1999-2002
consisted of raw data, derived and spatially processed data, all ofwhich were stored to
a 250m by 250m spatial unit.
A weighted overlay process was performed to analyse the total hazard for each study
site. The image environment was set, which involved setting the cell size, map extent,
evaluation scale and converting the vector layers from the master attribute table to a
grid, which is a format that allows consistent analysis of hazards. An evaluation scale
was decided and four hazard categories were finalized. The ability of the model to
simulate real world situations was made possible by assigning influences and biases to
each of the input layers. The model is semantic in that it can be adjusted and updated to
show the current level of combined hazard in any study site. The data chosen for
modeling is available from most of the local government councils in NSW, and thus the
model has wide applicability.
The project delivered:
• a broad based land use classification system compatible with the current risk
assessment method that allows quantification of hazard levels and
comparisons to be drawn between different areas,
• a systematic methodology and design for integrating aerospace data with
cartographic (thematic) information,
• the development of a spatial data model that can assist in strategic resource
planning,
• the development of a GIS database that provides for the integration of
disparate data through a continuous and consistent co-ordinate system.
201
Integrating RS ft GIS for Urban Fire Disaster Management. Sunil, 1999-2002
• a potential future link for specific site based information to assist the
management of emergency resources at incidents,
• a method which is repeatable and allows for periodic updates, and
• a method, which is applicable in any and all urban centres across NSW.
(Report to NSWFB, 2001 and NSW Fire News, 2002. See appendix VI for
summary of report)
8-2 Conclusions
8-2.1 Applicability of model in the NSWFB context
The current methodology adopted by the NSWFB is based on in-situ field surveys,
which involve a lot of time and may not be cost effective. Besides the methodology
does not depict the current level of hazard. The integrated model uses an orthorectified
image base to model hazards, thus providing an accurate planimetric database upon
which available vector and raster data may be overlain and analysed in combination.
This aspect of the model will be very useful for the NSWFB, as it will enable the
creation and flow of consistent spatia-temporal information from one level to another.
This will reduce any possibility of confusion in the data gathering process since all the
levels will use the same database. Additional input at the local level can be
incorporated into the database and used by officials in other levels. All this will lead to
a database system, that will have unique input from different levels, but can be related
and used at all the levels due to the fact that they are all in a single coordinate system.
The database will reduce duplication and repetition of GIS data and will also lead to a
cost effective way of developing decision support systems. By systematic validation of
the database, clarity can be lent to the database thus making it more reliable. New data
collected in the field can be incorporated into the model which can then be accessed at
202
Integrating RS ft GIS for Urban Fire Disaster Management. Sunil, 1999-2002
all fire stations and agency branches by worldwide web I internet access. This would
mean that the model would become increasingly informed about hazard. The model
therefore increases the possibility of data sharing and will be reliable sufficiently to be
implemented across all levels ofNSWFB.
The integrated model developed in the current research was planned with regular
interactions and feedback from the NSWFB officials. The methodology shows a major
improvement in data collection, analyses and mapping over the current NSWFB
methodology. The ability ofthe model to be extrapolated and used anywhere in NSW
is useful for the NSWFB since they require consistent data on hazard on a regional,
zonal and local level.
8-2.2 Universal applications
The choice of variables selected for modeling in the current research was limited by the
non-availability of some data. However an attempt was made to develop a methodology
to model hazard by combining variables which best explain the concept of hazard. If
more data is available they can be input to the model and spatially analysed. At the
moment data from Australia is used but the approach can be duplicated on a global
basis if the input layers are provided. Some common layers such as land-use can be
found in most countries or can be created by using high resolution airborne or
spacebome remote sensing data.
8-2.3 Data from new satellite remote sensing systems
New satellite data such as the Quick Bird II launched in 2001, that has a resolution of
0.61m by 0.61m and has a consistent accurate accuracy throughout the scene. Such data
203
Integrating RS & GIS for Urban Fire Disaster Management. Sunil, 1999-2002
bases can be used for an entire region and the methodology shown by the current study
may be used to develop semantic models of hazards. This will lead to a reliable and
consistent database, which will result in a uniform method of assessing hazards. Such
information will then be useful for allocating strategic resources and redistributing
existing resources. The use of satellite data will also provide currency to the entire
model since they can be secured at planned, regular intervals.
8-2.4 More variables may be required
Many other operational applications such as ambulance, bush fire, medical services,
and police, require additional variables apart from those included in the current
research where the objective was to model urban fire hazard. The current research
however does not include all these variables. The methodology may be extended to
develop systems for emergency organizations, as well as allied agencies, which may
seek information of the same type. With additional and related data, such systems can
solve problems related to data sharing, and will promote geographic data sharing.
8-2.5 Future research
Hazards are dynamic phenomenon as they change at regular intervals either resulting in
an increase in the level of existing hazard or a decrease. This is a very common trend in
developing countries where unplanned growth may lead to a fluctuation in the levels of
hazards, which in turn will lead to demand for additional resources (static and
dynamic). Emergency organizations have limited resources but are responsible for
providing services of all kinds, at all times, to an increasingly growing population and
complex infrastructures. This problem has an additional dimension in the rural-urban
interface, where new developments and activities occur rapidly and often go unnoticed,
204
Integrating RS 8: GIS for Urban Fire Disaster Management. Sunil, 1999-2002
and change the existing land-use, leading to a new type of hazard and vulnerability.
Timely detection of such a trend is vital to provide and plan for emergency services in
an optimal manner. Remote sensing is probably the only method for assessing hazards
particularly in near real time. Future research must focus on the systematic appraisal of
such remote sensing systems, which are constantly improving in their abilities, in order
to detect features more accurately, both in space and time. Issues dealing with the
appropriate resolution (spatial, spectral, and temporal) for assessing and modeling
hazards must be key areas of future research.
205
Integrating RS 8: GIS for Urban Fire Disaster Management. Sunil, 1999-2002
References
Abdullah, M. A. (1996), 'Urban photogrammetric data base for multi-purpose
cadastral-based information systems: the Riyadh city case', Journal of
Photogrammetry and Remote Sensing, Vol. 51, Issue 1, pp. 28-38.
Ahearn, A., and Chladil, M. (1999), 'How far do bushfrres penetrate urban areas?, In
Proceedings ofthe Australian Disaster Conference, Canberra, Australia, pp. 21-26.
Alexander, D. (1995), 'A Survey ofthe Field ofNatural Hazards and Disaster Studies',
In Geographical Information Systems In Assessing Natural Hazards, (Editors, Carrara,
A and Guzzetti, F), Kluwer Academic, Netherlands, pp. 1-19.
Altan, O.T.G., Kulur, S., Seker, D., Volz, S., Fritsch, D. and Sester, M. (2001),
'Photogrammetry and geographic information systems for quick assessment
documentation and analysis of earthquakes', Journal of Photogrammetry and Remote
Sensing, Vol. 55, Issues 5-6, pp. 359-372.
Ambrosia, V.G., Buechel, S.W., Brass, J.A., Peterson, J.R., Davies, R.H., Kane R.J.
and Spain, S. (1998), 'An integration of remote sensing, GIS and information
distribution for wildfire detection and management', Photogrammetric Engineering &
Remote Sensing, Vol. 64, No. 10, pp. 977-985.
206
Integrating RS 8: GIS for Urban Fire Disaster Management. Sunil, 1999-2002
Anderson, G.L., Everitt, D.E., Spencer, N.R. and Andrascik, R.J. (1996), 'Mapping
leafy spurge (Euphoria esula) infestations using aerial photography and geographic
information systems', Geocarto International, Vol.ll, No.1, pp. 81-88.
ANU. (1994), 'Ignite' simulation program. Firenet, Australian National University,
Canberra (Internal Bulletin Board).
AS/NZS-4360. (1995), 'Risk Management', Jointly published by Standards Australia,
Standards New Zealand.
Barredo, J., Benavides, I. A., Hervas, J. and Van-Westen, C. J. (2000), 'Comparing
heuristic landslide risk assessment techniques using GIS in the Tirajana basin, Gran
Canaria Island, Spain', Journal of Applied Earth Observation and Geoinformation
(JAG), Volume 2, Issue 1, pp. 9-23.
Berry, L. and King, D. (1999), 'Community response to tropical cyclones in northern
Australia, In Proc. Australian Disaster Conference, Canberra, Australia, pp.53-57.
Bhaskaran, S. (2001), 'Integrating GIS/RS for Hazard Categorization'. Technical report
prepared for the New South Wales Fire Brigades, Sydney, Australia.
Bhaskaran, S. and Datt, B. (2000), 'Sub-pixel analysis of urban surface materials -A
case study of Perth, Western Australia', In Proc. International Geosciences & Remote
Sensing Symposium, Honolulu, USA, pp.1535-1538.
Bhaskaran, S., Datt, B., Neal, T. and Forster, B. (2001), 'Hail storm vulnerability
assessment by using hyper spectral GIS/RS techniques', In Proc. International
207
Integrating RS a: GIS for Urban Fire Disaster Management. Sunil, 1999-2002
Geosciences & Remote Sensing Symposium, Sydney, Australia. pp. (Not provided in
Proc).
Bhaskaran, S., Forster, B. and Neal, T. (2001a), 'Integrating Imaging Spectroscopy and
GIS for Spatial Emergency Decision Support Systems (SEDSS)', A Case of Hailstorm
Damage and Post Disaster Management, Sydney, Australia, Technical Report
Submitted to the New South Wales Fire Brigades, Sydney.
Bhaskaran, S. and Neal, T. (2002), 'Integrating imaging spectroscopy and GIS for post
disaster management', a case of hailstorm damage in Sydney, Natural Hazards Special
Issue, August (submitted for publication).
Blakie, P., T, Cannon, I., Davis and Wisner, B. (1994), 'At Risk: Natural Hazards.
People's Vulnerability, and Disasters', Routledge, London and New York.
Boughton, G. (1998), 'The community: central to emergency risk management',
Australian Journal of Emergency Management, Vol.13, No 2, pp. 2-6.
Buckle, P. (1999), 'Redefining community and vulnerability in the context of
emergency management', Australian Journal of Disaster Management, Vol.l3 (4), pp.
21-34.
Bull, K.R. (1991), 'The critical loads/levels approach to gaseous pollutant emission
control, Environmental Pollution, 69, pp. 105-123.
208
Integrating RS 8: GIS for Urban Fire Disaster Management. Sunil, 1999-2002
Burby, R.J., Robert, I. E. D., Godschalk, D.R. and Olshansky, R.B. (2000), 'Creating
hazard resilient communities through land-use planning', Natural Hazards Review 1,
(May), pp. 99-106.
Burgan, R.E. and Shasby, M.B. (1984), 'Mapping broad-area fire potential from digital
fuel, terrain and weather data', Journal of Forestry, 82, pp. 228-231.
Cartalis, C. and Chrysoulakis, N. (2000), 'A new approach for the detection of major
fires caused by industrial accidents, using NOAA/ A VHRR imagery', International
Journal ofRemote Sensing, Vol. 21, No.8, pp.1743-1748.
Chakraborty, J. and Armstrong, P.M. (1999), 'Assessing the impact of airborne toxic
releases on populations with special needs', Professional Geographer, 53(1), pp. 119-
131.
Chou, Y.H., Minnich, R.A. and Chase, R.A. (1993), 'Mapping probability of fire
occurrence in San Jacinto Mountains, California, USA', Environmental Management,
17, pp.129-40.
Chuvieco, E. and Congalton, R.G. (1989), 'Application of remote sensing and
geographic information systems to forest fire hazard mapping', Rem. Sens.
Environment, 29, pp.147-159.
209
Integrating RS &. GIS for Urban Fire Disaster Management. Sunil, 1999-2002
Chuvieco, E. and Salas, J. (1996), 'Mapping the spatial distribution of forest fire danger
using GIS', International Journal of Geographic Information Science, 10(3), pp. 333-
345.
Cohen, R.E. and Ahearn, F.L. (1980), 'Handbook for Mental Health Care ofDisaster
Victims', Johns Hopkins, Baltimore.
Coppock, J.T. (1995), 'GIS and natural hazards': An overview from a GIS perspective,
In Geographical Information Systems In Assessing Natural Hazards, (Editors, Carrara,
A and Guzzetti, F), Kluwer Academic, Netherlands, pp. 21-35.
Cosentino, M.J., Woodcock, C.E and Franklin, J.E. (1981), 'Scene analysis for
wildland fire fuel characteristics in a Mediterranean climate', Presented at the 15th Int.
Symp. Rm. Sens. Environ., Ann Arbor, USA, MI, pp.11.
Coulter, L., Stow, D., Kiracofe, B., Langevin, C., Chen, D., Daeschner, S., Service, D.
and Kaiser, J. (1999), 'Deriving current land-use information for metropolitan
transportation planning through integration of remotely sensed data and GIS',
Photogrammetric Engineering and Remote Sensing, Vol.65, No 11, pp. 1293-1300.
Cava, T. J. and Church, R.L. (1997), 'Modelling community evacuation vulnerability
using GIS', International Journal of Geographic Information Science 11(8), pp 763-84.
210
Integrating RS & GIS for Urban Fire Disaster Management. Sunil, 1999-2002
Cutter, S.L. (1987), 'Airborne toxic releases', Environment, 29:12-17, pp. 28-31.
De-Fusco, L., Martellaci C., Peroni P. and D'Epifanio, A. (1992), 'A prototype system
for forest fire prevention and control', In Proc. The Central Symposium of the ISY
Conference, Munich, Germany.
Doyle, F. (1996), 'Thirty years of mapping from space', International Archives of
Photogrammetry and Remote Sensing, Vienna, 31(B4), pp. 227-229.
Dymon, U.J. (1994), 'Mapping: the missing link in reducing risk under SARA II', Risk,
Health, Safety and Environment, Vol. 5:4, pp. 337-360.
Ehlers, M. (1993), 'Remote Sensing and Geographic Information Systems: Image
Integrated Geographic Information Systems', Geographic Information Systems (GIS)
and Mapping-Practices and Standards, ASTM STP 1126, (Editors, Johnson, A.I.,
Pettersson, C.B. and Fulton, J.L), American Society for Testing and Materials,
Philadelphia, pp. 53-67.
Elo, 0., Palm, E. and Vrolijks, L. (1996), 'Disaster reduction in urban areas', fTC
Journal, 1996-1, pp. 29-37.
Environmental Systems Research Institute, Inc. (2000), 'Using ModelBuilder'. (2000),
'ModelBuilder for Arc View Spatial Analyst', ESR Institute.
211
Integrating RS ft GIS for Urban Fire Disaster Management. Sunil, 1999-2002
Epp, H. and Laneville, R. (1996), 'Satellite data and geographic information systems
for fire and resource management in the Canadian Arctic', Geocarto International,
Vol.l1, No.2, pp. 97-103.
Falls, R., Sellers, A., Holland, G., McKinnon, R., Galloway, L. and McGuffie, K.
(1999), 'The tropical cyclone coastal impacts program', a collaborative Australian
IDNDR initiative, In Proc. Australian Disaster Conference, Canberra, Australia, pp. 39-
47.
Farmer, D.F. (1997), 'Managing Environmental Pollution', Routledge, London.
Ferrier, G. (1999), 'Application of imaging spectrometer data in identifying
environmental pollution caused by mining at Rodaquilar, Spain, Journal of
Photogrammetry and Remote Sensing, Vol. 68, Issue 2, pp.125-137.
Fire News: New South Wales Fire Brigades. (1999), Sydney Hail Storm Special,
Vol.21, No.121, p.10.
Flentje, P. and Chowdhury, R. (1999), 'Geotechnical assessment and management of
148landslides triggered by a major storm event in Wollongong, Australia, In Proc.
Australian Disaster Conference, Canberra, Australia, pp. 269-274.
Forsman, D.P. (1988) 'Resource Management In: Managing Fire Services', Second
Edition, (Editors, Ronny, C. and John, A.G), pp.167-190,
Foresman, P.D. and Millette, T.L. (1997), 'Integration of Remote Sensing and GIS
Techniques for Planning, In Integration of Geographic Information Systems and
212
Integrating RS a GIS for Urban Fire Dfsaster Management. Sunfl, 1999-2002
Remote Sensing', (Editors. Jeffrey, L.S., John, E.E. and Kenneth, C.M.) Cambridge
University Press, Cambridge, pp. 134-157.
Forster, B. (1980), 'Urban residential ground cover using Landsat digital data',
Photogrammetric Engineering and Remote Sensing, 46, pp. 547-558.
Forster, B. (1983), 'Some urban measurements from Landsat data', Photogrammetric
Engineering and Remote Sensing, 49(12), pp. 1693-1707.
Forster, B. (1985), 'An examination of some problems and solutions in monitoring
urban areas from satellite platforms', International Journal of Remote Sensing, 6(3/4),
pp. 529-534.
Gao, J. and Skillcom, D. (1998), 'Capability of SPOT XS data in producing detailed
landcover maps at the rural-urban periphery', International Journal of Remote Sensing,
Vol. 19, No. 15, pp. 2877-2891.
Gamer, M.E. (1989), 'Risk Mitigation of Wildfire Hazards at the Wildland Urban
Interface', MA thesis on file with the University of Arkansas, Fayetteville, USA.
Giri, C. and Shrestha, S. (2000), 'Forest fire mapping in Huay Kha Kheang Wildlife
Sanctuary, Thailand', International Journal of Remote Sensing, Vol.lO, pp. 2023-2030.
Gong, P. and Howarth, P.J. (1990a), 'The use of structural information for improving
land cover classification accuracies at the rural-urban fringe', Photogrammetric
Engineering and Remote Sensing, 56(1), pp. 67-73.
213
Integrating RS & GIS for Urban Fire Disaster Management. Sunil, 1999-2002
Gong, P. and Howarth, P.J. (1990b), 'An assessment of some factors influencing
multispectral land-cover classification', Photogrammetric Engineering and Remote
Sensing, 56(5), pp. 597-603.
Gonzales, M.L. (2002), 'ESRI Product Review', [Online],
A vailable:www.intelligententerprise.com/00818/products.shtml [2002, Nov.1]
Gould, M, D., Joel, A. T. and Basil, S. (1988), 'Applying spatial search techniques to
chemical emergency management', ln Proc. GlS/LIS 1988. 3~ pp. 843-51
Granger, K., Jones, T., Leiba, M and Scott, G. (1999), 'Cities project: Community Risk
in Cairns, a Multihazard Risk Assessment', Report of Australian Geological Survey
Organization.
Granger, K. (2000), 'An information infrastructure for disaster management in Pacific
island countries', Australian Journal of Emergency Management, Vol.15, No. 1, pp.
20-32.
Grenzdorffer, G. and Bill, R. (1994), 'Digital orthophotos for mapping and
interpretation in hybrid GIS-environment', International Archives of Photogrammetry
and Remote Sensing, 30(4), pp. 467-475.
Guidelines for Hazardous Activity. (1992), Hazardous Industry Planning, Advisory
Paper No.6, Dept of Planning, Sydney, Australia.
Handmer, J. and Penning-Rowsell, B.C. (Editors) (1990), 'Hazard and the
Communication of Risk', Gower Technical Press, Aldershot, UK.
214
Integrating RS a: GIS for Urban Fire Disaster Management. Sunil, 1999-2002
Henderson, D., Reardon, G. and Ginger, J. (1999), 'Disaster prevention for the 21st
century', In Proc. Australian Disaster Conference, Canberra, Australia, pp. 47-52.
Hewitt, K. (Editor), (1983), Interpretations of Calamity, Allen and Unwin, London.
Hewitt, K. (1997), 'Regions of Risk: a Geographical Introduction to Disasters',
Longman, Harlow, UK.
Hodgson, M.E. and Palm, R. (1992), 'Attitude toward disaster: a GIS design for
analyzing human response to earthquake hazards', Geo-Info Systems, July-August
1992, pp. 41-51.
Jensen, J. (1993), 'Urban/Suburban landuse analysis', In Manual ofRemote Sensing,
Vol. ll, 2nd edition., (Editors. John, E. E), American Society ofPhotogrammetry, Falls
Church, USA.
Jensen, J.R. and Cowen, D.C. (1999), 'Remote Sensing of urban/suburban
infrastructure and socio-economic attributes', Review Article, Photogrammetric
Engineering & Remote Sensing, Vol. 65, No.5, pp. 611-622.
Jensen, J.R. and Toll, D. (1982), 'Detecting residential land-use development at the
urban fringe', Photogrammetric Engineering and Remote Sensing, 48(4), pp. 629-643.
Kam, T. (1995), 'Integrating GIS and remote sensing techniques for urban land-cover
and land-use analysis', Geocarto International, 10 (1), pp. 39-48.
215
Integrating RS 8: GIS for Urban Fire Disaster Management. Sunil, 1999-2002
Keller, A.Z., Wilson, H. and Kara-Zaitri, C. (1990), 'The Bradford Disaster Scale',
Disaster Management, Vol. 2, Issue 4, pp. 207-213.
Kelly, C. (1999), 'Simplifying disasters: developing a model for complex non-linear
events', Australian Journal ofEmergencyManagement, Vol.14, No.1, pp. 25-27.
Kushla, D. J. and Ripple, W.J. (1998), 'Assessing wildfire effects with Landsat
thematic mapper data', International Journal of Remote Sensing, Vol.l9, No. 13, pp.
2493-2507.
Lazzari, M. and Salvaneschi, P. (1999), 'Embedding a geographic information system
in a decision support system for landslide hazard monitoring', Natural Hazards, 20, pp.
185-195.
Leigh, R. and Kuhnel. (1999), 'Hailstorm risk assessment in New South Wales', In
Proc. Australian Disaster Conference, Canberra, Australia, pp. 275-280.
Lirrer, L., and Vitelli, L. (1998), 'Volcanic risk assessment and mapping in the
Vesuvian area using GIS', Natural Hazards, 17, pp. 1-15.
Lo, C. and Welch, R. (1977), 'Chinese urban population estimates', Annals of the
Association of American Geographers, 67, pp. 246-253.
Lowry, J. H., Harvey, J. M. and George, F. H. (1995), 'A GIS based sensitivity analysis
of community vulnerability to hazardous contaminants on the Mexico/US border',
Photogrammetric Engineering and Remote Sensing, 61(11), pp. 1347-59.
216
Integrating RS 8: GIS for Urban Fire Disaster Management. Sunil, 1999-2002
Luke, P. F., Andrew, J. L. H and Robert, W. (2001), 'Improved identification of
volcanic features using Landsat 7 ETM+', Journal of Photogrammetry and Remote
Sensing, Vol. 78, Issue 1-2, October, pp.180-193.
Managing Fire Services. (1988), Second Edition, (Editors, Ronny, J.C. and John, A.G),
Published for the ICMA Training Institute, USA.
Martellaci, C., Peroni, P. and D'Epifanio, A. (1993), 'Analysis ofbioclimatic factors to
evaluate fire risk conditions', In Pro c. Int. Workshop on Satellite Technologies and GIS
for Mediterranean Forest Mapping and Fire Management, Thessaloniki, Greece (in
stampa).
McMaster, H. (1999), 'Hailstorm risk assessment in rural New South Wales, In Proc.
Australian Disaster Conference, Canberra, Australia, pp. 281-286.
McMaster, R. B. (1990), 'Modelling community vulnerability to hazardous materials
using Geographic Informations Systems', In Introductory readings in GIS, (Editors,
Peuquet, D.J and Marble, D.F), London: Taylor and Francis, pp.183-94.
Mitchell, J.K. (1999), 'Megacities and natural disasters: a comparative analysis',
GeoJoumal, 49, pp. 137-142.
Murai, S. and Mustra, R. (1988), 'Assessment of the urban environment of Jakarta
using SPOT data', Asian-Pacific Remote Sensing Journal, 1 (1 ), pp. 39-48.
217
Integrating RS & GIS for Urban Fire Disaster Management. Sunil, 1999-2002
Nancy, H. F. F., Laura L. B., Yang, W. and Eric, S. K. (1999), 'Initial observations of
Radarsat imagery at fire-disturbed sites in interior Alaska', Remote Sensing of the
Environment, Vol. 68, Issue 1, April, pp. 89-94.
New South Wales Fire Brigade, (1996), 'Hazard Categorization Project', Corporate
Strategy Group, New South Wales Fire Brigades, Sydney, Australia.
Nossin, J. J. (1999), 'Monitoring of hazards and urban growth in Villavicencio,
Columbia, using scanned air photos and satellite imagery', Geo-joumal, 49, pp. 151-
158.
OAS. (1990), Disaster, Planning and Development: Managing Natural Hazards to
Reduce Loss, Department of Regional Development and Environment, Organization of
American States. Washington, USA, pp.80.
Omakupt, M. (1992), 'Application of GIS/RS for renewable resources damaged by
Typhoon Gay; Chumpton Province', In Proc. 17th ISPRS Congress, val. 29, part B7,
Commission 7, ASPRS, Bethesda, Maryland, USA, pp. 744-749.
O'Neill, A.L., Head, L.M. and Marthick, J.K. (1993), 'Integrating remote sensing and
spatial analysis techniques to compare aboriginal and pastoral fire patterns in the East
Kimberley, Australia', Applied Geography, 13, pp. 67-85.
Parent, P. (1991), 'Digital ortho-photography provides a new roll for GIS database
integration', GIS World, 4 (8), pp. 48-49.
218
Integrating RS 8: GIS for Urban Fire Disaster Management. Sunil, 1999-2002
Pareschi, M.T., Cavarra, L., Favalli, M., Giannini, F. and Meriggi, A. (2000), 'GIS and
volcanic risk management', Natural Hazards, 21, pp. 361-379.
Ramsey, M.S. and Arrowsmith, J.R. (2001), 'New images of fire scars may help to
mitigate future natural hazards', EOS, Trans. Amer. Geophys. Union, 82:36, pp. 393-
398.
Rayner, S. (1992), 'Cultural theory and risk analysis', In Social Theories ofRisk,
(Editors, Krimsky, S. and Golding, D), Praeger, Westport, pp. 83-155.
Remion, M.C. (1990), 'Assessment of Hurricane Hugo damage on state and private
lands in South Carolina', In Proc. Third Forest Service Remote Sensing Applications
Conference, ASPRS, Bethesda, Maryland, USA, pp. 41-46
Rhodes, A. and Reinholtd, S. (1999), 'A framework for understanding and monitoring
levels of preparedness for wildfire', In Proc. Australian Disaster Conference, Canberra,
Australia, pp. 141-146.
Riano, D., Chuvieco, E., Ustin, S., Zomer, R., Dennison, P., Roberts, D. and Salas, J.
(2001), 'Assessment ofvegetation regeneration after fire through multitemporal
analysis of A VIRIS images in the Santa Monica Mountains', Journal of
Photogrammetry and Remote Sensing, 79, Issue 1, pp.l80-193.
Richards, J. (1986), 'Remote Sensing Digital Image Analysis an Introduction'.
Springer-Verlag, New York.
219
Integrating RS a GIS for Urban Fire Disaster Management. Sunil, 1999-2002
Ridd, Merrill. (1995), 'Exploring a V-I-S (Vegetation impervious-surface-soil) model
for urban ecosystem analysis through remote sensing: Comparative anatomy for cities',
International Journal of Remote Sensing, 16, pp. 2165-85.
Ridley, H.M., Atkinson, P.M., Aplin, P., Muller, J. and Dowman. (1998), 'Evaluating
the potential of the forthcoming commercial U.S high resolution satellite sensor
imagery at the ordnance survey', Photogrammetric Engineering and Remote Sensing,
63(8), pp.997-1005.
Roessner, S., Uta-Heiden, K.S., Munier, K. and Kauffinann, H., (1998), 'Application of
hyperspectral DIAS data for differentiation of urban surfaces in the city of Dresden,
Germany, In First EARSel Workshop on Imaging Spectroscopy, University of Zurich,
Switzerland, 6-8 October, pp. 679-688.
Royal Society, (1983), Risk Assessment: Report of a Royal Society Study Group,
Royal Society, London.
Rynn, J.M.W. and Okazaki, K. (1999), 'Earthquake mitigation strategies in Australia
and the IDNDR RADIUS initiative', In Proc. Australian Disaster Conference,
Canberra, Australia, pp. 75-79.
Saraf, A. K. and Choudhury, P. R. (1997), 'Integrated application of remote sensing
and GIS groundwater exploration in hard rock terrain', In Proc. Int. Symp. on
Emerging Trends in Hydrology, Roorkee, India, Vol. I, pp. 435-442.
220
Integrating RS a GIS for Urban Fire Disaster Management. Sunil, 1999-2002
Saraf, A. K. and Choudhury, P. R. (1998), 'Integrated Remote Sensing and GIS for
Groundwater Exploration and Identification of artificial recharge sites', International
Journal of Remote Sensing, 19(10), pp. 1825 -1841.
Schaenman, P. (1988), 'Management information systems and data analysis', In
Managing Fire Services, Second Edition,(Editors, Ronny, J. C. and John, A. G) pp.129-
165.
Siegert, F. and Hoffmann, A.A. (2000), 'The 1998 forest fires in East Kalimantan
(Indonesia): A quantitative evaluation using high resolution Multitemporal ERS-2 SAR
Images and NOAA-A VHRR Hotspot Data, Journal of Photogrammetry and Remote
Sensing, Vol.72, Issue 1, pp. 64-77.
Smith, P., Nicholson, J. and Collett, L. (1996), In Proc. NDR96 Conference on Natural
Disaster Reduction, Gold Coast, Australia, Country Fire Authority (CFA),Victoria,
Australia, pp. (unavailable).
Smith, R., Craig, R., Steber, M., Marsden, J., McMillan, C. and Adams, J. (1999), 'Fire
in the top end', GIS User, No. 31, pp. 18-21.
Smyth, C.G. and Royle, S.A. (2000), 'Urban landslide hazards: incidence and causative
factors in Niteroi, Rio de Janeiro State, Brazil', Applied Geography, 20, pp. 95-117.
221
Integrating RS ft GIS for Urban Fire Disaster Management. Sunil, 1999-2002
Stenchion, P. (1997), 'Development and disaster management', Australian Journal of
Emergency Management, Vol. 8, No.1, pp. 40-44.
Sunil, B., Forster, B., Kusukawa, M. and Neal, T. (2001), 'Applications ofhigh spatial
broad band sensors for vulnerability mapping- a case of hail storm disaster in Sydney,
Australia', Asian Journal ofGeoinformatics, Vol. 1, No.3, March, pp. 53-61.
Sutton, P. (1997), 'Modeling population density with night-time satellite imagery and
GIS', Computers, Environment, and Urban Systems, 21(3/4), pp. 227-244.
Tappan, G.G., Moore D.G. and Knausenberger, W.l. (1991), 'Monitoring grasshopper
and locust habitats in Sahelian Africa using GIS and remote sensing technology'.
International Journal of Geographical Information Systems, Vol.5, pp. 123-135.
Thomson, C. N. and Hardin, P. (2000), 'Remote Sensing/GIS integration to identify
potential low-income housing sites', Cities, Vol.l7, No 2, pp. 97-109.
Thorpe, J., Thorpe, A. and Klimiuk M. (1994), 'The handling of large digital
orthophoto raster data-base in GIS', International Archives of Photogrammetry and
Remote Sensing, 31(4), pp. 457-459.
Ditto, J.I. (1998), 'The geography of disaster vulnerability in megacities', Applied
Geography, Vol. 18, No.1, pp. 7-16.
222
Integrating RS 8: GIS for Urban Fire Disaster Management. Sunil, 1999-2002
Ulbricht, K. A. and Heckendorff, W. D. (1998), 'Satellite images for recognition of
landscape and land-use changes', Journal of Photogrammetry and Remote Sensing,
Vol.53, Issue 4, pp. 235-243.
UNDRO, (1991), 'Mitigating Natural Disasters, Phenomena, Effects and Options'.
United Nations Disaster Relief Co-ordinator, United Nations, New York, pp.164.
USAID/OAS, (1993), Caribbean Disaster Mitigation Project, Project document
USAID/OAS, Washington D.C.
USEPA. (1996), 'Accidental release prevention requirements: Risk management
programs under the Clean Air Act, Section 112 ® (7). Federal Register 61 (120), pp.
31667-31730.
Uta, H., Roessner, S. and Segl, K. (2001), 'Potential ofhyperspectral data for material
oriented identification of urban surfaces', In Proc. 2nd International Symposium on
Remote Sensing ofUrban Area, Regensburg, Germany, pp. 69-77.
Verstappen, H. (1995), 'Aerospace technology and natural disaster reduction',
Adv.Space.Res, Vol. 15, No. 11, pp. (11)3-(11)15.
Visvalingam, M. (1991), 'Areal Units and the Linking of Data; Some Conceptual
Issues', (Editor, Worrall, L), Spatial Analysis and Spatial Policy Using Geographic
Information Systems, (Belhaven Press, London), pp. 12-37.
223
Integrating RS ft GIS for Urban Fire Disaster Management. Sunil, 1999-2002
Walker, G., Mooney, J. and Pratts, D. (2000), 'The people and the hazard: the spatial
context of major accident hazard management in Britain', Applied Geography, Vol. 20,
pp. 119-135.
Watson Jr., C. C. (1992), 'GIS aids hurricane planning', GIS World (special issue), July,
1992, pp. 46-52.
Weinstein, D., Green, K., Campbell, J. and Finney, M. (1995), 'Fire growth modelling
in an integrated GIS environment', In Proc. ESRI International User conference,
California, 22-26 May, and [Online] Available:
http:// gis.esri.com/library/userconf/proc95/to 1 OO/p092.html. [2002, October.26].
Welch, R. (1982), 'Spatial resolution requirements for urban studies', International
Journal of Remote Sensing, 3(2), pp.132-146.
Wells, M. and Mckinsey, D.E. (1991), 'Risk mitigation of wildfire hazards at the
wildland-urban interface in Northwest Arkansas', [Online], Available:
http://www.cast.uark.edu/~mike/Chapter2.html#Literature Review [2002, Oct. 26]
Westen van, C.J. (1993-4), 'Remote sensing and geographic information systems for
geological hazard mitigation', ITC Journal, 1993-4, pp. 393-399.
Whittow, J. (1980), Disasters: The Anatomy of Environmental Hazards, Pelican,
London.
224
Integrating RS 8: GIS for Urban Fire Disaster Management. Sunil, 1999-2002
Wiesmann, A., Wegmuller, U., Honikel, M., Strozzi, T., Charles, L. and Werner.
(2001), ' Potential and methodology of satellite based SAR for hazard mapping', In
Proc. IGARSS, Sydney, Australia, pp. (Not provided in proc).
Yool, S.R., Eckhardt, D.W. and Cosentino, M.J. (1985), 'Describing the brushfire
hazard in Southern California', Anal. Assoc. Am. Geogrph. 75: pp. 431-442.
Zerger, A.Z. (1998), 'Cyclone Inundation Risk Mapping', PhD Thesis, Australian
National University.
Zhou, Q. (1995), 'The integration of GIS and remote sensing for land resource and
environment management', In Proc. United Nations ESCAP Workshop on GIS/RS for
Land and Marine Resources and Environmental Management, Suva, Fiji, pp. 43-55.
225
Integrating RS ft GIS for Urban Fire Disaster Management. Sunil, 1999-2002
Appendix I
INTEGRATING IMAGING SPECTROSCOPY & GIS FOR SPATIAL EMERGENCY DECISION SUPPORT SYSTEMS
(SEDSS)
A Case of Hail Storm Damage and Post Disaster Management, Sydney, NSW, Australia
By
*Sunil Bhaskaran, *Bruce Forster & **Trevor Neal
*SCHOOL OF SURVEYING & SPATIAL INFORMATION SYSTEMS (Formerly Geomatic Engineering)
Faculty of Engineering, University ofNew South Wales Sydney,2052,NSVV
**CORPORATE STRATEGY DIVISION, New South Wales Fire Brigades
Sydney,2000 Australia
Technical Report Prepared for the Corporate Strategy Division, New South Wales Fire Brigades, Sydney, Australia.
December 2001
226

The following article has been removed from the digital copy of this thesis. Please see the print copy of the thesis for a complete manuscript.
Title: INTEGRATING IMAGING SPECTROSCOPY & GIS FORSPATIAL EMERGENCY DECISION SUPPORT SYSTEMS (SEDSS): A Case of Hail Storm Damage and Post Disaster Management, Sydney,NSW, Australia Authors: Sunil Bhaskaran, Bruce Forster & Trevor Neal
Integrating RS & GIS for Urban Fire Disaster Management. Sunil, 1999-2002
Appendix II
Description of layers in master table in (Bathurst And Hornsby-Shire) master attribute
table - Bathurst, NSW, Australia.
The MAT has fifteen (15) fields and one thousand eight (1 008) records of data, which
contain detailed hazard related information for each spatial unit. The Master Attribute
table was created after various spatial analysis operations in multiple GIS/RS
softwares.
1.Amgrd: This field shows the basic spatial units used in this study. The area of each
unit is given in metres (62,500 sq metres) which is equal to 250m by 250. The hazard
distribution is shown for each spatial unit, which enables comparison of different levels
of hazards.
2.Permtr (Perimeter): This field shows the total perimeter area of each spatial unit
3.Amcv _: The identification of each spatial unit is issued by the GIS system
automatically. These ID numbers are unique and were used to perform analyses.
4.Amcv _id: The identification issued by the user. This is also unique and can be
manipulated according to the users requirements. This id was also used in several
analyses.
5.Structr (Structures): The number of structures were calculated for the entire region of
Bathurst. Advanced sequel (SQL) programmes were used to intersect the number of
structures for each spatial units. This field shows the number of structures for each
spatial unit.
273
Integrating RS & GIS for Urban Fire Disaster Management. Sunil, 1999-2002
6.Rfarea (Roof Area): The built area in the region was calculated by drawing polygons
on the roofs of the structures from the orthorecti:fied aerial photo images. This field
gives an estimate of overall built area and the degree of congestion.
7. Resa (Residential area): Land-uses were estimated for each spatial unit by geometric
intersection. The field shows the area of residential land in each spatial unit
8.1nda (Industrial land-use): The industrial land-use for each spatial unit was estimated
by geometric intersection. The industrial land-use area covered by each spatial gives an
idea of the hazard posed by industries in that spatial unit
9. Sevbz (Service business): Commercial land-use was estimated for the entire region.
Commercial land-use was subdivided into service business and general business area.
This field shows the service business area for each spatial unit.
10. Genbz (General Business): Commercial land-use was estimated for the entire
region. Commercial land-use was subdivided into service business and general business
area. This field shows the general business area for each spatial unit.
274
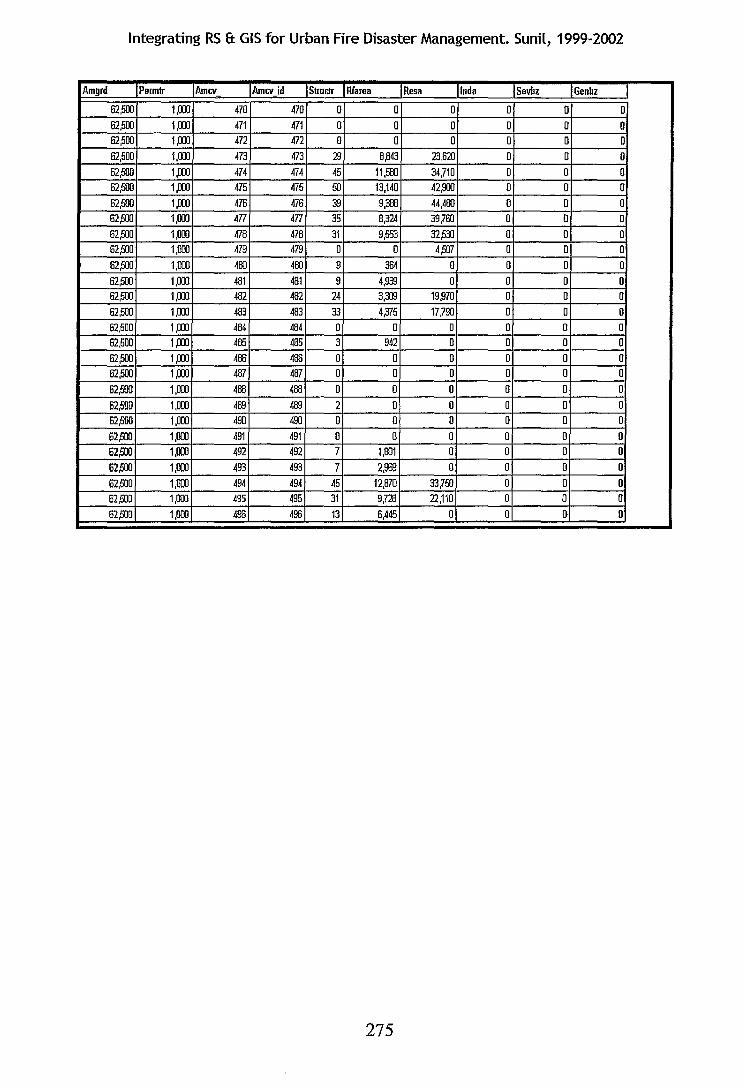
Integrating RS & GIS for Urban Fire Disaster Management. Sunil, 1999-2002
Amgrd Permtr Amcv Amcv id Structr Rfarea Resa lnda Sevbz Genbz
62,500 1,000 470 470 0 0 0 0 0 0 62,500 1,001 471 471 0 0 0 0 0 0 62,500 1,000 472 472 0 0 0 0 0 0 62,600 1,000 473 473 29 8,843 23,620 0 0 0 62,600 1,000 474 474 45 11,580 34,710 0 0 0 62,600 1,001 475 475 50 13,140 42,!XXI 0 0 0 62,500 1,000 476 476 39 9,388 44,480 0 0 0 62,500 1,000 477 477 35 8,324 39,760 0 0 0 62,500 1,000 478 478 31 9,553 32,530 0 0 0 62,500 1,000 479 479 0 0 4,507 0 0 0 62,500 1,000 480 480 9 364 0 0 0 0 62,500 1,000 481 481 9 4,939 0 0 0 0 62,500 1,000 482 482 24 3,313 19,970 0 0 0 62,500 1,00J 483 483 33 4,375 17,790 0 0 0 62,500 1,000 484 484 0 0 0 0 0 0 62,600 1,000 485 485 3 942 0 0 0 0 62,500 1,000 486 486 0 0 0 0 0 0 62,500 1,000 487 487 0 0 0 0 0 0 62,500 1,000 488 488 0 0 0 0 0 0 62,600 1,000 489 489 2 0 0 0 0 0 62,500 1,000 490 490 0 0 0 0 0 0 62,500 1,000 491 491 0 0 0 0 0 0 62,600 1,000 492 492 7 1,801 0 0 0 0 62,500 1,001 493 493 7 2,969 0 0 0 0 62,500 1,000 494 494 46 12,870 33,750 0 0 0 62,600 1,000 495 495 31 9,728 22,110 0 0 0 62,500 1,000 496 496 13 6,445 0 0 0· 0
275
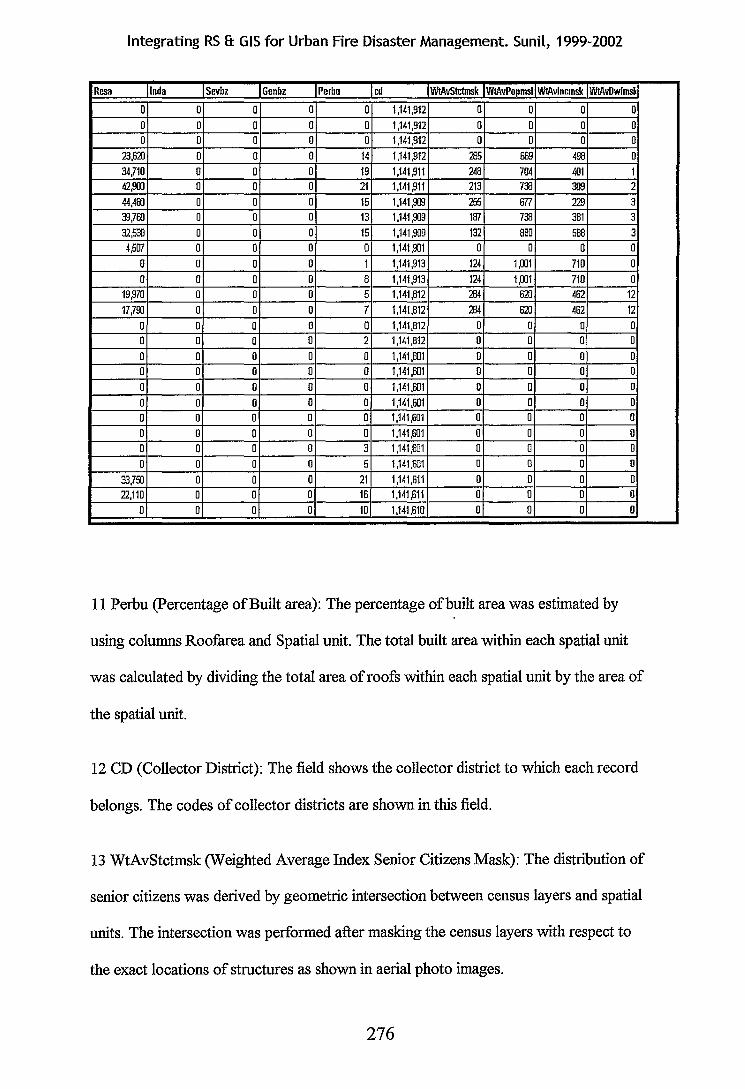
Integrating RS & GIS for Urban Fire Disaster Management. Sunil, 1999-2002
Resa lnda Sevbz Genbz Perbu cd IWtAvStctmsk WIAvPopmsl WIAvlncmsk WtAvDwlmsl<
0 0 0 0 0 1,141,912 0 0 0 0
0 0 0 0 0 1,141,912 0 0 0 0 0 0 0 0 0 1,141,912 0 0 0 0
23,62) 0 0 0 14 1,141,912 285 669 498 0 34,710 0 0 0 19 1,141,911 248 704 401 1 42,001 0 0 0 21 1,141,911 213 733 309 2 44,400 0 0 0 15 1,141,009 255 677 229 3 39,760 0 0 0 13 1,141 ,rog 187 733 381 3 32,5ll 0 0 0 15 1,141,909 132 880 588 3 4,507 0 0 0 0 1,141,901 0 0 0 0
0 0 0 0 1 1,141,913 124 1.001 710 0
0 0 0 0 8 1,141,913 124 1.001 710 0 19,970 0 0 0 5 1,141,812 284 62) 462 12
17.790 0 0 0 7 1,141,812 284 620 462 12
0 0 0 0 0 1,141,812 0 0 0 0 0 0 0 0 2 1,141,812 0 0 0 0
0 0 0 0 0 1,141,801 0 0 0 0 0 0 0 0 0 1,141,601 0 0 0 0
0 0 0 0 0 1,141,601 0 0 0 0
0 0 0 0 0 1,141,601 0 0 0 0 0 0 0 0 0 1,141,601 0 0 0 0
0 0 0 0 0 1,141,601 0 0 0 0 0 0 0 0 3 1,141,601 0 0 0 0
0 0 0 0 5 1,141,601 0 0 0 0
33,750 0 0 0 21 1,141,611 0 0 0 0 22,110 0 0 0 16 1,141,611 0 0 0 0
0 0 0 0 10 1,141,610 0 0 0 0
11 Perbu (Percentage ofBuilt area): The percentage ofbuilt area was estimated by
using columns Roofarea and Spatial unit. The total built area within each spatial unit
was calculated by dividing the total area of roofs within each spatial unit by the area of
the spatial unit.
12 CD (Collector District): The field shows the collector district to which each record
belongs. The codes of collector districts are shown in this field.
13 WtAvStctmsk (Weighted Average Index Senior Citizens Mask): The distribution of
senior citizens was derived by geometric intersection between census layers and spatial
units. The intersection was performed after masking the census layers with respect to
the exact locations of structures as shown in aerial photo images.
276
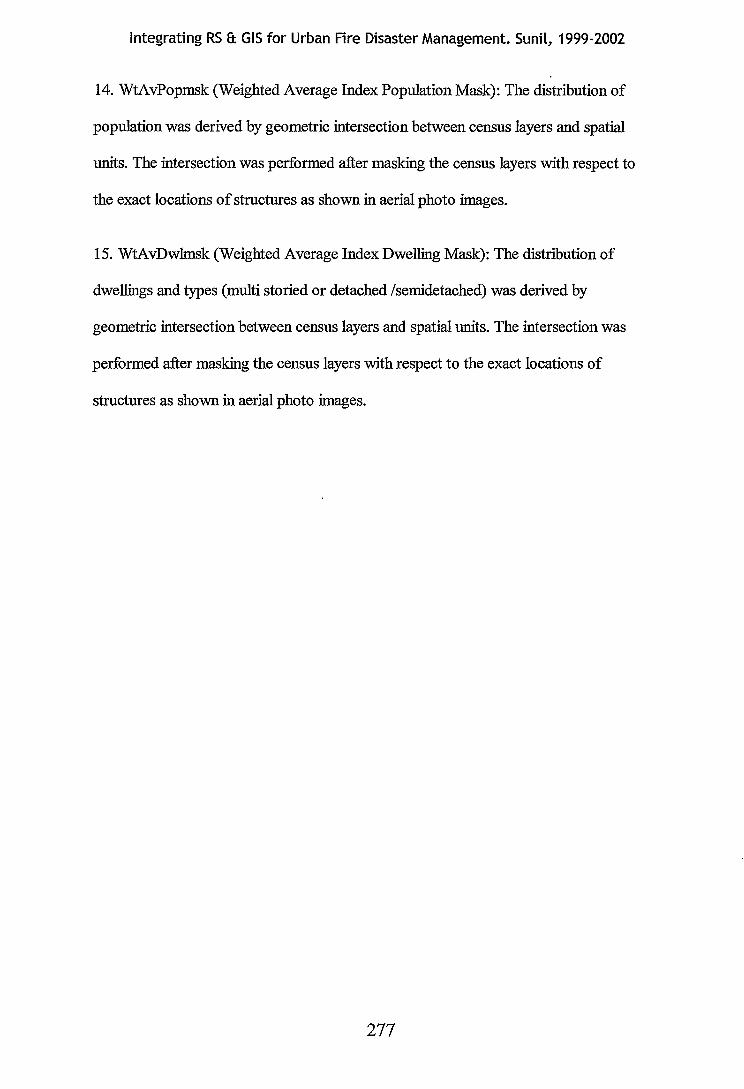
Integrating RS & GIS for Urban Fire Disaster Management. Sunil, 1999-2002
14. WtAvPopmsk (Weighted Average Index Population Mask): The distribution of
population was derived by geometric intersection between census layers and spatial
units. The intersection was performed after masking the census layers with respect to
the exact locations of structures as shown in aerial photo images.
15. WtAvDwlmsk (Weighted Average Index Dwelling Mask): The distribution of
dwellings and types (multi storied or detached /semidetached) was derived by
geometric intersection between census layers and spatial units. The intersection was
performed after masking the census layers with respect to the exact locations of
structures as shown in aerial photo images.
277
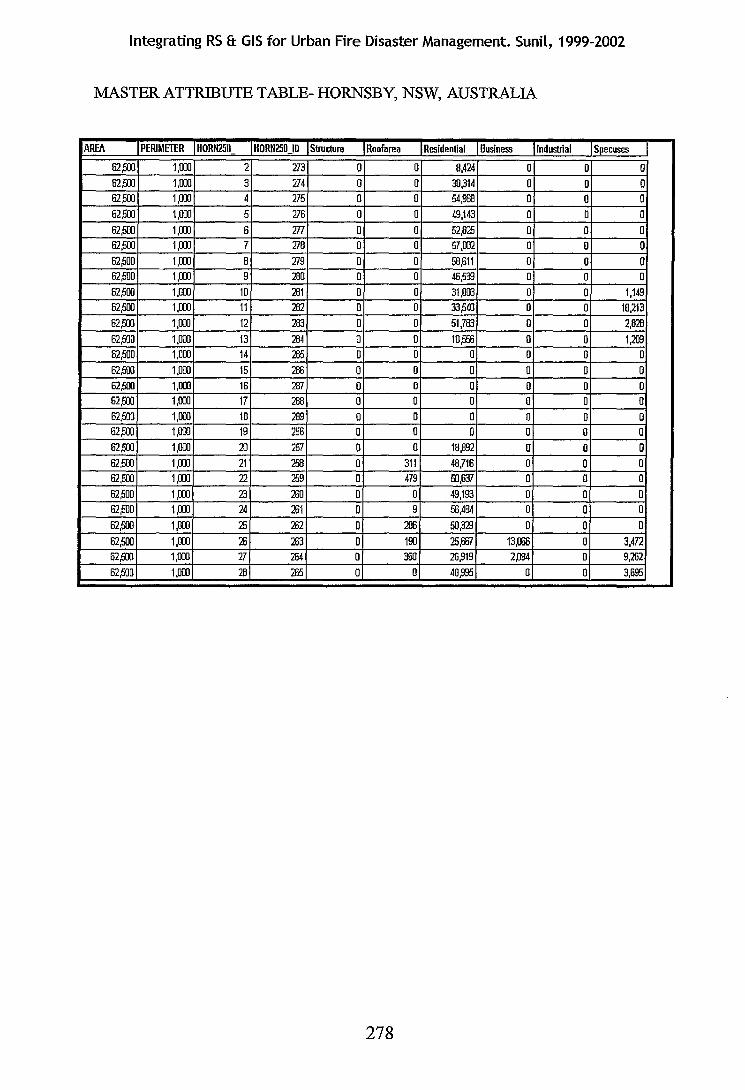
Integrating RS & GIS for Urban Fire Disaster Management. Sunil, 1999-2002
MASTER ATTRIBUTE TABLE- HORNSBY, NSW, AUSTRALIA
AREA PERIMRER HORH250 HORII250 _ID Structure _I_Roofarea Residential Business Industrial Specuses
62,500 1,000 2 273 0 0 8,424 0 0 0 62,500 1,000 3 274 0 0 30,314 0 0 0 62,500 1,000 4 275 0 0 54,988 0 0 0 62,500 1,000 5 276 0 0 49,143 0 0 0 62,500 1,000 6 277 0 0 52,825 0 0 0 62,500 1,000 7 278 0 0 57,002 0 0 0 62,500 1,000 B 279 0 0 58,611 0 0 0 62,500 1,000 9 280 0 0 46,539 0 0 0 62,500 1,000 10 281 0 0 31 ,oll3 0 0 1,149 62,500 1,000 11 282 0 0 33,540 0 0 18,213 62,500 1,000 12 283 0 0 51,783 0 0 2,828 62,500 1,000 13 284 0 0 10,5$ 0 0 1,209 62,500 1,000 14 285 0 0 0 0 0 0 62,500 1,000 15 286 0 0 0 0 0 0 62,500 1,000 16 287 0 0 0 0 0 0 62,500 1,000 17 288 0 0 0 0 0 0 62,500 1,000 18 289 0 0 0 0 0 0 62,500 1,000 19 256 0 0 0 0 0 0 62,500 1,000 20 257 0 0 18,892 0 0 0 62,500 1,000 21 25B 0 311 48,716 0 0 0 62,500 1,000 22 259 0 479 50,637 0 0 0 62,500 1,000 23 260 0 0 49,193 0 0 0 62,500 1,000 24 261 0 9 56,484 0 0 0
62,500 1,000 25 262 0 205 50,323 0 0 0 62,500 1,000 26 263 0 190 25,ff!il 13,oo6 0 3,472 62,500 1,000 27 264 0 360 26,919 2,094 0 9,262 62,500 1,000 28 265 0 0 48,995 0 0 3,695
278
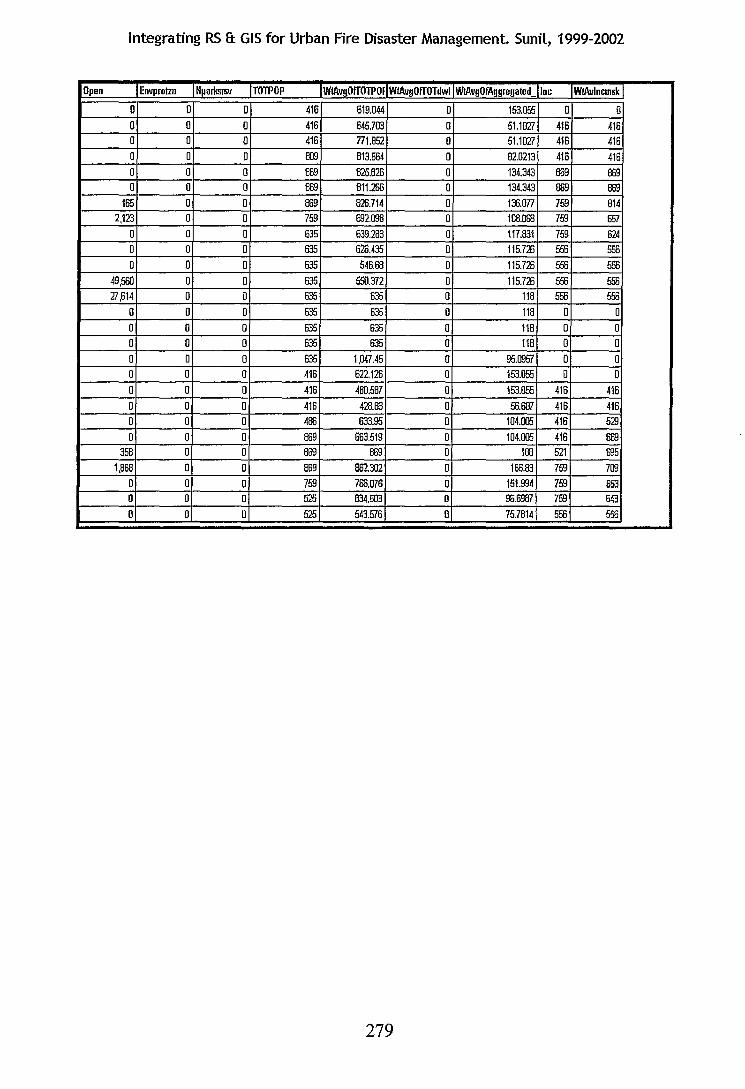
Integrating RS ft GIS for Urban Fire Disaster Management. Sunil, 1999-2002
Open IEnvprotzn Nparksw TOTPOP IWlAvgOfTOTPOI WtAvgOfTOTdwl WtAvgOfAggrcgated_ Inc WlAvlncmsk
0 0 0 416 619.044 0 153.055 0 0 0 0 0 416 645.703 0 51.1027 416 416 0 0 0 416 771.852 0 51.1027 416 416 0 0 0 809 813.564 0 82.0213 416 416 0 0 0 869 825.826 0 134.343 869 869 0 0 0 869 811.266 0 134.343 869 869
165 0 0 869 826.714 0 136.077 759 814 2,123 0 0 759 692.098 0 108.068 759 657
0 0 0 635 639.283 0 117.831 759 624 0 0 0 635 626..435 0 115.726 556 556 0 0 0 635 546.68 0 115.726 556 556
49,560 0 0 635 550.372 0 115.726 556 556 27,614 0 0 635 635 0 118 556 556
0 0 0 635 635 0 118 0 0 0 0 0 635 635 0 118 0 0 0 0 0 635 635 0 118 0 0 0 0 0 635 1,047.45 0 95.0957 0 0 0 0 0 416 622.126 0 153.055 0 0 0 0 0 416 480.587 0 153.055 416 416 0 0 0 416 428.83 0 56.607 416 416 0 0 0 486 633.95 0 104.005 416 529
0 0 0 869 663.519 0 104.005 416 669 358 0 0 869 869 0 188 521 695
1,868 0 0 869 862.302 0 166.83 759 709 0 0 0 759 766.076 0 151.994 759 653 0 0 0 525 834.503 0 96.6987 759 643
0 0 0 525 543.576 0 75.7814 556 556
279
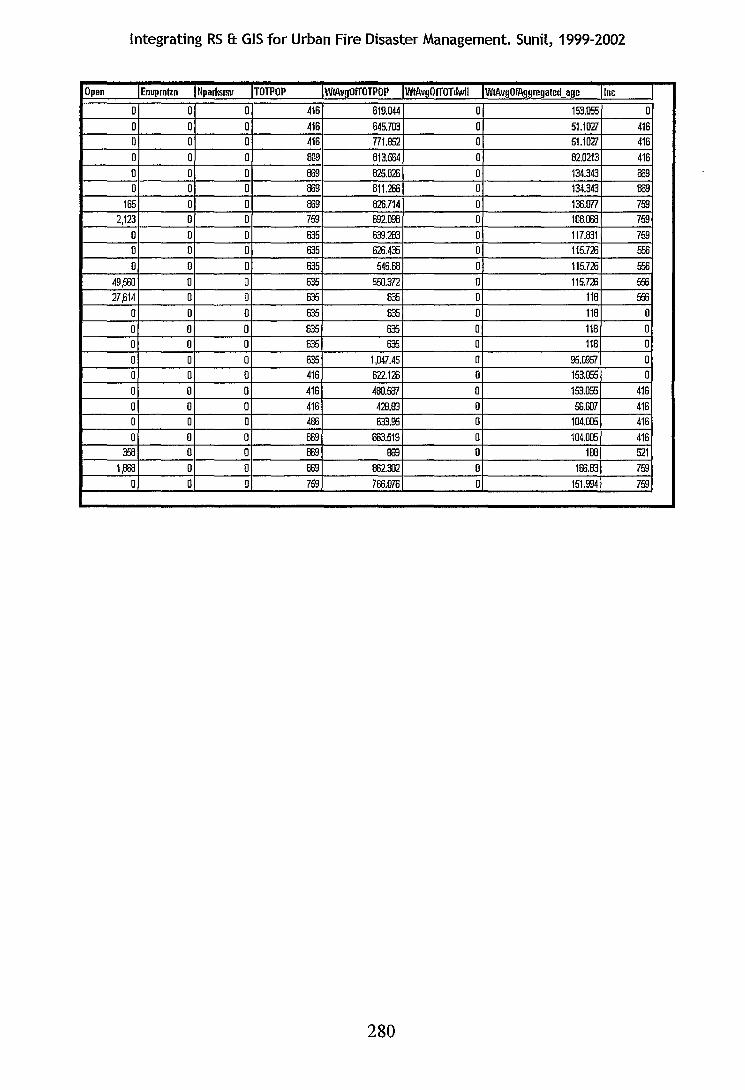
Integrating RS & GIS for Urban Fire Disaster Management. Sunil, 1999-2002
Open Emtprotzn NparksJSV TOTPOP WtAvgOfTOTPOP WtAvgOfTOTdwll WtAvgOfAggregaled_age Inc
0 0 0 416 619.044 0 153.055 0
0 0 0 416 645.703 0 51.1027 416 0 0 0 416 771.852 0 51.1027 416
0 0 0 809 813.564 0 82.0213 416 0 0 0 869 825.826 0 134.343 869 0 0 0 869 811.266 0 134.343 869
165 0 0 869 826.714 0 136.077 759 2,123 0 0 759 692.098 0 108.11i8 759
0 0 0 635 639.283 0 117.831 759 0 0 0 635 626.435 0 115.726 556
0 0 0 635 546.68 0 115.726 556 49,560 0 0 635 550.372 0 115.726 556 27,614 0 0 635 635 0 118 556
0 0 0 635 635 0 118 0
0 0 0 635 635 0 118 0 0 0 0 635 635 0 118 0
0 0 0 635 1,047.45 0 95.0957 0 0 0 0 416 622.126 0 153.055 0
0 0 0 416 480.587 0 153.055 416
0 0 0 416 428.83 0 56.607 416 0 0 0 486 633.95 0 104.005 416
0 0 0 869 663.519 0 104.005 416 358 0 0 869 869 0 188 521
1,868 0 0 869 862.302 0 1E6.83 759 0 0 0 759 766.076 0 151.994 759
280
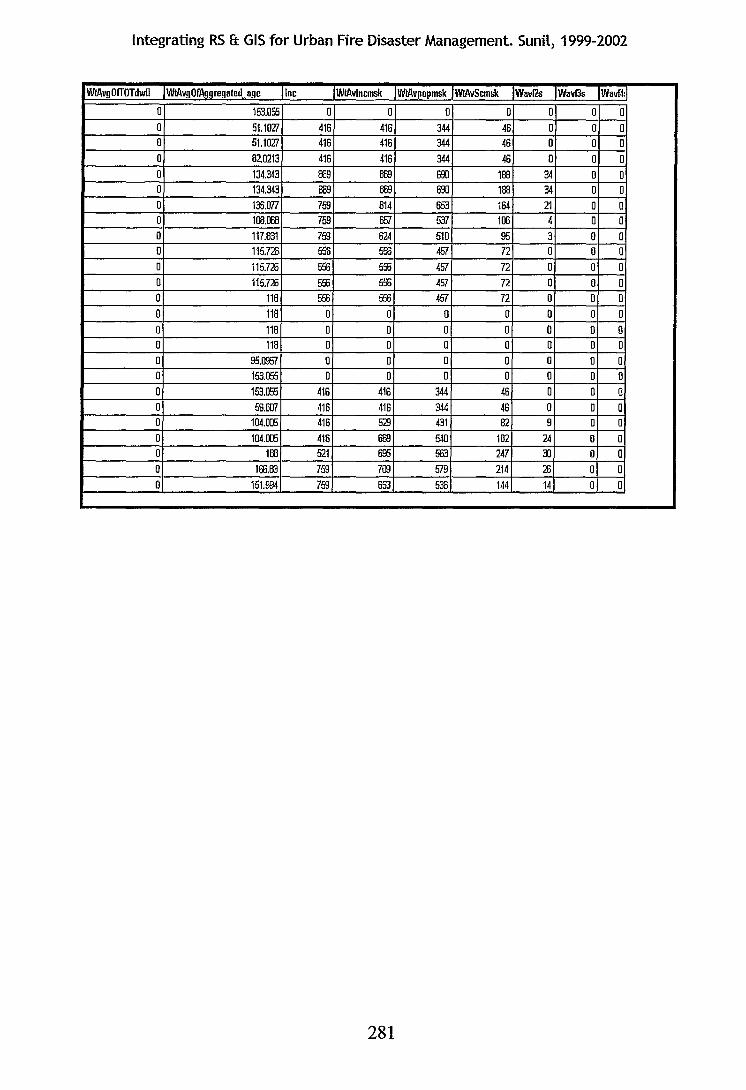
Integrating RS &: GIS for Urban Fire Disaster Management. Sunil, 1999-2002
W!AvgOfTOTdwll WfAvgOfAggregaled_age Inc W!Avlncmsk W!Avpopmsk WfAvScmsk Wavfls Wavf3s Wavf4:
0 153.055 0 0 0 0 0 0 a 0 51.1027 416 416 344 46 0 0 a 0 51.1027 416 416 344 46 a 0 0 0 82.0213 416 416 344 46 0 0 0 0 134.343 009 869 690 188 34 0 0 0 134.343 869 869 690 188 34 0 0 0 136.077 759 814 653 164 21 0 0 0 108.068 759 657 537 106 4 0 0 0 117.831 759 624 510 95 3 0 0 0 115.726 556 556 457 72 0 0 0 0 115.726 556 556 457 72 0 0 0 0 115.726 556 556 457 72 0 0 0 0 118 556 556 457 72 0 0 0
0 118 0 0 0 0 0 0 0
a 118 0 0 0 0 a 0 0 0 118 0 0 0 0 0 0 0 0 95.0957 0 0 0 0 0 0 0 0 153.055 0 0 0 0 0 0 0 0 153.055 416 416 344 46 0 0 0 0 56.607 416 416 344 46 0 0 a 0 104.005 416 529 431 82 9 0 0 0 104.005 416 669 540 182 24 0 0 0 188 521 695 563 247 ::0 0 0 0 166.83 759 709 579 214 26 0 0 0 151.994 759 653 536 144 14 0 0
281
Integrating RS & GIS for Urban Fire Disaster Management. Sunil, 1999-2002
282
Integrating RS ft GIS for Urban Fire Disaster Management. Sunil, 1999-2002
Appendix III
Update operations, options available and weighted average index method
The update operation and options considered before using the weighted average index
method. Many techniques of updating the geometrically intersected values to the
records in the Master Attribute Table. Of all the available methods ofupdating values
to the records the 'Weighted Average Index method was selected since the
generalization in this method was minimal.
An example of what each ofthe available methods does is described and shown below.
In this case the variable is population. For each grid the values will be updated after the
intersection process. The different CD codes are given in the first column. All these
CDs intersect the spatial unit.
The 'Sum' Method
1. Grid no 142
CDid Area Pop
1251 510 25 180m2 342 1251 505 2 337m2 931 1250 609 8 740m2 406 1250 608 25 920m2 413
Overall Area Pop Assigned is 342
2.Grid no 125
CDid Area Pop
1251512 12020 246 1251510 3143 342 1250608 6801 413 1250607 11900 700 1250606 28650 499
283
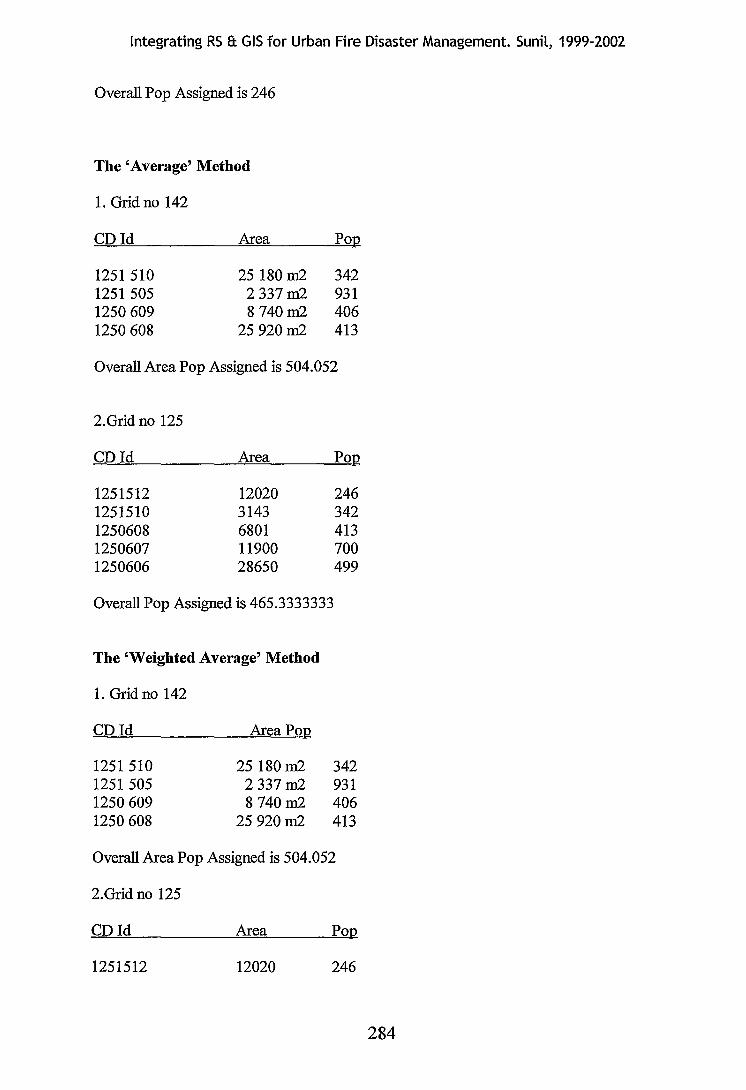
Integrating RS ft GIS for Urban Fire Disaster Management. Sunil, 1999-2002
Overall Pop Assigned is 246
The 'Average' Method
1. Grid no 142
CDid
1251 510 1251 505 1250 609 1250 608
Area Pop
25 180m2 342 2 337m2 931 8 740m2 406
25 920m2 413
Overall Area Pop Assigned is 504.052
2.Grid no 125
CDid
1251512 1251510 1250608 1250607 1250606
Area
12020 3143 6801 11900 28650
Pop
246 342 413 700 499
Overall Pop Assigned is 465.3333333
The 'Weighted Average' Method
1. Grid no 142
CDid
1251 510 1251 505 1250 609 1250 608
Area Pop
25 180m2 342 2 337m2 931 8 740m2 406
25 920m2 413
Overall Area Pop Assigned is 504.052
2.Grid no 125
CDid Area Pop
1251512 12020 246
284
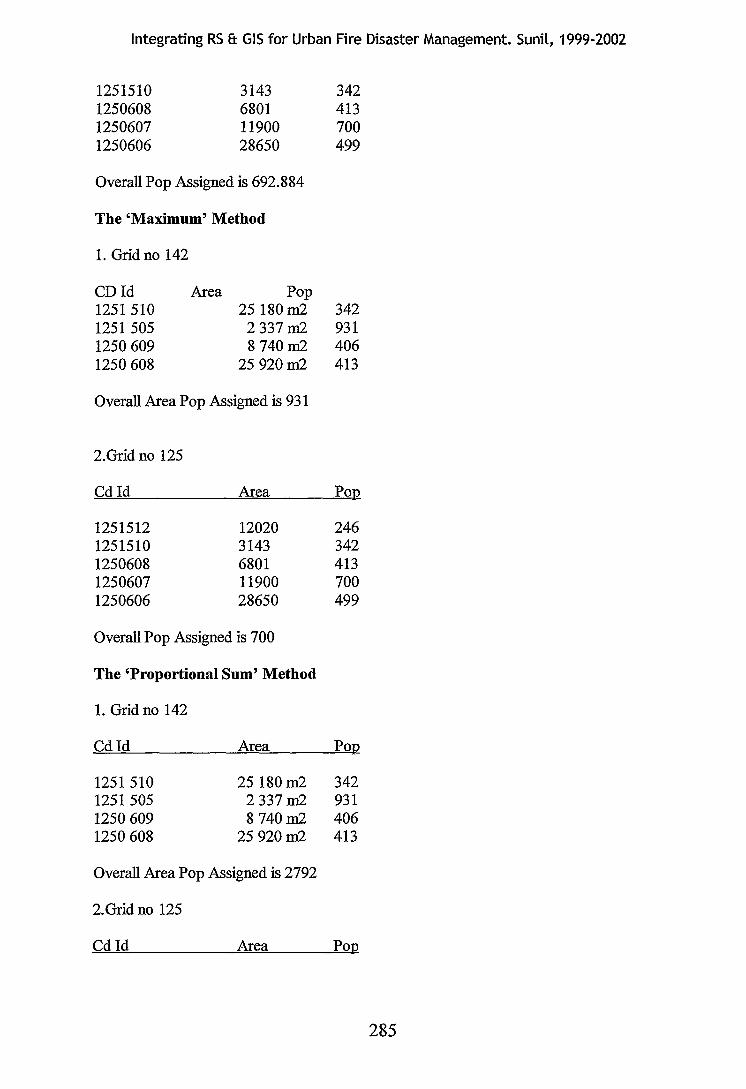
Integrating RS a GIS for Urban Fire Disaster Management. Sunil, 1999-2002
1251510 3143 342 1250608 6801 413 1250607 11900 700 1250606 28650 499
Overall Pop Assigned is 692.884
The 'Maximum' Method
1. Grid no 142
CDid Area Pop 1251 510 25 180m2 342 1251 505 2 337m2 931 1250 609 8 740m2 406 1250 608 25 920m2 413
Overall Area Pop Assigned is 931
2.Grid no 125
Cdld Area Pop
1251512 12020 246 1251510 3143 342 1250608 6801 413 1250607 11900 700 1250606 28650 499
Overall Pop Assigned is 700
The 'Proportional Sum' Method
1. Grid no 142
Cdld Area Pop
1251 510 25 180m2 342 1251 505 2 337m2 931 1250 609 8 740m2 406 1250 608 25 920m2 413
Overall Area Pop Assigned is 2792
2.Grid no 125
Cdld Area Pop
285
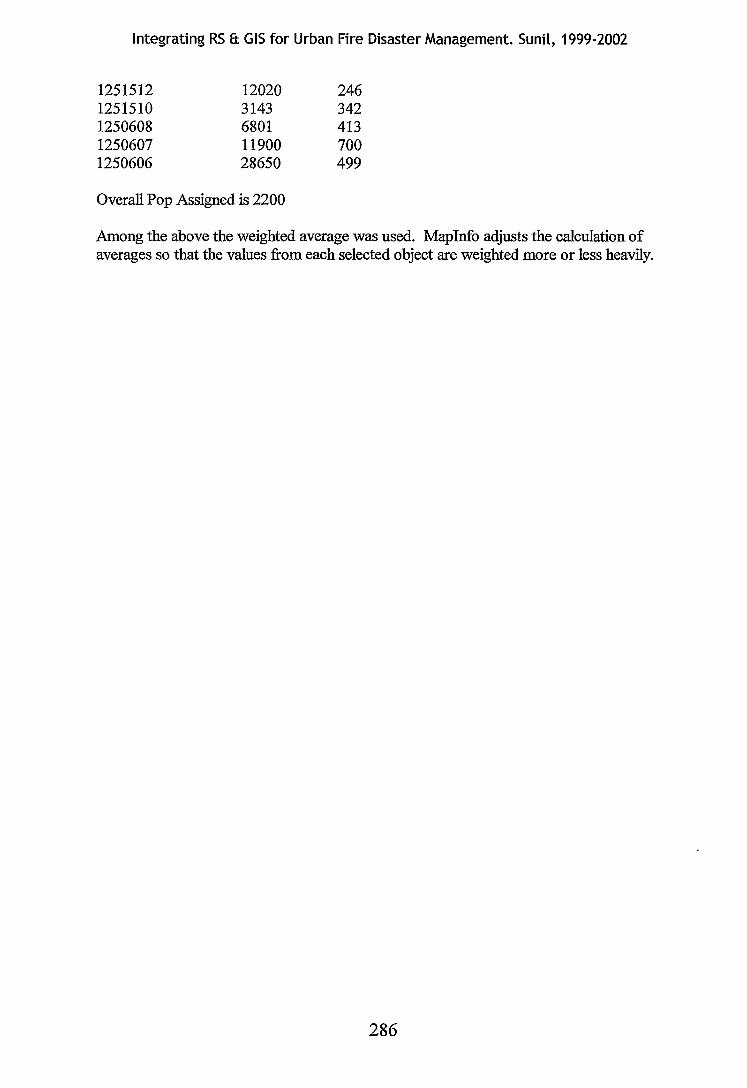
Integrating RS 8: GIS for Urban Fire Disaster Management. Sunil, 1999-2002
1251512 1251510 1250608 1250607 1250606
12020 3143 6801 11900 28650
Overall Pop Assigned is 2200
246 342 413 700 499
Among the above the weighted average was used. Maplnfo adjusts the calculation of averages so that the values from each selected object are weighted more or less heavily.
286
Integrating RS & GIS for Urban Fire Disaster Management. Sunil, 1999-2002
287
Integrating RS & GIS for Urban Fire Disaster Management. Sunil, 1999-2002
Appendix IV
New South Wales Incident Reports
This database describes the number of incidents as well as the percentage increase in
population, for each fire station in NSW by postcodes and available resources found at
the fire station. The incidents, which have occurred since 1991 till 1996 according to
local govermnent area are also shown. This data may be overlain on the hazard map
which would reveal new trends in the occurrences ofhazards
288
Integrating RS 8: GIS for Urban Fire Disaster Management. Sunil, 1999-2002
Intentionally left blank ••• •.•••••••..••••••.•••••••.•••••••••••••••••
289
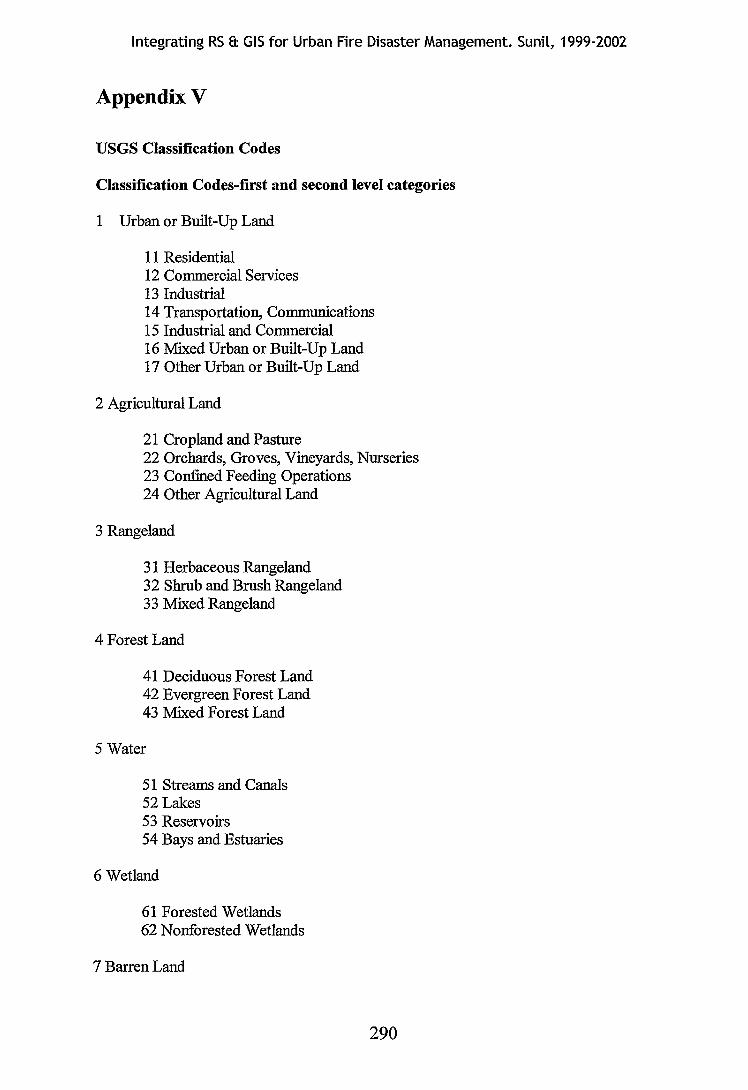
Integrating RS & GIS for Urban Fire Disaster Management. Sunil, 1999-2002
AppendixV
USGS Classification Codes
Classification Codes-first and second level categories
1 Urban or Built-Up Land
11 Residential 12 Commercial Services 13 Industrial 14 Transportation, Communications 15 Industrial and Commercial 16 Mixed Urban or Built-Up Land 17 Other Urban or Built-Up Land
2 Agricultural Land
21 Cropland and Pasture 22 Orchards, Groves, Vineyards, Nurseries 23 Confined Feeding Operations 24 Other Agricultural Land
3 Rangeland
31 Herbaceous Rangeland 32 Shrub and Brush Rangeland 33 Mixed Rangeland
4 Forest Land
41 Deciduous Forest Land 42 Evergreen Forest Land 43 Mixed Forest Land
5 Water
51 Streams and Canals 52 Lakes 53 Reservoirs 54 Bays and Estuaries
6 Wetland
61 Forested Wetlands 62 Nonforested Wetlands
7 Barren Land
290
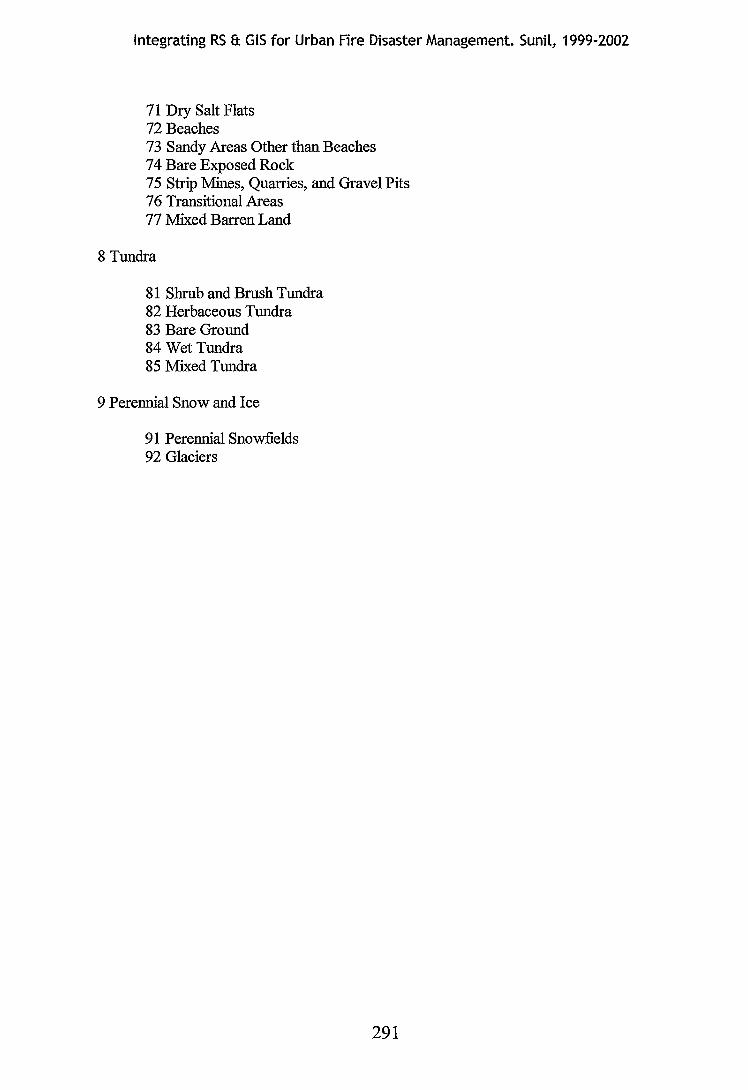
Integrating RS 8: GIS for Urban Fire Disaster Management. Sunil, 1999-2002
71 Dry Salt Flats 72 Beaches 73 Sandy Areas Other than Beaches 7 4 Bare Exposed Rock 75 Strip Mines, Quarries, and Gravel Pits 76 Transitional Areas 77 Mixed Barren Land
8 Tundra
81 Shrub and Brush Tundra 82 Herbaceous Tundra 83 Bare Ground 84 Wet Tundra 85 Mixed Tundra
9 Perennial Snow and Ice
91 Perennial Snowfields 92 Glaciers
291
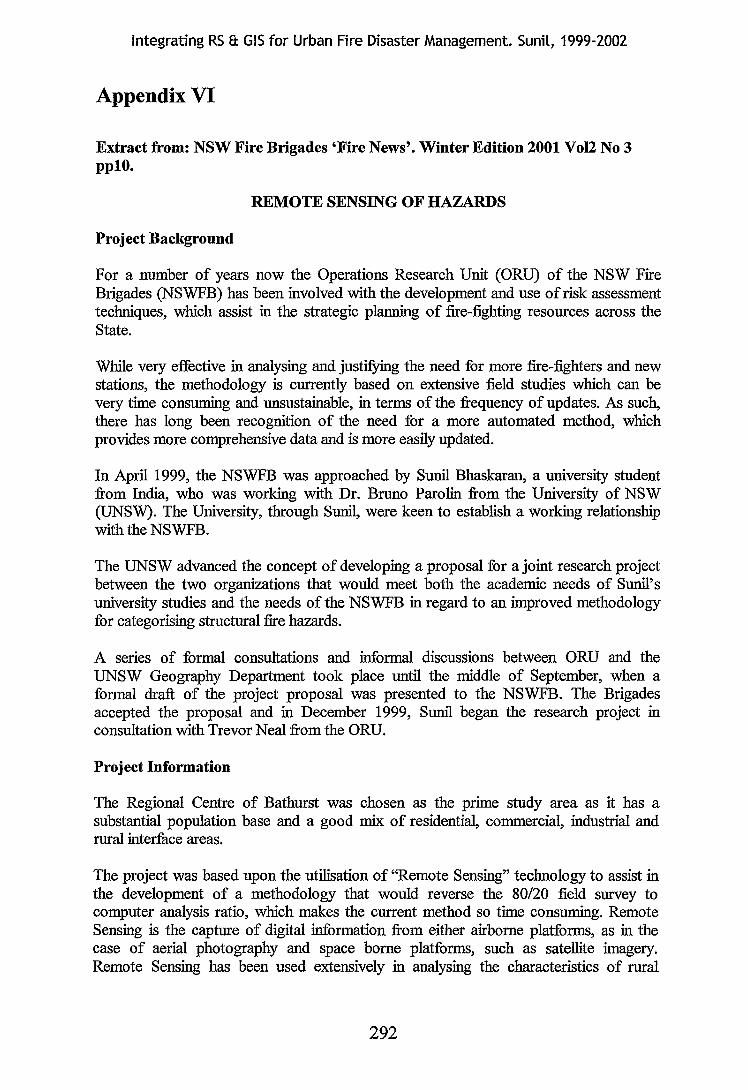
Integrating RS & GIS for Urban Fire Disaster Management. Sunil, 1999-2002
Appendix VI
Extract from: NSW Fire Brigades 'Fire News'. Winter Edition 2001 Vol2 No 3 pplO.
REMOTE SENSING OF HAZARDS
Project Background
For a number of years now the Operations Research Unit (ORU) of the NSW Fire Brigades (NSWFB) has been involved with the development and use of risk assessment techniques, which assist in the strategic planning of fire-fighting resources across the State.
While very effective in analysing and justifYing the need for more fire-fighters and new stations, the methodology is currently based on extensive field studies which can be very time consuming and unsustainable, in terms of the frequency of updates. As such, there has long been recognition of the need for a more automated method, which provides more comprehensive data and is more easily updated.
In April 1999, the NSWFB was approached by Sunil Bhaskaran, a university student from India, who was working with Dr. Bruno Parolin from the University of NSW (UNSW). The University, through Sunil, were keen to establish a working relationship with the NSWFB.
The UNSW advanced the concept of developing a proposal for a joint research project between the two organizations that would meet both the academic needs of Sunil's university studies and the needs of the NSWFB in regard to an improved methodology for categorising structural fire hazards.
A series of formal consultations and informal discussions between ORU and the UNSW Geography Department took place until the middle of September, when a formal draft of the project proposal was presented to the NSWFB. The Brigades accepted the proposal and in December 1999, Sunil began the research project in consultation with Trevor Neal from the ORU.
Project Information
The Regional Centre of Bathurst was chosen as the prime study area as it has a substantial population base and a good mix of residential, commercial, industrial and rural interface areas.
The project was based upon the utilisation of "Remote Sensing" technology to assist in the development of a methodology that would reverse the 80/20 field survey to computer analysis ratio, which makes the current method so time consuming. Remote Sensing is the capture of digital information from either airborne platforms, as in the case of aerial photography and space borne platforms, such as satellite imagery. Remote Sensing has been used extensively in analysing the characteristics of rural
292
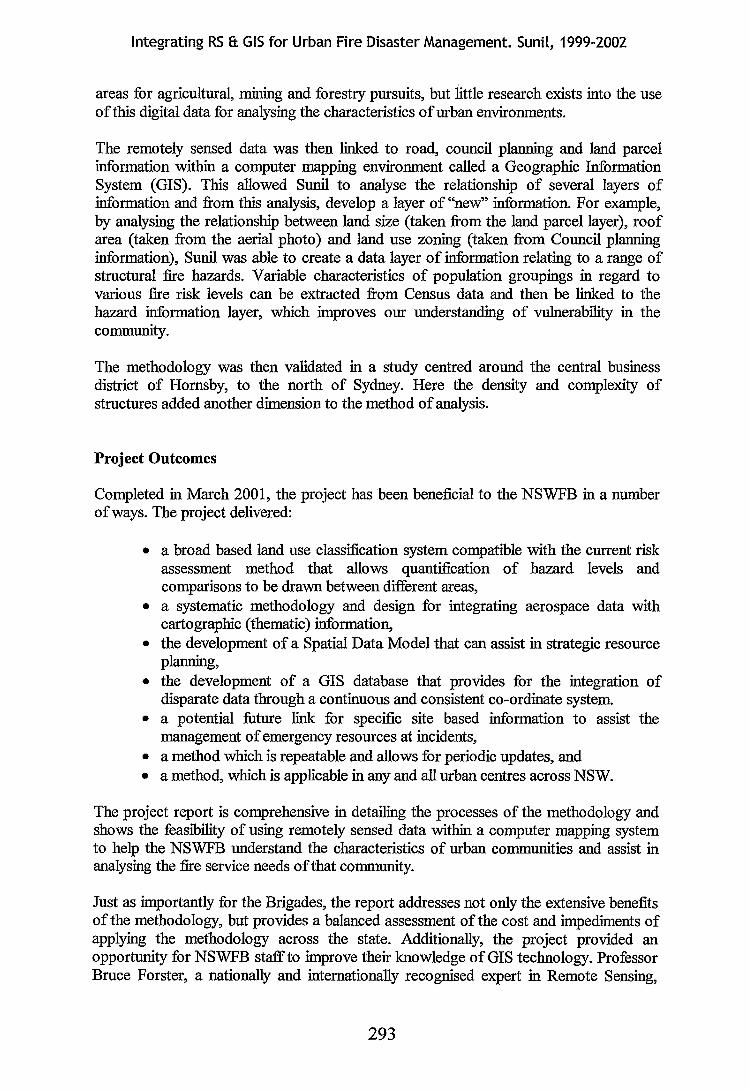
Integrating RS & GIS for Urban Fire Disaster Management. Sunil, 1999-2002
areas for agricultural, mining and forestry pursuits, but little research exists into the use of this digital data for analysing the characteristics of urban environments.
The remotely sensed data was then linked to road, council planning and land parcel information within a computer mapping environment called a Geographic Information System (GIS). This allowed Sunil to analyse the relationship of several layers of information and from this analysis, develop a layer of "new" information. For example, by analysing the relationship between land size (taken from the land parcel layer), roof area (taken from the aerial photo) and land use zoning (taken from Council planning information), Sunil was able to create a data layer of information relating to a range of structural fire hazards. Variable characteristics of population groupings in regard to various fire risk levels can be extracted from Census data and then be linked to the hazard information layer, which improves our understanding of vulnerability in the community.
The methodology was then validated in a study centred around the central business district of Hornsby, to the north of Sydney. Here the density and complexity of structures added another dimension to the method of analysis.
Project Outcomes
Completed in March 2001, the project has been beneficial to the NSWFB in a number of ways. The project delivered:
• a broad based land use classification system compatible with the current risk assessment method that allows quantification of hazard levels and comparisons to be drawn between different areas,
• a systematic methodology and design for integrating aerospace data with cartographic (thematic) information,
• the development of a Spatial Data Model that can assist in strategic resource planning,
• the development of a GIS database that provides for the integration of disparate data through a continuous and consistent co-ordinate system.
• a potential future link for specific site based information to assist the management of emergency resources at incidents,
• a method which is repeatable and allows for periodic updates, and • a method, which is applicable in any and all urban centres across NSW.
The project report is comprehensive in detailing the processes of the methodology and shows the feasibility of using remotely sensed data within a computer mapping system to help the NSWFB understand the characteristics of urban communities and assist in analysing the fire service needs of that community.
Just as importantly for the Brigades, the report addresses not only the extensive benefits of the methodology, but provides a balanced assessment ofthe cost and impediments of applying the methodology across the state. Additionally, the project provided an opportunity for NSWFB staff to improve their knowledge of GIS technology. Professor Bruce Forster, a nationally and internationally recognised expert in Remote Sensing,
293

Integrating RS & GIS for Urban Fire Disaster Management. Sunil, 1999-2002
assisted Sunil in providing skills training to NSWFB staff in remote sensing theory and techniques.
This joint project between the NSWFB and UNSW has been the topic of presentations by Sunil at a number of international conferences and seminars in Sydney, Taiwan, Adelaide, Hawaii and Singapore.
The project could not have been completed without the support and co-operation of Land & Property Information, Bathurst (formerly the Land Information Centre) that provided much of the digital data, together with the valuable input of officers from both Bathurst City Council and Hornsby Shire Council.
294
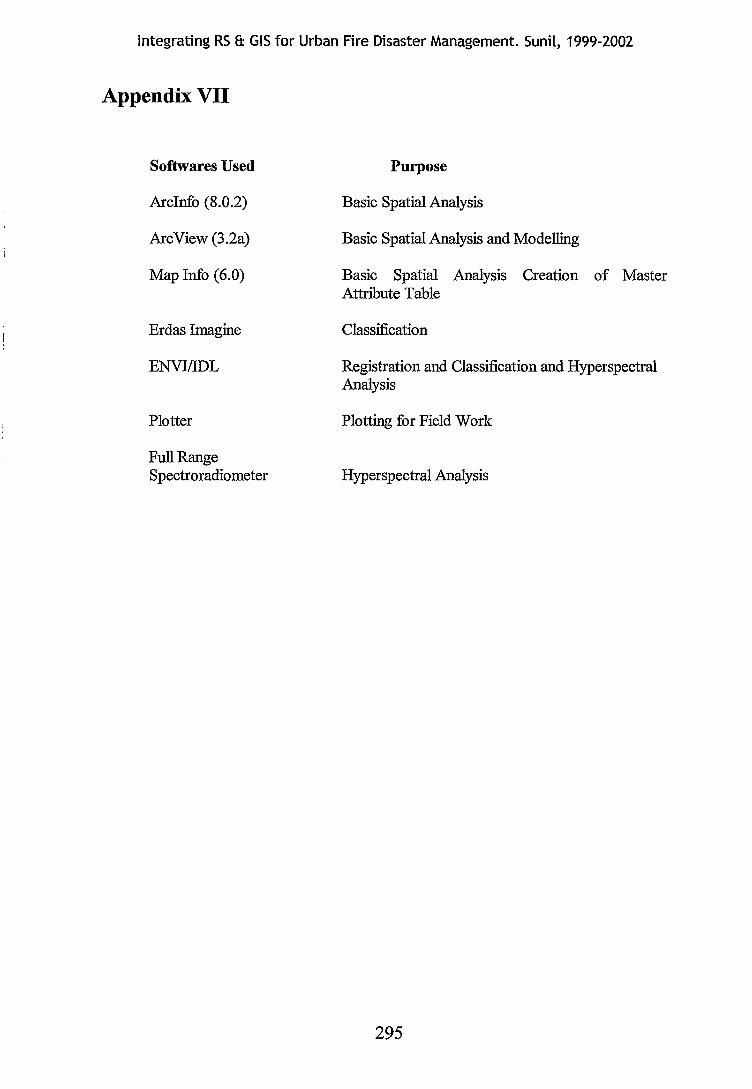
Integrating RS & GIS for Urban Fire Disaster Management. Sunil, 1999-2002
Appendix VII
Softwares Used
Arcinfo (8.0.2)
Arc View (3.2a)
Map Info (6.0)
Erdas Imagine
ENVIIIDL
Plotter
Full Range Spectroradiometer
Purpose
Basic Spatial Analysis
Basic Spatial Analysis and Modelling
Basic Spatial Analysis Creation of Master Attribute Table
Classification
Registration and Classification and Hyperspectral Analysis
Plotting for Field Work
Hyperspectral Analysis
295

. .. l>tJ!talprinhn&PhoiCIC.'Op)lfll
765 11armSt.LT'Ihmollro~a) 92804244 www.wor1dofprint .com.au
Corrtc ted -L\B