integrated sustainability assessment of bioenergy potentials in
TRANSCRIPT
Final Report for APN LCI PROJECT
Project Reference Number: LCI2013-04CMY(R)-Macandog
Low Carbon Initiatives Framework
The following collaborators worked on this project:
Dr. D.B. Magcale-Macandog (Project Leader), University of the Philippines Los Baños, Philippines, Email: [email protected]
Dr. L. Acosta (Scientific Coordinator), Potsdam Institute for Climate Impact Research, Germany, Email: [email protected]
Dr. Xuefeng Cui (Partner), Beijing Normal University, China, Email: [email protected]
Dr. K.S. Kavi Kumar (Partner), Madras School of Economics, India, Email: [email protected]
Integrated sustainability assessment of bioenergy
potentials in Asia: An application of a hybrid
approach on trade-offs and pathways (PIC-STRAP)
Integrated sustainability assessment of
bioenergy potentials in Asia: An application of a
hybrid approach on trade-offs and pathways
(PIC-STRAP)
Project Reference Number: LCI2013-04CMY(R)-Macandog
©Asia-Pacific Network for Global Change Research
1
K
OVERVIEW OF PROJECT WORK AND OUTCOMES
Non-technical summary Policies promoting use of renewable energy contribute to climate change mitigation. Among alternative sources of renewable energy, bioenergy has become the most challenged in policy debates due to its conflicting contributions to economic, social and ecological sustainability, for example, energy security versus food security, rural development versus people displacement, etc. The project aimed to thoroughly investigate the trade-offs and pathways for the development of bioenergy sector in Asia, in particular China, India and the Philippines. Trade-offs define the relative importance of economic, social and ecological factors affecting bioenergy production and pathways describe the direction or course to achieving bioenergy sustainability. The project’s interdisciplinary team applied complementary analytical tools from various scientific fields and use different kinds of data to understand these trade-offs and pathways from the policy, community, and scientific perspectives. The policy analysis was based on review of relevant literature, community perspective was analysed from survey of respondents from different groups of society, and scientific inquiries were based on statistical data, geographic information, and expert opinions. The results reveal that the main objectives of bioenergy policies are energy security and rural development; communities perceived bioenergy as good for the economy despites its negative impacts on food security; and few scientific evidence conforms to community preferences and expert opinions on the relevance of economic, social and ecological criteria for bioenergy sustainability.
Keywords: Asia, Bioenergy, Cluster analysis, Climate change, Factor analysis, Fuzzy logic, Integrated assessment, Path analysis, Sustainability pathways, Sustainability trade-offs
Objectives The main objectives of the project were: 1. To systematise existing knowledge on sustainability that will support the integrated assessment of development pathways in bioenergy; 2. To understand social perception on and policy preferences for the different bioenergy feedstock (i.e. 1st or 2nd generation) and indicators of sustainability; 3. To determine society’s sustainability trade-off decisions in the use of economic, social and environmental resources to develop the bioenergy sector; and 4. To identify pathways in bioenergy development and assess their effects on the sustainable transition towards low-carbon society (LCS).
Amount received and number years supported The Grant awarded to this project was: US$ 45,000 for Year 1 US$ 45,000 for Year 2
Activity undertaken The main activities undertaken in the project include data collection, cluster and conjoint analyses, GIS (geographic information system) analysis, fuzzy logic analysis, path analysis and multi-criteria analysis. The collected data include bioenergy policies/technologies from literature, field data from survey and stakeholder dialogue, GIS data of land use maps, and secondary data from statistical books. Information on policies and technologies provided context for the analysis of bioenergy sustainability. Using survey data, the cluster and conjoint analyses were conducted to estimate preferences for bioenergy feedstocks and sustainability indicators. Using secondary data and estimated preferences, fuzzy logic analysis was conducted to generate socio-economic sustainability
2
trade-offs. Using historical land use maps and stakeholder dialogue, spatial analysis was conducted to generate production activities trade-offs (i.e. based on land use transitions). Using the parameters of socio-economic sustainability and production activities trade-offs, path analysis was conducted to generate development pathways for bioenergy. Finally, stakeholder dialogues (i.e. participatory workshop, expert interviews) were conducted to assess the potentials and scenarios these pathways. The results of the analyses were/will be published in international journals. Kick-off meeting and framing workshop were conducted as a venue for the project partners to discuss updates and results on the activities.
Results The main results from the policy, community and scientific perspectives are as follows:
Bioenergy policies in China and India were significantly driven by the governments’ objective of achieving energy security to support the stable growth in the economies. Rural livelihood development has been an important objective for pursuing bioenergy policy in the Philippines as well as in India. Various institutional and resource constraints limit the potential of bioenergy to contribute these socio-economic objectives in these countries.
These policies may have provided general perceptions in the society about the economic
benefits from bioenergy. Although the surveyed communities think that bioenergy affects food
security, many of them perceived bioenergy as good for the economy. The communities’
preferred role of bioenergy for sustainable development reflects their social and economic
concerns, e.g. energy security in China, food security in India, and ecosystem degradation in the
Philippines.
The analysis of statistical data confirms the significance of energy security for the development
paths for bioenergy in China and India. But for many social and ecological sustainability factors,
the preferences of communities and opinion of experts diverge with the results of scientific
investigations. There is also not very high consensus among scientific experts on the role of
various sustainability factors on bioenergy development.
Relevance to the APN Goals, Science Agenda and to Policy Processes APN goals and science agenda: The project directly supports the Science Agenda of the APN’s Third Strategic Plan because PIC-STRAP’s (i) themes cut across the different scientific agenda including climate change, biodiversity, land use, resource utilisation, and pathways for sustainable development; (ii) sustainability concept highlights the inter-linkages between techno-economic, socio-ecological, and institutional issues; and (iii) methods improves the use of existing tools through integrative and participatory approaches, strengthen the relevance of society’s and policy decision-making in developing sustainable criteria, and allows the place-based integrative approach in three major biofuel producing countries in Asia. The latter enables the project to help strengthen the scientific capacity of the partners in conducting research of regional interest. In view of the cross-cutting themes, comprehensive concept, and integrative assessment methods of PIC-STRAP, it is well positioned to establish link to various regional and international research networks and thus to address the institutional agenda of APN’s Third Strategic Plan. Policy process: The groundwork for PIC-STRAP’s approach is a sustainability concept, which takes into account most relevant determinants of economic, social, and ecological sustainability of bioenergy development. Thus, the proposed project directly addresses the issues of sustainable development in establishing a bioenergy sector that is supportive of low-carbon initiatives. Because it is yet an evolving sector, the sustainability of bioenergy production in different countries is very elusive. Experiences show that bioenergy policies in one region can have impacts not only on its own but also on other regions’ social, economic and ecological sustainability. It is thus important to assess development pathways for bioenergy to exploit its potential benefits to creating a sustainable LCS. The participatory assessment framework in PIC-STRAP directly facilitates policy consultations and thus encourages debate on the issue, which is an important step to integrating the concept of
3
LCS in policy processes. In Europe, for example, policy debates contributed to developing an EU Roadmap for a competitive low carbon economy.
Self-evaluation Despite the challenges in collecting different types of data, the PIC-STRAP project successfully completed the collection of the necessary data for all components of the integrated sustainability assessment for bioenergy in the Philippines, India and China. A total of 578 respondents completed the web-based and CAPI survey in different provinces in the three countries. Time-series data for 18 indicators with comparable representation of economic, social, and ecological sustainability were collected for the sub-national levels in the three countries. The lack of historical high resolution land use data was resolved with the collection of additional time series data on areas of production by commodity type and computation of crop diversity index at the sub-national level. Experience on stakeholder dialogue and field surveys revealed that expert consultation on a personal basis is more effective in collecting expert knowledge due to limited time among participants and lack of priority for bioenergy issues at the local level. The results of the integrated assessment provided novel contributions to understanding sustainability of bioenergy production from different perspectives (policy, community, science). The project has involved several students and researchers in the data collection and analysis, providing opportunities for capacity building. Moreover, the project strengthened the regional research network among the partners and provided valuable opportunity for joint scientific publication in international journals.
Potential for further work Bioenergy has potential to contribute to climate change mitigation only if sustainability trade-offs are appropriately addressed. Results from this project have shown that bioenergy production can undermine social and ecological resilience, which could increase vulnerability to climate change impacts. Conducting similar integrated sustainability assessment in other Asian countries could increase knowledge that is relevant for the intergovernmental assessments such as the Intergovernmental Panel on Climate Change (IPCC) and Intergovernmental science-policy Platform on Biodiversity and Ecosystem Services (IPBES).
Publications Published
Acosta L.A., D.B. Magcale-Macandog, K.S. Kavi Kumar, X. Cui, E.A. Eugenio, P.B.M. Macandog, A.R. Salvacion and J.M.A. Eugenio, 2016. The Role of Bioenergy in Enhancing Energy, Food and Ecosystem Sustainability Based on Societal Perceptions and Preferences in Asia. Special Issue Agriculture Sustainability, Agriculture Journal, 6(2):1-26.
Eugenio, E.A., L.A. Acosta, N.H. Enano Jr., D.B. Magcale-Macandog, P.B.M. Macandog, J.P.P. Talubo, A.R. Salvacion, and J.M.A. Eugenio, 2016. What Influences Awareness of Farmers on Sustainability of Bioenergy Feedstock in the Philippines? APN Science Bulletin, Issue 6, 47-53.
Acosta L.A., D.B. Magcale-Macandog, K.S. Kavi Kumar, X. Cui, E.A. Eugenio, P.B.M. Macandog, A.R. Salvacion and J.M.A. Eugenio, 2015. The Role of Bioenergy in Energy-Food-Ecosystem Nexus in Asia, APN Policy Brief LCD-03, APN Global Change Perspectives, 4 pp.
Kavi Kumar, K.S., R.S. Soundar Raja and R. Manivasagan Biofuel Feedstock Cultivation in India: Implications for Food Security and Rural Livelihoods, MSE Working Paper 105/2015, Madras School of Economics, India, https://ideas.repec.org/p/mad/wpaper/2015-105.html
Acosta, L.A., E.A. Eugenio, N.H. Enano, D.B. Magcale-Macandog, B. Vega, P.B.M. Macandog and M.A. Lopez, 2014. Sustainability trade-offs in bioenergy development in the Philippines: An application of conjoint analysis, Biomass and Bioenergy 64:20-41.
Acosta, L.A., D.B. Magcale-Macandog, E.A. Eugenio, P.B.M. Macandog, X. Cui and K.S. Kavi Kumar, 2014. Knowledge and Opinion on the Sustainability of Bioenergy Production in Asia: Cases in China
4
and the Philippines, Asia-Pacific Network for Global Change Research (APN) Science Bulletin Issue 4, March 2014, 189-191. Conference
Eugenio, E.A., Acosta, L.A., Enano Jr., N.H., Magcale-Macandog, D.B., Macandog, P.B.M., & Talubo, J.P.P. (2013). Typology of Farmers’ Awareness on Sustainability of Alternative Bioenergy Feedstocks in the Philippines, Paper presented in the 2013 International ISSAAS Congress in Muntinlupa City, Philippines on November 11-15, 2013. (Appendix 7)
K.S. Kavi Kumar, “Jatropha Cultivation for Biodiesel: Food Security and Rural Livelihoods”, paper presented at Fourth MSE Faculty Seminar Series, 27-28 February 2014, Central University of Tamil Nadu, Thiruvarur. (Appendix 8) PIC-STRAP Working Papers
Eugenio, E.A., L.A. Acosta, N.H. Enano Jr., D.B. Magcale-Macandog, P.B.M. Macandog, J.P.P. Talubo, A.R. Salvacion, W. Lucht and J.M.A. Eugenio, 2014. Typology of Farmers’ Awareness on Sustainability of Alternative Bioenergy Feedstocks in the Philippines, Sustainability TRade‐offs and Pathways Working Paper #001‐2014. (Appendix 14)
Acosta, L.A., E.A. Eugenio, N.H. Enano Jr., D.B. Magcale-Macandog, B.A. Vega, P.B.M. Macandog, J.M.A. Eugenio, M.A. Lopez, A.R. Salvacion and W. Lucht, 2014. Sustainability trade‐offs in bioenergy development in the Philippines: An application of conjoint analysis. Sustainability TRade‐offs and Pathways (STRAP) Working Paper #002‐2014. (Appendix 15)
Kavi Kumar, K.S., R.S. Soundar Rajan and R. Manivasagan, 2014. Biofuel Feedstock Cultivation in India: Implications for Food Security and Rural Livelihoods, Sustainability TRade‐offs and Pathways (STRAP) Working Paper #003‐2014. (Appendix 16)
Acosta, L.A., X. Cui, D.B. Magcale‐Macandog, E.A. Eugenio, P.B.M. Macandog, J.M.A. Eugenio, and K.S. Kavi Kumar, 2014. Comparative analysis of knowledge and opinions of local communities on sustainability of bioenergy in the Philippines and China, Sustainability TRade‐offs and Pathways (STRAP) Working Paper #004‐2014. (Appendix 17). In Preparation: Tentative article titles are (1) Measuring trade-offs on economic, social and ecological sustainability of bioenergy production in Asia based on fuzzy logic analysis; (2) Multi-criteria decision analysis of sustainability criteria for bioenergy production in the Philippines, India and China; and (3) Comparisons of developments pathways for bioenergy production based on sustainability indicators and policy preferences in Asia.
Acknowledgments The partner in the Philippines is grateful to the support provided by the professors and research assistants in the University of the Philippines Los Banos (UPLB) including Joan Pauline Talubo, Edwin Rosell Abucay, Mic Ivan Sumilang, etc. Prof. Talubo and Prof. Abucay have supported the conduct of survey and stakeholder dialogue in the Philippines. Mr. Sumilang has provided support in the preparation of fuzzy data and solicitation of expert opinion. The support of the young scientists in UPLB in conducting stakeholder dialogue has been very valuable to the project: Milben A. Bragais, Ozzy Boy S. Nicopior, Lester Ryan P. Mojica, Marlon A. Reblora, Ricajay C. Dimalibot, Pattricia Eliz M. Legaspi, Randy P. Porcioncula, and Rose Anne H. Caraan. The partner in India would like to acknowledge the help extended by Mr. P. Naren and Mr. R. Manivasagan in conducting the survey of stakeholders; Mr. R.S. Soundar Rajan in carrying out competitiveness analysis of biofuel feedstocks; and Dr. A. Balasubramanian in conducting the expert survey. The Indian partner would also like to acknowledge Prof. Ramprasad Sengupta and several other Indian experts for their valuable inputs regarding the biofuel policy scenario in India. The partner in China would like to acknowledge the help of Mr. Lijuan Miao and Mr. Feng Zhu from the Beijing Normal University for conducting the survey. The PIC-STRAP team is very grateful to the Asia-Pacific Network for Global Change Research for providing financial support to conduct the very challenging but innovative activities of the project.
1
TECHNICAL REPORT
Preface PIC-STRAP is a research-based activity aimed at understanding sustainable transition criteria towards low-carbon society (LCS) using hybrid analytical tools that allow systematic investigation of trade-offs and pathways in the Philippines, India and China. Among renewable energy sources, bioenergy presents an enormous policy challenge for sustainable transition to LCS due to inevitable trade-offs including land use and market competition. The trade-offs result in diverging social perception on and policy strategies for bioenergy sustainability due to contextual differences across countries. A better understanding of human perception on the sustainability issues will help develop appropriate policy for complex but promising renewable energy sources.
2
Table of Contents
Low Carbon Initiatives Framework ......................................................................................................... 1
Preface .................................................................................................................................................... 1
List of Figures .......................................................................................................................................... 4
List of Tables ........................................................................................................................................... 4
List of Appendices ................................................................................................................................... 4
Acronyms ................................................................................................................................................ 5
1.0 Introduction ...................................................................................................................................... 6
2.0 Methodology ..................................................................................................................................... 7
2.1 Analytical Framework ................................................................................................................... 7
2.2 Data Collection .............................................................................................................................. 7
2.3 Data Analysis ................................................................................................................................. 9
2.3.1 Policy Preferences .................................................................................................................. 9
Policy analysis ................................................................................................................................. 9
Conjoint Analysis ............................................................................................................................. 9
2.3.2 Bioenergy Trade-offs ............................................................................................................ 11
Fuzzy logic analysis ....................................................................................................................... 11
Land use analysis .......................................................................................................................... 12
2.3.3 Development Pathways ....................................................................................................... 13
Path analysis ................................................................................................................................. 13
Multi-criteria analysis ................................................................................................................... 14
2.4 Project Management .................................................................................................................. 16
3.0 Results & Discussion ....................................................................................................................... 17
3.1 Policy Context and Preferences .................................................................................................. 17
3.1.1 Bioenergy Policies ................................................................................................................ 17
3.1.2 Policy Preferences ................................................................................................................ 20
3.2 Bioenergy Trade-offs ................................................................................................................... 25
3.2.1 Sustainability Trade-offs ...................................................................................................... 25
3.2.2 Land use Trade-offs .............................................................................................................. 28
3.3 Development Pathways .............................................................................................................. 29
3.3.1 Sustainability Pathways ....................................................................................................... 29
3.3.2 Sustainability Criteria ........................................................................................................... 30
3
4.0 Conclusions ..................................................................................................................................... 33
5.0 Future Directions ............................................................................................................................ 34
References ............................................................................................................................................ 35
4
List of Figures
Figure 1 Thematic and methodical framework of the hybrid approach STRAP ..................................... 8
Figure 2 Step 3 – defuzzification of the transposed fuzzy estimates .................................................... 12
Figure 3 Path analysis of economic, social and ecological determinants for crops to biofuel
conversion ............................................................................................................................................. 13
Figure 4 Criteria for economic sustainability ........................................................................................ 15
Figure 5 Criteria for social sustainability ............................................................................................... 15
Figure 6 Criteria for ecological sustainability ........................................................................................ 16
Figure 7 Location of the case study sites for the CAPI surveys in China, India and the Philippines .... 21
Figure 8 Profession of the respondents by type (a) and location (b) ................................................... 21
Figure 9 Preferences for the different conjoint attributes of bioenergy sustainability ....................... 23
Figure 10 Sustainability indicators for bioenergy production in China, India and the Philippines ....... 26
Figure 11 Sustainability indices at sub-national level in the Philippines, India and China, 2001-2010.27
Figure 12 Historical changes in global land use .................................................................................... 28
Figure 13 Changes in crop diversity index at sub-national level ........................................................... 29
Figure 14 Path analysis of sustainability indicators for the Philippines ................................................ 30
Figure 15 Comparisons on opinion on bioenergy sustainability between respondents and experts .. 31
List of Tables
Table 1 Economic, social and ecological sustainability attribute levels................................................ 10
Table 2 Logit estimates for utilities of the different types of biomass, by country. ............................. 23
Table 3 Analytic Hierarchy Process analysis of the expert opinion on sustainability of bioenergy ...... 32
List of Appendices
Appendix 1 Questionnaire for the Web-based and CAPI survey
Appendix 2 Questionnaire for the expert consultation
Appendix 3 PIC-STRAP kick-off meeting program and photos of activities, 12-15 June 2013
Appendix 4 Presentation on online survey during PIC-STRAP kick-off meeting
Appendix 5 Presentation on conjoint analysis during PIC-STRAP kick-off meeting
Appendix 6 Presentation on fuzzy logic during PIC-STRAP kick-off meeting
Appendix 7 Presentation during the International ISSAAS Congress, 11-15 Nov 2013
Appendix 8 Presentation during the Fourth MSE Faculty Seminar Series, 27-28 Feb 2014
Appendix 9 PIC-STRAP Framing Workshop program and photos of activities, 21-24 July 2014
Appendix 10 Presentation on analytical framework during PIC-STRAP framing workshop
Appendix 11 Presentation on Phil survey results during PIC-STRAP framing workshop
Appendix 12 Presentation on biofuels in India during PIC-STRAP framing workshop
Appendix 13 Policy context and analysis of expert opinions on bioenergy in India
Appendix 14 STRAP Working Paper #001-2014
Appendix 15 STRAP Working Paper #002-2014
Appendix 16 STRAP Working Paper #003-2014
Appendix 17 STRAP Working Paper #004-2014
5
Acronyms
AGRI Agriculture
AHP Analytic Hierarchy Process
APN Asia-Pacific Network for Global Change Research
CAPI Computer Aided Personal Interview
CBC Choice-based conjoint
GIS Geographic Information System
HB Hierarchical Bayes
HI Herfindahl Index
IMAGE Integrated Model to Assess the Global Environment
LCI Low Carbon Initiatives
LCS Low-carbon society
MATLAB MATrix LABoratory
MCA Multi-Criteria Analysis
NCR National Capital Region
NON-AGRI Non-agriculture
PIC-STRAP Integrated sustainability assessment of bioenergy potentials in Asia: An application of a hybrid approach on trade-offs and pathways
REEE Renewable Energy and Energy Efficiency
SEM Structural equation model
SmartPLS Partial least squares structural equation modelling
STRAP Sustainability TRade-offs and Pathways
6
1.0 Introduction The concept of low-carbon society (LCS) is now an important instrument to limiting global temperature increase below 2°C. LCS should be compatible with the principles of sustainable development, contribute to global reduction in greenhouse gases (GHG) emissions, promote use of low-carbon energy sources and production technologies, and adopt low-energy consumption behaviour (Skea & Nishioka 2008). Renewable energy resources and technologies are important to achieving LCS visions (Nakata et al. 2011). However, the relative contribution of the different renewable energy sources to a sustainable transition to LCS depends on the complexity of the systems. An energy system has three levels including the energy resources forming the primary energy, conversion technologies supplying secondary energy, and energy demand sectors comprising different energy consumers. Among the renewable energy sources, bioenergy presents an enormous policy challenge for sustainable transition to LCS due to inevitable trade-offs at different levels (Acosta-Michlik et al. 2011): (ii) Competing land use between food and fuel production, biodiversity protection and bioenergy production, and first and second generation feedstock production; (ii) Competing sources between domestically produced and imported biomass products and their feedstock; and (iii) Competing conversion technologies due to diverse range of options available to use and develop bioenergy. The trade-offs result in diverging social perception on and policy strategies for bioenergy sustainability due to contextual differences across countries. Moreover, bioenergy’s complex system involves not only alternative products and competing sectors, but also diverse actors interacting at and across different levels. As a result, bioenergy production not only provides opportunities but also causes conflicts in the course of fulfilling any diverging private and public interests along and within these inter-linkages (Faaij 2006).
A better understanding of human perception on the sustainability issues confronting bioenergy system, i.e. feedstock resources, conversion technologies, and energy demand, will help develop appropriate policy for complex but promising renewable energy sources. The PIC-STRAP proposed to contribute to this challenging task through application of integrated and trans-disciplinary approach, highlighting social perception and policy preferences that affects transition to low carbon and sustainable societies. It thus addresses cross-cutting activities of interest and thematic areas of the APN Low Carbon Initiatives (LCI) Programme. The PIC-STRAP adopted a novel hybrid approach called STRAP (Sustainability TRade-offs and Pathways), which is guided by the hypothesis that trade-off decisions on achieving a balance among economic, social and ecological goals are necessary conditions for assessing development pathways in bioenergy (Acosta-Michlik et al. 2011). The overall aim of the PIC-STRAP project was to develop sustainable transition criteria towards low-carbon societies using hybrid analytical tools that allows systematic investigation of trade-offs and pathways in the development of 1st and 2nd generation bioenergy in Asia, in particular China, India and the Philippines. This was achieved through the following specific scientific objectives:
a. To systematise existing knowledge on sustainability that will support the integrated assessment of
development pathways in bioenergy;
b. To understand social perception on and policy preferences for the different bioenergy feedstock (i.e. 1st or 2nd generation) and indicators of sustainability;
c. To determine society’s sustainability trade-off decisions in the use of economic, social and environmental resources to develop the bioenergy sector;
d. To identify alternative pathways in bioenergy development and assess their effects on the sustainable transition towards low-carbon society (LCS); and
e. To facilitate the integration and dissemination of the knowledge generated from PIC-STRAP.
7
The project provides answers to the following key questions on the sustainability of bioenergy production based on the policy, community and science perspectives. a. What are the main drivers for the implementation of bioenergy policies and significant barriers for
bioenergy sustainability in the Philippines, India and China?
b. What are the economic, social and ecological indicators that communities consider to be important for the sustainability of bioenergy production?
c. Do the paths for bioenergy development based on scientific evidence confirm the preferences of communities and opinion of experts?
Section 2 of the report presents the analytical and methodological framework to address the objectives of the project. Section 3 divides the discussion of the results according to three main topics that directly answer the project’s key questions. Section 4 and 5 provide conclusions and recommendations based on the results.
2.0 Methodology
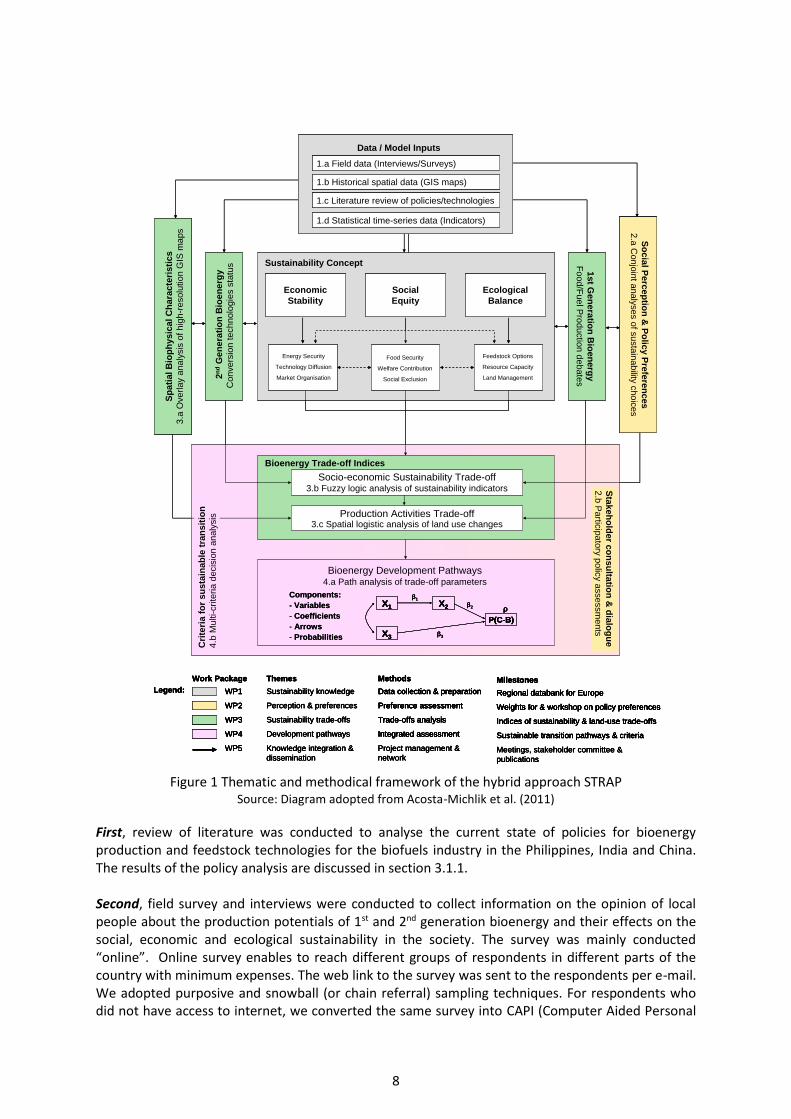
2.1 Analytical Framework The project built on the Sustainability Trade-offs and Pathways (STRAP) framework, which was proposed by Acosta-Michlik et al. (2011) as a hybrid approach for the integrated sustainability assessment of the potential for bioenergy production. Figure 1 presents the conceptual and methodological framework for the STRAP hybrid approach, integrating knowledge and data from socio-economic and ecological perspectives. Sustainability entails weighing the trade-offs between the determinants of economic stability, social equity and ecological balance in order to achieve desirable pathways for bioenergy development. “Determinants are factors or issues which significantly influence the nature of sustainability” (Acosta-Michlik et al. 2011, p.2793). The selection of the determinants were based on theories relevant to trade-offs analysis including economic comparative advantage, strategic niche management, techno-economic paradigm, and economic development. Energy security, technology diffusion and market organisation are the determinants for economic stability; food security, welfare contribution and social exclusion for social equity; and feedstock options, resource capacity and land management for ecological balance. The pathways are described based on the probability of converting land use for bioenergy production as a function of the interrelationships between the social, economic and ecological determinants of sustainability. The STRAP framework is a hybrid of analytical approaches from various fields including conjoint analysis, fuzzy logic, spatial analysis, path analysis and multi-criteria analysis. Figure 1 summarises what are the data requirements for, the technical applications in, and knowledge generation from PIC-STRAP project, and how they link to one another in assessing trade-offs and pathways in bioenergy production. The application of the STRAP framework in the PIC-STRAP generated trade-offs and pathways through systematic integration of not only diverse types of data and distinct analytical methods but also different analytical perspectives including bio-physical, techno-economic, and socio-ecological.
2.2 Data Collection Five types of data and information were collected to implement the methods in the STRAP framework including knowledge on bioenergy policies and technologies, field data on the perception on bioenergy production, statistical data on the determinants of bioenergy sustainability, spatial data on historical land use and transition, and expert opinion on sustainability determinants and historical land use.
8
Figure 1 Thematic and methodical framework of the hybrid approach STRAP Source: Diagram adopted from Acosta-Michlik et al. (2011)
First, review of literature was conducted to analyse the current state of policies for bioenergy production and feedstock technologies for the biofuels industry in the Philippines, India and China. The results of the policy analysis are discussed in section 3.1.1. Second, field survey and interviews were conducted to collect information on the opinion of local people about the production potentials of 1st and 2nd generation bioenergy and their effects on the social, economic and ecological sustainability in the society. The survey was mainly conducted “online”. Online survey enables to reach different groups of respondents in different parts of the country with minimum expenses. The web link to the survey was sent to the respondents per e-mail. We adopted purposive and snowball (or chain referral) sampling techniques. For respondents who did not have access to internet, we converted the same survey into CAPI (Computer Aided Personal
Sustainability Concept
1st G
en
era
tion
Bio
en
erg
y
Food/F
uel P
roductio
n d
ebate
s
2n
dG
en
era
tio
n B
ioen
erg
y
Convers
ion technolo
gie
s s
tatu
s
So
cia
l Perc
ep
tion
& P
olic
y P
refe
ren
ces
2.a
Conjo
int a
naly
ses o
f susta
inability
cho
ices
Sustainability trade-offs
Sustainability knowledge
Perception & preferences
Development pathways
Themes
Knowledge integration &
dissemination
Trade-offs analysis
Data collection & preparation
Preference assessment
Integrated assessment
Methods
Project management &
network
Indices of sustainability & land-use trade-offs
Regional databank for Europe
Weights for & workshop on policy preferences
Sustainable transition pathways & criteria
Milestones
Meetings, stakeholder committee &
publications
Legend:
WP3
WP1
WP2
WP4
Work Package
WP5
Sp
ati
al B
iop
hysic
al
Ch
ara
cte
risti
cs
3.a
Overla
y a
naly
sis
of hig
h-r
esolu
tion G
IS m
aps
Socio-economic Sustainability Trade-off3.b Fuzzy logic analysis of sustainability indicators
Bioenergy Trade-off Indices
Production Activities Trade-off3.c Spatial logistic analysis of land use changes
Bioenergy Development Pathways4.a Path analysis of trade-off parameters
Components:
- Variables
- Coefficients
- Arrows
- Probabilities
X1
P(C-B)
β1
β2
β3X3
X2 ρX1
P(C-B)
β1
β2
β3X3
X2 ρ
Sta
keh
old
er c
on
su
ltatio
n &
dia
log
ue
2.b
Partic
ipato
ry p
olic
y a
ssessm
ents
Data / Model Inputs
1.b Historical spatial data (GIS maps)
1.c Literature review of policies/technologies
1.a Field data (Interviews/Surveys)
1.d Statistical time-series data (Indicators)
Cri
teri
a f
or
su
sta
inab
le t
ran
sit
ion
4.b
Multi-crite
ria d
ecis
ion a
naly
sis
Economic
Stability
Social
Equity
Ecological
Balance
Energy Security
Technology Diffusion
Market Organisation
Feedstock Options
Resource Capacity
Land Management
Food Security
Welfare Contribution
Social Exclusion
Sustainability Concept
1st G
en
era
tion
Bio
en
erg
y
Food/F
uel P
roductio
n d
ebate
s
2n
dG
en
era
tio
n B
ioen
erg
y
Convers
ion technolo
gie
s s
tatu
s
So
cia
l Perc
ep
tion
& P
olic
y P
refe
ren
ces
2.a
Conjo
int a
naly
ses o
f susta
inability
cho
ices
So
cia
l Perc
ep
tion
& P
olic
y P
refe
ren
ces
2.a
Conjo
int a
naly
ses o
f susta
inability
cho
ices
Sustainability trade-offs
Sustainability knowledge
Perception & preferences
Development pathways
Themes
Knowledge integration &
dissemination
Trade-offs analysis
Data collection & preparation
Preference assessment
Integrated assessment
Methods
Project management &
network
Indices of sustainability & land-use trade-offs
Regional databank for Europe
Weights for & workshop on policy preferences
Sustainable transition pathways & criteria
Milestones
Meetings, stakeholder committee &
publications
Legend:
WP3
WP1
WP2
WP4
Work Package
WP5
Sustainability trade-offs
Sustainability knowledge
Perception & preferences
Development pathways
Themes
Knowledge integration &
dissemination
Sustainability trade-offs
Sustainability knowledge
Perception & preferences
Development pathways
Themes
Knowledge integration &
dissemination
Trade-offs analysis
Data collection & preparation
Preference assessment
Integrated assessment
Methods
Project management &
network
Trade-offs analysis
Data collection & preparation
Preference assessment
Integrated assessment
Methods
Trade-offs analysis
Data collection & preparation
Preference assessment
Integrated assessment
Trade-offs analysis
Data collection & preparation
Preference assessment
Integrated assessment
Methods
Project management &
network
Indices of sustainability & land-use trade-offs
Regional databank for Europe
Weights for & workshop on policy preferences
Sustainable transition pathways & criteria
Milestones
Meetings, stakeholder committee &
publications
Indices of sustainability & land-use trade-offs
Regional databank for Europe
Weights for & workshop on policy preferences
Sustainable transition pathways & criteria
Milestones
Indices of sustainability & land-use trade-offs
Regional databank for Europe
Weights for & workshop on policy preferences
Sustainable transition pathways & criteria
Indices of sustainability & land-use trade-offs
Regional databank for Europe
Weights for & workshop on policy preferences
Sustainable transition pathways & criteria
Milestones
Meetings, stakeholder committee &
publications
Legend:
WP3
WP1
WP2
WP4
Work Package
WP5
Legend:
WP3
WP1
WP2
WP4
WP3
WP1
WP2
WP4
Work Package
WP5
Sp
ati
al B
iop
hysic
al
Ch
ara
cte
risti
cs
3.a
Overla
y a
naly
sis
of hig
h-r
esolu
tion G
IS m
aps
Sp
ati
al B
iop
hysic
al
Ch
ara
cte
risti
cs
3.a
Overla
y a
naly
sis
of hig
h-r
esolu
tion G
IS m
aps
Socio-economic Sustainability Trade-off3.b Fuzzy logic analysis of sustainability indicators
Bioenergy Trade-off Indices
Production Activities Trade-off3.c Spatial logistic analysis of land use changes
Bioenergy Development Pathways4.a Path analysis of trade-off parameters
Components:
- Variables
- Coefficients
- Arrows
- Probabilities
X1
P(C-B)
β1
β2
β3X3
X2 ρX1
P(C-B)
β1
β2
β3X3
X2 ρ
Components:
- Variables
- Coefficients
- Arrows
- Probabilities
X1
P(C-B)
β1
β2
β3X3
X2 ρX1
P(C-B)
β1
β2
β3X3
X2 ρ
Sta
keh
old
er c
on
su
ltatio
n &
dia
log
ue
2.b
Partic
ipato
ry p
olic
y a
ssessm
ents
Data / Model Inputs
1.b Historical spatial data (GIS maps)
1.c Literature review of policies/technologies
1.a Field data (Interviews/Surveys)
1.d Statistical time-series data (Indicators)
Data / Model Inputs
1.b Historical spatial data (GIS maps)
1.c Literature review of policies/technologies
1.a Field data (Interviews/Surveys)
1.d Statistical time-series data (Indicators)
1.b Historical spatial data (GIS maps)
1.c Literature review of policies/technologies
1.a Field data (Interviews/Surveys)
1.b Historical spatial data (GIS maps)
1.c Literature review of policies/technologies
1.a Field data (Interviews/Surveys)
1.d Statistical time-series data (Indicators)
Cri
teri
a f
or
su
sta
inab
le t
ran
sit
ion
4.b
Multi-crite
ria d
ecis
ion a
naly
sis
Economic
Stability
Social
Equity
Ecological
Balance
Energy Security
Technology Diffusion
Market Organisation
Feedstock Options
Resource Capacity
Land Management
Food Security
Welfare Contribution
Social Exclusion
Economic
Stability
Economic
Stability
Social
Equity
Social
Equity
Ecological
Balance
Ecological
Balance
Energy Security
Technology Diffusion
Market Organisation
Feedstock Options
Resource Capacity
Land Management
Food Security
Welfare Contribution
Social Exclusion
9
Interview) module, which refers to data collection using a laptop or a personal computer not connected to the internet. CAPI survey enabled us to reach respondents from the farms who are important producers of bioenergy feedstock and who mostly do not have access to internet. However, because CAPI survey entails large budget, only specific case study areas were selected to interview the farmers. Details on the survey techniques and administration are published in Acosta et al. (2016). The survey data were analysed using conjoint analysis and the results are presented in section 3.1.2. The CAPI version of the survey is attached in Appendix 1. Third, statistical time-series data were collected to provide historical evidence on the capacity and ability of countries to attain sustainability objectives that are relevant to bioenergy development. The data will include annual time-series data to be collected from government authorities for the period 1970-2010. The data are indicators representing the different social, economic and ecological determinants as defined in the sustainability concept (Figure 1). The data correspond to the lowest possible administrative levels to capture the geographical differences within the case study countries. The statistical data were used for the fuzzy logic analysis and the results are presented in section 3.2.1.
Fourth, land use maps based on Geographical Information System (GIS) format were collected for the period between 1970 and 2010. The IMAGE global dataset, which has been improved to cover land use for biofuels, were used in this project. The maps were used for the spatial analysis and the results are presented in section 3.2.2. Moreover, the combined statistical and spatial data were the basis for generating parameters for the path analysis, which results are presented in section 3.3.1. And fifth, expert opinion on suitability of sustainability criteria as well as potential for bioenergy production was collected through stakeholder dialogue. The dialogue for the former was conducted on an individual basis to ensure unbiased opinion, while the latter was conducted on a participatory approach to allow group validation of opinion. The questions for the stakeholder dialogue are presented in Appendix 2 and the results are discussed in section 3.3.2.
2.3 Data Analysis
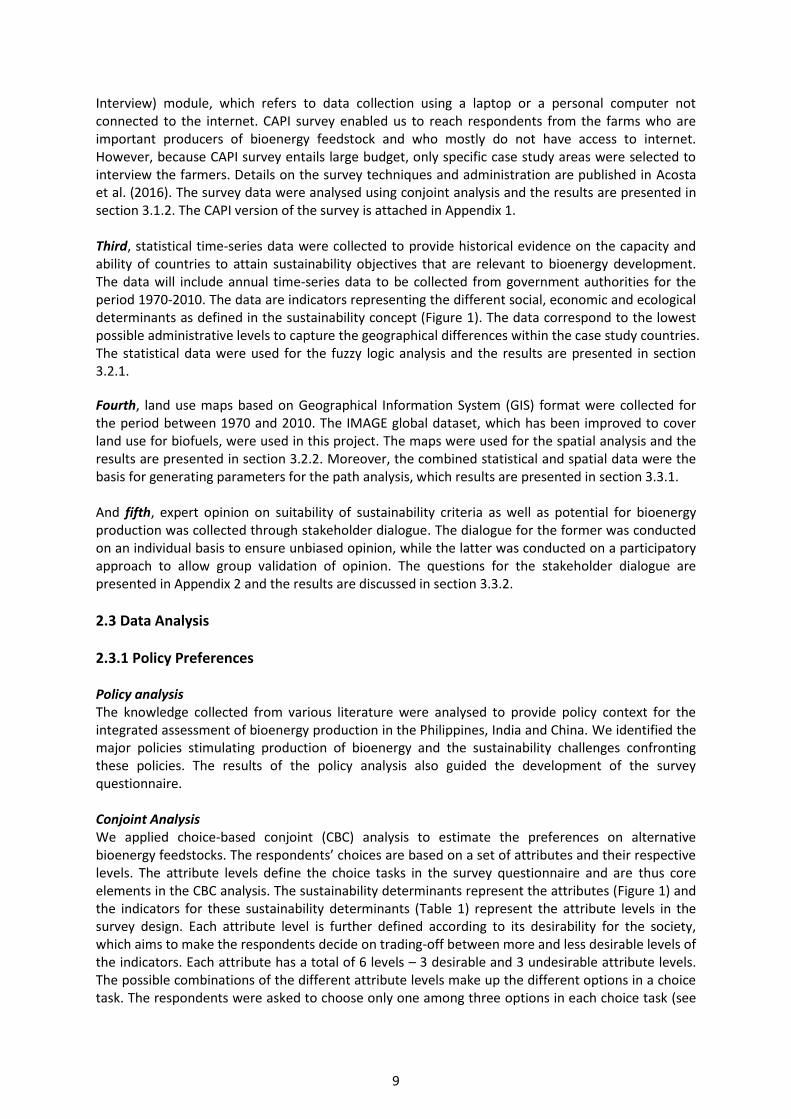
2.3.1 Policy Preferences Policy analysis The knowledge collected from various literature were analysed to provide policy context for the integrated assessment of bioenergy production in the Philippines, India and China. We identified the major policies stimulating production of bioenergy and the sustainability challenges confronting these policies. The results of the policy analysis also guided the development of the survey questionnaire. Conjoint Analysis We applied choice-based conjoint (CBC) analysis to estimate the preferences on alternative bioenergy feedstocks. The respondents’ choices are based on a set of attributes and their respective levels. The attribute levels define the choice tasks in the survey questionnaire and are thus core elements in the CBC analysis. The sustainability determinants represent the attributes (Figure 1) and the indicators for these sustainability determinants (Table 1) represent the attribute levels in the survey design. Each attribute level is further defined according to its desirability for the society, which aims to make the respondents decide on trading-off between more and less desirable levels of the indicators. Each attribute has a total of 6 levels – 3 desirable and 3 undesirable attribute levels. The possible combinations of the different attribute levels make up the different options in a choice task. The respondents were asked to choose only one among three options in each choice task (see
10
Appendix 1). To ensure efficient CBC design prior to the survey, we conducted statistical tests to identify the appropriate number of versions for the given number of options and tasks. We used 50 versions of the questionnaire, each having different set of options per tasks. The objective of the choice-based conjoint analysis is to estimate part-worths or utilities, which measure the relative desirability or worth of an attribute level ((Orme 2010), (Orme 2006)), i.e., the higher the utility, the more desirable is the attribute level. The respondents’ choices were analyzed using the CBC module, specifically the Hierarchical Bayes (HB) method of the Sawtooth Software (http://sawtoothsoftware.com/). The CBC/HB tool can capture preferences of individuals (i.e., respondent level) and groups of individuals (i.e., segment level) (Orme 2009). Details on the CBC/HB tool and equations are described in Acosta et al. (2016). Table 1 Economic, social and ecological sustainability attribute levels
Attribute levels More desirable Less desirable
Economic Stability A. Energy security 1. Domestic energy demand Low High 2. Domestic energy supply High Low 3. Foreign energy trade Low import High export B. Technology progress 1. R&D investment High Low 2. Technology deployment High Low 3. Energy efficiency High Low C. Market organisation 1. Market incentives High Low 2. Market infrastructure Good Poor 3. Trade constraints Low High
Social equity
A. Food security 1. Food self-sufficiency Increase Decrease 2. Purchasing power Increase Decrease 3. Affordability of food Increase Decrease B. Social welfare 1. Livelihood sources Increase Decrease 2. Job opportunities Increase Decrease 3. Household lifestyle Improve Worsen C. Social justice 1. Equal property rights Support Hinder 2. Home displacement Prevent Cause 3. Land dispossession Prevent Cause
Ecological balance
Production potential 1. Potential level Very high
High Moderate
Low Very low No potential
2. Feedstock sources* Crop/forest residues Fast-growing trees Perennial grasses
Starch-rich crops Sugar-rich crops Oil-rich crops
Resource capacity 1. Effects of population pressure Production potential
unaffected Production potential affected
11
2. Pressure on natural resources Put less pressure Put more pressure 3. Effects landscape and species
diversity Improve diversity Destroy diversity
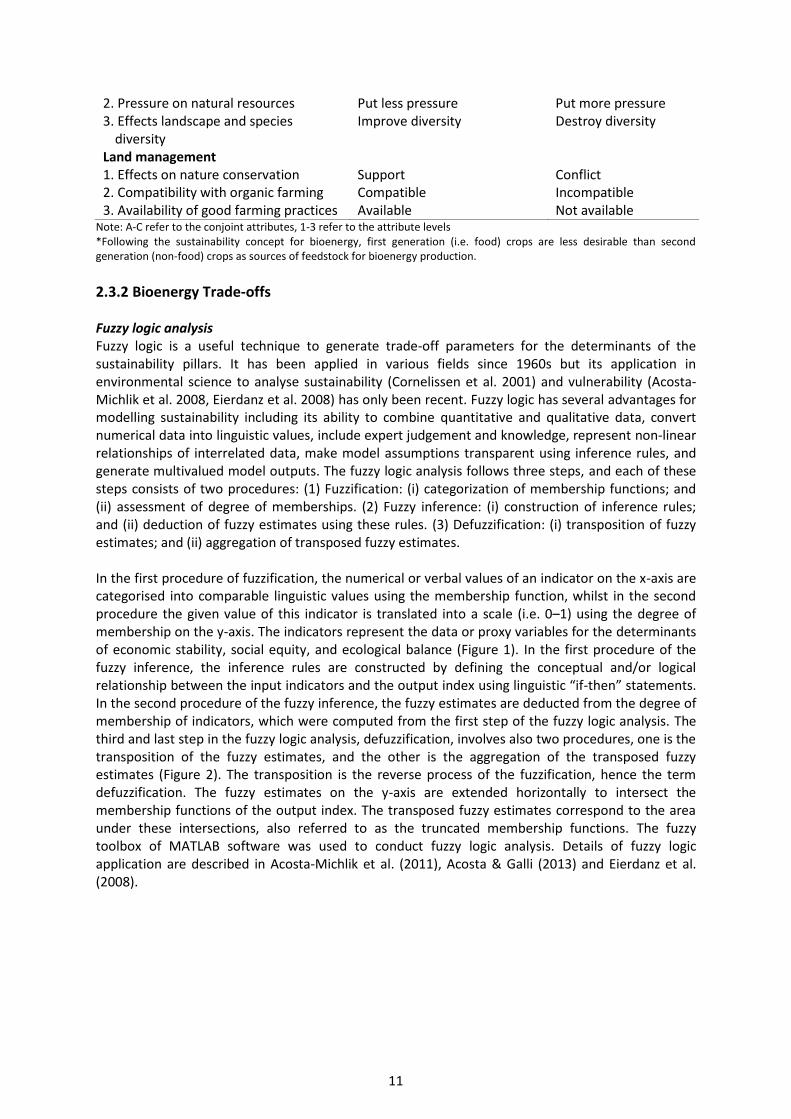
Land management 1. Effects on nature conservation Support Conflict 2. Compatibility with organic farming Compatible Incompatible 3. Availability of good farming practices Available Not available
Note: A-C refer to the conjoint attributes, 1-3 refer to the attribute levels *Following the sustainability concept for bioenergy, first generation (i.e. food) crops are less desirable than second generation (non-food) crops as sources of feedstock for bioenergy production.
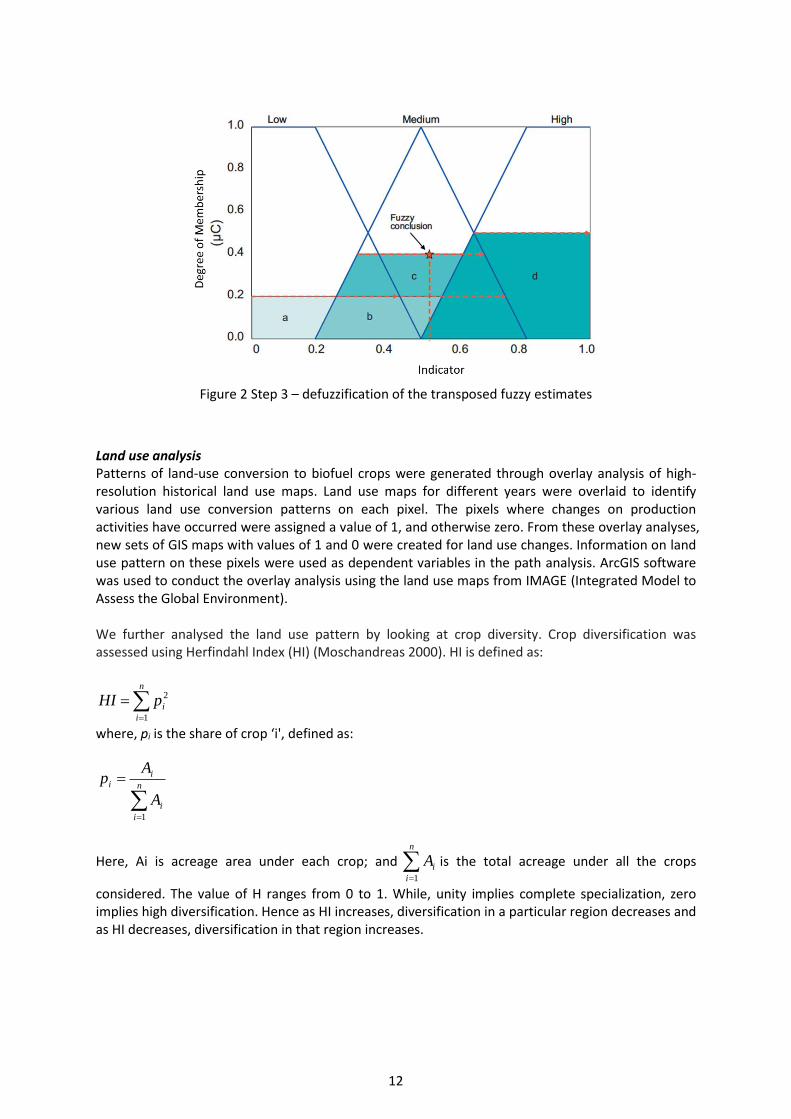
2.3.2 Bioenergy Trade-offs Fuzzy logic analysis Fuzzy logic is a useful technique to generate trade-off parameters for the determinants of the sustainability pillars. It has been applied in various fields since 1960s but its application in environmental science to analyse sustainability (Cornelissen et al. 2001) and vulnerability (Acosta-Michlik et al. 2008, Eierdanz et al. 2008) has only been recent. Fuzzy logic has several advantages for modelling sustainability including its ability to combine quantitative and qualitative data, convert numerical data into linguistic values, include expert judgement and knowledge, represent non-linear relationships of interrelated data, make model assumptions transparent using inference rules, and generate multivalued model outputs. The fuzzy logic analysis follows three steps, and each of these steps consists of two procedures: (1) Fuzzification: (i) categorization of membership functions; and (ii) assessment of degree of memberships. (2) Fuzzy inference: (i) construction of inference rules; and (ii) deduction of fuzzy estimates using these rules. (3) Defuzzification: (i) transposition of fuzzy estimates; and (ii) aggregation of transposed fuzzy estimates. In the first procedure of fuzzification, the numerical or verbal values of an indicator on the x-axis are categorised into comparable linguistic values using the membership function, whilst in the second procedure the given value of this indicator is translated into a scale (i.e. 0–1) using the degree of membership on the y-axis. The indicators represent the data or proxy variables for the determinants of economic stability, social equity, and ecological balance (Figure 1). In the first procedure of the fuzzy inference, the inference rules are constructed by defining the conceptual and/or logical relationship between the input indicators and the output index using linguistic “if-then” statements. In the second procedure of the fuzzy inference, the fuzzy estimates are deducted from the degree of membership of indicators, which were computed from the first step of the fuzzy logic analysis. The third and last step in the fuzzy logic analysis, defuzzification, involves also two procedures, one is the transposition of the fuzzy estimates, and the other is the aggregation of the transposed fuzzy estimates (Figure 2). The transposition is the reverse process of the fuzzification, hence the term defuzzification. The fuzzy estimates on the y-axis are extended horizontally to intersect the membership functions of the output index. The transposed fuzzy estimates correspond to the area under these intersections, also referred to as the truncated membership functions. The fuzzy toolbox of MATLAB software was used to conduct fuzzy logic analysis. Details of fuzzy logic application are described in Acosta-Michlik et al. (2011), Acosta & Galli (2013) and Eierdanz et al. (2008).
12
Figure 2 Step 3 – defuzzification of the transposed fuzzy estimates
Land use analysis Patterns of land-use conversion to biofuel crops were generated through overlay analysis of high-resolution historical land use maps. Land use maps for different years were overlaid to identify various land use conversion patterns on each pixel. The pixels where changes on production activities have occurred were assigned a value of 1, and otherwise zero. From these overlay analyses, new sets of GIS maps with values of 1 and 0 were created for land use changes. Information on land use pattern on these pixels were used as dependent variables in the path analysis. ArcGIS software was used to conduct the overlay analysis using the land use maps from IMAGE (Integrated Model to Assess the Global Environment). We further analysed the land use pattern by looking at crop diversity. Crop diversification was assessed using Herfindahl Index (HI) (Moschandreas 2000). HI is defined as:
n
i
ipHI1
2
where, pi is the share of crop ‘i', defined as:
n
i
i
ii
A
Ap
1
Here, Ai is acreage area under each crop; and
n
i
iA1
is the total acreage under all the crops
considered. The value of H ranges from 0 to 1. While, unity implies complete specialization, zero implies high diversification. Hence as HI increases, diversification in a particular region decreases and as HI decreases, diversification in that region increases.
13
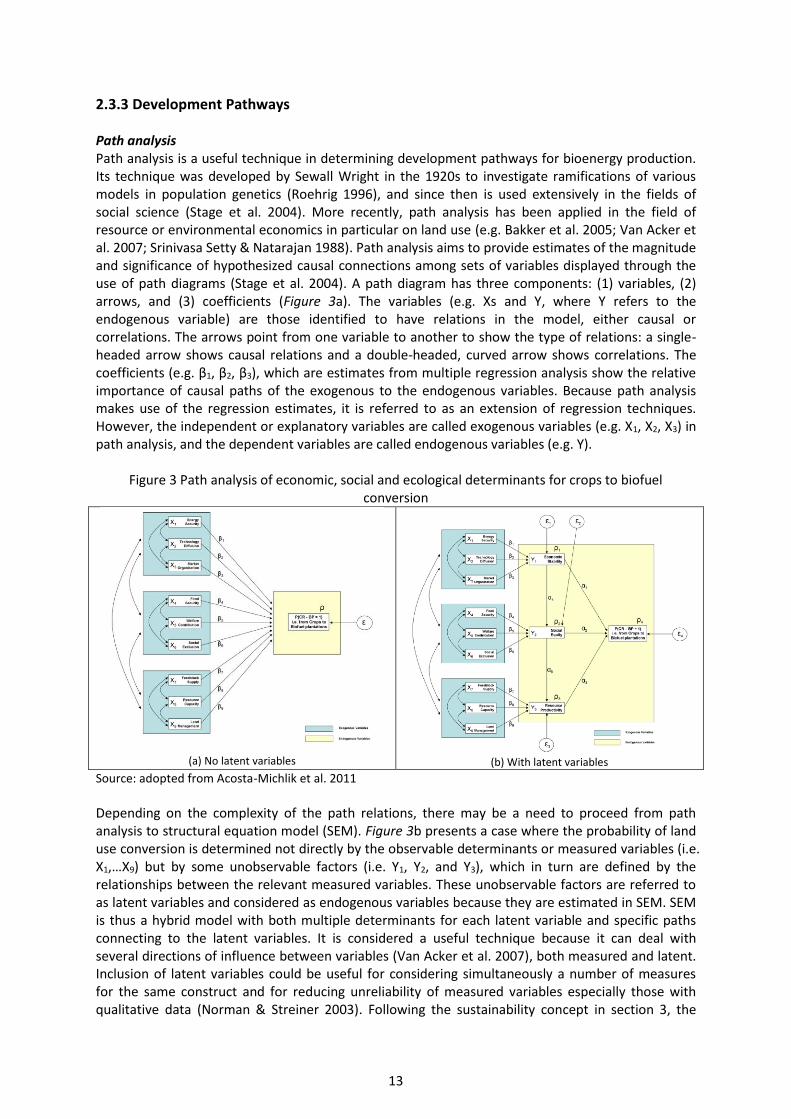
2.3.3 Development Pathways Path analysis Path analysis is a useful technique in determining development pathways for bioenergy production. Its technique was developed by Sewall Wright in the 1920s to investigate ramifications of various models in population genetics (Roehrig 1996), and since then is used extensively in the fields of social science (Stage et al. 2004). More recently, path analysis has been applied in the field of resource or environmental economics in particular on land use (e.g. Bakker et al. 2005; Van Acker et al. 2007; Srinivasa Setty & Natarajan 1988). Path analysis aims to provide estimates of the magnitude and significance of hypothesized causal connections among sets of variables displayed through the use of path diagrams (Stage et al. 2004). A path diagram has three components: (1) variables, (2) arrows, and (3) coefficients (Figure 3a). The variables (e.g. Xs and Y, where Y refers to the endogenous variable) are those identified to have relations in the model, either causal or correlations. The arrows point from one variable to another to show the type of relations: a single-headed arrow shows causal relations and a double-headed, curved arrow shows correlations. The coefficients (e.g. β1, β2, β3), which are estimates from multiple regression analysis show the relative importance of causal paths of the exogenous to the endogenous variables. Because path analysis makes use of the regression estimates, it is referred to as an extension of regression techniques. However, the independent or explanatory variables are called exogenous variables (e.g. X1, X2, X3) in path analysis, and the dependent variables are called endogenous variables (e.g. Y).
Figure 3 Path analysis of economic, social and ecological determinants for crops to biofuel conversion
(a) No latent variables
(b) With latent variables
Source: adopted from Acosta-Michlik et al. 2011
Depending on the complexity of the path relations, there may be a need to proceed from path analysis to structural equation model (SEM). Figure 3b presents a case where the probability of land use conversion is determined not directly by the observable determinants or measured variables (i.e. X1,…X9) but by some unobservable factors (i.e. Y1, Y2, and Y3), which in turn are defined by the relationships between the relevant measured variables. These unobservable factors are referred to as latent variables and considered as endogenous variables because they are estimated in SEM. SEM is thus a hybrid model with both multiple determinants for each latent variable and specific paths connecting to the latent variables. It is considered a useful technique because it can deal with several directions of influence between variables (Van Acker et al. 2007), both measured and latent. Inclusion of latent variables could be useful for considering simultaneously a number of measures for the same construct and for reducing unreliability of measured variables especially those with qualitative data (Norman & Streiner 2003). Following the sustainability concept in section 3, the
14
latent variables are represented by economic stability (Y1), social equity (Y2), and resource productivity (Y3). They are assumed to have direct paths to the probability of land use conversion and thus serve as intervening variables to the measured variables (i.e. determinants). Moreover, because they could influence each other, they also have indirect paths to the probability of land use conversion. The total effect to the probability of land use conversion is thus the additive values of all
α and β coefficients (i.e. 1
1
n
i
ii ). In addition to the path coefficients, the model
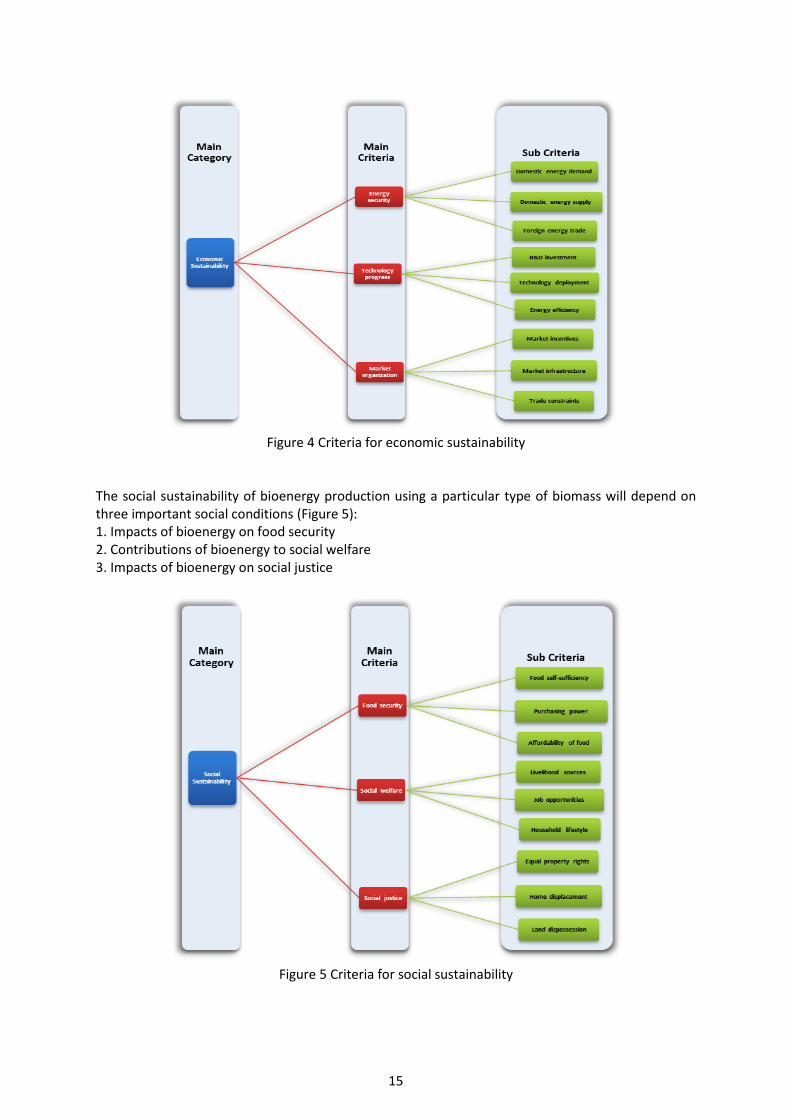
specification will generate estimates not only for the probability of land use conversion (ρ4), but also for economic stability (ρ1), social equity (ρ2), and resource productivity (ρ3). These latter three estimates provide a measure of the influence of the sustainability pillars on the bioenergy potentials. We used the SmartPLS to conduct the path and SEM analysis (Ringle et al. 2015). Multi-criteria analysis Multi-Criteria Analysis (MCA) is a decision tool that is applicable to solving problems that are characterised as a choice among alternatives with multiple criteria. MCA provides measures of judgement consistency and identifies priorities among alternatives and their criteria. The alternatives are evaluated with respect to each criterion, and the criteria are weighted according to the stakeholders’ assessment of their importance (Mustajoki & Marttunen 2013). The criteria consist of the magnitude and direction of interrelationships between the relevant sustainability indicators based on expert opinion (Figure 4-6). The following MCA steps were followed (DCLG 2009): (1) Establish the decision context; (2) Identify the options; (3) Identify the objectives and criteria that reflect the value associated with the consequences of each option; (4) Describe the expected performance of each option against the criteria; (5) Assess the value (i.e. score) associated with the consequences of each option; and (6) Assign weights for each of the criteria to reflect their relative importance to the decision. The decision context is the importance of the sustainability indicators for assessing bioenergy production. The three main criteria used to assess bioenergy sustainability include, economic sustainability, social sustainability and ecological sustainability. The economic sustainability of bioenergy production using a particular type of biomass will depend on three important economic conditions (Figure 4): 1. Contributions of bioenergy to energy security 2. Progress in technology for bioenergy 3. Quality of market structure for bioenergy
15
Figure 4 Criteria for economic sustainability
The social sustainability of bioenergy production using a particular type of biomass will depend on three important social conditions (Figure 5): 1. Impacts of bioenergy on food security 2. Contributions of bioenergy to social welfare 3. Impacts of bioenergy on social justice
Figure 5 Criteria for social sustainability
16
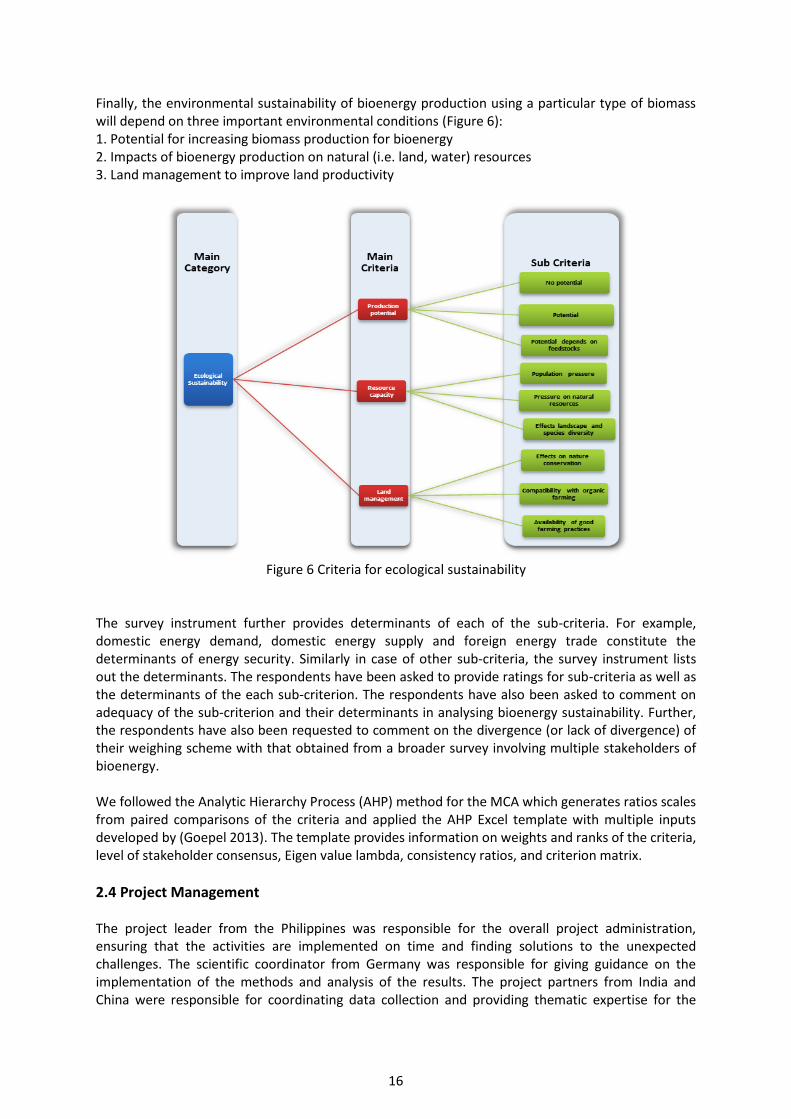
Finally, the environmental sustainability of bioenergy production using a particular type of biomass will depend on three important environmental conditions (Figure 6): 1. Potential for increasing biomass production for bioenergy 2. Impacts of bioenergy production on natural (i.e. land, water) resources 3. Land management to improve land productivity
Figure 6 Criteria for ecological sustainability
The survey instrument further provides determinants of each of the sub-criteria. For example, domestic energy demand, domestic energy supply and foreign energy trade constitute the determinants of energy security. Similarly in case of other sub-criteria, the survey instrument lists out the determinants. The respondents have been asked to provide ratings for sub-criteria as well as the determinants of the each sub-criterion. The respondents have also been asked to comment on adequacy of the sub-criterion and their determinants in analysing bioenergy sustainability. Further, the respondents have also been requested to comment on the divergence (or lack of divergence) of their weighing scheme with that obtained from a broader survey involving multiple stakeholders of bioenergy. We followed the Analytic Hierarchy Process (AHP) method for the MCA which generates ratios scales from paired comparisons of the criteria and applied the AHP Excel template with multiple inputs developed by (Goepel 2013). The template provides information on weights and ranks of the criteria, level of stakeholder consensus, Eigen value lambda, consistency ratios, and criterion matrix.
2.4 Project Management The project leader from the Philippines was responsible for the overall project administration, ensuring that the activities are implemented on time and finding solutions to the unexpected challenges. The scientific coordinator from Germany was responsible for giving guidance on the implementation of the methods and analysis of the results. The project partners from India and China were responsible for coordinating data collection and providing thematic expertise for the
17
case studies in their respective counties. For the Philippines, this was a joint responsibility of the project leader and scientific coordinator. The kick-off meeting was conducted in the Philippines in 2013 to prepare the team members on the procedure for data collection and build capacity on the data analysis (Appendix 3, 4, 5 and 6). The framing workshop was conducted in China in 2014 to discuss results of initial analysis and find solutions to the barriers on data collections (Appendix 9, 10, 11 and 12).
3.0 Results & Discussion
3.1 Policy Context and Preferences
3.1.1 Bioenergy Policies Although global biofuel production has significantly increased in recent years, the volume of production in Asia and its neighbouring Pacific countries remain small in comparison to countries in Europe and America (insert references). Taking into account, however, the available productive resources and development policies for bioenergy, Asia is expected to increase its share in global bioenergy production. There was a significant increase in bioethanol and biodiesel production in the last decade and the types of feedstock used in major producing countries in Asia. China and India were the 4th and 5th largest producers, respectively, of global bioethanol after the United States (54 billion litres), Brazil (26 billion litres) and Europe (5 billion litres) in 2014 (Acosta et al. 2016). At the same time, however, China and the Philippines have become major global importers of bioethanol. The case of the Philippines is interesting because it is the only country in the world that mainly uses coconut oil (more superior to palm oil in terms of impacts on climate, i.e. clean air, and ecosystem, i.e. agro-forest system) as feedstock for biodiesel production. Various policies are implemented in Asia to respond not only to international call for climate mitigation but also to the growing world demand for biofuels. The following discussion highlights that there is an increasing pressure to expand feedstock production and ensure domestic supply to meet the blending targets in China, India and the Philippines. Although there was a significant increase in biofuel production in these countries, the pressure continues as a consequence of government policies to promote domestic bioenergy sector. Philippines The Philippine Biofuels Act was signed as a law in January 2007, mandating the government agencies like the Department of Energy, Department of Environment and Natural Resources, Bureau of Products Standards, and Department of Science and Technology to promote the bioenergy sector. Moreover, a number of objectives had been formulated under the National Biofuels Feedstock Program of the Department of Agriculture including the production of sufficient amount of feedstock to meet the demand for biofuels, augmentation of farmers’ income, generation of rural employment, and development of idle and marginal lands. The Program’s incentives and promotion include government financing, credit facilitation services from selected local banks, tax incentives (exemption from value-added taxes for raw materials or feedstock like coconut, sugarcane, jatropha, cassava, and sweet sorghum), market development services, social amelioration, manpower development, seminars, conferences and workshops, tri-media information and web access. The Philippine Biofuels Act followed multi-stage strategy to promote local production and consumption of biofuels:
Within three months from the effectivity of the Act, a minimum of one percent biodiesel was required to be blended into all diesel engine fuels sold in the member economy;
18
Within two years from the effectivity of the Act, the feasibility of mandating a minimum of 2 percent blend of biodiesel was assessed taking into account considerations including but not limited to domestic supply and availability of locally-sourced biodiesel component;
Within two years from the effectivity of the Act, at least 5 percent bioethanol was to comprise the annual total volume of gasoline fuel sold and distributed by all oil companies in the country;
Within four years from the effectivity of the Act, the feasibility of mandating a minimum of 10 percent blend of bioethanol into all gasoline fuel distributed and sold by all oil companies was also assessed; and
According to National Biofuels Plan 2013-2030, the blending requirements for both biodiesel and bioethanol are to be increased to 20 percent by 2030.
Although it is envisioned that all biofuels to be blended with liquid fuels are to be sourced domestically, the Act also allows oil companies to import biofuels until 2010 to meet these blending targets. Moreover, biomass for bioenergy production is exempted from value added tax and biofuel companies with 60 percent local ownership are provided financial assistance (Zhou & Thomson 2009). Whilst there were no reported obstacles during the transition to a higher biodiesel blend due to adequate local supply (Corpuz 2009), the bioethanol situation was less stable. To comply with the bioethanol mandates, local companies continue to import bioethanol due to supply scarcity, price volatility and lack of competitiveness. In 2014, the Philippines had still one of the lowest domestic bioethanol production of 110 million litres. Despite concerns about the impacts of importing bioethanol on local production, the government continue to approve further imports which correspond to about 70% of the total volume required to meet the blending targets (Pacini et al. 2013). India India’s biofuel policy regime is influenced broadly by: (a) energy security concerns – ever increasing energy demand necessitates search for renewable energy alternatives given India’s limited fossil fuel reserves; (b) environmental concerns – growing local pollution and climate change concerns make it imperative to search for environmentally friendly alternatives; (c) wasteland utilization – biofuel feedstock cultivation could bring wastelands and other unproductive lands for effective utilization; and (d) enhance rural livelihood options. The National Policy on Biofuels adopted in 2009 envisaged strengthening India’s energy security by encouraging use of renewable energy resources to supplement transport fuels. The policy aims to replace 20 percent of transport petrol and diesel fuels with biofuels (bioethanol and biodiesel) by the end of 2017 (USDA 2012). The policy emphasized use of degraded land and waste land not suitable for agriculture to raise bioenergy feedstock to avoid food versus fuel dilemma. In addition to setting-up of a National Biofuel Fund for providing financial incentives, including subsidies and grants for new and second generation bioenergy feedstock, the policy also advocated establishing minimum support price mechanism to ensure fair price for bioenergy feedstock growers. There is also a basic model for jatropha cultivation that are supported by both public-private and private initiatives in India. In either case the cultivation is done in contract farming mode with the farmer leasing out his/her land for jatropha cultivation (since the cultivation requires 3-4 years to provide yields) and subsequently selling the jatropha seeds to the contracted company. The farmer is assured a fixed annual income till the crop starts giving yield. Oil extraction is done at one of oil extraction units (over 10 units exist in the state) and supplied to either national or international market. The feasibility analysis of meeting blending targets outlined in the National Biofuel Policy raises important issues regarding land availability in case of biodiesel production, and the need for identifying alternative feedstock in case of bioethanol production. While Singhal & Sengupta (2012) show that about 37.38 million hectares of wasteland suitable for jatropha cultivation is available in India. However, a significant number of rural population is dependent on miscellaneous tree growth
19
on this so-called wastelands for their food and livelihood. Also, the overall area under foodgrains has remained static in India over past decade or so. In such context use of wasteland for fuel purposes remains debatable. This acquires further importance in the context of South Asian Enigma of stagnant per-capita food consumption (compared to North Africa and West Asia) despite impressive growth registered in terms of per-capita income. In case of ethanol blending, the growing demand for alcohol from the potable and chemical sector (growing at 3-4 percent per annum) and the highest available alcohol from molasses pegged at 2.3 billion liters, there will be a shortage of alcohol even for 10 percent blending (Basavaraj et al. 2013). If molasses alone has to meet the entire requirement of 10 percent blending, an area covering approximately 10.5 million ha with 736.5 million tons of sugarcane has to be cultivated which translates into doubling of both area and production. Lack of technological inputs and infrastructures are considered the major hurdles for implementing such intervention. Further, it is not possible to increase the area under sugarcane beyond certain limit given that sugarcane is highly water intensive with a requirement of 20,000–30,000 cubic metre per ha per crop. Increasing the area under sugarcane will be at the cost of diverting land from other staple food crops (Raju et al. 2012). China The rapid growth of China’s economy (nearly 10% annually in the last three decades) also led to a rapid rise in demand for energy, which also gave rise to mounting concerns in the country about its national energy security. Despite the rapid growth of domestic energy production, demand has grown even faster. China has shifted from being a net energy exporter to being an importer since the late 1990s and is becoming one of the largest importers in the world in recent years (Qiu et al. 2010). Despite rapid development of energy demand, many Chinese rural households still depend heavily on traditional biomass energy for heating and cooking (Démurger & Fournier 2011). China is facing increasing energy pressure. Given the energy security concerns, the search for alternative sources of energy has become a top policy priority of the Government of China (Qiu et al. 2010). Renewable Energy and Energy Efficiency (REEE) policies become a national priority for the Chinese government, particularly since 2005 in six sectors: electricity, industry, transportation, buildings, and local government. The Chinese central government’s sound financial position allows significant investment in REEE (e.g. energy conservation and environmental protection; large capacity wind farms, biomass power plants, and transfer technology from biomass to liquid fuel; demonstration and industrialization project for jatropha; etc.) (Lo 2014). China’s biofuel industry has expanded rapidly since early 2000s. Bioethanol production reached by 69 percent from 1,647 in 2006 to 2,787 million litres in 2014. Four large-scale state-owned bioethanol plants in Heilongjiang, Jilin, Henan, and Anhui provinces were constructed in 2001. The total annual bioethanol production capacity of these four plants, which mainly use corn as feedstock, is approximately 1.5 million tons. In 2007, China set up another bioethanol plant based on cassava in Guangxi Province, which started operation in early 2008. The annual production capacity of this plant in the initial stage is 0.2 million tons. The Chinese government has established the medium and long-term development plan until 2020 (Liu et al. 2013). By the end of 2007, there were about 10 biodiesel plants operating in China. Most of them use industrial waste oil and waste cooking oil as feedstock. The total annual production capacity for all of these plants is less than 0.2 million tons. Biodiesel production needs a stable supply of lipid or vegetable oil, but China is short of those feedstocks. The major support policies during the implementation of the pilot testing program are as follows:
First, the 5% consumption tax on all bioethanols under the E10 program was waived for all bioethanol plants;
Second, the value-added tax (normally 17%) on bioethanol production was refunded at the end of each year;
20
Third, all bioethanol plants received subsidized ‘‘old grain” (grains reserved in national stocks that are not suitable for human consumption) for feedstock. This subsidy is jointly provided by the central and local governments;
Fourth, a subsidy was offered by the central government to ensure a minimum profit for each of bioethanol plants. That is, if despite all three support mechanisms described above, any bioethanol plant were to record a loss in the production and marketing of bioethanol, it would receive a subsidy from the Government that equals the gap between marketing revenues and production costs plus a reasonable profit that the firm could have obtained from an alternative investment. This subsidy is estimated for each plant at the end of each year.
In addition to these four support policies, the Government of China also ensured markets for the bioethanol produced by these state-owned plants. Bioethanol produced by private plants was not allowed to enter the market. While there are several potential feedstock crops available for bioethanol production, lack of land for feedstock production is one of major constraints in China’s bioethanol expansion.
3.1.2 Policy Preferences1 While the online survey facilitated analysis of conjoint preferences of various respondents from different professions in different regions in the Philippines, India and the Philippines, the CAPI survey focused on specific case study areas to provide information particularly on farmers’ preferences (Figure 7). In the Philippines, the farmer respondents were located in the provinces of Batangas and Quezon, which are main producers of sugarcane and coconut in the Calabarzon region. Calabarzon has a total land area of 1,664,403 hectares which comprise 5% of the Philippine Archipelago and the most populated region of the country with a population of 12,609,803 (BAS 2015). A total of 250 respondents were interviews in the Philippines, 60% of them are working in agriculture related profession (Figure 8). In India the CAPI survey with the farming community was carried out among farmers cultivating jatropha in Tamil Nadu. Tamil Nadu (Southern India) is one of the earliest states to have promoted biofuel promotion in India. The state started promotion of jatropha cultivation way back in 2002, ahead of the launch of National Biofuel Mission in 2003. Agriculture accounts for about 56% of the 160 respondents who were surveyed in India. In China, the Qu County in the province of Sichuan was chosen as the case study to do offline survey with local farmers. Qu County occupies about 2,000 km2 including more than 60 villages with 1.48 million residents. It is an important county in Sichuan with its agricultural products, but remains a least developing area in China. The number of survey respondents in China is 168, only 31% is working in agriculture related profession. More than half of the respondents in China are working in academe and research (Figure 8). The respondents working in private and non-government organisations dominate the survey in India, while respondents are almost equally distributed in different work locations in the Philippines.
1 Refer to Acosta et al. (2016) for more detailed analysis of the results. Parts of this section are excerpt from this article, which is published deliverable of the project.
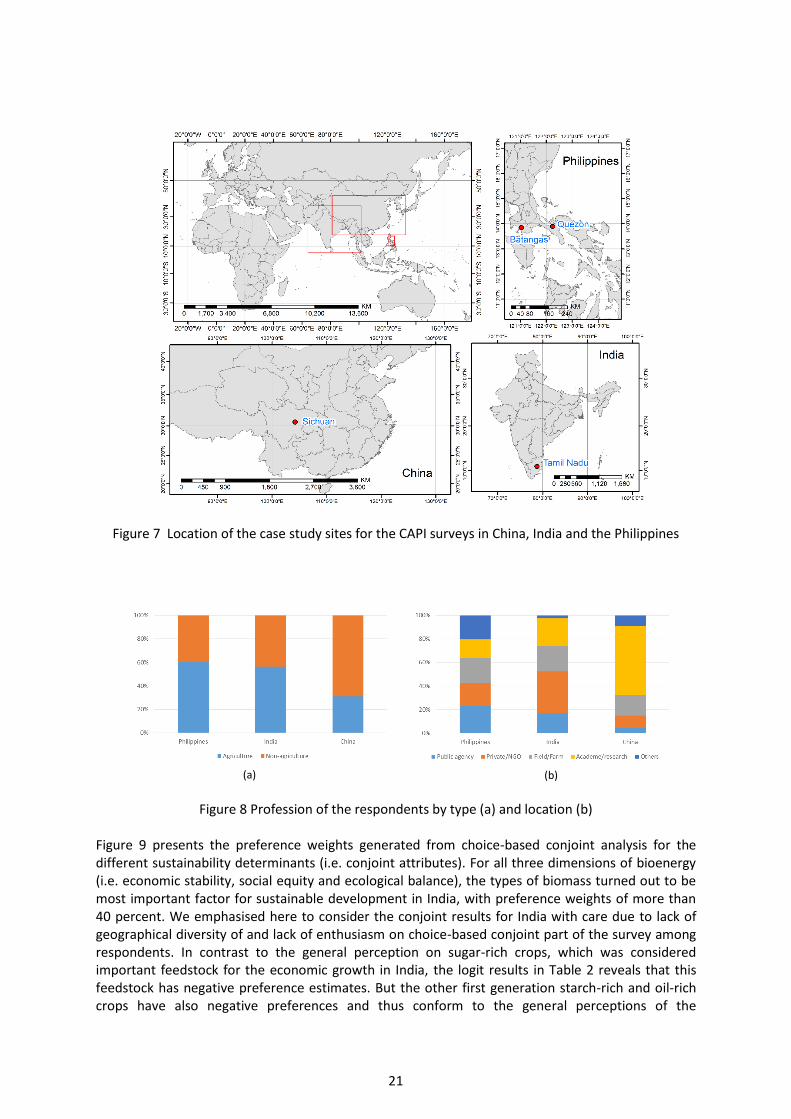
21
Figure 7 Location of the case study sites for the CAPI surveys in China, India and the Philippines
(a)
(b)
Figure 8 Profession of the respondents by type (a) and location (b)
Figure 9 presents the preference weights generated from choice-based conjoint analysis for the different sustainability determinants (i.e. conjoint attributes). For all three dimensions of bioenergy (i.e. economic stability, social equity and ecological balance), the types of biomass turned out to be most important factor for sustainable development in India, with preference weights of more than 40 percent. We emphasised here to consider the conjoint results for India with care due to lack of geographical diversity of and lack of enthusiasm on choice-based conjoint part of the survey among respondents. In contrast to the general perception on sugar-rich crops, which was considered important feedstock for the economic growth in India, the logit results in Table 2 reveals that this feedstock has negative preference estimates. But the other first generation starch-rich and oil-rich crops have also negative preferences and thus conform to the general perceptions of the
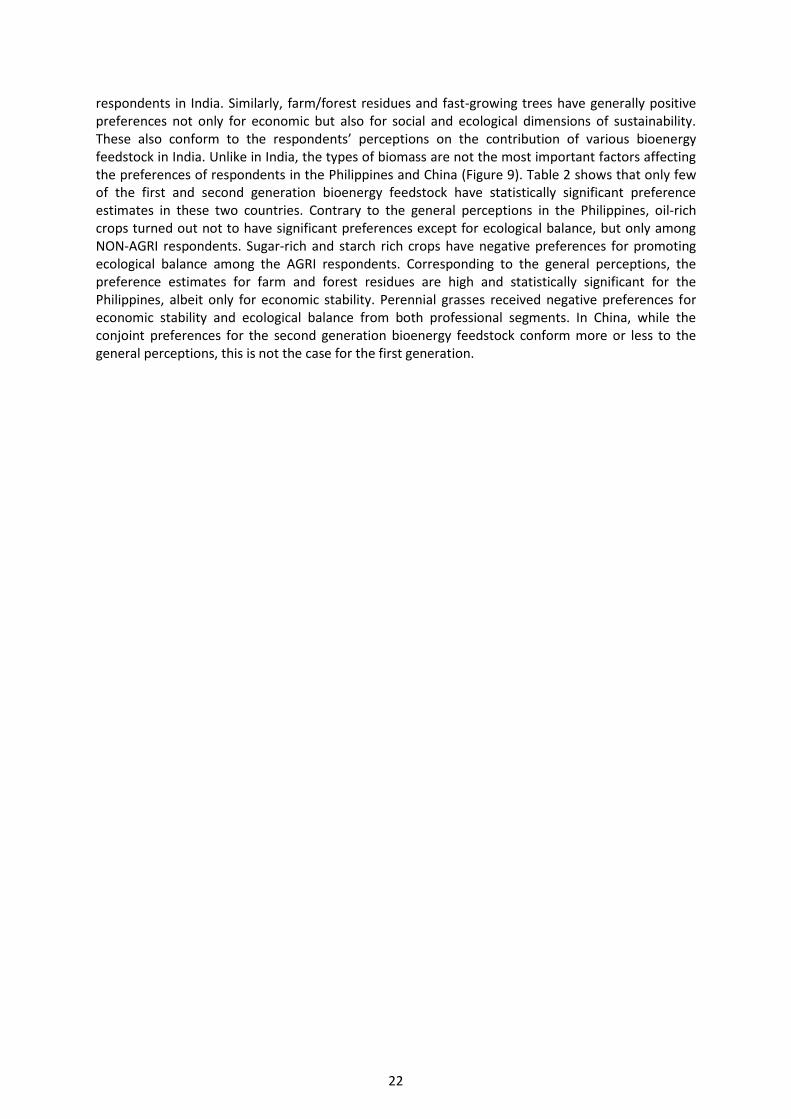
22
respondents in India. Similarly, farm/forest residues and fast-growing trees have generally positive preferences not only for economic but also for social and ecological dimensions of sustainability. These also conform to the respondents’ perceptions on the contribution of various bioenergy feedstock in India. Unlike in India, the types of biomass are not the most important factors affecting the preferences of respondents in the Philippines and China (Figure 9). Table 2 shows that only few of the first and second generation bioenergy feedstock have statistically significant preference estimates in these two countries. Contrary to the general perceptions in the Philippines, oil-rich crops turned out not to have significant preferences except for ecological balance, but only among NON-AGRI respondents. Sugar-rich and starch rich crops have negative preferences for promoting ecological balance among the AGRI respondents. Corresponding to the general perceptions, the preference estimates for farm and forest residues are high and statistically significant for the Philippines, albeit only for economic stability. Perennial grasses received negative preferences for economic stability and ecological balance from both professional segments. In China, while the conjoint preferences for the second generation bioenergy feedstock conform more or less to the general perceptions, this is not the case for the first generation.
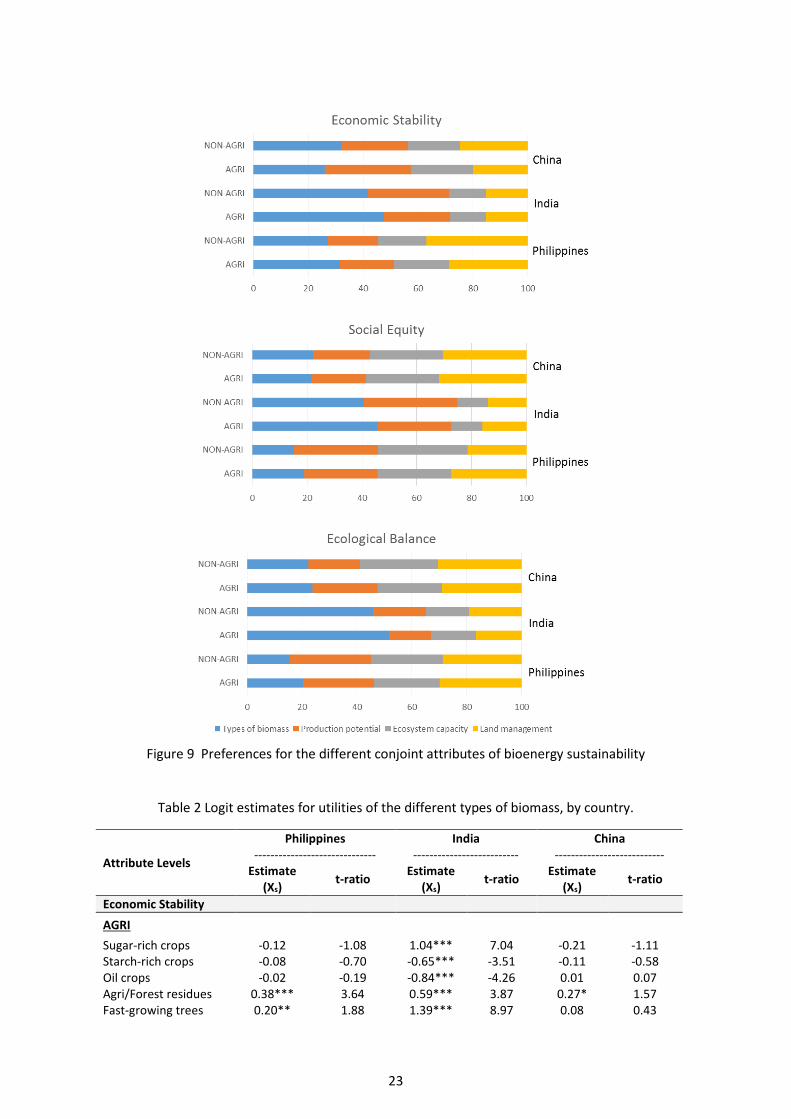
23
Figure 9 Preferences for the different conjoint attributes of bioenergy sustainability
Table 2 Logit estimates for utilities of the different types of biomass, by country.
Attribute Levels
Philippines ------------------------------
India --------------------------
China ---------------------------
Estimate (Xs)
t-ratio Estimate
(Xs) t-ratio
Estimate (Xs)
t-ratio
Economic Stability
AGRI
Sugar-rich crops -0.12 -1.08 1.04*** 7.04 -0.21 -1.11 Starch-rich crops -0.08 -0.70 -0.65*** -3.51 -0.11 -0.58 Oil crops -0.02 -0.19 -0.84*** -4.26 0.01 0.07 Agri/Forest residues 0.38*** 3.64 0.59*** 3.87 0.27* 1.57 Fast-growing trees 0.20** 1.88 1.39*** 8.97 0.08 0.43
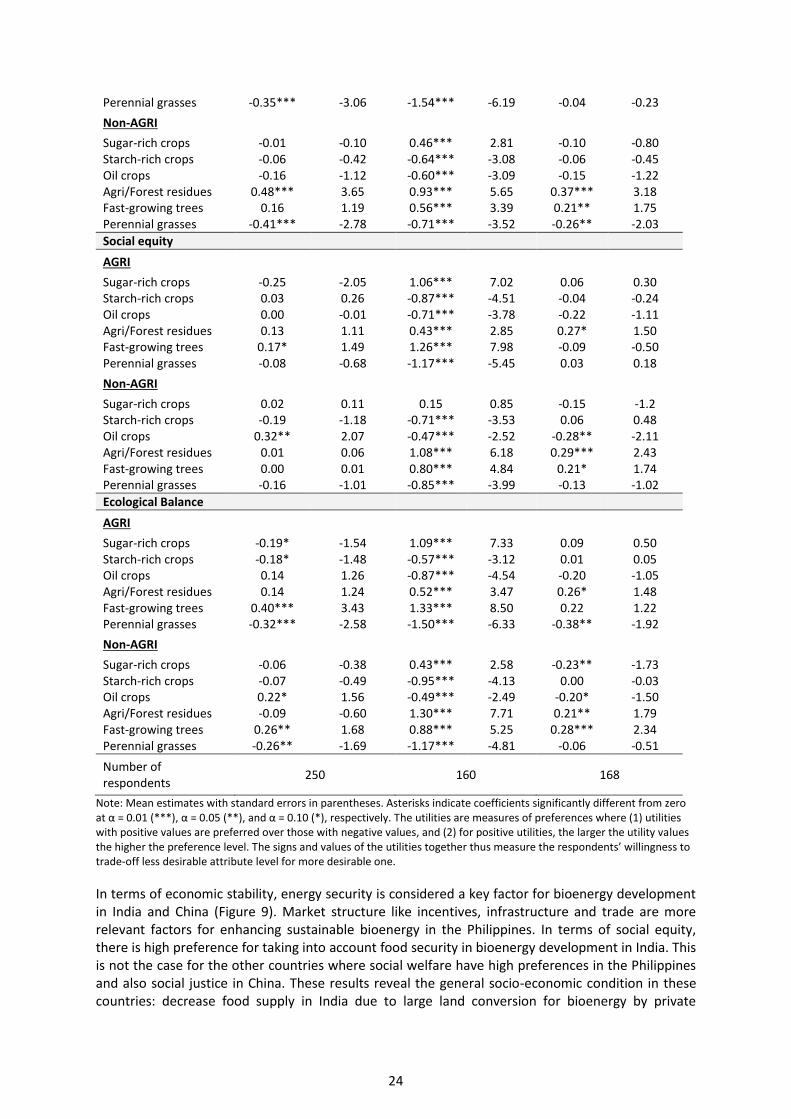
24
Perennial grasses -0.35*** -3.06 -1.54*** -6.19 -0.04 -0.23
Non-AGRI
Sugar-rich crops -0.01 -0.10 0.46*** 2.81 -0.10 -0.80 Starch-rich crops -0.06 -0.42 -0.64*** -3.08 -0.06 -0.45 Oil crops -0.16 -1.12 -0.60*** -3.09 -0.15 -1.22 Agri/Forest residues 0.48*** 3.65 0.93*** 5.65 0.37*** 3.18 Fast-growing trees 0.16 1.19 0.56*** 3.39 0.21** 1.75 Perennial grasses -0.41*** -2.78 -0.71*** -3.52 -0.26** -2.03
Social equity
AGRI
Sugar-rich crops -0.25 -2.05 1.06*** 7.02 0.06 0.30 Starch-rich crops 0.03 0.26 -0.87*** -4.51 -0.04 -0.24 Oil crops 0.00 -0.01 -0.71*** -3.78 -0.22 -1.11 Agri/Forest residues 0.13 1.11 0.43*** 2.85 0.27* 1.50 Fast-growing trees 0.17* 1.49 1.26*** 7.98 -0.09 -0.50 Perennial grasses -0.08 -0.68 -1.17*** -5.45 0.03 0.18
Non-AGRI
Sugar-rich crops 0.02 0.11 0.15 0.85 -0.15 -1.2 Starch-rich crops -0.19 -1.18 -0.71*** -3.53 0.06 0.48 Oil crops 0.32** 2.07 -0.47*** -2.52 -0.28** -2.11 Agri/Forest residues 0.01 0.06 1.08*** 6.18 0.29*** 2.43 Fast-growing trees 0.00 0.01 0.80*** 4.84 0.21* 1.74 Perennial grasses -0.16 -1.01 -0.85*** -3.99 -0.13 -1.02
Ecological Balance
AGRI
Sugar-rich crops -0.19* -1.54 1.09*** 7.33 0.09 0.50 Starch-rich crops -0.18* -1.48 -0.57*** -3.12 0.01 0.05 Oil crops 0.14 1.26 -0.87*** -4.54 -0.20 -1.05 Agri/Forest residues 0.14 1.24 0.52*** 3.47 0.26* 1.48 Fast-growing trees 0.40*** 3.43 1.33*** 8.50 0.22 1.22 Perennial grasses -0.32*** -2.58 -1.50*** -6.33 -0.38** -1.92
Non-AGRI
Sugar-rich crops -0.06 -0.38 0.43*** 2.58 -0.23** -1.73 Starch-rich crops -0.07 -0.49 -0.95*** -4.13 0.00 -0.03 Oil crops 0.22* 1.56 -0.49*** -2.49 -0.20* -1.50 Agri/Forest residues -0.09 -0.60 1.30*** 7.71 0.21** 1.79 Fast-growing trees 0.26** 1.68 0.88*** 5.25 0.28*** 2.34 Perennial grasses -0.26** -1.69 -1.17*** -4.81 -0.06 -0.51
Number of respondents
250 160 168
Note: Mean estimates with standard errors in parentheses. Asterisks indicate coefficients significantly different from zero at α = 0.01 (***), α = 0.05 (**), and α = 0.10 (*), respectively. The utilities are measures of preferences where (1) utilities with positive values are preferred over those with negative values, and (2) for positive utilities, the larger the utility values the higher the preference level. The signs and values of the utilities together thus measure the respondents’ willingness to trade-off less desirable attribute level for more desirable one.
In terms of economic stability, energy security is considered a key factor for bioenergy development in India and China (Figure 9). Market structure like incentives, infrastructure and trade are more relevant factors for enhancing sustainable bioenergy in the Philippines. In terms of social equity, there is high preference for taking into account food security in bioenergy development in India. This is not the case for the other countries where social welfare have high preferences in the Philippines and also social justice in China. These results reveal the general socio-economic condition in these countries: decrease food supply in India due to large land conversion for bioenergy by private
25
investors, lack of better livelihood from bioenergy in the Philippines because farmers continue to be only raw material (feedstock) producer, people displacement in China due to land conversion not only for bioenergy but also industrial purposes. In terms of ecological balance, production potential, ecosystem capacity and land management generally received equal preferences by the respondents in each country, except for the NON-AGRI respondents in China who have less preference for production potential.
3.2 Bioenergy Trade-offs
3.2.1 Sustainability Trade-offs The time-series data on economic, social and ecological indicators at the national and subnational levels were analysed using fuzzy analysis. Figure 10 presents the results of the analysis at the national level, which used the same set of data for the various indicators to allow cross-county comparisons. Overall, China has shown highest level of sustainability for bioenergy production since the 1980s particularly in terms of ecological balance, but also in economic stability and social equity since the mid-1990s. The trend in social equity was relatively erratic as compared to the other sustainability determinants throughout the last two decades, with economic stability turning irregular only in the early 1990s. The Philippines had the lowest level of ecological sustainability at only around 0.3 from the 1980s. India has the highest social equity in the 1980s, but dwindled in the following decades. From the 1990s, India had the lowest level of economic and social sustainability. Figure 11 presents the results of the fuzzy analysis at the subnational level. Not all indicators have the same set of data across the country due to difference in reporting and availability of data. Overall there was a variation in the level of bioenergy sustainability across regions or provinces in the three countries. For the Philippines, the level of sustainability was between 0.30 and 0.70, with the highest levels found in the regions in Mindanao. During the period 2000-2010 the lowest level of sustainability were found in the National Capital Region (NCR) and Central Visayas, where the two of the largest cities in the Philippines are located (i.e. Manila and Cebu). For India, the level of sustainability had a range of 2.5 and 6.5. A significant decline in level of sustainability were found in Bihar and Uttar Pradesh in 2010. Himachal Pradesh and Karnataka had the highest level of sustainability, with the latter showing the highest increase from 2000 to 2010. For China, the level of sustainability was between 0.35 and 0.70. Xinjiang showed the lowest sustainability, while Hubei and Zhejiang the highest. Sustainability continued to increase in Hubei, but decreased in Zhejiang in 2010.
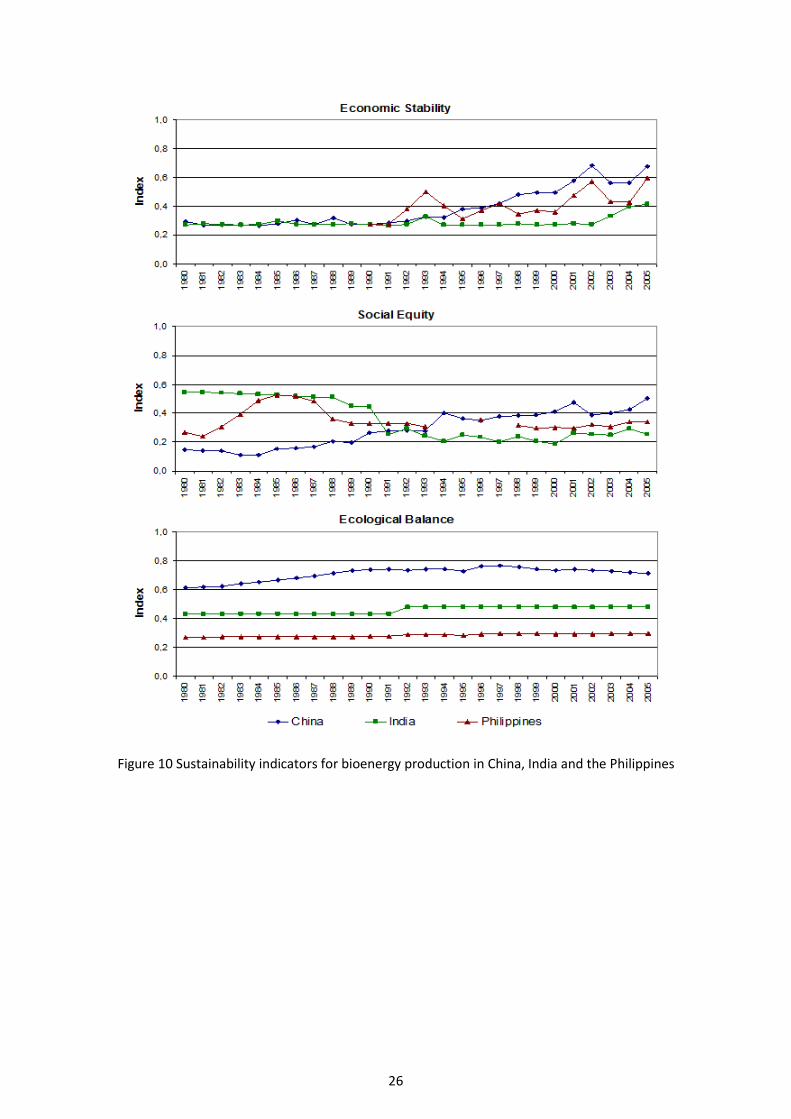
26
Figure 10 Sustainability indicators for bioenergy production in China, India and the Philippines
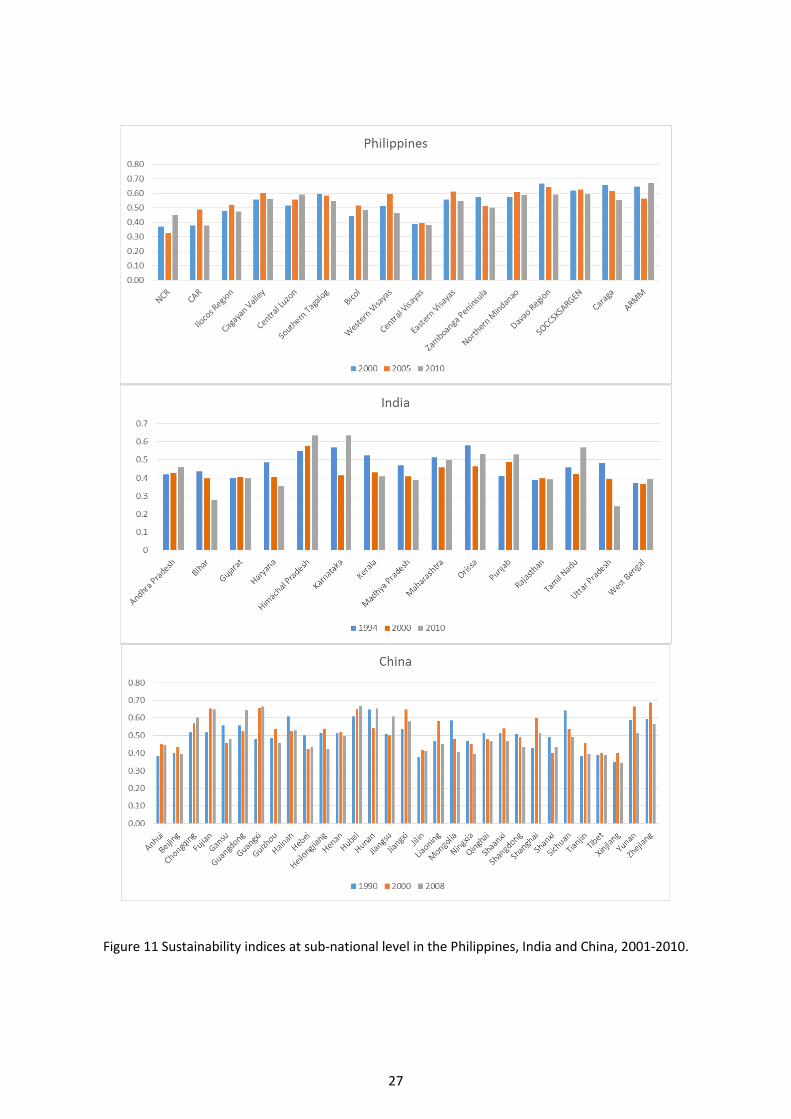
27
Figure 11 Sustainability indices at sub-national level in the Philippines, India and China, 2001-2010.
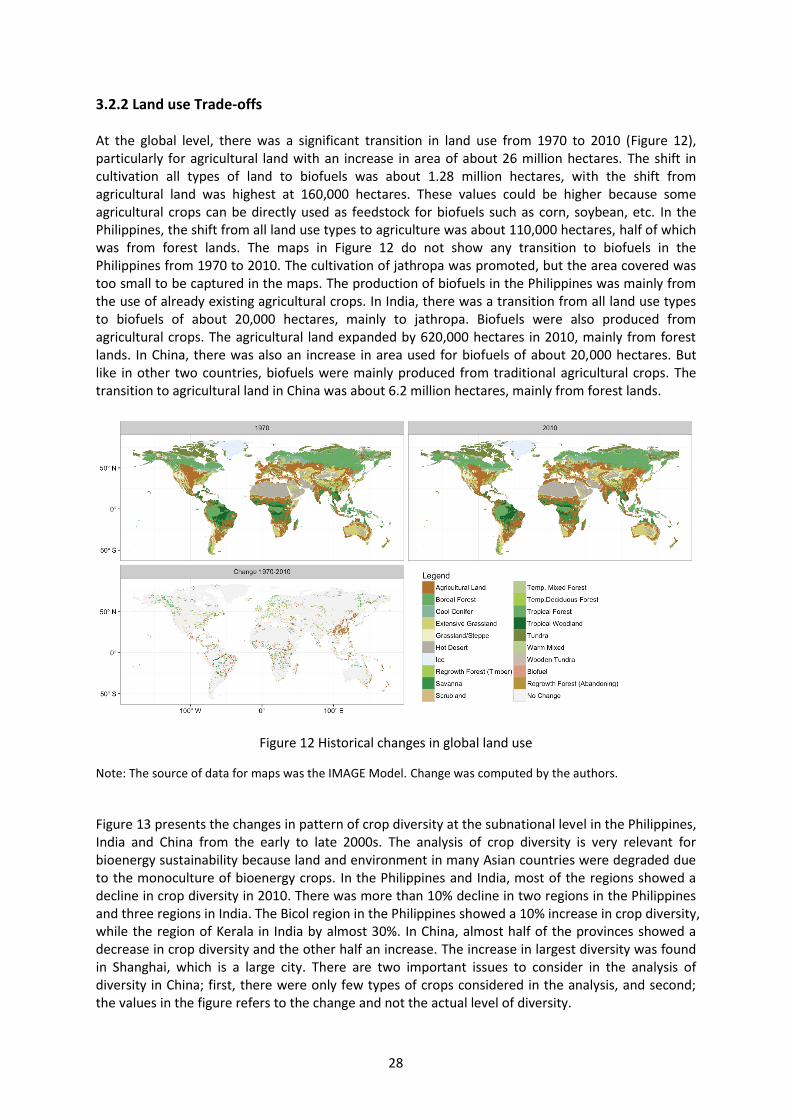
28
3.2.2 Land use Trade-offs At the global level, there was a significant transition in land use from 1970 to 2010 (Figure 12), particularly for agricultural land with an increase in area of about 26 million hectares. The shift in cultivation all types of land to biofuels was about 1.28 million hectares, with the shift from agricultural land was highest at 160,000 hectares. These values could be higher because some agricultural crops can be directly used as feedstock for biofuels such as corn, soybean, etc. In the Philippines, the shift from all land use types to agriculture was about 110,000 hectares, half of which was from forest lands. The maps in Figure 12 do not show any transition to biofuels in the Philippines from 1970 to 2010. The cultivation of jathropa was promoted, but the area covered was too small to be captured in the maps. The production of biofuels in the Philippines was mainly from the use of already existing agricultural crops. In India, there was a transition from all land use types to biofuels of about 20,000 hectares, mainly to jathropa. Biofuels were also produced from agricultural crops. The agricultural land expanded by 620,000 hectares in 2010, mainly from forest lands. In China, there was also an increase in area used for biofuels of about 20,000 hectares. But like in other two countries, biofuels were mainly produced from traditional agricultural crops. The transition to agricultural land in China was about 6.2 million hectares, mainly from forest lands.
Figure 12 Historical changes in global land use
Note: The source of data for maps was the IMAGE Model. Change was computed by the authors.
Figure 13 presents the changes in pattern of crop diversity at the subnational level in the Philippines, India and China from the early to late 2000s. The analysis of crop diversity is very relevant for bioenergy sustainability because land and environment in many Asian countries were degraded due to the monoculture of bioenergy crops. In the Philippines and India, most of the regions showed a decline in crop diversity in 2010. There was more than 10% decline in two regions in the Philippines and three regions in India. The Bicol region in the Philippines showed a 10% increase in crop diversity, while the region of Kerala in India by almost 30%. In China, almost half of the provinces showed a decrease in crop diversity and the other half an increase. The increase in largest diversity was found in Shanghai, which is a large city. There are two important issues to consider in the analysis of diversity in China; first, there were only few types of crops considered in the analysis, and second; the values in the figure refers to the change and not the actual level of diversity.
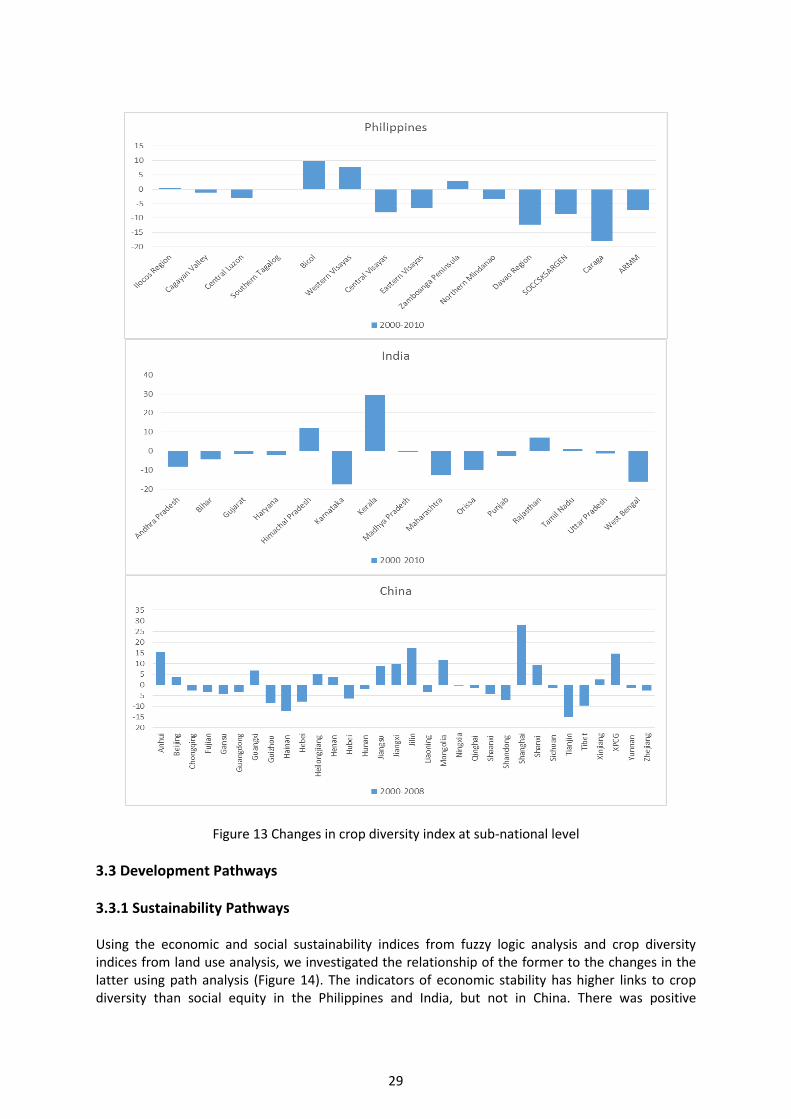
29
Figure 13 Changes in crop diversity index at sub-national level
3.3 Development Pathways
3.3.1 Sustainability Pathways Using the economic and social sustainability indices from fuzzy logic analysis and crop diversity indices from land use analysis, we investigated the relationship of the former to the changes in the latter using path analysis (Figure 14). The indicators of economic stability has higher links to crop diversity than social equity in the Philippines and India, but not in China. There was positive
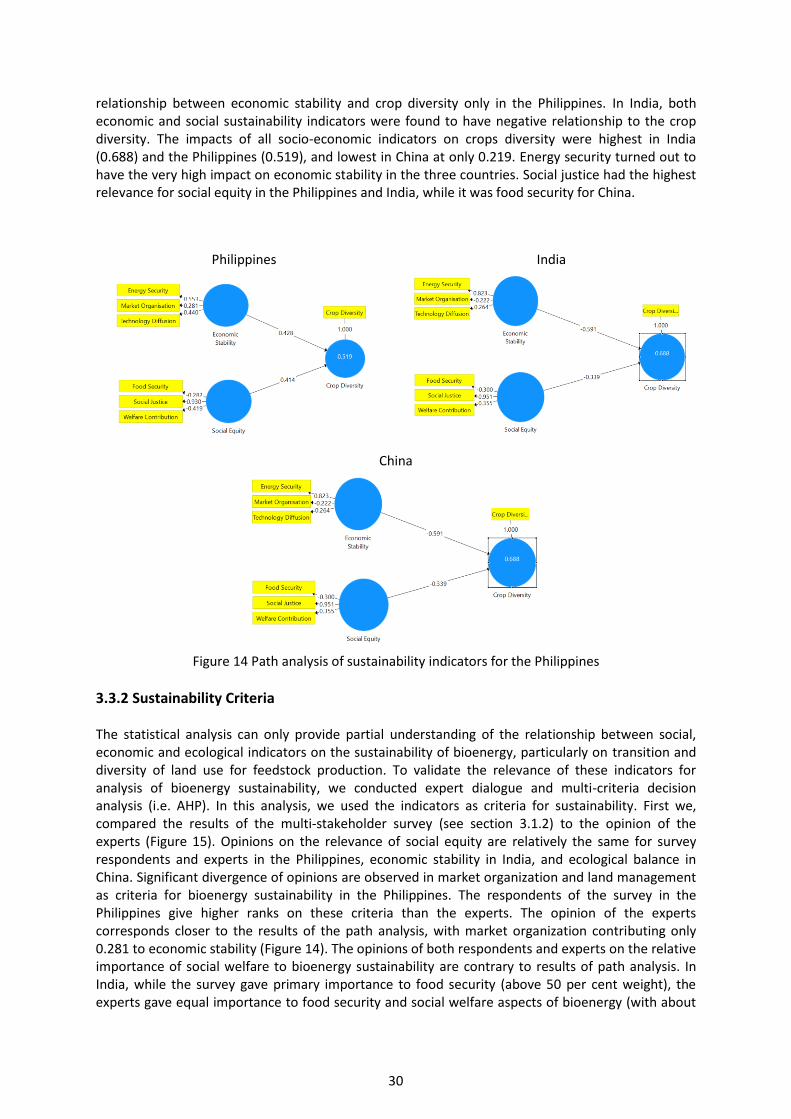
30
relationship between economic stability and crop diversity only in the Philippines. In India, both economic and social sustainability indicators were found to have negative relationship to the crop diversity. The impacts of all socio-economic indicators on crops diversity were highest in India (0.688) and the Philippines (0.519), and lowest in China at only 0.219. Energy security turned out to have the very high impact on economic stability in the three countries. Social justice had the highest relevance for social equity in the Philippines and India, while it was food security for China.
Philippines
India
China
Figure 14 Path analysis of sustainability indicators for the Philippines
3.3.2 Sustainability Criteria The statistical analysis can only provide partial understanding of the relationship between social, economic and ecological indicators on the sustainability of bioenergy, particularly on transition and diversity of land use for feedstock production. To validate the relevance of these indicators for analysis of bioenergy sustainability, we conducted expert dialogue and multi-criteria decision analysis (i.e. AHP). In this analysis, we used the indicators as criteria for sustainability. First we, compared the results of the multi-stakeholder survey (see section 3.1.2) to the opinion of the experts (Figure 15). Opinions on the relevance of social equity are relatively the same for survey respondents and experts in the Philippines, economic stability in India, and ecological balance in China. Significant divergence of opinions are observed in market organization and land management as criteria for bioenergy sustainability in the Philippines. The respondents of the survey in the Philippines give higher ranks on these criteria than the experts. The opinion of the experts corresponds closer to the results of the path analysis, with market organization contributing only 0.281 to economic stability (Figure 14). The opinions of both respondents and experts on the relative importance of social welfare to bioenergy sustainability are contrary to results of path analysis. In India, while the survey gave primary importance to food security (above 50 per cent weight), the experts gave equal importance to food security and social welfare aspects of bioenergy (with about
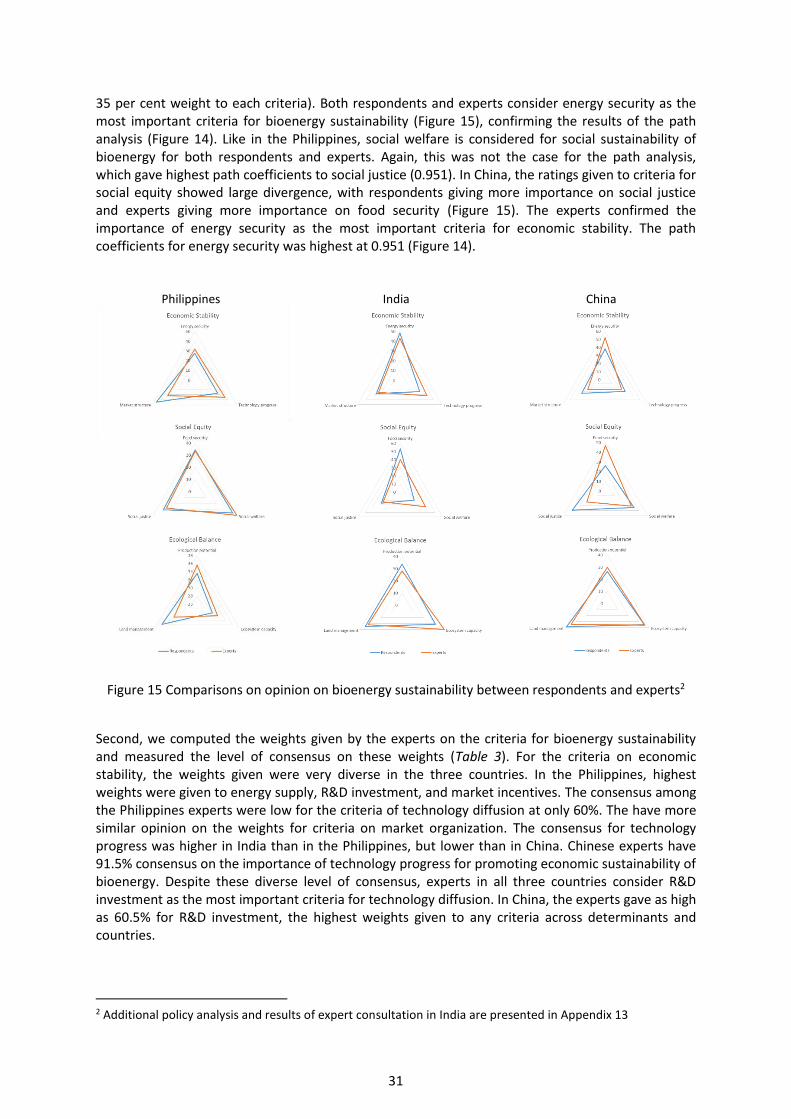
31
35 per cent weight to each criteria). Both respondents and experts consider energy security as the most important criteria for bioenergy sustainability (Figure 15), confirming the results of the path analysis (Figure 14). Like in the Philippines, social welfare is considered for social sustainability of bioenergy for both respondents and experts. Again, this was not the case for the path analysis, which gave highest path coefficients to social justice (0.951). In China, the ratings given to criteria for social equity showed large divergence, with respondents giving more importance on social justice and experts giving more importance on food security (Figure 15). The experts confirmed the importance of energy security as the most important criteria for economic stability. The path coefficients for energy security was highest at 0.951 (Figure 14).
Philippines
India
China
Figure 15 Comparisons on opinion on bioenergy sustainability between respondents and experts2
Second, we computed the weights given by the experts on the criteria for bioenergy sustainability and measured the level of consensus on these weights (Table 3). For the criteria on economic stability, the weights given were very diverse in the three countries. In the Philippines, highest weights were given to energy supply, R&D investment, and market incentives. The consensus among the Philippines experts were low for the criteria of technology diffusion at only 60%. The have more similar opinion on the weights for criteria on market organization. The consensus for technology progress was higher in India than in the Philippines, but lower than in China. Chinese experts have 91.5% consensus on the importance of technology progress for promoting economic sustainability of bioenergy. Despite these diverse level of consensus, experts in all three countries consider R&D investment as the most important criteria for technology diffusion. In China, the experts gave as high as 60.5% for R&D investment, the highest weights given to any criteria across determinants and countries.
2 Additional policy analysis and results of expert consultation in India are presented in Appendix 13
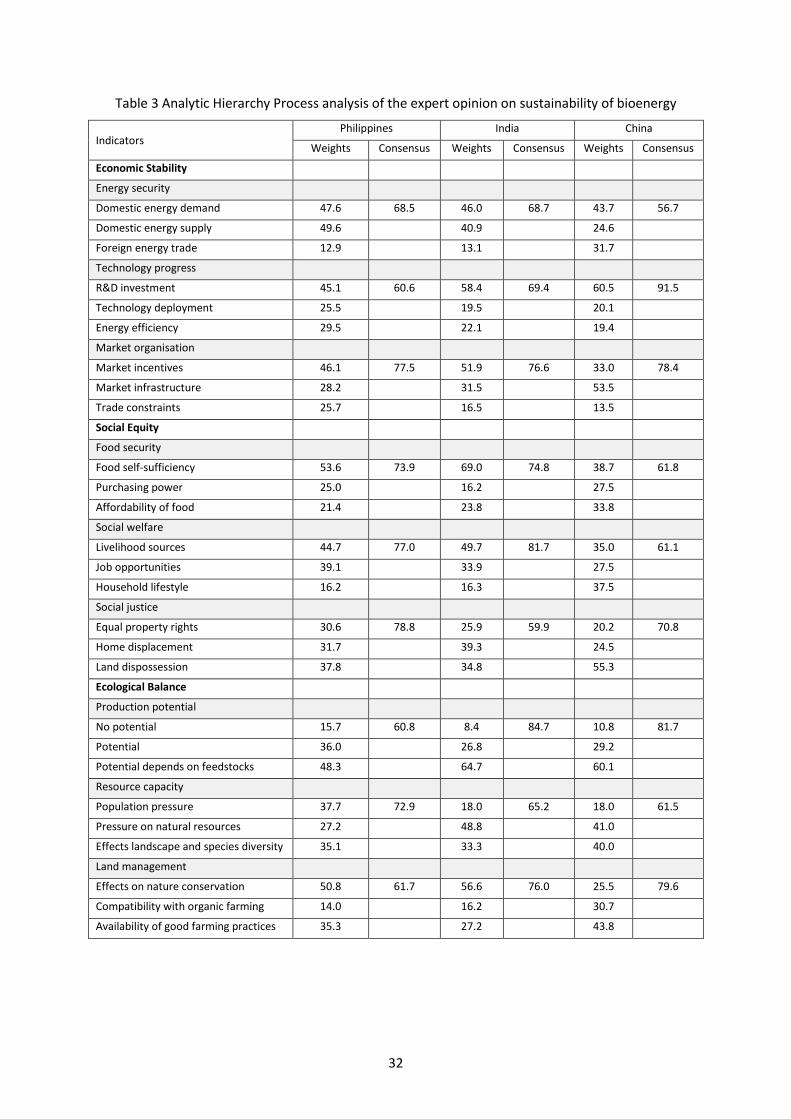
32
Table 3 Analytic Hierarchy Process analysis of the expert opinion on sustainability of bioenergy
Indicators Philippines India China
Weights Consensus Weights Consensus Weights Consensus
Economic Stability
Energy security
Domestic energy demand 47.6 68.5 46.0 68.7 43.7 56.7
Domestic energy supply 49.6 40.9 24.6
Foreign energy trade 12.9 13.1 31.7
Technology progress
R&D investment 45.1 60.6 58.4 69.4 60.5 91.5
Technology deployment 25.5 19.5 20.1
Energy efficiency 29.5 22.1 19.4
Market organisation
Market incentives 46.1 77.5 51.9 76.6 33.0 78.4
Market infrastructure 28.2 31.5 53.5
Trade constraints 25.7 16.5 13.5
Social Equity
Food security
Food self-sufficiency 53.6 73.9 69.0 74.8 38.7 61.8
Purchasing power 25.0 16.2 27.5
Affordability of food 21.4 23.8 33.8
Social welfare
Livelihood sources 44.7 77.0 49.7 81.7 35.0 61.1
Job opportunities 39.1 33.9 27.5
Household lifestyle 16.2 16.3 37.5
Social justice
Equal property rights 30.6 78.8 25.9 59.9 20.2 70.8
Home displacement 31.7 39.3 24.5
Land dispossession 37.8 34.8 55.3
Ecological Balance
Production potential
No potential 15.7 60.8 8.4 84.7 10.8 81.7
Potential 36.0 26.8 29.2
Potential depends on feedstocks 48.3 64.7 60.1
Resource capacity
Population pressure 37.7 72.9 18.0 65.2 18.0 61.5
Pressure on natural resources 27.2 48.8 41.0
Effects landscape and species diversity 35.1 33.3 40.0
Land management
Effects on nature conservation 50.8 61.7 56.6 76.0 25.5 79.6
Compatibility with organic farming 14.0 16.2 30.7
Availability of good farming practices 35.3 27.2 43.8
33
For social equity, the consensus among experts was relatively the same for all criteria in the Philippines (Table 3). Food self-sufficiency and livelihood sources were considered most important criteria for social equity not only in the Philippines but also in India. The consensus among experts in India on relative importance of livelihood resources was very high at 81.7%, the highest level for social equity criteria. In China, the most important criteria for social sustainability of bioenergy production is land dispossession with a weight of 55.3% and a consensus of 70.8%. Land dispossession turned out to be an important concern in the Philippines but with lower weight of 37.8%. In India, home displacement is considered more problematic by the experts than land dispossession. The consensus among experts on this is however quite low at only 59.9%. For ecological balance, experts in the three countries all suggest that potential of bioenergy production depends a lot on the type of feedstocks (Table 3). The consensus on this was very high in India and China at more than 80%, but low in the Philippines at only 60.8%. In the Philippines, the experts are of the opinion that population pressure is an important constraint to the sustainability of bioenergy production. This was not case in India and China, where the experts believe that the resource capacity for bioenergy depend on many other pressures on the natural resources. The consensus is however not very high with only 65.2% in India and 61.5 in China. The experts in the Philippines and India suggest that the effects of bioenergy on nature conservation will influence the sustainability of bioenergy production, with weights of more than 50%. In China, the experts are of the opinion that availability of good farming practices for bioenergy is more important than effects on nature conservation. The Chinese experts’ consensus on this is relatively high at 79.6%.
4.0 Conclusions The project combined various types of data (i.e. literature, survey, land use maps, time-series statistics, stakeholder dialogue, expert opinion) and applied complementary analytical tools (i.e. descriptive analysis, cluster and conjoint analysis, fuzzy logic analysis, path analysis, multi-criteria analysis) to provide answers to the three key questions on the sustainability of bioenergy production based on the policy, community and science perspectives. What are the main drivers for the implementation of bioenergy policies and significant barriers for bioenergy sustainability in the Philippines, India and China? Government policies on promoting use of bioenergy feedstock and obligatory biofuel blending targets have resulted to significant increase in bioenergy production in the Philippines, India and China. In 2014, China and India were the 4th and 5th largest producers, respectively, of global bioethanol after the United States, Brazil and Europe. The Philippines is the only country in the world that mainly uses coconut oil (more superior to palm oil in terms of impacts on climate, i.e. clean air, and ecosystem, i.e. agro-forest system) as feedstock for biodiesel production. Bioenergy policies in China and India were significantly driven by the governments’ objective of achieving energy security to support the stable growth in the economies. Rural livelihood development has been an important objective for pursuing bioenergy policy in the Philippines as well as in India. Various institutional and resource constraints limit the potential of bioenergy to contribute these socio-economic objectives in these countries. Despite the programs to enhance supply of and demand for domestically produced feedstock, the Philippines, India and China have become major global importers of biofuels. Increase dependence on imported biofuels contradicts the energy security and rural development objectives of the bioenergy policies. The main limiting factor for meeting domestic demand for biofuels is the lack of available land resources for bioenergy production. Moreover, in the Philippines, the demand for feedstock for bioethanol production competes with other industrial uses of sugarcane, which offers higher prices than bioethanol.
34
What are the economic, social and ecological indicators that communities consider to be important for the sustainability of bioenergy production? Bioenergy has been actively pursued by governments in the Philippines, India and China, with policies that support and provide incentives for the production and processing of bioethanol and biodiesel. These policies may have provided general perceptions in the society about the economic benefits from bioenergy. Moreover, the debate over fuel and food conflicts has been well discussed in the media, internet and academe, which are among the main sources of information of the respondents in these countries. Consequently, the surveyed communities perceived the first generation feedstocks, which are currently used and promoted by the government for the production of biofuels, as important for sustainable bioenergy production. The survey results further showed that crops, which are not widely used and do not offer alternative household use (e.g., perennial grasses), are not perceived as important and not preferred bioenergy feedstock. The preferred role of bioenergy for sustainable development reflects the social and economic concerns in the respective Asian countries, e.g., energy security in China, food security in India, and ecosystem degradation in the Philippines. This implies that the society expects that bioenergy development could contribute to solving these socio-economic problems. Overall, there is also significant awareness on the effects of bioenergy on ecological balance not only in the Philippines but also in other two Asian countries as revealed by the preferences on the determinants such as ecosystem capacity and land management. The comparison of conjoint preferences between energy security, food security and ecosystem capacity also revealed trade-offs that are largely linked to major sustainability concerns in the respective Asian countries. The high preference for energy security as in the case of China may thus overshadow other sustainability issue such as ecosystem degradation. Thus, policy should carefully weigh the impacts of bioenergy development on sustainability aspects that are closely interlinked (e.g. energy-food-ecosystem nexus) because if the society favour one or two sustainability aspects then it needs to pay high cost for another aspect. Do the paths for bioenergy development based on scientific evidence confirm the preferences of communities and opinion of experts? The analysis of statistical data confirms the significance of energy security for the development paths for bioenergy in China and India. These results conform to the preferences of communities in China but not in India. In India, the opinions of both communities and experts on the relative importance of social welfare to bioenergy sustainability are contrary to results of path analysis. While the communities gave primary importance only to food security, the experts gave equal importance to food security and social welfare aspects of bioenergy. In the Philippines, opinions on the relevance of social equity are relatively the same for communities and experts, but significant divergence of opinions are observed in market organization and land management as criteria for bioenergy sustainability in the Philippines. For many social and ecological sustainability factors, the preferences of communities and opinion of experts diverge with the results of scientific investigations. There is also not very high consensus among scientific experts on the role of various sustainability factors on bioenergy development. The divergence in evidence and opinions on the development paths for bioenergy may have implications in reducing barriers to and choosing the more appropriate feedstock for sustainable bioenergy production.
5.0 Future Directions There are some challenges that researchers should consider when applying integrated sustainability assessment model that requires different datasets. In the case of choice-based conjoint analysis, while web-based survey offers a wider geographical coverage at lesser costs, it is more difficult to implement because respondents usually do not respond to survey invitations, unless the respondent know the person who is sending the invitation. This was the case for India where the survey respondents have not been very enthusiastic in the topic given the low level of policy interest on the
35
biofuels compared to other renewable energy sources like wind and solar. As a result, it is not easy to ensure the representativeness of respondents for different parts of the society (e.g. government, academe, private sector, etc.). But the information collected from conjoint survey are very essential to understanding the perceived role of bioenergy in the lives of the people. When conducting similar study, it is thus worth investing more time and money to ensure survey representativeness. In the case of historical land use maps, available GIS data are not of appropriate high resolution to capture land use transitions that are useful for path analysis at the sub-national level. Investment on the development of such historical land use maps will be very useful for the countries in Asia. But crop diversity indices could be a valuable alternative for conducting path analysis of bioenergy sustainability. So in the case of time-series statistics, while data on area of production by commodity types are available for computation of crop diversity indices, government agencies could already include them as part of historical statistical database. Finally, funds are necessary to support regional research initiatives that apply integrated assessments to thoroughly investigate the sustainability debates that are relevant not only for policy and science but also for communities.
References Van Acker, V., Witlox, F. & Van Wee, B., 2007. The Effects of the Land Use System on Travel
Behavior: A Structural Equation Modeling Approach. Transportation Planning and Technology, 30(4), pp.331–353. Available at: http://www.tandfonline.com/doi/abs/10.1080/03081060701461675 [Accessed November 7, 2014].
Acosta, L.A. et al., 2016. The Role of Bioenergy in Enhancing Energy , Food and Ecosystem Sustainability Based on Societal Perceptions and Preferences in Asia. Agriculture, 6(19), pp.1–26.
Acosta, L.A. & Galli, F., 2013. Crisis Probability Curves ( CPCs ): A Model for Assessing Vulnerability Thresholds Across Space and Over Time. Journal of Environmental Science and Management, 16(1), pp.36–49.
Acosta-Michlik, L. et al., 2011. Integrated assessment of sustainability trade-offs and pathways for global bioenergy production: Framing a novel hybrid approach. Renewable and Sustainable Energy Reviews, 15(6), pp.2791–2809. Available at: http://linkinghub.elsevier.com/retrieve/pii/S1364032111000530 [Accessed November 7, 2014].
Acosta-Michlik, L. a. et al., 2008. Application of fuzzy models to assess susceptibility to droughts from a socio-economic perspective. Regional Environmental Change, 8(4), pp.151–160. Available at: http://link.springer.com/10.1007/s10113-008-0058-4 [Accessed November 7, 2014].
Bakker, M.M. et al., 2005. Soil erosion as a driver of land-use change. Agriculture, Ecosystems & Environment, 105(3), pp.467–481. Available at: http://linkinghub.elsevier.com/retrieve/pii/S0167880904002002 [Accessed October 19, 2014].
BAS, 2015. Regional Profile: CALABARZON. CountrySTAT Philippines, pp.1–2. Available at: http://countrystat.bas.gov.ph/?cont=16&r=4 [Accessed April 15, 2015].
Basavaraj, G. et al., 2013. Assessing viability of bio-ethanol production from sweet sorghum in India. Energy Policy, 56, pp.501–508. Available at: http://dx.doi.org/10.1016/j.enpol.2013.01.012.
Cornelissen, a. M.. et al., 2001. Assessment of the contribution of sustainability indicators to sustainable development: a novel approach using fuzzy set theory. Agriculture, Ecosystems & Environment, 86(2), pp.173–185. Available at: http://linkinghub.elsevier.com/retrieve/pii/S0167880900002723.
Corpuz, P.G., 2009. Philippines BIOFUELS ANNUAL - Philippine Bio-fuel Industry Outlook, United States Department of Agriculture (USDA), Washington, DC. Available at: http://gain.fas.usda.gov/Recent GAIN Publications/General Report_Manila_Philippines_6-1-2009.pdf.
36
DCLG, 2009. Multi-criteria analysis: a manual, London. Available at: http://eprints.lse.ac.uk/12761/1/Multi-criteria_Analysis.pdf.
Démurger, S. & Fournier, M., 2011. Poverty and firewood consumption : A case study of rural households in northern China. China Economic Review, 22(4), pp.512–523. Available at: http://dx.doi.org/10.1016/j.chieco.2010.09.009.
Eierdanz, F. et al., 2008. Using fuzzy set theory to address the uncertainty of susceptibility to drought. Regional Environmental Change, 8(4), pp.197–205. Available at: http://link.springer.com/10.1007/s10113-008-0069-1 [Accessed November 7, 2014].
Faaij, A.P.C., 2006. Bio-energy in Europe: changing technology choices. Energy Policy, 34(3), pp.322–342. Available at: http://linkinghub.elsevier.com/retrieve/pii/S0301421504002435 [Accessed July 9, 2014].
Goepel, K.D., 2013. BPMSG AHP Excel Template with multiple Inputs. , pp.1–6. Available at: http://bpmsg.com.
Liu, L., Liu, C. & Wang, J., 2013. Deliberating on renewable and sustainable energy policies in China. Renewable and Sustainable Energy Reviews, 17, pp.191–198. Available at: http://dx.doi.org/10.1016/j.rser.2012.09.018.
Lo, K., 2014. A critical review of China’s rapidly developing renewable energy and energy efficiency policies. Renewable and Sustainable Energy Reviews, 29, pp.508–516. Available at: http://dx.doi.org/10.1016/j.rser.2013.09.006.
Moschandreas, M., 2000. Business Economics, London: Thomson Learning. Mustajoki, J. & Marttunen, M., 2013. Comparison of Multi-Criteria Decision Analytical Software:
Searching for ideas for developing a new EIA-specific multi-criteria software, Jyväskylä. Available at: https://jyx.jyu.fi/dspace/bitstream/handle/123456789/49477/Annex7.5.13ComparisonofMultiCriteriaDecisionAnalyticalSoftware.pdf?sequence=1.
Nakata, T., Silva, D. & Rodionov, M., 2011. Application of energy system models for designing a low-carbon society. Progress in Energy and Combustion Science, 37(4), pp.462–502. Available at: http://linkinghub.elsevier.com/retrieve/pii/S0360128510000638 [Accessed July 25, 2014].
Norman, G.R. & Streiner, D.L., 2003. Path Analysis and Structural Equation Modeling. In G. R. Norman & D. L. Streiner, eds. Pdq Statistics. Ontario, Canada: BC Decker, pp. 156–176.
Orme, B., 2009. CBC/HB v5 - Software for Hierarchical Bayes Estimation for CBC Data, Sawtooth Software, Inc., Sequim, WA. Available at: http://www.sawtoothsoftware.com.
Orme, B., 2010. SSI Web v7.0 - Software for Web Interviewing and Conjoint Analysis, Sawtooth Software, Inc. Sequim, WA. Available at: http://www.sawtoothsoftware.com.
Orme, B., 2006. The Sawtooth Software Market Simulator ( A Supplement to the CBC v2 . 6 Manual ), Sawtooth Software, Inc., Sequim, WA. Available at: http://www.sawtoothsoftware.com.
Pacini, H. et al., 2013. The state of the market: Regulatory, trade and development perspectives, UNCTAD, Geneva.
Qiu, H. et al., 2010. Bioethanol development in China and the potential impacts on its agricultural economy. Applied Energy, 87(1), pp.76–83. Available at: http://linkinghub.elsevier.com/retrieve/pii/S0306261909003031 [Accessed October 31, 2014].
Raju, S.S. et al., 2012. Potential , Policy and Emerging, National Centre for Agricultural Economics and Policy Research, New Delhi. Available at: http://www.ncap.res.in/upload_files/policy_paper/pp27.pdf.
Ringle, C.M., Wende, S. & Becker, J.M., 2015. SmartPLS. Available at: htth://www.smartpls.com. Roehrig, S.F., 1996. Probabilistic inference and path analysis. Decision Support Systems, 16, pp.55–66. Singhal, R. & Sengupta, R., 2012. Energy Security and Biodiesel. Economic & Political Weekly,
XLVII(40), pp.66–73. Available at: http://www.epw.in.ezproxy.is.ed.ac.uk/system/files/pdf/2012_47/40/Energy_Security_and_Biodiesel.pdf.
Skea, J. & Nishioka, S., 2008. Policies and practices for a low-carbon society. Climate Policy, 8(sup1),
37
pp.S5–S16. Available at: http://www.tandfonline.com/doi/abs/10.3763/cpol.2008.0487 [Accessed November 7, 2014].
Srinivasa Setty, K.P. & Natarajan, R., 1988. Process analysis of becoming committed to energy conservation—A path analytic approach. Energy Conversion and Management, 28(1), pp.5–9. Available at: http://linkinghub.elsevier.com/retrieve/pii/0196890488900039 [Accessed November 7, 2014].
Stage, F.K., Carter, H.C. & Nora, A., 2004. Path Analysis: An Introduction and Analysis of a Decade of Research. The Journal of Educational Research, 98(1), pp.5–13. Available at: http://www.tandfonline.com/doi/abs/10.3200/JOER.98.1.5-13 [Accessed October 25, 2014].
USDA, 2012. India Biofuels Annual 2012, Washington, DC. Available at: http://gain.fas.usda.gov/Recent GAIN Publications/Biofuels Annual_New Delhi_India_6-20-2012.pdf.
Zhou, A. & Thomson, E., 2009. The development of biofuels in Asia. Applied Energy, 86(December 2007), pp.S11–S20. Available at: http://linkinghub.elsevier.com/retrieve/pii/S0306261909001561 [Accessed November 7, 2014].
Appendices (Available as separate documents)
Appendix 1 Questionnaire for the Web-based and CAPI survey
Appendix 2 Questionnaire for the expert consultation
Appendix 3 PIC-STRAP kick-off meeting program and photos of activities, 12-15 June 2013
Appendix 4 Presentation on online survey during PIC-STRAP kick-off meeting
Appendix 5 Presentation on conjoint analysis during PIC-STRAP kick-off meeting
Appendix 6 Presentation on fuzzy logic during PIC-STRAP kick-off meeting
Appendix 7 Presentation during the International ISSAAS Congress, 11-15 Nov 2013
Appendix 8 Presentation during the Fourth MSE Faculty Seminar Series, 27-28 Feb 2014
Appendix 9 PIC-STRAP Framing Workshop program and photos of activities, 21-24 July 2014
Appendix 10 Presentation on analytical framework during PIC-STRAP framing workshop
Appendix 11 Presentation on Phil survey results during PIC-STRAP framing workshop
Appendix 12 Presentation on biofuels in India during PIC-STRAP framing workshop
Appendix 13 Policy context and analysis of expert opinions on bioenergy in India
Appendix 14 STRAP Working Paper #001-2014
Appendix 15 STRAP Working Paper #002-2014
Appendix 16 STRAP Working Paper #003-2014
Appendix 17 STRAP Working Paper #004-2014
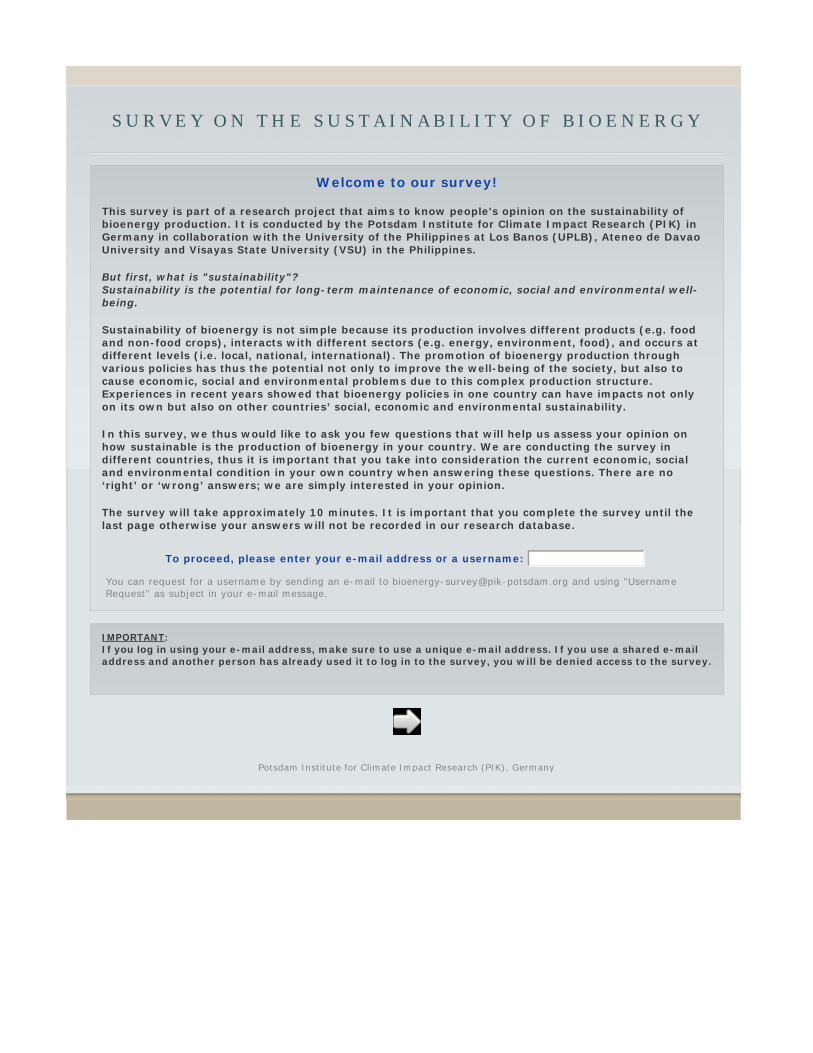
S U R V E Y O N T H E S U S T A I N A B I L I T Y O F B I O E N E R G Y
Welcome to our survey!
This survey is part of a research project that aims to know people's opinion on the sustainability of bioenergy production. It is conducted by the Potsdam Institute for Climate Impact Research (PIK) in Germany in collaboration with the University of the Philippines at Los Banos (UPLB), Ateneo de Davao University and Visayas State University (VSU) in the Philippines.
But first, what is "sustainability"? Sustainability is the potential for long-term maintenance of economic, social and environmental well-being.
Sustainability of bioenergy is not simple because its production involves different products (e.g. food and non-food crops), interacts with different sectors (e.g. energy, environment, food), and occurs at different levels (i.e. local, national, international). The promotion of bioenergy production through various policies has thus the potential not only to improve the well-being of the society, but also to cause economic, social and environmental problems due to this complex production structure. Experiences in recent years showed that bioenergy policies in one country can have impacts not only on its own but also on other countries’ social, economic and environmental sustainability.
In this survey, we thus would like to ask you few questions that will help us assess your opinion on how sustainable is the production of bioenergy in your country. We are conducting the survey in different countries, thus it is important that you take into consideration the current economic, social and environmental condition in your own country when answering these questions. There are no ‘right’ or ‘wrong’ answers; we are simply interested in your opinion.
The survey will take approximately 10 minutes. It is important that you complete the survey until the last page otherwise your answers will not be recorded in our research database.
You can request for a username by sending an e-mail to [email protected] and using "Username Request" as subject in your e-mail message.
To proceed, please enter your e-mail address or a username:
IMPORTANT: If you log in using your e-mail address, make sure to use a unique e-mail address. If you use a shared e-mail address and another person has already used it to log in to the survey, you will be denied access to the survey.
Potsdam Institute for Climate Impact Research (PIK), Germany
S U R V E Y O N T H E S U S T A I N A B I L I T Y O F B I O E N E R G Y
Where are you presently working?
government office
private company
farm, field
university/research institution
others
What is(are) your present line(s) of work? You can choose more than one.
agriculture
forest/environment
business
industry
education
engineering
commerce
transport
energy
services
others
Please select the location of your work:
Luzon Visayas Mindanao
Please provide below the name and address of the institution where you are currently working:
(For example: University of the Philippines, Los Banos, Laguna. If working on the farm, please give name of town and province)
0% 100%
Potsdam Institute for Climate Impact Research (PIK), Germany
S U R V E Y O N T H E S U S T A I N A B I L I T Y O F B I O E N E R G Y
Are you familiar with the term “bioenergy” (also known as biofuels)?
yes
no
0% 100%
Potsdam Institute for Climate Impact Research (PIK), Germany
S U R V E Y O N T H E S U S T A I N A B I L I T Y O F B I O E N E R G Y
Is your work related to bioenergy?
yes
no
0% 100%
Potsdam Institute for Climate Impact Research (PIK), Germany
S U R V E Y O N T H E S U S T A I N A B I L I T Y O F B I O E N E R G Y
How is your work related to bioenergy? You can choose more than one.
bioenergy research/study
government policy/program
bioenergy crop production
local extension services
bioenergy production (diesel, ethanol)
bionergy market/sales
bioenergy foreign import/export
bioenergy transport/distribution
bioenergy technical support
technology development
technology commercialization
others
0% 100%
Potsdam Institute for Climate Impact Research (PIK), Germany
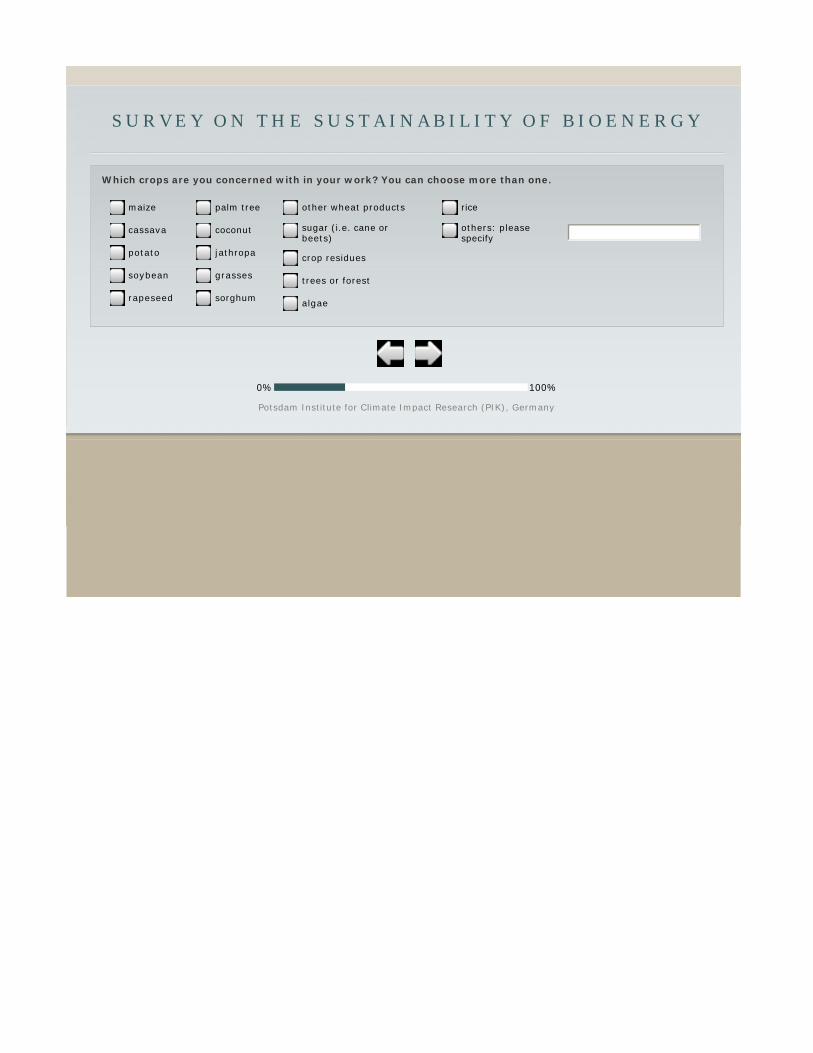
S U R V E Y O N T H E S U S T A I N A B I L I T Y O F B I O E N E R G Y
Which crops are you concerned with in your work? You can choose more than one.
maize
cassava
potato
soybean
rapeseed
palm tree
coconut
jathropa
grasses
sorghum
other wheat products
sugar (i.e. cane or beets)
crop residues
trees or forest
algae
rice
others: please specify
0% 100%
Potsdam Institute for Climate Impact Research (PIK), Germany
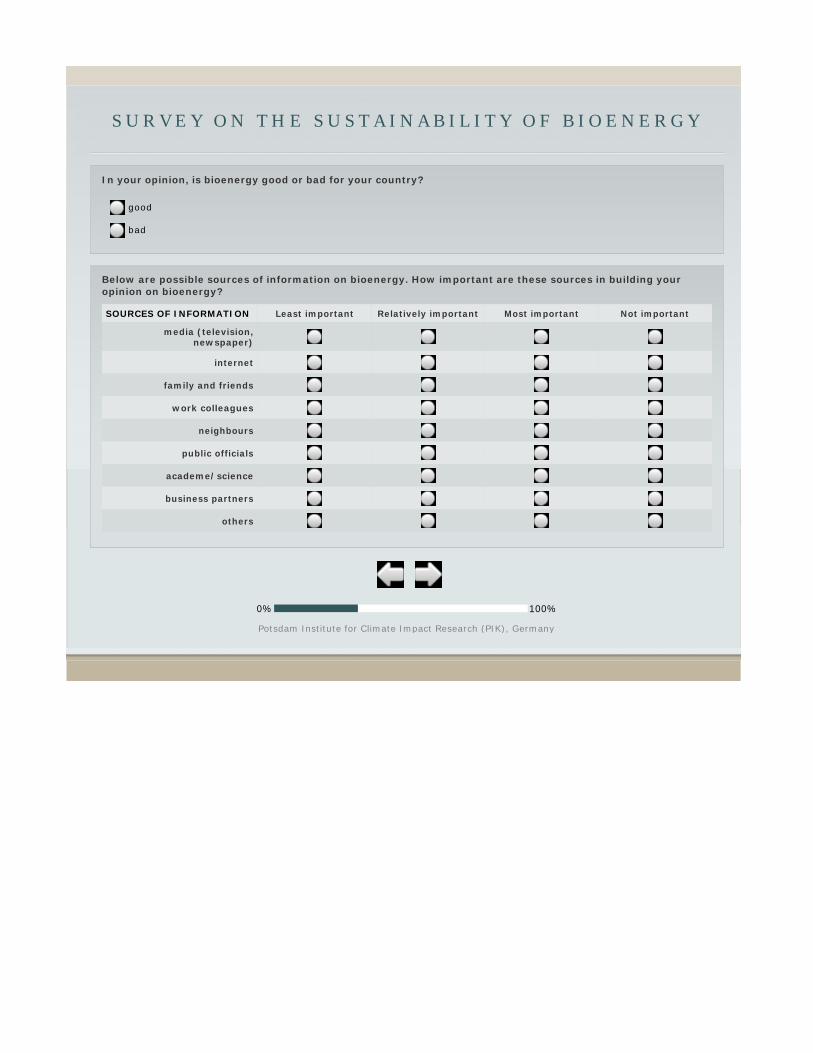
S U R V E Y O N T H E S U S T A I N A B I L I T Y O F B I O E N E R G Y
In your opinion, is bioenergy good or bad for your country?
good
bad
Below are possible sources of information on bioenergy. How important are these sources in building your opinion on bioenergy?
SOURCES OF INFORMATION Least important Relatively important Most important Not important
media (television, newspaper)
internet
family and friends
work colleagues
neighbours
public officials
academe/science
business partners
others
0% 100%
Potsdam Institute for Climate Impact Research (PIK), Germany
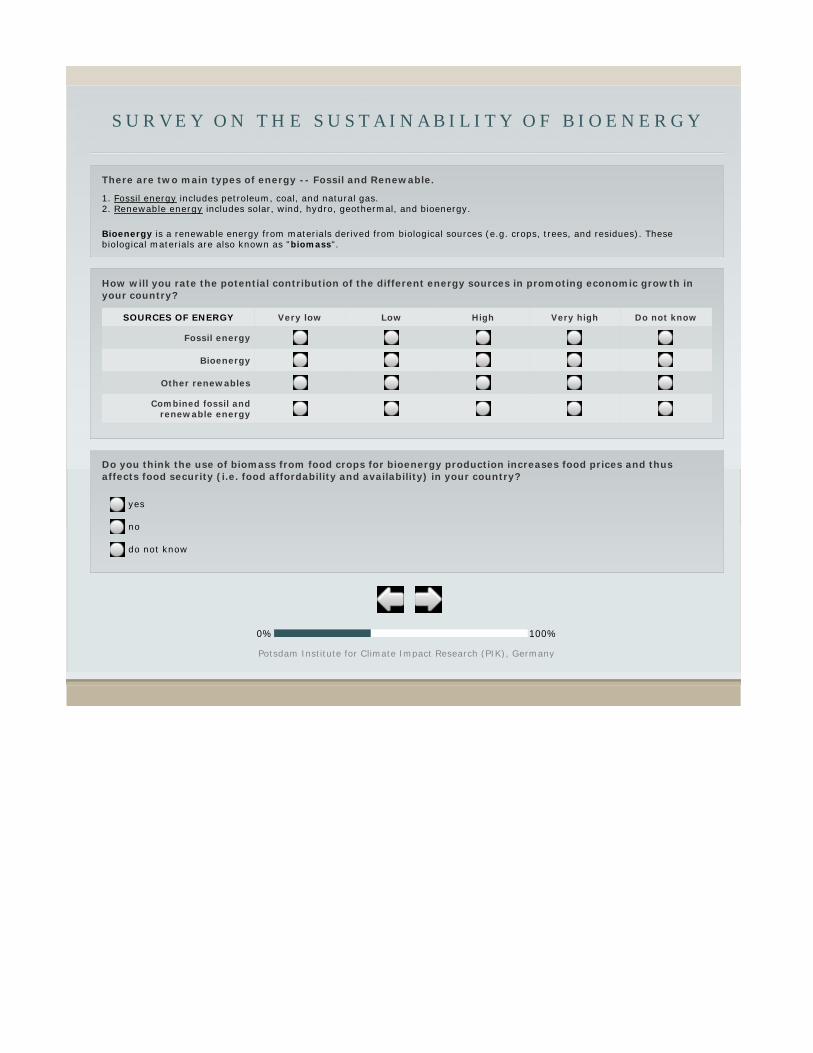
S U R V E Y O N T H E S U S T A I N A B I L I T Y O F B I O E N E R G Y
There are two main types of energy -- Fossil and Renewable.
1. Fossil energy includes petroleum, coal, and natural gas. 2. Renewable energy includes solar, wind, hydro, geothermal, and bioenergy.
Bioenergy is a renewable energy from materials derived from biological sources (e.g. crops, trees, and residues). These biological materials are also known as "biomass".
How will you rate the potential contribution of the different energy sources in promoting economic growth in your country?
SOURCES OF ENERGY Very low Low High Very high Do not know
Fossil energy
Bioenergy
Other renewables
Combined fossil and renewable energy
Do you think the use of biomass from food crops for bioenergy production increases food prices and thus affects food security (i.e. food affordability and availability) in your country?
yes
no
do not know
0% 100%
Potsdam Institute for Climate Impact Research (PIK), Germany
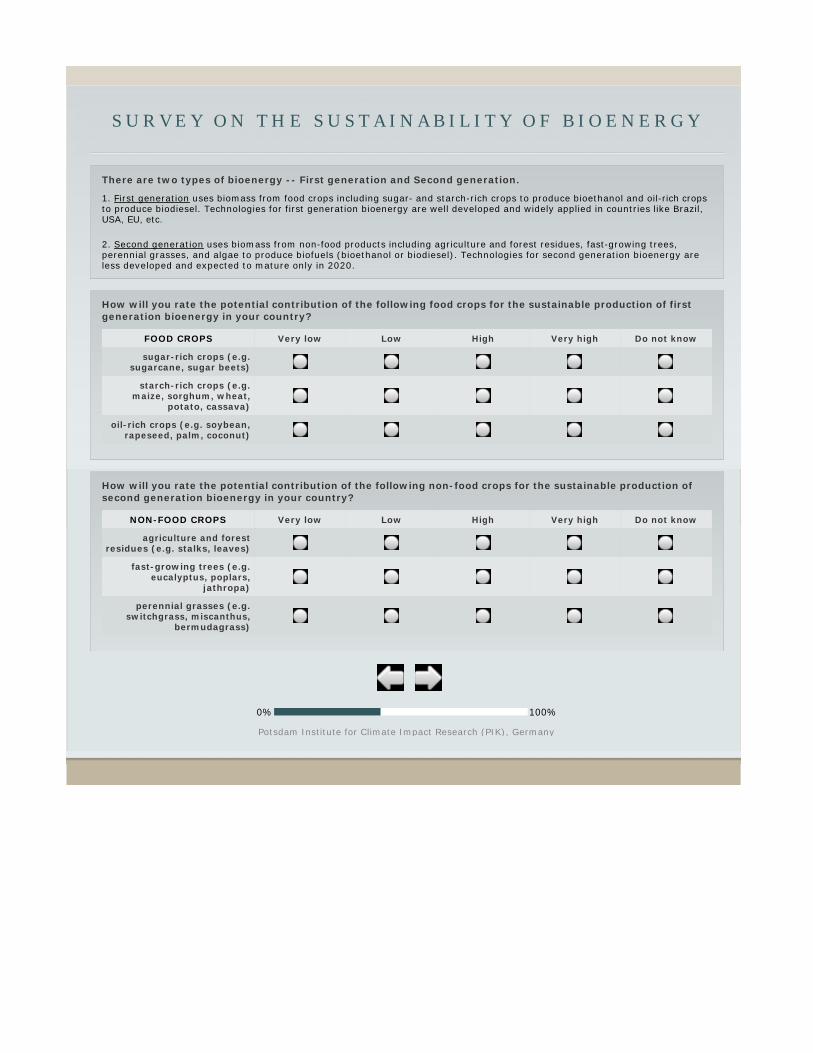
S U R V E Y O N T H E S U S T A I N A B I L I T Y O F B I O E N E R G Y
There are two types of bioenergy -- First generation and Second generation.
1. First generation uses biomass from food crops including sugar- and starch-rich crops to produce bioethanol and oil-rich crops to produce biodiesel. Technologies for first generation bioenergy are well developed and widely applied in countries like Brazil, USA, EU, etc.
2. Second generation uses biomass from non-food products including agriculture and forest residues, fast-growing trees, perennial grasses, and algae to produce biofuels (bioethanol or biodiesel). Technologies for second generation bioenergy are less developed and expected to mature only in 2020.
How will you rate the potential contribution of the following food crops for the sustainable production of first generation bioenergy in your country?
FOOD CROPS Very low Low High Very high Do not know
sugar-rich crops (e.g. sugarcane, sugar beets)
starch-rich crops (e.g. maize, sorghum, wheat,
potato, cassava)
oil-rich crops (e.g. soybean, rapeseed, palm, coconut)
How will you rate the potential contribution of the following non-food crops for the sustainable production of second generation bioenergy in your country?
NON-FOOD CROPS Very low Low High Very high Do not know
agriculture and forest residues (e.g. stalks, leaves)
fast-growing trees (e.g. eucalyptus, poplars,
jathropa)
perennial grasses (e.g. switchgrass, miscanthus,
bermudagrass)
0% 100%
Potsdam Institute for Climate Impact Research (PIK), Germany
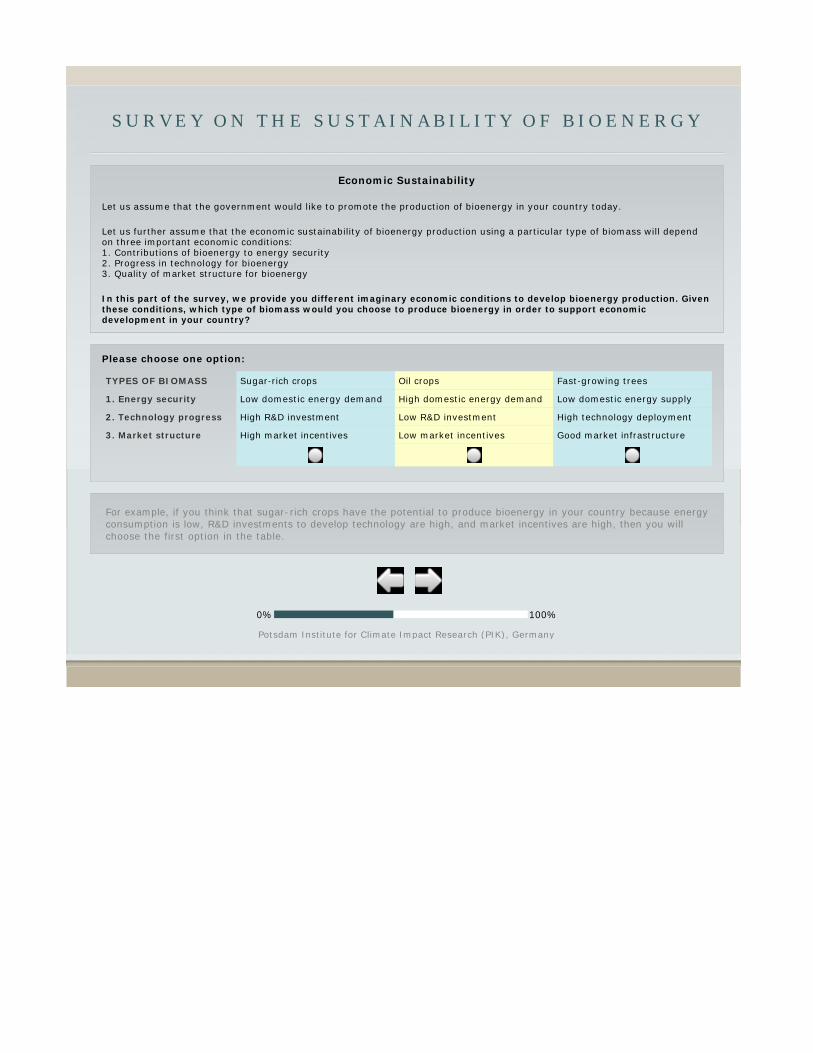
S U R V E Y O N T H E S U S T A I N A B I L I T Y O F B I O E N E R G Y
Economic Sustainability
Let us assume that the government would like to promote the production of bioenergy in your country today.
Let us further assume that the economic sustainability of bioenergy production using a particular type of biomass will depend on three important economic conditions: 1. Contributions of bioenergy to energy security 2. Progress in technology for bioenergy 3. Quality of market structure for bioenergy
In this part of the survey, we provide you different imaginary economic conditions to develop bioenergy production. Given these conditions, which type of biomass would you choose to produce bioenergy in order to support economic development in your country?
Please choose one option:
TYPES OF BIOMASS Sugar-rich crops Oil crops Fast-growing trees
1. Energy security Low domestic energy demand High domestic energy demand Low domestic energy supply
2. Technology progress High R&D investment Low R&D investment High technology deployment
3. Market structure High market incentives Low market incentives Good market infrastructure
For example, if you think that sugar-rich crops have the potential to produce bioenergy in your country because energy consumption is low, R&D investments to develop technology are high, and market incentives are high, then you will choose the first option in the table.
0% 100%
Potsdam Institute for Climate Impact Research (PIK), Germany
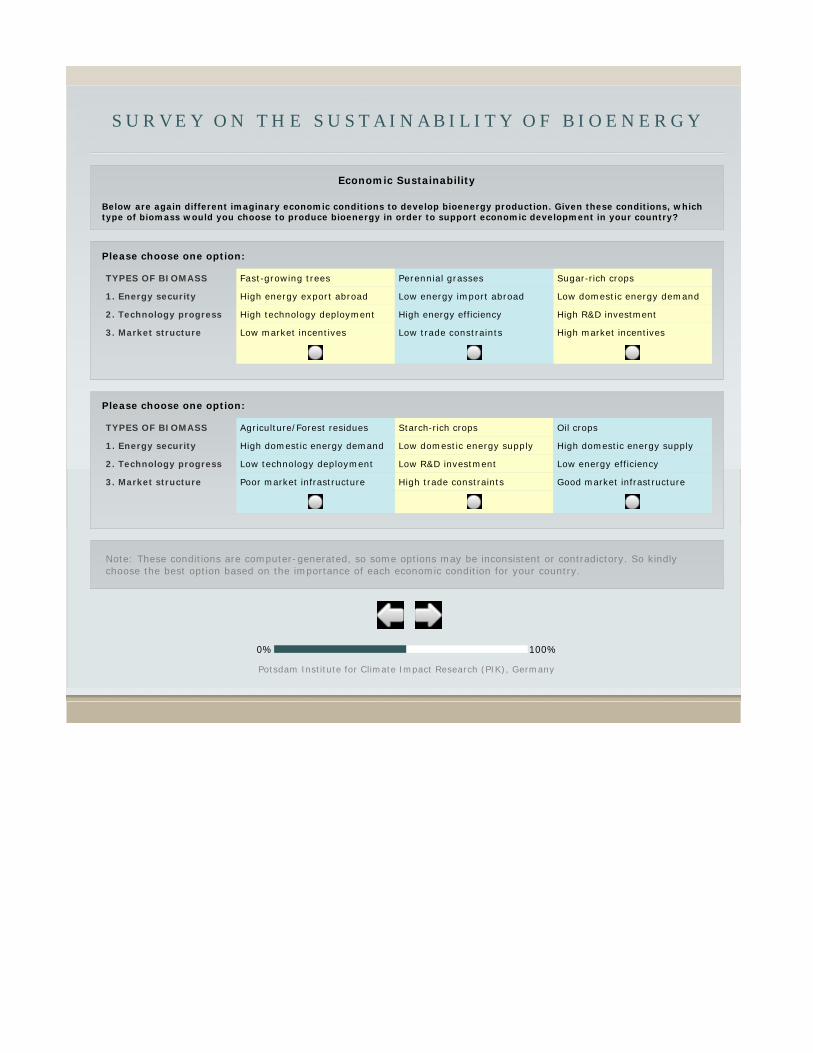
S U R V E Y O N T H E S U S T A I N A B I L I T Y O F B I O E N E R G Y
Economic Sustainability
Below are again different imaginary economic conditions to develop bioenergy production. Given these conditions, which type of biomass would you choose to produce bioenergy in order to support economic development in your country?
Please choose one option:
TYPES OF BIOMASS Fast-growing trees Perennial grasses Sugar-rich crops
1. Energy security High energy export abroad Low energy import abroad Low domestic energy demand
2. Technology progress High technology deployment High energy efficiency High R&D investment
3. Market structure Low market incentives Low trade constraints High market incentives
Please choose one option:
TYPES OF BIOMASS Agriculture/Forest residues Starch-rich crops Oil crops
1. Energy security High domestic energy demand Low domestic energy supply High domestic energy supply
2. Technology progress Low technology deployment Low R&D investment Low energy efficiency
3. Market structure Poor market infrastructure High trade constraints Good market infrastructure
Note: These conditions are computer-generated, so some options may be inconsistent or contradictory. So kindly choose the best option based on the importance of each economic condition for your country.
0% 100%
Potsdam Institute for Climate Impact Research (PIK), Germany
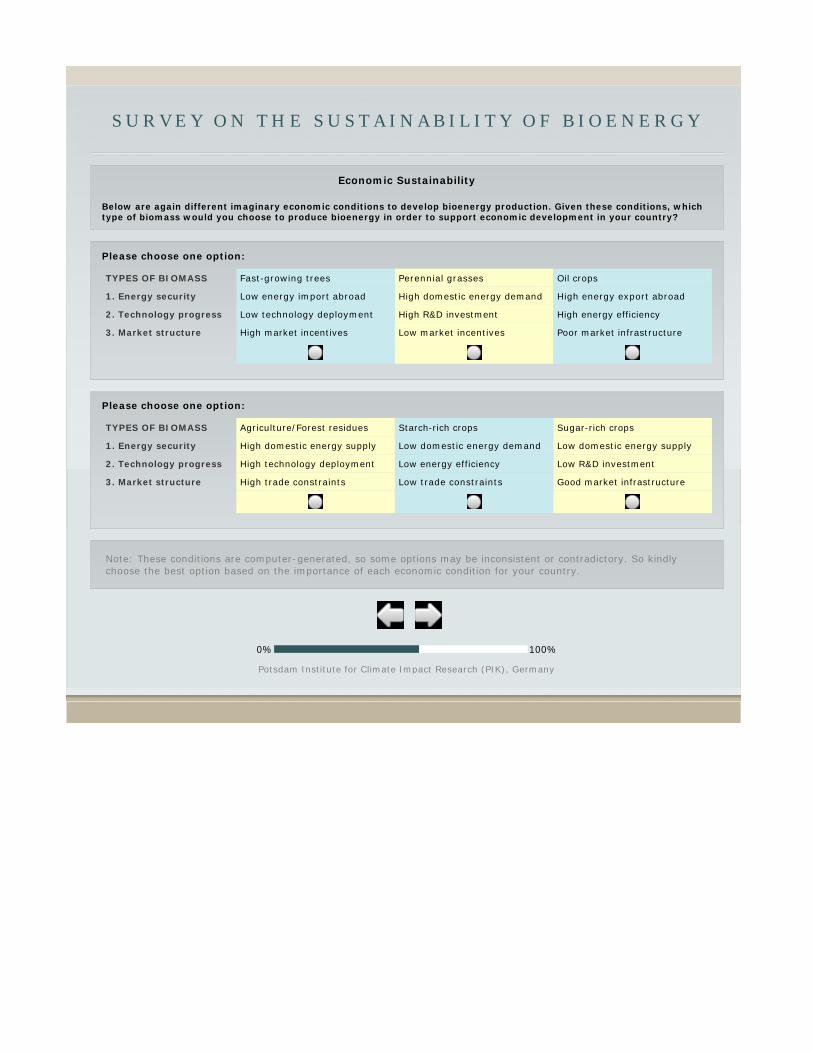
S U R V E Y O N T H E S U S T A I N A B I L I T Y O F B I O E N E R G Y
Economic Sustainability
Below are again different imaginary economic conditions to develop bioenergy production. Given these conditions, which type of biomass would you choose to produce bioenergy in order to support economic development in your country?
Please choose one option:
TYPES OF BIOMASS Fast-growing trees Perennial grasses Oil crops
1. Energy security Low energy import abroad High domestic energy demand High energy export abroad
2. Technology progress Low technology deployment High R&D investment High energy efficiency
3. Market structure High market incentives Low market incentives Poor market infrastructure
Please choose one option:
TYPES OF BIOMASS Agriculture/Forest residues Starch-rich crops Sugar-rich crops
1. Energy security High domestic energy supply Low domestic energy demand Low domestic energy supply
2. Technology progress High technology deployment Low energy efficiency Low R&D investment
3. Market structure High trade constraints Low trade constraints Good market infrastructure
Note: These conditions are computer-generated, so some options may be inconsistent or contradictory. So kindly choose the best option based on the importance of each economic condition for your country.
0% 100%
Potsdam Institute for Climate Impact Research (PIK), Germany
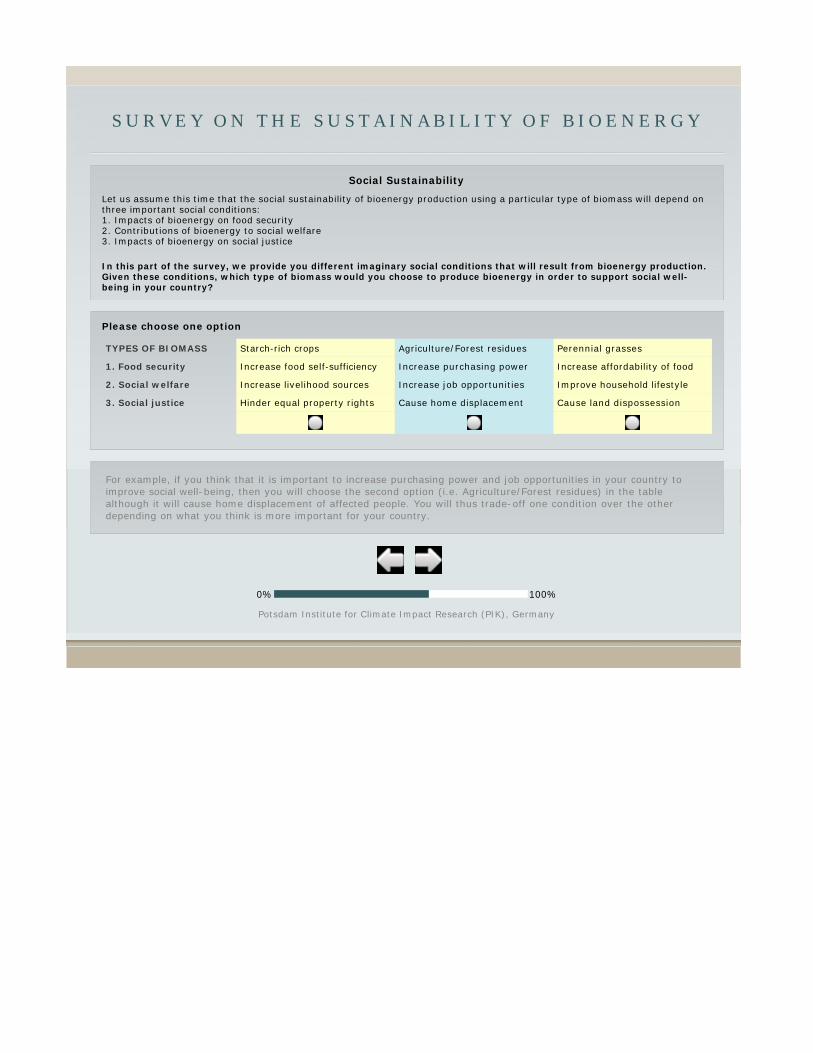
S U R V E Y O N T H E S U S T A I N A B I L I T Y O F B I O E N E R G Y
Social Sustainability
Let us assume this time that the social sustainability of bioenergy production using a particular type of biomass will depend on three important social conditions: 1. Impacts of bioenergy on food security 2. Contributions of bioenergy to social welfare 3. Impacts of bioenergy on social justice
In this part of the survey, we provide you different imaginary social conditions that will result from bioenergy production. Given these conditions, which type of biomass would you choose to produce bioenergy in order to support social well-being in your country?
Please choose one option
TYPES OF BIOMASS Starch-rich crops Agriculture/Forest residues Perennial grasses
1. Food security Increase food self-sufficiency Increase purchasing power Increase affordability of food
2. Social welfare Increase livelihood sources Increase job opportunities Improve household lifestyle
3. Social justice Hinder equal property rights Cause home displacement Cause land dispossession
For example, if you think that it is important to increase purchasing power and job opportunities in your country to improve social well-being, then you will choose the second option (i.e. Agriculture/Forest residues) in the table although it will cause home displacement of affected people. You will thus trade-off one condition over the other depending on what you think is more important for your country.
0% 100%
Potsdam Institute for Climate Impact Research (PIK), Germany
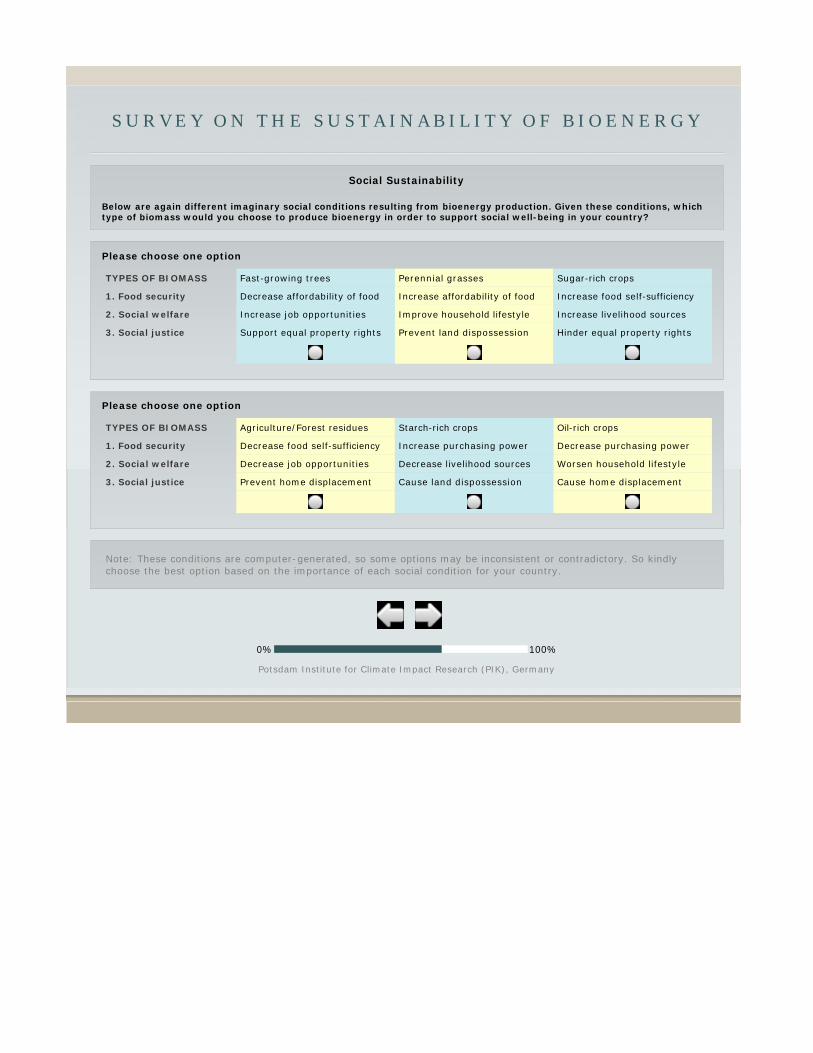
S U R V E Y O N T H E S U S T A I N A B I L I T Y O F B I O E N E R G Y
Social Sustainability
Below are again different imaginary social conditions resulting from bioenergy production. Given these conditions, which type of biomass would you choose to produce bioenergy in order to support social well-being in your country?
Please choose one option
TYPES OF BIOMASS Fast-growing trees Perennial grasses Sugar-rich crops
1. Food security Decrease affordability of food Increase affordability of food Increase food self-sufficiency
2. Social welfare Increase job opportunities Improve household lifestyle Increase livelihood sources
3. Social justice Support equal property rights Prevent land dispossession Hinder equal property rights
Please choose one option
TYPES OF BIOMASS Agriculture/Forest residues Starch-rich crops Oil-rich crops
1. Food security Decrease food self-sufficiency Increase purchasing power Decrease purchasing power
2. Social welfare Decrease job opportunities Decrease livelihood sources Worsen household lifestyle
3. Social justice Prevent home displacement Cause land dispossession Cause home displacement
Note: These conditions are computer-generated, so some options may be inconsistent or contradictory. So kindly choose the best option based on the importance of each social condition for your country.
0% 100%
Potsdam Institute for Climate Impact Research (PIK), Germany
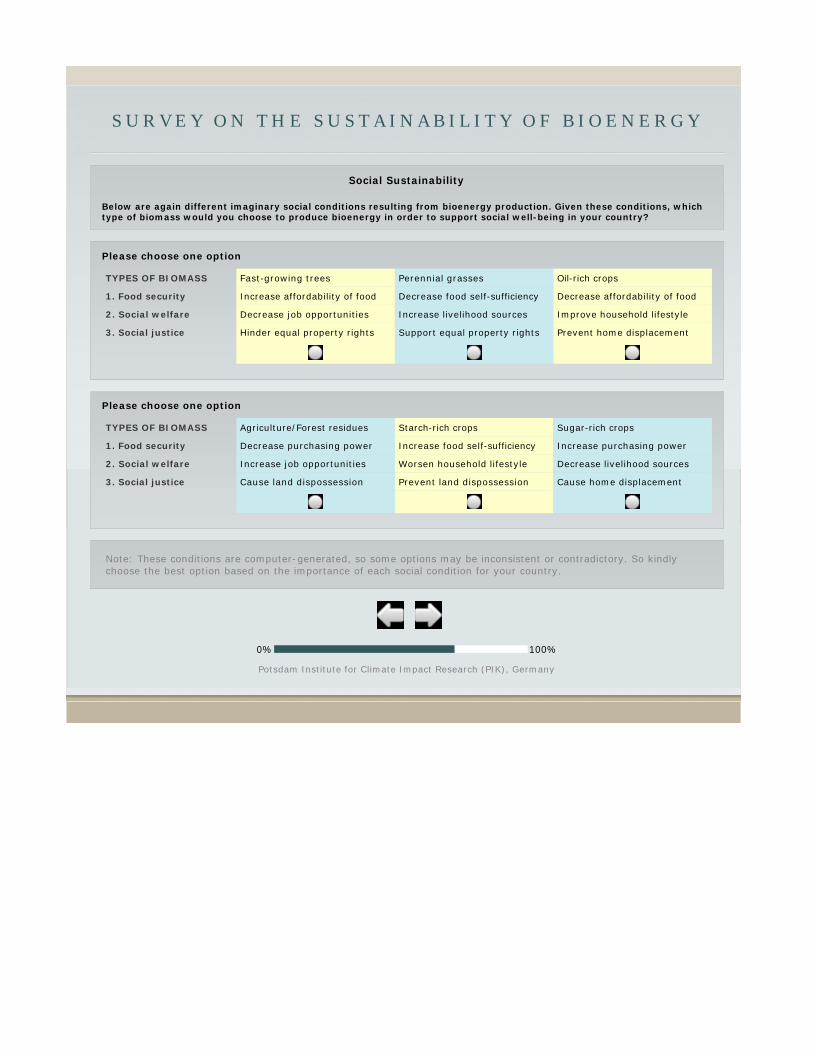
S U R V E Y O N T H E S U S T A I N A B I L I T Y O F B I O E N E R G Y
Social Sustainability
Below are again different imaginary social conditions resulting from bioenergy production. Given these conditions, which type of biomass would you choose to produce bioenergy in order to support social well-being in your country?
Please choose one option
TYPES OF BIOMASS Fast-growing trees Perennial grasses Oil-rich crops
1. Food security Increase affordability of food Decrease food self-sufficiency Decrease affordability of food
2. Social welfare Decrease job opportunities Increase livelihood sources Improve household lifestyle
3. Social justice Hinder equal property rights Support equal property rights Prevent home displacement
Please choose one option
TYPES OF BIOMASS Agriculture/Forest residues Starch-rich crops Sugar-rich crops
1. Food security Decrease purchasing power Increase food self-sufficiency Increase purchasing power
2. Social welfare Increase job opportunities Worsen household lifestyle Decrease livelihood sources
3. Social justice Cause land dispossession Prevent land dispossession Cause home displacement
Note: These conditions are computer-generated, so some options may be inconsistent or contradictory. So kindly choose the best option based on the importance of each social condition for your country.
0% 100%
Potsdam Institute for Climate Impact Research (PIK), Germany
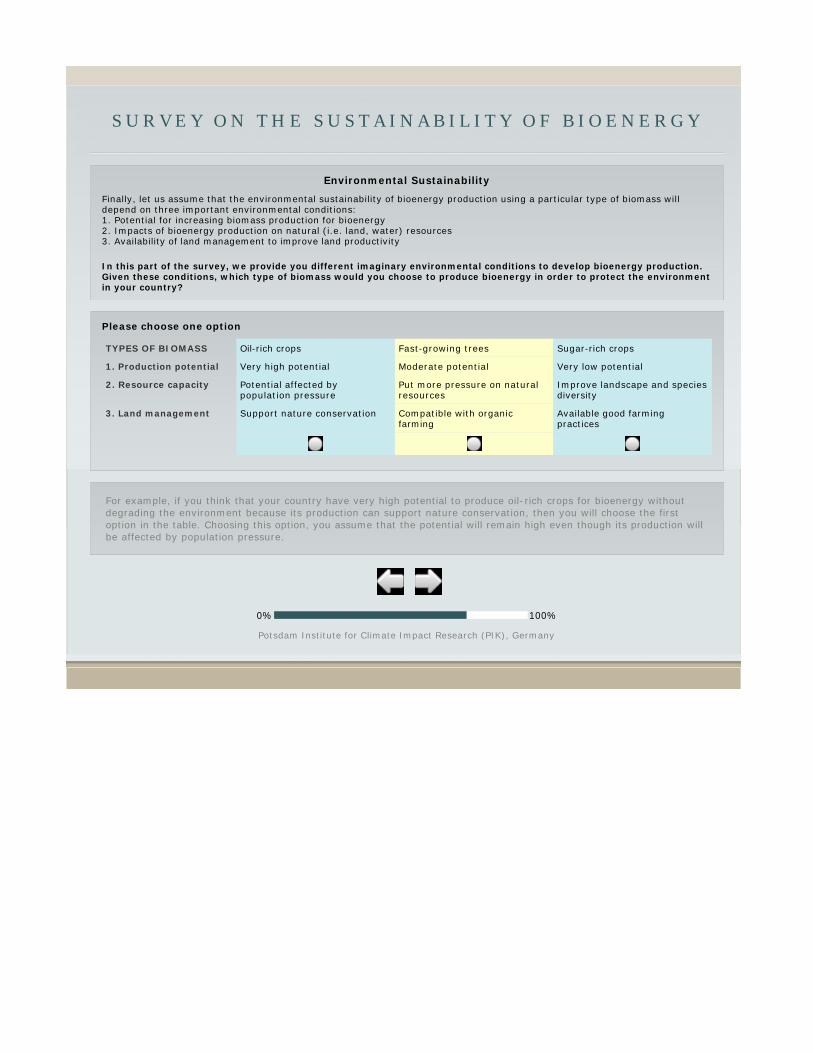
S U R V E Y O N T H E S U S T A I N A B I L I T Y O F B I O E N E R G Y
Environmental Sustainability
Finally, let us assume that the environmental sustainability of bioenergy production using a particular type of biomass will depend on three important environmental conditions: 1. Potential for increasing biomass production for bioenergy 2. Impacts of bioenergy production on natural (i.e. land, water) resources 3. Availability of land management to improve land productivity
In this part of the survey, we provide you different imaginary environmental conditions to develop bioenergy production. Given these conditions, which type of biomass would you choose to produce bioenergy in order to protect the environment in your country?
Please choose one option
TYPES OF BIOMASS Oil-rich crops Fast-growing trees Sugar-rich crops
1. Production potential Very high potential Moderate potential Very low potential
2. Resource capacity Potential affected by population pressure
Put more pressure on natural resources
Improve landscape and species diversity
3. Land management Support nature conservation Compatible with organic farming
Available good farming practices
For example, if you think that your country have very high potential to produce oil-rich crops for bioenergy without degrading the environment because its production can support nature conservation, then you will choose the first option in the table. Choosing this option, you assume that the potential will remain high even though its production will be affected by population pressure.
0% 100%
Potsdam Institute for Climate Impact Research (PIK), Germany
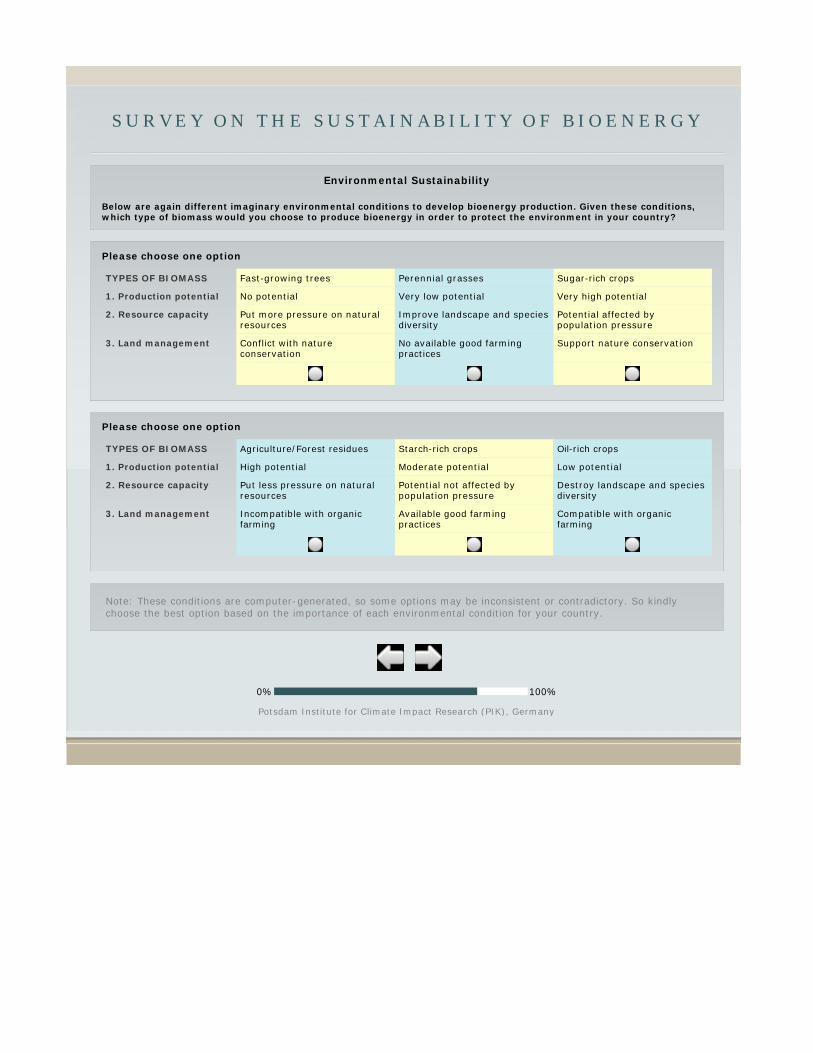
S U R V E Y O N T H E S U S T A I N A B I L I T Y O F B I O E N E R G Y
Environmental Sustainability
Below are again different imaginary environmental conditions to develop bioenergy production. Given these conditions, which type of biomass would you choose to produce bioenergy in order to protect the environment in your country?
Please choose one option
TYPES OF BIOMASS Fast-growing trees Perennial grasses Sugar-rich crops
1. Production potential No potential Very low potential Very high potential
2. Resource capacity Put more pressure on natural resources
Improve landscape and species diversity
Potential affected by population pressure
3. Land management Conflict with nature conservation
No available good farming practices
Support nature conservation
Please choose one option
TYPES OF BIOMASS Agriculture/Forest residues Starch-rich crops Oil-rich crops
1. Production potential High potential Moderate potential Low potential
2. Resource capacity Put less pressure on natural resources
Potential not affected by population pressure
Destroy landscape and species diversity
3. Land management Incompatible with organic farming
Available good farming practices
Compatible with organic farming
Note: These conditions are computer-generated, so some options may be inconsistent or contradictory. So kindly choose the best option based on the importance of each environmental condition for your country.
0% 100%
Potsdam Institute for Climate Impact Research (PIK), Germany
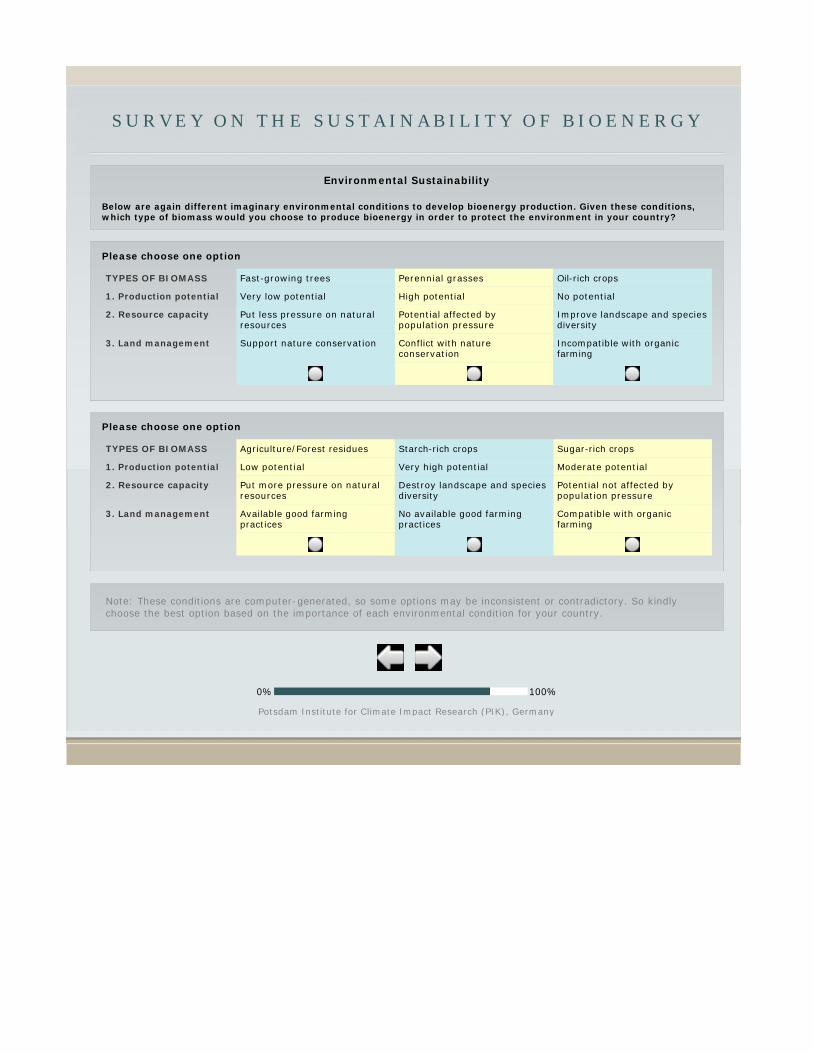
S U R V E Y O N T H E S U S T A I N A B I L I T Y O F B I O E N E R G Y
Environmental Sustainability
Below are again different imaginary environmental conditions to develop bioenergy production. Given these conditions, which type of biomass would you choose to produce bioenergy in order to protect the environment in your country?
Please choose one option
TYPES OF BIOMASS Fast-growing trees Perennial grasses Oil-rich crops
1. Production potential Very low potential High potential No potential
2. Resource capacity Put less pressure on natural resources
Potential affected by population pressure
Improve landscape and species diversity
3. Land management Support nature conservation Conflict with nature conservation
Incompatible with organic farming
Please choose one option
TYPES OF BIOMASS Agriculture/Forest residues Starch-rich crops Sugar-rich crops
1. Production potential Low potential Very high potential Moderate potential
2. Resource capacity Put more pressure on natural resources
Destroy landscape and species diversity
Potential not affected by population pressure
3. Land management Available good farming practices
No available good farming practices
Compatible with organic farming
Note: These conditions are computer-generated, so some options may be inconsistent or contradictory. So kindly choose the best option based on the importance of each environmental condition for your country.
0% 100%
Potsdam Institute for Climate Impact Research (PIK), Germany
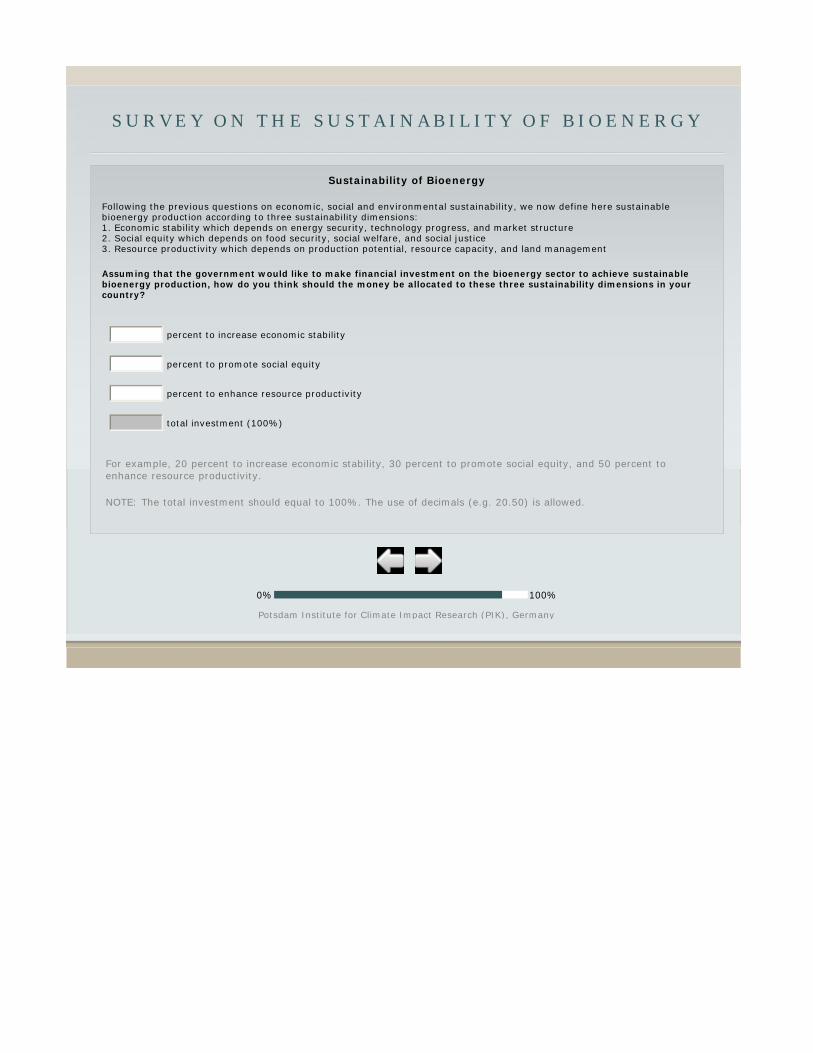
S U R V E Y O N T H E S U S T A I N A B I L I T Y O F B I O E N E R G Y
Sustainability of Bioenergy
Following the previous questions on economic, social and environmental sustainability, we now define here sustainable bioenergy production according to three sustainability dimensions: 1. Economic stability which depends on energy security, technology progress, and market structure 2. Social equity which depends on food security, social welfare, and social justice 3. Resource productivity which depends on production potential, resource capacity, and land management
Assuming that the government would like to make financial investment on the bioenergy sector to achieve sustainable bioenergy production, how do you think should the money be allocated to these three sustainability dimensions in your country?
For example, 20 percent to increase economic stability, 30 percent to promote social equity, and 50 percent to enhance resource productivity.
NOTE: The total investment should equal to 100%. The use of decimals (e.g. 20.50) is allowed.
percent to increase economic stability
percent to promote social equity
percent to enhance resource productivity
total investment (100%)
0% 100%
Potsdam Institute for Climate Impact Research (PIK), Germany
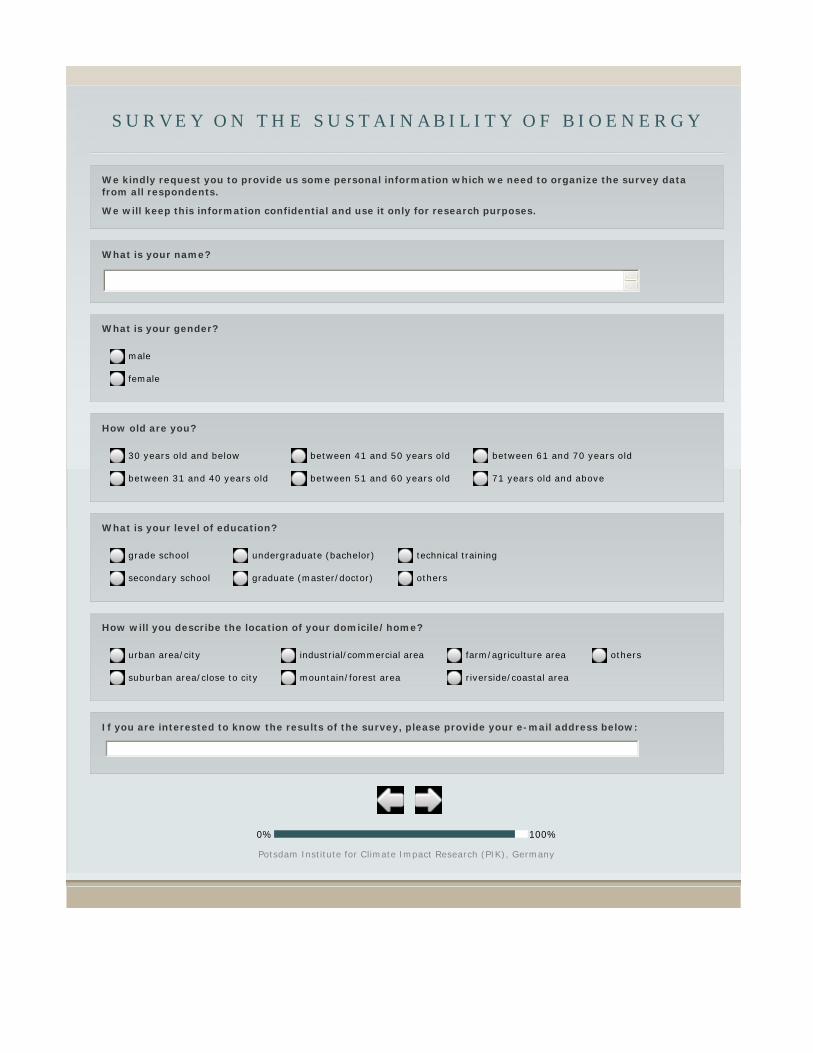
S U R V E Y O N T H E S U S T A I N A B I L I T Y O F B I O E N E R G Y
We kindly request you to provide us some personal information which we need to organize the survey data from all respondents.
We will keep this information confidential and use it only for research purposes.
What is your name?
What is your gender?
male
female
How old are you?
30 years old and below
between 31 and 40 years old
between 41 and 50 years old
between 51 and 60 years old
between 61 and 70 years old
71 years old and above
What is your level of education?
grade school
secondary school
undergraduate (bachelor)
graduate (master/doctor)
technical training
others
How will you describe the location of your domicile/home?
urban area/city
suburban area/close to city
industrial/commercial area
mountain/forest area
farm/agriculture area
riverside/coastal area
others
If you are interested to know the results of the survey, please provide your e-mail address below:
0% 100%
Potsdam Institute for Climate Impact Research (PIK), Germany
S U R V E Y O N T H E S U S T A I N A B I L I T Y O F B I O E N E R G Y
You have successfully completed the survey.
Contact Persons
Dr. Lilibeth Acosta-Michlik
Potsdam Institute for Climate Impact Research (PIK) Telegraphenberg A62, 14473 Potsdam, Germany
E-Mail: [email protected] Website: http://www.pik-potsdam.de/
Dr. Damasa B. Magcale-Macandog
Institute of Biological Sciences, University of the Philippines Los Banos
College, Laguna 4031, Philippines Website: http://www.ibs-uplb.org
Details on this study are available in:
Acosta-Michlik L, et al. Integrated assessment of sustainability trade-offs and pathways for global bioenergy
production: Framing a novel hybrid approach. Renewable and Sustainable Energy Reviews 15 (2011) 2791–2809.
We thank you for your kind support! 0% 100%
Potsdam Institute for Climate Impact Research (PIK), Germany

关 于 生 物 能 源 可 持 续 性 的 调 查
欢迎接受我们的调查!
这次调查是一个研究项目的一部分,项目的目的是了解人们对于生物能源的生产稳定性的认识,调查由德国波茨坦气候影响研究学院与中国北京师范大学联合组织。
首先,什么是可持续性呢? 可持续性是指经济、社会以及环境的长期永续发展的潜能。
生物能源的可持续性发展并不简单,因为它的发展涉及到不同的产品(例如,食物与非食物性作物),与不同部门(例如,能源,环境,食品)之间的相互作用,而且其发生在不同水平层次上(例如,地方的,国家的,国际的)。因此,通过各种政策实现的生物能源生产的提高不但具备提高社会生产力的潜能,而且能够因为这个复杂的生产结构而导致经济、社会和环境问题。近年来的经验表明,一国关于生物能源的政策不仅影响本国,甚至影响其他国家的社会、经济和环境的可持续性。
在这次调查中,我们希望通过您对几个问题的回答来了解在你们国家生物能源可持续性发展的情况。我们同时在几个国家进行这种问卷,因此,很重要的一点是,在回答这些问题时,请务必考虑贵国现在的经济、社会和环境因素。问卷中不涉及到“对”或“错”这种问题,我们只是希望听到您的见解。
这次问卷大概需要十分钟的时间,请完成这次调查的全部问题,否则无法将您的答案记录到我们的数据库中。
(注意:您的用户名已通过e-mail发给您。)
请输入您的用户名:
Potsdam Institute for Climate Impact Research (PIK), Germany

关 于 生 物 能 源 可 持 续 性 的 调 查
您现在的工作场所?
政府
y私营企业
农场
高校/研究所
其它
您现在的工作行业?您可以选择多个。
农业
森林/环境
商务
工业
教育
工程
贸易
运输
能源
服务
其它
请在下面位置填写您的工作地点及名称:
(例如:北京,北京师范大学。如果您在农场工作,仅提供地点就可以。)
0% 100%
Potsdam Institute for Climate Impact Research (PIK), Germany

关 于 生 物 能 源 可 持 续 性 的 调 查
您对“生物能源”一词熟悉吗?
是的
不
0% 100%
Potsdam Institute for Climate Impact Research (PIK), Germany

关 于 生 物 能 源 可 持 续 性 的 调 查
您的工作与生物能源相关吗?
是的
不
0% 100%
Potsdam Institute for Climate Impact Research (PIK), Germany

关 于 生 物 能 源 可 持 续 性 的 调 查
您的工作与生物能源有何关系?您可以选择一个以上。
生物能源研究/学习
政府政策/项目
生物能源作物生产
当地增设服务
生物能源生产(柴油机,乙烯醇)
生物能源市场/销售
生物能源国外进口/出口
生物能源运输/配送
生物能源技术支持
技术研发
技术商业化
其它
0% 100%
Potsdam Institute for Climate Impact Research (PIK), Germany
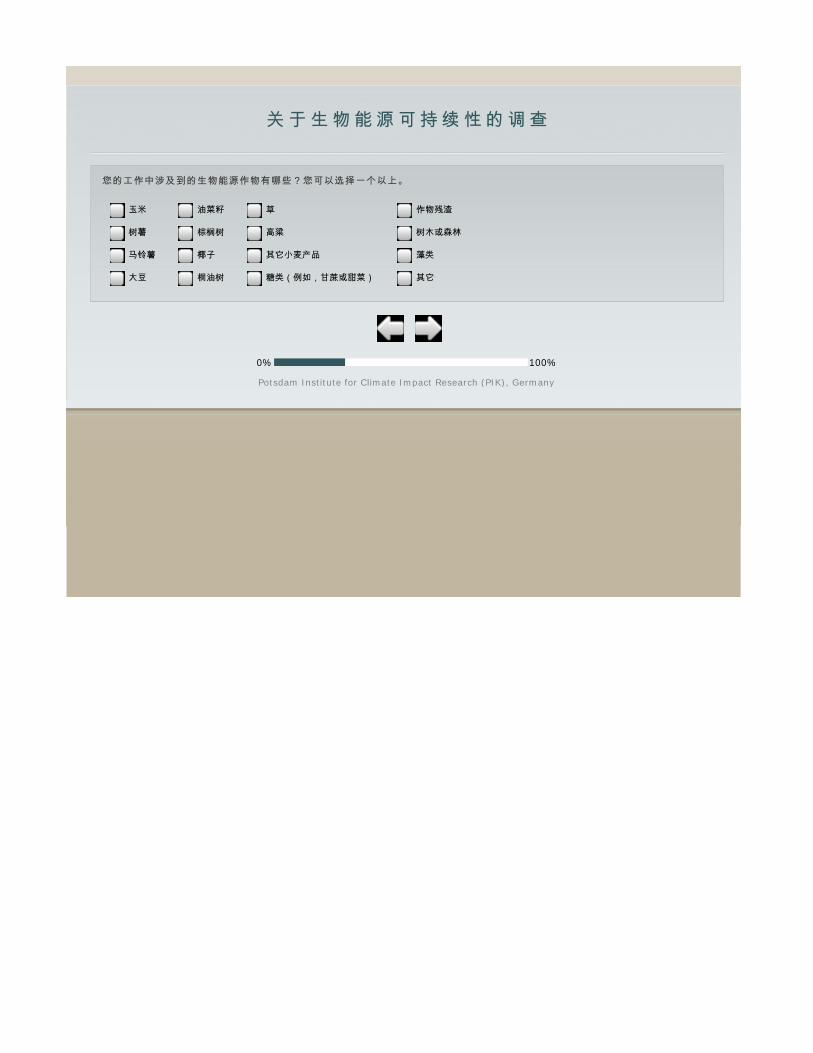
关 于 生 物 能 源 可 持 续 性 的 调 查
您的工作中涉及到的生物能源作物有哪些?您可以选择一个以上。
玉米
树薯
马铃薯
大豆
油菜籽
棕榈树
椰子
桐油树
草
高粱
其它小麦产品
糖类(例如,甘蔗或甜菜)
作物残渣
树木或森林
藻类
其它
0% 100%
Potsdam Institute for Climate Impact Research (PIK), Germany
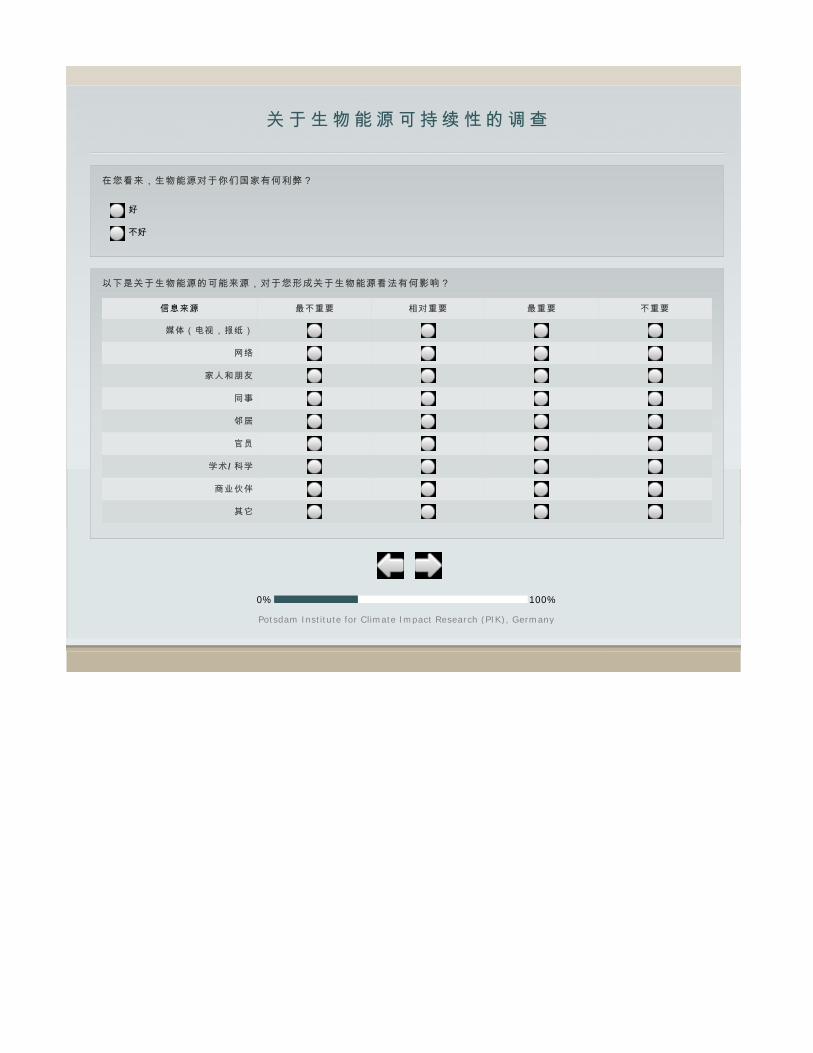
关 于 生 物 能 源 可 持 续 性 的 调 查
在您看来,生物能源对于你们国家有何利弊?
好
不好
以下是关于生物能源的可能来源,对于您形成关于生物能源看法有何影响?
信息来源 最不重要 相对重要 最重要 不重要
媒体(电视,报纸)
网络
家人和朋友
同事
邻居
官员
学术/科学
商业伙伴
其它
0% 100%
Potsdam Institute for Climate Impact Research (PIK), Germany
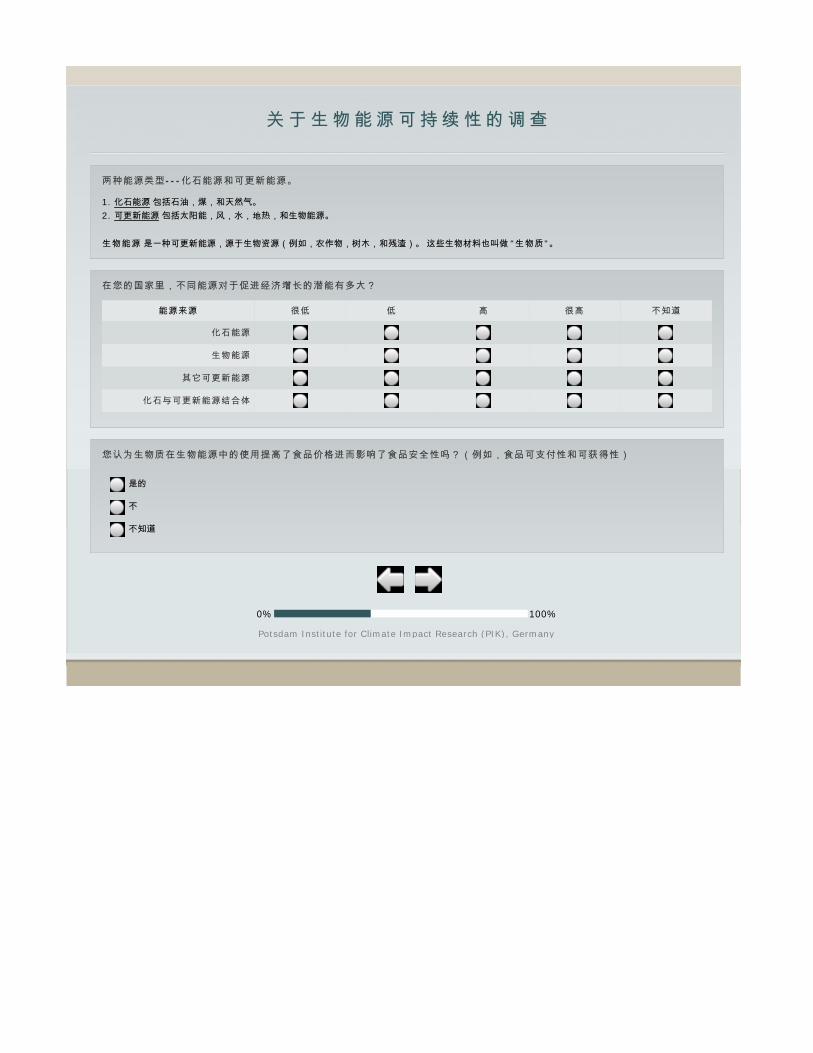
关 于 生 物 能 源 可 持 续 性 的 调 查
两种能源类型---化石能源和可更新能源。
1. 化石能源 包括石油,煤,和天然气。 2. 可更新能源 包括太阳能,风,水,地热,和生物能源。
生物能源 是一种可更新能源,源于生物资源(例如,农作物,树木,和残渣)。 这些生物材料也叫做 "生物质"。
在您的国家里,不同能源对于促进经济增长的潜能有多大?
能源来源 很低 低 高 很高 不知道
化石能源
生物能源
其它可更新能源
化石与可更新能源结合体
您认为生物质在生物能源中的使用提高了食品价格进而影响了食品安全性吗?(例如,食品可支付性和可获得性)
是的
不
不知道
0% 100%
Potsdam Institute for Climate Impact Research (PIK), Germany
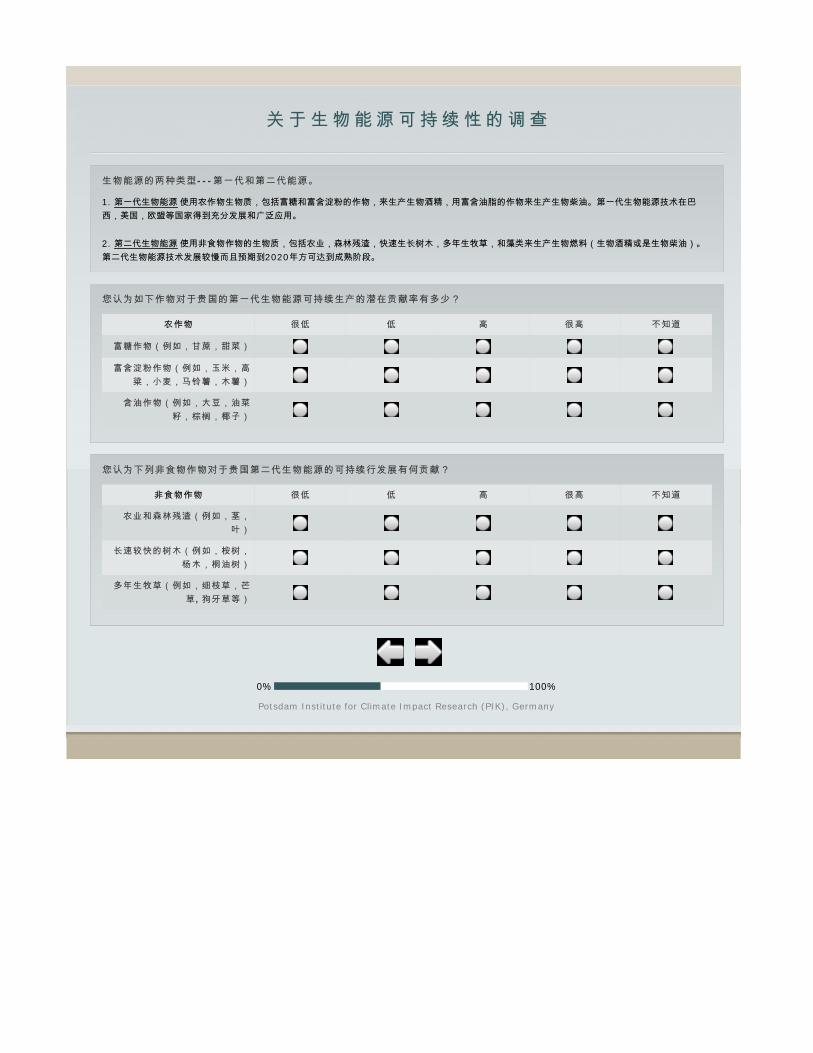
关 于 生 物 能 源 可 持 续 性 的 调 查
生物能源的两种类型---第一代和第二代能源。
1. 第一代生物能源 使用农作物生物质,包括富糖和富含淀粉的作物,来生产生物酒精,用富含油脂的作物来生产生物柴油。第一代生物能源技术在巴西,美国,欧盟等国家得到充分发展和广泛应用。
2. 第二代生物能源 使用非食物作物的生物质,包括农业,森林残渣,快速生长树木,多年生牧草,和藻类来生产生物燃料(生物酒精或是生物柴油)。第二代生物能源技术发展较慢而且预期到2020年方可达到成熟阶段。
您认为如下作物对于贵国的第一代生物能源可持续生产的潜在贡献率有多少?
农作物 很低 低 高 很高 不知道
富糖作物(例如,甘蔗,甜菜)
富含淀粉作物(例如,玉米,高粱,小麦,马铃薯,木薯)
含油作物(例如,大豆,油菜籽,棕榈,椰子)
您认为下列非食物作物对于贵国第二代生物能源的可持续行发展有何贡献?
非食物作物 很低 低 高 很高 不知道
农业和森林残渣(例如,茎,叶)
长速较快的树木(例如,桉树,杨木,桐油树)
多年生牧草(例如,细枝草,芒草, 狗牙草等)
0% 100%
Potsdam Institute for Climate Impact Research (PIK), Germany
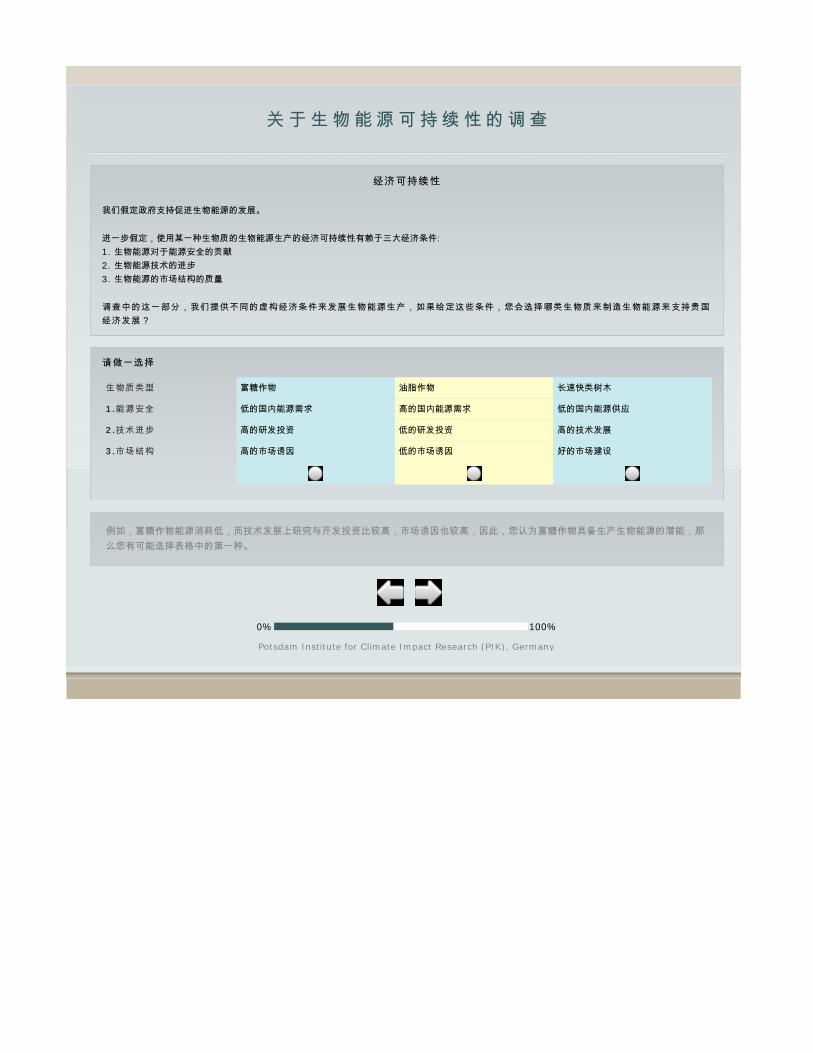
关 于 生 物 能 源 可 持 续 性 的 调 查
经济可持续性
我们假定政府支持促进生物能源的发展。
进一步假定,使用某一种生物质的生物能源生产的经济可持续性有赖于三大经济条件: 1. 生物能源对于能源安全的贡献 2. 生物能源技术的进步 3. 生物能源的市场结构的质量
调查中的这一部分,我们提供不同的虚构经济条件来发展生物能源生产,如果给定这些条件,您会选择哪类生物质来制造生物能源来支持贵国经济发展?
请做一选择
生物质类型 富糖作物 油脂作物 长速快类树木
1.能源安全 低的国内能源需求 高的国内能源需求 低的国内能源供应
2.技术进步 高的研发投资 低的研发投资 高的技术发展
3.市场结构 高的市场诱因 低的市场诱因 好的市场建设
例如,富糖作物能源消耗低,而技术发展上研究与开发投资比较高,市场诱因也较高,因此,您认为富糖作物具备生产生物能源的潜能,那么您有可能选择表格中的第一种。
0% 100%
Potsdam Institute for Climate Impact Research (PIK), Germany
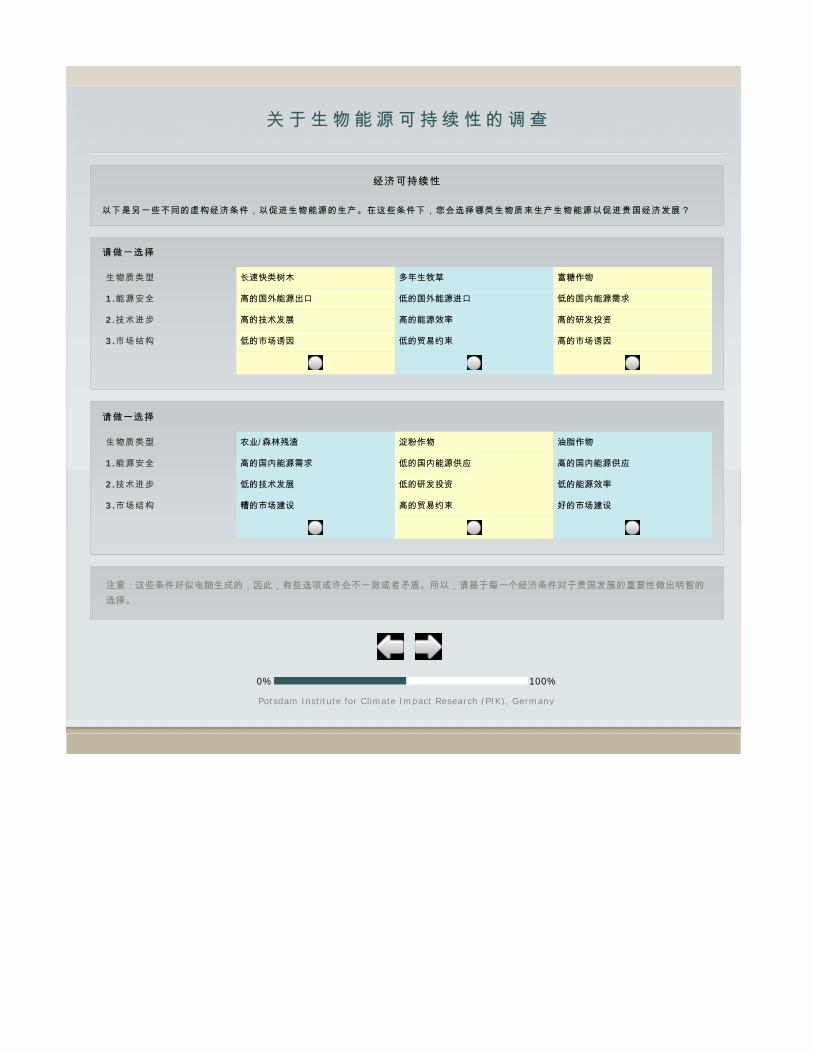
关 于 生 物 能 源 可 持 续 性 的 调 查
经济可持续性
以下是另一些不同的虚构经济条件,以促进生物能源的生产。在这些条件下,您会选择哪类生物质来生产生物能源以促进贵国经济发展?
请做一选择
生物质类型 长速快类树木 多年生牧草 富糖作物
1.能源安全 高的国外能源出口 低的国外能源进口 低的国内能源需求
2.技术进步 高的技术发展 高的能源效率 高的研发投资
3.市场结构 低的市场诱因 低的贸易约束 高的市场诱因
请做一选择
生物质类型 农业/森林残渣 淀粉作物 油脂作物
1.能源安全 高的国内能源需求 低的国内能源供应 高的国内能源供应
2.技术进步 低的技术发展 低的研发投资 低的能源效率
3.市场结构 糟的市场建设 高的贸易约束 好的市场建设
注意:这些条件好似电脑生成的,因此,有些选项或许会不一致或者矛盾。所以,请基于每一个经济条件对于贵国发展的重要性做出明智的选择。
0% 100%
Potsdam Institute for Climate Impact Research (PIK), Germany

关 于 生 物 能 源 可 持 续 性 的 调 查
经济可持续性
以下是另一些不同的虚构经济条件,以促进生物能源的生产。在这些条件下,您会选择哪类生物质来生产生物能源以促进贵国经济发展?
请做一选择
生物质类型 长速快类树木 多年生牧草 油脂作物
1.能源安全 低的国外能源进口 高的国内能源需求 高的国外能源出口
2.技术进步 低的技术发展 高的研发投资 高的能源效率
3.市场结构 高的市场诱因 低的市场诱因 糟的市场建设
请做一选择
生物质类型 农业/森林残渣 淀粉作物 富糖作物
1.能源安全 高的国内能源供应 低的国内能源需求 低的国内能源供应
2.技术进步 高的技术发展 低的能源效率 低的研发投资
3.市场结构 高的贸易约束 低的贸易约束 好的市场建设
注意:这些条件好似电脑生成的,因此,有些选项或许会不一致或者矛盾。所以,请基于每一个经济条件对于贵国发展的重要性做出明智的选择。
0% 100%
Potsdam Institute for Climate Impact Research (PIK), Germany
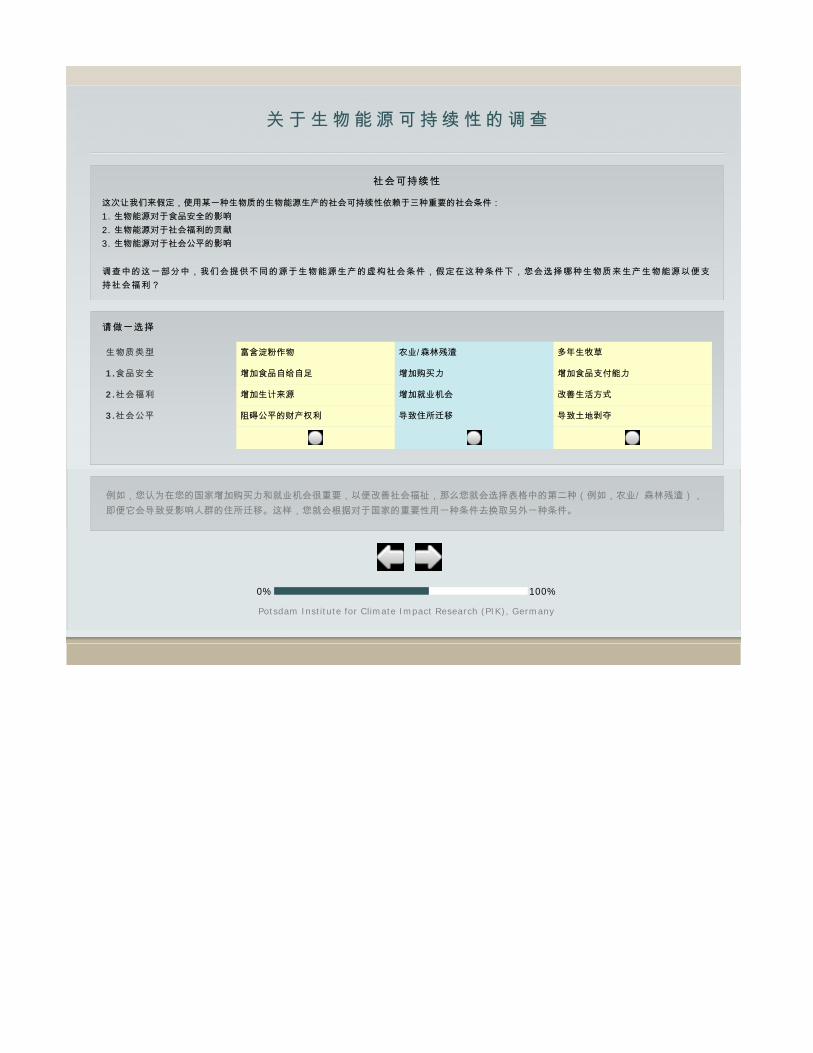
关 于 生 物 能 源 可 持 续 性 的 调 查
社会可持续性
这次让我们来假定,使用某一种生物质的生物能源生产的社会可持续性依赖于三种重要的社会条件: 1. 生物能源对于食品安全的影响 2. 生物能源对于社会福利的贡献 3. 生物能源对于社会公平的影响
调查中的这一部分中,我们会提供不同的源于生物能源生产的虚构社会条件,假定在这种条件下,您会选择哪种生物质来生产生物能源以便支持社会福利?
请做一选择
生物质类型 富含淀粉作物 农业/森林残渣 多年生牧草
1.食品安全 增加食品自给自足 增加购买力 增加食品支付能力
2.社会福利 增加生计来源 增加就业机会 改善生活方式
3.社会公平 阻碍公平的财产权利 导致住所迁移 导致土地剥夺
例如,您认为在您的国家增加购买力和就业机会很重要,以便改善社会福祉,那么您就会选择表格中的第二种(例如,农业/ 森林残渣),即便它会导致受影响人群的住所迁移。这样,您就会根据对于国家的重要性用一种条件去换取另外一种条件。
0% 100%
Potsdam Institute for Climate Impact Research (PIK), Germany
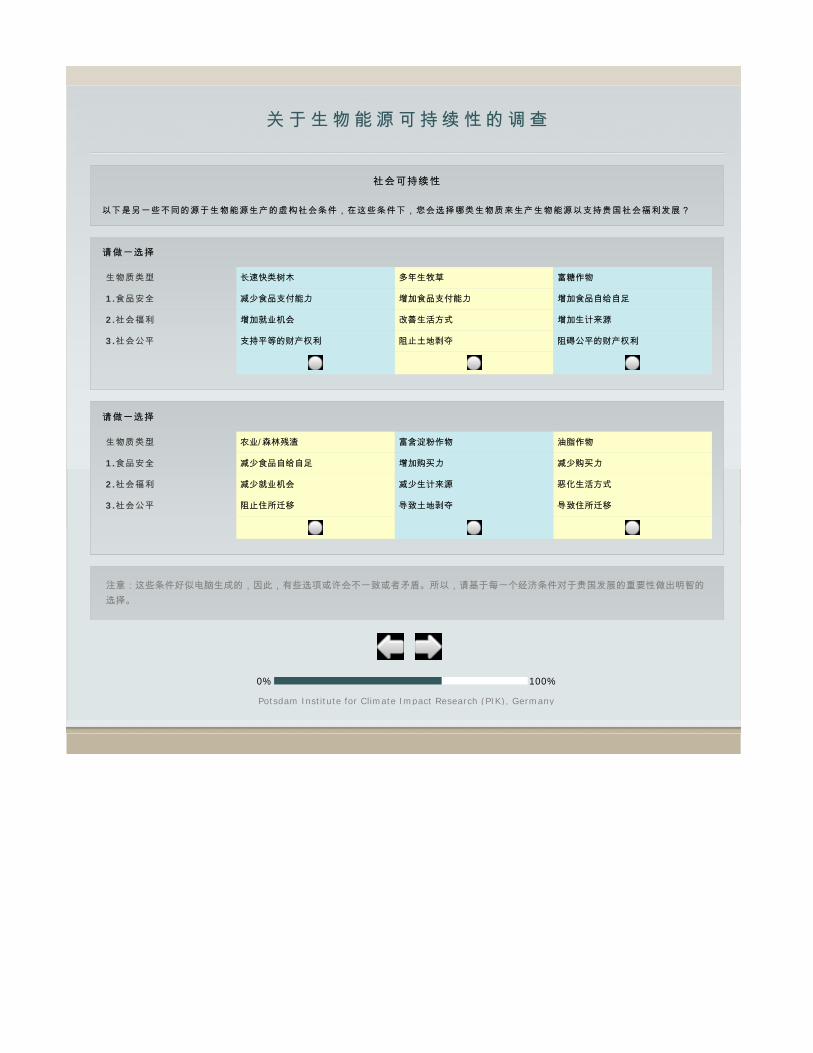
关 于 生 物 能 源 可 持 续 性 的 调 查
社会可持续性
以下是另一些不同的源于生物能源生产的虚构社会条件,在这些条件下,您会选择哪类生物质来生产生物能源以支持贵国社会福利发展?
请做一选择
生物质类型 长速快类树木 多年生牧草 富糖作物
1.食品安全 减少食品支付能力 增加食品支付能力 增加食品自给自足
2.社会福利 增加就业机会 改善生活方式 增加生计来源
3.社会公平 支持平等的财产权利 阻止土地剥夺 阻碍公平的财产权利
请做一选择
生物质类型 农业/森林残渣 富含淀粉作物 油脂作物
1.食品安全 减少食品自给自足 增加购买力 减少购买力
2.社会福利 减少就业机会 减少生计来源 恶化生活方式
3.社会公平 阻止住所迁移 导致土地剥夺 导致住所迁移
注意:这些条件好似电脑生成的,因此,有些选项或许会不一致或者矛盾。所以,请基于每一个经济条件对于贵国发展的重要性做出明智的选择。
0% 100%
Potsdam Institute for Climate Impact Research (PIK), Germany
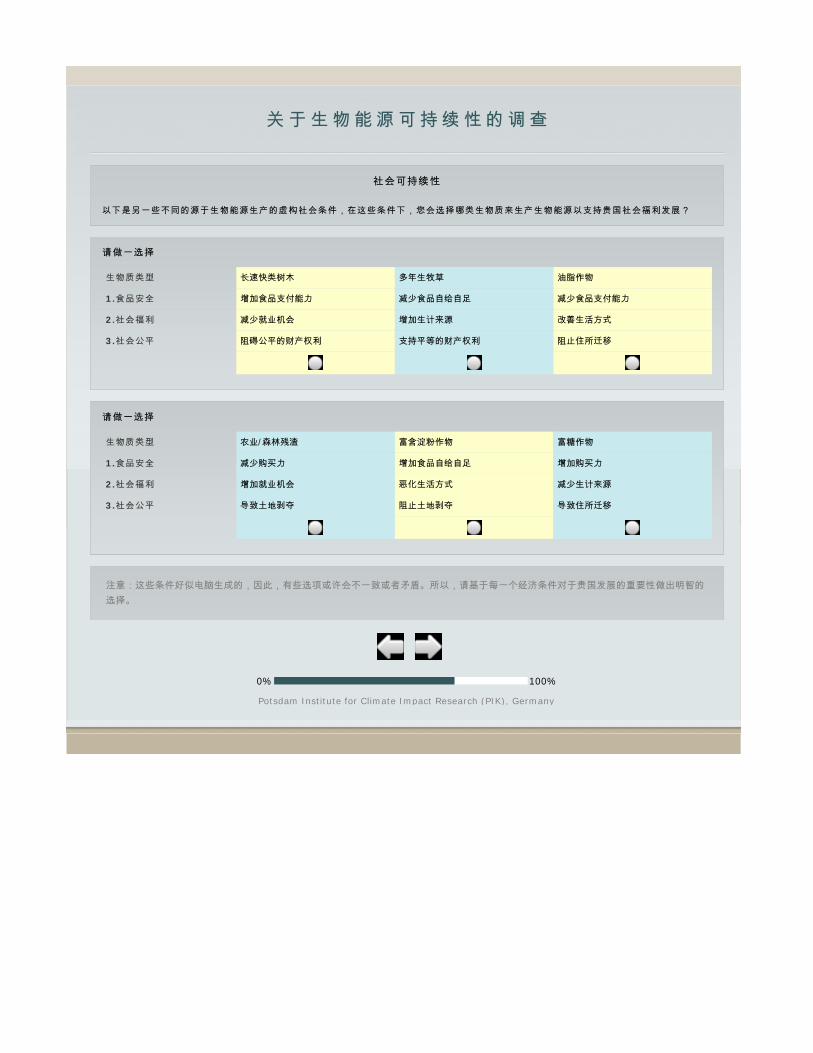
关 于 生 物 能 源 可 持 续 性 的 调 查
社会可持续性
以下是另一些不同的源于生物能源生产的虚构社会条件,在这些条件下,您会选择哪类生物质来生产生物能源以支持贵国社会福利发展?
请做一选择
生物质类型 长速快类树木 多年生牧草 油脂作物
1.食品安全 增加食品支付能力 减少食品自给自足 减少食品支付能力
2.社会福利 减少就业机会 增加生计来源 改善生活方式
3.社会公平 阻碍公平的财产权利 支持平等的财产权利 阻止住所迁移
请做一选择
生物质类型 农业/森林残渣 富含淀粉作物 富糖作物
1.食品安全 减少购买力 增加食品自给自足 增加购买力
2.社会福利 增加就业机会 恶化生活方式 减少生计来源
3.社会公平 导致土地剥夺 阻止土地剥夺 导致住所迁移
注意:这些条件好似电脑生成的,因此,有些选项或许会不一致或者矛盾。所以,请基于每一个经济条件对于贵国发展的重要性做出明智的选择。
0% 100%
Potsdam Institute for Climate Impact Research (PIK), Germany
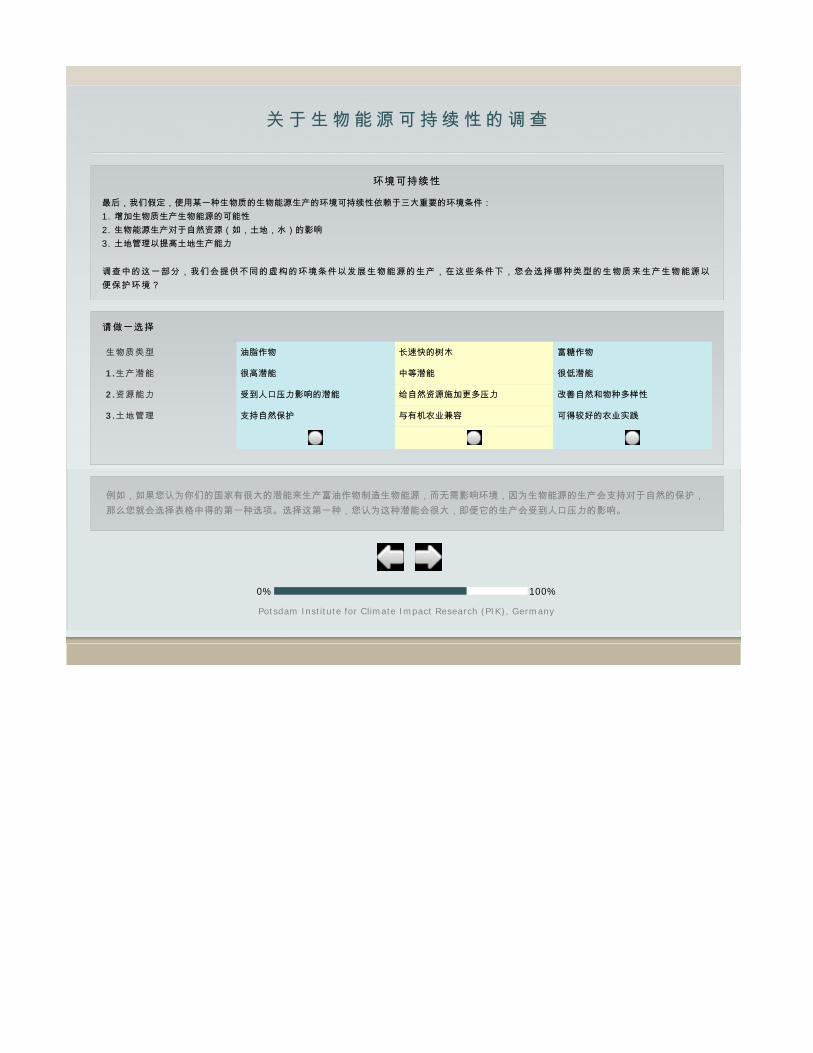
关 于 生 物 能 源 可 持 续 性 的 调 查
环境可持续性
最后,我们假定,使用某一种生物质的生物能源生产的环境可持续性依赖于三大重要的环境条件: 1. 增加生物质生产生物能源的可能性 2. 生物能源生产对于自然资源(如,土地,水)的影响 3. 土地管理以提高土地生产能力
调查中的这一部分,我们会提供不同的虚构的环境条件以发展生物能源的生产,在这些条件下,您会选择哪种类型的生物质来生产生物能源以便保护环境?
请做一选择
生物质类型 油脂作物 长速快的树木 富糖作物
1.生产潜能 很高潜能 中等潜能 很低潜能
2.资源能力 受到人口压力影响的潜能 给自然资源施加更多压力 改善自然和物种多样性
3.土地管理 支持自然保护 与有机农业兼容 可得较好的农业实践
例如,如果您认为你们的国家有很大的潜能来生产富油作物制造生物能源,而无需影响环境,因为生物能源的生产会支持对于自然的保护,那么您就会选择表格中得的第一种选项。选择这第一种,您认为这种潜能会很大,即便它的生产会受到人口压力的影响。
0% 100%
Potsdam Institute for Climate Impact Research (PIK), Germany

关 于 生 物 能 源 可 持 续 性 的 调 查
环境可持续性
以下是另一些不同的虚构的环境条件以促进生物能源的生产,在这些条件下,您会选择哪类生物质来生产生物能源以保护环境?
请做一选择
生物质类型 长速快的树木 多年生牧草 富糖作物
1.生产潜能 无潜能 很低潜能 很高潜能
2.资源能力 给自然资源施加更多压力 改善自然和物种多样性 受到人口压力影响的潜能
3.土地管理 与自热保护相冲突 不可得较好的农业实践 支持自然保护
请做一选择
生物质类型 农业/森林残渣 富含淀粉作物 油脂作物
1.生产潜能 高潜能 中等潜能 低潜能
2.资源能力 给自热资源施加更少压力 不受人口压力影响的潜能 破坏自然和物种多样性
3.土地管理 与有机农业不兼容 可得较好的农业实践 与有机农业兼容
注意:这些条件好似电脑生成的,因此,有些选项或许会不一致或者矛盾。所以,请基于每一个经济条件对于贵国发展的重要性做出明智的选择。
0% 100%
Potsdam Institute for Climate Impact Research (PIK), Germany

关 于 生 物 能 源 可 持 续 性 的 调 查
环境可持续性
以下是另一些不同的虚构的环境条件以促进生物能源的生产,在这些条件下,您会选择哪类生物质来生产生物能源以保护环境?
请做一选择
生物质类型 长速快的树木 多年生牧草 油脂作物
1.生产潜能 很低潜能 高潜能 无潜能
2.资源能力 给自热资源施加更少压力 受到人口压力影响的潜能 改善自然和物种多样性
3.土地管理 支持自然保护 与自热保护相冲突 与有机农业不兼容
请做一选择
生物质类型 农业/森林残渣 富含淀粉作物 富糖作物
1.生产潜能 低潜能 很高潜能 中等潜能
2.资源能力 给自然资源施加更多压力 破坏自然和物种多样性 不受人口压力影响的潜能
3.土地管理 可得较好的农业实践 不可得较好的农业实践 与有机农业兼容
注意:这些条件好似电脑生成的,因此,有些选项或许会不一致或者矛盾。所以,请基于每一个经济条件对于贵国发展的重要性做出明智的选择。
0% 100%
Potsdam Institute for Climate Impact Research (PIK), Germany
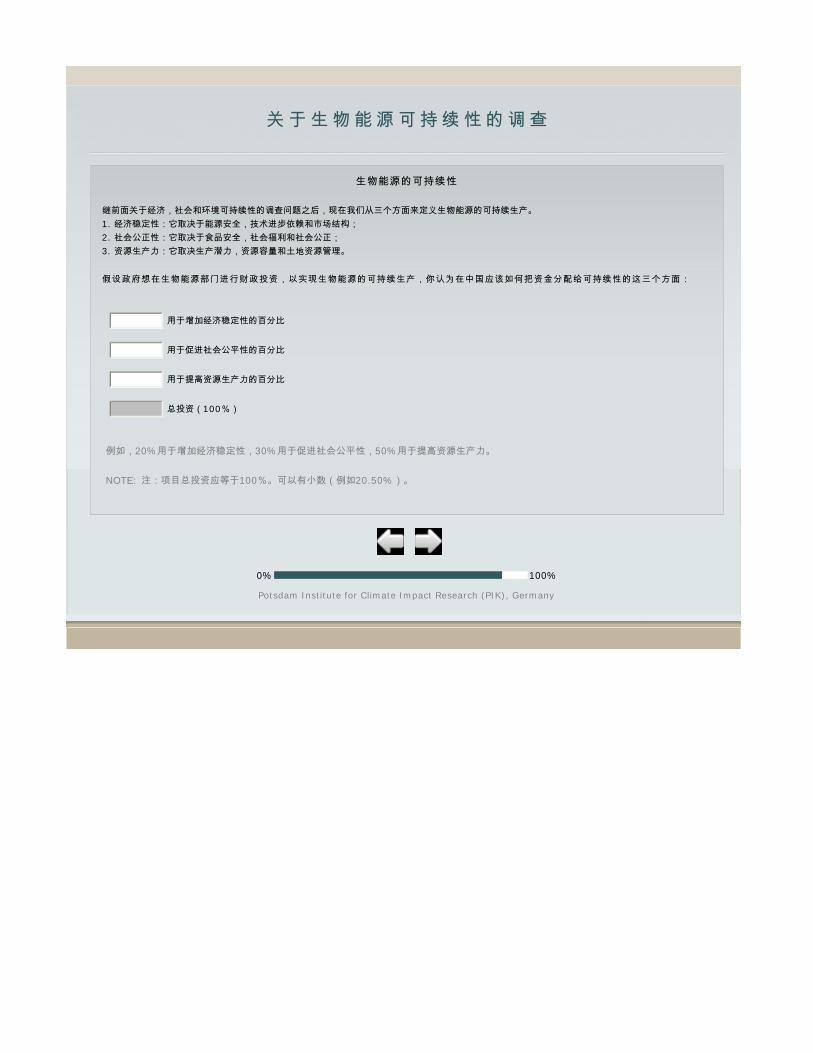
关 于 生 物 能 源 可 持 续 性 的 调 查
生物能源的可持续性
继前面关于经济,社会和环境可持续性的调查问题之后,现在我们从三个方面来定义生物能源的可持续生产。 1. 经济稳定性:它取决于能源安全,技术进步依赖和市场结构; 2. 社会公正性:它取决于食品安全,社会福利和社会公正; 3. 资源生产力:它取决生产潜力,资源容量和土地资源管理。
假设政府想在生物能源部门进行财政投资,以实现生物能源的可持续生产,你认为在中国应该如何把资金分配给可持续性的这三个方面:
例如,20%用于增加经济稳定性,30%用于促进社会公平性,50%用于提高资源生产力。
NOTE: 注:项目总投资应等于100%。可以有小数(例如20.50%)。
用于增加经济稳定性的百分比
用于促进社会公平性的百分比
用于提高资源生产力的百分比
总投资(100%)
0% 100%
Potsdam Institute for Climate Impact Research (PIK), Germany

关 于 生 物 能 源 可 持 续 性 的 调 查
我们恳请您提供给我们一些个人信息,这样我们就可以很好地组织这次众多被调查者提供的信息。
我们将对此信息进行保密并且仅仅用作研究目的。
您的姓名?
您的性别?
男
女
您的年龄?
30以下
30-40
41-50
51-60
61-70
71以上
您的教育水平?
小学
中学
大学(学士)
研究生(硕士/博士)
技术培训
其它
您如何描述您的住所/家?
城市
郊区/临近城市
工业区/商贸区
山区/林区
农场/农业地区
沿河/海区
其它
如果您对于调查的结果感兴趣,请提供您的e-mail地址:
0% 100%
Potsdam Institute for Climate Impact Research (PIK), Germany

关 于 生 物 能 源 可 持 续 性 的 调 查
您已成功完成此次调查。
联系人
德国 波茨坦 Telegraphenberg A62 14473
波茨坦气候影响研究学院 Lilibeth Acosta-Michlik博士
电子信箱: [email protected] 网址: http://www.pik-potsdam.de/
中国 北京 10085
北京师范大学 全球变化与地球系统科学研究院
崔雪锋博士 电子信箱: [email protected]
相关细节出处:
Acosta-Michlik L, et al. Integrated assessment of sustainability trade-offs and pathways for global bioenergy
production: Framing a novel hybrid approach. Renewable and Sustainable Energy Reviews 15 (2011) 2791–2809.
感谢你的大力支持!
0% 100%
Potsdam Institute for Climate Impact Research (PIK), Germany
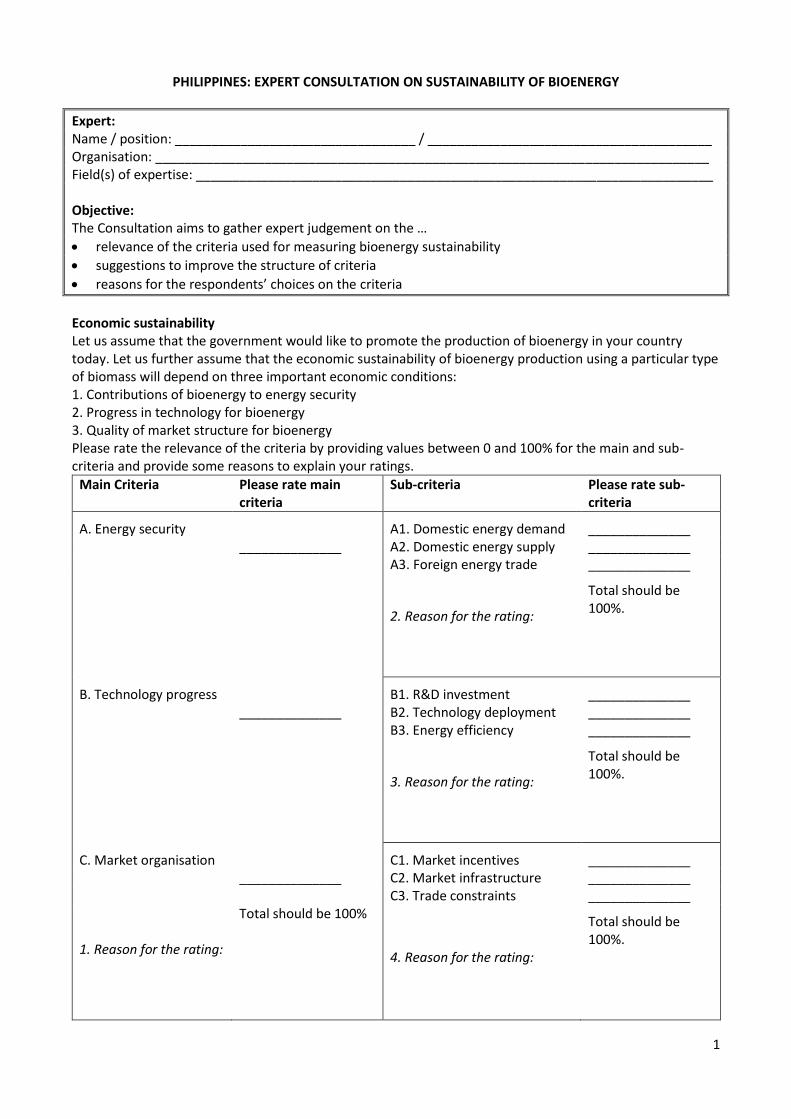
1
PHILIPPINES: EXPERT CONSULTATION ON SUSTAINABILITY OF BIOENERGY
Expert: Name / position: _________________________________ / _______________________________________ Organisation: ____________________________________________________________________________ Field(s) of expertise: _______________________________________________________________________ Objective: The Consultation aims to gather expert judgement on the …
relevance of the criteria used for measuring bioenergy sustainability
suggestions to improve the structure of criteria
reasons for the respondents’ choices on the criteria
Economic sustainability Let us assume that the government would like to promote the production of bioenergy in your country today. Let us further assume that the economic sustainability of bioenergy production using a particular type of biomass will depend on three important economic conditions: 1. Contributions of bioenergy to energy security 2. Progress in technology for bioenergy 3. Quality of market structure for bioenergy Please rate the relevance of the criteria by providing values between 0 and 100% for the main and sub-criteria and provide some reasons to explain your ratings.
Main Criteria Please rate main criteria
Sub-criteria Please rate sub-criteria
A. Energy security A1. Domestic energy demand ______________ ______________ A2. Domestic energy supply ______________ A3. Foreign energy trade ______________
2. Reason for the rating:
Total should be 100%.
B. Technology progress B1. R&D investment ______________ ______________ B2. Technology deployment ______________ B3. Energy efficiency ______________
3. Reason for the rating:
Total should be 100%.
C. Market organisation C1. Market incentives ______________ ______________ C2. Market infrastructure ______________ C3. Trade constraints ______________
1. Reason for the rating:
Total should be 100%
4. Reason for the rating:
Total should be 100%.
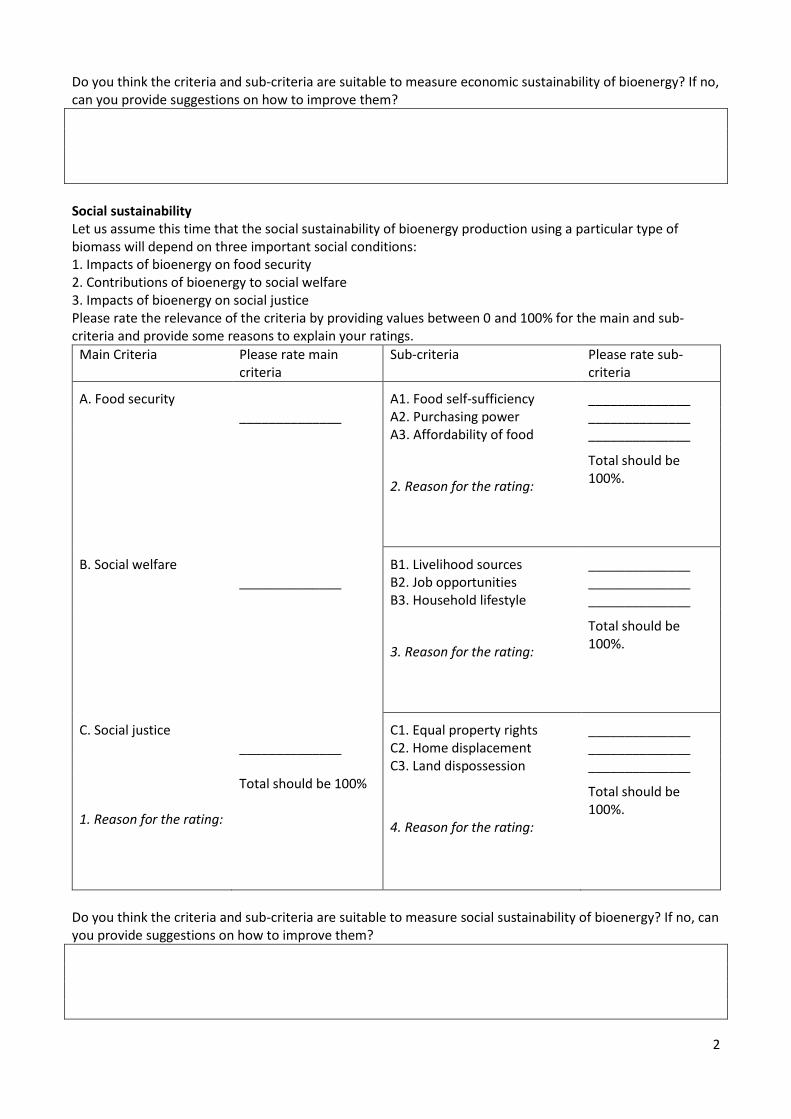
2
Do you think the criteria and sub-criteria are suitable to measure economic sustainability of bioenergy? If no, can you provide suggestions on how to improve them?
Social sustainability Let us assume this time that the social sustainability of bioenergy production using a particular type of biomass will depend on three important social conditions: 1. Impacts of bioenergy on food security 2. Contributions of bioenergy to social welfare 3. Impacts of bioenergy on social justice Please rate the relevance of the criteria by providing values between 0 and 100% for the main and sub-criteria and provide some reasons to explain your ratings.
Main Criteria Please rate main criteria
Sub-criteria Please rate sub-criteria
A. Food security A1. Food self-sufficiency ______________ ______________ A2. Purchasing power ______________ A3. Affordability of food ______________
2. Reason for the rating:
Total should be 100%.
B. Social welfare B1. Livelihood sources ______________ ______________ B2. Job opportunities ______________ B3. Household lifestyle ______________
3. Reason for the rating:
Total should be 100%.
C. Social justice C1. Equal property rights ______________ ______________ C2. Home displacement ______________ C3. Land dispossession ______________
1. Reason for the rating:
Total should be 100%
4. Reason for the rating:
Total should be 100%.
Do you think the criteria and sub-criteria are suitable to measure social sustainability of bioenergy? If no, can you provide suggestions on how to improve them?

3
Ecological sustainability Finally, let us assume that the environmental sustainability of bioenergy production using a particular type of biomass will depend on three important environmental conditions: 1. Potential for increasing biomass production for bioenergy 2. Impacts of bioenergy production on natural (i.e. land, water) resources 3. Availability of land management to improve land productivity Please rate the relevance of the criteria by providing values between 0 and 100% for the main and sub-criteria and provide some reasons to explain your ratings.
Main Criteria Please rate main criteria
Sub-criteria Please rate sub-criteria
A. Production potential A1. No potential ______________ ______________ A2. With potential ______________ A3. potential depend on
feedstocks ______________
2. Reason for the rating:
Total should be 100%.
B. Resource capacity B1. Effects of population pressure
______________
______________ B2. Pressure level on natural resources
______________
B3. Effects landscape and species diversity
______________
3. Reason for the rating:
Total should be 100%.
C. Land management C1. Effects on nature conservation
______________
______________ C2. Compatibility with organic farming
______________
C3. Availability of good farming practices
______________
1. Reason for the rating:
Total should be 100%
4. Reason for the rating:
Total should be 100%.
Do you think the criteria and sub-criteria are suitable to measure ecological sustainability of bioenergy? If no, can you provide suggestions on how to improve them?
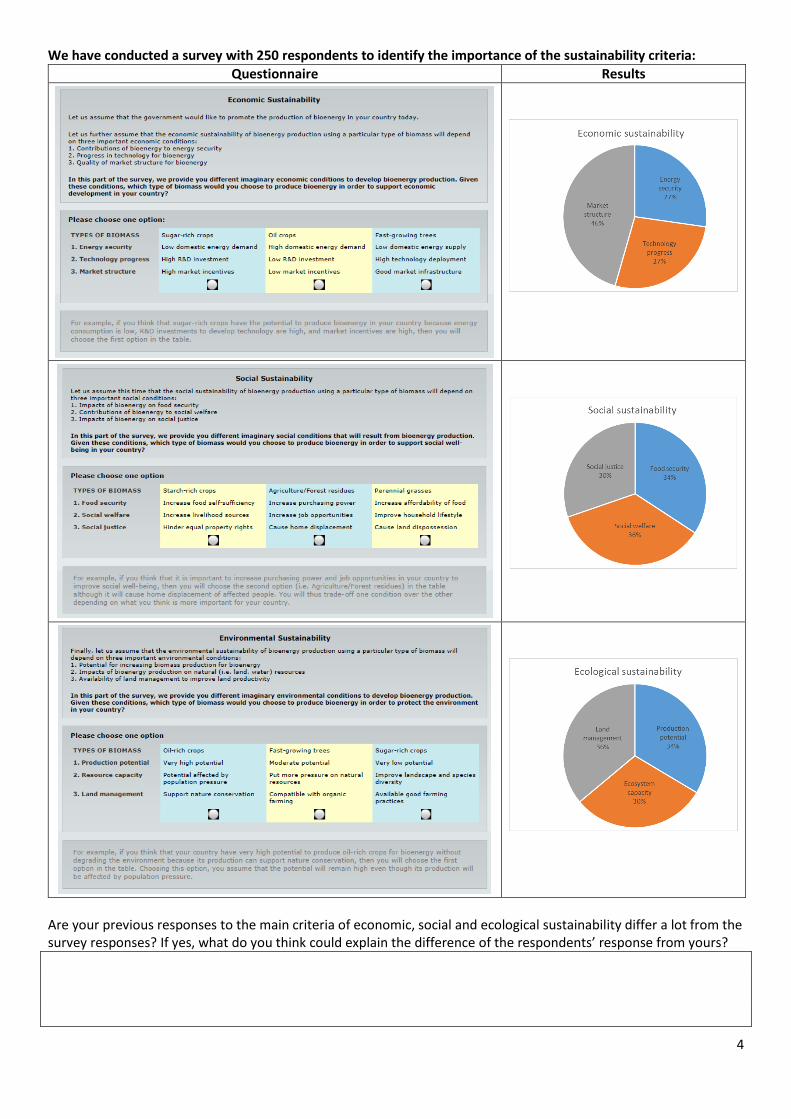
4
We have conducted a survey with 250 respondents to identify the importance of the sustainability criteria:
Questionnaire Results
Are your previous responses to the main criteria of economic, social and ecological sustainability differ a lot from the survey responses? If yes, what do you think could explain the difference of the respondents’ response from yours?

5
What are the government policies or programs to promote bioenergy/biofuel production in the Philippines that you are familiar with? In your opinion, what are the contributions or impacts of these policies and programs on the economic, social and ecological condition in the country?
Policy/Program Impacts

1
INDIA: EXPERT CONSULTATION ON SUSTAINABILITY OF BIOENERGY
Expert: Name / position: _________________________________ / _______________________________________ Organisation: ____________________________________________________________________________ Field(s) of expertise: _______________________________________________________________________ Objective: The Consultation aims to gather expert judgement on the …
relevance of the criteria used for measuring bioenergy sustainability
suggestions to improve the structure of criteria
reasons for the respondents’ choices on the criteria
Economic sustainability Let us assume that the government would like to promote the production of bioenergy in your country today. Let us further assume that the economic sustainability of bioenergy production using a particular type of biomass will depend on three important economic conditions: 1. Contributions of bioenergy to energy security 2. Progress in technology for bioenergy 3. Quality of market structure for bioenergy Please rate the relevance of the criteria by providing values between 0 and 100% for the main and sub-criteria and provide some reasons to explain your ratings.
Main Criteria Please rate main criteria
Sub-criteria Please rate sub-criteria
A. Energy security a. Domestic energy demand ______________ ______________ b. Domestic energy supply ______________ c. Foreign energy trade ______________
2. Reason for the rating:
Total should be 100%.
B. Technology progress a. R&D investment ______________ ______________ b. Technology deployment ______________ c. Energy efficiency ______________
3. Reason for the rating:
Total should be 100%.
C. Market organisation a. Market incentives ______________ ______________ b. Market infrastructure ______________ c. Trade constraints ______________
1. Reason for the rating:
Total should be 100%
4. Reason for the rating:
Total should be 100%.

2
Do you think the criteria and sub-criteria are suitable to measure economic sustainability of bioenergy? If no, can you provide suggestions on how to improve them?
Social sustainability Let us assume this time that the social sustainability of bioenergy production using a particular type of biomass will depend on three important social conditions: 1. Impacts of bioenergy on food security 2. Contributions of bioenergy to social welfare 3. Impacts of bioenergy on social justice Please rate the relevance of the criteria by providing values between 0 and 100% for the main and sub-criteria and provide some reasons to explain your ratings.
Main Criteria Please rate main criteria
Sub-criteria Please rate sub-criteria
A. Food security a. Food self-sufficiency ______________ ______________ b. Purchasing power ______________ c. Affordability of food ______________
2. Reason for the rating:
Total should be 100%.
B. Social welfare a. Livelihood sources ______________ ______________ b. Job opportunities ______________ c. Household lifestyle ______________
3. Reason for the rating:
Total should be 100%.
C. Social justice a. Equal property rights ______________ ______________ b. Home displacement ______________ c. Land dispossession ______________
1. Reason for the rating:
Total should be 100%
4. Reason for the rating:
Total should be 100%.
Do you think the criteria and sub-criteria are suitable to measure social sustainability of bioenergy? If no, can you provide suggestions on how to improve them?
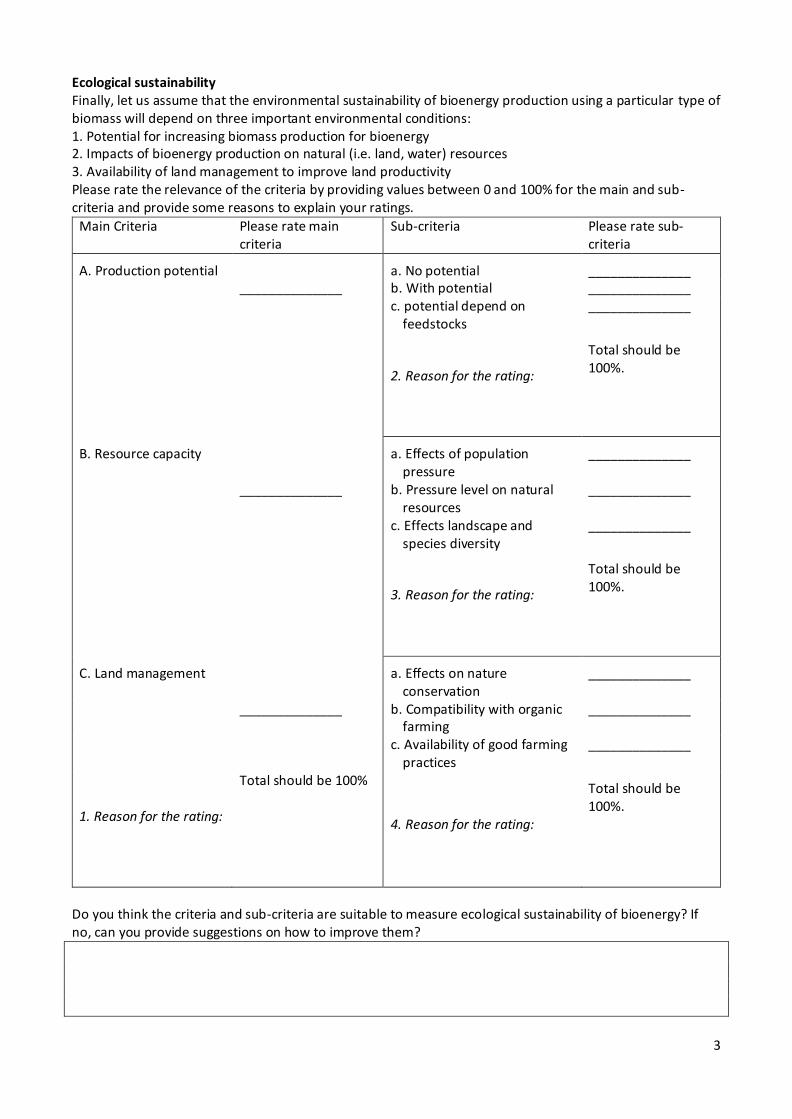
3
Ecological sustainability Finally, let us assume that the environmental sustainability of bioenergy production using a particular type of biomass will depend on three important environmental conditions: 1. Potential for increasing biomass production for bioenergy 2. Impacts of bioenergy production on natural (i.e. land, water) resources 3. Availability of land management to improve land productivity Please rate the relevance of the criteria by providing values between 0 and 100% for the main and sub-criteria and provide some reasons to explain your ratings.
Main Criteria Please rate main criteria
Sub-criteria Please rate sub-criteria
A. Production potential a. No potential ______________ ______________ b. With potential ______________ c. potential depend on
feedstocks ______________
2. Reason for the rating:
Total should be 100%.
B. Resource capacity a. Effects of population pressure
______________
______________ b. Pressure level on natural resources
______________
c. Effects landscape and species diversity
______________
3. Reason for the rating:
Total should be 100%.
C. Land management a. Effects on nature conservation
______________
______________ b. Compatibility with organic farming
______________
c. Availability of good farming practices
______________
1. Reason for the rating:
Total should be 100%
4. Reason for the rating:
Total should be 100%.
Do you think the criteria and sub-criteria are suitable to measure ecological sustainability of bioenergy? If no, can you provide suggestions on how to improve them?
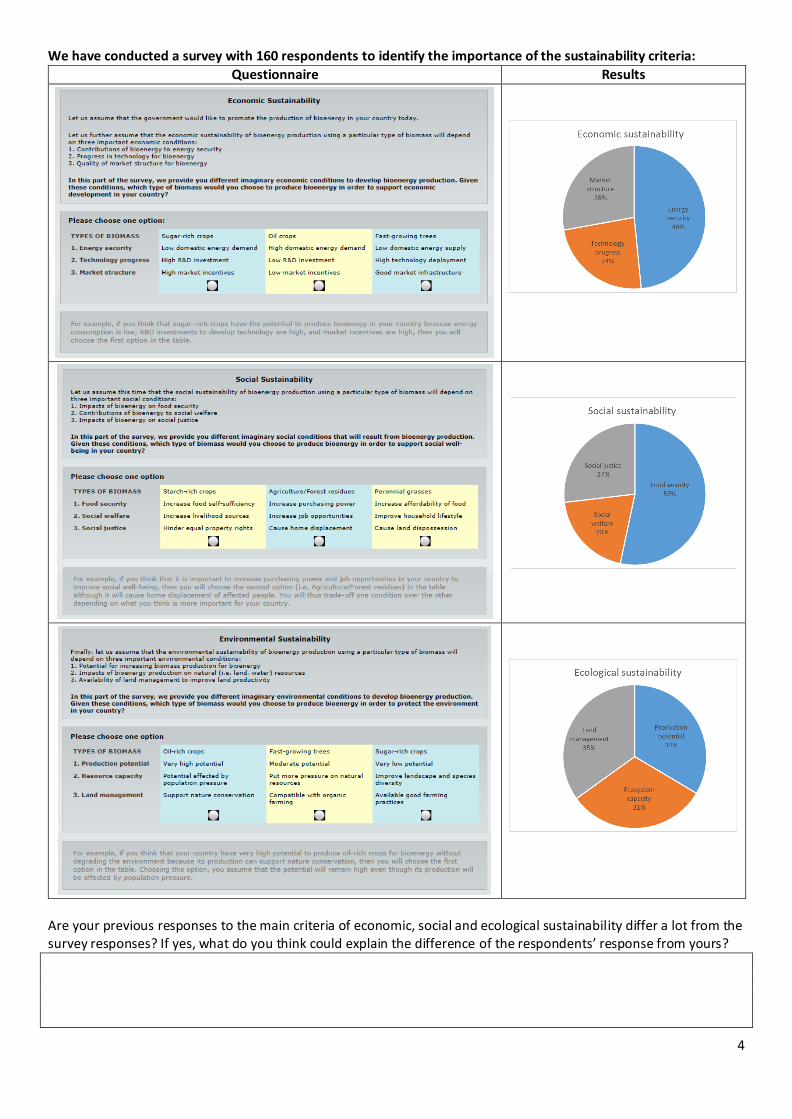
4
We have conducted a survey with 160 respondents to identify the importance of the sustainability criteria:
Questionnaire Results
Are your previous responses to the main criteria of economic, social and ecological sustainability differ a lot from the survey responses? If yes, what do you think could explain the difference of the respondents’ response from yours?

5
We have conducted exactly same survey in China and the Philippines. As compared to these other Asian countries, there was very low response rate or lack of interest in participating in the survey in India. In your opinion, what could be the reasons for the lack of interest on bioenergy debates in India?

1
EXPERT CONSULTATION ON SUSTAINABILITY OF BIOENERGY
Expert: Name / position: _________________________________ / _______________________________________ Organisation: ____________________________________________________________________________ Field(s) of expertise: _______________________________________________________________________ Objective: The Consultation aims to gather expert judgement on the …
relevance of the criteria used for measuring bioenergy sustainability
suggestions to improve the structure of criteria
reasons for the respondents’ choices on the criteria
Economic sustainability Let us assume that the government would like to promote the production of bioenergy in your country today. Let us further assume that the economic sustainability of bioenergy production using a particular type of biomass will depend on three important economic conditions: 1. Contributions of bioenergy to energy security 2. Progress in technology for bioenergy 3. Quality of market structure for bioenergy Please rate the relevance of the criteria by providing values between 0 and 100% for the main and sub-criteria and provide some reasons to explain your ratings.
Main Criteria Please rate main criteria
Sub-criteria Please rate sub-criteria
A. Energy security A1. Domestic energy demand ______________ ______________ A2. Domestic energy supply ______________ A3. Foreign energy trade ______________
2. Reason for the rating:
Total should be 100%.
B. Technology progress B1. R&D investment ______________ ______________ B2. Technology deployment ______________ B3. Energy efficiency ______________
3. Reason for the rating:
Total should be 100%.
C. Market organisation C1. Market incentives ______________ ______________ C2. Market infrastructure ______________ C3. Trade constraints ______________
1. Reason for the rating:
Total should be 100%
4. Reason for the rating:
Total should be 100%.
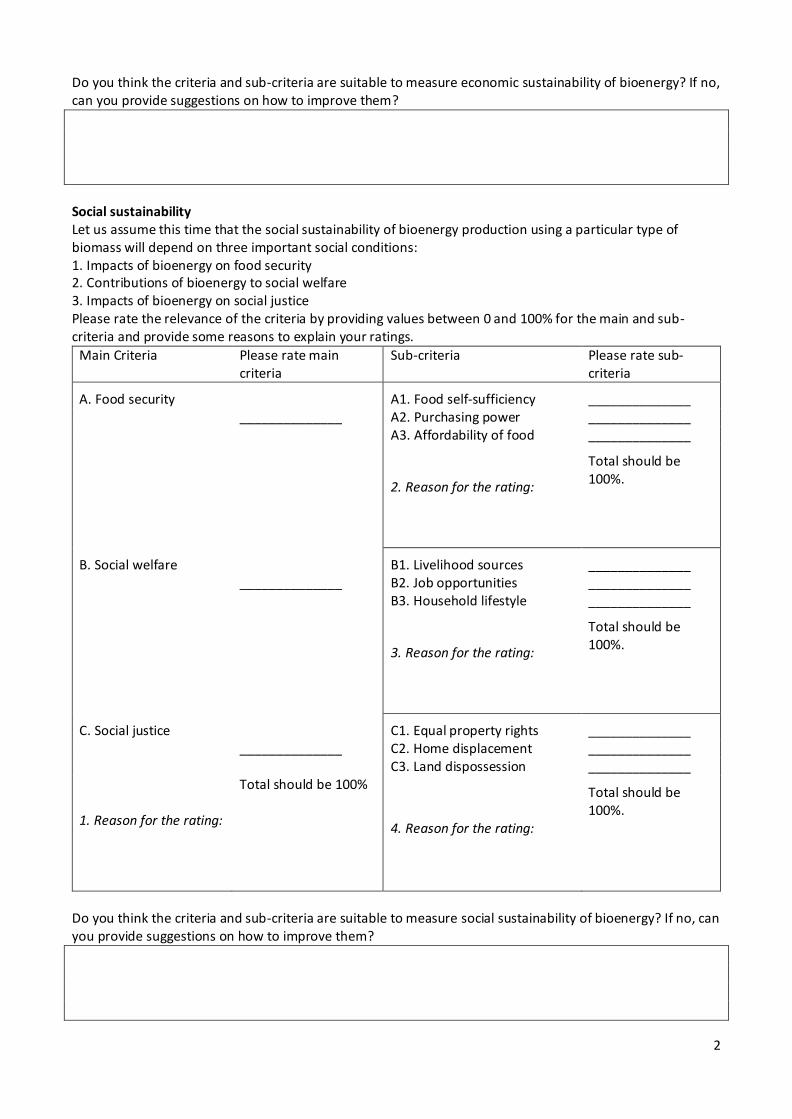
2
Do you think the criteria and sub-criteria are suitable to measure economic sustainability of bioenergy? If no, can you provide suggestions on how to improve them?
Social sustainability Let us assume this time that the social sustainability of bioenergy production using a particular type of biomass will depend on three important social conditions: 1. Impacts of bioenergy on food security 2. Contributions of bioenergy to social welfare 3. Impacts of bioenergy on social justice Please rate the relevance of the criteria by providing values between 0 and 100% for the main and sub-criteria and provide some reasons to explain your ratings.
Main Criteria Please rate main criteria
Sub-criteria Please rate sub-criteria
A. Food security A1. Food self-sufficiency ______________ ______________ A2. Purchasing power ______________ A3. Affordability of food ______________
2. Reason for the rating:
Total should be 100%.
B. Social welfare B1. Livelihood sources ______________ ______________ B2. Job opportunities ______________ B3. Household lifestyle ______________
3. Reason for the rating:
Total should be 100%.
C. Social justice C1. Equal property rights ______________ ______________ C2. Home displacement ______________ C3. Land dispossession ______________
1. Reason for the rating:
Total should be 100%
4. Reason for the rating:
Total should be 100%.
Do you think the criteria and sub-criteria are suitable to measure social sustainability of bioenergy? If no, can you provide suggestions on how to improve them?

3
Ecological sustainability Finally, let us assume that the environmental sustainability of bioenergy production using a particular type of biomass will depend on three important environmental conditions: 1. Potential for increasing biomass production for bioenergy 2. Impacts of bioenergy production on natural (i.e. land, water) resources 3. Availability of land management to improve land productivity Please rate the relevance of the criteria by providing values between 0 and 100% for the main and sub-criteria and provide some reasons to explain your ratings.
Main Criteria Please rate main criteria
Sub-criteria Please rate sub-criteria
A. Production potential A1. No potential ______________ ______________ A2. With potential ______________ A3. potential depend on
feedstocks ______________
2. Reason for the rating:
Total should be 100%.
B. Resource capacity B1. Effects of population pressure
______________
______________ B2. Pressure level on natural resources
______________
B3. Effects landscape and species diversity
______________
3. Reason for the rating:
Total should be 100%.
C. Land management C1. Effects on nature conservation
______________
______________ C2. Compatibility with organic farming
______________
C3. Availability of good farming practices
______________
1. Reason for the rating:
Total should be 100%
4. Reason for the rating:
Total should be 100%.
Do you think the criteria and sub-criteria are suitable to measure ecological sustainability of bioenergy? If no, can you provide suggestions on how to improve them?
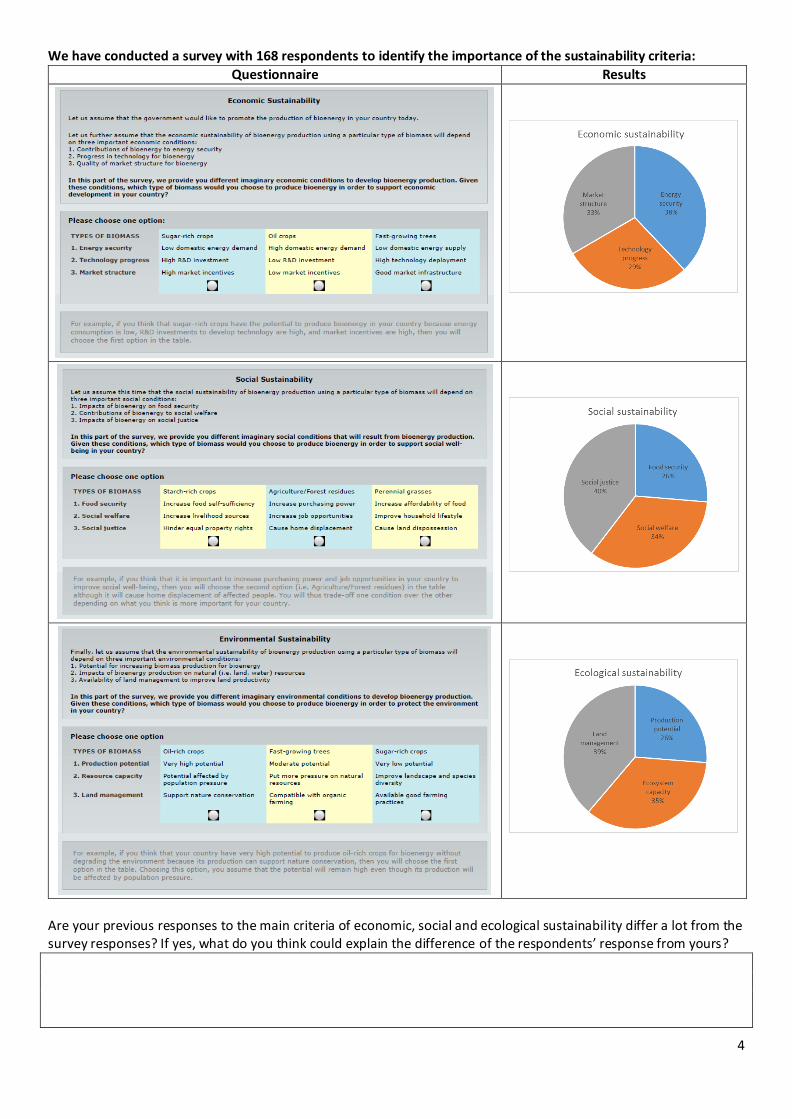
4
We have conducted a survey with 168 respondents to identify the importance of the sustainability criteria:
Questionnaire Results
Are your previous responses to the main criteria of economic, social and ecological sustainability differ a lot from the survey responses? If yes, what do you think could explain the difference of the respondents’ response from yours?

5
What are the government policies or programs to promote bioenergy/biofuel production in China that you are familiar with? In your opinion, what are the contributions or impacts of these policies and programs on the economic, social and ecological condition in the country?
Policy/Program Impacts
Kick-off Meeting
Integrated sustainability assessment of
bioenergy potentials in Asia: An application
of a hybrid approach on trade-offs and
pathways (PIC-STRAP)
UPLB, Philippines
June 12-15, 2013
Supported by:
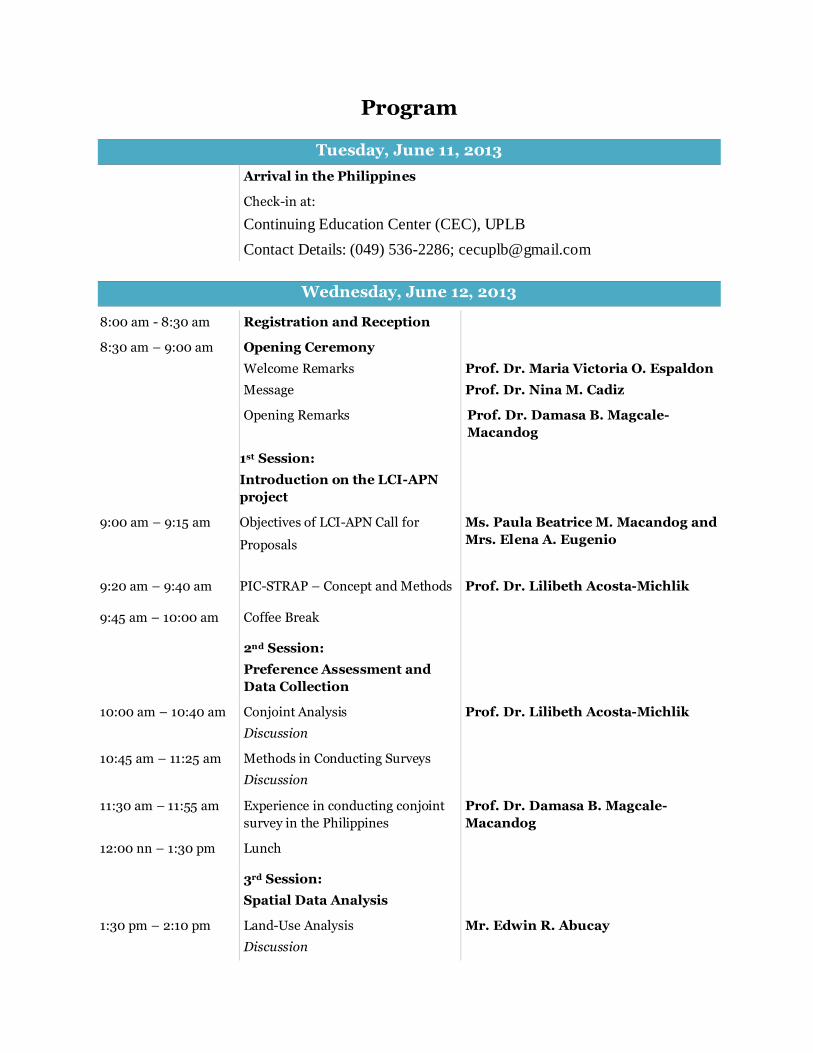
Program
Tuesday, June 11, 2013
Arrival in the Philippines
Check-in at:
Continuing Education Center (CEC), UPLB
Contact Details: (049) 536-2286; [email protected]
Wednesday, June 12, 2013
8:00 am - 8:30 am Registration and Reception
8:30 am – 9:00 am
Opening Ceremony
Welcome Remarks
Message
Prof. Dr. Maria Victoria O. Espaldon
Prof. Dr. Nina M. Cadiz
Opening Remarks Prof. Dr. Damasa B. Magcale-
Macandog
1st Session:
Introduction on the LCI-APN
project
9:00 am – 9:15 am Objectives of LCI-APN Call for
Proposals
Ms. Paula Beatrice M. Macandog and
Mrs. Elena A. Eugenio
9:20 am – 9:40 am PIC-STRAP – Concept and Methods Prof. Dr. Lilibeth Acosta-Michlik
9:45 am – 10:00 am Coffee Break
2nd Session:
Preference Assessment and
Data Collection
10:00 am – 10:40 am
Conjoint Analysis
Discussion
Prof. Dr. Lilibeth Acosta-Michlik
10:45 am – 11:25 am Methods in Conducting Surveys
Discussion
11:30 am – 11:55 am Experience in conducting conjoint
survey in the Philippines
Prof. Dr. Damasa B. Magcale-
Macandog
12:00 nn – 1:30 pm Lunch
3rd Session:
Spatial Data Analysis
1:30 pm – 2:10 pm Land-Use Analysis
Discussion
Mr. Edwin R. Abucay

2:15 pm – 2:55 pm Remote Sensing and GIS Mr. Arnold Salvacion
3:00 pm – 3:40 pm Inverse Modeling
Discussion
Dr. Xuefeng Cui
3:45 pm – 4:00 pm Coffee Break
4th Session:
Trade-offs Analysis
4:00 pm – 4:40 pm Fuzzy Logic Analysis
Discussion
Prof. Dr. K. S. Kavi Kumar
4:45 pm – 5:25 pm Logistic Analysis
Discussion
Prof. Dr. Lilibeth Acosta-Michlik
5:30 pm End of today’s sessions
Thursday, June 13, 2013
Project Planning
1st Discussion:
Identification of data to be
collected
8:00 am – 9:25 am Identification of Case Study Areas
9:30 am – 10:00 am Coffee Break
10:00 am – 11:25 am 2nd Discussion:
Allocation of tasks
Detailed Time Plan
11:30 am – 1:00 pm Lunch
1:00 pm – 3:25 pm 3rd Discussion:
Survey Plans
Population Size and Sampling
Online Survey (Training of use of
conjoint questionnaire)
Draft Questionnaire
3:30 pm – 4:00 pm Coffee Break
4:00 pm – 4:55 pm 4th Discussion:
Installation of Online Survey
Program in Laptops
5:00 pm End of today’s discussions

Friday, June 14, 2013
9:00 am – 11:00 am Meeting with UPLB-FI
Agenda:
Administration of project
Signing of documents with UPLB-FI
11:00 am – 12:00 nn Short Tour in UPLB and IRRI
12:00 nn – 1:00 pm Lunch (IRRI)
1:00 pm – 2:55 pm
Afternoon session:
Conjoint Analysis software training
3:00 pm – 3:30 pm Coffee Break
3:30 pm – 4:55 pm Fuzzy Logic software training
5:00 pm End of today’s activities
Saturday, June 15, 2013
Field Trip to Quezon Province
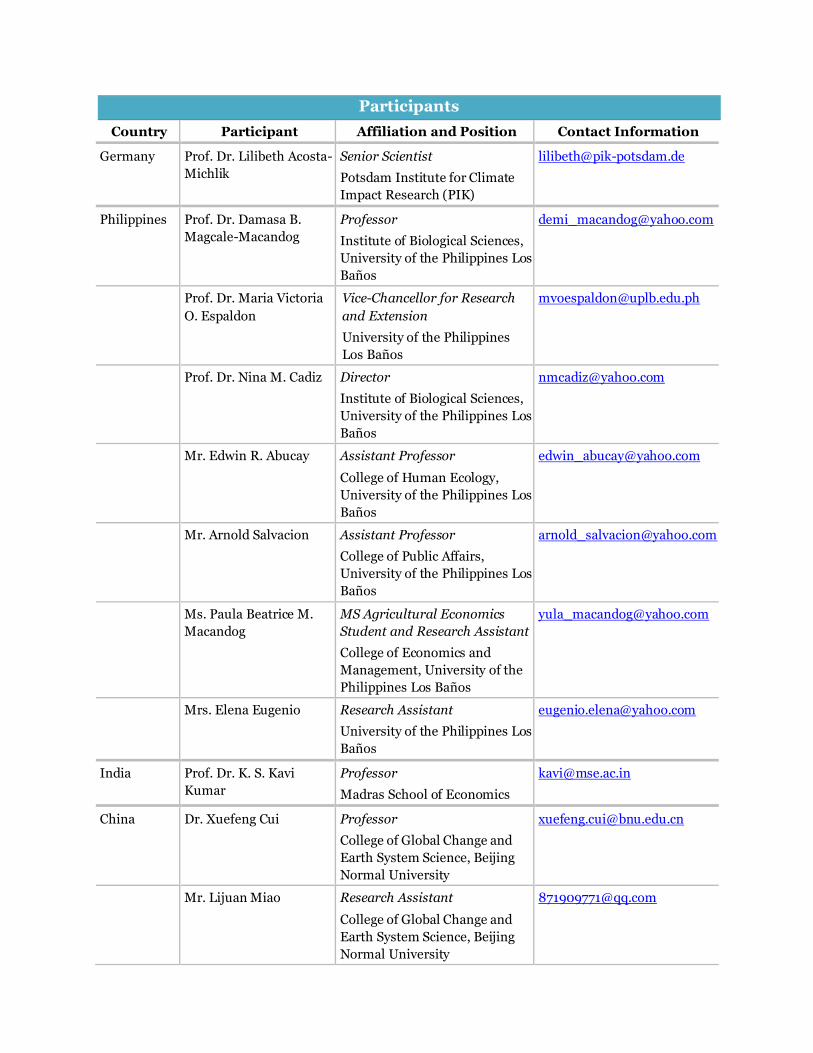
Participants
Country Participant Affiliation and Position Contact Information
Germany Prof. Dr. Lilibeth Acosta-
Michlik
Senior Scientist
Potsdam Institute for Climate
Impact Research (PIK)
Philippines Prof. Dr. Damasa B.
Magcale-Macandog
Professor
Institute of Biological Sciences,
University of the Philippines Los
Baños
Prof. Dr. Maria Victoria
O. Espaldon
Vice-Chancellor for Research
and Extension
University of the Philippines
Los Baños
Prof. Dr. Nina M. Cadiz Director
Institute of Biological Sciences,
University of the Philippines Los
Baños
Mr. Edwin R. Abucay Assistant Professor
College of Human Ecology,
University of the Philippines Los
Baños
Mr. Arnold Salvacion Assistant Professor
College of Public Affairs,
University of the Philippines Los
Baños
Ms. Paula Beatrice M.
Macandog
MS Agricultural Economics
Student and Research Assistant
College of Economics and
Management, University of the
Philippines Los Baños
Mrs. Elena Eugenio Research Assistant
University of the Philippines Los
Baños
India Prof. Dr. K. S. Kavi
Kumar
Professor
Madras School of Economics
China Dr. Xuefeng Cui Professor
College of Global Change and
Earth System Science, Beijing
Normal University
Mr. Lijuan Miao Research Assistant
College of Global Change and
Earth System Science, Beijing
Normal University

Mr. Feng Zhu Research Assistant
College of Global Change and
Earth System Science, Beijing
Normal University
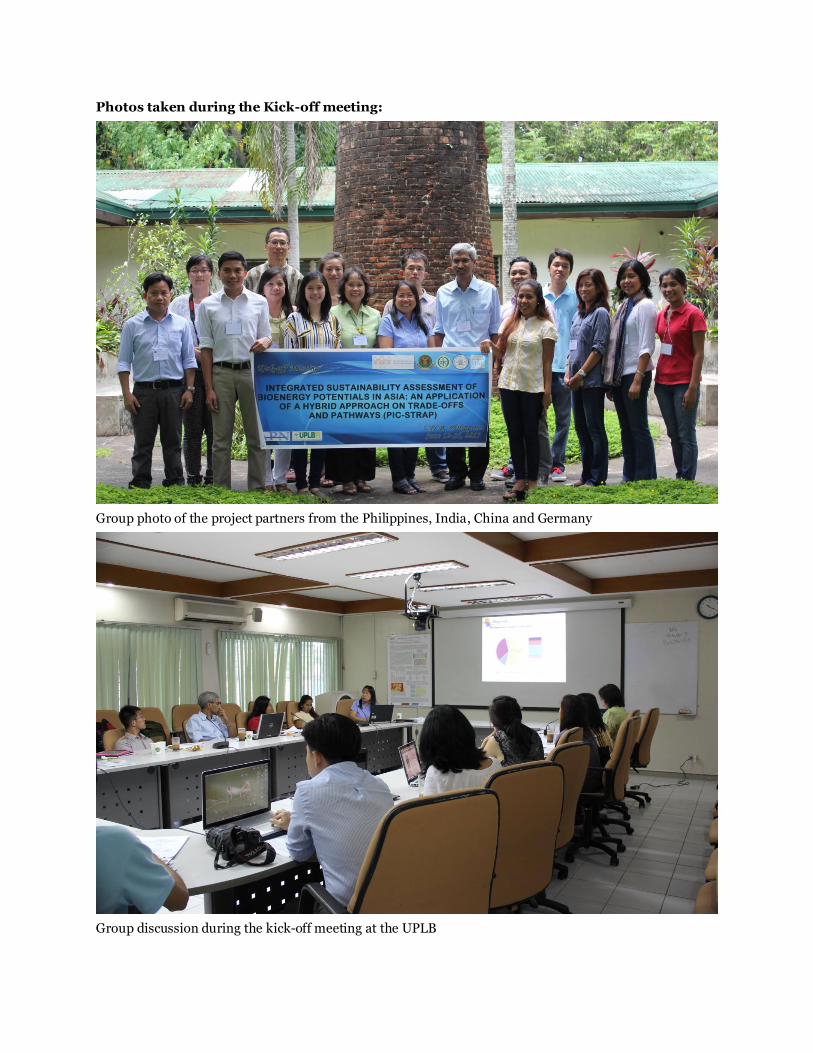
Photos taken during the Kick-off meeting:
Group photo of the project partners from the Philippines, India, China and Germany
Group discussion during the kick-off meeting at the UPLB
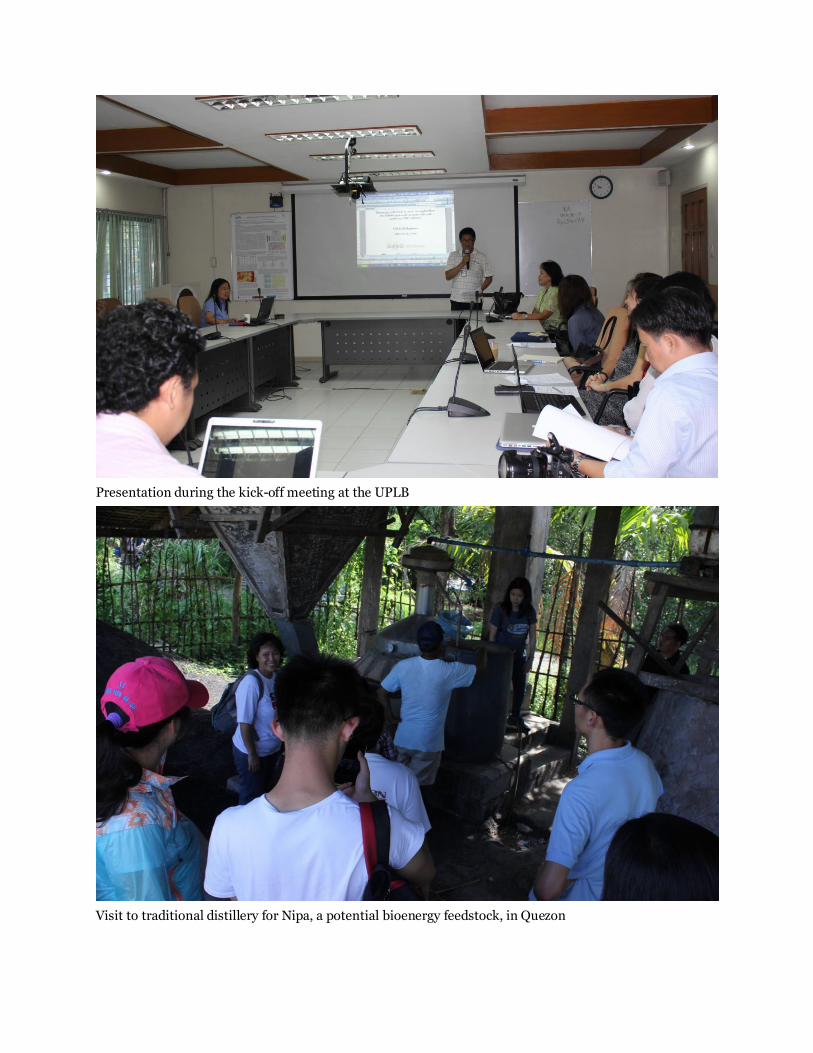
Presentation during the kick-off meeting at the UPLB
Visit to traditional distillery for Nipa, a potential bioenergy feedstock, in Quezon
Procedure for the Online Survey of PIC-STRAP
Elena Eugenio
University of the Philippines in Los Banos (UPLB)
PIC-STRAP Kick-off Meeting, UPLB, Philippines
June 12-15, 2013
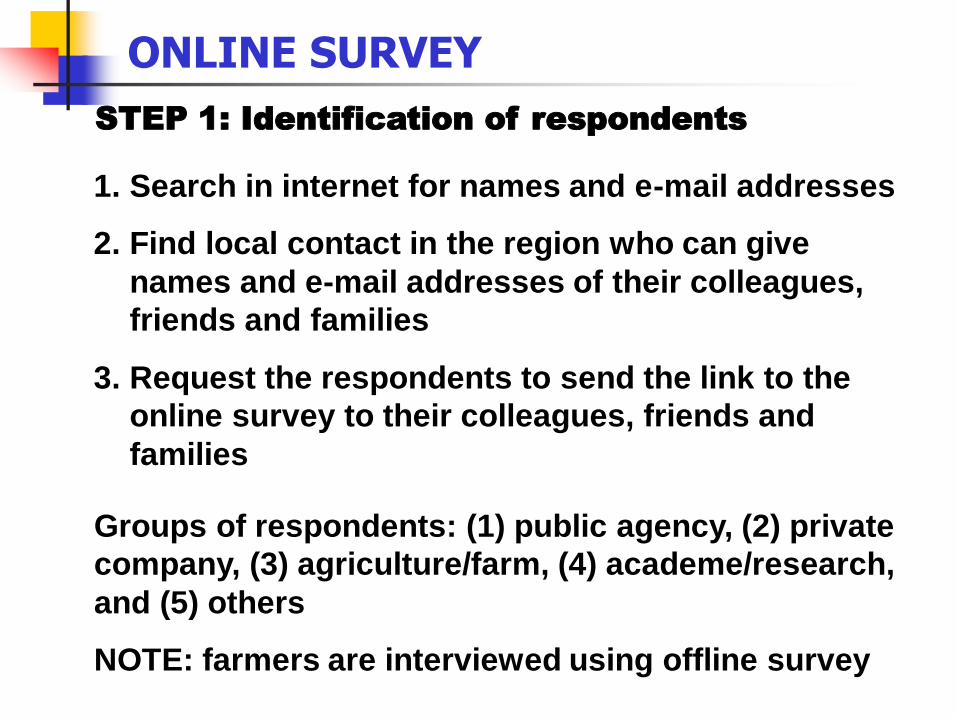
ONLINE SURVEY
STEP 1: Identification of respondents
1. Search in internet for names and e-mail addresses
2. Find local contact in the region who can give
names and e-mail addresses of their colleagues,
friends and families
3. Request the respondents to send the link to the
online survey to their colleagues, friends and
families
Groups of respondents: (1) public agency, (2) private
company, (3) agriculture/farm, (4) academe/research,
and (5) others
NOTE: farmers are interviewed using offline survey
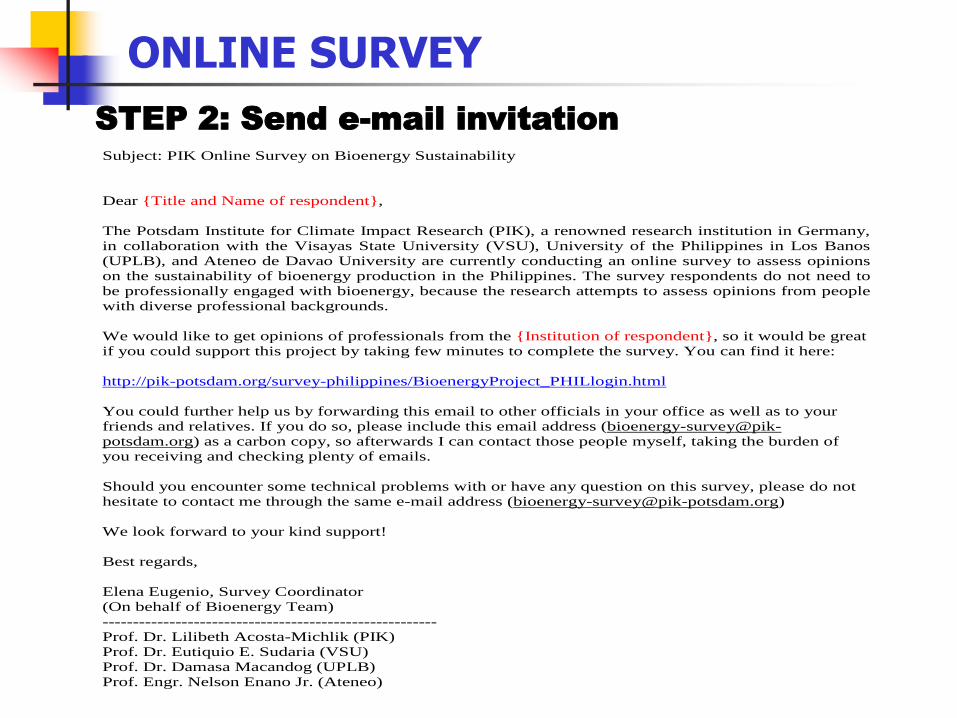
ONLINE SURVEY
STEP 2: Send e-mail invitationSubject: PIK Online Survey on Bioenergy Sustainability
Dear {Title and Name of respondent},
The Potsdam Institute for Climate Impact Research (PIK), a renowned research institution in Germany,
in collaboration with the Visayas State University (VSU), University of the Philippines in Los Banos
(UPLB), and Ateneo de Davao University are currently conducting an online survey to assess opinions
on the sustainability of bioenergy production in the Philippines. The survey respondents do not need to
be professionally engaged with bioenergy, because the research attempts to assess opinions from people
with diverse professional backgrounds.
We would like to get opinions of professionals from the {Institution of respondent}, so it would be great
if you could support this project by taking few minutes to complete the survey. You can find it here:
http://pik-potsdam.org/survey-philippines/BioenergyProject_PHILlogin.html
You could further help us by forwarding this email to other officials in your office as well as to your
friends and relatives. If you do so, please include this email address (bioenergy-survey@pik-
potsdam.org) as a carbon copy, so afterwards I can contact those people myself, taking the burden of
you receiving and checking plenty of emails.
Should you encounter some technical problems with or have any question on this survey, please do not
hesitate to contact me through the same e-mail address ([email protected])
We look forward to your kind support!
Best regards,
Elena Eugenio, Survey Coordinator
(On behalf of Bioenergy Team)
-------------------------------------------------------
Prof. Dr. Lilibeth Acosta-Michlik (PIK)
Prof. Dr. Eutiquio E. Sudaria (VSU)
Prof. Dr. Damasa Macandog (UPLB)
Prof. Engr. Nelson Enano Jr. (Ateneo)
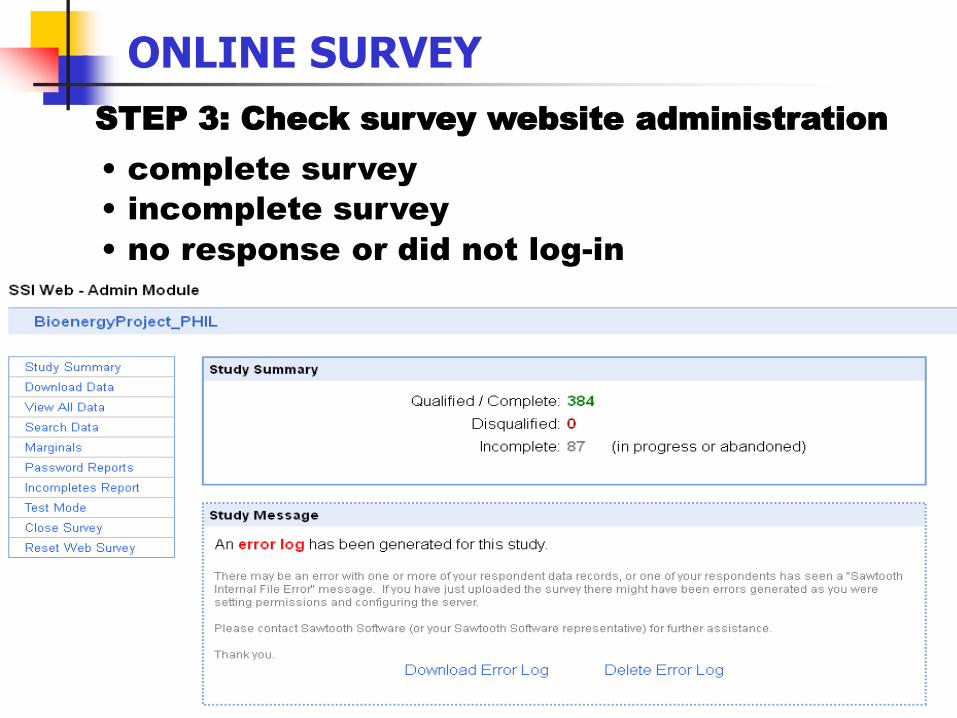
ONLINE SURVEY
STEP 3: Check survey website administration
• complete survey
• incomplete survey
• no response or did not log-in
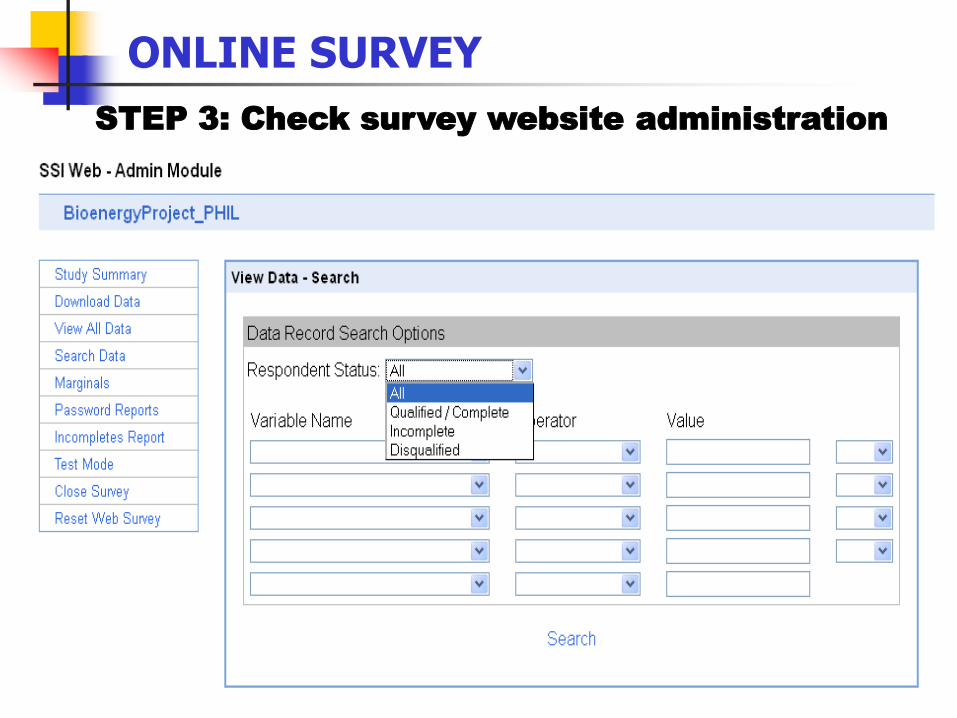
ONLINE SURVEY
STEP 3: Check survey website administration
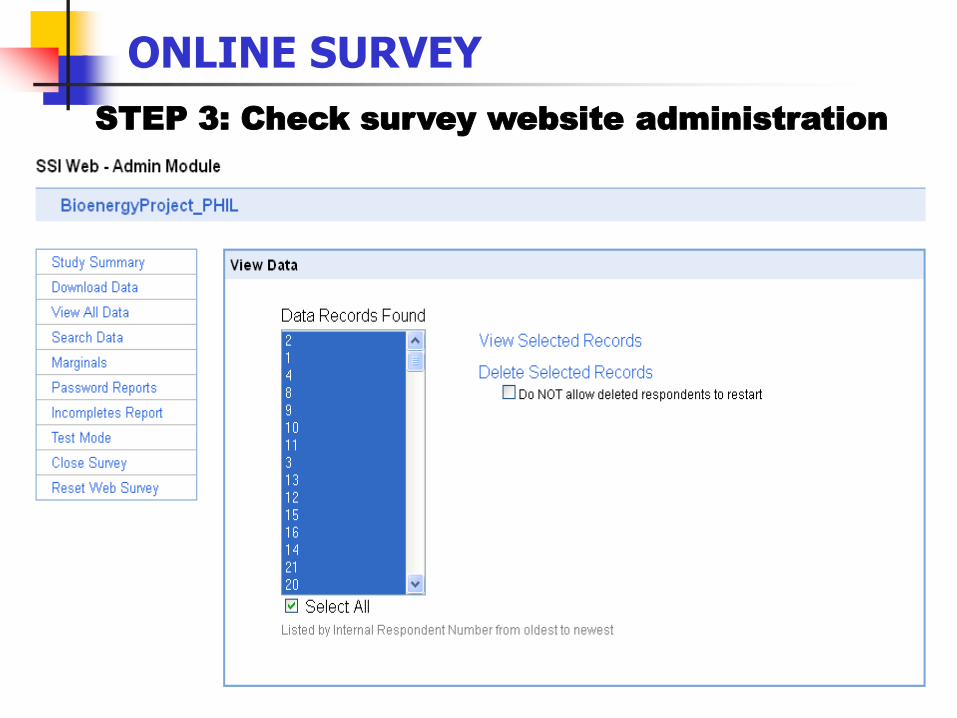
ONLINE SURVEY
STEP 3: Check survey website administration
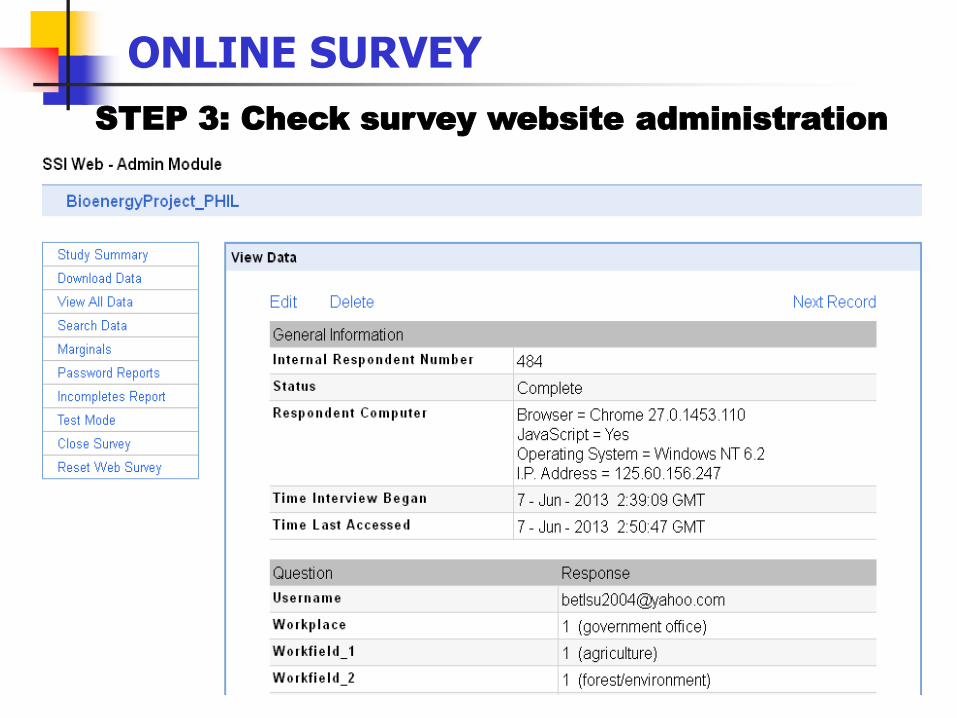
ONLINE SURVEY
STEP 3: Check survey website administration
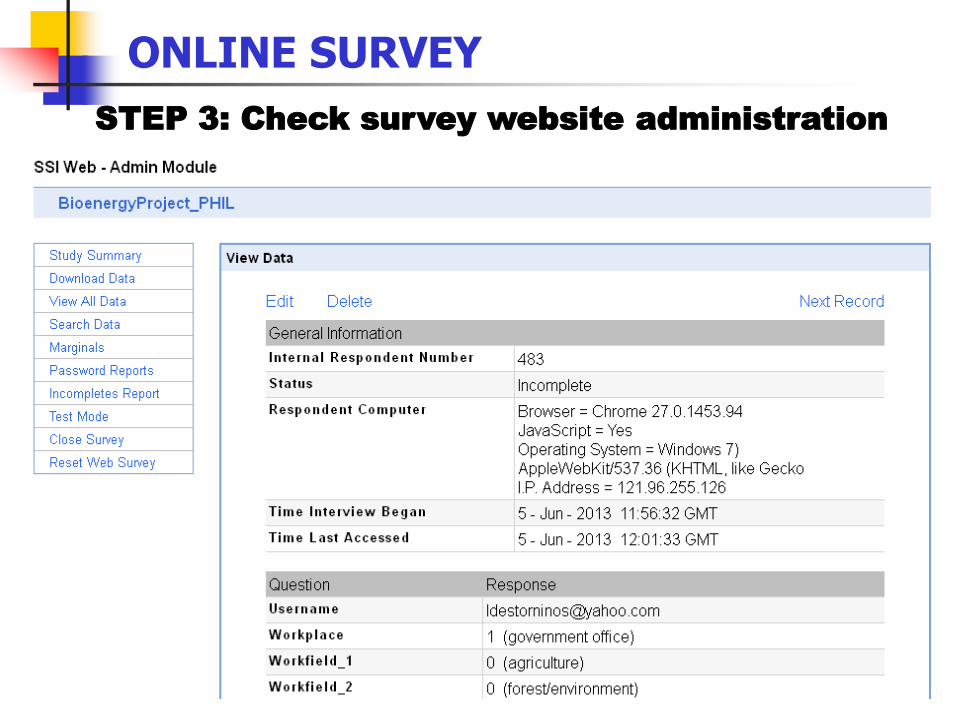
ONLINE SURVEY
STEP 3: Check survey website administration
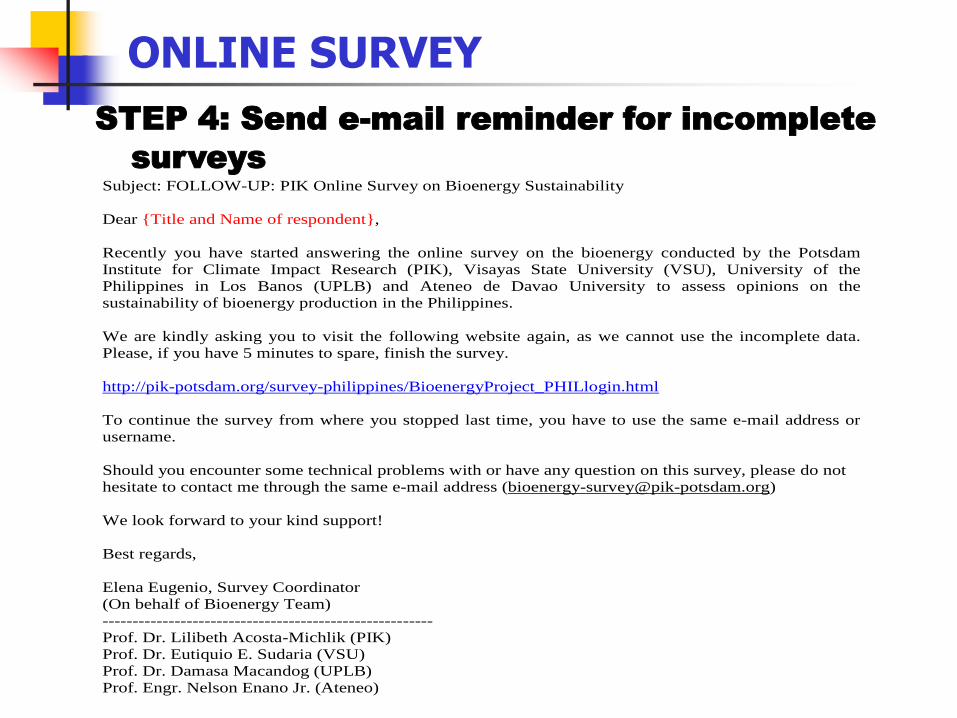
ONLINE SURVEY
STEP 4: Send e-mail reminder for incomplete
surveysSubject: FOLLOW-UP: PIK Online Survey on Bioenergy Sustainability
Dear {Title and Name of respondent},
Recently you have started answering the online survey on the bioenergy conducted by the Potsdam
Institute for Climate Impact Research (PIK), Visayas State University (VSU), University of the
Philippines in Los Banos (UPLB) and Ateneo de Davao University to assess opinions on the
sustainability of bioenergy production in the Philippines.
We are kindly asking you to visit the following website again, as we cannot use the incomplete data.
Please, if you have 5 minutes to spare, finish the survey.
http://pik-potsdam.org/survey-philippines/BioenergyProject_PHILlogin.html
To continue the survey from where you stopped last time, you have to use the same e-mail address or
username.
Should you encounter some technical problems with or have any question on this survey, please do not
hesitate to contact me through the same e-mail address ([email protected])
We look forward to your kind support!
Best regards,
Elena Eugenio, Survey Coordinator
(On behalf of Bioenergy Team)
-------------------------------------------------------
Prof. Dr. Lilibeth Acosta-Michlik (PIK)
Prof. Dr. Eutiquio E. Sudaria (VSU)
Prof. Dr. Damasa Macandog (UPLB)
Prof. Engr. Nelson Enano Jr. (Ateneo)
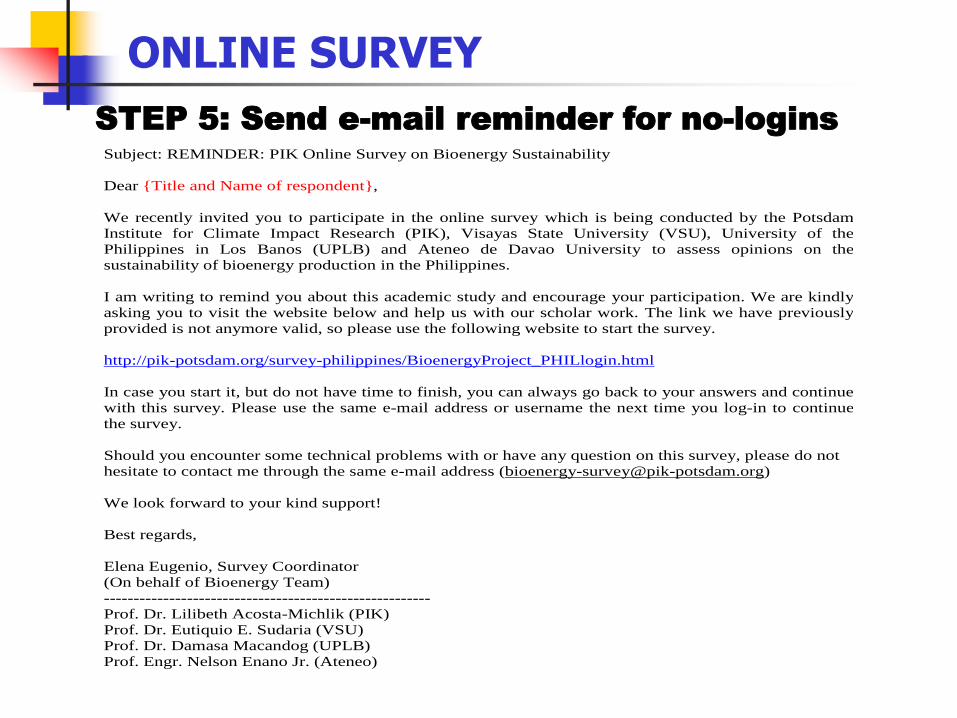
ONLINE SURVEY
STEP 5: Send e-mail reminder for no-loginsSubject: REMINDER: PIK Online Survey on Bioenergy Sustainability
Dear {Title and Name of respondent},
We recently invited you to participate in the online survey which is being conducted by the Potsdam
Institute for Climate Impact Research (PIK), Visayas State University (VSU), University of the
Philippines in Los Banos (UPLB) and Ateneo de Davao University to assess opinions on the
sustainability of bioenergy production in the Philippines.
I am writing to remind you about this academic study and encourage your participation. We are kindly
asking you to visit the website below and help us with our scholar work. The link we have previously
provided is not anymore valid, so please use the following website to start the survey.
http://pik-potsdam.org/survey-philippines/BioenergyProject_PHILlogin.html
In case you start it, but do not have time to finish, you can always go back to your answers and continue
with this survey. Please use the same e-mail address or username the next time you log-in to continue
the survey.
Should you encounter some technical problems with or have any question on this survey, please do not
hesitate to contact me through the same e-mail address ([email protected])
We look forward to your kind support!
Best regards,
Elena Eugenio, Survey Coordinator
(On behalf of Bioenergy Team)
-------------------------------------------------------
Prof. Dr. Lilibeth Acosta-Michlik (PIK)
Prof. Dr. Eutiquio E. Sudaria (VSU)
Prof. Dr. Damasa Macandog (UPLB)
Prof. Engr. Nelson Enano Jr. (Ateneo)
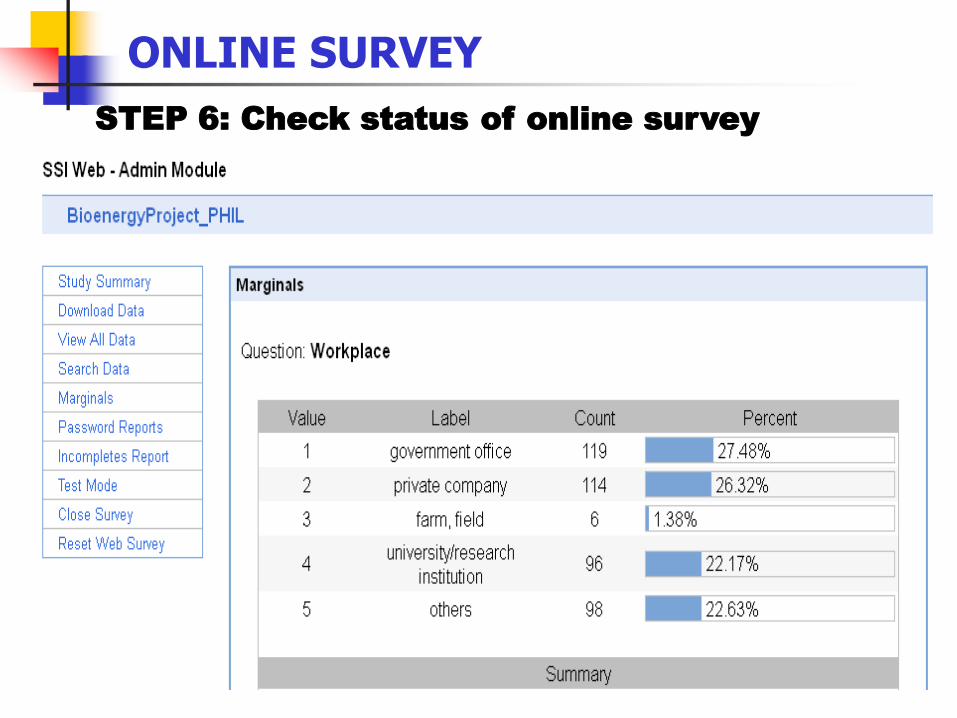
ONLINE SURVEY
STEP 6: Check status of online survey
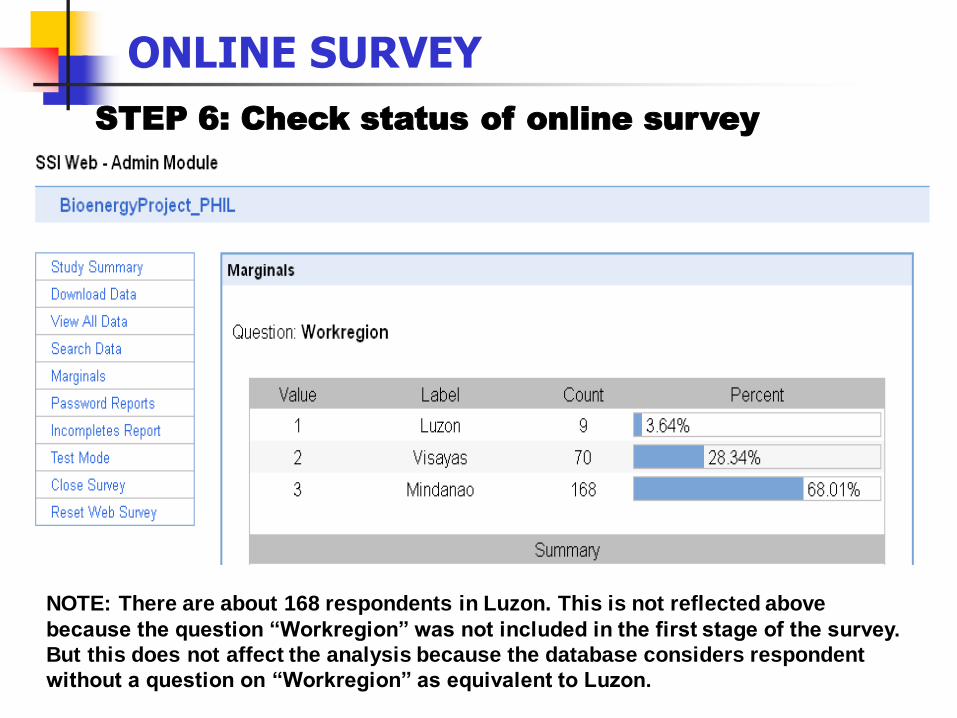
ONLINE SURVEY
STEP 6: Check status of online survey
NOTE: There are about 168 respondents in Luzon. This is not reflected above
because the question “Workregion” was not included in the first stage of the survey.
But this does not affect the analysis because the database considers respondent
without a question on “Workregion” as equivalent to Luzon.

Thanks for your attention!
Conjoint segmentation of policy preferences for a
sustainable biofuel production in the Philippines
Dr. Lilibeth Acosta-Michlik
Potsdam Institute for Climate Impact Research (PIK), Germany
PIC-STRAP Kick-off Meeting, UPLB, Philippines
June 12-15, 2013
1.Contribute to an understanding of trade-
off decisions on different determinants of
sustainable bioenergy
2.Apply conjoint analysis to elicit
preferences on sustainability of bioenergy
production
3.Show the utility of preference weights in
integrated assessments of sustainable
trade-offs and pathways
Conjoint in PIC-STRAP
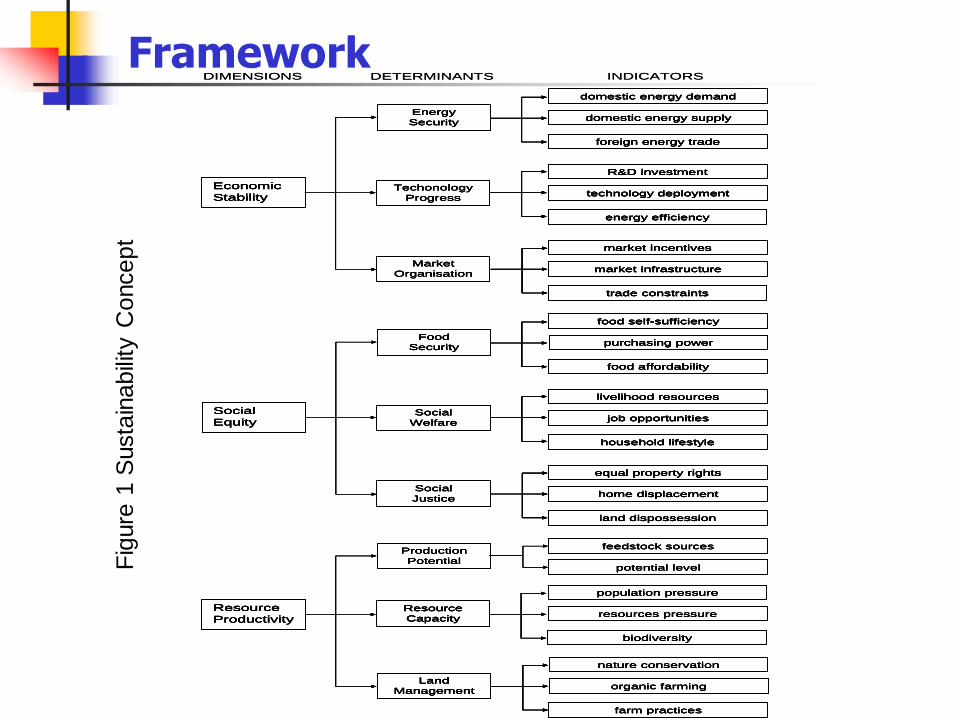
Framework
Economic
Stability
Energy
Security
Techonology
Progress
Market
Organisation
domestic energy demand
domestic energy supply
foreign energy trade
R&D investment
technology deployment
energy efficiency
market incentives
market infrastructure
trade constraints
Social
Equity
Food
Security
Social
Welfare
Social
Justice
food self-sufficiency
purchasing power
food affordability
livelihood resources
job opportunities
household lifestyle
equal property rights
home displacement
land dispossession
DETERMINANTS INDICATORSDIMENSIONS
Resource
Productivity
Production
Potential
Land
Management
nature conservation
organic farming
farm practices
Resource
Capacity
population pressure
resources pressure
biodiversity
feedstock sources
potential level
Economic
Stability
Energy
Security
Techonology
Progress
Market
Organisation
domestic energy demand
domestic energy supply
foreign energy trade
R&D investment
technology deployment
energy efficiency
market incentives
market infrastructure
trade constraints
Economic
Stability
Economic
Stability
Energy
Security
Energy
Security
Techonology
Progress
Techonology
Progress
Market
Organisation
Market
Organisation
domestic energy demand
domestic energy supply
foreign energy trade
R&D investment
technology deployment
energy efficiency
market incentives
market infrastructure
trade constraints
domestic energy demand
domestic energy supply
foreign energy trade
R&D investment
technology deployment
energy efficiency
market incentives
market infrastructure
trade constraints
domestic energy demand
domestic energy supply
foreign energy trade
R&D investment
technology deployment
energy efficiency
market incentives
market infrastructure
trade constraints
Social
Equity
Food
Security
Social
Welfare
Social
Justice
food self-sufficiency
purchasing power
food affordability
livelihood resources
job opportunities
household lifestyle
equal property rights
home displacement
land dispossession
Social
Equity
Social
Equity
Food
Security
Food
Security
Social
Welfare
Social
Welfare
Social
Justice
Social
Justice
food self-sufficiency
purchasing power
food affordability
livelihood resources
job opportunities
household lifestyle
equal property rights
home displacement
land dispossession
food self-sufficiency
purchasing power
food affordability
livelihood resources
job opportunities
household lifestyle
equal property rights
home displacement
land dispossession
food self-sufficiency
purchasing power
food affordability
livelihood resources
job opportunities
household lifestyle
equal property rights
home displacement
land dispossession
DETERMINANTS INDICATORSDIMENSIONS
Resource
Productivity
Production
Potential
Land
Management
nature conservation
organic farming
farm practices
Resource
Capacity
population pressure
resources pressure
biodiversity
feedstock sources
potential level
Resource
Productivity
Resource
Productivity
Production
Potential
Production
Potential
Land
Management
nature conservation
organic farming
farm practices
Land
Management
Land
Management
nature conservation
organic farming
farm practices
Resource
Capacity
population pressure
resources pressure
biodiversity
Resource
Capacity
Resource
Capacity
population pressure
resources pressure
biodiversity
feedstock sources
potential level
feedstock sources
potential levelFig
ure
1 S
usta
inab
ility
Concept
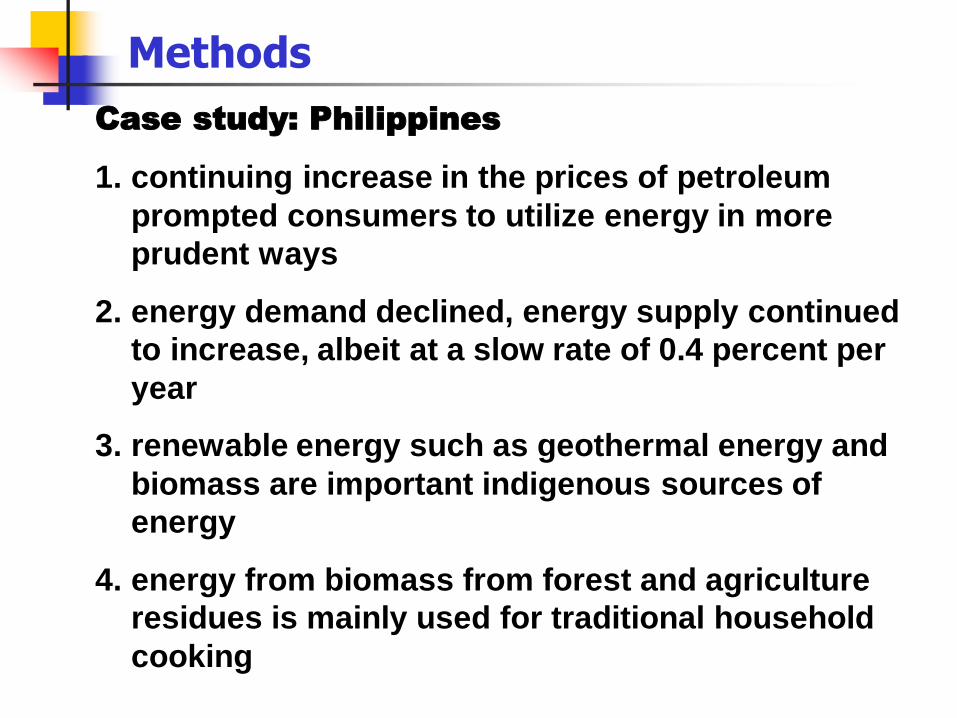
Methods
Case study: Philippines
1. continuing increase in the prices of petroleum
prompted consumers to utilize energy in more
prudent ways
2. energy demand declined, energy supply continued
to increase, albeit at a slow rate of 0.4 percent per
year
3. renewable energy such as geothermal energy and
biomass are important indigenous sources of
energy
4. energy from biomass from forest and agriculture
residues is mainly used for traditional household
cooking
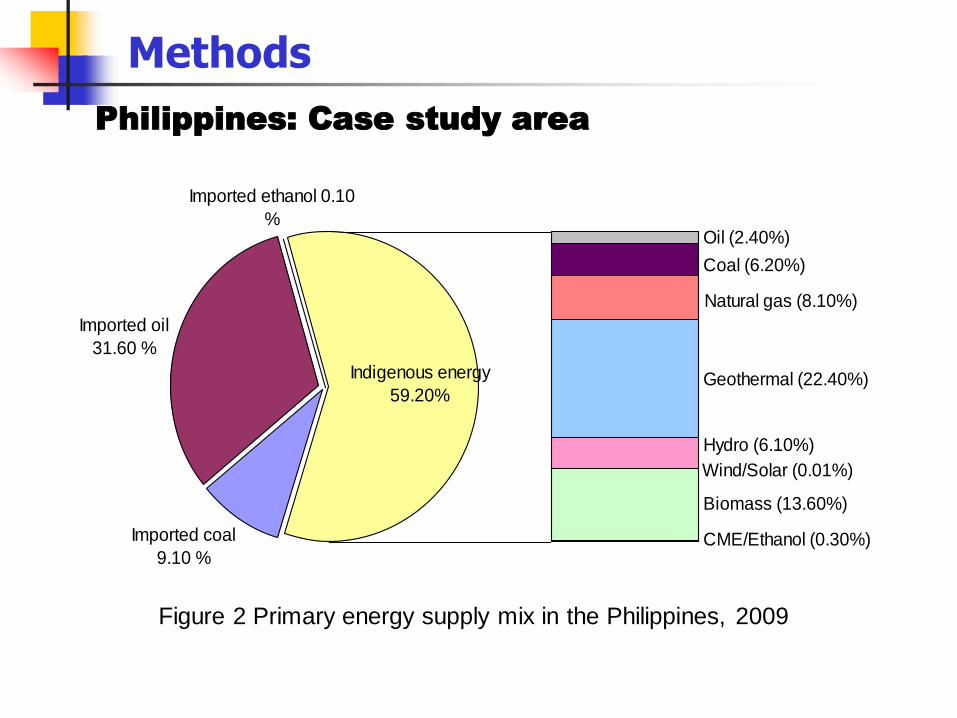
Methods
Philippines: Case study area
CME/Ethanol (0.30%)
Biomass (13.60%)
Wind/Solar (0.01%)
Hydro (6.10%)
Oil (2.40%)
Coal (6.20%)
Natural gas (8.10%)
Geothermal (22.40%)
Imported coal
9.10 %
Imported oil
31.60 %
Indigenous energy
59.20%
Imported ethanol 0.10
%
Figure 2 Primary energy supply mix in the Philippines, 2009
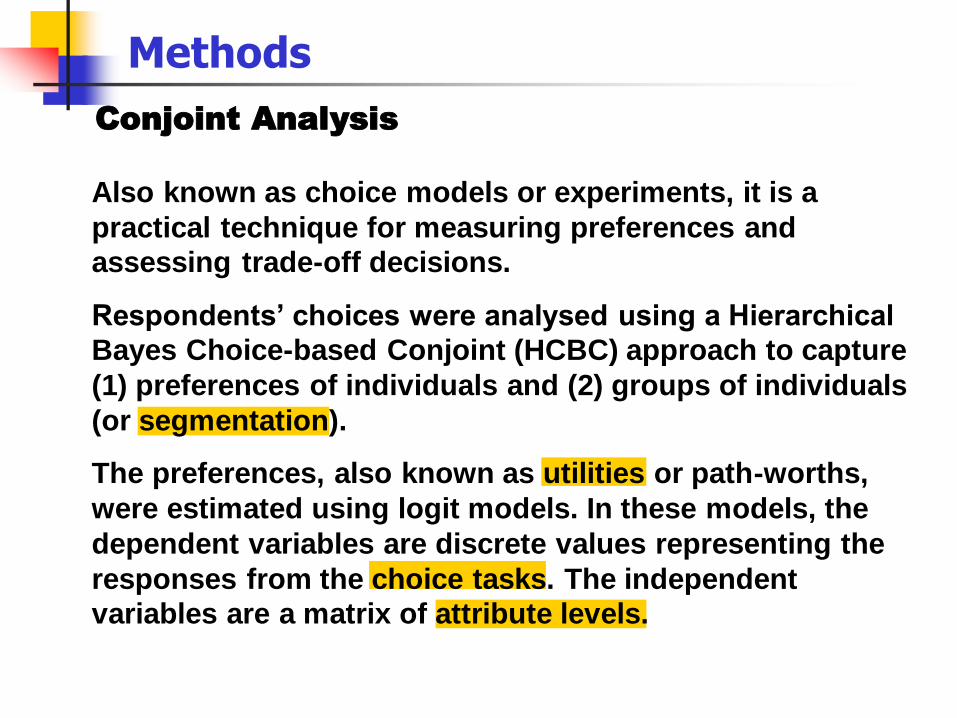
Also known as choice models or experiments, it is a
practical technique for measuring preferences and
assessing trade-off decisions.
Respondents’ choices were analysed using a Hierarchical
Bayes Choice-based Conjoint (HCBC) approach to capture
(1) preferences of individuals and (2) groups of individuals
(or segmentation).
The preferences, also known as utilities or path-worths,
were estimated using logit models. In these models, the
dependent variables are discrete values representing the
responses from the choice tasks. The independent
variables are a matrix of attribute levels.
Methods
Conjoint Analysis
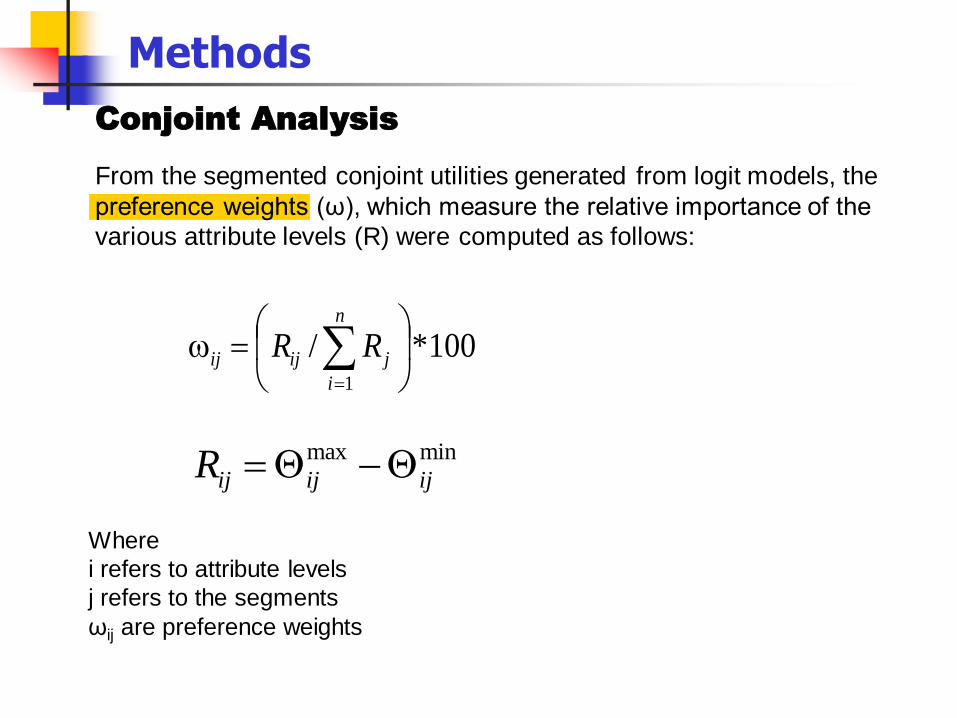
Where
i refers to attribute levels
j refers to the segments
ωij are preference weights
Methods
Conjoint Analysis
From the segmented conjoint utilities generated from logit models, the
preference weights (ω), which measure the relative importance of the
various attribute levels (R) were computed as follows:
100*/1
n
i
jijij RR
minmax
ijijijR
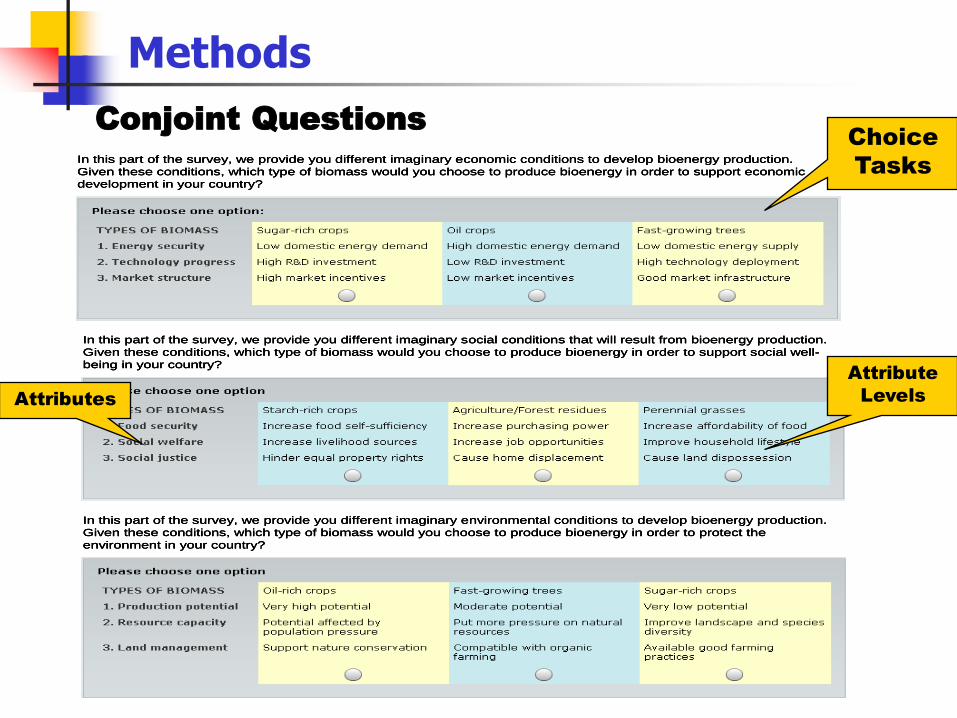
Methods
Conjoint QuestionsIn this part of the survey, we provide you different imaginary economic conditions to develop bioenergy production.
Given these conditions, which type of biomass would you choose to produce bioenergy in order to support economic
development in your country?
In this part of the survey, we provide you different imaginary social conditions that will result from bioenergy production.
Given these conditions, which type of biomass would you choose to produce bioenergy in order to support social well-
being in your country?
In this part of the survey, we provide you different imaginary environmental conditions to develop bioenergy production.
Given these conditions, which type of biomass would you choose to produce bioenergy in order to protect the
environment in your country?
In this part of the survey, we provide you different imaginary economic conditions to develop bioenergy production.
Given these conditions, which type of biomass would you choose to produce bioenergy in order to support economic
development in your country?
In this part of the survey, we provide you different imaginary economic conditions to develop bioenergy production.
Given these conditions, which type of biomass would you choose to produce bioenergy in order to support economic
development in your country?
In this part of the survey, we provide you different imaginary social conditions that will result from bioenergy production.
Given these conditions, which type of biomass would you choose to produce bioenergy in order to support social well-
being in your country?
In this part of the survey, we provide you different imaginary social conditions that will result from bioenergy production.
Given these conditions, which type of biomass would you choose to produce bioenergy in order to support social well-
being in your country?
In this part of the survey, we provide you different imaginary environmental conditions to develop bioenergy production.
Given these conditions, which type of biomass would you choose to produce bioenergy in order to protect the
environment in your country?
In this part of the survey, we provide you different imaginary environmental conditions to develop bioenergy production.
Given these conditions, which type of biomass would you choose to produce bioenergy in order to protect the
environment in your country?
Choice
Tasks
Attribute
LevelsAttributes
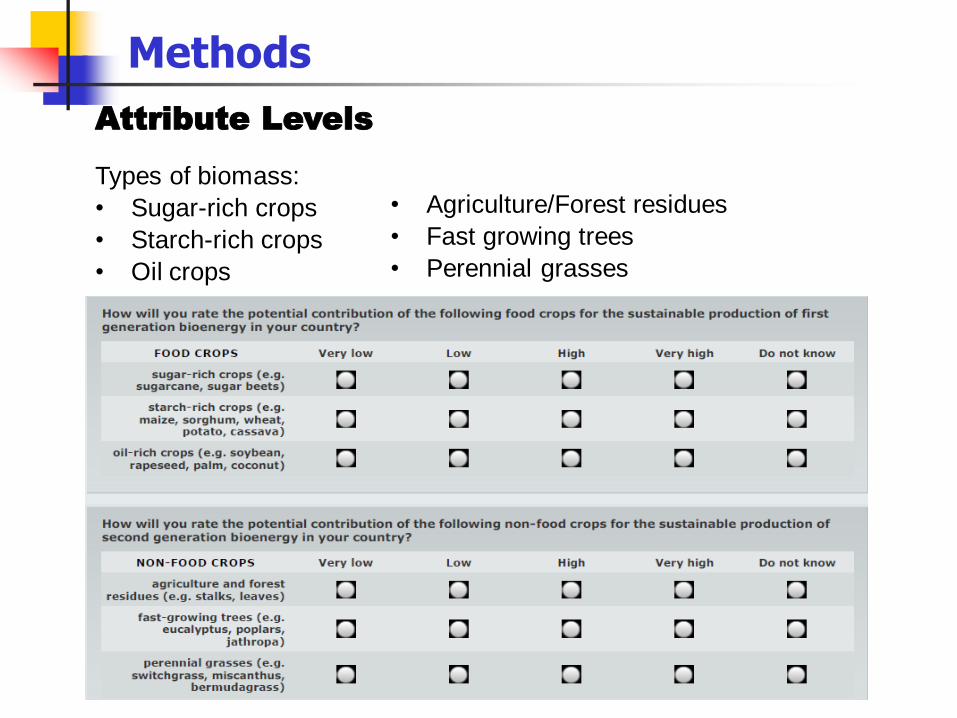
Methods
Attribute Levels
Types of biomass:
• Sugar-rich crops
• Starch-rich crops
• Oil crops
• Agriculture/Forest residues
• Fast growing trees
• Perennial grasses
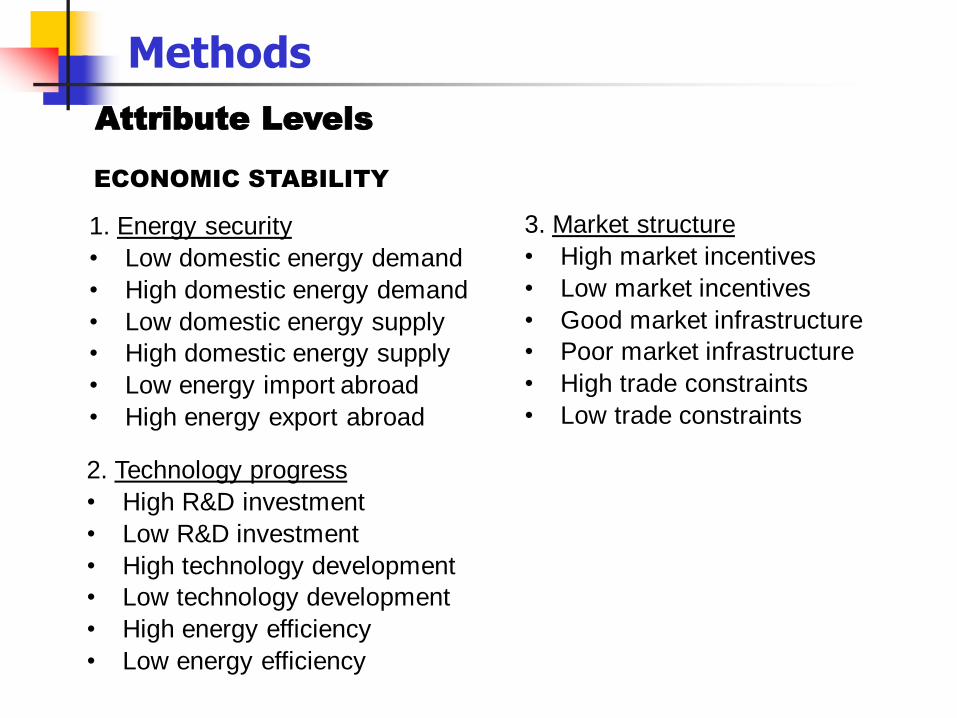
Methods
1. Energy security
• Low domestic energy demand
• High domestic energy demand
• Low domestic energy supply
• High domestic energy supply
• Low energy import abroad
• High energy export abroad
2. Technology progress
• High R&D investment
• Low R&D investment
• High technology development
• Low technology development
• High energy efficiency
• Low energy efficiency
3. Market structure
• High market incentives
• Low market incentives
• Good market infrastructure
• Poor market infrastructure
• High trade constraints
• Low trade constraints
ECONOMIC STABILITY
Attribute Levels
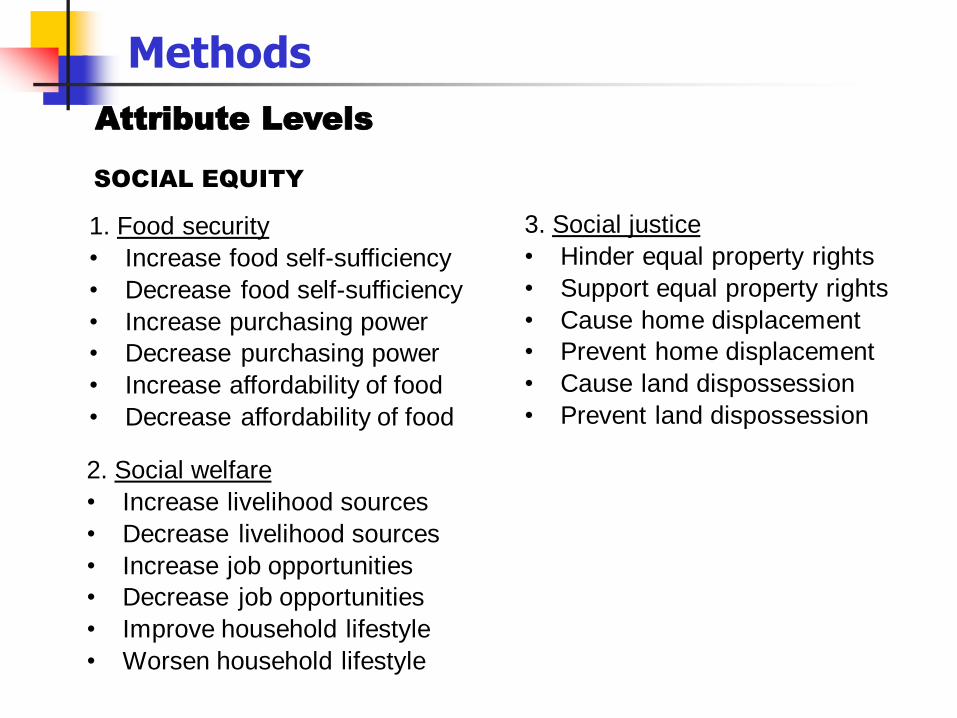
Methods
1. Food security
• Increase food self-sufficiency
• Decrease food self-sufficiency
• Increase purchasing power
• Decrease purchasing power
• Increase affordability of food
• Decrease affordability of food
2. Social welfare
• Increase livelihood sources
• Decrease livelihood sources
• Increase job opportunities
• Decrease job opportunities
• Improve household lifestyle
• Worsen household lifestyle
3. Social justice
• Hinder equal property rights
• Support equal property rights
• Cause home displacement
• Prevent home displacement
• Cause land dispossession
• Prevent land dispossession
SOCIAL EQUITY
Attribute Levels
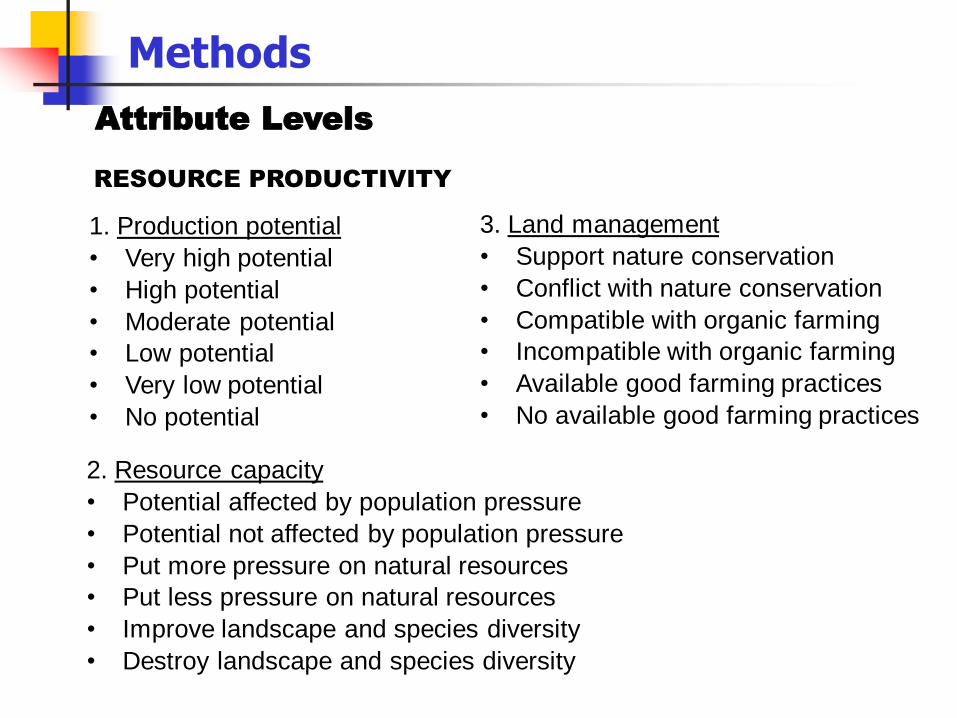
Methods
1. Production potential
• Very high potential
• High potential
• Moderate potential
• Low potential
• Very low potential
• No potential
2. Resource capacity
• Potential affected by population pressure
• Potential not affected by population pressure
• Put more pressure on natural resources
• Put less pressure on natural resources
• Improve landscape and species diversity
• Destroy landscape and species diversity
3. Land management
• Support nature conservation
• Conflict with nature conservation
• Compatible with organic farming
• Incompatible with organic farming
• Available good farming practices
• No available good farming practices
RESOURCE PRODUCTIVITY
Attribute Levels
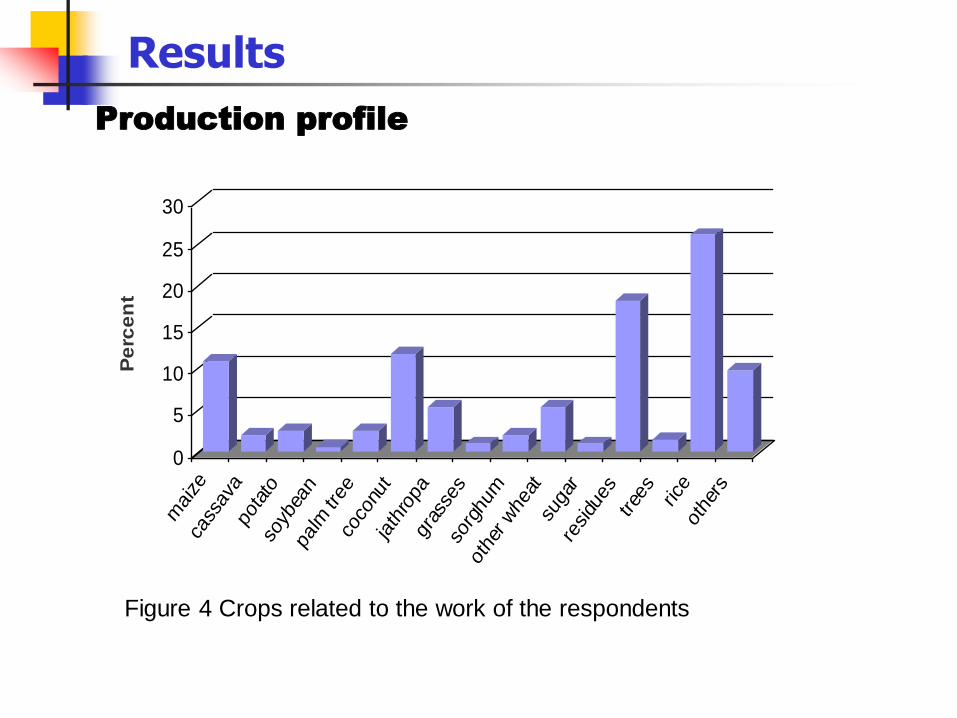
Results
Figure 4 Crops related to the work of the respondents
Production profile
0
5
10
15
20
25
30
Pe
rce
nt
mai
zeca
ssav
apo
tato
soyb
ean
palm
tree
coco
nut
jath
ropa
gras
ses
sorg
hum
othe
r w
heat
suga
rre
sidu
estree
sric
eot
hers
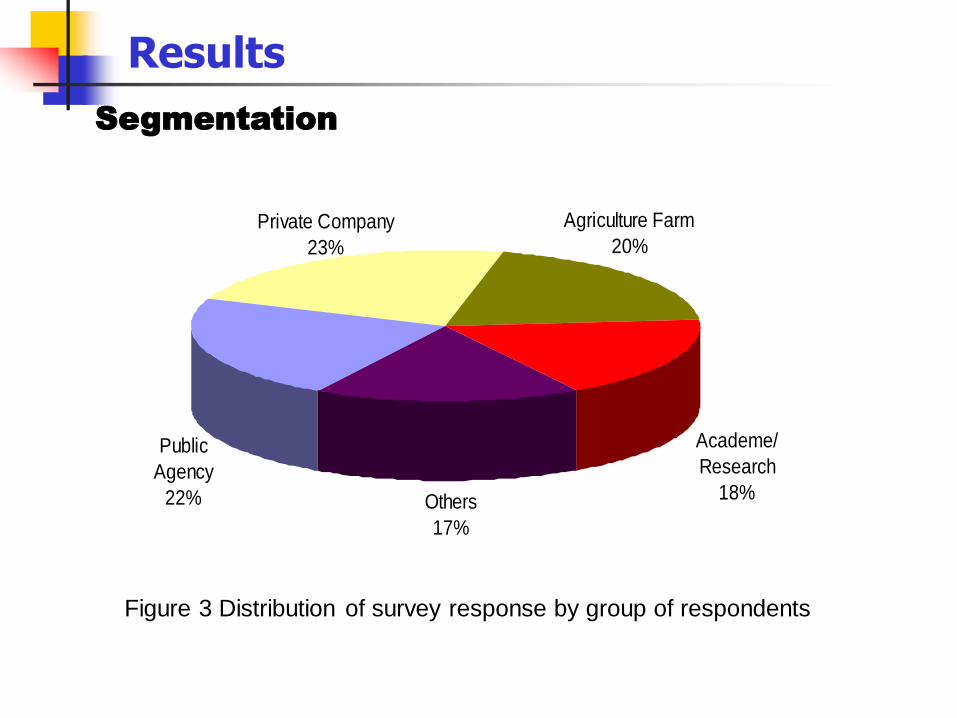
Results
Figure 3 Distribution of survey response by group of respondents
Segmentation
Others
17%
Academe/
Research
18%
Private Company
23%
Agriculture Farm
20%
Public
Agency
22%
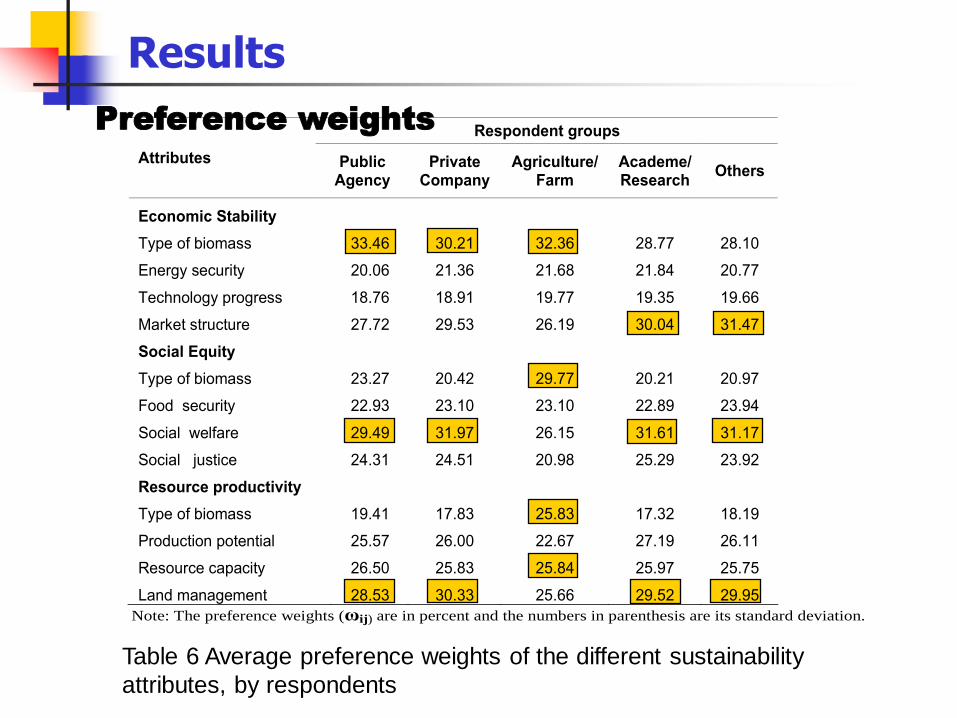
Results
Table 6 Average preference weights of the different sustainability
attributes, by respondents
Preference weights Respondent groups
Attributes Public Agency
Private Company
Agriculture/ Farm
Academe/ Research
Others
Economic Stability
Type of biomass 33.46 30.21 32.36 28.77 28.10
Energy security 20.06 21.36 21.68 21.84 20.77
Technology progress 18.76 18.91 19.77 19.35 19.66
Market structure 27.72 29.53 26.19 30.04 31.47
Social Equity
Type of biomass 23.27 20.42 29.77 20.21 20.97
Food security 22.93 23.10 23.10 22.89 23.94
Social welfare 29.49 31.97 26.15 31.61 31.17
Social justice 24.31 24.51 20.98 25.29 23.92
Resource productivity
Type of biomass 19.41 17.83 25.83 17.32 18.19
Production potential 25.57 26.00 22.67 27.19 26.11
Resource capacity 26.50 25.83 25.84 25.97 25.75
Land management 28.53 30.33 25.66 29.52 29.95
Note: The preference weights (ωij) are in percent and the numbers in parenthesis are its standard deviation.
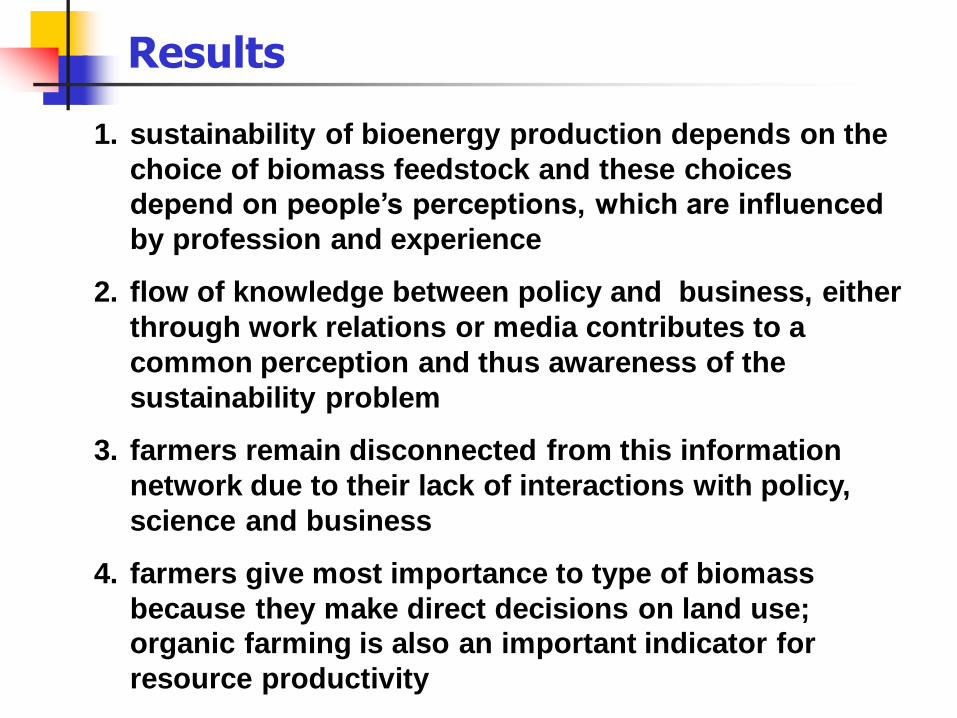
1. sustainability of bioenergy production depends on the
choice of biomass feedstock and these choices
depend on people’s perceptions, which are influenced
by profession and experience
2. flow of knowledge between policy and business, either
through work relations or media contributes to a
common perception and thus awareness of the
sustainability problem
3. farmers remain disconnected from this information
network due to their lack of interactions with policy,
science and business
4. farmers give most importance to type of biomass
because they make direct decisions on land use;
organic farming is also an important indicator for
resource productivity
Results
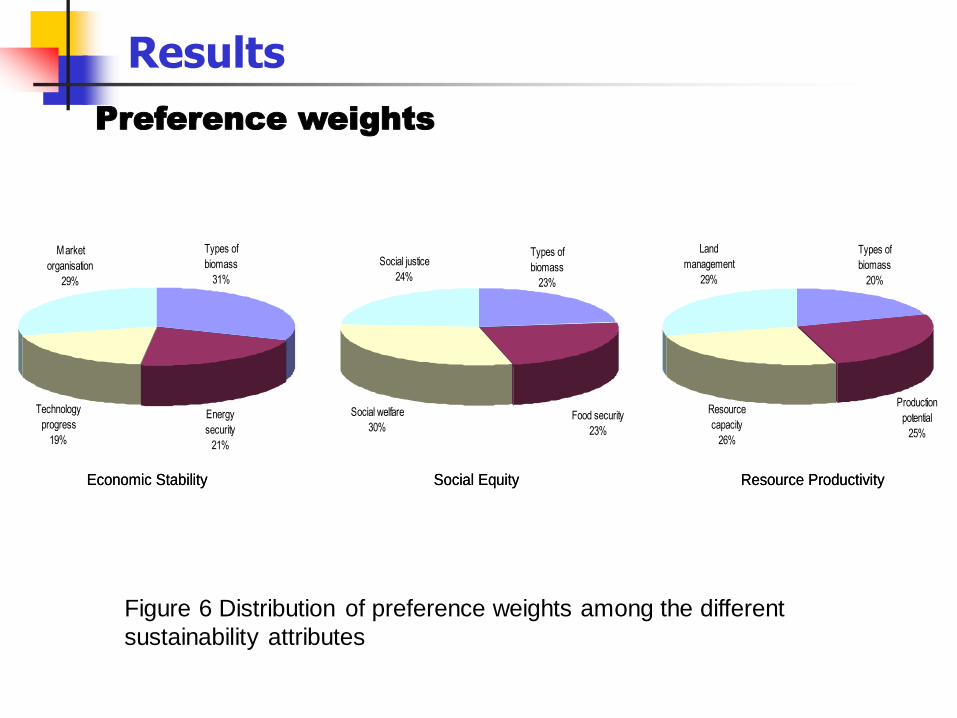
Results
Figure 6 Distribution of preference weights among the different
sustainability attributes
Preference weights
Food security
23%
Social welfare
30%
Types of
biomass
23%
Social justice
24%
Production
potential
25%
Resource
capacity
26%
Types of
biomass
20%
Land
management
29%
Economic Stability Resource ProductivitySocial Equity
Market
organisation
29%
Types of
biomass
31%
Technology
progress
19%
Energy
security
21%
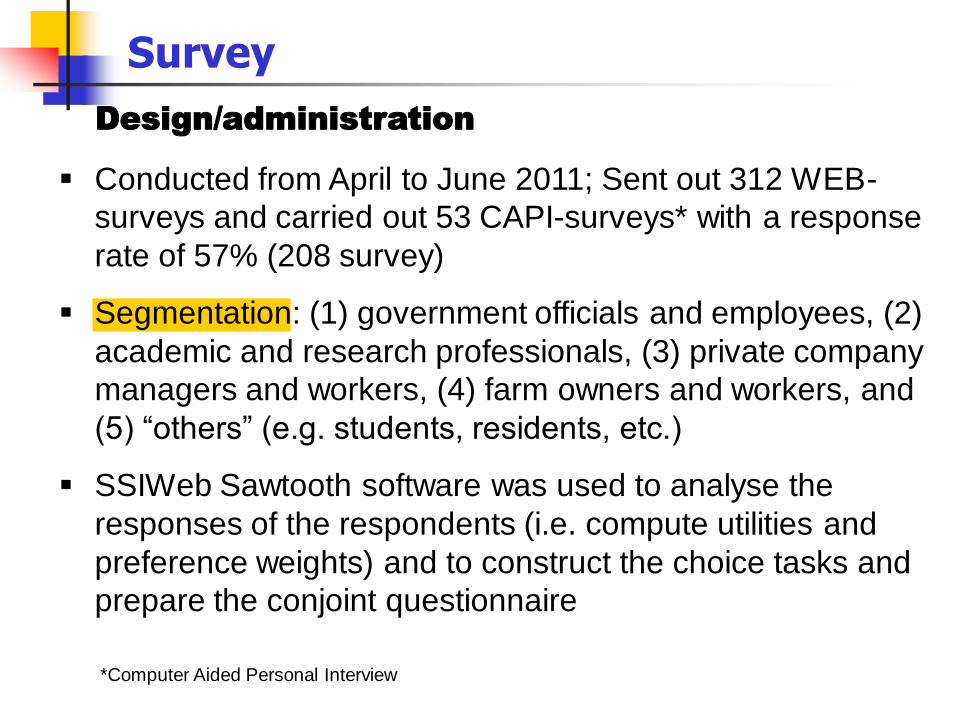
Survey
Design/administration
Conducted from April to June 2011; Sent out 312 WEB-
surveys and carried out 53 CAPI-surveys* with a response
rate of 57% (208 survey)
Segmentation: (1) government officials and employees, (2)
academic and research professionals, (3) private company
managers and workers, (4) farm owners and workers, and
(5) “others” (e.g. students, residents, etc.)
SSIWeb Sawtooth software was used to analyse the
responses of the respondents (i.e. compute utilities and
preference weights) and to construct the choice tasks and
prepare the conjoint questionnaire
*Computer Aided Personal Interview

Thanks for your attention!

Fuzzy Logic Analysis
K.S. Kavi KumarMSE, India
Project Kick-off Meeting: PIC-STRAP
UPLB, Philippines, June 12-15, 2013
Structure
• Biofuels in India – Broad Overview
• Fuzzy Inference System – Overview
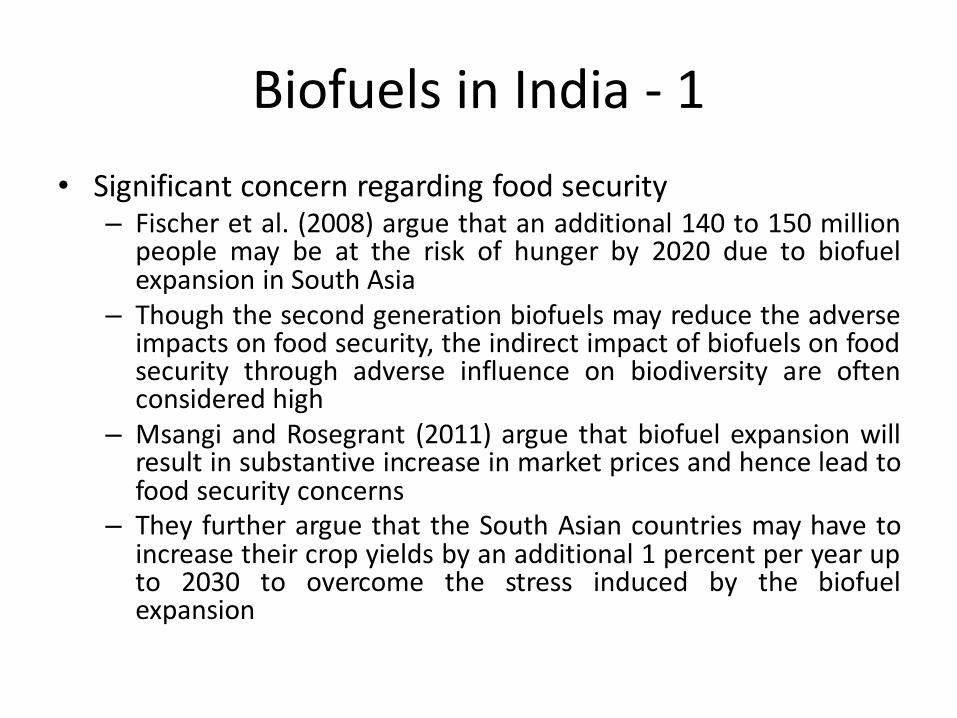
Biofuels in India - 1
• Significant concern regarding food security – Fischer et al. (2008) argue that an additional 140 to 150 million
people may be at the risk of hunger by 2020 due to biofuelexpansion in South Asia
– Though the second generation biofuels may reduce the adverseimpacts on food security, the indirect impact of biofuels on foodsecurity through adverse influence on biodiversity are oftenconsidered high
– Msangi and Rosegrant (2011) argue that biofuel expansion willresult in substantive increase in market prices and hence lead tofood security concerns
– They further argue that the South Asian countries may have toincrease their crop yields by an additional 1 percent per year upto 2030 to overcome the stress induced by the biofuelexpansion
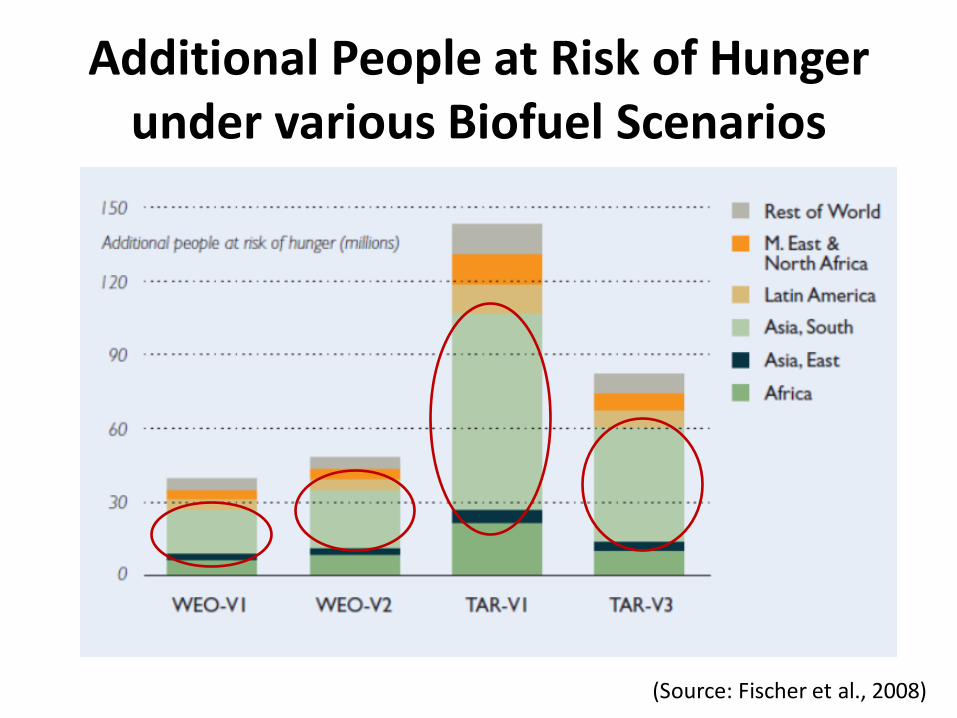
Additional People at Risk of Hunger under various Biofuel Scenarios
(Source: Fischer et al., 2008)
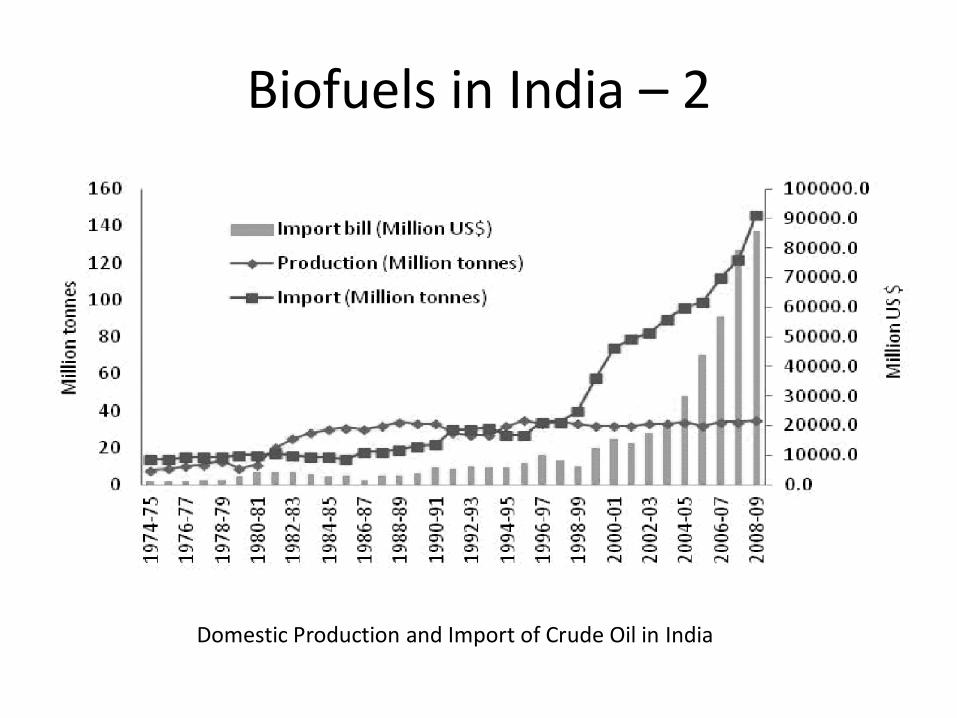
Biofuels in India – 2
Domestic Production and Import of Crude Oil in India
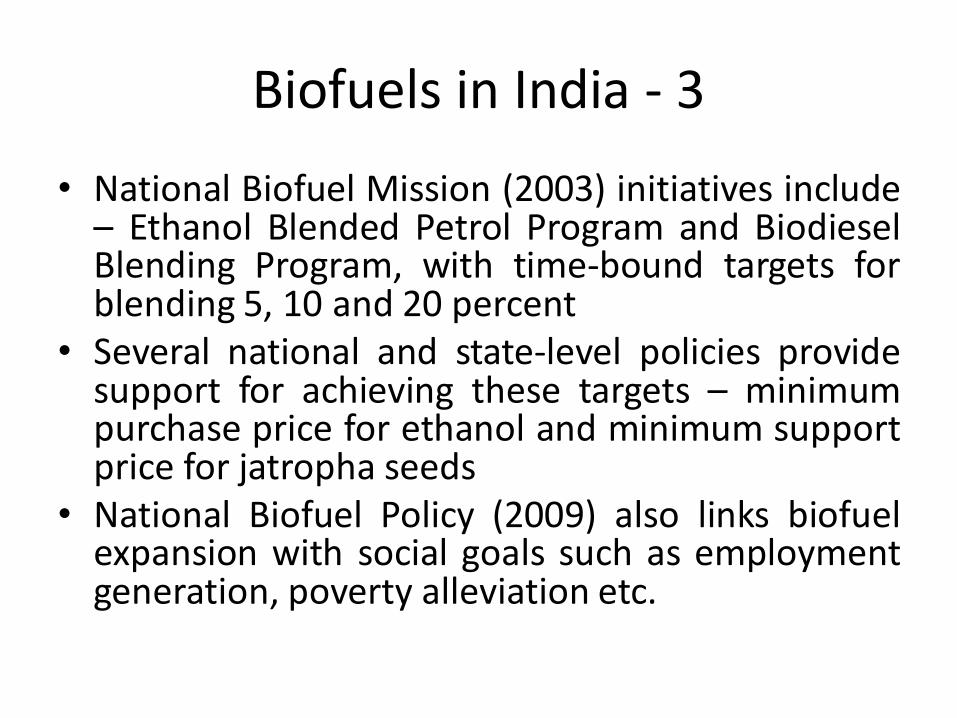
Biofuels in India - 3
• National Biofuel Mission (2003) initiatives include– Ethanol Blended Petrol Program and BiodieselBlending Program, with time-bound targets forblending 5, 10 and 20 percent
• Several national and state-level policies providesupport for achieving these targets – minimumpurchase price for ethanol and minimum supportprice for jatropha seeds
• National Biofuel Policy (2009) also links biofuelexpansion with social goals such as employmentgeneration, poverty alleviation etc.

Biofuels in India – 4
• Ethanol program – Economic viability not clear
– Long-term sustainability of molasses basedethanol blending uncertain• To reach 10% blending target by 2016-17, production of
737 million tons (covering area of 10.5 million ha) ofsugarcane would be required
• That implies more than doubling of production andarea – will have adverse implications for water demand
• Reaching 20% blending target will require large-scaleethanol imports!
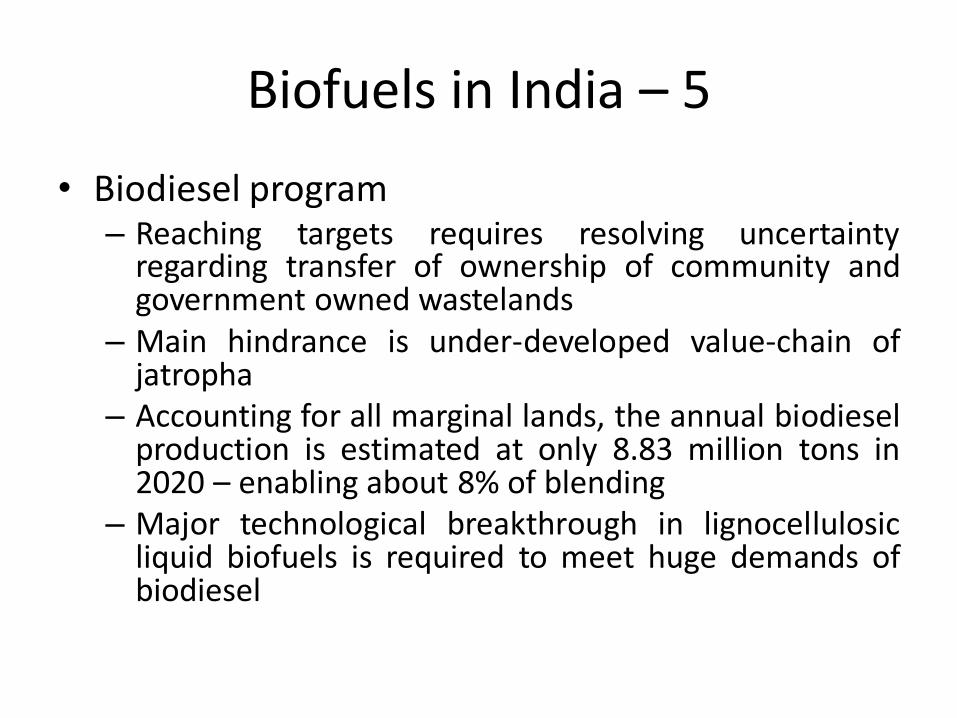
Biofuels in India – 5
• Biodiesel program– Reaching targets requires resolving uncertainty
regarding transfer of ownership of community andgovernment owned wastelands
– Main hindrance is under-developed value-chain ofjatropha
– Accounting for all marginal lands, the annual biodieselproduction is estimated at only 8.83 million tons in2020 – enabling about 8% of blending
– Major technological breakthrough in lignocellulosicliquid biofuels is required to meet huge demands ofbiodiesel
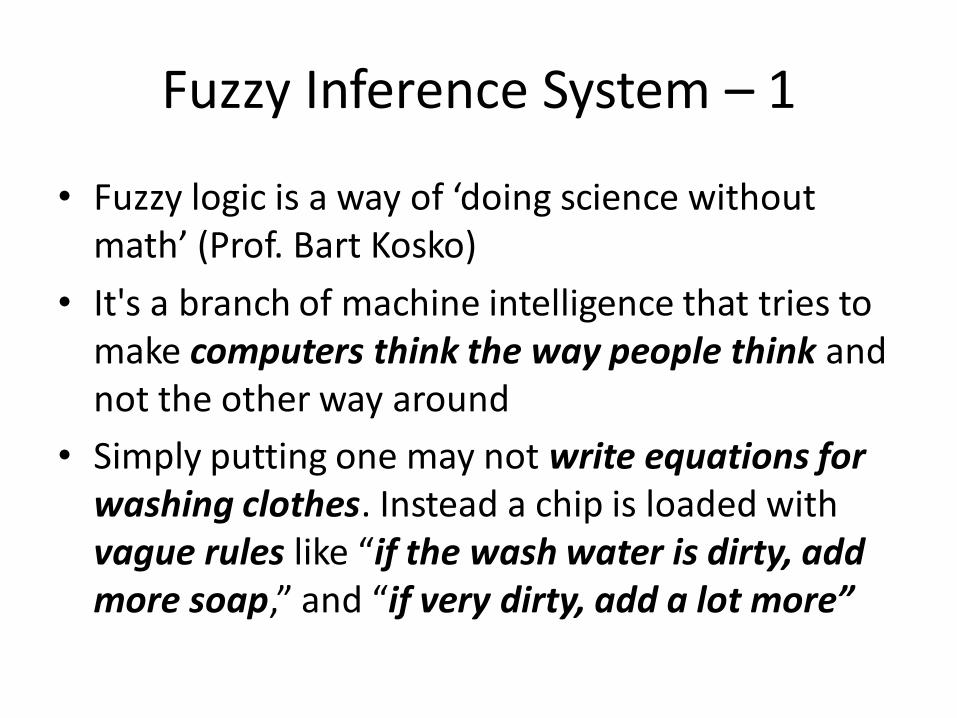
Fuzzy Inference System – 1
• Fuzzy logic is a way of ‘doing science without math’ (Prof. Bart Kosko)
• It's a branch of machine intelligence that tries to make computers think the way people think and not the other way around
• Simply putting one may not write equations for washing clothes. Instead a chip is loaded with vague rules like “if the wash water is dirty, add more soap,” and “if very dirty, add a lot more”
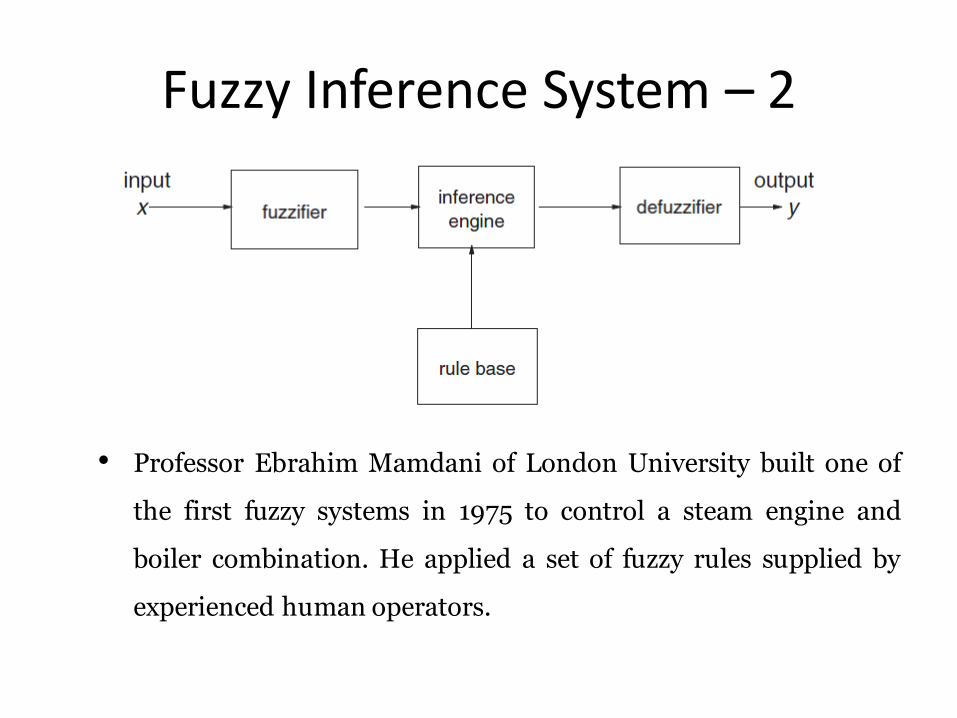
Fuzzy Inference System – 2
• Professor Ebrahim Mamdani of London University built one of
the first fuzzy systems in 1975 to control a steam engine and
boiler combination. He applied a set of fuzzy rules supplied by
experienced human operators.
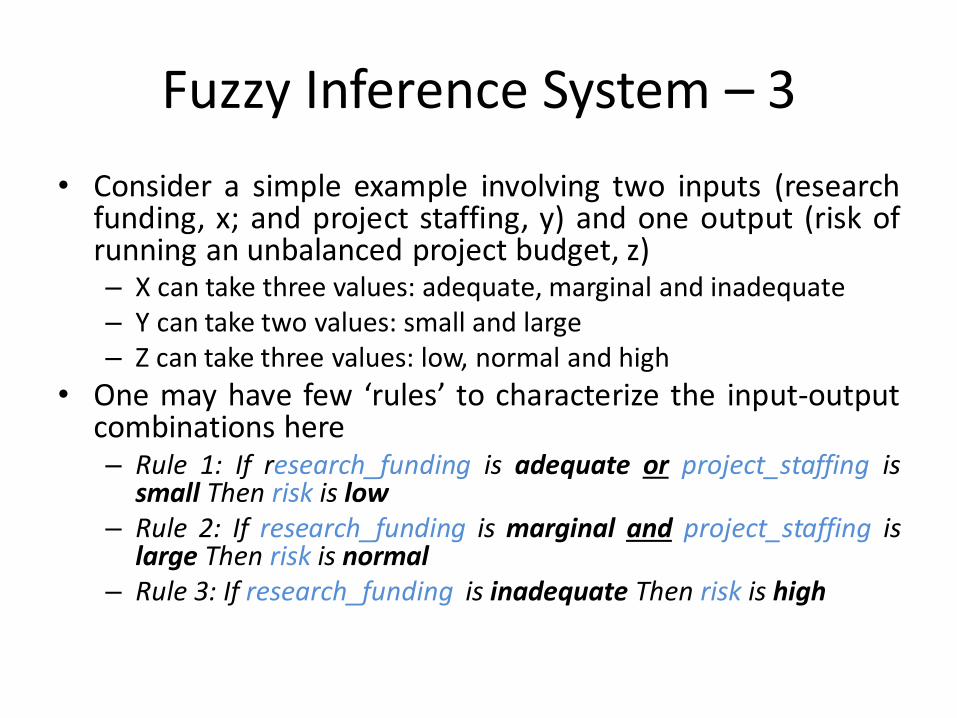
Fuzzy Inference System – 3
• Consider a simple example involving two inputs (researchfunding, x; and project staffing, y) and one output (risk ofrunning an unbalanced project budget, z)– X can take three values: adequate, marginal and inadequate– Y can take two values: small and large– Z can take three values: low, normal and high
• One may have few ‘rules’ to characterize the input-outputcombinations here– Rule 1: If research_funding is adequate or project_staffing is
small Then risk is low– Rule 2: If research_funding is marginal and project_staffing is
large Then risk is normal– Rule 3: If research_funding is inadequate Then risk is high
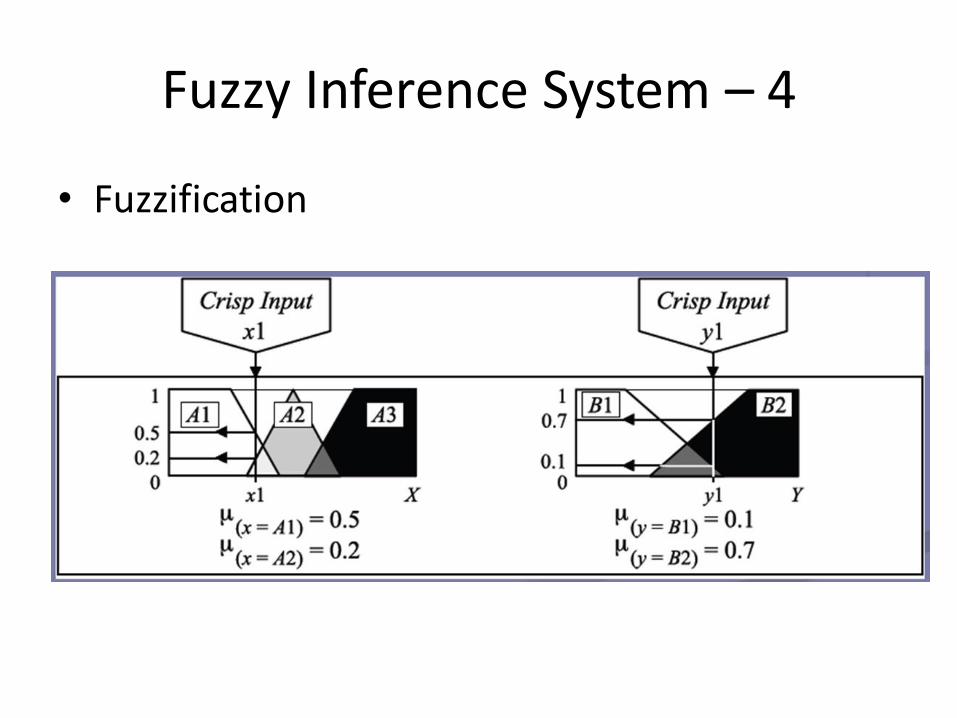
Fuzzy Inference System – 4
• Fuzzification
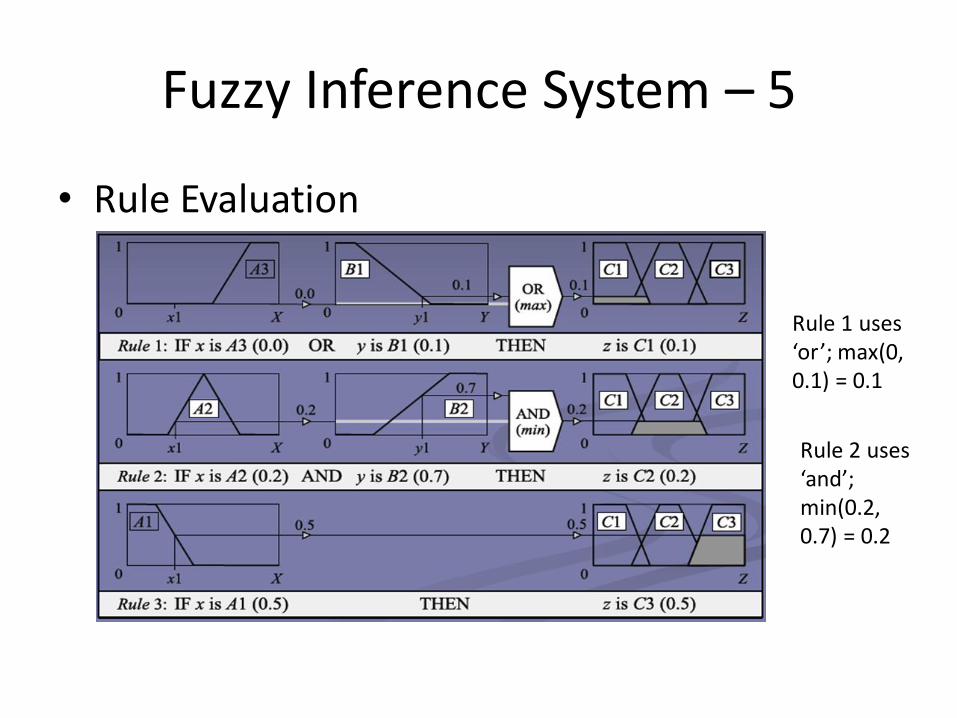
Fuzzy Inference System – 5
• Rule Evaluation
Rule 1 uses ‘or’; max(0, 0.1) = 0.1
Rule 2 uses ‘and’; min(0.2, 0.7) = 0.2
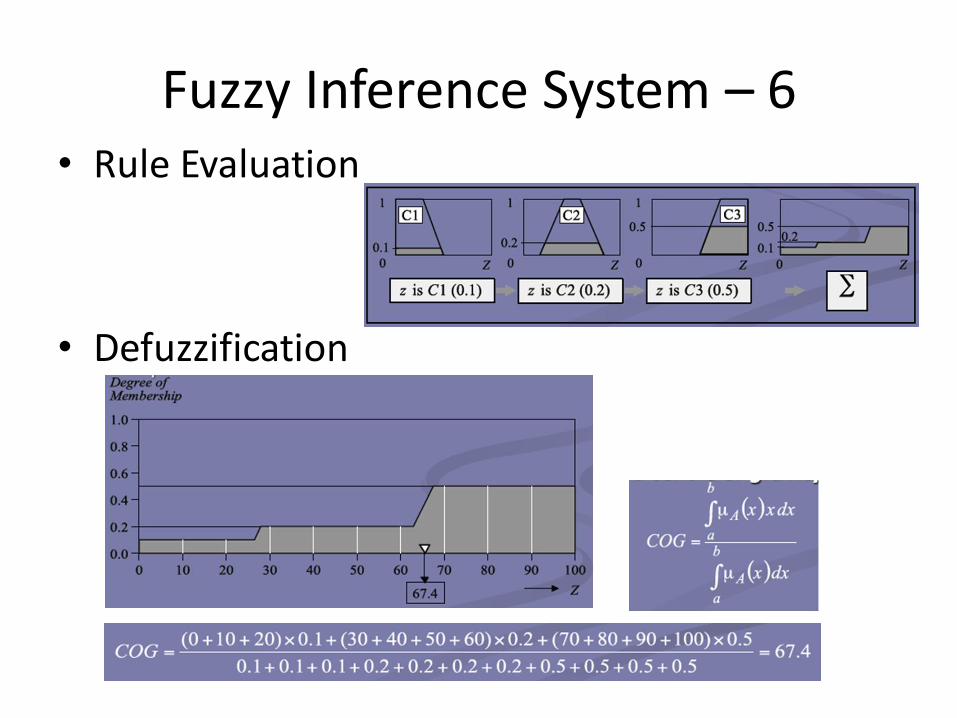
Fuzzy Inference System – 6• Rule Evaluation
• Defuzzification
FIS for Vulnerability Assessment – 1
• Vulnerability (to stress) is often considered toaddress (IPCC, 2001)
– Risk (Exposure)
– Characteristics of the entity (Sensitivity)
– Capacity to react (Adaptive Capacity)
• Empirical analyses through indicator-basedapproach (Moss et al., 2001; Brenkert andMalone, 2004; Acosta-Michlik et al., 2008;O’Brien et al., 2004)
FIS for Vulnerability Assessment – 2
• Indicator-based approaches – typicallyadopt simple aggregation (e.g., HDI)
• Fuzzy tools could be more appropriate
– For modeling outcomes that are ambiguous
– For making quantitative inferences fromlinguistic statements
– For analyzing interaction among severalindicators and developing aggregate index
FIS for Vulnerability Assessment – 3
• Developing aggregate vulnerability index usingfuzzy models involves– Fuzzification
– Fuzzy-inference
– Defuzzification
• Maps well with description (fuzzification),aggregation and inference (fuzzy-inference)phases – capability approach (Chiappero-Martinetti, 2000; 2006)
• Focus here on vulnerability rather than on well-being assessment
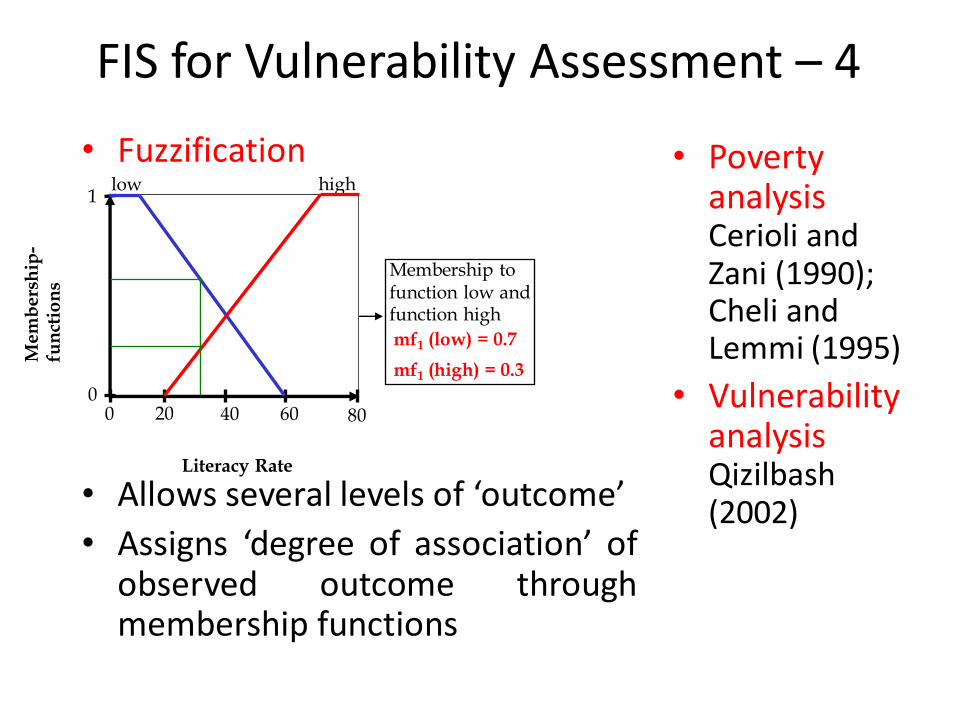
FIS for Vulnerability Assessment – 4
• Fuzzification
• Allows several levels of ‘outcome’
• Assigns ‘degree of association’ ofobserved outcome throughmembership functions
• Poverty analysisCerioli and Zani (1990); Cheli and Lemmi (1995)
• Vulnerability analysisQizilbash (2002)
Mem
bers
hip
-fu
nct
ion
s
high
Membership to function low and function high
mf1 (low) = 0.7
mf1 (high) = 0.3
Literacy Rate
0 200
1low
40 60 80
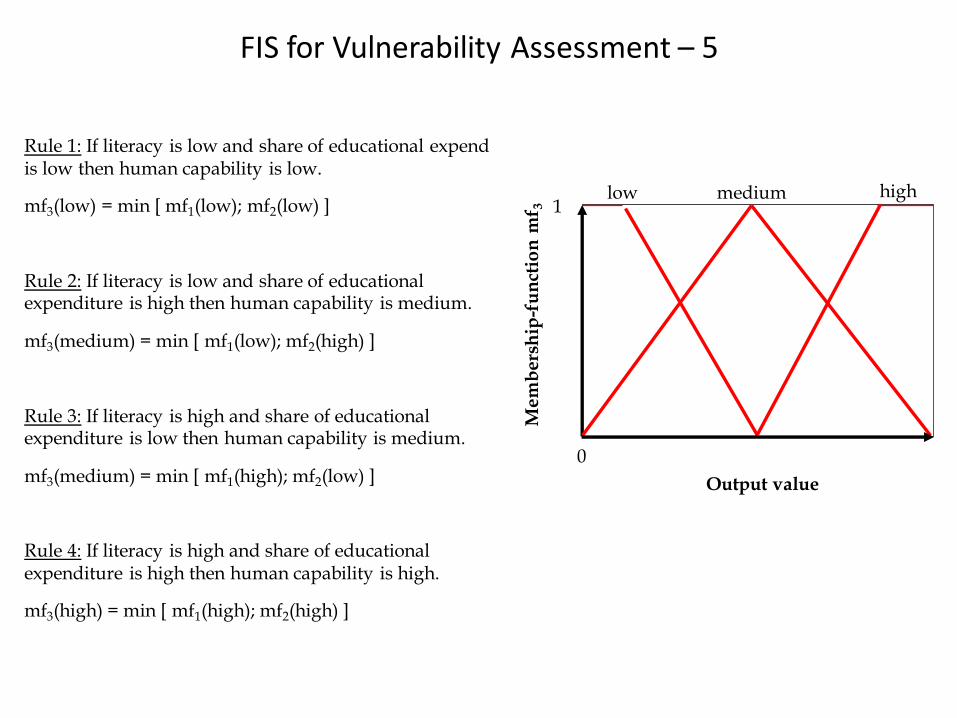
Rule 1: If literacy is low and share of educational expend is low then human capability is low.
mf3(low) = min [ mf1(low); mf2(low) ]
Rule 2: If literacy is low and share of educational expenditure is high then human capability is medium.
mf3(medium) = min [ mf1(low); mf2(high) ]
Rule 3: If literacy is high and share of educational expenditure is low then human capability is medium.
mf3(medium) = min [ mf1(high); mf2(low) ]
Rule 4: If literacy is high and share of educational expenditure is high then human capability is high.
mf3(high) = min [ mf1(high); mf2(high) ]
FIS for Vulnerability Assessment – 5
Mem
bers
hip
-fu
nct
ion
mf 3
Output value
0
1low highmedium
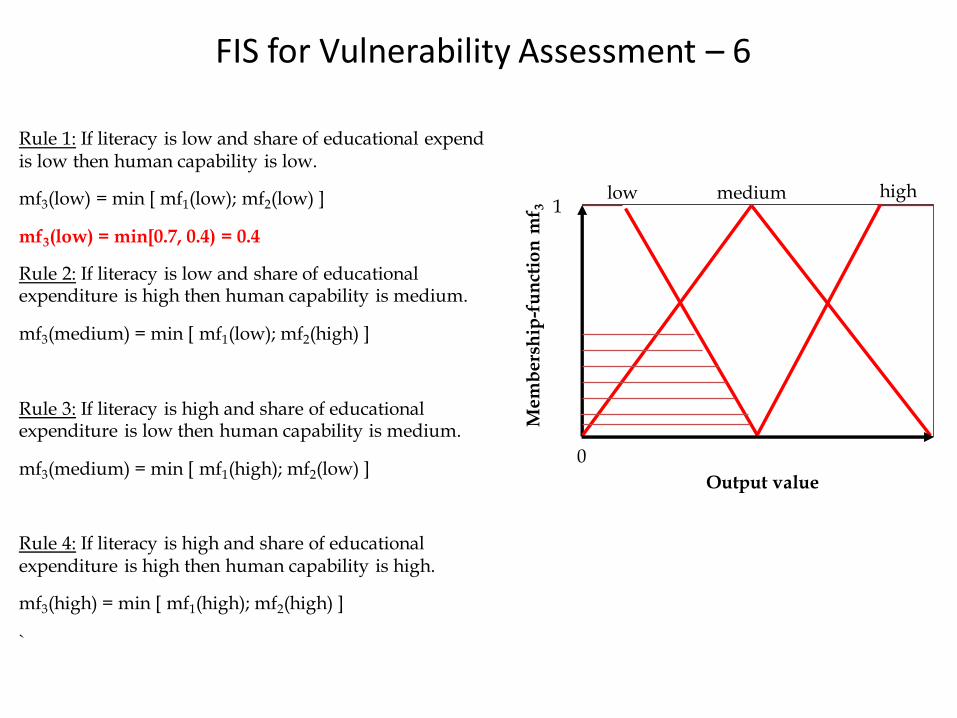
FIS for Vulnerability Assessment – 6
Rule 1: If literacy is low and share of educational expend is low then human capability is low.
mf3(low) = min [ mf1(low); mf2(low) ]
mf3(low) = min[0.7, 0.4) = 0.4
Rule 2: If literacy is low and share of educational expenditure is high then human capability is medium.
mf3(medium) = min [ mf1(low); mf2(high) ]
Rule 3: If literacy is high and share of educational expenditure is low then human capability is medium.
mf3(medium) = min [ mf1(high); mf2(low) ]
Rule 4: If literacy is high and share of educational expenditure is high then human capability is high.
mf3(high) = min [ mf1(high); mf2(high) ]
`
Mem
bers
hip
-fu
nct
ion
mf 3
Output value
0
1low highmedium
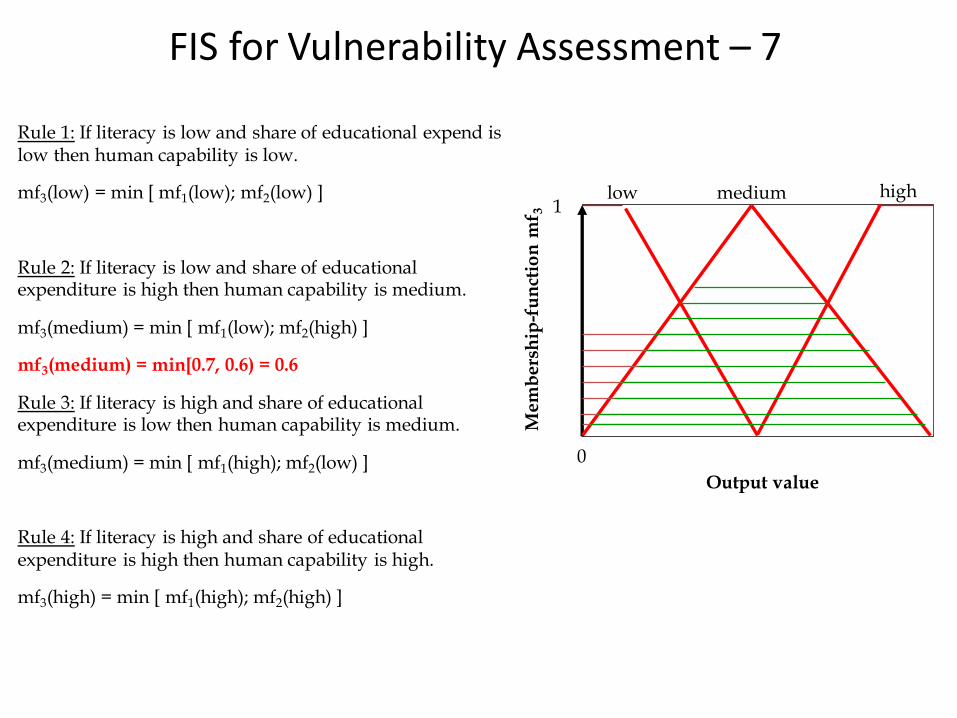
Rule 1: If literacy is low and share of educational expend is low then human capability is low.
mf3(low) = min [ mf1(low); mf2(low) ]
Rule 2: If literacy is low and share of educational expenditure is high then human capability is medium.
mf3(medium) = min [ mf1(low); mf2(high) ]
mf3(medium) = min[0.7, 0.6) = 0.6
Rule 3: If literacy is high and share of educational expenditure is low then human capability is medium.
mf3(medium) = min [ mf1(high); mf2(low) ]
Rule 4: If literacy is high and share of educational expenditure is high then human capability is high.
mf3(high) = min [ mf1(high); mf2(high) ]
Mem
bers
hip
-fu
nct
ion
mf 3
Output value
0
1low highmedium
FIS for Vulnerability Assessment – 7
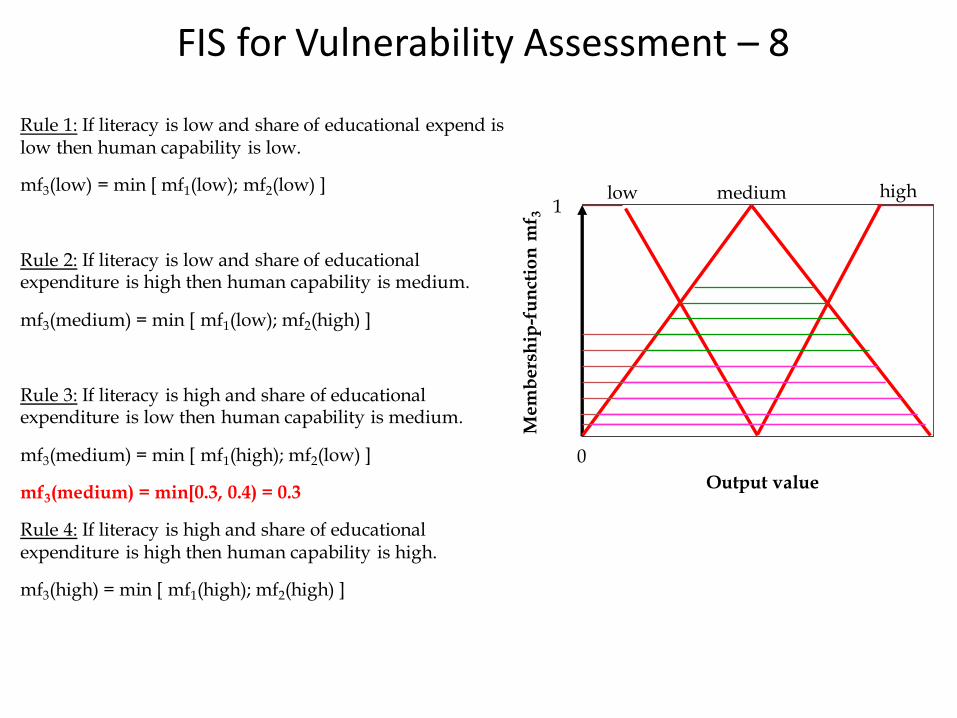
Rule 1: If literacy is low and share of educational expend is low then human capability is low.
mf3(low) = min [ mf1(low); mf2(low) ]
Rule 2: If literacy is low and share of educational expenditure is high then human capability is medium.
mf3(medium) = min [ mf1(low); mf2(high) ]
Rule 3: If literacy is high and share of educational expenditure is low then human capability is medium.
mf3(medium) = min [ mf1(high); mf2(low) ]
mf3(medium) = min[0.3, 0.4) = 0.3
Rule 4: If literacy is high and share of educational expenditure is high then human capability is high.
mf3(high) = min [ mf1(high); mf2(high) ]
Mem
bers
hip
-fu
nct
ion
mf 3
Output value
0
1low highmedium
FIS for Vulnerability Assessment – 8
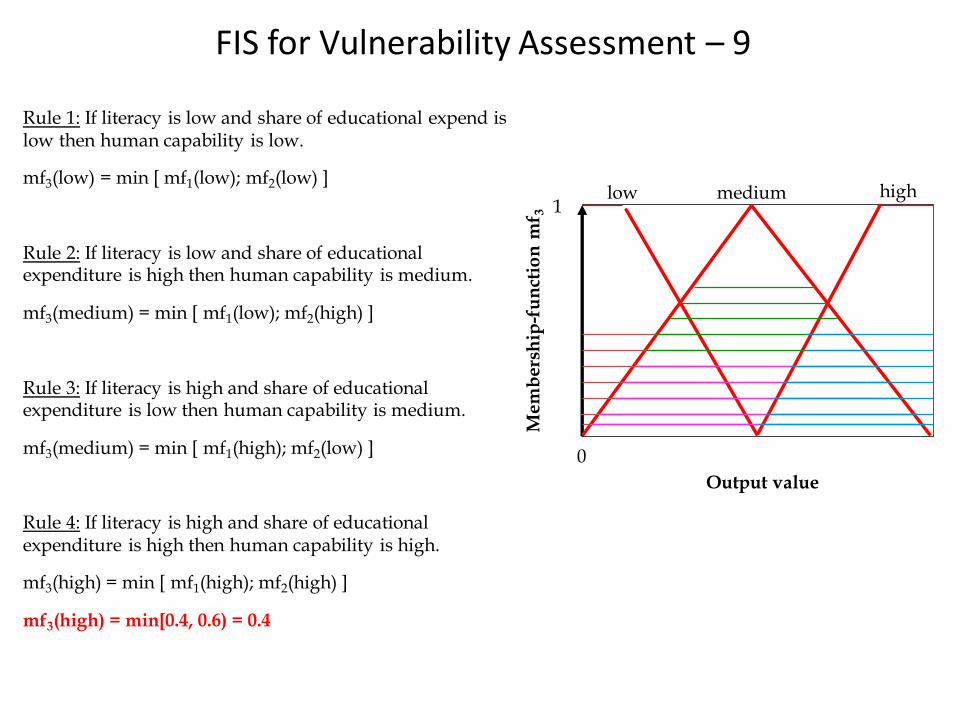
Rule 1: If literacy is low and share of educational expend is low then human capability is low.
mf3(low) = min [ mf1(low); mf2(low) ]
Rule 2: If literacy is low and share of educational expenditure is high then human capability is medium.
mf3(medium) = min [ mf1(low); mf2(high) ]
Rule 3: If literacy is high and share of educational expenditure is low then human capability is medium.
mf3(medium) = min [ mf1(high); mf2(low) ]
Rule 4: If literacy is high and share of educational expenditure is high then human capability is high.
mf3(high) = min [ mf1(high); mf2(high) ]
mf3(high) = min[0.4, 0.6) = 0.4
Mem
bers
hip
-fu
nct
ion
mf 3
Output value
0
1low highmedium
FIS for Vulnerability Assessment – 9
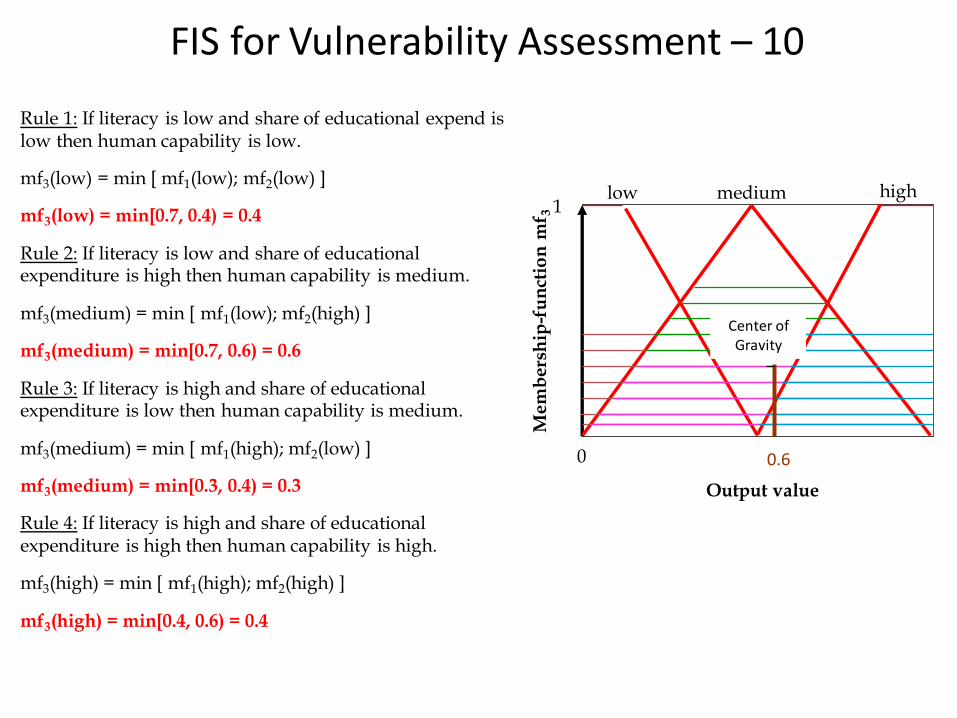
Rule 1: If literacy is low and share of educational expend is low then human capability is low.
mf3(low) = min [ mf1(low); mf2(low) ]
mf3(low) = min[0.7, 0.4) = 0.4
Rule 2: If literacy is low and share of educational expenditure is high then human capability is medium.
mf3(medium) = min [ mf1(low); mf2(high) ]
mf3(medium) = min[0.7, 0.6) = 0.6
Rule 3: If literacy is high and share of educational expenditure is low then human capability is medium.
mf3(medium) = min [ mf1(high); mf2(low) ]
mf3(medium) = min[0.3, 0.4) = 0.3
Rule 4: If literacy is high and share of educational expenditure is high then human capability is high.
mf3(high) = min [ mf1(high); mf2(high) ]
mf3(high) = min[0.4, 0.6) = 0.4
Mem
bers
hip
-fu
nct
ion
mf 3
Output value
0
1low highmedium
Center of Gravity
0.6
FIS for Vulnerability Assessment – 10

Thank you!
Typology of Farmers’ Awareness on Sustainability of
Alternative Bioenergy Feedstocks in the Philippines(Based on APN-funded PIC-STRAP Project)
Elena A. Eugenio, Lilibeth A. Acosta, Nelson H. Enano Jr., Damasa B. Magcale-Macandog, Paula Beatrice M. Macandog and Joan Pauline P.
Talubo
University of the Philippines in Los Banos, Philippines
2013 ISSAAS International Congress Linking Agriculture with Tourism: Meeting the Global Challenges of the Future.
Acacia Hotel Manila, PhilippinesNovember 11-15, 2013
Typology of Farmers’ Awareness on Sustainability of
Alternative Bioenergy Feedstocks in the Philippines
Outline:
1. Overview: Bioenergy development and potential
2. Objectives of the study
3. Case study areas: Calabarzon, Central Visayas and Davao
4. Methods: Survey, Descriptive, Factor and Cluster analyses
5. Results
5.1 Regional comparisons of survey respondents
5.2 Factors related to knowledge and opinion on bioenergy
5.3 Typology of farmers’ awareness on bioenergy sustainability
6. Conclusions
1. Overview:
Bioenergy development and potential
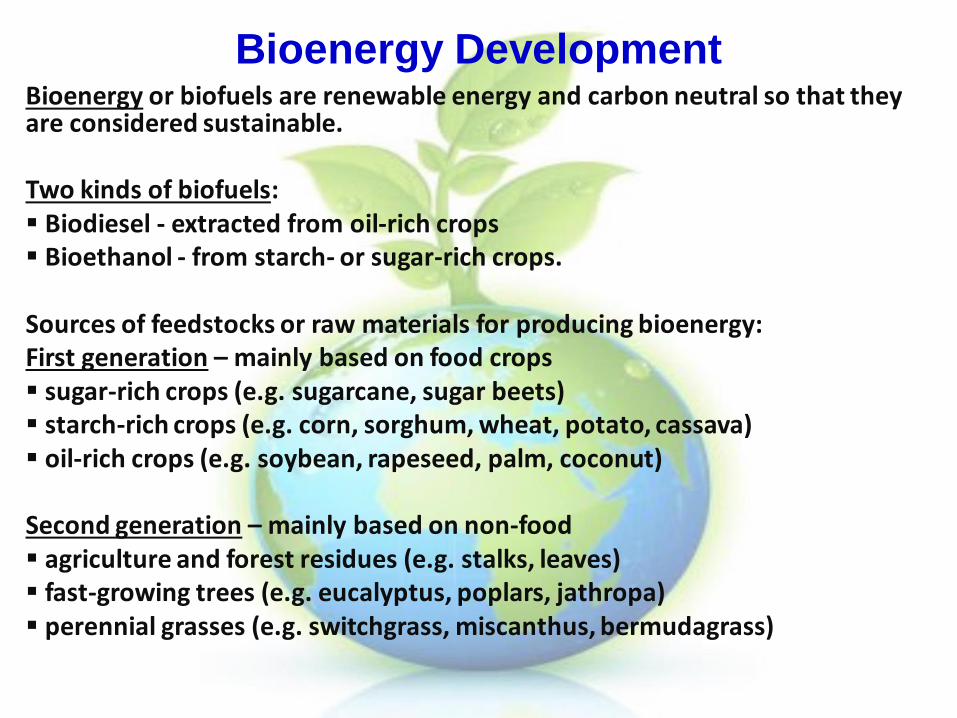
Bioenergy DevelopmentBioenergy or biofuels are renewable energy and carbon neutral so that they are considered sustainable.
Two kinds of biofuels: Biodiesel - extracted from oil-rich crops Bioethanol - from starch- or sugar-rich crops.
Sources of feedstocks or raw materials for producing bioenergy:First generation – mainly based on food crops sugar-rich crops (e.g. sugarcane, sugar beets) starch-rich crops (e.g. corn, sorghum, wheat, potato, cassava) oil-rich crops (e.g. soybean, rapeseed, palm, coconut)
Second generation – mainly based on non-food agriculture and forest residues (e.g. stalks, leaves) fast-growing trees (e.g. eucalyptus, poplars, jathropa) perennial grasses (e.g. switchgrass, miscanthus, bermudagrass)
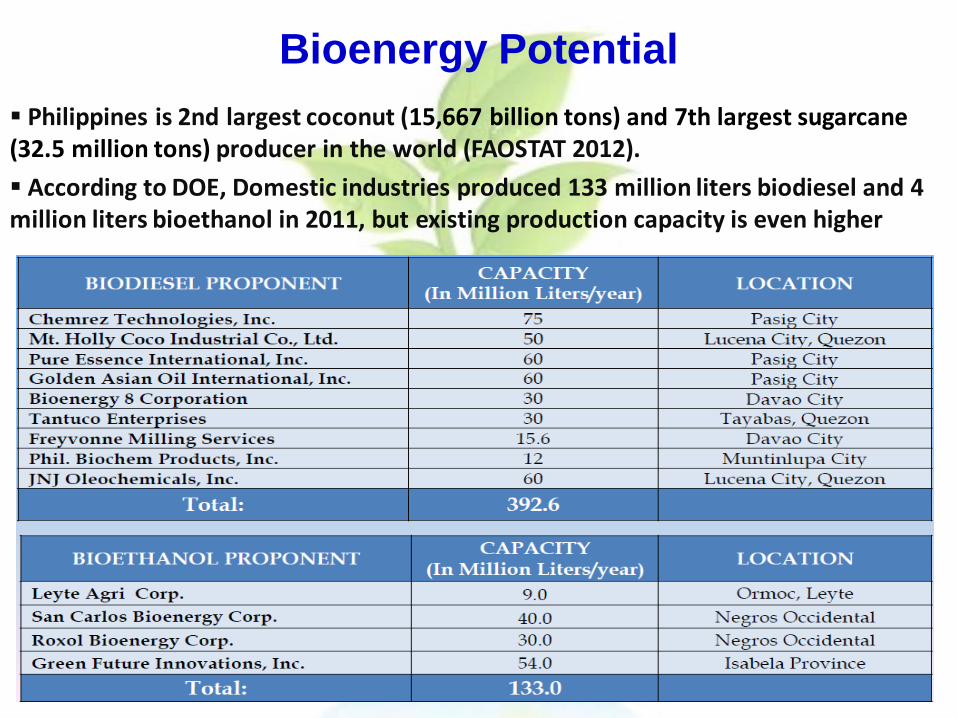
Philippines is 2nd largest coconut (15,667 billion tons) and 7th largest sugarcane (32.5 million tons) producer in the world (FAOSTAT 2012).
According to DOE, Domestic industries produced 133 million liters biodiesel and 4 million liters bioethanol in 2011, but existing production capacity is even higher
Bioenergy Potential
2. Objectives of the study
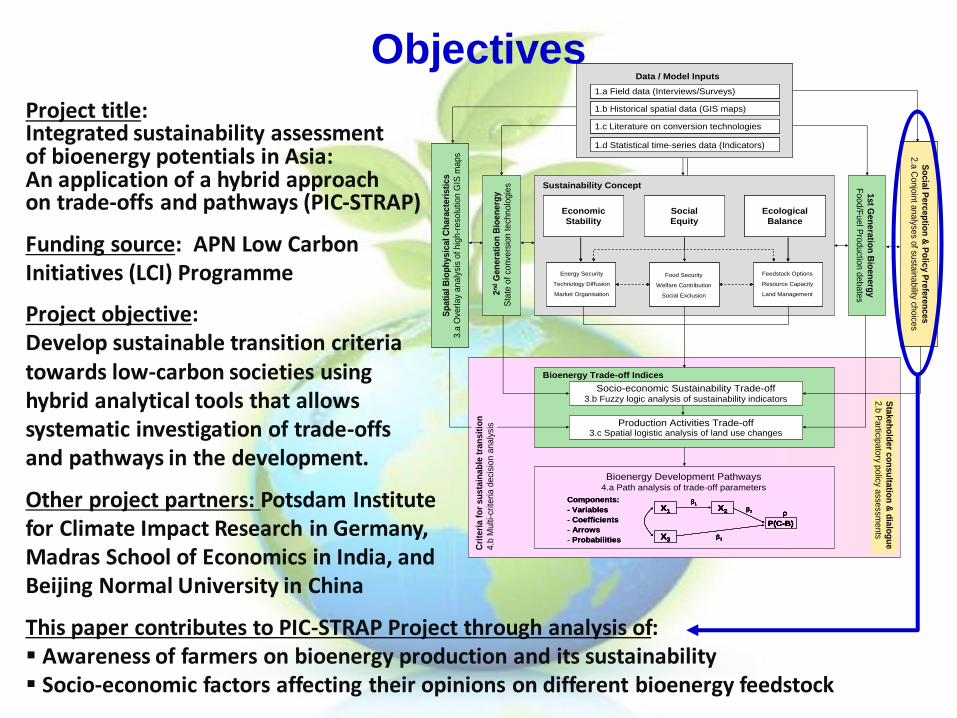
Project title:Integrated sustainability assessmentof bioenergy potentials in Asia: An application of a hybrid approach on trade-offs and pathways (PIC-STRAP)
Funding source: APN Low Carbon Initiatives (LCI) Programme
Project objective:Develop sustainable transition criteriatowards low-carbon societies using hybrid analytical tools that allowssystematic investigation of trade-offsand pathways in the development.
Other project partners: Potsdam Institute for Climate Impact Research in Germany,Madras School of Economics in India, andBeijing Normal University in China
This paper contributes to PIC-STRAP Project through analysis of: Awareness of farmers on bioenergy production and its sustainability Socio-economic factors affecting their opinions on different bioenergy feedstock
Objectives
Sustainability Concept
1st G
en
era
tion
Bio
en
erg
y
Food/F
uel P
roductio
n d
ebate
s
2n
dG
en
era
tio
n B
ioen
erg
y
Sta
te o
f co
nve
rsio
n t
ech
nolo
gie
s
So
cia
l Perc
ep
tion
& P
olic
y P
refe
ren
ces
2.a
Conjo
int a
nalyse
s of su
stain
ability ch
oice
s
So
cia
l Perc
ep
tion
& P
olic
y P
refe
ren
ces
2.a
Conjo
int a
nalyse
s of su
stain
ability ch
oice
s
Sp
ati
al B
iop
hysic
al
Ch
ara
cte
risti
cs
3.a
Ove
rla
y analy
sis
of hig
h-r
eso
lution G
IS m
aps
Sp
ati
al B
iop
hysic
al
Ch
ara
cte
risti
cs
3.a
Ove
rla
y analy
sis
of hig
h-r
eso
lution G
IS m
aps
Socio-economic Sustainability Trade-off3.b Fuzzy logic analysis of sustainability indicators
Bioenergy Trade-off Indices
Production Activities Trade-off3.c Spatial logistic analysis of land use changes
Bioenergy Development Pathways4.a Path analysis of trade-off parameters
Components:
- Variables
- Coefficients
- Arrows
- Probabilities
X1
P(C-B)
β1
β2
β3X3
X2 ρX1
P(C-B)
β1
β2
β3X3
X2 ρ
Components:
- Variables
- Coefficients
- Arrows
- Probabilities
X1
P(C-B)
β1
β2
β3X3
X2 ρX1
P(C-B)
β1
β2
β3X3
X2 ρ
Sta
keh
old
er c
on
su
ltatio
n &
dia
log
ue
2.b
Particip
ato
ry po
licy a
ssess
ments
Data / Model Inputs
1.b Historical spatial data (GIS maps)
1.c Literature on conversion technologies
1.a Field data (Interviews/Surveys)
1.d Statistical time-series data (Indicators)
Data / Model Inputs
1.b Historical spatial data (GIS maps)
1.c Literature on conversion technologies
1.a Field data (Interviews/Surveys)
1.d Statistical time-series data (Indicators)
1.b Historical spatial data (GIS maps)
1.c Literature on conversion technologies
1.a Field data (Interviews/Surveys)
1.b Historical spatial data (GIS maps)
1.c Literature on conversion technologies
1.a Field data (Interviews/Surveys)
1.d Statistical time-series data (Indicators)
Cri
teri
a f
or
su
sta
inab
le t
ran
sit
ion
4.b
Multi
-crite
ria d
eci
sion a
naly
sis
Economic
Stability
Social
Equity
Ecological
Balance
Energy Security
Technology Diffusion
Market Organisation
Feedstock Options
Resource Capacity
Land Management
Food Security
Welfare Contribution
Social Exclusion
Economic
Stability
Economic
Stability
Social
Equity
Social
Equity
Ecological
Balance
Ecological
Balance
Energy Security
Technology Diffusion
Market Organisation
Feedstock Options
Resource Capacity
Land Management
Food Security
Welfare Contribution
Social Exclusion
3. Case study areas:
Calabarzon, Central Visayas and Davao
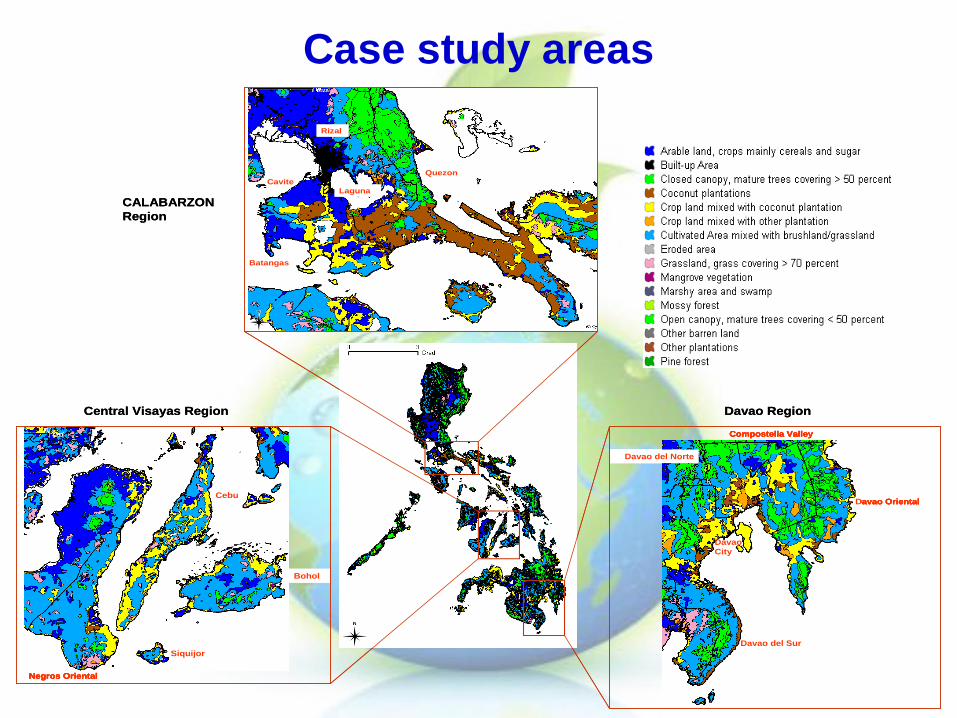
Davao Oriental
Compostella Valley
Davao del Norte
Davao del Sur
Davao
City
Davao Oriental
Compostella Valley
Davao del Norte
Davao del Sur
Davao
City
Siquijor
Bohol
Cebu
Negros Oriental
Siquijor
Bohol
Cebu
Negros Oriental
Quezon
Laguna
Cavite
Batangas
Rizal
Quezon
Laguna
Cavite
Batangas
Rizal
CALABARZON
Region
Central Visayas Region Davao Region
Davao Oriental
Compostella Valley
Davao del Norte
Davao del Sur
Davao
City
Davao Oriental
Compostella Valley
Davao del Norte
Davao del Sur
Davao
City
Siquijor
Bohol
Cebu
Negros Oriental
Siquijor
Bohol
Cebu
Negros Oriental
Quezon
Laguna
Cavite
Batangas
Rizal
Quezon
Laguna
Cavite
Batangas
Rizal
CALABARZON
Region
Central Visayas Region Davao Region
Case study areas
4. Methods:
Survey, Descriptive, Factor and Cluster
analyses
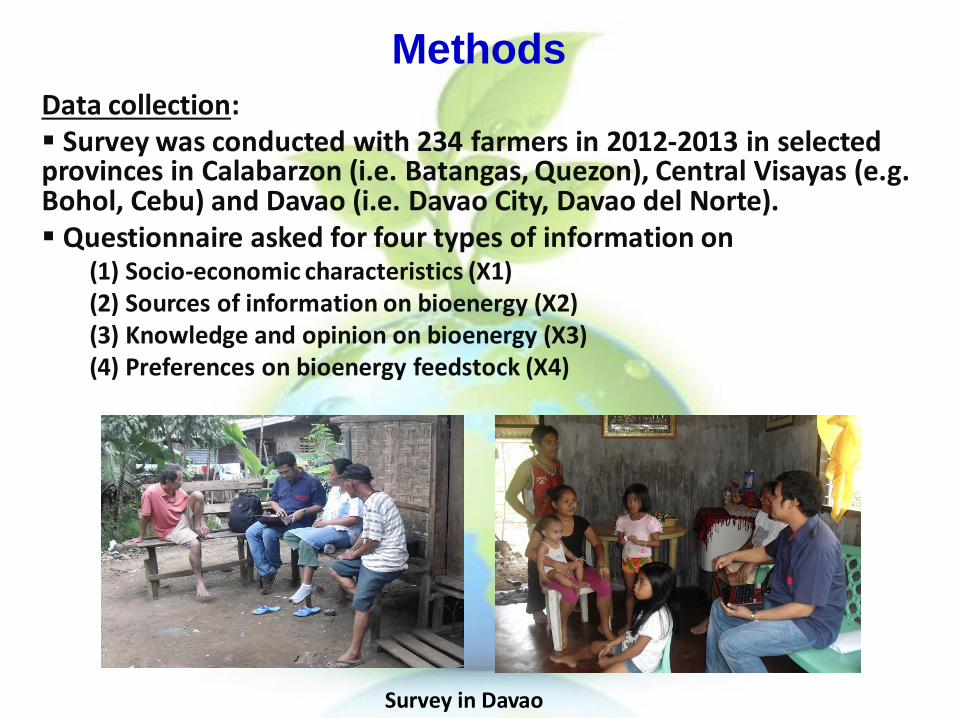
Data collection: Survey was conducted with 234 farmers in 2012-2013 in selected provinces in Calabarzon (i.e. Batangas, Quezon), Central Visayas (e.g. Bohol, Cebu) and Davao (i.e. Davao City, Davao del Norte). Questionnaire asked for four types of information on
(1) Socio-economic characteristics (X1) (2) Sources of information on bioenergy (X2) (3) Knowledge and opinion on bioenergy (X3)(4) Preferences on bioenergy feedstock (X4)
Methods
Survey in Davao
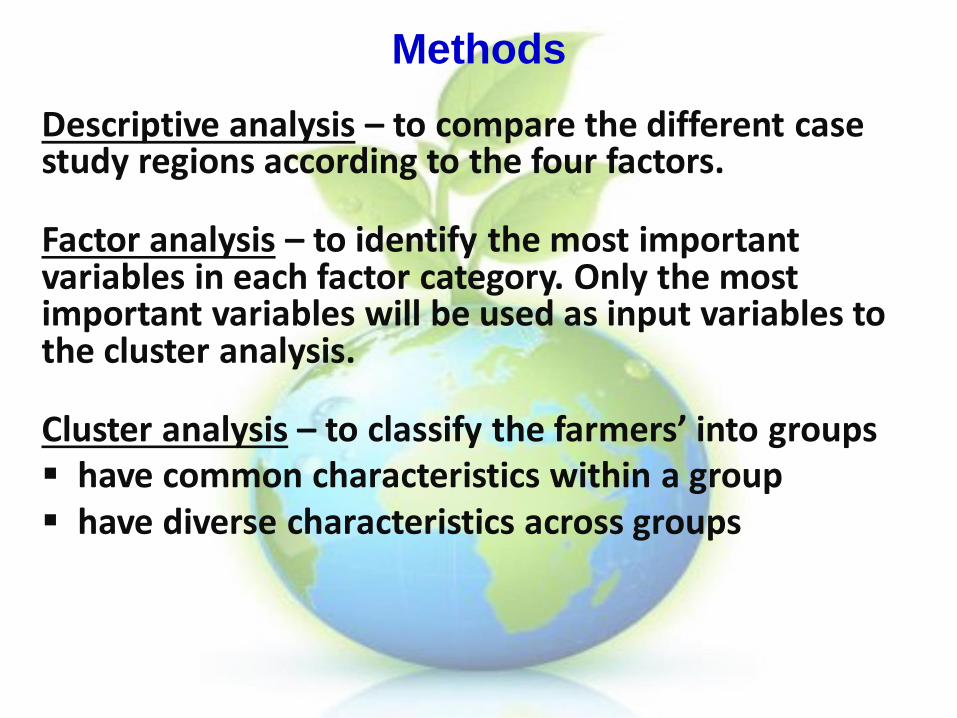
Descriptive analysis – to compare the different case study regions according to the four factors.
Factor analysis – to identify the most important variables in each factor category. Only the most important variables will be used as input variables to the cluster analysis.
Cluster analysis – to classify the farmers’ into groups have common characteristics within a group have diverse characteristics across groups
Methods
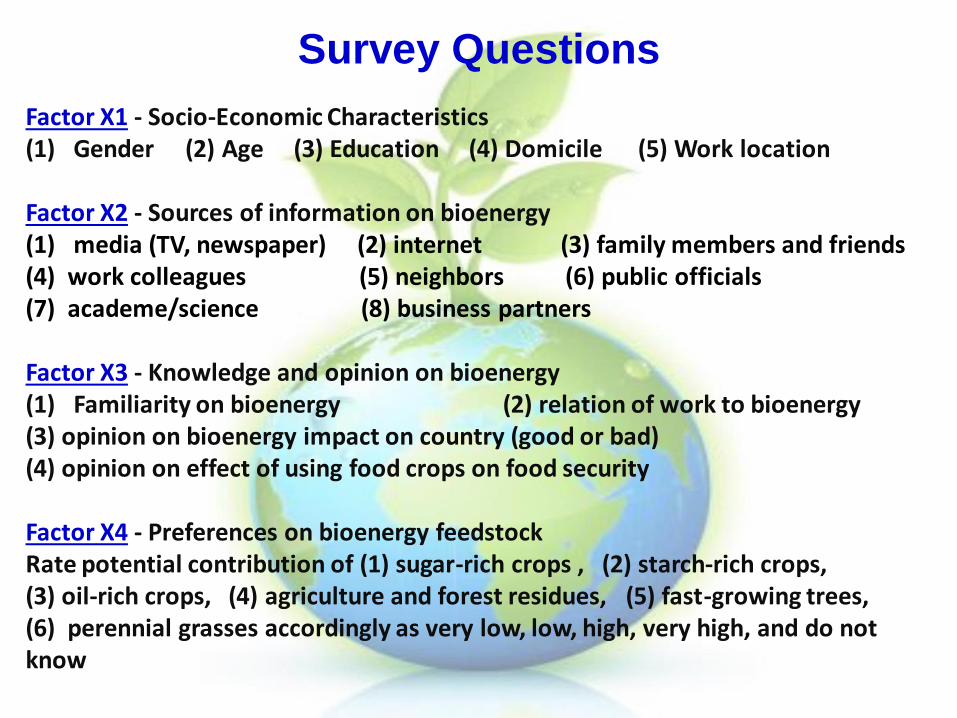
Factor X1 - Socio-Economic Characteristics (1) Gender (2) Age (3) Education (4) Domicile (5) Work location
Factor X2 - Sources of information on bioenergy(1) media (TV, newspaper) (2) internet (3) family members and friends (4) work colleagues (5) neighbors (6) public officials(7) academe/science (8) business partners
Factor X3 - Knowledge and opinion on bioenergy(1) Familiarity on bioenergy (2) relation of work to bioenergy (3) opinion on bioenergy impact on country (good or bad) (4) opinion on effect of using food crops on food security
Factor X4 - Preferences on bioenergy feedstockRate potential contribution of (1) sugar-rich crops , (2) starch-rich crops,(3) oil-rich crops, (4) agriculture and forest residues, (5) fast-growing trees,(6) perennial grasses accordingly as very low, low, high, very high, and do not know
Survey Questions
5. Results
5.1 Regional comparisons of survey
respondents
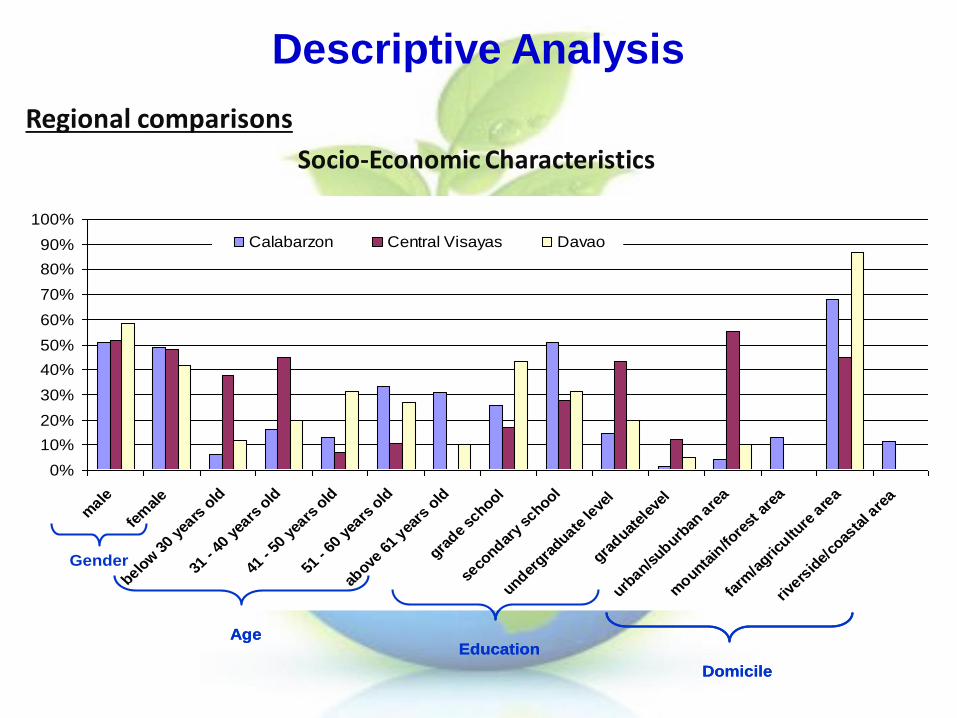
Regional comparisons
Socio-Economic Characteristics
0%
10%
20%
30%
40%
50%
60%
70%
80%
90%
100%
male
fem
ale
below
30
years
old
31 -
40 y
ears
old
41 -
50 y
ears
old
51 -
60 y
ears
old
above
61
years
old
grade
school
seco
ndary
school
undergra
duate le
vel
graduat
elev
el
urban/s
uburban
are
a
mounta
in/fo
rest
are
a
farm
/agric
ulture
are
a
rivers
ide/
coas
tal a
rea
Calabarzon Central Visayas Davao
Gender
AgeEducation
Domicile
Descriptive Analysis
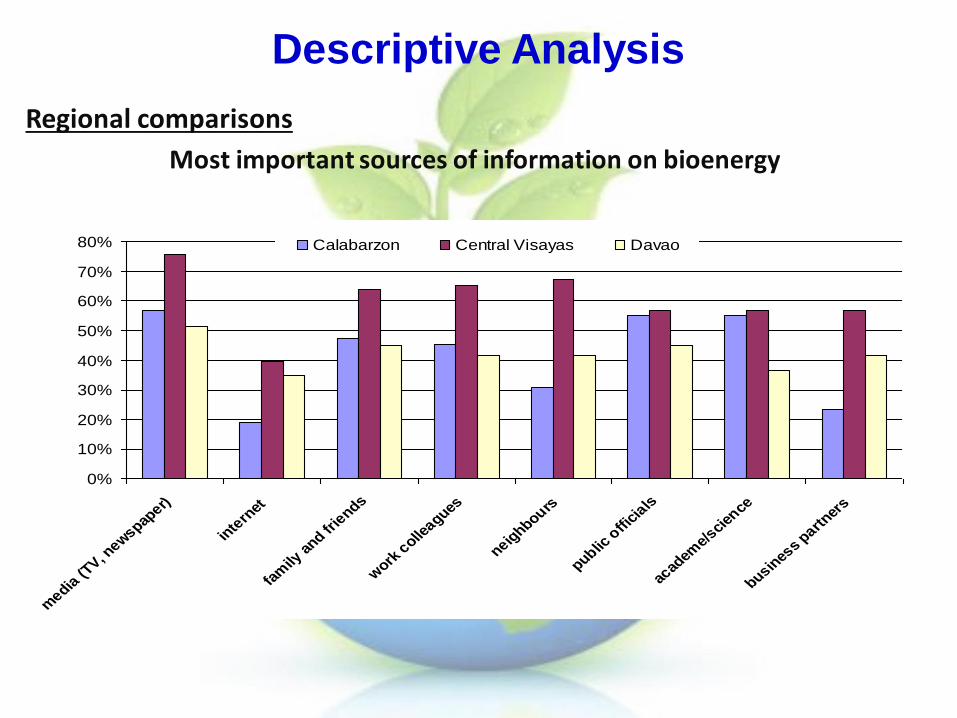
Regional comparisons
Most important sources of information on bioenergy
0%
10%
20%
30%
40%
50%
60%
70%
80%
media
(TV, n
ewspap
er)
inte
rnet
fam
ily a
nd frie
nds
work
colle
agues
neighbours
public o
ffici
als
acad
eme/
scien
ce
busines
s part
ners
Calabarzon Central Visayas Davao
Descriptive Analysis
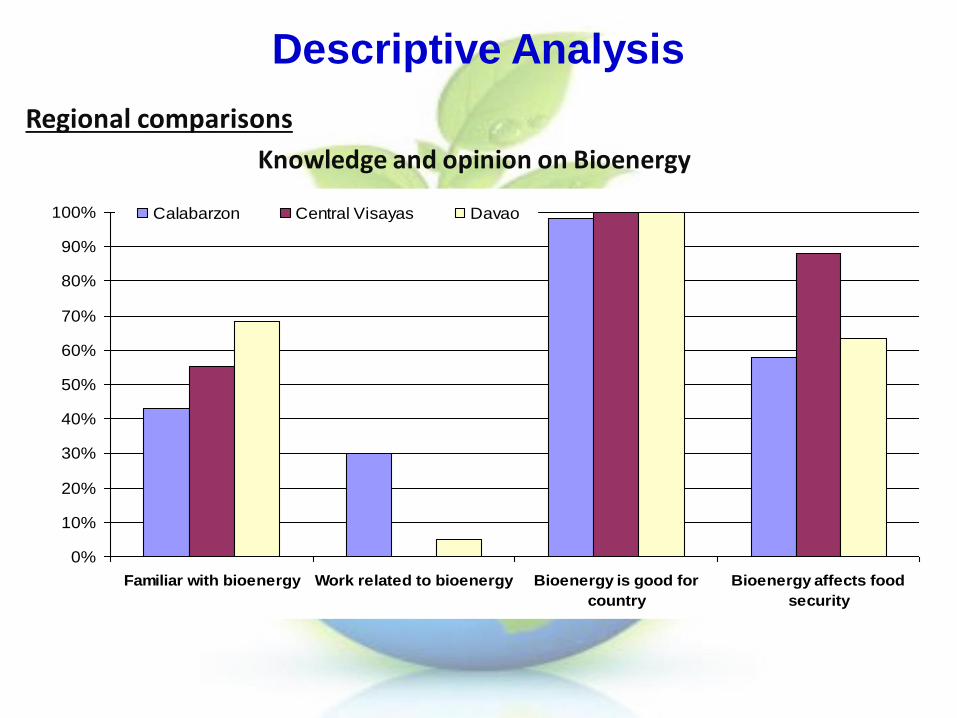
Regional comparisons
Knowledge and opinion on Bioenergy
0%
10%
20%
30%
40%
50%
60%
70%
80%
90%
100%
Familiar with bioenergy Work related to bioenergy Bioenergy is good for
country
Bioenergy affects food
security
Calabarzon Central Visayas Davao
Descriptive Analysis
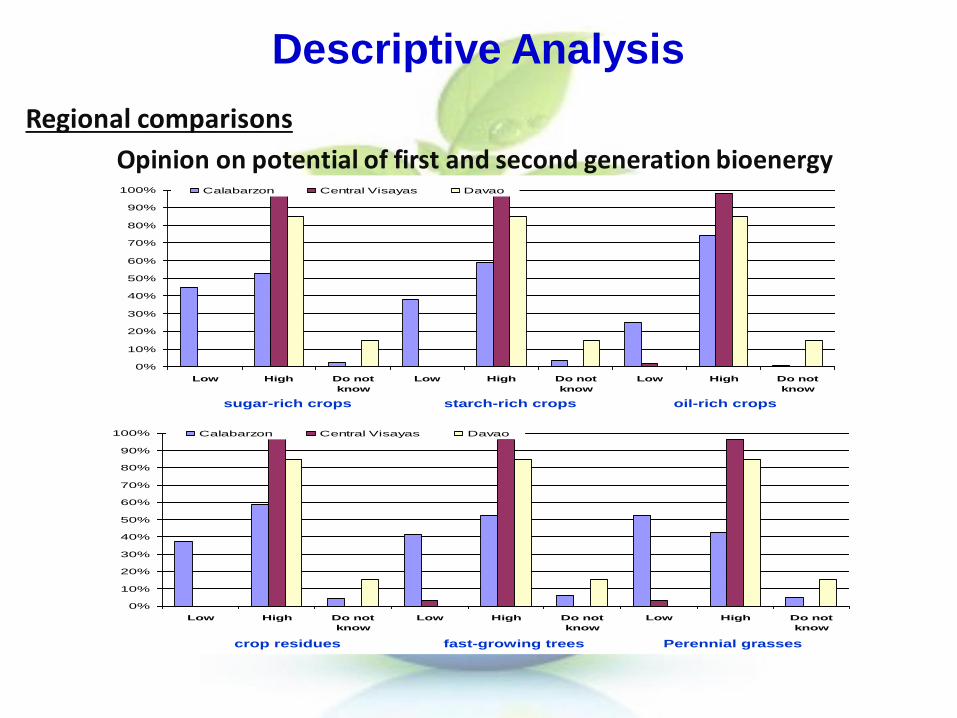
Regional comparisons
Opinion on potential of first and second generation bioenergy
0%
10%
20%
30%
40%
50%
60%
70%
80%
90%
100%
Low High Do not
know
Low High Do not
know
Low High Do not
know
Calabarzon Central Visayas Davao
0%
10%
20%
30%
40%
50%
60%
70%
80%
90%
100%
Low High Do not
know
Low High Do not
know
Low High Do not
know
Calabarzon Central Visayas Davao
sugar-rich crops starch-rich crops oil-rich crops
crop residues fast-growing trees Perennial grasses
Descriptive Analysis
5. Results
5.2 Factors related to knowledge and
opinion on bioenergy
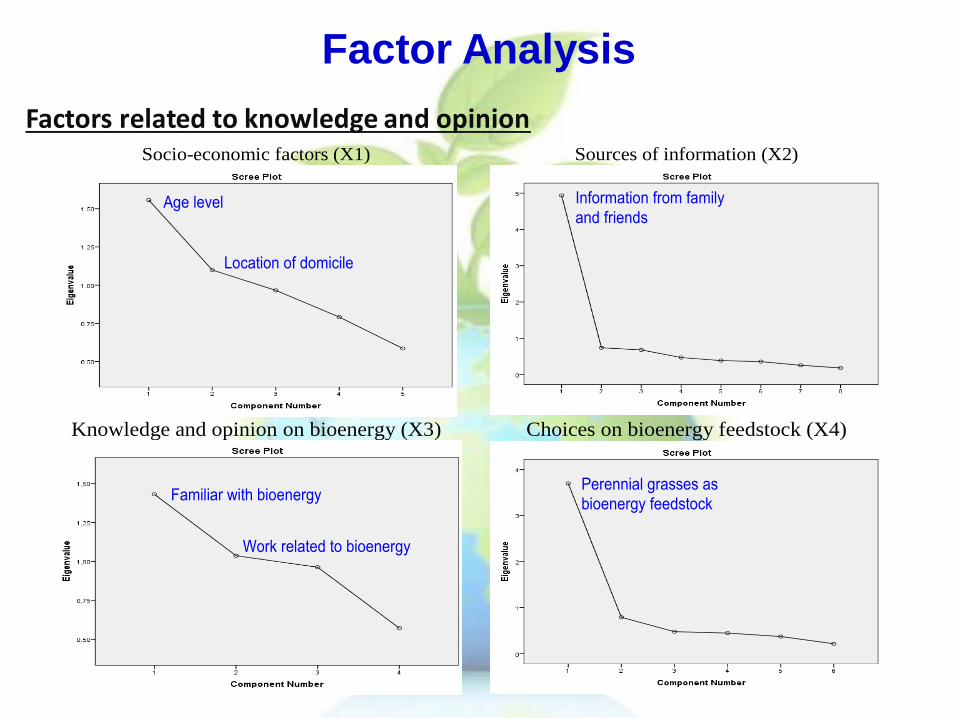
Factors related to knowledge and opinion
Factor Analysis
Socio-economic factors (X1)
Sources of information (X2)
Knowledge and opinion on bioenergy (X3)
Choices on bioenergy feedstock (X4)
Age level
Location of domicile
Information from family
and friends
Familiar with bioenergy
Work related to bioenergy
Perennial grasses as
bioenergy feedstock
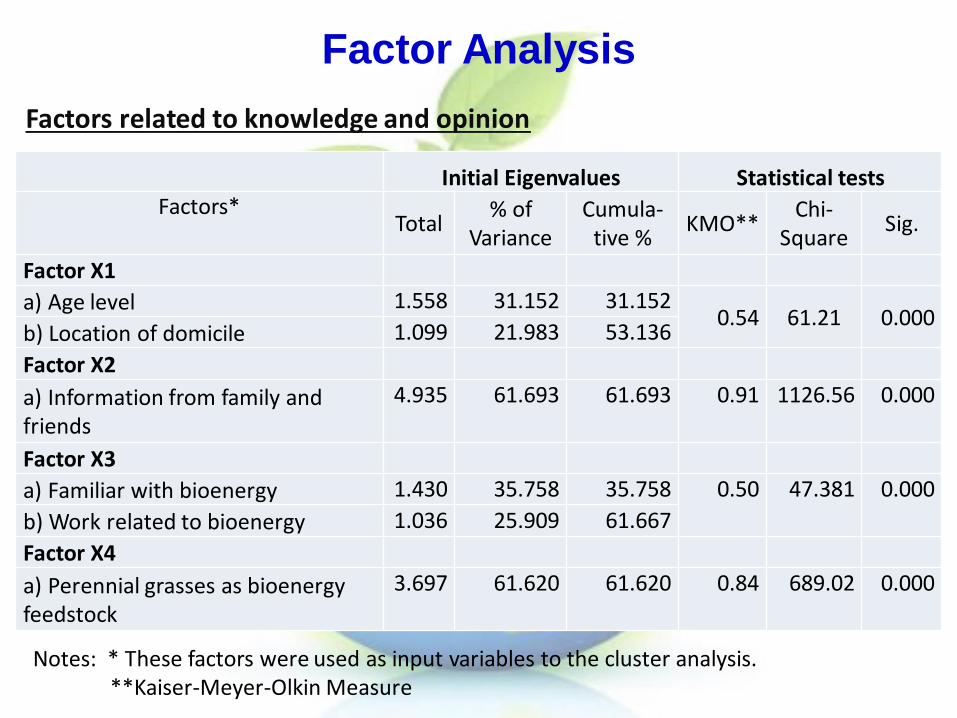
Factors related to knowledge and opinion
Notes: * These factors were used as input variables to the cluster analysis.**Kaiser-Meyer-Olkin Measure
Factor Analysis
Initial Eigenvalues Statistical testsFactors*
Total% of
VarianceCumula-
tive %KMO**
Chi-Square
Sig.
Factor X1
a) Age level 1.558 31.152 31.1520.54 61.21 0.000
b) Location of domicile 1.099 21.983 53.136
Factor X2
a) Information from family and friends
4.935 61.693 61.693 0.91 1126.56 0.000
Factor X3
a) Familiar with bioenergy 1.430 35.758 35.758 0.50 47.381 0.000
b) Work related to bioenergy 1.036 25.909 61.667
Factor X4
a) Perennial grasses as bioenergy feedstock
3.697 61.620 61.620 0.84 689.02 0.000
5. Results
5.3 Typology of farmers’ awareness on
bioenergy sustainability
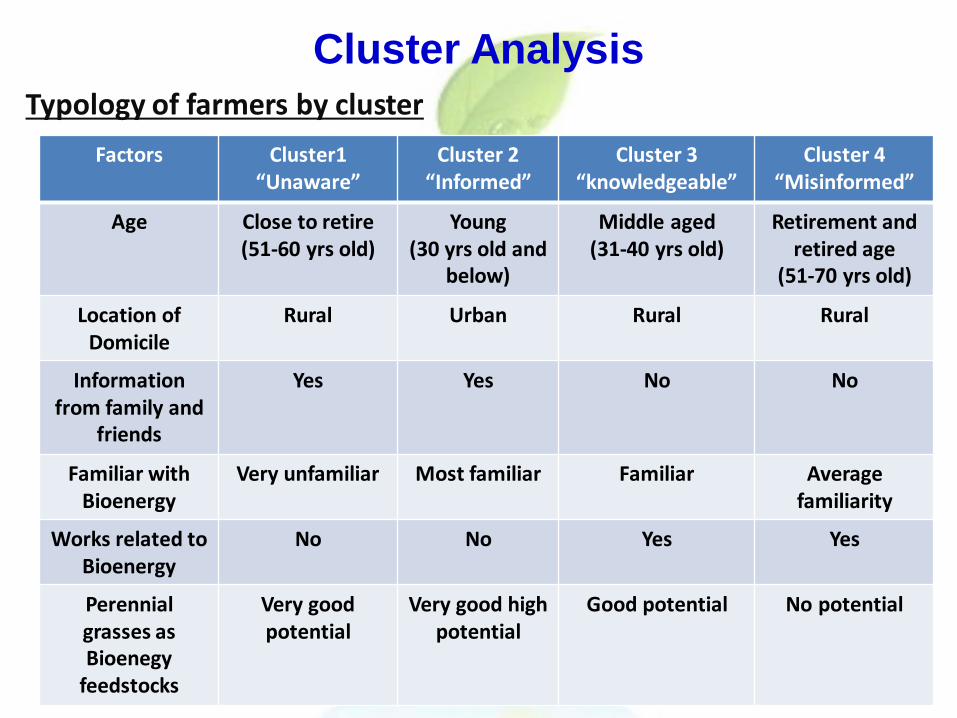
Cluster Analysis
Typology of farmers by cluster
Factors Cluster1“Unaware”
Cluster 2“Informed”
Cluster 3“knowledgeable”
Cluster 4“Misinformed”
Age Close to retire(51-60 yrs old)
Young(30 yrs old and
below)
Middle aged (31-40 yrs old)
Retirement and retired age
(51-70 yrs old)
Location of Domicile
Rural Urban Rural Rural
Information from family and
friends
Yes Yes No No
Familiar with Bioenergy
Very unfamiliar Most familiar Familiar Average familiarity
Works related to Bioenergy
No No Yes Yes
Perennial grasses as Bioenegy
feedstocks
Very good potential
Very good high potential
Good potential No potential
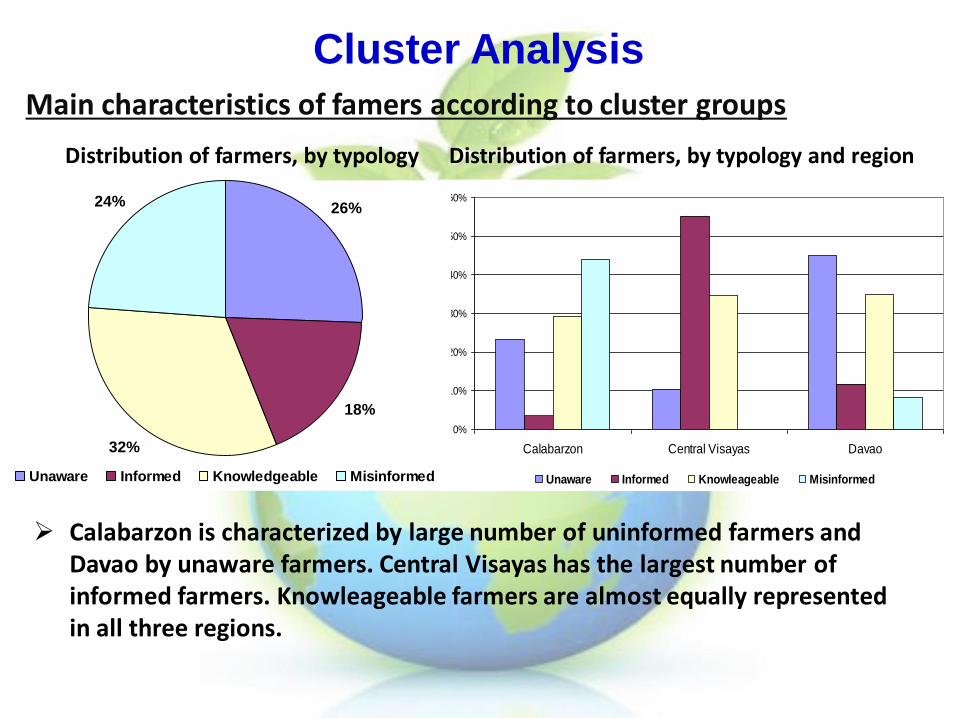
Cluster Analysis
Main characteristics of famers according to cluster groups
0%
10%
20%
30%
40%
50%
60%
Calabarzon Central Visayas Davao
Unaware Informed Knowleageable Misinformed
26%
18%
32%
24%
Unaware Informed Knowledgeable Misinformed
Distribution of farmers, by typology Distribution of farmers, by typology and region
Calabarzon is characterized by large number of uninformed farmers and Davao by unaware farmers. Central Visayas has the largest number of informed farmers. Knowleageable farmers are almost equally represented in all three regions.
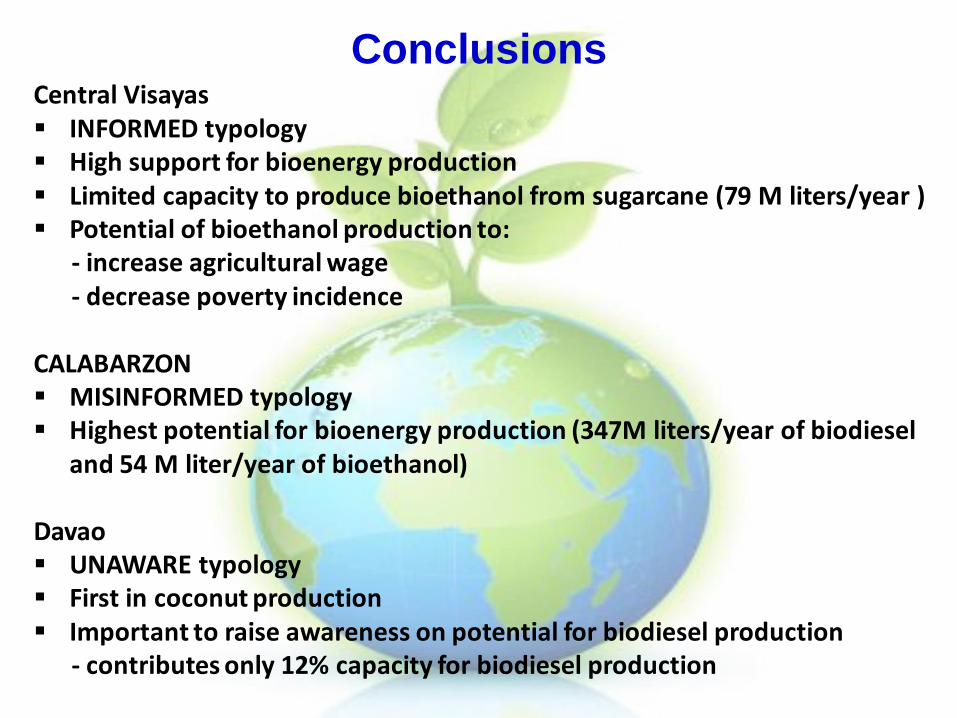
ConclusionsCentral Visayas INFORMED typology High support for bioenergy production Limited capacity to produce bioethanol from sugarcane (79 M liters/year ) Potential of bioethanol production to:
- increase agricultural wage- decrease poverty incidence
CALABARZON MISINFORMED typology Highest potential for bioenergy production (347M liters/year of biodiesel
and 54 M liter/year of bioethanol)
Davao UNAWARE typology First in coconut production Important to raise awareness on potential for biodiesel production
- contributes only 12% capacity for biodiesel production

Thank you
for your attention!
Jatropha Cultivation for BiodieselFood Security and Rural Livelihoods
K.S. Kavi Kumar
Fourth MSE Faculty Seminar Series27-28th February 2014
CUTN, Thiruvarur
Integrated sustainability assessment of bioenergy potentials in Asia: An application of a hybrid approach
on trade-offs and pathways (PIC-STRAP)Project funded by the APN
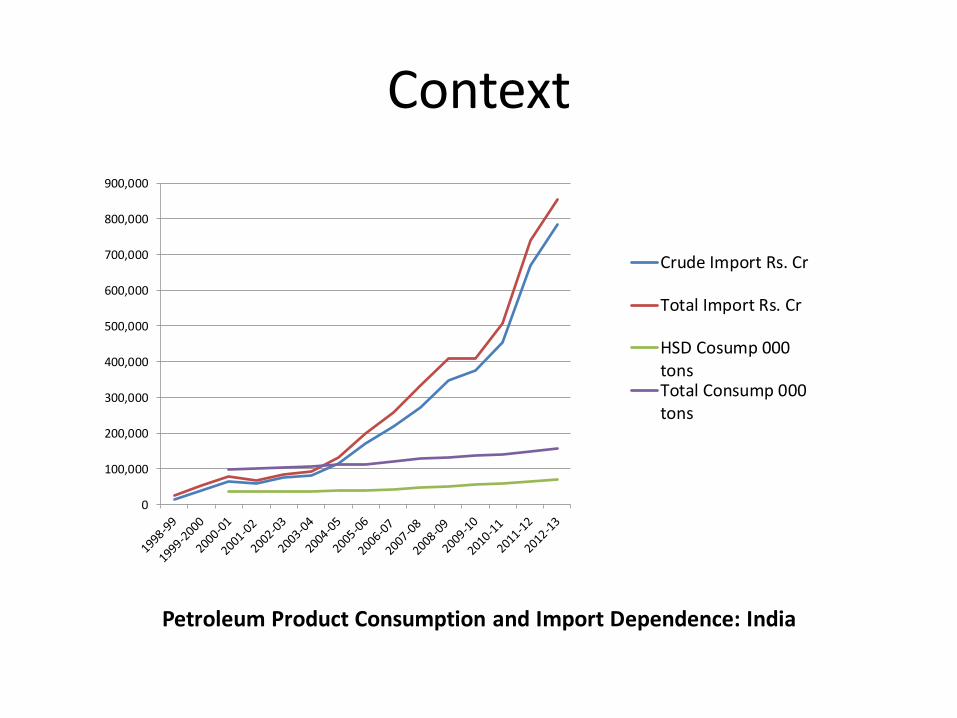
Context
0
100,000
200,000
300,000
400,000
500,000
600,000
700,000
800,000
900,000
Crude Import Rs. Cr
Total Import Rs. Cr
HSD Cosump 000tonsTotal Consump 000tons
Petroleum Product Consumption and Import Dependence: India

Context
• India’s imports of crude and petroleum productshave been growing at more than 7% since 2006
• Vehicle population is growing at 8-10 percentannually, with two-wheelers constituting 72percent of total number of registered motorvehicles
• Diesel meets an estimated 73 percent of fueldemand from transport sector– Combined demand of diesel and petrol is expected to
grow by over five percent over coming years

India’s Biofuel Policy
• National Policy on Biofuels (2009) proposed anindicative target to replace 20 percent of petroleumfuel consumption with biofuels (bioethanol andbiodiesel) by the end of 12th Five Year Plan (i.e., 2017);biofuel expansion is also linked with social goals suchas employment generation, poverty alleviation etc.– Ethanol blending with gasoline – revised target of 5%
mandatory blending; below 3% achieved in 2013
– Most biodiesel units operating in India have shifted toalternative feed stocks such as edible oil waste, animal fatetc.
– Biodiesel units are utilizing about 40% of existing capacity

Biofuels in India - 1
• Significant concern regarding food security – Fischer et al. (2008) argue that an additional 140 to 150 million
people may be at the risk of hunger by 2020 due to biofuelexpansion in South Asia
– Though the second generation biofuels may reduce the adverseimpacts on food security, the indirect impact of biofuels on foodsecurity through adverse influence on biodiversity are oftenconsidered high
– Msangi and Rosegrant (2011) argue that biofuel expansion willresult in substantive increase in market prices and hence lead tofood security concerns
– They further argue that the South Asian countries may have toincrease their crop yields by an additional 1 percent per year upto 2030 to overcome the stress induced by the biofuelexpansion
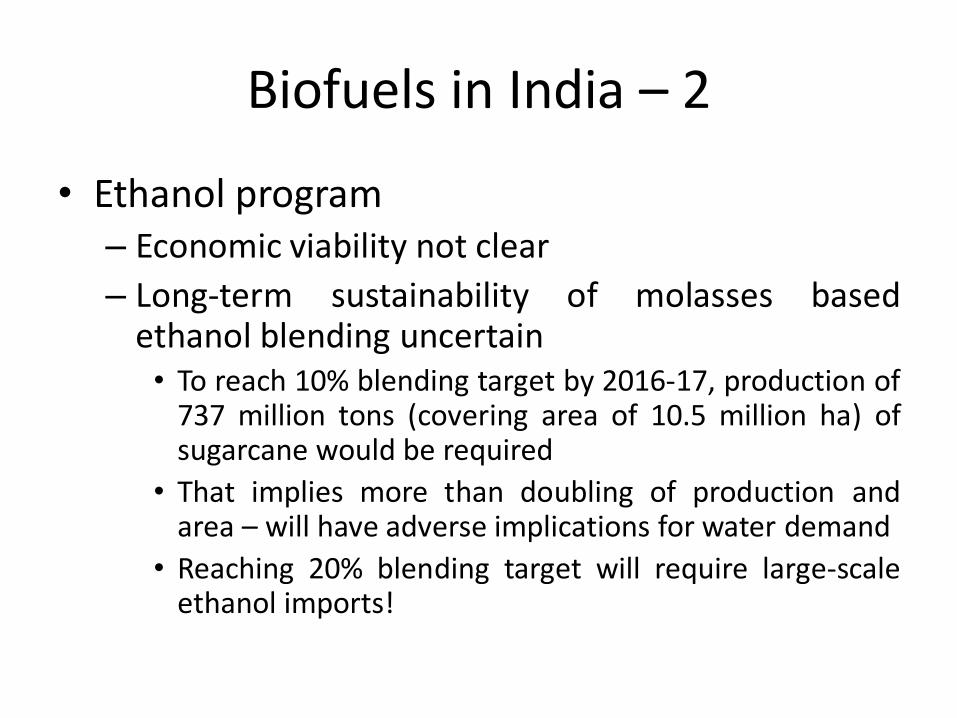
Biofuels in India – 2
• Ethanol program – Economic viability not clear
– Long-term sustainability of molasses basedethanol blending uncertain• To reach 10% blending target by 2016-17, production of
737 million tons (covering area of 10.5 million ha) ofsugarcane would be required
• That implies more than doubling of production andarea – will have adverse implications for water demand
• Reaching 20% blending target will require large-scaleethanol imports!
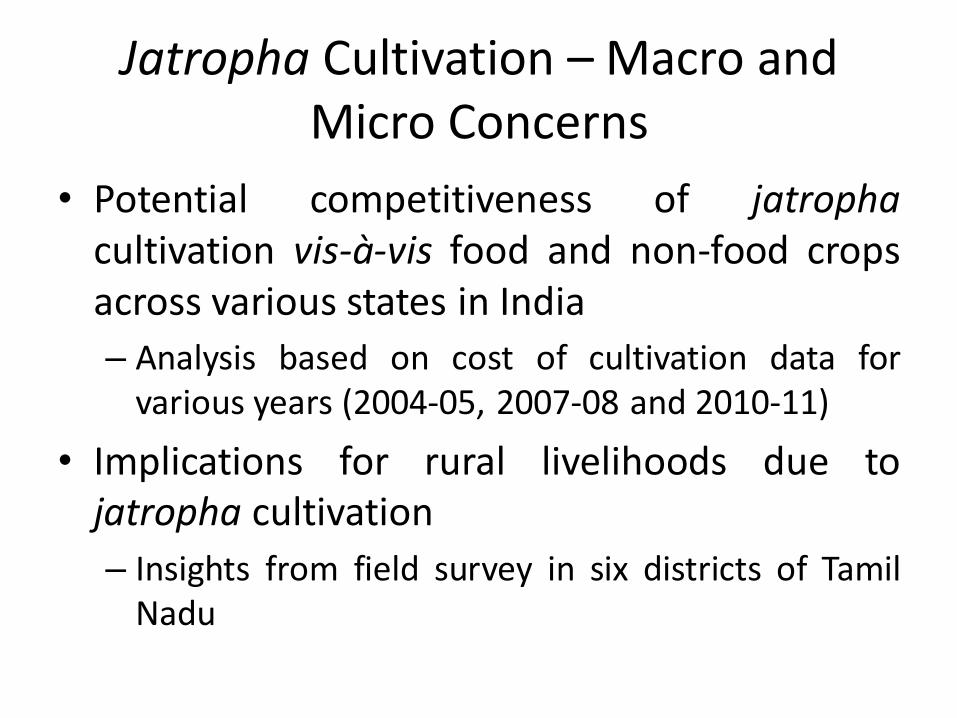
Jatropha Cultivation – Macro and Micro Concerns
• Potential competitiveness of jatrophacultivation vis-à-vis food and non-food cropsacross various states in India
– Analysis based on cost of cultivation data forvarious years (2004-05, 2007-08 and 2010-11)
• Implications for rural livelihoods due tojatropha cultivation
– Insights from field survey in six districts of TamilNadu
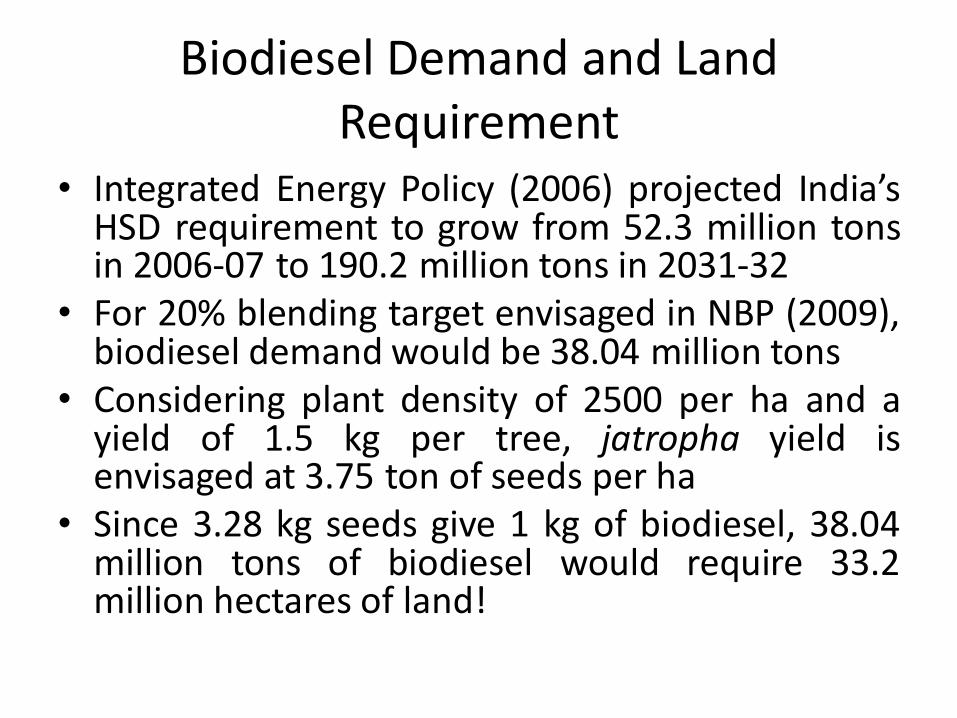
Biodiesel Demand and Land Requirement
• Integrated Energy Policy (2006) projected India’sHSD requirement to grow from 52.3 million tonsin 2006-07 to 190.2 million tons in 2031-32
• For 20% blending target envisaged in NBP (2009),biodiesel demand would be 38.04 million tons
• Considering plant density of 2500 per ha and ayield of 1.5 kg per tree, jatropha yield isenvisaged at 3.75 ton of seeds per ha
• Since 3.28 kg seeds give 1 kg of biodiesel, 38.04million tons of biodiesel would require 33.2million hectares of land!

Where is the ‘waste land’?
• Wasteland is described as “degraded land which can bebrought under vegetation cover with reasonable effort, andwhich is currently under-utilized and/or land which isdeteriorating for lack of appropriate water and soilmanagement or on account of natural causes. Wastelandscan result from inherent/imposed disabilities such as bylocation, environment, chemical and physical properties ofthe soil or financial or management constraints” (GOI, 2005).
• The overall area under foodgrains has remained static inIndia over the past decade or so. The use of ‘waste land’ forfuel purposes remains debatable in the context of SouthAsian Enigma of stagnant per-capita food consumption(compared to North Africa and West Asia) despiteimpressive growth registered in terms of per-capita income.
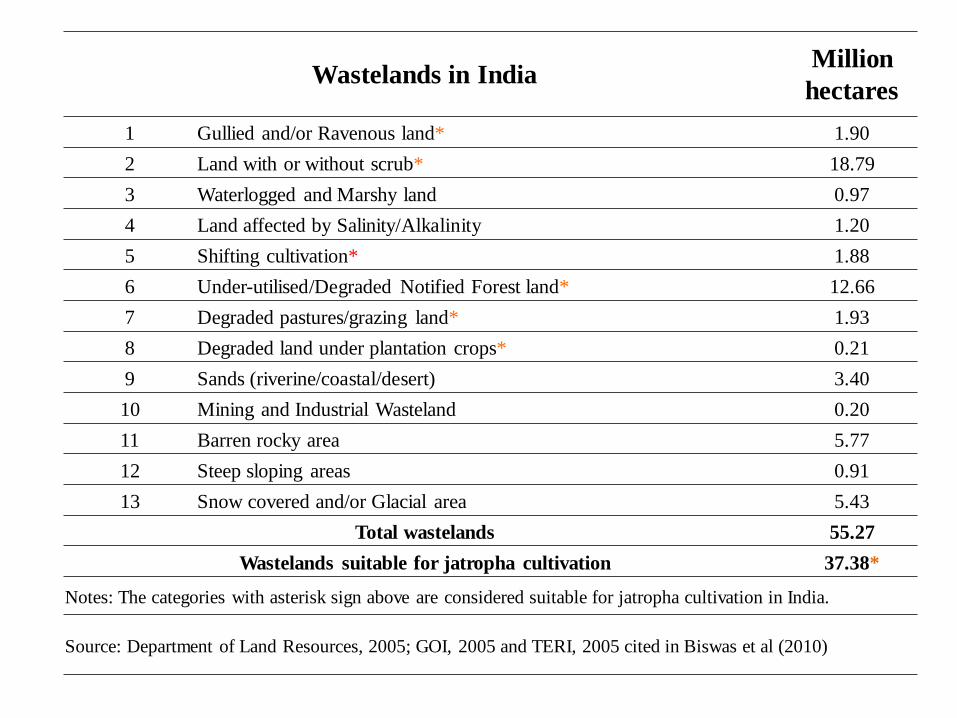
Wastelands in India Million
hectares
1 Gullied and/or Ravenous land* 1.90
2 Land with or without scrub* 18.79
3 Waterlogged and Marshy land 0.97
4 Land affected by Salinity/Alkalinity 1.20
5 Shifting cultivation* 1.88
6 Under-utilised/Degraded Notified Forest land* 12.66
7 Degraded pastures/grazing land* 1.93
8 Degraded land under plantation crops* 0.21
9 Sands (riverine/coastal/desert) 3.40
10 Mining and Industrial Wasteland 0.20
11 Barren rocky area 5.77
12 Steep sloping areas 0.91
13 Snow covered and/or Glacial area 5.43
Total wastelands 55.27
Wastelands suitable for jatropha cultivation 37.38*
Notes: The categories with asterisk sign above are considered suitable for jatropha cultivation in India.
Source: Department of Land Resources, 2005; GOI, 2005 and TERI, 2005 cited in Biswas et al (2010)
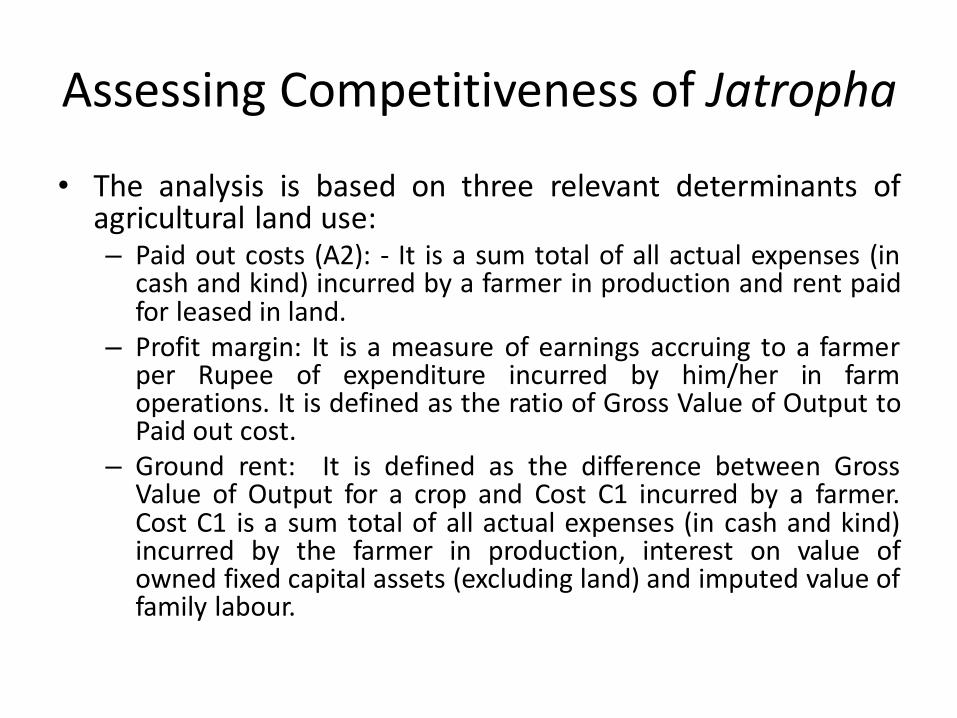
Assessing Competitiveness of Jatropha
• The analysis is based on three relevant determinants ofagricultural land use:– Paid out costs (A2): - It is a sum total of all actual expenses (in
cash and kind) incurred by a farmer in production and rent paidfor leased in land.
– Profit margin: It is a measure of earnings accruing to a farmerper Rupee of expenditure incurred by him/her in farmoperations. It is defined as the ratio of Gross Value of Output toPaid out cost.
– Ground rent: It is defined as the difference between GrossValue of Output for a crop and Cost C1 incurred by a farmer.Cost C1 is a sum total of all actual expenses (in cash and kind)incurred by the farmer in production, interest on value ofowned fixed capital assets (excluding land) and imputed value offamily labour.
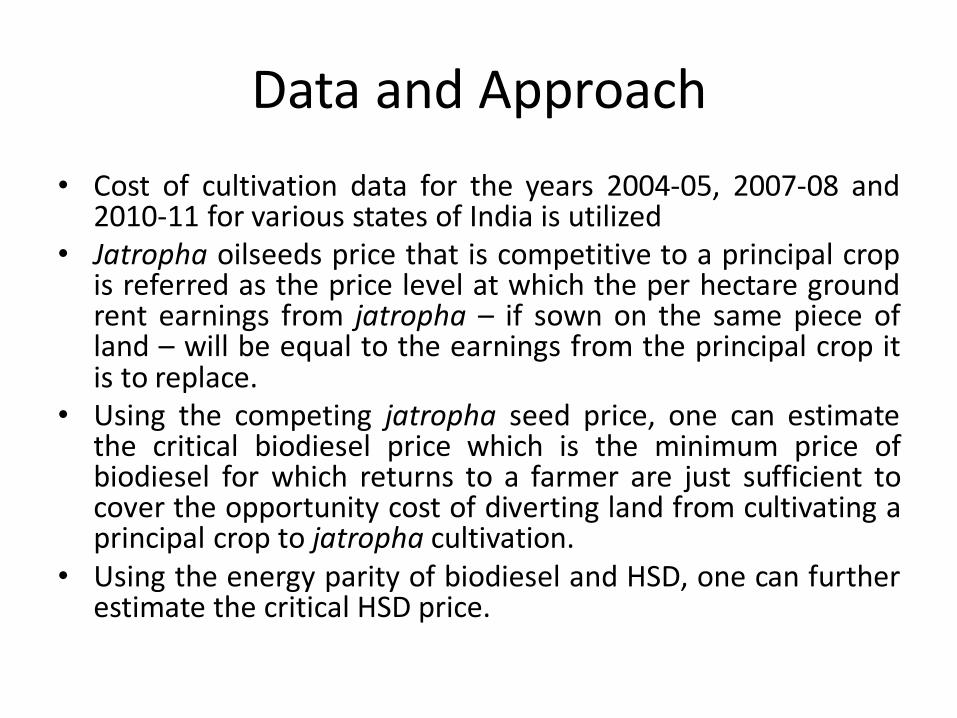
Data and Approach
• Cost of cultivation data for the years 2004-05, 2007-08 and2010-11 for various states of India is utilized
• Jatropha oilseeds price that is competitive to a principal cropis referred as the price level at which the per hectare groundrent earnings from jatropha – if sown on the same piece ofland – will be equal to the earnings from the principal crop itis to replace.
• Using the competing jatropha seed price, one can estimatethe critical biodiesel price which is the minimum price ofbiodiesel for which returns to a farmer are just sufficient tocover the opportunity cost of diverting land from cultivating aprincipal crop to jatropha cultivation.
• Using the energy parity of biodiesel and HSD, one can furtherestimate the critical HSD price.
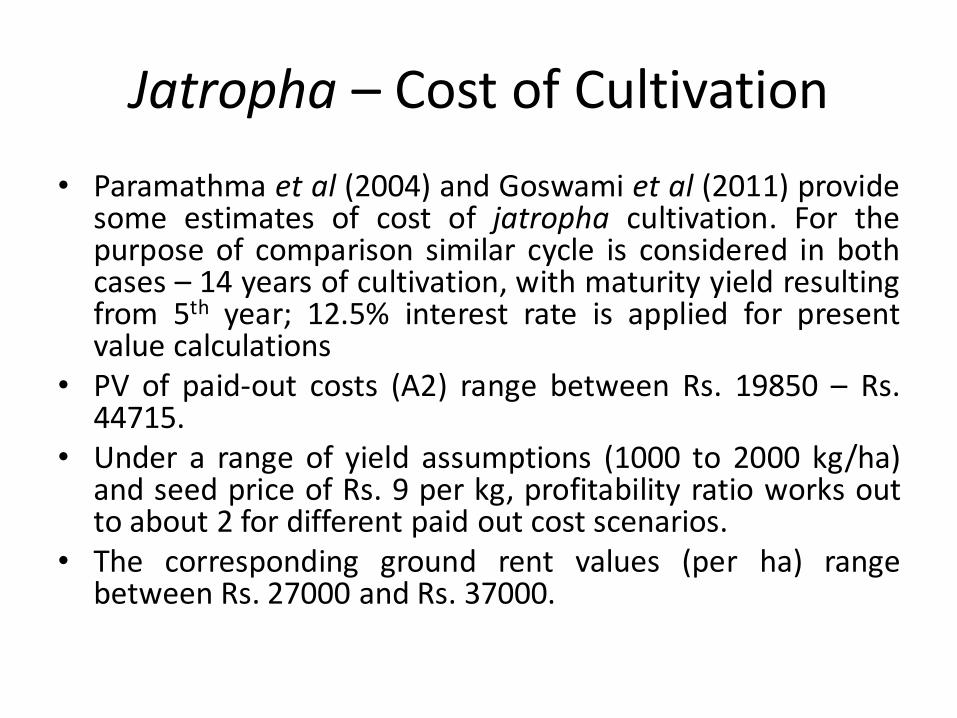
Jatropha – Cost of Cultivation
• Paramathma et al (2004) and Goswami et al (2011) providesome estimates of cost of jatropha cultivation. For thepurpose of comparison similar cycle is considered in bothcases – 14 years of cultivation, with maturity yield resultingfrom 5th year; 12.5% interest rate is applied for presentvalue calculations
• PV of paid-out costs (A2) range between Rs. 19850 – Rs.44715.
• Under a range of yield assumptions (1000 to 2000 kg/ha)and seed price of Rs. 9 per kg, profitability ratio works outto about 2 for different paid out cost scenarios.
• The corresponding ground rent values (per ha) rangebetween Rs. 27000 and Rs. 37000.
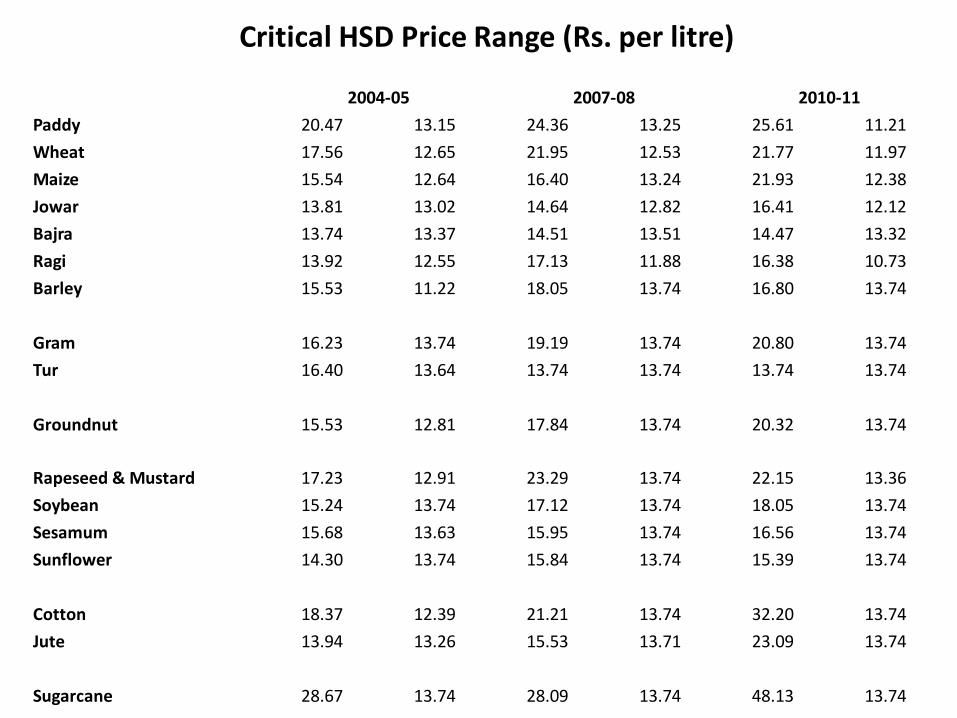
Critical HSD Price Range (Rs. per litre)
2004-05 2007-08 2010-11
Paddy 20.47 13.15 24.36 13.25 25.61 11.21
Wheat 17.56 12.65 21.95 12.53 21.77 11.97
Maize 15.54 12.64 16.40 13.24 21.93 12.38
Jowar 13.81 13.02 14.64 12.82 16.41 12.12
Bajra 13.74 13.37 14.51 13.51 14.47 13.32
Ragi 13.92 12.55 17.13 11.88 16.38 10.73
Barley 15.53 11.22 18.05 13.74 16.80 13.74
Gram 16.23 13.74 19.19 13.74 20.80 13.74
Tur 16.40 13.64 13.74 13.74 13.74 13.74
Groundnut 15.53 12.81 17.84 13.74 20.32 13.74
Rapeseed & Mustard 17.23 12.91 23.29 13.74 22.15 13.36
Soybean 15.24 13.74 17.12 13.74 18.05 13.74
Sesamum 15.68 13.63 15.95 13.74 16.56 13.74
Sunflower 14.30 13.74 15.84 13.74 15.39 13.74
Cotton 18.37 12.39 21.21 13.74 32.20 13.74
Jute 13.94 13.26 15.53 13.71 23.09 13.74
Sugarcane 28.67 13.74 28.09 13.74 48.13 13.74
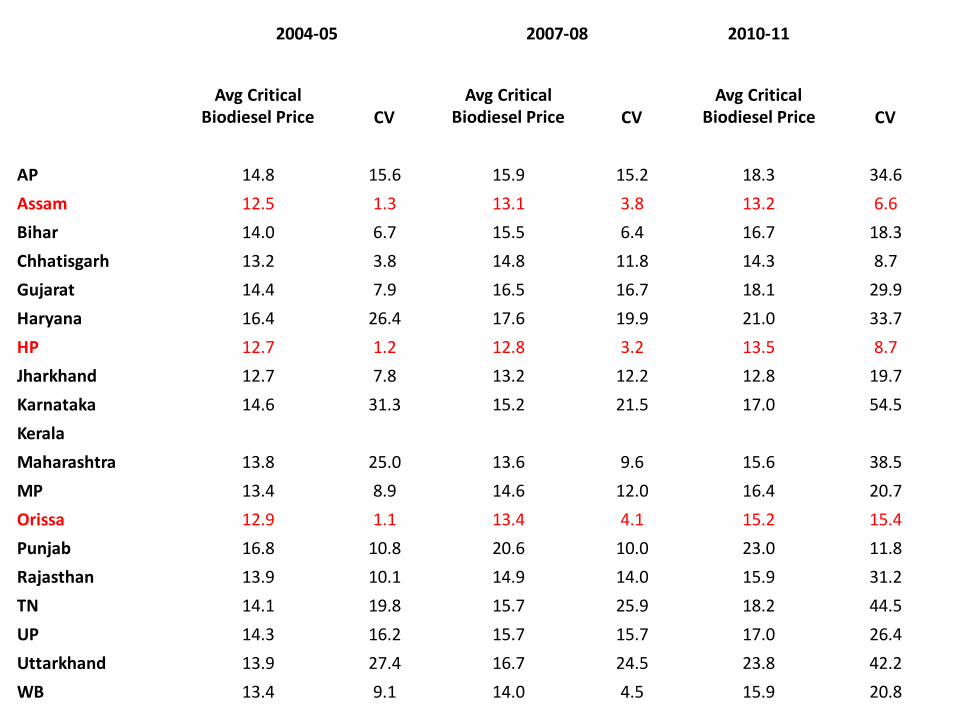
2004-05 2007-08 2010-11
Avg Critical Biodiesel Price CV
Avg Critical Biodiesel Price CV
Avg Critical Biodiesel Price CV
AP 14.8 15.6 15.9 15.2 18.3 34.6
Assam 12.5 1.3 13.1 3.8 13.2 6.6
Bihar 14.0 6.7 15.5 6.4 16.7 18.3
Chhatisgarh 13.2 3.8 14.8 11.8 14.3 8.7
Gujarat 14.4 7.9 16.5 16.7 18.1 29.9
Haryana 16.4 26.4 17.6 19.9 21.0 33.7
HP 12.7 1.2 12.8 3.2 13.5 8.7
Jharkhand 12.7 7.8 13.2 12.2 12.8 19.7
Karnataka 14.6 31.3 15.2 21.5 17.0 54.5
Kerala
Maharashtra 13.8 25.0 13.6 9.6 15.6 38.5
MP 13.4 8.9 14.6 12.0 16.4 20.7
Orissa 12.9 1.1 13.4 4.1 15.2 15.4
Punjab 16.8 10.8 20.6 10.0 23.0 11.8
Rajasthan 13.9 10.1 14.9 14.0 15.9 31.2
TN 14.1 19.8 15.7 25.9 18.2 44.5
UP 14.3 16.2 15.7 15.7 17.0 26.4
Uttarkhand 13.9 27.4 16.7 24.5 23.8 42.2
WB 13.4 9.1 14.0 4.5 15.9 20.8

Inferences..
• A lower CV makes food and other agricultural productsvulnerable to a competitive threat from energy cropcultivation (such as jatropha) if the estimated criticalprices of HSD are lower than the prevailing HSD prices.– The estimates are based on lower cost of cultivation
assessment for jatropha and also higher expected yield.Hence the critical prices of HSD estimated could beconsidered as under-estimates.
• For comparison it may be noted that storage pointprice of HSD was Rs. 38.05 per litre as of April 2013.
• States such as Orissa, HP, Assam appear to bevulnerable as the CV is below 10%.
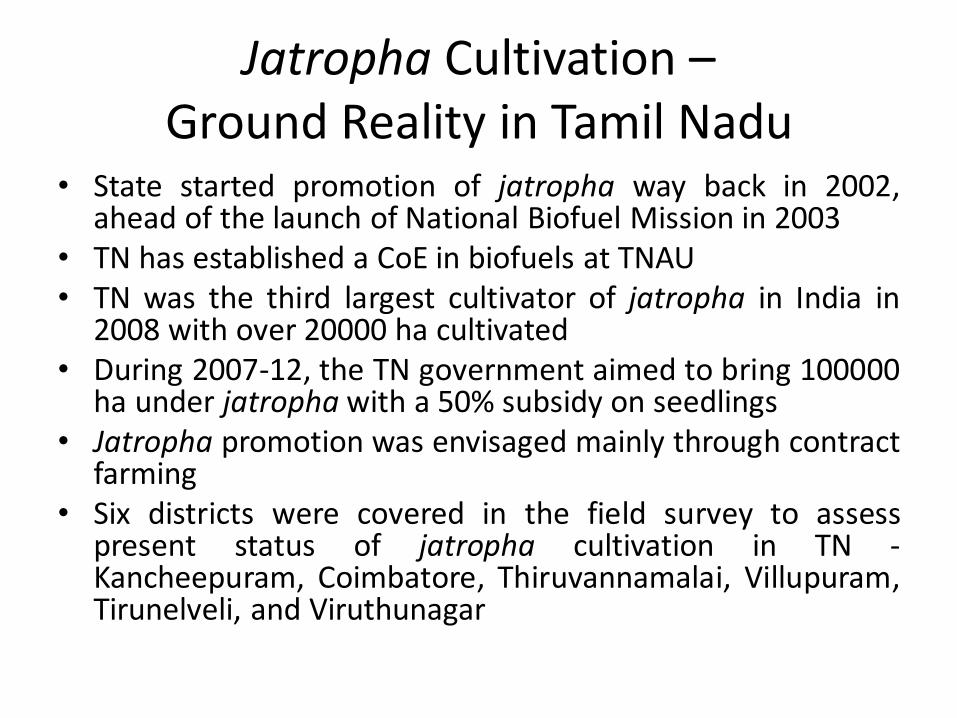
Jatropha Cultivation –Ground Reality in Tamil Nadu
• State started promotion of jatropha way back in 2002,ahead of the launch of National Biofuel Mission in 2003
• TN has established a CoE in biofuels at TNAU• TN was the third largest cultivator of jatropha in India in
2008 with over 20000 ha cultivated• During 2007-12, the TN government aimed to bring 100000
ha under jatropha with a 50% subsidy on seedlings• Jatropha promotion was envisaged mainly through contract
farming• Six districts were covered in the field survey to assess
present status of jatropha cultivation in TN -Kancheepuram, Coimbatore, Thiruvannamalai, Villupuram,Tirunelveli, and Viruthunagar

Jatropha in Kudankulam –inadequate water supply hasresulted in stunted growth withfew leaves (and seeds)

Another plot in Kudankulam – plants closer to the residential areasurvived due to seepage of water supplied to coconut trees

Field Survey – Insights
• Far lower yields with inadequate supply of water acting as majorconstraint
• High initial investment requirements favoring larger land holderscompared to small and marginal land holders
• Government initiatives cast shadow on the notion of wastelands –especially because at the village level the wastelands are often CPRsutilized by multiple stakeholders
• Government agencies viewed jatropha cultivation broadly similar toseveral other tree plantation programs!
• Lack of employment opportunities make jatropha less attractive –especially compared to prosopis
• The land targeted for jatropha is occupied by prosopis – historicallypromoted by several governments (starting from Anna Durai’speriod)
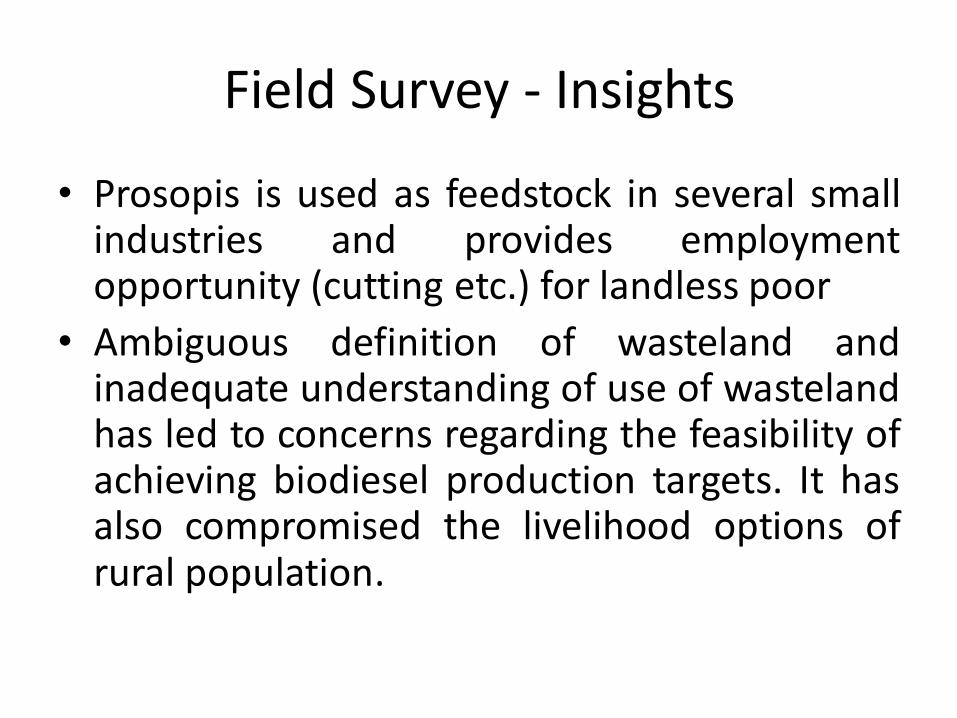
Field Survey - Insights
• Prosopis is used as feedstock in several smallindustries and provides employmentopportunity (cutting etc.) for landless poor
• Ambiguous definition of wasteland andinadequate understanding of use of wastelandhas led to concerns regarding the feasibility ofachieving biodiesel production targets. It hasalso compromised the livelihood options ofrural population.
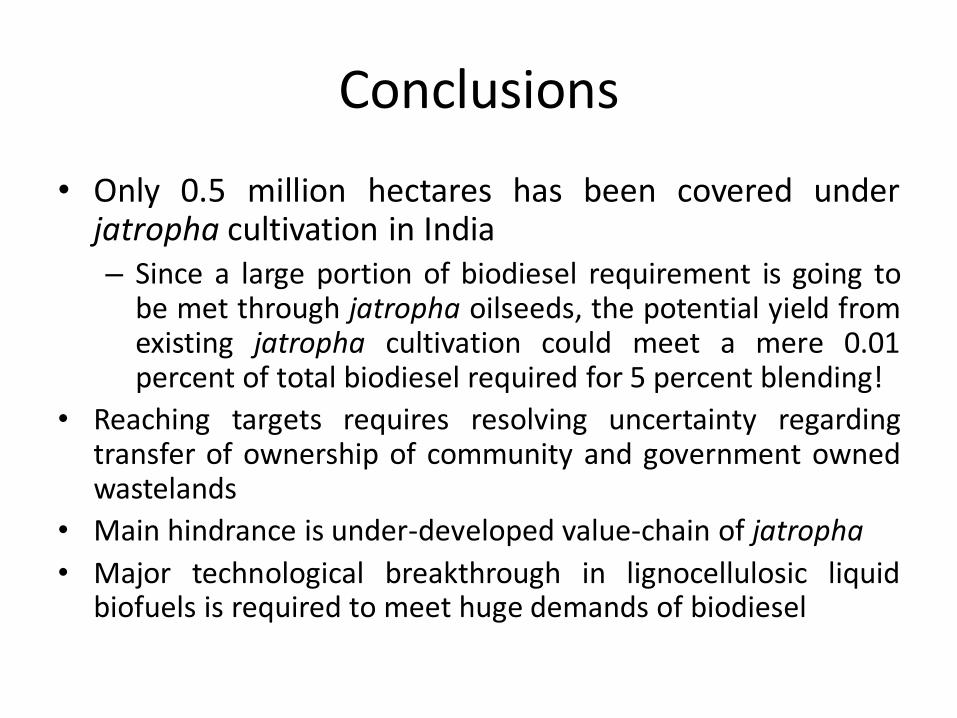
Conclusions
• Only 0.5 million hectares has been covered underjatropha cultivation in India– Since a large portion of biodiesel requirement is going to
be met through jatropha oilseeds, the potential yield fromexisting jatropha cultivation could meet a mere 0.01percent of total biodiesel required for 5 percent blending!
• Reaching targets requires resolving uncertainty regardingtransfer of ownership of community and government ownedwastelands
• Main hindrance is under-developed value-chain of jatropha
• Major technological breakthrough in lignocellulosic liquidbiofuels is required to meet huge demands of biodiesel

Thank you!
1
Framing Workshop
Integrated sustainability assessment of bioenergy
potentials in Asia: An application of a hybrid approach
on trade-offs and pathways (PIC-STRAP)
College of Global Change and Earth System Science,
Beijing Normal University
July 20-26, 2014
Project partners:
Funded/Supported by:
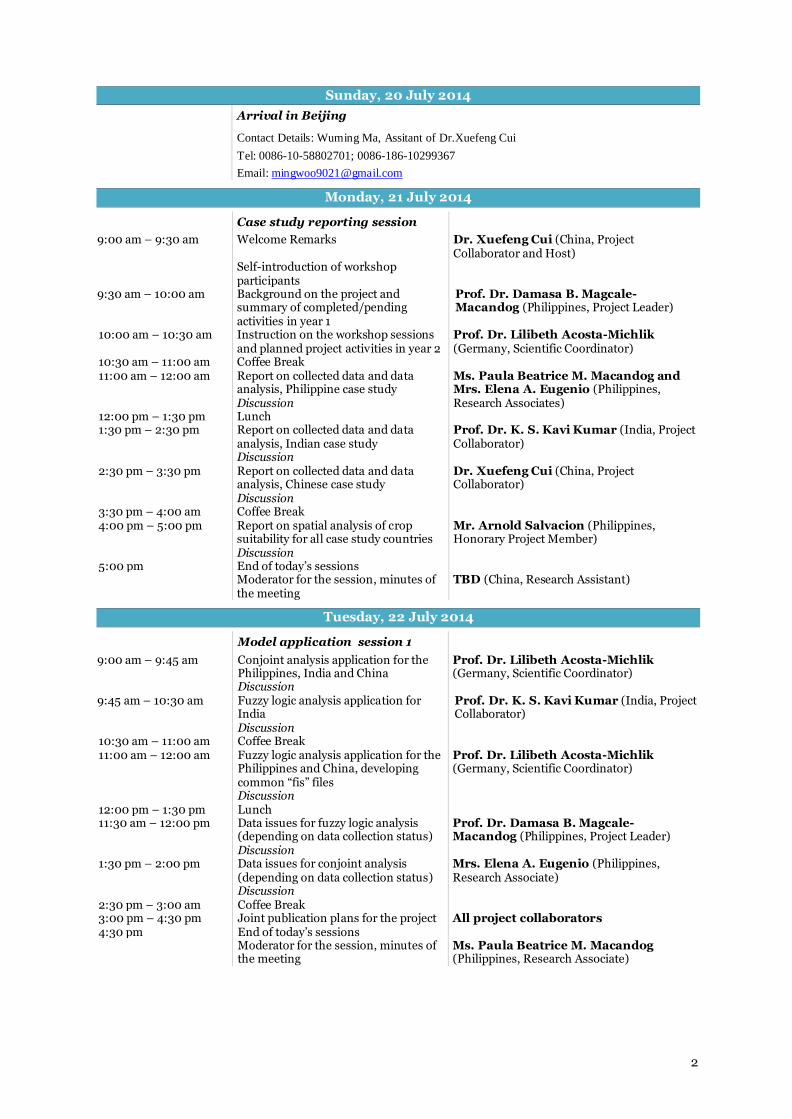
2
Sunday, 20 July 2014
Arrival in Beijing
Contact Details: Wuming Ma, Assitant of Dr.Xuefeng Cui
Tel: 0086-10-58802701; 0086-186-10299367
Email: [email protected]
Monday, 21 July 2014
Case study reporting session
9:00 am – 9:30 am Welcome Remarks Dr. Xuefeng Cui (China, Project Collaborator and Host)
Self-introduction of workshop participants
9:30 am – 10:00 am Background on the project and summary of completed/pending activities in year 1
Prof. Dr. Damasa B. Magcale- Macandog (Philippines, Project Leader)
10:00 am – 10:30 am Instruction on the workshop sessions and planned project activities in year 2
Prof. Dr. Lilibeth Acosta-Michlik (Germany, Scientific Coordinator)
10:30 am – 11:00 am Coffee Break 11:00 am – 12:00 am
Report on collected data and data analysis, Philippine case study Discussion
Ms. Paula Beatrice M. Macandog and Mrs. Elena A. Eugenio (Philippines, Research Associates)
12:00 pm – 1:30 pm Lunch 1:30 pm – 2:30 pm
Report on collected data and data analysis, Indian case study Discussion
Prof. Dr. K. S. Kavi Kumar (India, Project Collaborator)
2:30 pm – 3:30 pm
Report on collected data and data analysis, Chinese case study Discussion
Dr. Xuefeng Cui (China, Project Collaborator)
3:30 pm – 4:00 am Coffee Break 4:00 pm – 5:00 pm Report on spatial analysis of crop
suitability for all case study countries Discussion
Mr. Arnold Salvacion (Philippines, Honorary Project Member)
5:00 pm End of today’s sessions Moderator for the session, minutes of
the meeting TBD (China, Research Assistant)
Tuesday, 22 July 2014
Model application session 1
9:00 am – 9:45 am Conjoint analysis application for the Philippines, India and China Discussion
Prof. Dr. Lilibeth Acosta-Michlik (Germany, Scientific Coordinator)
9:45 am – 10:30 am Fuzzy logic analysis application for India Discussion
Prof. Dr. K. S. Kavi Kumar (India, Project Collaborator)
10:30 am – 11:00 am Coffee Break 11:00 am – 12:00 am
Fuzzy logic analysis application for the Philippines and China, developing common “fis” files Discussion
Prof. Dr. Lilibeth Acosta-Michlik (Germany, Scientific Coordinator)
12:00 pm – 1:30 pm Lunch 11:30 am – 12:00 pm Data issues for fuzzy logic analysis
(depending on data collection status) Discussion
Prof. Dr. Damasa B. Magcale- Macandog (Philippines, Project Leader)
1:30 pm – 2:00 pm Data issues for conjoint analysis (depending on data collection status) Discussion
Mrs. Elena A. Eugenio (Philippines, Research Associate)
2:30 pm – 3:00 am Coffee Break 3:00 pm – 4:30 pm Joint publication plans for the project All project collaborators 4:30 pm End of today’s sessions Moderator for the session, minutes of
the meeting Ms. Paula Beatrice M. Macandog (Philippines, Research Associate)
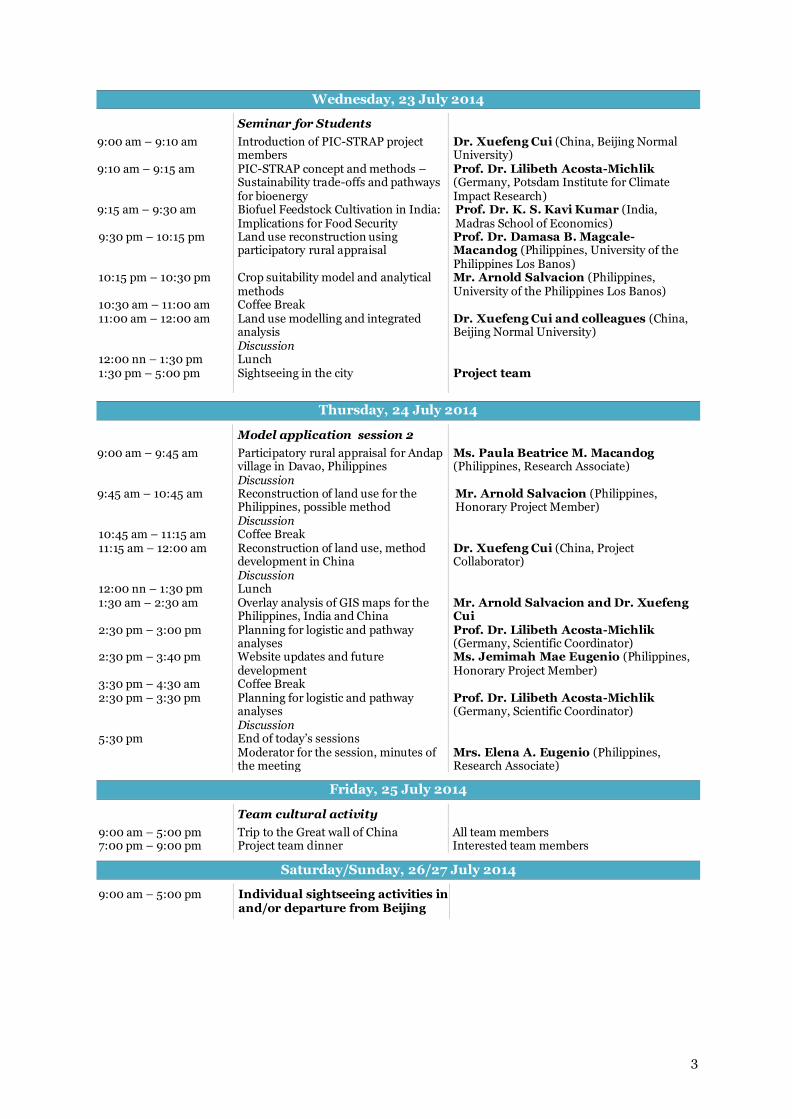
3
Wednesday, 23 July 2014
Seminar for Students
9:00 am – 9:10 am Introduction of PIC-STRAP project members
Dr. Xuefeng Cui (China, Beijing Normal University)
9:10 am – 9:15 am PIC-STRAP concept and methods – Sustainability trade-offs and pathways for bioenergy
Prof. Dr. Lilibeth Acosta-Michlik (Germany, Potsdam Institute for Climate Impact Research)
9:15 am – 9:30 am Biofuel Feedstock Cultivation in India: Implications for Food Security
Prof. Dr. K. S. Kavi Kumar (India, Madras School of Economics)
9:30 pm – 10:15 pm
Land use reconstruction using participatory rural appraisal
Prof. Dr. Damasa B. Magcale- Macandog (Philippines, University of the Philippines Los Banos)
10:15 pm – 10:30 pm
Crop suitability model and analytical methods
Mr. Arnold Salvacion (Philippines, University of the Philippines Los Banos)
10:30 am – 11:00 am Coffee Break 11:00 am – 12:00 am
Land use modelling and integrated analysis Discussion
Dr. Xuefeng Cui and colleagues (China, Beijing Normal University)
12:00 nn – 1:30 pm Lunch 1:30 pm – 5:00 pm
Sightseeing in the city Project team
Thursday, 24 July 2014
Model application session 2
9:00 am – 9:45 am Participatory rural appraisal for Andap village in Davao, Philippines Discussion
Ms. Paula Beatrice M. Macandog (Philippines, Research Associate)
9:45 am – 10:45 am Reconstruction of land use for the Philippines, possible method Discussion
Mr. Arnold Salvacion (Philippines, Honorary Project Member)
10:45 am – 11:15 am Coffee Break 11:15 am – 12:00 am
Reconstruction of land use, method development in China Discussion
Dr. Xuefeng Cui (China, Project Collaborator)
12:00 nn – 1:30 pm Lunch 1:30 am – 2:30 am Overlay analysis of GIS maps for the
Philippines, India and China Mr. Arnold Salvacion and Dr. Xuefeng Cui
2:30 pm – 3:00 pm
Planning for logistic and pathway analyses
Prof. Dr. Lilibeth Acosta-Michlik (Germany, Scientific Coordinator)
2:30 pm – 3:40 pm
Website updates and future development
Ms. Jemimah Mae Eugenio (Philippines, Honorary Project Member)
3:30 pm – 4:30 am Coffee Break 2:30 pm – 3:30 pm
Planning for logistic and pathway analyses Discussion
Prof. Dr. Lilibeth Acosta-Michlik (Germany, Scientific Coordinator)
5:30 pm End of today’s sessions Moderator for the session, minutes of
the meeting Mrs. Elena A. Eugenio (Philippines, Research Associate)
Friday, 25 July 2014
Team cultural activity
9:00 am – 5:00 pm Trip to the Great wall of China All team members 7:00 pm – 9:00 pm Project team dinner Interested team members
Saturday/Sunday, 26/27 July 2014
9:00 am – 5:00 pm Individual sightseeing activities in and/or departure from Beijing
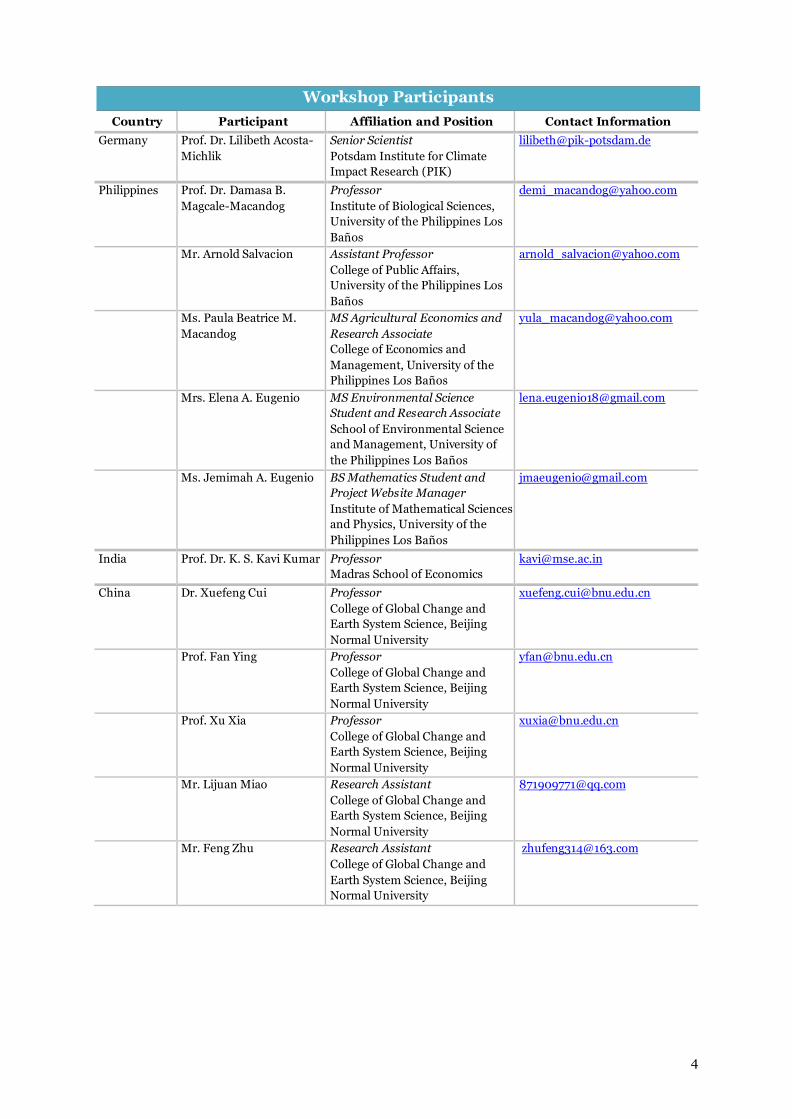
4
Workshop Participants
Country Participant Affiliation and Position Contact Information
Germany Prof. Dr. Lilibeth Acosta-
Michlik
Senior Scientist
Potsdam Institute for Climate
Impact Research (PIK)
Philippines Prof. Dr. Damasa B.
Magcale-Macandog
Professor
Institute of Biological Sciences,
University of the Philippines Los
Baños
Mr. Arnold Salvacion Assistant Professor
College of Public Affairs,
University of the Philippines Los
Baños
Ms. Paula Beatrice M.
Macandog
MS Agricultural Economics and
Research Associate
College of Economics and
Management, University of the
Philippines Los Baños
Mrs. Elena A. Eugenio MS Environmental Science
Student and Research Associate
School of Environmental Science
and Management, University of
the Philippines Los Baños
Ms. Jemimah A. Eugenio BS Mathematics Student and
Project Website Manager
Institute of Mathematical Sciences
and Physics, University of the
Philippines Los Baños
India Prof. Dr. K. S. Kavi Kumar Professor
Madras School of Economics
China Dr. Xuefeng Cui Professor
College of Global Change and
Earth System Science, Beijing
Normal University
Prof. Fan Ying Professor
College of Global Change and
Earth System Science, Beijing
Normal University
Prof. Xu Xia Professor
College of Global Change and
Earth System Science, Beijing
Normal University
Mr. Lijuan Miao Research Assistant
College of Global Change and
Earth System Science, Beijing
Normal University
Mr. Feng Zhu Research Assistant
College of Global Change and
Earth System Science, Beijing
Normal University
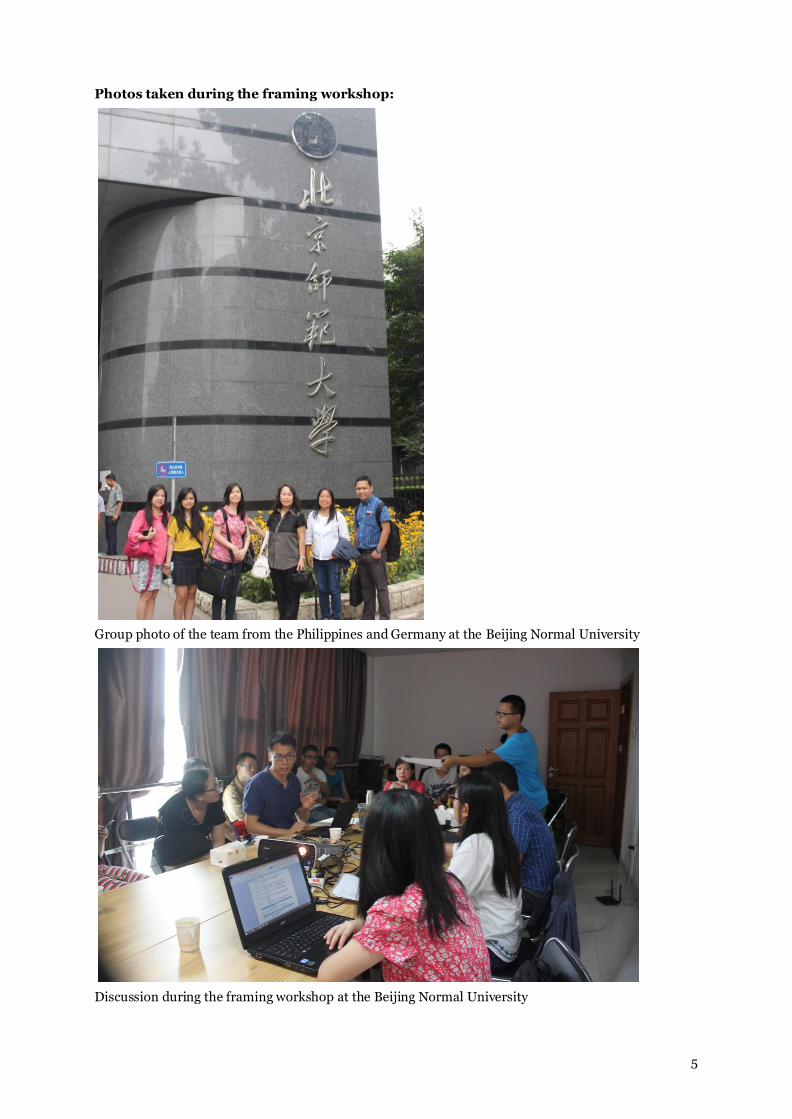
5
Photos taken during the framing workshop:
Group photo of the team from the Philippines and Germany at the Beijing Normal University
Discussion during the framing workshop at the Beijing Normal University
Hybrid approach STRAP to assess
sustainability trade-offs and
pathways
Lilibeth Acosta-Michlik
and PIC-STRAP Team
PIC-STRAP Framing Workshop
College of Global Change and Earth System Science
Beijing Normal University, China
21-24 July 2014
PIC-STRAP Team
1. Philippines (University of the Philippines Los Banos) –
Dr. Damasa B. Magcale-Macandog, E.A. Eugenio,
P.B.M. Macandog (A. Salvacion, J.M.A. Eugenio)
2. India (Madras School of Economics) – Dr. K. S. Kavi
Kumar, R. Manivasagan
3. China (Beijing Normal University) - Dr. Xuefeng Cui, L.
Miao, F. Zhu
4. Germany (Potsdam Institute for Climate Impacts
Research) - Dr. Lilibeth Acosta-Michlik
Integrated sustainability assessment of bioenergy potentials in Asia: An application of a hybrid approach on trade-offs and pathways (PIC-STRAP)
Outline
1. Background
2. Methods for sustainability
assessments
3. Hybrid approach - STRAP
• Sustainability concept
• Parametirisation (fuzzy, conjoint,
and logit analyses)
• Pathways and Path analysis
4. Illustration of applications
5. Summary: Data requirements
Background
Why bioenergy?
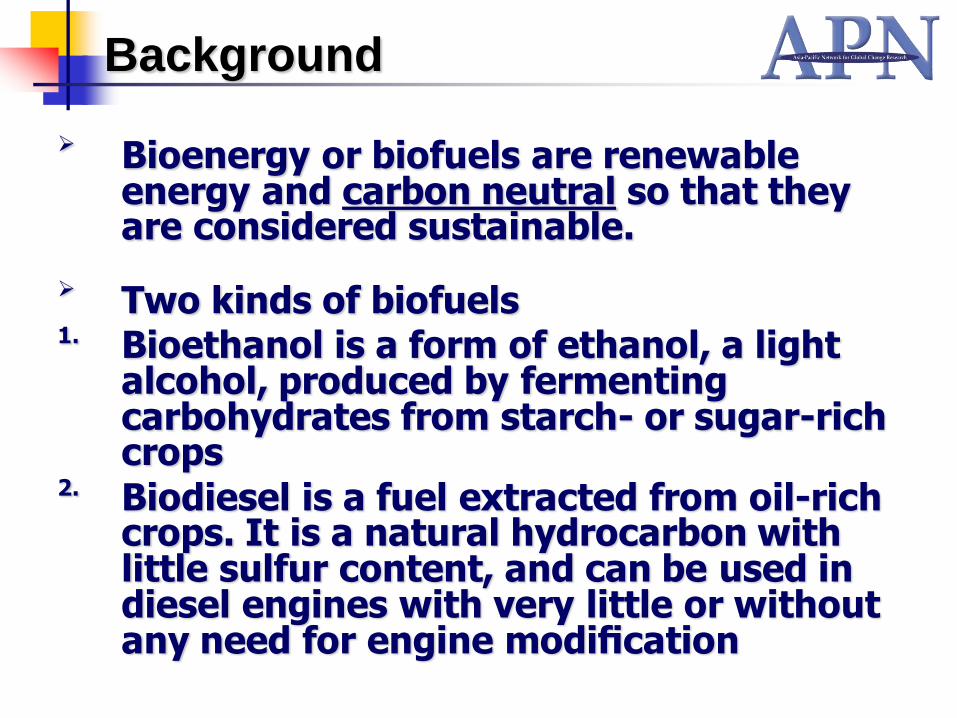
Bioenergy or biofuels are renewable energy and carbon neutral so that they are considered sustainable.
Two kinds of biofuels1. Bioethanol is a form of ethanol, a light
alcohol, produced by fermenting carbohydrates from starch- or sugar-rich crops
2. Biodiesel is a fuel extracted from oil-rich crops. It is a natural hydrocarbon with little sulfur content, and can be used in diesel engines with very little or without any need for engine modification
Background
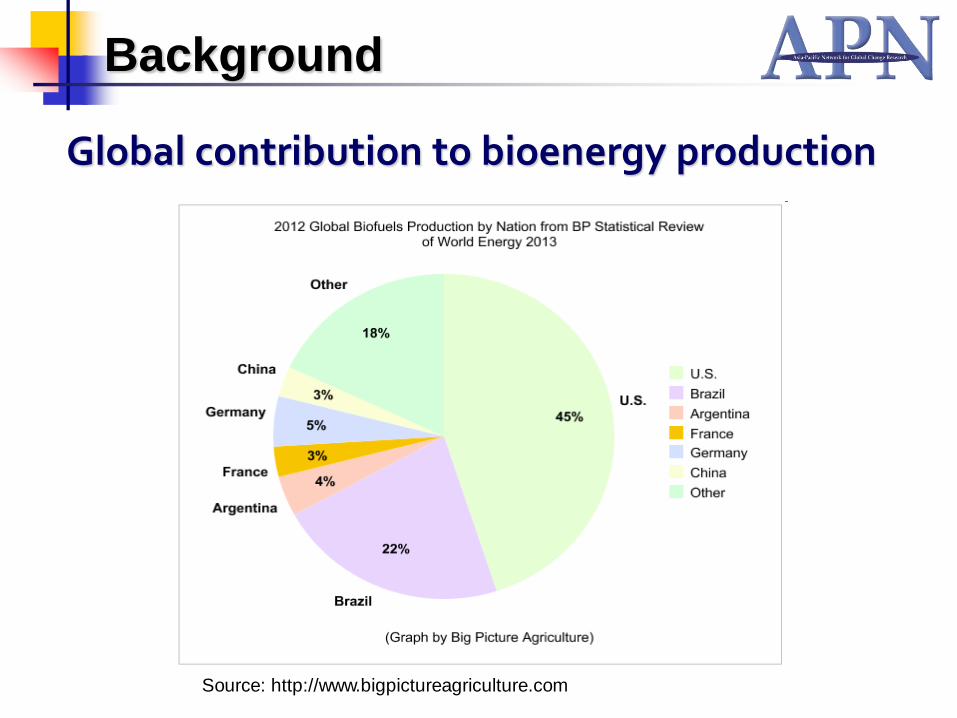
Global contribution to bioenergy production
Source: http://www.bigpictureagriculture.com
Background
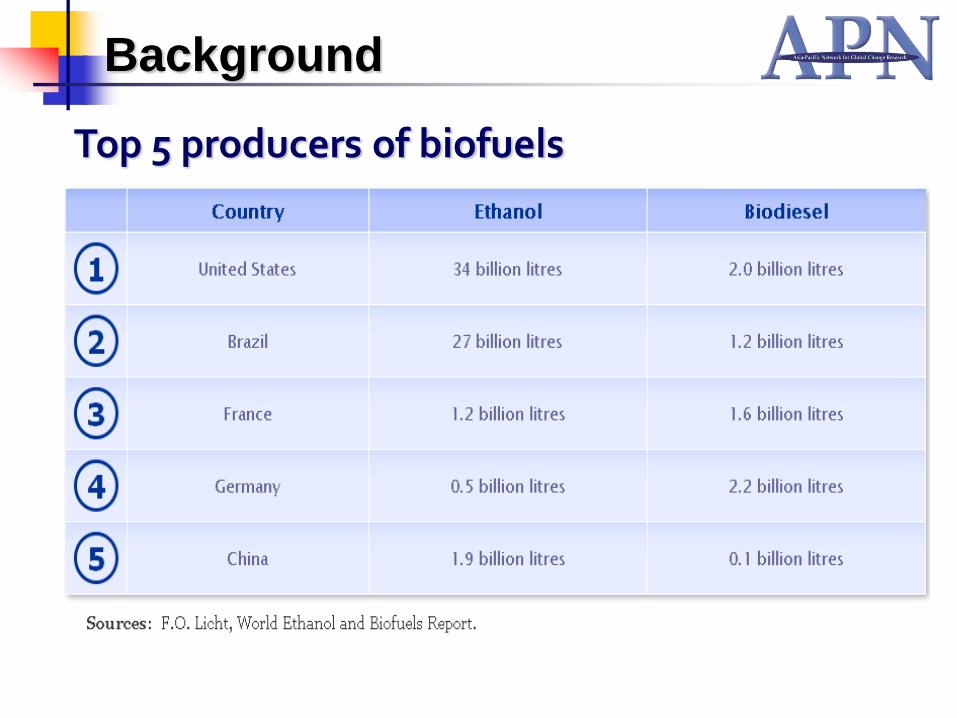
Top 5 producers of biofuels
Background
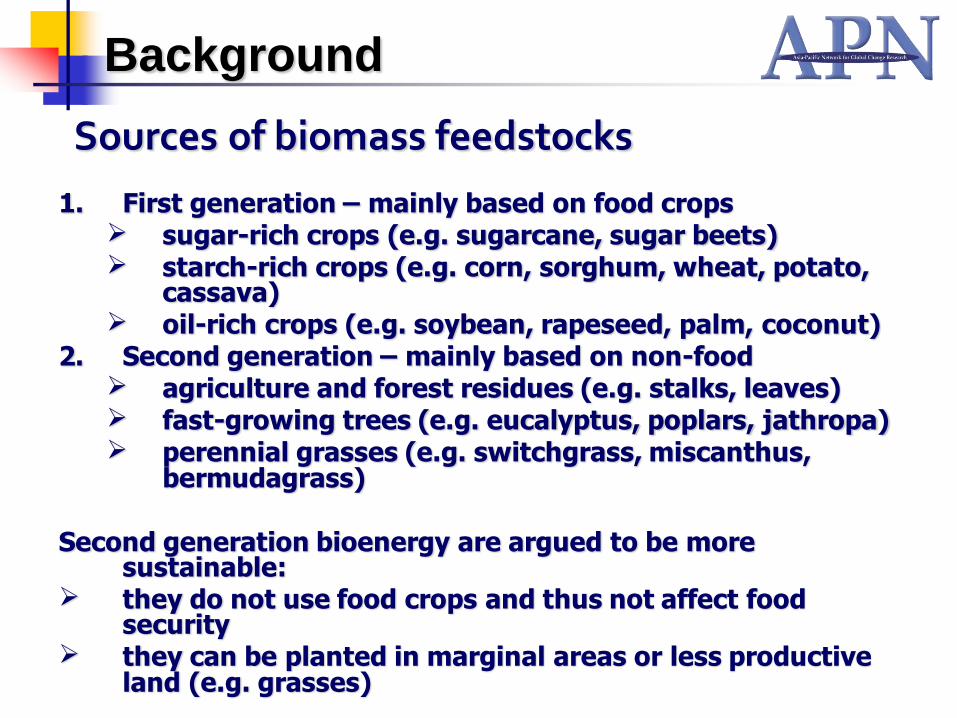
1. First generation – mainly based on food crops sugar-rich crops (e.g. sugarcane, sugar beets) starch-rich crops (e.g. corn, sorghum, wheat, potato,
cassava) oil-rich crops (e.g. soybean, rapeseed, palm, coconut)
2. Second generation – mainly based on non-food agriculture and forest residues (e.g. stalks, leaves) fast-growing trees (e.g. eucalyptus, poplars, jathropa) perennial grasses (e.g. switchgrass, miscanthus,
bermudagrass)
Second generation bioenergy are argued to be more sustainable:
they do not use food crops and thus not affect food security
they can be planted in marginal areas or less productive land (e.g. grasses)
Sources of biomass feedstocks
Background
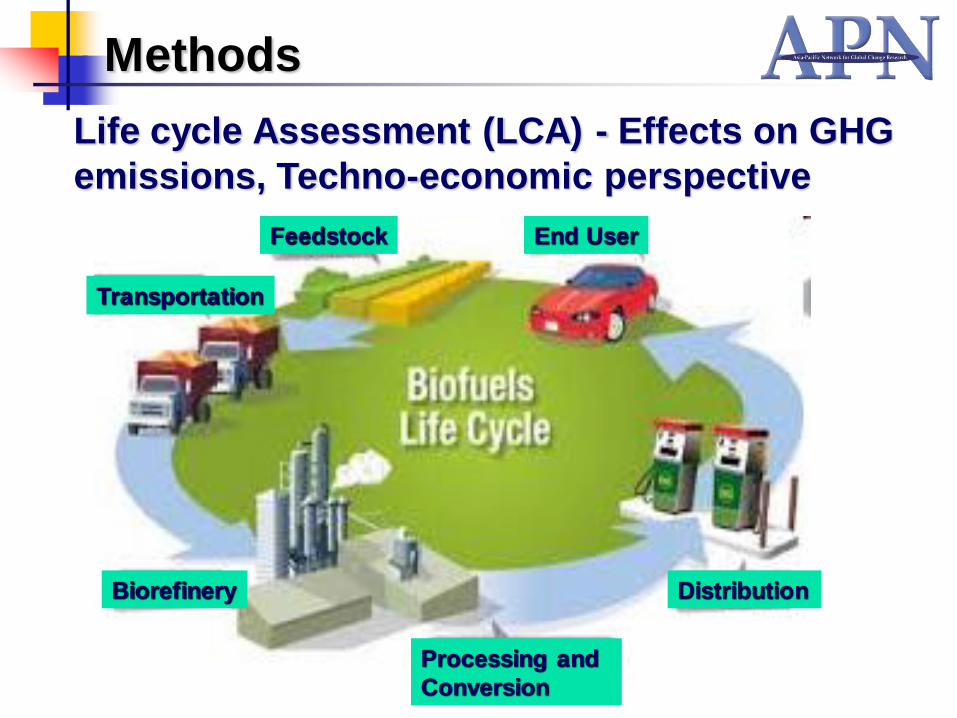
Life cycle Assessment (LCA) - Effects on GHG
emissions, Techno-economic perspective
End UserFeedstock
Transportation
Biorefinery
Processing and
Conversion
Distribution
Methods
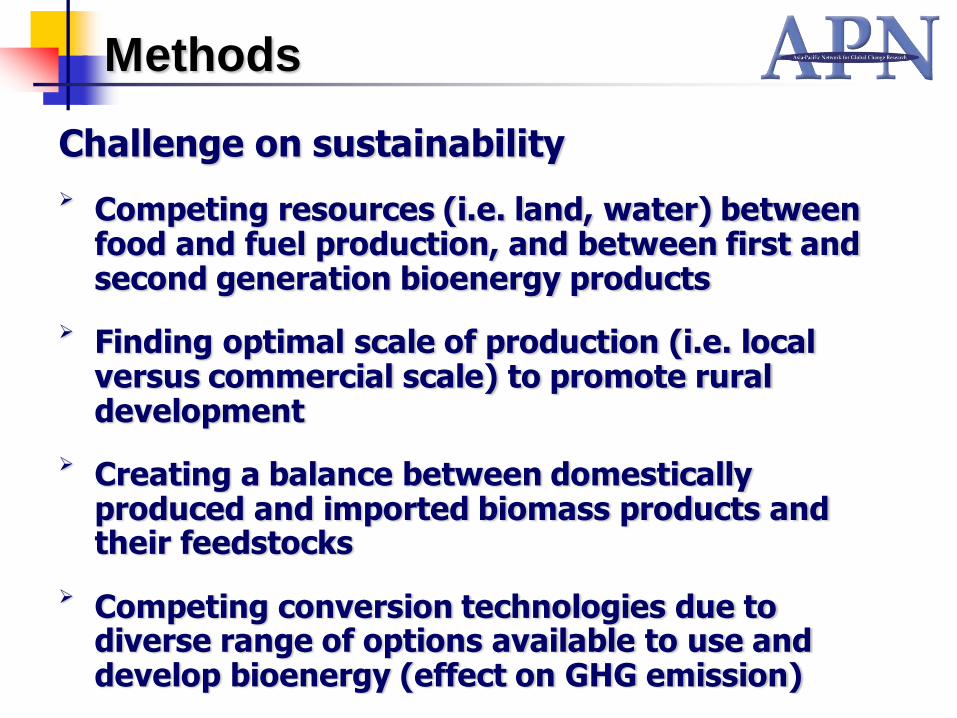
Challenge on sustainability
Competing resources (i.e. land, water) between food and fuel production, and between first and second generation bioenergy products
Finding optimal scale of production (i.e. local versus commercial scale) to promote rural development
Creating a balance between domestically produced and imported biomass products and their feedstocks
Competing conversion technologies due to diverse range of options available to use and develop bioenergy (effect on GHG emission)
Methods
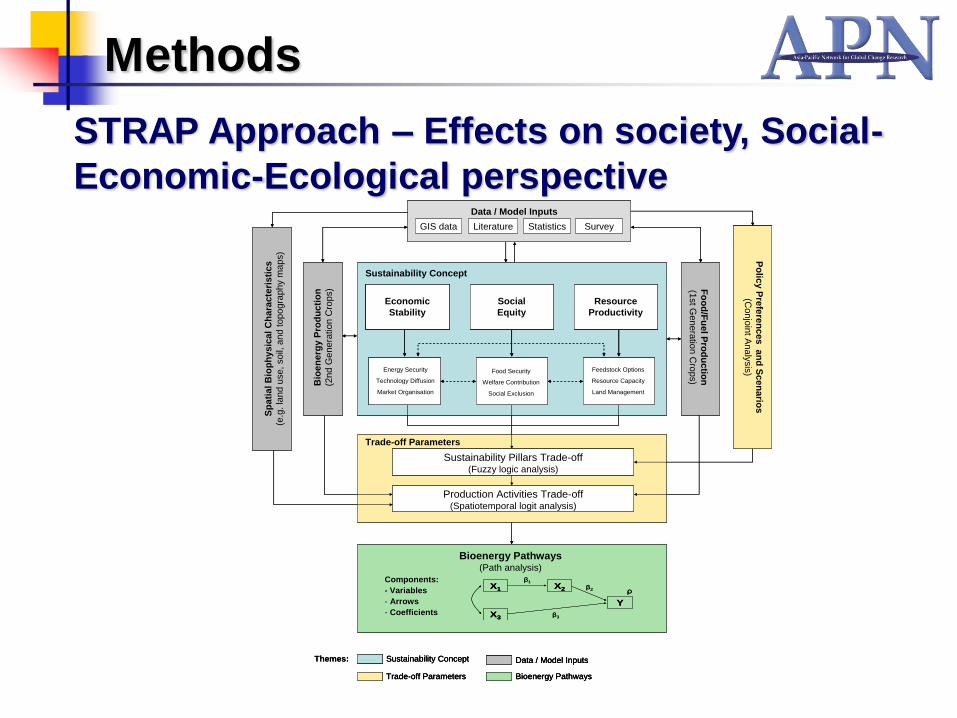
Bioenergy Pathways(Path analysis)
Sustainability Concept
Fo
od
/Fu
el P
rod
uc
tion
(1st G
ene
ratio
n C
rop
s)
Bio
en
erg
yP
rod
uc
tio
n
(2nd
Ge
ne
ratio
n C
rop
s)
Data / Model Inputs
GIS data StatisticsLiterature
Sustainability Pillars Trade-off(Fuzzy logic analysis)
Production Activities Trade-off(Spatiotemporal logit analysis)
Trade-off Parameters
Po
licy P
refe
ren
ces
an
d S
cen
ario
s
(Con
join
t Ana
lysis
)
Economic
Stability
Social
Equity
Resource
Productivity
Energy Security
Technology Diffusion
Market Organisation
Feedstock Options
Resource Capacity
Land Management
Food Security
Welfare Contribution
Social Exclusion
Survey
X1
Y
β1
β2
β3X3
X2 ρX1
Y
β1
β2
β3X3
X2 ρ
Components:
- Variables
- Arrows
- Coefficients
Sustainability Concept
Trade-off Parameters Bioenergy Pathways
Data / Model InputsThemes:
Sp
ati
al
Bio
ph
ysic
al
Ch
ara
cte
ris
tic
s
(e.g
. la
nd u
se,
so
il, a
nd
to
po
gra
ph
y m
aps)
Bioenergy Pathways(Path analysis)
Sustainability Concept
Fo
od
/Fu
el P
rod
uc
tion
(1st G
ene
ratio
n C
rop
s)
Bio
en
erg
yP
rod
uc
tio
n
(2nd
Ge
ne
ratio
n C
rop
s)
Data / Model Inputs
GIS data StatisticsLiterature
Sustainability Pillars Trade-off(Fuzzy logic analysis)
Sustainability Pillars Trade-off(Fuzzy logic analysis)
Production Activities Trade-off(Spatiotemporal logit analysis)
Production Activities Trade-off(Spatiotemporal logit analysis)
Trade-off Parameters
Po
licy P
refe
ren
ces
an
d S
cen
ario
s
(Con
join
t Ana
lysis
)
Po
licy P
refe
ren
ces
an
d S
cen
ario
s
(Con
join
t Ana
lysis
)
Economic
Stability
Social
Equity
Resource
Productivity
Energy Security
Technology Diffusion
Market Organisation
Feedstock Options
Resource Capacity
Land Management
Food Security
Welfare Contribution
Social Exclusion
Economic
Stability
Social
Equity
Resource
Productivity
Economic
Stability
Economic
Stability
Social
Equity
Social
Equity
Resource
Productivity
Resource
Productivity
Energy Security
Technology Diffusion
Market Organisation
Feedstock Options
Resource Capacity
Land Management
Food Security
Welfare Contribution
Social Exclusion
Survey
X1
Y
β1
β2
β3X3
X2 ρX1
Y
β1
β2
β3X3
X2 ρ
Components:
- Variables
- Arrows
- Coefficients
Sustainability Concept
Trade-off Parameters Bioenergy Pathways
Data / Model InputsSustainability Concept
Trade-off Parameters Bioenergy Pathways
Data / Model InputsThemes:
Sp
ati
al
Bio
ph
ysic
al
Ch
ara
cte
ris
tic
s
(e.g
. la
nd u
se,
so
il, a
nd
to
po
gra
ph
y m
aps)
STRAP Approach – Effects on society, Social-
Economic-Ecological perspective
Methods
STRAP Approach
Trade-offs
… is used in various fields as a concept to frame
knowledge discords and a tool to analyse alternative
options
Pathways
… a pathway defines the probability of converting land use
for bioenegy production as a function of the
interrelationships between the social, economic and
ecological pillars of sustainability
… pathways are a “logical” analysis of the trade-offs among
economic, social and ecological determinants of
sustainability
STRAP - Sustainability TRade-offs And Pathways
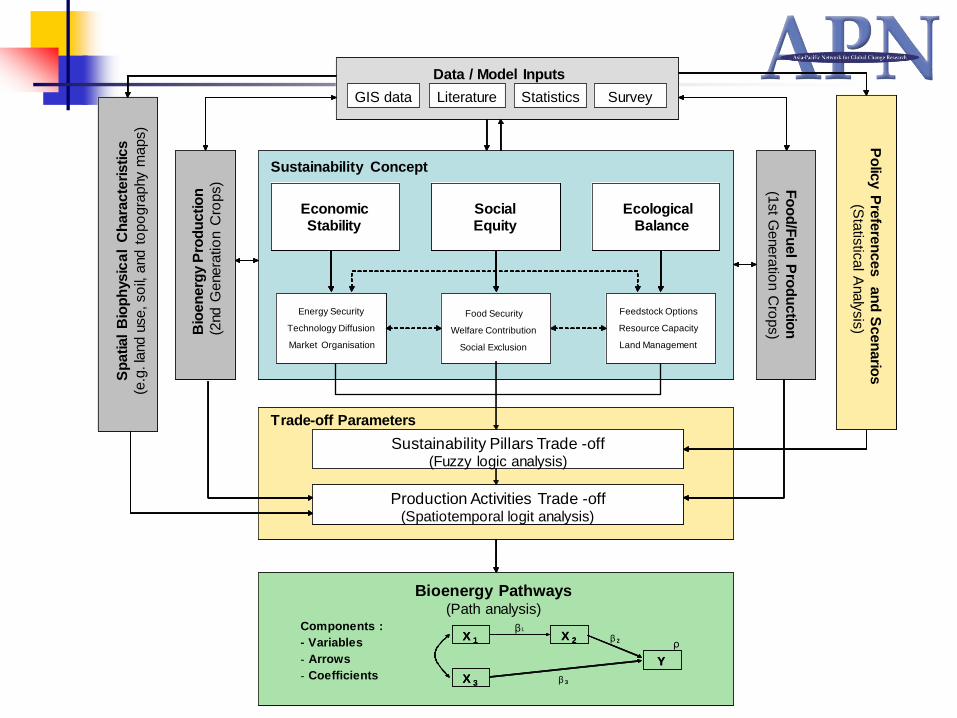
Bioenergy Pathways(Path analysis)
X 1
Y
? 1
? 2
? 3X 3
X 2 ?X 1
Y
? 1
? 2
? 3X 3
X 2 ?
Components :
- Variables
- Arrows
- Coefficients
Bioenergy Pathways(Path analysis)
X 1
Y
β1
β 2
β 3X 3
X 2 ρX 1
Y
2
3X 3
X 2
Components :
- Variables
- Arrows
- Coefficients
Sustainability Concept
Economic Stability
Social Equity
Resource Productivity
Energy Security
Technology Diffusion
Market Organisation
Feedstock Options
Resource Capacity
Land Management
Food Security
Welfare Contribution
Social Exclusion
Sustainability Concept
Economic Stability
Social Equity
Resource Productivity
Energy Security
Technology Diffusion
Market Organisation
Feedstock Options
Resource Capacity
Land Management
Food Security
Welfare Contribution
Social Exclusion
Economic Stability
Social Equity
Resource Productivity
Economic Stability
Economic Stability
Social EquitySocial Equity
Resource Productivity
Ecological Balance
Energy Security
Technology Diffusion
Market Organisation
Feedstock Options
Resource Capacity
Land Management
Food Security
Welfare Contribution
Social Exclusion
Bio
en
erg
yP
rod
uctio
n
(2nd G
enera
tio
n C
rops)
Bio
en
erg
yP
rod
uctio
n
(2nd G
enera
tio
n C
rops) F
oo
d/F
uel P
rod
uctio
n
(1st G
enera
tion C
rops)
Fo
od
/Fu
el P
rod
uctio
n
(1st G
enera
tion C
rops)
Sustainability Pillars Trade -off(Fuzzy logic analysis)
Production Activities Trade -off(Spatiotemporal logit analysis)
Trade-off Parameters
Sustainability Pillars Trade -off(Fuzzy logic analysis)
Sustainability Pillars Trade -off(Fuzzy logic analysis)
Production Activities Trade -off(Spatiotemporal logit analysis)
Production Activities Trade -off(Spatiotemporal logit analysis)
Trade-off Parameters
Po
licy P
refe
ren
ces a
nd
Scen
ario
s
(Co
njo
int A
naly
sis
)
Po
licy P
refe
ren
ces a
nd
Scen
ario
s
(Co
njo
int A
naly
sis
)
Po
licy P
refe
ren
ces a
nd
Scen
ario
s
(Sta
tistic
al A
naly
sis
)
Sp
atial
Bio
ph
ysic
al
Ch
ara
cte
ristics
(e.g
. la
nd
use, so
il, a
nd t
opo
gra
phy m
aps)
Sp
atial
Bio
ph
ysic
al
Ch
ara
cte
ristics
(e.g
. la
nd
use, so
il, a
nd t
opo
gra
phy m
aps)
Data / Model Inputs
GIS data StatisticsLiterature Survey
Data / Model Inputs
GIS data StatisticsLiterature Survey
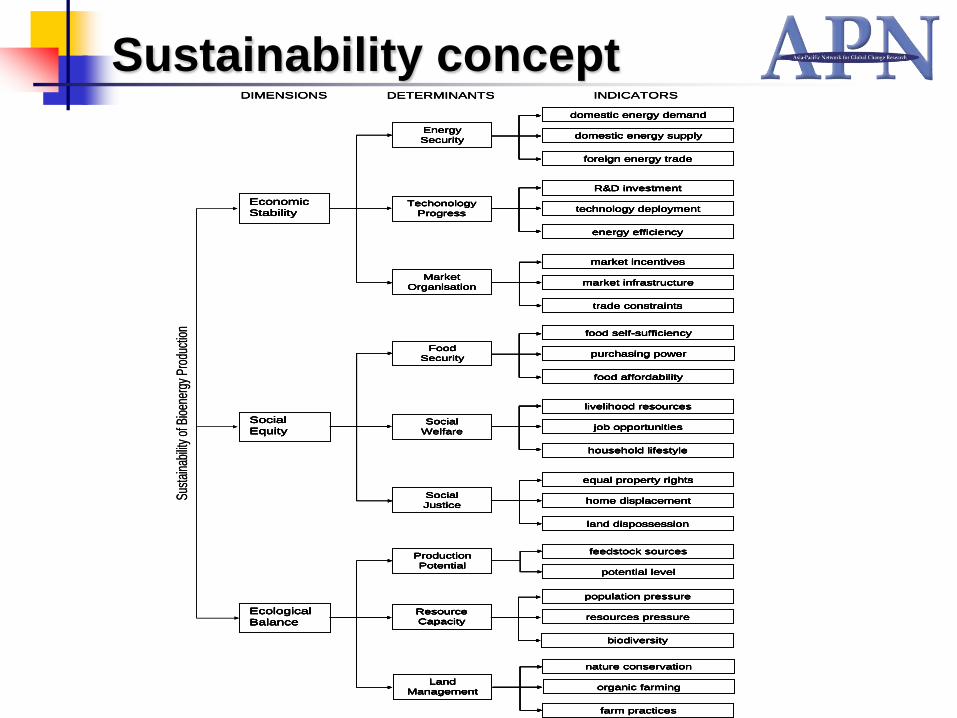
Sustainability concept
Economic
Stability
Energy
Security
Techonology
Progress
Market
Organisation
domestic energy demand
domestic energy supply
foreign energy trade
R&D investment
technology deployment
energy efficiency
market incentives
market infrastructure
trade constraints
Social
Equity
Food
Security
Social
Welfare
Social
Justice
food self-sufficiency
purchasing power
food affordability
livelihood resources
job opportunities
household lifestyle
equal property rights
home displacement
land dispossession
DETERMINANTS INDICATORSDIMENSIONS
Ecological
Balance
Production
Potential
Land
Management
nature conservation
organic farming
farm practices
Resource
Capacity
population pressure
resources pressure
biodiversity
feedstock sources
potential level
Sust
aina
bilit
yof
Bio
ener
gyPr
oduc
tion
Economic
Stability
Energy
Security
Techonology
Progress
Market
Organisation
domestic energy demand
domestic energy supply
foreign energy trade
R&D investment
technology deployment
energy efficiency
market incentives
market infrastructure
trade constraints
Social
Equity
Food
Security
Social
Welfare
Social
Justice
food self-sufficiency
purchasing power
food affordability
livelihood resources
job opportunities
household lifestyle
equal property rights
home displacement
land dispossession
DETERMINANTS INDICATORSDIMENSIONS
Ecological
Balance
Production
Potential
Land
Management
nature conservation
organic farming
farm practices
Resource
Capacity
population pressure
resources pressure
biodiversity
feedstock sources
potential level
Economic
Stability
Energy
Security
Techonology
Progress
Market
Organisation
domestic energy demand
domestic energy supply
foreign energy trade
R&D investment
technology deployment
energy efficiency
market incentives
market infrastructure
trade constraints
Economic
Stability
Economic
Stability
Energy
Security
Energy
Security
Techonology
Progress
Techonology
Progress
Market
Organisation
Market
Organisation
domestic energy demand
domestic energy supply
foreign energy trade
R&D investment
technology deployment
energy efficiency
market incentives
market infrastructure
trade constraints
domestic energy demand
domestic energy supply
foreign energy trade
R&D investment
technology deployment
energy efficiency
market incentives
market infrastructure
trade constraints
domestic energy demand
domestic energy supply
foreign energy trade
R&D investment
technology deployment
energy efficiency
market incentives
market infrastructure
trade constraints
Social
Equity
Food
Security
Social
Welfare
Social
Justice
food self-sufficiency
purchasing power
food affordability
livelihood resources
job opportunities
household lifestyle
equal property rights
home displacement
land dispossession
Social
Equity
Social
Equity
Food
Security
Food
Security
Social
Welfare
Social
Welfare
Social
Justice
Social
Justice
food self-sufficiency
purchasing power
food affordability
livelihood resources
job opportunities
household lifestyle
equal property rights
home displacement
land dispossession
food self-sufficiency
purchasing power
food affordability
livelihood resources
job opportunities
household lifestyle
equal property rights
home displacement
land dispossession
food self-sufficiency
purchasing power
food affordability
livelihood resources
job opportunities
household lifestyle
equal property rights
home displacement
land dispossession
DETERMINANTS INDICATORSDIMENSIONS
Ecological
Balance
Production
Potential
Land
Management
nature conservation
organic farming
farm practices
Resource
Capacity
population pressure
resources pressure
biodiversity
feedstock sources
potential level
Ecological
Balance
Ecological
Balance
Production
Potential
Production
Potential
Land
Management
nature conservation
organic farming
farm practices
Land
Management
Land
Management
nature conservation
organic farming
farm practices
Resource
Capacity
population pressure
resources pressure
biodiversity
Resource
Capacity
Resource
Capacity
population pressure
resources pressure
biodiversity
feedstock sources
potential level
feedstock sources
potential level
Sust
aina
bilit
yof
Bio
ener
gyPr
oduc
tion
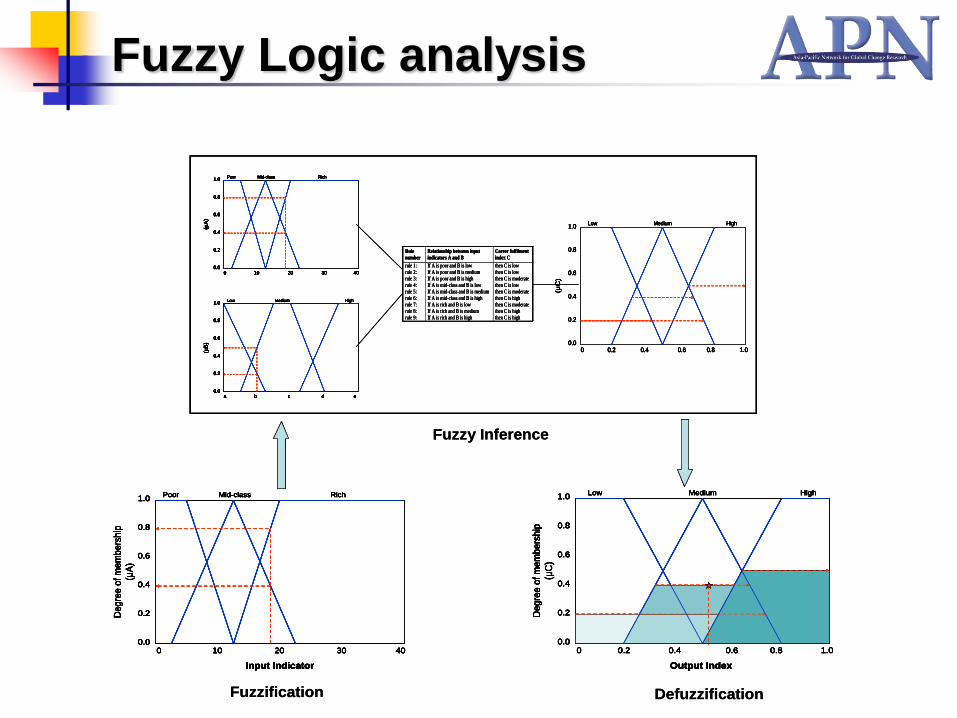
0 4010 20 30
Poor Mid-class Rich
0.8
0.0
0.2
0.4
0.6
1.0
Input Indicator
Degre
e o
f m
em
bers
hip
(μA
)
0 4010 20 30
Poor Mid-class Rich
0.8
0.0
0.2
0.4
0.6
1.0
Input Indicator
Degre
e o
f m
em
bers
hip
(μA
)
Output Index
0 1.00.2
Low Medium High
0.8
0.0
0.2
0.4
0.6
1.0
Degre
e o
f m
em
bers
hip
(μC
)
0.4 0.6 0.8
Output Index
0 1.00.2
Low Medium High
0.8
0.0
0.2
0.4
0.6
1.0
Degre
e o
f m
em
bers
hip
(μC
)
0.4 0.6 0.8
a eb c d
Low Medium High
0.8
0.0
0.2
0.4
0.6
1.0
(μB
)
0 4010 20 30
Poor Mid-class Rich
0.8
0.0
0.2
0.4
0.6
1.0
(μA
)
a eb c d
Low Medium High
0.8
0.0
0.2
0.4
0.6
1.0
(μB
)
a eb c d
Low Medium High
0.8
0.0
0.2
0.4
0.6
1.0
(μB
)
0 4010 20 30
Poor Mid-class Rich
0.8
0.0
0.2
0.4
0.6
1.0
(μA
)
0 4010 20 30
Poor Mid-class Rich
0.8
0.0
0.2
0.4
0.6
1.0
(μA
)
Rule
number
Relationship between input
indicators A and B
Career fulfilment
index C
rule 1: If A is poor and B is low then C is low
rule 2: If A is poor and B is medium then C is low
rule 3: If A is poor and B is high then C is moderate
rule 4: If A is mid-class and B is low then C is low
rule 5: If A is mid-class and B is medium then C is moderate
rule 6: If A is mid-class and B is high then C is high
rule 7: If A is rich and B is low then C is moderate
rule 8: If A is rich and B is medium then C is high
rule 9: If A is rich and B is high then C is high
0 1.00.2
Low Medium High
0.8
0.0
0.2
0.4
0.6
1.0
(μC
)
0.4 0.6 0.80 1.00.2
Low Medium High
0.8
0.0
0.2
0.4
0.6
1.0
(μC
)
0.4 0.6 0.8
Fuzzification Defuzzification
Fuzzy Inference
0 4010 20 30
Poor Mid-class Rich
0.8
0.0
0.2
0.4
0.6
1.0
Input Indicator
Degre
e o
f m
em
bers
hip
(μA
)
0 4010 20 30
Poor Mid-class Rich
0.8
0.0
0.2
0.4
0.6
1.0
Input Indicator
Degre
e o
f m
em
bers
hip
(μA
)
Output Index
0 1.00.2
Low Medium High
0.8
0.0
0.2
0.4
0.6
1.0
Degre
e o
f m
em
bers
hip
(μC
)
0.4 0.6 0.8
Output Index
0 1.00.2
Low Medium High
0.8
0.0
0.2
0.4
0.6
1.0
Degre
e o
f m
em
bers
hip
(μC
)
0.4 0.6 0.8
a eb c d
Low Medium High
0.8
0.0
0.2
0.4
0.6
1.0
(μB
)
0 4010 20 30
Poor Mid-class Rich
0.8
0.0
0.2
0.4
0.6
1.0
(μA
)
a eb c d
Low Medium High
0.8
0.0
0.2
0.4
0.6
1.0
(μB
)
a eb c d
Low Medium High
0.8
0.0
0.2
0.4
0.6
1.0
(μB
)
0 4010 20 30
Poor Mid-class Rich
0.8
0.0
0.2
0.4
0.6
1.0
(μA
)
0 4010 20 30
Poor Mid-class Rich
0.8
0.0
0.2
0.4
0.6
1.0
(μA
)
Rule
number
Relationship between input
indicators A and B
Career fulfilment
index C
rule 1: If A is poor and B is low then C is low
rule 2: If A is poor and B is medium then C is low
rule 3: If A is poor and B is high then C is moderate
rule 4: If A is mid-class and B is low then C is low
rule 5: If A is mid-class and B is medium then C is moderate
rule 6: If A is mid-class and B is high then C is high
rule 7: If A is rich and B is low then C is moderate
rule 8: If A is rich and B is medium then C is high
rule 9: If A is rich and B is high then C is high
0 1.00.2
Low Medium High
0.8
0.0
0.2
0.4
0.6
1.0
(μC
)
0.4 0.6 0.80 1.00.2
Low Medium High
0.8
0.0
0.2
0.4
0.6
1.0
(μC
)
0.4 0.6 0.8
0 4010 20 30
Poor Mid-class Rich
0.8
0.0
0.2
0.4
0.6
1.0
Input Indicator
Degre
e o
f m
em
bers
hip
(μA
)
0 4010 20 30
Poor Mid-class Rich
0.8
0.0
0.2
0.4
0.6
1.0
Input Indicator
Degre
e o
f m
em
bers
hip
(μA
)
Output Index
0 1.00.2
Low Medium High
0.8
0.0
0.2
0.4
0.6
1.0
Degre
e o
f m
em
bers
hip
(μC
)
0.4 0.6 0.8
Output Index
0 1.00.2
Low Medium High
0.8
0.0
0.2
0.4
0.6
1.0
Degre
e o
f m
em
bers
hip
(μC
)
0.4 0.6 0.8
a eb c d
Low Medium High
0.8
0.0
0.2
0.4
0.6
1.0
(μB
)
0 4010 20 30
Poor Mid-class Rich
0.8
0.0
0.2
0.4
0.6
1.0
(μA
)
a eb c d
Low Medium High
0.8
0.0
0.2
0.4
0.6
1.0
(μB
)
a eb c d
Low Medium High
0.8
0.0
0.2
0.4
0.6
1.0
(μB
)
0 4010 20 30
Poor Mid-class Rich
0.8
0.0
0.2
0.4
0.6
1.0
(μA
)
0 4010 20 30
Poor Mid-class Rich
0.8
0.0
0.2
0.4
0.6
1.0
(μA
)
Rule
number
Relationship between input
indicators A and B
Career fulfilment
index C
rule 1: If A is poor and B is low then C is low
rule 2: If A is poor and B is medium then C is low
rule 3: If A is poor and B is high then C is moderate
rule 4: If A is mid-class and B is low then C is low
rule 5: If A is mid-class and B is medium then C is moderate
rule 6: If A is mid-class and B is high then C is high
rule 7: If A is rich and B is low then C is moderate
rule 8: If A is rich and B is medium then C is high
rule 9: If A is rich and B is high then C is high
0 1.00.2
Low Medium High
0.8
0.0
0.2
0.4
0.6
1.0
(μC
)
0.4 0.6 0.80 1.00.2
Low Medium High
0.8
0.0
0.2
0.4
0.6
1.0
(μC
)
0.4 0.6 0.8
Fuzzification Defuzzification
Fuzzy Inference
Fuzzy Logic analysis
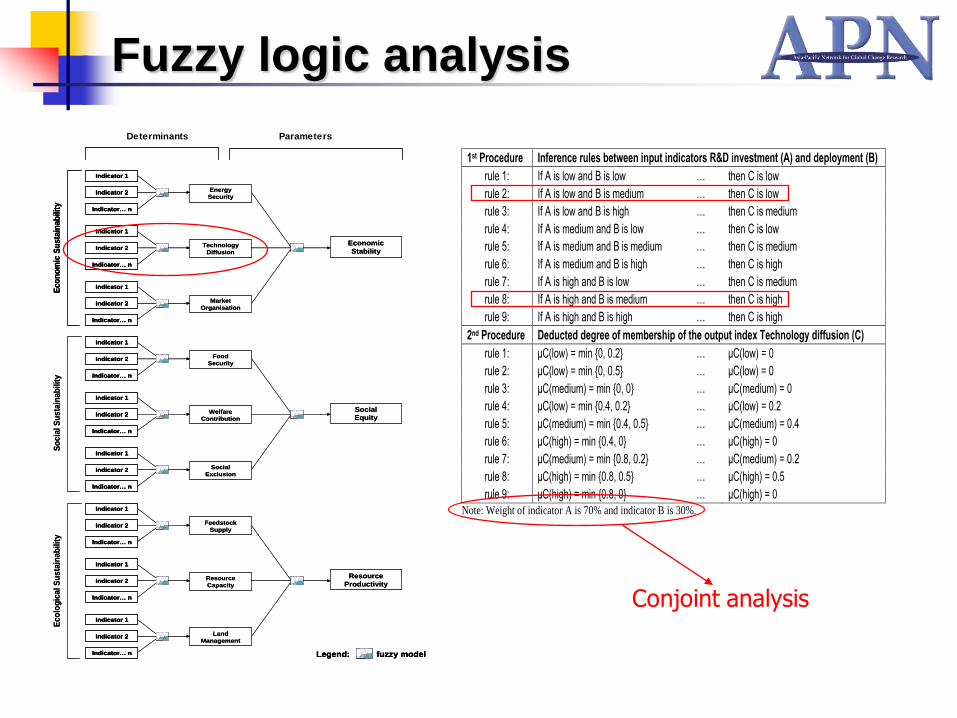
Fuzzy logic analysis E
co
log
ica
lS
us
tain
ab
ilit
y
Indicator 1
Indicator 2
Indicator… n
Indicator 1
Indicator 2
Indicator… n
Indicator 1
Indicator 2
Indicator… n
Feedstock
Supply
Resource
Capacity
Land
Management
Resource
Productivity
So
cia
lS
us
tain
ab
ilit
y
Indicator 1
Indicator 2
Indicator… n
Indicator 1
Indicator 2
Indicator… n
Indicator 1
Indicator 2
Indicator… n
Food
Security
Welfare
Contribution
Social
Exclusion
Social
Equity
Technology
Diffusion
Market
Organisation
Economic
Stability
Indicator 1
Indicator 2
Indicator… n
Indicator 1
Indicator 2
Indicator… n
Indicator 1
Indicator 2
Indicator… n
Ec
on
om
icS
us
tain
ab
ilit
y
Energy
Security
Determinants Sustainability Metrics
Legend: fuzzy model
Ec
olo
gic
al
Su
sta
ina
bil
ity
Indicator 1
Indicator 2
Indicator… n
Indicator 1
Indicator 2
Indicator… n
Indicator 1
Indicator 2
Indicator… n
Indicator 1
Indicator 2
Indicator… n
Indicator 1
Indicator 2
Indicator… n
Indicator 1
Indicator 2
Indicator… n
Feedstock
Supply
Resource
Capacity
Land
Management
Resource
Productivity
So
cia
lS
us
tain
ab
ilit
y
Indicator 1
Indicator 2
Indicator… n
Indicator 1
Indicator 2
Indicator… n
Indicator 1
Indicator 2
Indicator… n
Indicator 1
Indicator 2
Indicator… n
Indicator 1
Indicator 2
Indicator… n
Indicator 1
Indicator 2
Indicator… n
Food
Security
Welfare
Contribution
Social
Exclusion
Social
Equity
Technology
Diffusion
Market
Organisation
Economic
Stability
Indicator 1
Indicator 2
Indicator… n
Indicator 1
Indicator 2
Indicator… n
Indicator 1
Indicator 2
Indicator… n
Ec
on
om
icS
us
tain
ab
ilit
y
Indicator 1
Indicator 2
Indicator… n
Indicator 1
Indicator 2
Indicator… n
Indicator 1
Indicator 2
Indicator… n
Ec
on
om
icS
us
tain
ab
ilit
y
Energy
Security
DeterminantsDeterminants Sustainability MetricsSustainability Metrics
Legend: fuzzy modelLegend: fuzzy model
1st Procedure Inference rules between input indicators R&D investment (A) and deployment (B)
rule 1: If A is low and B is low … then C is low
rule 2: If A is low and B is medium … then C is low
rule 3: If A is low and B is high … then C is medium
rule 4: If A is medium and B is low … then C is low
rule 5: If A is medium and B is medium … then C is medium
rule 6: If A is medium and B is high … then C is high
rule 7: If A is high and B is low … then C is medium
rule 8: If A is high and B is medium … then C is high
rule 9: If A is high and B is high … then C is high
2nd Procedure Deducted degree of membership of the output index Technology diffusion (C)
rule 1: μC(low) = min {0, 0.2} … μC(low) = 0
rule 2: μC(low) = min {0, 0.5} … μC(low) = 0
rule 3: μC(medium) = min {0, 0} … μC(medium) = 0
rule 4: μC(low) = min {0.4, 0.2} … μC(low) = 0.2
rule 5: μC(medium) = min {0.4, 0.5} … μC(medium) = 0.4
rule 6: μC(high) = min {0.4, 0} … μC(high) = 0
rule 7: μC(medium) = min {0.8, 0.2} … μC(medium) = 0.2
rule 8: μC(high) = min {0.8, 0.5} … μC(high) = 0.5
rule 9: μC(high) = min {0.8, 0} … μC(high) = 0
Note: Weight of indicator A is 70% and indicator B is 30%.
Conjoint analysis
Determinants Parameters
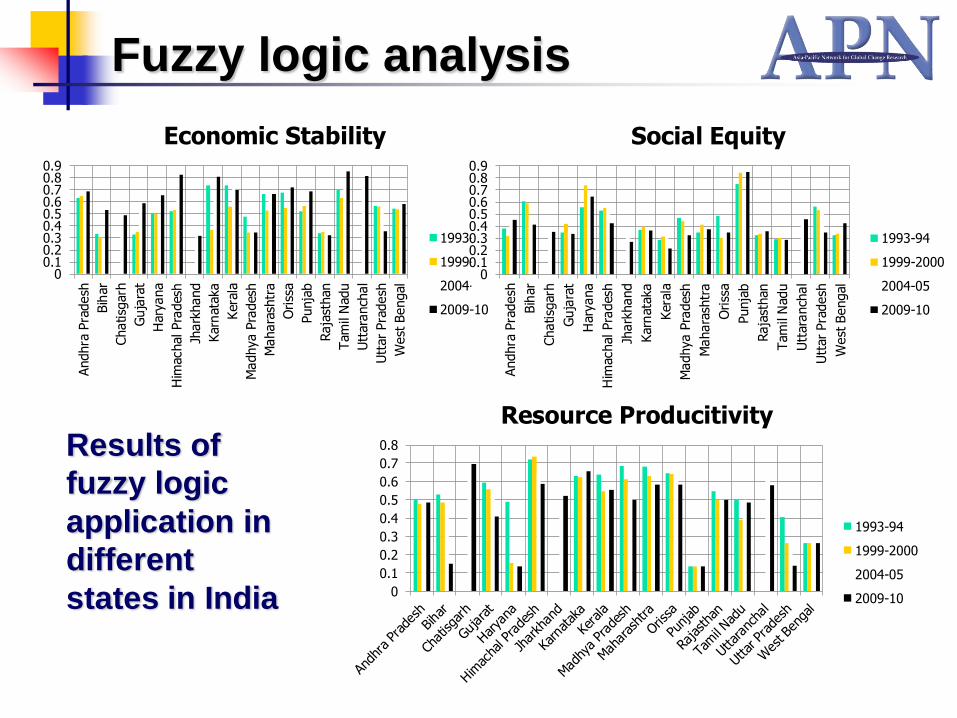
00.10.20.30.40.50.60.70.80.9
Andhra
Pra
desh
Bih
ar
Chatisg
arh
Guja
rat
Hary
ana
Him
achal Pra
desh
Jhark
hand
Karn
ata
ka
Kera
la
Madhya P
radesh
Mahara
shtr
a
Oriss
a
Punja
b
Raja
sthan
Tam
il N
adu
Utt
ara
nch
al
Utt
ar
Pra
desh
West
Bengal
Economic Stability
1993-94
1999-2000
2004-05
2009-10
Fuzzy logic analysis
00.10.20.30.40.50.60.70.80.9
Andhra
Pra
desh
Bih
ar
Chatisg
arh
Guja
rat
Hary
ana
Him
achal Pra
desh
Jhark
hand
Karn
ata
ka
Kera
la
Madhya P
radesh
Mahara
shtr
a
Oriss
a
Punja
b
Raja
sthan
Tam
il N
adu
Utt
ara
nch
al
Utt
ar
Pra
desh
West
Bengal
Social Equity
1993-94
1999-2000
2004-05
2009-10
0
0.1
0.2
0.3
0.4
0.5
0.6
0.7
0.8
Resource Producitivity
1993-94
1999-2000
2004-05
2009-10
Results of
fuzzy logic
application in
different
states in India
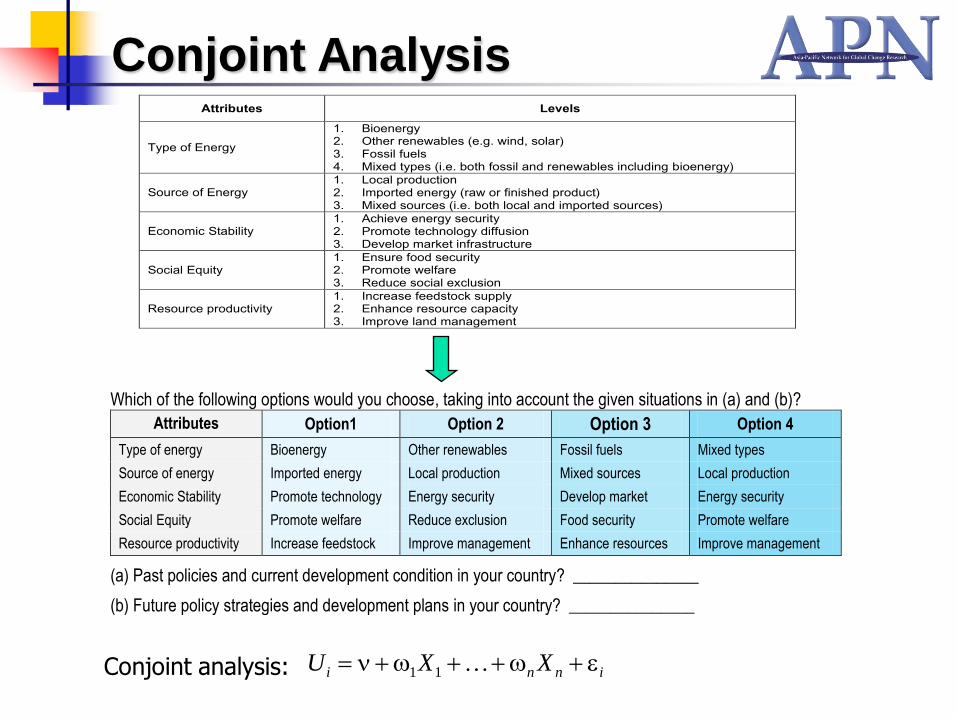
Conjoint AnalysisAttributes Levels
Type of Energy
1. Bioenergy 2. Other renewables (e.g. wind, solar) 3. Fossil fuels 4. Mixed types (i.e. both fossil and renewables including bioenergy)
Source of Energy 1. Local production 2. Imported energy (raw or finished product) 3. Mixed sources (i.e. both local and imported sources)
Economic Stability 1. Achieve energy security 2. Promote technology diffusion 3. Develop market infrastructure
Social Equity 1. Ensure food security 2. Promote welfare 3. Reduce social exclusion
Resource productivity 1. Increase feedstock supply 2. Enhance resource capacity 3. Improve land management
Which of the following options would you choose, taking into account the given situations in (a) and (b)?
Attributes Option1 Option 2 Option 3 Option 4
Type of energy Bioenergy Other renewables Fossil fuels Mixed types
Source of energy Imported energy Local production Mixed sources Local production
Economic Stability Promote technology Energy security Develop market Energy security
Social Equity Promote welfare Reduce exclusion Food security Promote welfare
Resource productivity Increase feedstock Improve management Enhance resources Improve management
(a) Past policies and current development condition in your country? _______________
(b) Future policy strategies and development plans in your country? _______________
inni XXU 11Conjoint analysis:
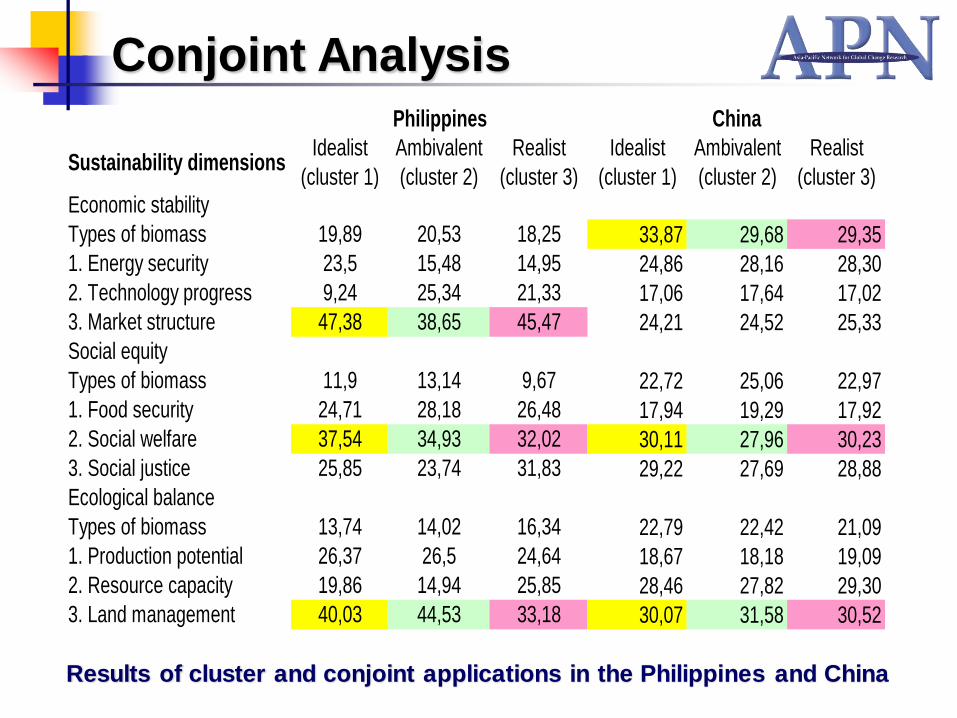
Conjoint Analysis
Sustainability dimensionsIdealist
(cluster 1)
Ambivalent
(cluster 2)
Realist
(cluster 3)
Idealist
(cluster 1)
Ambivalent
(cluster 2)
Realist
(cluster 3)
Economic stability
Types of biomass 19,89 20,53 18,25 33,87 29,68 29,35
1. Energy security 23,5 15,48 14,95 24,86 28,16 28,30
2. Technology progress 9,24 25,34 21,33 17,06 17,64 17,02
3. Market structure 47,38 38,65 45,47 24,21 24,52 25,33
Social equity
Types of biomass 11,9 13,14 9,67 22,72 25,06 22,97
1. Food security 24,71 28,18 26,48 17,94 19,29 17,92
2. Social welfare 37,54 34,93 32,02 30,11 27,96 30,23
3. Social justice 25,85 23,74 31,83 29,22 27,69 28,88
Ecological balance
Types of biomass 13,74 14,02 16,34 22,79 22,42 21,09
1. Production potential 26,37 26,5 24,64 18,67 18,18 19,09
2. Resource capacity 19,86 14,94 25,85 28,46 27,82 29,30
3. Land management 40,03 44,53 33,18 30,07 31,58 30,52
Philippines China
Results of cluster and conjoint applications in the Philippines and China
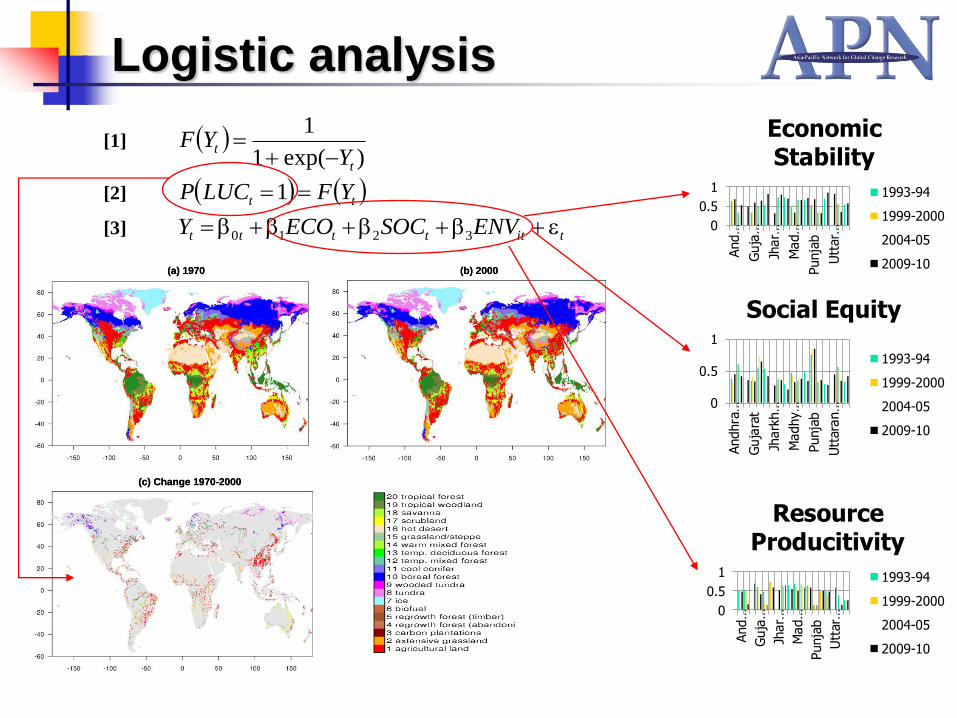
Logistic analysis
[1] )exp(1
1
t
tY
YF
1
[2] tt YFLUCP 1 2
[3] tittttt ENVSOCECOY 3210 3
(a) 1970 (b) 2000
(c) Change 1970-2000
(a) 1970 (b) 2000
(c) Change 1970-2000
0
0.5
1
And…
Guja…
Jhar…
Mad…
Punja
b
Uttar…
Economic Stability
1993-94
1999-2000
2004-05
2009-10
0
0.5
1
Andhra…
Guja
rat
Jharkh…
Madhy…
Punja
b
Uttaran…
Social Equity
1993-94
1999-2000
2004-05
2009-10
0
0.5
1
And…
Guja…
Jhar…
Mad…
Punja
b
Uttar…
Resource Producitivity
1993-94
1999-2000
2004-05
2009-10
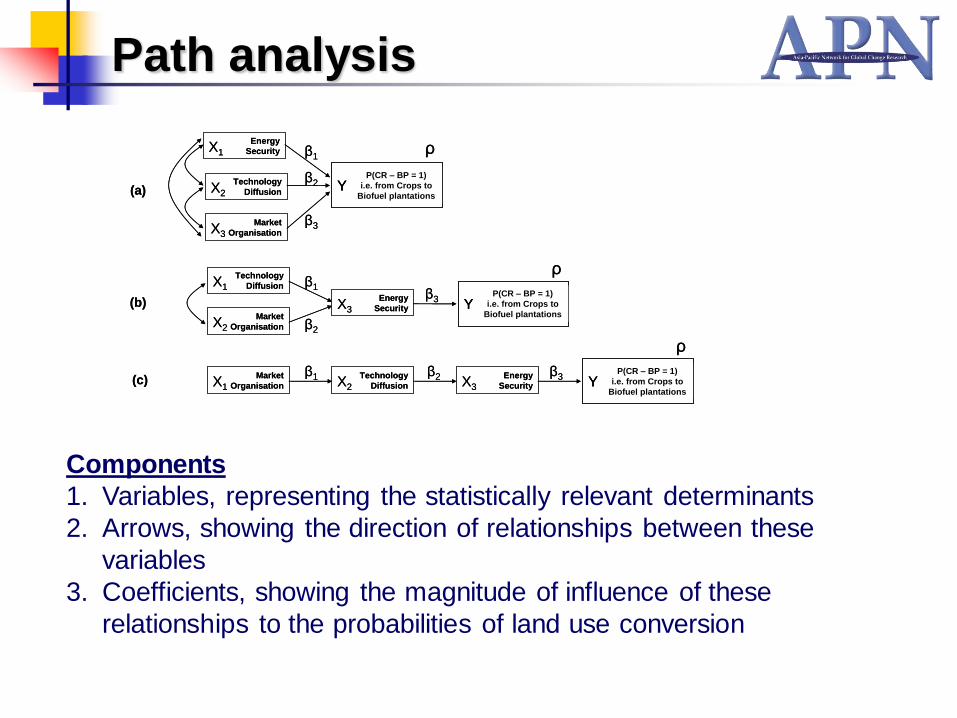
Path analysis
Technology
Diffusion
Market
Organisation
Energy
Security
Technology
Diffusion
Market
Organisation
Energy
Security
Market
Organisation
Technology
Diffusion
Energy
Security
(a)
(b)
(c)
X1
X2
X3
X1
X2
X1
X3
X2 X3
P(CR – BP = 1)
i.e. from Crops to
Biofuel plantationsY
P(CR – BP = 1)
i.e. from Crops to
Biofuel plantationsY
P(CR – BP = 1)
i.e. from Crops to
Biofuel plantationsY
β1
β1
β1
β2
β2
β2 β3
β3
β3
ρ
ρ
ρ
Technology
Diffusion
Market
Organisation
Energy
Security
Technology
Diffusion
Market
Organisation
Energy
Security
Market
Organisation
Technology
Diffusion
Energy
Security
(a)
(b)
(c)
X1
X2
X3
X1
X2
X1
X3
X2 X3
P(CR – BP = 1)
i.e. from Crops to
Biofuel plantationsY
P(CR – BP = 1)
i.e. from Crops to
Biofuel plantationsY
P(CR – BP = 1)
i.e. from Crops to
Biofuel plantationsY
P(CR – BP = 1)
i.e. from Crops to
Biofuel plantationsY
P(CR – BP = 1)
i.e. from Crops to
Biofuel plantationsY
P(CR – BP = 1)
i.e. from Crops to
Biofuel plantationsY
β1
β1
β1
β2
β2
β2 β3
β3
β3
ρ
ρ
ρ
Components
1. Variables, representing the statistically relevant determinants
2. Arrows, showing the direction of relationships between these
variables
3. Coefficients, showing the magnitude of influence of these
relationships to the probabilities of land use conversion
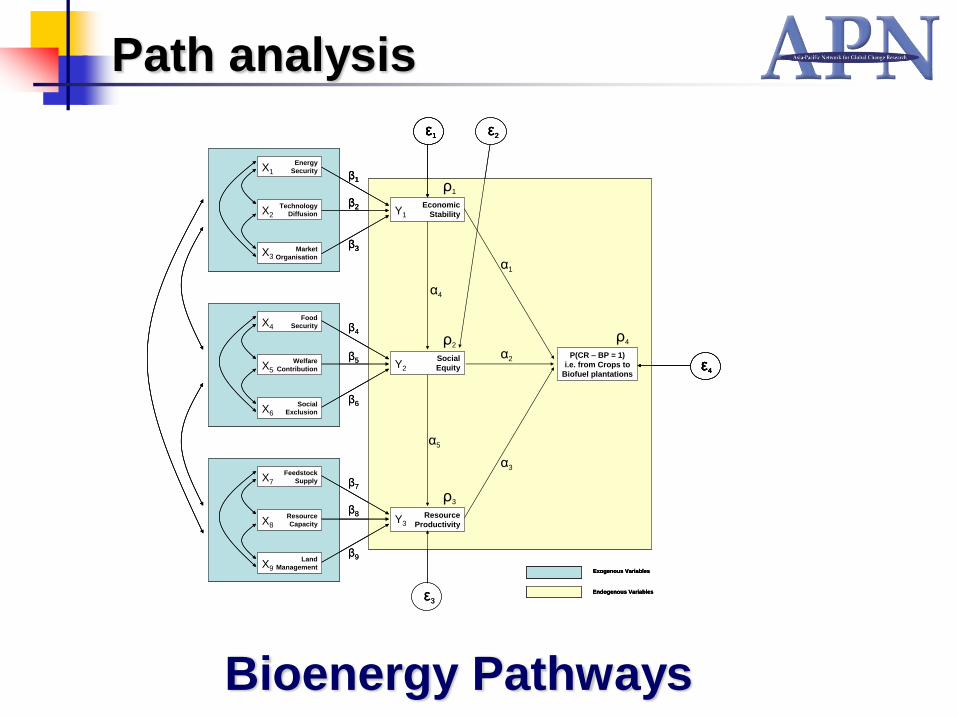
Path analysis
Exogenous Variables
Endogenous Variables
Economic
StabilityTechnology
Diffusion
Market
Organisation
Energy
Security
Welfare
Contribution
Social
Exclusion
Food
Security
Resource
Capacity
Land
Management
Feedstock
Supply
Social
Equity
Resource
Productivity
β1
β2
β3
β4
β5
β6
β7
β8
β9
α1
α2
α3
α4
α5
P(CR – BP = 1)
i.e. from Crops to
Biofuel plantationsε4
ρ4
ρ1
ρ2
ρ3
ε1
ε3
ε2
X1
X2
X3
X4
X5
X6
X7
X8
X9
Y1
Y2
Y3
Exogenous Variables
Endogenous Variables
Exogenous Variables
Endogenous Variables
Economic
StabilityTechnology
Diffusion
Market
Organisation
Energy
Security
Welfare
Contribution
Social
Exclusion
Food
Security
Resource
Capacity
Land
Management
Feedstock
Supply
Social
Equity
Resource
Productivity
β1
β2
β3
β1
β2
β3
β4
β5
β6
β7
β8
β9
α1
α2
α3
α4
α5
P(CR – BP = 1)
i.e. from Crops to
Biofuel plantationsε4ε4ε4
ρ4
ρ1
ρ2
ρ3
ε1ε1ε1
ε3
ε2ε2
X1
X2
X3
X4
X5
X6
X7
X8
X9
Y1
Y2
Y3
Bioenergy Pathways
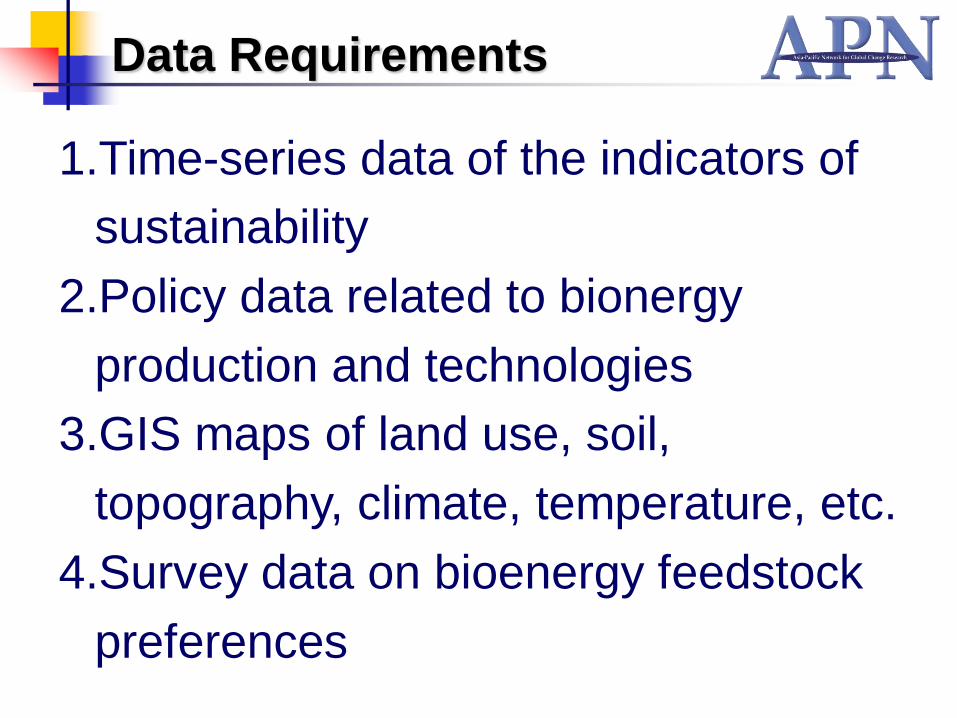
Data Requirements
1.Time-series data of the indicators of
sustainability
2.Policy data related to bionergy
production and technologies
3.GIS maps of land use, soil,
topography, climate, temperature, etc.
4.Survey data on bioenergy feedstock
preferences

Thank you for your attention!
Typology of Farmers’ Awareness
on Sustainability of Alternative
Bioenergy Feedstocks in the
Philippines
Elena A. Eugenio, Lilibeth A. Acosta, Nelson H. Enano Jr., Damasa M. Macandog, Paula Beatrice M. Macandog
and Joan Pauline P. TaluboUniversity of the Philippines in Los Banos, Philippines
PIC-STRAP Project Framing Workshop
Beijing, 21-24 July, 2014
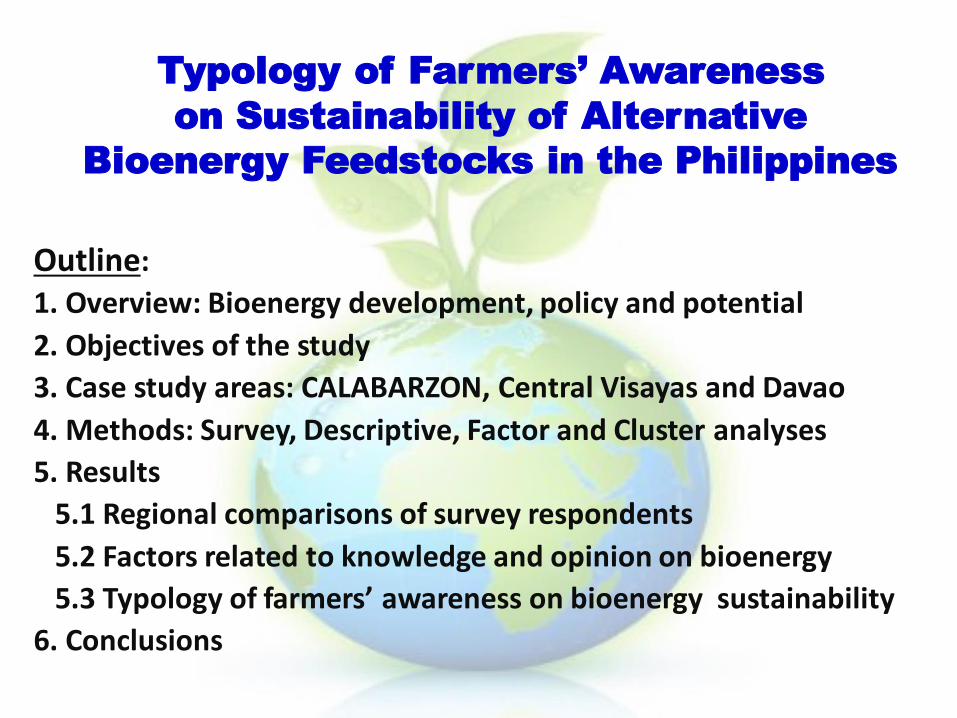
Typology of Farmers’ Awareness
on Sustainability of Alternative
Bioenergy Feedstocks in the Philippines
Outline:
1. Overview: Bioenergy development, policy and potential
2. Objectives of the study
3. Case study areas: CALABARZON, Central Visayas and Davao
4. Methods: Survey, Descriptive, Factor and Cluster analyses
5. Results
5.1 Regional comparisons of survey respondents
5.2 Factors related to knowledge and opinion on bioenergy
5.3 Typology of farmers’ awareness on bioenergy sustainability
6. Conclusions
1. Overview:
Bioenergy Development, Policy and
Potential
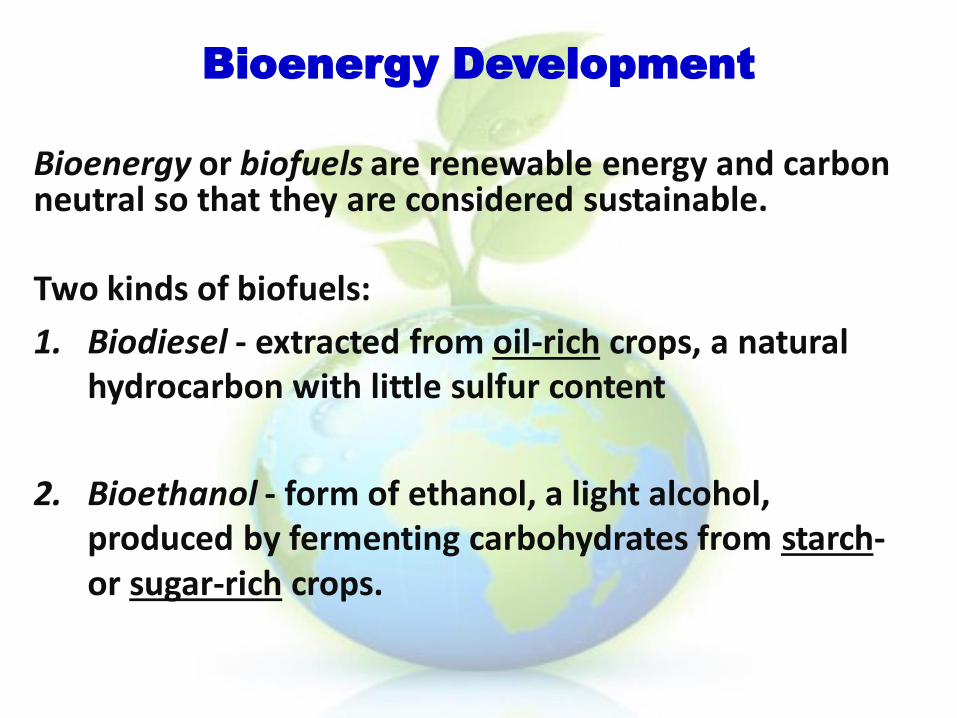
Bioenergy Development
Bioenergy or biofuels are renewable energy and carbon neutral so that they are considered sustainable.
Two kinds of biofuels:
1. Biodiesel - extracted from oil-rich crops, a natural hydrocarbon with little sulfur content
2. Bioethanol - form of ethanol, a light alcohol, produced by fermenting carbohydrates from starch-or sugar-rich crops.
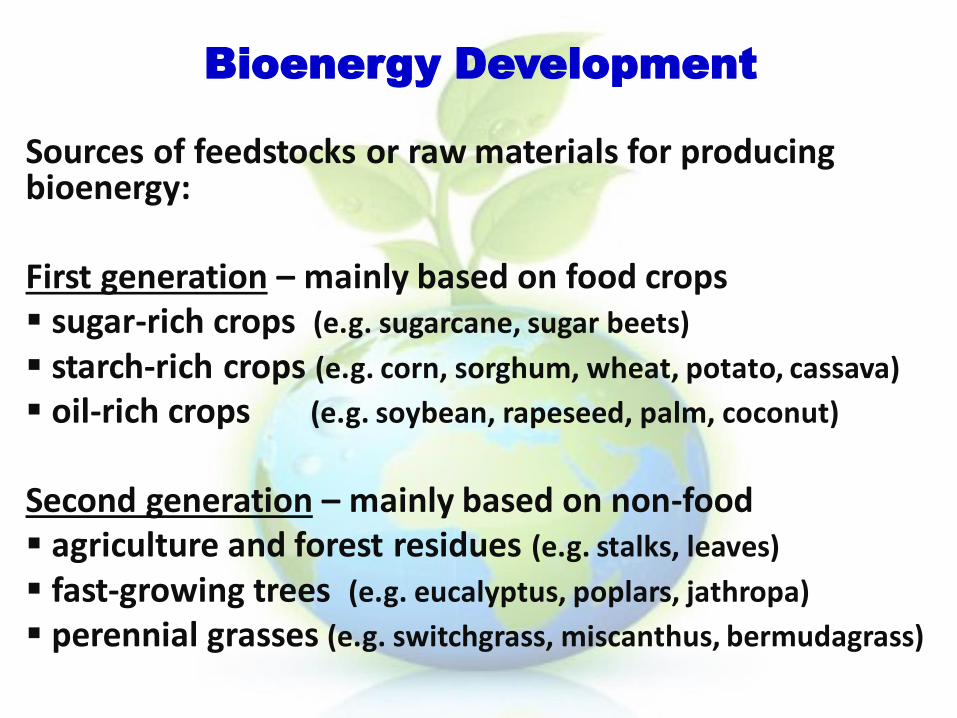
Bioenergy Development
Sources of feedstocks or raw materials for producing bioenergy:
First generation – mainly based on food crops sugar-rich crops (e.g. sugarcane, sugar beets)
starch-rich crops (e.g. corn, sorghum, wheat, potato, cassava)
oil-rich crops (e.g. soybean, rapeseed, palm, coconut)
Second generation – mainly based on non-food agriculture and forest residues (e.g. stalks, leaves)
fast-growing trees (e.g. eucalyptus, poplars, jathropa)
perennial grasses (e.g. switchgrass, miscanthus, bermudagrass)
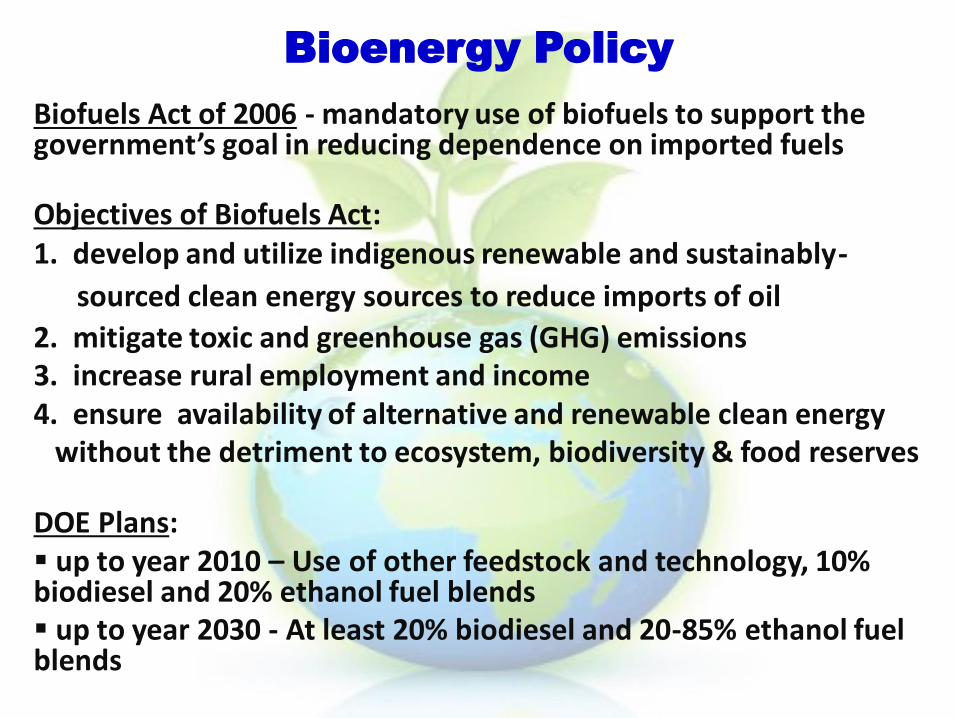
Biofuels Act of 2006 - mandatory use of biofuels to support the government’s goal in reducing dependence on imported fuels
Objectives of Biofuels Act:1. develop and utilize indigenous renewable and sustainably-
sourced clean energy sources to reduce imports of oil
2. mitigate toxic and greenhouse gas (GHG) emissions3. increase rural employment and income4. ensure availability of alternative and renewable clean energy
without the detriment to ecosystem, biodiversity & food reserves
DOE Plans: up to year 2010 – Use of other feedstock and technology, 10% biodiesel and 20% ethanol fuel blends up to year 2030 - At least 20% biodiesel and 20-85% ethanol fuel blends
Bioenergy Policy
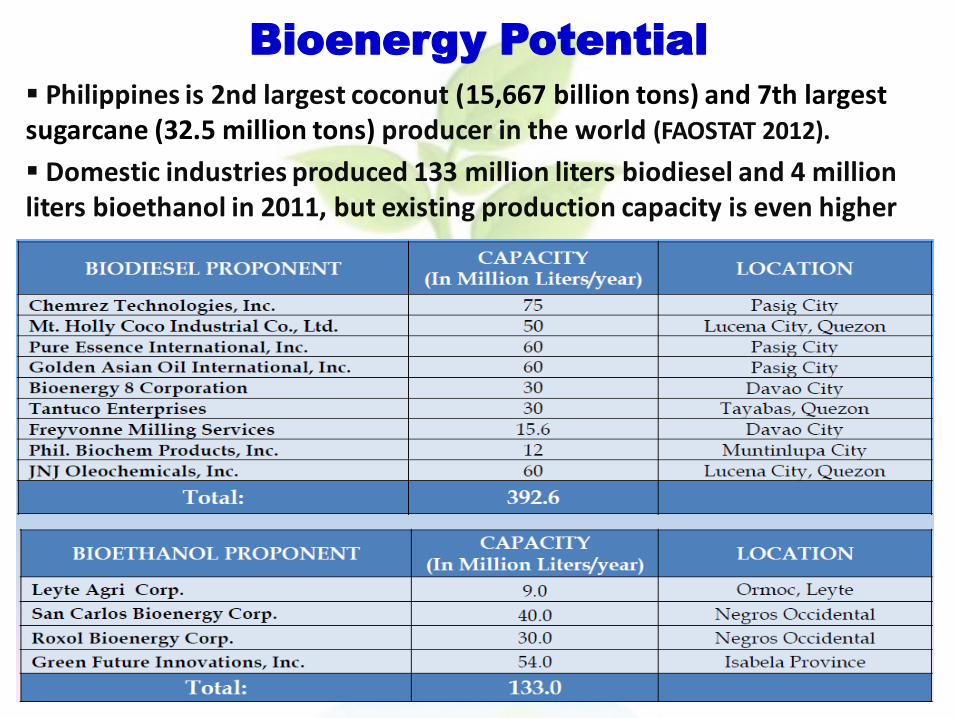
Philippines is 2nd largest coconut (15,667 billion tons) and 7th largest sugarcane (32.5 million tons) producer in the world (FAOSTAT 2012).
Domestic industries produced 133 million liters biodiesel and 4 million liters bioethanol in 2011, but existing production capacity is even higher
Bioenergy Potential
2. Objectives of the Study
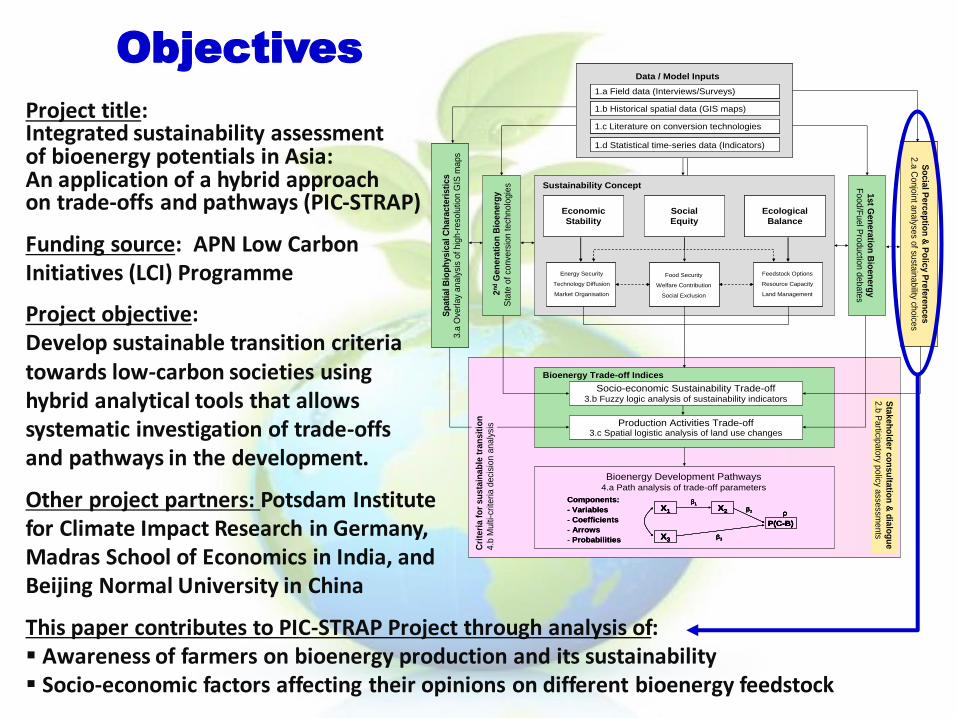
Project title:Integrated sustainability assessmentof bioenergy potentials in Asia: An application of a hybrid approach on trade-offs and pathways (PIC-STRAP)
Funding source: APN Low Carbon Initiatives (LCI) Programme
Project objective:Develop sustainable transition criteriatowards low-carbon societies using hybrid analytical tools that allowssystematic investigation of trade-offsand pathways in the development.
Other project partners: Potsdam Institute for Climate Impact Research in Germany,Madras School of Economics in India, andBeijing Normal University in China
This paper contributes to PIC-STRAP Project through analysis of: Awareness of farmers on bioenergy production and its sustainability Socio-economic factors affecting their opinions on different bioenergy feedstock
Objectives
Sustainability Concept
1st G
en
era
tion
Bio
en
erg
y
Food/F
uel P
roductio
n d
ebate
s
2n
dG
en
era
tio
n B
ioen
erg
y
Sta
te o
f co
nve
rsio
n t
ech
nolo
gie
s
So
cia
l Perc
ep
tion
& P
olic
y P
refe
ren
ces
2.a
Conjo
int a
nalyse
s of su
stain
ability ch
oice
s
So
cia
l Perc
ep
tion
& P
olic
y P
refe
ren
ces
2.a
Conjo
int a
nalyse
s of su
stain
ability ch
oice
s
Sp
ati
al B
iop
hysic
al
Ch
ara
cte
risti
cs
3.a
Ove
rla
y analy
sis
of hig
h-r
eso
lution G
IS m
aps
Sp
ati
al B
iop
hysic
al
Ch
ara
cte
risti
cs
3.a
Ove
rla
y analy
sis
of hig
h-r
eso
lution G
IS m
aps
Socio-economic Sustainability Trade-off3.b Fuzzy logic analysis of sustainability indicators
Bioenergy Trade-off Indices
Production Activities Trade-off3.c Spatial logistic analysis of land use changes
Bioenergy Development Pathways4.a Path analysis of trade-off parameters
Components:
- Variables
- Coefficients
- Arrows
- Probabilities
X1
P(C-B)
β1
β2
β3X3
X2 ρX1
P(C-B)
β1
β2
β3X3
X2 ρ
Components:
- Variables
- Coefficients
- Arrows
- Probabilities
X1
P(C-B)
β1
β2
β3X3
X2 ρX1
P(C-B)
β1
β2
β3X3
X2 ρ
Sta
keh
old
er c
on
su
ltatio
n &
dia
log
ue
2.b
Particip
ato
ry po
licy a
ssess
ments
Data / Model Inputs
1.b Historical spatial data (GIS maps)
1.c Literature on conversion technologies
1.a Field data (Interviews/Surveys)
1.d Statistical time-series data (Indicators)
Data / Model Inputs
1.b Historical spatial data (GIS maps)
1.c Literature on conversion technologies
1.a Field data (Interviews/Surveys)
1.d Statistical time-series data (Indicators)
1.b Historical spatial data (GIS maps)
1.c Literature on conversion technologies
1.a Field data (Interviews/Surveys)
1.b Historical spatial data (GIS maps)
1.c Literature on conversion technologies
1.a Field data (Interviews/Surveys)
1.d Statistical time-series data (Indicators)
Cri
teri
a f
or
su
sta
inab
le t
ran
sit
ion
4.b
Multi
-crite
ria d
eci
sion a
naly
sis
Economic
Stability
Social
Equity
Ecological
Balance
Energy Security
Technology Diffusion
Market Organisation
Feedstock Options
Resource Capacity
Land Management
Food Security
Welfare Contribution
Social Exclusion
Economic
Stability
Economic
Stability
Social
Equity
Social
Equity
Ecological
Balance
Ecological
Balance
Energy Security
Technology Diffusion
Market Organisation
Feedstock Options
Resource Capacity
Land Management
Food Security
Welfare Contribution
Social Exclusion
3. Case Study Areas:
CALABARZON
Central Visayas
Davao
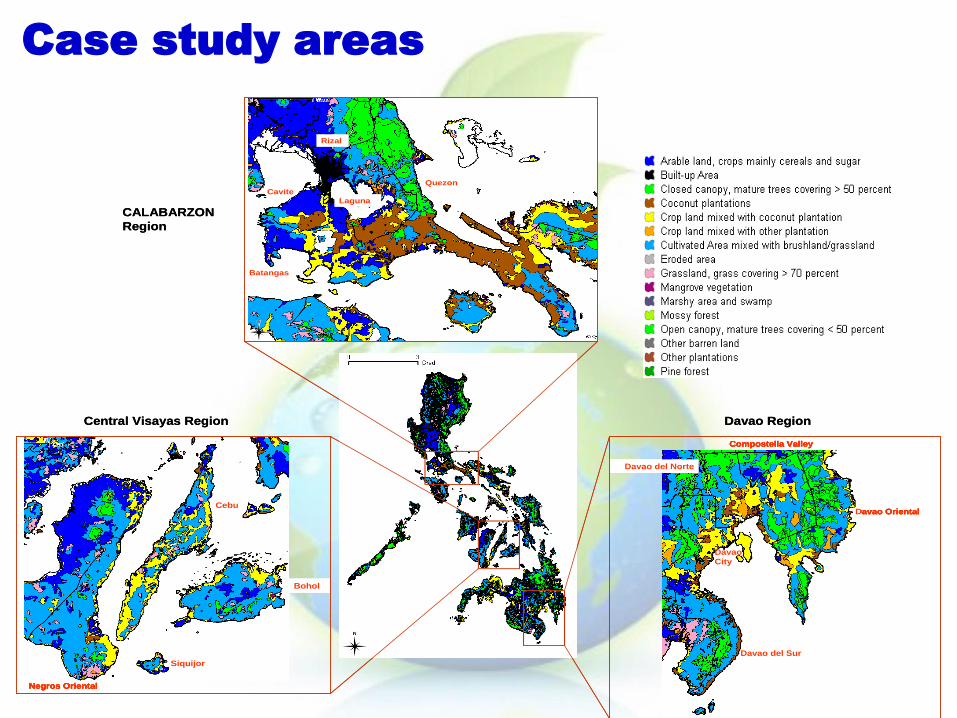
Davao Oriental
Compostella Valley
Davao del Norte
Davao del Sur
Davao
City
Davao Oriental
Compostella Valley
Davao del Norte
Davao del Sur
Davao
City
Siquijor
Bohol
Cebu
Negros Oriental
Siquijor
Bohol
Cebu
Negros Oriental
Quezon
Laguna
Cavite
Batangas
Rizal
Quezon
Laguna
Cavite
Batangas
Rizal
CALABARZON
Region
Central Visayas Region Davao Region
Davao Oriental
Compostella Valley
Davao del Norte
Davao del Sur
Davao
City
Davao Oriental
Compostella Valley
Davao del Norte
Davao del Sur
Davao
City
Siquijor
Bohol
Cebu
Negros Oriental
Siquijor
Bohol
Cebu
Negros Oriental
Quezon
Laguna
Cavite
Batangas
Rizal
Quezon
Laguna
Cavite
Batangas
Rizal
CALABARZON
Region
Central Visayas Region Davao Region
Case study areas
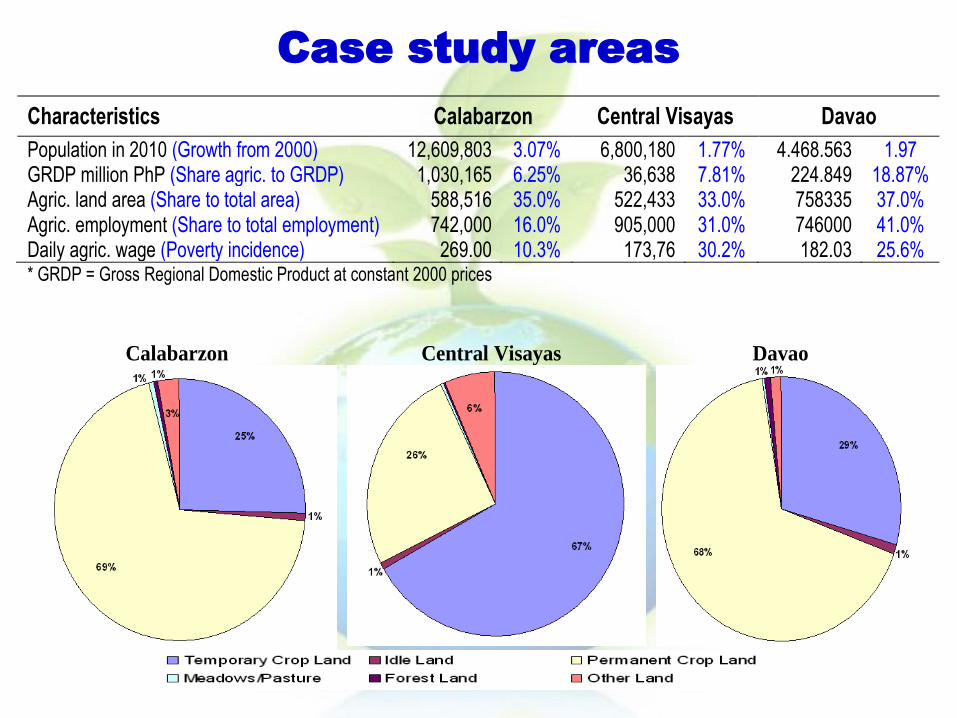
Characteristics Calabarzon Central Visayas Davao
Population in 2010 (Growth from 2000) 12,609,803 3.07% 6,800,180 1.77% 4.468.563 1.97 GRDP million PhP (Share agric. to GRDP) 1,030,165 6.25% 36,638 7.81% 224.849 18.87% Agric. land area (Share to total area) 588,516 35.0% 522,433 33.0% 758335 37.0% Agric. employment (Share to total employment) 742,000 16.0% 905,000 31.0% 746000 41.0% Daily agric. wage (Poverty incidence) 269.00 10.3% 173,76 30.2% 182.03 25.6% * GRDP = Gross Regional Domestic Product at constant 2000 prices
Calabarzon
Central Visayas
Davao
Case study areas
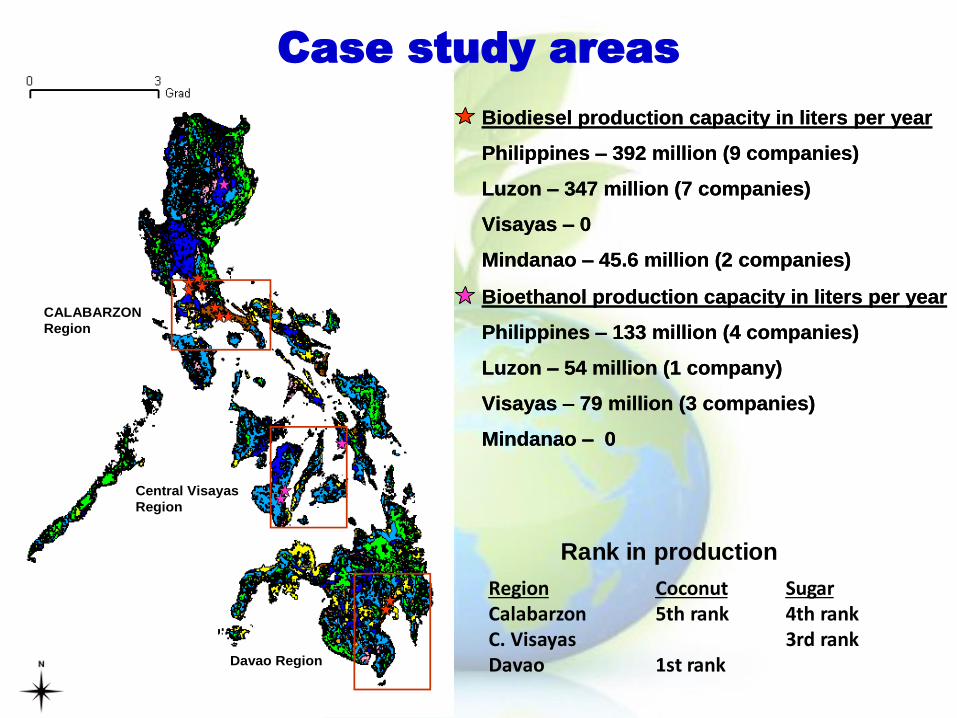
Case study areas
CALABARZON
Region
Central Visayas
Region
Davao Region
CALABARZON
Region
Central Visayas
Region
Davao Region
Biodiesel production capacity in liters per year
Philippines – 392 million (9 companies)
Luzon – 347 million (7 companies)
Visayas – 0
Mindanao – 45.6 million (2 companies)
Bioethanol production capacity in liters per year
Philippines – 133 million (4 companies)
Luzon – 54 million (1 company)
Visayas – 79 million (3 companies)
Mindanao – 0
Region Coconut SugarCalabarzon 5th rank 4th rankC. Visayas 3rd rankDavao 1st rank
Rank in production
4. Methods:
Survey
Descriptive Analysis
Factor Analysis
Cluster Analysis
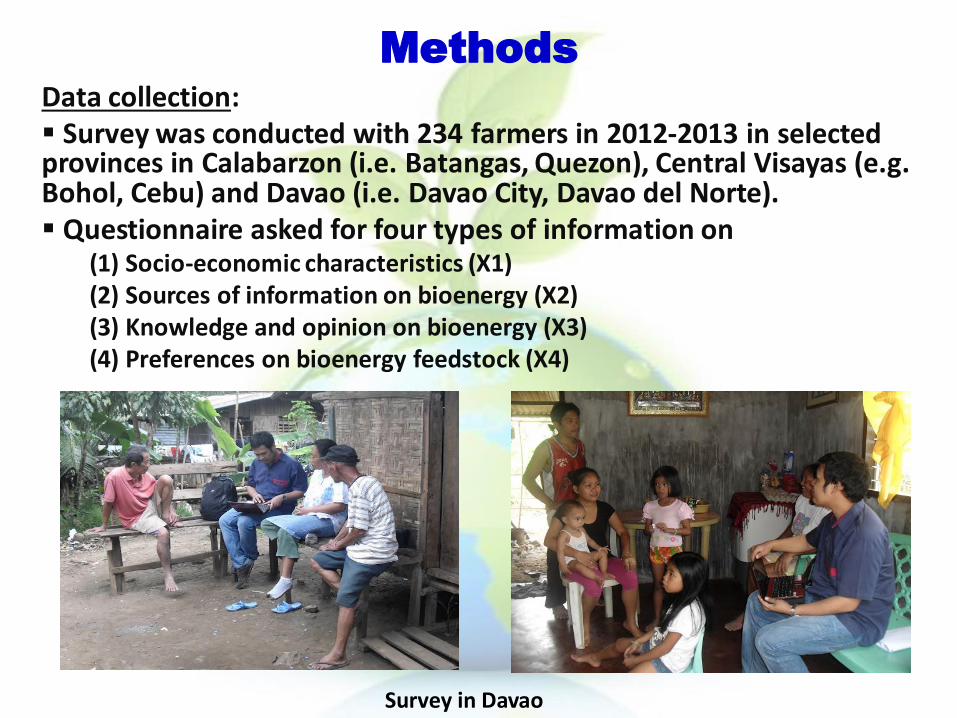
Methods
Survey in Davao
Data collection: Survey was conducted with 234 farmers in 2012-2013 in selected provinces in Calabarzon (i.e. Batangas, Quezon), Central Visayas (e.g. Bohol, Cebu) and Davao (i.e. Davao City, Davao del Norte). Questionnaire asked for four types of information on
(1) Socio-economic characteristics (X1) (2) Sources of information on bioenergy (X2) (3) Knowledge and opinion on bioenergy (X3)(4) Preferences on bioenergy feedstock (X4)
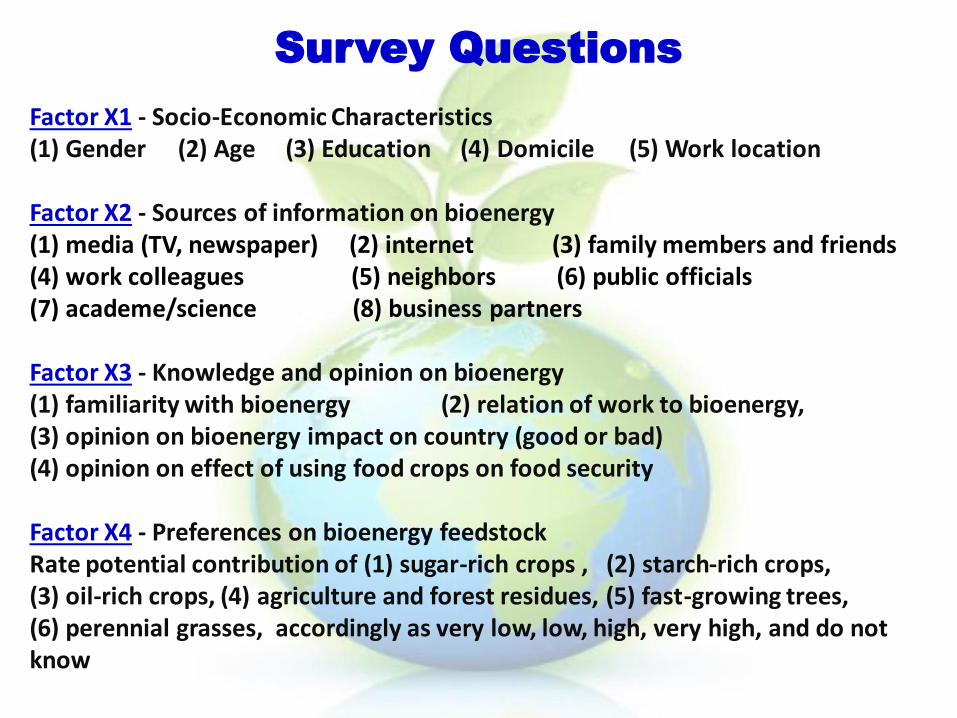
Factor X1 - Socio-Economic Characteristics (1) Gender (2) Age (3) Education (4) Domicile (5) Work location
Factor X2 - Sources of information on bioenergy(1) media (TV, newspaper) (2) internet (3) family members and friends (4) work colleagues (5) neighbors (6) public officials(7) academe/science (8) business partners
Factor X3 - Knowledge and opinion on bioenergy(1) familiarity with bioenergy (2) relation of work to bioenergy, (3) opinion on bioenergy impact on country (good or bad) (4) opinion on effect of using food crops on food security
Factor X4 - Preferences on bioenergy feedstockRate potential contribution of (1) sugar-rich crops , (2) starch-rich crops,(3) oil-rich crops, (4) agriculture and forest residues, (5) fast-growing trees,(6) perennial grasses, accordingly as very low, low, high, very high, and do not know
Survey Questions
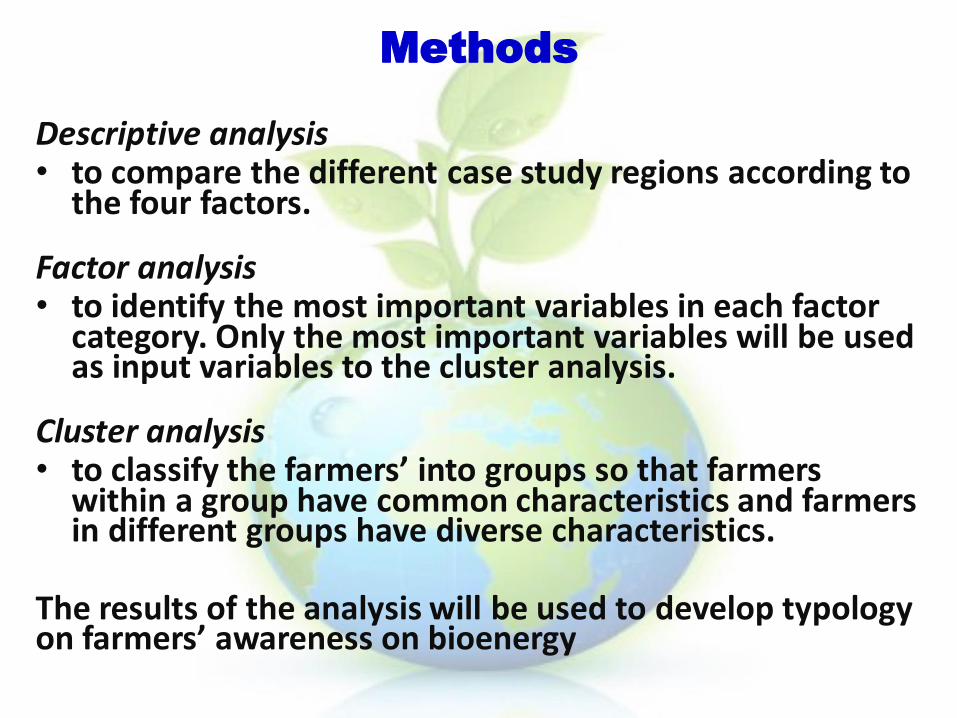
Descriptive analysis• to compare the different case study regions according to
the four factors.
Factor analysis • to identify the most important variables in each factor
category. Only the most important variables will be used as input variables to the cluster analysis.
Cluster analysis • to classify the farmers’ into groups so that farmers
within a group have common characteristics and farmers in different groups have diverse characteristics.
The results of the analysis will be used to develop typology on farmers’ awareness on bioenergy
Methods
5. Results
5.1 Regional Comparisons
of Survey Respondents
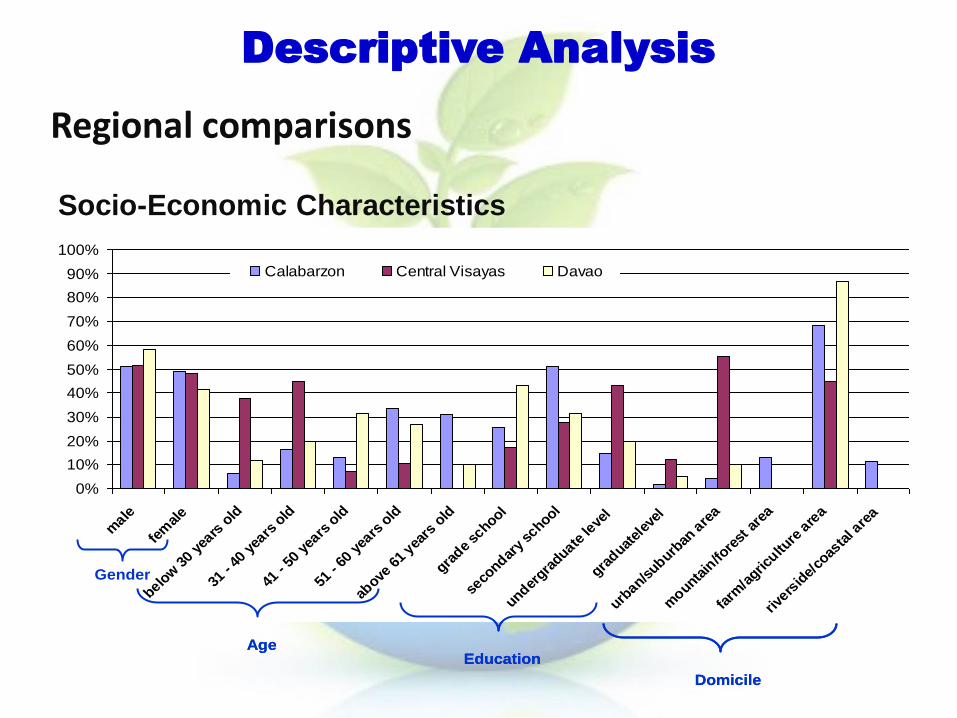
Regional comparisons
0%
10%
20%
30%
40%
50%
60%
70%
80%
90%
100%
male
fem
ale
below
30
years
old
31 -
40 y
ears
old
41 -
50 y
ears
old
51 -
60 y
ears
old
above
61
years
old
grade
school
seco
ndary
school
undergra
duate le
vel
graduat
elev
el
urban/s
uburban
are
a
mounta
in/fo
rest
are
a
farm
/agric
ulture
are
a
rivers
ide/
coas
tal a
rea
Calabarzon Central Visayas Davao
Gender
AgeEducation
Domicile
Descriptive Analysis
Socio-Economic Characteristics
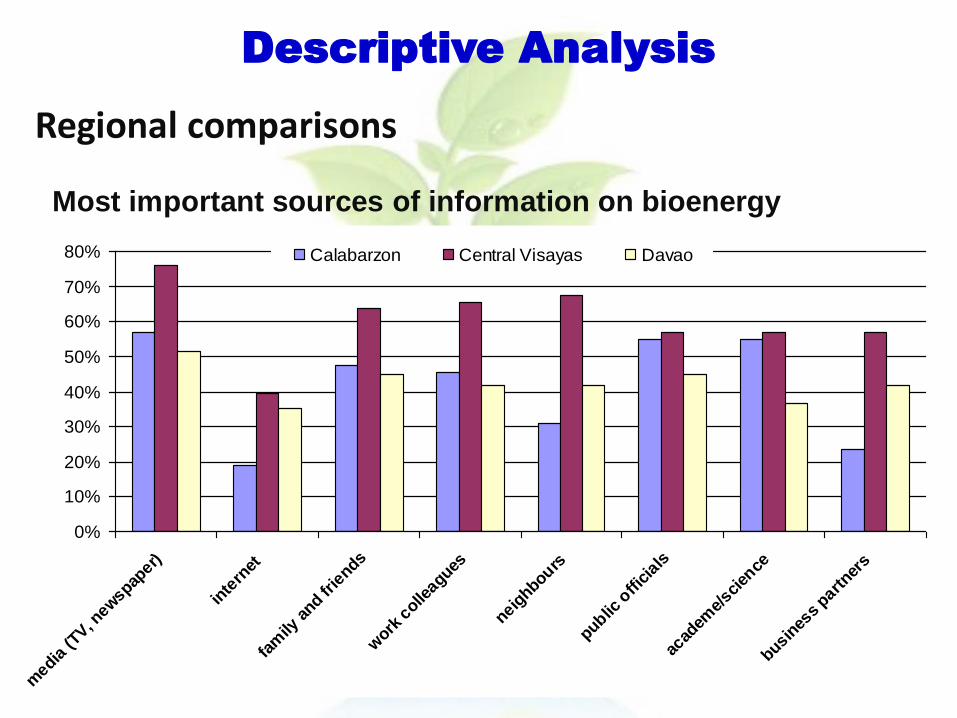
Regional comparisons
Descriptive Analysis
0%
10%
20%
30%
40%
50%
60%
70%
80%
media
(TV, n
ewspap
er)
inte
rnet
fam
ily a
nd frie
nds
work
colle
agues
neighbours
public o
ffici
als
acad
eme/
scien
ce
busines
s part
ners
Calabarzon Central Visayas Davao
Most important sources of information on bioenergy
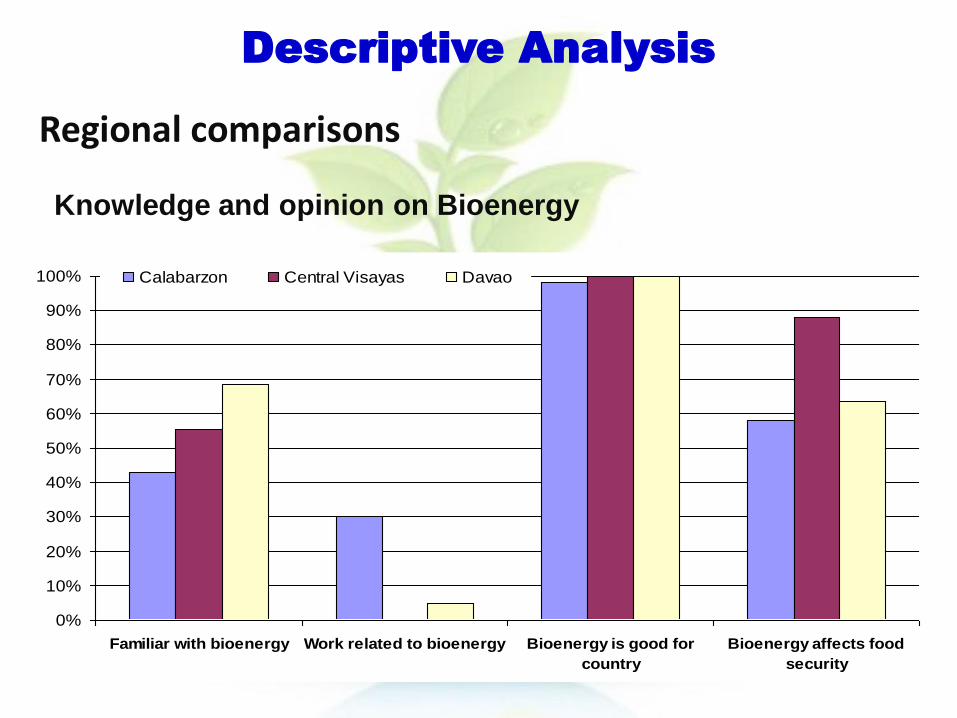
0%
10%
20%
30%
40%
50%
60%
70%
80%
90%
100%
Familiar with bioenergy Work related to bioenergy Bioenergy is good for
country
Bioenergy affects food
security
Calabarzon Central Visayas Davao
Descriptive Analysis
Regional comparisons
Knowledge and opinion on Bioenergy
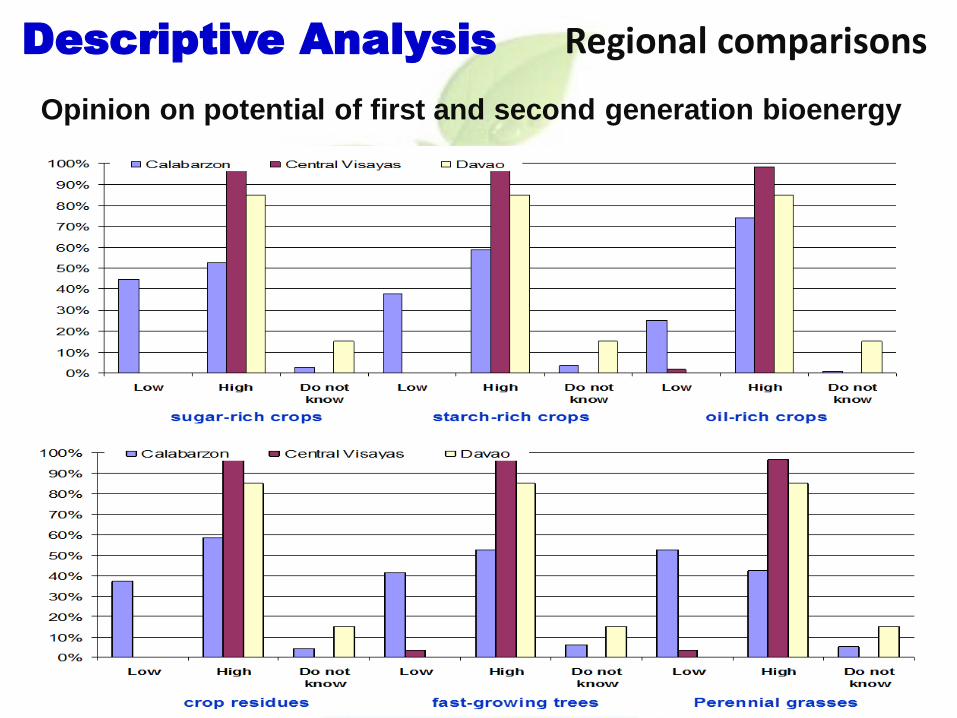
Descriptive Analysis Regional comparisons
Opinion on potential of first and second generation bioenergy
5. Results
5.2 Factors Related to Knowledge
and Opinion on Bioenergy
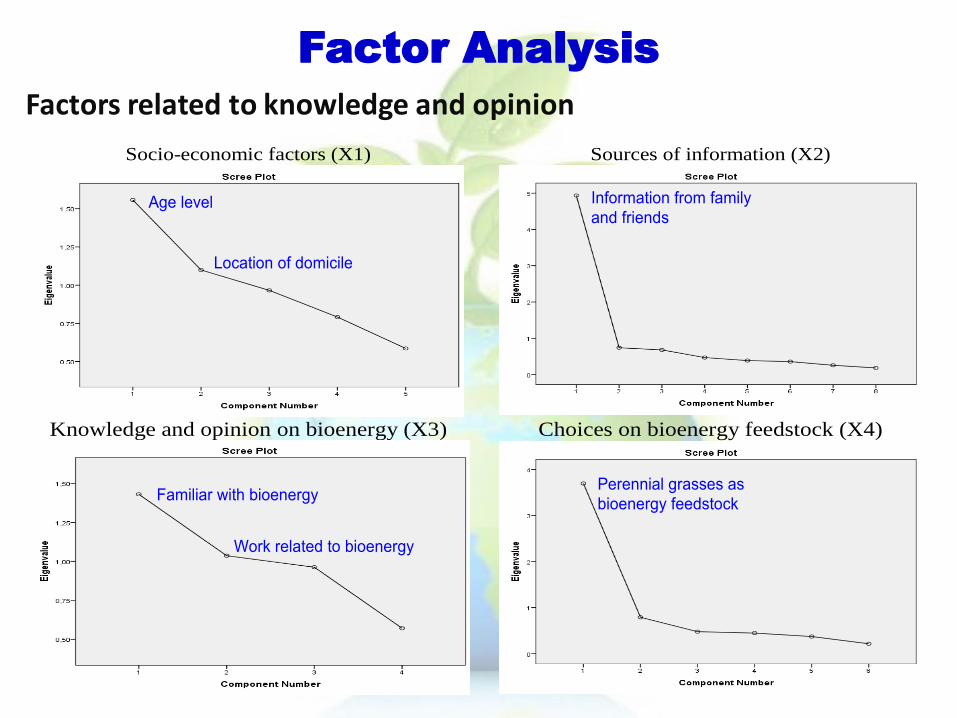
Factors related to knowledge and opinion
Factor Analysis
Socio-economic factors (X1)
Sources of information (X2)
Knowledge and opinion on bioenergy (X3)
Choices on bioenergy feedstock (X4)
Age level
Location of domicile
Information from family
and friends
Familiar with bioenergy
Work related to bioenergy
Perennial grasses as
bioenergy feedstock
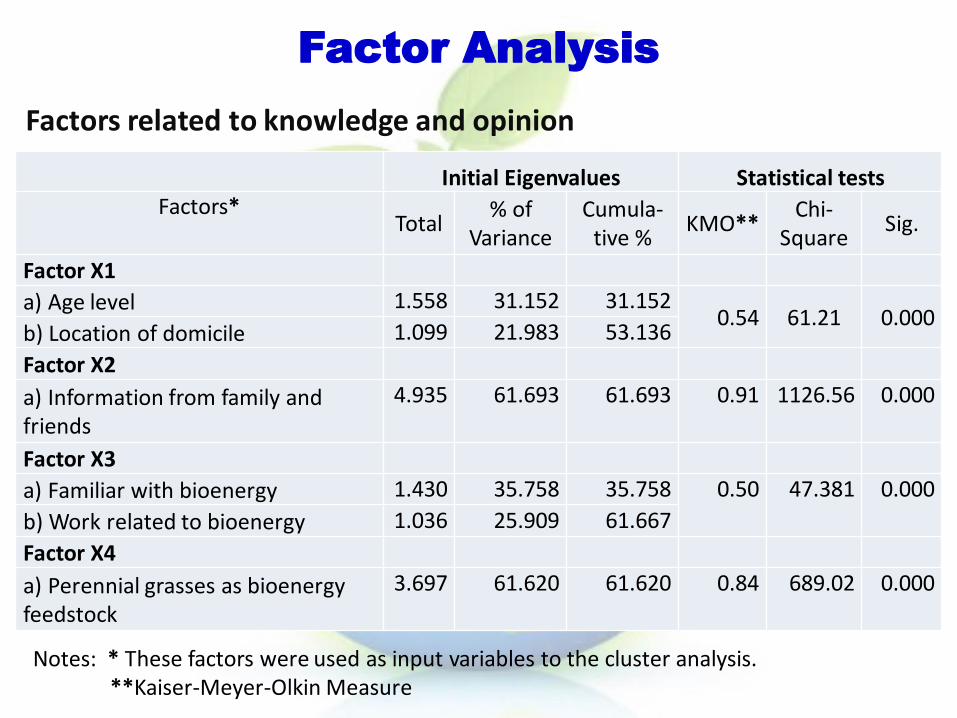
Factors related to knowledge and opinion
Notes: * These factors were used as input variables to the cluster analysis.**Kaiser-Meyer-Olkin Measure
Factor Analysis
Initial Eigenvalues Statistical testsFactors*
Total% of
VarianceCumula-
tive %KMO**
Chi-Square
Sig.
Factor X1
a) Age level 1.558 31.152 31.1520.54 61.21 0.000
b) Location of domicile 1.099 21.983 53.136
Factor X2
a) Information from family and friends
4.935 61.693 61.693 0.91 1126.56 0.000
Factor X3
a) Familiar with bioenergy 1.430 35.758 35.758 0.50 47.381 0.000
b) Work related to bioenergy 1.036 25.909 61.667
Factor X4
a) Perennial grasses as bioenergy feedstock
3.697 61.620 61.620 0.84 689.02 0.000
5. Results
5.3 Typology of Farmers’ Awareness
on Bioenergy Sustainability
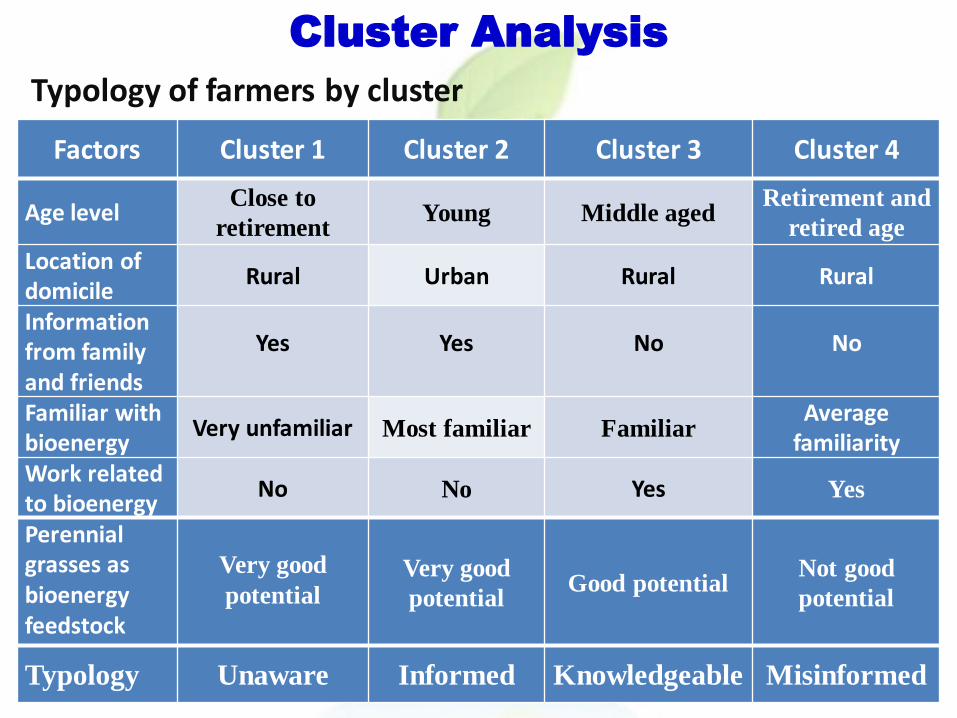
Cluster Analysis
Typology of farmers by cluster
Factors Cluster 1 Cluster 2 Cluster 3 Cluster 4
Age levelClose to
retirementYoung Middle aged
Retirement and
retired age
Location of domicile
Rural Urban Rural Rural
Information from family and friends
Yes Yes No No
Familiar with bioenergy
Very unfamiliar Most familiar FamiliarAverage
familiarityWork related to bioenergy
No No Yes Yes
Perennial grasses as bioenergy feedstock
Very good
potentialVery good
potential Good potential
Not good
potential
Typology Unaware Informed Knowledgeable Misinformed
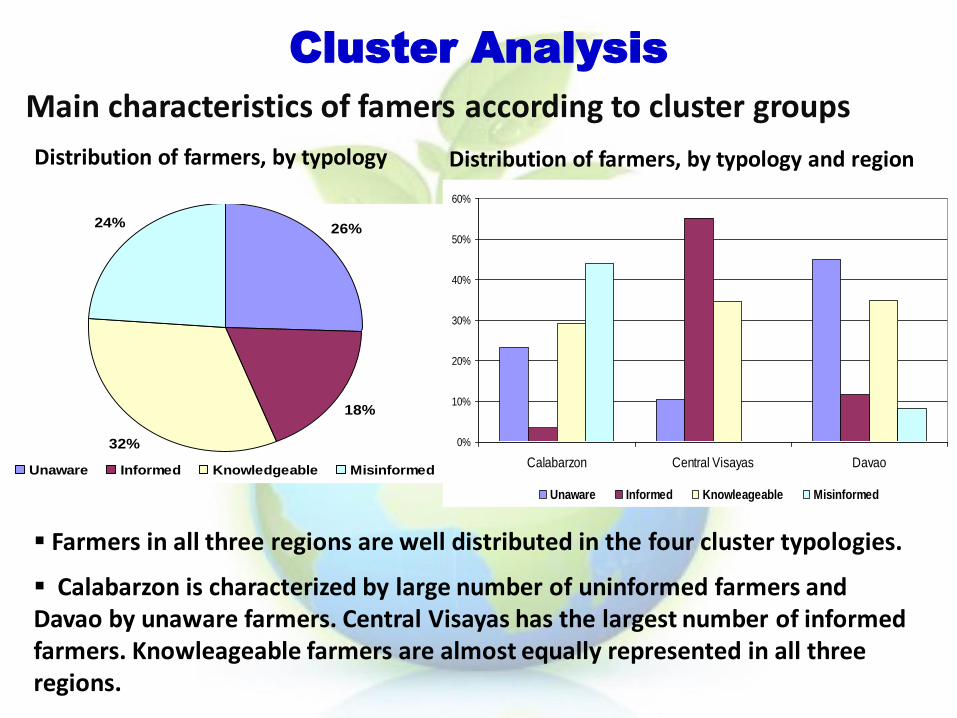
Cluster Analysis
Main characteristics of famers according to cluster groups
0%
10%
20%
30%
40%
50%
60%
Calabarzon Central Visayas Davao
Unaware Informed Knowleageable Misinformed
26%
18%
32%
24%
Unaware Informed Knowledgeable Misinformed
Distribution of farmers, by typology Distribution of farmers, by typology and region
Farmers in all three regions are well distributed in the four cluster typologies.
Calabarzon is characterized by large number of uninformed farmers and Davao by unaware farmers. Central Visayas has the largest number of informed farmers. Knowleageable farmers are almost equally represented in all three regions.
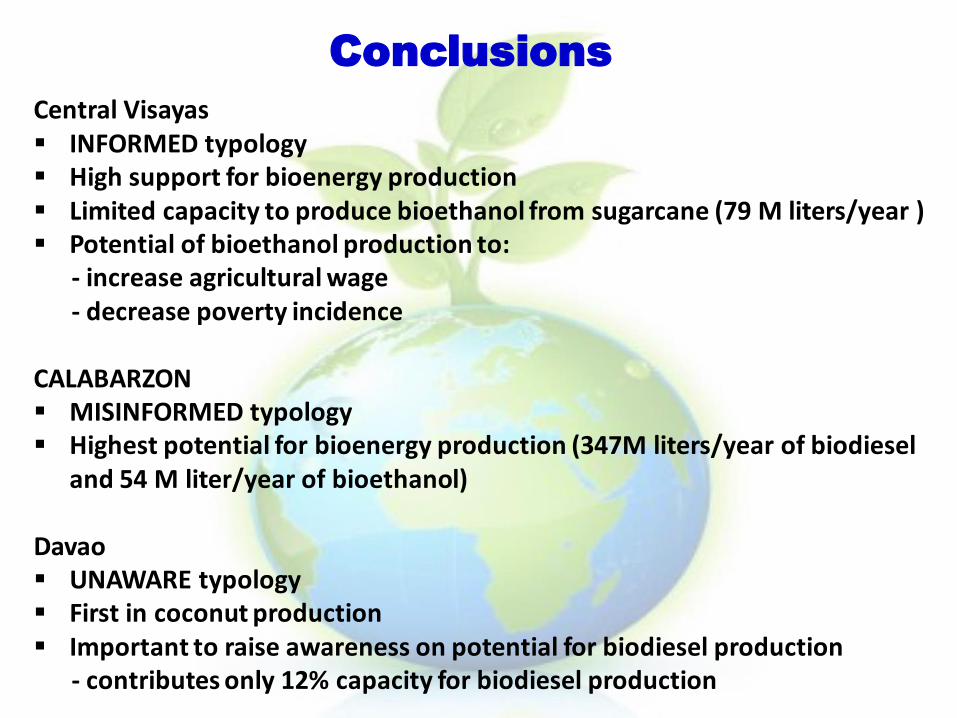
Conclusions
Central Visayas INFORMED typology High support for bioenergy production Limited capacity to produce bioethanol from sugarcane (79 M liters/year ) Potential of bioethanol production to:
- increase agricultural wage- decrease poverty incidence
CALABARZON MISINFORMED typology Highest potential for bioenergy production (347M liters/year of biodiesel
and 54 M liter/year of bioethanol)
Davao UNAWARE typology First in coconut production Important to raise awareness on potential for biodiesel production
- contributes only 12% capacity for biodiesel production

Thank You
for your attention!
Biofuel Feedstock Cultivation in India:Food Security and Rural Livelihoods
K.S. Kavi Kumar
PIC-STRAP Project Framing WorkshopBeijing, 21-24 July, 2014
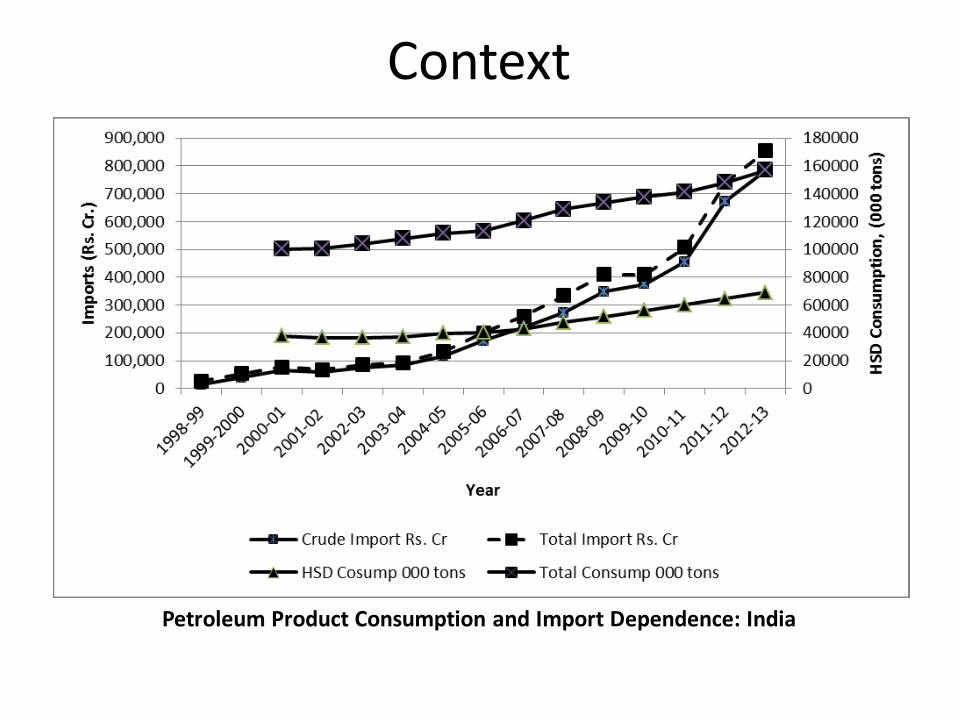
Context
Petroleum Product Consumption and Import Dependence: India
Context
• India’s imports of crude and petroleum productshave been growing at more than 7% since 2006
• Vehicle population is growing at 8-10 percentannually, with two-wheelers constituting 72percent of total number of registered motorvehicles
• Diesel meets an estimated 73 percent of fueldemand from transport sector– Combined demand of diesel and petrol is expected to
grow by over five percent over coming years
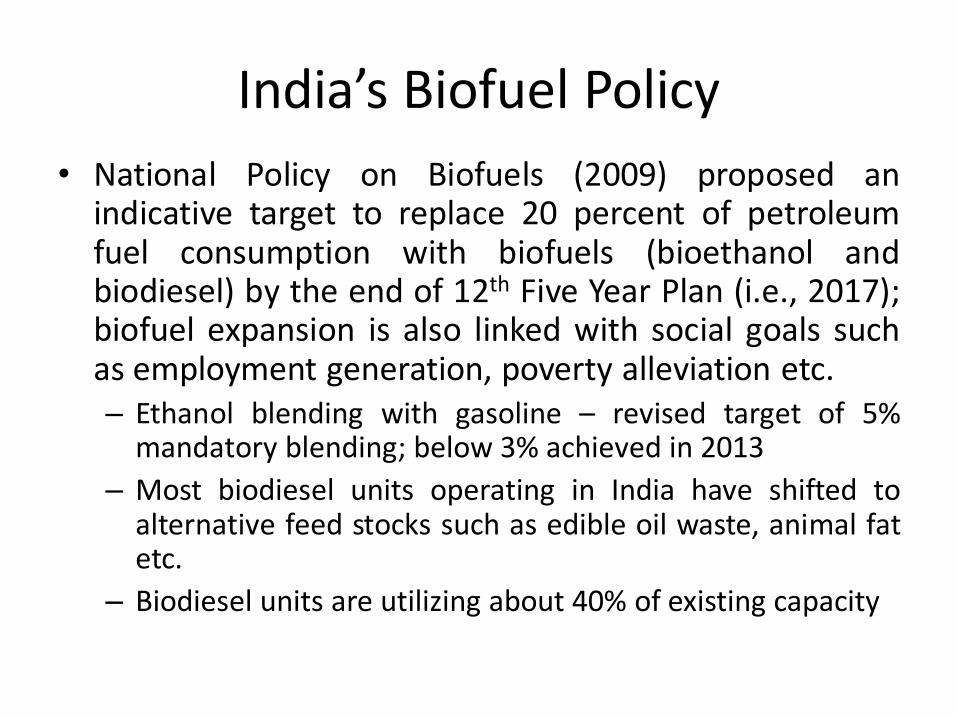
India’s Biofuel Policy
• National Policy on Biofuels (2009) proposed anindicative target to replace 20 percent of petroleumfuel consumption with biofuels (bioethanol andbiodiesel) by the end of 12th Five Year Plan (i.e., 2017);biofuel expansion is also linked with social goals suchas employment generation, poverty alleviation etc.– Ethanol blending with gasoline – revised target of 5%
mandatory blending; below 3% achieved in 2013
– Most biodiesel units operating in India have shifted toalternative feed stocks such as edible oil waste, animal fatetc.
– Biodiesel units are utilizing about 40% of existing capacity

Biofuels in India - 1
• Significant concern regarding food security – Fischer et al. (2008) argue that an additional 140 to 150 million
people may be at the risk of hunger by 2020 due to biofuelexpansion in South Asia
– Though the second generation biofuels may reduce the adverseimpacts on food security, the indirect impact of biofuels on foodsecurity through adverse influence on biodiversity are oftenconsidered high
– Msangi and Rosegrant (2011) argue that biofuel expansion willresult in substantive increase in market prices and hence lead tofood security concerns
– They further argue that the South Asian countries may have toincrease their crop yields by an additional 1 percent per year upto 2030 to overcome the stress induced by the biofuelexpansion
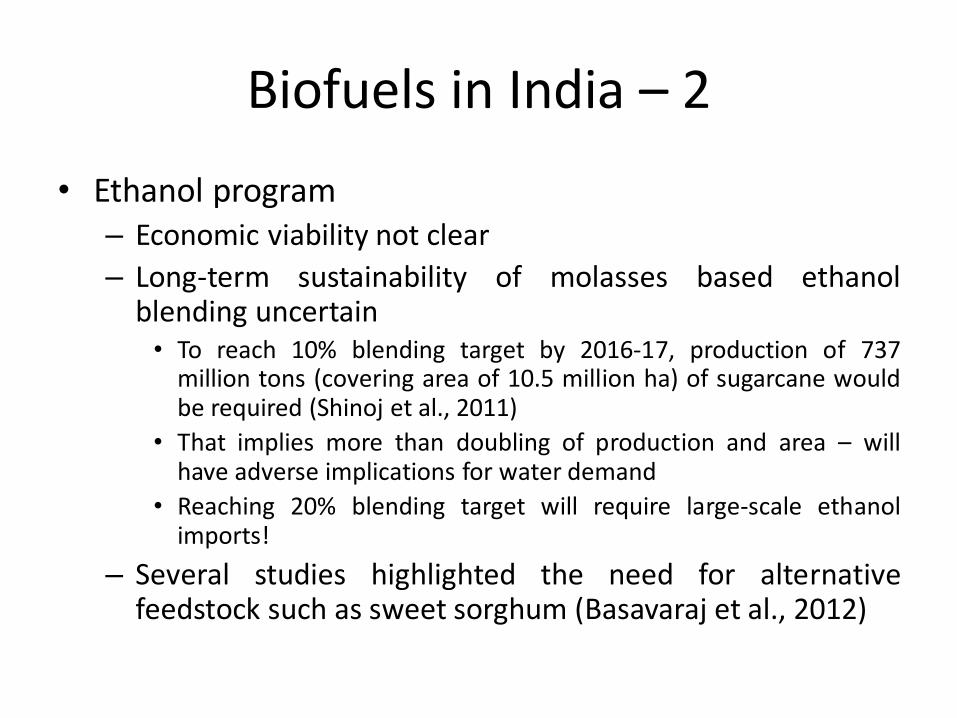
Biofuels in India – 2
• Ethanol program – Economic viability not clear
– Long-term sustainability of molasses based ethanolblending uncertain• To reach 10% blending target by 2016-17, production of 737
million tons (covering area of 10.5 million ha) of sugarcane wouldbe required (Shinoj et al., 2011)
• That implies more than doubling of production and area – willhave adverse implications for water demand
• Reaching 20% blending target will require large-scale ethanolimports!
– Several studies highlighted the need for alternativefeedstock such as sweet sorghum (Basavaraj et al., 2012)
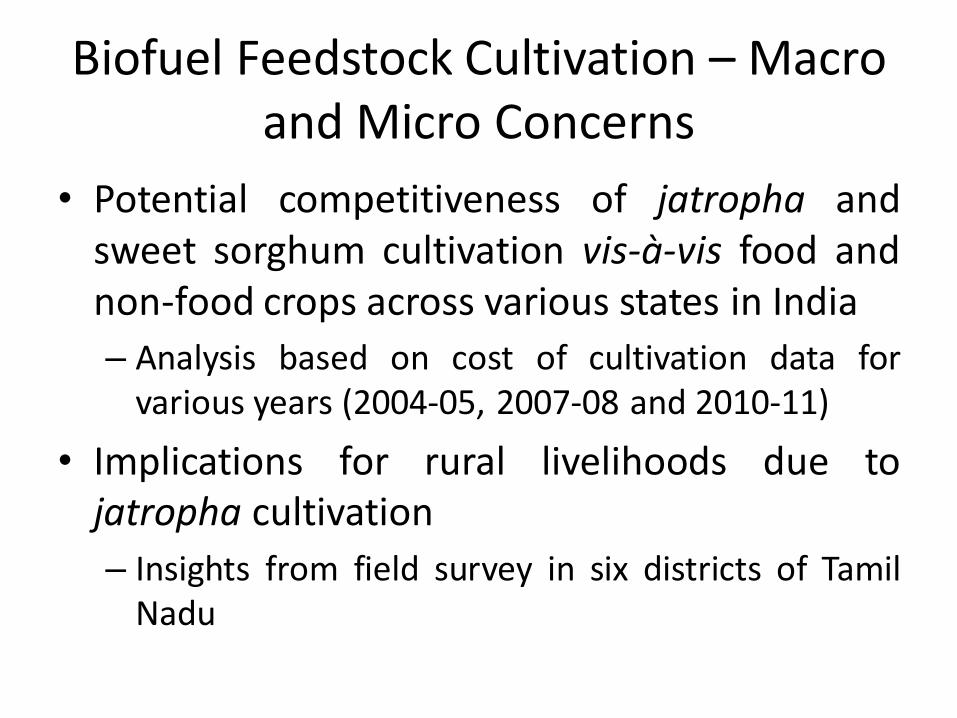
Biofuel Feedstock Cultivation – Macro and Micro Concerns
• Potential competitiveness of jatropha andsweet sorghum cultivation vis-à-vis food andnon-food crops across various states in India
– Analysis based on cost of cultivation data forvarious years (2004-05, 2007-08 and 2010-11)
• Implications for rural livelihoods due tojatropha cultivation
– Insights from field survey in six districts of TamilNadu

Biodiesel Demand and Land Requirement
• Integrated Energy Policy (2006) projected India’sHSD requirement to grow from 52.3 million tonsin 2006-07 to 190.2 million tons in 2031-32
• For 20% blending target envisaged in NBP (2009),biodiesel demand would be 38.04 million tons
• Considering plant density of 2500 per ha and ayield of 1.5 kg per tree, jatropha yield isenvisaged at 3.75 ton of seeds per ha
• Since 3.28 kg seeds give 1 kg of biodiesel, 38.04million tons of biodiesel would require 33.2million hectares of land!
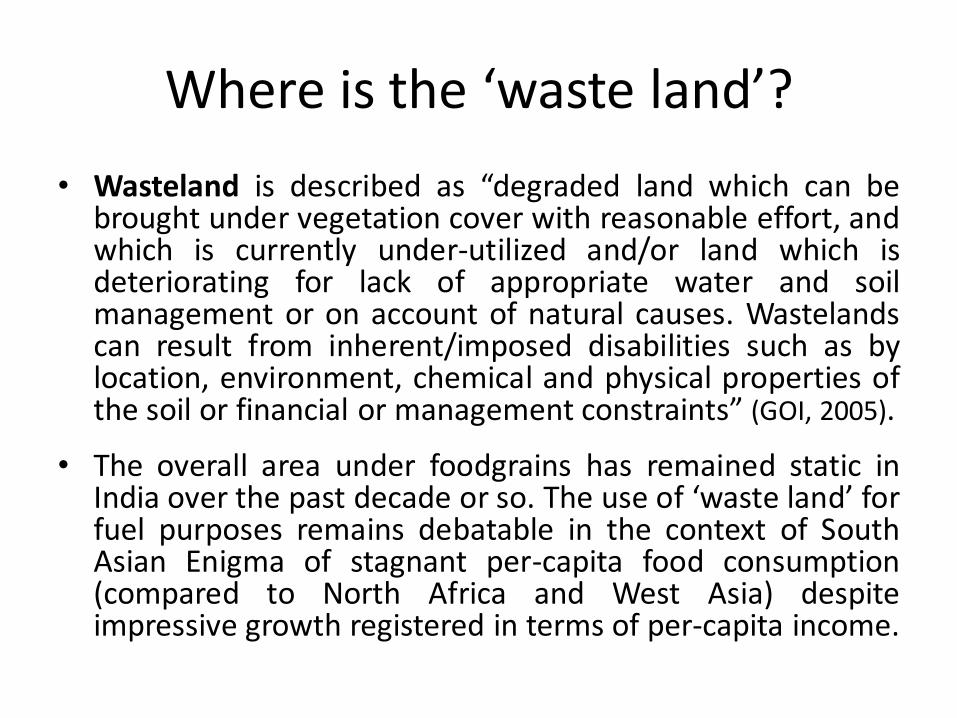
Where is the ‘waste land’?
• Wasteland is described as “degraded land which can bebrought under vegetation cover with reasonable effort, andwhich is currently under-utilized and/or land which isdeteriorating for lack of appropriate water and soilmanagement or on account of natural causes. Wastelandscan result from inherent/imposed disabilities such as bylocation, environment, chemical and physical properties ofthe soil or financial or management constraints” (GOI, 2005).
• The overall area under foodgrains has remained static inIndia over the past decade or so. The use of ‘waste land’ forfuel purposes remains debatable in the context of SouthAsian Enigma of stagnant per-capita food consumption(compared to North Africa and West Asia) despiteimpressive growth registered in terms of per-capita income.

Wastelands in India Million
hectares
1 Gullied and/or Ravenous land* 1.90
2 Land with or without scrub* 18.79
3 Waterlogged and Marshy land 0.97
4 Land affected by Salinity/Alkalinity 1.20
5 Shifting cultivation* 1.88
6 Under-utilised/Degraded Notified Forest land* 12.66
7 Degraded pastures/grazing land* 1.93
8 Degraded land under plantation crops* 0.21
9 Sands (riverine/coastal/desert) 3.40
10 Mining and Industrial Wasteland 0.20
11 Barren rocky area 5.77
12 Steep sloping areas 0.91
13 Snow covered and/or Glacial area 5.43
Total wastelands 55.27
Wastelands suitable for jatropha cultivation 37.38*
Notes: The categories with asterisk sign above are considered suitable for jatropha cultivation in India.
Source: Department of Land Resources, 2005; GOI, 2005 and TERI, 2005 cited in Biswas et al (2010)
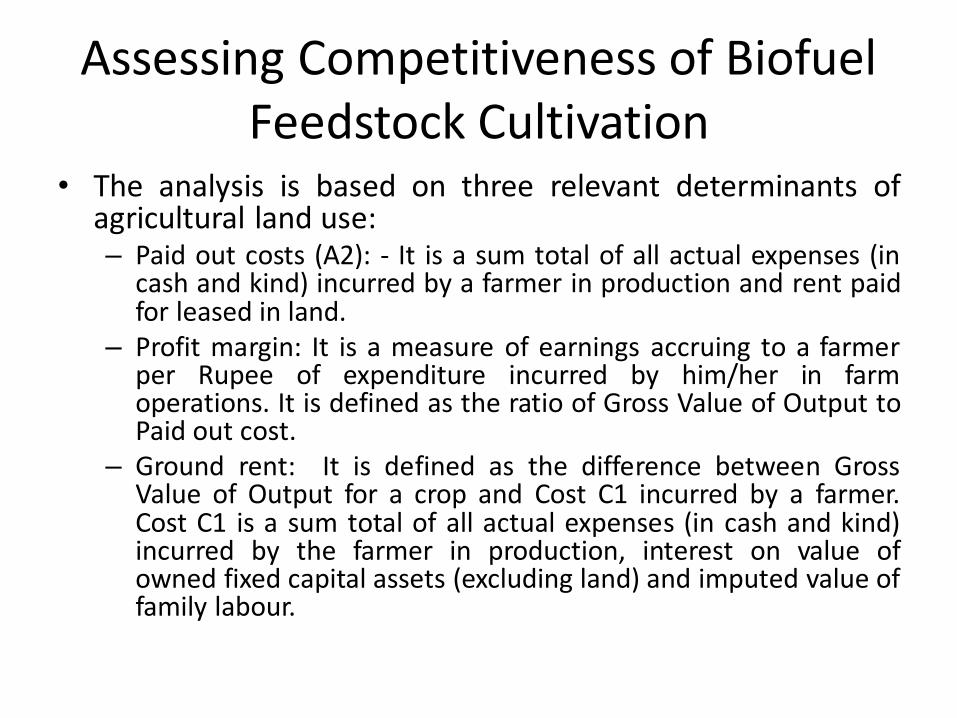
Assessing Competitiveness of Biofuel Feedstock Cultivation
• The analysis is based on three relevant determinants ofagricultural land use:– Paid out costs (A2): - It is a sum total of all actual expenses (in
cash and kind) incurred by a farmer in production and rent paidfor leased in land.
– Profit margin: It is a measure of earnings accruing to a farmerper Rupee of expenditure incurred by him/her in farmoperations. It is defined as the ratio of Gross Value of Output toPaid out cost.
– Ground rent: It is defined as the difference between GrossValue of Output for a crop and Cost C1 incurred by a farmer.Cost C1 is a sum total of all actual expenses (in cash and kind)incurred by the farmer in production, interest on value ofowned fixed capital assets (excluding land) and imputed value offamily labour.
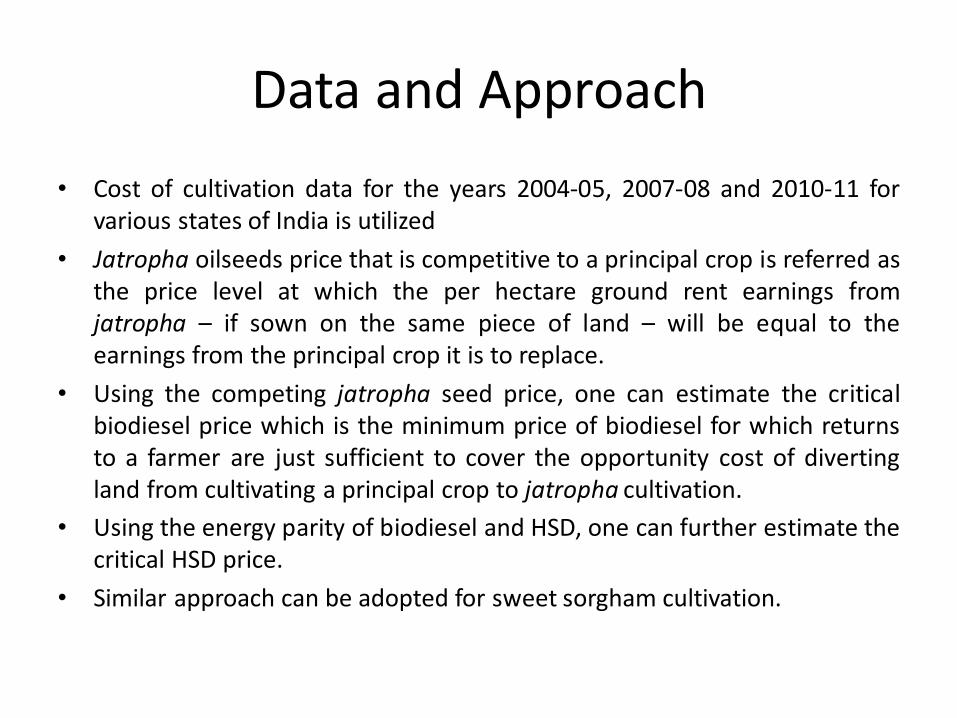
Data and Approach
• Cost of cultivation data for the years 2004-05, 2007-08 and 2010-11 forvarious states of India is utilized
• Jatropha oilseeds price that is competitive to a principal crop is referred asthe price level at which the per hectare ground rent earnings fromjatropha – if sown on the same piece of land – will be equal to theearnings from the principal crop it is to replace.
• Using the competing jatropha seed price, one can estimate the criticalbiodiesel price which is the minimum price of biodiesel for which returnsto a farmer are just sufficient to cover the opportunity cost of divertingland from cultivating a principal crop to jatropha cultivation.
• Using the energy parity of biodiesel and HSD, one can further estimate thecritical HSD price.
• Similar approach can be adopted for sweet sorgham cultivation.

Jatropha – Cost of Cultivation
• Paramathma et al (2004) and Goswami et al (2011) providesome estimates of cost of jatropha cultivation. For thepurpose of comparison similar cycle is considered in bothcases – 14 years of cultivation, with maturity yield resultingfrom 5th year; 12.5% interest rate is applied for presentvalue calculations
• PV of paid-out costs (A2) range between Rs. 19850 – Rs.44715.
• Under a range of yield assumptions (1000 to 2000 kg/ha)and seed price of Rs. 9 per kg, profitability ratio works outto about 2 for different paid out cost scenarios.
• The corresponding ground rent values (per ha) rangebetween Rs. 27000 and Rs. 37000.
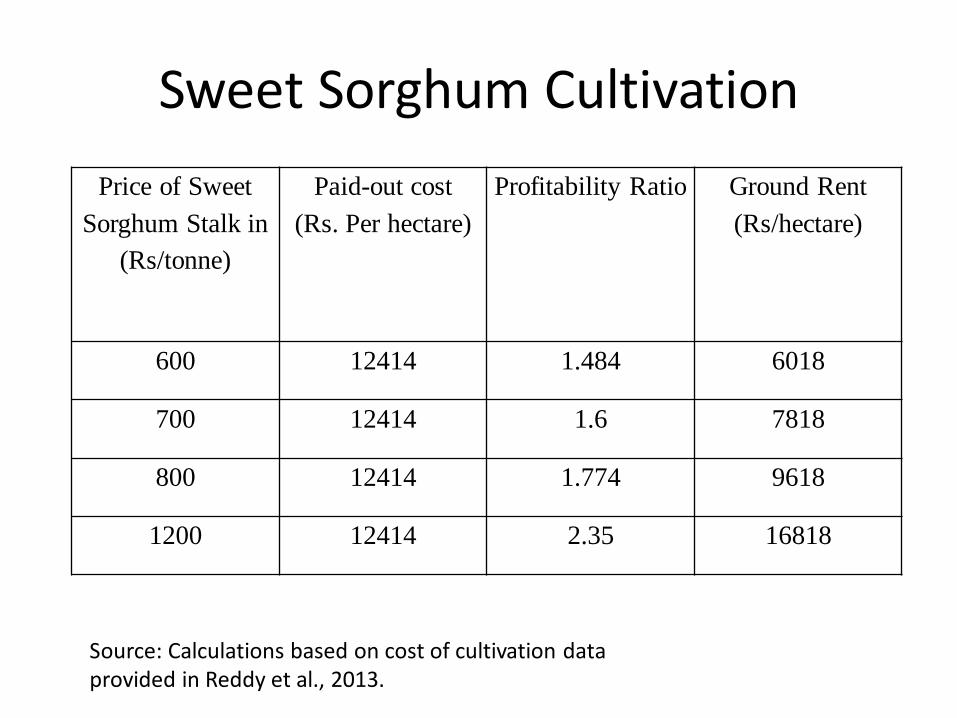
Sweet Sorghum Cultivation
Price of Sweet
Sorghum Stalk in
(Rs/tonne)
Paid-out cost
(Rs. Per hectare)
Profitability Ratio Ground Rent
(Rs/hectare)
600 12414 1.484 6018
700 12414 1.6 7818
800 12414 1.774 9618
1200 12414 2.35 16818
Source: Calculations based on cost of cultivation data provided in Reddy et al., 2013.

Critical HSD Price Range (Rs. per litre)
2004-05 2007-08 2010-11
Paddy 20.47 13.15 24.36 13.25 25.61 11.21
Wheat 17.56 12.65 21.95 12.53 21.77 11.97
Maize 15.54 12.64 16.40 13.24 21.93 12.38
Jowar 13.81 13.02 14.64 12.82 16.41 12.12
Bajra 13.74 13.37 14.51 13.51 14.47 13.32
Ragi 13.92 12.55 17.13 11.88 16.38 10.73
Barley 15.53 11.22 18.05 13.74 16.80 13.74
Gram 16.23 13.74 19.19 13.74 20.80 13.74
Tur 16.40 13.64 13.74 13.74 13.74 13.74
Groundnut 15.53 12.81 17.84 13.74 20.32 13.74
Rapeseed & Mustard 17.23 12.91 23.29 13.74 22.15 13.36
Soybean 15.24 13.74 17.12 13.74 18.05 13.74
Sesamum 15.68 13.63 15.95 13.74 16.56 13.74
Sunflower 14.30 13.74 15.84 13.74 15.39 13.74
Cotton 18.37 12.39 21.21 13.74 32.20 13.74
Jute 13.94 13.26 15.53 13.71 23.09 13.74
Sugarcane 28.67 13.74 28.09 13.74 48.13 13.74
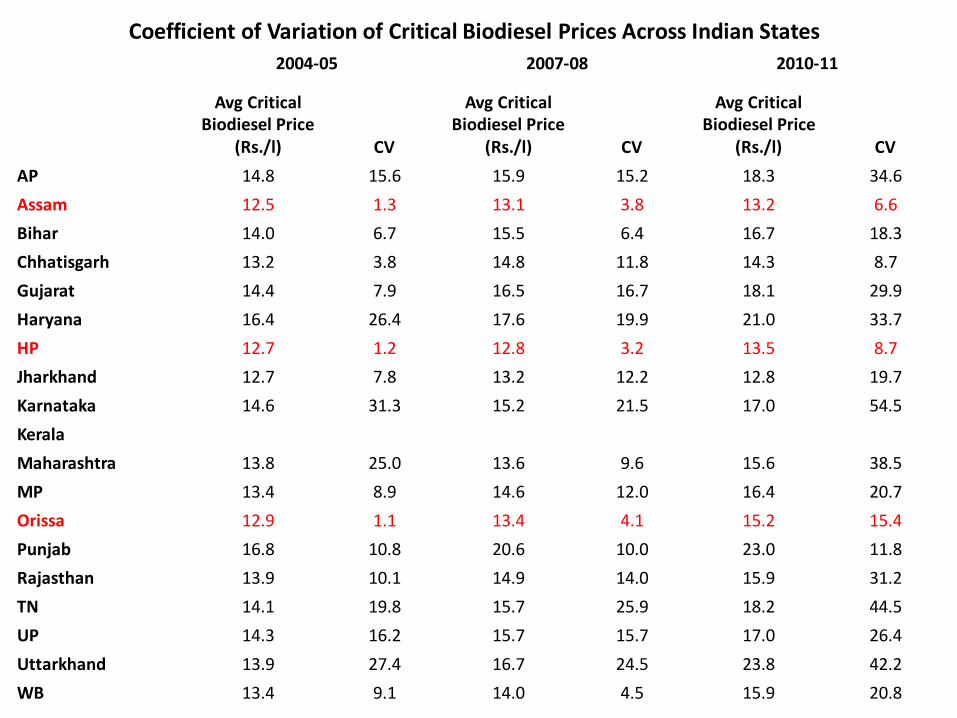
Coefficient of Variation of Critical Biodiesel Prices Across Indian States
2004-05 2007-08 2010-11
Avg Critical Biodiesel Price
(Rs./l) CV
Avg Critical Biodiesel Price
(Rs./l) CV
Avg Critical Biodiesel Price
(Rs./l) CV
AP 14.8 15.6 15.9 15.2 18.3 34.6
Assam 12.5 1.3 13.1 3.8 13.2 6.6
Bihar 14.0 6.7 15.5 6.4 16.7 18.3
Chhatisgarh 13.2 3.8 14.8 11.8 14.3 8.7
Gujarat 14.4 7.9 16.5 16.7 18.1 29.9
Haryana 16.4 26.4 17.6 19.9 21.0 33.7
HP 12.7 1.2 12.8 3.2 13.5 8.7
Jharkhand 12.7 7.8 13.2 12.2 12.8 19.7
Karnataka 14.6 31.3 15.2 21.5 17.0 54.5
Kerala
Maharashtra 13.8 25.0 13.6 9.6 15.6 38.5
MP 13.4 8.9 14.6 12.0 16.4 20.7
Orissa 12.9 1.1 13.4 4.1 15.2 15.4
Punjab 16.8 10.8 20.6 10.0 23.0 11.8
Rajasthan 13.9 10.1 14.9 14.0 15.9 31.2
TN 14.1 19.8 15.7 25.9 18.2 44.5
UP 14.3 16.2 15.7 15.7 17.0 26.4
Uttarkhand 13.9 27.4 16.7 24.5 23.8 42.2
WB 13.4 9.1 14.0 4.5 15.9 20.8
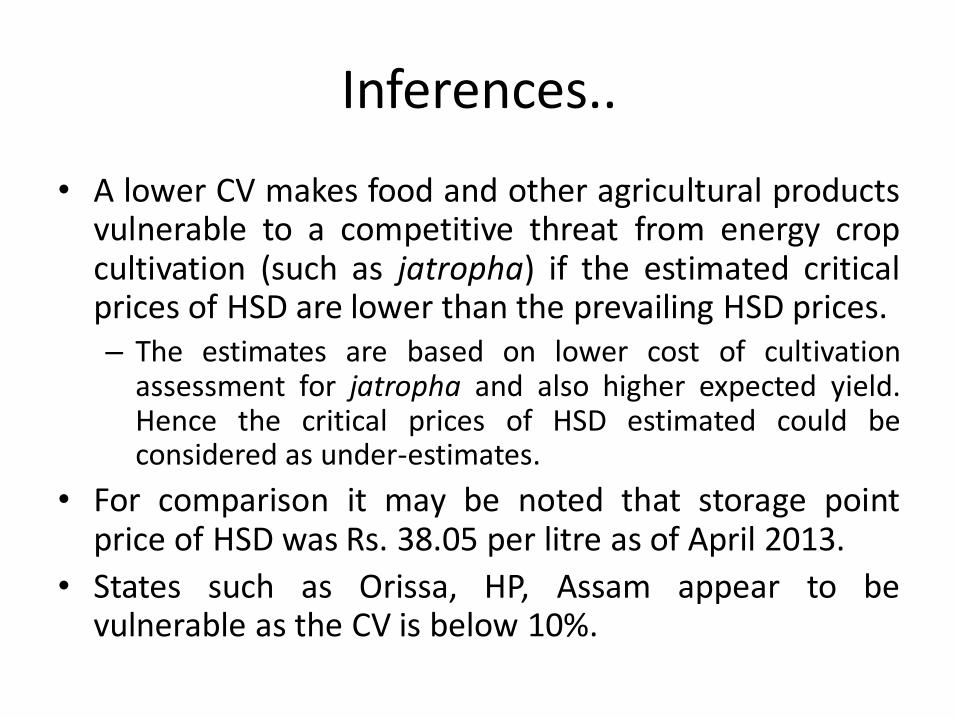
Inferences..
• A lower CV makes food and other agricultural productsvulnerable to a competitive threat from energy cropcultivation (such as jatropha) if the estimated criticalprices of HSD are lower than the prevailing HSD prices.– The estimates are based on lower cost of cultivation
assessment for jatropha and also higher expected yield.Hence the critical prices of HSD estimated could beconsidered as under-estimates.
• For comparison it may be noted that storage pointprice of HSD was Rs. 38.05 per litre as of April 2013.
• States such as Orissa, HP, Assam appear to bevulnerable as the CV is below 10%.
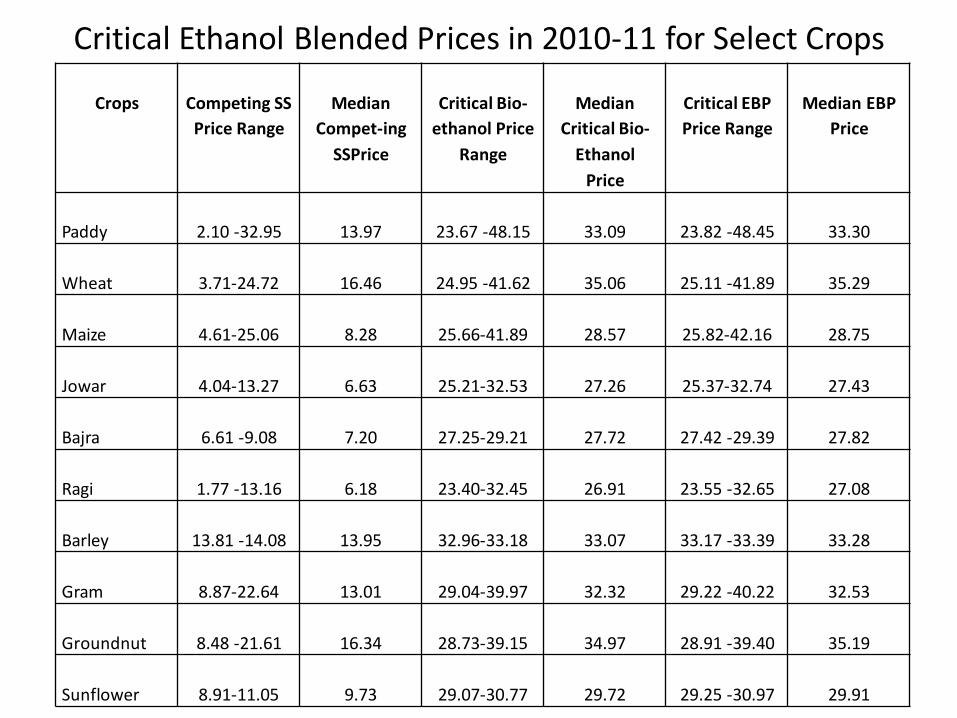
Critical Ethanol Blended Prices in 2010-11 for Select Crops
Crops Competing SS
Price Range
Median
Compet-ing
SSPrice
Critical Bio-
ethanol Price
Range
Median
Critical Bio-
Ethanol
Price
Critical EBP
Price Range
Median EBP
Price
Paddy 2.10 -32.95 13.97 23.67 -48.15 33.09 23.82 -48.45 33.30
Wheat 3.71-24.72 16.46 24.95 -41.62 35.06 25.11 -41.89 35.29
Maize 4.61-25.06 8.28 25.66-41.89 28.57 25.82-42.16 28.75
Jowar 4.04-13.27 6.63 25.21-32.53 27.26 25.37-32.74 27.43
Bajra 6.61 -9.08 7.20 27.25-29.21 27.72 27.42 -29.39 27.82
Ragi 1.77 -13.16 6.18 23.40-32.45 26.91 23.55 -32.65 27.08
Barley 13.81 -14.08 13.95 32.96-33.18 33.07 33.17 -33.39 33.28
Gram 8.87-22.64 13.01 29.04-39.97 32.32 29.22 -40.22 32.53
Groundnut 8.48 -21.61 16.34 28.73-39.15 34.97 28.91 -39.40 35.19
Sunflower 8.91-11.05 9.73 29.07-30.77 29.72 29.25 -30.97 29.91
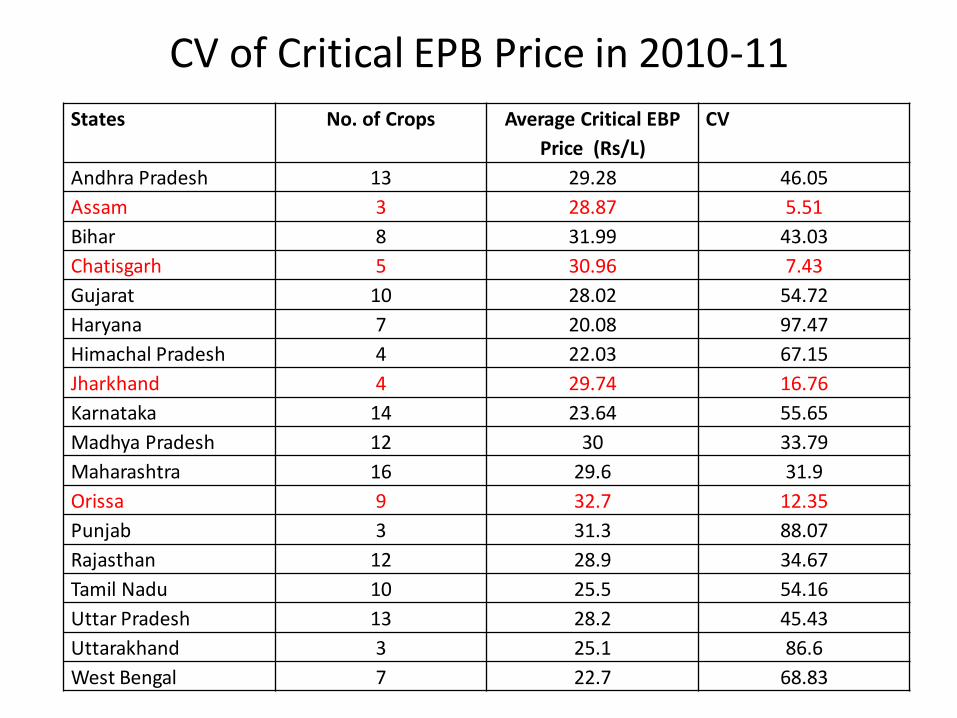
CV of Critical EPB Price in 2010-11
States No. of Crops Average Critical EBP
Price (Rs/L)
CV
Andhra Pradesh 13 29.28 46.05
Assam 3 28.87 5.51
Bihar 8 31.99 43.03
Chatisgarh 5 30.96 7.43
Gujarat 10 28.02 54.72
Haryana 7 20.08 97.47
Himachal Pradesh 4 22.03 67.15
Jharkhand 4 29.74 16.76
Karnataka 14 23.64 55.65
Madhya Pradesh 12 30 33.79
Maharashtra 16 29.6 31.9
Orissa 9 32.7 12.35
Punjab 3 31.3 88.07
Rajasthan 12 28.9 34.67
Tamil Nadu 10 25.5 54.16
Uttar Pradesh 13 28.2 45.43
Uttarakhand 3 25.1 86.6
West Bengal 7 22.7 68.83
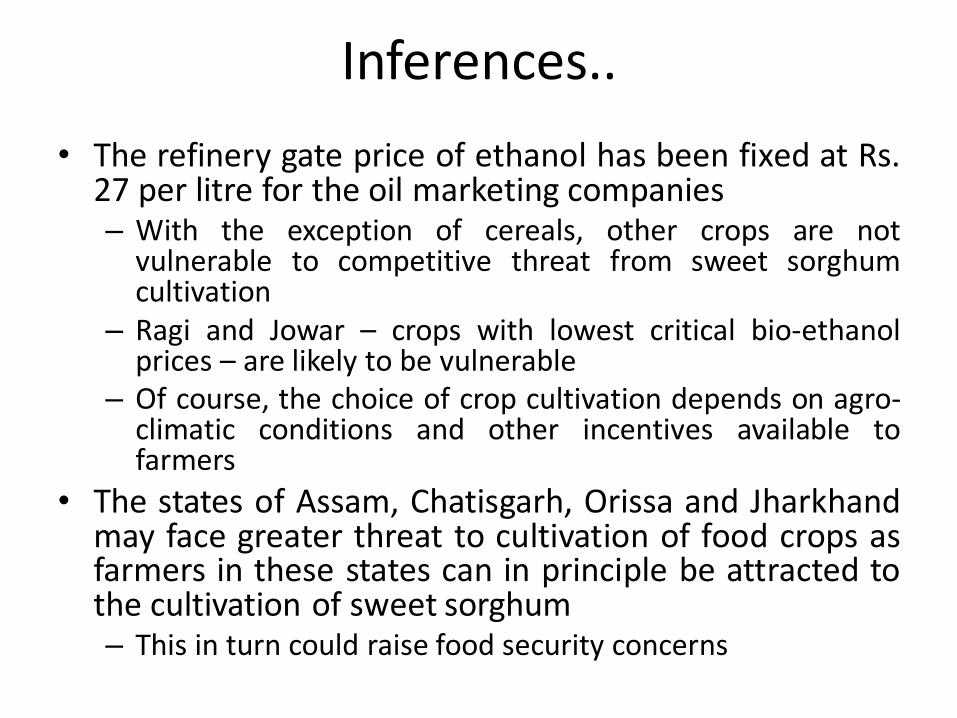
Inferences..
• The refinery gate price of ethanol has been fixed at Rs.27 per litre for the oil marketing companies– With the exception of cereals, other crops are not
vulnerable to competitive threat from sweet sorghumcultivation
– Ragi and Jowar – crops with lowest critical bio-ethanolprices – are likely to be vulnerable
– Of course, the choice of crop cultivation depends on agro-climatic conditions and other incentives available tofarmers
• The states of Assam, Chatisgarh, Orissa and Jharkhandmay face greater threat to cultivation of food crops asfarmers in these states can in principle be attracted tothe cultivation of sweet sorghum– This in turn could raise food security concerns

Jatropha Cultivation –Ground Reality in Tamil Nadu
• State started promotion of jatropha way back in 2002,ahead of the launch of National Biofuel Mission in 2003
• TN has established a CoE in biofuels at TNAU• TN was the third largest cultivator of jatropha in India in
2008 with over 20000 ha cultivated• During 2007-12, the TN government aimed to bring 100000
ha under jatropha with a 50% subsidy on seedlings• Jatropha promotion was envisaged mainly through contract
farming• Six districts were covered in the field survey to assess
present status of jatropha cultivation in TN -Kancheepuram, Coimbatore, Thiruvannamalai, Villupuram,Tirunelveli, and Viruthunagar
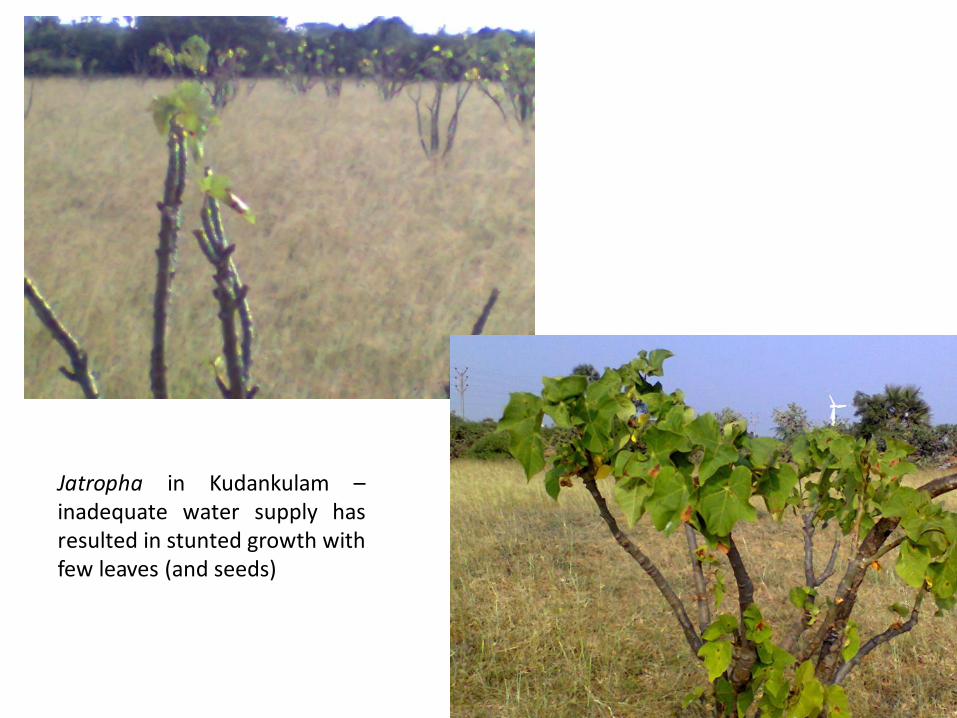
Jatropha in Kudankulam –inadequate water supply hasresulted in stunted growth withfew leaves (and seeds)
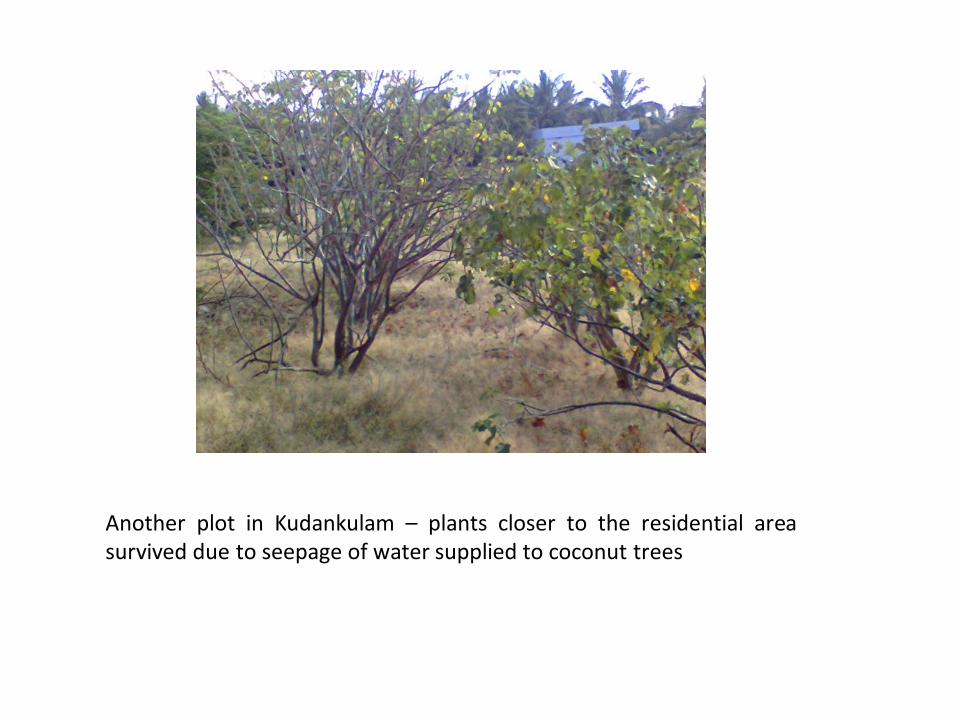
Another plot in Kudankulam – plants closer to the residential areasurvived due to seepage of water supplied to coconut trees
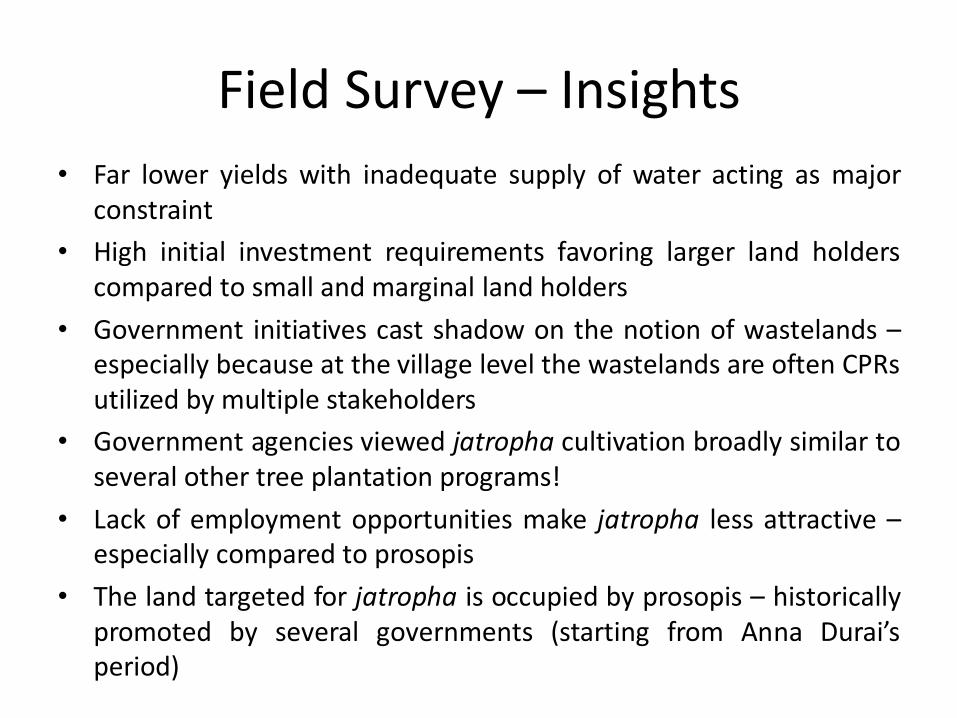
Field Survey – Insights
• Far lower yields with inadequate supply of water acting as majorconstraint
• High initial investment requirements favoring larger land holderscompared to small and marginal land holders
• Government initiatives cast shadow on the notion of wastelands –especially because at the village level the wastelands are often CPRsutilized by multiple stakeholders
• Government agencies viewed jatropha cultivation broadly similar toseveral other tree plantation programs!
• Lack of employment opportunities make jatropha less attractive –especially compared to prosopis
• The land targeted for jatropha is occupied by prosopis – historicallypromoted by several governments (starting from Anna Durai’speriod)

Field Survey - Insights
• Prosopis is used as feedstock in several smallindustries and provides employmentopportunity (cutting etc.) for landless poor
• Ambiguous definition of wasteland andinadequate understanding of use of wastelandhas led to concerns regarding the feasibility ofachieving biodiesel production targets. It hasalso compromised the livelihood options ofrural population.
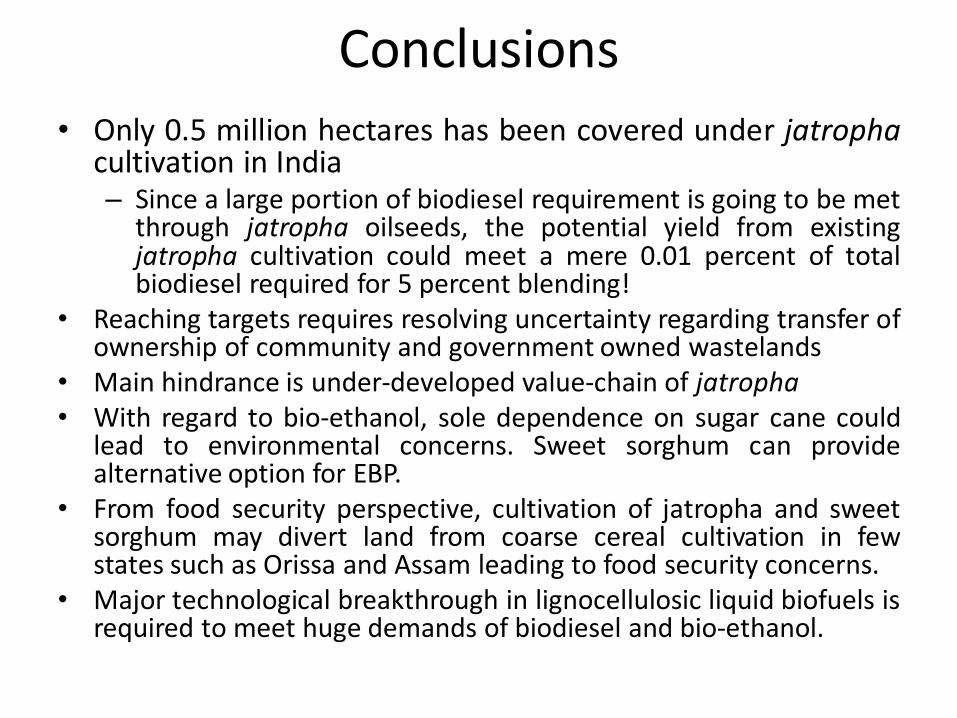
Conclusions• Only 0.5 million hectares has been covered under jatropha
cultivation in India– Since a large portion of biodiesel requirement is going to be met
through jatropha oilseeds, the potential yield from existingjatropha cultivation could meet a mere 0.01 percent of totalbiodiesel required for 5 percent blending!
• Reaching targets requires resolving uncertainty regarding transfer ofownership of community and government owned wastelands
• Main hindrance is under-developed value-chain of jatropha• With regard to bio-ethanol, sole dependence on sugar cane could
lead to environmental concerns. Sweet sorghum can providealternative option for EBP.
• From food security perspective, cultivation of jatropha and sweetsorghum may divert land from coarse cereal cultivation in fewstates such as Orissa and Assam leading to food security concerns.
• Major technological breakthrough in lignocellulosic liquid biofuels isrequired to meet huge demands of biodiesel and bio-ethanol.

Thank you!
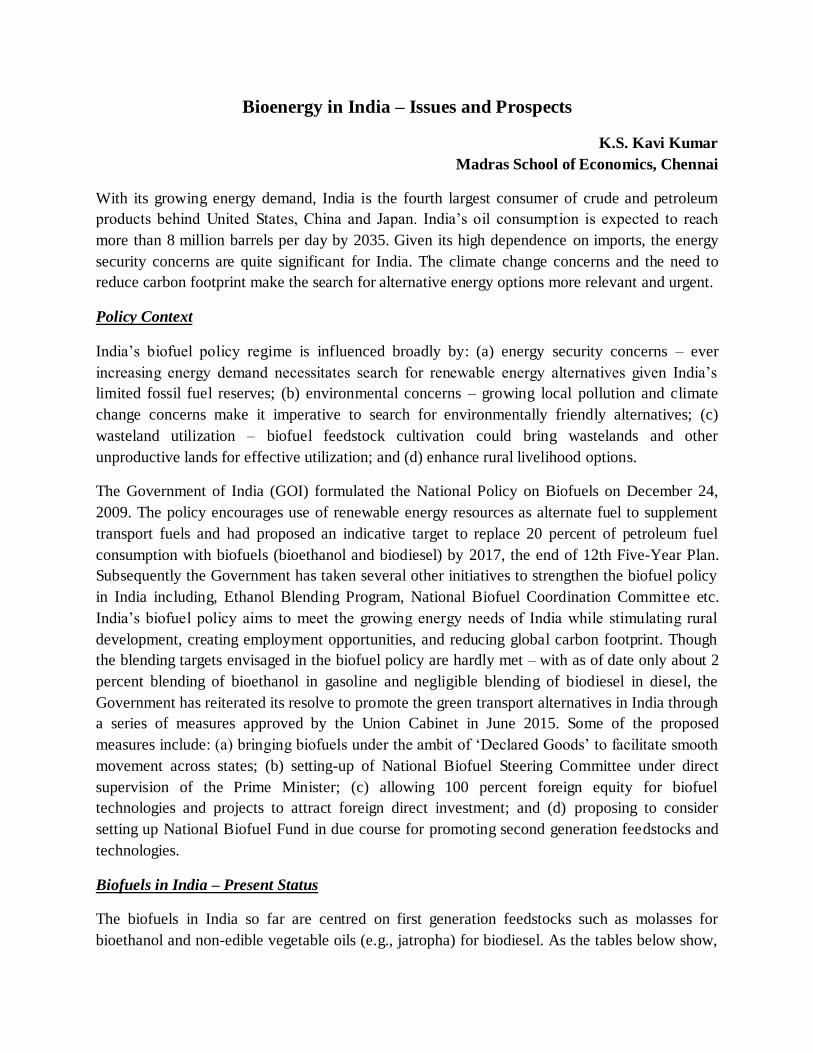
Bioenergy in India – Issues and Prospects
K.S. Kavi Kumar
Madras School of Economics, Chennai
With its growing energy demand, India is the fourth largest consumer of crude and petroleum
products behind United States, China and Japan. India’s oil consumption is expected to reach
more than 8 million barrels per day by 2035. Given its high dependence on imports, the energy
security concerns are quite significant for India. The climate change concerns and the need to
reduce carbon footprint make the search for alternative energy options more relevant and urgent.
Policy Context
India’s biofuel policy regime is influenced broadly by: (a) energy security concerns – ever
increasing energy demand necessitates search for renewable energy alternatives given India’s
limited fossil fuel reserves; (b) environmental concerns – growing local pollution and climate
change concerns make it imperative to search for environmentally friendly alternatives; (c)
wasteland utilization – biofuel feedstock cultivation could bring wastelands and other
unproductive lands for effective utilization; and (d) enhance rural livelihood options.
The Government of India (GOI) formulated the National Policy on Biofuels on December 24,
2009. The policy encourages use of renewable energy resources as alternate fuel to supplement
transport fuels and had proposed an indicative target to replace 20 percent of petroleum fuel
consumption with biofuels (bioethanol and biodiesel) by 2017, the end of 12th Five-Year Plan.
Subsequently the Government has taken several other initiatives to strengthen the biofuel policy
in India including, Ethanol Blending Program, National Biofuel Coordination Committee etc.
India’s biofuel policy aims to meet the growing energy needs of India while stimulating rural
development, creating employment opportunities, and reducing global carbon footprint. Though
the blending targets envisaged in the biofuel policy are hardly met – with as of date only about 2
percent blending of bioethanol in gasoline and negligible blending of biodiesel in diesel, the
Government has reiterated its resolve to promote the green transport alternatives in India through
a series of measures approved by the Union Cabinet in June 2015. Some of the proposed
measures include: (a) bringing biofuels under the ambit of ‘Declared Goods’ to facilitate smooth
movement across states; (b) setting-up of National Biofuel Steering Committee under direct
supervision of the Prime Minister; (c) allowing 100 percent foreign equity for biofuel
technologies and projects to attract foreign direct investment; and (d) proposing to consider
setting up National Biofuel Fund in due course for promoting second generation feedstocks and
technologies.
Biofuels in India – Present Status
The biofuels in India so far are centred on first generation feedstocks such as molasses for
bioethanol and non-edible vegetable oils (e.g., jatropha) for biodiesel. As the tables below show,
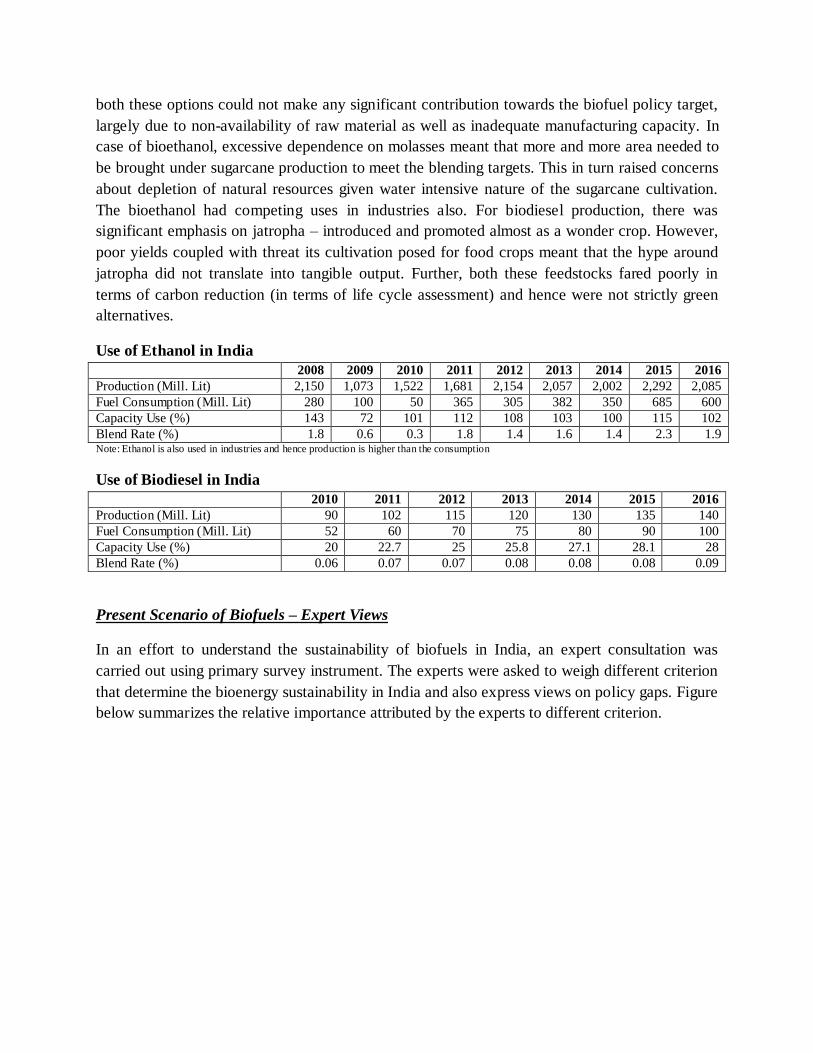
both these options could not make any significant contribution towards the biofuel policy target,
largely due to non-availability of raw material as well as inadequate manufacturing capacity. In
case of bioethanol, excessive dependence on molasses meant that more and more area needed to
be brought under sugarcane production to meet the blending targets. This in turn raised concerns
about depletion of natural resources given water intensive nature of the sugarcane cultivation.
The bioethanol had competing uses in industries also. For biodiesel production, there was
significant emphasis on jatropha – introduced and promoted almost as a wonder crop. However,
poor yields coupled with threat its cultivation posed for food crops meant that the hype around
jatropha did not translate into tangible output. Further, both these feedstocks fared poorly in
terms of carbon reduction (in terms of life cycle assessment) and hence were not strictly green
alternatives.
Use of Ethanol in India
2008 2009 2010 2011 2012 2013 2014 2015 2016
Production (Mill. Lit) 2,150 1,073 1,522 1,681 2,154 2,057 2,002 2,292 2,085
Fuel Consumption (Mill. Lit) 280 100 50 365 305 382 350 685 600
Capacity Use (%) 143 72 101 112 108 103 100 115 102
Blend Rate (%) 1.8 0.6 0.3 1.8 1.4 1.6 1.4 2.3 1.9 Note: Ethanol is also used in industries and hence production is higher than the consumption
Use of Biodiesel in India
2010 2011 2012 2013 2014 2015 2016
Production (Mill. Lit) 90 102 115 120 130 135 140
Fuel Consumption (Mill. Lit) 52 60 70 75 80 90 100
Capacity Use (%) 20 22.7 25 25.8 27.1 28.1 28
Blend Rate (%) 0.06 0.07 0.07 0.08 0.08 0.08 0.09
Present Scenario of Biofuels – Expert Views
In an effort to understand the sustainability of biofuels in India, an expert consultation was
carried out using primary survey instrument. The experts were asked to weigh different criterion
that determine the bioenergy sustainability in India and also express views on policy gaps. Figure
below summarizes the relative importance attributed by the experts to different criterion.
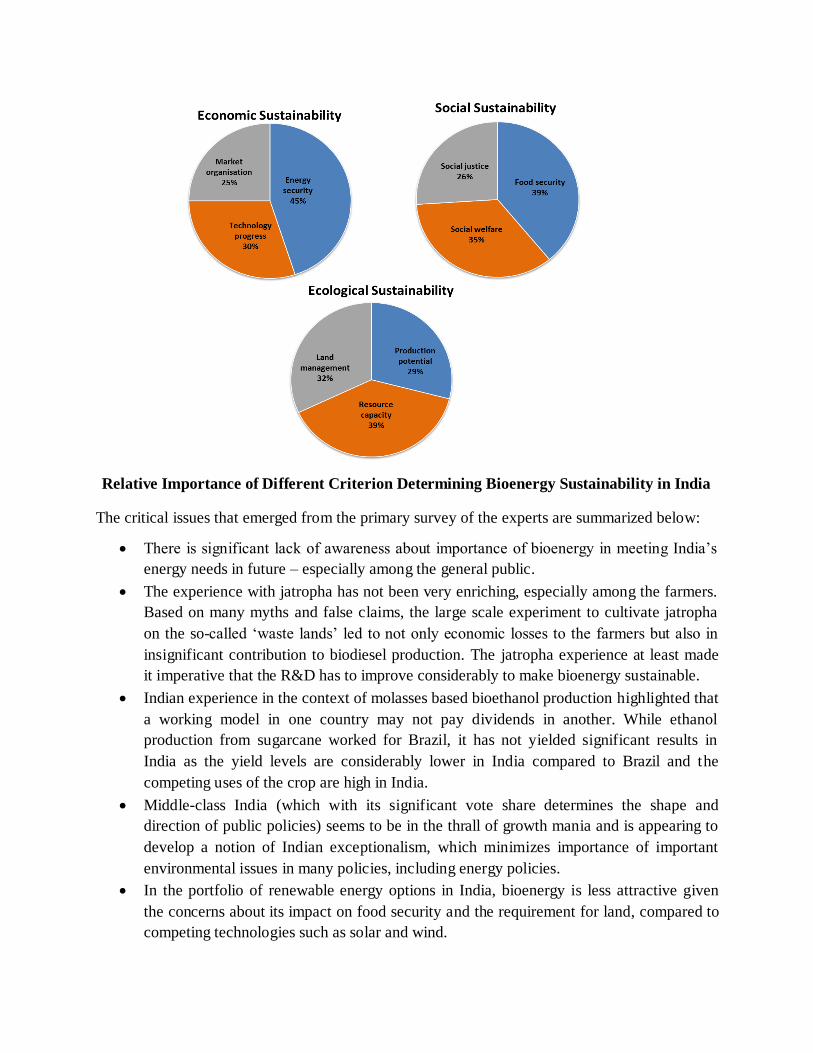
Relative Importance of Different Criterion Determining Bioenergy Sustainability in India
The critical issues that emerged from the primary survey of the experts are summarized below:
There is significant lack of awareness about importance of bioenergy in meeting India’s
energy needs in future – especially among the general public.
The experience with jatropha has not been very enriching, especially among the farmers.
Based on many myths and false claims, the large scale experiment to cultivate jatropha
on the so-called ‘waste lands’ led to not only economic losses to the farmers but also in
insignificant contribution to biodiesel production. The jatropha experience at least made
it imperative that the R&D has to improve considerably to make bioenergy sustainable.
Indian experience in the context of molasses based bioethanol production highlighted that
a working model in one country may not pay dividends in another. While ethanol
production from sugarcane worked for Brazil, it has not yielded significant results in
India as the yield levels are considerably lower in India compared to Brazil and the
competing uses of the crop are high in India.
Middle-class India (which with its significant vote share determines the shape and
direction of public policies) seems to be in the thrall of growth mania and is appearing to
develop a notion of Indian exceptionalism, which minimizes importance of important
environmental issues in many policies, including energy policies.
In the portfolio of renewable energy options in India, bioenergy is less attractive given
the concerns about its impact on food security and the requirement for land, compared to
competing technologies such as solar and wind.
The attention on bioenergy swings with the fossil fuel prices. It gets attention whenever
the oil prices soar high. Consistent and coherent policy to promote bioenergy is
conspicuous by its absence in India.
At a broad level, sustainability of bioenergy depends crucially on effective dissemination
of information, consistent policy, and widespread capacity building at various levels.
Shift towards Second Generation Biofuels
Given not so significant contribution made by the first generation biofuels, the focus has slowly
shifted towards the second generation feedstocks and technologies. The second generation
biofuels are derived from wastes – such as agricultural waste and municipal solid waste, and
hence in principal do not have impact on human and/or animal food chains. Also, these biofuels
provide significant carbon reductions compared to emissions from conventional hydrocarbon
based fuels.
Though the second generation biofuel technologies have not yet reached commercial stage, there
seems to be significant scope for commercialization soon. While there are eight second-
generation-ethanol production plants that are in commercial demonstration stage in the world,
adoption of the same to Indian conditions is not straight forward due to variety of reasons
including, feedstock specific nature of the technology, high capital costs involved, and high
capacity plants needed for availing scale advantages. In India due to small land holding size and
inadequate transport infrastructure, it is desirable to have small or medium scale plants (i.e.,
plants that operate with capacities such as 100-200 tonnes biomass per day). Similarly, it is
desirable to have technology that is insensitive to feedstock and technology that involves low
capital expenditure. In India, the initiatives taken by the Department of Biotechnology (DBT)
since 2008 have resulted in setting-up of demonstration scale plant of 10 tonnes biomass per day
capacity by a private company (India Glycols Ltd.) in April 2016. This is a major step forward as
India has significant amount of agricultural residues that can be converted to biofuels using 2 nd
generation biofuel technologies. A recent study by UNEP has estimated that future crop residue
in India can produce approximately 50 billion litres of biofuels by 2030-31. In addition, another
study estimates that more than 150 million tonnes of municipal solid waste collected in large to
small cities can produce over 40 million tonnes of biofuel using the second generation biofuel
technologies. These options when materialized have the potential to meet India’s blending
targets and put it firmly on the green energy path.
Bioenergy Sustainability Survey – Indian Experts
Key Findings
To contribute to the ongoing debate about bioenergy sustainability, a brief survey of experts has
been undertaken to learn about the importance, relevance and structure of sustainability criteria
for bioenergy systems in India. The bioenergy sustainability has been structured around three
primary criteria – namely, economic, social and ecological sustainability of bioenergy. Two
levels of sub-criteria have been used to further understand the determinants of each of these
dimensions. The specific objectives of the survey include:
relevance of the criteria used for assessing bioenergy sustainability
suggestions to improve the structure of criteria
reasons for the respondents’ choices on the criteria
The survey was undertaken to cross verify the findings from an earlier survey involving multiple
stakeholders associated with bioenergy in India. The survey instrument was administered on a
select list of experts familiar with bioenergy/biofuel scenario in India. The experts – drawn from
universities and think tanks – have been asked to weigh various criteria and sub-criteria
determining the bioenergy sustainability and have also been asked to provide reasons to
substantiate their weighing schemes. Given the limited scope of the survey, a select list of 23
experts working in the board fields of energy and environment are approached. More than 50 per
cent of experts responded to the survey despite tight deadline.
1.0 Description of the Survey Instrument
As mentioned above, the three main criteria used to assess bioenergy sustainability include,
economic sustainability, social sustainability and ecological sustainability. Each of these criteria
are explained further below.
Economic sustainability
The economic sustainability of bioenergy production using a particular type of biomass will
depend on three important economic conditions:
1. Contributions of bioenergy to energy security
2. Progress in technology for bioenergy
3. Quality of market structure for bioenergy
Social sustainability
The social sustainability of bioenergy production using a particular type of biomass will depend
on three important social conditions:
1. Impacts of bioenergy on food security
2. Contributions of bioenergy to social welfare
3. Impacts of bioenergy on social justice
Ecological sustainability
Finally, the environmental sustainability of bioenergy production using a particular type of
biomass will depend on three important environmental conditions:
1. Potential for increasing biomass production for bioenergy
2. Impacts of bioenergy production on natural (i.e. land, water) resources
3. Land management to improve land productivity
The survey instrument further provides determinants of each of the sub-criteria. For example,
domestic energy demand, domestic energy supply and foreign energy trade constitute the
determinants of energy security. Similarly in case of other sub-criteria, the survey instrument
lists out the determinants. The respondents have been asked to provide ratings for sub-criteria as
well as the determinants of the each sub-criterion. The respondents have also been asked to
comment on adequacy of the sub-criterion and their determinants in analyzing bioenergy
sustainability. Further, the respondents have also been requested to comment on the divergence
(or lack of divergence) of their weighing scheme with that obtained from a more broader survey
involving multiple stakeholders of bioenergy. The following sections discuss briefly the main
findings of the expert survey.
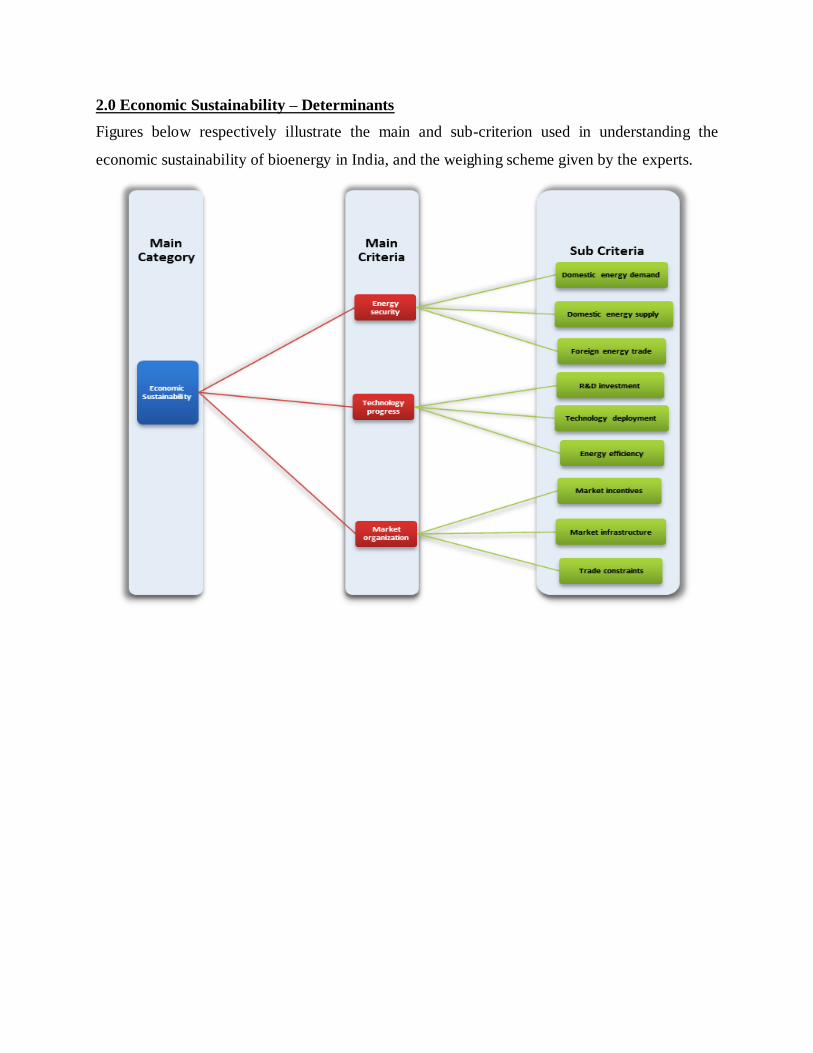
2.0 Economic Sustainability – Determinants
Figures below respectively illustrate the main and sub-criterion used in understanding the
economic sustainability of bioenergy in India, and the weighing scheme given by the experts.
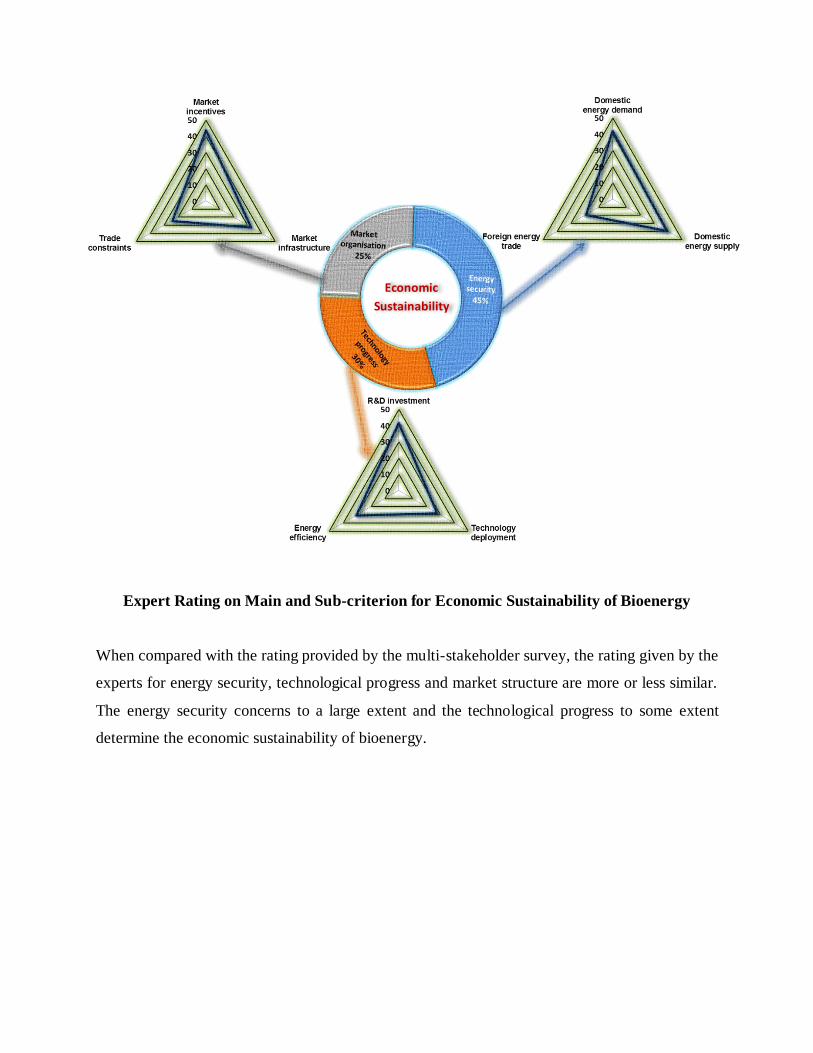
Expert Rating on Main and Sub-criterion for Economic Sustainability of Bioenergy
When compared with the rating provided by the multi-stakeholder survey, the rating given by the
experts for energy security, technological progress and market structure are more or less similar.
The energy security concerns to a large extent and the technological progress to some extent
determine the economic sustainability of bioenergy.
Economic
Sustainability
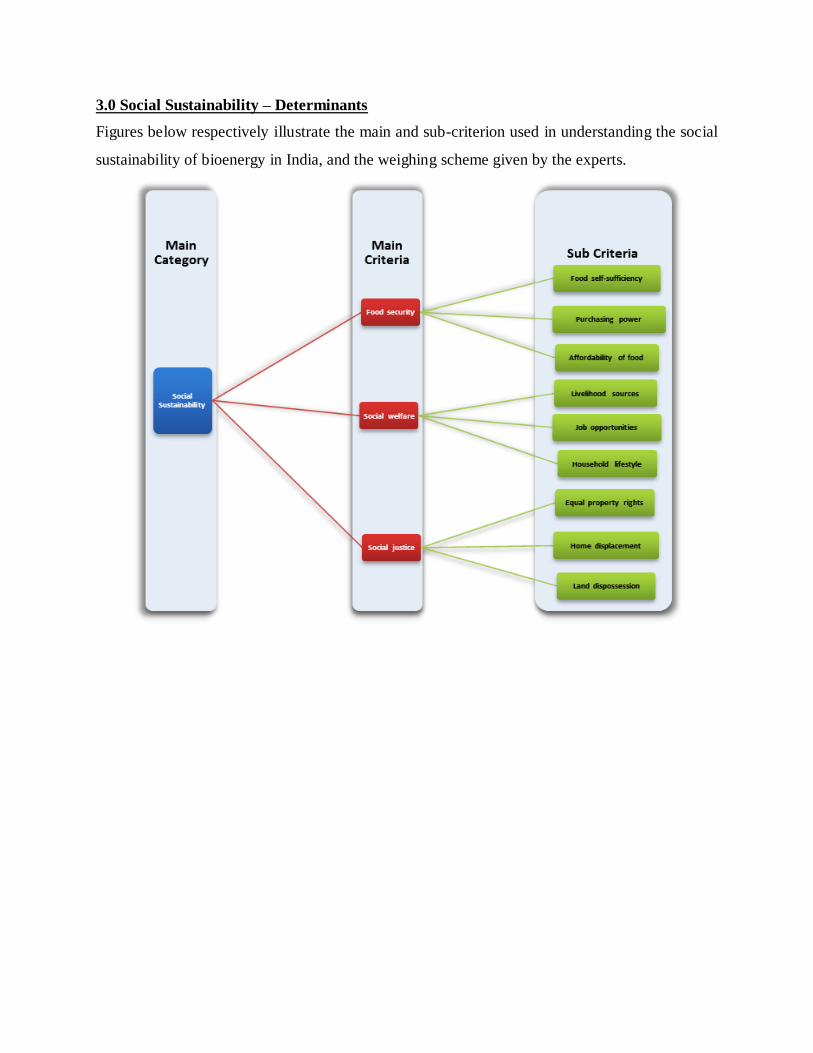
3.0 Social Sustainability – Determinants
Figures below respectively illustrate the main and sub-criterion used in understanding the social
sustainability of bioenergy in India, and the weighing scheme given by the experts.
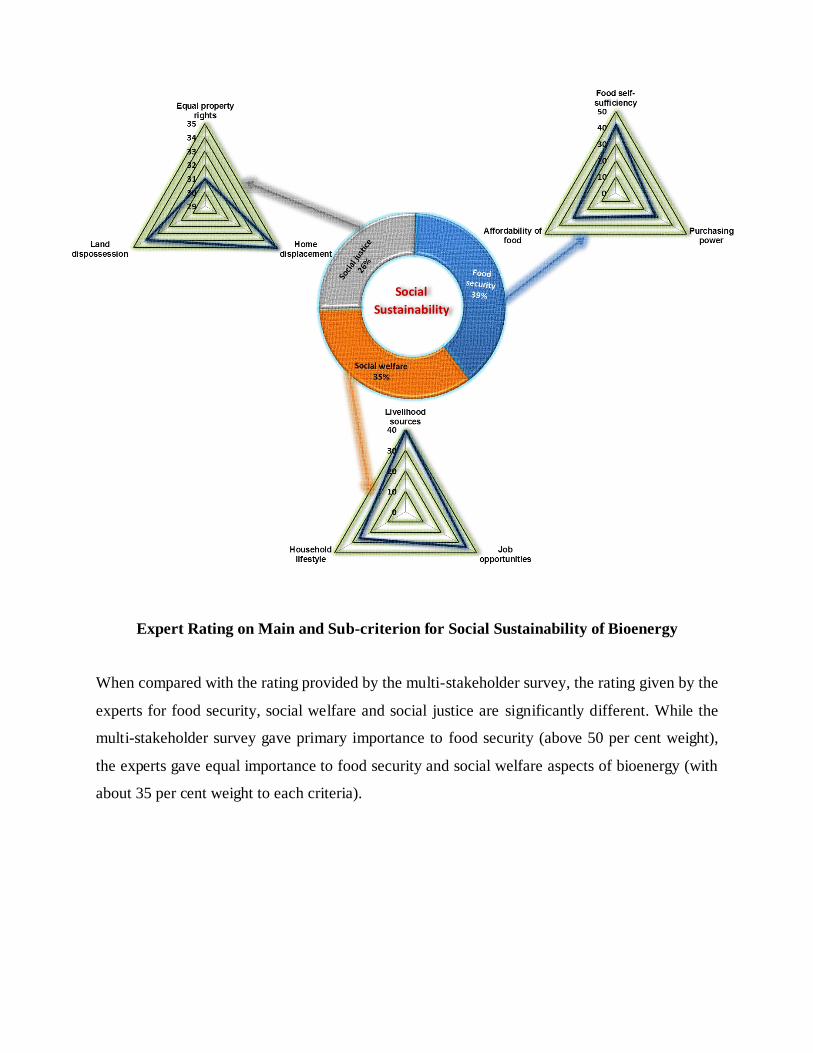
Expert Rating on Main and Sub-criterion for Social Sustainability of Bioenergy
When compared with the rating provided by the multi-stakeholder survey, the rating given by the
experts for food security, social welfare and social justice are significantly different. While the
multi-stakeholder survey gave primary importance to food security (above 50 per cent weight),
the experts gave equal importance to food security and social welfare aspects of bioenergy (with
about 35 per cent weight to each criteria).
Social
Sustainability
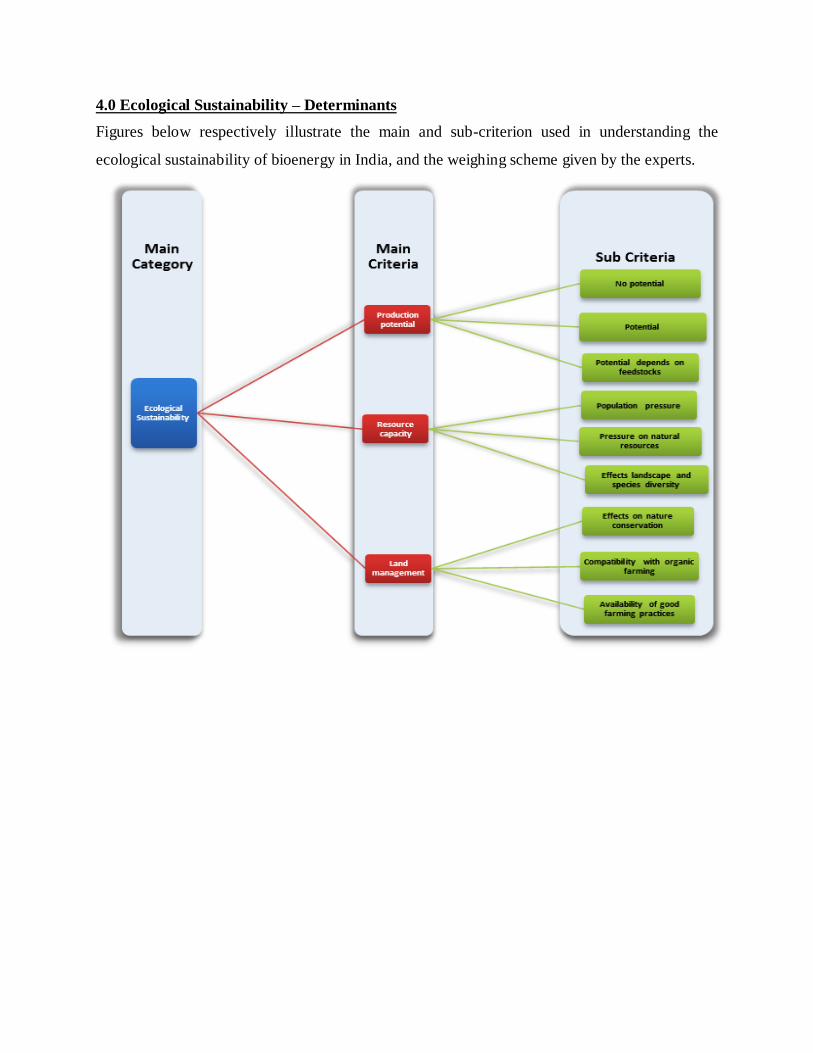
4.0 Ecological Sustainability – Determinants
Figures below respectively illustrate the main and sub-criterion used in understanding the
ecological sustainability of bioenergy in India, and the weighing scheme given by the experts.
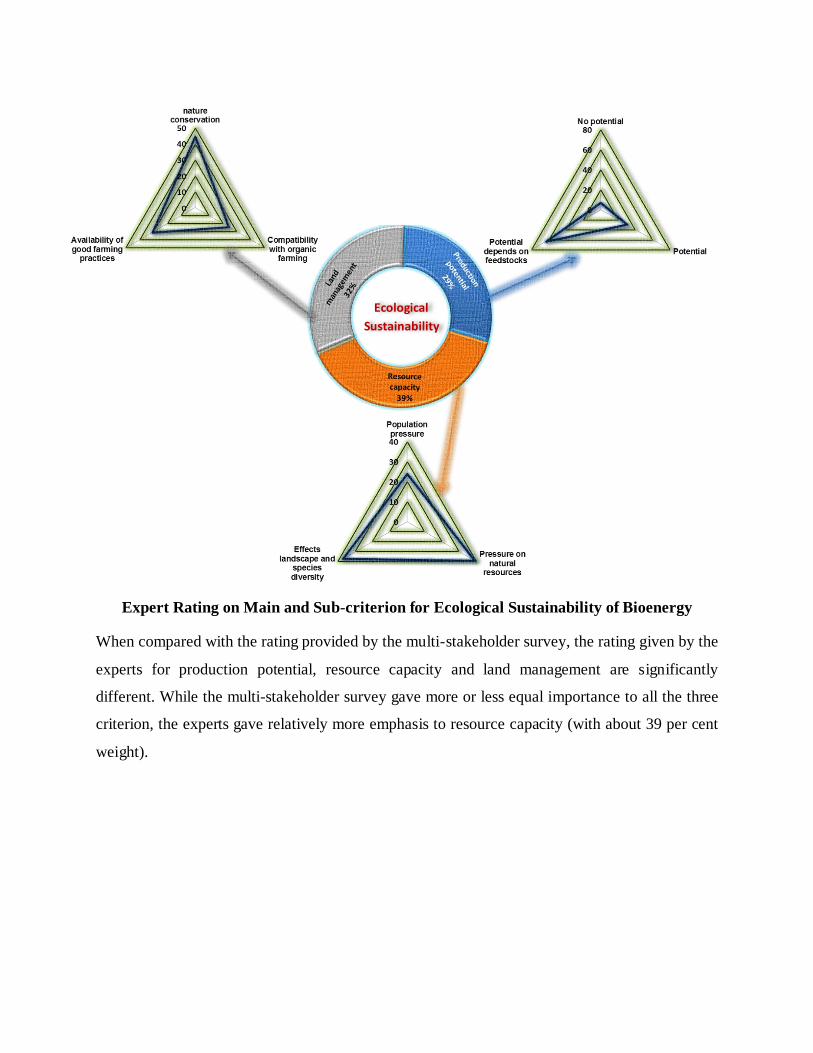
Expert Rating on Main and Sub-criterion for Ecological Sustainability of Bioenergy
When compared with the rating provided by the multi-stakeholder survey, the rating given by the
experts for production potential, resource capacity and land management are significantly
different. While the multi-stakeholder survey gave more or less equal importance to all the three
criterion, the experts gave relatively more emphasis to resource capacity (with about 39 per cent
weight).
Ecological
Sustainability
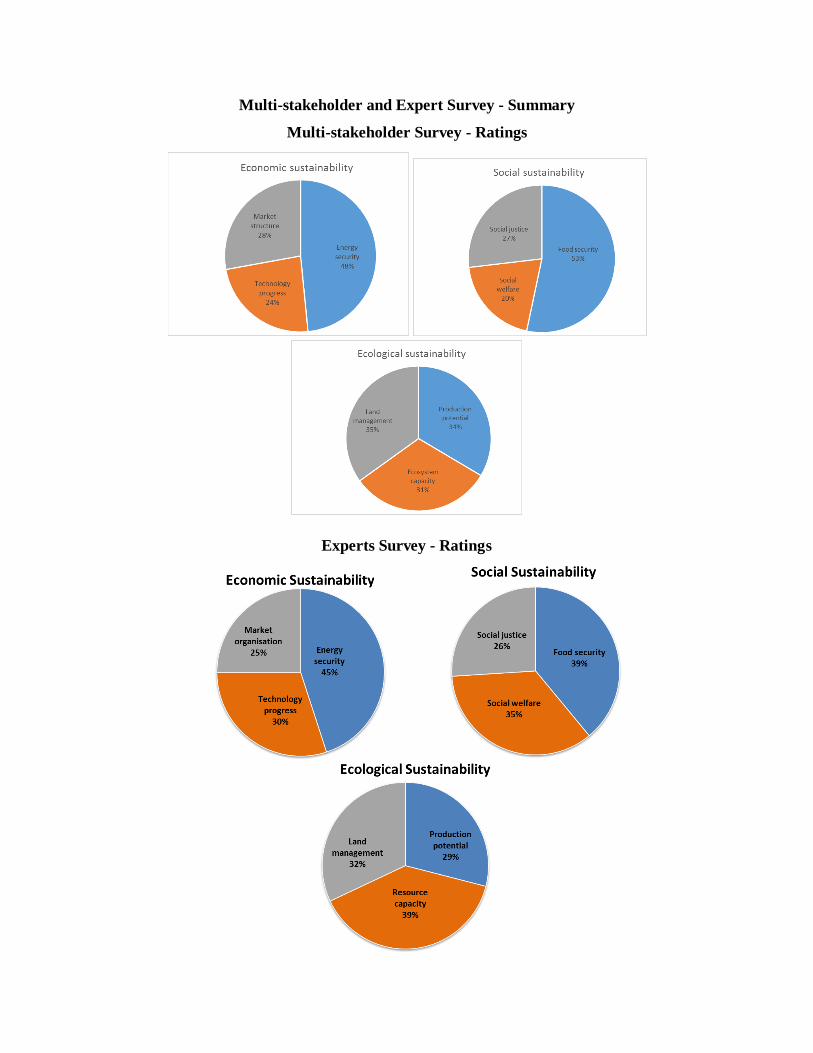
Multi-stakeholder and Expert Survey - Summary
Multi-stakeholder Survey - Ratings
Experts Survey - Ratings
STRAP Sustainability TRade‐offs and Pathways
Working Paper #001‐2014
Typology of Farmers’ Awareness on Sustainability of Alternative Bioenergy Feedstocks in the Philippines
Elena A. Eugenio14, Lilibeth A. Acosta12, Nelson H. Enano Jr.3, Damasa B. Magcale‐Macandog4, Paula Beatrice M. Macandog45, Joan Pauline P. Talubo6, Arnold R. Salvacion6,
Wolfgang Lucht27 and Jemimah Mae A. Eugenio8 1School of Environmental Science and Management, University of the Philippines in Los Banos, Philippines 2Potsdam Institute for Climate Impact Research, Telegraphenberg, 14473 Potsdam, Germany 3Tropical Institute for Climate Studies and Center for Renewable Energy and Alternative Technologies, Ateneo de Davao University, Philippines 4Institute of Biological Sciences, College of Arts and Sciences, University of the Philippines in Los Banos, Philippines 5College of Economics and Management, UPLB College, Philippines 6College of Public Affairs and Development, University of the Philippines Los Banos, Philippines 7Department of Geography, Humboldt University Berlin, Berlin, Germany 8Institute of Mathematical Sciences and Physics, College of Arts and Sciences, University of the Philippines in Los Banos, Philippines Funded by: Low Carbon Initiatives Framework
1
Typology of Farmers’ Awareness on Sustainability of Alternative Bioenergy Feedstocks in the Philippines
Elena A. Eugenio14, Lilibeth A. Acosta12, Nelson H. Enano Jr.3, Damasa B. Magcale‐Macandog4, Paula
Beatrice M. Macandog45, Joan Pauline P. Talubo6, Arnold R. Salvacion6, Wolfgang Lucht27 and Jemimah Mae A. Eugenio8
1School of Environmental Science and Management, University of the Philippines in Los Banos, Philippines 2Potsdam Institute for Climate Impact Research, Telegraphenberg, 14473 Potsdam, Germany 3Tropical Institute for Climate Studies and Center for Renewable Energy and Alternative Technologies, Ateneo de Davao University, Philippines 4Institute of Biological Sciences, College of Arts and Sciences, University of the Philippines in Los Banos, Philippines 5College of Economics and Management, UPLB College, Philippines 6College of Public Affairs and Development, University of the Philippines Los Banos, Philippines 7Department of Geography, Humboldt University Berlin, Berlin, Germany 8Institute of Mathematical Sciences and Physics, College of Arts and Sciences, University of the Philippines in Los Banos, Philippines Corresponding author: Elena A. Eugenio, Institute of Biological Sciences, College of Arts and Sciences, University of the Philippines in Los Banos, Philippines, Email: [email protected] Abstract The paper presents an analysis of bioenergy potential in the Philippines by understanding farmers’ perceptions on sustainable bioenergy production. It focuses on the opinions of farmers for both first generation (i.e. sugar‐rich crops, starch‐rich crops and oil‐rich crops) and second generation (i.e. agriculture/forest residues, fast‐growing trees, and perennial grasses) bioenergy crops, which are being or can be used for the production of biodiesel and bioethanol. Such an assessment is critical for many developing countries including the Philippines due to its impact on food security, particularly as a result of the negative effects of bioenergy feedstock production and processing on increasing water scarcity and agricultural land pressure. Moreover, farmers play a key role in the production of biomass feedstock for bioenergy, so it is important to understand their level of awareness on the effects of bioenergy on food security and economy. Field survey was conducted with farmers in three regions including Calabarzon, Central Visayas and Davao. The paper presents the results of the cluster analysis, which was applied to determine the socio‐economic profiles that characterize the opinions of the farmers. The survey results showed that there are differences in the level of awareness of the farmers in the different regions in the Philippines and these were categorized into four typologies, such as unaware, less awareness, moderate awareness and high awareness. Farmers with unaware typology were located in Calabarzon and Davao, large number of farmer with low to moderate awareness were found in Calabarzon and farmers with high awareness were located in Central Visayas. Keywords: Bioenergy, biofuels, cluster analysis, first and second generation bioenergy, food security, Philippines
2
1. Introduction The global production and consumption of biofuels have increased dramatically in the past few years, primarily due to intensifying concerns about national energy security, increasing oil prices, environmental considerations (i.e. climate change mitigation), and efforts to revitalize rural communities. The question today is not whether biofuels will be a part of the energy mix, but rather what economic, social, and environmental implications they will have [2, 34]. Biofuels or bioenergy are renewable energy and carbon neutral so that they are considered sustainable. As is generally known, there are two kinds of biofuels- biodiesel and bioethanol. Biodiesel is a fuel extracted typically from oils of coconut and oil palm. It is a natural hydrocarbon with little sulfur content, and can be used in diesel engines with very little or without any need for engine modification. Bioethanol, on the other hand, is a form of ethanol, a light alcohol, produced by fermenting carbohydrates, such as starch or sugar, in vegetable matter. Sources of bioethanol being explored are corn, sugarcane, cassava, and sweet sorghum [18, 25]. Due to unstable and increasing energy prices as well as increasing worldwide energy demand, many countries has perceived bioenergy as an attractive alternative or addition to meet their current and future energy needs [22]. Interest in liquid biofuels production and consumption has increased worldwide as part of government policies to address the growing scarcity of fossil fuels, and, at least in theory, to help mitigate adverse global climate change. The existing biofuels markets are dominated by U.S. ethanol production based on cornstarch (34,069 M liters/year), Brazilian ethanol production (24,500 M liters/year) based on sugarcane, and European biodiesel production (e.g..Germany with 2,819 and France with 1,972 in thousands of tonnes/year) based on rapeseed oil [24, 31]. Like in many other countries, the Philippines is implementing various bioenergy policies to reduce dependence on imported oil, enhance economic growth, contribute to climate change mitigation and promote rural development [1]. The Philippines has a large potential in producing bioenergy because crops that are used as feedstocks for the production of bioenergy are indigenous or locally grown (i.e. traditional) in the country. Other benefits that can be achieved by growing traditional crops as bioenergy is that, increase utilization of agricultural land, promote investment, and create jobs. Biofuels will give the otherwise traditional crops a boost towards value added processing. It will encourage investments, create jobs, and increase farmgate prices although production should be established. In the Philippines, production of biodiesel mainly uses domestic raw materials from coconut and bioethanol is mainly produced from sugarcanes. Other feedstocks under consideration by the Philippine government are jathropa, sweet sorghum, cassava and corn. However, corn as a biofuel feedstock has issues and threats on the supply of feeds for livestock. Currently, the Department of Agriculture (DA) is focused in using sugarcane as feedstock and the use of other crops like sweet sorghum and cassava remains in the R&D stage [14]. According to Department of Energy (DOE), domestic fuel industries in the Philippines produced 132.99 million liters of biodiesel and 4.14 million liters of bioethanol in 2011. These industries have much higher capacities (i.e. 393 and 133 million liters biodiesel and bioethanol, respectively) hence the country has more potential to produce biofuels domestically [10, 16]. However, since 2007, the Philippines have been importing bioethanol to meet the mandated level of 10% blending of bioethanol. In 2013 the bioethanol imports were as high as 248 million liters, which is about 83% of the required bioethanol blending by the government. The main reasons given for the dependence on bioethanol imports despite the available capacity for domestic production are due to inadequate capacity of existing sugarcane distilleries, low productivity, and high production costs erode the competitiveness of locally grown sugarcane [10].
3
Recent empirical study by Acosta et al. [1] revealed that an important barrier to the sustainability of bioenergy production in the Philippines is the lack of awareness among the farmers, who play key role as producers of feedstocks. They developed cluster typologies (i.e. Idealist, Ambivalent, Realist) based on their perceptions and opinions on bioenergy. The focus of their analysis was however not only the farmers but also respondents from the academe, private companies and public institutions in selected case study areas in Luzon in Mindanao. This paper aims to substantiate the findings on the lack of awareness of famers on bioenergy by (1) focusing analysis only on farmers; (2) expanding the case study areas to cover Visayas, largest producer of sugarcane for bioethanol; and (3) developing typologies on the level of farmers’ awareness. In this paper, we also analyze the preferred crops by the farmers for the production of bioenergy and their knowledge on the impacts of bioenergy on food security and economic growth. The paper is structured as follows: section 1 describes the development of bioenergy in the Philippines; section 2 discusses the methods used to collect and analyse the survey data; section 3 presents the results of the factor and cluster analyses; and section 4 provides conclusions. 2. Philippine bioenergy development The growing focus towards a cleaner and greener environment has directed the Philippine government to search for more alternative renewable sources of fuel and energy. With the recent enactment into law of the RA 9367 otherwise known as the Biofuels Act of 2006 last January 12, 2007, the mandatory use of biofuels shall be enforced in support to the government’s goal in reducing dependence on imported fuels with due regard to the protection of public health, the environment and natural [14]. The DOE likewise promulgated the Implementing Rules and Regulations (IRR) in 17 May 2007. The Biofuels Act is formally entitled “An act to direct the use of biofuels establishing for this purpose the biofuels program, appropriating funds therefore, and for other purposes.” The IRR covers the “production, blending, storage, handling, transportation, distribution, use, and sale of biofuels, biofuel-blends, and biofuel feedstock in the Philippines” [15, 22]. According to the DA, the objectives of Biofuels Act are as follows: (1) developing and utilizing indigenous renewable and sustainably-sourced clean energy sources to reduce dependence on imported oil; (2) mitigating toxic and greenhouse gas (GHG) emissions; (3) increasing rural employment and income; and (4) ensuring the availability of alternative and renewable clean energy without the detriment to the natural ecosystem, biodiversity and food reserves of the country [1, 5, 14, 15, 17]. The Biofuels Act also provides an incentive of a zero-rated specific tax on the biofuels component of blended gasoline or diesel. Other incentives include an exemption from value-added tax for the sale of raw materials in the production of biofuels, exemption from wastewater charges under the Clean Water Act, and the extension of financial assistance from government financial institutions for the production, storage, handling, and blending of biofuels [9]. To support and comply with the provisions of the Biofuels Act, the DA has been pursuing the Biofuel Feedstock Program, which provides (1) production support services, (2) extension support, education and training services, (3) credit facilitation, (4) research and development, (5) irrigation support services, other infrastructure and postharvest & development services, and (6) marketing development to promote the use of coconut and jathropa for biodiesel and sugarcane, cassava, and sweet sorghum for bioethanol [1]. The biofuel Acts emphasized the use of coconut as the major feedstock for biodiesel production. Its product Coconut Methyl Ester (CME), derived from coconut oil (CNO), possesses characteristics of superior quality and of competitive standards. Biodiesel is the name given to these esters when they are intended for use as transportation fuel [2]. The
4
Philippines success in biodiesel is primarily due to its being the world’s top coconut oil (CNO) producer [9, 10]. Out of the 79 provinces which comprise the country, 68 provinces produce coconuts. The total land area planted to coconut is 3.5 million hectares, in which Luzon covers 1.14 M ha, Visayas with 0.67 M has and Mindanao with 1.76 M has, about 25% of the agricultural lands, thus, more than 344 million nut-bearing trees were planted in the country, where Luzon has 105.50 M trees, Visayas has 68.76 M trees and Mindanao has 170.11 M trees, which produces more than 15.86 M metric tons for the 3 regions, where 3.18 M metric tons, 2.70 M metric tons and 9.44 M metric tons, respectively [4]. About one-third of the country's population depends directly or indirectly on the coconut industry as a source of income and a means of employment and livelihood, employing 2.6 million farmers and 1.9 million farm workers [14]. Developing coconut industry for sustainable biodiesel production will thus have great impact on rural development. While palm oil is now the main feedstock for producing biodiesel in Malaysia and Indonesia [31], there are only few pilot plantations growing oil palm in the Philippines. The government also supports the cultivation of jatropha, a second generation bioenergy crop, for the production of biodiesel. According to Acosta et al. (2013) the Philippines thus have the potential to develop a sustainable bioenergy sector using bioenergy crops that does not compete with food crops and agricultural lands. In the past years, the government has launched massive propagation and cultivation of jathropa seeds covering around 2 million hectares of unproductive, marginal and idle public and private lands all over the country. This effort was aimed to produce about 5,600 million liters of biofuel in the next 10 to 12 years [2, 9]. Jathropa can be planted in any soil types, even in marginal lands, and grows well under tropical and subtropical climate and is found throughout the country [18, 20, 29]. The jathropa cultivation was however encouraged also in productive lands, thus encouraging farmers to shift cultivation from other food crops. Moreover, farmers were not able to sell their jathropa harvest due to lack of awareness about its market. The National Biofuels Program recognizes the vital role of the sugarcane industry as the major supplier of feedstock for the production of bioethanol. The sugar industry is currently producing more than 10% surplus sugar that could very well supply a good portion of the country’s initial needs for bioethanol. Sugarcane provides the highest yield of ethanol per hectare compared to other crops (with the possible exception of sweet sorghum, the worth as feedstock of which remains to be proven locally). Nonetheless, sweet sorghum and cassava are additional ethanol feedstocks considered by the government for increasing future bioethanol production [2]. According to Sugar Regulatory Administration (2008), sugarcane industry will have to grow from the 398,872 hectare cropped for sugar on year 2007-08, which is about 18% in excess of the area needed for domestic sugar self-sufficiency, to an aggregate hectare that will supply feedstock for both sugar and bioethanol starting crop year 2008-09 as needed, without affecting sugar self-sufficiency. Sugarcane farmers in the Philippines are approximately 58,996 and around 5 million people are employed in the industry and other sugar-related activities [28]. The government considers it as the most reliable feedstock due to its well-established farming technologies and the highest yield per hectare compared to other feedstock (corn, cassava, and sweet sorghum). The Sugar Regulatory Administration (SRA) already identified 237,748 hectares of new sugar fields, mostly in Mindanao, that can be tapped to produce fuel ethanol [2]. At present, however, bioethanol sector is confronted by many structural problems and competition with sugar production resulting to large bioethanol imports. 3. Methods 3.1 Case study areas
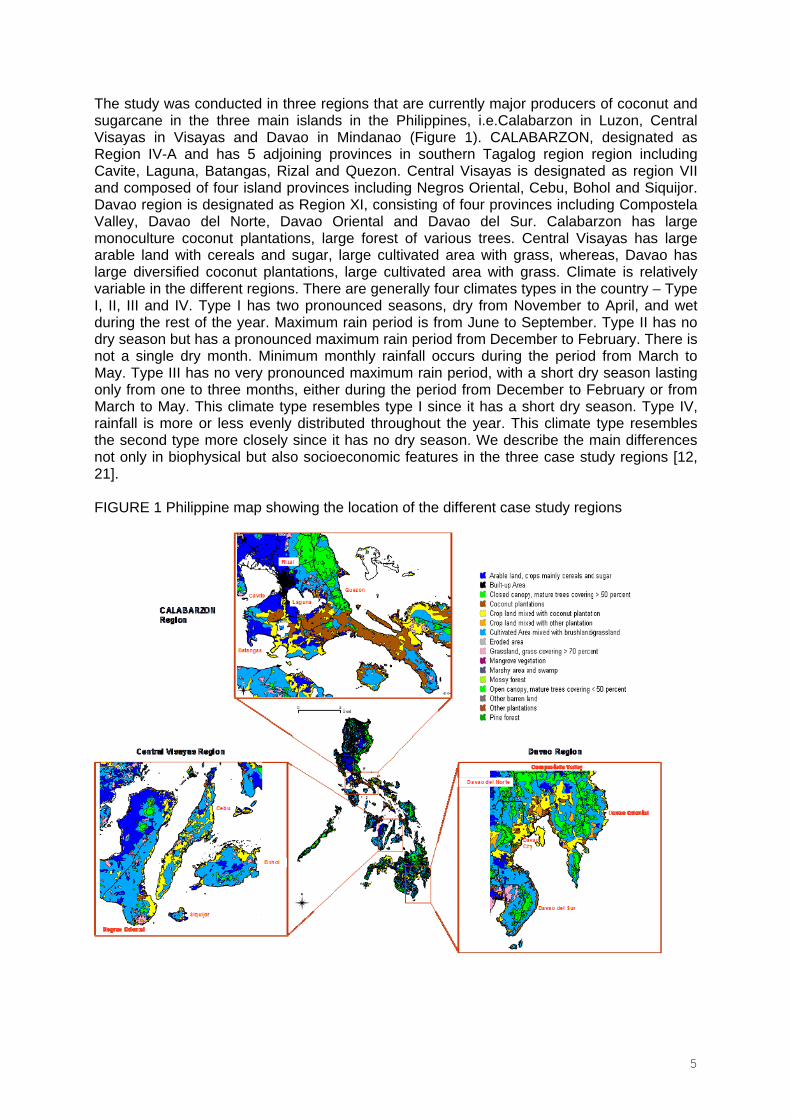
5
The study was conducted in three regions that are currently major producers of coconut and sugarcane in the three main islands in the Philippines, i.e.Calabarzon in Luzon, Central Visayas in Visayas and Davao in Mindanao (Figure 1). CALABARZON, designated as Region IV-A and has 5 adjoining provinces in southern Tagalog region region including Cavite, Laguna, Batangas, Rizal and Quezon. Central Visayas is designated as region VII and composed of four island provinces including Negros Oriental, Cebu, Bohol and Siquijor. Davao region is designated as Region XI, consisting of four provinces including Compostela Valley, Davao del Norte, Davao Oriental and Davao del Sur. Calabarzon has large monoculture coconut plantations, large forest of various trees. Central Visayas has large arable land with cereals and sugar, large cultivated area with grass, whereas, Davao has large diversified coconut plantations, large cultivated area with grass. Climate is relatively variable in the different regions. There are generally four climates types in the country – Type I, II, III and IV. Type I has two pronounced seasons, dry from November to April, and wet during the rest of the year. Maximum rain period is from June to September. Type II has no dry season but has a pronounced maximum rain period from December to February. There is not a single dry month. Minimum monthly rainfall occurs during the period from March to May. Type III has no very pronounced maximum rain period, with a short dry season lasting only from one to three months, either during the period from December to February or from March to May. This climate type resembles type I since it has a short dry season. Type IV, rainfall is more or less evenly distributed throughout the year. This climate type resembles the second type more closely since it has no dry season. We describe the main differences not only in biophysical but also socioeconomic features in the three case study regions [12, 21]. FIGURE 1 Philippine map showing the location of the different case study regions
6
CALABARZON CALABARZON has a total land area of 1,622,861 hectares which comprise 5% of the Philippine Archipelago and the most populated region of the country with population of 12,609,803 (Table 1). The four climate types are represented in this region. From the period 1971 - 2000 the measured average annual rainfall is 4,150.1 millimeters. [4, 6, 12, 21, 27]. The study sites for conducting survey in CALABARZON are in Infanta, Quezon and Batangas. Infanta, Quezon is a first class municipality in the province of Quezon, has a population of 648,181 (2010 census), situated at the northern part of Quezon province. The town has a total land area of 34,276 hectares. Half of the residents of Infanta rely on tertiary types of economic activity such as wholesale and retail, transportation, storage and communication, finance, insurance, real estate and business service, community, social and personal services. The other half earns through primary and secondary types of livelihood. Twenty-eight percent of the residents are still practicing agriculture, hunting and forestry and fishing, while 22% have ventured into mining and quarrying, manufacturing, electricity, gas and water and construction. Batangas is a first class province located on the southwestern part of Luzon with a total land area of 316,581 hectares and have a population of 2,377,395 [27]. Batangas is a combination of plains and mountains, as well as the world's smallest volcano, Mt. Taal, with an elevation of 600 meters, located in the middle of the Taal Lake. Other well-known peaks are Mt. Makulot with an elevation of 830 m, Mt. Talamitan with 700 m, Mt. Pico de Loro with 664 m, Mt. Batulao with 811 m, Mt. Manabo with 830 m, and Mt. Daguldol with 672 m. Batangas also has many islands, including Tingloy, Verde Island (Isla Verde), Fortune Island of Nasugbu. The Municipality of Nasugbu is the home of the plantation of Central Azucarera Don Pedro, the Philippines' largest producer of sugar and other sugarcane products. Batangueños are indeed fond of drinking. This is of no surprise since it lies in what is called the coconut belt that is the raw material for the local liqueurs, the “lambanog” with 90% proof alcohol and the “tuba” which is made of 5.68% alcohol and 13% sugar [3]. Table 1 Description of social-economic and biophysical characteristics in case study areas
Characteristics Calabarzon Central Visayas Davao
Population in 2010 (Growth from 2000) 12,609,803 3.07% 6,800,180 1.77% 4.468.563 1.97% GRDP million PhP (Share agric. to GRDP) 1,030,165 6.25% 36,638 7.81% 224.849 18.87% Agric. land area (Share to total area) 588,516 35.0% 522,433 33.0% 758335 37.0% Agric. employment (Share to total employment) 742,000 16.0% 905,000 31.0% 746000 41.0% Daily agric. wage (Poverty incidence) 269.00 10.3% 173,76 30.2% 182.03 25.6% * GRDP = Gross Regional Domestic Product at constant 2000 prices National Statistics Office (NSO), 2010
Central Visayas Central Visayas Region lies at the center of the Philippine archipelago between the two main islands of Luzon and Mindanao. It is the sixth smallest region in the country with a total land area of 1.58 million hectares. The population is also relatively small at 6,800,180 (Table 1). The region has Type II climate classification [4, 26]. The climate of the region is tropical-monsoonal. The tropical condition can be attributed to the location of Region VII which is about 100 to 110 north of the equator. The monsoonal condition, on the other hand, refers to two seasonal wind regimes, the northeasterly winds and the southwesterly winds. The mean annual temperature in the region is 27 0C, hottest months are February, March and April and the coldest month is January. Due to high temperature and the surrounding bodies of water, the region, as in the case of the Philippines as a whole, has a high relative humidity with mean of 82%.
7
With the exception of Bohol, the topography of Central Visayas is rugged and is characterized by highlands dominating the interior of the provinces, with narrow strips of arable land lining the coast. Of the region's total land area, the hilly to mountainous areas (those with slopes above 18%) constitute about 62 percent and the level to rolling lands account for the remaining 38 percent. The survey in Central Visayas region was conducted in Bohol and Cebu. Bohol has an area of 411,726 hectares. The province is the 10th largest island in the country.Unlike the other three provinces, Bohol is generally flat. Forty-seven (47) percent of the area has a slope of between 0-18 percent. It is not surprising thus, that Bohol should have vast tracts of agricultural lands which are found mostly in the interior of the province. In the interior region are found numerous haycock hills popularly known as the “Chocolate Hills, which have become tourism attractions. One of the larger islands is Panglao located off Tagbilaran City which today has become a major tourist destination in the country. Cebu province is composed of islands and islets, the largest of which are Mactan, Bantayan, and Camotes. The province has a total land area of 508,840 hectares which is 34 percent of the region's total area. The province's terrain is rugged and mountainous with low peaks forming a mountain range that stretches in the center of the island from the southern tip of Santander to Medellin in the north. The surface is characterized by sharp ridges. Osmeña Peak at 1,034 meters is the highest point of the island. The hilly to mountainous areas (slope of 18 percent and above) account for 68 percent of the province's total land area [26]. Davao Davao is located on the southeastern portion of Mindanao with a total land area of 2,035,742 ha. And has a population of 4,468,563 (Table 1). Davao has highest GDRP and highest share of employment in agriculture. It encloses the Davao Gulf and its regional center is Davao City. The region has Type II climate classification [4]. Agriculture is the main economic activity in the region and banana is the primary agricultural product produced. In 2007, the region produced a total of 3.1 metric tons - the highest among the regions. Other primary products include rice, corn, coconut, coffee, pineapple, sugarcane, durian, root crops, vegetables, livestock and poultry, fishing, timber and cut flowers. While the region's economy is predominantly agri-based, it is now developing into a centre for agro-industrial business, trade and tourism. Aside from its forestland and fertile fields, the region is famous for its rich mineral resources. The study sites for the survey in Davao region were mainly in Davao City and Davao del Norte [4, 26]. The Province of Davao del Norte is situated at the southeastern part of the region. It has a rugged, mountainous and moderately to steeply sloping areas on the western part and a wide alluvial plain on the central lowland area. A major portion of the alluvial plain is a flat tract of land; however, some places are gently undulating and exhibit a rolling topography. Its local commodities were abaca, banana (Cavendish/Cardava), cacao, coffee, durian, mango, vegetables, rubber tree, among others [12]. It has a population of 945,764 [27]. Davao City is the center of Metro Davao and has an area of 244,000 hectares, or 8% of the land area of Region XI. It is located in the southeastern part of Mindanao and the Southern Gateway more particularly to and from the neighbouring countries like Indonesia, Malaysia, Brunei, Australia, among others. A substantial part of Davao City is mountainous characterized by extensive mountain ranges with uneven distribution of plateaus and lowlands. The mountain range that delimits the western boundary of the city extends as far down to South Cotabato. This mountain range nurses the highest peak in the Philippines, which is Mt. Apo located at the boundaries of
8
North Cotabato, Davao del Sur and Davao City. Mt. Apo has an elevation of about 10.311 feet (3,144 meters) above sea level. It has been considered as semi-active volcano. Davao City enjoys a mild tropical climate. Compared with other parts of the Philippines in which there is a district hot and wet season. The city is outside the typhoon belt and lacks major seasonal variation. A surrounding mountain chain protect the city effectively from strong winds [11]. The city has a population of 1,449,296, making it the most populous in Mindanao and fourth-most populous city in the country [27]. 3.2 Data collection and analyses Survey design A household survey was conducted with 234 farmers in 2012-2013 in selected provinces in Calabarzon (i.e. Batangas, Quezon), Central Visayas (e.g. Bohol, Cebu) and Davao (i.e. Davao City, Davao del Norte). Questionnaire were constructed based on four types of information on (1) Socio-economic characteristics, (2) Sources of information on bioenergy, (3) Knowledge and opinion on bioenergy, and (4) Preferences on bioenergy feedstock. Socio-economic characteristics are answers to the following questions: What is your gender? How old are you? What is your level of education?
(1) grade school, (2) secondary school, (3) undergraduate (bachelor), (4) graduate (master/doctor), (5) technical training, (6) others
How will you describe the location of your domicile/home? (1) urban area/city, (2) suburban area/close to city, (3) industrial/commercial area, (4) mountain/forest area, (5) farm/agriculture area, (6) riverside/coastal area, (7) others
Where are you presently working? (1) Luzon, (2) Visayas, (3) Mindanao Sources of information on bioenergy are answers to the following question: How important are the following sources of information in building your opinion on bioenergy? Please choose from the following: (1) Least important, (2) Relatively important, (3) Most important, and (4) Not important. media (television, newspaper) neighbours internet public officials family and friends academe/science work colleagues business partners Knowledge and opinion on bioenergy are answers to the following questions: Please answer (1) Yes or (2) No Are you familiar with the term “bioenergy” (also known as biofuels)? Is your work related to bioenergy? In your opinion, is bioenergy good or bad for your country? Do you think the use of biomass from food crops for bioenergy production increases food
prices and thus affects food security (i.e. food affordability and availability) in your country?
Preferences on bioenergy feedstock are answers to the following questions: How will you rate the potential contribution of the following food crops (and non-food) for the sustainable production of first (and second) generation bioenergy in your country? Please choose from the following: (1) Very low, (2) Low, (3) High, (4) Very high, (5) Do not know
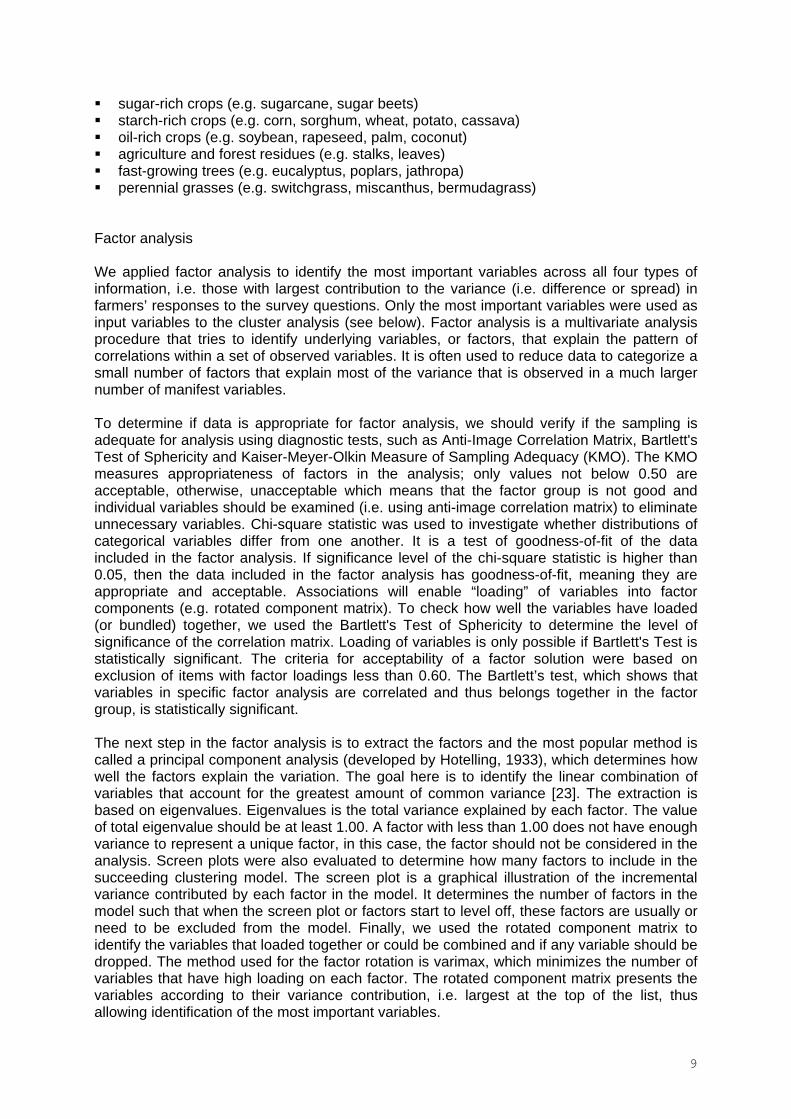
9
sugar-rich crops (e.g. sugarcane, sugar beets) starch-rich crops (e.g. corn, sorghum, wheat, potato, cassava) oil-rich crops (e.g. soybean, rapeseed, palm, coconut) agriculture and forest residues (e.g. stalks, leaves) fast-growing trees (e.g. eucalyptus, poplars, jathropa) perennial grasses (e.g. switchgrass, miscanthus, bermudagrass) Factor analysis We applied factor analysis to identify the most important variables across all four types of information, i.e. those with largest contribution to the variance (i.e. difference or spread) in farmers’ responses to the survey questions. Only the most important variables were used as input variables to the cluster analysis (see below). Factor analysis is a multivariate analysis procedure that tries to identify underlying variables, or factors, that explain the pattern of correlations within a set of observed variables. It is often used to reduce data to categorize a small number of factors that explain most of the variance that is observed in a much larger number of manifest variables. To determine if data is appropriate for factor analysis, we should verify if the sampling is adequate for analysis using diagnostic tests, such as Anti-Image Correlation Matrix, Bartlett's Test of Sphericity and Kaiser-Meyer-Olkin Measure of Sampling Adequacy (KMO). The KMO measures appropriateness of factors in the analysis; only values not below 0.50 are acceptable, otherwise, unacceptable which means that the factor group is not good and individual variables should be examined (i.e. using anti-image correlation matrix) to eliminate unnecessary variables. Chi-square statistic was used to investigate whether distributions of categorical variables differ from one another. It is a test of goodness-of-fit of the data included in the factor analysis. If significance level of the chi-square statistic is higher than 0.05, then the data included in the factor analysis has goodness-of-fit, meaning they are appropriate and acceptable. Associations will enable “loading” of variables into factor components (e.g. rotated component matrix). To check how well the variables have loaded (or bundled) together, we used the Bartlett's Test of Sphericity to determine the level of significance of the correlation matrix. Loading of variables is only possible if Bartlett's Test is statistically significant. The criteria for acceptability of a factor solution were based on exclusion of items with factor loadings less than 0.60. The Bartlett’s test, which shows that variables in specific factor analysis are correlated and thus belongs together in the factor group, is statistically significant. The next step in the factor analysis is to extract the factors and the most popular method is called a principal component analysis (developed by Hotelling, 1933), which determines how well the factors explain the variation. The goal here is to identify the linear combination of variables that account for the greatest amount of common variance [23]. The extraction is based on eigenvalues. Eigenvalues is the total variance explained by each factor. The value of total eigenvalue should be at least 1.00. A factor with less than 1.00 does not have enough variance to represent a unique factor, in this case, the factor should not be considered in the analysis. Screen plots were also evaluated to determine how many factors to include in the succeeding clustering model. The screen plot is a graphical illustration of the incremental variance contributed by each factor in the model. It determines the number of factors in the model such that when the screen plot or factors start to level off, these factors are usually or need to be excluded from the model. Finally, we used the rotated component matrix to identify the variables that loaded together or could be combined and if any variable should be dropped. The method used for the factor rotation is varimax, which minimizes the number of variables that have high loading on each factor. The rotated component matrix presents the variables according to their variance contribution, i.e. largest at the top of the list, thus allowing identification of the most important variables.
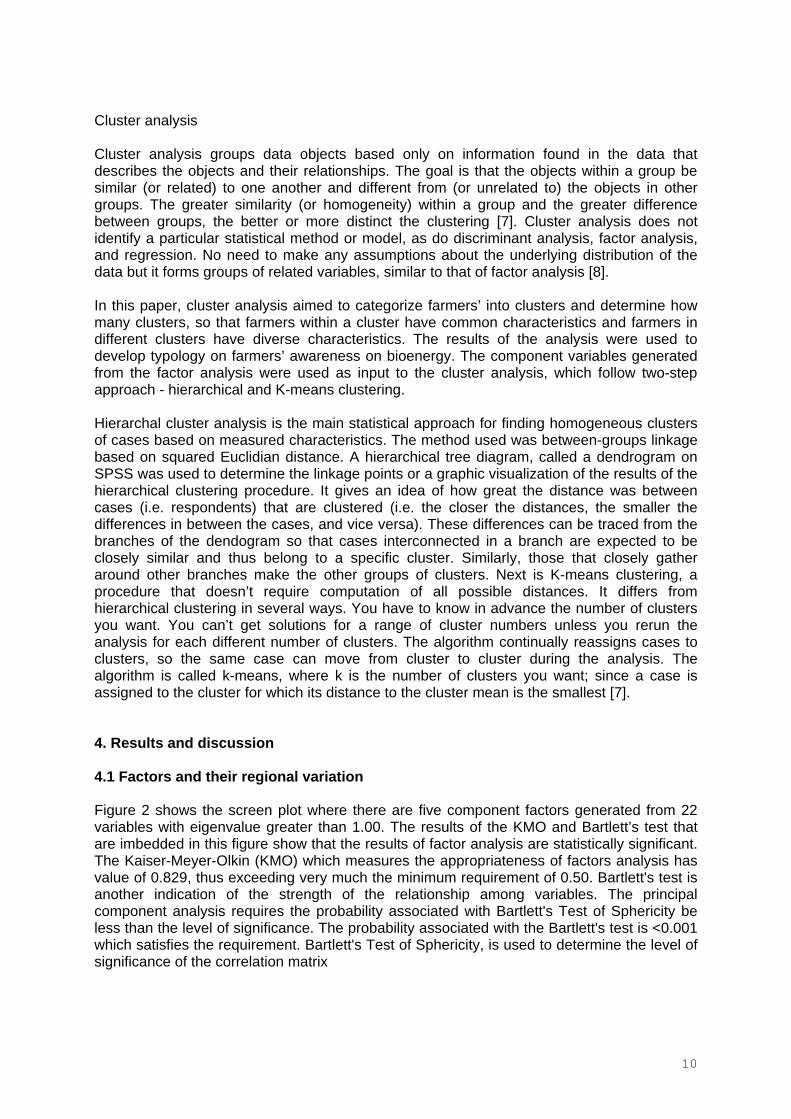
10
Cluster analysis Cluster analysis groups data objects based only on information found in the data that describes the objects and their relationships. The goal is that the objects within a group be similar (or related) to one another and different from (or unrelated to) the objects in other groups. The greater similarity (or homogeneity) within a group and the greater difference between groups, the better or more distinct the clustering [7]. Cluster analysis does not identify a particular statistical method or model, as do discriminant analysis, factor analysis, and regression. No need to make any assumptions about the underlying distribution of the data but it forms groups of related variables, similar to that of factor analysis [8]. In this paper, cluster analysis aimed to categorize farmers’ into clusters and determine how many clusters, so that farmers within a cluster have common characteristics and farmers in different clusters have diverse characteristics. The results of the analysis were used to develop typology on farmers’ awareness on bioenergy. The component variables generated from the factor analysis were used as input to the cluster analysis, which follow two-step approach - hierarchical and K-means clustering. Hierarchal cluster analysis is the main statistical approach for finding homogeneous clusters of cases based on measured characteristics. The method used was between-groups linkage based on squared Euclidian distance. A hierarchical tree diagram, called a dendrogram on SPSS was used to determine the linkage points or a graphic visualization of the results of the hierarchical clustering procedure. It gives an idea of how great the distance was between cases (i.e. respondents) that are clustered (i.e. the closer the distances, the smaller the differences in between the cases, and vice versa). These differences can be traced from the branches of the dendogram so that cases interconnected in a branch are expected to be closely similar and thus belong to a specific cluster. Similarly, those that closely gather around other branches make the other groups of clusters. Next is K-means clustering, a procedure that doesn’t require computation of all possible distances. It differs from hierarchical clustering in several ways. You have to know in advance the number of clusters you want. You can’t get solutions for a range of cluster numbers unless you rerun the analysis for each different number of clusters. The algorithm continually reassigns cases to clusters, so the same case can move from cluster to cluster during the analysis. The algorithm is called k-means, where k is the number of clusters you want; since a case is assigned to the cluster for which its distance to the cluster mean is the smallest [7].
4. Results and discussion 4.1 Factors and their regional variation Figure 2 shows the screen plot where there are five component factors generated from 22 variables with eigenvalue greater than 1.00. The results of the KMO and Bartlett’s test that are imbedded in this figure show that the results of factor analysis are statistically significant. The Kaiser-Meyer-Olkin (KMO) which measures the appropriateness of factors analysis has value of 0.829, thus exceeding very much the minimum requirement of 0.50. Bartlett's test is another indication of the strength of the relationship among variables. The principal component analysis requires the probability associated with Bartlett's Test of Sphericity be less than the level of significance. The probability associated with the Bartlett's test is <0.001 which satisfies the requirement. Bartlett's Test of Sphericity, is used to determine the level of significance of the correlation matrix
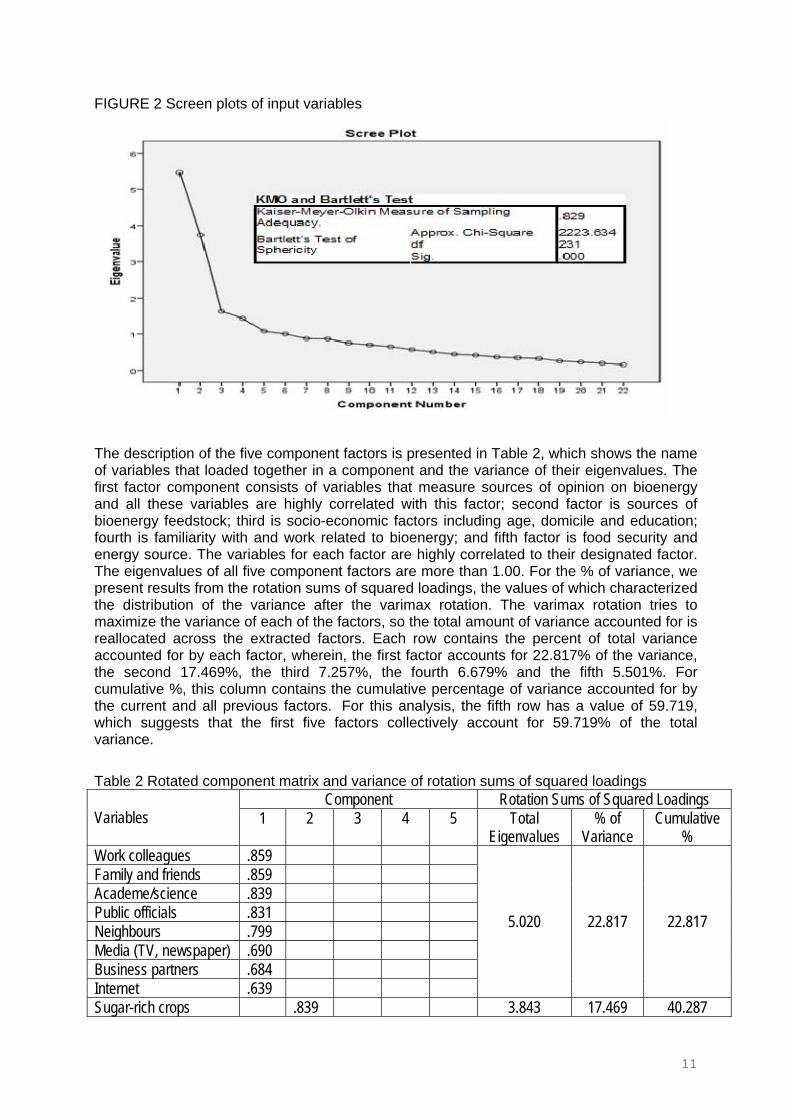
11
FIGURE 2 Screen plots of input variables
The description of the five component factors is presented in Table 2, which shows the name of variables that loaded together in a component and the variance of their eigenvalues. The first factor component consists of variables that measure sources of opinion on bioenergy and all these variables are highly correlated with this factor; second factor is sources of bioenergy feedstock; third is socio-economic factors including age, domicile and education; fourth is familiarity with and work related to bioenergy; and fifth factor is food security and energy source. The variables for each factor are highly correlated to their designated factor. The eigenvalues of all five component factors are more than 1.00. For the % of variance, we present results from the rotation sums of squared loadings, the values of which characterized the distribution of the variance after the varimax rotation. The varimax rotation tries to maximize the variance of each of the factors, so the total amount of variance accounted for is reallocated across the extracted factors. Each row contains the percent of total variance accounted for by each factor, wherein, the first factor accounts for 22.817% of the variance, the second 17.469%, the third 7.257%, the fourth 6.679% and the fifth 5.501%. For cumulative %, this column contains the cumulative percentage of variance accounted for by the current and all previous factors. For this analysis, the fifth row has a value of 59.719, which suggests that the first five factors collectively account for 59.719% of the total variance.
Table 2 Rotated component matrix and variance of rotation sums of squared loadings
Component Rotation Sums of Squared Loadings Variables 1 2 3 4 5 Total
Eigenvalues % of
Variance Cumulative
% Work colleagues .859 Family and friends .859 Academe/science .839 Public officials .831 Neighbours .799 Media (TV, newspaper) .690 Business partners .684 Internet .639
5.020 22.817 22.817
Sugar-rich crops .839 3.843 17.469 40.287
12
Perennial grasses .821 Starch-rich crops .816 Fast growing trees .803 Oil-rich crops .765 Agriculture & forest residues
.568
Age .751 Domicile .631 Education -.558
1.595 7.252 47.539
Familiar with bioenergy .809 Bioenergy work related .808
1.469 6.679 54.218
Affects food security .797 Bioenergy source .486
1.210 5.501 59.719
Extraction Method: Principal Component Analysis. Rotation Method: Varimax with Kaiser Normalization.
Table 3 compares the different case study regions according to the most important variables identified from factor analysis. Large number of famers in Central Visayas considers many important sources of information on bioenergy. The most important source for the three regions is media (TV, newspaper), while internet is the least source of information because most of the farmers live in farm, where internet is not that accessible in the area. Only media is considered most important by half of surveyed famers in Davao. Perceptions on potential on sources of bioenergy feedstock, for both first and second generation, tend to be similar across all three case study areas, i.e. high potential level, except for perennial grasses in Calabarzon where it has low potential as feedstock source. Second generation bioenergy feedstocks are argued to be more sustainable because they do not use food crops and thus not affect food security, and they can be planted in marginal areas or less productive land (e.g. grasses). Most farmers in Central Visayas are still very young, highly educated and mostly live in urban/sub-urban area. Farmers in Calabarzon are in their retirement and retired age and live in rural area, while farmers in Davao are in their middle and retirement age and great number of farmers live in rural area.
Table 3 Regional comparisons of most important variables
Factors Calabarzon Central Visayas Davao
Source of information
Work colleagues 45.69 % 65.52 % 41.67 %
Family & friends 47.41 % 63.79 % 45.00 %
Academe/science 55.17 % 56.90 % 36.67 %
Public officials 55.17 % 56.90 % 45.00 %
Neighbors 31.03 % 67.24 % 41.67 %
Media (TV, Newspaper) 56.90 % 75.86 % 51.67 %
Business partners 23.28 % 56.90 % 41.67 %
Internet 18.97 % 39.66 % 35.00 %
High potential for production
Sugar-rich crops 52.59 % 100.00 % 85.00 %
Perennial grasses 42.24 % 96.55 % 85.00 %
Starch-rich crops 58.62 % 100.00 % 85.00 %
Fast growing trees 52.59 % 96.55 % 85.00 %
Oil-rich crops 74.14 % 98.28 % 85.00 %
Agriculture/forest residues 58.62 % 100.00 % 85.00 %
Age
< 30 6.03 % 37.93 % 11.67 %
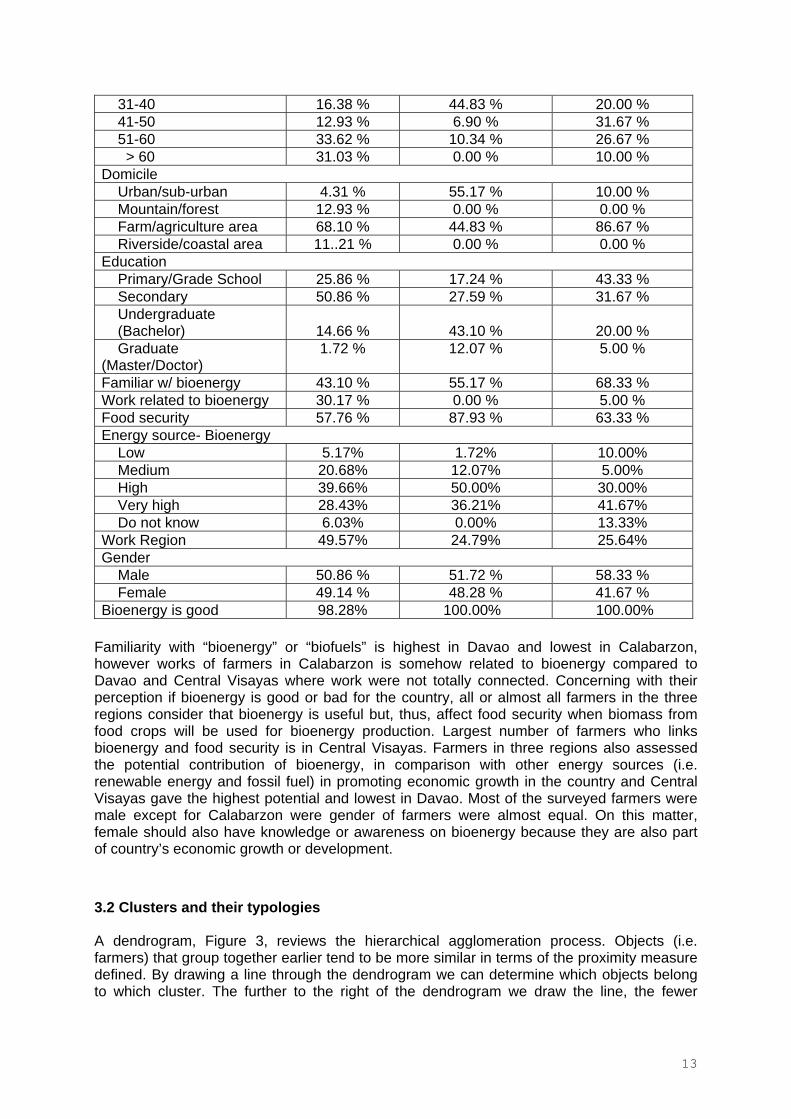
13
31-40 16.38 % 44.83 % 20.00 %
41-50 12.93 % 6.90 % 31.67 %
51-60 33.62 % 10.34 % 26.67 %
> 60 31.03 % 0.00 % 10.00 %
Domicile
Urban/sub-urban 4.31 % 55.17 % 10.00 %
Mountain/forest 12.93 % 0.00 % 0.00 %
Farm/agriculture area 68.10 % 44.83 % 86.67 %
Riverside/coastal area 11..21 % 0.00 % 0.00 %
Education
Primary/Grade School 25.86 % 17.24 % 43.33 %
Secondary 50.86 % 27.59 % 31.67 %
Undergraduate (Bachelor) 14.66 % 43.10 % 20.00 %
Graduate (Master/Doctor)
1.72 % 12.07 % 5.00 %
Familiar w/ bioenergy 43.10 % 55.17 % 68.33 %
Work related to bioenergy 30.17 % 0.00 % 5.00 %
Food security 57.76 % 87.93 % 63.33 %
Energy source- Bioenergy
Low 5.17% 1.72% 10.00%
Medium 20.68% 12.07% 5.00%
High 39.66% 50.00% 30.00%
Very high 28.43% 36.21% 41.67%
Do not know 6.03% 0.00% 13.33%
Work Region 49.57% 24.79% 25.64%
Gender
Male 50.86 % 51.72 % 58.33 %
Female 49.14 % 48.28 % 41.67 %
Bioenergy is good 98.28% 100.00% 100.00%
Familiarity with “bioenergy” or “biofuels” is highest in Davao and lowest in Calabarzon, however works of farmers in Calabarzon is somehow related to bioenergy compared to Davao and Central Visayas where work were not totally connected. Concerning with their perception if bioenergy is good or bad for the country, all or almost all farmers in the three regions consider that bioenergy is useful but, thus, affect food security when biomass from food crops will be used for bioenergy production. Largest number of farmers who links bioenergy and food security is in Central Visayas. Farmers in three regions also assessed the potential contribution of bioenergy, in comparison with other energy sources (i.e. renewable energy and fossil fuel) in promoting economic growth in the country and Central Visayas gave the highest potential and lowest in Davao. Most of the surveyed farmers were male except for Calabarzon were gender of farmers were almost equal. On this matter, female should also have knowledge or awareness on bioenergy because they are also part of country’s economic growth or development.
3.2 Clusters and their typologies A dendrogram, Figure 3, reviews the hierarchical agglomeration process. Objects (i.e. farmers) that group together earlier tend to be more similar in terms of the proximity measure defined. By drawing a line through the dendrogram we can determine which objects belong to which cluster. The further to the right of the dendrogram we draw the line, the fewer
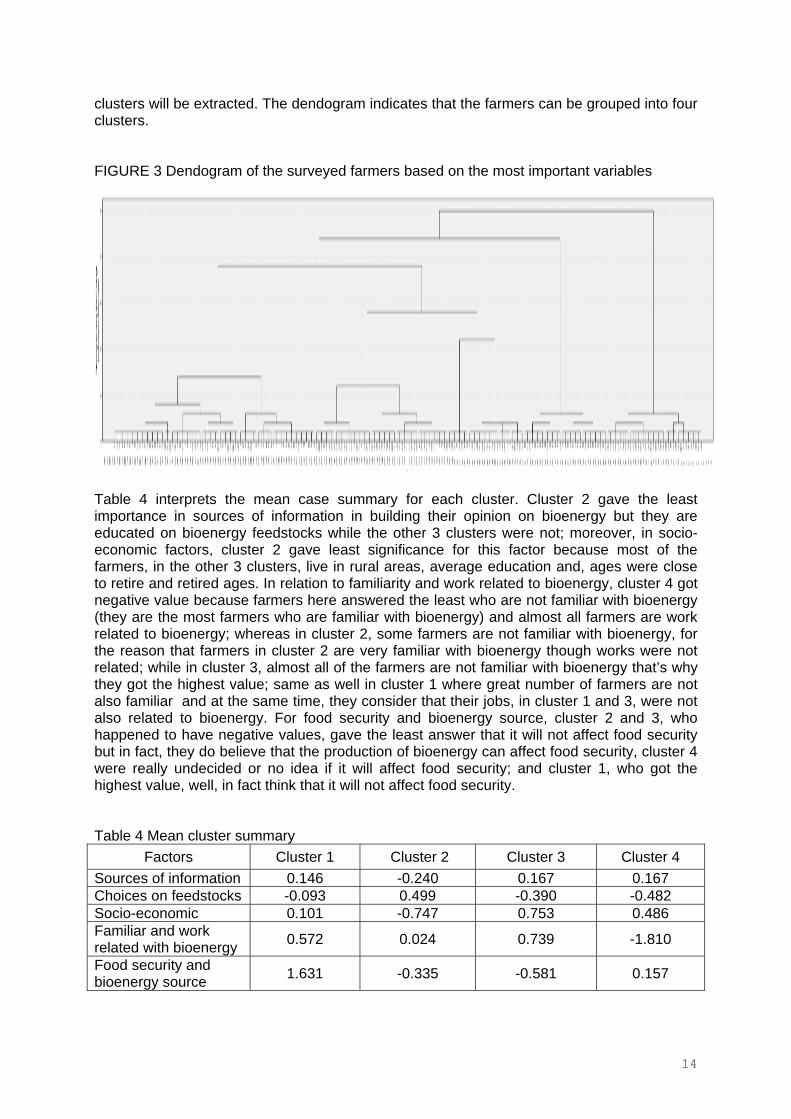
14
clusters will be extracted. The dendogram indicates that the farmers can be grouped into four clusters. FIGURE 3 Dendogram of the surveyed farmers based on the most important variables
Table 4 interprets the mean case summary for each cluster. Cluster 2 gave the least importance in sources of information in building their opinion on bioenergy but they are educated on bioenergy feedstocks while the other 3 clusters were not; moreover, in socio-economic factors, cluster 2 gave least significance for this factor because most of the farmers, in the other 3 clusters, live in rural areas, average education and, ages were close to retire and retired ages. In relation to familiarity and work related to bioenergy, cluster 4 got negative value because farmers here answered the least who are not familiar with bioenergy (they are the most farmers who are familiar with bioenergy) and almost all farmers are work related to bioenergy; whereas in cluster 2, some farmers are not familiar with bioenergy, for the reason that farmers in cluster 2 are very familiar with bioenergy though works were not related; while in cluster 3, almost all of the farmers are not familiar with bioenergy that’s why they got the highest value; same as well in cluster 1 where great number of farmers are not also familiar and at the same time, they consider that their jobs, in cluster 1 and 3, were not also related to bioenergy. For food security and bioenergy source, cluster 2 and 3, who happened to have negative values, gave the least answer that it will not affect food security but in fact, they do believe that the production of bioenergy can affect food security, cluster 4 were really undecided or no idea if it will affect food security; and cluster 1, who got the highest value, well, in fact think that it will not affect food security. Table 4 Mean cluster summary
Factors Cluster 1 Cluster 2 Cluster 3 Cluster 4
Sources of information 0.146 -0.240 0.167 0.167
Choices on feedstocks -0.093 0.499 -0.390 -0.482
Socio-economic 0.101 -0.747 0.753 0.486
Familiar and work related with bioenergy
0.572 0.024 0.739 -1.810
Food security and bioenergy source
1.631 -0.335 -0.581 0.157
15
Based on the responses of the farmers in each cluster on the questions related to the five components factors (Appendix 1), we analyzed the profiles of the clusters which give some indications on the typologies based on the level of awareness. These typologies, which we describe as unaware, low awareness, moderate awareness and high awareness, are as follows: Cluster 1 consists of farmers whose age is near to retire, residence is mainly rural area
and most important sources of information on bioenergy are other farmers. They think oil-rich crops have high potential contribution for the sustainable production of bioenergy. They have low familiarity with bioenergy and consider their work as not related to bioenergy. On the other hand, they believe that bioenergy does not affect food security but they are not sure if bioenergy can contribute to economic growth. The level of awareness of farmers in this cluster can be considered extremely low and can thus be characterized as “unaware”.
Cluster 2 consists of farmers who are middle aged, live in rural areas and highly educated. Media, e.g. TV and newspaper, and internet are relatively important sources of information. They counted non-food crops, such as perennial grasses, agriculture and forest residues, as feedstock to have very high potential contribution for the sustainable bioenergy production. They are the largest proportion of respondents who thinks potential is between high and very high for both non-food crops. They are very familiar with bioenergy although their work is not related to it. They believed that bioenergy will affect food security however it has very high potential for economic growth. As compare to the farmers in other clusters, those in this cluster can be considered very informed and thus have a typology of “high awareness”.
Cluster 3 consists of farmers whose age is close to retirement, residence in rural areas, and most important sources of information are family and friends. They consider only oil-rich crops to have high potential as bioenergy feedstock. They are not familiar with and consider their work as not related to bioenergy. Famers in this cluster have thus very close characteristics with those in cluster 1. However, in contrast to cluster 1 farmers, they believe that bioenergy has high potential for the economy but then will affect food security. These farmers can thus be considered to have a typology of “low awareness”.
Cluster 4 consists of farmers who are in retirement and retired age, live in rural area, educated and neighbors are relatively important source of information. They consider fast-growing trees have average potential for the second bioenergy feedstock. They are most familiar and largely think that their works are related to bioenergy and considered that bioenergy has average potential for economic growth. Regarding food security, farmers in this cluster are not sure about it because half of the total respondents answered that it will affect and other half answered that it will not. The level of awareness of the farmers can thus be considered moderate or typology corresponding to “moderate awareness”.
Figure 4 shows how the farmers are distributed into the four typologies. The largest number of farmers has a typology of high awareness (40%); quarter of them is clustered in low awareness; and almost equal proportion of farmers has typology unaware and moderate awareness. Farmers with high awareness were found predominantly in Central Visayas, next is Davao. Only few farmers are unaware in Central Visayas, while Davao has the least number of farmers who has low awareness. Calabarzon is where greatest number of farmers who has low to moderate awareness were located, also few farmers has high awareness. Unaware or extremely low awareness farmers have equal distribution in Calabarzon and Davao. No single farmer in Central Visayas has moderate awareness.

16
Figure 4 Distribution of farmers by typology and region
4. Discussion and conclusions This study presents the awareness of farmers on sustainability of alternative bioenergy feedstock and results show that there is variation on farmer’s awareness from different case study areas in the country Clustering of farmers from different region where categorized according on their knowledge on bioenergy. Farmer awareness varies from unaware, low awareness, moderate awareness to high awareness typologies. The greatest number of farmers with high awareness typology is located in Central Visayas, followed by Davao while Calabarzon has the least number of farmers with high awareness on bioenergy. Farmers with high awareness is greatest in Central Visayas for the reason that many farmers are still in their young age, age that still have the time and interest to explore or learn new ideas; highly educated, where they have supplementary knowledge from their schools/universities; and mostly reside in urban area were information reaches farmers ahead of time, are the significant factors that give farmers the additional information and knowledge, while farmers in Calabarzon and Davao mostly reside in rural areas and already in their retirement and retired age. Socio-economic factors have great impact on farmer’s knowledge, together with farmer’s sources of information and farmers with high awareness thinks media and internet as important sources and Central Visayas considers many sources of information. Farmers in this typology, though their work was not related to bioenergy, see non-food crops to have potential for bioenergy to be sustainable. Farmers with unaware typology were found mostly in Calabarzon and Davao where they have the same proportion of farmers. And farmers, in this typology, source of information came also from other farmer, consider oil-rich crops to have high potential as feedstock’s and believes that it will not affect food security but if this can contribute to country’s economic growth is uncertain for them. The largest numbers of farmers with low to moderate awareness were located in Calabarzon. Farmers most important sources of information came from their family, friends and neighbors. Farmers with low awareness typology are not familiar with bioenergy; consider oil-rich crops as feedstock and it can contribute to economic growth because for them this will not affect food security. Farmers with moderate awareness are mostly familiar with bioenergy and consider second-generation bioenergy feedstock, fast-growing trees, for the country to grow or develop but vague if it will affect food security.
17
Farmers should have understanding on this issue in view of the fact that they are the primary sector that will be involved whenever mass production of biofuels in the country will start off. Sustainability of feedstock for first and second generation bioenergy must be studied holistically to have sustainable production so that farmers will benefit most for they are the producer of bioenergy feedstock. Therefore, overview on bioenergy feedstock and production must be introduced to farmers for them to be familiar and aware. Acknowledgement This paper is based on one of the research activities from of the Integrated sustainability assessment of bioenergy potentials in Asia: An application of a hybrid approach on trade-offs and pathways (PIC-STRAP) project, which is being funded through the Low Carbon Initiatives Framework of the Asia-Pacific Network for Global Change Research (APN). References [1] Acosta, L. A., Enano, N. H., Jr., Magcale-Macandog, D. B., Engay, K. G., Herrera, M . N. Q., Nicopior, O. B. S., Sumilang, M. I. V., Eugenio, J. M A. and Luchta, W How sustainable is bioenergy production in the Philippines? A conjoint analysis of knowledge and opinions of people with different typologies. Appl Energy 2013;102:241-253. [2] Asia-Pacific economic Cooperation. APEC Biofuels. The Philippine Biofuel activities. 2008. <http://www.biofuels.apec.org/me_philippines.html>. [3] Batangas. The official website of Batangas Provinces. <http://www.batangas.gov.ph/#>. [4] BAS. CountrySTAT Philippines. Bureau of agricultural statistics (BAS); 2011.
<http://countrystat.bas.gov.ph>.
[5] Biofuel information. Biofuel News. 2011.
<http://www.bar.gov.ph/biofuelsinfo/news&events/ln20110703.asp>.
[6] Climate and Philippine climate types. Crop agriculture review. 2011.
<http://www.cropsreview.com/climate-types.html>.
[7] Cluster Analysis: Basic Concepts and Algorithmns. Chapter 8
<http://www-users.cs.umn.edu/~kumar/dmbook/ch8.pdf>.
[8] Cluster analysis with SPSS: Hierarchical cluster analysis. < http://www.fmi-
plovdiv.org/evlm/DBbg/database/studentbook/SPSS_CA_3_EN.pdf>.
[9] Corpuz PG. Philippine bio-fuel industry outlook (Philippines biofuels annual). US
Department of Agriculture; 2009. <http://gain.fas.usda.gov/Recent GAIN
Publications/General Report_Manila_Philippines_6-1-2009.pdf>.
[10] Corpuz PG. Philippine biofuel situation and outlook (Philippines biofuels annual). US
Department of Agriculture; 2013.
<http://gain.fas.usda.gov/Recent%20GAIN%20Publications/Biofuels%20Annual_Manila_Phili
ppines_7-10-2013.pdf>.
[11] Davao City. The official website of the City Government of Davao.
<http://www.davaocity.gov.ph/davao/>.
18
[12] Department of Agriculture. Regional Field Unit no. 4A. Calabarzon.
<http://www.calabarzon.da.gov.ph/index.php/regional-profile/physical-attributes>.
[13] DA. Davao Region. Agribusiness and marketing assistance division. 2013. <
http://davaoagribiz.da.gov.ph/index.php/profiles/davao-region/11-davao-del-norte>.
[14] DA. Biofuel feedstock program. Department of Agriculture, Philippines; 2011.
<http://www.bar.gov.ph/biofuelsinfo/downloads/DABP.pdf>.
[15] Department of Energy. Guidelines governing the biofuel feedstocks production, and
biofuels and biofuel blends production, distribution and sale under Republic Act No. 9367.
Joint Administrative Order No. 2008-1, Series of 2008. <
http://www.doe.gov.ph/doe_files/pdf/Issuances/JAO/JAO-No-2008-1.pdf>.
[16] DOE. Renewable energy. Department of energy, Philippines, Taguig City; 2010.
<http://www.doe.gov.ph/IPO web/linked files/2010/EIK10/ biomass_biofuels.pdf>.
[17] DOE. Republic Act 9367: An act to direct the use of biofuels, establishing for this
purpose the biofuel program, appropriating funds therefor, and for other purposes. <
http://www.doe.gov.ph/doe_files/pdf/Issuances/RA/RA%209367.pdf>.
[18] DOE. Republic of the Philippines. < http://www.doe.gov.ph/>.
[19] DOE. Rules and regulations implementing republic Act No. 9367.
<http://www.doe.gov.ph/doe_files/pdf/Issuances/DC/DC%202007-05-0006.pdf>.
[20] DOE Portal The official website of the Philippine DOE.
<http://www2.doe.gov.ph/AF/jatropha.htm>.
[21] Department of environment and Natural Resources. Region 4A-Calabarzon.
<http://calabarzon.denr.gov.ph/index.php/about-us/regional-profile/reg-profile-physical-socio-
eco>.
[22] ESCAP. Regional forum on bioenergy sector development: challenges, opportunities,
and way forward, 23–25 January 2008, Bangkok, Thailand; 2008.
<http://www.unapcaem.org/publication/bioenergy.pdf>.
[23] Factor analysis, path analysis and structural equation modelling. Ch. 14:324-351. Jones
and Bartlett Publishers.
[24] Havlik p, Schneider UA, Schmid E, Bottcher H, Fritz S, Skalsky R, et al. Global land-use
implication of first and second generation biofuels targets. Energy Policy 2010;1-13.
[25] Maruyama A, Aquino AP, Dimaranan XB, Kai S. Potential of biofuel crop production in
the Philippines: a preliminary analysis. HortResearch 2009;63:67–76.
[26] National Nutrition Council. Regional offices. <http://www.nnc.gov.ph/>.
[27] NSO. 2012. The 2010 census of population and housing reveals the Philippines
population at 92.34 million, National Statistics Office (NSO), Manila, Philippines: 2012.
<http://www.census.gov.ph/content/2010-census-population-and-housing-reveals-philippine-
population-9234-million>.
19
[28] Padilla-Fernandez MD and Nuthall PL. Technical efficiency in the production of
sugarcane in Central Negros area, Philippines: An application of data envelopment analysis.
J. ISSAAS 2010. Vol. 15. No. 1:77-90
[29] PNOC. Jatropha primer. Philippine National Oil Company (PNOC) – Alternative Fuels
Corporation; 2010. <http://www.pnoc-afc.com.ph/biodiesel/ jatropha.html>.
[30] Republic Act (RA) 9367. An act to direct the use of biofuels, establishing for this purpose
the biofuel program, appropriating funds therefore, and for other purposes. Government of
the Republic of the Philippines; 2006.
[31] Solomon BD. Biofuels and Sustainability. Ann. N. Y. Acad. Sci. 2010;1135:119-134
[32] SRA.RoadmaptoBioethanolthroughthesugarcaneindustryroute.QuezonCity, Philippines:
Department, sugar regulatory administration (SRA); 2008. p.25.
[33] Talubo, J.
[34] Von Braun J. When Food Makes Fuel: The Promises and Challenges of Biofuels. Biofuels, energy and agriculture 1.Keynote address at the Crawford Fund Annual Conference, Australia. August 15, 2007. International Food Policy Research Institute 2033 K Street, NW, Washington, DC 20006-1002, USA Email: [email protected]
Author's personal copy
Sustainability trade-offs in bioenergy developmentin the Philippines: An application of conjointanalysis
Lilibeth A. Acosta a,b,*, Elena A. Eugenio b,c, Nelson H. Enano Jr.d,Damasa B. Magcale-Macandog c, Belita A. Vega e,Paula Beatrice M. Macandog c,f, Jemimah Mae A. Eugenio g,Marilou A. Lopez h, Arnold R. Salvacion i, Wolfgang Lucht a
aPotsdam Institute for Climate Impact Research (PIK), Telegraphenberg, 14473 Potsdam, Germanyb School of Environmental Science and Management, University of the Philippines Los Banos (UPLB), Philippinesc Institute of Biological Sciences, College of Arts and Sciences, UPLB, PhilippinesdTropical Institute for Climate Studies and Center for Renewable Energy and Alternative Technologies, Ateneo de
Davao University, Philippinese Institute for Strategic Research and Development Studies, Visayas State University (VSU), PhilippinesfCollege of Economics and Management, UPLB, Philippinesg Institute of Mathematical Sciences and Physics, UPLB, PhilippineshSchool of Technology, University of the Philippines Visayas (UPV), Philippinesi Institute for Governance and Rural Development, College of Public Affairs and Development, UPLB, Philippines
a r t i c l e i n f o
Article history:
Received 15 July 2011
Received in revised form
4 March 2014
Accepted 11 March 2014
Available online 8 April 2014
Keywords:
Bioenergy
Biofuels
Conjoint analysis
Philippines
Sustainability
Trade-off analysis
a b s t r a c t
Sustainability assessments of bioenergy production are essential because it can have both
positive and negative impacts on society. Human preferences that influence trade-off de-
cisions on the relevant determinants and indicators of sustainability should be taken into
account in these assessments. In this paper, we conducted a survey with five groups of re-
spondents including government officials and employees, academic and research pro-
fessionals, private company managers and workers, farm owners and workers, and others
(e.g. students, residents, etc.) to assess their trade-off decisions onbioenergy development in
the Philippines. The analyses of the survey results reveal that sustainability of bioenergy
production will depend on the choice of biomass feedstock and these choices depend on
people’s perceptions.Heterogeneousperceptions among thedifferent groupsof respondents
on the appropriate bioenergy feedstock to achieve economic, social and ecological sustain-
ability suggest that sustainability of bioenergy is not a generic concept. The use of aggregate
indices for sustainability assessments that ignore these perceptions on bioenergy produc-
tion can thus be very misleading. The preference weights from conjoint analysis, which
measure human preferences on different determinants and indicators of economic, social
and ecological sustainability, can help improve sustainability assessments.
ª 2014 Elsevier Ltd. All rights reserved.
* Corresponding author. Potsdam Institute for Climate Impact Research (PIK), Telegraphenberg A62, 14473 Potsdam, Germany. Tel.: þ49331 2882643; fax: þ49 331 2882695.
E-mail address: [email protected] (L.A. Acosta).
Available online at www.sciencedirect.com
ScienceDirect
ht tp: / /www.elsevier .com/locate/biombioe
b i om a s s a n d b i o e n e r g y 6 4 ( 2 0 1 4 ) 2 0e4 1
http://dx.doi.org/10.1016/j.biombioe.2014.03.0150961-9534/ª 2014 Elsevier Ltd. All rights reserved.
STRAP Sustainability TRade‐offs and Pathways
Working Paper #003‐2014
Biofuel Feedstock Cultivation in India: Implications for Food Security and Rural Livelihoods
K.S. Kavi Kumar, R.S. Soundar Rajan and R. Manivasagan
Madras School of Economics, Gandhi Mandapam Road, Chennai – 600025 Funded by: Low Carbon Initiatives Framework
Biofuel Feedstock Cultivation in India:
Implications for Food Security and Rural Livelihoods
K.S. Kavi Kumar, R.S. Soundar Rajan and R. Manivasagan
Madras School of Economics, Gandhi Mandapam Road, Chennai – 600025
Abstract
Biofuels are acquiring importance due to their potential to mitigate greenhouse gas emissions.
The two most important biofuels – viz., bio-ethanol and bio-diesel, are largely considered
supplementary to the transport fuels. India has extensive programs and aims to blend 20 percent
of transport fuels with biofuels by 2017. This paper focuses on three aspects in the context of
biofuel production and policy in India. First, the paper looks at feasibility of meeting the biofuel
blending targets envisaged. While jatropha remains as the main feedstock for biodiesel
production, sweet sorghum could be considered as alternative feedstock to sugarcane for
bioethanol production. Secondly, the paper analyzes the competitiveness of jatropha and sweet
sorghum using the cost of cultivation data for a number of crops grown in major states of India
during the decade of 2000s. The results suggest that both jatropha and sweet sorghum could pose
threat to coarse cereals production. Lastly, the paper critically analyzes the viability of jatropha
plantations based on insights from field survey conducted in the Southern state of Tamil Nadu.
The paper argues that despite aggressive approach adopted by the Government of India,
inadequate attention paid to the institutional issues has resulted in unsatisfactory progress in
achieving the bio-diesel blending targets.
Key words: Bio-ethanol; Bio-diesel; Energy Policy; Economic Viability; Rural Livelihoods
JEL Codes: Q42; Q56; O13
1.0 Introduction
India is the fifth largest primary energy consumer and the fourth largest petroleum
consumer in the world. The growing population, increasing per capita income, infrastructural
development and rapid socio-economic development have spurted an increase in energy
consumption across all the major sectors of the Indian economy. Currently, India’s energy
demand is primarily met through non-renewable energy sources such as fossil fuels (coal, natural
gas and oil). Being short in domestic production, India mainly depends on crude oil imports that
have risen from 57.8 million tons in 1999-2000 to 172 million tons in 2011-12 which accounts
for 4 times of the domestic production which stand at 38 million tons in 2011-2012 (GoI, 2012).
The Crude oil prices imported from the international market has sharply risen from 26.65
USD/bbl to 111.12 USD/bbl in 2011-2012 (GoI, 2012). Given the limited domestic energy
resources, escalating crude oil prices, and growth in domestic consumption of petroleum
products, India’s oil import bill has inflated considerably (see figure 1). In the near future the
imports are slated to rise further with no major breakthrough in domestic oil production and the
phenomenal rise in vehicular population, as evident from the domestic sales that has rapidly
grown from 9.6 million vehicles in 2008 to over 17 million vehicles in 2013. India’s energy
policy has primarily focused on providing energy security to sustain high economic growth rate.
The “energy security” is broadly interpreted as adequate, clean and efficient supply of energy for
the input requirements of various producing sectors and the basic needs of households, along
with insurance against the risk of a disruption in supply or volatility of prices (GoI, 2006). Oil
being the dominant fuel in the world, like any other net oil-importing developing country, India’s
energy insecurity is centred on the uncertainty surrounding oil prices and its supply. Since oil,
like any other fossil fuel, is non-renewable, India faces increasingly difficult challenges in
ensuring energy security.
Among all end-uses, the scope for fuel substitution is highly restricted in the transport
sector, which is a very vital one because of its role in ensuring the mobility of goods and people.
The vehicular population is growing at 8-10 percent annually in India, with two-wheelers
constituting 72 percent of the total registered motor vehicles. Among the various petroleum
products, diesel meets an estimated 73 percent of fuel demand from transport sector. Figure 1
shows the increasing trend of high speed diesel consumption in India. With growing concerns of
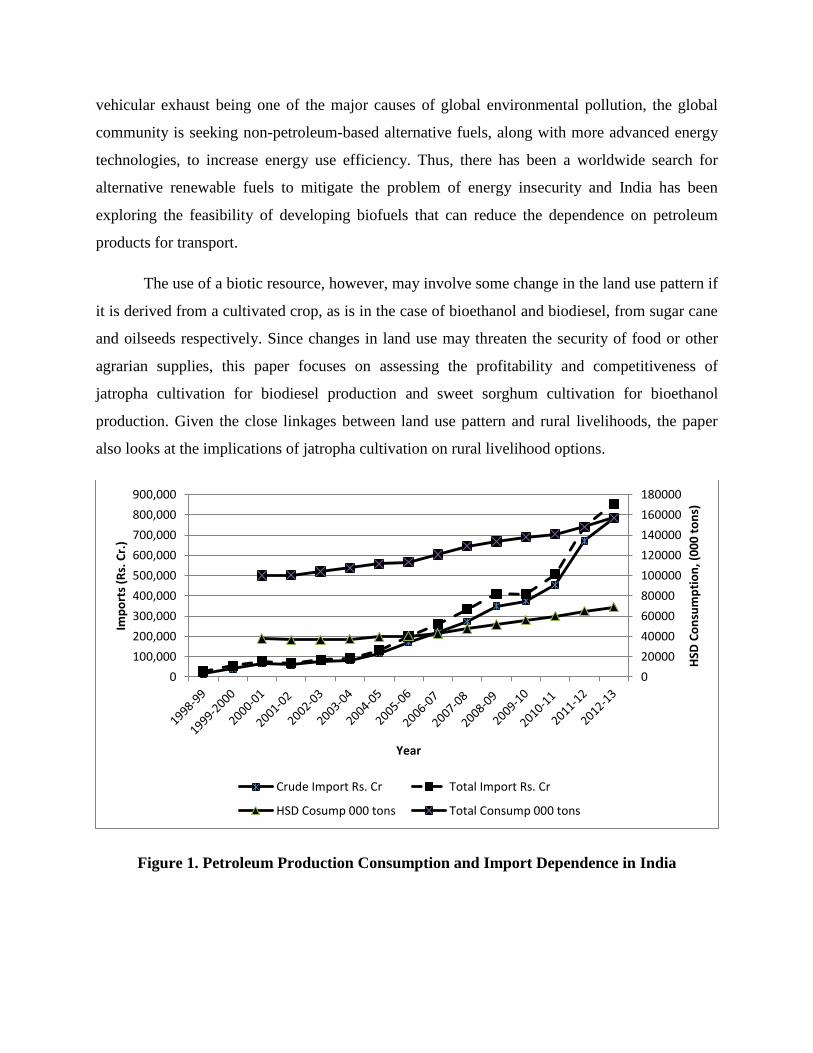
vehicular exhaust being one of the major causes of global environmental pollution, the global
community is seeking non-petroleum-based alternative fuels, along with more advanced energy
technologies, to increase energy use efficiency. Thus, there has been a worldwide search for
alternative renewable fuels to mitigate the problem of energy insecurity and India has been
exploring the feasibility of developing biofuels that can reduce the dependence on petroleum
products for transport.
The use of a biotic resource, however, may involve some change in the land use pattern if
it is derived from a cultivated crop, as is in the case of bioethanol and biodiesel, from sugar cane
and oilseeds respectively. Since changes in land use may threaten the security of food or other
agrarian supplies, this paper focuses on assessing the profitability and competitiveness of
jatropha cultivation for biodiesel production and sweet sorghum cultivation for bioethanol
production. Given the close linkages between land use pattern and rural livelihoods, the paper
also looks at the implications of jatropha cultivation on rural livelihood options.
Figure 1. Petroleum Production Consumption and Import Dependence in India
0
20000
40000
60000
80000
100000
120000
140000
160000
180000
0
100,000
200,000
300,000
400,000
500,000
600,000
700,000
800,000
900,000
HSD
Co
nsu
mp
tio
n, (
00
0 t
on
s)
Imp
ort
s (R
s. C
r.)
Year
Crude Import Rs. Cr Total Import Rs. Cr
HSD Cosump 000 tons Total Consump 000 tons
2.0 India’s Biofuel Policy Context
India’s biofuel policy regime is influenced broadly by: (a) energy security concerns –
ever increasing energy demand necessitates search for renewable energy alternatives given
India’s limited fossil fuel reserves; (b) environmental concerns – growing local pollution and
climate change concerns make it imperative to search for environmentally friendly alternatives;
(c) wasteland utilization – biofuel feedstock cultivation could bring wastelands and other
unproductive lands for effective utilization; and (d) enhance rural livelihood options. The
National Policy on Biofuels adopted in 2009 envisaged strengthening India’s energy security by
encouraging use of renewable energy resources to supplement transport fuels. The policy aimed
at achieving 20 percent blending of transport fuels petrol and diesel with bioethanol and bio-
diesel by 2017. The policy emphasized use of degraded land and waste land not suitable for
agriculture to raise biofuel feedstock to avoid food versus fuel dilemma. In addition to setting-up
of a National Biofuel Fund for providing financial incentives, including subsidies and grants for
new and second generation biofuel feedstock, the policy also advocated establishing minimum
support price mechanism to ensure fair price for biofuel feedstock growers.
Though the National Policy on Biofuels attempted to stay clear of food versus fuel
dilemma, a number of studies have cautioned against zealous promotion of biofuels. Fischer et
al. (2008) argue that an additional 140 to 150 million people may be at the risk of hunger by
2020 due to biofuel expansion in India and other South Asian countries. The authors further
observe that even though the second generation biofuels may reduce adverse impacts on food
security, the indirect impact of biofuels on food security through adverse influence on
biodiversity could be considerably high. Msangi and Rosegrant (2011) argue that biofuel
expansion will result in substantive increase in market prices and hence lead to food security
concerns. They further argue that the South Asian countries, including India, may have to
increase their crop yields by an additional 1 percent per year up to 2030 to overcome stress
induced by the biofuel expansion.
The feasibility analysis of meeting blending targets outlined in the National Biofuel
Policy raises important issues regarding land availability in case of biodiesel production, and the
need for identifying alternative feedstock in case of bioethanol production. Based on the
Integrated Energy Policy projections, India’s high speed diesel (HSD) requirement would reach
190 million tons by 2031-32. Twenty percent blending target outlined in the National Biofuel
Policy 2009 translates to biodiesel demand of about 38 million tons by 2031-32. With a yield of
around 3.75 tons per ha, cultivating jatropha in 33.2 million hectares of land would meet the
biodiesel demand. Singhal and Sengupta (2012) show that about 37.38 million hectares of
wasteland suitable for jatropha cultivation in available in India. However, as discussed further in
the fourth section below, the wasteland is not strictly wasteland with significant rural population
dependent on miscellaneous tree growth supported by such lands. Also, the overall area under
foodgrains has remained static in India over past decade or so. In such context use of wasteland
for fuel purposes remains debatable. This acquires further important in the context of South
Asian Enigma of stagnant per-capita food consumption (compared to North Africa and West
Asia) despite impressive growth registered in terms of per-capita income.
The bioethanol blending target set by the policy will need additional production capacity
and hence more bioethanol production plants, as well, require more sugar cane cultivation, if
molasses is used as primary feedstock. In the case of bioethanol production, molasses may have
to be diverted from other uses such as the alcohol or pharmaceutical industries. The availability
of molasses to meet blending mandates depends on cane and sugar production that are cyclical in
nature. Lower molasses availability will put pressure on molasses prices and availability of
molasses for ethanol production. Owing to the cyclical nature of sugarcane production in the
country, the processing industry experience periodic market glut of sugarcane and molasses
impacting prices. For example, the molasses prices in the last decade have fluctuated between Rs
1000 and Rs 5000 per ton (Shinoj et al., 2011). Additionally, ethanol produced has many other
alternative uses such as potable alcohol, and the chemical and pharmaceutical industry. During
the constrained ethanol supply periods, the utilization tends to be more towards potable and
industrial uses due to inability of the Oil Marketing Companies to procure the required amount
of fuel ethanol bending at prevailing market prices (Shinoj et al., 2011). Import of ethanol for
fuel usage is currently restricted through policy and even if made free, would cost the exchequer
very dearly, as the international markets for ethanol are already very tight due to demand from
other biofuel-consuming countries. Given the scenario of 10% blending requirement, the
growing demand for alcohol from the potable and chemical sector (growing at 3-4% per annum)
and the highest available alcohol from molasses pegged at 2.3 billion liters, there will be a
shortage of alcohol for blending (Basavaraj et al., 2012).
If molasses alone has to meet the entire requirement of 10% blending, an area covering
approximately 10.5 million ha with 736.5 million tons of sugarcane has to be cultivated (around
20–23% in excess of what is required for meeting the corresponding sugar demand) which
translates into doubling of both area and production. Presently, the country lacks both technology
and infrastructure required to implement this. Further, it is not possible to increase the area under
sugarcane beyond certain limit given that sugarcane is highly water intensive with a requirement
of 20,000–30,000 cubic metre per ha per crop. Increasing the area under sugarcane will be at the
cost of diverting land from other staple food crops (Shinoj et al., 2011). Hence, ethanol
production has to be augmented from alternative feedstocks. One such alternative is sweet
sorghum which is both resource saving and sustainable.
3.0 Biofuel Feedstock Cultivation – Competitiveness Analysis
For the purpose to assessing whether the cultivation of biofuel feedstock would become
competitive for other food and non-food crops being cultivated in a region the following
approach:
a) Biofuel feedstock price that is competitive to a principal crop is referred as the price level
at which the per hectare ground rent earnings from the biofuel feedstock – if sown on the
same piece of land – will be equal to the earnings from the principal crop it is to replace.
b) Using the competing biofuel feedstock price, one can estimate the critical
bioethanol/biodiesel price which is the minimum price of biofuel for which returns to a
farmer are just sufficient to cover the opportunity cost of diverting land from cultivating a
principal crop to biofuel feedstock cultivation.
c) Using the energy parity of bioethanol and petrol, and biodiesel and HSD, one can further
estimate the critical petrol and HSD prices.
d) Comparison of the computed critical petrol and HSD prices with the domestic storage
point prices reveal whether the food/non-food crops could be threatened by the biofuel
feedstock cultivation.
It is important to acknowledge here that cultivation of biofuel feedstock also crucially
depends, among other things, on agro-climatic conditions and soil quality. The approach adopted
here does not account for such bio-physical suitability assessment of biofuel feedstock
cultivation. For the purpose of implementing the above outlined approach the following
determinants of agricultural land use reported in the cost of cultivation data are utilized:
a) Paid out costs (A2): - It is a sum total of all actual expenses (in cash and kind)
incurred by a farmer in production and rent paid for leased in land.
b) Profit margin: It is a measure of earnings accruing to a farmer per Rupee of
expenditure incurred by him/her in farm operations. It is defined as the ratio of Gross
Value of Output to Paid out cost.
c) Ground rent: It is defined as the difference between Gross Value of Output for a crop
and Cost C1 incurred by a farmer. Cost C1 is a sum total of all actual expenses (in
cash and kind) incurred by the farmer in production, interest on value of owned fixed
capital assets (excluding land) and imputed value of family labour.
Competitiveness of jatropha and sweet sorghum are assessed using the approach outlined
above. The cost of cultivation data across various crops in all major states of India for the years
2004-05, 2007-08 and 2010-11 is utilized for this purpose. The competitiveness of jatropha and
sweet sorghum has been assessed against, (a) cereals – rice, wheat, jowar, bajra, maize, ragi and
barley; (b) pulses – gram, urad, and moong; (c) oilseeds – groundnut, rapeseed, soybean,
sunflower, and sesamum; (d) fibres – cotton and jute; and (e) other crops including sugar cane,
onion etc. Analysis is confined to 19 major states of India, namely, Andhra Pradesh, Assam,
Bihar, Chhattisgarh, Gujarat, Haryana, Himachal Pradesh, Jharkhand, Karnataka, Kerala,
Madhya Pradesh, Maharashtra, Orissa, Punjab, Rajasthan, Tamil Nadu, Uttar Pradesh,
Uttarakhand and West Bengal.
Cost of Cultivation Data for Biofuel Feedstock
Paramathma et al. (2004) and Goswami et al. (2011) provided some estimates of cost of
cultivation of jatropha. Jatropha being a plantation crop, its comparison with other annul crops
poses slight conceptual difficulty. Taking a specific life time for the jatropha plant and interest
rate for present value calculations, the paid out costs and revenue over life time of the plant are
converted to their annual cost equivalents. For the purpose of the calculations the life time is
taken here as 14 years and the interest rate is considered as 12.5 percent. Based on data provided
in Paramathma et al. (2004) and Goswami et al. (2011) the equivalent annual cost of jatropha
cultivation per hectare is estimated to be in the range of Rs. 17000 to Rs. 20000. With the seed
priced at Rs. 9 per kg, the equivalent annual revenue per hectare from jatropha cultivation is
estimated to be in the range of Rs. 65000 to Rs. 70000. Thus the ground rent per hectare ranges
between Rs. 48000 and Rs. 50000. The profitability ratio correspondingly would range between
3.5 and 4.0.
Sweet sorghum is similar to grain sorghum but possesses sugar-rich stalks, with higher
juice content. Because of its rapid growth, high sugar accumulation, high biomass production
potential and wider adapt ability, sweet sorghum can be grown in different agro-climatic
conditions. The sugar content in the juice extracted from sweet sorghum varies from 16-23%
Brix. It has good potential for jaggery and syrup production besides ethanol. The grain can be
used as food and the bagasse after extraction of juice from stalks is an excellent livestock feed. In
view of the potential benefits of sweet sorghum as a feedstock for bioethanol production, a pilot
value chain model of sweet sorghum as a food-feed-fodderfuel was tested in Andhra Pradesh,
India, to augment incomes of farmers while developing a sustainable sweet sorghum–ethanol
value chain under ICRISAT-NAIP (ICAR) Sweet Sorghum Value Chain Project by linking
sweet sorghum farmers to ethanol industry.
The source of farm input data was the farmers cultivating sweet sorghum under the project
and data were collected for the crop years 2008-09, 2009-10 and 2010-11 from Ibrahimbad
village in Medak district of Andhra Pradesh. The data collected was analyzed for various costs,
gross and net returns and input-output ratios of the crops. The costs of cultivation that were
covered include both paid-out costs and imputed costs. Paid-out costs included hired labor
(human, animal and machinery); expenses on material inputs such as seed, fertilizer, manure,
pesticides and irrigation; and rent paid for leased in land. Since some of the inputs used in the
production process came from family sources, the value of these inputs was imputed. The
method of imputing these costs was on the basis of the prevailing market rates for labor and
materials and postharvest prices of the main product and by-product. However, in calculating the
net returns to crop cultivation only cost concept A1 was considered, i.e, the value of paid-out
costs such as hired labor and expenses on materials while the imputed cost of family labor was
not included. All the costs and returns were based on the actual area reported by the farmers.
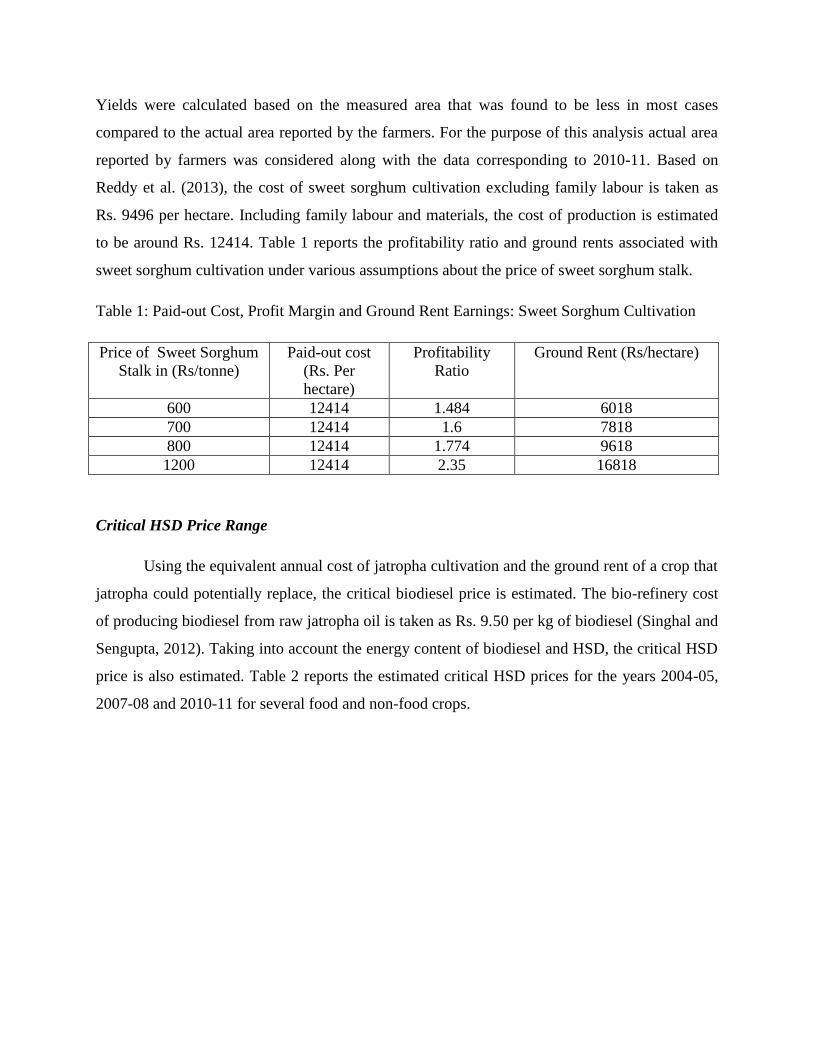
Yields were calculated based on the measured area that was found to be less in most cases
compared to the actual area reported by the farmers. For the purpose of this analysis actual area
reported by farmers was considered along with the data corresponding to 2010-11. Based on
Reddy et al. (2013), the cost of sweet sorghum cultivation excluding family labour is taken as
Rs. 9496 per hectare. Including family labour and materials, the cost of production is estimated
to be around Rs. 12414. Table 1 reports the profitability ratio and ground rents associated with
sweet sorghum cultivation under various assumptions about the price of sweet sorghum stalk.
Table 1: Paid-out Cost, Profit Margin and Ground Rent Earnings: Sweet Sorghum Cultivation
Price of Sweet Sorghum
Stalk in (Rs/tonne)
Paid-out cost
(Rs. Per
hectare)
Profitability
Ratio
Ground Rent (Rs/hectare)
600 12414 1.484 6018
700 12414 1.6 7818
800 12414 1.774 9618
1200 12414 2.35 16818
Critical HSD Price Range
Using the equivalent annual cost of jatropha cultivation and the ground rent of a crop that
jatropha could potentially replace, the critical biodiesel price is estimated. The bio-refinery cost
of producing biodiesel from raw jatropha oil is taken as Rs. 9.50 per kg of biodiesel (Singhal and
Sengupta, 2012). Taking into account the energy content of biodiesel and HSD, the critical HSD
price is also estimated. Table 2 reports the estimated critical HSD prices for the years 2004-05,
2007-08 and 2010-11 for several food and non-food crops.
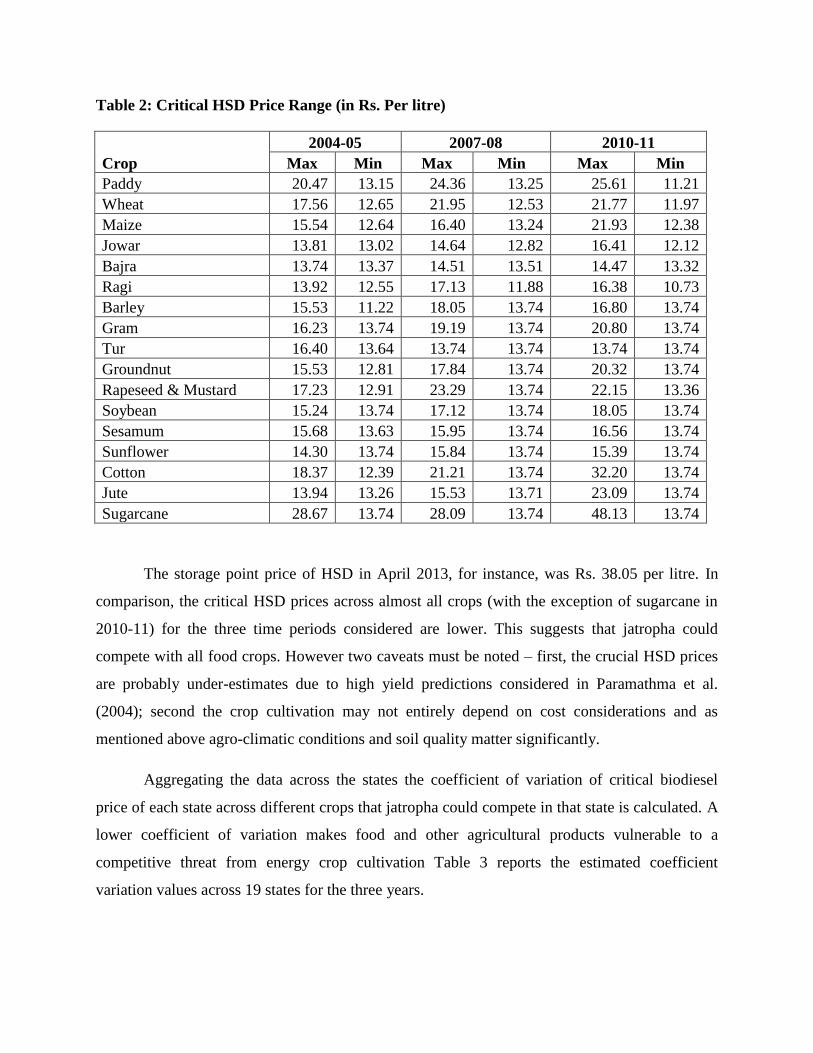
Table 2: Critical HSD Price Range (in Rs. Per litre)
Crop
2004-05 2007-08 2010-11
Max Min Max Min Max Min
Paddy 20.47 13.15 24.36 13.25 25.61 11.21
Wheat 17.56 12.65 21.95 12.53 21.77 11.97
Maize 15.54 12.64 16.40 13.24 21.93 12.38
Jowar 13.81 13.02 14.64 12.82 16.41 12.12
Bajra 13.74 13.37 14.51 13.51 14.47 13.32
Ragi 13.92 12.55 17.13 11.88 16.38 10.73
Barley 15.53 11.22 18.05 13.74 16.80 13.74
Gram 16.23 13.74 19.19 13.74 20.80 13.74
Tur 16.40 13.64 13.74 13.74 13.74 13.74
Groundnut 15.53 12.81 17.84 13.74 20.32 13.74
Rapeseed & Mustard 17.23 12.91 23.29 13.74 22.15 13.36
Soybean 15.24 13.74 17.12 13.74 18.05 13.74
Sesamum 15.68 13.63 15.95 13.74 16.56 13.74
Sunflower 14.30 13.74 15.84 13.74 15.39 13.74
Cotton 18.37 12.39 21.21 13.74 32.20 13.74
Jute 13.94 13.26 15.53 13.71 23.09 13.74
Sugarcane 28.67 13.74 28.09 13.74 48.13 13.74
The storage point price of HSD in April 2013, for instance, was Rs. 38.05 per litre. In
comparison, the critical HSD prices across almost all crops (with the exception of sugarcane in
2010-11) for the three time periods considered are lower. This suggests that jatropha could
compete with all food crops. However two caveats must be noted – first, the crucial HSD prices
are probably under-estimates due to high yield predictions considered in Paramathma et al.
(2004); second the crop cultivation may not entirely depend on cost considerations and as
mentioned above agro-climatic conditions and soil quality matter significantly.
Aggregating the data across the states the coefficient of variation of critical biodiesel
price of each state across different crops that jatropha could compete in that state is calculated. A
lower coefficient of variation makes food and other agricultural products vulnerable to a
competitive threat from energy crop cultivation Table 3 reports the estimated coefficient
variation values across 19 states for the three years.
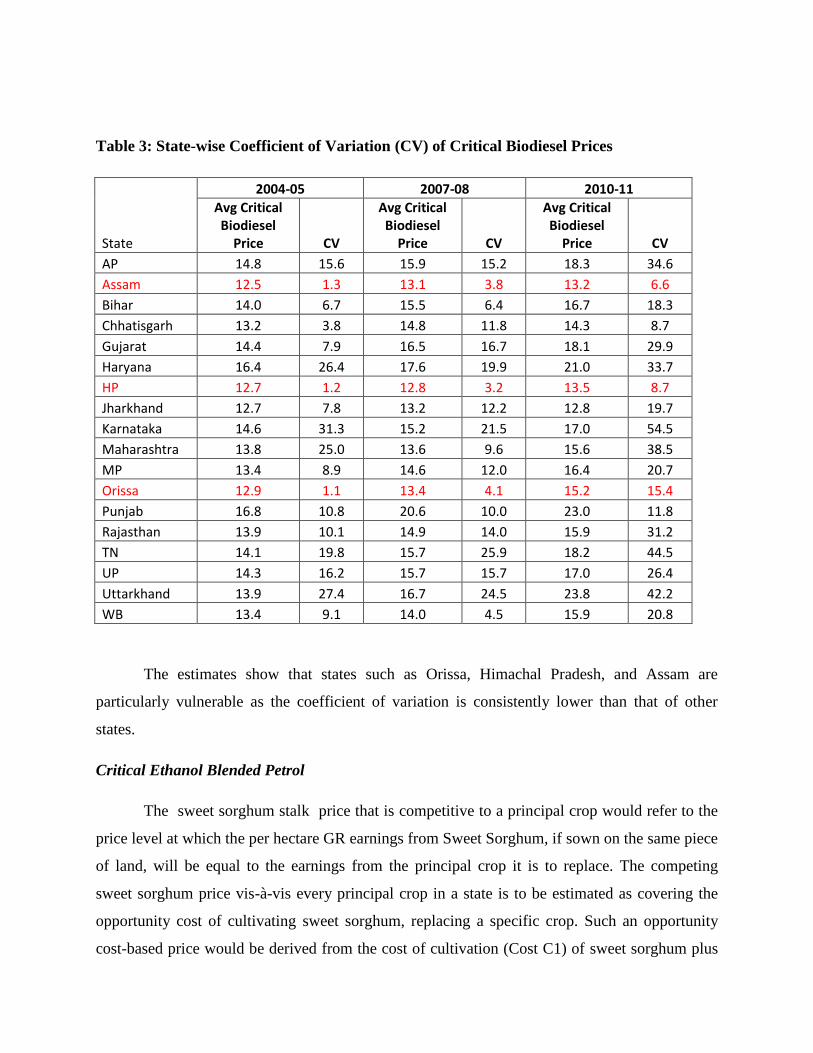
Table 3: State-wise Coefficient of Variation (CV) of Critical Biodiesel Prices
State
2004-05 2007-08 2010-11
Avg Critical Biodiesel
Price CV
Avg Critical Biodiesel
Price CV
Avg Critical Biodiesel
Price CV
AP 14.8 15.6 15.9 15.2 18.3 34.6
Assam 12.5 1.3 13.1 3.8 13.2 6.6
Bihar 14.0 6.7 15.5 6.4 16.7 18.3
Chhatisgarh 13.2 3.8 14.8 11.8 14.3 8.7
Gujarat 14.4 7.9 16.5 16.7 18.1 29.9
Haryana 16.4 26.4 17.6 19.9 21.0 33.7
HP 12.7 1.2 12.8 3.2 13.5 8.7
Jharkhand 12.7 7.8 13.2 12.2 12.8 19.7
Karnataka 14.6 31.3 15.2 21.5 17.0 54.5
Maharashtra 13.8 25.0 13.6 9.6 15.6 38.5
MP 13.4 8.9 14.6 12.0 16.4 20.7
Orissa 12.9 1.1 13.4 4.1 15.2 15.4
Punjab 16.8 10.8 20.6 10.0 23.0 11.8
Rajasthan 13.9 10.1 14.9 14.0 15.9 31.2
TN 14.1 19.8 15.7 25.9 18.2 44.5
UP 14.3 16.2 15.7 15.7 17.0 26.4
Uttarkhand 13.9 27.4 16.7 24.5 23.8 42.2
WB 13.4 9.1 14.0 4.5 15.9 20.8
The estimates show that states such as Orissa, Himachal Pradesh, and Assam are
particularly vulnerable as the coefficient of variation is consistently lower than that of other
states.
Critical Ethanol Blended Petrol
The sweet sorghum stalk price that is competitive to a principal crop would refer to the
price level at which the per hectare GR earnings from Sweet Sorghum, if sown on the same piece
of land, will be equal to the earnings from the principal crop it is to replace. The competing
sweet sorghum price vis-à-vis every principal crop in a state is to be estimated as covering the
opportunity cost of cultivating sweet sorghum, replacing a specific crop. Such an opportunity
cost-based price would be derived from the cost of cultivation (Cost C1) of sweet sorghum plus
the GR of the crop replaced in the state concerned. The competing GVO for sweet sorghum (in
Rupees per hectare) against ith principal crop in jth state would thus be equal to the Cost C1 of
cultivating sweet sorghum plus GR (or opportunity cost of land use) from the ith principal crop
in jth state. Using the above estimated competing GVO for Sweet Sorghum, along with the yield
of bio-ethanol syrup per tonne of stalk will provide the competing sweet sorghum stalk price
range in per kg terms. The estimated crop-wise stalk price value will thus be sufficient to cover
the opportunity cost of diverting the agricultural land for sweet sorghum cultivation.
Further, the equivalent value in per litre term of estimated value of one kg of salk
corresponding to a specific crop and the bio-refinery cost of converting raw syrup into bio-
ethanol taken together gives an estimate of the critical bio-ethanol price that would induce a
reallocation of resources in agriculture. The bio-refinery cost of producing bio-ethanol from
straw (excluding the cost of raw material) is estimated to be Rs 22 per litre (Reddy et al., 2013).
The critical bioethanol price calculated is the minimum price of bioethanol for which returns to a
farmer are just sufficient to cover the opportunity cost of diverting land from cultivating a
principal crop to sweet sorghum cultivation.
A farmer will be induced to divert his land for sweet sorghum cultivation if the ex-
refinery gate price of bioethanol exceeds the critical price level. On the basis of the GR earnings
for principal crops and a range of stalk prices, the median competing stalk price for each
principal crop is calculated (see Table 4). The critical bioethanol price for a particular
agricultural crop is estimated taking into account the competing sweet sorghum stalk price
corresponding to that crop and the bio-refinery cost of producing bioethanol from raw sweet
sorghum oil. The suitable use of low energy-consumption integrated technology for ethanol
production from sweet sorghum shall yield 91.9 kg of ethanol for a tonne input of sweet sorghum
stalk (Li et al., 2013). This yield of ethanol in kg per hectare is used to get the competing price of
Sweet Sorghum in Rs./kg. Adding the cost of raw material and the bio refinery cost (taken as Rs.
22 per litre as mentioned above) gives an estimate of the value of one kg of bioethanol. Using the
conversion factor of one kg of sweet sorghum stalk will yield to 1.26 litres of syrup, the price
bioethanol in rupees per litre is estimated. On an energy parity basis, the corresponding critical
EBP price is estimated. The calorific values of one litre of commercial ethanol and one litre of
bioethanol are taken respectively as 5074 kilocalories and 5042 kilocalories.
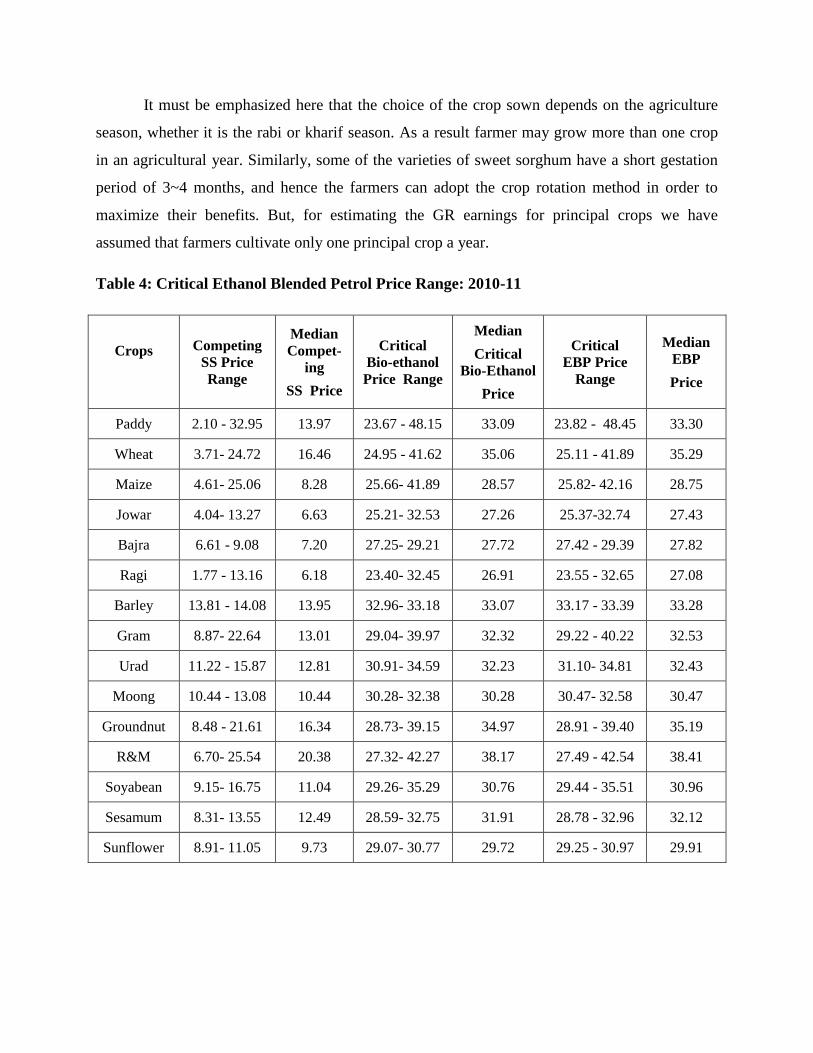
It must be emphasized here that the choice of the crop sown depends on the agriculture
season, whether it is the rabi or kharif season. As a result farmer may grow more than one crop
in an agricultural year. Similarly, some of the varieties of sweet sorghum have a short gestation
period of 3~4 months, and hence the farmers can adopt the crop rotation method in order to
maximize their benefits. But, for estimating the GR earnings for principal crops we have
assumed that farmers cultivate only one principal crop a year.
Table 4: Critical Ethanol Blended Petrol Price Range: 2010-11
Crops
Competing
SS Price
Range
Median
Compet-
ing
SS Price
Critical
Bio-ethanol
Price Range
Median
Critical
Bio-Ethanol
Price
Critical
EBP Price
Range
Median
EBP
Price
Paddy 2.10 - 32.95 13.97 23.67 - 48.15 33.09 23.82 - 48.45 33.30
Wheat 3.71- 24.72 16.46 24.95 - 41.62 35.06 25.11 - 41.89 35.29
Maize 4.61- 25.06 8.28 25.66- 41.89 28.57 25.82- 42.16 28.75
Jowar 4.04- 13.27 6.63 25.21- 32.53 27.26 25.37-32.74 27.43
Bajra 6.61 - 9.08 7.20 27.25- 29.21 27.72 27.42 - 29.39 27.82
Ragi 1.77 - 13.16 6.18 23.40- 32.45 26.91 23.55 - 32.65 27.08
Barley 13.81 - 14.08 13.95 32.96- 33.18 33.07 33.17 - 33.39 33.28
Gram 8.87- 22.64 13.01 29.04- 39.97 32.32 29.22 - 40.22 32.53
Urad 11.22 - 15.87 12.81 30.91- 34.59 32.23 31.10- 34.81 32.43
Moong 10.44 - 13.08 10.44 30.28- 32.38 30.28 30.47- 32.58 30.47
Groundnut 8.48 - 21.61 16.34 28.73- 39.15 34.97 28.91 - 39.40 35.19
R&M 6.70- 25.54 20.38 27.32- 42.27 38.17 27.49 - 42.54 38.41
Soyabean 9.15- 16.75 11.04 29.26- 35.29 30.76 29.44 - 35.51 30.96
Sesamum 8.31- 13.55 12.49 28.59- 32.75 31.91 28.78 - 32.96 32.12
Sunflower 8.91- 11.05 9.73 29.07- 30.77 29.72 29.25 - 30.97 29.91
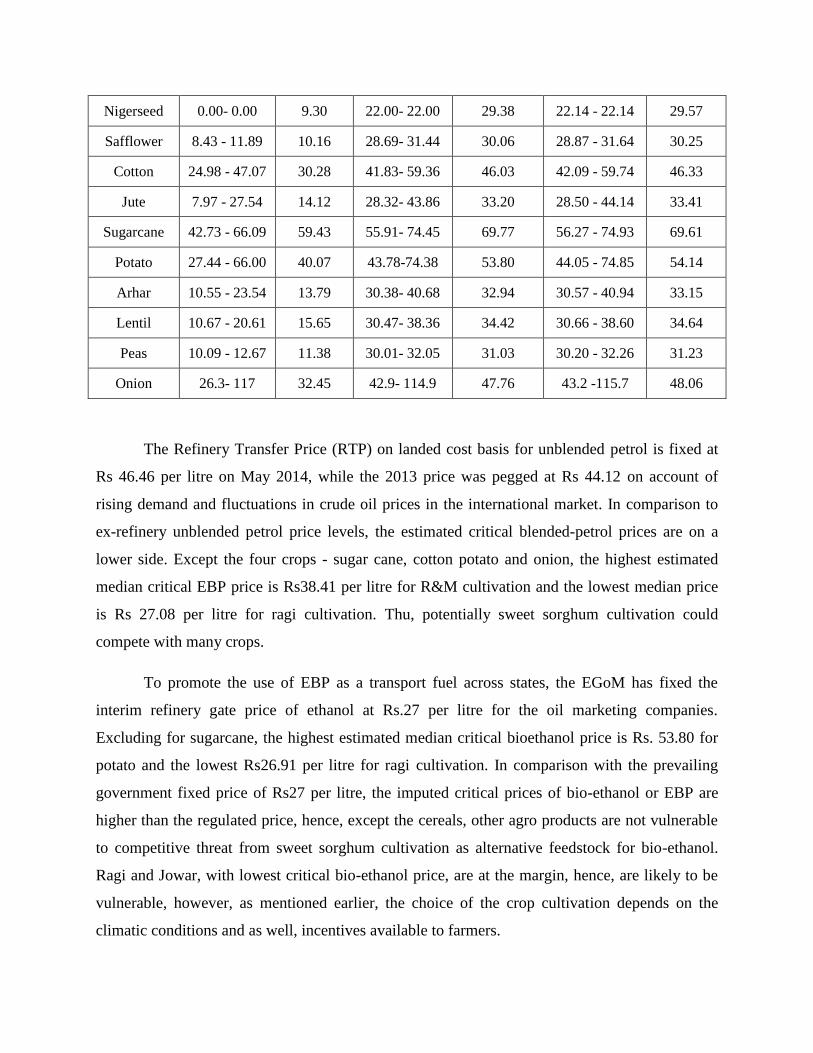
Nigerseed 0.00- 0.00 9.30 22.00- 22.00 29.38 22.14 - 22.14 29.57
Safflower 8.43 - 11.89 10.16 28.69- 31.44 30.06 28.87 - 31.64 30.25
Cotton 24.98 - 47.07 30.28 41.83- 59.36 46.03 42.09 - 59.74 46.33
Jute 7.97 - 27.54 14.12 28.32- 43.86 33.20 28.50 - 44.14 33.41
Sugarcane 42.73 - 66.09 59.43 55.91- 74.45 69.77 56.27 - 74.93 69.61
Potato 27.44 - 66.00 40.07 43.78-74.38 53.80 44.05 - 74.85 54.14
Arhar 10.55 - 23.54 13.79 30.38- 40.68 32.94 30.57 - 40.94 33.15
Lentil 10.67 - 20.61 15.65 30.47- 38.36 34.42 30.66 - 38.60 34.64
Peas 10.09 - 12.67 11.38 30.01- 32.05 31.03 30.20 - 32.26 31.23
Onion 26.3- 117 32.45 42.9- 114.9 47.76 43.2 -115.7 48.06
The Refinery Transfer Price (RTP) on landed cost basis for unblended petrol is fixed at
Rs 46.46 per litre on May 2014, while the 2013 price was pegged at Rs 44.12 on account of
rising demand and fluctuations in crude oil prices in the international market. In comparison to
ex-refinery unblended petrol price levels, the estimated critical blended-petrol prices are on a
lower side. Except the four crops - sugar cane, cotton potato and onion, the highest estimated
median critical EBP price is Rs38.41 per litre for R&M cultivation and the lowest median price
is Rs 27.08 per litre for ragi cultivation. Thu, potentially sweet sorghum cultivation could
compete with many crops.
To promote the use of EBP as a transport fuel across states, the EGoM has fixed the
interim refinery gate price of ethanol at Rs.27 per litre for the oil marketing companies.
Excluding for sugarcane, the highest estimated median critical bioethanol price is Rs. 53.80 for
potato and the lowest Rs26.91 per litre for ragi cultivation. In comparison with the prevailing
government fixed price of Rs27 per litre, the imputed critical prices of bio-ethanol or EBP are
higher than the regulated price, hence, except the cereals, other agro products are not vulnerable
to competitive threat from sweet sorghum cultivation as alternative feedstock for bio-ethanol.
Ragi and Jowar, with lowest critical bio-ethanol price, are at the margin, hence, are likely to be
vulnerable, however, as mentioned earlier, the choice of the crop cultivation depends on the
climatic conditions and as well, incentives available to farmers.
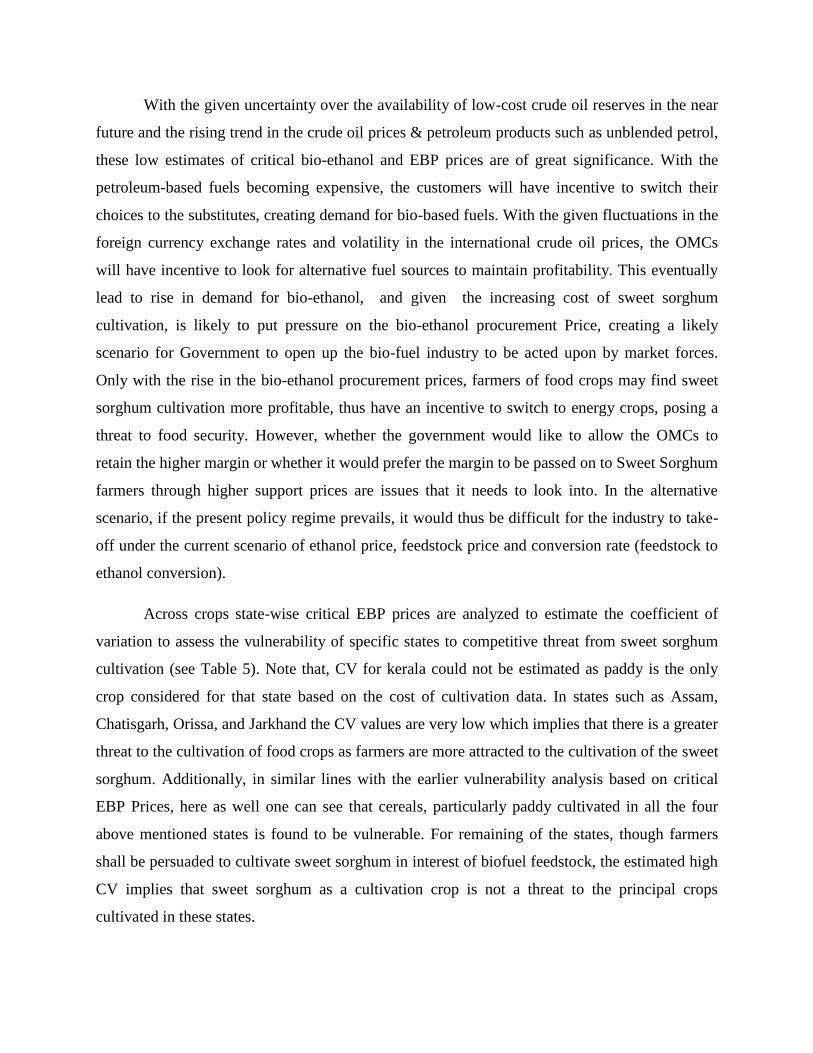
With the given uncertainty over the availability of low-cost crude oil reserves in the near
future and the rising trend in the crude oil prices & petroleum products such as unblended petrol,
these low estimates of critical bio-ethanol and EBP prices are of great significance. With the
petroleum-based fuels becoming expensive, the customers will have incentive to switch their
choices to the substitutes, creating demand for bio-based fuels. With the given fluctuations in the
foreign currency exchange rates and volatility in the international crude oil prices, the OMCs
will have incentive to look for alternative fuel sources to maintain profitability. This eventually
lead to rise in demand for bio-ethanol, and given the increasing cost of sweet sorghum
cultivation, is likely to put pressure on the bio-ethanol procurement Price, creating a likely
scenario for Government to open up the bio-fuel industry to be acted upon by market forces.
Only with the rise in the bio-ethanol procurement prices, farmers of food crops may find sweet
sorghum cultivation more profitable, thus have an incentive to switch to energy crops, posing a
threat to food security. However, whether the government would like to allow the OMCs to
retain the higher margin or whether it would prefer the margin to be passed on to Sweet Sorghum
farmers through higher support prices are issues that it needs to look into. In the alternative
scenario, if the present policy regime prevails, it would thus be difficult for the industry to take-
off under the current scenario of ethanol price, feedstock price and conversion rate (feedstock to
ethanol conversion).
Across crops state-wise critical EBP prices are analyzed to estimate the coefficient of
variation to assess the vulnerability of specific states to competitive threat from sweet sorghum
cultivation (see Table 5). Note that, CV for kerala could not be estimated as paddy is the only
crop considered for that state based on the cost of cultivation data. In states such as Assam,
Chatisgarh, Orissa, and Jarkhand the CV values are very low which implies that there is a greater
threat to the cultivation of food crops as farmers are more attracted to the cultivation of the sweet
sorghum. Additionally, in similar lines with the earlier vulnerability analysis based on critical
EBP Prices, here as well one can see that cereals, particularly paddy cultivated in all the four
above mentioned states is found to be vulnerable. For remaining of the states, though farmers
shall be persuaded to cultivate sweet sorghum in interest of biofuel feedstock, the estimated high
CV implies that sweet sorghum as a cultivation crop is not a threat to the principal crops
cultivated in these states.
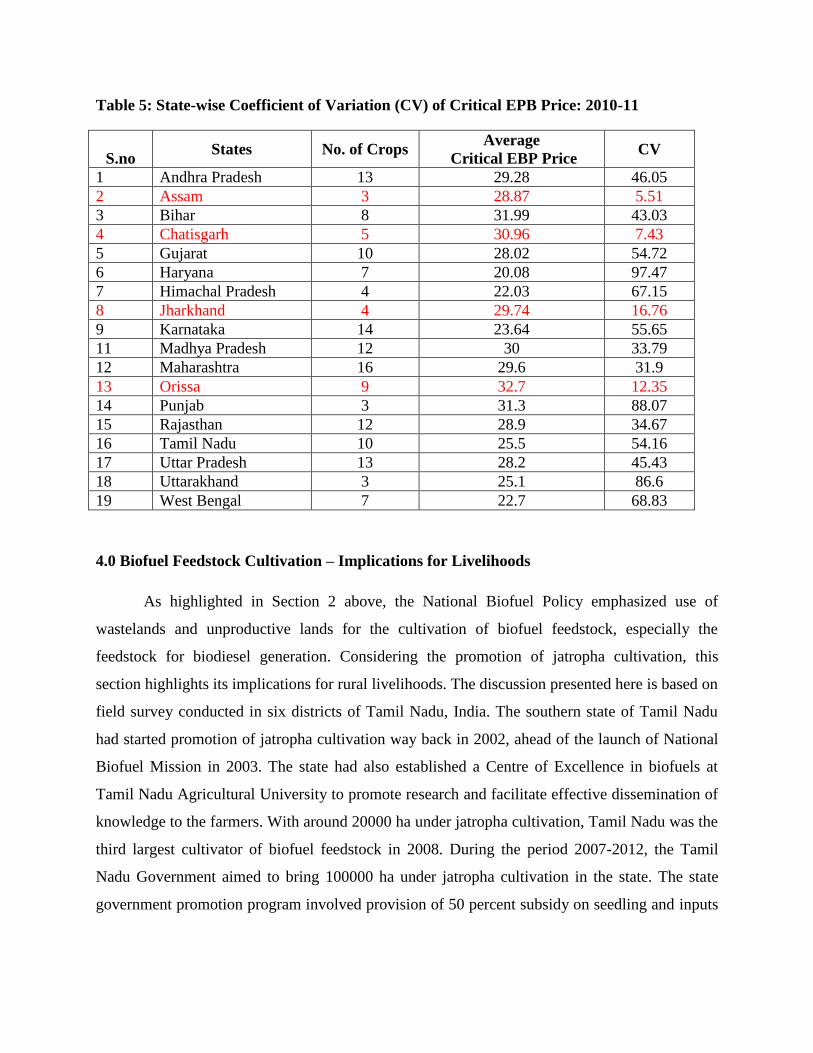
Table 5: State-wise Coefficient of Variation (CV) of Critical EPB Price: 2010-11
S.no States No. of Crops
Average
Critical EBP Price CV
1 Andhra Pradesh 13 29.28 46.05
2 Assam 3 28.87 5.51
3 Bihar 8 31.99 43.03
4 Chatisgarh 5 30.96 7.43
5 Gujarat 10 28.02 54.72
6 Haryana 7 20.08 97.47
7 Himachal Pradesh 4 22.03 67.15
8 Jharkhand 4 29.74 16.76
9 Karnataka 14 23.64 55.65
11 Madhya Pradesh 12 30 33.79
12 Maharashtra 16 29.6 31.9
13 Orissa 9 32.7 12.35
14 Punjab 3 31.3 88.07
15 Rajasthan 12 28.9 34.67
16 Tamil Nadu 10 25.5 54.16
17 Uttar Pradesh 13 28.2 45.43
18 Uttarakhand 3 25.1 86.6
19 West Bengal 7 22.7 68.83
4.0 Biofuel Feedstock Cultivation – Implications for Livelihoods
As highlighted in Section 2 above, the National Biofuel Policy emphasized use of
wastelands and unproductive lands for the cultivation of biofuel feedstock, especially the
feedstock for biodiesel generation. Considering the promotion of jatropha cultivation, this
section highlights its implications for rural livelihoods. The discussion presented here is based on
field survey conducted in six districts of Tamil Nadu, India. The southern state of Tamil Nadu
had started promotion of jatropha cultivation way back in 2002, ahead of the launch of National
Biofuel Mission in 2003. The state had also established a Centre of Excellence in biofuels at
Tamil Nadu Agricultural University to promote research and facilitate effective dissemination of
knowledge to the farmers. With around 20000 ha under jatropha cultivation, Tamil Nadu was the
third largest cultivator of biofuel feedstock in 2008. During the period 2007-2012, the Tamil
Nadu Government aimed to bring 100000 ha under jatropha cultivation in the state. The state
government promotion program involved provision of 50 percent subsidy on seedling and inputs
on cultivation practices. The jatropha cultivation was mainly envisaged through contract
farming, mostly on unproductive and wastelands.
During December 2013 and January 2014 a field survey was carried out in six districts of
Tamil Nadu to assess the present status of jatropha cultivation in Tamil Nadu. The six districts
covered are – Kancheepuram, Coimbatore, Thiruvannamalai, Villupuram, Tirunelveli, and
Viruthunagar. The field study indicated that barring a few isolated cases, the jatropha cultivation
has significantly declined in the recent years. The main reasons for declined interest in jatropha
cultivation include: (a) significantly lower realized yields on the fields compared to what have
been achieved in the research plots; (b) substantially high irrigation requirements for achieving
good yields – which again differed from what has been shown on research plots. High initial
investment requirements favoured larger land holders compared to small and marginal land
holders. This in turn undermined the very objective of the Biofuel Policy.
The Tamil Nadu governments’ initiatives for jatropha promotion cast shadow on the
notion of ‘wasteland’, especially because at the village level the wastelands are often common
property resources utilized by multiple stakeholders. The land targeted for jatropha cultivation is
largely occupied by prosopis – which in turn was historically promoted by several earlier
governments as a means of providing alternative livelihood opportunity for the rural households.
Prosopis is used as feedstock in small industries in rural areas and it provides significant
employment opportunity for landless poor (for cutting etc.). In comparison to prosopis, jatropha
cultivation with very less employment opportunities became less attractive. On its part, the
Government agencies viewed jatropha cultivation similar to other tree planting programs. As a
result the value chain has not developed and the cultivation targets remained elusive.
In sum, ambiguous definition of wasteland and inadequate understanding of use of
wastelands has led to concerns regarding feasibility of achieving biodiesel production targets. It
has also compromised the livelihood options of rural population. At all India level, with only 0.5
million hectares under jatropha cultivation, a mere 0.01 percent of total biodiesel required for 5
percent blending is achievable from the existing jatropha production. Reaching higher levels of
production (and blending targets) requires resolving uncertainty regarding transfer of ownership
of community and government owned lands and developing the value-chain of jatropha
production.
5.0 Conclusions
For a variety of reasons, the need for finding alternative energy sources to meet
justifiably growing energy demands in India is real and urgent. While jatropha remains as the
main feedstock for biodiesel production, sweet sorghum could be considered as alternative
feedstock for bioethanol production. The analysis presented in this paper suggests that from a
competitive perspective both jatropha and sweet sorghum could pose threat to food crops.
However, choice of crops for cultivation will depend on variety of other factors including
climatic and soil condition which have not been incorporated in the analysis presented here.
For India, it has been estimated that by dedicating 33 mha of degraded lands at a woody
biomass productivity of 4 tonnes per ha per year, 100 TWh of electricity could be produced
annually, meeting most of the rural electricity needs as well as providing carbon mitigation
benefit of 40 MtC annually. Actual availability of land for biofuel cultivation however would
depend on a number of factors including climatic and soil conditions, access to infrastructure
such as roads and electricity, as well as the ownership of the land. The available information
about wasteland suitability for oilseed plantations is sketchy and a proper wasteland mapping
exercise should precede any major biodiesel development program in India (Gunatilake, 2011).
Ethanol production from sugarcane offers significant potential to substitute for fossil fuel.
However, area under sugarcane needs to be stepped up substantially to meet the increasing
ethanol demand under different scenarios of ethanol blending with petrol. Schaldach et al. (2011)
estimated that the area for sugarcane production in India increases by 46% (5% blending
scenario), 79% (10% blending) and 144% (20% blending) under various blending scenarios.
Expansion in sugarcane area is at the expense of the extent of natural land, which
correspondingly decreases by 45%, 47% and 51%. However, adoption of yield increasing
technologies such as drip-fertigation has huge potential to increase the existing yield levels of
sugarcane and hence area expansion could be minimized if these technologies are adequately
supported through public policy.
There are also apprehensions that prolonged dependence on first generation crops for
biofuels will result in increased risk of deforestation with associated consequences of substantial

greenhouse gas emissions and loss of biodiversity. Thus extensive monitoring of deforestation
and other land use changes is essential.
REFERENCES
Belum VS Reddy, Ashok Kumar A, Ravinder Reddy Ch, Parthasarathy Rao P and Patil
JV(Eds.) (2013), ‘Developing a Sweet Sorghum Ethanol Value Chain’. International
Crops Research Institute for the Semi-Arid Tropics( ICRISAT).
G Basavaraj, P Parthasarathy Rao, Ch Ravinder Reddy, A Ashok Kumar, P Srinivasa Rao and
BVS Reddy (2012), ‘A Review of the National Biofuel Policy in India: A critique of the
Need to Promote Alternative Feedstocks’, International Crops Research Institute for the
Semi-Arid Tropics( ICRISAT).
G Basavaraj, P Parthasarathy Rao, Kaushik Basu, Ch Ravinder Reddy, A Ashok Kumar, P
Srinivasa Rao and BVS Reddy (2012). ‘Assessing Viability of Bio-ethanol Production
from Sweet Sorghum’, Working Paper Series no. 30, RP – Markets, Institutions and
Policies, International Crops Research Institute for the Semi-Arid Tropics.
GOI (2003): ‘Report of the Committee on Development of Biofuels’, Planning Commission,
Government of India.
GOI (2005): ‘Wastelands Atlas of India’, Department of Land Resources, Ministry of Rural
development, Government of India.
GOI (2006): ‘Integrated Energy Policy’, Report of the Expert Committee, Planning commission,
Government of India.
GOI (2009): ‘National Policy on Biofuels’, Ministry of New and Renewable Energy,
Government of India.
GOI (2010a): ‘The working Group Report on Road Transport for the Eleventh Five Year Plan’,
Planning commission of India.
GOI (2010b): ‘Estimates of Cost of cultivation /Production& Related Data’, Directorate of
Economics & Statistics, Government of India.
GOI (2013): ‘Twelfth Five Year Plan (2012–2017)’,Volume I, Planning commission of India.
GOI(2012): ‘Basic Statistics on Indian Petroleum and Natural Gas’, Ministry of Petroleum and
Natural Gas, government of India.
Gunatilake, H. (2011), ‘India: Study on Cross-sectoral Implications of Biofuel Production and
Use’, Final Report of TA 7250-IND Submitted to the Department of Economic Affairs,
Ministry of Finance, Asian Development Bank, Manila, The Philippines.
IOCL (2014), ‘Annexure Price Buildup of Petrol at Delhi effective 01-05-14’,
www.iocl.com/Products/PriceBuildup/Price_buildup_of_MS.pdf
Jihong Li, Shizhong Li, Bing Han, Menghui Yu, Guangming Li, and Yan Jiang (2013), ‘A novel
cost-effective technology to convert sucrose and homocelluloses in sweet sorghumStalks
into ethanol’, Biotechnology for Biofuels 2013, 6:174.
Msangi, S. and M. Rosegrant (2011), ‘World Agriculture in a Dynamically Changing
Environment: IFPRI’s Long-term Outlook for Food and Agriculture’, in P. Conforti (ed.),
Looking Ahead in World Food and Agriculture: Perspectives to 2050, Agricultural
Development Economics Division, Economic and Social Development Department, Food
and Agricultural Organization, Rome.
Robin Singhal and Ramprasad SenGupta (2012), ‘Energy Security and Biofuel, implications for
land use and Food Security’, Economics & Political Weekly, Vol XLVII No 40.
Saon Ray, Amrita Goldar and Smita Miglani (2011), ‘Ethanol Blending Policy: Supply and
Demand Issues’, Indian Council for Research on International Economic Relations.
Saon Ray, Amrita Goldar and Smita Miglani (2011), ‘Ethanol Blending Policy: Issues Related to
Pricing’, Indian Council for Research on International Economic Relations.
Schaldach R., J.A. Priess and J. Alcamo (2011), ‘Simulating the Impact of Biofuel Development
on Country-wide Land-use Change in India’, Biomass and Bioenergy, 35, 2401-2410.
Sen, Abhijit and M S Bhatia (2004), ‘State of the Indian Farmer: A Millennium Study Cost of
Cultivation and Farm Income’, NewDelhi: Academic Foundation, Vol 14.
Shinoj, P., S.S.Raju, Ramesh Chand, P K Joshi, Praduman Kumar and Siwa Msangi (2012),
‘Biofuels in India: Potential, Policy and Emerging Paradigms’, NationalCentre for
Agricultural Economics and Policy Research
STRAP Sustainability TRade‐offs and Pathways
Working Paper #004‐2014
Comparative analysis of knowledge and opinions of local communities on sustainability of bioenergy in the Philippines and China
Lilibeth A. Acosta12, Xuefeng Cui3, Damasa B. Magcale‐Macandog4, Elena A. Eugenio24, Paula Beatrice M. Macandog4, Jemimah Mae Eugenio5, and K. S. Kavi Kumar6
1Potsdam Institute for Climate Impact Research, Telegraphenberg, 14473 Potsdam, Germany 2School of Environmental Science and Management, University of the Philippines in Los Banos (UPLB), Philippines 3College of Global Change and Earth System Science, Beijing Normal University, No. 19 Xinjiekouwai Street, Beijing 100875, China 4Institute of Biological Sciences, College of Arts and Sciences, UPLB, Philippines 5Institute of Mathematical Sciences and Physics, College of Arts and Sciences, UPLB, Philippines 6Madras School of Economics, Gandhi Mandapam Road, Chennai – 600 025, India Funded by:
Low Carbon Initiatives Framework
1
Comparative analysis of knowledge and opinions of local communities on sustainability of bioenergy in the Philippines and China
Lilibeth A. Acosta12, Xuefeng Cui3, Damasa B. Magcale-Macandog4, Elena A. Eugenio24,
Paula Beatrice M. Macandog4, Jemimah Mae Eugenio5, and K. S. Kavi Kumar6 1Potsdam Institute for Climate Impact Research, Telegraphenberg, 14473 Potsdam, Germany 2School of Environmental Science and Management, University of the Philippines in Los Banos (UPLB), Philippines 3College of Global Change and Earth System Science, Beijing Normal University, No. 19 Xinjiekouwai Street, Beijing 100875, China 4Institute of Biological Sciences, College of Arts and Sciences, UPLB, Philippines 5Institute of Mathematical Sciences and Physics, College of Arts and Sciences, UPLB, Philippines 6Madras School of Economics, Gandhi Mandapam Road, Chennai – 600 025, India Corresponding author: Dr. L. Acosta, Potsdam Institute for Climate Impact Research (PIK), Telegraphenberg A62, 14473 Potsdam, Germany. Tel.: +49 331 2882643; Fax: +49 331 2882695; E-mail: [email protected] 1 Introduction The concept of low-carbon society (LCS) has recently become an important instrument to limiting global temperature increase below 2°C. LCS should be compatible with the principles of sustainable development, contribute to global reduction in greenhouse gases (GHG) emissions, promote use of low-carbon energy sources and production technologies, and adopt low-energy consumption behaviour (Skea & Nishioka 2008). Renewable energy resources and technologies are important to achieving LCS visions (Nakata et al. 2011). However, the relative contribution of the different renewable energy sources to a sustainable transition to LCS depends on the complexity of the systems. An energy system has three levels including the energy resources forming the primary energy, conversion technologies supplying secondary energy, and energy demand sectors comprising different energy consumers. Among the renewable energy sources, bioenergy presents an enormous policy challenge for sustainable transition to LCS due to inevitable trade-offs at different levels (Acosta-Michlik et al. 2011): (ii) Competing land use between food and fuel production, biodiversity protection and bioenergy production, and first and second generation feedstock production; (ii) Competing sources between domestically produced and imported biomass products and their feedstock; and (iii) Competing conversion technologies due to diverse range of options available to use and develop bioenergy. The trade-offs result in diverging social perception on and policy strategies for bioenergy sustainability due to contextual differences across countries. Moreover, bioenergy’s complex system involves not only alternative products and competing sectors, but also diverse actors interacting at and across different levels. As a result, bioenergy production not only provides opportunities but also causes conflicts in the course of fulfilling any diverging private and public interests along and within these inter-linkages (Faaij 2006). A better understanding of human perception on the sustainability issues confronting bioenergy system, i.e. feedstock resources, conversion technologies, and energy demand, will help develop appropriate policy for complex but promising renewable energy sources. PIC-
2
STRAP (Integrated sustainability assessment of bioenergy potentials in Asia: An application of a hybrid approach on trade-offs and pathways) project contributes to this challenging task through application of integrated and trans-disciplinary approach, highlighting social perception and policy preferences that affects transition to low carbon and sustainable societies. PIC-STRAP adopts a novel hybrid approach called STRAP (Sustainability TRade-offs and Pathways), which is guided by the hypothesis that trade-off decisions on achieving a balance among economic, social and ecological goals are necessary conditions for assessing development pathways in bioenergy (Acosta-Michlik et al. 2011). The overall aim of the PIC-STRAP project is to develop sustainable transition criteria towards low-carbon societies using hybrid analytical tools that allows systematic investigation of trade-offs and pathways in the development of first- and second generation bioenergy in Asia, in particular China, India and the Philippines. This paper presents the results of sustainability trade-offs in the Philippines and China using cluster and conjoint analyses. Its main objective is to compare the knowledge and opinions of local people on the contribution of bioenergy to economic stability, social equity and ecological balance in these two Asian countries. The paper is structured as follows: Section 2 highlights bioenergy policy and trends in the Philippines and China; Section 3 presents the methods used for data collection and analyses; and Section 4 discusses the results of the cluster and conjoint analyses. 2 Bioenergy policy and trends 2.1 Philippines Energy demand in the Philippines was growing at an average annual rate of negative 0 .3 percent from 24.4 to 23.8 MTOE (i.e. Million Tons of Oil Equivalent) from 1999 to 2009 (DOE 2009) despite the increase in gross domestic product (GDP) and population (NSCB 2009). The economy has been growing at an average annual rate of 4.5 percent, with GDP increasing from 918.2 to 1,432.0 billion Pesos from 1999 to 2009. The average annual growth rate of the population was 2.1 percent, increasing from 74.7 million to 92.2 million for the same period. The negative growth in energy demand is also reflected in the constant decline in energy (-4.0 percent), oil (-6.4 percent) and electricity (-0.4 percent) intensity over the same period. The declining trend in energy consumption and intensity has been mainly contributed to the decline in energy demand in residential applications and in agriculture, which showed an average annual growth rate of -2.8 and -2.1 percent, respectively. The continuing increase in the prices of petroleum prompted the consumers to utilize energy in more prudent ways (Salire 2007). After the transport sector (36.5 percent), the residential sector (26 percent) accounted for the largest share in total domestic energy demand. Whilst energy demand declined, energy supply continued to increase, albeit at a slow rate of 0.4 percent per year from 38.1 to 39.6 MTOE. The self-sufficiency level in energy increased from 48.6 percent in 1999 to 59.2 percent in 2009 as a result of the increase in indigenously supplied energy. Renewable energy such as geothermal energy and biomass are important indigenous sources of energy in the Philippines. The energy from biomass, which is mostly derived from forest and agriculture residues, and bagasse, is mainly used for traditional household cooking. Thus, there is a potential for increasing household welfare through improvement in the use of biomass (Samson et al. 2001). Like in many other countries, the Philippines is implementing various bioenergy policies to reduce dependence on imported oil, enhance economic growth, increase energy efficiency and contribute to climate change mitigation. The most prominent policy is the Biofuels Act of 2006, which mandates a 2 percent blend of biodiesel into all diesel fuel in 2008 and 10
3
percent blend of bioethanol into all gasoline fuel in 2010. According to the DA, the objectives of Biofuels Act are as follows: (1) developing and utilizing indigenous renewable and sustainably-sourced clean energy sources to reduce dependence on imported oil; (2) mitigating toxic and greenhouse gas (GHG) emissions; (3) increasing rural employment and income; and (4) ensuring the availability of alternative and renewable clean energy without the detriment to the natural ecosystem, biodiversity and food reserves of the country (Bento 2008, Naylor et al 2007, Clancy 2008, Sydorovych and Wossink 2008). The Biofuels Act also provides an incentive of a zero-rated specific tax on the biofuels component of blended gasoline or diesel. Other incentives include an exemption from value-added tax for the sale of raw materials in the production of biofuels, exemption from wastewater charges under the Clean Water Act, and the extension of financial assistance from government financial institutions for the production, storage, handling, and blending of biofuels (Ceccon and Miramontes 2008). To support and comply with the provisions of the Biofuels Act, the DA has been pursuing the Biofuel Feedstock Program, which provides (1) production support services, (2) extension support, education and training services, (3) credit facilitation, (4) research and development, (5) irrigation support services, other infrastructure and postharvest & development services, and (6) marketing development to promote the use of coconut and jathropa for biodiesel and sugarcane, cassava, and sweet sorghum for bioethanol (Bento 2008). The Act also allows oil companies to import biofuels until 2010 to meet these policy targets. Whilst there were no reported obstacles during the transition to a higher biodiesel blend due to adequate local supply (Corpuz 2009), the bioethanol situation was less stable. To comply with the bioethanol mandates, local companies have been importing bioethanol due to supply scarcity and price volatility. In 2009 ethanol accounted for 0.30 percent of the total indigenous energy supply and 0.10 percent of the total domestic energy supply. Despite concerns about the impacts of importing bioethanol on local production, the government approved further imports in 2011 to meet its biofuel blending targets (DA-BAR 2011). The local supply of biodiesel and bioethanol is largely produced from coconut and sugarcane; both are traditional crops in the Philippines. Other potential biomass for bioenergy production includes jathropa for biodiesel, and cassava and sweet sorghum for bioethanol. The ethanol yields per hectare per year are 4,550 liters for sugarcane, 1,395 liters for cassava, and 6,000 liters for sweet sorghum (SRA 2008). The biodiesel yields per hectare are 630 liters for coconut and 1,892 liters for jatropha (DOE 2010). The government supports the production of jatropha for biodiesel because it is a non-staple crop and grows on marginal lands. 2.2 China China’s economy has experienced remarkable growth since economic reforms initiated in 1978. Annual average growth rate of gross domestic product (GDP) reached nearly 10% in the last three decades. The rapid growth of China’s economy also led to a rapid rise in demand for energy that also gave rise to mounting concerns in the country about its national energy security. Despite the rapid growth of domestic energy production, demand has grown even faster. China has shifted from being a net energy exporter to being an importer since the late 1990s and is becoming one of the largest importers in the world in recent years (Qiu, Huang et al. 2010). Despite rapid development of energy demand, many Chinese rural households still depend heavily on traditional biomass energy for heating and cooking (Démurger and Fournier 2011). China is facing increasing energy pressure. Given the energy security concerns, the search for alternative sources of energy has become a top policy priority of the Government of China (Qiu, Huang et al. 2010).
4
Renewable energy and energy efficiency (REEE) policies become a national priority for the Chinese government, particularly since 2005 in six sectors: electricity, industry, transportation, buildings, and local government. Fortunately, unlike many other national governments, the Chinese central government is blessed with a sound financial position, which allows significant investment in REEE. In 2012, spending on energy conservation and environmental protection totaled 200 billion RMB (Lo 2014). S&T program funds and investment in energy related areas make it possible for Chinese researchers to cooperate with their international partners in various ways. The MOST and NDRC also cooperate to promote the development of energy. The National Development and Reform Commission (NDRC) NDRC and MOST Ministry of Science and Technology (MOST) of China co-fund several international cooperation energy projects. In 2007, the “Renewable and New Energy International Cooperation Program” was launched by the NDRC and MOST together. It focuses on large capacity wind farms, biomass power plants, and transfer technology from biomass to liquid fuel. In 2007, MOST and the Italian Environment Protection Foundation initiated the “Demonstration and Industrialization Project of Producing Biodiesel from Jatropha curcas L. in Sichuan” and has established several pilot plantations of Jatropha curcas L. in the Sichuan province (Lo 2014). China’s biofuel industry has expanded rapidly since early 2000s. Bioethanol production reached 1.35 million tons in 2007. Four large-scale state-owned bioethanol plants in Heilongjiang, Jilin, Henan, and Anhui provinces were constructed in 2001. The total annual bioethanol production capacity of these four plants, which mainly use maize as feedstock, is approximately 1.5 million tons. In 2007, China set up another bioethanol plant based on cassava in Guangxi Province, which started operation in early 2008. The annual production capacity of this plant in the initial stage is 0.2 million tons. Chinese government has established the medium and long-term development plan, at the end of 2020 (Liu, Liu et al. 2013). By the end of 2007, there were about 10 biodiesel plants operating in China. Most of them use industrial waste oil and waste cooking oil as feedstock. The total annual production capacity for all of these plants is less than 0.2 million tons. Biodiesel production needs a stable supply of lipid or vegetable oil as feedstock, but China is short of those feedstocks. These two policy documents specified the following major support policies during the implementation of the pilot testing program: First, the 5% consumption tax on all bioethanols under the E10 program was waived for
all bioethanol plants; Second, the value-added tax (normally 17%) on bioethanol production was refunded at the
end of each year; Third, all bioethanol plants received subsidized ‘‘old grain” (grains reserved in national
stocks that are not suitable for human consumption) for feedstock. 1 This subsidy is jointly provided by the central and local governments;
Fourth, a subsidy was offered by the central government to ensure a minimum profit for each of bioethanol plants. That is, if despite all three support mechanisms described above, any bioethanol plant were to record a loss in the production and marketing of bioethanol, it would receive a subsidy from the Government that equals the gap between marketing revenues and production costs plus a reasonable profit that the firm could have obtained from an alternative investment. This subsidy is estimated for each plant at the end of each year. Besides these four support policies, the Government of China also ensured markets for the bioethanols produced by these state-owned plants. Bioethanol produced by private plants was not allowed to enter the market.
5
China is now the third largest bioethanol producer in the world after the United State and Brazil. While there are several potential feedstock crops available for bioethanol production, lack of land for feedstock production is one of major constraints in China’s bioethanol expansion. 3 Methods 3.1 Segmentation of conjoint preferences Segmentation seeks to combine homogeneous population into a group with similar preferences or to segregate heterogeneous population into groups with dissimilar preferences. Although there is no single segmentation approach, it can generally be described as forward or backward and a-priori or post-hoc (Andrews and Currim 2003). The initial foci of segmentation in forward approach are the respondents’ basic characteristics (e.g. demographics) or distinct attitude towards an issue, and in backward approach are the preferences from conjoint analysis. In both approaches, segmentation can be determined using expert judgement (i.e. a-priori approach) or clustering techniques (i.e. post-hoc approach). A-priori segmentation is also referred to as conceptual approach where the grouping criteria are known in advance, whilst post-hoc segmentation is data-driven approach requiring quantitative techniques to analyse the data (Dolnicar 2002). Cluster analysis is the most widely adopted technique for post-hoc segmentation (e.g. Hoek et al. 1996, Dolnicar 2002, Dillon and Mukherjee 2006), which is thus often referred to as cluster-based segmentation (Green et al. 2001). According to Andrews and Currim (2003), when segmentation is based on cluster analysis of conjoint part worths (or utilities) then one is following a backward post-hoc approach. In this paper, we followed a forward post-hoc approach where we use information on respondents’ perception on bioenergy to create well-defined segments of conjoint preferences. Specifically, the heterogeneity in the population is captured in covariates describing the knowledge and opinions of the respondents on the effects of bioenergy on food security and economic growth. These covariates are used in the model as segments to define utility (i.e. preference/part-worth) structures of respondents who have similar knowledge and opinions. In cluster-based segmentation, Green et al. (2001) explained that the data are allowed to speak for themselves in terms of finding groups who share similar needs, attitudes, trade-offs, or benefits. The cluster analysis follows the two-step approach described in Hair et al. (1995), which combines both hierarchical and non-hierarchical clustering procedures to arrive at the most realistic cluster solution for the data set. The two-step approach is the most appropriate method for clustering population using categorical variables (Shih et al. 2010, Dymnicki & Henry 2011). These variables are the responses of the respondents to the following survey questions: Question: Response variables:
Are you familiar with the term “bioenergy” (also known as biofuels)?
1 = yes 2 = no
In your opinion, is bioenergy good or bad for the economy in your country?
1 = yes 2 = no
Do you think the use of biomass from food crops for bioenergy production increases food prices and thus affects food security (i.e. food affordability and availability) in your country?
1= yes 2 = no 3 = do not know
6
The number of clusters for segmentation was identified by running different cluster analyses for different cluster numbers and comparing the cluster quality based on the measure of cohesion and separation (SPSS 2007). After identifying the optimal number of clusters from the two-step clustering approach using SPSS software, matrix scoring1 was carried out to identify the cluster attributes or typologies of the segmented population. Conjoint analyses were then applied to each population segment, which represent a distinct typology. Conjoint analysis (also known as choice models or experiments) is a practical technique for measuring preferences that is widely used in different scientific fields including psychology, transport, economics, and environment. Farber & Griner (2000) provide a summary of the application of conjoint analysis for environmental valuation. Considerable attention has been given to this technique both in academe and industry to measure preferences through utility trade-offs among products and services (Lee et al. 2006, Green & Srinivasan 1990), particularly in agro-environments (e.g. Tano et al. 2003, Stevens et al. 2002, Moran et al. 2007, Blamey et al. 2000). Conjoint technique is suitable for analysing human decisions, particularly for understanding the process by which individuals develop their preferences for products or services (Sayadi et al. 2005). The preferences are assumed to be influenced, on the one hand, by the individual’s subjective perceptions on the presented choices and, on the other hand, by its economic, social and cultural environment. Conjoint measurement assumes that a product can be described according to the levels of a set of attributes, and the consumer’s overall judgement with respect to that product is based on these attribute levels (Sayadi et al. 2009). In choice-based conjoint (CBC) analysis, a set of attributes and their respective levels define the respondents’ choices. Specifically, the combinations of attribute levels define the choice tasks in conjoint surveys. A conjoint study leads to a set of part-worths or utilities that quantify respondents’ preferences for each level of each attribute (Orme 2010). It is a measure of relative desirability or worth so that the higher the utility, the more desirable is the attribute level (Orme 2006). In this paper, the responses from the survey were analysed using a Hierarchical Bayes Choice-based Conjoint (HCBC) model that is able to capture preferences of individuals (i.e. respondent level) and groups of individuals (i.e. segment level) (Orme 2009): (1) iiii XY
(2) iii z
Where in the first equation Yi is a vector of the responses from the choice tasks, Xi is a matrix of the attribute levels, βi is the p-dimensional vector of regression coefficients representing the utilities, and εi is a p-dimensional vector of random error terms. In the second equation, Θ is a p by q matrix of regression coefficients (i.e. utilities), zi is a q-dimensional vector of covariates and δi is a p-dimensional vector of random error terms. The HCBC model is called hierarchical because it models respondents’ preferences as a function of a lower- or individual-level (within-respondents) model and an upper-level (pooled across respondents) model (Orme & Howell 2009). According to Lenk et al. (1996), hierarchical Bayes analysis creates the opportunity to recover both the individual-level part-worths and heterogeneity in part-worths, even when the number of responses per respondent is less than the number of parameters per respondent. The parth-worths were calculated using HB/CBC module of the
1 Matrix scoring is a method to synthesize the collected survey data and a common technique that has been widely used in participatory research for assessing the relative importance of different activities in people’s livelihoods (DFID 2002).
7
SSIWeb Sawtooth software (Orme 2010). Using the part-worths or utilities, we also calculated the importance of each attribute by dividing the utility range with the sum of the attributes’ utility ranges, where the range is the difference between the highest and lowest utility. 3.2 Survey framework and design Following the STRAP framework, we characterise sustainability using three dimensions – economic stability, social equity, and resource productivity (Table 1). These dimensions are represented by determinants, which are issues or phenomena that significantly influence the nature of sustainability. For determinants that are not directly measurable, indicators provide a benchmark to quantify and simplify the concept or idea they represent. A more detailed discussion on the interconnections and interdependencies between the different determinants and indicators of social, economic and ecological dimensions of sustainability is available in Acosta-Michlik et al. (2011). In the context of bioenergy development, economic stability depends on energy security, technology progress and market organisation, social equity is influenced by food security, social welfare and social justice, and resource productivity is associated with production potential, resource capacity and land management. These determinants represent economic, social, and environmental issues, which many policies aim to address to attain sustainability. The focus of the policies may not necessarily represent the preferences of the society, and these social preferences are manifested on the perceived importance of the individual indicators for each determinant. These indicators are related to human basic needs affecting energy, food, income, property rights, productivity, etc. The determinants of economic stability, social equity and resource productivity represent the attributes and the indicators for these sustainability determinants represent the attribute levels in the survey design. In the discussion of the results, we will also refer to the sustainability determinants as attributes and sustainability indicators as attribute levels to conform to the terminologies that are used in conjoint analysis. Each attribute level is further defined according to its desirability for the society, which aims to make the respondents decide on trading-off between more and less desirable levels of the sustainability indicators (Table 1). Each attribute has a total of 6 levels – 3 desirable and 3 undesirable attribute levels. The possible combinations of the different attribute levels make up the different options in a choice task. Table 2 presents an example of a choice task for the different sustainability dimensions. In the survey questionnaire, the respondents were given 5 choice tasks (1 fixed task and 4 random tasks) for each of the sustainability dimensions. In each choice task the respondents were asked to choose only one among three options. The options are linked to a given type of biomass, which can be either first generation (i.e. sugar-rich crops, starch-rich crops and oil-rich crops) or second generation (i.e. agriculture/forest residues, fast-growing trees, and perennial grasses) bioenergy crops. We used the feedstock attribute levels as reference for each option so that the respondents can explicitly link their choice decisions to the types of biomass.
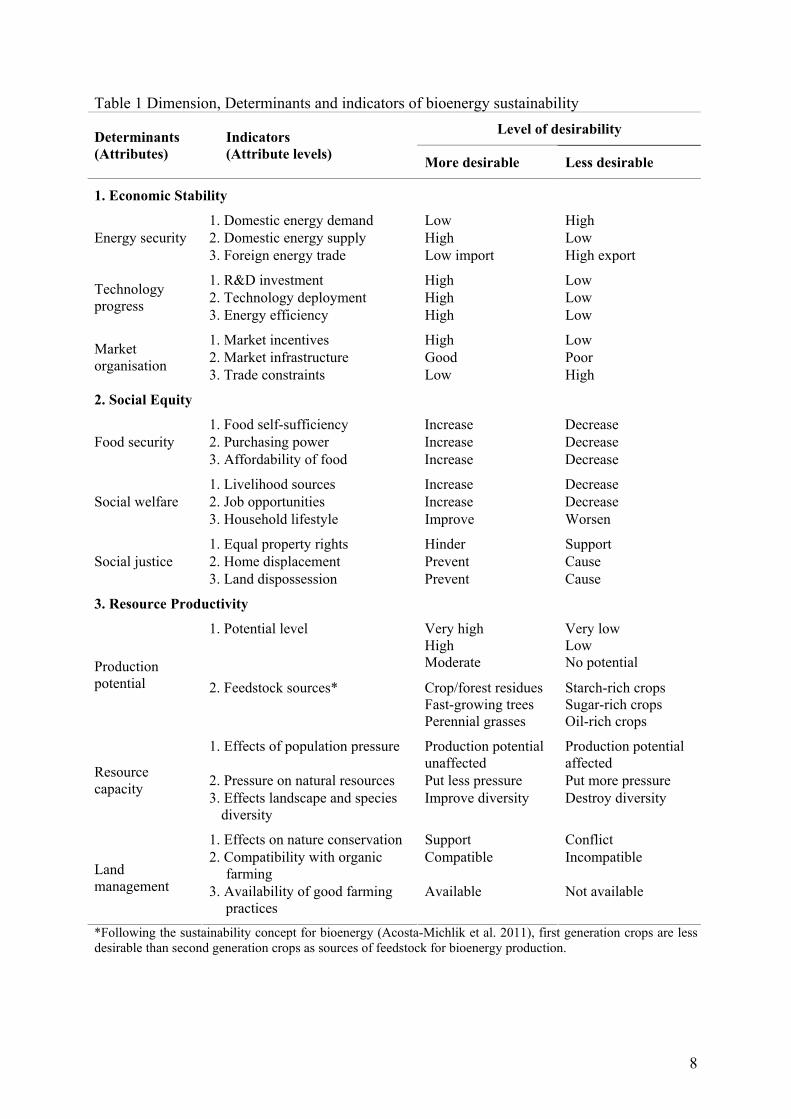
8
Table 1 Dimension, Determinants and indicators of bioenergy sustainability
Level of desirability Determinants (Attributes)
Indicators (Attribute levels)
More desirable Less desirable
1. Economic Stability
1. Domestic energy demand Low High 2. Domestic energy supply High Low Energy security 3. Foreign energy trade Low import High export
1. R&D investment High Low 2. Technology deployment High Low
Technology progress
3. Energy efficiency High Low
1. Market incentives High Low 2. Market infrastructure Good Poor
Market organisation
3. Trade constraints Low High
2. Social Equity
1. Food self-sufficiency Increase Decrease 2. Purchasing power Increase Decrease Food security 3. Affordability of food Increase Decrease
1. Livelihood sources Increase Decrease 2. Job opportunities Increase Decrease Social welfare 3. Household lifestyle Improve Worsen
1. Equal property rights Hinder Support 2. Home displacement Prevent Cause Social justice 3. Land dispossession Prevent Cause
3. Resource Productivity
1. Potential level Very high High Moderate
Very low Low No potential Production
potential 2. Feedstock sources* Crop/forest residues Fast-growing trees Perennial grasses
Starch-rich crops Sugar-rich crops Oil-rich crops
1. Effects of population pressure Production potential unaffected
Production potential affected
2. Pressure on natural resources Put less pressure Put more pressure Resource capacity
3. Effects landscape and species diversity
Improve diversity Destroy diversity
1. Effects on nature conservation Support Conflict 2. Compatibility with organic
farming Compatible Incompatible
Land management 3. Availability of good farming
practices Available Not available
*Following the sustainability concept for bioenergy (Acosta-Michlik et al. 2011), first generation crops are less desirable than second generation crops as sources of feedstock for bioenergy production.
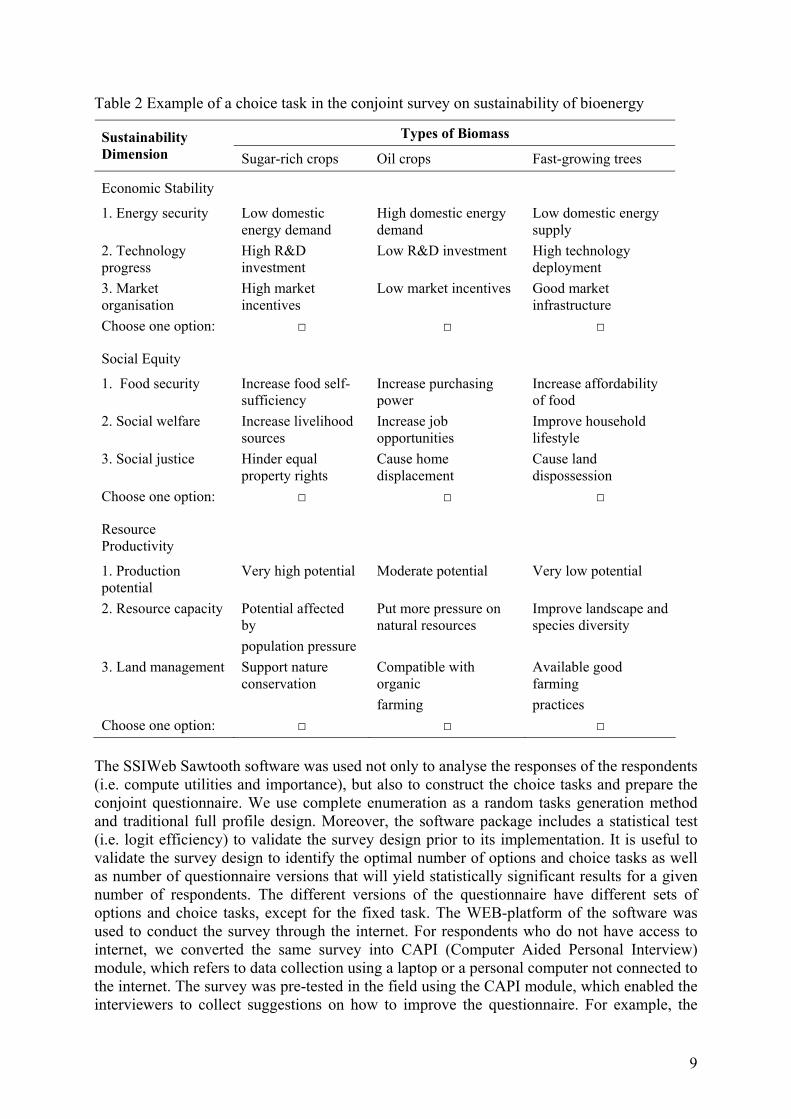
9
Table 2 Example of a choice task in the conjoint survey on sustainability of bioenergy
Types of Biomass Sustainability Dimension Sugar-rich crops Oil crops Fast-growing trees
Economic Stability
1. Energy security Low domestic energy demand
High domestic energy demand
Low domestic energy supply
2. Technology progress
High R&D investment
Low R&D investment High technology deployment
3. Market organisation
High market incentives
Low market incentives Good market infrastructure
Choose one option: □ □ □
Social Equity
1. Food security Increase food self-sufficiency
Increase purchasing power
Increase affordability of food
2. Social welfare Increase livelihood sources
Increase job opportunities
Improve household lifestyle
3. Social justice Hinder equal property rights
Cause home displacement
Cause land dispossession
Choose one option: □ □ □
Resource Productivity
1. Production potential
Very high potential Moderate potential Very low potential
2. Resource capacity Potential affected by
population pressure
Put more pressure on natural resources
Improve landscape and species diversity
3. Land management Support nature conservation
Compatible with organic
farming
Available good farming
practices
Choose one option: □ □ □
The SSIWeb Sawtooth software was used not only to analyse the responses of the respondents (i.e. compute utilities and importance), but also to construct the choice tasks and prepare the conjoint questionnaire. We use complete enumeration as a random tasks generation method and traditional full profile design. Moreover, the software package includes a statistical test (i.e. logit efficiency) to validate the survey design prior to its implementation. It is useful to validate the survey design to identify the optimal number of options and choice tasks as well as number of questionnaire versions that will yield statistically significant results for a given number of respondents. The different versions of the questionnaire have different sets of options and choice tasks, except for the fixed task. The WEB-platform of the software was used to conduct the survey through the internet. For respondents who do not have access to internet, we converted the same survey into CAPI (Computer Aided Personal Interview) module, which refers to data collection using a laptop or a personal computer not connected to the internet. The survey was pre-tested in the field using the CAPI module, which enabled the interviewers to collect suggestions on how to improve the questionnaire. For example, the
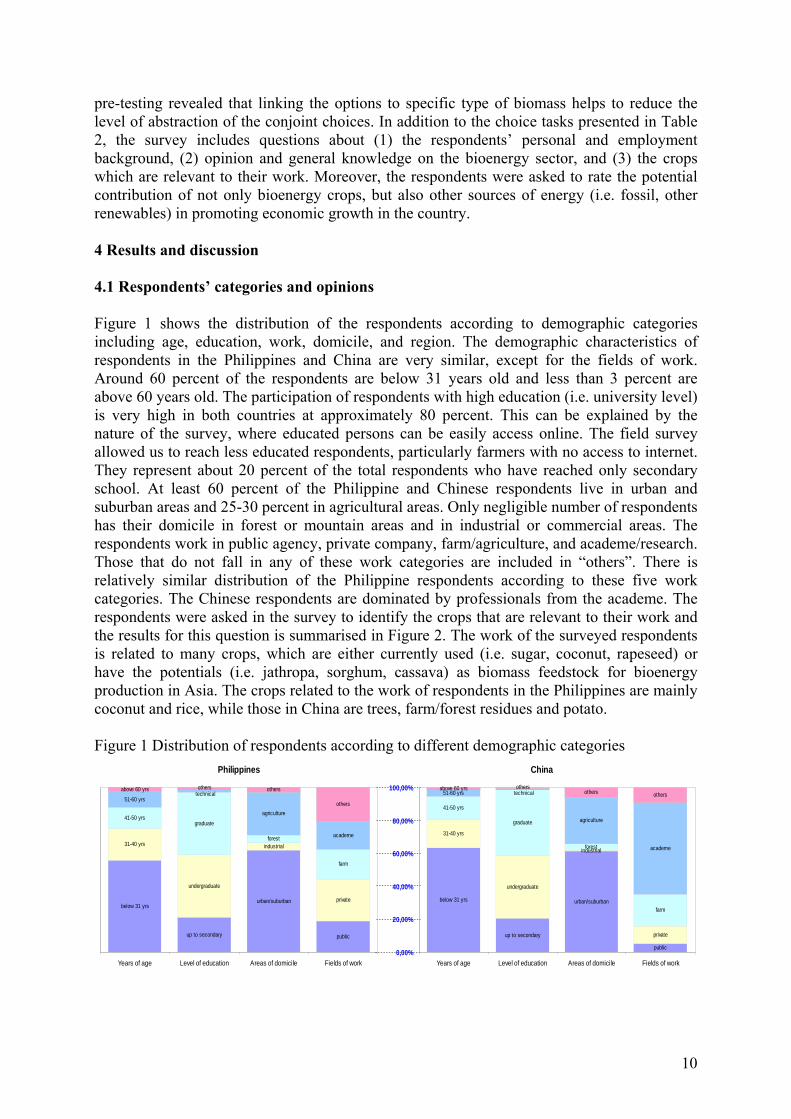
10
pre-testing revealed that linking the options to specific type of biomass helps to reduce the level of abstraction of the conjoint choices. In addition to the choice tasks presented in Table 2, the survey includes questions about (1) the respondents’ personal and employment background, (2) opinion and general knowledge on the bioenergy sector, and (3) the crops which are relevant to their work. Moreover, the respondents were asked to rate the potential contribution of not only bioenergy crops, but also other sources of energy (i.e. fossil, other renewables) in promoting economic growth in the country. 4 Results and discussion 4.1 Respondents’ categories and opinions Figure 1 shows the distribution of the respondents according to demographic categories including age, education, work, domicile, and region. The demographic characteristics of respondents in the Philippines and China are very similar, except for the fields of work. Around 60 percent of the respondents are below 31 years old and less than 3 percent are above 60 years old. The participation of respondents with high education (i.e. university level) is very high in both countries at approximately 80 percent. This can be explained by the nature of the survey, where educated persons can be easily access online. The field survey allowed us to reach less educated respondents, particularly farmers with no access to internet. They represent about 20 percent of the total respondents who have reached only secondary school. At least 60 percent of the Philippine and Chinese respondents live in urban and suburban areas and 25-30 percent in agricultural areas. Only negligible number of respondents has their domicile in forest or mountain areas and in industrial or commercial areas. The respondents work in public agency, private company, farm/agriculture, and academe/research. Those that do not fall in any of these work categories are included in “others”. There is relatively similar distribution of the Philippine respondents according to these five work categories. The Chinese respondents are dominated by professionals from the academe. The respondents were asked in the survey to identify the crops that are relevant to their work and the results for this question is summarised in Figure 2. The work of the surveyed respondents is related to many crops, which are either currently used (i.e. sugar, coconut, rapeseed) or have the potentials (i.e. jathropa, sorghum, cassava) as biomass feedstock for bioenergy production in Asia. The crops related to the work of respondents in the Philippines are mainly coconut and rice, while those in China are trees, farm/forest residues and potato. Figure 1 Distribution of respondents according to different demographic categories
Philippines
public
urban/suburban
up to secondary
below 31 yrsprivate
industrial
undergraduate
31-40 yrs
farm
forest
graduate41-50 yrs
academe
agriculture
technical51-60 yrs
others
othersothersabove 60 yrs
Years of age Level of education Areas of domicile Fields of work
China
below 31 yrs
up to secondary
urban/suburban
public
31-40 yrs
undergraduate
industrial
private
41-50 yrs
graduate
forest
farm
51-60 yrs technical
agriculture
academe
above 60 yrs othersothers others
0,00%
20,00%
40,00%
60,00%
80,00%
100,00%
Years of age Level of education Areas of domicile Fields of work
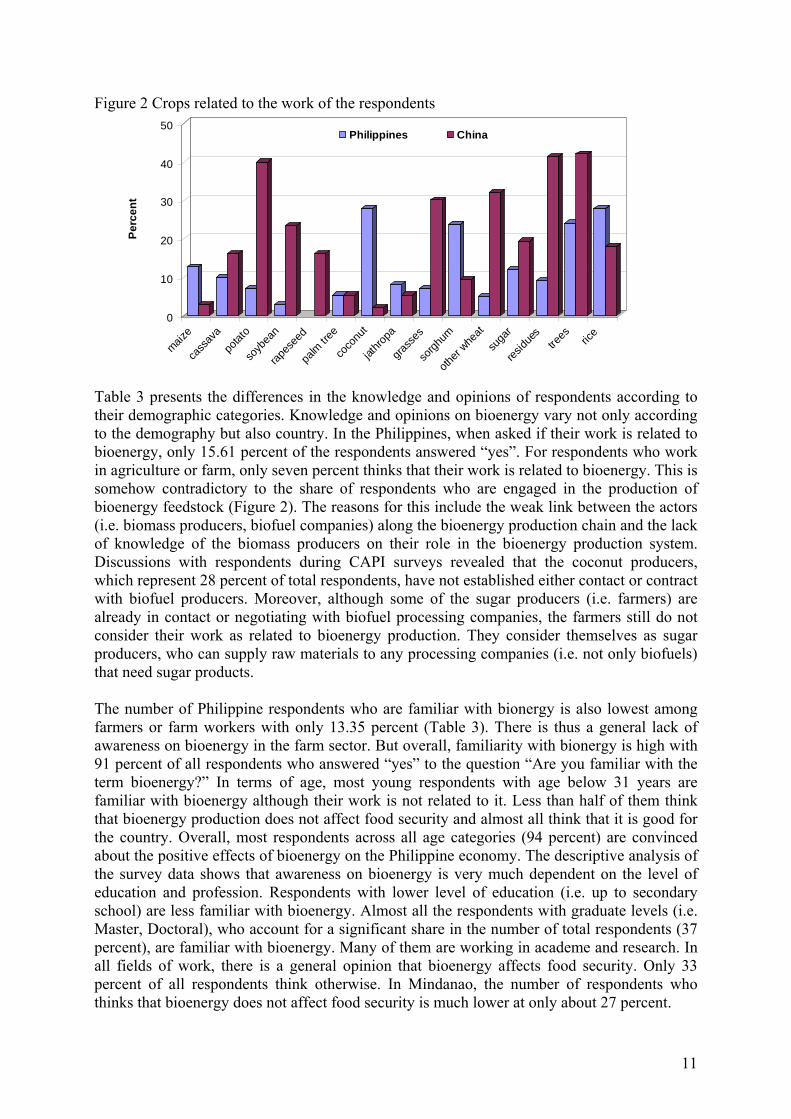
11
Figure 2 Crops related to the work of the respondents Table 3 presents the differences in the knowledge and opinions of respondents according to their demographic categories. Knowledge and opinions on bioenergy vary not only according to the demography but also country. In the Philippines, when asked if their work is related to bioenergy, only 15.61 percent of the respondents answered “yes”. For respondents who work in agriculture or farm, only seven percent thinks that their work is related to bioenergy. This is somehow contradictory to the share of respondents who are engaged in the production of bioenergy feedstock (Figure 2). The reasons for this include the weak link between the actors (i.e. biomass producers, biofuel companies) along the bioenergy production chain and the lack of knowledge of the biomass producers on their role in the bioenergy production system. Discussions with respondents during CAPI surveys revealed that the coconut producers, which represent 28 percent of total respondents, have not established either contact or contract with biofuel producers. Moreover, although some of the sugar producers (i.e. farmers) are already in contact or negotiating with biofuel processing companies, the farmers still do not consider their work as related to bioenergy production. They consider themselves as sugar producers, who can supply raw materials to any processing companies (i.e. not only biofuels) that need sugar products. The number of Philippine respondents who are familiar with bionergy is also lowest among farmers or farm workers with only 13.35 percent (Table 3). There is thus a general lack of awareness on bioenergy in the farm sector. But overall, familiarity with bionergy is high with 91 percent of all respondents who answered “yes” to the question “Are you familiar with the term bioenergy?” In terms of age, most young respondents with age below 31 years are familiar with bioenergy although their work is not related to it. Less than half of them think that bioenergy production does not affect food security and almost all think that it is good for the country. Overall, most respondents across all age categories (94 percent) are convinced about the positive effects of bioenergy on the Philippine economy. The descriptive analysis of the survey data shows that awareness on bioenergy is very much dependent on the level of education and profession. Respondents with lower level of education (i.e. up to secondary school) are less familiar with bioenergy. Almost all the respondents with graduate levels (i.e. Master, Doctoral), who account for a significant share in the number of total respondents (37 percent), are familiar with bioenergy. Many of them are working in academe and research. In all fields of work, there is a general opinion that bioenergy affects food security. Only 33 percent of all respondents think otherwise. In Mindanao, the number of respondents who thinks that bioenergy does not affect food security is much lower at only about 27 percent.
0
10
20
30
40
50P
erc
en
t
mai
ze
cass
ava
pota
to
soyb
ean
rape
seed
palm
tree
coco
nut
jath
ropa
gras
ses
sorg
hum
othe
r whe
at
suga
r
residu
es
trees ric
e
Philippines China
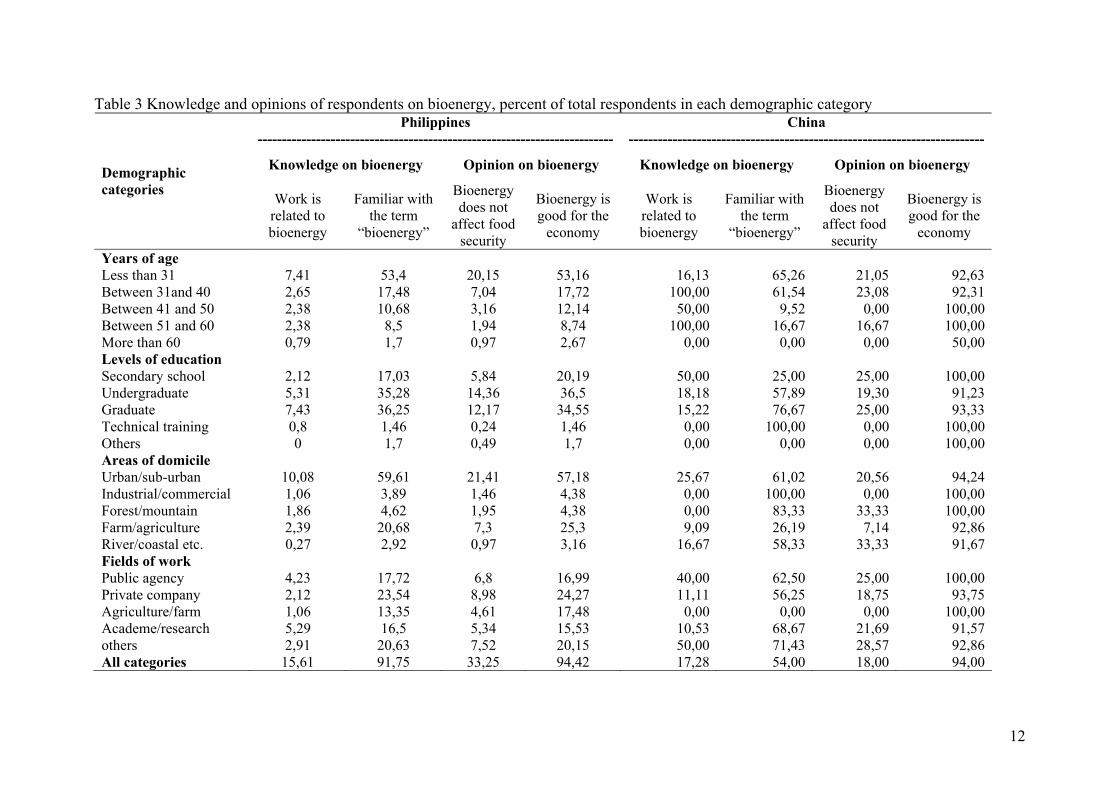
12
Table 3 Knowledge and opinions of respondents on bioenergy, percent of total respondents in each demographic category Philippines
------------------------------------------------------------------------- China
-------------------------------------------------------------------------
Knowledge on bioenergy Opinion on bioenergy Knowledge on bioenergy Opinion on bioenergy Demographic categories
Work is related to bioenergy
Familiar with the term
“bioenergy”
Bioenergy does not
affect food security
Bioenergy is good for the
economy
Work is related to bioenergy
Familiar with the term
“bioenergy”
Bioenergy does not
affect food security
Bioenergy is good for the
economy
Years of age Less than 31 7,41 53,4 20,15 53,16 16,13 65,26 21,05 92,63 Between 31and 40 2,65 17,48 7,04 17,72 100,00 61,54 23,08 92,31 Between 41 and 50 2,38 10,68 3,16 12,14 50,00 9,52 0,00 100,00 Between 51 and 60 2,38 8,5 1,94 8,74 100,00 16,67 16,67 100,00 More than 60 0,79 1,7 0,97 2,67 0,00 0,00 0,00 50,00 Levels of education Secondary school 2,12 17,03 5,84 20,19 50,00 25,00 25,00 100,00 Undergraduate 5,31 35,28 14,36 36,5 18,18 57,89 19,30 91,23 Graduate 7,43 36,25 12,17 34,55 15,22 76,67 25,00 93,33 Technical training 0,8 1,46 0,24 1,46 0,00 100,00 0,00 100,00 Others 0 1,7 0,49 1,7 0,00 0,00 0,00 100,00 Areas of domicile Urban/sub-urban 10,08 59,61 21,41 57,18 25,67 61,02 20,56 94,24 Industrial/commercial 1,06 3,89 1,46 4,38 0,00 100,00 0,00 100,00 Forest/mountain 1,86 4,62 1,95 4,38 0,00 83,33 33,33 100,00 Farm/agriculture 2,39 20,68 7,3 25,3 9,09 26,19 7,14 92,86 River/coastal etc. 0,27 2,92 0,97 3,16 16,67 58,33 33,33 91,67 Fields of work Public agency 4,23 17,72 6,8 16,99 40,00 62,50 25,00 100,00 Private company 2,12 23,54 8,98 24,27 11,11 56,25 18,75 93,75 Agriculture/farm 1,06 13,35 4,61 17,48 0,00 0,00 0,00 100,00 Academe/research 5,29 16,5 5,34 15,53 10,53 68,67 21,69 91,57 others 2,91 20,63 7,52 20,15 50,00 71,43 28,57 92,86 All categories 15,61 91,75 33,25 94,42 17,28 54,00 18,00 94,00
13
In China, although overall only 17.28 percent of the respondents (i.e. less than 2 percent higher than in the Philippines) think that their work is related to bioenergy, the variance across demographic categories much larger than in the Philippines. None of the respondents working in agriculture thinks that their work is linked to bioenergy, although farmers account for significant share in crop-related work (Figure 2), e.g. potato 28 percent, sorghum 29 percent, other wheat 58 percent, sugar 10 percent and crops residues 47 percent of all respondents. Moreover, none of the farmers is familiar with bioenergy. Hence like in the Philippines, farmers are not aware of the potential link of their work to bioenergy sector. All farmer respondents think that bioenergy affects food security, but it is nonetheless good for the Chinese economy. Note that on the question on food security (see section 3.1) the issue of increase in food prices was also raised. Obviously, there is little understanding on the link of food prices to, on the one hand, purchasing power of communities and, on the other hand, economic growth. Like the farmers, all respondents working in public agency also think that bioenergy can contribute to economic growth in China. Moreover, majority of the respondents (i.e. above 90 percent) from other professions also think the same. This is in contrast to the Philippines where, regardless of the profession, only less than 25 percent of the respondents think that bioenergy is good for the Philippine economy. The favourable opinion of Chinese respondents can be attributed to the strong policy support for bioenergy, making China the world’s third largest bioethanol producer. As a result, most respondents regardless of demographic characteristics think that bioenergy is good for the economy. Nonetheless, only relatively small proportion of the respondents thinks that bioenergy does not affect food security. Significant share of Chinese respondents whose work is related to bioenergy are with ages 31-40 and 51-60 years, but familiarity to bioenergy is relatively low particularly for the older group of respondents. The case is however the opposite for other demographic categories of respondents, with familiarity being high although work is not related to bioenergy. This include respondents with age less than 31 years, education of at least undergraduate, domicile outside farm or agriculture, and work in private company and academe. 4.2 Respondents’ cluster typologies To create the segments for the conjoint analysis, we used three variables in clustering the respondents including familiarity with bionergy and opinion on the effects of bioenergy on food security and economy. The relationship of the respondents’ work to bioenergy was excluded because it turned out to be an irrelevant variable in the cluster analysis. This can be explained by the low number of the respondents (i.e., below 20 percent) who indicated that their work is related to bioenergy (Table 3). Three clusters were identified from the two-step cluster approach with a total respondent share of 30.1, 22.3 and 47.6 percent in the Philippines and 23.3, 48.0 and 28.7 percent in China (Figure 3). There is thus relatively equal distribution of respondents not only among the three clusters but also between the two countries. The cluster with the largest number of respondents is cluster 3 in the Philippines and cluster 2 in China. The fit of the model for the Philippines is better than China, which can be explained by the larger number of observations in the former country.
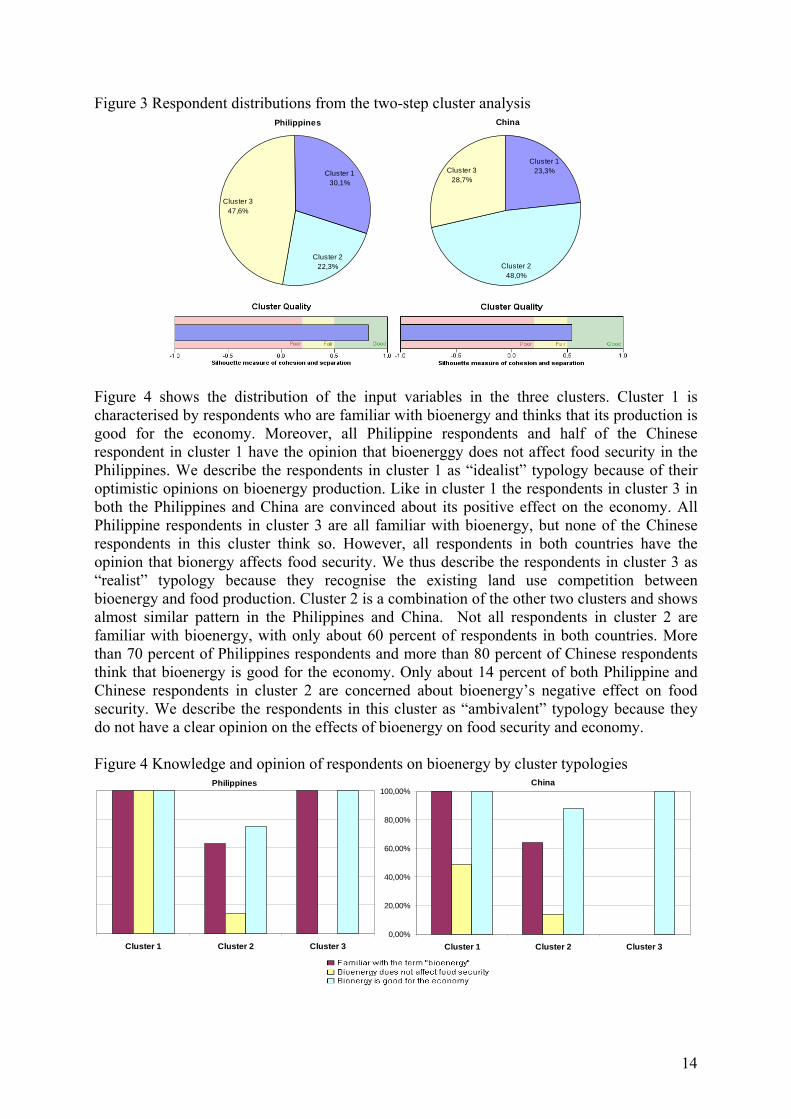
14
Figure 3 Respondent distributions from the two-step cluster analysis Figure 4 shows the distribution of the input variables in the three clusters. Cluster 1 is characterised by respondents who are familiar with bioenergy and thinks that its production is good for the economy. Moreover, all Philippine respondents and half of the Chinese respondent in cluster 1 have the opinion that bioenerggy does not affect food security in the Philippines. We describe the respondents in cluster 1 as “idealist” typology because of their optimistic opinions on bioenergy production. Like in cluster 1 the respondents in cluster 3 in both the Philippines and China are convinced about its positive effect on the economy. All Philippine respondents in cluster 3 are all familiar with bioenergy, but none of the Chinese respondents in this cluster think so. However, all respondents in both countries have the opinion that bionergy affects food security. We thus describe the respondents in cluster 3 as “realist” typology because they recognise the existing land use competition between bioenergy and food production. Cluster 2 is a combination of the other two clusters and shows almost similar pattern in the Philippines and China. Not all respondents in cluster 2 are familiar with bioenergy, with only about 60 percent of respondents in both countries. More than 70 percent of Philippines respondents and more than 80 percent of Chinese respondents think that bioenergy is good for the economy. Only about 14 percent of both Philippine and Chinese respondents in cluster 2 are concerned about bioenergy’s negative effect on food security. We describe the respondents in this cluster as “ambivalent” typology because they do not have a clear opinion on the effects of bioenergy on food security and economy. Figure 4 Knowledge and opinion of respondents on bioenergy by cluster typologies
Philippines
Cluster 1
30,1%
Cluster 3
47,6%
Cluster 2
22,3%
China
Cluster 1
23,3%Cluster 3
28,7%
Cluster 2
48,0%
Philippines
Cluster 1 Cluster 2 Cluster 3
China
0,00%
20,00%
40,00%
60,00%
80,00%
100,00%
Cluster 1 Cluster 2 Cluster 3
15
The results of the matrix scoring reveal the characteristics of the three cluster typologies (Table 4). The idealist typology in the Philippines and China consists mainly of respondents whose age is less than 40 and live in urban and suburban areas. Significant number of idealist respondents in China is working in the academe. But they are represented in various professions in the Philippines. Common characteristic of idealist typology in both countries is the importance of science as source of information on bioenergy. Idealist respondents in China consider fossil as the most important source of energy to promote economic growth, while those in the Philippines think otherwise. In the latter country, fossil combined with renewable energy including bioenergy is considered good source of energy. Overall, higher share of Philippine respondents with idealist typology consider first and second generation bioenergy feedstocks as important energy sources. Like the idealist typology, ambivalent typology is characterized by respondents with age less than 40 and domicile in urban and suburban areas in the Philippines and China. There are very few Chinese respondents with age above 40 years in this cluster. The Philippine respondents with ambivalent typology have mainly undergraduate and lower level of education. Ambivalent typology in China is dominated by respondents with academic profession. Whilst farmers are largely represented in ambivalent typology in the Philippines, no single farmer has ambivalent typology in China. After academe and science, media and internet are very important for respondents with ambivalent typology not only in the Philippines but also in China. They thus have very similar sources of information with the idealist typology. The respondents with ambivalent typology consider fossil as important source of energy not only in China but also in the Philippines. The proportion of respondents with this opinion is however lower in the latter (33.70 percent) than in the former (52.78 percent) country. About 20 percent of both Philippine and Chinese respondents with ambivalent typology think that bioenergy is important for the economy. The Chinese respondents with realist typology have very different characteristics from those with other typologies. They have age above 40 years and domicile in farm and forest. There is far larger number of respondents with undergraduate and secondary education. A significant number of respondents (67.44 percent) with realist typology in China are farmers and whose main sources of information are their family, friends and neighbours. The share of respondents who think favourably of fossil fuel in promoting Chinese economy is much lower for realist typology than the other two typologies. Nonetheless, hardly any of them think that bioenergy feedstocks are useful for the economy. In the Philippines, realist typology has relatively similar knowledge and opinion with the idealist and ambivalent typologies, albeit with different proportion of respondents. This is particularly evident on their opinions on energy sources. Compared with ambivalent typology, there are more respondents with realist typology who consider fossil combined with renewable energy including bioenergy is considered good source of energy. In contrast to idealist typology, respondents with realist typology strongly prefer fossil and strongly reject bioenergy as sustainable sources of energy. This conforms to the opinion of all respondents in the realist typology that bioenergy affects food security. When given the choices between the different sources of biomass feedstock, they think that sugar-rich crops and fast growing trees have very high potential to contribute to sustainable production of bioenergy.
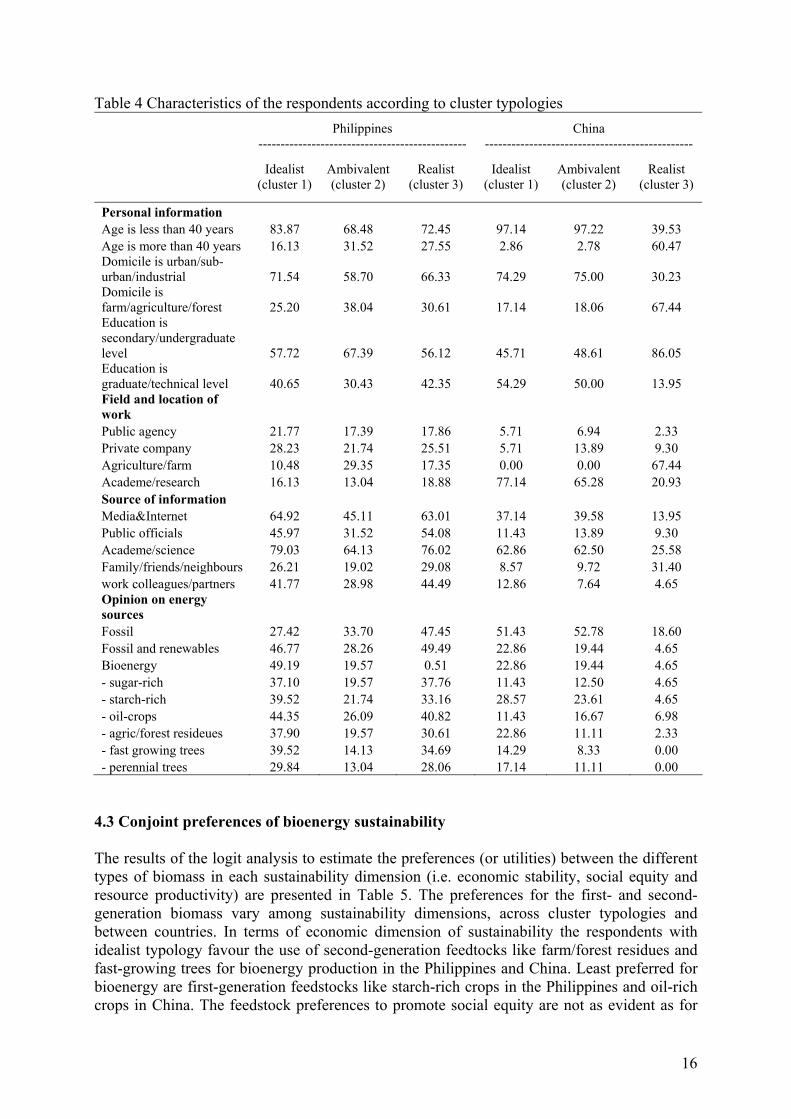
16
Table 4 Characteristics of the respondents according to cluster typologies
Philippines
----------------------------------------------- China
-----------------------------------------------
Idealist (cluster 1)
Ambivalent (cluster 2)
Realist (cluster 3)
Idealist (cluster 1)
Ambivalent (cluster 2)
Realist (cluster 3)
Personal information Age is less than 40 years 83.87 68.48 72.45 97.14 97.22 39.53 Age is more than 40 years 16.13 31.52 27.55 2.86 2.78 60.47 Domicile is urban/sub-urban/industrial 71.54 58.70 66.33 74.29 75.00 30.23 Domicile is farm/agriculture/forest 25.20 38.04 30.61 17.14 18.06 67.44 Education is secondary/undergraduate level 57.72 67.39 56.12 45.71 48.61 86.05 Education is graduate/technical level 40.65 30.43 42.35 54.29 50.00 13.95 Field and location of work Public agency 21.77 17.39 17.86 5.71 6.94 2.33 Private company 28.23 21.74 25.51 5.71 13.89 9.30 Agriculture/farm 10.48 29.35 17.35 0.00 0.00 67.44 Academe/research 16.13 13.04 18.88 77.14 65.28 20.93 Source of information Media&Internet 64.92 45.11 63.01 37.14 39.58 13.95 Public officials 45.97 31.52 54.08 11.43 13.89 9.30 Academe/science 79.03 64.13 76.02 62.86 62.50 25.58 Family/friends/neighbours 26.21 19.02 29.08 8.57 9.72 31.40 work colleagues/partners 41.77 28.98 44.49 12.86 7.64 4.65 Opinion on energy sources Fossil 27.42 33.70 47.45 51.43 52.78 18.60 Fossil and renewables 46.77 28.26 49.49 22.86 19.44 4.65 Bioenergy 49.19 19.57 0.51 22.86 19.44 4.65 - sugar-rich 37.10 19.57 37.76 11.43 12.50 4.65 - starch-rich 39.52 21.74 33.16 28.57 23.61 4.65 - oil-crops 44.35 26.09 40.82 11.43 16.67 6.98 - agric/forest resideues 37.90 19.57 30.61 22.86 11.11 2.33 - fast growing trees 39.52 14.13 34.69 14.29 8.33 0.00 - perennial trees 29.84 13.04 28.06 17.14 11.11 0.00
4.3 Conjoint preferences of bioenergy sustainability The results of the logit analysis to estimate the preferences (or utilities) between the different types of biomass in each sustainability dimension (i.e. economic stability, social equity and resource productivity) are presented in Table 5. The preferences for the first- and second-generation biomass vary among sustainability dimensions, across cluster typologies and between countries. In terms of economic dimension of sustainability the respondents with idealist typology favour the use of second-generation feedtocks like farm/forest residues and fast-growing trees for bioenergy production in the Philippines and China. Least preferred for bioenergy are first-generation feedstocks like starch-rich crops in the Philippines and oil-rich crops in China. The feedstock preferences to promote social equity are not as evident as for
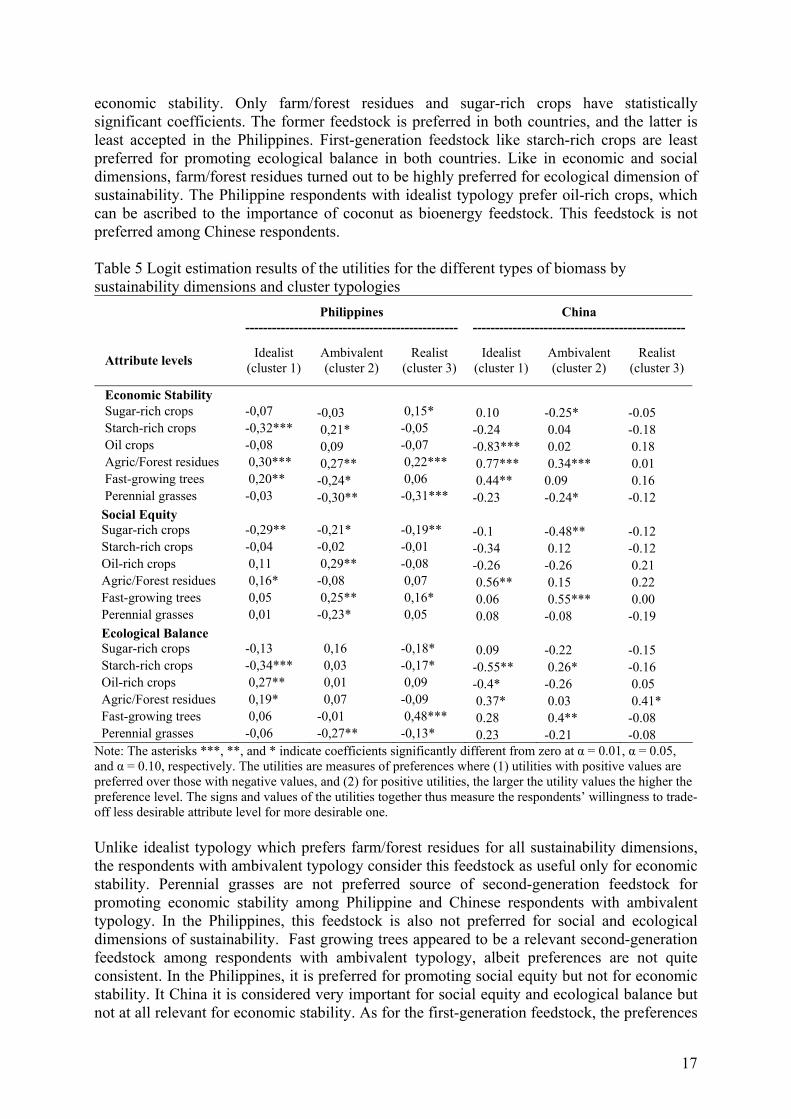
17
economic stability. Only farm/forest residues and sugar-rich crops have statistically significant coefficients. The former feedstock is preferred in both countries, and the latter is least accepted in the Philippines. First-generation feedstock like starch-rich crops are least preferred for promoting ecological balance in both countries. Like in economic and social dimensions, farm/forest residues turned out to be highly preferred for ecological dimension of sustainability. The Philippine respondents with idealist typology prefer oil-rich crops, which can be ascribed to the importance of coconut as bioenergy feedstock. This feedstock is not preferred among Chinese respondents. Table 5 Logit estimation results of the utilities for the different types of biomass by sustainability dimensions and cluster typologies
Philippines
------------------------------------------------ China
------------------------------------------------
Attribute levels Idealist
(cluster 1) Ambivalent (cluster 2)
Realist (cluster 3)
Idealist (cluster 1)
Ambivalent (cluster 2)
Realist (cluster 3)
Economic Stability Sugar-rich crops -0,07 -0,03 0,15* 0.10 -0.25* -0.05 Starch-rich crops -0,32*** 0,21* -0,05 -0.24 0.04 -0.18 Oil crops -0,08 0,09 -0,07 -0.83*** 0.02 0.18 Agric/Forest residues 0,30*** 0,27** 0,22*** 0.77*** 0.34*** 0.01 Fast-growing trees 0,20** -0,24* 0,06 0.44** 0.09 0.16 Perennial grasses -0,03 -0,30** -0,31*** -0.23 -0.24* -0.12 Social Equity Sugar-rich crops -0,29** -0,21* -0,19** -0.1 -0.48** -0.12 Starch-rich crops -0,04 -0,02 -0,01 -0.34 0.12 -0.12 Oil-rich crops 0,11 0,29** -0,08 -0.26 -0.26 0.21 Agric/Forest residues 0,16* -0,08 0,07 0.56** 0.15 0.22 Fast-growing trees 0,05 0,25** 0,16* 0.06 0.55*** 0.00 Perennial grasses 0,01 -0,23* 0,05 0.08 -0.08 -0.19 Ecological Balance Sugar-rich crops -0,13 0,16 -0,18* 0.09 -0.22 -0.15 Starch-rich crops -0,34*** 0,03 -0,17* -0.55** 0.26* -0.16 Oil-rich crops 0,27** 0,01 0,09 -0.4* -0.26 0.05 Agric/Forest residues 0,19* 0,07 -0,09 0.37* 0.03 0.41* Fast-growing trees 0,06 -0,01 0,48*** 0.28 0.4** -0.08 Perennial grasses -0,06 -0,27** -0,13* 0.23 -0.21 -0.08
Note: The asterisks ***, **, and * indicate coefficients significantly different from zero at α = 0.01, α = 0.05, and α = 0.10, respectively. The utilities are measures of preferences where (1) utilities with positive values are preferred over those with negative values, and (2) for positive utilities, the larger the utility values the higher the preference level. The signs and values of the utilities together thus measure the respondents’ willingness to trade-off less desirable attribute level for more desirable one. Unlike idealist typology which prefers farm/forest residues for all sustainability dimensions, the respondents with ambivalent typology consider this feedstock as useful only for economic stability. Perennial grasses are not preferred source of second-generation feedstock for promoting economic stability among Philippine and Chinese respondents with ambivalent typology. In the Philippines, this feedstock is also not preferred for social and ecological dimensions of sustainability. Fast growing trees appeared to be a relevant second-generation feedstock among respondents with ambivalent typology, albeit preferences are not quite consistent. In the Philippines, it is preferred for promoting social equity but not for economic stability. It China it is considered very important for social equity and ecological balance but not at all relevant for economic stability. As for the first-generation feedstock, the preferences
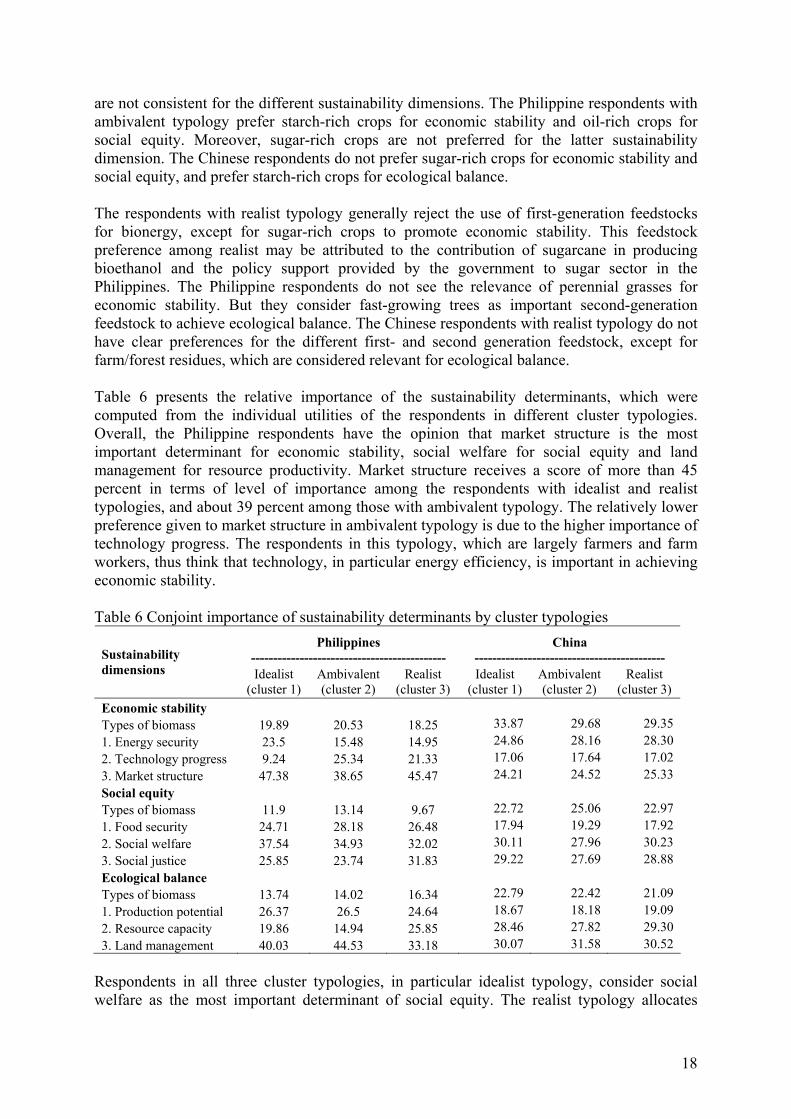
18
are not consistent for the different sustainability dimensions. The Philippine respondents with ambivalent typology prefer starch-rich crops for economic stability and oil-rich crops for social equity. Moreover, sugar-rich crops are not preferred for the latter sustainability dimension. The Chinese respondents do not prefer sugar-rich crops for economic stability and social equity, and prefer starch-rich crops for ecological balance. The respondents with realist typology generally reject the use of first-generation feedstocks for bionergy, except for sugar-rich crops to promote economic stability. This feedstock preference among realist may be attributed to the contribution of sugarcane in producing bioethanol and the policy support provided by the government to sugar sector in the Philippines. The Philippine respondents do not see the relevance of perennial grasses for economic stability. But they consider fast-growing trees as important second-generation feedstock to achieve ecological balance. The Chinese respondents with realist typology do not have clear preferences for the different first- and second generation feedstock, except for farm/forest residues, which are considered relevant for ecological balance. Table 6 presents the relative importance of the sustainability determinants, which were computed from the individual utilities of the respondents in different cluster typologies. Overall, the Philippine respondents have the opinion that market structure is the most important determinant for economic stability, social welfare for social equity and land management for resource productivity. Market structure receives a score of more than 45 percent in terms of level of importance among the respondents with idealist and realist typologies, and about 39 percent among those with ambivalent typology. The relatively lower preference given to market structure in ambivalent typology is due to the higher importance of technology progress. The respondents in this typology, which are largely farmers and farm workers, thus think that technology, in particular energy efficiency, is important in achieving economic stability. Table 6 Conjoint importance of sustainability determinants by cluster typologies
Philippines --------------------------------------------
China ------------------------------------------- Sustainability
dimensions Idealist (cluster 1)
Ambivalent (cluster 2)
Realist (cluster 3)
Idealist (cluster 1)
Ambivalent (cluster 2)
Realist (cluster 3)
Economic stability Types of biomass 19.89 20.53 18.25 33.87 29.68 29.35
1. Energy security 23.5 15.48 14.95 24.86 28.16 28.30
2. Technology progress 9.24 25.34 21.33 17.06 17.64 17.02
3. Market structure 47.38 38.65 45.47 24.21 24.52 25.33
Social equity Types of biomass 11.9 13.14 9.67 22.72 25.06 22.97
1. Food security 24.71 28.18 26.48 17.94 19.29 17.92
2. Social welfare 37.54 34.93 32.02 30.11 27.96 30.23
3. Social justice 25.85 23.74 31.83 29.22 27.69 28.88
Ecological balance Types of biomass 13.74 14.02 16.34 22.79 22.42 21.09
1. Production potential 26.37 26.5 24.64 18.67 18.18 19.09
2. Resource capacity 19.86 14.94 25.85 28.46 27.82 29.30
3. Land management 40.03 44.53 33.18 30.07 31.58 30.52
Respondents in all three cluster typologies, in particular idealist typology, consider social welfare as the most important determinant of social equity. The realist typology allocates
19
almost similar level of importance to social welfare and social justice. As compared to other indicators of resource productivity, land management has the highest level of importance in all cluster typologies. For the ambivalent typology, it is as high as 44 percent. This is not surprising because farmers and farm workers, who largely represent the ambivalent typology, are more directly confronted with the productivity issues related to land management. The level of importance given to the different determinants of sustainability dimensions is generally higher among the Chinese than the Philippine respondents. Like in the Philippines, social welfare and land management are the most important determinants for social equity and resource productivity, respectively, for idealist typology in China. But for economic stability, the type of biomass is considered most important by the Chinese respondents with idealist typology. The most important determinants for economic, social and ecological sustainability are the same for idealist, ambivalent and realist typologies. Acknowledgement: This article is part of the authors’ work in the Integrated sustainability assessment of bioenergy potentials in Asia: An application of a hybrid approach on trade-offs and pathways (PIC-STRAP) Project funded funded through the Low Carbon Initiatives Framework of the Asia-Pacific Network for Global Change Research (APN). References:
Acosta-Michlik, L., Lucht, W., Bondeau, A., & Beringer, T. (2011). Integrated assessment of sustainability trade-offs and pathways for global bioenergy production: Framing a novel hybrid approach. Renewable and Sustainable Energy Reviews, 15, 2791–2809. doi: 10.1016/j.rser.2011.02.011.
Andrews RL, Currim IS. Recovering and profiling the true segmentation structure in markets: an empirical investigation intern. J Res Marketing 2003;20:177–92.
Bento, A. M. (2008). Biofuels: Economic and Public Policy Considerations. In R. Howarth & S. Bringezu, Biofuels: Environmental Consequences and Interactions with Changing Land Use (pp. 195-203). Gummersbach Germany: Cornell University, Ithaca NY, USA. Retrieved from http://cip.cornell.edu/biofuels/.
Blamey, R. K., Bennett, J. W., Louviere, J. J., Morrison, M. D., & Rolfe, J. (2000). A test of policy labels in environmental choice modelling studies. Ecological Economics, 32, 269 - 286.
Ceccon E, Miramontes O. Reversing deforestation? Bioenergy and society in two Brazilian models. Ecological Economics 2008; 67:311-317.
Clancy JS. Are biofuels pro-poor? Assessing the evidence. European Journal of Development Research 2008; 20:416-431.
Corpuz, P. G. (2009). Philippine Bio-fuel Industry Outlook (Philippines Biofuels Annual). Manila. Retrieved from http://gain.fas.usda.gov/Recent GAIN Publications/General Report_Manila_Philippines_6-1-2009.pdf.
DA-BAR. (2011). Philippines bioethanol imbalance led by competition from sugar. Quezon City, Philippines. Retrieved from http://www.bar.gov.ph/biofuelsinfo/news&events/ln20110703.asp.
20
Démurger, S. and M. Fournier (2011). "Poverty and firewood consumption: A case study of rural households in northern China." China economic review 22(4): 512-523.
Dillon B, Mukherjee S. A guide to the design and execution of segmentation studies. In: Grover R, Vriens M, editors. The handbook of marketing research: uses, misuses, and future advances. SAGE Publications, Inc.; 2006.
DOE. (2009). Key energy statistics. Energy. Taguig City, Philippines: Department of Energy (DOE). Retrieved from http://www.doe.gov.ph/statistics/statistics.htm.
DOE. (2010). Renewable Energy. City. Taguig City, Philippines. Retrieved from http://www.doe.gov.ph/IPO web/linked files/2010/EIK10/biomass_biofuels.pdf.
Dolnicar S. A review of data-driven market segmentation in tourism. J Travel Tourism Marketing 2002;12(1):1–22.
Dymnicki, A. B., & Henry, D. B. (2011). Use of Clustering Methods to Understand More about the Case. Methodological Innovations Online, 6(2), 6-26. doi: 10.4256/mio.2010.0033.
Faaij, A. P. (2006). Bio-energy in Europe: changing technology choices. Energy Policy, 34(2006), 322-342. doi: 10.1016/j.enpol.2004.03.026.
Farber, S., & Griner, B. (2000). Using Conjoint Analysis To Value Ecosystem Change. Environmental Science & Technology, 34(8), 1407-1412. doi: 10.1021/es990727r.
Green PE, Krieger AM, Wind Y. Thirty years of conjoint analysis: reflections and prospects. Interfaces 2001;31(3):S56–73.
Green, P. E., & Srinivasan, V. (1990). Conjoint Analysis in Marketing: New Developments with Implications for Research and Practice. Journal of Marketing, 54(4), 3-19. Retrieved from http://www.jstor.org/stable/1251756.
Hair, J. F., Anderson, R. E., Tatham, R. L., & Black, W. C. (1995). Multivariate data analysis (4th Editio., p. pp. 757). New Jersey: Prentice-Hall, Inc.
Hoek J, Gendall P, Esslemont D. Market segmentation a search for the holy grail? J Marketing Pract: Appl Marketing Sci 1996;2(1):25–34.
Lee, K. C., Choi, H., Lee, D. H., & Kang, S. (2006). Quantitative Measurement of Quality Attribute Preferences Using Conjoint Analysis. In S. Gilroy & M. Harrison, Interactive Systems: Lecture Notes in Computer Science (Volume 394., pp. 213-224). Berlin: Springer-Verlag. doi: DOI: 10.1007/11752707_18.
Lenk, P. J., DeSarbo, W. S., Green, P. E., & Young, M. R. (1996). Hierarchical Bayes Conjoint Analysis: Recovery Of Partworth Heterogeneity From Reduced Experimental Designs. Marketing Science, 15(2), 173-191.
Liu, L.-q., C.-x. Liu and J.-s. Wang (2013). "Deliberating on renewable and sustainable energy policies in China." Renewable and Sustainable Energy Reviews 17(0): 191-198.
Lo, K. (2014). "A critical review of China's rapidly developing renewable energy and energy efficiency policies." Renewable and Sustainable Energy Reviews 29(C): 508-516.
21
Moran, D., Mcvittie, A., Allcroft, D. J., & Elston, D. A. (2007). Quantifying public preferences for agri-environmental policy in Scotland: A comparison of methods. Ecological Economics, 63, 42-53. doi: 10.1016/j.ecolecon.2006.09.018.
Nakata, T., Silva, D., & Rodionov, M. (2011). Application of energy system models for designing a low-carbon society. Progress in Energy and Combustion Science, 37, 462-502. doi: 10.1016/j.pecs.2010.08.001.
Naylor RL, Liska AJ, Burke MB, Falcon WP, Gaskell JC, Rozelle SD, Cassman KG. The ripple effect: Biofuels, food security and the environment. Environment 2007; 49: 30-43.
NSCB. (2009). Philippine Statistical Yearbook (PSY). Makati City, Philippines: National Statistical Coordination Board (NSCB). Retrieved from http://www.nscb.gov.ph/publication/psy/default.asp Publications.
Orme, B. (2006). The Sawtooth Software Market Simulator (A Supplement to the CBC v2.6 Manual). Word Journal Of The International Linguistic Association. Sequim, WA. Retrieved from http://www.sawtoothsoftware.com/education/techpap.shtml.
Orme, B. (2010). SSI Web v7.0 Software for Web Interviewing and Conjoint Analysis. Analysis. Sequim, WA. Retrieved from http://www.sawtoothsoftware.com/education/techpap.shtml.
Orme, B. K. (2009). Which Conjoint Method Should I Use? Research Paper Series (Vol. 98382, p. 6). Sequim: Sawtooth Software, Inc. Retrieved from http://www.sawtoothsoftware.com/download/techpap/whichmth.pdf.
Orme, B., & Howell, J. (2009). Application of Covariates Within Sawtooth Software’s CBC/HB Program: Theory and Practical Example. Research paper Series (Vol. 98382, p. 20). Sequim, WA. Retrieved from http://www.sawtoothsoftware.com/education/techpap.shtml.
Qiu, H., J. Huang, J. Yang, S. Rozelle, Y. Zhang, Y. Zhang and Y. Zhang (2010). "Bioethanol development in China and the potential impacts on its agricultural economy." Applied Energy 87(1): 76-83.
Salire, S. M. (2007). Energy Demand Situation and Outlook in the Philippines: 2005-2014. 10th National Convention on Statistics (NCS). Taguig City, Philippines. Retrieved from http://www.nscb.gov.ph/ncs/10thNCS/papers/contributed papers/cps-11/cps11-01.pdf.
Samson, R., Stohl, D., Elepano, A., & Maio, A. D. (2001). Enhancing Household Biomass Energy Use in the Philippines. In Strategies for Enhancing Biomass Utilization in the Philippines (pp. 1-28). Quebec, Canada: Resource Efficient Agricultural Production (REAP). Retrieved from http://www.reap-canada.com/online_library/IntDev/id_mts/3 Enhancing Household.PDFhttp://www.p2pays.org/ref/19/18956.pdf.
Sayadi, S., Gonzalez-Roa, M. C., & Calatrava-requena, J. (2009). Public preferences for landscape features: The case of agricultural landscape in mountainous Mediterranean areas. Land Use Policy, 26, 334-344. doi: 10.1016/j.landusepol.2008.04.003.
Sayadi, S., Roa, M. C., & Requena, J. C. (2005). Ranking versus scale rating in conjoint analysis: Evaluating landscapes in mountainous regions in southeastern Spain. Ecological Economics, 55, 539 - 550. doi: 10.1016/j.ecolecon.2004.12.010.
22
Shih, M., Jheng, J., & Lai, L. (2010). A Two-Step Method for Clustering Mixed Categroical and Numeric Data. Tamkang Journal of Science and Engineering, 13(1), 11-19.
Skea, J., & Nishioka, S. (2008). Policies and practices for a low-carbon society. Climate Policy, 8, 5-16. doi: 10.3763/cpol.2008.0487.
SPSS. PASW Statistics base 18. Chicago (IL): SPSS Inc.; 2007.
SRA. (2008). Roadmap to Bioethanol through the sugarcane industry route. Quezon City, Philippines. Retrieved from http://www.sra.gov.ph/menu_pdf/update_bioethanol.pdf.
Stevens, T. H., White, S., Kittredge, D. B., & Dennis, D. (2002). Factors affecting NIPF landowner participation in management programs: a Massachusetts case study. Journal of Forest Economics, 184, 169-184.
Sydorovych O, Wossink A. The meaning of agricultural sustainability: Evidence from a conjoint choice survey. Agricultural Systems 2008; 98:10-20.
Tano, K., Kamuanga, M., Faminow, M. D., & Swallow, B. (2003). Using conjoint analysis to estimate farmer’s preferences for cattle traits in West Africa. Ecological Economics, 45, 393-407. doi: 10.1016/S0921-8009(03)00093-4.