biomass resource analyses & future bioenergy scenarios
TRANSCRIPT

Biomass Resource Analyses & Future
Bioenergy Scenarios
A Thesis submitted to The University of Manchester for the degree of:
Doctor of Philosophy in Environmental Engineering
In the Faculty of Engineering & Physical Sciences
2014
Andrew James Welfle
Tyndall Centre for Climate Change Research, School of Mechanical Aerospace
& Civil Engineering

Andrew Welfle - ID: 81163530
2
Table of Contents List
Abstract 10
Declaration 11
Copyright Statement 12
Acknowledgements 13
PhD Programme Outputs 14
1) Published Work 14
2) Other Work 14
3) Notable Activities 15
4) Presentations 15
Chapter 1 - Introduction .................................................................................................................................... 17
1.1 Opening Statement 18
1.2 Research Context 20
1.2.1 The Wider Research Context - Climate Change 20
1.2.2 Energy Profiles 24
1.2.3 The Global Energy Consumption Profile 25
1.2.4 UK Energy Consumption Profile 26
1.2.5 Renewable Energy & the UK’s Renewables Profile 28
1.2.6 Energy Scenarios – Modelling Future Trends 30
1.2.7 UK Climate Change, Energy & Bioenergy Policy 31
1.2.8 The Emergence & Development of the Climate Change Policy Agenda 31
1.2.9 UK Climate Change & Renewable Energy Policy Timeline 32
1.2.10 Key UK & EU Policy Mechanisms & Instruments 34
1.3 Thesis Rationale 40
1.4 Research Problem Statement 41
1.5 Research Aims & Objectives 42
1.5.1 Research Aim 1 42
1.5.2 Research Aim 2 42
1.5.3 Research Aim 3 43
1.6 Thesis Storyline 43
1.6.1 Chapter 1 – Introduction 44
1.6.2 Chapter 2 – Biomass as a Renewable Energy Resource 44
1.6.3 Chapter 3 – Biomass Resource Modelling 44
1.6.4 Chapter 4 – Developing the Biomass Resource Model 44
1.6.5 Chapter 5 – Drivers Influencing Biomass Resource Availability & Bioenergy 45
1.6.6 Chapter 6 – UK Biomass Resource Scenarios 45
1.6.7 Chapter 7 – The Future UK Bioenergy Sector 46
1.6.8 Chapter 8 – Global Biomass Trade: Supply, Demand, Limitations & Sustainability 47
1.6.9 Chapter 9 – Case Study: Brazil’s Biomass Resource Analysis 47
1.6.10 Chapter 10 – An Alternative UK Bioenergy Strategy 48
1.6.11 Chapter 11 – Thesis Conclusions 48
1.6.12 Thesis References 48
1.6.13 Thesis Appendices 48
Chapter 2 - Biomass as a Renewable Energy Resource .................................................................................. 49
2.1 Biomass as a Renewable Energy Resource 50
2.1.1 A Renewed Interest in Biomass as a Fuel 50
2.1.2 The Storage of Energy within Biomass 50
2.1.3 Biomass Composition, Characteristics & Fuel Properties 51
2.1.4 The Variable Characteristics of Biomass Materials 55
2.1.5 The Negative Impacts of Biomass for Energy Generation 56
Andrew Welfle - ID: 81163530
3
2.2 Biomass Feedstocks, Resources & Energy Pathways 58
2.2.1 Categories of Biomass 58
2.2.2 Lignocellulosic Biomass Resources 62
2.3 Energy Generation from Biomass & Conversion Pathways 64
2.3.1 Biomass Conversion Pathways 64
2.3.2 Direct Combustion Processes 65
2.3.3 Thermochemical Conversion Processes 68
2.3.4 Biochemical Conversion Processes 71
2.3.5 Comparing Biochemical versus Thermochemical Processes 73
2.3.6 Conversion of Lignocellulosic Materials 74
2.3.7 The UK’s Bioenergy & Bio-refining Systems & Infrastructure 74
Chapter 3 - Biomass Resource Modelling ......................................................................................................... 76
3.1 Biomass Resource Modelling 77
3.1.1 An Extensive Global Resource 77
3.1.2 An Introduction to Resource Modelling 77
3.1.3 Biomass Resource Modelling 81
3.1.4 Estimating the Global Biomass Resource 84
3.1.5 Modelling the UK’s Indigenous Biomass Resource 86
Chapter 4 - Developing the Biomass Resource Model ..................................................................................... 89
4.1 Introducing the Biomass Resource Modelling 90
4.1.1 Aims & Objectives of the Biomass Resource Model 90
4.1.2 Influential Studies & Research 93
4.1.3 New Modelling Knowledge & Niche 94
4.1.4 The Biomass Resource Model Structure 96
4.1.5 Constructing & Navigating the Biomass Resource Model 100
4.1.6 Applying the Biomass Resource Model 103
4.2 UK BRM - Developing the Stage One Methodology 106
4.2.1 UK Population Dynamics 106
4.2.2 UK Built-Up Land Area 107
4.2.3 UK Forests, Woodlands & Plantations 108
4.2.4 UK Food & Agriculture Systems 109
4.2.5 Agriculture & Biomass Productivity Yields 112
4.2.6 Land Area to Meet Food Commodity Demands 115
4.2.7 UK Land Availability 116
4.3 UK BRM - Stage One Modelling Mechanics 117
4.3.1 Stage One Analysis Calculation Equations Key 117
4.3.2 Modelling Food & Agriculture Systems to 2050 118
4.3.3 Modelling Land-Use Dynamics to 2050 119
4.4 UK BRM - Developing the Stage Two Methodology 121
4.4.1 UK Forest System Productivity & Characteristics 121
4.4.2 Forestry Residues 126
4.4.3 Forestry-Industry Dynamics 127
4.4.4 Industrial Residues 130
4.4.5 Agricultural Residues 130
4.4.6 Straw Agricultural Residues 131
4.4.7 Slurry Agricultural Residues 132
4.4.8 Arboriculture (Arb) Residues 132
4.4.9 Wastes 133
4.4.10 Sewage Waste 136
4.4.11 Grown Biomass & Energy Crops 136
4.5 UK BRM - Stage Two Modelling Mechanics 139
4.5.1 Stage Two Analysis Calculation Equations Key 139
4.5.2 Modelling Forest-Industry Dynamics 140
Andrew Welfle - ID: 81163530
4
4.5.3 Modelling Biomass Resource Availability Dynamics 141
4.6 UK BRM – Developing the Stage Three Methodology 144
4.6.1 Resource Availability for the Bioenergy Sector 144
4.6.2 Energy Content of Resources 145
4.6.3 Developing a Methodology for Analysing Bioenergy Potentials 145
4.6.4 Pre-Treatment Pathways 146
4.6.5 Energy Conversion Pathways 146
4.6.6 Preferred Bioenergy Conversion Pathway 147
4.6.7 Total Bioenergy Potential 148
4.6.8 Energy Targets & Demands 149
4.7 UK BRM - Stage Three Modelling Mechanics 150
4.7.1 Stage Three Analysis Calculation Equations Key 150
4.7.2 Modelling Bioenergy Potential of Available Biomass Resources 150
Chapter 5 - Drivers Influencing Biomass Resource Availability & Bioenergy ........................................... 153
5.1 Drivers Influencing Biomass Resource Availability 154
5.1.1 Biomass Resource Drivers 155
5.1.2 The BRM’s Analysis Drivers 156
5.1.3 Discussion of Drivers Analysed within the BRM 157
5.1.4 Discussion of Drivers Not Directly Analysed within the BRM 164
5.2 UK BRM Drivers Sensitivity Analysis 170
5.2.1 Developing a Sensitivity Analysis Methodology 170
5.2.2 UK Baseline Scenario – Forecast Biomass Resource Availability 171
5.2.3 Biomass Resources Demonstrating Potential for the UK Bioenergy Sector 176
5.2.4 BRM Drivers Sensitivity Analysis 177
5.2.5 Key Chapter & Sensitivity Analysis Outputs & Conclusions 191
Chapter 6 - UK Biomass Resource Scenarios ................................................................................................. 194
6.1 Developing UK Biomass Resource Scenarios 195
6.1.1 An Introduction to Scenario Based Analysis 195
6.1.2 Developing Biomass Resource Scenarios 197
6.1.3 Developing the UK Food Focus (Foo-F) Biomass Resource Scenario 199
6.1.4 Developing the UK Economic Focus (Eco-F) Biomass Resource Scenario 200
6.1.5 Developing the UK Conservation Focus (Con-F) Biomass Resource Scenario 202
6.1.6 Developing the UK Energy Focus (Ene-F) Biomass Resource Scenario 204
6.2 UK Biomass Availability & Bioenergy 207
6.2.1 Biomass Resource Scenarios – Land Utilisation Forecasts 207
6.2.2 Biomass Resource Scenarios – Resource Availability Forecasts 210
6.2.3 Biomass Resource Scenarios – Bioenergy Potential Forecasts 214
6.2.4 Key Scenario Analyses Conclusions 217
Chapter 7 - The Future UK Energy & Bioenergy System ............................................................................ 219
7.1 Current & Future UK Bioenergy Sector 220
7.1.1 The Current & Future UK Bioenergy Sector 221
7.1.2 The UK Bio-Heat Sector 222
7.1.3 The UK Bio-Power Sector 224
7.1.4 The UK Bio-Fuel Sector 228
7.1.5 UK Biomass Resource Import Forecasts 230
7.1.6 Trends and Conclusions of Future UK Bioenergy 232
7.2 Biomass Resource Balance Analysis 234
7.2.1 Resource Balance Analysis Methodology 234
7.2.2 Resource Balance Analysis Results 237
7.2.3 Resource Balance Analysis Discussions 238
7.2.4 Chapter Conclusions & Consequences for the Future UK Bioenergy Sector 240
Chapter 8 - Global Biomass Trade - Supply, Demand, Limitations & Sustainability ................................ 242
8.1 Global Biomass Trade – Supply, Demand, Limitations & Sustainability 243

Andrew Welfle - ID: 81163530
5
8.1.1 Increasing Global Demand for Biomass 243
8.1.2 Global Biomass Trade Markets 244
8.1.3 Biomass Resources Key Global Trade Flows 247
8.1.4 Global Biomass Trade Limitations & Uncertainty 249
8.1.5 Sustainability of Global Biomass Resource Production 252
8.1.6 Chapter Conclusions & Consequences for the UK Bioenergy Sector 258
Chapter 9 - Case Study: Brazilian Biomass Resource Analyses ................................................................... 260
9.1 Case Study – Brazil’s Biomass Resource Analyses 261
9.2 The Brazil Biomass Resource Model – Stage One Analyses 263
9.2.1 Brazil Population Dynamics 263
9.2.2 Brazil Built-Up Land Area 263
9.2.3 Brazil Forests, Woodlands & Plantations 264
9.2.4 Brazil Food & Agriculture Systems 264
9.2.5 Agriculture & Biomass Productivity Yields 265
9.2.6 Land Area to Meet Food Commodity Demands 265
9.2.7 Brazil Land Availability 266
9.3 The Brazil Biomass Resource Model – Stage Two Analyses 267
9.3.1 Forestry System Productivity & Characteristics 267
9.3.2 Forestry Residues 270
9.3.3 Industrial Residues 270
9.3.4 Straw Agricultural Residues 271
9.3.5 Slurry Agricultural Residues 271
9.3.6 Arboriculture Residues 272
9.3.7 Wastes 273
9.3.8 Sewage Waste 274
9.3.9 Grown Biomass & Energy Crops 275
9.4 The Brazil Biomass Resource Model – Stage Three Analyses 278
9.5 Brazil Biomass Resource Availability 279
9.5.1 Brazil Biomass Supply Chain Dynamics to 2030 279
9.5.2 Brazil Baseline Scenario – Land-Use Analysis 280
9.5.3 Brazil Baseline Scenario – Biomass Resource Availability Analysis 282
9.6 Brazil Bioenergy Scenarios 286
9.6.1 Brazil Current Energy System 286
9.6.2 Brazil’s Future Energy Strategy & Targets 291
9.6.3 Global Comparisons – Leading Energy Targets & Strategies 294
9.6.4 Developing Brazil Bioenergy Scenarios 296
9.6.5 Brazil Bioenergy Scenarios – Bioenergy Potentials 302
9.6.6 Brazil Bioenergy Scenarios – Resource Balance Analysis 304
9.6.7 Chapter Conclusions & Consequences for the Future UK Bioenergy Sector 307
Chapter 10 - An Alternative UK Bioenergy Strategy .................................................................................... 310
10.1 An Alternative UK Bioenergy Strategy 311
10.1.1 Thesis Analysis Key Conclusions 312
10.2 Alternative Policy & Strategy Options 315
10.2.1 UK Grown Biomass & Energy Crops 315
10.2.2 Plant Based Agricultural Residues 318
10.2.3 Animal Based Agricultural Residues 322
10.2.4 Household & Organic Wastes 328
10.2.5 Promoting the UK Bio-Heat Sector 331
Chapter 11 - Thesis Conclusions ..................................................................................................................... 336
11.1 Thesis Conclusions 337
11.1.1 Summary of Thesis Conclusions 337
11.2 Deductions & Implications 341
11.2.1 Conclusion – Develop a Bioenergy Sector Compatible with UK Resources 341

Andrew Welfle - ID: 81163530
6
11.2.2 Conclusion - Developing Mobilisation & Utilisation Strategies 342
11.2.3 Conclusion – Placing Greater Focus on Indigenous Resources 343
11.3 Original Contributions to Knowledge 345
11.3.1 Biomass Resource Model 345
11.3.2 Food & Industry Biomass Demands 347
11.3.3 UK Indigenous Biomass Resource Analyses 347
11.3.4 Brazil Biomass Resource Forecasts & Bioenergy Scenarios 348
11.4 Limitations & Further Work 350
11.4.1 Changing Food Diets 350
11.4.2 Climate Change Impacts 350
11.4.3 Spatial Scale & Distribution of Modelling 351
11.4.4 Energy Conversion Modelling 351
11.4.5 Chemical Industry 352
11.4.6 Supply Chain Drivers 352
11.5 Concluding Statement 354
Thesis References .............................................................................................................................................. 356
Thesis Appendices............................................................................................................................................. 380
85,995 Words
Andrew Welfle - ID: 81163530
7
Tables List Table 1.1: Climate Change Characteristics of the Core Greenhouse Gases ......................................................... 21
Table 2.1: Comparison of Typical Fuel Characteristic Values for Biomass & Fossil Fuels ................................. 53
Table 2.2: Typical Pyrolysis of Wood Product Yields ......................................................................................... 69
Table 2.3: Comparison of Biochemical & Thermochemical Biofuel & Energy Yields ....................................... 73
Table 2.4: Summary of the UK and EU’s Operating & Planned Bioenergy Systems .......................................... 75
Table 3.1: Global Biomass Resource Estimates ................................................................................................... 77
Table 3.2: Summary & Characteristics of Existing Biomass Resource Models ................................................... 84
Table 4.1: Summary of the Analysed Biomass Categories & Specific Resources ............................................... 99
Table 4.2: Summary of Excel Tabs within the BRM .......................................................................................... 101
Table 4.3: Overview of the BRM’s Main Control Panel Variables .................................................................... 103
Table 4.4: UK Population Forecasts ................................................................................................................... 107
Table 4.5: FAO Food Commodity Datasets Utilised Within the BRM .............................................................. 110
Table 4.6: References Providing Data on Current UK Agriculture Productivity Yields .................................... 114
Table 4.7: References Providing Data on Future Agriculture Productivity Yields ............................................. 115
Table 4.8: Equation Calculations Key for the BRM’s Stage One Analyses ....................................................... 117
Table 4.9: Forest Productivity Scenarios for Forestry Commission Estate Forests ............................................ 122
Table 4.10: Forest Productivity Scenario for Forest Systems within the Private Sector Estate .......................... 124
Table 4.11: Waste Streams & Availability for the Bioenergy Sector ................................................................. 134
Table 4.12: DEFRA Scenarios for UK Waste Generation to 2050 ..................................................................... 135
Table 4.13: DEFRA Scenarios for UK Waste Management to 2050.................................................................. 136
Table 4.14: BRM Default Biomass Resource & Energy Crop Planting Strategies ............................................ 138
Table 4.15: Equation Calculations Key for the BRM’s Stage Two Analyses .................................................... 139
Table 4.16: Equation Calculations Key for the BRM’s Stage Three Analyses .................................................. 150
Table 5.1: Drivers Influencing Biomass Resources & the BRM’s Analysis Capability ..................................... 156
Table 5.2: Summary of Key Drivers Influencing UK Biomass Resource Availability ...................................... 157
Table 5.3: Reports Studies & Research Influencing the UK Baseline Scenario ................................................. 171
Table 5.4: UK BRM Drivers Influencing the Availability of Grown Resources ................................................ 179
Table 5.5: UK BRM Drivers Influencing the Availability of Residue Resources .............................................. 184
Table 5.6: UK BRM Drivers Influencing the Availability of Waste Resources ................................................. 189
Table 5.7: Research Summary Ranking Indigenous Resource Influences & Contributors ................................ 192
Table 6.1: UK BRM Biomass Resource Scenarios ............................................................................................ 198
Table 6.2: Summary of Biomass Resource Scenario Characteristics & Forecast Assumptions ......................... 206
Table 7.1: Bioenergy Contribution of Resources within the UK Bioenergy Sector (2012)................................ 221
Table 7.2: UK Bioenergy Sector Installed Capacity & Generation (2012) ........................................................ 221
Table 7.3: UK Renewable Energy Roadmap (2011) Near-Term Bioenergy Estimates by 2020 ........................ 222
Table 7.4: Feedstock Co-fired with Fossil Fuels in the UK ................................................................................ 227
Table 7.5: UK Bioenergy Sector Utilisation of Feedstocks to Produce Biofuels ............................................... 230
Table 7.6: Future Bioenergy Sector Trends and Key Resource Demands .......................................................... 233
Table 7.7: Scenarios Mid and Long-Term Forecasts of UK Biofuels Demand .................................................. 236
Table 7.8: UK BRM Resources Compatible with Future UK Bioenergy Sector Demands ................................ 236
Table 9.1: Brazil Population Forecasts ............................................................................................................... 263
Table 9.2: Brazil Urban Development Land Area Forecasts (Hectares) ............................................................. 264
Table 9.3: Brazil BRM Forestry Growth Scenarios ............................................................................................ 269
Table 9.4: Brazil BRM Forestry Productivity Scenarios .................................................................................... 270
Table 9.5: Waste Streams & Availability for the Bioenergy Sector ................................................................... 273
Table 9.6: Reports Studies and Research Influencing the Brazil Baseline Scenarios ......................................... 280
Table 9.7: Overview of Brazil Bioenergy Scenario Themes and Targets ........................................................... 302
Table 9.8: Brazil BRM Resources Identified as Potentially Suitable for Exportation ........................................ 305
Table 10.1: UK Plant Based Farming Renewable Energy Characteristics ......................................................... 318
Table 10.2: UK Animal Based Farming Renewable Energy Characteristics ..................................................... 323
Andrew Welfle - ID: 81163530
8
Figures List Figure 1.1: Combustion Greenhouse Gas Calculations ........................................................................................ 20
Figure 1.2: Schematic Demonstrating the Greenhouse Effect .............................................................................. 21
Figure 1.3: The Utilisation of Fossil Fuels since the Industrial Revolution ......................................................... 22
Figure 1.4: Graphs Demonstrating the Atmospheric CO2 since the Industrial Revolution ................................... 23
Figure 1.5: Energy Source Contributions to Global Primary Energy Consumption (2011) ................................. 25
Figure 1.6: Global Discrepancy between Population and Energy Consumption .................................................. 26
Figure 1.7: UK Total Annual Primary Energy Consumption 1970-2010 ............................................................. 27
Figure 1.8: Contribution of Energy Source to UK’s Annual Energy Consumption 1970-2010 ........................... 27
Figure 1.9: Contribution of the UK Renewable Energy Technologies in 2010 .................................................... 30
Figure 1.10: Development Timeline of the UK’s Key Climate Change & Energy Policies ................................. 34
Figure 1.11: Energy Policy Framework ................................................................................................................ 35
Figure 2.1: The Photosynthesis Reaction ............................................................................................................. 51
Figure 2.2: Moisture Content Calculations ........................................................................................................... 52
Figure 2.3: The Principal Components of Biomass Material ................................................................................ 55
Figure 2.4: Biomass Combustion Reactions ......................................................................................................... 56
Figure 2.5: Typical Biomass Conversion Pathway & Pollutants .......................................................................... 56
Figure 2.6: Biomass Resource Categories & the Key Life-Cycle Processes ........................................................ 59
Figure 2.7: Overview of Key Biomass Conversion Pathways & Products ........................................................... 64
Figure 2.8: Summary of the Core Biomass Conversion Pathways & Resulting Products .................................... 65
Figure 2.9: Biomass Gasification Conversion Processes ...................................................................................... 70
Figure 3.1: Non-Renewable Resource Economic Dynamics ................................................................................ 79
Figure 3.2: Ratio of Global Fossil Fuel Consumption to Years of Remaining Reserve ....................................... 80
Figure 3.3: Biomass Modelling Resolution Potentials.......................................................................................... 82
Figure 3.4: Typical Structure & Analysis Flow for a Resource Focused Biomass Model ................................... 83
Figure 3.5: Range of Global Biomass Resource Estimates .................................................................................. 85
Figure 3.6: Range of Biomass Resource and Related Land Category Estimates .................................................. 86
Figure 4.1: The Biomass Resource Model Methodology Architecture ................................................................ 97
Figure 4.2: UK Population Forecasts .................................................................................................................. 107
Figure 4.3: UK Change in Built-Up Area Forecasts ........................................................................................... 108
Figure 4.4: UK Forested Area Forecasts ............................................................................................................ 109
Figure 4.5: Evaluating Productivity Yields within the BRM .............................................................................. 113
Figure 4.6: Forecast Land Area Required to Meet Total Food Commodity Demands ....................................... 115
Figure 4.7: Calculation Equations Applied within the BRM Agricultural System & Food Demand Analyses.. 119
Figure 4.8: Calculation Equations Applied within the BRM’s Land-Use Analyses ........................................... 120
Figure 4.9: Forestry Commission Estate Standing Volume Forecasts ................................................................ 123
Figure 4.10: Forestry Commission Productivity Forecasts ................................................................................. 123
Figure 4.11: Private Sector Estate Standing Volume Forecasts .......................................................................... 125
Figure 4.12: Private Sector Estate Productivity Forecasts .................................................................................. 125
Figure 4.13: Forestry System & Industry Dynamics Analysed within the BRM................................................ 129
Figure 4.14: Analysis of Straw Agricultural Residues within the BRM ............................................................. 131
Figure 4.15: Analysis of Slurry Agricultural Residues within the BRM ............................................................ 132
Figure 4.16: Modelling Future Planting Strategies within the BRM .................................................................. 137
Figure 4.17: Modelling Resource Flows within the BRM’s Forestry-Industry Analysis Module ...................... 141
Figure 4.18: Calculation Equations Applied within the BRM’s Resource Availability Analyses ...................... 143
Figure 4.19: Modelling the Biomass Resource Bioenergy Conversion Pathway ............................................... 145
Figure 4.20: Description of BRM’s Resource-Bioenergy Filter Analysis Methodology .................................... 146
Figure 4.21: Preferred Bioenergy Conversion Pathways within the BRM ......................................................... 148
Figure 4.20: Analysing the Bioenergy Potentials Generated from Resources within the BRM ......................... 149
Figure 4.22: Biomass Flow & Modelling Mechanics of the BRM’s Pre-Treatment Processing Analyses ........ 151
Figure 4.23: Calculation Equations Applied within the BRM’s Bioenergy Potential Analyses ......................... 152
Figure 5.1: Availability of UK Biomass Resource Categories within the Baseline Scenario ............................. 173
Figure 5.2: UK Baseline Scenario Biomass Resource Availability .................................................................... 176
Figure 5.3: UK Baseline Scenario – Proportional Contribution of Key Biomass Resources ............................. 177
Figure 5.4: Biomass Grown Resources Sensitivity Analysis Radar Chart ......................................................... 178
Figure 5.5: Biomass Residue Resources Sensitivity Analysis Radar Chart ........................................................ 183
Figure 5.6: Biomass Waste Resources Sensitivity Analysis Radar Chart ........................................................... 188
Figure 6.1: Visual Conceptualisation of Scenario Pathways Based Analysis ..................................................... 196
Figure 6.2: UK BRM Scenarios Analysis - UK Land Utilisation Profiles ......................................................... 208
Andrew Welfle - ID: 81163530
9
Figure 6.3: UK BRM Scenarios Analyses – Biomass Resource Availabilities .................................................. 212
Figure 6.4: UK BRM Scenario Analyses – Forecast Bioenergy Potentials & Energy Target Comparisons ...... 216
Figure 7.1: Capacity of Operational and Planned UK Bio-power Projects ........................................................ 225
Figure 7.2: Potential Delivered Energy from Use of Biomass in Transport ....................................................... 229
Figure 7.3: Forecast Range of Domestic & Imported Biomass Resource Utilisation ......................................... 231
Figure 7.4: Analysis of UK Wood Fibre Resource Availability, Future Demand & Deficits to 2025 ............... 237
Figure 7.5: Analysis of UK Indigenous Biofuel Energy, Future Demand & Deficits in 2030 ........................... 238
Figure 8.1: Predominant Global Trade Flows of Biomass Resources for Energy End Uses .............................. 245
Figure 9.1: Brazil Forestry Area & Designations to 2050 within the Scenario 3 Pathway ................................. 269
Figure 9.2: Brazil Plantation Strategy to 2050 within the Brazil Baseline Scenarios ......................................... 277
Figure 9.3: Brazil Land-Use within the Baseline Scenario to 2030 .................................................................... 281
Figure 9.4: Brazil Biomass Resource Availability within the Baseline Scenario to 2030 .................................. 283
Figure 9.5: Brazil Baseline Scenario – Validation of Wood Resource Availability Forecasture ....................... 284
Figure 9.6: Brazil Baseline Scenario – Validation of Energy Crop Availability Forecast.................................. 285
Figure 9.7: Energy Technologies Contributing to Brazil’s Total Primary Energy Supply (2011) ..................... 287
Figure 9.8: Fuels & Resources Contributing to Generate Brazil’s Power (2011) ............................................... 288
Figure 9.9: Fuels & Resources Utilised within Brazil’s Transport Sector (2011) .............................................. 289
Figure 9.10: Brazil Bioenergy Scenarios – Contribution from Energy Technologies ........................................ 298
Figure 9.11: Brazilian Primary Energy & Bioenergy Demand Forecasts ........................................................... 303
Figure 9.12: Brazilian Bioenergy Sector Resource Demands & Surplus Resources Available for Export ........ 306
Figure 10.1: Density of Plant Based Agriculture Compared to Transport Network Development .................... 320
Figure 10.2: Density of Animal Based Agriculture Compared to Transport Network Development ................. 325

Andrew Welfle - ID: 81163530
10
Abstract
The University of Manchester
Andrew James Welfle
Biomass Resource Analyses & Future Bioenergy Scenarios
March 2014
___________________________________________________________________________
The United Kingdom has committed itself to ambitious and legally-binding Greenhouse Gas
emission reduction, and renewable energy contribution targets. Energy production from
biomass is expected to play a significant role in achieving these targets. The PhD Research
Project as presented in this Thesis provides an analysis of the UK’s indigenous biomass
resources, and the potential they offer in servicing domestic bioenergy requirements.
The biomass resource supply chain dynamics within the UK, govern the availability of these
indigenous resources. By modelling these supply chain dynamics, an assessment has been
undertaken; the principle aim of which was to evaluate the potential contribution that
indigenous biomass resources can make towards the UK’s future energy mix.
This Research finds that the United Kingdom has considerable indigenous biomass resources
that could potentially be made available, if the UK were able to develop its supply chains to
appropriately mobilise these resources. However, the specific demands and the direction of
development of the UK’s future bioenergy sector, as driven by the UK Government’s current
strategies and policies; demonstrate degrees of incompatibility with the forecast potential of
biomass resource availability.
The consequence of this disparity is likely to result in rising biomass resource imports to
balance the UK’s future energy demands. Further analysis highlights the potential impacts,
inherent uncertainties, and risks to the United Kingdom’s bioenergy sector; associated with
trade within future global biomass resource markets.
The concluding themes are based on analyses and discussions that indicate that the UK
should implement strategies to develop its indigenous resources, and develop its supply
chains to optimise these resources; rather than become heavily reliant on imports from the
global markets.
Andrew Welfle - ID: 81163530
11
Declaration
The University of Manchester
Andrew James Welfle
Biomass Resource Analyses & Future Bioenergy Scenarios
March 2014
___________________________________________________________________________
No portion of the work referred to in this Thesis has been submitted in support of an
application for another degree or qualification, at The University of Manchester or any other
University or other Institute of learning.
Andrew Welfle - ID: 81163530
12
Copyright Statement
The University of Manchester
Andrew James Welfle
Biomass Resource Analyses & Future Bioenergy Scenarios
March 2014
___________________________________________________________________________
The author of this Thesis (“the Thesis”), including any appendices and / or schedules to this
Thesis; owns certain copyright or related rights within it (“the Copyright”) and he has given
The University of Manchester certain rights to use such Copyright, including for
administrative purposes.
Copies of this Thesis, either in full or in extracts, and whether in hard or electronic copy, may
be made only in accordance with the ‘Copyright, Designs, and Patents Act 1988’ (as
amended) and regulations issued under it or, where appropriate, in accordance with licensing
agreements which the University has from time to time. This page must form part of any such
copies made.
The ownership of certain Copyright, patents, designs, trademarks, and other intellectual
property (“the Intellectual Property”) and any reproductions of copyright works in the Thesis,
for example graphs and tables (“Reproductions”), which may be described in this Thesis;
may not be owned by the author and may be owned by third parties. Such Intellectual
Property and Reproductions cannot and must not be made available for use without the prior
written permission of the owner(s) of the relevant Intellectual Property and/or Reproductions.
Further information on the conditions under which disclosure, publication and
commercialisation of this Thesis, the Copyright and any Intellectual Property and / or
Reproductions described in it may take place, is available in the University IP Policy (see
http://www.campus.manchester.ac.uk/medialibrary/policies/intellectual-property.pdf), in any
relevant Thesis restriction declarations deposited in the University Library, The University
Library’s regulations (see http://www.manchester.ac.uk/library/aboutus/regulations) and in
The University’s policy on presentation of Theses.

Andrew Welfle - ID: 81163530
13
Acknowledgements
The University of Manchester
Andrew James Welfle
Biomass Resource Analyses & Future Bioenergy Scenarios
March 2014
___________________________________________________________________________
This Thesis has been prepared and written following a three-year PhD Programme carried out
at the Tyndall Centre for Climate Change Research, within The University of Manchester
School of Mechanical Aerospace and Civil Engineering.
Special thanks for help and support during the PhD programme are given to:
Dr. Paul Gilbert
Dr. Patricia Thornley
Professor Kevin Anderson
And all the Researchers & Staff of the Tyndall Centre for Climate Research, University of
Manchester.
Andrew Welfle - ID: 81163530
14
PhD Programme Outputs
The key research outputs and outreach activities undertaken during the PhD Programme are
summarised in the Tables below. Information about further activities is also shown within
Appendix 17.0.
1) Published Work
1)
Title: Meeting Bioenergy Targets with Reduced Imports
Reference:
Welfle. A, Gilbert. P, Thornley. P, 2013, ‘Meeting Bioenergy Targets with
Reduced Imports’, 21st European Biomass Conference & Exhibition,
Copenhagen, Denmark, Proceedings, pp. 21-29
Details Submitted at the Conference in addition to carrying out an oral presentation
Status: Published within the European Biomass Conference 2013 Proceedings
2)
Title: Securing a Bioenergy Future without Imports
Reference: Welfle. A, Gilbert. P, Thornley. P, 2014, ‘Securing a Bioenergy Future without
Imports’, Energy Policy, Vol. 68, pp.1-14
Details A copy of this paper can be found in Appendix 15.0 of this Thesis.
Status: Accepted and Published within Energy Policy Journal
3)
Title: Increasing Biomass Resource Availability through Supply Chain Analysis
Reference: Welfle. A, Gilbert. P, Thornley. P, 2014, ‘Refocusing Bioenergy Strategies’,
Biomass & Bioenergy, In Press
Details A copy of this paper can be found in Appendix 15.0 of this Thesis.
Status: Accepted and Published within Biomass & Bioenergy Journal
2) Other Work
1)
Title: Global Biomass Trade Caution (preliminary title)
Reference: Welfle. A, 2014, ‘Global Biomass Trade Caution’, Journal to be Confirmed
Details A third research paper from this PhD’s output has been written, but to date it is
undecided to which Journal it will be submitted.
Status: Draft Paper Written and Awaiting Submittal to Selected Journal
2)
Title: DECC Bioenergy Calculator – Model Validation Report
Details
Carried out a validation of the UK Department for Energy & Climate Change’s
Bioenergy Calculator Tool in a consultancy role. This involved carrying out a
quality assurance exercise checking Calculator Tool, before it was subject to a
stakeholder consultation process and eventual publication. .
Status: Submitted to the DECC Science & Innovation Team
Andrew Welfle - ID: 81163530
15
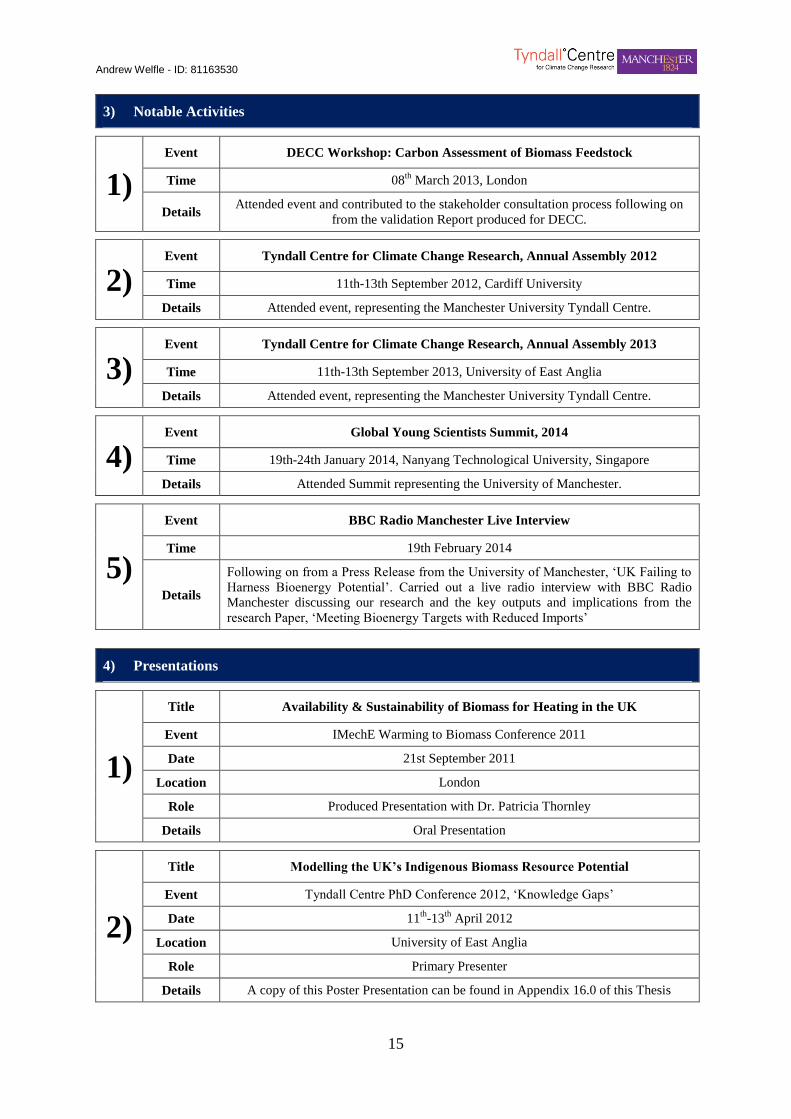
3) Notable Activities
1)
Event DECC Workshop: Carbon Assessment of Biomass Feedstock
Time 08th
March 2013, London
Details Attended event and contributed to the stakeholder consultation process following on
from the validation Report produced for DECC.
2) Event Tyndall Centre for Climate Change Research, Annual Assembly 2012
Time 11th-13th September 2012, Cardiff University
Details Attended event, representing the Manchester University Tyndall Centre.
3) Event Tyndall Centre for Climate Change Research, Annual Assembly 2013
Time 11th-13th September 2013, University of East Anglia
Details Attended event, representing the Manchester University Tyndall Centre.
4) Event Global Young Scientists Summit, 2014
Time 19th-24th January 2014, Nanyang Technological University, Singapore
Details Attended Summit representing the University of Manchester.
5)
Event BBC Radio Manchester Live Interview
Time 19th February 2014
Details
Following on from a Press Release from the University of Manchester, ‘UK Failing to
Harness Bioenergy Potential’. Carried out a live radio interview with BBC Radio
Manchester discussing our research and the key outputs and implications from the
research Paper, ‘Meeting Bioenergy Targets with Reduced Imports’
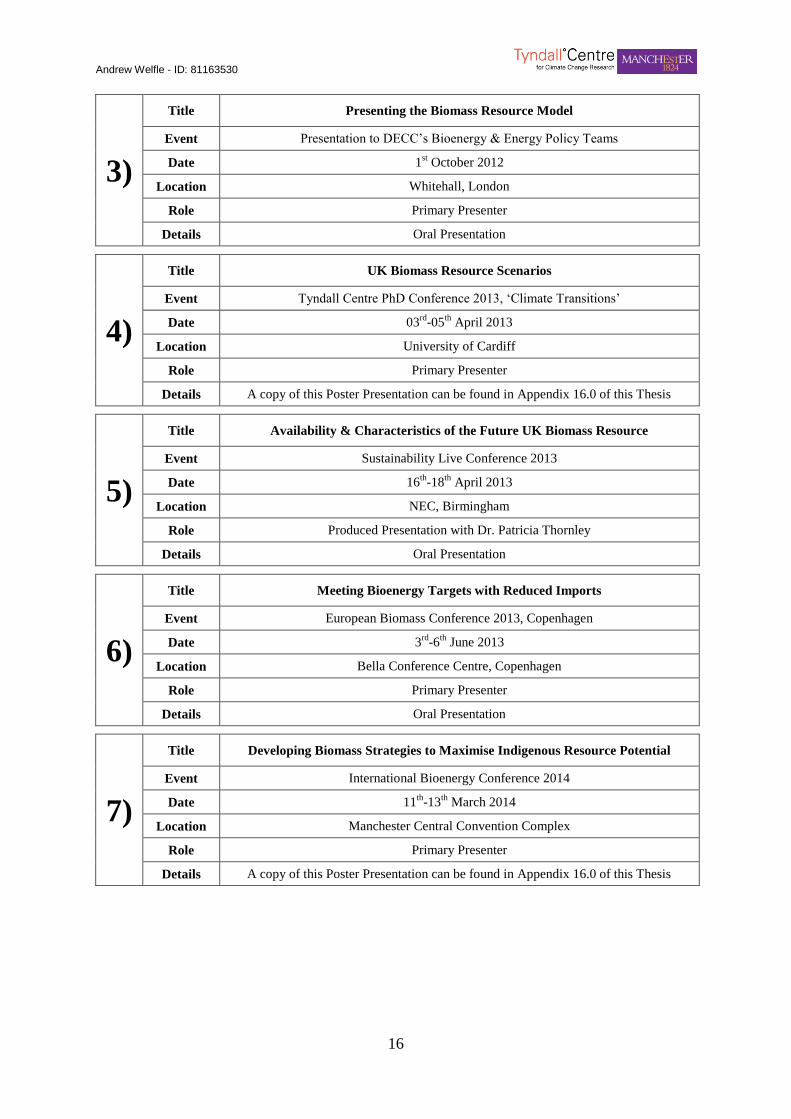
4) Presentations
1)
Title Availability & Sustainability of Biomass for Heating in the UK
Event IMechE Warming to Biomass Conference 2011
Date 21st September 2011
Location London
Role Produced Presentation with Dr. Patricia Thornley
Details Oral Presentation
2)
Title Modelling the UK’s Indigenous Biomass Resource Potential
Event Tyndall Centre PhD Conference 2012, ‘Knowledge Gaps’
Date 11th
-13th
April 2012
Location University of East Anglia
Role Primary Presenter
Details A copy of this Poster Presentation can be found in Appendix 16.0 of this Thesis
Andrew Welfle - ID: 81163530
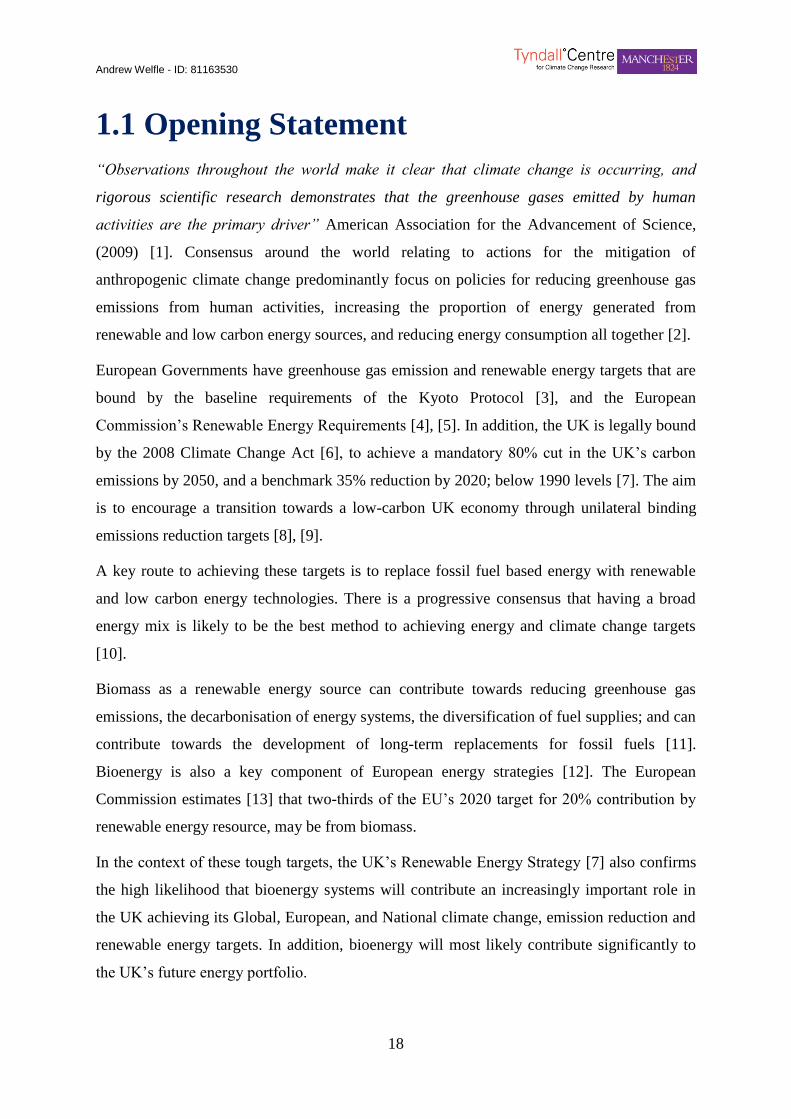
16
3)
Title Presenting the Biomass Resource Model
Event Presentation to DECC’s Bioenergy & Energy Policy Teams
Date 1st October 2012
Location Whitehall, London
Role Primary Presenter
Details Oral Presentation
4)
Title UK Biomass Resource Scenarios
Event Tyndall Centre PhD Conference 2013, ‘Climate Transitions’
Date 03rd
-05th
April 2013
Location University of Cardiff
Role Primary Presenter
Details A copy of this Poster Presentation can be found in Appendix 16.0 of this Thesis
5)
Title Availability & Characteristics of the Future UK Biomass Resource
Event Sustainability Live Conference 2013
Date 16th
-18th
April 2013
Location NEC, Birmingham
Role Produced Presentation with Dr. Patricia Thornley
Details Oral Presentation
6)
Title Meeting Bioenergy Targets with Reduced Imports
Event European Biomass Conference 2013, Copenhagen
Date 3rd
-6th
June 2013
Location Bella Conference Centre, Copenhagen
Role Primary Presenter
Details Oral Presentation
7)
Title Developing Biomass Strategies to Maximise Indigenous Resource Potential
Event International Bioenergy Conference 2014
Date 11th
-13th
March 2014
Location Manchester Central Convention Complex
Role Primary Presenter
Details A copy of this Poster Presentation can be found in Appendix 16.0 of this Thesis

Andrew Welfle - ID: 81163530
17
Chapter 1 - Introduction
Andrew Welfle - ID: 81163530
18
1.1 Opening Statement
“Observations throughout the world make it clear that climate change is occurring, and
rigorous scientific research demonstrates that the greenhouse gases emitted by human
activities are the primary driver” American Association for the Advancement of Science,
(2009) [1]. Consensus around the world relating to actions for the mitigation of
anthropogenic climate change predominantly focus on policies for reducing greenhouse gas
emissions from human activities, increasing the proportion of energy generated from
renewable and low carbon energy sources, and reducing energy consumption all together [2].
European Governments have greenhouse gas emission and renewable energy targets that are
bound by the baseline requirements of the Kyoto Protocol [3], and the European
Commission’s Renewable Energy Requirements [4], [5]. In addition, the UK is legally bound
by the 2008 Climate Change Act [6], to achieve a mandatory 80% cut in the UK’s carbon
emissions by 2050, and a benchmark 35% reduction by 2020; below 1990 levels [7]. The aim
is to encourage a transition towards a low-carbon UK economy through unilateral binding
emissions reduction targets [8], [9].
A key route to achieving these targets is to replace fossil fuel based energy with renewable
and low carbon energy technologies. There is a progressive consensus that having a broad
energy mix is likely to be the best method to achieving energy and climate change targets
[10].
Biomass as a renewable energy source can contribute towards reducing greenhouse gas
emissions, the decarbonisation of energy systems, the diversification of fuel supplies; and can
contribute towards the development of long-term replacements for fossil fuels [11].
Bioenergy is also a key component of European energy strategies [12]. The European
Commission estimates [13] that two-thirds of the EU’s 2020 target for 20% contribution by
renewable energy resource, may be from biomass.
In the context of these tough targets, the UK’s Renewable Energy Strategy [7] also confirms
the high likelihood that bioenergy systems will contribute an increasingly important role in
the UK achieving its Global, European, and National climate change, emission reduction and
renewable energy targets. In addition, bioenergy will most likely contribute significantly to
the UK’s future energy portfolio.

Andrew Welfle - ID: 81163530
19
However, as bioenergy pathways are being assumed in many national energy strategies
globally [14], critical assessment of biomass resource availabilities is essential as increased
mobilisation of biomass resource will be required to meet the growing demand. Most energy
strategies of EU Member States assume the utilisation of non-EU sourced biomass to meet
their forecast demands [15]; so there is also likely to be increased demand (competition) [16]
for globally traded biomass resources in the future. As a consequence, there are many
limitations and notable sustainability implications relating to the global trade and reliance on
imported biomass resource [17].
However, the factors that determine the availability of biomass resources are not always
clear. Currently in the UK the biomass resources and feed-stocks utilised for the generation
of heat, power, and transport fuels, are a combination of indigenous resource and materials
imported from both the EU and wider global markets [8], [9].
The focus of the PhD Research Project on which this Thesis is based, was to gain a greater
understanding of the potential and limitations of biomass resource availability in the UK, and
how competing demands for the same biomass resources are likely to influence the UK’s
bioenergy sector. The UK’s ability to meet its own biomass requirements with indigenous
resources, determines the extent to which the UK may have to compete for biomass resource
commodities on the global markets. This Thesis presents research that focuses on the
following: analysis of the UK’s biomass resource supply chain dynamics, evaluating the
types and extent of indigenous biomass resources that the UK can practically mobilise,
analysing the UK’s potential future biomass resource demands, forecasting the extent that the
UK may have to import biomass resources to balance these demands, analysing the global
biomass trade markets, and undertaking a case-study analysis of a large biomass exporting
country in order to evaluate the nature of the future global markets from which the UK may
have to trade, and finally, to develop a series of strategies that the UK could potentially
implement in order to maximise its utilisation of indigenous resource.

Andrew Welfle - ID: 81163530
20
1.2 Research Context
This section of the Introduction Chapter provides further background context to the wider
research project. This includes a literature review driven summary of the concepts of climate
change, an introduction to the UK’s energy systems; including how we currently generate our
energy. This section also includes a discussion of renewable energy technologies, their role
within the UK, and their contribution to mitigating anthropogenic climate change.
1.2.1 The Wider Research Context - Climate Change
A. Anthropogenic Climate Change
Anthropogenic climate change is summarised by MacKay (2008) [18] in three simple steps:
Fossil fuels are burnt through human activities, causing atmospheric CO2
concentrations to increase.
CO2 is a greenhouse gas.
Increasing the atmospheric CO2 concentrations, results in increasing global
temperatures and many other impacts.
B. What are Greenhouse Gases
C + O2 CO2 + Energy
Carbon + Oxygen Carbon Dioxide + Energy 1) Figure 1.1: Combustion Greenhouse Gas Calculations
Figure 1.1: Combustion Greenhouse Gas Calculations
As the equation in Figure 1.1 highlights, when any carbon based fuel is combusted, be it
wood, coal, petroleum or natural gas, greenhouse gases (GHG’s) and particularly CO2 will be
produced. The natural process of photosynthesis locks atmospheric CO2 into plant matter,
which when combusted however many years later or in whatever form, releases the CO2 back
into the atmosphere. The problem we face (the global population), is that CO2 levels are
increasing at a rate of about 0.4% per annum, and with relentless human activities continually
consuming fossil fuels this is likely to increase further [19]. The GHG’s that currently
provide the greatest concerns in terms of climate impact are; Carbon dioxide (CO2), Methane
(CH4), Nitrous Oxide (N2O), Chlorofluorocarbons (CFC’s) and Tropospheric Ozone (O3).
CO2 now accounts for ~57% of the ‘greenhouse effect’, CH4 ~17% and CFC’s ~5% [19].
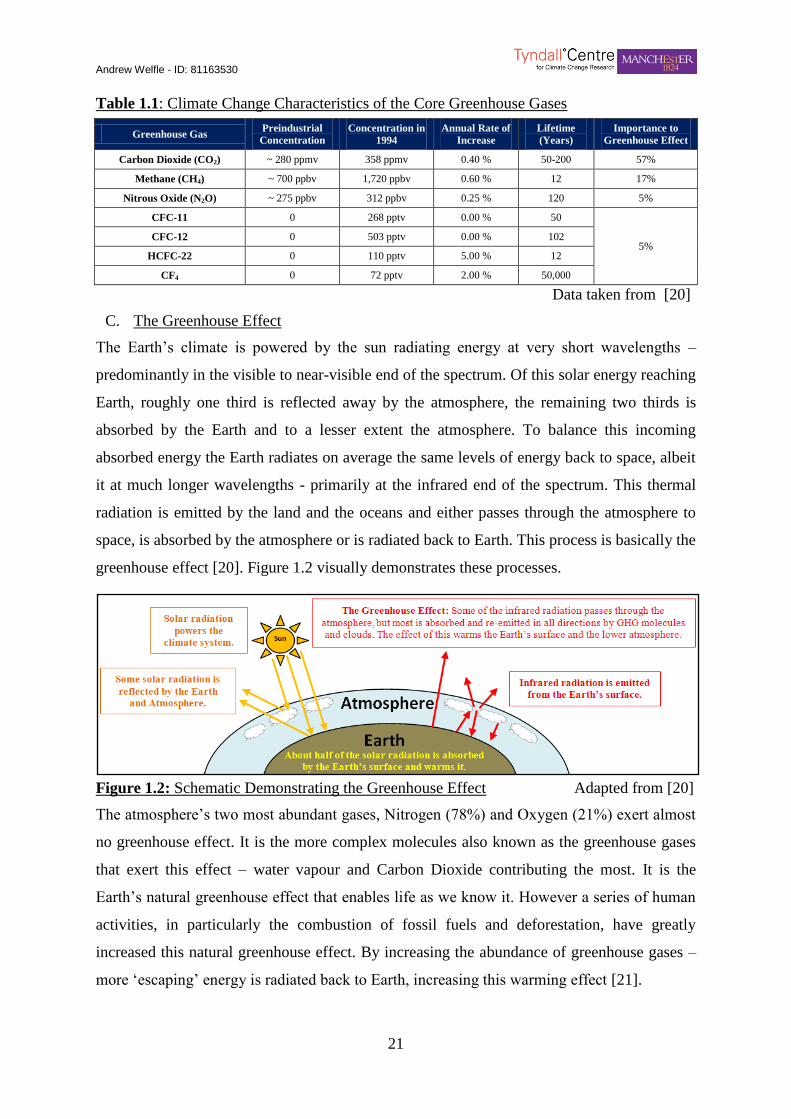
Table 1.1 provides a summary of the characteristics of key GHG’s and their respective
impacts toward climate change.
Andrew Welfle - ID: 81163530
21
Table 1.1: Climate Change Characteristics of the Core Greenhouse Gases Table 1) Table 1.1: C limate Change C haracteristics of the Core Greenhouse Gases
Greenhouse Gas Preindustrial
Concentration
Concentration in
1994
Annual Rate of
Increase
Lifetime
(Years)
Importance to
Greenhouse Effect
Carbon Dioxide (CO2) ~ 280 ppmv 358 ppmv 0.40 % 50-200 57%
Methane (CH4) ~ 700 ppbv 1,720 ppbv 0.60 % 12 17%
Nitrous Oxide (N2O) ~ 275 ppbv 312 ppbv 0.25 % 120 5%
CFC-11 0 268 pptv 0.00 % 50
5% CFC-12 0 503 pptv 0.00 % 102
HCFC-22 0 110 pptv 5.00 % 12
CF4 0 72 pptv 2.00 % 50,000
Data taken from [20]
C. The Greenhouse Effect
The Earth’s climate is powered by the sun radiating energy at very short wavelengths –
predominantly in the visible to near-visible end of the spectrum. Of this solar energy reaching
Earth, roughly one third is reflected away by the atmosphere, the remaining two thirds is
absorbed by the Earth and to a lesser extent the atmosphere. To balance this incoming
absorbed energy the Earth radiates on average the same levels of energy back to space, albeit
it at much longer wavelengths - primarily at the infrared end of the spectrum. This thermal
radiation is emitted by the land and the oceans and either passes through the atmosphere to
space, is absorbed by the atmosphere or is radiated back to Earth. This process is basically the
greenhouse effect [20]. Figure 1.2 visually demonstrates these processes.
2) Figure 1.2: Sche matic Demonstrating t he Greenhouse Effect
Figure 1.2: Schematic Demonstrating the Greenhouse Effect Adapted from [20]
The atmosphere’s two most abundant gases, Nitrogen (78%) and Oxygen (21%) exert almost
no greenhouse effect. It is the more complex molecules also known as the greenhouse gases
that exert this effect – water vapour and Carbon Dioxide contributing the most. It is the
Earth’s natural greenhouse effect that enables life as we know it. However a series of human
activities, in particularly the combustion of fossil fuels and deforestation, have greatly
increased this natural greenhouse effect. By increasing the abundance of greenhouse gases –
more ‘escaping’ energy is radiated back to Earth, increasing this warming effect [21].
Andrew Welfle - ID: 81163530
22
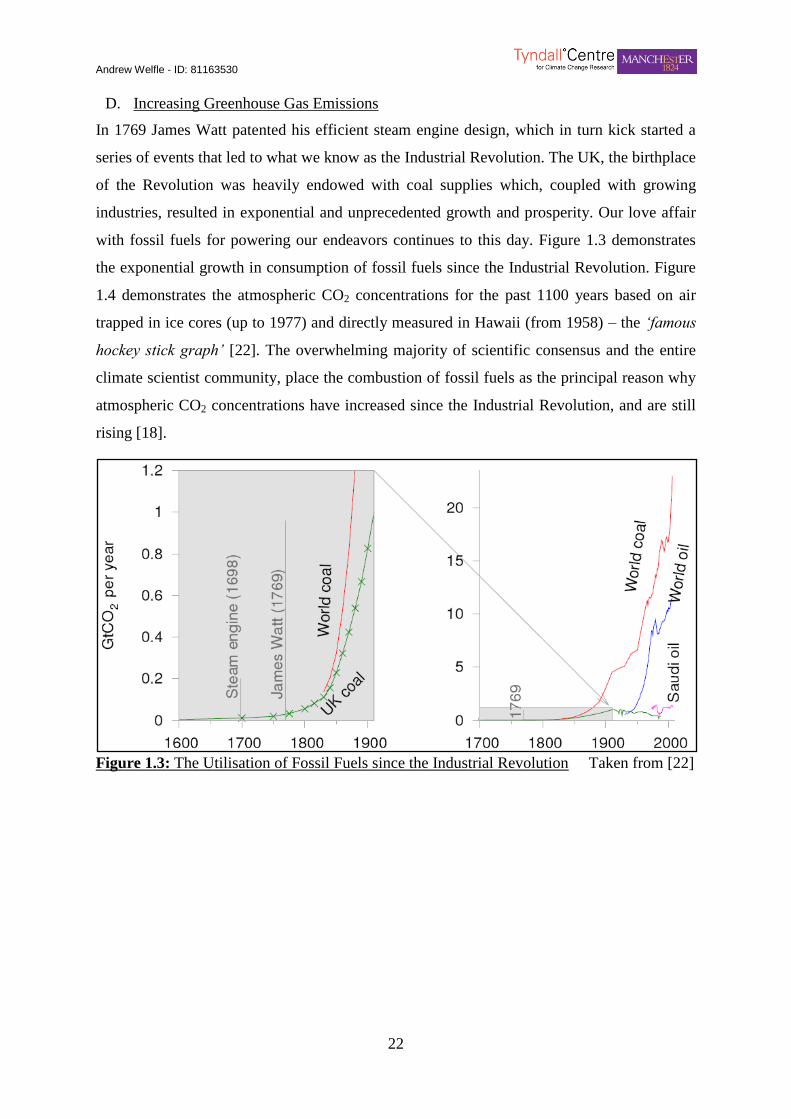
D. Increasing Greenhouse Gas Emissions
In 1769 James Watt patented his efficient steam engine design, which in turn kick started a
series of events that led to what we know as the Industrial Revolution. The UK, the birthplace
of the Revolution was heavily endowed with coal supplies which, coupled with growing
industries, resulted in exponential and unprecedented growth and prosperity. Our love affair
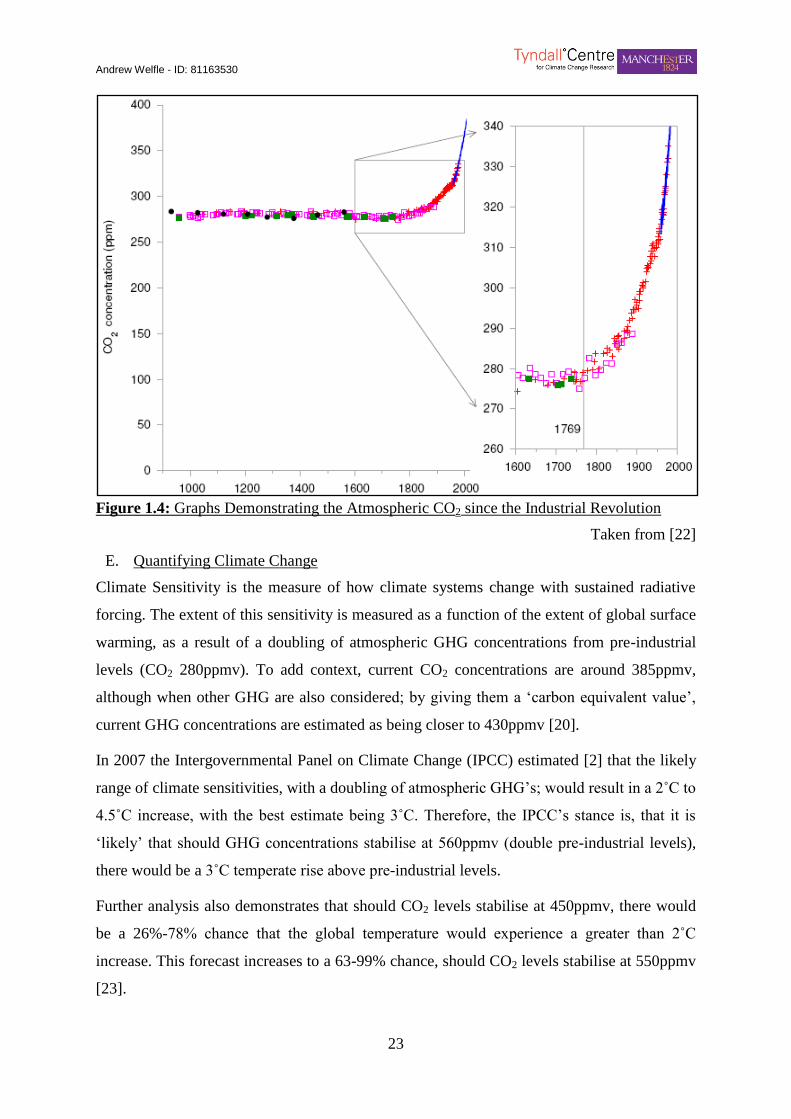
with fossil fuels for powering our endeavors continues to this day. Figure 1.3 demonstrates
the exponential growth in consumption of fossil fuels since the Industrial Revolution. Figure
1.4 demonstrates the atmospheric CO2 concentrations for the past 1100 years based on air
trapped in ice cores (up to 1977) and directly measured in Hawaii (from 1958) – the ‘famous
hockey stick graph’ [22]. The overwhelming majority of scientific consensus and the entire
climate scientist community, place the combustion of fossil fuels as the principal reason why
atmospheric CO2 concentrations have increased since the Industrial Revolution, and are still
rising [18].
3) Figure 1.3: The Uti lisation of F ossi l Fuels since the Industrial Revo lut ion
Figure 1.3: The Utilisation of Fossil Fuels since the Industrial Revolution Taken from [22]
Andrew Welfle - ID: 81163530
23
4) Figure 1.4: Graphs De monstrating t he Atmospheric CO2 since the Industrial Revolution
Figure 1.4: Graphs Demonstrating the Atmospheric CO2 since the Industrial Revolution
Taken from [22]
E. Quantifying Climate Change
Climate Sensitivity is the measure of how climate systems change with sustained radiative
forcing. The extent of this sensitivity is measured as a function of the extent of global surface
warming, as a result of a doubling of atmospheric GHG concentrations from pre-industrial
levels (CO2 280ppmv). To add context, current CO2 concentrations are around 385ppmv,
although when other GHG are also considered; by giving them a ‘carbon equivalent value’,
current GHG concentrations are estimated as being closer to 430ppmv [20].
In 2007 the Intergovernmental Panel on Climate Change (IPCC) estimated [2] that the likely
range of climate sensitivities, with a doubling of atmospheric GHG’s; would result in a 2˚C to
4.5˚C increase, with the best estimate being 3˚C. Therefore, the IPCC’s stance is, that it is
‘likely’ that should GHG concentrations stabilise at 560ppmv (double pre-industrial levels),
there would be a 3˚C temperate rise above pre-industrial levels.
Further analysis also demonstrates that should CO2 levels stabilise at 450ppmv, there would
be a 26%-78% chance that the global temperature would experience a greater than 2˚C
increase. This forecast increases to a 63-99% chance, should CO2 levels stabilise at 550ppmv
[23].

Andrew Welfle - ID: 81163530
24
F. Uncertainty & Response to Climate Change
There remains a huge degree of uncertainty in the level at which atmospheric CO2
concentrations may peak, and even more uncertainty regarding the impacts that different
levels of global temperature rise may produce. The predicted list of potential drastic impacts
is long, without mentioning the potential melting of the Greenland Icecap and resulting sea
level rises. However, it is conceivable that ecosystems around the globe would be
significantly altered to the extent that the supply of certain goods and services we now take
for granted, may end [18].
In the absence of any explicit global consensus regarding the values or metrics that reflect
‘dangerous’ from ‘acceptable’ climate change, European leaders have worked together to
ensure that the EU takes the international lead in ensuring that global average temperature
increases, do not exceed pre-industrial levels by more than 2˚C [24]. Despite all the
uncertainties that still surround the issues of climate change, the IPCC highlight [2] the
undisputed issues crucial to the climate change and energy debate:
Global consumption of energy derived from fossil-fuel sources continues to increase.
This continuing and rising consumption is resulting in increasing CO2, which is the
‘‘the most important anthropogenic greenhouse gas’’.
Global unprecedented effort will be required over the next decade if CO2 emissions
are to peak and begin to decline, through the reduction of energy consumption and
decarbonisation of supplies.
Climate change and energy issues have shot up the political agenda over the past 20 years.
The UK’s emissions did reduce during the 1990’s, but this is predominantly a consequence of
declining manufacturing industries, and a large scale switch from coal to gas energy
generation. Subsequent recent policies have largely failed to prevent further growth in
emissions [25].
1.2.2 Energy Profiles
This next section focuses on evaluating the types and contribution of different energy sources
to the overall global demand, and what types of energy source are used in the UK. Renewable
energy technologies are reviewed in the context of the wider context. This section is designed
to demonstrate the current dominance of fossil fuels across much of the world, but also how
energy modelling and scenario development, can steer future energy decisions towards
technologies such as those of the bioenergy sector.
Andrew Welfle - ID: 81163530
25
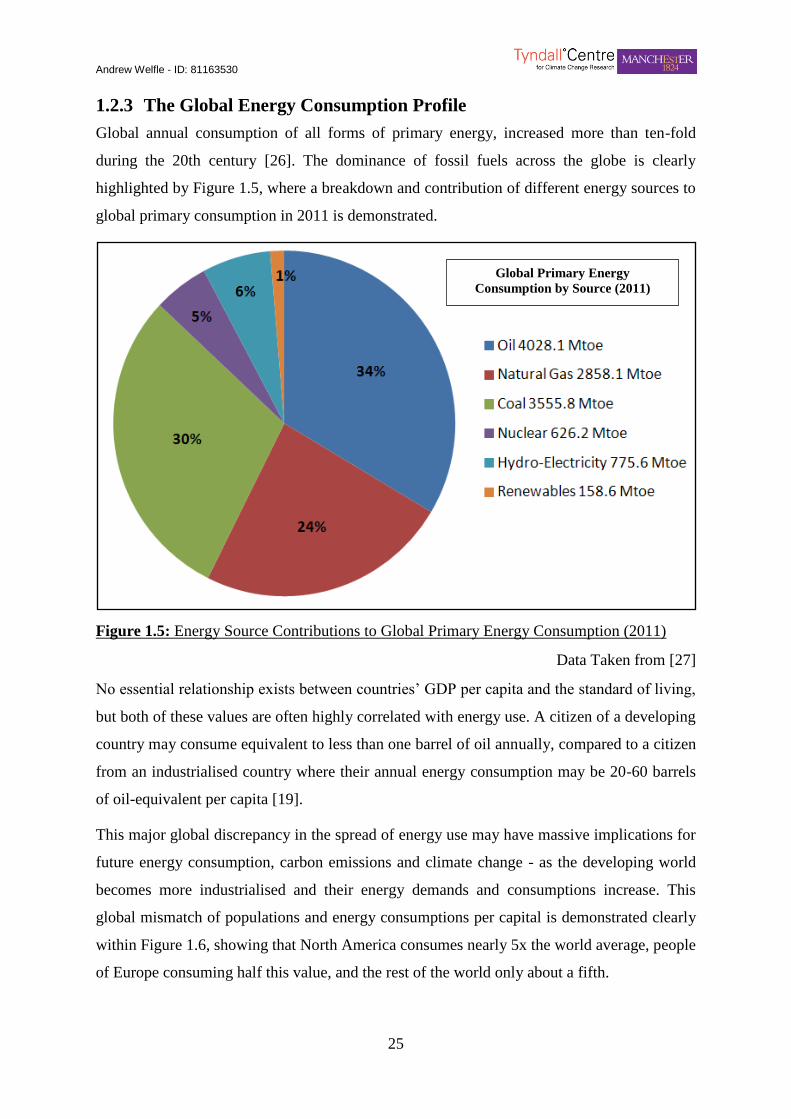
1.2.3 The Global Energy Consumption Profile
Global annual consumption of all forms of primary energy, increased more than ten-fold
during the 20th century [26]. The dominance of fossil fuels across the globe is clearly
highlighted by Figure 1.5, where a breakdown and contribution of different energy sources to
global primary consumption in 2011 is demonstrated.
5) Figure 1.5: Energy Source Contributions to Global Primary Energy Consumption (2011)
Figure 1.5: Energy Source Contributions to Global Primary Energy Consumption (2011)
Data Taken from [27]
No essential relationship exists between countries’ GDP per capita and the standard of living,
but both of these values are often highly correlated with energy use. A citizen of a developing
country may consume equivalent to less than one barrel of oil annually, compared to a citizen
from an industrialised country where their annual energy consumption may be 20-60 barrels
of oil-equivalent per capita [19].
This major global discrepancy in the spread of energy use may have massive implications for
future energy consumption, carbon emissions and climate change - as the developing world
becomes more industrialised and their energy demands and consumptions increase. This
global mismatch of populations and energy consumptions per capital is demonstrated clearly
within Figure 1.6, showing that North America consumes nearly 5x the world average, people
of Europe consuming half this value, and the rest of the world only about a fifth.
Global Primary Energy
Consumption by Source (2011)

Andrew Welfle - ID: 81163530
26
6) Figure 1.6: Global D iscrepancy between Population and Energy Consumpt ion
Figure 1.6: Global Discrepancy between Population and Energy Consumption
Taken from [18]
A. Fossil Fuel Durability
With such reliance on fossil fuels for our energy, major concerns exist relating to the
durability of these resources - let alone the side-effect climate implications of continuing to
use fossil fuels [26].
If current consumption rates continue, proven world coal reserves should last for about 200
years, oil reserves for approximately 40 years, and natural gas reserves for around 60 years. It
is also predicted that the production of liquid fuels, including non-conventional as well as
conventional sources; is likely to peak between 2005 and 2015. The peak production of
natural gas is predicted for around 2030, and from then onward despite large quantities of oil
and gas reserves remaining, the overall resource will decline [28]. Therefore it is clearly time
to start looking seriously, at alternative energy options to take over from fossil fuels.
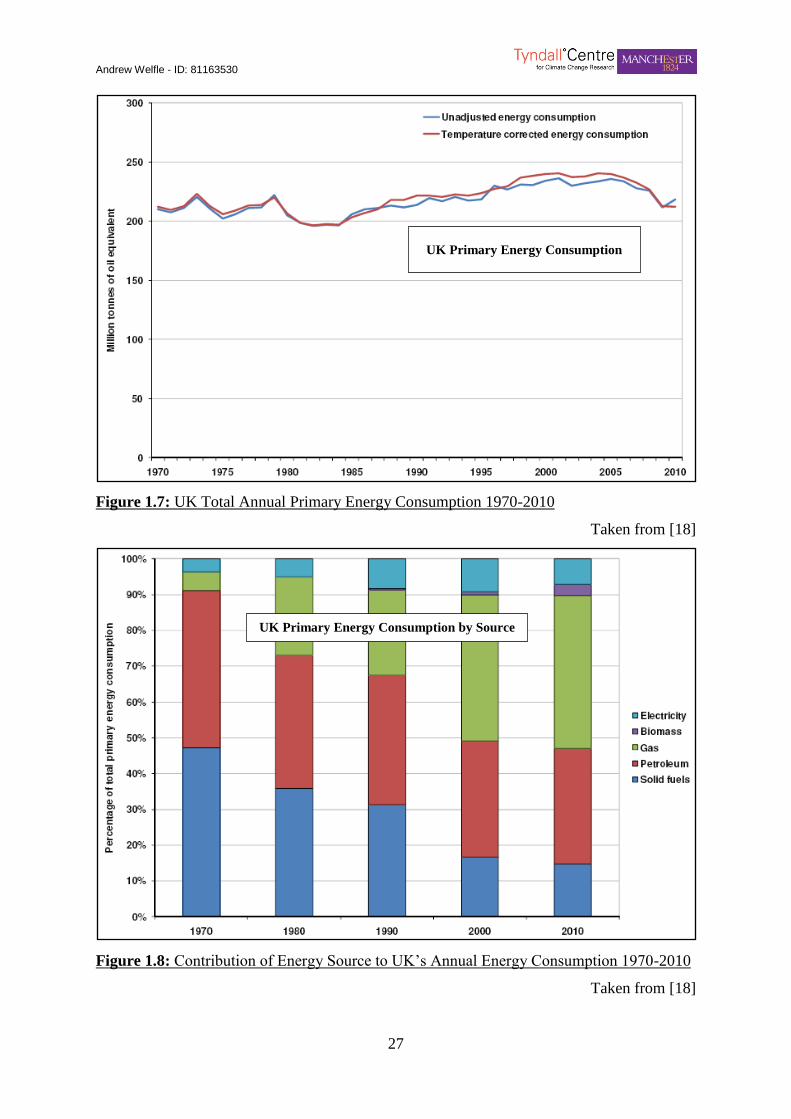
1.2.4 UK Energy Consumption Profile
In 2010 the UK’s overall primary energy consumption was 218.5 Mtoe, a 3% rise on 2009;
although primary energy consumption levels in 2009 experienced a 20 year low – attributed
to the economic downturn [29]. The Graphs in both Figures 1.7 and 1.8, demonstrate trends
in both the UK’s total annual primary energy consumption over the past 40 years, and also a
breakdown of the energy sources providing our energy.
Andrew Welfle - ID: 81163530
27
7) Figure 1.7: U K Tota l Annual Primary Energy Consumption 1970-2010
Figure 1.7: UK Total Annual Primary Energy Consumption 1970-2010
Taken from [18]
8) Figure 1.8: Contribution of Energy Source to UK’s A nnua l Energy Consumption 1970-2010
Figure 1.8: Contribution of Energy Source to UK’s Annual Energy Consumption 1970-2010
Taken from [18]
UK Primary Energy Consumption
UK Primary Energy Consumption by Source

Andrew Welfle - ID: 81163530
28
Figure 1.7 highlights that the UK’s primary energy consumption in 2010 was at its lowest
since 1987 and between 1990 and 2010, primary energy consumption on a temperature
corrected basis decreased by 4% [29]. Figure 1.8 demonstrates the changing contribution of
different energy sources to the UK’s energy mix. The rise of energy from gas over the past 40
years is clearly demonstrated, along with the decline of energy from coal – in part
demonstrated by the ‘solid fuels’ category. Another rising contributor clearly evident from
the 2010 data category is energy from biomass resources.
1.2.5 Renewable Energy & the UK’s Renewables Profile
Renewable energy has been defined as:
‘Energy obtained from the continuous or repetitive currents of energy recurring in the
natural environment'.
Twidell & Weir (2006) [30]
A. An Introduction to Renewable Energy Sources
Boyle (2004) [26] categorises sources of renewable energy into three distinct groups: those
that directly use the sun; those that indirectly use the sun; and renewable sources non-reliant
on the sun. These categories can be further explained as follows [26]:
i. Direct Solar Energy Renewable Sources
Solar energy can be directly converted using various renewable technologies.
Solar-Thermal: Solar energy can be absorbed by solar-thermal hot water collectors
to provide hot water or space heating.
Solar Concentrated Power: The concentration of direct solar radiation by mirrors
can also produce the high temperatures to power solar concentrator power stations.
Photovoltaic Panels: Direct solar radiation can also be converted into electricity
using photovoltaic panels that are strategically orientated on roofs and facades.
Passive Design: The utilisation of passive design techniques in buildings can also
enhance the use of direct solar energy for lighting and space heating requirements.
ii. In-Direct Solar Energy Renewable Sources
It is the evaporation of water as a result of direct solar radiation that powers our rivers once
precipitated back to Earth.
Hydro-Power: Powerful water flows around the globe allowing the generation of
hydroelectric power.
Andrew Welfle - ID: 81163530
29
Wave & Wind Power: The differential contact of solar radiation across the globe as
a result of varying latitude, essentially powers our ocean currents and winds as
massive heat flow takes place towards the poles. This allows the generation of both
wave and wind power.
Bioenergy: Solar energy has its most obvious role in the growing of plant life.
Biomass materials are essentially formed from air and water through the influence of
sunlight. Biomass has been an important and essential source of energy for millennia.
The chemical energy stored within biomass during photosynthesis is released through
either combustion of the biomass, or after its conversion to another source of fuel.
During photosynthesis, radiant solar energy drives the chemical reactions in which the
carbon atoms from CO2 and the Hydrogen atoms from water combine to produce
carbohydrate compounds of different lengths, and Oxygen. It is this process that locks
up CO2, making biomass fuels carbon neutral; the CO2 released during combustion
balancing that taken up during photosynthesis.
iii. Non-Solar Energy Renewable Sources
The remaining major sources of renewable energy that are not reliant on solar radiation are
tidal energy and geothermal energy.
Tidal Energy: Harnessing the power of the oceans tides by directing the tidal flow of
water to either power turbines or other mechanical generators.
Geothermal Energy: Utilisation of heat energy from within the Earth, that results
from the gravitational contraction of the planet and decay of radioactive elements.
B. The UK’s Renewable Energy Mix
In 2010, electricity generated from renewable sources in the UK reached 25.7 TWh.
Collectively renewable sources generated 6.8% of the UK’s total electricity generation. Heat
from renewable sources reached 1,212 Ktoe, and renewable biofuel for transportation reached
1,214 Ktoe [29].
Figure 1.9 demonstrates a breakdown of the UK’s total renewable energy generation in 2010
as produced from different energy technologies. This highlights the large contribution of
energy from biomass energy sources with further notable contributions from wind power.

Andrew Welfle - ID: 81163530
30
9) Figure 1.9: Contribution of the U K Renewable Energy Techno logies in 2010
Figure 1.9: Contribution of the UK Renewable Energy Technologies in 2010
Taken from [31]
1.2.6 Energy Scenarios – Modelling Future Trends
Energy scenario analysis first emerged during the 1970s-80s, as a response to limitations in
trend forecasting and the requirement to forward plan energy decisions. Our ability to predict
medium-long term is potentially dangerous due to the high complexity of human systems. As
a result, the concepts of energy scenario analysis were developed with the aim of exploring
alternative futures, and to enable decision making to be based on broad assessments [25].
Energy modelling and its output results are becoming increasingly important, as the future
world may very well be dependent on decisions made, based on today’s modelling scenarios.
Therefore, the management of energy resources and modelling of scenarios in an optimal
fashion has become mandatory amongst energy planners and policy makers. Energy scenario
modelling involves the effective planning and utilisation of all the energy resources available,
and the reliable supply and efficient management of resources – essentially a fully integrated
approach that considers options on technical, organisational, and behavioral levels [32].
Energy forecasting models are typically developed specifically for a Nation or utility, and are
normally dependent on a series of pre-determined prevailing economic and market
conditions. Some prominent energy scenario models developed for UK systems are as
follows:
A. DECC 2050 Pathways Analysis [33], [34]
DECC’s 2050 Pathways Analysis Tool is designed to help policymakers, the energy industry,
and to help the public understand these choices. For each sector of the economy four scenario
Contribution of UK Renewable Technologies (2010)
Andrew Welfle - ID: 81163530
31
trajectories are developed, ranging from little/no effort to reduce emission or save energy,
through to ambitious targets that push towards the extremes of what can be achieved.
DECC’s 2050 Pathways Calculator is publically available, allowing users to develop their
own scenarios of changes; for achieving an 80% reduction in greenhouse gas emissions by
2050, while ensuring that energy supply balances demand.
B. MARKAL Energy Model [35]
The MARKAL Model is a numerical model that is designed to carry out economic analysis
of different energy systems at the National level, to represent its evolution over a period up to
50 years. The MARKAL model measures a series of parameters including energy costs, plant
costs, plant performances, and building performance. The model is designed to evaluate the
optimal technology scenario to suite the required energy demands.
C. Tyndall Decarbonisation Scenarios [36], [37]
The Tyndall decarbonisation scenarios project outlines alternative pathways for achieving the
60% reduction in CO2 emissions from 1990 levels by 2050, as adopted as a goal by the UK
Government.
1.2.7 UK Climate Change, Energy & Bioenergy Policy
In the previous section it was discussed how energy scenario models are being developed to
help planners direct their future energy decisions, to aid the reduction of carbon emissions
and to focus on renewable technologies. This next section provides an introduction to the
policies, instruments, and mechanisms that are currently being used to steer such decisions.
This section is of particular importance to the overall research focus, as it provides
background information regarding the forces that are helping the development of the
bioenergy sector in the UK. The specific policies and policy mechanisms discussed within
this section, demonstrating particular relevance to this research.
1.2.8 The Emergence & Development of the Climate Change Policy
Agenda
The fundamental aims of renewable energy and climate change policies are to increase the
uptake of renewable technologies, reduce GHG emissions, mitigate environmental impacts,
and enhance energy security. The main challenge for policy makers in this area is to create a
framework that will accelerate progress towards carbon targets, and prevent undesired
negative impacts along the way [26].
Andrew Welfle - ID: 81163530
32
The optimal energy technology mix will likely require research, and development of policy
that invests in a portfolio of technologies. Although it is not clear which technologies this
portfolio should contain, as the process of research and development is inherently uncertain
[38].
Globally, a wide range of policy responses and instruments are being implemented in
response to global climate change. Near term policy responses include both restrictions on
emissions through limits or taxes, and the investment in environmentally friendly
technologies [39].
The UK has always positioned itself towards the forefront of policy making in this area. A
Report by the Royal Commission [40] developed a series of themes and concepts aimed at
addressing the issue of climate change, and relationships with the supply of energy. The
principal recommendation of the Report’s analysis was that the CO2 emissions from the UK’s
human activities should be reduced by 60% below 1998 levels by 2050. At the time, this
target stood out as being too radical to be politically acceptable; as it went well beyond the
binding commitments of the Kyoto Protocol [3]. However, as the agenda hardened, the UK
has legislated well beyond this proposed target through the development of the Climate
Change Act [6], that requires an 80% reduction in 1990 level CO2 emissions by 2050.
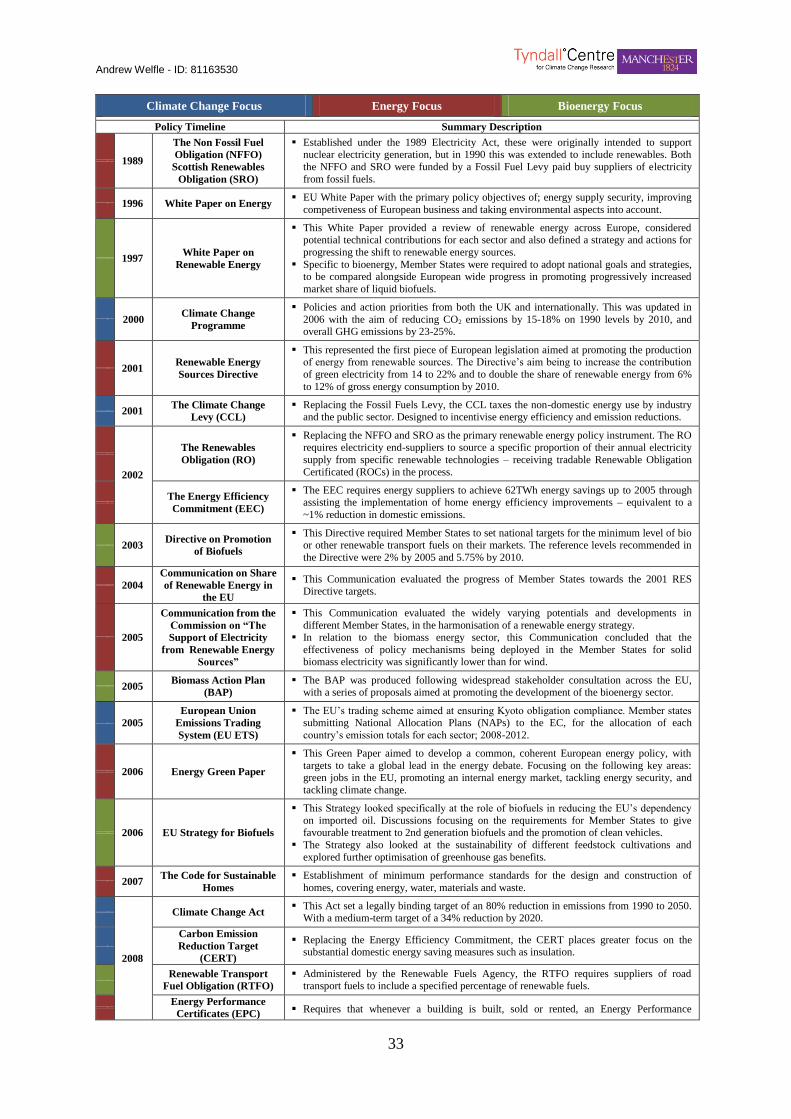
1.2.9 UK Climate Change & Renewable Energy Policy Timeline
The UK has experienced gradual progression in its development of climate change and
energy policy. Figure 1.10 provides a timeline of this step-by-step policy development
process, also providing a summary description of each key stage. The colour classifications
identify the different types of policies relevant to each theme.
Andrew Welfle - ID: 81163530
33
Climate Change Focus Energy Focus Bioenergy Focus
Policy Timeline Summary Description
1989
The Non Fossil Fuel
Obligation (NFFO)
Scottish Renewables
Obligation (SRO)
Established under the 1989 Electricity Act, these were originally intended to support nuclear electricity generation, but in 1990 this was extended to include renewables. Both
the NFFO and SRO were funded by a Fossil Fuel Levy paid buy suppliers of electricity
from fossil fuels.
1996 White Paper on Energy EU White Paper with the primary policy objectives of; energy supply security, improving
competiveness of European business and taking environmental aspects into account.
1997 White Paper on
Renewable Energy
This White Paper provided a review of renewable energy across Europe, considered potential technical contributions for each sector and also defined a strategy and actions for
progressing the shift to renewable energy sources.
Specific to bioenergy, Member States were required to adopt national goals and strategies, to be compared alongside European wide progress in promoting progressively increased
market share of liquid biofuels.
2000 Climate Change
Programme
Policies and action priorities from both the UK and internationally. This was updated in
2006 with the aim of reducing CO2 emissions by 15-18% on 1990 levels by 2010, and overall GHG emissions by 23-25%.
2001 Renewable Energy
Sources Directive
This represented the first piece of European legislation aimed at promoting the production of energy from renewable sources. The Directive’s aim being to increase the contribution
of green electricity from 14 to 22% and to double the share of renewable energy from 6%
to 12% of gross energy consumption by 2010.
2001 The Climate Change
Levy (CCL)
Replacing the Fossil Fuels Levy, the CCL taxes the non-domestic energy use by industry and the public sector. Designed to incentivise energy efficiency and emission reductions.
2002
The Renewables
Obligation (RO)
Replacing the NFFO and SRO as the primary renewable energy policy instrument. The RO requires electricity end-suppliers to source a specific proportion of their annual electricity
supply from specific renewable technologies – receiving tradable Renewable Obligation
Certificated (ROCs) in the process.
The Energy Efficiency
Commitment (EEC)
The EEC requires energy suppliers to achieve 62TWh energy savings up to 2005 through assisting the implementation of home energy efficiency improvements – equivalent to a
~1% reduction in domestic emissions.
2003 Directive on Promotion
of Biofuels
This Directive required Member States to set national targets for the minimum level of bio or other renewable transport fuels on their markets. The reference levels recommended in
the Directive were 2% by 2005 and 5.75% by 2010.
2004
Communication on Share
of Renewable Energy in
the EU
This Communication evaluated the progress of Member States towards the 2001 RES Directive targets.
2005
Communication from the
Commission on “The
Support of Electricity
from Renewable Energy
Sources”
This Communication evaluated the widely varying potentials and developments in
different Member States, in the harmonisation of a renewable energy strategy.
In relation to the biomass energy sector, this Communication concluded that the
effectiveness of policy mechanisms being deployed in the Member States for solid biomass electricity was significantly lower than for wind.
2005 Biomass Action Plan
(BAP)
The BAP was produced following widespread stakeholder consultation across the EU, with a series of proposals aimed at promoting the development of the bioenergy sector.
2005
European Union
Emissions Trading
System (EU ETS)
The EU’s trading scheme aimed at ensuring Kyoto obligation compliance. Member states submitting National Allocation Plans (NAPs) to the EC, for the allocation of each
country’s emission totals for each sector; 2008-2012.
2006 Energy Green Paper
This Green Paper aimed to develop a common, coherent European energy policy, with
targets to take a global lead in the energy debate. Focusing on the following key areas: green jobs in the EU, promoting an internal energy market, tackling energy security, and
tackling climate change.
2006 EU Strategy for Biofuels
This Strategy looked specifically at the role of biofuels in reducing the EU’s dependency
on imported oil. Discussions focusing on the requirements for Member States to give favourable treatment to 2nd generation biofuels and the promotion of clean vehicles.
The Strategy also looked at the sustainability of different feedstock cultivations and
explored further optimisation of greenhouse gas benefits.
2007 The Code for Sustainable
Homes
Establishment of minimum performance standards for the design and construction of
homes, covering energy, water, materials and waste.
2008
Climate Change Act This Act set a legally binding target of an 80% reduction in emissions from 1990 to 2050.
With a medium-term target of a 34% reduction by 2020.
Carbon Emission
Reduction Target
(CERT)
Replacing the Energy Efficiency Commitment, the CERT places greater focus on the substantial domestic energy saving measures such as insulation.
Renewable Transport
Fuel Obligation (RTFO)
Administered by the Renewable Fuels Agency, the RTFO requires suppliers of road transport fuels to include a specified percentage of renewable fuels.
Energy Performance
Certificates (EPC) Requires that whenever a building is built, sold or rented, an Energy Performance
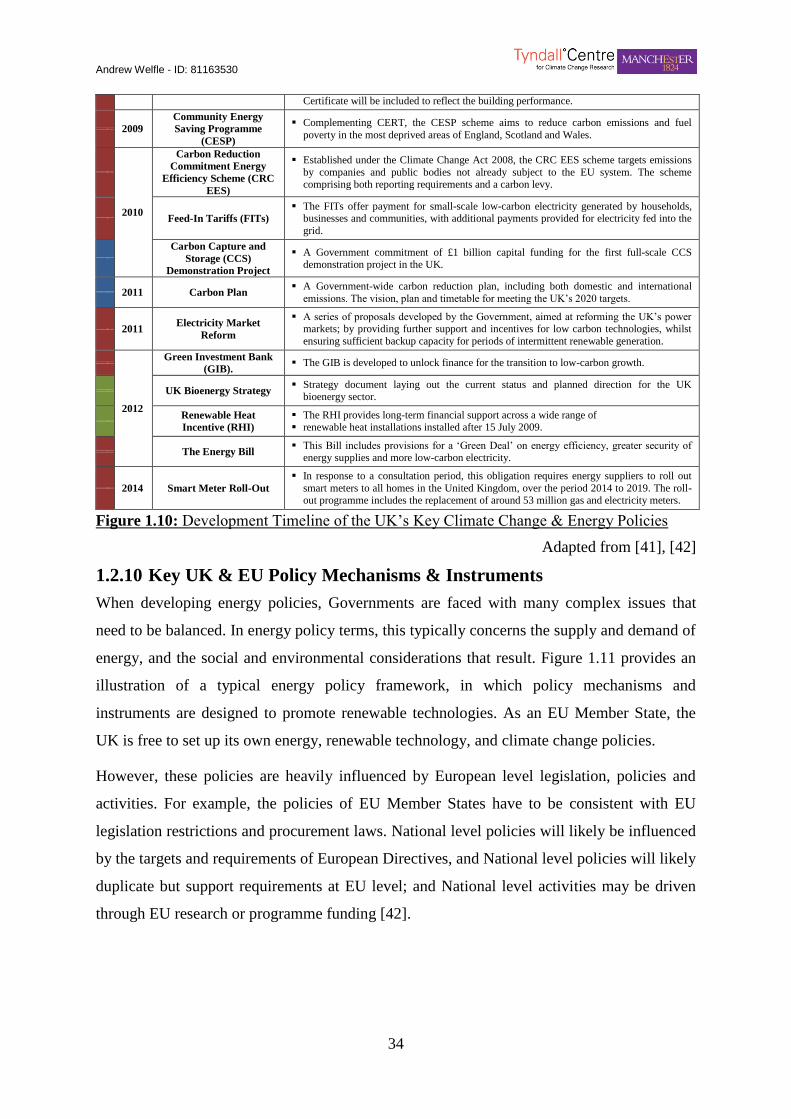
Andrew Welfle - ID: 81163530
34
Certificate will be included to reflect the building performance.
2009
Community Energy
Saving Programme
(CESP)
Complementing CERT, the CESP scheme aims to reduce carbon emissions and fuel
poverty in the most deprived areas of England, Scotland and Wales.
2010
Carbon Reduction
Commitment Energy
Efficiency Scheme (CRC
EES)
Established under the Climate Change Act 2008, the CRC EES scheme targets emissions
by companies and public bodies not already subject to the EU system. The scheme comprising both reporting requirements and a carbon levy.
Feed-In Tariffs (FITs)
The FITs offer payment for small-scale low-carbon electricity generated by households, businesses and communities, with additional payments provided for electricity fed into the
grid.
Carbon Capture and
Storage (CCS)
Demonstration Project
A Government commitment of £1 billion capital funding for the first full-scale CCS demonstration project in the UK.
2011 Carbon Plan A Government-wide carbon reduction plan, including both domestic and international
emissions. The vision, plan and timetable for meeting the UK’s 2020 targets.
2011 Electricity Market
Reform
A series of proposals developed by the Government, aimed at reforming the UK’s power markets; by providing further support and incentives for low carbon technologies, whilst
ensuring sufficient backup capacity for periods of intermittent renewable generation.
2012
Green Investment Bank
(GIB). The GIB is developed to unlock finance for the transition to low-carbon growth.
UK Bioenergy Strategy Strategy document laying out the current status and planned direction for the UK
bioenergy sector.
Renewable Heat
Incentive (RHI)
The RHI provides long-term financial support across a wide range of renewable heat installations installed after 15 July 2009.
The Energy Bill This Bill includes provisions for a ‘Green Deal’ on energy efficiency, greater security of
energy supplies and more low-carbon electricity.
2014 Smart Meter Roll-Out
In response to a consultation period, this obligation requires energy suppliers to roll out
smart meters to all homes in the United Kingdom, over the period 2014 to 2019. The roll-out programme includes the replacement of around 53 million gas and electricity meters.
10) Figure 1.10: Development Timeline of the U K’s Key Climate Change & Energy Policies
Figure 1.10: Development Timeline of the UK’s Key Climate Change & Energy Policies
Adapted from [41], [42]
1.2.10 Key UK & EU Policy Mechanisms & Instruments
When developing energy policies, Governments are faced with many complex issues that
need to be balanced. In energy policy terms, this typically concerns the supply and demand of
energy, and the social and environmental considerations that result. Figure 1.11 provides an
illustration of a typical energy policy framework, in which policy mechanisms and
instruments are designed to promote renewable technologies. As an EU Member State, the
UK is free to set up its own energy, renewable technology, and climate change policies.
However, these policies are heavily influenced by European level legislation, policies and
activities. For example, the policies of EU Member States have to be consistent with EU
legislation restrictions and procurement laws. National level policies will likely be influenced
by the targets and requirements of European Directives, and National level policies will likely
duplicate but support requirements at EU level; and National level activities may be driven
through EU research or programme funding [42].
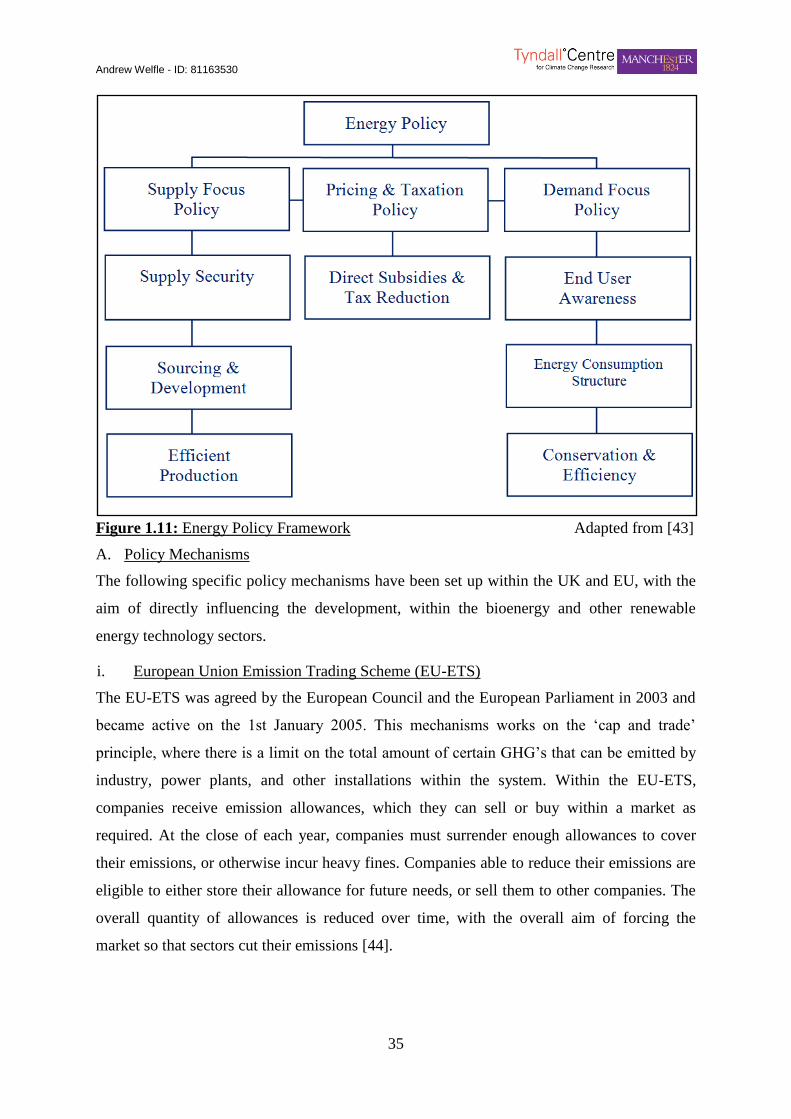
Andrew Welfle - ID: 81163530
35
11) Figure 1.11: Energy Policy Framewor k
Figure 1.11: Energy Policy Framework Adapted from [43]
A. Policy Mechanisms
The following specific policy mechanisms have been set up within the UK and EU, with the
aim of directly influencing the development, within the bioenergy and other renewable
energy technology sectors.
i. European Union Emission Trading Scheme (EU-ETS)
The EU-ETS was agreed by the European Council and the European Parliament in 2003 and
became active on the 1st January 2005. This mechanisms works on the ‘cap and trade’
principle, where there is a limit on the total amount of certain GHG’s that can be emitted by
industry, power plants, and other installations within the system. Within the EU-ETS,
companies receive emission allowances, which they can sell or buy within a market as
required. At the close of each year, companies must surrender enough allowances to cover
their emissions, or otherwise incur heavy fines. Companies able to reduce their emissions are
eligible to either store their allowance for future needs, or sell them to other companies. The
overall quantity of allowances is reduced over time, with the overall aim of forcing the
market so that sectors cut their emissions [44].
Andrew Welfle - ID: 81163530
36
ii. European Carbon Capture & Storage (CCS)
In 2009 the European Commission initiated the ‘CCS Directive’ [45] and set out supporting
mechanisms for the first CCS demonstration plants, under the ‘European Economic Program
for Recovery’ (EEPR) [46]. Across the EU, there is a common understanding that CCS
technologies will play a key role in reducing global CO2 emissions in the future.
CCS is proposed to provide an important contribution, in assisting the UK in meeting its CO2
emission reduction targets. The EU CCS initiative in the UK is becoming a reality in the form
of the White Rose Project under development across Yorkshire [47].
iii. Emission Performance Standards (EPS)
EPS’s are a method of setting benchmarks for the maximum levels of GHG emissions that
can be emitted for a certain amount of energy generated. In the UK, EPS’s have had previous
success in reducing the NOx, SOx, and particulate emissions from different installations [48].
The UK Government regards the EPS as a ‘regulatory backstop’; an important part of a
combined package of mechanisms, to prevent the unabated construction and operation of new
coal-fired power stations [49]
B. Policy Instruments
The next section provides a summary and discussion of some of the different policy
instruments that have been developed, and which are currently being adopted globally; across
the EU and within the UK. These include both statutory requirements, taxation based policy
instruments, and policy instruments driven by incentive. Each is designed to increase the
uptake of renewable technologies, reduce emissions, and mitigate climate change.
C. Policy Instruments - Statutory Requirement & Taxation Based
The following policy instruments have been designed and are currently being implemented to
promote the uptake of renewable technologies and climate change preventative actions; as a
statutory requirement or through promotion as a result of taxation.
i. Climate Change Levy (CCL)
The UK CCL is a taxation based policy instrument, focusing on the energy delivered to non-
domestic users throughout the UK. It is directly linked to the energy delivered and is
designed to incentivise energy efficiency and reduce carbon emissions. Electricity generated
from renewable technologies and approved co-generation schemes are exempt from the Levy.
Electricity generated from nuclear facilities is also subject to the Levy, despite the minimal
direct emissions resulting from this generation method [50].
Andrew Welfle - ID: 81163530
37
For the UK bioenergy sector the CCL has been judged to be ineffective [51]. This is likely
due to the relatively small costs of the Levy itself – fundamentally making it more
economical to remain with fossil fuel based sources, than to switch to renewable technology
alternatives that attract higher capital costs. Similar policy instruments appear to have a much
greater influence in other EU Member States, notably in Germany and Sweden [51].
ii. The UK Renewable Obligation (RO) Scheme
The RO is the main policy instrument for promoting renewable electricity projects throughout
the UK. The focus of the RO is to place an obligation on all licensed suppliers of electricity
in the UK, to source an increasing proportion of their electricity from renewable sources.
Alternatively, the licensed electricity suppliers may hold ‘Renewable Obligation Certificates’
(ROCs) equal to the required percentage [52].
ROCs are essentially Green certificates that are issued to the generators of ‘eligible
renewable electricity’ within the UK, and supplied to customers within the UK by licensed
suppliers. In summary one ‘ROC’ is issued for each megawatt hour (MWh) of ‘eligible
renewable electricity’ output generated. The overall design of the RO in conjunction with
ROCs provides an incentive for the continual development of renewable electricity
generation capacity [52].
In relation to the bioenergy sector, the introduction of the RO has failed to demonstrate any
significant increases in capacity compared to other renewable technologies. This failure is
attributed to the single price offered through the RO for all renewable electricity; it being
uneconomical for bio-electricity to compete with cheaper options for the UK, such as wind
power; although RO updates will likely attempt to address this [53].
iii. UK Renewable Transport Fuel Obligation (RTFO)
The RTFO is a requirement for transport fuel suppliers to ensure that ≥5% of fuel for road
vehicles, is sourced from sustainable energy sources. The RTFO also requires additional
reporting of the carbon related impacts throughout feedstock production stages [54]. All
suppliers operating within the UK with a biofuel threshold usage of over 450,000 l/yr. are
required to report their performance [55].
In practice, the RTFO is mostly achieved by blending bio-ethanol, bio-methanol, biodiesel,
and biogas (derived from a wide range of biomass resource feedstock) with fossil fuels. The
UK Department for Transport (DfT) estimates [54] that the RTFO will help promote a
Andrew Welfle - ID: 81163530
38
movement towards a target of 1/3 of all UK transport sector fuel, being produced
domestically. The RTFO also keeps the UK ahead of related EU level legislation.
iv. Electricity Market Reform
The Government is consulting on a series of options for reforming the UK electricity
markets. These being designed to balance the best deals for customers, whilst providing
existing and potential new entrants to the energy sector, with the certainty they need to
generate investment. The focus is to ensure that low carbon technologies become increasingly
attractive choices for investors, and ensuring that backup capacity is adequately rewarded.
Key proposals are [56]:
Feed-in Tariffs: Long-term contracts that are designed to provide greater revenue
certainty for low-carbon generation. A ‘contract for difference’ (CFD) model for low-
carbon generation is proposed; that should control consumer costs, provide stable
investor returns, and maintain the market incentives to generate when electricity
demand is high.
Capacity Payments: Targeted payment schemes to encourage and ensure security of
supply and the construction of flexible reserve plants or demand reduction measures.
These capacity payments ensure that there is a generation capacity buffer during
periods of intermittent and inflexible low-carbon generation.
Emissions Performance Standards: Upper limits to the extent that carbon intensive
power stations can emit emissions. Enforcing existing requirements for the building of
no new coal plants without effective carbon capture and storage capabilities.
D. Policy Instruments – Incentive & Investment Based
An alternative policy instrument approach for promoting and developing the renewable
energy and specifically biofuel sectors, are based on incentives such as energy subsidies.
Energy subsidies keep processes for consumers below market levels, or for producers above
market levels. The primary motive is to make renewable technologies highly economical and
viable for investment by the private sector [51]. A discussion of some incentive and
investment based schemes are discussed in the following section.
i. UK Renewable Heat Incentive (RHI)
The RHI is the world’s first and longest running financial support programme for renewable
heat generation. The RHI pays incentives to participants of the scheme, who generate and use
renewable energy to heat their buildings. The RHI is applicable to solar-thermal, ground-
source, and water-source heat pumps and biomass boiler systems [57].
Andrew Welfle - ID: 81163530
39
Although the RHI has delivered modest success since its launch, it took 6 years to finalise,
following its initial introduction by the UK Department for Energy & Climate Change
(DECC). This period was very damaging for the development of the bio-heat sector that has
seen a large policy focus shift towards bio-power energy pathways [58].
ii. Green Certificates
Green Certificates are typically a tradable commodity that may be gained as a function of the
amounts of renewable energy generated. It is typical for one certificate to represent the
generation of 1 MWh of generation.
Green certificates in the UK have not been universally successful for the bioenergy sector in
comparison to the success found with other renewable technologies [51].
iii. Feed-In-Tariff (FiT)
The UK FiT policy instruments have been developed for application to predominantly small-
scale electricity generation systems, where a fixed sum is paid for the generation
technologies. In the UK, the FiT was designed with a few standout features applicable to the
bioenergy sector – including Combined Heat and Power (CHP). The majority of EU Member
States selected FiT’s and price premiums as the policy instruments of choice to support the
introduction of renewable technologies [48].
The UK Government estimated [51] that FiT’s supporting small-scale renewable energy
generation, would cost £8.6 billion up to 2030; although only produce a carbon savings worth
£0.42 billion. The cost effectiveness and efficiency of such a policy instrument must
therefore remain questionable.
Andrew Welfle - ID: 81163530
40
1.3 Thesis Rationale
The rationale for undertaking this Research Project stems from a series of uncertainties and
questions. The designed research framework aims and objectives; are developed to address
each of these themes:
Legislated Targets – the UK has ambitious GHG gas reduction and renewable
energy contribution targets [59].
Bioenergy - the UK has plans for energy from biomass resources to make large
contributions to these targets.
Uncertainty – a comprehensive review is required of the UK’s biomass resource
supply chains, to further understand how much the UK’s indigenous resource will be
able to contribute towards the future UK bioenergy sector’s resource demands.
Bioenergy Sector – further understanding is required about how the UK’s bioenergy
and the biomass resource supply chain dynamics may develop in the future.
Imports – if the UK is going to have to import more biomass in the future to balance
its demands, the implications of this are still relatively unknown.
Trade – with biomass being identified as a key part of energy strategies in countries
all around the world, there are still many more questions than answers about how the
global biomass markets will develop, and whether supplies will be able to balance
rapidly growing demands.
Andrew Welfle - ID: 81163530
41
1.4 Research Problem Statement
The following statement reflects the structure of the fundament research problem that the
PhD Research Project has been developed to address. The statement represents the
overarching questions, and the gaps in current knowledge that the PhD Research has been
undertaken to fill.
The UK has ambitious GHG reduction and renewable energy technology contribution targets,
that it is legislated meet through a series of progressive benchmark targets to the year 2050.
Energy from biomass is proposed to make large contributions towards the UK’s ability to
meet these targets. Questions remain as to the types and extent that UK indigenous biomass
resources may be available to contribute to balancing future bioenergy demands. Also, what
types and extent of biomass resources will the UK potentially need to import from the global
biomass trade markets, if indigenous resources are found to be insufficient to balance
demand? With the UK and many other countries around the world developing energy
strategies that rely on bioenergy pathways, further major questions remain as to how the
future global biomass trade markets will develop; and fundamentally whether supply will be
able to meet growing global demand? There are also many further unanswered questions
relating to how the UK Government could further develop its bioenergy strategies and
policies; to help mobilise and utilise a greater proportion of indigenous biomass resource, in
order to reduce the extent of biomass that may need to be imported in the future?
Andrew Welfle - ID: 81163530
42
1.5 Research Aims & Objectives
This section discusses the key aims and objectives of the PhD Research. These aims and
objectives steer the research and analysis directions; undertaken during the project as
documented in this Thesis.
1.5.1 Research Aim 1
Develop a modelling tool that would enable the analysis of biomass supply chain dynamics
for a chosen country or geographic area.
A. Objectives
The objectives of Research Aim 1 are as follows:
Through the undertaking of wide literature reviews, develop a modelling tool that can
be applied to reflect the biomass resource supply chain dynamics in both the UK and
Brazil; in order to evaluate both the UK’s and Brazil’s biomass resource potentials.
Develop the modelling tool so that agricultural land requirements and the biomass
dependent industry’s resource demands, are forecast and fully accounted; so that any
biomass resource availability forecasts are in addition to food and industry demands
being met.
Through further wide literature reviews, develop the modelling tool so that bioenergy
potential forecasts, can be developed using the resources identified as being available;
taking into consideration the broad range of biomass resources, bioenergy conversion
process, and potential forms of bioenergy that could be generated.
1.5.2 Research Aim 2
Determine the UK’s indigenous biomass resource potential, and the availability of indigenous
resource that may be utilised by the UK bioenergy sector, without impacting food systems or
existing biomass resource markets.
A. Objectives
The objectives of Research Aim 2 are as follows:
Through the development of a series of biomass resource scenarios that reflect
different potential pathways that the UK could take, with varying focus on developing
the UK bioenergy sector; analyse the potential availability of UK indigenous biomass
resource that could be used by the UK bioenergy sector.
Andrew Welfle - ID: 81163530
43
Compare the biomass resource availability forecasts from each of the biomass
scenarios, against forecasts of UK bioenergy sector’s resource demands; in order to
determine whether the extent and types of available UK biomass resource, may be
able to balance the UK’s resource demands.
Evaluate the extent and types of biomass resources that the future UK bioenergy
sector may need to import from the global biomass trade markets, if indigenous
resources are insufficient to balance UK demands.
1.5.3 Research Aim 3
Evaluate the nature and characteristics of the global biomass trade markets, and analyse how
these may change in the future.
A. Objectives
The objectives of Research Aim 3 are as follows:
Determine the major supply and demand regions and countries that are currently
driving global biomass resource trade, and evaluate whether these may change in the
future.
Identify the current trade flows of key biomass resources, and also evaluate how these
may evolve in the future.
Through focusing on the biomass supply chain dynamics of a key biomass exporting country
(Brazil), evaluate whether future biomass exports traded on the global biomass markets, may
be sufficient to balance demands.
1.6 Thesis Storyline
This final section of the Introduction Chapter presents the framework of the ‘Thesis
Storyline’. This represents the structure developed to present the literature reviews,
methodologies, analyses, results, data, discussions, and conclusions of the wider PhD
Research Project, as reflected within this Thesis. The structure has been designed to flow,
presenting a ‘story’ of the research. The Thesis Chapters have been developed to provide a
background to the research, followed by a presentation of the methodologies; moving on to
present the analyses, results, discussions, and finally the conclusions. As the Chapters
progress, further methodologies are presented followed by their respective results,
discussions, and conclusions. This specific approach was chosen to reflect the actual
progression and chronological order in which the research was undertaken. The conclusions
Andrew Welfle - ID: 81163530
44
derived from each theme of the research; in turn, influence the successive steps taken within
the PhD Research Project.
The Thesis Storyline progresses through the following structure of Chapters:
1.6.1 Chapter 1 – Introduction
This Introduction Chapter is listed as Chapter 1 within the chronological ordering of the
Thesis Chapters.
1.6.2 Chapter 2 – Biomass as a Renewable Energy Resource
Chapter 2 presents a literature review driven analysis of the different types and forms of
biomass, and the range of bioenergy pathways that make biomass resources attractive energy
options. The Chapter aims to set the scene in discussing the broad range of biomass
resources, and their varying characteristics. The Chapter also discusses the equally wide
range of bioenergy conversion pathway options, and potential end products that make
biomass a versatile renewable energy resource.
Chapter 2 links to other Chapters, in that it provides the knowledge based framework that is
required when assessing different types of biomass, and their applicability to different
bioenergy conversion pathways to produce various forms of energy or related products.
1.6.3 Chapter 3 – Biomass Resource Modelling
Chapter 3 presents a literature review driven discussion of the concepts of biomass resource
modelling. This includes an analysis of the different modelling methodologies, developed to
analyse biomass resources at various geographic and spatial scales. Also, methodologies
developed to analyse different themes of biomass research that have varying focus, such as
modelling biomass economic feasibilities or resource potentials.
Chapter 3 is essential to the Thesis Storyline as it introduces the concepts of biomass resource
modelling that are integrated into the development of the Biomass Resource Model – the
primary tool developed to carry out all analyses throughout the research.
1.6.4 Chapter 4 – Developing the Biomass Resource Model
Chapter 4 represents the primary methodology Chapter within the Thesis. This includes a full
discussion of how the Biomass Resource Model (BRM) was developed, and a presentation of
the specific calculation equations that make up the modelling mechanics, of each analysis
theme within the BRM. The BRM is designed as a flexible tool that can be adapted to model
the full biomass resource supply chain dynamics, and bioenergy systems of a given country

Andrew Welfle - ID: 81163530
45
or geographic region. Chapter 4 focuses on the development of the UK BRM; designed to
analyse the UK’s biomass resource supply chains, and forecast how the UK’s indigenous
biomass resource may develop in the future.
The methodologies developed within Chapter 4 are important and closely linked to each of
the other Chapters where analysis is undertaken, using the BRM.
1.6.5 Chapter 5 – Drivers Influencing Biomass Availability & Bioenergy
Chapter 5 represents the first Chapter where the research analysis is undertaken. The Chapter
starts with a literature review driven assessment, to identify and further understand the broad
range of biomass resource supply chain drivers that are closely linked, and provide influence
in determining the potential availability of different biomass resources. A wide literature
review is also undertaken to gain an understanding of the UK’s current supply chain
characteristics, and also to determine how these may change in the future.
The UK BRM is calibrated to reflect the ‘literature review informed’ future UK biomass
supply chain characteristics. Thus a ‘UK Baseline Scenario’ is developed within the UK
BRM, and an analysis is undertaken to evaluate the UK’s potential biomass resource
availability for this scenario. A sensitivity analysis is then carried out, to determine the extent
to which each specific driver within the UK BRM influences the different biomass resource
availability forecasts. Chapters 5’s results, discussions, and conclusions, focus on
highlighting the specific supply chain drivers that are identified as providing the greatest and
least influence in determining the potential availability of biomass resources.
The analysis undertaken in Chapter 5 is linked closely to that undertaken in Chapter 6, where
scenarios are developed; and Chapter 10 where the BRM is adapted to reflect Brazil’s
biomass supply chains.
The UK BRM baseline scenario analyses and the supply chain driver sensitivity analyses
undertaken in Chapter 5, reflect work submitted and reviewed by Elsevier’s Biomass and
Bioenergy Journal under the title of: ‘Increasing Biomass Resource Availability through
Supply Chain Analysis’. Further details of this submission are discussed in the PhD Outputs
Section, and the Paper is presented in Appendix 15.
1.6.6 Chapter 6 – UK Biomass Resource Scenarios
Chapter 6 progresses the Thesis Storyline on from the analysis undertaken in Chapter 5. In
Chapter 6, further literature review driven analysis is undertaken to understand how the UK’s
biomass supply chain characteristics may change if the UK were to follow a series of
Andrew Welfle - ID: 81163530
46
potential future pathways, where varying degrees of focus are placed on developing the UK’s
bioenergy sector and mobilisation of UK biomass resource. Respective scenarios are
developed within the UK BRM representing these potential future pathways and biomass
resource availability, and bioenergy potential forecasts are developed and extensively
analysed.
Analyses within Chapter 6 identify the specific types of biomass resource that demonstrate
the highest potential value for the UK bioenergy sector. In addition an analysis is undertaken
to forecast the UK’s potential maximum resource mobilisation levels, and how these
indigenous biomass resources may contribute to the UK’s energy targets.
The analysis undertaken in Chapter 6 builds upon that undertaken in Chapter 5, and also
forms the basis for the discussions and analysis undertaken in Chapter 7.
The UK BRM scenarios analysis undertaken in Chapter 6 reflects work published within
‘Elsevier’s Energy Policy Journal’, under the title: ‘Securing a Bioenergy Future without
Imports’. Further details of this submission are discussed in the PhD Outputs Section, and the
Paper is presented in Appendix 15.
1.6.7 Chapter 7 – The Future UK Bioenergy Sector
Chapter 7 starts with a literature review driven analysis of the UK’s current bioenergy
strategies and policies. This is undertaken to gain a greater understanding of where the UK’s
bioenergy sector currently stands, and the likely directions it may take in the near, medium,
and long-terms. Following this review, an analysis is undertaken to evaluate the types and
extent of biomass resources that the UK bioenergy sector will likely require, if the current
strategies and plans were to be realised.
Drawing on the results of the scenario analyses in Chapter 6, a resource balance analysis is
undertaken that compares the specific potential future demands of the UK bioenergy sector,
against the potential indigenous biomass resource availabilities forecast for each scenario.
The main conclusions from Chapter 7 are the evaluations of whether or not the UK is found
to have sufficient types of, and the extent of, indigenous biomass resources; in order to meet
its future demands. The assumptions being that the UK will have to import resources to
balance its demands, if indigenous resources are found to be insufficient.
The analysis undertaken in Chapter 7, builds directly on from that undertaken in Chapter 6, in
that the scenario forecasts from Chapter 6, are used within Chapter 7’s biomass resource
Andrew Welfle - ID: 81163530
47
balance analysis assessments. The nature of the results presented in Chapter 7, also heavily
influenced the successive directions of the PhD Research Project; therefore the successive
Chapters of the Thesis are heavily linked to Chapter 7.
The UK BRM biomass resource balance analysis undertaken in Chapter 7 reflects the work
published within Elsevier’s Energy Policy Journal under the title, ‘Securing a Bioenergy
Future without Imports’. Further details of this submission are discussed in the PhD Outputs
Section, and the Paper is listed in Appendix 15.
1.6.8 Chapter 8 – Global Biomass Trade: Supply, Demand, Limitations &
Sustainability
Chapter 8 presents a further literature review driven analysis; this time focusing on the global
biomass trade markets. The concept of this Chapter is to further analyse and understand the
global markets, in which countries have to trade if they require biomass resource imports to
balance their demands. The discussion areas focus on identifying: the key supply and demand
regions for biomass trade; the major trade flows of different types of biomass; how the
market might develop; the potential limitations; and the sustainability impacts associated with
the global trade of biomass.
Chapter 8 is closely linked to Chapter 7 in that it discusses the global markets in which the
UK will have to trade, if the UK faces a deficit of indigenous resources to meet its demands.
As before, Chapter 9 is heavily influenced by Chapter 8, in which Brazil is highlighted as a
case study of a country with a large biomass resource, and the export potential to drive the
global biomass trade markets.
The analysis of global trade markets discussed in Chapter 8 reflects the work of a third
Journal Paper with the preliminary title, ‘Global Biomass Trade Caution’. Further details of
this proposed submission are discussed in the PhD Outputs Section.
1.6.9 Chapter 9 – Case Study: Brazil’s Biomass Resource Analysis
Chapter 9 focuses on Brazil, as a case study of a country that exports, and is forecast to
increasingly export, biomass resources for global trade. The Chapter presents methodologies,
describing how the Biomass Resource Model was adapted to reflect the biomass resource
supply chains of Brazil (Brazil BRM). Drawing on the methodologies of Chapter 5, a
‘literature review informed’ Brazil BRM Baseline Scenario is developed, to forecast the
extent and types of biomass resources that Brazil may have in the future, and how much they
may be able to export.
Andrew Welfle - ID: 81163530
48
A unique area of analyses is undertaken in Chapter 9, in developing a series of ‘Brazil
Bioenergy Scenarios’. Again drawing on literature and influenced by a series of Case Study
Countries; scenarios are developed that evaluate how Brazil’s energy strategies and policies
may develop in the future, if the Brazilian Government were to set targets with varying
ambitions, to increase the renewable energy technology contribution towards the Brazilian
energy mix. The key conclusions from Chapter 9, discuss the potential impacts to the global
biomass trade markets and future net importing countries; if countries such as Brazil were to
start utilising greater proportions of their biomass resources to deliver domestic energy
demands, rather than importing them.
The Brazilian bioenergy scenario analyses of Chapter 9, reflects the core body of work of a
third Journal Paper; with the preliminary title, ‘Global Biomass Trade Caution’. Further
details of this proposed submission are discussed in the PhD Outputs Section.
1.6.10 Chapter 10 – An Alternative UK Bioenergy Strategy
Chapter 10 brings the focus of the Thesis back to the UK. In reflecting on the conclusions
drawn from each of the previous Thesis Chapters, Chapter 10 draws on literature and key
case studies, to present a series of themes, strategies, and policy innovations; the proposal of
which present potential alternative UK bioenergy strategy options. These potential strategies
are designed with the aim of increasing the UK’s focus, on utilising key biomass resources
that demonstrate the greatest potential. Thus, the Chapter presents alternative UK bioenergy
strategy options.
1.6.11 Chapter 11 – Thesis Conclusions
Chapter 11 presents the PhD Conclusions including: an analysis of the research results and
conclusions, with respect to the initial PhD Research aims and objectives; an assessment of
the implications of the research conclusions; identification of the limitations of the work; and
suggested areas of additional work that would further develop the research.
1.6.12 Thesis References
This section within the Thesis presents the complete list of references. These are ranked
chronologically in relation to their reference points throughout the Thesis texts.
1.6.13 Thesis Appendices
The final section of the Thesis presents the various Appendices referenced throughout the
Thesis.
Andrew Welfle - ID: 81163530
49
Chapter 2 - Biomass as a Renewable Energy Resource

Andrew Welfle - ID: 81163530
50
2.1 Biomass as a Renewable Energy
Resource
The following Chapter introduces and discusses the various characteristics of biomass
materials that make them important fuels. In the context of the overall Thesis structure, this
Chapter is important in developing the background information; discussing why different
biomass materials have varying properties, and why biomass is flexible in allowing a range of
energy generation or conversion pathways.
2.1.1 A Renewed Interest in Biomass as a Fuel
There is a renewed interest in the widespread utilisation of biomass resources for the
generation of energy. Interest is focused on: the conversion of energy crops to produce
transport fuels, the direct combustion of resource to generate heat, or the co-firing of biomass
with other fossil fuels to produce power. Compared to other renewable energy supplies,
biomass offers the distinct advantage of being a readily storable energy resource, with a wide
geographic spread [60].
This trend has been reaffirmed by the European Parliament, in noting: “Biomass has many
advantages over conventional energy sources, as well as over some other renewable
energies; in particular: relatively low costs, less dependence on short-term weather changes,
promotion of regional economic structures, and provision of alternative sources of income
for farmers” [61].
Energy produced from biomass and its conversion products, represents an ever-increasing
proportion of today’s energy mix. Biomass materials can be converted into liquids, solids or
gaseous fuels; through a series of conversion processes, in order to enhance its energy
content. The ability to convert biomass materials through physical, chemical or biological
processes, allows the transformation of carbonaceous solid materials that may be awkward to
handle, bulky and of low energy concentration; into fuels with enriched physicochemical
characteristics, with the added options for economic storage and transferability [62].
2.1.2 The Storage of Energy within Biomass
The energy within biomass originates from the Sun, as a result of the processes of
photosynthesis. Essentially, CO2 from the air is converted into other Carbon based molecules
such as sugars (Figure 2.1). As the Sun’s energy is intercepted by the photosynthetic active
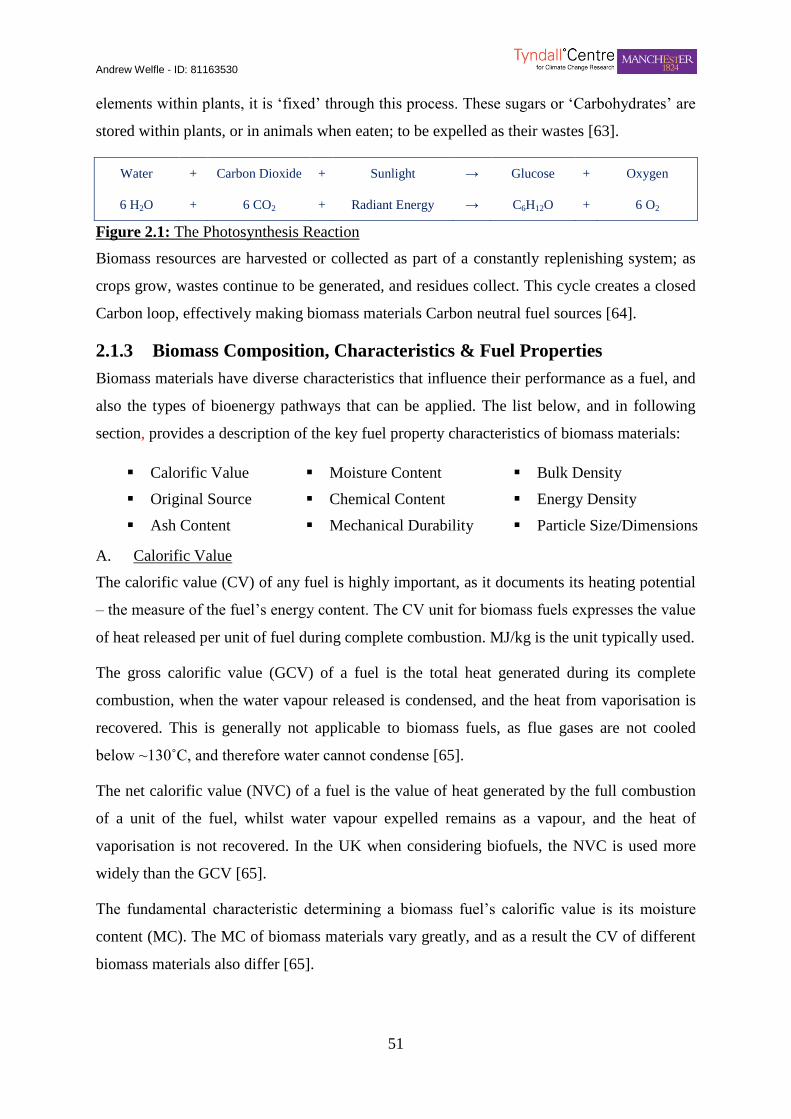
Andrew Welfle - ID: 81163530
51
elements within plants, it is ‘fixed’ through this process. These sugars or ‘Carbohydrates’ are
stored within plants, or in animals when eaten; to be expelled as their wastes [63].
Water + Carbon Dioxide + Sunlight → Glucose + Oxygen
6 H2O + 6 CO2 + Radiant Energy → C6H12O + 6 O2 12) Figure 2.1: The Photosynt hesis Reaction
Figure 2.1: The Photosynthesis Reaction
Biomass resources are harvested or collected as part of a constantly replenishing system; as
crops grow, wastes continue to be generated, and residues collect. This cycle creates a closed
Carbon loop, effectively making biomass materials Carbon neutral fuel sources [64].
2.1.3 Biomass Composition, Characteristics & Fuel Properties
Biomass materials have diverse characteristics that influence their performance as a fuel, and
also the types of bioenergy pathways that can be applied. The list below, and in following
section, provides a description of the key fuel property characteristics of biomass materials:
Calorific Value Moisture Content Bulk Density
Original Source Chemical Content Energy Density
Ash Content Mechanical Durability Particle Size/Dimensions
A. Calorific Value
The calorific value (CV) of any fuel is highly important, as it documents its heating potential
– the measure of the fuel’s energy content. The CV unit for biomass fuels expresses the value
of heat released per unit of fuel during complete combustion. MJ/kg is the unit typically used.
The gross calorific value (GCV) of a fuel is the total heat generated during its complete
combustion, when the water vapour released is condensed, and the heat from vaporisation is
recovered. This is generally not applicable to biomass fuels, as flue gases are not cooled
below ~130˚C, and therefore water cannot condense [65].
The net calorific value (NVC) of a fuel is the value of heat generated by the full combustion
of a unit of the fuel, whilst water vapour expelled remains as a vapour, and the heat of
vaporisation is not recovered. In the UK when considering biofuels, the NVC is used more
widely than the GCV [65].
The fundamental characteristic determining a biomass fuel’s calorific value is its moisture
content (MC). The MC of biomass materials vary greatly, and as a result the CV of different
biomass materials also differ [65].
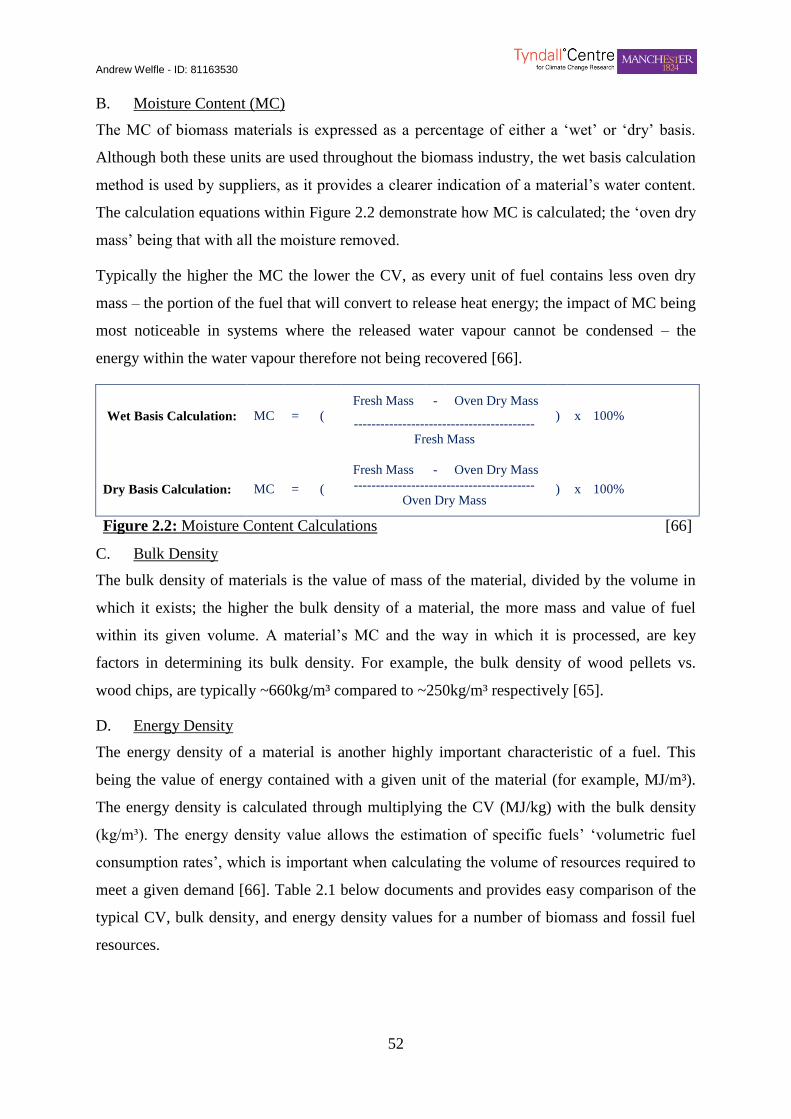
Andrew Welfle - ID: 81163530
52
B. Moisture Content (MC)
The MC of biomass materials is expressed as a percentage of either a ‘wet’ or ‘dry’ basis.
Although both these units are used throughout the biomass industry, the wet basis calculation
method is used by suppliers, as it provides a clearer indication of a material’s water content.
The calculation equations within Figure 2.2 demonstrate how MC is calculated; the ‘oven dry
mass’ being that with all the moisture removed.
Typically the higher the MC the lower the CV, as every unit of fuel contains less oven dry
mass – the portion of the fuel that will convert to release heat energy; the impact of MC being
most noticeable in systems where the released water vapour cannot be condensed – the
energy within the water vapour therefore not being recovered [66].
Wet Basis Calculation: MC = (
Fresh Mass - Oven Dry Mass
) x 100% -----------------------------------------
Fresh Mass
Dry Basis Calculation: MC = (
Fresh Mass - Oven Dry Mass
) x 100% -----------------------------------------
Oven Dry Mass
Figure 2.2: Moisture Content Calculations [66] 13) Figure 2.2: Moisture Content Calculations
C. Bulk Density
The bulk density of materials is the value of mass of the material, divided by the volume in
which it exists; the higher the bulk density of a material, the more mass and value of fuel
within its given volume. A material’s MC and the way in which it is processed, are key
factors in determining its bulk density. For example, the bulk density of wood pellets vs.
wood chips, are typically ~660kg/m³ compared to ~250kg/m³ respectively [65].
D. Energy Density
The energy density of a material is another highly important characteristic of a fuel. This
being the value of energy contained with a given unit of the material (for example, MJ/m³).
The energy density is calculated through multiplying the CV (MJ/kg) with the bulk density
(kg/m³). The energy density value allows the estimation of specific fuels’ ‘volumetric fuel
consumption rates’, which is important when calculating the volume of resources required to
meet a given demand [66]. Table 2.1 below documents and provides easy comparison of the
typical CV, bulk density, and energy density values for a number of biomass and fossil fuel
resources.
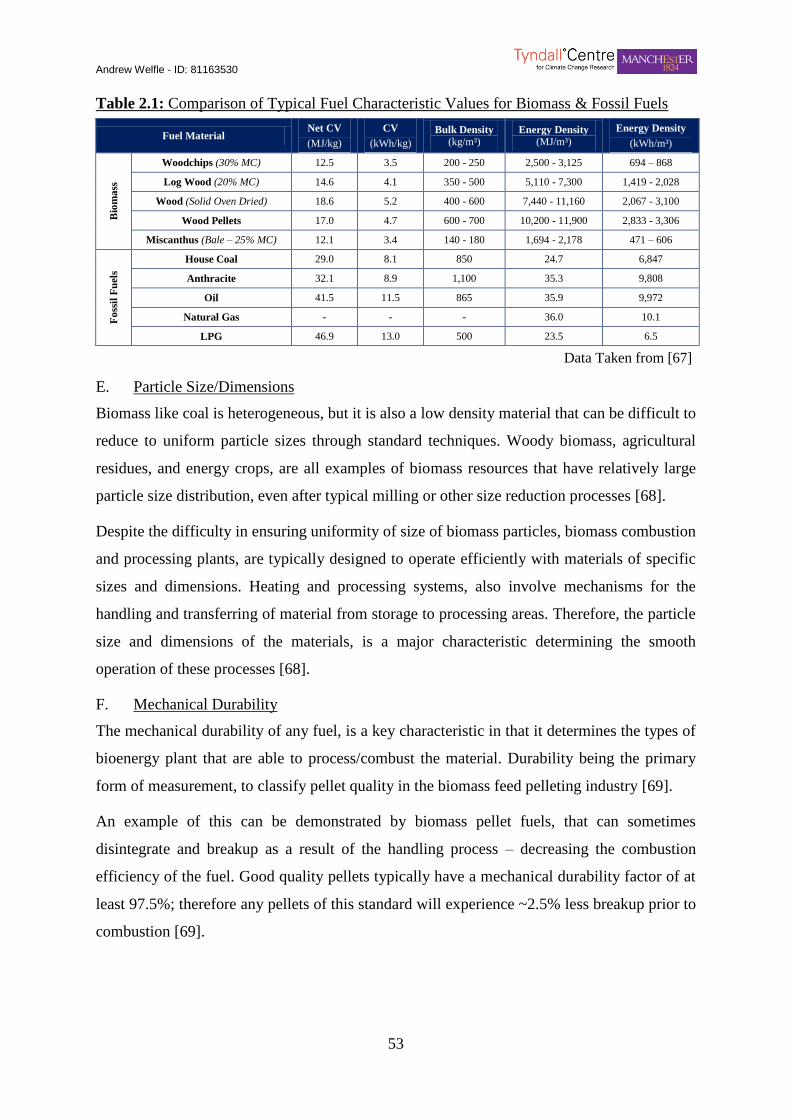
Andrew Welfle - ID: 81163530
53
Table 2.1: Comparison of Typical Fuel Characteristic Values for Biomass & Fossil Fuels Table 2) Table 2.1: Comparison of Typical F uel C haracteristic Values for Biomass & Foss il F uels
Fuel Material Net CV
(MJ/kg)
CV
(kWh/kg)
Bulk Density
(kg/m³) Energy Density
(MJ/m³)
Energy Density
(kWh/m³)
Bio
ma
ss
Woodchips (30% MC) 12.5 3.5 200 - 250 2,500 - 3,125 694 – 868
Log Wood (20% MC) 14.6 4.1 350 - 500 5,110 - 7,300 1,419 - 2,028
Wood (Solid Oven Dried) 18.6 5.2 400 - 600 7,440 - 11,160 2,067 - 3,100
Wood Pellets 17.0 4.7 600 - 700 10,200 - 11,900 2,833 - 3,306
Miscanthus (Bale – 25% MC) 12.1 3.4 140 - 180 1,694 - 2,178 471 – 606
Fo
ssil
Fu
els
House Coal 29.0 8.1 850 24.7 6,847
Anthracite 32.1 8.9 1,100 35.3 9,808
Oil 41.5 11.5 865 35.9 9,972
Natural Gas - - - 36.0 10.1
LPG 46.9 13.0 500 23.5 6.5
Data Taken from [67]
E. Particle Size/Dimensions
Biomass like coal is heterogeneous, but it is also a low density material that can be difficult to
reduce to uniform particle sizes through standard techniques. Woody biomass, agricultural
residues, and energy crops, are all examples of biomass resources that have relatively large
particle size distribution, even after typical milling or other size reduction processes [68].
Despite the difficulty in ensuring uniformity of size of biomass particles, biomass combustion
and processing plants, are typically designed to operate efficiently with materials of specific
sizes and dimensions. Heating and processing systems, also involve mechanisms for the
handling and transferring of material from storage to processing areas. Therefore, the particle
size and dimensions of the materials, is a major characteristic determining the smooth
operation of these processes [68].
F. Mechanical Durability
The mechanical durability of any fuel, is a key characteristic in that it determines the types of
bioenergy plant that are able to process/combust the material. Durability being the primary
form of measurement, to classify pellet quality in the biomass feed pelleting industry [69].
An example of this can be demonstrated by biomass pellet fuels, that can sometimes
disintegrate and breakup as a result of the handling process – decreasing the combustion
efficiency of the fuel. Good quality pellets typically have a mechanical durability factor of at
least 97.5%; therefore any pellets of this standard will experience ~2.5% less breakup prior to
combustion [69].
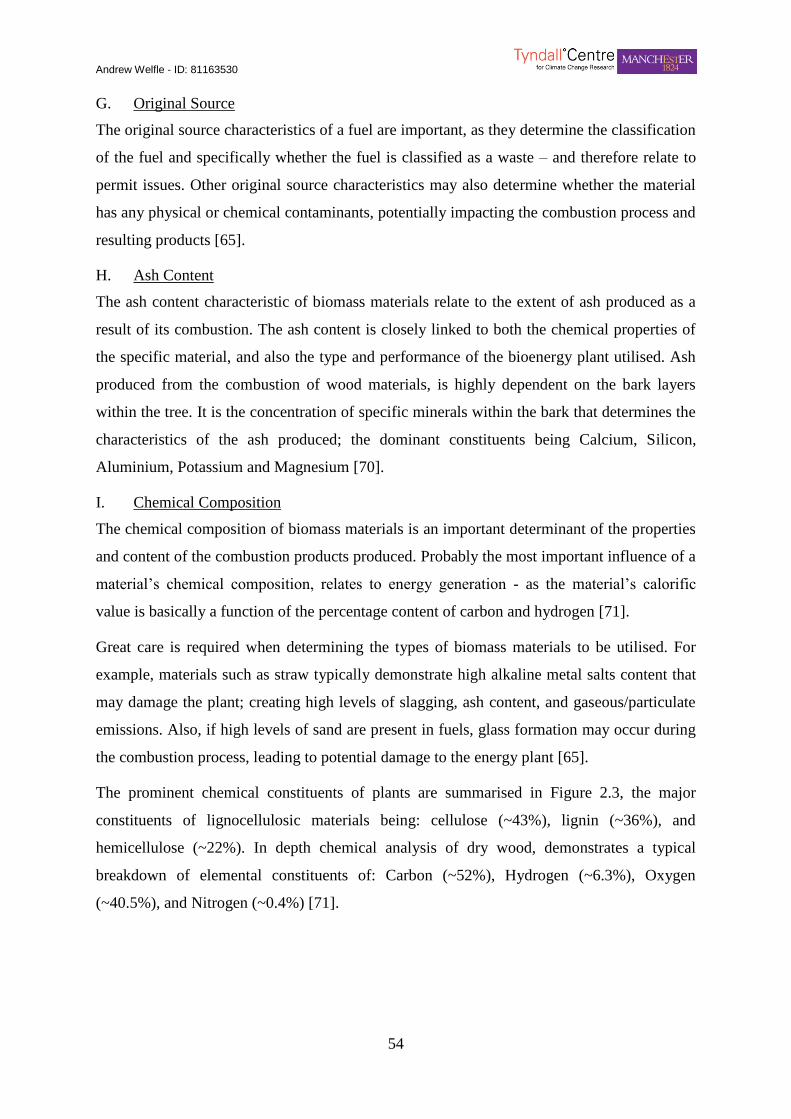
Andrew Welfle - ID: 81163530
54
G. Original Source
The original source characteristics of a fuel are important, as they determine the classification
of the fuel and specifically whether the fuel is classified as a waste – and therefore relate to
permit issues. Other original source characteristics may also determine whether the material
has any physical or chemical contaminants, potentially impacting the combustion process and
resulting products [65].
H. Ash Content
The ash content characteristic of biomass materials relate to the extent of ash produced as a
result of its combustion. The ash content is closely linked to both the chemical properties of
the specific material, and also the type and performance of the bioenergy plant utilised. Ash
produced from the combustion of wood materials, is highly dependent on the bark layers
within the tree. It is the concentration of specific minerals within the bark that determines the
characteristics of the ash produced; the dominant constituents being Calcium, Silicon,
Aluminium, Potassium and Magnesium [70].
I. Chemical Composition
The chemical composition of biomass materials is an important determinant of the properties
and content of the combustion products produced. Probably the most important influence of a
material’s chemical composition, relates to energy generation - as the material’s calorific
value is basically a function of the percentage content of carbon and hydrogen [71].
Great care is required when determining the types of biomass materials to be utilised. For
example, materials such as straw typically demonstrate high alkaline metal salts content that
may damage the plant; creating high levels of slagging, ash content, and gaseous/particulate
emissions. Also, if high levels of sand are present in fuels, glass formation may occur during
the combustion process, leading to potential damage to the energy plant [65].
The prominent chemical constituents of plants are summarised in Figure 2.3, the major
constituents of lignocellulosic materials being: cellulose (~43%), lignin (~36%), and
hemicellulose (~22%). In depth chemical analysis of dry wood, demonstrates a typical
breakdown of elemental constituents of: Carbon (~52%), Hydrogen (~6.3%), Oxygen
(~40.5%), and Nitrogen (~0.4%) [71].
Andrew Welfle - ID: 81163530
55
14) Figure 2.3: The Principal Components of Biomass Material
Figure 2.3: The Principal Components of Biomass Material Adapted from [72]
2.1.4 The Variable Characteristics of Biomass Materials
It is often difficult to establish a representative biomass composition breakdown, for all the
different biomass feedstocks; due to the large range of variations. In some cases this makes
reliance on biomass as the sole fuel source, problematic. There are various solutions to this
issue; including pre-treatments that may remove undesired contaminants such Chlorine or
Potassium [73]. One of the best ways to anticipate the performance of different biomass
types; is through the accumulation of knowledge relevant to each type of biomass.
A. The Phyllis Database
Until relatively recently, information relating to the composition and characteristics of
different biomass types was scattered amongst various texts, and was expressed in varying
units. The ‘Phyllis Database’, designed by the Energy Centre for the Netherlands, is a
comprehensive source of information detailing the average compositions of different biomass
types and wastes. As of 1998, the Phyllis Database has been made available for third parties,
and the data records continue to develop [74].
B. Biomass Combustion Models
Another way of categorising the characteristics of different biomass materials is through a
biomass combustion model; the main biomass combustion reactions summarised by Figure
2.4. Biomass combustion models are a method of analysing combustion data, at either
macroscopic or microscopic scales. The macroscopic properties are derived following a
‘macroscopic analysis’, that typically looks at values for: ultimate analysis, heating value,
moisture content, particle size, bulk density, and ash fusion temperature. Values derived

Andrew Welfle - ID: 81163530
56
following a Microscopic Analysis, may include: thermal, chemical kinetic, and specific
mineral data [73].
Non-
Reacting Solid
→
Heat
+ Drying
→ Pyrolysis →
Pre-
Combustion Reactions
→
Primary Gas
Phase Combustion
→ Secondary
Combustion →
Effluent
Stack Gas
Figure 2.4: Biomass Combustion Reactions [73] 15) Figure 2.4: Biomass Combustion Reactions
2.1.5 The Negative Impacts of Biomass for Energy Generation
Whilst biomass resources represent many advantages as fuels, there are also problems
relating to the utilisation of biomass for energy pathways. Often highlighted impacts include
environmental pollution resulting directly from the energy conversion processes and also
problems relating to land-use change such as deforestation or impacts on food productivity.
A. Pollution Impacts
In all cases of combustion, there is potential for the release of airborne pollutants. Figure 2.5
provides a step-by-step demonstration of a typical conversion pathway of biomass materials,
and highlights the stages of pollutant generation. The predominant pollutants relating to the
conversion of biomass materials being as follows:
Methane
Nitrogen Oxides
Furans
Sulphur Oxides
Hydrogen Chloride
Dioxins
Organic & Inorganic Air Particulates
Polyaromatic Hydrocarbons (PAHs)
Volatile Organic Compounds (VOCs)
Wet Biomass → Heating /
Drying →
Dry
Biomass
Biomass →
Volatiles
(tar &
gases)
+ Char
Volatiles + Air → CO + CO2 (+PAH + Unburned Hydrocarbons
+ Soot + Inorganic Aerosols)
Char + Air → CO + CO2
Volatiles (N, S, K) → N, S, K based Pollutants
Char (N, S, K) → N, S, K based Pollutants 16) Figure 2.5: Typical Biomass Conversion Pathway & Po llutants
Figure 2.5: Typical Biomass Conversion Pathway & Pollutants Adapted from [60]
Biomass materials can broadly be classified into groups based on an evaluation of their
source. Although the chemical and physical properties of different biomass types in each
group don’t always correlate, there is growing suggestion that these groupings can indicate
the types of pollutants that may occur. For example, the extent of smoke is likely a function
Andrew Welfle - ID: 81163530
57
of the lignin content, and NOx pollutants typically depend on the combustion environment.
All biomass materials contain: Nitrogen, Potassium, Phosphorus, Calcium, Magnesium,
Sodium, and Silicon; with other species also containing: Manganese, Iron, Molybdenum,
Copper, and Zinc; in varying compositions based on the growing conditions and time of
harvesting. It is the composition of these elements in different biomass samples that
ultimately determine the pollutants produced [60].
B. Land-Use Impacts
Another major issue related to biomass, and particularly the growth of energy crops; relates
to land-use change. The widespread planting of energy crops on deforested land, or land that
may otherwise be used for the production of foods; is a major issue.
The impact of land-use changes with a shift towards the production of biofuels; has been
demonstrated to have large ‘unseen’ carbon impacts, depending on types of vegetation
present on the land before clearing [75]. Whilst the widespread growth of biofuels in poorer
areas of the world, on land that would otherwise be used for food production, has sometimes
been demonstrated to result in food shortages, and large food price spikes for the local
populations [76].
The potential impacts of land-use change and on food systems, relating to the production of
biomass; are key themes addressed and discussed further within Chapters 4 and 8 of this
Thesis.
Andrew Welfle - ID: 81163530
58
2.2 Biomass Feedstocks, Resources &
Energy Pathways
Building on the previous section’s review of the properties and characteristics of biomass
materials; this next section introduces the different biomass resources and feedstocks that are
available for the bioenergy sector. This categorises the different types of biomass in relation
to their sources and properties, and places them within the context of the research project,
linking different biomass resources to particular energy generation and conversion pathways.
2.2.1 Categories of Biomass
Biomass materials by definition; are any organic matter that has been derived from plants.
This includes plant and animal materials such as: wood from forests, crops, seaweed, material
unused from agricultural and forestry processes, as well as organic industrial, human and
animal wastes [63].
In energy terms, globally the majority of bioenergy generated comes from wood and wood
wastes (~64%), municipal solid wastes (MSW) (~24%), agricultural wastes and residues
(~5%), and landfill gases resulting from the decomposition of organic wastes (~5%) [71].
However, the range of biomass materials used for the production of biofuels, bio-chemicals,
and direct energy generation, is extensive. The list below provides a brief snapshot of just
some of the prominent biomass feedstocks and resources that are used by the bio-energy
industry.
Straw Waste Vegetable Oil Waste Wood
Poultry Litter Switchgrass Reed Canary Grass
Wood Pellets Short Rotation Coppice Short Rotation Forestry
Wheat Palm Oil MSW
Oil Seed Rape Sweet Sorghum Animal Slurry
Jatropha Olive Residues Palm Kernels
Sugar Cane Forestry Residues Mechanically & Biologically
Treated Waste (MBT) Arb Arisings Sawmill Co-Products
Figure 2.6 demonstrates the principal categories of biomass resources and feedstocks that are
typically used within bioenergy pathways, within the UK. The diagram also provides an
introduction to the key supply chain processes, conversion options and end use outputs,
depending on the biomass types involved and the desired end uses.
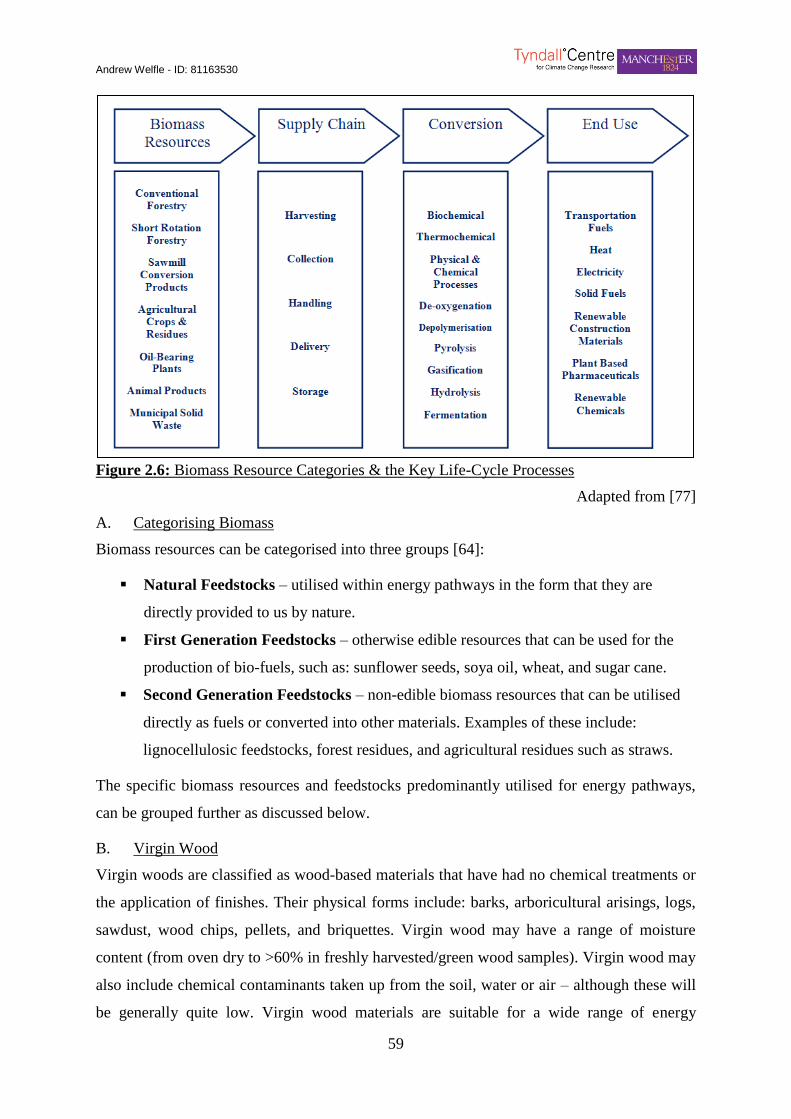
Andrew Welfle - ID: 81163530
59
17) Figure 2.6: Biomass Resource Categories & the Key Life-Cycle Processes
Figure 2.6: Biomass Resource Categories & the Key Life-Cycle Processes
Adapted from [77]
A. Categorising Biomass
Biomass resources can be categorised into three groups [64]:
Natural Feedstocks – utilised within energy pathways in the form that they are
directly provided to us by nature.
First Generation Feedstocks – otherwise edible resources that can be used for the
production of bio-fuels, such as: sunflower seeds, soya oil, wheat, and sugar cane.
Second Generation Feedstocks – non-edible biomass resources that can be utilised
directly as fuels or converted into other materials. Examples of these include:
lignocellulosic feedstocks, forest residues, and agricultural residues such as straws.
The specific biomass resources and feedstocks predominantly utilised for energy pathways,
can be grouped further as discussed below.
B. Virgin Wood
Virgin woods are classified as wood-based materials that have had no chemical treatments or
the application of finishes. Their physical forms include: barks, arboricultural arisings, logs,
sawdust, wood chips, pellets, and briquettes. Virgin wood may have a range of moisture
content (from oven dry to >60% in freshly harvested/green wood samples). Virgin wood may
also include chemical contaminants taken up from the soil, water or air – although these will
be generally quite low. Virgin wood materials are suitable for a wide range of energy
Andrew Welfle - ID: 81163530
60
applications, as they can be directly combusted to generate heat and power at various scales,
or can be converted through technologies to produce a range of liquid of gaseous biofuels
[78].
i. Virgin Wood from Forestry:
Forestry represents the primary source of timber and virgin woods. Harvested materials have
a range of physical shapes, sizes, characteristics, and moisture content – meaning pre-
treatments process will be necessary, to render the materials suitable for bioenergy systems
[78].
ii. Virgin Wood from Arboricultural (Arb) Arisings:
This virgin wood material will include residues from the managements of municipal/private
parks and gardens, tree surgery processes, and the maintenance of infrastructure such as
railways and road margins. Like forestry sourced material, virgin wood from arboricultural
arisings, will likely need pre-treatment and processing, as due to the nature of the materials
there may be a high proportion of brash material, bark and leaves. Chipping onsite being the
typical processing method adopted [78].
iii. Virgin Wood from Industry:
Wood processing industries such as mills and timber merchants are another major source of
wood; although the forms and characteristics of the materials are likely to vary [78]:
Sawmill resources are likely to include a high proportion of bark content.
Other resources may have been kiln dried (resulting in extremely low moisture
content level), making it highly suitable for pelletising or blending with other
materials.
Sawdust collected from different stages of processing will likely have a range of
moisture content and will be highly suitable for pelletising.
C. Energy Crops
Energy crops are those that are grown specifically as fuels, and provide high output per
hectare of growth. Extensive research has been undertaken to determine which strains of crop
perform best under UK conditions. The key biomass categories being: Short Rotation Energy
Crops, Grasses & Non-Woody Energy Crops, and Agricultural Energy Crops [78].
The ultimate aim is to maximise the growth output of energy crops from each harvest. This
being measured either in the crop yield per unit area, or the quantities of biofuels generated as
a result [78].

Andrew Welfle - ID: 81163530
61
In order to achieve high levels of biomass production, processes have to be weighed against
the potentially damaging environmental impacts of some intensive crop management
techniques. For example excessive use of fertiliser may have several impacts; including
emissions of NOx or release of Nitrogen based compounds into groundwater. The ultimate
goal being to produce high yields of energy crops, with high outputs and minimal or zero
inputs [78].
D. Agricultural Residues
Agricultural residues consist of a range of products that stem from agricultural processes,
some of which are potentially, highly valuable bioenergy fuels. These range from dry
materials such as straws and poultry litter, to wet materials such as slurry and silage; dry
materials being highly suitable for direct combustion conversion pathways, whereas the wet
materials are energetically inefficient for combustion, may be awkward/expensive to
transport, and are therefore typically utilised in close proximity to the production site in
biochemical based systems.
Another important issue with agricultural residues is that many of the materials have
alternative markets or uses, competing for their bioenergy value. For example, these residues
may be used for soil nutrient recycling processes; displacing the use of conventional synthetic
fertilisers or products [78].
E. Food Waste
At each stage of the food supply chain, residues and waste are likely to be generated. It has
been calculated that up to one third of all food grown for human consumption in the UK, is
actually thrown away [79]!
Food wastes can be divided into dry and wet waste categories, although the majority have
relatively high moisture content. This represents a massive potential biomass resource for the
energy sector – particular through the biochemical conversion pathways [78].
F. Industrial Waste & Co-Products
Many industrialised processes produce biomass wastes and residues that offer potential for
the bioenergy sector.
The predominant wood based materials from industry include: untreated woods, treated
woods, wood composites, and laminates. These materials can contain contaminants such as
heavy metals, arsenic and halogens, that are likely to cause hazardous or toxic by-products,
bottom ash, fly ash, and flue gas emissions.

Andrew Welfle - ID: 81163530
62
The basic technologies that enable conversion and energy generation from virgin woods are
the same for treated woods. However regulatory and environmental restraints will often
require these materials to be pre-treated, removing contaminants before processing by the
energy sector [78].
Industrial processes also generate wastes; residues and co-products that are not wood based
but are still biomass derived. These include: paper pulp and wastes, textiles, and sewage
sludge [78].
2.2.2 Lignocellulosic Biomass Resources
Lignocellulosic biomass resources are typically: low-cost crops, forestry residues, wood
process wastes, ‘woody’ vegetation, and the partial organic matter fraction of municipal solid
wastes. Wherever these materials are available, there is potential to produce biofuels and
generate energy, with minimal if any impact on food or fibre crop production [80].
A. Composition of Lignocellulosic Materials
Lignocellulosic biomass materials are made up of three major components: lignin, cellulose
and hemicellulose [64]:
Cellulose – made up of linear polysaccharides in the cell walls of wood fibres.
Biomass typically comprises 40-50% cellulose.
Hemicellulose - surrounds the cellulose fibres and provides the linkage between
cellulose and lignin within plant structure (15-30%).
Lignin – A highly complex material that is concentrated between the outer layers of
plant fibres. This provides structural rigidity, holding polysaccharides fibres together
(15-30%).
B. Pre-Treatment of Lignocellulosic Materials
The main focus when pre-treating lignocellulosic material is to break down the complex
molecular structures of the material. This allows the material to easily undergo bioenergy
conversion processes, in order to produce usable hydrocarbons as fuels, chemicals, and other
products [64].
The main obstacle to utilising simple pre-treatment processes on lignocellulosic materials is
that the major components of the material; lignin and cellulose, are tough to break down; due
to the rigidity and protective nature provided by lignin and hemicellulose, surrounding the
cellulose micro fibrils. Therefore alternative pre-treatment processes are required to
effectively breakdown the cellulose [64].
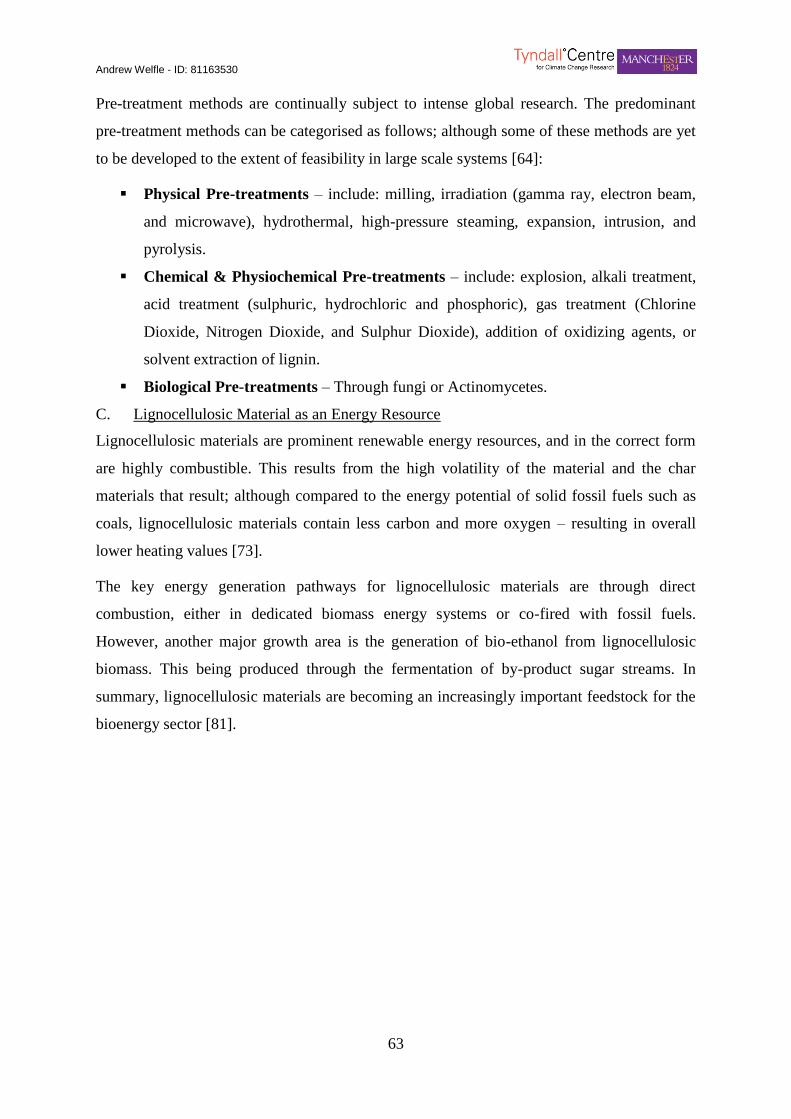
Andrew Welfle - ID: 81163530
63
Pre-treatment methods are continually subject to intense global research. The predominant
pre-treatment methods can be categorised as follows; although some of these methods are yet
to be developed to the extent of feasibility in large scale systems [64]:
Physical Pre-treatments – include: milling, irradiation (gamma ray, electron beam,
and microwave), hydrothermal, high-pressure steaming, expansion, intrusion, and
pyrolysis.
Chemical & Physiochemical Pre-treatments – include: explosion, alkali treatment,
acid treatment (sulphuric, hydrochloric and phosphoric), gas treatment (Chlorine
Dioxide, Nitrogen Dioxide, and Sulphur Dioxide), addition of oxidizing agents, or
solvent extraction of lignin.
Biological Pre-treatments – Through fungi or Actinomycetes.
C. Lignocellulosic Material as an Energy Resource
Lignocellulosic materials are prominent renewable energy resources, and in the correct form
are highly combustible. This results from the high volatility of the material and the char
materials that result; although compared to the energy potential of solid fossil fuels such as
coals, lignocellulosic materials contain less carbon and more oxygen – resulting in overall
lower heating values [73].
The key energy generation pathways for lignocellulosic materials are through direct
combustion, either in dedicated biomass energy systems or co-fired with fossil fuels.
However, another major growth area is the generation of bio-ethanol from lignocellulosic
biomass. This being produced through the fermentation of by-product sugar streams. In
summary, lignocellulosic materials are becoming an increasingly important feedstock for the
bioenergy sector [81].
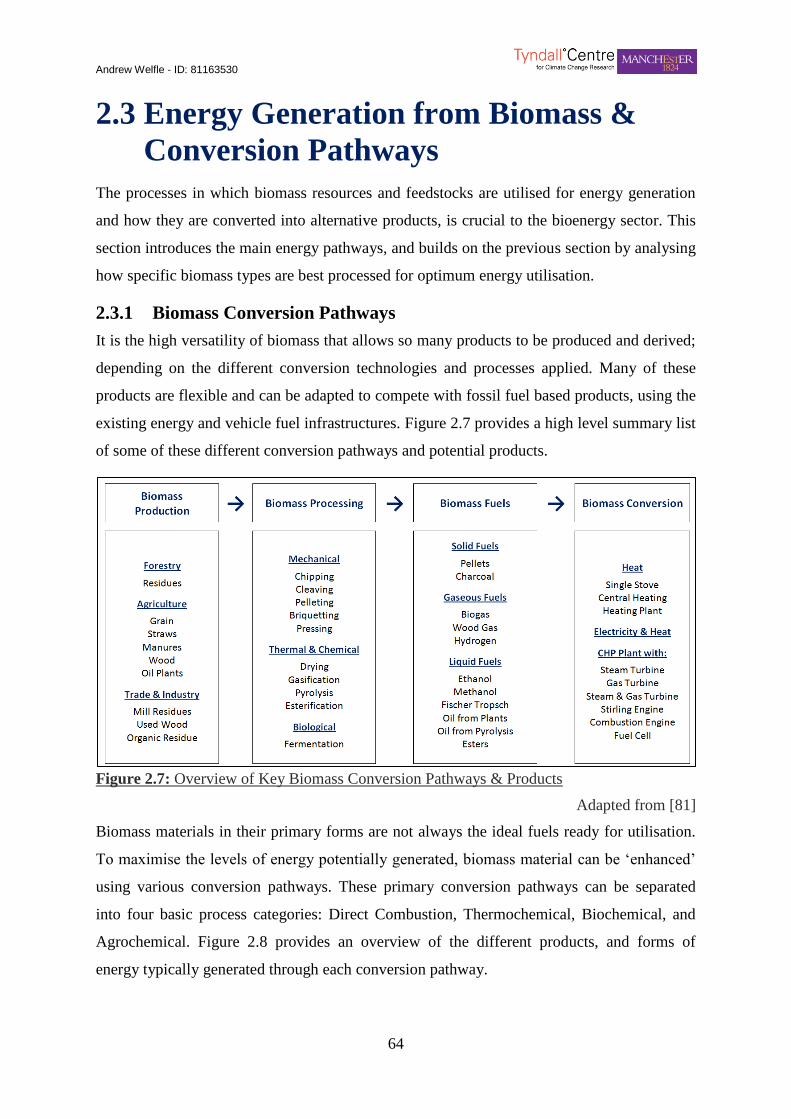
Andrew Welfle - ID: 81163530
64
2.3 Energy Generation from Biomass &
Conversion Pathways
The processes in which biomass resources and feedstocks are utilised for energy generation
and how they are converted into alternative products, is crucial to the bioenergy sector. This
section introduces the main energy pathways, and builds on the previous section by analysing
how specific biomass types are best processed for optimum energy utilisation.
2.3.1 Biomass Conversion Pathways
It is the high versatility of biomass that allows so many products to be produced and derived;
depending on the different conversion technologies and processes applied. Many of these
products are flexible and can be adapted to compete with fossil fuel based products, using the
existing energy and vehicle fuel infrastructures. Figure 2.7 provides a high level summary list
of some of these different conversion pathways and potential products.
18) Figure 2.7: Overview of Key Biomass Conversion Pathw ays & Products
Figure 2.7: Overview of Key Biomass Conversion Pathways & Products
Adapted from [81]
Biomass materials in their primary forms are not always the ideal fuels ready for utilisation.
To maximise the levels of energy potentially generated, biomass material can be ‘enhanced’
using various conversion pathways. These primary conversion pathways can be separated
into four basic process categories: Direct Combustion, Thermochemical, Biochemical, and
Agrochemical. Figure 2.8 provides an overview of the different products, and forms of
energy typically generated through each conversion pathway.
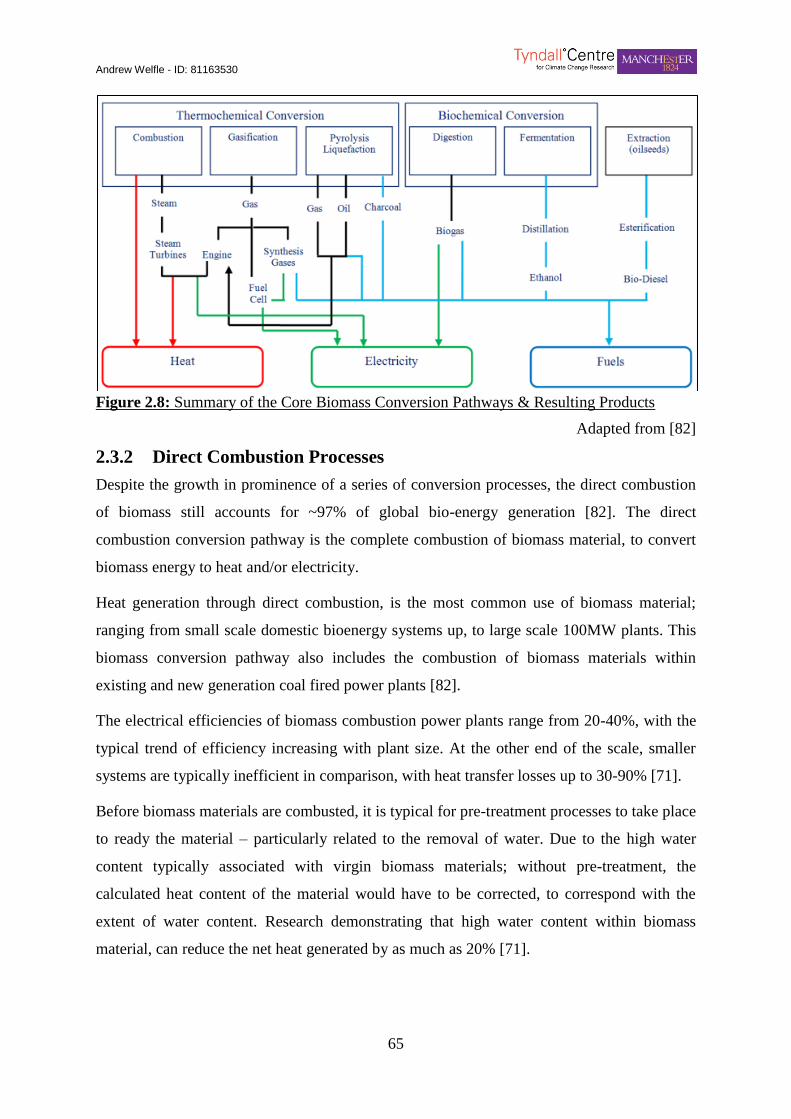
Andrew Welfle - ID: 81163530
65
19) Figure 2.8: Summary of the Core Biomass Conversion Pat hways & Resulting Products
Figure 2.8: Summary of the Core Biomass Conversion Pathways & Resulting Products
Adapted from [82]
2.3.2 Direct Combustion Processes
Despite the growth in prominence of a series of conversion processes, the direct combustion
of biomass still accounts for ~97% of global bio-energy generation [82]. The direct
combustion conversion pathway is the complete combustion of biomass material, to convert
biomass energy to heat and/or electricity.
Heat generation through direct combustion, is the most common use of biomass material;
ranging from small scale domestic bioenergy systems up, to large scale 100MW plants. This
biomass conversion pathway also includes the combustion of biomass materials within
existing and new generation coal fired power plants [82].
The electrical efficiencies of biomass combustion power plants range from 20-40%, with the
typical trend of efficiency increasing with plant size. At the other end of the scale, smaller
systems are typically inefficient in comparison, with heat transfer losses up to 30-90% [71].
Before biomass materials are combusted, it is typical for pre-treatment processes to take place
to ready the material – particularly related to the removal of water. Due to the high water
content typically associated with virgin biomass materials; without pre-treatment, the
calculated heat content of the material would have to be corrected, to correspond with the
extent of water content. Research demonstrating that high water content within biomass
material, can reduce the net heat generated by as much as 20% [71].
Andrew Welfle - ID: 81163530
66
A. Co-firing Biomass Resources with Coal
Co-firing simply refers to the combustion of biomass material alongside coal for the
generation of power. As biomass material is classified as being carbon neutral; the dual
combustion of biomass with coal brings down the total carbon emissions per unit of energy
produced, compared to the scenario where coal is combusted on its own.
Coal and biomass materials are quite different in composition, and as a result, the content of
the emissions produced during co-firing are different to the conventional combustion of either
fuel. Research has shown that the co-firing of biomass material with coal is capable of
reducing both NOx and SOx emissions from those of conventional coal plants. Co-firing may
also result in reduced fuel costs, reductions in wastes, and also lower soil and water pollution;
dependent on the properties of the biomass material utilised. Co-firing can therefore have a
positive effect on both the environment and the economics of power generation [82]. The
advantages and disadvantages of co-firing wood based biomass with coal, at an existing coal-
fired power plant are summarised below [83]:
i. Advantages:
Utilisation of existing coal-fired power plant infrastructure.
Promoting the development of wood based biomass fuel industry.
Reduction in CO2 emissions compared to conventional coal generation.
Prolonging the resource life of fossil fuels.
Reducing the emissions content for Sulphur, Nitrogen and ash – in turn reducing the
environmental impacts and the investment/maintenance costs.
ii. Disadvantages:
Decline in thermal efficiency performance compared to generating with coal alone.
Raising the procurement and utilisation costs of resources – as a result of transporting
woody biomass.
Difficulties in effective use of mixed ash.
Eroding the concept of bioenergy being a clean renewable energy option.
Potentially delaying the utilisation of biomass material alone for energy generation, and
the development of new technologies and processes.

Andrew Welfle - ID: 81163530
67
Co-firing is a popular and often convenient option for reducing Carbon emissions, whilst
utilising existing energy infrastructure. As a result of the UK’s reliance and legacy of coal
fired power stations, co-firing biomass is becoming an increasingly utilised generation
technology in the UK [84]. As a result, there is a growing requirement for suitable biomass
for these power plants; with increasing volumes of resource being imported [85] – a key
theme that will be analysed and discussed later in this Thesis.
B. Different Fuels for Different Combustion Plant Systems
A further consideration when utilising biomass for energy pathways, is the range of
bioenergy plant specifications that can be applied; each typically requiring feedstocks with
varying properties. An example of this is demonstrated below, where the combustion systems
highlighted, require biomass materials with different specific properties for optimal
operation.
i. Suspended Systems
This system typically requires biomass feedstock particles that are reduced to a range of
10µm–1000 µm in order to ensure complete burnout within a few seconds of resident time in
the combustion chamber [60].
ii. Fluidised Bed Systems
For this type of system the biomass feedstocks are typically pelletised or chipped to 2-5mm
to satisfy the fluidisation requirements. Although this system type can also take larger
particles, that would in turn minimise the amount of energy that may be used during
processing phases [60].
iii. Packed-Bed Systems
In this type of system the biomass feedstocks can be fired either in the form they are received,
or with minimum level of pre-processing required. Biomass particle sizes typically ranging
from 5-100mm, or even higher with logs up to 50cm [60].
iv. Direct Firing, Power Stations & Co-Firing
Power stations would typically require biomass fuels that have been pulverised to a similar
size to that of coal, in order to achieve the high level combustion intensities sought. The
pulverisation of biomass or co-firing with coal; requiring particles ground to less than 1mm in
size [60].
However, this can present a problem for fibrous biomass fuel types, as it is difficult and
expensive in energy/cost terms; fibrous biomass requiring typically 5x more energy than coal
Andrew Welfle - ID: 81163530
68
when pulverising. Potential options available include the process of torrefaction to modify the
nature of the material, to allow easier milling; or the utilisation of alternative feedstocks that
are less fibrous such as palm kernel expeller or olive waste [60].
2.3.3 Thermochemical Conversion Processes
The core Thermochemical conversion processes applied to biomass materials, are pyrolysis
and gasification.
A. Pyrolysis
Pyrolysis is the thermal decomposition of biomass in the absence of Oxygen. It is the first
step in the combustion and gasification of biomass materials, although in these processes the
pyrolysis stage is followed by the total or partial oxidation of the primary products. In
pyrolysis, the biomass material decomposes to generate: aerosols, vapours, and some
charcoal – each having value in energy terms. In summary, pyrolysis is the thermal
degradation of biomass material into more useful fuels [86].
The pyrolysis of biomass material is an attractive conversion option as it enables solid
biomass and waste materials, to be readily converted into liquid products. Liquid fuels having
advantages in terms of transportation, storage, combustion, retrofitting, and flexibility in
production and marketing [72].
i. Pyrolysis – Conversion Modes
Depending on the conversion reaction conditions and the specification of the biomass
material reacted, pyrolysis conversion will produce a wide range of products with differing
attributes; the predominant products being: bio-oil/crude (liquid), charcoal, non-condensable
gases, acetic acid, acetone, and methanol [86].
Conventional slow pyrolysis of biomass materials has been undertaken for 1000’s of years in
the production of charcoal. In this mode of pyrolysis, the feedstock is held at constant
temperature or slowly heated. This process enables vapours to be continually removed – the
resulting products having high charcoal content. Alternatively, during flash pyrolysis, small
dried biomass particles are thermo-chemically converted into a range of products that are up
to 75% liquid fuels, with smaller quantities of charcoal and non-condensable gases [72].
Table 2.2 summarises typical product yields with the pyrolysis of wood under different
reaction conditions.
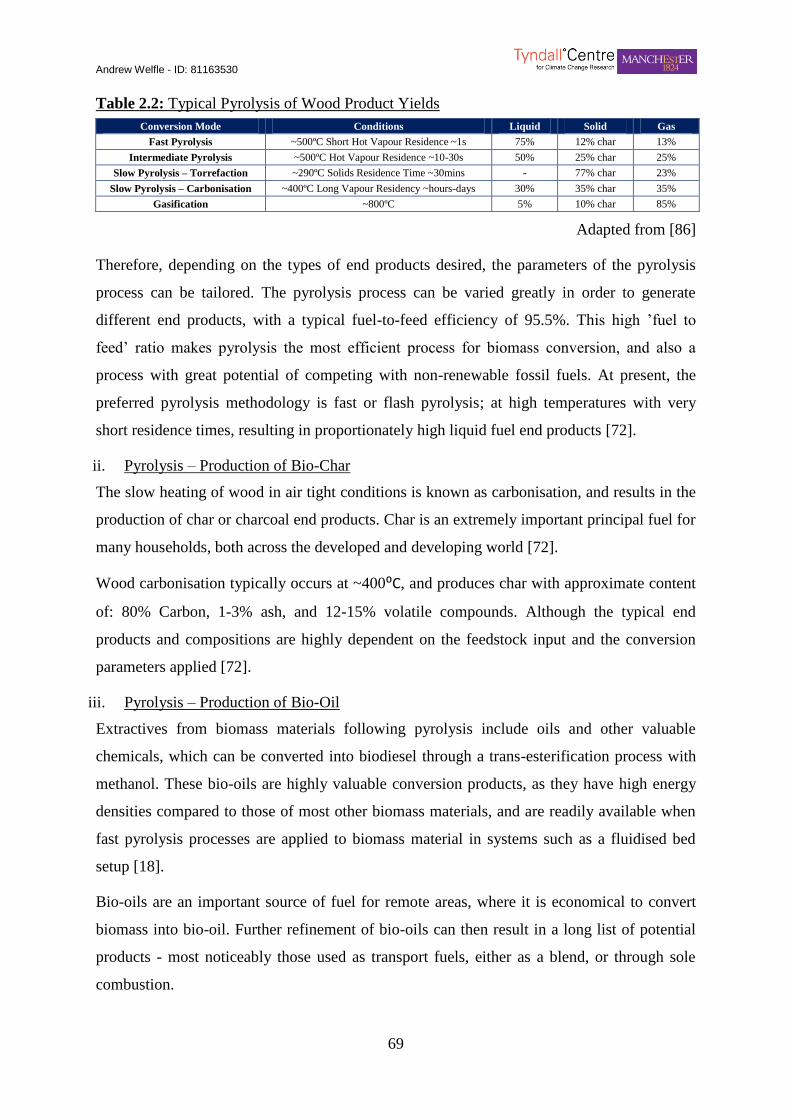
Andrew Welfle - ID: 81163530
69
Table 2.2: Typical Pyrolysis of Wood Product Yields Table 3) Table 2.2: Typical Pyro lysis of Wood Product Yields
Conversion Mode Conditions Liquid Solid Gas
Fast Pyrolysis ~500ºC Short Hot Vapour Residence ~1s 75% 12% char 13%
Intermediate Pyrolysis ~500ºC Hot Vapour Residence ~10-30s 50% 25% char 25%
Slow Pyrolysis – Torrefaction ~290ºC Solids Residence Time ~30mins - 77% char 23%
Slow Pyrolysis – Carbonisation ~400ºC Long Vapour Residency ~hours-days 30% 35% char 35%
Gasification ~800ºC 5% 10% char 85%
Adapted from [86]
Therefore, depending on the types of end products desired, the parameters of the pyrolysis
process can be tailored. The pyrolysis process can be varied greatly in order to generate
different end products, with a typical fuel-to-feed efficiency of 95.5%. This high ’fuel to
feed’ ratio makes pyrolysis the most efficient process for biomass conversion, and also a
process with great potential of competing with non-renewable fossil fuels. At present, the
preferred pyrolysis methodology is fast or flash pyrolysis; at high temperatures with very
short residence times, resulting in proportionately high liquid fuel end products [72].
ii. Pyrolysis – Production of Bio-Char
The slow heating of wood in air tight conditions is known as carbonisation, and results in the
production of char or charcoal end products. Char is an extremely important principal fuel for
many households, both across the developed and developing world [72].
Wood carbonisation typically occurs at ~400⁰C, and produces char with approximate content
of: 80% Carbon, 1-3% ash, and 12-15% volatile compounds. Although the typical end
products and compositions are highly dependent on the feedstock input and the conversion
parameters applied [72].
iii. Pyrolysis – Production of Bio-Oil
Extractives from biomass materials following pyrolysis include oils and other valuable
chemicals, which can be converted into biodiesel through a trans-esterification process with
methanol. These bio-oils are highly valuable conversion products, as they have high energy
densities compared to those of most other biomass materials, and are readily available when
fast pyrolysis processes are applied to biomass material in systems such as a fluidised bed
setup [18].
Bio-oils are an important source of fuel for remote areas, where it is economical to convert
biomass into bio-oil. Further refinement of bio-oils can then result in a long list of potential
products - most noticeably those used as transport fuels, either as a blend, or through sole
combustion.
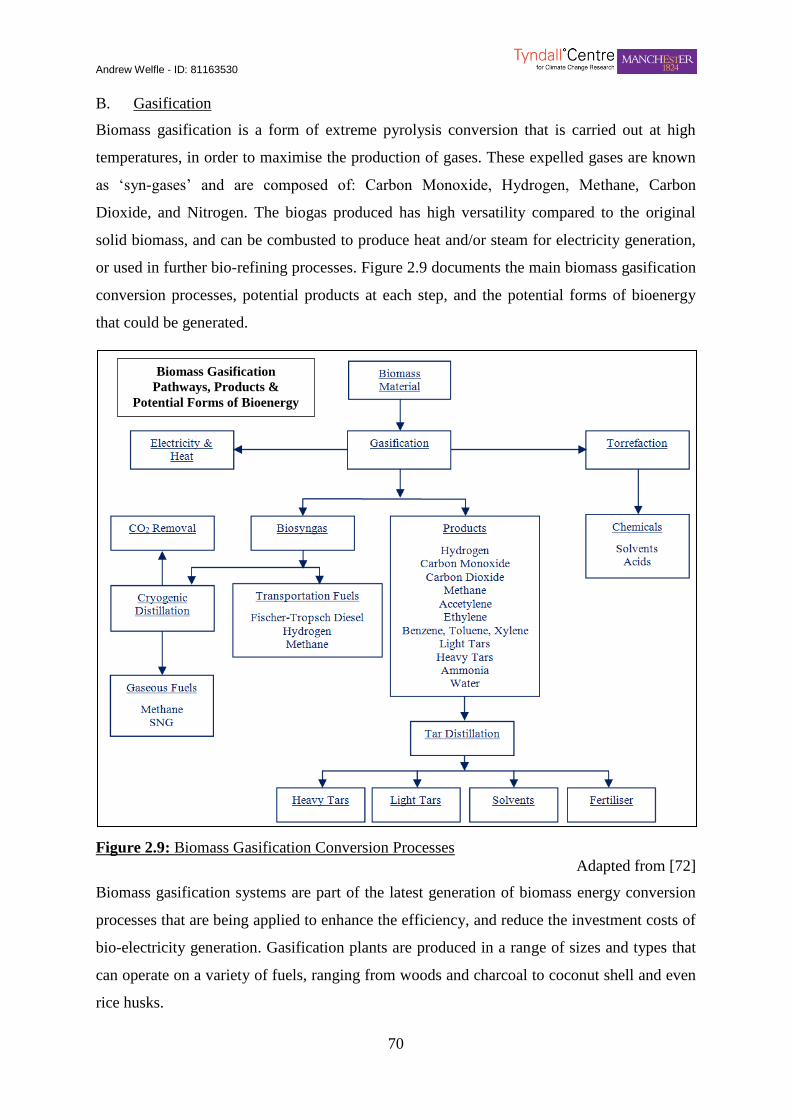
Andrew Welfle - ID: 81163530
70
B. Gasification
Biomass gasification is a form of extreme pyrolysis conversion that is carried out at high
temperatures, in order to maximise the production of gases. These expelled gases are known
as ‘syn-gases’ and are composed of: Carbon Monoxide, Hydrogen, Methane, Carbon
Dioxide, and Nitrogen. The biogas produced has high versatility compared to the original
solid biomass, and can be combusted to produce heat and/or steam for electricity generation,
or used in further bio-refining processes. Figure 2.9 documents the main biomass gasification
conversion processes, potential products at each step, and the potential forms of bioenergy
that could be generated.
20) Figure 2.9: Biomass Gasification Conversion Processes
Figure 2.9: Biomass Gasification Conversion Processes
Adapted from [72]
Biomass gasification systems are part of the latest generation of biomass energy conversion
processes that are being applied to enhance the efficiency, and reduce the investment costs of
bio-electricity generation. Gasification plants are produced in a range of sizes and types that
can operate on a variety of fuels, ranging from woods and charcoal to coconut shell and even
rice husks.
Biomass Gasification
Pathways, Products &
Potential Forms of Bioenergy
Andrew Welfle - ID: 81163530
71
Efficiencies up to 50% have been found to be achievable, using combined-cycle gas turbine
systems where waste gases are recovered to operate steam turbines; demonstrating that such
biomass plants can be as economical as conventional coal-fired plants. The power output
being determined by the economic and ready supply of the biomass fuels [87].
C. Gasification - Fischer Tropsch Synthesis
The Fischer-Tropsch Synthesis (FTS) process was developed in 1923 by German scientists
Franz Fischer and Hans Tropsch. The aim of FTS was to produce long chained hydrocarbons
from a CO and H2 gas mix. The FTS process is now well established for producing a variety
of fuels. FTS operates at low temperatures (LTFT), to produce a ‘syn-crude’ that has a large
fraction of heavy, waxy hydrocarbons. When FTS is operated at higher temperatures (HTFT),
light syn-crude and olefins are produced. The HTFT primary products can be refined into
environmentally friendly gasoline and diesel, solvents and olefins. The LTFT heavy
hydrocarbons products can be refined to waxes, or if hydrocracked and/or isomerised, to
produce diesel, base-stock for lube oils and naphtha [71]. The production of fuels through
FTS has several notable advantages and disadvantages [88]:
i. Advantages
The FTS process can produce hydrocarbons of different lengths from any carbon based
feedstock, which can then be refined to produce transportable liquid fuels.
As FTS products are functionally similar to conventional refinery products, they can be
processed by existing transportation, storage and refueling infrastructure as used for
petroleum based products. The products are also compatible with current vehicles, and
blendable with current petroleum based fuels.
Products from the FTS process are of high quality, being free of Nitrogen, aromatics,
and other contaminants that are typically found in petroleum based products.
ii. Dis-advantages
The capital costs of FTS conversion plants are higher and the energy efficiency of
producing FTS liquid fuels is comparatively lower than that for alternative fuels, such
as Hydrogen, Dimethyl Ether, Methanol, and conventional biofuels.
2.3.4 Biochemical Conversion Processes
As biomass is a natural material, nature has developed numerous highly efficient biochemical
processes for breaking down the constituent molecules within biomass. Many of these
processes can be harnessed to convert biomass into a wide range of products. Biomass
Andrew Welfle - ID: 81163530
72
biochemical conversion processes, differ to thermochemical processes in that they proceed at
lower temperatures and lower reaction rates. Both produce a wide range of products. Biomass
materials and feedstocks with higher moisture content are generally best suited for
biochemical conversion. The biochemical conversion processes of greatest interest to the
bioenergy sector being: fermentation and anaerobic digestion.
A. Biomass Fermentation
Ethanol can be produced directly from biomass through the fermentation conversion
pathway. The best know source of ethanol is sugar cane, but there is an extensive list of
alternate materials that can be used including: wheat, sugar beet, and even wood. The choice
of the biomass feedstock utilised is highly important to the fermentation process, as it
typically makes up 55-80% of the fuels end selling price - starch based biomass materials
being typically the cheapest, but requiring additional processing [89].
The production of (bio)-ethanol from biomass is one way to reduce both the consumption of
crude oil and environmental pollution. Conversion technologies for producing ethanol from
cellulosic biomass resources such as: forest materials, agricultural residues, and urban wastes,
are major areas for research focus, and are continually edging towards commercial viability.
Although in order to produce ethanol from cellulosic biomass, pre-treatment processes are
required to reduce the sample size, break down the hemicelluloses to sugars, and open up the
structural components of the cellulose [89].
Bio-ethanol is an important bio-fuel that can be widely utilised, in some cases directly
substituting for conventional transport fuel. The leading case study being Brazil, where
widespread use of feedstocks such as sugarcane are utilised for the production of bio-ethanol
transport fuels, on an industrial scale [89].
B. Anaerobic Digestion
Within the anaerobic digestion conversion pathway, biomass material is decomposed through
bacterial action in the absence of Oxygen. Anaerobic digestion typically takes place within
digesters that range from household systems (1m³), to large commercial installations (up to
~2000m³) [71]. The predominant useful products are [66]:
Biogases – principally methane that can be combusted directly within internal
combustion engines to generate electricity.
Solid Residues – known as fibre or digestate, these are similar to and can be used as
compost material.

Andrew Welfle - ID: 81163530
73
Liquid Liquor – this liquid portion can be used as a fertiliser that may or may not
contain useful levels of nitrate and phosphate, depending on the input feedstocks.
Depending on the feedstock, heavy metal contamination can also occur.
The anaerobic digestion process itself can take place over different temperature ranges and
time periods. ‘Mesophilic Digestion’ takes place between the 20-40˚C temperature range with
the reaction lasting over a month or two. While ‘Thermophilic Digestion’ takes place
between the 50-65˚C temperature range over a shorter period of time [66].
2.3.5 Comparing Biochemical versus Thermochemical Processes
No clear financial or technological advantages currently exist, between biomass biochemical
and thermo-chemical conversion pathways. Although scientific consensus accepts that both
pathways still have significant technical and environmental barriers to overcome to improve
the processes, if they are to truly compete with the fossil fuel industry [80].
Table 2.3 provides a summary of some of the bio-fuel and energy generation yields for
sample biochemical and thermochemical processes.
Table 2.3: Comparison of Biochemical & Thermochemical Biofuel & Energy Yields Table 4) Table 2.3: Comparison of Bioc hemical & Thermoche mical Biof uel & Energy Yields
Processes Biofuel Yield
(l/dry t) Energy Content
(MJ/l) (LHV) Energy Yields
(GJ/t)
Biochemical
Conversion Enzymatic Hydrolysis Ethanol 110 - 300 21.1 2.3 - 6.3
Thermochemical
Conversion
Syngas-to-Fischer Tropsch Diesel 75 - 200 34.4 2.6 - 6.9
Syngas-to-Ethanol 120 - 160 21.1 2.5 - 3.4
Data Taken from [80]
A key difference between biochemical and thermochemical processes is that the lignin
component of biomass materials becomes a residue during biochemical conversion processes,
whilst it becomes a further fuel for heat and power generation, during thermochemical
processes. Another fundamental difference between the processes is the range of end use
products; biochemical processes predominantly produce bio-ethanol, whilst the
thermochemical process routes, can produce synthesis gases that may be utilised to produce a
wider range of longer chained hydrocarbons [80].
The main improvements that are being pursued across all the conversion process pathways
are: the refinement of the input feedstock characteristics, improvement of pre-treatment
processes, enhancing system efficiencies, lowering overall production costs, and improving
the general process integration [80].

Andrew Welfle - ID: 81163530
74
2.3.6 Conversion of Lignocellulosic Materials
Producing biofuels and generating energy from lignocellulosic feedstock material, can be
achieved using both biochemical and thermochemical conversion processes. Biomass
materials, particularly lignocellulosic biomass feedstocks, are prominent alternative energy
sources, as in the correct form they are highly combustible – a result of the high volatility of
the fuel and resulting char material. However, compared to comparable solid fossil fuels such
as coal, biomass contains less carbon, more oxygen and has an overall lower heating value
[73]. Current scientific focus is looking heavily into the following pathways for optimum use
of lignocellulosic materials:
Biochemical – Enzymes and micro-organisms are utilised to convert the cellulose and
hemicellulose fractions of the feedstock material into sugars. These are then converted
into bio-ethanol through fermentation.
Thermochemical – Pyrolysis and gasification techniques are utilised to produce
synthesis gases – CO and H2. From these synthesis gases, multiple long carbon-chain
hydrocarbon biofuel products are generated, such as synthetic diesel or ethanol.
[73]
The generation of bio-ethanol from lignocellulosic biomass, is a major industry growth area.
Lignocellulosic materials are particularly sought after as an appropriate input-feedstock in
this process, as they are not directly linked to food production. There is wide expectation that
the on-going ‘biotechnology revolution’, driven by commercial aspirations will result in large
cost reductions in lignocellulosic bio-ethanol production, over the coming years [81].
2.3.7 The UK’s Bioenergy & Bio-refining Systems & Infrastructure
Bioenergy and refinery facilities are where biomass conversion processes take place on large
scales. Bio-refining processes, typically integrate a series of biomass conversion processes
and technologies, to produce a range of desired products: biofuels, bio-power, bio-heat, and
‘value-added’ chemicals etc. Bio-refineries being the bioenergy equivalent of the modern
crude oil refinery, producing multiple grades of petroleum based fuels and products.
Table 2.4 below, provides a summary of the types of bioenergy and refinery system
infrastructures that are currently operating across the EU, and within the UK. Information and
data relating the UK’s planned and current operating bioenergy infrastructures, can be
sourced from, the Office of Gas & Electricity Markets (Ofgem) or The National Non-Food
Crops Centre (NNFCC) [90]–[92].

Andrew Welfle - ID: 81163530
75
Table 2.4: Summary of the UK and EU’s Operating & Planned Bioenergy Systems Table 5) Table 2.4: Summary of the UK and EU’s Operating & P lanned Bioe nergy Systems
Bioenergy Systems Typical Capacity
Range
Net Efficiency
(LHV basis) Status and Deployment in the UK & EU
Biogas
Production
Anaerobic
digestion
Up to several MWe
10–15%
(electrical)
Well-established technology.
Widely applied for homogeneous wet organic
waste streams and wastewater.
Landfill gas Up to several 100
kWe
Equivalent to
Engine
Efficiency
Very attractive GHG mitigation option.
Widely applied in EU and generally part of waste
treatment policies in most countries.
Combustion
Heat Domestic 1–5
MWth
From Very Low
(Classic Fireplaces)
up to 70–90% for Modern Furnaces.
Classic firewood use still widely utilised across
Europe, but decreasing. Replacement by modern heating systems.
CHP
0.1–1 MWe 60–90% (overall) Widely deployed in Scandinavia countries,
Austria, Germany and to a lesser extent France.
Increasing in scale and electrical efficiency with time.
1–10 MWe 80–100% (overall)
Stand Alone 20–100 MWe 20–40% (electrical)
Well-established technology, especially deployed
in Scandinavia. Various advanced concepts include using Fluid
Bed technology to give high efficiency, low costs
with high flexibility. Mass burning or waste incineration has much
higher capital costs and lower efficiencies,
although widely applied in Netherlands & Germany.
Co-
Combustion
5–20MWe at
Existing Coal-
Fired Stations. Higher for New
Multi-Fuel Plants.
30–40% (electrical)
Widely deployed in many EU countries.
Interest for larger biomass co-firing systems is growing.
Gasification
Heat Usually Smaller
Capacity Range
80–90%
(overall)
Commercially available and deployed. However the total contribution to energy
production in the EU is very limited.
CHP gas
engine 0.1–1 MWe 15–30%
Deployment limited due to relatively high costs,
critical operational demands and fuel quality.
Biomass Integrated
Gasification
Combined Cycle
30–100 MWe
40–50% (or higher
electrical
efficiency)
Demonstration phase at 5–10 MWe range
obtained.
Rapid development in the 1990’s has stalled in recent years.
First generation concepts proving capitally
expensive.
Pyrolysis Bio-oil
Generally Smaller
Capacities are
Proposed of Several 100 kWth
60–70% Heat
Content of Bio-oil/
Feedstock.
Not commercially available; mostly considered a
pre-treatment option for longer distance transport.
Adapted from [82]
Andrew Welfle - ID: 81163530
76
Chapter 3 - Biomass Resource Modelling
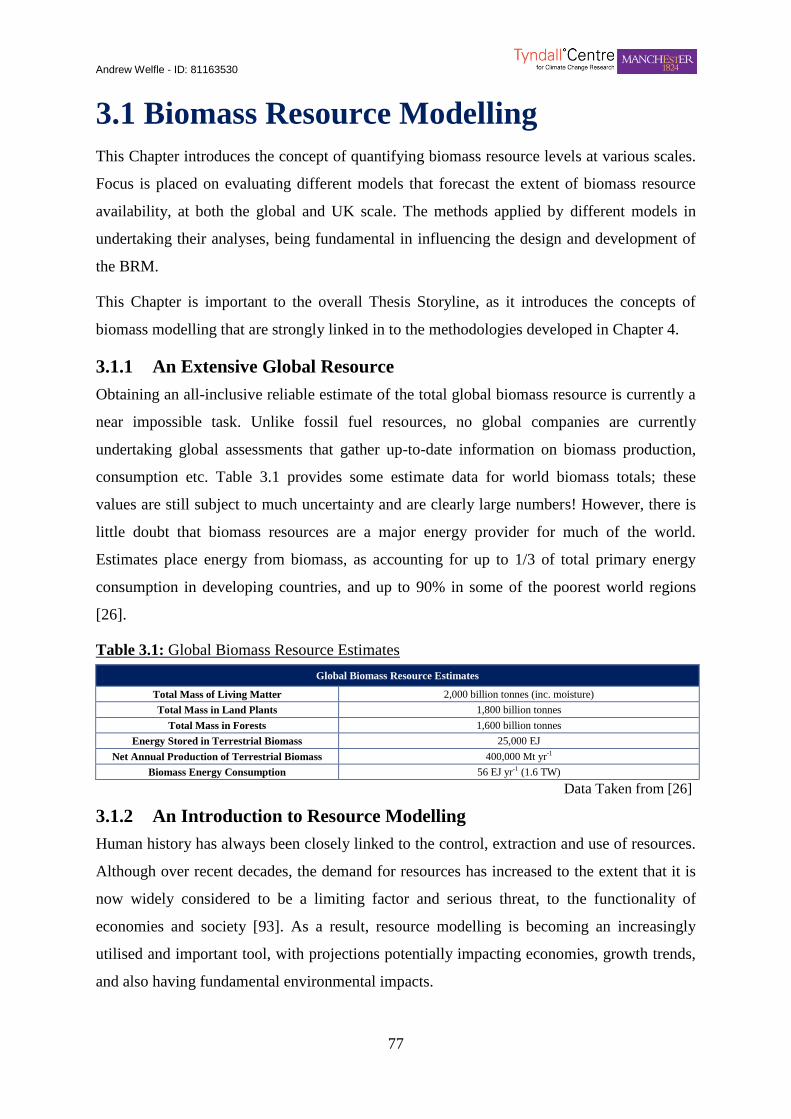
Andrew Welfle - ID: 81163530
77
3.1 Biomass Resource Modelling
This Chapter introduces the concept of quantifying biomass resource levels at various scales.
Focus is placed on evaluating different models that forecast the extent of biomass resource
availability, at both the global and UK scale. The methods applied by different models in
undertaking their analyses, being fundamental in influencing the design and development of
the BRM.
This Chapter is important to the overall Thesis Storyline, as it introduces the concepts of
biomass modelling that are strongly linked in to the methodologies developed in Chapter 4.
3.1.1 An Extensive Global Resource
Obtaining an all-inclusive reliable estimate of the total global biomass resource is currently a
near impossible task. Unlike fossil fuel resources, no global companies are currently
undertaking global assessments that gather up-to-date information on biomass production,
consumption etc. Table 3.1 provides some estimate data for world biomass totals; these
values are still subject to much uncertainty and are clearly large numbers! However, there is
little doubt that biomass resources are a major energy provider for much of the world.
Estimates place energy from biomass, as accounting for up to 1/3 of total primary energy
consumption in developing countries, and up to 90% in some of the poorest world regions
[26].
Table 3.1: Global Biomass Resource Estimates Table 6) Table 3.1: Global Biomass Resource Estimates
Global Biomass Resource Estimates
Total Mass of Living Matter 2,000 billion tonnes (inc. moisture)
Total Mass in Land Plants 1,800 billion tonnes
Total Mass in Forests 1,600 billion tonnes
Energy Stored in Terrestrial Biomass 25,000 EJ
Net Annual Production of Terrestrial Biomass 400,000 Mt yr-1
Biomass Energy Consumption 56 EJ yr-1 (1.6 TW)
Data Taken from [26]
3.1.2 An Introduction to Resource Modelling
Human history has always been closely linked to the control, extraction and use of resources.
Although over recent decades, the demand for resources has increased to the extent that it is
now widely considered to be a limiting factor and serious threat, to the functionality of
economies and society [93]. As a result, resource modelling is becoming an increasingly
utilised and important tool, with projections potentially impacting economies, growth trends,
and also having fundamental environmental impacts.
Andrew Welfle - ID: 81163530
78
Resource modelling is essentially the science of estimating supply versus demand, and
attempting to quantify resource reserves. Projections of future resource supplies and demands
therefore rely heavily on estimations of resource availability. A fundamental question for the
developers of resource models, is whether the past can provide a guide to the future [94]? The
reality is, that resource modelling scenarios in the future may be vastly different from
historical experiences, therefore rendering simple predictions based on extrapolation of past
trends and behaviours, highly suspect. Resource projections are further complicated by
technological uncertainties, political impediments, and potential unseen changes affecting
supplies [95].
Resource modelling and data analysis, of some form or another, has arguably been
undertaken for as long as goods and resources have been in-demand and traded. Although on-
going analysis over recent times has revealed two distinct trends [93]:
A decoupling is occurring between global resource extraction and use, from economic
growth. Perhaps highlighting that on a global scale, economic output may be becoming
less resource dependent; and ‘scale effect’ influences may be operating.
At the same time global resource extraction in absolute terms, is increasing in all
regions – a trend clearly incompatible with the concepts of sustainable development.
A. Why Model Resources
All governmental and management actions, decisions, regulations, and controls; rely on
quantitative contexts and numerical information to provide drivers, precautionary indicators,
reference points and cost-benefit analyses [96]. Projections developed through modelling,
provide the structure for many resource governance, and management decisions. However,
the vast array of resource types and characteristics means that no set modelling
methodologies can be universally applied; resource modelling projections varying in both
accuracy and relevance based on the resource, modelling methodology applied, and scales
[96].
B. Modelling Non-Renewable Resources
As by definition non-renewable resources are finite, the availability and abundance of these
resources will drive any supply and demand projections. History has proved, that the
pathways of non-renewable resource extraction can be predicted through the application of
‘Hotelling’s Rule’. This states that: extraction trends through time will follow the most
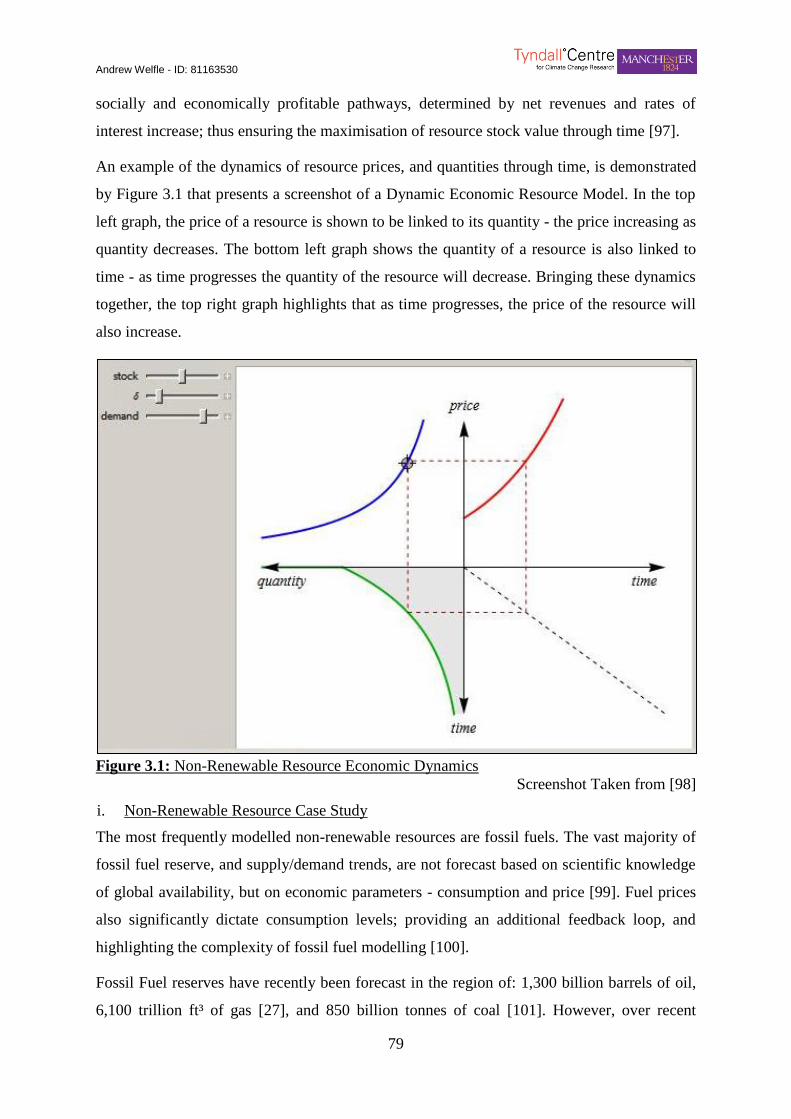
Andrew Welfle - ID: 81163530
79
socially and economically profitable pathways, determined by net revenues and rates of
interest increase; thus ensuring the maximisation of resource stock value through time [97].
An example of the dynamics of resource prices, and quantities through time, is demonstrated
by Figure 3.1 that presents a screenshot of a Dynamic Economic Resource Model. In the top
left graph, the price of a resource is shown to be linked to its quantity - the price increasing as
quantity decreases. The bottom left graph shows the quantity of a resource is also linked to
time - as time progresses the quantity of the resource will decrease. Bringing these dynamics
together, the top right graph highlights that as time progresses, the price of the resource will
also increase.
21) Figure 3.1: Non-Renewable Resource Economic Dynamics
Figure 3.1: Non-Renewable Resource Economic Dynamics
Screenshot Taken from [98]
i. Non-Renewable Resource Case Study
The most frequently modelled non-renewable resources are fossil fuels. The vast majority of
fossil fuel reserve, and supply/demand trends, are not forecast based on scientific knowledge
of global availability, but on economic parameters - consumption and price [99]. Fuel prices
also significantly dictate consumption levels; providing an additional feedback loop, and
highlighting the complexity of fossil fuel modelling [100].
Fossil Fuel reserves have recently been forecast in the region of: 1,300 billion barrels of oil,
6,100 trillion ft³ of gas [27], and 850 billion tonnes of coal [101]. However, over recent
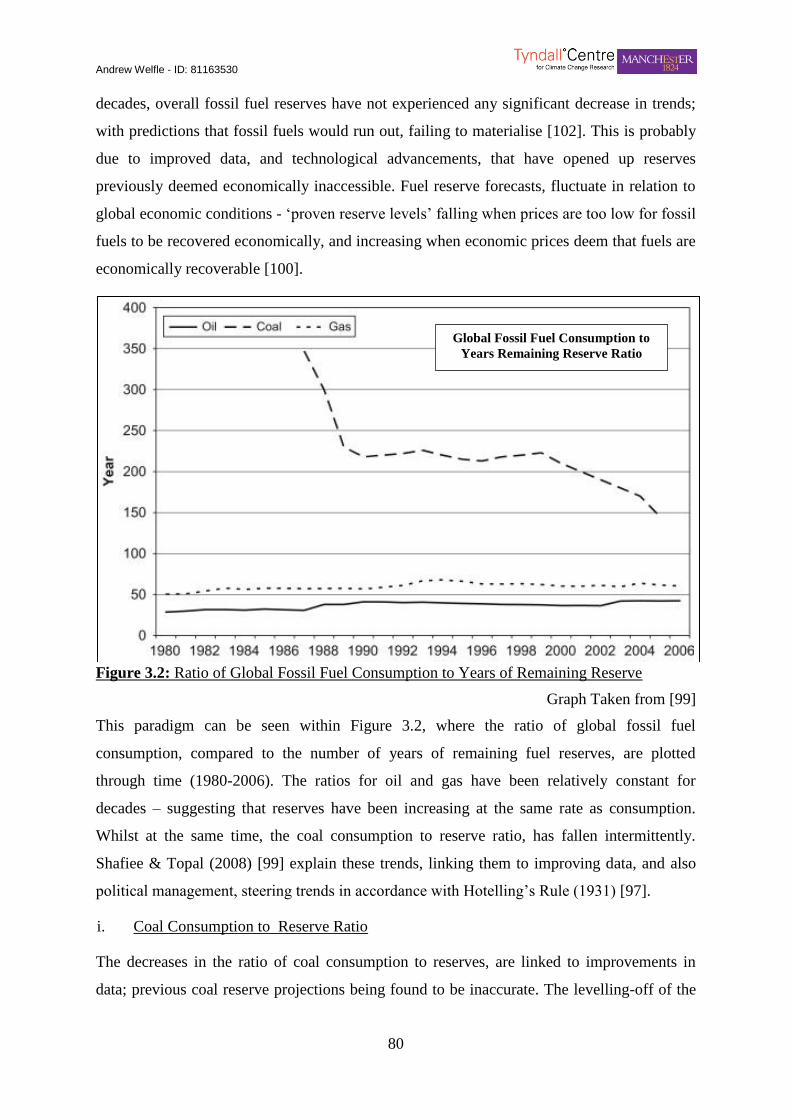
Andrew Welfle - ID: 81163530
80
decades, overall fossil fuel reserves have not experienced any significant decrease in trends;
with predictions that fossil fuels would run out, failing to materialise [102]. This is probably
due to improved data, and technological advancements, that have opened up reserves
previously deemed economically inaccessible. Fuel reserve forecasts, fluctuate in relation to
global economic conditions - ‘proven reserve levels’ falling when prices are too low for fossil
fuels to be recovered economically, and increasing when economic prices deem that fuels are
economically recoverable [100].
22) Figure 3.2: Ratio of Global Fossil Fuel C onsumption to Years of Remaining Reserve
Figure 3.2: Ratio of Global Fossil Fuel Consumption to Years of Remaining Reserve
Graph Taken from [99]
This paradigm can be seen within Figure 3.2, where the ratio of global fossil fuel
consumption, compared to the number of years of remaining fuel reserves, are plotted
through time (1980-2006). The ratios for oil and gas have been relatively constant for
decades – suggesting that reserves have been increasing at the same rate as consumption.
Whilst at the same time, the coal consumption to reserve ratio, has fallen intermittently.
Shafiee & Topal (2008) [99] explain these trends, linking them to improving data, and also
political management, steering trends in accordance with Hotelling’s Rule (1931) [97].
i. Coal Consumption to Reserve Ratio
The decreases in the ratio of coal consumption to reserves, are linked to improvements in
data; previous coal reserve projections being found to be inaccurate. The levelling-off of the
Global Fossil Fuel Consumption to
Years Remaining Reserve Ratio

Andrew Welfle - ID: 81163530
81
ratio at certain periods through time, being linked to technological advancements, making
more reserves economically accessible [99].
ii. Oil & Gas Consumption to Reserve Ratio
This relatively constant ratio is also linked to technological advancements opening up new
reserves, but also to politico-economic incentives; in only disclosing information relating to
reserve abundance and sizes, to maintain maximised fuel prices [99].
C. Modelling Renewable Resources
Approaches and strategies for modelling renewable resources tend to differ from those for
non-renewables, as an additional dynamic exists – the resources are not finite. However, the
focus of these models still revolves around projecting trends of supply and demand, and
quantifying the extent of the resource reserve. Modelling biomass resources is an excellent
case study for the modelling of renewable resources.
3.1.3 Biomass Resource Modelling
“The global biomass potential and its use to provide energy, cannot be measured; it
can only be modelled”
UKERC (2011) [103]
Biomass resource modelling, typically aims to produce estimates of the availability of the
biomass materials, from a range of sources, at a chosen geographic scale. Biomass resource
models are highly variable in complexity, but all aim to utilise data and information, to
estimate an aspect of the bioenergy sectors future development. Forecasts of potential
biomass resource availability can typically be categorised, into one of four resolution groups,
as discussed below and highlighted within Figure 3.3.
A. Theoretical or Ultimate Modelling Forecasts
Biomass resource forecasts, of the potential quantity of resource that can be grown
/harvested/collected annually; are limited only by fundamental physical and/or biological
barriers. These may be the biological plant growing conditions that could be linked to climate
change, or the physical land surface area available for growing biomass. This scenario
category, is not typical as a useful means of estimating biomass production levels, but could
be used as a comparative analysis tool [104].
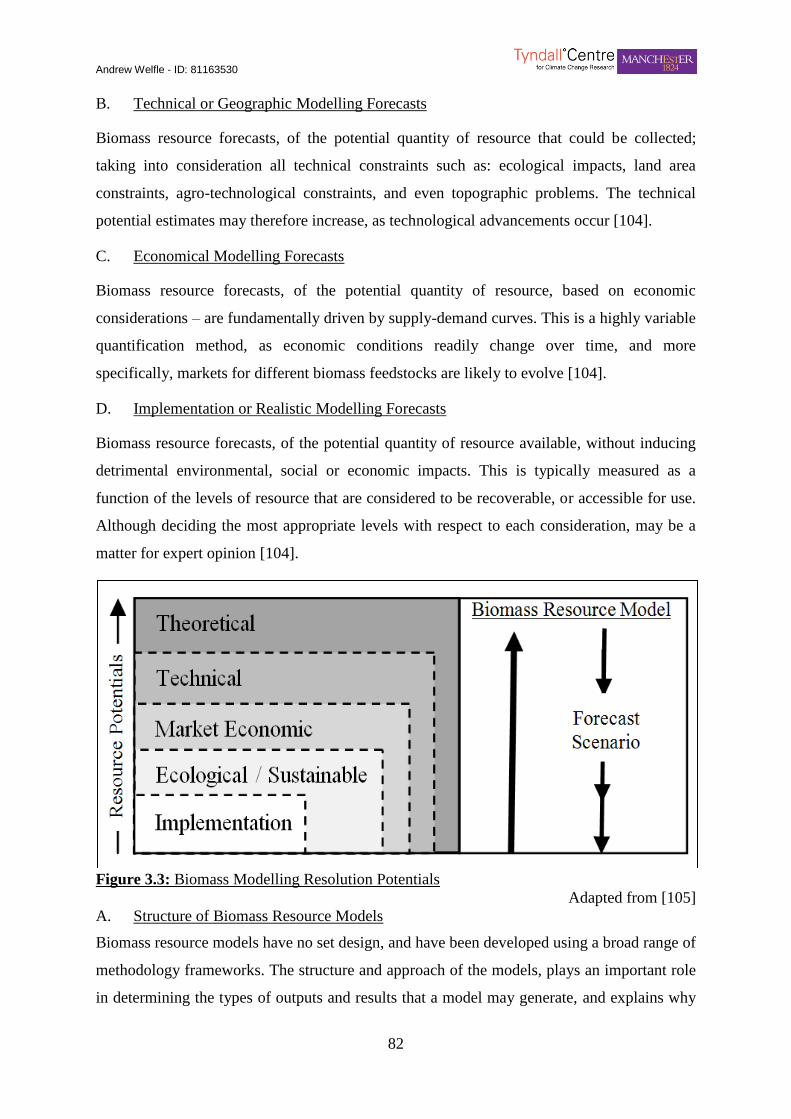
Andrew Welfle - ID: 81163530
82
B. Technical or Geographic Modelling Forecasts
Biomass resource forecasts, of the potential quantity of resource that could be collected;
taking into consideration all technical constraints such as: ecological impacts, land area
constraints, agro-technological constraints, and even topographic problems. The technical
potential estimates may therefore increase, as technological advancements occur [104].
C. Economical Modelling Forecasts
Biomass resource forecasts, of the potential quantity of resource, based on economic
considerations – are fundamentally driven by supply-demand curves. This is a highly variable
quantification method, as economic conditions readily change over time, and more
specifically, markets for different biomass feedstocks are likely to evolve [104].
D. Implementation or Realistic Modelling Forecasts
Biomass resource forecasts, of the potential quantity of resource available, without inducing
detrimental environmental, social or economic impacts. This is typically measured as a
function of the levels of resource that are considered to be recoverable, or accessible for use.
Although deciding the most appropriate levels with respect to each consideration, may be a
matter for expert opinion [104].
23) Figure 3.3: Biomass Modelling Reso lution P otentials
Figure 3.3: Biomass Modelling Resolution Potentials
Adapted from [105]
A. Structure of Biomass Resource Models
Biomass resource models have no set design, and have been developed using a broad range of
methodology frameworks. The structure and approach of the models, plays an important role
in determining the types of outputs and results that a model may generate, and explains why
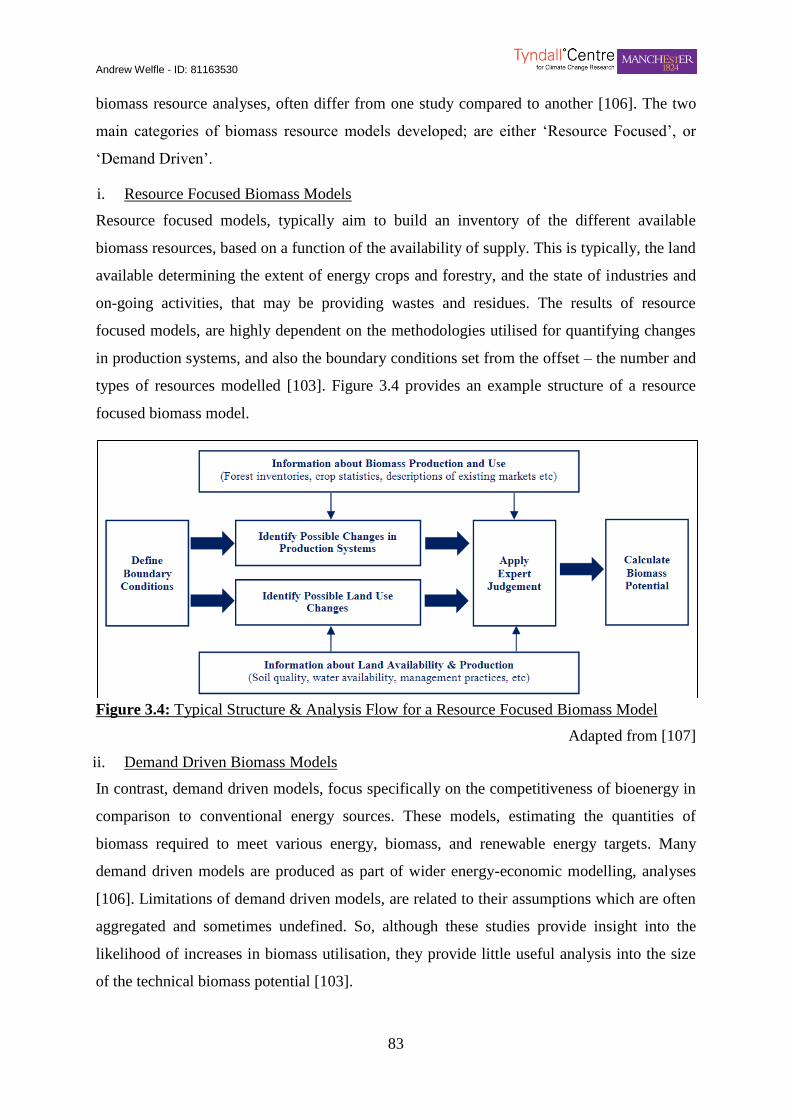
Andrew Welfle - ID: 81163530
83
biomass resource analyses, often differ from one study compared to another [106]. The two
main categories of biomass resource models developed; are either ‘Resource Focused’, or
‘Demand Driven’.
i. Resource Focused Biomass Models
Resource focused models, typically aim to build an inventory of the different available
biomass resources, based on a function of the availability of supply. This is typically, the land
available determining the extent of energy crops and forestry, and the state of industries and
on-going activities, that may be providing wastes and residues. The results of resource
focused models, are highly dependent on the methodologies utilised for quantifying changes
in production systems, and also the boundary conditions set from the offset – the number and
types of resources modelled [103]. Figure 3.4 provides an example structure of a resource
focused biomass model.
24) Figure 3.4: Typical Structure & Ana lysis Flow for a Resource Focuse d Biomass Model
Figure 3.4: Typical Structure & Analysis Flow for a Resource Focused Biomass Model
Adapted from [107]
ii. Demand Driven Biomass Models
In contrast, demand driven models, focus specifically on the competitiveness of bioenergy in
comparison to conventional energy sources. These models, estimating the quantities of
biomass required to meet various energy, biomass, and renewable energy targets. Many
demand driven models are produced as part of wider energy-economic modelling, analyses
[106]. Limitations of demand driven models, are related to their assumptions which are often
aggregated and sometimes undefined. So, although these studies provide insight into the
likelihood of increases in biomass utilisation, they provide little useful analysis into the size
of the technical biomass potential [103].

Andrew Welfle - ID: 81163530
84
3.1.4 Estimating the Global Biomass Resource
Estimating the global biomass resource is fraught with difficulty, and is by no means a
straightforward process. Therefore, the estimates that we do have; are derived from the realm
of biomass resource modelling work, of which there is plenty. A list of some of the existing
studies that have utilised or developed biomass resource models, are shown and described
within Table 3.2.
Table 3.2: Summary & Characteristics of Existing Biomass Resource Models Table 7) Table 3.2: Summary & Characteristics of Existing Biomass Resource Models
Timeframe Biomass Model References Resolution Approach
2020 Bauen et al (2004) [108] Theoretical + Realistic R-F
FAO (2010) [109] Demand D-D
2025 Sims (2006) [110] Theoretical + Technical R-F
2030 IEA (2008) [111] Demand D-D
Moreira (2006) [112] Technical + Economical R-F
2050
Beringer et al (2011) [113] Realistic R-F
Cannell (2003) [114] Theoretical + Realistic R-F
de Vries et al (2007) [115] Theoretical + Technical + Economical R-F
Erb et al (2009) [116] Theoretical + Technical + Economical R-F-L
Field et al (2008) [117] Theoretical R-F-L
Fischer & Schrattenholzer (2001) [118] Technical R-F
Haberl et al (2010) [119] Geographic A-S
Hall et al (1993) [120] Technical R-F
Hoogwijk et al (2003) [106] Geographic A-S
Hoogwijk (2004) [106] Geographic + Technical + Economical R-F
Johansson et al (1993) [121] Technical R-F
Lysen et al (2008) [122] Geographic R-F
Smeets et al (2007) [123] Technical R-F
Thran et al (2010) [124] Technical R-F
WEA (2000) [125] Technical R-F
Wolf et al (2003) [126] Technical R-F
Schubert et al (2009) [127] Technical R-F
2050-2100 Hoogwijk et al (2005) [104] Geographic + Technical D-D
Yamamoto et al (2000) [128] Ultimate + Realistic R-F-L
2100
Yamamoto et al (2001) [129] Ultimate + Realistic R-F-L
Yamamoto et al (1999) [130] Ultimate + Realistic R-F-L
Rokityanskiy et al (2007) [131] Economical R-F-L
Key: Approach
R-F : Resource Focus Biomass Models
R-F-L : Resource Focus Biomass Models Driven by Land-Use Assessments
D-D : Demand Driven Biomass Model
The UK Energy Research Centre (UKERC), and Imperial College London, completed a
comparison study that looked at and analysed over 120 different global biomass resource
estimations, based on numerous biomass models [103]. The range of timescales analysed
varied from short (to 2020), medium (to 2050), and long term (to 2100). The majority, focus
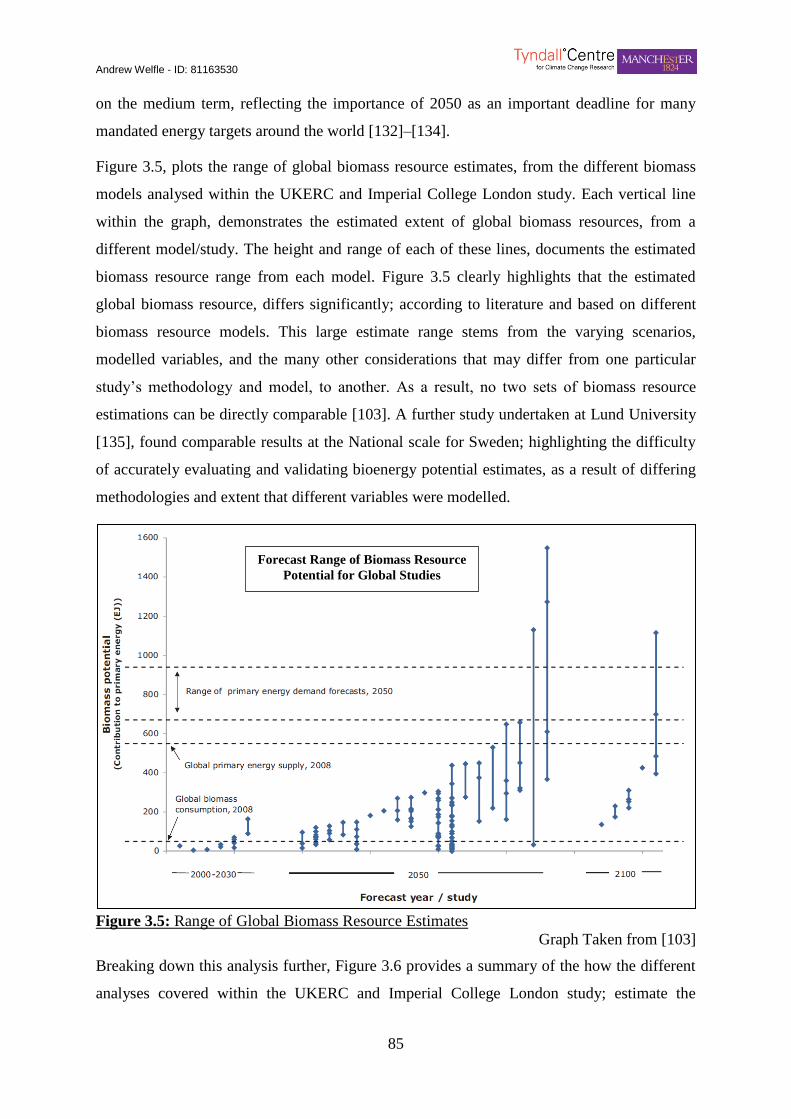
Andrew Welfle - ID: 81163530
85
on the medium term, reflecting the importance of 2050 as an important deadline for many
mandated energy targets around the world [132]–[134].
Figure 3.5, plots the range of global biomass resource estimates, from the different biomass
models analysed within the UKERC and Imperial College London study. Each vertical line
within the graph, demonstrates the estimated extent of global biomass resources, from a
different model/study. The height and range of each of these lines, documents the estimated
biomass resource range from each model. Figure 3.5 clearly highlights that the estimated
global biomass resource, differs significantly; according to literature and based on different
biomass resource models. This large estimate range stems from the varying scenarios,
modelled variables, and the many other considerations that may differ from one particular
study’s methodology and model, to another. As a result, no two sets of biomass resource
estimations can be directly comparable [103]. A further study undertaken at Lund University
[135], found comparable results at the National scale for Sweden; highlighting the difficulty
of accurately evaluating and validating bioenergy potential estimates, as a result of differing
methodologies and extent that different variables were modelled.
25) Figure 3.5: Range of Global Biomass Resource Estimates
Figure 3.5: Range of Global Biomass Resource Estimates
Graph Taken from [103]
Breaking down this analysis further, Figure 3.6 provides a summary of the how the different
analyses covered within the UKERC and Imperial College London study; estimate the
Forecast Range of Biomass Resource
Potential for Global Studies

Andrew Welfle - ID: 81163530
86
resource potentials from different categories of biomass. A wide range of estimates can be
seen, resulting from variations in how different studies analyse and define resources – again
highlighting the caution to be applied when interpreting this Graph. However, what Figure
3.6 does highlight, is that the greatest potential global biomass resource contributor, is likely
to be from energy crop resources.
26) Figure 3.6: Range of Biomass Resource and Related Land Category Estimates
Figure 3.6: Range of Biomass Resource and Related Land Category Estimates
Graph Taken from [103]
3.1.5 Modelling the UK’s Indigenous Biomass Resource
The UK’s indigenous biomass resource is an area of research that has been looked at by a
number of bodies, and through a series of studies. These focus on, quantifying the extent of
the UK’s biomass resource from different perspectives, including models that take both
resource-focused and demand-driven, approaches. The following discussion introduces some
of these studies, and goes on to highlight the focus of each; also introducing potential
knowledge gaps in current research that this PhD research aims to fill.
A. DECC - 2050 Pathways Analysis
The DECC 2050 Pathways Analysis tool, was designed to provide full energy-industry
scenarios, for meeting the UK’s 2050 carbon targets. The 2050 Pathways Calculator,
allowing users to develop their own combinations of levels of change, to achieve an 80%
reduction in carbon emissions by 2050; while ensuring that energy supply meets demand
Forecast Range of Global Biomass Potential
for Resource Categories
Andrew Welfle - ID: 81163530
87
[34]. The Report itself, describes six different Pathways Scenarios, selected to demonstrate
varied routes to 2050, ranging from: a scenario requiring significant effort across all energy
sectors, to scenarios with minimal or high contribution from particular technologies,
including bioenergy.
The DECC 2050 Pathways Analysis, is an energy Demand Driven study – looking at the
issues from a top down perspective; estimating the demand of biomass resource, based on the
extent that the bioenergy sector, is selected to contribute to the UK’s overall energy mix.
Therefore, although this study provides a valuable tool, for analysing the potential of the
bioenergy sector in the UK, in comparison to other energy technologies for meeting the
carbon targets; it does not provide analysis on the resource potentials of different indigenous
biomass resources or feedstocks.
B. AEA Consulting - UK and Global Bioenergy Resource Analysis
This analysis, produced by AEA Consulting for DECC, looks at the UK’s indigenous
biomass resource available for the bioenergy sector, over the 2010-2030 timescale. The aims
and objectives of this analysis are to assess the potential of UK’s biomass resources and
feedstocks that are available to the market; taking into consideration, barriers of deployment
for the different resources, under different assumptions. AEA’s analysis methodology is
resource-focused, estimating biomass resource availability under different development
scenarios: Business as Usual Scenario, High Investment Scenario, and a Low Development
Scenario [136], [137].
AEA’s analysis follows a rigid format that systematically looks at each biomass resource,
with respect to these three development scenarios. The analysis methodology is heavily
weighted in analysing the economic potential forecasts, and to a certain extent, technological
potential forecasts, for each biomass resource in the UK. The analysis’ resource-focused
approach includes an assessment of many of the variables associated with quantifying each
resource.
C. E4Tech - Biomass Supply Curves for the UK Analysis
Also developed for DECC, E4Tech’s report focuses on analysing resource availability supply
curves, for different biomass resource categories; for those produced indigenously in the UK,
but also for potentially available material, imported from EU and other global markets. The
analysis looks at a snapshot of timeframes: 2008, 2010, 2015, and 2030; applying the
following scenarios: Business as Usual Scenario, Introduction of the EU Renewable Energy

Andrew Welfle - ID: 81163530
88
Directive Scenario, High Sustainability Focus Scenario, and a High
Industrial/Economic/Technological Growth Scenario [138].
Similar to the AEA analysis, the E4Tech study is heavily focused on economic and
technological potential forecasts, of biomass resources produced in the UK. The study also
focuses on the EU and global markets competing with the UK, for potential imports of
biomass resource. E4tech adopt a resource-focused modelling approach, although much of
the analysis focuses on estimating the potential costs to the UK, in meeting its renewable
energy targets, while having to compete globally for imported material. The indigenous
resource quantification aspects of the analysis, notably explores how the UK could best
utilise its indigenously available resources; in order to minimise the levels of biomass imports
potentially required.
Andrew Welfle - ID: 81163530
89
Chapter 4 - Developing the Biomass Resource Model

Andrew Welfle - ID: 81163530
90
4.1 Introducing the Biomass Resource
Model
The following Chapter of the Thesis introduces the Biomass Resource Model (BRM); the key
analysis tool developed during the PhD programme. This builds upon the theoretical
framework developed in Chapters 2 and 3, and provides a full walk-through and discussion of
the BRM’s developed methodologies. The specific calculation equations applied within the
BRM, are also listed; these reflecting the modelling mechanics developed for each area of
analysis undertaken.
The BRM has been developed to provide a tool capable of providing answers to the research
questions at the heart of this PhD; and to occupy a niche allowing research to be undertaken,
in areas previously not covered by pre-existing biomass resource models.
This Chapter provides an overview of all the literature, research, studies, reports, and data
that have been utilised in developing the BRM. Existing biomass resource models that
influenced the BRM’s design are highlighted, and reasoning is provided where new
methodologies are developed.
Initially, the Chapter discusses the aims and objectives of the BRM, presenting the BRM’s
structure; including the tools and software applied in its development. Then it moves on to
discuss the progressive development of each analysis stage within the BRM, and the specific
modelling mechanics applied to undertake each stage of the analysis.
4.1.1 Aims & Objectives of the Biomass Resource Model
During development of the BRM, it was important to have clear and succinct aims and
objectives of what the Model would allow and provide, in terms of its analysis capability, and
desired outputs. Therefore, the parameters of the PhD research questions and the aims as
discussed in the Introduction (Chapter 1); were the key factors governing its design. Thus the
primary aim was to develop the BRM into a functional tool, capable of performing
appropriate analyses and addressing each of the PhD research questions in turn.
A. Aims of the Biomass Resource Model
The aim was to create a flexible tool that could reflect upon, analyse and provide forecasts of:
indigenous biomass resource supply chains, availability of potential biomass resources for the
bioenergy sector, and ultimately the bioenergy potential from indigenous resources within the
desired country or geographic region.

Andrew Welfle - ID: 81163530
91
To reflect the many dynamics, drivers, and variables that may influence the availability of
different forms of biomass resources, and the bioenergy generated; the BRM sets out the
following specific aims:
Land Based Biomass – aims to provide estimates of the resource extent and potential
availability for the bioenergy sector, of all land-based biomass resources to 2050;
within the desired country or region.
Land-Use Influences – aims to model the land-use dynamics and influences that
determine the extent and availability of all land-based biomass resources to 2050;
within the desired country or region.
Food Systems – aims to model the land-based food systems to 2050, within the desired
country or region - specifically focusing on the nexus between food and biomass for
energy. The BRM, aiming to evaluate biomass resource availability scenarios that do
not adversely impact food system productivity.
Competing Markets – aims to evaluate, quantify, and model the resource demands of
industries and other markets that may compete with the bioenergy sector for biomass
resource, to 2050; within the desired country or region. The BRM, aiming to evaluate
biomass resource availability scenarios that do not adversely impact the ability of
competing markets to meet their own biomass resource demand.
Bioenergy Pathways – aims to allow the analysis and evaluation of scenarios of
biomass resource utilisation, within different bioenergy pathways. The BRM, analysing
the bioenergy potential from indigenous resources, and comparing these to the relevant
energy targets.
Developing Scenarios – aims to provide a modelling interface, and ability to control
influencing drivers within the BRM, so that resource availability and bioenergy
potential scenarios can be developed; reflecting different potential future pathways
within the desired country or region, to 2050.
Andrew Welfle - ID: 81163530
92
B. Objectives of the Biomass Resource Model
A set of key objectives were developed that each reflect a different aspect of the modelling
methodology, and collectively allow the analysis required to answer the key PhD research
questions. These objectives are as follows:
Influences, Variables & Drivers – the objective is to model and understand all the
different influences, variables and drivers within biomass supply chains, that work in
determining the extent and availability of different biomass resources.
o Modelling the interactions and influences that land-use may have on biomass
resource availability to 2050. Whether the land is: forested, built-up, pastoral or
arable agriculture, un-utilised, or dedicated for the production of biomass potentially
available for the energy sector.
o Modelling the interactions and influences that population and social behaviours may
have on biomass resource availability to 2050. Including the extent and types of
foods required to meet demand, waste generation, and management behaviours.
o Modelling the interactions and influences that food production systems may have on
biomass resource availability to 2050. Including the extent and land requirements to
continue to meet food demands, and the resource opportunities that agriculture and
food product systems may provide for the bioenergy sector.
Quantifying Indigenous Resources – the objective is to model and quantify the extent
of all land based biomass resources, and evaluate their potential availability for the
bioenergy sector.
o Modelling and evaluating biomass resource availability and opportunities to 2050.
Including: resources grown specifically for the bioenergy sector, wastes and residues
collected from on-going activities, such as: wood, food or agricultural based
industries, and emerging resources opportunities such as arboriculture arisings,
forestry residues, and organic wastes.
o Modelling and evaluating the resource demands of industries and markets that may
compete with the bioenergy sector for resources, to 2050.
o Modelling and evaluating the bioenergy sectors resource demands to 2050. To
develop resource balance analyses, and to determine the extent that indigenous
resource may be able to meet this demand.

Andrew Welfle - ID: 81163530
93
Bioenergy Potential & Targets – the objective is to model and evaluate the bioenergy
generation potential of indigenous biomass resources, through the range of conversion
pathways; comparing these to renewable energy and bioenergy targets.
o Model and evaluate the bioenergy potential of indigenous resource to 2050. Taking
into consideration and allowing for the potential utilisation of the range of bioenergy
conversion and pre-treatment pathways, applicable to different biomass resources.
o Model and evaluate the primary energy, renewable energy, and bioenergy targets of
the desired country or region, to 2050. Evaluating the extent that bioenergy from
indigenous biomass resource, may contribute to these.
o Model and determine the extent that indigenous resources are in deficit or surplus in
the desired country or region, to 2050. Evaluating the biomass resource trade
balances that reflect the desired country or region’s required strategy; to meet their
biomass resource demands and energy targets.
4.1.2 Influential Studies & Research
A key stage in developing the BRM to meet the required aims and objectives was the
evaluation of existing studies, models, and methodologies; and to draw influence from these
when developing the BRM’s analysis methodology. As discussed in Chapter 3, a large
number of relevant studies have been undertaken, applying different methodologies and
modelling approaches; applicable to different geographic scales. As part of the process for
developing the BRM design concept; many of these studies were evaluated, with the merits
and limitations of the different methodologies considered.
Following this review process, it was decided to develop a modelling methodology with a
bottom-up, resource-focused approach. This would enable the full biomass resource potential
to be analysed, based on predicted levels of production and supply change interactions; rather
than changes in demand related to top-down forces. Development of the specific BRM
structure and approaches are discussed in greater detail, later in this Chapter. Two existing
studies were identified, that utilised relevant methodologies that could be adapted for the
BRM to meet the prescribed aims and objectives. These studies described below, provided
the greatest influence when developing the BRM’s methodologies and structure.
Andrew Welfle - ID: 81163530
94
A. Fischer et al (2007) - Assessment of Biomass Potentials for Biofuel Feedstock
Production in Europe
The Fischer et al (2007) study [139], was carried out under the Renewable Fuels for Europe
Project (REFUEL), in collaboration with the International Institute for Applied Systems
Analysis (IIASA). This study implements a resource-focused modelling approach;
specifically focusing on land-use influences across Europe, on biomass resource, and
feedstock productivity.
The notable and relevant aspects of this study include the methodologies applied and
scenarios developed to reflect agricultural systems, and the potential interactions with the
bioenergy sector. Future available land for potential bio-fuel production, being forecast,
whilst satisfying projected food and feed demands; to maintain European self-reliance levels.
B. Smeets et al (2004) - A Quickscan of Global Bio-Energy Potentials to 2050
The Smeets et al (2004) study [140], utilises a biomass resource model that applies a bottom-
up, resource-focused methodology, to analyse the global bioenergy potentials to 2050. The
analysis methodology is based on the evaluation of data, studies, and a range of relevant
factors that may influence bioenergy potential, such as: population growth, per capita food
consumption, and the efficiency of food production systems.
The types of biomass resources and feedstocks that the study models, includes: dedicated
bioenergy crops, forestry growth, waste streams, and agricultural and forestry residues.
Further relevant aspects of the methodology include the evaluation of bioenergy potential;
influenced by the demands for food, industrial round-wood, traditional wood fuels, and the
requirements to maintain forestry systems to protect biodiversity. In addition, the study is
notable in placing special attention on the technical potential of reducing the land area
required for food production, to meet demand; through increased productivity and efficiency
of food systems. Only agricultural land surplus to the requirement of meeting food demand is
considered, for the potential growth of biomass for the bioenergy sector.
This methodology was also developed following an extensive review of existing studies, and
therefore represents a key influential reference study for the BRM.
4.1.3 New Modelling Knowledge & Niche
As there are numerous existing biomass resource models, each with wide ranging
characteristics, it is important that the BRM does not simply replicate these. The BRM has
been designed to draw influence from existing leading research and methodologies, and also

Andrew Welfle - ID: 81163530
95
provide an original tool to progress and bridge gaps in knowledge. An overview of the
BRM’s characteristics and features, differentiate it from pre-existing models, and further
knowledge in this research area can be summarised as follows:
Geographic Flexibility – the BRM is designed to be flexible to geographic scale. The
structure of the BRM has been developed to be rigid, but the data applicable to each
analysis area, can be amended and updated to reflect different countries or geographic
regions. The vast majority of existing biomass resource models are developed to focus
on specific geographic areas, countries or regions.
Modelling Approach – the BRM adopts a resource-focused modelling approach,
analysing the theoretical biomass resource potential of the desired country or region.
Through calibration of the BRM to reflect the supply chain dynamics of future potential
scenarios, theoretical potential forecasts can be refined into realistic biomass resource
potential forecasts. In the UK where the majority of this PhD research is focused, a
large portion of models are demand driven [34], or resource focused [136]–[138] with
economic or technical biomass resource potential forecasts being prioritised. For the
UK, the BRM therefore provides a further analysis tool that is flexible in allowing the
evaluation of biomass resource potentials, beyond economic and technical constraints;
as discussed in greater detail with Chapter 3.
Whole System Dynamics – The BRM has been designed to reflect the whole system
and supply chain dynamics that may influence the availability of all land based
indigenous biomass resources, for the desired country or region. The majority of related
studies and models also analyse how different drivers and variables may influence
resource availability. However, they usually focus on one or a limited range of
resources and also focus on specific drivers that influence availability. The whole
system analysis approach adopted by the BRM therefore goes further than most studies;
allowing the scenarios and resource forecasts that are developed, to be more holistic.
Biomass Resource Scenarios – the BRM has been developed to be highly flexible, in
that each of the variables and drivers that reflect the dynamics of biomass supply
chains, can be controlled. Calibrating the dynamics of the Model in this way enables
future scenarios to be developed, and biomass resource potential estimates to be
forecast under these. Many existing related studies produce or make reference to

Andrew Welfle - ID: 81163530
96
resource scenarios. The flexibility of the BRM in both geographic extent, and its ability
to calibrate all influences, makes it a valuable additional analysis tool.
Biomass, Food & Competing Markets – Building on the methodologies developed by
Smeets et al (2004) [140], and Fischer et al (2007) [139]; the BRM has been developed
to produce biomass resource forecasts, in parallel with the ongoing need to meet food
system requirements, industrial land, and other resource demands. The model allows
modulation of these other essential requirements, while determining the extent of
resources available for the bioenergy sector. The BRM joins a short list of existing
models and studies that allow this format of analysis. The BRM provides advancement
over other models in being highly flexible and with the ability to analyse scenarios:
evaluating the availability of biomass resources where there is a desire to increase food
production, or conversely, where there is increased economic focus and therefore
greater dedication of resources to industry, rather than the bioenergy sector.
4.1.4 The Biomass Resource Model Structure
The following section introduces the BRM’s structure and design, providing an overview
description of the aims of each analysis stage within the Model.
The Model’s analysis has been designed to progress in three key stages; albeit with many
interlinking variables between each stage. The BRM’s architecture is reflected by Figure 4.1,
where the overarching design and progression of the analysis is shown. The three analysis
stages are represented by different colours within Figure 4.1; which also highlights each of
the variables and key steps that take place within each stage.
The BRM’s analysis timeframe spans the period from 2010 to 2050, with individual analysis
time-interval forecasts provided for the years: 2015, 2020, 2030, and 2050. The year 2010 is
chosen as the baseline for the BRM’s analysis, as this was latest year demonstrating complete
datasets at the time of initial development of the BRM. The year 2050 is chosen as the
analysis end point, as this represents the timeframe for key UK target strategies; these being:
energy, carbon mitigation, and other relevant strategy targets. The 2015 analysis timeframe is
chosen to provide a near-term forecast. The 2020 and 2030 analysis time frames are chosen
as they provide a mid-term bridge to the 2050 endpoint; and also represent the dates of
further key strategy targets.
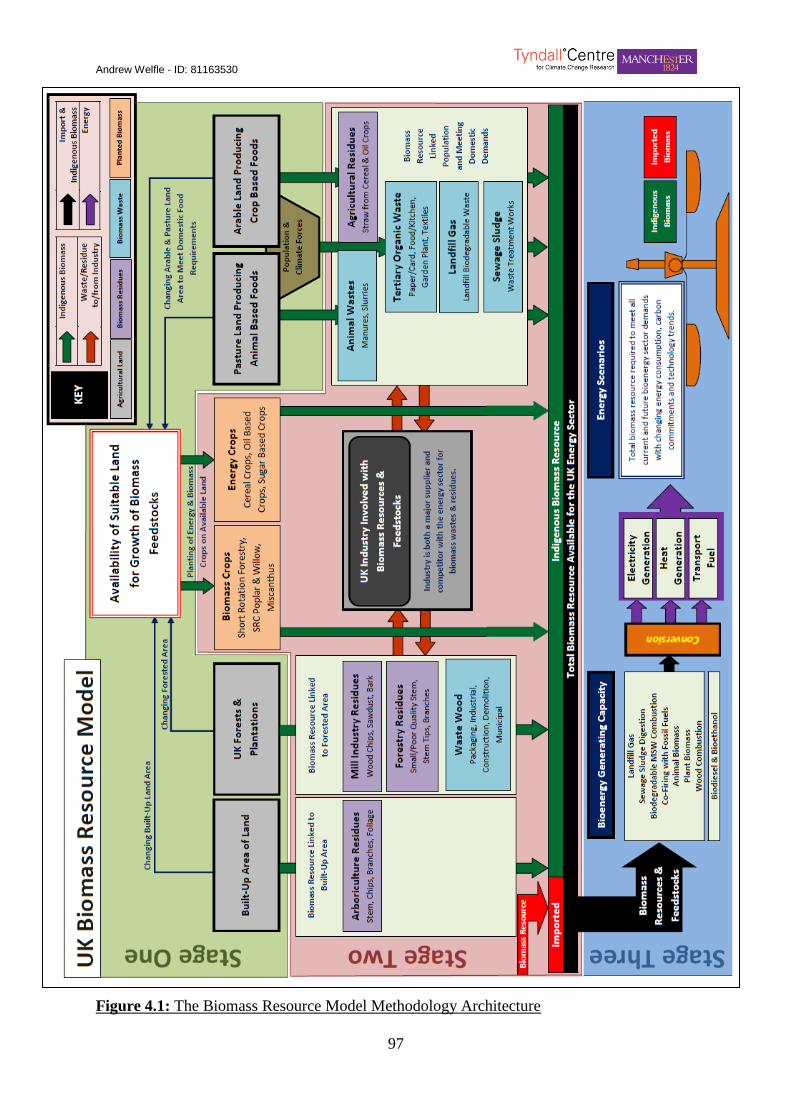
Andrew Welfle - ID: 81163530
97
Figure 4.1: The Biomass Resource Model Methodology Architecture
27) Figure 4.1: The Biomass Resource Model Methodology Architecture

Andrew Welfle - ID: 81163530
98
A. Analysis Stage One – Assessment of Land-Use Influences on Biomass Resource
Availability
Analysis Stage One, allows an assessment of the land-use influences that may impact
biomass resource availability. This analysis calculates the area of UK land utilised to meet
various demands, including: food production, further urban development, and forestry; to
2050. The remaining suitable UK land area is then highlighted as being potentially available
for the production of biomass resources, for the bioenergy sector. The key of aims of
Analysis Stage One are:
The Aims of Analysis Stage One:
Determine the domestic food consumption and total demands, based on future population
scenarios leading to 2050. Estimate the land requirement to produce this quantity of food.
Determine the extent of urban and built-up land area, and forecast how this may change, to
2050.
Determine the extent of woodland and forested land area, and forecast how this may change,
to 2050.
Estimate the area of land that may be available for alternative uses; including the potential
production of biomass resource for the bioenergy sector to 2050.
The analysis progresses by defining the types and areas of land in the UK, and forecasting
how these may change in the future. Ultimately, this assessment defines the land area which
may potentially be available, for the production of biomass resource for the bioenergy sector.
B. Analysis Stage Two – Biomass Resource Availability
Analysis Stage Two of the BRM is designed to provide an analysis of the potential
availability of different biomass resources to 2050; for the bioenergy sector. The key focus of
Stage Two is the quantification of all biomass resources, whether they are wastes and
residues from on-going activities, or specifically grown for purpose. Also, following on
directly from the analysis of Stage One, biomass resource planting scenarios and strategies
are also explored; utilising the land identified as being potentially available and suitable for
resource growth. The key aims of Analysis Stage Two are:
The Aims of Analysis Stage Two:
Using the available land identified within Stage One of the Model, analyse the potential
biomass resource that can be grown for the bioenergy sector to 2050.
Quantify the indigenous land based biomass resource that may be potentially available, to
the bioenergy sector to 2050; including: grown resources, wastes and residues.
Quantify the biomass resources that may be potentially required, by competing markets other
than the bioenergy sector to 2050.

Andrew Welfle - ID: 81163530
99
A summary of the specific biomass resources and feedstocks analysed within the Model, and
how they are categorised, is demonstrated within Table 4.1. These resources and feedstocks
demonstrating the default design of the BRM; but this list can be extended to include more or
less resources depending on the country or geographic region modelled.
Table 4.1: Summary of the Analysed Biomass Categories & Specific Resources Table 8) Table 4.1: Summary of the Analyse d Biomass C ategories & Specific Resources
Resource Categories Resources & Feedstocks
Energy &
Biomass
Crops
Grown on
Available
Land
Biomass Crops (non-food crops)
Grasses Switch Grass / Reed Canary Grass / Miscanthus
Short Rotation Coppice Poplar / Willow
Short Rotation Forestry Eucalyptus / Beech / Sycamore
Other Forestry Pine / Birch / Spruce / Fir / Ash
Energy Crops
(food crops)
Cereal Crops Barley / Oats / Wheat
Oil Crops Oilseed Rape / Palm / Soya / Sunflower
Sugar Crops Sugarcane / Sorghum / Sugar Beet
Forestry Resource Direct Forestry
Production Softwood - Wood Fuel / Hardwood - Wood Fuel
Biomass
Residues
Resources
Agricultural
Residues
Straw Wheat / Barley / Oats / Other Cereals / Oilseed Rape / Others
Slurry & Manure Cow Manure / Pig Manure / Poultry Litter / Sheep Manure
Forestry Residues Wood Residues Forest Residues
Arboriculture
Arisings
Collected from Urban
Areas Total Arboriculture Arising
Industry Residues Residues from Wood
Industries Wood Chips / Bark / Sawdust & Other
Biomass
Waste
Resources
Household,
Industry & Other
Wastes
Wastes
Chemicals / Used Oils / Health Care & Biological / Metallic / Glass /
Paper & Card / Rubber / Plastic / Wood / Textile / Containing PCB’s /
Minerals / Sludge / Animal & Vegetable / Animal Wastes / Food Preparation & Products / Animal Faeces, Urine & Manure /
Household & Similar / Mixed & Undifferentiated Materials / Sorting
Residues / Others
Sewage Water Treatment Works Sewage Sludge
The analysis in Stage Two quantifies and forecasts the extent and availability of the biomass
resource listed in Table 4.1; taking into consideration the demands and requirements of
industries, potentially competing with the bioenergy sector for resources. This includes the
analysis of factors such as: the extent that resources are collected / harvested / generated; and
drivers, such as: economic and industry productivity trends, and the ways in which resources
are managed through their life-cycle, and supply chains.
C. Analysis Stage Three – Bioenergy Potentials & Demand
Analysis Stage Three of the Model is designed to evaluate the bioenergy potential of the
specific indigenous resource quantities calculated within Stage Two; comparing this against
projected primary energy demand, and mandated or forecast energy, renewable energy, and
bioenergy targets to 2050. The Stage Three analysis allows an assessment of the bioenergy
potential of indigenous resources, and the determination of whether the country or geographic
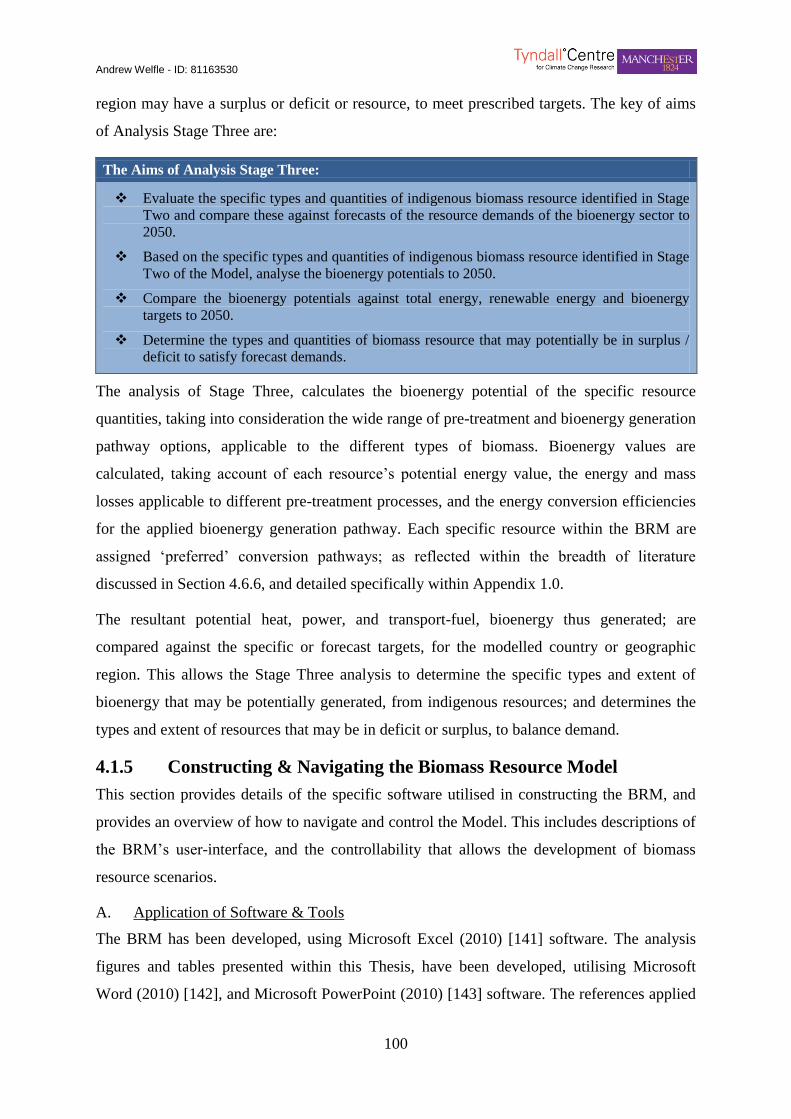
Andrew Welfle - ID: 81163530
100
region may have a surplus or deficit or resource, to meet prescribed targets. The key of aims
of Analysis Stage Three are:
The Aims of Analysis Stage Three:
Evaluate the specific types and quantities of indigenous biomass resource identified in Stage
Two and compare these against forecasts of the resource demands of the bioenergy sector to
2050.
Based on the specific types and quantities of indigenous biomass resource identified in Stage
Two of the Model, analyse the bioenergy potentials to 2050.
Compare the bioenergy potentials against total energy, renewable energy and bioenergy
targets to 2050.
Determine the types and quantities of biomass resource that may potentially be in surplus /
deficit to satisfy forecast demands.
The analysis of Stage Three, calculates the bioenergy potential of the specific resource
quantities, taking into consideration the wide range of pre-treatment and bioenergy generation
pathway options, applicable to the different types of biomass. Bioenergy values are
calculated, taking account of each resource’s potential energy value, the energy and mass
losses applicable to different pre-treatment processes, and the energy conversion efficiencies
for the applied bioenergy generation pathway. Each specific resource within the BRM are
assigned ‘preferred’ conversion pathways; as reflected within the breadth of literature
discussed in Section 4.6.6, and detailed specifically within Appendix 1.0.
The resultant potential heat, power, and transport-fuel, bioenergy thus generated; are
compared against the specific or forecast targets, for the modelled country or geographic
region. This allows the Stage Three analysis to determine the specific types and extent of
bioenergy that may be potentially generated, from indigenous resources; and determines the
types and extent of resources that may be in deficit or surplus, to balance demand.
4.1.5 Constructing & Navigating the Biomass Resource Model
This section provides details of the specific software utilised in constructing the BRM, and
provides an overview of how to navigate and control the Model. This includes descriptions of
the BRM’s user-interface, and the controllability that allows the development of biomass
resource scenarios.
A. Application of Software & Tools
The BRM has been developed, using Microsoft Excel (2010) [141] software. The analysis
figures and tables presented within this Thesis, have been developed, utilising Microsoft
Word (2010) [142], and Microsoft PowerPoint (2010) [143] software. The references applied
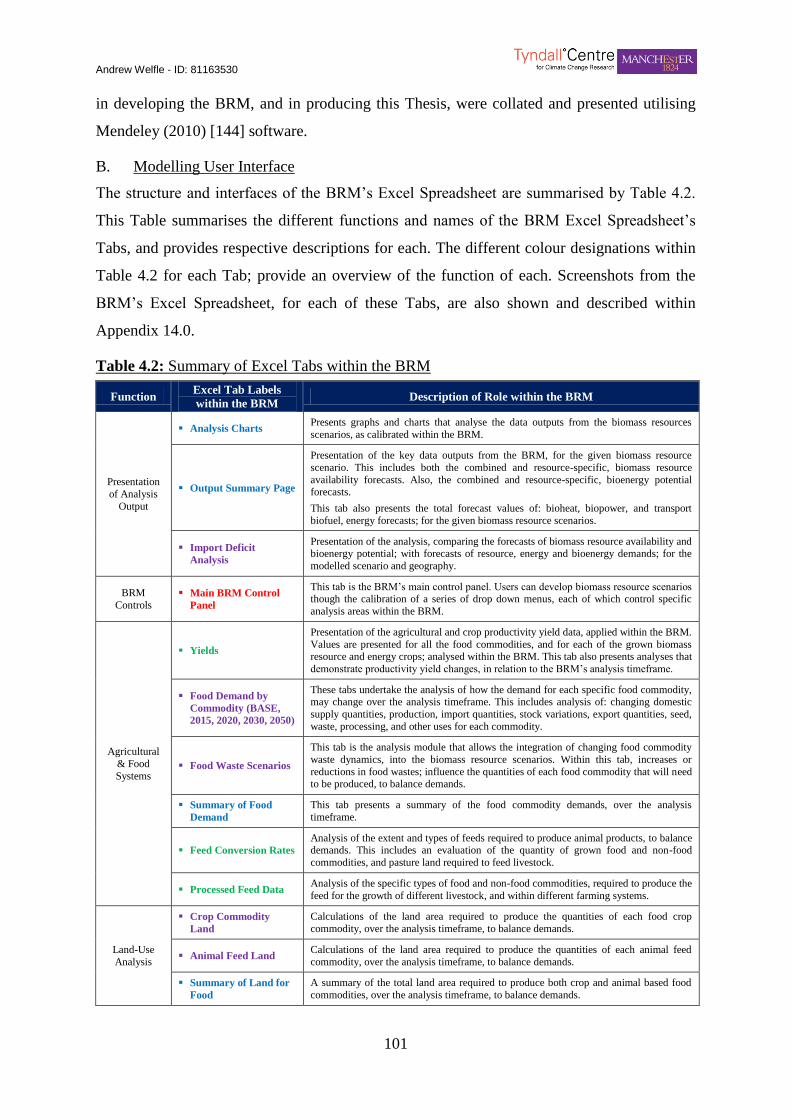
Andrew Welfle - ID: 81163530
101
in developing the BRM, and in producing this Thesis, were collated and presented utilising
Mendeley (2010) [144] software.
B. Modelling User Interface
The structure and interfaces of the BRM’s Excel Spreadsheet are summarised by Table 4.2.
This Table summarises the different functions and names of the BRM Excel Spreadsheet’s
Tabs, and provides respective descriptions for each. The different colour designations within
Table 4.2 for each Tab; provide an overview of the function of each. Screenshots from the
BRM’s Excel Spreadsheet, for each of these Tabs, are also shown and described within
Appendix 14.0.
Table 4.2: Summary of Excel Tabs within the BRM Table 9) Table 4.2: Summary of Excel Tabs within the BRM
Function Excel Tab Labels
within the BRM Description of Role within the BRM
Presentation
of Analysis
Output
Analysis Charts Presents graphs and charts that analyse the data outputs from the biomass resources
scenarios, as calibrated within the BRM.
Output Summary Page
Presentation of the key data outputs from the BRM, for the given biomass resource
scenario. This includes both the combined and resource-specific, biomass resource
availability forecasts. Also, the combined and resource-specific, bioenergy potential forecasts.
This tab also presents the total forecast values of: bioheat, biopower, and transport
biofuel, energy forecasts; for the given biomass resource scenarios.
Import Deficit
Analysis
Presentation of the analysis, comparing the forecasts of biomass resource availability and bioenergy potential; with forecasts of resource, energy and bioenergy demands; for the
modelled scenario and geography.
BRM
Controls Main BRM Control
Panel
This tab is the BRM’s main control panel. Users can develop biomass resource scenarios though the calibration of a series of drop down menus, each of which control specific
analysis areas within the BRM.
Agricultural
& Food
Systems
Yields
Presentation of the agricultural and crop productivity yield data, applied within the BRM.
Values are presented for all the food commodities, and for each of the grown biomass resource and energy crops; analysed within the BRM. This tab also presents analyses that
demonstrate productivity yield changes, in relation to the BRM’s analysis timeframe.
Food Demand by
Commodity (BASE,
2015, 2020, 2030, 2050)
These tabs undertake the analysis of how the demand for each specific food commodity, may change over the analysis timeframe. This includes analysis of: changing domestic
supply quantities, production, import quantities, stock variations, export quantities, seed,
waste, processing, and other uses for each commodity.
Food Waste Scenarios
This tab is the analysis module that allows the integration of changing food commodity
waste dynamics, into the biomass resource scenarios. Within this tab, increases or
reductions in food wastes; influence the quantities of each food commodity that will need to be produced, to balance demands.
Summary of Food
Demand
This tab presents a summary of the food commodity demands, over the analysis
timeframe.
Feed Conversion Rates
Analysis of the extent and types of feeds required to produce animal products, to balance demands. This includes an evaluation of the quantity of grown food and non-food
commodities, and pasture land required to feed livestock.
Processed Feed Data Analysis of the specific types of food and non-food commodities, required to produce the
feed for the growth of different livestock, and within different farming systems.
Land-Use
Analysis
Crop Commodity
Land
Calculations of the land area required to produce the quantities of each food crop
commodity, over the analysis timeframe, to balance demands.
Animal Feed Land Calculations of the land area required to produce the quantities of each animal feed
commodity, over the analysis timeframe, to balance demands.
Summary of Land for
Food
A summary of the total land area required to produce both crop and animal based food
commodities, over the analysis timeframe, to balance demands.
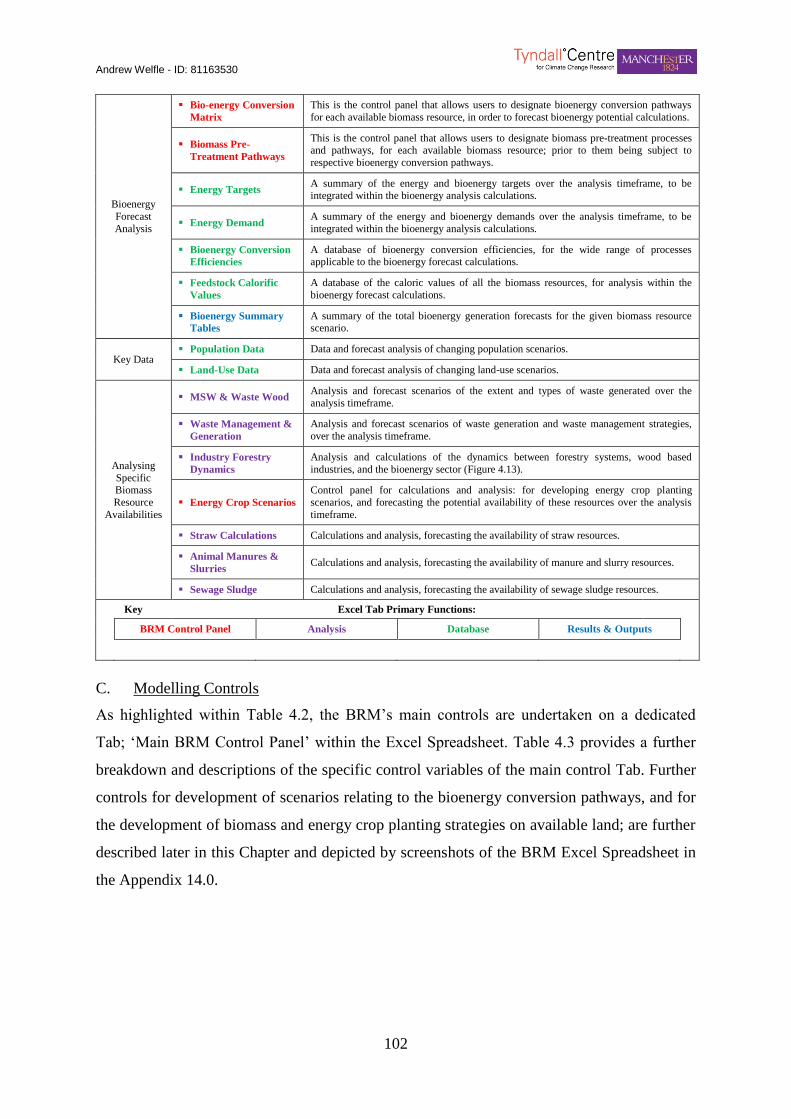
Andrew Welfle - ID: 81163530
102
Bioenergy
Forecast
Analysis
Bio-energy Conversion
Matrix
This is the control panel that allows users to designate bioenergy conversion pathways
for each available biomass resource, in order to forecast bioenergy potential calculations.
Biomass Pre-
Treatment Pathways
This is the control panel that allows users to designate biomass pre-treatment processes and pathways, for each available biomass resource; prior to them being subject to
respective bioenergy conversion pathways.
Energy Targets A summary of the energy and bioenergy targets over the analysis timeframe, to be integrated within the bioenergy analysis calculations.
Energy Demand A summary of the energy and bioenergy demands over the analysis timeframe, to be
integrated within the bioenergy analysis calculations.
Bioenergy Conversion
Efficiencies
A database of bioenergy conversion efficiencies, for the wide range of processes applicable to the bioenergy forecast calculations.
Feedstock Calorific
Values
A database of the caloric values of all the biomass resources, for analysis within the
bioenergy forecast calculations.
Bioenergy Summary
Tables
A summary of the total bioenergy generation forecasts for the given biomass resource scenario.
Key Data Population Data Data and forecast analysis of changing population scenarios.
Land-Use Data Data and forecast analysis of changing land-use scenarios.
Analysing
Specific Biomass
Resource
Availabilities
MSW & Waste Wood Analysis and forecast scenarios of the extent and types of waste generated over the
analysis timeframe.
Waste Management &
Generation
Analysis and forecast scenarios of waste generation and waste management strategies,
over the analysis timeframe.
Industry Forestry
Dynamics
Analysis and calculations of the dynamics between forestry systems, wood based
industries, and the bioenergy sector (Figure 4.13).
Energy Crop Scenarios
Control panel for calculations and analysis: for developing energy crop planting
scenarios, and forecasting the potential availability of these resources over the analysis
timeframe.
Straw Calculations Calculations and analysis, forecasting the availability of straw resources.
Animal Manures &
Slurries Calculations and analysis, forecasting the availability of manure and slurry resources.
Sewage Sludge Calculations and analysis, forecasting the availability of sewage sludge resources.
Key Excel Tab Primary Functions:
BRM Control Panel Analysis Database Results & Outputs
C. Modelling Controls
As highlighted within Table 4.2, the BRM’s main controls are undertaken on a dedicated
Tab; ‘Main BRM Control Panel’ within the Excel Spreadsheet. Table 4.3 provides a further
breakdown and descriptions of the specific control variables of the main control Tab. Further
controls for development of scenarios relating to the bioenergy conversion pathways, and for
the development of biomass and energy crop planting strategies on available land; are further
described later in this Chapter and depicted by screenshots of the BRM Excel Spreadsheet in
the Appendix 14.0.

Andrew Welfle - ID: 81163530
103
Table 4.3: Overview of the BRM’s Main Control Panel Variables Table 10) Table 4.3: Overview of the BRM’s Main Control P anel V ariables
Themes BRM Main Control
Panel Variables Descriptions
Development Built Up Land Area
% Change in built up land area between each analysis timeframe. Or the option to link
the expansion of built up land area to the changing population rate.
Population Change Low, Medium and High population change forecasts over the analysis time frame.
Agricultural
Productivity
& Food
Systems
Agricultural Productivity
Yields
Options for Lower Range, Upper Range, Medium and Mean yield levels for all
agricultural production processes.
Projected Agricultural
Productivity Yields
Options for Lower Range, Upper Range, Medium and Mean forecast increases in
productivity yields for all agricultural processes.
Food Commodity Waste
Scenarios
Option to activate or disable scenarios with varying food waste levels.
% Change in the rate of food waste generation between each analysis timeframe.
Food Commodity Export
Scenarios
Option to activate or disable scenarios with varying food commodity exports.
% Change in the rate of food commodity exports between each analysis timeframe.
Food Commodity Import
Scenarios
Option to activate or disable scenarios with varying food commodity imports.
% Change in the rate of food commodity imports between each analysis timeframe.
Forestry &
Wood Based
Industry
Dynamics
Expansion & Productivity
of Forestry
Options of a series of scenarios for forestry expansion and productivity, as developed
by specialised research, such as that carried out by the Forestry Commission.
Wood Based Industry Demand
% Change in the rate of wood based industry resource demands.
Forestry Product Export
Scenarios % Change in the rate of forestry product exports between each analysis timeframe.
Forestry Product Import Scenarios
% Change in the rate of forestry product imports between each analysis timeframe.
Waste
Resource
Dynamics
Waste Generation Trends Options of a series of scenarios for waste generation as developed by specialised
research such as that by DEFRA.
Waste Management Trends
Options of a series of scenarios for waste management as developed by specialised research such as that by DEFRA.
Further
Biomass
Resource
Dynamics
Forestry Residues % Change in the extent that this resource is collected and made available to the
bioenergy sector.
Arboricultural Arisings % Change in the extent that this resource is collected and made available to the bioenergy sector.
Straw Agricultural
Residues
% Change in the extent that this resource is harvested and made available to the
bioenergy sector.
Slurry & Manure Agricultural Residues
% Change in the extent that this resource is collected and made available to the bioenergy sector.
Biomass &
Energy Crop
Planting
Strategies
Biomass & Energy Crop
Planting Scenarios
Option to activate a default or to develop a customised biomass and energy crop
planting scenario - making use of the land forecast as being available for growth.
Proportion of Available Land Utilised for Growth
% of the area of land forecast as being suitable and available for biomass growth that is to be utilised within planting strategies between each analysis timeframe.
4.1.6 Applying the Biomass Resource Model
The BRM is applied within this research to reflect and analyse the biomass resource supply
chain dynamics of two geographies; that of the United Kingdom and that of Brazil. This
section describes the key analysis processes undertaken for each country, through application
of the BRM.
A. The UK Biomass Resource Model
In the first instance, BRM is developed to reflect the biomass resource supply chain dynamics
within the UK. The UK is chosen as the first analysis case study, as this research has been
Andrew Welfle - ID: 81163530
104
funded by the UK Engineering & Physical Sciences Research Council (EPSRC).
Furthermore, the UK represents an ideal example of a developed nation with strong
bioenergy aspirations, but with uncertain indigenous biomass resource availability. The UK
BRM analyses as discussed in this Thesis focus on the following:
Drivers – the variables that influence the availability of biomass resources in the UK
are evaluated through application of the BRM to the UK’s biomass resource supply
chains (Chapter 5). Each of these supply chain drivers are listed and their influence on
biomass availability, discussed. This analysis is undertaken to gain a greater
understanding of which drivers are the most, and the least influential, in determining
resource availability. In addition the BRM is used to evaluate the ‘availability
robustness’ of specific biomass resources; the level of influence specific resource
availabilities have on supply chain dynamics. The desired outcome of this research
being: to identify those drivers most influential in effecting the availability of the most
needed biomass resources. And then to review current actions, strategies and policies,
in the light of this new information; with a view to optimizing future availability of
indigenous biomass resource and subsequent bioenergy potential (Chapter 10).
Biomass Resource Scenarios – a series of scenarios are developed and constructed
within the UK BRM, to represent the different pathways the UK could take, to 2050
(Chapter 6). These scenarios forecast the extent of the UK’s indigenous biomass
resource availability, and the bioenergy potential. This analysis is undertaken in order
to gain a greater understanding of the different levels of bioenergy that could be
generated from indigenous resource to 2050; with varying future commitments for
mobilising resources and developing the UK bioenergy sector.
Bioenergy Sector Potential & Targets - further analysis is undertaken to determine
the forms and extent of future possible bioenergy generation, in relation to the UK’s
energy targets (Chapter 7). Also, carrying out analyses to evaluate the types and extent
of resources that will be potentially required by the future UK bioenergy sector. A
resource-trade-balance analysis is then undertaken, to evaluate the specific types of
biomass resource that the UK may need to import, to balance the future bioenergy
sector’s demands; and comparing these to the indigenous domestic resources
potentially available.

Andrew Welfle - ID: 81163530
105
B. The Brazil Biomass Resource Model
The BRM is then adapted to reflect the biomass resource supply chain dynamics within
Brazil. Brazil is chosen as the second analysis case study, as Brazil represents a developing
nation with extensive biomass resources, and is a predominant contributor to the global
biomass trade market. The Brazil BRM analyses within this Thesis progresses as follows:
Bioenergy Sector – following an extensive literature review process, a baseline
scenario is developed to reflect Brazil’s biomass resource supply chains. The Brazil
BRM is utilised to forecast Brazil’s biomass resource availability and bioenergy
potential to 2050 (Chapter 9). This analysis is undertaken to understand the specific
types and extent of biomass resources within Brazil, and the potential forms and extent
of bioenergy generation. This analysis allows a biomass resource balance assessment to
be undertaken, to evaluate the types and extent of resources that may potentially be
available to the international biomass trade markets.
Bioenergy Scenarios – a literature review process is undertaken to analyse Brazil’s
energy and bioenergy targets to 2050 (Chapter 9). A further literature review is carried
out to assess and compare the energy and bioenergy targets and strategies of a series of
countries, who are currently leading the way in terms of energy efficiency, renewable
energy contribution, and bioenergy. Scenarios are then developed within the Brazil
BRM to understand how Brazil’s biomass resource balance may change, if Brazil were
to adopt targets and strategies comparable to those of leading countries. This analysis is
undertaken to evaluate how the global biomass trade markets may be impacted if
countries such as Brazil, were to adopt strategies requiring them to utilise higher
proportion of their biomass resources for domestic use, with less available for export
(Chapter 9).

Andrew Welfle - ID: 81163530
106
4.2 UK BRM - Developing the Stage One
Methodology
The following section of the Thesis discusses in detail, how the Stage One analyses of the
BRM were developed. This section focuses on presenting the key studies and methodologies
that influenced the design of the Stage One analyses; with all the data sources utilised, being
referenced. The specific discussions in this Chapter focus on the development of the UK
BRM; with adaptations integrated to develop the Brazil BRM, discussed later in Chapter 9.
Section 4.3 of this Chapter, supported by screenshots of the BRM Excel Spreadsheet in
Appendix 14.0; goes onto present the precise calculations and mechanics, and to show how
the Stage One analyses of the BRM are modelled.
A step-by-step walk through of the Stage One BRM methodologies is provided; focusing on
the following key analysis areas:
Population Dynamics Food & Agriculture Systems
Built-Up Land Area Agriculture Land
Land Availability Growing Biomass
Food Commodity Demands Agriculture & Biomass Yields
Woodlands, Forests & Plantations
4.2.1 UK Population Dynamics
The confirmed official UK population data for 2010 has been taken to provide baseline
figures for the UK BRM’s analysis. High, Medium, and Low population change forecasts
have been sourced from the United Nation’s ‘Population Division’ [145]. Highlighted within
Table 4.4 and Figure 4.2, these provide the population change scenarios for the analysis
timeframes, within the Model.
Following the methodologies developed by Smeets et al (2004) [140], and Fischer et al
(2007) [139]; population change scenarios provide much of the basis for calculating future
food production, and commodity requirements to meet domestic food demand. The data of
the chosen population forecast scenarios is thus used consistently throughout the BRM; with
the Medium Forecast applied as the default, wherever population dynamics are required.
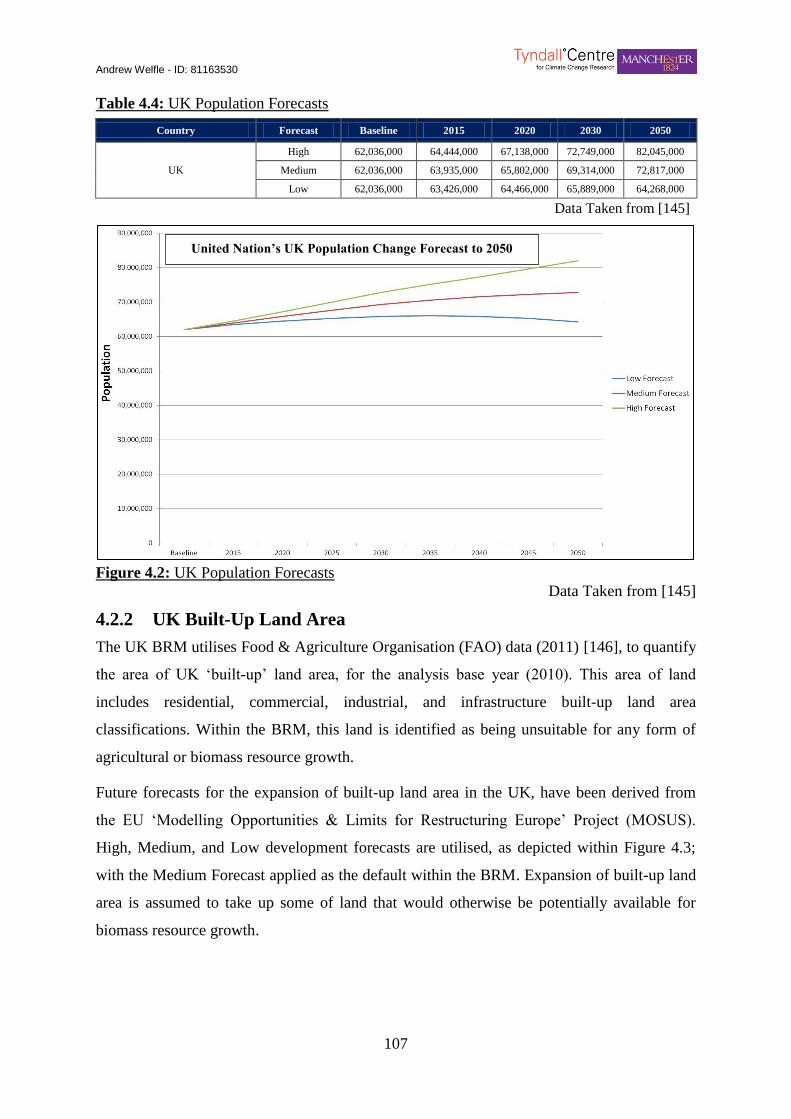
Andrew Welfle - ID: 81163530
107
Table 4.4: UK Population Forecasts Table 11) Table 4.4: UK Population Forecasts
Country Forecast Baseline 2015 2020 2030 2050
UK
High 62,036,000 64,444,000 67,138,000 72,749,000 82,045,000
Medium 62,036,000 63,935,000 65,802,000 69,314,000 72,817,000
Low 62,036,000 63,426,000 64,466,000 65,889,000 64,268,000
Data Taken from [145]
28) Figure 4.2: UK Population Forecasts
Figure 4.2: UK Population Forecasts
Data Taken from [145]
4.2.2 UK Built-Up Land Area
The UK BRM utilises Food & Agriculture Organisation (FAO) data (2011) [146], to quantify
the area of UK ‘built-up’ land area, for the analysis base year (2010). This area of land
includes residential, commercial, industrial, and infrastructure built-up land area
classifications. Within the BRM, this land is identified as being unsuitable for any form of
agricultural or biomass resource growth.
Future forecasts for the expansion of built-up land area in the UK, have been derived from
the EU ‘Modelling Opportunities & Limits for Restructuring Europe’ Project (MOSUS).
High, Medium, and Low development forecasts are utilised, as depicted within Figure 4.3;
with the Medium Forecast applied as the default within the BRM. Expansion of built-up land
area is assumed to take up some of land that would otherwise be potentially available for
biomass resource growth.
United Nation’s UK Population Change Forecast to 2050
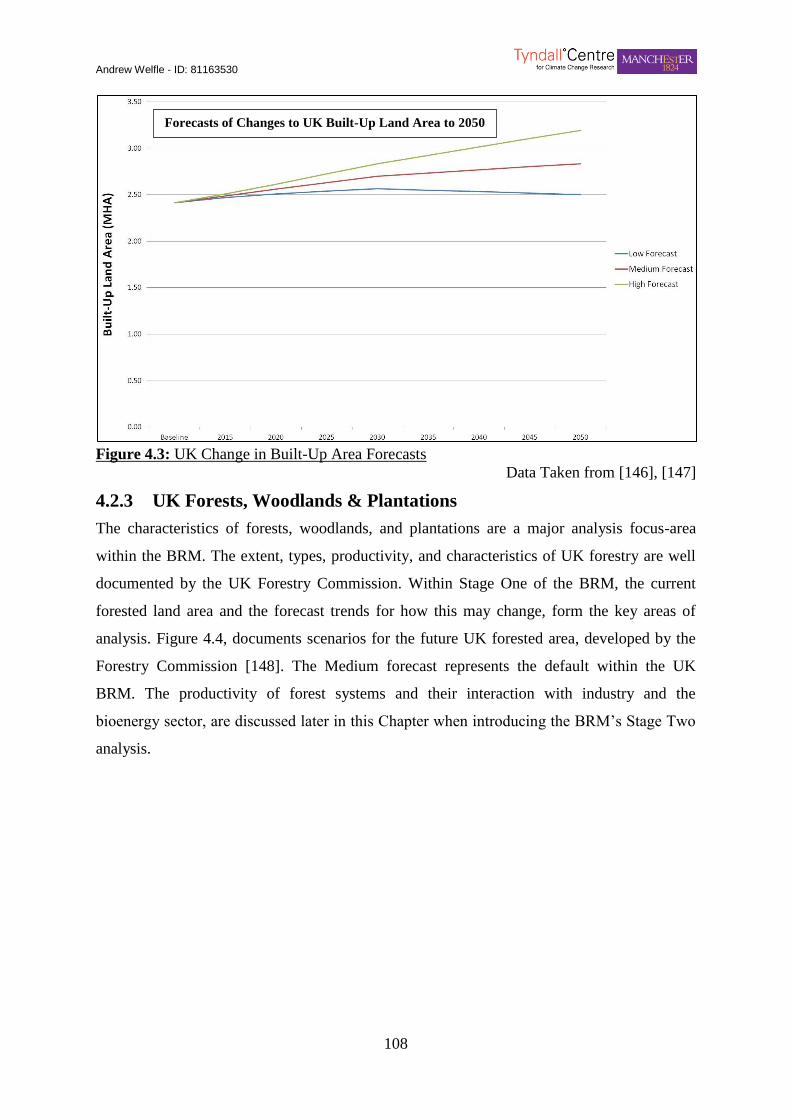
Andrew Welfle - ID: 81163530
108
29) Figure 4.3: UK C hange in B uilt-Up Area Forecasts
Figure 4.3: UK Change in Built-Up Area Forecasts
Data Taken from [146], [147]
4.2.3 UK Forests, Woodlands & Plantations
The characteristics of forests, woodlands, and plantations are a major analysis focus-area
within the BRM. The extent, types, productivity, and characteristics of UK forestry are well
documented by the UK Forestry Commission. Within Stage One of the BRM, the current
forested land area and the forecast trends for how this may change, form the key areas of
analysis. Figure 4.4, documents scenarios for the future UK forested area, developed by the
Forestry Commission [148]. The Medium forecast represents the default within the UK
BRM. The productivity of forest systems and their interaction with industry and the
bioenergy sector, are discussed later in this Chapter when introducing the BRM’s Stage Two
analysis.
Forecasts of Changes to UK Built-Up Land Area to 2050
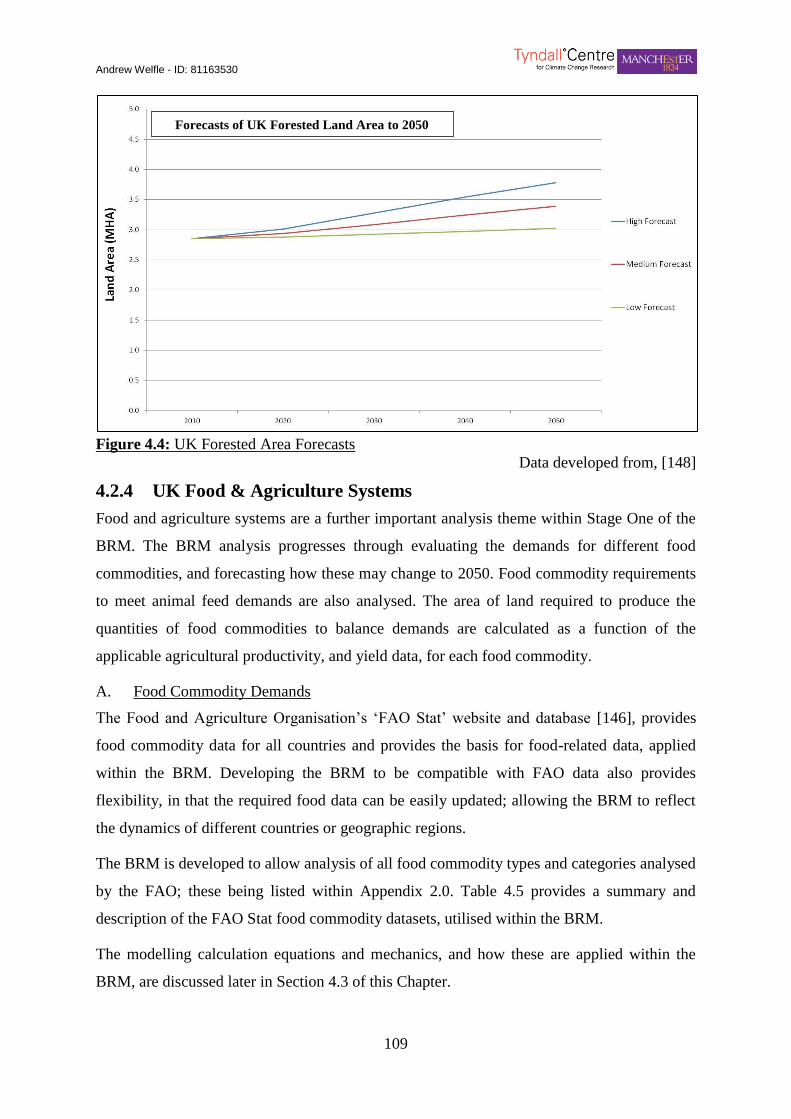
Andrew Welfle - ID: 81163530
109
30) Figure 4.4: UK Forested Area Forecasts
Figure 4.4: UK Forested Area Forecasts
Data developed from, [148]
4.2.4 UK Food & Agriculture Systems
Food and agriculture systems are a further important analysis theme within Stage One of the
BRM. The BRM analysis progresses through evaluating the demands for different food
commodities, and forecasting how these may change to 2050. Food commodity requirements
to meet animal feed demands are also analysed. The area of land required to produce the
quantities of food commodities to balance demands are calculated as a function of the
applicable agricultural productivity, and yield data, for each food commodity.
A. Food Commodity Demands
The Food and Agriculture Organisation’s ‘FAO Stat’ website and database [146], provides
food commodity data for all countries and provides the basis for food-related data, applied
within the BRM. Developing the BRM to be compatible with FAO data also provides
flexibility, in that the required food data can be easily updated; allowing the BRM to reflect
the dynamics of different countries or geographic regions.
The BRM is developed to allow analysis of all food commodity types and categories analysed
by the FAO; these being listed within Appendix 2.0. Table 4.5 provides a summary and
description of the FAO Stat food commodity datasets, utilised within the BRM.
The modelling calculation equations and mechanics, and how these are applied within the
BRM, are discussed later in Section 4.3 of this Chapter.
Forecasts of UK Forested Land Area to 2050
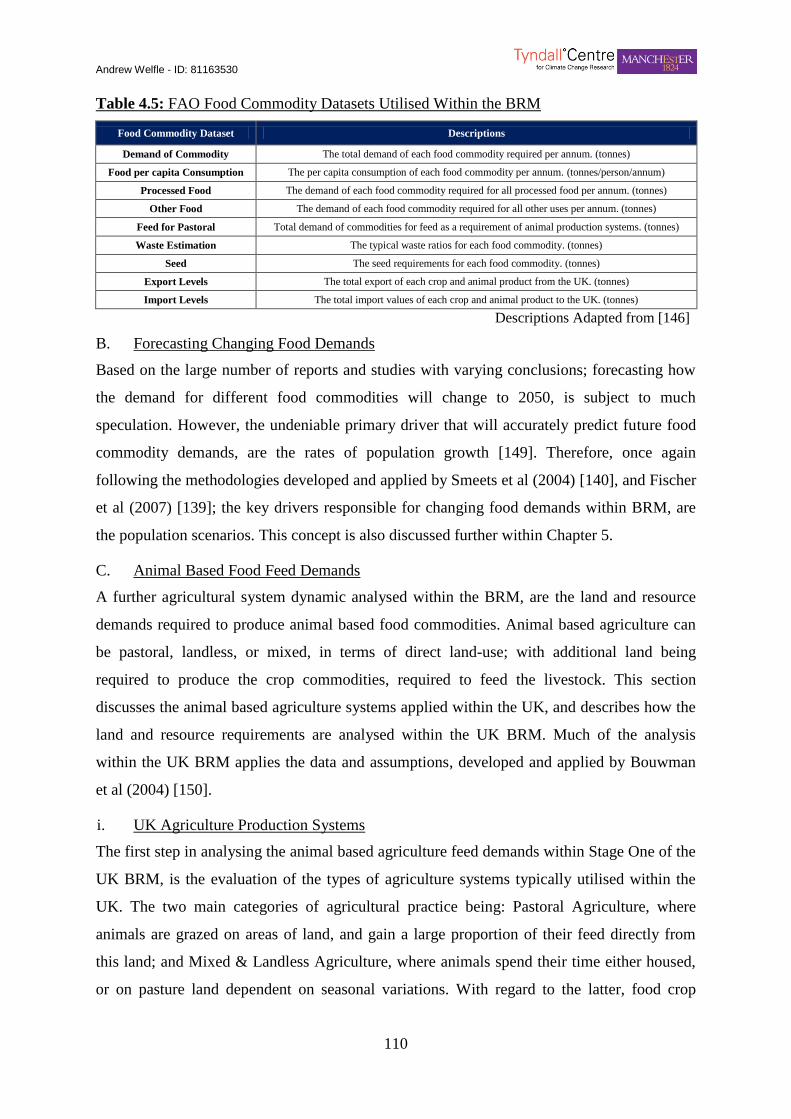
Andrew Welfle - ID: 81163530
110
Table 4.5: FAO Food Commodity Datasets Utilised Within the BRM Table 12) Table 4.5: FAO Food Co mmodity D atasets Utilised Within the BRM
Food Commodity Dataset Descriptions
Demand of Commodity The total demand of each food commodity required per annum. (tonnes)
Food per capita Consumption The per capita consumption of each food commodity per annum. (tonnes/person/annum)
Processed Food The demand of each food commodity required for all processed food per annum. (tonnes)
Other Food The demand of each food commodity required for all other uses per annum. (tonnes)
Feed for Pastoral Total demand of commodities for feed as a requirement of animal production systems. (tonnes)
Waste Estimation The typical waste ratios for each food commodity. (tonnes)
Seed The seed requirements for each food commodity. (tonnes)
Export Levels The total export of each crop and animal product from the UK. (tonnes)
Import Levels The total import values of each crop and animal product to the UK. (tonnes)
Descriptions Adapted from [146]
B. Forecasting Changing Food Demands
Based on the large number of reports and studies with varying conclusions; forecasting how
the demand for different food commodities will change to 2050, is subject to much
speculation. However, the undeniable primary driver that will accurately predict future food
commodity demands, are the rates of population growth [149]. Therefore, once again
following the methodologies developed and applied by Smeets et al (2004) [140], and Fischer
et al (2007) [139]; the key drivers responsible for changing food demands within BRM, are
the population scenarios. This concept is also discussed further within Chapter 5.
C. Animal Based Food Feed Demands
A further agricultural system dynamic analysed within the BRM, are the land and resource
demands required to produce animal based food commodities. Animal based agriculture can
be pastoral, landless, or mixed, in terms of direct land-use; with additional land being
required to produce the crop commodities, required to feed the livestock. This section
discusses the animal based agriculture systems applied within the UK, and describes how the
land and resource requirements are analysed within the UK BRM. Much of the analysis
within the UK BRM applies the data and assumptions, developed and applied by Bouwman
et al (2004) [150].
i. UK Agriculture Production Systems
The first step in analysing the animal based agriculture feed demands within Stage One of the
UK BRM, is the evaluation of the types of agriculture systems typically utilised within the
UK. The two main categories of agricultural practice being: Pastoral Agriculture, where
animals are grazed on areas of land, and gain a large proportion of their feed directly from
this land; and Mixed & Landless Agriculture, where animals spend their time either housed,
or on pasture land dependent on seasonal variations. With regard to the latter, food crop
Andrew Welfle - ID: 81163530
111
commodities and other resources are thus required to feed the livestock during the periods
when they are housed. A list of the key animal based product categories as analysed within
the BRM are as follows:
Beef Meat Based Products Poultry Based Products
Mutton & Goat Based Products Other Products with Pastoral Land Requirements
Pork Based Products Other Products with Mixed & Landless Requirements
Milk & Dairy Based Products
Appendix 3.0 presents data sourced from Bouwman et al (2004) [150], reflecting the
proportions of time taken, by each animal based product category, while utilising
predominantly pastoral, and mixed and landless systems, in the UK.
ii. Feeding Practices
The next step the BRM undertakes is the evaluation of the specific feed requirements of
livestock produced within both pastoral, and mixed & landless systems, in the UK. This
analysis step is undertaken to determine if there are any, additional land requirements needed
to grow the food commodities, to balance the feed demands, for all animal based agricultural
practices. Also, to identify the areas of pasture land required, to balance the demands of
pastoral agricultural practices.
The BRM again utilises the data and methodology applied by Bouwman et al (2004) [150],
which lists the typical feed requirements, for producing different livestock. This essentially
provides agricultural practice assumptions for different regions, including: the extent of feed
that each different category of livestock will consume, the specific food crops and animal
based products that will have to be produced for feed requirements, the extent that residues
and fodder will be consumed, the quantities of grass that will be required either directly from
the land, or grown and harvested, and/or the extent that scavenging for food, (with no
accounted land or resource requirements) may be adopted as the agricultural system method.
The feed data utilised within the UK BRM to reflect UK livestock feed agricultural practices,
is listed within Appendix 3.0.
iii. Animal Feed Raw Material Composition
The BRM then undertakes analyses to evaluate the typical compositions of feed for different
livestock categories. This is carried out to determine the land area that may be required to
produce the quantities of crop and animal food commodities, to balance the feed demands.
Andrew Welfle - ID: 81163530
112
The UK BRM utilises typical feed composition data provided by the UK Department for
Environment, Food and Rural Affairs (DEFRA) [151]. This is listed within Appendix 3.0.
iv. Feed Conversion Efficiencies
The BRM then applies feed conversion efficiency data, to determine the typical quantities of
feed (kg) that are required to produce an equivalent mass (kg) of animal food product. This is
an important analysis step, as it allows the total demand of different crop commodities to be
calculated, to produce the required quantities of animal product. The BRM adopts a similar
methodology for determining feed conversion efficiencies, as that developed for analysing
crop productivity yields. A literature review was undertaken to determine the range of feed
conversion efficiency values, calculated for different livestock categories in the UK. The key
reports, studies and research, providing UK feed conversion efficiency data, are listed below.
The specific data utilised within the UK BRM are listed in Appendix 3.0; with the Mean
values applied as the default control options, within the BRM.
Bouwman et al (2004) [150] DairyCo (2010) [152]
FAO (1996, 2010, 2011) [109], [153], [154] Jolly & Wallace (2007) [155]
v. Land Requirement to Produce Animal Based Food Commodities
The final step in this phase of the Stage One BRM analyses, are calculations of the total land
area that would be required to produce the animal based food commodities, to balance
demands; including areas of pasture land and additional lands, required to produce the
commodities for making animal feed.
The BRM approaches this analysis through linking these animal feed land requirements, with
that required to produce the crop commodities, for meeting overall demands. Thus the
production of additional crop commodities for animal feed is modelled, in addition to that of
crops for food consumption. The land area required for pastoral agricultural practices is
analysed as a function of the typical grass productivity yields in the UK, and the amount of
food (grass) necessary to produce the required quantities of animal product. Data reflecting
these dynamics are listed in Appendix 3.0.
4.2.5 Agriculture & Biomass Productivity Yields
Agriculture and biomass resource productivity yields are key data utilised within the BRM, to
forecast the areas of land that may be required to produce the desired levels of commodities.
The productivity yields are also used within the BRM, as a function for modelling potential
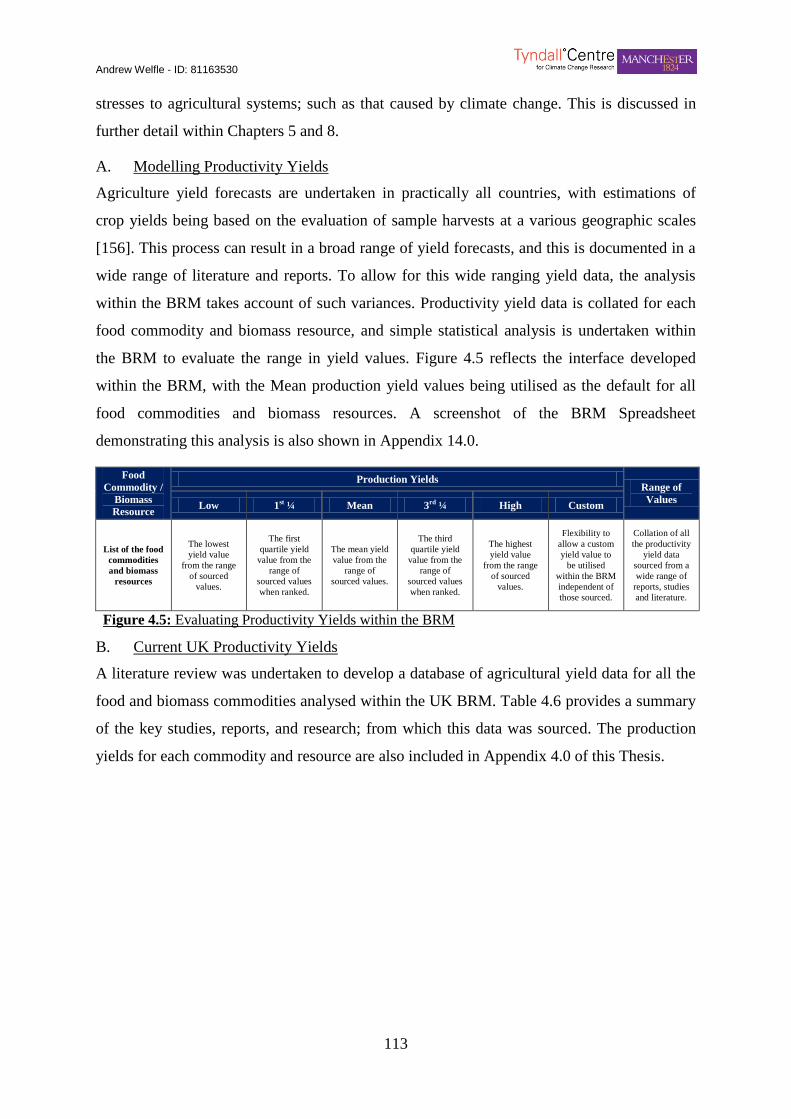
Andrew Welfle - ID: 81163530
113
stresses to agricultural systems; such as that caused by climate change. This is discussed in
further detail within Chapters 5 and 8.
A. Modelling Productivity Yields
Agriculture yield forecasts are undertaken in practically all countries, with estimations of
crop yields being based on the evaluation of sample harvests at a various geographic scales
[156]. This process can result in a broad range of yield forecasts, and this is documented in a
wide range of literature and reports. To allow for this wide ranging yield data, the analysis
within the BRM takes account of such variances. Productivity yield data is collated for each
food commodity and biomass resource, and simple statistical analysis is undertaken within
the BRM to evaluate the range in yield values. Figure 4.5 reflects the interface developed
within the BRM, with the Mean production yield values being utilised as the default for all
food commodities and biomass resources. A screenshot of the BRM Spreadsheet
demonstrating this analysis is also shown in Appendix 14.0.
Food
Commodity /
Biomass
Resource
Production Yields Range of
Values Low 1st ¼ Mean 3rd ¼ High Custom
List of the food
commodities
and biomass
resources
The lowest
yield value
from the range
of sourced
values.
The first
quartile yield
value from the
range of
sourced values
when ranked.
The mean yield
value from the
range of
sourced values.
The third
quartile yield
value from the
range of
sourced values
when ranked.
The highest
yield value
from the range
of sourced
values.
Flexibility to
allow a custom
yield value to
be utilised
within the BRM
independent of
those sourced.
Collation of all
the productivity
yield data
sourced from a
wide range of
reports, studies
and literature.
Figure 4.5: Evaluating Productivity Yields within the BRM 31) Figure 4.5: Eva luating Productivity Yields wit hin the BRM
B. Current UK Productivity Yields
A literature review was undertaken to develop a database of agricultural yield data for all the
food and biomass commodities analysed within the UK BRM. Table 4.6 provides a summary
of the key studies, reports, and research; from which this data was sourced. The production
yields for each commodity and resource are also included in Appendix 4.0 of this Thesis.
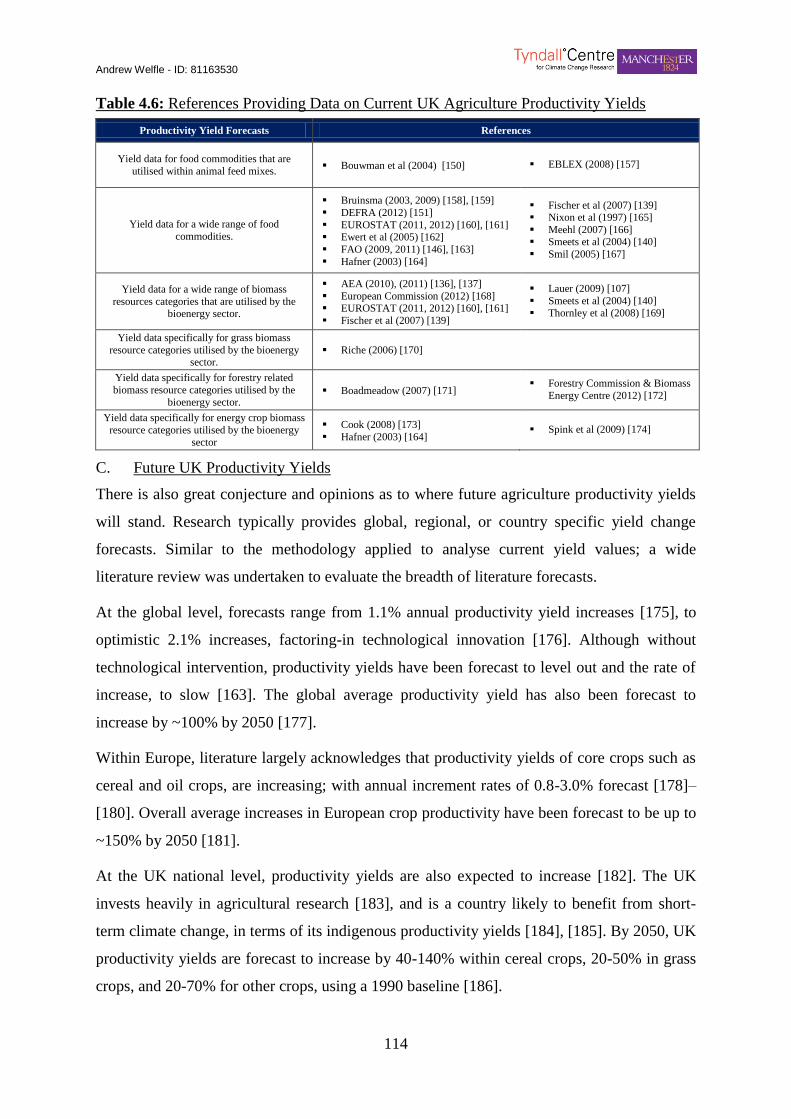
Andrew Welfle - ID: 81163530
114
Table 4.6: References Providing Data on Current UK Agriculture Productivity Yields Table 13) Table 4.6: References Providing Data on Current UK Agricult ure Productivity Yields
Productivity Yield Forecasts References
Yield data for food commodities that are
utilised within animal feed mixes. Bouwman et al (2004) [150] EBLEX (2008) [157]
Yield data for a wide range of food
commodities.
Bruinsma (2003, 2009) [158], [159]
DEFRA (2012) [151]
EUROSTAT (2011, 2012) [160], [161] Ewert et al (2005) [162]
FAO (2009, 2011) [146], [163]
Hafner (2003) [164]
Fischer et al (2007) [139] Nixon et al (1997) [165]
Meehl (2007) [166] Smeets et al (2004) [140]
Smil (2005) [167]
Yield data for a wide range of biomass
resources categories that are utilised by the bioenergy sector.
AEA (2010), (2011) [136], [137]
European Commission (2012) [168] EUROSTAT (2011, 2012) [160], [161]
Fischer et al (2007) [139]
Lauer (2009) [107]
Smeets et al (2004) [140] Thornley et al (2008) [169]
Yield data specifically for grass biomass
resource categories utilised by the bioenergy sector.
Riche (2006) [170]
Yield data specifically for forestry related
biomass resource categories utilised by the
bioenergy sector. Boadmeadow (2007) [171]
Forestry Commission & Biomass
Energy Centre (2012) [172]
Yield data specifically for energy crop biomass
resource categories utilised by the bioenergy
sector
Cook (2008) [173]
Hafner (2003) [164] Spink et al (2009) [174]
C. Future UK Productivity Yields
There is also great conjecture and opinions as to where future agriculture productivity yields
will stand. Research typically provides global, regional, or country specific yield change
forecasts. Similar to the methodology applied to analyse current yield values; a wide
literature review was undertaken to evaluate the breadth of literature forecasts.
At the global level, forecasts range from 1.1% annual productivity yield increases [175], to
optimistic 2.1% increases, factoring-in technological innovation [176]. Although without
technological intervention, productivity yields have been forecast to level out and the rate of
increase, to slow [163]. The global average productivity yield has also been forecast to
increase by ~100% by 2050 [177].
Within Europe, literature largely acknowledges that productivity yields of core crops such as
cereal and oil crops, are increasing; with annual increment rates of 0.8-3.0% forecast [178]–
[180]. Overall average increases in European crop productivity have been forecast to be up to
~150% by 2050 [181].
At the UK national level, productivity yields are also expected to increase [182]. The UK
invests heavily in agricultural research [183], and is a country likely to benefit from short-
term climate change, in terms of its indigenous productivity yields [184], [185]. By 2050, UK
productivity yields are forecast to increase by 40-140% within cereal crops, 20-50% in grass
crops, and 20-70% for other crops, using a 1990 baseline [186].

Andrew Welfle - ID: 81163530
115
The UK BRM applies these considerations, working on the assumption that the maximum
increment in crop productivity yields to 2050, will by 150%; with further commodity specific
forecasts appropriately accounted for. A summary of the key documents utilised within the
literature review process, are shown in Table 4.7.
Table 4.7: References Providing Data on Future Agriculture Productivity Yields Table 14) Table 4.7: References Providing Data on Fut ure Agricult ure Productiv ity Yields
Productivity Yield Forecasts References
Future Productivity Forecasts for a wide
range of food commodities.
Alexandratos et al (2006) [187]
Bruinsma (2003, 2009) [158], [159]
Deepal et al (2013) [178]
Erb et al (2009) [116] Ewert et al (2005) [162]
FAO (2009) [163]
IPCC (2007) [184] van der Mensbrugghe et al (2011) [176]
Moeller & Grethe (2010) [179]
Nelson et al (2010) [188]
Nikos & Bruinsma (2012) [175] Randers (2012) [177]
Tilman et al (2011) [189]
UK Government (2012) [186] Jaggard et al (2010) [181]
DEFRA (2010) [182]
Future Productivity Forecasts for a wide
range for biomass resource categories
that are utilised by the bioenergy sector.
AEA (2010, 2011) [136], [137]
E4Tech (2009) [138] Haberl et al (2011) [180]
IPCC (2007) [184] Moeller & Grethe (2010) [179]
Randers (2012) [177]
4.2.6 Land Area to Meet Food Commodity Demands
Once the demand for each food commodity is determined, the BRM forecasts the land area
that may be required to produce the quantities of food commodities, to balance demands. This
land area being a function of: the arable and pastoral food commodity demands, the animal
feed commodity demands, arable and pastoral agricultural productivity yields, and population
change scenarios. The overview of this dynamic is highlighted within Figure 4.6, and the
calculation mechanics are specifically documented in Section 4.3 of this Chapter.
32) Figure 4.6: Forecast Land Area Required to Meet Total F ood C ommodity Demands
Figure 4.6: Forecast Land Area Required to Meet Total Food Commodity Demands
Andrew Welfle - ID: 81163530
116
A. Prioritising Land for Food Production
A key focus area of the BRM’s analysis methodology is the prioritisation of land area to meet
food demands, before it is identified as being potentially available for the production of
biomass resources. This reflects similar methodologies developed by Smeets et al (2004)
[140] and Fischer et al (2007) [139].
4.2.7 UK Land Availability
The final analysis step within Stage One analyses of the BRM is to forecast the total area of
land that may be available and suitable, for the production of biomass resources. This land
area is calculated in reflection of the methodology development, by Fischer et al (2007)
[139]. The calculation mechanics of this analysis is specifically documented in Section 4.3 of
this Chapter.
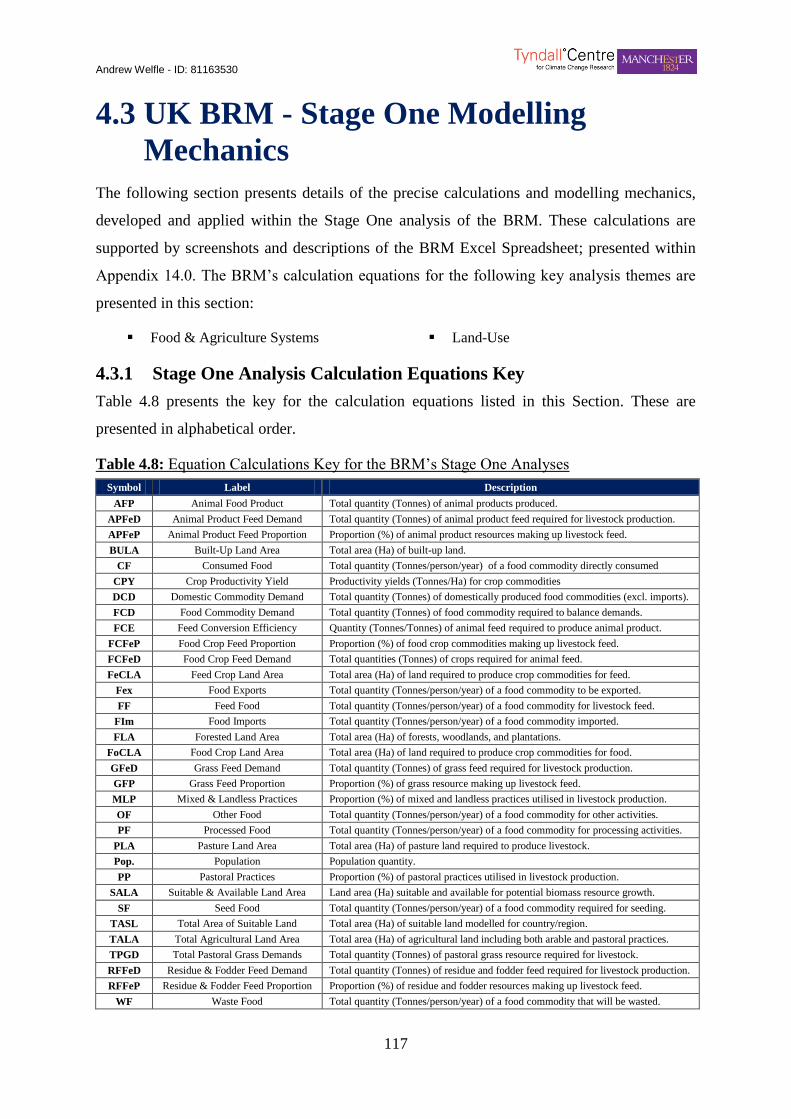
Andrew Welfle - ID: 81163530
117
4.3 UK BRM - Stage One Modelling
Mechanics
The following section presents details of the precise calculations and modelling mechanics,
developed and applied within the Stage One analysis of the BRM. These calculations are
supported by screenshots and descriptions of the BRM Excel Spreadsheet; presented within
Appendix 14.0. The BRM’s calculation equations for the following key analysis themes are
presented in this section:
Food & Agriculture Systems Land-Use
4.3.1 Stage One Analysis Calculation Equations Key
Table 4.8 presents the key for the calculation equations listed in this Section. These are
presented in alphabetical order.
Table 4.8: Equation Calculations Key for the BRM’s Stage One Analyses Table 15) Table 4.8: Equation C alculations Key for the BRM’s Stage One A nalyses
Symbol Label Description
AFP Animal Food Product Total quantity (Tonnes) of animal products produced.
APFeD Animal Product Feed Demand Total quantity (Tonnes) of animal product feed required for livestock production.
APFeP Animal Product Feed Proportion Proportion (%) of animal product resources making up livestock feed.
BULA Built-Up Land Area Total area (Ha) of built-up land.
CF Consumed Food Total quantity (Tonnes/person/year) of a food commodity directly consumed
CPY Crop Productivity Yield Productivity yields (Tonnes/Ha) for crop commodities
DCD Domestic Commodity Demand Total quantity (Tonnes) of domestically produced food commodities (excl. imports).
FCD Food Commodity Demand Total quantity (Tonnes) of food commodity required to balance demands.
FCE Feed Conversion Efficiency Quantity (Tonnes/Tonnes) of animal feed required to produce animal product.
FCFeP Food Crop Feed Proportion Proportion (%) of food crop commodities making up livestock feed.
FCFeD Food Crop Feed Demand Total quantities (Tonnes) of crops required for animal feed.
FeCLA Feed Crop Land Area Total area (Ha) of land required to produce crop commodities for feed.
Fex Food Exports Total quantity (Tonnes/person/year) of a food commodity to be exported.
FF Feed Food Total quantity (Tonnes/person/year) of a food commodity for livestock feed.
FIm Food Imports Total quantity (Tonnes/person/year) of a food commodity imported.
FLA Forested Land Area Total area (Ha) of forests, woodlands, and plantations.
FoCLA Food Crop Land Area Total area (Ha) of land required to produce crop commodities for food.
GFeD Grass Feed Demand Total quantity (Tonnes) of grass feed required for livestock production.
GFP Grass Feed Proportion Proportion (%) of grass resource making up livestock feed.
MLP Mixed & Landless Practices Proportion (%) of mixed and landless practices utilised in livestock production.
OF Other Food Total quantity (Tonnes/person/year) of a food commodity for other activities.
PF Processed Food Total quantity (Tonnes/person/year) of a food commodity for processing activities.
PLA Pasture Land Area Total area (Ha) of pasture land required to produce livestock.
Pop. Population Population quantity.
PP Pastoral Practices Proportion (%) of pastoral practices utilised in livestock production.
SALA Suitable & Available Land Area Land area (Ha) suitable and available for potential biomass resource growth.
SF Seed Food Total quantity (Tonnes/person/year) of a food commodity required for seeding.
TASL Total Area of Suitable Land Total area (Ha) of suitable land modelled for country/region.
TALA Total Agricultural Land Area Total area (Ha) of agricultural land including both arable and pastoral practices.
TPGD Total Pastoral Grass Demands Total quantity (Tonnes) of pastoral grass resource required for livestock.
RFFeD Residue & Fodder Feed Demand Total quantity (Tonnes) of residue and fodder feed required for livestock production.
RFFeP Residue & Fodder Feed Proportion Proportion (%) of residue and fodder resources making up livestock feed.
WF Waste Food Total quantity (Tonnes/person/year) of a food commodity that will be wasted.

Andrew Welfle - ID: 81163530
118
4.3.2 Modelling Food & Agriculture Systems to 2050
The following section presents the calculation equations applied within the BRM for the
modelling of agricultural systems, and the food demand analyses undertaken. These
equations are described below and listed in Figure 4.7.
Calculating Food Commodity Demands (Eq.1a)
The calculation equation applied for analysing specific food commodity demands
within the BRM.
Calculating Domestic Food Commodity Demands (Eq.1b)
The calculation equation applied for analysing the domestic production of each food
commodity within the BRM. This calculation excludes the influence of food imports.
Calculating Total Pastoral Grass Required for Livestock (Eq.1c)
The calculation equation applied within the BRM, for analysing the total grass
resource demands for livestock production, utilising pastoral agricultural systems.
Calculating Total Grass Resource Required for Livestock Feed (Eq.1d)
The calculation equation applied within the BRM, for analysing the total quantities of
grass feed demands required by livestock, produced within mixed and landless
agricultural systems.
Calculating Total Food Crop Commodities Required for Livestock Feed (Eq.1e)
The calculation equation applied within the BRM, for analysing the total quantities of
food crop feed commodity demands, for livestock produced within mixed and
landless agricultural systems.
Calculating Total Residue & Fodder Resource Required for Livestock Feed (Eq.1f)
The calculation equation applied within the BRM, for analysing the total quantities of
residue and fodder feed resource demands, for livestock produced within mixed and
landless agricultural systems.
Calculating Total Animal Product Resource Required for Livestock Feed (Eq.1g)
The calculation equation applied within the BRM, for analysing the total quantities of
animal product feed resource demands, for livestock produced within mixed and
landless agricultural systems.
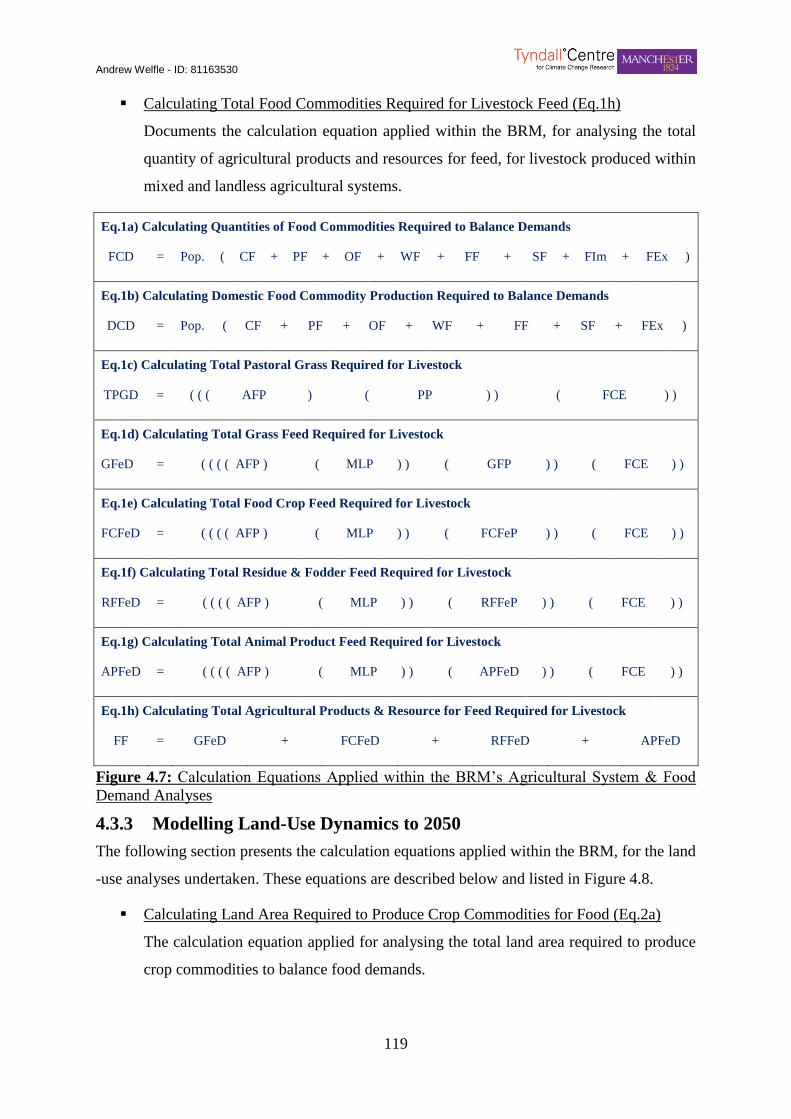
Andrew Welfle - ID: 81163530
119
Calculating Total Food Commodities Required for Livestock Feed (Eq.1h)
Documents the calculation equation applied within the BRM, for analysing the total
quantity of agricultural products and resources for feed, for livestock produced within
mixed and landless agricultural systems.
Eq.1a) Calculating Quantities of Food Commodities Required to Balance Demands
FCD = Pop. ( CF + PF + OF + WF + FF + SF + FIm + FEx )
Eq.1b) Calculating Domestic Food Commodity Production Required to Balance Demands
DCD = Pop. ( CF + PF + OF + WF + FF + SF + FEx )
Eq.1c) Calculating Total Pastoral Grass Required for Livestock
TPGD = ( ( ( AFP ) ( PP ) ) ( FCE ) )
Eq.1d) Calculating Total Grass Feed Required for Livestock
GFeD = ( ( ( ( AFP ) ( MLP ) ) ( GFP ) ) ( FCE ) )
Eq.1e) Calculating Total Food Crop Feed Required for Livestock
FCFeD = ( ( ( ( AFP ) ( MLP ) ) ( FCFeP ) ) ( FCE ) )
Eq.1f) Calculating Total Residue & Fodder Feed Required for Livestock
RFFeD = ( ( ( ( AFP ) ( MLP ) ) ( RFFeP ) ) ( FCE ) )
Eq.1g) Calculating Total Animal Product Feed Required for Livestock
APFeD = ( ( ( ( AFP ) ( MLP ) ) ( APFeD ) ) ( FCE ) )
Eq.1h) Calculating Total Agricultural Products & Resource for Feed Required for Livestock
FF = GFeD + FCFeD + RFFeD + APFeD
33) Figure 4.7: Calculation Equations Applied w ithin the BRM’s Agricultural Syste m & Food De mand A nalyses
Figure 4.7: Calculation Equations Applied within the BRM’s Agricultural System & Food
Demand Analyses
4.3.3 Modelling Land-Use Dynamics to 2050
The following section presents the calculation equations applied within the BRM, for the land
-use analyses undertaken. These equations are described below and listed in Figure 4.8.
Calculating Land Area Required to Produce Crop Commodities for Food (Eq.2a)
The calculation equation applied for analysing the total land area required to produce
crop commodities to balance food demands.

Andrew Welfle - ID: 81163530
120
Calculating Land Area Required to Produce Crop Commodities for Feed (Eq.2b)
The calculation equation applied for analysing the total land area required to produce
crop commodities, to balance animal feed demands.
Calculating Pasture Land Area Required for Livestock (Eq.2c)
The calculation equation applied for analysing the total area of pasture land required
to balance the grass feed demands of livestock.
Calculating Total Agriculture Land Area (Eq.2d)
The calculation equation applied for analysing the total land area required for all
agricultural processes, to balance domestic food commodity supply demands.
Calculating the Area of Land Suitable & Available for Biomass Growth (Eq.2e)
The calculation equation applied for analysing the area of available and suitable land,
for the potential growth of biomass resources and energy crops within the BRM.
Eq.2a) Calculating Land Area Required to Produce Food Crop Commodities
FoCLA = DCD / CPY
Eq.2b) Calculating Land Area Required to Produce Feed Crop Commodities
FeCLA = FCFeD / CPY
Eq.2c) Calculating Pasture Land Area Required for Livestock
PLA = TPGD / CPY
Eq.2d) Calculating Total Agricultural Land Area Required to Balance Domestic Production Demands
TALA = FoCLA + FeCLA + PLA
Eq.2e) Calculating Land Area Suitable & Available for Biomass Resource & Energy Crop Growth
SALA = TASL - ( FLA + BULA + TALA )
34) Figure 4.8: Calculation Equations Applied w ithin the BRM’s Land Use Analyses
Figure 4.8: Calculation Equations Applied within the BRM’s Land-Use Analyses

Andrew Welfle - ID: 81163530
121
4.4 UK BRM - Developing the Stage Two
Methodology
The following section of the Thesis discusses in detail, the development of Stage Two
analyses of the BRM. The BRM’s Stage Two analysis, aims to quantify and forecast the
availability of different resources and feedstocks for the bioenergy sector. The specific
resources analysed are listed in Table 4.1. At each stage, the key studies and methodologies
that influenced the design of the BRM are listed, and all the data sources utilised are
referenced.
Section 4.5 of this Chapter, supported by screenshots of the BRM Excel Spreadsheet in
Appendix 14.0, goes on to provide further discussions of the precise calculations mechanics,
of how the Stage Two analyses of the BRM are modelled.
A step-by-step walk through of the Stage Two BRM methodology is provided, focusing on
the following key analysis areas:
Forest Productivity Forestry Residues Industry – Forestry Dynamics
Industrial Residues Agricultural Residues Arboriculture Residues
Waste Generation Waste Management Biomass Planting Strategies
4.4.1 UK Forest System Productivity & Characteristics
The UK Forestry Commission produces a wide range of reports and statistics that describe
the current and forecast forestry systems. These document the extent, types, and
characteristics of forests, woodlands, and plantations in the UK. Within the Stage Two
analysis of the BRM, forestry systems are important as they provide resources to both UK
industries, and the bioenergy sector. The productivity of forestry systems are therefore a key
focus for the analysis.
A. UK Forest Productivity Forecasts
The UK BRM utilises the Forestry Commission’s productivity scenarios, to forecast potential
pathways that UK forestry could take [190]–[197]. The Forestry Commission develop
separate forecasts, for forestry within the Forestry Commission Estate, and forecasts for the
Private Sector Estate. These forecasts are derived by assessing: the forested area, the forestry
characteristics within the area, the rapidity of tree growth (yield class), and options for
when/if the trees are harvested.

Andrew Welfle - ID: 81163530
122
i. Forestry Forecasts for the Forestry Commission Estate
Forestry Commission Estate information, pertaining to forestry area and characteristics, are
extracted from the Forestry Commission’s well-established ‘Sub-Compartment Database’.
This database provides a periodically updated record, of all land managed by the Forestry
Commission. Each stand of trees is represented spatially, with further information detailing
individual characteristics, such as: species, planting, year, spacing, and yield class.
Information from the Sub-Compartment Database is utilised to estimate the standing-volume
for each spatial area. Forestry Commission ‘growth and yield’ models, are then applied to
‘grow’ the stands. The further application of harvesting events, relating to the felling or
thinning of the forests over the forecast period; allow the development of Standing Volume,
and Increment and Production Volumes projections, for each forecast. The timing and scale
of felling and thinning events, ultimately determining the nature of each forecast [192], [195].
The Forestry Commission have two main scenarios that forecast the productivity of forestry
systems on their Estate. These scenarios are described in Table 4.9. The Forestry Standing
Volumes, and Forestry Productivities data, from these scenarios, are reflected within Figures
4.9 and 4.10 respectively. The UK BRM utilises the ‘Market Behaviour’ forecast scenario as
the default, to reflect the productivity of forestry systems within the Forestry Commission
Estate.
Table 4.9: Forest Productivity Scenarios for Forestry Commission Estate Forests Table 16) Table 4.9: Forest Productiv ity Scenarios for Forestry Commiss ion Estate Forests
Forestry Commission
Scenarios Description
Biological Potential (BP)
This scenario reflects the forecast productivity of forestry systems where they
are left to achieve their biological potential, only constrained by physical
factors. Limited thinning and felling activities are assumed to reflect moderate
wind-risk measures.
Market Behaviour (MB)
This scenario reflects the Forestry Commission Estate management plans.
Management of forestry systems including felling and thinning strategies take
place to maximise the health and productivity of the forestry systems.
Adapted from [192], [195]
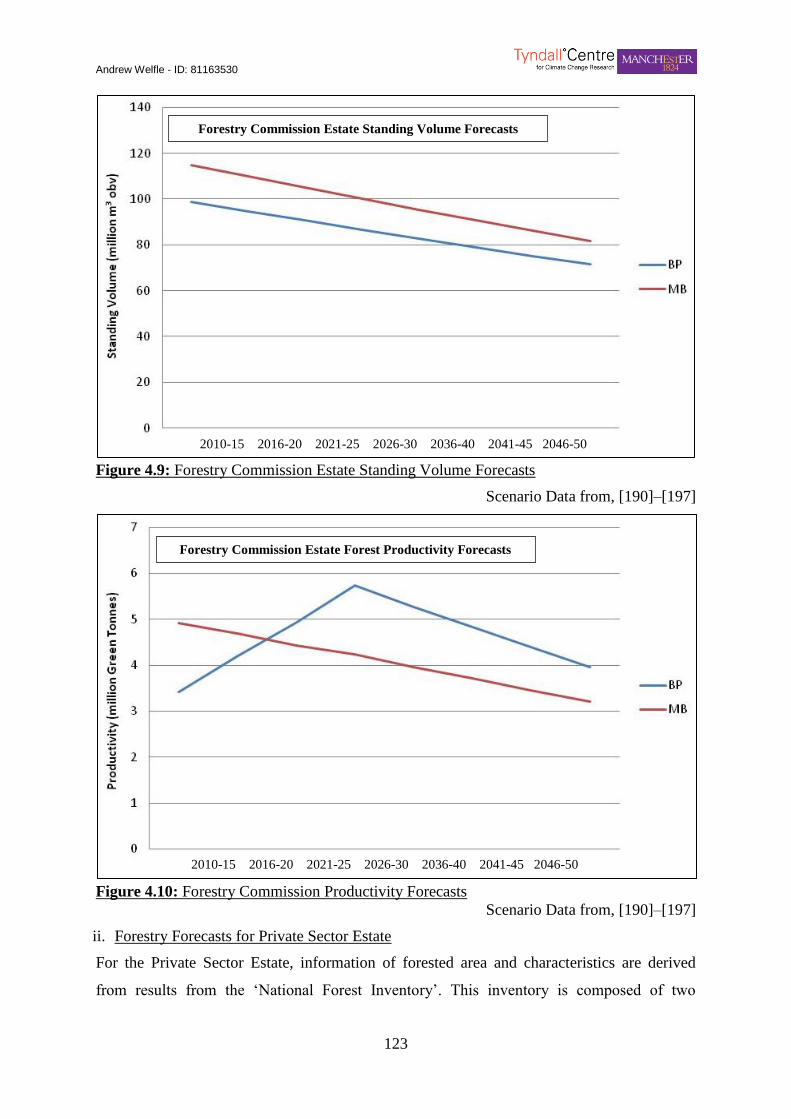
Andrew Welfle - ID: 81163530
123
35) Figure 4.9: Forestry Commission Estate Standing V olume Forecasts
Figure 4.9: Forestry Commission Estate Standing Volume Forecasts
Scenario Data from, [190]–[197]
36) Figure 4.10: Forestry Commission Productiv ity Forecasts
Figure 4.10: Forestry Commission Productivity Forecasts
Scenario Data from, [190]–[197]
ii. Forestry Forecasts for Private Sector Estate
For the Private Sector Estate, information of forested area and characteristics are derived
from results from the ‘National Forest Inventory’. This inventory is composed of two
Forestry Commission Estate Standing Volume Forecasts
Forestry Commission Estate Forest Productivity Forecasts
2010-15 2016-20 2021-25 2026-30 2036-40 2041-45 2046-50
2010-15 2016-20 2021-25 2026-30 2036-40 2041-45 2046-50
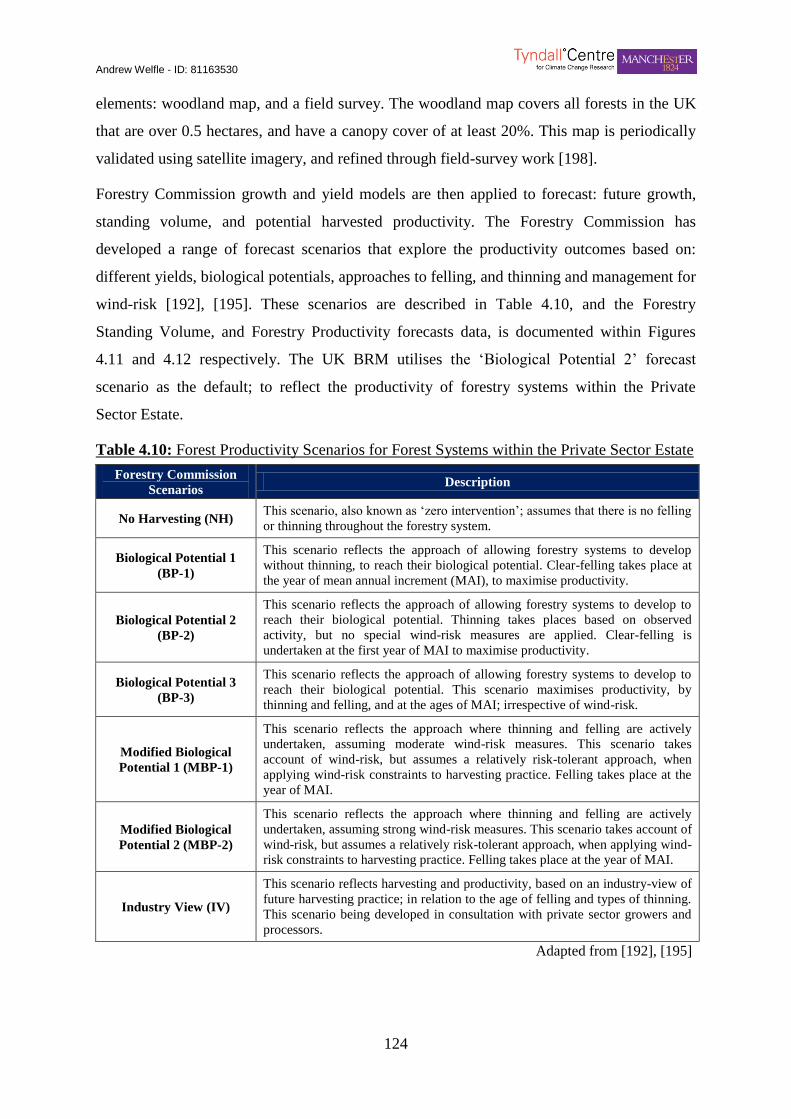
Andrew Welfle - ID: 81163530
124
elements: woodland map, and a field survey. The woodland map covers all forests in the UK
that are over 0.5 hectares, and have a canopy cover of at least 20%. This map is periodically
validated using satellite imagery, and refined through field-survey work [198].
Forestry Commission growth and yield models are then applied to forecast: future growth,
standing volume, and potential harvested productivity. The Forestry Commission has
developed a range of forecast scenarios that explore the productivity outcomes based on:
different yields, biological potentials, approaches to felling, and thinning and management for
wind-risk [192], [195]. These scenarios are described in Table 4.10, and the Forestry
Standing Volume, and Forestry Productivity forecasts data, is documented within Figures
4.11 and 4.12 respectively. The UK BRM utilises the ‘Biological Potential 2’ forecast
scenario as the default; to reflect the productivity of forestry systems within the Private
Sector Estate.
Table 4.10: Forest Productivity Scenarios for Forest Systems within the Private Sector Estate Table 17) Table 4.10: Forest Productivity Sce nario for Forest Syste ms w ithin the Private Sector Estate
Forestry Commission
Scenarios Description
No Harvesting (NH) This scenario, also known as ‘zero intervention’; assumes that there is no felling
or thinning throughout the forestry system.
Biological Potential 1
(BP-1)
This scenario reflects the approach of allowing forestry systems to develop
without thinning, to reach their biological potential. Clear-felling takes place at
the year of mean annual increment (MAI), to maximise productivity.
Biological Potential 2
(BP-2)
This scenario reflects the approach of allowing forestry systems to develop to
reach their biological potential. Thinning takes places based on observed
activity, but no special wind-risk measures are applied. Clear-felling is
undertaken at the first year of MAI to maximise productivity.
Biological Potential 3
(BP-3)
This scenario reflects the approach of allowing forestry systems to develop to
reach their biological potential. This scenario maximises productivity, by
thinning and felling, and at the ages of MAI; irrespective of wind-risk.
Modified Biological
Potential 1 (MBP-1)
This scenario reflects the approach where thinning and felling are actively
undertaken, assuming moderate wind-risk measures. This scenario takes
account of wind-risk, but assumes a relatively risk-tolerant approach, when
applying wind-risk constraints to harvesting practice. Felling takes place at the
year of MAI.
Modified Biological
Potential 2 (MBP-2)
This scenario reflects the approach where thinning and felling are actively
undertaken, assuming strong wind-risk measures. This scenario takes account of
wind-risk, but assumes a relatively risk-tolerant approach, when applying wind-
risk constraints to harvesting practice. Felling takes place at the year of MAI.
Industry View (IV)
This scenario reflects harvesting and productivity, based on an industry-view of
future harvesting practice; in relation to the age of felling and types of thinning.
This scenario being developed in consultation with private sector growers and
processors.
Adapted from [192], [195]
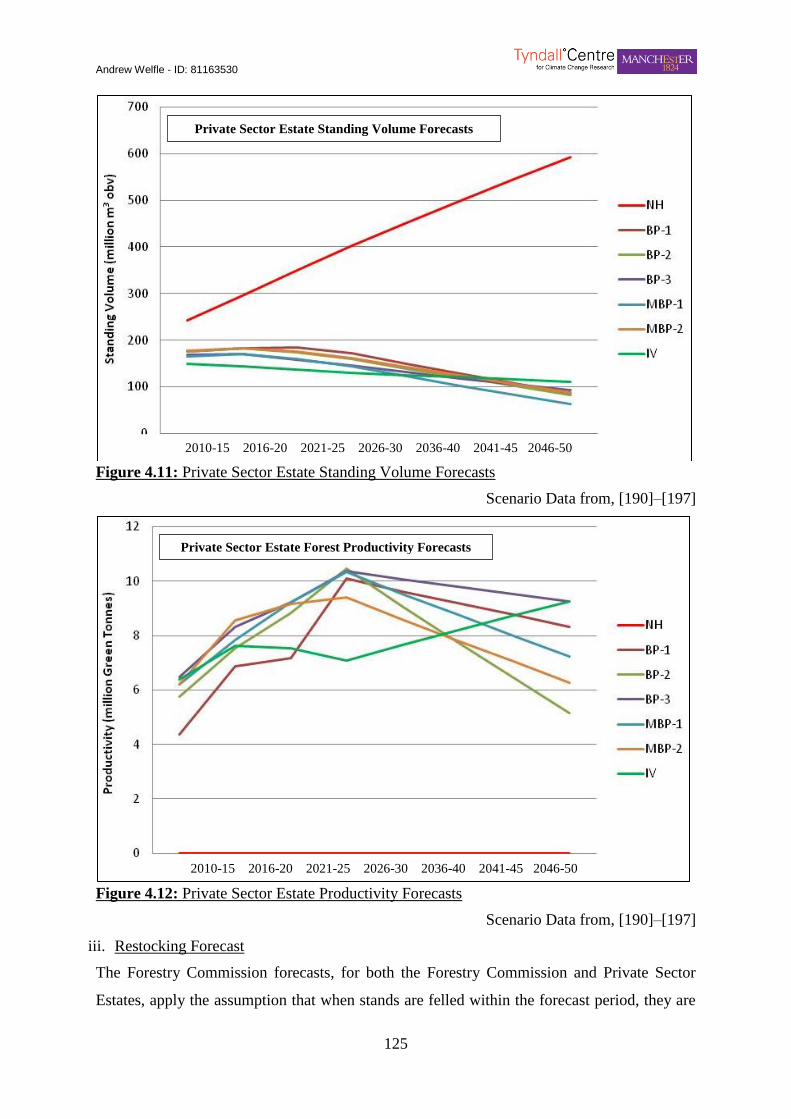
Andrew Welfle - ID: 81163530
125
37) Figure 4.11: Private Sector Estate Standing Volume Forecasts
Figure 4.11: Private Sector Estate Standing Volume Forecasts
Scenario Data from, [190]–[197]
38) Figure 4.12: Private Sector Estate Productivity Forecasts
Figure 4.12: Private Sector Estate Productivity Forecasts
Scenario Data from, [190]–[197]
iii. Restocking Forecast
The Forestry Commission forecasts, for both the Forestry Commission and Private Sector
Estates, apply the assumption that when stands are felled within the forecast period, they are
Private Sector Estate Standing Volume Forecasts
Private Sector Estate Forest Productivity Forecasts
2010-15 2016-20 2021-25 2026-30 2036-40 2041-45 2046-50
2010-15 2016-20 2021-25 2026-30 2036-40 2041-45 2046-50

Andrew Welfle - ID: 81163530
126
restocked with tree species with the same yield-class (like-for-like). The impact of restocking,
on production and standing volumes within the forecast analysis is minimal for the forecast
period; as restocked areas will mostly mature and produce resources after the forecast period.
The Forestry Commission’s ‘like-for-like’ assumption, is only one possible scenario for
restocking; the National Forest Inventory, aiming in future, to provide a range of restocking
scenarios to explore the impacts of this assumption [195].
4.4.2 Forestry Residues
Forestry residues are typically low value, low density resources, such as: stem-wood, stem
tips and branches collected from the forest floor, or as a result of timber harvesting or
thinning processes. The resource is often regarded as an afterthought and not specifically
targeted, but its inclusion as a potential resource opportunity for the bioenergy sector, can
provide valuable increases to harvesting efficiencies [78].
A. Current Resource
Forest residues in the UK are virtually untapped as a resource, and may have significance for
the bioenergy sector. The UK BRM utilises data calculated for the UK’s ‘managed forested
area’; produced by McKay (2003) [199], to reflect the current resource. No studies have been
carried out that focus on analysing the potential resource from the ‘unmanaged forested area’;
as by its very nature, forest management is required to harvest this resource. The BRM’s
analysis of forestry residues therefore reflects that from managed forests.
B. Availability for the Bioenergy Sector
The main driver determining the availability of forestry residues for the bioenergy sector is
the extent to which the resource may be harvestable. The UK BRM’s analysis reflects that
developed by E4tech (2009) [138]; where a limit of 50% of the available resource is deemed
harvestable by 2015, and up to 100% thereafter. A further key variable that may limit the
extent that forestry residues are available to the bioenergy sector, relates to whether
competing markets will emerge for this resource; McKay et al (2003) [199], predicting that
there may be up to an 83% reduction in resource availability for the bioenergy sector, if
competing markets emerge.
C. Future Resource
The future potential of forestry residues for the bioenergy sector in the UK, are analysed
within the UK BRM using the methodology developed by E4tech (2009) [138]. This
forecasts the potential levels of resource, as a function of changing managed forested area.

Andrew Welfle - ID: 81163530
127
The forestry residue availability analysis within the BRM is thus linked to the Forestry
Commission’s forecasts [148], [200]. The BRM is also developed to allow the analyses of
potential resource availability for the bioenergy sector, with and without competition for the
resource from other industries.
Further details of the precise calculation mechanics within the BRM, relating to the analysis
of forestry residue resources, are documented in Section 4.5 of this Chapter.
4.4.3 Forestry-Industry Dynamics
One of the most important themes modelled within the BRM is that relating to the dynamics
between forestry systems, and the industries that rely on forest productivity. These forestry-
industry dynamics, and the flow of resource between them, offer a wide range of
opportunities for the bioenergy sector; in terms of resources sourced directly from the
forestry systems themselves, and residues resulting from industrial processes.
The following section describes the approach and methodologies, for how these dynamics are
modelled within the BRM. Further detailed descriptions and the precise calculation
mechanics of the BRM, are documented in Section 4.5 of this Chapter.
A. Modelling Structure
The analysis module within the BRM that models all the forestry-industry dynamics is
represented as a sub-model, within the wider BRM structure. The aim when developing this
forestry-industry analysis module of the BRM was to create a tool that allows a ‘closed-loop’
evaluation, of forestry systems and their numerous links to industries. This starts with the
evaluation of the extent and productivity of forestry systems (Section 4.4.1), followed by the
tracking and analysis of all resources produced by these forests. The BRM tracks the current
flow, and forecasts potential future flows of forest products and resources, distributed
between each of the demand industries. It also evaluates their respective industry
productivities, and at the same time accounts for all wastes and residues that are generated;
these being potentially available and suitable, for utilisation as feedstocks within bioenergy
pathways. Imports and exports, of both raw forestry resources and wood based products are
also accounted for.
Figure 4.13 provides a high-level overview of the modelling structure of the forestry-industry
analysis module, developed within the BRM. The individual industries, product categories,
and resource distribution flows, have been designed following close evaluation of the FAO’s
‘Global Wood Fibre Reports’ [201], [202]. These are used as the base for the modelling
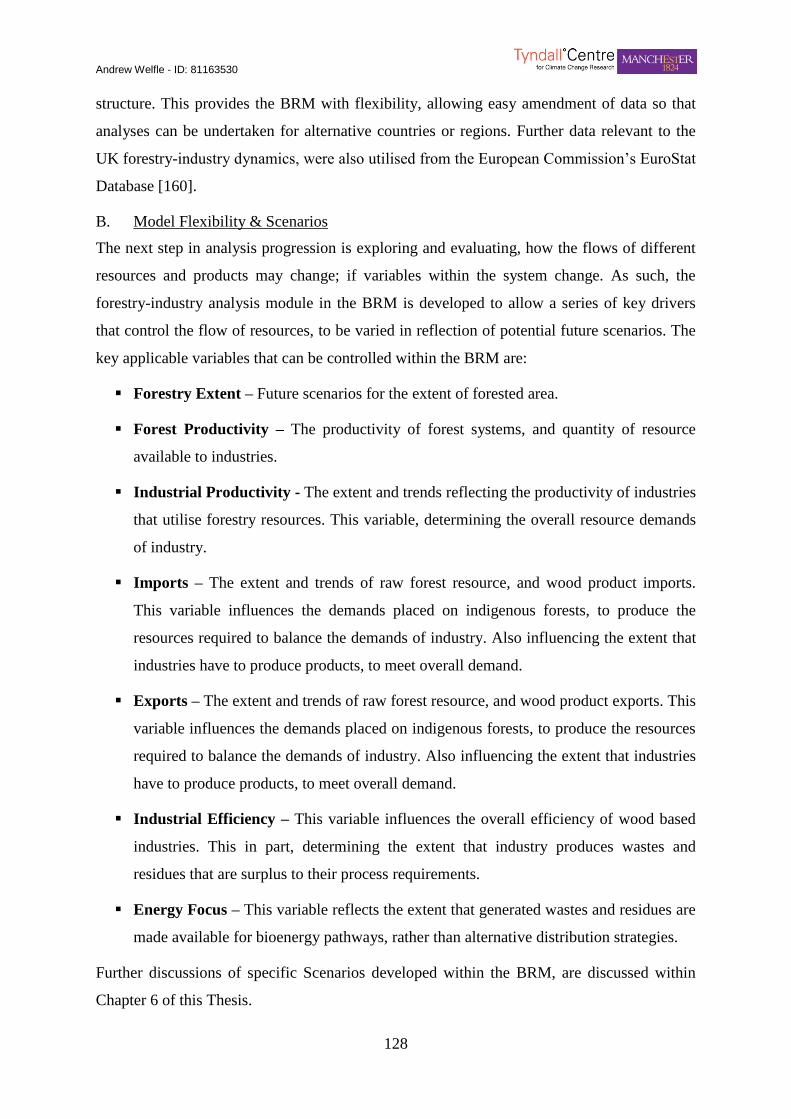
Andrew Welfle - ID: 81163530
128
structure. This provides the BRM with flexibility, allowing easy amendment of data so that
analyses can be undertaken for alternative countries or regions. Further data relevant to the
UK forestry-industry dynamics, were also utilised from the European Commission’s EuroStat
Database [160].
B. Model Flexibility & Scenarios
The next step in analysis progression is exploring and evaluating, how the flows of different
resources and products may change; if variables within the system change. As such, the
forestry-industry analysis module in the BRM is developed to allow a series of key drivers
that control the flow of resources, to be varied in reflection of potential future scenarios. The
key applicable variables that can be controlled within the BRM are:
Forestry Extent – Future scenarios for the extent of forested area.
Forest Productivity – The productivity of forest systems, and quantity of resource
available to industries.
Industrial Productivity - The extent and trends reflecting the productivity of industries
that utilise forestry resources. This variable, determining the overall resource demands
of industry.
Imports – The extent and trends of raw forest resource, and wood product imports.
This variable influences the demands placed on indigenous forests, to produce the
resources required to balance the demands of industry. Also influencing the extent that
industries have to produce products, to meet overall demand.
Exports – The extent and trends of raw forest resource, and wood product exports. This
variable influences the demands placed on indigenous forests, to produce the resources
required to balance the demands of industry. Also influencing the extent that industries
have to produce products, to meet overall demand.
Industrial Efficiency – This variable influences the overall efficiency of wood based
industries. This in part, determining the extent that industry produces wastes and
residues that are surplus to their process requirements.
Energy Focus – This variable reflects the extent that generated wastes and residues are
made available for bioenergy pathways, rather than alternative distribution strategies.
Further discussions of specific Scenarios developed within the BRM, are discussed within
Chapter 6 of this Thesis.
Andrew Welfle - ID: 81163530
129
Figure 4.13: Forestry System & Industry Dynamics Analysed within the BRM
39) Figure 4.13: Forestry System & Industry Dynamics Analysed within the BRM
Andrew Welfle - ID: 81163530
130
4.4.4 Industrial Residues
Many industrial processes and manufacturing operations produce wastes and residues that
represent potential resources opportunities, for the bioenergy sector [78].
A. Current Resource
The current levels of biomass resources produced from UK industries, is generally well
documented. The Forestry Commission provide widespread data [200] that documents
resource flows to and from industries, particularly for the wood mill sector. The UK BRM is
developed to utilise this data, in addition to datasets provided by the FAO [201]. The
methodology for evaluating the extent that industry-residue resources, are potentially
available for the bioenergy sector, are adapted from those applied by E4tech (2009) [138],
and AEA Consulting (2010, 2011) [136], [137].
B. Availability for the Bioenergy Sector
The key variables determining the availability of industrial residues for the bioenergy sector
within the BRM are: the extent to which residues are generated, and the end-use distribution
of these resources. The UK BRM links residue generation, to industry productivity and
economic trends [203]–[206]. The default distribution scenario for residues, including those
available for the bioenergy sector, is assumed to progress at a constant rate within the BRM.
However, the BRM is flexible; allowing alternative scenarios to be developed by varying the
extent of the available resource, potentially available for bioenergy pathways (discussed
further in Chapter 6).
C. Future Resource
The future availability of industrial residues for the bioenergy sector within the BRM, are
dependent on the precise scenarios developed within the BRM, and linked to industry
productivity and residue distribution trends.
4.4.5 Agricultural Residues
Agricultural residues are a series of materials resulting from agricultural processes, some of
which are potentially highly valuable for the bioenergy sector. These range from
predominantly dry materials such as, straws and poultry litter, to wet materials such as, slurry
and silage [78]. The BRM’s analyses, categorises agricultural residues into two groups:
Straws (dry), and Slurries (wet).
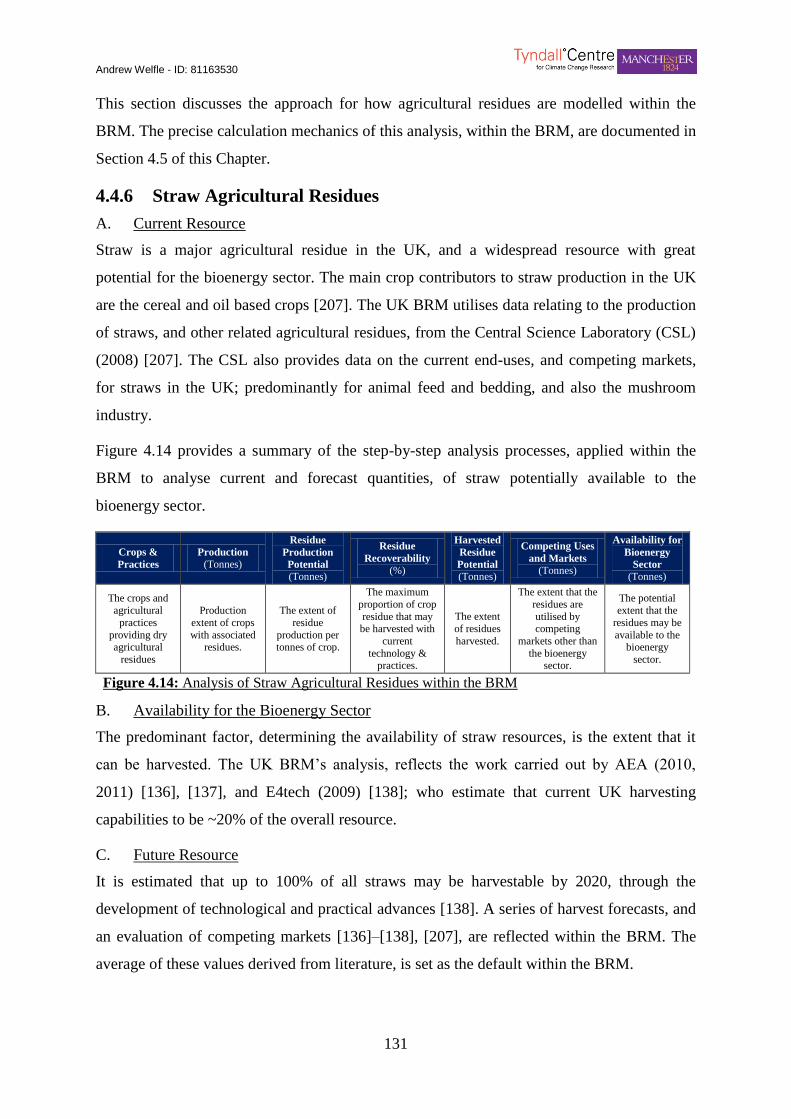
Andrew Welfle - ID: 81163530
131
This section discusses the approach for how agricultural residues are modelled within the
BRM. The precise calculation mechanics of this analysis, within the BRM, are documented in
Section 4.5 of this Chapter.
4.4.6 Straw Agricultural Residues
A. Current Resource
Straw is a major agricultural residue in the UK, and a widespread resource with great
potential for the bioenergy sector. The main crop contributors to straw production in the UK
are the cereal and oil based crops [207]. The UK BRM utilises data relating to the production
of straws, and other related agricultural residues, from the Central Science Laboratory (CSL)
(2008) [207]. The CSL also provides data on the current end-uses, and competing markets,
for straws in the UK; predominantly for animal feed and bedding, and also the mushroom
industry.
Figure 4.14 provides a summary of the step-by-step analysis processes, applied within the
BRM to analyse current and forecast quantities, of straw potentially available to the
bioenergy sector.
Crops &
Practices
Production
(Tonnes)
Residue
Production
Potential
(Tonnes)
Residue
Recoverability
(%)
Harvested
Residue
Potential
(Tonnes)
Competing Uses
and Markets
(Tonnes)
Availability for
Bioenergy
Sector
(Tonnes)
The crops and
agricultural
practices
providing dry agricultural
residues
Production
extent of crops
with associated residues.
The extent of
residue
production per tonnes of crop.
The maximum
proportion of crop
residue that may be harvested with
current
technology & practices.
The extent
of residues
harvested.
The extent that the
residues are
utilised by competing
markets other than
the bioenergy sector.
The potential
extent that the
residues may be
available to the bioenergy
sector.
Figure 4.14: Analysis of Straw Agricultural Residues within the BRM 40) Figure 4.14: Ana lysis of Straw Agric ultura l Residues w ithin the BRM
B. Availability for the Bioenergy Sector
The predominant factor, determining the availability of straw resources, is the extent that it
can be harvested. The UK BRM’s analysis, reflects the work carried out by AEA (2010,
2011) [136], [137], and E4tech (2009) [138]; who estimate that current UK harvesting
capabilities to be ~20% of the overall resource.
C. Future Resource
It is estimated that up to 100% of all straws may be harvestable by 2020, through the
development of technological and practical advances [138]. A series of harvest forecasts, and
an evaluation of competing markets [136]–[138], [207], are reflected within the BRM. The
average of these values derived from literature, is set as the default within the BRM.
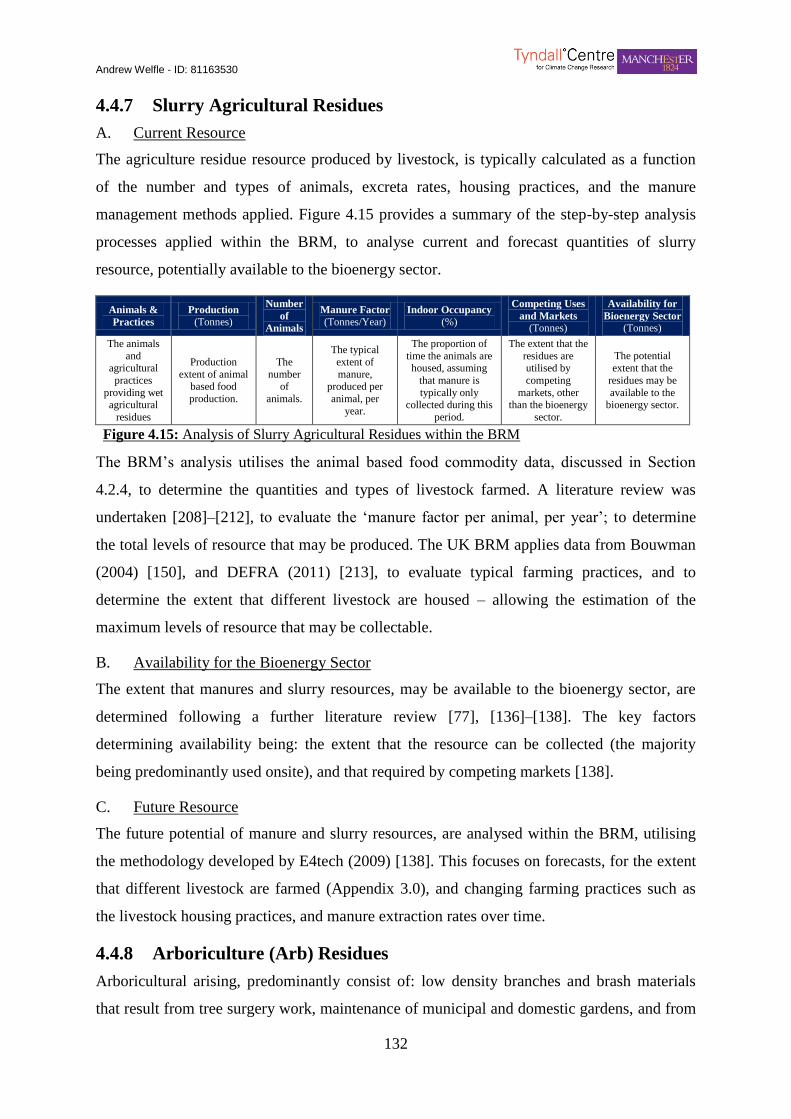
Andrew Welfle - ID: 81163530
132
4.4.7 Slurry Agricultural Residues
A. Current Resource
The agriculture residue resource produced by livestock, is typically calculated as a function
of the number and types of animals, excreta rates, housing practices, and the manure
management methods applied. Figure 4.15 provides a summary of the step-by-step analysis
processes applied within the BRM, to analyse current and forecast quantities of slurry
resource, potentially available to the bioenergy sector.
Animals &
Practices
Production
(Tonnes)
Number
of
Animals
Manure Factor
(Tonnes/Year) Indoor Occupancy
(%)
Competing Uses
and Markets
(Tonnes)
Availability for
Bioenergy Sector
(Tonnes)
The animals
and agricultural
practices
providing wet agricultural
residues
Production
extent of animal
based food
production.
The
number
of
animals.
The typical
extent of
manure,
produced per
animal, per
year.
The proportion of
time the animals are housed, assuming
that manure is
typically only collected during this
period.
The extent that the
residues are utilised by
competing
markets, other than the bioenergy
sector.
The potential
extent that the
residues may be
available to the bioenergy sector.
Figure 4.15: Analysis of Slurry Agricultural Residues within the BRM 41) Figure 4.15: Ana lysis of Slurry Agricultural Res idues wit hin the BRM
The BRM’s analysis utilises the animal based food commodity data, discussed in Section
4.2.4, to determine the quantities and types of livestock farmed. A literature review was
undertaken [208]–[212], to evaluate the ‘manure factor per animal, per year’; to determine
the total levels of resource that may be produced. The UK BRM applies data from Bouwman
(2004) [150], and DEFRA (2011) [213], to evaluate typical farming practices, and to
determine the extent that different livestock are housed – allowing the estimation of the
maximum levels of resource that may be collectable.
B. Availability for the Bioenergy Sector
The extent that manures and slurry resources, may be available to the bioenergy sector, are
determined following a further literature review [77], [136]–[138]. The key factors
determining availability being: the extent that the resource can be collected (the majority
being predominantly used onsite), and that required by competing markets [138].
C. Future Resource
The future potential of manure and slurry resources, are analysed within the BRM, utilising
the methodology developed by E4tech (2009) [138]. This focuses on forecasts, for the extent
that different livestock are farmed (Appendix 3.0), and changing farming practices such as
the livestock housing practices, and manure extraction rates over time.
4.4.8 Arboriculture (Arb) Residues
Arboricultural arising, predominantly consist of: low density branches and brash materials
that result from tree surgery work, maintenance of municipal and domestic gardens, and from
Andrew Welfle - ID: 81163530
133
the verges of roads and railways. Collectively, this resource category can yield large
quantities of arisings and residues that may be a suitable for the bioenergy sector, if
appropriately handled and processed [78].
This section, discusses the methods adopted in the BRM, for analysing the potential
availability of arboricultural residue resources. Further details of the precise modelling
calculations and mechanics of the BRM, are documented in Section 4.5 of this Chapter.
A. Current Resource
The BRM’s analysis methodology, accounting for the potential availability of arboricultural
residues; reflects that developed by MacKay (2003) [199], and Holmes & Nevin (2001)
[214].
B. Availability for the Bioenergy Sector
The BRM utilises a methodology for analysing the resource potential for the bioenergy
sector, reflecting that developed by E4tech (2009) [138]; where all wood is assumed to have
an average moisture content of 60%, and a mixed range of wood types, species, and
classifications are assumed.
C. Future Resource
Forecasts for the future arboriculture resource potential are predicted by the Wood Panel
Industries Federation (2010) [204], and are thought unlikely to vary much, until 2025 and
beyond; although there are likely to be trends relating to tree planting strategies in urban
areas. Therefore, the BRM’s analysis links future arboriculture resource availability with the
scenarios of changing built-up land area (discussed further in Chapter 6).
4.4.9 Wastes
Waste resources are a significant resource, and are becoming increasingly utilised within
energy pathways [78]. Therefore, modelling of waste resources within the BRM represents an
important area of analysis. Waste resources constitute a wide range of material types, with
many characteristics, from: woods, packaging, foods, and demolition and construction
outputs. Extensive existing work has been carried out, to develop and understand waste
resource categories, and to quantify them [206], [215]–[219]. Modelling the potential
availability of any given waste resource, for the bioenergy sector, requires an assessment of
how much waste is generated, and an understanding of the waste management strategies in
place that determines how it is distributed.
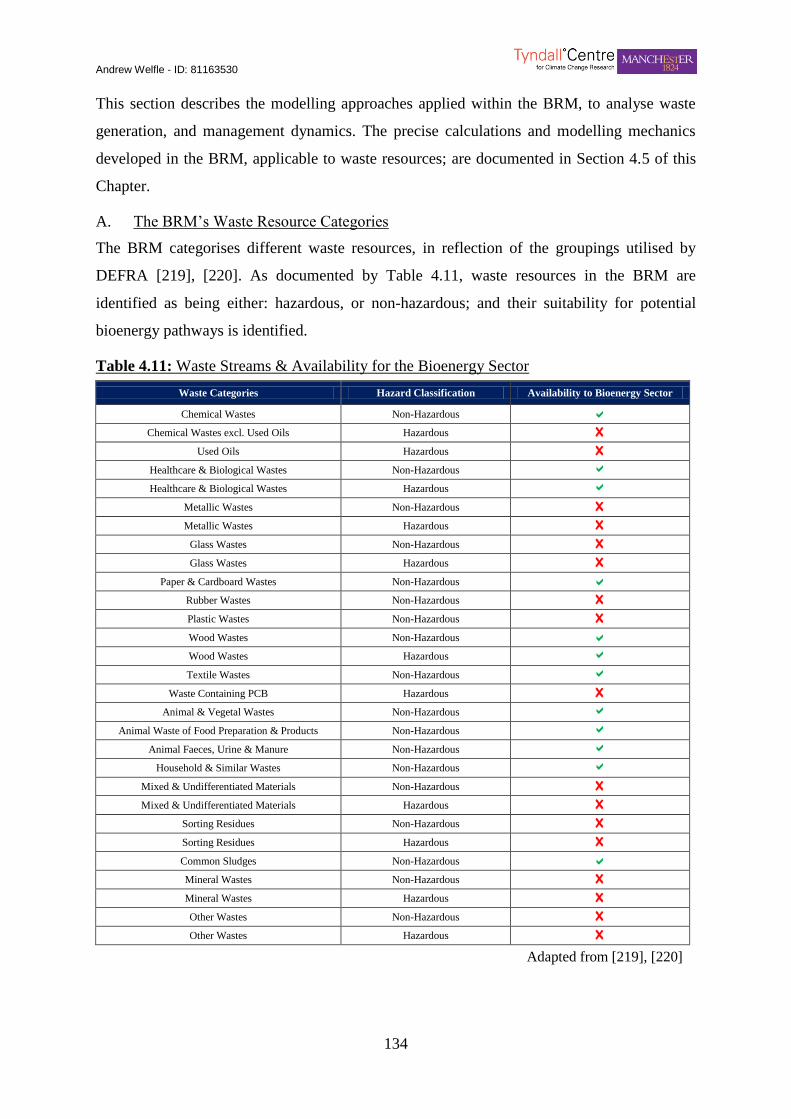
Andrew Welfle - ID: 81163530
134
This section describes the modelling approaches applied within the BRM, to analyse waste
generation, and management dynamics. The precise calculations and modelling mechanics
developed in the BRM, applicable to waste resources; are documented in Section 4.5 of this
Chapter.
A. The BRM’s Waste Resource Categories
The BRM categorises different waste resources, in reflection of the groupings utilised by
DEFRA [219], [220]. As documented by Table 4.11, waste resources in the BRM are
identified as being either: hazardous, or non-hazardous; and their suitability for potential
bioenergy pathways is identified.
Table 4.11: Waste Streams & Availability for the Bioenergy Sector Table 18) Table 4.11: Waste Streams & Ava ilability for the Bioenergy Sector
Waste Categories Hazard Classification Availability to Bioenergy Sector
Chemical Wastes Non-Hazardous Chemical Wastes excl. Used Oils Hazardous X
Used Oils Hazardous X
Healthcare & Biological Wastes Non-Hazardous
Healthcare & Biological Wastes Hazardous
Metallic Wastes Non-Hazardous X
Metallic Wastes Hazardous X
Glass Wastes Non-Hazardous X
Glass Wastes Hazardous X
Paper & Cardboard Wastes Non-Hazardous Rubber Wastes Non-Hazardous X
Plastic Wastes Non-Hazardous X
Wood Wastes Non-Hazardous Wood Wastes Hazardous
Textile Wastes Non-Hazardous
Waste Containing PCB Hazardous X
Animal & Vegetal Wastes Non-Hazardous
Animal Waste of Food Preparation & Products Non-Hazardous
Animal Faeces, Urine & Manure Non-Hazardous
Household & Similar Wastes Non-Hazardous
Mixed & Undifferentiated Materials Non-Hazardous X
Mixed & Undifferentiated Materials Hazardous X
Sorting Residues Non-Hazardous X
Sorting Residues Hazardous X
Common Sludges Non-Hazardous Mineral Wastes Non-Hazardous X
Mineral Wastes Hazardous X
Other Wastes Non-Hazardous X
Other Wastes Hazardous X
Adapted from [219], [220]
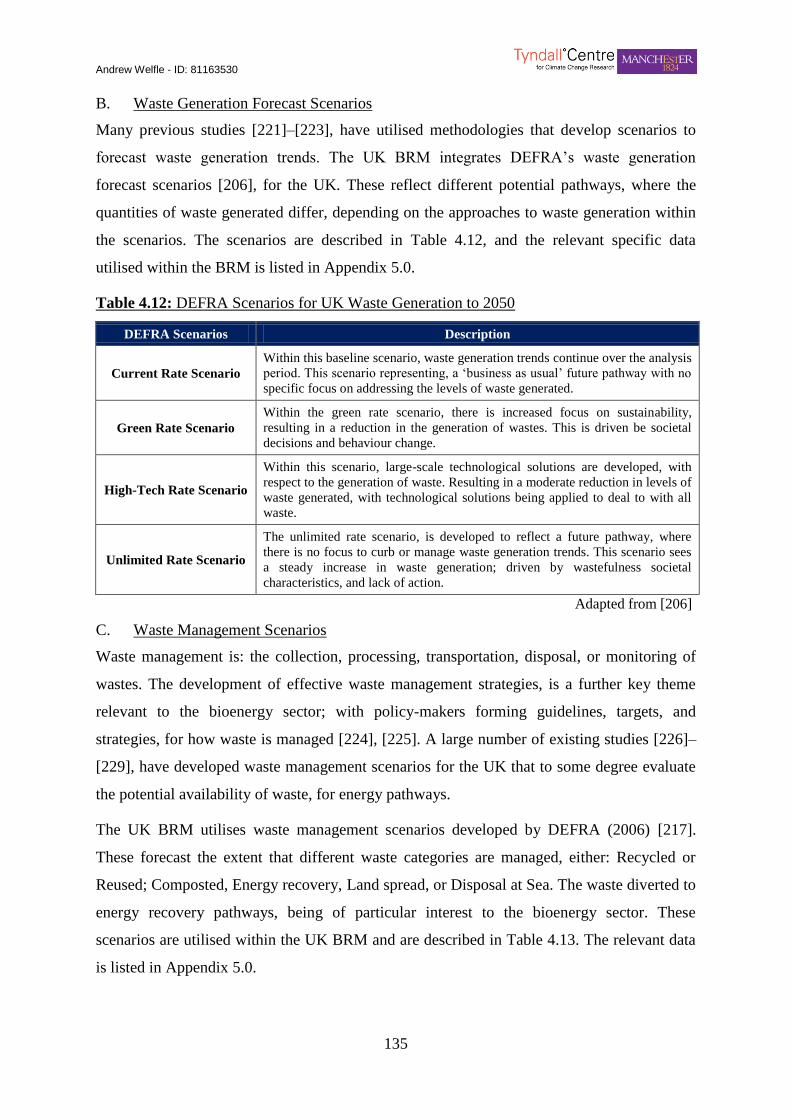
Andrew Welfle - ID: 81163530
135
B. Waste Generation Forecast Scenarios
Many previous studies [221]–[223], have utilised methodologies that develop scenarios to
forecast waste generation trends. The UK BRM integrates DEFRA’s waste generation
forecast scenarios [206], for the UK. These reflect different potential pathways, where the
quantities of waste generated differ, depending on the approaches to waste generation within
the scenarios. The scenarios are described in Table 4.12, and the relevant specific data
utilised within the BRM is listed in Appendix 5.0.
Table 4.12: DEFRA Scenarios for UK Waste Generation to 2050 Table 19) Table 4.12: DEFRA Scenarios for UK Waste Generation to 2050
DEFRA Scenarios Description
Current Rate Scenario
Within this baseline scenario, waste generation trends continue over the analysis
period. This scenario representing, a ‘business as usual’ future pathway with no
specific focus on addressing the levels of waste generated.
Green Rate Scenario
Within the green rate scenario, there is increased focus on sustainability,
resulting in a reduction in the generation of wastes. This is driven be societal
decisions and behaviour change.
High-Tech Rate Scenario
Within this scenario, large-scale technological solutions are developed, with
respect to the generation of waste. Resulting in a moderate reduction in levels of
waste generated, with technological solutions being applied to deal to with all
waste.
Unlimited Rate Scenario
The unlimited rate scenario, is developed to reflect a future pathway, where
there is no focus to curb or manage waste generation trends. This scenario sees
a steady increase in waste generation; driven by wastefulness societal
characteristics, and lack of action.
Adapted from [206]
C. Waste Management Scenarios
Waste management is: the collection, processing, transportation, disposal, or monitoring of
wastes. The development of effective waste management strategies, is a further key theme
relevant to the bioenergy sector; with policy-makers forming guidelines, targets, and
strategies, for how waste is managed [224], [225]. A large number of existing studies [226]–
[229], have developed waste management scenarios for the UK that to some degree evaluate
the potential availability of waste, for energy pathways.
The UK BRM utilises waste management scenarios developed by DEFRA (2006) [217].
These forecast the extent that different waste categories are managed, either: Recycled or
Reused; Composted, Energy recovery, Land spread, or Disposal at Sea. The waste diverted to
energy recovery pathways, being of particular interest to the bioenergy sector. These
scenarios are utilised within the UK BRM and are described in Table 4.13. The relevant data
is listed in Appendix 5.0.

Andrew Welfle - ID: 81163530
136
Table 4.13: DEFRA Scenarios for UK Waste Management to 2050 Table 20) Table 4.13: DEFRA Scenarios for UK Waste Manage ment to 2050
DEFRA Scenarios Description
Current Rate Scenario Within this baseline scenario, current estimates of waste material management
practices and distribution continue.
Resource Recovery
Scenario
Within this scenario, waste management and distribution, moves towards
increasing the upper recycling-rate limits; with focus on material recycling and
composting.
Energy Recovery
Scenario
Within this energy recovery scenario, waste management and distribution,
moves towards increased energy recovery, with focus on heat energy pathways
and anaerobic digestion, where applicable.
Combined Recovery
Scenario
The combined recovery scenario provides a balanced approach; with both
increased recycling, and energy recovery rates, above current levels.
Adapted from [217]
4.4.10 Sewage Waste
Sewage sludge is the useful by-product of waste-water treatment, where solids are separated
from liquids. This resource can be spread on farmland, incinerated, and can be utilised within
bioenergy pathways [78].
This section, describes the modelling methodologies for analysing potential sewage waste
availability for the bioenergy sector, within the BRM. Further details of the precise
calculations and modelling mechanisms applied, are documented in Section 4.5 of this
Chapter.
A. Current Resource
Sewage waste is a relatively constant and reliable biomass resource; with its availability and
utilisation within energy pathways, well documented by DECC (2011) [67].
B. Availability for the Bioenergy Sector
Datasets: [67], [78], [136]–[138], [230], documenting the proportion of sewage waste
available for the bioenergy sector, are utilised within the UK BRM.
C. Future Resource
The BRM applies methodologies, developed by AEA Consulting (2010, 20110) [136], [137],
and E4tech (2009) [138]; to forecast the resource availability and bioenergy potential of
sewage wastes. This works on the assumption that resource availability forecasts will be
linked to the population change scenarios, applied within the BRM (discussed further in
Chapter 6).
4.4.11 Grown Biomass & Energy Crops
The final major group of resources analysed within Stage Two of the BRM, are the biomass
resources and energy crops, grown specifically for the bioenergy sector. The BRM’s analysis
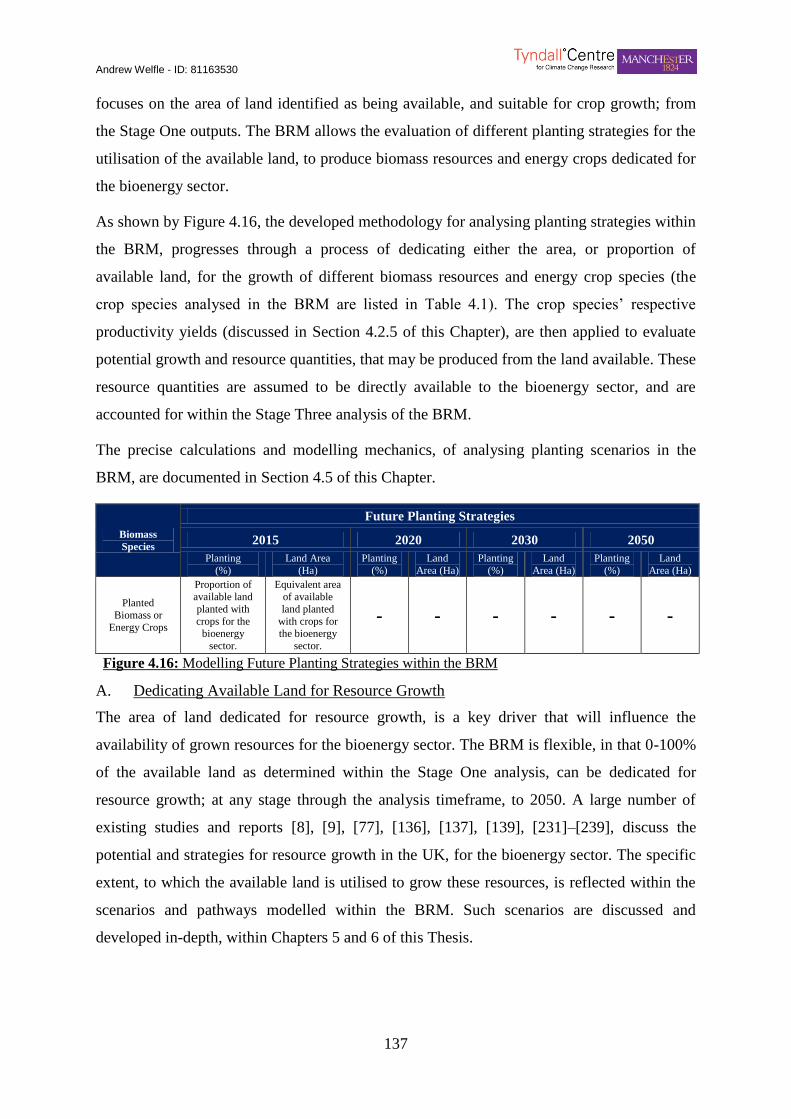
Andrew Welfle - ID: 81163530
137
focuses on the area of land identified as being available, and suitable for crop growth; from
the Stage One outputs. The BRM allows the evaluation of different planting strategies for the
utilisation of the available land, to produce biomass resources and energy crops dedicated for
the bioenergy sector.
As shown by Figure 4.16, the developed methodology for analysing planting strategies within
the BRM, progresses through a process of dedicating either the area, or proportion of
available land, for the growth of different biomass resources and energy crop species (the
crop species analysed in the BRM are listed in Table 4.1). The crop species’ respective
productivity yields (discussed in Section 4.2.5 of this Chapter), are then applied to evaluate
potential growth and resource quantities, that may be produced from the land available. These
resource quantities are assumed to be directly available to the bioenergy sector, and are
accounted for within the Stage Three analysis of the BRM.
The precise calculations and modelling mechanics, of analysing planting scenarios in the
BRM, are documented in Section 4.5 of this Chapter.
Biomass
Species
Future Planting Strategies
2015 2020 2030 2050
Planting
(%) Land Area
(Ha) Planting
(%)
Land
Area (Ha)
Planting
(%)
Land
Area (Ha)
Planting
(%)
Land
Area (Ha)
Planted
Biomass or
Energy Crops
Proportion of
available land
planted with
crops for the
bioenergy
sector.
Equivalent area
of available
land planted
with crops for
the bioenergy
sector.
- - - - - -
Figure 4.16: Modelling Future Planting Strategies within the BRM 42) Figure 4.16: Modell ing Fut ure Planting Strategies within the BRM
A. Dedicating Available Land for Resource Growth
The area of land dedicated for resource growth, is a key driver that will influence the
availability of grown resources for the bioenergy sector. The BRM is flexible, in that 0-100%
of the available land as determined within the Stage One analysis, can be dedicated for
resource growth; at any stage through the analysis timeframe, to 2050. A large number of
existing studies and reports [8], [9], [77], [136], [137], [139], [231]–[239], discuss the
potential and strategies for resource growth in the UK, for the bioenergy sector. The specific
extent, to which the available land is utilised to grow these resources, is reflected within the
scenarios and pathways modelled within the BRM. Such scenarios are discussed and
developed in-depth, within Chapters 5 and 6 of this Thesis.
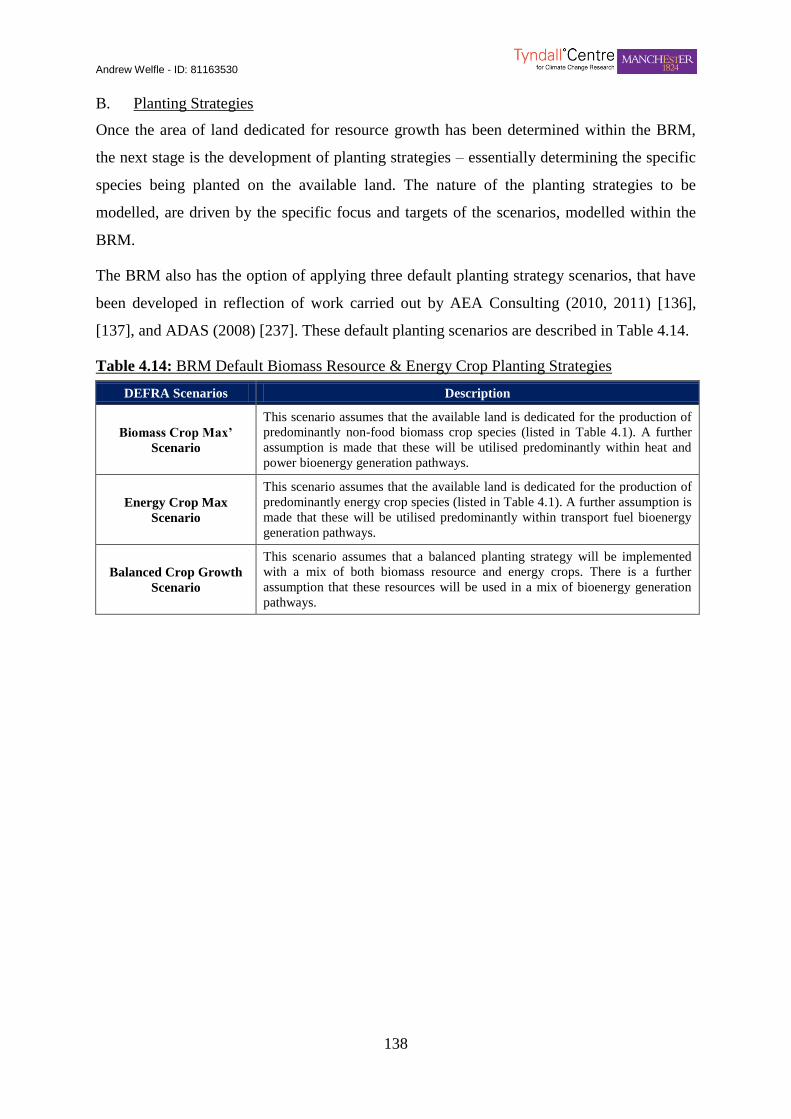
Andrew Welfle - ID: 81163530
138
B. Planting Strategies
Once the area of land dedicated for resource growth has been determined within the BRM,
the next stage is the development of planting strategies – essentially determining the specific
species being planted on the available land. The nature of the planting strategies to be
modelled, are driven by the specific focus and targets of the scenarios, modelled within the
BRM.
The BRM also has the option of applying three default planting strategy scenarios, that have
been developed in reflection of work carried out by AEA Consulting (2010, 2011) [136],
[137], and ADAS (2008) [237]. These default planting scenarios are described in Table 4.14.
Table 4.14: BRM Default Biomass Resource & Energy Crop Planting Strategies Table 21) Table 4.14: BRM Default Biomass Resource & Energy Crop Planting Strategies
DEFRA Scenarios Description
Biomass Crop Max’
Scenario
This scenario assumes that the available land is dedicated for the production of
predominantly non-food biomass crop species (listed in Table 4.1). A further
assumption is made that these will be utilised predominantly within heat and
power bioenergy generation pathways.
Energy Crop Max
Scenario
This scenario assumes that the available land is dedicated for the production of
predominantly energy crop species (listed in Table 4.1). A further assumption is
made that these will be utilised predominantly within transport fuel bioenergy
generation pathways.
Balanced Crop Growth
Scenario
This scenario assumes that a balanced planting strategy will be implemented
with a mix of both biomass resource and energy crops. There is a further
assumption that these resources will be used in a mix of bioenergy generation
pathways.
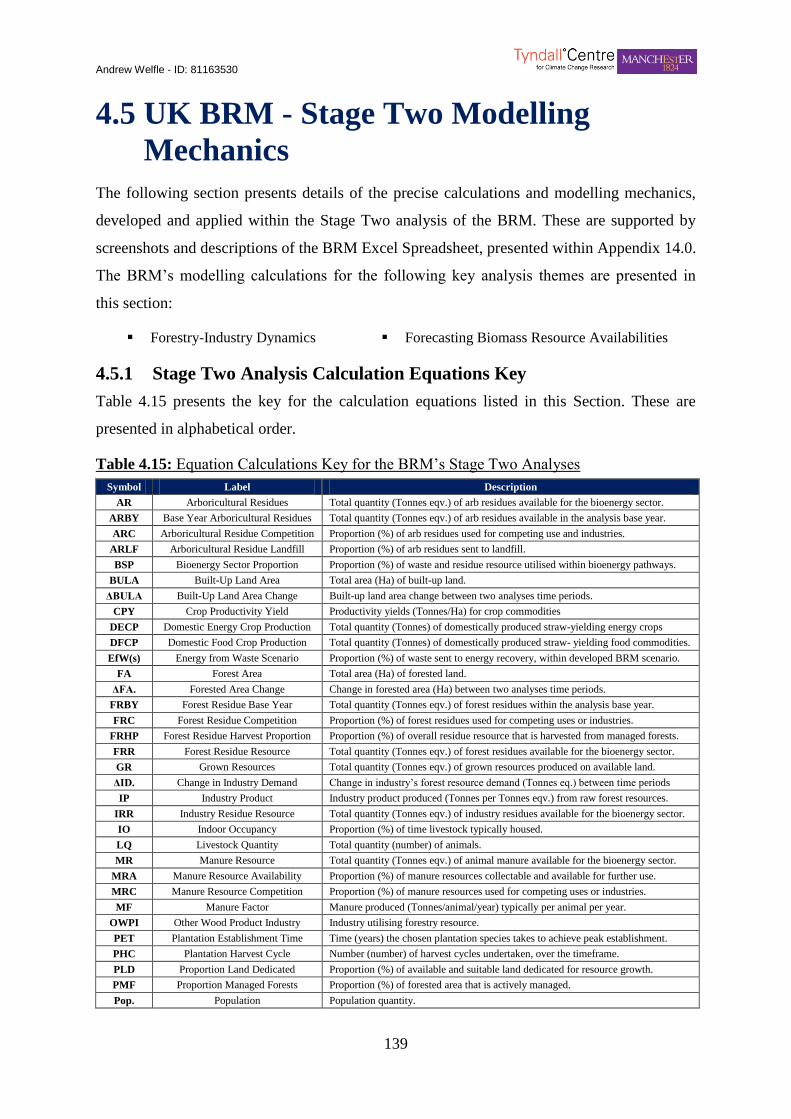
Andrew Welfle - ID: 81163530
139
4.5 UK BRM - Stage Two Modelling
Mechanics
The following section presents details of the precise calculations and modelling mechanics,
developed and applied within the Stage Two analysis of the BRM. These are supported by
screenshots and descriptions of the BRM Excel Spreadsheet, presented within Appendix 14.0.
The BRM’s modelling calculations for the following key analysis themes are presented in
this section:
Forestry-Industry Dynamics Forecasting Biomass Resource Availabilities
4.5.1 Stage Two Analysis Calculation Equations Key
Table 4.15 presents the key for the calculation equations listed in this Section. These are
presented in alphabetical order.
Table 4.15: Equation Calculations Key for the BRM’s Stage Two Analyses Table 22) Table 4. 15: Equation Calculations Key for the BRM’s Stage Two A nalyses
Symbol Label Description
AR Arboricultural Residues Total quantity (Tonnes eqv.) of arb residues available for the bioenergy sector.
ARBY Base Year Arboricultural Residues Total quantity (Tonnes eqv.) of arb residues available in the analysis base year.
ARC Arboricultural Residue Competition Proportion (%) of arb residues used for competing use and industries.
ARLF Arboricultural Residue Landfill Proportion (%) of arb residues sent to landfill.
BSP Bioenergy Sector Proportion Proportion (%) of waste and residue resource utilised within bioenergy pathways.
BULA Built-Up Land Area Total area (Ha) of built-up land.
ΔBULA Built-Up Land Area Change Built-up land area change between two analyses time periods.
CPY Crop Productivity Yield Productivity yields (Tonnes/Ha) for crop commodities
DECP Domestic Energy Crop Production Total quantity (Tonnes) of domestically produced straw-yielding energy crops
DFCP Domestic Food Crop Production Total quantity (Tonnes) of domestically produced straw- yielding food commodities.
EfW(s) Energy from Waste Scenario Proportion (%) of waste sent to energy recovery, within developed BRM scenario.
FA Forest Area Total area (Ha) of forested land.
ΔFA. Forested Area Change Change in forested area (Ha) between two analyses time periods.
FRBY Forest Residue Base Year Total quantity (Tonnes eqv.) of forest residues within the analysis base year.
FRC Forest Residue Competition Proportion (%) of forest residues used for competing uses or industries.
FRHP Forest Residue Harvest Proportion Proportion (%) of overall residue resource that is harvested from managed forests.
FRR Forest Residue Resource Total quantity (Tonnes eqv.) of forest residues available for the bioenergy sector.
GR Grown Resources Total quantity (Tonnes eqv.) of grown resources produced on available land.
ΔID. Change in Industry Demand Change in industry’s forest resource demand (Tonnes eq.) between time periods
IP Industry Product Industry product produced (Tonnes per Tonnes eqv.) from raw forest resources.
IRR Industry Residue Resource Total quantity (Tonnes eqv.) of industry residues available for the bioenergy sector.
IO Indoor Occupancy Proportion (%) of time livestock typically housed.
LQ Livestock Quantity Total quantity (number) of animals.
MR Manure Resource Total quantity (Tonnes eqv.) of animal manure available for the bioenergy sector.
MRA Manure Resource Availability Proportion (%) of manure resources collectable and available for further use.
MRC Manure Resource Competition Proportion (%) of manure resources used for competing uses or industries.
MF Manure Factor Manure produced (Tonnes/animal/year) typically per animal per year.
OWPI Other Wood Product Industry Industry utilising forestry resource.
PET Plantation Establishment Time Time (years) the chosen plantation species takes to achieve peak establishment.
PHC Plantation Harvest Cycle Number (number) of harvest cycles undertaken, over the timeframe.
PLD Proportion Land Dedicated Proportion (%) of available and suitable land dedicated for resource growth.
PMF Proportion Managed Forests Proportion (%) of forested area that is actively managed.
Pop. Population Population quantity.
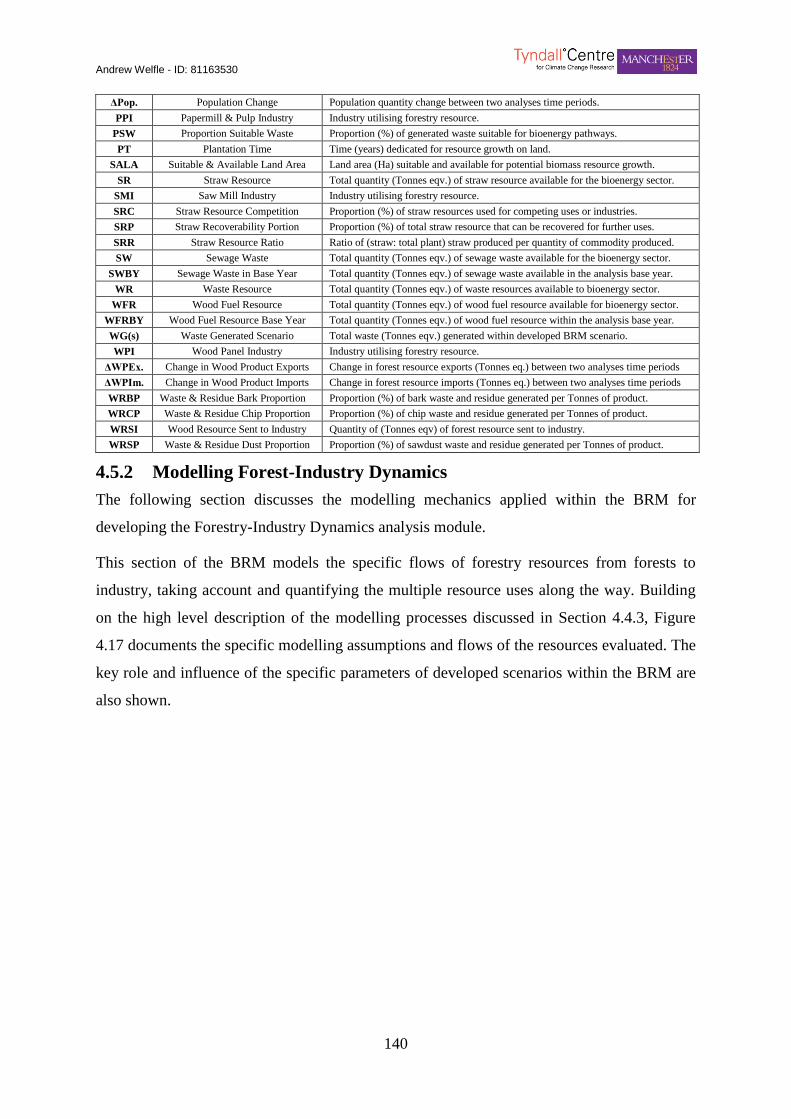
Andrew Welfle - ID: 81163530
140
ΔPop. Population Change Population quantity change between two analyses time periods.
PPI Papermill & Pulp Industry Industry utilising forestry resource.
PSW Proportion Suitable Waste Proportion (%) of generated waste suitable for bioenergy pathways.
PT Plantation Time Time (years) dedicated for resource growth on land.
SALA Suitable & Available Land Area Land area (Ha) suitable and available for potential biomass resource growth.
SR Straw Resource Total quantity (Tonnes eqv.) of straw resource available for the bioenergy sector.
SMI Saw Mill Industry Industry utilising forestry resource.
SRC Straw Resource Competition Proportion (%) of straw resources used for competing uses or industries.
SRP Straw Recoverability Portion Proportion (%) of total straw resource that can be recovered for further uses.
SRR Straw Resource Ratio Ratio of (straw: total plant) straw produced per quantity of commodity produced.
SW Sewage Waste Total quantity (Tonnes eqv.) of sewage waste available for the bioenergy sector.
SWBY Sewage Waste in Base Year Total quantity (Tonnes eqv.) of sewage waste available in the analysis base year.
WR Waste Resource Total quantity (Tonnes eqv.) of waste resources available to bioenergy sector.
WFR Wood Fuel Resource Total quantity (Tonnes eqv.) of wood fuel resource available for bioenergy sector.
WFRBY Wood Fuel Resource Base Year Total quantity (Tonnes eqv.) of wood fuel resource within the analysis base year.
WG(s) Waste Generated Scenario Total waste (Tonnes eqv.) generated within developed BRM scenario.
WPI Wood Panel Industry Industry utilising forestry resource.
ΔWPEx. Change in Wood Product Exports Change in forest resource exports (Tonnes eq.) between two analyses time periods
ΔWPIm. Change in Wood Product Imports Change in forest resource imports (Tonnes eq.) between two analyses time periods
WRBP Waste & Residue Bark Proportion Proportion (%) of bark waste and residue generated per Tonnes of product.
WRCP Waste & Residue Chip Proportion Proportion (%) of chip waste and residue generated per Tonnes of product.
WRSI Wood Resource Sent to Industry Quantity of (Tonnes eqv) of forest resource sent to industry.
WRSP Waste & Residue Dust Proportion Proportion (%) of sawdust waste and residue generated per Tonnes of product.
4.5.2 Modelling Forest-Industry Dynamics
The following section discusses the modelling mechanics applied within the BRM for
developing the Forestry-Industry Dynamics analysis module.
This section of the BRM models the specific flows of forestry resources from forests to
industry, taking account and quantifying the multiple resource uses along the way. Building
on the high level description of the modelling processes discussed in Section 4.4.3, Figure
4.17 documents the specific modelling assumptions and flows of the resources evaluated. The
key role and influence of the specific parameters of developed scenarios within the BRM are
also shown.

Andrew Welfle - ID: 81163530
141
Forested Land Area (Ha)
(Varied through BRM Scenarios)
↓ ↓ ↓ ↓
Forestry Standing Volume (m³ obs)
↓ ↓ ↓ ↓
Managed Forest (%)
(Varied through BRM Scenarios)
↓ ↓
Forest Productivity (Green Tonnes)
(Varied through BRM Scenarios)
← Imports (Green Tonnes)
(Varied through BRM Scenarios)
→ Exports (Green Tonnes)
(Varied through BRM Scenarios)
↓
↓
Wood Fuel Resource
(%)
Proportion of
Resource Sent to
Industry (%)
↓
Industry Demand (odt)
(Varied through BRM Scenarios)
↓ ↓
Production of
Industrial Residues
Available to the
Bioenergy Sector
(Varied through BRM
Scenarios)
Wood Based Products
(Tonnes)
← Imports (Tonnes)
(Varied through BRM Scenarios)
→ Export (Tonnes)
(Varied through BRM Scenarios)
43) Figure 4.17: Modell ing Resource Flows within t he BRM’s Forestry-Industry Ana lysis Module
Figure 4.17: Modelling Resource Flows within the BRM’s Forestry-Industry Analysis
Module
4.5.3 Modelling Biomass Resource Availability Dynamics
The following section presents the calculation equations applied within the BRM, for
analysing the availability of key biomass resources. These equations are described below and
listed in Figure 4.18.
Calculating Industry Residue Resource for the Bioenergy Sector (Eq.3a)
The calculation equation applied within the BRM, for analysing the potential
availability of industry residues for the bioenergy sector, over the analysis timeframe.
Calculating Resource Direct from Forestry Systems for the Bioenergy Sector (Eq.3b)
The calculation equation applied within the BRM, for analysing the potential
availability of resources direct from forests, such as wood fuels for the bioenergy
sector, over the analysis timeframe.
Andrew Welfle - ID: 81163530
142
Calculating Forest Residue Resource for the Bioenergy Sector (Eq.3c)
The calculation equation applied within the BRM, for analysing the potential
availability of forest residues for the bioenergy sector, over the analysis timeframe.
Calculating Straw Resource for the Bioenergy Sector (Eq.3d)
The calculation equation applied within the BRM, for analysing the potential
availability of straw resources for the bioenergy sector, over the analysis timeframe.
Calculating Manure & Slurry Resource for the Bioenergy Sector (Eq.3e)
The calculation equation applied within the BRM, for analysing the potential
availability of animal manure and slurry resources for the bioenergy sector, over the
analysis timeframe.
Calculating Arboricultural Residues for the Bioenergy Sector (Eq.3f)
The calculation equation applied within the BRM, for analysing the potential
availability of arboricultural arising residues for the bioenergy sector, over the
analysis timeframe.
Calculating Waste Resource Available for the Bioenergy Sector (Eq.3g)
The calculation equation applied within the BRM, for analysing the potential
availability of different waste resources for the bioenergy sector, over the analysis
timeframe.
Calculating Sewage Resource Available for the Bioenergy Sector (Eq.3h)
The calculation equation applied within the BRM, for analysing the potential
availability of sewage resources for the bioenergy sector, over the analysis timeframe.
Calculating Grown Resource Potential Planted on Available & Suitable Land (Eq.3i)
The calculation equations applied within the BRM, for analysing the potential
availability of grown resources produced on suitable and available land. These
equations, reflecting the mechanisms of the BRM’s analyses, for evaluating biomass
resource and energy crop planting strategies.
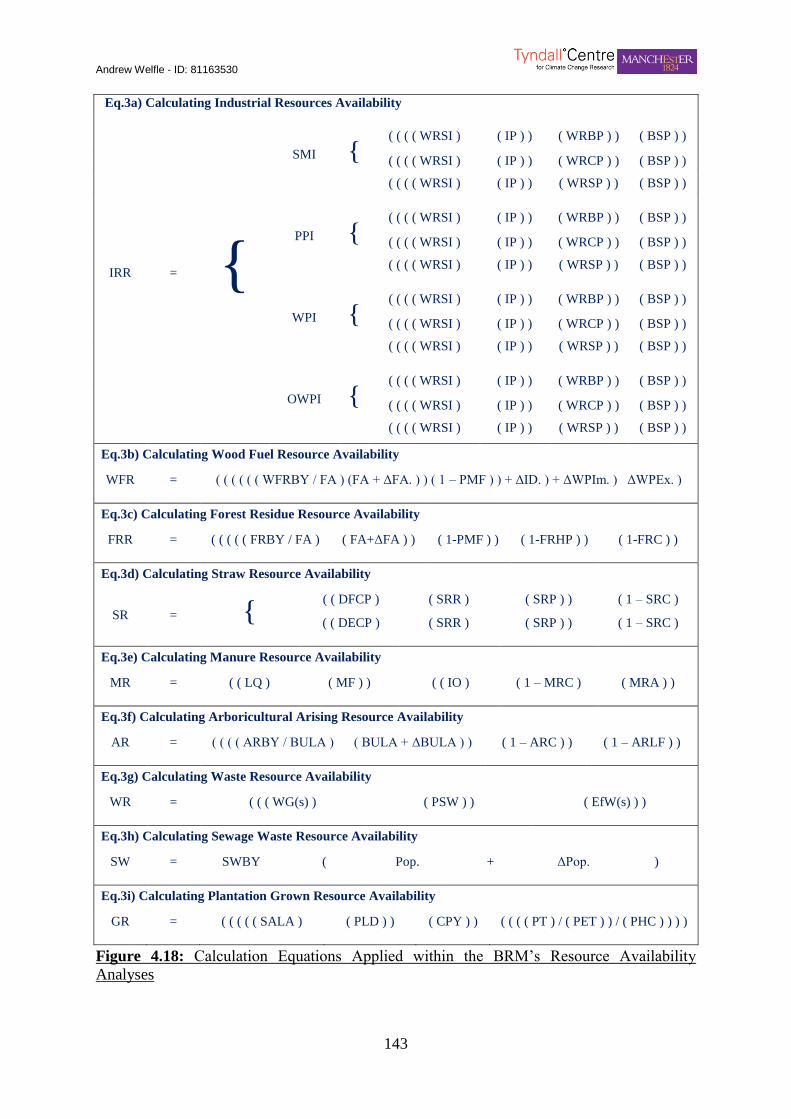
Andrew Welfle - ID: 81163530
143
Eq.3a) Calculating Industrial Resources Availability
IRR = {
SMI { ( ( ( ( WRSI ) ( IP ) ) ( WRBP ) ) ( BSP ) )
( ( ( ( WRSI ) ( IP ) ) ( WRCP ) ) ( BSP ) )
( ( ( ( WRSI ) ( IP ) ) ( WRSP ) ) ( BSP ) )
PPI { ( ( ( ( WRSI ) ( IP ) ) ( WRBP ) ) ( BSP ) )
( ( ( ( WRSI ) ( IP ) ) ( WRCP ) ) ( BSP ) )
( ( ( ( WRSI ) ( IP ) ) ( WRSP ) ) ( BSP ) )
WPI { ( ( ( ( WRSI ) ( IP ) ) ( WRBP ) ) ( BSP ) )
( ( ( ( WRSI ) ( IP ) ) ( WRCP ) ) ( BSP ) )
( ( ( ( WRSI ) ( IP ) ) ( WRSP ) ) ( BSP ) )
OWPI { ( ( ( ( WRSI ) ( IP ) ) ( WRBP ) ) ( BSP ) )
( ( ( ( WRSI ) ( IP ) ) ( WRCP ) ) ( BSP ) )
( ( ( ( WRSI ) ( IP ) ) ( WRSP ) ) ( BSP ) )
Eq.3b) Calculating Wood Fuel Resource Availability
WFR = ( ( ( ( ( ( WFRBY / FA ) (FA + ΔFA. ) ) ( 1 – PMF ) ) + ΔID. ) + ΔWPIm. ) ΔWPEx. )
Eq.3c) Calculating Forest Residue Resource Availability
FRR = ( ( ( ( ( FRBY / FA ) ( FA+ΔFA ) ) ( 1-PMF ) ) ( 1-FRHP ) ) ( 1-FRC ) )
Eq.3d) Calculating Straw Resource Availability
SR = {
( ( DFCP ) ( SRR ) ( SRP ) ) ( 1 – SRC )
( ( DECP ) ( SRR ) ( SRP ) ) ( 1 – SRC )
Eq.3e) Calculating Manure Resource Availability
MR = ( ( LQ ) ( MF ) ) ( ( IO ) ( 1 – MRC ) ( MRA ) )
Eq.3f) Calculating Arboricultural Arising Resource Availability
AR = ( ( ( ( ARBY / BULA ) ( BULA + ΔBULA ) ) ( 1 – ARC ) ) ( 1 – ARLF ) )
Eq.3g) Calculating Waste Resource Availability
WR = ( ( ( WG(s) ) ( PSW ) ) ( EfW(s) ) )
Eq.3h) Calculating Sewage Waste Resource Availability
SW = SWBY ( Pop. + ΔPop. )
Eq.3i) Calculating Plantation Grown Resource Availability
GR = ( ( ( ( ( SALA ) ( PLD ) ) ( CPY ) ) ( ( ( ( PT ) / ( PET ) ) / ( PHC ) ) ) )
44) Figure 4.18: Calculation Equations A pplied w ithin t he BRM’s Resource Availabil ity Ana lyses
Figure 4.18: Calculation Equations Applied within the BRM’s Resource Availability
Analyses
Andrew Welfle - ID: 81163530
144
4.6 UK BRM – Developing the Stage Three
Methodology
The following section of the Thesis, discusses in detail the development of the Stage Three
analysis of the BRM. The BRM’s Stage Three analysis aims to quantify and forecast the
bioenergy potential of the resources available to the bioenergy sector, as identified within
BRM’s Stage Two analysis.
At each stage, the key studies and methodologies that influenced the design of the BRM, and
all the data sources utilised, are referenced. Section 4.7 of this Chapter, supported by
screenshots of the BRM Excel Spreadsheet in Appendix 14.0, goes onto provide further
discussions of the precise calculation equations applied; that define the mechanics for how
the Stage Three analysis of the BRM was modelled.
A step-by-step walk through of the Stage Three BRM methodology is provided, focusing on
the following key analysis areas:
Total Resource Availability Approach for Analysing Bioenergy Potential
Energy Content of Resources Biomass Pre-Treatment Pathways
Bioenergy Conversion Pathways Preferred Bioenergy Conversion Pathways
Total Bioenergy Potential Energy Targets & Demands
4.6.1 Resource Availability for the Bioenergy Sector
The first step, within the Stage Three analysis of the BRM is the assessment of the total
resource availability to the bioenergy sector that will be evaluated to determine the bioenergy
potential. Within the BRM, the resource outputs from each analysis step of the Stage Two
analysis are collated, and if required, converted into uniform resource quantity units, in
preparation for bioenergy conversion analysis.
The uniform unit applied within this stage of the Model, is ‘tonnes equivalent’ of each
specific resource category. For solid biomass resource categories, the combined quantity is
calculated, taking account of the varying moisture content typical of different resources [74],
[78]. Conversion factors, utilised within the BRM for calculating conversions between
different forms and states of biomass, are listed within Appendix 1.0. Potential resource
losses, and energy debts associated with any pre-treatment processes, are accounted for. For
wet biomass resource categories, the combined resource quantities are collated and presented
in both wet volume, and the oven dry tonnes equivalent. Conversion of the biomass resource
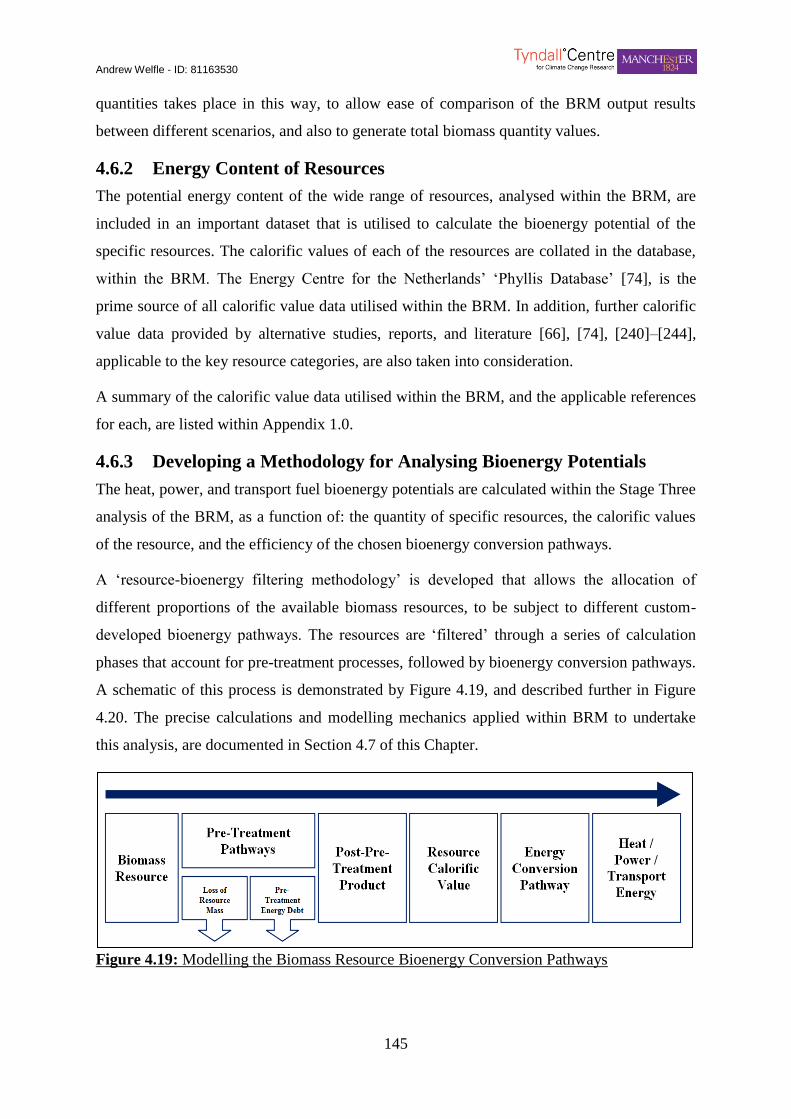
Andrew Welfle - ID: 81163530
145
quantities takes place in this way, to allow ease of comparison of the BRM output results
between different scenarios, and also to generate total biomass quantity values.
4.6.2 Energy Content of Resources
The potential energy content of the wide range of resources, analysed within the BRM, are
included in an important dataset that is utilised to calculate the bioenergy potential of the
specific resources. The calorific values of each of the resources are collated in the database,
within the BRM. The Energy Centre for the Netherlands’ ‘Phyllis Database’ [74], is the
prime source of all calorific value data utilised within the BRM. In addition, further calorific
value data provided by alternative studies, reports, and literature [66], [74], [240]–[244],
applicable to the key resource categories, are also taken into consideration.
A summary of the calorific value data utilised within the BRM, and the applicable references
for each, are listed within Appendix 1.0.
4.6.3 Developing a Methodology for Analysing Bioenergy Potentials
The heat, power, and transport fuel bioenergy potentials are calculated within the Stage Three
analysis of the BRM, as a function of: the quantity of specific resources, the calorific values
of the resource, and the efficiency of the chosen bioenergy conversion pathways.
A ‘resource-bioenergy filtering methodology’ is developed that allows the allocation of
different proportions of the available biomass resources, to be subject to different custom-
developed bioenergy pathways. The resources are ‘filtered’ through a series of calculation
phases that account for pre-treatment processes, followed by bioenergy conversion pathways.
A schematic of this process is demonstrated by Figure 4.19, and described further in Figure
4.20. The precise calculations and modelling mechanics applied within BRM to undertake
this analysis, are documented in Section 4.7 of this Chapter.
45) Figure 4.19: Modell ing the Biomass Resource Bioenergy Conversion Pathway
Figure 4.19: Modelling the Biomass Resource Bioenergy Conversion Pathways
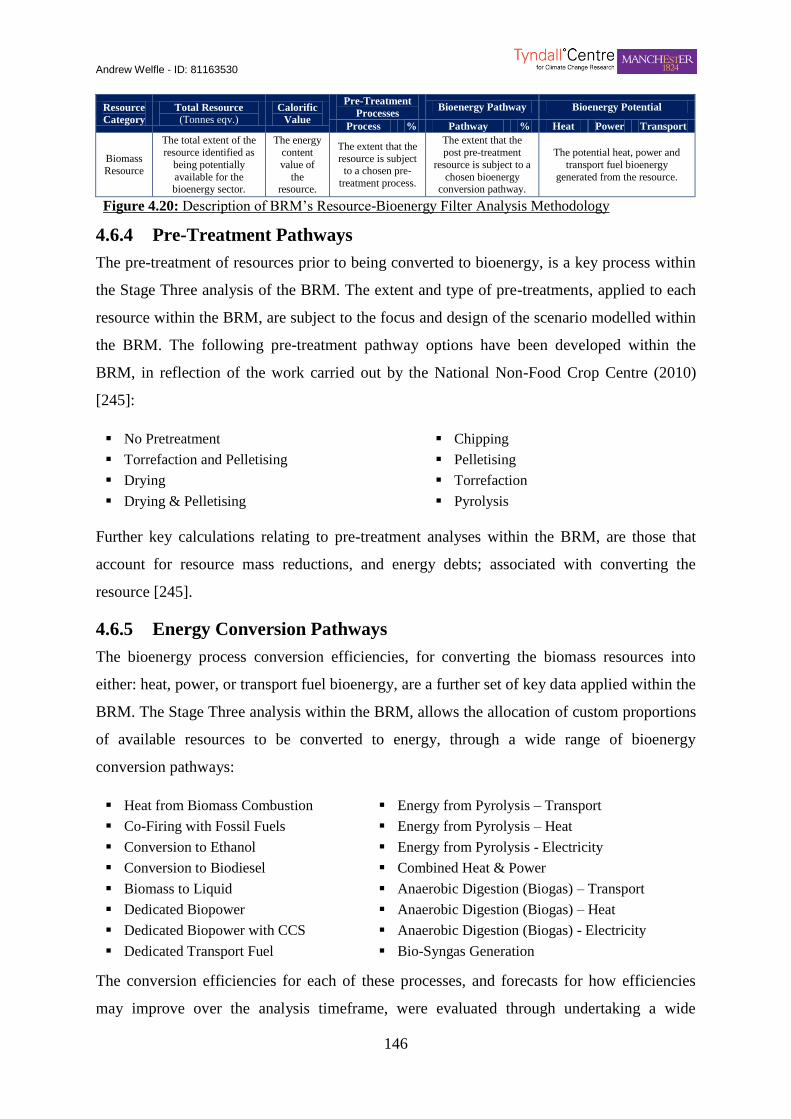
Andrew Welfle - ID: 81163530
146
Resource
Category
Total Resource
(Tonnes eqv.) Calorific
Value
Pre-Treatment
Processes Bioenergy Pathway Bioenergy Potential
Process % Pathway % Heat Power Transport
Biomass
Resource
The total extent of the
resource identified as
being potentially
available for the bioenergy sector.
The energy
content
value of
the resource.
The extent that the
resource is subject to a chosen pre-
treatment process.
The extent that the
post pre-treatment
resource is subject to a
chosen bioenergy conversion pathway.
The potential heat, power and
transport fuel bioenergy
generated from the resource.
Figure 4.20: Description of BRM’s Resource-Bioenergy Filter Analysis Methodology 46) Figure 4.20: Descript ion of BRM’s Resource-Bioenergy Filter Analysis Methodology
4.6.4 Pre-Treatment Pathways
The pre-treatment of resources prior to being converted to bioenergy, is a key process within
the Stage Three analysis of the BRM. The extent and type of pre-treatments, applied to each
resource within the BRM, are subject to the focus and design of the scenario modelled within
the BRM. The following pre-treatment pathway options have been developed within the
BRM, in reflection of the work carried out by the National Non-Food Crop Centre (2010)
[245]:
No Pretreatment
Torrefaction and Pelletising
Drying
Drying & Pelletising
Chipping
Pelletising
Torrefaction
Pyrolysis
Further key calculations relating to pre-treatment analyses within the BRM, are those that
account for resource mass reductions, and energy debts; associated with converting the
resource [245].
4.6.5 Energy Conversion Pathways
The bioenergy process conversion efficiencies, for converting the biomass resources into
either: heat, power, or transport fuel bioenergy, are a further set of key data applied within the
BRM. The Stage Three analysis within the BRM, allows the allocation of custom proportions
of available resources to be converted to energy, through a wide range of bioenergy
conversion pathways:
Heat from Biomass Combustion
Co-Firing with Fossil Fuels
Conversion to Ethanol
Conversion to Biodiesel
Biomass to Liquid
Dedicated Biopower
Dedicated Biopower with CCS
Dedicated Transport Fuel
Energy from Pyrolysis – Transport
Energy from Pyrolysis – Heat
Energy from Pyrolysis - Electricity
Combined Heat & Power
Anaerobic Digestion (Biogas) – Transport
Anaerobic Digestion (Biogas) – Heat
Anaerobic Digestion (Biogas) - Electricity
Bio-Syngas Generation
The conversion efficiencies for each of these processes, and forecasts for how efficiencies
may improve over the analysis timeframe, were evaluated through undertaking a wide
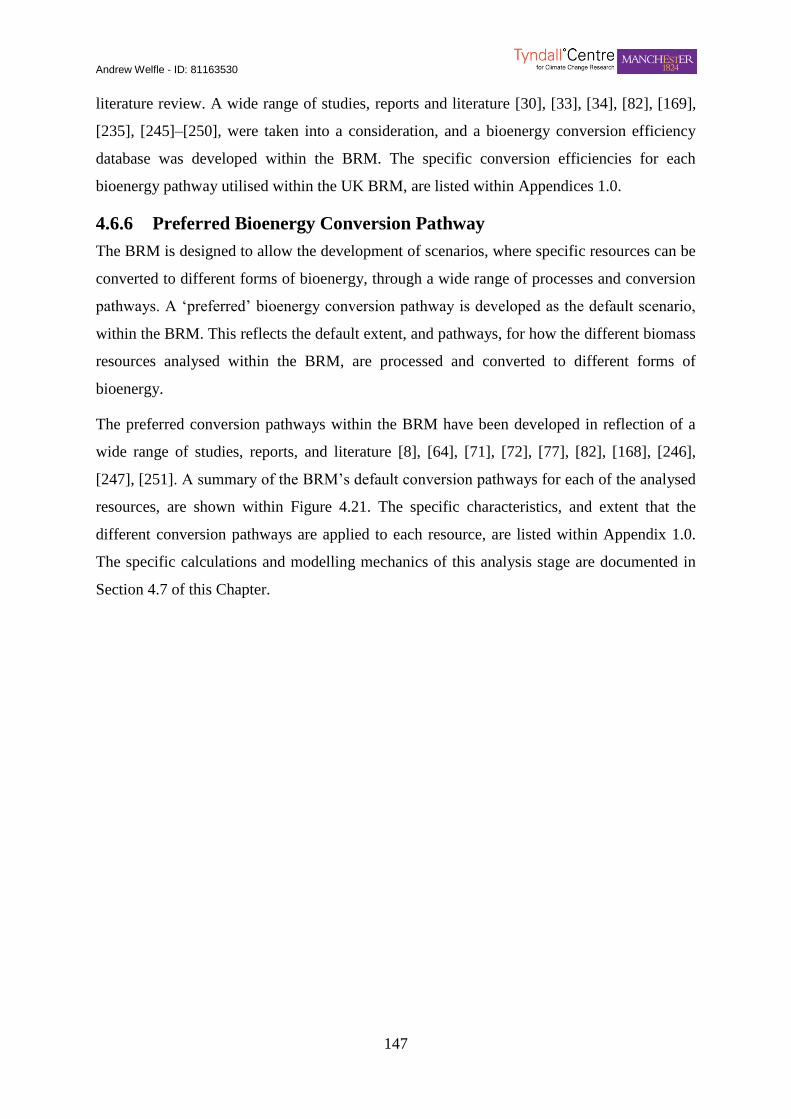
Andrew Welfle - ID: 81163530
147
literature review. A wide range of studies, reports and literature [30], [33], [34], [82], [169],
[235], [245]–[250], were taken into a consideration, and a bioenergy conversion efficiency
database was developed within the BRM. The specific conversion efficiencies for each
bioenergy pathway utilised within the UK BRM, are listed within Appendices 1.0.
4.6.6 Preferred Bioenergy Conversion Pathway
The BRM is designed to allow the development of scenarios, where specific resources can be
converted to different forms of bioenergy, through a wide range of processes and conversion
pathways. A ‘preferred’ bioenergy conversion pathway is developed as the default scenario,
within the BRM. This reflects the default extent, and pathways, for how the different biomass
resources analysed within the BRM, are processed and converted to different forms of
bioenergy.
The preferred conversion pathways within the BRM have been developed in reflection of a
wide range of studies, reports, and literature [8], [64], [71], [72], [77], [82], [168], [246],
[247], [251]. A summary of the BRM’s default conversion pathways for each of the analysed
resources, are shown within Figure 4.21. The specific characteristics, and extent that the
different conversion pathways are applied to each resource, are listed within Appendix 1.0.
The specific calculations and modelling mechanics of this analysis stage are documented in
Section 4.7 of this Chapter.

Andrew Welfle - ID: 81163530
148
Biomass Resources Analysed within
the BRM Resource Forms
Pre-
Treatment &
Processing
Post Pre-
Treatment
Resources
Bio-energy
Conversion
Processes
Forms of
Bioenergy
Grown
Biomass &
Energy
Crops
Biomass Crops
Grasses Solid Hydrocarbon Baling Solid Fuel Combustion Heat Bioenergy
Power Bioenergy
Short
Rotation
Coppice
Solid Hydrocarbon Chipping Solid Fuel Combustion Heat Bioenergy
Pelletising Solid Fuel Combustion Power Bioenergy
Short
Rotation Forestry
Solid Hydrocarbon Chipping Solid Fuel Combustion Heat Bioenergy
Pelletising Solid Fuel Combustion Power Bioenergy
Other
Forestry Solid Hydrocarbon
Chipping Solid Fuel Combustion Heat Bioenergy
Pelletising Solid Fuel Combustion Power Bioenergy
Energy
Crops
Cereal Crops Solid Hydrocarbon Hydrolysis Bio-ethanol Biofuels
Generation Transport Bioenergy
Oil Crops Solid Hydrocarbon Transesterification Bio-Diesel Biofuels
Generation
Transport
Bioenergy
Sugar Crops Solid Hydrocarbon Fermentation Bio-ethanol Biofuels
Generation
Transport
Bioenergy
Direct Forestry Production Solid Hydrocarbon Chipping Solid Fuel Combustion Heat Bioenergy
Pelletising Solid Fuel Combustion Power Bioenergy
Biomass
Residues
Resources
Agricultural
Residues
Straw Solid Hydrocarbon Baling Solid Fuel Combustion Heat Bioenergy
Combustion Power Bioenergy
Slurry & Manure
Liquid Hydrocarbon Anaerobic Digestion
Bio-Methane Combustion Power Bioenergy
Forestry Residues Solid Hydrocarbon Chipping Solid Fuel Combustion Heat Bioenergy
Arboriculture Arisings Solid Hydrocarbon Chipping Solid Fuel Combustion Heat Bioenergy
Industry Residues Solid Hydrocarbon Chipping Solid Fuel Combustion Heat Bioenergy
Pelletising Solid Fuel Combustion Power Bioenergy
Biomass
Waste
Resources
Household, Industry & Other
Wastes
Solid Hydrocarbon Sorting Solid Fuel Combustion Power Bioenergy
Liquid Hydrocarbon Anaerobic
Digestion Bio-Methane Combustion Power Bioenergy
Sewage Liquid Hydrocarbon Anaerobic
Digestion Bio-Methane Combustion Power Bioenergy
Key
Forms of Resource Forms of Bioenergy
Solid Resources Transport Bioenergy
Liquid Resources Power Bioenergy
Gaseous Resources Heat Bioenergy
47) Figure 4.21: Preferred Bioenergy Conversion P athways within t he BRM
Figure 4.21: Preferred Bioenergy Conversion Pathways within the BRM
4.6.7 Total Bioenergy Potential
Once the bioenergy potential from all available biomass resources within the BRM has been
analysed, these values are collated to evaluate the combined totals and forms of bioenergy
generated for the given scenario modelled. As presented within Figure 4.22, these bioenergy
values form key analysis outputs that can be compared against energy targets and also enable
comparisons to be derived between different scenarios developed in the BRM.
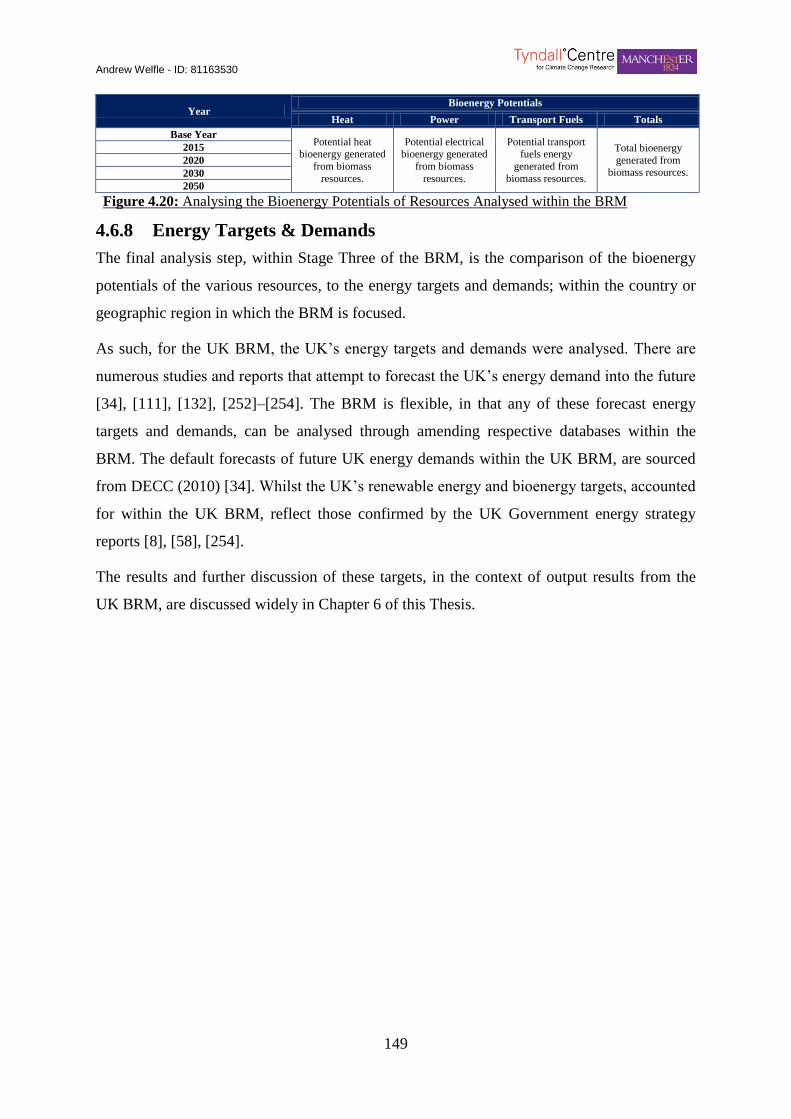
Andrew Welfle - ID: 81163530
149
Year Bioenergy Potentials
Heat Power Transport Fuels Totals
Base Year Potential heat
bioenergy generated
from biomass
resources.
Potential electrical bioenergy generated
from biomass
resources.
Potential transport fuels energy
generated from
biomass resources.
Total bioenergy
generated from biomass resources.
2015
2020
2030
2050
Figure 4.20: Analysing the Bioenergy Potentials of Resources Analysed within the BRM 48) Figure 4.20: Ana lysing t he Bioenergy Potentia ls Generated from Resources within t he BRM
4.6.8 Energy Targets & Demands
The final analysis step, within Stage Three of the BRM, is the comparison of the bioenergy
potentials of the various resources, to the energy targets and demands; within the country or
geographic region in which the BRM is focused.
As such, for the UK BRM, the UK’s energy targets and demands were analysed. There are
numerous studies and reports that attempt to forecast the UK’s energy demand into the future
[34], [111], [132], [252]–[254]. The BRM is flexible, in that any of these forecast energy
targets and demands, can be analysed through amending respective databases within the
BRM. The default forecasts of future UK energy demands within the UK BRM, are sourced
from DECC (2010) [34]. Whilst the UK’s renewable energy and bioenergy targets, accounted
for within the UK BRM, reflect those confirmed by the UK Government energy strategy
reports [8], [58], [254].
The results and further discussion of these targets, in the context of output results from the
UK BRM, are discussed widely in Chapter 6 of this Thesis.
Andrew Welfle - ID: 81163530
150
4.7 UK BRM - Stage Three Modelling
Mechanics
The following section, presents details of the precise calculations and modelling mechanics,
developed and applied within the BRM’s Stage Three analysis. These are supported by
screenshots, and descriptions of the BRM Excel Spreadsheet, presented within Appendix
14.0. The BRM’s modelling calculations for the following key analysis theme is presented in
this section:
Calculating the Bioenergy Potential of Biomass Resources
4.7.1 Stage Three Analysis Calculation Equations Key
Table 4.16 presents the key for the calculation equations listed in this Section. These are
presented in alphabetical order.
Table 4.16: Equation Calculations Key for the BRM’s Stage Three Analyses Table 23) Table 4.16: Equation Calculations Key for the BRM’s Stage Three Analyses
Symbol Label Description
AR Arboricultural Residues Total quantity (Tonnes eqv.) of arb residues available for the bioenergy sector.
BCE Bioenergy Conversion Efficiency Energy efficiency (%) of the selected bioenergy conversion process.
BRCV Biomass Resource Calorific Value Calorific energy (MJ/Tonne) content of biomass resource.
FRR Forest Residue Resource Total quantity (Tonnes eqv.) of forest residues available for the bioenergy sector.
GR Grown Resources Total quantity (Tonnes eqv.) of grown resources produced on available land.
GRBPn Bioenergy from Grown Resource Bioenergy potential (MJ) from a given grown resource.
IRR Industry Residue Resource Total quantity (Tonnes eqv.) of industry residues available for the bioenergy sector.
PoPTR Post Pre-Treatment Resource Total quantity (Tonnes eqv.) of resource post pre-treatment processing.
PrPTR Pre Pre-Treatment Resource Total quantity (Tonnes eqv.) of resource sent for pre-treatment processing.
PTED Pre-Treatment Energy Debt Energy debt (MJ/Tonne) associated within the applied pre-treatment processing
RBP Resource Bioenergy Potential Bioenergy potential (MJ) of the biomass resources subject to bioenergy pathways.
RRBPn Bioenergy from Residue Resource Bioenergy potential (MJ) from a given residue resource.
LRM Loss in Resource Mass Loss in resource mass (Tonnes eqv.) resulting from pre-treatment processing.
MR Manure Resource Total quantity (Tonnes eqv.) of animal manure available for the bioenergy sector.
WRBPn Bioenergy from Waste Resource Bioenergy potential (MJ) from a given waste resource.
SR Straw Resource Total quantity (Tonnes eqv.) of straw resource available for the bioenergy sector.
SW Sewage Waste Total quantity (Tonnes eqv.) of sewage waste available for the bioenergy sector.
TGRBP Total Grown Resource Bioenergy Total bioenergy potential (MJ) of all grown resources within a given BRM scenario.
TRBP Total Resource Bioenergy Potential Total bioenergy potential (MJ) of all available resources within a given scenario.
TRRBP Total Residue Resource Bioenergy Total bioenergy potential (MJ) of all residue resources within a given BRM scenario.
TWRBP Total Waste Resource Bioenergy Total bioenergy potential (MJ) of all waste resources within a given BRM scenario.
WR Waste Resource Total quantity (Tonnes eqv.) of waste resources available to the bioenergy sector.
WFR Wood Fuel Resource Total quantity (Tonnes eqv.) of wood fuel resource available for bioenergy sector.
4.7.2 Modelling Bioenergy Potential of Available Biomass Resources
The following section, presents the calculation equations applied within the BRM, for
analysing the potential bioenergy that may be generated from the biomass resource available
to the bioenergy sector; in a given developed scenario. These equations are described below
and listed in Figure 4.23.
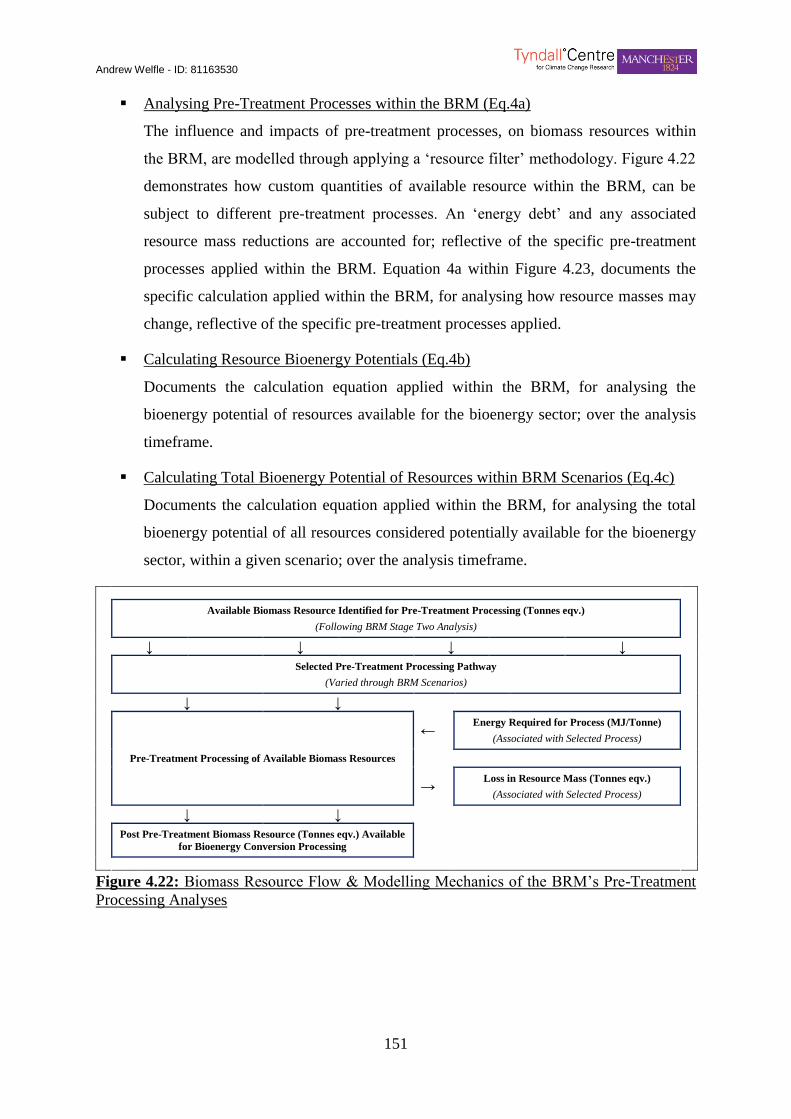
Andrew Welfle - ID: 81163530
151
Analysing Pre-Treatment Processes within the BRM (Eq.4a)
The influence and impacts of pre-treatment processes, on biomass resources within
the BRM, are modelled through applying a ‘resource filter’ methodology. Figure 4.22
demonstrates how custom quantities of available resource within the BRM, can be
subject to different pre-treatment processes. An ‘energy debt’ and any associated
resource mass reductions are accounted for; reflective of the specific pre-treatment
processes applied within the BRM. Equation 4a within Figure 4.23, documents the
specific calculation applied within the BRM, for analysing how resource masses may
change, reflective of the specific pre-treatment processes applied.
Calculating Resource Bioenergy Potentials (Eq.4b)
Documents the calculation equation applied within the BRM, for analysing the
bioenergy potential of resources available for the bioenergy sector; over the analysis
timeframe.
Calculating Total Bioenergy Potential of Resources within BRM Scenarios (Eq.4c)
Documents the calculation equation applied within the BRM, for analysing the total
bioenergy potential of all resources considered potentially available for the bioenergy
sector, within a given scenario; over the analysis timeframe.
Available Biomass Resource Identified for Pre-Treatment Processing (Tonnes eqv.)
(Following BRM Stage Two Analysis)
↓ ↓ ↓ ↓
Selected Pre-Treatment Processing Pathway
(Varied through BRM Scenarios)
↓ ↓
Pre-Treatment Processing of Available Biomass Resources
← Energy Required for Process (MJ/Tonne)
(Associated with Selected Process)
→ Loss in Resource Mass (Tonnes eqv.)
(Associated with Selected Process)
↓ ↓
Post Pre-Treatment Biomass Resource (Tonnes eqv.) Available
for Bioenergy Conversion Processing
49) Figure 4.22: Biomass Resource Flow & Modelling Mechanics of t he BRM’s Pre-Treatment Processing A nalyses
Figure 4.22: Biomass Resource Flow & Modelling Mechanics of the BRM’s Pre-Treatment
Processing Analyses

Andrew Welfle - ID: 81163530
152
Eq.4a) Calculating Resource Mass Changes through Pre-Treatment Processing
PoPTR = PrPTR - LRM
Eq.4b) Calculating Bioenergy Potential of Biomass Resources
RBP = ( ( ( ( PoPTR ) ( AFCV ) ) ( BCE ) ) – PTED )
Eq.4c) Calculating Bioenergy Potential of Biomass Resources
TRBP = {
TGRBP = { ( ( ( ( GR – LRM ) ( AFCV ) ) ( BCE ) ) - PTED )
( ( ( ( WFR – LRM ) ( AFCV ) ) ( BCE ) ) - PTED )
TRRBP = {
( ( ( ( AR – LRM ) ( AFCV ) ) ( BCE ) ) - PTED )
( ( ( ( FRR – LRM ) ( AFCV ) ) ( BCE ) ) - PTED )
( ( ( ( IRR – LRM ) ( AFCV ) ) ( BCE ) ) - PTED )
( ( ( ( MR – LRM ) ( AFCV ) ) ( BCE ) ) - PTED )
( ( ( ( SR – LRM ) ( AFCV ) ) ( BCE ) ) - PTED )
TWRBP = { ( ( ( ( SW – LRM ) ( AFCV ) ) ( BCE ) ) - PTED )
( ( ( ( WR – LRM ) ( AFCV ) ) ( BCE ) ) - PTED )
50) Figure 4.23: Calculation Equations A pplied w ithin t he BRM’s Bioenergy Potential A nalyses
Figure 4.23: Calculation Equations Applied within the BRM’s Bioenergy Potential Analyses

Andrew Welfle - ID: 81163530
153
Chapter 5 - Drivers Influencing Biomass Resource Availability & Bioenergy

Andrew Welfle - ID: 81163530
154
5.1 Drivers Influencing Biomass Resource
Availability
This Chapter has been developed to provide a discussion of the different variables and drivers
within supply chains; that influence the availability of biomass resources, and resulting
bioenergy potential.
The Chapter begins with a literature review driven evaluation, of the types of drivers and
variables, within biomass supply chains. The Chapter then builds on the methodology of
Chapter 4; highlighting and evaluating the various drivers that are inherently developed
within the BRM. It is the calibration of these drivers within the BRM that enables the
modelling of different scenarios. The drivers within the BRM are listed, and a literature
review is undertaken, to analyse why these BRM drivers may influence supply chains
dynamics, and vary the availability of biomass for the bioenergy sector.
The first analysis within the Thesis, using the BRM is then introduced. A baseline UK
biomass resource scenario is modelled within the BRM. This baseline scenario reflects the
UK’s biomass supply chain dynamics to 2050; with the driver characteristics within the BRM
calibrated to reflect an averaged assessment of how these may change to 2050, as informed
by a broad literature review. A methodology is then developed and applied, carrying out a
sensitivity analysis, to evaluate the specific influences that each driver has on different types
of biomass resources. The aim being, to identify: the key biomass resource types within the
baseline scenario that demonstrate greatest potential for the bioenergy sector, the specific
drivers that have greatest influence in determining the availability of these resources, and
those drivers that have minimal or limited influence on determining the availability of any
biomass resources.
The Chapter concludes in highlighting the specific biomass resources that demonstrate the
greatest potential for the bioenergy sector, and the specific drivers that should potentially be
targeted, to maximise the availability of the specific resource. This Chapter’s relevance, in
the overall Thesis progression, is the contribution of key data and conclusions to discussions
in Chapter 10; where ideas will be proposed for the development of refocused and alternative
bioenergy strategies for the UK.
Andrew Welfle - ID: 81163530
155
5.1.1 Biomass Resource Drivers
The analyses within the BRM, as with all biomass resource models, are based on developing
an understanding of, and modelling the different supply chain drivers that may influence
biomass resources. The realistic availability of any given resource for the energy sector
requires evaluation of the quantities available, and the environmental and economic viability
of making it available to the energy market [78]. These drivers can be categorised reflecting
the work carried out by AEA Consulting (2010, 2011) [136], [137]:
Policy Drivers – energy and environmental themed policies are particularly important
in determining a secure long-term energy strategy. Waste, agricultural, and forestry
policies have great influence in determining the potential availability of specific
resources.
Market Drivers – biomass is a relatively immature market in the UK. The level of
understanding that potential resource suppliers / buyers have of the UK market,
determines the levels of uncertainty, and likelihood of commitments to long term
contracts.
Technical Drivers – are the influences and barriers that may drive the actual processes
of energy generation. These may include issues such as the availability of fuel
standards, or the ability to integrate biomass resources with the existing fossil fuel
dominated network.
Infrastructure Drivers – are influences relating to the performance of all facilities
required for the bioenergy sector to operate, including: the harvesting, collection,
storage, and transport of feedstocks.
All biomass resource models and assessments revolve around analysing the influence of
different drivers. As such, the range of drivers listed within the literature that are identified as
being influential of biomass resource, is extremely broad. The studies, reports, and research
listed below, provided influence when developing the BRM. Collectively, they are
representative of a broad range of biomass research, and each analyse different drivers
relating to biomass resources. The specific drivers identified and analysed within each of
these sources, are listed and categorised within Table 5.1. Table 5.1 also highlights the
capability of the BRM, identifying which of the listed drivers can be analysed within the
BRM.
Lysen (2008) [122] Smeets & Faaij (2007) [251]
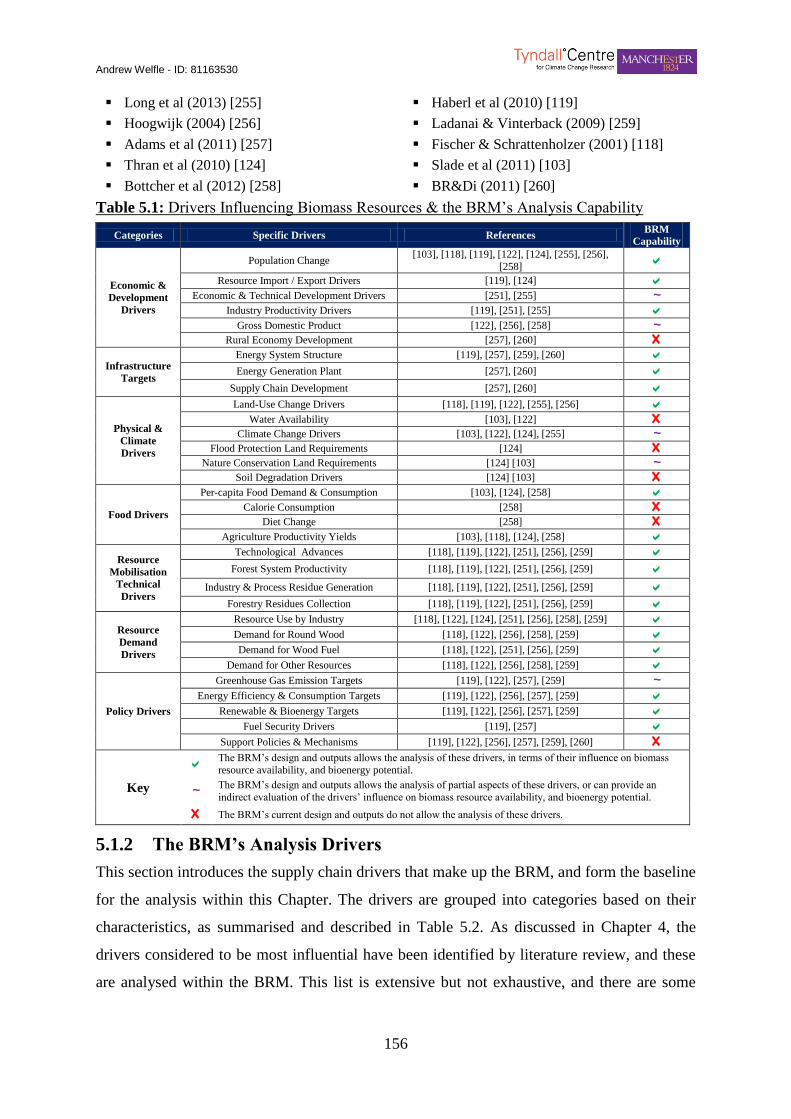
Andrew Welfle - ID: 81163530
156
Long et al (2013) [255]
Hoogwijk (2004) [256]
Adams et al (2011) [257]
Thran et al (2010) [124]
Bottcher et al (2012) [258]
Haberl et al (2010) [119]
Ladanai & Vinterback (2009) [259]
Fischer & Schrattenholzer (2001) [118]
Slade et al (2011) [103]
BR&Di (2011) [260]
Table 5.1: Drivers Influencing Biomass Resources & the BRM’s Analysis Capability Table 24) Table 5.1: Drivers Influencing Biomass Resources & the BRM’s Analys is Capabil ity
Categories Specific Drivers References BRM
Capability
Economic &
Development
Drivers
Population Change [103], [118], [119], [122], [124], [255], [256],
[258]
Resource Import / Export Drivers [119], [124] Economic & Technical Development Drivers [251], [255] ~
Industry Productivity Drivers [119], [251], [255] Gross Domestic Product [122], [256], [258] ~
Rural Economy Development [257], [260] X
Infrastructure
Targets
Energy System Structure [119], [257], [259], [260] Energy Generation Plant [257], [260]
Supply Chain Development [257], [260]
Physical &
Climate
Drivers
Land-Use Change Drivers [118], [119], [122], [255], [256] Water Availability [103], [122] X
Climate Change Drivers [103], [122], [124], [255] ~ Flood Protection Land Requirements [124] X
Nature Conservation Land Requirements [124] [103] ~ Soil Degradation Drivers [124] [103] X
Food Drivers
Per-capita Food Demand & Consumption [103], [124], [258] Calorie Consumption [258] X
Diet Change [258] X Agriculture Productivity Yields [103], [118], [124], [258]
Resource
Mobilisation
Technical
Drivers
Technological Advances [118], [119], [122], [251], [256], [259] Forest System Productivity [118], [119], [122], [251], [256], [259]
Industry & Process Residue Generation [118], [119], [122], [251], [256], [259] Forestry Residues Collection [118], [119], [122], [251], [256], [259]
Resource
Demand
Drivers
Resource Use by Industry [118], [122], [124], [251], [256], [258], [259] Demand for Round Wood [118], [122], [256], [258], [259] Demand for Wood Fuel [118], [122], [251], [256], [259]
Demand for Other Resources [118], [122], [256], [258], [259]
Policy Drivers
Greenhouse Gas Emission Targets [119], [122], [257], [259] ~ Energy Efficiency & Consumption Targets [119], [122], [256], [257], [259]
Renewable & Bioenergy Targets [119], [122], [256], [257], [259] Fuel Security Drivers [119], [257]
Support Policies & Mechanisms [119], [122], [256], [257], [259], [260] X
Key
The BRM’s design and outputs allows the analysis of these drivers, in terms of their influence on biomass
resource availability, and bioenergy potential. ~ The BRM’s design and outputs allows the analysis of partial aspects of these drivers, or can provide an
indirect evaluation of the drivers’ influence on biomass resource availability, and bioenergy potential.
X The BRM’s current design and outputs do not allow the analysis of these drivers.
5.1.2 The BRM’s Analysis Drivers
This section introduces the supply chain drivers that make up the BRM, and form the baseline
for the analysis within this Chapter. The drivers are grouped into categories based on their
characteristics, as summarised and described in Table 5.2. As discussed in Chapter 4, the
drivers considered to be most influential have been identified by literature review, and these
are analysed within the BRM. This list is extensive but not exhaustive, and there are some
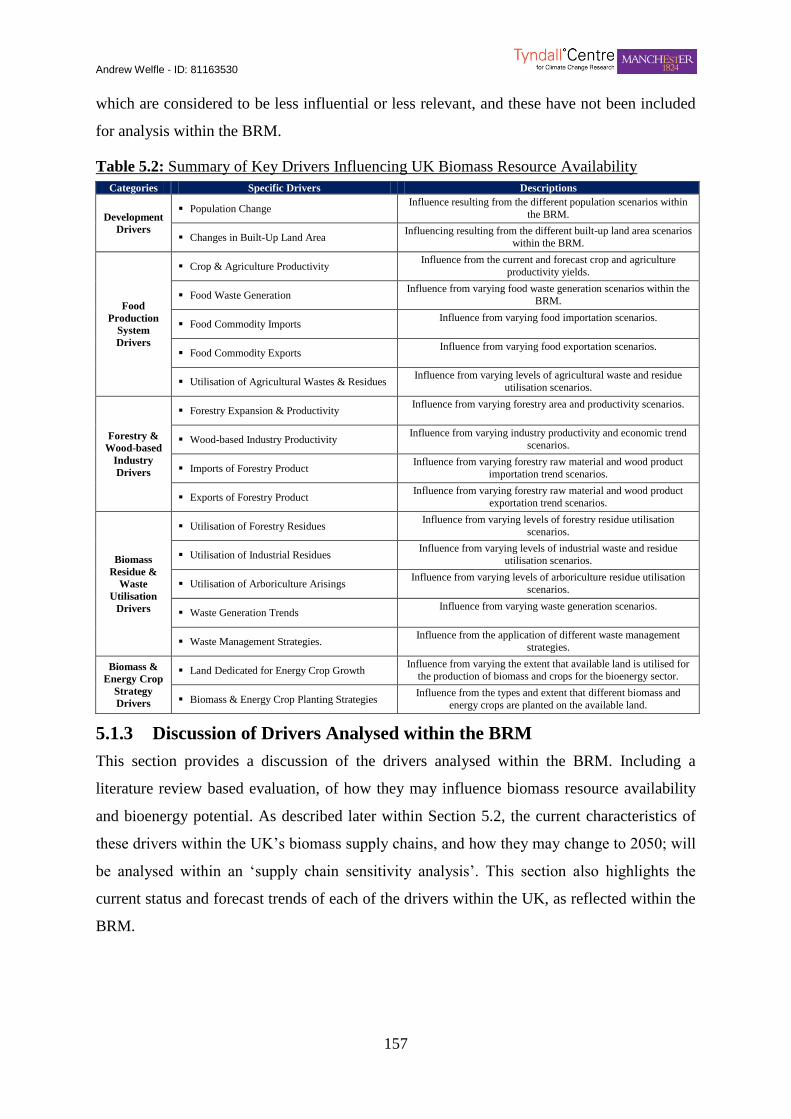
Andrew Welfle - ID: 81163530
157
which are considered to be less influential or less relevant, and these have not been included
for analysis within the BRM.
Table 5.2: Summary of Key Drivers Influencing UK Biomass Resource Availability Table 25) Table 5.2: Summary of Key Drivers Influencing UK Biomass Resource Availability
Categories Specific Drivers Descriptions
Development
Drivers
Population Change Influence resulting from the different population scenarios within
the BRM.
Changes in Built-Up Land Area Influencing resulting from the different built-up land area scenarios
within the BRM.
Food
Production
System
Drivers
Crop & Agriculture Productivity Influence from the current and forecast crop and agriculture
productivity yields.
Food Waste Generation Influence from varying food waste generation scenarios within the
BRM.
Food Commodity Imports Influence from varying food importation scenarios.
Food Commodity Exports Influence from varying food exportation scenarios.
Utilisation of Agricultural Wastes & Residues Influence from varying levels of agricultural waste and residue
utilisation scenarios.
Forestry &
Wood-based
Industry
Drivers
Forestry Expansion & Productivity Influence from varying forestry area and productivity scenarios.
Wood-based Industry Productivity Influence from varying industry productivity and economic trend
scenarios.
Imports of Forestry Product Influence from varying forestry raw material and wood product
importation trend scenarios.
Exports of Forestry Product Influence from varying forestry raw material and wood product
exportation trend scenarios.
Biomass
Residue &
Waste
Utilisation
Drivers
Utilisation of Forestry Residues Influence from varying levels of forestry residue utilisation
scenarios.
Utilisation of Industrial Residues Influence from varying levels of industrial waste and residue
utilisation scenarios.
Utilisation of Arboriculture Arisings Influence from varying levels of arboriculture residue utilisation
scenarios.
Waste Generation Trends Influence from varying waste generation scenarios.
Waste Management Strategies. Influence from the application of different waste management
strategies.
Biomass &
Energy Crop
Strategy
Drivers
Land Dedicated for Energy Crop Growth Influence from varying the extent that available land is utilised for
the production of biomass and crops for the bioenergy sector.
Biomass & Energy Crop Planting Strategies Influence from the types and extent that different biomass and
energy crops are planted on the available land.
5.1.3 Discussion of Drivers Analysed within the BRM
This section provides a discussion of the drivers analysed within the BRM. Including a
literature review based evaluation, of how they may influence biomass resource availability
and bioenergy potential. As described later within Section 5.2, the current characteristics of
these drivers within the UK’s biomass supply chains, and how they may change to 2050; will
be analysed within an ‘supply chain sensitivity analysis’. This section also highlights the
current status and forecast trends of each of the drivers within the UK, as reflected within the
BRM.
Andrew Welfle - ID: 81163530
158
A. Development Drivers
The following drivers have been grouped within the development category. These reflect the
BRM’s capability of analysing biomass resource availability, and bioenergy potential; with
varying development characteristics.
i. Population Change
Population growth is the fundamental influence for all long term outlooks relating to food and
agriculture [180]. The widely expected, large increases in global food demand to 2050 are
based on forecasts of increasing population [158]. Food and agricultural systems are closely
linked to many biomass resource supply chains; therefore population is a driver with key
influence on biomass resource availability.
Within the UK BRM, the available population forecast scenarios reflect those developed by
the United Nations Population Division [145].
ii. Built-Up Land Area
Urbanisation is a further driver that influences food and agriculture systems [261]. Changes
in the extent of built-up land area may directly influence the area of available land that could
otherwise be dedicated for biomass production. Any development on agricultural lands will
also result in a requirement for food to be produced elsewhere, to meet demand.
The UK BRM utilises forecasts of current and future built-up land areas for the UK, as
developed within the EU MOSUS Project [147].
B. Food Production System Drivers
The next series of drivers have been grouped within the food production system category.
These reflect the BRM’s capability of analysing biomass resource availability, and bioenergy
potential, with varying food production system dynamics.
i. Crop and Agriculture Productivity
The productivity of land and agricultural yields, are important drivers that directly influence
the production of biomass. Where crop yields can be increased, agricultural land may be
freed for growth of biomass and energy crops [140], [262]. Also, where biomass and energy
crop yields can be enhanced, more resource can be produced for the bioenergy sector from
the land available.
Improvements and variances in food and crop systems productivity result from the collective
influence of a range of manageable external inputs. The UK has great strength in crop
science, resulting in a greater understanding of crop responses to global climate change [233].
Andrew Welfle - ID: 81163530
159
Mueller et al (2012) [263], suggest that the ‘yield gap’ - the difference between attainable and
actual yields, will continue to be reduced. Other forecasts suggest that average yield increases
of 70% by 2050, are possible for most crops; through improved nutrient management,
irrigation, and productivity techniques [263], [264].
Harberl et al (2011) [180], found that Western European yields could experience further
mean increases of >16% from CO2 fertilization by 2050; resulting from climate change forces
(>2% without CO2 fertilization).
However, whilst the main northern hemisphere producers of food and biomass crops, may
experience favourable conditions from climate change in the next 40 years, regions where
rising food demand is most pronounced, will likely see production hindered. This may lead to
a greater number of countries relying on fewer, high latitude producers; greatly increasing
vulnerability to extreme weather events, in these regions [185].
Current and forecast food and crop agricultural yields are analysed within the BRM, and
reflect those documented in a wide range of studies and literature, including those that predict
climate change impacts [107], [116], [136]–[140], [146], [150], [151], [157]–[182], [184]–
[189] (Section 4.2.5).
ii. Food Waste Generation
Food waste influences the availability of biomass resource in multiple ways. Food waste
itself, is a plausible resource for bioenergy generation pathways. At the same time, food
waste is a factor that reduces the supply chain efficiency – the greater the waste from the
system, the more land is required, to produce food commodity quantities, to meet demand.
Research estimates that 25-50% of food produced, is wasted along the supply chain [265]–
[267]. 50% of the UK’s food waste comes from households, where at some point at least 60%
of this waste could have been consumed [218]. The European Commission is targeting a 50%
reduction in food wastes by 2020 [268], and the UK Government Office for Science, suggests
that by halving food waste by 2050, this saving may be equivalent to 25% of current
productivity [269], [270].
UK food waste trends and reduction targets are analysed within the BRM, utilising a series of
forecasts [146], [269]–[272].
iii. Food Commodity Imports and Exports
Food commodity import and export trends are drivers that can influence biomass availability,
as they contribute towards determining the area of land that is required to produce the food
Andrew Welfle - ID: 81163530
160
quantities, to meet demand. Any land dedicated for food production is therefore unavailable
for biomass or energy crop growth.
The majority of the UK’s imports come from the EU, with the Common Agricultural Policy
and EU Directives, strongly influencing the shape of the UK food system [273]. The UK
currently produces about half of the food it consumes, and is ~60% ‘self-sufficient’ [274].
The UK Government’s stance is, “it sees no economic or environmental rationale for
Government to set targets, to raise UK output of particular food products in step with changes
in global food demand” [273].
The BRM’s analysis takes into consideration these stances and forecasts towards future food
import/export trends; the BRM utilising data from a series of studies [146], [203], [271], to
reflect the UK’s approach.
iv. Utilisation of Agricultural Wastes and Residues
Agricultural wastes and residues reflect a resource category with sizeable potential for the
bioenergy sector [275]. The key influence determining the availability of these resources is
the extent to which they are harvested / collected, and the competition for the resource.
The BRM’s analysis, reflects a wide range of research and studies that forecast the extent and
timeframes to which these resources could be utilised, for energy generation [77], [138],
[139], [206], [207], [211]–[213], [276]. These range from 20%-100% utilisation of the total
resource, with typically half of this being available for the bioenergy sector. The UK
Department for Food & Rural Affairs, provide sustainability guidance on the extent that
agricultural residues should be returned to the soil; to protect and enhance soil and
biodiversity (10% Lower Limit, 50% Higher Limit) [9].
The range of these forecasts and the sustainability limits, form the basis of analysis of this
driver within the BRM.
C. Forestry & Wood-Based Industry Drivers
The following drivers have been grouped within the forestry and wood-based industry
category. These reflect the BRM’s capability of analysing biomass resource availability and
bioenergy potential, with varying forestry productivity levels and resource demand of
industry.
i. Forestry Expansion and Productivity
The extent and productivity of forestry systems, directly influences the availability of
resources for the bioenergy sector. Forests provide energy generation opportunities, either
Andrew Welfle - ID: 81163530
161
through resources specifically harvested for the bioenergy sector, or via the collection of
residues. Forests also provide indirect opportunities for the bioenergy sector, through
supplying resource to wood-based industries, that in turn produce wastes and residues that
can be utilised by the bioenergy sector.
These drivers are analysed within the BRM, through utilisation of the UK Forestry
Commission’s Forested Area and Productivity forecasts [190]–[197].
ii. Wood-based Industry Productivity
The on-going activities of wood-based industries produce wastes and residues that provide an
opportunity for the bioenergy sector. At the same time, these wood-based industries require
raw forestry products, for which it competes directly with the bioenergy sector for the lower
grades of resource. Therefore, wood-based industries represent a driver for biomass resource
that may both increase, and decrease the availability of resource for the bioenergy sector.
The BRM utilises existing data [203]–[205], and forecasts [204], that predict the trends and
directions that UK wood industries may take.
iii. Imports and Exports of Forestry Product.
Forestry raw material, and wood-product import and export trends, can influence the
availability of biomass resource, through determining the extent that the indigenous forestry
systems are utilised. Where imports are increased and exports are reduced, there will be less
strain on indigenous forestry systems, to produce the wood resource required to meet
demand. This may in turn provide increased opportunities for the bioenergy sector. Likewise,
reduced imports and increased exports would have the counter influence, putting greater
strain on indigenous forests.
The BRM again utilises existing data [203]–[205], and forecasts [204], that predict the trends
and directions that UK forestry products imports/exports may follow.
D. Biomass Residue & Waste Utilisation Drivers
The following drivers have been grouped within the biomass residue and waste utilisation
category. These reflect the BRM’s capability of analysing biomass resource availability, and
bioenergy potential, with the utilisation of different waste and residue resources.
i. Utilisation of Forestry Residues
Forestry residues represent an opportunity for the bioenergy sector that is currently un-
utilised in the UK [138]. The availability extent of this resource is dependent on: the
Andrew Welfle - ID: 81163530
162
proportion extracted from forestry systems, the emergence of competing markets, and the
proportions left in-situ to maintain the health of the habitat.
Forest Certification Standards, set by: the Forestry Stewardship Commission (FSC Criterion
5.3 & 6.3), Ministerial Conference on the Protection of Forests in Europe (MCPFE Criterion
2 & 3), and the Programme for the Endorsement of Forest Certification (PEFC Criterion 4);
all provide details for the minimisation of on-site harvesting and residue processing,
maintenance of ecosystem health, and function and protection of biodiversity [277].
The BRM’s analysis of this driver reflects these sustainability guidance levels, and the full
range of residue extraction levels; forecast by research and studies [138], [199], [259], [277],
[278].
ii. Utilisation of Industrial Residues
The key drivers influencing the availability of industrial residues are the extent to which they
can be collected, or processed. The total resource generated being driven by the productivity
efficiency and applied processes, of UK wood-based industries. Biomass residues from on-
going industrial processes, representing a potential opportunity for the bioenergy sector
[262]. The BRM analyses this driver through the utilisation of data that reflects current and
forecast productivity and efficiency trends, for the UK’s wood-based industries [203]–[205];
including forecasts of the extent that industry residues may potentially be available to the
bioenergy sector [138], [279], [280].
iii. Utilisation of Arboricultural Arisings
The Forestry Commission (2013) [281], confirm that UK Local Authorities and tree surgeons
produce thousands of tonnes of arboriculture arisings. The majority of this is currently land-
filled, stored for landscaping applications, or burnt onsite. With correct processing, handling,
grading and storing; these residues provide an opportunity for the bioenergy sector. The key
drivers determining resource availability are the extent to which the resource is harvested /
collected, and the competition for the resource.
The BRM utilises forecasts from a series of research and studies [138], [199], [204], that
estimate that up to 100% of arboriculture arising could be utilised by the bioenergy sector.
E. Waste Generation Trends & Waste Management Strategies
The potential availability of waste resources for the bioenergy sector is influenced by two key
drivers: the amount of waste being generated, and the strategies implemented for how this
waste is managed.
Andrew Welfle - ID: 81163530
163
The BRM analyses these drivers through the utilisation of a series of datasets [206], [215]–
[218], [282], that reflect the UK’s current waste system. Scenarios developed by DEFRA
[206], [217], that forecast waste generation and management trends, are utilised to analyse
how these different pathways may influence the availability of biomass resource for the
bioenergy sector.
F. Biomass & Energy Crop Strategy Drivers
The following drivers have been grouped within the biomass & energy crop strategy
category. These reflect the BRM’s capability of analysing biomass resource availability and
bioenergy potential, with varying land area, and planting strategies. The drivers within this
category and a discussion of their influence are as follows:
i. Land Dedicated for Grown Biomass Resources & Energy Crops
The area of land dedicated for biomass and energy crop growth is a fundamental driver in
determining the potential availability of grown resource. Grown biomass resources have an
important role to play in helping to achieve the UK’s renewable energy targets [8], [9]. The
UK Department for Energy & Climate Change estimate [8], [9], that for the UK to meet these
targets, approximately 0.35 MHa of land needs to be dedicated for energy crops – a large
increase from the current <0.025 MHa utilised. Although 0.35 MHa seems large it currently
reflects <2% of UK agricultural land; an area that could be easily realised through farmers
utilising un-used / marginal lands.
A large number of reports and studies estimate that varying amounts of the UK’s >17 MHa of
agriculture land, could be dedicated for biomass resource growth [231], [232]. Potential land
dedication estimates range from 0.35-1.0 MHa [77], [136], [137], [233]–[237]; whilst the
theoretical maximum available land for short rotation coppices and Miscanthus, without
impacting food systems, have been estimated to be between 0.93-3.63 MHa [8], [9].
The European Environment Agency (EEA) also reported that between 0.8-3.4 MHa of land
could be released in the UK by 2030, by reform of the Common Agricultural Policy [236].
Fischer et al (2007) [139], estimating that half of this released land would be former
grassland.
The BRM takes into consideration these estimates when analysing this key driver, and in
determining the proportion of free land to be dedicated for biomass resource growth.
Andrew Welfle - ID: 81163530
164
ii. Biomass & Energy Crop Planting Strategies
Strategies that determine the types and extent that different biomass and energy crops are
planted on the available land, is a further driver within the BRM; although analysis of this
driver has been excluded from the sensitivity analysis undertaken in Section 5.2. This is
because the range of variables and combination of planting strategies that could be analysed
is vast. Therefore, this driver within the BRM’s analysis is set by default to reflect the
‘balanced crop growth scenario’, as described in Table 4.14, and influenced by literature
[136], [137], [237]. Biomass and energy crop planting strategies are also discussed further
within Chapter 6 and 10.
5.1.4 Discussion of Drivers Not Directly Analysed within the BRM
The next section provides a discussion of the drivers identified within Table 5.2 that cannot
be directly analysed within the BRM. This section is important as it identifies some of the
limitations of the BRM’s analysis, and highlights further influences to biomass resources that
are not included within the BRM analysis based conclusions of this Thesis.
A. Drivers Partially or Indirectly Analysed within the BRM
The following drivers listed within Table 5.2 are identified as being partially or indirectly
analysed within the BRM:
i. Gross Domestic Product & Economic Development
The influences of gross domestic product (GDP) on biomass resources are not directly
analysed within the BRM. However, other indicators and factors closely linked to GDP are
analysed: industry productivity, forest raw materials and wood product import / export rates,
food commodity import / export rates, built-up land area, and population.
A vast range of literature has analysed the relationships between energy and economic trends.
Payne (2010) [283], provides an overview examining over 100 of these, and concludes that
there is no clear consensus about the dynamics of this relationship; although further studies
focusing on the relationship between biomass and GDP, find a positive unidirectional link
[284], and further relationships between industrial productivity and employment with
bioenergy [285].
The generation of biomass and wastes are also themselves, important drivers in the energy-
GDP relationship [286]. Analysis carried out by Ohler & Fetters (2014) [286], also confirmed
the complexity of this relationship, but concluded that a 1% increase in bioenergy generation
could be linked to a 0.129% increase in real GDP. At the same time, their short-term

Andrew Welfle - ID: 81163530
165
causality analysis concluded that there was negative short-term impact on GDP from
bioenergy growth, but also a positive impact on bioenergy from GDP growth.
ii. Nature Conservation Land Requirements & Environmental Protection Policies
The influences of nature conservation land requirements on biomass resources are also not
directly analysed within the BRM. However, other indicators and factors closely linked to
conservation are analysed: forest productivity, forestry residue utilisation, built-up land area,
and the waste drivers. A conservation focused scenario is also developed within the BRM, as
discussed widely within Chapter 6.
The bioenergy sector’s increasing demand for resources will add additional pressure on land
systems. According to Melillo et al (2009) [287], a future without forestry conservation may
lead to large scale increases in cropland expansion into formally unused / forested land.
Restricting land availability for biomass plantations, by conserving natural forests will
require additional efforts in the agricultural sector, principally to increase their productivity
yields, but will also likely lead to a decrease in the availability of biomass resources [288].
In further considering the conservation of forested land, an increasing number of papers
[289]–[297], have discussed the relationship between biodiversity and growth of resources
for the bioenergy sector. The overwhelming consensus from these papers highlights a
negative impact on biodiversity [298].
The general conclusions are that the following widespread biomass production practices
would have to be limited, if full policies to preserve biodiversity are implemented; these
likely resulting in reduced biomass resource productivity:
Reduction in intensification practices such as converting long-term or permanent
crops into annual harvest, and management practices [293], [294].
Reduced of limited utilisation of pesticides
Reduced use of land management practices that may lead to pronounced losses of
habitat biodiversity such as, landscaping or maintenance of hedgerows [299], [300].
Reduced planting of species that impact soil organic stocks; as demonstrated to
potentially take place with Miscanthus plantations [301].
Andrew Welfle - ID: 81163530
166
iii. Climate Change Drivers
The influences of climate change on biomass resources and bioenergy also cannot directly be
analysed within the BRM. However agricultural productivity yields are analysed, these being
utilised within the BRM to reflect potential climate change influence on food systems.
The relationships between climate change drivers and bioenergy are complex and extensive.
Bioenergy being a key energy pathway increasingly utilised to mitigate fossil fuel energy-
driven climate change, but climate changes also having large feedback effects, in terms of the
levels of bioenergy potential [302].
Climate change will likely have large impacts on both food and biomass productivity systems
(discussed further in Chapters 6 and 8). A notable component of the IPCC’s scenarios [303]
forecasting potential climate change impacts are their projected impacts on biomass and
biofuel production. Their conclusions being, that climate change may have major
implications for forests and related industries. Further studies have focused specifically on
these relationships, such as Kirlenk & Sedjo (2007) [304], who reviewed historic climate
change events and their impact on forestry systems.
A number of studies have concluded that climate change drivers may lead to increased global
forest productivity and a migration towards the poles, as a result of increased CO2
concentrations, increased temperatures, and extended growing seasons; this potentially
leading to increased resource availability and hence lower prices [305]–[309]. However,
these studies fail to address the forecast increases in productivity limitation factors that will
likely result from climate change, such as an increase in pests and weeds [163], [304], [309].
On the energy demand side, consumption of biomass resources for energy pathways have
been forecast to increase by as much as 5-7 fold by 2050, due to climate change drivers, such
as rising fossil fuel energy prices, and technological advances in the bioenergy sector [310].
Many studies estimating the impacts of climate change, fail to take account of these
potentially large increases in demand [304]. Raunikar et al (2010) [311], highlight that any
climate change impacts that result in a narrowing of biomass resource fuel wood prices,
towards that of roundwood used by industries, would lead to a major unbalancing of market
competition for resource between industries.
There is a strong acknowledged link between land-use change, and climate change. The
increased production of biomass resource is a major cause of land-use change in many
regions of the world. Berndes et al (2010) [302], highlighted that land-use change emissions,
Andrew Welfle - ID: 81163530
167
predominantly resulting from the conversion of forests to agricultural land, have contributed
roughly 1/3 of GHG emissions since 1850.
Land-use change impacts, can be categorised as being either direct or indirect. An example of
direct land-use change being the clearing of forests to produce biomass resource for
agriculture. Whilst indirect land-use change could be the displacement of food producers,
who go onto re-establish their operations and generate land-use change elsewhere. Land-use
change emissions arising when the biomass of the cleared forest or natural ecosystems are
burned, or when land management practices result in a release of soil carbon stocks [302].
iv. Greenhouse Gas Emission Targets
The influences of GHG emission targets on biomass resources and bioenergy cannot directly
be analysed within the BRM. However, the influences of linked energy, energy efficiency,
renewable energy, and bioenergy targets, can be analysed within the BRM to reflect GHG
targets. This is undertaken later in the Thesis within Chapter 9.
GHG emission targets are a prominent driving force, promoting the development of the
bioenergy sector [3]–[8], [10], [12], [13], [312]. The more stringent and ambitious the targets,
the greater the focus placed on alternative and renewable energy technologies, including
bioenergy.
B. Drivers Not Analysed with the BRM
The following drivers listed within Table 5.2, cannot currently be directly analysed within the
BRM.
i. Rural Economy Development
Most biomass resources are located within rural areas, and therefore the development and
characteristics of these areas can have large influences on bioenergy [313]. Hillring (2002)
[314], found a close relationship between the development of rural industries and bioenergy
supply chains; identifying a series of key characteristics that may result in large increases in
bioenergy potential. These being:
Direct employment from the rural areas in production and processing related
industries, results in a greater ‘buy-in’ to the bioenergy sector [314].
The availability of local people, who are skilled, educated and suitable to work within
related industries, can have large influences on bioenergy potentials [315].
Andrew Welfle - ID: 81163530
168
The development of local infrastructure is a major factor influencing the potential
utilisation of the local resources [314].
Integration of supply chains and production processes linked to end-use bioenergy
systems, and maintenance within a given area, can result in large increases in
efficiencies and bioenergy potentials [316].
ii. Water Availability
There is an inextricable link between bioenergy and water. Water quantity and quality being
identified as emerging issues of concern for the bioenergy sector; the availability of water
being a major factor in determining the extent that bioenergy may contribute to the overall
energy balance. Water is already a scarce resource in many regions of the world, so the
expansion and intensification of bioenergy production, is likely to contribute to existing
pressures [317].
Water utilisation typically occurs throughout biomass resource production cycles, including
the processed and energy conversion steps [317]. Therefore, the practices and strategies
relating to how biomass resources are produced are major determinants of both the
potentially positive and negative impacts, on water systems [318].
iii. Flood Protection Land Requirements
Flood plains and land dedicated for the management of water systems can have a close
relationship with biomass resources. Growth of biomass on this land can improve the flood
protective performance of the land, as well as produce opportunities for the bioenergy sector
[319]. The production of biomass on this land may also provide water quality and flood
control characteristics, during flood events [320], [321].
iv. Soil Degradation Drivers
As with all agricultural production, the growing of biomass resources can degrade soil
fertility, if not managed sustainably. This is particularly reflective of monoculture that can
leach and acidify soil [322]. All forms of land degradation, ultimately results in reductions in
soil fertility and productivity. This can cause loss of protective soil cover, resulting in
increased vulnerability and further degradation [323].
All forms of biomass cultivation should attempt to increase soil health, and also decrease the
risk of soil degradation. Monitoring of the soil organic matter content, can ensure that soil
health is maintained or enhanced under local conditions [322].

Andrew Welfle - ID: 81163530
169
A further relationship between soil degradation and bioenergy is that particular biomass
species can be produced on degraded or marginal lands, unsuitable for food commodity
crops. Degraded lands, therefore represent an opportunity as well as a potential problem for
biomass resource production [324].
v. Diet Change & Calorie Consumption
Haberl et al (2011) [180] and Alexandratos et al (2006) [187], have undertaken analyses that
in part, looks at the relationships between changing diet and calorie food trends, on biomass
resource production and bioenergy potential. These studies developed and analysed scenarios
where populations vary their calorie intake, and also focus on different food commodities
(change their diets). The conclusions highlighted a strong link between ‘richer’ diets, and
increased meat compositions; with reduced levels of biomass availability resulting from the
increased land requirement, to produce the food commodities for these dietary choices.
Alternatively, the ‘frugal’ diet and lower calorie scenario within the study, was found to be
highly linked to bioenergy potentials. In developed counties such as those in Western Europe,
population diets and calorific intakes are considered to have peaked, in terms of impacts on
bioenergy potentials [116].
vi. Support Policies & Mechanisms
There is a close link between success and development of the bioenergy sector, and support
policies and mechanisms; although there does not appear to be any ‘correct’ combinations of
policies or strategies, to fit all circumstances [325]. Thornley & Cooper (2008) [51], carried
out an analysis of the types and effectiveness of different policy instruments in promoting
bioenergy. An overview of these key policy instrument groups applied by Governments, were
summarised within the Introduction (Chapter 1).
Andrew Welfle - ID: 81163530
170
5.2 UK BRM Drivers Sensitivity Analysis
The following section includes the sensitivity analysis, undertaken to evaluate the extent that
different drivers within the BRM influence biomass resource. The section starts with an
introduction to the methodology developed to undertake the sensitivity analysis; going on to
present the results of the analysis for the UK BRM, and finishing with discussions and
conclusions based on the analysis results. The outputs from this Chapter contribute towards
the analysis undertaken within Chapter 7, where the UK’s bioenergy future is discussed, and
Chapter 10, where ideas are expressed for the development of an alternative Bioenergy
Strategy for the UK.
5.2.1 Developing a Sensitivity Analysis Methodology
This section describes the methodology developed for analysing the extent that different
drivers influence resource availability, within the BRM. A sensitivity analysis approach is
applied, as this form of analysis is highly applicable to modelling assessments where a
measurement of uncertainty can be apportioned to different input variables [326]. A series of
existing studies have undertaken similar sensitivity analyses, focusing on biomass supply
chain interactions and dynamics [327], [328], resource harvesting dynamics [329], and
biomass technical and economic analysis assessment [330].
A. Developing a Baseline UK Biomass Resource Scenario
The first step taken to carry out the sensitivity analysis was the development of a baseline UK
biomass resource scenario, within the BRM. This is carried out in order to generate some
biomass resource availability and bioenergy potential forecasts for the UK. The measurement
of variations from these baseline values can then be calculated, and the attributed influence
from different drivers accounted for. Developing a UK Baseline Scenario also enables an
initial assessment of the specific types of biomass resources that may present the greatest
opportunities for the bioenergy sector.
A literature review was carried out to analyse the current characteristics of drivers within the
UK, and to develop an idea of how these may change, to 2050 (Section 5.1). A database was
then produced, collating the range of values that literature and studies forecast for each of
these. This ‘values-database’ was then analysed to develop a series of average or mean values
for each of the drivers, to 2050. These values therefore representing a ‘literature informed’
mean ‘Baseline Scenario’ of how the UK’s biomass supply chains may function. Calibrating
the BRM to reflect this baseline enables an evaluation of the ‘average’ availability, and the
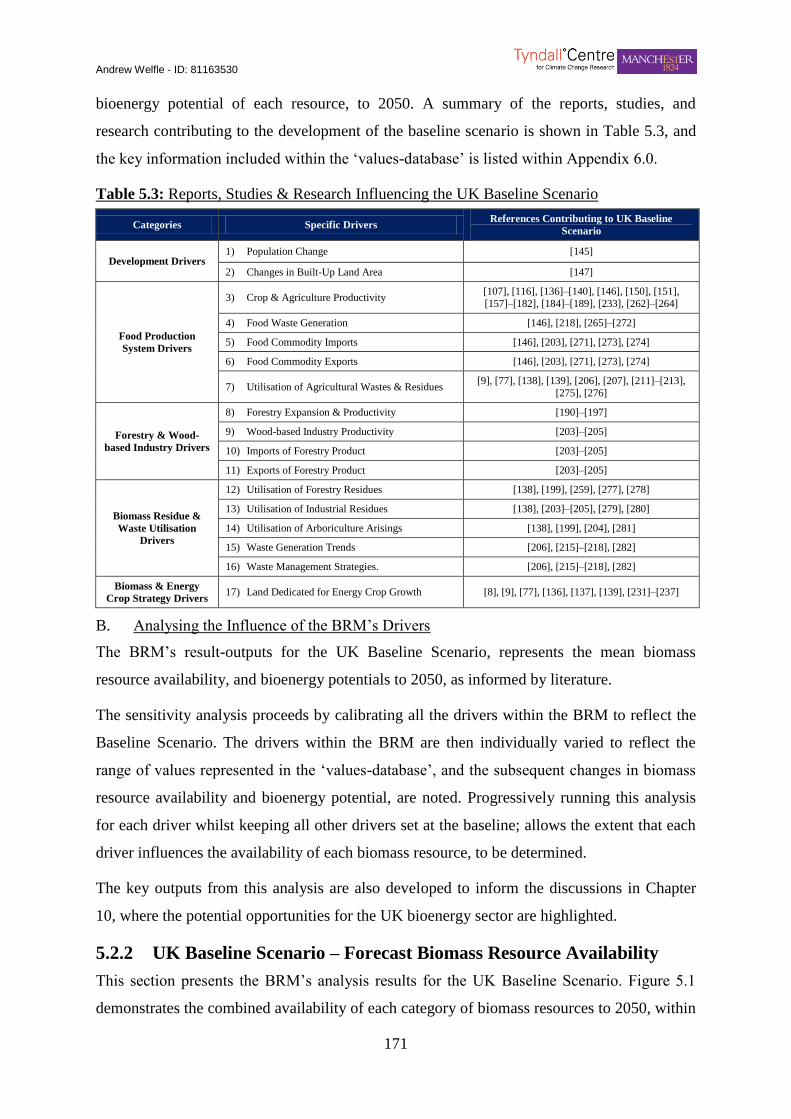
Andrew Welfle - ID: 81163530
171
bioenergy potential of each resource, to 2050. A summary of the reports, studies, and
research contributing to the development of the baseline scenario is shown in Table 5.3, and
the key information included within the ‘values-database’ is listed within Appendix 6.0.
Table 5.3: Reports, Studies & Research Influencing the UK Baseline Scenario Table 26) Table 5.3: Reports St udies & Research Influe ncing the UK Baseline Scenario
Categories Specific Drivers References Contributing to UK Baseline
Scenario
Development Drivers 1) Population Change [145]
2) Changes in Built-Up Land Area [147]
Food Production
System Drivers
3) Crop & Agriculture Productivity [107], [116], [136]–[140], [146], [150], [151],
[157]–[182], [184]–[189], [233], [262]–[264]
4) Food Waste Generation [146], [218], [265]–[272]
5) Food Commodity Imports [146], [203], [271], [273], [274]
6) Food Commodity Exports [146], [203], [271], [273], [274]
7) Utilisation of Agricultural Wastes & Residues [9], [77], [138], [139], [206], [207], [211]–[213],
[275], [276]
Forestry & Wood-
based Industry Drivers
8) Forestry Expansion & Productivity [190]–[197]
9) Wood-based Industry Productivity [203]–[205]
10) Imports of Forestry Product [203]–[205]
11) Exports of Forestry Product [203]–[205]
Biomass Residue &
Waste Utilisation
Drivers
12) Utilisation of Forestry Residues [138], [199], [259], [277], [278]
13) Utilisation of Industrial Residues [138], [203]–[205], [279], [280]
14) Utilisation of Arboriculture Arisings [138], [199], [204], [281]
15) Waste Generation Trends [206], [215]–[218], [282]
16) Waste Management Strategies. [206], [215]–[218], [282]
Biomass & Energy
Crop Strategy Drivers 17) Land Dedicated for Energy Crop Growth [8], [9], [77], [136], [137], [139], [231]–[237]
B. Analysing the Influence of the BRM’s Drivers
The BRM’s result-outputs for the UK Baseline Scenario, represents the mean biomass
resource availability, and bioenergy potentials to 2050, as informed by literature.
The sensitivity analysis proceeds by calibrating all the drivers within the BRM to reflect the
Baseline Scenario. The drivers within the BRM are then individually varied to reflect the
range of values represented in the ‘values-database’, and the subsequent changes in biomass
resource availability and bioenergy potential, are noted. Progressively running this analysis
for each driver whilst keeping all other drivers set at the baseline; allows the extent that each
driver influences the availability of each biomass resource, to be determined.
The key outputs from this analysis are also developed to inform the discussions in Chapter
10, where the potential opportunities for the UK bioenergy sector are highlighted.
5.2.2 UK Baseline Scenario – Forecast Biomass Resource Availability
This section presents the BRM’s analysis results for the UK Baseline Scenario. Figure 5.1
demonstrates the combined availability of each category of biomass resources to 2050, within
Andrew Welfle - ID: 81163530
172
the UK Baseline Scenario. A further dynamic highlighted within Figure 5.1, is the extent that
availability of each of the resource categories may increase, over the analysis timeframe. This
important dynamic is highlighted, as it provides an initial insight into the levels of work or
actions that may be required if the higher levels of resource availability are to be achieved.
Figure 5.2 then demonstrates a greater depth analysis; documenting the potential availability
of each specific biomass resource forecast within the UK Baseline Scenario, to 2050. The
stacked bar charts highlight the availability of each specific resource type; whilst the stacked
line graphs connecting each of the bars, provide differentiation between resource categories:
grown resources, residue resources, and waste resources.
Each of these Figures are presented and discussed within the following sections:
A. UK Baseline Scenario - Biomass Resource Category Analysis
i. Results
Figure 5.1 shows the UK Baseline Scenario forecasts of biomass availability within each of
the three resource categories, to 2050. Figure 5.1 clearly documents trends of increasing
resource availability, as forecast by literature and reflected within this scenario.
‘Grown Resources’ are shown to have a relatively low availability in 2015
(>2,044,000 Tonnes), but this potentially increases by >1050% by 2050 (to
>23,533,000 Tonnes).
‘Residue Resources’ in 2015 are shown to have a potential availability of >10,929,000
Tonnes, potentially increasing by >115% by 2050 (to >23,447,000 Tonnes).
‘Waste Resources’ in 2015 are shown to have a potential availability >15,220,000
Tonnes, potentially increasing by >491% by 2050 (to >90,000,000 Tonnes).

Andrew Welfle - ID: 81163530
173
51) Figure 5.1: Availability of U K Biomass Resource Categories within t he Baseline Scenario
Figure 5.1: Availability of UK Biomass Resource Categories within the Baseline Scenario
ii. Discussion
The results presented within Figure 5.1 represent three levels of analysis for the UK Baseline
Scenario: the extent that the different categories of biomass may be available over the
analysis timeframe, the levels of resource category availability in the near-term (by 2015),
and the potential increment in availability between 2015 and 2050.
Analysing the potential availability of different categories of resource over the analysis
timeframe is important, as it identifies how much resource could potentially be mobilised for
the bioenergy sector under Baseline Scenario conditions. The near-term forecasts are
important as they provide an insight into how much resource may be available, without
extensive further actions and management of supply chains. The analysis of the forecast
increment range from 2015-2050 provides an indication of the potential effort and actions
that may be required to achieve resource availability levels, that reflect the higher levels
Using this premise to analyse the three categories, Figure 5.1 shows that ‘Grown Biomass
Resources’ are forecast to have relatively low near-term availability, but large potential
availability by 2050. The large forecast increase in potential availability over the analysis
timeframe, suggests that the availability of resources from within this category may be highly
variable, depending on the characteristics of influential drivers. The changing characteristics
of one or multiple drivers, are potentially forcing this trend. Also, the large resource
Forecast Availability of Biomass Resource
Categories within the UK Baseline Scenario
Andrew Welfle - ID: 81163530
174
availability increment from the near term to 2050, highlighting that substantial effort may be
required to manage these drivers, if the upper limits of resource availability are to be
achieved, from the low base forecast for 2015.
‘Residue Biomass Resources’ in Figure 5.1 are shown to have ‘medium’ near-term
availability compared to the other two resource categories. This increases at a steady rate to
2050, although the availability of biomass residue resources, documents the lowest overall
increment of the three resource categories. The relatively continuous and uniform incremental
rate of resource availability over the analysis period, suggests that residue resources may be
relatively robust to influencing drivers. The small forecast increment in residue resource
availability from the near-term to 2050, suggests that lower levels of effort may be required
to achieve the higher levels of the resource availability forecast. However, the small increase
in resources availability at a narrowing increment rate over the analysis timeframe, could also
suggest a resource that is getting close to its maximum availability potential [331].
Figure 5.1 shows that ‘Waste Biomass Resources’ within the UK Baseline Scenario, have
near-term availability that exceeds the other two categories, and the potential forecast by
2050 represents the greatest opportunity for the UK bioenergy sector. A large overall increase
in waste resource availability is forecast; this taking place at a rapid rate. This suggests that
waste resources may also be highly susceptible to changes in the characteristics of supply
chain drivers. The near-term high availability of waste resources may represent a good
opportunity for the UK bioenergy sector; although significant effort and actions may be
required to manage the influential supply chain drivers, if the upper limits of resource
availability as forecast, are to be realised.
B. UK Baseline Scenario - Biomass Resource Availability
i. Results
Figure 5.2 and the data within Appendix 6.0 document the forecast availability of each
specific biomass resource within the UK Baseline Scenario, to 2050. This analysis also
clearly reflects the overall increase in resource availability forecast, over the analysis
timeframe. Deeper evaluation of Figure 5.2 highlights that several specific biomass resources
dominate the analysis, contributing a majority proportion to the overall biomass resource
available.
Within the Grown Resources category, ‘biomass and energy crop resources’ grown
specifically for the bioenergy sector dominate, especially towards the end of the analysis
Andrew Welfle - ID: 81163530
175
timeframe. These make up: 43% (873,000 Tonnes) of the available resource within the
category in the near future (2015,), 60% (2,908,000 Tonnes) by 2020, 71% (7,316,000
Tonnes) by 2030, and 97% (24,416,000 Tonnes) by 2050.
Within the Residue Resources category, ‘agricultural residues’ dominate throughout the
analysis timeframe. The contribution proportion of both ‘plant and animal based agriculture
residues’ to this category remains relatively constant with: 94% (10,238,000 Tonnes) of the
available resource within the category in the near future (2015,), 93% (11,081,000 Tonnes)
by 2020, 94% (16,110,000 Tonnes) by 2030, and 96% (22,424,000 Tonnes) by 2050.
The dominant resources within the Waste Resource category are ‘household wastes’. The
contribution proportion of ‘household wastes’ to the overall wastes resource category also
remains relatively constant with: 45% (6,780,000 Tonnes) of the available resource within the
category in the near future (2015,), 48% (16,149,000 Tonnes) by 2020, 48% (34,848,000
Tonnes) by 2030, and 45% (40,716,000 Tonnes) by 2050.
‘Food and organic wastes’ are also shown to be biomass resource that may demonstrate large
potential for the bioenergy sector in terms of resource availability. The ‘other wastes’ types
listed within the analysis, represented a collation of all other waste streams (Table 4.1) that
were not within the categories of: household, food, or organic. Collectively ‘other wastes’ are
also forecast to represent a potentially significant resource available for the bioenergy sector.

Andrew Welfle - ID: 81163530
176
52) Figure 5.2: UK Baseline Scenario Biomass Resource Availability
Figure 5.2: UK Baseline Scenario Biomass Resource Availability
ii. Discussion
The analysis documented within Figure 5.2 and corresponding data within Appendix 6.0,
highlights a series of specific biomass resources that may demonstrate particular potential for
the bioenergy sector, in terms of the potential extent of their availability.
5.2.3 Biomass Resources Demonstrating Potential for the UK Bioenergy
Sector
As described within the previous sections, ‘household wastes’, ‘agricultural residues’ and
‘biomass and energy crops’ are shown within the UK Baseline Scenario to demonstrate
particular potential for the UK bioenergy sector, in terms of their potential availability. These
representing the dominant resources contributing within each of the biomass categories
analysed within the BRM.
Figure 5.3 highlights the proportional contribution of these resources to the total available
biomass resource, and the total bioenergy potential, analysed within the UK Baseline
Scenario. The bioenergy potential documented within this analysis reflects the conversion of
the resources quantified within Figure 5.3, through application of the ‘preferred bioenergy
conversion pathways’ (Appendix 1.0) for each specific resource.
Within the UK Baseline Scenarios, the combined contribution from these three resources are
forecast to make up >55% of total available biomass, and >60% bioenergy potential by 2050.
Forecast Availability of Specific Biomass
Resources within the UK Baseline Scenario
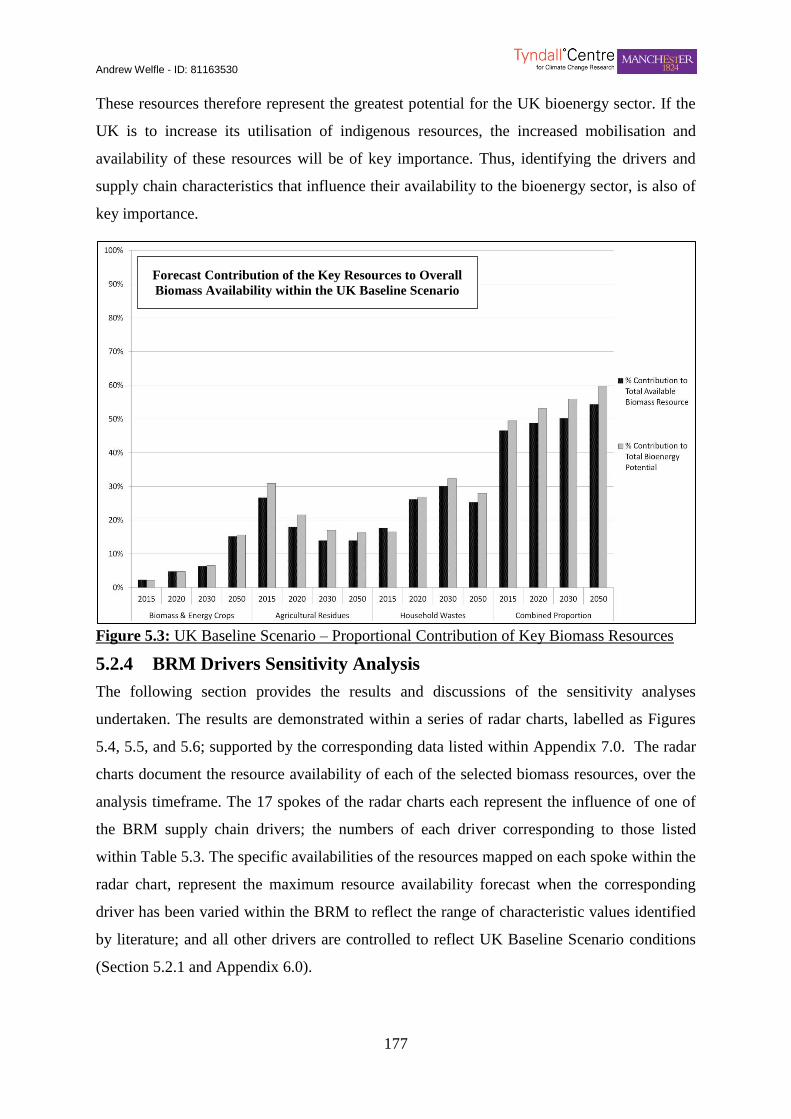
Andrew Welfle - ID: 81163530
177
These resources therefore represent the greatest potential for the UK bioenergy sector. If the
UK is to increase its utilisation of indigenous resources, the increased mobilisation and
availability of these resources will be of key importance. Thus, identifying the drivers and
supply chain characteristics that influence their availability to the bioenergy sector, is also of
key importance.
53) Figure 5.3: UK Baseline Scenario – Proportiona l Contribution of Key Biomass Resources
Figure 5.3: UK Baseline Scenario – Proportional Contribution of Key Biomass Resources
5.2.4 BRM Drivers Sensitivity Analysis
The following section provides the results and discussions of the sensitivity analyses
undertaken. The results are demonstrated within a series of radar charts, labelled as Figures
5.4, 5.5, and 5.6; supported by the corresponding data listed within Appendix 7.0. The radar
charts document the resource availability of each of the selected biomass resources, over the
analysis timeframe. The 17 spokes of the radar charts each represent the influence of one of
the BRM supply chain drivers; the numbers of each driver corresponding to those listed
within Table 5.3. The specific availabilities of the resources mapped on each spoke within the
radar chart, represent the maximum resource availability forecast when the corresponding
driver has been varied within the BRM to reflect the range of characteristic values identified
by literature; and all other drivers are controlled to reflect UK Baseline Scenario conditions
(Section 5.2.1 and Appendix 6.0).
Forecast Contribution of the Key Resources to Overall
Biomass Availability within the UK Baseline Scenario
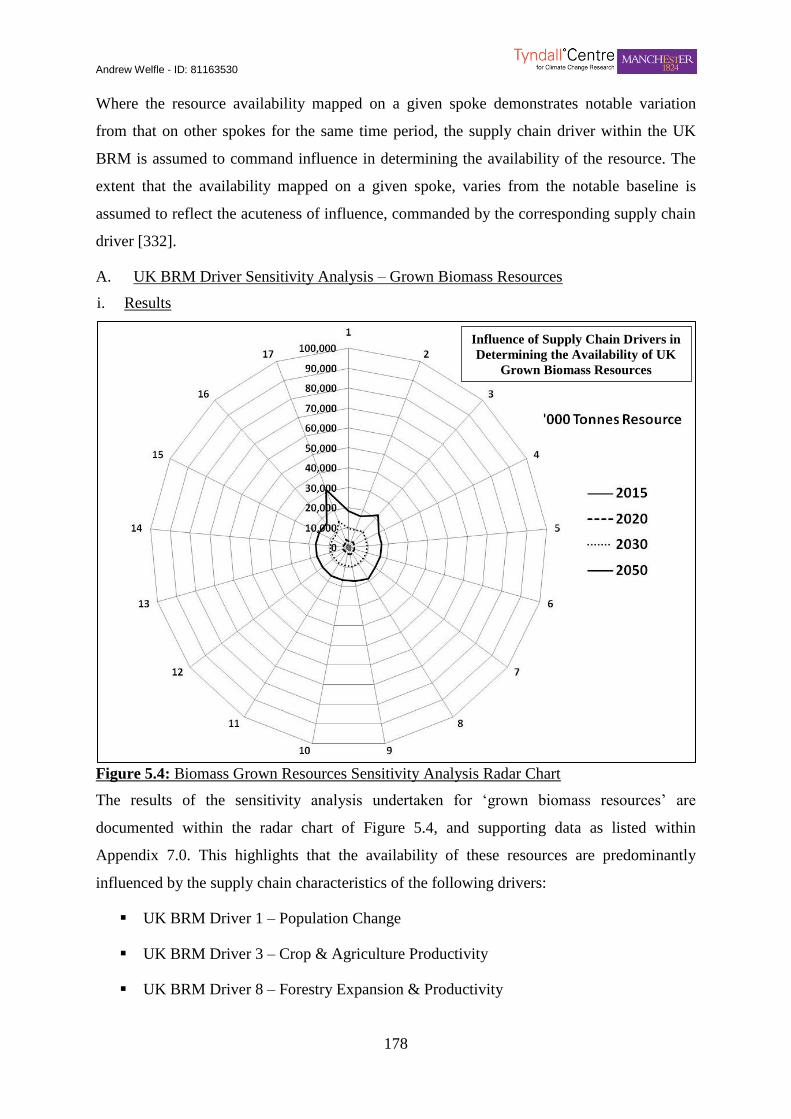
Andrew Welfle - ID: 81163530
178
Where the resource availability mapped on a given spoke demonstrates notable variation
from that on other spokes for the same time period, the supply chain driver within the UK
BRM is assumed to command influence in determining the availability of the resource. The
extent that the availability mapped on a given spoke, varies from the notable baseline is
assumed to reflect the acuteness of influence, commanded by the corresponding supply chain
driver [332].
A. UK BRM Driver Sensitivity Analysis – Grown Biomass Resources
i. Results
54) Figure 5.4: Biomass Grown Resources Sensitivity A na lysis Radar Chart
Figure 5.4: Biomass Grown Resources Sensitivity Analysis Radar Chart
The results of the sensitivity analysis undertaken for ‘grown biomass resources’ are
documented within the radar chart of Figure 5.4, and supporting data as listed within
Appendix 7.0. This highlights that the availability of these resources are predominantly
influenced by the supply chain characteristics of the following drivers:
UK BRM Driver 1 – Population Change
UK BRM Driver 3 – Crop & Agriculture Productivity
UK BRM Driver 8 – Forestry Expansion & Productivity
Influence of Supply Chain Drivers in
Determining the Availability of UK
Grown Biomass Resources
Andrew Welfle - ID: 81163530
179
UK BRM Driver 17 – Land Dedicated for Energy Crop Growth
Four of the seventeen analysed supply chain drivers within the UK BRM, are highlighted as
commanding degrees of influence on the availability of ‘grown biomass resources’.
Population change dynamics (Driver 1), and variations in the expanse and productivity of
forest systems (Driver 8), are shown to have only marginal influence on the availability of
these resources. Changes in crop and agricultural productivity (Driver 3) are shown to control
a greater influence, especially towards the end of the analysis timeframe where the potential
availability of ‘grown biomass resources’, can be seen to be noticeably higher than that of
Baseline Scenario conditions. However, the extent that land is made available and utilised for
resource growth (Driver17) can be clearly identified as the key characteristic within the BRM
that influences the availability of these resources. The sensitivity analysis highlights that if
the upper limits of land are made available and utilised for resource growth, as documented
by literature, the availability of ‘biomass and energy crops’ for the bioenergy sector may be
>87% greater in 2050, compared to scenarios where lower limits of land are utilised.
Following the sensitivity analysis undertaken on the combined grown biomass resource
category, further sensitivity analyses were undertaken for each individual biomass resource
within the category. The supply chain influences on each of these are listed in Table 5.4,
reflecting the data of Appendix 7.0.
Table 5.4: UK BRM Drivers Influencing the Availability of Grown Resources Table 27) Table 5.4: UK BRM Drivers Influencing t he Availability of Grown Resources
Grown Resources UK BRM Drivers Influencing Resource Availability
Biomass & Energy
Crops
Population Change (Driver 1)
Changes in Built-Up Land Area (Driver 2)
Crop & Agriculture Productivity (Driver 3)
Food Waste Generation (Driver 4)
Land Dedicated for Energy Crop Growth (Driver 17)
Dedicated Forestry
Resources Forestry Expansion & Productivity (Driver 8) Wood-based Industry Productivity (Driver 9)
ii. Discussion
The sensitivity analysis for the grown biomass resources category, found that the availability
of these resources were predominantly influenced by four drivers within the BRM. Marginal
influences were shown to come from population change trends, and the changing expanse and
productivity of forestry systems. Stronger influences were found to be linked to the
productivity of crops and agricultural systems, and the extent that available land is utilised for
resource production. These linkages are discussed as follows:
Population Change – Population is a key driver, providing influence throughout the
BRM. For the Baseline Scenario the sensitivity analysis has highlighted a potential
increase in the availability of grown resources, when the different population forecasts
Andrew Welfle - ID: 81163530
180
are applied within the BRM. Population is closely linked to the food commodity
demand and land requirements analysis, within the BRM; with lower population
forecasts resulting in reduced demands for land to produce food, and an increased
availability of land that may potentially be available for alternative uses. The main
output from this analysis, highlights and stresses the inverse relationship between
population growth and availability of land.
Forestry Systems – The expanse and productivity of forestry systems within the
BRM can be linked directly to the potential availability of grown biomass resources.
In addition to providing resource to a wide range of wood-based and competing
industries, forests also potentially provide resources directly to the bioenergy sector,
as accounted for within the BRM.
Productivity Yields – The relationship between crop yields and the potential
availability of grown resources for the bioenergy sector is also easily explained. The
sensitivity analysis confirms that in circumstances where increased yield and
productivity levels are achieved, a greater extent of resource will be produced and
available to the bioenergy sector, from the land utilised. Also where the productivity
of agricultural land increases, less area will be required to produce the food levels to
meet demand. Thus more land may be utilised for alternative activity such as resource
production for the bioenergy sector. Of the drivers analysed within the BRM, the
productivity of crop and agricultural systems is shown to be the second most
influential supply chain characteristic on determining the availability of grown
resources.
Utilising Available Land – The extent that available land is utilised for resource
production is shown to be a highly influential driver. The greater the area of available
land utilised and dedicated for the growth of resources for the bioenergy sector, the
greater the availability of the resource. If this characteristic is managed appropriately
resulting in increases in available land utilisation, the sensitivity analysis highlights
that large increases in resource availability may be achieved. The influence of this
driver on determining the availability of grown resources surpasses all others within
the BRM.
Other UK BRM drivers that were identified to provide influence on the availability of
specific grown biomass resources were: changes in area of built-up land, food waste
Andrew Welfle - ID: 81163530
181
generation trends, and the productivity of wood-based industries. The influences of these
drivers on resource availability were found to be relatively minor; as they did not heavily
register within the combined grown resource category analysis. They are discussed as
follows:
Built-Up Land Area Trends – There is an inverse relationship between changes in
the built-up land area and the availability of biomass and energy crops. Any land
being developed as reflected within the BRM is identified as no longer being available
for resource production, resulting in an overall reduction in potential resource
availability. The relatively minor infringement of new developments on UK land that
could otherwise be utilised for resource growth, explains the minor influence of this
driver within the analysis.
Food Waste Trends – A further relationship exists between food waste trends and the
potential availability of biomass and energy crop resources. The extent and
characteristics of food waste within any food system, plays a large role in determining
the efficiency of the system. The greater the extent of food wastes, the more land and
food commodity production will be required to meet demands. Therefore, as the
sensitivity analysis has flagged the characteristic of food waste trends as having a
degree of influence in determining the extent of land that may be available for
alternative uses; this will ultimately have some influence on the potential availability
of biomass and energy crops.
Industry Productivity Trends – The sensitivity analysis highlighted a relationship
between the productivity of wood-based industries, and the availability of resources
for the bioenergy sector sourced directly from forestry systems. This link is also
straightforward to explain, as wood-based industries compete directly with the
bioenergy sector for certain grades of resource from forests. Changes in the
productivity and hence demand of these industries, will result in more / less resource
being available to the bioenergy sector. The design of the Baseline Scenario within
the UK BRM also ensures that industry requirements for resources are delivered
ahead of those being identified as required for the bioenergy sector; thus this scenario
dynamic promotes this inverse relationship.
A further insight that can be derived from sensitivity analysis radar charts are the rates of
resource availability increment, over the analysis timeframe. The spacing between the lines

Andrew Welfle - ID: 81163530
182
represents the time interval over the analysis timeframe. Figure 5.4 demonstrates that the
near-term availability of grown biomass category resources, according to the UK Baseline
Scenario; is small. This reaffirms that analysis shown within Figure 5.1, showing that there is
huge scope for increasing biomass and energy crop resource levels, but upper limits of
growth would likely require sector transformations with substantial commitment / investment
changes.
iii. Resources that Demonstrate the Greatest Potential for the UK Bioenergy Sector
As described earlier in this Section, ‘biomass and energy crops’ were identified as resources
that may demonstrate particular potential for the UK bioenergy sector in the future. The
sensitivity analysis identifies that the productivity of crops and agriculture systems (Driver
3), and the area of available land dedicated for resource growth (Driver 17), are the key
influences.
The influence of realising higher levels of crop and agricultural productivity is shown to
potentially increase the availability of this resource by >30% by 2050; whilst realising higher
levels of available land utilisation as forecast by literature, is found to potentially improve
resource availability by as much as >87% by 2050. Highlighting that if the UK wants to
increase its biomass and energy crop resource; focusing on anything other than increasing
land availability, is unlikely to deliver the same scale of results.
These analysis outputs and conclusions are taken forward to Chapter 10, where potential
strategies are discussed for increasing the availability and utilisation of biomass and energy
crops.

Andrew Welfle - ID: 81163530
183
B. UK BRM Driver Sensitivity Analysis – Residue Resources
i. Results
55) Figure 5.5: Biomass Residue Resources Se nsitiv ity Analys is Radar Chart
Figure 5.5: Biomass Residue Resources Sensitivity Analysis Radar Chart
The results of the sensitivity analysis undertaken for ‘residue biomass resources’ are
documented within the radar chart of Figure 5.5, supported by data listed within Appendix
7.0. This highlights that the availability of these resources are predominantly influenced by
the supply chain characteristics of the following drivers:
UK BRM Driver 1 – Population Change
UK BRM Driver 7 – Utilisation of Agricultural Wastes & Residues
UK BRM Driver 8 – Forestry Expansion & Productivity
UK BRM Driver 9 – Wood-based Industry Productivity
Four of the seventeen analysed supply chain drivers within the UK BRM are also highlighted
as commanding degrees of influence on the availability of ‘residue biomass resources’. The
analysis demonstrates that none of the drivers reflected within the BRM command significant
influence in determining the availability of these resources. Varying population change
dynamics (Driver 1), and the extent and productivity of forestry systems (Driver 8), are
Influence of Supply Chain Drivers in
Determining the Availability of UK
Residue Biomass Resources
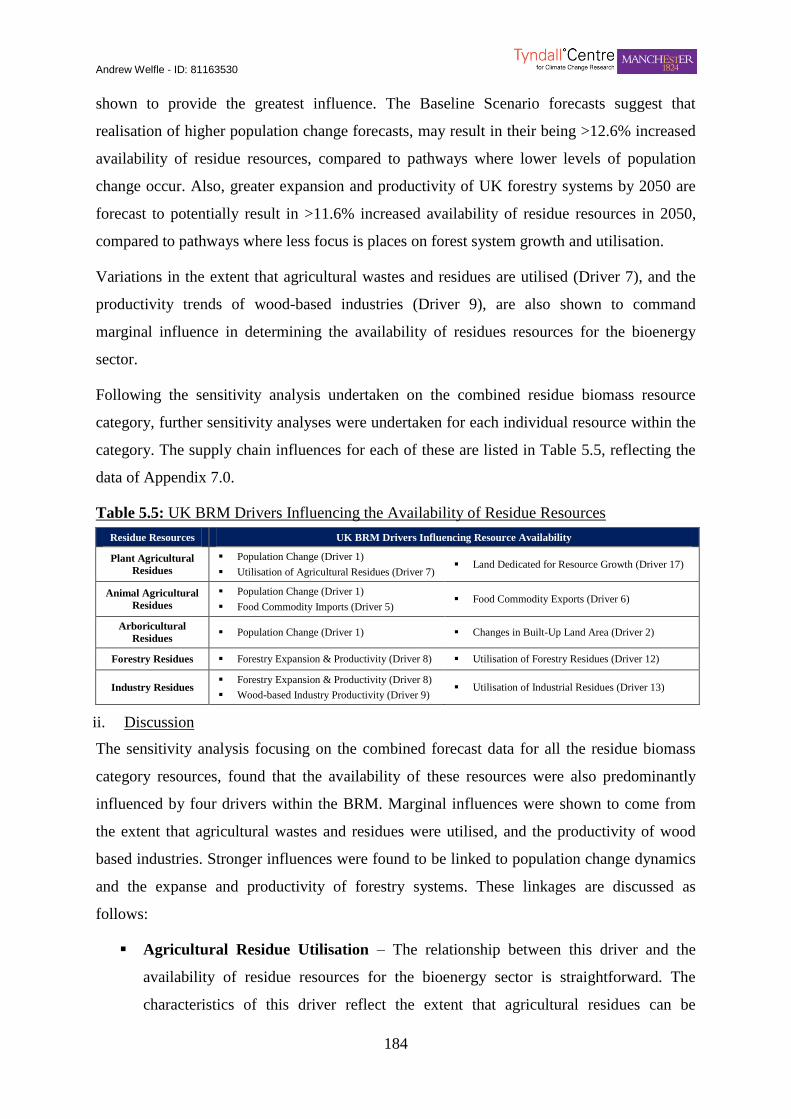
Andrew Welfle - ID: 81163530
184
shown to provide the greatest influence. The Baseline Scenario forecasts suggest that
realisation of higher population change forecasts, may result in their being >12.6% increased
availability of residue resources, compared to pathways where lower levels of population
change occur. Also, greater expansion and productivity of UK forestry systems by 2050 are
forecast to potentially result in >11.6% increased availability of residue resources in 2050,
compared to pathways where less focus is places on forest system growth and utilisation.
Variations in the extent that agricultural wastes and residues are utilised (Driver 7), and the
productivity trends of wood-based industries (Driver 9), are also shown to command
marginal influence in determining the availability of residues resources for the bioenergy
sector.
Following the sensitivity analysis undertaken on the combined residue biomass resource
category, further sensitivity analyses were undertaken for each individual resource within the
category. The supply chain influences for each of these are listed in Table 5.5, reflecting the
data of Appendix 7.0.
Table 5.5: UK BRM Drivers Influencing the Availability of Residue Resources Table 28) Table 5.5: UK BRM Drivers Influencing t he Availability of Res idue Resources
Residue Resources UK BRM Drivers Influencing Resource Availability
Plant Agricultural
Residues
Population Change (Driver 1)
Utilisation of Agricultural Residues (Driver 7) Land Dedicated for Resource Growth (Driver 17)
Animal Agricultural
Residues
Population Change (Driver 1)
Food Commodity Imports (Driver 5) Food Commodity Exports (Driver 6)
Arboricultural
Residues Population Change (Driver 1) Changes in Built-Up Land Area (Driver 2)
Forestry Residues Forestry Expansion & Productivity (Driver 8) Utilisation of Forestry Residues (Driver 12)
Industry Residues Forestry Expansion & Productivity (Driver 8)
Wood-based Industry Productivity (Driver 9) Utilisation of Industrial Residues (Driver 13)
ii. Discussion
The sensitivity analysis focusing on the combined forecast data for all the residue biomass
category resources, found that the availability of these resources were also predominantly
influenced by four drivers within the BRM. Marginal influences were shown to come from
the extent that agricultural wastes and residues were utilised, and the productivity of wood
based industries. Stronger influences were found to be linked to population change dynamics
and the expanse and productivity of forestry systems. These linkages are discussed as
follows:
Agricultural Residue Utilisation – The relationship between this driver and the
availability of residue resources for the bioenergy sector is straightforward. The
characteristics of this driver reflect the extent that agricultural residues can be
Andrew Welfle - ID: 81163530
185
harvested, and the extent that these resources are potentially distributed between the
bioenergy sector and other competing industries or uses. Thus, as highlighted by the
sensitivity analysis, this driver has direct influence on resources potentially available
for energy pathways.
Industry Productivity Trends – A further straightforward relationship exists
between the productivity of wood-based industries and the availability of residue
resources. As accounted for within the BRM, wood-based industries may provide a
source of resource for the bioenergy sector, in the form of wastes and residues from
their on-going processes. Therefore, as the sensitivity analysis highlights, a link is
shown between the productivity of industries and the amount of resource they
potentially produce that could potentially be utilised by the bioenergy sector.
Population Change – The sensitivity analysis identified a strong relationship
between population change and the availability of residue resources. This relationship
can be explained by the linkages within the BRM between population and food
commodity demand and production. Changes in population result in responding
changes in the level of food commodities produced, as adjustments are made to meet
demand. As both plant and animal based agricultural residues contribute a large
proportion of the overall resources within this category, changes in the production of
crops or animals will likewise result in notable changes in the availability of
agricultural residues.
Forestry Systems – A strong relationship is also shown to exist between forestry
systems and the availability of residue resources. This link can be explained by the
key role that forest systems have in influencing the levels of wood-based resources
that move through supply chains, as reflected within the BRM. The productivity of
forestry systems directly influencing the amount of forestry residues that are
potentially available, the levels of resource that are distributed to industry, and also
directly to the bioenergy sector – opportunities for residue generation and availability,
potentially occurring at every step along these supply chains.
Other UK BRM drivers that were identified to provide influence on the availability of
specific residue resources were: utilisation of available land, food commodity imports, food
commodity exports, changes in area of built-up land, utilisation forestry residues, and
utilisation of industrial residues. The influences of these drivers on resource availability were

Andrew Welfle - ID: 81163530
186
found to be relatively minor, as they did not heavily register within the combined residue
resource category analysis. They are discussed as follows:
Utilisation of Available Land – Available land is utilised within the UK Baseline
Scenario for production of resources directly for the bioenergy sector. A proportion of
this dedicated land is utilised for the production of biomass and energy crop species
that generate plant based agricultural residues, during the production cycle. Therefore,
as highlighted within the sensitivity analysis, a relationship exists between this driver
and the availability of residue resources.
Food commodity Imports & Exports – The relationship between food commodity
imports and exports on agricultural residues, stems from the linkages within the BRM
between the levels of food commodities produced to meet demand. The UK Baseline
Scenario within the BRM is developed to ensure that current food demand is always
sufficed, with variations in import and export levels influencing the extent that food
commodities are produced in the UK. This having a direct link with the levels of
agricultural residues that may potentially be available.
Changes in Area of Built-Up Land – Arboriculture arisings are linked directly to
changes in built-up land area within the BRM. Therefore, this relationship highlighted
by the sensitivity analysis, is straightforward. The overall availability of arboriculture
arising in comparison to the other residue resources, explains why variation in this
resource’s availability and the influence of this driver are not notable within the
combined residue resource category analysis.
Utilisation Forestry Residues – This driver reflect the extent that forestry residues
are collected and the proportion that may potentially be available for the bioenergy
sector. Therefore, as the sensitivity analysis highlighted, the characteristic of this
driver has clear influences on the availability of the resource.
Utilisation of Industrial Residues – Similar to the previous driver, this characteristic
reflects the extent that industrial residues are made potentially available to the
bioenergy sector. Thus, this driver is confirmed to have a clear degree of influence on
determining the availability of industrial residue resources.
Figure 5.5 also provides further insights through analysing the changing rates of resource
availability, over the analysis timeframe. The spacing between the lines, representing each
time interval over the analysis timeframe; shows a gradual and steady increase in residue
Andrew Welfle - ID: 81163530
187
resource availability. This reaffirms the analysis shown within Figure 5.1, where residue
resources are highlighted as providing a relatively large near-term resource opportunity for
the UK bioenergy sector. The availability of residues increases at a steady rate to 2050,
suggesting the relative robustness of residue resources, in resisting influence from changing
supply chain characteristics.
iii. Resources that Demonstrate the Greatest Potential for the UK Bioenergy Sector
As described earlier within this Section, ‘agricultural residues’ combining both plant and
animal based resources, are identified as the resources that may demonstrate particular
potential for the UK bioenergy sector, in the future. The sensitivity analysis identifies that
population change (Driver 1), and the extent that agricultural residues are utilised (Driver 7),
are the key drivers that provide influence in determining the availability of these resources.
Agricultural residues are shown to have relatively high near–term and continuing availability,
that is shown to be relatively constant and robust to major fluctuations caused by the
influencing drivers. This resource availability is forecast to exceed 10,238,000 Tonnes in
2015, and steadily increase by >109% by 2050. Based on this analysis, agricultural residues
are justifiably highlighted as potentially providing reliable and robust opportunities for the
bioenergy sector.
These analysis outputs and conclusions are again taken forward to Chapter 10, where
potential strategies are discussed for increasing the availability and utilisation of agricultural
residues.
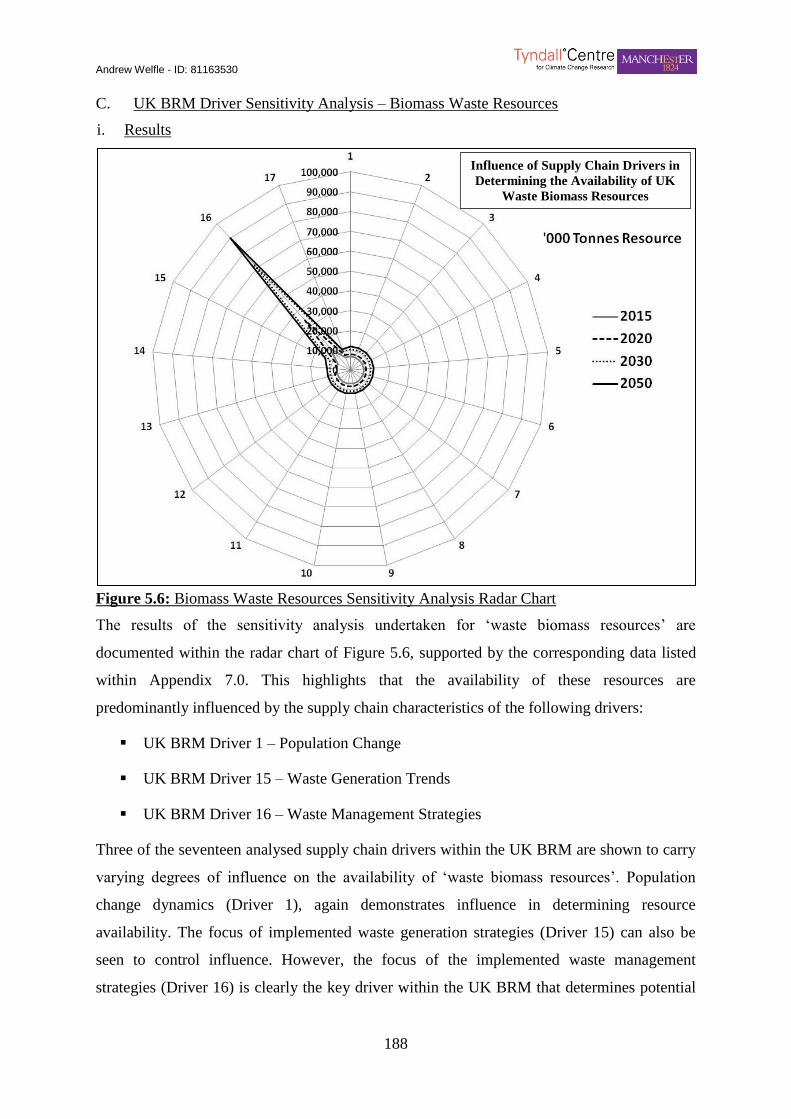
Andrew Welfle - ID: 81163530
188
C. UK BRM Driver Sensitivity Analysis – Biomass Waste Resources
i. Results
56) Figure 5.6: Biomass Waste Resources Se nsitiv ity Ana lys is Radar Chart
Figure 5.6: Biomass Waste Resources Sensitivity Analysis Radar Chart
The results of the sensitivity analysis undertaken for ‘waste biomass resources’ are
documented within the radar chart of Figure 5.6, supported by the corresponding data listed
within Appendix 7.0. This highlights that the availability of these resources are
predominantly influenced by the supply chain characteristics of the following drivers:
UK BRM Driver 1 – Population Change
UK BRM Driver 15 – Waste Generation Trends
UK BRM Driver 16 – Waste Management Strategies
Three of the seventeen analysed supply chain drivers within the UK BRM are shown to carry
varying degrees of influence on the availability of ‘waste biomass resources’. Population
change dynamics (Driver 1), again demonstrates influence in determining resource
availability. The focus of implemented waste generation strategies (Driver 15) can also be
seen to control influence. However, the focus of the implemented waste management
strategies (Driver 16) is clearly the key driver within the UK BRM that determines potential
Influence of Supply Chain Drivers in
Determining the Availability of UK
Waste Biomass Resources
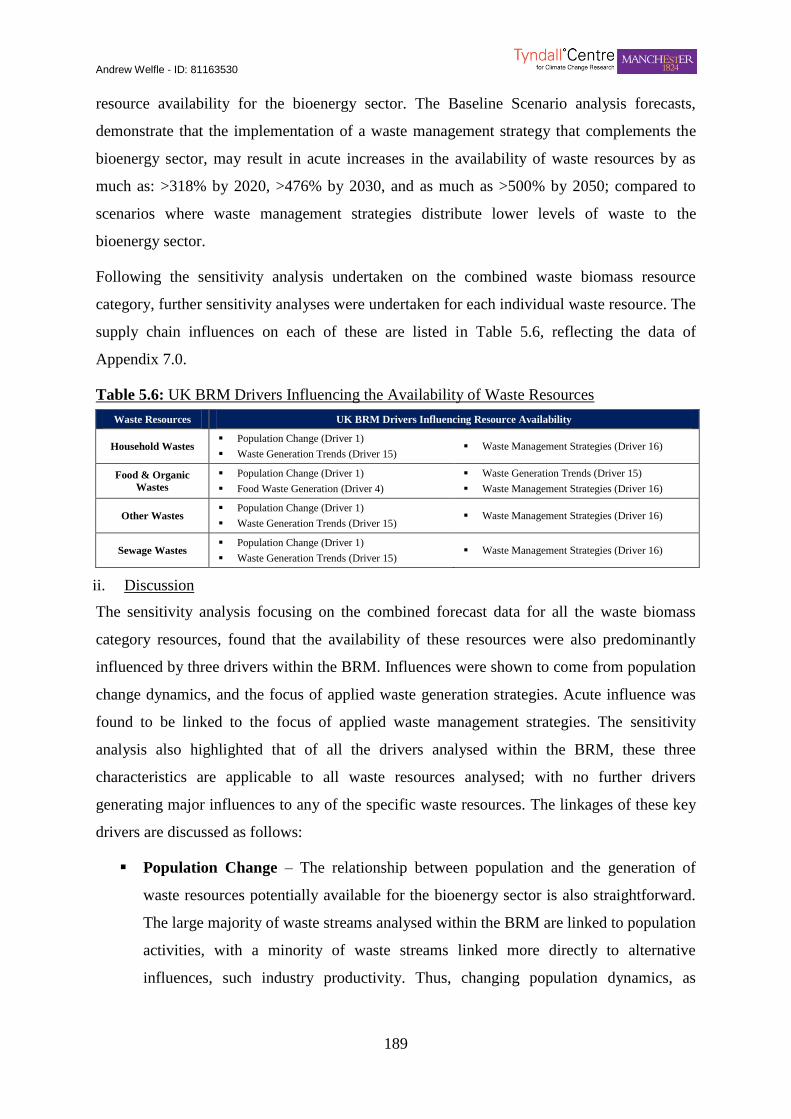
Andrew Welfle - ID: 81163530
189
resource availability for the bioenergy sector. The Baseline Scenario analysis forecasts,
demonstrate that the implementation of a waste management strategy that complements the
bioenergy sector, may result in acute increases in the availability of waste resources by as
much as: >318% by 2020, >476% by 2030, and as much as >500% by 2050; compared to
scenarios where waste management strategies distribute lower levels of waste to the
bioenergy sector.
Following the sensitivity analysis undertaken on the combined waste biomass resource
category, further sensitivity analyses were undertaken for each individual waste resource. The
supply chain influences on each of these are listed in Table 5.6, reflecting the data of
Appendix 7.0.
Table 5.6: UK BRM Drivers Influencing the Availability of Waste Resources Table 29) Table 5.6: UK BRM Drivers Influencing t he Availability of Waste Resources
Waste Resources UK BRM Drivers Influencing Resource Availability
Household Wastes Population Change (Driver 1)
Waste Generation Trends (Driver 15) Waste Management Strategies (Driver 16)
Food & Organic
Wastes
Population Change (Driver 1)
Food Waste Generation (Driver 4)
Waste Generation Trends (Driver 15)
Waste Management Strategies (Driver 16)
Other Wastes Population Change (Driver 1)
Waste Generation Trends (Driver 15) Waste Management Strategies (Driver 16)
Sewage Wastes Population Change (Driver 1)
Waste Generation Trends (Driver 15) Waste Management Strategies (Driver 16)
ii. Discussion
The sensitivity analysis focusing on the combined forecast data for all the waste biomass
category resources, found that the availability of these resources were also predominantly
influenced by three drivers within the BRM. Influences were shown to come from population
change dynamics, and the focus of applied waste generation strategies. Acute influence was
found to be linked to the focus of applied waste management strategies. The sensitivity
analysis also highlighted that of all the drivers analysed within the BRM, these three
characteristics are applicable to all waste resources analysed; with no further drivers
generating major influences to any of the specific waste resources. The linkages of these key
drivers are discussed as follows:
Population Change – The relationship between population and the generation of
waste resources potentially available for the bioenergy sector is also straightforward.
The large majority of waste streams analysed within the BRM are linked to population
activities, with a minority of waste streams linked more directly to alternative
influences, such industry productivity. Thus, changing population dynamics, as
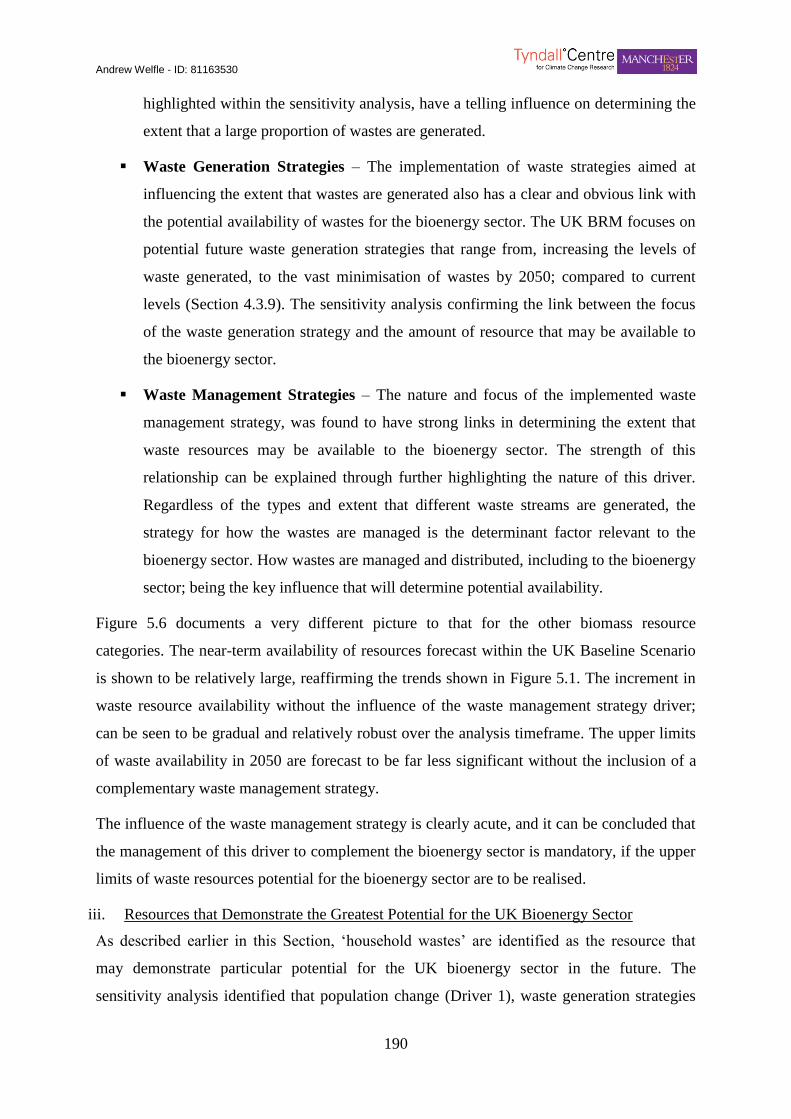
Andrew Welfle - ID: 81163530
190
highlighted within the sensitivity analysis, have a telling influence on determining the
extent that a large proportion of wastes are generated.
Waste Generation Strategies – The implementation of waste strategies aimed at
influencing the extent that wastes are generated also has a clear and obvious link with
the potential availability of wastes for the bioenergy sector. The UK BRM focuses on
potential future waste generation strategies that range from, increasing the levels of
waste generated, to the vast minimisation of wastes by 2050; compared to current
levels (Section 4.3.9). The sensitivity analysis confirming the link between the focus
of the waste generation strategy and the amount of resource that may be available to
the bioenergy sector.
Waste Management Strategies – The nature and focus of the implemented waste
management strategy, was found to have strong links in determining the extent that
waste resources may be available to the bioenergy sector. The strength of this
relationship can be explained through further highlighting the nature of this driver.
Regardless of the types and extent that different waste streams are generated, the
strategy for how the wastes are managed is the determinant factor relevant to the
bioenergy sector. How wastes are managed and distributed, including to the bioenergy
sector; being the key influence that will determine potential availability.
Figure 5.6 documents a very different picture to that for the other biomass resource
categories. The near-term availability of resources forecast within the UK Baseline Scenario
is shown to be relatively large, reaffirming the trends shown in Figure 5.1. The increment in
waste resource availability without the influence of the waste management strategy driver;
can be seen to be gradual and relatively robust over the analysis timeframe. The upper limits
of waste availability in 2050 are forecast to be far less significant without the inclusion of a
complementary waste management strategy.
The influence of the waste management strategy is clearly acute, and it can be concluded that
the management of this driver to complement the bioenergy sector is mandatory, if the upper
limits of waste resources potential for the bioenergy sector are to be realised.
iii. Resources that Demonstrate the Greatest Potential for the UK Bioenergy Sector
As described earlier in this Section, ‘household wastes’ are identified as the resource that
may demonstrate particular potential for the UK bioenergy sector in the future. The
sensitivity analysis identified that population change (Driver 1), waste generation strategies

Andrew Welfle - ID: 81163530
191
(Driver 15), and waste management strategies (Driver 16), are the key drivers that provide
influence in determining the availability of this resource.
The analysis finds that implementation of a waste management strategy that focuses on
energy from waste generation pathways, could provide >40,716,000 Tonnes of household
wastes for the bioenergy sector by 2050. Household wastes therefore represent a very
substantial opportunity for the bioenergy sector, albeit reliant completely on the development
of a complementary waste management strategy. Aside from this standout opportunity, the
analysis also highlights that if a waste management strategy is not complementary to the
bioenergy sector, the baseline levels of resource availability are much less attractive.
These analysis outputs and conclusions are again taken forward to Chapter 10, where
potential avenues for developing complementary waste management strategies are discussed,
for increasing the availability and utilisation of household waste resources by the bioenergy
sector.
5.2.5 Key Chapter & Sensitivity Analysis Outputs & Conclusions
The following section provides an overview of the key analysis outputs and conclusions from
Chapter 5. These are taken forward to Chapter 10, where discussions focus on potential
avenues for the development of alternative bioenergy strategies, with increased bioenergy
generation utilising indigenous biomass resources.
A. The Influence of Supply Chain Drivers on Biomass Resource Availability
This Chapter has analysed a wide range of drivers, finding large variances in their influence
in determining biomass availability for the bioenergy sector. The research also highlights that
particular resources demonstrate significantly greater availability potential than others.
Therefore, if the contribution of indigenous resources is to be maximised, the research
suggests that investments in bioenergy strategies should perhaps be increasingly focused and
targeted.
Table 5.7 provides a key summary of this Chapter’s analysis; ranking the specific resources
and drivers, based on their analysed contribution towards increasing the potential of each
indigenous resource in the UK. Table 5.7 highlights the specific resources that are determined
to demonstrate the greatest and least potential for the UK bioenergy sector, in terms of their
availability; also the specific drivers that have been determined to command the greatest and
least influence in determining resource availability.
Andrew Welfle - ID: 81163530
192
Table 5.7: Research Summary Ranking Indigenous Resource Influences & Contributors Table 30) Table 5.7: Research Summary Ranking Indige nous Resource Influe nces & Contributors
Ranking
Ranked UK BRM Drivers Demonstrated to
Command Levels of Influence on Determining
Biomass Resource Availability
Ranked Potential of Resources for the UK
Bioenergy Sector in Terms of Availability &
Bioenergy Potential
High Ranking
Drivers & Resources with
Greatest Influence &
Contribution Potential
Waste Management Strategies
Land Dedicated for Energy Crop Growth
Agricultural Residues
Household Wastes
Biomass & Energy Crops
Other Wastes
Medium Ranking
Drivers & Resources with
Mid Influence &
Contribution Potential
Crop & Agriculture Productivity
Population Change
Changes in Built-Up Land Area
Food Waste Generation
Utilisation of Agricultural Wastes & Residues
Forestry Expansion & Productivity
Waste Generation Trends
Dedicated Forestry Resources
Forestry Residues
Food & Organic Wastes
Low Ranking
Drivers & Resources with
Lowest Influence &
Contribution Potential
Food Commodity Imports
Food Commodity Exports
Wood-based Industry Productivity
Imports of Forestry Product
Exports of Forestry Product
Utilisation of Forestry Residues
Utilisation of Industrial Residues
Utilisation of Arboriculture Arisings
Sewage Wastes
Industry Residues
Arboricultural Residues
The analyses results from Chapter 5 highlight the potential importance of applying a targeted
approach for increasing the availability and utilisation of UK indigenous resources. This is in
contrast to the relatively broad policy focus approach, currently being implemented within
the UK. The present UK Bioenergy Strategy aiming to maximise the opportunities for
improving biomass supplies from all feedstocks, through policies aimed at managing a broad
range of drivers [8]; as discussed in greater detail within Chapters 7 and 10.
B. Grown Resources Demonstrating Greatest Potential for the UK Bioenergy Sector
UK grown biomass resources and energy crops are being identified in the grown resource
category, to demonstrate the greatest potential for the UK bioenergy sector. The standout
driver influencing the availability of these resources was identified as the utilisation of
available land, dedicated for their growth. However, the analysis also highlighted that this
resource currently has a relatively low starting base, and therefore concerted efforts will be
required in managing the drivers that influence availability; if anywhere near the upper levels
of resource forecasts are to be realised. These may include the implementation of policies that
encourage or incentivise the utilisation of available land, for the growth of resource dedicated
for the bioenergy sector.
C. Residue Resources Demonstrating Greatest Potential for the UK Bioenergy Sector
UK agricultural residues (straws & slurries) are being identified as the resources from the
residue resource category that demonstrate the greatest potential for the UK bioenergy sector;
whilst also continuing to be utilised by competing industries and to maintain soil systems.
The availability of residues was found to be comparatively robust to influencing drivers; the
Andrew Welfle - ID: 81163530
193
extent that resources are harvested / collected, being the most influential factor. Availability
of residues is forecast to steadily increase without any major influences from supply chain
drivers - confirming that residues may represent a continuous and reliable, near and long-term
indigenous resource option for the bioenergy sector.
D. Waste Resources Demonstrating Greatest Potential for the UK Bioenergy Sector
Household wastes are being identified as the resources from the waste resource category that
demonstrate the greatest potential for the UK bioenergy sector. Waste resources are found to
be highly influenced by one key driver; the waste management system adopted. The
availability of waste resources was found to be much diminished when the adopted waste
management strategy was uncomplimentary to the bioenergy sector; such as strategies
focussing on resource recovery, or continuation of landfill trends. Therefore, if wastes are
going to be increasingly utilised by the bioenergy sector, the analysis confirms the
importance of developing policies for the implementation of more effective waste
management strategies.

Andrew Welfle - ID: 81163530
194
Chapter 6 - UK Biomass Resource Scenarios
Andrew Welfle - ID: 81163530
195
6.1 Developing UK Biomass Resource
Scenarios
This Chapter explores the different scenario pathways that the UK could take in the future
with regard to the development of its bioenergy sector, and resource supply chains; analysing
within each scenario, the fluctuation of the availability of the different biomass resources for
the bioenergy sector. The Chapter also undertakes an assessment of which pathways the UK
could pursue, in order to best utilise the available indigenous resources. Chapter 6 aims to
build on the analysis undertaken within Chapter 5, where the influences of each individual
driver within the BRM, were assessed in isolation. The development of scenarios, allows the
simultaneous calibration of these same supply chain drivers, to reflect whole system
dynamics within the UK. This facilitates a deeper evaluation of how the different supply
chain drivers analysed within the BRM can form relationships, linkages, and feedbacks; that
may collectively influence the potential availability of UK indigenous resource for the UK
bioenergy sector.
The Chapter starts within an introduction and discussion of the nature of the different
scenarios, and why this form of analysis is highly relevant to the wider research project. The
Chapter goes on to introduce the concepts of the specific biomass resource scenarios
developed; providing in-depth discussions and literature review driven reasoning for the
supply chain characteristics reflected within the BRM, for each scenario. The Chapter then
presents the results of the analysis; principally documenting the levels of resource availability
and bioenergy potentials analysed. The key relationships and feedbacks that emerge are
discussed, and the favourability of different supply chain characteristics and bioenergy
conversion pathways, are highlighted.
The main analysis outputs and conclusions from Chapter 6 are then taken forward and
contribute towards the discussions within Chapter 10; where alternative bioenergy strategy
options for the UK are proposed.
6.1.1 An Introduction to Scenario Based Analysis
This section provides an introduction to scenario based analysis, and explains why this
analysis approach is highly relevant to this research project.
Scenario analysis is the evaluation of potential future events through the consideration of
alternative plausible, although not equally likely states of the world (scenarios) [333].
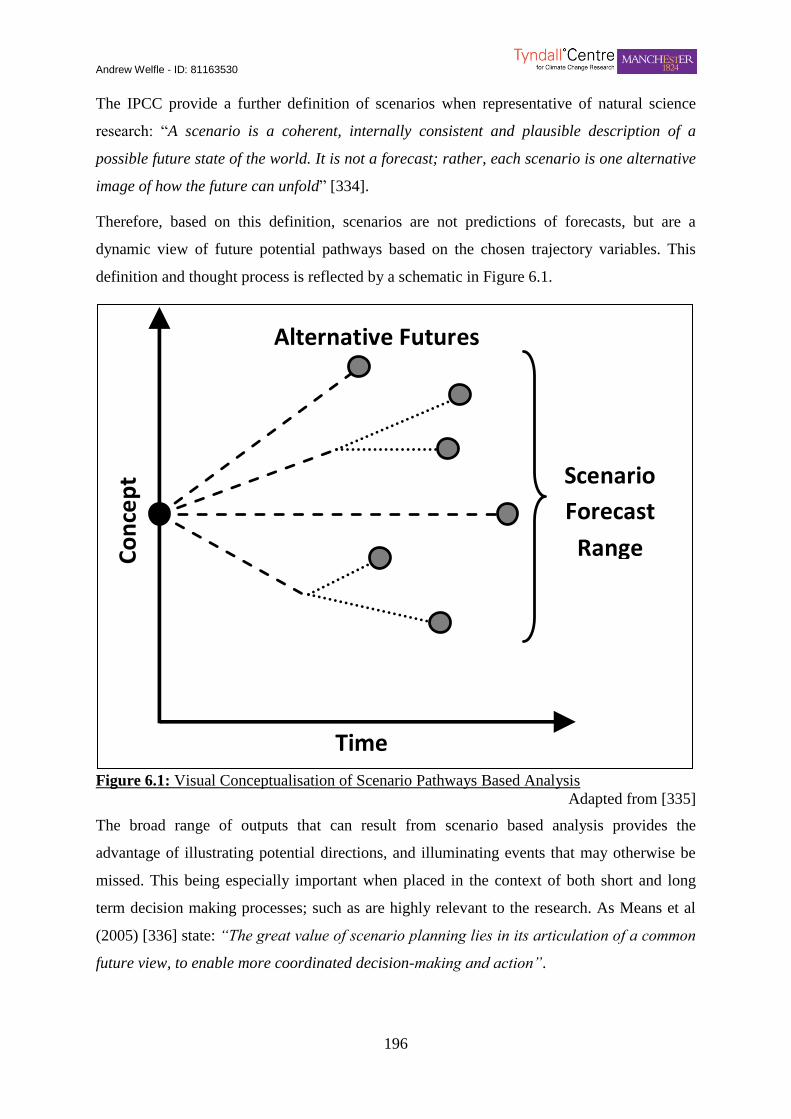
Andrew Welfle - ID: 81163530
196
The IPCC provide a further definition of scenarios when representative of natural science
research: “A scenario is a coherent, internally consistent and plausible description of a
possible future state of the world. It is not a forecast; rather, each scenario is one alternative
image of how the future can unfold” [334].
Therefore, based on this definition, scenarios are not predictions of forecasts, but are a
dynamic view of future potential pathways based on the chosen trajectory variables. This
definition and thought process is reflected by a schematic in Figure 6.1.
57) Figure 6.1: Visual Conceptualisation of Scenario Pathw ays Based A na lysis
Figure 6.1: Visual Conceptualisation of Scenario Pathways Based Analysis
Adapted from [335]
The broad range of outputs that can result from scenario based analysis provides the
advantage of illustrating potential directions, and illuminating events that may otherwise be
missed. This being especially important when placed in the context of both short and long
term decision making processes; such as are highly relevant to the research. As Means et al
(2005) [336] state: “The great value of scenario planning lies in its articulation of a common
future view, to enable more coordinated decision-making and action”.
Time
Co
nce
pt
Alternative Futures
Scenario
Forecast
Range

Andrew Welfle - ID: 81163530
197
A. Drawing Influence from Existing Biomass Resource Scenario Research
There will undoubtedly be countless expected, and also many currently unforeseen variables
that will influence UK biomass resource supply chains through to 2050. The only certainty
about carrying out a long-term analysis, such as the 2050 analysis timeframe adopted within
this research; is that there are likely to be many uncertainties. Therefore, a scenario approach
has been identified as the best option for exploration of the potential outcomes of pathways
subject to alternative assumptions.
Comparative biomass resource scenario approaches, have been utilised by a series of existing
studies. These develop scenarios that forecast global biomass resource potential [59], [124],
or specifically focus on the potential of specific resources within a set geography [337],
[338].
The flexibility of the BRM enables any developed scenarios to command a degree of realism,
in terms of reflecting supply chain interactions. Reflecting on previous relevant studies, the
parameters within each scenario developed within this research, are built up through the
calibration of the BRM drivers. The characteristics, extent, and the direction in which these
drivers are varied within each scenario, will reflect a wide range of previous research and
studies that provide forecasts. These are introduced and discussed later in this Chapter.
6.1.2 Developing Biomass Resource Scenarios
Four core biomass resource scenarios have been developed, that are designed to reflect
different potential pathways that the UK could take, to 2050. Each of these potential
pathways will be analysed to determine: the potential extents and types of biomass resource
that may be available to the UK bioenergy sector by 2050, and the forms and levels of
bioenergy that could potentially be generated. A further three sub-scenarios are also
developed to evaluate the bioenergy potential from UK indigenous resource, when alternative
bioenergy conversion pathways are prioritised. These scenarios are introduced and described
in Table 6.1.
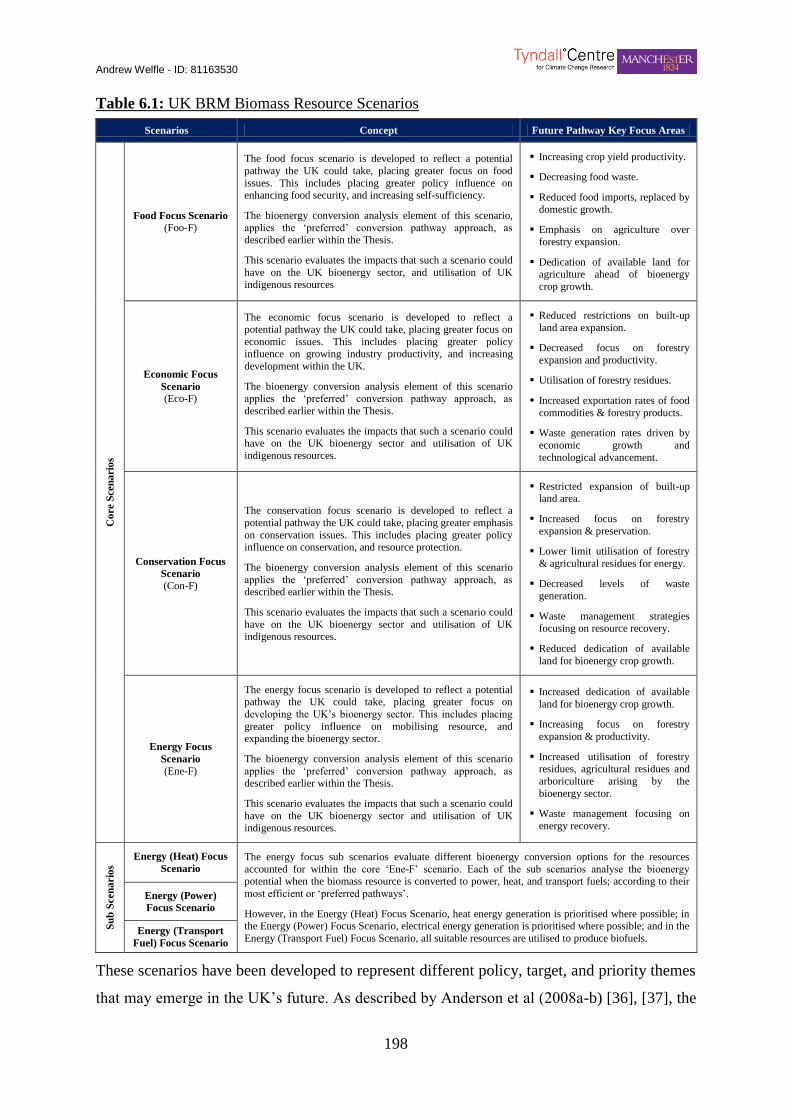
Andrew Welfle - ID: 81163530
198
Table 6.1: UK BRM Biomass Resource Scenarios Table 31) Table 6.1: UK BRM Biomass Resource Scenarios
Scenarios Concept Future Pathway Key Focus Areas
Co
re
Scen
ari
os
Food Focus Scenario
(Foo-F)
The food focus scenario is developed to reflect a potential
pathway the UK could take, placing greater focus on food
issues. This includes placing greater policy influence on enhancing food security, and increasing self-sufficiency.
The bioenergy conversion analysis element of this scenario,
applies the ‘preferred’ conversion pathway approach, as described earlier within the Thesis.
This scenario evaluates the impacts that such a scenario could
have on the UK bioenergy sector, and utilisation of UK indigenous resources
Increasing crop yield productivity.
Decreasing food waste.
Reduced food imports, replaced by
domestic growth.
Emphasis on agriculture over
forestry expansion.
Dedication of available land for agriculture ahead of bioenergy
crop growth.
Economic Focus
Scenario
(Eco-F)
The economic focus scenario is developed to reflect a potential pathway the UK could take, placing greater focus on
economic issues. This includes placing greater policy influence on growing industry productivity, and increasing
development within the UK.
The bioenergy conversion analysis element of this scenario applies the ‘preferred’ conversion pathway approach, as
described earlier within the Thesis.
This scenario evaluates the impacts that such a scenario could have on the UK bioenergy sector and utilisation of UK
indigenous resources.
Reduced restrictions on built-up
land area expansion.
Decreased focus on forestry
expansion and productivity.
Utilisation of forestry residues.
Increased exportation rates of food
commodities & forestry products.
Waste generation rates driven by
economic growth and
technological advancement.
Conservation Focus
Scenario
(Con-F)
The conservation focus scenario is developed to reflect a
potential pathway the UK could take, placing greater emphasis
on conservation issues. This includes placing greater policy influence on conservation, and resource protection.
The bioenergy conversion analysis element of this scenario
applies the ‘preferred’ conversion pathway approach, as described earlier within the Thesis.
This scenario evaluates the impacts that such a scenario could
have on the UK bioenergy sector and utilisation of UK
indigenous resources.
Restricted expansion of built-up land area.
Increased focus on forestry
expansion & preservation.
Lower limit utilisation of forestry
& agricultural residues for energy.
Decreased levels of waste generation.
Waste management strategies
focusing on resource recovery.
Reduced dedication of available
land for bioenergy crop growth.
Energy Focus
Scenario
(Ene-F)
The energy focus scenario is developed to reflect a potential pathway the UK could take, placing greater focus on
developing the UK’s bioenergy sector. This includes placing
greater policy influence on mobilising resource, and expanding the bioenergy sector.
The bioenergy conversion analysis element of this scenario
applies the ‘preferred’ conversion pathway approach, as described earlier within the Thesis.
This scenario evaluates the impacts that such a scenario could
have on the UK bioenergy sector and utilisation of UK indigenous resources.
Increased dedication of available
land for bioenergy crop growth.
Increasing focus on forestry
expansion & productivity.
Increased utilisation of forestry residues, agricultural residues and
arboriculture arising by the
bioenergy sector.
Waste management focusing on
energy recovery.
Su
b S
cen
ario
s
Energy (Heat) Focus
Scenario The energy focus sub scenarios evaluate different bioenergy conversion options for the resources
accounted for within the core ‘Ene-F’ scenario. Each of the sub scenarios analyse the bioenergy potential when the biomass resource is converted to power, heat, and transport fuels; according to their
most efficient or ‘preferred pathways’.
However, in the Energy (Heat) Focus Scenario, heat energy generation is prioritised where possible; in the Energy (Power) Focus Scenario, electrical energy generation is prioritised where possible; and in the
Energy (Transport Fuel) Focus Scenario, all suitable resources are utilised to produce biofuels.
Energy (Power)
Focus Scenario
Energy (Transport
Fuel) Focus Scenario
These scenarios have been developed to represent different policy, target, and priority themes
that may emerge in the UK’s future. As described by Anderson et al (2008a-b) [36], [37], the

Andrew Welfle - ID: 81163530
199
scenarios have been designed to be prospective, quantitative, and normative; in that they
reflect probable future pathways based on the extension of key variable quantities. In
developing each scenario, it is also important to highlight and stress the key design
parameters that ensure that the footprint from each of the developed scenarios, have minimal
impacts in the following key areas:
In each scenario throughout the analysis timeframe, the UK continues to produce food
commodities that at a minimum represent a continuation of current self-sufficiency. In
other words, the production of biomass resources within each scenario, does not
negatively impact the UK’s ability to feed itself.
In each scenario throughout the analysis timeframe, UK industries and all other
activities that currently or may in the future compete for resources with the bioenergy
sector; will be allocated resource to meet their demands ahead of being identified as
being potentially available for the bioenergy sector. In other words, the production of
biomass resources within each scenario, does not negatively impact the UK’s wood-
based industries from continuing to work.
6.1.3 Developing the UK Food Focus (Foo-F) Biomass Resource Scenario
The Foo-F Scenario has been developed to analyse forecasts of biomass resource availability
for the bioenergy sector; within a future pathway where prime focus has been placed on
improving food security and self-sufficiency.
A. Scenario Context
Since World War Two, European agricultural policy has focused on enhancing food self-
sufficiency for the European population, and as demonstrated by recent overproduction of
food, has been highly successful [339]. However, an enormous future challenge looms -
having to feed up to 9-10 billion people by 2050, globally [271]. Agricultural systems are
highly sensitive to climate fluctuations, and a 2°C rise in mean global temperature reflecting
the Intergovernmental Panel on Climate Change’s lowest emission scenarios, is predicted to
result in widespread destabilisation of farming systems across the world [340]. In addition to
the uncertainty regarding food systems, the large-scale production of biofuels is becoming a
significant competitor for agricultural land – and whilst energy security concerns may justify
the production of biofuels, the proposed scale of production raises questions about the trade-
offs between biofuels and food crops [341]. The key issue relating to future food systems
remains, whether these can keep pace with steep growing demands and dietary transitions, in
Andrew Welfle - ID: 81163530
200
an environment of climate change and numerous other drivers [341]. This strain will put
pressure on Europe’s future supply chains. Enhancing food security and self-sufficiency may
re-emerge as prominent areas of concern for future governments.
B. A Future Pathway with Food Focus
Although complete food self-sufficiency is not a current target for the UK, it is important that
food systems adapt, so that the UK is able to cope with future stresses in the food system
[269], [270]. The UK currently produces about half of the food it consumes, and is ~60%
‘self-sufficient’ [151]. Recognised strategies to address future food issues include: closing the
yield gap – the difference between attainable yields and realised yield by increasing
agricultural productivity through technologies, research, and investment; reducing wastes
from food systems, changing diets, and expanding aquaculture opportunities [271].
UK agricultural productivity has been increasing at a steady trajectory through time, and
increased research, development, and investment in the sector is likely to see this trend
continue [79], [188], [342]. Estimates also suggest that 30-50% of food grown worldwide
may be lost or wasted, before and after it reaches the consumer. Therefore, future emphasis
should be placed on addressing wastes – the UK Government Office for Sciences suggesting
that food waste could be realistically halved by 2050; equivalent to as much as 25% of
current productivity [269], [270].
All actions should be realised through coordinated and multifaceted strategies, where
sustainability is key. This ‘sustainable intensification’ involves an enhancement of current
business-as-usual trends; where agricultural systems remain largely unchanged and demands
follow current projections, but agricultural productivity becomes increasingly efficient [343].
A summary of the key focus areas and an overview of the studies, reports, and literature
utilised to develop the future Foo-F pathway, are shown in Table 6.2. An overview of the
specific UK BRM supply chain driver characteristics and values for the scenario, are listed
within Appendix 8.0.
6.1.4 Developing the UK Economic Focus (Eco-F) Biomass Resource
Scenario
The Eco-F Scenario has been developed to analyse forecasts of biomass resource availability
for the energy sector; in a future where emphasis is placed on economic growth over all other
considerations.
Andrew Welfle - ID: 81163530
201
A. Scenario Context
Following the 2008 - 09 financial crisis, an agenda aimed at encouraging economic growth
and a return to financial stability, is currently the major driving force behind UK policy. In
the UK, timber and wood-based industries are well established and contribute about 1.5% to
UK exports; equivalent to 2.5% of the global share [203]. The flow of resources between the
environment and industry constitutes the physical foundations of economies – this ‘economic
metabolism’ being a key indicator of economic health [161], [344]. It is the growth and
dynamics associated with the wood-based industries that will be a key influence in
determining the availability of biomass resources available for the bioenergy sector, within
this scenario.
In terms of development of the bioenergy sector, many countries are showing considerable
interest in bioenergy from an economic viewpoint because of the value-added (income) and
employment opportunities that bioenergy can bring, especially in the rural areas where the
resources are produced / collected [345]. However, studies such as those of Marques &
Fuinhas (2012) [346], have concluded that the high costs associated with supporting
renewable energy options are actually an economic burden, as polices such as paying
elevated tariffs for electricity generated by renewable energy, results in an economically
counter-productive effect, and deceleration in economic activity. As things stand, European
countries have energy systems and infrastructures that are deeply grounded in fossil fuel
provision [346]. Therefore, if future policy, finance, and focus are not directed towards
renewable energy pathways, it is unlikely that there will be a widespread move away from
conventional fossil fuel generation. A future pathway focused on economic growth may not
specifically focus on the development of the bioenergy sector through the mobilisation of
biomass resource or the building of bioenergy infrastructure; but through increased on-going
activities within wood-based industries, there may still be opportunities for the bioenergy
sector.
B. A Pathway with Economic Focus
A future pathway with economic focus will reflect policies designed to encourage the growth
of industry, which in turn may compete for biomass resource but also provide new
opportunities for the bioenergy sector. The UK Wood Panel Industry Federation (WPIF)
identifies the growth of the bioenergy sector as a major concern in competing for resource,
“As subsidised energy generators can afford to out-pay the wood panel industry for primary
raw material” [205]. Therefore, a future pathway with economic focus would ensure that the
Andrew Welfle - ID: 81163530
202
wood industry’s resource demands are prioritised above those of the bioenergy sector.
Industry’s future resource demands have been forecast by the WPIF [204], and forestry
expansion and productivity scenarios are forecast by the Forestry Commission [190]–[197].
To reflect market behaviour these forecasts are utilised within the Eco-F Scenario.
Meta-analysis of a series of studies [347], concludes that there is statistical significance
between economic growth and aggregate export levels, especially relating to both
manufactured and energy-based export categories. Therefore, it should be expected that a
future pathway with economic focus may reflect increases in export levels, particularly wood
products with relevance to the bioenergy sector.
Greyson (2007) [348], states that; “realising zero waste and sustainability with continued
economic growth may not be achievable within the scope of current practices”. Therefore,
the future patterns of waste generation and management within this scenario may reflect a
continuation of current or very similar trends. To model this, the waste strategies within this
scenario utilise DEFRA’s technologically driven forecasts [206], [215]–[218], [282]. These
predict that large-scale solutions and technology will be key factors in dealing with waste
generation issues.
A summary of the key focus areas and an overview of the studies, reports, and literature
utilised to develop the future Eco-F pathway, are shown in Table 6.2. An overview of the UK
BRM supply chain driver characteristics for this scenario, are listed within Appendix 8.0.
6.1.5 Developing the UK Conservation Focus (Con-F) Biomass Resource
Scenario
The Con-F Scenario has been developed to analyse forecasts of biomass resource availability
for the bioenergy sector, within a future pathway where emphasis is placed on a paradigm of
enhanced conservation and preservation of biodiversity and resources.
A. Scenario Context
A century ago, forestry cover in the UK was at an all-time low; although following a series of
phases of forestry focus this increased by two and a half times to the ~13% cover present
today. However, planting rates in recent years have once again stagnated, leading to
recognition that it is time to regain focus and ‘up the game’, particularly when measured
against the context of having to mitigate and adapt to climate change [349].
The UK’s approach to conservation relies on a series of partnerships between statutory,
voluntary, academic, and business sectors; at both the National and local scale. The prime
Andrew Welfle - ID: 81163530
203
focus being to maintain and create habitats and ecosystems, halt the decline of biodiversity,
and enhance the robustness of sites to environmental change [350]. This is backed up by a
wide spectrum of legislative requirements that aim at safeguarding forestry, biodiversity, and
conservation [351].
The UK has well established wood based industries that rely on forestry productivity, but at
the same time there is increasing inclusion of forestry resources within renewable energy
strategies [259], and the awareness of forestry resources and ancient woodlands in terms of
ecological value, is increasing [352]. Collectively these three competing demands and
priorities will shape the pathway for utilisation of forestry in the future.
A further increasingly prominent conservation issue is resource availability and scarcity - a
theme motivating new waste management strategies at both the European and UK level
[353]. There is great scope for improvement in the UK, where recycling levels stand at about
39% of municipal waste compared to >60% in leading places such as Austria and Germany
[354]. To help develop innovative and exemplary practices that drive behaviour towards
enhanced sustainability, the UK Government has on-going ‘Zero Waste Places’ initiatives
[355] - “A simple way of encapsulating the aim to go as far as possible in reducing the
environmental impact of waste. It is a visionary goal which seeks to prevent waste occurring,
conserves resources and recovers all value from materials” [356].
B. A Pathway with Conservation Focus
A trade-off exists between biodiversity, conservation, and optimal biomass resource
production for the bioenergy sector. Erb, et al [357], found that estimates of global biomass
crop potential are lowered by 9-32% when land areas of wilderness, of biodiversity
importance, and with protection status; are excluded from assessments. The German
Advisory Council on Global Change also found that a minimum of 10-20% of global land
should be protected if the biosphere’s functions, such as climate regulation and biodiversity
are to be preserved [358]. 14% of land is currently protected globally [267]; meaning a
further 6%, equivalent to 540,000 km² is required [359]. In summary, a future pathway with
conservation focus will undoubtedly result in lower levels of biomass resource being
available for the bioenergy sector.
In the UK, the Forestry Commission have a wide range of forestry expansion and
productivity scenarios that reflect varying levels of forest growth and utilisation [190]–[197].
Andrew Welfle - ID: 81163530
204
A future pathway with conservation focus will reflect the upper projections for forestry
expansion, with the management and felling of these forests reflective of this pathway.
The approach of the UK forestry industry has progressively shifted primarily from timber
production, to increasingly multi-purpose values that include conservation [360]. Forestry
industries having an important role to play in conservation, as the industry’s long-term
sustainability depends on the resource [361]. Therefore, industry within a future pathway of
conservation focus would continue to utilise forests, albeit strongly abiding to the
requirement of the ‘UK Forestry Standard’ [362].
Research [363], [364], also highlights that the extraction of residues from both forestry and
agricultural systems may pose a risk for the maintenance of soil fertility; with the essential
requirement to ensure that removal of residues don’t exceed levels required to maintain food
and habitats for organisms, and to ensure protection against soil compaction, and for the
maintenance of soil fertility [277], [278]. Therefore, a future pathway with a conservation
focus, will likely avoid the upper limit utilisation of both forestry and agricultural residues.
Waste generation and management strategies will reflect future pathways of reduced waste
generation, and increased levels of resource recovery from waste streams. Scenarios
reflecting these pathways have been forecast by DEFRA [206], [215]–[218], [282], and will
form the basis of future waste analysis within the Con-F Scenario.
A summary of the key focus areas and an overview of the studies, reports, and literature
utilised to develop the future Con-F pathway, are shown in Table 6.2. An overview of the UK
BRM supply chain driver characteristic data, are listed within Appendix 8.0.
6.1.6 Developing the UK Energy Focus (Ene-F) Biomass Resource
Scenario
The Ene-F Scenario has been developed to analyse forecasts of biomass resource availability
for the energy sector, in a future pathway where prime focus has been placed on expanding
the UK bioenergy sector.
A. Scenario Context
As already discussed within the Thesis Introduction (Chapter 1), the UK has legally binding
CO2 emission and renewable energy targets; including a series of bioenergy targets relating to
heat, power, transport fuel, and overall energy generation [7], [58], [254]. The Energy Focus
Scenario sets out a future pathway where the maximum achievable levels of bioenergy are
generated, from indigenous biomass resources. The strategy is for the UK to maximise its
Andrew Welfle - ID: 81163530
205
bioenergy generation potential through the utilisation of indigenous resources, and reduce
potential reliance on imported resources.
B. A Pathway with Energy Focus
The concept behind this scenario is to explore the upper limits of indigenous biomass
resources that could realistically be mobilised for the bioenergy sector, to 2050. This involves
mobilising and pushing the limits on resource availability, across the range of biomass
categories.
Within this future pathway the upper limits of available and suitable land (after food demands
are met), is dedicated for the potential growth of biomass resources and energy crops [136],
[137], [237]. The energy focus scenario will reflect the Forestry Commission’s Forest
Expansion and Productivity Forecasts [190]–[197], that provide the greatest resource
potential for the bioenergy sector. A further future opportunity explored, is highlighted by
The Independent Panel on Forestry [365], “Only 52% of UK forests and woodland are
currently actively managed, so major resource use opportunities may exist if progress is
made in this area”.
There are also notable biomass resource opportunities potentially available for the bioenergy
sector, in the form of wastes and residues from on-going activities in the UK [275]. As such,
a future pathway with energy focus will work towards achieving increased harvest and
collection (biological & realistic) limits for biomass residues, from forestry, agricultural, and
industrial processes. The waste generation and management strategies adopted, also reflect
DEFRA’s forecast pathways where energy recovery is the focus [206], [215]–[218], [282].
A summary of the key focus areas and an overview of the studies, reports, and literature
utilised to develop the future Ene-F pathway, are shown in Table 6.2. An overview of the UK
BRM supply chain driver characteristic data, are listed within Appendix 8.0.
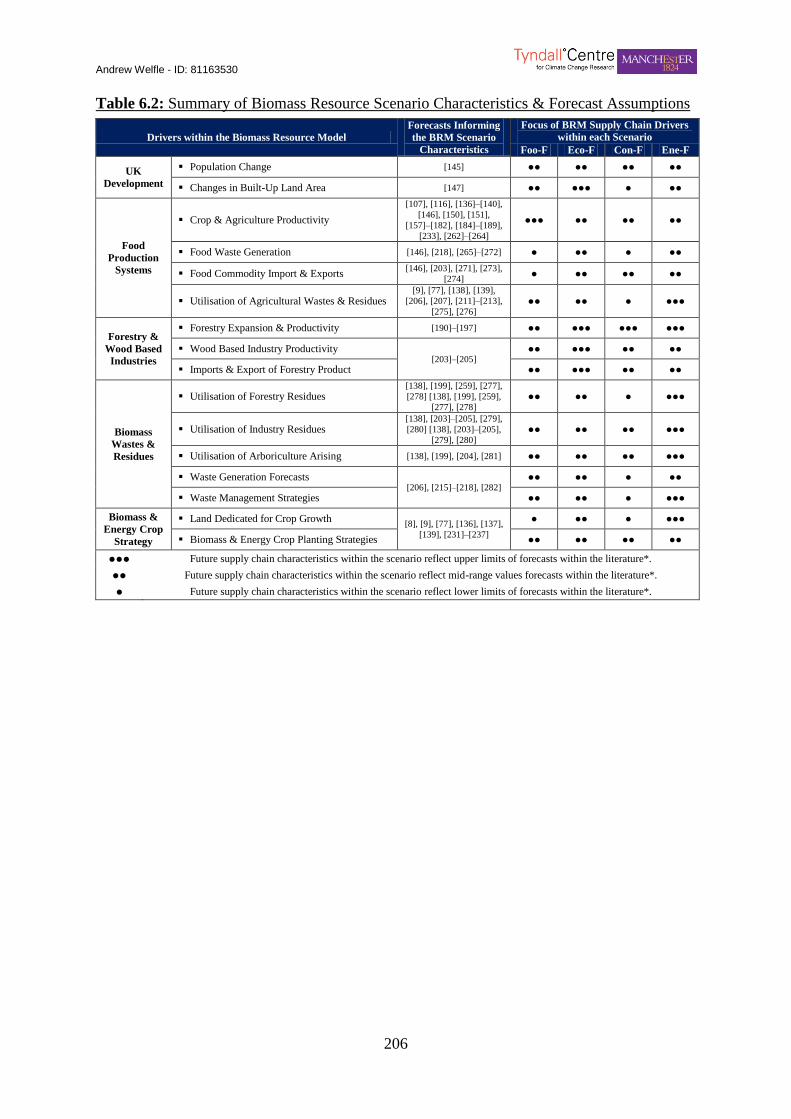
Andrew Welfle - ID: 81163530
206
Table 6.2: Summary of Biomass Resource Scenario Characteristics & Forecast Assumptions Table 32) Table 6.2: Summary of Biomass Resource Scenario C haracteristics & Forecast Assumptions
Drivers within the Biomass Resource Model
Forecasts Informing
the BRM Scenario
Characteristics
Focus of BRM Supply Chain Drivers
within each Scenario
Foo-F Eco-F Con-F Ene-F
UK
Development
Population Change [145] ●● ●● ●● ●●
Changes in Built-Up Land Area [147] ●● ●●● ● ●●
Food
Production
Systems
Crop & Agriculture Productivity
[107], [116], [136]–[140],
[146], [150], [151],
[157]–[182], [184]–[189],
[233], [262]–[264]
●●● ●● ●● ●●
Food Waste Generation [146], [218], [265]–[272] ● ●● ● ●●
Food Commodity Import & Exports [146], [203], [271], [273],
[274] ● ●● ●● ●●
Utilisation of Agricultural Wastes & Residues [9], [77], [138], [139],
[206], [207], [211]–[213],
[275], [276] ●● ●● ● ●●●
Forestry &
Wood Based
Industries
Forestry Expansion & Productivity [190]–[197] ●● ●●● ●●● ●●●
Wood Based Industry Productivity [203]–[205]
●● ●●● ●● ●●
Imports & Export of Forestry Product ●● ●●● ●● ●●
Biomass
Wastes &
Residues
Utilisation of Forestry Residues [138], [199], [259], [277],
[278] [138], [199], [259],
[277], [278] ●● ●● ● ●●●
Utilisation of Industry Residues [138], [203]–[205], [279],
[280] [138], [203]–[205],
[279], [280] ●● ●● ●● ●●●
Utilisation of Arboriculture Arising [138], [199], [204], [281] ●● ●● ●● ●●●
Waste Generation Forecasts [206], [215]–[218], [282]
●● ●● ● ●●
Waste Management Strategies ●● ●● ● ●●●
Biomass &
Energy Crop
Strategy
Land Dedicated for Crop Growth [8], [9], [77], [136], [137],
[139], [231]–[237]
● ●● ● ●●●
Biomass & Energy Crop Planting Strategies ●● ●● ●● ●●
●●● Future supply chain characteristics within the scenario reflect upper limits of forecasts within the literature*.
●● Future supply chain characteristics within the scenario reflect mid-range values forecasts within the literature*.
● Future supply chain characteristics within the scenario reflect lower limits of forecasts within the literature*.

Andrew Welfle - ID: 81163530
207
6.2 UK Biomass Availability & Bioenergy
The following section presents and discusses the results of the scenario analyses, undertaken
within the UK BRM. This includes an analysis of UK land utilisation, biomass resource
availability, and bioenergy potential; from each of the scenarios over the analysis timeframe.
The key scenario analysis outputs and conclusions are then summarised and taken forward to
Chapter 10, where they are discussed in relation to the wider research findings.
6.2.1 Biomass Resource Scenarios – Land Utilisation Forecasts
The first analysis presented, documents how UK land is utilised within each of the developed
scenarios. This is reflected by Figure 6.2, where the stacked bar charts reflect the breakdown
of UK land between the different key land-use categories. The corresponding data from this
analysis is also listed within Appendix 8.0. Areas of land with characteristics unsuitable for
crop growth such as: rivers, mountains, coasts and lakes; are excluded from the analysis and
are not reflected within Figure 6.2.
The ‘Other Land’ category within Figure 6.2 represents the area of land that could potentially
be utilised for resource growth, but is currently un-utilised in that respect. The ‘Land
Dedicated for Biomass & Energy Crops’ category, reflects the area of land within each
scenario that has been specifically dedicated for growth of biomass, for the bioenergy sector.
The ‘Built-Up Land Area’ category reflects land that is developed; such as that utilised for
buildings, roads and infrastructure. ‘Agriculture Land’ represents the land area within each
scenario dedicated to both pastoral and arable food productivity. The ‘Forestry and
Woodland’ category reflects the area of both managed and unmanaged forests / woodlands,
within each scenario.
A. Scenario Analysis Results
Figure 6.2 allows the evaluation of how, shifts in land-use change occur within each of the
scenarios, over the analysis timeframe. Many of these trends are straightforward to explain;
however, a number of further emerging trends are worthy of further analysis.
As may be expected, the proportion of UK land dedicated for forests is shown to be greatest
within the Con-F scenario; although overall there is only marginal variation in the area of
forested land area between each of the scenarios. A similar level of variation is demonstrated
for the Con-F, Eco-F, and Ene-F scenarios, in terms of the land area dedicated to agriculture.
An interesting trend is shown within the Foo-F scenario, where the land dedicated for
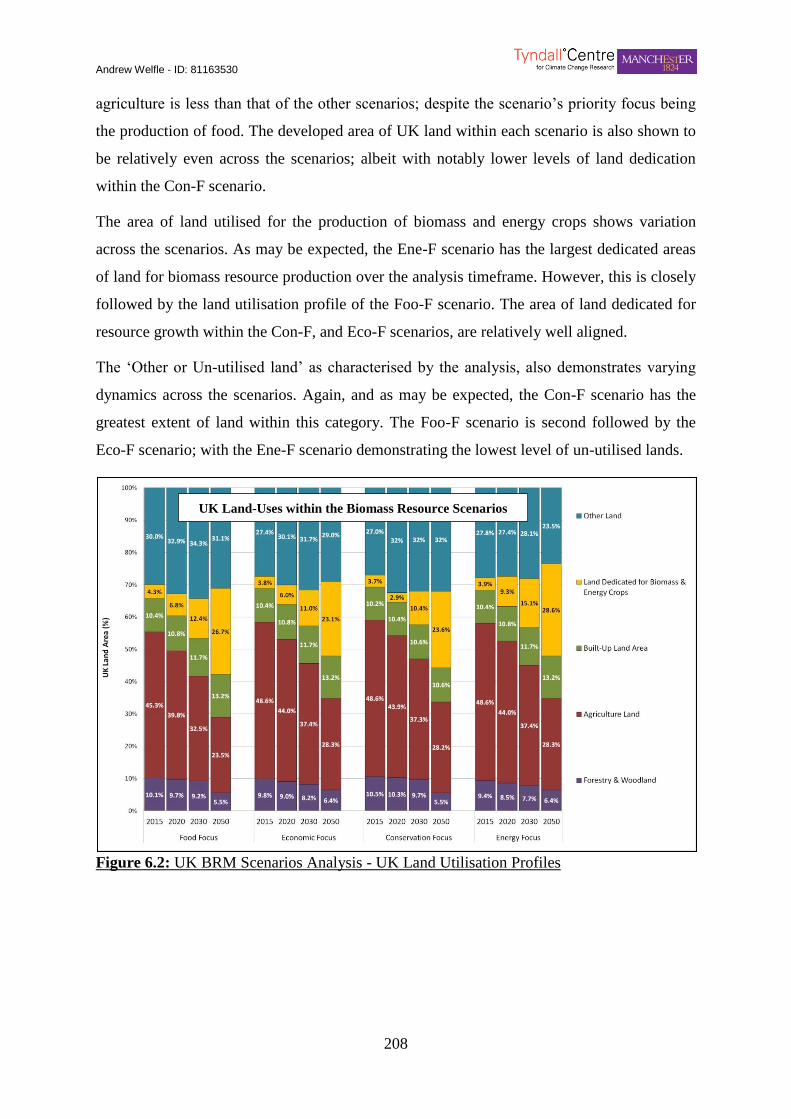
Andrew Welfle - ID: 81163530
208
agriculture is less than that of the other scenarios; despite the scenario’s priority focus being
the production of food. The developed area of UK land within each scenario is also shown to
be relatively even across the scenarios; albeit with notably lower levels of land dedication
within the Con-F scenario.
The area of land utilised for the production of biomass and energy crops shows variation
across the scenarios. As may be expected, the Ene-F scenario has the largest dedicated areas
of land for biomass resource production over the analysis timeframe. However, this is closely
followed by the land utilisation profile of the Foo-F scenario. The area of land dedicated for
resource growth within the Con-F, and Eco-F scenarios, are relatively well aligned.
The ‘Other or Un-utilised land’ as characterised by the analysis, also demonstrates varying
dynamics across the scenarios. Again, and as may be expected, the Con-F scenario has the
greatest extent of land within this category. The Foo-F scenario is second followed by the
Eco-F scenario; with the Ene-F scenario demonstrating the lowest level of un-utilised lands.
Figure 6.2: UK BRM Scenarios Analysis - UK Land Utilisation Profiles
58) Figure 6.2: UK BRM Scenarios Analys is - UK Land Utilisation Profiles
UK Land-Uses within the Biomass Resource Scenarios

Andrew Welfle - ID: 81163530
209
B. Scenario Analysis Discussions
There are a series of obvious and interesting trends demonstrated within the land utilisation
analysis, for each scenario. The main focus in carrying out this evaluation is to provide a
greater depth of understanding of the dynamics within each scenario.
An example of a relatively obvious analysis outcome can be seen in the evaluation of the
extent that UK land is dedicated to forests, within each scenario. As maybe expected, the
Con-F scenario dedicates the largest area of land of all the scenarios to forests; reflecting the
scenario’s focus on forestry growth and lower limits of exploitation. The relatively small
range of variation between all the scenarios perhaps reflects a parameter limitation of the
BRM. The developed scenarios all utilise UK Forestry Commission forest system scenario
forecasts; thus the limits of forestry expansion within the UK BRM are reflective of the
Forestry Commission’s outlook.
The agricultural land utilisation profiles within each scenario, document some noteworthy
trends. Little variation exists between the agricultural land within the Ene-F, Con-F, and Eco-
F scenarios, but in the Foo-F scenarios where a greater extent of agricultural land may be
expected, the opposite trend is actually realised. Despite the focus of this scenario being to
enhance food productivity, this analysis highlights that the combined characteristics of this
scenario, result in less agricultural land being required to produce more food. This suggests
that a future pathway that focuses on enhancing the productivity of the land and agricultural
systems, in addition to increasing the efficiency of food systems through reducing wastes;
may have important feedback benefits for the land system.
A further straight forward observation is seen within the built-up land area analysis, where
the Con-F scenario is shown to have lower trends of developed land area compared to the
other scenarios. This can be directly linked back to the development of the scenarios, where
the Con-F scenario future pathway, assumes that lower levels of future development will take
place on land that could otherwise be useful to agricultural systems.
The area of available land utilised for the production of resources for the bioenergy sector, is
shown to be greatest within the Ene-F scenario; this dynamic reflecting the scenario’s aim to
maximise resource availability, including the higher limit utilisation of available land. The
interesting outcome from this section of the analysis comes from the Foo-F scenario, where a
greater proportion of land can be seen to be utilised for biomass resource and energy crop
growth, exceeding that within the Eco-F and Con-F scenarios. Despite this scenario’s focus
Andrew Welfle - ID: 81163530
210
being the production of food, the Foo-F scenario is shown to be able to achieve this target
whilst also dedicating larger areas of land for biomass and energy crop growth for the
bioenergy sector. The root of this dynamic, once again can be linked back to the increased
productivity of the food systems, and the feedback benefit of more land being available for
alternative uses.
This dynamic is further highlighted within the ‘Other land’ category of the analysis, where
the Foo-F scenario again demonstrates comparatively large areas of land that are un-utilised
in terms of the analysis characteristics. Only the Con-F scenario is documented to have
greater land in this category, reflecting this scenario’s focus on reduced land for biomass
resource production, and natural resource utilisation.
6.2.2 Biomass Resource Scenarios – Resource Availability Forecasts
Figure 6.3 and the data within Appendix 8.0 document the forecast availability of each
specific biomass resource within each of the developed scenarios, to 2050. The stacked bar
charts within Figure 6.3, demonstrate the availability of different biomass resources over the
analysis timeframe. The stacked lines joining these bars provide segregation, highlighting the
different resources within each of the biomass categories (Table 4.1). The grouping of the
resources into their respective categories allows higher level analysis, and identification of
the changing trends to 2050.
A. Scenario Analysis Results
A high level evaluation of Figure 6.3 demonstrates that biomass resource availability across
the scenarios reflect a wide range of dynamics and trends. This section sets out to highlight
these, so they can be discussed in depth.
The standout observation from Figure 6.3 is the large potential availability of resources
forecast within the Ene-F scenario, far exceeding that of the other scenarios. The Foo-F
scenario is forecast to have the second greatest abundance of resources, with the Eco-F and
Con-F scenarios trailing closely behind.
UK biomass resources within the Ene-F scenario is forecast to have upper near-term
(2015) availability of >46,000 Tonnes, increasing by 89% to >87,000 Tonnes in 2020,
to >168,000 Tonnes (266% overall increment) by 2030, and to >237,000 Tonnes
(416% overall increment by 2050).
UK biomass resources within the Foo-F scenario is forecast to have upper near-term
(2015) availability of >23,000 Tonnes, increasing by 23% to >34,000 Tonnes in 2020,

Andrew Welfle - ID: 81163530
211
to >63,000 Tonnes (121% overall increment) by 2030, and to >112,000 Tonnes
(297% overall increment by 2050).
UK biomass resources within the Eco-F scenario is forecast to have upper near-term
(2015) availability of >27,000 Tonnes, increasing by 18% to >32,000 Tonnes in 2020,
to >54,000 Tonnes (98% overall increment) by 2030, and to >90,000 Tonnes (235%
overall increment by 2050).
UK biomass resources within the Con-F scenario is forecast to have upper near-term
(2015) availability of >22,000 Tonnes, increasing by 10% to >24,000 Tonnes in 2020,
to >40,000 Tonnes (87% overall increment) by 2030, and to >80,000 Tonnes (272%
overall increment by 2050).
The availability of agricultural residues, grown biomass and energy crops, and household
wastes, are again shown to be dominant across the scenarios; reflecting the results from
Chapter 5. A reverse to this trend is seen within the Con-F scenario, where the availability of
household and all other waste resources, can be seen to gradually decline over the analysis
timeframe. Resources directly available to the bioenergy sector from forestry systems are also
seen to be a notable contributor, within the Ene-F scenario.
Further evaluation of the grown biomass category resources highlights that there is only
marginal variation in the overall availability of these resources, across the scenarios. A
notable dynamic can be seen between the Foo-F and Ene-F scenarios where there is an
overall greater availability of grown resources within the Ene-F scenario; but the Foo-F
scenario can be seen to have a greater proportion of biomass and energy crop resources
available. Little variation in grown resource availability is shown between the Eco-F and
Con-F scenarios.
A further dynamic shown through closer evaluation of the residue biomass category
resources, is the relatively continuous and similar availability of these resources across the
scenarios. Marginally greater levels of agricultural residues are shown to be available within
the Foo-F and Ene-F scenarios; whilst marginally greater levels of industrial residues are
shown to be potentially available within both the Eco-F and Ene-F scenarios. The Con-F
scenario is shown to have marginally lower levels of residue resource availability, compared
to each of the other scenarios.
The availability of waste biomass category resources across the scenarios, demonstrates great
variances. The availability of wastes within the Ene-F scenario far exceeds that of any other

Andrew Welfle - ID: 81163530
212
scenario. At the same time, the availability of waste resources within the Con-F scenario
progressively reduces over the analysis timeframe. Little variance is demonstrated between
the availability of waste resource forecast, within both the Foo-F and Eco-F scenarios.
59) Figure 6.3: UK BRM Scenarios Analys is – Biomass Resource Availabil ities
Figure 6.3: UK BRM Scenarios Analyses – Biomass Resource Availabilities
B. Scenario Analysis Discussions
The range and extent of resources forecast to be potentially available within the Ene-F
scenario may be regarded within this analysis, as the upper limits of resource mobilisation
within the UK. This scenario provides an opportunity to highlight the maximum potential the
UK indigenous resources could provide for the UK bioenergy sector. However, the
indigenous resource potentials forecast within the other scenarios may represent future
pathways the UK could take, and may represent a more credible reality. Therefore, it is
important to not only understand what the upper limit potentials may be, but also to gain a
greater understanding of some of the factors differentiating the other three scenarios. Thus,
the discussions within this section aim to evaluate these key factors and influences.
Across the scenario analyses, a series of key resource categories were again identified as
demonstrating greatest potential availability; these reflecting those previously identified
within the UK Baseline Scenario (Chapter 5), being: household wastes, agricultural residues
and grown biomass, and energy crops. There were a few exceptions such as within the Con-F
scenario, where the scenario’s overarching focus to increasingly reduce, reuse, and recycle
Forecast Availability of Specific Resources for
the Biomass Resource Scenarios
Andrew Welfle - ID: 81163530
213
wastes over the analysis timeframe, resulted in much reduced waste availability forecasts.
Another exception was found within the Ene-F scenario, where the forecast availability of
resources direct from forestry systems are shown to be significant; reflecting this scenarios
overarching focus to increase the productivity of forestry systems.
The analysis has highlighted that across all of the scenarios, the variation in the availability of
resources within the grown biomass category is only marginal. Notable levels of resources
available directly from forestry systems, are forecast within the Ene-F scenario which skews
the availability of grown biomass resource within the Ene-F scenario, upwards. If this
dynamic is overlooked, the overall scenario analyses highlight that the availability of grown
biomass resources and energy crops, reflect only marginal variances. This suggests that there
may be common influences across the scenarios, determining the availability of forestry
resources. As highlighted within the sensitivity analysis (Chapter 5), the utilisation of
available land may be the prime determining factor influencing the availability of these
resources. Differentiation in the extent of land utilisation is defined between the scenarios,
however this marginal variance may be a function of the UK land area itself; with further
variations in proportional utilisation of a limited land area, also equating to limited variance
in resource availability.
The further dynamic identified through closer evaluation of the grown biomass resources
category, is the greater availability of biomass resource and energy crops within the Foo-F
scenario, compared to that within the Ene-F scenario. This is unexpected, as one of the
overarching themes of the Ene-F scenario is the greater utilisation of available land. This
dynamic can again be explained by highlighting areas of positive feedback, resulting from
placing greater focus on food and agricultural systems. Enhancement of, and working
towards greater productivity of both land and agricultural systems, such as reflected within
the Foo-F scenario, also has benefits for resource production for the bioenergy sector. Despite
the Foo-F scenario dedicating a smaller proportion of land for resource growth (Figure 6.2)
compared to the Ene-F scenario; the Foo-F scenario is able to produce more resources from
the land utilised.
The standout result, when focusing on the residue resources analyses, is the continuous
availability of this resource. Both over the analysis timeframe, and when comparing
scenarios, the availability of residue resource is relatively constant; reflecting the key
conclusions from the previous sensitivity analysis sections.

Andrew Welfle - ID: 81163530
214
However, upon closer inspection of the residue resource analysis, trends and relationships do
emerge. Marginally greater levels of agricultural residues are forecast to be available within
both the Foo-F and Ene-F scenarios. This link can be explained within the Foo-F scenario due
to the dynamic that more food commodities are being produced – resulting in greater
opportunities for the availability of residues. Whilst within the Ene-F scenario, this dynamic
may be reflective of the upper limits of agricultural residue collection; harvesting and
utilisation.
A further less pronounced trend demonstrated within both the Eco-F and Ene-F scenarios, are
greater levels of industrial residues forecast as being available. These can be attributed to the
greater forest industry productivity embedded within the Eco-F scenario, and again the
greater utilisation of industrial residues within the Ene-F scenario. The reduced utilisation of
both forestry and agricultural residues within the Con-F scenario is a further dynamic that
sets this scenario apart from the others. It also further explains why overall resource
availability is forecast to be lowest within the Con-F scenario.
Within the scenario analyses, the potential availability of waste resources for the bioenergy
sector is a story of two strategies. The Ene-F scenario adopts a waste generation strategy that
reflects business-as-usual trends over the analysis timeframe, but adopts a waste management
strategy that strongly focuses on energy recovery. As such, the large potential of waste
resources for the bioenergy sector is clearly demonstrated within the Ene-F scenario. In
contrast, the Con-F scenario adopts a waste generation strategy that moves towards waste
reduction over the analysis timeframe, and a waste management strategy that focuses on the
reuse and recycling of waste resources. The available waste resources within the Con-F
scenario fall over the analysis period, reflecting a much less promising opportunity for the
bioenergy sector. This analysis reaffirms the conclusions developed within the previous
sensitivity analysis sections, once again stressing the importance of a waste strategy focus if
energy from wastes is targeted.
6.2.3 Biomass Resource Scenarios – Bioenergy Potential Forecasts
The analysis focusing on the bioenergy potential of the different scenarios is documented
within Figure 6.4, and supported by the data listed within Appendix 8.0. Figure 6.4 highlights
the bioenergy generation potential for each of the core scenarios, and also for the Ene-F sub-
scenarios; where the prioritisation of the different conversion pathways is explored. The
bioenergy potential forecasts are plotted for comparison against DECC’s (2010) [34] forecast
range for future UK primary energy demand. UK renewable energy and bioenergy
Andrew Welfle - ID: 81163530
215
contribution targets [8], [357], [358], are also highlighted within Figure 6.4; represented by
the triangle and dash markers respectively.
A. Scenario Analysis Results
Figure 6.4 highlights the broad range of bioenergy potential forecasts of the different
scenarios; these energy values representing the potential levels of bioenergy generated when
all of the resources quantified within Figure 6.4, are converted to bioenergy.
Comparisons of the bioenergy potential analysed for each of the core scenarios, demonstrates
that the Ene-F scenario is forecast to provide the greatest contribution of bioenergy; followed
by the Foo-F scenario, which is in turn followed by the Con-F and Eco-F scenarios.
Indigenous biomass resources within the Ene-F scenario are shown to be able to potentially
contribute as much as 20.8-32.6% towards the UK’s primary energy demand by 2050.
Resources within the Foo-F scenario potentially contributing 16.0-20.0% by 2050; and
between 12.3-19.3% and 11.9-18.6% potential bioenergy contributions from indigenous
resource; respectively for the Con-F and Eco-F scenarios.
Comparisons of the Ene-F sub-scenarios highlight that future pathways with focus on heat
conversion pathways, would generate the greatest bioenergy potential from the resources
available. The transport fuel focused sub-scenario, showing the least energy potential from
the resources available, and the power focused sub-scenario placed between these. The Ene-F
heat sub-scenario, demonstrates that UK indigenous resources could generate between 28.0-
43.9% of the UK’s primary energy demand by 2050. The Ene-F power sub-scenario showing
that between 20.8-32.6% of UK primary energy demand could be delivered; with the Ene-F
transport fuel scenario highlighting that 13.7-21.4% of demand could be met by 2050, from
UK indigenous biomass resources.
In summary, Figure 6.4 highlights that bioenergy generated from indigenous resources within
each of the developed scenarios, could potentially provide a highly significant contribution
towards the UK’s future renewable energy, and bioenergy targets. Bioenergy from these
scenarios are forecast to potentially contribute between 16.3-49.5% towards the UK’s 2020
renewable energy target, and 17.3-53.5% towards the 2030 target. Indigenous resources
within all of the scenarios, aside from the Eco-F and Con-F scenarios; are forecast to be able
to potentially contribute levels of bioenergy, above the UK’s 2050 bioenergy target.

Andrew Welfle - ID: 81163530
216
60) Figure 6.4: UK BRM Scenario Ana lyses – F orecast Bioenergy Potentials & Energy Target Comparisons
Figure 6.4: UK BRM Scenario Analyses – Forecast Bioenergy Potentials & Energy Target
Comparisons
B. Scenario Analysis Discussions
The scenario forecasts of bioenergy potential analyses, demonstrate that if the UK were to
follow these various pathways to mobilise biomass resources in reflection of any of the
developed scenarios; UK indigenous resource could potentially make a significant
contribution to meeting primary energy demand.
As perhaps expected, the Ene-F scenario demonstrates the highest bioenergy potential
forecast; this reflecting the upper limit of biomass resource mobilisation. The Ene-F core and
its related sub-scenarios, providing a potential ‘high level watermark’ of the contributions
that UK indigenous biomass resource could make to the UK energy mix. The main Ene-F
core scenario reflects the conversion of available biomass resource through a broad and
evenly balanced range of conversion pathways, to generate different forms of bioenergy. The
Ene-F sub-scenario forecasts provide an opportunity to analyse the different levels of
bioenergy potentials that may be generated, when different forms of bioenergy are prioritised.
Figure 6.4 clearly highlights that utilising UK indigenous biomass resource within the bio-
heat conversion pathway would generate the most energy, from the resources available.
This is an important analysis output that needs to be analysed further, and is therefore
identified as a key dynamic to be taken forward to the discussions within Chapter 10.
Forecast Bioenergy Potential of Resources
for the Biomass Resource Scenarios
Andrew Welfle - ID: 81163530
217
A further important output from this analysis is the identification that a future pathway that
focuses on the food sector (Foo-F scenario), may also present great opportunities for the
bioenergy sector. Figure 6.4 also demonstrates that the bioenergy potential forecast generated
by the Foo-F scenario noticeably exceeds those of either the Eco-F, or Con-F scenarios. This
reinforces the perceived relationship that exists between food systems and opportunities for
the bioenergy sector. This analysis appears to demonstrate that there may be a stronger link
between the bioenergy sector and the development of food systems, to a far greater extent
than observed with scenarios promoting economic development, or a move towards increased
conservation practices.
The bioenergy potential forecasts from both the Eco-F and Con-F scenarios were found to be
highly aligned. Although the forecast bioenergy potentials from these scenarios don’t appear
as attractive as to those of the Ene-F and Foo-F scenarios; they highlight that there may still
be significant opportunities derived from the mobilisation of large levels of biomass resource
for the bioenergy sector; where wider focus of policies and strategies are directed towards
economic or conservation priorities.
6.2.4 Key Scenario Analyses Conclusions
The following section presents the key conclusions from the biomass resource scenario
analyses undertaken in Chapter 6. These are taken forward to Chapter 10, where discussions
focus on the potential avenues for the development of alternative bioenergy strategies that
could potentially optimise the generation of bioenergy from UK indigenous biomass
resource.
A. High Availability of Biomass Resource without Impacting Food and Industrial Systems
Each of the scenarios developed within this Chapter were designed to evaluate the potential
availability of indigenous resources within the UK, for the bioenergy sector; without
adversely impacting on food and industrial productivities. The scenario analyses found that
high levels of indigenous resources could be mobilised without impacting food systems;
including the growth of biomass resources and energy crops without an adverse effect on
food production; and even enhancing food production in the case of the Foo-F scenario. A
wide range of other biomass resources were also identified as providing potential
opportunities for the bioenergy sector without limiting the productivity of UK wood based
industries; and even enhancing the productivity of related industries within the Eco-F
scenario.
Andrew Welfle - ID: 81163530
218
B. Robust & Continuous Resource Availability from On-going UK Activities
Residue resources including: agricultural, forestry, industrial, and arboriculture arisings, were
again found to represent a continuous and robust resource that maintained a high availability,
regardless of the scenario, or time-interval within the analysis timeframe. Agricultural
residues, particularly both straws and slurries were identified as major potential opportunities
for the UK bioenergy sector due to their high abundance, availability robustness, and current
under-utilisation [67].
C. Large Potential from Waste Resources
The potential availability of future waste resources for utilisation within the UK bioenergy
sector was found to hinge on the nature of the focus of implemented waste strategies. Within
the Ene-F scenario where the adopted waste management strategy emphasised energy
recovery, the potential waste resource availability for the bioenergy sector, was shown to be
highly substantial by 2050. Likewise within the Con-F scenario, where a strategy of reduced
waste generation and resource recovery was adopted; the potential for the bioenergy sector
was much less attractive. The abundance of household, food, and organic waste streams, were
again documented as showing particular potential for the UK bioenergy sector.
D. Food Focus Positive Feedback Benefit
Throughout the scenario analyses, it was increasingly highlighted that a future pathway that
emphasised an increase in food productivity, and reduction of wastes from food systems, as
modelled within the Foo-F scenario; resulted in large potential feedback benefits for the
bioenergy sector. Increasing the productivity of the land not only resulted in increased food
security and self-sufficiency, but ultimately resulted in less land being required to produce
more food; potentially freeing up additional land for biomass resource and energy crop
growth.
E. Heat Conversion Pathways Providing Most Energy Efficient Use of Resources
The energy sub-scenario analyses focusing on different bioenergy conversion pathways,
highlighted that the prioritisation of heat bioenergy conversion pathways with suitable
resources; resulted in the greatest levels of bioenergy generation. This suggests that possibly
the best pathway for the UK to optimise the energy potential of its indigenous biomass
resources, may be to direct selected resources for the bio-refinery industries, with all
remaining suitable resources being dedicated for heat generation pathways. Generation of
renewable electricity, potentially being better achieved through alternative technology
pathways.
Andrew Welfle - ID: 81163530
219
Chapter 7 - The Future UK Energy & Bioenergy System

Andrew Welfle - ID: 81163530
220
7.1 Current & Future UK Bioenergy Sector
Chapter 7 directs focus of the Thesis onto the UK bioenergy sector. The Chapter includes a
description of the present-day status of the UK bioenergy sector, and a discussion of the
possible future directions that the sector could take to 2050. The nature and direction of the
UK bioenergy sector being a key theme, and an important moving component within the
wider context of this research project.
In the previous Chapter, biomass resource scenarios were developed to evaluate different
pathways that the UK could take; analysing the potential availability of different UK biomass
resources within each scenario, and evaluating the bioenergy that could potentially be
generated from these resources. Chapter 7 continues the progress of the research, taking the
next step in asking, what types and how much biomass, will the UK bioenergy sector actually
require in the future? Chapter 7 links the conclusions from these discussions with those of the
scenario analyses from Chapter 6; highlighting approximately what the UK may be able to
produce / mobilise indigenously, and what may need to be imported from abroad in order to
balance demands.
Chapter 7 starts by highlighting the various UK Government reports and studies that can be
utilised to gain a greater understanding of the nature of the current UK bioenergy sector.
These also allow a greater understanding of how current UK strategies and policies are
steering the bioenergy sector, and provide an indication of the possible future state of the
sector, if these strategies and policies are implemented to fruition.
The Chapter then provides a discussion regarding the various industries that comprise the UK
bioenergy sector, and then moves on to provides an overview of the current status and
possible future development of the UK’s bio-heat, bio-power, and biofuel sectors. The
Chapter also focuses on the specific resources and feedstocks that each of these sectors may
require. Conclusions are then developed, forecasting the predominant biomass resource and
feedstock requirements of the UK bioenergy sector; for the near, mid and long terms, to 2050.
Chapter 7 then moves on to a section of further analysis, where a methodology is developed
to undertake ‘biomass resource balance analyses’. This compares the biomass resource
availability forecasts from each of the scenarios developed within Chapter 6, against the
perceived future resource requirements of the UK bioenergy sector. The conclusions from
these analyses highlighting the likely types, and the extent to which different resources may
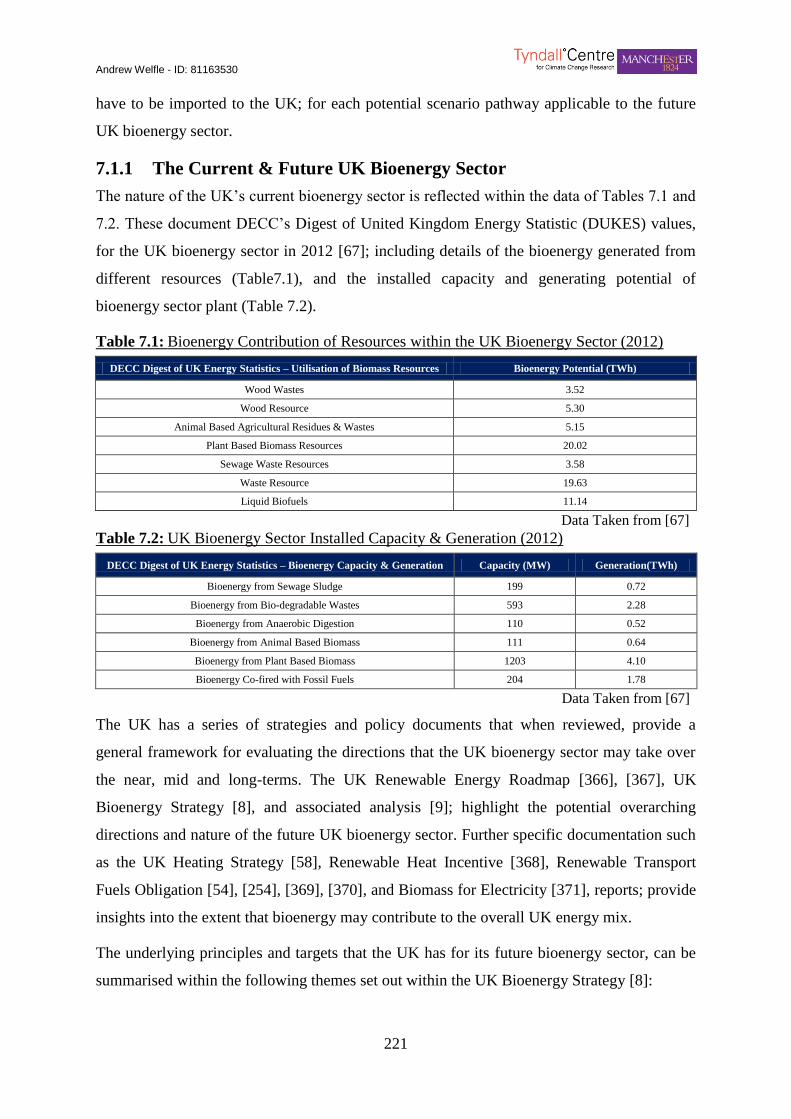
Andrew Welfle - ID: 81163530
221
have to be imported to the UK; for each potential scenario pathway applicable to the future
UK bioenergy sector.
7.1.1 The Current & Future UK Bioenergy Sector
The nature of the UK’s current bioenergy sector is reflected within the data of Tables 7.1 and
7.2. These document DECC’s Digest of United Kingdom Energy Statistic (DUKES) values,
for the UK bioenergy sector in 2012 [67]; including details of the bioenergy generated from
different resources (Table7.1), and the installed capacity and generating potential of
bioenergy sector plant (Table 7.2).
Table 7.1: Bioenergy Contribution of Resources within the UK Bioenergy Sector (2012) Table 33) Table 7.1: Bioenergy Contribut ion of Resources within t he UK Bioe nergy Sector (2012)
DECC Digest of UK Energy Statistics – Utilisation of Biomass Resources Bioenergy Potential (TWh)
Wood Wastes 3.52
Wood Resource 5.30
Animal Based Agricultural Residues & Wastes 5.15
Plant Based Biomass Resources 20.02
Sewage Waste Resources 3.58
Waste Resource 19.63
Liquid Biofuels 11.14
Data Taken from [67]
Table 7.2: UK Bioenergy Sector Installed Capacity & Generation (2012) Table 34) Table 7.2: UK Bioenergy Sector Instal led Capacity & Generation (2012)
DECC Digest of UK Energy Statistics – Bioenergy Capacity & Generation Capacity (MW) Generation(TWh)
Bioenergy from Sewage Sludge 199 0.72
Bioenergy from Bio-degradable Wastes 593 2.28
Bioenergy from Anaerobic Digestion 110 0.52
Bioenergy from Animal Based Biomass 111 0.64
Bioenergy from Plant Based Biomass 1203 4.10
Bioenergy Co-fired with Fossil Fuels 204 1.78
Data Taken from [67]
The UK has a series of strategies and policy documents that when reviewed, provide a
general framework for evaluating the directions that the UK bioenergy sector may take over
the near, mid and long-terms. The UK Renewable Energy Roadmap [366], [367], UK
Bioenergy Strategy [8], and associated analysis [9]; highlight the potential overarching
directions and nature of the future UK bioenergy sector. Further specific documentation such
as the UK Heating Strategy [58], Renewable Heat Incentive [368], Renewable Transport
Fuels Obligation [54], [254], [369], [370], and Biomass for Electricity [371], reports; provide
insights into the extent that bioenergy may contribute to the overall UK energy mix.
The underlying principles and targets that the UK has for its future bioenergy sector, can be
summarised within the following themes set out within the UK Bioenergy Strategy [8]:

Andrew Welfle - ID: 81163530
222
Bioenergy is identified as an important part of the UK energy mix that is required if
the UK is to meet its carbon reduction, and renewable technology contribution targets.
Key focus is placed on bioenergy heat and power generation pathways, applying CHP
systems that efficiently utilise recoverable wastes.
Bioenergy heat generation pathways are targeted for high temperature industrial
processes. Also, to provide a transitional energy role for the heating of buildings, and
the use of recoverable waste heat from bio-power and industrial processes.
Target to increasingly utilise biofuels from sustainably sourced feedstocks to produce
biofuels for the transport sector.
Bioenergy technologies are to be utilised to decarbonise current coal plants, through
co-firing and full plant conversions.
Imported resources to the UK are expected to form the majority of that utilised.
Whilst indigenous resources are expected to form a cost effective, sustainable secure
resource base for the UK bioenergy sector.
Table 7.3: UK Renewable Energy Roadmap (2011) Near-Term Bioenergy Estimates by 2020 Table 35) Table 7.3: UK Renewable Energy Roadmap (2011) Near-Term Bioe nergy Estimates by 2020
UK Renewable Energy Roadmap - Bioenergy Pathways UK Bioenergy in 2020 (TWh)
(Central Range Estimate)
UK Biomass Resource Demand for
Energy in 2020 (Mt/yr) (Central Range Estimate)
Bio-power Generation Pathways 32-50 16-22
Bio-Heat Generation Pathways 36-50 5-10
Biofuel Pathways for Transport Up to 48 7-15
Data Taken from [367]
Table 7.3 documents the central range near-term estimates by DECC [367], for how much
energy the UK bioenergy sector could generate by 2020, and how much resource the sector
may require. The following sections provide more detailed discussions, describing the nature
of the current, forecast future, and specific resource requirements of the UK bioenergy sector.
7.1.2 The UK Bio-Heat Sector
This section describes the nature of the current UK bio-heat sector, also describing how the
sector may evolve if the current planned directions for UK bio-heat generation are realised. A
further discussion is provided describing the predominant resources and feedstocks utilised
by the current UK bio-heat sector; also highlighting how these may change in the future.
A. The Current UK Bio-Heat Sector
The contribution of bio-heat systems to the UK’s heating demand is currently small,
reflecting around 1% of total heating demand [8]. However DECC’s Heating Strategy [58]
Andrew Welfle - ID: 81163530
223
confirms that the UK market for lower carbon heating is rapidly expanding, with bio-heat
pathways heavily contributing to this growth. The Strategy confirms the potential application
of bio-heat pathways for space-heating, industrial applications, within wider heat networks,
and to a limited extent; to displace natural gas in the grid with bio-methane.
Although the UK Bioenergy Strategy [8] confirms that within the wider context of
decarbonising the heat sector, bio-heat may only be able to contribute a marginal role; bio-
heat applications focusing on areas of the heat network that may otherwise be difficult to
decarbonise, such as within high temperature industrial processes.
B. The Future UK Bio-Heat Sector
However, from the UK’s current low base of bio-heat contribution, the introduction of the
Renewable Heat Incentive [368], has committed the Government to an ambition for 12% of
the Country’s heat to be sources from renewable pathways; with much of this being from
biomass [372]. This would equate to bio-heat contributing around 6% of the UK’s heat
energy demands by 2020 [8].
The UK Bioenergy Strategy [8], also lays out a number of key potential applications for
bioenergy heating that are deemed to be cost-effective, and low risk for the near and medium
term. They can be summarised as follows:
Large on-going role in replacing conventional fossil fuel based high temperature
industrial processes.
A near and medium term transitional role in decarbonising both domestic and non-
domestic heating demands. Particularly where alternative low carbon technologies are
not suitable.
A potential medium term role for biogas for space heating applications, and within the
longer term for high-temperature industrial process heating.
Increasing role in heating buildings through networks utilising waste heat from
biomass based power plants, and bioenergy driven industrial processes.
The long term future for UK bio-heat applications is expected to become increasingly
important with the further development and deployment of carbon capture and storage
technologies; especially within district heating and industrial applications [8]. An
increasingly greater role from bioenergy heating pathways is also expected, if higher levels of
biomass resources are available in the future [366].
Andrew Welfle - ID: 81163530
224
C. UK Bio-Heat Sector Feedstock and Resource Demands
Currently in the UK, both wood pellets and chips are the predominant feedstocks utilised
within bio-heat systems; the Forestry Commission [373], confirming that only one sixth of
pellets currently utilised within the UK are produced from UK forestry systems; the
remaining being imported. Pellets in the UK are used extensively in both the domestic, and
small and medium commercial sectors [374].
The Forestry Commission [373], also confirm that almost all wood chips currently utilised
within the UK bio-heat systems, are sourced from the UK; the chips predominantly composed
of wood from UK industry residues, forestry residues, arboriculture arisings, and residues
from other processes.
DUKES [67], also confirms that bio-heat generation is being undertaken directly or following
applicable pre-treatments, using the following resources: sewage sludge, wood fuel, animal
based wastes and residues, plant based residues, and biodegradable wastes.
Future potential growths of the UK’s bio-heat sector will likely lead to an increased demand
for imported wood pellets and chips, if current trends continue; and also increased demands
for feedstocks to meet the requirements of bioenergy conversion pathways to produce
biogases [136]–[138], [374].
7.1.3 The UK Bio-Power Sector
This section describes the nature of the current UK bio-power sector, also describing how the
sector may evolve if the current planned directions for UK bio-power are realised. Further
focus is also placed on discussing the role that biomass fulfils within UK’s co-firing
bioenergy pathways. The predominant resources and feedstocks utilised to generate direct
bio-power, and / or within co-firing pathways, are highlighted. Future potential resource
utilisation trends are also discussed.
A. The Current UK Dedicated Bio-Power Sector
In 2011, bio-power generation contributed less than 3% to the total electricity generated in
the UK [8]; although the relative cost-effectiveness of bio-power pathways, compared to
alternative renewable technologies, makes it an attractive option for increased contribution in
the UK, towards delivering renewable energy targets [9].
Currently a broad range of dedicated bio-power technologies are utilised in the UK, including
notable electricity generation contributions from: anaerobic digestion, direct combustion, and
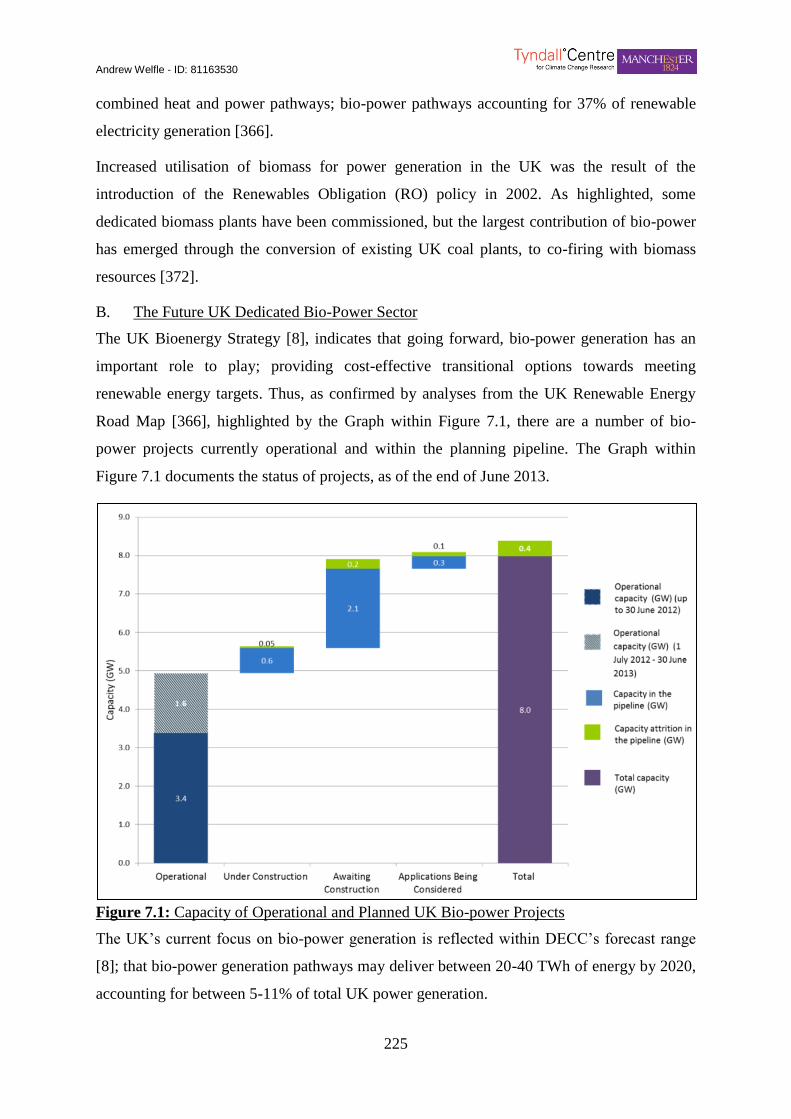
Andrew Welfle - ID: 81163530
225
combined heat and power pathways; bio-power pathways accounting for 37% of renewable
electricity generation [366].
Increased utilisation of biomass for power generation in the UK was the result of the
introduction of the Renewables Obligation (RO) policy in 2002. As highlighted, some
dedicated biomass plants have been commissioned, but the largest contribution of bio-power
has emerged through the conversion of existing UK coal plants, to co-firing with biomass
resources [372].
B. The Future UK Dedicated Bio-Power Sector
The UK Bioenergy Strategy [8], indicates that going forward, bio-power generation has an
important role to play; providing cost-effective transitional options towards meeting
renewable energy targets. Thus, as confirmed by analyses from the UK Renewable Energy
Road Map [366], highlighted by the Graph within Figure 7.1, there are a number of bio-
power projects currently operational and within the planning pipeline. The Graph within
Figure 7.1 documents the status of projects, as of the end of June 2013.
61) Figure 7.1: Capacity of Operational and Planned U K Bio-power Projects
Figure 7.1: Capacity of Operational and Planned UK Bio-power Projects
The UK’s current focus on bio-power generation is reflected within DECC’s forecast range
[8]; that bio-power generation pathways may deliver between 20-40 TWh of energy by 2020,
accounting for between 5-11% of total UK power generation.
Andrew Welfle - ID: 81163530
226
However, beyond 2020, the analyses of the Bioenergy Strategy [8], [9], forecasts that the
cost- effectiveness of deploying bio-power generation pathways is likely to significantly fall.
This forecast trend resulting from the currently perceived need during this timeframe, to
tackle the ‘harder-to-decarbonise’ sectors, such as aviation and shipping. The nature of the
UK bio-power sector after 2020, being forecast to be limited to generation pathways that will
focus on contribution towards peak electricity, utilising wastes, CHP systems, and the
application of bio-methane in high-efficiency generation systems.
The Bioenergy Strategy [8], confirms that in the longer term up to 2050, the prospect of
utilising biomass for power generation should be treated with caution; unless effective linked
carbon capture and storage technologies emerge.
C. Current UK Bio-Power Sector Co-firing with Fossil Fuels
In 2010, coal generation in the UK provided 108 GWh of power, representing 28% of the
total power generated [67]. The utilisation of biomass co-fired with coal within existing
converted coal fired plants, is both a low-cost renewable energy, and a technology that is
reducing the carbon footprint of the UK energy system [8]. The combustion systems of
modern power plants allow the substitution of coal with biomass, up to approximately 5-10%
biomass contribution; without the need for significant mechanical changes [67].
DECC’s analysis carried out within the UK Bioenergy Strategy [8], [9], confirms that as
biomass displaces coal within the feedstock mix, the cost of each tonne of CO2 mitigated
within a co-firing power station, is significantly less compared to a dedicated bio-power
plant. Also, within the current sustainability criteria, the analysis also documents that the
conversion of existing coal plant, may lead to a carbon saving of at least 624 kg of CO2/MWh
of power generated. The capacity of bio-power co-firing plants in the UK in 2012 was 204
MW (Table 7.2) [67].
Initial policies that cleared the path for the emergence of bioenergy co-firing pathways in the
UK were aimed at being transitional technologies. The target was to encourage the
establishment of large-scale UK energy crop production, and the commissioning of a series of
dedicated bio-power plants. However, it has become increasingly clear that these intentions
are not feasible in practice - resulting from the lack of confidence in the long term value of
the technology pathway, given the uncertain lifespan of coal plants, and the perception of
there being insufficient UK biomass to satisfy a rapidly growing demand for suitable biomass
resource [372].

Andrew Welfle - ID: 81163530
227
D. Future UK Bio-Power Sector Co-firing with Fossil Fuels
Whilst the deployment of dedicated bio-power plants may be less cost-effective in their
abatement of carbon emissions compared to co-fired converted plant; dedicated bio-power
plants will largely achieve higher bioenergy conversion efficiencies, and will have much
longer life spans than converted plants [8].
It is expected that in the 2020’s, over 20 GW of the UK’s existing coal and nuclear power
plants will close. This being the result of many of these power plants reaching the end of their
natural life-spans [372], but also significantly for the fossil fuel based plants, the added
economic pressures from the EU Emissions Trading System (EU ETS) [375], and the
Industrial Emissions Directive (IED) [376].
As such, bio-power co-firing is very much regarded as a short to mid-term option within the
UK that allows the rapid decarbonisation of the UK power sector, the extension of the
lifespan of generating assets, and the time to allow transition to alternative more sustainable
low carbon generation technologies [366].
E. UK Bio-Power Sector Feedstock and Resource Demands
A large number of reports and studies describe the biomass resources currently utilised within
the UK bio-power sector [67], [371], [377]–[379]. DUKES statistics [67], confirm that the
predominant feedstocks are sewage sludge, biodegradable wastes, and both plant and animal
based biomass resources. DECC collates databases describing the utilised feedstocks; for the
development of analyses in relation to the Renewable Obligation (RO) reporting. For the
period 2011-2012 [371], wood based feedstocks contributed 1.7 million odt of resource to
UK bioenergy pathways (52% UK sourced, 48% imported), and non-wood based feedstock
contributed 4.0 million odt of resource (70% UK sources, 30% imported).
Table 7.4: Feedstock Co-fired with Fossil Fuels in the UK Table 36) Table 7.4: Feedstoc k Co-fired w ith Fossil Fuels in the UK
Feedstocks Utilised within UK Bio-Power Co-firing Pathways Capacity (TWh)
Biomass & Energy Crops (SRC, Willow, Miscanthus) UK
Shea Residues (Meal & Pellets) Imported
Sunflower Pellets Imported
Sewage Sludge & Waste Derived Fuels UK
Cereal Crop Agricultural Residues & Pellets UK
Tallow UK
Olive Wastes (Residue & Expeller) Imported
Wood (Sawdust, Chips, Pellets) UK & Imported
Palm Residues (Palm Kernel Expeller, Shell, Pellets, Oil) Imported
Taken from [77], [380], [381]

Andrew Welfle - ID: 81163530
228
Table 7.4 demonstrates the typical contribution of different feedstocks to co-firing pathways
in the UK. Also, highlighting the typical location from where these resources are sourced. As
described within the previous sections, power generation from co-firing pathways is likely to
experience large increases over the near and medium terms in the UK. Therefore, it is the
demand for the resources listed within Table 7.4 that will most likely reflect the sharpest
increases; with a large proportion of future resources having to be imported to balance
demand.
7.1.4 The UK Bio-Fuel Sector
This section describes the nature of the current UK bio-fuel sector, also describing how the
sector may evolve, if the current planned directions for UK bio-fuel contribution to the
transport sector are realised. A further discussion is provided, describing the predominant
resources and feedstocks utilised to currently produce biofuels in the UK; also highlighting
how these may change in the future.
A. The Current UK Bio-Fuels Sector
For as long as the UK utilises fossil fuels to power its transport sector, sustainable first
generation biofuels such as biodiesel, bio-ethanol, and bio-methane; may provide a cost-
effective contribution option for reducing the carbon emission of UK transport [8].
The Renewable Transport Fuel Obligation (RFTO) is the UK Government’s primary policy
for reducing the carbon emissions from the transport sector [369]. Biofuels are at the heart of
this policy, where in 2010 >1.5 million litres of biofuels were blended with conventional
fuels and utilised within the UK transport system; equivalent to 12.8 TWh of energy and
3.3% of total road fuel demand [8]. In 2010, biodiesel contributed 71% towards this total with
bio-ethanol providing the remaining. However, the composition of biofuels utilised within the
UK has since been shifting and currently reflect a near balance between biodiesel and bio-
ethanol [366].
B. The Future UK Bio-Fuels Sector
In the medium term, the UK Government believes that biofuels will provide an increasing
contribution towards balancing fuel demands. Building on the base developed by the RFTO,
the growth of advanced biofuels from lignocellulosic feedstocks such as woods and wastes;
are forecast to play an increasing role in reducing transport emissions through the 2020’s [8],
[366].

Andrew Welfle - ID: 81163530
229
However, analysis carried out by DECC linked to the UK Bioenergy Strategy [8], [9],
concluded that the potential long-term contribution of biofuels within the transport sector, is
uncertain; the future role of biofuels likely linked to the availability of feedstocks, the
adherence to widening sustainability requirements, the costs of biofuels, and emerging
competition from other technologies such as ‘Ultra Low Emission Vehicles’.
Figure 7.2 presents a graph produced by DECC [8], which demonstrates the current long term
uncertainty of the contribution of biofuels in the UK. The Graph highlights the range of
biofuel contribution forecasts developed through DECC’s scenarios analysis. The presented
results demonstrate that the future availability of different feedstocks, and the success of
future bio-carbon-capture-storage (Bio-CCS) technologies; may be key drivers influencing
the future contribution of different biofuels for transportation categories.
62) Figure 7.2: Potential Delivered Energy from U se of Biomass in Transport
Figure 7.2: Potential Delivered Energy from Use of Biomass in Transport
Taken from [8]
DECC’s key conclusion from this particular analysis was: “the importance to keep options
open, neither picking winners nor abandoning the range of low carbon technologies” [8].
This is a stance from the Government that echoes through large areas of UK bioenergy policy
[382].
C. UK Bio-Fuel Sector Feedstock and Resource Demands
As discussed in the previous section, bio-diesel and bio-ethanol are the predominant biofuels
developed and utilised within the UK bioenergy sector. The specific biomass resources and
feedstocks utilised to produce these fuels within UK bio-refineries, are discussed within a
wide range of reports and studies [67], [370], [379], [383]. However, the most descriptive

Andrew Welfle - ID: 81163530
230
statistics can be sourced from the UK Department for Transport; where large databases for
the RTFO are collated to account and verify the sustainability, and carbon intensity of
biofuels produced.
Table 7.5: UK Bioenergy Sector Utilisation of Feedstocks to Produce Biofuels Table 37) Table 7.5: UK Bioenergy Sector Utilisation of Feedstoc ks to Produce Biofuels
Biofuel Type Feedstock Resource Origin
UK Imported
Biodiesel
Oilseed Rape 20.0% 80.0%
Palm Oil 0.0% 100.0%
Soy 0.0% 100.0%
Tallow (category 1) 44.9% 55.1%
Tallow (category 3 or unknown) 100.0% 0.0%
Used Cooking oil 40.6% 59.4%
Bio-ethanol
Corn from the EC 0.0% 100.0%
Corn from outside the EC 0.0% 100.0%
Sugar Beet 57.9% 42.1%
Sugar Cane 0.0% 100.0%
Wheat 0.0% 100.0%
Biogas Municipal Organic Wastes 100.0% 0.0%
Bio-methanol Crude Glycerine 0.0% 100.0%
MTBE Crude Glycerine 0.0% 100.0%
Pure Vegetable oil Used cooking oil 100.0% 0.0%
Proportion of UK Feedstocks 17%
Proportion of Imported Feedstocks 83%
Data Taken from [370]
Table 7.5 highlights such data, representing the feedstocks utilised to produce biofuels over
RTFO Period 5 (15th April 2012 – 14th April 2013) [370]. This table highlights the typical
feedstocks utilised to produce each type of biofuel, and the proportion of these resources that
have been sourced either from the UK, or have been imported. The statistics for this RTFO
Period demonstrate the current heavy reliance on imported resources; a trend that is highly
likely to intensify as the demands for biofuels increase.
7.1.5 UK Biomass Resource Import Forecasts
The accompanying analyses of the 2009 UK Renewable Energy Strategy [7], optimistically
indicated that there could be sufficient biomass resource potential within the UK, to meet the
2020 bio-heat and bio-power demands; also noting albeit without quantification, that
imported biomass resources are likely to play a role within the future UK bioenergy sector.
Successive reports have since increasingly acknowledged the importance of biomass imports,
for meeting the demands of the UK bioenergy sector - given the limited availability of
suitable indigenous resources [384].

Andrew Welfle - ID: 81163530
231
The UK’s increasing demands for biofuels over the long-term, and for feedstocks to co-fire
with coal over the short to mid-term; are identified as the key drivers for increased imports.
The UK having insufficient availability of suitable indigenous resources to balance the
increasing demands of these bioenergy pathways [8], [372], [385].
The graph demonstrated within Figure 7.3 is taken from the UK Bioenergy Strategy [8],
where DECC provides forecast ranges of the potential future domestic, and imported resource
utilisation by the UK bioenergy sector. The graph highlights the assumptions of the analysis.
These being: the potential range of domestic resource utilisation may plateau beyond 2030,
imported resources will be increasingly utilised in reflection of the current bioenergy
strategy’s pathway - peaking in the mid-term to 2030 before dropping, assumedly as
alternative low carbon technologies increase their contribution to the UK energy system.
63) Figure 7.3: Forecast Range of Domestic & Imported Biomass Resource Utilisation
Figure 7.3: Forecast Range of Domestic & Imported Biomass Resource Utilisation
Graph Taken from [8]
However, developing appropriate scenarios that attempt to analyse future biomass import
scenarios is highly complex; due to the multi-level influences and uncertainties related to:
food, energy, competing resource market trends, global emissions policies, and ultimately
costs [103]. Important resource assessments are illustrative rather that robust forecasts of
future trends [384]. An assumption chosen by a number of studies [384], [386], is that 2% of
the total resource available on the global markets may be available for the UK. This 2% value
is chosen as it reflects the UK’s share of global primary energy consumption.

Andrew Welfle - ID: 81163530
232
With this in mind, the only certainties are that if the pathways set out by the current UK
Bioenergy Strategy, mature [8]; the UK will require increasing levels of biomass resource
imports to balance its demands and in the future the UK will be competing within a
potentially volatile global market for resources.
Further potential impacts associated with imported resources include the potentially negative
embodied sustainability concerns ranging from: ecosystem and biodiversity damage, food
security issues for the indigenous rural poor, and concerns resulting from both direct and
indirect land-use change [372]. The future costs associated with ‘secure’ sustainability
certification have been estimated to range from 10-50% added premium [387], [388], which
only serves to add further potential uncertainties for the future bioenergy sector. These issues
are discussed further in Chapter 8 of this Thesis.
7.1.6 Trends and Conclusions of Future UK Bioenergy
Based on discussions within this Chapter, the key trends and conclusions describing the
nature of the potential future UK bioenergy sector are summarised within Table 7.6. The
trends are highlighted, describing how the different forms of the bioenergy sector may change
in the near, medium, and long terms. The predominant types of resources required to meet the
demands of the future bioenergy sector based on current views, are also shown. These
conclusions form the basis for comparisons within the resource balance analysis undertaken
in the following sections.
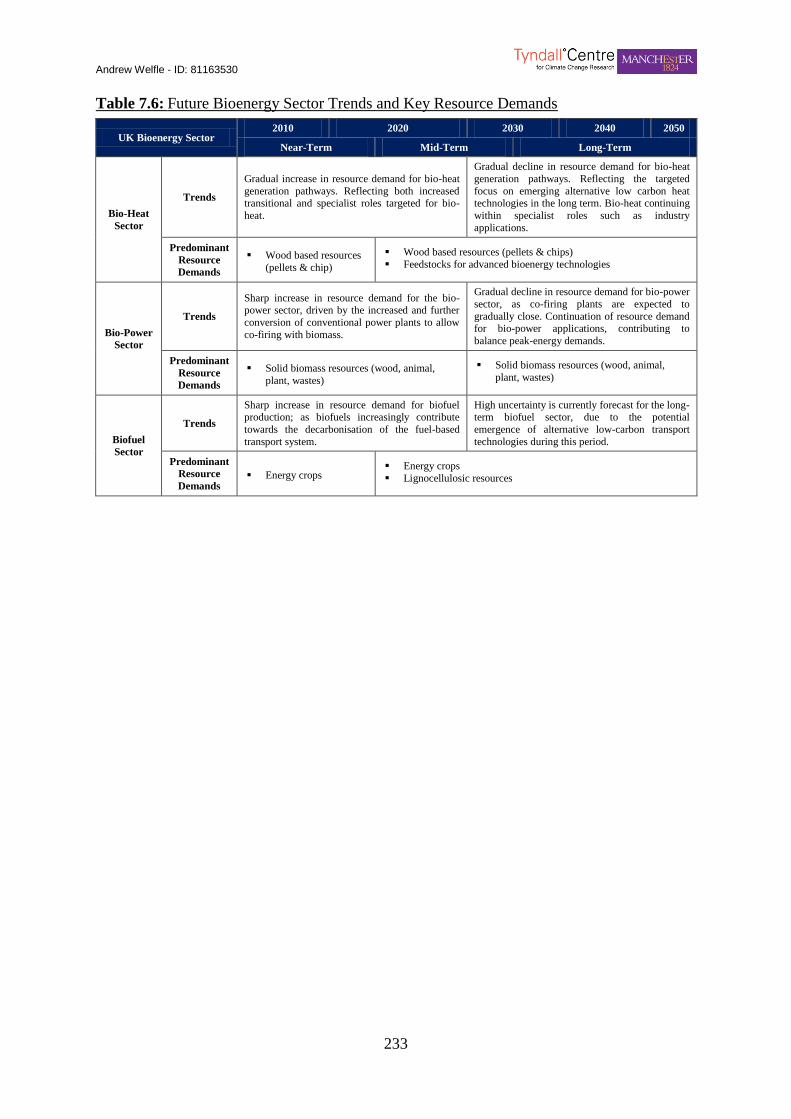
Andrew Welfle - ID: 81163530
233
Table 7.6: Future Bioenergy Sector Trends and Key Resource Demands Table 38) Table 7.6: Fut ure Bioenergy Sector Trends and Key Resource Demands
UK Bioenergy Sector 2010 2020 2030 2040 2050
Near-Term Mid-Term Long-Term
Bio-Heat
Sector
Trends
Gradual increase in resource demand for bio-heat
generation pathways. Reflecting both increased transitional and specialist roles targeted for bio-
heat.
Gradual decline in resource demand for bio-heat
generation pathways. Reflecting the targeted
focus on emerging alternative low carbon heat technologies in the long term. Bio-heat continuing
within specialist roles such as industry
applications.
Predominant
Resource
Demands
Wood based resources
(pellets & chip)
Wood based resources (pellets & chips)
Feedstocks for advanced bioenergy technologies
Bio-Power
Sector
Trends
Sharp increase in resource demand for the bio-power sector, driven by the increased and further
conversion of conventional power plants to allow
co-firing with biomass.
Gradual decline in resource demand for bio-power
sector, as co-firing plants are expected to
gradually close. Continuation of resource demand for bio-power applications, contributing to
balance peak-energy demands.
Predominant
Resource
Demands
Solid biomass resources (wood, animal,
plant, wastes)
Solid biomass resources (wood, animal,
plant, wastes)
Biofuel
Sector
Trends
Sharp increase in resource demand for biofuel production; as biofuels increasingly contribute
towards the decarbonisation of the fuel-based
transport system.
High uncertainty is currently forecast for the long-term biofuel sector, due to the potential
emergence of alternative low-carbon transport
technologies during this period.
Predominant
Resource
Demands Energy crops
Energy crops
Lignocellulosic resources

Andrew Welfle - ID: 81163530
234
7.2 Biomass Resource Balance Analysis
The second part of Chapter 7 introduces the resource balance analysis undertaken within the
research project. This reflects a comparison of the types and extent of resources, forecast to
be required by the future UK bioenergy sector; with the availability of UK indigenous
resources previously forecast within the biomass resource scenarios analysis of Chapter 6.
The main conclusions from this analysis are the evaluation of the extent, and types of
resources that the UK may have to import to balance future demands.
This section progresses with an introduction to the methodologies developed, followed by the
results and discussions, before drawing conclusions for the consequences for the future UK
bioenergy sector.
7.2.1 Resource Balance Analysis Methodology
The methodology for undertaking the resource balance analysis within the research represents
a straightforward comparison of forecasts of future demands, against the potential availability
of resources forecast within scenarios analysis (Chapter 6).
As summarised by Table 7.6, the future demands of the UK bioenergy sector are likely to
vary greatly in both the type, and extent of resources required to 2050; the longer-term
demand forecasts over this timeframe reflecting many uncertainties. Therefore, the resource
balance analysis focuses on the predominant resource requirements of the UK bioenergy
sector, to the medium-term of the analysis timeframe (2020-2030).
The summaries within Table 7.6 conclude that the predominant resource demands of the UK
bio-power and bio-heat sectors, to this medium-term time period; are likely to be typically
wood-based feedstocks for the respective power and heat generation technologies. Whilst the
resource demands for the UK biofuel sector to this medium term, are forecast to be
predominantly energy crops, and later, lignocellulosic resources. Future forecast demands for
each of these resource groups are discussed below.
A. Forecasting the Feedstock Demands of the Future UK Bio-Power and Bio-Heat Sectors
The UK’s future feedstock and resource demands for its bio-power and bio-heat sectors, have
been analysed and forecast by many reports and studies [8], [136]–[138], [372]. The
predominant resource types required to service these sectors are wood-based biomass
resources. These resources are also extensively utilised by a wide range of UK industries that
are competing, or will compete with the UK bioenergy sector.
Andrew Welfle - ID: 81163530
235
Therefore, the resource balance analysis opts to utilise the future UK wood-fibre demand
forecasts, as developed by the ‘Confederation of Forest Industries’ (ConFor), ‘UK Forest
Products Association’ (UKFPA), and the ‘Wood Panel Industries Federation’ (WPIF); in
close collaboration with the UK Forestry Commission [204], [205]. These resource demand
forecasts span to 2025, taking consideration of: the wood-fibre requirements for all UK
wood-based industries, the growing demand for biomass co-firing plants, and the resource
requirements of dedicated bioenergy technologies. The forecasts of this assessment are also
validated through their relative alignment with studies making similar assessments; produced
for DECC [136]–[138].
B. Forecasting the Feedstock Demands of the Future UK Biofuel Sector
There are likewise, many studies and developed scenarios that analyse how the UK’s demand
for biofuels and the feedstocks required to produce biofuels; may change in the future. The
UK Energy Research Centre Report, ‘The UK Energy System in 2050’ [389], evaluates and
compares scenarios developed in a range of key studies; that in part analyse the future
potential directions that the UK transport sector could take, and relevantly, the extent that
biofuels may be utilised. The forecasts of the studies evaluated within this Report [389], form
the baseline for determining the UK’s future biofuel demands within the biomass resource
balance analyse. The scenarios and studies are:
i. UK Energy Research Centre (UKERC) Scenarios
Reports [252], [389]–[391], produced by UKERC; have developed a series of ‘Energy 2050
Scenarios’ over two phases. These reflect a broad range of forecasts for biofuels utilisation by
the future UK transport sector. These scenarios evaluate different pathways with: varying
ranges of carbon reduction targets to 2050 (40-90% from baseline levels), the implementation
of different technologies, the near-term response and implementation of carbon reduction
actions, and different rates of carbon reduction actions over the timeframe. The range of
biofuel utilisation forecasts from the UKERC scenarios, are reflected within the data of Table
7.7.
ii. The UK Committee on Climate Change (CCC) Scenarios
The CCC’s ‘Fourth Carbon Budget Report’ [392], develops a series of scenarios that
represent future biofuel demand forecasts that take a cautionary approach to their wider
utilisation. Within this Report [392], the CCC forecast lower-end biofuel utilisation levels
compared to forecasts produced by other studies; this reflecting the on-going sustainability
concerns relating to land-use stresses, and other wider impacts associated with biofuel
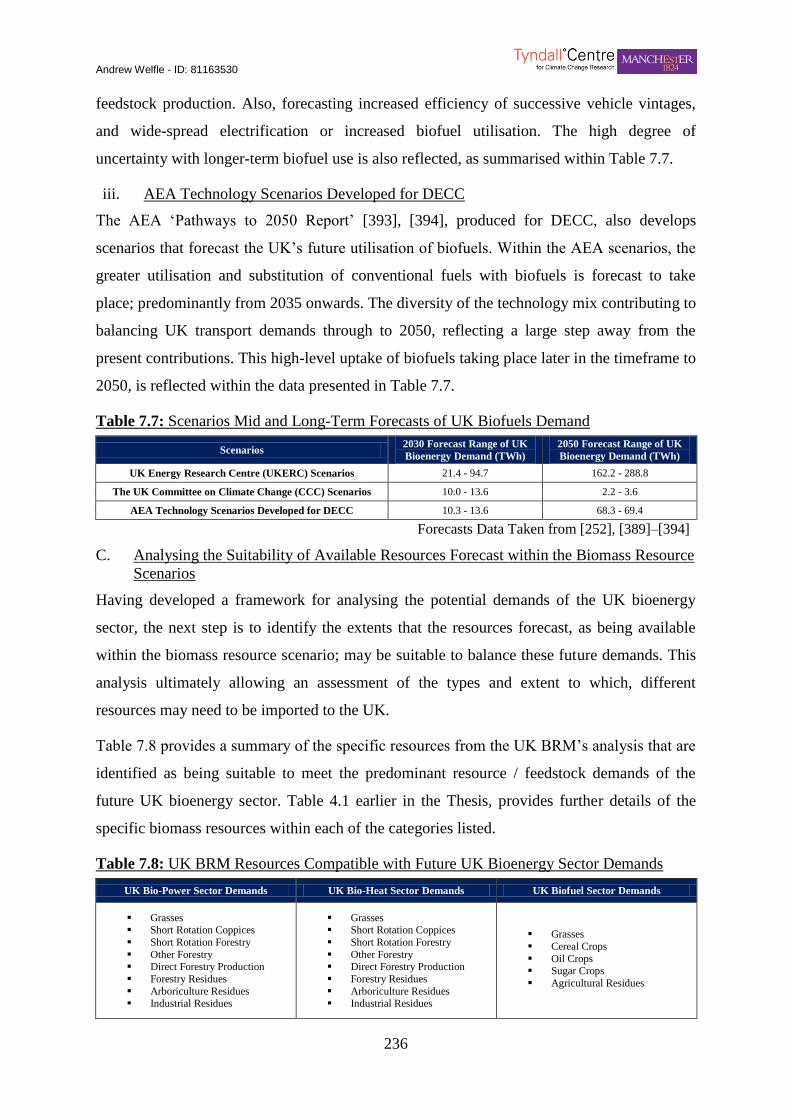
Andrew Welfle - ID: 81163530
236
feedstock production. Also, forecasting increased efficiency of successive vehicle vintages,
and wide-spread electrification or increased biofuel utilisation. The high degree of
uncertainty with longer-term biofuel use is also reflected, as summarised within Table 7.7.
iii. AEA Technology Scenarios Developed for DECC
The AEA ‘Pathways to 2050 Report’ [393], [394], produced for DECC, also develops
scenarios that forecast the UK’s future utilisation of biofuels. Within the AEA scenarios, the
greater utilisation and substitution of conventional fuels with biofuels is forecast to take
place; predominantly from 2035 onwards. The diversity of the technology mix contributing to
balancing UK transport demands through to 2050, reflecting a large step away from the
present contributions. This high-level uptake of biofuels taking place later in the timeframe to
2050, is reflected within the data presented in Table 7.7.
Table 7.7: Scenarios Mid and Long-Term Forecasts of UK Biofuels Demand Table 39) Table 7.7: Scenario s Mid and Long-Term Forecasts of UK Biofuels Demand
Scenarios 2030 Forecast Range of UK
Bioenergy Demand (TWh)
2050 Forecast Range of UK
Bioenergy Demand (TWh)
UK Energy Research Centre (UKERC) Scenarios 21.4 - 94.7 162.2 - 288.8
The UK Committee on Climate Change (CCC) Scenarios 10.0 - 13.6 2.2 - 3.6
AEA Technology Scenarios Developed for DECC 10.3 - 13.6 68.3 - 69.4
Forecasts Data Taken from [252], [389]–[394]
C. Analysing the Suitability of Available Resources Forecast within the Biomass Resource
Scenarios
Having developed a framework for analysing the potential demands of the UK bioenergy
sector, the next step is to identify the extents that the resources forecast, as being available
within the biomass resource scenario; may be suitable to balance these future demands. This
analysis ultimately allowing an assessment of the types and extent to which, different
resources may need to be imported to the UK.
Table 7.8 provides a summary of the specific resources from the UK BRM’s analysis that are
identified as being suitable to meet the predominant resource / feedstock demands of the
future UK bioenergy sector. Table 4.1 earlier in the Thesis, provides further details of the
specific biomass resources within each of the categories listed.
Table 7.8: UK BRM Resources Compatible with Future UK Bioenergy Sector Demands Table 40) Table 7.8: UK BRM Resources Compatible with F uture UK Bioenergy Sector Demands
UK Bio-Power Sector Demands UK Bio-Heat Sector Demands UK Biofuel Sector Demands
Grasses Short Rotation Coppices
Short Rotation Forestry
Other Forestry Direct Forestry Production
Forestry Residues
Arboriculture Residues Industrial Residues
Grasses Short Rotation Coppices
Short Rotation Forestry
Other Forestry Direct Forestry Production
Forestry Residues
Arboriculture Residues Industrial Residues
Grasses
Cereal Crops
Oil Crops Sugar Crops
Agricultural Residues
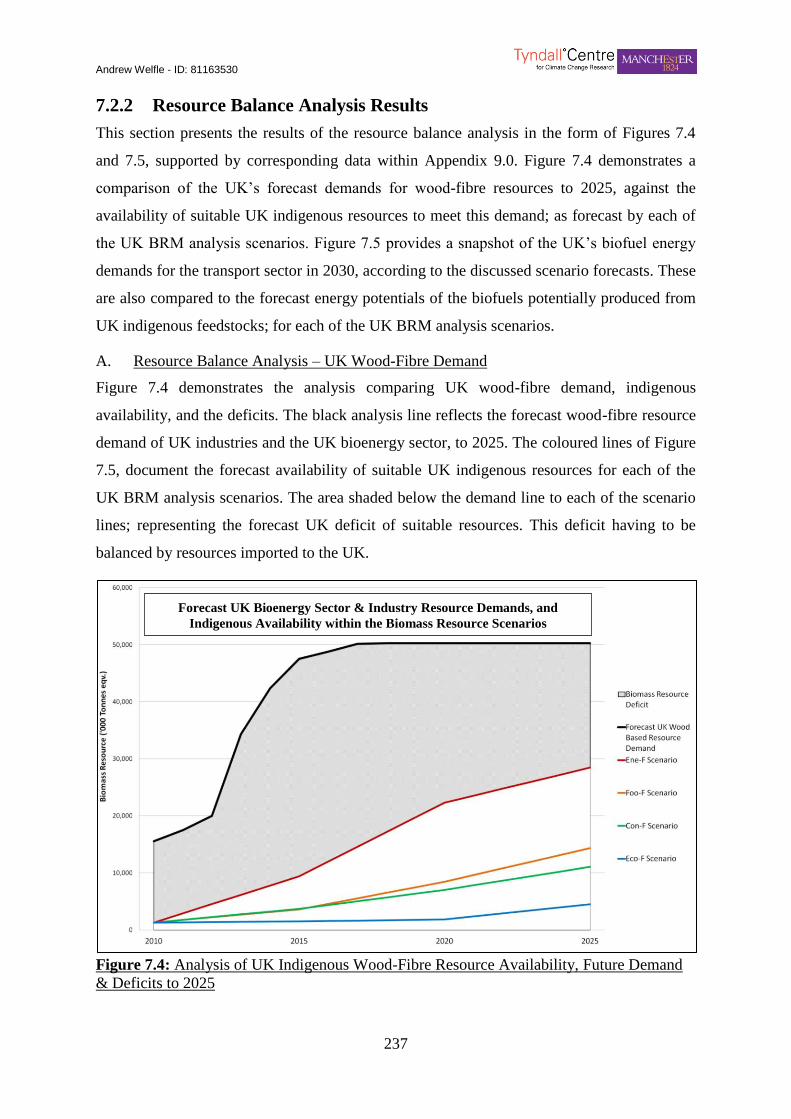
Andrew Welfle - ID: 81163530
237
7.2.2 Resource Balance Analysis Results
This section presents the results of the resource balance analysis in the form of Figures 7.4
and 7.5, supported by corresponding data within Appendix 9.0. Figure 7.4 demonstrates a
comparison of the UK’s forecast demands for wood-fibre resources to 2025, against the
availability of suitable UK indigenous resources to meet this demand; as forecast by each of
the UK BRM analysis scenarios. Figure 7.5 provides a snapshot of the UK’s biofuel energy
demands for the transport sector in 2030, according to the discussed scenario forecasts. These
are also compared to the forecast energy potentials of the biofuels potentially produced from
UK indigenous feedstocks; for each of the UK BRM analysis scenarios.
A. Resource Balance Analysis – UK Wood-Fibre Demand
Figure 7.4 demonstrates the analysis comparing UK wood-fibre demand, indigenous
availability, and the deficits. The black analysis line reflects the forecast wood-fibre resource
demand of UK industries and the UK bioenergy sector, to 2025. The coloured lines of Figure
7.5, document the forecast availability of suitable UK indigenous resources for each of the
UK BRM analysis scenarios. The area shaded below the demand line to each of the scenario
lines; representing the forecast UK deficit of suitable resources. This deficit having to be
balanced by resources imported to the UK.
64) Figure 7.4: Analysis of UK Indigenous Wood Fibre Resource Availability, F uture De mand & Deficits to 2025
Figure 7.4: Analysis of UK Indigenous Wood-Fibre Resource Availability, Future Demand
& Deficits to 2025
Forecast UK Bioenergy Sector & Industry Resource Demands, and
Indigenous Availability within the Biomass Resource Scenarios
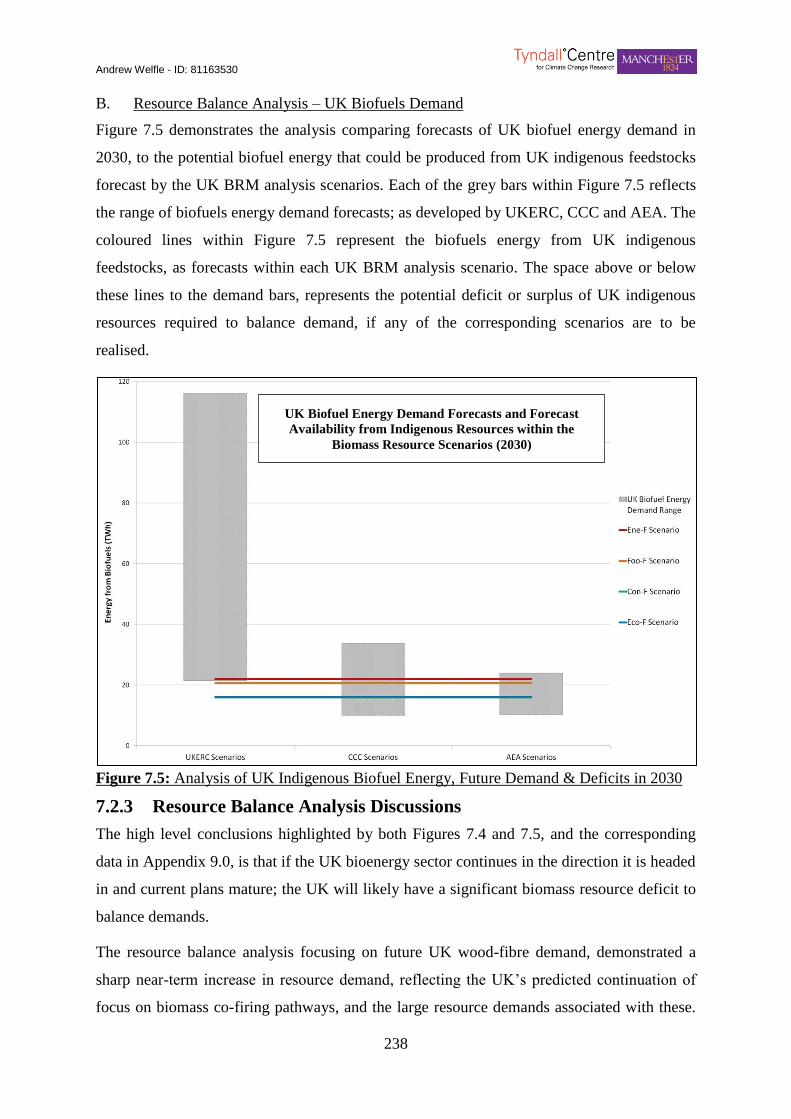
Andrew Welfle - ID: 81163530
238
B. Resource Balance Analysis – UK Biofuels Demand
Figure 7.5 demonstrates the analysis comparing forecasts of UK biofuel energy demand in
2030, to the potential biofuel energy that could be produced from UK indigenous feedstocks
forecast by the UK BRM analysis scenarios. Each of the grey bars within Figure 7.5 reflects
the range of biofuels energy demand forecasts; as developed by UKERC, CCC and AEA. The
coloured lines within Figure 7.5 represent the biofuels energy from UK indigenous
feedstocks, as forecasts within each UK BRM analysis scenario. The space above or below
these lines to the demand bars, represents the potential deficit or surplus of UK indigenous
resources required to balance demand, if any of the corresponding scenarios are to be
realised.
65) Figure 7.5: Analysis of UK Indigenous Biofuel Energy, F uture De mand & Deficits in 2030
Figure 7.5: Analysis of UK Indigenous Biofuel Energy, Future Demand & Deficits in 2030 7.2.3 Resource Balance Analysis Discussions
The high level conclusions highlighted by both Figures 7.4 and 7.5, and the corresponding
data in Appendix 9.0, is that if the UK bioenergy sector continues in the direction it is headed
in and current plans mature; the UK will likely have a significant biomass resource deficit to
balance demands.
The resource balance analysis focusing on future UK wood-fibre demand, demonstrated a
sharp near-term increase in resource demand, reflecting the UK’s predicted continuation of
focus on biomass co-firing pathways, and the large resource demands associated with these.
UK Biofuel Energy Demand Forecasts and Forecast
Availability from Indigenous Resources within the
Biomass Resource Scenarios (2030)
Andrew Welfle - ID: 81163530
239
The demand for wood-fibre resources is shown to plateau through the 2020’s in Figure 7.4,
reflecting the expected ‘end to fossil fuel plant conversions’ leading to the gradual closures of
co-firing plants.
The impact of the UK’s pathway towards increased co-firing generation, on the UK biomass
supply chains, can be seen through focusing on the Ene-F scenario. This scenario represents
the research’s upper-limits view of UK indigenous biomass resource availability; in terms of
growth and mobilisation of resource for the bioenergy sector. Figure 7.4 demonstrates that for
much of the analysis timeframe to 2025, suitable UK resources within the Ene-F scenario,
even at their maximum levels, appear to meet less than half of the total wood-fibre resource-
demand. If considering that the Ene-F scenario may be the least likely of the scenarios to be
realised; the resource deficits will probably be more accurately reflected by that represented
with the other three scenarios. The resource deficit is thus likely to be considerable.
Similar conclusions can be drawn through careful evaluation of the resource balance analysis
which focuses on future UK biofuels demand. This analysis provided a snapshot of how the
biofuels resource balance may look in 2030, according to a series of different scenarios.
Analysis of the UKERC scenarios, which looked at various scenarios for future utilisation of
biofuels in the UK, resoundingly highlights the potential deficit for suitable UK indigenous
resource availability. The forecast range in biofuel demands largely exceeds the potential of
indigenous resources; according to the UK BRM analysis scenarios. The rapid utilisation of
biofuels to 2050, forecast by the UKERC scenarios (Table 7.7), highlights that the resource-
deficit trend would most likely intensify only if the corresponding scenarios were to be
realised.
The CCC scenarios, which took a cautious lower-limit stance towards future biofuel
utilisation in the UK, also forecast a high likelihood that in the medium-term to 2050, the UK
would most likely have a resource deficit, if it is to produce sufficient biofuels to balance
future demands. The CCC scenario forecasts to 2050 (Table 7.7), documented a gradual
decline in biofuels utilisation, suggesting that if any of the CCC scenarios were to be realised,
the UK may have a greater availability of resources in the long-term that could be distributed
for alternative uses.
The AEA scenarios for DECC, reflected medium and long-term increases in biofuel demand
to 2050, with rapid utilisation taking place beyond 2030. These scenarios present a slow and
gradual incremental utilisation of biofuels, to 2030. Despite this slow-start trend, Figure 7.5
Andrew Welfle - ID: 81163530
240
still predicts that the UK may likely have insufficient suitable resources to balance demands;
leading to resource deficits and the need for feedstock imports.
The biomass resource balance analysis focusing on biofuels, once again highlights the
uncertainty of the extent to which biofuels will contribute to the future UK transport energy
sector. However, the analysis shows with some certainty, that it is highly likely whichever
scenario is realised; the UK may face potentially large deficits of suitable feedstocks to
produce the biofuels, needed to balance future demand.
The biomass resource balance analysis presents a juxtaposition of the key conclusions arrived
at in Chapter 6. Those conclusions postulated that the biomass resource availability and
bioenergy potential projected from each scenario, especially the Ene-F scenario; were capable
of contributing significantly to the UK’s renewable energy targets and primary energy
demand.
7.2.4 Chapter Conclusions & Consequences for the Future UK Bioenergy
Sector
Chapter 7 provides a greater understanding of the several future pathways the UK bioenergy
sector may follow; as directed by current biomass resource strategies and policies. It also
provides an analysis of the types of resources required, and the extent to which the UK may
need to import biomass resource and feedstocks, in order to balance future demand.
The following key analysis outputs and conclusions are deemed to be important and highly
relevant to the wider research project. These concepts and themes will be taken forward to
Chapter 10, where they will contribute to the discussion of possible future alternative UK
bioenergy strategies.
A. Predominant Resource Types Required by the Future UK Bioenergy Sector
The UK’s current and planned bioenergy sector directions focus predominantly on power
bioenergy pathways, and like many countries the UK will require mainly woody biomass
(primarily wood pellets and to a lesser extent wood chips) for this energy generation
pathway. Biofuels (biodiesel and bio-ethanol) and suitable feedstocks to produce them are
also widely sought, for current and future transport sector developments [395].
B. Uncertainties with the UK Bioenergy Sector Future Directions
Chapter 7 has highlighted many uncertainties relating to the future of the UK bioenergy
sector. The wide range of characteristic variances found within the demand scenarios
analysed within this Chapter; highlights the limited consensus shared amongst ‘UK bioenergy

Andrew Welfle - ID: 81163530
241
experts’. The UK Government Strategy and Policy documents reviewed in the early stages of
this Chapter, also acknowledge this lack of clarity. These uncertainties will have to be
resolved if the UK bioenergy sector is to continue to develop and to meet bioenergy demands
and satisfy key carbon emission targets. This is something that will be addressed further
within Chapter 10.
C. Large Indigenous Resource Deficits to Balance Future Demand
Overall the key output from this Chapter is that the UK has high potential availability of
specific indigenous biomass resources, capable of making a significant contribution towards
meeting energy targets (Chapter 6). However, large potential resource deficits are forecast for
the specific types of biomass that will be needed for the proposed future UK bioenergy
industry.
D. UK Biomass Resource Trade Requirements
The forecasts highlighted in this Chapter lead to the conclusion that the UK will very likely
have to trade extensively within global markets for the biomass resources it needs to balance
future energy demand. For the currently held bioenergy strategies to mature, the UK could
become increasingly dependent on imported resources. The international markets for biomass
resources are still relatively immature and therefore add yet another future uncertainty [136],
[137]. Issues of trade uncertainties will be covered in Chapters 8 and 9 of this Thesis.

Andrew Welfle - ID: 81163530
242
Chapter 8 - Global Biomass Trade - Supply, Demand, Limitations & Sustainability
Andrew Welfle - ID: 81163530
243
8.1 Global Biomass Trade – Supply,
Demand, Limitations & Sustainability
Chapter 8 introduces and provides a description of the global biomass trade market. The
Chapter is literature review driven, discussing the key biomass resource supply and demand
regions around the world, and also provides an overview of the major flows of biomass
resource currently taking place. The Chapter also discusses how these flows may change as
the global trade markets mature. The Chapter goes on to provide discussions of the key
limitations and barriers that may limit increased global biomass trade, and also the
sustainability issues and implications, associated with the expansion of biomass resource
productivity to serve global markets.
Chapter 8 is well placed within the Thesis, providing an insight into the current and future
biomass trade markets, in which the UK will have to operate, in order to balance its
increasing resource demands. The Chapter also discusses those countries that may offer
potential trading opportunities for biomass resource, and highlights some possible limitations,
risks, and sustainability implications for these trade flows. Chapter 8 provides specific
sections that focus on the UK’s requirements, and its position within the global market. A
section also highlights the position of Brazil in the global market. Brazil provides the case-
study region under focus within Chapter 9; representing an example of a key country,
possibly capable of providing large amounts of resource for future global markets, including
the UK.
8.1.1 Increasing Global Demand for Biomass
Energy from biomass pathways currently contributes approximately 10% of total global
energy supply. Two thirds of this bioenergy is utilised within developing countries, the
remaining being generated within the industrialised world [10]. Bioenergy is an attractive
energy option for all stages of industrial development, due to its flexibility, potential for
integration with world-wide development strategies [259], and the general acceptance that
greenhouse gas emissions from biomass resources are carbon-neutral [13].
The IEA / IRENA Global Renewable Energy Policies and Measures Database [396],
confirms that more than 60 countries currently have national targets or policies supporting
renewable energy. In countries such as the EU Member States, biomass is expected to play a
major role in contributing over 50% towards their renewable energy targets [397], [398].

Andrew Welfle - ID: 81163530
244
Despite widespread growing global demand, biomass is unevenly distributed; with some
regions with the greatest demands, having comparatively low resource availability potentials
[106], [131], [251], [377]. Trade has an important role to play, with biomass being described
as, “The most important renewable energy carrier worldwide” [124]. Short-term trends
appear to show that countries and regions with strong economies and development will
increase their requirement for imported biomass resource; whilst less developed countries
will continue their development largely reliant on fossil fuels [399].
As a result of recent energy policies, Europe has become the prime market for the trade of
biomass for energy [400]. More than 30% of biomass resource currently consumed in the EU
is imported [401], and demand is forecast to rise by almost 50% between 2010 and 2020
[402]. Demands for biofuels are expected to rise sharply, driven by Europe’s ambitious
biofuel mandates; whilst the demand for wood pellets are forecast to increase three-fold by
2020, as governments offer renewable energy subsides [258].
In summary, developed countries and regions such as the EU, are set on a trajectory of
increased utilisation of bioenergy pathways, to meet energy demands. As their renewable
energy policies are implemented and targets met, ever greater quantities of biomass resource
will probably have to be imported to generate this energy.
8.1.2 Global Biomass Trade Markets
The key forces driving the global trade in biomass resources for the bioenergy sector are: the
price of fossil fuels (especially oil), the implementation of policy mandates aimed at reducing
GHG emissions, and increasing policy and financial mechanisms supporting bioenergy
pathways [17].
Figure 8.1, highlights the major trade flows of biomass for bioenergy, around the world.
Brazil is the major exporter of bio-ethanol; predominately to the EU, the United States and
Japan [403]. The United States, Argentina, Indonesia, and Malaysia, are the largest exporters
of biodiesel; mainly to the EU [403]. The major exporters of wood pellets are Canada, the
United States, Russia and the Balkan States; with Europe once again being the largest
importing region [404]–[406].

Andrew Welfle - ID: 81163530
245
66) Figure 8.1: Predominant Global Trade F lows of Biomass Resources for Energy End Uses
Figure 8.1: Predominant Global Trade Flows of Biomass Resources for Energy End Uses
A. Focus on the UK & Biomass Trade
The UK Department for Transport reported that around 25% of feedstocks purchased for
current UK bioenergy plants, were indigenous resources; the remaining being imported from
the EU, North America, Russia, South Africa, New Zealand (predominantly wood pellets);
Brazil (biofuels), and Malaysia and Indonesia (palm oil) [254].
Important drivers influencing the demand levels of imported resources are: insufficient
indigenous resources to balance demand (Chapter 7), and expensive domestic resources that
are already widely utilised by a series of existing demand markets [407].
UK resource exports for energy end-uses are highly limited. They are restricted
predominantly to residue resource categories and are usually kept within the frameworks of
large multinational companies; this trade therefore largely representing a redistribution of
resources rather than stand-alone trades. This explains the data secrecy and why it is hard to
obtain an accurate picture of these on-going intra-organisation trades [407].
B. Focus on Brazil & Biomass Trade
The 1973 oil crisis and the recession that followed to 1975 saw oil prices soar, hindering
economies all around the World. This triggered Brazil to initiate its Ethanol Program which
has evolved to the present day, where almost all road transport is powered by fuel containing
between 25-100% ethanol [408].
The Brazilian Government have also developed a series of renewable energy policies [132]–
[134] that target increased energy contributions from a broad range of low carbon
technologies; with Brazilian States such as Sao Paulo going even further with such targets
Key Global Biomass
Resource Trade Flows
Andrew Welfle - ID: 81163530
246
[409]. These renewable energy policies require extensive use of indigenous biomass
resources, making Brazil a country whose infrastructure and focus are heavily directed
towards bioenergy [410].
i. Bio-ethanol Production & Trade Status
Globally, Brazil is the second largest producer of bio-ethanol, behind the United States.
However, Brazil is also the largest exporter, driven by a Brazilian bio-ethanol industry that
has lower production costs than the United States. It also has the potential to significantly
enlarge its already vast production of feedstock crops such as sugarcane - the predominant
feedstock for the bio-ethanol industry [407]. Thus Brazil is highly important for the global
biofuel market.
Traditionally in the most favourable production years, Brazilian exports of bio-ethanol have
never represented more than 15% of total production, which highlights the importance of the
domestic market. Investments have, and are continuing to be focused on developing the
export market; although perspectives continue to predict only gradual growth over the near-
term [407].
To satisfy the large domestic market and growth in export demands, sugarcane production
rates have reflected average annual increases of 9.7% in recent years; this trend resulting
from continual improvements in productivity, high domestic and international demands for
sugar, and the continuing focus on the export market that drives a continual flow of
investment [395].
Brazil is well placed to continue this production trend as it has vast areas of arable savannah
that could potentially be utilised to produce crops, without risk of deforestation [410].
Brazil’s Ministry of Agriculture, Livestock & Food Supply [411]; estimates that the potential
scope for crop expansion exceeds 119 MHa; through the cultivation of savannah (69 MHa),
and the conversion of pasturelands (50 MHa).
ii. Biodiesel Production & Trade Status
Brazil is a large consumer of biodiesel which is overwhelmingly imported; there being little
or no data describing Brazilian biodiesel exports, so this is taken to be negligible [407], [412].
iii. Wood Biomass Production & Trade Status
Brazil has a large, albeit predominately domestic market for wood biomass resource. This is
utilised largely for charcoal and wood briquette production [413]. There is only meagre and

Andrew Welfle - ID: 81163530
247
highly dispersed information documenting wood biomass resource exports; aside from small
quantities of pellets [407].
However, the Brazilian market is considered by some, especially within the EU; to be a
highly promising future trading-partner for wood biomass. Brazil’s proximity, established
trade routes for biofuel-based resources, and the large relatively undeveloped wood-based
market, driving this enthusiasm; although questions still remain as to the extent that wood-
based biomass exports from Brazil to the EU, could meet the EU’s stringent sustainability
requirements [16].
There are a growing number of Brazilian companies developing information about the
European markets, with a view to establishing wood pellet trade links. This is widely
regarded as being a good opportunity for Brazil, but remains in an early phase and far from
widespread deployment [407].
The Brazilian Association of Industry Biomass & Renewable Energy ABIB [412], confirmed
that Brazil currently has 10 plants producing wood pellets, predominantly using pine and
eucalyptus residues as feedstocks. These have a reported capacity of about 320,000 tonnes
per year [412]. More pellet plants are currently under development which will increase pellet
production to over 3 million tonnes by the end of 2014; with a series of further plants
following by 2018 / 19. The realisation of these plans will place Brazil as a major future
producer and exporter of pellets; the majority expected to go to Europe [414].
8.1.3 Biomass Resources Key Global Trade Flows
This next section takes a broader approach, describing the major flows of different biomass
resources around the World; focusing on the trade of biofuel and wood-based biomass
resources.
A. Bio-ethanol – Key Global Trade Flows
As already highlighted, there are two leading producers of ethanol that dominate the global
market; the United States and Brazil. These account for over 85% of the world market [407].
Brazil is the largest exporting country with the United States and the EU being the greatest
importers, followed by Canada and Japan [17].
The UK and Sweden are amongst the largest importers of ethanol in the EU, of which 32% in
2009 was estimated to be used to power the transport sector [17]; Brazil being the
predominant supplier of bio-ethanol to the EU [16]
Andrew Welfle - ID: 81163530
248
In 2009 it was estimated that between 40 and 51 PJ of ethanol fuels were traded globally
[403]. The uncertainty range of this data, relates to the imprecise accounting methods for
ethanol end-uses. For example: uses for transport fuels, industrial processes, or by beverage
industries; also the improper utilisation of trade-codes and categories for both ethanol
biofuels and the producing feedstocks. All this adds to the uncertainty [407].
B. Biodiesel – Key Global Trade Flows
The global production of biodiesel has been increasing strongly since 2005 [17]. This trend is
reflected in the rise of global production from 20 PJ in 2000 to around 565 PJ in 2009 [403].
Driven by the European biofuels mandates [258], the EU has the World’s most developed
biodiesel industry, producing two thirds of global productivity [17]. Germany, France, Spain,
and Italy, being the leading producers [415]; with Rapeseed oil produced within the EU being
the major feedstock providing two thirds of total production. Imported feedstocks such as
Soybean oil, Palm oil, and to a lesser extent further Rapeseed oil; representing the final third
[416].
Other major biodiesel producers include the United States, Argentina, and Brazil. With more
than 95% of global biodiesel exports being directed toward the EU [417]; Germany and
France consuming almost half of this amount [407].
C. Wood Pellets - Key Global Trade Flows
The global biomass pellet market has also been growing exponentially for the past 10 years,
with levels currently comparable to those of both ethanol and biodiesel, in terms of traded
volumes [17].
Driven by European Commission mandates and incentives to increase renewable energy
generation and reduce carbon emissions, the EU is also the World’s largest wood pellet
market [416]; wood pellets replacing or being co-fired with coal to either generate electricity
[258], or to produce heat with reduced greenhouse gas emissions [416]. Thus the EU has the
largest demand for pellets with Sweden leading the way; followed closely by Denmark, the
Netherlands, Belgium, Germany, and Italy [407]. To meet this demand the EU is also the
largest importer of pellets with about 3.4 million tonnes imported in 2010; of which about
half can be assumed to have been intra-traded inside the EU [418].
North America is the largest exporter of pellets, the majority of these again going to the EU.
Canada is the dominant exporter who also supply pellets to the United States. In
Scandinavian countries despite there being significant domestic pellet production, large

Andrew Welfle - ID: 81163530
249
increases in demand are outpacing production, thus increasing volumes of pellets are
imported from the Baltic Regions and Russia, to balance their demand [416]. Further minor
biomass pellet trade-flows to the EU are also taking place and growing, from Australia,
Argentina, and South Africa [398].
The European Biomass Association (AEBIOM) [398], forecasts that the EU’s consumption
of wood pellets will continue its steep rise; estimating increases from the 2.5 Mtoe in 2008 to
as much as 20 - 32 Mtoe in 2020. North American exports being targeted by the EU to
provide the major share of these near and mid-term demands [17].
D. Wood Chip - Key Global Trade Flows
For many years over the past decade, Japan has been the largest importer of wood chips,
attracting over 50% of the global trade in this resource. Although China is expected to
become the predominant importer within the next few years [419].
The greatest producers of wood chips in recent time have been: Canada (37%), Australia
(8%), Sweden (7%), Russia (6%), and China / Finland (each with 5% of global production)
[420]; all these countries incidentally and relevantly, having large pulp and paper production
industries.
Once again, largely due to recent energy policies, price competitiveness, and a strong forestry
sector; the EU has become a growing major market for the wood-chip trade [421]. The EU is
a net importer of wood chips but also demonstrates the dynamics of EU Member State intra-
trading. Within the EU, Sweden, Finland, Austria, and Italy, are major EU Member State
importers; with Germany, Latvia, and Estonia being the major exporters [422]. From outside
the EU, wood chips are increasingly being sourced from Russia, Uruguay, Brazil, and Canada
[422].
Potential trends in the future trade of wood chips may be indicated by the on-going shift in
the production of pulp and paper industries; moving from the Northern to Southern
hemispheres [400].
8.1.4 Global Biomass Trade Limitations & Uncertainty
This next section of Chapter 8 provides a discussion of the limitations and uncertainties that
relate to the global trade of biomass. These having great influence in acting as potential
barriers to the future growth of the global biomass market; and are highly relevant to this
research as they may control the levels of resource that demand-led countries such as the UK,
may be able to import.
Andrew Welfle - ID: 81163530
250
These barriers can principally be defined as: any feature, mechanism, or issue that either
directly or indirectly hinders the development of the international trade of biomass
commodities for energy end-uses [17]. The key barriers to the growth of the global biomass
markets are highlighted by a number of studies [17], [423]–[425]. Each of these barriers is
discussed and their relevance to the UK, highlighted in the following sections.
A. Technical Barriers
Technical barriers to the continued growth of the global biomass trade markets essentially set
the benchmark for the extent that available resources around the World are suitable, and can
therefore be traded to demand regions; technical constraints representing the quality control,
and fuel characteristics requirements of the current and future bioenergy sectors [425].
Technical standards are the key mechanisms applied to ensure that these minimum resource
and fuel requirements are met. Adherence to these standards reduces the risks to potential
importers, whilst also ensuring the safety to potential customers; as in the case for biofuels. A
key example being: the maximum proportions of either bio-ethanol or biodiesel that can be
blended with fossil fuels, to ensure that the imported biofuels are regulatory compliant and
meet technical performance requirements [17].
Technical barriers are an important mechanism required by potential importing countries
such as the UK, to reduce risk. The barriers themselves reduce the overall extent that
resources may be available for trade, but in the long-term act as a driver for increasing the
overall quality and performance of the resources traded globally.
B. Economic & Trade Barriers
The economic and financial mechanisms applicable to the global trade markets are perhaps
the most essential drivers, and sometimes barriers to the growth of biomass trade. These
potential barriers are applicable at each stage within supply chains, but most importantly for
the growth in trade of biomass; economic influences that both enable and constrain resource
imports, exports and utilisation; are most relevant [425].
Export subsidies or tariffs are a key example of a potential economic trade barrier that may
impact the trade of biomass commodities; influencing the extent that countries develop export
markets. The influence of export economic mechanisms on the global biomass markets can
be seen within a case study of Argentina. Here, a differential in export tax was set for
finished biodiesel products (20%), and the feedstocks for biodiesel production (32%). This
differential in tax provided an incentivisation for the domestic production and export of
Andrew Welfle - ID: 81163530
251
finished biodiesel; rather than the exportation of raw feedstocks for biodiesel generation
elsewhere [426]. This distortion, although generating growth in the Argentinean bioenergy
sector, continues to create a disadvantage for other biodiesel producing regions that may rely
on the importation of raw feedstocks [427].
Import tariffs represent a further driver that may either incentivise or render the importation
of biomass resources uneconomical. The bio-ethanol import tariffs of countries range from
6%, up to 186% in the case of India. Biodiesel import tariffs are typically lower than that for
bio-ethanol [428], whilst countries typically have no tariffs for the importation of solid
biomass such as pellets [17].
In the UK, the import duty rates for biomass pellets is 0%, with standard rate VAT. In the UK
budget of 1st April 2012, the duty rate for liquid biofuels was raised to equal that of
conventional fuels. The duty rate for both bio-ethanol and biodiesel utilised for road use was
set at 0.5795p / Litre, and 0.1114p / Litre for non-road use [429].
C. Logistical Barriers
A further major barrier to the growth of biomass trade markets is the logistics of transporting
the resource around the World. A large proportion of resources being harvested and sourced
from regions of the World that have infrastructure that lags behind ambition [425].
The fuel characteristics required by bioenergy systems are often highly specific. Therefore,
the nature and properties of the resources traded is a vital element of the global trade market.
Thus a major barrier to trade is the maturity of technical and pre-treatment technologies. To
ensure cost-efficient transportation and favourable energy characteristics to satisfy bioenergy
importation legislations, compacting and densification technologies are vital to ensure that
biomass trade becomes increasingly viable; the final density per volume of transported solid
biomass resources being far less than liquid biofuel resources; albeit this ratio is continually
improving. [17].
D. Regulatory Barriers
Regulatory systems are also highly influential in determining both the types and extent that
different resources may or may not be imported, for a given country’s bioenergy sector.
Changing regulations that incentivise or prioritise different bioenergy pathways, and thus the
resources required to fuel them; can strongly influence the resources traded on the global
markets. For example, changing the technology focus of feed-in-tariffs either incentivises the
utilisation of particular resources in bioenergy pathways, or may otherwise render them
Andrew Welfle - ID: 81163530
252
uneconomical. Regulatory systems therefore represent a major barrier for the whole
bioenergy sector and throughout supply chains [424].
Further potential regulatory influences are represented in the form of sanitary or
phytosanitary measures. These are technical regulations that can place potential constraints
on the trade and movements of resources across international borders. These are typically
implemented to target the reduction risks associated with biological impacts, such as the
spread of pests or pathogens around the World [17].
Meeting these requirements is often straightforward through chain-of-custody tracking and
assessments; although on occasion imported resources especially from developing regions to
demand regions, are rejected [428]. For imports brought into the EU, thorough inspections
are widespread, especially for under-bark untreated category imports [428].
Sustainability criteria represent further regulatory requirements and minimum standards
placed on imported resources. These regulations typically presenting a framework of
sustainability performance compliance criteria such as: ecological, land-use, competing
market and food system impacts; as well as embodied energy and greenhouse gas emission
thresholds [425]. The sustainability barriers and implications of the global trade of biomass
are discussed further in Section 8.1.5 of this Chapter.
E. Geopolitical Barriers
Geopolitical instabilities present risks and barriers to all international trade, with biomass
being no different. These instabilities can highly influence the price and supply security of all
energy commodities, most pronouncedly for the fossil fuels. Although these potential risks to
biomass supply are thought to be less extreme and more manageable, they still present major
potential uncertainties and limitations for the future biomass commodity markets [65].
Also, many potential biomass exporting regions of the World are often those with higher risk
of political instability. Thus trading with these regions and investment in enabling-
infrastructure also carries risks [424].
8.1.5 Sustainability of Global Biomass Resource Production
This next section provides an overview of some of the key sustainability issues that result
from the increased productivity and development of a global biomass trade market.
Bioenergy differs from all other renewable and conventional energy pathways, as it is largely
directly tied to the farms, forests, and ecosystems; from which biomass resources and
feedstocks are extracted. Thus this close association within bioenergy systems and supply
Andrew Welfle - ID: 81163530
253
chains creates the potential for wide-ranging environmental and social impacts that can be
both positive and negative [430]. Many of these major potential impacts are discussed in the
following sections.
A. Potential Biomass Cultivation Impacts
Increased production of biomass for the bioenergy sector may incur negative impacts on a
wide range of issues including: water systems, air quality, social impacts, biodiversity, and
soil systems [15], [431].
i. Ecosystem & Biodiversity Impacts
The potential impacts of increased biomass cultivation on biodiversity and ecosystems stem
from stresses on land availability and use. The impacts from the production of biomass range
from the complete transformation and potential destruction of ecosystems, to the selective
extraction of resources resulting in a potential gradual degradation in the health of
ecosystems [432], [433].
The loss of valuable ecosystems continues to be the key factor linked to biomass production
in certain regions around the World. Increased agriculture and unsustainable forest
management practices are the key drivers of this risk [434].
It is internationally acknowledged that protecting biodiversity in zones, is an insufficient
mechanism aimed at halting the reduction of global biodiversity. Protection zones often
experience continued exploitation of border regions, with gradual continual degradation
infiltrating the whole ecosystem. Thus specific activities for cultivating biomass resource for
the bioenergy sector have to be addressed in terms of their compatibility with biodiversity
protection [275], [434]. However, it is also acknowledged that biomass resource cultivation
may also present scope for providing positive biodiversity benefits through the appropriate
planning and management of production systems. [275].
A further related impact of biomass resource production is that to soil systems. Unsuitable
and unmanaged cultivation practices potentially leading to loss of topsoil through erosion, as
well as the risk of soil compaction. Soil systems represent vast sinks of organic carbon that if
released through degradation or erosion of the soil structures, will create large carbon
emission impacts [434].
ii. Water Impacts
The impact of biomass resource cultivation on water is often overlooked in discussions.
Agriculture around the World already places significant demands on water resources.
Andrew Welfle - ID: 81163530
254
Increased production of biomass places further stresses, impacting both water quantity and
quality. With water stresses are already a highly relevant issue in some of the regions with the
greatest focus on resource production for energy end-uses. The sustainable production of
biomass ensuring that cultivation remains in-line with water availability is essential if conflict
between biomass growth and other water demands are to be averted [275].
iii. Social Impacts
Potential sustainability impacts resulting from increased biomass resource production that can
impact on society are frequently overlooked; none being more important than issues relating
to food security. The land-used for biomass production is always a limited resource, and
therefore the production of biomass itself may reduce a region’s food productivity. In some
regions of the World this may present major implications for local populations [434].
Further localised impacts on food availability may have the influence of driving up the price
of food commodities. Negative food-security impacts are especially prevalent for net-food-
importing countries, and specifically net-food-purchasing households. The prices of key
staple food commodities related to income levels, determining ability of households to
affordably meet their food needs [435].
B. Potential Air Quality Impacts
A further and often overlooked sustainability impact of bioenergy sector, are its potential
impacts on air quality. Significant air pollution can potentially occur, when any biological
materials are combusted without the utilisation of appropriate technologies to limit these
[275].
Particulate emissions are a potential major air quality issue particularly associated with
bioenergy systems without appropriate treatment technologies. Although particulate controls
have improved over recent years in many places around the World, small particulates can
remain a concern for local air quality, especially where small-scale bioenergy systems or
practices are utilised [77].
Bioenergy combustion systems can also produce sulphur (SOx) emissions. However, these
are of relatively minor concern especially when the bioenergy systems are replacing oil and
coal-based combustion systems that would otherwise generate large concentrations of SOx
emissions [77].
NOx emissions are a further category of pollutants which are more difficult to control as they
result from all combustion processes regardless of the fuel types. Advanced combustion
Andrew Welfle - ID: 81163530
255
systems can reduce NOx emissions to minimal levels, but the investment requirements for
these technological advances render them unsuitable for small bioenergy applications [77].
C. Potential Land-Use Change Impacts
A close relationships exists between bioenergy and demand for finite land supplies. Thus the
increased use of bioenergy and the requirement to produce more resources to balance
demands; represents a growing area of stress for land. Direct and indirect land-use-change
impacts can potentially result in increased greenhouse gas emissions that may reverse any
savings offered through bioenergy utilisation in the first place [275].
The greatest perceived biomass land-use issue is the conflict between the production of food
commodities and biomass resources for energy; direct conflicts arising as the focus for
agricultural lands shift from producing food crops to dedicated energy crops. Many of the
traditional food commodities such as: cereal, sugar, and oil-based crops, also being widely
used as bioenergy feedstocks [430].
A further issue that is heavily associated with the production of biomass are GHG emissions
that may result from changing land-use and land management practices. GHG emissions
predominantly contributed by CO2, CH4, and N2O; result from agricultural inputs such as
fertilisers and the releasing of carbon emissions locked within soil and flora systems.
Further indirect emissions may also arise from market-driven land-use change; as forests,
grasslands, and / or other ecosystems, are cleared in order to produce crops to compensate for
lands diverted to produce bioenergy bound resources [430].
As such, the impacts attributed to indirect land-use can be difficult to quantify and are
sometimes a controversial subject [430]; as the accounting of impacts and GHG emissions
from displaced lands, may occur outside the country or region in which the direct land-use
change occurred [434].
Methods for estimating indirect land-use change are highly complex [15], and include
approaches that use macro-economic, econometric, and biophysical models [436]. A review
undertaken by Croezen et al (2010) [437], concluded that the increased demand for resources
for the bioenergy sector, will likely accelerate intensification of agricultural productivity and
the widespread conversion of forestry and grassland systems to arable lands; sometimes far
away from where the direct land-use change impacts occurred.
Andrew Welfle - ID: 81163530
256
D. Potential Greenhouse Gas Emission Impacts
Bioenergy is widely promoted as a low carbon source of energy. The combustion of biomass
releases carbon emissions, with the carbon-neutral logic stemming from the fact that the
carbon released is once again taken up by the growth of further biomass over the short-term.
However, the initial uptake of carbon during biomass growth stages and released during the
combustion stage, are not the full story. The accounting and reduction of GHG emissions
across the whole life cycle of bioenergy systems should be a minimum pre-requisite for any
bioenergy development [275].
Bioenergy systems create a ‘carbon-debt’ that represents a time gap between the release of
carbon emissions during the extraction, transportation, and combustion of biomass; and the
time required to rebuild stores of carbon through new resource growth. This ‘payback period’
can vary drastically depending on the types of biomass utilised, the land types, and the land-
use changes occurring; as well as further influences from a long list of other variables. In
some scenarios this payback period may represent many decades or even centuries, before
new biomass growth is able to absorb the equivalent carbon initially released [431].
Research carried out by the UK Environment Agency (2009) [438], [439], demonstrated the
importance of developing and adhering to best practices in terms of cultivation, processing,
and the bioenergy conversion processes; if significant GHG emission reductions are to be
achieved through bioenergy. Also emphasising that GHG emissions resulting from land-use
change may negate all savings achieved through the utilisation of biomass, if best practices
and guidelines are not adhered to. Although they also found that the utilisation of waste and
residue resources in bioenergy pathways may result in significantly greater carbon emission
savings; than the utilisation of grown resource for the bioenergy sector that may have
incurred land-use change emission debts.
Land-use change emissions are highly important as existing forests and other flora systems
represent large carbon sinks. They also represent vast mechanisms that sequester further
carbon emissions. Therefore, removing these systems either as feedstocks to directly to
produce bioenergy, or with the aim to free up land for crop cultivation, will result in large
GHG emission impacts [275].
It is widely argued that current regulations around the World, and relevant to this research in
the EU; fail to guarantee that resources utilised in bioenergy systems take account of these
whole supply chain emissions, and therefore many bioenergy systems and supply chains are

Andrew Welfle - ID: 81163530
257
not truly carbon neutral [431]. Also, it is very difficult to ensure that resources with
unfavourable lifecycle balances do not enter EU supply chains, given the nature of
international commodity markets [275].
E. Sustainability Schemes & Certification
With the growth of the biomass and biofuel industry, the need to ensure sustainability at each
step within supply chains becomes increasingly important. Biomass sustainability and
certification frameworks and tools are the chosen strategy to ensure sustainability, and
demonstrate chains of custody to account for the impact of different resources. The remit of
these, cover supply chain characteristics, and features ranging from land-use impacts, social
issues, and agricultural practices; to whole life-cycle assessments of embedded energy and
carbon, as discussed previously in this Chapter [440].
Studies carried out by van Dam et al (2010) [441], and Scarlat & Dallemand (2011) [442];
review and describe a wide range of sustainability targets, schemes, and certification
frameworks from around the World that target enhanced sustainability of biomass supply
chains. A summary of some of the key applicable schemes relevant to both the UK and Brazil
are listed as listed as follows:
European Commission & Parliament – Biomass & Bioenergy Requirements [13],
[443]
European Committee for Standardisation – Bioenergy [444]
International Organisation for Standardisation – Bioenergy [445]
Fair Trade Labelling Organisations (FLO) [446]
United Nations Energy – Bioenergy Framework [447]
United Nations Environment Program – Bioenergy Framework [448]
Global Bioenergy Partnership (GBEP) – Bioenergy Framework [449]
Round Table on Sustainable Palm Oil (RSPO) – Framework [450]
Round Table on Responsible Soy (RTRS) – Framework [451]
Better Sugarcane Initiative Ltd (BSI) – Framework [452]
Rainforest Alliance – Forestry Framework [453]
Forest Stewardship Council (FSC) – Forestry Framework [454]
Program for Endorsement of Forest Certification (PEFC) – Forestry Framework [446]
United Kingdom Renewable Transport Fuels Obligation (RTFO) – Biofuels Transport
[54]
Brazil Social Fuel Seal – Biofuel Framework [455]
Andrew Welfle - ID: 81163530
258
International Sustainability & Carbon Certification (ISCC) – Biofuels Framework
[456]
Drax Power Ltd – Sustainability Policy [457]
The Council on Sustainable Biomass Production (CSBP) – Framework [458]
World Wildlife Fund – Bioenergy Framework [459]
However, as this brief summary highlights, the number and range of sustainability
frameworks that have been developed to address bioenergy issues is extremely broad. Thus
there are doubts and uncertainties as to whether the protocols and requirements of respective
frameworks may be followed accurately [15]; especially within countries and regions with
existing weak regulation and enforcement [460]. There are also concerns regarding the great
variance within sustainability schemes, with both linked and differing understandings of
sustainable systems and issues. This results in a potential reduction in the overall creditability
and influence of the underling sustainability goals they aim to achieve [461].
8.1.6 Chapter Conclusions & Consequences for the UK Bioenergy Sector
Chapter 8 has provided discussions and descriptions of the current and potential future global
biomass trade markets. In relevance to this research these descriptions have highlighted the
nature of the global markets that the UK will increasingly have to operate within, if it is to
balance its resource demands. The Chapter has also identified some potential barriers and
limitations that are likely to continue or emerge, that may influence the ability of the UK
bioenergy sector to meet its resource demands. Some of the key conclusions and
consequences for the UK bioenergy sector can be summarised as follows:
A. Expanding Biomass Resource Trade
The Chapter determined that the global biomass trade markets are growing rapidly yet are
still far from maturity. Although it is clear which regions will represent the future major
exporters and importers of resources, and where and what the major flows of resources will
be. One certainty has emerged, this being that the volumes of resources currently traded are
likely to vastly increase. However, a major uncertainty remains as to how the major trade
flows may change as the energy aspirations of developing countries continue to evolve.
B. Trade Hub Europe
For each of the major traded biomass resource categories, principally the wood-based and
biofuel resources; Europe has been found to be the key trading hub and demand region for all
biomass resources. Driven by renewable energy and GHG reduction targets Europe’s
demands for all biomass resources as highlighted throughout the literature, comes across as
Andrew Welfle - ID: 81163530
259
being insatiable. All major biomass trade flows appear to be headed towards the EU. This
may represent both positive and negative issues for the UK bioenergy sector. The UK being a
part of the central hub of biomass trade, will likely present opportunities. On the other hand
the UK bioenergy sector is competing within the global market for biomass resource against
its neighbouring EU Member States, who have their own equally large(r) and growing
demands for resources. Resources destined for the UK can be easily diverted to any number
of EU ports as a result of any number of influencing factors – a practice already typical
within the oil and gas energy global trade market [462]. A further conclusion drawn from the
EU’s position in the global market is potentially a premonition of what global demands may
resemble if other regions continue to develop and direct greater focus on their respective
bioenergy sectors. This placing unforeseen stresses on the resources available for trade [463].
C. Trade Limitations
A series of potential barriers were identified that may represent to varying degrees,
significant limitations to the future growth of the global biomass trade markets. A concluding
theme developed from these particular discussions, is that the presence of a wide range of
international and even geopolitical drivers, will influence the global biomass markets; as with
they do with any other internationally traded commodity. These limitations highlighting
potential risks for the UK in the future, in having little control over these drivers, and having
an increasing proportion of its energy generation mix dependent on imported resources.
D. Sustainability Implications
A wide range of sustainability issues were also highlighted as being associated with the
increased production of biomass resources around the World. The major conclusions from
these discussions within this Chapter highlighting the irrelevance of pursuing bioenergy
pathways to reduce GHG emissions, if the supply chains and / or related land-use and
cultivation practices, are not undertaken to ‘best practice’. The potential impacts of both
direct and indirect land-use change and ecosystem degradation, negating any benefits
associated with applying bioenergy pathways over those of conventional fuels. A further
social-responsibility conclusion can are be derived, highlighting the importance of ensuring
that supply chains also respect and are developed to prevent negative impacts within the
regions where the resources are cultivated.
Andrew Welfle - ID: 81163530
260
Chapter 9 - Case Study: Brazilian Biomass Resource Analyses
Andrew Welfle - ID: 81163530
261
9.1 Case Study – Brazil’s Biomass Resource
Analyses
Chapter 9 provides further analyses of the global biomass trade markets, through focusing on
Brazil. Brazil represents a case study of a country that has a leading role to play in both the
current and long-term future of the global biomass trade markets. As Chapter 8 concluded,
Brazil is a dominant producer and the top exporter of bio-ethanol and related feedstocks. This
was found to be a trend that is forecast to continue, and potentially intensify. Brazil is also
identified as a key country where there may be great opportunities for the future exportation
of wood-based biomass resources for the bioenergy sector.
The aim of Chapter 9 is to gain a greater understanding of the biomass supply chains and
resource opportunities that Brazil may provide in the future. The analyses are undertaken
through the adaptation of the Biomass Resource Model to reflect the biomass resource
dynamics within Brazil (Brazil BRM), and analysing how these may change in the future.
Further important analyses are undertaken to evaluate how levels of biomass resources
exported from Brazil may change in the future, if Brazil’s domestic energy focus were to
change so that a greater proportion of its indigenous resources were utilised to meet domestic
energy demands, rather than being exported. This analysis is undertaken through the
development of a series of bioenergy scenarios that represent different pathways, in which
bioenergy may increasingly contribute to Brazil’s energy mix; allowing the potential impacts
on resource exports to be evaluated and forecast.
The relevance and importance of the Brazilian analyses to the research project and
specifically to the UK, is the evaluation of a further currently unforeseen dynamic that may
potentially influence the global biomass resource markets – on which the UK is likely to be
reliant in order balance its future biomass resource demands.
Brazil is the ideal case study for this analysis as Brazil represents a major contributor to the
global biofuel markets, and more relevantly the biomass resource global market. Thus any
influences impacting Brazil’s contribution of resources available for global trade will likely
have large impacts across the global market.
Chapter 9 starts with a discussion of how the BRM is adapted to reflect the biomass supply
dynamics in Brazil (Brazil BRM). This section provides descriptions of Brazil’s supply chain
characteristics and lists all the references utilised to adapt the BRM. This section does not

Andrew Welfle - ID: 81163530
262
discuss the methodologies of the Brazil BRM, as these reflect those developed and presented
within Chapter 4 for the UK BRM.
Chapter 9 goes on to provide an initial evaluation of biomass resources potentially available
within Brazil, and evaluates how these are likely to change to 2050. This is undertaken
through the development of a Brazil Baseline Scenario within the BRM, similar to that
developed for the UK within Chapter 5.
A series of Brazil bioenergy scenarios are then developed, reflecting directions that Brazil
could potentially take to 2050; utilising varying increased levels of their indigenous resources
to meet their domestic energy demands, rather than exporting them.
A resource balance analysis is then undertaken reflecting that carried out for the UK in
Chapter 7. This analysis enables an evaluation of the extent that Brazil may export biomass
resources in the future, in reflection of each of the developed bioenergy scenarios.
Finally Chapter 9 draws conclusions from the analyses that may help to predict the future
state of global biomass trade market, and the relevance of this specifically for the UK.
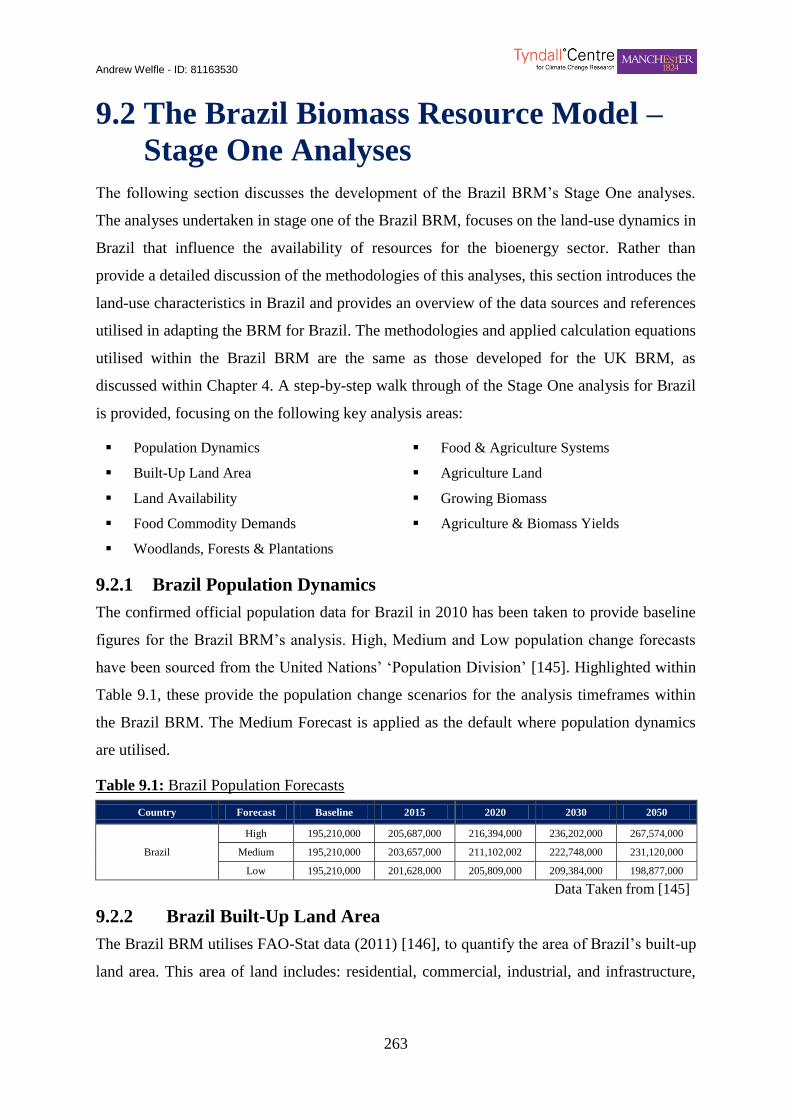
Andrew Welfle - ID: 81163530
263
9.2 The Brazil Biomass Resource Model –
Stage One Analyses
The following section discusses the development of the Brazil BRM’s Stage One analyses.
The analyses undertaken in stage one of the Brazil BRM, focuses on the land-use dynamics in
Brazil that influence the availability of resources for the bioenergy sector. Rather than
provide a detailed discussion of the methodologies of this analyses, this section introduces the
land-use characteristics in Brazil and provides an overview of the data sources and references
utilised in adapting the BRM for Brazil. The methodologies and applied calculation equations
utilised within the Brazil BRM are the same as those developed for the UK BRM, as
discussed within Chapter 4. A step-by-step walk through of the Stage One analysis for Brazil
is provided, focusing on the following key analysis areas:
Population Dynamics Food & Agriculture Systems
Built-Up Land Area Agriculture Land
Land Availability Growing Biomass
Food Commodity Demands Agriculture & Biomass Yields
Woodlands, Forests & Plantations
9.2.1 Brazil Population Dynamics
The confirmed official population data for Brazil in 2010 has been taken to provide baseline
figures for the Brazil BRM’s analysis. High, Medium and Low population change forecasts
have been sourced from the United Nations’ ‘Population Division’ [145]. Highlighted within
Table 9.1, these provide the population change scenarios for the analysis timeframes within
the Brazil BRM. The Medium Forecast is applied as the default where population dynamics
are utilised.
Table 9.1: Brazil Population Forecasts Table 41) Table 9.1: Brazil Population Forecasts
Country Forecast Baseline 2015 2020 2030 2050
Brazil
High 195,210,000 205,687,000 216,394,000 236,202,000 267,574,000
Medium 195,210,000 203,657,000 211,102,002 222,748,000 231,120,000
Low 195,210,000 201,628,000 205,809,000 209,384,000 198,877,000
Data Taken from [145]
9.2.2 Brazil Built-Up Land Area
The Brazil BRM utilises FAO-Stat data (2011) [146], to quantify the area of Brazil’s built-up
land area. This area of land includes: residential, commercial, industrial, and infrastructure,
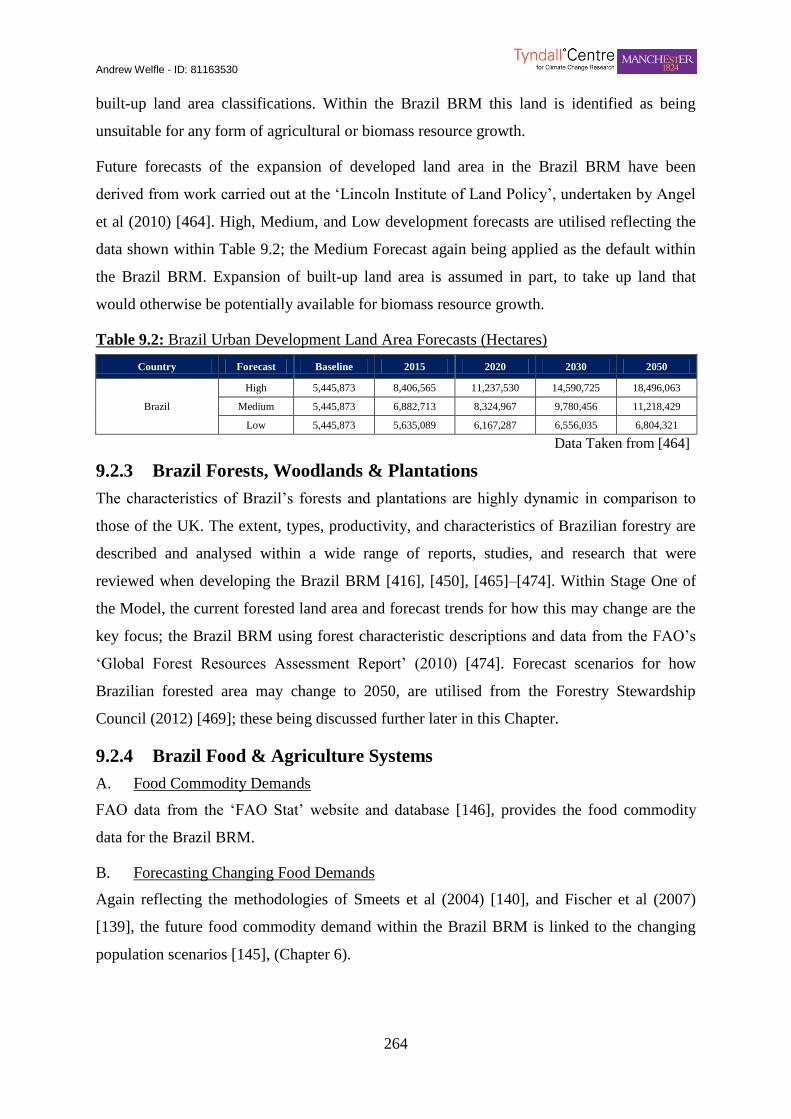
Andrew Welfle - ID: 81163530
264
built-up land area classifications. Within the Brazil BRM this land is identified as being
unsuitable for any form of agricultural or biomass resource growth.
Future forecasts of the expansion of developed land area in the Brazil BRM have been
derived from work carried out at the ‘Lincoln Institute of Land Policy’, undertaken by Angel
et al (2010) [464]. High, Medium, and Low development forecasts are utilised reflecting the
data shown within Table 9.2; the Medium Forecast again being applied as the default within
the Brazil BRM. Expansion of built-up land area is assumed in part, to take up land that
would otherwise be potentially available for biomass resource growth.
Table 9.2: Brazil Urban Development Land Area Forecasts (Hectares) Table 42) Table 9.2: Brazil Ur ban Development Land Area Forecasts (Hectares)
Country Forecast Baseline 2015 2020 2030 2050
Brazil
High 5,445,873 8,406,565 11,237,530 14,590,725 18,496,063
Medium 5,445,873 6,882,713 8,324,967 9,780,456 11,218,429
Low 5,445,873 5,635,089 6,167,287 6,556,035 6,804,321
Data Taken from [464]
9.2.3 Brazil Forests, Woodlands & Plantations
The characteristics of Brazil’s forests and plantations are highly dynamic in comparison to
those of the UK. The extent, types, productivity, and characteristics of Brazilian forestry are
described and analysed within a wide range of reports, studies, and research that were
reviewed when developing the Brazil BRM [416], [450], [465]–[474]. Within Stage One of
the Model, the current forested land area and forecast trends for how this may change are the
key focus; the Brazil BRM using forest characteristic descriptions and data from the FAO’s
‘Global Forest Resources Assessment Report’ (2010) [474]. Forecast scenarios for how
Brazilian forested area may change to 2050, are utilised from the Forestry Stewardship
Council (2012) [469]; these being discussed further later in this Chapter.
9.2.4 Brazil Food & Agriculture Systems
A. Food Commodity Demands
FAO data from the ‘FAO Stat’ website and database [146], provides the food commodity
data for the Brazil BRM.
B. Forecasting Changing Food Demands
Again reflecting the methodologies of Smeets et al (2004) [140], and Fischer et al (2007)
[139], the future food commodity demand within the Brazil BRM is linked to the changing
population scenarios [145], (Chapter 6).
Andrew Welfle - ID: 81163530
265
C. Animal Based Food Feed Demands
The Brazil BRM’s analysis of animal feed demands again utilises the data and assumptions
largely developed and applied by Bouwman et al (2004) [150]. Specific data for Brazil
reflecting: the applied animal based agriculture production systems [150], feeding practices
[150], feed compositions [475], and animal feed conversion efficiencies [150], [153], [209],
[476]–[478]; that are utilised. The key data values and assumptions utilised for these being
listed within Appendix 10.
The total land area required to produce animal based products to meet demand, is again based
on the area of pasture and arable land required to produce feed for animal growth.
9.2.5 Agriculture & Biomass Productivity Yields
A. Current Brazil Productivity Yields
A Brazil focused literature review was undertaken to develop a database of agricultural yield
data for all the food and biomass resource commodities analysed within the Brazil BRM
[140], [146], [150], [158], [159], [163], [165]–[167], [479]–[481]. Production yields for each
commodity and grown resource analysed within the Brazil BRM are listed within Appendix
11.0.
B. Future Brazil Productivity Yields
A further Brazil focused literature review was undertaken to analyse how agricultural
productivity yields may change to 2050. A review of a broad range of studies [21], [116],
[158], [159], [163], [175], [177]–[181], [184], [187]–[189], [481]–[486], concluded that
global agricultural yields are expected to increase by 20-200% by 2050. Agricultural
productivity yield trends for South America and Brazil range from +60% to 160% by 2050.
In reflection of these studies a default increased productivity of +120% is assumed for
increased commodity productivity, within the Brazil BRM.
9.2.6 Land Area to Meet Food Commodity Demands
Once the demand for each food commodity is determined, the Brazil BRM forecasts the land
area that may be required to produce the volumes of food commodities to balance demands.
This land area being a function of: the arable and pastoral food commodity demands, the
animal feed commodity demands, arable and pastoral agricultural productivity yields, and
population change scenarios.
Andrew Welfle - ID: 81163530
266
A. Prioritising Land for Food Production
The Brazil BRM prioritises the area of land to meet food demands before it is identified as
being potentially available for the production of biomass resources. This reflects the
methodologies developed by Smeets et al (2004) [140], and Fischer et al (2007) [139].
9.2.7 Brazil Land Availability
The final analysis step within Stage One of the Brazil BRM is again to forecast the total area
of land that may be available and suitable for the production of biomass resources. This land
area being calculated as a function of: the land area required to meet food commodity
demands, the area of built-up land, the forested land area, and the area of land unsuitable for
biomass production.
Andrew Welfle - ID: 81163530
267
9.3 The Brazil Biomass Resource Model –
Stage Two Analyses
This next section discusses the development of the Brazil BRM’s Stage Two analyses. The
analyses undertaken in stage two of the Brazil BRM, focuses on quantifying and forecasting
the availability of the different biomass resources analysed within the BRM. Once again,
rather than providing a detailed discussion of the methodologies of this analysis, this section
provides an overview of the data sources and references utilised; so that the BRM is adapted
to reflect Brazil’s biomass supply chains. The methodologies and applied calculation
equations are the same as those developed for the UK BRM, as discussed within Chapter 4. A
step-by-step walk through of the Stage Two analyses for the Brazil BRM is provided,
focusing on the following key analysis areas:
Forest Productivity Forestry Residues Industry – Forestry Dynamics
Industrial Residues Agricultural Residues Arboriculture Residues
Waste Generation Waste Management Biomass Planting Strategies
9.3.1 Forestry System Productivity & Characteristics
This section discusses the extents and characteristics of Brazil’s forestry industry, also
forecasting how productivity may change through to 2050. The productivity of forests within
the Brazil BRM drives industry and also provides resources directly to the bioenergy sector.
A. The Brazilian Forestry System
The extent (forestry area and standing volume) and characteristics (types and uses) of
Brazil’s forests are described within a large number of studies. Although the Brazil BRM
focuses on reports carried out by the FAO (2010), ‘Global Forest Resources Assessment’
[474], to evaluate the current status of Brazilian forests; and Buongiorno et al (2012)
‘Outlook to 2060 for World Forests & Forest Industries’ [470], to analyse how these may
change to 2050.
Current Brazilian forestry systems are quantified and categorised to reflect the way in which
they are used. These categories reflect those developed by the FAO as described below [474],
[487]; the ‘Production’ designated category representing those forests linked to the bioenergy
sector.
Production - Forest areas within this designation have the primary use of producing
wood fibre for industry and the bioenergy sector. This classification of forestry also

Andrew Welfle - ID: 81163530
268
includes activities of subsistence collection of wood, for both energy and wood-based
product use.
Protection of Soil & Water - These forested areas are designated for the primary use
of protecting soil and water systems. These areas include those subject to national
regulations that restrict the use of wood in order to maintain tree cover and vegetation
to protect soils.
Conservation of Biodiversity - The primary use of forests within this designation are
to conserve and maintain the biodiversity and the health of ecosystems. These areas
include forests with protection status.
Social Services - These forests are designated primarily for social services such as:
recreation, tourism, education, research, conservation and / or sites of cultural or
spiritual value. Forests utilised for subsistence wood fuel and wood product
requirements are not included in this category.
Multiple Use – Multiple-use designated forests have more than one purpose, where
none of the above categories are considered as the sole predominant designated
function.
Other - Forestry areas that have utilisation designations where the primary function is
other than that of production, conservation, social services, or multiple use.
None / Unknown Use - Forestry area currently with no known utilisation
designations.
i. Changing Forestry Systems to 2050
The Brazil BRM integrates a series of scenarios that forecast how forestry may change to
2050, as developed by Buongiorno et al (2012) [470]. The overall forestry area will change
over the analysis period, as will the designations of ‘forest category’ also evolve. These
scenarios are described in Table 9.3. Scenario 3 is applied as the default option within the
Brazil BRM. Figure 9.1 demonstrates a stacked area chart, reflecting changes to ‘overall
forest area and designations’ within Scenario 3, to 2050.
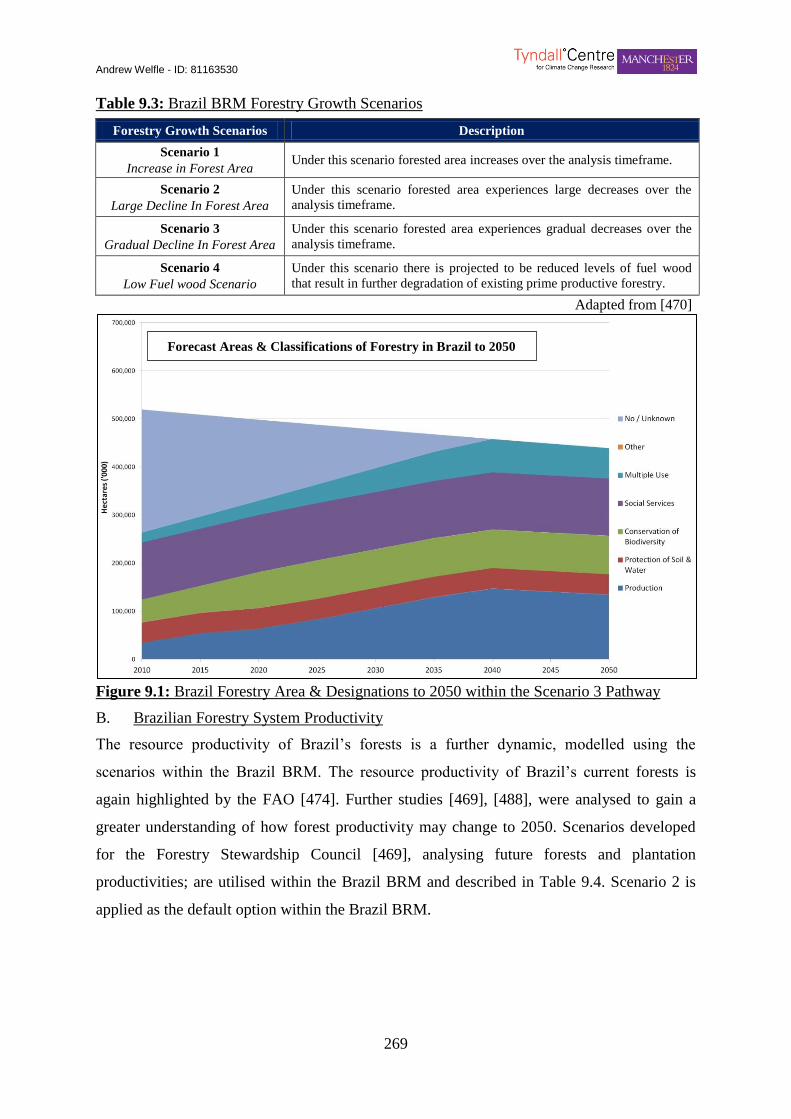
Andrew Welfle - ID: 81163530
269
Table 9.3: Brazil BRM Forestry Growth Scenarios Table 43) Table 9.3: Brazil BRM Forestry Growth Scenarios
Forestry Growth Scenarios Description
Scenario 1
Increase in Forest Area Under this scenario forested area increases over the analysis timeframe.
Scenario 2
Large Decline In Forest Area
Under this scenario forested area experiences large decreases over the
analysis timeframe.
Scenario 3
Gradual Decline In Forest Area
Under this scenario forested area experiences gradual decreases over the
analysis timeframe.
Scenario 4
Low Fuel wood Scenario
Under this scenario there is projected to be reduced levels of fuel wood
that result in further degradation of existing prime productive forestry.
Adapted from [470]
67) Figure 9.1: Brazil Forestry Area & Designations to 2050 within the Scenario 3 Pat hway
Figure 9.1: Brazil Forestry Area & Designations to 2050 within the Scenario 3 Pathway
B. Brazilian Forestry System Productivity
The resource productivity of Brazil’s forests is a further dynamic, modelled using the
scenarios within the Brazil BRM. The resource productivity of Brazil’s current forests is
again highlighted by the FAO [474]. Further studies [469], [488], were analysed to gain a
greater understanding of how forest productivity may change to 2050. Scenarios developed
for the Forestry Stewardship Council [469], analysing future forests and plantation
productivities; are utilised within the Brazil BRM and described in Table 9.4. Scenario 2 is
applied as the default option within the Brazil BRM.
Forecast Areas & Classifications of Forestry in Brazil to 2050
Andrew Welfle - ID: 81163530
270
Table 9.4: Brazil BRM Forestry Productivity Scenarios Table 44) Table 9.4: Brazil BRM Forestry Productivity Scenarios
Forestry Growth Scenarios Description
Scenario 1
Continuation of Current
This scenario represents a steady continuation of present harvest and
productivity levels.
Scenario 2
Steady Productivity Increase
This scenario represents a steady increase in harvest and productivity
levels. These resulting from technological improvements and increased
managements of forestry systems
Scenario 3
Large Productivity Increase
This scenario represents the theoretical upper limits of harvest and
productivity levels.
Adapted from [469]
9.3.2 Forestry Residues
A. Current Resource
Forestry residues are utilised extensively throughout Brazil, albeit predominantly as wood
fuel for small scale and domestic uses [488]. The extent and potential of forestry residues
from Brazil’s extensive forests has been analysed to be significant [489].
B. Availability for the Bioenergy Sector
The Brazil BRM calculates the availability of forestry residues for the bioenergy sector as a
function of the area of managed and plantation forests, and the harvest proportion
capabilities.
C. Future Resource
A review of studies and literature [251], [377], [488]–[490], highlights that by 2050 up to
45% of available forestry residues may be harvested and may potentially be available for
utilisation by the bioenergy sector. The Brazil BRM also takes account of the forestry and
plantation growth scenarios, discussed further within Chapter 4 and Section 9.3.9.
9.3.3 Industrial Residues
A. Current Resource
The current levels of biomass resources produced from Brazilian industries are not well
documented beyond the information provided by larger companies. Although Brazil does
have an extensive number of industries reliant and using forestry resources [469], [488].
B. Availability for the Bioenergy Sector
The Brazil BRM calculates the availability of industrial residues for the bioenergy sector as a
function of the growth of wood based industries, and the extent that residues are not utilised
by competing industries.
Andrew Welfle - ID: 81163530
271
C. Future Resource
The future resource opportunities from industrial residues are modelled within the Brazil
BRM, utilising forecasts of current resource levels [469]; with growth calculated as a
function of both resource growth and trade dynamics [470].
9.3.4 Straw Agricultural Residues
A. Current Resource
The Brazil BRM utilises trend data for the production of straw and other related agricultural
residues from the Brazilian Ministry of Agriculture, Livestock & Food Supply [411].
Forster-Carneiro et al (2013) [491], provide data on the current end-uses and competing
markets for straws in Brazil; predominantly reutilisation of resources by the agricultural
sector.
B. Availability for the Bioenergy Sector
The predominant factor determining the availability of straw resources within the Brazil
BRM is the limitation extent that it can be harvested. The Brazil BRM’s analysis reflecting
the work carried out within a series of reports which estimate Brazilian harvesting
capabilities [411], [488], [491]–[494].
C. Future Resource
It is estimated that up to 40% of all straws may be harvestable by 2050 through the
development of technological and practical advances [488]. A series of harvest potential
forecasts and evaluations of competing markets [411], [488], [491]–[494]; are reflected
within the Brazil BRM. The mean average of these values derived from this literature, is set
as the default within the Brazil BRM.
9.3.5 Slurry Agricultural Residues
A. Current Resource
The agriculture residue resource produced by animals within the Brazil BRM is again
calculated as a function of: the number and types of livestock, the excreta rates, housing
practices, and the manure management methods applied.
The Brazil BRM’s analysis utilises the animal based food commodity data discussed in
Section 9.2.4, to determine the number and type of livestock farmed. A literature review was
undertaken [208]–[212], to evaluate the ‘manure factor per animal per year’, to determine the
total levels of resource that may be produced. Data sourced from Bouwman et al (2004)
[150], and Schmidt (2009) [495], is applied to evaluate typical farming practices and to

Andrew Welfle - ID: 81163530
272
determine the duration that different animal species are housed – allowing the estimation of
the maximum levels of resource that may be collectable.
B. Availability for the Bioenergy Sector
The extent that resources may be available to the bioenergy sector, are determined following
a further literature review [150], [208], [495]–[500]. The key factors in determining
availability being: the extent that the resource can be collected, and the volume required by
competing markets – predominantly used onsite.
C. Future Resource
The future potential of slurry resource is analysed within the Brazil BRM utilising the
methodology developed by E4tech (2009) [138]. This focuses on forecasts of the number of
animals that will be farmed (Section 9.2.4), and changing farming practices such as the extent
that animals are housed, and manure extraction rates over time.
9.3.6 Arboriculture Residues
There is very little reporting of arboricultural residues in Brazil aside from that for large
municipal areas; the majority of resources collected from urban areas and urban forests being
distributed to landfill sites [501], [502]. There is no literature or accounts describing
utilisation of these resources within bioenergy pathways.
A. Current Resource
As such the Brazil BRM assumes that no arboricultural arisings are currently utilised within
bioenergy pathways.
B. Availability for the Bioenergy Sector
As the large majority of arboricultural arising are currently diverted to landfill sites [501],
[502], the Brazil BRM assumes that the current availability for the bioenergy sector is
negligible.
C. Future Resource
The Brazil BRM makes the assumption that the potential extent of the arboriculture resources
will expand in line with urban development [464], this reflecting the same general
assumption made for the UK BRM [199]. The Brazil BRM also assumes that in the future the
Brazilian bioenergy sector may start to utilise the resources previously diverted to landfill.
These assumptions being: in 2015 - 1% of resources, in 2020 - 5% of resources, in 2030 -
10% of resources, and in 2050 - 20% of resources. These reflect the modest assumptions of
increased waste management practices [503].
Andrew Welfle - ID: 81163530
273
9.3.7 Wastes
Brazil is a rapidly expanding economy and thus it has been forecast that a Brazilian waste-
generation ‘population boom’ is still to come [504]. Waste generation and management data
in Brazil does not appear to reflect the whole picture of what is actually happening but is
continually improving. Current waste generation and especially waste management practices
in Brazil are reflective of the country’s rapid on-going growth, and poorly developed waste
management policies. Energy recovery from waste applications is currently not widely
utilised, however the Brazilian Government has ambitions for increased energy recovery
applications [505].
A. Brazil BRM Waste Resource Categories
The Brazil BRM categorises different waste resources in reflection of the statistics and
methodologies used by the Brazilian Business Commitment for Recycling (CEMPRE) [506],
[507]. Table 9.5 demonstrates the predominant waste categories as accounted for in Brazil,
also highlighting their availability for the bioenergy sector as reflected within the Brazil
BRM.
Table 9.5: Waste Streams & Availability for the Bioenergy Sector Table 45) Table 9.5: Waste Streams & Ava ilabil ity for the Bioenergy Sector
Waste Categories Hazard Classification Availability to Bioenergy Sector
Metallic Wastes Non-Hazardous X Metallic Wastes Hazardous X
Glass Wastes Mixed X Paper & Cardboard Wastes Non-Hazardous
Rubber Wastes Non-Hazardous X Wood Wastes Mixed Textile Wastes Non-Hazardous
Animal & Vegetable Wastes Non-Hazardous
Adapted from [506], [507]
B. Waste Generation Forecasts Scenarios
There are a series of reports and studies [504], [507]–[510], that develop scenarios
forecasting waste generation trends in Brazil. The Brazil BRM is developed integrating
Brazilian waste generation forecast scenarios, as produced by the University of Sao Paulo
[506]. These scenarios reflect both upper and lower limit forecasts for how waste may be
generated in the future. A reference rate scenario is also developed, representing a ‘business
as usual’ future forecast. The waste generated trends data relevant to these scenarios as
utilised within the Brazil BRM, is listed in Appendix 12.0.

Andrew Welfle - ID: 81163530
274
C. Waste Management Scenarios
Brazilian waste management practices remain far behind those of many of the more
developed countries, such as the UK. The majority of Brazil’s waste streams are disposed of
through landfill sites. However Brazil has high ambitions to increase its waste management
practices; principally to increase the proportion of wastes it recycles, reuses, and utilises
within energy recovery pathways.
The Brazil BRM is developed to reflect scenarios for the management of Brazil’s future
wastes, as researched by the University of Utrecht in consultancy MWH for the Brazilian
Ministry of Infrastructure & the Environment [505]. The data from this research will help to
determine the extent and distribution of wastes within the following scenarios: Reference
Rate, Waste Law, and Recycling+. A further description of these scenarios is provided
below, and the corresponding waste distribution proportions reflected within the Brazil BRM
are documented in Appendix 12.0.
Reference Rate Scenario: Represents a business-as-usual continuation of waste
distribution within Brazil. This reflects large proportions of waste being distributed to
landfill sites, with marginal reuse and recycling practices. No waste within this
scenario is made available to the bioenergy sector for energy recovery processes
[505].
Waste Law Scenario: Is based on Brazilian waste land and targets set within the
Brazilian National Waste Plan [511]. This scenario favours the reuse and recycling of
wastes rather than energy recovery options. The reduction of the proportion of wastes
distributed to landfill being the prime objective [505].
Recycling + Scenario: Greater focus is placed on the recycling and reuse of resources
rather than distribution to landfill sites. This scenario also focuses on increasing the
anaerobic digestion of organic wastes thereby providing great opportunities for the
Brazilian bioenergy sector [505].
9.3.8 Sewage Waste
Currently only about 50% of the Brazilian population is connected to public sewage grid
systems; with only 28% these having sewage treatment infrastructure in place [512]. The
majority of the remaining sewage wastes are discharged into rivers, the sea, and other
dumping sites [513].

Andrew Welfle - ID: 81163530
275
The lack of a universal sewage system and treatment works in Brazil has large health and
well-being implications; with the missed opportunities for the bioenergy sector being a
distant priority [514].
Of the sewage that is treated in Brazil, the most common treatments are based on stabilisation
lagoons and sludge processing systems. In rural areas individual systems and septic tanks are
widely utilised with wastes being filtered, treated and percolated through soils [514].
A. Current Resource
The current sewage resource is reflective of the current sewage system networks and
infrastructure in Brazil; the infrastructure determining the extent that sewage resource may be
collected, and its availability as a potential bioenergy resource. The current utilisation of
sewage resources within Brazilian energy pathways is limited and restricted to large
municipal areas [512]–[514].
B. Availability for the Bioenergy Sector
As with the UK BRM the overall sewage resource for the Brazil BRM is calculated, and
forecast to change in-step with population growth [145]. The availability of sewage waste
resources identified within the Brazil BRM are also determined as a function of the current
and future development of the sewage infrastructure; this representing a percentage of the
overall resource that may be available for energy pathways [512]–[514].
C. Future Resource
Government and Industry have developed a roadmap for developing sewage and sanitation
networks to cover the whole of Brazil. At the current and planned rate of investment, it may
take up to 60 years for this level of coverage to be achieved [515], [516]. Thus the Brazil
BRM utilises these trends when modelling the future total availability of sewage resources,
and their potential availability for the Brazilian bioenergy sector.
9.3.9 Grown Biomass & Energy Crops
The final major group of resources evaluated within Stage Two of the BRM’s analyses, are
the biomass resources and energy crops grown specifically for the bioenergy sector. This
analysis utilises the area of land identified as being available and suitable for crop growth,
from Stage One of the Model’s analysis, and allows the evaluation of different planting
strategies for the utilisation of this land.
Andrew Welfle - ID: 81163530
276
A. Dedicating Available Land for Resource Growth & Plantation Strategies
The characteristics of Brazil’s current and forecast future plantations are well discussed in
literature [146], [416], [450], [465]–[467], [469], [471]–[473], [517]–[519]. The extent that
available land is utilised within the Brazil BRM, for the cultivation of resources dedicated for
the bioenergy sector; reflects these studies. The combined view showing the potential extent
of Brazilian plantations to 2050 are: >52.8 MHa by 2015, >61.5 MHa by 2020, >79.0 MHa
by 2030, and >114.0 MHa by 2050. Further details documenting the proportion of land with
respect to other land-uses in Brazil, are described in Section 9.5.1 later in this Chapter; where
a Brazil Baseline Scenario is developed.
Literature confirms that Brazilian plantation resources, potentially grown specifically for the
bioenergy sector will focus on the following key crops:
Poplar [465], [469], [517] Sugarcane [146], [416], [465], [467], [469], [471], [473], [518]
Palm [450], [465] Soya [146], [416], [465], [469], [519]
Pine [465], [469], [517] Eucalyptus [465], [469], [472], [517]
Jatropha [465], [469], [517]
A literature review was undertaken focusing on each of these key plantation species, and a
‘baseline planting strategy’ was developed to reflect the extent that available land is
dedicated for the growth of each. Figure 9.2, highlights the land dedicated to each of the key
plantation crops, when the Brazil BRM is calibrated to reflect the default Brazil Baseline
Scenario (discussed later in Section 9.5.1). When analysing Figure 9.2, it is important to
consider the respective land productivity yields for each specific crop, as the extent that land
is dedicated to each crop does not necessarily reflect the overall standing of resource
produced.
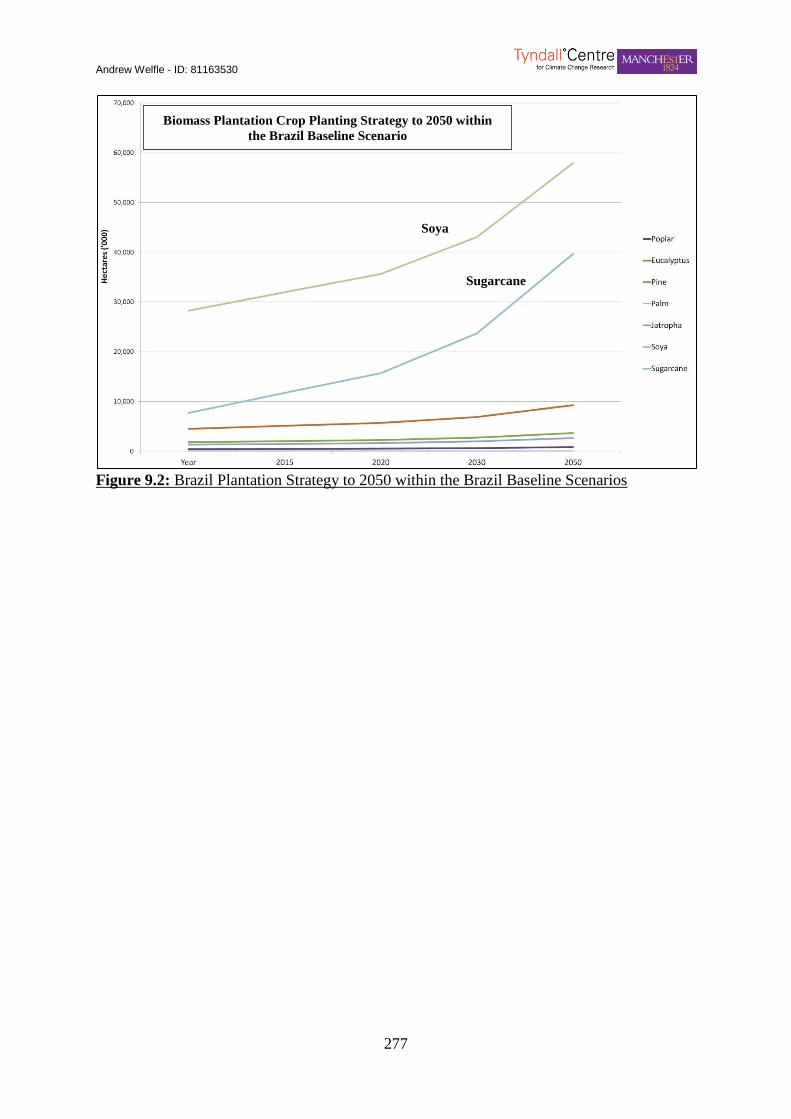
Andrew Welfle - ID: 81163530
277
68) Figure 9.2: Brazil P lantation Strategy to 2050 w ithin the Brazil Baseline Scenarios
Figure 9.2: Brazil Plantation Strategy to 2050 within the Brazil Baseline Scenarios
Biomass Plantation Crop Planting Strategy to 2050 within
the Brazil Baseline Scenario
Sugarcane
Soya
Andrew Welfle - ID: 81163530
278
9.4 The Brazil Biomass Resource Model –
Stage Three Analyses
The Stage Three analyses undertaken within the Brazil BRM follow the same pathways as
that developed for the UK BRM (Chapter 4). However, further unique analysis is undertaken
with respect to accounting for differing bioenergy conversion priorities, and the energy target
requirements applicable to Brazil.
The Brazil BRM utilises the same BRM parameters, values, and analysis methodologies as
those applied within the UK BRM for determining the bioenergy potential of the resources
accounted for within Stage Two. Where the analysis methodologies diverge however, is
instead of comparing these bioenergy potential values against static, energy, renewable
energy, and bioenergy targets defined by legislation; the Brazil BRM compares the bioenergy
potential calculations against a series of scenarios of future bioenergy demands. These
scenarios are developed to reflect varying levels of targeted contributions from bioenergy.
Thus when undertaking the resource balance analysis for the Brazil BRM, these scenarios
allow evaluation of the extent to which Brazilian biomass resources may be available for
exportation to the global biomass trade markets; in line with forecasts of the varying levels of
indigenous utilisation of resources.
Andrew Welfle - ID: 81163530
279
9.5 Brazil Biomass Resource Availability
This section of the Chapter includes the results and discussions of the Brazilian biomass
resource availability, and the bioenergy potential analyses undertaken. The section starts with
the development of a Brazil Baseline Scenario, to determine the potential availability of
different resources to 2030. Bioenergy scenarios are then developed to evaluate how
Brazilian biomass resource exports may be impacted, if a greater proportion of indigenous
resources are utilised to meet domestic bioenergy demands.
The analysis timeframe is undertaken to 2030 instead of 2050 for the Brazil bioenergy
scenarios. The reasoning behind this analysis timeframe for the Brazil BRM research is that
2030 reflects the mid-term timeframe, when the UK bioenergy utilisation forecasts are
predicted to potentially peak. Beyond 2030 there is increasingly greater uncertainty (Chapter
7). Therefore, restricting the analysis to 2030 allows the analysis conclusions relating the
UK’s potential importation of resources; to be regarded with greater realisation.
9.5.1 Brazil Biomass Supply Chain Dynamics to 2030
The first step within the analysis is to develop a Baseline Scenario for Brazil, in order to
evaluate the extent that different biomass resources may be available to 2030.
A. Developing a Brazil Baseline Scenario
Reflecting the methodology developed and discussed in Chapter 5, a database was produced
collating the range of values that literature and studies forecast for how Brazilian biomass
supply chains may vary to 2030. This ‘literature informed’ mean or ‘Baseline Scenario’,
enables the evaluation of the ‘average’ availability of each resource to 2030.
A summary of the reports, studies and research contributing to the development of the Brazil
Baseline Scenario are listed in Table 9.6, and the key information describing how the Brazil
BRM is calibrated to reflect this scenario, is documented within Appendix 13.0.

Andrew Welfle - ID: 81163530
280
Table 9.6: Reports Studies and Research Influencing the Brazil Baseline Scenarios Table 46) Table 9.6: Reports St udies and Research Influencing the Brazil Baseline Scenarios
Categories Specific Drivers Descriptions
Development Drivers Population Change [145]
Changes in Built-Up Land Area [146], [464]
Food Production
System Drivers
Crop & Agriculture Productivity
[21], [116], [140], [146], [150], [153], [158], [159],
[163], [165]–[167], [175], [177]–[181], [184], [187]–[189], [209], [475]–[486]
Food Waste Generation [79]
Food Commodity Imports [468], [470], [520], [521]
Food Commodity Exports
Utilisation of Agricultural Wastes & Residues [138], [150], [208]–[212], [411], [488], [491]–[500]
Forestry & Wood-
based Industry Drivers
Forestry Expansion & Productivity [416], [450], [465]–[474], [481]
Wood-based Industry Productivity [468], [469]
Imports of Forestry Product [470], [520], [521]
Exports of Forestry Product
Biomass Residue &
Waste Utilisation
Drivers
Utilisation of Forestry Residues [251], [377], [488]–[490]
Utilisation of Industrial Residues [468]–[470], [488]
Utilisation of Arboriculture Arisings [199], [464], [501]–[503]
Waste Generation Trends [504]–[510], [512]–[516]
Waste Management Strategies. [505]
Biomass & Energy
Crop Strategy Drivers
Land Dedicated for Energy Crop Growth [146], [416], [450], [465]–[467], [469], [471]–[473],
[517]–[519] Biomass Resource Planting Strategies
9.5.2 Brazil Baseline Scenario – Land-Use Analysis
Reflecting the analysis undertaken in Chapter 6 for the UK BRM scenarios, this first step in
analysing the Brazil Baseline Scenario evaluates how land-use, changes over the analysis
timeframe. Land-use change trends, providing a first indication of the dynamics taking place
that may influence the availability of different biomass resources.
A. Land-Use Analysis – Results & Discussions
Figure 9.3 documents the Brazil Baseline Scenario land-use change trends, to 2030. The
stacked columns of Figure 9.3 each reflect a breakdown of Brazil’s land-use classifications.
The total land area analysed, representing Brazil’s total area of suitable land that could
otherwise potentially be utilised to grow resources for the bioenergy sector.
Reflected by the ‘Forestry and Woodland’ category, the proportion of forested area in Brazil
is forecast to decline to 2030. This trend is potentially reflective of exploitation of forestry
systems beyond any replanting rates.
At the same time an increase in the proportion of ‘Land Dedicated for Biomass & Energy
Crops’ is documented. This reflects the trend towards increased utilisation of available land
within the Baseline Scenario, for growth of resources for the bioenergy sector.
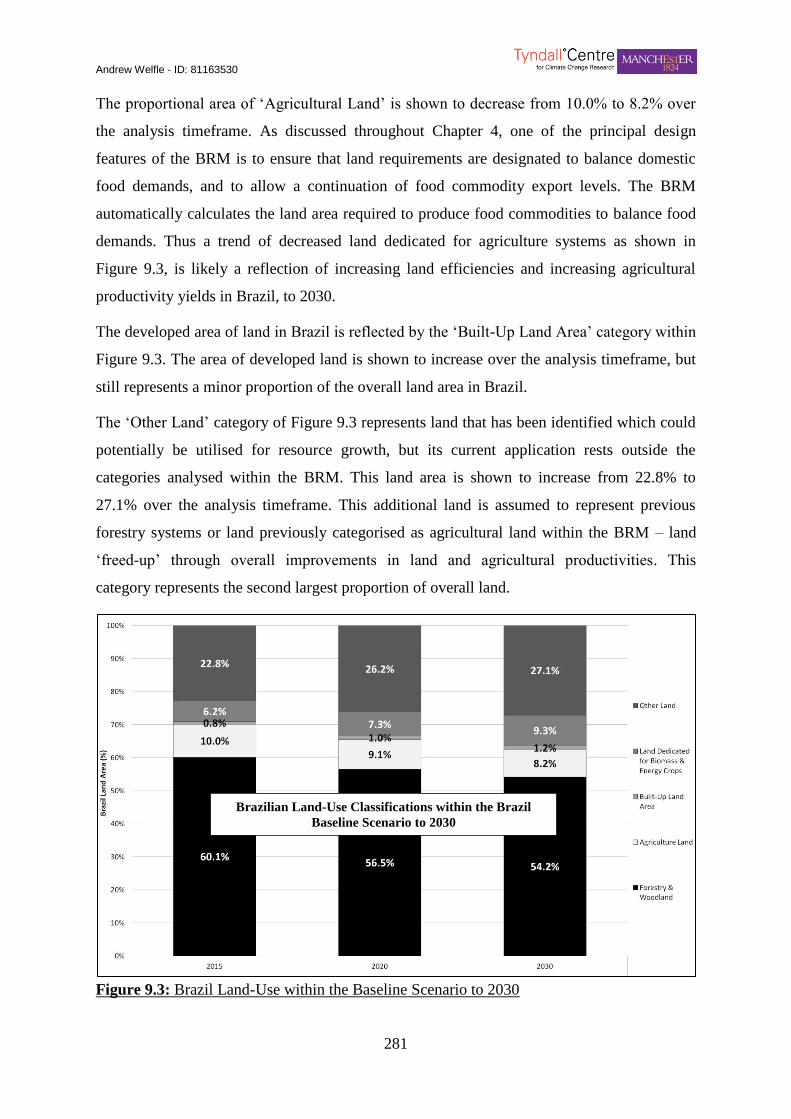
Andrew Welfle - ID: 81163530
281
The proportional area of ‘Agricultural Land’ is shown to decrease from 10.0% to 8.2% over
the analysis timeframe. As discussed throughout Chapter 4, one of the principal design
features of the BRM is to ensure that land requirements are designated to balance domestic
food demands, and to allow a continuation of food commodity export levels. The BRM
automatically calculates the land area required to produce food commodities to balance food
demands. Thus a trend of decreased land dedicated for agriculture systems as shown in
Figure 9.3, is likely a reflection of increasing land efficiencies and increasing agricultural
productivity yields in Brazil, to 2030.
The developed area of land in Brazil is reflected by the ‘Built-Up Land Area’ category within
Figure 9.3. The area of developed land is shown to increase over the analysis timeframe, but
still represents a minor proportion of the overall land area in Brazil.
The ‘Other Land’ category of Figure 9.3 represents land that has been identified which could
potentially be utilised for resource growth, but its current application rests outside the
categories analysed within the BRM. This land area is shown to increase from 22.8% to
27.1% over the analysis timeframe. This additional land is assumed to represent previous
forestry systems or land previously categorised as agricultural land within the BRM – land
‘freed-up’ through overall improvements in land and agricultural productivities. This
category represents the second largest proportion of overall land.
69) Figure 9.3: Brazil Land U se within the Basel ine Scenario to 2030
Figure 9.3: Brazil Land-Use within the Baseline Scenario to 2030
Brazilian Land-Use Classifications within the Brazil
Baseline Scenario to 2030

Andrew Welfle - ID: 81163530
282
9.5.3 Brazil Baseline Scenario – Biomass Resource Availability Analysis
The next section presents the results of the Brazil Baseline Scenario analysis, determining the
availability of different biomass resources to 2030.
A. Biomass Resource Availability Analysis – Results & Discussions
Figure 9.4, documents the biomass resource availability analysis for the Brazil Baseline
Scenario to 2030. The stacked bar charts of Figure 9.4 represent the extent of resource
availability for the given year in, the analysis timeframe. The stacked line charts linking the
bars allow further visual analysis, by providing a breakdown of the different resource within
each of the resource categories of the BRM: Grown Resources, Residue Resources, and
Waste Resources (further described in Table 4.1).
Figure 9.4 does not have to be examined closely to identify the clear dominance in
availability of a few key resources in comparison to the overall totals. The ‘Energy Crops’
category reflects the availability of all oil, sugar, and cereal-based crop species. They are
forecast to contribute >71.5% of the resource total by 2015; rising to >74.8% by 2030. The
production and availability of sugarcane resource, is by far the dominant contributor to this
resource group. This analysis outcome aligns with Brazil’s standing as the World’s second
largest sugarcane producer, and largest exporter [416], [488].
Other significant resources with large availabilities reflected within Figure 9.4, are: the
‘Biomass Crops’, ‘Forestry Resources’, and ‘Agricultural Residues’. ‘Biomass Crops’
consisting of plantation species such as eucalyptus and poplar, are forecast to contribute
>5.9% of the resource total by 2015, falling to >4.2% by 2030. ‘Forestry Resources’
reflecting resources harvested directly from forestry systems, are forecast to contribute
>14.1% of the total resource by 2015, falling to 10.94% by 2030. ‘Agricultural Residues’
consisting both of straws and slurry resources, are forecast to contribute >7.5% of the
resource total by 2015, rising to >8.6% in 2030.
The production dominance and increasing focus on the growth of ‘Energy Crops’
(sugarcane), overshadows that of the other main biomass resource categories. Despite the
availabilities of both ‘Forestry Resources’ and ‘Biomass Resources’ increasing over the
analysis timeframe, their overall proportional contribution to the biomass resource total
decreases – such is the rapid rate of increase in the forecast for sugarcane production. A
further ‘beneficiary’ within the resources category, resulting from this rapid increase in
energy crops, is the linked increase in agricultural residues; the proportional contribution of
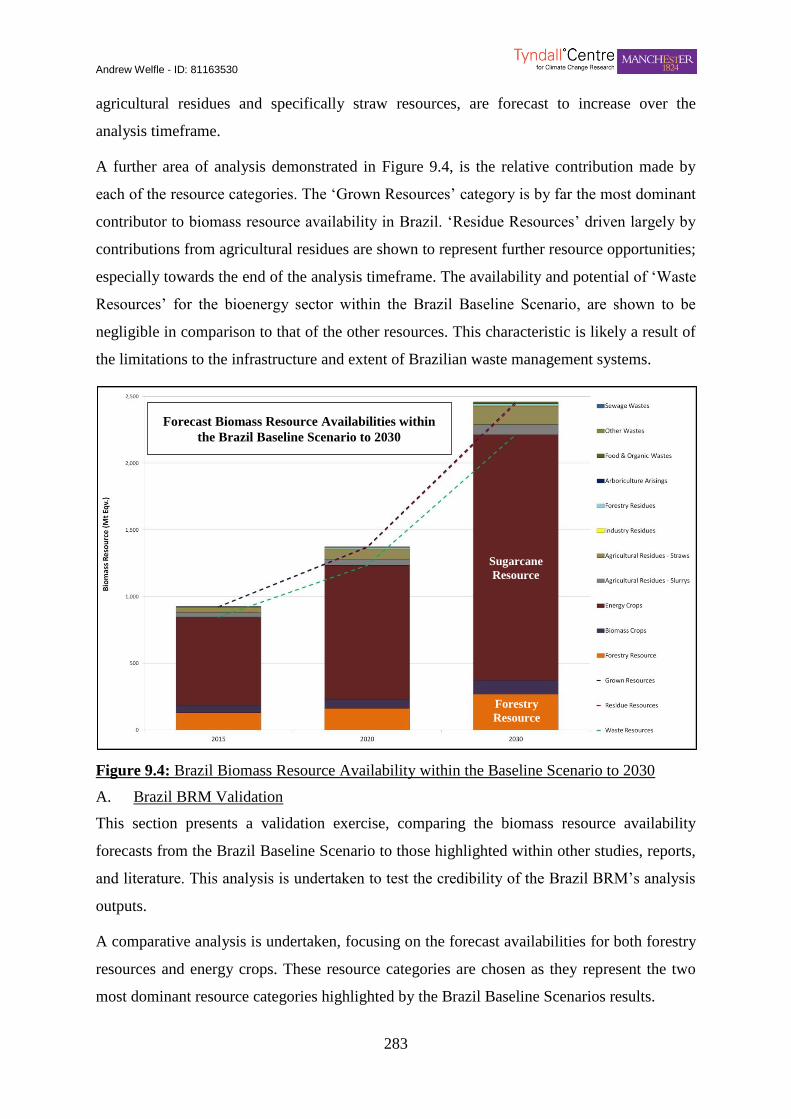
Andrew Welfle - ID: 81163530
283
agricultural residues and specifically straw resources, are forecast to increase over the
analysis timeframe.
A further area of analysis demonstrated in Figure 9.4, is the relative contribution made by
each of the resource categories. The ‘Grown Resources’ category is by far the most dominant
contributor to biomass resource availability in Brazil. ‘Residue Resources’ driven largely by
contributions from agricultural residues are shown to represent further resource opportunities;
especially towards the end of the analysis timeframe. The availability and potential of ‘Waste
Resources’ for the bioenergy sector within the Brazil Baseline Scenario, are shown to be
negligible in comparison to that of the other resources. This characteristic is likely a result of
the limitations to the infrastructure and extent of Brazilian waste management systems.
70) Figure 9.4: Brazil Biomass Resource Availabil ity within t he Baseline Scenario to 2030
Figure 9.4: Brazil Biomass Resource Availability within the Baseline Scenario to 2030
A. Brazil BRM Validation
This section presents a validation exercise, comparing the biomass resource availability
forecasts from the Brazil Baseline Scenario to those highlighted within other studies, reports,
and literature. This analysis is undertaken to test the credibility of the Brazil BRM’s analysis
outputs.
A comparative analysis is undertaken, focusing on the forecast availabilities for both forestry
resources and energy crops. These resource categories are chosen as they represent the two
most dominant resource categories highlighted by the Brazil Baseline Scenarios results.
Forecast Biomass Resource Availabilities within
the Brazil Baseline Scenario to 2030
Sugarcane
Resource
Forestry
Resource

Andrew Welfle - ID: 81163530
284
A wide literature review was undertaken to evaluate the range of existing forecasts which
estimate availabilities of forestry resources and wood-based resources [470], [489], [522],
[523], and also energy crop resources [123], [124], [180], [251], [524]–[533]; produced by
Brazil in the year 2030. The Brazil Baseline Scenario’s forecasts for these resources in 2030
are then compared to the forecasts from the relevant studies. These comparisons are presented
in the graphs of Figures 9.5 and 9.6.
71) Figure 9.5: Brazil Baseline Scenario – Va lidation of Wood Resource Availability Forecasture
Figure 9.5: Brazil Baseline Scenario Validation of Wood Resource Availability Forecast
Range of Brazilian Wood
Resource Availability
Forecasts by 2030
According to Literature,
and Forecast Availability
within the Brazil Baseline
Scenario
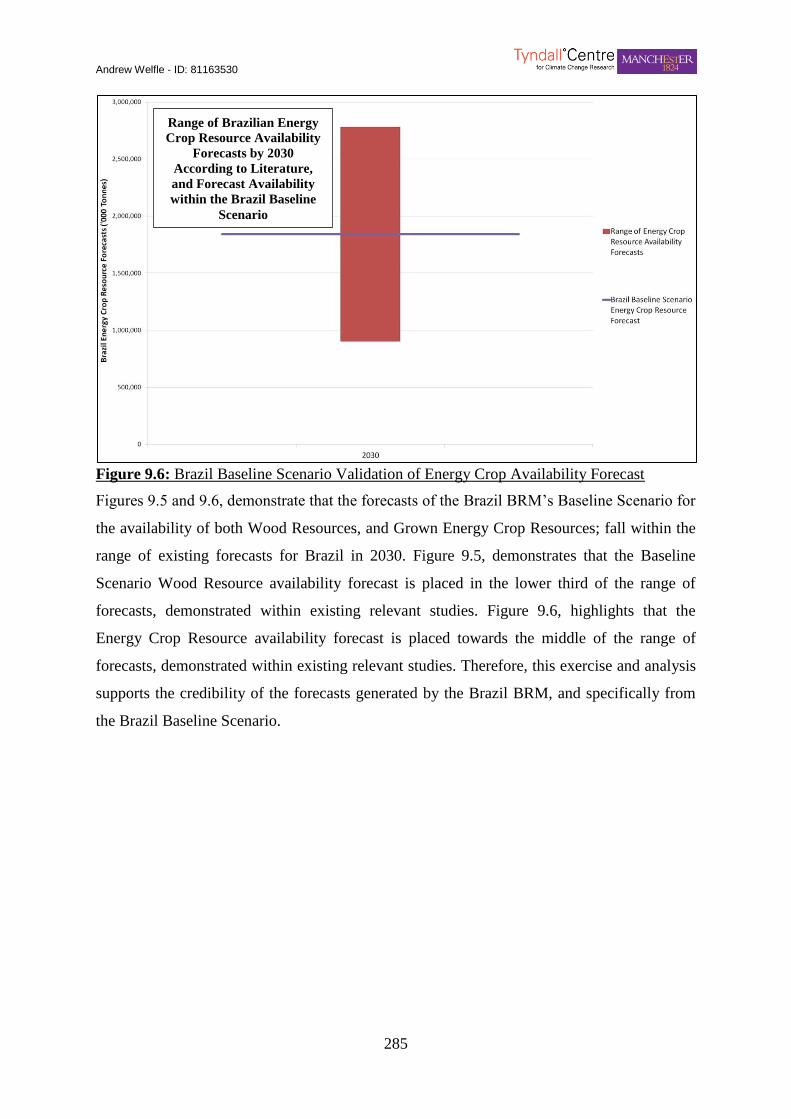
Andrew Welfle - ID: 81163530
285
72) Figure 9.6: Brazil Baseline Scenario – Va lidation of Energy Crop A vailability Forecast
Figure 9.6: Brazil Baseline Scenario Validation of Energy Crop Availability Forecast
Figures 9.5 and 9.6, demonstrate that the forecasts of the Brazil BRM’s Baseline Scenario for
the availability of both Wood Resources, and Grown Energy Crop Resources; fall within the
range of existing forecasts for Brazil in 2030. Figure 9.5, demonstrates that the Baseline
Scenario Wood Resource availability forecast is placed in the lower third of the range of
forecasts, demonstrated within existing relevant studies. Figure 9.6, highlights that the
Energy Crop Resource availability forecast is placed towards the middle of the range of
forecasts, demonstrated within existing relevant studies. Therefore, this exercise and analysis
supports the credibility of the forecasts generated by the Brazil BRM, and specifically from
the Brazil Baseline Scenario.
Range of Brazilian Energy
Crop Resource Availability
Forecasts by 2030
According to Literature,
and Forecast Availability
within the Brazil Baseline
Scenario

Andrew Welfle - ID: 81163530
286
9.6 Brazil Bioenergy Scenarios
This next section introduces the bioenergy scenarios analyses, undertaken using the Brazil
BRM Baseline Scenario. The aim of this section is to analyse how Brazil’s potential biomass
resource balance may change, should the Brazilian Government decide in the future to
implement strategies that vary their domestic consumption of biomass resources, to meet
their own domestic energy demands.
The key output from this section is the evaluation of the extent to which global biomass
markets may be impacted, should the actual future exports from countries such as Brazil
differ from, the expected forecasts widely documented by literature (Chapter 8).
This section is structured by initially undertaking an analysis of Brazil’s current energy
systems, and highlighting the strategies and policies directing Brazil’s current energy
pathway. Brazil’s energy strategies and related targets are then compared to those of other
countries from around the World. This comparative analysis will provide further context, and
allow the Brazilian Government’s energy ambitions to be benchmarked against those of other
countries. The comparison may also provide some useful insight into how Brazil’s energy
strategies and targets may evolve in the future.
A series of ‘Brazil Bioenergy Scenarios’ are then developed to reflect varying energy
strategies that Brazil may pursue. These scenarios are then applied to the Brazil BRM
Baseline Scenario to evaluate how Brazil’s biomass resource balance and potential resource
exports, may be impacted under the influence of varying energy strategies and targets.
9.6.1 Brazil Current Energy System
As highlighted the first step in this section is to undertake an analysis outlining the nature of
the Brazil’s current energy system. This is best reflected by data and reports provided by the
International Energy Agency (IEA) within their ‘Energy Balance Reports’ [534]. Figures 9.7,
9.8, and 9.9, introduce pie-charts presenting the IEA’s data which reflects: energy
technologies contributing to Brazil’s primary energy supply in 2011 (Figure 9.7), the fuels
and resources utilised to generate Brazil’s power in 2011 (Figure 9.8), and the fuels and
resources utilised within Brazil’s transport sector in 2011 (Figure 9.9). A similar graph is not
presented describing the fuels and resources utilised to generate Brazil’s heat energy, as
dedicated heat and power is generated almost entirely utilising charcoal biomass resources
[132].
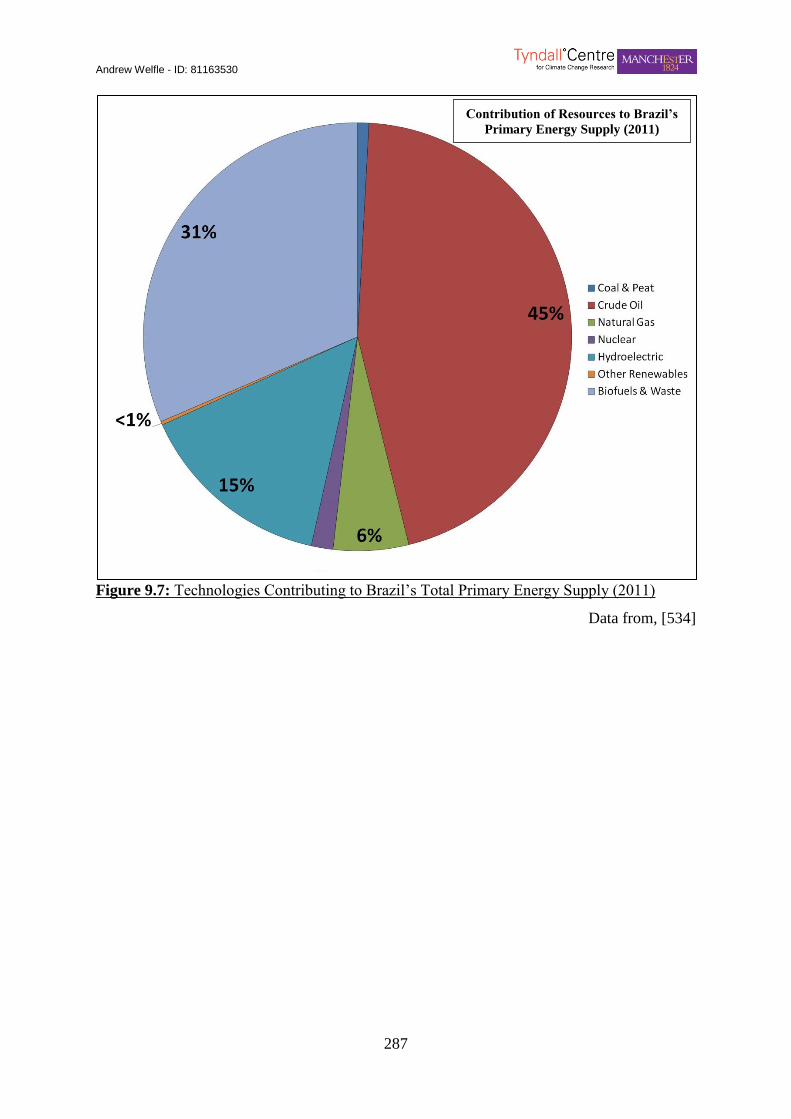
Andrew Welfle - ID: 81163530
287
Figure 9.7: Technologies Contributing to Brazil’s Total Primary Energy Supply (2011) 73) Figure 9.7: Energy Technolog ies Contributing to Brazil’s Total Primary Energy Supply (2011)
Data from, [534]
Contribution of Resources to Brazil’s
Primary Energy Supply (2011)
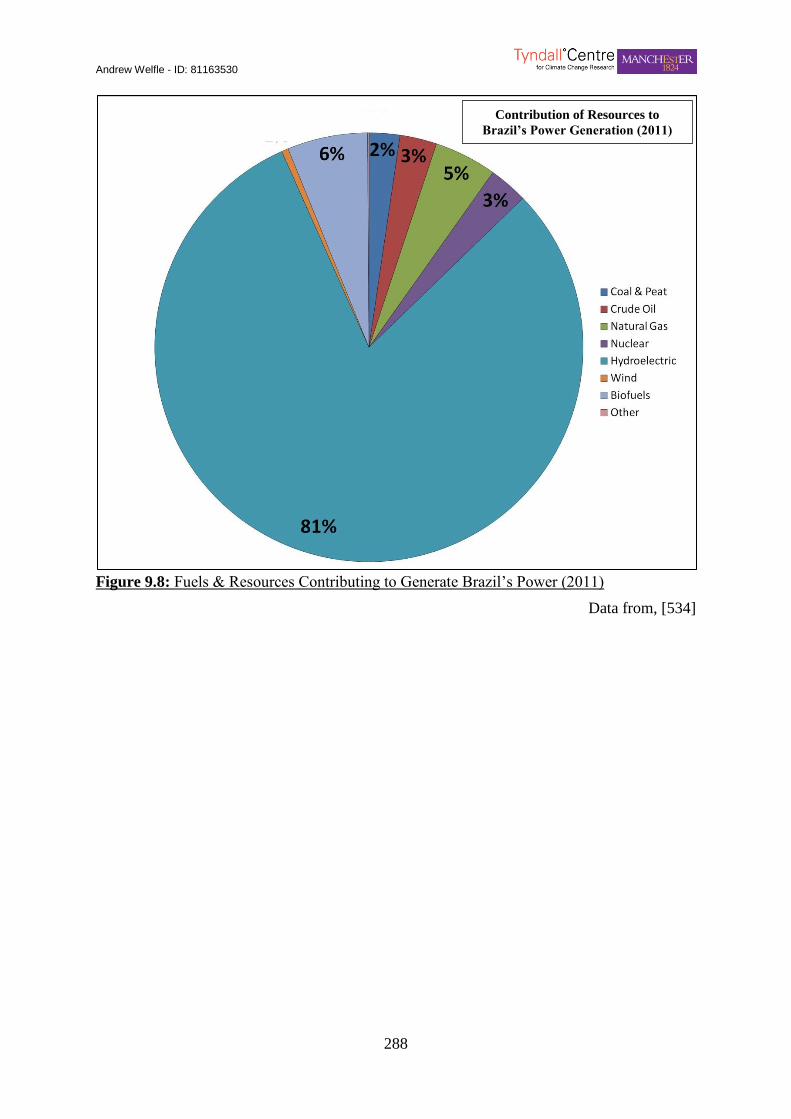
Andrew Welfle - ID: 81163530
288
74) Figure 9.8: Fuels & Resources Contribut ing to Generate Brazil’s P ower (2011)
Figure 9.8: Fuels & Resources Contributing to Generate Brazil’s Power (2011)
Data from, [534]
Contribution of Resources to
Brazil’s Power Generation (2011)
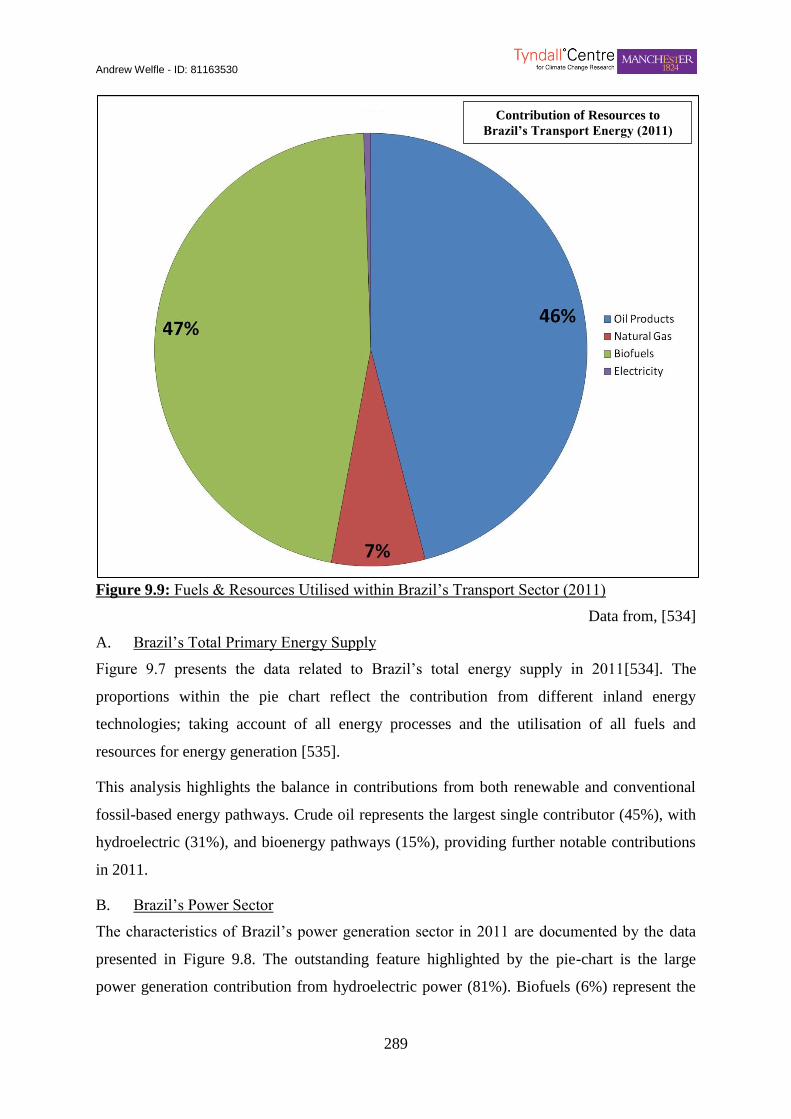
Andrew Welfle - ID: 81163530
289
75) Figure 9.9: Fuels & Resources Utilised wit hin Brazil’s Transport Sector (2011)
Figure 9.9: Fuels & Resources Utilised within Brazil’s Transport Sector (2011)
Data from, [534]
A. Brazil’s Total Primary Energy Supply
Figure 9.7 presents the data related to Brazil’s total energy supply in 2011[534]. The
proportions within the pie chart reflect the contribution from different inland energy
technologies; taking account of all energy processes and the utilisation of all fuels and
resources for energy generation [535].
This analysis highlights the balance in contributions from both renewable and conventional
fossil-based energy pathways. Crude oil represents the largest single contributor (45%), with
hydroelectric (31%), and bioenergy pathways (15%), providing further notable contributions
in 2011.
B. Brazil’s Power Sector
The characteristics of Brazil’s power generation sector in 2011 are documented by the data
presented in Figure 9.8. The outstanding feature highlighted by the pie-chart is the large
power generation contribution from hydroelectric power (81%). Biofuels (6%) represent the
Contribution of Resources to
Brazil’s Transport Energy (2011)
Andrew Welfle - ID: 81163530
290
second largest contributor in 2011, with the remaining power generated from a broad range of
other energy technologies.
The current dominance of hydroelectric power stems from the 1,025 Hydro Power Plants
presently operating as of 2012; the Itaipú Hydro Power Plant alone generating 14,000 MW,
equivalent to approximately 20% of Brazil’s electricity consumption [536].
The key output from this analysis most relevant to this Thesis section, is the dominance of
hydropower and the likely future trend in further hydropower development; determining the
future direction and nature of Brazil’s power sector.
C. Brazil’s Transport Energy Sector
Figure 9.9 presents the energy data for Brazil’s transport sector in 2011[534]. Once again this
pie-chart demonstrates a balance of the fuels and resources utilised in Brazil’s transport
energy sector. Biofuels are highlighted as the largest contributor (47%) to energy demand,
almost balanced with oil-based transport fuels (46%) in 2011. The large contribution from
biofuels reflects Brazil’s focus [488], and mandates [537], requiring the widespread
utilisation of blended fuels across its transport sector.
The key output from the analysis relevant to this Thesis section, is the engrained biofuel
demands of the Brazilian transport sector. Brazil’s future domestic requirements for biofuels
and related feedstocks are likely to be highly linked to future trends within the transport
sector.
D. Brazil’s Heat Energy Sector
Biomass and specifically charcoal, is the current predominant fuel of choice for both
domestic and industrial heat generation. Heavy industries such as Brazil’s steel plants are also
notably reliant on charcoal instead of coal to drive their heat generation and production
processes [538]. Although coal consumption by industry is growing, the dominance of
charcoal is encouraged by the Government within the ‘National Plan on Climate Change’
[539], and remains an abundantly available resource.
Trends influencing the continued and further utilisation of biomass (charcoal) within Brazil’s
heating sector will therefore be a further key factor influencing Brazil future domestic
biomass demands; and thus may potentially influence the availability of resources for export.
Andrew Welfle - ID: 81163530
291
9.6.2 Brazil’s Future Energy Strategy & Targets
This section progresses through evaluating Brazil’s relevant energy initiatives, targets,
strategies, and mandates. Discussions are provided highlighting how each may drive the
future direction of Brazil’s energy sector.
A. Brazil Energy Sector – Strategies
The Strategies listed in this section represent Brazilian Governmental current targets and
broad objectives, for the development of the future Brazilian energy sector.
i. ‘Brazil’s ‘2010 to 2019 Decennial Plan for Energy Expansion’ Plan (translated) [540]
Brazil’s Decennial Plan sets out a series of energy targets to aim towards by 2019. The key
themes of these include plans to start the phasing-out of fossil fuel plants, replaced by the
following:
Hydro-Power : Target from 83.1 GW in 2010 to 116.7 GW by 2019
Small Scale Hydro-Power: Target from 4 GW in 2010 to 7GW by 2019
Bioenergy: Target from 5.4 GW in 2010 to 8.5 GW by 2019
Wind-Power: Target from 1.4 GW in 2010 to 6 GW by 2019
ii. Brazil’s ‘National Climate Change Plan’ (translated) [539]
The National Climate Change Plan is Brazil’s key strategy that focuses on reducing GHG
emissions, energy efficiency, renewable energy generation, rural electrification, and the
potential climate change impacts from deforestation. Specific key targets of the plan are:
Target for electricity produced through co-firing pathways with sugarcane based
biofuels to be at least 11.4% by 2030.
Stimulate the use of thermal solar domestic heating applications.
Investigate how to facilitate energy from waste pathways.
Increase the utilisation of biofuels.
Encourage the industrial sector to increase their utilisation of biofuels.
iii. ‘India-Brazil-South Africa Declaration on Clean Energy’ [541]
This Declaration reflects a joint Strategy for the Governments of Brazil, India, and South
Africa to pool resources and research knowledge, relating to renewable energy technologies.
The objective is to promote and stimulate growth of the renewable energy sector through
collaboration. This includes cooperation in research on clean coal technologies, innovative
technologies, advanced bioenergy pathways, and the commercialisation of clean energy.
Andrew Welfle - ID: 81163530
292
iv. Brazil’s ‘2030 National Energy Plan’ (translated) [533]
Brazil’s 2030 National Energy Plan lays out further targets for the Brazilian energy sector to
work towards by 2030. The Plan sets out broad objectives within the following themes:
Large focus on developing Brazil’s natural gas power sector over the timeframe.
Further focus on the development of Brazil’s nuclear sector.
Increased utilisation of biomass and biofuels.
Focus on energy efficiency measures.
B. Brazil Energy Sector – Targets & Mandates
This next section presents some the specific energy related mandates and targets currently
active within Brazil.
i. Brazil’s ‘Renewable Energy Auction Requirements’ [542], [543]
Brazilian energy distributors are required to sign up to long-term contracts when auctioning
their electricity to meet demands. This is undertaken through a reverse auction system that
favours low carbon and renewable energy generation.
The structure of this auction creates incentives for the developers of low carbon and
renewable energy plants as it enhances their position in the market. An example being
Brazil’s first biomass-only reserve auction in 2008, where 2,379 MW of power from a series
of 31 sugarcane and Napier Grass feedstock powers plants, were auctioned with contracts
extending to 15 years [543].
ii. Brazil’s ‘Biodiesel Mandates’ [537]
Brazil’s Mines & Energy Ministry have enacted laws that mandate the requirement for
biodiesel to have minimum blend inclusions of a mix of plant, crop, or reused oils.
In 2008, the ANP Resolution 7/2008 established new minimum biodiesel specification
requirements, setting limits on many of the parameters that were previously only
reported. It was mandated that biodiesel blend should be set at 5% (B5 Biodiesel).
In 2011, a biodiesel blend mandate of 10% (B10 Biodiesel) was proposed by the
Energy Ministry for Presidential approval.
In 2012, a consultation was undertaken aimed at enabling the use of B100 biodiesel
and to expand the number of possible raw materials that may be included in the blend.
Andrew Welfle - ID: 81163530
293
iii. Brazil’s ‘Bio-ethanol Mandates’ [377], [544], [545]
Since 1976 the Brazilian Government has mandated the blending of bio-ethanol with
conventional fossil fuels. This initially required a blend range of 10-22% bio-ethanol content,
although this has progressed to the present day where there are no longer any light vehicles in
Brazil, operating on pure petroleum based fuels [545].
In 1993, the mandatory blend was fixed by law at 22% anhydrous ethanol (E22) by
volume in the entire country, but with leeway to the Executive to set different
percentages of ethanol within pre-established boundaries.
In 2003, the blend range was amended within set limits: at 20% minimum, and a
maximum of 25%.
In 2007, a blend of 25% bio-ethanol (E25 Blend) was mandated.
In 2011, the lower limit was reduced to 18% as a result of recurring ethanol shortages
and periodic high prices between harvest seasons [546].
C. Brazil Future Energy Strategy & Targets - Discussion
The Brazilian Energy Strategies discussed within this section, provide insight into the future
potential directions of the Brazilian energy sector. Brazil’s Decennial Plan [540], sets out
strong targets for increased renewable energy generation, especially for large-scale
hydroelectric power. Whilst the analysis of Brazil’s key energy mandates highlighted Brazil’s
strong links and further aspirations for the role of biofuels within the transport sector.
These suggest that Brazil has fixed targets and a desired direction involving the increased
utilisation of biofuels and hydroelectric power.
Brazil has large resources and favourable conditions to match its strong aspirations for
increased hydropower and biofuels. However, further reports [536], [547], highlight that
regardless of Brazil’s various energy strategies, the majority of the near-term major
developments within the Brazilian energy sector, are /or have been focused on the
development of the fossil fuel sectors; specifically natural gas plants. Much of this impetus
linked to the hosting of major sporting events; the 2014 Football World Cup, and the 2016
Olympics. Szklo et al (2013) [547], forecast that the contribution of renewable energy
generation to Brazil’s energy mix will be much diminished in 2030 compared to current
levels, unless the pace of renewable technology development keeps up with that of
conventional fuels.
Andrew Welfle - ID: 81163530
294
The analysis within Chapter 8 found that Brazil is a global giant in terms of its productivity
of biofuel feedstocks, and has great potential to vastly increase its productivity levels further.
Brazil is also a potential sleeping giant in relation to future wood-based biomass resources,
especially pellet production, and has large existing [132] and vast potential hydropower
opportunities [533]. In reflection of these themes, the current ambitions, targets, and
aspirations for Brazil’s energy sector could be described as modest at best compared to the
targets of some other countries with less fortunate resource backing.
9.6.3 Global Comparisons – Leading Energy Targets & Strategies
Building on the theme developed in the previous section, the following discussions provide
some comparisons and analyses of Case Study Countries, who currently lead the way in
terms of energy strategies, renewable energy contribution targets, GHG emission reductions,
and energy efficiency.
The aims of this section are to move the discussion towards identifying the potential
directions that the Brazilian Government could take, if it were to decide to utilise a greater
proportion of its natural resources to generate its future energy.
A. Case Study Countries
The Governments of many Nations are currently discussing and implementing targets and
strategies that have varying levels of ambition: to reduce their respective GHG emissions,
increase the development of renewable energy technologies, and enhance energy efficiencies
[548]. Various databases are available online [133], [134], [396], that allow the search and
comparison of energy related policies and targets for different countries; with more than 60
countries currently having national targets or policies supporting renewable energy
technologies [396].
Three Case Study Countries have been strategically identified, each implementing different
approaches in working towards their respective ambitious energy system objectives:
Germany, Norway, and Denmark. Although at first thought, the similarities between each of
these countries and Brazil may seem slim in terms of comparisons of their stages of
development, resource availability and land characteristics; it is Brazil who has the land area,
the natural resources and the development momentum. As the World Resources Institute
stated [549], Brazil is placed amongst the top GHG emitting countries, but looking forward to
2030 and beyond, it also has great potential and the capability to achieve large reductions in
emissions.

Andrew Welfle - ID: 81163530
295
i. Case Study - Germany
Germany is chosen as the first Cast Study Country as it appears to have juxtaposed and
contradictory characteristics; being a country with a strong and growing industrial base as
well as having strong renewable energy and carbon reduction ambitions. Therefore, the
energy strategy and targets developed by the German Government, focusing on increasing
renewable energy contributions and GHG emissions reductions whilst also maintaining this
industrial base; present an example of a case study that could appear to be reflective of a
large number of other countries.
The German Government’s ‘Energy Transition Strategy’ (translated name) [550], sets out
aims and objectives for “making German industries stronger through making them more
efficient for a greener future”. The roadmap developed to achieve these targets focuses on
increasing energy efficiency through mandating a series of progressively stringent energy
reduction waypoints, accompanied by the increasing contributions from the range of
renewable energy technologies [551]. Germany’s key mandated energy targets are as follows:
Energy Demand Reduction Targets - Reduce energy demand below 2008 baseline
levels by: 20% by 2020, and by 50% by 2050.
Renewable Energy Contributions Targets – Achieve contribution levels of: 18% by
2020, 30% by 2030, and 60% by 2050.
Electricity Reduction Targets – Reduce electricity consumption below 2008
baseline levels by: 10% by 2020, and 25% by 2050.
Renewable Electricity Contribution Targets – Achieve renewable electricity levels
of: 35% by 2020, 50% by 2030, 65% by 2040, and 80% by 2050.
ii. Case Study - Norway
Norway is chosen as the second Case Study Country as Norway represents a highly
developed country that has vast fossil fuel resource reserves, an economy heavily linked to
the oil and gas industry, but also a country with strong renewable energy and GHG reduction
ambitions. Norway’s relationship with fossil fuels makes it an interesting case study of a
country whose ambitious energy strategies stand out; representing a potential reference for
countries with similar characteristic contradictions.
Norway is ranked 62nd in terms of its land area [146], 118th in terms of its population size
[145], but in 2011 was the World’s 8th largest exporter of crude oil and the third largest
exporter of natural gas, with significant reserves still untapped under the North Sea [552]. In
Andrew Welfle - ID: 81163530
296
addition to having these strong linkages with the oil and gas industry, Norway has set itself
the target of becoming carbon neutral by 2050 [553].
The key element to Norway’s strategy for achieving this goal is the provision for trading
international carbon credits [554] as part of its energy policies. Norway’s ‘Energy Road Map
2050’ [555], confirming that all existing and new policy instruments relating to Norway’s
petroleum, energy and transport sectors, will target GHG emission reductions. These will be
achieved principally through increasing energy efficiencies, increasing the contributions from
renewable energy technologies, and progressively implementing technological advances that
result in carbon or energy savings. The utilisation of fossil fuel based energy systems being
minimised, reflecting a low baseline contribution to the Norwegian energy mix.
iii. Case Study - Denmark
Denmark is the third Case Study country chosen, as it also has unique characteristics that
make it stand-out as a leading country in terms of renewable energy and GHG emission
reductions.
The Danish Government has taken the stance that it is no longer possible to build prosperity
on the back of finite fossil fuel resources, and thus future Danish prosperity should be
founded on energy efficiency and renewable energy technologies [556]. As such, Denmark
has developed a series of ambitious energy-policy targets that will lead towards Denmark’s
whole energy and transport systems, being based 100% on renewable energy technologies by
2050 [557].
The Case Study of Denmark represents the upper limits of potential that any given country
could aspire to, in order to reduce the impacts of its energy system. Therefore, Denmark’s
energy targets and strategies are relevant to all countries.
9.6.4 Developing Brazil Bioenergy Scenarios
This next section develops a series of Bioenergy Scenarios that represent potential directions
the Brazilian bioenergy sector could take in the future. Drawing on the themes provided by
the Case Study Countries in the previous section, these Bioenergy Scenarios will reflect
ambitious targets that Brazil could potentially develop, if it were to move towards greater
utilisation of its renewable resources.
The key element of the analysis relevant to this section of the research is the identification of
how the potential demands of the future Brazilian bioenergy sector may change. The biomass
resource demands from each of the Bioenergy Scenarios are compared to the potential

Andrew Welfle - ID: 81163530
297
availability of resources, forecast within the Brazil BRM Baseline Scenario. The target of this
analysis is to identify how Brazil’s resource balance may change, and essentially the extent to
which potential Brazilian biomass exports may be impacted, if Brazil were to utilise a greater
proportion of its resources for its domestic energy demands.
A. Brazil Bioenergy Scenario - Structures
The developed Bioenergy Scenarios reflect trajectories of how demand for energy from
different technologies may evolve in Brazil. This methodology reflects other research [280],
[558]–[561], where energy-modelling scenarios have been applied to provide instruments to
inform policymakers on decisions relating to GHG reduction and renewable energy targets.
The Bioenergy Scenarios are developed utilising the IEA’s ‘World Energy Outlook’
Scenarios [132], to inform a baseline of trends for how the Brazilian energy sector may
evolve. The IEA Scenarios are utilised as follows:
i. IEA’s ‘Current Policies Scenario’ [132]
The IEA’s Current Policies Scenarios are developed to reflect how the energy systems of
different countries may evolve, based on the assumption that all energy strategies and polices
that are current and formally adopted, will be realised through to maturity.
The Brazilian Current Policies Scenario developed by the IEA, therefore reflects what the
Brazilian energy system may look like if all of Brazil’s current energy policies and strategies
were realised.
ii. IEA’s ‘450 Scenario’ [132]
The IEA’s 450 Scenarios are developed reflecting how the energy systems of different
countries may evolve, assuming implementation of their high-end national pledges and strong
policies beyond 2020. The overarching aims of the 450 Scenarios includes the near-universal
reduction of fossil-fuel based subsidies, to achieve the objective of limiting the global
concentration of GHG’s in the atmosphere to 450 parts per million of CO2, and global
temperature increase to 2°C.
The Brazilian 450 Scenario developed by the IEA, therefore reflects what the Brazilian
energy system may look like if increased focus is placed on renewable technologies, and the
utilisation of fossil fuel systems are reduced.
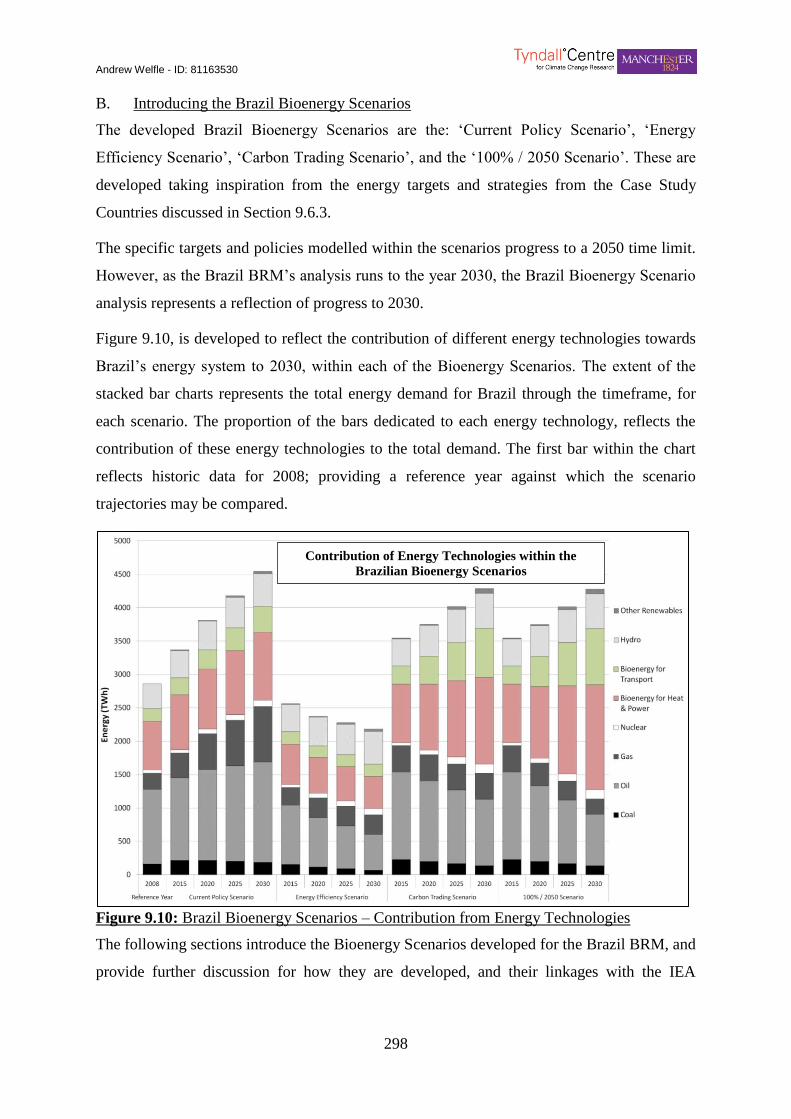
Andrew Welfle - ID: 81163530
298
B. Introducing the Brazil Bioenergy Scenarios
The developed Brazil Bioenergy Scenarios are the: ‘Current Policy Scenario’, ‘Energy
Efficiency Scenario’, ‘Carbon Trading Scenario’, and the ‘100% / 2050 Scenario’. These are
developed taking inspiration from the energy targets and strategies from the Case Study
Countries discussed in Section 9.6.3.
The specific targets and policies modelled within the scenarios progress to a 2050 time limit.
However, as the Brazil BRM’s analysis runs to the year 2030, the Brazil Bioenergy Scenario
analysis represents a reflection of progress to 2030.
Figure 9.10, is developed to reflect the contribution of different energy technologies towards
Brazil’s energy system to 2030, within each of the Bioenergy Scenarios. The extent of the
stacked bar charts represents the total energy demand for Brazil through the timeframe, for
each scenario. The proportion of the bars dedicated to each energy technology, reflects the
contribution of these energy technologies to the total demand. The first bar within the chart
reflects historic data for 2008; providing a reference year against which the scenario
trajectories may be compared.
76) Figure 9.10: Brazil Bioe nergy Scenarios – Contribution from Energy Technologies
Figure 9.10: Brazil Bioenergy Scenarios – Contribution from Energy Technologies
The following sections introduce the Bioenergy Scenarios developed for the Brazil BRM, and
provide further discussion for how they are developed, and their linkages with the IEA
Contribution of Energy Technologies within the
Brazilian Bioenergy Scenarios
Andrew Welfle - ID: 81163530
299
Scenarios and other inspiring literature. The dynamics of Figure 9.10 with respect to each
Bioenergy Scenario are also discussed.
C. Brazil Bioenergy Scenario – Current Policy Scenario
The Current Policy Scenario (C-P Scenario) is developed to reflect how the contribution of
different energy technologies may evolve, if current Brazilian energy targets and strategies
are realised. The characteristics of this scenario reflect those of the IEA’s Current Policies
Scenario [132].
This scenario is important to the analysis as it provides a baseline indication of how Brazil’s
bioenergy sector may evolve, and the potential extent of Brazil’s domestic biomass resource
requirements by 2030, without any policy changes. The range of variances of the other three
scenarios compared with the C-P Scenario thus provides an indication of the levels of
ambition that they represent.
Figure 9.10, highlights that within the C-P Scenario there is a gradual increase in energy
produced from both renewable and fossil fuel energy technologies, to 2030. The energy
generated by each of the energy technologies, apart from the coal energy pathways; are
forecast to increase. Energy contributions from both biomass and hydropower technologies
are shown to increase but only in-line with those from other technologies.
Overall, there is a gradual but significant increase in total energy demand over this period.
This being especially evident when compared to Brazil’s energy demands for the historic
data-reference year (2008). Few significant trends can be identified to indicate that
prioritisation is focused towards any given energy technology.
An overview of the themes and targets of the C-P Scenario are summarised within Table 9.7.
D. Brazil Bioenergy Scenario – Energy Efficiency Scenario
The Energy Efficiency Scenario (E-E Scenario) has been developed drawing influences from
the Case Study of Germany. Within this scenario, energy reduction is the key target achieved
by increased efficiency. Focus is also placed on key renewable technologies over fossil fuels.
This E-E Scenario adopts ambitious energy reduction targets reflecting those developed by
Germany. This includes a target for a 20% reduction in primary energy demand by 2020
based on 2008 levels, and a 50% reduction by 2050. A further reduction in electricity demand
is targeted to reflect a 10% reduction in consumption by 2020 based on 2008 levels, and a
25% reduction by 2050.
Andrew Welfle - ID: 81163530
300
The E-E Scenario makes the assumptions that energy generation trends from hydroelectric,
nuclear power and other renewable technologies (wind & solar etc.), will continue to increase
in-line with those forecast within the IEA inspired C-P Scenario. The C-P Scenario also
assumes that energy from natural gas plants and bioenergy technologies will be maintained;
as reductions are prioritised from oil and coal technology pathways. It is assumed that energy
contributions from oil, and coal-energy technologies, will reduce over the analysis timeframe
in-line with falling energy demand.
The overall energy and specific technology contribution trends, for the E-E Scenario are
clearly highlighted within Figure 9.10. The standout observation from this analysis is the
forecast showing an overall reduction in energy demand over the analysis time frame; the
historic data of the reference year (2008) putting this trend in perspective. As stipulated, the
levels of energy generated from hydroelectric, nuclear, and other renewable technologies are
forecast to increase over the analysis timeframe. The energy contribution from natural gas
and bioenergy technologies are shown to be maintained as the contributions from oil and gas
technologies falls.
An overview of the themes and targets of the E-E Scenario are summarised within Table 9.7.
E. Brazil Bioenergy Scenario – Carbon Trading Scenario
The Carbon Trading Scenario (C-T Scenario) has been developed drawing influences from
the Norway Case Study. The focus of this scenario is the reduction in contribution of fossil
fuel energy systems to minimum baseline levels by 2050, a reduction of energy demands
through enhanced efficiencies, and the increased focus on renewable technologies.
The specific characteristics of the C-T Scenario are developed through utilising assumptions
reflective of the IEA’s ‘450 Scenario’ for Brazil [132], and also from the ‘Pathways to a
Low-Carbon Economy for Brazil’ Report [548], produced by McKinsey & Company, aimed
at informing Brazilian and global policy makers.
McKinsey & Company (2011) [548], concluded that Brazil could potentially continue to
develop within an evolved energy mix, that included contributions from fossil fuel energy
technologies that reflected 14% of total demands. Therefore, the C-T Scenario utilises this
14% fossil fuel technology contribution as the potential baseline level. The C-T Scenario is
therefore developed to assume that the contributions from all fossil fuel technologies will
reduce at a steady rate, to achieve 14% minimum contribution levels by of 2050
Andrew Welfle - ID: 81163530
301
The C-T Scenario is developed on the assumption that total energy demands and the energy
contributions from hydroelectric, nuclear, and other renewable technologies will continue to
increase in-line with levels forecast within the IEA’s 450 Scenario [132]; as the contribution
from fossil fuel technologies fall. The C-T Scenario assumes that bioenergy technologies will
be increasingly utilised to balance the overall demands.
The trends and characteristics of the C-T Scenario are also reflected within Figure 9.10. The
overall energy demands of the Scenario are shown to increase, reflecting the forecasts of the
IEA ‘450 Scenario’. The contributions from hydroelectric, nuclear, and other renewable
technologies, increase to the limits also forecast within the IEA’ ‘450 Scenario’. The
contributions from fossil fuel based technologies can be seen to fall at a steady rate, whilst
the contributions from bioenergy technologies increase to balance the demand.
An overview of the themes and targets of the C-T Scenario are summarised within Table 9.7.
F. Brazil Bioenergy Scenario – The 100% / 2050 Scenario
Finally, the 100% / 2050 Scenario (100-50 Scenario) has been developed drawing influence
from the Denmark Case Study. This scenario is designed to analyse the potential dynamics if
Brazil were to adopt a similar ultimate target; to generate 100% of its energy from renewable
and low carbon technologies by 2050.
The 100-50 Scenario is developed reflecting a similar structure to that of the C-T Scenario.
Increases in total energy demands and contributions from hydroelectric, nuclear, and other
renewable technologies, reflect the forecast of the IEA’s ‘450 Scenario’ [132]. The
contribution of fossil fuel technologies are assumed to gradually reduce, in reflection of
trends that would see their contributions reduced to 0% by 2050, if realised. The contribution
from bioenergy technologies are assumed to increase at rates required to balance the energy
demands, thus largely taking over from the energy demands previously provided by fossil
fuel technologies.
The nature and characteristics of the 100-50 Scenarios are also reflected within Figure 9.10.
Here, the overall energy demands of the Scenario and the contributions from hydroelectric,
nuclear, and other renewable technologies, are shown to increase to the limits also forecast
within the IEA’s ‘450 Scenario’. The contribution from fossil fuel technologies are shown to
fall, notably at a greater rate than those demonstrated within the C-T Scenario. Likewise the
contributions from bioenergy technologies are shown to increase, again notably greater than
levels reflected within the C-T Scenario.

Andrew Welfle - ID: 81163530
302
An overview of the themes and targets of the 100-50 Scenario are summarised within Table
9.7.
Table 9.7: Overview of Brazil Bioenergy Scenario Themes and Targets Table 47) Table 9.7: Overview of Brazil Bioenergy Scenario The mes and Targets
Bioenergy Scenario Scenario Key Targets & Themes
Current Policy Scenario Energy efficiency & renewable contribution levels reflect those of the IEA’s ‘Current Policy
Scenarios’ [132].
Energy Efficiency Scenario Energy demand reduction targets below 2008 levels: 20% by 2020 / 50% by 2050.
Electricity reduction targets below 2008 levels: 10% by 2020 / 25% by 2050.
Carbon Trading Scenario
Fossil fuel energy contribution decrease to 14% minimal levels by 2050, reflecting the ‘McKinsey & Company’ Scenario [548]
Renewable energy technology contribution increases, and energy efficiency increases
reflecting the IEA’s ‘450 Scenario’ [132].
Bioenergy pathways further contributing to balance demand.
100% / 2050 Scenario
Renewable energy contribution target: 100% by 2050.
Renewable energy technology contribution increases and energy efficiency increases
reflecting the IEA’s ‘450 Scenario’ [132].
Energy from biomass pathways further contributing to achieve 100% renewable generation.
9.6.5 Brazil Bioenergy Scenarios – Bioenergy Potentials
The next step in the Bioenergy Scenarios analyses is to evaluate the energy-demand
dynamics of the scenarios, and compare and place them in the context of the forecasts of the
Brazil BRM Baseline Scenario.
A. Brazil Bioenergy Potentials - Results
The key output data allowing this analysis is presented within the graph of Figure 9.11, where
the energy data and trends are highlighted. At the top of Figure 9.11 the forecast range of
Brazil’s future primary energy demands are shown. This range of data reflects that of the
energy scenario forecasts developed by the IEA [132]. The primary energy demand trend line
shown to be reducing over the analysis timeframe, further reflects the potential trajectory of
primary energy demand, if Brazil were to adopt and realise energy reduction targets as
described for the E-E Scenario.
The series of solid coloured lines towards the bottom of Figure 9.11, each represent the
various bioenergy demands that would be required if any of the developed Bioenergy
Scenarios were realised. These demands reflecting the proportional contribution of bioenergy
technologies to the overall energy mix within each scenario.
The dashed coloured line presented within Figure 9.11, represents the bioenergy potential of
the resources forecast as being available within the Brazil BRM Baseline Scenario. These
bioenergy values are calculated reflecting the quantities of different resources forecast as
being available and converted to bioenergy; utilising the ‘preferred’ energy conversion
pathways applicable to each resource. The details of the chosen pre-treatment and conversion

Andrew Welfle - ID: 81163530
303
pathways relevant to each resource are discussed further within Chapter 4, and are
documented in Appendix 1.0.
77) Figure 9.11: Brazil ian Primary Energy & Bioenergy Demand Forecasts
Figure 9.11: Brazilian Primary Energy & Bioenergy Demand Forecasts
B. Brazil Bioenergy Potentials - Discussion
Figure 9.11 demonstrates a broad range of trends. The standout observation is the extent of
the bioenergy potential of resources, forecast as being available within the Brazil BRM
Scenario. These are shown to have the capacity to potentially contribute >47% of Brazils
total primary energy demand by 2015, rising to levels that may exceed their total energy
demand by 2030. This analysis once again highlights and reaffirms Brazil’s position as a
major current producer, and also a major potential future producer of biomass resources. The
analysis also significantly validates the concept that Brazil has large biomass resource
capacity and the potential capability if it chooses in the future, to redirect its energy sector to
make greater use of these – potentially reflecting any of the developed Bioenergy Scenarios.
The distance within Figure 9.11 between the Baseline Scenario’s Bioenergy Potential and the
bioenergy demands of the respective scenarios, also provides an indication of the extent of
potential surplus biomass resources that Brazil may have available, if any of the scenarios
Forecast Bioenergy Potential, Primary
Energy Demands & Bioenergy Demands
within the Brazilian Bioenergy Scenarios
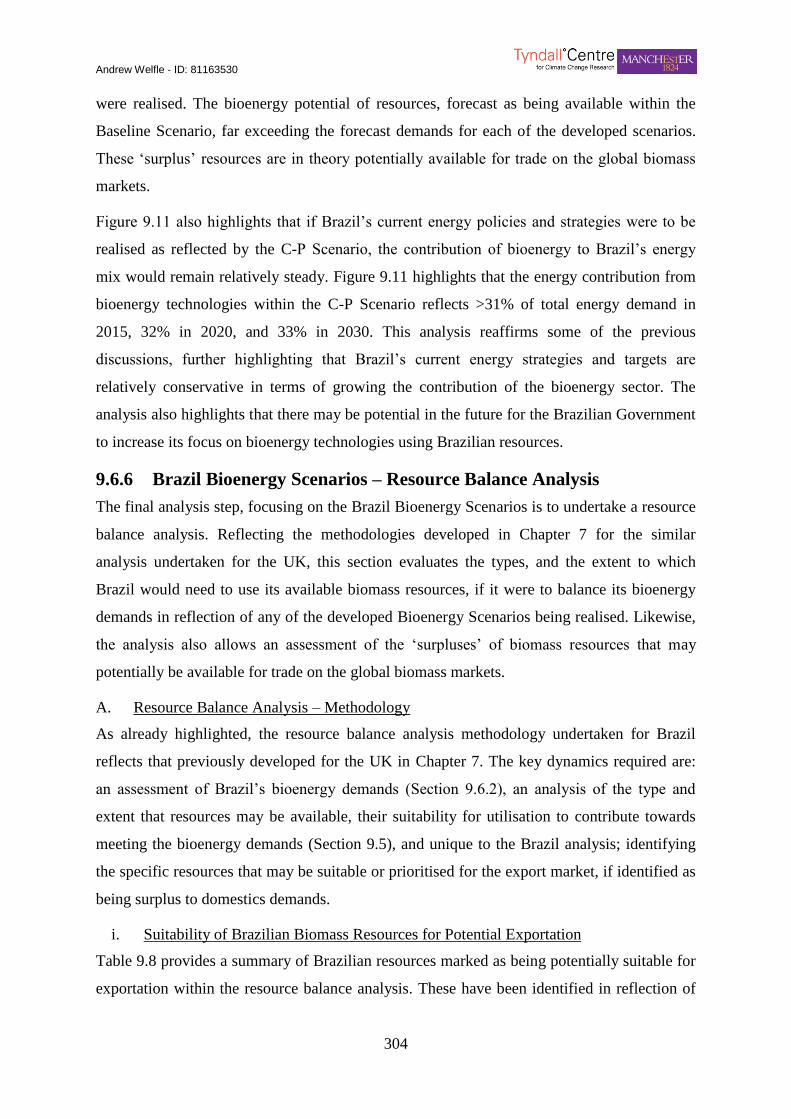
Andrew Welfle - ID: 81163530
304
were realised. The bioenergy potential of resources, forecast as being available within the
Baseline Scenario, far exceeding the forecast demands for each of the developed scenarios.
These ‘surplus’ resources are in theory potentially available for trade on the global biomass
markets.
Figure 9.11 also highlights that if Brazil’s current energy policies and strategies were to be
realised as reflected by the C-P Scenario, the contribution of bioenergy to Brazil’s energy
mix would remain relatively steady. Figure 9.11 highlights that the energy contribution from
bioenergy technologies within the C-P Scenario reflects >31% of total energy demand in
2015, 32% in 2020, and 33% in 2030. This analysis reaffirms some of the previous
discussions, further highlighting that Brazil’s current energy strategies and targets are
relatively conservative in terms of growing the contribution of the bioenergy sector. The
analysis also highlights that there may be potential in the future for the Brazilian Government
to increase its focus on bioenergy technologies using Brazilian resources.
9.6.6 Brazil Bioenergy Scenarios – Resource Balance Analysis
The final analysis step, focusing on the Brazil Bioenergy Scenarios is to undertake a resource
balance analysis. Reflecting the methodologies developed in Chapter 7 for the similar
analysis undertaken for the UK, this section evaluates the types, and the extent to which
Brazil would need to use its available biomass resources, if it were to balance its bioenergy
demands in reflection of any of the developed Bioenergy Scenarios being realised. Likewise,
the analysis also allows an assessment of the ‘surpluses’ of biomass resources that may
potentially be available for trade on the global biomass markets.
A. Resource Balance Analysis – Methodology
As already highlighted, the resource balance analysis methodology undertaken for Brazil
reflects that previously developed for the UK in Chapter 7. The key dynamics required are:
an assessment of Brazil’s bioenergy demands (Section 9.6.2), an analysis of the type and
extent that resources may be available, their suitability for utilisation to contribute towards
meeting the bioenergy demands (Section 9.5), and unique to the Brazil analysis; identifying
the specific resources that may be suitable or prioritised for the export market, if identified as
being surplus to domestics demands.
i. Suitability of Brazilian Biomass Resources for Potential Exportation
Table 9.8 provides a summary of Brazilian resources marked as being potentially suitable for
exportation within the resource balance analysis. These have been identified in reflection of

Andrew Welfle - ID: 81163530
305
wide literature consensus [17], [403], [407], [421], [463], [488], [562], of the different
resources that are currently or are expected to be widely traded by Brazil.
The quantities of these specific resources identified within the biomass resource balance
analysis to be surplus to the demand-requirements of the Brazilian bioenergy sector, will be
highlighted as being potentially available for exportation.
Table 9.8: Brazil BRM Resources Identified as Potentially Suitable for Exportation Table 48) Table 9.8: Brazil BRM Resources Identifie d as P otentially Suitable for Exportation
Brazilian Resources Suitable for Exportation
Grasses
Short Rotation Coppices
Short Rotation Forestry Resources
Cereal Crops
Oil Crops
Sugar Crops
Forestry Residue Resources
Industry Residues Resources
Resources Directly from Forestry Systems
B. Resource Balance Analysis – Results
The results of the Brazil resource balance analysis are documented within Figure 9.12. Here
the stacked-bar charts represent the total availability of resources over the analysis timeframe.
The proportions of resources that are required to meet the Brazilian bioenergy sectors
demands, and those identified as being potentially suitable and available for export, are
highlighted for each bioenergy scenario.
A further dynamic highlighted by Figure 9.12 is the trend demonstrating the change in extent
that resources are available and suitable for exportation in 2030. Identified as the ‘Trend’ bars
within Figure 9.12, these highlight the differential availability of resources for exportation for
each of the bioenergy scenarios, in comparison to the Current Policy Scenario. These trend
values represent the forecast reductions or increases in biomass resource quantities that may
be available for trade on the global markets, if Brazil were to adopt and realise any of the
developed bioenergy scenarios.
Another characteristic highlighted within Figure 9.12 that needs further explanation, is the
difference in the resource totals quantified within each of the columns. The resources
analysed for each Bioenergy Scenario reflect the same forecasts of the Brazil BRM Baseline
Scenario. The different resource totals are a consequence of the process of identifying
resources as being either potentially suitable or unsuitable for exportation. Only those
resources deemed suitable for exportation, and which show a surplus are quantified within the
analysis of Figure 9.12.
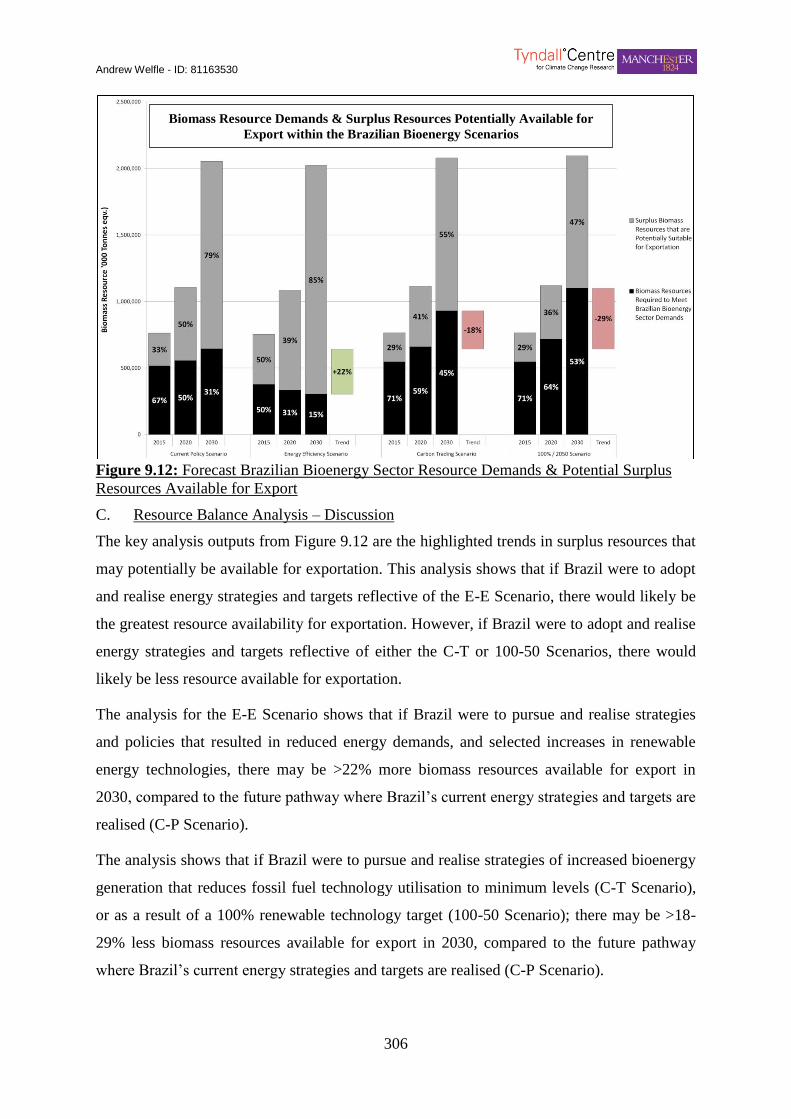
Andrew Welfle - ID: 81163530
306
78) Figure 9.12: Forecast Brazilian Bioenergy Sector Resource Demands & Potential Surplus Resources Available for Export
Figure 9.12: Forecast Brazilian Bioenergy Sector Resource Demands & Potential Surplus
Resources Available for Export
C. Resource Balance Analysis – Discussion
The key analysis outputs from Figure 9.12 are the highlighted trends in surplus resources that
may potentially be available for exportation. This analysis shows that if Brazil were to adopt
and realise energy strategies and targets reflective of the E-E Scenario, there would likely be
the greatest resource availability for exportation. However, if Brazil were to adopt and realise
energy strategies and targets reflective of either the C-T or 100-50 Scenarios, there would
likely be less resource available for exportation.
The analysis for the E-E Scenario shows that if Brazil were to pursue and realise strategies
and policies that resulted in reduced energy demands, and selected increases in renewable
energy technologies, there may be >22% more biomass resources available for export in
2030, compared to the future pathway where Brazil’s current energy strategies and targets are
realised (C-P Scenario).
The analysis shows that if Brazil were to pursue and realise strategies of increased bioenergy
generation that reduces fossil fuel technology utilisation to minimum levels (C-T Scenario),
or as a result of a 100% renewable technology target (100-50 Scenario); there may be >18-
29% less biomass resources available for export in 2030, compared to the future pathway
where Brazil’s current energy strategies and targets are realised (C-P Scenario).
Biomass Resource Demands & Surplus Resources Potentially Available for
Export within the Brazilian Bioenergy Scenarios

Andrew Welfle - ID: 81163530
307
These analysis findings are highly significant as Brazil is currently the top global exporter of
ethanol biofuels and is forecast to increase its exports (Chapter 8). To add further context to
this potential scenario, the International Energy Agency state that a ≥7% fall in the global
supply of oil to 2030 [563]–[565]is classified as an energy ‘disruption’ (crisis).
Therefore, with high-demand resources such as biofuels being predominantly produced in a
few key countries [410], if Brazil or any other large exporter were to reduce their exports by
anywhere near >29%, there would likely be significant ramifications for the global biomass
resource markets. The implications are most significant for those countries whose current
energy and bioenergy strategies, plan to rely heavily on imported biomass resources to
balance their future demands.
Therefore, this analysis should raise significant concerns for those countries planning
strategies that may be heavily reliant on global biomass trade markets, to balance their
demands. Aside from taking on the multiple risks, limitations, and impacts associated with
trading biomass resources (Chapter 7), those countries who adopt such strategies risk
becoming dependent on the major biomass resource exporting Nations for the continued
availability of resources, in highly a competitive market.
9.6.7 Chapter Conclusions & Consequences for the UK Bioenergy Sector
Chapter 9 has provided discussions and further analyses of Brazil’s current and future
biomass resource potentials. Through the process of adapting the Biomass Resource Model to
reflect the dynamics and characteristics of Brazil’s biomass resource supply chains (Brazil
BRM), a greater understanding has been gained regarding the extent of Brazil’s existing
biomass resource availability, and the dynamics affecting their potential availability, within
possible future energy scenarios. The Brazil BRM was applied to develop forecasts of the
extent and types of biomass resources that may be available to Brazil’s domestic bioenergy
sector, to the year 2030. A further literature-review driven analysis was undertaken to review
Brazil’s current bioenergy sector, and to further understand how this may evolve.
A series of potential Bioenergy Scenarios were developed to evaluate how Brazil may
potentially utilise its biomass resources in the future. These developed scenarios drew
influences and themes from a series of Case Study Countries, who currently lead the way in
terms of energy and GHG reduction strategies. The key output from this section’s analyses
was the evaluation of how Brazil’s biomass resource potential exports may be impacted, if
Andrew Welfle - ID: 81163530
308
Brazil were to vary its future utilisation of biomass for its domestic energy demands rather
than exporting it.
The key conclusions and the relevant potential consequences for the UK bioenergy sector can
be summarised as follows:
A. Brazilian Biomass Resource Availability
The first key conclusion of this Chapter’s analysis, results from the Brazil BRM’s literature-
informed Baseline Scenario. Reflecting the general consensus of a wide range of literature
highlighted in Chapter 8, Brazil was found to have vast biomass resources that were forecast
to potentially increase over the analysis timeframe, to 2030. The analyses highlighted Brazil’s
large potential to increase its production of the crops and feedstocks, required to produce
biofuels. Brazil’s current and potential future large wood-based biomass resources were also
identified. The consequences of these results for the global biomass trade markets, and
relevantly for the UK bioenergy sector; are that Brazil has the potential to continue to be a
dominant player in exporting resources for global trade in the future.
B. Brazilian Biomass Resource Export Caution
The second key conclusion from Chapter 9 flags a cautionary note, and contradicts other
findings within this Chapter. Although Brazil was identified as having large current and
future potential biomass resources, and at first-sight Brazil can be identified as a renewable
energy-focused country; Brazil’s current energy strategies and targets were found to be
relatively conservative and modest with respect their planned future ambitions. The analysis
found that Brazil may have enough biomass resources to meet is entire forecast primary
energy demands, and the literature also determined that Brazil has the potential to increases
its already large hydroelectric generation capacity. Therefore, with such a current focus on
renewable energy generation and bio-fuel production, it is entirely possible that the Brazilian
Government may decide in future, to utilise a greater proportion its biomass resources to
meet its own domestic renewable energy demands, and for bio-fuel exports, rather than focus
on exporting them (progress towards the 100–50 and CT- Scenarios).
This Chapter’s analysis tested a series of ambitious potential bioenergy strategies that the
Brazilian Government could potentially adopt, resulting in Brazil using a larger proportion of
its biomass resources. The analysis found that Brazil could export up to >29% less biomass if
it were to adopt and realise more ambitious domestic energy strategies.

Andrew Welfle - ID: 81163530
309
This key conclusion presents a strong cautionary notice for countries such as the UK who are
developing bioenergy strategies that will require large biomass resource imports to balance
their future demands.

Andrew Welfle - ID: 81163530
310
Chapter 10 - An Alternative UK Bioenergy Strategy
Andrew Welfle - ID: 81163530
311
10.1 An Alternative UK Bioenergy Strategy
Chapter 10 draws together the key conclusions and analysis results from across the Thesis. A
widespread study of the UK’s biomass resource supply chains and bioenergy sector has been
undertaken, and a further analysis has focused on the global biomass trade markets; including
a case study of a large biomass exporting country, Brazil. For each of these key analysis
themes covered within the Thesis, a series of conclusions and potential consequences for the
UK’s bioenergy sector were developed and identified.
In summary, the Thesis so far has found that:
The UK’s biomass resource supply chains are highly complex, although the research
found that a few key drivers provide great influence in determining the potential
availability of indigenous biomass resources for the UK bioenergy sector (Chapter 5).
A few key specific UK biomass resource types were identified which demonstrated
the greatest potential for the UK bioenergy sector, in terms of the extent of their
potential availability and the bioenergy that they could potentially generate (Chapters
5 and 6).
If the UK were to implement strategies with varying levels of ambition, aimed at
mobilising indigenous biomass resources for its bioenergy sector, the potential
bioenergy generated was forecast to be capable of making large contributions towards
meeting the UK’s energy, renewable energy, and bioenergy targets (Chapter 6).
The current direction of the UK bioenergy sector is driven predominantly by the UK’s
energy and bioenergy strategies and policies, and is moving towards a future where a
large proportion of the biomass resources required to balance demand will have to be
imported. As the UK has neither the extent, nor the specific forms of biomass
resources required to fuel a bioenergy sector within its planned future strategy, the
UK is headed towards a future increasingly reliant on imported biomass resources
(Chapter 7).
The global biomass resource trade markets were also found to be highly dynamic; the
majority of trade being driven by the growing demands of a few key regions, and the
flow of the majority of resources arising from a few key dominant regions. The global
biomass markets were found to be relatively immature and still developing; whilst a

Andrew Welfle - ID: 81163530
312
number of important limitations, uncertainties, and sustainability impacts were
highlighted as being linked with the global trade of biomass resources (Chapter 8).
Focusing on Brazil as a dominant biomass exporting country, the potential availability
of Brazilian biomass resources were found to be vast, with much potential for further
productivity growth. However, the research also found that if Brazil were to utilise
greater proportions of its available biomass to meet domestic future energy demands,
Brazilian biomass exports could potentially fall resulting in large potential deficits for
the global biomass trade markets, thus negatively impacting those countries reliant on
imported biomass to balance their demands (Chapter 9).
Chapter 10 brings the focus of the Thesis back to the UK. In reflection of the potential
uncertainties associated with increasing reliance on imported biomass resources, Chapter 10
aims to evaluate potential future strategies that the UK could adopt to mobilise and utilise a
greater proportion of its indigenous resources for its domestic bioenergy sector.
The Chapter is structured by first re-highlighting the specific analyses conclusions of
Chapters 5, 6, and 7; these providing a framework of key potential areas that an ‘alternative
UK bioenergy strategy’ could focus on.
The Chapter then progresses through a discussion of the potential shortfalls within the current
UK energy and bioenergy strategies and polices; and goes on to highlight potential
opportunities for change. Barriers restricting change are identified, existing and proposed
policies, and case studies from both the UK and other countries are highlighted in suggesting
potential mechanisms for reducing these barriers.
The themes and concepts of this Chapter represent an alternative UK bioenergy strategy, one
in which the UK could potentially mobilise and utilise a greater proportion of its biomass
resources for its bioenergy sector to reduce its future dependence on imported resources.
10.1.1 Thesis Analysis Key Conclusions
The first step in Chapter 10 is to re-highlight some of the key analysis conclusions identified
within previous chapters; predominantly from the UK focused analyses of Chapters 5 to 7.
The following section documents how the analyses conclusions have been grouped and
structured within this Chapter, and highlights the discussion areas that will be covered when
proposing potential directions for an alternative UK bioenergy strategy:
Andrew Welfle - ID: 81163530
313
A. UK High Potential Resources & Key Supply Chain Drivers
The analyses of Chapters 5 and 6 found that particular UK biomass resources demonstrated
significantly greater availability and bioenergy potential than others. Chapter 5 found that
specific supply chain drivers are highly influential in determining the availability of different
forms of biomass, and therefore a targeted approach should be developed to increase the
availability and utilisation of UK indigenous resources.
Both Chapters 5 and 6 developed a consensus concluding that the UK biomass resources that
demonstrate the greatest potential in terms of resource availability and bioenergy potential
are: UK grown biomass resources and energy crops, agricultural residues, and household and
organic wastes. The sensitivity analysis undertaken within Chapter 5 found that the following
supply chain drivers represented key influences, and would therefore need to be appropriately
targeted and managed to maximise the availability of these resources:
UK Grown Biomass & Energy Crops - the standout driver influencing the
availability of these resources was identified as the extent that available land was
utilised for their growth.
Agricultural Residues - the availability of all residues were found to be
comparatively robust to influencing drivers; the extent to which resources can be
harvested / collected being the most influential factor.
Household & Organic Wastes – all waste resources were found to be highly
influenced by one key driver; the nature of the waste management system adopted.
The analyses of Chapter 6 also highlighted the key relationships between both biomass and
food systems. Strong, efficient, and productive food systems were found to provide many
positive feed-back benefits for the production of biomass for the bioenergy sector.
i. Approach for Developing an Alternative UK Bioenergy Strategy
The barriers representing the main obstacles preventing the UK from growing and utilising
more of its indigenous biomass resources, energy crops, agricultural residues, household and
organic wastes, are discussed. A series of potential ‘enabling mechanisms’ are identified that
could be applied to increase the utilisation of these resources. These mechanisms are drawn
from ideas and concepts of existing biomass applications, policies, and case studies, from
both the UK and around the World.
Andrew Welfle - ID: 81163530
314
B. Current UK Bioenergy Strategies & Policies
The analysis from Chapter 6 highlighted that the prioritisation of heat bioenergy conversion
pathways with suitable resources, resulted in the greatest levels of bioenergy generation from
the resources available. The research conclusions of Chapter 6 suggest that the UK could gain
the greatest potential from its indigenous biomass resources, if specific selected resources
were utilised within the bio-refinery industries, with all remaining suitable resources being
dedicated for heat generation pathways. Chapter 6 also concluded that the generation of
renewable electricity could potentially be better achieved through alternative technology
pathways.
However, the analysis of Chapter 7 highlighted that the UK’s current and planned future
bioenergy sector strategies predominantly focus on bio-power bioenergy pathways, and
biofuels for the transport sector. This strategy is found likely to lead to an increasingly large
UK biomass resource deficit, greater resource imports, and trade within increasingly
competitive global biomass resource markets, to balance future demand.
A further key conclusion from Chapter 7 highlighted the on-going uncertainties relating to
the future of the UK bioenergy sector; there being limited consensus between ‘UK bioenergy
experts’ as to what the future UK bioenergy sector will look like. Chapter 7 highlighting that
this level of uncertainty and clarity, undoubtedly provides a significant barrier to increased
growth of the UK bioenergy sector.
i. Approach for Developing an Alternative UK Bioenergy Strategy
This Chapter works through the conflicting themes evident between the analysis conclusions,
and the current directions and strategies for the future UK bioenergy sector. It focuses on
identifying the current prospects and barriers for the UK bio-heat sector. This includes
highlighting the UK’s current stance toward bio-heat generation and identifying ‘enabling
mechanisms’ in the form of policy suggestions that could be implemented to steer the UK
towards increased bio-heat generation.
The Chapter goes on to discuss the impact of uncertainty on the future development of the
UK bioenergy sector. Discussions highlight the key reasons for this uncertainty and identify
potential policies and mechanisms that may be implemented to reduce uncertainty.
Andrew Welfle - ID: 81163530
315
10.2 Alternative Policy & Strategy Options
The following discussions in this section highlight the current barriers preventing the greater
growth and utilisation of biomass and energy crops, agricultural residues, and household and
organic wastes; by the UK bioenergy sector. In each case potential enabling mechanisms, and
bioenergy strategy and policy options are highlighted that may increase the utilisation of
these resources. Particular focus is placed on addressing and potentially managing the key
supply chain drivers as highlighted within Chapter 5.
The section then goes on to highlight the perceived barriers of the UK’s bioenergy strategies
and policies, to increased development of the UK bio-heat sector. Potential alternative policy
and strategy options are highlighted that may increase focus on development of the bio-heat
sector.
10.2.1 UK Grown Biomass & Energy Crops
Biomass and energy crops grown in the UK were identified within both Chapters 5 and 6, as
resources representing high potential for the UK bioenergy sector. Chapter 5 also identified
that the area of available land dedicated for crop growth, was the defining driver influencing
the availability of these resources for the bioenergy sector. The UK Bioenergy Strategy [8],
recognises that production of energy crops on unused lands, or lands of low ecological value
is essential in ensuring that growth in the bioenergy sector is achieved. The area of available
land dedicated to grow these resources is essentially reliant on UK farmers utilising their
lands to grow crops for the bioenergy sector, rather than for food. The UK’s primary
incentive mechanism for promoting farmers to grow biomass resources and energy crops has
been the ‘Energy Crops Scheme’ [566]. This provides financial incentives to farmers for
establishing Miscanthus, and short-rotation coppice biomass crops, either for their own
utilisation or to supply the wider bioenergy industry. The main incentive focuses on
providing subsidies equivalent to approximately 50% of actual costs (supplies / materials),
contractor costs, and / or 50% of on-farm costs – such as for labour and machinery; where
applicable
Despite such Government incentive schemes and investment, widespread dedication of lands
to grow biomass and energy crops has not materialised across the UK. This being partially
due to the lack of promotion [566] of these schemes, as well as a series of further barriers as
discussed in the next section.
Andrew Welfle - ID: 81163530
316
A. Barriers for Further UK Utilisation
Through consultation exercises and analyses by Natural England (2014) [566], and the
NNFCC (2012a, 2012b) [235], [567], identified educational, economic, legislative, and
technical barriers that are perceived to prevent the wider utilisation of agricultural lands for
biomass resource and energy crop production. These are summarised as follows:
i. Educational Barriers:
Awareness – promotion of the Energy Crop Scheme has been relatively poor with
little or no promotion of the scheme [235], [567].
Tradition - key crops such as Miscanthus and SRC Willow, differ from the typical
range of crops produced by farmers. These therefore require a break from traditional
agricultural practices, which can present a daunting prospect [235].
Practice - farmers were typically found to have a poor understanding of the best
practices for establishment and management of energy crops [235].
ii. Economic:
Cash Flow – the period between planting and the first harvests of biomass and energy
crops can be a critical financially factor. Support for cash flow during this period is
lacking under present conditions [235].
Margins – the current profit margins associated with small-scale production of
resources means there is little room for error [235], [567].
Market - the link between farmers and the end-use markets for their energy crops
needs to be supported. [235].
iii. Legislative:
Inflexibility - a legislative barrier exists in that new ‘innovative’ crops such as
Switchgrass are not classified as energy crops under the Renewables Obligation (RO).
The RO needing to be further developed and updated to enable access to finance for
energy-crop supply chains, and infrastructure [235], [566], [567].
iv. Technical:
Compatibility – the specific fuel requirements of many Bioenergy Plants, especially
the smaller bioenergy systems, are not always compatible with the widely varying
characteristic of the crops produced [235], [566], [567].

Andrew Welfle - ID: 81163530
317
Infrastructure - further financial support is required to develop processing
infrastructure such as pelleting equipment. This would facilitate greater transportation
of resources and an opening-up of markets [235], [566], [567].
B. Proposed Enabling Mechanisms to Increase UK Utilisation
There is strong demand for biomass resources and energy crops grown in the UK, not only
for large-scale co-firing power plants, but also for local use within smaller-scale pellet
systems [568]. Therefore, it is important to develop mechanisms to reduce the above barriers
and allow the markets to develop naturally.
As confirmed by the UK Forestry Commission (2013) [569], producing biomass resources
and energy crops may not only reduce energy generation GHG emissions, but also offer great
opportunity for diversification within the agricultural sector; whilst also providing potential
environmental and biodiversity benefits. Thus the wider benefits of growing resources for the
energy sector need to be better promoted.
The fundamental barriers relating to the stability of policy and financial packages, especially
in respect of: the Energy Crop Scheme, the Renewable Heat Incentive, and Feed-in-Tariff
schemes [235], need to be addressed. Good examples already taking place in the UK are the
policies and incentives developed for the promotion of wood fuels. The Forestry
Commission’s 2011 ‘Wood fuel Strategy’ [570], lays out a framework of targets and a
roadmap for how to increase the availability and use of wood fuels. This strategy is backed-
up by various national policies and incentives; notably fronted by the Renewable Heat
Incentive [571]. With further grants and subsidies available, such as the ‘Wood fuel
Woodland Improvement Grant’ and the ‘English Woodland Grant Scheme’ that specifically
target development of wood-fuel supply chains and production bases [572]. This UK example
represents a clear and concise strategy, and an incentive framework that could ideally be
replicated and focused on biomass resource and energy crops.
A report carried out for the European Commission (2012) [573], summarised some of the
leading incentive schemes currently being applied across the EU to promote biomass and
energy crop growth. These provide insight into further potential directions that the UK
Government could take in developing policies.
Finland – bioenergy plants have access to investment support (~15 – 30 % of capital
costs), and emission trading feeds are not applicable where biofuels are utilised.
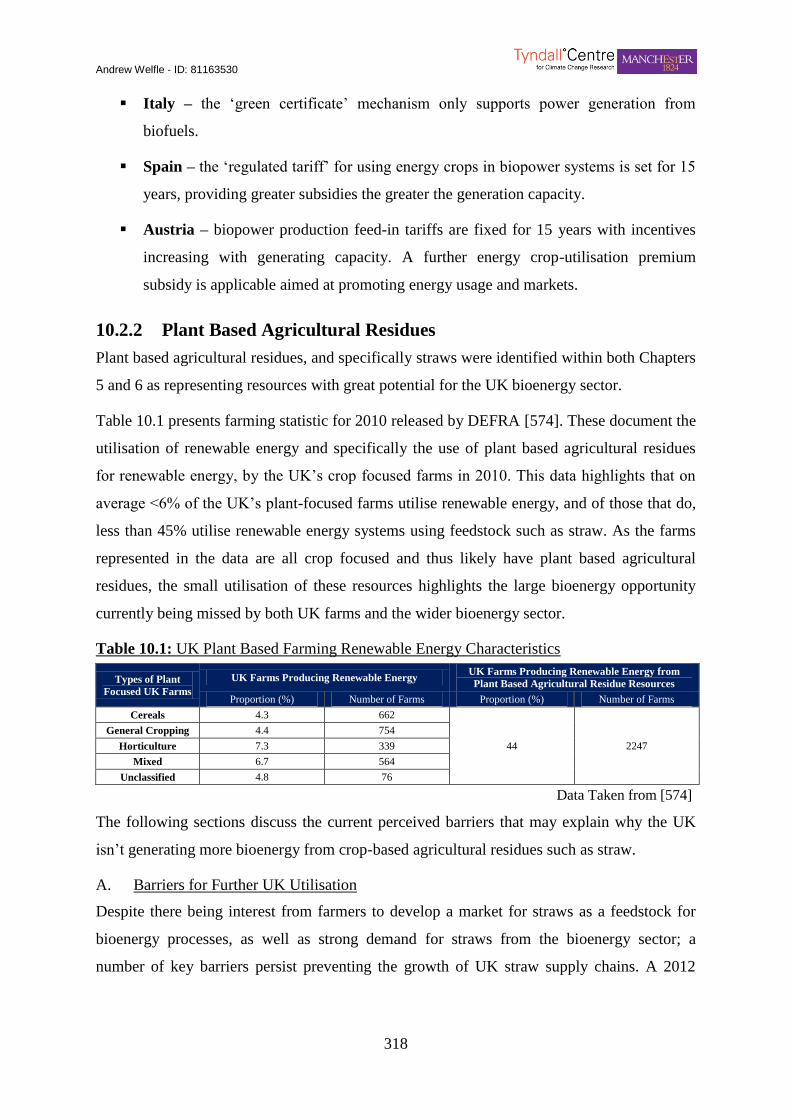
Andrew Welfle - ID: 81163530
318
Italy – the ‘green certificate’ mechanism only supports power generation from
biofuels.
Spain – the ‘regulated tariff’ for using energy crops in biopower systems is set for 15
years, providing greater subsidies the greater the generation capacity.
Austria – biopower production feed-in tariffs are fixed for 15 years with incentives
increasing with generating capacity. A further energy crop-utilisation premium
subsidy is applicable aimed at promoting energy usage and markets.
10.2.2 Plant Based Agricultural Residues
Plant based agricultural residues, and specifically straws were identified within both Chapters
5 and 6 as representing resources with great potential for the UK bioenergy sector.
Table 10.1 presents farming statistic for 2010 released by DEFRA [574]. These document the
utilisation of renewable energy and specifically the use of plant based agricultural residues
for renewable energy, by the UK’s crop focused farms in 2010. This data highlights that on
average <6% of the UK’s plant-focused farms utilise renewable energy, and of those that do,
less than 45% utilise renewable energy systems using feedstock such as straw. As the farms
represented in the data are all crop focused and thus likely have plant based agricultural
residues, the small utilisation of these resources highlights the large bioenergy opportunity
currently being missed by both UK farms and the wider bioenergy sector.
Table 10.1: UK Plant Based Farming Renewable Energy Characteristics Table 49) Table 10 .1: UK P lant Base d Farming Renewable Energy Characteristics
Types of Plant
Focused UK Farms
UK Farms Producing Renewable Energy UK Farms Producing Renewable Energy from
Plant Based Agricultural Residue Resources
Proportion (%) Number of Farms Proportion (%) Number of Farms
Cereals 4.3 662
44 2247
General Cropping 4.4 754
Horticulture 7.3 339
Mixed 6.7 564
Unclassified 4.8 76
Data Taken from [574]
The following sections discuss the current perceived barriers that may explain why the UK
isn’t generating more bioenergy from crop-based agricultural residues such as straw.
A. Barriers for Further UK Utilisation
Despite there being interest from farmers to develop a market for straws as a feedstock for
bioenergy processes, as well as strong demand for straws from the bioenergy sector; a
number of key barriers persist preventing the growth of UK straw supply chains. A 2012
Andrew Welfle - ID: 81163530
319
Report by the Institute for European Environmental Policy [575], identifies 5 key barriers to
enhancing the supply and sourcing of straw.
Underdeveloped Markets – with the exception of Denmark, the lack of supply
chains for straw for bioenergy purposes across Europe is identified as being linked to
underdevelopment of the markets.
Competing Uses – straws represent an agricultural residue with a long list of
alternative uses. Straw having important roles in maintaining the health of soils but
also with many other farming applications. Any straw sourced for the bioenergy
sector having to compete with these agricultural applications.
Inaccurate Guidance – incorrect and improper use of straw to maintain soil health
can lead to large unnecessary usage that impacts the availability of straws for other
purposes.
Undeveloped Infrastructure – the inaccessibility and lack of appropriate agricultural
machinery and infrastructure for the handling and processing of straws, represents a
major issue in terms of supplying this resource to the bioenergy sector.
Resource Variability – as a result of varying climatic conditions and fluctuating
straw-harvest yields, variability in the quantity and quality of straws has large
implications for the bioenergy sector that typically requires specific fuel characteristic
specifications.
B. Proposed Enabling Mechanisms to Increase UK Utilisation
The following section presents a series of ideas, policy options, and potential strategies that
could be implemented to encourage the greater utilisation of plant based residues by the UK
bioenergy sector. Figure 10.1 presents screenshots from the European Commission’s
EUROSTAT Statistical Atlas 2013 [576]. The annotated map on the left demonstrates the
density of plant based farming within each region of the UK. Whilst the annotated map on the
right demonstrates the development of roads and transport networks the UK’s major regions.
In each case the darker the colour, corresponds to the greater density of farming or transport
networks, respectfully. Figure 10.1 further informs the discussions in the following sections.

Andrew Welfle - ID: 81163530
320
79) Figure 10.1: Density of Plant Based Agriculture Compared to Transport Network Development
Figure 10.1: Density of Plant based Agriculture Compared to Transport Network
Development
Taken from [576]
i. Market Development
The immaturity of the market for straw agricultural residues is identified as the primary
barrier limiting the development of the bioenergy sector. Despite some companies investing
heavily in establishing bioenergy plants, the supply chains are still lagging behind [575]. The
NNFCC [567], also identify the lack of investment in equipment and infrastructure as a
further fundamental obstacle to the future development of the UK’s straw bioenergy sector.
Figure 10.1 demonstrates that the UK regions with highest density of crop-based agriculture
are not those with the most developed transportation infrastructure. This adds to the problems
of the high transportation costs associated with the typically high dispersion, bulk, and low-
value associated with straws. Appropriate investment in processing machinery and
infrastructure would lower the economic costs of transporting straw resource [577].
A market-driven innovation taking place between the Sleaford Straw CHP Plant operated by
Eco2 energy [578], and the resource supplying farmers, is an agreement that the farmers will
receive free delivery of ‘process residues’ that can in-turn be reused to supplement fertilisers
to stimulate further growth. This incentive was developed to further encourage the supply of
straw for the plant, whilst also raising the profile of the technology. This case study of an
industry innovation, provides an example of the types of mechanisms that may organically

Andrew Welfle - ID: 81163530
321
develop as markets mature; and is something that needs to be encouraged across the UK
where applicable [575].
When it comes to the straw bioenergy sector, Denmark is by far the leading country in both
the development of their supply chains, and bioenergy plant infrastructure. This was
recognised in the UK Department for Trade & Industry’s 2004 Report [579]; ‘Co-operative
Energy Lessons from Denmark & Sweden’. However, in a further industry report undertaken
by Tybirk et al (2010) [580], that compared the biomass supply chain development
characteristics of different North Sea Region countries, including that of the UK; they
concluded that the UK’s often rural supply chains lacked Government support, and the UK
has no major manufacturers of bioenergy systems; placing it at a distinct disadvantage.
Therefore, drawing lessons from Denmark, the key reasons why Danish straw harvesting
infrastructure and market development are so strong; can be linked to a few key policy
initiatives [575]:
Policy Driver - the use of straw in Denmark has been historically policy-driven with
the aim of increasing Denmark’s energy security, through maximising use of their
indigenous resources.
Financial Support – Danish Government mandates have required that a higher price
is paid for energy generated from straw resources.
Collaboration – contracts made between the bioenergy sector, individual farmers and
intermediary contractors, allows high specification straw harvesting and processing
equipment to be lent to farmers during harvest period, in order to provide the
bioenergy sector with the fuels they require.
Price Control – farmers producing straw submit bids to energy companies stating
their price and volumes, and the energy companies are at liberty to buy the resource
they require but at the prices demanded by farmers.
Scale – contracts between farmers and energy companies are the same regardless of
whether the producer is an individual farmer, or a large farming association. This
includes contracts with large associations, but also small co-operative contracts that
combine the limited straw resources from small farms.
Andrew Welfle - ID: 81163530
322
Each of these Danish policies represents a potential opportunity for the UK Government to
further develop UK policy; through the emulation of policy initiatives that have been
successfully implemented elsewhere.
ii. The Role of the Common Agricultural Policy
The European Common Agricultural Policy (CAP) has also been identified as potentially
providing mechanisms for increasing the utilisation of straw resources.
A 2013 Report by the Institute for European Environmental Policy [577], identifies key
influences that the CAP could provide in supporting the increased use of straw as a feedstock:
Soil Safeguards - the inclusion of environmental requirements and safeguards for the
protection of soils, may provide accurate guidance to farmers confirming the levels of
straw resources be returned to the soil. Thus reducing circumstances where excessive
straw is utilised.
Supply Chain Guidance - develop initiatives to help improve the efficiency and
functionality of agricultural-residue supply chains.
Encourage Relationships - drawing on the CAP’S broad range of institutional, local,
and individual farm partners and relationships. The CAP may provide the opportunity
to grow relationships to encourage the growth of supply chains, and to link producers
with processors.
10.2.3 Animal Based Agricultural Residues
Animal based agricultural residues and specifically manures and slurries, were also identified
within both Chapters 5 and 6 as representing resources with great potential for the UK
bioenergy sector.
The utilisation of these resources within anaerobic digestion bioenergy pathways may
represent large opportunities for the UK, as these pathways if applied appropriately could: be
highly profitable, create jobs, lead to further energy generation, and greatly reduce GHG
emissions [581]
Table 10.2, presents farming statistic for 2010 released by DEFRA [574]. These document
the utilisation of renewable energy and specifically the use of animal based agricultural
residues for renewable energy, by the UK’s animal-focused farms in 2010. This data
highlights that on average <5% of the UK’s animal-focused farms utilise renewable energy,
and of those that do, less than 50% utilise renewable energy systems using feedstock such as
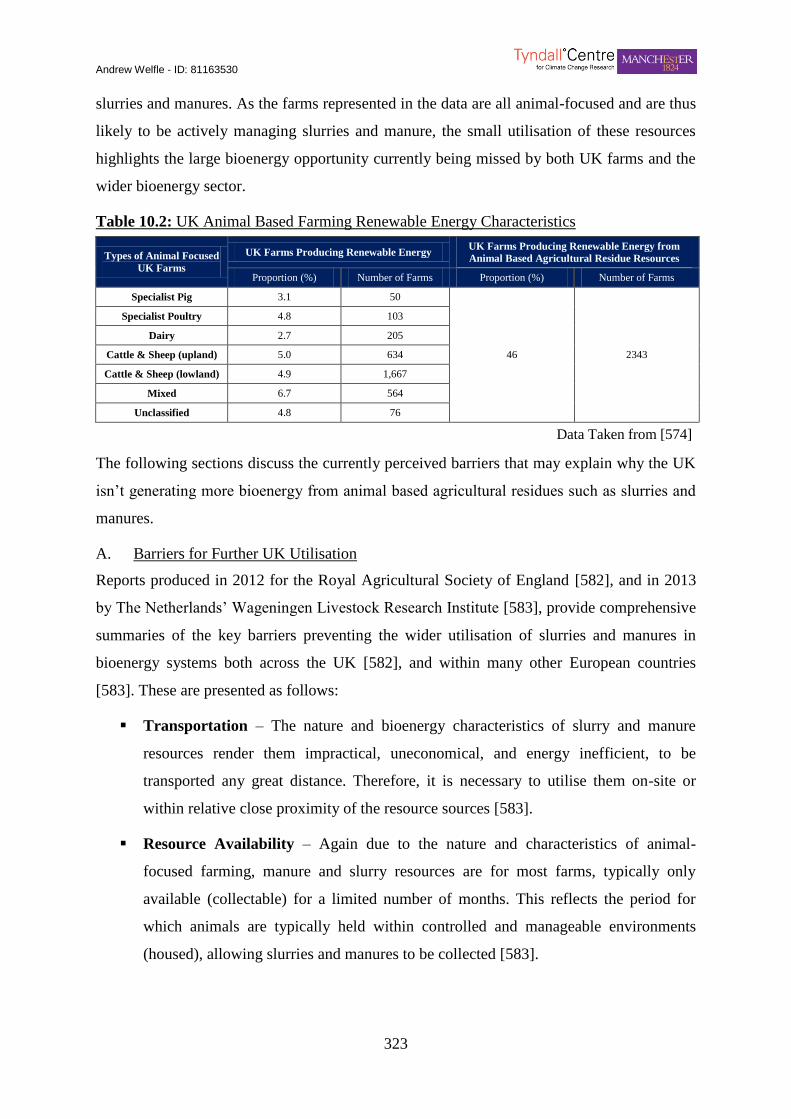
Andrew Welfle - ID: 81163530
323
slurries and manures. As the farms represented in the data are all animal-focused and are thus
likely to be actively managing slurries and manure, the small utilisation of these resources
highlights the large bioenergy opportunity currently being missed by both UK farms and the
wider bioenergy sector.
Table 10.2: UK Animal Based Farming Renewable Energy Characteristics Table 50) Table 10 .2: UK A nimal Based Far ming Renewable Energy C haracteristics
Types of Animal Focused
UK Farms
UK Farms Producing Renewable Energy UK Farms Producing Renewable Energy from
Animal Based Agricultural Residue Resources
Proportion (%) Number of Farms Proportion (%) Number of Farms
Specialist Pig 3.1 50
46 2343
Specialist Poultry 4.8 103
Dairy 2.7 205
Cattle & Sheep (upland) 5.0 634
Cattle & Sheep (lowland) 4.9 1,667
Mixed 6.7 564
Unclassified 4.8 76
Data Taken from [574]
The following sections discuss the currently perceived barriers that may explain why the UK
isn’t generating more bioenergy from animal based agricultural residues such as slurries and
manures.
A. Barriers for Further UK Utilisation
Reports produced in 2012 for the Royal Agricultural Society of England [582], and in 2013
by The Netherlands’ Wageningen Livestock Research Institute [583], provide comprehensive
summaries of the key barriers preventing the wider utilisation of slurries and manures in
bioenergy systems both across the UK [582], and within many other European countries
[583]. These are presented as follows:
Transportation – The nature and bioenergy characteristics of slurry and manure
resources render them impractical, uneconomical, and energy inefficient, to be
transported any great distance. Therefore, it is necessary to utilise them on-site or
within relative close proximity of the resource sources [583].
Resource Availability – Again due to the nature and characteristics of animal-
focused farming, manure and slurry resources are for most farms, typically only
available (collectable) for a limited number of months. This reflects the period for
which animals are typically held within controlled and manageable environments
(housed), allowing slurries and manures to be collected [583].
Andrew Welfle - ID: 81163530
324
Spatial Constraint – Anaerobic digestion (AD) systems, the most suitable bioenergy
systems for the use of manure and slurry resources; require physical space. The
economics of AD systems are also largely improved through the addition of energy
crop feedstocks. These require potentially large areas for growth of feedstocks and
their production is often incompatible with the nature of farms which have the large
animal based biomass resources [582].
Capital Costs – The initial costs of digesters and associated infrastructure are high,
and are unlikely to come down in cost significantly in the near-term, until there is a
more active market, and regulations are refined. Access to capital to meet these high
initial costs can be difficult [582].
Incentives – Current incentives in the UK are the Feed-in-Tariffs and also potentially
the Renewable Heat Incentives. However, the current incentive bandings in addition
to the small-scale of the average AD system makes them debatably uneconomical and
unattractive options, in comparison to simply building or continuing to use a slurry
store [582].
Collaboration Complexity – The time and costs associated with developing large
community or district systems that pool the resources from a number of local sites,
can be highly complex. These systems requiring larger capital costs, extra annual
maintenance, present reliability issues, have increased digester complexity, and can
often be hampered by infrastructure and wider grid-connection issues [582], [583].
B. Proposed Enabling Mechanisms to Increase UK Utilisation
The following section presents a series of ideas, policy options, and potential strategies that
could be implemented to encourage the greater utilisation of animal based residues by the UK
bioenergy sector.
Figure 10.2 presents screenshots from the European Commission’s EUROSTAT Statistical
Atlas 2013 [576]. The annotated map on the left demonstrates the density of animal based
farming within each major region of the UK. Whilst the annotated map on the right
demonstrates the development of roads and transport networks within the UK’s major
regions. In each case the darker the colour corresponds to the greater density of farming or
development of transport networks, respectfully. Figure 10.2 informs discussions in the
following sections.

Andrew Welfle - ID: 81163530
325
80) Figure 10.2: Density of Animal Based A gricult ure Compared to Transport Networ k Development
Figure 10.2: Density of Animal based Agriculture Compared to Transport Network
Development
Taken from [576]
i. Addressing Transport Barriers
A transportation barrier was identified in that it is impractical and uneconomical to transport
animal based agricultural residues any great distances from the resource source. Also, as a
result of the very nature of most farms, these resources are located in rural areas away from
nodes where energy is most required. Therefore, slurries and manures are typically most
suited for use on-site or within a localised area [582]. This transport barrier is also hinted
within Figure 10.2, where the regions with the greatest density of animal based farms are in
contrast to the regions with the most developed transport networks.
Enabling strategies to reduce transport barriers may include the greater utilisation of these
resources on-site where the resources are on or within localised district systems.
However, there is a further option that involves the processing of raw slurries and manure
into resource forms that are more suitable for transport as well as representing higher-value
energy fuels. Mechanical separation is the process of converting slurries and manures into
solid organic fuels; the resulting materials being highly stable and suitable for composting,
drying, pelletising, and anaerobic digestion [583].
The Baltic Manure Project [584] funded by the European Commission, has demonstrated that
mechanical separation technologies have been commercially available and viable for a long

Andrew Welfle - ID: 81163530
326
time. ‘Screw press filter separation systems’ were found to represent, cheap, highly efficient,
and low-maintenance machinery that provide a valuable addition to farms to increase their
utilisation of slurry and manure resources. The European Commission’s ‘Bio-Energy Farm’
project [585], demonstrates further projects across Europe (but not in the UK) that have
successfully applied these technologies. This highlights a further potential opportunity for
UK farmers and the bioenergy sector.
ii. Bioenergy System Scales
The barriers and opportunities affecting the development of anaerobic digestion (AD)
systems can be very variable, depending on the scale of the system. As highlighted in the
previous section the transportation of slurries and manures can present problems. Therefore,
the primary bioenergy option for utilising these resources is likely to be within small-scale
systems on or near to the resource sources.
A large number of environmental and agricultural benefits have been highlighted to further
support the development of small-scale AD systems such as, potentially reducing the
exposure of farms to rising fossil fuel costs, providing sources of renewable energy and
fertiliser; whilst also improving slurry storage, handling, hygiene, and distribution processes
[582].
Aside from designing financial incentives and mechanisms to promote the development of
small-scale AD systems, the Royal Agricultural Society of England [582] have highlighted a
series of further important actions that should be fostered in order to promote AD
technologies to the relevant farmers and stakeholders. These include:
Education – it is important to inform and educate farmers, bankers, and regulators
about the potentials of small-scale AD technologies.
Collaboration – promote industry and relevant bodies such as WRAP and the
NNFCC, to sit down and work with farmers, regulators, financiers, and planners; to
develop sufficient policies and enabling mechanisms to extend this technology’s
application.
Demonstration – it is important to make the technology accessible so that
prospective farmers and stakeholders are given the opportunity to visit AD sites to
gain a greater understanding of the technology.
Andrew Welfle - ID: 81163530
327
At the other end of the technological scale, large and district AD plants represent further
options for the greater utilisation of slurries and manures. As Figure 10.2 highlights, many of
the UK’s animal focused farms are clustered in high densities regions. In Counties such as
Devon, Cheshire, North Yorkshire, and Cumbria where there are large cattle and dairy herds,
there are also significant opportunities for the development of large-scale AD facilities [581].
Large systems may require significant capital costs in the region of one to five million
pounds, rendering them unaffordable for individual farmers; although this may become a
more viable option for farms located in the close proximity to each other and able to work
together in cooperatives, pooling their resources [581].
The community owned ‘NW 1000 kW Energy Farm’, in Silloth, West Cumbria; being an
excellent UK example. Here, eight farms in Cumbria located within 2.5 miles of the central
AD plant, generate energy from around 30,000 tonnes of slurry and silage per year [586].
This represents an excellent example of the potential of what can be achieved, and should be
further promoted to stimulate interest from potential future participants in similar schemes
[582].
iii. Incentives
Potentially the most important barriers to the development of AD or any renewable
technologies are financial. The 2011 joint DEFRA and DECC ‘Anaerobic Digestion Strategy
& Action Plan’ [587], and updated by DEFRA’s Annual Report (2013) [588]; presented the
array of financial mechanisms and incentives designed to promote the development of AD
plants in the UK. In summary these included:
Incentives - the design of incentives so that the options to develop AD plants, are as
at least as attractive as simply building slurry storage tanks.
Feed-in-Tariffs - the development of a more advantageous Feed-in-Tariff band for
smaller-scale AD systems.
Renewable Heat Incentive - the design of the Renewable Heat Incentive to
incentivise small-scale systems where the generation of electricity is not possible and
subsequently the systems are applicable for Feed-in-Tariffs.
Capital Funding - the introduction of funding models for renewable technologies
with options for lower interest rates and initial payment holidays.
Andrew Welfle - ID: 81163530
328
However, the AD sector in the UK is still highly underdeveloped, especially when compared
against other countries such as Germany [589]. In Germany, the AD Sector has been
supported by the German Renewable Energies Act that has paved-the-way for widespread
uptake of the technology through a combination of financial incentives, in addition to
Permitting and Regulatory support [590].
A specific policy that was developed to provide strong support for AD technologies [589],
was the ‘2009 German Gas Network Ordinance’(GasNZV) [591], that placed an obligation
on all gas-grid operators to allow preferred grid access to AD plants that have requested
access. Also, the additional requirement for the grid operators to fund 75% of grid access
costs for all distances less than 1 km; the AD operator then funds the remaining 25% up to a
maximum of €250,000. This represents an example of a constructive and innovative policy
that supports the development of the AD Sector by reducing the financial barriers of
development.
10.2.4 Household & Organic Wastes
Household and organic wastes were also identified within both Chapters 5, and 6, as
representing resources with vast potential for the UK Bioenergy Sector. Although Chapter 5
found that realising this potential was strongly reliant on the UK developing waste
management strategies that complement the bioenergy sector.
In the UK energy from waste has historically had a poor image, with landfill distribution and
early incinerators favoured to simply reduce volumes. However, with the introduction of
Land-Fill Diversion Targets and the development of new energy from waste technologies;
bioenergy pathways are back on the UK’s agenda. Although the UK’s waste strategies and
policies focus on waste reduction and recycling, efficient energy recovery remains an
important element of the strategy to both generate energy, and reduce land-filled waste
volumes [592].
The following section discusses the barriers to the wider uptake of energy from waste
technologies in the UK, and those that prevent waste management strategies from currently
maximising energy recovery.
A. Barriers for Further UK Utilisation
There are a broad range of issues that represent barriers to the further utilisation of energy
from waste systems in the UK. These include social implications, regulation hurdles, and
technical and economic barriers as summarised:

Andrew Welfle - ID: 81163530
329
Incentive – the cost comparison of energy from waste systems compared to landfill
represents a strong barrier against the further development of this sector. The 1999
introduction of the ‘Landfill Tax Escalator’ has reduced this barrier, but near-term and
medium-term cost analysis, still favours landfill distribution over energy recovery
[593].
Waste Hierarchy – the supply of biomass-waste-feedstocks is restricted by the waste
hierarchy that is in turn driven by the UK’s waste policy’s primary focus; to reduce
landfill and recycle. Thus a further barrier exists in that plants are not necessarily able
to access the types and extent of waste-feedstocks that they require [567].
Opposition – by far the greatest barrier to the development of energy from all waste-
systems is the social opposition led by individual local communities and the lobbying
by regional and national environmental-action-groups; social opposition contributing
to the planning rejection / withdrawal of almost 25% of proposed plants on the UK
Planning Register in 2010 [594].
Finances – the Government’s definition of biomass wastes can vary between different
departments and thus the available subsidy regimes for particular wastes for bioenergy
generation also varies. This represents a barrier preventing developers from accessing
the finances required to grow the sector [567].
B. Proposed Enabling Mechanisms to Increase UK Utilisation
i. Development of Waste Management Strategies
There are limitations as to how far the UK can develop its waste management strategies as
across all EU Member States, these are almost entirely regulated by EU Directives. These
Directives define both the political framework and the national regulations in all the EU
countries. However, the reality is that most EU countries are not yet complaint with these
standards, with New EU Member States having defined dates for achieving compliance goals
[595].
The extent that energy recovery technologies are utilised across the EU are strongly
controlled by the ‘Waste Framework Directive’ [596]. Whilst the EU’s ‘Landfill Directive’
[597], sets targets for land-filled waste proportions, and also influence the extent that waste
resources are potentially available to the bioenergy sector. The EU’s ‘Waste Incineration
Directive’ [598], defines the legal framework, sets incineration emission standards, and
Andrew Welfle - ID: 81163530
330
widely encourages Member States to use wastes for energy. The EU ‘Renewable Energy
(Electricity) Directive [599], also strongly promotes energy from waste pathways.
However, adaptations of EU Directives into national laws, allows room for manoeuvre; with
the definitions of wastes in the context of bioenergy being a key variable that differs with
each Member State. This manoeuvrability is a key area where different Member States can
adjust the parameters of their waste management strategies to variably favour energy from
waste generation, through determining the extent of the resource that may be eligible for
subsidisation [595]. A number of key variances between Member States that should
potentially be reviewed and considered by the United Kingdom are as follows:
Germany – energy from waste is not favoured, with wastes being classified as having
no biomass origin and waste incineration plants are exempted from carbon trading.
Sweden - 50% of the power generated from wastes are classified as bioenergy, the
remaining allocated to fossil fuels where CO2 Certificates are applied.
The Netherlands – classify 50% of power from waste incineration as bioenergy,
although only if the conversion efficiency exceeds 30%.
Finland - 60% of the energy generated from wastes is classified as bioenergy.
ii. Addressing Public Perception Barriers
In relation to addressing the large barriers associated with the opposition to energy from
waste technologies by the public and environmental groups; the UK could draw influence
from scenarios around the World and specifically within other EU Member States, where
public opinions are far less hostile. A review undertaken by WMW (2014) [600], compared
the perspectives and opinions of different relevant stakeholders linked to the energy-from-
waste sectors both in the UK and within countries with strong energy-from-waste traditions.
As summarised below, there are many themes that the UK could focus on and develop to help
promote the UK’s energy-from-waste sector, and ultimately utilise the UK’s potentially large
biomass waste resources.
Denmark & Sweden - have a long tradition of waste incineration, with the
Scandinavian population sympathetic of the technologies. This results from the cheap
heating provided by waste powered district heating systems. Also, the close
relationship that energy-from-waste operators develop with local populations, starting
at a young age where school children and the public are invited to tour energy-from-
waste plants.

Andrew Welfle - ID: 81163530
331
European Commission – the ‘Waste Framework Directive’ raises awareness that
pollutants are highly regulated and restricted from energy-from-waste plants.
UK Consultation Consultant – The key energy-from-waste barrier that topped
people’s list of priorities during a broad consultation exercise was the proximity of the
Plants to populations. Public perceptions were largely softened with discussion linked
energy-from-waste systems with: energy security, waste minimisation, and climate
change themes.
UK Waste Management Company – research carried out by SITA UK (2011) [601],
found that 79% of 1000 participants interviewed in the UK favoured energy-from-
waste pathways. Their research concluding that the voices of minority groups often
overshadow the opinions of the majority.
10.2.5 Promoting the UK Bio-Heat Sector
The research conclusions from Chapter 6 highlighted the motion that the UK should utilise its
biomass resources to generate heat, as bioenergy heat conversion pathways were found to
provide the greatest energy for the resources available; Chapter 6 also stating that the UK
should potentially focus on generating its renewable power from alternative technologies
other than biomass, to allow biomass resource distribution to the bio-heat sector.
However, the analysis of the UK Bioenergy Strategy undertaken in Chapter 7 provided
contrasting conclusions – in the near to medium-term the UK bioenergy sector is headed
towards a future with increased focus on bio-power generation pathways with bio-heat
favoured for small-scale and selected industrial applications.
Therefore, with the UK’s policy-focus seemingly prioritising the use of its domestic
resources for bio-power systems (and specifically co-firing plants) rather than for bio-heat,
the UK’s strategy and policies themselves may represent the greatest barriers to the broader
development of the UK bio-heat sector.
DEFRA’s 2007 Biomass Strategy [77], acknowledged that biomass was under-utilised within
UK heating applications, although it would have to play a central role in the UK meeting its
renewable heat energy targets. The key mechanism that has since further developed to
encourage and enable the development of bio-heat applications, is the UK’s Renewable Heat
Incentive. Despite this scheme, there are many currently perceived barriers that are
preventing the wider development of UK bio-heat applications. The following discussions
Andrew Welfle - ID: 81163530
332
within this section go on to highlight these barriers, and also to identify and present potential
enabling mechanisms and alternative strategies that may reduce these barriers.
A. Barriers for the UK Bio-Heat Sector
The following section presents a series of identified barriers that are perceived to be
preventing the wider development of the UK’s Bio-Heat Sector. These range from social,
practical, technical, and financial issues preventing the development of both small-scale, and
large and district-scale systems.
i. Broad Bio-Heat Sector Barriers:
Heat Demand – with respect to heat generated through CHP systems, the lack of
continuous heat demands required for optimal use can significantly reduce the
efficiency of the systems, and as such degrade the appeal of bio-heat systems [602].
Economics – the financial considerations of bio-heat-systems even when Renewable
Heat Incentive subsidies are applicable, can still be uneconomical in comparison to
alternative conventional heating technologies [567], [602], [603].
Resource Chains – with the development of large-scale bio-power and co-firing
plants in the UK, there is extreme competition for biomass resources. As many bio-
heat-systems are small and domestic-scale, the resource supply chains can be / appear
inaccessible. Therefore, a major barrier exists as to where biomass resource will come
from to fuel the UK’s Bio-Heat Sector if it is to continue to grow [567], [603].
ii. Small Scale Bio-Heat System Barriers
Capital Cost - Installation costs of small-scale biomass boiler system are typically
three times the cost of an oil or gas system equivalent [603]. Also, the conversion of
any existing infrastructure to adapt to biomass systems can also be expensive [567].
Application – biomass boiler systems are unfamiliar to the majority of the UK
population. This presents barriers to new prospective users as the typical requirement
to load the systems, and also source unfamiliar fuel supplies, can represent social
obstacles [567].
Space – biomass boiler and fuel stores require much more space than alternative fossil
fuel based systems; this presenting a barrier or even making the technologies
impractical for certain applications [567].
Andrew Welfle - ID: 81163530
333
Air Quality - as many dense UK urban areas already exceed the required threshold
values for Particulate and Nitrogen Oxides emissions, all new sources receive large
scrutiny. The Air Quality legislation needs updating to recognise the characteristics of
biomass systems. Until this issue is addressed, it will remain a barrier to the wider
adoption of bio-heat system applications [567], [603], [604].
iii. Large Scale Bio-Heat System Barriers:
Capital Cost - costs associated with the infrastructure connecting district-systems to
the grid can be large. The current comparatively low-load factors of UK’s district
networks further reduce the economics [603].
Consumer Resistance – consumers, especially within urban areas may resist the
long-term contracts necessary to secure the development of district heating
infrastructure [603] [567].
Disruption – urban networks require extensive excavation and the laying of pipe-
work which will likely result in disruptions to transport systems and utilities [602],
[603].
B. Proposed Enabling Mechanisms to Encourage Further UK Bio-Heat Generation
A wide range of studies have been undertaken that focus on identifying the barriers and
potential solutions [7], [257], [604]–[613], for further developing the Bioenergy Sector and
specifically for bio-heat applications [567], [603].
This section presents some potential strategies or innovations that the UK Government could
consider to break-down the barriers preventing the development of both small and large-scale
bio-heat applications.
i. Promotion of Small Scale Bio-Heat
The UK’s Renewable Heat Incentive has so far proved to be relatively successful with a large
number of businesses taking up the opportunity to become ‘Greener’ predominantly through
the application of bioenergy heating systems. The UK’s Government have also confirmed
[57] that the RHI will be further supplemented in spring of 2014, with an additional scheme
aimed specifically at households.
However, to supplement the UK’s future planned policies there are a range of further
initiatives that have been undertaken across other EU Member States, from which the UK
Government could draw inspiration. For example, the European Commission funded ‘Bio-
Housing Project’ [614], was undertaken across: Finland, Austria, France, Italy, and Spain;
with the prime aim of identifying and removing the barriers for the widespread utilisation of
Andrew Welfle - ID: 81163530
334
bio-heat-systems across European homes. This project included collaborative work involving:
house builders / owners, bio-heat and housing-industry engineers, boiler manufacturers, fuel
specialists, and whole range of other relevant housing and heating stakeholders. The key
project outcomes were the design and production of universal bioenergy systems, and
associated supporting information tools and guidance materials; these addressing each of the
technical, practicality, and social barriers that were identified as holding back the domestic
bio-heat industry. This represents the kind of project that the United Kingdom should be
aiming to participate in; to develop the UK markets and learn from other Member States who
have far-more advanced bio-heat sectors.
Sweden represents the EU Member State with the greatest bio-heat utilisation level. The
growth of Sweden’s bio-heat sector has gradually taken place over more than a century [615].
Sweden therefore represents an ideal case study of a country that the UK should be looking
at, with regard to developing a regulatory and financial support framework to help the UK
Bio-Heat Sector to grow. A summary of Sweden’s standout policies promoting bio-heat are
as follows:
Project Approval - the approval of solid biomass plants by Swedish authorities is not
perceived as a barrier. Sweden has highly stringent noise, emission, and other impact-
thresholds required to achieve planning approval. However, the advanced bio-heat
market and authorities well versed in bioenergy technologies; smooth the application
process [615].
Public Perception – the Swedish public are also highly knowledgeable of bioenergy
technologies as a result of their widespread application. They are also widely
consulted within each project, and therefore public opposition to bioenergy
developments is not considered a typical barrier [615].
Financing – Swedish banks are familiar with financing bioenergy projects. As a result
of Sweden’s carbon and energy taxation schemes that favour bioenergy systems;
financing bioenergy projects is typically straightforward [615].
Stability – the market perspectives, political framework and bioenergy supporting
financial structures are well known and stable in Sweden, providing high level of
certainty for potential investors [615].
Andrew Welfle - ID: 81163530
335
Supply - special focus is placed on ensuring reliable, sustainable, and long-term
feedstock supplies within all bioenergy projects. The market entry requirement for all
new potential Swedish resource suppliers being highly formalised [615].
ii. Promotion of Large Scale Bio-Heat
When it comes to addressing the barriers typically associated with large and district-scale
bio-heat applications, many European countries, again can be used as best practice case
studies, as a result of their long-standing traditions and their gradual development of the
technologies. Denmark and Sweden again lead the way and represent countries that the UK
could learn from, in terms of both financing and promoting larger-scale bio-heat applications.
Ericsson (2009) [616], highlights the key themes that make the Swedish and Danish bio-heat
markets so strong:
Ownership – municipalities play an important role in establishing district-heating
systems as they are already responsible for local electricity distribution. This eases the
infrastructure planning development process and automatically includes all public
building into the network.
Public Perception – the cost effective, reliable, and high reputations associated with
district-heating systems within both Denmark and Sweden, ease public perspectives of
further proposed developments.
Subsidies – a range of schemes have been developed for both Denmark and Sweden
that have encouraged the development of large-scale systems in preference to
conventional networks.

Andrew Welfle - ID: 81163530
336
Chapter 11 - Thesis Conclusions
Andrew Welfle - ID: 81163530
337
11.1 Thesis Conclusions
Chapter 11 of the Thesis presents the conclusions; bringing together and summarising the
various analyses results and individual Chapter conclusions, from across the Thesis.
Deductions are arrived at from the results and their potential wider implications are
discussed. The Chapter also highlights specific methodologies, results, and conclusions that
represent original research, and will therefore contribute towards advancing or strengthening
existing knowledge in their respective research themes.
Chapter 11 also highlights and acknowledges the various limitations that relate to the
research undertaken. Recommendations are provided of further work that could be
undertaken to address perceived limitations, and to engage further research of interesting and
important themes. The Chapter concludes with a final concluding statement that summarises
the Thesis.
11.1.1 Summary of Thesis Conclusions
This first section of the Conclusion Chapter provides a recapping of the key analysis results
and conclusions from each of the Thesis Chapters where analysis was undertaken:
A. Chapter 5 – Drivers Influencing Biomass Resource Availability & Bioenergy
High Potential UK Resources - the research highlights that particular resources
demonstrate significantly greater availability and bioenergy potential than others.
Household wastes, agricultural residues, and UK grown biomass resources and energy
crops, demonstrating the greatest potential for the UK’s bioenergy sector.
Availability of UK Grown Biomass Resources & Energy Crops - the utilisation of
available suitable lands for resource growth, is the key driver influencing the
availability of these resources. UK grown resources are found to demonstrate
relatively low near-term resource availabilities, thus concerted planning may be
required if anywhere near the upper-levels of the resource forecasts are to be realised.
Availability of Agricultural Residues - availability of all residues was found to be
comparatively robust to influencing drivers; the extent that resources are harvested /
collected being the most influential factor. The availabilities of agricultural-resource
residues are forecast to steadily increase without any major influences from drivers.
Availability of Household Wastes - found to be highly influenced by one key driver;
the waste management system adopted. The availability of waste resources was found
Andrew Welfle - ID: 81163530
338
to be much diminished when the adopted waste management strategy was
uncomplimentary to the bioenergy sector.
B. Chapter 6 - UK Biomass Resource Scenarios
High Potential Availability of Indigenous Biomass – high-levels of indigenous
resources within the UK could be mobilised without impacting food or industry
systems; including the growth of biomass resources and energy crops within the UK,
without adversely impacting food production.
Biomass Residue Resources - again found to represent continuous and robust
resources that maintained a high-availability regardless of the scenario or duration
within the analysis timeframe.
Biomass Waste Resources - availability and promise of waste resources for the UK’s
bioenergy sector were again found to hinge on the focus of implemented waste
strategies.
Food – Biomass Positive Feedback Relationship - a future scenario pathway that
emphasised, increasing productivity and reducing wastes from food-systems resulted
in large future feedback benefits for the bioenergy sector. Increasing the productivity
of the land not only resulted in increased food-security and self-sufficiency, but
ultimately resulted in less land being required to produce more food; potentially
freeing up additional land for biomass resource and bio-energy crop growth.
Prioritisation of Bio-Heat Conversion Pathways - the prioritisation of heat
bioenergy conversion pathways with suitable resources resulted in the greatest levels
of bioenergy generation. This suggests that the best option for the UK to make the
most of its indigenous biomass resources may potentially be, for selected resources to
be utilised by industries involved in bio-refinery to produce specialised products, with
all remaining suitable resources being dedicated for heat generation pathways. The
generation of renewable electricity, potentially being best achieved through
alternative technology pathways.
C. Chapter 7 – The Future UK Bioenergy Sector
Future Bioenergy Sector Resource Demands – current and planned bioenergy
sector directions reflect an increasing focus towards bio-power bioenergy pathways,
and like many other countries the UK will require large quantities of wood-type
biomass resources for this energy generation pathway. Biofuels and the suitable
Andrew Welfle - ID: 81163530
339
feedstocks to produce them are also widely sought for the current and future transport
sector.
Future Uncertainties – there are increasing uncertainties relating to the future of the
UK bioenergy sector, especially for medium to long-term forecasts.
Indigenous Resource Deficits - large potential resource deficits are forecast of the
specific types of biomass that the planned UK bioenergy sector will require.
UK Biomass Trade Requirements - if the UK’s current bioenergy plans mature, it is
forecast that the UK will likely become increasingly dependent on imported
resources.
D. Chapter 8 - Global Biomass Trade: Supply, Demand, Limitations & Sustainability
Growing Biomass Resource Trade - the global biomass trade markets are growing
fast yet are still far from maturity. A certainty that has emerged is that the volumes of
resources currently traded, are likely to vastly increase. However, a major uncertainty
remains as to how the biomass resource trade flow may change, as the energy
aspirations of developing countries continue to evolve.
Trade Hub Europe - Europe is found to be the key trading hub and demand region
for all forms of biomass resources. Driven by renewable energy and GHG reduction
targets, Europe’s demands for all biomass resources as highlighted throughout all
literature, comes across as being insatiable.
Trade Limitations - there are a wide range of international and even geopolitical
drivers that will influence the global biomass markets, as with any other
internationally traded commodity. These limitations may represent a potential risk for
the UK, as it will have limited control over these drivers.
Sustainability Implications – the process of pursuing bioenergy pathways to reduce
GHG emission becomes irrelevant, if the supply chains, and / or related land-use and
cultivation practices; are not undertaken to ‘best practice’ to reduce sustainability and
climate change risk impacts.
E. Chapter 8 - Global Biomass Trade: Supply, Demand, Limitations & Sustainability
Brazilian Biomass Resource Availability - Brazil was found to have vast biomass
resources that were forecast to potentially increase to 2030 and beyond. Brazil
Andrew Welfle - ID: 81163530
340
therefore has the potential to continue to be a dominant player, in exporting resources
for global trade in the future.
Brazilian Biomass Resource Export Caution – if the Brazilian Government were to
make future change to their energy strategies and polices, and utilise a greater
proportion of their resources for domestic use, there may be large impacts on the
levels of resource that Brazil would export; and thus less available within the global
trade markets.
F. Chapter 10 - An Alternative UK Bioenergy Strategy
Case Studies & Innovation – A broad range of potential strategy and policy options
were highlighted that the UK Government could potentially consider implementing, in
order to enhance the mobilisation and utilisation of UK indigenous resources by the
UK bioenergy sector.
Andrew Welfle - ID: 81163530
341
11.2 Deductions & Implications
It is possible to draw one bold overarching deduction from the research findings and
conclusions; that the UK Government should potentially consider re-evaluating its current
biomass strategies and policies.
11.2.1 Conclusion – Develop a Bioenergy Sector Compatible with UK
Resources
Throughout the Research Project themes have developed from the analyses results that go
against the paradigm of the UK’s current biomass resource and bioenergy sector landscape.
The analyses and results of Chapters 5 and 6, found that the UK had the potential to mobilise
large levels of indigenous resources, with large resource availability potentials represented by
waste resources, residues from on-going activities and resources grown specifically for the
bioenergy sector. It was found that if these resources were mobilised in reflection of any of
the biomass resource scenarios developed in Chapter 6, UK indigenous resources could make
large contributions towards the UK meeting its energy, renewable energy and bioenergy
targets.
However, in the analysis undertaken in Chapter 7 these potentially available UK indigenous
resources are compared against the specific demands forecast for the UK bioenergy sector, if
current UK policies and strategies progress through to maturity. The types of resource that
the UK’s planned future bioenergy sector would demand, were found to be out of balance
with the types of indigenous biomass resource that were found to be potentially available in
the UK. This suggests that the UK’s Bioenergy Sector development plans don’t necessarily
take appropriate consideration of the UK’s indigenous resources. Thus the UK is likely to
have to import increasing levels of biomass resource in the future, to balance its demands.
The research analysis undertaken in Chapter 6, also highlighted that the prioritisation of bio-
heat energy pathways would represent the best use of the UK’s indigenous biomass
resources, as this pathway would provide the highest energy levels for the resources
available. However, this conclusion is contradicted by the research analysis undertaken in
Chapter 7, where an evaluation of the UK’s bioenergy strategies and policies highlighted that
in the near to medium-term especially, large-scale bio-power systems are highly favoured in
addition to increasing requirements for biofuels and related feedstocks for the transport
sector. This further highlights that UK’s bioenergy strategy and policies may not have been
developed in reflection of the resources available.
Andrew Welfle - ID: 81163530
342
11.2.2 Conclusion - Developing Mobilisation & Utilisation Strategies
This Research Project has found that the UK Government’s stance of “not picking winners”
[8], potentially goes against the themes developed in the conclusions of this research. The
analysis results suggest that the UK should be picking winners when it comes to focusing on
UK indigenous biomass, and according to this research those winners are: household and
organic wastes, agricultural residues, and biomass resources and energy crops grown on UK
land.
The research results from Chapters 5 and 6, both highlight that these resources demonstrate
significantly greater potential for the UK’s bioenergy sector in terms of volumes of resource
that could potentially be produced / harvested / collected. The supply chain sensitivity
analyses undertaken in Chapter 5 also highlighted that if the UK wants to increase the
availability of these domestic resources, it should be focusing on managing the precise supply
chain drivers that demonstrate the greatest influence on their availabilities; not focusing on
promoting a broad range of initiatives.
The resource types that were found to potentially provide the UK Bioenergy Sector with the
greatest extent of biomass resource are wastes. The supply chain sensitivity analysis
highlighted that the development of a complementary waste management system is the single
most important issue to address, if the UK is to realise the potential of these resources. The
discussions in Chapter 10 highlighted that European Union Directives are the key influencing
factors that determine how the UK can manage its wastes. However, lessons from other EU
Member States should teach the UK that EU legislation should be used as a tool to help
develop the energy from its waste sector; not hinder it. The strict waste categorisation criteria,
emission thresholds, and technology-impact requirements, required by EU legislation; should
be embraced to aid the application processes. Drawing on influences from Scandinavia, the
UK public should be integrated into the planning processes and familiarised with energy-
from-waste technologies, in order to reduce opposition.
Agricultural residues were also found to be resources that if sufficiently mobilised, may also
provide significant volumes of resource for the UK bioenergy sector. The supply chain
sensitivity analysis highlighted that these resources are robust to variances, are largely
available in reflection of the extent that they can be harvested and the ability of supply chains
to deliver the resource to bioenergy plants; or in the case of manure and slurries,
predominantly used on-site or within the local area. Chapter 10, presented research that
highlighted the proportion of UK farms that currently utilise their agricultural biomass

Andrew Welfle - ID: 81163530
343
residues within bioenergy pathways; and demonstrated that there is large potential for growth
in the availability and utilisation of this resource.
Chapter 10 again highlighted that the United Kingdom can learn from Scandinavian examples
of best-practice, where Denmark is the European leader in terms of agricultural straw residue
utilisation in bioenergy processes. Potential lessons learned should include the concept that
once a market has matured beyond a certain threshold, market forces will take over and
supply chains will naturally strengthen as the result of innovation and competition. Denmark
lends a perfect example to highlight this concept. In order to provide stimulation and to get
markets to initiate development, Chapter 10 highlighted policies implemented by the Danish
Government that the UK Government could potentially emulate; through a reverse-auctioning
systems and universal contract agreement between the bioenergy sector and farmers, a market
for straw resource will develop.
Chapter 10 also highlighted the barriers that exist to prospective individuals or groups of
farmers wishing to invest in anaerobic digestion systems to generate bioenergy from their
animal based agricultural residues. The lack of finance and subsidy-economics were
identified as major issues preventing such investments in the UK, especially when compared
against the alternative costs for simply storing or spreading the collected agricultural
residues.
The research conclusions from Chapters 5 and 6 also found that the resource opportunity
provided by UK grown biomass resource and energy crops for the UK Bioenergy Sector was
also large; although heavily dependent on encouraging farmers to use their lands to grow
these resources. The research thus highlighted a major missed opportunity and a large barrier
that the UK Government should surely work to address.
11.2.3 Conclusion – Placing Greater Focus on Indigenous Resources
The UK should ideally be making more of its potential indigenous resources, not locking
itself into strategies that are reliant on the types and extent of biomass resources that the UK
does not have. The research suggests that the UK should potentially import biomass to
supplement its indigenous biomass resources, to support its bioenergy sector; not plan for
these imported resources to form the majority resource base.
Analysis undertaken within Chapter 8 highlighted that the global biomass trade markets are
growing strongly, and there will most likely be adequate biomass resources available until at
least the medium-term future (2030). However, Chapter 8 also highlighted the potential
Andrew Welfle - ID: 81163530
344
limitations, and highly significant sustainability impacts and risks associated with the future
global trade in biomass. Biomass resources that have been produced utilising less than best-
practice and with associated impacts such as, land-use change, and / or deforestation, are
likely to be far more negative for climate change, than any positive benefit gained from
switching to bioenergy in place of conventional fuels. A future UK that becomes reliant on
imported biomass resources will have to deal with these uncertainties.
Further potential opportunities and / or risks were identified in Chapter 8, in that Europe is
clearly becoming the global trade-hub for all types of biomass, with all major trade-flows
headed into the EU. Although this may place the United Kingdom at the centre of biomass
trade, having the UK’s major competitors for the same resources, in such close proximity in
times of market uncertainties, may lead to steeply rising costs.
However, the most revealing research theme developed in Chapter 9 results from the
bioenergy scenarios analysis, where it was determined that Brazil’s biomass resource exports
may be impacted, if it were to increase the ambitions of its current energy strategies and
policies - to utilise great proportions of its resources for domestic energy generation. The
results found that almost a 30% reduction in export levels may be realised if the Brazilian
Government were to strengthen its policies. As Brazil is the World’s largest exporter of bio-
ethanol and sugarcane feedstocks, a reduction in exports below expected future anticipated
levels, of anywhere near this extent would likely have major implications on the future
biomass markets, and on those countries heavily reliant on imported resources. Although
Brazil does not presently shows signs of aiming to increase the ambitions of its domestic bio-
energy policies, it does highlight a broader theme; that if a major exporter or a combination
of multiple smaller exporters were to marginally increase the use of their own biomass
resources rather than exporting them; the collective impact on global markets could be
significant. This therefore presents a further cautionary note for the UK Government to
consider, before fully committing to future development pathways that could potentially lock
the UK into biomass resource deficits, and reliance on global markets over which it has
limited influence.
Andrew Welfle - ID: 81163530
345
11.3 Original Contributions to Knowledge
This section highlights some of the original methodologies and analyses techniques
developed and applied through the Research Project. The section also identifies the key
analyses results and conclusions that contribute to strengthening or furthering knowledge
within the related research themes.
11.3.1 Biomass Resource Model
The Biomass Resource Model developed as the Research Project’s key analysis tool,
represents a series of unique methodologies, and allows the development of unique analyses.
A. Whole System Analysis
As widely discussed within the methodologies of Chapter 4 the BRM was developed drawing
influence from a wide range of existing models, reports, and research. The BRM represents a
unique tool as it is capable of modelling whole-system supply chains for any land-based
biomass resources, and also provides the capability of analysing the bioenergy potential of
resources analysed.
Alternative models including those that influenced the development of the BRM, largely
focus on modelling a few key resources for a specific country, or are highly broad;
developing global-level forecasts. As such, those alternative models which are also capable of
analysing bioenergy potentials are restricted to forecasts focusing on a limited number of
resources, or for making broad-ranging global predictions.
B. Structural Flexibility
The BRM also represents a unique biomass modelling tool which is highly flexible, in that it
can be amended for application to any country of region; restricted only by the availability of
data. A large part of the BRM’s flexibility stems from its design, and its utilisation of data
from universal sources such as the FAO, IEA, and UN; who publish data relevant to almost
all countries.
This flexibility allows the BRM to generate biomass resource forecasts for different countries
such as the UK (Chapters 5 and 6), and Brazil (Chapter 9). In each case the methodological
structure of the BRM is maintained, and thus the BRM’s forecasts for each country can be
compared without having to account for the increased variances in assumptions and
limitations, if they were separate Models.

Andrew Welfle - ID: 81163530
346
C. Supply Chain Sensitivity Analyses
As Chapter 5 confirms, the influences and drivers that may impact biomass resource supply
chains have previously been analysed and addressed by a wide range of previous studies.
Each of these studies focused either on biomass supply chains as hypothetical concepts, or
focused on the influences to a specific resource, within a specific country, or within a specific
supply chain. The BRM’s supply chain sensitivity analysis undertaken in Chapter 5 focused
on the UK, and provided a unique analysis of how UK biomass supply chains impact the
range of land-based biomass resources.
Further recognition of the BRM’s flexibility is highlighted by the concept that a further
sensitivity analysis exercise could just as easily have been undertaken for the Brazil case
study.
D. Link between Biomass & Bioenergy
As already hinted at, the link provided within the BRM between available biomass resources
and their bioenergy potential, provides a further original area of analysis. The majority of
biomass resource models focus predominantly on determining the availability of specific
resources, and stop short of undertaking further analysis to determine the bioenergy potential
forecasts [103].
As demonstrated by the Power, Heat, and Transport Fuel, Sub-Scenarios developed within
Chapter 6, the BRM’s link between resources and bioenergy, as well as the BRM’s capability
to ‘prioritise’ different conversion pathways if desired; enables opportunities for advanced
scenario analysis. This being a further analysis dynamic that stands the BRM apart from the
majority of alternative tools.
E. Ultimate Realistic Biomass Resource Forecasts
As introduced in Chapter 3 and described in the methodologies of Chapter 4, the BRM is
bottom-up resource focused and produces forecasts of the ultimate realistic potential of
biomass resource availability. Then through the calibration of the BRM’s drivers, practical
biomass availability forecasts are developed. The large majority of models applicable to the
UK are demand-driven, in that they first focus on the energy required before calculating the
resource required to balance this demand. The majority UK models are also designed to
generate economic focused biomass resource forecasts – determining the extent to which
resources may affordably be mobilised.

Andrew Welfle - ID: 81163530
347
This is a further differentiation that sets the BRM apart from the majority of other UK
models. Thus this allows the BRM to undertaken analyses different from that of most other
UK focused models.
11.3.2 Food & Industry Biomass Demands
The BRM’s key design characteristic to first allocate land and resource requirements to
balance the demands of both the food and biomass linked industries, is a further feature of the
BRM that allows unique analyses.
All the biomass resource analyses produced by the BRM and presented in this Thesis reflect
the design assumption that food and industry will not be impacted by the increased utilisation
of biomass for energy pathways.
11.3.3 UK Indigenous Biomass Resource Analyses
UK biomass research knowledge focusing on the analysis of different biomass resources is a
relatively well covered research theme. However, there are particular areas of UK focused
analysis undertaken in this Research Project that may fill gaps in existing knowledge, or at
least strengthen existing knowledge.
A. Biomass Resource Scenarios
The development of the biomass resource scenarios and the bioenergy potential forecasts
within Chapter 6; contribute further results and data towards the existing knowledge base in
the relevant research areas. The scenario resource availability and bioenergy potential
forecasts developed in this Research Project can be defined from those of the majority of
existing studies, in that they present analyses for the full range of land-based biomass
resources.
In addition, the choice of developing the four scenarios that focus on, Economic,
Conservation, Food, and Energy prioritised pathways, sets these results apart from the
majority of existing biomass scenario research focused on the UK. Most previous UK
biomass scenario analyses have focused on evaluating the economic affordability and
technical potential of biomass and bioenergy. The Food focused and Conservation focused
biomass resource scenarios developed for the UK, were found to be especially unique in
focus, compared to those of other existing studies reviewed when developing the research
theme.
Andrew Welfle - ID: 81163530
348
B. UK Biomass Supply Balance
When developing the research themes within Chapter 7, a series of existing UK focused
reports were identified that discussed how UK biomass resource should potentially be best
used [617]. However, no specific research was found that links biomass resource availability
forecasts, with forecast scenarios of the specific types and quantities of biomass resources
required by the UK’s demand sectors.
Therefore, the resource balance analysis undertaken in Chapter 7 represents an area of
research that will contribute to a gap in UK biomass research knowledge.
11.3.4 Brazil Biomass Resource Forecasts & Bioenergy Scenarios
Despite Brazil having vast biomass resources and being a dominant participant in the global
biomass markets, there was a real scarcity of in-depth reporting regarding Brazil’s biomass
resources, and the extent of the data and information available for development of the Brazil
BRM was considerably less than that available when developing the UK BRM. A significant
number of Brazil focused reports were examined, these having been compiled by
international institutes and companies, and by Universities in the United States and here in
Europe. Thus the Brazil focused research carried out in Chapters 8 and 9 should contribute
further to the existing knowledge base.
A. Brazilian Biomass Resource Availability
As discussed in Chapters 8 and 9, there are a number of studies and reports that attempt to
quantify Brazil’s current biomass resource, and a much smaller number of studies and reports
that attempt to forecast how these may change in the future. The majority the reports provide
either broad-range, or highly specific estimates of how much biomass resource,
(predominantly focusing on Sugarcane feedstock) Brazil is capable of producing, or will
produce.
Applying the BRM to Brazil and developing a literature informed Brazil Baseline Scenario,
enabled forecasts to be made that reflected Brazil’s biomass supply chains, allowing an
assessment of all land-based resources to be undertaken. Based on the literature reviews, and
as part of the process of developing this theme within the Research Project, it was not
possible to identify any resource assessments that covered the complete spectrum of biomass
resources. Thus, the results of Brazil Biomass Resource Availability analyses presented in
Chapter 9, add to the limited knowledge base currently available in this research area.

Andrew Welfle - ID: 81163530
349
B. Bioenergy Scenarios Analyses & Resource Export Implications
All of the existing literature reviewed when developing the Brazil research theme focused on
Brazil as a dominant current and future exporter of biomass. No studies were found that
considered the potential dynamic that the Brazilian Government or that of any other major
biomass exporting country may increase the ambitions of their energy strategies and policies.
As such the resource balance analyses linked to the Bioenergy Scenarios undertaken for
Brazil in Chapter 9, represents an original theme of biomass research that is absent from
reference in current publications.

Andrew Welfle - ID: 81163530
350
11.4 Limitations & Further Work
This next section of the Conclusion Chapter highlights some of the key limitations attributed
to the adopted research methodologies implemented in the Research Project. In each case
there are discussions regarding the potential impacts of the perceived limitation, and
justification is provided where appropriate, explaining why the limitation was not addressed
further within the Research Project. In addition, this section highlights further proposed work
that could be undertaken in the future to reduce these limitations.
11.4.1 Changing Food Diets
Large aspects of the BRM’s analyses relate strongly to the food system, and the demands for
food commodities. The methodologies reflect previous studies [123], [140], where growth in
food commodity demand has been linked to population change. However, these previous
studies and also the BRM do not allow analyses relating to changes in dietary trends. Trends
relating to increased or reduced meat consumption, or changes in the consumption of specific
crop-based food commodities, will likely have implications influencing the availability of
resources for the bioenergy sector.
Therefore, this represents a limitation of the BRM and is something that could potentially be
updated as a further project. For example, a report carried out by Bow-Larkin et al (2012)
[618], developed potential scenarios where dietary trends and food systems adapted as a
result of potential climate change drivers. Integrating such research with analyses from the
BRM could potentially provide some interesting results.
11.4.2 Climate Change Impacts
Within the BRM, the potential impacts of climate change on biomass supply chain dynamics
is modelled largely through the integration of assumption onto the land and crop productivity
yields. However, by their very nature climate change impacts are forecast to be highly broad,
influencing all aspects and levels within countries, societies, and systems etc. As such, the
accurate modelling of climate change impacts represents a highly complex process, and
represents a potential limitation of the applied methodologies.
A further limitation to the research, relates to addressing sustainability, land-use change, and
other climate change related impacts associated with biomass resource production and trade.
Chapter 8 highlighted the broad themes and impacts that may be linked to the production and
trade of biomass. However, the Research Project and wider BRM methodology could have
Andrew Welfle - ID: 81163530
351
gone much further, potentially undertaking life cycle analysis assessments to measure the
potential impacts linked to biomass trade flows.
This represents further work that is currently planned as part of future projects involving: The
Supergen Bioenergy Hub, The Department of Energy & Climate Change, The University of
Manchester, The Imperial College London, Southampton University, and Rothamsted
Research. The BRM and the analysis outputs and conclusions from this Research Project will
filter into these planned future works where appropriate.
11.4.3 Spatial Scale & Distribution of Modelling
A large limitation of the developed modelling approach, relates to the spatial resolution of the
capable analysis. The BRM was designed to model the overall and average, dynamics and
distribution associated with biomass resource supply chains of the country or region in
question. Single values being developed to represent this desired geography.
This represents a limitation, as in reality biomass resources may be highly distributed or
concentrated in a few key nodes. This also applies when modelling the productivity and
characteristics of land, as all the land within a country is obviously not all the same. The
BRM assumes that all land identified as being suitable and potentially available for the
production of biomass and energy crops, has the same (averaged) potential productivity
characteristics, which will clearly not be the case.
A series of initial attempts were made to increase the spatial resolution capability of the
BRM, although these clashed with the further requirement for the BRM to be highly flexible
and to be amended to reflect the supply change dynamics of different countries. When
developing the UK BRM acquiring reflective data sets that accurately reflected the dynamics
of each UK Region or even UK County was not possible, due to the number of dynamics
measured and lack of appropriate data at the County resolution.
Ideally the BRM would have a higher analysis resolution, and as such this is a key area that
further work could explore especially if specifically focusing on a single country or region.
11.4.4 Energy Conversion Modelling
The BRM’s developed methodology for calculating bioenergy potentials, based on the
developed ‘preferred energy conversion’ pathways methodology (Appendix 1.0). This
presents a limitation, as this premise relies on the major assumption that all resources
potentially available for the bioenergy sector would be processed using preferred conversion
pathways to generate the forms of energy that are most ‘suitable’ to those resources.

Andrew Welfle - ID: 81163530
352
Although this may be the case with the majority of the resources it is unlikely to fully reflect
reality.
This therefore represents a limitation in the way that the bioenergy potentials are calculated
throughout the Research Project. Further work could be undertaken to further understand how
resource use within bioenergy pathways may develop, however these forecasts will also be
based on their own assumptions.
11.4.5 Chemical Industry
The chemical industry is a further dynamic that has not received emphasis within the adopted
modelling approach.
The chemical industry is closely linked with biomass with some projections for 2030
showing that up to 35% of global chemical production could to some extent, be based on
biomass resources [619]. Whether the chemical sector uses more biomass resources will
depend on whether energy, feedstocks, or alternative chemicals will result in net GHG
emission savings, in comparison to the fuels being replaced [620].
As the chemical industry plays an important role in the UK economy, as both a major
exporter and employer, there is high potential that the growth and development of this
industry will be prioritised. This may potentially lead to further increasing demands for
biomass resources [621].
This research does not widely consider the demands and the growth dynamic of the Chemical
Industry, and this highlights a further limitation, and a potential focus for further work.
11.4.6 Supply Chain Drivers
Chapter 5, documents the range of supply chain drivers that are identified by a large number
of studies (Table 5.1), as potentially providing influence in determining the extent that
biomass resource may be available. Chapter 5 goes on to list the specific drivers which can or
cannot be analysed within the BRM. Thus, there is a series of further drivers that were not
considered directly within the methodology and as such represent a limitation. These are
listed as follows:
Gross Domestic Product
Rural Economy Development
Water Availability
Support Policies & Mechanisms
Soil Degradation Drivers
Flood Protection Land Requirements
Supply Change Resilience
Diet Change
Environmental Protection Policies
Calorie Consumption

Andrew Welfle - ID: 81163530
353
Many of these supply chain drivers and influences could potentially be analysed within the
existing BRM, either through developing assumptions (for example dedicating specific areas
of land for flood defenses), or through the development of specific scenarios (such as to test
the influence of changing calorie consumption and diets). These were not carried in the
Research Project as they were deemed to present research direction that didn’t align with the
key aims and objectives.
However, other drivers such as water availability or financial support mechanisms cannot
currently be directly modelled within the BRM, and therefore represent further limitations of
the Research Project.
Andrew Welfle - ID: 81163530
354
11.5 Concluding Statement
This Thesis presents the work undertaken during a Three Year PhD Research Project within
the Tyndall Centre for Climate Change Research, at the University of Manchester.
The themes of the work focused on the analyses of biomass resource supply chains, and how
they influence the availability of biomass resources. These themes were placed within the
context of the United Kingdom’s high bioenergy aspirations, having ambitious renewable
energy and climate change targets, to which biomass is expected to make large contributions.
Through the development and application of a Biomass Resource Model, the research
focused on analysing the extent that UK indigenous biomass resources could contribute to
these targets.
Analyses were undertaken to evaluate how the UK’s biomass supply chain dynamics
influence the availability of different biomass resources. A selection of biomass resource
scenarios were then developed, placing emphasis on different United Kingdom future energy
pathways. The potential availability of various indigenous resources was evaluated within the
context of the future development of the UK bioenergy sector, and its associated resource
supply chains.
The analyses found that the United Kingdom has potentially large availabilities of specific
indigenous biomass resources; predominantly, household and organic wastes, and agricultural
residues. In addition, it also shows significant potential for the growth of biomass resources
and energy crops specifically for the bioenergy sector.
Further analyses compared these scenario results with the forecast demands of the future UK
bioenergy Sector based on current UK bioenergy strategies, found that the types and the
extent of biomass resources that the UK will require, are out of balance with those identified
as being predominantly available. Thus the key conclusions from the research, focus on the
theme that the future development and direction of the United Kingdom’s bioenergy sector,
will not be driven by the potential availability of the UK’s domestic and indigenous biomass
resources, but is likely be become highly dependent on imported biomass resources to
balance future demands; with significant inherent risks being identified with such a strategy.
A further area of research was undertaken which identified that the global biomass resource
markets have embedded uncertainties, and potentially major sustainability implications linked
to the trade of biomass.

Andrew Welfle - ID: 81163530
355
Therefore, the Thesis Conclusions deduce that the UK Government should consider
refocusing its Bioenergy Strategies and Polices, so that they are to a larger extent driven by
the development and exploitation of the UK’s indigenous resources, rather than the premise
of future availability of imported biomass resource.
Andrew Welfle - ID: 81163530
356
Thesis References
Andrew Welfle - ID: 81163530
357
1) American Association for the Advancement of Science. Scientific Consensus – Climate Change. Statement
made to the United States Senate, Washington DC. [Internet]. 2009 [cited 2014 Mar]. Available from:
http://www.aaas.org/sites/default/files/migrate/uploads/climateletterfinal.pdf
2) Intergovernmental Panel on Climate Change. Climate Change 2007: Impacts, Adaptation and
Vulnerability. Contribution of Working Group II to the Fourth Assessment Report of the IPCC.
[Internet]. 2007 [cited 2014 Feb]. Available from: http://www.ipcc.ch/pdf/assessment-
report/ar4/wg2/ar4-wg2-intro.pdf
3) United Nations. Kyoto Protocol to the United Nations Framework Convention on Climate Change.
[Internet]. 1998 [cited 2012 May]. Available from: http://unfccc.int/resource/docs/convkp/kpeng.pdf
4) European Commission. 20 by 2020: Europe’s Climate Change Opportunity, COM (2008) 30. Brussels:
Commission of the European Communities; 2008.
5) European Commission. Renewable Energy Roadmap: Renewable Energies in the 21st Century, COM
(2006) 848. Brussels: Commission of the European Communities; 2006.
6) UK Government. UK Climate Change Act 2008: Elizabeth II. Chapter 27, 12/2008 415435 19585.
London: Parliament Publication Office; 2008.
7) UK Government. The UK Renewable Energy Strategy. Cm 7686. [Internet]. 2009 [cited 2012 March].
Available from:
https://www.gov.uk/government/uploads/system/uploads/attachment_data/file/228866/7686.pdf
8) DECC. UK Bioenergy Strategy. URN: 12D/077. London: Department of Energy & Climate Change; 2012.
9) DECC. Bioenergy Strategy Analytical Annex. URN: 12D/078. London: Department of Energy & Climate
Change; 2012.
10) IEA. Large Industrial Users of Energy Biomass. Task 40: Sustainable International Bioenergy Trade
Report. Paris: International Energy Agency; 2013.
11) European Commission. An EU Strategy for Biofuels, COM (2006) 34. Brussels: Commission of the
European Communities; 2006.
12) Panoutsou C, Eleftheriadis J, Nikolaou A. Biomass Supply in EU27 from 2010 to 2030. Energy Policy.
2009; 37(12): 5675–5686.
13) European Commission. Promotion of the Use of Energy from Renewable Sources, Directive 2009/28/EC.
Amending and Subsequently Repealing Directives 2001/77/EC and 2003/30/EC. Brussels: Official
Journal of the European Union 2009; 2009.
14) Eurelectric. Biomass 2020: Opportunities, Challenges and Solutions. D/2011/12.105/51. [Internet]. 2011
[cited 2013 Feb]. Available from: http://www.eurelectric.org/media/26720/resap_biomass_2020_8-11-
11_prefinal-2011-113-0004-01-e.pdf
15) Upham P, Riesch H, Tomei J, Thornley P. The Sustainability of Forestry Biomass Supply for EU
Bioenergy: A post-normal approach to environmental risk and uncertainty. Environmental Science and
Policy. 2011; 14(6): 510-518.
16) Hewitt J. Flows of Biomass to and from the EU: An Analysis of Data and Trends. Brussels: FERN; 2011.
17) Junginger M, van Dam J, Zarrilli S, Mohamed F, Marchal D, Faaij A. Opportunities and Barriers for
International Bioenergy Trade. Energy Policy. 2011; 39(4): 2028-2041.
18) MacKay D. Sustainable Energy – Without the Hot Air. Version 3.5.2. Cambridge: UIT Cambridge Ltd;
2008.
19) Ristinen R, Kraushaar J. Energy and the Environment. 2nd ed. Hoboken, New Jersey: John Wiley and
Sons Publishing; 2006.
20) Intergovernmental Panel on Climate Change. IPCC Fourth Assessment Report: Climate Change 2007.
(AR4). [Internet]. 2007 [cited 2012 March]. Available from:
http://www.ipcc.ch/publications_and_data/ar4/wg1/en/tssts-2-1.html.
21) Intergovernmental Panel on Climate Change. Climate Change 2007: Synthesis Report. [Internet]. 2007
[cited 2012 March]. Available from: http://www.ipcc.ch/pdf/assessment-report/ar4/syr/ar4_syr.pdf
22) Mann M, Bradley R, Hughes M. Northern Hemisphere Temperatures during the Past Millennium:
Inferences, Uncertainties, and Limitations. American Geophysical Union. 1994; 3.1(14): 1-2.
23) Meinshausen, M. What Does a 2˚C Target Mean for Greenhouse Gas Concentrations? A Brief Analysis
Based on Multi-Gas Emission Pathways and Several Climate Sensitivity Uncertainty Estimates. In:
Schellnhuber H, Carmer W, Nakicenovic N, Wigley T, Yohe G. editors. Avoiding Dangerous Climate
Change. Cambridge: Cambridge University Press; 2006. p. 253–279.
24) European Commission. Limiting Global Climate Change to 2 Degrees Celsius: The Way Ahead for 2020
and Beyond, COM (2007) 0002. Brussels: Commission of the European Communities; 2007.
25) Anderson K, Bows A, Mander S. From Long-Term Targets to Cumulative Emission Pathways: Reframing
UK Climate Policy. Energy Policy. 2008; 36(10): 3714-3722.
26) Boyle G. Renewable Energy: Power for a Sustainable Future. 3rd ed. Oxford: Oxford University Press;
2012.
Andrew Welfle - ID: 81163530
358
27) British Petroleum. BP Statistical Review of World Energy 2007. [Internet]. 2007 [cited 2012 June].
Available from: http://www.bp.com/content/dam/bp-country/en.../statistical_review_2007.pdf
28) British Petroleum. BP Statistical Review of World Energy 2011. [Internet]. 2011 [cited 2012 June].
Available from: http://www.bp.com/sectionbodycopy.do?categoryId=7500andcontentId=7068481
29) DECC. Energy Consumption in the United Kingdom, Ref: 14D/208. [Internet]. 2012 [cited 2013 June].
Available from: http://www.decc.gov.uk/assets/decc/Statistics/publications/ecuk/file11250.pdf
30) Twidell J. Weir A. Renewable Energy Resources. 2nd ed. Oxford: Taylor & Francis Publishing; 2006.
31) DECC. Statistical Release 2010 – UK Greenhouse Gas Emissions, Final Figures, Ref: 12/008. [Internet].
2012 [cited 2012 July]. Available from: http://www.decc.gov.uk/assets/decc/11/stats/climate-
change/4282-statistical-release-2010-uk-greenhouse-gas-emissi.pdf
32) Suganthi L, Samuel A. Energy Models for Demand Forecasting - A Review. Renewable and Sustainable
Energy Reviews. 2012; 16(2): 1223-1240.
33) DECC. 2050 Pathways Analysis: Response to the Call for Evidence – Part 2. URN 11D / 0024. [Internet].
2011 [cited 2012 July]. Available from:
http://www.decc.gov.uk/assets/decc/what%20we%20do/a%20low%20carbon%20uk/2050/216-2050-
pathways-analysis-report.pdf
34) DECC. 2050 Pathways Analysis, July 2010. [Internet]. 2010 [cited 2012 July]. Available from:
http://www.decc.gov.uk/assets/decc/what%20we%20do/a%20low%20carbon%20uk/2050/216-2050-
pathways-analysis-report.pdf
35) IEA. MARKAL Model. Paris: International Energy Agency; 2012.
36) Mander S, Bows A, Anderson K, Shackley S, Agnolucci P, Ekins P. The Tyndall Decarbonisation
Scenarios - Part I: Development of a backcasting methodology with stakeholder participation. Energy
Policy. 2008; 36(10): 3754-3763.
37) Anderson K, Mander S, Bows A, Shackley S, Agnolucci P, Ekins P. The Tyndall Decarbonisation
Scenarios-Part II: Scenarios for a 60% CO2 Reduction in the UK. Energy Policy. 2008; 36(10): 3764-
3773.
38) Baker E, Shittu E. Uncertainty and Endogenous Technical Change in Climate Policy Models. Energy
Economics. 2008; 30(6): 2817-2828.
39) Hoffert M, Caldeira K, Jain A, Haites E, Harvey D, Seth D, et al. Energy Implication of Future
Stabilization of Atmospheric CO2 Content. Nature.1998; 395: 881-884.
40) Royal Commission on Environmental Pollution. Energy - The Changing Climate, 22nd Report. London:
The Stationery Office; 2000.
41) Centre for Climate Change Economics and Policy. Climate Change Policy in the United Kingdom. Policy
Paper, ECO/WKP(2011)55. London: Centre for Climate Change Economics and Policy, Grantham
Research Institute on Climate Change and the Environment; 2011.
42) Thornley P. European (Bio) Energy Policy 1996-2006, WWDR4. Manchester: Tyndall Centre for Climate
Change Research, University of Manchester; 2006.
43) UNESCAP. Policy Dialogue: Energy for Sustainable Development in Asia and the Pacific. Bangkok,
Thailand. United Nations. Economic and Social Commission for Asia and the Pacific; 2013
44) European Commission Climate Action. The EU Emission Trading System, EU ETS. [Internet]. 2012.
[cited 2012 Mar]. Available from: http://www.ec.europa.eu/clima/policies/ets/index_en.htm.
45) European Commission. Geological Storage of Carbon Dioxide, Directive 2009/31/EC. Brussels: Official
Journal of European Union, 2009.
46) European Commission. CO2 Capture and Storage Project Network. Brussels: The European CCS
Demonstration Network; 2012.
47) 2Co Energy. Don Valley Power Project. Guildford: 2Co Energy; 2012.
48) Radgen P, Butterfield J, Rosenow J. EPS, ETS, Renewable Obligations and Feed in Tariffs - Critical
Reflections on the Compatibility of Different Instruments to Combat Climate Change. Energy
Procedia. 2011; 4: 5814-5821.
49) UK Parliament. Electricity Market Reform. Fourth Report of Session 2010-12, Volume 1. Emission
Performance Standards Consultation Report, HC 742. [Internet]. 2011 [cited 2012 March]. Available
from:http://www.publications.parliament.uk/pa/cm201012/cmselect/cmenergy/742/742.pdf
50) British Energy. Green Certificates. [Internet]. London: EDF Energy; 2007 [cited 2012 March]. Available
from: http://www.british- energy.com/documents/Green_Certificates.pdf.2007
51) Thornley P, Cooper D. The Effectiveness of Policy Instruments in Promoting Bioenergy. Biomass &
Bioenergy. 2008; 32(10): 903-913.
52) OFGEM. What is the Renewables Obligation?. London: Office of Gas and Electricity Markets; 2011.
53) Thornley P, Brammer J, Rogers J, Huang Y, Rezvani S. Making Bioelectricity Economic in the UK, 17TH
European Biomass Conference and Exhibition; 2009 29 Jun/Jul, 29-3; Hamburg. Italy: ETA Florence
Renewable Energies; 2009.
Andrew Welfle - ID: 81163530
359
54) DfT. Feasibility Study on Certification for a Renewable Transport Fuel Obligation: Final Report. London:
Department for Transport; 2005.
55) Upham P, Thornley P, Tomei J, Boucher P. Substitute Biodiesel Feedstocks for the UK: A Review of
Sustainability Issues with Reference to the UK RTFO. Journal of Cleaner Production. 2009; 17(1):
S37-S45.
56) DECC. Electricity Market Reform – Consultation Document. Cm7983. London: Department of Energy &
Climate Change; 2010.
57) DECC. Increasing the Use of Low-Carbon Technologies: Renewable Heat Incentive. London: Department
of Energy & Climate Change; 2014.
58) DECC. The Future of Heating: A Strategic Framework for Low Carbon Heat in the UK, Ref: 12D/020.
London: Department of Energy & Climate Change; 2012.
59) Kraxner F, Norstom E, Havlik P, Gusti M, Mosnier A, Frank S, et al. Global Bioenergy Scenarios – Future
Forest Development, Land-use Implications, and Trade-Offs. Biomass & Bioenergy. 2013; 57: 86-96.
60) Williams A, Jones J, Pourkashanian M. Pollutants from the Combustion of Solid Biomass Fuel. Progress in
Energy and Combustion Science. 2012; 38(2): 113-137.
61) European Commission. The Biomass Action Plan, COM (2005) 628. Brussels: Commission of the
European Communities; 2008.
62) Haykırı-Açma H. Combustion Characteristics of Different Biomass Materials. Energy Conversion and
Management. 2003; 44(1): 155-162.
63) Saidur R, Abelaziz E, Demirbas A, Hossain M, Mekhilef S. A Review on Biomass as a Fuel for Boilers.
Renewable & Sustainable Energy Reviews. 2011; 15(5): 2262-2289.
64) Bhaskar T, Balagurumurthy B, Singh R, Naik D, Kumar A, Goyal H. Thermochemical Conversion of
Biomass to Biofuels. In: Biofuels – Alternative Feedstocks and Conversion Processes. Pandey A,
Larroche C, Ricke S, Dussap C, Gnansounou E, editors. London: Elsevier Academic Press. 2011.
65) Carbon Trust. Biomass Heating - A Practical Guide for Potential Users: In-Depth Guide CTG012. London:
Carbon Trust; 2009.
66) Biomass Energy Centre. Moisture Content. [Internet]. 2012 [updated 2012; cited 2012 Aug]. Available
from:
http://www.biomassenergycentre.org.uk/portal/page?_pageid=75,177178and_dad=portaland_schema=
PORTAL.
67) DECC. Digest of United Kingdom Energy Statistics 2011, 2011/066. [Internet]. 2011 [cited 2012 Aug].
Available from: http://webarchive.nationalarchives.gov.uk/20121217150421/http://www.d
ecc.gov.uk/assets/decc/11/stats/publications/dukes/2329-statistical-press-release.pdf
68) Bridgeman T, Darvel L, Jones J, Williams P, Fahmi R, Bridgewater A, et al. Influence of Particle Size on
the Analytical and Chemical Properties of Two Energy Crops. Fuel. 2007; 86(1-2): 60-72.
69) Kaliyan N, Morey V. Factors Affecting Strength and Durability of Densified Biomass Products. Biomass
& Bioenergy. 2009; 33(3): 337–359.
70) Olander B, Steenari B. Characterization of Ashes from Wood and Straw. Biomass & Bioenergy.1995; 8(2):
105-115.
71) Demirbas A. Biomass Resource Facilities and Biomass Conversion Processing for Fuels and Chemicals.
Energy Conversion and Management. 2001; 42(11): 1357-1378.
72) Demirbas A. Biorefineries: Current Activities and Future Developments. Energy Conversion and
Management. 2009; 50(11): 2782-2801.
73) Demirbas A. Combustion Characteristics of Different Biomass Fuels. Progress in Energy and Combustion
Science. 2004; 30(2): 219-230.
74) Energy Centre of The Netherlands. PHYLLIS: ECN Database - The Composition of Biomass and Waste.
[Internet]. Petten, The Netherlands: Energy Research Centre of The Netherlands; 2011 [cited 2012
March]. Available from: http://www.ecn.nl/phyllis/info.asp
75) Delucchi M. Modelling Environmental and Social Aspects in the Assessment of Biofuels. Biomass &
Bioenergy. 2011; 35(6): 2337-2360.
76) Harvey M, Pilgrim S. The New Competition for Land: Food, Energy, and Climate Change. Food Policy.
2011; 36(1): S40-S51.
77) DEFRA, DfT. UK Biomass Strategy, Ref: 12D/077. [Internet]. 2007 [cited 2012 Nov]. Available from:
http://www.decc.gov.uk/assets/decc/what%20we%20do/uk%20energy%20supply/energy%20mix/rene
wable%20energy/explained/bioenergy/policy_strat/1_20091021164854_e_@@_ukbiomassstrategy.pdf
78) Biomass Energy Centre. Resource Availability. [Internet]. 2012 [cited 2012 Nov]. Available from:
http://www.biomassenergycentre.org.uk/portal/page?_pageid=74,393180and_dad=portaland_schema=
PORTAL
Andrew Welfle - ID: 81163530
360
79) FAO. Global Food Losses and Food Waste: Extent Causes and Prevention. [Internet]. Rome: Food and
Agriculture Organization; 2011 [cited 2012 Nov]. Available from: http://
www.fao.org/fileadmin/user_upload/ags/publications/GFL_web.pdf.
80) Sims R, Mabee W, Saddler J, Taylor M. An Overview of Second Generation Biofuel Technologies.
Bioresource Technology. 2010; 101(6): 1570-1580.
81) Helena L, Chum R, Overend R. Biomass and Renewable Fuels. Fuel Processing Technology. 2001; 71(1–
3): 187-195.
82) Faaij A. Bio-energy in Europe: Changing Technology Choices. Energy Policy. 2006; 34(3): 322-342.
83) Yoshioka T, Hirata S, Matsumura, Y. Sakanishi K. Woody Biomass Resources and Conversion in Japan:
The Current Situation and Projections to 2010 and 2050. Biomass & Bioenergy. 2005; 29(5): 336-346.
84) Darvell L, Jones J, Gudka B, Baxter X, Saddawi A, Williams A, et al. Combustion Properties of Some
Power Station Biomass Fuels. Fuel. 2010; 89(10): 2881-2890.
85) Perry M, Rosillo-Calle F. Co-Firing Report – United Kingdom. UK Task Force 40 Report. London:
Imperial College; 2006.
86) Bridgwater A. Fast Pyrolysis of Biomass. In: Bridgwater T, Hofbauer H, van Loo S, editors. Thermal
Biomass Conversion. Cambridge: CPL Press; 2009. p. 37-78.
87) Overend R. Biomass Gasification: A Growing Business. Renewable Energy World. 1998; 1(3): 27-31.
88) Takeshita T, Yamaji K. Important Roles of Fischer–Tropsch Synfuels in the Global Energy Future. Energy
Policy. 2008; 36(8): 2773-2783.
89) Demirbas A. Biochemical Processes. In: Demirbas A, editor. Biorefineries. London: Springer Science &
Business Media Publishing; 2010. p.193-209.
90) Ofgem. Bioenergy Systems. [Internet]. London: Office of Gas and Electricity Markets; 2012 [cited 2013
June]. Available from: http:// www.ofgem.gov.uk/Sustainability/Pages/Sustain.aspx
91) NNFCC. The UK Biorenewables Landscape Map Database. York: National Non-Food Crops Centre;
2012.
92) NNFCC. The UK Biorenewables Landscape Map. York: National Non-Food Crops Centre; 2012.
93) Behrens A, Giljum S, Kovanda J, Niza S. The Material Basis of the Global Economy: Worldwide Patterns
of Natural Resource Extraction and their Implications for Sustainable Resource Use Policies.
Ecological Economics. 2007; 64(2): 444-453.
94) Dunham K, Manners G, Govett M, Govett G. Resources Policy Conference 78 Discussion Report: Session
1 – Future Supply and Demand for Resources. Resources Policy. 1978; 4(3): 210-211.
95) Rowse J. Constructing a Supply Function for a Depletable Resource. Resources and Energy. 1986; 10(1):
15–29.
96) Lara M, Doyen L. Sustainable Management of Natural Resources: Mathematical Models and Methods.
Berlin: Springer-Verlag, Environmental Science and Engineering; 2010.
97) Hotelling H. The Economics of Exhaustible Resources. Journal of Political Economy. 1931; 39(2): 137-
175.
98) Wolfram Demonstrations Project. Non-Renewable Resource Economics. Champaign, Illinois: Wolfram
Research; 2012.
99) Shafiee S, Topal E. When will Fossil Fuel Reserves be diminished?. Energy Policy. 2009; 37(1): 181-189.
100) IEA. Findings of Recent IEA Work 2007: Coal Information 2007. Paris: International Energy Agency;
2008.
101) WEC. Survey of Energy Resources. London: World Energy Council; 2007.
102) Shihab-Eldin A, Hamel M, Brennand G. Oil Outlook to 2025. OPEC Review. 2004; 28: 155-205.
103) UK Energy Research Centre. Energy from Biomass: the size of the global resource, ISBN: 1 903144 108.
London: Imperial College Centre for Energy Policy and Technology; 2011.
104) Hoogwijk M, Faaij A, Eickhout B. Potentials of Biomass Energy out to 2100, for Four IPCC SRES Land-
Use Scenarios. Biomass & Bioenergy. 2005; 29(4): 225-257.
105) Batidzirai B, Smeets E, Faaij A. Harmonising Bioenergy Resource Potentials – Methodological Lessons
from Review of State of the Art Bioenergy Potential Assessments. Renewable and Sustainable Energy
Reviews. 2012; 16(9): 6598-6630.
106) Berndes G, Hoogwijn M. van den Broek R. The Contribution of Biomass in Future Global Energy Supply:
A Review of 17 Studies. Biomass & Bioenergy. 2003; 25(1): 1-28.
107) Lauer M. Current Terrestrial Methods and Activities for Biomass Potential Assessment in Europe, 17th
European Biomass Conference & Exhibition. 2009 Jun 29 - Jul 3; Hamburg; Joanneum Research,
Institute of Energy Research.
108) Bauen A, Woods J, Hailes R. Biopower switch! Biomass Blueprint to meet 15% of OECD Demand by
2020. London: Imperial College, E4tech Ltd; 2004.
109) OECD. Food and Agricultural Outlook 2010-2019. Rome: Organisation for Economic Co-operation and
Development; 2010.

Andrew Welfle - ID: 81163530
361
110) Sims R, Hastings A, Schlamadinger B. Energy Crops: Current Status and Future Prospects. Global Change
Biology. 2006; 12(11): 2054-2076.
111) IEA. World Energy Outlook 2008. Paris: International Energy Agency; 2008.
112) Moreira J. Global Biomass Energy Potential. In: Dixon R, editor. Mitigation and Adaptation Strategies for
Global Change. London: Springer Science & Business Media Publishing. 2006. p. 313-342.
113) Beringer T, Lucht W, Schaphoff S. Bioenergy Production Potential of Global Biomass Plantations under
Environmental and Agricultural Constraints. Global Change Biology – Bioenergy. 2011; 3(4): 299-312.
114) Cannell M. Carbon Sequestration and Biomass Energy Offset: Theoretical, Potential and Achievable
Capacities Globally, in Europe and the UK. Biomass & Bioenergy. 2003; 24(2): 97-116.
115) de Vries B, van Vuuren D, Hoogwijk M. Renewable Energy Sources: Their global potential for the first-
half of the 21st Century at a Global Level: An Integrated Approach. Energy Policy. 2007; 35(4): 2590-
2610.
116) Erb K, Haberl H, Krausmann F, Lauk C, Plutzar C, Steinberger J, et al. Eating the Planet: Feeding and
Fuelling the World Sustainably, Fairly and Humanely - a Scoping Study. Austria: Potsdam Institute;
2009.
117) Field B, Campbell J, Lobell D. Biomass Energy: The Scale of the Potential Resource. Trends in Ecology &
Evolution. 2008; 23(2): 65-72.
118) Fischer G, Schrattenholzer L. Global Bioenergy Potentials through 2050. Biomass & Bioenergy. 2001;
20(3): 151-159.
119) Haberl H, Beringer T, Bhattacharya S, Erb K, Hoogwijk M. The Global Technical Potential of Bio-energy
in 2050 Considering Sustainability Constraints. Current Opinion in Environmental Sustainability. 2010;
2(5-6): 394-403.
120) Hall D, Rosillo-Calle F, Williams R, Woods J. Biomass for Energy: Supply Prospects. In: Johansson T,
Kelly H, Reddy A, Williams R, editors. Renewables for Fuels and Electricity. Washington DC: Island
Press; 1993.
121) Johansson T, Kelly H, Reddy A, Williams R. A Renewables-Intensive Global Energy Scenario (RIDGES).
Appendix to Chapter 1. In: Johansson T, Kelly H, Reddy A, Williams R, editors. Renewables for Fuels
and Electricity. Washington DC: Island Press; 1993.
122) Netherlands Environmental Assessment Agency. Biomass assessment: Assessment of Global Biomass
Potentials and their Links to Food, Water, Biodiversity, Energy Demand and Economy, Report 500102
012. Amsterdam: Netherlands Environmental Assessment Agency; 2008.
123) Smeets E, Faaij A, Lewandowski I, Turkenburg W. A Bottom-up Assessment and Review of Global Bio-
energy Potentials to 2050. Progress in Energy and Combustion Science. 2007; 33(1): 56-106.
124) Thran D, Seidenberger T, Zeddies J, Offermann R. Global Biomass Potentials - Resources, Drivers and
Scenario Results. Energy for Sustainable Development. 2010; 14(3): 200-205.
125) UNDP. Chapter 5 Energy Resources. In: World Energy Assessment. Energy and the Challenge of
Sustainability. New York: United Nations Development Programme; 2000.
126) Wolf J, Bindraban P, Luijten J, Vleeshouwers L. Exploratory Study on the Land Area Required for Global
Food Supply and the Potential Global Production of Bioenergy. Agricultural System. 2003; 76(3): 841-
861.
127) Schubert R, Schellnhuber H, Buchmann N, Epiney A, Grießhammer R, Kulessa M, et al. ‘Future
Bioenergy and Sustainable Land Use’. Berlin: German Advisory Council on Global Change; 2009.
128) Yamamoto H, Yamaji K, Fujino J. Scenario Analysis of Bioenergy Resources and CO2 Emissions with a
Global Land Use and Energy Model. Applied Energy. 2000; 66(4): 325-337.
129) Yamamoto H, Fujino J, Yamaji K. Evaluation of Bioenergy Potential with a Multi-Regional Global-Land-
Use-and-Energy Model. Biomass & Bioenergy. 2001; 21(3): 185-203.
130) Yamamoto H, Yamaji K, Fujino J. Evaluation of Bioenergy Resources with a Global Land Use and Energy
Model Formulated with SD Technique. Applied Energy. 1999; 63(2): 101-13.
131) Rokityanskiy D, Benítez P, Kraxner F, McCallum I, Obersteiner M, Rametsteiner E, et al. Geographically
Explicit Global Modelling of Land-Use Change, Carbon Sequestration, and Biomass Supply.
Technological Forecasting and Social Change. 2007; 74(7): 1057-1082.
132) IEA. World Energy Outlook 2010. Paris: International Energy Agency; 2010.
133) Renewable Energy Policy Network for the 21st Century. Renewables 2013 – Global Status Report, ISBN
978-3-9815934-0-2. [Internet]. 2013 [cited 2013 Dec]. Available from:
http://www.ren21.net/portals/0/documents/resources/gsr/2013/gsr2013_lo wres.pdf
134) Martinot E, Dienst C, Weiliang L, Qimin C. Renewable Energy Futures: Targets, Scenarios and Pathways.
Annual Review of Environment and Resources. 2007; 32: 205-239.
135) Helby P, Borjesson P, Hansen C, Röös A, Rosenqvist H, Takeuchi L. Market Development Problems for
Sustainable Bio-energy Systems in Sweden. BIOMARK Project, Report No. 38. Sweden: Lund
University; 2004.

Andrew Welfle - ID: 81163530
362
136) AEA Consulting. UK and Global Bioenergy Resource – Final Report. Report for Department of Energy &
Climate Change, AEA/ED56029. Oxford: Oxford Economics, Biomass Energy Centre, Forest
Research, AEA Consulting; 2011.
137) AEA Consulting. UK and Global Bioenergy Resource - Annex 1 Report: Details of Analysis. Report for
Department of Energy & Climate Change, AEA/ED56029/Final. Oxford: Oxford Economics, Biomass
Energy Centre, Forest Research, AEA Consulting; 2010.
138) E4tech. Biomass Supply Curves for the UK. Report for the Department of Energy & Climate Change.
London: E4Tech Ltd; 2009.
139) Fischer G, Hizsnyik E, Prieler S, van Velthuizen H. Assessment of Biomass Potentials for Biofuel
Feedstock Production in Europe: Methodology and Results. European Union Refuel Program
Luxemburg. [Internet]. Austria: International Institute for Applied Systems Analysis; 2007 [cited 2012
Sep]. Available from: http://www.refuel.eu/uploads/media/Refuel-D6-Jul2007-final6.pdf.
140) Smeets E, Faaij A, Lewandowski I. A Quickscan of Global Bio-Energy Potentials to 2050. [Internet].
Utrecht: Copernicus Institute; 2004 [cited 2012 Oct]. Available from: http://
www.bioenergytrade.org/downloads/smeetsglobalquickscan2050.pdf
141) Microsoft. Microsoft Excel. Computer Software. [Internet]. Redmond, Washington: Microsoft; [2010].
Available from: http://office.microsoft.com/en-GB/
142) Microsoft. Microsoft Word. Computer Software. [Internet]. Redmond, Washington: Microsoft; [2010].
Available from: http://office.microsoft.com/en-GB/
143) Microsoft. Microsoft PowerPoint. Computer Software. [Internet]. Redmond, Washington: Microsoft;
[2010]. Available from: http://office.microsoft.com/en-GB/
144) Mendeley. Reference Manager. Computer Software. [Internet]. London: Mendeley Ltd; [2013]. Available
from: http://www.mendeley.com/
145) United Nations. World Population Prospects. [Internet]. New York: United Nations Population Division;
2010 [cited: 2012 Oct]. Available from:
http://esa.un.org/wpp/documentation/WPP%202010%20publications.htm
146) FAO. FAO Statistics Food Commodity Datasets. [Internet]. 2012 [cited 2012 Oct]. Available from:
http://faostat.fao.org/site/291/default.aspx
147) Prieler S. Built-Up and Associated Land Area Increases in Europe. MOSUS Model: WP3 – Environmental
Evaluation. Laxenburg, Austria: International Institute for Applied Systems Analysis; 2011.
148) Thomson A, Hallsworth S. Projections of Emissions and Removals from the LULUCF Sector to 2050.
Inventory and Projections of UK Emissions by Sources and Removals by Sinks Due to Land Use,
Land-Use Change and Forestry. London: Department of Energy & Climate Change, Centre for Ecology
and Hydrology; 2011.
149) Döös B, Shaw R. Can We Predict the Future Food Production? A Sensitivity Analysis. Global
Environmental Change. 1999; 9(4): 261-283.
150) Bouwman A, van der Hoek W, Eickhout B, Soenario I. Exploring Changes in World Ruminant Production
Systems. Agricultural Systems. 2005; 84(2): 121-153.
151) DEFRA. Agriculture in the United Kingdom, National Statistics 2012. [Internet]. London: Department for
Environment, Food and Rural Affairs; 2012. [cited 2013 Jun]. Available from:
https://www.gov.uk/government/uploads/system/uploads/attachment_data/file/208436/auk-2012-
25jun13.pdf
152) DairyCo, Milkbench+. Profiting from Efficient Milk Production. [Internet]. Kenilworth: Agriculture and
Horticulture Development Board; 2009. Available from:
http://www.dairyco.org.uk/non_umbraco/download.aspx?media=11427
153) Sere C, Steinfeld H, Groenewold J. Food and Agricultural Organization. World Livestock Production
Systems – Current Status, Issues and Trends. Rome: Food and Agriculture Organization; 1995.
154) FAO. Estimation of Total Concentrate Feed Utilisation in World Regions and Production Systems. Rome:
Food and Agriculture Organization; 2011.
155) Jolly S, Wallace A. Best Practice for Production Feeding of Lambs: a review of the literature. Clare,
Australia: Meat and Livestock Australia, Productive Nutrition Pty Ltd; 2007.
156) Spinks G. Uses and Methods of Crop Forecasting. Review of Marketing and Agricultural Economics.
1956; 24(1): 1-15.
157) EBLEX. Improving Pasture for Better Returns. Beef and Sheep BRP Manual 1, Better Returns
Programme. Kenilworth: EBLEX; 2008.
158) Bruinsma J. World Agriculture: Towards 2015–2030: An FAO Perspective. London: Earthscan
Publications Ltd. 2003.
159) Bruinsma J. The Resource Outlook to 2050: By how Much do Land, Water Use and Crop Yields need to
Increase by 2050? FAO Expert Meeting, How To Feed the World In 2050; 2009 June 24-26; Rome.

Andrew Welfle - ID: 81163530
363
160) European Commission. EuroStat - Forestry Statistics Database. [Internet]. 2011. [cited 2012 Mar].
Available from: http://epp.eurostat.ec.europa.eu/portal/page/portal/forestry/data/database
161) European Commission. EuroStat - Forestry Statistics Database. [Internet]. 2012 [cited 2012 Mar].
Available from: http://epp.eurostat.ec.europa.eu/portal/page/portal/forestry/data/database.
162) Ewert F, Rounsevell M, Reginster I, Metzger M, Leemans R. Future Scenarios of European Agricultural
Land Use: Estimating Changes in Crop Productivity. In: Aeschlimann J, Boutin C, Burel F, Carter M,
Edwards A, Saggar S, et al. editors. London: Elsevier Ltd. 2005. p. 101-116.
163) FAO. How to Feed the World in 2050. Global Agriculture Towards 2050. High Level Expert Forum.
Rome: Food and Agriculture Organization; 2009.
164) Hafner S. Trends in Maize, Rice and Wheat Yields for 188 Nations Over the Past 40 Years: a Prevalence
of Linear Growth. Agriculture, Ecosystems Environment. 2003; 97(1): 275-283.
165) Nixon P, Bullard M. The Effect of Fertiliser, Variety and Harvesting Timing on the Yield of Phalaris
Arundinacea L. Aspects of Applied Biology. 1997; 49: 237-240.
166) Meehl G, Stocker T, et al. Global Climate Projections. In: Solomon S, Qin M, Manning Z, Chen M,
Marquis K, Averyt M, et al. editors. Climate Change 2007: The Physical Science Basis: Contribution of
Working Group I to the Fourth Assessment Report of the IPCC. Geneva: Intergovernmental Panel on
Climate Change; 2007.
167) Smil V. Do We Need Higher Farm Yields during the First Half of the 21st Century? In: Sylvester-Bradley
R, Wiseman J. editors. Yields of Farmed Species: Constraints and Opportunities in the 21st Century.
Nottingham: Nottingham University Press; 2005. p. 1–14.
168) European Commission. Bioenergy - National Biomass Action Plans, COM (2005) 0628. Brussels:
Commission of the European Communities; 2008.
169) Thornley P, Tomei J, Upham P. Supergen Biomass & Bioenergy Consortium: Theme 6 Resource
Assessment Feedstock Properties. [Internet]. Manchester: Supergen Bioenergy Consortium; University
of Manchester; 2008 [cited 2013 Jul]. Available from: http:// www.escholar.manchester.ac.uk/uk-ac-
man-scw:34562
170) Riche A. A Trial of the Suitability of Switchgrass and Reed Canary Grass as Biofuel Crops under UK
Conditions. ETSU B/CR/ 00655/00/00. Harpenden: Rothamsted Research; 2005.
171) Broadmeadow M. Climate Change and Woodlands in Northwest England. Bristol: Forestry Commission
England; 2007.
172) Forestry Commission. Biomass Energy Centre. Information Sheet 3 – Short Rotation Coppice (SRC).
Bristol: Forestry Commission England; 2012.
173) Cook S. Sunflowers – A Growers Guide. Cambridge: ADAS UK Ltd; 2008.
174) Spink J, Street P, Sylvester-Bradley R, Berry P. The Potential to Increase Productivity of Wheat and
Oilseed Rape in the UK. Report to the Government Chief Scientific Officer, Professor John
Beddington. London: Department for Innovation, Universities & Skills; 2009.
175) Nikos A, Bruinsma J. World Agriculture towards 2030/2050: The 2012 Revision. ESA Working Paper No.
12-03; 2012. Rome: Food and Agriculture Organisation of the United Nations; 2012.
176) Van der Mensbrugghe D, Israel O, Burns A, Baffes J. Macroeconomic Environment and Commodity
Markets: A Longer-Term Outlook. Looking Ahead in World Food and Agriculture: Perspectives to
2050. Rome: Food and Agriculture Organization; 2011.
177) Randers J. 2052: A Global Forecast for the Next Forty Years. Cambridge: Programme for Sustainability
Leadership. Cambridge: University of Cambridge; 2012.
178) Deepak R, Mueller N, West P, Foley J. Yields Trends Are Insufficient to Double Global Crop Production
by 2050. PLoS ONE. 2013; 8(6).
179) Moeller T, Grethe H. Climate Change and European Agriculture in 2050: Outlook for Cereal and Oilseed
Markets, Thirteenth Annual Conference on Global Economic Analysis; 2010 Jun 9-11; Penang,
Malaysia.
180) Haberl H, Erb K, Krausmann F, Bondeau A, Lauk C, Muller C, et al. Global Bioenergy Potentials from
Agricultural Land in 2050: Sensitivity to Climate Change, Diets and Yields. Biomass & Bioenergy.
2011; 35(12): 4753–4769.
181) Jaggard K, Qi A, Ober E. Possible Changes to Arable Crop Yields by 2050. Philosophical Transactions of
the Royal Society. 2010; 365(1554): 2835-2851.
182) DEFRA. UK Food Security Assessment: Detailed Analysis. London: Department for Environment, Food
and Rural Affairs; 2010.
183) UK Government. A UK Strategy for Agriculture Technologies. BIS/13/1060. London: Government and
Industry in Partnership, Department for Business, Innovation and Skills; 2013.
184) McCarthy J, Canziani O, Leary N, Dokken D, White, Kasey. Climate Change 2001: Impacts, Adaptation,
and Vulnerability. Geneva: Intergovernmental Panel on Climate Change. Cambridge University Press;
2001.
Andrew Welfle - ID: 81163530
364
185) Roeder M, Thornley P, Campbell G, Bows A. Emissions Associated with Meeting the Future Global
Wheat Demand: A Case Study of UK Production under Climate Change Constraints. Environmental
Science and Policy. 2014; 39: 13-24.
186) UK Government. Climate Change Risk – Agriculture. London: Welsh Government, Department of the
Environment, Scottish Government, Department for Environment, Food and Rural Affairs; 2012.
187) FAO. World Agriculture: Towards 2030 / 2050: Interim Report - Prospects for Food, Nutrition,
Agriculture and Major Commodity Groups. Rome: Food and Agriculture Organization, Global
Perspective Studies Unit; 2006.
188) Nelson G, Rosegrant M, Palazzo A, Gray I, Ingersoll C, Robertson R, et al. Food Security, Farming, and
Climate Change to 2050: Scenarios, Results, Policy Options. Washington DC: International Food
Policy Research Institute; 2010.
189) Tilman D, Balzer C, Hill J, Befort B. Global Food Demand and the Sustainable Intensification of
Agriculture. Proceedings of the National Academy of Science of the United States of America. 2011;
108(50): 20260-20264.
190) Forestry Commission. Forestry Statistics 2010: A Compendium of Statistics about Woodland, Forestry and
Primary Wood Processing in the UK. National Statistics, Forecast Technical Document. Bristol:
Forestry Commission; 2010.
191) Forestry Commission. Restocking in the Forecast. Forecast Technical Document. Bristol: Forestry
Commission; 2012.
192) Forestry Commission. GB 25 Year Forecast of Standing Coniferous Volume and Increment. National
Forest Inventory Report. Bristol: Forestry Commission; 2012.
193) Forestry Commission. Forecast Types. Forecast Technical Document. Bristol: Forestry Commission; 2012.
194) Forestry Commission. Growing Stock Volume Forecasts. Forecast Technical Document. Bristol: Forestry
Commission; 2012.
195) Forestry Commission. 25 Year Forecast of Softwood Timber Availability. National Forest Inventory
Report. Bristol: Forestry Commission; 2012.
196) Forestry Commission. Volume Increment Forecasts. Forecast Technical Document. Bristol: Forestry
Commission; 2012.
197) Forestry Commission. Felling and Removals Forecast. Forecast Technical Document. Bristol: Forestry
Commission; 2012.
198) Forestry Commission. National Forest Inventory. [Internet]. 2014 [cited 2014 Feb]. Available from:
http://www.forestry.gov.uk/inventory.
199) McKay H, Hudson J, Hudson R. Wood fuel Resource in Britain. Edinburgh: DTI, Scottish Enterprise,
Welsh Assembly, Forestry Commission; 2003.
200) Forestry Commission. Forestry Facts and Figures 2011 - A Summary of Statistics about Woodland and
Forestry. [Internet]. 2011 [cited 2012 Nov]. Available from: http://
www.forestry.gov.uk/forestry/INFD-7AQKNX.
201) Williams J, Duinker P, Bull G. Implications of Sustainable Forest Management for Global Fibre Supply.
Global Fibre Supply Study - Working Paper Series. Rome: Food and Agriculture Organization; 1997.
202) Bull G, Mabbee W, Scharpenberg R. Global Fibre Supply Model. Rome: Food and Agriculture
Organization; 1998.
203) BIS. Industrial Strategy: UK Sector Analysis. BIS Economics, Paper No.18. London: Department for
Business Innovation and Skills; 2012.
204) Clegg J. Wood Fibre Availability and Demand in Britain 2007 to 2025. Grantham: Confederation of Forest
Industries, UK Forest Products Association, Wood Panel Industries Federation; 2010.
205) WPIF. Make Wood Work. Grimsby: Wood Panel Industries Federation; 2012.
206) DEFRA. The Economics of Waste and Waste Policy. Waste Economics Team: Environment and Growth
Economics, PB1354. [Internet]. 2011 [cited 2013 Oct]. Available from:
http://www.defra.gov.uk/publications/files/pb13548-economic-principles-wr110613.pdf
207) Central Science Laboratory. National and Regional Supply / Demand Balance for Agricultural Straw in
Great Britain. [Internet]. 2008 [cited 2013 May]. Available from:
http://www.northwoods.org.uk/files/northwoods/StrawAvailabilityinGreatBritain.pdf
208) Alexander S. Pollution Control for Horse Stables and Backyard Livestock. Washington DC: United States
Environmental Protection Agency; 1994.
209) FAO. Agribusiness Handbooks. Rome: Food and Agriculture Organization, Investment Centre; 1999.
210) DEFRA. Fertiliser Manual. 8th Edition. Report RB209. London: Department for Environment, Food and
Rural Affairs; 2010.
211) Smith K, Charles D, Moorhouse D. Nitrogen Excretion by Farm Livestock with Respect to Land Spreading
Requirements and Controlling Nitrogen Losses to Ground Surface Waters – Part 1: Cattle and Sheep.
Bioresource Technology. 2000; 71(2): 173-181.

Andrew Welfle - ID: 81163530
365
212) Smith K, Charles D, Moorhouse D. Nitrogen Excretion by Farm Livestock with respect to Land Spreading
Requirements and Controlling Nitrogen Losses to Ground Surface Waters – Part 2: Pigs and Poultry.
Bioresource Technology. 2000; 71(2): 183-194.
213) DEFRA. Farm Practices Survey. [Internet]. 2011 [cited 2013 Sept]. Available from:
http://www.defra.gov.uk/statistics/foodfarm/enviro/farmpractice/
214) Holmes N, Nevin M. Arboricultural Arising Scotland Study - Report to the Forestry Commission Scotland.
[Internet]. 2010 [cited 2013 March]. Available from:
http://www.usewoodfuel.co.uk/media/237449/arboricultural-arisings-scotland-executive-summary.pdf
215) WRAP. Wood Waste Market Situation Report - April 2011. London: Waste & Resources Action
Programme; 2013.
216) WRAP. Wood Waste Market in the UK- Summary Report. London: Waste & Resources Action
Programme; 2009.
217) DEFRA. Carbon Balances and Energy Impacts of the Management of UK Wastes, DEFRA R&D Project
WRT 237. London: Department for Environment, Food and Rural Affairs; 2006.
218) DEFRA. Government Review of Waste Policy in England 2011, PB13540. London: Department for
Environment, Food and Rural Affairs; 2011.
219) DEFRA. Commercial and Industrial Waste Statistical Data Set, ENV20. London: Department for
Environment, Food and Rural Affairs; 2011.
220) DEFRA. UK Waste Data and Management. Statistical Data Set, ENV23. London: Department for
Environment, Food and Rural Affairs; 2011.
221) Electris C, Raskin P, Rosen R, Stutz J. The Century Ahead: Four Global Scenarios, Technical
Documentation. Boston: Tellus Institute; 2010.
222) Ostblom G, Soderman M, Sjostrom M. Analysing Future Solid Waste Generation - Soft Linking a Model
of Waste Management with a CGE-Model for Sweden. Stockholm: National Institute of Economic
Research; 2010.
223) Tukker A, Hoogendoorn J, Luiten H, Schindel K, Wiedmann T, Albertshauser U. Scenario of Household
Waste Generation in 2020. Report EUR 20771EN. Brussels: European Commission; 2003.
224) EPA. Solid Waste Management: A Local Challenge with Global Impacts. EPA530-F-02-026. Washington
DC: Environmental Protection Agency; 2002.
225) European Commission. Being Wise with Waste: The EU’s Approach to Waste Management. DOI
10.2779/93543. [Internet]. 2010 [cited 2012 Jan]. Available from:
http://ec.europa.eu/environment/waste/pdf/WASTE%20BROCHURE.pdf
226) Emery A, Davies A, Griffiths A, Williams K. Environmental and Economic Modelling: A Case Study of
Municipal Solid Waste Management Scenarios in Wales. Resources, Conservation and Recycling.
2007; 49(3): 244-263.
227) Arena U, Di Gregorio F. A Waste Management Planning Based on Substance Flow Analysis. Resources,
Conservation and Recycling. 2014; 85: 54-66.
228) Munster M, Finnveden G, Wenzel H. Future Waste Treatment and Energy Systems – Examples of Joint
Scenarios. Waste Management. 2013; 33(11): 2457-2464.
229) Di Corato L, Montinan N. Flexible Waste Management under Uncertainty. European Journal of
Operational Research. 2014; 234(1): 174-185.
230) Pyromex. Energy Information and Data. Switzerland: Pyromex AG, Rotkreuz; 2011.
231) Rowe R, Whitaker J, Chapman J, Howard D, Taylor G. Life Cycle Assessment in the Bioenergy Sector:
Developing a Systematic Review. London: UK Energy Research Centre; 2008.
232) Rowe R, Street N, Taylor G. Identifying Potential Environmental Impacts of the Large-Scale Deployment
of Dedicated Bioenergy Crops in the UK. Renewable & Sustainable Energy Reviews. 2009; 13(1):
271-290.
233) Taylor G. Bioenergy for Heat and Electricity in the UK: A Research Atlas and Roadmap. Energy Policy.
2008; 36(12): 4383–4389.
234) Biomass Task Force. Biomass Task Force: Report to Government. London: Department for Environment,
Food and Rural Affairs; 2005.
235) NNFCC. Domestic Energy Crops; Potential and Constraints Review URN: 12D/081. York: National Non-
Food Crops Centre; 2012.
236) EEA. Estimating the Environmentally Compatible Bioenergy Potential from Agriculture. Technical Report
No. 12/2007. Copenhagen: European Environment Agency; 2007.
237) ADAS. Addressing the Land Use Issues for Non-Food Crops, in Response to Increasing Fuel and Energy
Generation Opportunities, NNFCC Project 08-004. [Internet]. 2008 [cited 2012 Mar]. Available from:
http:// www.nnfcc.co.uk/publications/view?sectorKey=energy-
fuelsandb_start:int=60andtypeKey=publications
Andrew Welfle - ID: 81163530
366
238) Hastings A, Clifton-Brown J, Wattenbach M, Mitchell C, Stampfl P, Smith P. Future Energy Potential of
Miscanthus in Europe. Global Change Biology – Bioenergy. 2009; 1(2): 180-196.
239) Hastings A, Clifton-Brown J, Wattenbach M, Mitchell C, Stampfl P, Smith P. Potential of Miscanthus
Grasses to Provide Energy and Hence Reduce Greenhouse Gas Emissions. Agronomy for Sustainable
Development. 2008; 28(4): 465-472.
240) Blade Energy Crops. Planting & Managing Switchgrass as a Dedicated Energy Crop. Thousand Oaks,
California: Ceres Inc; 2009.
241) Jenkins A, Newman R. Miscanthus: Practical Aspects of Biofuel Development. Didcot: AEA Technology;
2002.
242) Curkeet R. Wood Combustion Basics: Environment Protection Agency Workshop; 2011 Mar 2. London:
Intertek Group plc; 2011.
243) JatroBioFuels. Calorific Value of Fuels. Gilbert, Arizona: Jatro International Pte Ltd; 2014.
244) DECC. Estimated Average Calorific Values of Fuels. Digest of UK Energy Statistics, A.1-A3. London:
Department of Energy & Climate Change; 2013.
245) NNFCC. Techno-Economic Assessment of Biomass ‘Densification’ Technologies. Project 08-15. York:
National Non-Food Crop Centre; 2010.
246) IEA. Energy Technology Perspectives: Scenarios and Strategies to 2050. Paris: International Energy
Agency; 2006.
247) IEA. Energy Technology Perspectives: Scenarios and Strategies to 2050. Paris: International Energy
Agency; 2008.
248) Mambre V. Biomass Gasification for Production of Green Energy, 24th World Gas Conference; 2009 Oct
5-9; Buenos Aires.
249) Boerrigter H. Economy of Biomass to Liquid (BTL) Plants – An Engineering Assessment. Petten: Energy
Research Centre of The Netherlands; 2006.
250) Powell T, Lenton T. Future Carbon Dioxide Removal via Biomass Energy Constrained by Agricultural
Efficiency and Dietary Trends. Energy and Environmental Science. 2012; 5(8): 8116-8133.
251) Smeets E, Faaij A. Bioenergy Potentials from Forestry in 2050: An Assessment of the Drivers that
Determine the Potentials. Climate Change. 2007; 8: 353-390.
252) UK Energy Research Centre. Making the Transition to a Secure and Low Carbon Energy System.
Synthesis Report, Report: S3097. [Internet]. 2010 [cited 2012 Oct]. Available from:
http://www.ukerc.ac.uk/Downloads/PDF/U/UKERCEnergy2050/0906UKERC2050.pdf
253) National Grid. UK Future Energy Scenarios. Warwick: National Grid; 2011.
254) DfT. Renewable Transport Fuels Obligation: Quarterly Report. Report 5. London: Department for
Transport; 2011.
255) Long H, Li X, Wang H, Jia J. Biomass Resources and their Bioenergy Potential Estimation: A Review.
Renewable & Sustainable Energy Reviews. 2013; 26: 344-352.
256) Hoogwijk M. On the Global and Regional Potential of Renewable Energy Sources. Utrecht: Universiteit
Utrecht; 2004.
257) Adams P, Hammond G, McManus M, Mezzullo W. Barriers to and Drivers for UK Bioenergy
Development. Renewable and Sustainable Energy Reviews. 2011; 15(2): 1217-1227.
258) Bottcher H, Frank S, Havlik P. Biomass Availability and Supply Analysis. Laxenburg, Austria:
International Institute for Applied Systems Analysis, Biomass Futures; 2012.
259) Ladanai S, Vinterbäck J. Global Potential of Sustainable Biomass for Energy. Uppsala, Sweden:
Department of Energy & Technology; 2009.
260) BR&Di. Increasing Feedstock Production for Biofuels: Economic Drivers, Environmental Implications,
and the Role of Research, HD9502.5.B543. Washington DC: Biomass Research and Development
Initiative, U.S. Department of Agriculture, U.S. Department of Energy; 2011.
261) Muller A, Schmidhuber J, Hoogeveen J, Steduto P. Some Insights in the Effect of Growing Bio-energy
Demand on Global Food Security and Natural Resources, International Conference – Linkages
Between Energy Water Management For Agriculture In Developing Countries; Hyderabad, India; 2007
Jan 28-31.
262) Welfle A, Gilbert P, Thornley P. Securing a Bioenergy Future without Imports. Energy Policy. 2014; 68:
1-14.
263) Mueller N, Gerber J, Johnston M, Ray D, Ramankutty N, Foley J. Closing Yield Gaps Through Nutrient
and Water Management. Nature. 2012; 490: 254–257.
264) Soil Association. Telling Porkies – The Big Fat Lie about Doubling Food Production. [Internet]. 2010
[cited 2010 Nov]. Available from:
http://www.soilassociation.org/LinkClick.aspx?fileticket=qbavgJQPY%2Fc%3D&tabid=680
265) C-Tech Innovation. United Kingdom Food and Drink Processing Mass Balance. Loughborough: Biffa-
Award Programme on Sustainable Resource Use; 2002.
Andrew Welfle - ID: 81163530
367
266) Green A, Johnston N. Food Surplus; Reduction, Recovery and Recycle. In: Waldron K, Faulds C, Smith A,
editors. Total Food: Exploiting Co-Products – Minimizing Waste. Norwich: Institute of Food Research;
2004. p. 35-40.
267) Nellman C, MacDevette M, Manders T, Eickhout B, Svihus B, Prins A. The Environment Food Crisis -
The Environment’s Role in Averting Future Food Crises. New York: United Nations Environment
Programme; 2009.
268) European Commission. Reducing the Amount of Food Wasted by European Consumers Each Year.
Record No.35319. [Internet]. 2012 [cited 2013 Mar]. Available from:
http://cordis.europa.eu/news/rcn/35319_en.html
269) UK Government Office for Science. The Future of Food and Farming: Challenges and Choices for Global
Sustainability. Ref: BIS/11/546. London: Foresight; 2011.
270) UK Government Office for Science. Foresight Project on Global Food and Farming Futures – Synthesis
Report C4: Food System Scenarios and Modelling. London: Foresight; 2011.
271) Godfray H, Beddington J, Crute I, Haddad L, Lawrence L, Muir J, et al. Food Security: The Challenge of
Feeding 9 Billion People. Science. 2010; 327: 812–818.
272) Lipinski B, Hanson C, Waite R, Searchinger T. Reducing Food Loss and Waste. Washington DC: World
Resources Institute; 2013.
273) House of Commons Environment, Food and Rural Affairs Committee. Securing Food Supplies up to 2050:
The Challenges Faced by the UK. Fourth Report of Session 2008-09. Vol. 1, HC 213-I, Incorporating
HC 266, Session 2008-09. London: Parliament Publication Office; 2009.
274) DEFRA. Driving Export Growth in the Farming, Food and Drink Sector: A Plan of Action 2012, PB13702.
London: Department for Environment, Food and Rural Affairs; 2012.
275) Institute for European Environmental Policy. Securing Biomass for Energy - Developing an
Environmentally Responsible Industry for the UK Now and into the Future. London: RSPB, Friends of
the Earth, Greenpeace UK, Woodland Trust; 2011.
276) Kilpatrick J. Addressing the Land Use Issues for Non-Food Crops, in Response to Increasing Fuel and
Energy Generation Opportunities. Hereford: ADAS Rosemaund; 2008.
277) Stupak I, Lattimore B, Titus B, Smith T. Criteria and Indicators for Sustainable Forest Fuel Production and
Harvesting: A Review of Current Standards for Sustainable Forest Management. Biomass &
Bioenergy. 2011; 35(8): 3287–3308.
278) Lattimore B, Smith C, Titus B, Stupak I, Egnell G. Environmental Factors in Woodfuel Production:
Opportunities, Risks, and Criteria and Indicators for Sustainable Practices. Biomass & Bioenergy.
2009; 33(10): 1321–1342.
279) Perlack R, Wright L, Turhollow A, Graham R, Stokes B, Erbach D. Biomass as Feedstock for a Bioenergy
and Bioproducts Industry: The Technical Feasibility of a Billion-Ton Annual Supply. Washington DC:
Department of Energy, Department of Agriculture; 2005.
280) Jablonski S, Strachan N, Brand C, Pantaleo A, Bauen A. A Systematic Assessment of Bioenergy
Representation in the MARKAL Model: Insights on the Formulation of Bioenergy Scenarios. 2008.
London: Imperial College London, Kings College London, Oxford Environmental Change Institute;
2008.
281) Forestry Commission. Wood Fuel Resources. Bristol: Forestry Commission; 2013.
282) DEFRA. Consultation on Recovery and Recycling Targets for Packaging Waste for 2013-2017: A
Consultation on Proposed Changes to the Producer Responsibility Obligations (Packaging Waste)
Regulations 2007 (as amended) and the Producer Responsibility Obligations (Packaging Waste)
Regulations (Northern Ireland) 2007 (as amended). London: The Scottish Government, Welsh
Government, Department for Environment, Food and Rural Affairs; 2011.
283) Payne J. Survey of the International Evidence on the Casual Relationship between Energy Consumption
and Growth. Journal of Economic Studies. 2010; 37(1): 53-95.
284) Payne J. On Biomass Energy Consumption and Real Output in the US. Energy Sources. 2011; B(6): 47-52.
285) Ewing B, Sari R, Soytas U. The Relationship between Disaggregate Energy Consumption and Industrial
Production in the United States: An ARDL Approach. Energy Economics. 2008; 30(5): 2302-2313.
286) Ohler A, Fetters I. The Causal Relationship between Renewable Electricity Generation and GDP Growth:
A Study of Energy Sources. Energy Economics. 2014; 43: 125-139.
287) Melillo J, Kicklighter D, Gurgel A, Cronin T, Paltsec S, Felzer B, et al. Indirect Emissions from Biofuels:
How Important? Science. 2009; 326 (5958): 1397-1399.
288) Popp A, Krause M, Dietrich P, Lotze-Campen H, Leimbach M, Beringer T, et al. Additional CO2
Emissions from Land Use Change – Forest Conservation as a Precondition for Sustainable Production
of Second Generation Bioenergy. Ecological Economics. 2012; 74: 64-70.
289) Fargione J. Is Bioenergy for the Birds? An Evaluation of Alternative Future Bioenergy Landscapes.
Proceedings of the National Academy of Sciences of the USA. 2010; 10(1073).
Andrew Welfle - ID: 81163530
368
290) Britt C. Report for Department for Environment, Food & Rural Affairs Impacts on Biodiversity.
Wolverhampton: ADAS; 2002.
291) Dornburg V, Faaij A, Verweij P, Langeveld H, van de Ven G, Wester F. Biomass Assessment: Assessment
of Global Biomass Potentials and their Links to Food, Water, Biodiversity, Energy Demand and
Economy: Report / WAB. Utrecht: Universiteit Utrecht; 2008.
292) Eggers J, Troltzsch K, Falcucci A, Maiorano L, Verburg P, Framstad E. Is Biofuel Policy Harming
Biodiversity in Europe? Global Change Biology – Bioenergy. 2009; 1(1): 18-34.
293) Framstad E, Berglund H, Gundersen V, Heikkila R, Lankinen N, Peltola T. Increased Biomass Harvesting
for Bioenergy - Effects on Biodiversity, Landscape Amenities and Cultural Heritage Values.
Copenhagen: Nordic Council of Ministers; 2009.
294) Karacic, A. Production and Ecological Aspects of Short Rotation Poplars in Sweden. PhD Thesis. Uppsala:
Swedish University of Agricultural Sciences; 2005.
295) Meehan T, Hurlbert A, Gratton C. Bird Communities in Future Bioenergy Landscapes of the Upper
Midwest. Proceedings of the National Academy of Sciences of the USA. 2010; 107(12): 5617 –21.
296) Sala O, Sax D, Leslie H. Biodiversity Consequences of Biofuel Production. In: Howarth R, Bringezu S,
editors. Biofuels: Environmental Consequences and Interactions with Changing Land Use. New York:
Cornell University, Proceedings of the Scientific Committee on Problems of the Environment
(SCOPE), International Biofuels Project Rapid Assessment; 2009.
297) Schleupner C, Schneider U. Effects of Bioenergy Policies and Targets on European Wetland Restoration
Options. Environmental Science and Policy. 2010; 13(8): 721-732.
298) Pedroli B, Elbersen B, Frederiksen P, Grandin U, Heikkila R, Henning K, et al. Is Energy Cropping in
Europe Compatible with Biodiversity? – Opportunities and Threats to Biodiversity from Land-Based
Production of Biomass for Bioenergy Purposes. Biomass & Bioenergy. 2013; 55: 73-86.
299) Nadai A, van der Horst D. Introduction: Landscapes of Energies. Landscape Research. 2010; 35(2): 143-
155.
300) Steubing B, Zah R, Waeger P, Ludwig C. Bioenergy in Switzerland: Assessing the Domestic Sustainable
Biomass Potential. Renewable and Sustainable Energy Reviews. 2010; 14: 2256-2265.
301) Liebig M, Schmer M, Vogel K, Mitchell R. Soil Carbon Storage by Switchgrass Grown for Bioenergy.
Bioenergy Research. 2008; 1(1): 215-222.
302) Berndes G, Bird N, Cowie A. Bioenergy, Land Use Change and Climate Change Mitigation. Paris: IEA
Bioenergy; 2010.
303) IPCC. Impacts, Adaptation and Vulnerability. Geneva: Intergovernmental Panel on Climate Change; 2007.
304) Kirilenko A, Sedjo R. Climate Change Impacts on Forestry. Proceedings of the National Academy of
Sciences. 2007; 104(50): 19697–19702.
305) Nabuurs G, Prussinen A, Karjalainen T, Herhard M, Kramer K. Stem Volume Increment Changes in
European Forests Due to Climate Change - A Simulation Study with the EFISCEN Model. Global
Change Biology. 2002; 8: 304–316.
306) Sohngen B, Mendelsohn R. Valuing the Impact of Large-Scale Ecological Change in a Market: The Effect
of Climate Change on U.S. Timber. American Economic Review. 1998; 88(4): 689–710.
307) Perez-Garcia J, Joyce L, McGuire A, Xiao X. Impacts of Climate Change on the Global Forest Sector.
Climatic Change. 2002; 54: 439–461.
308) Solberg B, Moiseyev A, Kallio A. Economic Impacts of Accelerating Forest Growth in Europe. Forest
Policy and Economics. 2003; 5: 157–171.
309) Sohngen B, Sedjo R. Impacts of Climate Change on Forest Product Markets: Implications for North
American Producers. The Forestry Chronicle. 2005; 81(5): 669–674.
310) Alcamo J, van Vuuren D, Ringer C. Cramer W. Masui T. Alder J, Schulze K. Changes in Nature's Balance
Sheet: Model-Based Estimates of Future Worldwide Ecosystem Services. Ecology and Society. 2005;
10(2): 1-19.
311) Raunikar R, Buongiorno J, Turner J, Zhu S. Global Outlook for Wood and Forest with the Bioenergy
Demand Implied by Scenarios of the Intergovernmental Panel on Climate Change. Forest Policy
Economics. 2010; 12: 48-56.
312) Deloitte. Knock on Wood: Is Biomass the Answer to 2020?. London: Deloitte LPP; 2012.
313) Arodudu O, Voinov A, van Duren I. Assessing Bioenergy Potential in Rural Areas – A NEG-EROEI
Approach. Biomass & Bioenergy. 2013; 58: 350-364.
314) Hillring B. Rural Development and Bioenergy – Experience from 20 Year of Development in Sweden.
Biomass & Bioenergy. 2002. 23(6); 443-451.
315) Ager B, Engsás J. Local Action Programs to Create Job Opportunities in Forestry. Report. 186.
Garpenberg: Department of Operational Efficiency, Swedish University of Agricultural Sciences; 1990.
316) Porter M. Competitive Strategy, Techniques for Analysing Industries and Competitors. New York: The
Free Press, MacMillan Publishing Co. Inc; 1980.
Andrew Welfle - ID: 81163530
369
317) UNEP. Towards a Green Economy: Pathways to Sustainable Development and Poverty Eradication – A
Synthesis for Policy Makers. New York: United Nations Environment Programme; 2011.
318) Perry C, Steduto R, Allen G, Burt C. Increasing Productivity in Irrigated Agriculture: Agronomic
Constraints and Hydrological Realities. Agricultural Water Management. 2009; 96(11): 1517-1524.
319) Government of British Columbia. What is Bioenergy. [Internet]. Victoria: Ministry of Energy and Mines;
2014 [cited 2014 March]; Available from:
http://www.empr.gov.bc.ca/RET/RENEWABLEENERGYTECHNOLOGIES/BIOENERGY/Pages/def
ault.aspx
320) Laine T, Rauma E, Ghirardi T, Haataja A, Kontinen H, Masuda S, Environmental Special Course at the
Helsinki University Centre for Environment – Interdisciplinary Approach to Forests and Climate
Change - Group 3: Economics of Climate Change and Forests Economics of the Climate Change and
Bioenergy in Fennoscandia. Helsinki: Finnish Forest Research Institute, University of Helsinki; 2009.
321) IUCN. Indirect Effects of Bioenergy – Effects on Landscapes and Livelihoods. IEA ExCO 63 Proceedings
of the Workshop on Indirect Effects of Bioenergy. Rotterdam: International Union for Conservation of
Nature; 2009.
322) UNEP. Soil. [Internet]. 2014 [cited 2014 March]; Available from:
http://www.unep.org/bioenergy/Issues/BioenergyRisks/Soil/tabid/79447/Default.aspx
323) Wiegmann K, Hennenberg K, Fritsche U. Degraded Land and Sustainable Bioenergy Feedstock
Production – Issue Paper, Joint International Workshop on High Nature Value Criteria and Potential for
Sustainable Use of Degraded Lands. Darmstadt: Öko-Institut; 2008.
324) Wicke B. Bioenergy Production on Degraded and Marginal Land: Assessing its Potentials, Economic
Performance, and Environmental Impacts for Different Settings and Geographical Scales. Utrecht:
Universiteit Utrecht; 2011.
325) Swinbank A. EU Support for Biofuels and Bioenergy, Environmental Sustainability Criteria, and Trade
Policy. Geneva: ICTSD Programme on Agricultural Trade and Sustainable Development; 2009.
326) Fasso A. Sensitivity for Environmental Models and Monitoring Networks. Bergamo, Italy: University of
Bergamo, Department IGI; 2006.
327) Mafakheri F, Nasiri F. Modelling of Biomass-to-Energy Supply Chain Operations: Applications,
Challenges and Research Directions. Energy Policy. 2014; 67: 116-126.
328) Kim J, Realff M, Lee J. Optimal Design and Global Sensitivity Analysis of Biomass Supply Chain
Networks for Biofuels Under Uncertainty. Computers and Chemical Engineering. 2011; 35(9): 1738-
1751.
329) Wang F, Mladenoff D, Forrester J, Keough C, Parton W. Global Sensitivity Analysis of a Modified
CENTURY Model for Simulating Impacts of Harvesting Fine Woody Biomass for Bioenergy.
Ecological Modelling. 2013; 259: 16-23.
330) McIlveen-Wright D, Huang Y, Rezvani S, Redpath D, Anderson M, Dave A, Hewitt N. A Technical and
Economic Analysis of Three Large Scale Biomass Combustion Plants in the UK. Applied Energy.
2013; 112: 396-404.
331) WTO. World Trade Report 2010: Chapter B – Natural Resources: Definitions, Trade Patterns and
Globalization. Geneva: World Trade Organisation; 2010.
332) Marshal H. Sensitivity Analysis - Technology Management Handbook. Chapter 8.12. Boca Raton, Florida:
CRC Press LLC; 1999.
333) Giljum S, Behrens A, Hinterberger C, Meyer B. Modelling Scenarios Towards a Sustainable Use of
Natural Resources in Europe. Environmental Science and Policy. 2008; 11(3): 204-216.
334) IPCC. Data Distribution Centre – Definitions. [Internet]. 2008 [cited 2013 Jan]; Available from:
www.ipcc-data.org/ddc_definitions.html.
335) Timpe C, Scheepers M. A Look into the Future: Scenarios for Distributed Generation in Europe. ECN-C-
04-012. Petten, The Netherlands: Energy Centre of The Netherlands; 2003.
336) Means E, Patrick R, Ospina L, West N. Scenario Planning: A Tool to Manage Future Water Utility
Uncertainty. Journal of American Water Works Association. 2005; 97(10): 68-75.
337) Larsen L, Jepsen M, Frederiksen P. Scenarios for Biofuel Demands, Biomass Production and Land Use –
The Case of Denmark. Biomass & Bioenergy. 2013; 55: 27-40.
338) Dam J, Faaij A, Lewandowski I, Fischer G. Biomass Production Potentials in Central and Eastern Europe
under Different Scenarios. Biomass & Bioenergy. 2007; 31(6): 345-366.
339) Ignaciuk A, Vohringer F, Ruijs A, Ierland E. Competition between Biomass and Food Production in the
Presence of Energy Policies: A Partial Equilibrium Analysis. Energy Policy. 2006; 34: 1127-1138.
340) Easterling W, Aggarwal P, Batima P, Brander K, Erda L, Howden S, Kirilenko A, Morton J, Soussana J,
Schmidhuber J, Tubiello F. Food, Fibre and Forest Products. In: Parry M, Canziani O, Palutikof J, van
der Linden P, Hanson C, editors. Climate Change 2007: Impacts, Adaptation and Vulnerability.

Andrew Welfle - ID: 81163530
370
Contribution of Working Group II to the Fourth Assessment Report of the Intergovernmental Panel on
Climate Change. Cambridge: Cambridge University Press. p. 273–313; 2007.
341) Thomas V, Choi D, Luo D, Okwo A, Wang J. Relation of Biofuel to Bioelectricity and Agriculture: Food
Security, Fuel Security, and Reducing Greenhouse Emissions. Chemical Engineering Research and
Design. 2009; 87: 1140-1146.
342) Burgess P, Morris J. Agricultural Technology and Land Use Futures: The UK Case. Land Use Policy.
2009; 26S: S222-S229.
343) Smith P. Delivering Food Security without Increasing Pressure on Land. Global Food Security. 2012; 2(1):
18-23.
344) Bringezu S, Moriguchi Y. Material Flow Analysis. Chapter 8. In: Ayres R, Ayres L. Handbook of
Industrial Ecology. Cheltenham: Edward Elgar Publishers. p. 79–90; 2002.
345) Steininger K, Wojan T. Economic Impact of Bioenergy Development - Some Evidence from Europe and
the US. EuroChoices. 2011; 10(3): 31-37.
346) Marques A, Fuinhas J. Is Renewable Energy Effective in Promoting Growth?. Energy Policy. 2012; 46:
434–442.
347) Mookerjee R. A Meta-Analysis of the Export Growth Hypothesis. Economics Letters. 2006; 91(3): 395–
401.
348) Greyson J. An Economic Instrument for Zero Waste, Economic Growth and Sustainability. Journal of
Cleaner Production. 2007; 15(13–14): 1382–1390.
349) Woodland Trust. The State of the UK’s Forests, Woods and Trees: Perspectives from the Sector. A Report
to Mark the International Year of Forests. Grantham: Woodland Trust; 2011.
350) DEFRA. UK Conservation Strategies. Joint Nature Conservation Committee. [Internet]. 2012 [cited 2013
Jan]. Available from: http://www.jncc.defra.gov.uk/page-4512.
351) Shoene D, Bernier P. Adapting Forestry and Forests to Climate Change: A Challenge to Change the
Paradigm. Forest Policy and Economics. 2012; 24: 12-19.
352) Goldberg E, Kirby K, Hall J, Latham J. The Ancient Woodland Concept as a Practical Conservation Tool
in Great Britain. Journal for Nature Conservation. 2007; 15: 109-119.
353) Pires A, Martinho G, Chang N. Solid Waste Management in European Countries: A Review of Systems
Analysis Techniques. Journal of Environmental Management. 2011; 92: 1033–1050.
354) Hill J, Shaw B, Hislop H. A Zero Waste UK. London: Green Alliance; 2006.
355) Phillips P, Tudor T, Bird H, Bates M. A Critical Review of a Key Waste Strategy Initiative in England:
Zero Waste Places Projects 2008-2009. Resource Conservation and Recycling. 2011; 55: 335-343.
356) DEFRA. Criteria Guidance for Zero Waste Place Proposals. London: Department for Environment, Food
and Rural Affairs; 2008.
357) Erb K, Haberl H, Plutzar C. Dependency of Global Primary Bioenergy Crop Potentials in 2050 on Food
Systems, Yields, Biodiversity Conservation and Political Stability. Energy Policy. 2012; 47: 260–269.
358) Schellnuber H, Kokott J, Beeses F, Fraedrich K, Klemmer P, Kruse-Graumann L, Neumann C, Renn O,
Schulze E, Tilzer M, Velsinger P, Zimmermann H. Conservation and Sustainable Use of the Biosphere.
Berlin: Germany Advisory Council on Global Change; 1999.
359) Cornelissen S, Koper M, Deng Y. The Role of Bioenergy in a Fully Sustainable Global Energy System.
Biomass & Bioenergy. 2012; 41: 21–33.
360) Cameron A. Has Commercial Timber Production Become an Inconvenient Truth?. Commercial Timber,
RSFS Scottish Forestry. 2011; 65(2): 12-16.
361) Scottish Forest Industries Cluster. Scotland’s Forest Industries. Glasgow: Forest Industries Development
Council, Scottish Enterprise; 2013.
362) Forestry Commission. The UK Forestry Standard: The Government’s Approach to Sustainable Forestry.
Edinburgh: Forestry Commission; 2011.
363) Blanco-Canqui H, Lal R. Crop Residue Removal Impacts on Soil Productivity and Environmental Quality.
Critical Reviews in Plant Sciences. 2009; 28: 139-163.
364) Lal R. Soil and Environmental Implications of Using Crop Residues as Biofuel Feedstock. International
Sugar Journal. 2006; 108: 161–167.
365) DEFRA. Independent Panel on Forestry - Progress Report. London: Department for Environment, Food
and Rural Affairs; 2011.
366) DECC. UK Renewable Energy Roadmap Update 2013. London: Department of Energy & Climate
Change; 2013
367) DECC. UK Renewable Energy Roadmap. [Internet]. 2011 [cited 2012 March] Available from:
http//www.decc.gov.uk/en/content/cms/meeting_energy/renewable_ener/re_roadmap/re_roadmap.aspx.
368) DECC. The Renewable Heat Incentive. London: Department of Energy & Climate Change; 2011.
369) DfT. Renewable Transport Fuel Obligation Statistics 2012/13, Report 3. London: Department for
Transport; 2013.

Andrew Welfle - ID: 81163530
371
370) DfT. Renewable Transport Fuel Obligation Statistics: Obligation Period 5, 2012/13, Report 2 Data Tables.
London: Department for Transport; 2013.
371) DECC. Use of UK Biomass for Electricity and CHP. London: Department of Energy & Climate Change;
2013.
372) Woods J, Rosillo-Calle F, Murphy R, Strapasson A, Burdett N, Black M. The Availability of Sustainable
Biomass for Use in UK Power Generation. London: LCA Works, Drax Power Ltd; 2011.
373) Forestry Commission. Woodfuel Statistics. [Internet] 2009 [cited 2013 March]; Available from:
www.forestry.gov.uk/pdf/woodfuel2008.pdf/$FILE/
374) E4tech. Biomass Prices in the Heat and Electricity Sectors in the UK. Report for the Department of Energy
& Climate Change. London: E4Tech Ltd; 2010.
375) European Commission. The EU Emissions Trade System (EU ETS). [Internet]. 2014 [cited 2014 March];
Available from: http://www.ec.europa.eu/clima/policies/ets/index_en.htm
376) European Commission. Industrial Emissions. Directive 2010/75/EU. Official Journal of the European
Union. 2010; L 134: 17-119.
377) Chum H, Faaij A, Moreira J, Berndes G, Dhamija P, Dong H, Gabrielle B, Goss A, Lucht W, Mapa M,
Masera Cerutti O, McIntyre T, Pingoud K. Bioenergy. In: IPCC Special Report on Renewable Energy
Sources and Climate Change Mitigation. New York: Cambridge University Press; 2011.
378) Thornley P. Increasing Biomass Based Power Generation in the UK. Energy Policy. 2006; 34(15): 2087-
2099.
379) Thornley P. Biofuels Review. Report for Government Office for Science. Report
BA07067/2012/rep001r04. Manchester: Tyndall Centre for Climate Change Research, Sustainable
Consumption Institute, University of Manchester; 2012.
380) Woods J, Tipper R, Brown G, Diaz-Chavez R, Lovell J, Groot P. Evaluating the Sustainability of Co-
Firing in the UK. London: Department of Trade and Industry; 2006.
381) Korhaliller S. The UK’s Biomass Energy Development Plan. London: International Institute for
Environment and Development; 2010.
382) Levidow L, Papaioannou T, Borda-Rodriquez A. Innovation Priorities for UK Bioenergy: Technological
Expectations within Path Dependence. Science and Technology Studies. Milton Keynes: The Open
University; 2013.
383) EBTP. Biofuels Certification. [Internet]. Brussels: European Biofuels Technology Platform. 2014 [cited
2014 Feb]. Available from: www.biofuelstp.eu/certification.html
384) McDowall W, Anandarajah G, Dodds P, Tomei J. Implications of Sustainability Constraints on UK
Bioenergy Development: Assessing Optimistic and Precautionary Approaches with UK MARKAL.
Energy Policy. 2012; 47: 424-436.
385) RSPB. Bioenergy: A Burning Issue. Sand, Bedfordshire: Royal Society for the Protection of Birds; 2011.
386) Jablonski S, Brand C, Pantaleo A, Perry M, Pepinster M, Bauen A, Panoutsou C, Varma B, Premier G, De
Wit M. Proposed Dataset for UK MARKAL Bioenergy Structure. TSEC-BIOSYS MARKAL,
Working Paper 2BIS. London: Imperial College; 2009.
387) Jablonski S, Strachan N, Brand C, Bauen A. The Role of Bioenergy in the UK’s Energy Future
Formulation and Modelling of Long-Term UK Bioenergy Scenarios. Energy Policy. 2010; 38: 5799–
5816.
388) Smeets E, Faaij A. The Impact of Sustainability Criteria on the Costs and Potentials of Bioenergy
Production - Applied for Case Studies in Brazil and Ukraine. Biomass & Bioenergy. 2010; 34: 319–
333.
389) UKERC. The UK Energy System in 2050: Comparing Low-Carbon, Resilient Scenarios. London: UK
Energy Research Centre; 2013.
390) Anandarajah G, Strachan N, Ekins P, Kannan R, Hughes N. Pathways to a Low Carbon Economy: Energy
Systems Modelling. UKERC Report UKERC/RR/ESM/2009/001. London: UK Energy Research
Council; 2009.
391) Skea J, Ekins P, Winskel M. Energy 2050: The Transition to a Secure, Low-Carbon Energy System for the
UK. London: Earthscan Publishing; 2011.
392) CCC. The Fourth Carbon Budget: Reducing Emissions through the 1990s. London: The Committee on
Climate Change; 2010.
393) AEA Consulting. Pathways to 2050 – Key Results. Report to the Department of Energy & Climate
Change. London: AEA Consulting; 2011.
394) AEA Consulting. Pathways to 2050 – Detailed Analyses. Report to the Department of Energy & Climate
Change. London: AEA Consulting; 2011.
395) IEA. Sustainable International BioEnergy Trade: Securing Supply and Demand. Paris: International
Energy Agency; 2011.

Andrew Welfle - ID: 81163530
372
396) IEA, IRENA. Global Renewable Energy Policies and Measures Database. Paris: International Energy
Agency. International Renewable Energy Agency; 2014.
397) European Climate Foundation. Biomass for Heat and Power – Opportunities and Economics. Vattenfall:
McKinsey and Company, European Climate Foundation, Sodra, Sceaskog; 2010.
398) AEBIOM. Forest Sustainability and Carbon Balance of EU Importation of North American Forest Biomass
for Bioenergy Production. Brussels: AEBIOM, BC Bioenergy Network, US Industrial Pellet
Association; 2013.
399) Hillring B. World Trade in Forest Products & Wood Fuel. Biomass & Bioenergy. 2006; 30: 815-825.
400) IEA Bioenergy. Global Wood Chip Trade for Energy. Utrecht: Universiteit Utrecht, Essent Energie, ETA
Florence Renewable Energies; 2012.
401) European Academies Science Advisory Council. The Current Status of Biofuels in the European Union,
their Environmental Impacts and Future Prospects. Leopoldin: German National Academy of Sciences;
2012.
402) RISI. European Biomass Review. Boston, Massachusetts: RISI; 2011.
403) Lamers P, Hamelinck C, Junginger M, Faaij A. International Bioenergy Trade – A Review of Past
Developments in the Liquid Biofuel Market. Renewable & Sustainable Energy Reviews.2011; 15(6):
2655-2676.
404) Bradley D, Diesenreither F, Wild M, Tromborg E. World Biofuel Shipping Study. Task 40 Report. Vienna:
IEA Bioenergy; 2009.
405) Spelter H, Toth D. North America’s Wood Pellet Sector. Research Paper FPL-RP-656. Madison,
Wisconsin: U.S Department of Agriculture, Forest Service, Forest Products Laboratory; 2009.
406) Sikkema R, Steiner M, Junginger M, Heigl W, Hansen M, Faaij, A. The European Wood Pellet Markets:
Current Status and Prospects for 2020. Biofuels Bioproducts and Biorefining. 2011; 5(3): 250-278.
407) Junginger H, Jonker J, Faaij A, Cocchi M, Hektor B, Hess R, Heinimö, J, Hennig C, Kranzl L, Marchal D,
Matzenberger J, Nikolaisen L, Pelkmans L, Rosillo-Calle F, Schouwenberg P, Trømborg E, Walter A.
Summary, Synthesis and Conclusions from IEA Bioenergy Task 40 Country Reports on International
Bioenergy Trade. Utrecht: Universiteit Utrecht; 2011.
408) Lynch D. Brazil Hopes to Build on its Ethanol Success. [Internet]. New York: USA Today; 2006 [cited
2013 Jan]; Available from: http://usatoday30.usatoday.com/money/world/2006-03-28-brazil-ethanol-
cover_x.htm
409) Sao Paulo. Plano Paulista De Energia: PPE 2020. Sao Paulo: Governo Do Estado Sao Paulo, Secretaria de
Energia; 2012.
410) ERS. Can Brazil Meet the World’s Growing Need for Ethanol. Washington DC: Economic Research
Service, United States Department of Agriculture; 2011.
411) Embrapa. Brazilian Agroenergy Plan 2006-2011. Brasilia: Ministry of Agriculture, Livestock and Food
Supply; 2006.
412) ABIB. Brazil Status Report. Curitiba Parana: Brazilian Association Industry; 2011.
413) IEA Bioenergy. Global Wood Pellet Industry Market and Trade Study. Utrecht: ETA Florence Renewable
Energies, Danish Technological Institute, Universiteit Utrecht, Lappeenrant University of Technology,
Climate Change Solutions, Idaho National Laboratory, DBFZ, Essent Energie; 2011.
414) Downey K. Plant Update. South America, Bioenergy Insight. 2011; 2(2): 38-39.
415) EurObserv’ER. Biofuels Barometer. Systèmes Solaires in EurObserv’ER. le Journal des Energies
Renouvelable. 2009; 192.
416) USDA. Biofuels Annual Report: Brazil. GAIN BR13005. Washington DC: United States Department of
Agriculture, Global Agricultural Information; 2013.
417) Carriquiry M, Dong F, Du X, Elobeid A, Fabiosa J, Chavez E, Pan S. World Market Impacts of High
Biofuel Use in the European Union. Iowa: Centre for Agricultural and Rural Development, Iowa State
University; 2010.
418) Sikkema R, Steiner M, Junginger M, Hiegl W. Development and Promotion of a Transparent European
Pellets Market - Final Report on Producers, Traders and Consumers of Wood Pellets. Report for the
European Commission. Holzforschung, Austria: HFA; 2009.
419) Aguilar F, Saunders A. Policy Instruments Promoting Wood-to-Energy uses in the Continental United
States. Journal of Forestry. 2010; 108: 132-140.
420) Bradley D, Kranzl D, Diesenreiter L, Nelson F, Hess R. Bio-Trade and Bioenergy Success Stories. Task 40
Report. Utrecht: Universiteit Utrecht; 2009.
421) Lamers P, Junginger M, Hamelinck C, Faaij A. Developments in International Solid Biofuel Trade - An
Analysis of Volumes, Policies, and Market Factors. Renewable and Sustainable Energy Reviews. 2012;
16(5): 3176-3199.
422) Alakangas E, Heikkinen E, Lensu A, Vesterinen T. Biomass Fuel Trade in Europe. Jyväskylä, Finland:
VTT; 2007.
Andrew Welfle - ID: 81163530
373
423) Faaij A. Biomass Markets and Trade. IEA Roadmap Workshop, Sustainable Feedstock Supply for
Bioenergy and Biofuels; Paris; 15-16th September 2010.
424) Bradley D, Hektor B, Schouwenberg P. World Bio-Trade Equity Fund Study. IEA Task 40 Report.
Ottawa, Canada: Climate Change Solutions; 2010.
425) Junginger M, Faaij A. Biofuel Trade Issues. Launching Conference of the European Technology Platform
for Biofuels. Utrecht; Utrecht University; 8th June 2006.
426) CADER. International Production Rankings, Increasing Production Levels, and Ongoing International
Commercial Disputes. State of the Argentine Biodiesel Industry First Semester 2009 Report. Buenos
Aires: CADER; 2009.
427) EBB. Restoring a Level-Playing Field with Argentine Biodiesel Producers. Brussels: European Biodiesel
Board; 2009.
428) Steenblik R, Simón J. Biofuels - At What Cost? Government Support for Ethanol and Biodiesel in
Switzerland. Geneva: Global Subsidies Initiative of the International Institute for Sustainable
Development; 2007.
429) UK Government. Fuel Duty Rates. [Internet]. London: HM Revenue and Customs; 2014 [cited 2014 Feb];
Available from: http//www.gov.uk/government/publications/rates-and-allowances-excise-duty-
hydrocarbon-oils
430) EESI. Biomass and Land Use. [Internet]. Washington DC: Environmental and Energy Studies Institute;
2014 [cited 2014 Feb]; Available from: http://www.eesi.org/biomass_land_use
431) FERN. Sustainability Issues for Solid Biomass in Electricity, Heating and Cooling. NGO Briefing.
Brussels: Bird Life International, Greenpeace, European Environmental Bureau, Client Earth, FERN;
2011.
432) ESA. Biofuels: Implications for Land Use and Biodiversity, Biofuels and Sustainability Reports.
Washington DC: Ecological Society of America; 2010.
433) Hennenberg K. The Power of Bioenergy Related Standards to Protect Biodiversity. Conservation Biology.
2011; 24: 412-423.
434) Fritsche U. Sustainable Bioenergy: Key Criteria and Indicators. Biomass Futures Project. Darmstadt: Öko-
Institut; 2012.
435) GBEP. The GBEP Sustainability Indicators for Bioenergy. Rome: Global Bio-Energy Partnership; 2011.
436) IFEU. Synopsis Current Models and Methods Applicable to Indirect Land-Use Change. Heidelberg:
Institute for Energy and Environmental Research; 2009.
437) Croezen H, Bergsma G, Otten M, van Valkengoed M, Biofuels: Indirect Land Use Change and Climate
Impact. Delft, The Netherlands: International Land Coalition; 2010.
438) Environment Agency. Biomass: Carbon Sink or Carbon Sinner?. London: UK Environment Agency; 2009.
439) Environment Agency. Minimising Greenhouse Gas Emissions from Biomass Energy Generation. London:
UK Environment Agency; 2009.
440) EBTP. Biofuels Certification. [Internet]. Brussels: European Biofuels Technology Platform; 2014 [cited
2014 Feb]; Available from: http://www.biofuelstp.eu/certification.html
441) Van Dam J, Junginger M, Faaij A. From the Global Efforts on Certification of Bioenergy Towards an
Integrated Approach Based on Sustainable Land Use Planning. Renewable and Sustainable Energy
Reviews. 2010; 14(9): 2445-2472.
442) Scarlat N, Dalleman J. Recent Developments of Biofuels / Bioenergy Sustainability Certification: A
Global Overview. Energy Policy. 2011; 39(3): 1630-1646.
443) European Commission. Sustainability Requirements for the use of Solid and Gaseous Biomass Sources in
Electricity, Heating and Cooling, COM (2010) 11. Brussels: Commission of the European
Communities; 2009.
444) Costenoble O. CEN Standardization Work on Sustainable Biomass. [Internet]. The Netherlands: NEN
Energy Resources, Delft; 2008 [cited 2012 April]; Available from:
http://ec.europa.eu/energy/renewables/events/doc/2009_03_19/session7/costenoble.pdf
445) ISO. Sustainability Criteria for Bioenergy. Working Group 4 Meeting. ISO/PC 248. Berlin: International
Organization for Standardization; 2009.
446) Fehrenbach H, Glegrich J, Reinhardt G, Schmitz J, Sayer U, Gretz M, et al. Criteria for a Sustainable Use
of Bioenergy on a Global Scale. Heidelberg: Institut für Energie-und Umweltforschung, FSC
Arbeitsgruppe Deutschland, Germanwatch; 2008.
447) United Nations Energy. Sustainable Bioenergy: A Framework for Decision Makers, TC/D/A. [Internet].
2007 [cited 2013 April]; Available from: http://www.un-
energy.org/sites/default/files/share/une/susdev.biofuels.fao_.pdf
448) United Nations Energy Environment Programme. Bioenergy. [Internet]. New York: UNEP; 2010 [cited
2012 May]; Available from:
http://www.unep.org/bioenergy/Portals/48107/publications/Bioenergy_Overview.pdf
Andrew Welfle - ID: 81163530
374
449) Global Bioenergy Partnership Sustainability Indicators for Bioenergy. [Internet]. Rome: Food and
Agricultural Organisation of the United Nations; 2011 [cited 2013 Dec]; Available from:
http://www.globalbioenergy.org/fileadmin/user_upload/gbep/docs/Indicators/The_GBEP_Sustainabilit
y_Indicators_for_Bioenergy_FINAL.pdf
450) RSPO. Quick Facts 2013. [Internet]. Kuala Lumpur: Roundtable on Sustainable Palm Oil; 2013 [cited
2014 Jan]; Available from: http://www.european-
summit.rspo.org/fileadmin/press/QuickFacts_March_2013.pdf
451) RTRS. Factsheet. Buenos Aires: Argentina Roundtable on Responsible Soy; 2009.
452) BSI. Factsheet - The Better Sugarcane Initiative. London: World Wildlife Fund; 2009.
453) Rainforest Alliance. Smartsource Programme and Smartwood Verification. New York: Rainforest
Alliance; 2009.
454) FSC. International Standard FSC Principles and Criteria for Forest Stewardship. FSC-STD-01-001. Bonn:
Forest Stewardship Council; 1996.
455) BIOPACT. An in-depth look at Brazil's Social Fuel Seal. [Internet]. London: Nature Blog Network; 2009
[cited 2013 Jan]; Available from: http://www.news.mongabay.com/bioenergy/2008/01/brazils-
biodiesel-mandate-comes-into.html
456) Bottmer P. ISCC Communications. Gülzow: International Sustainability and Carbon Certification; 2009.
457) Drax. Sustainability Policy for Biomass. Selby: Drax Power Ltd; 2009.
458) CSBP. Council on Sustainable Biomass Production. Rome: Food & Agriculture Organization, The Council
on Sustainable Biomass Production; 2009.
459) Fritsche U. Sustainability Standards for Bioenergy. Berlin: Öko-Institut, World Wildlife Fund; 2006.
460) Upham P, Tomei J. Biofuels and Regulatory Co-Production: Critical Stakeholder Perceptions of Carbon
and Sustainability Reporting in the UK Renewable Transport Fuel Obligation. Manchester: University
of Manchester, Kings College London; 2010.
461) Upham P. A comparison of Sustainability Theory with UK and European Airports Policy and Practice.
Journal of Environmental Management. 2001; 63(3): 237-248.
462) EIA. World Oil Transit Chokepoints. Washington DC: U.S. Energy Information Administration; 2012.
463) Junginger M, Goh C, Faaij A. International Bioenergy Trade – History, Status and Outlook on Securing
Sustainable Bioenergy Supply, Demand and Markets. Springer Link Publishing; 2014.
464) Angel S, Parent J, Civco D, Blei A, Potere D. A Planet of Cities: Urban Land Cover Estimates and
Projections for All Countries, 2000-2050. Kentucky: Lincoln Institute of Land Policy; 2010.
465) BRACELPA. The 4FS Challenge: Spotlight on Brazil Panel. Growing the Future Global Strategies for
Sustainable Success, Pricewaterhouse Coopers 26th Annual Global Forest and Paper Industry
Conference; Vancouver; 09 May 2013.
466) GRID-Arendal. Impacts on Environmental Degradation on Yield and Area. Rapid Response Assessments.
The Environmental Food Crisis. Arendal, Norway: GRID-Arendal; 2013.
467) Fischer G, Teixeira E, Hizsnyik E, Velthuizen H. Land Use Dynamics and Sugarcane Production.
Sugarcane Ethanol, Chapter 2. Wageningen Academic Publishing; 2008.
468) FAO. Forest Products. Rome: Food and Agriculture Organization; 2010.
469) Indufor. Strategic Review on the Future of Forest Plantations. Report for Forestry Stewardship Council.
Helsinki: Indufor; 2012.
470) Buongiorno J, Zhu S, Raunikar R, Prestemon J. Outlook to 2060 for World Forests and Forest Industries:
A Technical Document Supporting the Forest Services 2010 RPA Assessment. Asheville, North
Carolina: Southern Research Station; 2012.
471) Sparovek G, Berndes G, Martins A, Maule S, Burgi R, Smorigo J. Bioenergy and Food Production for
Local Development in Brazil: Inputs for Policy-Making. Sao Paulo: Piraciaba, GAJ Editora e
Comunicacao; 2010.
472) Couto L, Nicholas I, Wright L, Short Rotation Eucalypt Plantations for Energy in Brazil. Task 43:2011:02.
Minas Gerais, Brazil: IEA Bioenergy; 2011.
473) Valdes C. Brazil’s Ethanol Industry: Looking Forward. BIO-02. Washington DC: United States
Department of Agriculture, Economic Research Service; 2011.
474) FAO. Global Forest Resources Assessment 2010 – Main Report. Forestry Paper 163. Rome: Food and
Agriculture Organization; 2010
475) Sindirações. Brazilian Feed Figures. Sao Paulo: IFIF, Feed Latina, Brazilian Feed Industry Association;
2011.
476) FAO. Interactions between Livestock Production Systems. Rome: Food and Agriculture Organization;
1995.
477) van der Steen H, Prall G, Plastow G. Application of Genomics to the Pork Industry. Journal of Animal
Science. 2005; 83: E1–E8.
Andrew Welfle - ID: 81163530
375
478) Smil V. Feeding the World: A Challenge for the Twenty-First Century. Cambridge, Massachusetts: MIT
Press; 2000.
479) Index Mundi. Commodity Yields. [Internet]. 2013 [cited 2013 Nov]; Available from:
www.indexmundi.com/agriculture/
480) FAO. OECD-FAO Agricultural Outlook 2010-2019. Rome: Food and Agriculture Organization; 2010.
481) Capdeville G. New Feedstock for Bioenergy: RDandI at Embrapa Agroenergy. Sao Paulo: Global
Bioenergy Partnership, Ministerio da Agricultura Pecuaria e Abastecimento; 2013.
482) Cassidy E, West P, Gerber J, Foley J. Redefining Agricultural Yields: from Tonnes to People Nourished
per Hectare. Environmental Research Letters. Letter 8, 034015. IOP Publishing; 2013.
483) Grassini P, Eskridge K, Cassman K. Distinguishing between Yield Advances and Yield Plateaus in
Historical Crop Production Trends. Nature Communications. 2013; 4(2918).
484) NIC. Global Trends 2030: Alternative Worlds. Washington DC: National Intelligence Council; 2012.
485) Matthews A. Growth in Global Food Demand to 2050. Brussels: The Institute of International and
European Affairs; 2013.
486) Kruse J. Estimation Demand for Agricultural Commodities to 2050. Washington DC: Global Harvest
Initiative; 2010.
487) FAO. Global Forest Resources Assessment 2010 – Terms and Definitions. Rome: Food and Agriculture
Organization; 2010.
488) Oliveira C. The Future for Bioenergy and Biomass Brazil. Sao Paulo: Brazilian Association Industry,
Biomass and Renewable Energy; 2011.
489) FAO. Forests and Energy. FAO Forestry Paper 154. Rome: Food and Agricultural Organization; 2008.
490) Bentsen N, Felby C. Technical Potentials of Biomass for Energy Services from Current Agriculture and
Forestry in Selected Countries in Europe. The Americas and Asia. Forest and Landscape Working
Papers, 55/2010. Copenhagen: University of Copenhagen; 2010.
491) Forster-Carneiro T, Berni M, Dorileo I, Rostagno M. Biorefinery Study of Availability of Agriculture
Residues and Wastes for Integrated Biorefineries in Brazil. Resources, Conservation and Recycling.
2013; 77: 78-88.
492) Landell M, Scarpari M, Xavier M, Anjos I, Baptista A, Aguiar C, Silva D, Bidóia M, Brancalião S,
Bressiani J, Campos M, Miguel P, Silva T, Silva V, Anjos L, Ogata B. Residual Biomass Potential of
Commercial and Pre-Commercial Sugarcane Cultivars. Scienta Agricola. 2013; 70(5): 299-304.
493) Torres F, Albejante C, Berni M, Dorileo I. Síntese de Informações Resultados de Experiência Profissional
Pretérita, Contatos Profissionais, e Levantamento de Dados Junto às Instituições Privadas e Estatais,
Relatório Final. Sao Paulo: Empresa de Pesquisa Energética (EPE) e Empresa MCPAR Engenharia;
2011.
494) Cherubini F, Ulgiati S. Crop Residues as Raw Materials for Biorefinery Systems – a LCA Case Study.
Applied Energy. 2010; 87: 47–57.
495) Schmidt G. Swine Production and Manure Management in Brazil. Sao Paulo: Embrapa, Ministerio da
Agricultura Pecuaria e Abastecimento; 2009.
496) Scottish Agricultural College. Farm Management Handbook. 29th Edition. Edinburgh: SAC Publishing;
2008.
497) Embrapa. Methane Emissions from Livestock. Sao Paulo: Brazilian Agricultural Research Corporation;
2002.
498) Junior C, Goulart R, Albertini T, Feigl B, Cerri C, Vasconcelos J, Bernoux M, Lanna D, Cerri C. Brazilian
Beef Cattle Feedlot Manure Management: A Country Survey. Journal of Animal Science. 2013; 91(4):
1811-1818.
499) IPCC. Emissions from Livestock and Manure Management. Guidelines for National Greenhouse Gas
Inventories, Chapter 10. Geneva: Intergovernmental Panel on Climate Change; 2006.
500) Oliveira M, Somariva R, Junior O, Neto J, Bretas A, Perrone O, Reversat J. Biomass Electricity
Generation Using Industry Poultry Waste. Brussels: European Association for the Development of
Renewable Energies, Environment and Power Quality; 2012.
501) Guerra M, Alucci M. Nature in Megacities: Sao Paulo / Brazil – A Case Study. Weimar: Bauhaus-
Univeritat; 2009.
502) Pedlowski M, Da Silva V, Adell J, Heynen N. Urban Forest and Environmental Inequality in Campos dos
Goytacazes, Rio de Janeiro, Brazil. Urban Ecosystems. 2002; 6: 9-20.
503) Mavropouplos A. Waste Management 2030+. Northbrook, Illinois: Waste Management World; 2011.
504) Araujo M, Magrini A, Mahler C, Bilitewski B. A Model for Estimation of Potential Generation of Waste
Electrical and Electronic Equipment in Brazil. Waste Management. 2012; 32(2): 335-342.
505) Brazilian Ministry of Infrastructure and the Environment. The Potential for Waste Management in Brazil
to Minimize GHG Emissions and Maximize Re-use of Materials. Utrecht: MWH, Universiteit Utrecht;
2012.
Andrew Welfle - ID: 81163530
376
506) Neto J. Brazilian Scenario for the Recycling Industry. POMS 23rd Annual Conference; Chicago; 20th-23rd
April 2011.
507) CEMPRE. Brazilian Waste Factsheet. Sao Paulo: Brazilian Business Commitment for Recycling; 2013.
508) World Bank. Brazil Low Carbon Case Study – Waste. Technical Synthesis Report. Washington DC: World
Bank; 2010.
509) World Bank. Mitigation Climate Change Through Development - Brazil Low Carbon Case Study.
Technical Synthesis Report. Washington DC: World Bank; 2010.
510) BSR. Waste Not, Want Not: An Overview of Food Waste. [Internet]. 2011 [cited 2013 March]; Available
from: http://www.bsr.org/reports/BSR_Waste_Not_Want_Not_An_Overview_Food_Waste.pdf
511) Ministry of the Environment. Brazilian Solid Waste National Policy. Law 12.305/2010, Decree
7.404/2010. Sao Paulo: Environmental Ministry of the Brazil Secretariat of Water Resources and Urban
Environment Department of Urban Environment; 2010.
512) Sistema Nacional de Informações sobre Saneamento Básico. Ministério das Cidades. Diagnóstico dos
Serviços de Água e Esgoto. Sao Paulo, Brazil; 2012.
513) Lino F, Ismail K. Alternative Treatments for the Municipal Solid Waste and Domestic Sewage in
Campinas, Brazil. Resources, Conservation and Recycling. 2013; 81: 24-30.
514) Salomon K, Lora E. Estimate of the Electric Energy Generating Potential for Different Sources of Biogas
in Brazil. Biomass & Bioenergy. 2009; 33(9): 1101-1107.
515) UKTI. Brazil Opportunities in Environment and Water. London: UK Trade and Investment; 2010.
516) UN-Habitat. Global Atlas of Excreta, Wastewater Sludge, and Biosolids Management: Moving Forward
the Sustainable and Welcome uses of a Global Resource. New York: United Nations Human
Settlements Programme, Greater Moncton Sewerage Commission; 2008.
517) IBGE. Contas Regionais. Sao Paulo: Brazilian Institute of Geography and Statistics; 2008.
518) ProForest. RFA Annual Report: Case Study on Brazilian Sugarcane. Oxford: ProForest UK; 2009.
519) Kruglianskas I. Soy Production in South America: Key Issues and Challenges. Oxford: ProForest UK;
2010.
520) PwC. From Sao Paulo to Shanghai – New Consumer Dynamics: Brazil. Rio de Janeiro: Pricewaterhouse
Coopers; 2007.
521) ING. ING International Trade Study - Developments in Global Trade: from 1995 to 2017. Amsterdam:
ING; 2011.
522) FAO. Woodfuels and Climate Change Mitigation – Case Studies from Brazil, India and Mexico. Rome:
Food and Agriculture Organization; 2010.
523) Felfi F, Mesa J, Rocha J, Filippetto D, Luengo C, Pippo W. Biomass Briquetting and its Perspectives in
Brazil. Biomass & Bioenergy. 2011; 35: 236-242.
524) Leite R, Leal M, Cortez L, Griffin W, Scandiffio M. Can Brazil Replace 5% of the 2025 Gasoline World
Demand with Ethanol?. Energy. 2009; 34: 655-661.
525) PwC. Renewable Energy Brazil. Rio de Janeiro: Pricewaterhouse Coopers; 2013.
526) Lora E, Andrade R. Biomass as Energy Source in Brazil. Renewable and Sustainable Energy Reviews.
2009; 13: 777-788.
527) Koornneef J, van Breevoort P, Hamelinck C, Hendriks C, Hoogwijk M, Koop K, Koper M, Dixon T,
Camps A. Global Potential for Biomass and Carbon Dioxide Capture, Transport and Storage up to
2050. International Journal of Greenhouse Gas Control. 2012; 11: 117-132.
528) Fearnside P. Plantation Forestry in Brazil Projections to 2050. Biomass & Bioenergy. 1998; 15(6): 437-
450.
529) Kaup F, Nitsch M, Menezes, T. E2025 – Brazil’s – Aspirations for a Massive Worldwide Substitution of
Gasoline by 2025. Berlin: Potsdam Institute for Climate Impact Research; 2011.
530) Sundfeld E. Bioenergy Technology Development in Brazil. Sao Paulo: Embrapa and Ministerio da
Agricultura, Pecuaria e Abastecimento; 2009.
531) Macedo I. Ethanol: Current Situation and Outlook. Sao Paulo: Ministerio Das Relacoes Exteriores; 2007.
532) WWF. Green Light for Sugarcane in Amazon is a Serious Political and Environmental Setback. Brasilia:
World Wildlife Fund; 2013.
533) EPE. National Energy Plan 2030 (PNE 2030). Energy Planning Company. Rio de Janeiro: Energy
Planning Company and Ministry of Mines and Energy; 2007.
534) IEA. Brazil: Energy Balances Report for 2011. Paris: International Energy Agency; 2014.
535) IEA. Glossary of Terms. Paris: International Energy Agency; 2014.
536) AS/COA. Brazil’s Energy Agenda: The Way Forward. New York: Amercas Society/Council of the
Americas Energy Action Group; 2013.
537) ANP. Mandatory Biodiesel Requirement. Sao Paulo: Agencia Nacional de Petroleo Gas Natural e
Biocombustivies; 2014.
Andrew Welfle - ID: 81163530
377
538) EIA. International Energy Outlook 2013 – Industrial Sector Energy Consumption. Washington DC: U.S
Energy Information Administration; 2013.
539) MME. Plano Nacional Sobre Mudanca Clima – Brazil. Brasília: Ministry of Mines and Energy; 2007.
540) EPE. Plano Decenal de Expansao de Energia. Sao Paulo: Empresa de Pesquisa Energetica, Ministy of
Mines and Energy; 2010.
541) WRI. India-Brazil-South Africa Declaration on Clean Energy. Washington DC: World Resources Institute;
2007.
542) ANEEL. Realiza leilão da UHE Três Irmãos na Sexta-Feira. Sao Paulo: Agencia Nacional de Energia
Electrica; 2009.
543) ANEEL. Electric Power Auctions – Biomass. Sao Paulo: Agencia Nacional de Energia Electrica; 2008.
544) CCPR. Lei Nº 8.723, de 28 de Outubro de 1993, Dispõe Sobre a Redução de Emissão de Poluentes por
Veículos Automotores e dá Outras Providências. Sao Paulo: Casa Civil da Presidência da República;
1993.
545) Rico J. Programa de Biocombustíveis no Brasil e na Colômbia: uma Análise da Implantação, Resultados e
Perspectivas. Ph.D. Dissertation Thesis. Universidade de São Paulo; 2008.
546) MAPA. Portaria Nº 143, de 27 de Junho de 2007. Sao Paulo: Ministério da Agricultura, Pecuária e
Abastecimento. 2007.
547) Szklo A Lucena A Schaeffer R. The Brazilian Energy Sector: The Transitional to an Energy Industry of the
Future. Rio de Janeiro: EMBA Consortium; 2013.
548) McKinsey and Company. Pathways to a Low-Carbon Economy for Brazil. Sao Paulo: McKinsey and
Company; 2011.
549) WRI. Climatic Analysis Indicators – Brazil Country Profiles. Washington DC: World Resources Institute;
2009.
550) Morris C, Pehnt M. Energy Transition: The German Energiewende. Berlin: Heinrich Böll Foundation;
2012.
551) The German Government. The Federal Government's Energy Concept of 2010 and the Transformation of
the Energy System of 2011. Berlin: Federal Ministry of Economics and Technology, Federal Ministry
for the Environment, Nature Conservation and Nuclear Safety; 2011.
552) IEA. Key World Energy Statistics. Paris: International Energy Agency; 2013.
553) The Norwegian Government. Norwegian Climate Policy. Report No. 34(2006-2007). Oslo: Norwegian
Ministry of the Environment; 2012.
554) IEA. Nordic Energy Technology Perspectives – Pathways to a Carbon Neutral Energy Future. Paris:
International Energy Agency, Norden Nordic Energy Research; 2012.
555) Graabak I. Nordic Energy Road Map 2050 – Strategic Choices towards Carbon Neutrality. Sustainable
Energy Systems 2050, Norden Energy Research. SES Annual Conference; Stockholm; 11-12
September 2013.
556) The Danish Government. National Action Plan for Renewable Energy in Denmark. Copenhagen: Klima og
Energi Guiden; 2010.
557) The Danish Government. Our Future Energy. Copenhagen: The Danish Ministry of Climate, Energy and
Buildings; 2011.
558) Chiodi A, Gargiulo M, Rogan F, Deane J, Lavigne D, Rout U, Gallachoir B. Modelling the Impacts of
Challenging 2050 European Climate Mitigation Targets on Irelands Energy System. Energy Policy.
2013; 53: 169-189.
559) Koljonen T, Flyktman M, Lehtil A, Pahkala K, Peltola E, Savolainen I. The Role of CCS and Renewables
in Tackling Climate Change. Energy Procedia. 2009; 1: 4323-4330.
560) Glynn J, Chiodi A, Gargiulo M, Deane J, Bazilian M, O’Gallachoir B. Energy Security Analysis: The Case
of Constrained Oil Supply for Ireland. Energy Policy. 2014; 66: 312–325.
561) Strachan N, Pye S, Kannan R. The Iterative Contribution and Relevance of Modelling to UK Energy
Policy. Energy Policy. 2009; 37: 850-860.
562) Kastner T, Erb K, Nonhebel S. International Wood Trade and Forest Change: A Global Analysis. Global
Environmental Change. 2011; 21: 947-956.
563) Colgan J. The International Energy Agency: Challenges for the 21st Century. Policy Paper Series 6. Berlin:
Global Public Policy Institute; 2013.
564) Inderwildi O, King D. Energy Transport, and the Environment. Springer Publishing; 2012.
565) Chakarova V. Oil Supply Crises: Cooperation and Discord in the West. Lexington Books; 2012.
566) Natural England. Energy Crop Scheme. London: Department for Environment, Food and Rural Affairs;
2014.
567) McDermott F, Hopwood L, Evans G. NNFCC Barriers to Bioenergy Matrix. Report for Department of
Energy & Climate Change. York: National Non-Food Crops Centre; 2012.
Andrew Welfle - ID: 81163530
378
568) DEFRA. Rural Development Programme for England. London: Department for Environment, Food and
Rural Affairs; 2013.
569) Forestry Commission. Energy Crops – Benefits of Green Space. [Internet]. 2013 [cited 2014 Jan].
Available from: http://www.forestry.gov.uk/fr/INFD-8ADLM4.
570) Forestry Commission. A Woodfuel Strategy for England. Bristol: Forestry Commission England; 2011.
571) Forestry Commission. Government Woodfuel Policy. [Internet]. 2014 [cited 2014 Jan]. Available from:
www.forestry.gov.uk/forestry/INFD-7WMH6Q.
572) Forestry Commission. Grants for Woodfuel Production. Bristol: Forestry Commission England; 2011.
573) Jyväskylä Innovation Oy, MTT Agrifood Research. Energy from Field Energy Crops – A Handbook for
Energy Producers. Report for the European Commission. Finland: Jyväskylä Innovation Oy; 2009.
574) DEFRA. Farming Statistics – Diversification and Renewable Energy Production on Farms in England
2010. National Statistics. London: Department for Environment, Food and Rural Affairs; 2013.
575) Kretschmer B, Allen B, Hart K. Mobilising Cereal Straw in the EU to Feed Advanced Biofuel Production.
London: Institute for European Environmental Policy; 2012.
576) EuroStat. Statistical Atlas – EuroStat Regional Yearbook 2013. Brussels: European Commission; 2013.
577) Kretschmer B, Buckwell A, Smith C, Watkins E, Allen B. Recycling Agricultural, Forestry and Food
Wastes and Residues for Sustainable Bioenergy and Biomaterials. Science and Technology Options
Assessment. Brussels: European Parliament; 2013.
578) Eco2. Sleaford Renewable Energy Plant, Community Benefits. Sleaford: Eco2; 2014.
579) DTI. Co-operative Energy Lessons from Denmark and Sweden. Global Watch Mission Report. London:
Department for Trade and Industry; 2004.
580) Tybirk K, Eriksson P, Carlsson B, Lindberg L, Gerdes H, McGovern G, Ptacnikova R, Fisher I, Skadberg
G, Aarskog I. Biomass Supply Chain Mobilization in North Sea Region. Denmark: Agro Business
Park; 2010.
581) Local United. Energy Farms – Anaerobic Digestion. Milton Keynes: National Energy Centre; 2011.
582) Bywater A. A Review of Anaerobic Digestion Plants on UK Farms – Barriers, Benefits and Case Studies.
Kenilworth: Royal Agricultural Society of England; 2012.
583) de Buisonje F. Manure Management and Processing. Wageningen, The Netherlands: UR Livestock
Research; 2013.
584) Baltic Manure. Sustainable Manure Management in the Baltic Sea Region. Copenhagen: Baltic Forum for
Innovative Technologies for Sustainable Manure Management; 2014.
585) BioEnergy Farm. BioEnergy Farm: Implementation Plan for BioEnergy Farm. IEE Contract No:
IEE/09/637 S12.558213. Brussels: European Commission; 2011.
586) PlanLoCal. An Anaerobic Digester in Silloth. Silloth: CoRE Cooperative; 2013.
587) DECC, DEFRA. Anaerobic Digestion Strategy and Action Plan. London: Department of Energy &
Climate Change, Department for Environment, Food and Rural Affairs; 2011.
588) DEFRA. Anaerobic Digestion Strategy and Action Plan – Annual Report 2012-13. London: Department
for Environment, Food and Rural Affairs; 2013.
589) Humphries A. Implementation of Anaerobic Digestion in the UK, California and Germany. Report
Produced for the Farmers Club. London; 2011.
590) The German Government. Erneuerbare-Energien-Gesetz EEG. Berlin: Federal Ministry of Economics and
Technology; 2011.
591) Bundesnetzagentur. Biogas and the German Ordinance of Gas Network Access (GasNZV). Berlin: Federal
Ministry for the Environment, Nature, Conservation and Nuclear Safety; 2011.
592) DEFRA. Energy from Waste. February 2014 Revised Edition. London: Department for Environment, Food
and Rural Affairs; 2014.
593) WMW. UK Urged to Supply More Energy Through Waste. Northbrook, Illinois: Waste Management
World; 2011.
594) Cheeseman C, Velis C. WTERT-UK Opportunities and Barriers. London: Imperial College, Department of
Civil and Environmental Engineering; 2010.
595) Fagernäs L, Johansson A, Wilén C, Sipilä K, Mäkinen T, Helynen S, Daugherty E, den Uil H, Vehlow J,
Kåberger T, Rogulska M. Bioenergy in Europe – Opportunities and Barriers. Notes 2353. Helsinki:
VTT Research; 2006.
596) European Commission. Waste Framework Directive. Directive 1991/156/EEC, Amending and
Subsequently Repealing Directive 75/442/EEC. Official Journal of the European Union. 1991; L 78:
32-37.
597) European Commission. Landfill of Waste. Directive 1999/31/EC. Official Journal of the European Union.
1999; L 182: 1-19.
598) European Commission. Waste Incineration. Directive 2000/76/EC. Official Journal of the European Union.
2000; L 332: 91-111.

Andrew Welfle - ID: 81163530
379
599) European Commission. Renewable Energy: The Promotion of Electricity from Renewable Energy Sources.
Directive 2001/77/EC. Official Journal of the European Union. 2001; L 283: 33-40.
600) WMW. The Burning Question: How is the Public Perception of Waste to Energy Improving?. Northbrook,
Illinois: Waste Management World; 2014.
601) SITA UK. Public Attitudes to Community Buy in for Waste and Resource Infrastructure. Maidenhead:
SITA UK; 2011.
602) Kampman B, Bergsma G. Better Use of Biomass for Energy. Dublin: IEA, RETD, IEA Bioenergy; 2010.
603) AEA Consulting. The UK Supply Curve for Renewable Heat. Report for DECC, NERA Economic
Consulting. London: AEA Consulting; 2009.
604) McCormick K, Kaberger T. Key Barriers for Bioenergy in Europe: Economic Conditions, Know-How and
Institutional Capacity, and Supply Chain Co-ordination. Biomass Bioenergy. 2007; 31(7): 443-452.
605) Coyne M. Biomass: A Sensible 2020 Target?. Dublin: Dalkia Ireland; 2013.
606) Piterou A, Shackley S, Upham P. Project ARBRE: Lessons for Bio-energy Developers and Policy-Makers.
Energy Policy. 2008; 36(6): 2044-2050.
607) Upreti B. Conflict over Biomass Energy Development in the United Kingdom: Some Observations and
Lessons from England and Wales. Energy Policy. 2004; 32(6): 785-800.
608) Upham P, Shackley S. The Case of a Proposed 21.5 MWe Biomass Gasifier in Winkleigh, Devon:
Implications for Governance of Renewable Energy Planning. Energy Policy. 2006; 34(15): 2161-2172.
609) Upham P, Shackley S. Local Public Opinion of a Proposed 21.5 MWe Biomass Gasifier in Devon:
Questionnaire Survey Results. Biomass Bioenergy. 2007; 31(6): 433-441.
610) Thornley P, Wright E. Evaluation of Bioenergy Projects. In: Bridgwater A, editor. Fast Pyrolysis of
Biomass a Handbook. Vol. 2. London: CPL Press; 2002.
611) Ecofys. Planning and Installing Bioenergy Systems – A Guide for Installers, Architects and Engineers.
First Edition. London: Earthscan Publications Ltd; 2005.
612) Deublein D, Steinhauser A. Biogas from Waste and Renewable Resources. Weinheim: Wiley-VCH
Publishing; 2008.
613) EUBIA. Bioenergy Drivers. European Biomass Industry Association. Brussels: European Biomass
Industry Association; 2014.
614) BioHousing Project. Success Stories of Biomass Heating in Small Scale. Report for the European
Commission. Finland: Jyväskylä Innovation Oy; 2009.
615) CrossBorder Bioenergy. EU Handbook – Small Scale Heating Markets. Report for the European
Commission. Brussels: AEBIOM; 2012.
616) Ericsson K. Introduction and Development of the Swedish District Heating Systems. A Report Prepared as
Part of the IEE Project for the European Commission. Sweden: Lund University; 2009.
617) Slade R, Bauen A, Gross R. Prioritising the Best Use of Biomass Resources: Conceptualising Trade-Offs.
London: UK Energy Research Centre; 2010.
618) Bows A, Dawkins E, Gough C, Mander S, McLachlan C, Roeder R, Thom L, Thornley P, Wood R. What’s
Cooking? Adaptation and Mitigation in the UK Food System. Manchester: Tyndall Centre for Climate
Change Research, University of Manchester; 2012.
619) McNally C, Gotpagar J, Mansson A. The Future Chemical in China Learnings and Opportunities for
Capturing Growth. Beijing: Booz & Company; 2011.
620) Gilbert P, Thornley P. Decarbonising the Fertiliser Industry using Biomass Gasification. 19th European
Biomass Conference and Exhibition; Berlin; 6-10 June 2011.
621) Gilbert P, Roeder M, Thornley P. Can the UK Afford (not) to Produce Chemicals in 2050?. Manchester:
Tyndall Centre for Climate Change Research, University of Manchester; 2013.
622) Forestry Commission. Conversion Factors. [Internet]. 2011 [cited 2012 Feb]. Available from:
http://www.forestry.gov.uk/website/forstats2011.nsf/LUContents/ADF349044D5CBC4580257625003
7375E.
623) AEBIOM. Wood Fuels Handbook. Brussels: European Biomass Association; 2008.

Andrew Welfle - ID: 81163530
380
Thesis Appendices
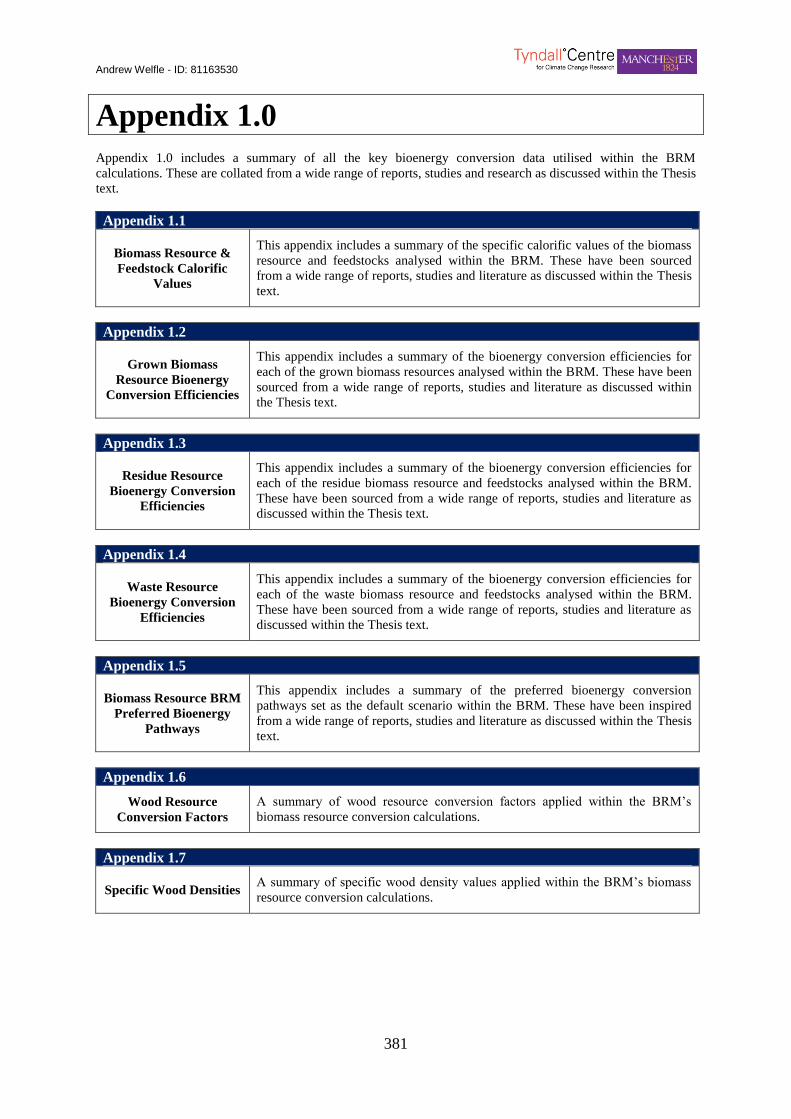
Andrew Welfle - ID: 81163530
381
Appendix 1.0
Appendix 1.0 includes a summary of all the key bioenergy conversion data utilised within the BRM
calculations. These are collated from a wide range of reports, studies and research as discussed within the Thesis
text.
Appendix 1.1
Biomass Resource &
Feedstock Calorific
Values
This appendix includes a summary of the specific calorific values of the biomass
resource and feedstocks analysed within the BRM. These have been sourced
from a wide range of reports, studies and literature as discussed within the Thesis
text.
Appendix 1.2
Grown Biomass
Resource Bioenergy
Conversion Efficiencies
This appendix includes a summary of the bioenergy conversion efficiencies for
each of the grown biomass resources analysed within the BRM. These have been
sourced from a wide range of reports, studies and literature as discussed within
the Thesis text.
Appendix 1.3
Residue Resource
Bioenergy Conversion
Efficiencies
This appendix includes a summary of the bioenergy conversion efficiencies for
each of the residue biomass resource and feedstocks analysed within the BRM.
These have been sourced from a wide range of reports, studies and literature as
discussed within the Thesis text.
Appendix 1.4
Waste Resource
Bioenergy Conversion
Efficiencies
This appendix includes a summary of the bioenergy conversion efficiencies for
each of the waste biomass resource and feedstocks analysed within the BRM.
These have been sourced from a wide range of reports, studies and literature as
discussed within the Thesis text.
Appendix 1.5
Biomass Resource BRM
Preferred Bioenergy
Pathways
This appendix includes a summary of the preferred bioenergy conversion
pathways set as the default scenario within the BRM. These have been inspired
from a wide range of reports, studies and literature as discussed within the Thesis
text.
Appendix 1.6
Wood Resource
Conversion Factors
A summary of wood resource conversion factors applied within the BRM’s
biomass resource conversion calculations.
Appendix 1.7
Specific Wood Densities A summary of specific wood density values applied within the BRM’s biomass
resource conversion calculations.

Andrew Welfle - ID: 81163530
382
Appendix 1.1: Biomass Resource & Feedstock Calorific Values
Resource
Category Resources Post Pre-Treatment Resource
Higher
Heating
Value
(MJ/Tonne)
Lower
Heating
Value
(MJ/Tonne)
Biomass
Crops
Grasses
Switch Grass
Switch Grass 18024 16767
Pellets 18950 -
Char 16337 12799
Char & Pellets 18950 -
Char 16337 12799
Switch Grass Chips (10% MC) 18024 16767
Switch Grass Pellets (10% MC) 18950 -
Reed Canary
Grass
Reed Canary Grass 18370 17126
Pellets 18950 -
Char 16337 12799
Char & Pellets 18950 -
Char 16337 12799
Reed Canary Grass Chips (10% MC) 18024 16767
Reed Canary Grass Pellets (10% MC) 18950 -
Miscanthus
Miscanthus 19070 17860
Pellets 15081 -
Char - 17300
Char & Pellets 15081 -
Char 17300
Miscanthus Chips (10% MC) 15081 -
Miscanthus Pellets (10% MC) 15081 -
Short
Rotation
Coppices
Poplar
Poplar 18255 17000
Pellets 17640 -
Char - -
Char & Pellets 17640 -
Char - -
SRC Chips (25% MC) 11323 -
SRC Pellets (10% MC) 17640 -
Willow
Willow 18255 17000
Pellets 17640 -
Char 26700 25805
Char & Pellets 17640 -
Char 26700 25805
SRC Chips (25% MC) 19600 18326
SRC Pellets (10% MC) 17640 -
Forestry
Eucalyptus Wood Pellets (10% MC) 16280 17700
Wood Chips (25% MC) 16280 17700
Beech
Raw Material 18800 17582
Pellets 16780 18200
Char 19530 20710
Char & Pellets 19530 20710
Char 19530 20710
Ash
Raw Material 20750 19244
Pellets 16780 18200
Char 19530 20710
Char & Pellets 19530 20710
Char 19530 20710
Birch
Raw Material 20120 18702
Pellets 16780 18200
Char 19530 20710
Char & Pellets 19530 20710
Char 19530 20710
Sycamore
Raw Material 19080 -
Pellets 17280 -
Char 17500 -
Char & Pellets 17280 -
Char 17500 -
Pine
Raw Material 20217 18873
Pellets 17280 -
Char - -
Char & Pellets 17280 -
Char - -
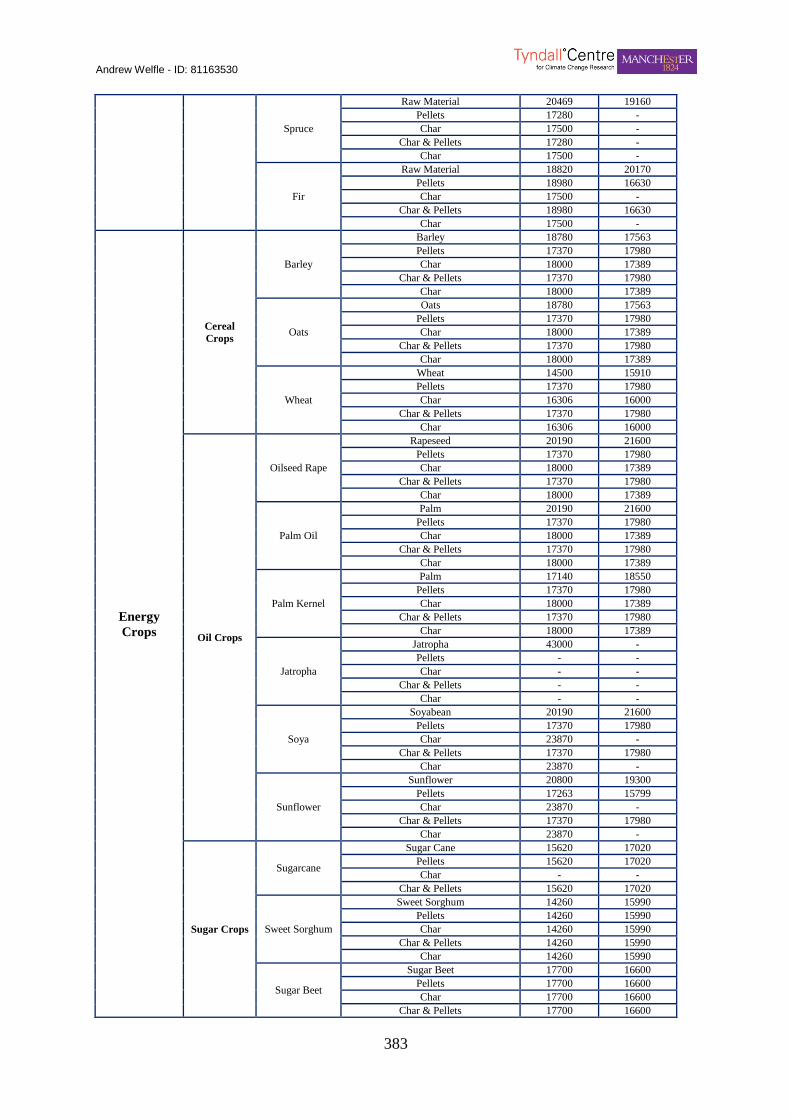
Andrew Welfle - ID: 81163530
383
Spruce
Raw Material 20469 19160
Pellets 17280 -
Char 17500 -
Char & Pellets 17280 -
Char 17500 -
Fir
Raw Material 18820 20170
Pellets 18980 16630
Char 17500 -
Char & Pellets 18980 16630
Char 17500 -
Energy
Crops
Cereal
Crops
Barley
Barley 18780 17563
Pellets 17370 17980
Char 18000 17389
Char & Pellets 17370 17980
Char 18000 17389
Oats
Oats 18780 17563
Pellets 17370 17980
Char 18000 17389
Char & Pellets 17370 17980
Char 18000 17389
Wheat
Wheat 14500 15910
Pellets 17370 17980
Char 16306 16000
Char & Pellets 17370 17980
Char 16306 16000
Oil Crops
Oilseed Rape
Rapeseed 20190 21600
Pellets 17370 17980
Char 18000 17389
Char & Pellets 17370 17980
Char 18000 17389
Palm Oil
Palm 20190 21600
Pellets 17370 17980
Char 18000 17389
Char & Pellets 17370 17980
Char 18000 17389
Palm Kernel
Palm 17140 18550
Pellets 17370 17980
Char 18000 17389
Char & Pellets 17370 17980
Char 18000 17389
Jatropha
Jatropha 43000 -
Pellets - -
Char - -
Char & Pellets - -
Char - -
Soya
Soyabean 20190 21600
Pellets 17370 17980
Char 23870 -
Char & Pellets 17370 17980
Char 23870 -
Sunflower
Sunflower 20800 19300
Pellets 17263 15799
Char 23870 -
Char & Pellets 17370 17980
Char 23870 -
Sugar Crops
Sugarcane
Sugar Cane 15620 17020
Pellets 15620 17020
Char - -
Char & Pellets 15620 17020
Sweet Sorghum
Sweet Sorghum 14260 15990
Pellets 14260 15990
Char 14260 15990
Char & Pellets 14260 15990
Char 14260 15990
Sugar Beet
Sugar Beet 17700 16600
Pellets 17700 16600
Char 17700 16600
Char & Pellets 17700 16600
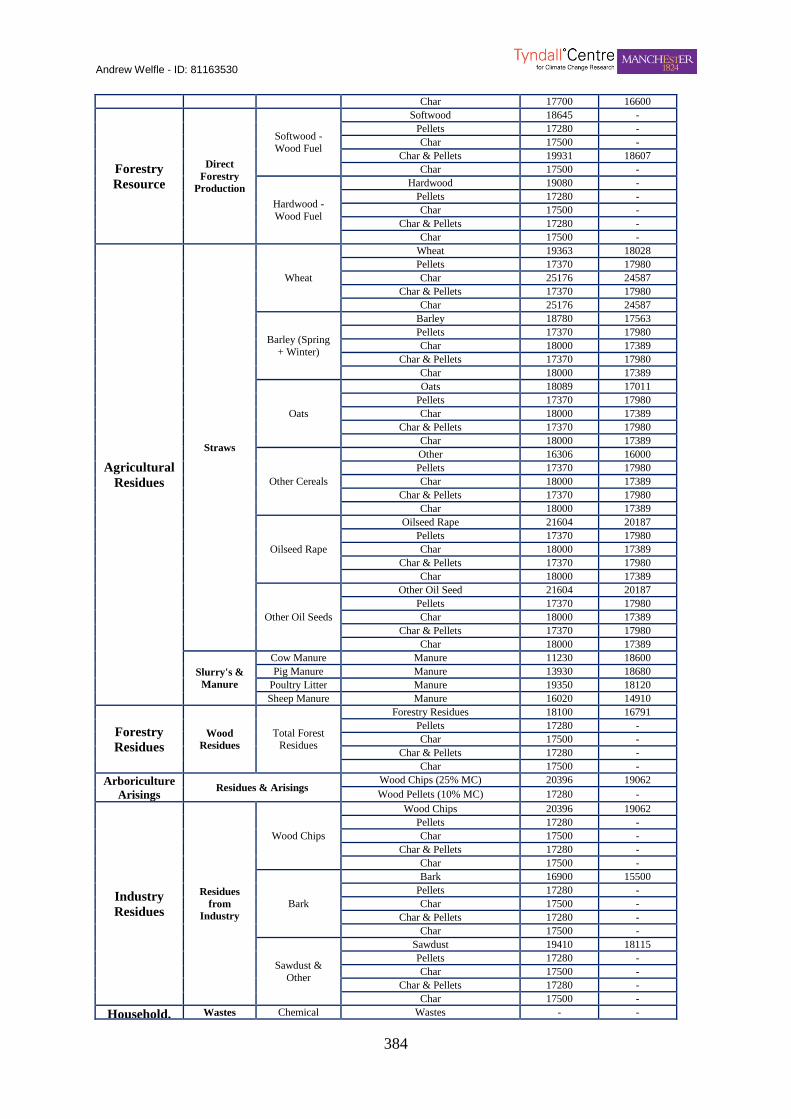
Andrew Welfle - ID: 81163530
384
Char 17700 16600
Forestry
Resource
Direct
Forestry
Production
Softwood -
Wood Fuel
Softwood 18645 -
Pellets 17280 -
Char 17500 -
Char & Pellets 19931 18607
Char 17500 -
Hardwood -
Wood Fuel
Hardwood 19080 -
Pellets 17280 -
Char 17500 -
Char & Pellets 17280 -
Char 17500 -
Agricultural
Residues
Straws
Wheat
Wheat 19363 18028
Pellets 17370 17980
Char 25176 24587
Char & Pellets 17370 17980
Char 25176 24587
Barley (Spring
+ Winter)
Barley 18780 17563
Pellets 17370 17980
Char 18000 17389
Char & Pellets 17370 17980
Char 18000 17389
Oats
Oats 18089 17011
Pellets 17370 17980
Char 18000 17389
Char & Pellets 17370 17980
Char 18000 17389
Other Cereals
Other 16306 16000
Pellets 17370 17980
Char 18000 17389
Char & Pellets 17370 17980
Char 18000 17389
Oilseed Rape
Oilseed Rape 21604 20187
Pellets 17370 17980
Char 18000 17389
Char & Pellets 17370 17980
Char 18000 17389
Other Oil Seeds
Other Oil Seed 21604 20187
Pellets 17370 17980
Char 18000 17389
Char & Pellets 17370 17980
Char 18000 17389
Slurry's &
Manure
Cow Manure Manure 11230 18600
Pig Manure Manure 13930 18680
Poultry Litter Manure 19350 18120
Sheep Manure Manure 16020 14910
Forestry
Residues Wood
Residues
Total Forest Residues
Forestry Residues 18100 16791
Pellets 17280 -
Char 17500 -
Char & Pellets 17280 -
Char 17500 -
Arboriculture
Arisings Residues & Arisings
Wood Chips (25% MC) 20396 19062
Wood Pellets (10% MC) 17280 -
Industry
Residues
Residues
from
Industry
Wood Chips
Wood Chips 20396 19062
Pellets 17280 -
Char 17500 -
Char & Pellets 17280 -
Char 17500 -
Bark
Bark 16900 15500
Pellets 17280 -
Char 17500 -
Char & Pellets 17280 -
Char 17500 -
Sawdust &
Other
Sawdust 19410 18115
Pellets 17280 -
Char 17500 -
Char & Pellets 17280 -
Char 17500 -
Household, Wastes Chemical Wastes - -
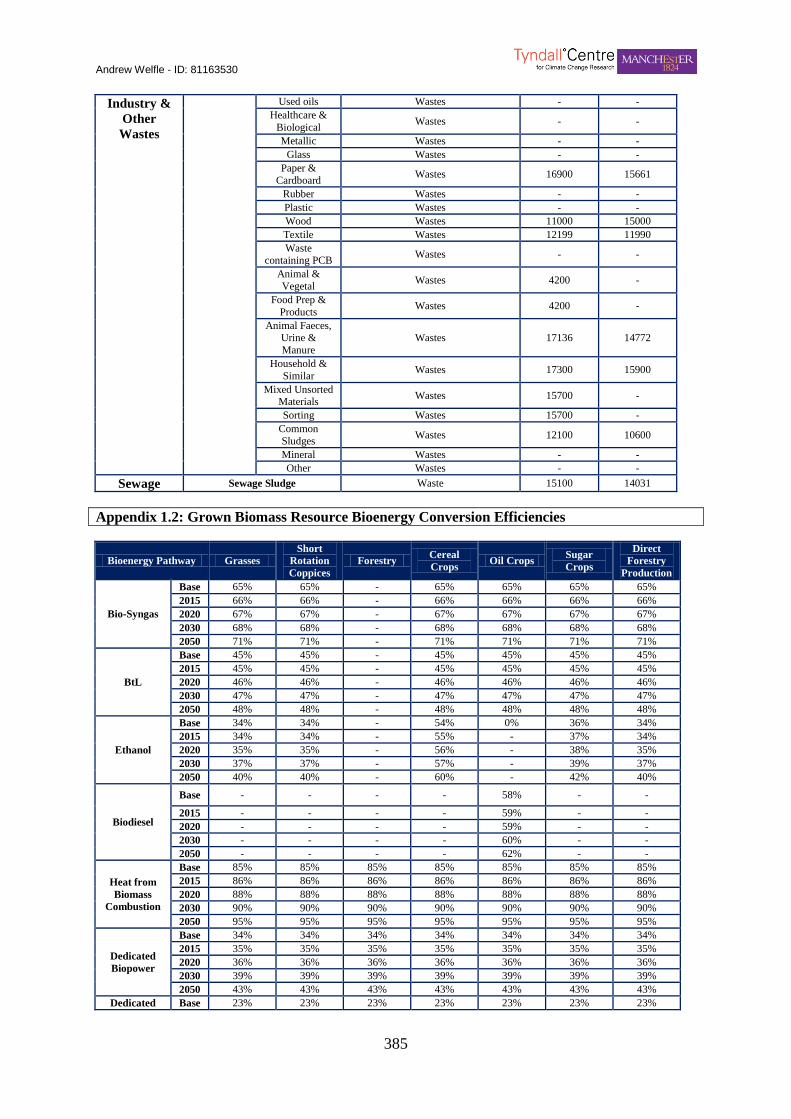
Andrew Welfle - ID: 81163530
385
Industry &
Other
Wastes
Used oils Wastes - -
Healthcare &
Biological Wastes - -
Metallic Wastes - -
Glass Wastes - -
Paper &
Cardboard Wastes 16900 15661
Rubber Wastes - -
Plastic Wastes - -
Wood Wastes 11000 15000
Textile Wastes 12199 11990
Waste containing PCB
Wastes - -
Animal &
Vegetal Wastes 4200 -
Food Prep &
Products Wastes 4200 -
Animal Faeces, Urine &
Manure
Wastes 17136 14772
Household &
Similar Wastes 17300 15900
Mixed Unsorted Materials
Wastes 15700 -
Sorting Wastes 15700 -
Common
Sludges Wastes 12100 10600
Mineral Wastes - -
Other Wastes - -
Sewage Sewage Sludge Waste 15100 14031
Appendix 1.2: Grown Biomass Resource Bioenergy Conversion Efficiencies
Bioenergy Pathway Grasses
Short
Rotation
Coppices
Forestry Cereal
Crops Oil Crops
Sugar
Crops
Direct
Forestry
Production
Bio-Syngas
Base 65% 65% - 65% 65% 65% 65%
2015 66% 66% - 66% 66% 66% 66%
2020 67% 67% - 67% 67% 67% 67%
2030 68% 68% - 68% 68% 68% 68%
2050 71% 71% - 71% 71% 71% 71%
BtL
Base 45% 45% - 45% 45% 45% 45%
2015 45% 45% - 45% 45% 45% 45%
2020 46% 46% - 46% 46% 46% 46%
2030 47% 47% - 47% 47% 47% 47%
2050 48% 48% - 48% 48% 48% 48%
Ethanol
Base 34% 34% - 54% 0% 36% 34%
2015 34% 34% - 55% - 37% 34%
2020 35% 35% - 56% - 38% 35%
2030 37% 37% - 57% - 39% 37%
2050 40% 40% - 60% - 42% 40%
Biodiesel
Base - - - - 58% - -
2015 - - - - 59% - -
2020 - - - - 59% - -
2030 - - - - 60% - -
2050 - - - - 62% - -
Heat from
Biomass
Combustion
Base 85% 85% 85% 85% 85% 85% 85%
2015 86% 86% 86% 86% 86% 86% 86%
2020 88% 88% 88% 88% 88% 88% 88%
2030 90% 90% 90% 90% 90% 90% 90%
2050 95% 95% 95% 95% 95% 95% 95%
Dedicated
Biopower
Base 34% 34% 34% 34% 34% 34% 34%
2015 35% 35% 35% 35% 35% 35% 35%
2020 36% 36% 36% 36% 36% 36% 36%
2030 39% 39% 39% 39% 39% 39% 39%
2050 43% 43% 43% 43% 43% 43% 43%
Dedicated Base 23% 23% 23% 23% 23% 23% 23%
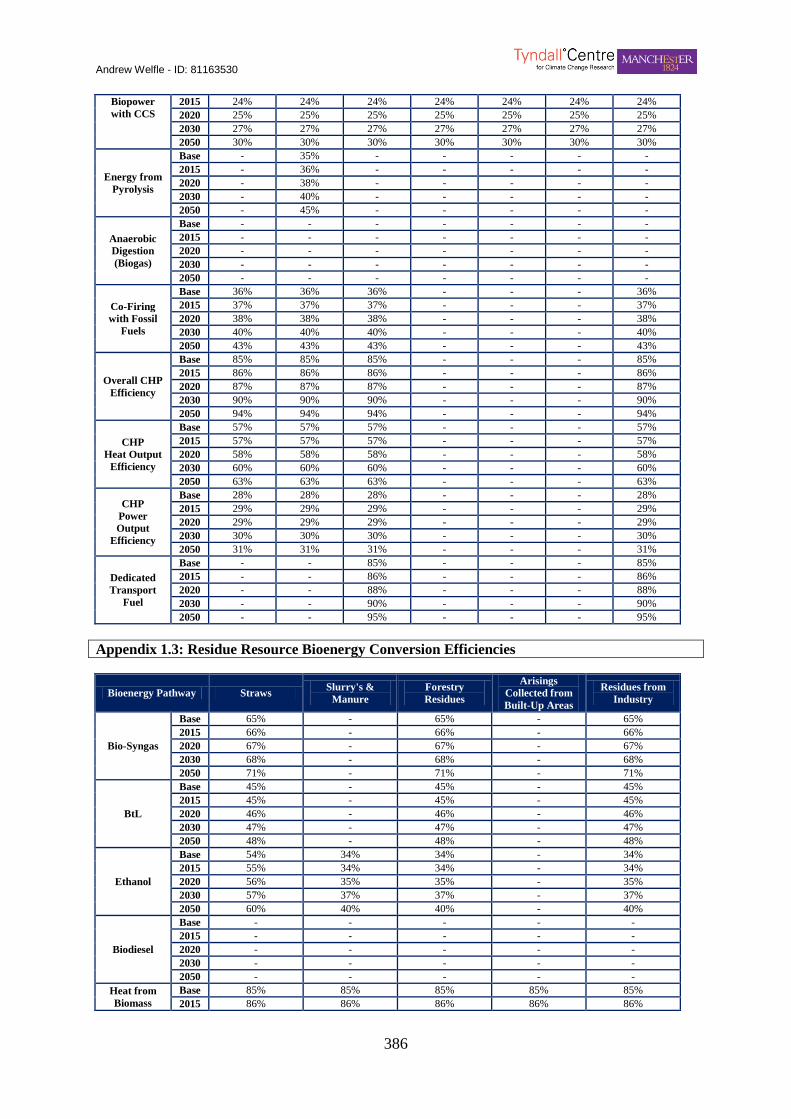
Andrew Welfle - ID: 81163530
386
Biopower
with CCS
2015 24% 24% 24% 24% 24% 24% 24%
2020 25% 25% 25% 25% 25% 25% 25%
2030 27% 27% 27% 27% 27% 27% 27%
2050 30% 30% 30% 30% 30% 30% 30%
Energy from
Pyrolysis
Base - 35% - - - - -
2015 - 36% - - - - -
2020 - 38% - - - - -
2030 - 40% - - - - -
2050 - 45% - - - - -
Anaerobic
Digestion
(Biogas)
Base - - - - - - -
2015 - - - - - - -
2020 - - - - - - -
2030 - - - - - - -
2050 - - - - - - -
Co-Firing
with Fossil
Fuels
Base 36% 36% 36% - - - 36%
2015 37% 37% 37% - - - 37%
2020 38% 38% 38% - - - 38%
2030 40% 40% 40% - - - 40%
2050 43% 43% 43% - - - 43%
Overall CHP
Efficiency
Base 85% 85% 85% - - - 85%
2015 86% 86% 86% - - - 86%
2020 87% 87% 87% - - - 87%
2030 90% 90% 90% - - - 90%
2050 94% 94% 94% - - - 94%
CHP
Heat Output
Efficiency
Base 57% 57% 57% - - - 57%
2015 57% 57% 57% - - - 57%
2020 58% 58% 58% - - - 58%
2030 60% 60% 60% - - - 60%
2050 63% 63% 63% - - - 63%
CHP
Power
Output
Efficiency
Base 28% 28% 28% - - - 28%
2015 29% 29% 29% - - - 29%
2020 29% 29% 29% - - - 29%
2030 30% 30% 30% - - - 30%
2050 31% 31% 31% - - - 31%
Dedicated
Transport
Fuel
Base - - 85% - - - 85%
2015 - - 86% - - - 86%
2020 - - 88% - - - 88%
2030 - - 90% - - - 90%
2050 - - 95% - - - 95%
Appendix 1.3: Residue Resource Bioenergy Conversion Efficiencies
Bioenergy Pathway Straws Slurry's &
Manure
Forestry
Residues
Arisings
Collected from
Built-Up Areas
Residues from
Industry
Bio-Syngas
Base 65% - 65% - 65%
2015 66% - 66% - 66%
2020 67% - 67% - 67%
2030 68% - 68% - 68%
2050 71% - 71% - 71%
BtL
Base 45% - 45% - 45%
2015 45% - 45% - 45%
2020 46% - 46% - 46%
2030 47% - 47% - 47%
2050 48% - 48% - 48%
Ethanol
Base 54% 34% 34% - 34%
2015 55% 34% 34% - 34%
2020 56% 35% 35% - 35%
2030 57% 37% 37% - 37%
2050 60% 40% 40% - 40%
Biodiesel
Base - - - - -
2015 - - - - -
2020 - - - - -
2030 - - - - -
2050 - - - - -
Heat from
Biomass
Base 85% 85% 85% 85% 85%
2015 86% 86% 86% 86% 86%
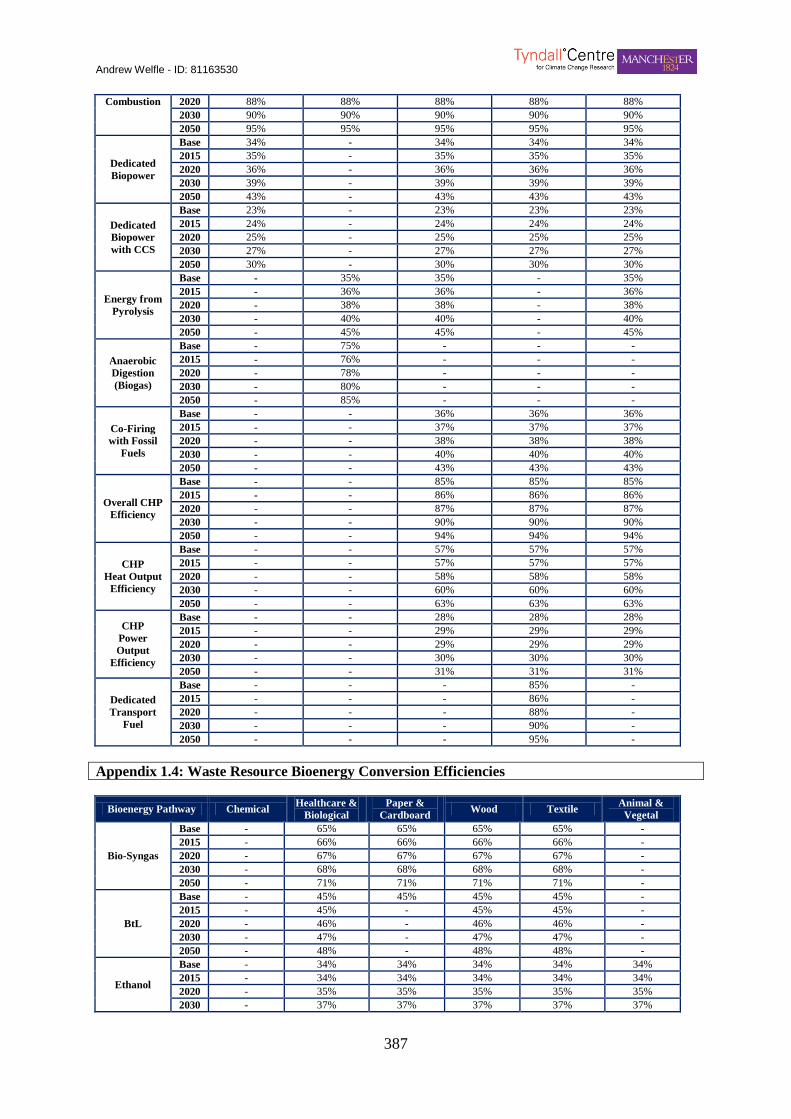
Andrew Welfle - ID: 81163530
387
Combustion 2020 88% 88% 88% 88% 88%
2030 90% 90% 90% 90% 90%
2050 95% 95% 95% 95% 95%
Dedicated
Biopower
Base 34% - 34% 34% 34%
2015 35% - 35% 35% 35%
2020 36% - 36% 36% 36%
2030 39% - 39% 39% 39%
2050 43% - 43% 43% 43%
Dedicated
Biopower
with CCS
Base 23% - 23% 23% 23%
2015 24% - 24% 24% 24%
2020 25% - 25% 25% 25%
2030 27% - 27% 27% 27%
2050 30% - 30% 30% 30%
Energy from
Pyrolysis
Base - 35% 35% - 35%
2015 - 36% 36% - 36%
2020 - 38% 38% - 38%
2030 - 40% 40% - 40%
2050 - 45% 45% - 45%
Anaerobic
Digestion
(Biogas)
Base - 75% - - -
2015 - 76% - - -
2020 - 78% - - -
2030 - 80% - - -
2050 - 85% - - -
Co-Firing
with Fossil
Fuels
Base - - 36% 36% 36%
2015 - - 37% 37% 37%
2020 - - 38% 38% 38%
2030 - - 40% 40% 40%
2050 - - 43% 43% 43%
Overall CHP
Efficiency
Base - - 85% 85% 85%
2015 - - 86% 86% 86%
2020 - - 87% 87% 87%
2030 - - 90% 90% 90%
2050 - - 94% 94% 94%
CHP
Heat Output
Efficiency
Base - - 57% 57% 57%
2015 - - 57% 57% 57%
2020 - - 58% 58% 58%
2030 - - 60% 60% 60%
2050 - - 63% 63% 63%
CHP
Power
Output
Efficiency
Base - - 28% 28% 28%
2015 - - 29% 29% 29%
2020 - - 29% 29% 29%
2030 - - 30% 30% 30%
2050 - - 31% 31% 31%
Dedicated
Transport
Fuel
Base - - - 85% -
2015 - - - 86% -
2020 - - - 88% -
2030 - - - 90% -
2050 - - - 95% -
Appendix 1.4: Waste Resource Bioenergy Conversion Efficiencies
Bioenergy Pathway Chemical Healthcare &
Biological
Paper &
Cardboard Wood Textile
Animal &
Vegetal
Bio-Syngas
Base - 65% 65% 65% 65% -
2015 - 66% 66% 66% 66% -
2020 - 67% 67% 67% 67% -
2030 - 68% 68% 68% 68% -
2050 - 71% 71% 71% 71% -
BtL
Base - 45% 45% 45% 45% -
2015 - 45% - 45% 45% -
2020 - 46% - 46% 46% -
2030 - 47% - 47% 47% -
2050 - 48% - 48% 48% -
Ethanol
Base - 34% 34% 34% 34% 34%
2015 - 34% 34% 34% 34% 34%
2020 - 35% 35% 35% 35% 35%
2030 - 37% 37% 37% 37% 37%

Andrew Welfle - ID: 81163530
388
2050 - 40% 40% 40% 40% 40%
Biodiesel
Base - - - - - -
2015 - - - - - -
2020 - - - - - -
2030 - - - - - -
2050 - - - - - -
Heat from
Biomass
Combustion
Base 85% 85% 85% 85% 85% 85%
2015 86% 86% 86% 86% 86% 86%
2020 88% 88% 88% 88% 88% 88%
2030 90% 90% 90% 90% 90% 90%
2050 95% 95% 95% 95% 95% 95%
Dedicated
Biopower
Base - 34% 34% 34% 34% -
2015 - 35% 35% 35% 35% -
2020 - 36% 36% 36% 36% -
2030 - 39% 39% 39% 39% -
2050 - 43% 43% 43% 43% -
Dedicated
Biopower
with CCS
Base - 23% 23% 23% 23% -
2015 - 24% - 24% 24% -
2020 - 25% - 25% 25% -
2030 - 27% - 27% 27% -
2050 - 30% - 30% 30% -
Energy from
Pyrolysis
Base - 35% 35% 35% 35% 35%
2015 - 36% 36% 36% 36% 36%
2020 - 38% 38% 38% 38% 38%
2030 - 40% 40% 40% 40% 40%
2050 - 45% 45% 45% 45% 45%
Anaerobic
Digestion
(Biogas)
Base - - - - - 55%
2015 - - - - - 56%
2020 - - - - - 58%
2030 - - - - - 61%
2050 - - - - - 66%
Co-Firing
with Fossil
Fuels
Base - 36% 36% 36% 36% -
2015 - 37% 37% 37% 37% -
2020 - 38% 38% 38% 38% -
2030 - 40% 40% 40% 40% -
2050 - 43% 43% 43% 43% -
Overall CHP
Efficiency
Base - 85% 85% 85% 85% -
2015 - 86% 86% 86% 86% -
2020 - 87% 87% 87% 87% -
2030 - 90% 90% 90% 90% -
2050 - 94% 94% 94% 94% -
CHP
Heat Output
Efficiency
Base - 57% 57% 57% 57% -
2015 - 57% 57% 57% 57% -
2020 - 58% 58% 58% 58% -
2030 - 60% 60% 60% 60% -
2050 - 63% 63% 63% 63% -
CHP
Power
Output
Efficiency
Base - 28% 28% 28% 28% -
2015 - 29% 29% 29% 29% -
2020 - 29% 29% 29% 29% -
2030 - 30% 30% 30% 30% -
2050 - 31% 31% 31% 31% -
Dedicated
Transport
Fuel
Base - - - - - -
2015 - - - - - -
2020 - - - - - -
2030 - - - - - -
2050 - - - - - -
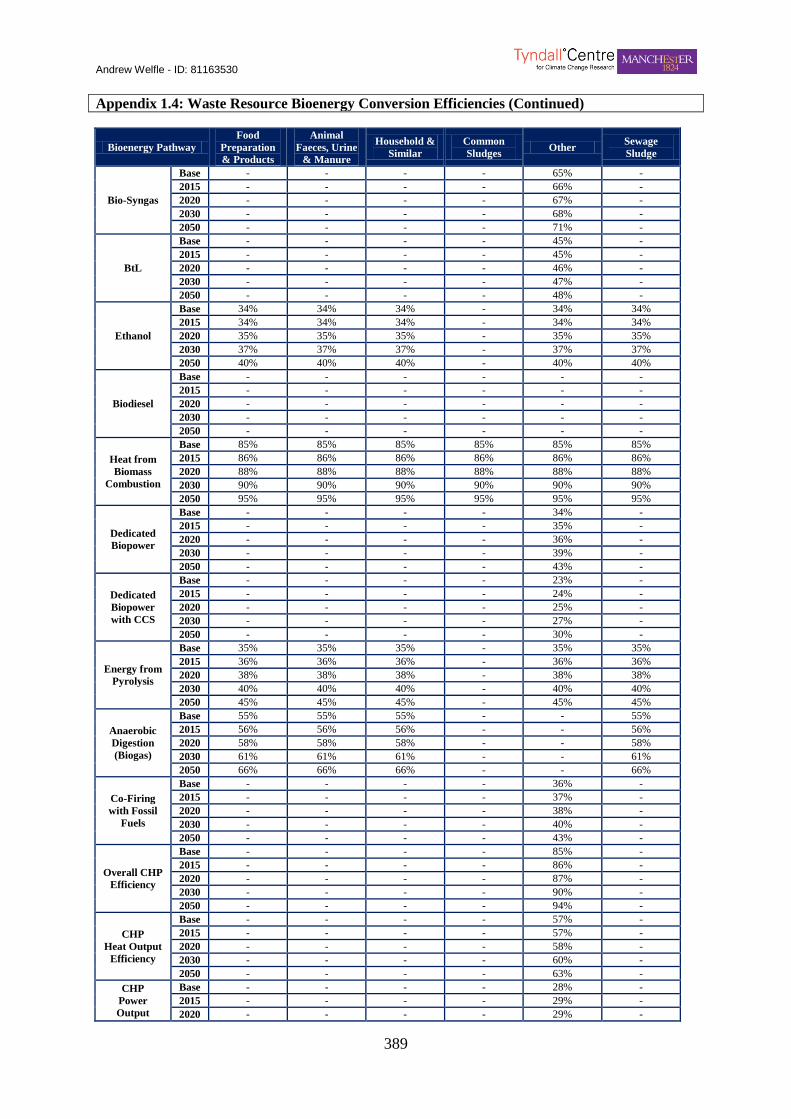
Andrew Welfle - ID: 81163530
389
Appendix 1.4: Waste Resource Bioenergy Conversion Efficiencies (Continued)
Bioenergy Pathway
Food
Preparation
& Products
Animal
Faeces, Urine
& Manure
Household &
Similar
Common
Sludges Other
Sewage
Sludge
Bio-Syngas
Base - - - - 65% -
2015 - - - - 66% -
2020 - - - - 67% -
2030 - - - - 68% -
2050 - - - - 71% -
BtL
Base - - - - 45% -
2015 - - - - 45% -
2020 - - - - 46% -
2030 - - - - 47% -
2050 - - - - 48% -
Ethanol
Base 34% 34% 34% - 34% 34%
2015 34% 34% 34% - 34% 34%
2020 35% 35% 35% - 35% 35%
2030 37% 37% 37% - 37% 37%
2050 40% 40% 40% - 40% 40%
Biodiesel
Base - - - - - -
2015 - - - - - -
2020 - - - - - -
2030 - - - - - -
2050 - - - - - -
Heat from
Biomass
Combustion
Base 85% 85% 85% 85% 85% 85%
2015 86% 86% 86% 86% 86% 86%
2020 88% 88% 88% 88% 88% 88%
2030 90% 90% 90% 90% 90% 90%
2050 95% 95% 95% 95% 95% 95%
Dedicated
Biopower
Base - - - - 34% -
2015 - - - - 35% -
2020 - - - - 36% -
2030 - - - - 39% -
2050 - - - - 43% -
Dedicated
Biopower
with CCS
Base - - - - 23% -
2015 - - - - 24% -
2020 - - - - 25% -
2030 - - - - 27% -
2050 - - - - 30% -
Energy from
Pyrolysis
Base 35% 35% 35% - 35% 35%
2015 36% 36% 36% - 36% 36%
2020 38% 38% 38% - 38% 38%
2030 40% 40% 40% - 40% 40%
2050 45% 45% 45% - 45% 45%
Anaerobic
Digestion
(Biogas)
Base 55% 55% 55% - - 55%
2015 56% 56% 56% - - 56%
2020 58% 58% 58% - - 58%
2030 61% 61% 61% - - 61%
2050 66% 66% 66% - - 66%
Co-Firing
with Fossil
Fuels
Base - - - - 36% -
2015 - - - - 37% -
2020 - - - - 38% -
2030 - - - - 40% -
2050 - - - - 43% -
Overall CHP
Efficiency
Base - - - - 85% -
2015 - - - - 86% -
2020 - - - - 87% -
2030 - - - - 90% -
2050 - - - - 94% -
CHP
Heat Output
Efficiency
Base - - - - 57% -
2015 - - - - 57% -
2020 - - - - 58% -
2030 - - - - 60% -
2050 - - - - 63% -
CHP
Power
Output
Base - - - - 28% -
2015 - - - - 29% -
2020 - - - - 29% -

Andrew Welfle - ID: 81163530
390
Efficiency 2030 - - - - 30% -
2050 - - - - 31% -
Dedicated
Transport
Fuel
Base - - - - - -
2015 - - - - - -
2020 - - - - - -
2030 - - - - - -
2050 - - - - - -
Appendix 1.5: Biomass Resource BRM Preferred Bioenergy Pathways
Resources
Base Year 2015 2020 2030 2050
Bioenergy
Pathways %
Bioenergy
Pathways %
Bioenergy
Pathways %
Bioenergy
Pathways %
Bioenergy
Pathways %
Grasses H-BC 100 H-BC 100 H-BC 100 H-BC 100 H-BC 100
Short
Rotation
Coppices
H-BC 50 H-BC 50 H-BC 50 H-BC 50 H-BC 50
D-BP 50 D-BP 50 D-BP 50 D-BP 50 D-BP 50
Forestry H-BC 25 H-BC 25 H-BC 25 H-BC 25 H-BC 25
D-BP 75 D-BP 75 D-BP 75 D-BP 75 D-BP 75
Cereal Crops Eth 100 Eth 100 Eth 100 Eth 100 Eth 100
Oil Crops BioDl 100 BioDl 100 BioDl 100 BioDl 100 BioDl 100
Sugar Crops Eth 100 Eth 100 Eth 100 Eth 100 Eth 100
Direct
Forestry
Production
D-BP 80 D-BP 80 D-BP 80 D-BP 80 D-BP 80
H-BC 20 H-BC 20 H-BC 20 H-BC 20 H-BC 20
Straws D-BP 80 D-BP 80 D-BP 80 D-BP 80 D-BP 80
H-BC 20 H-BC 20 H-BC 20 H-BC 20 H-BC 20
Slurry's &
Manure
AD-H 30 AD-H 30 AD-H 30 AD-H 30 AD-H 30
AD-P 70 AD-P 70 AD-P 70 AD-P 70 AD-P 70
Wood
Residues
H-BC 70 H-BC 70 H-BC 70 H-BC 70 H-BC 70
D-BP 30 D-BP 30 D-BP 30 D-BP 30 D-BP 30
Residues &
Arisings
H-BC 70 H-BC 70 H-BC 70 H-BC 70 H-BC 70
D-BP 30 D-BP 30 D-BP 30 D-BP 30 D-BP 30
Residues
from
Industry
H-BC 70 H-BC 70 H-BC 70 H-BC 70 H-BC 70
D-BP 30 D-BP 30 D-BP 30 D-BP 30 D-BP 30
Healthcare
& Biological H-BC 100 H-BC 100 H-BC 100 H-BC 100 H-BC 100
Paper &
Cardboard
H-BC 30 H-BC 30 H-BC 30 H-BC 30 H-BC 30
D-BP 70 D-BP 70 D-BP 70 D-BP 70 D-BP 70
Wood H-BC 30 H-BC 30 H-BC 30 H-BC 30 H-BC 30
D-BP 70 D-BP 70 D-BP 70 D-BP 70 D-BP 70
Textile H-BC 30 H-BC 30 H-BC 30 H-BC 30 H-BC 30
D-BP 70 D-BP 70 D-BP 70 D-BP 70 D-BP 70
Animal &
Vegetal
AD-P 70 AD-P 70 AD-P 70 AD-P 70 AD-P 70
AD-H 30 AD-H 30 AD-H 30 AD-H 30 AD-H 30
Food Prep &
Products
AD-P 70 AD-P 70 AD-P 70 AD-P 70 AD-P 70
AD-H 30 AD-H 30 AD-H 30 AD-H 30 AD-H 30
Animal
Faeces,
Urine &
Manure
AD-P 70 AD-P 70 AD-P 70 AD-P 70 AD-P 70
AD-H 30 AD-H 30 AD-H 30 AD-H 30 AD-H 30
Household &
Similar
H-BC 30 H-BC 30 H-BC 30 H-BC 30 H-BC 30
D-BP 70 D-BP 70 D-BP 70 D-BP 70 D-BP 70
Mixed
Unsorted
Materials
H-BC 30 H-BC 30 H-BC 30 H-BC 30 H-BC 30
D-BP 70 D-BP 70 D-BP 70 D-BP 70 D-BP 70
Sorting H-BC 30 H-BC 30 H-BC 30 H-BC 30 H-BC 30
D-BP 70 D-BP 70 D-BP 70 D-BP 70 D-BP 70
Mineral H-BC 30 H-BC 30 H-BC 30 H-BC 30 H-BC 30
D-BP 70 D-BP 70 D-BP 70 D-BP 70 D-BP 70
Other H-BC 30 H-BC 30 H-BC 30 H-BC 30 H-BC 30
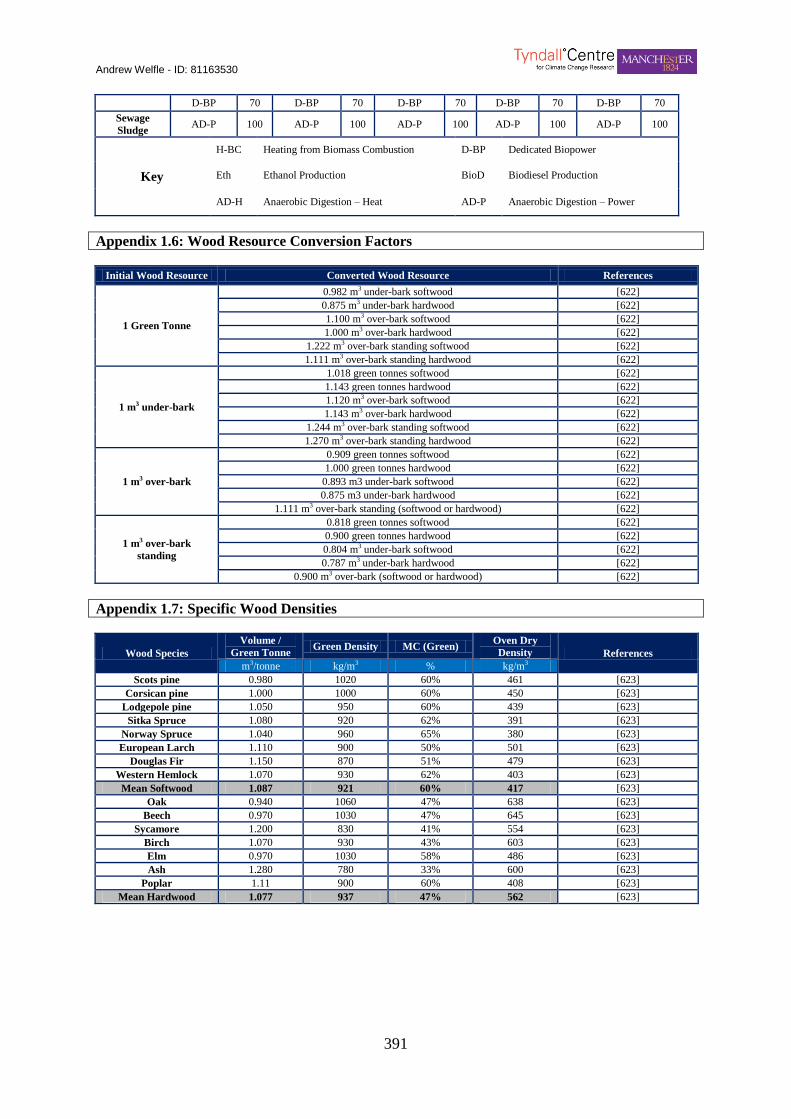
Andrew Welfle - ID: 81163530
391
D-BP 70 D-BP 70 D-BP 70 D-BP 70 D-BP 70
Sewage
Sludge AD-P 100 AD-P 100 AD-P 100 AD-P 100 AD-P 100
Key
H-BC Heating from Biomass Combustion D-BP Dedicated Biopower
Eth Ethanol Production BioD Biodiesel Production
AD-H Anaerobic Digestion – Heat AD-P Anaerobic Digestion – Power
Appendix 1.6: Wood Resource Conversion Factors
Initial Wood Resource Converted Wood Resource References
1 Green Tonne
0.982 m3 under-bark softwood [622]
0.875 m3 under-bark hardwood [622]
1.100 m3 over-bark softwood [622]
1.000 m3 over-bark hardwood [622]
1.222 m3 over-bark standing softwood [622]
1.111 m3 over-bark standing hardwood [622]
1 m3 under-bark
1.018 green tonnes softwood [622]
1.143 green tonnes hardwood [622]
1.120 m3 over-bark softwood [622]
1.143 m3 over-bark hardwood [622]
1.244 m3 over-bark standing softwood [622]
1.270 m3 over-bark standing hardwood [622]
1 m3 over-bark
0.909 green tonnes softwood [622]
1.000 green tonnes hardwood [622]
0.893 m3 under-bark softwood [622]
0.875 m3 under-bark hardwood [622]
1.111 m3 over-bark standing (softwood or hardwood) [622]
1 m3 over-bark
standing
0.818 green tonnes softwood [622]
0.900 green tonnes hardwood [622]
0.804 m3 under-bark softwood [622]
0.787 m3 under-bark hardwood [622]
0.900 m3 over-bark (softwood or hardwood) [622]
Appendix 1.7: Specific Wood Densities
Wood Species
Volume /
Green Tonne Green Density MC (Green)
Oven Dry
Density References
m3/tonne kg/m3 % kg/m3
Scots pine 0.980 1020 60% 461 [623]
Corsican pine 1.000 1000 60% 450 [623]
Lodgepole pine 1.050 950 60% 439 [623]
Sitka Spruce 1.080 920 62% 391 [623]
Norway Spruce 1.040 960 65% 380 [623]
European Larch 1.110 900 50% 501 [623]
Douglas Fir 1.150 870 51% 479 [623]
Western Hemlock 1.070 930 62% 403 [623]
Mean Softwood 1.087 921 60% 417 [623]
Oak 0.940 1060 47% 638 [623]
Beech 0.970 1030 47% 645 [623]
Sycamore 1.200 830 41% 554 [623]
Birch 1.070 930 43% 603 [623]
Elm 0.970 1030 58% 486 [623]
Ash 1.280 780 33% 600 [623]
Poplar 1.11 900 60% 408 [623]
Mean Hardwood 1.077 937 47% 562 [623]

Andrew Welfle - ID: 81163530
392
Appendix 2.0
Appendix 2.0 includes a list of all the specific food commodities categorised by the FAO and analysed within
the BRM.
Appendix 2.1
Crop Based Food
Commodities
A full list of the crop based food commodities categorised by the FAO and
analysed within the BRM.
Appendix 2.2
Animal Based Food
Commodities
A full list of the animal based food commodities categorised by the FAO. And
analysed within the BRM.
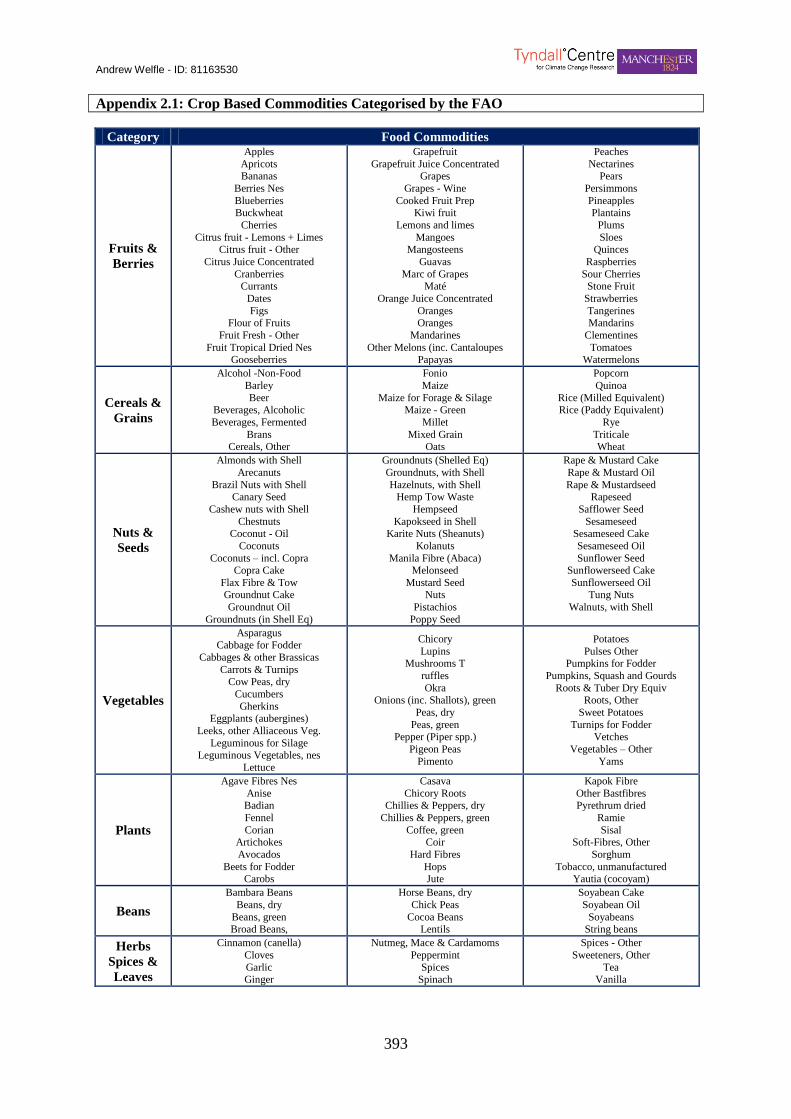
Andrew Welfle - ID: 81163530
393
Appendix 2.1: Crop Based Commodities Categorised by the FAO
Category Food Commodities
Fruits &
Berries
Apples
Apricots Bananas
Berries Nes
Blueberries Buckwheat
Cherries
Citrus fruit - Lemons + Limes Citrus fruit - Other
Citrus Juice Concentrated
Cranberries Currants
Dates
Figs Flour of Fruits
Fruit Fresh - Other
Fruit Tropical Dried Nes Gooseberries
Grapefruit
Grapefruit Juice Concentrated Grapes
Grapes - Wine
Cooked Fruit Prep Kiwi fruit
Lemons and limes
Mangoes Mangosteens
Guavas
Marc of Grapes Maté
Orange Juice Concentrated
Oranges Oranges
Mandarines
Other Melons (inc. Cantaloupes Papayas
Peaches
Nectarines Pears
Persimmons
Pineapples Plantains
Plums
Sloes Quinces
Raspberries
Sour Cherries Stone Fruit
Strawberries
Tangerines Mandarins
Clementines
Tomatoes Watermelons
Cereals &
Grains
Alcohol -Non-Food
Barley
Beer Beverages, Alcoholic
Beverages, Fermented
Brans Cereals, Other
Fonio
Maize
Maize for Forage & Silage Maize - Green
Millet
Mixed Grain Oats
Popcorn
Quinoa
Rice (Milled Equivalent) Rice (Paddy Equivalent)
Rye
Triticale Wheat
Nuts &
Seeds
Almonds with Shell
Arecanuts
Brazil Nuts with Shell Canary Seed
Cashew nuts with Shell
Chestnuts Coconut - Oil
Coconuts
Coconuts – incl. Copra Copra Cake
Flax Fibre & Tow Groundnut Cake
Groundnut Oil
Groundnuts (in Shell Eq)
Groundnuts (Shelled Eq)
Groundnuts, with Shell
Hazelnuts, with Shell Hemp Tow Waste
Hempseed
Kapokseed in Shell Karite Nuts (Sheanuts)
Kolanuts
Manila Fibre (Abaca) Melonseed
Mustard Seed Nuts
Pistachios
Poppy Seed
Rape & Mustard Cake
Rape & Mustard Oil
Rape & Mustardseed Rapeseed
Safflower Seed
Sesameseed Sesameseed Cake
Sesameseed Oil
Sunflower Seed Sunflowerseed Cake
Sunflowerseed Oil Tung Nuts
Walnuts, with Shell
Vegetables
Asparagus Cabbage for Fodder
Cabbages & other Brassicas
Carrots & Turnips Cow Peas, dry
Cucumbers
Gherkins Eggplants (aubergines)
Leeks, other Alliaceous Veg.
Leguminous for Silage Leguminous Vegetables, nes
Lettuce
Chicory
Lupins Mushrooms T
ruffles
Okra Onions (inc. Shallots), green
Peas, dry
Peas, green Pepper (Piper spp.)
Pigeon Peas
Pimento
Potatoes
Pulses Other Pumpkins for Fodder
Pumpkins, Squash and Gourds
Roots & Tuber Dry Equiv Roots, Other
Sweet Potatoes
Turnips for Fodder Vetches
Vegetables – Other
Yams
Plants
Agave Fibres Nes
Anise Badian
Fennel
Corian Artichokes
Avocados
Beets for Fodder Carobs
Casava
Chicory Roots Chillies & Peppers, dry
Chillies & Peppers, green
Coffee, green Coir
Hard Fibres
Hops Jute
Kapok Fibre
Other Bastfibres Pyrethrum dried
Ramie
Sisal Soft-Fibres, Other
Sorghum
Tobacco, unmanufactured Yautia (cocoyam)
Beans
Bambara Beans
Beans, dry
Beans, green Broad Beans,
Horse Beans, dry
Chick Peas
Cocoa Beans Lentils
Soyabean Cake
Soyabean Oil
Soyabeans String beans
Herbs
Spices &
Leaves
Cinnamon (canella)
Cloves
Garlic Ginger
Nutmeg, Mace & Cardamoms
Peppermint
Spices Spinach
Spices - Other
Sweeteners, Other
Tea Vanilla
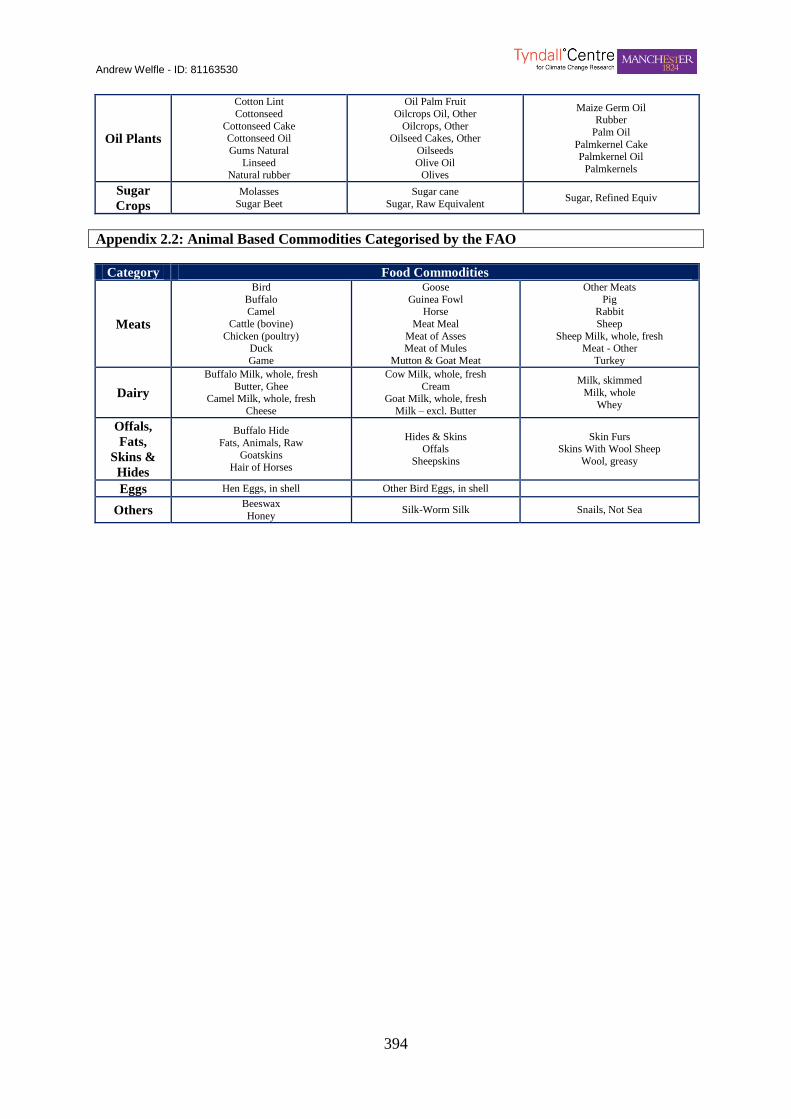
Andrew Welfle - ID: 81163530
394
Oil Plants
Cotton Lint
Cottonseed
Cottonseed Cake Cottonseed Oil
Gums Natural
Linseed Natural rubber
Oil Palm Fruit
Oilcrops Oil, Other
Oilcrops, Other Oilseed Cakes, Other
Oilseeds
Olive Oil Olives
Maize Germ Oil Rubber
Palm Oil
Palmkernel Cake Palmkernel Oil
Palmkernels
Sugar
Crops
Molasses
Sugar Beet
Sugar cane
Sugar, Raw Equivalent Sugar, Refined Equiv
Appendix 2.2: Animal Based Commodities Categorised by the FAO
Category Food Commodities
Meats
Bird
Buffalo Camel
Cattle (bovine)
Chicken (poultry) Duck
Game
Goose
Guinea Fowl Horse
Meat Meal
Meat of Asses Meat of Mules
Mutton & Goat Meat
Other Meats
Pig Rabbit
Sheep
Sheep Milk, whole, fresh Meat - Other
Turkey
Dairy
Buffalo Milk, whole, fresh
Butter, Ghee Camel Milk, whole, fresh
Cheese
Cow Milk, whole, fresh
Cream Goat Milk, whole, fresh
Milk – excl. Butter
Milk, skimmed
Milk, whole
Whey
Offals,
Fats,
Skins &
Hides
Buffalo Hide
Fats, Animals, Raw
Goatskins Hair of Horses
Hides & Skins Offals
Sheepskins
Skin Furs Skins With Wool Sheep
Wool, greasy
Eggs Hen Eggs, in shell Other Bird Eggs, in shell
Others Beeswax
Honey Silk-Worm Silk Snails, Not Sea

Andrew Welfle - ID: 81163530
395
Appendix 3.0
Appendix 3.0 includes an overview of the datasets within the BRM’s calculations analysing UK feed
commodity dynamics. These are utilised within the Model to analyse the amount of land and resources required
to produce animal based food commodities to meet demand.
Appendix 3.1
UK Agriculture
Production Systems
Data within this table reflects the proportions of different types of agricultural
practices applied within the UK to produce the respective animal based products.
Appendix 3.2
Feed Composition Data within this table demonstrates the typical agricultural practices and nature
of feed that is required to produce different animal based products in the UK.
Appendix 3.3
Animal Feed Raw
Material Content
Data within this table demonstrates the raw material content of animal feed
utilised within the UK.
Appendix 3.4
Feed Conversion
Efficiencies
Data within this table demonstrates the typical feed conversion efficiencies for
different animal categories in the UK. These values representing the amount of
feed (kg) that is required to produce an equivalent mass (kg) of animal product.
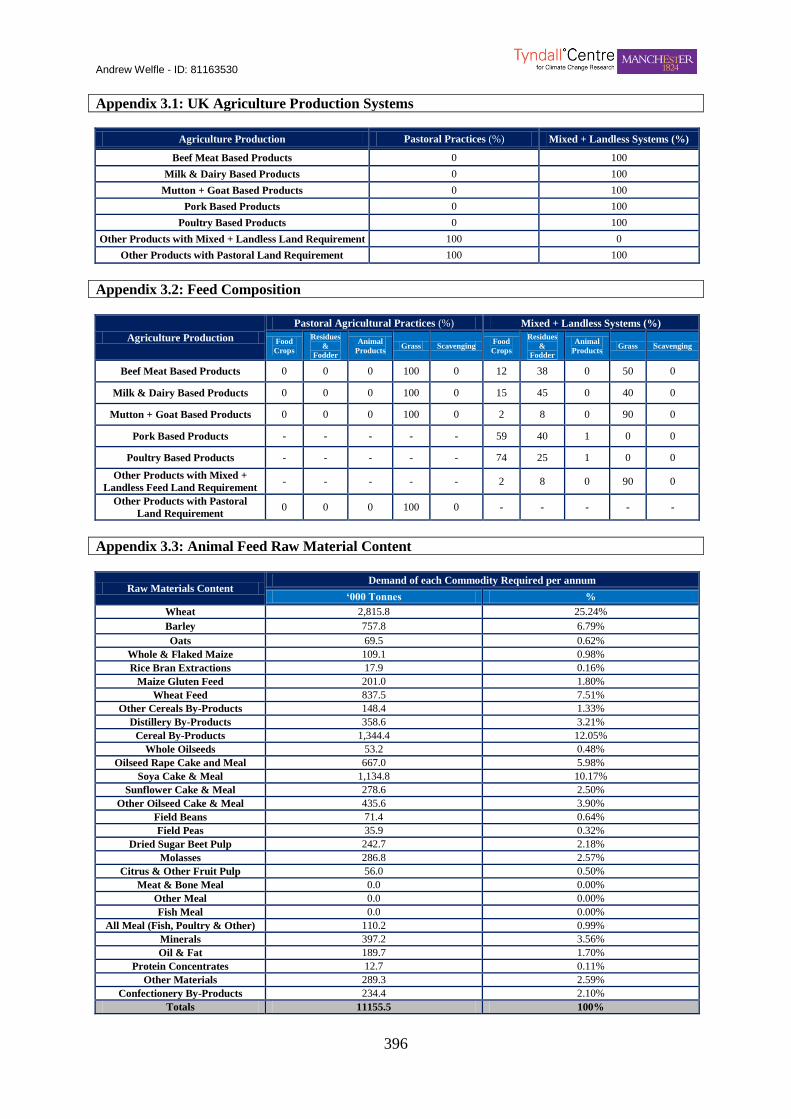
Andrew Welfle - ID: 81163530
396
Appendix 3.1: UK Agriculture Production Systems
Agriculture Production Pastoral Practices (%) Mixed + Landless Systems (%)
Beef Meat Based Products 0 100
Milk & Dairy Based Products 0 100
Mutton + Goat Based Products 0 100
Pork Based Products 0 100
Poultry Based Products 0 100
Other Products with Mixed + Landless Land Requirement 100 0
Other Products with Pastoral Land Requirement 100 100
Appendix 3.2: Feed Composition
Agriculture Production
Pastoral Agricultural Practices (%) Mixed + Landless Systems (%)
Food
Crops
Residues
&
Fodder
Animal
Products Grass Scavenging
Food
Crops
Residues
&
Fodder
Animal
Products Grass Scavenging
Beef Meat Based Products 0 0 0 100 0 12 38 0 50 0
Milk & Dairy Based Products 0 0 0 100 0 15 45 0 40 0
Mutton + Goat Based Products 0 0 0 100 0 2 8 0 90 0
Pork Based Products - - - - - 59 40 1 0 0
Poultry Based Products - - - - - 74 25 1 0 0
Other Products with Mixed +
Landless Feed Land Requirement - - - - - 2 8 0 90 0
Other Products with Pastoral
Land Requirement 0 0 0 100 0 - - - - -
Appendix 3.3: Animal Feed Raw Material Content
Raw Materials Content Demand of each Commodity Required per annum
‘000 Tonnes %
Wheat 2,815.8 25.24%
Barley 757.8 6.79%
Oats 69.5 0.62%
Whole & Flaked Maize 109.1 0.98%
Rice Bran Extractions 17.9 0.16%
Maize Gluten Feed 201.0 1.80%
Wheat Feed 837.5 7.51%
Other Cereals By-Products 148.4 1.33%
Distillery By-Products 358.6 3.21%
Cereal By-Products 1,344.4 12.05%
Whole Oilseeds 53.2 0.48%
Oilseed Rape Cake and Meal 667.0 5.98%
Soya Cake & Meal 1,134.8 10.17%
Sunflower Cake & Meal 278.6 2.50%
Other Oilseed Cake & Meal 435.6 3.90%
Field Beans 71.4 0.64%
Field Peas 35.9 0.32%
Dried Sugar Beet Pulp 242.7 2.18%
Molasses 286.8 2.57%
Citrus & Other Fruit Pulp 56.0 0.50%
Meat & Bone Meal 0.0 0.00%
Other Meal 0.0 0.00%
Fish Meal 0.0 0.00%
All Meal (Fish, Poultry & Other) 110.2 0.99%
Minerals 397.2 3.56%
Oil & Fat 189.7 1.70%
Protein Concentrates 12.7 0.11%
Other Materials 289.3 2.59%
Confectionery By-Products 234.4 2.10%
Totals 11155.5 100%

Andrew Welfle - ID: 81163530
397
Appendix A3.4: Feed Conversion Efficiencies
Agriculture Production
Pastoral Agricultural Practices (feed kg/product kg)
Mixed + Landless Systems (%)
(feed kg/product kg)
Low Range Mean High Range Low Range Mean High Range
Beef Meat Based Products 8.0 16.7 33.0 8.0 10.5 15.0
Milk & Dairy Based Products 1.7 1.7 1.7 0.7 0.9 1.2
Mutton + Goat Based Products 29.0 29.0 29.0 5.4 9.0 17.0
Pork Based Products 3.3 4.6 6.2 2.2 4.4 6.2
Poultry Based Products 2.5 3.1 3.6 1.7 2.8 4.0
Other Products with Mixed +
Landless Feed Land Requirement - - - 8.5 8.5 8.5
Other Products with Pastoral
Land Requirement 14.6 14.6 14.6 - - -
Andrew Welfle - ID: 81163530
398
Appendix 4.0
Appendix 4.0 includes a summary of the range of food crop and biomass resource productivity yield data
utilised within the BRM’s calculations.
Appendix 4.1
Crop Commodity
Productivity Yields
A summary of the productivity yield data of all crop commodities analysed
within the BRM.
Appendix 4.2
Biomass Resource
Productivity Yields
A summary of the productivity yield data of all biomass resources analysed
within the BRM.
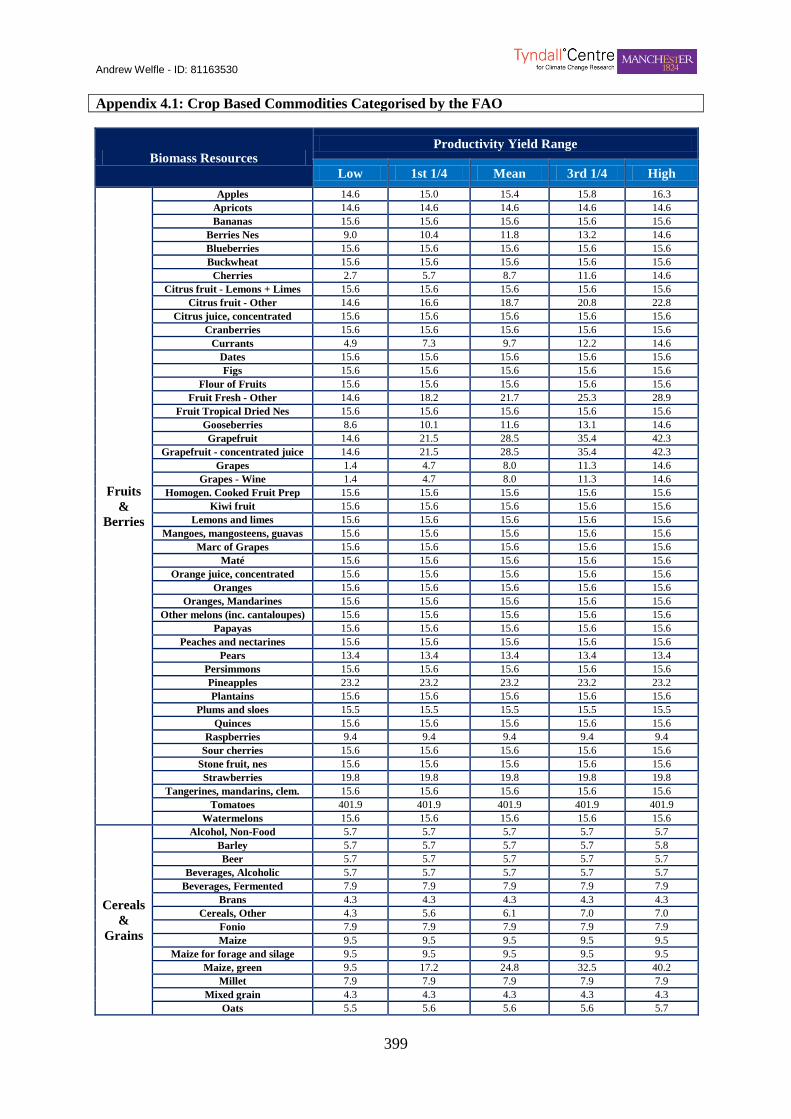
Andrew Welfle - ID: 81163530
399
Appendix 4.1: Crop Based Commodities Categorised by the FAO
Biomass Resources Productivity Yield Range
Low 1st 1/4 Mean 3rd 1/4 High
Fruits
&
Berries
Apples 14.6 15.0 15.4 15.8 16.3
Apricots 14.6 14.6 14.6 14.6 14.6
Bananas 15.6 15.6 15.6 15.6 15.6
Berries Nes 9.0 10.4 11.8 13.2 14.6
Blueberries 15.6 15.6 15.6 15.6 15.6
Buckwheat 15.6 15.6 15.6 15.6 15.6
Cherries 2.7 5.7 8.7 11.6 14.6
Citrus fruit - Lemons + Limes 15.6 15.6 15.6 15.6 15.6
Citrus fruit - Other 14.6 16.6 18.7 20.8 22.8
Citrus juice, concentrated 15.6 15.6 15.6 15.6 15.6
Cranberries 15.6 15.6 15.6 15.6 15.6
Currants 4.9 7.3 9.7 12.2 14.6
Dates 15.6 15.6 15.6 15.6 15.6
Figs 15.6 15.6 15.6 15.6 15.6
Flour of Fruits 15.6 15.6 15.6 15.6 15.6
Fruit Fresh - Other 14.6 18.2 21.7 25.3 28.9
Fruit Tropical Dried Nes 15.6 15.6 15.6 15.6 15.6
Gooseberries 8.6 10.1 11.6 13.1 14.6
Grapefruit 14.6 21.5 28.5 35.4 42.3
Grapefruit - concentrated juice 14.6 21.5 28.5 35.4 42.3
Grapes 1.4 4.7 8.0 11.3 14.6
Grapes - Wine 1.4 4.7 8.0 11.3 14.6
Homogen. Cooked Fruit Prep 15.6 15.6 15.6 15.6 15.6
Kiwi fruit 15.6 15.6 15.6 15.6 15.6
Lemons and limes 15.6 15.6 15.6 15.6 15.6
Mangoes, mangosteens, guavas 15.6 15.6 15.6 15.6 15.6
Marc of Grapes 15.6 15.6 15.6 15.6 15.6
Maté 15.6 15.6 15.6 15.6 15.6
Orange juice, concentrated 15.6 15.6 15.6 15.6 15.6
Oranges 15.6 15.6 15.6 15.6 15.6
Oranges, Mandarines 15.6 15.6 15.6 15.6 15.6
Other melons (inc. cantaloupes) 15.6 15.6 15.6 15.6 15.6
Papayas 15.6 15.6 15.6 15.6 15.6
Peaches and nectarines 15.6 15.6 15.6 15.6 15.6
Pears 13.4 13.4 13.4 13.4 13.4
Persimmons 15.6 15.6 15.6 15.6 15.6
Pineapples 23.2 23.2 23.2 23.2 23.2
Plantains 15.6 15.6 15.6 15.6 15.6
Plums and sloes 15.5 15.5 15.5 15.5 15.5
Quinces 15.6 15.6 15.6 15.6 15.6
Raspberries 9.4 9.4 9.4 9.4 9.4
Sour cherries 15.6 15.6 15.6 15.6 15.6
Stone fruit, nes 15.6 15.6 15.6 15.6 15.6
Strawberries 19.8 19.8 19.8 19.8 19.8
Tangerines, mandarins, clem. 15.6 15.6 15.6 15.6 15.6
Tomatoes 401.9 401.9 401.9 401.9 401.9
Watermelons 15.6 15.6 15.6 15.6 15.6
Cereals
&
Grains
Alcohol, Non-Food 5.7 5.7 5.7 5.7 5.7
Barley 5.7 5.7 5.7 5.7 5.8
Beer 5.7 5.7 5.7 5.7 5.7
Beverages, Alcoholic 5.7 5.7 5.7 5.7 5.7
Beverages, Fermented 7.9 7.9 7.9 7.9 7.9
Brans 4.3 4.3 4.3 4.3 4.3
Cereals, Other 4.3 5.6 6.1 7.0 7.0
Fonio 7.9 7.9 7.9 7.9 7.9
Maize 9.5 9.5 9.5 9.5 9.5
Maize for forage and silage 9.5 9.5 9.5 9.5 9.5
Maize, green 9.5 17.2 24.8 32.5 40.2
Millet 7.9 7.9 7.9 7.9 7.9
Mixed grain 4.3 4.3 4.3 4.3 4.3
Oats 5.5 5.6 5.6 5.6 5.7
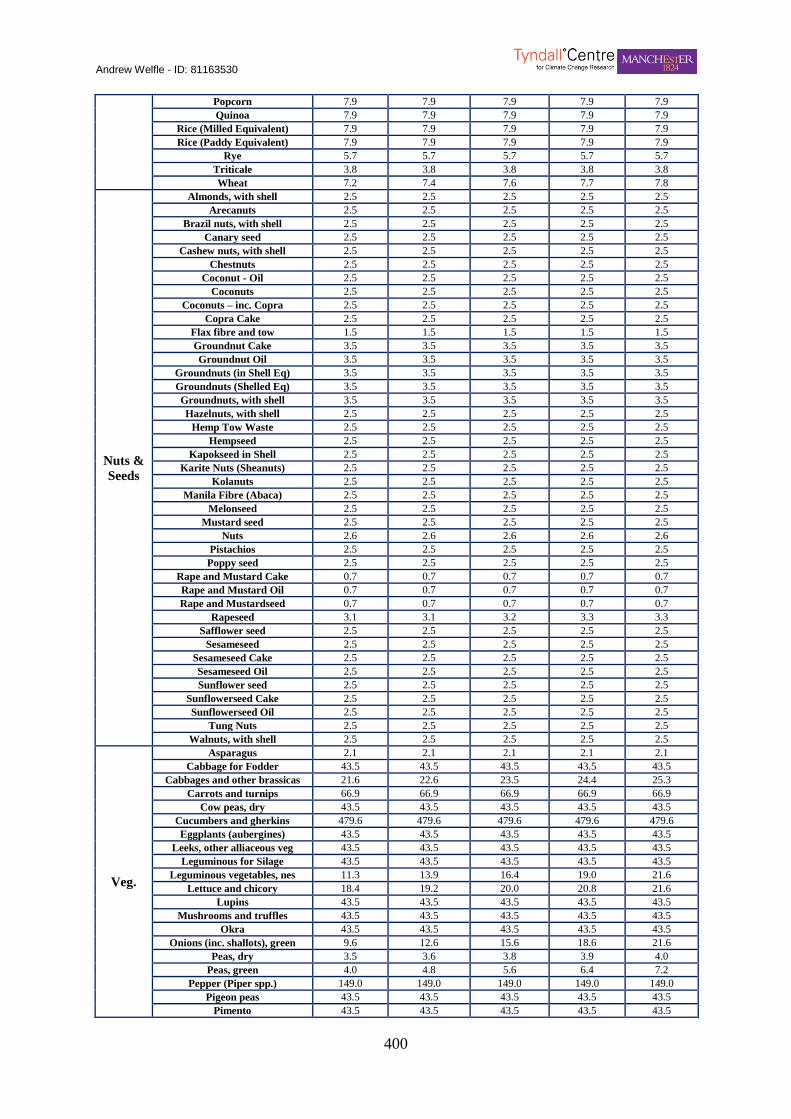
Andrew Welfle - ID: 81163530
400
Popcorn 7.9 7.9 7.9 7.9 7.9
Quinoa 7.9 7.9 7.9 7.9 7.9
Rice (Milled Equivalent) 7.9 7.9 7.9 7.9 7.9
Rice (Paddy Equivalent) 7.9 7.9 7.9 7.9 7.9
Rye 5.7 5.7 5.7 5.7 5.7
Triticale 3.8 3.8 3.8 3.8 3.8
Wheat 7.2 7.4 7.6 7.7 7.8
Nuts &
Seeds
Almonds, with shell 2.5 2.5 2.5 2.5 2.5
Arecanuts 2.5 2.5 2.5 2.5 2.5
Brazil nuts, with shell 2.5 2.5 2.5 2.5 2.5
Canary seed 2.5 2.5 2.5 2.5 2.5
Cashew nuts, with shell 2.5 2.5 2.5 2.5 2.5
Chestnuts 2.5 2.5 2.5 2.5 2.5
Coconut - Oil 2.5 2.5 2.5 2.5 2.5
Coconuts 2.5 2.5 2.5 2.5 2.5
Coconuts – inc. Copra 2.5 2.5 2.5 2.5 2.5
Copra Cake 2.5 2.5 2.5 2.5 2.5
Flax fibre and tow 1.5 1.5 1.5 1.5 1.5
Groundnut Cake 3.5 3.5 3.5 3.5 3.5
Groundnut Oil 3.5 3.5 3.5 3.5 3.5
Groundnuts (in Shell Eq) 3.5 3.5 3.5 3.5 3.5
Groundnuts (Shelled Eq) 3.5 3.5 3.5 3.5 3.5
Groundnuts, with shell 3.5 3.5 3.5 3.5 3.5
Hazelnuts, with shell 2.5 2.5 2.5 2.5 2.5
Hemp Tow Waste 2.5 2.5 2.5 2.5 2.5
Hempseed 2.5 2.5 2.5 2.5 2.5
Kapokseed in Shell 2.5 2.5 2.5 2.5 2.5
Karite Nuts (Sheanuts) 2.5 2.5 2.5 2.5 2.5
Kolanuts 2.5 2.5 2.5 2.5 2.5
Manila Fibre (Abaca) 2.5 2.5 2.5 2.5 2.5
Melonseed 2.5 2.5 2.5 2.5 2.5
Mustard seed 2.5 2.5 2.5 2.5 2.5
Nuts 2.6 2.6 2.6 2.6 2.6
Pistachios 2.5 2.5 2.5 2.5 2.5
Poppy seed 2.5 2.5 2.5 2.5 2.5
Rape and Mustard Cake 0.7 0.7 0.7 0.7 0.7
Rape and Mustard Oil 0.7 0.7 0.7 0.7 0.7
Rape and Mustardseed 0.7 0.7 0.7 0.7 0.7
Rapeseed 3.1 3.1 3.2 3.3 3.3
Safflower seed 2.5 2.5 2.5 2.5 2.5
Sesameseed 2.5 2.5 2.5 2.5 2.5
Sesameseed Cake 2.5 2.5 2.5 2.5 2.5
Sesameseed Oil 2.5 2.5 2.5 2.5 2.5
Sunflower seed 2.5 2.5 2.5 2.5 2.5
Sunflowerseed Cake 2.5 2.5 2.5 2.5 2.5
Sunflowerseed Oil 2.5 2.5 2.5 2.5 2.5
Tung Nuts 2.5 2.5 2.5 2.5 2.5
Walnuts, with shell 2.5 2.5 2.5 2.5 2.5
Veg.
Asparagus 2.1 2.1 2.1 2.1 2.1
Cabbage for Fodder 43.5 43.5 43.5 43.5 43.5
Cabbages and other brassicas 21.6 22.6 23.5 24.4 25.3
Carrots and turnips 66.9 66.9 66.9 66.9 66.9
Cow peas, dry 43.5 43.5 43.5 43.5 43.5
Cucumbers and gherkins 479.6 479.6 479.6 479.6 479.6
Eggplants (aubergines) 43.5 43.5 43.5 43.5 43.5
Leeks, other alliaceous veg 43.5 43.5 43.5 43.5 43.5
Leguminous for Silage 43.5 43.5 43.5 43.5 43.5
Leguminous vegetables, nes 11.3 13.9 16.4 19.0 21.6
Lettuce and chicory 18.4 19.2 20.0 20.8 21.6
Lupins 43.5 43.5 43.5 43.5 43.5
Mushrooms and truffles 43.5 43.5 43.5 43.5 43.5
Okra 43.5 43.5 43.5 43.5 43.5
Onions (inc. shallots), green 9.6 12.6 15.6 18.6 21.6
Peas, dry 3.5 3.6 3.8 3.9 4.0
Peas, green 4.0 4.8 5.6 6.4 7.2
Pepper (Piper spp.) 149.0 149.0 149.0 149.0 149.0
Pigeon peas 43.5 43.5 43.5 43.5 43.5
Pimento 43.5 43.5 43.5 43.5 43.5

Andrew Welfle - ID: 81163530
401
Potatoes 40.2 41.4 42.2 43.2 43.8
Pulses Other 2.8 3.0 3.1 3.3 3.5
Pumpkins for Fodder 43.5 43.5 43.5 43.5 43.5
Pumpkins, squash and gourds 43.5 43.5 43.5 43.5 43.5
Roots & Tuber Dry Equiv 9.0 9.0 9.0 9.0 9.0
Roots, Other 43.5 43.5 43.5 43.5 43.5
Sweet potatoes 43.5 43.5 43.5 43.5 43.5
Turnips for Fodder 43.5 43.5 43.5 43.5 43.5
Vetches 43.5 43.5 43.5 43.5 43.5
Vegetables - Other 12.5 14.8 17.1 19.3 21.6
Yams 43.5 43.5 43.5 43.5 43.5
Plants
Agave Fibres Nes 38.2 38.2 38.2 38.2 38.2
Anise, badian, fennel, corian. 38.2 38.2 38.2 38.2 38.2
Artichokes 38.2 38.2 38.2 38.2 38.2
Avocados 38.2 38.2 38.2 38.2 38.2
Beets for Fodder 38.2 38.2 38.2 38.2 38.2
Carobs 38.2 38.2 38.2 38.2 38.2
Casava 1.3 1.3 1.3 1.3 1.3
Chicory roots 38.2 38.2 38.2 38.2 38.2
Chillies and peppers, dry 38.2 38.2 38.2 38.2 38.2
Chillies and peppers, green 149.0 149.0 149.0 149.0 149.0
Coffee, green 38.2 38.2 38.2 38.2 38.2
Coir 38.2 38.2 38.2 38.2 38.2
Hard Fibres, Other 38.2 38.2 38.2 38.2 38.2
Hops 1.3 1.3 1.3 1.3 1.3
Jute 38.2 38.2 38.2 38.2 38.2
Kapok Fibre 38.2 38.2 38.2 38.2 38.2
Other Bastfibres 38.2 38.2 38.2 38.2 38.2
Pyrethrum, Dried 38.2 38.2 38.2 38.2 38.2
Ramie 38.2 38.2 38.2 38.2 38.2
Sisal 38.2 38.2 38.2 38.2 38.2
Soft-Fibres, Other 1.3 1.3 1.3 1.3 1.3
Sorghum 38.2 38.2 38.2 38.2 38.2
Tobacco, unmanufactured 38.2 38.2 38.2 38.2 38.2
Yautia (cocoyam) 38.2 38.2 38.2 38.2 38.2
Beans
Bambara beans 4.4 4.4 4.4 4.4 4.4
Beans, dry 3.7 5.0 6.3 7.6 8.9
Beans, green 3.7 5.0 6.2 7.5 8.8
Broad beans, horse beans, dry 3.7 3.8 4.0 4.1 4.2
Chick peas 4.4 4.4 4.4 4.4 4.4
Cocoa beans 4.4 4.4 4.4 4.4 4.4
Lentils 4.4 4.4 4.4 4.4 4.4
Soyabean Cake 2.8 3.0 3.3 3.5 3.7
Soyabean Oil 2.8 3.0 3.3 3.5 3.7
Soyabeans 2.8 3.0 3.3 3.5 3.7
String beans 4.4 4.4 4.4 4.4 4.4
Herbs
Spices
&
Leaves
Cinnamon (canella) 39.7 39.7 39.7 39.7 39.7
Cloves 39.7 39.7 39.7 39.7 39.7
Garlic 39.7 39.7 39.7 39.7 39.7
Ginger 39.7 39.7 39.7 39.7 39.7
Nutmeg, mace and cardamoms 39.7 39.7 39.7 39.7 39.7
Peppermint 39.7 39.7 39.7 39.7 39.7
Spices, nes 39.7 39.7 39.7 39.7 39.7
Spinach 39.7 39.7 39.7 39.7 39.7
Spices - Other 39.7 39.7 39.7 39.7 39.7
Sweeteners, Other 39.7 39.7 39.7 39.7 39.7
Tea 39.7 39.7 39.7 39.7 39.7
Vanilla 39.7 39.7 39.7 39.7 39.7
Oil
Plants
Cotton Lint 1.6 1.7 1.8 1.9 2.0
Cottonseed 1.6 1.7 1.8 1.9 2.0
Cottonseed Cake 1.6 1.7 1.8 1.9 2.0
Cottonseed Oil 1.6 1.7 1.8 1.9 2.0
Gums Natural 2.0 2.0 2.0 2.0 2.0
Linseed 1.6 1.7 1.8 1.9 2.0
Natural rubber 2.0 2.0 2.0 2.0 2.0
Oil palm fruit 2.0 2.0 2.0 2.0 2.0
Oilcrops Oil, Other 1.6 1.7 2.3 2.6 3.3
Oilcrops, Other 1.6 1.7 2.3 2.6 3.3

Andrew Welfle - ID: 81163530
402
Oilseed Cakes, Other 1.6 1.7 2.3 2.6 3.3
Oilseeds, Nes 1.6 1.7 2.3 2.6 3.3
Olive Oil 2.0 2.0 2.0 2.0 2.0
Olives 2.0 2.0 2.0 2.0 2.0
Maise Germ Oil 1.6 1.7 1.8 1.9 2.0
Rubber 2.0 2.0 2.0 2.0 2.0
Palm Oil 2.0 2.0 2.0 2.0 2.0
Palmkernel Cake 2.0 2.0 2.0 2.0 2.0
Palmkernel Oil 2.0 2.0 2.0 2.0 2.0
Palmkernels 2.0 2.0 2.0 2.0 2.0
Sugar
Crops
Molasses 53.9 54.2 54.6 54.9 55.3
Sugar Beet 9.5 31.7 39.6 54.6 55.3
Sugar cane 49.6 49.6 49.6 49.6 49.6
Sugar, Raw Equivalent 53.9 54.2 54.6 54.9 55.3
Sugar, Refined Equiv 53.9 54.2 54.6 54.9 55.3
Appendix 4.2: Biomass Resource Productivity Yields
Category Biomass Resources Productivity Yield Range
Low 1st 1/4 Mean 3rd 1/4 High
Biomass
Resources
Miscanthus 5.0 6.9 12.8 18.0 24.1
Willow 7.0 8.0 8.6 9.0 10.0
Poplar 5.6 6.5 7.7 8.8 10.0
Beech 8.0 9.0 9.9 10.9 11.8
Birch 5.0 6.5 7.7 9.0 10.0
Eucalyptus 9.0 10.5 12.0 13.5 15.0
Fir 8.0 10.5 13.0 15.5 18.0
Pine 8.0 8.5 9.0 9.5 10.0
Spruce 8.0 9.5 11.0 12.5 14.0
Sycamore 6.0 6.8 7.0 7.3 8.0
Sunflower 1.5 1.8 2.0 2.3 2.5
Reed Canary Grass 2.9 5.8 8.9 11.9 15.0
Switch Grass 6.0 6.7 9.6 11.4 15.4
Ash 10.0 10.0 10.0 10.0 10.0
Pasture Grass 10.5 11.3 12.0 12.8 13.5

Andrew Welfle - ID: 81163530
403
Appendix 5.0
Appendix 5.0 includes a summary of the applicable data utilised within the UK BRM for the waste generation
and waste management scenario calculations.
Appendix 5.1 Waste Generation
Scenarios – Household
Waste
Household waste generation scenario data reflecting the DEFRA forecast
scenarios as described within the Thesis text.
Appendix 5.2
Waste Generation
Scenarios – Other
Waste
Other waste generation scenario data reflecting the DEFRA forecast scenarios as
described within the Thesis text.
Appendix 5.3 Waste Management
Scenarios – Current
Rate + Resource
Recovery
Waste management strategy data reflecting DEFRA’s Current Rate and Resource
Recovery scenarios as described within the Thesis text.
Appendix 5.4 Waste Management
Scenarios – Energy
Recovery + Combined
Recovery
Waste management strategy data reflecting DEFRA’s Energy Recovery and
Combined Recovery scenarios as described within the Thesis text.
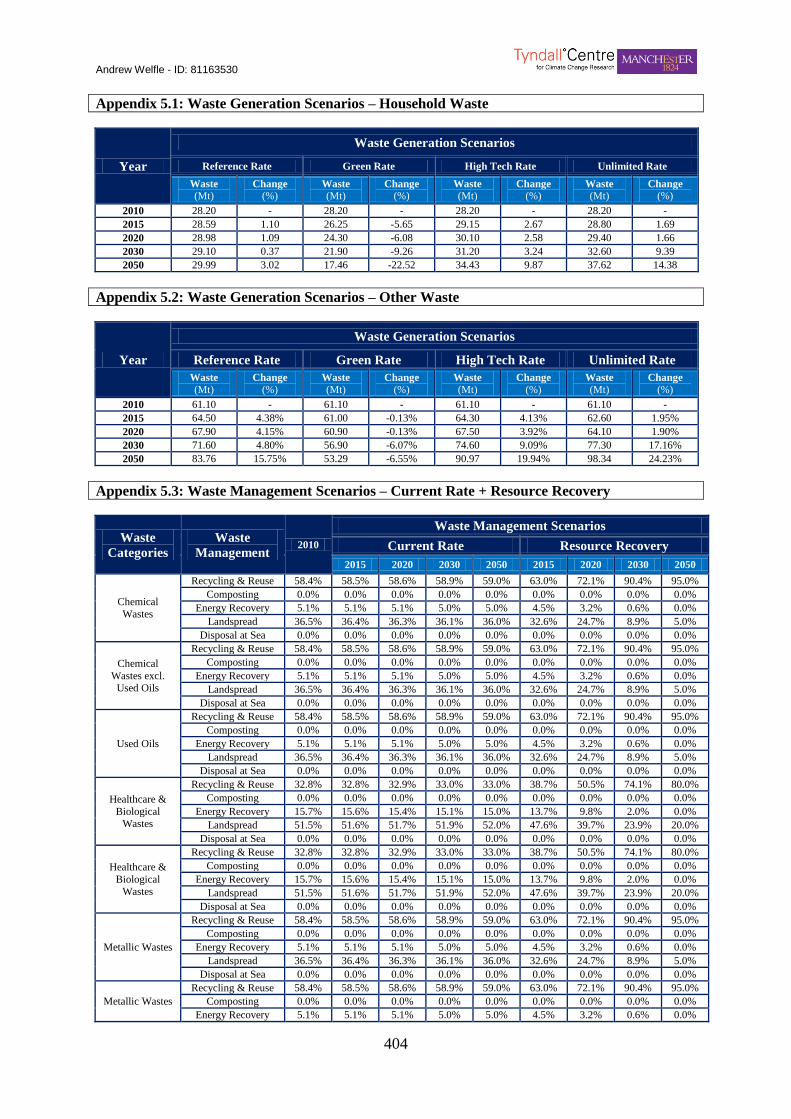
Andrew Welfle - ID: 81163530
404
Appendix 5.1: Waste Generation Scenarios – Household Waste
Year
Waste Generation Scenarios
Reference Rate Green Rate High Tech Rate Unlimited Rate
Waste
(Mt) Change
(%) Waste
(Mt) Change
(%) Waste
(Mt) Change
(%) Waste
(Mt) Change
(%)
2010 28.20 - 28.20 - 28.20 - 28.20 -
2015 28.59 1.10 26.25 -5.65 29.15 2.67 28.80 1.69
2020 28.98 1.09 24.30 -6.08 30.10 2.58 29.40 1.66
2030 29.10 0.37 21.90 -9.26 31.20 3.24 32.60 9.39
2050 29.99 3.02 17.46 -22.52 34.43 9.87 37.62 14.38
Appendix 5.2: Waste Generation Scenarios – Other Waste
Year
Waste Generation Scenarios
Reference Rate Green Rate High Tech Rate Unlimited Rate
Waste
(Mt) Change
(%) Waste
(Mt) Change
(%) Waste
(Mt) Change
(%) Waste
(Mt) Change
(%)
2010 61.10 - 61.10 - 61.10 - 61.10 -
2015 64.50 4.38% 61.00 -0.13% 64.30 4.13% 62.60 1.95%
2020 67.90 4.15% 60.90 -0.13% 67.50 3.92% 64.10 1.90%
2030 71.60 4.80% 56.90 -6.07% 74.60 9.09% 77.30 17.16%
2050 83.76 15.75% 53.29 -6.55% 90.97 19.94% 98.34 24.23%
Appendix 5.3: Waste Management Scenarios – Current Rate + Resource Recovery
Waste
Categories
Waste
Management 2010
Waste Management Scenarios
Current Rate Resource Recovery
2015 2020 2030 2050 2015 2020 2030 2050
Chemical
Wastes
Recycling & Reuse 58.4% 58.5% 58.6% 58.9% 59.0% 63.0% 72.1% 90.4% 95.0%
Composting 0.0% 0.0% 0.0% 0.0% 0.0% 0.0% 0.0% 0.0% 0.0%
Energy Recovery 5.1% 5.1% 5.1% 5.0% 5.0% 4.5% 3.2% 0.6% 0.0%
Landspread 36.5% 36.4% 36.3% 36.1% 36.0% 32.6% 24.7% 8.9% 5.0%
Disposal at Sea 0.0% 0.0% 0.0% 0.0% 0.0% 0.0% 0.0% 0.0% 0.0%
Chemical
Wastes excl. Used Oils
Recycling & Reuse 58.4% 58.5% 58.6% 58.9% 59.0% 63.0% 72.1% 90.4% 95.0%
Composting 0.0% 0.0% 0.0% 0.0% 0.0% 0.0% 0.0% 0.0% 0.0%
Energy Recovery 5.1% 5.1% 5.1% 5.0% 5.0% 4.5% 3.2% 0.6% 0.0%
Landspread 36.5% 36.4% 36.3% 36.1% 36.0% 32.6% 24.7% 8.9% 5.0%
Disposal at Sea 0.0% 0.0% 0.0% 0.0% 0.0% 0.0% 0.0% 0.0% 0.0%
Used Oils
Recycling & Reuse 58.4% 58.5% 58.6% 58.9% 59.0% 63.0% 72.1% 90.4% 95.0%
Composting 0.0% 0.0% 0.0% 0.0% 0.0% 0.0% 0.0% 0.0% 0.0%
Energy Recovery 5.1% 5.1% 5.1% 5.0% 5.0% 4.5% 3.2% 0.6% 0.0%
Landspread 36.5% 36.4% 36.3% 36.1% 36.0% 32.6% 24.7% 8.9% 5.0%
Disposal at Sea 0.0% 0.0% 0.0% 0.0% 0.0% 0.0% 0.0% 0.0% 0.0%
Healthcare &
Biological Wastes
Recycling & Reuse 32.8% 32.8% 32.9% 33.0% 33.0% 38.7% 50.5% 74.1% 80.0%
Composting 0.0% 0.0% 0.0% 0.0% 0.0% 0.0% 0.0% 0.0% 0.0%
Energy Recovery 15.7% 15.6% 15.4% 15.1% 15.0% 13.7% 9.8% 2.0% 0.0%
Landspread 51.5% 51.6% 51.7% 51.9% 52.0% 47.6% 39.7% 23.9% 20.0%
Disposal at Sea 0.0% 0.0% 0.0% 0.0% 0.0% 0.0% 0.0% 0.0% 0.0%
Healthcare &
Biological
Wastes
Recycling & Reuse 32.8% 32.8% 32.9% 33.0% 33.0% 38.7% 50.5% 74.1% 80.0%
Composting 0.0% 0.0% 0.0% 0.0% 0.0% 0.0% 0.0% 0.0% 0.0%
Energy Recovery 15.7% 15.6% 15.4% 15.1% 15.0% 13.7% 9.8% 2.0% 0.0%
Landspread 51.5% 51.6% 51.7% 51.9% 52.0% 47.6% 39.7% 23.9% 20.0%
Disposal at Sea 0.0% 0.0% 0.0% 0.0% 0.0% 0.0% 0.0% 0.0% 0.0%
Metallic Wastes
Recycling & Reuse 58.4% 58.5% 58.6% 58.9% 59.0% 63.0% 72.1% 90.4% 95.0%
Composting 0.0% 0.0% 0.0% 0.0% 0.0% 0.0% 0.0% 0.0% 0.0%
Energy Recovery 5.1% 5.1% 5.1% 5.0% 5.0% 4.5% 3.2% 0.6% 0.0%
Landspread 36.5% 36.4% 36.3% 36.1% 36.0% 32.6% 24.7% 8.9% 5.0%
Disposal at Sea 0.0% 0.0% 0.0% 0.0% 0.0% 0.0% 0.0% 0.0% 0.0%
Metallic Wastes
Recycling & Reuse 58.4% 58.5% 58.6% 58.9% 59.0% 63.0% 72.1% 90.4% 95.0%
Composting 0.0% 0.0% 0.0% 0.0% 0.0% 0.0% 0.0% 0.0% 0.0%
Energy Recovery 5.1% 5.1% 5.1% 5.0% 5.0% 4.5% 3.2% 0.6% 0.0%
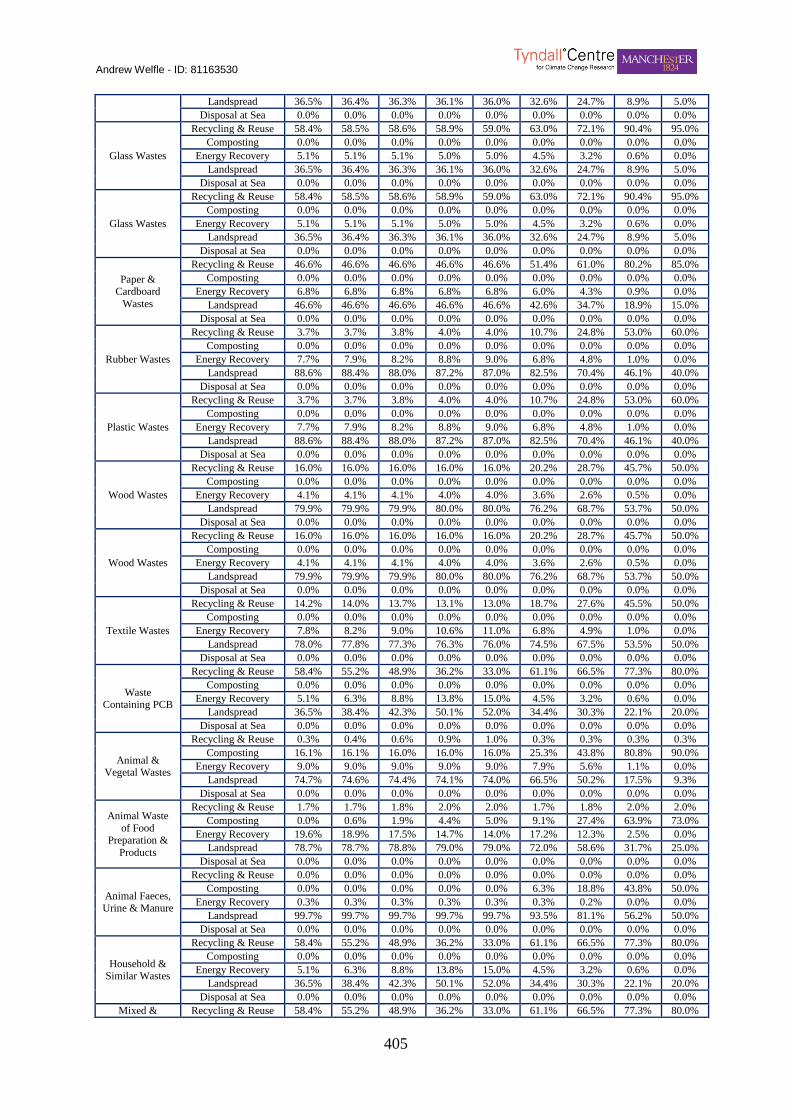
Andrew Welfle - ID: 81163530
405
Landspread 36.5% 36.4% 36.3% 36.1% 36.0% 32.6% 24.7% 8.9% 5.0%
Disposal at Sea 0.0% 0.0% 0.0% 0.0% 0.0% 0.0% 0.0% 0.0% 0.0%
Glass Wastes
Recycling & Reuse 58.4% 58.5% 58.6% 58.9% 59.0% 63.0% 72.1% 90.4% 95.0%
Composting 0.0% 0.0% 0.0% 0.0% 0.0% 0.0% 0.0% 0.0% 0.0%
Energy Recovery 5.1% 5.1% 5.1% 5.0% 5.0% 4.5% 3.2% 0.6% 0.0%
Landspread 36.5% 36.4% 36.3% 36.1% 36.0% 32.6% 24.7% 8.9% 5.0%
Disposal at Sea 0.0% 0.0% 0.0% 0.0% 0.0% 0.0% 0.0% 0.0% 0.0%
Paper & Cardboard
Wastes
Recycling & Reuse 46.6% 46.6% 46.6% 46.6% 46.6% 51.4% 61.0% 80.2% 85.0%
Composting 0.0% 0.0% 0.0% 0.0% 0.0% 0.0% 0.0% 0.0% 0.0%
Energy Recovery 6.8% 6.8% 6.8% 6.8% 6.8% 6.0% 4.3% 0.9% 0.0%
Landspread 46.6% 46.6% 46.6% 46.6% 46.6% 42.6% 34.7% 18.9% 15.0%
Disposal at Sea 0.0% 0.0% 0.0% 0.0% 0.0% 0.0% 0.0% 0.0% 0.0%
Rubber Wastes
Recycling & Reuse 3.7% 3.7% 3.8% 4.0% 4.0% 10.7% 24.8% 53.0% 60.0%
Composting 0.0% 0.0% 0.0% 0.0% 0.0% 0.0% 0.0% 0.0% 0.0%
Energy Recovery 7.7% 7.9% 8.2% 8.8% 9.0% 6.8% 4.8% 1.0% 0.0%
Landspread 88.6% 88.4% 88.0% 87.2% 87.0% 82.5% 70.4% 46.1% 40.0%
Disposal at Sea 0.0% 0.0% 0.0% 0.0% 0.0% 0.0% 0.0% 0.0% 0.0%
Plastic Wastes
Recycling & Reuse 3.7% 3.7% 3.8% 4.0% 4.0% 10.7% 24.8% 53.0% 60.0%
Composting 0.0% 0.0% 0.0% 0.0% 0.0% 0.0% 0.0% 0.0% 0.0%
Energy Recovery 7.7% 7.9% 8.2% 8.8% 9.0% 6.8% 4.8% 1.0% 0.0%
Landspread 88.6% 88.4% 88.0% 87.2% 87.0% 82.5% 70.4% 46.1% 40.0%
Disposal at Sea 0.0% 0.0% 0.0% 0.0% 0.0% 0.0% 0.0% 0.0% 0.0%
Wood Wastes
Recycling & Reuse 16.0% 16.0% 16.0% 16.0% 16.0% 20.2% 28.7% 45.7% 50.0%
Composting 0.0% 0.0% 0.0% 0.0% 0.0% 0.0% 0.0% 0.0% 0.0%
Energy Recovery 4.1% 4.1% 4.1% 4.0% 4.0% 3.6% 2.6% 0.5% 0.0%
Landspread 79.9% 79.9% 79.9% 80.0% 80.0% 76.2% 68.7% 53.7% 50.0%
Disposal at Sea 0.0% 0.0% 0.0% 0.0% 0.0% 0.0% 0.0% 0.0% 0.0%
Textile Wastes
Recycling & Reuse 14.2% 14.0% 13.7% 13.1% 13.0% 18.7% 27.6% 45.5% 50.0%
Composting 0.0% 0.0% 0.0% 0.0% 0.0% 0.0% 0.0% 0.0% 0.0%
Energy Recovery 7.8% 8.2% 9.0% 10.6% 11.0% 6.8% 4.9% 1.0% 0.0%
Landspread 78.0% 77.8% 77.3% 76.3% 76.0% 74.5% 67.5% 53.5% 50.0%
Disposal at Sea 0.0% 0.0% 0.0% 0.0% 0.0% 0.0% 0.0% 0.0% 0.0%
Waste Containing PCB
Recycling & Reuse 58.4% 55.2% 48.9% 36.2% 33.0% 61.1% 66.5% 77.3% 80.0%
Composting 0.0% 0.0% 0.0% 0.0% 0.0% 0.0% 0.0% 0.0% 0.0%
Energy Recovery 5.1% 6.3% 8.8% 13.8% 15.0% 4.5% 3.2% 0.6% 0.0%
Landspread 36.5% 38.4% 42.3% 50.1% 52.0% 34.4% 30.3% 22.1% 20.0%
Disposal at Sea 0.0% 0.0% 0.0% 0.0% 0.0% 0.0% 0.0% 0.0% 0.0%
Animal & Vegetal Wastes
Recycling & Reuse 0.3% 0.4% 0.6% 0.9% 1.0% 0.3% 0.3% 0.3% 0.3%
Composting 16.1% 16.1% 16.0% 16.0% 16.0% 25.3% 43.8% 80.8% 90.0%
Energy Recovery 9.0% 9.0% 9.0% 9.0% 9.0% 7.9% 5.6% 1.1% 0.0%
Landspread 74.7% 74.6% 74.4% 74.1% 74.0% 66.5% 50.2% 17.5% 9.3%
Disposal at Sea 0.0% 0.0% 0.0% 0.0% 0.0% 0.0% 0.0% 0.0% 0.0%
Animal Waste
of Food Preparation &
Products
Recycling & Reuse 1.7% 1.7% 1.8% 2.0% 2.0% 1.7% 1.8% 2.0% 2.0%
Composting 0.0% 0.6% 1.9% 4.4% 5.0% 9.1% 27.4% 63.9% 73.0%
Energy Recovery 19.6% 18.9% 17.5% 14.7% 14.0% 17.2% 12.3% 2.5% 0.0%
Landspread 78.7% 78.7% 78.8% 79.0% 79.0% 72.0% 58.6% 31.7% 25.0%
Disposal at Sea 0.0% 0.0% 0.0% 0.0% 0.0% 0.0% 0.0% 0.0% 0.0%
Animal Faeces, Urine & Manure
Recycling & Reuse 0.0% 0.0% 0.0% 0.0% 0.0% 0.0% 0.0% 0.0% 0.0%
Composting 0.0% 0.0% 0.0% 0.0% 0.0% 6.3% 18.8% 43.8% 50.0%
Energy Recovery 0.3% 0.3% 0.3% 0.3% 0.3% 0.3% 0.2% 0.0% 0.0%
Landspread 99.7% 99.7% 99.7% 99.7% 99.7% 93.5% 81.1% 56.2% 50.0%
Disposal at Sea 0.0% 0.0% 0.0% 0.0% 0.0% 0.0% 0.0% 0.0% 0.0%
Household & Similar Wastes
Recycling & Reuse 58.4% 55.2% 48.9% 36.2% 33.0% 61.1% 66.5% 77.3% 80.0%
Composting 0.0% 0.0% 0.0% 0.0% 0.0% 0.0% 0.0% 0.0% 0.0%
Energy Recovery 5.1% 6.3% 8.8% 13.8% 15.0% 4.5% 3.2% 0.6% 0.0%
Landspread 36.5% 38.4% 42.3% 50.1% 52.0% 34.4% 30.3% 22.1% 20.0%
Disposal at Sea 0.0% 0.0% 0.0% 0.0% 0.0% 0.0% 0.0% 0.0% 0.0%
Mixed & Recycling & Reuse 58.4% 55.2% 48.9% 36.2% 33.0% 61.1% 66.5% 77.3% 80.0%

Andrew Welfle - ID: 81163530
406
Undifferentiated
Materials
Composting 0.0% 0.0% 0.0% 0.0% 0.0% 0.0% 0.0% 0.0% 0.0%
Energy Recovery 5.1% 6.3% 8.8% 13.8% 15.0% 4.5% 3.2% 0.6% 0.0%
Landspread 36.5% 38.4% 42.3% 50.1% 52.0% 34.4% 30.3% 22.1% 20.0%
Disposal at Sea 0.0% 0.0% 0.0% 0.0% 0.0% 0.0% 0.0% 0.0% 0.0%
Mixed & Undifferentiated
Materials
Recycling & Reuse 58.4% 55.2% 48.9% 36.2% 33.0% 61.1% 66.5% 77.3% 80.0%
Composting 0.0% 0.0% 0.0% 0.0% 0.0% 0.0% 0.0% 0.0% 0.0%
Energy Recovery 5.1% 6.3% 8.8% 13.8% 15.0% 4.5% 3.2% 0.6% 0.0%
Landspread 36.5% 38.4% 42.3% 50.1% 52.0% 34.4% 30.3% 22.1% 20.0%
Disposal at Sea 0.0% 0.0% 0.0% 0.0% 0.0% 0.0% 0.0% 0.0% 0.0%
Sorting
Residues
Recycling & Reuse 84.1% 84.2% 84.5% 84.9% 85.0% 85.5% 88.2% 93.6% 95.0%
Composting 0.0% 0.0% 0.0% 0.0% 0.0% 0.0% 0.0% 0.0% 0.0%
Energy Recovery 0.2% 0.3% 0.5% 0.9% 1.0% 0.2% 0.1% 0.0% 0.0%
Landspread 16.0% 15.8% 15.3% 14.3% 14.0% 14.6% 11.9% 6.4% 5.0%
Disposal at Sea 0.0% 0.0% 0.0% 0.0% 0.0% 0.0% 0.0% 0.0% 0.0%
Common
Sludges
Recycling & Reuse 0.0% 0.0% 0.0% 0.0% 0.0% 0.0% 0.0% 0.0% 0.0%
Composting 0.0% 0.0% 0.0% 0.0% 0.0% 6.3% 18.8% 43.8% 50.0%
Energy Recovery 0.3% 0.3% 0.3% 0.3% 0.3% 0.3% 0.2% 0.0% 0.0%
Landspread 99.7% 99.7% 99.7% 99.7% 99.7% 93.5% 81.1% 56.2% 50.0%
Disposal at Sea 0.0% 0.0% 0.0% 0.0% 0.0% 0.0% 0.0% 0.0% 0.0%
Mineral Wastes
Recycling & Reuse 2.0% 2.0% 2.0% 2.0% 2.0% 13.6% 36.9% 83.4% 95.0%
Composting 0.0% 0.0% 0.0% 0.0% 0.0% 0.0% 0.0% 0.0% 0.0%
Energy Recovery 0.0% 0.0% 0.0% 0.0% 0.0% 0.0% 0.0% 0.0% 0.0%
Landspread 98.0% 94.6% 87.9% 74.4% 71.0% 86.4% 63.1% 16.6% 5.0%
Disposal at Sea 0.0% 3.4% 10.1% 23.6% 27.0% 0.0% 0.0% 0.0% 0.0%
Other Wastes
Recycling & Reuse 58.4% 55.2% 48.9% 36.2% 33.0% 61.1% 66.5% 77.3% 80.0%
Composting 0.0% 0.0% 0.0% 0.0% 0.0% 0.0% 0.0% 0.0% 0.0%
Energy Recovery 5.1% 6.3% 8.8% 13.8% 15.0% 4.5% 3.2% 0.6% 0.0%
Landspread 36.5% 38.4% 42.3% 50.1% 52.0% 34.4% 30.3% 22.1% 20.0%
Disposal at Sea 0.0% 0.0% 0.0% 0.0% 0.0% 0.0% 0.0% 0.0% 0.0%
Appendix A5.4: Waste Management Scenarios – Energy Recovery + Combined Recovery
Waste
Categories
Waste
Management 2010
Waste Management Scenarios
Current Rate Resource Recovery
2015 2020 2030 2050 2015 2020 2030 2050
Chemical
Wastes
Recycling & Reuse 58.4% 58.5% 58.6% 58.9% 59.0% 58.5% 58.6% 58.9% 59.0%
Composting 0.0% 0.0% 0.0% 0.0% 0.0% 0.0% 0.0% 0.0% 0.0%
Energy Recovery 5.1% 5.1% 5.1% 5.0% 5.0% 5.1% 5.1% 5.0% 5.0%
Landspread 36.5% 36.4% 36.3% 36.1% 36.0% 36.4% 36.3% 36.1% 36.0%
Disposal at Sea 0.0% 0.0% 0.0% 0.0% 0.0% 0.0% 0.0% 0.0% 0.0%
Chemical
Wastes excl.
Used Oils
Recycling & Reuse 58.4% 58.5% 58.6% 58.9% 59.0% 58.5% 58.6% 58.9% 59.0%
Composting 0.0% 0.0% 0.0% 0.0% 0.0% 0.0% 0.0% 0.0% 0.0%
Energy Recovery 5.1% 5.1% 5.1% 5.0% 5.0% 5.1% 5.1% 5.0% 5.0%
Landspread 36.5% 36.4% 36.3% 36.1% 36.0% 36.4% 36.3% 36.1% 36.0%
Disposal at Sea 0.0% 0.0% 0.0% 0.0% 0.0% 0.0% 0.0% 0.0% 0.0%
Healthcare & Recycling & Reuse 32.8% 28.7% 20.5% 4.1% 0.0% 38.7% 50.5% 74.1% 80.0%
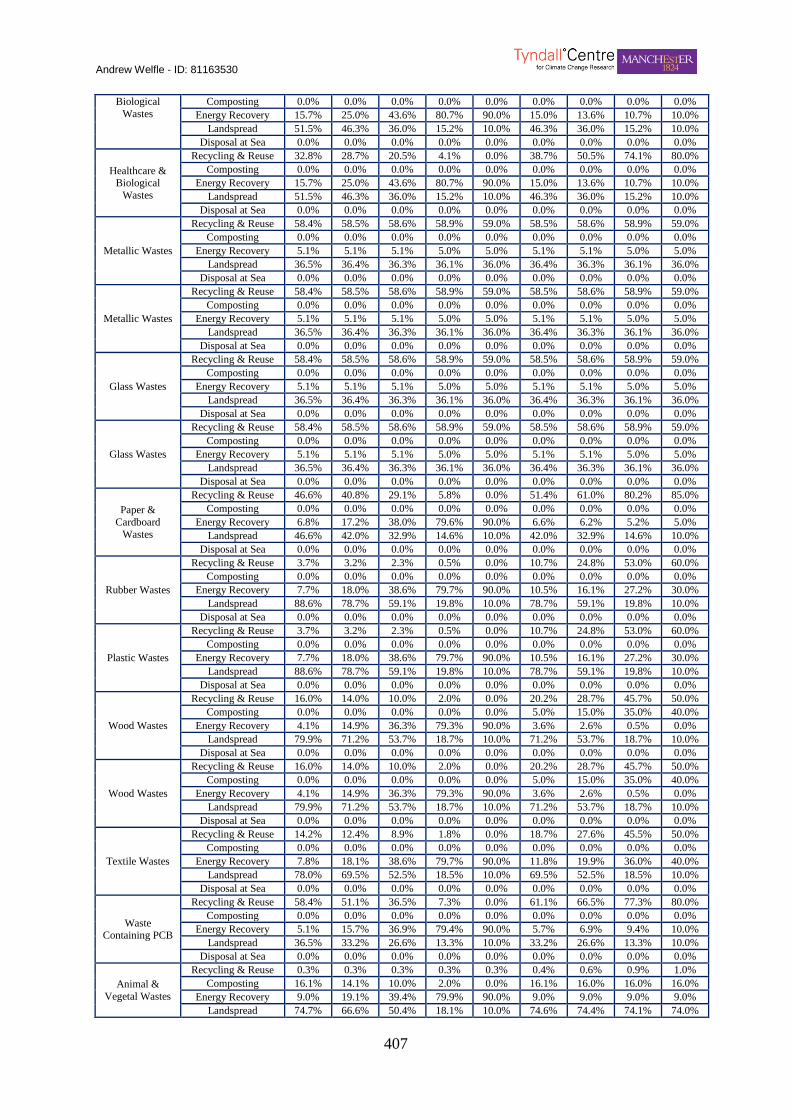
Andrew Welfle - ID: 81163530
407
Biological
Wastes
Composting 0.0% 0.0% 0.0% 0.0% 0.0% 0.0% 0.0% 0.0% 0.0%
Energy Recovery 15.7% 25.0% 43.6% 80.7% 90.0% 15.0% 13.6% 10.7% 10.0%
Landspread 51.5% 46.3% 36.0% 15.2% 10.0% 46.3% 36.0% 15.2% 10.0%
Disposal at Sea 0.0% 0.0% 0.0% 0.0% 0.0% 0.0% 0.0% 0.0% 0.0%
Healthcare & Biological
Wastes
Recycling & Reuse 32.8% 28.7% 20.5% 4.1% 0.0% 38.7% 50.5% 74.1% 80.0%
Composting 0.0% 0.0% 0.0% 0.0% 0.0% 0.0% 0.0% 0.0% 0.0%
Energy Recovery 15.7% 25.0% 43.6% 80.7% 90.0% 15.0% 13.6% 10.7% 10.0%
Landspread 51.5% 46.3% 36.0% 15.2% 10.0% 46.3% 36.0% 15.2% 10.0%
Disposal at Sea 0.0% 0.0% 0.0% 0.0% 0.0% 0.0% 0.0% 0.0% 0.0%
Metallic Wastes
Recycling & Reuse 58.4% 58.5% 58.6% 58.9% 59.0% 58.5% 58.6% 58.9% 59.0%
Composting 0.0% 0.0% 0.0% 0.0% 0.0% 0.0% 0.0% 0.0% 0.0%
Energy Recovery 5.1% 5.1% 5.1% 5.0% 5.0% 5.1% 5.1% 5.0% 5.0%
Landspread 36.5% 36.4% 36.3% 36.1% 36.0% 36.4% 36.3% 36.1% 36.0%
Disposal at Sea 0.0% 0.0% 0.0% 0.0% 0.0% 0.0% 0.0% 0.0% 0.0%
Glass Wastes
Recycling & Reuse 58.4% 58.5% 58.6% 58.9% 59.0% 58.5% 58.6% 58.9% 59.0%
Composting 0.0% 0.0% 0.0% 0.0% 0.0% 0.0% 0.0% 0.0% 0.0%
Energy Recovery 5.1% 5.1% 5.1% 5.0% 5.0% 5.1% 5.1% 5.0% 5.0%
Landspread 36.5% 36.4% 36.3% 36.1% 36.0% 36.4% 36.3% 36.1% 36.0%
Disposal at Sea 0.0% 0.0% 0.0% 0.0% 0.0% 0.0% 0.0% 0.0% 0.0%
Paper &
Cardboard
Wastes
Recycling & Reuse 46.6% 40.8% 29.1% 5.8% 0.0% 51.4% 61.0% 80.2% 85.0%
Composting 0.0% 0.0% 0.0% 0.0% 0.0% 0.0% 0.0% 0.0% 0.0%
Energy Recovery 6.8% 17.2% 38.0% 79.6% 90.0% 6.6% 6.2% 5.2% 5.0%
Landspread 46.6% 42.0% 32.9% 14.6% 10.0% 42.0% 32.9% 14.6% 10.0%
Disposal at Sea 0.0% 0.0% 0.0% 0.0% 0.0% 0.0% 0.0% 0.0% 0.0%
Rubber Wastes
Recycling & Reuse 3.7% 3.2% 2.3% 0.5% 0.0% 10.7% 24.8% 53.0% 60.0%
Composting 0.0% 0.0% 0.0% 0.0% 0.0% 0.0% 0.0% 0.0% 0.0%
Energy Recovery 7.7% 18.0% 38.6% 79.7% 90.0% 10.5% 16.1% 27.2% 30.0%
Landspread 88.6% 78.7% 59.1% 19.8% 10.0% 78.7% 59.1% 19.8% 10.0%
Disposal at Sea 0.0% 0.0% 0.0% 0.0% 0.0% 0.0% 0.0% 0.0% 0.0%
Plastic Wastes
Recycling & Reuse 3.7% 3.2% 2.3% 0.5% 0.0% 10.7% 24.8% 53.0% 60.0%
Composting 0.0% 0.0% 0.0% 0.0% 0.0% 0.0% 0.0% 0.0% 0.0%
Energy Recovery 7.7% 18.0% 38.6% 79.7% 90.0% 10.5% 16.1% 27.2% 30.0%
Landspread 88.6% 78.7% 59.1% 19.8% 10.0% 78.7% 59.1% 19.8% 10.0%
Disposal at Sea 0.0% 0.0% 0.0% 0.0% 0.0% 0.0% 0.0% 0.0% 0.0%
Wood Wastes
Recycling & Reuse 16.0% 14.0% 10.0% 2.0% 0.0% 20.2% 28.7% 45.7% 50.0%
Composting 0.0% 0.0% 0.0% 0.0% 0.0% 5.0% 15.0% 35.0% 40.0%
Energy Recovery 4.1% 14.9% 36.3% 79.3% 90.0% 3.6% 2.6% 0.5% 0.0%
Landspread 79.9% 71.2% 53.7% 18.7% 10.0% 71.2% 53.7% 18.7% 10.0%
Disposal at Sea 0.0% 0.0% 0.0% 0.0% 0.0% 0.0% 0.0% 0.0% 0.0%
Textile Wastes
Recycling & Reuse 14.2% 12.4% 8.9% 1.8% 0.0% 18.7% 27.6% 45.5% 50.0%
Composting 0.0% 0.0% 0.0% 0.0% 0.0% 0.0% 0.0% 0.0% 0.0%
Energy Recovery 7.8% 18.1% 38.6% 79.7% 90.0% 11.8% 19.9% 36.0% 40.0%
Landspread 78.0% 69.5% 52.5% 18.5% 10.0% 69.5% 52.5% 18.5% 10.0%
Disposal at Sea 0.0% 0.0% 0.0% 0.0% 0.0% 0.0% 0.0% 0.0% 0.0%
Waste Containing PCB
Recycling & Reuse 58.4% 51.1% 36.5% 7.3% 0.0% 61.1% 66.5% 77.3% 80.0%
Composting 0.0% 0.0% 0.0% 0.0% 0.0% 0.0% 0.0% 0.0% 0.0%
Energy Recovery 5.1% 15.7% 36.9% 79.4% 90.0% 5.7% 6.9% 9.4% 10.0%
Landspread 36.5% 33.2% 26.6% 13.3% 10.0% 33.2% 26.6% 13.3% 10.0%
Disposal at Sea 0.0% 0.0% 0.0% 0.0% 0.0% 0.0% 0.0% 0.0% 0.0%
Animal &
Vegetal Wastes
Recycling & Reuse 0.3% 0.3% 0.3% 0.3% 0.3% 0.4% 0.6% 0.9% 1.0%
Composting 16.1% 14.1% 10.0% 2.0% 0.0% 16.1% 16.0% 16.0% 16.0%
Energy Recovery 9.0% 19.1% 39.4% 79.9% 90.0% 9.0% 9.0% 9.0% 9.0%
Landspread 74.7% 66.6% 50.4% 18.1% 10.0% 74.6% 74.4% 74.1% 74.0%
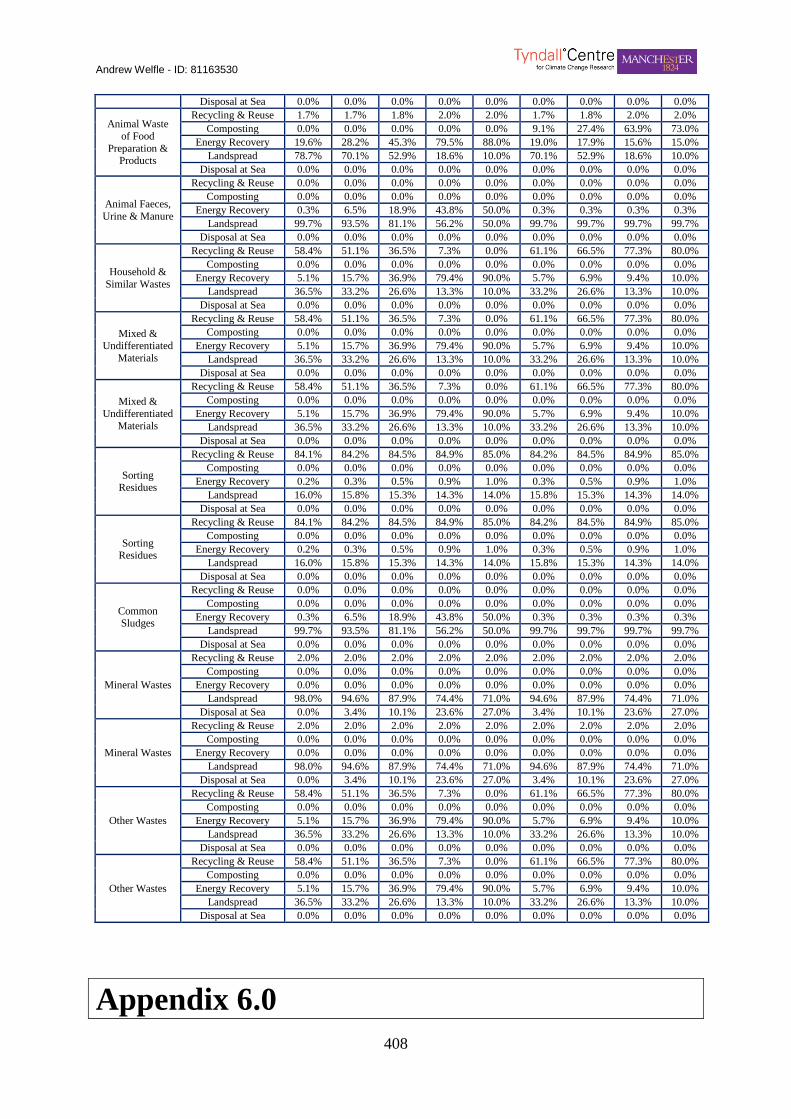
Andrew Welfle - ID: 81163530
408
Disposal at Sea 0.0% 0.0% 0.0% 0.0% 0.0% 0.0% 0.0% 0.0% 0.0%
Animal Waste
of Food
Preparation & Products
Recycling & Reuse 1.7% 1.7% 1.8% 2.0% 2.0% 1.7% 1.8% 2.0% 2.0%
Composting 0.0% 0.0% 0.0% 0.0% 0.0% 9.1% 27.4% 63.9% 73.0%
Energy Recovery 19.6% 28.2% 45.3% 79.5% 88.0% 19.0% 17.9% 15.6% 15.0%
Landspread 78.7% 70.1% 52.9% 18.6% 10.0% 70.1% 52.9% 18.6% 10.0%
Disposal at Sea 0.0% 0.0% 0.0% 0.0% 0.0% 0.0% 0.0% 0.0% 0.0%
Animal Faeces,
Urine & Manure
Recycling & Reuse 0.0% 0.0% 0.0% 0.0% 0.0% 0.0% 0.0% 0.0% 0.0%
Composting 0.0% 0.0% 0.0% 0.0% 0.0% 0.0% 0.0% 0.0% 0.0%
Energy Recovery 0.3% 6.5% 18.9% 43.8% 50.0% 0.3% 0.3% 0.3% 0.3%
Landspread 99.7% 93.5% 81.1% 56.2% 50.0% 99.7% 99.7% 99.7% 99.7%
Disposal at Sea 0.0% 0.0% 0.0% 0.0% 0.0% 0.0% 0.0% 0.0% 0.0%
Household &
Similar Wastes
Recycling & Reuse 58.4% 51.1% 36.5% 7.3% 0.0% 61.1% 66.5% 77.3% 80.0%
Composting 0.0% 0.0% 0.0% 0.0% 0.0% 0.0% 0.0% 0.0% 0.0%
Energy Recovery 5.1% 15.7% 36.9% 79.4% 90.0% 5.7% 6.9% 9.4% 10.0%
Landspread 36.5% 33.2% 26.6% 13.3% 10.0% 33.2% 26.6% 13.3% 10.0%
Disposal at Sea 0.0% 0.0% 0.0% 0.0% 0.0% 0.0% 0.0% 0.0% 0.0%
Mixed & Undifferentiated
Materials
Recycling & Reuse 58.4% 51.1% 36.5% 7.3% 0.0% 61.1% 66.5% 77.3% 80.0%
Composting 0.0% 0.0% 0.0% 0.0% 0.0% 0.0% 0.0% 0.0% 0.0%
Energy Recovery 5.1% 15.7% 36.9% 79.4% 90.0% 5.7% 6.9% 9.4% 10.0%
Landspread 36.5% 33.2% 26.6% 13.3% 10.0% 33.2% 26.6% 13.3% 10.0%
Disposal at Sea 0.0% 0.0% 0.0% 0.0% 0.0% 0.0% 0.0% 0.0% 0.0%
Sorting Residues
Recycling & Reuse 84.1% 84.2% 84.5% 84.9% 85.0% 84.2% 84.5% 84.9% 85.0%
Composting 0.0% 0.0% 0.0% 0.0% 0.0% 0.0% 0.0% 0.0% 0.0%
Energy Recovery 0.2% 0.3% 0.5% 0.9% 1.0% 0.3% 0.5% 0.9% 1.0%
Landspread 16.0% 15.8% 15.3% 14.3% 14.0% 15.8% 15.3% 14.3% 14.0%
Disposal at Sea 0.0% 0.0% 0.0% 0.0% 0.0% 0.0% 0.0% 0.0% 0.0%
Common Sludges
Recycling & Reuse 0.0% 0.0% 0.0% 0.0% 0.0% 0.0% 0.0% 0.0% 0.0%
Composting 0.0% 0.0% 0.0% 0.0% 0.0% 0.0% 0.0% 0.0% 0.0%
Energy Recovery 0.3% 6.5% 18.9% 43.8% 50.0% 0.3% 0.3% 0.3% 0.3%
Landspread 99.7% 93.5% 81.1% 56.2% 50.0% 99.7% 99.7% 99.7% 99.7%
Disposal at Sea 0.0% 0.0% 0.0% 0.0% 0.0% 0.0% 0.0% 0.0% 0.0%
Mineral Wastes
Recycling & Reuse 2.0% 2.0% 2.0% 2.0% 2.0% 2.0% 2.0% 2.0% 2.0%
Composting 0.0% 0.0% 0.0% 0.0% 0.0% 0.0% 0.0% 0.0% 0.0%
Energy Recovery 0.0% 0.0% 0.0% 0.0% 0.0% 0.0% 0.0% 0.0% 0.0%
Landspread 98.0% 94.6% 87.9% 74.4% 71.0% 94.6% 87.9% 74.4% 71.0%
Disposal at Sea 0.0% 3.4% 10.1% 23.6% 27.0% 3.4% 10.1% 23.6% 27.0%
Other Wastes
Recycling & Reuse 58.4% 51.1% 36.5% 7.3% 0.0% 61.1% 66.5% 77.3% 80.0%
Composting 0.0% 0.0% 0.0% 0.0% 0.0% 0.0% 0.0% 0.0% 0.0%
Energy Recovery 5.1% 15.7% 36.9% 79.4% 90.0% 5.7% 6.9% 9.4% 10.0%
Landspread 36.5% 33.2% 26.6% 13.3% 10.0% 33.2% 26.6% 13.3% 10.0%
Disposal at Sea 0.0% 0.0% 0.0% 0.0% 0.0% 0.0% 0.0% 0.0% 0.0%
Appendix 6.0

Andrew Welfle - ID: 81163530
409
Appendix 6.0 includes a summary of the data utilised in developing the UK BRM Baseline Scenario.
Appendix 6.1 Literature Informed
UK BRM Characteristic
Values
A summary of the upper limit, lower limit and average driver characteristic
values from the UK values-database as described within the Thesis text.
Appendix 6.2
UK Baseline Scenario
Resource Availability &
Bioenergy Potential
Forecasts
A summary of the output data from the UK Baseline Scenario developed within
the UK BRM Driver Sensitivity Analysis. This includes forecasts of biomass
resource availability (‘000 Tonnes) and bioenergy potential (TWh) over the
analysis timeframe to 2050.

Andrew Welfle - ID: 81163530
410
Appendix 6.1: Literature Informed UK BRM Characteristic Values
Analysis
Year
Driver
Characteristics
UK Forecast Range Informed by Literature
Population
Change
Changes in
Built-Up Land
Area
Crop &
Agriculture
Productivity
Food Waste
Generation
Food
Commodity
Imports
BRM’s
population
change scenarios
BRM’s built-up
land area
scenarios
Change in
agriculture
productivity
Change in food waste generation
Change in food import levels
2015
Lower Limit Low Forecast Low Forecast +0.00% +4.32% +0.00%
Average Medium Forecast Medium Forecast +18.00% -2.34% +2.25%
Upper Limit High Forecast High Forecast +36.00% -9.00% +4.50%
2020
Lower Limit Low Forecast Low Forecast +0.00% +9.50% +0.00%
Average Medium Forecast Medium Forecast +40.00% -5.20% +5.00%
Upper Limit High Forecast High Forecast +80.00% -20.00% +10.00%
2030
Lower Limit Low Forecast Low Forecast +0.00% +14.40% +0.00%
Average Medium Forecast Medium Forecast +60.00% -7.80% +7.50%
Upper Limit High Forecast High Forecast +120.00% -30.00% +15.00%
2050
Lower Limit Low Forecast Low Forecast +0.00% +24.00% +0.00%
Average Medium Forecast Medium Forecast +100.00% -13.00% +12.50%
Upper Limit High Forecast High Forecast +200.00% -50.00% +25.00%
Range Informed by Li
Appendix 6.1: Literature Informed UK BRM Characteristic Values (continued)
Analysis
Year
Driver
Characteristics
UK Forecast Range Informed by Literature
Food
Commodity
Exports
Utilisation of
Agricultural
Wastes &
Residues
Forestry
Expansion &
Productivity
Wood-based
Industry
Productivity
Imports of
Forestry
Product
Change in food
export levels
Proportion of
total available resources utilised
Forestry
Commission Scenarios
Change in
industry productivity
Change in
forestry raw material imports
2015
Lower Limit +1.80% 0.00%
Evaluation of each of the
forestry
productivity scenarios
discussed within
the Thesis
+0.00% -25.00%
Average +3.15% 9.00% +1.80% +0.00%
Upper Limit +4.50% 18.00% +5.00% +140.00%
2020
Lower Limit +4.00% 0.00% +0.00% -10.00%
Average +7.00% 20.00% +4.00% +0.00%
Upper Limit +10.00% 40.00% +5.00% +15.00%
2030
Lower Limit +6.00% 0.00% +0.00% -5.00%
Average +10.50% 30.00% +6.00% +0.00%
Upper Limit +15.00% 60.00% +7.00% +5.00%
2050
Lower Limit +10.00% 0.00% +0.00% -5.00%
Average +17.50% 50.00% +10.00% +0.00%
Upper Limit +25.00% 100.00% +20.00% +5.00%
Appendix 6.1: Literature Informed UK BRM Characteristic Values (continued)
Analysis
Year
Driver
Characteristics
UK Forecast Range Informed by Literature
Exports of
Forestry
Product
Utilisation of
Forestry
Residues
Utilisation of
Industrial
Residues
Utilisation of
Arboriculture
Arisings
Waste
Generation
Trends
Change in
forestry raw
material exports
Proportion of
total available
resources utilised
Proportion of
total available
resources utilised
Proportion of
total available
resources utilised
DEFRA Scenarios
2015
Lower Limit -25.00% 0.00% 0.00% 65.00%
Evaluation of
each of the waste
generation scenarios
discussed within
the Thesis
Average +0.00% 9.00% 9.00% 65.00%
Upper Limit +10.00% 20.00% 20.00% 65.00%
2020
Lower Limit -10.00% 0.00% 0.00% 70.00%
Average +0.00% 20.00% 20.00% 100.00%
Upper Limit +25.00% 75.00% 75.00% 100.00%
2030
Lower Limit -5.00% 0.00% 0.00% 85.00%
Average +0.00% 30.00% 30.00% 100.00%
Upper Limit +5.00% 100.00% 100.00% 100.00%
2050
Lower Limit -5.00% 0.00% 0.00% 100.00%
Average +0.00% 50.00% 50.00% 100.00%
Upper Limit +5.00% 100.00% 100.00% 100.00%
Informed by Li
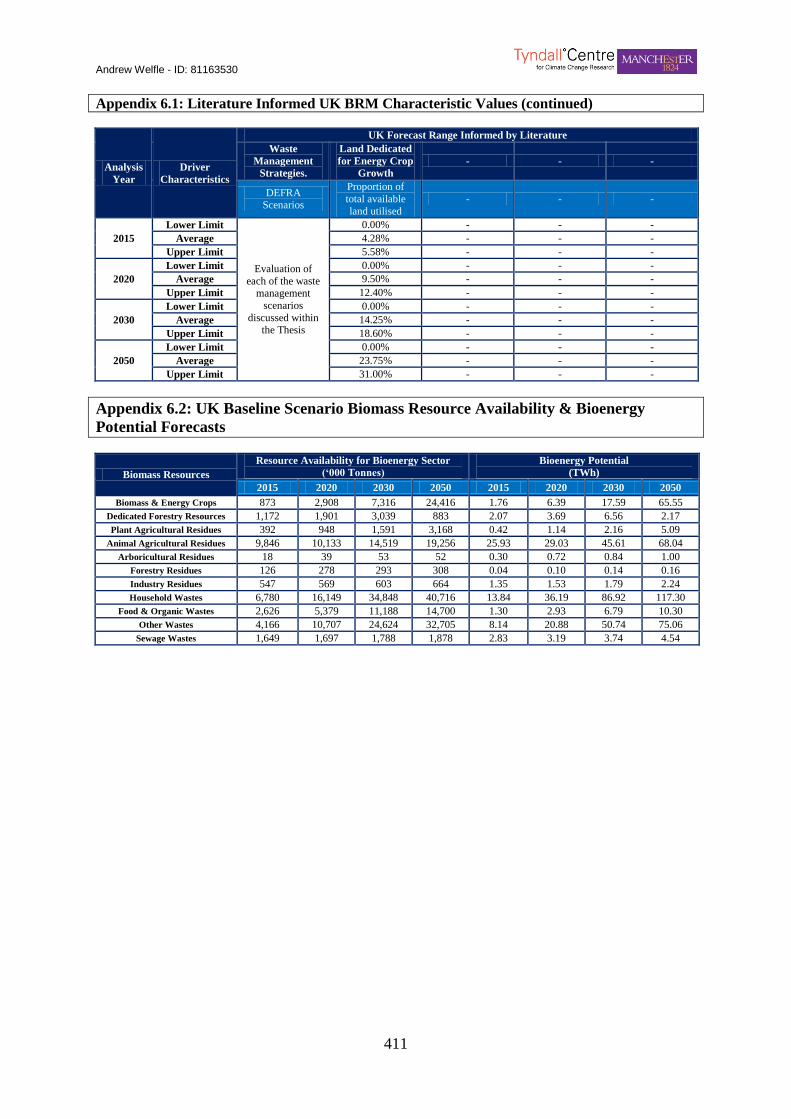
Andrew Welfle - ID: 81163530
411
Appendix 6.1: Literature Informed UK BRM Characteristic Values (continued)
Analysis
Year
Driver
Characteristics
UK Forecast Range Informed by Literature
Waste
Management
Strategies.
Land Dedicated
for Energy Crop
Growth
- - -
DEFRA Scenarios
Proportion of
total available
land utilised
- - -
2015
Lower Limit
Evaluation of
each of the waste management
scenarios
discussed within the Thesis
0.00% - - -
Average 4.28% - - -
Upper Limit 5.58% - - -
2020
Lower Limit 0.00% - - -
Average 9.50% - - -
Upper Limit 12.40% - - -
2030
Lower Limit 0.00% - - -
Average 14.25% - - -
Upper Limit 18.60% - - -
2050
Lower Limit 0.00% - - -
Average 23.75% - - -
Upper Limit 31.00% - - -
Appendix 6.2: UK Baseline Scenario Biomass Resource Availability & Bioenergy
Potential Forecasts
Biomass Resources
Resource Availability for Bioenergy Sector
(‘000 Tonnes) Bioenergy Potential
(TWh)
2015 2020 2030 2050 2015 2020 2030 2050
Biomass & Energy Crops 873 2,908 7,316 24,416 1.76 6.39 17.59 65.55
Dedicated Forestry Resources 1,172 1,901 3,039 883 2.07 3.69 6.56 2.17
Plant Agricultural Residues 392 948 1,591 3,168 0.42 1.14 2.16 5.09
Animal Agricultural Residues 9,846 10,133 14,519 19,256 25.93 29.03 45.61 68.04
Arboricultural Residues 18 39 53 52 0.30 0.72 0.84 1.00
Forestry Residues 126 278 293 308 0.04 0.10 0.14 0.16
Industry Residues 547 569 603 664 1.35 1.53 1.79 2.24
Household Wastes 6,780 16,149 34,848 40,716 13.84 36.19 86.92 117.30
Food & Organic Wastes 2,626 5,379 11,188 14,700 1.30 2.93 6.79 10.30
Other Wastes 4,166 10,707 24,624 32,705 8.14 20.88 50.74 75.06
Sewage Wastes 1,649 1,697 1,788 1,878 2.83 3.19 3.74 4.54
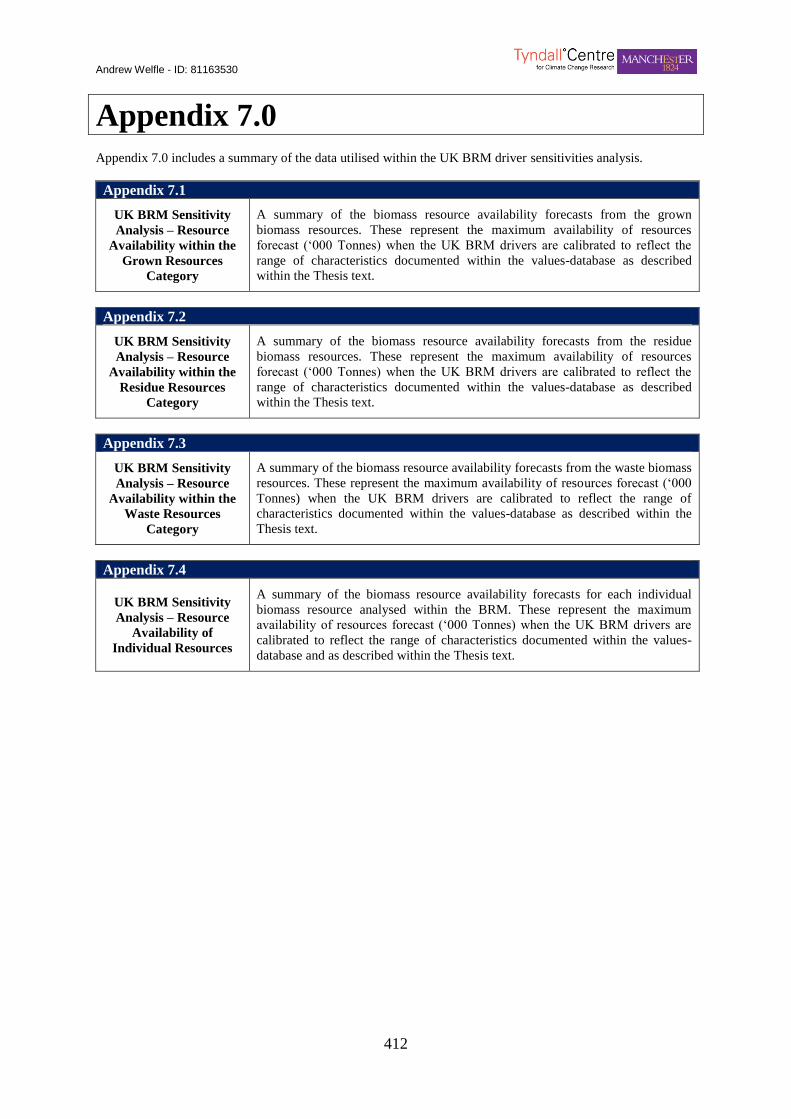
Andrew Welfle - ID: 81163530
412
Appendix 7.0
Appendix 7.0 includes a summary of the data utilised within the UK BRM driver sensitivities analysis.
Appendix 7.1
UK BRM Sensitivity
Analysis – Resource
Availability within the
Grown Resources
Category
A summary of the biomass resource availability forecasts from the grown
biomass resources. These represent the maximum availability of resources
forecast (‘000 Tonnes) when the UK BRM drivers are calibrated to reflect the
range of characteristics documented within the values-database as described
within the Thesis text.
Appendix 7.2
UK BRM Sensitivity
Analysis – Resource
Availability within the
Residue Resources
Category
A summary of the biomass resource availability forecasts from the residue
biomass resources. These represent the maximum availability of resources
forecast (‘000 Tonnes) when the UK BRM drivers are calibrated to reflect the
range of characteristics documented within the values-database as described
within the Thesis text.
Appendix 7.3
UK BRM Sensitivity
Analysis – Resource
Availability within the
Waste Resources
Category
A summary of the biomass resource availability forecasts from the waste biomass
resources. These represent the maximum availability of resources forecast (‘000
Tonnes) when the UK BRM drivers are calibrated to reflect the range of
characteristics documented within the values-database as described within the
Thesis text.
Appendix 7.4
UK BRM Sensitivity
Analysis – Resource
Availability of
Individual Resources
A summary of the biomass resource availability forecasts for each individual
biomass resource analysed within the BRM. These represent the maximum
availability of resources forecast (‘000 Tonnes) when the UK BRM drivers are
calibrated to reflect the range of characteristics documented within the values-
database and as described within the Thesis text.

Andrew Welfle - ID: 81163530
413
Appendix 7.1: UK BRM Sensitivity Analysis – Resource Availability within the Grown
Resource Category
UK BRM Drivers
Maximum Grown Biomass Resource Availability with Variation of BRM
Drivers (‘000 Tonnes)
2015 2020 2030 2050
Population Change 1,018 3,002 9,620 18,339
Changes in Built-Up Land Area 1,002 2,938 9,259 16,729
Crop & Agriculture Productivity 1,173 3,359 10,865 21,857
Food Waste Generation 1,003 2,940 9,265 16,744
Food Commodity Imports 1,001 2,935 9,248 16,697
Food Commodity Exports 1,001 2,935 9,248 16,697
Utilisation of Agricultural Wastes & Residues 1,001 2,935 9,248 16,697
Forestry Expansion & Productivity 1,939 3,449 9,341 18,636
Wood-based Industry Productivity 1,467 3,504 9,817 17,266
Imports of Forestry Product 1,001 2,935 9,248 16,697
Exports of Forestry Product 1,001 2,935 9,248 16,697
Utilisation of Forestry Residues 861 2,680 8,993 16,442
Utilisation of Industrial Residues 1,001 2,935 9,248 16,697
Utilisation of Arboriculture Arisings 1,001 2,935 9,248 16,697
Waste Generation Trends 861 2,680 8,993 16,442
Waste Management Strategies. 861 2,680 8,993 16,442
Land Dedicated for Energy Crop Growth 1,610 4,165 13,844 31,081
Appendix 7.2: UK BRM Sensitivity Analysis – Resource Availability within the Residue
Resource Category
UK BRM Drivers
Maximum Residue Biomass Resource Availability with Variation of BRM
Drivers (‘000 Tonnes)
2015 2020 2030 2050
Population Change 11,455 13,595 20,377 27,037
Changes in Built-Up Land Area 11,371 13,366 19,572 24,269
Crop & Agriculture Productivity 11,371 13,366 19,576 24,279
Food Waste Generation 11,371 13,366 19,572 24,269
Food Commodity Imports 11,371 13,366 19,572 24,269
Food Commodity Exports 11,371 13,366 19,572 24,269
Utilisation of Agricultural Wastes & Residues 11,748 14,224 20,956 26,747
Forestry Expansion & Productivity 11,429 13,918 22,014 29,710
Wood-based Industry Productivity 11,337 13,364 19,642 24,474
Imports of Forestry Product 11,371 13,366 19,572 24,269
Exports of Forestry Product 11,371 13,366 19,572 24,269
Utilisation of Forestry Residues 11,615 13,072 18,506 24,269
Utilisation of Industrial Residues 11,371 13,621 19,616 24,269
Utilisation of Arboriculture Arisings 11,371 13,621 19,616 24,269
Waste Generation Trends 11,371 13,366 19,572 24,269
Waste Management Strategies. 11,371 13,366 19,572 24,269
Land Dedicated for Energy Crop Growth 11,373 13,366 19,597 24,360
Appendix 7.3: UK BRM Sensitivity Analysis – Resource Availability within the Waste
Resource Category
UK BRM Drivers
Maximum Waste Biomass Resource Availability with Variation of BRM
Drivers (‘000 Tonnes)
2015 2020 2030 2050
Population Change 6,929 8,216 10,619 12,041
Changes in Built-Up Land Area 6,916 8,182 10,530 11,803
Crop & Agriculture Productivity 6,916 8,182 10,530 11,803
Food Waste Generation 6,916 8,182 10,530 11,803
Food Commodity Imports 6,916 8,182 10,530 11,803
Food Commodity Exports 6,916 8,182 10,530 11,803
Utilisation of Agricultural Wastes & Residues 6,916 8,182 10,530 11,803
Forestry Expansion & Productivity 6,916 8,182 10,530 11,803
Wood-based Industry Productivity 6,916 8,182 10,530 11,803
Imports of Forestry Product 6,916 8,182 10,530 11,803
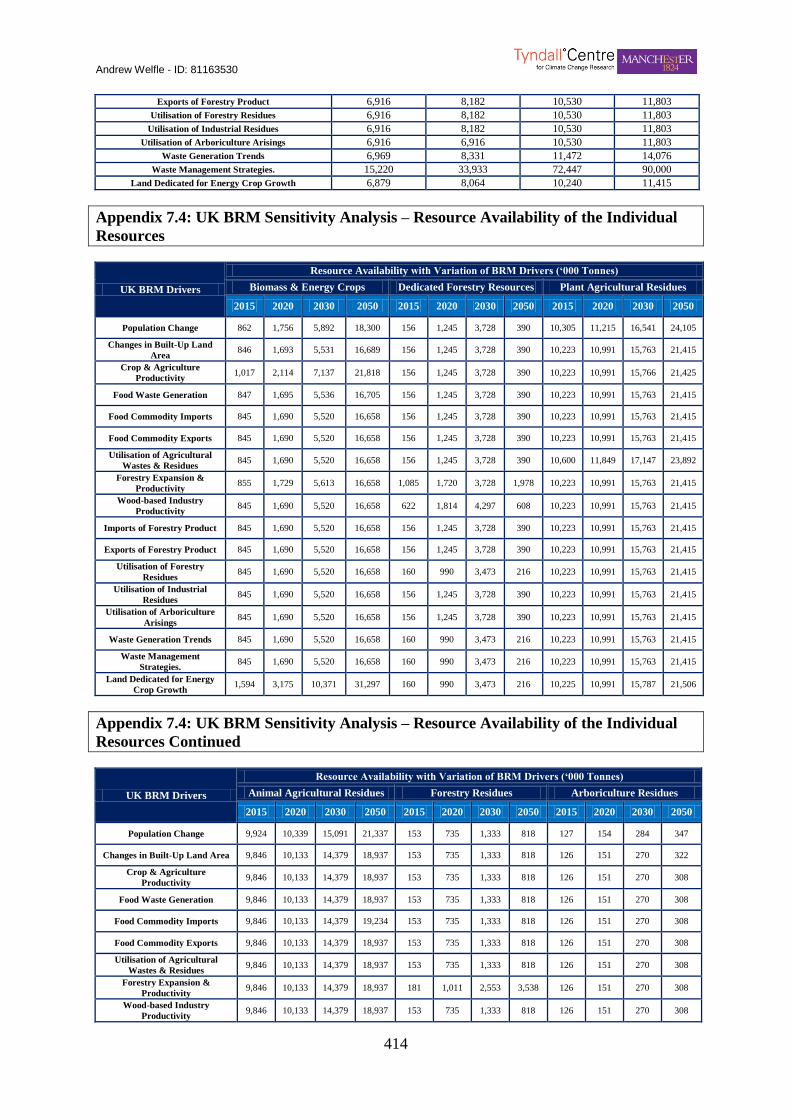
Andrew Welfle - ID: 81163530
414
Exports of Forestry Product 6,916 8,182 10,530 11,803
Utilisation of Forestry Residues 6,916 8,182 10,530 11,803
Utilisation of Industrial Residues 6,916 8,182 10,530 11,803
Utilisation of Arboriculture Arisings 6,916 6,916 10,530 11,803
Waste Generation Trends 6,969 8,331 11,472 14,076
Waste Management Strategies. 15,220 33,933 72,447 90,000
Land Dedicated for Energy Crop Growth 6,879 8,064 10,240 11,415
Appendix 7.4: UK BRM Sensitivity Analysis – Resource Availability of the Individual
Resources
UK BRM Drivers
Resource Availability with Variation of BRM Drivers (‘000 Tonnes)
Biomass & Energy Crops Dedicated Forestry Resources Plant Agricultural Residues
2015 2020 2030 2050 2015 2020 2030 2050 2015 2020 2030 2050
Population Change 862 1,756 5,892 18,300 156 1,245 3,728 390 10,305 11,215 16,541 24,105
Changes in Built-Up Land
Area 846 1,693 5,531 16,689 156 1,245 3,728 390 10,223 10,991 15,763 21,415
Crop & Agriculture
Productivity 1,017 2,114 7,137 21,818 156 1,245 3,728 390 10,223 10,991 15,766 21,425
Food Waste Generation 847 1,695 5,536 16,705 156 1,245 3,728 390 10,223 10,991 15,763 21,415
Food Commodity Imports 845 1,690 5,520 16,658 156 1,245 3,728 390 10,223 10,991 15,763 21,415
Food Commodity Exports 845 1,690 5,520 16,658 156 1,245 3,728 390 10,223 10,991 15,763 21,415
Utilisation of Agricultural
Wastes & Residues 845 1,690 5,520 16,658 156 1,245 3,728 390 10,600 11,849 17,147 23,892
Forestry Expansion &
Productivity 855 1,729 5,613 16,658 1,085 1,720 3,728 1,978 10,223 10,991 15,763 21,415
Wood-based Industry
Productivity 845 1,690 5,520 16,658 622 1,814 4,297 608 10,223 10,991 15,763 21,415
Imports of Forestry Product 845 1,690 5,520 16,658 156 1,245 3,728 390 10,223 10,991 15,763 21,415
Exports of Forestry Product 845 1,690 5,520 16,658 156 1,245 3,728 390 10,223 10,991 15,763 21,415
Utilisation of Forestry
Residues 845 1,690 5,520 16,658 160 990 3,473 216 10,223 10,991 15,763 21,415
Utilisation of Industrial
Residues 845 1,690 5,520 16,658 156 1,245 3,728 390 10,223 10,991 15,763 21,415
Utilisation of Arboriculture
Arisings 845 1,690 5,520 16,658 156 1,245 3,728 390 10,223 10,991 15,763 21,415
Waste Generation Trends 845 1,690 5,520 16,658 160 990 3,473 216 10,223 10,991 15,763 21,415
Waste Management
Strategies. 845 1,690 5,520 16,658 160 990 3,473 216 10,223 10,991 15,763 21,415
Land Dedicated for Energy
Crop Growth 1,594 3,175 10,371 31,297 160 990 3,473 216 10,225 10,991 15,787 21,506
Appendix 7.4: UK BRM Sensitivity Analysis – Resource Availability of the Individual
Resources Continued
UK BRM Drivers
Resource Availability with Variation of BRM Drivers (‘000 Tonnes)
Animal Agricultural Residues Forestry Residues Arboriculture Residues
2015 2020 2030 2050 2015 2020 2030 2050 2015 2020 2030 2050
Population Change 9,924 10,339 15,091 21,337 153 735 1,333 818 127 154 284 347
Changes in Built-Up Land Area 9,846 10,133 14,379 18,937 153 735 1,333 818 126 151 270 322
Crop & Agriculture
Productivity 9,846 10,133 14,379 18,937 153 735 1,333 818 126 151 270 308
Food Waste Generation 9,846 10,133 14,379 18,937 153 735 1,333 818 126 151 270 308
Food Commodity Imports 9,846 10,133 14,379 19,234 153 735 1,333 818 126 151 270 308
Food Commodity Exports 9,846 10,133 14,379 18,937 153 735 1,333 818 126 151 270 308
Utilisation of Agricultural
Wastes & Residues 9,846 10,133 14,379 18,937 153 735 1,333 818 126 151 270 308
Forestry Expansion &
Productivity 9,846 10,133 14,379 18,937 181 1,011 2,553 3,538 126 151 270 308
Wood-based Industry
Productivity 9,846 10,133 14,379 18,937 153 735 1,333 818 126 151 270 308
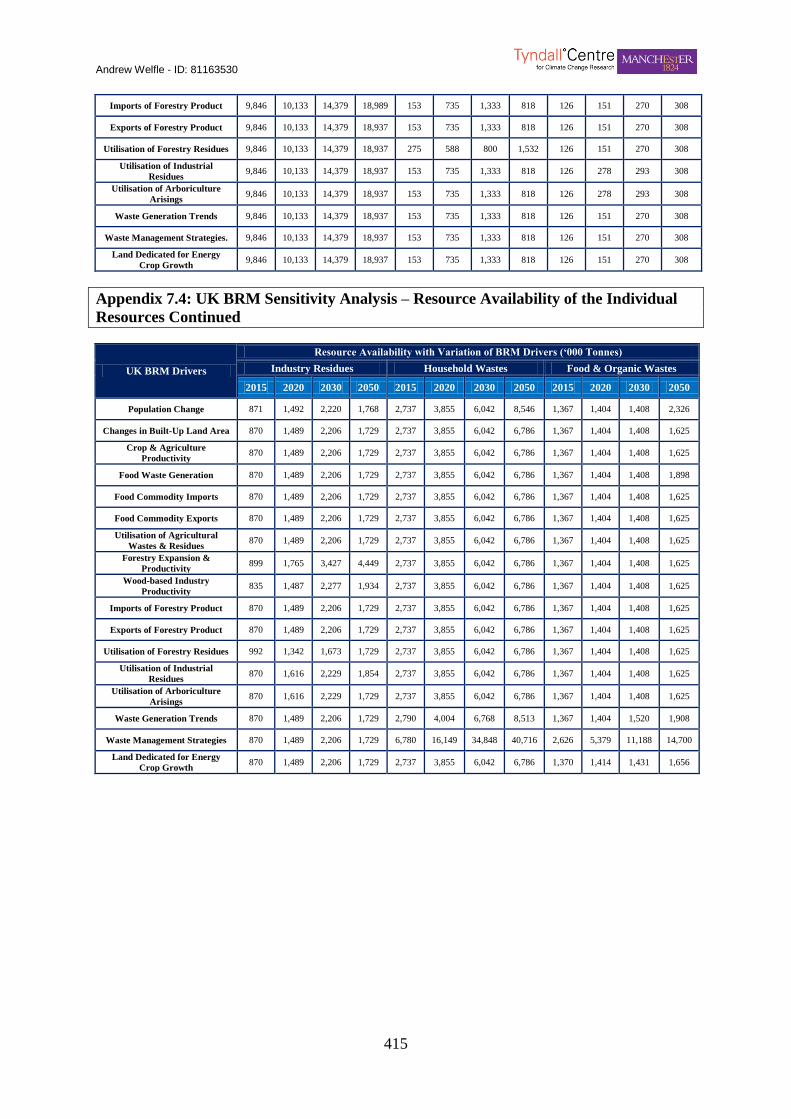
Andrew Welfle - ID: 81163530
415
Imports of Forestry Product 9,846 10,133 14,379 18,989 153 735 1,333 818 126 151 270 308
Exports of Forestry Product 9,846 10,133 14,379 18,937 153 735 1,333 818 126 151 270 308
Utilisation of Forestry Residues 9,846 10,133 14,379 18,937 275 588 800 1,532 126 151 270 308
Utilisation of Industrial
Residues 9,846 10,133 14,379 18,937 153 735 1,333 818 126 278 293 308
Utilisation of Arboriculture
Arisings 9,846 10,133 14,379 18,937 153 735 1,333 818 126 278 293 308
Waste Generation Trends 9,846 10,133 14,379 18,937 153 735 1,333 818 126 151 270 308
Waste Management Strategies. 9,846 10,133 14,379 18,937 153 735 1,333 818 126 151 270 308
Land Dedicated for Energy
Crop Growth 9,846 10,133 14,379 18,937 153 735 1,333 818 126 151 270 308
Appendix 7.4: UK BRM Sensitivity Analysis – Resource Availability of the Individual
Resources Continued
UK BRM Drivers
Resource Availability with Variation of BRM Drivers (‘000 Tonnes)
Industry Residues Household Wastes Food & Organic Wastes
2015 2020 2030 2050 2015 2020 2030 2050 2015 2020 2030 2050
Population Change 871 1,492 2,220 1,768 2,737 3,855 6,042 8,546 1,367 1,404 1,408 2,326
Changes in Built-Up Land Area 870 1,489 2,206 1,729 2,737 3,855 6,042 6,786 1,367 1,404 1,408 1,625
Crop & Agriculture
Productivity 870 1,489 2,206 1,729 2,737 3,855 6,042 6,786 1,367 1,404 1,408 1,625
Food Waste Generation 870 1,489 2,206 1,729 2,737 3,855 6,042 6,786 1,367 1,404 1,408 1,898
Food Commodity Imports 870 1,489 2,206 1,729 2,737 3,855 6,042 6,786 1,367 1,404 1,408 1,625
Food Commodity Exports 870 1,489 2,206 1,729 2,737 3,855 6,042 6,786 1,367 1,404 1,408 1,625
Utilisation of Agricultural
Wastes & Residues 870 1,489 2,206 1,729 2,737 3,855 6,042 6,786 1,367 1,404 1,408 1,625
Forestry Expansion &
Productivity 899 1,765 3,427 4,449 2,737 3,855 6,042 6,786 1,367 1,404 1,408 1,625
Wood-based Industry
Productivity 835 1,487 2,277 1,934 2,737 3,855 6,042 6,786 1,367 1,404 1,408 1,625
Imports of Forestry Product 870 1,489 2,206 1,729 2,737 3,855 6,042 6,786 1,367 1,404 1,408 1,625
Exports of Forestry Product 870 1,489 2,206 1,729 2,737 3,855 6,042 6,786 1,367 1,404 1,408 1,625
Utilisation of Forestry Residues 992 1,342 1,673 1,729 2,737 3,855 6,042 6,786 1,367 1,404 1,408 1,625
Utilisation of Industrial
Residues 870 1,616 2,229 1,854 2,737 3,855 6,042 6,786 1,367 1,404 1,408 1,625
Utilisation of Arboriculture
Arisings 870 1,616 2,229 1,729 2,737 3,855 6,042 6,786 1,367 1,404 1,408 1,625
Waste Generation Trends 870 1,489 2,206 1,729 2,790 4,004 6,768 8,513 1,367 1,404 1,520 1,908
Waste Management Strategies 870 1,489 2,206 1,729 6,780 16,149 34,848 40,716 2,626 5,379 11,188 14,700
Land Dedicated for Energy
Crop Growth 870 1,489 2,206 1,729 2,737 3,855 6,042 6,786 1,370 1,414 1,431 1,656
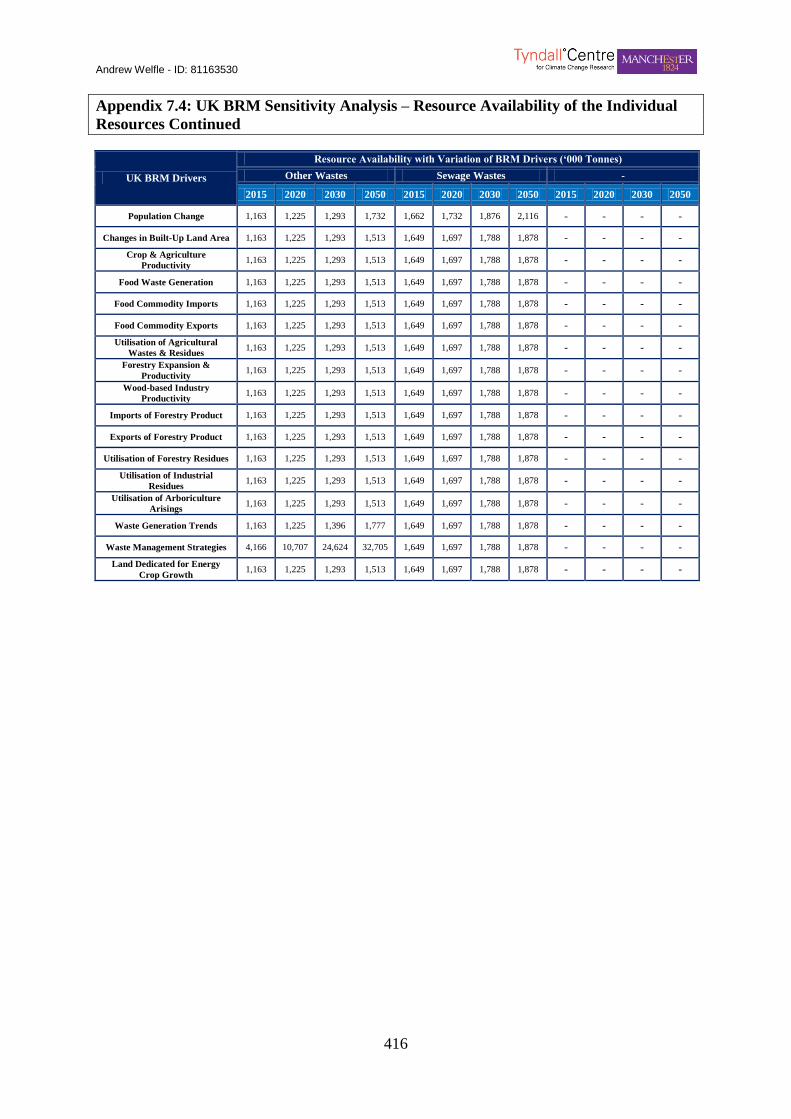
Andrew Welfle - ID: 81163530
416
Appendix 7.4: UK BRM Sensitivity Analysis – Resource Availability of the Individual
Resources Continued
UK BRM Drivers
Resource Availability with Variation of BRM Drivers (‘000 Tonnes)
Other Wastes Sewage Wastes -
2015 2020 2030 2050 2015 2020 2030 2050 2015 2020 2030 2050
Population Change 1,163 1,225 1,293 1,732 1,662 1,732 1,876 2,116 - - - -
Changes in Built-Up Land Area 1,163 1,225 1,293 1,513 1,649 1,697 1,788 1,878 - - - -
Crop & Agriculture
Productivity 1,163 1,225 1,293 1,513 1,649 1,697 1,788 1,878 - - - -
Food Waste Generation 1,163 1,225 1,293 1,513 1,649 1,697 1,788 1,878 - - - -
Food Commodity Imports 1,163 1,225 1,293 1,513 1,649 1,697 1,788 1,878 - - - -
Food Commodity Exports 1,163 1,225 1,293 1,513 1,649 1,697 1,788 1,878 - - - -
Utilisation of Agricultural
Wastes & Residues 1,163 1,225 1,293 1,513 1,649 1,697 1,788 1,878 - - - -
Forestry Expansion &
Productivity 1,163 1,225 1,293 1,513 1,649 1,697 1,788 1,878 - - - -
Wood-based Industry
Productivity 1,163 1,225 1,293 1,513 1,649 1,697 1,788 1,878 - - - -
Imports of Forestry Product 1,163 1,225 1,293 1,513 1,649 1,697 1,788 1,878 - - - -
Exports of Forestry Product 1,163 1,225 1,293 1,513 1,649 1,697 1,788 1,878 - - - -
Utilisation of Forestry Residues 1,163 1,225 1,293 1,513 1,649 1,697 1,788 1,878 - - - -
Utilisation of Industrial
Residues 1,163 1,225 1,293 1,513 1,649 1,697 1,788 1,878 - - - -
Utilisation of Arboriculture
Arisings 1,163 1,225 1,293 1,513 1,649 1,697 1,788 1,878 - - - -
Waste Generation Trends 1,163 1,225 1,396 1,777 1,649 1,697 1,788 1,878 - - - -
Waste Management Strategies 4,166 10,707 24,624 32,705 1,649 1,697 1,788 1,878 - - - -
Land Dedicated for Energy
Crop Growth 1,163 1,225 1,293 1,513 1,649 1,697 1,788 1,878 - - - -
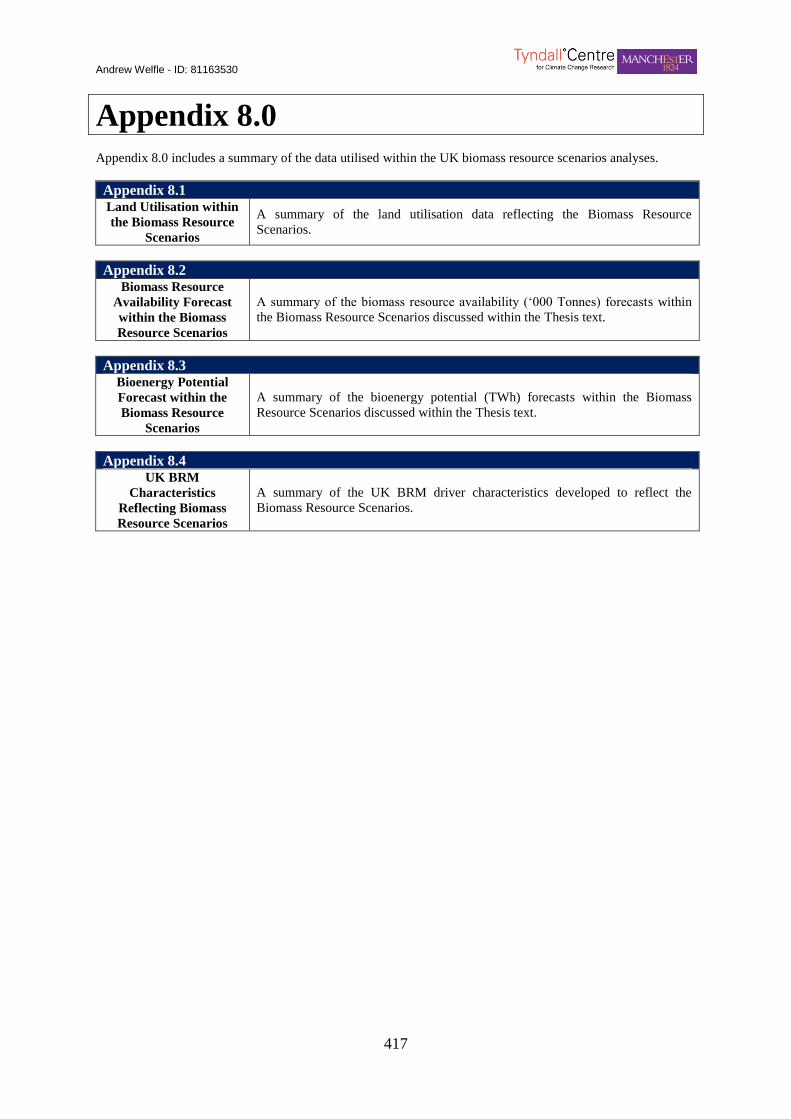
Andrew Welfle - ID: 81163530
417
Appendix 8.0
Appendix 8.0 includes a summary of the data utilised within the UK biomass resource scenarios analyses.
Appendix 8.1 Land Utilisation within
the Biomass Resource
Scenarios
A summary of the land utilisation data reflecting the Biomass Resource
Scenarios.
Appendix 8.2 Biomass Resource
Availability Forecast
within the Biomass
Resource Scenarios
A summary of the biomass resource availability (‘000 Tonnes) forecasts within
the Biomass Resource Scenarios discussed within the Thesis text.
Appendix 8.3 Bioenergy Potential
Forecast within the
Biomass Resource
Scenarios
A summary of the bioenergy potential (TWh) forecasts within the Biomass
Resource Scenarios discussed within the Thesis text.
Appendix 8.4 UK BRM
Characteristics
Reflecting Biomass
Resource Scenarios
A summary of the UK BRM driver characteristics developed to reflect the
Biomass Resource Scenarios.
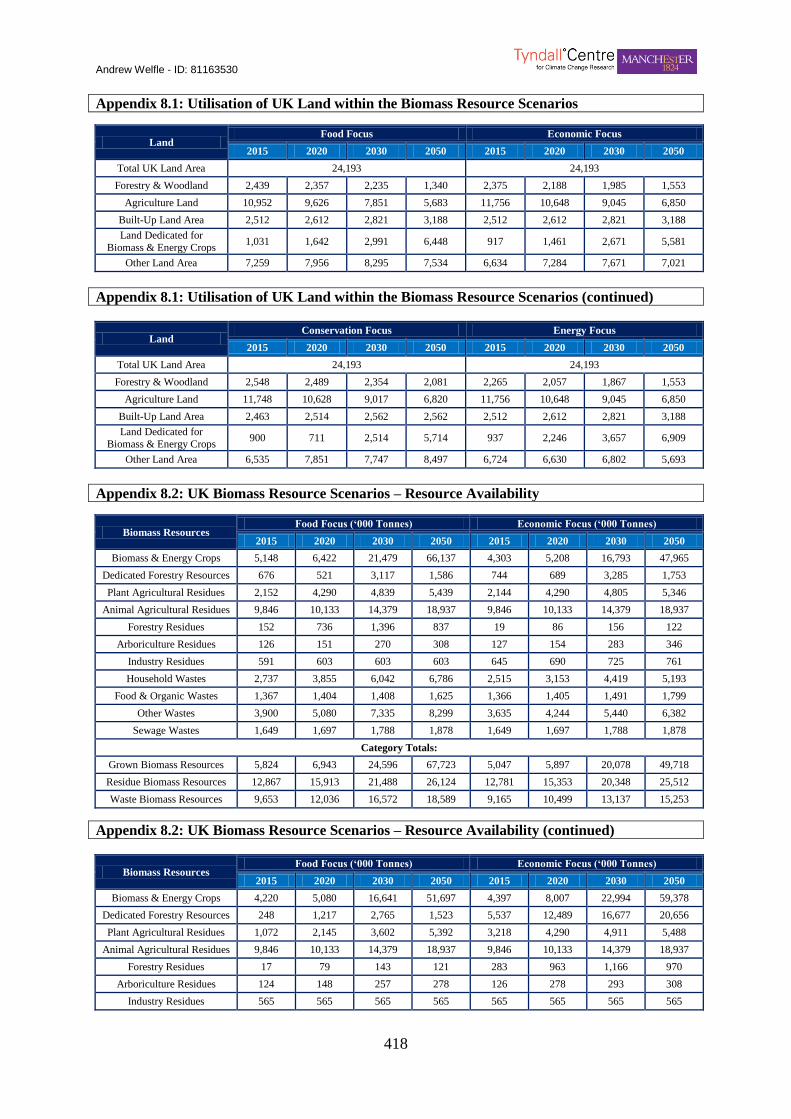
Andrew Welfle - ID: 81163530
418
Appendix 8.1: Utilisation of UK Land within the Biomass Resource Scenarios Range Informed by Li
Land Food Focus Economic Focus
2015 2020 2030 2050 2015 2020 2030 2050
Total UK Land Area 24,193 24,193
Forestry & Woodland 2,439 2,357 2,235 1,340 2,375 2,188 1,985 1,553
Agriculture Land 10,952 9,626 7,851 5,683 11,756 10,648 9,045 6,850
Built-Up Land Area 2,512 2,612 2,821 3,188 2,512 2,612 2,821 3,188
Land Dedicated for
Biomass & Energy Crops 1,031 1,642 2,991 6,448 917 1,461 2,671 5,581
Other Land Area 7,259 7,956 8,295 7,534 6,634 7,284 7,671 7,021
Appendix 8.1: Utilisation of UK Land within the Biomass Resource Scenarios (continued)
Land Conservation Focus Energy Focus
2015 2020 2030 2050 2015 2020 2030 2050
Total UK Land Area 24,193 24,193
Forestry & Woodland 2,548 2,489 2,354 2,081 2,265 2,057 1,867 1,553
Agriculture Land 11,748 10,628 9,017 6,820 11,756 10,648 9,045 6,850
Built-Up Land Area 2,463 2,514 2,562 2,562 2,512 2,612 2,821 3,188
Land Dedicated for
Biomass & Energy Crops 900 711 2,514 5,714 937 2,246 3,657 6,909
Other Land Area 6,535 7,851 7,747 8,497 6,724 6,630 6,802 5,693
Appendix 8.2: UK Biomass Resource Scenarios – Resource Availability Informed by Li
Biomass Resources Food Focus (‘000 Tonnes) Economic Focus (‘000 Tonnes)
2015 2020 2030 2050 2015 2020 2030 2050
Biomass & Energy Crops 5,148 6,422 21,479 66,137 4,303 5,208 16,793 47,965
Dedicated Forestry Resources 676 521 3,117 1,586 744 689 3,285 1,753
Plant Agricultural Residues 2,152 4,290 4,839 5,439 2,144 4,290 4,805 5,346
Animal Agricultural Residues 9,846 10,133 14,379 18,937 9,846 10,133 14,379 18,937
Forestry Residues 152 736 1,396 837 19 86 156 122
Arboriculture Residues 126 151 270 308 127 154 283 346
Industry Residues 591 603 603 603 645 690 725 761
Household Wastes 2,737 3,855 6,042 6,786 2,515 3,153 4,419 5,193
Food & Organic Wastes 1,367 1,404 1,408 1,625 1,366 1,405 1,491 1,799
Other Wastes 3,900 5,080 7,335 8,299 3,635 4,244 5,440 6,382
Sewage Wastes 1,649 1,697 1,788 1,878 1,649 1,697 1,788 1,878
Category Totals:
Grown Biomass Resources 5,824 6,943 24,596 67,723 5,047 5,897 20,078 49,718
Residue Biomass Resources 12,867 15,913 21,488 26,124 12,781 15,353 20,348 25,512
Waste Biomass Resources 9,653 12,036 16,572 18,589 9,165 10,499 13,137 15,253
Appendix 8.2: UK Biomass Resource Scenarios – Resource Availability (continued)
Biomass Resources Food Focus (‘000 Tonnes) Economic Focus (‘000 Tonnes)
2015 2020 2030 2050 2015 2020 2030 2050
Biomass & Energy Crops 4,220 5,080 16,641 51,697 4,397 8,007 22,994 59,378
Dedicated Forestry Resources 248 1,217 2,765 1,523 5,537 12,489 16,677 20,656
Plant Agricultural Residues 1,072 2,145 3,602 5,392 3,218 4,290 4,911 5,488
Animal Agricultural Residues 9,846 10,133 14,379 18,937 9,846 10,133 14,379 18,937
Forestry Residues 17 79 143 121 283 963 1,166 970
Arboriculture Residues 124 148 257 278 126 278 293 308
Industry Residues 565 565 565 565 565 565 565 565
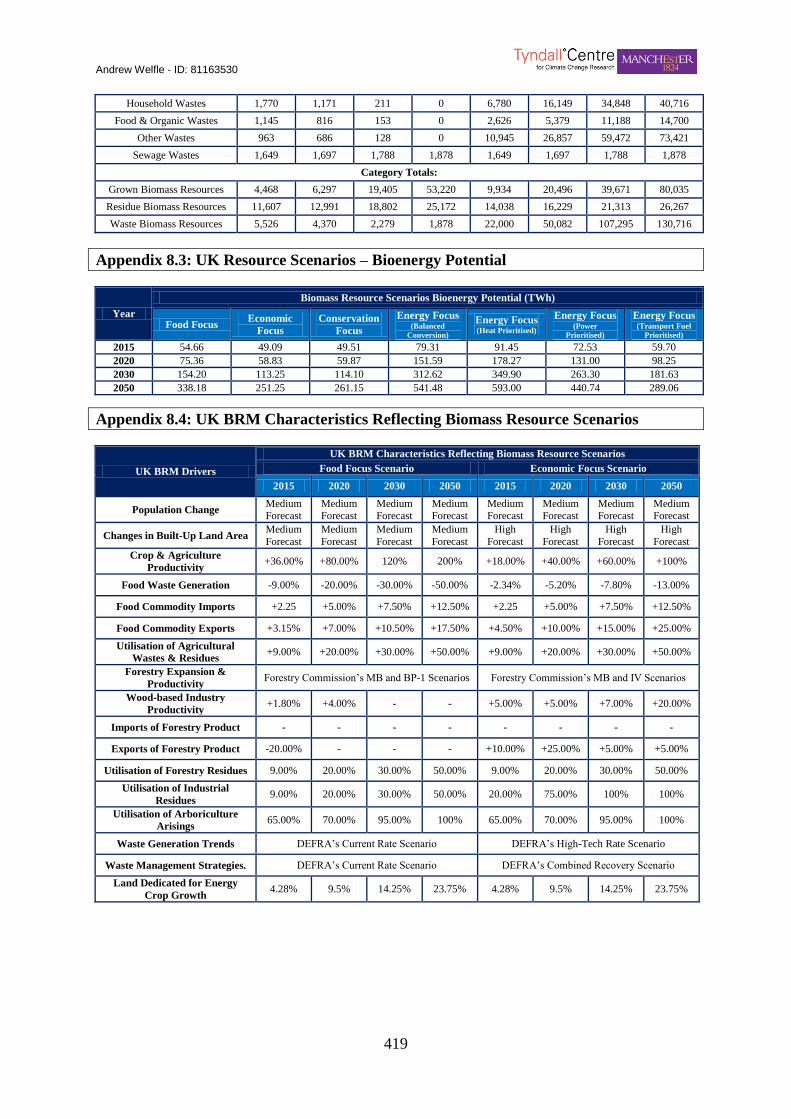
Andrew Welfle - ID: 81163530
419
Household Wastes 1,770 1,171 211 0 6,780 16,149 34,848 40,716
Food & Organic Wastes 1,145 816 153 0 2,626 5,379 11,188 14,700
Other Wastes 963 686 128 0 10,945 26,857 59,472 73,421
Sewage Wastes 1,649 1,697 1,788 1,878 1,649 1,697 1,788 1,878
Category Totals:
Grown Biomass Resources 4,468 6,297 19,405 53,220 9,934 20,496 39,671 80,035
Residue Biomass Resources 11,607 12,991 18,802 25,172 14,038 16,229 21,313 26,267
Waste Biomass Resources 5,526 4,370 2,279 1,878 22,000 50,082 107,295 130,716
Appendix 8.3: UK Resource Scenarios – Bioenergy Potential
Year
Biomass Resource Scenarios Bioenergy Potential (TWh)
Food Focus Economic
Focus
Conservation
Focus
Energy Focus (Balanced
Conversion)
Energy Focus (Heat Prioritised)
Energy Focus (Power
Prioritised)
Energy Focus (Transport Fuel
Prioritised)
2015 54.66 49.09 49.51 79.31 91.45 72.53 59.70
2020 75.36 58.83 59.87 151.59 178.27 131.00 98.25
2030 154.20 113.25 114.10 312.62 349.90 263.30 181.63
2050 338.18 251.25 261.15 541.48 593.00 440.74 289.06
Appendix 8.4: UK BRM Characteristics Reflecting Biomass Resource Scenarios
UK BRM Drivers
UK BRM Characteristics Reflecting Biomass Resource Scenarios
Food Focus Scenario Economic Focus Scenario
2015 2020 2030 2050 2015 2020 2030 2050
Population Change Medium Forecast
Medium Forecast
Medium Forecast
Medium Forecast
Medium Forecast
Medium Forecast
Medium Forecast
Medium Forecast
Changes in Built-Up Land Area Medium
Forecast
Medium
Forecast
Medium
Forecast
Medium
Forecast
High
Forecast
High
Forecast
High
Forecast
High
Forecast
Crop & Agriculture
Productivity +36.00% +80.00% 120% 200% +18.00% +40.00% +60.00% +100%
Food Waste Generation -9.00% -20.00% -30.00% -50.00% -2.34% -5.20% -7.80% -13.00%
Food Commodity Imports +2.25 +5.00% +7.50% +12.50% +2.25 +5.00% +7.50% +12.50%
Food Commodity Exports +3.15% +7.00% +10.50% +17.50% +4.50% +10.00% +15.00% +25.00%
Utilisation of Agricultural
Wastes & Residues +9.00% +20.00% +30.00% +50.00% +9.00% +20.00% +30.00% +50.00%
Forestry Expansion &
Productivity Forestry Commission’s MB and BP-1 Scenarios Forestry Commission’s MB and IV Scenarios
Wood-based Industry
Productivity +1.80% +4.00% - - +5.00% +5.00% +7.00% +20.00%
Imports of Forestry Product - - - - - - - -
Exports of Forestry Product -20.00% - - - +10.00% +25.00% +5.00% +5.00%
Utilisation of Forestry Residues 9.00% 20.00% 30.00% 50.00% 9.00% 20.00% 30.00% 50.00%
Utilisation of Industrial
Residues 9.00% 20.00% 30.00% 50.00% 20.00% 75.00% 100% 100%
Utilisation of Arboriculture
Arisings 65.00% 70.00% 95.00% 100% 65.00% 70.00% 95.00% 100%
Waste Generation Trends DEFRA’s Current Rate Scenario DEFRA’s High-Tech Rate Scenario
Waste Management Strategies. DEFRA’s Current Rate Scenario DEFRA’s Combined Recovery Scenario
Land Dedicated for Energy
Crop Growth 4.28% 9.5% 14.25% 23.75% 4.28% 9.5% 14.25% 23.75%
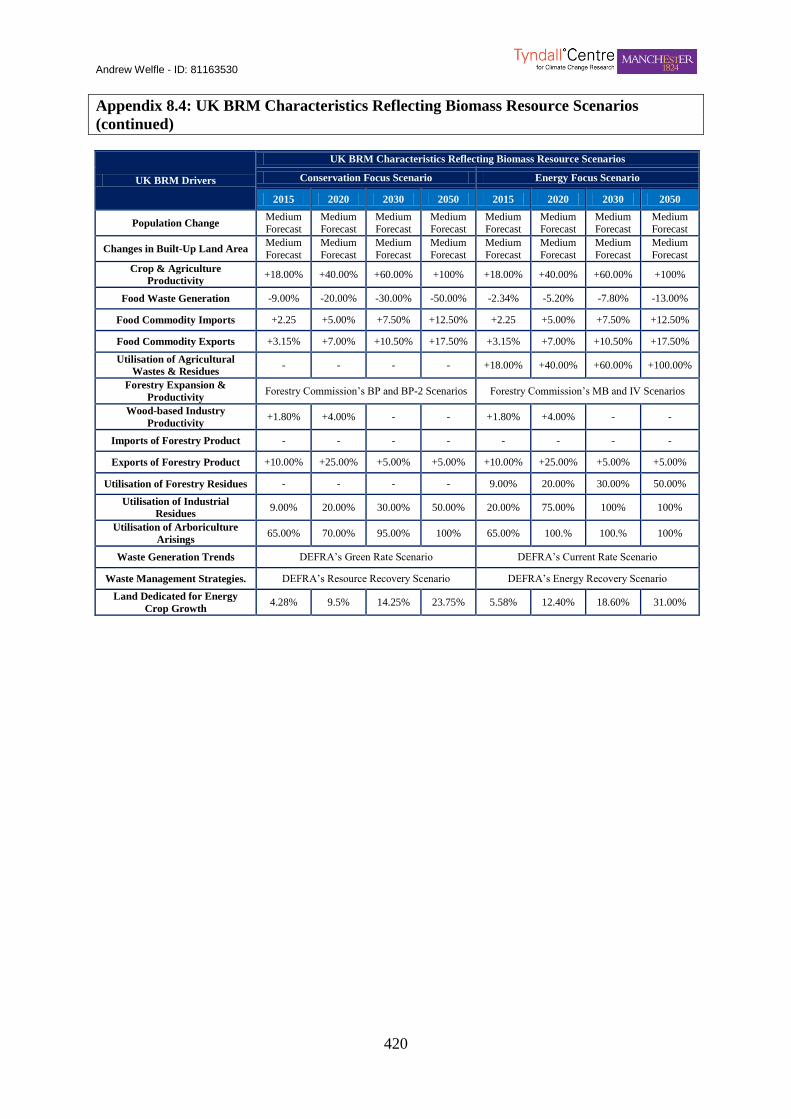
Andrew Welfle - ID: 81163530
420
Appendix 8.4: UK BRM Characteristics Reflecting Biomass Resource Scenarios
(continued)
UK BRM Drivers
UK BRM Characteristics Reflecting Biomass Resource Scenarios
Conservation Focus Scenario Energy Focus Scenario
2015 2020 2030 2050 2015 2020 2030 2050
Population Change Medium
Forecast
Medium
Forecast
Medium
Forecast
Medium
Forecast
Medium
Forecast
Medium
Forecast
Medium
Forecast
Medium
Forecast
Changes in Built-Up Land Area Medium
Forecast
Medium
Forecast
Medium
Forecast
Medium
Forecast
Medium
Forecast
Medium
Forecast
Medium
Forecast
Medium
Forecast
Crop & Agriculture
Productivity +18.00% +40.00% +60.00% +100% +18.00% +40.00% +60.00% +100%
Food Waste Generation -9.00% -20.00% -30.00% -50.00% -2.34% -5.20% -7.80% -13.00%
Food Commodity Imports +2.25 +5.00% +7.50% +12.50% +2.25 +5.00% +7.50% +12.50%
Food Commodity Exports +3.15% +7.00% +10.50% +17.50% +3.15% +7.00% +10.50% +17.50%
Utilisation of Agricultural
Wastes & Residues - - - - +18.00% +40.00% +60.00% +100.00%
Forestry Expansion &
Productivity Forestry Commission’s BP and BP-2 Scenarios Forestry Commission’s MB and IV Scenarios
Wood-based Industry
Productivity +1.80% +4.00% - - +1.80% +4.00% - -
Imports of Forestry Product - - - - - - - -
Exports of Forestry Product +10.00% +25.00% +5.00% +5.00% +10.00% +25.00% +5.00% +5.00%
Utilisation of Forestry Residues - - - - 9.00% 20.00% 30.00% 50.00%
Utilisation of Industrial
Residues 9.00% 20.00% 30.00% 50.00% 20.00% 75.00% 100% 100%
Utilisation of Arboriculture
Arisings 65.00% 70.00% 95.00% 100% 65.00% 100.% 100.% 100%
Waste Generation Trends DEFRA’s Green Rate Scenario DEFRA’s Current Rate Scenario
Waste Management Strategies. DEFRA’s Resource Recovery Scenario DEFRA’s Energy Recovery Scenario
Land Dedicated for Energy
Crop Growth 4.28% 9.5% 14.25% 23.75% 5.58% 12.40% 18.60% 31.00%
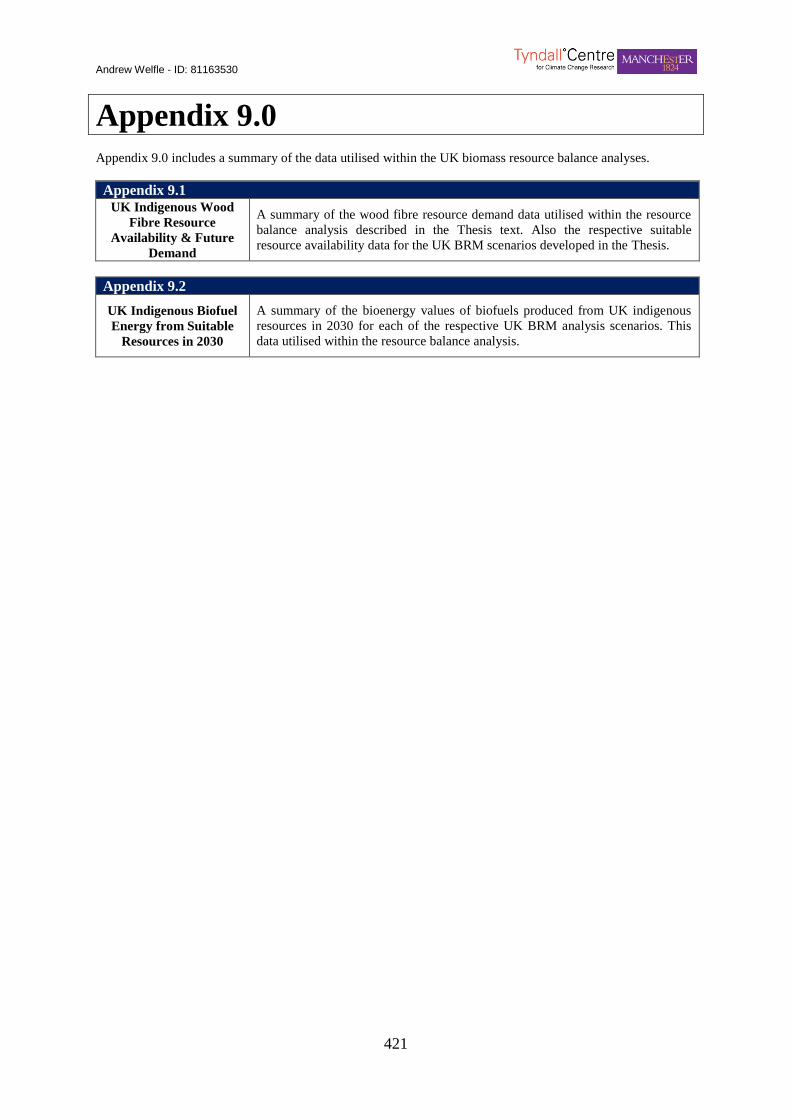
Andrew Welfle - ID: 81163530
421
Appendix 9.0
Appendix 9.0 includes a summary of the data utilised within the UK biomass resource balance analyses.
Appendix 9.1 UK Indigenous Wood
Fibre Resource
Availability & Future
Demand
A summary of the wood fibre resource demand data utilised within the resource
balance analysis described in the Thesis text. Also the respective suitable
resource availability data for the UK BRM scenarios developed in the Thesis.
Appendix 9.2
UK Indigenous Biofuel
Energy from Suitable
Resources in 2030
A summary of the bioenergy values of biofuels produced from UK indigenous
resources in 2030 for each of the respective UK BRM analysis scenarios. This
data utilised within the resource balance analysis.

Andrew Welfle - ID: 81163530
422
Appendix 9.1: UK Indigenous Wood Fibre Resource Availability & Future Demand (‘000
Tonnes)
Year
Forecast UK
Wood Fibre
Demand
Scenarios
Food Focus Economic Focus Conservation
Focus Energy Focus
(Balanced Conversion)
2010 15,542 1,276 1,276 1,276 1,276
2015 47,508 3,593 1,475 3,690 9,378
2020 50,263 8,433 1,828 7,009 22,302
2025 50,263 14,307 4,504 11,042 28,439
Appendix 9.2: UK Indigenous Biofuel Energy from Suitable Resources in 2030 (TWh)
2030 Scenarios
Food Focus Economic Focus Conservation Focus Energy Focus (Balanced Conversion)
Biofuels Energy (TWh) 20.62 16.05 15.88 21.95
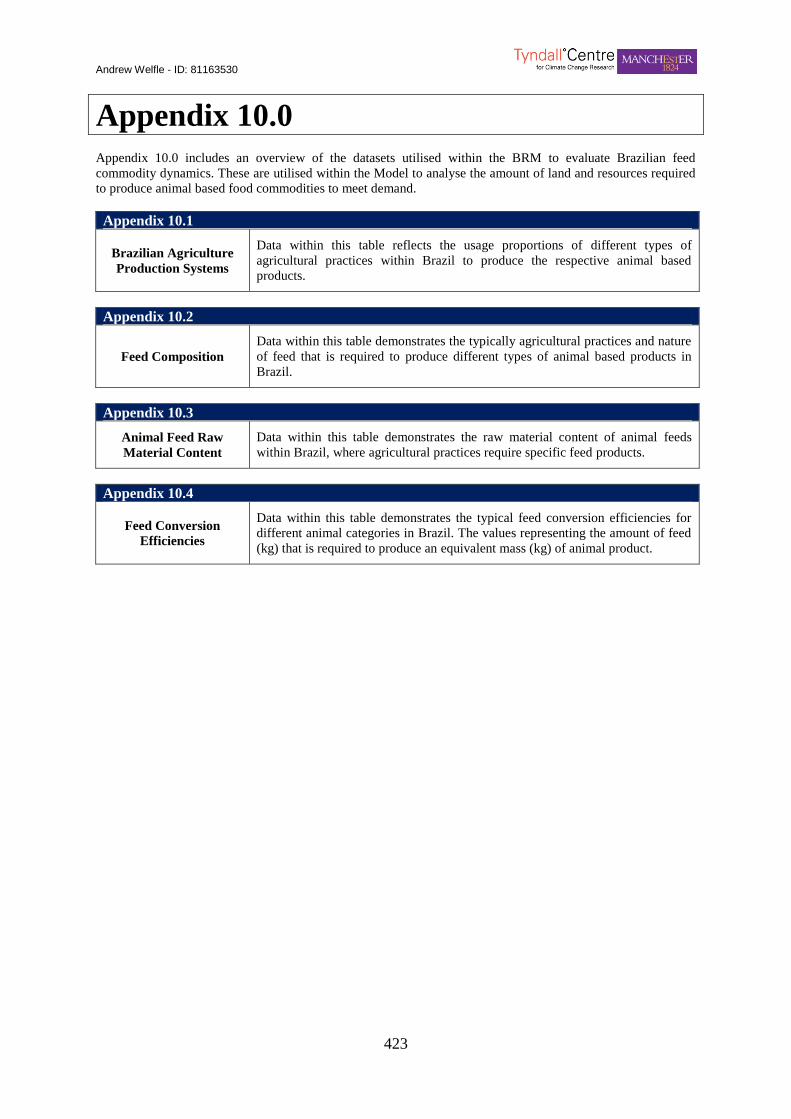
Andrew Welfle - ID: 81163530
423
Appendix 10.0
Appendix 10.0 includes an overview of the datasets utilised within the BRM to evaluate Brazilian feed
commodity dynamics. These are utilised within the Model to analyse the amount of land and resources required
to produce animal based food commodities to meet demand.
Appendix 10.1
Brazilian Agriculture
Production Systems
Data within this table reflects the usage proportions of different types of
agricultural practices within Brazil to produce the respective animal based
products.
Appendix 10.2
Feed Composition
Data within this table demonstrates the typically agricultural practices and nature
of feed that is required to produce different types of animal based products in
Brazil.
Appendix 10.3
Animal Feed Raw
Material Content
Data within this table demonstrates the raw material content of animal feeds
within Brazil, where agricultural practices require specific feed products.
Appendix 10.4
Feed Conversion
Efficiencies
Data within this table demonstrates the typical feed conversion efficiencies for
different animal categories in Brazil. The values representing the amount of feed
(kg) that is required to produce an equivalent mass (kg) of animal product.
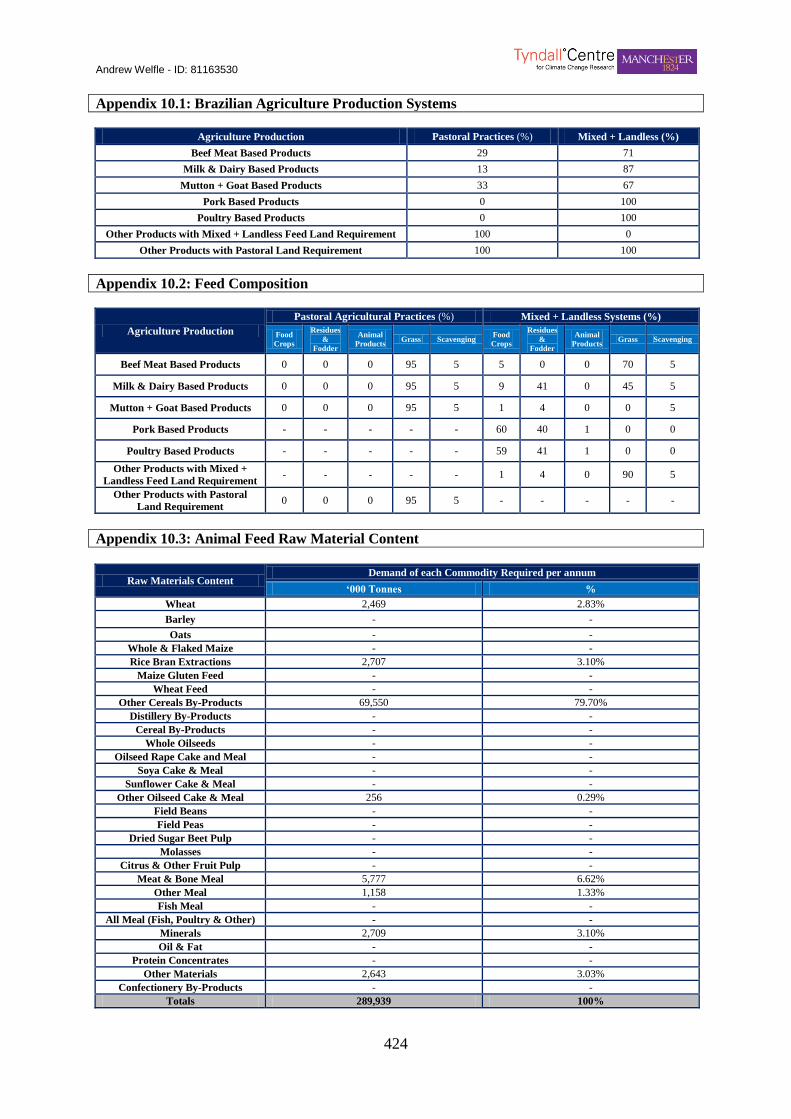
Andrew Welfle - ID: 81163530
424
Appendix 10.1: Brazilian Agriculture Production Systems
Agriculture Production Pastoral Practices (%) Mixed + Landless (%)
Beef Meat Based Products 29 71
Milk & Dairy Based Products 13 87
Mutton + Goat Based Products 33 67
Pork Based Products 0 100
Poultry Based Products 0 100
Other Products with Mixed + Landless Feed Land Requirement 100 0
Other Products with Pastoral Land Requirement 100 100
Appendix 10.2: Feed Composition
Agriculture Production
Pastoral Agricultural Practices (%) Mixed + Landless Systems (%)
Food
Crops
Residues
&
Fodder
Animal
Products Grass Scavenging
Food
Crops
Residues
&
Fodder
Animal
Products Grass Scavenging
Beef Meat Based Products 0 0 0 95 5 5 0 0 70 5
Milk & Dairy Based Products 0 0 0 95 5 9 41 0 45 5
Mutton + Goat Based Products 0 0 0 95 5 1 4 0 0 5
Pork Based Products - - - - - 60 40 1 0 0
Poultry Based Products - - - - - 59 41 1 0 0
Other Products with Mixed +
Landless Feed Land Requirement - - - - - 1 4 0 90 5
Other Products with Pastoral
Land Requirement 0 0 0 95 5 - - - - -
Appendix 10.3: Animal Feed Raw Material Content
Raw Materials Content Demand of each Commodity Required per annum
‘000 Tonnes %
Wheat 2,469 2.83%
Barley - -
Oats - -
Whole & Flaked Maize - -
Rice Bran Extractions 2,707 3.10%
Maize Gluten Feed - -
Wheat Feed - -
Other Cereals By-Products 69,550 79.70%
Distillery By-Products - -
Cereal By-Products - -
Whole Oilseeds - -
Oilseed Rape Cake and Meal - -
Soya Cake & Meal - -
Sunflower Cake & Meal - -
Other Oilseed Cake & Meal 256 0.29%
Field Beans - -
Field Peas - -
Dried Sugar Beet Pulp - -
Molasses - -
Citrus & Other Fruit Pulp - -
Meat & Bone Meal 5,777 6.62%
Other Meal 1,158 1.33%
Fish Meal - -
All Meal (Fish, Poultry & Other) - -
Minerals 2,709 3.10%
Oil & Fat - -
Protein Concentrates - -
Other Materials 2,643 3.03%
Confectionery By-Products - -
Totals 289,939 100%
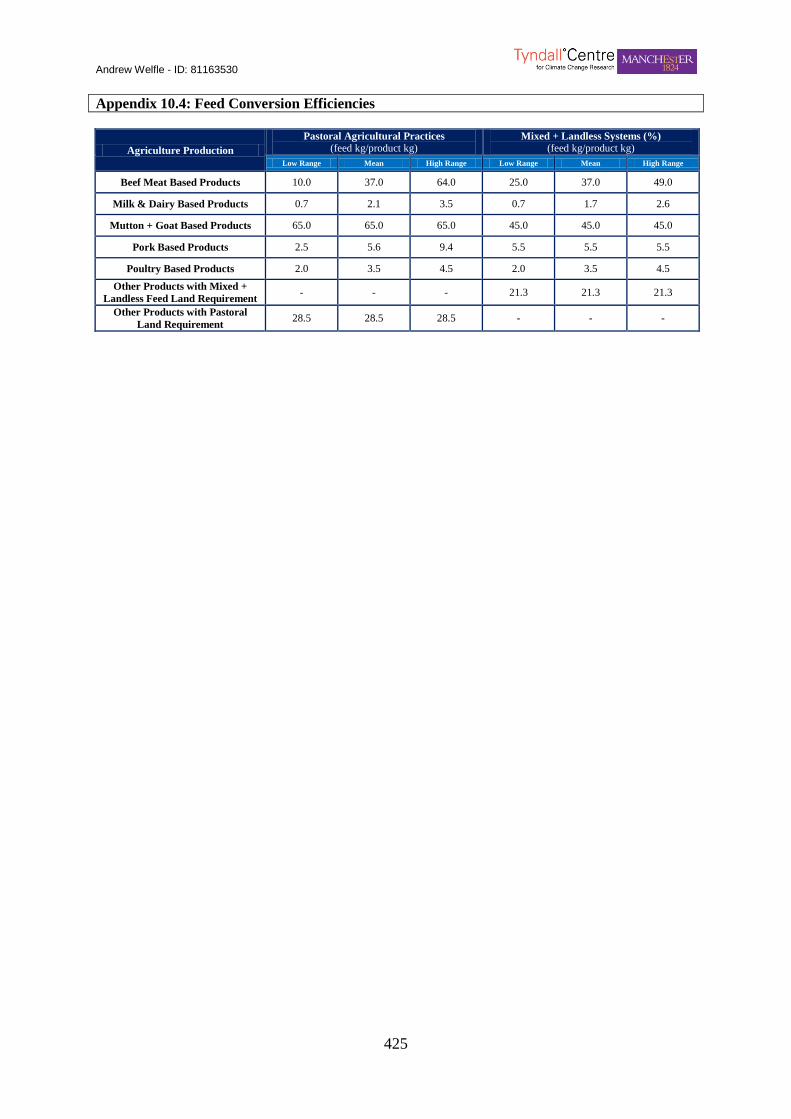
Andrew Welfle - ID: 81163530
425
Appendix 10.4: Feed Conversion Efficiencies
Agriculture Production
Pastoral Agricultural Practices (feed kg/product kg)
Mixed + Landless Systems (%)
(feed kg/product kg)
Low Range Mean High Range Low Range Mean High Range
Beef Meat Based Products 10.0 37.0 64.0 25.0 37.0 49.0
Milk & Dairy Based Products 0.7 2.1 3.5 0.7 1.7 2.6
Mutton + Goat Based Products 65.0 65.0 65.0 45.0 45.0 45.0
Pork Based Products 2.5 5.6 9.4 5.5 5.5 5.5
Poultry Based Products 2.0 3.5 4.5 2.0 3.5 4.5
Other Products with Mixed +
Landless Feed Land Requirement - - - 21.3 21.3 21.3
Other Products with Pastoral
Land Requirement 28.5 28.5 28.5 - - -
Andrew Welfle - ID: 81163530
426
Appendix A11.0
Appendix 11.0 includes a summary of the range of the food crop and biomass resource productivity yield data
utilised within the Brazil BRM.
Appendix 11.1
Crop Commodity
Productivity Yields
A summary of the productivity yield data of all food crop commodities analysed
within the Brazil BRM.
Appendix 11.2
Biomass Resource
Productivity Yields
A summary of the productivity yield data of all biomass resources analysed
within the Brazil BRM.
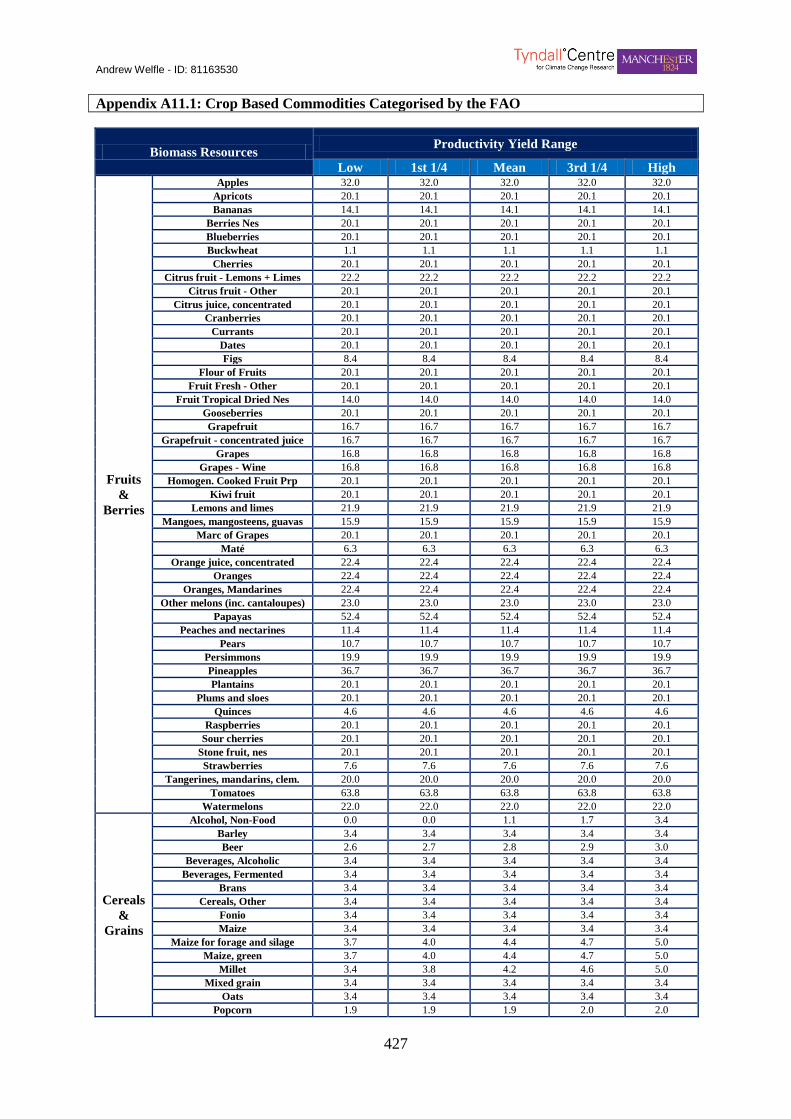
Andrew Welfle - ID: 81163530
427
Appendix A11.1: Crop Based Commodities Categorised by the FAO
Biomass Resources Productivity Yield Range
Low 1st 1/4 Mean 3rd 1/4 High
Fruits
&
Berries
Apples 32.0 32.0 32.0 32.0 32.0
Apricots 20.1 20.1 20.1 20.1 20.1
Bananas 14.1 14.1 14.1 14.1 14.1
Berries Nes 20.1 20.1 20.1 20.1 20.1
Blueberries 20.1 20.1 20.1 20.1 20.1
Buckwheat 1.1 1.1 1.1 1.1 1.1
Cherries 20.1 20.1 20.1 20.1 20.1
Citrus fruit - Lemons + Limes 22.2 22.2 22.2 22.2 22.2
Citrus fruit - Other 20.1 20.1 20.1 20.1 20.1
Citrus juice, concentrated 20.1 20.1 20.1 20.1 20.1
Cranberries 20.1 20.1 20.1 20.1 20.1
Currants 20.1 20.1 20.1 20.1 20.1
Dates 20.1 20.1 20.1 20.1 20.1
Figs 8.4 8.4 8.4 8.4 8.4
Flour of Fruits 20.1 20.1 20.1 20.1 20.1
Fruit Fresh - Other 20.1 20.1 20.1 20.1 20.1
Fruit Tropical Dried Nes 14.0 14.0 14.0 14.0 14.0
Gooseberries 20.1 20.1 20.1 20.1 20.1
Grapefruit 16.7 16.7 16.7 16.7 16.7
Grapefruit - concentrated juice 16.7 16.7 16.7 16.7 16.7
Grapes 16.8 16.8 16.8 16.8 16.8
Grapes - Wine 16.8 16.8 16.8 16.8 16.8
Homogen. Cooked Fruit Prp 20.1 20.1 20.1 20.1 20.1
Kiwi fruit 20.1 20.1 20.1 20.1 20.1
Lemons and limes 21.9 21.9 21.9 21.9 21.9
Mangoes, mangosteens, guavas 15.9 15.9 15.9 15.9 15.9
Marc of Grapes 20.1 20.1 20.1 20.1 20.1
Maté 6.3 6.3 6.3 6.3 6.3
Orange juice, concentrated 22.4 22.4 22.4 22.4 22.4
Oranges 22.4 22.4 22.4 22.4 22.4
Oranges, Mandarines 22.4 22.4 22.4 22.4 22.4
Other melons (inc. cantaloupes) 23.0 23.0 23.0 23.0 23.0
Papayas 52.4 52.4 52.4 52.4 52.4
Peaches and nectarines 11.4 11.4 11.4 11.4 11.4
Pears 10.7 10.7 10.7 10.7 10.7
Persimmons 19.9 19.9 19.9 19.9 19.9
Pineapples 36.7 36.7 36.7 36.7 36.7
Plantains 20.1 20.1 20.1 20.1 20.1
Plums and sloes 20.1 20.1 20.1 20.1 20.1
Quinces 4.6 4.6 4.6 4.6 4.6
Raspberries 20.1 20.1 20.1 20.1 20.1
Sour cherries 20.1 20.1 20.1 20.1 20.1
Stone fruit, nes 20.1 20.1 20.1 20.1 20.1
Strawberries 7.6 7.6 7.6 7.6 7.6
Tangerines, mandarins, clem. 20.0 20.0 20.0 20.0 20.0
Tomatoes 63.8 63.8 63.8 63.8 63.8
Watermelons 22.0 22.0 22.0 22.0 22.0
Cereals
&
Grains
Alcohol, Non-Food 0.0 0.0 1.1 1.7 3.4
Barley 3.4 3.4 3.4 3.4 3.4
Beer 2.6 2.7 2.8 2.9 3.0
Beverages, Alcoholic 3.4 3.4 3.4 3.4 3.4
Beverages, Fermented 3.4 3.4 3.4 3.4 3.4
Brans 3.4 3.4 3.4 3.4 3.4
Cereals, Other 3.4 3.4 3.4 3.4 3.4
Fonio 3.4 3.4 3.4 3.4 3.4
Maize 3.4 3.4 3.4 3.4 3.4
Maize for forage and silage 3.7 4.0 4.4 4.7 5.0
Maize, green 3.7 4.0 4.4 4.7 5.0
Millet 3.4 3.8 4.2 4.6 5.0
Mixed grain 3.4 3.4 3.4 3.4 3.4
Oats 3.4 3.4 3.4 3.4 3.4
Popcorn 1.9 1.9 1.9 2.0 2.0
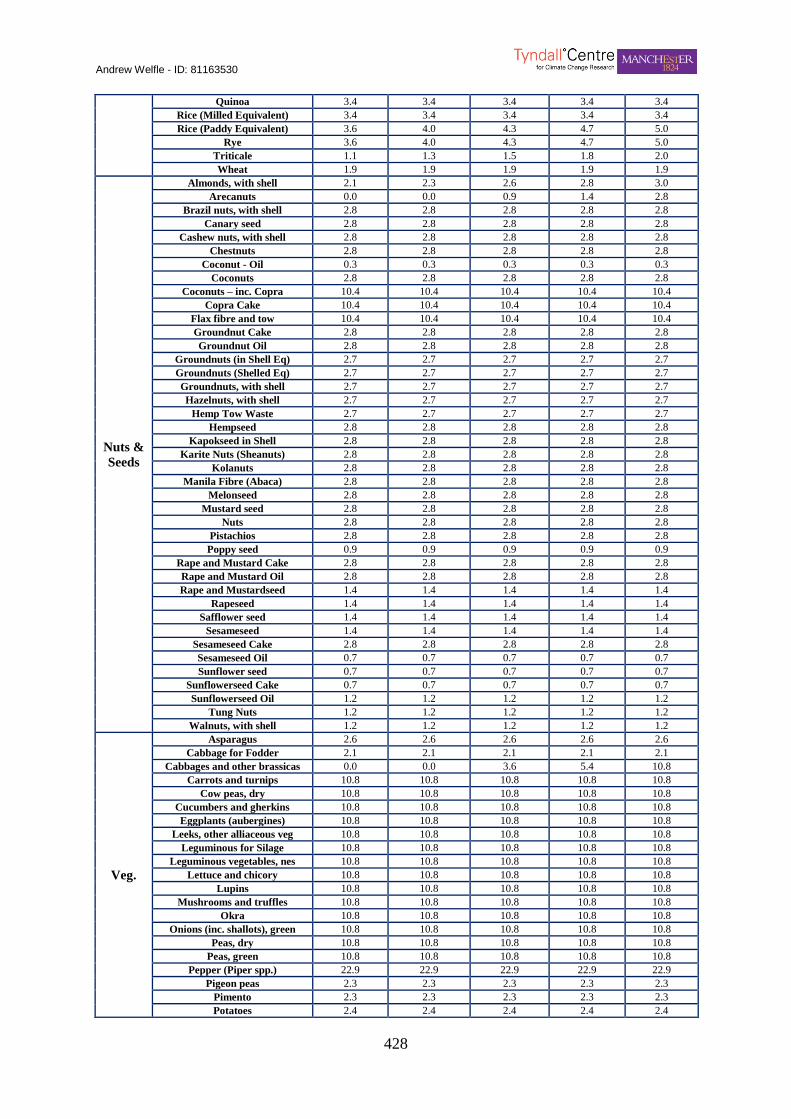
Andrew Welfle - ID: 81163530
428
Quinoa 3.4 3.4 3.4 3.4 3.4
Rice (Milled Equivalent) 3.4 3.4 3.4 3.4 3.4
Rice (Paddy Equivalent) 3.6 4.0 4.3 4.7 5.0
Rye 3.6 4.0 4.3 4.7 5.0
Triticale 1.1 1.3 1.5 1.8 2.0
Wheat 1.9 1.9 1.9 1.9 1.9
Nuts &
Seeds
Almonds, with shell 2.1 2.3 2.6 2.8 3.0
Arecanuts 0.0 0.0 0.9 1.4 2.8
Brazil nuts, with shell 2.8 2.8 2.8 2.8 2.8
Canary seed 2.8 2.8 2.8 2.8 2.8
Cashew nuts, with shell 2.8 2.8 2.8 2.8 2.8
Chestnuts 2.8 2.8 2.8 2.8 2.8
Coconut - Oil 0.3 0.3 0.3 0.3 0.3
Coconuts 2.8 2.8 2.8 2.8 2.8
Coconuts – inc. Copra 10.4 10.4 10.4 10.4 10.4
Copra Cake 10.4 10.4 10.4 10.4 10.4
Flax fibre and tow 10.4 10.4 10.4 10.4 10.4
Groundnut Cake 2.8 2.8 2.8 2.8 2.8
Groundnut Oil 2.8 2.8 2.8 2.8 2.8
Groundnuts (in Shell Eq) 2.7 2.7 2.7 2.7 2.7
Groundnuts (Shelled Eq) 2.7 2.7 2.7 2.7 2.7
Groundnuts, with shell 2.7 2.7 2.7 2.7 2.7
Hazelnuts, with shell 2.7 2.7 2.7 2.7 2.7
Hemp Tow Waste 2.7 2.7 2.7 2.7 2.7
Hempseed 2.8 2.8 2.8 2.8 2.8
Kapokseed in Shell 2.8 2.8 2.8 2.8 2.8
Karite Nuts (Sheanuts) 2.8 2.8 2.8 2.8 2.8
Kolanuts 2.8 2.8 2.8 2.8 2.8
Manila Fibre (Abaca) 2.8 2.8 2.8 2.8 2.8
Melonseed 2.8 2.8 2.8 2.8 2.8
Mustard seed 2.8 2.8 2.8 2.8 2.8
Nuts 2.8 2.8 2.8 2.8 2.8
Pistachios 2.8 2.8 2.8 2.8 2.8
Poppy seed 0.9 0.9 0.9 0.9 0.9
Rape and Mustard Cake 2.8 2.8 2.8 2.8 2.8
Rape and Mustard Oil 2.8 2.8 2.8 2.8 2.8
Rape and Mustardseed 1.4 1.4 1.4 1.4 1.4
Rapeseed 1.4 1.4 1.4 1.4 1.4
Safflower seed 1.4 1.4 1.4 1.4 1.4
Sesameseed 1.4 1.4 1.4 1.4 1.4
Sesameseed Cake 2.8 2.8 2.8 2.8 2.8
Sesameseed Oil 0.7 0.7 0.7 0.7 0.7
Sunflower seed 0.7 0.7 0.7 0.7 0.7
Sunflowerseed Cake 0.7 0.7 0.7 0.7 0.7
Sunflowerseed Oil 1.2 1.2 1.2 1.2 1.2
Tung Nuts 1.2 1.2 1.2 1.2 1.2
Walnuts, with shell 1.2 1.2 1.2 1.2 1.2
Veg.
Asparagus 2.6 2.6 2.6 2.6 2.6
Cabbage for Fodder 2.1 2.1 2.1 2.1 2.1
Cabbages and other brassicas 0.0 0.0 3.6 5.4 10.8
Carrots and turnips 10.8 10.8 10.8 10.8 10.8
Cow peas, dry 10.8 10.8 10.8 10.8 10.8
Cucumbers and gherkins 10.8 10.8 10.8 10.8 10.8
Eggplants (aubergines) 10.8 10.8 10.8 10.8 10.8
Leeks, other alliaceous veg 10.8 10.8 10.8 10.8 10.8
Leguminous for Silage 10.8 10.8 10.8 10.8 10.8
Leguminous vegetables, nes 10.8 10.8 10.8 10.8 10.8
Lettuce and chicory 10.8 10.8 10.8 10.8 10.8
Lupins 10.8 10.8 10.8 10.8 10.8
Mushrooms and truffles 10.8 10.8 10.8 10.8 10.8
Okra 10.8 10.8 10.8 10.8 10.8
Onions (inc. shallots), green 10.8 10.8 10.8 10.8 10.8
Peas, dry 10.8 10.8 10.8 10.8 10.8
Peas, green 10.8 10.8 10.8 10.8 10.8
Pepper (Piper spp.) 22.9 22.9 22.9 22.9 22.9
Pigeon peas 2.3 2.3 2.3 2.3 2.3
Pimento 2.3 2.3 2.3 2.3 2.3
Potatoes 2.4 2.4 2.4 2.4 2.4
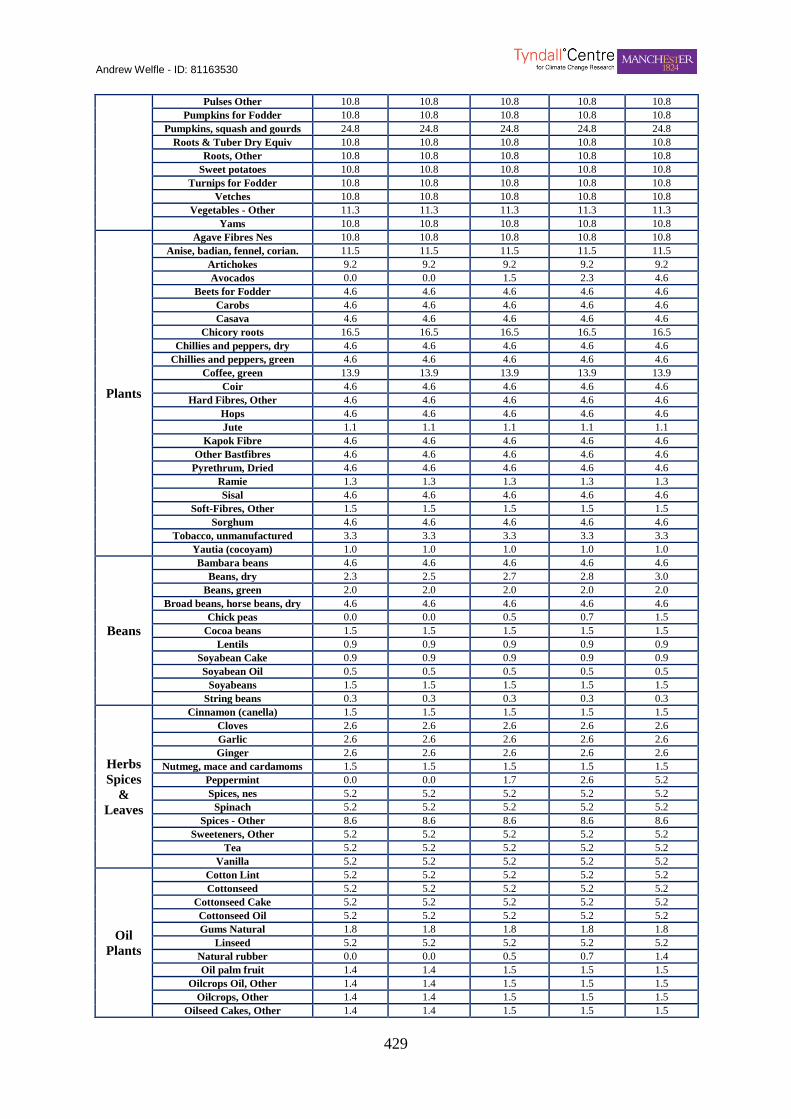
Andrew Welfle - ID: 81163530
429
Pulses Other 10.8 10.8 10.8 10.8 10.8
Pumpkins for Fodder 10.8 10.8 10.8 10.8 10.8
Pumpkins, squash and gourds 24.8 24.8 24.8 24.8 24.8
Roots & Tuber Dry Equiv 10.8 10.8 10.8 10.8 10.8
Roots, Other 10.8 10.8 10.8 10.8 10.8
Sweet potatoes 10.8 10.8 10.8 10.8 10.8
Turnips for Fodder 10.8 10.8 10.8 10.8 10.8
Vetches 10.8 10.8 10.8 10.8 10.8
Vegetables - Other 11.3 11.3 11.3 11.3 11.3
Yams 10.8 10.8 10.8 10.8 10.8
Plants
Agave Fibres Nes 10.8 10.8 10.8 10.8 10.8
Anise, badian, fennel, corian. 11.5 11.5 11.5 11.5 11.5
Artichokes 9.2 9.2 9.2 9.2 9.2
Avocados 0.0 0.0 1.5 2.3 4.6
Beets for Fodder 4.6 4.6 4.6 4.6 4.6
Carobs 4.6 4.6 4.6 4.6 4.6
Casava 4.6 4.6 4.6 4.6 4.6
Chicory roots 16.5 16.5 16.5 16.5 16.5
Chillies and peppers, dry 4.6 4.6 4.6 4.6 4.6
Chillies and peppers, green 4.6 4.6 4.6 4.6 4.6
Coffee, green 13.9 13.9 13.9 13.9 13.9
Coir 4.6 4.6 4.6 4.6 4.6
Hard Fibres, Other 4.6 4.6 4.6 4.6 4.6
Hops 4.6 4.6 4.6 4.6 4.6
Jute 1.1 1.1 1.1 1.1 1.1
Kapok Fibre 4.6 4.6 4.6 4.6 4.6
Other Bastfibres 4.6 4.6 4.6 4.6 4.6
Pyrethrum, Dried 4.6 4.6 4.6 4.6 4.6
Ramie 1.3 1.3 1.3 1.3 1.3
Sisal 4.6 4.6 4.6 4.6 4.6
Soft-Fibres, Other 1.5 1.5 1.5 1.5 1.5
Sorghum 4.6 4.6 4.6 4.6 4.6
Tobacco, unmanufactured 3.3 3.3 3.3 3.3 3.3
Yautia (cocoyam) 1.0 1.0 1.0 1.0 1.0
Beans
Bambara beans 4.6 4.6 4.6 4.6 4.6
Beans, dry 2.3 2.5 2.7 2.8 3.0
Beans, green 2.0 2.0 2.0 2.0 2.0
Broad beans, horse beans, dry 4.6 4.6 4.6 4.6 4.6
Chick peas 0.0 0.0 0.5 0.7 1.5
Cocoa beans 1.5 1.5 1.5 1.5 1.5
Lentils 0.9 0.9 0.9 0.9 0.9
Soyabean Cake 0.9 0.9 0.9 0.9 0.9
Soyabean Oil 0.5 0.5 0.5 0.5 0.5
Soyabeans 1.5 1.5 1.5 1.5 1.5
String beans 0.3 0.3 0.3 0.3 0.3
Herbs
Spices
&
Leaves
Cinnamon (canella) 1.5 1.5 1.5 1.5 1.5
Cloves 2.6 2.6 2.6 2.6 2.6
Garlic 2.6 2.6 2.6 2.6 2.6
Ginger 2.6 2.6 2.6 2.6 2.6
Nutmeg, mace and cardamoms 1.5 1.5 1.5 1.5 1.5
Peppermint 0.0 0.0 1.7 2.6 5.2
Spices, nes 5.2 5.2 5.2 5.2 5.2
Spinach 5.2 5.2 5.2 5.2 5.2
Spices - Other 8.6 8.6 8.6 8.6 8.6
Sweeteners, Other 5.2 5.2 5.2 5.2 5.2
Tea 5.2 5.2 5.2 5.2 5.2
Vanilla 5.2 5.2 5.2 5.2 5.2
Oil
Plants
Cotton Lint 5.2 5.2 5.2 5.2 5.2
Cottonseed 5.2 5.2 5.2 5.2 5.2
Cottonseed Cake 5.2 5.2 5.2 5.2 5.2
Cottonseed Oil 5.2 5.2 5.2 5.2 5.2
Gums Natural 1.8 1.8 1.8 1.8 1.8
Linseed 5.2 5.2 5.2 5.2 5.2
Natural rubber 0.0 0.0 0.5 0.7 1.4
Oil palm fruit 1.4 1.4 1.5 1.5 1.5
Oilcrops Oil, Other 1.4 1.4 1.5 1.5 1.5
Oilcrops, Other 1.4 1.4 1.5 1.5 1.5
Oilseed Cakes, Other 1.4 1.4 1.5 1.5 1.5

Andrew Welfle - ID: 81163530
430
Oilseeds, Nes 1.4 1.4 1.4 1.4 1.4
Olive Oil 1.4 1.4 1.4 1.4 1.4
Olives 1.4 1.4 1.4 1.4 1.4
Maise Germ Oil 1.4 1.4 1.4 1.4 1.4
Rubber 1.4 1.4 1.4 1.4 1.4
Palm Oil 1.4 1.4 1.4 1.4 1.4
Palmkernel Cake 1.4 1.8 2.2 2.6 3.0
Palmkernel Oil 1.4 1.8 2.2 2.6 3.0
Palmkernels 0.2 0.2 0.2 0.2 0.2
Sugar
Crops
Molasses 0.2 0.2 0.2 0.2 0.2
Sugar Beet 0.2 0.2 0.2 0.2 0.2
Sugar cane 1.4 1.4 1.4 1.4 1.4
Sugar, Raw Equivalent 1.4 1.4 1.4 1.4 1.4
Sugar, Refined Equiv 1.4 1.4 1.4 1.4 1.4
Appendix A11.2: Biomass Resource Productivity Yields
Category Biomass Resources Productivity Yield Range
Low 1st 1/4 Mean 3rd 1/4 High
Biomass
Resources
Miscanthus 5.0 6.9 12.8 18.0 24.1
Willow 7.0 8.0 8.6 9.0 10.0
Poplar 5.6 6.5 7.7 8.8 10.0
Beech 8.0 9.0 9.9 10.9 11.8
Birch 5.0 6.5 7.7 9.0 10.0
Casuarina 0.0 0.0 0.0 0.0 0.0
Eucalyptus 9.0 10.5 12.0 13.5 15.0
Fir 8.0 10.5 13.0 15.5 18.0
Oak 0.0 0.0 0.0 0.0 0.0
Pine 8.0 8.5 9.0 9.5 10.0
Redwood 0.0 0.0 0.0 0.0 0.0
Spruce 8.0 9.5 11.0 12.5 14.0
Sycamore 6.0 6.8 7.0 7.3 8.0
Subabul 0.0 0.0 0.0 0.0 0.0
Sunflower 1.5 1.8 2.0 2.3 2.5
Reed Canary Grass 2.9 5.8 8.9 11.9 15.0
Jatropha 4.5 5.6 6.8 7.9 9.0
Switch Grass 6.0 6.7 9.6 11.4 15.4
Ash 10.0 10.0 10.0 10.0 10.0
Pasture Grass 10.5 11.3 12.0 12.8 13.5
Andrew Welfle - ID: 81163530
431
Appendix 12.0
Appendix 12.0 includes a summary of the waste generation and waste management strategies utilised within the
Brazil BRM and described within the Thesis text.
Appendix 12.1
Waste Generation
Scenarios
Brazil waste generation scenarios developed by the University of Sao Paulo and
utilised in the Brazil BRM as described within the Thesis text.
Appendix 12.2
Waste Management
Scenarios
Brazil waste management strategy scenarios developed by the University of
Utrecht and MWH as described within the Thesis text.
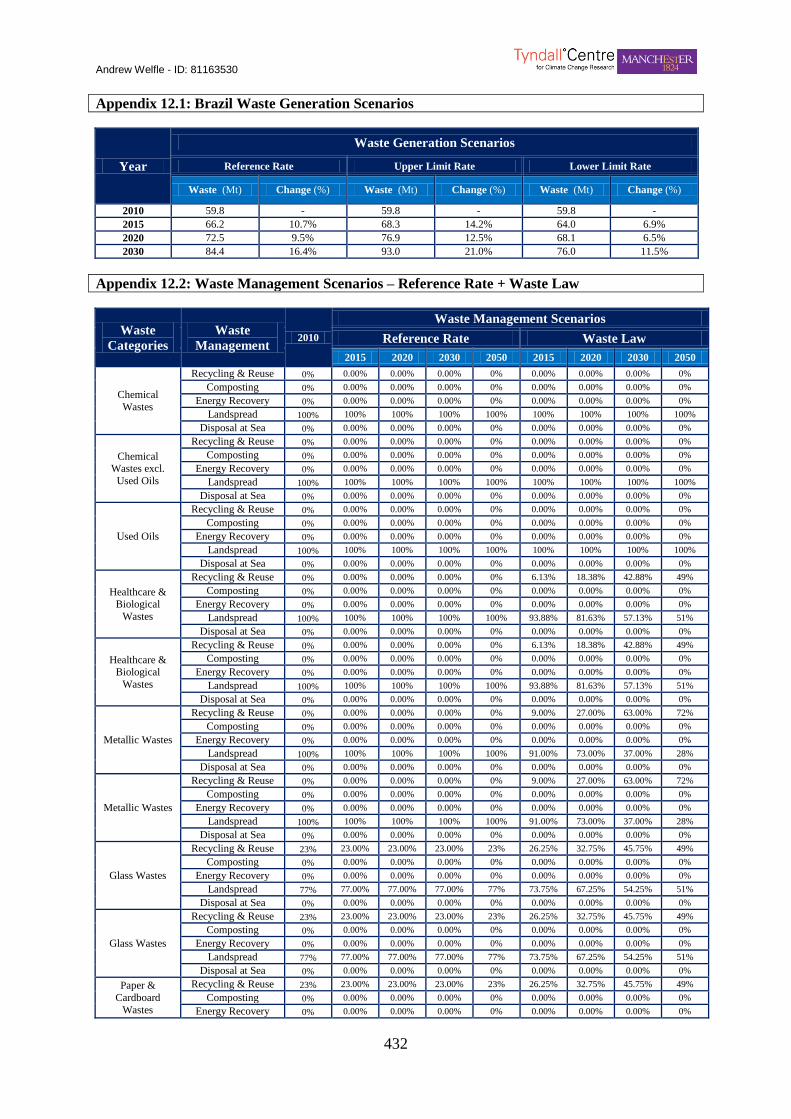
Andrew Welfle - ID: 81163530
432
Appendix 12.1: Brazil Waste Generation Scenarios
Year
Waste Generation Scenarios
Reference Rate Upper Limit Rate Lower Limit Rate
Waste (Mt) Change (%) Waste (Mt) Change (%) Waste (Mt) Change (%)
2010 59.8 - 59.8 - 59.8 -
2015 66.2 10.7% 68.3 14.2% 64.0 6.9%
2020 72.5 9.5% 76.9 12.5% 68.1 6.5%
2030 84.4 16.4% 93.0 21.0% 76.0 11.5%
Appendix 12.2: Waste Management Scenarios – Reference Rate + Waste Law
Waste
Categories
Waste
Management 2010
Waste Management Scenarios
Reference Rate Waste Law
2015 2020 2030 2050 2015 2020 2030 2050
Chemical
Wastes
Recycling & Reuse 0% 0.00% 0.00% 0.00% 0% 0.00% 0.00% 0.00% 0%
Composting 0% 0.00% 0.00% 0.00% 0% 0.00% 0.00% 0.00% 0%
Energy Recovery 0% 0.00% 0.00% 0.00% 0% 0.00% 0.00% 0.00% 0%
Landspread 100% 100% 100% 100% 100% 100% 100% 100% 100%
Disposal at Sea 0% 0.00% 0.00% 0.00% 0% 0.00% 0.00% 0.00% 0%
Chemical Wastes excl.
Used Oils
Recycling & Reuse 0% 0.00% 0.00% 0.00% 0% 0.00% 0.00% 0.00% 0%
Composting 0% 0.00% 0.00% 0.00% 0% 0.00% 0.00% 0.00% 0%
Energy Recovery 0% 0.00% 0.00% 0.00% 0% 0.00% 0.00% 0.00% 0%
Landspread 100% 100% 100% 100% 100% 100% 100% 100% 100%
Disposal at Sea 0% 0.00% 0.00% 0.00% 0% 0.00% 0.00% 0.00% 0%
Healthcare & Biological
Wastes
Recycling & Reuse 0% 0.00% 0.00% 0.00% 0% 6.13% 18.38% 42.88% 49%
Composting 0% 0.00% 0.00% 0.00% 0% 0.00% 0.00% 0.00% 0%
Energy Recovery 0% 0.00% 0.00% 0.00% 0% 0.00% 0.00% 0.00% 0%
Landspread 100% 100% 100% 100% 100% 93.88% 81.63% 57.13% 51%
Disposal at Sea 0% 0.00% 0.00% 0.00% 0% 0.00% 0.00% 0.00% 0%
Metallic Wastes
Recycling & Reuse 0% 0.00% 0.00% 0.00% 0% 9.00% 27.00% 63.00% 72%
Composting 0% 0.00% 0.00% 0.00% 0% 0.00% 0.00% 0.00% 0%
Energy Recovery 0% 0.00% 0.00% 0.00% 0% 0.00% 0.00% 0.00% 0%
Landspread 100% 100% 100% 100% 100% 91.00% 73.00% 37.00% 28%
Disposal at Sea 0% 0.00% 0.00% 0.00% 0% 0.00% 0.00% 0.00% 0%
Glass Wastes
Recycling & Reuse 23% 23.00% 23.00% 23.00% 23% 26.25% 32.75% 45.75% 49%
Composting 0% 0.00% 0.00% 0.00% 0% 0.00% 0.00% 0.00% 0%
Energy Recovery 0% 0.00% 0.00% 0.00% 0% 0.00% 0.00% 0.00% 0%
Landspread 77% 77.00% 77.00% 77.00% 77% 73.75% 67.25% 54.25% 51%
Disposal at Sea 0% 0.00% 0.00% 0.00% 0% 0.00% 0.00% 0.00% 0%
Paper &
Cardboard
Wastes
Recycling & Reuse 23% 23.00% 23.00% 23.00% 23% 26.25% 32.75% 45.75% 49%
Composting 0% 0.00% 0.00% 0.00% 0% 0.00% 0.00% 0.00% 0%
Energy Recovery 0% 0.00% 0.00% 0.00% 0% 0.00% 0.00% 0.00% 0%
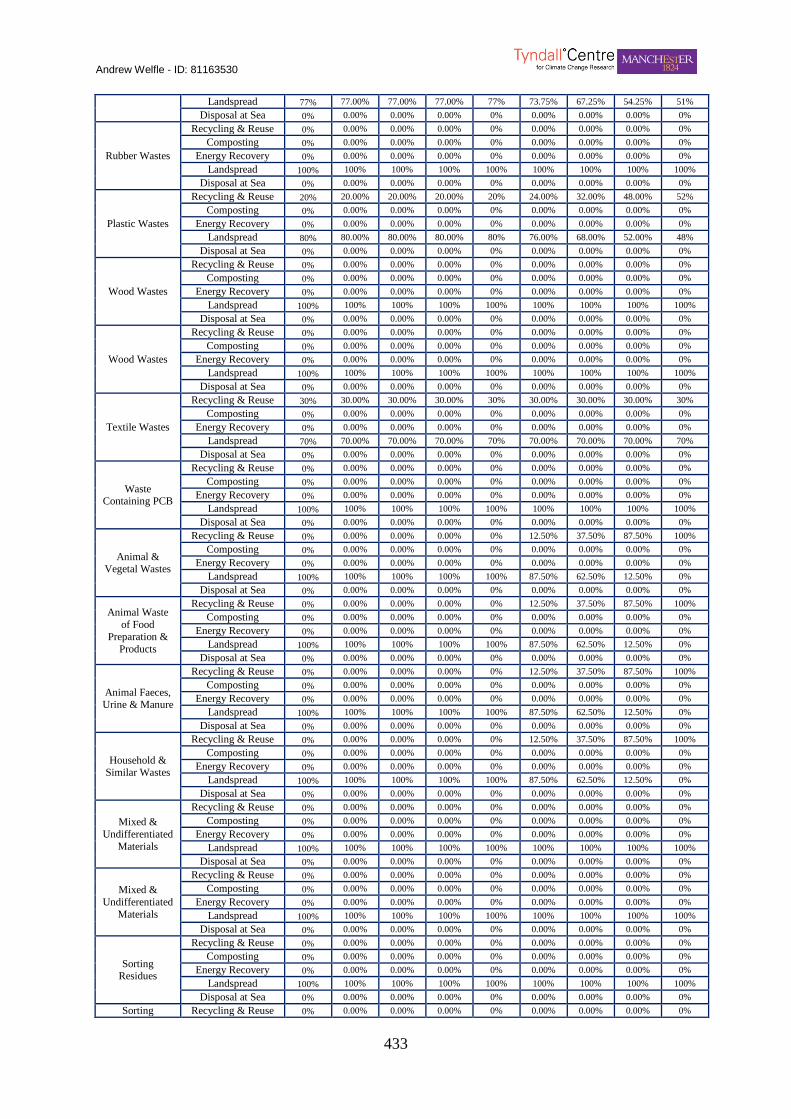
Andrew Welfle - ID: 81163530
433
Landspread 77% 77.00% 77.00% 77.00% 77% 73.75% 67.25% 54.25% 51%
Disposal at Sea 0% 0.00% 0.00% 0.00% 0% 0.00% 0.00% 0.00% 0%
Rubber Wastes
Recycling & Reuse 0% 0.00% 0.00% 0.00% 0% 0.00% 0.00% 0.00% 0%
Composting 0% 0.00% 0.00% 0.00% 0% 0.00% 0.00% 0.00% 0%
Energy Recovery 0% 0.00% 0.00% 0.00% 0% 0.00% 0.00% 0.00% 0%
Landspread 100% 100% 100% 100% 100% 100% 100% 100% 100%
Disposal at Sea 0% 0.00% 0.00% 0.00% 0% 0.00% 0.00% 0.00% 0%
Plastic Wastes
Recycling & Reuse 20% 20.00% 20.00% 20.00% 20% 24.00% 32.00% 48.00% 52%
Composting 0% 0.00% 0.00% 0.00% 0% 0.00% 0.00% 0.00% 0%
Energy Recovery 0% 0.00% 0.00% 0.00% 0% 0.00% 0.00% 0.00% 0%
Landspread 80% 80.00% 80.00% 80.00% 80% 76.00% 68.00% 52.00% 48%
Disposal at Sea 0% 0.00% 0.00% 0.00% 0% 0.00% 0.00% 0.00% 0%
Wood Wastes
Recycling & Reuse 0% 0.00% 0.00% 0.00% 0% 0.00% 0.00% 0.00% 0%
Composting 0% 0.00% 0.00% 0.00% 0% 0.00% 0.00% 0.00% 0%
Energy Recovery 0% 0.00% 0.00% 0.00% 0% 0.00% 0.00% 0.00% 0%
Landspread 100% 100% 100% 100% 100% 100% 100% 100% 100%
Disposal at Sea 0% 0.00% 0.00% 0.00% 0% 0.00% 0.00% 0.00% 0%
Textile Wastes
Recycling & Reuse 30% 30.00% 30.00% 30.00% 30% 30.00% 30.00% 30.00% 30%
Composting 0% 0.00% 0.00% 0.00% 0% 0.00% 0.00% 0.00% 0%
Energy Recovery 0% 0.00% 0.00% 0.00% 0% 0.00% 0.00% 0.00% 0%
Landspread 70% 70.00% 70.00% 70.00% 70% 70.00% 70.00% 70.00% 70%
Disposal at Sea 0% 0.00% 0.00% 0.00% 0% 0.00% 0.00% 0.00% 0%
Waste Containing PCB
Recycling & Reuse 0% 0.00% 0.00% 0.00% 0% 0.00% 0.00% 0.00% 0%
Composting 0% 0.00% 0.00% 0.00% 0% 0.00% 0.00% 0.00% 0%
Energy Recovery 0% 0.00% 0.00% 0.00% 0% 0.00% 0.00% 0.00% 0%
Landspread 100% 100% 100% 100% 100% 100% 100% 100% 100%
Disposal at Sea 0% 0.00% 0.00% 0.00% 0% 0.00% 0.00% 0.00% 0%
Animal & Vegetal Wastes
Recycling & Reuse 0% 0.00% 0.00% 0.00% 0% 12.50% 37.50% 87.50% 100%
Composting 0% 0.00% 0.00% 0.00% 0% 0.00% 0.00% 0.00% 0%
Energy Recovery 0% 0.00% 0.00% 0.00% 0% 0.00% 0.00% 0.00% 0%
Landspread 100% 100% 100% 100% 100% 87.50% 62.50% 12.50% 0%
Disposal at Sea 0% 0.00% 0.00% 0.00% 0% 0.00% 0.00% 0.00% 0%
Animal Waste
of Food
Preparation &
Products
Recycling & Reuse 0% 0.00% 0.00% 0.00% 0% 12.50% 37.50% 87.50% 100%
Composting 0% 0.00% 0.00% 0.00% 0% 0.00% 0.00% 0.00% 0%
Energy Recovery 0% 0.00% 0.00% 0.00% 0% 0.00% 0.00% 0.00% 0%
Landspread 100% 100% 100% 100% 100% 87.50% 62.50% 12.50% 0%
Disposal at Sea 0% 0.00% 0.00% 0.00% 0% 0.00% 0.00% 0.00% 0%
Animal Faeces, Urine & Manure
Recycling & Reuse 0% 0.00% 0.00% 0.00% 0% 12.50% 37.50% 87.50% 100%
Composting 0% 0.00% 0.00% 0.00% 0% 0.00% 0.00% 0.00% 0%
Energy Recovery 0% 0.00% 0.00% 0.00% 0% 0.00% 0.00% 0.00% 0%
Landspread 100% 100% 100% 100% 100% 87.50% 62.50% 12.50% 0%
Disposal at Sea 0% 0.00% 0.00% 0.00% 0% 0.00% 0.00% 0.00% 0%
Household & Similar Wastes
Recycling & Reuse 0% 0.00% 0.00% 0.00% 0% 12.50% 37.50% 87.50% 100%
Composting 0% 0.00% 0.00% 0.00% 0% 0.00% 0.00% 0.00% 0%
Energy Recovery 0% 0.00% 0.00% 0.00% 0% 0.00% 0.00% 0.00% 0%
Landspread 100% 100% 100% 100% 100% 87.50% 62.50% 12.50% 0%
Disposal at Sea 0% 0.00% 0.00% 0.00% 0% 0.00% 0.00% 0.00% 0%
Mixed &
Undifferentiated
Materials
Recycling & Reuse 0% 0.00% 0.00% 0.00% 0% 0.00% 0.00% 0.00% 0%
Composting 0% 0.00% 0.00% 0.00% 0% 0.00% 0.00% 0.00% 0%
Energy Recovery 0% 0.00% 0.00% 0.00% 0% 0.00% 0.00% 0.00% 0%
Landspread 100% 100% 100% 100% 100% 100% 100% 100% 100%
Disposal at Sea 0% 0.00% 0.00% 0.00% 0% 0.00% 0.00% 0.00% 0%
Sorting Residues
Recycling & Reuse 0% 0.00% 0.00% 0.00% 0% 0.00% 0.00% 0.00% 0%
Composting 0% 0.00% 0.00% 0.00% 0% 0.00% 0.00% 0.00% 0%
Energy Recovery 0% 0.00% 0.00% 0.00% 0% 0.00% 0.00% 0.00% 0%
Landspread 100% 100% 100% 100% 100% 100% 100% 100% 100%
Disposal at Sea 0% 0.00% 0.00% 0.00% 0% 0.00% 0.00% 0.00% 0%
Sorting Recycling & Reuse 0% 0.00% 0.00% 0.00% 0% 0.00% 0.00% 0.00% 0%

Andrew Welfle - ID: 81163530
434
Residues Composting 0% 0.00% 0.00% 0.00% 0% 0.00% 0.00% 0.00% 0%
Energy Recovery 0% 0.00% 0.00% 0.00% 0% 0.00% 0.00% 0.00% 0%
Landspread 100% 100% 100% 100% 100% 100% 100% 100% 100%
Disposal at Sea 0% 0.00% 0.00% 0.00% 0% 0.00% 0.00% 0.00% 0%
Common
Sludges
Recycling & Reuse 0% 0.00% 0.00% 0.00% 0% 0.00% 0.00% 0.00% 0%
Composting 0% 0.00% 0.00% 0.00% 0% 0.00% 0.00% 0.00% 0%
Energy Recovery 0% 0.00% 0.00% 0.00% 0% 0.00% 0.00% 0.00% 0%
Landspread 100% 100% 100% 100% 100% 100% 100% 100% 100%
Disposal at Sea 0% 0.00% 0.00% 0.00% 0% 0.00% 0.00% 0.00% 0%
Mineral Wastes
Recycling & Reuse 0% 0.00% 0.00% 0.00% 0% 0.00% 0.00% 0.00% 0%
Composting 0% 0.00% 0.00% 0.00% 0% 0.00% 0.00% 0.00% 0%
Energy Recovery 0% 0.00% 0.00% 0.00% 0% 0.00% 0.00% 0.00% 0%
Landspread 100% 100% 100% 100% 100% 100% 100% 100% 100%
Disposal at Sea 0% 0.00% 0.00% 0.00% 0% 0.00% 0.00% 0.00% 0%
Other Wastes
Recycling & Reuse 0% 0.00% 0.00% 0.00% 0% 0.00% 0.00% 0.00% 0%
Composting 0% 0.00% 0.00% 0.00% 0% 0.00% 0.00% 0.00% 0%
Energy Recovery 0% 0.00% 0.00% 0.00% 0% 0.00% 0.00% 0.00% 0%
Landspread 100% 100% 100% 100% 100% 100% 100% 100% 100%
Disposal at Sea 0% 0.00% 0.00% 0.00% 0% 0.00% 0.00% 0.00% 0%
Appendix 12.2: Waste Management Scenarios – Recycling +
Waste
Categories
Waste
Management 2010
Waste Management Scenarios
Recycling+ Resource Recovery
2015 2020 2030 2050 2015 2020 2030 2050
Chemical
Wastes
Recycling & Reuse 0% 0.00% 0.00% 0.00% 0% - - - -
Composting 0% 0.00% 0.00% 0.00% 0% - - - -
Energy Recovery 0% 12.50% 37.50% 87.50% 100% - - - -
Landspread 100% 87.50% 62.50% 12.50% 0% - - - -
Disposal at Sea 0% 0.00% 0.00% 0.00% 0% - - - -
Chemical
Wastes excl.
Used Oils
Recycling & Reuse 0% 0.00% 0.00% 0.00% 0% - - - -
Composting 0% 0.00% 0.00% 0.00% 0% - - - -
Energy Recovery 0% 12.50% 37.50% 87.50% 100% - - - -
Landspread 100% 87.50% 62.50% 12.50% 0% - - - -
Disposal at Sea 0% 0.00% 0.00% 0.00% 0% - - - -
Used Oils
Recycling & Reuse 0% 0.00% 0.00% 0.00% 0% - - - -
Composting 0% 0.00% 0.00% 0.00% 0% - - - -
Energy Recovery 0% 12.50% 37.50% 87.50% 100% - - - -
Landspread 100% 87.50% 62.50% 12.50% 0% - - - -
Disposal at Sea 0% 0.00% 0.00% 0.00% 0% - - - -
Healthcare &
Biological
Wastes
Recycling & Reuse 0% 10.00% 30.00% 70.00% 80% - - - -
Composting 0% 0.00% 0.00% 0.00% 0% - - - -
Energy Recovery 0% 2.50% 7.50% 17.50% 20% - - - -
Landspread 100% 87.50% 62.50% 12.50% 0% - - - -
Disposal at Sea 0% 0.00% 0.00% 0.00% 0% - - - -
Healthcare &
Biological
Wastes
Recycling & Reuse 0% 10.00% 30.00% 70.00% 80% - - - -
Composting 0% 0.00% 0.00% 0.00% 0% - - - -
Energy Recovery 0% 2.50% 7.50% 17.50% 20% - - - -
Landspread 100% 87.50% 62.50% 12.50% 0% - - - -
Disposal at Sea 0% 0.00% 0.00% 0.00% 0% - - - -
Metallic Wastes
Recycling & Reuse 0% 9.63% 28.88% 67.38% 77% - - - -
Composting 0% 0.00% 0.00% 0.00% 0% - - - -
Energy Recovery 0% 2.88% 8.63% 20.13% 23% - - - -
Landspread 100% 87.50% 62.50% 12.50% 0% - - - -
Disposal at Sea 0% 0.00% 0.00% 0.00% 0% - - - -
Metallic Wastes Recycling & Reuse 0% 9.63% 28.88% 67.38% 77% - - - -
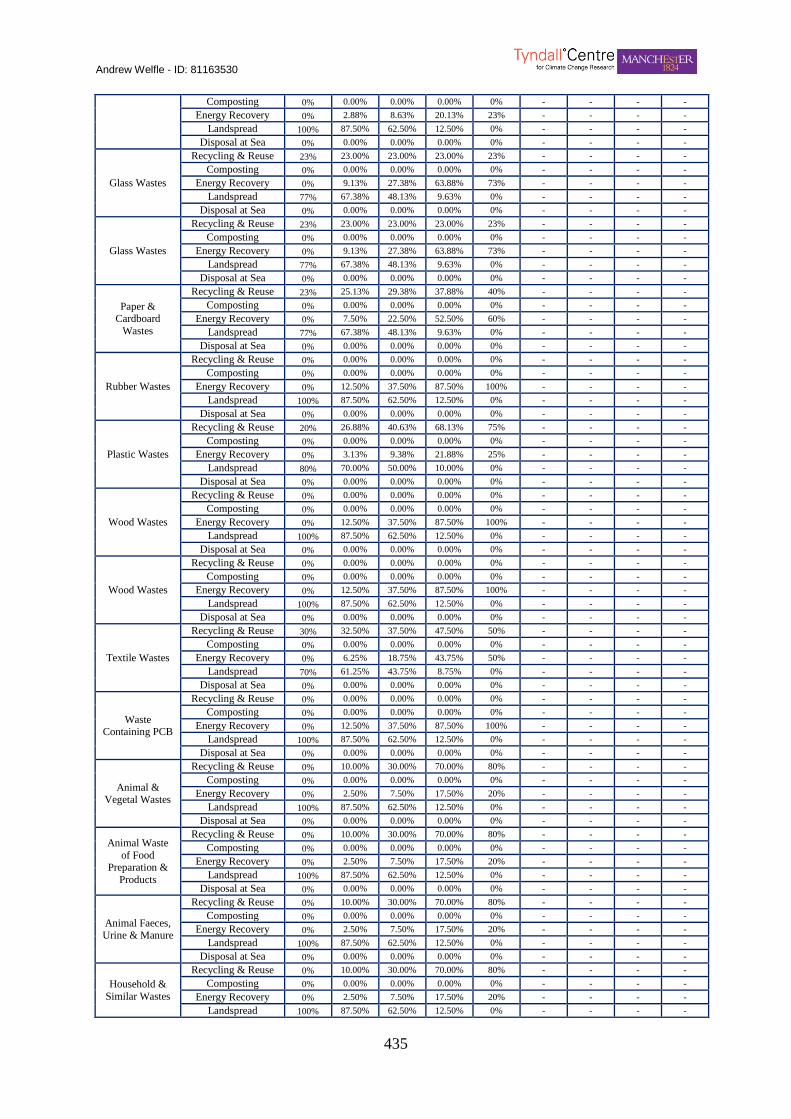
Andrew Welfle - ID: 81163530
435
Composting 0% 0.00% 0.00% 0.00% 0% - - - -
Energy Recovery 0% 2.88% 8.63% 20.13% 23% - - - -
Landspread 100% 87.50% 62.50% 12.50% 0% - - - -
Disposal at Sea 0% 0.00% 0.00% 0.00% 0% - - - -
Glass Wastes
Recycling & Reuse 23% 23.00% 23.00% 23.00% 23% - - - -
Composting 0% 0.00% 0.00% 0.00% 0% - - - -
Energy Recovery 0% 9.13% 27.38% 63.88% 73% - - - -
Landspread 77% 67.38% 48.13% 9.63% 0% - - - -
Disposal at Sea 0% 0.00% 0.00% 0.00% 0% - - - -
Glass Wastes
Recycling & Reuse 23% 23.00% 23.00% 23.00% 23% - - - -
Composting 0% 0.00% 0.00% 0.00% 0% - - - -
Energy Recovery 0% 9.13% 27.38% 63.88% 73% - - - -
Landspread 77% 67.38% 48.13% 9.63% 0% - - - -
Disposal at Sea 0% 0.00% 0.00% 0.00% 0% - - - -
Paper & Cardboard
Wastes
Recycling & Reuse 23% 25.13% 29.38% 37.88% 40% - - - -
Composting 0% 0.00% 0.00% 0.00% 0% - - - -
Energy Recovery 0% 7.50% 22.50% 52.50% 60% - - - -
Landspread 77% 67.38% 48.13% 9.63% 0% - - - -
Disposal at Sea 0% 0.00% 0.00% 0.00% 0% - - - -
Rubber Wastes
Recycling & Reuse 0% 0.00% 0.00% 0.00% 0% - - - -
Composting 0% 0.00% 0.00% 0.00% 0% - - - -
Energy Recovery 0% 12.50% 37.50% 87.50% 100% - - - -
Landspread 100% 87.50% 62.50% 12.50% 0% - - - -
Disposal at Sea 0% 0.00% 0.00% 0.00% 0% - - - -
Plastic Wastes
Recycling & Reuse 20% 26.88% 40.63% 68.13% 75% - - - -
Composting 0% 0.00% 0.00% 0.00% 0% - - - -
Energy Recovery 0% 3.13% 9.38% 21.88% 25% - - - -
Landspread 80% 70.00% 50.00% 10.00% 0% - - - -
Disposal at Sea 0% 0.00% 0.00% 0.00% 0% - - - -
Wood Wastes
Recycling & Reuse 0% 0.00% 0.00% 0.00% 0% - - - -
Composting 0% 0.00% 0.00% 0.00% 0% - - - -
Energy Recovery 0% 12.50% 37.50% 87.50% 100% - - - -
Landspread 100% 87.50% 62.50% 12.50% 0% - - - -
Disposal at Sea 0% 0.00% 0.00% 0.00% 0% - - - -
Wood Wastes
Recycling & Reuse 0% 0.00% 0.00% 0.00% 0% - - - -
Composting 0% 0.00% 0.00% 0.00% 0% - - - -
Energy Recovery 0% 12.50% 37.50% 87.50% 100% - - - -
Landspread 100% 87.50% 62.50% 12.50% 0% - - - -
Disposal at Sea 0% 0.00% 0.00% 0.00% 0% - - - -
Textile Wastes
Recycling & Reuse 30% 32.50% 37.50% 47.50% 50% - - - -
Composting 0% 0.00% 0.00% 0.00% 0% - - - -
Energy Recovery 0% 6.25% 18.75% 43.75% 50% - - - -
Landspread 70% 61.25% 43.75% 8.75% 0% - - - -
Disposal at Sea 0% 0.00% 0.00% 0.00% 0% - - - -
Waste Containing PCB
Recycling & Reuse 0% 0.00% 0.00% 0.00% 0% - - - -
Composting 0% 0.00% 0.00% 0.00% 0% - - - -
Energy Recovery 0% 12.50% 37.50% 87.50% 100% - - - -
Landspread 100% 87.50% 62.50% 12.50% 0% - - - -
Disposal at Sea 0% 0.00% 0.00% 0.00% 0% - - - -
Animal & Vegetal Wastes
Recycling & Reuse 0% 10.00% 30.00% 70.00% 80% - - - -
Composting 0% 0.00% 0.00% 0.00% 0% - - - -
Energy Recovery 0% 2.50% 7.50% 17.50% 20% - - - -
Landspread 100% 87.50% 62.50% 12.50% 0% - - - -
Disposal at Sea 0% 0.00% 0.00% 0.00% 0% - - - -
Animal Waste
of Food Preparation &
Products
Recycling & Reuse 0% 10.00% 30.00% 70.00% 80% - - - -
Composting 0% 0.00% 0.00% 0.00% 0% - - - -
Energy Recovery 0% 2.50% 7.50% 17.50% 20% - - - -
Landspread 100% 87.50% 62.50% 12.50% 0% - - - -
Disposal at Sea 0% 0.00% 0.00% 0.00% 0% - - - -
Animal Faeces, Urine & Manure
Recycling & Reuse 0% 10.00% 30.00% 70.00% 80% - - - -
Composting 0% 0.00% 0.00% 0.00% 0% - - - -
Energy Recovery 0% 2.50% 7.50% 17.50% 20% - - - -
Landspread 100% 87.50% 62.50% 12.50% 0% - - - -
Disposal at Sea 0% 0.00% 0.00% 0.00% 0% - - - -
Household &
Similar Wastes
Recycling & Reuse 0% 10.00% 30.00% 70.00% 80% - - - -
Composting 0% 0.00% 0.00% 0.00% 0% - - - -
Energy Recovery 0% 2.50% 7.50% 17.50% 20% - - - -
Landspread 100% 87.50% 62.50% 12.50% 0% - - - -
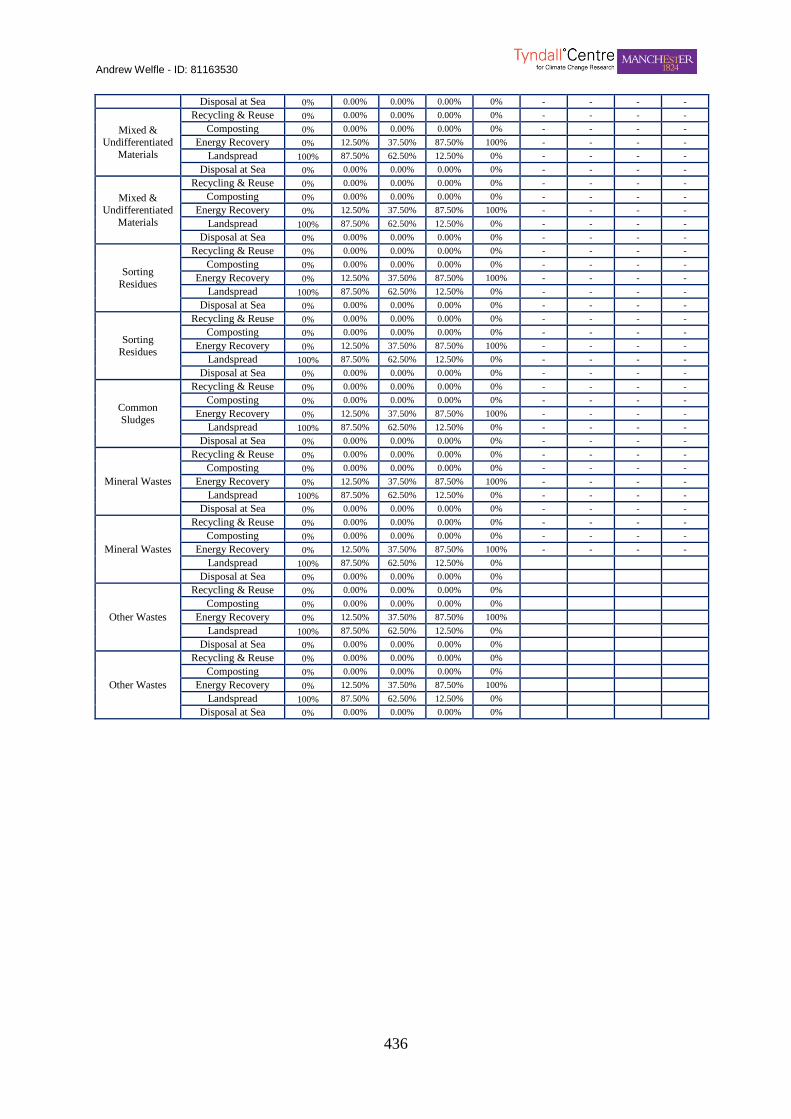
Andrew Welfle - ID: 81163530
436
Disposal at Sea 0% 0.00% 0.00% 0.00% 0% - - - -
Mixed & Undifferentiated
Materials
Recycling & Reuse 0% 0.00% 0.00% 0.00% 0% - - - -
Composting 0% 0.00% 0.00% 0.00% 0% - - - -
Energy Recovery 0% 12.50% 37.50% 87.50% 100% - - - -
Landspread 100% 87.50% 62.50% 12.50% 0% - - - -
Disposal at Sea 0% 0.00% 0.00% 0.00% 0% - - - -
Mixed & Undifferentiated
Materials
Recycling & Reuse 0% 0.00% 0.00% 0.00% 0% - - - -
Composting 0% 0.00% 0.00% 0.00% 0% - - - -
Energy Recovery 0% 12.50% 37.50% 87.50% 100% - - - -
Landspread 100% 87.50% 62.50% 12.50% 0% - - - -
Disposal at Sea 0% 0.00% 0.00% 0.00% 0% - - - -
Sorting
Residues
Recycling & Reuse 0% 0.00% 0.00% 0.00% 0% - - - -
Composting 0% 0.00% 0.00% 0.00% 0% - - - -
Energy Recovery 0% 12.50% 37.50% 87.50% 100% - - - -
Landspread 100% 87.50% 62.50% 12.50% 0% - - - -
Disposal at Sea 0% 0.00% 0.00% 0.00% 0% - - - -
Sorting
Residues
Recycling & Reuse 0% 0.00% 0.00% 0.00% 0% - - - -
Composting 0% 0.00% 0.00% 0.00% 0% - - - -
Energy Recovery 0% 12.50% 37.50% 87.50% 100% - - - -
Landspread 100% 87.50% 62.50% 12.50% 0% - - - -
Disposal at Sea 0% 0.00% 0.00% 0.00% 0% - - - -
Common
Sludges
Recycling & Reuse 0% 0.00% 0.00% 0.00% 0% - - - -
Composting 0% 0.00% 0.00% 0.00% 0% - - - -
Energy Recovery 0% 12.50% 37.50% 87.50% 100% - - - -
Landspread 100% 87.50% 62.50% 12.50% 0% - - - -
Disposal at Sea 0% 0.00% 0.00% 0.00% 0% - - - -
Mineral Wastes
Recycling & Reuse 0% 0.00% 0.00% 0.00% 0% - - - -
Composting 0% 0.00% 0.00% 0.00% 0% - - - -
Energy Recovery 0% 12.50% 37.50% 87.50% 100% - - - -
Landspread 100% 87.50% 62.50% 12.50% 0% - - - -
Disposal at Sea 0% 0.00% 0.00% 0.00% 0% - - - -
Mineral Wastes
Recycling & Reuse 0% 0.00% 0.00% 0.00% 0% - - - -
Composting 0% 0.00% 0.00% 0.00% 0% - - - -
Energy Recovery 0% 12.50% 37.50% 87.50% 100% - - - -
Landspread 100% 87.50% 62.50% 12.50% 0%
Disposal at Sea 0% 0.00% 0.00% 0.00% 0%
Other Wastes
Recycling & Reuse 0% 0.00% 0.00% 0.00% 0%
Composting 0% 0.00% 0.00% 0.00% 0%
Energy Recovery 0% 12.50% 37.50% 87.50% 100%
Landspread 100% 87.50% 62.50% 12.50% 0%
Disposal at Sea 0% 0.00% 0.00% 0.00% 0%
Other Wastes
Recycling & Reuse 0% 0.00% 0.00% 0.00% 0%
Composting 0% 0.00% 0.00% 0.00% 0%
Energy Recovery 0% 12.50% 37.50% 87.50% 100%
Landspread 100% 87.50% 62.50% 12.50% 0%
Disposal at Sea 0% 0.00% 0.00% 0.00% 0%

Andrew Welfle - ID: 81163530
437
Appendix 13.0
Appendix 13.0 includes a summary of the data utilised in developing the Brazil BRM Baseline Scenario.
Appendix 13.1 Literature Informed
Brazil BRM
Characteristic Values
A summary of the upper limit, lower limit and average driver characteristic
values from the Brazil values-database described within the Thesis text.
Appendix 13.2
Brazil Baseline Scenario
Resource Availability
Forecasts
A summary of the output data from the Brazil Baseline Scenario developed
within the Chapter 9 Case Study of Brazil. This includes forecasts of biomass
resource availability (‘000 Tonnes) over the analysis timeframe to 2030.
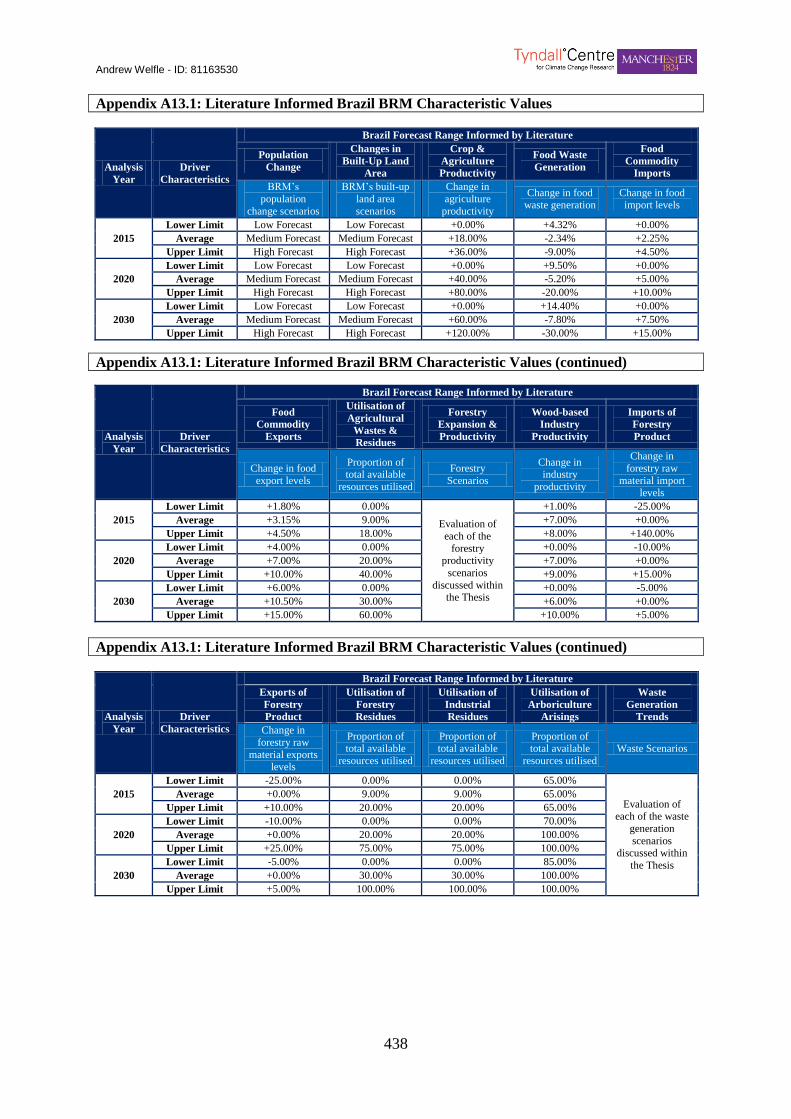
Andrew Welfle - ID: 81163530
438
Appendix A13.1: Literature Informed Brazil BRM Characteristic Values
Analysis
Year
Driver
Characteristics
Brazil Forecast Range Informed by Literature
Population
Change
Changes in
Built-Up Land
Area
Crop &
Agriculture
Productivity
Food Waste
Generation
Food
Commodity
Imports
BRM’s
population
change scenarios
BRM’s built-up
land area
scenarios
Change in
agriculture
productivity
Change in food waste generation
Change in food import levels
2015
Lower Limit Low Forecast Low Forecast +0.00% +4.32% +0.00%
Average Medium Forecast Medium Forecast +18.00% -2.34% +2.25%
Upper Limit High Forecast High Forecast +36.00% -9.00% +4.50%
2020
Lower Limit Low Forecast Low Forecast +0.00% +9.50% +0.00%
Average Medium Forecast Medium Forecast +40.00% -5.20% +5.00%
Upper Limit High Forecast High Forecast +80.00% -20.00% +10.00%
2030
Lower Limit Low Forecast Low Forecast +0.00% +14.40% +0.00%
Average Medium Forecast Medium Forecast +60.00% -7.80% +7.50%
Upper Limit High Forecast High Forecast +120.00% -30.00% +15.00%
Range Informed by Li
Appendix A13.1: Literature Informed Brazil BRM Characteristic Values (continued)
Analysis
Year
Driver
Characteristics
Brazil Forecast Range Informed by Literature
Food
Commodity
Exports
Utilisation of
Agricultural
Wastes &
Residues
Forestry
Expansion &
Productivity
Wood-based
Industry
Productivity
Imports of
Forestry
Product
Change in food
export levels
Proportion of total available
resources utilised
Forestry
Scenarios
Change in industry
productivity
Change in
forestry raw
material import levels
2015
Lower Limit +1.80% 0.00%
Evaluation of
each of the
forestry productivity
scenarios
discussed within the Thesis
+1.00% -25.00%
Average +3.15% 9.00% +7.00% +0.00%
Upper Limit +4.50% 18.00% +8.00% +140.00%
2020
Lower Limit +4.00% 0.00% +0.00% -10.00%
Average +7.00% 20.00% +7.00% +0.00%
Upper Limit +10.00% 40.00% +9.00% +15.00%
2030
Lower Limit +6.00% 0.00% +0.00% -5.00%
Average +10.50% 30.00% +6.00% +0.00%
Upper Limit +15.00% 60.00% +10.00% +5.00%
Appendix A13.1: Literature Informed Brazil BRM Characteristic Values (continued)
Analysis
Year
Driver
Characteristics
Brazil Forecast Range Informed by Literature
Exports of
Forestry
Product
Utilisation of
Forestry
Residues
Utilisation of
Industrial
Residues
Utilisation of
Arboriculture
Arisings
Waste
Generation
Trends
Change in
forestry raw
material exports levels
Proportion of total available
resources utilised
Proportion of total available
resources utilised
Proportion of total available
resources utilised
Waste Scenarios
2015
Lower Limit -25.00% 0.00% 0.00% 65.00%
Evaluation of each of the waste
generation
scenarios discussed within
the Thesis
Average +0.00% 9.00% 9.00% 65.00%
Upper Limit +10.00% 20.00% 20.00% 65.00%
2020
Lower Limit -10.00% 0.00% 0.00% 70.00%
Average +0.00% 20.00% 20.00% 100.00%
Upper Limit +25.00% 75.00% 75.00% 100.00%
2030
Lower Limit -5.00% 0.00% 0.00% 85.00%
Average +0.00% 30.00% 30.00% 100.00%
Upper Limit +5.00% 100.00% 100.00% 100.00%
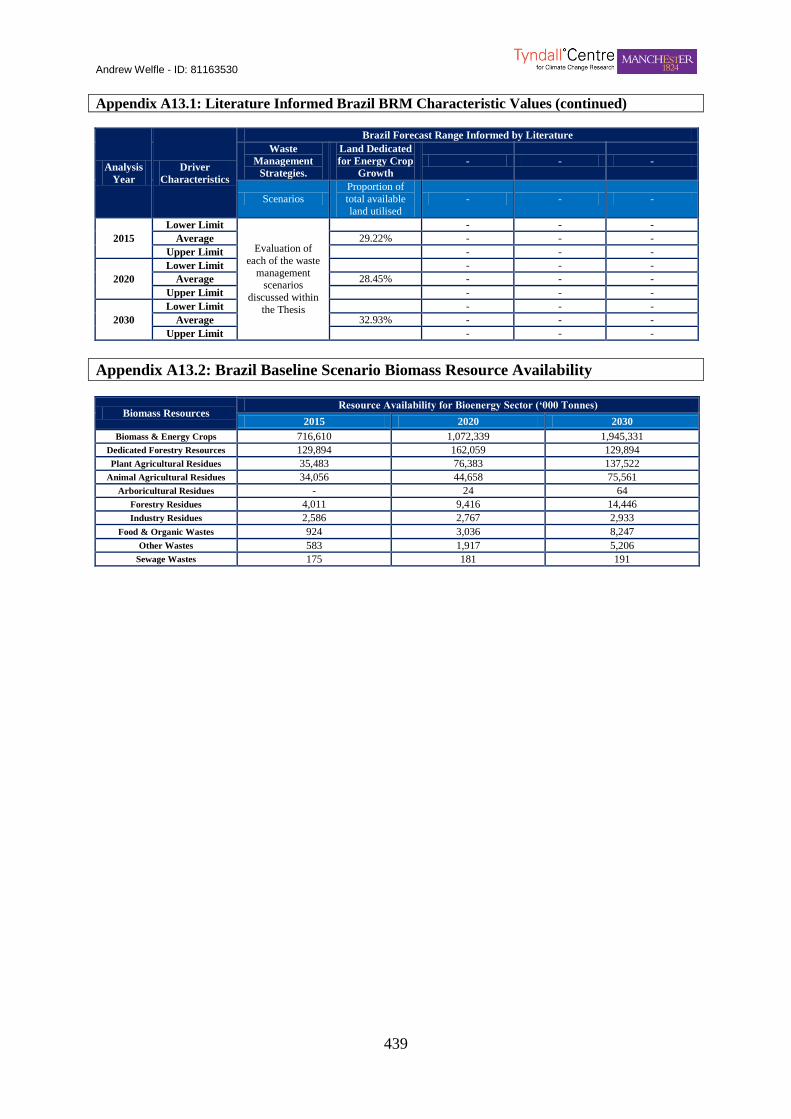
Andrew Welfle - ID: 81163530
439
Appendix A13.1: Literature Informed Brazil BRM Characteristic Values (continued)
Analysis
Year
Driver
Characteristics
Brazil Forecast Range Informed by Literature
Waste
Management
Strategies.
Land Dedicated
for Energy Crop
Growth
- - -
Scenarios
Proportion of
total available
land utilised
- - -
2015
Lower Limit
Evaluation of
each of the waste
management scenarios
discussed within
the Thesis
- - -
Average 29.22% - - -
Upper Limit - - -
2020
Lower Limit - - -
Average 28.45% - - -
Upper Limit - - -
2030
Lower Limit - - -
Average 32.93% - - -
Upper Limit - - -
Appendix A13.2: Brazil Baseline Scenario Biomass Resource Availability
Biomass Resources Resource Availability for Bioenergy Sector (‘000 Tonnes)
2015 2020 2030
Biomass & Energy Crops 716,610 1,072,339 1,945,331
Dedicated Forestry Resources 129,894 162,059 129,894
Plant Agricultural Residues 35,483 76,383 137,522
Animal Agricultural Residues 34,056 44,658 75,561
Arboricultural Residues - 24 64
Forestry Residues 4,011 9,416 14,446
Industry Residues 2,586 2,767 2,933
Food & Organic Wastes 924 3,036 8,247
Other Wastes 583 1,917 5,206
Sewage Wastes 175 181 191
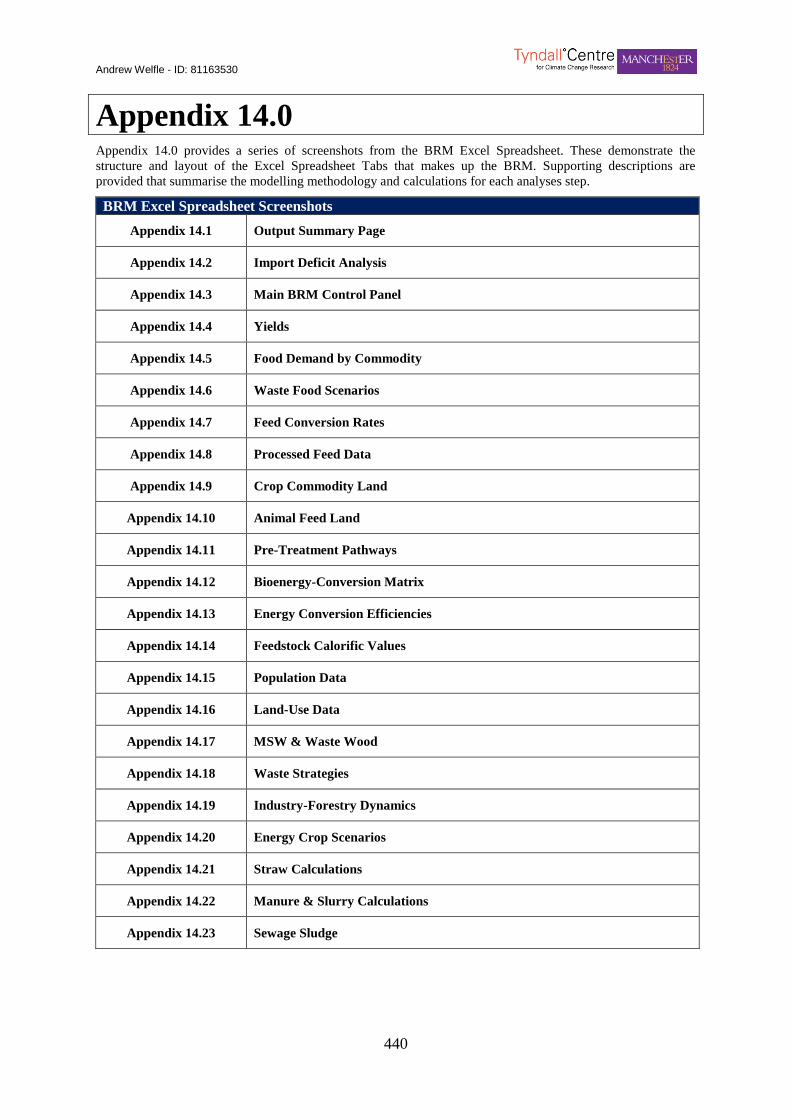
Andrew Welfle - ID: 81163530
440
Appendix 14.0 Appendix 14.0 provides a series of screenshots from the BRM Excel Spreadsheet. These demonstrate the
structure and layout of the Excel Spreadsheet Tabs that makes up the BRM. Supporting descriptions are
provided that summarise the modelling methodology and calculations for each analyses step.
BRM Excel Spreadsheet Screenshots
Appendix 14.1 Output Summary Page
Appendix 14.2 Import Deficit Analysis
Appendix 14.3 Main BRM Control Panel
Appendix 14.4 Yields
Appendix 14.5 Food Demand by Commodity
Appendix 14.6 Waste Food Scenarios
Appendix 14.7 Feed Conversion Rates
Appendix 14.8 Processed Feed Data
Appendix 14.9 Crop Commodity Land
Appendix 14.10 Animal Feed Land
Appendix 14.11 Pre-Treatment Pathways
Appendix 14.12 Bioenergy-Conversion Matrix
Appendix 14.13 Energy Conversion Efficiencies
Appendix 14.14 Feedstock Calorific Values
Appendix 14.15 Population Data
Appendix 14.16 Land-Use Data
Appendix 14.17 MSW & Waste Wood
Appendix 14.18 Waste Strategies
Appendix 14.19 Industry-Forestry Dynamics
Appendix 14.20 Energy Crop Scenarios
Appendix 14.21 Straw Calculations
Appendix 14.22 Manure & Slurry Calculations
Appendix 14.23 Sewage Sludge
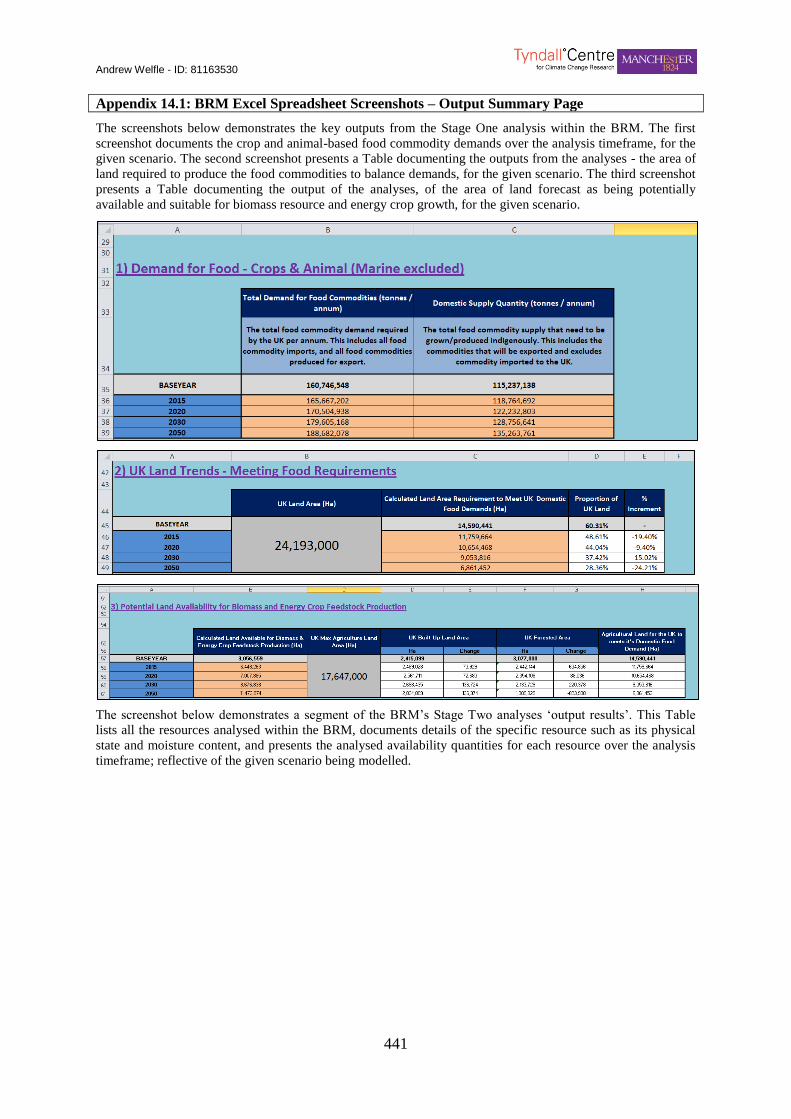
Andrew Welfle - ID: 81163530
441
Appendix 14.1: BRM Excel Spreadsheet Screenshots – Output Summary Page
The screenshots below demonstrates the key outputs from the Stage One analysis within the BRM. The first
screenshot documents the crop and animal-based food commodity demands over the analysis timeframe, for the
given scenario. The second screenshot presents a Table documenting the outputs from the analyses - the area of
land required to produce the food commodities to balance demands, for the given scenario. The third screenshot
presents a Table documenting the output of the analyses, of the area of land forecast as being potentially
available and suitable for biomass resource and energy crop growth, for the given scenario.
The screenshot below demonstrates a segment of the BRM’s Stage Two analyses ‘output results’. This Table
lists all the resources analysed within the BRM, documents details of the specific resource such as its physical
state and moisture content, and presents the analysed availability quantities for each resource over the analysis
timeframe; reflective of the given scenario being modelled.

Andrew Welfle - ID: 81163530
442
The screenshot below demonstrates a further segment of the BRM’s Stage Two analyses ‘output results’. The
Table lists the combined availabilities (Tonnes eqv.) of all Grown, Residue, and Waste Biomass Resources, over
the analysis timeframe; for the given scenario being modelled. The Figure also visually documents the ‘active
data’ being used within the BRM’s calculations.
The two screenshots below demonstrate different segments of the BRM’s Stage Three analyses ‘output results’.
The Tables provide various levels of analyses, including the bioenergy potential of the resources forecast as
being potentially available for the bioenergy sector over the analysis timeframe; for the given scenario being
modelled. The Figure provides further visual presentation of these output results.
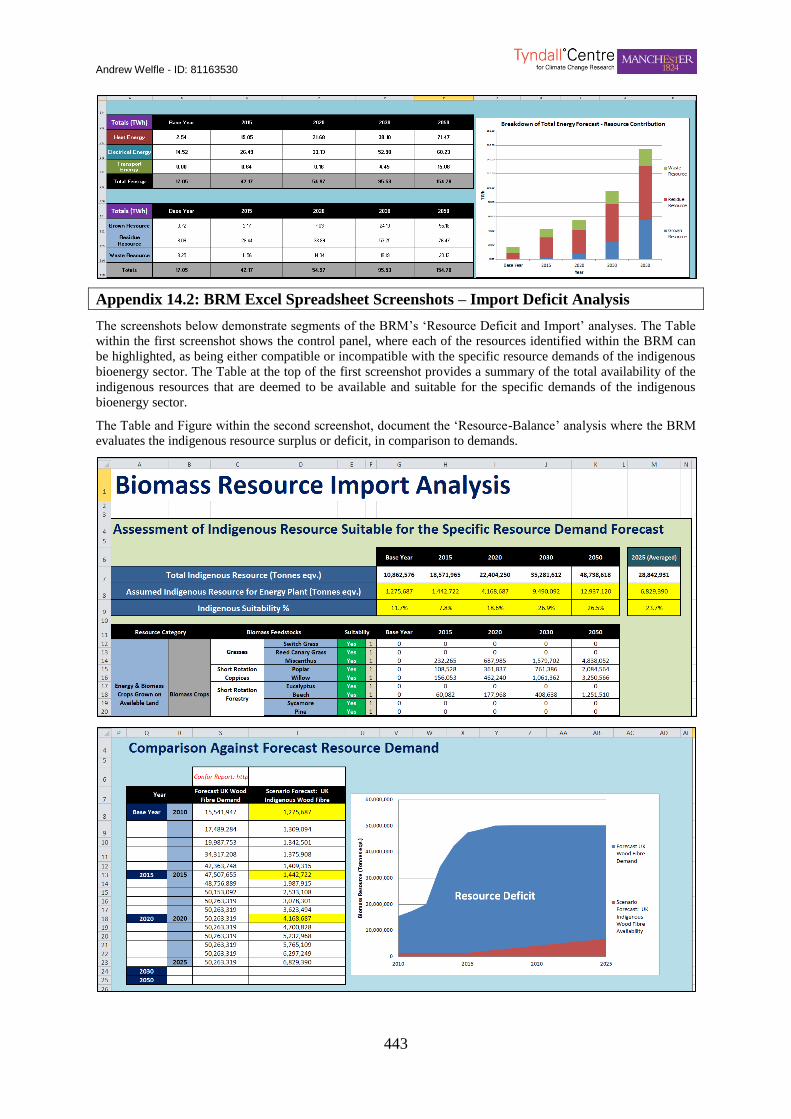
Andrew Welfle - ID: 81163530
443
Appendix 14.2: BRM Excel Spreadsheet Screenshots – Import Deficit Analysis
The screenshots below demonstrate segments of the BRM’s ‘Resource Deficit and Import’ analyses. The Table
within the first screenshot shows the control panel, where each of the resources identified within the BRM can
be highlighted, as being either compatible or incompatible with the specific resource demands of the indigenous
bioenergy sector. The Table at the top of the first screenshot provides a summary of the total availability of the
indigenous resources that are deemed to be available and suitable for the specific demands of the indigenous
bioenergy sector.
The Table and Figure within the second screenshot, document the ‘Resource-Balance’ analysis where the BRM
evaluates the indigenous resource surplus or deficit, in comparison to demands.
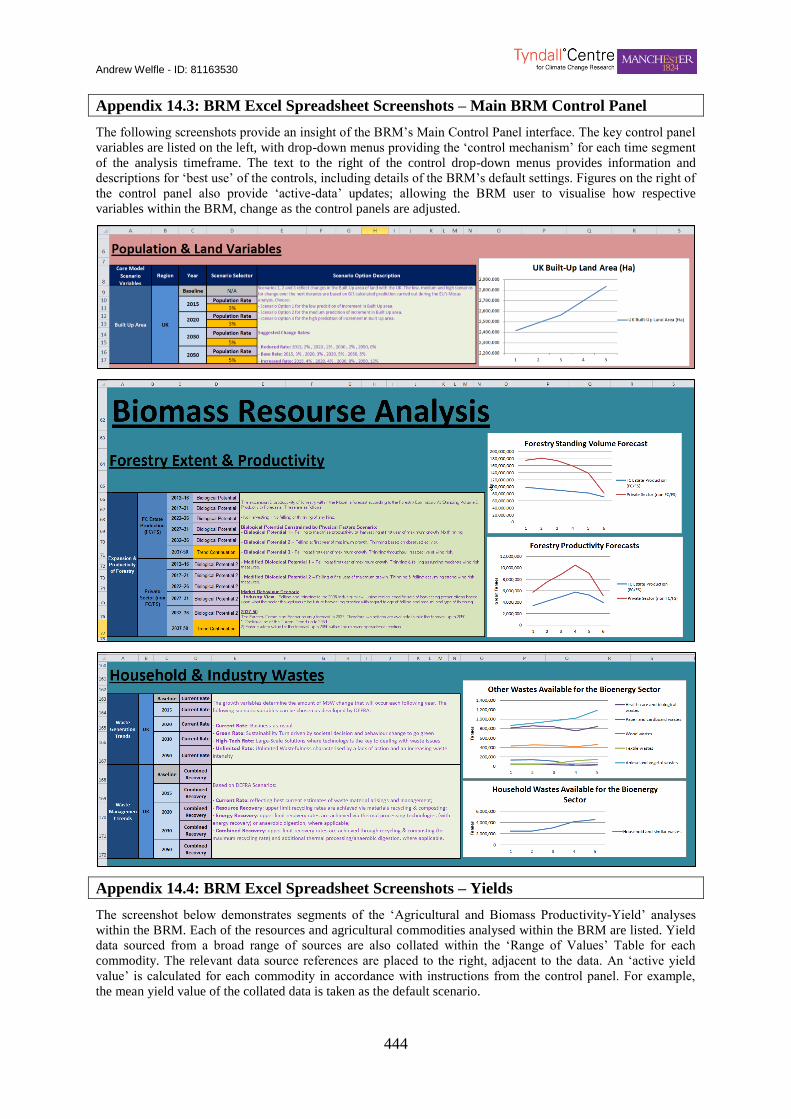
Andrew Welfle - ID: 81163530
444
Appendix 14.3: BRM Excel Spreadsheet Screenshots – Main BRM Control Panel
The following screenshots provide an insight of the BRM’s Main Control Panel interface. The key control panel
variables are listed on the left, with drop-down menus providing the ‘control mechanism’ for each time segment
of the analysis timeframe. The text to the right of the control drop-down menus provides information and
descriptions for ‘best use’ of the controls, including details of the BRM’s default settings. Figures on the right of
the control panel also provide ‘active-data’ updates; allowing the BRM user to visualise how respective
variables within the BRM, change as the control panels are adjusted.
Appendix 14.4: BRM Excel Spreadsheet Screenshots – Yields
The screenshot below demonstrates segments of the ‘Agricultural and Biomass Productivity-Yield’ analyses
within the BRM. Each of the resources and agricultural commodities analysed within the BRM are listed. Yield
data sourced from a broad range of sources are also collated within the ‘Range of Values’ Table for each
commodity. The relevant data source references are placed to the right, adjacent to the data. An ‘active yield
value’ is calculated for each commodity in accordance with instructions from the control panel. For example,
the mean yield value of the collated data is taken as the default scenario.

Andrew Welfle - ID: 81163530
445
The Table at the top of the screenshot shows the control panel for forecasting how yields may change over the
BRM’s analysis timeframe. Depending on the nature of the analysis required, a default yield improvement
scenario can be selected from a series of default options, or a custom designed scenario can be applied that
controls how future yields may change. The ‘yellow highlighted’ cells to the left of the screenshot demonstrate
the ‘active productivity yields’ for each commodity, over the analysis timeframe for the given scenario.
Appendix 14.5: BRM Excel Spreadsheet Screenshots – Food Demand by Commodity
The screenshot below demonstrates segments of the ‘Food Commodity Demand’ analyses for the Base Year
within the BRM. Each food commodity analysed within the BRM is listed and the corresponding food
commodity utilisation data is collated. These Tabs and their associated equations calculate forecasts of the
‘Total Demand’ for each commodity. Successive analysis Tabs within the BRM forecast how specific food
commodity demands may change for each the successive analysis time period up to 2050. Changing commodity
production demands are driven by: population change, food waste dynamics, and food import / export scenarios,
reflected within the specific parameters of any given scenario developed within the BRM.

Andrew Welfle - ID: 81163530
446
Appendix 14.6: BRM Excel Spreadsheet Screenshots – Waste Food Scenarios
The screenshot below demonstrates segments of the ‘Waste Food Scenarios’ analyses module within the BRM.
The analysis undertaken within this Tab links the BRM’s control panel with each of the food commodity
demand Tabs. Reflective of the food waste parameters for the given scenario, the analysis calculates in the left
columns of the Table, the quantity of each food commodity that is required to balance demand, if food waste
generation trends change.
Appendix 14.7: BRM Excel Spreadsheet Screenshots – Feed Conversion Rates
The screenshot below demonstrates segments of the BRM’s database, and analyses of the ‘Feed Conversion
Rates’ for specific animal food products. The Tables within this Tab list the data for quantities of feed required
to produce specific volumes of animal food product. Highlighted by the upper Table within the screenshot, data
is utilised relevant to the specific livestock and agricultural practices applied to produce them. The segment of
the Table at the bottom of the screenshot, demonstrates that the BRM utilises data collated from various regions
of the World with their respective agricultural practices. In this screenshot, the applied scenario reflects Western
European agriculture.
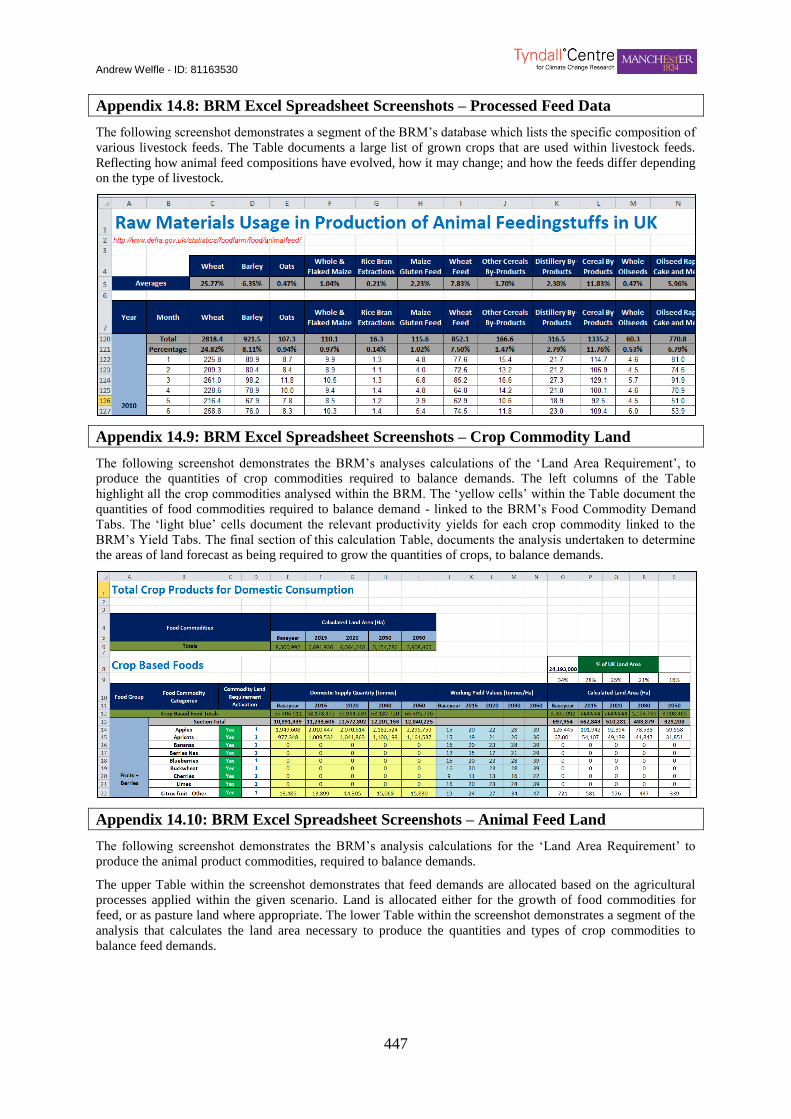
Andrew Welfle - ID: 81163530
447
Appendix 14.8: BRM Excel Spreadsheet Screenshots – Processed Feed Data
The following screenshot demonstrates a segment of the BRM’s database which lists the specific composition of
various livestock feeds. The Table documents a large list of grown crops that are used within livestock feeds.
Reflecting how animal feed compositions have evolved, how it may change; and how the feeds differ depending
on the type of livestock.
Appendix 14.9: BRM Excel Spreadsheet Screenshots – Crop Commodity Land
The following screenshot demonstrates the BRM’s analyses calculations of the ‘Land Area Requirement’, to
produce the quantities of crop commodities required to balance demands. The left columns of the Table
highlight all the crop commodities analysed within the BRM. The ‘yellow cells’ within the Table document the
quantities of food commodities required to balance demand - linked to the BRM’s Food Commodity Demand
Tabs. The ‘light blue’ cells document the relevant productivity yields for each crop commodity linked to the
BRM’s Yield Tabs. The final section of this calculation Table, documents the analysis undertaken to determine
the areas of land forecast as being required to grow the quantities of crops, to balance demands.
Appendix 14.10: BRM Excel Spreadsheet Screenshots – Animal Feed Land
The following screenshot demonstrates the BRM’s analysis calculations for the ‘Land Area Requirement’ to
produce the animal product commodities, required to balance demands.
The upper Table within the screenshot demonstrates that feed demands are allocated based on the agricultural
processes applied within the given scenario. Land is allocated either for the growth of food commodities for
feed, or as pasture land where appropriate. The lower Table within the screenshot demonstrates a segment of the
analysis that calculates the land area necessary to produce the quantities and types of crop commodities to
balance feed demands.
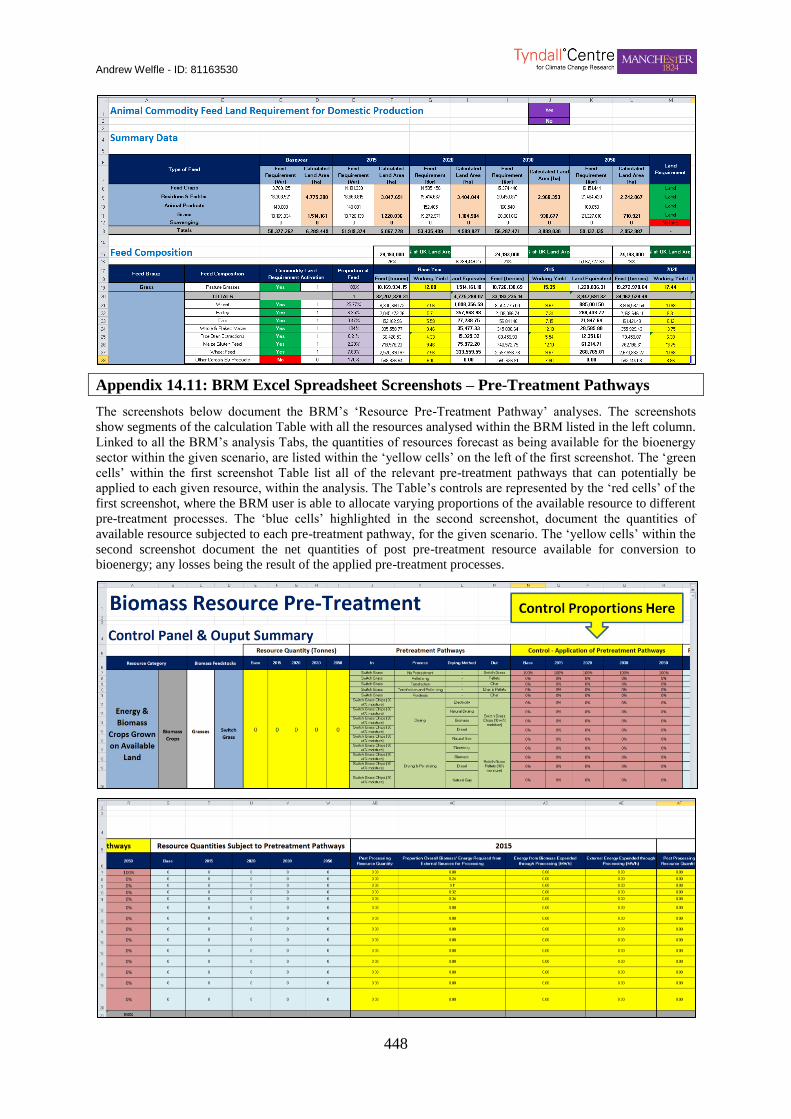
Andrew Welfle - ID: 81163530
448
Appendix 14.11: BRM Excel Spreadsheet Screenshots – Pre-Treatment Pathways
The screenshots below document the BRM’s ‘Resource Pre-Treatment Pathway’ analyses. The screenshots
show segments of the calculation Table with all the resources analysed within the BRM listed in the left column.
Linked to all the BRM’s analysis Tabs, the quantities of resources forecast as being available for the bioenergy
sector within the given scenario, are listed within the ‘yellow cells’ on the left of the first screenshot. The ‘green
cells’ within the first screenshot Table list all of the relevant pre-treatment pathways that can potentially be
applied to each given resource, within the analysis. The Table’s controls are represented by the ‘red cells’ of the
first screenshot, where the BRM user is able to allocate varying proportions of the available resource to different
pre-treatment processes. The ‘blue cells’ highlighted in the second screenshot, document the quantities of
available resource subjected to each pre-treatment pathway, for the given scenario. The ‘yellow cells’ within the
second screenshot document the net quantities of post pre-treatment resource available for conversion to
bioenergy; any losses being the result of the applied pre-treatment processes.
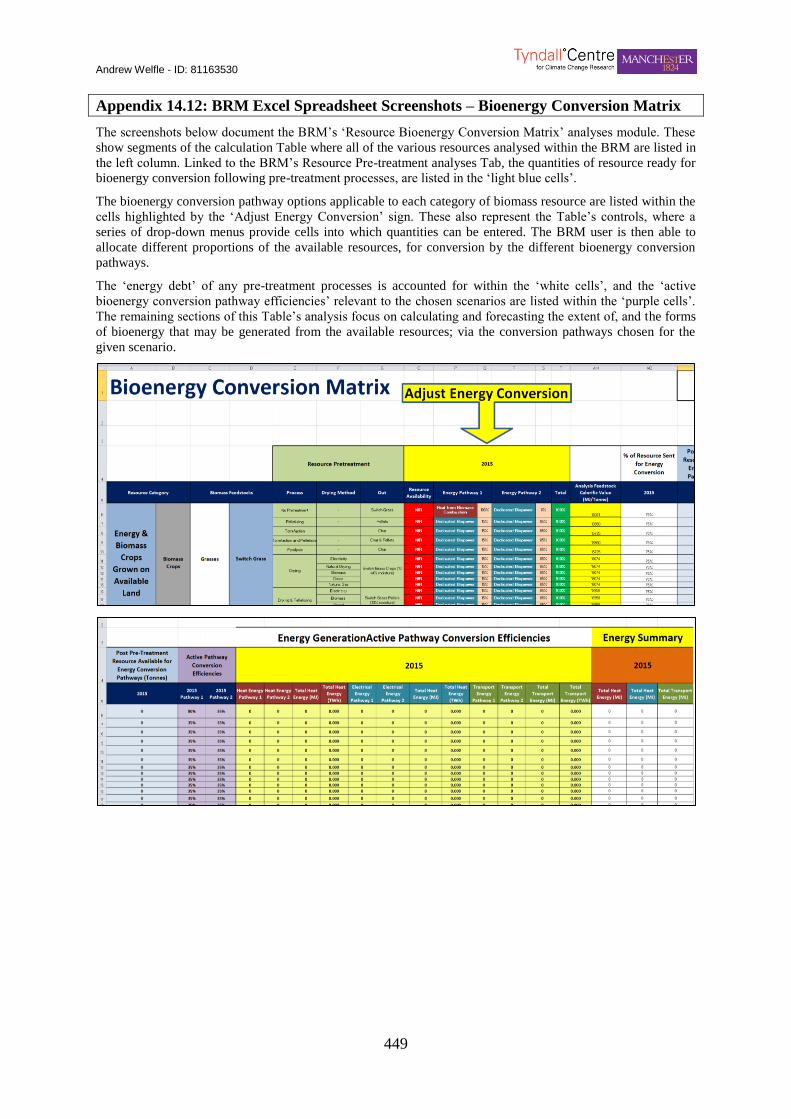
Andrew Welfle - ID: 81163530
449
Appendix 14.12: BRM Excel Spreadsheet Screenshots – Bioenergy Conversion Matrix
The screenshots below document the BRM’s ‘Resource Bioenergy Conversion Matrix’ analyses module. These
show segments of the calculation Table where all of the various resources analysed within the BRM are listed in
the left column. Linked to the BRM’s Resource Pre-treatment analyses Tab, the quantities of resource ready for
bioenergy conversion following pre-treatment processes, are listed in the ‘light blue cells’.
The bioenergy conversion pathway options applicable to each category of biomass resource are listed within the
cells highlighted by the ‘Adjust Energy Conversion’ sign. These also represent the Table’s controls, where a
series of drop-down menus provide cells into which quantities can be entered. The BRM user is then able to
allocate different proportions of the available resources, for conversion by the different bioenergy conversion
pathways.
The ‘energy debt’ of any pre-treatment processes is accounted for within the ‘white cells’, and the ‘active
bioenergy conversion pathway efficiencies’ relevant to the chosen scenarios are listed within the ‘purple cells’.
The remaining sections of this Table’s analysis focus on calculating and forecasting the extent of, and the forms
of bioenergy that may be generated from the available resources; via the conversion pathways chosen for the
given scenario.
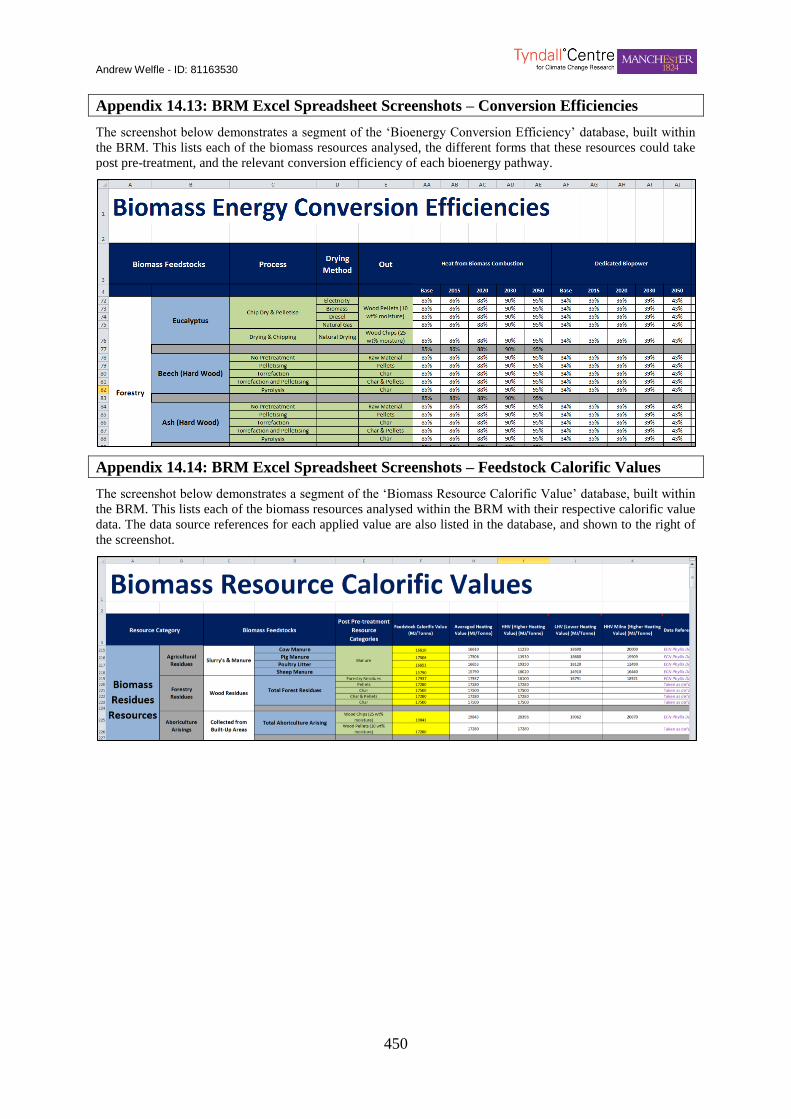
Andrew Welfle - ID: 81163530
450
Appendix 14.13: BRM Excel Spreadsheet Screenshots – Conversion Efficiencies
The screenshot below demonstrates a segment of the ‘Bioenergy Conversion Efficiency’ database, built within
the BRM. This lists each of the biomass resources analysed, the different forms that these resources could take
post pre-treatment, and the relevant conversion efficiency of each bioenergy pathway.
Appendix 14.14: BRM Excel Spreadsheet Screenshots – Feedstock Calorific Values
The screenshot below demonstrates a segment of the ‘Biomass Resource Calorific Value’ database, built within
the BRM. This lists each of the biomass resources analysed within the BRM with their respective calorific value
data. The data source references for each applied value are also listed in the database, and shown to the right of
the screenshot.
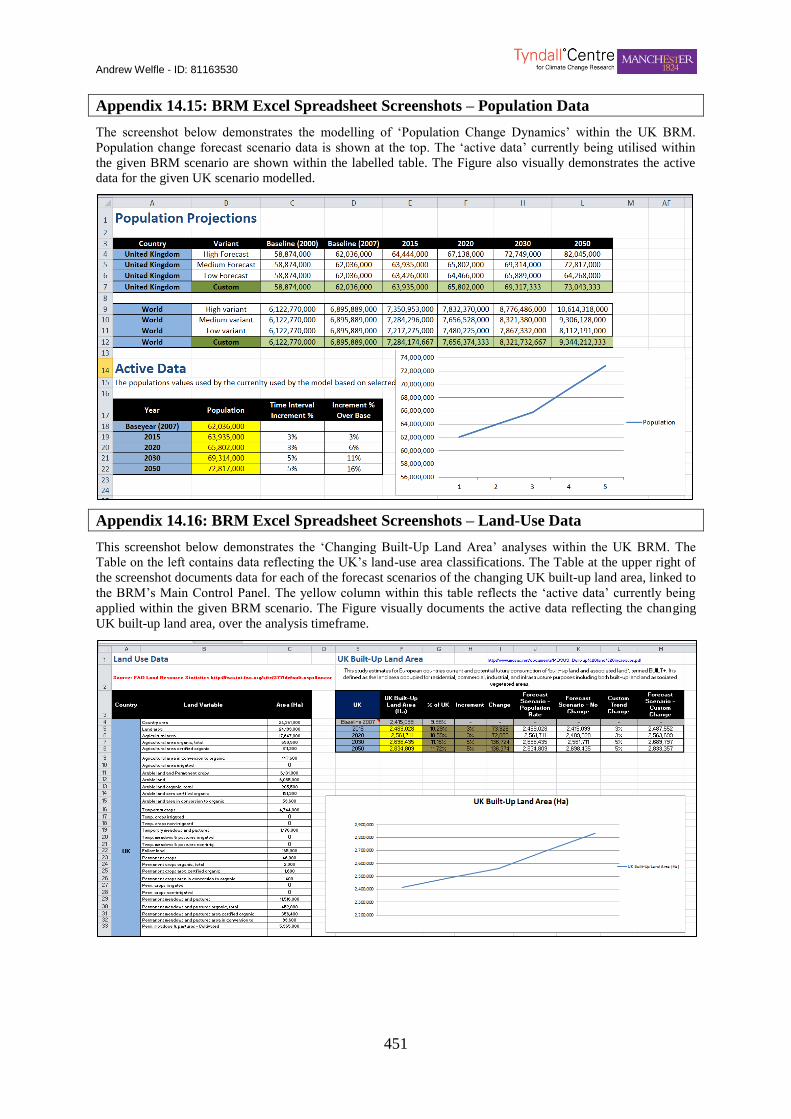
Andrew Welfle - ID: 81163530
451
Appendix 14.15: BRM Excel Spreadsheet Screenshots – Population Data
The screenshot below demonstrates the modelling of ‘Population Change Dynamics’ within the UK BRM.
Population change forecast scenario data is shown at the top. The ‘active data’ currently being utilised within
the given BRM scenario are shown within the labelled table. The Figure also visually demonstrates the active
data for the given UK scenario modelled.
Appendix 14.16: BRM Excel Spreadsheet Screenshots – Land-Use Data
This screenshot below demonstrates the ‘Changing Built-Up Land Area’ analyses within the UK BRM. The
Table on the left contains data reflecting the UK’s land-use area classifications. The Table at the upper right of
the screenshot documents data for each of the forecast scenarios of the changing UK built-up land area, linked to
the BRM’s Main Control Panel. The yellow column within this table reflects the ‘active data’ currently being
applied within the given BRM scenario. The Figure visually documents the active data reflecting the changing
UK built-up land area, over the analysis timeframe.
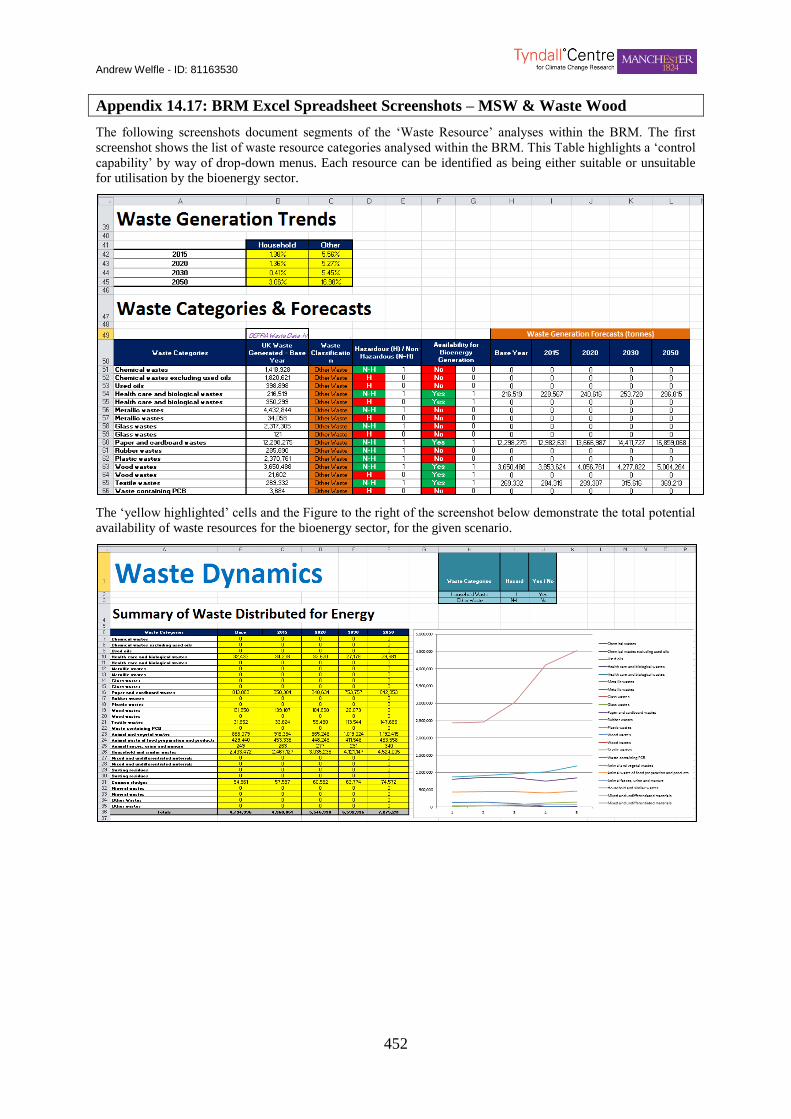
Andrew Welfle - ID: 81163530
452
Appendix 14.17: BRM Excel Spreadsheet Screenshots – MSW & Waste Wood
The following screenshots document segments of the ‘Waste Resource’ analyses within the BRM. The first
screenshot shows the list of waste resource categories analysed within the BRM. This Table highlights a ‘control
capability’ by way of drop-down menus. Each resource can be identified as being either suitable or unsuitable
for utilisation by the bioenergy sector.
The ‘yellow highlighted’ cells and the Figure to the right of the screenshot below demonstrate the total potential
availability of waste resources for the bioenergy sector, for the given scenario.
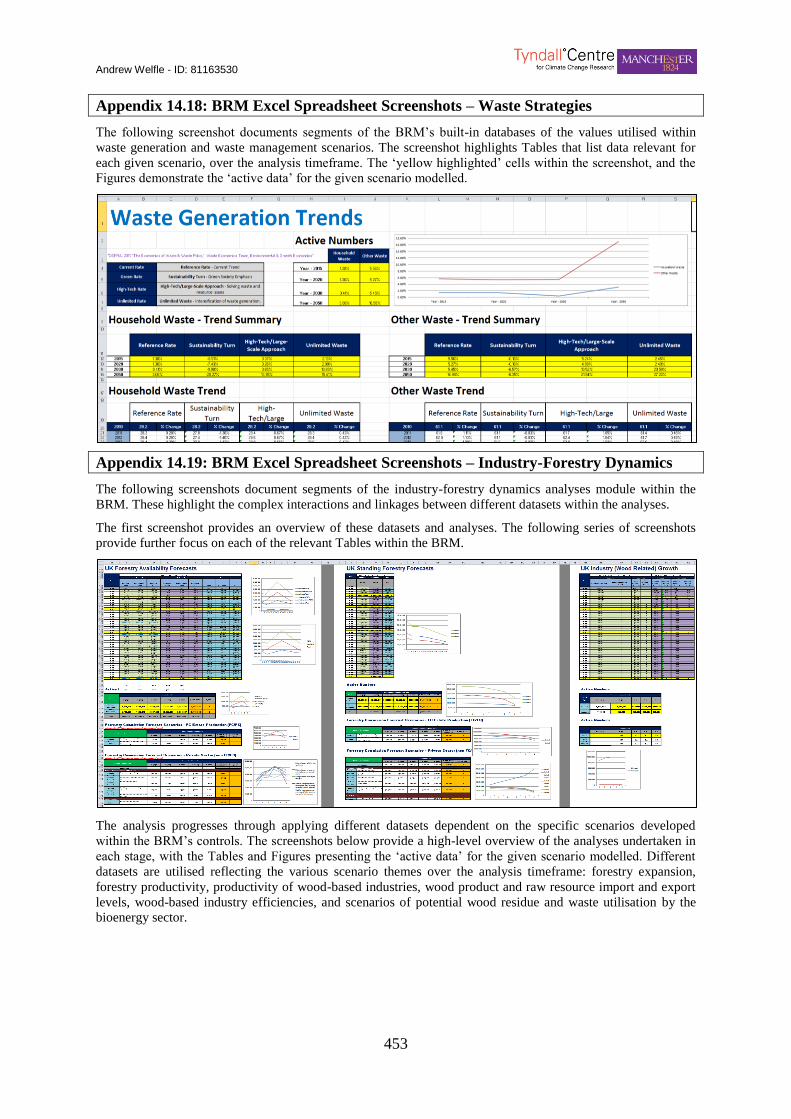
Andrew Welfle - ID: 81163530
453
Appendix 14.18: BRM Excel Spreadsheet Screenshots – Waste Strategies
The following screenshot documents segments of the BRM’s built-in databases of the values utilised within
waste generation and waste management scenarios. The screenshot highlights Tables that list data relevant for
each given scenario, over the analysis timeframe. The ‘yellow highlighted’ cells within the screenshot, and the
Figures demonstrate the ‘active data’ for the given scenario modelled.
Appendix 14.19: BRM Excel Spreadsheet Screenshots – Industry-Forestry Dynamics
The following screenshots document segments of the industry-forestry dynamics analyses module within the
BRM. These highlight the complex interactions and linkages between different datasets within the analyses.
The first screenshot provides an overview of these datasets and analyses. The following series of screenshots
provide further focus on each of the relevant Tables within the BRM.
The analysis progresses through applying different datasets dependent on the specific scenarios developed
within the BRM’s controls. The screenshots below provide a high-level overview of the analyses undertaken in
each stage, with the Tables and Figures presenting the ‘active data’ for the given scenario modelled. Different
datasets are utilised reflecting the various scenario themes over the analysis timeframe: forestry expansion,
forestry productivity, productivity of wood-based industries, wood product and raw resource import and export
levels, wood-based industry efficiencies, and scenarios of potential wood residue and waste utilisation by the
bioenergy sector.

Andrew Welfle - ID: 81163530
454
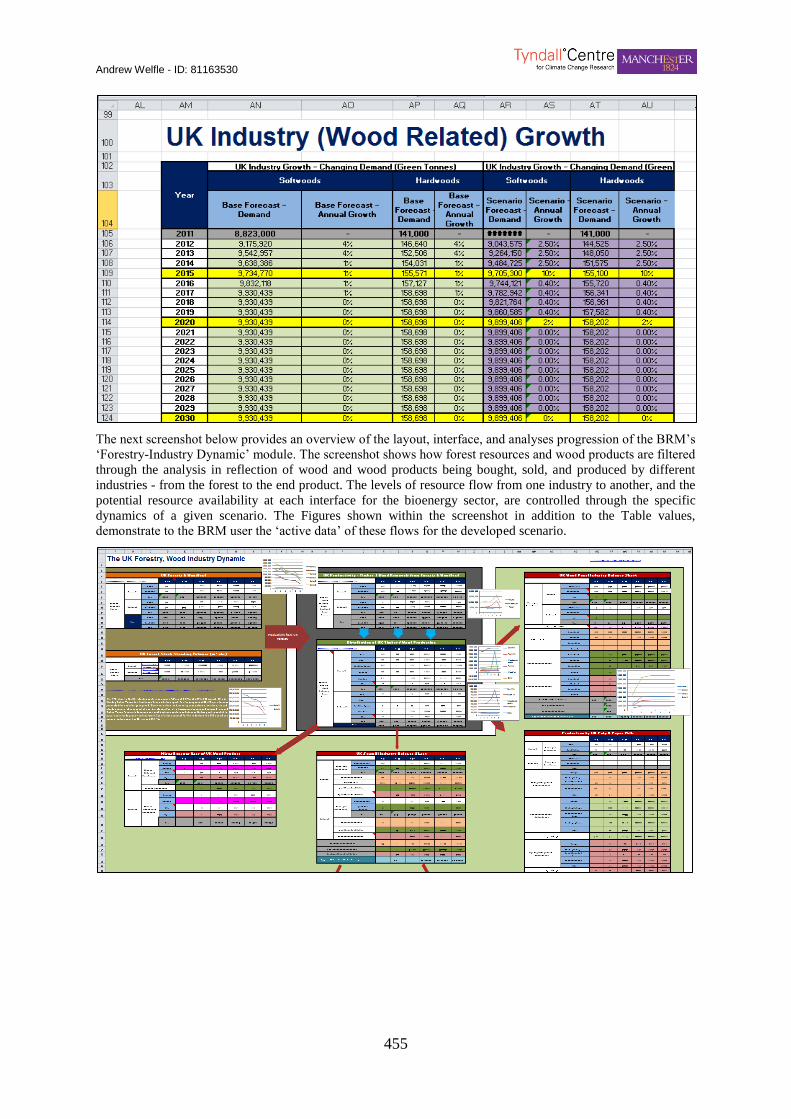
Andrew Welfle - ID: 81163530
455
The next screenshot below provides an overview of the layout, interface, and analyses progression of the BRM’s
‘Forestry-Industry Dynamic’ module. The screenshot shows how forest resources and wood products are filtered
through the analysis in reflection of wood and wood products being bought, sold, and produced by different
industries - from the forest to the end product. The levels of resource flow from one industry to another, and the
potential resource availability at each interface for the bioenergy sector, are controlled through the specific
dynamics of a given scenario. The Figures shown within the screenshot in addition to the Table values,
demonstrate to the BRM user the ‘active data’ of these flows for the developed scenario.

Andrew Welfle - ID: 81163530
456
The next series of screenshots provide a greater focus on the different datasets and analyses processes within the
BRM’s ‘Forestry-Industry Dynamic’ module.
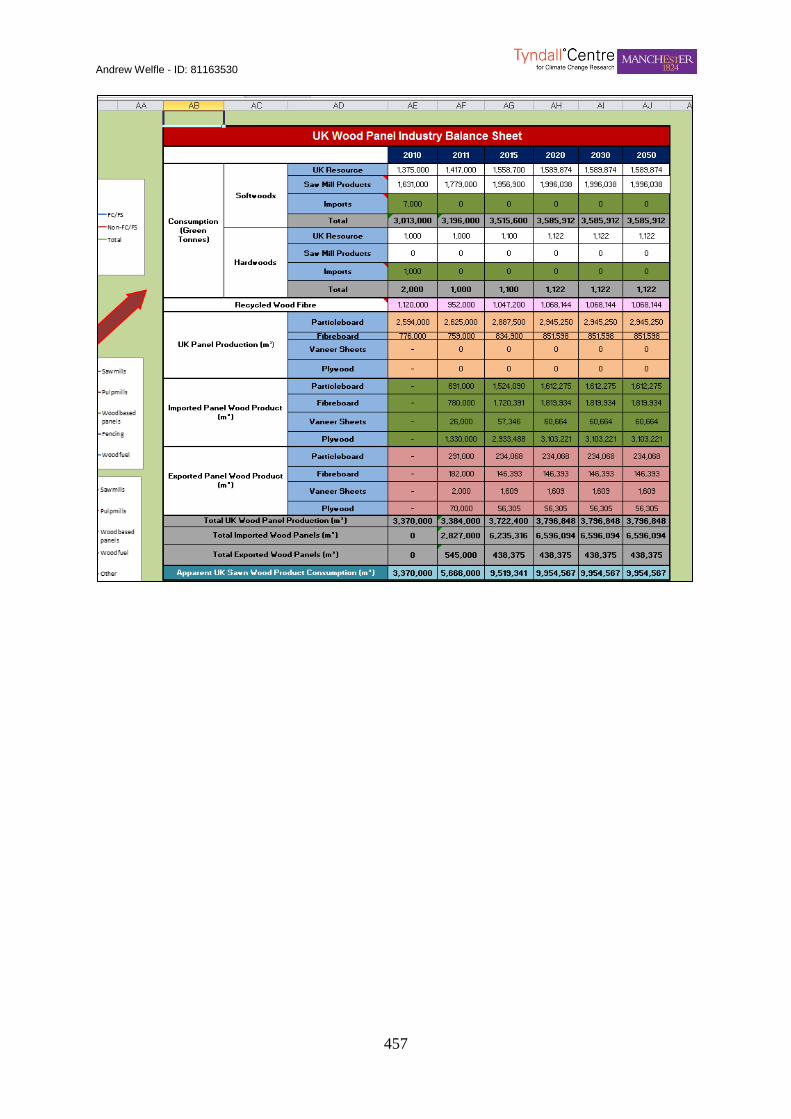
Andrew Welfle - ID: 81163530
457
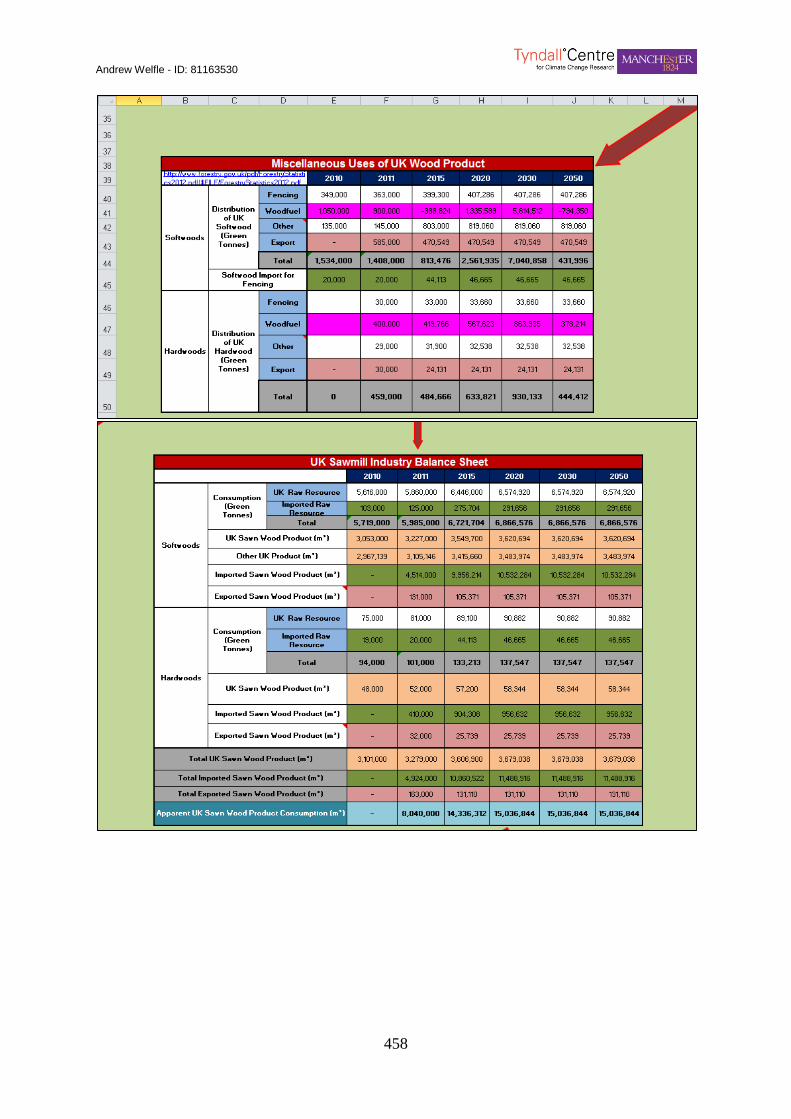
Andrew Welfle - ID: 81163530
458
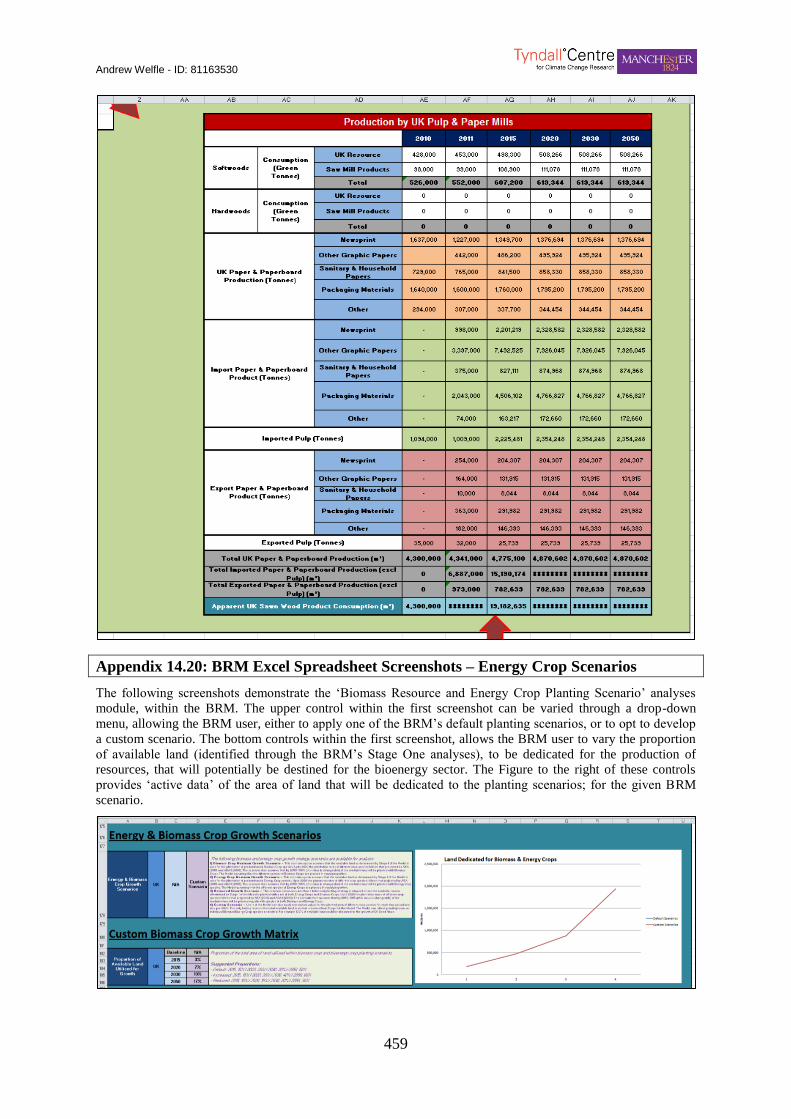
Andrew Welfle - ID: 81163530
459
Appendix 14.20: BRM Excel Spreadsheet Screenshots – Energy Crop Scenarios
The following screenshots demonstrate the ‘Biomass Resource and Energy Crop Planting Scenario’ analyses
module, within the BRM. The upper control within the first screenshot can be varied through a drop-down
menu, allowing the BRM user, either to apply one of the BRM’s default planting scenarios, or to opt to develop
a custom scenario. The bottom controls within the first screenshot, allows the BRM user to vary the proportion
of available land (identified through the BRM’s Stage One analyses), to be dedicated for the production of
resources, that will potentially be destined for the bioenergy sector. The Figure to the right of these controls
provides ‘active data’ of the area of land that will be dedicated to the planting scenarios; for the given BRM
scenario.
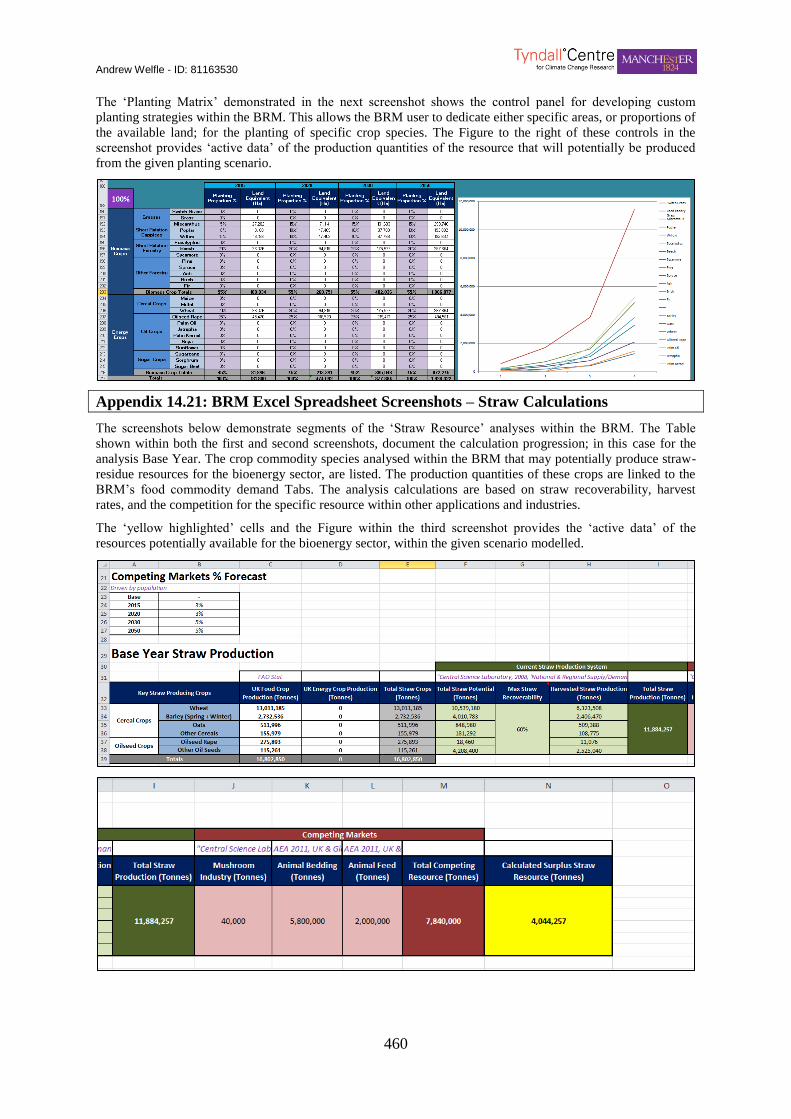
Andrew Welfle - ID: 81163530
460
The ‘Planting Matrix’ demonstrated in the next screenshot shows the control panel for developing custom
planting strategies within the BRM. This allows the BRM user to dedicate either specific areas, or proportions of
the available land; for the planting of specific crop species. The Figure to the right of these controls in the
screenshot provides ‘active data’ of the production quantities of the resource that will potentially be produced
from the given planting scenario.
Appendix 14.21: BRM Excel Spreadsheet Screenshots – Straw Calculations
The screenshots below demonstrate segments of the ‘Straw Resource’ analyses within the BRM. The Table
shown within both the first and second screenshots, document the calculation progression; in this case for the
analysis Base Year. The crop commodity species analysed within the BRM that may potentially produce straw-
residue resources for the bioenergy sector, are listed. The production quantities of these crops are linked to the
BRM’s food commodity demand Tabs. The analysis calculations are based on straw recoverability, harvest
rates, and the competition for the specific resource within other applications and industries.
The ‘yellow highlighted’ cells and the Figure within the third screenshot provides the ‘active data’ of the
resources potentially available for the bioenergy sector, within the given scenario modelled.
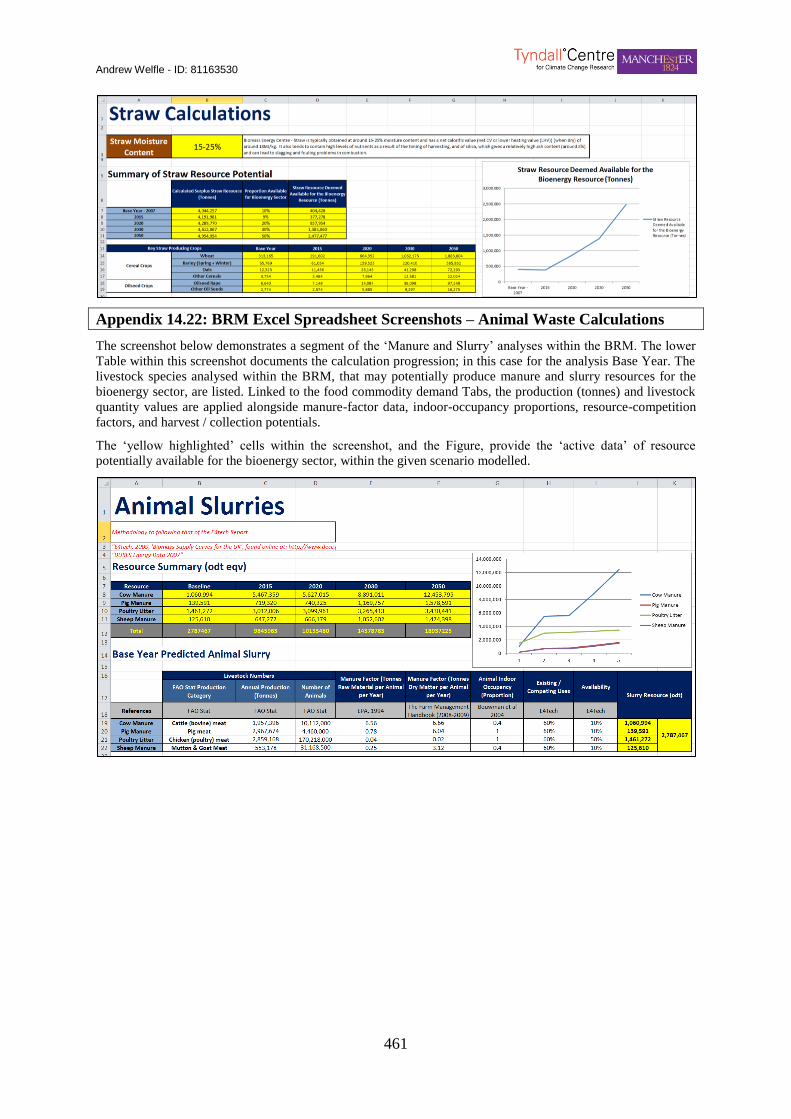
Andrew Welfle - ID: 81163530
461
Appendix 14.22: BRM Excel Spreadsheet Screenshots – Animal Waste Calculations
The screenshot below demonstrates a segment of the ‘Manure and Slurry’ analyses within the BRM. The lower
Table within this screenshot documents the calculation progression; in this case for the analysis Base Year. The
livestock species analysed within the BRM, that may potentially produce manure and slurry resources for the
bioenergy sector, are listed. Linked to the food commodity demand Tabs, the production (tonnes) and livestock
quantity values are applied alongside manure-factor data, indoor-occupancy proportions, resource-competition
factors, and harvest / collection potentials.
The ‘yellow highlighted’ cells within the screenshot, and the Figure, provide the ‘active data’ of resource
potentially available for the bioenergy sector, within the given scenario modelled.
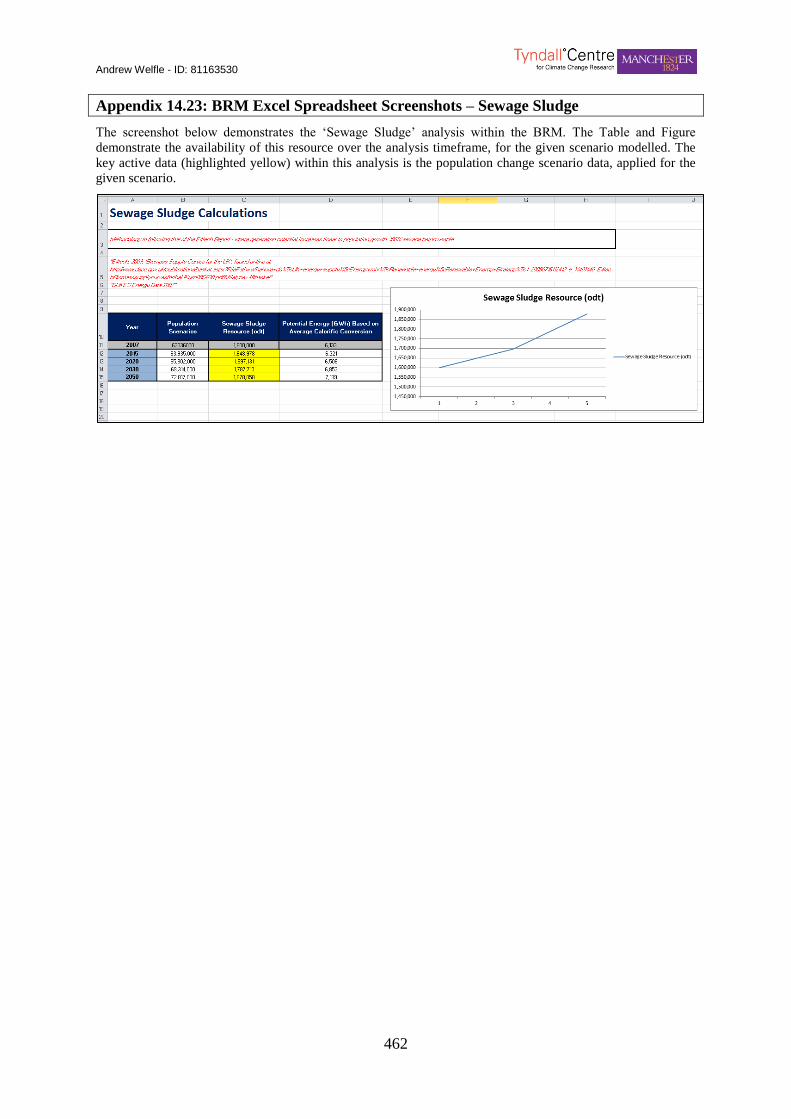
Andrew Welfle - ID: 81163530
462
Appendix 14.23: BRM Excel Spreadsheet Screenshots – Sewage Sludge
The screenshot below demonstrates the ‘Sewage Sludge’ analysis within the BRM. The Table and Figure
demonstrate the availability of this resource over the analysis timeframe, for the given scenario modelled. The
key active data (highlighted yellow) within this analysis is the population change scenario data, applied for the
given scenario.
Andrew Welfle - ID: 81163530
463
Appendix 15.0
Appendix 15.0 includes copies of the Journal Papers written during the PhD Programme. The titles and details
of the Papers are introduced below:
Appendix A15.1
Journal Paper 1 ‘Securing a Bioenergy Future without Imports’
Submitted to and accepted by Energy Policy Journal.
Appendix A15.2
Journal Paper 2 ‘Increasing Biomass Resource Availability through Supply Chain Analysis’
Submitted to and accepted by Biomass & Bioenergy Journal.
Andrew Welfle - ID: 81163530
464
Appendix A15.1: Energy Policy Journal Paper
Securing a Bioenergy Future without Imports
Reference:
Welfle A, Gilbert P, Thornley P. Securing a Bioenergy Future without Imports. Energy Policy. 2014; 68: 1-14.
Abstract
The UK has legally binding renewable energy and greenhouse gas targets. Energy from biomass is anticipated to
make major contributions to these. However there are concerns about the availability and sustainability of
biomass for the bioenergy sector. A Biomass Resource Model has been developed that reflects the key biomass
supply-chain dynamics and interactions determining resource availability, taking into account climate, food,
land and other constraints. The Model has been applied to the UK, developing four biomass resource scenarios
to analyse resource availability and energy generation potential within different contexts. The Model shows that
indigenous biomass resources and energy crops could service up to 44% of UK energy demand by 2050 without
impacting food systems. The scenarios show, residues from agriculture, forestry and industry provide the most
robust resource, potentially providing up to 6.5% of primary energy demand by 2050. Waste resources are found
to potentially provide up to 15.4% and specifically grown biomass and energy crops up to 22% of demand. The
UK is therefore projected to have significant indigenous biomass resources to meet its targets. However the
dominant biomass resource opportunities identified in the paper are not consistent with current UK bioenergy
strategies, risking biomass deficit despite resource abundance.
Introduction
European Governments have greenhouse gas emission and renewable energy targets that are bound by the
baseline requirements of the Kyoto Protocol [1], and the European Commission’s renewable energy
requirements [2-3]. In addition, the UK is legally bound by the 2008 Climate Change Act [4], to achieve a
mandatory 80% cut in the UK’s carbon emissions by 2050 and a benchmark 35% reduction by 2020, below
1990 levels [5]. The aim; to encourage a transition towards a low-carbon UK economy through unilateral
binding emissions reduction targets [6].
A key route to achieving these targets is to replace fossil fuel based energy with renewable and low carbon
energy technologies. It is becoming increasingly accepted that having a broad energy mix is likely to be the best
method to achieving energy and climate change targets [7]. Biomass as a renewable energy source contributes
towards reducing greenhouse gas emissions, decarbonisation of energy systems, diversification of fuel supplies,
and the development of long-term replacements for fossil fuels [8]. Despite some concerns over the level of
biofuels deployment, bioenergy remains a key component of European energy strategies [9]. The European
Commission estimates that two-thirds of EU’s 2020 target for 20% contribution by renewable energy resource
may be from biomass [10]. The UK’s Renewable Energy Strategy does not propose targets for individual
technologies, but confirms that bioenergy systems will likely contribute significantly to the UK’s future energy
portfolio [5].
However, biomass pathways are being assumed in many national energy strategies globally [11], so critical
assessment of the biomass resource availability is essential. Most energy strategies of European States assume
the use of non-EU sourced biomass to meet their forecast demands [12], so there is likely to be increased
demand (competition) for globally traded biomass in the future and there are also concerns about ensuring its
sustainability.
The UK provides a case study of a nation with strong bioenergy aspirations but uncertain biomass resource
availability. This paper analyses the UK’s projected biomass resource availability under different future contexts
and constraints. A Biomass Resource Model has been developed that: allows the analysis of forecast scenarios
of biomass resource availability to the year 2050; compares indigenous biomass availability against prescribed
biomass and renewable energy targets; and enables an evaluation of bioenergy strategies in terms of indigenous
resource availability and deficits.
The Model has been developed to reflect a wide range of interacting variables that influence biomass resource
availability. The Model can be calibrated to capture the potential range of these variables in different possible
futures. This paper explores four forecasts of potential pathways that the UK could take to 2050, and measures
the biomass resource availability and potential for the bioenergy sector. The scenarios analysed are:
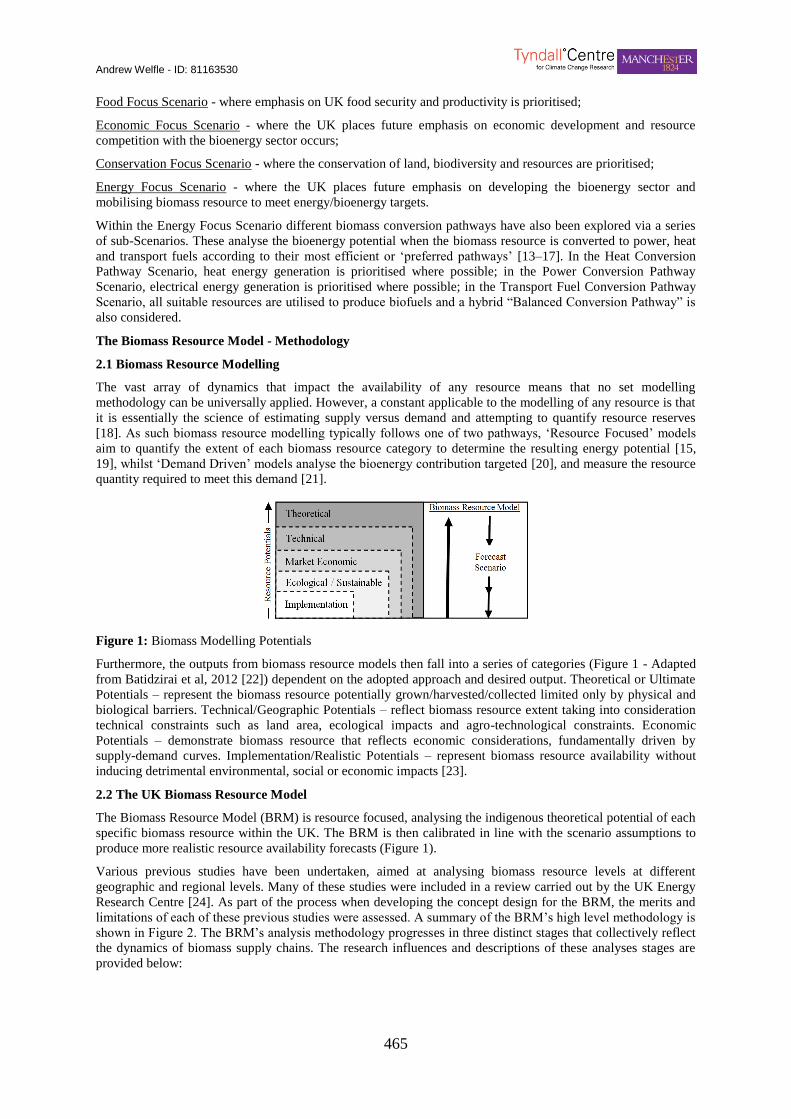
Andrew Welfle - ID: 81163530
465
Food Focus Scenario - where emphasis on UK food security and productivity is prioritised;
Economic Focus Scenario - where the UK places future emphasis on economic development and resource
competition with the bioenergy sector occurs;
Conservation Focus Scenario - where the conservation of land, biodiversity and resources are prioritised;
Energy Focus Scenario - where the UK places future emphasis on developing the bioenergy sector and
mobilising biomass resource to meet energy/bioenergy targets.
Within the Energy Focus Scenario different biomass conversion pathways have also been explored via a series
of sub-Scenarios. These analyse the bioenergy potential when the biomass resource is converted to power, heat
and transport fuels according to their most efficient or ‘preferred pathways’ [13–17]. In the Heat Conversion
Pathway Scenario, heat energy generation is prioritised where possible; in the Power Conversion Pathway
Scenario, electrical energy generation is prioritised where possible; in the Transport Fuel Conversion Pathway
Scenario, all suitable resources are utilised to produce biofuels and a hybrid “Balanced Conversion Pathway” is
also considered.
The Biomass Resource Model - Methodology
2.1 Biomass Resource Modelling
The vast array of dynamics that impact the availability of any resource means that no set modelling
methodology can be universally applied. However, a constant applicable to the modelling of any resource is that
it is essentially the science of estimating supply versus demand and attempting to quantify resource reserves
[18]. As such biomass resource modelling typically follows one of two pathways, ‘Resource Focused’ models
aim to quantify the extent of each biomass resource category to determine the resulting energy potential [15,
19], whilst ‘Demand Driven’ models analyse the bioenergy contribution targeted [20], and measure the resource
quantity required to meet this demand [21].
Figure 1: Biomass Modelling Potentials
Furthermore, the outputs from biomass resource models then fall into a series of categories (Figure 1 - Adapted
from Batidzirai et al, 2012 [22]) dependent on the adopted approach and desired output. Theoretical or Ultimate
Potentials – represent the biomass resource potentially grown/harvested/collected limited only by physical and
biological barriers. Technical/Geographic Potentials – reflect biomass resource extent taking into consideration
technical constraints such as land area, ecological impacts and agro-technological constraints. Economic
Potentials – demonstrate biomass resource that reflects economic considerations, fundamentally driven by
supply-demand curves. Implementation/Realistic Potentials – represent biomass resource availability without
inducing detrimental environmental, social or economic impacts [23].
2.2 The UK Biomass Resource Model
The Biomass Resource Model (BRM) is resource focused, analysing the indigenous theoretical potential of each
specific biomass resource within the UK. The BRM is then calibrated in line with the scenario assumptions to
produce more realistic resource availability forecasts (Figure 1).
Various previous studies have been undertaken, aimed at analysing biomass resource levels at different
geographic and regional levels. Many of these studies were included in a review carried out by the UK Energy
Research Centre [24]. As part of the process when developing the concept design for the BRM, the merits and
limitations of each of these previous studies were assessed. A summary of the BRM’s high level methodology is
shown in Figure 2. The BRM’s analysis methodology progresses in three distinct stages that collectively reflect
the dynamics of biomass supply chains. The research influences and descriptions of these analyses stages are
provided below:
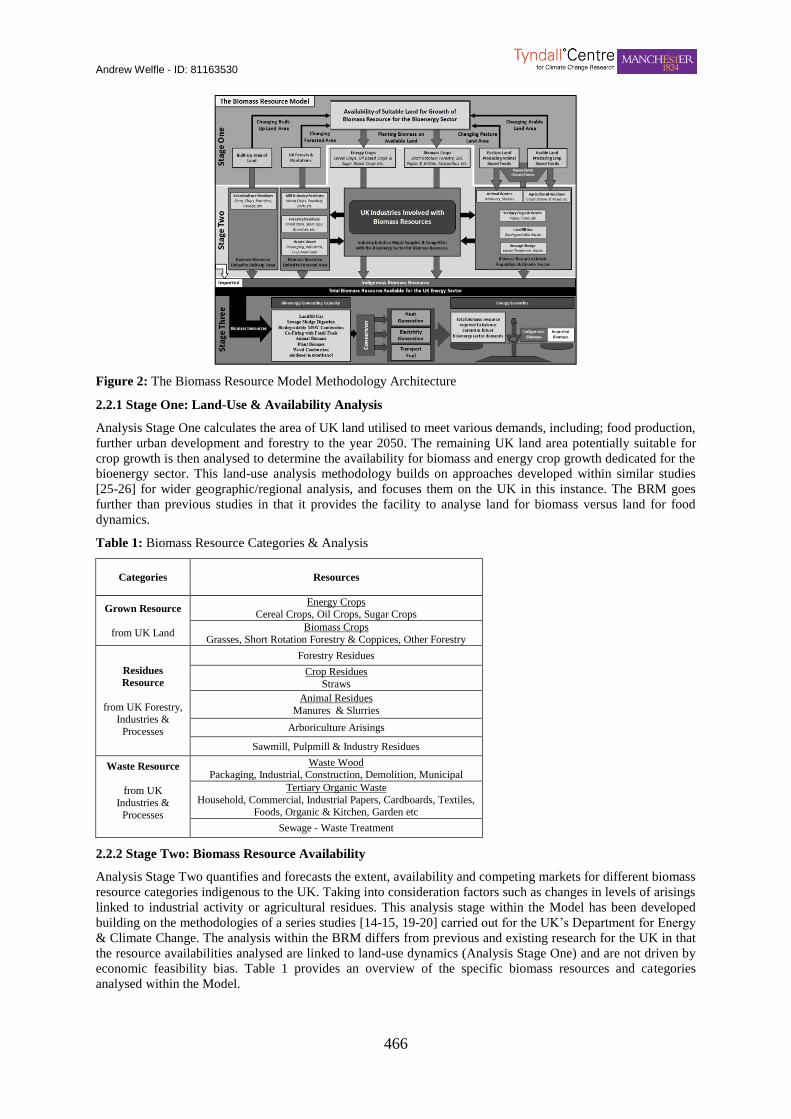
Andrew Welfle - ID: 81163530
466
Figure 2: The Biomass Resource Model Methodology Architecture
2.2.1 Stage One: Land-Use & Availability Analysis
Analysis Stage One calculates the area of UK land utilised to meet various demands, including; food production,
further urban development and forestry to the year 2050. The remaining UK land area potentially suitable for
crop growth is then analysed to determine the availability for biomass and energy crop growth dedicated for the
bioenergy sector. This land-use analysis methodology builds on approaches developed within similar studies
[25-26] for wider geographic/regional analysis, and focuses them on the UK in this instance. The BRM goes
further than previous studies in that it provides the facility to analyse land for biomass versus land for food
dynamics.
Table 1: Biomass Resource Categories & Analysis
Categories Resources
Grown Resource
from UK Land
Energy Crops Cereal Crops, Oil Crops, Sugar Crops
Biomass Crops
Grasses, Short Rotation Forestry & Coppices, Other Forestry
Residues
Resource
from UK Forestry, Industries &
Processes
Forestry Residues
Crop Residues
Straws
Animal Residues
Manures & Slurries
Arboriculture Arisings
Sawmill, Pulpmill & Industry Residues
Waste Resource
from UK Industries &
Processes
Waste Wood Packaging, Industrial, Construction, Demolition, Municipal
Tertiary Organic Waste
Household, Commercial, Industrial Papers, Cardboards, Textiles, Foods, Organic & Kitchen, Garden etc
Sewage - Waste Treatment
2.2.2 Stage Two: Biomass Resource Availability
Analysis Stage Two quantifies and forecasts the extent, availability and competing markets for different biomass
resource categories indigenous to the UK. Taking into consideration factors such as changes in levels of arisings
linked to industrial activity or agricultural residues. This analysis stage within the Model has been developed
building on the methodologies of a series studies [14-15, 19-20] carried out for the UK’s Department for Energy
& Climate Change. The analysis within the BRM differs from previous and existing research for the UK in that
the resource availabilities analysed are linked to land-use dynamics (Analysis Stage One) and are not driven by
economic feasibility bias. Table 1 provides an overview of the specific biomass resources and categories
analysed within the Model.
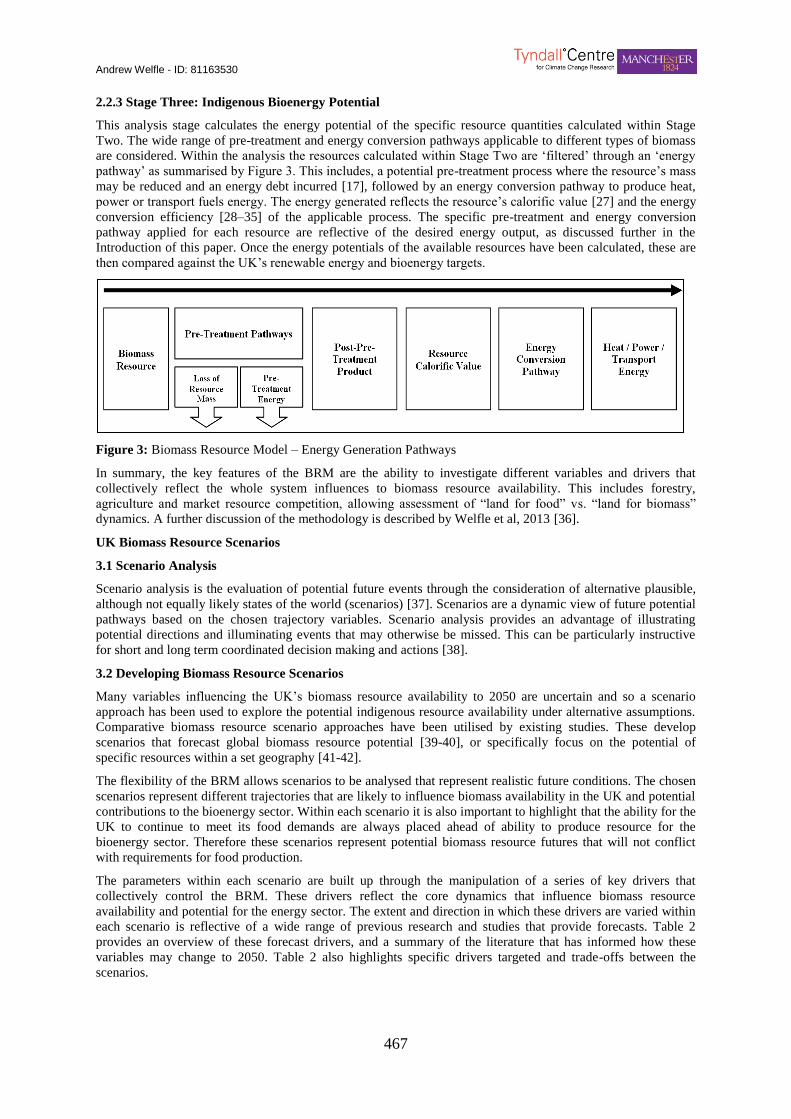
Andrew Welfle - ID: 81163530
467
2.2.3 Stage Three: Indigenous Bioenergy Potential
This analysis stage calculates the energy potential of the specific resource quantities calculated within Stage
Two. The wide range of pre-treatment and energy conversion pathways applicable to different types of biomass
are considered. Within the analysis the resources calculated within Stage Two are ‘filtered’ through an ‘energy
pathway’ as summarised by Figure 3. This includes, a potential pre-treatment process where the resource’s mass
may be reduced and an energy debt incurred [17], followed by an energy conversion pathway to produce heat,
power or transport fuels energy. The energy generated reflects the resource’s calorific value [27] and the energy
conversion efficiency [28–35] of the applicable process. The specific pre-treatment and energy conversion
pathway applied for each resource are reflective of the desired energy output, as discussed further in the
Introduction of this paper. Once the energy potentials of the available resources have been calculated, these are
then compared against the UK’s renewable energy and bioenergy targets.
Figure 3: Biomass Resource Model – Energy Generation Pathways
In summary, the key features of the BRM are the ability to investigate different variables and drivers that
collectively reflect the whole system influences to biomass resource availability. This includes forestry,
agriculture and market resource competition, allowing assessment of “land for food” vs. “land for biomass”
dynamics. A further discussion of the methodology is described by Welfle et al, 2013 [36].
UK Biomass Resource Scenarios
3.1 Scenario Analysis
Scenario analysis is the evaluation of potential future events through the consideration of alternative plausible,
although not equally likely states of the world (scenarios) [37]. Scenarios are a dynamic view of future potential
pathways based on the chosen trajectory variables. Scenario analysis provides an advantage of illustrating
potential directions and illuminating events that may otherwise be missed. This can be particularly instructive
for short and long term coordinated decision making and actions [38].
3.2 Developing Biomass Resource Scenarios
Many variables influencing the UK’s biomass resource availability to 2050 are uncertain and so a scenario
approach has been used to explore the potential indigenous resource availability under alternative assumptions.
Comparative biomass resource scenario approaches have been utilised by existing studies. These develop
scenarios that forecast global biomass resource potential [39-40], or specifically focus on the potential of
specific resources within a set geography [41-42].
The flexibility of the BRM allows scenarios to be analysed that represent realistic future conditions. The chosen
scenarios represent different trajectories that are likely to influence biomass availability in the UK and potential
contributions to the bioenergy sector. Within each scenario it is also important to highlight that the ability for the
UK to continue to meet its food demands are always placed ahead of ability to produce resource for the
bioenergy sector. Therefore these scenarios represent potential biomass resource futures that will not conflict
with requirements for food production.
The parameters within each scenario are built up through the manipulation of a series of key drivers that
collectively control the BRM. These drivers reflect the core dynamics that influence biomass resource
availability and potential for the energy sector. The extent and direction in which these drivers are varied within
each scenario is reflective of a wide range of previous research and studies that provide forecasts. Table 2
provides an overview of these forecast drivers, and a summary of the literature that has informed how these
variables may change to 2050. Table 2 also highlights specific drivers targeted and trade-offs between the
scenarios.
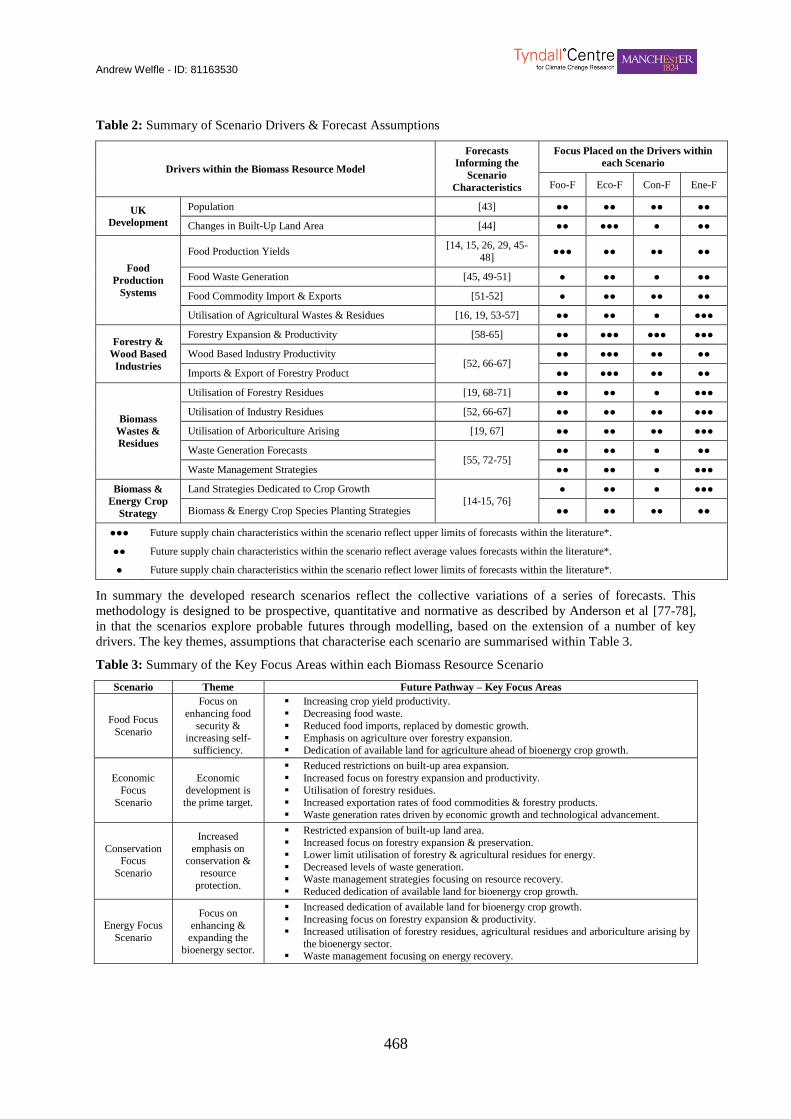
Andrew Welfle - ID: 81163530
468
Table 2: Summary of Scenario Drivers & Forecast Assumptions
Drivers within the Biomass Resource Model
Forecasts
Informing the
Scenario
Characteristics
Focus Placed on the Drivers within
each Scenario
Foo-F Eco-F Con-F Ene-F
UK
Development
Population [43] ●● ●● ●● ●●
Changes in Built-Up Land Area [44] ●● ●●● ● ●●
Food
Production
Systems
Food Production Yields [14, 15, 26, 29, 45-
48] ●●● ●● ●● ●●
Food Waste Generation [45, 49-51] ● ●● ● ●●
Food Commodity Import & Exports [51-52] ● ●● ●● ●●
Utilisation of Agricultural Wastes & Residues [16, 19, 53-57] ●● ●● ● ●●●
Forestry &
Wood Based
Industries
Forestry Expansion & Productivity [58-65] ●● ●●● ●●● ●●●
Wood Based Industry Productivity [52, 66-67]
●● ●●● ●● ●●
Imports & Export of Forestry Product ●● ●●● ●● ●●
Biomass
Wastes &
Residues
Utilisation of Forestry Residues [19, 68-71] ●● ●● ● ●●●
Utilisation of Industry Residues [52, 66-67] ●● ●● ●● ●●●
Utilisation of Arboriculture Arising [19, 67] ●● ●● ●● ●●●
Waste Generation Forecasts [55, 72-75]
●● ●● ● ●●
Waste Management Strategies ●● ●● ● ●●●
Biomass &
Energy Crop
Strategy
Land Strategies Dedicated to Crop Growth [14-15, 76]
● ●● ● ●●●
Biomass & Energy Crop Species Planting Strategies ●● ●● ●● ●●
●●● Future supply chain characteristics within the scenario reflect upper limits of forecasts within the literature*.
●● Future supply chain characteristics within the scenario reflect average values forecasts within the literature*.
● Future supply chain characteristics within the scenario reflect lower limits of forecasts within the literature*.
In summary the developed research scenarios reflect the collective variations of a series of forecasts. This
methodology is designed to be prospective, quantitative and normative as described by Anderson et al [77-78],
in that the scenarios explore probable futures through modelling, based on the extension of a number of key
drivers. The key themes, assumptions that characterise each scenario are summarised within Table 3.
Table 3: Summary of the Key Focus Areas within each Biomass Resource Scenario
Scenario Theme Future Pathway – Key Focus Areas
Food Focus
Scenario
Focus on
enhancing food
security &
increasing self-sufficiency.
Increasing crop yield productivity.
Decreasing food waste.
Reduced food imports, replaced by domestic growth.
Emphasis on agriculture over forestry expansion. Dedication of available land for agriculture ahead of bioenergy crop growth.
Economic
Focus
Scenario
Economic
development is
the prime target.
Reduced restrictions on built-up area expansion.
Increased focus on forestry expansion and productivity.
Utilisation of forestry residues.
Increased exportation rates of food commodities & forestry products. Waste generation rates driven by economic growth and technological advancement.
Conservation Focus
Scenario
Increased
emphasis on conservation &
resource
protection.
Restricted expansion of built-up land area.
Increased focus on forestry expansion & preservation. Lower limit utilisation of forestry & agricultural residues for energy.
Decreased levels of waste generation. Waste management strategies focusing on resource recovery.
Reduced dedication of available land for bioenergy crop growth.
Energy Focus
Scenario
Focus on
enhancing & expanding the
bioenergy sector.
Increased dedication of available land for bioenergy crop growth.
Increasing focus on forestry expansion & productivity.
Increased utilisation of forestry residues, agricultural residues and arboriculture arising by
the bioenergy sector. Waste management focusing on energy recovery.
Andrew Welfle - ID: 81163530
469
3.2.1 Food Focus (Foo-F) Scenario
The Foo-F Scenario has been developed to analyse forecasts of biomass resource availability for the energy
sector, within a future pathway where prime focus has been placed on improving food security and self-
sufficiency.
Scenario Context
Since World War Two European agricultural policy has focused on enhancing food self-sufficiency for the
European population and, as demonstrated by recent overproduction of food, has been highly successful [79].
However an enormous future challenge looms - having to feed up to 9-10 billion people by 2050 globally [51].
Agricultural systems are highly sensitive to climate fluctuations, and a 2°C rise in mean global temperature
reflecting the Intergovernmental Panel on Climate Change’s lowest emission scenarios is predicted to result in
widespread destabilization of farming systems across the world [80]. In addition to the uncertainty regarding
food systems, the large scale production of biofuels is becoming a significant competitor for agricultural land –
and whilst energy security concerns may justify the production of biofuels, the proposed scale of production
raises questions about the trade-offs between biofuels and food crops [81]. The key issue relating to future food
systems remains whether they can keep pace with steep growing demand and dietary transitions in an
environment of climate change and numerous other drivers [82]. This strain will put pressure on Europe’s future
supply chains. Enhancing food security and self-sufficiency may re-emerge as prominent areas of concern for
future governments.
A Future Pathway with Food Focus
Although complete food self-sufficiency is not a current target for the UK, it is important that food systems
adapt so that the UK is able to cope with future stresses in the food system [49-50]. The UK currently produces
about half of the food it consumes, and is ~60% ‘self-sufficient’ [47]. Recognised strategies to address future
food issues include: closing the yield gap – the difference between attainable yields and realised yield;
increasing agricultural productivity through technologies, research and investment; reducing wastes from food
systems; changing diets; and expanding aquaculture opportunities [51].
UK agricultural productivity has been increasing at a steady trajectory through time, and increased research,
development and investment in the sector is likely to see this trend continue [83]. Estimates also suggest that 30-
50% of food grown worldwide may be lost or wasted before and after it reaches the consumer. Therefore future
emphasis should be placed on addressing wastes – the UK Government Office for Sciences suggesting that food
waste could be realistically halved by 2050, equivalent to as much as 25% of current productivity [49-50].
All actions should be realised through coordinated and multifaceted strategies where sustainability is key. This
‘sustainable intensification’ involves an enhancement of current business-as-usual trends. Where agricultural
systems remain largely unchanged and demands follow current projections, but agricultural productivity
becomes increasingly efficient [84].
A summary of the key focus areas and actions within the Foo-F Scenario future pathway are shown in Table 3.
3.2.2 Economic Focus (Eco-F) Scenario
The Eco-F Scenario has been developed to analyse forecasts of biomass resource availability for the energy
sector, in a future where emphasis is placed on economic growth over all other considerations.
Scenario Context
Following the 2008/9 financial problems, an agenda aimed at encouraging economic growth is currently at the
forefront driving the majority of UK policy. In the UK, timber and wood based industries are well established
and contribute about 1.5% of UK export, equivalent to 2.5% of the global share [52]. The flow of materials
between the economy and the environment constitutes the physical foundations of economies – this ‘economic
metabolism’ being a key indicator of economic health [85-86]. It is the growth and dynamics associated with the
wood based industry that will be a key influence in determining in the availability of biomass resources
available for the bioenergy sector within this scenario.
In terms of development of the bioenergy sector, many countries are showing considerable interest in bioenergy
from an economic basis because of the value added (income) and employment opportunities that bioenergy can
bring, especially in the rural areas where the resources are produced/collected [87]. However studies such as
Marques & Fuinhas (2012) [88] have concluded that the high costs associated with supporting renewable energy
options are actually an economic burden, as polices such as increasing tariffs for electricity results in an
economically counterproductive effect and deceleration in economic activity. As things stand European
countries have energy systems and infrastructures that are deeply grounded in fossil fuel provision [88].
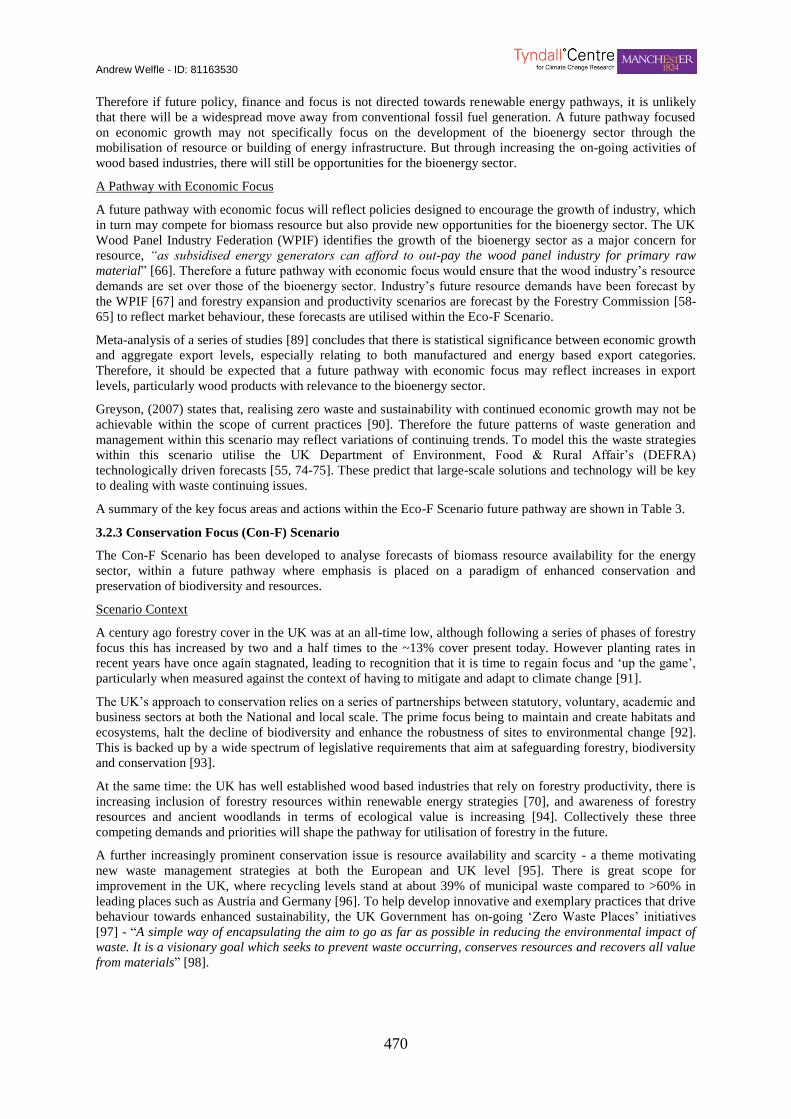
Andrew Welfle - ID: 81163530
470
Therefore if future policy, finance and focus is not directed towards renewable energy pathways, it is unlikely
that there will be a widespread move away from conventional fossil fuel generation. A future pathway focused
on economic growth may not specifically focus on the development of the bioenergy sector through the
mobilisation of resource or building of energy infrastructure. But through increasing the on-going activities of
wood based industries, there will still be opportunities for the bioenergy sector.
A Pathway with Economic Focus
A future pathway with economic focus will reflect policies designed to encourage the growth of industry, which
in turn may compete for biomass resource but also provide new opportunities for the bioenergy sector. The UK
Wood Panel Industry Federation (WPIF) identifies the growth of the bioenergy sector as a major concern for
resource, “as subsidised energy generators can afford to out-pay the wood panel industry for primary raw
material” [66]. Therefore a future pathway with economic focus would ensure that the wood industry’s resource
demands are set over those of the bioenergy sector. Industry’s future resource demands have been forecast by
the WPIF [67] and forestry expansion and productivity scenarios are forecast by the Forestry Commission [58-
65] to reflect market behaviour, these forecasts are utilised within the Eco-F Scenario.
Meta-analysis of a series of studies [89] concludes that there is statistical significance between economic growth
and aggregate export levels, especially relating to both manufactured and energy based export categories.
Therefore, it should be expected that a future pathway with economic focus may reflect increases in export
levels, particularly wood products with relevance to the bioenergy sector.
Greyson, (2007) states that, realising zero waste and sustainability with continued economic growth may not be
achievable within the scope of current practices [90]. Therefore the future patterns of waste generation and
management within this scenario may reflect variations of continuing trends. To model this the waste strategies
within this scenario utilise the UK Department of Environment, Food & Rural Affair’s (DEFRA)
technologically driven forecasts [55, 74-75]. These predict that large-scale solutions and technology will be key
to dealing with waste continuing issues.
A summary of the key focus areas and actions within the Eco-F Scenario future pathway are shown in Table 3.
3.2.3 Conservation Focus (Con-F) Scenario
The Con-F Scenario has been developed to analyse forecasts of biomass resource availability for the energy
sector, within a future pathway where emphasis is placed on a paradigm of enhanced conservation and
preservation of biodiversity and resources.
Scenario Context
A century ago forestry cover in the UK was at an all-time low, although following a series of phases of forestry
focus this has increased by two and a half times to the ~13% cover present today. However planting rates in
recent years have once again stagnated, leading to recognition that it is time to regain focus and ‘up the game’,
particularly when measured against the context of having to mitigate and adapt to climate change [91].
The UK’s approach to conservation relies on a series of partnerships between statutory, voluntary, academic and
business sectors at both the National and local scale. The prime focus being to maintain and create habitats and
ecosystems, halt the decline of biodiversity and enhance the robustness of sites to environmental change [92].
This is backed up by a wide spectrum of legislative requirements that aim at safeguarding forestry, biodiversity
and conservation [93].
At the same time: the UK has well established wood based industries that rely on forestry productivity, there is
increasing inclusion of forestry resources within renewable energy strategies [70], and awareness of forestry
resources and ancient woodlands in terms of ecological value is increasing [94]. Collectively these three
competing demands and priorities will shape the pathway for utilisation of forestry in the future.
A further increasingly prominent conservation issue is resource availability and scarcity - a theme motivating
new waste management strategies at both the European and UK level [95]. There is great scope for
improvement in the UK, where recycling levels stand at about 39% of municipal waste compared to >60% in
leading places such as Austria and Germany [96]. To help develop innovative and exemplary practices that drive
behaviour towards enhanced sustainability, the UK Government has on-going ‘Zero Waste Places’ initiatives
[97] - “A simple way of encapsulating the aim to go as far as possible in reducing the environmental impact of
waste. It is a visionary goal which seeks to prevent waste occurring, conserves resources and recovers all value
from materials” [98].

Andrew Welfle - ID: 81163530
471
A Pathway with Conservation Focus
Trade-offs exist between biodiversity, conservation and optimal biomass resource production for the bioenergy
sector. Erb, et al [99] found that estimates of global biomass crop potential are lowered by 9-32% when land
areas of wilderness, biodiversity importance and with protection status are excluded from assessments. The
German Advisory Council on Global Change also found that a minimum of 10-20% of global land should be
protected if the biosphere’s functions such as climate regulation and biodiversity are to be preserved [100]. 14%
of land is currently protected globally [101], meaning a further 6% equivalent to 540,000 km² is required [102].
In summary a future pathway with conservation focus will undoubtedly result in lower levels of biomass
resource being available for the bioenergy sector.
In the UK, the Forestry Commission have a wide range of forestry expansion and productivity scenarios that
reflect varying levels of forest growth and utilisation [58-65]. A future pathway with conservation focus will
reflect the upper projections for forestry expansion. The management of forests including felling is
The approach of the UK forestry industry has progressively shifted primarily from timber production to
increasingly multi-purpose values that include conservation [103]. Forestry industries having an important role
to play in conservation, as the industries long-term sustainability depends on the resource [104]. Therefore
industry within a future pathway with conservation focus would therefore continue to utilise forests, albeit
strongly abiding to the requirement of the ‘UK Forestry Standard’ [105].
Research [106-107] also highlights that the extraction of residues from both forestry and agricultural systems
may pose a risk for the maintenance of soil fertility. It being important that residue removals don’t exceed levels
required to maintain food and habitats for organisms, provide protection against soil compaction or for
maintenance of soil fertility [69, 71]. Therefore a future pathway with conservation focus will likely avoid the
upper limits utilisation of both forestry and agricultural residues.
Waste generation and management strategies will reflect future pathways of reduced waste generation and
increased levels of resource recovery from waste streams. Scenarios reflecting these pathways have been
forecast by the DEFRA [55, 74-75], and will form the basis of future waste analysis within the Con-F Scenario.
A summary of the key focus areas and actions within the Con-F Scenario future pathway are shown in Table 3.
3.2.4 Energy Focus (Ene-F) Scenario
The Ene-F Scenario has been developed to analyse forecasts of biomass resource availability for the energy
sector, in a future pathway where prime focus has been placed on expanding the UK bioenergy sector.
Scenario Context
As already discussed the UK has legally binding energy, carbon and renewable energy targets, including a series
of bioenergy targets relating to heat, power and transport fuel, and overall generation [6, 108-109]. The Energy
Focus Scenario sets out a future pathway where the maximum achievable levels of bioenergy are generated from
indigenous biomass resources. The strategy being for the UK to maximise it’s bioenergy generation potential
through the utilisation of indigenous resources, and reduce potential reliance on imported imported resources.
A Pathway with Energy Focus
The concept behind this scenario is to explore the upper limits of indigenous biomass resources that could
realistically be mobilised for the bioenergy sector to 2050. This involves mobilising and pushing the limits on
resource availability across the range of biomass categories.
Within this future pathway the upper limits of available and suitable land (after food demands are met) is
dedicated for the potential growth of energy and biomass crops [14, 76]. The energy focus scenario will reflect
the Forestry Commission’s forest expansion and productivity forecasts [58-65] that provide the greatest resource
potential for the bioenergy sector. A further future opportunity explored is highlighted by The Independent
Panel on Forestry [110], “only 52% of UK forests and woodland are currently actively managed, so major
resource use opportunities may exist if progress is made in this area”.
There are also notable biomass resource opportunities potentially available for the bioenergy sector in the form
of wastes and residues from on-going activites in the UK [111]. As such a future pathway with energy focus will
work towards achieving increased harvest and collection (biological & realistic) limits for biomass residues,
from forestry, agricultural and industrial processes. The waste generation and management strategies adopted
also reflect DEFRA’s forecast pathways where energy recovery is the focus [55, 74-75].
A summary of the key focus areas and actions within the Ene-F Scenario future pathway are shown in Table 3.
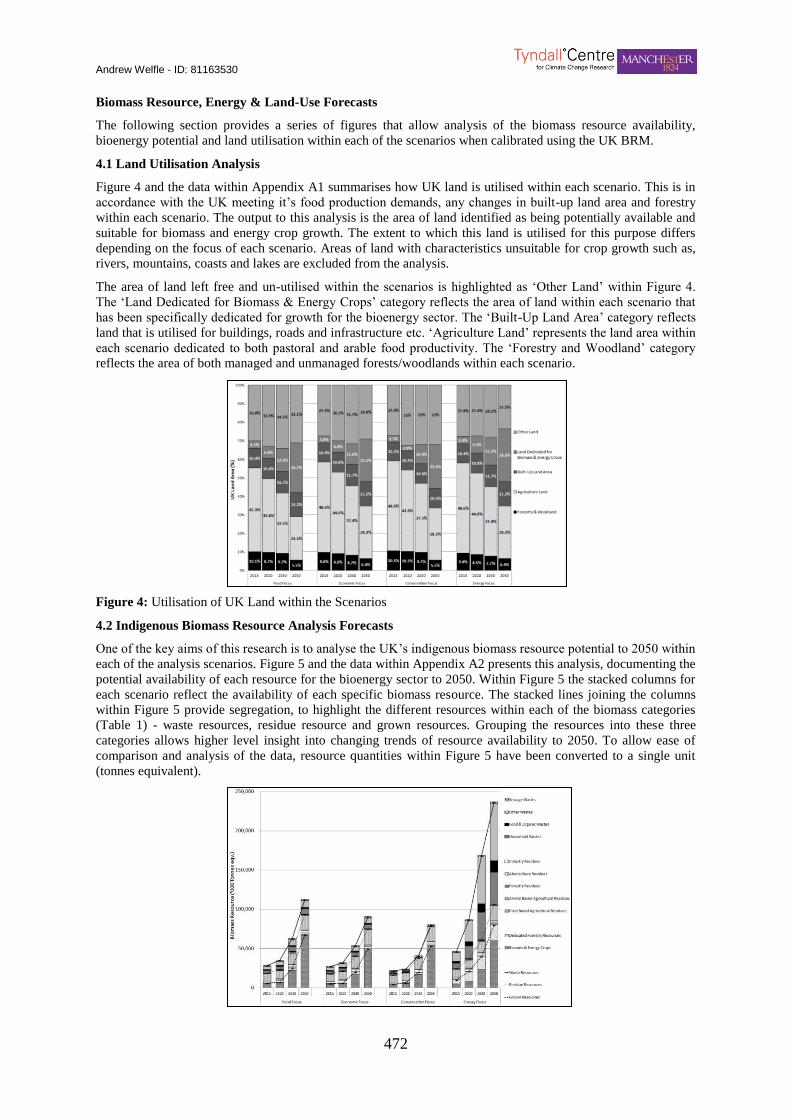
Andrew Welfle - ID: 81163530
472
Biomass Resource, Energy & Land-Use Forecasts
The following section provides a series of figures that allow analysis of the biomass resource availability,
bioenergy potential and land utilisation within each of the scenarios when calibrated using the UK BRM.
4.1 Land Utilisation Analysis
Figure 4 and the data within Appendix A1 summarises how UK land is utilised within each scenario. This is in
accordance with the UK meeting it’s food production demands, any changes in built-up land area and forestry
within each scenario. The output to this analysis is the area of land identified as being potentially available and
suitable for biomass and energy crop growth. The extent to which this land is utilised for this purpose differs
depending on the focus of each scenario. Areas of land with characteristics unsuitable for crop growth such as,
rivers, mountains, coasts and lakes are excluded from the analysis.
The area of land left free and un-utilised within the scenarios is highlighted as ‘Other Land’ within Figure 4.
The ‘Land Dedicated for Biomass & Energy Crops’ category reflects the area of land within each scenario that
has been specifically dedicated for growth for the bioenergy sector. The ‘Built-Up Land Area’ category reflects
land that is utilised for buildings, roads and infrastructure etc. ‘Agriculture Land’ represents the land area within
each scenario dedicated to both pastoral and arable food productivity. The ‘Forestry and Woodland’ category
reflects the area of both managed and unmanaged forests/woodlands within each scenario.
Figure 4: Utilisation of UK Land within the Scenarios
4.2 Indigenous Biomass Resource Analysis Forecasts
One of the key aims of this research is to analyse the UK’s indigenous biomass resource potential to 2050 within
each of the analysis scenarios. Figure 5 and the data within Appendix A2 presents this analysis, documenting the
potential availability of each resource for the bioenergy sector to 2050. Within Figure 5 the stacked columns for
each scenario reflect the availability of each specific biomass resource. The stacked lines joining the columns
within Figure 5 provide segregation, to highlight the different resources within each of the biomass categories
(Table 1) - waste resources, residue resource and grown resources. Grouping the resources into these three
categories allows higher level insight into changing trends of resource availability to 2050. To allow ease of
comparison and analysis of the data, resource quantities within Figure 5 have been converted to a single unit
(tonnes equivalent).
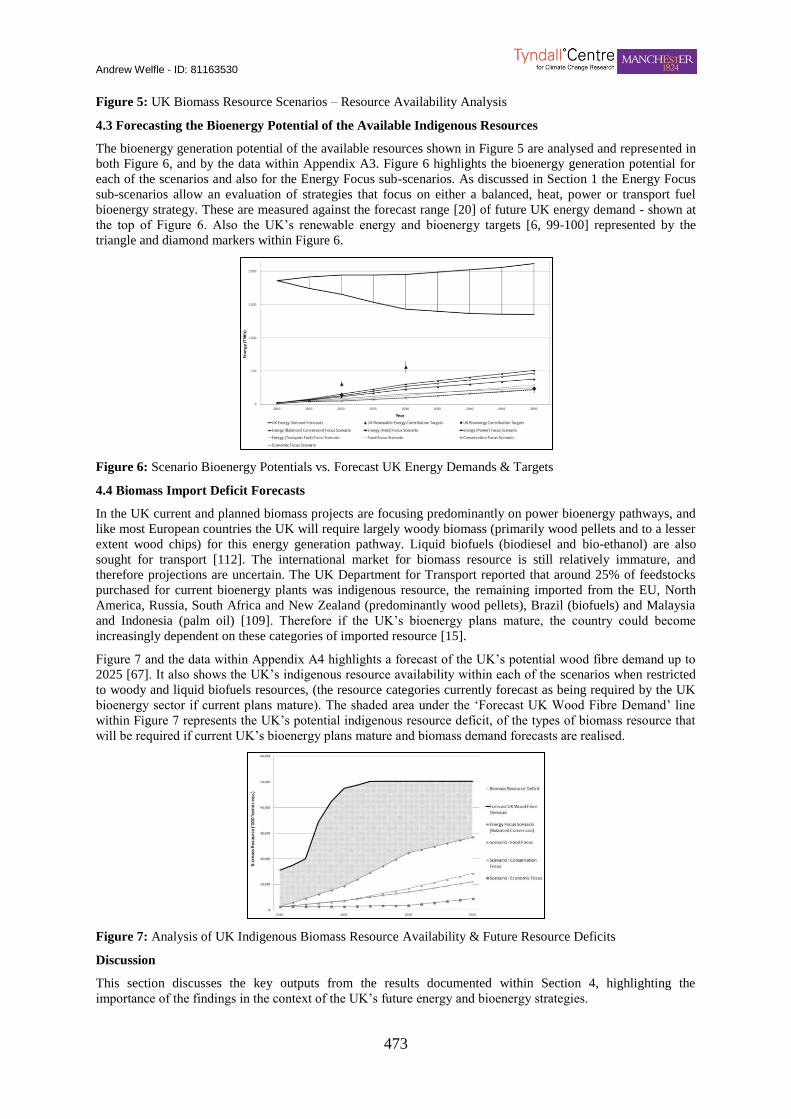
Andrew Welfle - ID: 81163530
473
Figure 5: UK Biomass Resource Scenarios – Resource Availability Analysis
4.3 Forecasting the Bioenergy Potential of the Available Indigenous Resources
The bioenergy generation potential of the available resources shown in Figure 5 are analysed and represented in
both Figure 6, and by the data within Appendix A3. Figure 6 highlights the bioenergy generation potential for
each of the scenarios and also for the Energy Focus sub-scenarios. As discussed in Section 1 the Energy Focus
sub-scenarios allow an evaluation of strategies that focus on either a balanced, heat, power or transport fuel
bioenergy strategy. These are measured against the forecast range [20] of future UK energy demand - shown at
the top of Figure 6. Also the UK’s renewable energy and bioenergy targets [6, 99-100] represented by the
triangle and diamond markers within Figure 6.
Figure 6: Scenario Bioenergy Potentials vs. Forecast UK Energy Demands & Targets
4.4 Biomass Import Deficit Forecasts
In the UK current and planned biomass projects are focusing predominantly on power bioenergy pathways, and
like most European countries the UK will require largely woody biomass (primarily wood pellets and to a lesser
extent wood chips) for this energy generation pathway. Liquid biofuels (biodiesel and bio-ethanol) are also
sought for transport [112]. The international market for biomass resource is still relatively immature, and
therefore projections are uncertain. The UK Department for Transport reported that around 25% of feedstocks
purchased for current bioenergy plants was indigenous resource, the remaining imported from the EU, North
America, Russia, South Africa and New Zealand (predominantly wood pellets), Brazil (biofuels) and Malaysia
and Indonesia (palm oil) [109]. Therefore if the UK’s bioenergy plans mature, the country could become
increasingly dependent on these categories of imported resource [15].
Figure 7 and the data within Appendix A4 highlights a forecast of the UK’s potential wood fibre demand up to
2025 [67]. It also shows the UK’s indigenous resource availability within each of the scenarios when restricted
to woody and liquid biofuels resources, (the resource categories currently forecast as being required by the UK
bioenergy sector if current plans mature). The shaded area under the ‘Forecast UK Wood Fibre Demand’ line
within Figure 7 represents the UK’s potential indigenous resource deficit, of the types of biomass resource that
will be required if current UK’s bioenergy plans mature and biomass demand forecasts are realised.
Figure 7: Analysis of UK Indigenous Biomass Resource Availability & Future Resource Deficits
Discussion
This section discusses the key outputs from the results documented within Section 4, highlighting the
importance of the findings in the context of the UK’s future energy and bioenergy strategies.
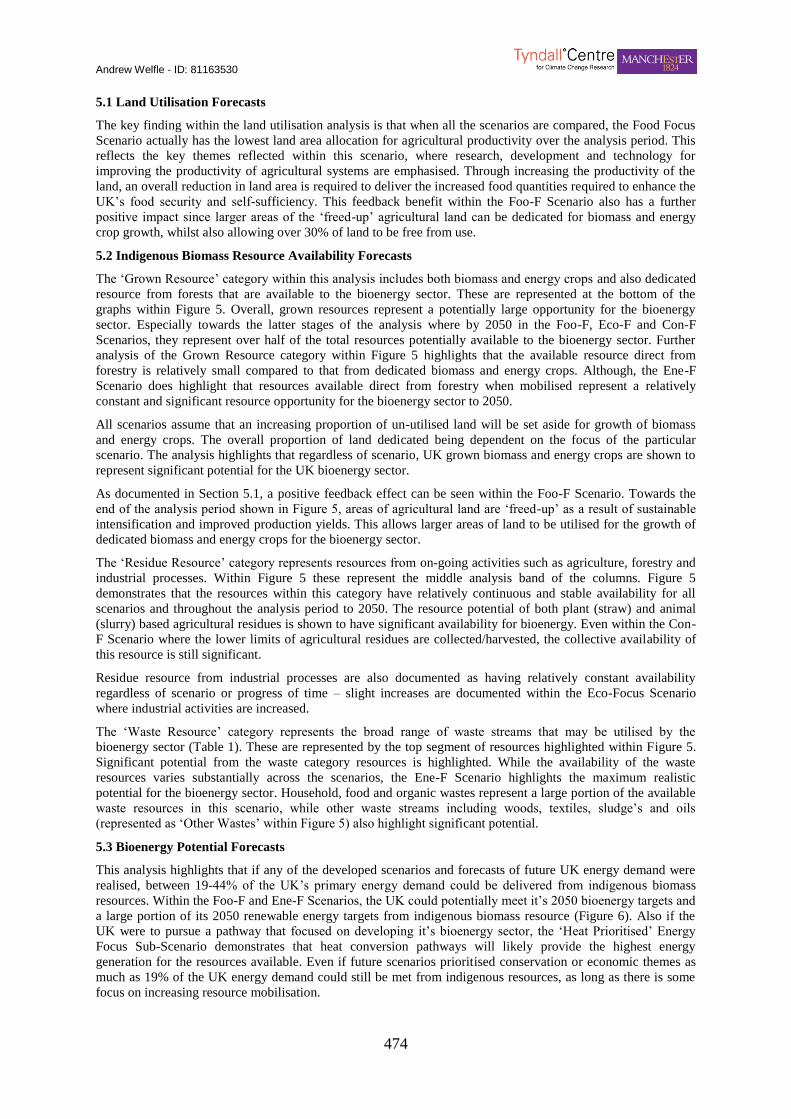
Andrew Welfle - ID: 81163530
474
5.1 Land Utilisation Forecasts
The key finding within the land utilisation analysis is that when all the scenarios are compared, the Food Focus
Scenario actually has the lowest land area allocation for agricultural productivity over the analysis period. This
reflects the key themes reflected within this scenario, where research, development and technology for
improving the productivity of agricultural systems are emphasised. Through increasing the productivity of the
land, an overall reduction in land area is required to deliver the increased food quantities required to enhance the
UK’s food security and self-sufficiency. This feedback benefit within the Foo-F Scenario also has a further
positive impact since larger areas of the ‘freed-up’ agricultural land can be dedicated for biomass and energy
crop growth, whilst also allowing over 30% of land to be free from use.
5.2 Indigenous Biomass Resource Availability Forecasts
The ‘Grown Resource’ category within this analysis includes both biomass and energy crops and also dedicated
resource from forests that are available to the bioenergy sector. These are represented at the bottom of the
graphs within Figure 5. Overall, grown resources represent a potentially large opportunity for the bioenergy
sector. Especially towards the latter stages of the analysis where by 2050 in the Foo-F, Eco-F and Con-F
Scenarios, they represent over half of the total resources potentially available to the bioenergy sector. Further
analysis of the Grown Resource category within Figure 5 highlights that the available resource direct from
forestry is relatively small compared to that from dedicated biomass and energy crops. Although, the Ene-F
Scenario does highlight that resources available direct from forestry when mobilised represent a relatively
constant and significant resource opportunity for the bioenergy sector to 2050.
All scenarios assume that an increasing proportion of un-utilised land will be set aside for growth of biomass
and energy crops. The overall proportion of land dedicated being dependent on the focus of the particular
scenario. The analysis highlights that regardless of scenario, UK grown biomass and energy crops are shown to
represent significant potential for the UK bioenergy sector.
As documented in Section 5.1, a positive feedback effect can be seen within the Foo-F Scenario. Towards the
end of the analysis period shown in Figure 5, areas of agricultural land are ‘freed-up’ as a result of sustainable
intensification and improved production yields. This allows larger areas of land to be utilised for the growth of
dedicated biomass and energy crops for the bioenergy sector.
The ‘Residue Resource’ category represents resources from on-going activities such as agriculture, forestry and
industrial processes. Within Figure 5 these represent the middle analysis band of the columns. Figure 5
demonstrates that the resources within this category have relatively continuous and stable availability for all
scenarios and throughout the analysis period to 2050. The resource potential of both plant (straw) and animal
(slurry) based agricultural residues is shown to have significant availability for bioenergy. Even within the Con-
F Scenario where the lower limits of agricultural residues are collected/harvested, the collective availability of
this resource is still significant.
Residue resource from industrial processes are also documented as having relatively constant availability
regardless of scenario or progress of time – slight increases are documented within the Eco-Focus Scenario
where industrial activities are increased.
The ‘Waste Resource’ category represents the broad range of waste streams that may be utilised by the
bioenergy sector (Table 1). These are represented by the top segment of resources highlighted within Figure 5.
Significant potential from the waste category resources is highlighted. While the availability of the waste
resources varies substantially across the scenarios, the Ene-F Scenario highlights the maximum realistic
potential for the bioenergy sector. Household, food and organic wastes represent a large portion of the available
waste resources in this scenario, while other waste streams including woods, textiles, sludge’s and oils
(represented as ‘Other Wastes’ within Figure 5) also highlight significant potential.
5.3 Bioenergy Potential Forecasts
This analysis highlights that if any of the developed scenarios and forecasts of future UK energy demand were
realised, between 19-44% of the UK’s primary energy demand could be delivered from indigenous biomass
resources. Within the Foo-F and Ene-F Scenarios, the UK could potentially meet it’s 2050 bioenergy targets and
a large portion of its 2050 renewable energy targets from indigenous biomass resource (Figure 6). Also if the
UK were to pursue a pathway that focused on developing it’s bioenergy sector, the ‘Heat Prioritised’ Energy
Focus Sub-Scenario demonstrates that heat conversion pathways will likely provide the highest energy
generation for the resources available. Even if future scenarios prioritised conservation or economic themes as
much as 19% of the UK energy demand could still be met from indigenous resources, as long as there is some
focus on increasing resource mobilisation.
Andrew Welfle - ID: 81163530
475
5.4 Indigenous Resource Deficits and Imports
Figure 7 shows the results in the context of the UK’s renewable energy and bioenergy strategies. Even though
the UK has potentially large indigenous biomass resource availability (Figure 5) and a large portion of the UK’s
energy targets could be met through the utilisation of these indigenous resources (Figure 6), the UK does not
have an abundance of the ‘woody’ and transport fuel compatible biomass resources required to meet future
demand, if the UK’s current bioenergy plans mature. Figure 7 shows that even within the Ene-F Scenario where
the upper limits of indigenous biomass resource are mobilised, a large resource deficit will still exist when
compared to the forecast resource demand. In summary this analysis describes an uncomfortable nexus between
the high potential availability of various indigenous resource categories, and the current and future bioenergy
strategies that are potentially steering the UK towards reliance on biomass resource imports. Highlighting the
concept that the UK is not potentially investing in the appropriate biomass technologies and infrastructure to
match the indigenous opportunities.
Conclusions - Scenario Lessons
The scenarios developed in this study were designed to represent four potential pathways that could be realised
in the UK, in order to determine the biomass resource potentials and implications for the bioenergy sector. They
allow an assessment of the potential impacts of different variables and contexts on potential biomass resource
supply. The key policy conclusions arising from the analysis are highlighted below.
High Potential Availability of Biomass & Energy Crops without Impacting Food Systems - The analysis shows
that the potential availability of biomass and energy crops for the bioenergy sector remains high, even when
land is ‘ring-fenced’ for the UK to maintain it’s food production requirements (and even enhanced food
production within the Food Focus Scenario).
Robust & Continuous Resource Availability from On-going UK Activities – Biomass residue resources,
including agricultural, forestry, industrial and arboriculture residues were found to represent a continuous and
robust resource that maintained a high availability regardless of the scenario or time within the analysis.
Agricultural residues, particularly both straw and slurry resources represent a major opportunity for the
bioenergy sector due to their high abundance, availability robustness and current under-utilisation [113].
Large Potential from Waste Resources – Within the Energy Focus Scenario where the adopted waste
management strategy emphasised energy recovery, the potential waste resource availability for the bioenergy
sector was shown to be substantial (>1308 million tonnes equivalent per year in 2050). Likewise within the
Conservation Focus Scenario where a strategy of reduced waste generation and resource recovery was adopted,
the potential for the bioenergy sector was much less attractive (>1.8 million tonnes equivalent per year in 2050).
The abundance of both household and food/plant based waste streams were identified as showing particular
potential for the bioenergy sector.
A Food Focus Positive Feedback Benefit – Analysis within the Food Focus Scenario found that a future
pathway that emphasised increasing the productivity and reduction of wastes from food systems, resulted in
future benefits for the bioenergy sector. Increasing the productivity of the land not only resulted in increased
food security and self-sufficiency, but ultimately resulted in less land being required to produce more food –
freeing up additional land for biomass growth.
Heat Conversion Pathways Providing Most Energy Efficient Use of Resources – The analysis of the energy
conversion sub-scenarios (Figure 6), highlighted that the prioritisation of heat energy conversion pathways with
suitable resources, resulted in the greatest levels of bioenergy generation. This suggests that the best option for
the UK to make the most of its indigenous biomass resource is potentially for, selected resources to be utilised
by the industries in bio-refineries with all remaining suitable resources being dedicated for heat generation
pathways. The generation of renewable electricity being achieved through alternative technologies.
Indigenous Resource Abundance & Our Pathway Towards Increased Resource Deficit – Overall the results
identified the high potential availability of indigenous resources for the bioenergy sector (Figure 5), the large
contributions that indigenous resource could make towards the UK achieving it’s energy targets (Figure 6), but
the forecasts deficits in biomass resources that the UK will need to import in order to supply the current and
planned bioenergy sector (Figure 7). In summary this analysis highlights the non and under-utilisation of
indigenous biomass resources in the UK, and the major currently missed opportunities that are contrary to the
current direction of the UK bioenergy sector.

Andrew Welfle - ID: 81163530
476
Appendix A15.2: Biomass & Bioenergy Journal Paper
Increasing Biomass Resource Availability through Supply Chain Analysis
Reference:
Welfle A, Gilbert P, Thornley P. Increasing Biomass Resource Availability through Supply Chain Analysis.
Biomass & Bioenergy. 2014; 70: 249-226.
Abstract
Increased inclusion of biomass in energy strategies all over the world means that greater mobilisation of
biomass resources will be required to meet demand. Strategies of many EU countries assume the future use of
non-EU sourced biomass. An increasing number of studies call for the UK to consider alternative options,
principally to better utilise indigenous resources. This research identifies the indigenous biomass resources that
demonstrate the greatest promise for the UK bioenergy sector and evaluates the extent that different supply
chain drivers influence resource availability.
The analysis finds that the UK’s resources with greatest primary bioenergy potential are household wastes
(>115TWh by 2050), energy crops (>100TWh by 2050) and agricultural residues (>80TWh by 2050). The
availability of biomass waste resources were found to demonstrate great promise for the bioenergy sector,
although are highly susceptible to influences, most notably by the focus of adopted waste management
strategies. Biomass residue resources were found to be the resource category least susceptible to influence, with
relatively high near-term availability that is forecast to increase - therefore representing a potentially robust
resource for the bioenergy sector. The near-term availability of UK energy crops was found to be much less
significant compared to other resource categories. Energy crops represent long-term potential for the bioenergy
sector, although achieving higher limits of availability will be dependent on the successful management of key
influencing drivers. The research highlights that the availability of indigenous resources are largely influenced
by a few key drivers, this contradicting areas of consensus of current UK bioenergy policy.
1) Introduction
The UK energy sector is facing it’s greatest challenges for at least a generation. The sector is expected to renew
its energy generation portfolio, whilst providing secure, reliable, affordable and low carbon energy to its
customers [1]. Energy from biomass provides options for the energy sector that can provide parts of the solution
to each of these challenges.
Despite some concerns over the extent of biofuels deployment, bioenergy is key to many European energy
strategies [2]; the European Commission estimates that energy from biomass may contribute up to two-thirds of
the EU’s 2020 target for 20% renewable energy contribution [3]. The UK’s Renewable Energy Strategy also
confirms that energy from biomass will significantly contribute towards the UK’s energy portfolio [4].
Inclusion of energy from biomass pathways in both national and global energy strategies [5] means that
increased mobilisation of biomass resource will be required to meet demand. The energy strategies of many EU
countries currently assume the extensive use of non-EU sourced biomass [6], which will increase competition
for suitable feedstocks [7].
The UK faces urgent choices regarding the future direction of its bioenergy sector. If current plans mature the
sector will be increasingly dominated by large scale biopower co-firing systems that will lock the UK into
indigenous deficits of the feedstocks required to keep these plants running [8-9]. There are an increasing number
of studies and calls [9–13] for the UK to consider alternative biomass options, principally to make better use of
the indigenous resources available. Welfle et al [9] showed, through the development of a series of UK biomass
resource scenarios, that the UK could potentially deliver 22% of its primary energy demand in 2050 through
indigenously grown biomass and energy crops, 6.5% through the utilisation of indigenous residue resources
from on-going activities and a further 15.4% from waste resources.
The UK has many potential sources of biomass suitable for energy options. If indigenous resources are to be
increasingly utilised, it is important that a greater understanding is achieved, of how different influencing drivers
determine the extent that biomass resources become available to the bioenergy sector. Assessing the availability
of any given resource being a matter of evaluating how much it is realistically, environmentally and
economically viable to be made available to the energy market [14]. Some of these key drivers can be
categorised as follows [15-16]:
Policy Drivers – energy and environmental themed policies are particularly important in determining a
secure long-term energy strategy. Waste, agricultural and forestry policies have great influence in
determining the potential availability of specific resources.
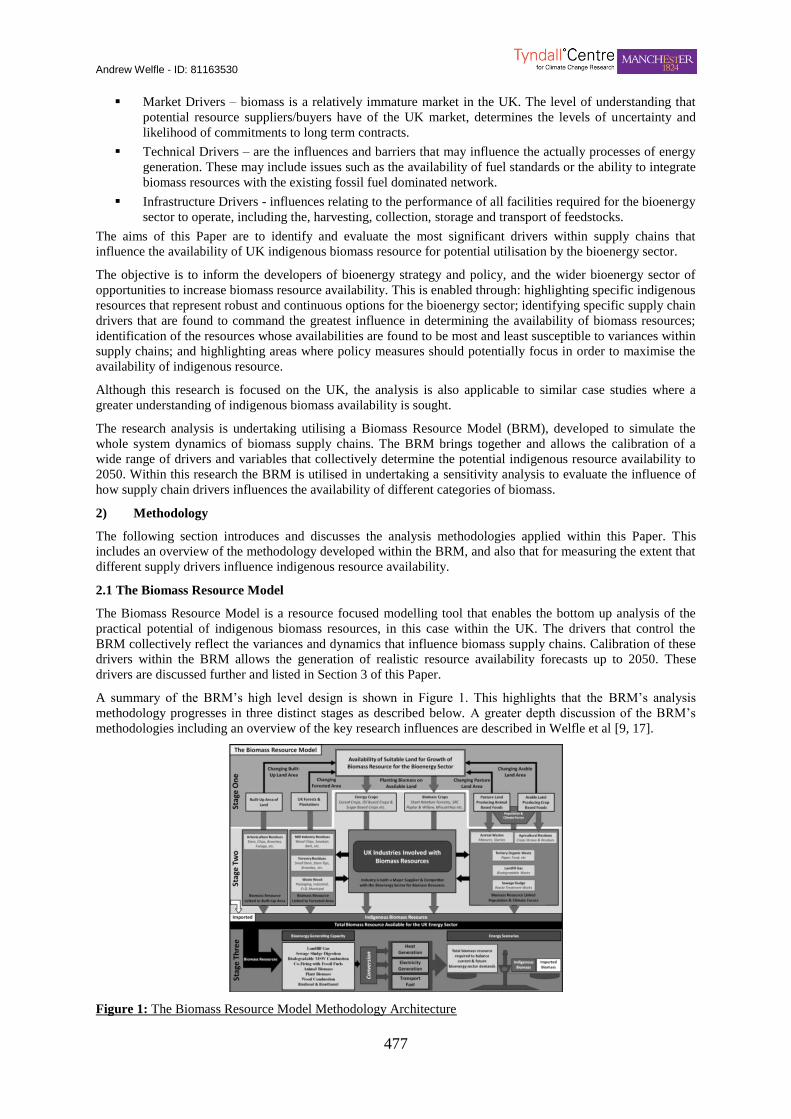
Andrew Welfle - ID: 81163530
477
Market Drivers – biomass is a relatively immature market in the UK. The level of understanding that
potential resource suppliers/buyers have of the UK market, determines the levels of uncertainty and
likelihood of commitments to long term contracts.
Technical Drivers – are the influences and barriers that may influence the actually processes of energy
generation. These may include issues such as the availability of fuel standards or the ability to integrate
biomass resources with the existing fossil fuel dominated network.
Infrastructure Drivers - influences relating to the performance of all facilities required for the bioenergy
sector to operate, including the, harvesting, collection, storage and transport of feedstocks.
The aims of this Paper are to identify and evaluate the most significant drivers within supply chains that
influence the availability of UK indigenous biomass resource for potential utilisation by the bioenergy sector.
The objective is to inform the developers of bioenergy strategy and policy, and the wider bioenergy sector of
opportunities to increase biomass resource availability. This is enabled through: highlighting specific indigenous
resources that represent robust and continuous options for the bioenergy sector; identifying specific supply chain
drivers that are found to command the greatest influence in determining the availability of biomass resources;
identification of the resources whose availabilities are found to be most and least susceptible to variances within
supply chains; and highlighting areas where policy measures should potentially focus in order to maximise the
availability of indigenous resource.
Although this research is focused on the UK, the analysis is also applicable to similar case studies where a
greater understanding of indigenous biomass availability is sought.
The research analysis is undertaking utilising a Biomass Resource Model (BRM), developed to simulate the
whole system dynamics of biomass supply chains. The BRM brings together and allows the calibration of a
wide range of drivers and variables that collectively determine the potential indigenous resource availability to
2050. Within this research the BRM is utilised in undertaking a sensitivity analysis to evaluate the influence of
how supply chain drivers influences the availability of different categories of biomass.
2) Methodology
The following section introduces and discusses the analysis methodologies applied within this Paper. This
includes an overview of the methodology developed within the BRM, and also that for measuring the extent that
different supply drivers influence indigenous resource availability.
2.1 The Biomass Resource Model
The Biomass Resource Model is a resource focused modelling tool that enables the bottom up analysis of the
practical potential of indigenous biomass resources, in this case within the UK. The drivers that control the
BRM collectively reflect the variances and dynamics that influence biomass supply chains. Calibration of these
drivers within the BRM allows the generation of realistic resource availability forecasts up to 2050. These
drivers are discussed further and listed in Section 3 of this Paper.
A summary of the BRM’s high level design is shown in Figure 1. This highlights that the BRM’s analysis
methodology progresses in three distinct stages as described below. A greater depth discussion of the BRM’s
methodologies including an overview of the key research influences are described in Welfle et al [9, 17].
Figure 1: The Biomass Resource Model Methodology Architecture
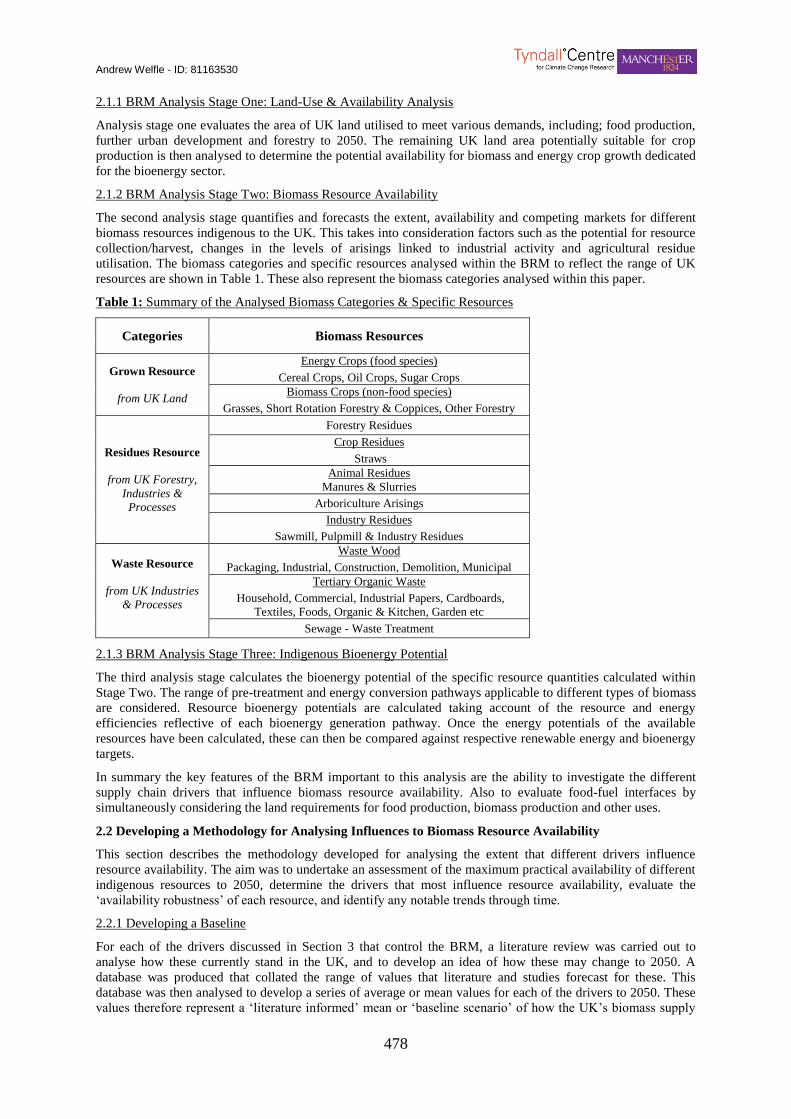
Andrew Welfle - ID: 81163530
478
2.1.1 BRM Analysis Stage One: Land-Use & Availability Analysis
Analysis stage one evaluates the area of UK land utilised to meet various demands, including; food production,
further urban development and forestry to 2050. The remaining UK land area potentially suitable for crop
production is then analysed to determine the potential availability for biomass and energy crop growth dedicated
for the bioenergy sector.
2.1.2 BRM Analysis Stage Two: Biomass Resource Availability
The second analysis stage quantifies and forecasts the extent, availability and competing markets for different
biomass resources indigenous to the UK. This takes into consideration factors such as the potential for resource
collection/harvest, changes in the levels of arisings linked to industrial activity and agricultural residue
utilisation. The biomass categories and specific resources analysed within the BRM to reflect the range of UK
resources are shown in Table 1. These also represent the biomass categories analysed within this paper.
Table 1: Summary of the Analysed Biomass Categories & Specific Resources
Categories Biomass Resources
Grown Resource
from UK Land
Energy Crops (food species)
Cereal Crops, Oil Crops, Sugar Crops
Biomass Crops (non-food species)
Grasses, Short Rotation Forestry & Coppices, Other Forestry
Residues Resource
from UK Forestry,
Industries &
Processes
Forestry Residues
Crop Residues
Straws
Animal Residues
Manures & Slurries
Arboriculture Arisings
Industry Residues
Sawmill, Pulpmill & Industry Residues
Waste Resource
from UK Industries
& Processes
Waste Wood
Packaging, Industrial, Construction, Demolition, Municipal
Tertiary Organic Waste
Household, Commercial, Industrial Papers, Cardboards,
Textiles, Foods, Organic & Kitchen, Garden etc
Sewage - Waste Treatment
2.1.3 BRM Analysis Stage Three: Indigenous Bioenergy Potential
The third analysis stage calculates the bioenergy potential of the specific resource quantities calculated within
Stage Two. The range of pre-treatment and energy conversion pathways applicable to different types of biomass
are considered. Resource bioenergy potentials are calculated taking account of the resource and energy
efficiencies reflective of each bioenergy generation pathway. Once the energy potentials of the available
resources have been calculated, these can then be compared against respective renewable energy and bioenergy
targets.
In summary the key features of the BRM important to this analysis are the ability to investigate the different
supply chain drivers that influence biomass resource availability. Also to evaluate food-fuel interfaces by
simultaneously considering the land requirements for food production, biomass production and other uses.
2.2 Developing a Methodology for Analysing Influences to Biomass Resource Availability
This section describes the methodology developed for analysing the extent that different drivers influence
resource availability. The aim was to undertake an assessment of the maximum practical availability of different
indigenous resources to 2050, determine the drivers that most influence resource availability, evaluate the
‘availability robustness’ of each resource, and identify any notable trends through time.
2.2.1 Developing a Baseline
For each of the drivers discussed in Section 3 that control the BRM, a literature review was carried out to
analyse how these currently stand in the UK, and to develop an idea of how these may change to 2050. A
database was produced that collated the range of values that literature and studies forecast for these. This
database was then analysed to develop a series of average or mean values for each of the drivers to 2050. These
values therefore represent a ‘literature informed’ mean or ‘baseline scenario’ of how the UK’s biomass supply
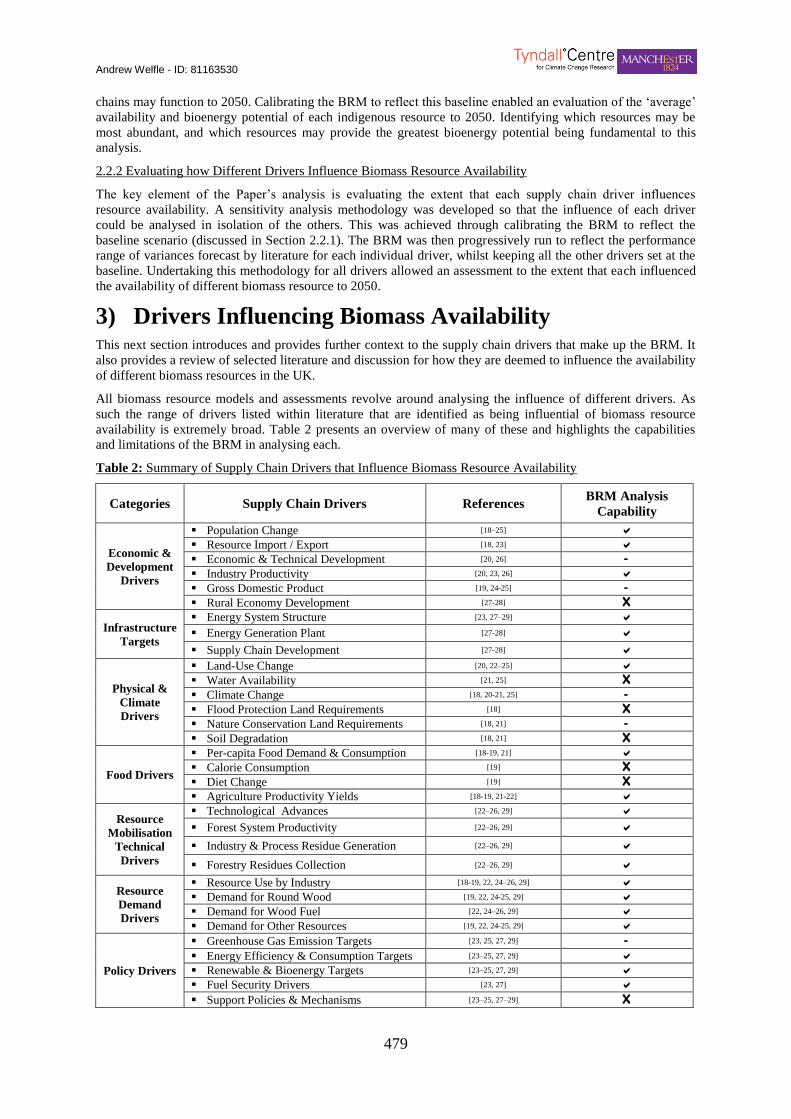
Andrew Welfle - ID: 81163530
479
chains may function to 2050. Calibrating the BRM to reflect this baseline enabled an evaluation of the ‘average’
availability and bioenergy potential of each indigenous resource to 2050. Identifying which resources may be
most abundant, and which resources may provide the greatest bioenergy potential being fundamental to this
analysis.
2.2.2 Evaluating how Different Drivers Influence Biomass Resource Availability
The key element of the Paper’s analysis is evaluating the extent that each supply chain driver influences
resource availability. A sensitivity analysis methodology was developed so that the influence of each driver
could be analysed in isolation of the others. This was achieved through calibrating the BRM to reflect the
baseline scenario (discussed in Section 2.2.1). The BRM was then progressively run to reflect the performance
range of variances forecast by literature for each individual driver, whilst keeping all the other drivers set at the
baseline. Undertaking this methodology for all drivers allowed an assessment to the extent that each influenced
the availability of different biomass resource to 2050.
3) Drivers Influencing Biomass Availability This next section introduces and provides further context to the supply chain drivers that make up the BRM. It
also provides a review of selected literature and discussion for how they are deemed to influence the availability
of different biomass resources in the UK.
All biomass resource models and assessments revolve around analysing the influence of different drivers. As
such the range of drivers listed within literature that are identified as being influential of biomass resource
availability is extremely broad. Table 2 presents an overview of many of these and highlights the capabilities
and limitations of the BRM in analysing each.
Table 2: Summary of Supply Chain Drivers that Influence Biomass Resource Availability
Categories Supply Chain Drivers References BRM Analysis
Capability
Economic &
Development
Drivers
Population Change [18–25] Resource Import / Export [18, 23] Economic & Technical Development [20, 26] - Industry Productivity [20, 23, 26] Gross Domestic Product [19, 24-25] - Rural Economy Development [27-28] X
Infrastructure
Targets
Energy System Structure [23, 27–29] Energy Generation Plant [27-28]
Supply Chain Development [27-28]
Physical &
Climate
Drivers
Land-Use Change [20, 22–25] Water Availability [21, 25] X Climate Change [18, 20-21, 25] - Flood Protection Land Requirements [18] X Nature Conservation Land Requirements [18, 21] - Soil Degradation [18, 21] X
Food Drivers
Per-capita Food Demand & Consumption [18-19, 21] Calorie Consumption [19] X Diet Change [19] X Agriculture Productivity Yields [18-19, 21-22]
Resource
Mobilisation
Technical
Drivers
Technological Advances [22–26, 29] Forest System Productivity [22–26, 29]
Industry & Process Residue Generation [22–26, 29]
Forestry Residues Collection [22–26, 29]
Resource
Demand
Drivers
Resource Use by Industry [18-19, 22, 24–26, 29] Demand for Round Wood [19, 22, 24-25, 29] Demand for Wood Fuel [22, 24–26, 29] Demand for Other Resources [19, 22, 24-25, 29]
Policy Drivers
Greenhouse Gas Emission Targets [23, 25, 27, 29] - Energy Efficiency & Consumption Targets [23–25, 27, 29] Renewable & Bioenergy Targets [23–25, 27, 29] Fuel Security Drivers [23, 27] Support Policies & Mechanisms [23–25, 27–29] X
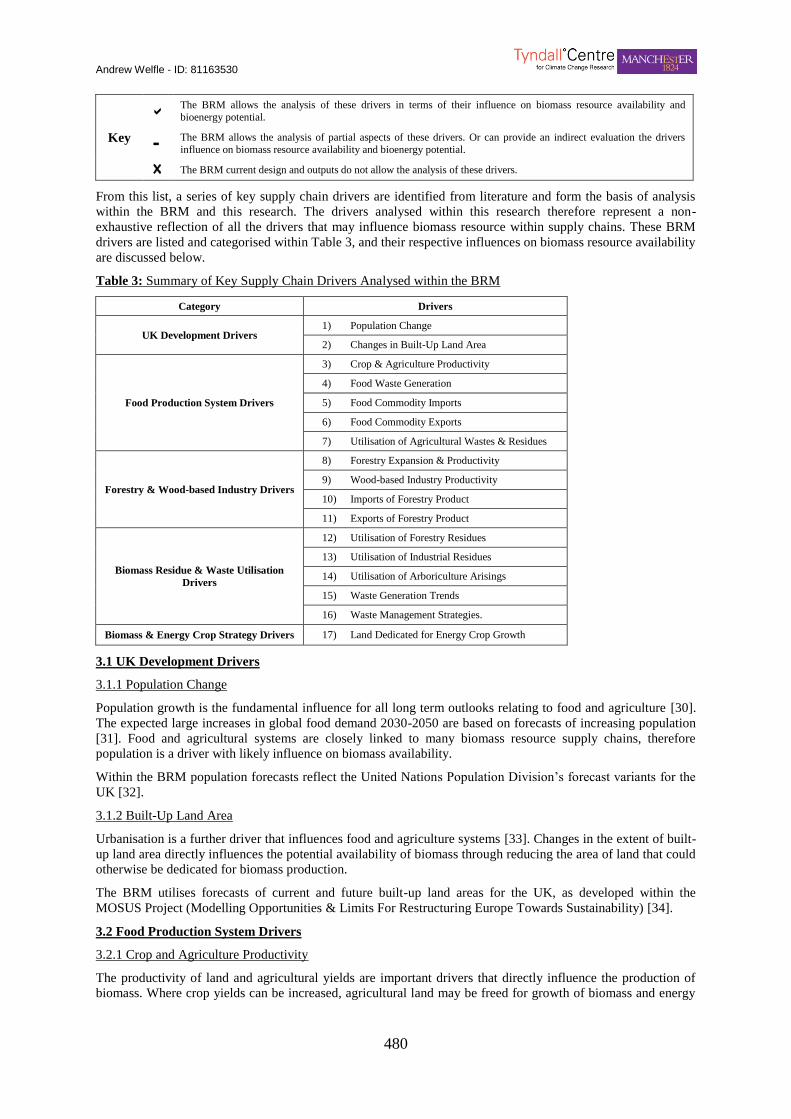
Andrew Welfle - ID: 81163530
480
Key
The BRM allows the analysis of these drivers in terms of their influence on biomass resource availability and
bioenergy potential.
- The BRM allows the analysis of partial aspects of these drivers. Or can provide an indirect evaluation the drivers
influence on biomass resource availability and bioenergy potential.
X The BRM current design and outputs do not allow the analysis of these drivers.
From this list, a series of key supply chain drivers are identified from literature and form the basis of analysis
within the BRM and this research. The drivers analysed within this research therefore represent a non-
exhaustive reflection of all the drivers that may influence biomass resource within supply chains. These BRM
drivers are listed and categorised within Table 3, and their respective influences on biomass resource availability
are discussed below.
Table 3: Summary of Key Supply Chain Drivers Analysed within the BRM
Category Drivers
UK Development Drivers 1) Population Change
2) Changes in Built-Up Land Area
Food Production System Drivers
3) Crop & Agriculture Productivity
4) Food Waste Generation
5) Food Commodity Imports
6) Food Commodity Exports
7) Utilisation of Agricultural Wastes & Residues
Forestry & Wood-based Industry Drivers
8) Forestry Expansion & Productivity
9) Wood-based Industry Productivity
10) Imports of Forestry Product
11) Exports of Forestry Product
Biomass Residue & Waste Utilisation
Drivers
12) Utilisation of Forestry Residues
13) Utilisation of Industrial Residues
14) Utilisation of Arboriculture Arisings
15) Waste Generation Trends
16) Waste Management Strategies.
Biomass & Energy Crop Strategy Drivers 17) Land Dedicated for Energy Crop Growth
3.1 UK Development Drivers
3.1.1 Population Change Population growth is the fundamental influence for all long term outlooks relating to food and agriculture [30].
The expected large increases in global food demand 2030-2050 are based on forecasts of increasing population
[31]. Food and agricultural systems are closely linked to many biomass resource supply chains, therefore
population is a driver with likely influence on biomass availability.
Within the BRM population forecasts reflect the United Nations Population Division’s forecast variants for the
UK [32].
3.1.2 Built-Up Land Area
Urbanisation is a further driver that influences food and agriculture systems [33]. Changes in the extent of built-
up land area directly influences the potential availability of biomass through reducing the area of land that could
otherwise be dedicated for biomass production.
The BRM utilises forecasts of current and future built-up land areas for the UK, as developed within the
MOSUS Project (Modelling Opportunities & Limits For Restructuring Europe Towards Sustainability) [34].
3.2 Food Production System Drivers
3.2.1 Crop and Agriculture Productivity
The productivity of land and agricultural yields are important drivers that directly influence the production of
biomass. Where crop yields can be increased, agricultural land may be freed for growth of biomass and energy

Andrew Welfle - ID: 81163530
481
crops [9]. Also where biomass and energy crop yields can be enhanced, more resource can be produced from the
land available.
Improvements and variances in food and crop systems productivity results from the collective influence of a
range of manageable and external inputs. The UK has great strength in crop science, including increasing
understanding of responses to global climate change [35]. Mueller et al [36] suggest that the ‘yield gap’ - the
difference between attainable & actual yields, will continue to be reduced. Other forecasts suggest that yield
increases of 70% by 2050 are possible for most crops through improved nutrient management, irrigation and
productivity techniques [36-37].
Harberl et al [30] found that Western European yields could experience further mean increases of >16% from
CO2 fertilisation by 2050, resulting from climate change forces (>2% without CO2 fertilisation).
Although whilst the main northern hemisphere producers may experience favourable conditions from climate
change in the next 40 years, regions where rising food demand is most pronounced will likely see production
hindered. This may lead to a greater number of countries relying on fewer high latitude producers – increasing
vulnerability to extreme weather events in these regions [38].
Current and forecast crop and agricultural yields analysed within the BRM reflects those documented in a wide
range of studies and literature, including predicted climate change impacts [15-16, 38–44].
3.2.2 Food Waste Generation
Food waste influences the availability of biomass resource in multiple ways. Food waste itself is a plausible
resource for bioenergy generation pathways. At the same time food waste is a factor that reduces the supply
chain efficiency – the greater waste from the system, the more land is required to produce food commodity
quantities to meet demand.
Research estimates that 25-50% of food produced is wasted along the supply chain [45–47]. 50% of the UK’s
food waste comes from households, where at some point at least 60% of this waste could have been consumed
[48]. The European Commission is targeting a 50% reduction in food wastes by 2020 [49], and the UK
Government Office for Science suggests that halving food waste by 2050 may be equivalent to 25% of current
productivity [50-51].
These waste reduction targets are considered in the analysis, through the BRM utilising a series of forecasts
[39], [50–53] to quantify UK food waste trends.
3.2.3 Food Commodity Imports and Exports
Food commodity import and export trends are drivers that can influence biomass availability, as they contribute
towards determining the area of UK land that is required to produce the food quantities to meet demand. Any
land dedicated for food production is therefore unavailable for biomass or energy crop growth.
The majority of the UK’s imports come from the EU, with the Common Agricultural Policy and EU Directives
strongly influencing the shape of the UK food system [54]. The UK currently produces about half of the food it
consumes, and is ~60% ‘self-sufficient’ [55]. The UK Government’s stance is that it “sees no economic or
environmental rationale for Government to set targets to raise UK output of particular food products in step with
changes in global food demand” [54].
The analysis takes into consideration these stances of future food import/export trends, the BRM utilising data
from a series of studies [39, 52, 56] to reflect the UK’s path.
3.2.4 Utilisation of Agricultural Wastes and Residues
Agricultural wastes and residues reflect a resource category with sizeable potential for the bioenergy sector [10].
Welfle et al [9] found that this category of biomass resource could deliver up to 80 TWh of bioenergy by 2050.
The key drivers determining the availability of this resource for the bioenergy sector is the extent to which it is
harvested/collected and the competition for the resource. The BRM and analysis reflects the wide range of
research and studies that forecast the extent and timeframes to which these resources could be utilised for energy
generation: 20%-100% of total resource could be utilised, with typically half of this being available for the
energy sector [57–65]. The UK Department for Food & Rural Affairs (DEFRA) provide sustainability guidance
on the extent that agricultural residues should be returned to the soil to protect and enhance soil and biodiversity
(10% Lower Limit, 50% Higher Limit) [66].
Andrew Welfle - ID: 81163530
482
3.3 Forestry and Wood-based Industry Drivers
3.3.1 Forestry Expansion and Productivity
The extent and productivity of forestry systems directly influences the availability of resources for the bioenergy
sector. Forests provide energy generation opportunities either through specifically harvested resources, or via
the collection of residues. Forests also provide indirect opportunities for the bioenergy sector through supplying
resource to wood-based industries, that in turn produce wastes and residues that can be utilised by the bioenergy
sector.
The BRM utilises the UK Forestry Commission’s expansion and productivity forecasts [67–74].
3.3.2 Wood-based Industry Productivity
The on-going activities of wood-based industries produce wastes and residues that provide an opportunity for
the bioenergy sector. At the same time wood-based industries require raw forestry products, of which it
competes directly with the bioenergy sector for the lower grades of resource.
The BRM utilises existing data [56, 75, 76] and forecasts [76] that predict the trends and directions that UK
wood industries may take.
3.3.3 Imports and Exports of Forestry Product.
Forestry product import and export trends can influence the availability of biomass resource through
determining the extent that the indigenous forestry systems are utilised. Where imports are increased and
exports are reduced, there will be less strain on indigenous forestry systems to produce the wood resource
required to meet demand. This may in turn provide increased opportunities for the bioenergy sector. Likewise
reduced imports and increased exports would have the counter influence, putting greater strain on indigenous
forests.
The BRM again utilises existing data [56, 75-76] and forecasts [76] that predict the trends and directions that
UK forestry products imports/exports may follow.
3.4 Biomass Residue & Waste Utilisation Drivers
3.4.1 Utilisation of Forestry Residues
Forestry residues represent an opportunity for the bioenergy sector that is currently un-utilised in the UK [58].
The availability extent of this resource is dependent on the proportion extracted from forestry systems and the
proportions left in-situ to maintain the health of the habitat.
The BRM reflects the full range of residue extraction levels recommended by research and studies [29, 58, 77–
79], from 10% to as much as 100% by 2020 [58].
Forest certification standards set by the Forestry Stewardship Commission (FSC Criterion 5.3 & 6.3),
Ministerial Conference on the Protection of Forests in Europe (MCPFE Criterion 2 & 3) and Programme for the
Endorsement of Forest Certification (PEFC Criterion 4) all provide details for the minimisation of on-site
harvesting and residue processing, maintenance of ecosystem health and function and protection of biodiversity
[78]
3.4.2 Utilisation of Industrial Residues
Biomass residues from on-going industrial processes represent a potential opportunity for the bioenergy sector
[9]. The key drivers influencing the availability of this resource category are the extent to which it can be
collected/processed, and productivity of the UK wood-based industry.
The BRM utilises data that reflects current and forecast productivity trends for the UK’s wood-based industries
[56, 75-76], and also forecasts of potential industry residue utilisation for energy [58, 80-81].
3.4.3 Utilisation of Arboricultural Arisings
UK Local Authorities and tree surgeons produce thousands of tonnes of arboriculture arisings. The majority of
this is currently land-filled, stored for landscaping applications or burnt onsite. Although with correct
processing, handling, grading and storing, these residues provide an opportunity for the bioenergy sector [82].
The key drivers determining resource availability are the extent to which the resource is harvested/collected and
the competition for the resource.
The BRM utilises forecasts from a series of research and studies that forecast that up to 100% of arboriculture
arising could be utilised by the bioenergy sector [58, 76-77].
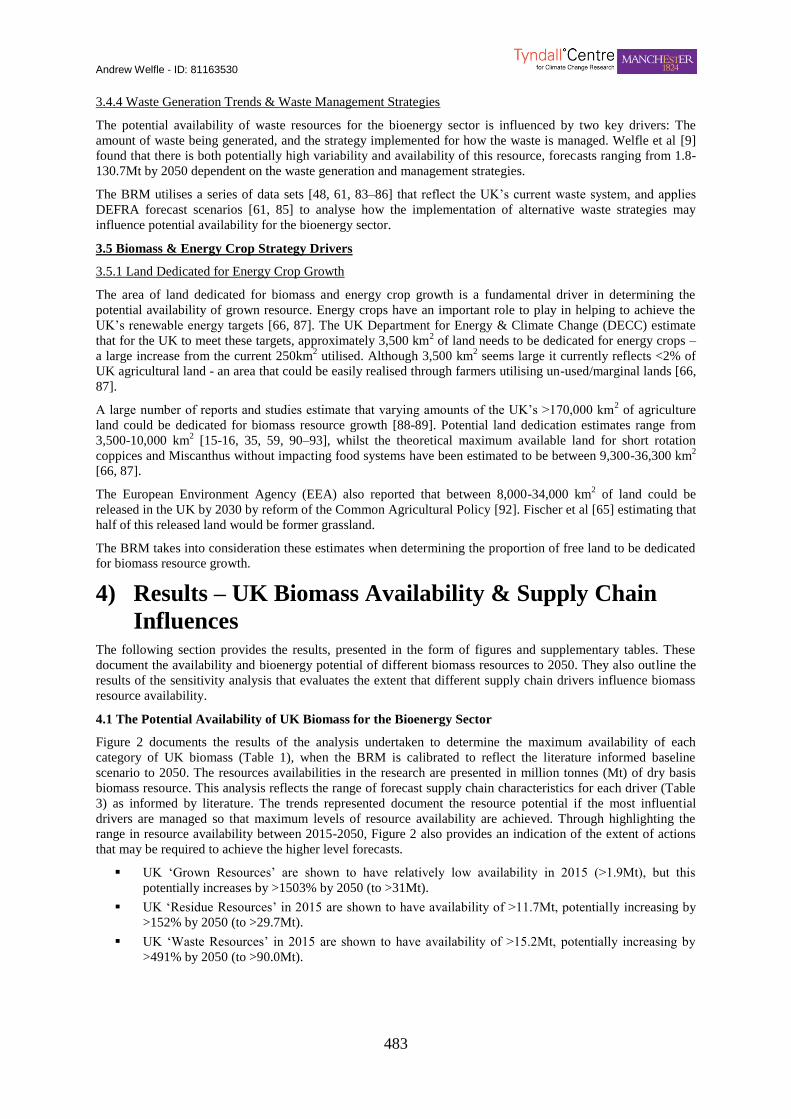
Andrew Welfle - ID: 81163530
483
3.4.4 Waste Generation Trends & Waste Management Strategies
The potential availability of waste resources for the bioenergy sector is influenced by two key drivers: The
amount of waste being generated, and the strategy implemented for how the waste is managed. Welfle et al [9]
found that there is both potentially high variability and availability of this resource, forecasts ranging from 1.8-
130.7Mt by 2050 dependent on the waste generation and management strategies.
The BRM utilises a series of data sets [48, 61, 83–86] that reflect the UK’s current waste system, and applies
DEFRA forecast scenarios [61, 85] to analyse how the implementation of alternative waste strategies may
influence potential availability for the bioenergy sector.
3.5 Biomass & Energy Crop Strategy Drivers
3.5.1 Land Dedicated for Energy Crop Growth
The area of land dedicated for biomass and energy crop growth is a fundamental driver in determining the
potential availability of grown resource. Energy crops have an important role to play in helping to achieve the
UK’s renewable energy targets [66, 87]. The UK Department for Energy & Climate Change (DECC) estimate
that for the UK to meet these targets, approximately 3,500 km2 of land needs to be dedicated for energy crops –
a large increase from the current 250km2 utilised. Although 3,500 km
2 seems large it currently reflects <2% of
UK agricultural land - an area that could be easily realised through farmers utilising un-used/marginal lands [66,
87].
A large number of reports and studies estimate that varying amounts of the UK’s >170,000 km2 of agriculture
land could be dedicated for biomass resource growth [88-89]. Potential land dedication estimates range from
3,500-10,000 km2 [15-16, 35, 59, 90–93], whilst the theoretical maximum available land for short rotation
coppices and Miscanthus without impacting food systems have been estimated to be between 9,300-36,300 km2
[66, 87].
The European Environment Agency (EEA) also reported that between 8,000-34,000 km2 of land could be
released in the UK by 2030 by reform of the Common Agricultural Policy [92]. Fischer et al [65] estimating that
half of this released land would be former grassland.
The BRM takes into consideration these estimates when determining the proportion of free land to be dedicated
for biomass resource growth.
4) Results – UK Biomass Availability & Supply Chain
Influences The following section provides the results, presented in the form of figures and supplementary tables. These
document the availability and bioenergy potential of different biomass resources to 2050. They also outline the
results of the sensitivity analysis that evaluates the extent that different supply chain drivers influence biomass
resource availability.
4.1 The Potential Availability of UK Biomass for the Bioenergy Sector
Figure 2 documents the results of the analysis undertaken to determine the maximum availability of each
category of UK biomass (Table 1), when the BRM is calibrated to reflect the literature informed baseline
scenario to 2050. The resources availabilities in the research are presented in million tonnes (Mt) of dry basis
biomass resource. This analysis reflects the range of forecast supply chain characteristics for each driver (Table
3) as informed by literature. The trends represented document the resource potential if the most influential
drivers are managed so that maximum levels of resource availability are achieved. Through highlighting the
range in resource availability between 2015-2050, Figure 2 also provides an indication of the extent of actions
that may be required to achieve the higher level forecasts.
UK ‘Grown Resources’ are shown to have relatively low availability in 2015 (>1.9Mt), but this
potentially increases by >1503% by 2050 (to >31Mt).
UK ‘Residue Resources’ in 2015 are shown to have availability of >11.7Mt, potentially increasing by
>152% by 2050 (to >29.7Mt).
UK ‘Waste Resources’ in 2015 are shown to have availability of >15.2Mt, potentially increasing by
>491% by 2050 (to >90.0Mt).
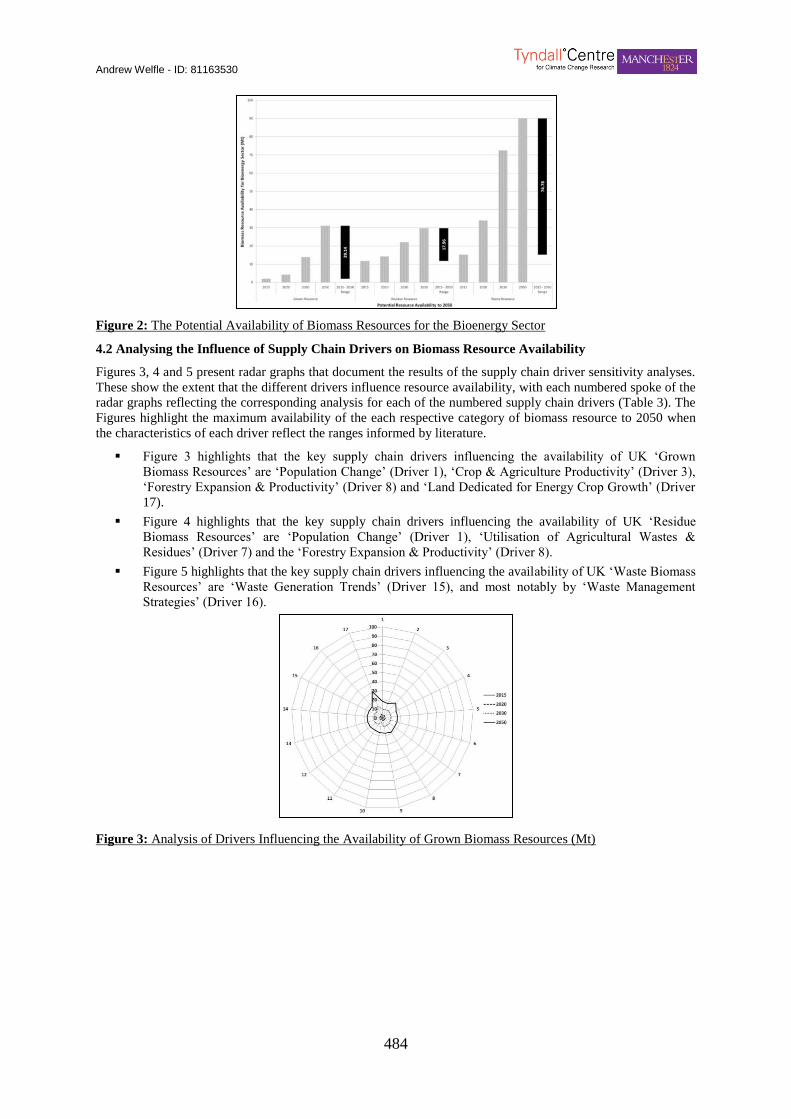
Andrew Welfle - ID: 81163530
484
Figure 2: The Potential Availability of Biomass Resources for the Bioenergy Sector
4.2 Analysing the Influence of Supply Chain Drivers on Biomass Resource Availability
Figures 3, 4 and 5 present radar graphs that document the results of the supply chain driver sensitivity analyses.
These show the extent that the different drivers influence resource availability, with each numbered spoke of the
radar graphs reflecting the corresponding analysis for each of the numbered supply chain drivers (Table 3). The
Figures highlight the maximum availability of the each respective category of biomass resource to 2050 when
the characteristics of each driver reflect the ranges informed by literature.
Figure 3 highlights that the key supply chain drivers influencing the availability of UK ‘Grown
Biomass Resources’ are ‘Population Change’ (Driver 1), ‘Crop & Agriculture Productivity’ (Driver 3),
‘Forestry Expansion & Productivity’ (Driver 8) and ‘Land Dedicated for Energy Crop Growth’ (Driver
17).
Figure 4 highlights that the key supply chain drivers influencing the availability of UK ‘Residue
Biomass Resources’ are ‘Population Change’ (Driver 1), ‘Utilisation of Agricultural Wastes &
Residues’ (Driver 7) and the ‘Forestry Expansion & Productivity’ (Driver 8).
Figure 5 highlights that the key supply chain drivers influencing the availability of UK ‘Waste Biomass
Resources’ are ‘Waste Generation Trends’ (Driver 15), and most notably by ‘Waste Management
Strategies’ (Driver 16).
Figure 3: Analysis of Drivers Influencing the Availability of Grown Biomass Resources (Mt)
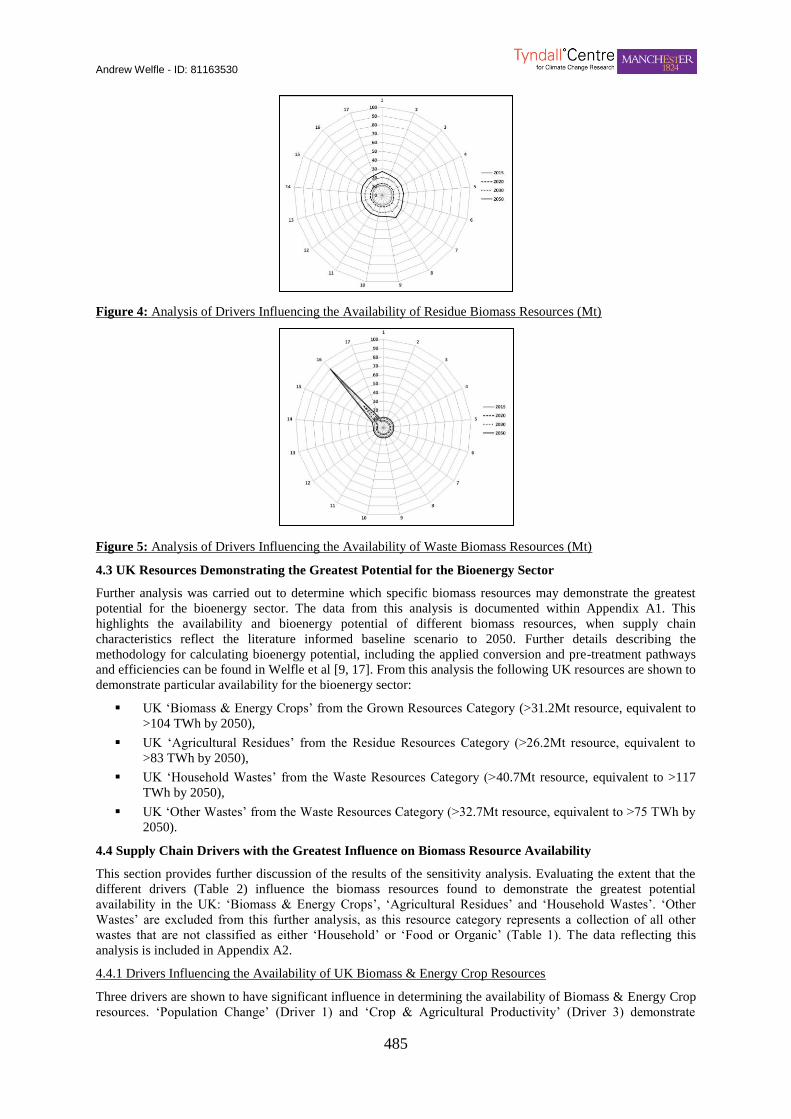
Andrew Welfle - ID: 81163530
485
Figure 4: Analysis of Drivers Influencing the Availability of Residue Biomass Resources (Mt)
Figure 5: Analysis of Drivers Influencing the Availability of Waste Biomass Resources (Mt)
4.3 UK Resources Demonstrating the Greatest Potential for the Bioenergy Sector
Further analysis was carried out to determine which specific biomass resources may demonstrate the greatest
potential for the bioenergy sector. The data from this analysis is documented within Appendix A1. This
highlights the availability and bioenergy potential of different biomass resources, when supply chain
characteristics reflect the literature informed baseline scenario to 2050. Further details describing the
methodology for calculating bioenergy potential, including the applied conversion and pre-treatment pathways
and efficiencies can be found in Welfle et al [9, 17]. From this analysis the following UK resources are shown to
demonstrate particular availability for the bioenergy sector:
UK ‘Biomass & Energy Crops’ from the Grown Resources Category (>31.2Mt resource, equivalent to
>104 TWh by 2050),
UK ‘Agricultural Residues’ from the Residue Resources Category (>26.2Mt resource, equivalent to
>83 TWh by 2050),
UK ‘Household Wastes’ from the Waste Resources Category (>40.7Mt resource, equivalent to >117
TWh by 2050),
UK ‘Other Wastes’ from the Waste Resources Category (>32.7Mt resource, equivalent to >75 TWh by
2050).
4.4 Supply Chain Drivers with the Greatest Influence on Biomass Resource Availability
This section provides further discussion of the results of the sensitivity analysis. Evaluating the extent that the
different drivers (Table 2) influence the biomass resources found to demonstrate the greatest potential
availability in the UK: ‘Biomass & Energy Crops’, ‘Agricultural Residues’ and ‘Household Wastes’. ‘Other
Wastes’ are excluded from this further analysis, as this resource category represents a collection of all other
wastes that are not classified as either ‘Household’ or ‘Food or Organic’ (Table 1). The data reflecting this
analysis is included in Appendix A2.
4.4.1 Drivers Influencing the Availability of UK Biomass & Energy Crop Resources
Three drivers are shown to have significant influence in determining the availability of Biomass & Energy Crop
resources. ‘Population Change’ (Driver 1) and ‘Crop & Agricultural Productivity’ (Driver 3) demonstrate

Andrew Welfle - ID: 81163530
486
marginal influence in determining the potential availability of this resource. However the ‘Land Dedicated for
Energy Crop Growth’ (Driver 17) is shown to be the key influence. The results shows that if the upper limits of
land are made available for biomass and energy crop growth (Driver 17) as forecast by literature, the availability
of this resource may be >87% greater in 2050 compared to scenarios where lower limits of land are utilised.
4.4.2 Drivers Influencing the Availability of UK Agricultural Residue Resources
The availability of Agricultural Residue resources is demonstrated to be influenced by ‘Population Change’
(Driver 1) and the ‘Utilisation of Agricultural Residues’ (Driver 7). The analysis shows that realisation of higher
population forecasts (Driver 1) may potentially increase the availability of this resource in 2050 by >12.6%.
Whilst realising upper limits of agricultural residue collection/harvests and utilisation (Driver 7) as forecast by
literature, may result in >11.6% greater resource availability by 2050.
4.4.3 Drivers Influencing the Availability of UK Household Waste Resources
The potential availability of Household Waste resources for the bioenergy sector is demonstrated to be
influenced by both ‘Waste Generation Trends’ (Driver 15) and ‘Waste Management Strategies’ (Driver 16).
Forecast trends of waste generation (Driver 15) are shown to have a minor influence on the availability of this
resource. In contrast the results confirm that the waste management strategy adopted (Driver 16) represents a
major influence. A waste management strategy complementing the bioenergy sector as forecast by literature
may increase the availability of this resource: >318% by 2020, >476% by 2030 and >500% by 2050, compared
to forecasts where waste is less utilised by the bioenergy sector.
5) Discussion - Maximising the Potential of UK Biomass This next section provides a discussion of the results highlighted within Section 4. Identifying which of the
UK’s indigenous biomass resources may provide the best opportunities for the bioenergy sector, and how these
relate to current UK policy.
5.1 The Potential of UK Biomass Resources for the Bioenergy Sector to 2050
For UK resources to substantially contribute towards meeting bioenergy targets, it is important to highlight
which of the broad range of resources may provide the greatest potential and opportunities for the bioenergy
sector.
The results presented within Figure 2 represent three levels of analysis: the maximum potential availability of
different categories of UK biomass; the extent that each resource category may be available in the near-term (by
2015); and also the range in potential resource increment between 2015 and 2050. The maximum availability
potential is important, as it identifies how much resource could be mobilised for the bioenergy sector if
influencing supply chain drivers are effectively managed. The near-term forecast and 2015-2050 increment
ranges are important as they provide an insight into how much resource will be available without extensive
further actions and management of drivers, and likewise provide an indication of the effort that may be required
to achieve the higher levels of forecast availability.
Using this premise to evaluate the result for the three analysed biomass categories: Figure 2 shows that UK
‘Grown Biomass Resources’ are forecast to have relatively low near-term availability, but large potential by
2050. This suggests that these resources may be highly influenced by supply chain drivers, and substantial effort
may be required to manage these in order to increase the resource availability from the low base. The research
highlights that potentially UK grown biomass and energy crops represents the greatest resource opportunities for
the bioenergy sector. Figure 3 confirms that the availability of land dedicated for the growth of these resources
is the key driver requiring appropriate management if higher levels of resource availability are to be realised.
The research highlights that UK agricultural residues represent large resource opportunities for the bioenergy
sector. Figure 2 demonstrates that UK’s ‘Residue Biomass Resources’ are shown to have ‘medium’ near-term
availability compared to the other two resource categories. This increases at a steady rate to 2050 suggesting
that residue resources are relatively robust to supply chain influences and less effort may be required to increase
residue availability in comparison to the other resources categories. The relatively continuous increment in
resource availability demonstrated by the spacing of the analysis time-lines within Figure 4 also highlights that
the availability of residue resources shows robustness to supply chain influences.
Household wastes are also found to represent large resource opportunities for the bioenergy sector. Figure 2
shows that UK ‘Waste Biomass Resources’ have near-term availability that exceeds the other two categories and
the potential maximum increase in waste resource availability to 2050 is significant. This large increment
suggests that waste resources are highly susceptible to supply chain influences, and significant effort may be
required to manage these if the higher forecasts of resource availability are to be realised. This is reaffirmed

Andrew Welfle - ID: 81163530
487
within Figure 5 where the influence of implemented waste management strategies is shown to be key. This
research therefore highlights that in the long-term, wastes may represent resource options with significant
potential for the bioenergy sector, albeit reliant on the implementation of complementary waste management
strategies.
5.2 Increasing the Focus of Bioenergy Strategies
The UK Bioenergy Strategy aims to maximise the opportunities for improving the availability of all biomass
resources through policies aimed at managing a broad range of supply chain drivers [87].
This research has analysed a wide range of supply chain drivers, finding large variances in their influence in
determining biomass availability for the bioenergy sector. The research also highlights that particular resources
demonstrate significantly greater availability and bioenergy potential than others. Therefore if the contribution
of UK resources is to be maximised, the research suggests that bioenergy policies and strategies should become
increasingly focused and targeted.
Table 4 summarises the research findings: ranking the UK’s biomass resources based on their availability and
bioenergy potential; also ranking the analysed supply chain drivers based on their influence in increasing UK
biomass availability for the bioenergy sector.
Table 4: Analysis Summary Ranking UK Biomass Availability, Bioenergy Potential & Supply Chain Influences
Ranking Influencing Drivers Resource Availability & Bioenergy Potential
for Bioenergy Sector
High Ranking
Drivers & Resources with
the Greatest
Influence/Potential
Waste Management Strategies
Land Dedicated for Energy Crop
Growth
Agricultural Residues
Household Wastes
Biomass & Energy Crops
Other Wastes
Medium Ranking
Drivers & Resources with
Medium Influence/Potential
Crop & Agriculture Productivity
Population Change
Changes in Built-Up Land Area
Food Waste Generation
Utilisation of Agricultural Wastes & Residues
Forestry Expansion & Productivity
Waste Generation Trends
Dedicated Forestry Resources
Forestry Residues
Food & Organic Wastes
Low Ranking
Drivers & Resources with
the Least
Influence/Potential
Food Commodity Imports
Food Commodity Exports
Wood-based Industry Productivity
Imports of Forestry Product
Exports of Forestry Product
Utilisation of Forestry Residues
Utilisation of Industrial Residues
Utilisation of Arboriculture Arisings
Sewage Wastes
Industry Residues
Arboricultural Residues
5.3 Potential Strategies for Increasing UK Resource Availability for the Bioenergy Sector
The following section discusses the current UK context, barriers and potential strategies for increasing the
availability of the UK’s resources in the context of the research findings.
5.3.1 Strategies for Increasing the Availability of UK Resources Grown for the Bioenergy Sector
Research Outputs
The research identifies ‘Crop and Agricultural Productivity’ and the area of ‘Land Dedicated for Energy Crop
Growth’ as the drivers that most significantly influence the availability of UK grown biomass resources such as
energy crops.
The influence of realising higher limits of crop and agricultural productivity is shown to potentially increase the
availability of this resource by >30% by 2050. This is an unsurprising trend, as greater crop yields will also
benefit the production of crops dedicated for the energy sector. Although the standout driver with key influence
on this resource is utilisation of available land dedicated for growth. Realising maximum levels of available land
utilisation demonstrates a potential >87% improvement in resource availability in 2050, compared to conditions

Andrew Welfle - ID: 81163530
488
with reduced land-use. Highlighting that if the UK wants to increase its biomass and energy crop resource,
focusing on anything other than increasing land availability is unlikely to deliver the same scale of results.
Current UK Policy & Strategy Context
The UK Bioenergy Strategy [87] states that the increased growth of resources on unused or low ecosystem value
lands is essential for producing resources for the bioenergy sector. Although the area of available land dedicated
to grow these resources is essentially reliant on UK farmers utilising their lands to grow crops for the energy
sector rather than foods. To promote this the UK’s primary incentive mechanism to promote farmers to grow
biomass and energy crops has been the ‘Energy Crops Scheme’. Although over the lifetime of the scheme
widespread dedication of lands to grow biomass and energy crops has not materialised [94]. A summary of key
barriers preventing land owner from producing resources for the bioenergy sector are presented in Table 5.
Pathways for Increasing Resource Availability
The demand for biomass and energy crops is growing fast [95], whilst their production offers environmental and
economic benefits much wider than for just the energy sector [96]. Thus developing a policy framework and
financial packages especially with respect to the Renewable Heat Incentive, Feed-in-Tariffs and a reworked
Energy Crop Scheme are essential to reduce barriers and allow markets to drive progress [91].
The UK’s already has good comparative examples of policies and incentives in the form of the Forestry
Commission’s ‘Woodfuel Strategy’ [97], where a roadmap and framework of targets backed by incentives are
increasing the availability and use of woodfuels. There are also many examples of leading incentive schemes
currently being applied across the EU to promote the bioenergy sector and incentivise the growth of resources
[98]. These provide insights into further potential directions that the Government could go in developing UK
policies.
5.3.2 Strategies for Increasing the Utilisation of Agricultural Residues by the Bioenergy Sector
Research Outputs
‘Population Change’ and the ‘Utilisation of Agricultural Residues’ are the two drivers identified by the research
as providing the greatest influencing the availability of this resource. These linkages appear to be self-evident,
higher levels of population growth means that more food will need to be produced, resulting in greater
availability of agricultural residues. At the same time the greater extent that agricultural residues are
collected/harvested, the greater availability for the bioenergy sector.
However the more valuable analysis highlighted by Figure 2 and also reflected within Figure 4, is the near-term
and continuous availability of agricultural residues - shown to be relatively constant and robust to major
fluctuations caused by supply chain influences. The resource availability in 2015 is also forecast to exceed
10.3Mt and steadily increase by >109% by 2050. Based on this analysis, agricultural residues should be
highlighted and targeted within bioenergy strategies as reliable and robust opportunities for the bioenergy sector.
Current UK Policy & Strategy Policy Context
There are currently comparatively low levels of agricultural residues utilisation by the bioenergy sector in the
UK. This trend is reflected in UK farming statistics [99] documenting that: <5% of the UK’s livestock focused
farms generate renewable energy, and of these <50% utilise manures and slurry feedstocks. Whilst <6% of
arable agriculture focused farms generate renewable energy, and of these <45% utilise feedstocks such as
straws. The UK Bioenergy Strategy [87] recognises the need to work to improve the economics of respective
supply chains and bioenergy pathways, although many barriers remain as summarised in Table 5.
Potential Mechanisms for Increasing Resource Availability
There are many case studies that the UK could consider where agricultural residues are widely utilised by the
bioenergy sector. Within Europe, Denmark represents the leading example of straw residue utilisation.
Denmark’s established harvesting infrastructure and market development is the consequence of targeted policy
driven initiatives, such as: mandates requiring that higher prices are paid for energy from straws; collaborations
between the bioenergy sector, individual farmer and specialised contractors enabling the shared utilisation of
high specification harvesting and processing equipment; and a market structure that provides farmers with
enhanced controls over their pricing demands, and standard contracts between produces and generators
regardless of resource scale [100].
The utilisation of slurries and manures within anaerobic digestion bioenergy systems from large scale farms or
localised farming cooperatives, represents key opportunities for the UK bioenergy sector. Raising awareness
[101] and financial support [102] for these systems is key. The UK has an array of existing financial
mechanisms and incentives [103-104] designed to promote this sector, although it remains highly undeveloped
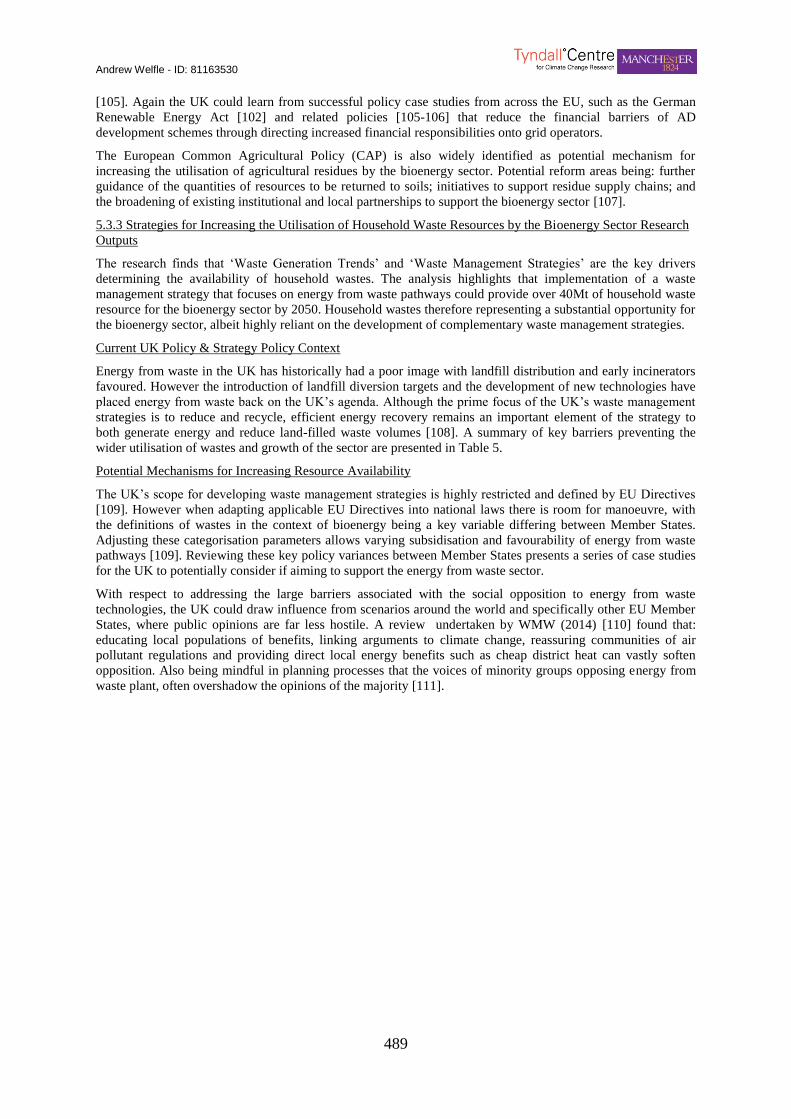
Andrew Welfle - ID: 81163530
489
[105]. Again the UK could learn from successful policy case studies from across the EU, such as the German
Renewable Energy Act [102] and related policies [105-106] that reduce the financial barriers of AD
development schemes through directing increased financial responsibilities onto grid operators.
The European Common Agricultural Policy (CAP) is also widely identified as potential mechanism for
increasing the utilisation of agricultural residues by the bioenergy sector. Potential reform areas being: further
guidance of the quantities of resources to be returned to soils; initiatives to support residue supply chains; and
the broadening of existing institutional and local partnerships to support the bioenergy sector [107].
5.3.3 Strategies for Increasing the Utilisation of Household Waste Resources by the Bioenergy Sector Research
Outputs
The research finds that ‘Waste Generation Trends’ and ‘Waste Management Strategies’ are the key drivers
determining the availability of household wastes. The analysis highlights that implementation of a waste
management strategy that focuses on energy from waste pathways could provide over 40Mt of household waste
resource for the bioenergy sector by 2050. Household wastes therefore representing a substantial opportunity for
the bioenergy sector, albeit highly reliant on the development of complementary waste management strategies.
Current UK Policy & Strategy Policy Context
Energy from waste in the UK has historically had a poor image with landfill distribution and early incinerators
favoured. However the introduction of landfill diversion targets and the development of new technologies have
placed energy from waste back on the UK’s agenda. Although the prime focus of the UK’s waste management
strategies is to reduce and recycle, efficient energy recovery remains an important element of the strategy to
both generate energy and reduce land-filled waste volumes [108]. A summary of key barriers preventing the
wider utilisation of wastes and growth of the sector are presented in Table 5.
Potential Mechanisms for Increasing Resource Availability
The UK’s scope for developing waste management strategies is highly restricted and defined by EU Directives
[109]. However when adapting applicable EU Directives into national laws there is room for manoeuvre, with
the definitions of wastes in the context of bioenergy being a key variable differing between Member States.
Adjusting these categorisation parameters allows varying subsidisation and favourability of energy from waste
pathways [109]. Reviewing these key policy variances between Member States presents a series of case studies
for the UK to potentially consider if aiming to support the energy from waste sector.
With respect to addressing the large barriers associated with the social opposition to energy from waste
technologies, the UK could draw influence from scenarios around the world and specifically other EU Member
States, where public opinions are far less hostile. A review undertaken by WMW (2014) [110] found that:
educating local populations of benefits, linking arguments to climate change, reassuring communities of air
pollutant regulations and providing direct local energy benefits such as cheap district heat can vastly soften
opposition. Also being mindful in planning processes that the voices of minority groups opposing energy from
waste plant, often overshadow the opinions of the majority [111].

Andrew Welfle - ID: 81163530
490
Table 5: Key Barriers to the Greater Production & Utilisation of UK Resources by the Bioenergy Sector
Biomass
Resources Barriers to Increasing Resource Availability for the Bioenergy Sector
Grown
Biomass &
Energy
Crops
[91, 94, 112]
Educational – awareness to incentive schemes, reluctance to move away from producing
traditional agricultural crops, and poor understanding of energy crop establishment and
management best practice.
Economic – cash flow problems between planting and harvests, current margins associated with
small scale productions, and the lack of links between biomass producers and markets.
Legislative – lack of recognition of certain ‘innovative’ crops by inventive schemes.
Technical – specific fuel requirements of bioenergy systems place increased demands on
resources produced, and lack of processing infrastructure that would increase the economic
viabilities.
Plant Based
Agricultural
Residues
(straws)
[100]
Underdeveloped Markets – the lack of established supply chains for straw for bioenergy
purposes.
Competing Uses – straws are extensively used by existing markets with which the bioenergy
sector will compete for resource.
Inaccurate Guidance – overuse of the resource beyond best practice to maintain soil health can
lead to large unnecessary impacts on resource availability.
Undeveloped Infrastructure – the inaccessibility and lack of appropriate machinery and
infrastructure for the handling and processing of straw residues.
Resource Variability – due to varying climatic conditions and fluctuating harvest yields, the
variability in the quantity and quality of straws has large implications for the bioenergy sector
that typically requires specific fuel specifications.
Animal
Based
Agricultural
Residues
(slurries &
manures)
[101, 113]
Transportation – The nature and bioenergy characteristics of slurries and manures makes them
impractical, uneconomical and energy inefficient to be transported any great distance.
Resource Availability – as a result of UK farming practices, slurry and manure can only
typically by collected for a limited number of months, reflecting livestock housing regimes.
Spatial Constraint – anaerobic digestion (AD) systems, the most suitable bioenergy systems for
the use of manure and slurry resources require physical space. The economics of AD systems are
also largely improved through the addition of energy crops feedstocks, which may require
additional (potentially large) planting areas that are typically incompatible with the nature of the
farms with the large animal based biomass resources.
Capital Costs – the capital costs of digesters and associated infrastructure is high and are
unlikely to fall significantly in the near-term.
Collaboration Complexity – The time and costs associated with developing large community
or district systems that pool resources from a number of local sites can be highly complex and
costly.
Waste
Resources
[112, 114,
115]
Incentive – the cost comparison of energy from waste systems compared to landfill represents a
strong barrier against the further development of this sector.
Waste Hierarchy – the supply of the specific waste feedstocks required by bioenergy systems is
restricted by the waste hierarchy and the UK’s waste policies primary focus to reduce and
recycle.
Opposition – social opposition led by local communities and the lobbying of environmental
action groups are by far the greatest barrier to the development of the UK energy from waste
sector.
Finances – the varying definitions of biomass wastes and their respective subsidy regimes can
prevent developers from accessing the finances required to grow the sector.
6) Conclusions A Biomass Resource Model (BRM) was developed reflecting the UK’s indigenous biomass supply chains. The
drivers controlling the BRM were calibrated to 2050 to analyse current and forecast parameters in reflection of a
wide literature review. The analysis focused on the development of a baseline scenario to determine the specific
indigenous biomass resources that demonstrate the greatest potential for the UK bioenergy sector. Systematic
analysis of the BRM’s drivers allowed the evaluation of the extent that they influence indigenous resource
availability to 2050. Key policy conclusions for increasing the availability of UK indigenous resource for the
bioenergy sector are highlighted below.
Andrew Welfle - ID: 81163530
491
Biomass and Energy Crops, Agricultural Residues and Household Wastes - are identified as the
biomass resources that demonstrate the greatest promise for the UK bioenergy sector, in terms of their
availability quantity and bioenergy potential.
Potential and Mobilisation of Grown Biomass Resource – UK grown biomass and energy crop
resources have been identified as potentially providing >31Mt for the bioenergy sector by 2050. The
standout driver influencing the availability of these resources was identified as the uptake of available
land dedicated for its growth. However the analysis also highlighted that this resource currently has a
relatively low starting base, with >1.9Mt forecast by 2015. Therefore concerted efforts will be required
in managing the drivers that influence availability, if anywhere near the upper levels of resource
forecasts are to be realised. These should include the implementation of policies that
encourage/incentivise the utilisation of available land for the growth of resource dedicated for the
bioenergy sector.
Potential and Mobilisation of Biomass Residue Resource – Residue biomass resources were identified
as potentially providing up to >29.8Mt of resource for the bioenergy sector by 2050. Agricultural
residues (straws & slurries) make up the majority of this quantity, whilst also continuing to be utilised
to maintain soil systems. The availability of residues was forecast to steadily increase and be
comparatively robust to supply chain influences. Biomass residues therefore representing a potentially
continuous and reliable near and long-term indigenous resource option for the bioenergy sector.
Potential and Mobilisation of Biomass Waste Resource – Waste biomass in the UK was identified as
potentially providing up to >89Mt of resource for the bioenergy sector by 2050. Household wastes
being the largest waste contributor. Wastes were found to be highly influenced by one key driver, the
waste management system adopted. The availability of waste resources was found to be much
diminished when the adopted waste management strategy was uncomplimentary to the bioenergy
sector. Therefore if wastes are to be increasingly utilised by the bioenergy sector, the analysis confirms
the importance of implementing policies for effective development of waste management strategies.
Refocusing Bioenergy Strategies to Increase the Availability of Indigenous Resources - The paper
highlights the importance of applying a targeted approach for increasing the potential of indigenous
resources. This is contrary to the broad policy focus approach currently being implemented in the UK.
The analysis has identified that there are multiple biomass resource opportunities in the UK, but
realisation of the upper levels of resource availability forecasts is highly dependent on the
implementation of effective policies that target and manage the specific supply chain drivers most
influential for each respective biomass resources.

Andrew Welfle - ID: 81163530
492
Appendix 16.0
Appendix 16.0 includes copies of the Poster Presentations delivered during the PhD Programme. The titles and
details of the relevant events for each presentation are introduced below:
Appendix A16.1
Event Tyndall Centre PhD Conference 2012
Title ‘Knowledge Gaps’
Date 11th
-13th
April 2012
Location University of East Anglia
Presentation Title ‘Modelling the UK’s Indigenous Biomass Resource Potential’
Role Primary Presenter
Appendix A16.2
Event Tyndall Centre PhD Conference 2013
Title ‘Climate Transitions’
Date 03rd
-05th
April 2013
Location University of Cardiff
Presentation Title ‘UK Biomass Resource Scenarios’
Role Primary Presenter
Appendix A16.3
Event International Bioenergy Conference 2014
Date 11th
-13th
March 2013
Location Manchester Central Convention Complex
Presentation Title ‘Refocusing Biomass Strategies to Maximise Indigenous Resource Potential’
Role Primary Presenter

Andrew Welfle - ID: 81163530
493
Appendix A16.1: Modelling the UK’s Indigenous Biomass Resource Potential

Andrew Welfle - ID: 81163530
494
Appendix A16.2: UK Biomass Resource Scenarios
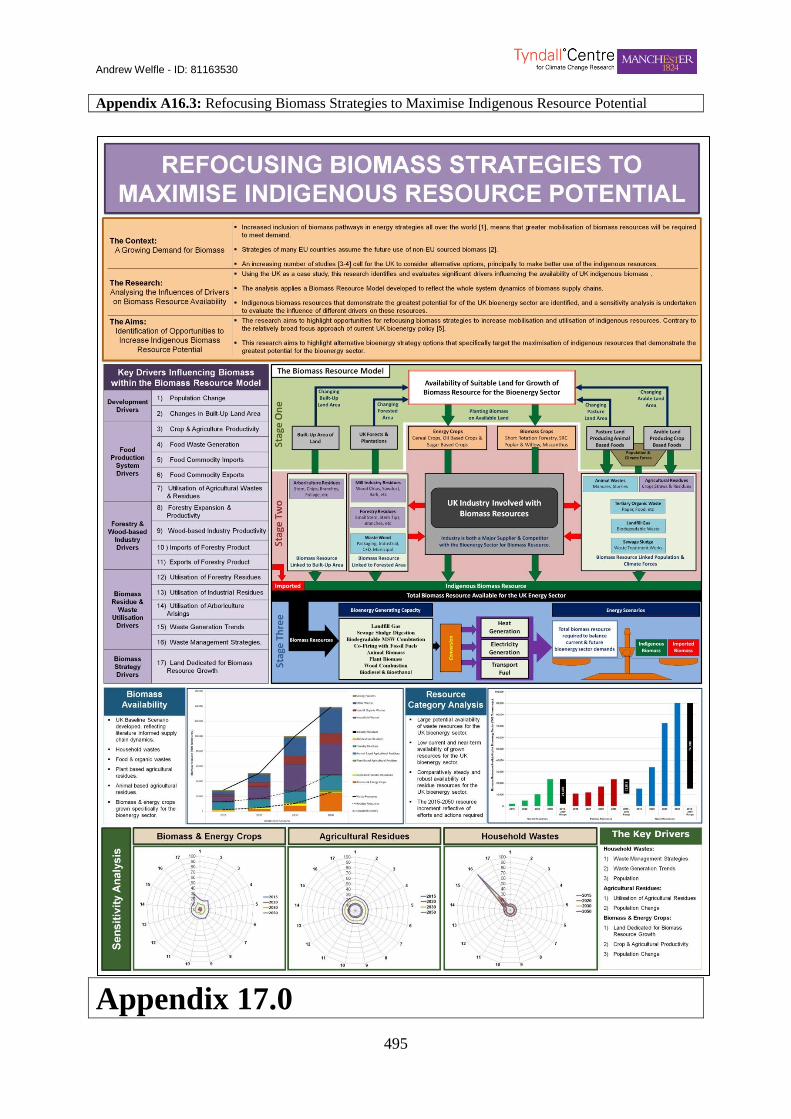
Andrew Welfle - ID: 81163530
495
Appendix A16.3: Refocusing Biomass Strategies to Maximise Indigenous Resource Potential
Appendix 17.0
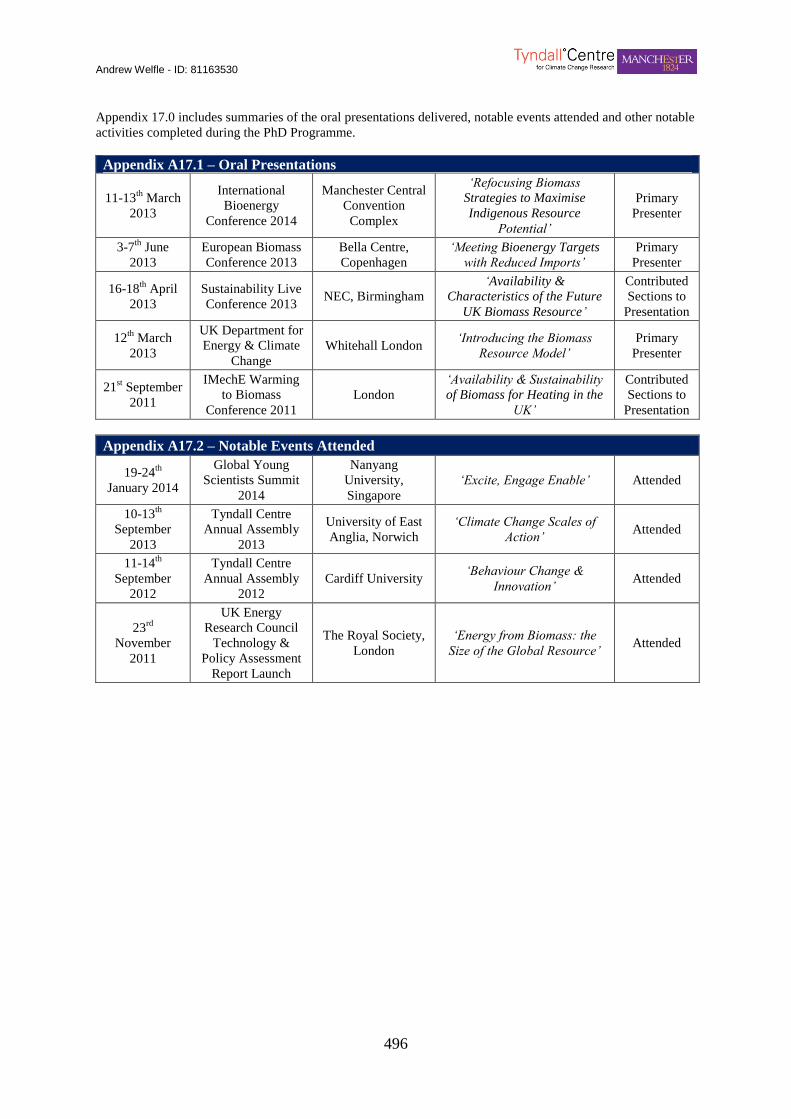
Andrew Welfle - ID: 81163530
496
Appendix 17.0 includes summaries of the oral presentations delivered, notable events attended and other notable
activities completed during the PhD Programme.
Appendix A17.1 – Oral Presentations
11-13th
March
2013
International
Bioenergy
Conference 2014
Manchester Central
Convention
Complex
‘Refocusing Biomass
Strategies to Maximise
Indigenous Resource
Potential’
Primary
Presenter
3-7th
June
2013
European Biomass
Conference 2013
Bella Centre,
Copenhagen
‘Meeting Bioenergy Targets
with Reduced Imports’
Primary
Presenter
16-18th
April
2013
Sustainability Live
Conference 2013 NEC, Birmingham
‘Availability &
Characteristics of the Future
UK Biomass Resource’
Contributed
Sections to
Presentation
12th
March
2013
UK Department for
Energy & Climate
Change
Whitehall London ‘Introducing the Biomass
Resource Model’
Primary
Presenter
21st September
2011
IMechE Warming
to Biomass
Conference 2011
London
‘Availability & Sustainability
of Biomass for Heating in the
UK’
Contributed
Sections to
Presentation
Appendix A17.2 – Notable Events Attended
19-24th
January 2014
Global Young
Scientists Summit
2014
Nanyang
University,
Singapore
‘Excite, Engage Enable’ Attended
10-13th
September
2013
Tyndall Centre
Annual Assembly
2013
University of East
Anglia, Norwich
‘Climate Change Scales of
Action’ Attended
11-14th
September
2012
Tyndall Centre
Annual Assembly
2012
Cardiff University ‘Behaviour Change &
Innovation’ Attended
23rd
November
2011
UK Energy
Research Council
Technology &
Policy Assessment
Report Launch
The Royal Society,
London
‘Energy from Biomass: the
Size of the Global Resource’ Attended
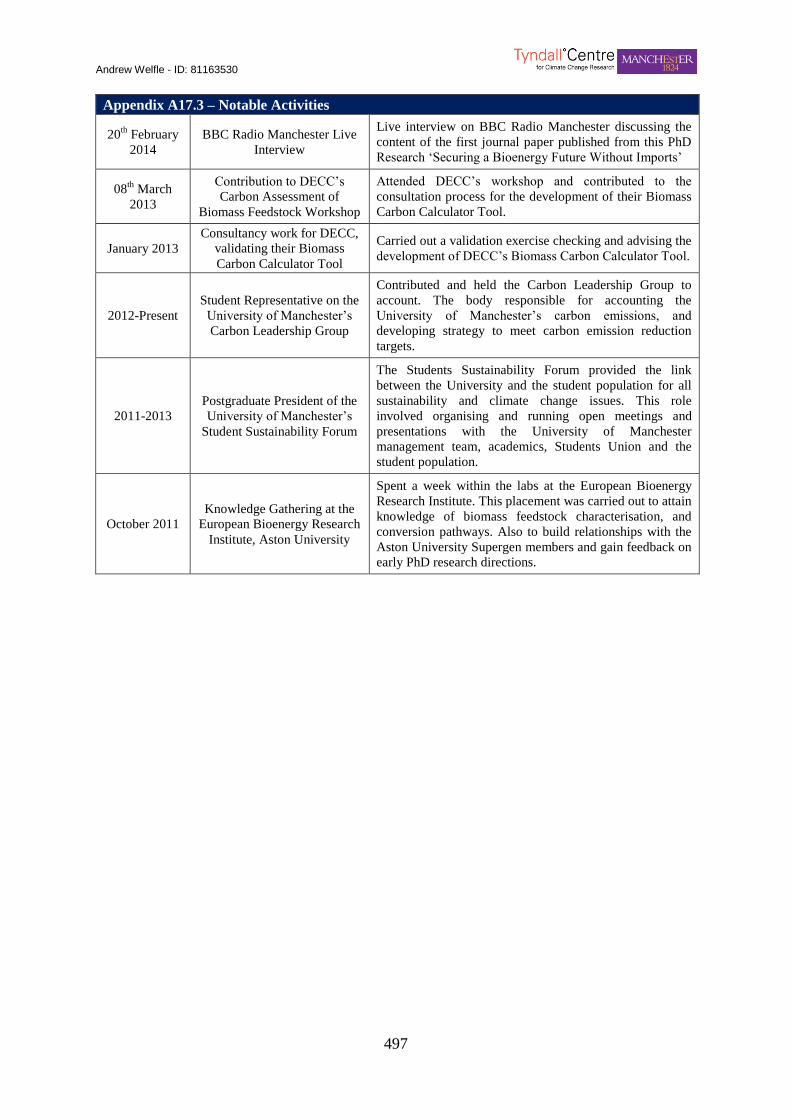
Andrew Welfle - ID: 81163530
497
Appendix A17.3 – Notable Activities
20th
February
2014
BBC Radio Manchester Live
Interview
Live interview on BBC Radio Manchester discussing the
content of the first journal paper published from this PhD
Research ‘Securing a Bioenergy Future Without Imports’
08th
March
2013
Contribution to DECC’s
Carbon Assessment of
Biomass Feedstock Workshop
Attended DECC’s workshop and contributed to the
consultation process for the development of their Biomass
Carbon Calculator Tool.
January 2013
Consultancy work for DECC,
validating their Biomass
Carbon Calculator Tool
Carried out a validation exercise checking and advising the
development of DECC’s Biomass Carbon Calculator Tool.
2012-Present
Student Representative on the
University of Manchester’s
Carbon Leadership Group
Contributed and held the Carbon Leadership Group to
account. The body responsible for accounting the
University of Manchester’s carbon emissions, and
developing strategy to meet carbon emission reduction
targets.
2011-2013
Postgraduate President of the
University of Manchester’s
Student Sustainability Forum
The Students Sustainability Forum provided the link
between the University and the student population for all
sustainability and climate change issues. This role
involved organising and running open meetings and
presentations with the University of Manchester
management team, academics, Students Union and the
student population.
October 2011
Knowledge Gathering at the
European Bioenergy Research
Institute, Aston University
Spent a week within the labs at the European Bioenergy
Research Institute. This placement was carried out to attain
knowledge of biomass feedstock characterisation, and
conversion pathways. Also to build relationships with the
Aston University Supergen members and gain feedback on
early PhD research directions.