implementation of bioenergy in brazil – 2021 update
TRANSCRIPT
This report was prepared from the 2021 IEA World Energy Balances and Renewables Information,
combined with data and information provided by the IEA Bioenergy Executive Committee and Task
members for 20191. Reference is also made to FAOstat as well as data from national statistics. All
individual country reports were reviewed by the national delegates to the IEA Bioenergy Executive
Committee, who have approved the content. General background on the approach and definitions
can be found in the central introductory report for all country reports.
Edited by: Luc Pelkmans, Technical Coordinator IEA Bioenergy
Contributions: Angela Oliveira da Costa, Leonidas Bially Olegario dos Santos, Rachel Martins
Henriques, Rafael Barros Araujo - The Energy Research Office (EPE), Brazil
HIGHLIGHTS
• Renewables make up almost half (46%) of Brazil’s total energy supply in 2019. Around 70% of renewable energy supply is from biomass.
• The main application of bioenergy is in the use of solid biomass for renewable heat, particularly in industries (40%). Bioenergy represents more than 50% of heat provision.
• Biofuels represent 25% of transport fuels in Brazil, which is very high compared to other countries in the world, and the biofuel share is still increasing. Bioethanol is the most important biofuel, on average representing 49% by energy of combined gasoline and ethanol use. The role of biodiesel is growing (to replace diesel in heavy duty vehicles) and in 2019 represents 9.6% by energy of diesel use.
• Electricity production in Brazil is dominated by hydropower, with a modest role for bioenergy (mostly through industry CHP plants). The role of wind and solar power is growing, but still at low level.
• Since the beginning of the 21st century, the Brazilian government has resorted to public policies to stimulate the biofuels market, such as tax differentiation between fossil fuels and renewables, mandatory mixing of anhydrous ethanol in gasoline and biodiesel in fossil diesel and the inclusion of flex fuel vehicles, enabling the use of E100. The latest actions are an additional boost to the
1 While data for 2020 are starting to become available at national level, it was decided to consider trends up to 2019 for good comparability and benchmarking between the different IEA Bioenergy member countries. Care should also be taken when using 2020 data for analysing trends as these data are distorted by the COVID19 Pandemic.
Implementation of bioenergy
in Brazil – 2021 update
IEA Bioenergy: 10 2021
Country Reports
2
matrix's renewability are National Biofuels Policy – RenovaBio and Future Fuels’ Program.
COUNTRY PROFILE
Population and land use
Brazil is the largest country in South America.
It has a total land area of 8.36 million km² with
a population of 211 million. This means that
the average population density is relatively
low at 25 persons per km².
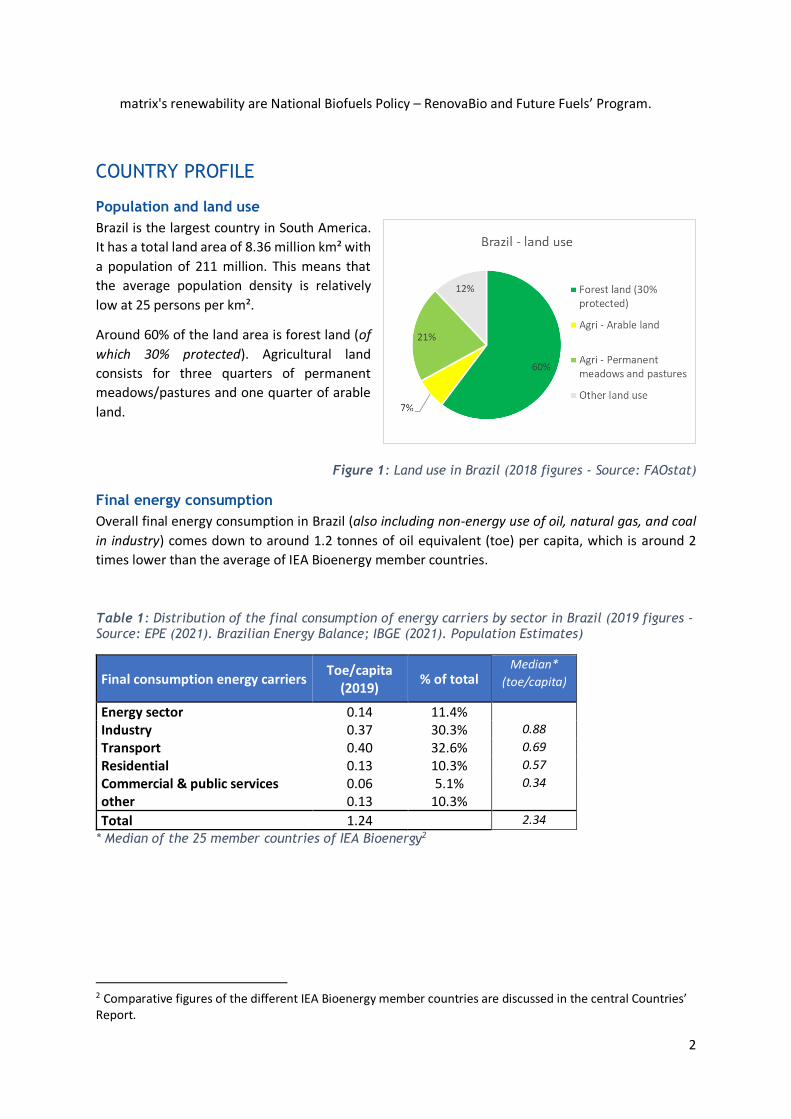
Around 60% of the land area is forest land (of
which 30% protected). Agricultural land
consists for three quarters of permanent
meadows/pastures and one quarter of arable
land.
Figure 1: Land use in Brazil (2018 figures - Source: FAOstat)
Final energy consumption
Overall final energy consumption in Brazil (also including non-energy use of oil, natural gas, and coal
in industry) comes down to around 1.2 tonnes of oil equivalent (toe) per capita, which is around 2
times lower than the average of IEA Bioenergy member countries.
Table 1: Distribution of the final consumption of energy carriers by sector in Brazil (2019 figures - Source: EPE (2021). Brazilian Energy Balance; IBGE (2021). Population Estimates)
Final consumption energy carriers Toe/capita
(2019) % of total
Median*
(toe/capita)
Energy sector 0.14 11.4% Industry 0.37 30.3% 0.88
Transport 0.40 32.6% 0.69
Residential 0.13 10.3% 0.57
Commercial & public services 0.06 5.1% 0.34
other 0.13 10.3%
Total 1.24 2.34
* Median of the 25 member countries of IEA Bioenergy2
2 Comparative figures of the different IEA Bioenergy member countries are discussed in the central Countries’ Report.
3
NATIONAL POLICY FRAMEWORK IN BRAZIL
One of the drivers for the national renewable energy policy framework today is the Federative
Republic of Brazil’s Nationally Determined Contribution (NDC)3 towards achieving the objective of the
United Nations Framework Convention on Climate Change (UNFCCC). This document, announced in
December 2015 in the Paris Conference (COP 21), and updated in 2020, set the economy-wide
emissions reduction targets (37%, by 2025, 43% by 2030). The document affirms that these goals are
compatible with the indicative objective of achieving carbon neutrality in 2060 and emphasizes that a
more ambitious time horizon – such as the year 2050 – might be considered under the proper
functioning of the market mechanisms under the Paris Agreement.
The adopted commitments consist of economy-wide, absolute targets, stated to be consistent with
the sectors present in the National Inventory of Greenhouse Gas Emissions (energy; industrial
processes; land use, land-use change and forestry; and waste treatment).
There are no specific sector goals, but the NDC asserts that the targets will be translated into policies
and measures to be implemented by the Brazilian Federal government. This provides the broad
perspective for Brazilian energy trends for the next years and guidance for the main energy planning
document, the PDE (Ten Year’s Energy Expansion Plan, also known as Plan for Energy Expansion),
elaborated by EPE (Energy Research Agency) and published every year by the Ministry of Mines and
Energy.
Also, all policies, measures, and actions to implement Brazil’s NDC are carried out under the National
Policy on Climate Change (Law 12,187/2009), the Law on the Protection of Native Forests (Law
12,651/2012, hereinafter referred as Forest Code), the Law on the National System of Conservation
Units (Law 9,985/2000), related legislation, instruments and planning processes. The Government of
Brazil is committed to implementing its NDC with full respect to human rights, in particular rights of
vulnerable communities, indigenous populations, traditional communities, and workers in sectors
affected by relevant policies and plans, while promoting gender-responsive measures.
Brazil is a developing country with several challenges regarding poverty eradication, education, public
health, employment, housing, infrastructure, and energy access. Despite these challenges, Brazil’s
current actions in the global effort against climate change represent one of the largest undertakings
by any single country to date, having reduced its emissions by 43.9% (GWP-100; IPCC SAR) in 2015 in
relation to 2005 levels4.
One of the main important routes to reduce emissions is the use of renewable sources, including
biofuels. There are several benefits from the use of biofuels in the Brazilian energy matrix, which can
be observed in the economic, social, and environmental spheres. Considering liquid biofuels, since
Brazilian production of gasoline and diesel is not sufficient to meet domestic demand, the
consumption of ethanol and biodiesel acts favourably to reduce the risks related to the instability of
the world market and to increase security of energy supply. The absence of these biofuels could result
in an increase in imports of fossil analogues, affecting Brazil's trade balance.
The most evident social impacts of using biofuels are related to the creation of jobs and income,
whether in the agricultural phase of their production, or in the industrial stage, including in the
countryside. In the case of biodiesel, a stand-out initiative is the Social Biofuel Seal (Selo
3 Available at: http://www.planalto.gov.br/ccivil_03/_ato2015-2018/2017/decreto/D9073.htm 4 Source: MCTIC. Estimativas anuais de emissões de gases de efeito estufa no Brasil. Fourth edition (2017). Available at http://sirene.mcti.gov.br/publicacoes, accessed on 30 August 2018.
4
Biocombustível Social), which benefits small farmers with family farming insertion to the biofuel
production process. It is estimated that ethanol production supports over 1.5 million direct and
indirect jobs5 in Brazil in 2019. Indirectly, jobs are also generated in the industry of cultivation
implements, agricultural machinery business and services with much trading occurring in rural areas
of the country. Besides, it is possible to identify positive impacts on infrastructure, improvements in
motorways and railways, in the food production and in the life quality of people living in the
neighbouring areas.
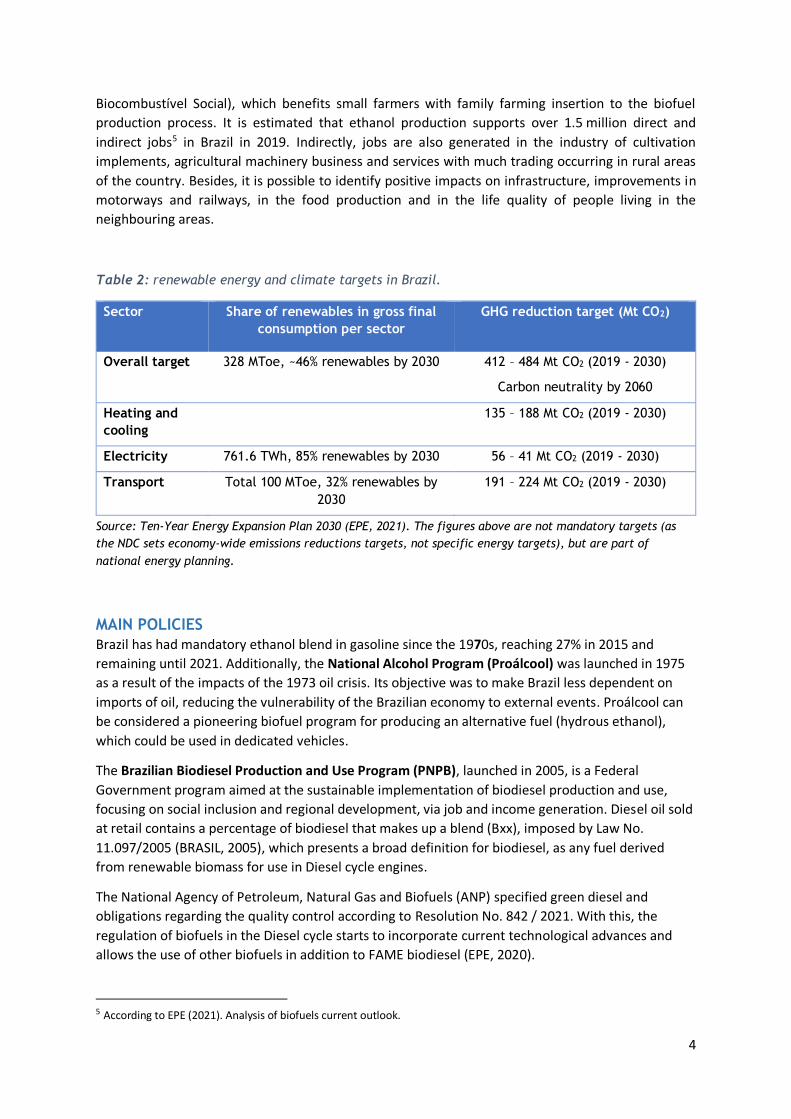
Table 2: renewable energy and climate targets in Brazil.
Sector Share of renewables in gross final
consumption per sector
GHG reduction target (Mt CO2)
Overall target 328 MToe, ~46% renewables by 2030 412 – 484 Mt CO2 (2019 - 2030)
Carbon neutrality by 2060
Heating and
cooling
135 – 188 Mt CO2 (2019 - 2030)
Electricity 761.6 TWh, 85% renewables by 2030 56 – 41 Mt CO2 (2019 - 2030)
Transport Total 100 MToe, 32% renewables by
2030
191 – 224 Mt CO2 (2019 - 2030)
Source: Ten-Year Energy Expansion Plan 2030 (EPE, 2021). The figures above are not mandatory targets (as
the NDC sets economy-wide emissions reductions targets, not specific energy targets), but are part of
national energy planning.
MAIN POLICIES Brazil has had mandatory ethanol blend in gasoline since the 1970s, reaching 27% in 2015 and
remaining until 2021. Additionally, the National Alcohol Program (Proálcool) was launched in 1975
as a result of the impacts of the 1973 oil crisis. Its objective was to make Brazil less dependent on
imports of oil, reducing the vulnerability of the Brazilian economy to external events. Proálcool can
be considered a pioneering biofuel program for producing an alternative fuel (hydrous ethanol),
which could be used in dedicated vehicles.
The Brazilian Biodiesel Production and Use Program (PNPB), launched in 2005, is a Federal
Government program aimed at the sustainable implementation of biodiesel production and use,
focusing on social inclusion and regional development, via job and income generation. Diesel oil sold
at retail contains a percentage of biodiesel that makes up a blend (Bxx), imposed by Law No.
11.097/2005 (BRASIL, 2005), which presents a broad definition for biodiesel, as any fuel derived
from renewable biomass for use in Diesel cycle engines.
The National Agency of Petroleum, Natural Gas and Biofuels (ANP) specified green diesel and
obligations regarding the quality control according to Resolution No. 842 / 2021. With this, the
regulation of biofuels in the Diesel cycle starts to incorporate current technological advances and
allows the use of other biofuels in addition to FAME biodiesel (EPE, 2020).
5 According to EPE (2021). Analysis of biofuels current outlook.
5
In 2017, Brazil established the Brazilian Policy for Biofuels - RENOVABIO, by the Law No.
13,576/2017, which creates a regulatory framework to revitalize the biofuels sector, encouraging
energy efficiency gains in biofuels production and use. The policy aims to reduce the carbon intensity
of the transport fuel matrix by 10% and avoid 620 million tons of CO2eq emissions from 2018 until
2030. In 2020, the Decarbonization Credit (CBIO), that corresponds to 1 ton CO2eq avoided into the
atmosphere, started its commercialization in the Brazilian stock exchange (B3). Even with Covid-19
pandemic effects fuel distributors achieved 97.6% of the established goal (14.9 million CBIOs). CBIO
average price was R$ 43 (US$ 8) and producers’ revenue with this asset reached R$ 650 Mi (US$ 125
Mi) (EPE, 2021).
A description of renewable energy and climate policies and measures in Brazil is available at the
IEA’s Policies and Measures Database: https://www.iea.org/policies?country=Brazil
Specific policies related to renewable electricity, renewable heat and transport biofuels will be
highlighted in the chapters about the role of bioenergy in different sectors.
6
THE CONTRIBUTION OF BIOENERGY IN NATIONAL ENERGY SUPPLY
TOTAL ENERGY SUPPLY
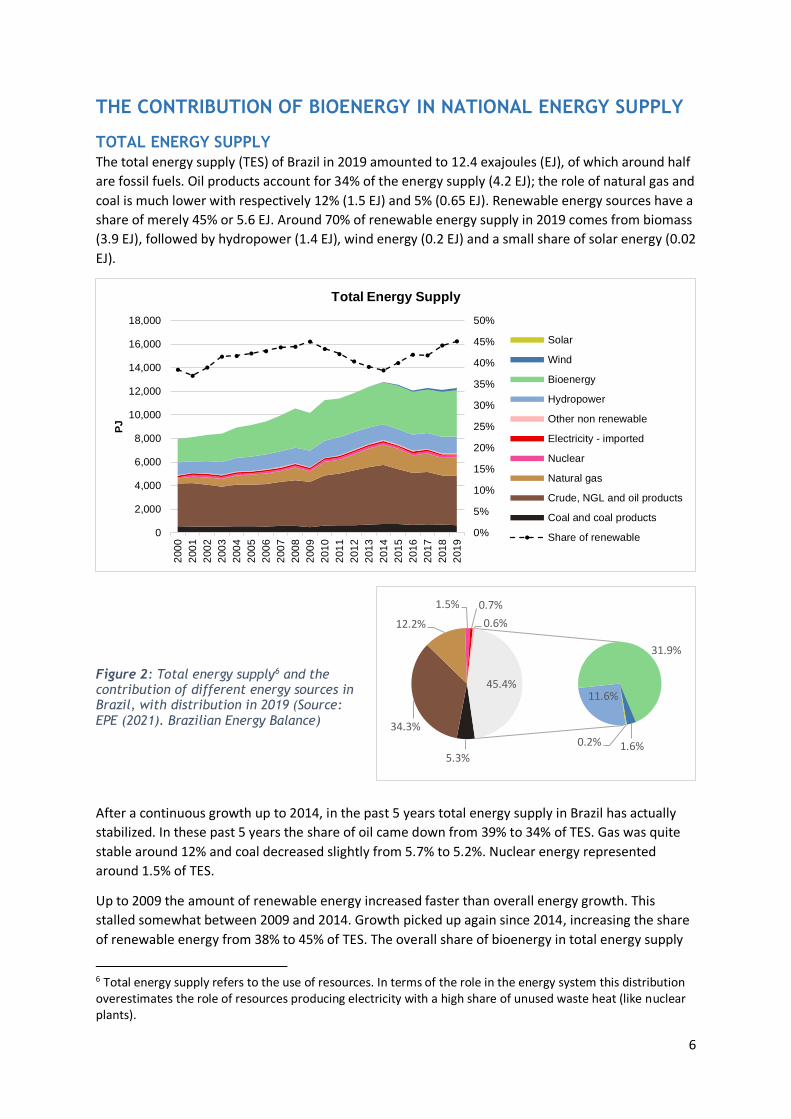
The total energy supply (TES) of Brazil in 2019 amounted to 12.4 exajoules (EJ), of which around half
are fossil fuels. Oil products account for 34% of the energy supply (4.2 EJ); the role of natural gas and
coal is much lower with respectively 12% (1.5 EJ) and 5% (0.65 EJ). Renewable energy sources have a
share of merely 45% or 5.6 EJ. Around 70% of renewable energy supply in 2019 comes from biomass
(3.9 EJ), followed by hydropower (1.4 EJ), wind energy (0.2 EJ) and a small share of solar energy (0.02
EJ).
Figure 2: Total energy supply6 and the contribution of different energy sources in Brazil, with distribution in 2019 (Source: EPE (2021). Brazilian Energy Balance)
After a continuous growth up to 2014, in the past 5 years total energy supply in Brazil has actually
stabilized. In these past 5 years the share of oil came down from 39% to 34% of TES. Gas was quite
stable around 12% and coal decreased slightly from 5.7% to 5.2%. Nuclear energy represented
around 1.5% of TES.
Up to 2009 the amount of renewable energy increased faster than overall energy growth. This
stalled somewhat between 2009 and 2014. Growth picked up again since 2014, increasing the share
of renewable energy from 38% to 45% of TES. The overall share of bioenergy in total energy supply
6 Total energy supply refers to the use of resources. In terms of the role in the energy system this distribution overestimates the role of resources producing electricity with a high share of unused waste heat (like nuclear plants).
0%
5%
10%
15%
20%
25%
30%
35%
40%
45%
50%
0
2,000
4,000
6,000
8,000
10,000
12,000
14,000
16,000
18,000
200
0
200
1
200
2
200
3
200
4
200
5
200
6
200
7
200
8
200
9
201
0
201
1
201
2
201
3
201
4
201
5
201
6
201
7
201
8
201
9
PJ
Total Energy Supply
Solar
Wind
Bioenergy
Hydropower
Other non renewable
Electricity - imported
Nuclear
Natural gas
Crude, NGL and oil products
Coal and coal products
Share of renewable
5.3%
34.3%
12.2%
1.5% 0.7%
0.6%
11.6%
31.9%
1.6%0.2%
45.4%
7
increased steadily from 27.5% to 31.7% in the past 5 years. In the same period hydropower
fluctuated around 11%, wind power increased from 0.3 to 1.6% and solar energy (PV and solar
thermal) from 0.2 to 0.5%.
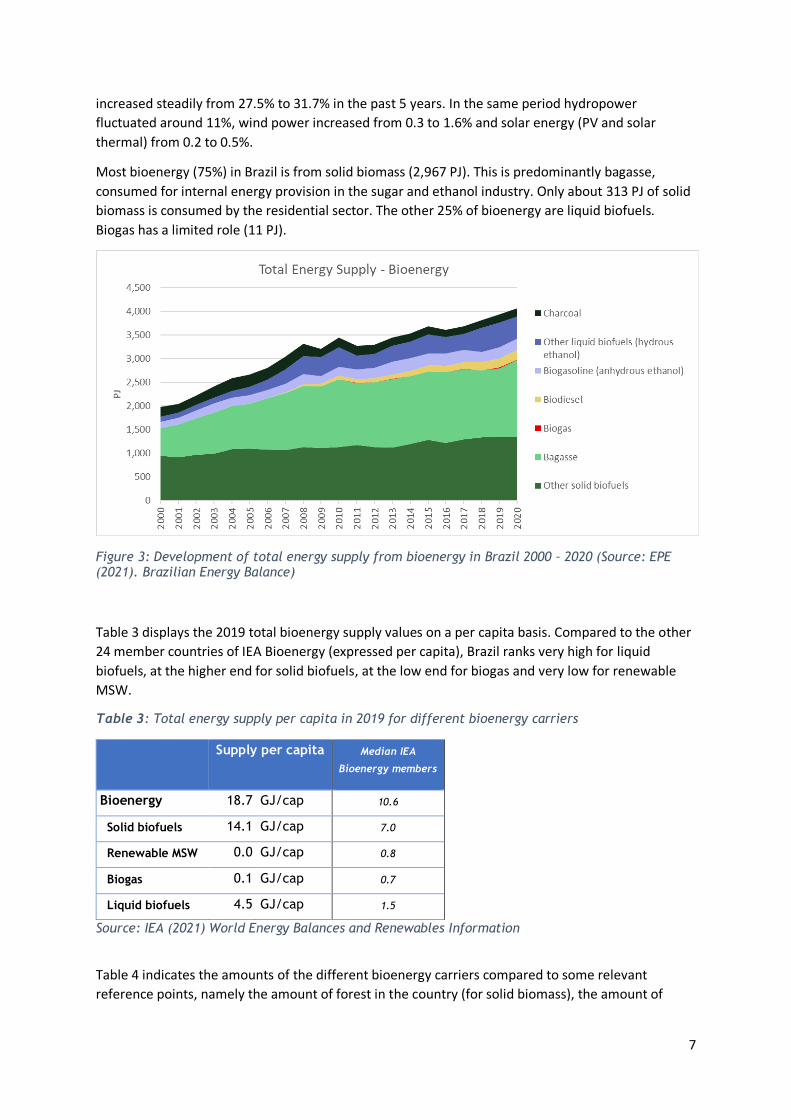
Most bioenergy (75%) in Brazil is from solid biomass (2,967 PJ). This is predominantly bagasse,
consumed for internal energy provision in the sugar and ethanol industry. Only about 313 PJ of solid
biomass is consumed by the residential sector. The other 25% of bioenergy are liquid biofuels.
Biogas has a limited role (11 PJ).
Figure 3: Development of total energy supply from bioenergy in Brazil 2000 – 2020 (Source: EPE (2021). Brazilian Energy Balance)
Table 3 displays the 2019 total bioenergy supply values on a per capita basis. Compared to the other
24 member countries of IEA Bioenergy (expressed per capita), Brazil ranks very high for liquid
biofuels, at the higher end for solid biofuels, at the low end for biogas and very low for renewable
MSW.
Table 3: Total energy supply per capita in 2019 for different bioenergy carriers
Supply per capita Median IEA
Bioenergy members
Bioenergy 18.7 GJ/cap 10.6
Solid biofuels 14.1 GJ/cap 7.0
Renewable MSW 0.0 GJ/cap 0.8
Biogas 0.1 GJ/cap 0.7
Liquid biofuels 4.5 GJ/cap 1.5
Source: IEA (2021) World Energy Balances and Renewables Information
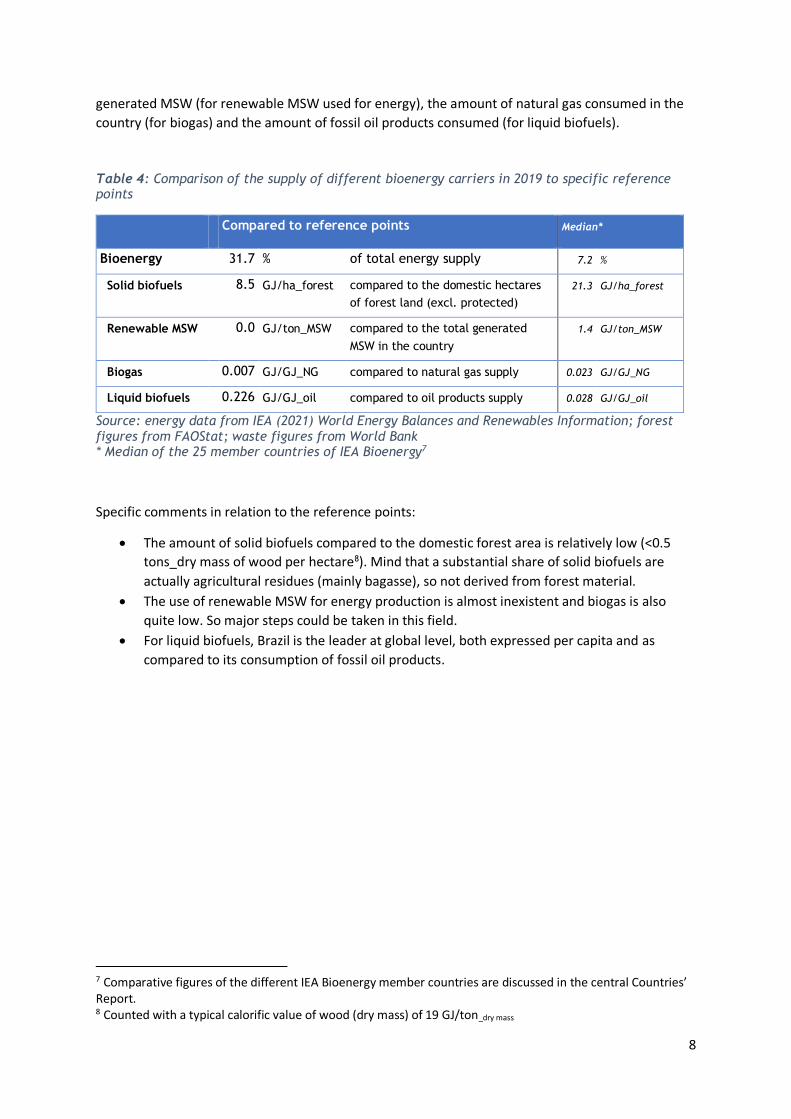
Table 4 indicates the amounts of the different bioenergy carriers compared to some relevant
reference points, namely the amount of forest in the country (for solid biomass), the amount of
8
generated MSW (for renewable MSW used for energy), the amount of natural gas consumed in the
country (for biogas) and the amount of fossil oil products consumed (for liquid biofuels).
Table 4: Comparison of the supply of different bioenergy carriers in 2019 to specific reference points
Compared to reference points Median*
Bioenergy 31.7 % of total energy supply 7.2 %
Solid biofuels 8.5 GJ/ha_forest compared to the domestic hectares
of forest land (excl. protected)
21.3 GJ/ha_forest
Renewable MSW 0.0 GJ/ton_MSW compared to the total generated
MSW in the country
1.4 GJ/ton_MSW
Biogas 0.007 GJ/GJ_NG compared to natural gas supply 0.023 GJ/GJ_NG
Liquid biofuels 0.226 GJ/GJ_oil compared to oil products supply 0.028 GJ/GJ_oil
Source: energy data from IEA (2021) World Energy Balances and Renewables Information; forest figures from FAOStat; waste figures from World Bank * Median of the 25 member countries of IEA Bioenergy7
Specific comments in relation to the reference points:
• The amount of solid biofuels compared to the domestic forest area is relatively low (<0.5
tons_dry mass of wood per hectare8). Mind that a substantial share of solid biofuels are
actually agricultural residues (mainly bagasse), so not derived from forest material.
• The use of renewable MSW for energy production is almost inexistent and biogas is also
quite low. So major steps could be taken in this field.
• For liquid biofuels, Brazil is the leader at global level, both expressed per capita and as
compared to its consumption of fossil oil products.
7 Comparative figures of the different IEA Bioenergy member countries are discussed in the central Countries’ Report. 8 Counted with a typical calorific value of wood (dry mass) of 19 GJ/ton_dry mass
9
ROLE OF BIOENERGY IN DIFFERENT SECTORS
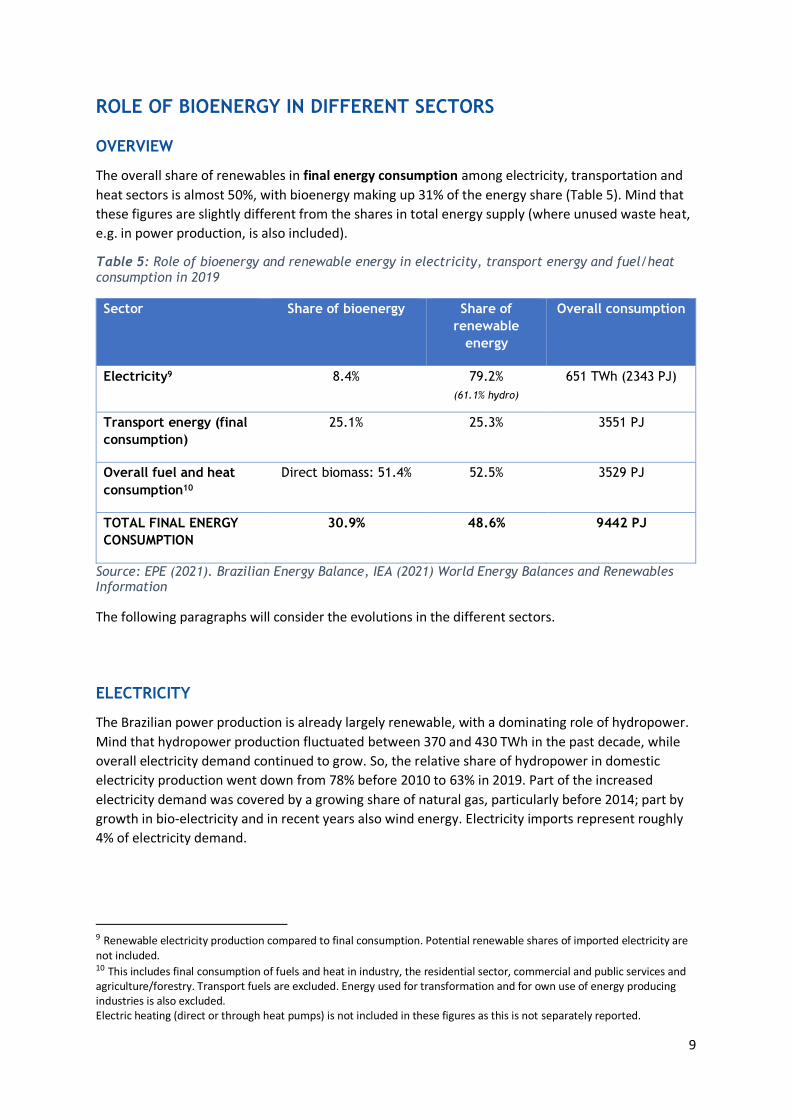
OVERVIEW
The overall share of renewables in final energy consumption among electricity, transportation and
heat sectors is almost 50%, with bioenergy making up 31% of the energy share (Table 5). Mind that
these figures are slightly different from the shares in total energy supply (where unused waste heat,
e.g. in power production, is also included).
Table 5: Role of bioenergy and renewable energy in electricity, transport energy and fuel/heat consumption in 2019
Sector Share of bioenergy Share of
renewable
energy
Overall consumption
Electricity9 8.4% 79.2%
(61.1% hydro)
651 TWh (2343 PJ)
Transport energy (final
consumption)
25.1% 25.3% 3551 PJ
Overall fuel and heat
consumption10
Direct biomass: 51.4% 52.5% 3529 PJ
TOTAL FINAL ENERGY
CONSUMPTION
30.9% 48.6% 9442 PJ
Source: EPE (2021). Brazilian Energy Balance, IEA (2021) World Energy Balances and Renewables Information
The following paragraphs will consider the evolutions in the different sectors.
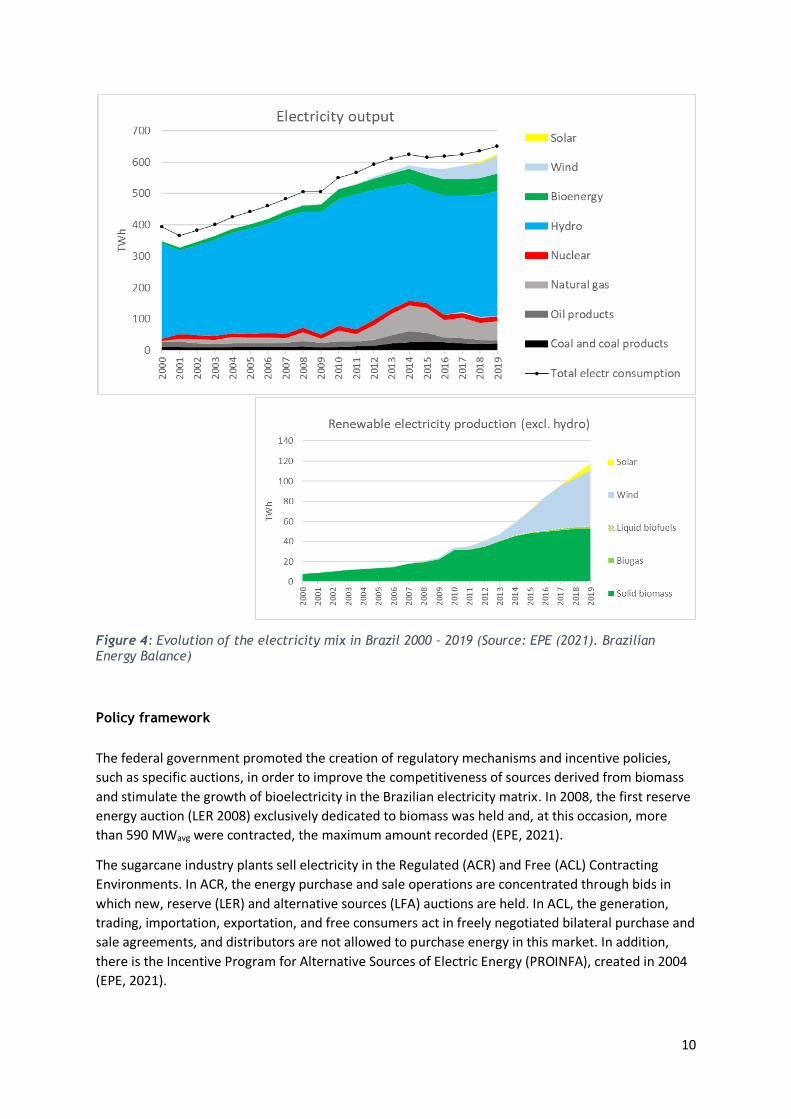
ELECTRICITY
The Brazilian power production is already largely renewable, with a dominating role of hydropower.
Mind that hydropower production fluctuated between 370 and 430 TWh in the past decade, while
overall electricity demand continued to grow. So, the relative share of hydropower in domestic
electricity production went down from 78% before 2010 to 63% in 2019. Part of the increased
electricity demand was covered by a growing share of natural gas, particularly before 2014; part by
growth in bio-electricity and in recent years also wind energy. Electricity imports represent roughly
4% of electricity demand.
9 Renewable electricity production compared to final consumption. Potential renewable shares of imported electricity are not included. 10 This includes final consumption of fuels and heat in industry, the residential sector, commercial and public services and agriculture/forestry. Transport fuels are excluded. Energy used for transformation and for own use of energy producing industries is also excluded. Electric heating (direct or through heat pumps) is not included in these figures as this is not separately reported.
10
Figure 4: Evolution of the electricity mix in Brazil 2000 – 2019 (Source: EPE (2021). Brazilian Energy Balance)
Policy framework
The federal government promoted the creation of regulatory mechanisms and incentive policies,
such as specific auctions, in order to improve the competitiveness of sources derived from biomass
and stimulate the growth of bioelectricity in the Brazilian electricity matrix. In 2008, the first reserve
energy auction (LER 2008) exclusively dedicated to biomass was held and, at this occasion, more
than 590 MWavg were contracted, the maximum amount recorded (EPE, 2021).
The sugarcane industry plants sell electricity in the Regulated (ACR) and Free (ACL) Contracting
Environments. In ACR, the energy purchase and sale operations are concentrated through bids in
which new, reserve (LER) and alternative sources (LFA) auctions are held. In ACL, the generation,
trading, importation, exportation, and free consumers act in freely negotiated bilateral purchase and
sale agreements, and distributors are not allowed to purchase energy in this market. In addition,
there is the Incentive Program for Alternative Sources of Electric Energy (PROINFA), created in 2004
(EPE, 2021).
11
More recently, RenovaBio aims to cooperate in meeting Brazil's commitments under the Paris
Agreement by pushing efficiency increase at ethanol plants, including biomass cogeneration and
biogas production.
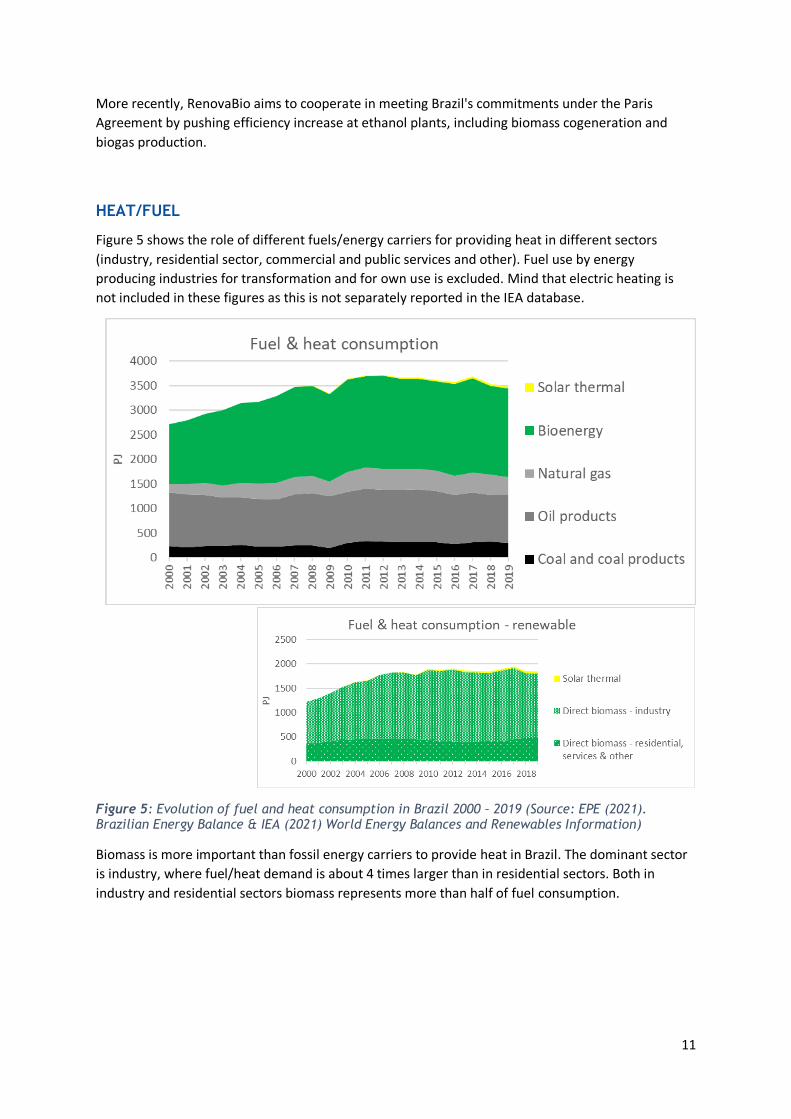
HEAT/FUEL
Figure 5 shows the role of different fuels/energy carriers for providing heat in different sectors
(industry, residential sector, commercial and public services and other). Fuel use by energy
producing industries for transformation and for own use is excluded. Mind that electric heating is
not included in these figures as this is not separately reported in the IEA database.
Figure 5: Evolution of fuel and heat consumption in Brazil 2000 – 2019 (Source: EPE (2021). Brazilian Energy Balance & IEA (2021) World Energy Balances and Renewables Information)
Biomass is more important than fossil energy carriers to provide heat in Brazil. The dominant sector
is industry, where fuel/heat demand is about 4 times larger than in residential sectors. Both in
industry and residential sectors biomass represents more than half of fuel consumption.
12
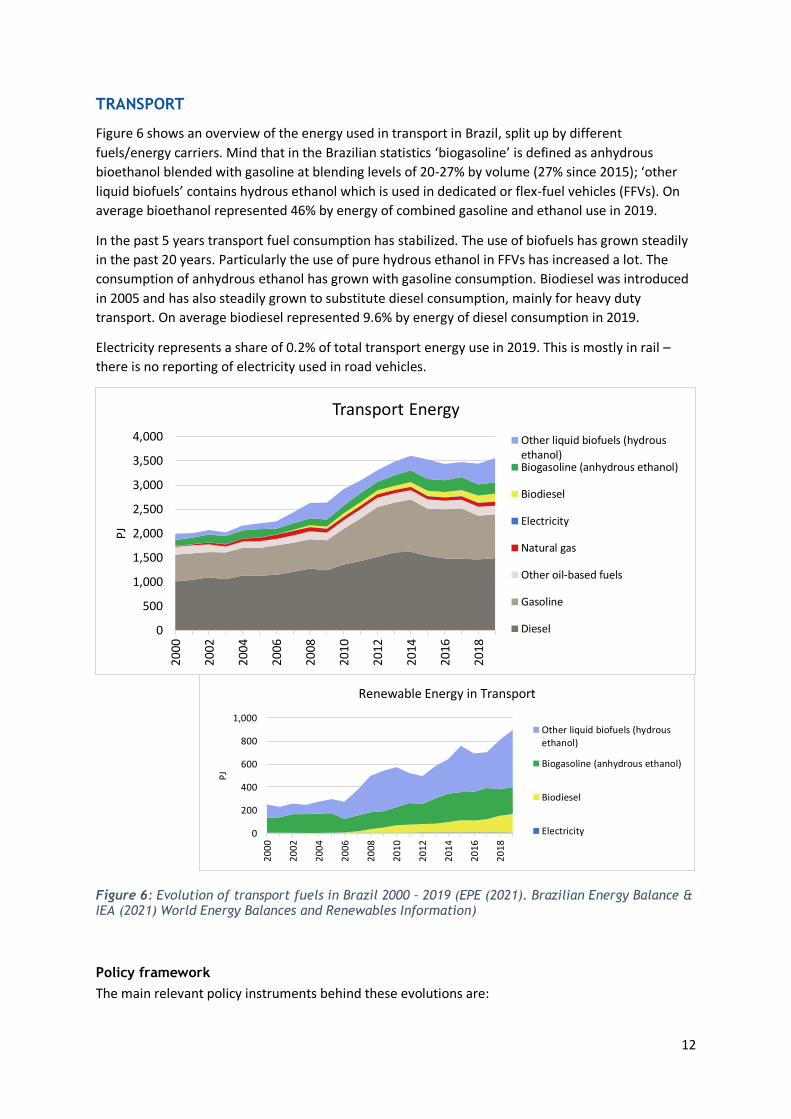
TRANSPORT
Figure 6 shows an overview of the energy used in transport in Brazil, split up by different
fuels/energy carriers. Mind that in the Brazilian statistics ‘biogasoline’ is defined as anhydrous
bioethanol blended with gasoline at blending levels of 20-27% by volume (27% since 2015); ‘other
liquid biofuels’ contains hydrous ethanol which is used in dedicated or flex-fuel vehicles (FFVs). On
average bioethanol represented 46% by energy of combined gasoline and ethanol use in 2019.
In the past 5 years transport fuel consumption has stabilized. The use of biofuels has grown steadily
in the past 20 years. Particularly the use of pure hydrous ethanol in FFVs has increased a lot. The
consumption of anhydrous ethanol has grown with gasoline consumption. Biodiesel was introduced
in 2005 and has also steadily grown to substitute diesel consumption, mainly for heavy duty
transport. On average biodiesel represented 9.6% by energy of diesel consumption in 2019.
Electricity represents a share of 0.2% of total transport energy use in 2019. This is mostly in rail –
there is no reporting of electricity used in road vehicles.
Figure 6: Evolution of transport fuels in Brazil 2000 – 2019 (EPE (2021). Brazilian Energy Balance & IEA (2021) World Energy Balances and Renewables Information)
Policy framework
The main relevant policy instruments behind these evolutions are:
0
500
1,000
1,500
2,000
2,500
3,000
3,500
4,000
2000
2002
2004
2006
2008
2010
2012
2014
2016
2018
PJ
Transport Energy
Other liquid biofuels (hydrousethanol)Biogasoline (anhydrous ethanol)
Biodiesel
Electricity
Natural gas
Other oil-based fuels
Gasoline
Diesel
0
200
400
600
800
1,000
20
00
20
02
20
04
20
06
20
08
20
10
20
12
20
14
20
16
20
18
PJ
Renewable Energy in Transport
Other liquid biofuels (hydrousethanol)
Biogasoline (anhydrous ethanol)
Biodiesel
Electricity
13
- Biofuel addition on petroleum products: National Alcohol Program (PROALCOOL), in the 1970s,
and the Brazilian Biodiesel Production and Use Program (PNPB) in 2005.
o Since 2015, all automotive gasoline sold at retail contains, by mandate, 27% of anhydrous
ethanol (E27). As well as the diesel sold, which had roughly 11% biodiesel added in 2019
and currently the blend is 13%.
- Flex fuel technology, established in 2003, enabled consumers to choose between E27 and E100.
- Federal and state tax differentiation between renewables and fossils11, and credit lines to
sugarcane industry supporting sugarcane rural producer and its cooperatives to select business
plans and promote projects that contemplate the development, production, and
commercialization of new industrial technologies for sugarcane biomass (E2G, gasification, etc.).
RESEARCH FOCUS RELATED TO BIOENERGY
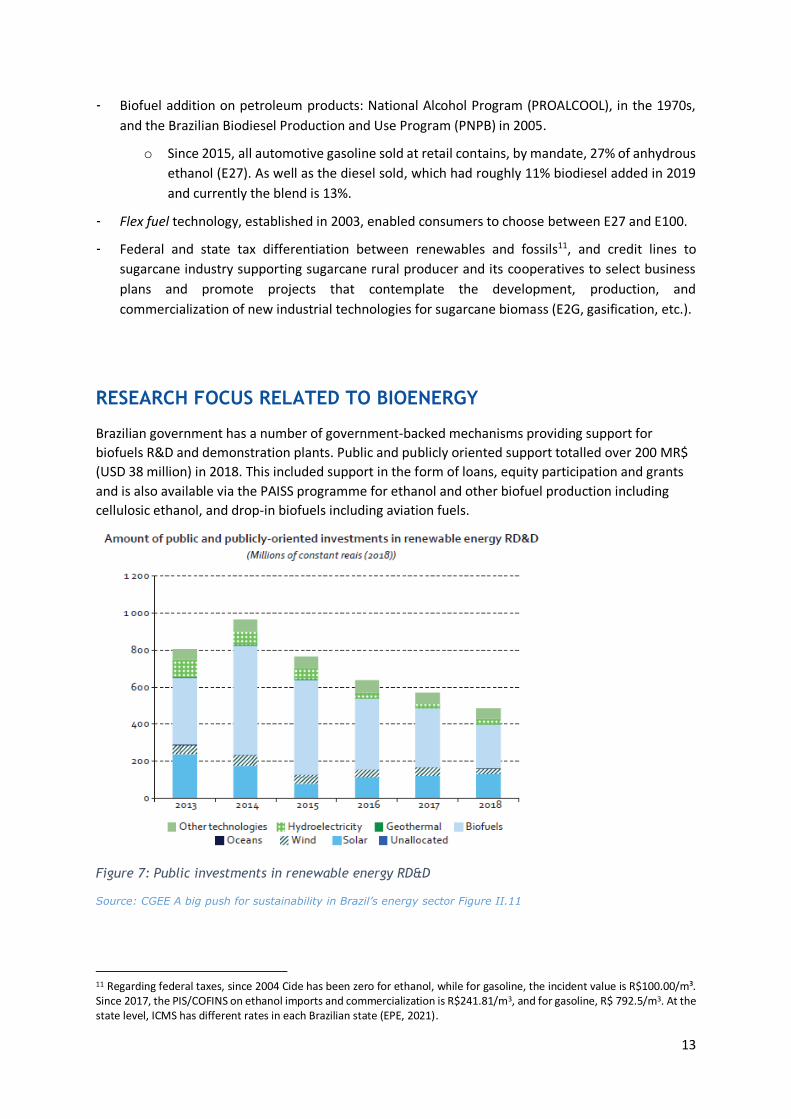
Brazilian government has a number of government-backed mechanisms providing support for
biofuels R&D and demonstration plants. Public and publicly oriented support totalled over 200 MR$
(USD 38 million) in 2018. This included support in the form of loans, equity participation and grants
and is also available via the PAISS programme for ethanol and other biofuel production including
cellulosic ethanol, and drop-in biofuels including aviation fuels.
Figure 7: Public investments in renewable energy RD&D
Source: CGEE A big push for sustainability in Brazil’s energy sector Figure II.11
11 Regarding federal taxes, since 2004 Cide has been zero for ethanol, while for gasoline, the incident value is R$100.00/m³. Since 2017, the PIS/COFINS on ethanol imports and commercialization is R$241.81/m3, and for gasoline, R$ 792.5/m3. At the state level, ICMS has different rates in each Brazilian state (EPE, 2021).
14
RECENT MAJOR BIOENERGY DEVELOPMENTS
Concerning 2nd generation ethanol (E2G), currently, in Brazil there are GranBio's Bioflex-I commercial
plants, in São Miguel dos Campos (AL), with a nominal capacity of 60 million litres/year, and Raízen's,
in Piracicaba (SP), with 42 million litres /year. Regarding Raízen, it overcame the main challenges,
having produced 20 million litres in 2019. In June 2021, the company announced that it will invest in
a new E2G plant, whose production capacity will be 82 million litres per year. The investment has a
long-term contract to sell 91% of production with a global energy player. The forecast is that
activities will start in 2023 (EPE, 2021).
Recently, the Future Fuels’ Program, which was established through CNPE Resolution No. 7 in 2021,
aims to increase the participation of sustainable and low-carbon fuels, integrating several public
policies, such as RenovaBio, the Brazilian Program Production and Use of Biodiesel, the National
Vehicle Labeling Program and Route 2030. Aviation biojet fuel and sustainable alternatives in the
maritime sector will also be included. Measures for carbon capture in biofuel production and
hydrogen will also be proposed by this program (EPE, 2021).
At the end of April 2021, the federal government established the guidelines for the preparation of
the National Hydrogen Program, through CNPE Resolution No. 6, of April 20, 2021, for the
development of its entire production and distribution and insertion chain in several important
sectors, such as transport, steel, and fertilizers (EPE, 2021).
LINKS TO SOURCES OF INFORMATION
Brazilian Nationally Determined Contribution (NDC), Accessed on 30 august 2018:
http://www.itamaraty.gov.br/images/ed_desenvsust/BRAZIL-iNDC-english.pdf or
http://www4.unfccc.int/submissions/INDC/Published%20Documents/Brazil/1/BRAZIL%20iNDC%20e
nglish%20FINAL.pdf
EPE, 2021. Analysis of biofuels current outlook: https://www.epe.gov.br/pt/publicacoes-dados-
abertos/publicacoes/analise-de-conjuntura-dos-biocombustiveis
EPE, 2021. Brazilian Energy Balance: http://www.epe.gov.br/en/publications/publications/brazilian-
energy-balance and http://www.epe.gov.br/pt/publicacoes-dados-abertos/publicacoes/balanco-
energetico-nacional-ben
EPE, 2021. Ten Year’s Energy Expansion Plan: http://www.epe.gov.br/pt/publicacoes-dados-
abertos/publicacoes/plano-decenal-de-expansao-de-energia-pde
EPE, 2020. (in Portuguese) Combustíveis Alternativos para motores do ciclo Diesel. Empresa de
Pesquisa Energética, Rio de Janeiro. Accessed on 24 May 2020, available at
https://www.epe.gov.br/sites-pt/publicacoes-dados-
abertos/publicacoes/PublicacoesArquivos/publicacao-
467/NT_Combustiveis_renovaveis_em_%20motores_ciclo_Diesel.pdf
CGEE A big push for sustainability in Brazil’s energy sector.
https://www.cepal.org/en/events/energy-big-push-accelerating-clean-energy-innovation-
brazil#:~:text=Since%20early-
15
2019%2C%20the%20Energy%20Big%20Push%20%28EBP%29%20Brazil,and%20experts%20in%20ene
rgy%20and%20innovation%20in%20Brazil.
IBGE (2021). Population Estimates. Series 2001-2020.
https://www.ibge.gov.br/en/statistics/social/population/18448-estimates-of-resident-population-
for-municipalities-and-federation-units.html?=&t=downloads
The IEA Bioenergy Technology Collaboration Programme (TCP) is organised under the auspices of the International Energy Agency (IEA) but is functionally
and legally autonomous. Views, findings and publications of the IEA Bioenergy TCP do not necessarily represent the views or policies of the IEA Secretariat
or its individual member countries.