albanian agriculture and bioenergy, status and perspectives
TRANSCRIPT
Albanian Agriculture
and
Bioenergy,
Status and Perspectives
Evan Rroço, Manjola Banja
Bioenergy and bioeconomy, status and perspectives
Israel, 2015

Surface 28 000 km2
Population ̴ 3 million inhabitants
GDP (nominal) - 14 billion USD
Contribution to the GDP %
Industry 11,7
Agriculture and Fishery 19.3
Construction 11.0
Transport, Tourism and Communication
30,5
Services 13.4
Financial Transactions 14.1
Country profile, 2012
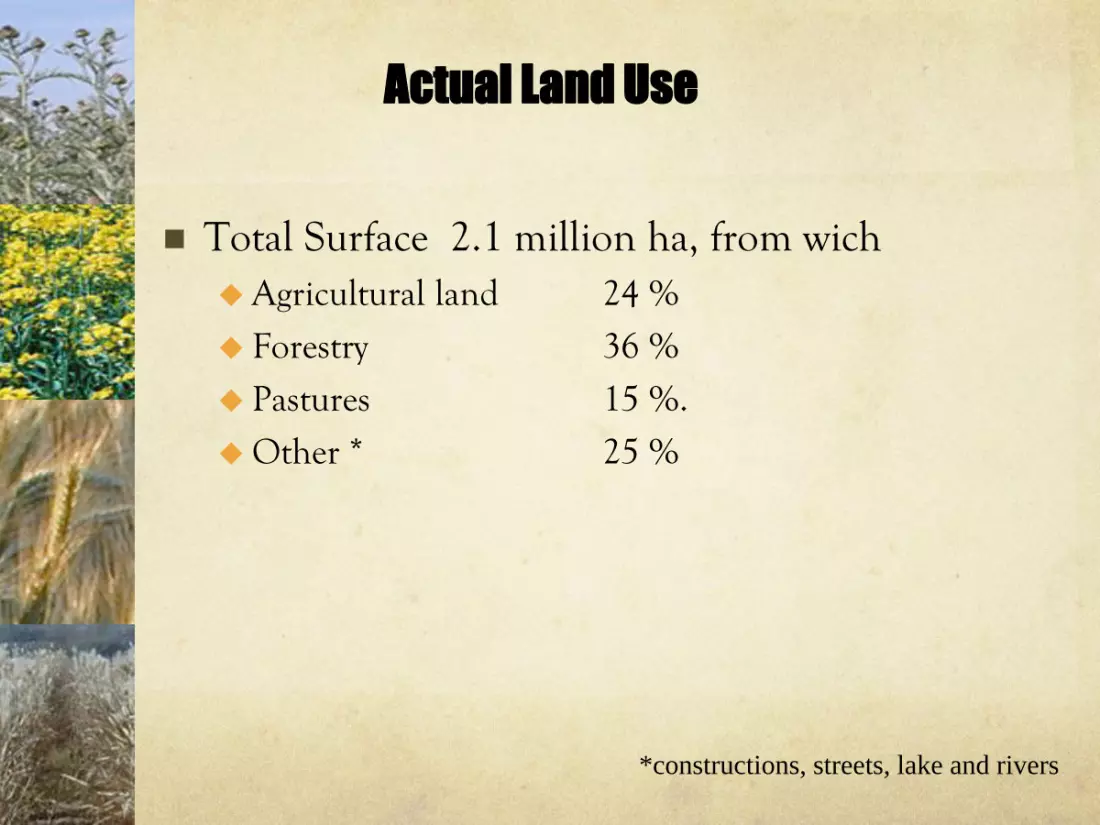
Actual Land Use
Total Surface 2.1 million ha, from wich Agricultural land 24 %
Forestry 36 %
Pastures 15 %.
Other * 25 %
*constructions, streets, lake and rivers

Northen and eastern part - Continental climate
Southern and Western part – Mediterranean climate.
Average rainfall 1400 mm y-1
Very wet winter
Very dry summer
Climate

Agricultural situation
Very small farm size (1.0 -1.5 ha)
High fragmentation
Land property not definitely solved
Low investments and crediting
Low subsidies
High input prices
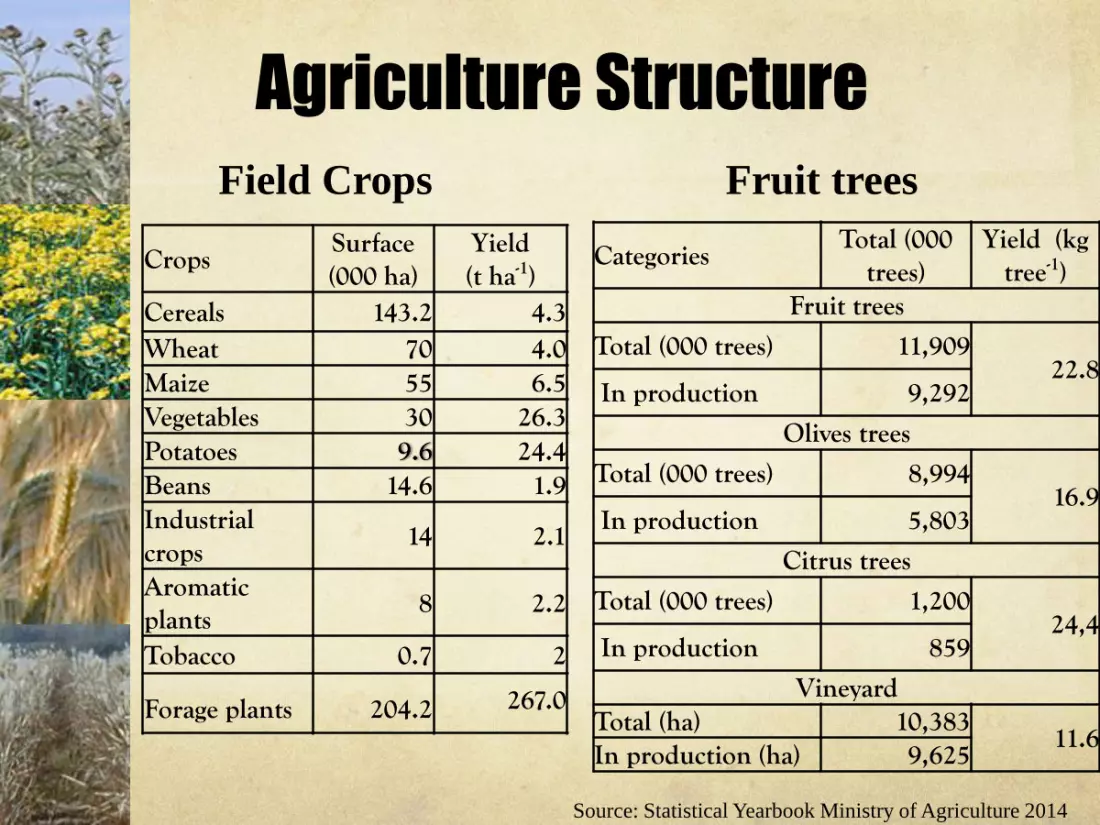
Agriculture Structure
Crops Surface (000 ha)
Yield (t ha-1)
Cereals 143.2 4.3 Wheat 70 4.0 Maize 55 6.5 Vegetables 30 26.3 Potatoes 9.6 24.4 Beans 14.6 1.9 Industrial crops
14 2.1
Aromatic plants
8 2.2
Tobacco 0.7 2
Forage plants 204.2 267.0
Field Crops Fruit trees
Source: Statistical Yearbook Ministry of Agriculture 2014
Categories Total (000
trees) Yield (kg
tree-1) Fruit trees
Total (000 trees) 11,909 22.8
In production 9,292
Olives trees
Total (000 trees) 8,994 16.9
In production 5,803
Citrus trees
Total (000 trees) 1,200 24,4
In production 859
Vineyard Total (ha) 10,383
11.6 In production (ha) 9,625
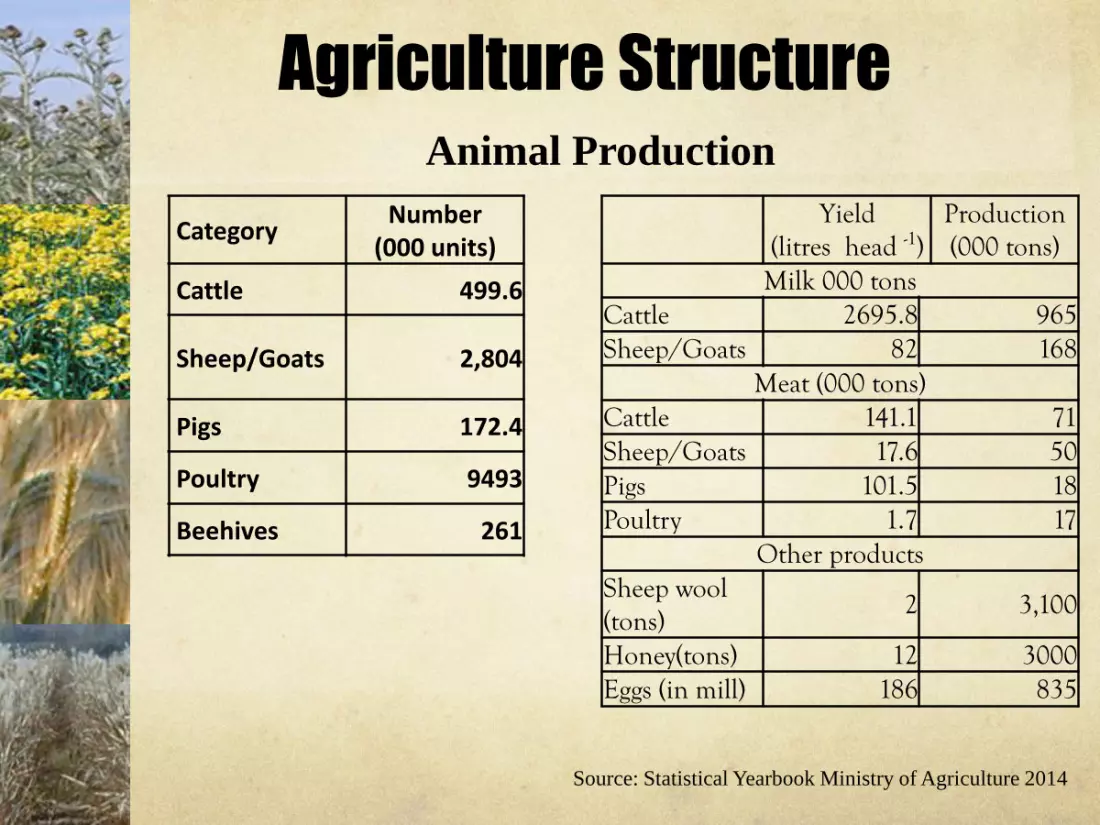
Agriculture Structure Animal Production
Category Number
(000 units)
Cattle 499.6
Sheep/Goats 2,804
Pigs 172.4
Poultry 9493
Beehives 261
Source: Statistical Yearbook Ministry of Agriculture 2014
Yield
(litres head -1) Production (000 tons)
Milk 000 tons Cattle 2695.8 965 Sheep/Goats 82 168
Meat (000 tons) Cattle 141.1 71 Sheep/Goats 17.6 50 Pigs 101.5 18 Poultry 1.7 17
Other products Sheep wool (tons)
2 3,100
Honey(tons) 12 3000 Eggs (in mill) 186 835

Import-Export of
Agricultural Products
Main exports – aromatic plants and fresh vegetables
Main imports – wheat and wheat products; animal products
Categories Export vs. Import ratio Plant products 1 : 6.1 Animal products 1 : 4.8 Processed products 1 : 8.4 Total 1 : 6.7
Source: Statistical Yearbook Ministry of Agriculture 2013
Agriculture tendences
Slight increase of size farms
Yield increase
Increase of farms accessing market (from 18% three
years ago – 22% actually)
Increase of surface cultivated with more intensive crops
(fruits, vegetables and aromatic plants).

Energy mix indicators, 2012
Primary energy production 2034 ktoe
Gross inland consumption 2319 ktoe
Final energy consumption 1953 ktoe
Gross electricity consumption 665 ktoe
Energy dependence 98%
Energy intensity 180 toe/USD
GHG emissions 7.3 Mt CO2 eq
Source: Albanian Statistical Office, 2014
UNFCCC, 2014

Renewable energy indicators, 2012
Renewable energy mix 649 ktoe
Renewable energy share 31.6%
Renewable electricity 406 ktoe
Renewable heat 213 ktoe
Renewable energy in transport 29 ktoe
GHG emissions savings 6.8 Mt CO2 eq
Source: Albanian 1st RE progress report, 2015

Renewable energy total 1256 ktoe
Renewable energy share 38%
Renewable energy installed capacity 2791 MW
Renewable electricity 760 ktoe
Renewable heat 391 ktoe
Renewable energy in transport 105 ktoe
Renewable energy indicators, 2020
Source: Albanian NREAP, (draft), 2012
Legal Framework Agriculture - Energy
National Strategy for Rural and Agricultural
Development (2014-2020)
Law on Renewable Energy Sources 138/2013
Transposes partly the Directive 2009/28/EC
(Article 17 on sustainability not fulfilled)
First renewable energy progress report, 2015
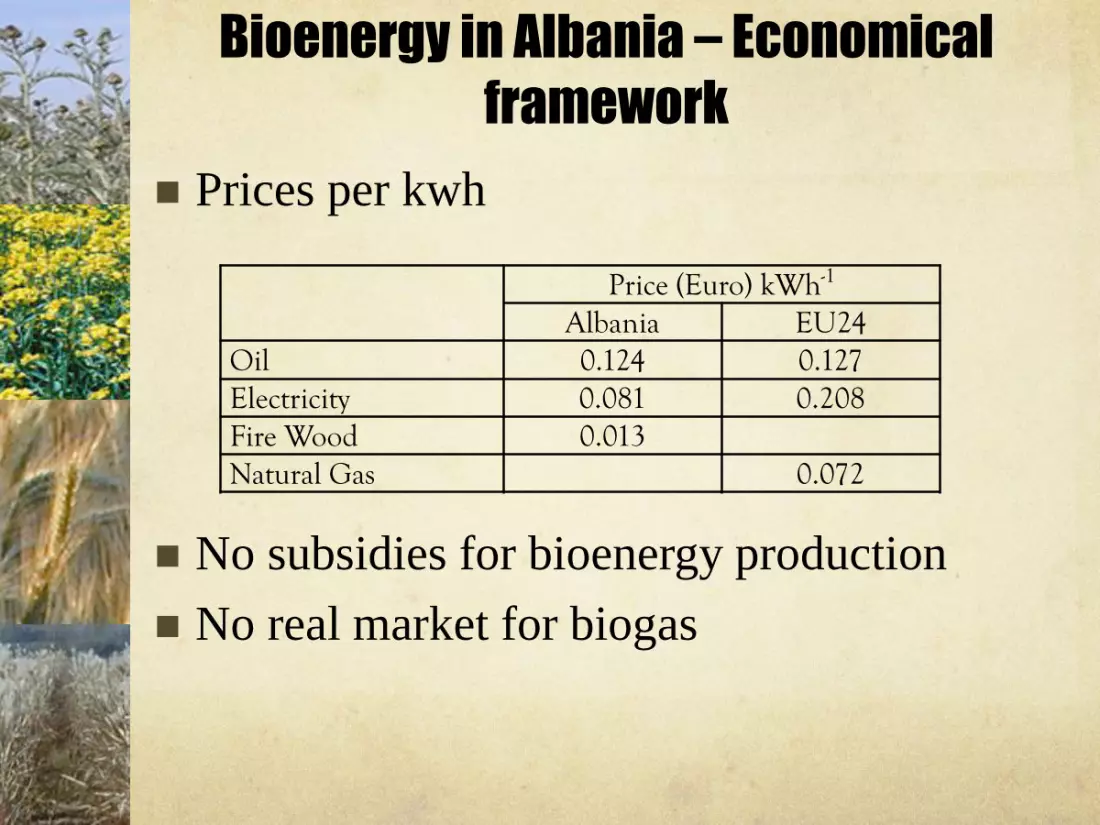
Bioenergy in Albania – Economical
framework
No subsidies for bioenergy production
No real market for biogas
Prices per kwh
Price (Euro) kWh-1
Albania EU24 Oil 0.124 0.127 Electricity 0.081 0.208 Fire Wood 0.013 Natural Gas 0.072

Bioenergy opportunities
Fire wood – main source
Processing residues for energy
Olive processing residues
Wood processing residues
Agriculture residues – not yet used
Remote possibility to produce bioenergy from
dedicated energetic crops.

Forest situation and use
Forest fond
Source: Albanian Statistical Office, 2013 and 2014
Capacity /000m3 %
Total forests 76,483 100
State forests 49,714 65
Locally administrated forests 22,945 30
Private forests 3,824 5
Forest use
Description Unit Private Subjects Rural
Estimated Illegal cuttings Total
Timber wood 000 m3 1.576 819 1.220 3.6 Timber for mines 000 m3 0.531 0 0.337 0.9 Wood stick 000 m3 0 0 0.05 0.05
Fire wood 000 mst
87.68 1,257 11.251 1,356
Memorandum for forest use

Albanian Bioenergy Potentials

Agriculture residues potential
Arable crops residues for biogas production
Crop
Surface
(000 ha)
Collection
coefficient
Byproduct Collected
(000 Mt) Toe
Wheat 73.2 0.3 75.8 30,470
Maize 53.5 0.3 90.9 36,522
Rye 1.3 0.3 0.8 319
Barley 2.4 0.3 1.3 537
Oats 12.5 0.3 5.5 2,215
Vegetables 31.0 0.1 38.8 11,887
Potatoes 9.3 0.1 2.0 606
Beans 14.6 0.2 0.5 142
Tabacco 1.3 0.2 0.0 10
Sunflower 1.4 0.2 0.3 99
Soybean 0.3 0.2 0.0 9
Forage 208.9 0.0
Total 409.8 130.3 82,816

Agriculture residues potential (cont.)
Livestock residues for biogas production
1000 heads
Total
manure
production
1000 ton
Coef. Of
manure
collection
1000 m3 Biogas
Cattle 498 654,372 20% 5,889
Sheep 1,809 132,057 10% 2,245
Goats 810 1620 10% 1,005
Pigs 159 116,070 30% 1,741
Equidae 97 708100 10% 9,963
Poultry 9494 103,959 30% 3,119
Slaughterhouse residues 461
Total 151,227 24,423

Agriculture residues potential (cont.)
Fruit trees residues for energy
Residues
(ton)
Collection
coefficient
Total
Residues
(ton)
Energy
Giga Joule Toe
Fruits trees 52,231 30% 15,669 188,031 4,490
Olives 64,002 20% 12,800 153,605 3,668
Citruses 5,052 20% 1,010 12,124 290
Vineyards + Pergola 28,595 30% 8,579 85,785 2,049
Total 149,880 38,059 439,545 10,496

Bioenergy in a typical farm
Crop Surface Collection
coefficient
Byproduct
Collected (Mt) Toe
Wheat 0.5 0.3 0.48 0.21
Maize 0.3 0.3 5.35 0.20
Vegetables 0.2 0.1 0.16 0.08
Forage 0.2 0 0.00
Total 1.2 5.99 0.49
Heads
Coef. of
Manure
Collection
Byproduct
Collected
(Mt)
Biogas
(m3) Toe
Cattle 5 0.2 1.314 59 52.4
Total 53 toe

Bioeconomy Bioeconomy encompasses the production of renewable
biological resources and their conversion into food, feed, bio-
based products and bioenergy via innovative and efficient
technologies.
(European Forum for the Bioeconomy)
Three pillars of Bioeconomy
1. Investments in research,
innovation and skills;
2. Reinforced policy interaction
and stakeholder engagement;
3. Enhancement of markets and
competitiveness.

Bioeconomy in Albania o Policy integration
o National Strategy for Development and Integration
2015 – 2020 (under preparation)
o Coordination especially in Agriculture and
Environmental issues between the two Ministries.
o Need for an aimed politics to better coordinate all the
efforts in the other sectors.
o No legal acts approved (no strategy, no action plan, no
funds allocated) for Bioeconomy.
o Two public communications on climate change.
o Low private stakeholders involvement

Bioeconomy in Albania
Market and competitiveness
Lack on market possibilities and infrastructures (ex.
for bioenergy).
Ongoing improvements in the legal framework on
business competitiveness

Bioeconomy in Albania Research
Strategic Programme for Development of Innovation
and Technology of SMEs 2011-2016
National Strategy for Science, Technology and
Innovation 2009-2015
Insufficient Financing in R&D (0.01% of the state
budget),
Still insufficient research infrastructure (despite
improvements in the last 5 years)

Bioeconomy in Albania Research
Different studies on environment protection,
especially in the hot spots.
Map of the most suitable crops for each region
Research in improving water and fertilizers use
efficiency.
Limited possibilities in fundamental research
Need for a better coordination of the human and
infrastructural potential.
