integrated annual report 2015
TRANSCRIPT
INTEGRATED ANNUAL REPORT 2015
Integrated Annual Report 2015
ContentsMessage from the President and CEO 2
Tokio Marine Group’s Value Creation Model 4Transition of Value Creation 6Value Creation Case Studies 8Value Creation on Site 10Value Creation Results 12 1. Position 12 2. Financial and Non-Financial Highlights 16
Management Strategies 21 President Tsuyoshi Nagano on Tokio Marine
Group’s Management Strategy 22 CFO Masashi Oba on Tokio Marine Group’s
Capital Strategy 31 CRO Takayuki Yuasa on Tokio Marine Group’s
Risk Management 34
Operations Section 35 Tokio Marine Group at a Glance 36 Domestic Non-Life Insurance Business 38 Domestic Life Insurance Business 44 International Insurance Business 48 Financial and General Businesses 55
The Power of Our People 57 Tokio Marine Group’s Human Resources
Development Philosophy 58 Spreading the Tokio Marine Group Spirit 60 Refining Expertise 62 Empowering Women 63 Cultivating a Global Perspective 64
Management System 66 Directors and Audit & Supervisory
Board Members 68 Interview with an Outside Audit & Supervisory
Board Member 70 Corporate Governance 72 Internal Control System and Compliance 76 Risk Management 77
Financial Data 79Corporate Data 143
Editorial PolicyTokio Marine Group has established a new Group message, “To Be a Good Company”, to show its resolve to continue to aim to be a “Good Company”.
To present our ideas and measures for continuing to aim to be a “Good Company” in a format that is easy for our stakeholders to understand, we have published this Integrated Annual Report, which comprehensively compiles non-financial information such as the value creation processes and CSR activities that are the foundation of our sustainable growth in addition to financial information such as business results and management strategies.
Note: In editing this report, we have referred to international guidelines including the “International Integrated Reporting Framework 1.0” proposed by the International Integrated Reporting Council (IIRC) and aimed to take the perspective of stakeholders.
Forward-Looking StatementsAll forward-looking information is based on current information and assumptions available to Tokio Marine Holdings at the time of the preparation of this report and is subject to a range of inherent risks and uncertainties. Readers should note that actual results may vary materially from those estimated, anticipated, expected or projected in this report and no assurances can be given that any such forward-looking information will prove to have been accurate.
We will be there for our customers, playing our part in society in times of need.
We will balance our strength as an organization with compassion as
individuals, looking beyond profit to deliver fully on our commitments.
Through our collective efforts, we will strive to be a Good Company, living up to the trust
placed in us.
With customer trust as the foundation for all its activities, Tokio Marine Group continually strives to raise corporate value.
Through the provision of the highest quality products and services, Tokio Marine Group aims to deliver safety and security to all our customers.
By developing sound, profitable and growing businesses throughout the world, Tokio Marine Group will fulfill its mandate to shareholders.
Tokio Marine Group will continue to build an open and dynamic corporate culture that enables each and every employee to demonstrate his or her creative potential.
Acting as a good corporate citizen through fair and responsible management, Tokio Marine Group will broadly contribute to the development of society.
Tokio Marine Group Corporate Philosophy
1Tokio Marine Holdings
Message from the President and CEO
2 Integrated Annual Report 2015
The end of March 2015 marked the end of the previous Mid-Term Business Plan and thanks to the trust placed in us by our customers and shareholders we were able to achieve all our targets. In both fiscal 2013 and fiscal 2014 we were able to achieve record earnings as a Group and our domestic non-life, domestic life and international businesses were all able to exceed their respective targets. This was in spite of a tough domestic market due to ongoing deflationary pressure and the recovery efforts of the Great East Japan Earthquake as well as challenging international markets caused by the monetary crisis especially within the Eurozone. As a result of this growth we were able to increase dividends for three consecutive years while also implementing a stock buyback in fiscal 2014. In April 2015 we launched the new Mid-Term Business Plan “To Be a Good Company 2017”. The phrase “To Be a Good Company” expresses our strong commitment to work to earn our customers’ trust and to be there for them in their moment of need. The only thing that can make this vision a reality is our people: people who have been empowered and enabled to act for the benefit of customers and society. Looking back over the past 136 years, it was not necessarily a smooth journey of continued success. There were times when we faced crises and catastrophes but it was always the power of our people that allowed us to overcome these challenges. As we continue on with our timeless endeavor to be a “Good Company” we will build on the legacy and DNA left to us by previous generations. At the same time, we will leverage our diverse business portfolio, expertise, sound capital bases, and other distinctive strengths such as our global brand and network, so that customers will continue to choose our services. We will also continue to enhance our management strategy based on enterprise risk management (ERM), transparent
corporate governance, and diverse human resources. By further developing this value-creating business model we can increase the value that each of our organizations contributes, and provide security and safety to both customers and their communities while also realizing continuous profit growth and capital efficiency improvements. Looking at the mid-to-long-term, we expect that our business environment will change due to various factors such as demographic shifts, technological advancements, such as autonomous vehicles and artificial intelligence, and global warming. In the new Mid-Term Business Plan, we are aiming to deliver continuous profit growth by successfully forecasting the emerging risks and evolving our business portfolio and model so that we can deliver future growth. Through these measures, we are going to make Tokio Marine a truly capable global insurance group. In June, we announced the acquisition of HCC Insurance Holdings, a top tier U.S. specialty insurance group. This will enhance our global risk diversification, and further improve our capital efficiency and continuous profit growth. In other words, we are now able to develop a more stable business foundation for the management of the entire Group. By executing these measures and improving the integrated Group capability, we will continue on with our journey to be a “Good Company” that plays an important role for our customers and the societies we work in. I would like to thank our shareholders and stakeholders for your continued support of Tokio Marine Group.
Tsuyoshi NaganoPresident and CEO
Tokio Marine Group Aims to Be a “Good Company” That Can Continue to Sustainably Provide Value to Its Stakeholders.
3Tokio Marine Holdings
Tokio Marine Group Strengths Value CreationValue Creation Process
Domestic Non-LifeInsurance Business
▶Page 38
Domestic LifeInsurance Business
▶Page 44
InternationalInsurance Business
▶Page 48
Financial andGeneral Businesses
▶Page 55
Our GroupDNA
Well-BalancedBusinessPortfolio
ExpandingGlobal Network
Expertise andAccumulatedKnow-how
SoundFinancial Base
A global insurance group that delivers
sustainable growth by providing safety and security
to customers worldwide
Management Vision
Achieving sustainable growth and enhancing capital efficiency centered on enterprise risk management (ERM)
Management Strategies
Achieving sound,transparent management
CorporateGovernance
Diversity
The Power of Our People
Page 21
Page 72
Page 57
Producing employees and partners who support local communities and society
Creating a safe, secure and sustainable future
Providing safety and security to customers,
local communities and society worldwide through
the insurance business
Continuously enhancing shareholder value
Tokio Marine Group’s Value Creation Model
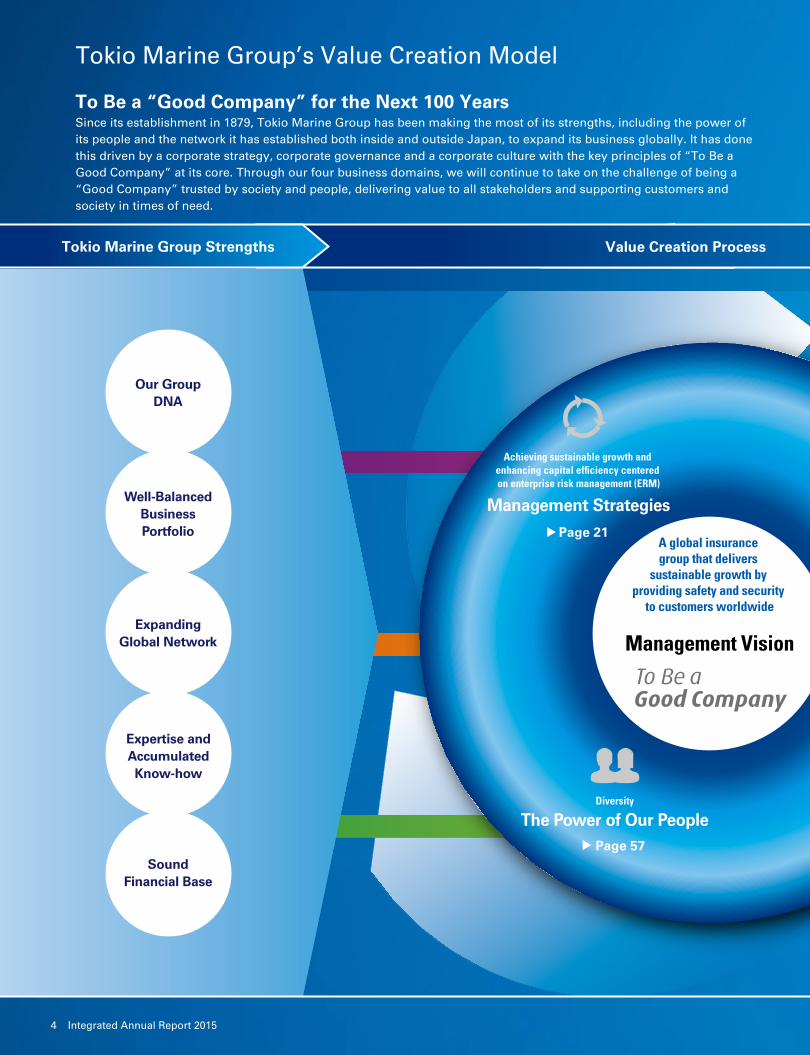
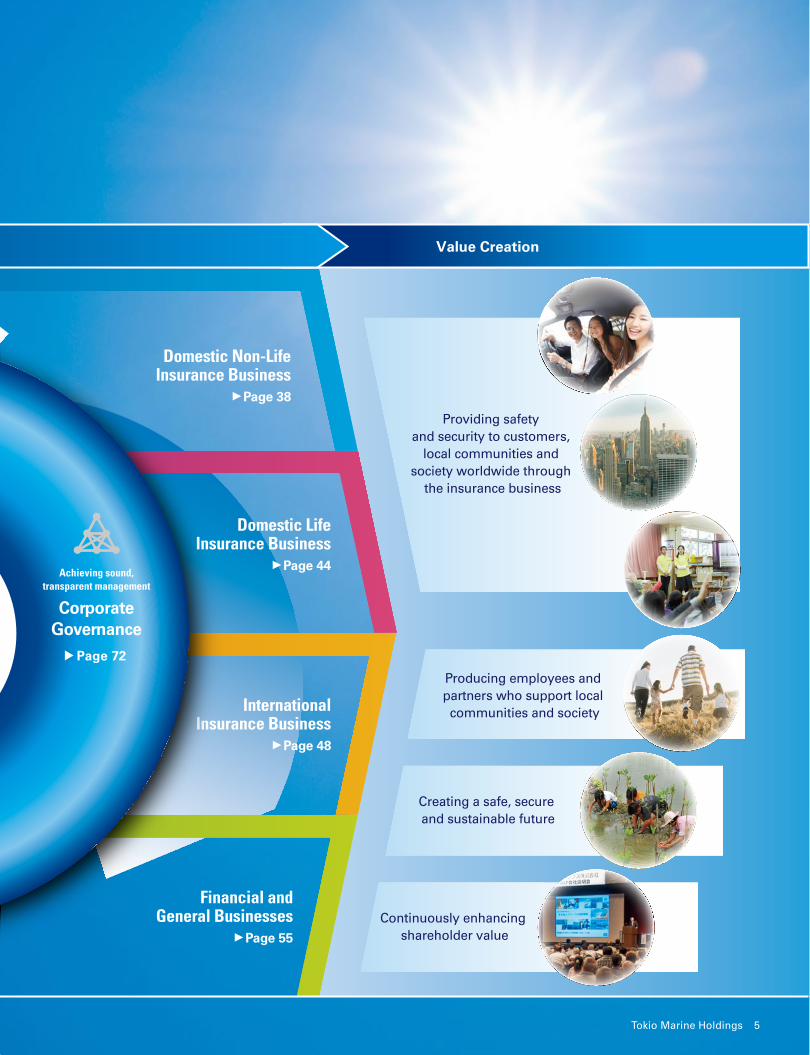
To Be a “Good Company” for the Next 100 YearsSince its establishment in 1879, Tokio Marine Group has been making the most of its strengths, including the power of its people and the network it has established both inside and outside Japan, to expand its business globally. It has done this driven by a corporate strategy, corporate governance and a corporate culture with the key principles of “To Be a Good Company” at its core. Through our four business domains, we will continue to take on the challenge of being a “Good Company” trusted by society and people, delivering value to all stakeholders and supporting customers and society in times of need.
4 Integrated Annual Report 2015
Tokio Marine Group Strengths Value CreationValue Creation Process
Domestic Non-LifeInsurance Business
▶Page 38
Domestic LifeInsurance Business
▶Page 44
InternationalInsurance Business
▶Page 48
Financial andGeneral Businesses
▶Page 55
Our GroupDNA
Well-BalancedBusinessPortfolio
ExpandingGlobal Network
Expertise andAccumulatedKnow-how
SoundFinancial Base
A global insurance group that delivers
sustainable growth by providing safety and security
to customers worldwide
Management Vision
Achieving sustainable growth and enhancing capital efficiency centered on enterprise risk management (ERM)
Management Strategies
Achieving sound,transparent management
CorporateGovernance
Diversity
The Power of Our People
Page 21
Page 72
Page 57
Producing employees and partners who support local communities and society
Creating a safe, secure and sustainable future
Providing safety and security to customers,
local communities and society worldwide through
the insurance business
Continuously enhancing shareholder value
5Tokio Marine Holdings
Transition of Value Creation
Further Value Creation
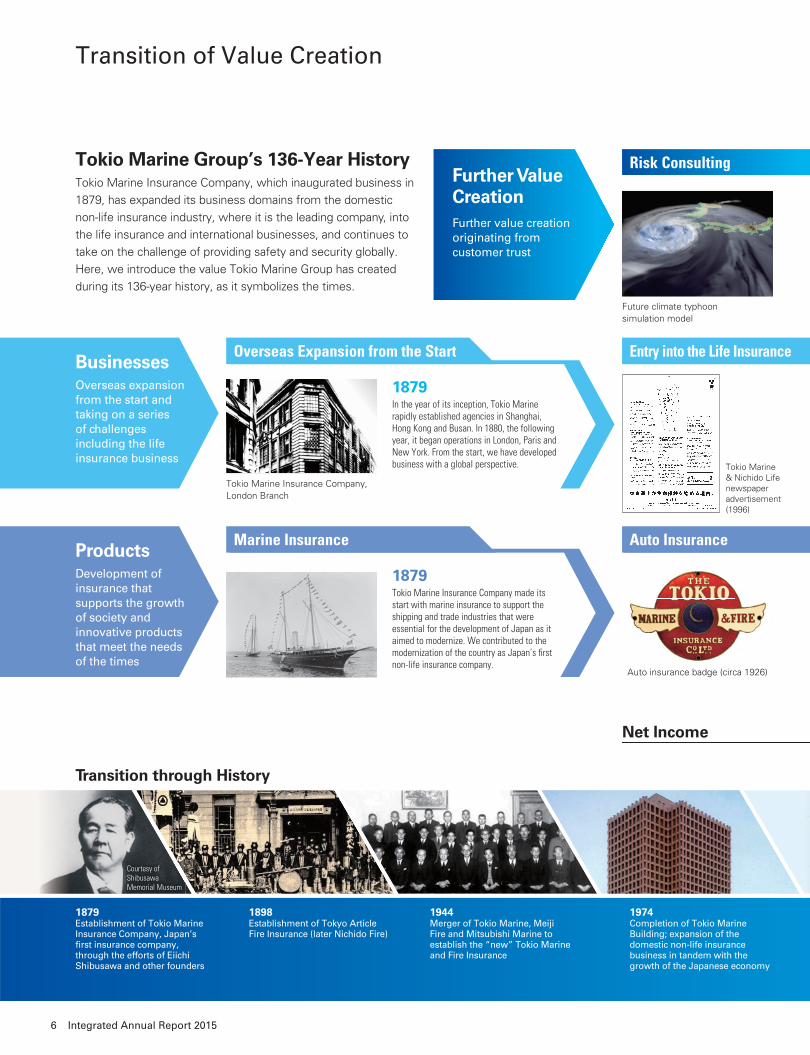
In the year of its inception, Tokio Marine rapidly established agencies in Shanghai, Hong Kong and Busan. In 1880, the following year, it began operations in London, Paris and New York. From the start, we have developed business with a global perspective.
Tokio Marine Insurance Company made its start with marine insurance to support the shipping and trade industries that were essential for the development of Japan as it aimed to modernize. We contributed to the modernization of the country as Japan’s fi rst non-life insurance company.
Businesses
Products
Tokio Marine Group’s 136-Year HistoryTokio Marine Insurance Company, which inaugurated business in
1879, has expanded its business domains from the domestic
non-life insurance industry, where it is the leading company, into
the life insurance and international businesses, and continues to
take on the challenge of providing safety and security globally.
Here, we introduce the value Tokio Marine Group has created
during its 136-year history, as it symbolizes the times.
1879
1879
Risk Consulting
Entry into the Life Insurance
Auto Insurance
Overseas Expansion from the Start
Marine Insurance
Overseas expansion from the start and taking on a series of challenges including the life insurance business
Development of insurance that supports the growth of society and innovative products that meet the needs of the times
Further value creation originating from customer trust
1879Establishment of Tokio Marine Insurance Company, Japan’s fi rst insurance company, through the efforts of Eiichi Shibusawa and other founders
1898Establishment of Tokyo Article Fire Insurance (later Nichido Fire)
1974 Completion of Tokio Marine Building; expansion of the domestic non-life insurance business in tandem with the growth of the Japanese economy
1944 Merger of Tokio Marine, Meiji Fire and Mitsubishi Marine to establish the “new” Tokio Marine and Fire Insurance
Transition through History
Net Income
Tokio Marine Insurance Company, London Branch
Auto insurance badge (circa 1926)
Future climate typhoon simulation model
Courtesy of Shibusawa Memorial Museum
Tokio Marine & Nichido Life newspaper advertisement (1996)
6 Integrated Annual Report 2015
(Fiscal years)20
1420
1220
0420
0620
0820
1020
0220
1320
0520
0720
0920
1120
03
(Billions of yen)
250
100
50
0
200
150
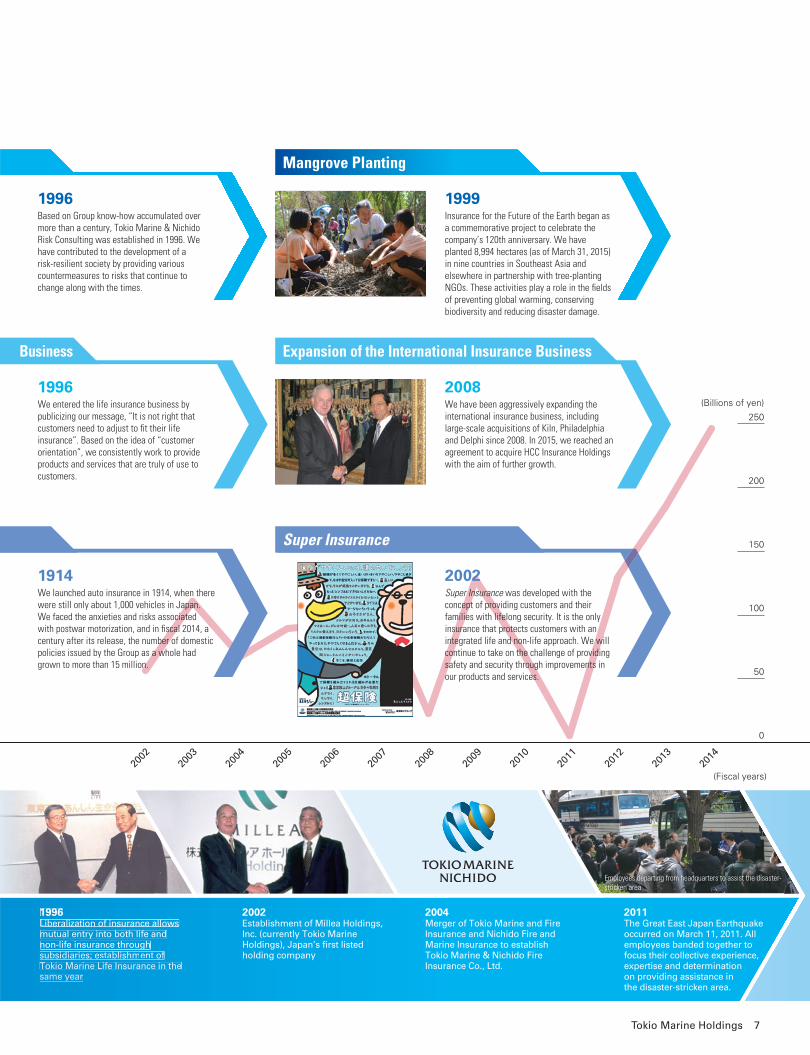
Based on Group know-how accumulated over more than a century, Tokio Marine & Nichido Risk Consulting was established in 1996. We have contributed to the development of a risk-resilient society by providing various countermeasures to risks that continue to change along with the times.
Insurance for the Future of the Earth began as a commemorative project to celebrate the company’s 120th anniversary. We have planted 8,994 hectares (as of March 31, 2015) in nine countries in Southeast Asia and elsewhere in partnership with tree-planting NGOs. These activities play a role in the fi elds of preventing global warming, conserving biodiversity and reducing disaster damage.
We entered the life insurance business by publicizing our message, “It is not right that customers need to adjust to fi t their life insurance”. Based on the idea of “customer orientation”, we consistently work to provide products and services that are truly of use to customers.
We have been aggressively expanding the international insurance business, including large-scale acquisitions of Kiln, Philadelphia and Delphi since 2008. In 2015, we reached an agreement to acquire HCC Insurance Holdings with the aim of further growth.
We launched auto insurance in 1914, when there were still only about 1,000 vehicles in Japan. We faced the anxieties and risks associated with postwar motorization, and in fi scal 2014, a century after its release, the number of domestic policies issued by the Group as a whole had grown to more than 15 million.
Super Insurance was developed with the concept of providing customers and their families with lifelong security. It is the only insurance that protects customers with an integrated life and non-life approach. We will continue to take on the challenge of providing safety and security through improvements in our products and services.
19991996
20081996
1914 2002
Mangrove Planting
Business Expansion of the International Insurance Business
Super Insurance
2011The Great East Japan Earthquake occurred on March 11, 2011. All employees banded together to focus their collective experience, expertise and determination on providing assistance in the disaster-stricken area.
2004 Merger of Tokio Marine and Fire Insurance and Nichido Fire and Marine Insurance to establish Tokio Marine & Nichido Fire Insurance Co., Ltd.
1996Liberalization of insurance allows mutual entry into both life andnon-life insurance throughsubsubsidsidiariariesies; e; estastabliblishmshmentent ofof Tokio Marine Life Insurance in the same year
2002 Establishment of Millea Holdings, Inc. (currently Tokio Marine Holdings), Japan’s fi rst listed holding company
Employees departing from headquarters to assist the disaster-stricken area
7Tokio Marine Holdings
Value Creation Case Studies
Domestic Insurance Business
Super Insurance
Overseas Insurance Business
IFFCO-TOKIO General Insurance in India
Super Insurance with Original Features Super Insurance, launched in 2002, was created under
the customer-oriented concept of combining various types
of insurance that had previously been sold separately into a
single product package.
Customers and their families face various risks, including
traffi c accidents, fi re, injury and illness, and death. Super Insurance considers these risks in their entirety, as
customers and agents work together to assemble all-in-one
life and non-life insurance while determining coverage and
premiums. This enables truly super fi tted coverage for
households without omissions or overlaps. Moreover, using
tablet devices and employing a format that displays the
necessity of coverage as “yes” or “no” choices serve to
visualize intangible insurance to raise customer interest in
insurance, which they often fi nd diffi cult or hard to
understand. This gives customers a sense that insurance is
more transparent and important.
Super Insurance is also unique in providing coverage
unavailable in conventional insurance. For example,
conventional earthquake insurance provides at most 50% of
the limit of liability (insured amount) for the coverage.
However, purchasing a policy with the unique Super
Rolling Out a Combined Model of Indian-Style Development Based on Know-How Accumulated in Japan We are deploying an original business model utilizing the
know-how we have accumulated in Japan for improvement
of the insurance diffusion rate and healthy expansion of
non-life insurance in India. Across a geographically vast area
we are providing innovative products and services that meet
customer needs. We are also promoting the expansion of a
network of large-scale franchisees and the development of a
network of more than 12 thousand individual agents with a
focus on a global retail strategy. Measures have included
sales of auto insurance in cooperation with car dealers. These
measures are based on a Japanese business model and have
been tailored to match the Indian sales style. In addition, to
provide safety and security to more customers, we are
building a diverse sales network rooted in local markets with
the development of sales bases closely linked to local
communities by rolling out a model unique to IFFCO-TOKIO,
which is based on Tokio Marine & Nichido’s agent training
system. The number of in-force policies has grown to more
than 5,550,000 and over 95% of the business portfolio is
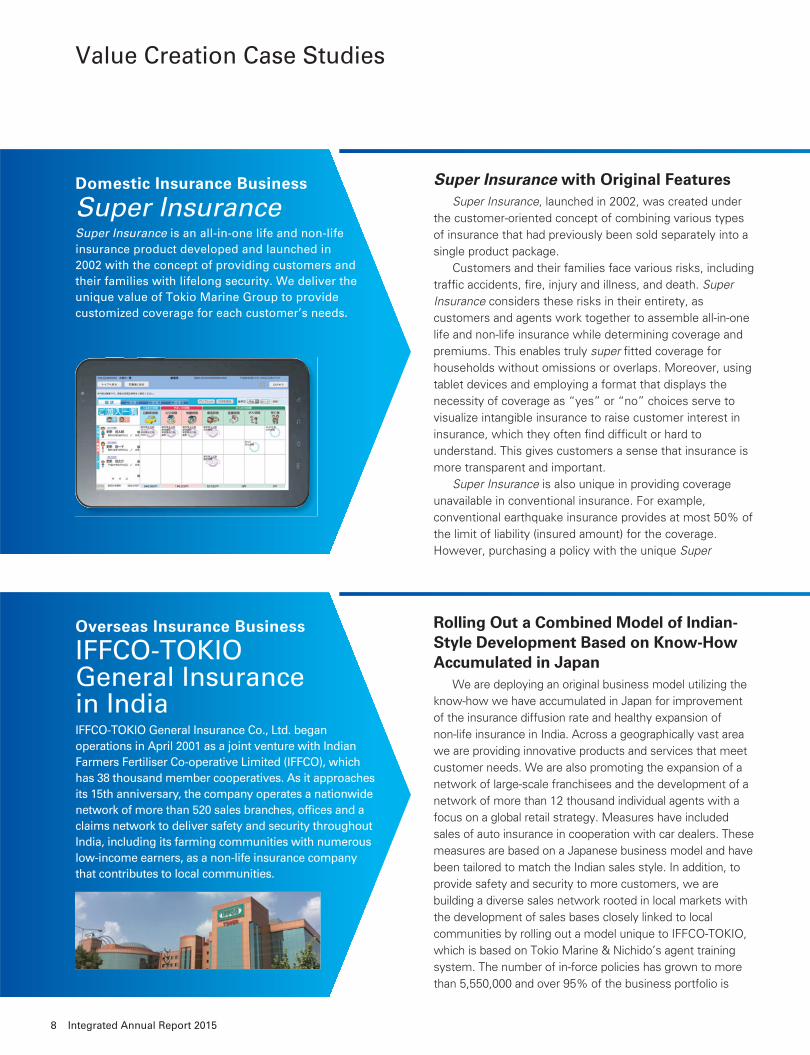
Super Insurance is an all-in-one life and non-life insurance product developed and launched in 2002 with the concept of providing customers and their families with lifelong security. We deliver the unique value of Tokio Marine Group to provide customized coverage for each customer’s needs.
IFFCO-TOKIO General Insurance Co., Ltd. began operations in April 2001 as a joint venture with Indian Farmers Fertiliser Co-operative Limited (IFFCO), which has 38 thousand member cooperatives. As it approaches its 15th anniversary, the company operates a nationwide network of more than 520 sales branches, offi ces and a claims network to deliver safety and security throughout India, including its farming communities with numerous low-income earners, as a non-life insurance company that contributes to local communities.
8 Integrated Annual Report 2015
Insurance rider providing additional coverage for earthquake
and other types of insurance allows a maximum of 100%
coverage1,2 of damage caused by an earthquake, a volcanic
eruption, or an associated tsunami.
Super Insurance also allows consultations on insurance
to be unifi ed into a single liaison point. By also giving
customers a single point of contact for policy review
consultations and in the event of an accident, we can
provide responsive support.1. For earthquake insurance policies with 50% (maximum) of the limit of liability
(insured amount) for the coverage.
2. Specifi c underwriting conditions may apply to the policy.
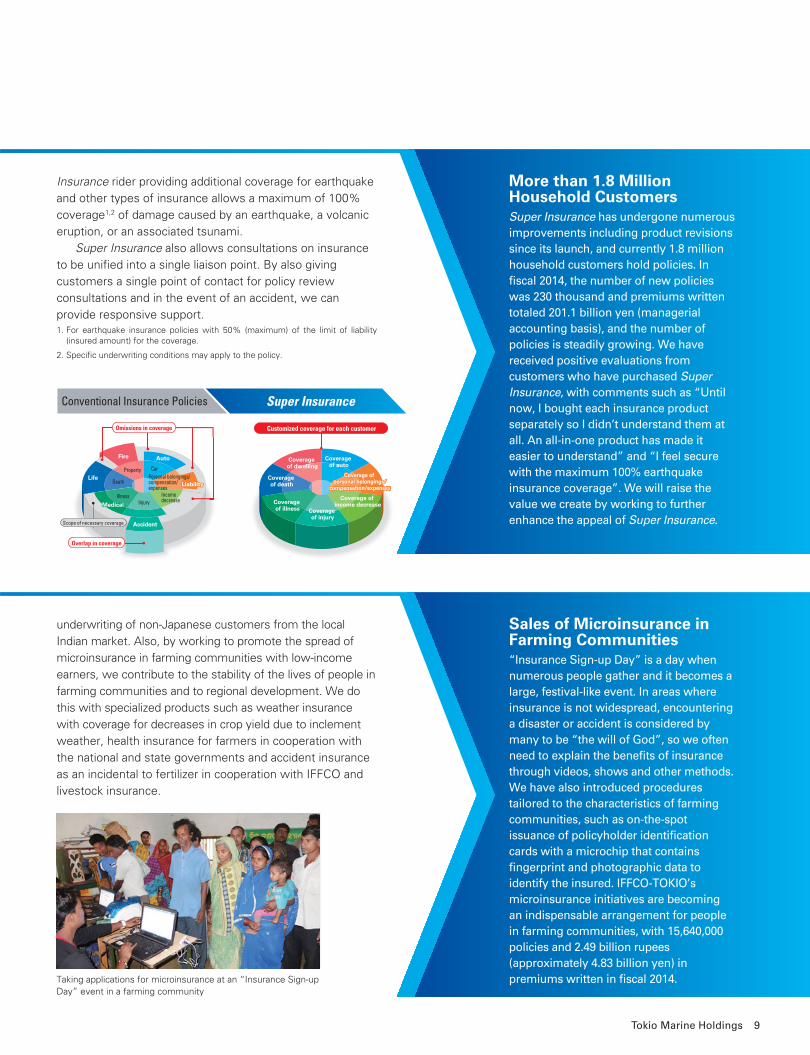
Property
Fire AutoAuto
Life
Car
Income decrease
DeathPersonal belongings/compensation/expenses LiabilityLiability
InjuryIllness
MedicalMedical
Scope of necessary coverage Accident
Overlap in coverage
Omissions in coverage
Coverage of dwelling
Coverage of auto
Coverage of personal belongings/
compensation/expenses
Coverage of personal belongings/
compensation/expenses
Coverage of death
Coverage of income decrease
Coverage of injury
Customized coverage for each customer
Coverage of illness
underwriting of non-Japanese customers from the local
Indian market. Also, by working to promote the spread of
microinsurance in farming communities with low-income
earners, we contribute to the stability of the lives of people in
farming communities and to regional development. We do
this with specialized products such as weather insurance
with coverage for decreases in crop yield due to inclement
weather, health insurance for farmers in cooperation with
the national and state governments and accident insurance
as an incidental to fertilizer in cooperation with IFFCO and
livestock insurance.
More than 1.8 Million Household CustomersSuper Insurance has undergone numerous improvements including product revisions since its launch, and currently 1.8 million household customers hold policies. In fi scal 2014, the number of new policies was 230 thousand and premiums written totaled 201.1 billion yen (managerial accounting basis), and the number of policies is steadily growing. We have received positive evaluations from customers who have purchased Super Insurance, with comments such as “Until now, I bought each insurance product separately so I didn’t understand them at all. An all-in-one product has made it easier to understand” and “I feel secure with the maximum 100% earthquake insurance coverage”. We will raise the value we create by working to further enhance the appeal of Super Insurance.
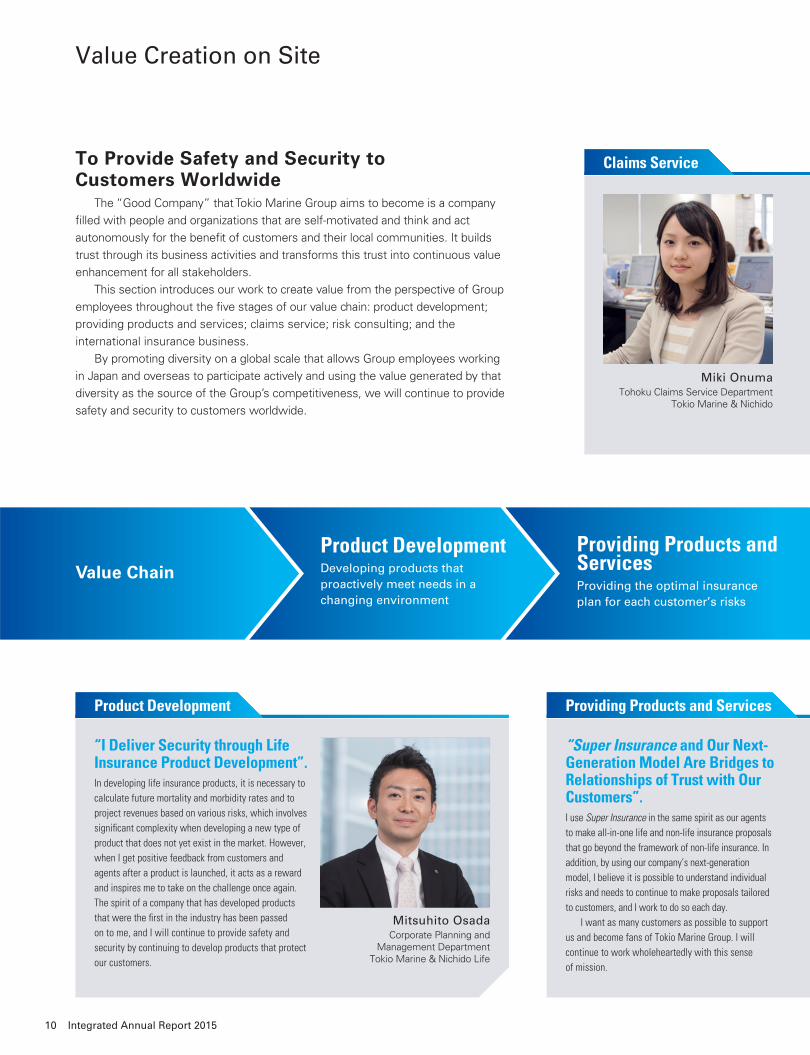
Sales of Microinsurance in Farming Communities“Insurance Sign-up Day” is a day when numerous people gather and it becomes a large, festival-like event. In areas where insurance is not widespread, encountering a disaster or accident is considered by many to be “the will of God”, so we often need to explain the benefi ts of insurance through videos, shows and other methods. We have also introduced procedures tailored to the characteristics of farming communities, such as on-the-spot issuance of policyholder identifi cation cards with a microchip that contains fi ngerprint and photographic data to identify the insured. IFFCO-TOKIO’s microinsurance initiatives are becoming an indispensable arrangement for people in farming communities, with 15,640,000 policies and 2.49 billion rupees (approximately 4.83 billion yen) in premiums written in fi scal 2014.
Conventional Insurance Policies Super Insurance
Taking applications for microinsurance at an “Insurance Sign-up Day” event in a farming community
9Tokio Marine Holdings
Value Creation on Site
To Provide Safety and Security to Customers Worldwide The “Good Company” that Tokio Marine Group aims to become is a company
fi lled with people and organizations that are self-motivated and think and act
autonomously for the benefi t of customers and their local communities. It builds
trust through its business activities and transforms this trust into continuous value
enhancement for all stakeholders.
This section introduces our work to create value from the perspective of Group
employees throughout the fi ve stages of our value chain: product development;
providing products and services; claims service; risk consulting; and the
international insurance business.
By promoting diversity on a global scale that allows Group employees working
in Japan and overseas to participate actively and using the value generated by that
diversity as the source of the Group’s competitiveness, we will continue to provide
safety and security to customers worldwide.
Miki OnumaTohoku Claims Service Department
Tokio Marine & Nichido
“Super Insurance and Our Next-Generation Model Are Bridges to Relationships of Trust with Our Customers”.I use Super Insurance in the same spirit as our agents
to make all-in-one life and non-life insurance proposals
that go beyond the framework of non-life insurance. In
addition, by using our company’s next-generation
model, I believe it is possible to understand individual
risks and needs to continue to make proposals tailored
to customers, and I work to do so each day.
I want as many customers as possible to support
us and become fans of Tokio Marine Group. I will
continue to work wholeheartedly with this sense
of mission.
“I Deliver Security through Life Insurance Product Development”.In developing life insurance products, it is necessary to
calculate future mortality and morbidity rates and to
project revenues based on various risks, which involves
signifi cant complexity when developing a new type of
product that does not yet exist in the market. However,
when I get positive feedback from customers and
agents after a product is launched, it acts as a reward
and inspires me to take on the challenge once again.
The spirit of a company that has developed products
that were the fi rst in the industry has been passed
on to me, and I will continue to provide safety and
security by continuing to develop products that protect
our customers.
Mitsuhito OsadaCorporate Planning and
Management DepartmentTokio Marine & Nichido Life
Product DevelopmentDeveloping products that proactively meet needs in a changing environment
Providing Products and ServicesProviding the optimal insurance plan for each customer’s risks
Value Chain
Claims Service
Product Development Providing Products and Services
10 Integrated Annual Report 2015
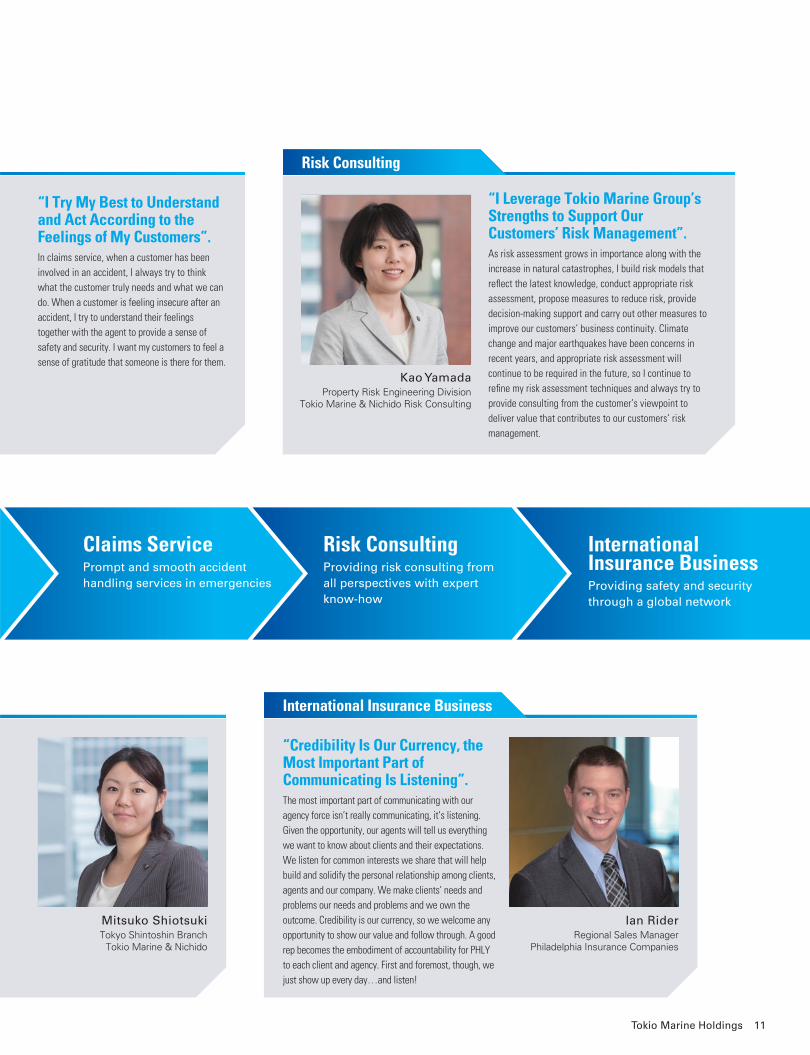
“I Try My Best to Understand and Act According to the Feelings of My Customers”.In claims service, when a customer has been
involved in an accident, I always try to think
what the customer truly needs and what we can
do. When a customer is feeling insecure after an
accident, I try to understand their feelings
together with the agent to provide a sense of
safety and security. I want my customers to feel a
sense of gratitude that someone is there for them.
“I Leverage Tokio Marine Group’s Strengths to Support Our Customers’ Risk Management”.As risk assessment grows in importance along with the
increase in natural catastrophes, I build risk models that
refl ect the latest knowledge, conduct appropriate risk
assessment, propose measures to reduce risk, provide
decision-making support and carry out other measures to
improve our customers’ business continuity. Climate
change and major earthquakes have been concerns in
recent years, and appropriate risk assessment will
continue to be required in the future, so I continue to
refi ne my risk assessment techniques and always try to
provide consulting from the customer’s viewpoint to
deliver value that contributes to our customers’ risk
management.
Kao YamadaProperty Risk Engineering Division
Tokio Marine & Nichido Risk Consulting
Mitsuko ShiotsukiTokyo Shintoshin Branch
Tokio Marine & Nichido
“Credibility Is Our Currency, the Most Important Part of Communicating Is Listening”. The most important part of communicating with our
agency force isn’t really communicating, it’s listening.
Given the opportunity, our agents will tell us everything
we want to know about clients and their expectations.
We listen for common interests we share that will help
build and solidify the personal relationship among clients,
agents and our company. We make clients’ needs and
problems our needs and problems and we own the
outcome. Credibility is our currency, so we welcome any
opportunity to show our value and follow through. A good
rep becomes the embodiment of accountability for PHLY
to each client and agency. First and foremost, though, we
just show up every day…and listen!
Ian RiderRegional Sales Manager
Philadelphia Insurance Companies
Claims ServicePrompt and smooth accident handling services in emergencies
Risk ConsultingProviding risk consulting from all perspectives with expert know-how
International Insurance BusinessProviding safety and security through a global network
Risk Consulting
International Insurance Business
11Tokio Marine Holdings
Value Creation Results
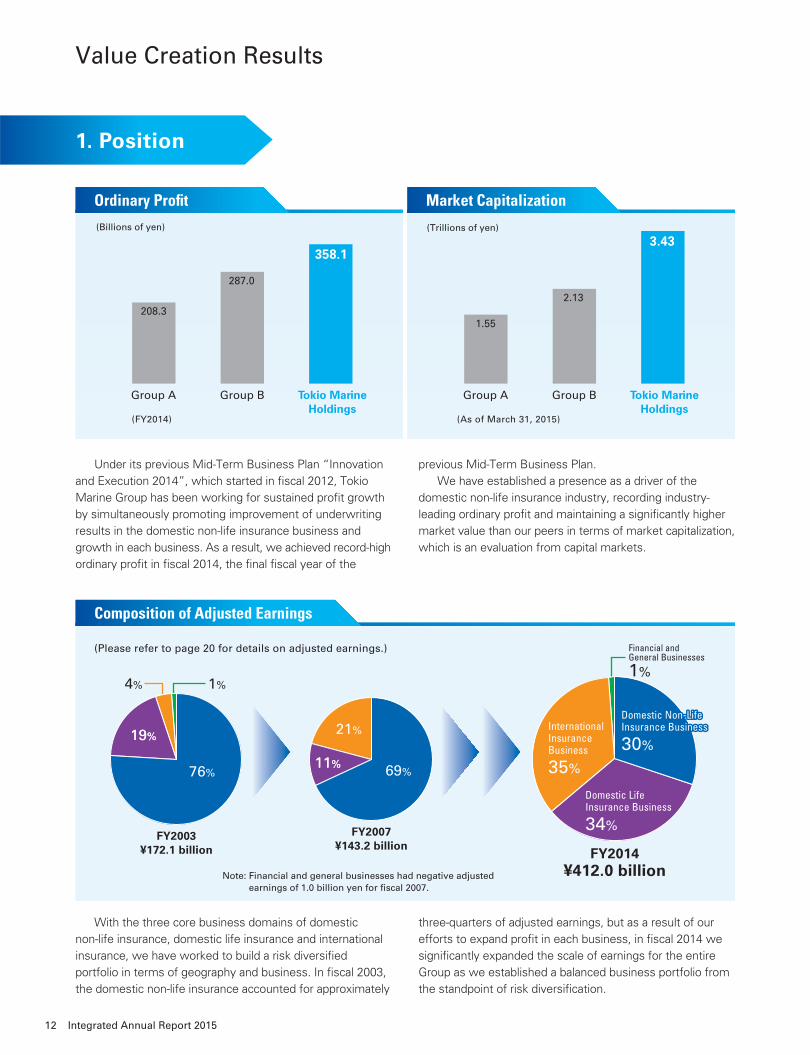
1%
Financial and General Businesses
1%
69%
(Please refer to page 20 for details on adjusted earnings.)
FY2003¥172.1 billion
FY2007¥143.2 billion
FY2014¥412.0 billion
International Insurance Business
35%
4%
11%11%
21%21%Domestic Non-Life Domestic Non-Life Insurance BusinessInsurance Business
3030%%
Domestic Non-Life Insurance Business
30%
Domestic Non-Life Insurance Business
30%
Domestic Life Insurance Business
34%
Domestic Life Insurance Business
34%
Domestic Life Insurance Business
34%
76%
19%19%
Note: Financial and general businesses had negative adjusted earnings of 1.0 billion yen for fi scal 2007.
Under its previous Mid-Term Business Plan “Innovation
and Execution 2014”, which started in fi scal 2012, Tokio
Marine Group has been working for sustained profi t growth
by simultaneously promoting improvement of underwriting
results in the domestic non-life insurance business and
growth in each business. As a result, we achieved record-high
ordinary profi t in fi scal 2014, the fi nal fi scal year of the
previous Mid-Term Business Plan.
We have established a presence as a driver of the
domestic non-life insurance industry, recording industry-
leading ordinary profi t and maintaining a signifi cantly higher
market value than our peers in terms of market capitalization,
which is an evaluation from capital markets.
With the three core business domains of domestic
non-life insurance, domestic life insurance and international
insurance, we have worked to build a risk diversifi ed
portfolio in terms of geography and business. In fi scal 2003,
the domestic non-life insurance accounted for approximately
three-quarters of adjusted earnings, but as a result of our
efforts to expand profi t in each business, in fi scal 2014 we
signifi cantly expanded the scale of earnings for the entire
Group as we established a balanced business portfolio from
the standpoint of risk diversifi cation.
1. Position
12 Integrated Annual Report 2015
Group A Group B Tokio MarineHoldings
208.3
287.0
358.1
(FY2014)
(Billions of yen)
Group A Group B Tokio MarineHoldings
1.55
2.13
3.43
(As of March 31, 2015)
(Trillions of yen)
Market CapitalizationOrdinary Profi t
Composition of Adjusted Earnings
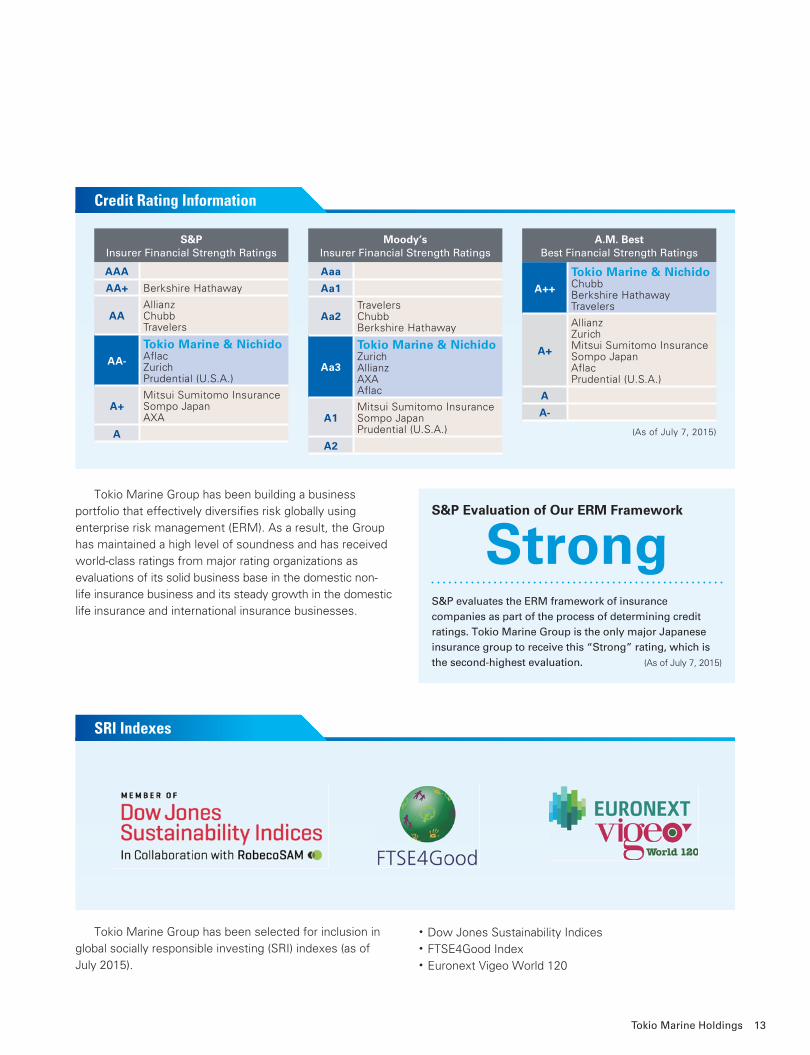
Tokio Marine Group has been building a business
portfolio that effectively diversifi es risk globally using
enterprise risk management (ERM). As a result, the Group
has maintained a high level of soundness and has received
world-class ratings from major rating organizations as
evaluations of its solid business base in the domestic non-
life insurance business and its steady growth in the domestic
life insurance and international insurance businesses.
S&PInsurer Financial Strength Ratings
AAA
AA+ Berkshire Hathaway
AAAllianzChubbTravelers
AA-
Tokio Marine & NichidoAflacZurichPrudential (U.S.A.)
A+Mitsui Sumitomo InsuranceSompo JapanAXA
A
Moody’sInsurer Financial Strength Ratings
Aaa
Aa1
Aa2TravelersChubbBerkshire Hathaway
Aa3
Tokio Marine & NichidoZurichAllianzAXAAflac
A1Mitsui Sumitomo InsuranceSompo JapanPrudential (U.S.A.)
A2
A.M. BestBest Financial Strength Ratings
A++
Tokio Marine & NichidoChubbBerkshire HathawayTravelers
A+
AllianzZurichMitsui Sumitomo InsuranceSompo JapanAflacPrudential (U.S.A.)
A
A-
(As of July 7, 2015)
Tokio Marine Group has been selected for inclusion in
global socially responsible investing (SRI) indexes (as of
July 2015).
• Dow Jones Sustainability Indices
• FTSE4Good Index
• Euronext Vigeo World 120
S&P Evaluation of Our ERM Framework
StrongS&P evaluates the ERM framework of insurance companies as part of the process of determining credit ratings. Tokio Marine Group is the only major Japanese insurance group to receive this “Strong” rating, which is the second-highest evaluation. (As of July 7, 2015)
13Tokio Marine Holdings
Credit Rating Information
SRI Indexes
Topic 1
Topic 2
Social Contribution through Participation in International Initiatives Tokio Marine Group contributes to a safe, secure
and sustainable future as a signatory to and a participant
in the United Nations Global Compact (UNGC), the
United Nations Environment Programme Finance
Initiative (UNEP FI), Principles for Sustainable Insurance
(PSI) and the United Nations Principles for Responsible
Investment (PRI).
PRI signatory organizations Tokio Marine Asset
Management and Tokio Maine & Nichido have made
clear their endorsement and acceptance of “Japan’s
Stewardship Code”, a set of principles for responsible
institutional investors, and engage in constructive
dialogue for the sustainable growth of investee
companies.
In addition, through participation in the Disaster
Risk Reduction Private Sector Partnership (DRR-PSP)
of the United Nations Offi ce for Disaster Risk Reduction
(UNISDR), ClimateWise and the Geneva Association’s
Extreme Events and Climate Risk Working Group, Tokio
Marine Group is working to resolve the issues of climate
change and natural disasters and mitigate their damage.
At the Third UN World Conference on Disaster Risk
Reduction held in March 2015 in Sendai, Tokio Marine &
Nichido contributed to the success of the conference
and a more resilient society by presenting the results
of industry-academia collaborative research with Tohoku
University (including the development of a stochastic risk
assessment method for earthquake-induced tsunamis),
promoting global sharing and dialogue regarding insurance
and risk management knowledge, unveiling disaster
prevention solutions, and other efforts.
JPX-Nikkei Index 400 The JPX-Nikkei Index 400 is composed of companies
with high appeal for investors, which meet the
requirement of global investment standards, such as
effi cient use of capital and an investor-focused
management perspective. Tokio Marine Holdings has
been selected for inclusion for two consecutive years
since the establishment of the index in 2014.
14 Integrated Annual Report 2015
Topic 3
Under its previous Mid-Term Business Plan
“Innovation and Execution 2014”, Tokio Marine
Holdings has been working to enhance its customer
contacts, raise the quality of its operations and
transform work styles using IT, with the aim of
“sustaining our industry-leading premium growth by
strengthening customer contacts through improved
utilization of our IT infrastructure”.
Tokio Marine & Nichido, our main company in the
domestic non-life insurance business, achieved simple,
smooth and speedy business processes through a core
system reconstruction project to drastically reform
increasingly complex products, operations and systems
all at once. Moreover, a “next-generation model”
project to innovate business processes between
customers and agents has enabled insurance contract
procedures using tablet devices, generating results
such as product descriptions
that are easy for customers to
understand and making time
for communication between
customers and agents. In
addition, the company
started a “work style
transformation” project that
enables work that was
previously conducted in an
offi ce to be done on a tablet
device without time and
space restrictions, building
an infrastructure for highly
productive and diverse
work styles.
We will continue to promote the proactive use
of IT for management innovation and enhanced
competitiveness that lead to increases in corporate value.
Tokio Marine & Nichido’s consistent objectives for
all business innovation projects
• Enhance customer service quality
• Enhance productivity
• Innovation in work style
• Differentiation from other companies
• Enhance sales and profitability
Promotion of core system
reconstruction project
Innovation in customercontacts using mobile devices
(next-generation model)
Insurance Agents
Business processesfor insurance sales
Business processes betweeninsurance company and agents
Customers
Insurance applicationsystem using mobile devices
(One Day Auto Insurance, etc.)
Customers’ insuranceapplication process
Insurance Company
Transform employee work styles with intranet terminal improvements
Infrastructure to support the work styles of insurance
company employees
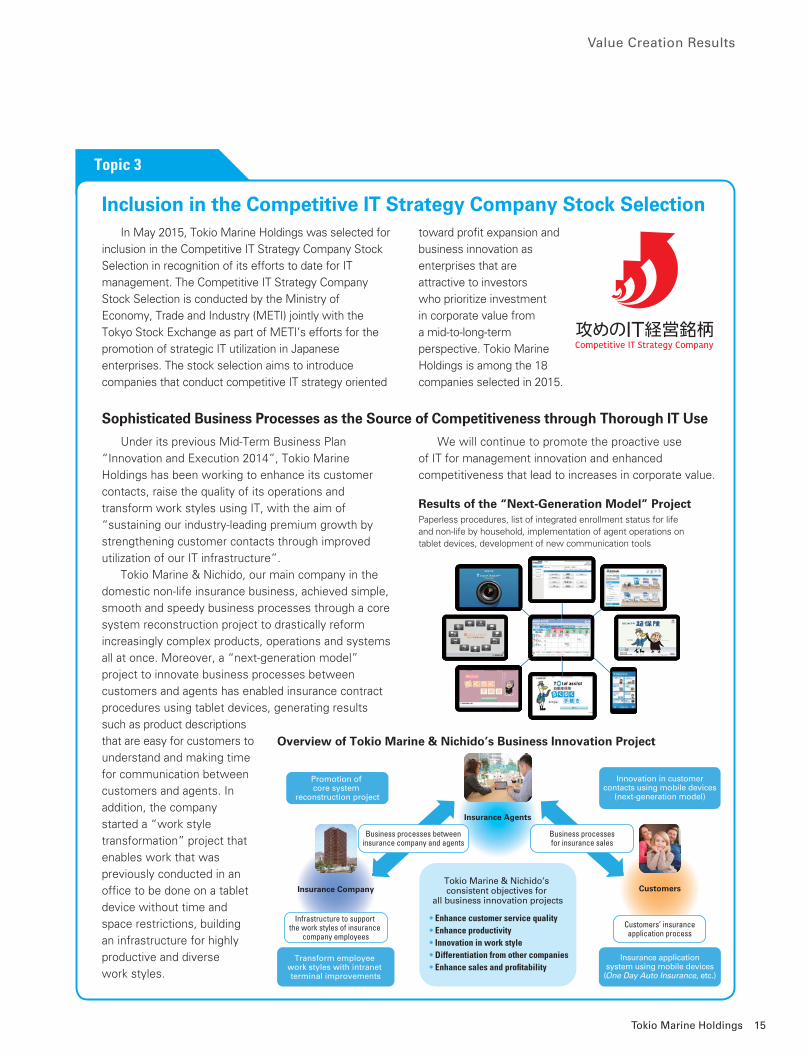
Inclusion in the Competitive IT Strategy Company Stock Selection
Sophisticated Business Processes as the Source of Competitiveness through Thorough IT Use
Value Creation Results
In May 2015, Tokio Marine Holdings was selected for
inclusion in the Competitive IT Strategy Company Stock
Selection in recognition of its efforts to date for IT
management. The Competitive IT Strategy Company
Stock Selection is conducted by the Ministry of
Economy, Trade and Industry (METI) jointly with the
Tokyo Stock Exchange as part of METI’s efforts for the
promotion of strategic IT utilization in Japanese
enterprises. The stock selection aims to introduce
companies that conduct competitive IT strategy oriented
toward profi t expansion and
business innovation as
enterprises that are
attractive to investors
who prioritize investment
in corporate value from
a mid-to-long-term
perspective. Tokio Marine
Holdings is among the 18
companies selected in 2015.
Overview of Tokio Marine & Nichido’s Business Innovation Project
Results of the “Next-Generation Model” ProjectPaperless procedures, list of integrated enrollment status for life and non-life by household, implementation of agent operations on tablet devices, development of new communication tools
15Tokio Marine Holdings
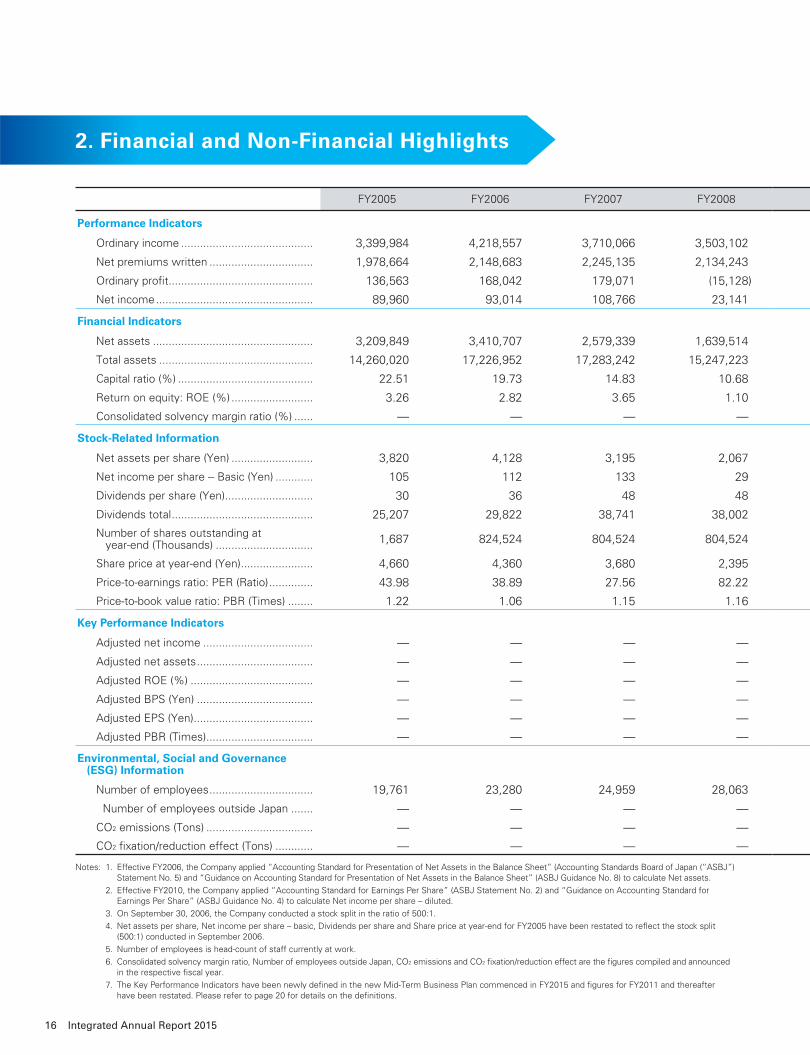
FY2005 FY2006 FY2007 FY2008
Performance Indicators
Ordinary income .......................................... 3,399,984 4,218,557 3,710,066 3,503,102
Net premiums written ................................. 1,978,664 2,148,683 2,245,135 2,134,243
Ordinary profi t .............................................. 136,563 168,042 179,071 (15,128)
Net income .................................................. 89,960 93,014 108,766 23,141
Financial Indicators
Net assets ................................................... 3,209,849 3,410,707 2,579,339 1,639,514
Total assets ................................................. 14,260,020 17,226,952 17,283,242 15,247,223
Capital ratio (%) ........................................... 22.51 19.73 14.83 10.68
Return on equity: ROE (%) .......................... 3.26 2.82 3.65 1.10
Consolidated solvency margin ratio (%) ...... — — — —
Stock-Related Information
Net assets per share (Yen) .......................... 3,820 4,128 3,195 2,067
Net income per share -- Basic (Yen) ............ 105 112 133 29
Dividends per share (Yen) ............................ 30 36 48 48
Dividends total ............................................. 25,207 29,822 38,741 38,002
Number of shares outstanding at year-end (Thousands) ............................... 1,687 824,524 804,524 804,524
Share price at year-end (Yen) ....................... 4,660 4,360 3,680 2,395
Price-to-earnings ratio: PER (Ratio) .............. 43.98 38.89 27.56 82.22
Price-to-book value ratio: PBR (Times) ........ 1.22 1.06 1.15 1.16
Key Performance Indicators
Adjusted net income ................................... — — — —
Adjusted net assets ..................................... — — — —
Adjusted ROE (%) ....................................... — — — —
Adjusted BPS (Yen) ..................................... — — — —
Adjusted EPS (Yen) ...................................... — — — —
Adjusted PBR (Times) .................................. — — — —
Environmental, Social and Governance (ESG) Information
Number of employees ................................. 19,761 23,280 24,959 28,063
Number of employees outside Japan ....... — — — —
CO2 emissions (Tons) .................................. — — — —
CO2 fi xation/reduction effect (Tons) ............ — — — —
Notes: 1. Effective FY2006, the Company applied “Accounting Standard for Presentation of Net Assets in the Balance Sheet” (Accounting Standards Board of Japan (“ASBJ”) Statement No. 5) and “Guidance on Accounting Standard for Presentation of Net Assets in the Balance Sheet” (ASBJ Guidance No. 8) to calculate Net assets.
2. Effective FY2010, the Company applied “Accounting Standard for Earnings Per Share” (ASBJ Statement No. 2) and “Guidance on Accounting Standard for Earnings Per Share” (ASBJ Guidance No. 4) to calculate Net income per share – diluted.
3. On September 30, 2006, the Company conducted a stock split in the ratio of 500:1.
4. Net assets per share, Net income per share – basic, Dividends per share and Share price at year-end for FY2005 have been restated to refl ect the stock split (500:1) conducted in September 2006.
5. Number of employees is head-count of staff currently at work.
6. Consolidated solvency margin ratio, Number of employees outside Japan, CO2 emissions and CO2 fi xation/reduction effect are the fi gures compiled and announced in the respective fi scal year.
7. The Key Performance Indicators have been newly defi ned in the new Mid-Term Business Plan commenced in FY2015 and fi gures for FY2011 and thereafter have been restated. Please refer to page 20 for details on the defi nitions.
2. Financial and Non-Financial Highlights
16 Integrated Annual Report 2015
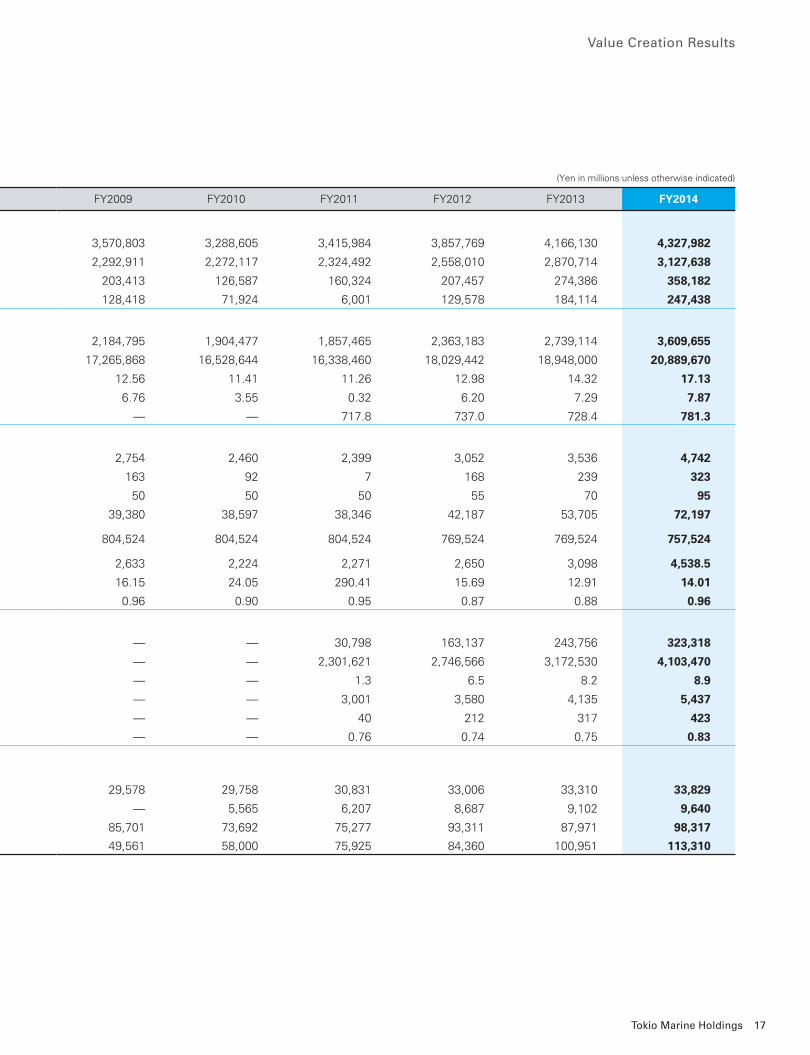
FY2009 FY2010 FY2011 FY2012 FY2013 FY2014
3,570,803 3,288,605 3,415,984 3,857,769 4,166,130 4,327,982
2,292,911 2,272,117 2,324,492 2,558,010 2,870,714 3,127,638
203,413 126,587 160,324 207,457 274,386 358,182
128,418 71,924 6,001 129,578 184,114 247,438
2,184,795 1,904,477 1,857,465 2,363,183 2,739,114 3,609,655
17,265,868 16,528,644 16,338,460 18,029,442 18,948,000 20,889,670
12.56 11.41 11.26 12.98 14.32 17.13
6.76 3.55 0.32 6.20 7.29 7.87
— — 717.8 737.0 728.4 781.3
2,754 2,460 2,399 3,052 3,536 4,742
163 92 7 168 239 323
50 50 50 55 70 95
39,380 38,597 38,346 42,187 53,705 72,197
804,524 804,524 804,524 769,524 769,524 757,524
2,633 2,224 2,271 2,650 3,098 4,538.5
16.15 24.05 290.41 15.69 12.91 14.01
0.96 0.90 0.95 0.87 0.88 0.96
— — 30,798 163,137 243,756 323,318
— — 2,301,621 2,746,566 3,172,530 4,103,470
— — 1.3 6.5 8.2 8.9
— — 3,001 3,580 4,135 5,437
— — 40 212 317 423
— — 0.76 0.74 0.75 0.83
29,578 29,758 30,831 33,006 33,310 33,829
— 5,565 6,207 8,687 9,102 9,640
85,701 73,692 75,277 93,311 87,971 98,317
49,561 58,000 75,925 84,360 100,951 113,310
Value Creation Results
(Yen in millions unless otherwise indicated)
17Tokio Marine Holdings
(Billions of yen)
2014201320122011201020092008200720062005
3,609.6
4,103.4
0
1,000
2,000
3,000
4,000
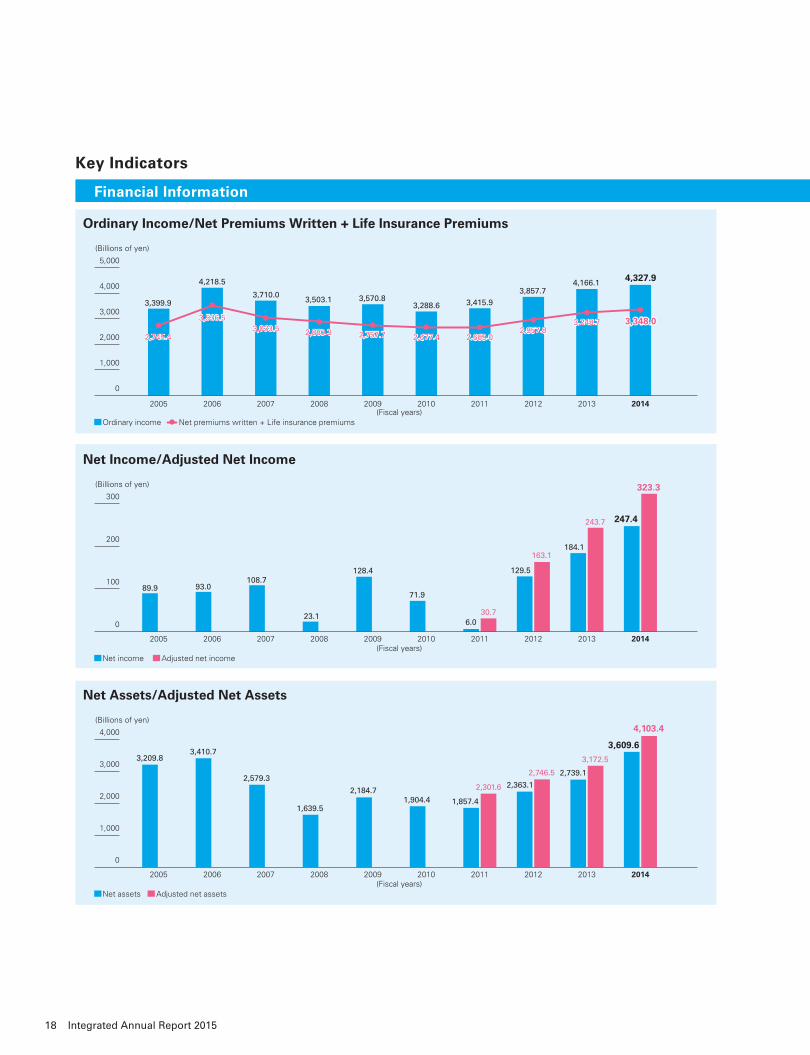
Net assets Adjusted net assets
Net Assets/Adjusted Net Assets
(Fiscal years)
2,739.1
2,363.1
1,857.41,904.42,184.7
1,639.5
2,579.3
3,410.73,209.8 3,172.5
2,746.5
2,301.6
(Billions of yen)
2014201320122011201020092008200720062005
247.4
323.3
Net income Adjusted net income
Net Income/Adjusted Net Income
(Fiscal years)
0
100
200
300
184.1
129.5
6.0
71.9
128.4
23.1
108.793.089.9
243.7
163.1
30.7
(Billions of yen)
2014201320122011201020092008200720062005
0
1,000
2,000
3,000
4,000
5,000
3,348.03,348.0
4,327.9
Ordinary income Net premiums written + Life insurance premiums
Ordinary Income/Net Premiums Written + Life Insurance Premiums
(Fiscal years)
4,166.13,857.7
3,415.93,288.63,570.83,503.1
3,710.0
4,218.5
3,399.9
3,248.73,248.72,957.82,957.8
2,669.02,669.02,677.42,677.42,757.72,757.72,880.32,880.33,033.53,033.53,536.53,536.5
2,745.42,745.4
Key Indicators
Financial Information
18 Integrated Annual Report 2015
(Tons)
201420132012201120102009
113,310
98,31798,317
CO2 emissions CO2 fixation/reduction effectNote: The main reason in the increase in CO2 emissions in FY2014 was the increase in the CO2 emission factors of Japanese power utilities; energy consumption itself decreased in FY2014.
CO2 Emissions and CO2 Fixation/Reduction Effect
(Fiscal years)
0
30,000
60,000
90,000
120,000
(Billions of yen) (Yen)
2014201320122011201020092008200720062005
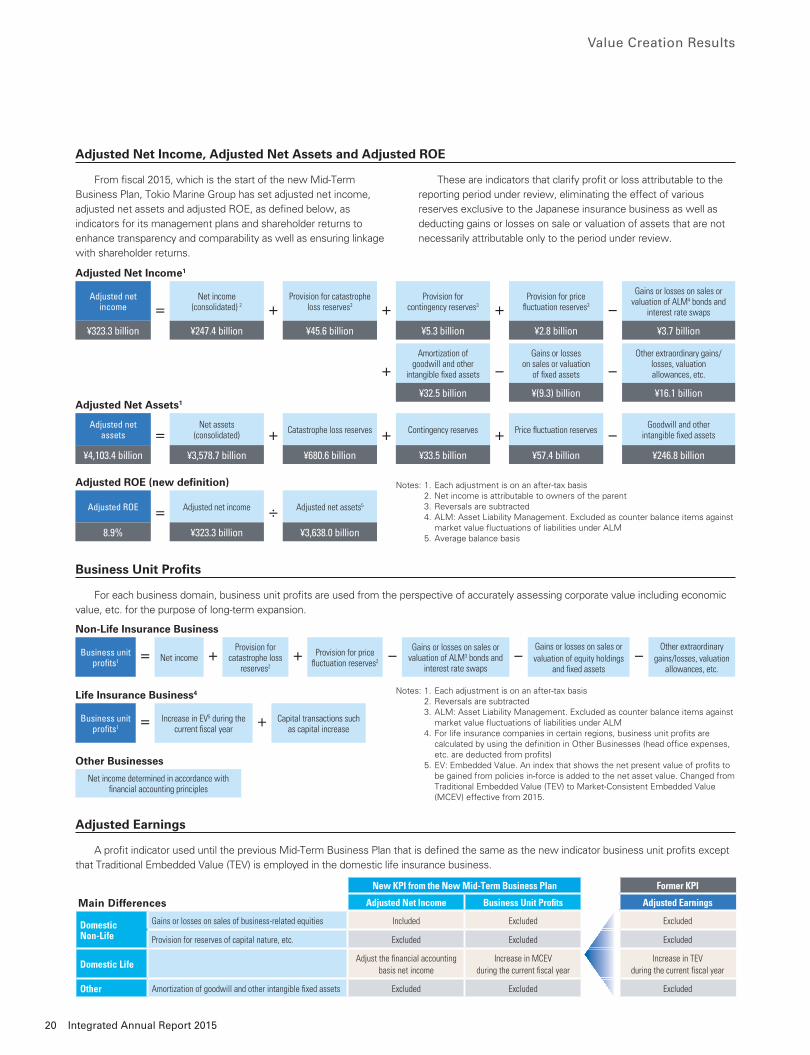
Dividends (left scale) Dividends per share (right scale)Note: Dividends per share for FY2005 have been restated to reflect the stock split (500:1) conducted in September 2006.
Dividends/Dividends per Share
(Fiscal years)
0
20
40
60
80
9595
7070
5555505050505050484848483636
3030
72.2
53.7
42.238.338.639.438.038.7
29.825.2
0
30
60
90
120
150
(%)
2014201320122011201020092008200720062005
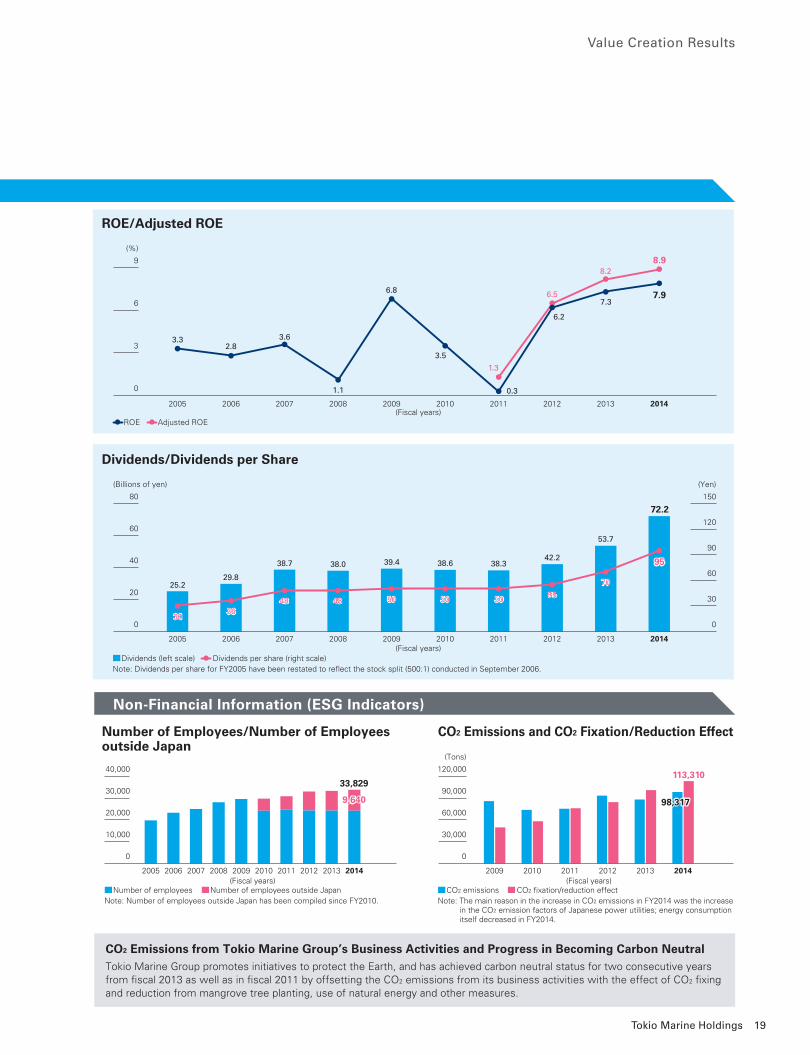
7.9
8.9
ROE Adjusted ROE
ROE/Adjusted ROE
(Fiscal years)
0
3
6
98.2
6.5
1.3
7.3
6.2
0.3
3.5
6.8
1.1
3.62.8
3.3
Value Creation Results
Non-Financial Information (ESG Indicators)
CO2 Emissions from Tokio Marine Group’s Business Activities and Progress in Becoming Carbon NeutralTokio Marine Group promotes initiatives to protect the Earth, and has achieved carbon neutral status for two consecutive years from fi scal 2013 as well as in fi scal 2011 by offsetting the CO2 emissions from its business activities with the effect of CO2 fi xing and reduction from mangrove tree planting, use of natural energy and other measures.
2014201320122011201020092008200720062005
33,829
9,6409,640
Number of employees Number of employees outside JapanNote: Number of employees outside Japan has been compiled since FY2010.
Number of Employees/Number of Employees outside Japan
(Fiscal years)
0
10,000
20,000
30,000
40,000
19Tokio Marine Holdings
From fi scal 2015, which is the start of the new Mid-Term
Business Plan, Tokio Marine Group has set adjusted net income,
adjusted net assets and adjusted ROE, as defi ned below, as
indicators for its management plans and shareholder returns to
enhance transparency and comparability as well as ensuring linkage
with shareholder returns.
These are indicators that clarify profi t or loss attributable to the
reporting period under review, eliminating the effect of various
reserves exclusive to the Japanese insurance business as well as
deducting gains or losses on sale or valuation of assets that are not
necessarily attributable only to the period under review.
Adjusted Net Income, Adjusted Net Assets and Adjusted ROE
Value Creation Results
Adjusted Earnings
For each business domain, business unit profi ts are used from the perspective of accurately assessing corporate value including economic
value, etc. for the purpose of long-term expansion.
Business Unit Profi ts
Adjusted Net Income1
Adjusted Net Assets1
Adjusted ROE (new defi nition)
Adjusted net income
¥323.3 billion
Adjusted net assets
¥4,103.4 billion
Adjusted ROE
8.9%
Net income (consolidated) 2
¥247.4 billion
Net assets (consolidated)
¥3,578.7 billion
Adjusted net income
¥323.3 billion
Provision for catastrophe loss reserves3
¥45.6 billion
Catastrophe loss reserves
¥680.6 billion
Adjusted net assets5
¥3,638.0 billion
Provision for contingency reserves3
¥5.3 billion
Contingency reserves
¥33.5 billion
Amortization of goodwill and other
intangible fi xed assets
¥32.5 billion
Provision for price fl uctuation reserves3
¥2.8 billion
Price fl uctuation reserves
¥57.4 billion
Gains or losses on sales or valuation
of fi xed assets
¥(9.3) billion
Gains or losses on sales or valuation of ALM4 bonds and
interest rate swaps
¥3.7 billion
Goodwill and other intangible fi xed assets
¥246.8 billion
Other extraordinary gains/losses, valuation allowances, etc.
¥16.1 billion
=
=
=
+
+
÷
+
+
+
+
+
-
-
-
-
Notes: 1. Each adjustment is on an after-tax basis 2. Net income is attributable to owners of the parent 3. Reversals are subtracted 4. ALM: Asset Liability Management. Excluded as counter balance items against
market value fl uctuations of liabilities under ALM 5. Average balance basis
Non-Life Insurance Business
Business unit profi ts1 Net income
Provision for catastrophe loss
reserves2
Provision for price fl uctuation reserves2
Gains or losses on sales or valuation of ALM3 bonds and
interest rate swaps
Gains or losses on sales or valuation of equity holdings
and fi xed assets
Other extraordinary gains/losses, valuation
allowances, etc.= + + - - -
Life Insurance Business4
Business unit profi ts1
Increase in EV5 during the current fi scal year
Capital transactions such as capital increase
= +
Notes: 1. Each adjustment is on an after-tax basis 2. Reversals are subtracted 3. ALM: Asset Liability Management. Excluded as counter balance items against
market value fl uctuations of liabilities under ALM 4. For life insurance companies in certain regions, business unit profi ts are
calculated by using the defi nition in Other Businesses (head offi ce expenses, etc. are deducted from profi ts)
5. EV: Embedded Value. An index that shows the net present value of profi ts to be gained from policies in-force is added to the net asset value. Changed from Traditional Embedded Value (TEV) to Market-Consistent Embedded Value (MCEV) effective from 2015.
Other Businesses
Net income determined in accordance with fi nancial accounting principles
New KPI from the New Mid-Term Business Plan Former KPI
Main Differences Adjusted Net Income Business Unit Profi ts Adjusted Earnings
Domestic Non-Life
Gains or losses on sales of business-related equities Included Excluded Excluded
Provision for reserves of capital nature, etc. Excluded Excluded Excluded
Domestic LifeAdjust the fi nancial accounting
basis net incomeIncrease in MCEV
during the current fi scal yearIncrease in TEV
during the current fi scal year
Other Amortization of goodwill and other intangible fi xed assets Excluded Excluded Excluded
A profi t indicator used until the previous Mid-Term Business Plan that is defi ned the same as the new indicator business unit profi ts except
that Traditional Embedded Value (TEV) is employed in the domestic life insurance business.
20 Integrated Annual Report 2015
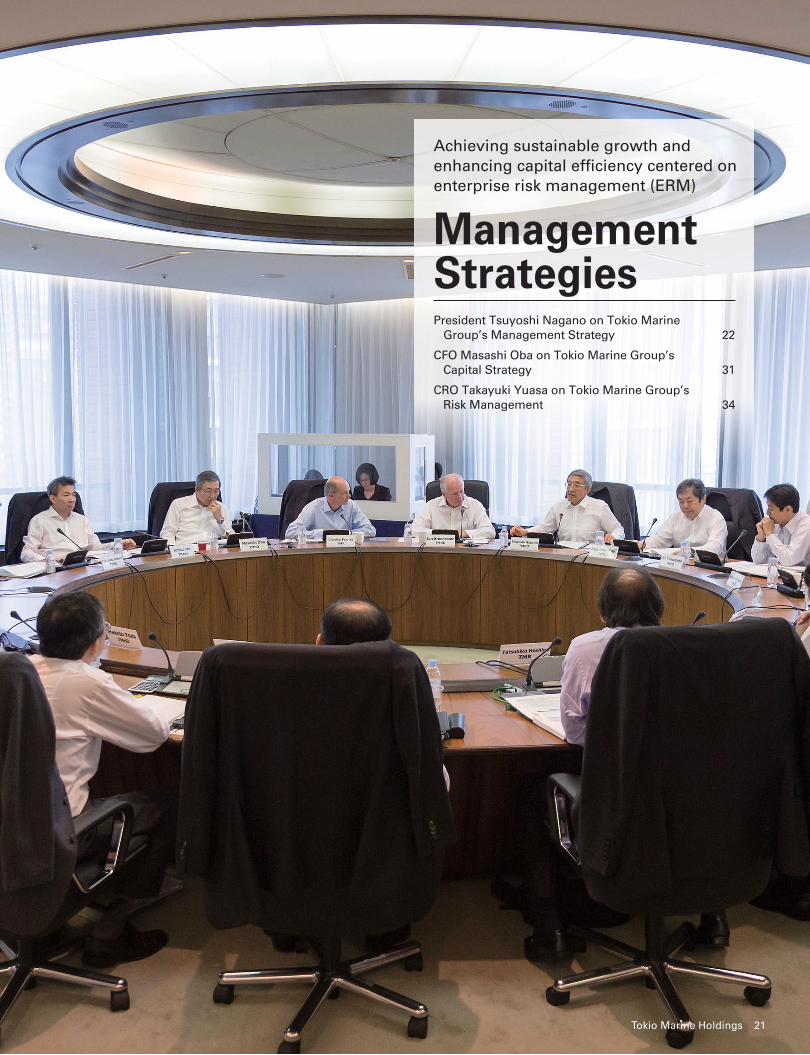
Achieving sustainable growth and enhancing capital efficiency centered on enterprise risk management (ERM)
Management Strategies
President Tsuyoshi Nagano on Tokio Marine Group’s Management Strategy 22
CFO Masashi Oba on Tokio Marine Group’s Capital Strategy 31
CRO Takayuki Yuasa on Tokio Marine Group’s Risk Management 34
21Tokio Marine Holdings
Review of the Previous Mid-Term Business Plan “Innovation and Execution 2014”
We accomplished our objectives of both expanding profi t and enhancing capital effi ciency as adjusted earnings and adjusted ROE signifi cantly exceeded our initial targets.
We launched our previous Mid-Term Business Plan
“Innovation and Execution 2014” when the Great East
Japan Earthquake was fresh in our minds and the global
fi nancial markets were experiencing instability due to the
European debt crisis. Also around this time for Tokio
Marine Group’s businesses, profi tability in auto insurance
was inconsistent with a combined ratio often above 100%.
Acknowledging the surrounding environment, under
the previous Mid-Term Business Plan we aimed to expand
profi t, mainly by improving the profi tability of the domestic
non-life insurance business, as well as working to enhance
capital effi ciency by promoting global risk diversifi cation
centered on enterprise risk management (ERM).
As a result, in fi scal 2014 we achieved adjusted
earnings of 412 billion yen and adjusted ROE of 9.3%,
signifi cantly exceeding our initial targets (adjusted
earnings of 230 to 260 billion yen and adjusted ROE of
7% or higher). We were also able to deliver the benefi ts
of these achievements to our shareholders through a
signifi cant enhancement of shareholder returns, including
increases in dividends for three consecutive fi scal years
and share repurchases.
Each business signifi cantly exceeded its quantitative
targets. Improvement was seen in each of their profi t
indicators over time, showing that the earning power of
the Group as a whole has been increasing. I realize that
this was the one of the most important achievements of
the previous Mid-Term Business Plan.
For example, in the domestic non-life insurance
business, we worked to improve the profi tability of
products, mainly in auto insurance, as well as business
effi ciency, and continued to reduce business-related
equities. At the same time, we strived for top-line
growth by making maximum use of the sales
capabilities generated by our Business Renovation
Project. As a result, the combined ratio on a private
insurance E/I basis improved substantially by 13.2
points from fi scal 2011 to 90.6%, and the top line
achieved a compound annual growth rate of 4.5%,
exceeding the market average.
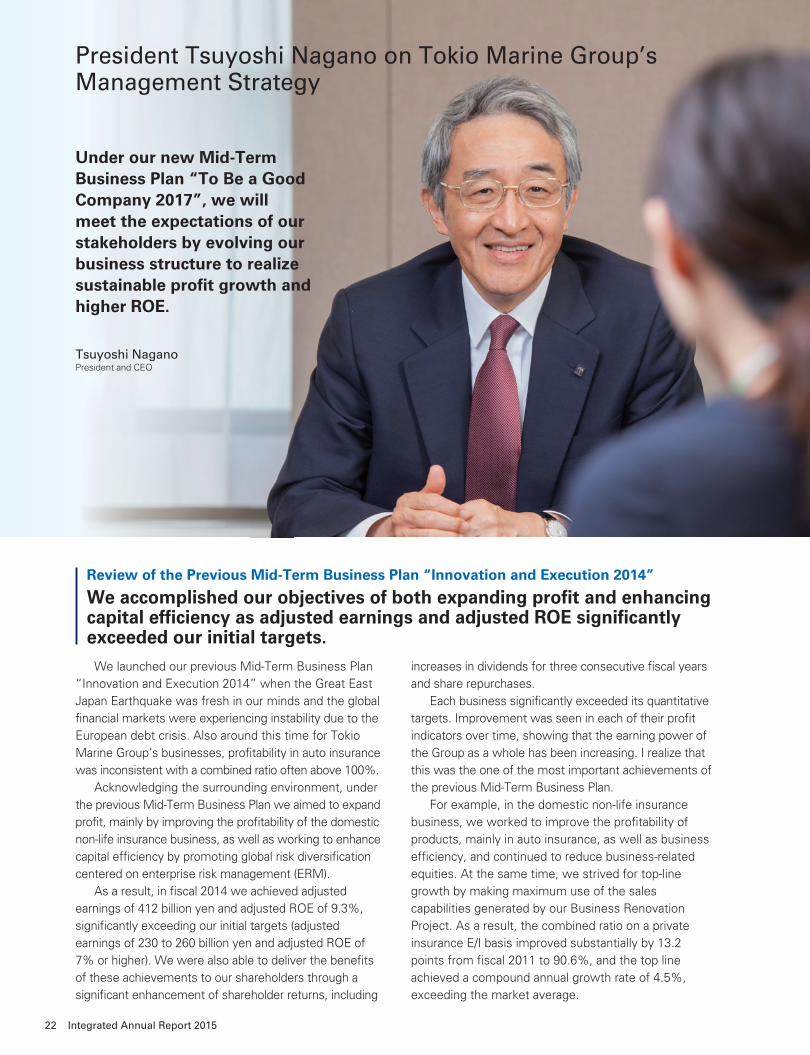
President Tsuyoshi Nagano on Tokio Marine Group’s Management Strategy
Under our new Mid-Term Business Plan “To Be a Good Company 2017”, we will meet the expectations of our stakeholders by evolving our business structure to realize sustainable profi t growth and higher ROE.
Tsuyoshi NaganoPresident and CEO
22 Integrated Annual Report 2015
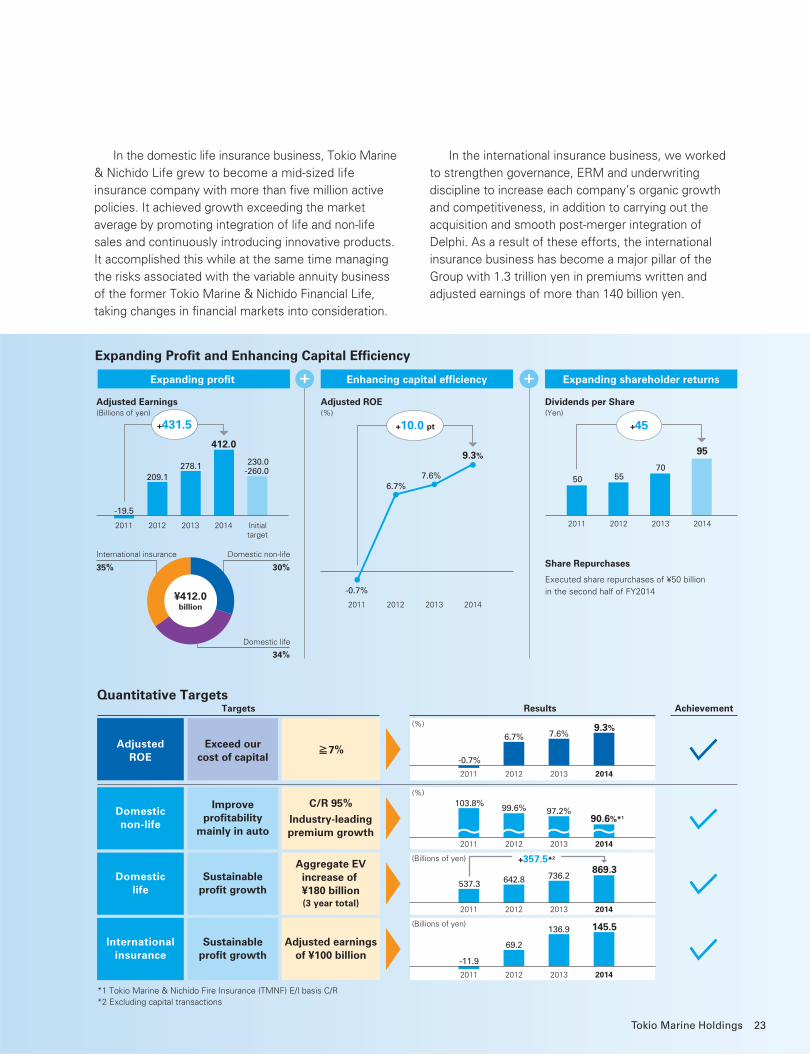
In the domestic life insurance business, Tokio Marine
& Nichido Life grew to become a mid-sized life
insurance company with more than fi ve million active
policies. It achieved growth exceeding the market
average by promoting integration of life and non-life
sales and continuously introducing innovative products.
It accomplished this while at the same time managing
the risks associated with the variable annuity business
of the former Tokio Marine & Nichido Financial Life,
taking changes in fi nancial markets into consideration.
In the international insurance business, we worked
to strengthen governance, ERM and underwriting
discipline to increase each company’s organic growth
and competitiveness, in addition to carrying out the
acquisition and smooth post-merger integration of
Delphi. As a result of these efforts, the international
insurance business has become a major pillar of the
Group with 1.3 trillion yen in premiums written and
adjusted earnings of more than 140 billion yen.
Expanding Profit and Enhancing Capital Efficiency
Expanding profit Enhancing capital efficiency Expanding shareholder returns
Adjusted Earnings Adjusted ROE Dividends per Share
Share Repurchases
Executed share repurchases of ¥50 billion
in the second half of FY2014
Domestic non-life
Domestic life
International insurance
¥412.0billion
30%
34%
35%
2011
-19.5
209.1278.1 230.0
-260.0
412.0
2012 2013 2014 Initialtarget
+431.5
2011
50 5570
95
2012 2013 2014
+45
2011
-0.7%
6.7%7.6%
9.3%
2012 2013 2014
+10.0 pt
+ +
(Billions of yen) (%) (Yen)
Quantitative Targets
*1 Tokio Marine & Nichido Fire Insurance (TMNF) E/I basis C/R*2 Excluding capital transactions
Targets Results Achievement
AdjustedROE
Domesticnon-life
Domesticlife
Exceed ourcost of capital
Improveprofitability
mainly in auto
Sustainableprofit growth
Internationalinsurance
Sustainableprofit growth
≧7%
C/R 95%
Industry-leadingpremium growth
Aggregate EVincrease of ¥180 billion(3 year total)
Adjusted earningsof ¥100 billion
2011
-0.7%
6.7% 7.6%9.3%
2012 2013 2014
2011
103.8% 99.6% 97.2%90.6%*1
2012 2013 2014
2011
537.3 642.8 736.2869.3
2012 2013 2014
2011
-11.9
69.2
136.9 145.5
2012 2013 2014
+357.5*2
~~~~
(%)
(%)
(Billions of yen)
(Billions of yen)
23Tokio Marine Holdings
New Mid-Term Business Plan “To Be a Good Company 2017”
Shifting to a Sustainable Profi t Growth Stage That Delivers Sustainable Profi t Growth and Higher ROE
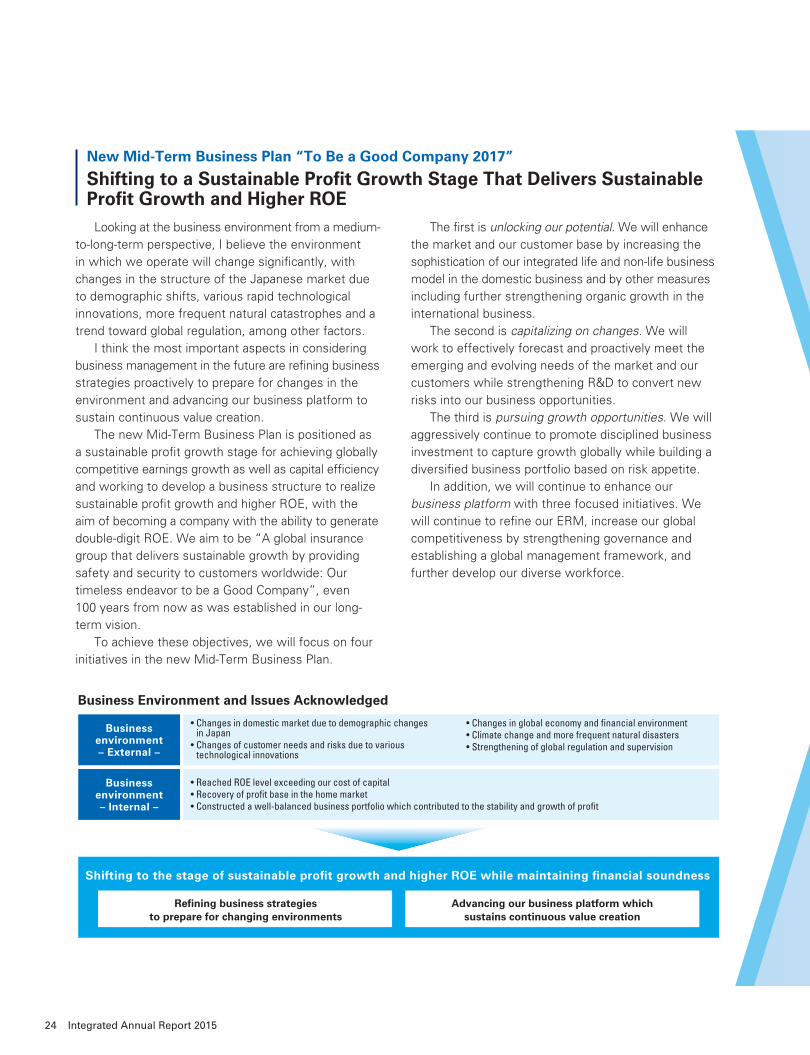
Looking at the business environment from a medium-
to-long-term perspective, I believe the environment
in which we operate will change signifi cantly, with
changes in the structure of the Japanese market due
to demographic shifts, various rapid technological
innovations, more frequent natural catastrophes and a
trend toward global regulation, among other factors.
I think the most important aspects in considering
business management in the future are refi ning business
strategies proactively to prepare for changes in the
environment and advancing our business platform to
sustain continuous value creation.
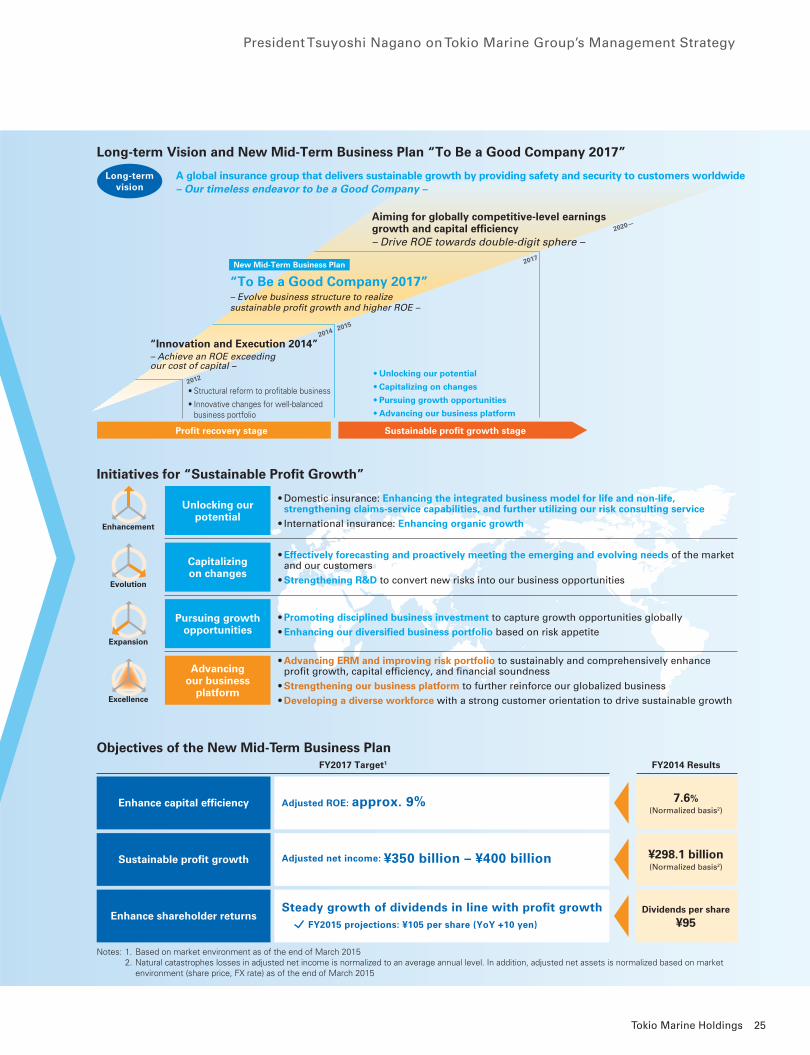
The new Mid-Term Business Plan is positioned as
a sustainable profi t growth stage for achieving globally
competitive earnings growth as well as capital effi ciency
and working to develop a business structure to realize
sustainable profi t growth and higher ROE, with the
aim of becoming a company with the ability to generate
double-digit ROE. We aim to be “A global insurance
group that delivers sustainable growth by providing
safety and security to customers worldwide: Our
timeless endeavor to be a Good Company”, even
100 years from now as was established in our long-
term vision.
To achieve these objectives, we will focus on four
initiatives in the new Mid-Term Business Plan.
The fi rst is unlocking our potential. We will enhance
the market and our customer base by increasing the
sophistication of our integrated life and non-life business
model in the domestic business and by other measures
including further strengthening organic growth in the
international business.
The second is capitalizing on changes. We will
work to effectively forecast and proactively meet the
emerging and evolving needs of the market and our
customers while strengthening R&D to convert new
risks into our business opportunities.
The third is pursuing growth opportunities. We will
aggressively continue to promote disciplined business
investment to capture growth globally while building a
diversifi ed business portfolio based on risk appetite.
In addition, we will continue to enhance our
business platform with three focused initiatives. We
will continue to refi ne our ERM, increase our global
competitiveness by strengthening governance and
establishing a global management framework, and
further develop our diverse workforce.
Business Environment and Issues Acknowledged
Businessenvironment– External –
• Changes in domestic market due to demographic changes in Japan
• Changes of customer needs and risks due to various technological innovations
• Changes in global economy and financial environment• Climate change and more frequent natural disasters• Strengthening of global regulation and supervision
• Reached ROE level exceeding our cost of capital• Recovery of profit base in the home market• Constructed a well-balanced business portfolio which contributed to the stability and growth of profit
Businessenvironment– Internal –
Shifting to the stage of sustainable profit growth and higher ROE while maintaining financial soundness
Refining business strategiesto prepare for changing environments
Advancing our business platform whichsustains continuous value creation
24 Integrated Annual Report 2015
Long-term Vision and New Mid-Term Business Plan “To Be a Good Company 2017”
Long-termvision
A global insurance group that delivers sustainable growth by providing safety and security to customers worldwide– Our timeless endeavor to be a Good Company –
Profit recovery stage Sustainable profit growth stage
• Structural reform to profitable business
• Innovative changes for well-balanced business portfolio
• Unlocking our potential
• Capitalizing on changes
• Pursuing growth opportunities
• Advancing our business platform
“Innovation and Execution 2014”– Achieve an ROE exceeding our cost of capital –
“To Be a Good Company 2017”– Evolve business structure to realizesustainable profit growth and higher ROE –
New Mid-Term Business Plan
2014
2012
2015
2017
2020—Aiming for globally competitive-level earningsgrowth and capital efficiency– Drive ROE towards double-digit sphere –
Initiatives for “Sustainable Profit Growth”
Excellence
Expansion
Evolution
Enhancement
• Domestic insurance: Enhancing the integrated business model for life and non-life, strengthening claims-service capabilities, and further utilizing our risk consulting service
• International insurance: Enhancing organic growth
• Effectively forecasting and proactively meeting the emerging and evolving needs of the market and our customers
• Strengthening R&D to convert new risks into our business opportunities
• Promoting disciplined business investment to capture growth opportunities globally• Enhancing our diversified business portfolio based on risk appetite
• Advancing ERM and improving risk portfolio to sustainably and comprehensively enhance profit growth, capital efficiency, and financial soundness
• Strengthening our business platform to further reinforce our globalized business• Developing a diverse workforce with a strong customer orientation to drive sustainable growth
Unlocking ourpotential
Capitalizingon changes
Pursuing growthopportunities
Advancingour business
platform
Objectives of the New Mid-Term Business Plan
Notes: 1. Based on market environment as of the end of March 2015 2. Natural catastrophes losses in adjusted net income is normalized to an average annual level. In addition, adjusted net assets is normalized based on market environment (share price, FX rate) as of the end of March 2015
FY2017 Target1 FY2014 Results
Enhance capital efficiency Adjusted ROE: approx. 9% 7.6%(Normalized basis2)
¥298.1 billion(Normalized basis2)
Dividends per share
¥95
Sustainable profit growth Adjusted net income: ¥350 billion – ¥400 billion
Enhance shareholder returnsSteady growth of dividends in line with profit growth FY2015 projections: ¥105 per share (YoY +10 yen)
President Tsuyoshi Nagano on Tokio Marine Group’s Management Strategy
25Tokio Marine Holdings
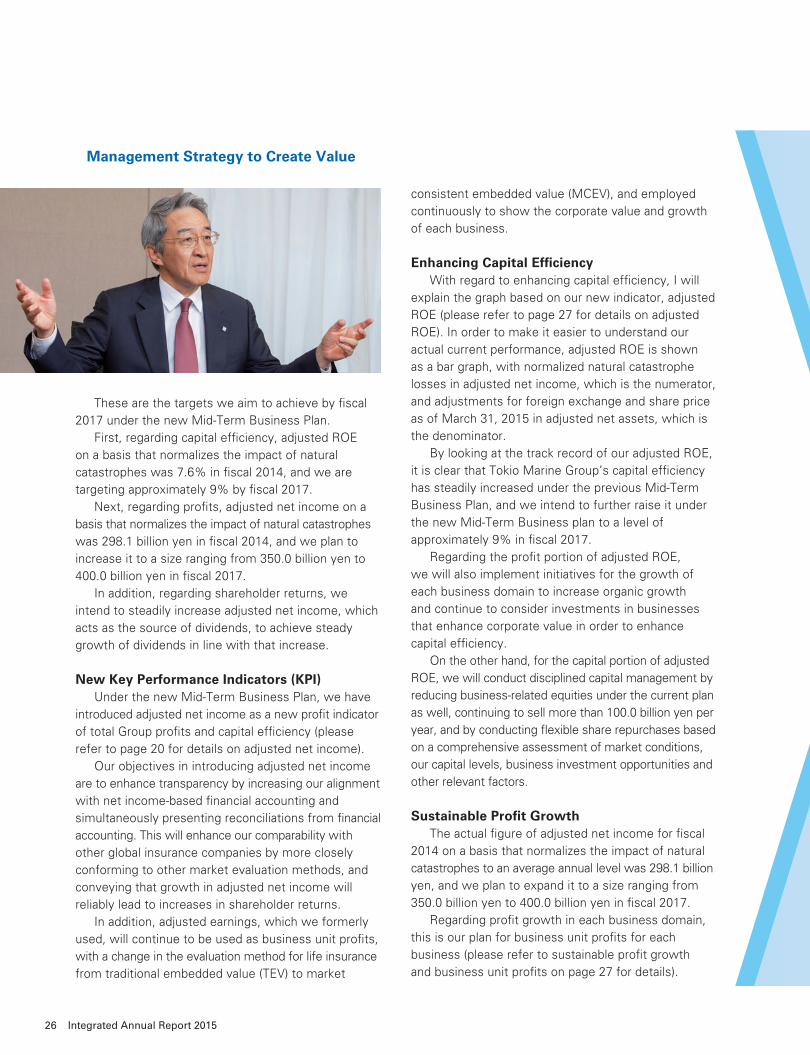
Management Strategy to Create Value
These are the targets we aim to achieve by fi scal
2017 under the new Mid-Term Business Plan.
First, regarding capital effi ciency, adjusted ROE
on a basis that normalizes the impact of natural
catastrophes was 7.6% in fi scal 2014, and we are
targeting approximately 9% by fi scal 2017.
Next, regarding profi ts, adjusted net income on a
basis that normalizes the impact of natural catastrophes
was 298.1 billion yen in fi scal 2014, and we plan to
increase it to a size ranging from 350.0 billion yen to
400.0 billion yen in fi scal 2017.
In addition, regarding shareholder returns, we
intend to steadily increase adjusted net income, which
acts as the source of dividends, to achieve steady
growth of dividends in line with that increase.
New Key Performance Indicators (KPI) Under the new Mid-Term Business Plan, we have
introduced adjusted net income as a new profi t indicator
of total Group profi ts and capital effi ciency (please
refer to page 20 for details on adjusted net income).
Our objectives in introducing adjusted net income
are to enhance transparency by increasing our alignment
with net income-based fi nancial accounting and
simultaneously presenting reconciliations from fi nancial
accounting. This will enhance our comparability with
other global insurance companies by more closely
conforming to other market evaluation methods, and
conveying that growth in adjusted net income will
reliably lead to increases in shareholder returns.
In addition, adjusted earnings, which we formerly
used, will continue to be used as business unit profi ts,
with a change in the evaluation method for life insurance
from traditional embedded value (TEV) to market
consistent embedded value (MCEV), and employed
continuously to show the corporate value and growth
of each business.
Enhancing Capital Effi ciency With regard to enhancing capital effi ciency, I will
explain the graph based on our new indicator, adjusted
ROE (please refer to page 27 for details on adjusted
ROE). In order to make it easier to understand our
actual current performance, adjusted ROE is shown
as a bar graph, with normalized natural catastrophe
losses in adjusted net income, which is the numerator,
and adjustments for foreign exchange and share price
as of March 31, 2015 in adjusted net assets, which is
the denominator.
By looking at the track record of our adjusted ROE,
it is clear that Tokio Marine Group’s capital effi ciency
has steadily increased under the previous Mid-Term
Business Plan, and we intend to further raise it under
the new Mid-Term Business plan to a level of
approximately 9% in fi scal 2017.
Regarding the profi t portion of adjusted ROE,
we will also implement initiatives for the growth of
each business domain to increase organic growth
and continue to consider investments in businesses
that enhance corporate value in order to enhance
capital effi ciency.
On the other hand, for the capital portion of adjusted
ROE, we will conduct disciplined capital management by
reducing business-related equities under the current plan
as well, continuing to sell more than 100.0 billion yen per
year, and by conducting fl exible share repurchases based
on a comprehensive assessment of market conditions,
our capital levels, business investment opportunities and
other relevant factors.
Sustainable Profi t Growth The actual fi gure of adjusted net income for fi scal
2014 on a basis that normalizes the impact of natural
catastrophes to an average annual level was 298.1 billion
yen, and we plan to expand it to a size ranging from
350.0 billion yen to 400.0 billion yen in fi scal 2017.
Regarding profi t growth in each business domain,
this is our plan for business unit profi ts for each
business (please refer to sustainable profi t growth
and business unit profi ts on page 27 for details).
26 Integrated Annual Report 2015
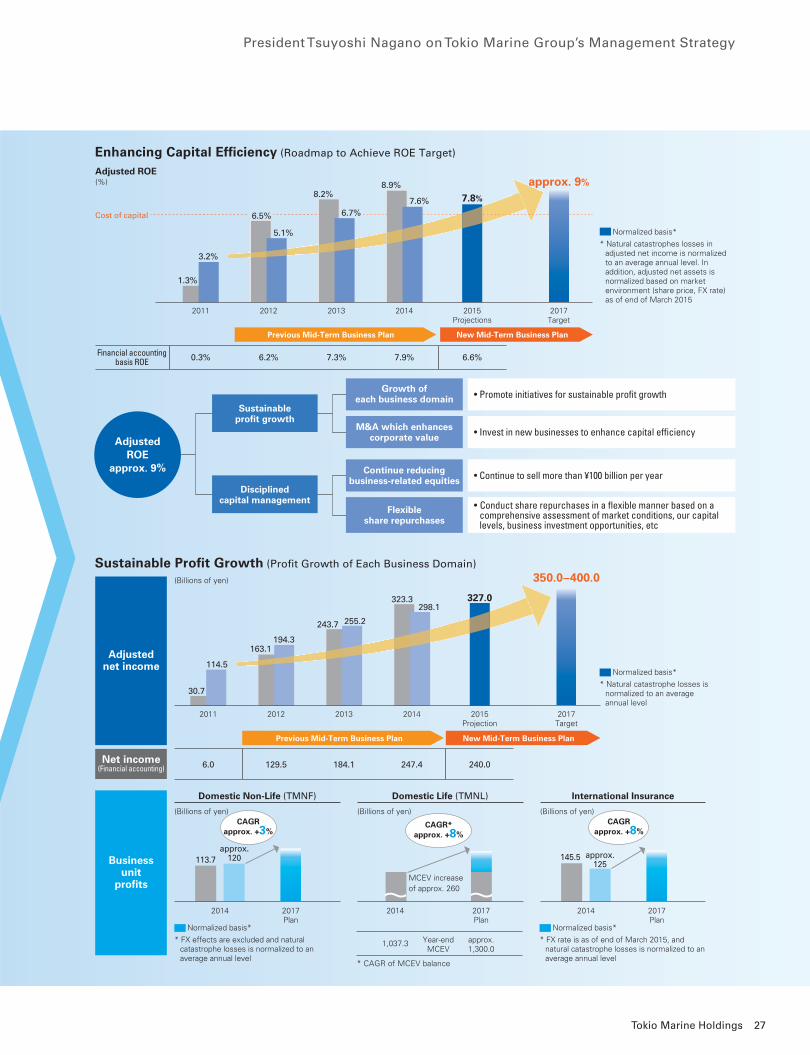
Enhancing Capital Efficiency (Roadmap to Achieve ROE Target)
Adjusted ROE
Financial accountingbasis ROE
2011 2012 2013 2014 2015Projections
2017Target
0.3% 6.2% 7.3% 7.9% 6.6%
1.3%
Cost of capital 6.5%
8.2%8.9% approx. 9%
New Mid-Term Business PlanPrevious Mid-Term Business Plan
Normalized basis*
* Natural catastrophes losses in adjusted net income is normalized to an average annual level. In addition, adjusted net assets is normalized based on market environment (share price, FX rate) as of end of March 2015
Sustainableprofit growth
Growth ofeach business domain
M&A which enhancescorporate value
Continue reducingbusiness-related equities
Flexibleshare repurchases
• Promote initiatives for sustainable profit growth
• Invest in new businesses to enhance capital efficiency
• Continue to sell more than ¥100 billion per year
• Conduct share repurchases in a flexible manner based on a comprehensive assessment of market conditions, our capital levels, business investment opportunities, etc
Disciplinedcapital management
AdjustedROE
approx. 9%
7.8%
3.2%
5.1%
6.7%7.6%
(%)
Sustainable Profit Growth (Profit Growth of Each Business Domain)
2011 2012 2013 2014 2015Projection
2017Target
6.0 129.5 184.1 247.4 240.0
30.7
approx.120 approx.
125
114.5
163.1194.3
243.7 255.2
323.3298.1
327.0
350.0–400.0
New Mid-Term Business PlanPrevious Mid-Term Business Plan
2014 2017Plan
2014
1,037.3
2017Plan
approx.1,300.0
Year-endMCEV
Normalized basis*
* Natural catastrophe losses is normalized to an average annual level
Normalized basis*
* FX effects are excluded and natural catastrophe losses is normalized to an average annual level
Normalized basis*
* FX rate is as of end of March 2015, and natural catastrophe losses is normalized to an average annual level
Net income(Financial accounting)
Adjustednet income
Businessunit
profits
Domestic Non-Life (TMNF) Domestic Life (TMNL) International Insurance
(Billions of yen) (Billions of yen) (Billions of yen)
2014 2017Plan
113.7 145.5
CAGRapprox. +3%
CAGR*approx. +8%
CAGRapprox. +8%
MCEV increaseof approx. 260
* CAGR of MCEV balance
~ ~
(Billions of yen)
President Tsuyoshi Nagano on Tokio Marine Group’s Management Strategy
27Tokio Marine Holdings
Our domestic non-life insurance business will work
for sustainable profi t growth as the core business
company of the Group, and aims for a compound
annual growth rate of approximately 3% from 120.0
billion yen in business unit profi ts at the end of fi scal
2014 on which the impact of natural catastrophes is
normalized to an average annual level.
The domestic life insurance business will work for
a compound annual growth rate of approximately 8%
while controlling risk as the growth driver of the
Group, and aims for an increase of approximately
260.0 billion yen in embedded value over the three-
year period of the plan.
The international insurance business will continue to
pursue global growth opportunities and a geographically
diversifi ed business portfolio as the profi t growth driver
of the Group as a whole. The business will aim for a
compound annual growth rate of approximately 8%
from 125.0 billion yen in business unit profi ts for fi scal
2014 on which the impact of natural catastrophes is
normalized to an average annual level and with foreign
exchange and share price as of March 31, 2015 in
adjusted net assets.
In June 2015, we announced our agreement to
acquire HCC Insurance Holdings, Inc., a U.S. specialty
insurance company with a highly diversifi ed portfolio,
handling over 100 classes of largely non-correlated
lines of specialty insurance. We expect to complete
the acquisition during October to December 2015, and
will pursue smooth integration with the company and
synergies with our existing businesses.
Asset Management Regarding asset management, in order to maintain
our fi nancial soundness we aim to enhance profi tability
within the scope of risk tolerance while keeping in
mind risk control through asset and liability management
(ALM) and ensuring liquidity for future payments for
claims, maturity refunds and other purposes.
In addition, we will further promote global portfolio
diversifi cation in line with the expansion of the
international insurance business while further
strengthening investment capability by enhancing
coordination among Group companies, both in Japan
and overseas.
Moreover, Tokio Marine & Nichido will continue to
sell business-related equities from the perspective of
enhancing capital effi ciency and risk control, among
other factors. Under the previous Mid-Term Business
Plan, it reduced business-related equities by a total of
approximately 336.0 billion yen over the three-year
period, and will continue to sell more than 100.0 billion
yen per year.
Shareholder Returns Tokio Marine Group’s basic policy on shareholder
returns under the new Mid-Term Business Plan, which
remains unchanged, is to increase dividends, which
are our primary means of shareholder returns, in line
with profi t growth and deliver them to our shareholders.
From the viewpoint of aiming for stable growth in
dividends, we will use adjusted net income, the Group’s
new profi t indicator, as the source of dividends, which
we plan to increase in line with profi t growth, and the
payout ratio as a guide is above 35% of average adjusted
net income. In fi scal 2014, annual dividends per share
were 95 yen, an increase of 25 yen from the previous
fi scal year. In fi scal 2015, we also intend to increase
dividends per share in line with profi t growth, and as
of the beginning of the fi scal year, we project a 10 yen
per share increase to 105 yen.
In addition, we conducted share repurchases of
50 billion yen in the second half of fi scal 2014, and
we will continue to consider share repurchases as a
means of adjusting capital, conducting them in a
fl exible manner based on a comprehensive assessment
of market conditions, our capital levels, business
investment opportunities and other relevant factors.
28 Integrated Annual Report 2015
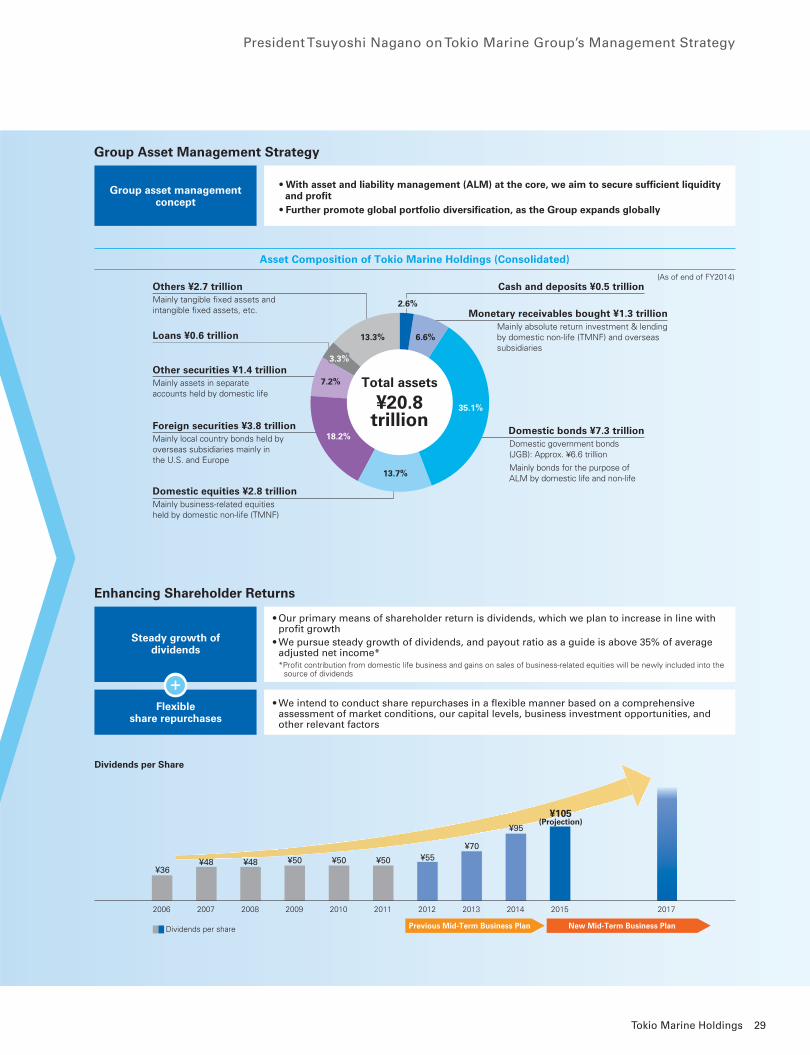
Group Asset Management Strategy
Group asset managementconcept
• With asset and liability management (ALM) at the core, we aim to secure sufficient liquidity and profit
• Further promote global portfolio diversification, as the Group expands globally
Asset Composition of Tokio Marine Holdings (Consolidated)
Total assets
¥20.8 trillion
(As of end of FY2014)Cash and deposits ¥0.5 trillion
Monetary receivables bought ¥1.3 trillionMainly absolute return investment & lending by domestic non-life (TMNF) and overseas subsidiaries
Domestic equities ¥2.8 trillionMainly business-related equitiesheld by domestic non-life (TMNF)
Foreign securities ¥3.8 trillionMainly local country bonds held byoverseas subsidiaries mainly inthe U.S. and Europe
Other securities ¥1.4 trillion
Loans ¥0.6 trillion
Mainly assets in separateaccounts held by domestic life
Others ¥2.7 trillionMainly tangible fixed assets andintangible fixed assets, etc.
Domestic bonds ¥7.3 trillionDomestic government bonds (JGB): Approx. ¥6.6 trillion
Mainly bonds for the purpose of ALM by domestic life and non-life
35.1%
13.7%
18.2%
7.2%
13.3% 6.6%
2.6%
3.3%3.3%
Enhancing Shareholder Returns
Steady growth ofdividends
• Our primary means of shareholder return is dividends, which we plan to increase in line with profit growth
• We pursue steady growth of dividends, and payout ratio as a guide is above 35% of average adjusted net income*
*Profit contribution from domestic life business and gains on sales of business-related equities will be newly included into the source of dividends
Flexibleshare repurchases
• We intend to conduct share repurchases in a flexible manner based on a comprehensive assessment of market conditions, our capital levels, business investment opportunities, and other relevant factors
+
20072006 2008 20102009 20122011 201520142013 2017
¥36¥48 ¥50 ¥50 ¥50 ¥55
¥70
New Mid-Term Business PlanPrevious Mid-Term Business Plan
¥48
Dividends per share
¥95
¥105(Projection)
Dividends per Share
President Tsuyoshi Nagano on Tokio Marine Group’s Management Strategy
29Tokio Marine Holdings
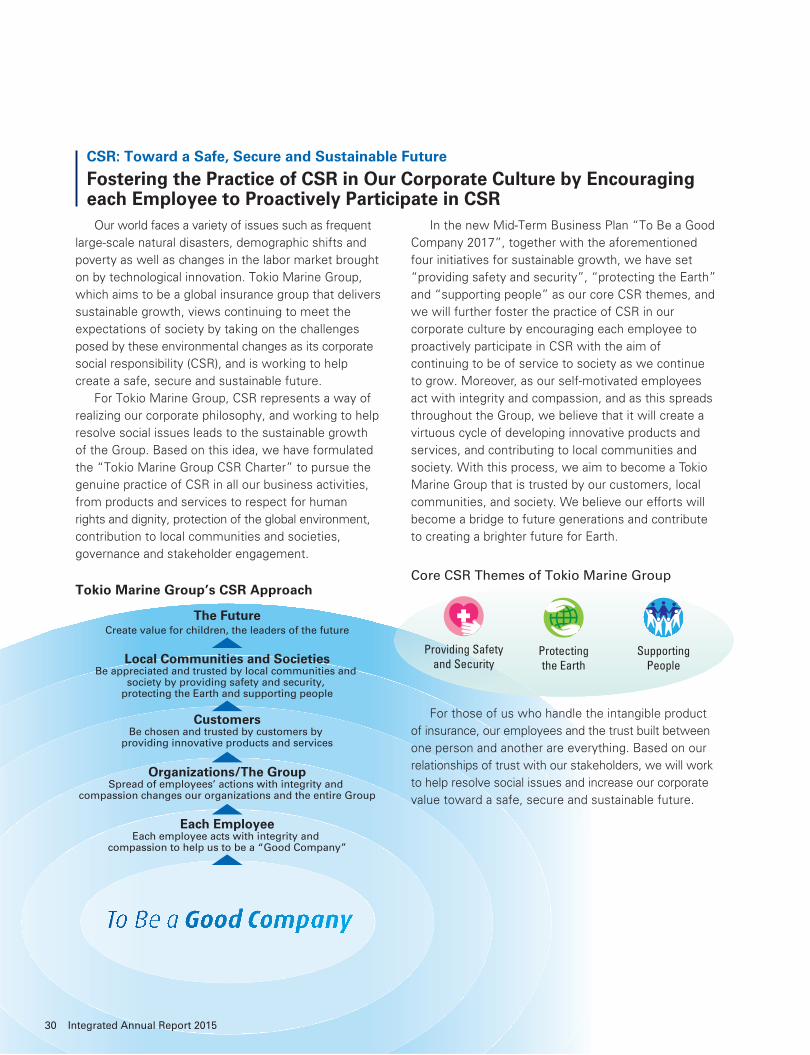
Our world faces a variety of issues such as frequent
large-scale natural disasters, demographic shifts and
poverty as well as changes in the labor market brought
on by technological innovation. Tokio Marine Group,
which aims to be a global insurance group that delivers
sustainable growth, views continuing to meet the
expectations of society by taking on the challenges
posed by these environmental changes as its corporate
social responsibility (CSR), and is working to help
create a safe, secure and sustainable future.
For Tokio Marine Group, CSR represents a way of
realizing our corporate philosophy, and working to help
resolve social issues leads to the sustainable growth
of the Group. Based on this idea, we have formulated
the “Tokio Marine Group CSR Charter” to pursue the
genuine practice of CSR in all our business activities,
from products and services to respect for human
rights and dignity, protection of the global environment,
contribution to local communities and societies,
governance and stakeholder engagement.
CSR: Toward a Safe, Secure and Sustainable Future
Fostering the Practice of CSR in Our Corporate Culture by Encouraging each Employee to Proactively Participate in CSR
Tokio Marine Group’s CSR Approach
Protecting the Earth
Supporting People
Providing Safety and Security
Core CSR Themes of Tokio Marine Group
In the new Mid-Term Business Plan “To Be a Good
Company 2017”, together with the aforementioned
four initiatives for sustainable growth, we have set
“providing safety and security”, “protecting the Earth”
and “supporting people” as our core CSR themes, and
we will further foster the practice of CSR in our
corporate culture by encouraging each employee to
proactively participate in CSR with the aim of
continuing to be of service to society as we continue
to grow. Moreover, as our self-motivated employees
act with integrity and compassion, and as this spreads
throughout the Group, we believe that it will create a
virtuous cycle of developing innovative products and
services, and contributing to local communities and
society. With this process, we aim to become a Tokio
Marine Group that is trusted by our customers, local
communities, and society. We believe our efforts will
become a bridge to future generations and contribute
to creating a brighter future for Earth.
For those of us who handle the intangible product
of insurance, our employees and the trust built between
one person and another are everything. Based on our
relationships of trust with our stakeholders, we will work
to help resolve social issues and increase our corporate
value toward a safe, secure and sustainable future.
Organizations/The GroupSpread of employees’ actions with integrity and
compassion changes our organizations and the entire Group
Each EmployeeEach employee acts with integrity and
compassion to help us to be a “Good Company”
CustomersBe chosen and trusted by customers by
providing innovative products and services
Local Communities and SocietiesBe appreciated and trusted by local communities and
society by providing safety and security, protecting the Earth and supporting people
The FutureCreate value for children, the leaders of the future
30 Integrated Annual Report 2015
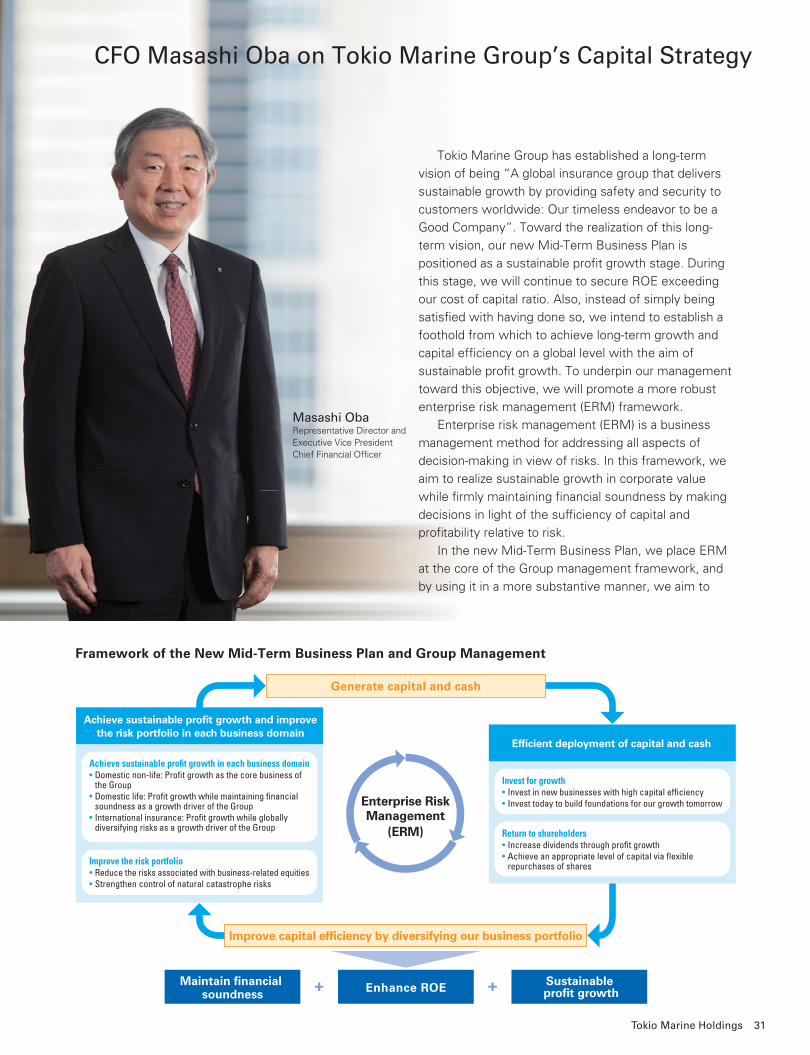
Improve capital efficiency by diversifying our business portfolio
Enterprise RiskManagement
(ERM)
Generate capital and cash
Maintain financial soundness Enhance ROE+ + Sustainable
profit growth
Achieve sustainable profit growth in each business domain• Domestic non-life: Profit growth as the core business of
the Group• Domestic life: Profit growth while maintaining financial
soundness as a growth driver of the Group• International insurance: Profit growth while globally
diversifying risks as a growth driver of the Group
Improve the risk portfolio• Reduce the risks associated with business-related equities• Strengthen control of natural catastrophe risks
Achieve sustainable profit growth and improvethe risk portfolio in each business domain
Efficient deployment of capital and cash
Invest for growth• Invest in new businesses with high capital efficiency• Invest today to build foundations for our growth tomorrow
Return to shareholders• Increase dividends through profit growth• Achieve an appropriate level of capital via flexible
repurchases of shares
Framework of the New Mid-Term Business Plan and Group Management
Masashi ObaRepresentative Director and Executive Vice PresidentChief Financial Offi cer
CFO Masashi Oba on Tokio Marine Group’s Capital Strategy
Tokio Marine Group has established a long-term
vision of being “A global insurance group that delivers
sustainable growth by providing safety and security to
customers worldwide: Our timeless endeavor to be a
Good Company”. Toward the realization of this long-
term vision, our new Mid-Term Business Plan is
positioned as a sustainable profi t growth stage. During
this stage, we will continue to secure ROE exceeding
our cost of capital ratio. Also, instead of simply being
satisfi ed with having done so, we intend to establish a
foothold from which to achieve long-term growth and
capital effi ciency on a global level with the aim of
sustainable profi t growth. To underpin our management
toward this objective, we will promote a more robust
enterprise risk management (ERM) framework.
Enterprise risk management (ERM) is a business
management method for addressing all aspects of
decision-making in view of risks. In this framework, we
aim to realize sustainable growth in corporate value
while fi rmly maintaining fi nancial soundness by making
decisions in light of the suffi ciency of capital and
profi tability relative to risk.
In the new Mid-Term Business Plan, we place ERM
at the core of the Group management framework, and
by using it in a more substantive manner, we aim to
31Tokio Marine Holdings
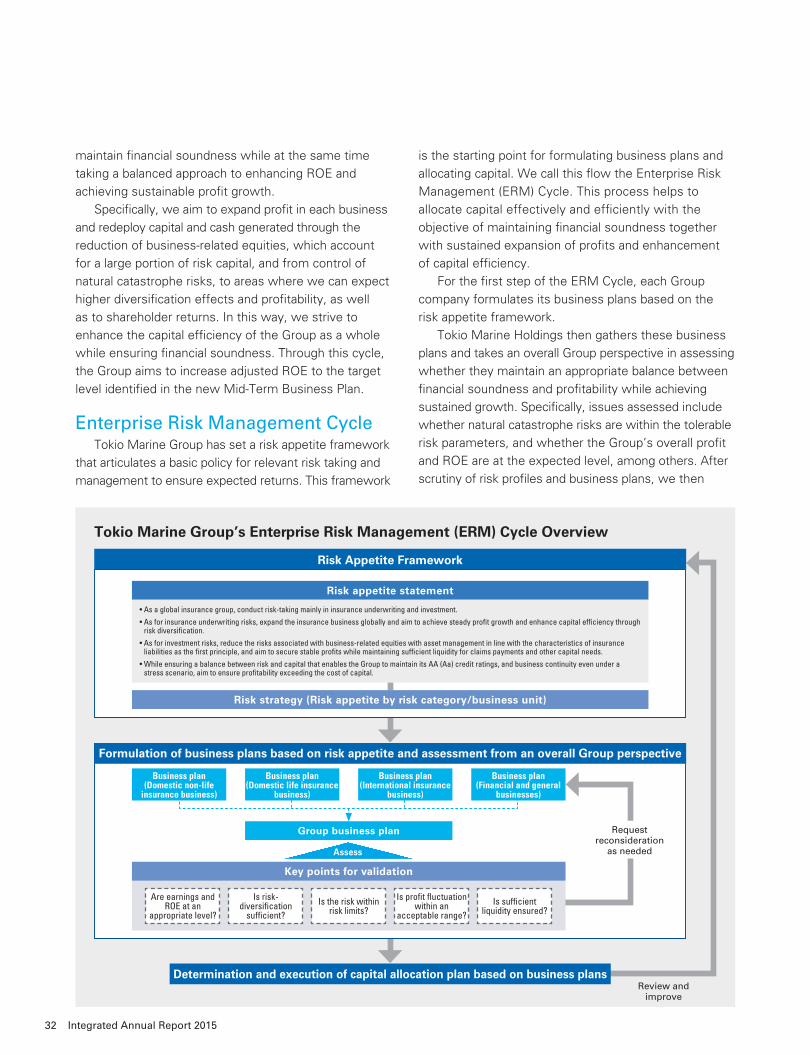
maintain fi nancial soundness while at the same time
taking a balanced approach to enhancing ROE and
achieving sustainable profi t growth.
Specifi cally, we aim to expand profi t in each business
and redeploy capital and cash generated through the
reduction of business-related equities, which account
for a large portion of risk capital, and from control of
natural catastrophe risks, to areas where we can expect
higher diversifi cation effects and profi tability, as well
as to shareholder returns. In this way, we strive to
enhance the capital effi ciency of the Group as a whole
while ensuring fi nancial soundness. Through this cycle,
the Group aims to increase adjusted ROE to the target
level identifi ed in the new Mid-Term Business Plan.
Enterprise Risk Management Cycle Tokio Marine Group has set a risk appetite framework
that articulates a basic policy for relevant risk taking and
management to ensure expected returns. This framework
is the starting point for formulating business plans and
allocating capital. We call this fl ow the Enterprise Risk
Management (ERM) Cycle. This process helps to
allocate capital effectively and effi ciently with the
objective of maintaining fi nancial soundness together
with sustained expansion of profi ts and enhancement
of capital effi ciency.
For the fi rst step of the ERM Cycle, each Group
company formulates its business plans based on the
risk appetite framework.
Tokio Marine Holdings then gathers these business
plans and takes an overall Group perspective in assessing
whether they maintain an appropriate balance between
fi nancial soundness and profi tability while achieving
sustained growth. Specifi cally, issues assessed include
whether natural catastrophe risks are within the tolerable
risk parameters, and whether the Group’s overall profi t
and ROE are at the expected level, among others. After
scrutiny of risk profi les and business plans, we then
Tokio Marine Group’s Enterprise Risk Management (ERM) Cycle Overview
Determination and execution of capital allocation plan based on business plans
Risk Appetite Framework
Formulation of business plans based on risk appetite and assessment from an overall Group perspective
Group business plan
Business plan (Domestic non-life
insurance business)
Business plan (Domestic life insurance
business)
Business plan (International insurance
business)
Business plan (Financial and general
businesses)
Request reconsideration
as needed
Key points for validation
Are earnings and ROE at an
appropriate level?
Is risk-diversifi cation
suffi cient?Is the risk within
risk limits?Is profi t fl uctuation
within an acceptable range?
Is suffi cient liquidity ensured?
Assess
Review andimprove
Risk strategy (Risk appetite by risk category/business unit)
Risk appetite statement
• As a global insurance group, conduct risk-taking mainly in insurance underwriting and investment.
• As for insurance underwriting risks, expand the insurance business globally and aim to achieve steady profi t growth and enhance capital effi ciency through risk diversifi cation.
• As for investment risks, reduce the risks associated with business-related equities with asset management in line with the characteristics of insurance liabilities as the fi rst principle, and aim to secure stable profi ts while maintaining suffi cient liquidity for claims payments and other capital needs.
• While ensuring a balance between risk and capital that enables the Group to maintain its AA (Aa) credit ratings, and business continuity even under a stress scenario, aim to ensure profi tability exceeding the cost of capital.
32 Integrated Annual Report 2015
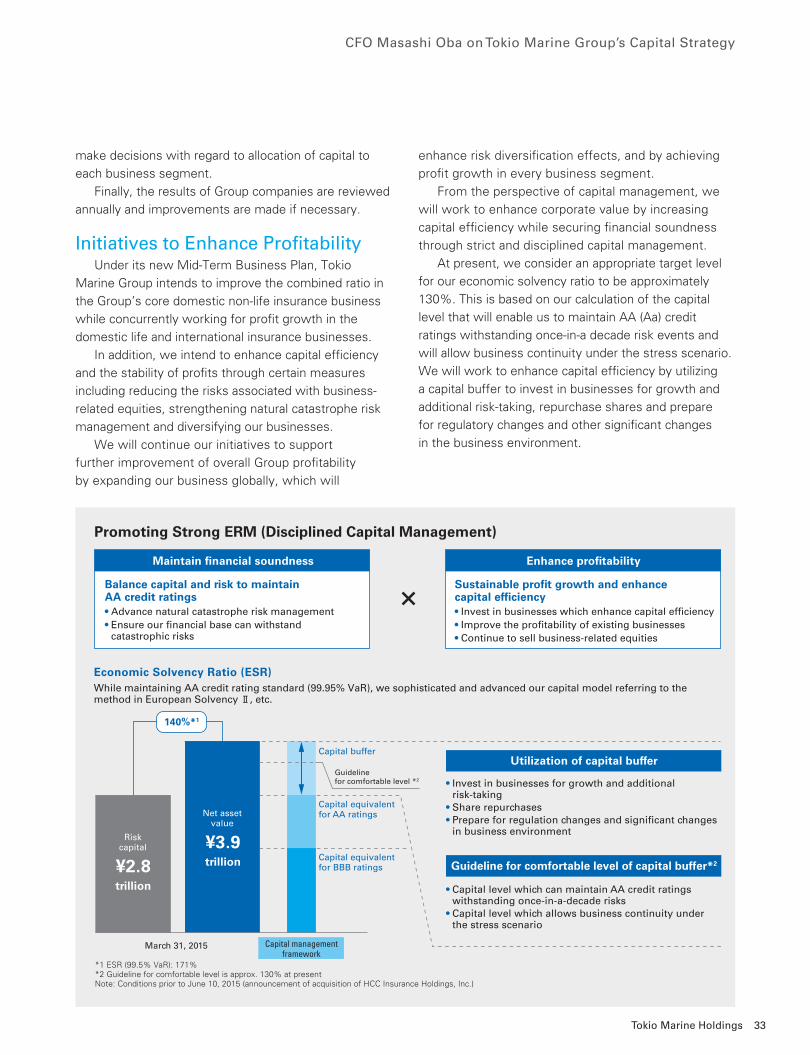
make decisions with regard to allocation of capital to
each business segment.
Finally, the results of Group companies are reviewed
annually and improvements are made if necessary.
Initiatives to Enhance Profi tability Under its new Mid-Term Business Plan, Tokio
Marine Group intends to improve the combined ratio in
the Group’s core domestic non-life insurance business
while concurrently working for profi t growth in the
domestic life and international insurance businesses.
In addition, we intend to enhance capital effi ciency
and the stability of profi ts through certain measures
including reducing the risks associated with business-
related equities, strengthening natural catastrophe risk
management and diversifying our businesses.
We will continue our initiatives to support
further improvement of overall Group profi tability
by expanding our business globally, which will
enhance risk diversifi cation effects, and by achieving
profi t growth in every business segment.
From the perspective of capital management, we
will work to enhance corporate value by increasing
capital effi ciency while securing fi nancial soundness
through strict and disciplined capital management.
At present, we consider an appropriate target level
for our economic solvency ratio to be approximately
130%. This is based on our calculation of the capital
level that will enable us to maintain AA (Aa) credit
ratings withstanding once-in-a decade risk events and
will allow business continuity under the stress scenario.
We will work to enhance capital effi ciency by utilizing
a capital buffer to invest in businesses for growth and
additional risk-taking, repurchase shares and prepare
for regulatory changes and other signifi cant changes
in the business environment.
Riskcapital
¥2.8trillion
Net assetvalue
¥3.9trillion
Maintain financial soundness
Balance capital and risk to maintainAA credit ratings• Advance natural catastrophe risk management• Ensure our financial base can withstand
catastrophic risks
Enhance profitability
Sustainable profit growth and enhance capital efficiency• Invest in businesses which enhance capital efficiency• Improve the profitability of existing businesses• Continue to sell business-related equities
Economic Solvency Ratio (ESR)While maintaining AA credit rating standard (99.95% VaR), we sophisticated and advanced our capital model referring to the method in European Solvency Ⅱ, etc.
Capital managementframework
Utilization of capital buffer
• Invest in businesses for growth and additional risk-taking
• Share repurchases• Prepare for regulation changes and significant changes
in business environment
Guideline for comfortable level of capital buffer*2
• Capital level which can maintain AA credit ratings withstanding once-in-a-decade risks
• Capital level which allows business continuity under the stress scenario
Capital buffer
Guidelinefor comfortable level *2
Capital equivalentfor AA ratings
Capital equivalentfor BBB ratings
March 31, 2015
*1 ESR (99.5% VaR): 171%*2 Guideline for comfortable level is approx. 130% at presentNote: Conditions prior to June 10, 2015 (announcement of acquisition of HCC Insurance Holdings, Inc.)
140%*1
Promoting Strong ERM (Disciplined Capital Management)
CFO Masashi Oba on Tokio Marine Group’s Capital Strategy
33Tokio Marine Holdings
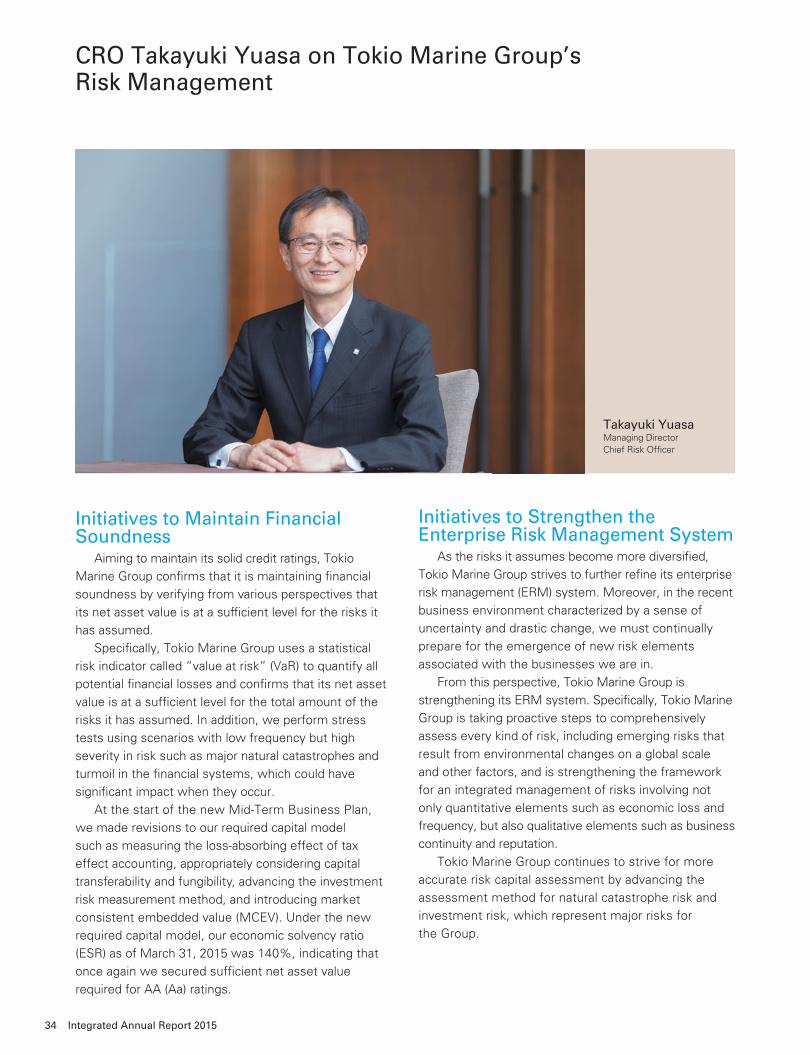
Initiatives to Maintain Financial Soundness Aiming to maintain its solid credit ratings, Tokio
Marine Group confi rms that it is maintaining fi nancial
soundness by verifying from various perspectives that
its net asset value is at a suffi cient level for the risks it
has assumed.
Specifi cally, Tokio Marine Group uses a statistical
risk indicator called “value at risk” (VaR) to quantify all
potential fi nancial losses and confi rms that its net asset
value is at a suffi cient level for the total amount of the
risks it has assumed. In addition, we perform stress
tests using scenarios with low frequency but high
severity in risk such as major natural catastrophes and
turmoil in the fi nancial systems, which could have
signifi cant impact when they occur.
At the start of the new Mid-Term Business Plan,
we made revisions to our required capital model
such as measuring the loss-absorbing effect of tax
effect accounting, appropriately considering capital
transferability and fungibility, advancing the investment
risk measurement method, and introducing market
consistent embedded value (MCEV). Under the new
required capital model, our economic solvency ratio
(ESR) as of March 31, 2015 was 140%, indicating that
once again we secured suffi cient net asset value
required for AA (Aa) ratings.
Takayuki YuasaManaging DirectorChief Risk Offi cer
Initiatives to Strengthen the Enterprise Risk Management System As the risks it assumes become more diversifi ed,
Tokio Marine Group strives to further refi ne its enterprise
risk management (ERM) system. Moreover, in the recent
business environment characterized by a sense of
uncertainty and drastic change, we must continually
prepare for the emergence of new risk elements
associated with the businesses we are in.
From this perspective, Tokio Marine Group is
strengthening its ERM system. Specifi cally, Tokio Marine
Group is taking proactive steps to comprehensively
assess every kind of risk, including emerging risks that
result from environmental changes on a global scale
and other factors, and is strengthening the framework
for an integrated management of risks involving not
only quantitative elements such as economic loss and
frequency, but also qualitative elements such as business
continuity and reputation.
Tokio Marine Group continues to strive for more
accurate risk capital assessment by advancing the
assessment method for natural catastrophe risk and
investment risk, which represent major risks for
the Group.
CRO Takayuki Yuasa on Tokio Marine Group’s Risk Management
34 Integrated Annual Report 2015
Providing safety and security to customers worldwide
Operations Section
Tokio Marine Group at a Glance 36
Domestic Non-Life Insurance Business 38
Domestic Life Insurance Business 44
International Insurance Business 48
Financial and General Businesses 55
35Tokio Marine Holdings
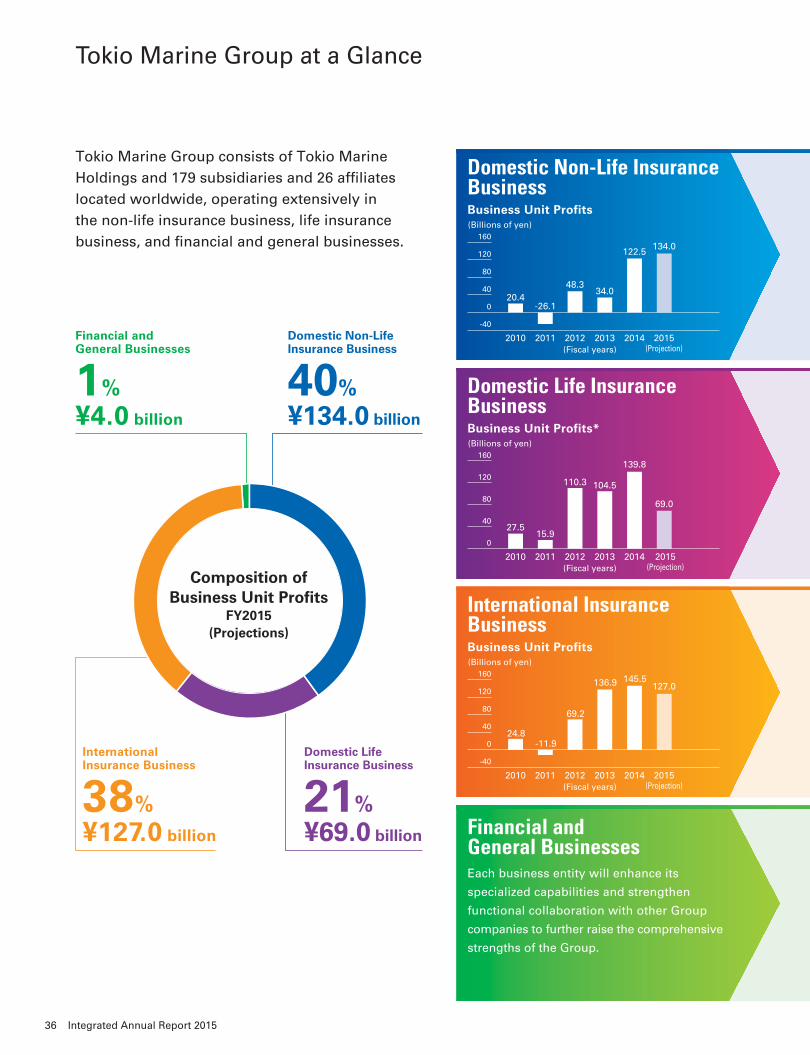
Tokio Marine Group at a Glance
Tokio Marine Group consists of Tokio Marine Holdings and 179 subsidiaries and 26 affi liates located worldwide, operating extensively in the non-life insurance business, life insurance business, and fi nancial and general businesses.
Composition of Business Unit Profi ts
FY2015(Projections)
Domestic Non-Life Insurance Business
40%¥134.0 billion
Financial and General Businesses
1%¥4.0 billion
Domestic Life Insurance Business
21%¥69.0 billion
International Insurance Business
38%¥127.0 billion
Domestic Non-Life Insurance BusinessBusiness Unit Profits
2010 2011 2012 2013 2014
20.4-26.1
48.334.0
122.5 134.0
(Fiscal years)
160
80
120
40
0
-40
2015(Projection)
(Billions of yen)
Domestic Life Insurance BusinessBusiness Unit Profits*
(Fiscal years)2010 2011 2012 2013 2014
27.515.9
110.3 104.5
139.8
69.0
160
80
120
40
0
2015(Projection)
(Billions of yen)
International Insurance BusinessBusiness Unit Profits
(Fiscal years)2010 2011 2012 2013 2014
24.8-11.9
69.2
136.9 127.0145.5160
80
120
40
0
-40
2015(Projection)
(Billions of yen)
Each business entity will enhance its
specialized capabilities and strengthen
functional collaboration with other Group
companies to further raise the comprehensive
strengths of the Group.
Financial and General Businesses
36 Integrated Annual Report 2015
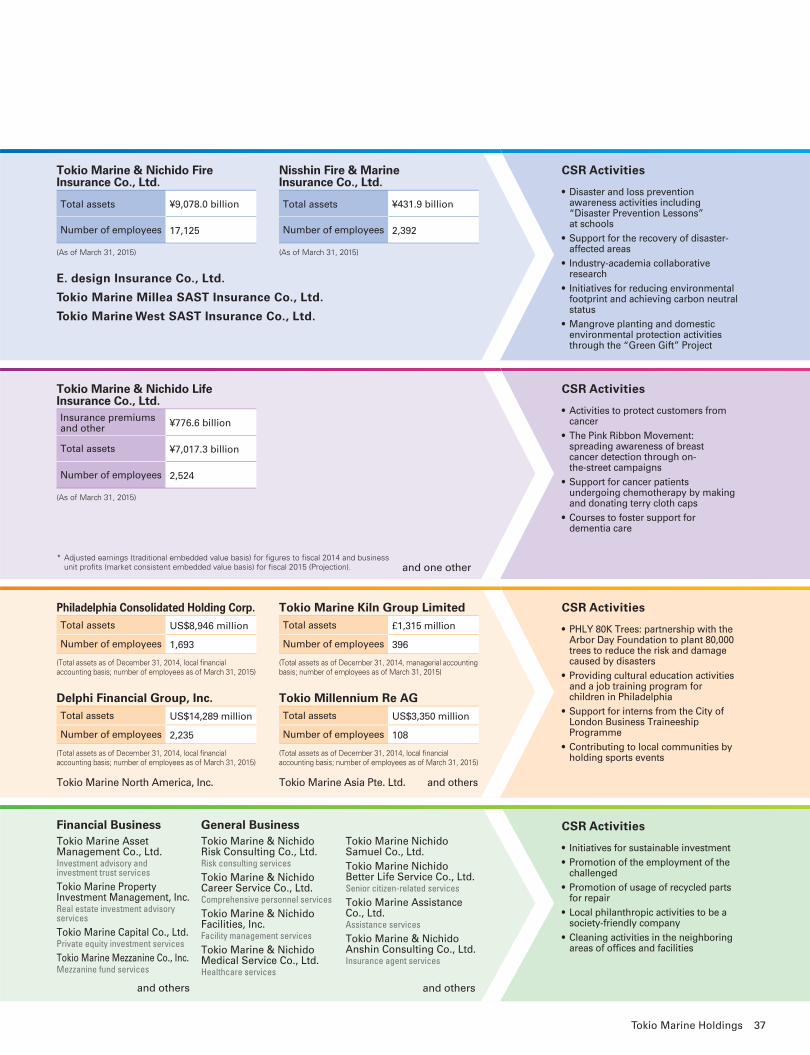
Tokio Marine & Nichido Fire Insurance Co., Ltd.
Total assets ¥9,078.0 billion
Number of employees 17,125
(As of March 31, 2015)
E. design Insurance Co., Ltd.
Tokio Marine Millea SAST Insurance Co., Ltd.
Tokio Marine West SAST Insurance Co., Ltd.
Nisshin Fire & Marine Insurance Co., Ltd.
Total assets ¥431.9 billion
Number of employees 2,392
(As of March 31, 2015)
Tokio Marine & Nichido Life Insurance Co., Ltd.Insurance premiums and other ¥776.6 billion
Total assets ¥7,017.3 billion
Number of employees 2,524
(As of March 31, 2015)
Philadelphia Consolidated Holding Corp.Total assets US$8,946 million
Number of employees 1,693
(Total assets as of December 31, 2014, local fi nancial accounting basis; number of employees as of March 31, 2015)
Tokio Marine Kiln Group LimitedTotal assets £1,315 million
Number of employees 396
(Total assets as of December 31, 2014, managerial accounting basis; number of employees as of March 31, 2015)
Delphi Financial Group, Inc.Total assets US$14,289 million
Number of employees 2,235
(Total assets as of December 31, 2014, local fi nancial accounting basis; number of employees as of March 31, 2015)
Tokio Marine North America, Inc.
Tokio Millennium Re AGTotal assets US$3,350 million
Number of employees 108
(Total assets as of December 31, 2014, local fi nancial accounting basis; number of employees as of March 31, 2015)
Tokio Marine Asia Pte. Ltd. and others
and one other
Financial BusinessTokio Marine Asset Management Co., Ltd.Investment advisory and investment trust servicesTokio Marine Property Investment Management, Inc.Real estate investment advisory servicesTokio Marine Capital Co., Ltd.Private equity investment servicesTokio Marine Mezzanine Co., Inc.Mezzanine fund services
and others
General BusinessTokio Marine & Nichido Risk Consulting Co., Ltd.Risk consulting servicesTokio Marine & Nichido Career Service Co., Ltd.Comprehensive personnel servicesTokio Marine & Nichido Facilities, Inc.Facility management servicesTokio Marine & Nichido Medical Service Co., Ltd.Healthcare services
Tokio Marine Nichido Samuel Co., Ltd.Tokio Marine Nichido Better Life Service Co., Ltd.Senior citizen-related servicesTokio Marine Assistance Co., Ltd.Assistance servicesTokio Marine & Nichido Anshin Consulting Co., Ltd.Insurance agent services
and others
CSR Activities
CSR Activities
CSR Activities
CSR Activities
• Disaster and loss prevention awareness activities including “Disaster Prevention Lessons” at schools
• Support for the recovery of disaster-affected areas
• Industry-academia collaborative research
• Initiatives for reducing environmental footprint and achieving carbon neutral status
• Mangrove planting and domestic environmental protection activities through the “Green Gift” Project
• Activities to protect customers from cancer
• The Pink Ribbon Movement: spreading awareness of breast cancer detection through on-the-street campaigns
• Support for cancer patients undergoing chemotherapy by making and donating terry cloth caps
• Courses to foster support for dementia care
• PHLY 80K Trees: partnership with the Arbor Day Foundation to plant 80,000 trees to reduce the risk and damage caused by disasters
• Providing cultural education activities and a job training program for children in Philadelphia
• Support for interns from the City of London Business Traineeship Programme
• Contributing to local communities by holding sports events
• Initiatives for sustainable investment• Promotion of the employment of the
challenged• Promotion of usage of recycled parts
for repair• Local philanthropic activities to be a
society-friendly company • Cleaning activities in the neighboring
areas of offi ces and facilities
* Adjusted earnings (traditional embedded value basis) for fi gures to fi scal 2014 and business unit profi ts (market consistent embedded value basis) for fi scal 2015 (Projection).
37Tokio Marine Holdings
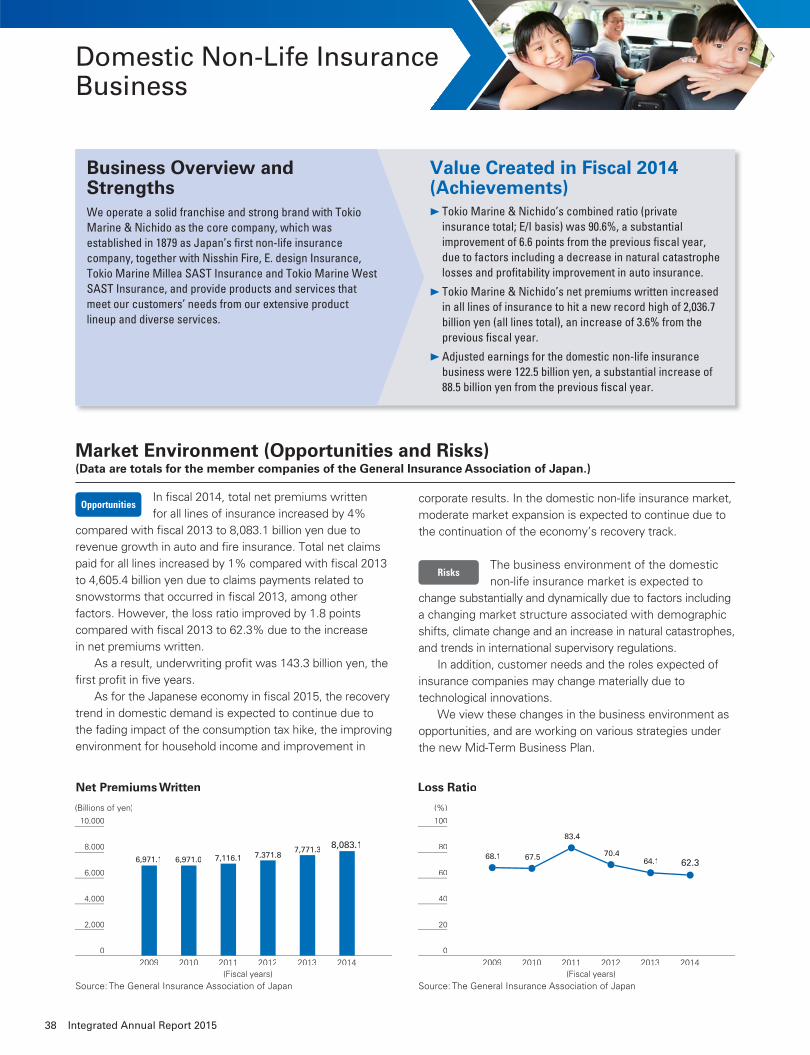
Value Created in Fiscal 2014 (Achievements)
Market Environment (Opportunities and Risks)
(Data are totals for the member companies of the General Insurance Association of Japan.)
In fi scal 2014, total net premiums written
for all lines of insurance increased by 4%
compared with fi scal 2013 to 8,083.1 billion yen due to
revenue growth in auto and fi re insurance. Total net claims
paid for all lines increased by 1% compared with fi scal 2013
to 4,605.4 billion yen due to claims payments related to
snowstorms that occurred in fi scal 2013, among other
factors. However, the loss ratio improved by 1.8 points
compared with fi scal 2013 to 62.3% due to the increase
in net premiums written.
As a result, underwriting profi t was 143.3 billion yen, the
fi rst profi t in fi ve years.
As for the Japanese economy in fi scal 2015, the recovery
trend in domestic demand is expected to continue due to
the fading impact of the consumption tax hike, the improving
environment for household income and improvement in
corporate results. In the domestic non-life insurance market,
moderate market expansion is expected to continue due to
the continuation of the economy’s recovery track.
The business environment of the domestic
non-life insurance market is expected to
change substantially and dynamically due to factors including
a changing market structure associated with demographic
shifts, climate change and an increase in natural catastrophes,
and trends in international supervisory regulations.
In addition, customer needs and the roles expected of
insurance companies may change materially due to
technological innovations.
We view these changes in the business environment as
opportunities, and are working on various strategies under
the new Mid-Term Business Plan.
Tokio Marine & Nichido’s combined ratio (private insurance total; E/I basis) was 90.6%, a substantial improvement of 6.6 points from the previous fi scal year, due to factors including a decrease in natural catastrophe losses and profi tability improvement in auto insurance.
Tokio Marine & Nichido’s net premiums written increased in all lines of insurance to hit a new record high of 2,036.7 billion yen (all lines total), an increase of 3.6% from the previous fi scal year.
Adjusted earnings for the domestic non-life insurance business were 122.5 billion yen, a substantial increase of 88.5 billion yen from the previous fi scal year.
Domestic Non-Life Insurance Business
Opportunities
Risks
Net Premiums Written
2009 2010 2011 2012 2013 2014
6,971.1 6,971.0 7,116.1 7,371.87,771.3 8,083.1
(Fiscal years) (Fiscal years)
68.1 67.5
83.4
70.464.1 62.3
10,000
(Billions of yen)
0
8,000
6,000
4,000
2,000
Loss Ratio
2009 2010 2011 2012 2013 2014
100
(%)
0
80
60
40
20
Source: The General Insurance Association of Japan Source: The General Insurance Association of Japan
Business Overview and StrengthsWe operate a solid franchise and strong brand with Tokio Marine & Nichido as the core company, which was established in 1879 as Japan’s fi rst non-life insurance company, together with Nisshin Fire, E. design Insurance, Tokio Marine Millea SAST Insurance and Tokio Marine West SAST Insurance, and provide products and services that meet our customers’ needs from our extensive product lineup and diverse services.
38 Integrated Annual Report 2015
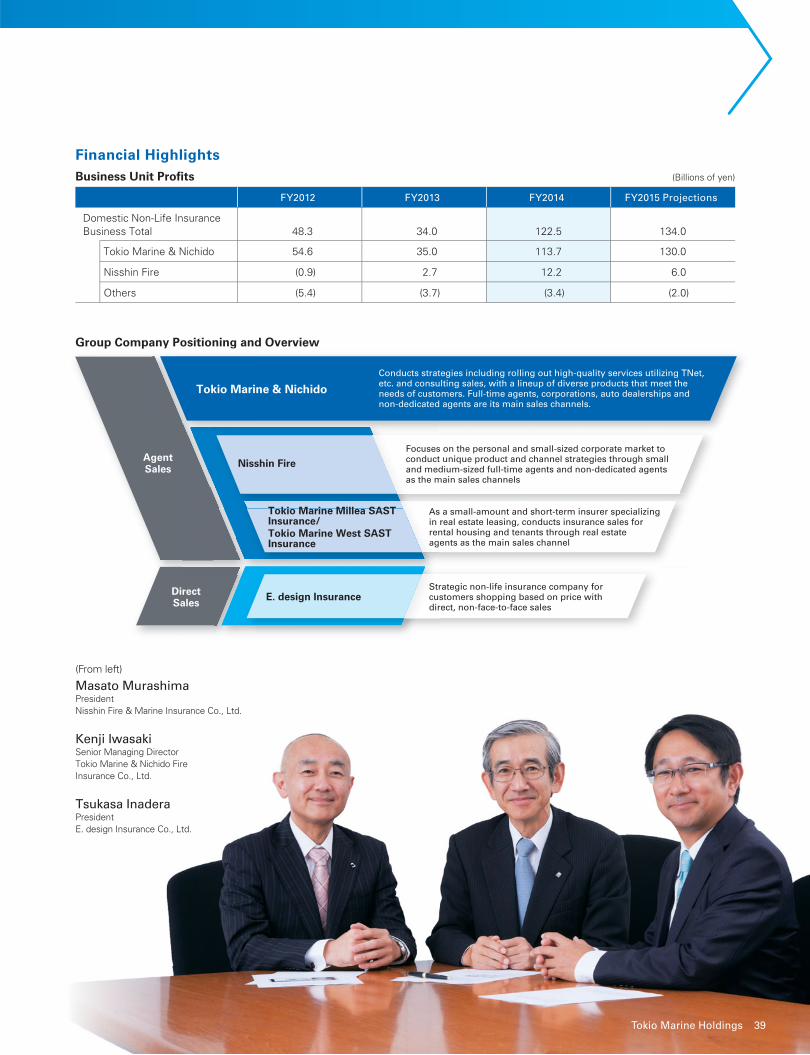
Group Company Positioning and Overview
DirectSales
Nisshin Fire
Tokio Marine Millea SAST Insurance/ Tokio Marine West SAST Insurance
Conducts strategies including rolling out high-quality services utilizing TNet, etc. and consulting sales, with a lineup of diverse products that meet the needs of customers. Full-time agents, corporations, auto dealerships and non-dedicated agents are its main sales channels.
Focuses on the personal and small-sized corporate market to conduct unique product and channel strategies through small and medium-sized full-time agents and non-dedicated agents as the main sales channels
As a small-amount and short-term insurer specializing in real estate leasing, conducts insurance sales for rental housing and tenants through real estate agents as the main sales channel
E. design InsuranceStrategic non-life insurance company for customers shopping based on price with direct, non-face-to-face sales
Tokio Marine & Nichido
AgentSales
(From left)
Masato MurashimaPresidentNisshin Fire & Marine Insurance Co., Ltd.
Kenji IwasakiSenior Managing DirectorTokio Marine & Nichido Fire Insurance Co., Ltd.
Tsukasa InaderaPresidentE. design Insurance Co., Ltd.
Financial HighlightsBusiness Unit Profi ts (Billions of yen)
FY2012 FY2013 FY2014 FY2015 Projections
Domestic Non-Life InsuranceBusiness Total 48.3 34.0 122.5 134.0
Tokio Marine & Nichido 54.6 35.0 113.7 130.0
Nisshin Fire (0.9) 2.7 12.2 6.0
Others (5.4) (3.7) (3.4) (2.0)
39Tokio Marine Holdings
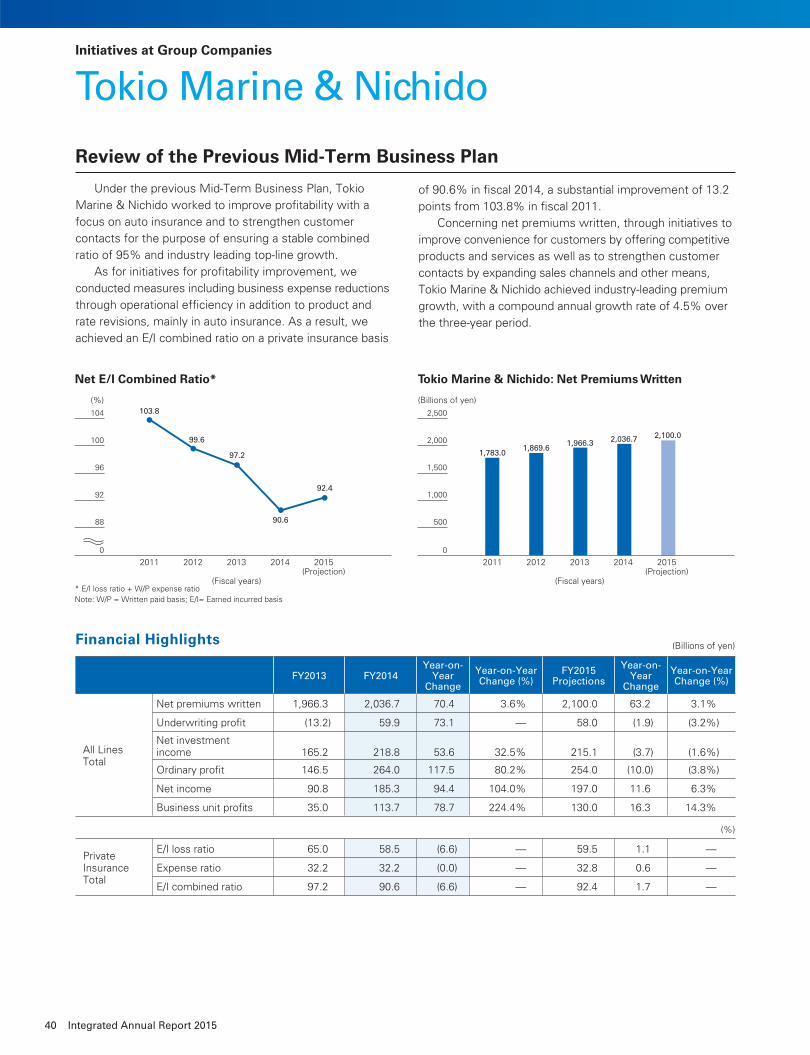
Review of the Previous Mid-Term Business Plan
Under the previous Mid-Term Business Plan, Tokio
Marine & Nichido worked to improve profi tability with a
focus on auto insurance and to strengthen customer
contacts for the purpose of ensuring a stable combined
ratio of 95% and industry leading top-line growth.
As for initiatives for profi tability improvement, we
conducted measures including business expense reductions
through operational effi ciency in addition to product and
rate revisions, mainly in auto insurance. As a result, we
achieved an E/I combined ratio on a private insurance basis
of 90.6% in fi scal 2014, a substantial improvement of 13.2
points from 103.8% in fi scal 2011.
Concerning net premiums written, through initiatives to
improve convenience for customers by offering competitive
products and services as well as to strengthen customer
contacts by expanding sales channels and other means,
Tokio Marine & Nichido achieved industry-leading premium
growth, with a compound annual growth rate of 4.5% over
the three-year period.
Initiatives at Group Companies
Tokio Marine & Nichido
2011 2012 2013 2014 2015(Projection)
(%)
104
96
88
0
2011 2012 2013 2014 2015(Projection)
100
92
(Billions of yen)
2,500
1,500
500
0
2,000
1,000
Net E/I Combined Ratio*
103.8
99.6
97.2
90.6
92.4
* E/I loss ratio + W/P expense ratioNote: W/P = Written paid basis; E/I= Earned incurred basis
Tokio Marine & Nichido: Net Premiums Written
1,783.01,869.6
1,966.3 2,036.7 2,100.0
(Fiscal years) (Fiscal years)
Financial Highlights
FY2013 FY2014Year-on-
YearChange
Year-on-YearChange (%)
FY2015Projections
Year-on-Year
Change
Year-on-YearChange (%)
All Lines Total
Net premiums written 1,966.3 2,036.7 70.4 3.6% 2,100.0 63.2 3.1%
Underwriting profi t (13.2) 59.9 73.1 — 58.0 (1.9) (3.2%)
Net investment income 165.2 218.8 53.6 32.5% 215.1 (3.7) (1.6%)
Ordinary profi t 146.5 264.0 117.5 80.2% 254.0 (10.0) (3.8%)
Net income 90.8 185.3 94.4 104.0% 197.0 11.6 6.3%
Business unit profi ts 35.0 113.7 78.7 224.4% 130.0 16.3 14.3%
PrivateInsuranceTotal
E/I loss ratio 65.0 58.5 (6.6) — 59.5 1.1 —
Expense ratio 32.2 32.2 (0.0) — 32.8 0.6 —
E/I combined ratio 97.2 90.6 (6.6) — 92.4 1.7 —
(Billions of yen)
(%)
40 Integrated Annual Report 2015
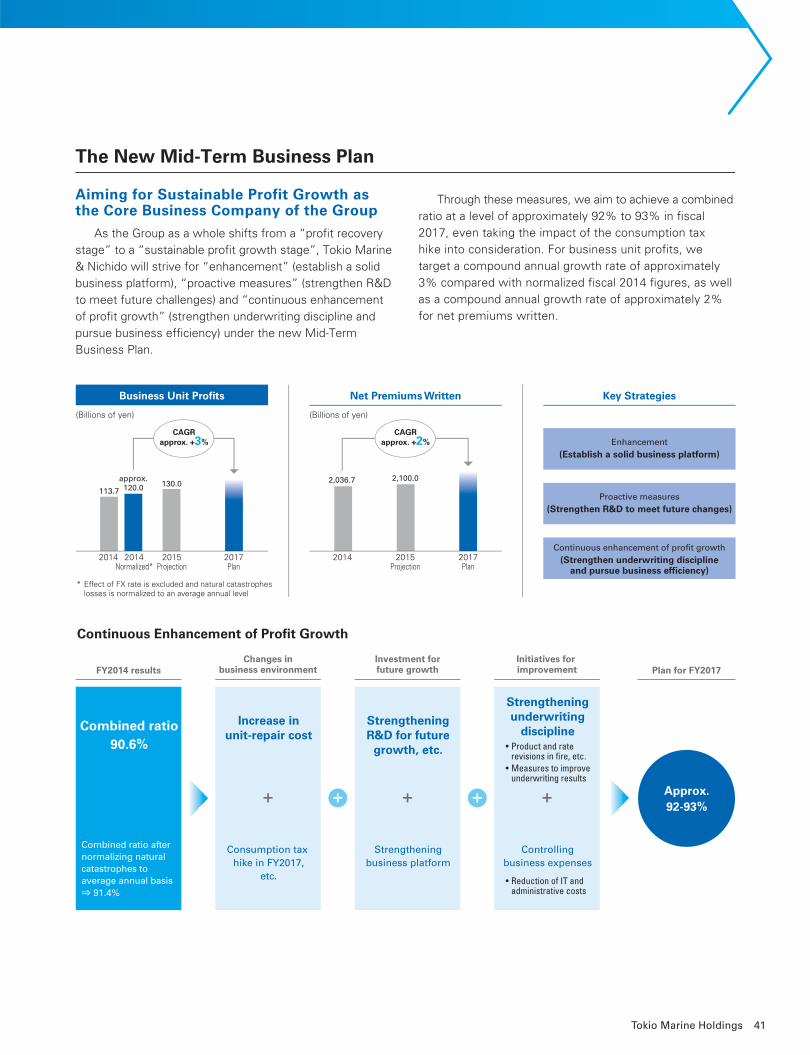
Aiming for Sustainable Profit Growth as the Core Business Company of the Group
As the Group as a whole shifts from a “profi t recovery
stage” to a “sustainable profi t growth stage”, Tokio Marine
& Nichido will strive for “enhancement” (establish a solid
business platform), “proactive measures” (strengthen R&D
to meet future challenges) and “continuous enhancement
of profi t growth” (strengthen underwriting discipline and
pursue business effi ciency) under the new Mid-Term
Business Plan.
Through these measures, we aim to achieve a combined
ratio at a level of approximately 92% to 93% in fi scal
2017, even taking the impact of the consumption tax
hike into consideration. For business unit profi ts, we
target a compound annual growth rate of approximately
3% compared with normalized fi scal 2014 fi gures, as well
as a compound annual growth rate of approximately 2%
for net premiums written.
The New Mid-Term Business Plan
Business Unit Profits Net Premiums Written Key Strategies
2014 2014Normalized*
2015Projection
2017Plan
CAGRapprox. +3%
113.7
approx.120.0 130.0
* Effect of FX rate is excluded and natural catastrophes losses is normalized to an average annual level
2014 2015Projection
2017Plan
CAGRapprox. +2%
2,036.7 2,100.0
Enhancement(Establish a solid business platform)
Proactive measures(Strengthen R&D to meet future changes)
Continuous enhancement of profit growth(Strengthen underwriting discipline
and pursue business efficiency)
(Billions of yen) (Billions of yen)
FY2014 results
Continuous Enhancement of Profit Growth
+++
Combined ratio90.6%
Combined ratio after normalizing natural catastrophes toaverage annual basis⇒ 91.4%
Changes inbusiness environment
Increase inunit-repair cost
Consumption tax hike in FY2017,
etc.
Investment forfuture growth
StrengtheningR&D for future
growth, etc.
Initiatives for improvement
Strengtheningunderwriting
discipline
Plan for FY2017
• Product and rate revisions in fire, etc.• Measures to improve underwriting results
• Reduction of IT and administrative costs
Strengtheningbusiness platform
Controllingbusiness expenses
+ + Approx.92-93%
41Tokio Marine Holdings
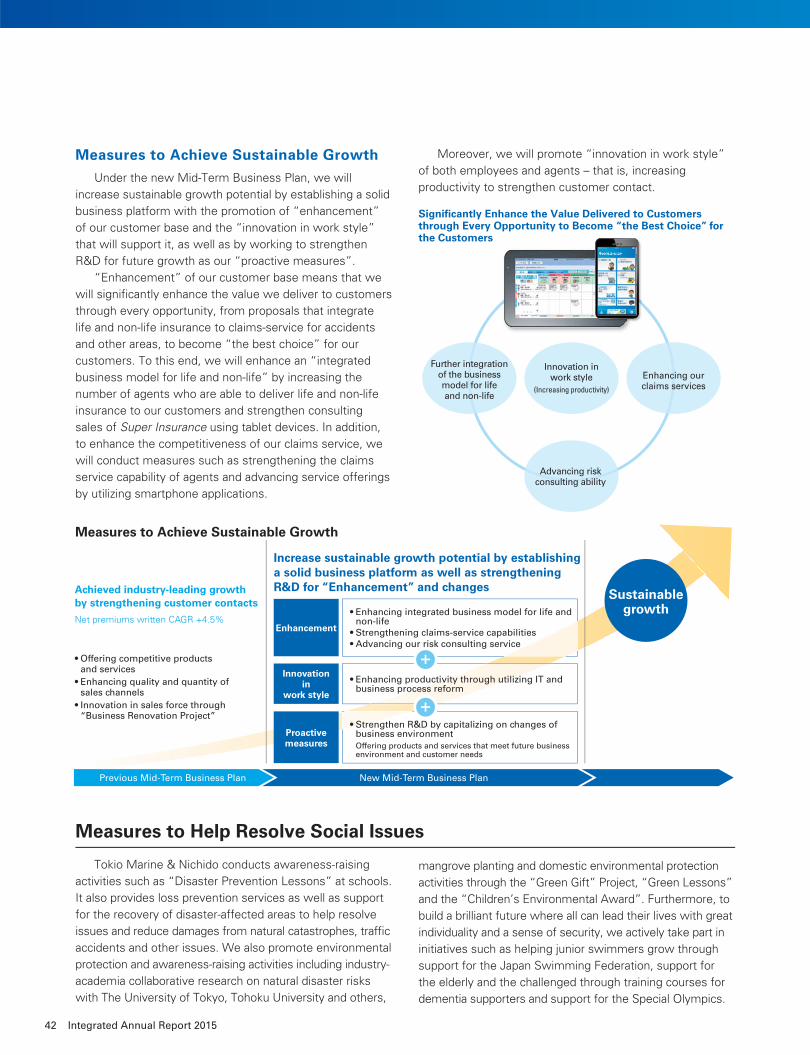
Measures to Help Resolve Social Issues
Measures to Achieve Sustainable Growth
Under the new Mid-Term Business Plan, we will
increase sustainable growth potential by establishing a solid
business platform with the promotion of “enhancement”
of our customer base and the “innovation in work style”
that will support it, as well as by working to strengthen
R&D for future growth as our “proactive measures”.
“Enhancement” of our customer base means that we
will signifi cantly enhance the value we deliver to customers
through every opportunity, from proposals that integrate
life and non-life insurance to claims-service for accidents
and other areas, to become “the best choice” for our
customers. To this end, we will enhance an “integrated
business model for life and non-life” by increasing the
number of agents who are able to deliver life and non-life
insurance to our customers and strengthen consulting
sales of Super Insurance using tablet devices. In addition,
to enhance the competitiveness of our claims service, we
will conduct measures such as strengthening the claims
service capability of agents and advancing service offerings
by utilizing smartphone applications.
Moreover, we will promote “innovation in work style”
of both employees and agents – that is, increasing
productivity to strengthen customer contact.
Tokio Marine & Nichido conducts awareness-raising
activities such as “Disaster Prevention Lessons” at schools.
It also provides loss prevention services as well as support
for the recovery of disaster-affected areas to help resolve
issues and reduce damages from natural catastrophes, traffi c
accidents and other issues. We also promote environmental
protection and awareness-raising activities including industry-
academia collaborative research on natural disaster risks
with The University of Tokyo, Tohoku University and others,
mangrove planting and domestic environmental protection
activities through the “Green Gift” Project, “Green Lessons”
and the “Children’s Environmental Award”. Furthermore, to
build a brilliant future where all can lead their lives with great
individuality and a sense of security, we actively take part in
initiatives such as helping junior swimmers grow through
support for the Japan Swimming Federation, support for
the elderly and the challenged through training courses for
dementia supporters and support for the Special Olympics.
Measures to Achieve Sustainable Growth
Achieved industry-leading growthby strengthening customer contacts
Net premiums written CAGR +4.5%
• Offering competitive products and services• Enhancing quality and quantity of sales channels• Innovation in sales force through “Business Renovation Project”
Increase sustainable growth potential by establishing a solid business platform as well as strengthening R&D for “Enhancement” and changes
Enhancement
Innovationin
work style
• Enhancing productivity through utilizing IT and business process reform
Proactivemeasures
• Strengthen R&D by capitalizing on changes of business environment Offering products and services that meet future business environment and customer needs
Sustainablegrowth
New Mid-Term Business PlanPrevious Mid-Term Business Plan
+
+
• Enhancing integrated business model for life and non-life• Strengthening claims-service capabilities• Advancing our risk consulting service
Signifi cantly Enhance the Value Delivered to Customers through Every Opportunity to Become “the Best Choice” for the Customers
Further integration of the business model for life and non-life
Enhancing our claims services
Innovation in work style
(Increasing productivity)
Advancing risk consulting ability
42 Integrated Annual Report 2015
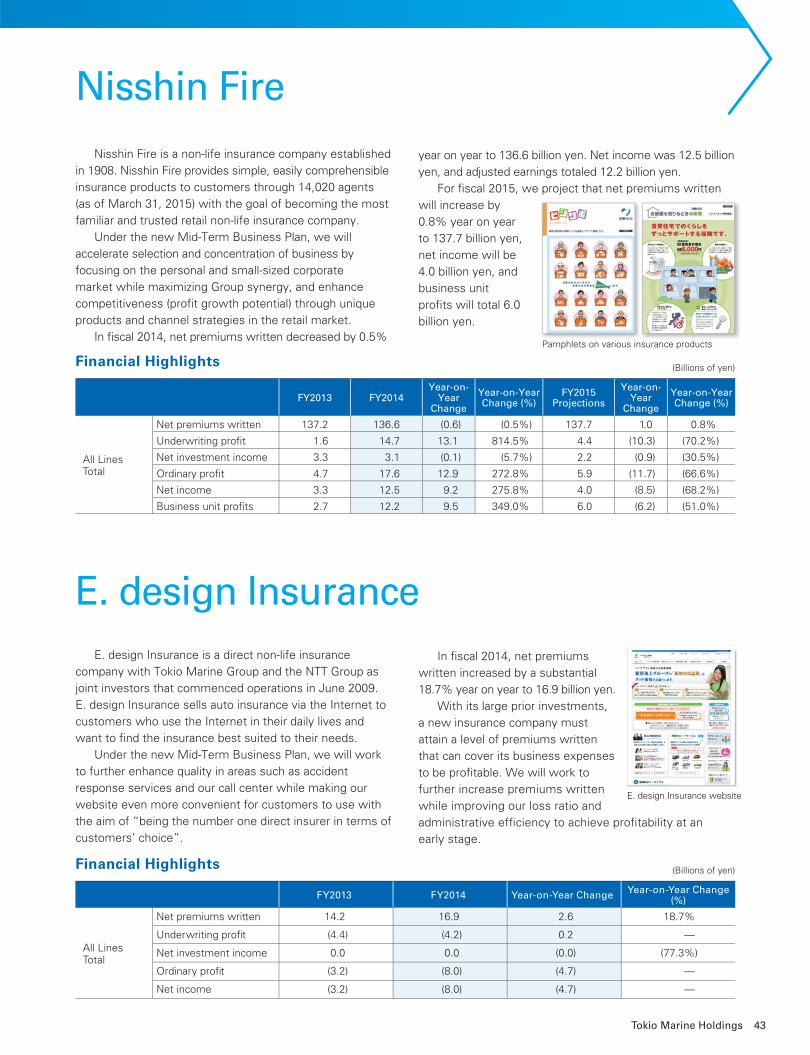
Nisshin Fire is a non-life insurance company established
in 1908. Nisshin Fire provides simple, easily comprehensible
insurance products to customers through 14,020 agents
(as of March 31, 2015) with the goal of becoming the most
familiar and trusted retail non-life insurance company.
Under the new Mid-Term Business Plan, we will
accelerate selection and concentration of business by
focusing on the personal and small-sized corporate
market while maximizing Group synergy, and enhance
competitiveness (profi t growth potential) through unique
products and channel strategies in the retail market.
In fi scal 2014, net premiums written decreased by 0.5%
E. design Insurance is a direct non-life insurance
company with Tokio Marine Group and the NTT Group as
joint investors that commenced operations in June 2009.
E. design Insurance sells auto insurance via the Internet to
customers who use the Internet in their daily lives and
want to fi nd the insurance best suited to their needs.
Under the new Mid-Term Business Plan, we will work
to further enhance quality in areas such as accident
response services and our call center while making our
website even more convenient for customers to use with
the aim of “being the number one direct insurer in terms of
customers’ choice”.
year on year to 136.6 billion yen. Net income was 12.5 billion
yen, and adjusted earnings totaled 12.2 billion yen.
For fi scal 2015, we project that net premiums written
will increase by
0.8% year on year
to 137.7 billion yen,
net income will be
4.0 billion yen, and
business unit
profi ts will total 6.0
billion yen.
In fi scal 2014, net premiums
written increased by a substantial
18.7% year on year to 16.9 billion yen.
With its large prior investments,
a new insurance company must
attain a level of premiums written
that can cover its business expenses
to be profi table. We will work to
further increase premiums written
while improving our loss ratio and
administrative effi ciency to achieve profi tability at an
early stage.
Nisshin Fire
E. design Insurance
Financial Highlights
FY2013 FY2014Year-on-
YearChange
Year-on-YearChange (%)
FY2015Projections
Year-on-Year
Change
Year-on-YearChange (%)
All Lines Total
Net premiums written 137.2 136.6 (0.6) (0.5%) 137.7 1.0 0.8%
Underwriting profi t 1.6 14.7 13.1 814.5% 4.4 (10.3) (70.2%)
Net investment income 3.3 3.1 (0.1) (5.7%) 2.2 (0.9) (30.5%)
Ordinary profi t 4.7 17.6 12.9 272.8% 5.9 (11.7) (66.6%)
Net income 3.3 12.5 9.2 275.8% 4.0 (8.5) (68.2%)
Business unit profi ts 2.7 12.2 9.5 349.0% 6.0 (6.2) (51.0%)
(Billions of yen)
Financial Highlights
FY2013 FY2014 Year-on-Year Change Year-on-Year Change(%)
All Lines Total
Net premiums written 14.2 16.9 2.6 18.7%
Underwriting profi t (4.4) (4.2) 0.2 —
Net investment income 0.0 0.0 (0.0) (77.3%)
Ordinary profi t (3.2) (8.0) (4.7) —
Net income (3.2) (8.0) (4.7) —
(Billions of yen)
Pamphlets on various insurance products
E. design Insurance website
43Tokio Marine Holdings
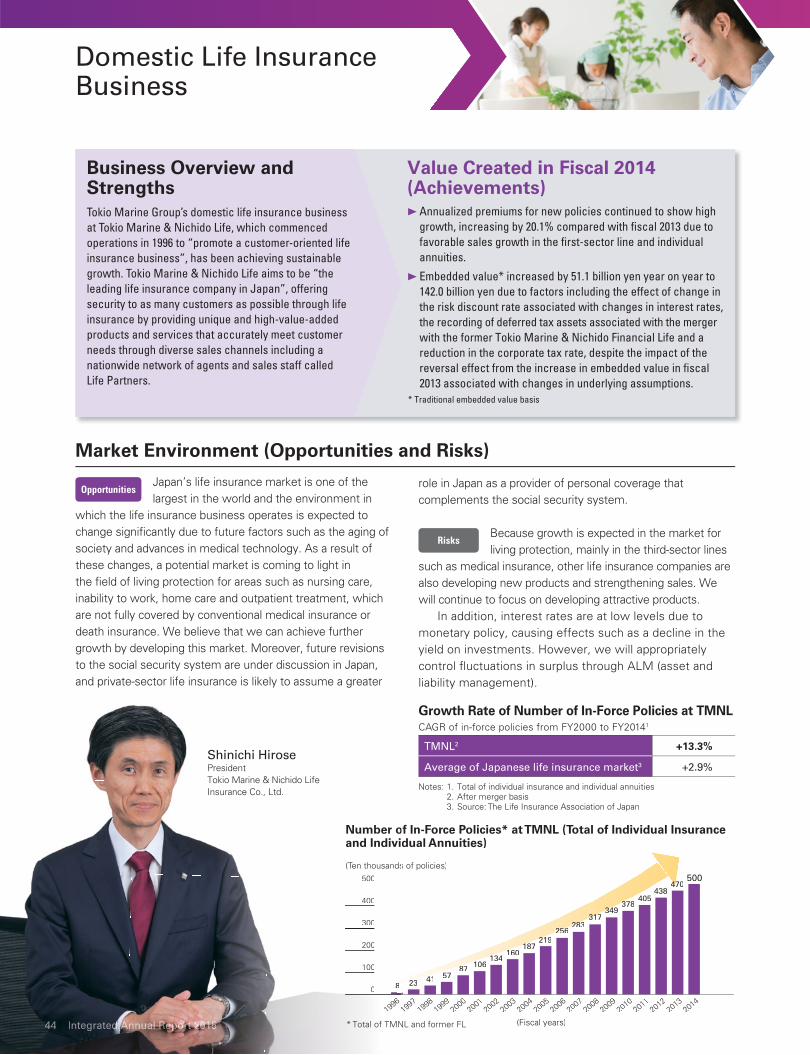
Shinichi HirosePresidentTokio Marine & Nichido Life Insurance Co., Ltd.
Market Environment (Opportunities and Risks)
Japan’s life insurance market is one of the
largest in the world and the environment in
which the life insurance business operates is expected to
change signifi cantly due to future factors such as the aging of
society and advances in medical technology. As a result of
these changes, a potential market is coming to light in
the fi eld of living protection for areas such as nursing care,
inability to work, home care and outpatient treatment, which
are not fully covered by conventional medical insurance or
death insurance. We believe that we can achieve further
growth by developing this market. Moreover, future revisions
to the social security system are under discussion in Japan,
and private-sector life insurance is likely to assume a greater
role in Japan as a provider of personal coverage that
complements the social security system.
Because growth is expected in the market for
living protection, mainly in the third-sector lines
such as medical insurance, other life insurance companies are
also developing new products and strengthening sales. We
will continue to focus on developing attractive products.
In addition, interest rates are at low levels due to
monetary policy, causing effects such as a decline in the
yield on investments. However, we will appropriately
control fl uctuations in surplus through ALM (asset and
liability management).
Domestic Life Insurance Business
500
88 232 41 57878 106
13411601
18712192
25625628328
3173134934
3783405
43847047
(Fiscal years)
500
s of policies)(Ten thousands
0
300
100
400
200
199619971 1998
19992000
20012002
20032004
20052006
20072008
20092010
20112012
20132014
of In-Force Policies* at TMNL (Total of Individual InsuranceNumber odual Annuities)and Indivi
* Total of TMNL and former FL
Growth Rate of Number of In-Force Policies at TMNLCAGR of in-force policies from FY2000 to FY20141
TMNL2 +13.3%
Average of Japanese life insurance market3 +2.9%
Notes: 1. Total of individual insurance and individual annuities 2. After merger basis 3. Source: The Life Insurance Association of Japan
Value Created in Fiscal 2014 (Achievements)
Annualized premiums for new policies continued to show high growth, increasing by 20.1% compared with fi scal 2013 due to favorable sales growth in the fi rst-sector line and individual annuities.
Embedded value* increased by 51.1 billion yen year on year to 142.0 billion yen due to factors including the effect of change in the risk discount rate associated with changes in interest rates, the recording of deferred tax assets associated with the merger with the former Tokio Marine & Nichido Financial Life and a reduction in the corporate tax rate, despite the impact of the reversal effect from the increase in embedded value in fi scal 2013 associated with changes in underlying assumptions.
* Traditional embedded value basis
Business Overview and StrengthsTokio Marine Group’s domestic life insurance business at Tokio Marine & Nichido Life, which commenced operations in 1996 to “promote a customer-oriented life insurance business”, has been achieving sustainable growth. Tokio Marine & Nichido Life aims to be “the leading life insurance company in Japan”, offering security to as many customers as possible through life insurance by providing unique and high-value-added products and services that accurately meet customer needs through diverse sales channels including a nationwide network of agents and sales staff called Life Partners.
Opportunities
Risks
444444444444444444 Intntegreg ateddd dd d AAAd Add Add AAdd AAAAAd AAAAAAAAnnunnunnunnunununnuuuual alalalalaalal aaallall RepRepRepepepepRepRepepRepepRepReRepRepepeRepRepRepepepppRepRRepepppRepRRRRepReppRepReRepportooortortortorortoortortortortororortortortrtortrtrtrtrortrrtrrto t 20202020202020202200220200202020202020202002020202015151515151551515515515515155151115
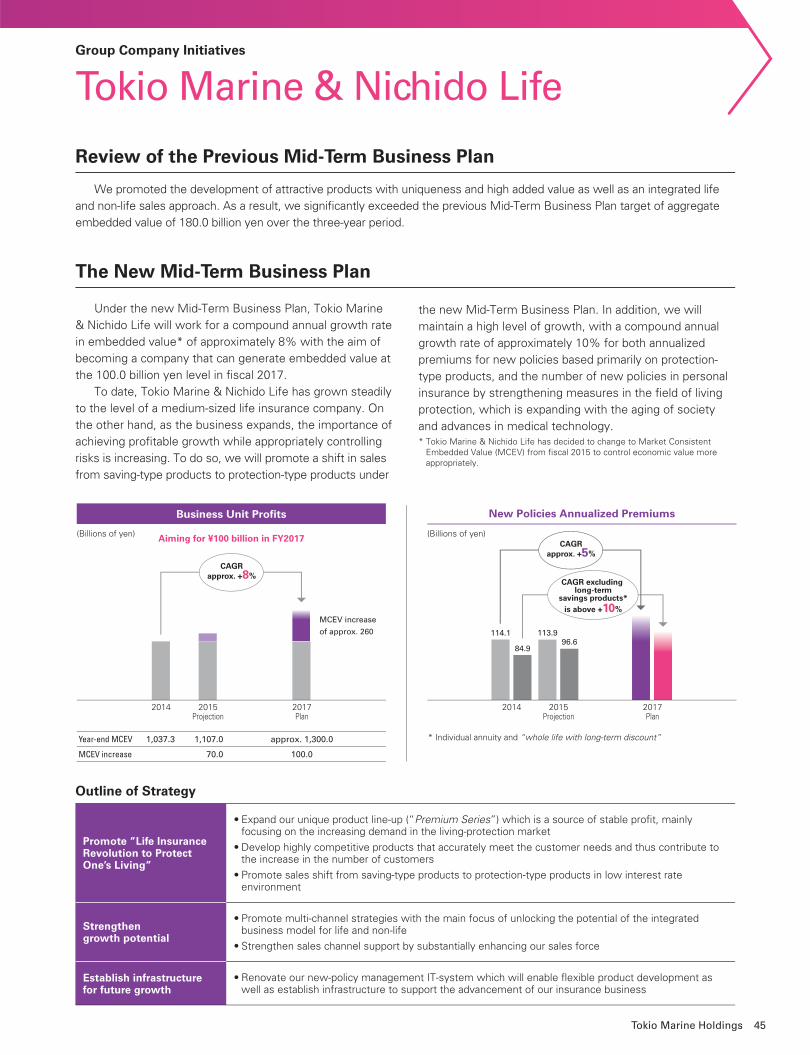
We promoted the development of attractive products with uniqueness and high added value as well as an integrated life
and non-life sales approach. As a result, we signifi cantly exceeded the previous Mid-Term Business Plan target of aggregate
embedded value of 180.0 billion yen over the three-year period.
Review of the Previous Mid-Term Business Plan
The New Mid-Term Business Plan
Under the new Mid-Term Business Plan, Tokio Marine
& Nichido Life will work for a compound annual growth rate
in embedded value* of approximately 8% with the aim of
becoming a company that can generate embedded value at
the 100.0 billion yen level in fi scal 2017.
To date, Tokio Marine & Nichido Life has grown steadily
to the level of a medium-sized life insurance company. On
the other hand, as the business expands, the importance of
achieving profi table growth while appropriately controlling
risks is increasing. To do so, we will promote a shift in sales
from saving-type products to protection-type products under
the new Mid-Term Business Plan. In addition, we will
maintain a high level of growth, with a compound annual
growth rate of approximately 10% for both annualized
premiums for new policies based primarily on protection-
type products, and the number of new policies in personal
insurance by strengthening measures in the fi eld of living
protection, which is expanding with the aging of society
and advances in medical technology.* Tokio Marine & Nichido Life has decided to change to Market Consistent
Embedded Value (MCEV) from fi scal 2015 to control economic value more appropriately.
Group Company Initiatives
Tokio Marine & Nichido Life
Business Unit Profits New Policies Annualized Premiums
2014 2015Projection
2017Plan
CAGRapprox. +8%
Aiming for ¥100 billion in FY2017
Year-end MCEV
MCEV increase
1,037.3 1,107.0
70.0
approx. 1,300.0
100.0
* Individual annuity and “whole life with long-term discount”
MCEV increase
of approx. 260
2014 2015Projection
2017Plan
CAGR excluding long-term
savings products*is above +10%
CAGRapprox. +5%
114.1 113.9
84.996.6
(Billions of yen)(Billions of yen)
Outline of Strategy
Promote ”Life InsuranceRevolution to ProtectOne’s Living”
• Expand our unique product line-up (“Premium Series”) which is a source of stable profi t, mainly focusing on the increasing demand in the living-protection market
• Develop highly competitive products that accurately meet the customer needs and thus contribute to the increase in the number of customers
• Promote sales shift from saving-type products to protection-type products in low interest rate environment
Strengthengrowth potential
• Promote multi-channel strategies with the main focus of unlocking the potential of the integratedbusiness model for life and non-life
• Strengthen sales channel support by substantially enhancing our sales force
Establish infrastructurefor future growth
• Renovate our new-policy management IT-system which will enable fl exible product development as well as establish infrastructure to support the advancement of our insurance business
45Tokio Marine Holdings
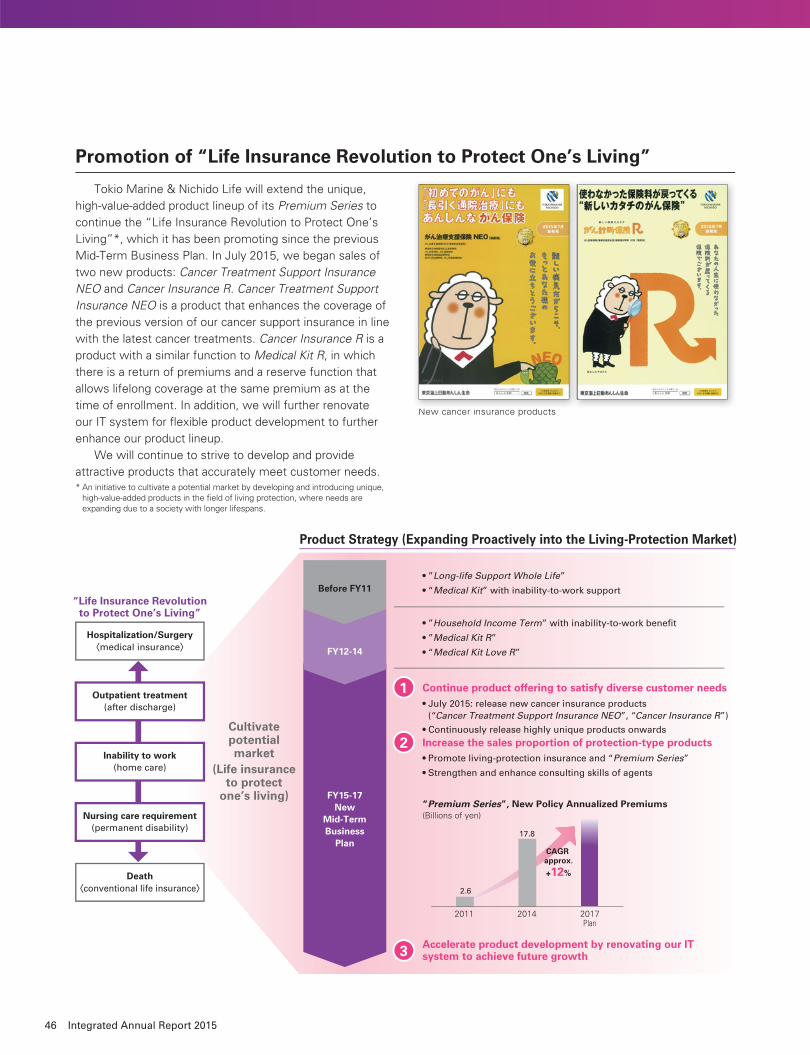
Promotion of “Life Insurance Revolution to Protect One’s Living”
Tokio Marine & Nichido Life will extend the unique,
high-value-added product lineup of its Premium Series to
continue the “Life Insurance Revolution to Protect One’s
Living”*, which it has been promoting since the previous
Mid-Term Business Plan. In July 2015, we began sales of
two new products: Cancer Treatment Support Insurance NEO and Cancer Insurance R. Cancer Treatment Support Insurance NEO is a product that enhances the coverage of
the previous version of our cancer support insurance in line
with the latest cancer treatments. Cancer Insurance R is a
product with a similar function to Medical Kit R, in which
there is a return of premiums and a reserve function that
allows lifelong coverage at the same premium as at the
time of enrollment. In addition, we will further renovate
our IT system for fl exible product development to further
enhance our product lineup.
We will continue to strive to develop and provide
attractive products that accurately meet customer needs.* An initiative to cultivate a potential market by developing and introducing unique,
high-value-added products in the fi eld of living protection, where needs are expanding due to a society with longer lifespans.
New cancer insurance productsN i d
“Life Insurance Revolutionto Protect One’s Living”
Product Strategy (Expanding Proactively into the Living-Protection Market)
Hospitalization/Surgery〈medical insurance〉
Death〈conventional life insurance〉
Cultivatepotentialmarket
(Life insuranceto protect
one’s living)
1
• ”Long-life Support Whole Life”
• “Medical Kit” with inability-to-work support
• ”Household Income Term” with inability-to-work benefit
• ”Medical Kit R”
• “Medical Kit Love R”
• July 2015: release new cancer insurance products (“Cancer Treatment Support Insurance NEO”, “Cancer Insurance R”)
• Continuously release highly unique products onwards
• Promote living-protection insurance and “Premium Series”
• Strengthen and enhance consulting skills of agents
FY15-17New
Mid-TermBusiness
Plan
FY12-14
Before FY11
Continue product offering to satisfy diverse customer needs
2 Increase the sales proportion of protection-type products
3 Accelerate product development by renovating our ITsystem to achieve future growth
2011 2014 2017Plan
2.6
17.8
“Premium Series”, New Policy Annualized Premiums(Billions of yen)
Outpatient treatment(after discharge)
Inability to work(home care)
Nursing care requirement(permanent disability)
CAGR approx.
+12%
46 Integrated Annual Report 2015
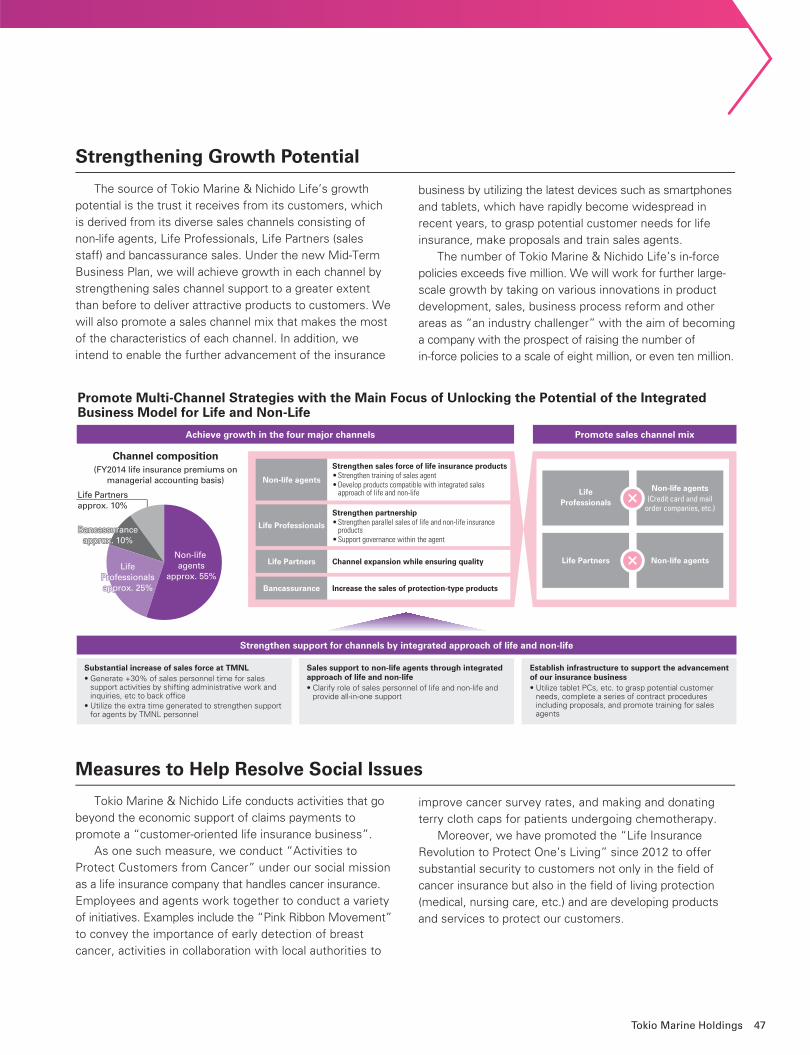
Strengthening Growth Potential
Measures to Help Resolve Social Issues
The source of Tokio Marine & Nichido Life’s growth
potential is the trust it receives from its customers, which
is derived from its diverse sales channels consisting of
non-life agents, Life Professionals, Life Partners (sales
staff) and bancassurance sales. Under the new Mid-Term
Business Plan, we will achieve growth in each channel by
strengthening sales channel support to a greater extent
than before to deliver attractive products to customers. We
will also promote a sales channel mix that makes the most
of the characteristics of each channel. In addition, we
intend to enable the further advancement of the insurance
Tokio Marine & Nichido Life conducts activities that go
beyond the economic support of claims payments to
promote a “customer-oriented life insurance business”.
As one such measure, we conduct “Activities to
Protect Customers from Cancer” under our social mission
as a life insurance company that handles cancer insurance.
Employees and agents work together to conduct a variety
of initiatives. Examples include the “Pink Ribbon Movement”
to convey the importance of early detection of breast
cancer, activities in collaboration with local authorities to
business by utilizing the latest devices such as smartphones
and tablets, which have rapidly become widespread in
recent years, to grasp potential customer needs for life
insurance, make proposals and train sales agents.
The number of Tokio Marine & Nichido Life’s in-force
policies exceeds fi ve million. We will work for further large-
scale growth by taking on various innovations in product
development, sales, business process reform and other
areas as “an industry challenger” with the aim of becoming
a company with the prospect of raising the number of
in-force policies to a scale of eight million, or even ten million.
improve cancer survey rates, and making and donating
terry cloth caps for patients undergoing chemotherapy.
Moreover, we have promoted the “Life Insurance
Revolution to Protect One’s Living” since 2012 to offer
substantial security to customers not only in the fi eld of
cancer insurance but also in the fi eld of living protection
(medical, nursing care, etc.) and are developing products
and services to protect our customers.
Promote Multi-Channel Strategies with the Main Focus of Unlocking the Potential of the Integrated Business Model for Life and Non-Life
Achieve growth in the four major channels
Strengthen support for channels by integrated approach of life and non-life
Promote sales channel mix
Substantial increase of sales force at TMNL• Generate +30% of sales personnel time for sales
support activities by shifting administrative work and inquiries, etc to back office
• Utilize the extra time generated to strengthen support for agents by TMNL personnel
Sales support to non-life agents through integrated approach of life and non-life• Clarify role of sales personnel of life and non-life and
provide all-in-one support
Establish infrastructure to support the advancement of our insurance business• Utilize tablet PCs, etc. to grasp potential customer
needs, complete a series of contract procedures including proposals, and promote training for sales agents
Channel composition(FY2014 life insurance premiums on
managerial accounting basis)
Non-life agents
approx. 55%Life
Professionalsapprox. 25%
LifeProfessionalsapprox. 25%
Bancassuranceapprox. 10%
Bancassuranceapprox. 10%
Life Partnersapprox. 10%
Non-life agentsNon-life agents
(Credit card and mailorder companies, etc.)
LifeProfessionals
Life Professionals
Life Partners
Bancassurance
Strengthen sales force of life insurance products• Strengthen training of sales agent• Develop products compatible with integrated sales approach of life and non-life
Strengthen partnership• Strengthen parallel sales of life and non-life insurance products • Support governance within the agent
Channel expansion while ensuring quality
Increase the sales of protection-type products
×
Non-life agentsLife Partners ×
47Tokio Marine Holdings
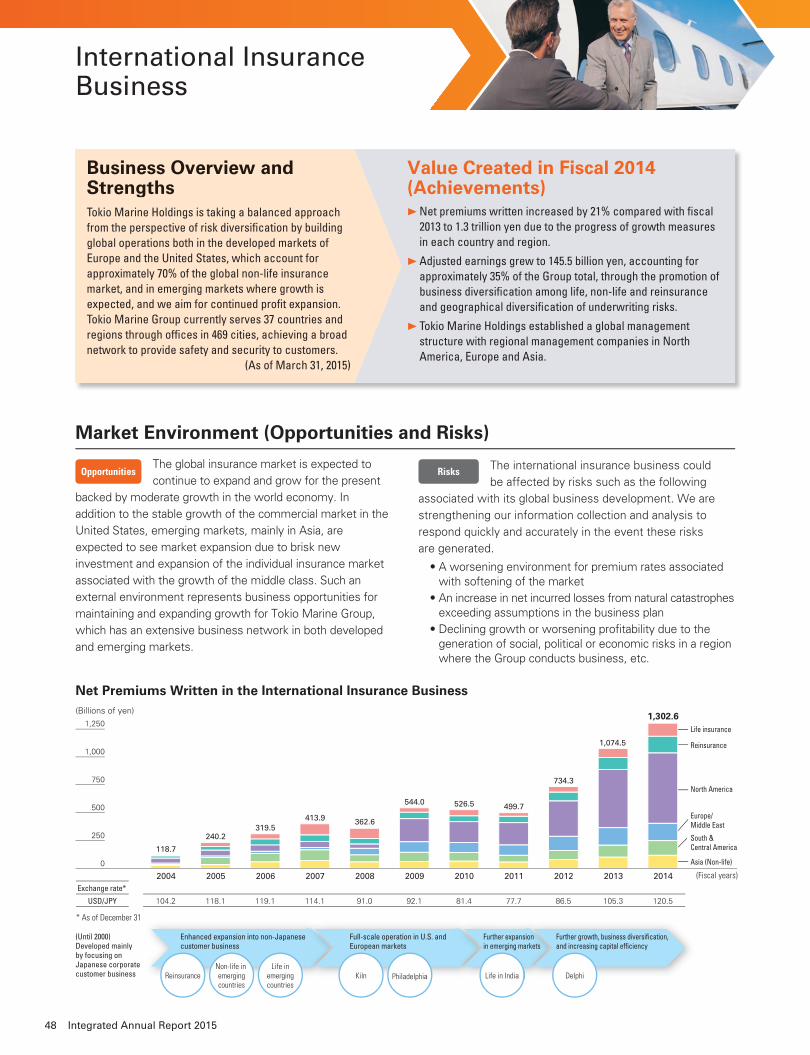
International Insurance Business
Life insurance
Reinsurance
North America
Europe/Middle East
South & Central America
Asia (Non-life)
2004 2005 2006 2007 2008 2009 2010 2011 2012 2013 2014
250
1,000
750
500
0
1,250
118.7
240.2319.5
413.9 362.6
544.0 526.5 499.7
734.3
1,074.5
1,302.6
40
(Billions of yen)
Exchange rate*
USD/JPY
* As of December 31
(Fiscal years)
104.2 118.1 119.1 114.1 91.0 92.1 81.4 77.7 86.5 105.3 120.5
(Until 2000)Developed mainly by focusing on Japanese corporate customer business
Enhanced expansion into non-Japanese customer business
ReinsuranceNon-life in emergingcountries
Life inemergingcountries
Full-scale operation in U.S. and European markets
Kiln Philadelphia
Further expansion in emerging markets
Life in India
sionarkets
Further growth, business diversification, and increasing capital efficiency
Delphi
Net Premiums Written in the International Insurance Business
Value Created in Fiscal 2014 (Achievements)
Net premiums written increased by 21% compared with fi scal 2013 to 1.3 trillion yen due to the progress of growth measures in each country and region.
Adjusted earnings grew to 145.5 billion yen, accounting for approximately 35% of the Group total, through the promotion of business diversifi cation among life, non-life and reinsurance and geographical diversifi cation of underwriting risks.
Tokio Marine Holdings established a global management structure with regional management companies in North America, Europe and Asia.
Business Overview and StrengthsBusiness Overview andStrengths
Market Environment (Opportunities and Risks)
The global insurance market is expected to
continue to expand and grow for the present
backed by moderate growth in the world economy. In
addition to the stable growth of the commercial market in the
United States, emerging markets, mainly in Asia, are
expected to see market expansion due to brisk new
investment and expansion of the individual insurance market
associated with the growth of the middle class. Such an
external environment represents business opportunities for
maintaining and expanding growth for Tokio Marine Group,
which has an extensive business network in both developed
and emerging markets.
The international insurance business could
be affected by risks such as the following
associated with its global business development. We are
strengthening our information collection and analysis to
respond quickly and accurately in the event these risks
are generated.
• A worsening environment for premium rates associated with softening of the market
• An increase in net incurred losses from natural catastrophes exceeding assumptions in the business plan
• Declining growth or worsening profi tability due to the generation of social, political or economic risks in a region where the Group conducts business, etc.
Opportunities Risks
Tokio Marine Holdings is taking a balanced approach from the perspective of risk diversifi cation by building global operations both in the developed markets of Europe and the United States, which account for approximately 70% of the global non-life insurance market, and in emerging markets where growth is expected, and we aim for continued profi t expansion. Tokio Marine Group currently serves 37 countries and regions through offi ces in 469 cities, achieving a broad network to provide safety and security to customers. (As of March 31, 2015)
48 Integrated Annual Report 2015
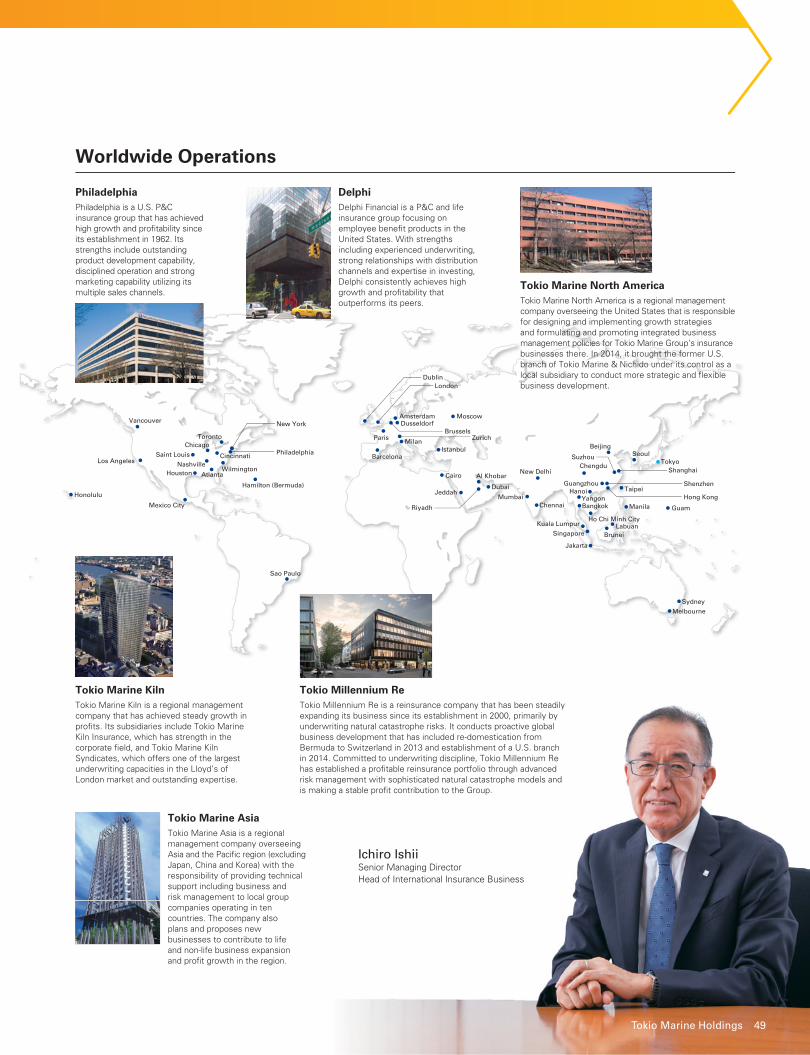
Honolulu
Sao Paulo
Toronto
DublinLondon
Moscow
Barcelona
MilanParis
AmsterdamDusseldorf
BrusselsZurich
Istanbul
TokyoShanghai
ShenzhenTaipei
Hong Kong
Guam
Sydney
Melbourne
Manila
LabuanBrunei
Ho Chi Minh City
Seoul
Cairo Al Khobar
Dubai
Chennai Bangkok
New Delhi
Hamilton (Bermuda)
Wilmington
Vancouver
Los Angeles
Chicago Beijing
SuzhouChengduNashville
AtlantaHouston
Jeddah HanoiYangon
Guangzhou
Mumbai
Kuala Lumpur
Singapore
Jakarta
RiyadhMexico City
Saint Louis
New York
PhiladelphiaCincinnati
Ichiro IshiiSenior Managing Director Head of International Insurance Business
Worldwide Operations
Tokio Marine Asia
PhiladelphiaPhiladelphia is a U.S. P&C insurance group that has achieved high growth and profi tability since its establishment in 1962. Its strengths include outstanding product development capability, disciplined operation and strong marketing capability utilizing its multiple sales channels.
DelphiDelphi Financial is a P&C and life insurance group focusing on employee benefi t products in the United States. With strengths including experienced underwriting, strong relationships with distribution channels and expertise in investing, Delphi consistently achieves high growth and profi tability that outperforms its peers.
Tokio Marine KilnTokio Marine Kiln is a regional management company that has achieved steady growth in profi ts. Its subsidiaries include Tokio Marine Kiln Insurance, which has strength in the corporate fi eld, and Tokio Marine Kiln Syndicates, which offers one of the largest underwriting capacities in the Lloyd’s of London market and outstanding expertise.
Tokio Millennium ReTokio Millennium Re is a reinsurance company that has been steadily expanding its business since its establishment in 2000, primarily by underwriting natural catastrophe risks. It conducts proactive global business development that has included re-domestication from Bermuda to Switzerland in 2013 and establishment of a U.S. branch in 2014. Committed to underwriting discipline, Tokio Millennium Re has established a profi table reinsurance portfolio through advanced risk management with sophisticated natural catastrophe models and is making a stable profi t contribution to the Group.
Tokio Marine Asia is a regional management company overseeing Asia and the Pacifi c region (excluding Japan, China and Korea) with the responsibility of providing technical support including business and risk management to local group companies operating in ten countries. The company also plans and proposes new businesses to contribute to life and non-life business expansion and profi t growth in the region.
Tokio Marine North AmericaTokio Marine North America is a regional management company overseeing the United States that is responsible for designing and implementing growth strategies and formulating and promoting integrated business management policies for Tokio Marine Group’s insurance businesses there. In 2014, it brought the former U.S. branch of Tokio Marine & Nichido under its control as a local subsidiary to conduct more strategic and fl exible business development.
Tokio Marine Holdings 49
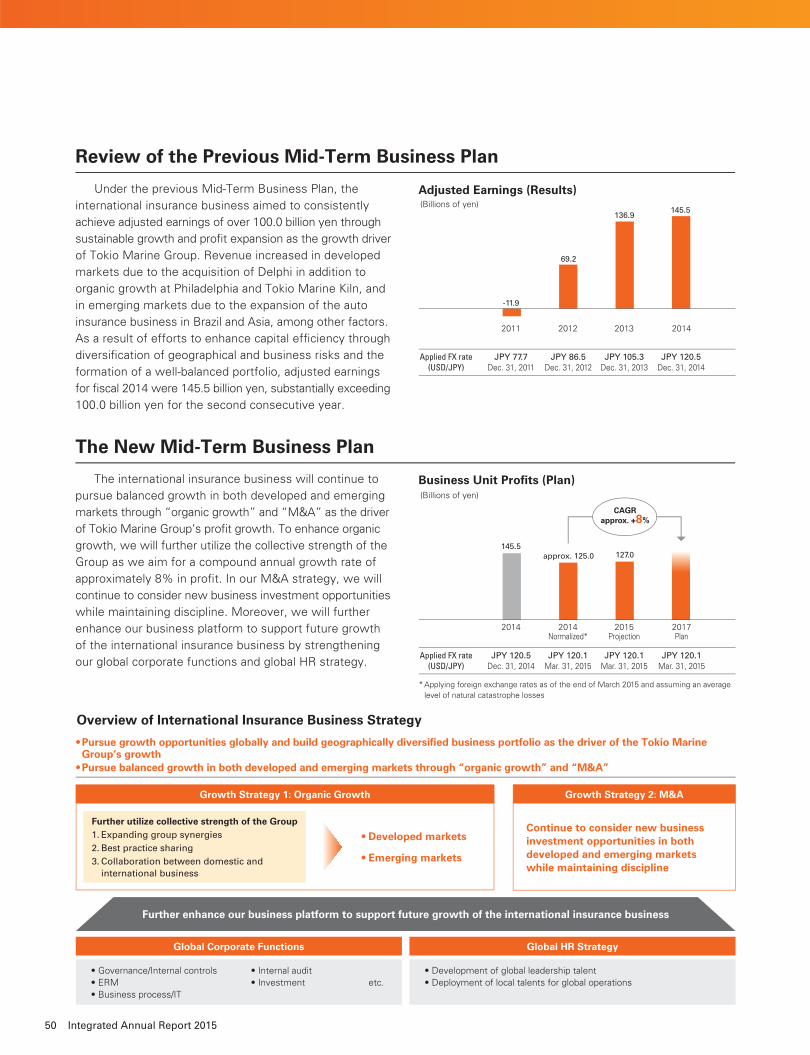
Review of the Previous Mid-Term Business Plan
The New Mid-Term Business Plan
Under the previous Mid-Term Business Plan, the
international insurance business aimed to consistently
achieve adjusted earnings of over 100.0 billion yen through
sustainable growth and profi t expansion as the growth driver
of Tokio Marine Group. Revenue increased in developed
markets due to the acquisition of Delphi in addition to
organic growth at Philadelphia and Tokio Marine Kiln, and
in emerging markets due to the expansion of the auto
insurance business in Brazil and Asia, among other factors.
As a result of efforts to enhance capital effi ciency through
diversifi cation of geographical and business risks and the
formation of a well-balanced portfolio, adjusted earnings
for fi scal 2014 were 145.5 billion yen, substantially exceeding
100.0 billion yen for the second consecutive year.
The international insurance business will continue to
pursue balanced growth in both developed and emerging
markets through “organic growth” and “M&A” as the driver
of Tokio Marine Group’s profi t growth. To enhance organic
growth, we will further utilize the collective strength of the
Group as we aim for a compound annual growth rate of
approximately 8% in profi t. In our M&A strategy, we will
continue to consider new business investment opportunities
while maintaining discipline. Moreover, we will further
enhance our business platform to support future growth
of the international insurance business by strengthening
our global corporate functions and global HR strategy.
Adjusted Earnings (Results)
Business Unit Profi ts (Plan)
2011 2012 2013 2014
Applied FX rate(USD/JPY)
JPY 77.7Dec. 31, 2011
JPY 86.5Dec. 31, 2012
JPY 105.3Dec. 31, 2013
JPY 120.5Dec. 31, 2014
-11.9
69.2
136.9145.5
(Billions of yen)
CAGRapprox. +8%
2014 2014Normalized*
2015Projection
2017Plan
Applied FX rate(USD/JPY)
JPY 120.5Dec. 31, 2014
JPY 120.1Mar. 31, 2015
JPY 120.1Mar. 31, 2015
JPY 120.1Mar. 31, 2015
145.5approx. 125.0 127.0
* Applying foreign exchange rates as of the end of March 2015 and assuming an average level of natural catastrophe losses
(Billions of yen)
Overview of International Insurance Business Strategy
• Governance/Internal controls• ERM• Business process/IT
• Internal audit• Investment etc.
• Pursue growth opportunities globally and build geographically diversified business portfolio as the driver of the Tokio Marine Group’s growth• Pursue balanced growth in both developed and emerging markets through “organic growth” and “M&A”
Growth Strategy 1: Organic Growth
Global Corporate Functions
Further enhance our business platform to support future growth of the international insurance business
• Development of global leadership talent• Deployment of local talents for global operations
Global HR Strategy
Growth Strategy 2: M&A
Further utilize collective strength of the Group1. Expanding group synergies2. Best practice sharing3. Collaboration between domestic and international business
• Developed markets
• Emerging markets
Continue to consider new businessinvestment opportunities in bothdeveloped and emerging marketswhile maintaining discipline
50 Integrated Annual Report 2015
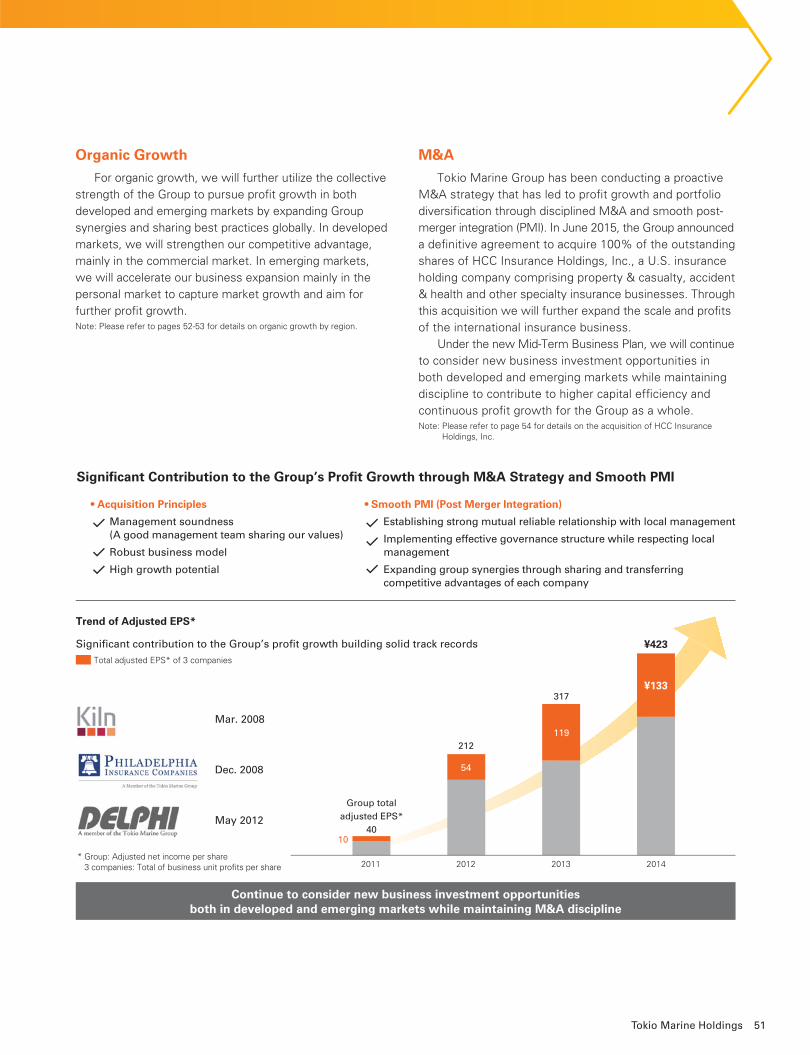
Organic Growth
For organic growth, we will further utilize the collective
strength of the Group to pursue profi t growth in both
developed and emerging markets by expanding Group
synergies and sharing best practices globally. In developed
markets, we will strengthen our competitive advantage,
mainly in the commercial market. In emerging markets,
we will accelerate our business expansion mainly in the
personal market to capture market growth and aim for
further profi t growth.Note: Please refer to pages 52-53 for details on organic growth by region.
M&A
Tokio Marine Group has been conducting a proactive
M&A strategy that has led to profi t growth and portfolio
diversifi cation through disciplined M&A and smooth post-
merger integration (PMI). In June 2015, the Group announced
a defi nitive agreement to acquire 100% of the outstanding
shares of HCC Insurance Holdings, Inc., a U.S. insurance
holding company comprising property & casualty, accident
& health and other specialty insurance businesses. Through
this acquisition we will further expand the scale and profi ts
of the international insurance business.
Under the new Mid-Term Business Plan, we will continue
to consider new business investment opportunities in
both developed and emerging markets while maintaining
discipline to contribute to higher capital effi ciency and
continuous profi t growth for the Group as a whole.Note: Please refer to page 54 for details on the acquisition of HCC Insurance
Holdings, Inc.
Significant Contribution to the Group’s Profit Growth through M&A Strategy and Smooth PMI
• Acquisition Principles
Management soundness (A good management team sharing our values)
Robust business model
High growth potential
Trend of Adjusted EPS*
Significant contribution to the Group’s profit growth building solid track records Total adjusted EPS* of 3 companies
• Smooth PMI (Post Merger Integration)
Establishing strong mutual reliable relationship with local management
Implementing effective governance structure while respecting local management
Expanding group synergies through sharing and transferring competitive advantages of each company
Continue to consider new business investment opportunitiesboth in developed and emerging markets while maintaining M&A discipline
2011 2012 2013 2014
Group totaladjusted EPS*
40
212
317
¥423
¥133
54
10
119Mar. 2008
Dec. 2008
May 2012
* Group: Adjusted net income per share3 companies: Total of business unit profi ts per share
51Tokio Marine Holdings
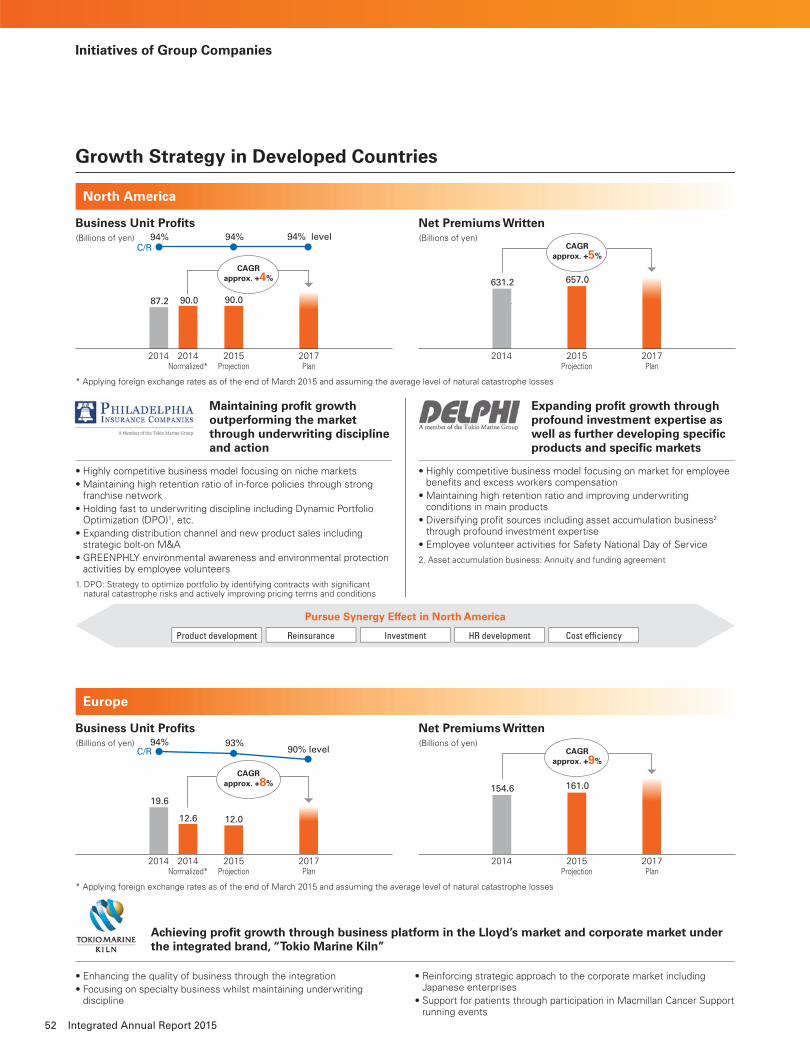
Initiatives of Group Companies
Growth Strategy in Developed Countries
North America
Europe
Business Unit Profi ts
Business Unit Profi ts
Maintaining profi t growth outperforming the market through underwriting discipline and action
• Highly competitive business model focusing on niche markets• Maintaining high retention ratio of in-force policies through strong
franchise network• Holding fast to underwriting discipline including Dynamic Portfolio
Optimization (DPO)1, etc.• Expanding distribution channel and new product sales including
strategic bolt-on M&A• GREENPHLY environmental awareness and environmental protection
activities by employee volunteers
1. DPO: Strategy to optimize portfolio by identifying contracts with signifi cant natural catastrophe risks and actively improving pricing terms and conditions
Achieving profi t growth through business platform in the Lloyd’s market and corporate market under the integrated brand, “Tokio Marine Kiln”
• Enhancing the quality of business through the integration• Focusing on specialty business whilst maintaining underwriting
discipline
• Reinforcing strategic approach to the corporate market including Japanese enterprises
• Support for patients through participation in Macmillan Cancer Support running events
Expanding profi t growth through profound investment expertise as well as further developing specifi c products and specifi c markets
• Highly competitive business model focusing on market for employee benefi ts and excess workers compensation
• Maintaining high retention ratio and improving underwriting conditions in main products
• Diversifying profi t sources including asset accumulation business2 through profound investment expertise
• Employee volunteer activities for Safety National Day of Service
2. Asset accumulation business: Annuity and funding agreement
Net Premiums Written
Net Premiums Written
Pursue Synergy Effect in North America
Product development Reinsurance Investment HR development Cost effi ciency
2014 2014Normalized*
2015Projection
2017Plan
94%
87.2 90.0 90.0
631.2 657.0
94% 94% level(Billions of yen)C/R
CAGRapprox. +4%
2014 2015Projection
2017Plan
872 900
(Billions of yen)CAGR
approx. +5%
2014 2014Normalized*
2015Projection
2017Plan
94%
19.6
12.6 12.0
154.6 161.0
93%90% level
(Billions of yen)C/R
CAGRapprox. +8%
2014 2015Projection
2017Plan
900
(Billions of yen)CAGR
approx. +9%
* Applying foreign exchange rates as of the end of March 2015 and assuming the average level of natural catastrophe losses
* Applying foreign exchange rates as of the end of March 2015 and assuming the average level of natural catastrophe losses
52 Integrated Annual Report 2015
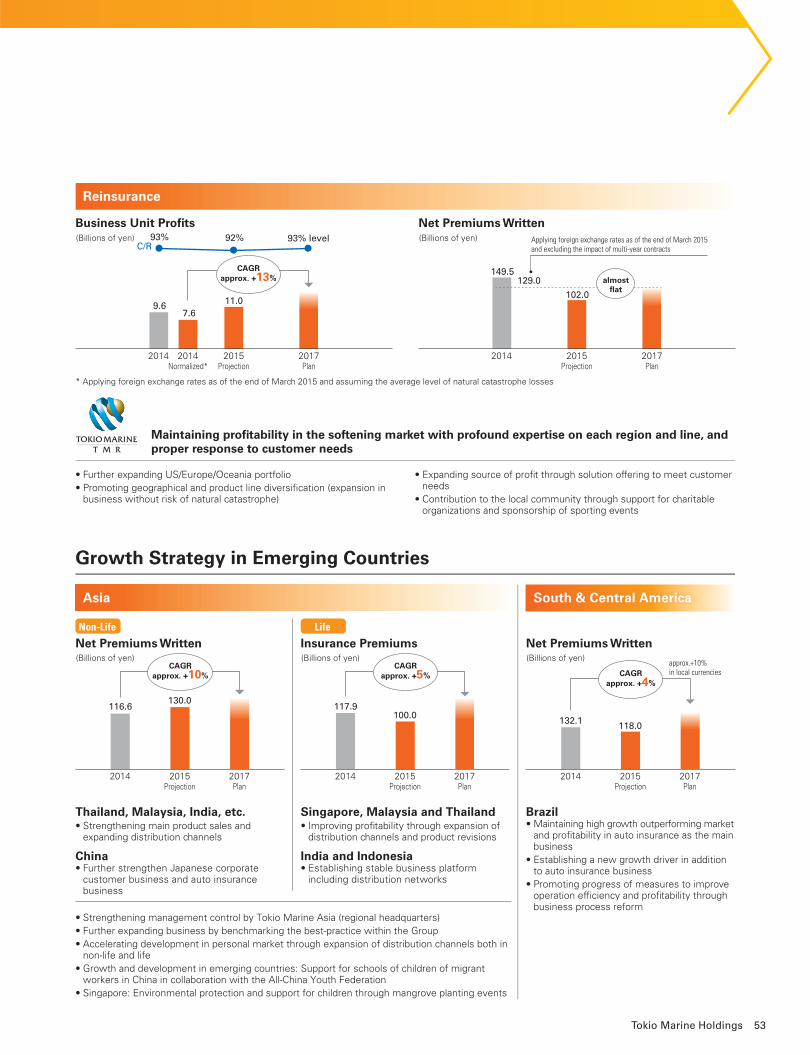
Growth Strategy in Emerging Countries
Reinsurance
Asia South & Central America
Maintaining profi tability in the softening market with profound expertise on each region and line, and proper response to customer needs
• Further expanding US/Europe/Oceania portfolio• Promoting geographical and product line diversifi cation (expansion in
business without risk of natural catastrophe)
• Expanding source of profi t through solution offering to meet customer needs
• Contribution to the local community through support for charitable organizations and sponsorship of sporting events
• Strengthening management control by Tokio Marine Asia (regional headquarters)• Further expanding business by benchmarking the best-practice within the Group• Accelerating development in personal market through expansion of distribution channels both in
non-life and life• Growth and development in emerging countries: Support for schools of children of migrant
workers in China in collaboration with the All-China Youth Federation• Singapore: Environmental protection and support for children through mangrove planting events
Net Premiums WrittenBusiness Unit Profi ts
Net Premiums Written Insurance Premiums Net Premiums WrittenNon-Life Life
2014 2014Normalized*
2015Projection
2017Plan
93%
9.67.6
11.0
149.5
102.0
129.0
92% 93% level(Billions of yen)C/R
CAGRapprox. +13%
2014 2015Projection
2017Plan
(Billions of yen)
almostflat
Applying foreign exchange rates as of the end of March 2015 and excluding the impact of multi-year contracts
(Billions of yen)
2014 2015Projection
2017Plan
116.6130.0
CAGRapprox. +10%
(Billions of yen)
2014 2015Projection
2017Plan
117.9100.0
CAGRapprox. +5%
(Billions of yen)
2014 2015Projection
2017Plan
132.1 118.0
CAGRapprox. +4%
approx.+10%in local currencies
Thailand, Malaysia, India, etc.• Strengthening main product sales and
expanding distribution channels
China• Further strengthen Japanese corporate
customer business and auto insurance business
Singapore, Malaysia and Thailand• Improving profi tability through expansion of
distribution channels and product revisions
India and Indonesia• Establishing stable business platform
including distribution networks
Brazil• Maintaining high growth outperforming market
and profi tability in auto insurance as the main business
• Establishing a new growth driver in addition to auto insurance business
• Promoting progress of measures to improve operation effi ciency and profi tability through business process reform
* Applying foreign exchange rates as of the end of March 2015 and assuming the average level of natural catastrophe losses
53Tokio Marine Holdings
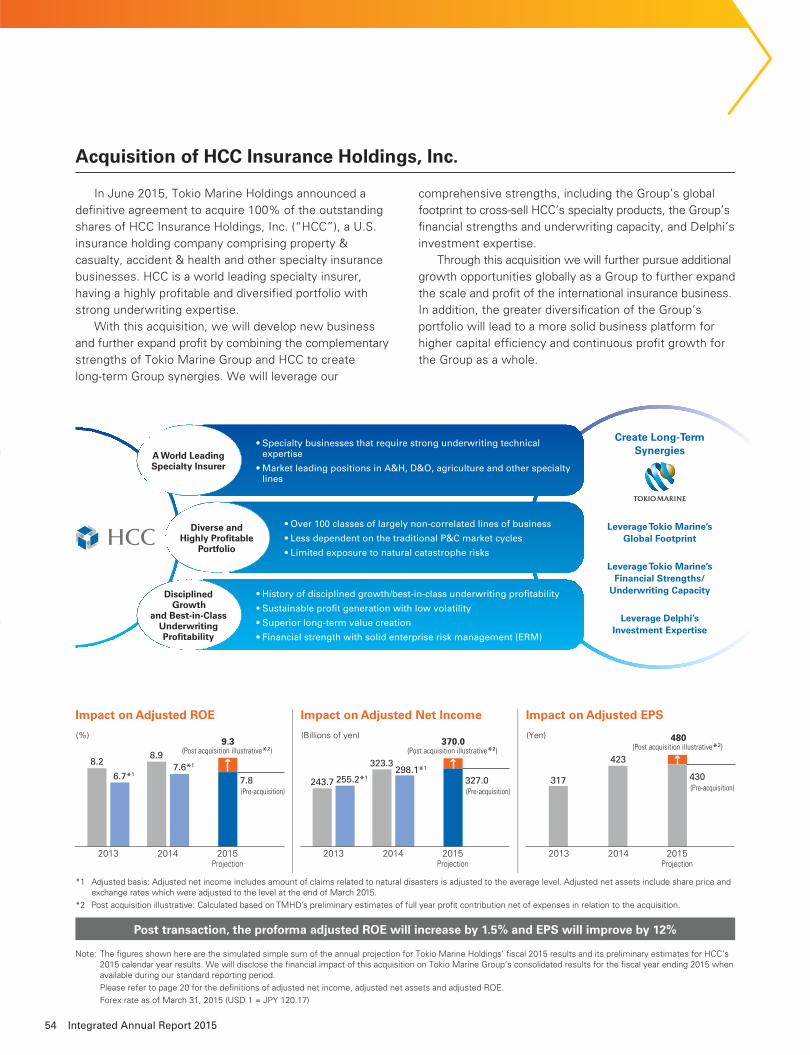
Acquisition of HCC Insurance Holdings, Inc.
In June 2015, Tokio Marine Holdings announced a
defi nitive agreement to acquire 100% of the outstanding
shares of HCC Insurance Holdings, Inc. (“HCC”), a U.S.
insurance holding company comprising property &
casualty, accident & health and other specialty insurance
businesses. HCC is a world leading specialty insurer,
having a highly profi table and diversifi ed portfolio with
strong underwriting expertise.
With this acquisition, we will develop new business
and further expand profi t by combining the complementary
strengths of Tokio Marine Group and HCC to create
long-term Group synergies. We will leverage our
comprehensive strengths, including the Group’s global
footprint to cross-sell HCC’s specialty products, the Group’s
fi nancial strengths and underwriting capacity, and Delphi’s
investment expertise.
Through this acquisition we will further pursue additional
growth opportunities globally as a Group to further expand
the scale and profi t of the international insurance business.
In addition, the greater diversifi cation of the Group’s
portfolio will lead to a more solid business platform for
higher capital effi ciency and continuous profi t growth for
the Group as a whole.
A World LeadingSpecialty Insurer
• Specialty businesses that require strong underwriting technical expertise
• Market leading positions in A&H, D&O, agriculture and other specialty lines
Diverse andHighly Profi table
Portfolio
• Over 100 classes of largely non-correlated lines of business
• Less dependent on the traditional P&C market cycles
• Limited exposure to natural catastrophe risks
Disciplined Growth
and Best-in-ClassUnderwritingProfi tability
• History of disciplined growth/best-in-class underwriting profi tability
• Sustainable profi t generation with low volatility
• Superior long-term value creation
• Financial strength with solid enterprise risk management (ERM)
Create Long-Term Synergies
Leverage Tokio Marine’s Global Footprint
Leverage Tokio Marine’s Financial Strengths/
Underwriting Capacity
Leverage Delphi’s Investment Expertise
Impact on Adjusted ROE Impact on Adjusted Net Income Impact on Adjusted EPS
(%)
2013 2014 2015Projection
8.2
6.7*17.6*1
8.9
(Billions of yen)9.3
7.8
(Post acquisition illustrative*2)
(Pre-acquisition)
2013 2014 2015Projection
243.7298.1*1
323.3
370.0
327.0
(Post acquisition illustrative*2)
(Pre-acquisition)
255.2*1
(Yen)
2013 2014 2015Projection
317
423
480
430
(Post acquisition illustrative*2)
(Pre-acquisition)
*1 Adjusted basis: Adjusted net income includes amount of claims related to natural disasters is adjusted to the average level. Adjusted net assets include share price and exchange rates which were adjusted to the level at the end of March 2015.
*2 Post acquisition illustrative: Calculated based on TMHD’s preliminary estimates of full year profi t contribution net of expenses in relation to the acquisition.
Note: The fi gures shown here are the simulated simple sum of the annual projection for Tokio Marine Holdings’ fi scal 2015 results and its preliminary estimates for HCC’s 2015 calendar year results. We will disclose the fi nancial impact of this acquisition on Tokio Marine Group’s consolidated results for the fi scal year ending 2015 when available during our standard reporting period.
Please refer to page 20 for the defi nitions of adjusted net income, adjusted net assets and adjusted ROE.
Forex rate as of March 31, 2015 (USD 1 = JPY 120.17)
Post transaction, the proforma adjusted ROE will increase by 1.5% and EPS will improve by 12%
54 Integrated Annual Report 2015
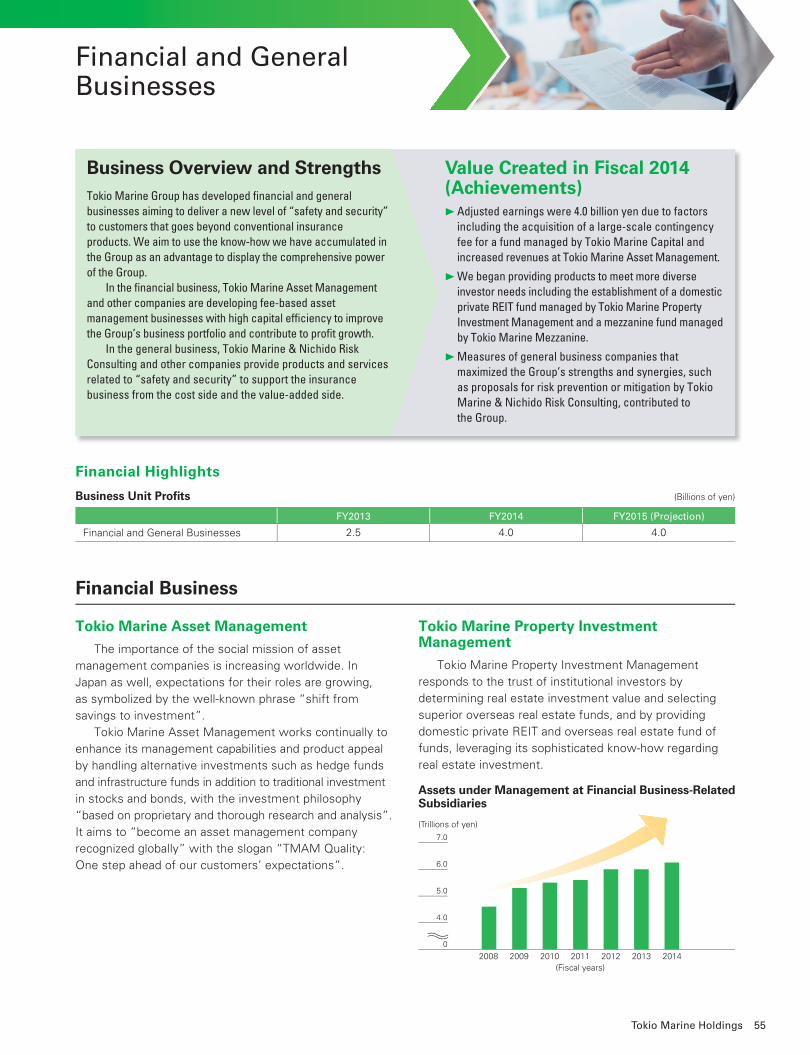
Financial Business
Tokio Marine Asset Management
The importance of the social mission of asset
management companies is increasing worldwide. In
Japan as well, expectations for their roles are growing,
as symbolized by the well-known phrase “shift from
savings to investment”.
Tokio Marine Asset Management works continually to
enhance its management capabilities and product appeal
by handling alternative investments such as hedge funds
and infrastructure funds in addition to traditional investment
in stocks and bonds, with the investment philosophy
“based on proprietary and thorough research and analysis”.
It aims to “become an asset management company
recognized globally” with the slogan “TMAM Quality:
One step ahead of our customers’ expectations”.
Tokio Marine Property Investment Management
Tokio Marine Property Investment Management
responds to the trust of institutional investors by
determining real estate investment value and selecting
superior overseas real estate funds, and by providing
domestic private REIT and overseas real estate fund of
funds, leveraging its sophisticated know-how regarding
real estate investment.
Financial and General Businesses
2008 2009 2010 2011 2012 20142013(Fiscal years)
(Trillions of yen)
7.0
6.0
4.0
0
5.0
Assets under Management at Financial Business-Related Subsidiaries
Financial Highlights
Business Unit Profi ts (Billions of yen)
FY2013 FY2014 FY2015 (Projection)
Financial and General Businesses 2.5 4.0 4.0
Value Created in Fiscal 2014 (Achievements)
Adjusted earnings were 4.0 billion yen due to factors including the acquisition of a large-scale contingency fee for a fund managed by Tokio Marine Capital and increased revenues at Tokio Marine Asset Management.
We began providing products to meet more diverse investor needs including the establishment of a domestic private REIT fund managed by Tokio Marine Property Investment Management and a mezzanine fund managed by Tokio Marine Mezzanine.
Measures of general business companies that maximized the Group’s strengths and synergies, such as proposals for risk prevention or mitigation by Tokio Marine & Nichido Risk Consulting, contributed to the Group.
Tokio Marine Group has developed fi nancial and general businesses aiming to deliver a new level of “safety and security” to customers that goes beyond conventional insurance products. We aim to use the know-how we have accumulated in the Group as an advantage to display the comprehensive power of the Group. In the fi nancial business, Tokio Marine Asset Management and other companies are developing fee-based asset management businesses with high capital effi ciency to improve the Group’s business portfolio and contribute to profi t growth. In the general business, Tokio Marine & Nichido Risk Consulting and other companies provide products and services related to “safety and security” to support the insurance business from the cost side and the value-added side.
Business Overview and Strengths
55Tokio Marine Holdings
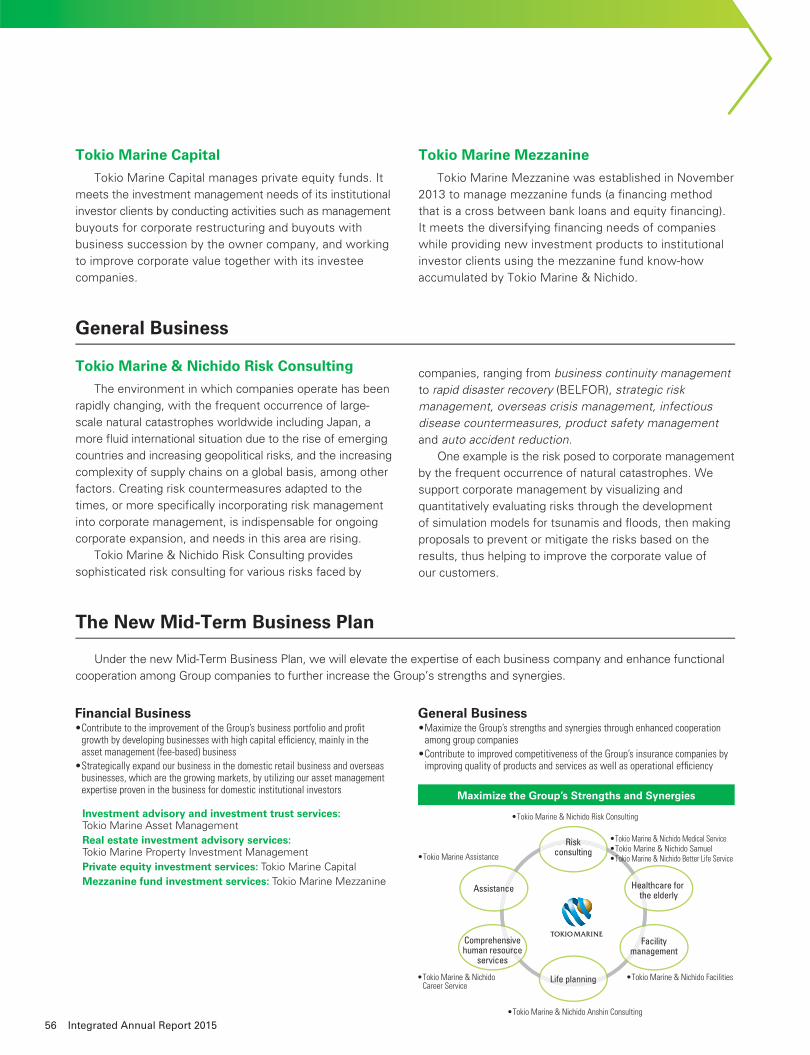
Tokio Marine Capital
Tokio Marine Capital manages private equity funds. It
meets the investment management needs of its institutional
investor clients by conducting activities such as management
buyouts for corporate restructuring and buyouts with
business succession by the owner company, and working
to improve corporate value together with its investee
companies.
Tokio Marine Mezzanine
Tokio Marine Mezzanine was established in November
2013 to manage mezzanine funds (a fi nancing method
that is a cross between bank loans and equity fi nancing).
It meets the diversifying fi nancing needs of companies
while providing new investment products to institutional
investor clients using the mezzanine fund know-how
accumulated by Tokio Marine & Nichido.
General Business
The New Mid-Term Business Plan
Tokio Marine & Nichido Risk Consulting
The environment in which companies operate has been
rapidly changing, with the frequent occurrence of large-
scale natural catastrophes worldwide including Japan, a
more fl uid international situation due to the rise of emerging
countries and increasing geopolitical risks, and the increasing
complexity of supply chains on a global basis, among other
factors. Creating risk countermeasures adapted to the
times, or more specifi cally incorporating risk management
into corporate management, is indispensable for ongoing
corporate expansion, and needs in this area are rising.
Tokio Marine & Nichido Risk Consulting provides
sophisticated risk consulting for various risks faced by
Under the new Mid-Term Business Plan, we will elevate the expertise of each business company and enhance functional
cooperation among Group companies to further increase the Group’s strengths and synergies.
companies, ranging from business continuity management to rapid disaster recovery (BELFOR), strategic risk management, overseas crisis management, infectious disease countermeasures, product safety management and auto accident reduction.
One example is the risk posed to corporate management
by the frequent occurrence of natural catastrophes. We
support corporate management by visualizing and
quantitatively evaluating risks through the development
of simulation models for tsunamis and fl oods, then making
proposals to prevent or mitigate the risks based on the
results, thus helping to improve the corporate value of
our customers.
Financial Business• Contribute to the improvement of the Group’s business portfolio and profit
growth by developing businesses with high capital efficiency, mainly in the asset management (fee-based) business
• Strategically expand our business in the domestic retail business and overseas businesses, which are the growing markets, by utilizing our asset management expertise proven in the business for domestic institutional investors
General Business• Maximize the Group’s strengths and synergies through enhanced cooperation
among group companies• Contribute to improved competitiveness of the Group’s insurance companies by
improving quality of products and services as well as operational efficiency
Maximize the Group’s Strengths and Synergies
Investment advisory and investment trust services:Tokio Marine Asset Management
Real estate investment advisory services:Tokio Marine Property Investment Management
Private equity investment services: Tokio Marine Capital
Mezzanine fund investment services: Tokio Marine Mezzanine
Riskconsulting
Life planning
Assistance Healthcare for the elderly
Comprehensivehuman resource
services
Facilitymanagement
• Tokio Marine & Nichido Risk Consulting
• Tokio Marine Assistance
• Tokio Marine & Nichido Career Service
• Tokio Marine & Nichido Facilities
• Tokio Marine & Nichido Anshin Consulting
• Tokio Marine & Nichido Medical Service• Tokio Marine & Nichido Samuel• Tokio Marine & Nichido Better Life Service
56 Integrated Annual Report 2015
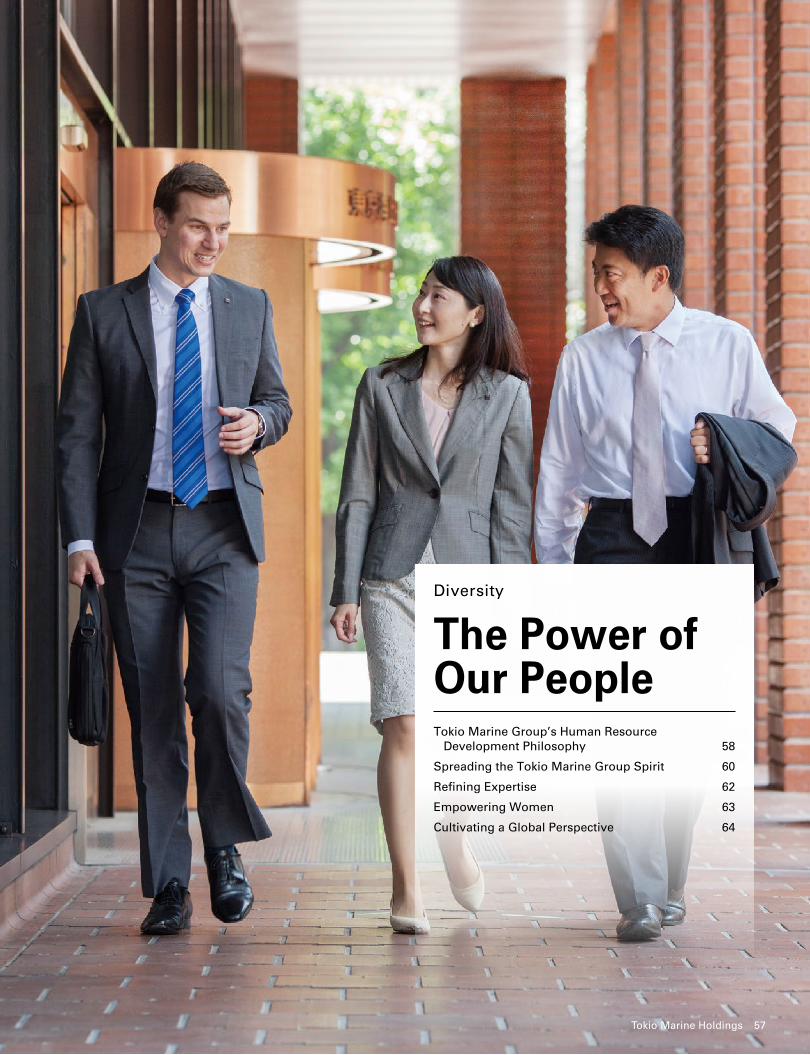
Diversity
The Power of Our People
Tokio Marine Group’s Human Resource Development Philosophy 58
Spreading the Tokio Marine Group Spirit 60
Refining Expertise 62
Empowering Women 63
Cultivating a Global Perspective 64
Tokio Marine Holdings 57
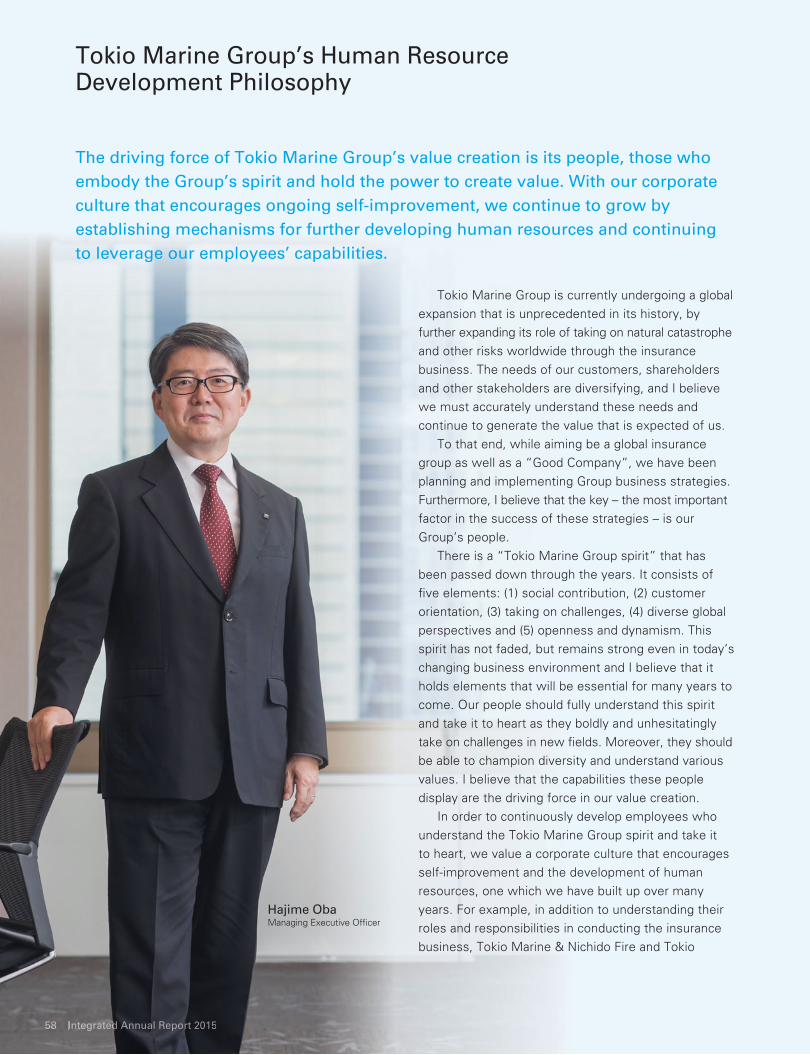
Tokio Marine Group’s Human Resource Development Philosophy
The driving force of Tokio Marine Group’s value creation is its people, those who
embody the Group’s spirit and hold the power to create value. With our corporate
culture that encourages ongoing self-improvement, we continue to grow by
establishing mechanisms for further developing human resources and continuing
to leverage our employees’ capabilities.
Tokio Marine Group is currently undergoing a global
expansion that is unprecedented in its history, by
further expanding its role of taking on natural catastrophe
and other risks worldwide through the insurance
business. The needs of our customers, shareholders
and other stakeholders are diversifying, and I believe
we must accurately understand these needs and
continue to generate the value that is expected of us.
To that end, while aiming be a global insurance
group as well as a “Good Company”, we have been
planning and implementing Group business strategies.
Furthermore, I believe that the key – the most important
factor in the success of these strategies – is our
Group’s people.
There is a “Tokio Marine Group spirit” that has
been passed down through the years. It consists of
fi ve elements: (1) social contribution, (2) customer
orientation, (3) taking on challenges, (4) diverse global
perspectives and (5) openness and dynamism. This
spirit has not faded, but remains strong even in today’s
changing business environment and I believe that it
holds elements that will be essential for many years to
come. Our people should fully understand this spirit
and take it to heart as they boldly and unhesitatingly
take on challenges in new fi elds. Moreover, they should
be able to champion diversity and understand various
values. I believe that the capabilities these people
display are the driving force in our value creation.
In order to continuously develop employees who
understand the Tokio Marine Group spirit and take it
to heart, we value a corporate culture that encourages
self-improvement and the development of human
resources, one which we have built up over many
years. For example, in addition to understanding their
roles and responsibilities in conducting the insurance
business, Tokio Marine & Nichido Fire and Tokio
Hajime ObaManaging Executive Offi cer
585858 IntIntntegregregrateateateeddd Ad Ad Ad Ad Ad Ad Adddd nnunnnual aaal aaa Repepepepororrtrrt 20202 155
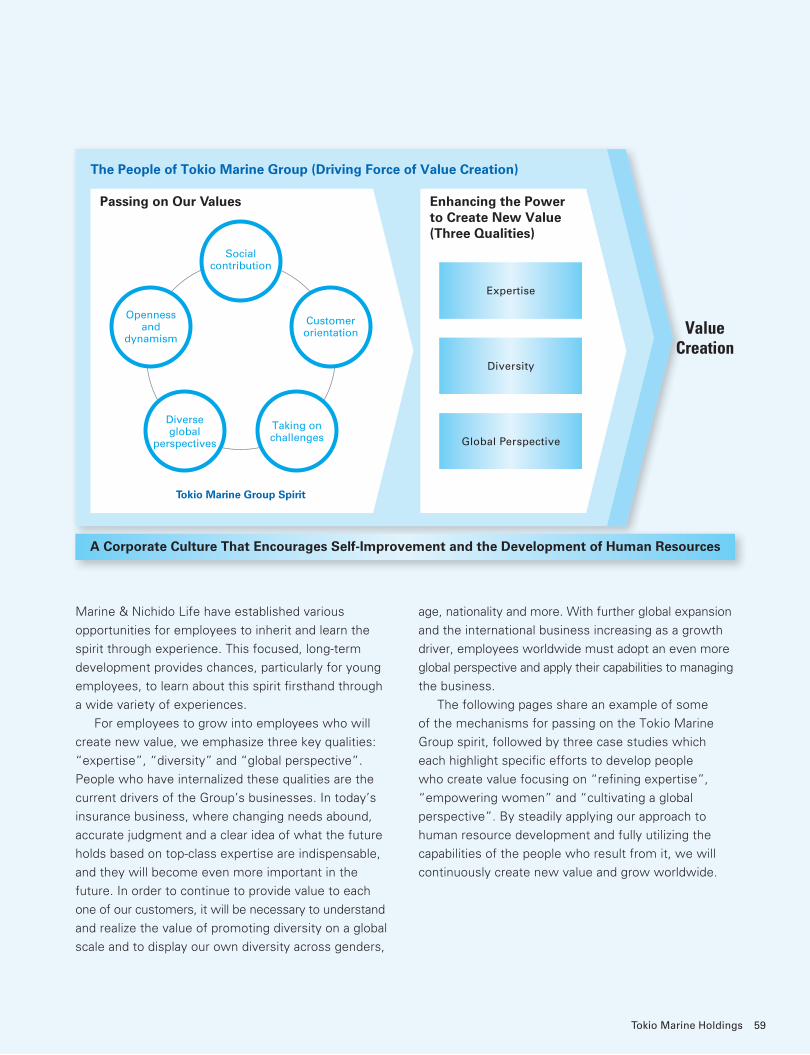
Marine & Nichido Life have established various
opportunities for employees to inherit and learn the
spirit through experience. This focused, long-term
development provides chances, particularly for young
employees, to learn about this spirit fi rsthand through
a wide variety of experiences.
For employees to grow into employees who will
create new value, we emphasize three key qualities:
“expertise”, “diversity” and “global perspective”.
People who have internalized these qualities are the
current drivers of the Group’s businesses. In today’s
insurance business, where changing needs abound,
accurate judgment and a clear idea of what the future
holds based on top-class expertise are indispensable,
and they will become even more important in the
future. In order to continue to provide value to each
one of our customers, it will be necessary to understand
and realize the value of promoting diversity on a global
scale and to display our own diversity across genders,
age, nationality and more. With further global expansion
and the international business increasing as a growth
driver, employees worldwide must adopt an even more
global perspective and apply their capabilities to managing
the business.
The following pages share an example of some
of the mechanisms for passing on the Tokio Marine
Group spirit, followed by three case studies which
each highlight specifi c efforts to develop people
who create value focusing on “refi ning expertise”,
“empowering women” and “cultivating a global
perspective”. By steadily applying our approach to
human resource development and fully utilizing the
capabilities of the people who result from it, we will
continuously create new value and grow worldwide.
The People of Tokio Marine Group (Driving Force of Value Creation)
A Corporate Culture That Encourages Self-Improvement and the Development of Human Resources
Tokio Marine Group Spirit
Socialcontribution
Taking onchallenges
Diverseglobal
perspectives
Customerorientation
Opennessand
dynamism
Passing on Our Values Enhancing the Power to Create New Value (Three Qualities)
Diversity
Global Perspective
Expertise
Value Creation
59Tokio Marine Holdings
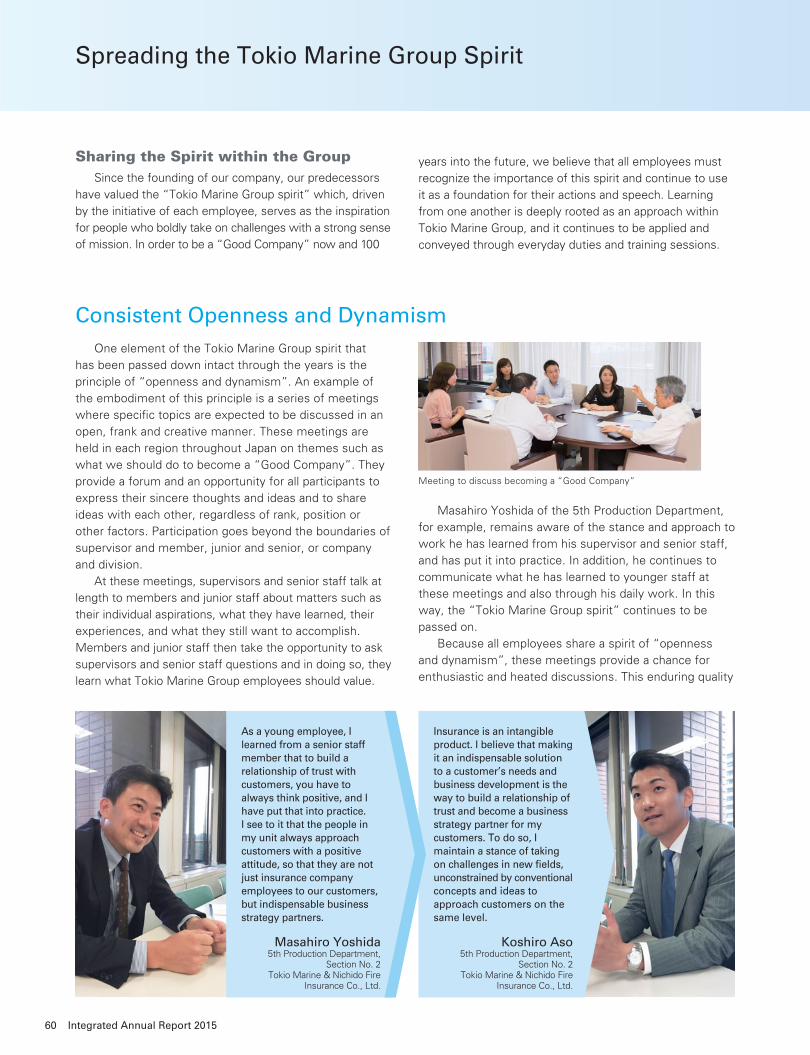
Spreading the Tokio Marine Group Spirit
One element of the Tokio Marine Group spirit that
has been passed down intact through the years is the
principle of “openness and dynamism”. An example of
the embodiment of this principle is a series of meetings
where specifi c topics are expected to be discussed in an
open, frank and creative manner. These meetings are
held in each region throughout Japan on themes such as
what we should do to become a “Good Company”. They
provide a forum and an opportunity for all participants to
express their sincere thoughts and ideas and to share
ideas with each other, regardless of rank, position or
other factors. Participation goes beyond the boundaries of
supervisor and member, junior and senior, or company
and division.
At these meetings, supervisors and senior staff talk at
length to members and junior staff about matters such as
their individual aspirations, what they have learned, their
experiences, and what they still want to accomplish.
Members and junior staff then take the opportunity to ask
supervisors and senior staff questions and in doing so, they
learn what Tokio Marine Group employees should value.
Masahiro Yoshida of the 5th Production Department,
for example, remains aware of the stance and approach to
work he has learned from his supervisor and senior staff,
and has put it into practice. In addition, he continues to
communicate what he has learned to younger staff at
these meetings and also through his daily work. In this
way, the “Tokio Marine Group spirit” continues to be
passed on.
Because all employees share a spirit of “openness
and dynamism”, these meetings provide a chance for
enthusiastic and heated discussions. This enduring quality
As a young employee, I learned from a senior staff member that to build a relationship of trust with customers, you have to always think positive, and I have put that into practice. I see to it that the people in my unit always approach customers with a positive attitude, so that they are not just insurance company employees to our customers, but indispensable business strategy partners.
Insurance is an intangible product. I believe that making it an indispensable solution to a customer’s needs and business development is the way to build a relationship of trust and become a business strategy partner for my customers. To do so, I maintain a stance of taking on challenges in new fi elds, unconstrained by conventional concepts and ideas to approach customers on the same level.
Masahiro Yoshida5th Production Department,
Section No. 2Tokio Marine & Nichido Fire
Insurance Co., Ltd.
Koshiro Aso5th Production Department,
Section No. 2Tokio Marine & Nichido Fire
Insurance Co., Ltd.
Sharing the Spirit within the Group Since the founding of our company, our predecessors
have valued the “Tokio Marine Group spirit” which, driven
by the initiative of each employee, serves as the inspiration
for people who boldly take on challenges with a strong sense
of mission. In order to be a “Good Company” now and 100
years into the future, we believe that all employees must
recognize the importance of this spirit and continue to use
it as a foundation for their actions and speech. Learning
from one another is deeply rooted as an approach within
Tokio Marine Group, and it continues to be applied and
conveyed through everyday duties and training sessions.
Consistent Openness and Dynamism
Meeting to discuss becoming a “Good Company”
60 Integrated Annual Report 2015
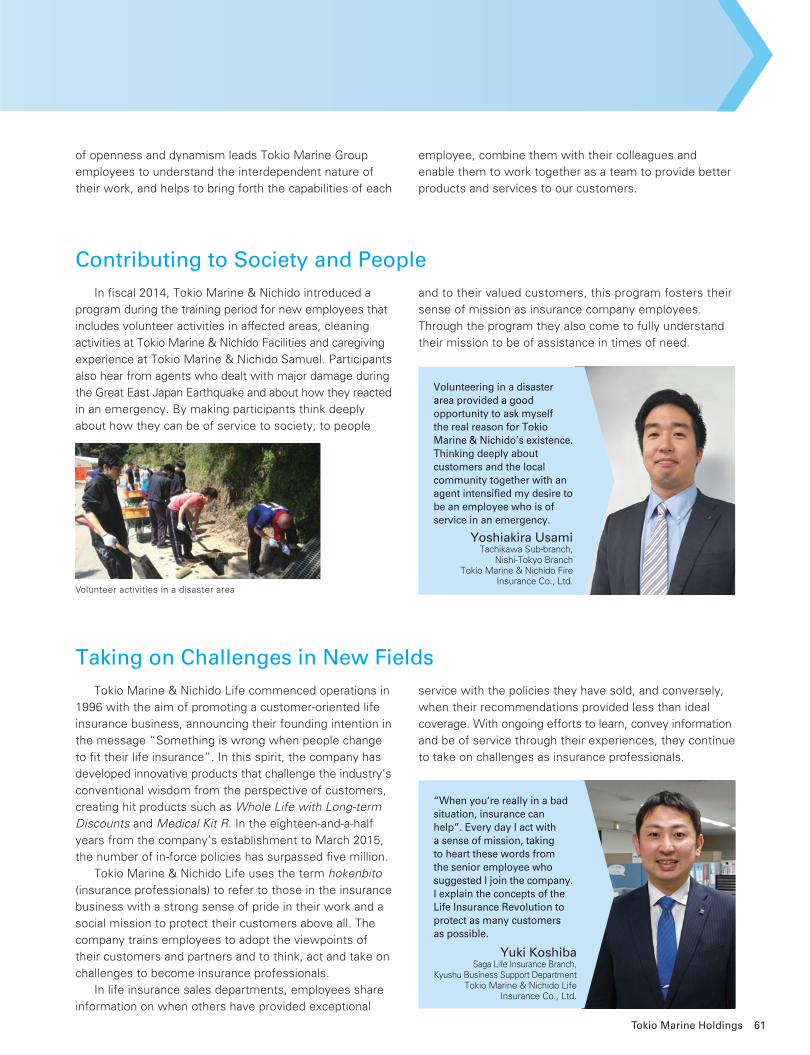
In fi scal 2014, Tokio Marine & Nichido introduced a
program during the training period for new employees that
includes volunteer activities in affected areas, cleaning
activities at Tokio Marine & Nichido Facilities and caregiving
experience at Tokio Marine & Nichido Samuel. Participants
also hear from agents who dealt with major damage during
the Great East Japan Earthquake and about how they reacted
in an emergency. By making participants think deeply
about how they can be of service to society, to people
and to their valued customers, this program fosters their
sense of mission as insurance company employees.
Through the program they also come to fully understand
their mission to be of assistance in times of need.
Contributing to Society and People
Tokio Marine & Nichido Life commenced operations in
1996 with the aim of promoting a customer-oriented life
insurance business, announcing their founding intention in
the message “Something is wrong when people change
to fi t their life insurance”. In this spirit, the company has
developed innovative products that challenge the industry’s
conventional wisdom from the perspective of customers,
creating hit products such as Whole Life with Long-term Discounts and Medical Kit R. In the eighteen-and-a-half
years from the company’s establishment to March 2015,
the number of in-force policies has surpassed fi ve million.
Tokio Marine & Nichido Life uses the term hokenbito
(insurance professionals) to refer to those in the insurance
business with a strong sense of pride in their work and a
social mission to protect their customers above all. The
company trains employees to adopt the viewpoints of
their customers and partners and to think, act and take on
challenges to become insurance professionals.
In life insurance sales departments, employees share
information on when others have provided exceptional
service with the policies they have sold, and conversely,
when their recommendations provided less than ideal
coverage. With ongoing efforts to learn, convey information
and be of service through their experiences, they continue
to take on challenges as insurance professionals.
Taking on Challenges in New Fields
Volunteering in a disaster area provided a good opportunity to ask myself the real reason for Tokio Marine & Nichido’s existence. Thinking deeply about customers and the local community together with an agent intensifi ed my desire to be an employee who is of service in an emergency.
Yoshiakira UsamiTachikawa Sub-branch,
Nishi-Tokyo Branch Tokio Marine & Nichido Fire
Insurance Co., Ltd.
“When you’re really in a bad situation, insurance can help”. Every day I act with a sense of mission, taking to heart these words from the senior employee who suggested I join the company. I explain the concepts of the Life Insurance Revolution to protect as many customers as possible.
Yuki KoshibaSaga Life Insurance Branch,
Kyushu Business Support DepartmentTokio Marine & Nichido Life
Insurance Co., Ltd.
Volunteer activities in a disaster area
of openness and dynamism leads Tokio Marine Group
employees to understand the interdependent nature of
their work, and helps to bring forth the capabilities of each
employee, combine them with their colleagues and
enable them to work together as a team to provide better
products and services to our customers.
61Tokio Marine Holdings
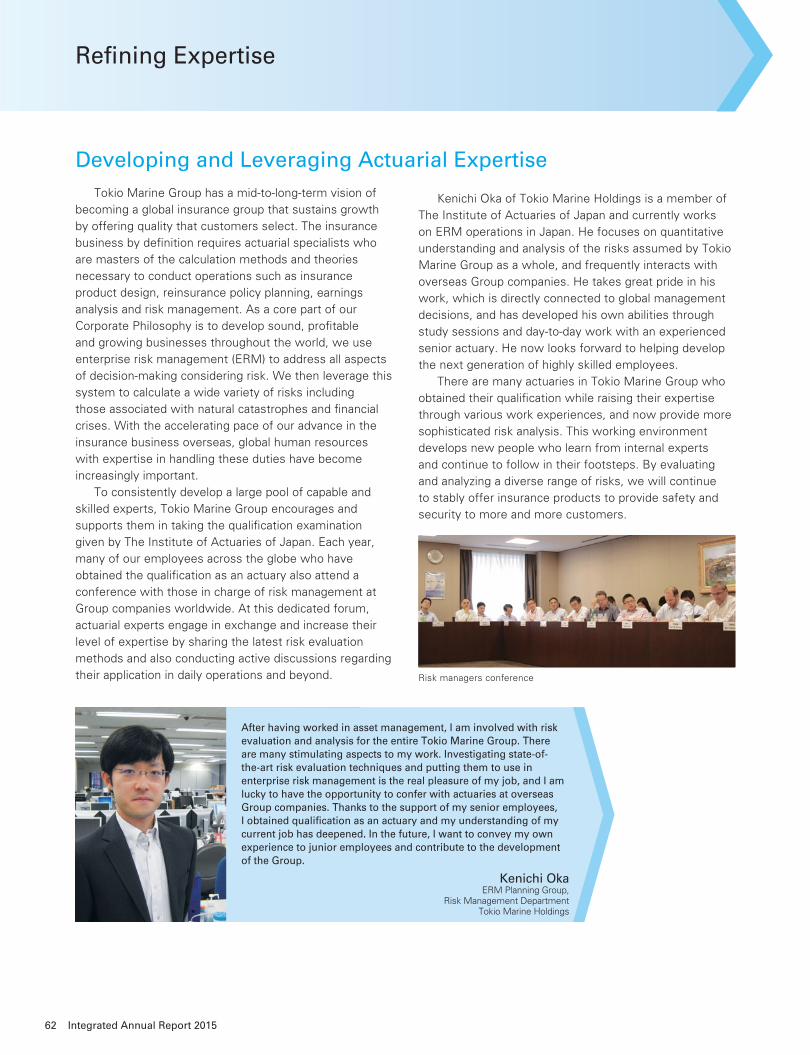
Refi ning Expertise
Tokio Marine Group has a mid-to-long-term vision of
becoming a global insurance group that sustains growth
by offering quality that customers select. The insurance
business by defi nition requires actuarial specialists who
are masters of the calculation methods and theories
necessary to conduct operations such as insurance
product design, reinsurance policy planning, earnings
analysis and risk management. As a core part of our
Corporate Philosophy is to develop sound, profi table
and growing businesses throughout the world, we use
enterprise risk management (ERM) to address all aspects
of decision-making considering risk. We then leverage this
system to calculate a wide variety of risks including
those associated with natural catastrophes and fi nancial
crises. With the accelerating pace of our advance in the
insurance business overseas, global human resources
with expertise in handling these duties have become
increasingly important.
To consistently develop a large pool of capable and
skilled experts, Tokio Marine Group encourages and
supports them in taking the qualifi cation examination
given by The Institute of Actuaries of Japan. Each year,
many of our employees across the globe who have
obtained the qualifi cation as an actuary also attend a
conference with those in charge of risk management at
Group companies worldwide. At this dedicated forum,
actuarial experts engage in exchange and increase their
level of expertise by sharing the latest risk evaluation
methods and also conducting active discussions regarding
their application in daily operations and beyond.
Kenichi Oka of Tokio Marine Holdings is a member of
The Institute of Actuaries of Japan and currently works
on ERM operations in Japan. He focuses on quantitative
understanding and analysis of the risks assumed by Tokio
Marine Group as a whole, and frequently interacts with
overseas Group companies. He takes great pride in his
work, which is directly connected to global management
decisions, and has developed his own abilities through
study sessions and day-to-day work with an experienced
senior actuary. He now looks forward to helping develop
the next generation of highly skilled employees.
There are many actuaries in Tokio Marine Group who
obtained their qualifi cation while raising their expertise
through various work experiences, and now provide more
sophisticated risk analysis. This working environment
develops new people who learn from internal experts
and continue to follow in their footsteps. By evaluating
and analyzing a diverse range of risks, we will continue
to stably offer insurance products to provide safety and
security to more and more customers.
Developing and Leveraging Actuarial Expertise
After having worked in asset management, I am involved with risk evaluation and analysis for the entire Tokio Marine Group. There are many stimulating aspects to my work. Investigating state-of-the-art risk evaluation techniques and putting them to use in enterprise risk management is the real pleasure of my job, and I am lucky to have the opportunity to confer with actuaries at overseas Group companies. Thanks to the support of my senior employees, I obtained qualifi cation as an actuary and my understanding of my current job has deepened. In the future, I want to convey my own experience to junior employees and contribute to the development of the Group.
Kenichi OkaERM Planning Group,
Risk Management DepartmentTokio Marine Holdings
Risk managers conference
62 Integrated Annual Report 2015
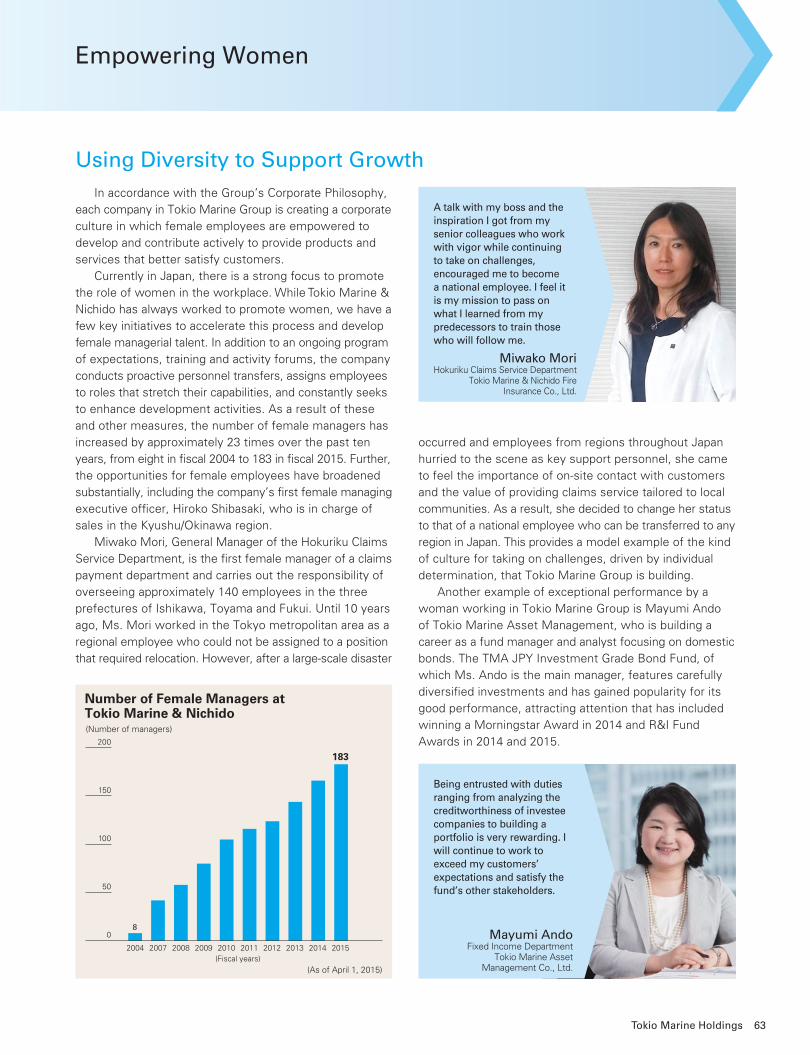
Empowering Women
In accordance with the Group’s Corporate Philosophy,
each company in Tokio Marine Group is creating a corporate
culture in which female employees are empowered to
develop and contribute actively to provide products and
services that better satisfy customers.
Currently in Japan, there is a strong focus to promote
the role of women in the workplace. While Tokio Marine &
Nichido has always worked to promote women, we have a
few key initiatives to accelerate this process and develop
female managerial talent. In addition to an ongoing program
of expectations, training and activity forums, the company
conducts proactive personnel transfers, assigns employees
to roles that stretch their capabilities, and constantly seeks
to enhance development activities. As a result of these
and other measures, the number of female managers has
increased by approximately 23 times over the past ten
years, from eight in fi scal 2004 to 183 in fi scal 2015. Further,
the opportunities for female employees have broadened
substantially, including the company’s fi rst female managing
executive offi cer, Hiroko Shibasaki, who is in charge of
sales in the Kyushu/Okinawa region.
Miwako Mori, General Manager of the Hokuriku Claims
Service Department, is the fi rst female manager of a claims
payment department and carries out the responsibility of
overseeing approximately 140 employees in the three
prefectures of Ishikawa, Toyama and Fukui. Until 10 years
ago, Ms. Mori worked in the Tokyo metropolitan area as a
regional employee who could not be assigned to a position
that required relocation. However, after a large-scale disaster
occurred and employees from regions throughout Japan
hurried to the scene as key support personnel, she came
to feel the importance of on-site contact with customers
and the value of providing claims service tailored to local
communities. As a result, she decided to change her status
to that of a national employee who can be transferred to any
region in Japan. This provides a model example of the kind
of culture for taking on challenges, driven by individual
determination, that Tokio Marine Group is building.
Another example of exceptional performance by a
woman working in Tokio Marine Group is Mayumi Ando
of Tokio Marine Asset Management, who is building a
career as a fund manager and analyst focusing on domestic
bonds. The TMA JPY Investment Grade Bond Fund, of
which Ms. Ando is the main manager, features carefully
diversifi ed investments and has gained popularity for its
good performance, attracting attention that has included
winning a Morningstar Award in 2014 and R&I Fund
Awards in 2014 and 2015.
Using Diversity to Support Growth
Number of Female Managers at Tokio Marine & Nichido
2009200820072004 2010 2011 2012 2013 20152014
(Number of managers)
200
150
100
50
0
(Fiscal years)
(As of April 1, 2015)
183
8
Being entrusted with duties ranging from analyzing the creditworthiness of investee companies to building a portfolio is very rewarding. I will continue to work to exceed my customers’ expectations and satisfy the fund’s other stakeholders.
Mayumi AndoFixed Income Department
Tokio Marine Asset Management Co., Ltd.
A talk with my boss and the inspiration I got from my senior colleagues who work with vigor while continuing to take on challenges, encouraged me to become a national employee. I feel it is my mission to pass on what I learned from my predecessors to train those who will follow me.
Miwako MoriHokuriku Claims Service Department
Tokio Marine & Nichido Fire Insurance Co., Ltd.
63Tokio Marine Holdings
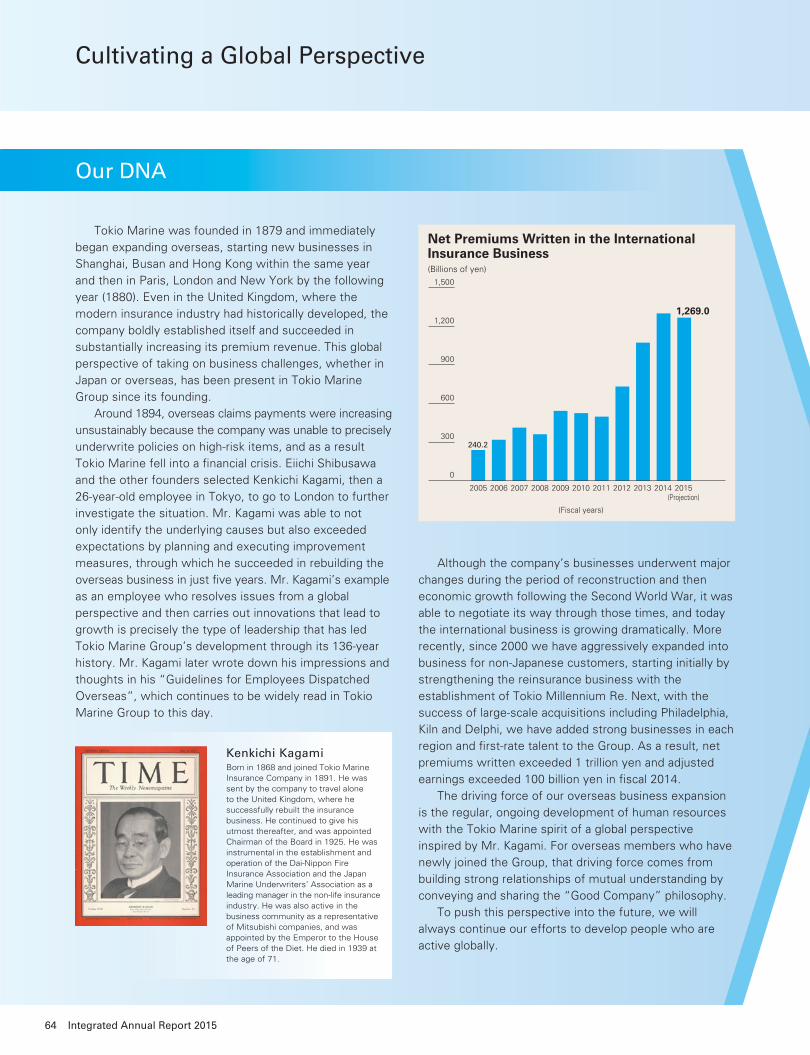
Cultivating a Global Perspective
Tokio Marine was founded in 1879 and immediately
began expanding overseas, starting new businesses in
Shanghai, Busan and Hong Kong within the same year
and then in Paris, London and New York by the following
year (1880). Even in the United Kingdom, where the
modern insurance industry had historically developed, the
company boldly established itself and succeeded in
substantially increasing its premium revenue. This global
perspective of taking on business challenges, whether in
Japan or overseas, has been present in Tokio Marine
Group since its founding.
Around 1894, overseas claims payments were increasing
unsustainably because the company was unable to precisely
underwrite policies on high-risk items, and as a result
Tokio Marine fell into a fi nancial crisis. Eiichi Shibusawa
and the other founders selected Kenkichi Kagami, then a
26-year-old employee in Tokyo, to go to London to further
investigate the situation. Mr. Kagami was able to not
only identify the underlying causes but also exceeded
expectations by planning and executing improvement
measures, through which he succeeded in rebuilding the
overseas business in just fi ve years. Mr. Kagami’s example
as an employee who resolves issues from a global
perspective and then carries out innovations that lead to
growth is precisely the type of leadership that has led
Tokio Marine Group’s development through its 136-year
history. Mr. Kagami later wrote down his impressions and
thoughts in his “Guidelines for Employees Dispatched
Overseas”, which continues to be widely read in Tokio
Marine Group to this day.
Although the company’s businesses underwent major
changes during the period of reconstruction and then
economic growth following the Second World War, it was
able to negotiate its way through those times, and today
the international business is growing dramatically. More
recently, since 2000 we have aggressively expanded into
business for non-Japanese customers, starting initially by
strengthening the reinsurance business with the
establishment of Tokio Millennium Re. Next, with the
success of large-scale acquisitions including Philadelphia,
Kiln and Delphi, we have added strong businesses in each
region and fi rst-rate talent to the Group. As a result, net
premiums written exceeded 1 trillion yen and adjusted
earnings exceeded 100 billion yen in fi scal 2014.
The driving force of our overseas business expansion
is the regular, ongoing development of human resources
with the Tokio Marine spirit of a global perspective
inspired by Mr. Kagami. For overseas members who have
newly joined the Group, that driving force comes from
building strong relationships of mutual understanding by
conveying and sharing the “Good Company” philosophy.
To push this perspective into the future, we will
always continue our efforts to develop people who are
active globally.
Our DNA
(Fiscal years)
Net Premiums Written in the International Insurance Business
2008200720062005 2009 2010 2011 2012 2015(Projection)
20142013
(Billions of yen)
1,500
900
300
0
1,269.0
240.2
1,200
600
Kenkichi KagamiBorn in 1868 and joined Tokio Marine Insurance Company in 1891. He was sent by the company to travel alone to the United Kingdom, where he successfully rebuilt the insurance business. He continued to give his utmost thereafter, and was appointed Chairman of the Board in 1925. He was instrumental in the establishment and operation of the Dai-Nippon Fire Insurance Association and the Japan Marine Underwriters’ Association as a leading manager in the non-life insurance industry. He was also active in the business community as a representative of Mitsubishi companies, and was appointed by the Emperor to the House of Peers of the Diet. He died in 1939 at the age of 71.
64 Integrated Annual Report 2015
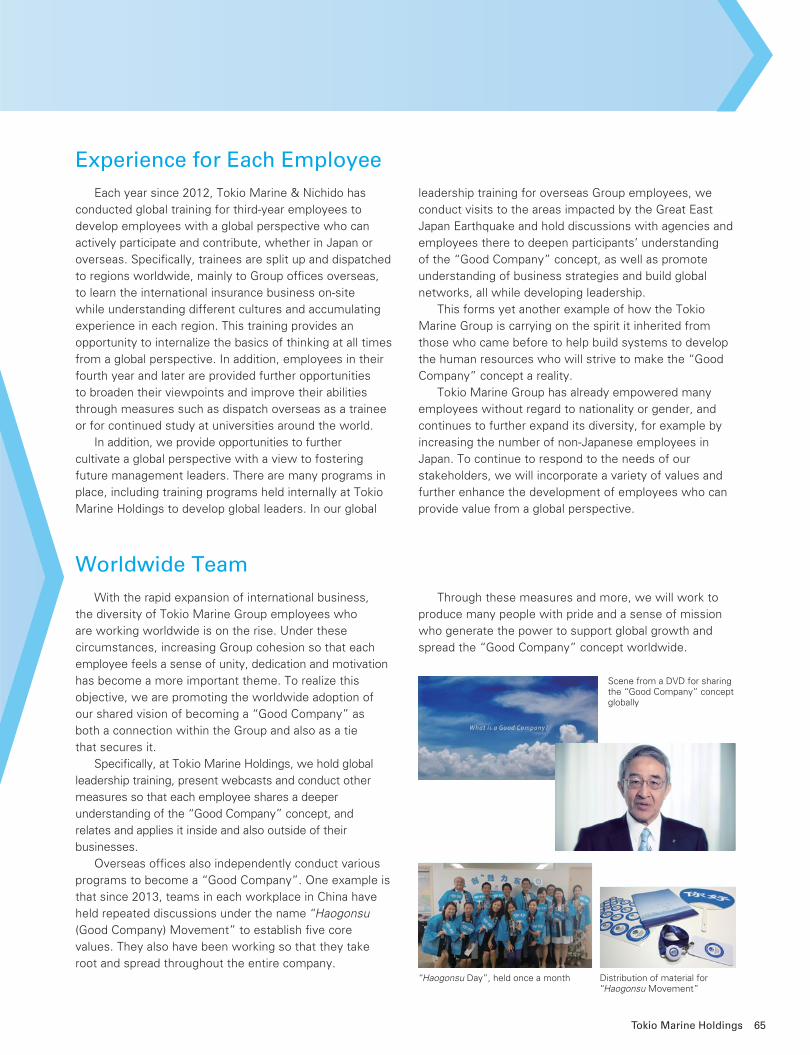
Each year since 2012, Tokio Marine & Nichido has
conducted global training for third-year employees to
develop employees with a global perspective who can
actively participate and contribute, whether in Japan or
overseas. Specifi cally, trainees are split up and dispatched
to regions worldwide, mainly to Group offi ces overseas,
to learn the international insurance business on-site
while understanding different cultures and accumulating
experience in each region. This training provides an
opportunity to internalize the basics of thinking at all times
from a global perspective. In addition, employees in their
fourth year and later are provided further opportunities
to broaden their viewpoints and improve their abilities
through measures such as dispatch overseas as a trainee
or for continued study at universities around the world.
In addition, we provide opportunities to further
cultivate a global perspective with a view to fostering
future management leaders. There are many programs in
place, including training programs held internally at Tokio
Marine Holdings to develop global leaders. In our global
leadership training for overseas Group employees, we
conduct visits to the areas impacted by the Great East
Japan Earthquake and hold discussions with agencies and
employees there to deepen participants’ understanding
of the “Good Company” concept, as well as promote
understanding of business strategies and build global
networks, all while developing leadership.
This forms yet another example of how the Tokio
Marine Group is carrying on the spirit it inherited from
those who came before to help build systems to develop
the human resources who will strive to make the “Good
Company” concept a reality.
Tokio Marine Group has already empowered many
employees without regard to nationality or gender, and
continues to further expand its diversity, for example by
increasing the number of non-Japanese employees in
Japan. To continue to respond to the needs of our
stakeholders, we will incorporate a variety of values and
further enhance the development of employees who can
provide value from a global perspective.
Experience for Each Employee
With the rapid expansion of international business,
the diversity of Tokio Marine Group employees who
are working worldwide is on the rise. Under these
circumstances, increasing Group cohesion so that each
employee feels a sense of unity, dedication and motivation
has become a more important theme. To realize this
objective, we are promoting the worldwide adoption of
our shared vision of becoming a “Good Company” as
both a connection within the Group and also as a tie
that secures it.
Specifi cally, at Tokio Marine Holdings, we hold global
leadership training, present webcasts and conduct other
measures so that each employee shares a deeper
understanding of the “Good Company” concept, and
relates and applies it inside and also outside of their
businesses.
Overseas offi ces also independently conduct various
programs to become a “Good Company”. One example is
that since 2013, teams in each workplace in China have
held repeated discussions under the name “Haogonsu
(Good Company) Movement” to establish fi ve core
values. They also have been working so that they take
root and spread throughout the entire company.
Through these measures and more, we will work to
produce many people with pride and a sense of mission
who generate the power to support global growth and
spread the “Good Company” concept worldwide.
Worldwide Team
Scene from a DVD for sharing the “Good Company” concept globally
“Haogonsu Day”, held once a month Distribution of material for “Haogonsu Movement”
65Tokio Marine Holdings
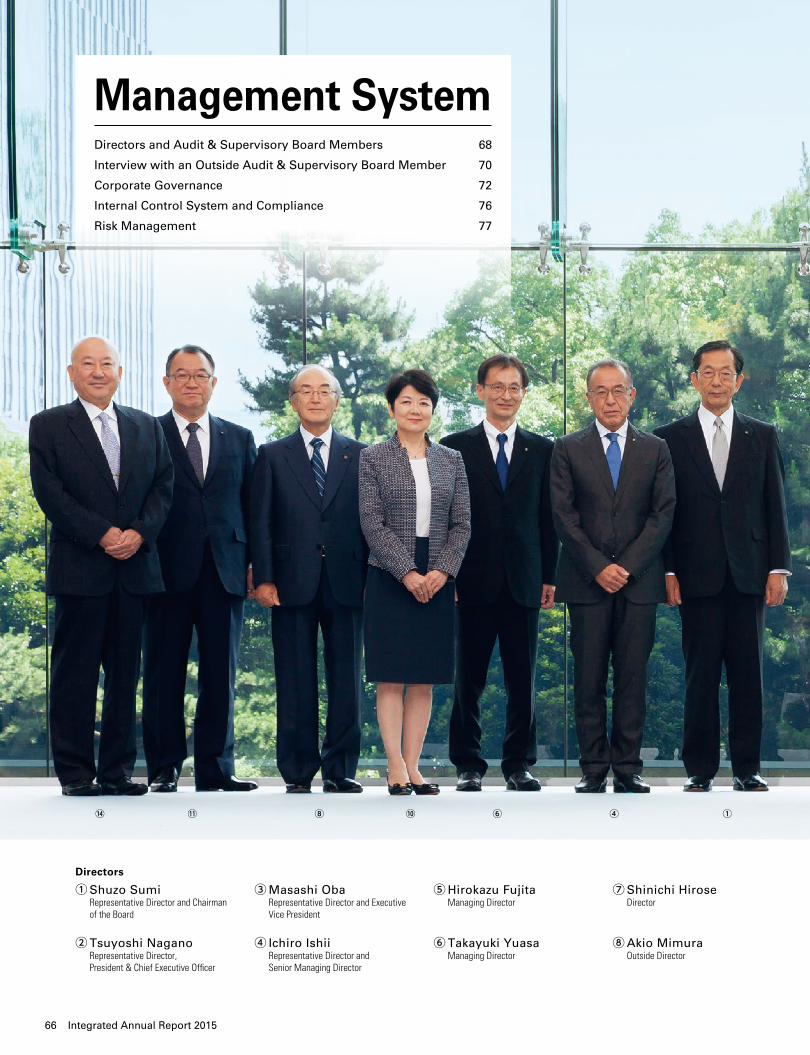
Management System
Directors and Audit & Supervisory Board Members 68
Interview with an Outside Audit & Supervisory Board Member 70
Corporate Governance 72
Internal Control System and Compliance 76
Risk Management 77
Directors
①Shuzo Sumi Representative Director and Chairman
of the Board
②Tsuyoshi Nagano Representative Director,
President & Chief Executive Officer
③ Masashi Oba Representative Director and Executive
Vice President
④Ichiro Ishii Representative Director and
Senior Managing Director
⑤Hirokazu Fujita Managing Director
⑥Takayuki Yuasa Managing Director
⑦Shinichi Hirose Director
⑧Akio Mimura Outside Director
⑭ ⑪ ⑧ ⑩ ⑥ ④ ①
66 Integrated Annual Report 2015
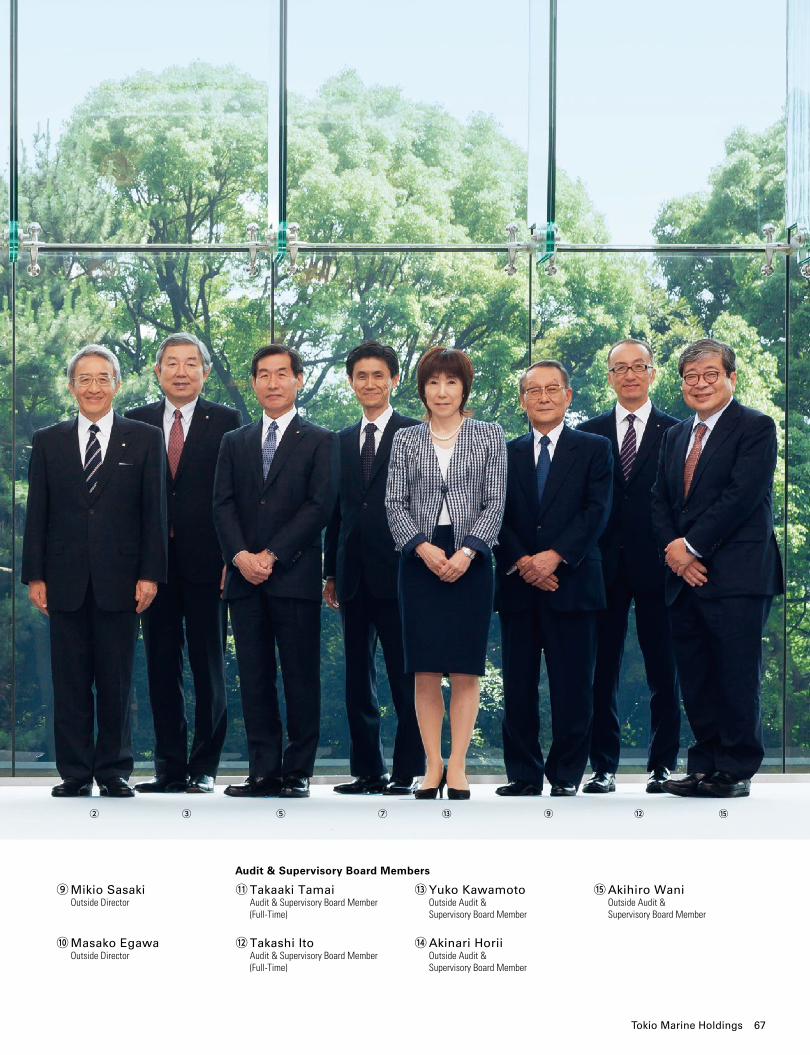
⑨Mikio Sasaki Outside Director
⑩Masako Egawa Outside Director
⑪ Takaaki Tamai Audit & Supervisory Board Member
(Full-Time)
⑫Takashi Ito Audit & Supervisory Board Member
(Full-Time)
⑬Yuko Kawamoto Outside Audit &
Supervisory Board Member
⑭Akinari Horii Outside Audit &
Supervisory Board Member
⑮Akihiro Wani Outside Audit &
Supervisory Board Member
Audit & Supervisory Board Members
② ③ ⑤ ⑦ ⑬ ⑨ ⑫ ⑮
67Tokio Marine Holdings
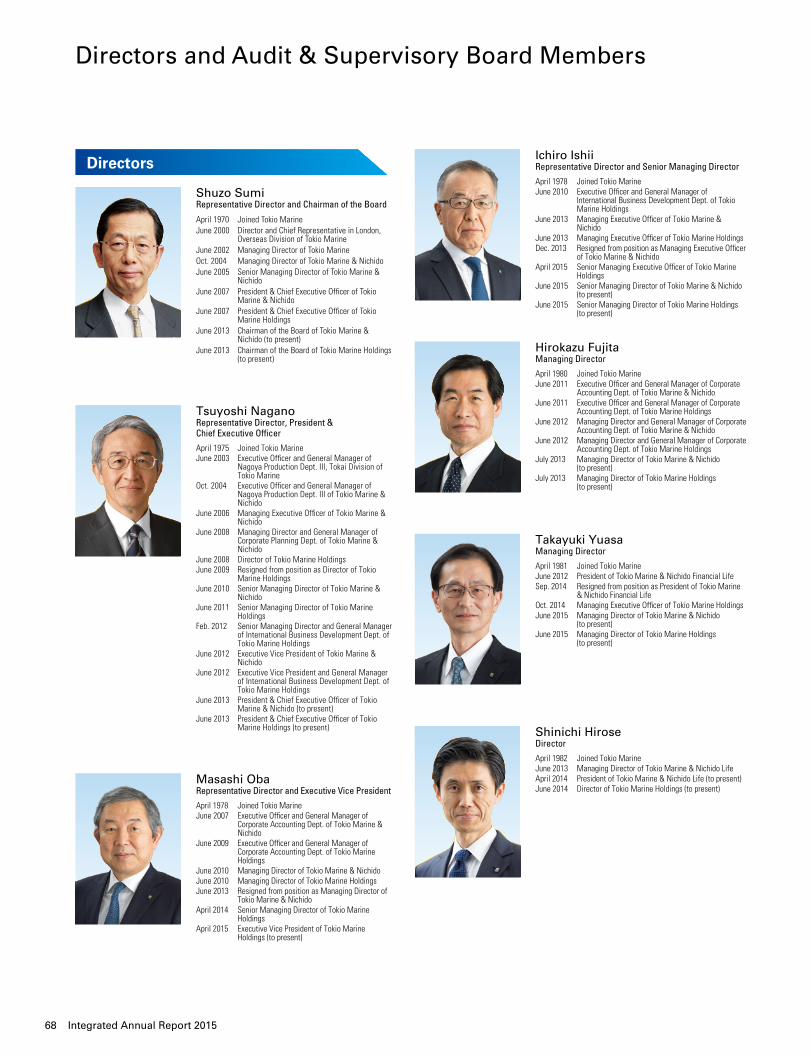
April 1970 Joined Tokio MarineJune 2000 Director and Chief Representative in London,
Overseas Division of Tokio MarineJune 2002 Managing Director of Tokio MarineOct. 2004 Managing Director of Tokio Marine & NichidoJune 2005 Senior Managing Director of Tokio Marine &
NichidoJune 2007 President & Chief Executive Officer of Tokio
Marine & NichidoJune 2007 President & Chief Executive Officer of Tokio
Marine HoldingsJune 2013 Chairman of the Board of Tokio Marine &
Nichido (to present)June 2013 Chairman of the Board of Tokio Marine Holdings
(to present)
Shuzo SumiRepresentative Director and Chairman of the Board
April 1975 Joined Tokio MarineJune 2003 Executive Officer and General Manager of
Nagoya Production Dept. III, Tokai Division of Tokio Marine
Oct. 2004 Executive Officer and General Manager of Nagoya Production Dept. III of Tokio Marine & Nichido
June 2006 Managing Executive Officer of Tokio Marine & Nichido
June 2008 Managing Director and General Manager of Corporate Planning Dept. of Tokio Marine & Nichido
June 2008 Director of Tokio Marine HoldingsJune 2009 Resigned from position as Director of Tokio
Marine HoldingsJune 2010 Senior Managing Director of Tokio Marine &
NichidoJune 2011 Senior Managing Director of Tokio Marine
HoldingsFeb. 2012 Senior Managing Director and General Manager
of International Business Development Dept. of Tokio Marine Holdings
June 2012 Executive Vice President of Tokio Marine & Nichido
June 2012 Executive Vice President and General Manager of International Business Development Dept. of Tokio Marine Holdings
June 2013 President & Chief Executive Officer of Tokio Marine & Nichido (to present)
June 2013 President & Chief Executive Officer of Tokio Marine Holdings (to present)
Tsuyoshi NaganoRepresentative Director, President & Chief Executive Officer
Masashi ObaRepresentative Director and Executive Vice President
April 1978 Joined Tokio MarineJune 2007 Executive Officer and General Manager of
Corporate Accounting Dept. of Tokio Marine & Nichido
June 2009 Executive Officer and General Manager of Corporate Accounting Dept. of Tokio Marine Holdings
June 2010 Managing Director of Tokio Marine & NichidoJune 2010 Managing Director of Tokio Marine HoldingsJune 2013 Resigned from position as Managing Director of
Tokio Marine & NichidoApril 2014 Senior Managing Director of Tokio Marine
HoldingsApril 2015 Executive Vice President of Tokio Marine
Holdings (to present)
Shinichi HiroseDirector
April 1982 Joined Tokio MarineJune 2013 Managing Director of Tokio Marine & Nichido LifeApril 2014 President of Tokio Marine & Nichido Life (to present)June 2014 Director of Tokio Marine Holdings (to present)
Hirokazu FujitaManaging Director
Ichiro IshiiRepresentative Director and Senior Managing Director
April 1980 Joined Tokio MarineJune 2011 Executive Officer and General Manager of Corporate
Accounting Dept. of Tokio Marine & NichidoJune 2011 Executive Officer and General Manager of Corporate
Accounting Dept. of Tokio Marine HoldingsJune 2012 Managing Director and General Manager of Corporate
Accounting Dept. of Tokio Marine & NichidoJune 2012 Managing Director and General Manager of Corporate
Accounting Dept. of Tokio Marine HoldingsJuly 2013 Managing Director of Tokio Marine & Nichido
(to present)July 2013 Managing Director of Tokio Marine Holdings
(to present)
April 1978 Joined Tokio MarineJune 2010 Executive Officer and General Manager of
International Business Development Dept. of Tokio Marine Holdings
June 2013 Managing Executive Officer of Tokio Marine & Nichido
June 2013 Managing Executive Officer of Tokio Marine HoldingsDec. 2013 Resigned from position as Managing Executive Officer
of Tokio Marine & NichidoApril 2015 Senior Managing Executive Officer of Tokio Marine
HoldingsJune 2015 Senior Managing Director of Tokio Marine & Nichido
(to present)June 2015 Senior Managing Director of Tokio Marine Holdings
(to present)
Takayuki YuasaManaging Director
April 1981 Joined Tokio MarineJune 2012 President of Tokio Marine & Nichido Financial LifeSep. 2014 Resigned from position as President of Tokio Marine
& Nichido Financial LifeOct. 2014 Managing Executive Officer of Tokio Marine HoldingsJune 2015 Managing Director of Tokio Marine & Nichido
(to present)June 2015 Managing Director of Tokio Marine Holdings
(to present)
Directors
Directors and Audit & Supervisory Board Members
68 Integrated Annual Report 2015
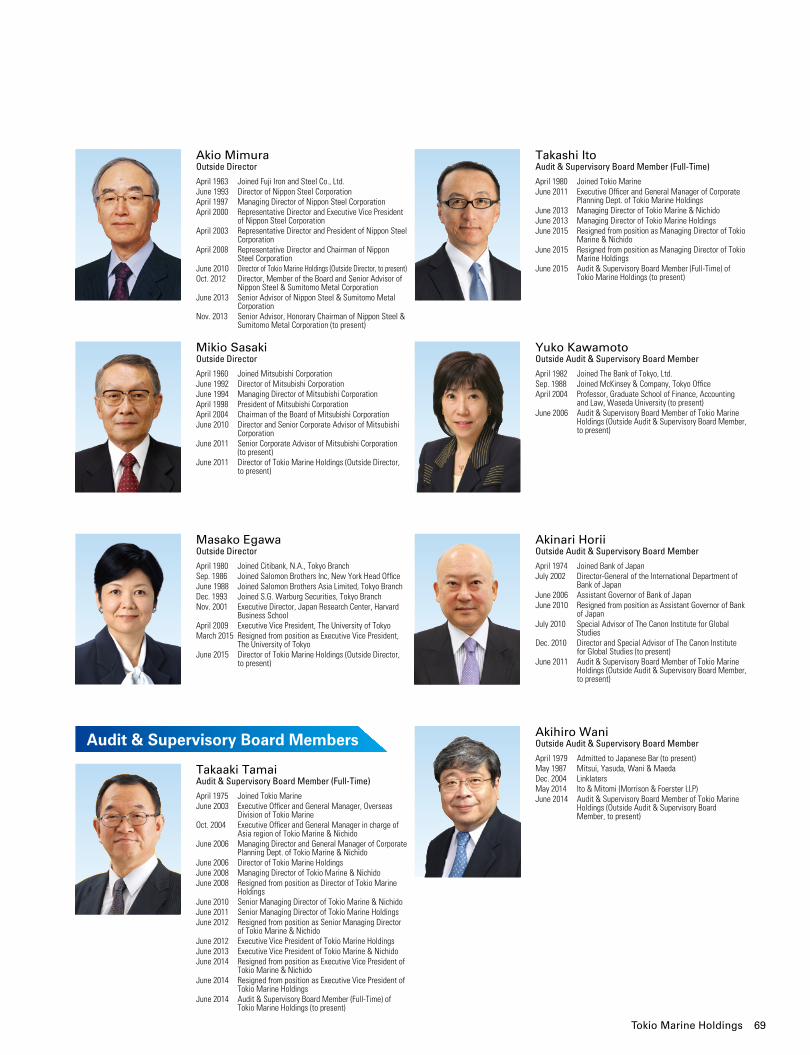
Takaaki TamaiAudit & Supervisory Board Member (Full-Time)
Yuko KawamotoOutside Audit & Supervisory Board Member
Akinari HoriiOutside Audit & Supervisory Board Member
Akihiro WaniOutside Audit & Supervisory Board Member
April 1975 Joined Tokio MarineJune 2003 Executive Officer and General Manager, Overseas
Division of Tokio MarineOct. 2004 Executive Officer and General Manager in charge of
Asia region of Tokio Marine & NichidoJune 2006 Managing Director and General Manager of Corporate
Planning Dept. of Tokio Marine & NichidoJune 2006 Director of Tokio Marine HoldingsJune 2008 Managing Director of Tokio Marine & NichidoJune 2008 Resigned from position as Director of Tokio Marine
HoldingsJune 2010 Senior Managing Director of Tokio Marine & NichidoJune 2011 Senior Managing Director of Tokio Marine HoldingsJune 2012 Resigned from position as Senior Managing Director
of Tokio Marine & NichidoJune 2012 Executive Vice President of Tokio Marine HoldingsJune 2013 Executive Vice President of Tokio Marine & NichidoJune 2014 Resigned from position as Executive Vice President of
Tokio Marine & NichidoJune 2014 Resigned from position as Executive Vice President of
Tokio Marine HoldingsJune 2014 Audit & Supervisory Board Member (Full-Time) of
Tokio Marine Holdings (to present)
Takashi ItoAudit & Supervisory Board Member (Full-Time)
April 1980 Joined Tokio MarineJune 2011 Executive Officer and General Manager of Corporate
Planning Dept. of Tokio Marine HoldingsJune 2013 Managing Director of Tokio Marine & NichidoJune 2013 Managing Director of Tokio Marine HoldingsJune 2015 Resigned from position as Managing Director of Tokio
Marine & NichidoJune 2015 Resigned from position as Managing Director of Tokio
Marine HoldingsJune 2015 Audit & Supervisory Board Member (Full-Time) of
Tokio Marine Holdings (to present)
Akio MimuraOutside Director
April 1963 Joined Fuji Iron and Steel Co., Ltd.June 1993 Director of Nippon Steel CorporationApril 1997 Managing Director of Nippon Steel CorporationApril 2000 Representative Director and Executive Vice President
of Nippon Steel CorporationApril 2003 Representative Director and President of Nippon Steel
CorporationApril 2008 Representative Director and Chairman of Nippon
Steel CorporationJune 2010 Director of Tokio Marine Holdings (Outside Director, to present)Oct. 2012 Director, Member of the Board and Senior Advisor of
Nippon Steel & Sumitomo Metal CorporationJune 2013 Senior Advisor of Nippon Steel & Sumitomo Metal
CorporationNov. 2013 Senior Advisor, Honorary Chairman of Nippon Steel &
Sumitomo Metal Corporation (to present)
Mikio SasakiOutside Director
April 1960 Joined Mitsubishi CorporationJune 1992 Director of Mitsubishi CorporationJune 1994 Managing Director of Mitsubishi CorporationApril 1998 President of Mitsubishi CorporationApril 2004 Chairman of the Board of Mitsubishi CorporationJune 2010 Director and Senior Corporate Advisor of Mitsubishi
CorporationJune 2011 Senior Corporate Advisor of Mitsubishi Corporation
(to present)June 2011 Director of Tokio Marine Holdings (Outside Director,
to present)
April 1974 Joined Bank of JapanJuly 2002 Director-General of the International Department of
Bank of JapanJune 2006 Assistant Governor of Bank of JapanJune 2010 Resigned from position as Assistant Governor of Bank
of JapanJuly 2010 Special Advisor of The Canon Institute for Global
StudiesDec. 2010 Director and Special Advisor of The Canon Institute
for Global Studies (to present)June 2011 Audit & Supervisory Board Member of Tokio Marine
Holdings (Outside Audit & Supervisory Board Member, to present)
April 1979 Admitted to Japanese Bar (to present)May 1987 Mitsui, Yasuda, Wani & MaedaDec. 2004 LinklatersMay 2014 Ito & Mitomi (Morrison & Foerster LLP)June 2014 Audit & Supervisory Board Member of Tokio Marine
Holdings (Outside Audit & Supervisory Board Member, to present)
April 1982 Joined The Bank of Tokyo, Ltd.Sep. 1988 Joined McKinsey & Company, Tokyo OfficeApril 2004 Professor, Graduate School of Finance, Accounting
and Law, Waseda University (to present)June 2006 Audit & Supervisory Board Member of Tokio Marine
Holdings (Outside Audit & Supervisory Board Member, to present)
Masako EgawaOutside Director
April 1980 Joined Citibank, N.A., Tokyo BranchSep. 1986 Joined Salomon Brothers Inc, New York Head OfficeJune 1988 Joined Salomon Brothers Asia Limited, Tokyo BranchDec. 1993 Joined S.G. Warburg Securities, Tokyo BranchNov. 2001 Executive Director, Japan Research Center, Harvard
Business SchoolApril 2009 Executive Vice President, The University of TokyoMarch 2015 Resigned from position as Executive Vice President,
The University of TokyoJune 2015 Director of Tokio Marine Holdings (Outside Director,
to present)
Audit & Supervisory Board Members
69Tokio Marine Holdings
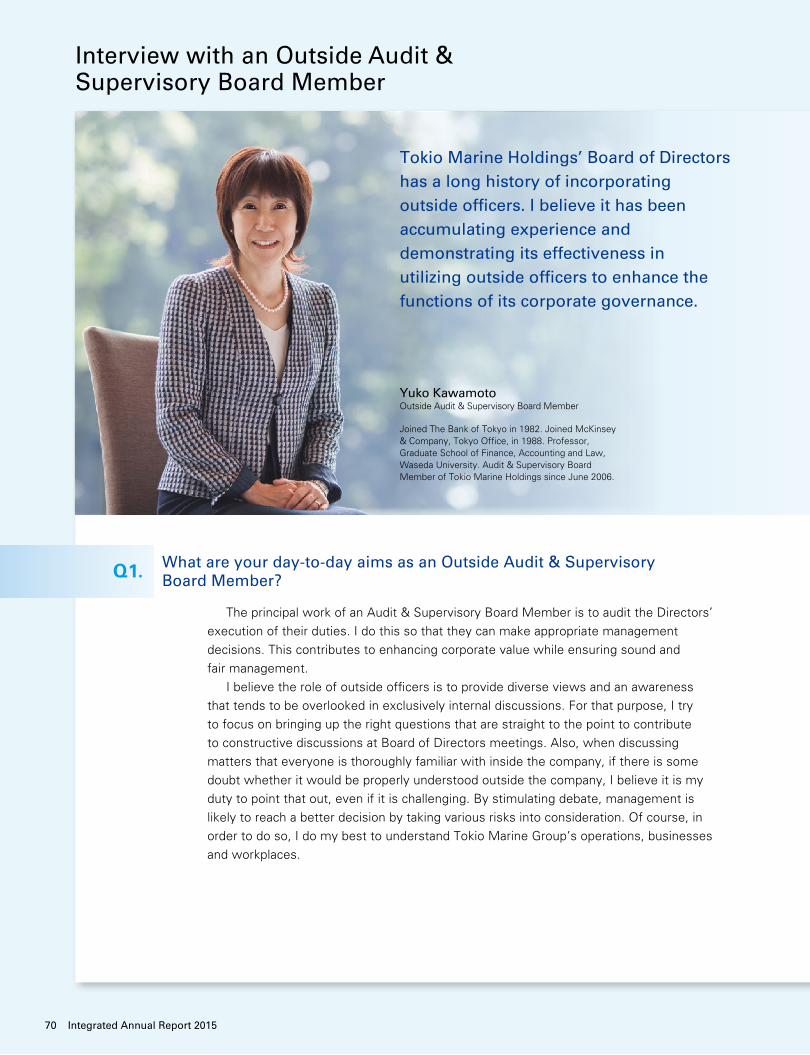
The principal work of an Audit & Supervisory Board Member is to audit the Directors’ execution of their duties. I do this so that they can make appropriate management decisions. This contributes to enhancing corporate value while ensuring sound and fair management. I believe the role of outside officers is to provide diverse views and an awareness that tends to be overlooked in exclusively internal discussions. For that purpose, I try to focus on bringing up the right questions that are straight to the point to contribute to constructive discussions at Board of Directors meetings. Also, when discussing matters that everyone is thoroughly familiar with inside the company, if there is some doubt whether it would be properly understood outside the company, I believe it is my duty to point that out, even if it is challenging. By stimulating debate, management is likely to reach a better decision by taking various risks into consideration. Of course, in order to do so, I do my best to understand Tokio Marine Group’s operations, businesses and workplaces.
Q1. What are your day-to-day aims as an Outside Audit & Supervisory Board Member?
Interview with an Outside Audit & Supervisory Board Member
Tokio Marine Holdings’ Board of Directors has a long history of incorporating outside officers. I believe it has been accumulating experience and demonstrating its effectiveness in utilizing outside officers to enhance the functions of its corporate governance.
Yuko KawamotoOutside Audit & Supervisory Board Member
Joined The Bank of Tokyo in 1982. Joined McKinsey & Company, Tokyo Office, in 1988. Professor, Graduate School of Finance, Accounting and Law, Waseda University. Audit & Supervisory Board Member of Tokio Marine Holdings since June 2006.
70 Integrated Annual Report 2015
Tokio Marine Holdings’ Board of Directors has a long history of incorporating outside officers. I believe it has been accumulating experience and demonstrating its effectiveness in utilizing outside officers to enhance the functions of its corporate governance. Discussions at Board of Directors meetings are lively, and the frankness and transparency that enables one to speak freely is a characteristic of Tokio Marine Holdings. For example, in formulating the new Mid-Term Business Plan, the Board of Directors was involved in discussions from an early stage, and shaped the discussions while listening to external opinions. I can say that this is a progressive example among Japanese corporations. When the points at issue become clear during lively discussions and we modify our conclusions, this is the moment when I realize that Board discussions are not merely a formality. If I were to mention a point where we can continue to improve, I would suggest that we increase opportunities to be exposed to new information and new ways of thinking, for example by attending international conferences – in other words, it is important to increase interaction with people from different fields. I believe this will lead to better governance.
Tokio Marine Group has significantly expanded in a wide range of areas including the proportion of sales and income accounted for by its international insurance business, its customer base and the number of employees. From the former business centered on domestic operations, its business base and the very environment in which it operates have become increasingly global. In this situation, it has become increasingly important to incorporate and appropriately manage diversity as a new strength in its organization, corporate culture and management, and to link it to enhancement in corporate value. Under these circumstances, measures for continuous innovation, training global personnel and innovations in working style (pursuit of diverse working styles to achieve a work-life balance through efficiency) are top priority issues. I believe that a women-friendly workplace is a workplace that it usually comfortable for anyone, because most have fair and transparent evaluation systems. I would like Tokio Marine Group to continue striving toward a global level of diversity and to look to other global companies as the benchmark. The commitment of the insurance business to be there for clients in their moment of need, and a vision and corporate philosophy of being a “Good Company” with customer trust as the source of corporate value creation, is the basis of increasing the fairness and soundness of a company. I value this as a potential driving force for continuously enhancing corporate value.
Q2. You have been involved in Tokio Marine Holdings’ management as an Outside Audit & Supervisory Board Member for a long time (9 years). How has Tokio Marine Group’s corporate governance changed, and how do you evaluate its current state?
Q3. Do you have any advice for Tokio Marine Group on continuously increasing corporate value toward its aim of becoming a “Good Company”?
71Tokio Marine Holdings
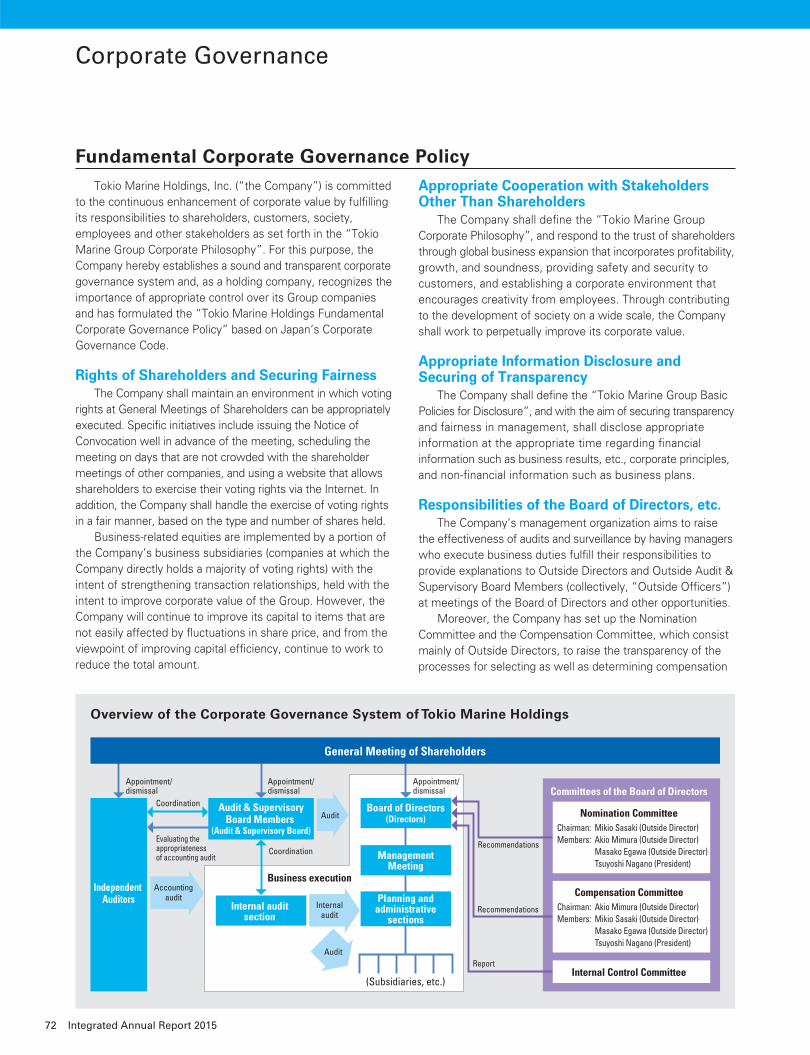
Independent Auditors
Appointment/dismissal
Evaluating theappropriateness of accounting audit
Coordination
Coordination
Appointment/dismissal
Report
Appointment/dismissal
Business execution
(Subsidiaries, etc.)
Audit
Internalaudit
Accountingaudit
Committees of the Board of Directors
Audit & SupervisoryBoard Members
(Audit & Supervisory Board)
ManagementMeeting
Planning andadministrative
sections
Board of Directors(Directors)
Chairman: Mikio Sasaki (Outside Director)Members: Akio Mimura (Outside Director) Masako Egawa (Outside Director) Tsuyoshi Nagano (President)
Nomination Committee
Internal Control Committee
Chairman: Akio Mimura (Outside Director)Members: Mikio Sasaki (Outside Director) Masako Egawa (Outside Director) Tsuyoshi Nagano (President)
Compensation CommitteeInternal audit
section
Recommendations
Recommendations
General Meeting of Shareholders
Audit
Overview of the Corporate Governance System of Tokio Marine Holdings
Corporate Governance
Tokio Marine Holdings, Inc. (“the Company”) is committed to the continuous enhancement of corporate value by fulfi lling its responsibilities to shareholders, customers, society, employees and other stakeholders as set forth in the “Tokio Marine Group Corporate Philosophy”. For this purpose, the Company hereby establishes a sound and transparent corporate governance system and, as a holding company, recognizes the importance of appropriate control over its Group companies and has formulated the “Tokio Marine Holdings Fundamental Corporate Governance Policy” based on Japan’s Corporate Governance Code.
Rights of Shareholders and Securing Fairness The Company shall maintain an environment in which voting rights at General Meetings of Shareholders can be appropriately executed. Specifi c initiatives include issuing the Notice of Convocation well in advance of the meeting, scheduling the meeting on days that are not crowded with the shareholder meetings of other companies, and using a website that allows shareholders to exercise their voting rights via the Internet. In addition, the Company shall handle the exercise of voting rights in a fair manner, based on the type and number of shares held. Business-related equities are implemented by a portion of the Company’s business subsidiaries (companies at which the Company directly holds a majority of voting rights) with the intent of strengthening transaction relationships, held with the intent to improve corporate value of the Group. However, the Company will continue to improve its capital to items that are not easily affected by fl uctuations in share price, and from the viewpoint of improving capital effi ciency, continue to work to reduce the total amount.
Appropriate Cooperation with Stakeholders Other Than Shareholders The Company shall defi ne the “Tokio Marine Group Corporate Philosophy”, and respond to the trust of shareholders through global business expansion that incorporates profi tability, growth, and soundness, providing safety and security to customers, and establishing a corporate environment that encourages creativity from employees. Through contributing to the development of society on a wide scale, the Company shall work to perpetually improve its corporate value.
Appropriate Information Disclosure and Securing of Transparency The Company shall defi ne the “Tokio Marine Group Basic Policies for Disclosure”, and with the aim of securing transparency and fairness in management, shall disclose appropriate information at the appropriate time regarding fi nancial information such as business results, etc., corporate principles, and non-fi nancial information such as business plans.
Responsibilities of the Board of Directors, etc. The Company’s management organization aims to raise the effectiveness of audits and surveillance by having managers who execute business duties fulfi ll their responsibilities to provide explanations to Outside Directors and Outside Audit & Supervisory Board Members (collectively, “Outside Offi cers”) at meetings of the Board of Directors and other opportunities. Moreover, the Company has set up the Nomination Committee and the Compensation Committee, which consist mainly of Outside Directors, to raise the transparency of the processes for selecting as well as determining compensation
Fundamental Corporate Governance Policy
72 Integrated Annual Report 2015
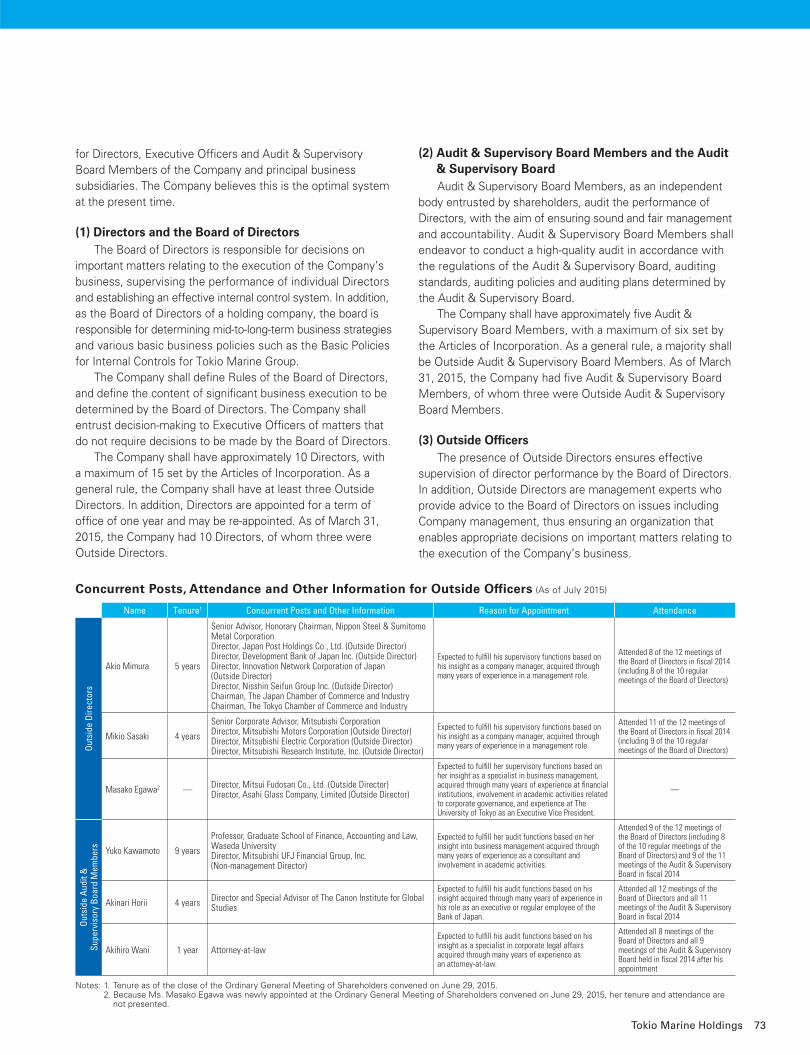
Name Tenure1 Concurrent Posts and Other Information Reason for Appointment Attendance
Outs
ide
Dire
ctor
s
Akio Mimura 5 years
Senior Advisor, Honorary Chairman, Nippon Steel & Sumitomo Metal CorporationDirector, Japan Post Holdings Co., Ltd. (Outside Director)Director, Development Bank of Japan Inc. (Outside Director)Director, Innovation Network Corporation of Japan(Outside Director)Director, Nisshin Seifun Group Inc. (Outside Director)Chairman, The Japan Chamber of Commerce and IndustryChairman, The Tokyo Chamber of Commerce and Industry
Expected to fulfi ll his supervisory functions based on his insight as a company manager, acquired through many years of experience in a management role.
Attended 8 of the 12 meetings of the Board of Directors in fi scal 2014 (including 8 of the 10 regular meetings of the Board of Directors)
Mikio Sasaki 4 years
Senior Corporate Advisor, Mitsubishi CorporationDirector, Mitsubishi Motors Corporation (Outside Director)Director, Mitsubishi Electric Corporation (Outside Director)Director, Mitsubishi Research Institute, Inc. (Outside Director)
Expected to fulfi ll his supervisory functions based on his insight as a company manager, acquired through many years of experience in a management role.
Attended 11 of the 12 meetings of the Board of Directors in fi scal 2014 (including 9 of the 10 regular meetings of the Board of Directors)
Masako Egawa2 — Director, Mitsui Fudosan Co., Ltd. (Outside Director)Director, Asahi Glass Company, Limited (Outside Director)
Expected to fulfi ll her supervisory functions based on her insight as a specialist in business management, acquired through many years of experience at fi nancial institutions, involvement in academic activities related to corporate governance, and experience at The University of Tokyo as an Executive Vice President.
—
Outs
ide
Audi
t &Su
perv
isor
y Bo
ard
Mem
bers Yuko Kawamoto 9 years
Professor, Graduate School of Finance, Accounting and Law, Waseda UniversityDirector, Mitsubishi UFJ Financial Group, Inc.(Non-management Director)
Expected to fulfi ll her audit functions based on her insight into business management acquired through many years of experience as a consultant and involvement in academic activities.
Attended 9 of the 12 meetings of the Board of Directors (including 8 of the 10 regular meetings of the Board of Directors) and 9 of the 11 meetings of the Audit & SupervisoryBoard in fi scal 2014
Akinari Horii 4 years Director and Special Advisor of The Canon Institute for Global Studies
Expected to fulfi ll his audit functions based on his insight acquired through many years of experience in his role as an executive or regular employee of the Bank of Japan.
Attended all 12 meetings of the Board of Directors and all 11 meetings of the Audit & Supervisory Board in fi scal 2014
Akihiro Wani 1 year Attorney-at-law
Expected to fulfi ll his audit functions based on his insight as a specialist in corporate legal affairs acquired through many years of experience asan attorney-at-law.
Attended all 8 meetings of the Board of Directors and all 9 meetings of the Audit & Supervisory Board held in fi scal 2014 after his appointment
Notes: 1. Tenure as of the close of the Ordinary General Meeting of Shareholders convened on June 29, 2015. 2. Because Ms. Masako Egawa was newly appointed at the Ordinary General Meeting of Shareholders convened on June 29, 2015, her tenure and attendance are
not presented.
Concurrent Posts, Attendance and Other Information for Outside Officers (As of July 2015)
for Directors, Executive Offi cers and Audit & Supervisory Board Members of the Company and principal business subsidiaries. The Company believes this is the optimal system at the present time.
(1) Directors and the Board of Directors The Board of Directors is responsible for decisions on important matters relating to the execution of the Company’s business, supervising the performance of individual Directors and establishing an effective internal control system. In addition, as the Board of Directors of a holding company, the board is responsible for determining mid-to-long-term business strategies and various basic business policies such as the Basic Policies for Internal Controls for Tokio Marine Group. The Company shall defi ne Rules of the Board of Directors, and defi ne the content of signifi cant business execution to be determined by the Board of Directors. The Company shall entrust decision-making to Executive Offi cers of matters that do not require decisions to be made by the Board of Directors. The Company shall have approximately 10 Directors, with a maximum of 15 set by the Articles of Incorporation. As a general rule, the Company shall have at least three Outside Directors. In addition, Directors are appointed for a term of offi ce of one year and may be re-appointed. As of March 31, 2015, the Company had 10 Directors, of whom three were Outside Directors.
(2) Audit & Supervisory Board Members and the Audit & Supervisory Board
Audit & Supervisory Board Members, as an independent body entrusted by shareholders, audit the performance of Directors, with the aim of ensuring sound and fair management and accountability. Audit & Supervisory Board Members shall endeavor to conduct a high-quality audit in accordance with the regulations of the Audit & Supervisory Board, auditing standards, auditing policies and auditing plans determined by the Audit & Supervisory Board. The Company shall have approximately fi ve Audit & Supervisory Board Members, with a maximum of six set by the Articles of Incorporation. As a general rule, a majority shall be Outside Audit & Supervisory Board Members. As of March 31, 2015, the Company had fi ve Audit & Supervisory Board Members, of whom three were Outside Audit & Supervisory Board Members.
(3) Outside Offi cers The presence of Outside Directors ensures effective supervision of director performance by the Board of Directors. In addition, Outside Directors are management experts who provide advice to the Board of Directors on issues including Company management, thus ensuring an organization that enables appropriate decisions on important matters relating to the execution of the Company’s business.
73Tokio Marine Holdings
The presence of Outside Audit & Supervisory Board Members creates an auditing organization with an independent and objective perspective. In addition, it enhances the effectiveness of the Audit & Supervisory Board and ensures an organization that maintains sound, transparent management. An Outside Offi cer for whom none of the following is applicable may be selected to ensure his or her perspective is independent of the Company.
1. A manager, former manager, employee, or former employee of the Company
2. A manager or employee of a company with which the Company has signifi cant transactions (or has had in the recent past)
3. A person related to a Director or Audit & Supervisory Board Member of the Company
4. A person in an advisory role who has been receiving a large sum, or has received in the recent past, of compensation from the Company other than due to performance of duties as Director or Audit & Supervisory Board Member
The Company currently has three Outside Directors and three Outside Audit & Supervisory Board Members. With reference to the above criteria*, the Company has been able to determine their independence from it and has therefore fi led declarations naming all six of them as independent directors/auditors as prescribed by the Tokyo Stock Exchange. * Group companies conduct insurance-related transactions with certain companies at
which Outside Offi cers formerly served. However, these transactions constitute less than one percent of consolidated ordinary income.
(4) Nomination Committee and Compensation Committee
The Company has established the Nomination Committee and the Compensation Committee, which consist mainly of Outside Directors, to raise the transparency of the processes for selecting as well as determining compensation for Directors, Audit & Supervisory Board Members and Executive Offi cers of the Company and principal business subsidiaries. The Nomination Committee reports to the Board of Directors. It deliberates on the requirements for and the appointment and dismissal of candidate Directors, Audit & Supervisory Board Members, and Executive Offi cers of the Company and principal business subsidiaries. The Compensation Committee reports to the Board of Directors. Its duties include deliberating on the compensation system and evaluating the performance of Directors and Executive Offi cers of the Company and principal business subsidiaries. The Nomination Committee and the Compensation Committee generally consist of approximately fi ve members each. As a general rule, a majority of the members of each committee are selected from outside of the Company, and the chairman of each committee is one of the outside members.
(5) Policies for Determining the Method for Calculating Compensation for Directors, Audit & Supervisory Board Members and Executive Offi cers
Basic policies for determining compensation for Directors and Audit & Supervisory Board Members of the Company and its principal Group companies are as follows:
• Ensure “transparency”, “fairness” and “objectivity” regarding compensation for Directors, Audit & Supervisory Board Members and Executive Offi cers;
• Strengthen incentives for improving the business performance of the Company by introducing a performance-linked compensation system;
• Enhance accountability through sharing returns with shareholders by introducing a compensation system linked to meeting the Company’s business results indices based on the management strategy and Company share price; and
• Fully implement a performance-based pay system through processes designed to objectively evaluate individual performance of Directors (Full-Time) and Executive Offi cers with respect to management objectives.
In order to determine the level of compensation for Directors, Audit & Supervisory Board Members and Executive Offi cers, the Company shall set the standard of compensation for each position, depending on the responsibilities of Directors, Audit & Supervisory Board Members and Executive Offi cers, and take the business performance of the Company and the level of compensation of other companies into consideration. Based on ability to meet business results indices, etc., defi ned by the management strategy, evaluations on business results shall be made on a yearly basis at the Company and principal business subsidiaries, and the results of such evaluations will be incorporated into compensation for Directors, Audit & Supervisory Board Members and Executive Offi cers of the Company and the relevant business subsidiaries.
(6) Compensation System for Directors, Audit & Supervisory Board Members and Executive Offi cers of Tokio Marine Group
Compensation for Directors (Full-Time) and Executive Offi cers consists of three elements: fi xed compensation, bonuses related to the business performance of the Company and the performance of the individual, and stock options. Compensation for Directors (Part-Time) consists of two elements: fi xed compensation and stock options. Compensation for Audit & Supervisory Board Members consists of one element: fi xed compensation. The compensation system for Directors, Audit & Supervisory Board Members and Executive Offi cers of the Company’s principal business subsidiaries shall generally be identical to that applied to Directors, Audit & Supervisory Board Members and Executive Offi cers of the Company. The Board of Directors makes decisions regarding the above compensation system based on reports from the Compensation Committee.
74 Integrated Annual Report 2015
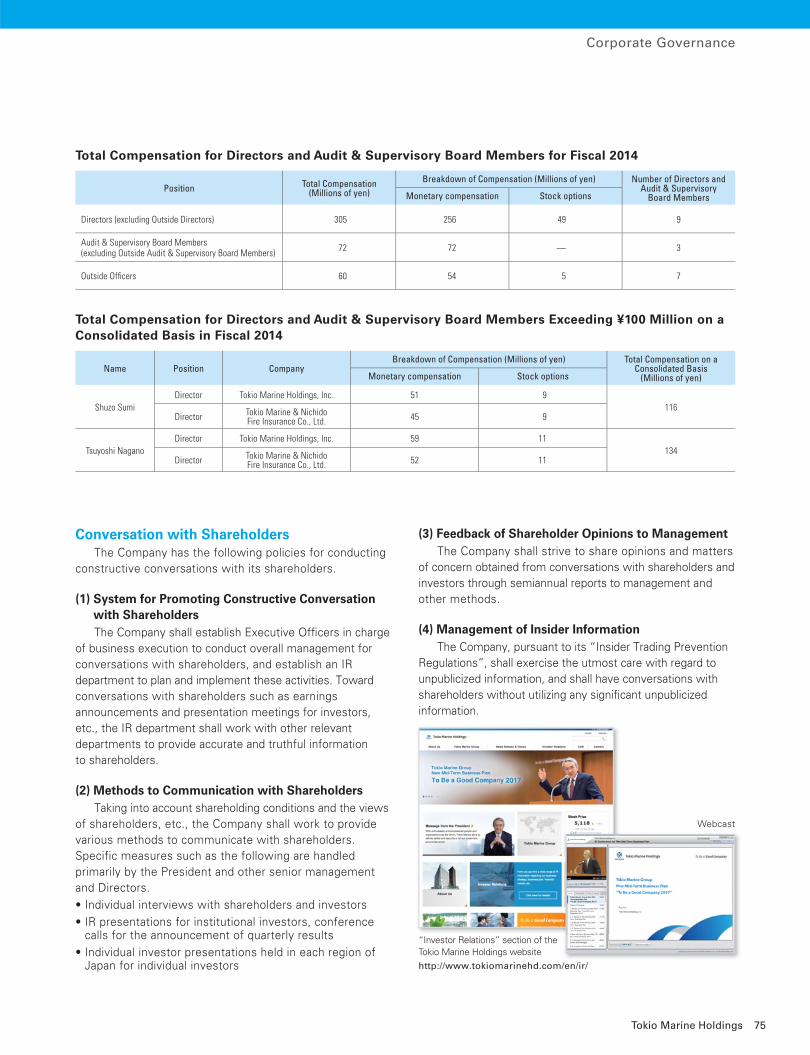
Corporate Governance
Total Compensation for Directors and Audit & Supervisory Board Members for Fiscal 2014
Position Total Compensation(Millions of yen)
Breakdown of Compensation (Millions of yen) Number of Directors and Audit & Supervisory
Board MembersMonetary compensation Stock options
Directors (excluding Outside Directors) 305 256 49 9
Audit & Supervisory Board Members(excluding Outside Audit & Supervisory Board Members)
72 72 — 3
Outside Offi cers 60 54 5 7
“Investor Relations” section of the Tokio Marine Holdings website
http://www.tokiomarinehd.com/en/ir/
Total Compensation for Directors and Audit & Supervisory Board Members Exceeding ¥100 Million on a Consolidated Basis in Fiscal 2014
Name Position CompanyBreakdown of Compensation (Millions of yen) Total Compensation on a
Consolidated Basis(Millions of yen)Monetary compensation Stock options
Shuzo SumiDirector Tokio Marine Holdings, Inc. 51 9
116Director Tokio Marine & Nichido
Fire Insurance Co., Ltd. 45 9
Tsuyoshi NaganoDirector Tokio Marine Holdings, Inc. 59 11
134Director Tokio Marine & Nichido
Fire Insurance Co., Ltd. 52 11
Conversation with Shareholders The Company has the following policies for conducting constructive conversations with its shareholders.
(1) System for Promoting Constructive Conversation with Shareholders
The Company shall establish Executive Offi cers in charge of business execution to conduct overall management for conversations with shareholders, and establish an IR department to plan and implement these activities. Toward conversations with shareholders such as earnings announcements and presentation meetings for investors, etc., the IR department shall work with other relevant departments to provide accurate and truthful information to shareholders.
(2) Methods to Communication with Shareholders Taking into account shareholding conditions and the views of shareholders, etc., the Company shall work to provide various methods to communicate with shareholders. Specific measures such as the following are handled primarily by the President and other senior management and Directors.
• Individual interviews with shareholders and investors
• IR presentations for institutional investors, conference calls for the announcement of quarterly results
• Individual investor presentations held in each region of Japan for individual investors
(3) Feedback of Shareholder Opinions to Management The Company shall strive to share opinions and matters of concern obtained from conversations with shareholders and investors through semiannual reports to management and other methods.
(4) Management of Insider Information The Company, pursuant to its “Insider Trading Prevention Regulations”, shall exercise the utmost care with regard to unpublicized information, and shall have conversations with shareholders without utilizing any signifi cant unpublicized information.
Webcast
75Tokio Marine Holdings
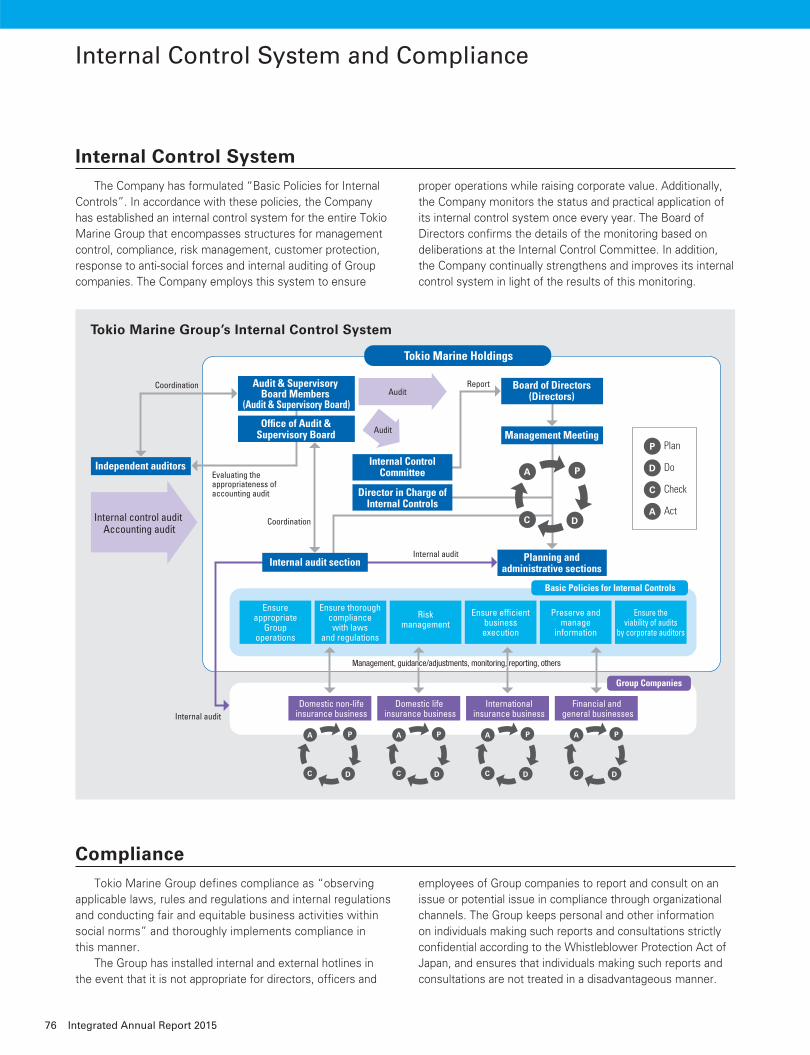
Independent auditors
Planning andadministrative sections
Domestic non-lifeinsurance business
Domestic life insurance business
Internationalinsurance business
Financial and general businesses
Ensureappropriate
Groupoperations
Ensure thoroughcompliancewith laws
and regulations
Riskmanagement
Ensure efficientbusinessexecution
Ensure theviability of audits
by corporate auditors
Preserve andmanage
information
Office of Audit &Supervisory Board
Internal audit
Internal audit
Report
Coordination
Evaluating the appropriateness of accounting audit
Coordination Board of Directors(Directors)
Management Meeting
Audit & Supervisory Board Members
(Audit & Supervisory Board)
Internal ControlCommittee
Director in Charge ofInternal Controls
Internal audit section
A P
C D
A P
C D
A P
C D
A P
C D
A P
C D
Basic Policies for Internal Controls
Group Companies
Internal control audit Accounting audit
P Plan
D Do
C Check
A Act
Audit
Management, guidance/adjustments, monitoring, reporting, othersManagement, guidance/adjustments, monitoring, reporting, others
Tokio Marine Holdings
Audit
The Company has formulated “Basic Policies for Internal Controls”. In accordance with these policies, the Company has established an internal control system for the entire Tokio Marine Group that encompasses structures for management control, compliance, risk management, customer protection, response to anti-social forces and internal auditing of Group companies. The Company employs this system to ensure
Tokio Marine Group defi nes compliance as “observing applicable laws, rules and regulations and internal regulations and conducting fair and equitable business activities within social norms” and thoroughly implements compliance in this manner. The Group has installed internal and external hotlines in the event that it is not appropriate for directors, offi cers and
proper operations while raising corporate value. Additionally, the Company monitors the status and practical application of its internal control system once every year. The Board of Directors confi rms the details of the monitoring based on deliberations at the Internal Control Committee. In addition, the Company continually strengthens and improves its internal control system in light of the results of this monitoring.
employees of Group companies to report and consult on an issue or potential issue in compliance through organizational channels. The Group keeps personal and other information on individuals making such reports and consultations strictly confi dential according to the Whistleblower Protection Act of Japan, and ensures that individuals making such reports and consultations are not treated in a disadvantageous manner.
Tokio Marine Group’s Internal Control System
Internal Control System and Compliance
Compliance
Internal Control System
76 Integrated Annual Report 2015
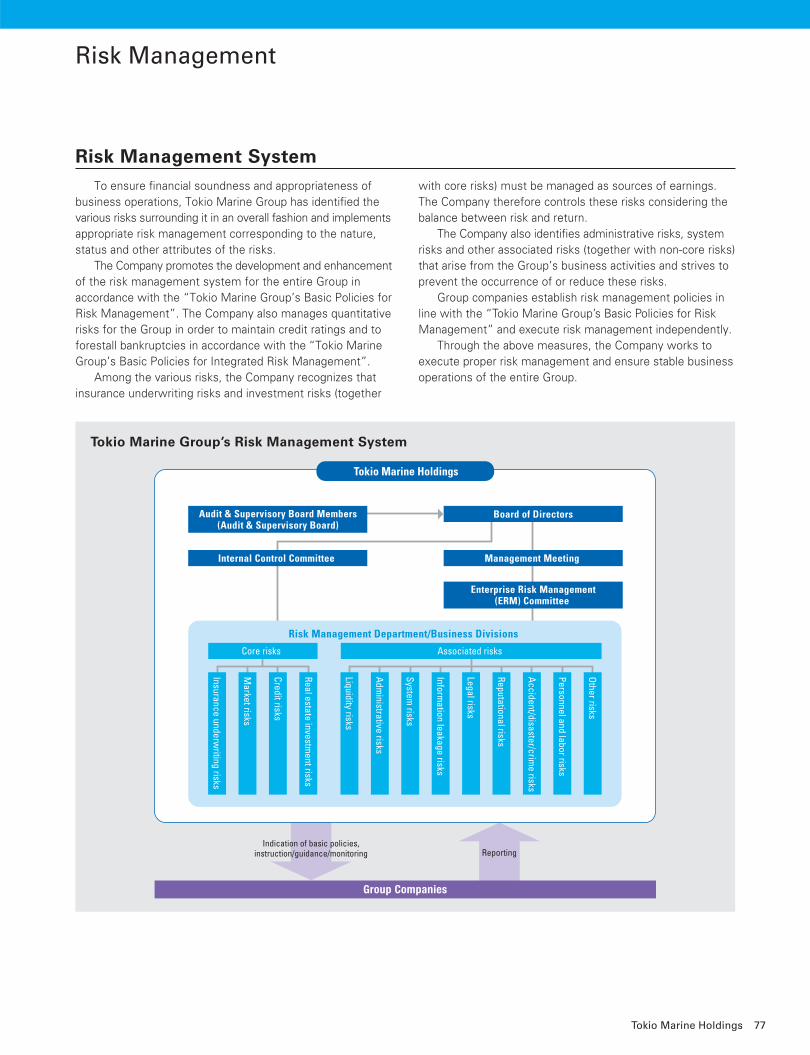
To ensure fi nancial soundness and appropriateness of business operations, Tokio Marine Group has identifi ed the various risks surrounding it in an overall fashion and implements appropriate risk management corresponding to the nature, status and other attributes of the risks. The Company promotes the development and enhancement of the risk management system for the entire Group in accordance with the “Tokio Marine Group’s Basic Policies for Risk Management”. The Company also manages quantitative risks for the Group in order to maintain credit ratings and to forestall bankruptcies in accordance with the “Tokio Marine Group’s Basic Policies for Integrated Risk Management”. Among the various risks, the Company recognizes that insurance underwriting risks and investment risks (together
with core risks) must be managed as sources of earnings. The Company therefore controls these risks considering the balance between risk and return. The Company also identifi es administrative risks, system risks and other associated risks (together with non-core risks) that arise from the Group’s business activities and strives to prevent the occurrence of or reduce these risks. Group companies establish risk management policies in line with the “Tokio Marine Group’s Basic Policies for Risk Management” and execute risk management independently. Through the above measures, the Company works to execute proper risk management and ensure stable business operations of the entire Group.
Risk Management
Reporting
Group Companies
Indication of basic policies,instruction/guidance/monitoring
Tokio Marine Holdings
Audit & Supervisory Board Members(Audit & Supervisory Board)
Internal Control Committee
Board of Directors
Management Meeting
Enterprise Risk Management(ERM) Committee
Risk Management Department/Business Divisions
Core risks
Insurance underwriting risks
Market risks
Credit risks
Real estate investment risks
Liquidity risks
Administrative risks
System risks
Information leakage risks
Other risks
Personnel and labor risks
Reputational risks
Accident/disaster/crime risks
Legal risks
Associated risks
Tokio Marine Group’s Risk Management System
Risk Management System
77Tokio Marine Holdings
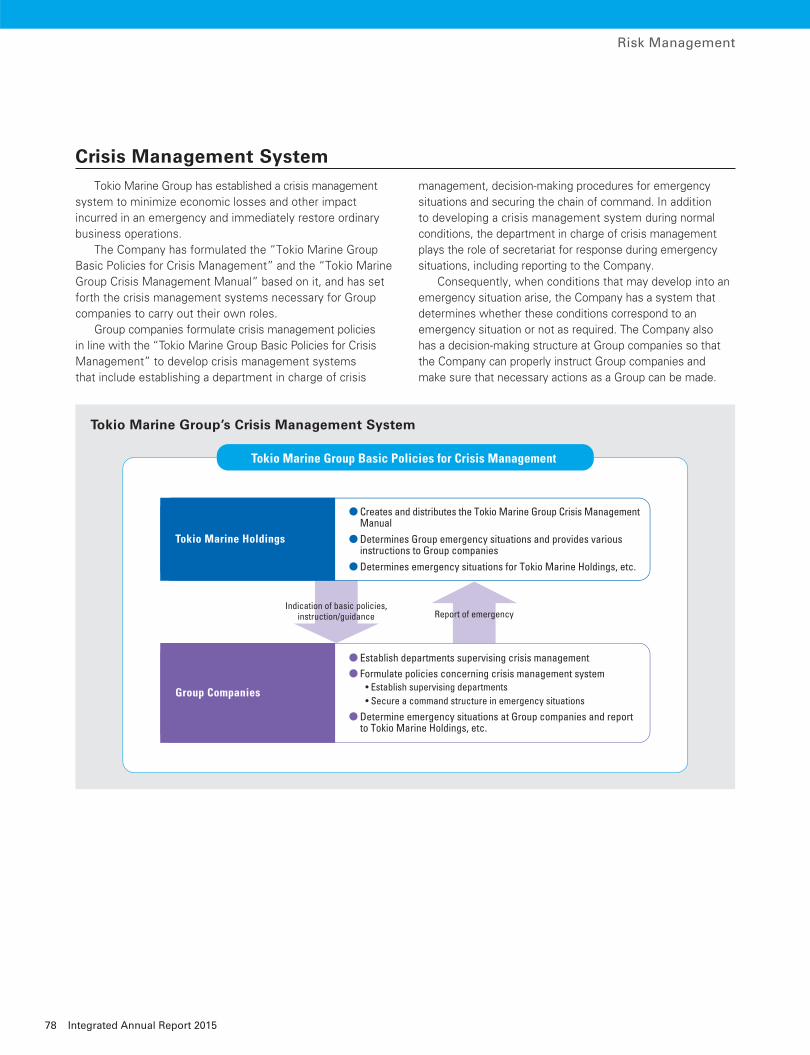
Tokio Marine Group Basic Policies for Crisis Management
Report of emergencyIndication of basic policies,
instruction/guidance
Tokio Marine Holdings
● Creates and distributes the Tokio Marine Group Crisis Management Manual● Determines Group emergency situations and provides various
instructions to Group companies● Determines emergency situations for Tokio Marine Holdings, etc.
Group Companies
● Establish departments supervising crisis management● Formulate policies concerning crisis management system
● Determine emergency situations at Group companies and report to Tokio Marine Holdings, etc.
• Establish supervising departments• Secure a command structure in emergency situations
Tokio Marine Group’s Crisis Management System
Risk Management
Tokio Marine Group has established a crisis management system to minimize economic losses and other impact incurred in an emergency and immediately restore ordinary business operations. The Company has formulated the “Tokio Marine Group Basic Policies for Crisis Management” and the “Tokio Marine Group Crisis Management Manual” based on it, and has set forth the crisis management systems necessary for Group companies to carry out their own roles. Group companies formulate crisis management policies in line with the “Tokio Marine Group Basic Policies for Crisis Management” to develop crisis management systems that include establishing a department in charge of crisis
management, decision-making procedures for emergency situations and securing the chain of command. In addition to developing a crisis management system during normal conditions, the department in charge of crisis management plays the role of secretariat for response during emergency situations, including reporting to the Company. Consequently, when conditions that may develop into an emergency situation arise, the Company has a system that determines whether these conditions correspond to an emergency situation or not as required. The Company also has a decision-making structure at Group companies so that the Company can properly instruct Group companies and make sure that necessary actions as a Group can be made.
Crisis Management System
78 Integrated Annual Report 2015
Change in Key Business Indicators (Consolidated Basis) 80
Financial Information 81
Independent Auditor’s Report 128
Solvency Margin Ratio 129
Interest-Rate Sensitivity of ALM Surplus Value 136
Embedded Value 137
Statutory Reserve 142
Financial Data
Tokio Marine Holdings 79
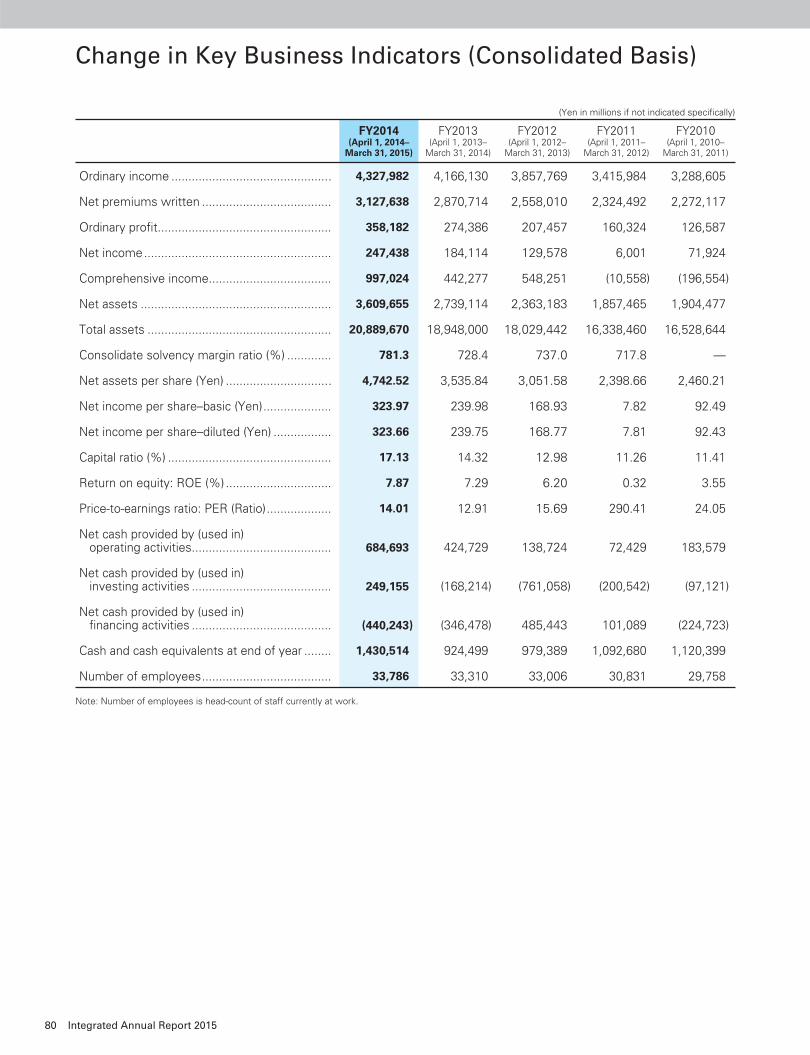
(Yen in millions if not indicated specifi cally)
FY2014(April 1, 2014–
March 31, 2015)
FY2013(April 1, 2013–
March 31, 2014)
FY2012(April 1, 2012–
March 31, 2013)
FY2011(April 1, 2011–
March 31, 2012)
FY2010(April 1, 2010–
March 31, 2011)
Ordinary income ............................................... 4,327,982 4,166,130 3,857,769 3,415,984 3,288,605
Net premiums written ...................................... 3,127,638 2,870,714 2,558,010 2,324,492 2,272,117
Ordinary profi t ................................................... 358,182 274,386 207,457 160,324 126,587
Net income ....................................................... 247,438 184,114 129,578 6,001 71,924
Comprehensive income .................................... 997,024 442,277 548,251 (10,558) (196,554)
Net assets ........................................................ 3,609,655 2,739,114 2,363,183 1,857,465 1,904,477
Total assets ...................................................... 20,889,670 18,948,000 18,029,442 16,338,460 16,528,644
Consolidate solvency margin ratio (%) ............. 781.3 728.4 737.0 717.8 —
Net assets per share (Yen) ............................... 4,742.52 3,535.84 3,051.58 2,398.66 2,460.21
Net income per share–basic (Yen) .................... 323.97 239.98 168.93 7.82 92.49
Net income per share–diluted (Yen) ................. 323.66 239.75 168.77 7.81 92.43
Capital ratio (%) ................................................ 17.13 14.32 12.98 11.26 11.41
Return on equity: ROE (%) ............................... 7.87 7.29 6.20 0.32 3.55
Price-to-earnings ratio: PER (Ratio) ................... 14.01 12.91 15.69 290.41 24.05
Net cash provided by (used in) operating activities ......................................... 684,693 424,729 138,724 72,429 183,579
Net cash provided by (used in) investing activities ......................................... 249,155 (168,214) (761,058) (200,542) (97,121)
Net cash provided by (used in) fi nancing activities ......................................... (440,243) (346,478) 485,443 101,089 (224,723)
Cash and cash equivalents at end of year ........ 1,430,514 924,499 979,389 1,092,680 1,120,399
Number of employees ...................................... 33,786 33,310 33,006 30,831 29,758
Note: Number of employees is head-count of staff currently at work.
80 Integrated Annual Report 2015
Change in Key Business Indicators (Consolidated Basis)
The accompanying consolidated fi nancial statements have been prepared in accordance with the Regulations Concerning Terminology, Forms and Preparation Methods of Consolidated Financial Statements (Ministry of Finance Ordinance No. 28, 1976, hereinafter called “Consolidated Statements Regulations”). The consolidated fi nancial statements have been also prepared in conformity with the Enforcement Regulations for the Insurance Business Act (Ministry of Finance Ordinance No. 5, 1996, hereinafter called “Insurance Act Enforcement Regulations”), as stipulated under Articles 46 and 68 of the Consolidated Statements Regulations.
The Company and its domestic consolidated subsidiaries maintain their accounts and records in accordance with the provisions set forth in the Corporation Law of Japan and the Financial Instruments and Exchange Act of Japan, and in conformity with accounting principles generally accepted in Japan, which are different in certain respects as to application and disclosure requirements of International Financial Reporting Standards. Amounts less than ¥1 million have been omitted in the consolidated fi nancial statements. As a result, the total thereto does not necessarily agree with the sum of the individual account balances.
Pursuant to Article 193-2, Paragraph 1 of the Financial Instruments and Exchange Act of Japan, Tokio Marine Holdings’ consolidated fi nancial statements for the
fi scal year ended March 31, 2015 have been audited and certifi ed by PricewaterhouseCoopers Aarata.
The Company takes conscious steps to achieve appropriateness of the consolidated fi nancial statements. For example, the Company is a member of the Financial Accounting Standards Foundation, management and employees participate in associated seminars held by the leading accounting fi rms and the Company
subscribes to specialized accounting books in order to provide adequate guidance and frameworks for application of fi nancial standards. Each of those steps are taken to enable the management and employees to appropriately understand the accounting standards and to coordinate with the changes in accounting procedures.
1. Preparation of Consolidated Financial Statements
2. Auditor’s Certifi cation
3. Conscious Steps to Achieve Appropriateness of the Consolidated Financial Statements
81Tokio Marine Holdings
Financial Information
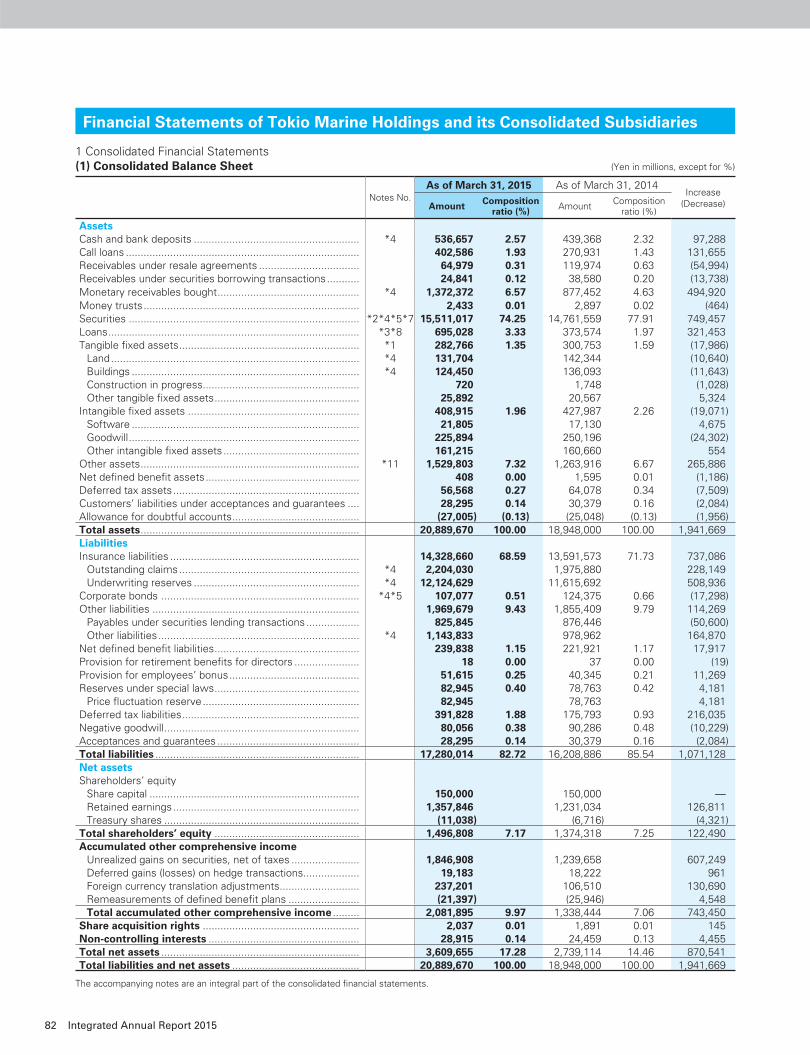
1 Consolidated Financial Statements(1) Consolidated Balance Sheet (Yen in millions, except for %)
As of March 31, 2015 As of March 31, 2014Increase
(Decrease)Notes No.
Amount Composition ratio (%) Amount
Composition ratio (%)
AssetsCash and bank deposits ........................................................ *4 536,657 2.57 439,368 2.32 97,288Call loans ............................................................................... 402,586 1.93 270,931 1.43 131,655Receivables under resale agreements .................................. 64,979 0.31 119,974 0.63 (54,994)Receivables under securities borrowing transactions ........... 24,841 0.12 38,580 0.20 (13,738)Monetary receivables bought ................................................ *4 1,372,372 6.57 877,452 4.63 494,920Money trusts ......................................................................... 2,433 0.01 2,897 0.02 (464)Securities .............................................................................. *2*4*5*7 15,511,017 74.25 14,761,559 77.91 749,457Loans ..................................................................................... *3*8 695,028 3.33 373,574 1.97 321,453Tangible fi xed assets ............................................................. *1 282,766 1.35 300,753 1.59 (17,986) Land .................................................................................... *4 131,704 142,344 (10,640) Buildings ............................................................................. *4 124,450 136,093 (11,643) Construction in progress..................................................... 720 1,748 (1,028) Other tangible fi xed assets ................................................. 25,892 20,567 5,324Intangible fi xed assets .......................................................... 408,915 1.96 427,987 2.26 (19,071) Software ............................................................................. 21,805 17,130 4,675 Goodwill .............................................................................. 225,894 250,196 (24,302) Other intangible fi xed assets .............................................. 161,215 160,660 554Other assets .......................................................................... *11 1,529,803 7.32 1,263,916 6.67 265,886Net defi ned benefi t assets .................................................... 408 0.00 1,595 0.01 (1,186)Deferred tax assets ............................................................... 56,568 0.27 64,078 0.34 (7,509)Customers’ liabilities under acceptances and guarantees .... 28,295 0.14 30,379 0.16 (2,084)Allowance for doubtful accounts ........................................... (27,005) (0.13) (25,048) (0.13) (1,956)Total assets .......................................................................... 20,889,670 100.00 18,948,000 100.00 1,941,669LiabilitiesInsurance liabilities ................................................................ 14,328,660 68.59 13,591,573 71.73 737,086 Outstanding claims ............................................................. *4 2,204,030 1,975,880 228,149 Underwriting reserves ........................................................ *4 12,124,629 11,615,692 508,936Corporate bonds ................................................................... *4*5 107,077 0.51 124,375 0.66 (17,298)Other liabilities ...................................................................... 1,969,679 9.43 1,855,409 9.79 114,269 Payables under securities lending transactions .................. 825,845 876,446 (50,600) Other liabilities .................................................................... *4 1,143,833 978,962 164,870Net defi ned benefi t liabilities ................................................. 239,838 1.15 221,921 1.17 17,917Provision for retirement benefi ts for directors ...................... 18 0.00 37 0.00 (19)Provision for employees’ bonus ............................................ 51,615 0.25 40,345 0.21 11,269Reserves under special laws ................................................. 82,945 0.40 78,763 0.42 4,181 Price fl uctuation reserve ..................................................... 82,945 78,763 4,181Deferred tax liabilities ............................................................ 391,828 1.88 175,793 0.93 216,035Negative goodwill .................................................................. 80,056 0.38 90,286 0.48 (10,229)Acceptances and guarantees ................................................ 28,295 0.14 30,379 0.16 (2,084)Total liabilities ..................................................................... 17,280,014 82.72 16,208,886 85.54 1,071,128Net assetsShareholders’ equity Share capital ....................................................................... 150,000 150,000 — Retained earnings ............................................................... 1,357,846 1,231,034 126,811 Treasury shares .................................................................. (11,038) (6,716) (4,321)Total shareholders’ equity ................................................. 1,496,808 7.17 1,374,318 7.25 122,490Accumulated other comprehensive income Unrealized gains on securities, net of taxes ....................... 1,846,908 1,239,658 607,249 Deferred gains (losses) on hedge transactions ................... 19,183 18,222 961 Foreign currency translation adjustments ........................... 237,201 106,510 130,690 Remeasurements of defi ned benefi t plans ........................ (21,397) (25,946) 4,548 Total accumulated other comprehensive income ......... 2,081,895 9.97 1,338,444 7.06 743,450Share acquisition rights ..................................................... 2,037 0.01 1,891 0.01 145Non-controlling interests ................................................... 28,915 0.14 24,459 0.13 4,455Total net assets ................................................................... 3,609,655 17.28 2,739,114 14.46 870,541Total liabilities and net assets ........................................... 20,889,670 100.00 18,948,000 100.00 1,941,669
The accompanying notes are an integral part of the consolidated fi nancial statements.
Financial Statements of Tokio Marine Holdings and its Consolidated Subsidiaries
82 Integrated Annual Report 2015
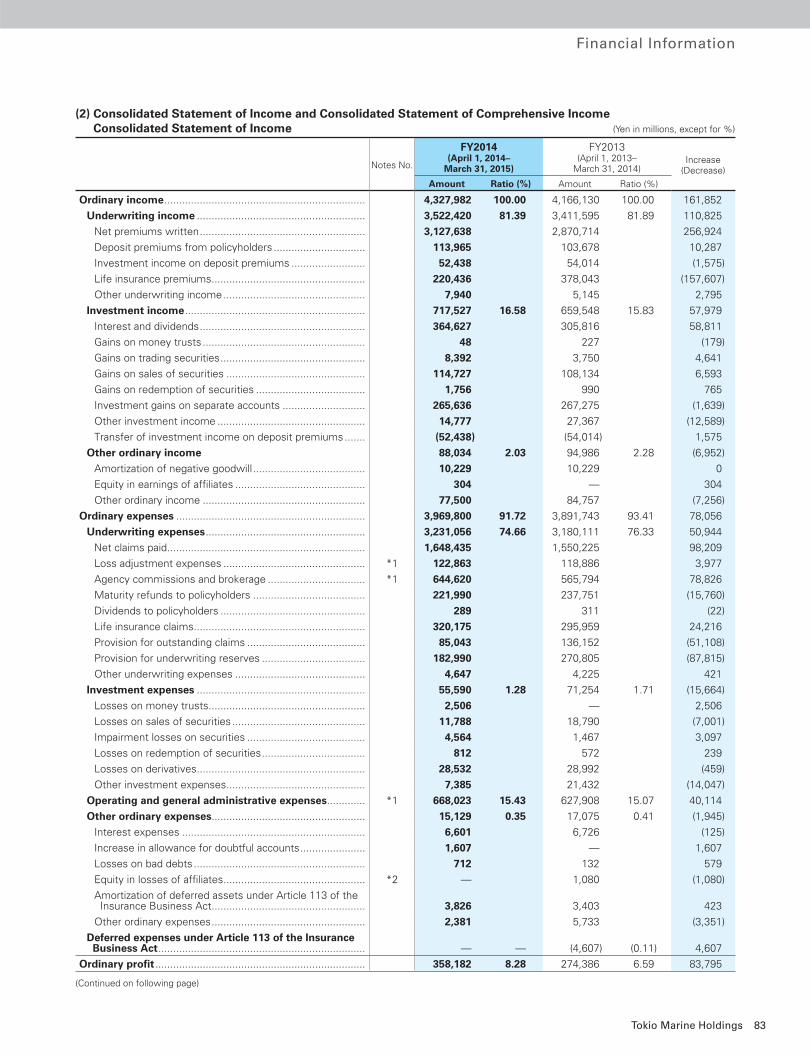
Financial Information
(2) Consolidated Statement of Income and Consolidated Statement of Comprehensive IncomeConsolidated Statement of Income (Yen in millions, except for %)
Notes No.
FY2014(April 1, 2014–
March 31, 2015)
FY2013(April 1, 2013–
March 31, 2014)Increase
(Decrease)
Amount Ratio (%) Amount Ratio (%)
Ordinary income .................................................................... 4,327,982 100.00 4,166,130 100.00 161,852
Underwriting income ......................................................... 3,522,420 81.39 3,411,595 81.89 110,825
Net premiums written ........................................................ 3,127,638 2,870,714 256,924
Deposit premiums from policyholders ............................... 113,965 103,678 10,287
Investment income on deposit premiums ......................... 52,438 54,014 (1,575)
Life insurance premiums .................................................... 220,436 378,043 (157,607)
Other underwriting income ................................................ 7,940 5,145 2,795
Investment income ............................................................. 717,527 16.58 659,548 15.83 57,979
Interest and dividends ........................................................ 364,627 305,816 58,811
Gains on money trusts ....................................................... 48 227 (179)
Gains on trading securities ................................................. 8,392 3,750 4,641
Gains on sales of securities ............................................... 114,727 108,134 6,593
Gains on redemption of securities ..................................... 1,756 990 765
Investment gains on separate accounts ............................ 265,636 267,275 (1,639)
Other investment income .................................................. 14,777 27,367 (12,589)
Transfer of investment income on deposit premiums ....... (52,438) (54,014) 1,575
Other ordinary income 88,034 2.03 94,986 2.28 (6,952)
Amortization of negative goodwill ...................................... 10,229 10,229 0
Equity in earnings of affi liates ............................................ 304 — 304
Other ordinary income ....................................................... 77,500 84,757 (7,256)
Ordinary expenses ................................................................ 3,969,800 91.72 3,891,743 93.41 78,056
Underwriting expenses ...................................................... 3,231,056 74.66 3,180,111 76.33 50,944
Net claims paid ................................................................... 1,648,435 1,550,225 98,209
Loss adjustment expenses ................................................ *1 122,863 118,886 3,977
Agency commissions and brokerage ................................. *1 644,620 565,794 78,826
Maturity refunds to policyholders ...................................... 221,990 237,751 (15,760)
Dividends to policyholders ................................................. 289 311 (22)
Life insurance claims .......................................................... 320,175 295,959 24,216
Provision for outstanding claims ........................................ 85,043 136,152 (51,108)
Provision for underwriting reserves ................................... 182,990 270,805 (87,815)
Other underwriting expenses ............................................ 4,647 4,225 421
Investment expenses ......................................................... 55,590 1.28 71,254 1.71 (15,664)
Losses on money trusts ..................................................... 2,506 — 2,506
Losses on sales of securities ............................................. 11,788 18,790 (7,001)
Impairment losses on securities ........................................ 4,564 1,467 3,097
Losses on redemption of securities ................................... 812 572 239
Losses on derivatives ......................................................... 28,532 28,992 (459)
Other investment expenses ............................................... 7,385 21,432 (14,047)
Operating and general administrative expenses ............. *1 668,023 15.43 627,908 15.07 40,114
Other ordinary expenses.................................................... 15,129 0.35 17,075 0.41 (1,945)
Interest expenses .............................................................. 6,601 6,726 (125)
Increase in allowance for doubtful accounts ...................... 1,607 — 1,607
Losses on bad debts .......................................................... 712 132 579
Equity in losses of affi liates ................................................ *2 — 1,080 (1,080)
Amortization of deferred assets under Article 113 of the Insurance Business Act .................................................... 3,826 3,403 423
Other ordinary expenses .................................................... 2,381 5,733 (3,351)
Deferred expenses under Article 113 of the Insurance Business Act ...................................................................... — — (4,607) (0.11) 4,607
Ordinary profi t ....................................................................... 358,182 8.28 274,386 6.59 83,795
(Continued on following page)
83Tokio Marine Holdings
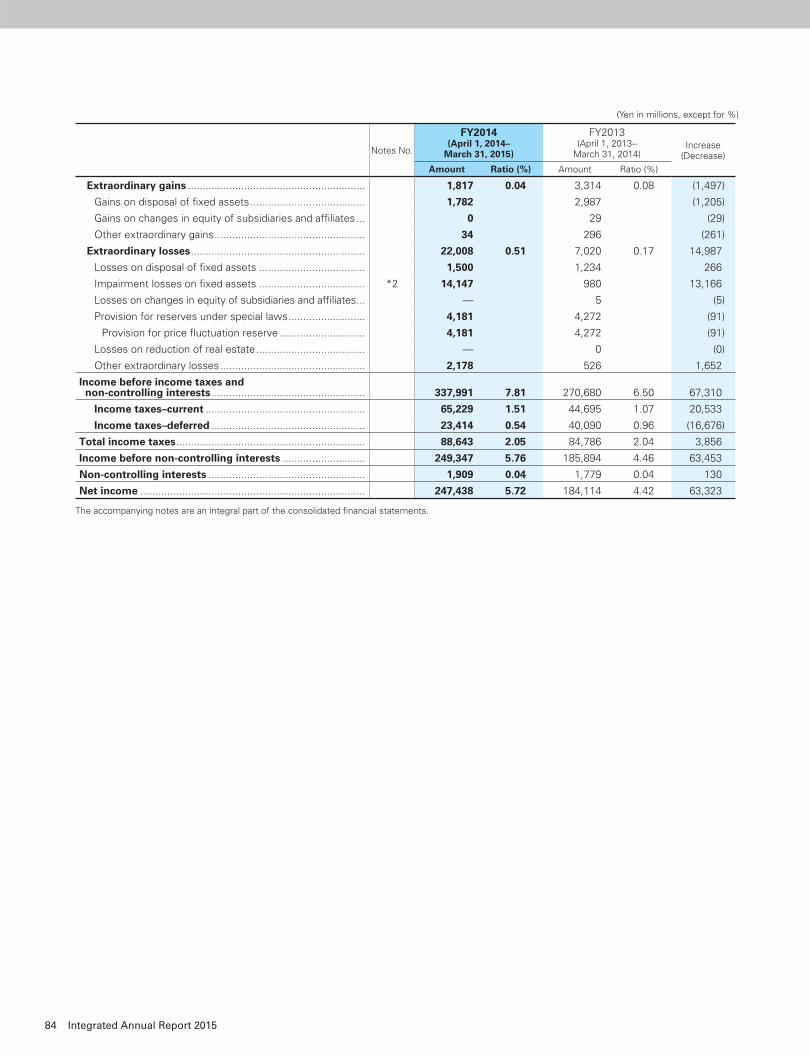
(Yen in millions, except for %)
Notes No.
FY2014(April 1, 2014–
March 31, 2015)
FY2013(April 1, 2013–
March 31, 2014)Increase
(Decrease)
Amount Ratio (%) Amount Ratio (%)
Extraordinary gains ............................................................ 1,817 0.04 3,314 0.08 (1,497)
Gains on disposal of fi xed assets ....................................... 1,782 2,987 (1,205)
Gains on changes in equity of subsidiaries and affi liates ... 0 29 (29)
Other extraordinary gains ................................................... 34 296 (261)
Extraordinary losses ........................................................... 22,008 0.51 7,020 0.17 14,987
Losses on disposal of fi xed assets .................................... 1,500 1,234 266
Impairment losses on fi xed assets .................................... *2 14,147 980 13,166
Losses on changes in equity of subsidiaries and affi liates ... — 5 (5)
Provision for reserves under special laws .......................... 4,181 4,272 (91)
Provision for price fl uctuation reserve ............................. 4,181 4,272 (91)
Losses on reduction of real estate ..................................... — 0 (0)
Other extraordinary losses ................................................. 2,178 526 1,652
Income before income taxes and non-controlling interests .................................................... 337,991 7.81 270,680 6.50 67,310
Income taxes–current ...................................................... 65,229 1.51 44,695 1.07 20,533
Income taxes–deferred .................................................... 23,414 0.54 40,090 0.96 (16,676)
Total income taxes ................................................................ 88,643 2.05 84,786 2.04 3,856
Income before non-controlling interests ............................ 249,347 5.76 185,894 4.46 63,453
Non-controlling interests ..................................................... 1,909 0.04 1,779 0.04 130
Net income ............................................................................ 247,438 5.72 184,114 4.42 63,323
The accompanying notes are an integral part of the consolidated fi nancial statements.
84 Integrated Annual Report 2015
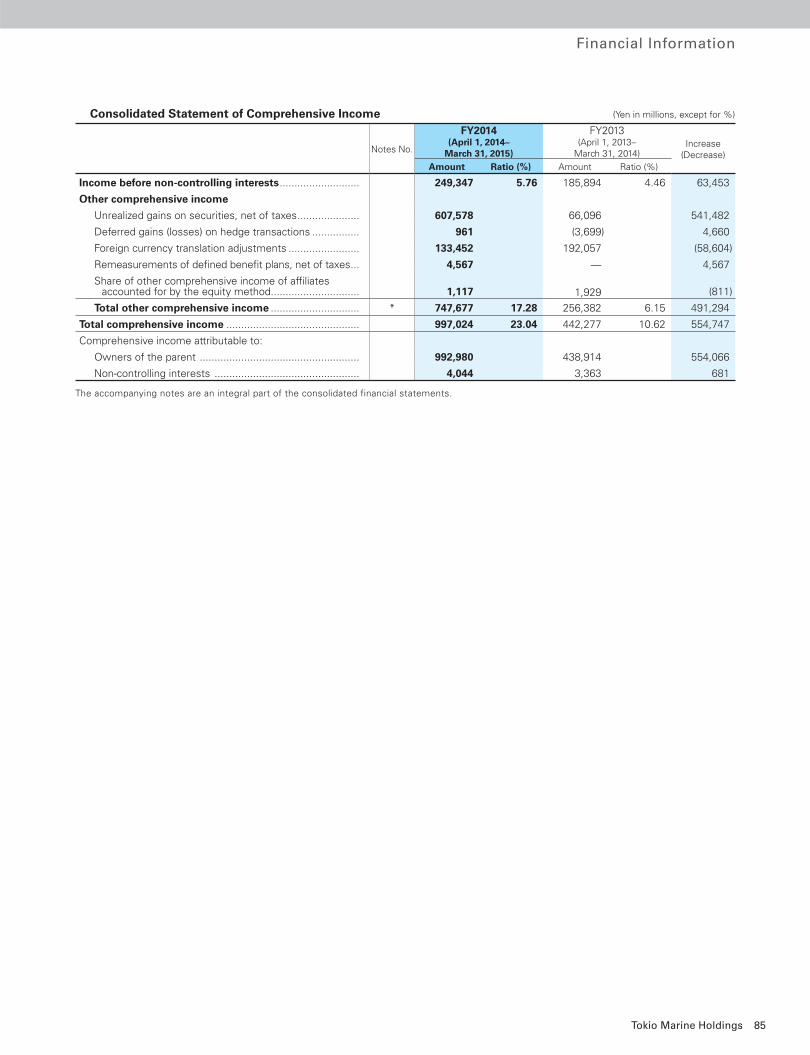
Financial Information
Consolidated Statement of Comprehensive Income (Yen in millions, except for %)
Notes No.
FY2014(April 1, 2014–
March 31, 2015)
FY2013(April 1, 2013–
March 31, 2014)Increase
(Decrease)Amount Ratio (%) Amount Ratio (%)
Income before non-controlling interests ........................... 249,347 5.76 185,894 4.46 63,453
Other comprehensive income
Unrealized gains on securities, net of taxes ..................... 607,578 66,096 541,482
Deferred gains (losses) on hedge transactions ................ 961 (3,699) 4,660
Foreign currency translation adjustments ........................ 133,452 192,057 (58,604)
Remeasurements of defi ned benefi t plans, net of taxes ... 4,567 — 4,567
Share of other comprehensive income of affi liates accounted for by the equity method.............................. 1,117 1,929 (811)
Total other comprehensive income .............................. * 747,677 17.28 256,382 6.15 491,294
Total comprehensive income ............................................. 997,024 23.04 442,277 10.62 554,747
Comprehensive income attributable to:
Owners of the parent ...................................................... 992,980 438,914 554,066
Non-controlling interests ................................................. 4,044 3,363 681
The accompanying notes are an integral part of the consolidated financial statements.
85Tokio Marine Holdings
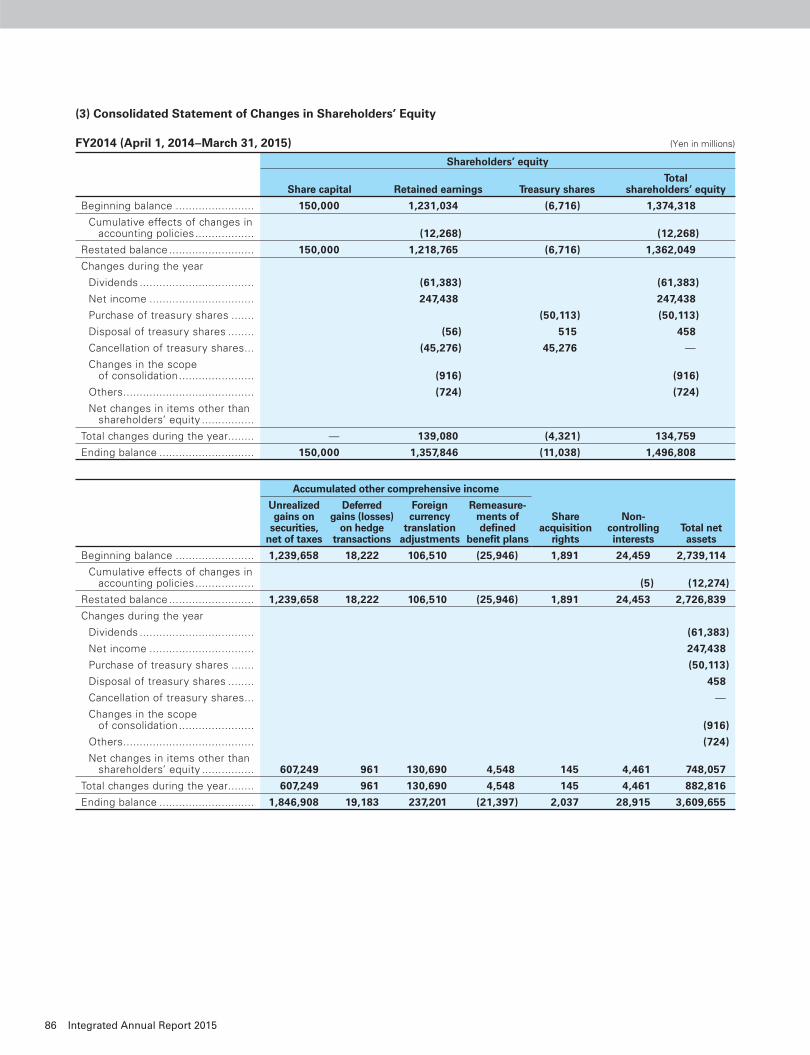
(3) Consolidated Statement of Changes in Shareholders’ Equity
FY2014 (April 1, 2014–March 31, 2015) (Yen in millions)
Shareholders’ equity
Share capital Retained earnings Treasury sharesTotal
shareholders’ equity
Beginning balance ........................ 150,000 1,231,034 (6,716) 1,374,318
Cumulative effects of changes in accounting policies .................. (12,268) (12,268)
Restated balance .......................... 150,000 1,218,765 (6,716) 1,362,049
Changes during the year
Dividends ................................... (61,383) (61,383)
Net income ................................ 247,438 247,438
Purchase of treasury shares ....... (50,113) (50,113)
Disposal of treasury shares ........ (56) 515 458
Cancellation of treasury shares ... (45,276) 45,276 —
Changes in the scope of consolidation ....................... (916) (916)
Others ........................................ (724) (724)
Net changes in items other than shareholders’ equity ................
Total changes during the year........ — 139,080 (4,321) 134,759
Ending balance ............................. 150,000 1,357,846 (11,038) 1,496,808
Accumulated other comprehensive income
Share acquisition
rights
Non-controllinginterests
Total net assets
Unrealized gains on
securities, net of taxes
Deferred gains (losses)
on hedge transactions
Foreign currency
translationadjustments
Remeasure-ments of defi ned
benefi t plans
Beginning balance ........................ 1,239,658 18,222 106,510 (25,946) 1,891 24,459 2,739,114
Cumulative effects of changes in accounting policies .................. (5) (12,274)
Restated balance .......................... 1,239,658 18,222 106,510 (25,946) 1,891 24,453 2,726,839
Changes during the year
Dividends ................................... (61,383)
Net income ................................ 247,438
Purchase of treasury shares ....... (50,113)
Disposal of treasury shares ........ 458
Cancellation of treasury shares ... —
Changes in the scope of consolidation ....................... (916)
Others ........................................ (724)
Net changes in items other than shareholders’ equity ................ 607,249 961 130,690 4,548 145 4,461 748,057
Total changes during the year........ 607,249 961 130,690 4,548 145 4,461 882,816
Ending balance ............................. 1,846,908 19,183 237,201 (21,397) 2,037 28,915 3,609,655
86 Integrated Annual Report 2015
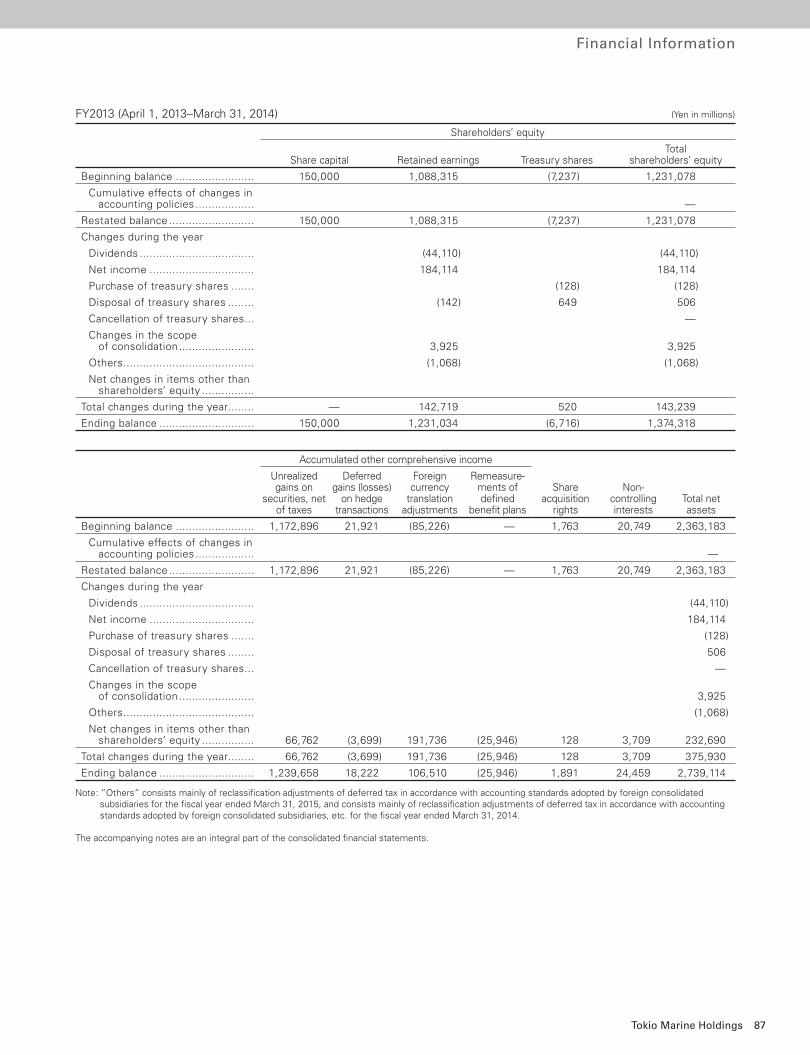
Financial Information
FY2013 (April 1, 2013–March 31, 2014) (Yen in millions)
Shareholders’ equity
Share capital Retained earnings Treasury sharesTotal
shareholders’ equity
Beginning balance ........................ 150,000 1,088,315 (7,237) 1,231,078
Cumulative effects of changes in accounting policies .................. —
Restated balance .......................... 150,000 1,088,315 (7,237) 1,231,078
Changes during the year
Dividends ................................... (44,110) (44,110)
Net income ................................ 184,114 184,114
Purchase of treasury shares ....... (128) (128)
Disposal of treasury shares ........ (142) 649 506
Cancellation of treasury shares ... —
Changes in the scope of consolidation ....................... 3,925 3,925
Others ........................................ (1,068) (1,068)
Net changes in items other than shareholders’ equity ................
Total changes during the year........ — 142,719 520 143,239
Ending balance ............................. 150,000 1,231,034 (6,716) 1,374,318
Accumulated other comprehensive income
Share acquisition
rights
Non-controllinginterests
Total net assets
Unrealized gains on
securities, net of taxes
Deferred gains (losses)
on hedge transactions
Foreign currency
translationadjustments
Remeasure-ments of defi ned
benefi t plans
Beginning balance ........................ 1,172,896 21,921 (85,226) — 1,763 20,749 2,363,183
Cumulative effects of changes in accounting policies .................. —
Restated balance .......................... 1,172,896 21,921 (85,226) — 1,763 20,749 2,363,183
Changes during the year
Dividends ................................... (44,110)
Net income ................................ 184,114
Purchase of treasury shares ....... (128)
Disposal of treasury shares ........ 506
Cancellation of treasury shares ... —
Changes in the scope of consolidation ....................... 3,925
Others ........................................ (1,068)
Net changes in items other than shareholders’ equity ................ 66,762 (3,699) 191,736 (25,946) 128 3,709 232,690
Total changes during the year........ 66,762 (3,699) 191,736 (25,946) 128 3,709 375,930
Ending balance ............................. 1,239,658 18,222 106,510 (25,946) 1,891 24,459 2,739,114
Note: “Others” consists mainly of reclassifi cation adjustments of deferred tax in accordance with accounting standards adopted by foreign consolidated subsidiaries for the fi scal year ended March 31, 2015, and consists mainly of reclassifi cation adjustments of deferred tax in accordance with accounting standards adopted by foreign consolidated subsidiaries, etc. for the fi scal year ended March 31, 2014.
The accompanying notes are an integral part of the consolidated fi nancial statements.
87Tokio Marine Holdings
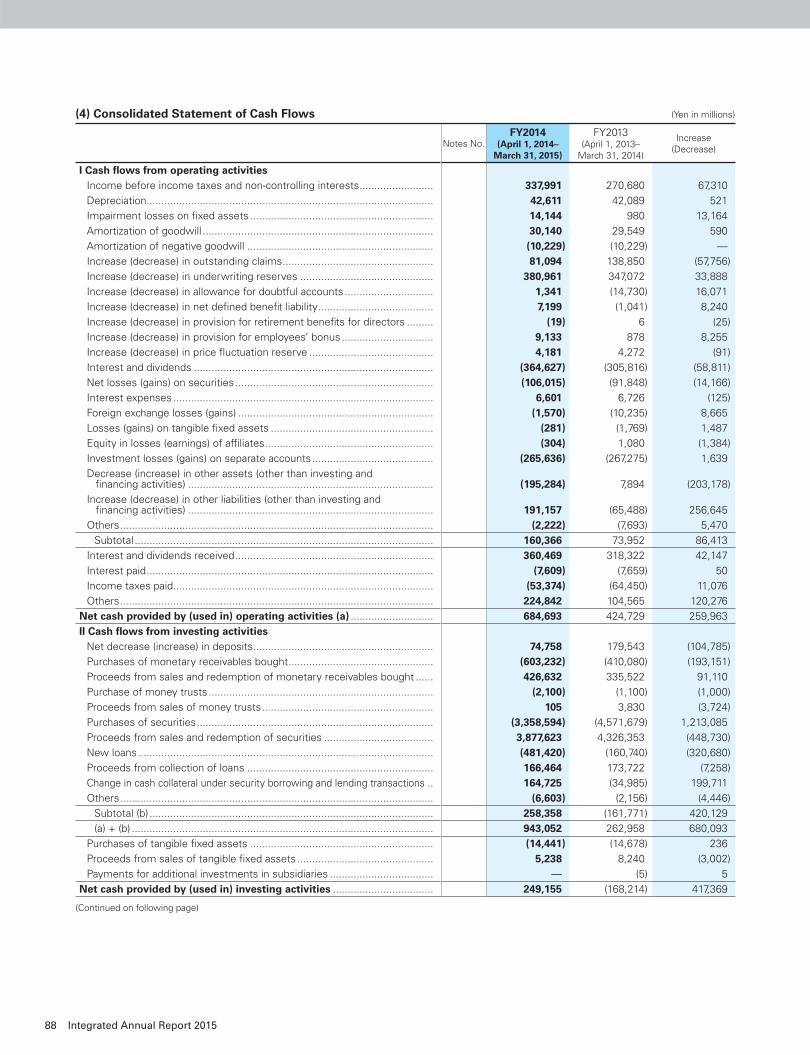
(4) Consolidated Statement of Cash Flows (Yen in millions)
Notes No.FY2014
(April 1, 2014–March 31, 2015)
FY2013(April 1, 2013–
March 31, 2014)
Increase (Decrease)
I Cash fl ows from operating activities Income before income taxes and non-controlling interests ......................... 337,991 270,680 67,310
Depreciation................................................................................................. 42,611 42,089 521
Impairment losses on fi xed assets .............................................................. 14,144 980 13,164
Amortization of goodwill .............................................................................. 30,140 29,549 590
Amortization of negative goodwill ............................................................... (10,229) (10,229) —
Increase (decrease) in outstanding claims ................................................... 81,094 138,850 (57,756)
Increase (decrease) in underwriting reserves ............................................. 380,961 347,072 33,888
Increase (decrease) in allowance for doubtful accounts .............................. 1,341 (14,730) 16,071
Increase (decrease) in net defi ned benefi t liability ....................................... 7,199 (1,041) 8,240
Increase (decrease) in provision for retirement benefi ts for directors ......... (19) 6 (25)
Increase (decrease) in provision for employees’ bonus ............................... 9,133 878 8,255
Increase (decrease) in price fl uctuation reserve .......................................... 4,181 4,272 (91)
Interest and dividends ................................................................................. (364,627) (305,816) (58,811)
Net losses (gains) on securities ................................................................... (106,015) (91,848) (14,166)
Interest expenses ........................................................................................ 6,601 6,726 (125)
Foreign exchange losses (gains) .................................................................. (1,570) (10,235) 8,665
Losses (gains) on tangible fi xed assets ....................................................... (281) (1,769) 1,487
Equity in losses (earnings) of affi liates ......................................................... (304) 1,080 (1,384)
Investment losses (gains) on separate accounts ......................................... (265,636) (267,275) 1,639
Decrease (increase) in other assets (other than investing and fi nancing activities) ................................................................................... (195,284) 7,894 (203,178)
Increase (decrease) in other liabilities (other than investing and fi nancing activities) ................................................................................... 191,157 (65,488) 256,645
Others .......................................................................................................... (2,222) (7,693) 5,470
Subtotal ..................................................................................................... 160,366 73,952 86,413
Interest and dividends received ................................................................... 360,469 318,322 42,147
Interest paid ................................................................................................. (7,609) (7,659) 50
Income taxes paid........................................................................................ (53,374) (64,450) 11,076
Others .......................................................................................................... 224,842 104,565 120,276
Net cash provided by (used in) operating activities (a) ............................ 684,693 424,729 259,963
II Cash fl ows from investing activities Net decrease (increase) in deposits ............................................................. 74,758 179,543 (104,785)
Purchases of monetary receivables bought ................................................. (603,232) (410,080) (193,151)
Proceeds from sales and redemption of monetary receivables bought ...... 426,632 335,522 91,110
Purchase of money trusts ............................................................................ (2,100) (1,100) (1,000)
Proceeds from sales of money trusts .......................................................... 105 3,830 (3,724)
Purchases of securities ................................................................................ (3,358,594) (4,571,679) 1,213,085
Proceeds from sales and redemption of securities ..................................... 3,877,623 4,326,353 (448,730)
New loans .................................................................................................... (481,420) (160,740) (320,680)
Proceeds from collection of loans ............................................................... 166,464 173,722 (7,258)
Change in cash collateral under security borrowing and lending transactions .. 164,725 (34,985) 199,711
Others .......................................................................................................... (6,603) (2,156) (4,446)
Subtotal (b) ................................................................................................ 258,358 (161,771) 420,129
(a) + (b) ...................................................................................................... 943,052 262,958 680,093
Purchases of tangible fi xed assets .............................................................. (14,441) (14,678) 236
Proceeds from sales of tangible fi xed assets .............................................. 5,238 8,240 (3,002)
Payments for additional investments in subsidiaries ................................... — (5) 5
Net cash provided by (used in) investing activities .................................. 249,155 (168,214) 417,369
(Continued on following page)
88 Integrated Annual Report 2015
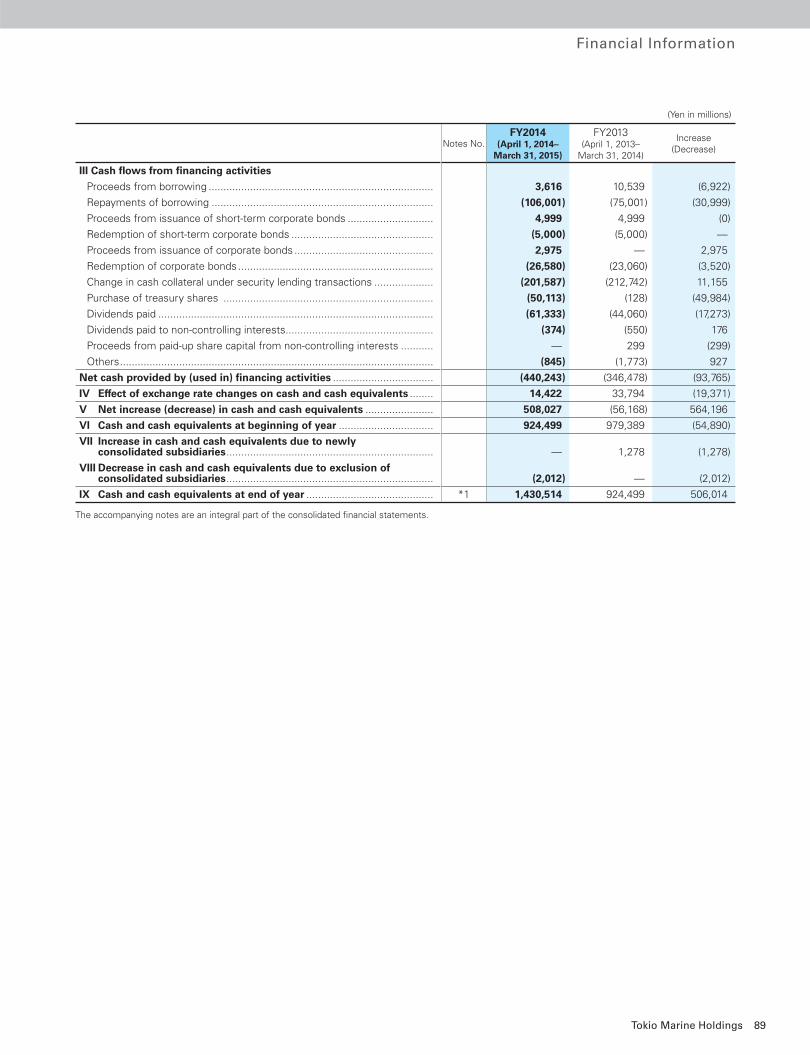
Financial Information
Notes No.FY2014
(April 1, 2014–March 31, 2015)
FY2013(April 1, 2013–
March 31, 2014)
Increase (Decrease)
III Cash fl ows from fi nancing activities
Proceeds from borrowing ............................................................................ 3,616 10,539 (6,922)
Repayments of borrowing ........................................................................... (106,001) (75,001) (30,999)
Proceeds from issuance of short-term corporate bonds ............................. 4,999 4,999 (0)
Redemption of short-term corporate bonds ................................................ (5,000) (5,000) —
Proceeds from issuance of corporate bonds ............................................... 2,975 — 2,975
Redemption of corporate bonds .................................................................. (26,580) (23,060) (3,520)
Change in cash collateral under security lending transactions .................... (201,587) (212,742) 11,155
Purchase of treasury shares ....................................................................... (50,113) (128) (49,984)
Dividends paid ............................................................................................. (61,333) (44,060) (17,273)
Dividends paid to non-controlling interests .................................................. (374) (550) 176
Proceeds from paid-up share capital from non-controlling interests ........... — 299 (299)
Others .......................................................................................................... (845) (1,773) 927
Net cash provided by (used in) fi nancing activities .................................. (440,243) (346,478) (93,765)
IV Effect of exchange rate changes on cash and cash equivalents ........ 14,422 33,794 (19,371)
V Net increase (decrease) in cash and cash equivalents ....................... 508,027 (56,168) 564,196
VI Cash and cash equivalents at beginning of year ................................ 924,499 979,389 (54,890)
VII Increase in cash and cash equivalents due to newly consolidated subsidiaries ...................................................................... — 1,278 (1,278)
VIII Decrease in cash and cash equivalents due to exclusion of consolidated subsidiaries ...................................................................... (2,012) — (2,012)
IX Cash and cash equivalents at end of year ........................................... *1 1,430,514 924,499 506,014
The accompanying notes are an integral part of the consolidated fi nancial statements.
(Yen in millions)
89Tokio Marine Holdings
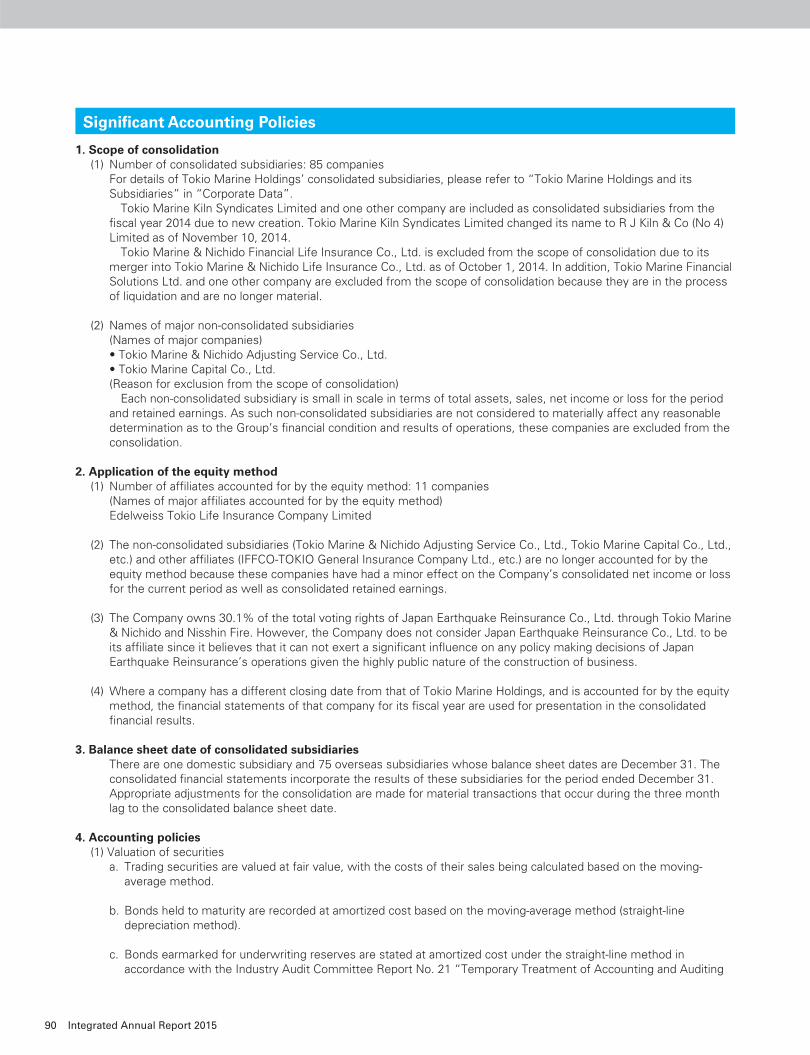
1. Scope of consolidation(1) Number of consolidated subsidiaries: 85 companies
For details of Tokio Marine Holdings’ consolidated subsidiaries, please refer to “Tokio Marine Holdings and its Subsidiaries” in “Corporate Data”. Tokio Marine Kiln Syndicates Limited and one other company are included as consolidated subsidiaries from the fi scal year 2014 due to new creation. Tokio Marine Kiln Syndicates Limited changed its name to R J Kiln & Co (No 4) Limited as of November 10, 2014. Tokio Marine & Nichido Financial Life Insurance Co., Ltd. is excluded from the scope of consolidation due to its merger into Tokio Marine & Nichido Life Insurance Co., Ltd. as of October 1, 2014. In addition, Tokio Marine Financial Solutions Ltd. and one other company are excluded from the scope of consolidation because they are in the process of liquidation and are no longer material.
(2) Names of major non-consolidated subsidiaries(Names of major companies)• Tokio Marine & Nichido Adjusting Service Co., Ltd.• Tokio Marine Capital Co., Ltd.(Reason for exclusion from the scope of consolidation) Each non-consolidated subsidiary is small in scale in terms of total assets, sales, net income or loss for the period and retained earnings. As such non-consolidated subsidiaries are not considered to materially affect any reasonable determination as to the Group’s fi nancial condition and results of operations, these companies are excluded from the consolidation.
2. Application of the equity method(1) Number of affi liates accounted for by the equity method: 11 companies
(Names of major affi liates accounted for by the equity method)Edelweiss Tokio Life Insurance Company Limited
(2) The non-consolidated subsidiaries (Tokio Marine & Nichido Adjusting Service Co., Ltd., Tokio Marine Capital Co., Ltd., etc.) and other affi liates (IFFCO-TOKIO General Insurance Company Ltd., etc.) are no longer accounted for by the equity method because these companies have had a minor effect on the Company’s consolidated net income or loss for the current period as well as consolidated retained earnings.
(3) The Company owns 30.1% of the total voting rights of Japan Earthquake Reinsurance Co., Ltd. through Tokio Marine & Nichido and Nisshin Fire. However, the Company does not consider Japan Earthquake Reinsurance Co., Ltd. to be its affi liate since it believes that it can not exert a signifi cant infl uence on any policy making decisions of Japan Earthquake Reinsurance’s operations given the highly public nature of the construction of business.
(4) Where a company has a different closing date from that of Tokio Marine Holdings, and is accounted for by the equity method, the fi nancial statements of that company for its fi scal year are used for presentation in the consolidated fi nancial results.
3. Balance sheet date of consolidated subsidiariesThere are one domestic subsidiary and 75 overseas subsidiaries whose balance sheet dates are December 31. The consolidated fi nancial statements incorporate the results of these subsidiaries for the period ended December 31. Appropriate adjustments for the consolidation are made for material transactions that occur during the three month lag to the consolidated balance sheet date.
4. Accounting policies(1) Valuation of securities
a. Trading securities are valued at fair value, with the costs of their sales being calculated based on the moving-average method.
b. Bonds held to maturity are recorded at amortized cost based on the moving-average method (straight-line depreciation method).
c. Bonds earmarked for underwriting reserves are stated at amortized cost under the straight-line method in accordance with the Industry Audit Committee Report No. 21 “Temporary Treatment of Accounting and Auditing
Signifi cant Accounting Policies
90 Integrated Annual Report 2015
Financial Information
Concerning Securities Earmarked for Underwriting Reserve in Insurance Industry” issued by the Japanese Institute of Certifi ed Public Accountants (the “JICPA”), November 16, 2000.
The following is a summary of the risk management policy concerning bonds earmarked for underwriting reserves. In order to adequately manage interest rate risk related to assets and liabilities, Tokio Marine & Nichido Life has
established the following underwriting reserve subgroups: “the dollar-denominated underwriting reserve for insurance policies during the period of deferment regarding individual annuity insurance denominated in U.S. dollars with a policy cancellation refund based on market interest rates”, “accumulated fund of underwriting reserve for insurance policies during the period of deferment regarding individual annuity insurance with fl oating interest rates”, “accumulated fund of underwriting reserve for insurance policies of single payment whole-life insurance with fl oating interest rates denominated in U.S. dollars”, “accumulated fund of underwriting reserve for insurance policies of single payment whole-life insurance with fl oating interest rates” and “accumulated fund of underwriting reserve for insurance policies of single payment individual annuity insurance”. Tokio Marine & Nichido Life’s policy is to match the duration of the underwriting reserve in each subgroup with bonds of the same or similar duration that are earmarked for underwriting reserves.
d. Available-for-sale securities with fair value are measured at fair value mainly based upon the market price on the closing date.
Unrealized gains/losses on available-for-sale securities are included in net assets and costs of sales are calculated using the moving-average method.
e. Available-for-sale securities whose fair value cannot be measured reliably are stated at original cost by the moving-average method.
f. Investments in non-consolidated subsidiaries and affi liates that are not subject to the equity method are stated at original cost by the moving-average method.
g. Securities held in individually managed money trusts that are mainly invested in securities for trading are accounted for under the fair value.
(2) Valuation of derivative transactionsDerivative fi nancial instruments are accounted for by the fair value.
(3) Depreciation methods for material depreciable assetsa. Tangible fi xed assets Tangible fi xed assets owned by the Company and its domestic consolidated subsidiaries are depreciated using the
declining balance method. Only buildings that were acquired on or after April 1, 1998 excluding fi xtures attached to buildings are depreciated using the straight-line method.
b. Intangible fi xed assets Intangible fi xed assets recognized in acquisitions of overseas subsidiaries are amortized over the estimated useful
life refl ecting the pattern of the assets’ future economic benefi ts.
(4) Accounting policies for signifi cant reserves and allowancesa. Allowance for doubtful accounts In order to provide reserves for losses from bad debts, a general allowance is made pursuant to the rules of asset
self-assessment and the rules of asset write-off. Allowances are made by domestic consolidated insurance subsidiaries as follows:
For receivables from any debtor who has legally, or in practice, become insolvent (due to bankruptcy, special liquidation or suspension of transactions with banks based on the rules governing clearing houses, etc.) and for receivables from any debtor who has substantially become insolvent, reserves are provided based on the amount of any such receivables less the amount expected to be collectible calculated based on the disposal of collateral or execution of guarantees.
For receivables from any debtor who is likely to become insolvent in the near future, reserves are provided based on the overall solvency assessment of the relevant debtor. The net amount of such receivables considered to be collectible through the disposal of collateral or execution of guarantees is deducted from such receivables.
For receivables other than those described above, the amount of receivables is multiplied by the default rate, which is computed based on historical loan loss experience in certain previous periods, and is included in the accompanying consolidated fi nancial statements.
In addition, all receivables are assessed by the asset accounting department and the asset management department in accordance with the rules for self-assessment of asset quality. Subsequently, the asset auditing
91Tokio Marine Holdings
departments, which are independent from other asset-related departments, conduct audits of the assessment results of the other asset-related departments. Reserves for bad debts are accounted for based on such assessment results as stated above.
b. Provision for retirement benefi ts for directors Some domestic consolidated subsidiaries set aside a provision for retirement benefi ts for their directors as of the
end of the fi scal year in accordance with the bylaw.
c. Provision for employees’ bonus To provide for payment of bonuses to employees, the Company and its consolidated domestic subsidiaries
maintain reserves for employees’ bonuses based on the expected amount to be paid.
d. Price fl uctuation reserve Domestic consolidated insurance subsidiaries maintain reserves under Article 115 of the Insurance Business Act in
order to provide for possible losses or damages arising from fl uctuation of share prices.
(5) Accounting methods for employees’ severance and retirement benefi tsa. The method of attributing expected retirement benefi ts to periods In calculating the retirement benefi t obligations, the method of attributing expected retirement benefi ts to periods
is mainly based on the benefi t formula basis.
b. The method of amortization of actuarial gains and losses and past service costs Actuarial difference for each fi scal year is amortized proportionally from the following fi scal year using the straight-
line method over a certain number of years (5 to 13 years) within the average remaining work period of employees at the time of occurrence.
Past service costs are amortized by the straight-line method over a certain number of years (7 to 13 years) within the average remaining work period of employees at the time of occurrence.
(Changes in Accounting Policies) Regarding Accounting Standard for Retirement Benefi ts (ASBJ (The Accounting Standards Board of Japan)
Statement No. 26, May 17, 2012; hereinafter the “Accounting Standard for Retirement Benefi ts”) and the Guidance on Accounting Standard for Retirement Benefi ts (ASBJ Guidance No. 25, May 17, 2012; hereinafter the “Guidance on Retirement Benefi ts”), the Company has been applying the provisions stated in Clause 35 of the Accounting Standard for Retirement Benefi ts and in Clause 67 of the Guidance on Retirement Benefi ts since the beginning of the fi scal year 2014 and reviewed its method of calculating retirement benefi t obligations and service costs. The Company has changed the attribution method for projected retirement benefi ts from the point basis to the benefi t formula basis. Also, the Company has changed the method for determining the discount rate from the use of the period approximate to the expected average remaining working lives of employees to the use of a single weighted average discount rate refl ecting the estimated timing and amount of benefi t payments.
The application of the Accounting Standard for Retirement Benefi ts and the Guidance on Retirement Benefi ts is subject to the transitional accounting treatment set forth in Clause 37 of the Accounting Standard for Retirement Benefi ts, and the effect of the change is included in retained earnings at the beginning of the fi scal year 2014.
As a result, net defi ned benefi t assets decreased by 153 million yen, net defi ned benefi t liabilities increased by 17,562 million yen and retained earnings decreased by 12,268 million yen at the beginning of the fi scal year 2014. Also, ordinary profi t and income before income taxes and non-controlling interests for the fi scal year 2014 increased by 1,250 million yen, respectively.
The effect of this change on per-share fi gures is described on the relevant section.
(6) Consumption taxesFor the Company and its domestic consolidated subsidiaries, consumption tax is accounted for by the tax-excluded method except for underwriting and general administrative costs incurred by domestic consolidated insurance subsidiaries which are accounted for by the tax-included method. In addition, any non-deductible consumption taxes, in respect of assets, are included in other assets and are amortized over fi ve years using the straight-line method.
(7) LeasesNon-transferable fi nance leases, commencing prior to April 1, 2008 are accounted for as operating lease transactions.
92 Integrated Annual Report 2015
Financial Information
(8) Hedge accountinga. Interest rate To mitigate interest rate fl uctuation risk associated with long-term insurance policies, Tokio Marine & Nichido and
Tokio Marine & Nichido Life conduct asset liability management to control such risk by evaluating and analyzing fi nancial assets and insurance liabilities simultaneously.
As for interest rate swap transactions that are used to manage such risk, Tokio Marine & Nichido and Tokio Marine & Nichido Life apply deferred hedge accounting to the swap transactions based upon the Industry Audit Committee Report No. 26, “Accounting and Auditing Treatments related to Application of Accounting for Financial Instruments in the Insurance Industry” (issued by the JICPA, September 3, 2002–hereinafter called “Report No. 26”).
Effectiveness is not evaluated for hedge treatments because it is believed to have high hedge effectiveness since the Company groups hedged insurance liabilities with the interest rate swaps that are the hedge instruments, based on the period remaining for the instruments.
Tokio Marine & Nichido accounts for any deferred gains on hedge transactions as of the end of March 2003 that were calculated based on the Industry Audit Committee’s Report No.16, “Accounting and Auditing Treatments related to Application of Accounting for Financial Instruments in the Insurance Industry” (issued by the JICPA, March 31, 2000), which was applicable prior to the application of Report No. 26, using the straight-line method over the remaining hedging period (1-17 years). The accounting treatment for such deferred gains is based on the transitional measures in Report No. 26. Deferred gains under this treatment as of March 31, 2015 were 11,203 million yen (14,856 million yen at the end of the fi scal year 2013) and the amount accounted for in the consolidated fi nancial statements for the fi scal year 2014 was 3,653 million yen (3,782 million yen at the end of the fi scal year 2013).
b. Foreign exchange In Tokio Marine & Nichido, fair value hedge accounting and assignment accounting are applied to certain currency
swaps and foreign exchange forward contracts utilized to reduce currency risk in assets denominated in foreign currency. Assessment of hedge effectiveness is omitted since the hedge is highly effective because the principal term of the hedging instruments and the hedged items are identical. Deferred hedge accounting is applied to borrowings denominated in foreign currency utilized to reduce currency risk in interest in overseas subsidiaries. Hedge effectiveness is determined based on the change in value of hedging instruments and hedged items during the period from the inception of the hedge to the time of assessment comparing these cumulative changes of market value.
(9) Methods of amortization of goodwill and amortization periodsRegarding goodwill recognized as an asset on the consolidated balance sheet, goodwill in connection with Philadelphia Consolidated Holdings Corp. is amortized over 20 years using the straight-line method. Goodwill in connection with Tokio Marine Kiln Group Limited is amortized over 10 years using the straight-line method. Goodwill in connection with Delphi Financial Group, Inc. is amortized over 5 years using the straight-line method. Other goodwill is amortized over 5 to 15 years using the straight-line method. Other goodwill in small amounts is amortized immediately. Negative goodwill incurred before March 31, 2010 and recognized as a liability on the consolidated balance sheet is amortized over 20 years using the straight-line method.
(10) Scope of cash and cash equivalents included in the consolidated statement of cash fl owsCash and cash equivalents for the consolidated statement of cash fl ows consist of cash on-hand, demand deposits and short-term investments with original maturities or redemption of 3 months or less at the date of acquisition.
(11) Accounting for deferred assets under Article 113 of the Insurance Business ActThe Company evaluated the amortization of deferred assets under Article 113 of the Insurance Business Act for E. design Insurance Co., Ltd.
“Accounting Standard for Business Combinations” (ASBJ Statement No. 21, September 13, 2013)“Accounting Standard for Consolidated Financial Statements” (ASBJ Statement No. 22, September 13, 2013)“Accounting Standard for Business Divestitures” (ASBJ Statement No. 7, September 13, 2013)“Accounting Standard for Earnings Per Share” (ASBJ Statement No. 2, September 13, 2013)“Guidance on Accounting Standard for Business Combinations and Accounting Standard for Business Divestitures” (ASBJ Guidance No.10, September 13, 2013)“Guidance on Accounting Standard for Earnings Per Share” (ASBJ Guidance No. 4, September 13, 2013)
Accounting Standards Issued but Not Yet Adopted
93Tokio Marine Holdings
1. Outline of changesThese accounting standards were revised with a primary focus on 1) accounting for changes in parent company ownership interests in subsidiaries due to events such as acquisition of additional shares when the parent company retains control; 2) accounting for acquisition-related expenses; 3) changes in the presentation of net income and the change in nomenclature from “minority interests” to “non-controlling interests”; and 4) provisional accounting treatment.
2. Date of applicationThe Company and its major domestic consolidated subsidiaries plan to adopt the accounting standards from beginning of the fi scal year 2015, and plan to apply the provisional accounting treatment for business combinations conducted on or after April 1, 2015.
3. EffectThe Company has not yet determined the impact of adopting the accounting standard on its consolidated fi nancial statements.
*1. Accumulated depreciation of tangible fi xed assets and deferred capital gains for tax purposes, deducted from acquisition costs are as follows:
(Yen in millions)
As of March 31, 2015 As of March 31, 2014
Accumulated depreciation ................................................................................. 351,466 348,554
Deferred capital gains for tax purposes ............................................................ 19,383 19,734
*2. Securities of non-consolidated subsidiaries and affi liates, etc. are as follows: (Yen in millions)
As of March 31, 2015 As of March 31, 2014
Securities (equity) .............................................................................................. 87,720 64,502
Securities (partnership) ...................................................................................... 14,189 39,768
*3. Amounts of loans to borrowers in bankruptcy are as follows: (Yen in millions)
As of March 31, 2015 As of March 31, 2014
Loans to borrowers in bankruptcy ..................................................................... 393 393
Loans past due .................................................................................................. 3,179 1,800
Loans past due for three months or more ......................................................... — 49
Restructured loans ............................................................................................ 8,751 6,446
Total ................................................................................................................... 12,324 8,690
Note: Loans are generally placed on non-accrual status when substantial doubt is considered to exist when loans are past due for a certain period or for other reasons (“Non-accrual status loans”; any part of bad debt written-off is excluded). Loans to borrowers in bankruptcy represent non-accrual loans after a partial charge-off of claims deemed uncollectible, which are defi ned in Article 96, paragraph 1, subparagraph 3 (a) to (e) (maximum amount transferable to reserve for bad debts) and subparagraph 4 of the Enforcement Ordinance of the Corporation Tax Law (Ordinance No. 97, 1965). Loans past due are non-accrual status loans, other than loans to borrowers in bankruptcy and loans on which interest payments are deferred in order to assist business restructuring or fi nancial recovery of the borrowers. Loans past due for three months or more are defi ned as loans on which any principal or interests payments are delayed for three months or more from the date following the due date. Loans classifi ed as loans to borrowers in bankruptcy and past due loans are excluded. Restructured loans are loans on which concessions (e.g. reduction of the stated interest rate, deferral of interest payment, extension of the maturity date, forgiveness of debt) are granted to borrowers in fi nancial diffi culties to assist them in their corporate restructuring or fi nancial recovery by improving their ability to repay creditors. Restructured loans do not include loans classifi ed as loans to borrowers in bankruptcy, past due loans or loans past due for three months or more.
Notes to Consolidated Balance Sheet
94 Integrated Annual Report 2015
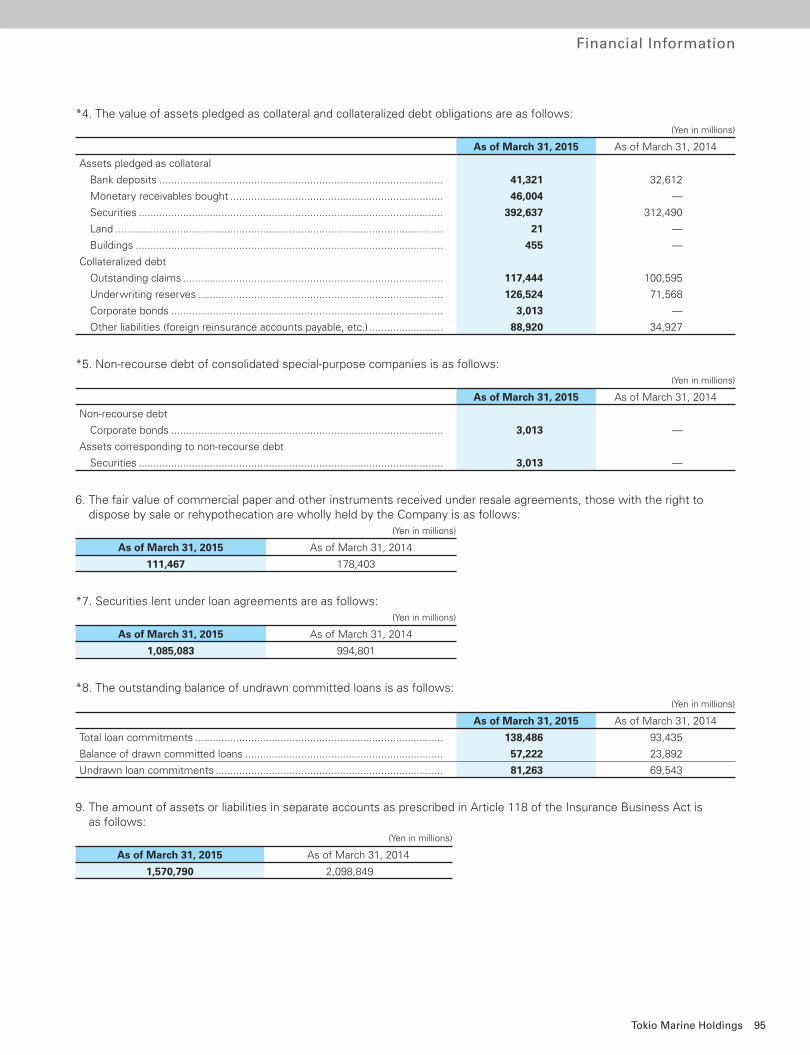
Financial Information
*4. The value of assets pledged as collateral and collateralized debt obligations are as follows: (Yen in millions)
As of March 31, 2015 As of March 31, 2014
Assets pledged as collateral
Bank deposits ................................................................................................ 41,321 32,612
Monetary receivables bought ........................................................................ 46,004 —
Securities ....................................................................................................... 392,637 312,490
Land ............................................................................................................... 21 —
Buildings ........................................................................................................ 455 —
Collateralized debt
Outstanding claims ........................................................................................ 117,444 100,595
Underwriting reserves ................................................................................... 126,524 71,568
Corporate bonds ............................................................................................ 3,013 —
Other liabilities (foreign reinsurance accounts payable, etc.) ......................... 88,920 34,927
*5. Non-recourse debt of consolidated special-purpose companies is as follows: (Yen in millions)
As of March 31, 2015 As of March 31, 2014
Non-recourse debt
Corporate bonds ............................................................................................ 3,013 —
Assets corresponding to non-recourse debt
Securities ....................................................................................................... 3,013 —
6. The fair value of commercial paper and other instruments received under resale agreements, those with the right to dispose by sale or rehypothecation are wholly held by the Company is as follows:
(Yen in millions)
As of March 31, 2015 As of March 31, 2014
111,467 178,403
*7. Securities lent under loan agreements are as follows: (Yen in millions)
As of March 31, 2015 As of March 31, 2014
1,085,083 994,801
*8. The outstanding balance of undrawn committed loans is as follows: (Yen in millions)
As of March 31, 2015 As of March 31, 2014
Total loan commitments .................................................................................... 138,486 93,435
Balance of drawn committed loans ................................................................... 57,222 23,892
Undrawn loan commitments ............................................................................. 81,263 69,543
9. The amount of assets or liabilities in separate accounts as prescribed in Article 118 of the Insurance Business Act is as follows:
(Yen in millions)
As of March 31, 2015 As of March 31, 2014
1,570,790 2,098,849
95Tokio Marine Holdings
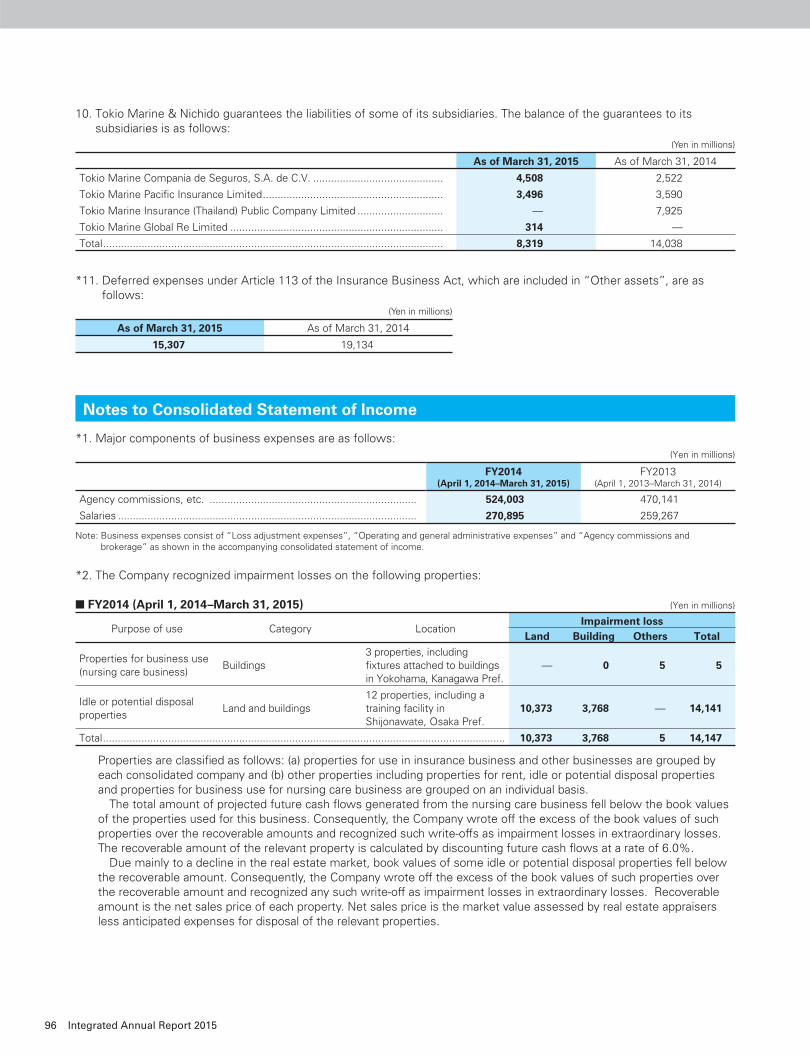
10. Tokio Marine & Nichido guarantees the liabilities of some of its subsidiaries. The balance of the guarantees to its subsidiaries is as follows:
(Yen in millions)
As of March 31, 2015 As of March 31, 2014
Tokio Marine Compania de Seguros, S.A. de C.V. ............................................ 4,508 2,522
Tokio Marine Pacifi c Insurance Limited ............................................................. 3,496 3,590
Tokio Marine Insurance (Thailand) Public Company Limited ............................. — 7,925
Tokio Marine Global Re Limited ........................................................................ 314 —
Total ................................................................................................................... 8,319 14,038
*11. Deferred expenses under Article 113 of the Insurance Business Act, which are included in “Other assets”, are as follows:
(Yen in millions)
As of March 31, 2015 As of March 31, 2014
15,307 19,134
*1. Major components of business expenses are as follows: (Yen in millions)
FY2014(April 1, 2014–March 31, 2015)
FY2013(April 1, 2013–March 31, 2014)
Agency commissions, etc. ...................................................................... 524,003 470,141
Salaries ..................................................................................................... 270,895 259,267
Note: Business expenses consist of “Loss adjustment expenses”, “Operating and general administrative expenses” and “Agency commissions and brokerage” as shown in the accompanying consolidated statement of income.
*2. The Company recognized impairment losses on the following properties:
■ FY2014 (April 1, 2014–March 31, 2015) (Yen in millions)
Purpose of use Category LocationImpairment loss
Land Building Others Total
Properties for business use(nursing care business)
Buildings3 properties, including fi xtures attached to buildings in Yokohama, Kanagawa Pref.
— 0 5 5
Idle or potential disposal properties
Land and buildings12 properties, including a training facility in Shijonawate, Osaka Pref.
10,373 3,768 — 14,141
Total ........................................................................................................................................ 10,373 3,768 5 14,147
Properties are classifi ed as follows: (a) properties for use in insurance business and other businesses are grouped by each consolidated company and (b) other properties including properties for rent, idle or potential disposal properties and properties for business use for nursing care business are grouped on an individual basis.
The total amount of projected future cash fl ows generated from the nursing care business fell below the book values of the properties used for this business. Consequently, the Company wrote off the excess of the book values of such properties over the recoverable amounts and recognized such write-offs as impairment losses in extraordinary losses. The recoverable amount of the relevant property is calculated by discounting future cash fl ows at a rate of 6.0%.
Due mainly to a decline in the real estate market, book values of some idle or potential disposal properties fell below the recoverable amount. Consequently, the Company wrote off the excess of the book values of such properties over the recoverable amount and recognized any such write-off as impairment losses in extraordinary losses. Recoverable amount is the net sales price of each property. Net sales price is the market value assessed by real estate appraisers less anticipated expenses for disposal of the relevant properties.
Notes to Consolidated Statement of Income
96 Integrated Annual Report 2015
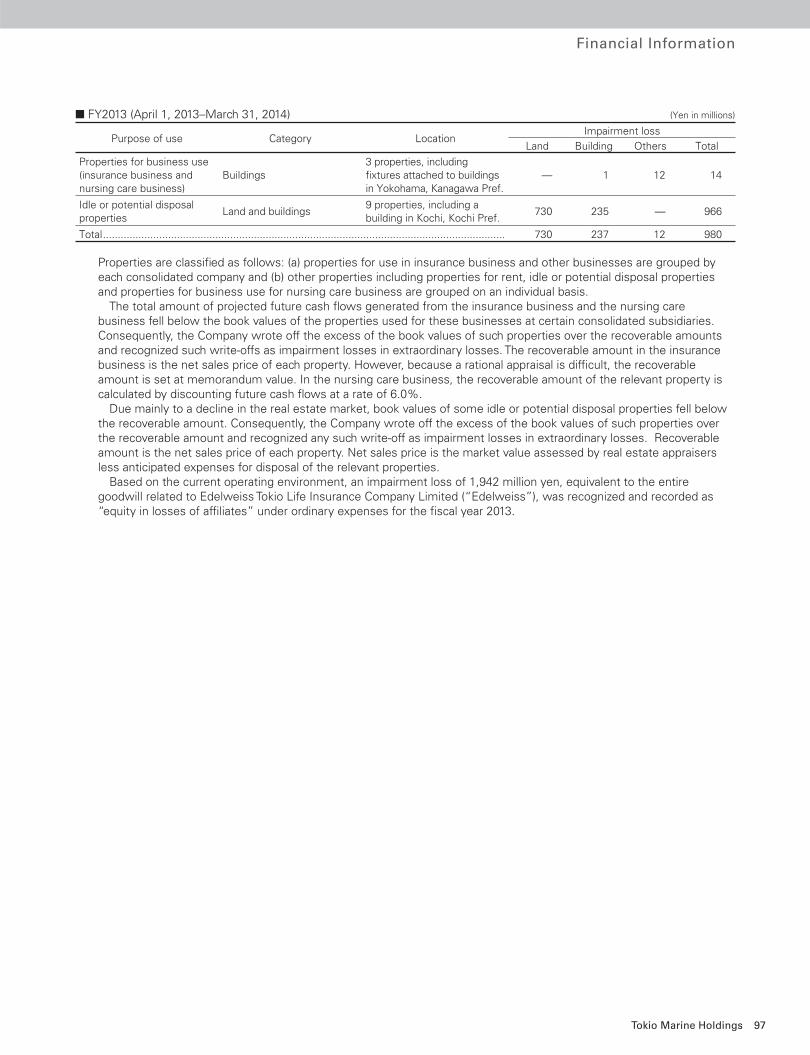
Financial Information
■ FY2013 (April 1, 2013–March 31, 2014) (Yen in millions)
Purpose of use Category LocationImpairment loss
Land Building Others Total
Properties for business use(insurance business and nursing care business)
Buildings3 properties, including fi xtures attached to buildings in Yokohama, Kanagawa Pref.
— 1 12 14
Idle or potential disposal properties
Land and buildings9 properties, including a building in Kochi, Kochi Pref.
730 235 — 966
Total ........................................................................................................................................ 730 237 12 980
Properties are classifi ed as follows: (a) properties for use in insurance business and other businesses are grouped by each consolidated company and (b) other properties including properties for rent, idle or potential disposal properties and properties for business use for nursing care business are grouped on an individual basis.
The total amount of projected future cash fl ows generated from the insurance business and the nursing care business fell below the book values of the properties used for these businesses at certain consolidated subsidiaries. Consequently, the Company wrote off the excess of the book values of such properties over the recoverable amounts and recognized such write-offs as impairment losses in extraordinary losses. The recoverable amount in the insurance business is the net sales price of each property. However, because a rational appraisal is diffi cult, the recoverable amount is set at memorandum value. In the nursing care business, the recoverable amount of the relevant property is calculated by discounting future cash fl ows at a rate of 6.0%.
Due mainly to a decline in the real estate market, book values of some idle or potential disposal properties fell below the recoverable amount. Consequently, the Company wrote off the excess of the book values of such properties over the recoverable amount and recognized any such write-off as impairment losses in extraordinary losses. Recoverable amount is the net sales price of each property. Net sales price is the market value assessed by real estate appraisers less anticipated expenses for disposal of the relevant properties.
Based on the current operating environment, an impairment loss of 1,942 million yen, equivalent to the entire goodwill related to Edelweiss Tokio Life Insurance Company Limited (“Edelweiss”), was recognized and recorded as “equity in losses of affi liates” under ordinary expenses for the fi scal year 2013.
97Tokio Marine Holdings
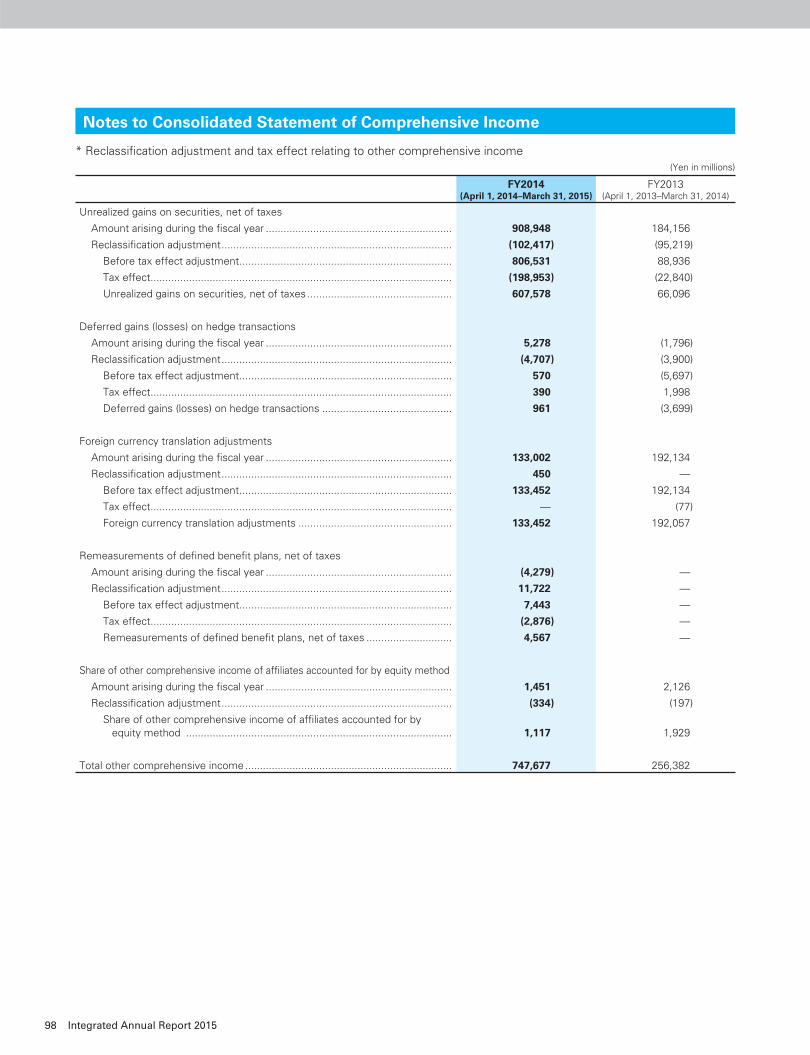
* Reclassifi cation adjustment and tax effect relating to other comprehensive income (Yen in millions)
FY2014(April 1, 2014–March 31, 2015)
FY2013(April 1, 2013–March 31, 2014)
Unrealized gains on securities, net of taxes
Amount arising during the fi scal year ............................................................... 908,948 184,156
Reclassifi cation adjustment .............................................................................. (102,417) (95,219)
Before tax effect adjustment ........................................................................ 806,531 88,936
Tax effect ...................................................................................................... (198,953) (22,840)
Unrealized gains on securities, net of taxes ................................................. 607,578 66,096
Deferred gains (losses) on hedge transactions
Amount arising during the fi scal year ............................................................... 5,278 (1,796)
Reclassifi cation adjustment .............................................................................. (4,707) (3,900)
Before tax effect adjustment ........................................................................ 570 (5,697)
Tax effect ...................................................................................................... 390 1,998
Deferred gains (losses) on hedge transactions ............................................ 961 (3,699)
Foreign currency translation adjustments
Amount arising during the fi scal year ............................................................... 133,002 192,134
Reclassifi cation adjustment .............................................................................. 450 —
Before tax effect adjustment ........................................................................ 133,452 192,134
Tax effect ...................................................................................................... — (77)
Foreign currency translation adjustments .................................................... 133,452 192,057
Remeasurements of defi ned benefi t plans, net of taxes
Amount arising during the fi scal year ............................................................... (4,279) —
Reclassifi cation adjustment .............................................................................. 11,722 —
Before tax effect adjustment ........................................................................ 7,443 —
Tax effect ...................................................................................................... (2,876) —
Remeasurements of defi ned benefi t plans, net of taxes ............................. 4,567 —
Share of other comprehensive income of affi liates accounted for by equity method
Amount arising during the fi scal year ............................................................... 1,451 2,126
Reclassifi cation adjustment .............................................................................. (334) (197)
Share of other comprehensive income of affi liates accounted for by equity method .......................................................................................... 1,117 1,929
Total other comprehensive income ...................................................................... 747,677 256,382
Notes to Consolidated Statement of Comprehensive Income
98 Integrated Annual Report 2015
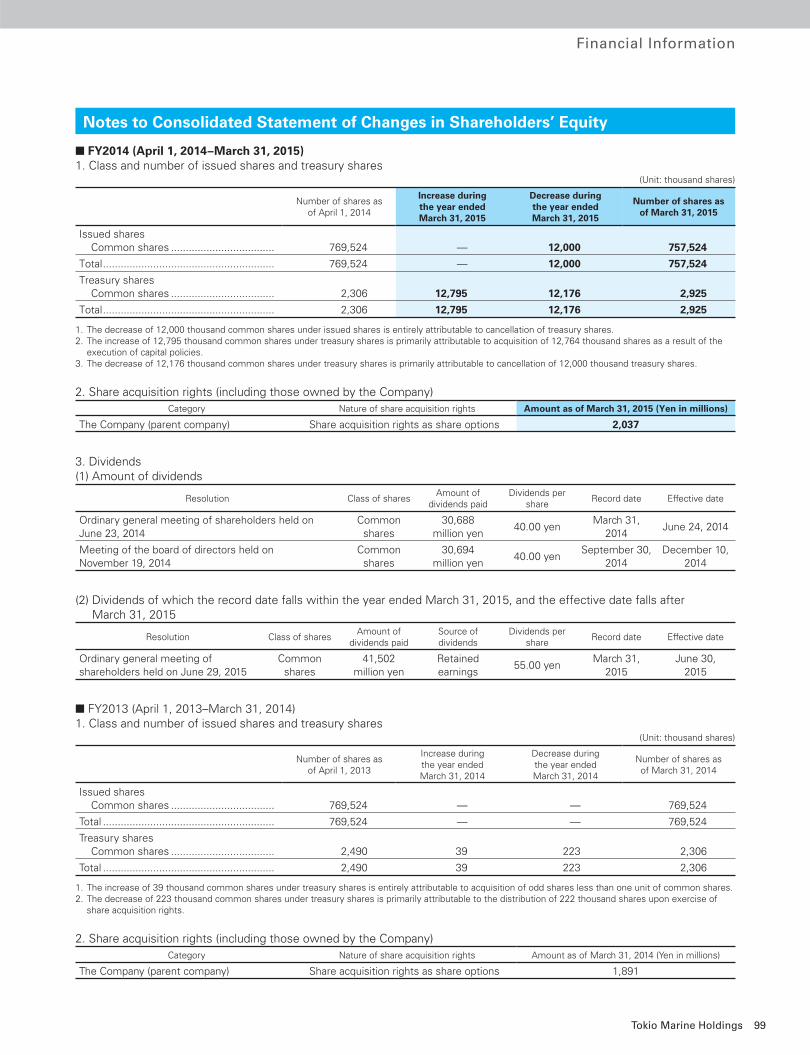
Financial Information
■ FY2014 (April 1, 2014–March 31, 2015)1. Class and number of issued shares and treasury shares (Unit: thousand shares)
Number of shares asof April 1, 2014
Increase duringthe year endedMarch 31, 2015
Decrease duringthe year endedMarch 31, 2015
Number of shares asof March 31, 2015
Issued shares Common shares ................................... 769,524 — 12,000 757,524
Total .......................................................... 769,524 — 12,000 757,524
Treasury shares Common shares ................................... 2,306 12,795 12,176 2,925
Total .......................................................... 2,306 12,795 12,176 2,925
1. The decrease of 12,000 thousand common shares under issued shares is entirely attributable to cancellation of treasury shares.2. The increase of 12,795 thousand common shares under treasury shares is primarily attributable to acquisition of 12,764 thousand shares as a result of the
execution of capital policies.3. The decrease of 12,176 thousand common shares under treasury shares is primarily attributable to cancellation of 12,000 thousand treasury shares.
2. Share acquisition rights (including those owned by the Company)Category Nature of share acquisition rights Amount as of March 31, 2015 (Yen in millions)
The Company (parent company) Share acquisition rights as share options 2,037
3. Dividends(1) Amount of dividends
Resolution Class of sharesAmount of
dividends paidDividends per
shareRecord date Effective date
Ordinary general meeting of shareholders held on June 23, 2014
Common shares
30,688 million yen
40.00 yenMarch 31,
2014June 24, 2014
Meeting of the board of directors held on November 19, 2014
Common shares
30,694million yen
40.00 yenSeptember 30,
2014December 10,
2014
(2) Dividends of which the record date falls within the year ended March 31, 2015, and the effective date falls after March 31, 2015
Resolution Class of sharesAmount of
dividends paidSource of dividends
Dividends per share
Record date Effective date
Ordinary general meeting of shareholders held on June 29, 2015
Common shares
41,502million yen
Retainedearnings
55.00 yenMarch 31,
2015June 30,
2015
■ FY2013 (April 1, 2013–March 31, 2014)1. Class and number of issued shares and treasury shares (Unit: thousand shares)
Number of shares as of April 1, 2013
Increase during the year ended March 31, 2014
Decrease during the year ended March 31, 2014
Number of shares as of March 31, 2014
Issued shares Common shares ................................... 769,524 — — 769,524
Total .......................................................... 769,524 — — 769,524
Treasury shares Common shares ................................... 2,490 39 223 2,306
Total .......................................................... 2,490 39 223 2,306
1. The increase of 39 thousand common shares under treasury shares is entirely attributable to acquisition of odd shares less than one unit of common shares.2. The decrease of 223 thousand common shares under treasury shares is primarily attributable to the distribution of 222 thousand shares upon exercise of
share acquisition rights.
2. Share acquisition rights (including those owned by the Company)Category Nature of share acquisition rights Amount as of March 31, 2014 (Yen in millions)
The Company (parent company) Share acquisition rights as share options 1,891
Notes to Consolidated Statement of Changes in Shareholders’ Equity
99Tokio Marine Holdings
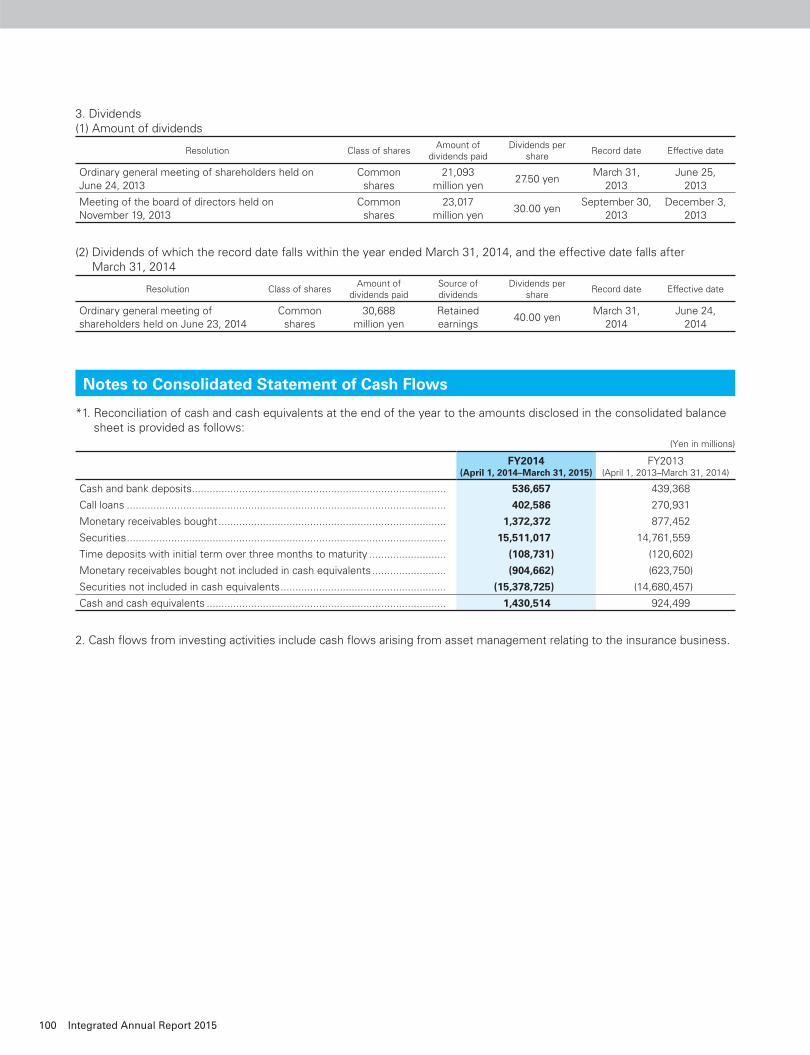
3. Dividends(1) Amount of dividends
Resolution Class of sharesAmount of
dividends paidDividends per
shareRecord date Effective date
Ordinary general meeting of shareholders held on June 24, 2013
Common shares
21,093million yen
27.50 yenMarch 31,
2013June 25,
2013
Meeting of the board of directors held on November 19, 2013
Common shares
23,017million yen
30.00 yenSeptember 30,
2013December 3,
2013
(2) Dividends of which the record date falls within the year ended March 31, 2014, and the effective date falls after March 31, 2014
Resolution Class of sharesAmount of
dividends paidSource of dividends
Dividends per share
Record date Effective date
Ordinary general meeting of shareholders held on June 23, 2014
Common shares
30,688million yen
Retainedearnings
40.00 yenMarch 31,
2014June 24,
2014
*1. Reconciliation of cash and cash equivalents at the end of the year to the amounts disclosed in the consolidated balance sheet is provided as follows:
(Yen in millions)
FY2014(April 1, 2014–March 31, 2015)
FY2013(April 1, 2013–March 31, 2014)
Cash and bank deposits ...................................................................................... 536,657 439,368
Call loans ............................................................................................................ 402,586 270,931
Monetary receivables bought ............................................................................. 1,372,372 877,452
Securities ............................................................................................................ 15,511,017 14,761,559
Time deposits with initial term over three months to maturity .......................... (108,731) (120,602)
Monetary receivables bought not included in cash equivalents ......................... (904,662) (623,750)
Securities not included in cash equivalents ........................................................ (15,378,725) (14,680,457)
Cash and cash equivalents ................................................................................. 1,430,514 924,499
2. Cash fl ows from investing activities include cash fl ows arising from asset management relating to the insurance business.
Notes to Consolidated Statement of Cash Flows
100 Integrated Annual Report 2015
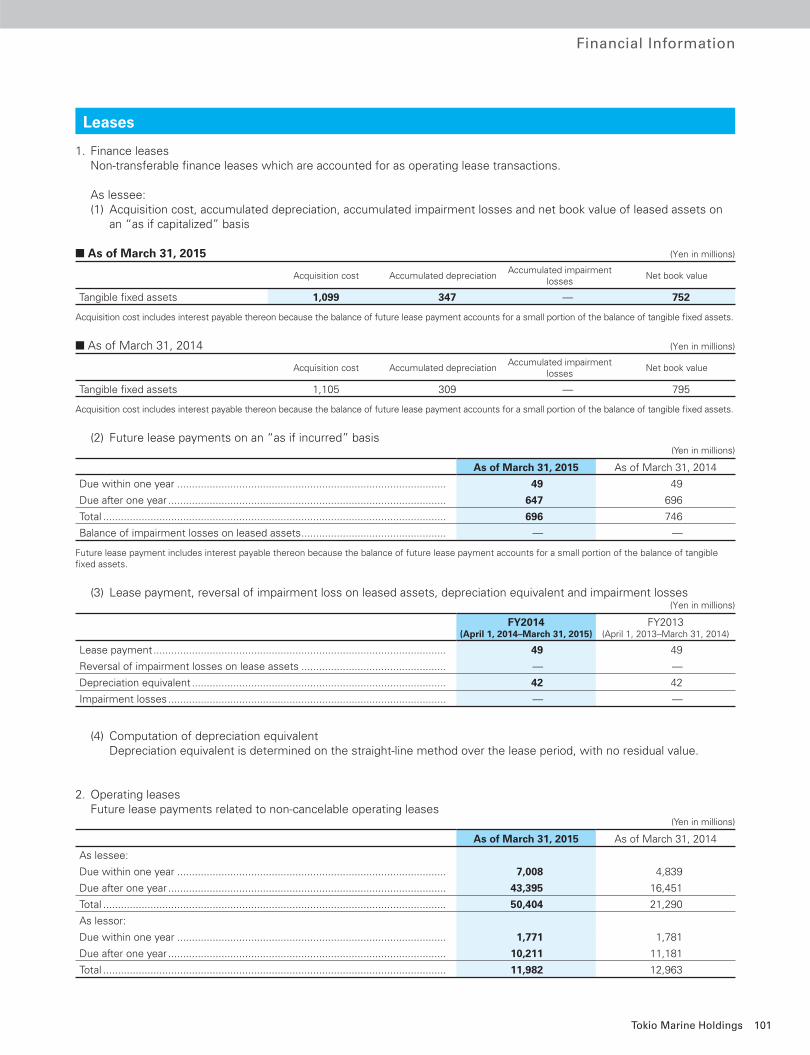
Financial Information
1. Finance leases Non-transferable fi nance leases which are accounted for as operating lease transactions.
As lessee:(1) Acquisition cost, accumulated depreciation, accumulated impairment losses and net book value of leased assets on
an “as if capitalized” basis
■ As of March 31, 2015 (Yen in millions)
Acquisition cost Accumulated depreciationAccumulated impairment
lossesNet book value
Tangible fi xed assets 1,099 347 — 752
Acquisition cost includes interest payable thereon because the balance of future lease payment accounts for a small portion of the balance of tangible fi xed assets.
■ As of March 31, 2014 (Yen in millions)
Acquisition cost Accumulated depreciationAccumulated impairment
lossesNet book value
Tangible fi xed assets 1,105 309 — 795
Acquisition cost includes interest payable thereon because the balance of future lease payment accounts for a small portion of the balance of tangible fi xed assets.
(2) Future lease payments on an “as if incurred” basis (Yen in millions)
As of March 31, 2015 As of March 31, 2014
Due within one year ........................................................................................... 49 49
Due after one year .............................................................................................. 647 696
Total .................................................................................................................... 696 746
Balance of impairment losses on leased assets ................................................. — —
Future lease payment includes interest payable thereon because the balance of future lease payment accounts for a small portion of the balance of tangible fi xed assets.
(3) Lease payment, reversal of impairment loss on leased assets, depreciation equivalent and impairment losses (Yen in millions)
FY2014(April 1, 2014–March 31, 2015)
FY2013(April 1, 2013–March 31, 2014)
Lease payment ................................................................................................... 49 49
Reversal of impairment losses on lease assets ................................................. — —
Depreciation equivalent ...................................................................................... 42 42
Impairment losses .............................................................................................. — —
(4) Computation of depreciation equivalent Depreciation equivalent is determined on the straight-line method over the lease period, with no residual value.
2. Operating leases Future lease payments related to non-cancelable operating leases
(Yen in millions)
As of March 31, 2015 As of March 31, 2014
As lessee:
Due within one year ........................................................................................... 7,008 4,839
Due after one year .............................................................................................. 43,395 16,451
Total .................................................................................................................... 50,404 21,290
As lessor:
Due within one year ........................................................................................... 1,771 1,781
Due after one year .............................................................................................. 10,211 11,181
Total .................................................................................................................... 11,982 12,963
Leases
101Tokio Marine Holdings
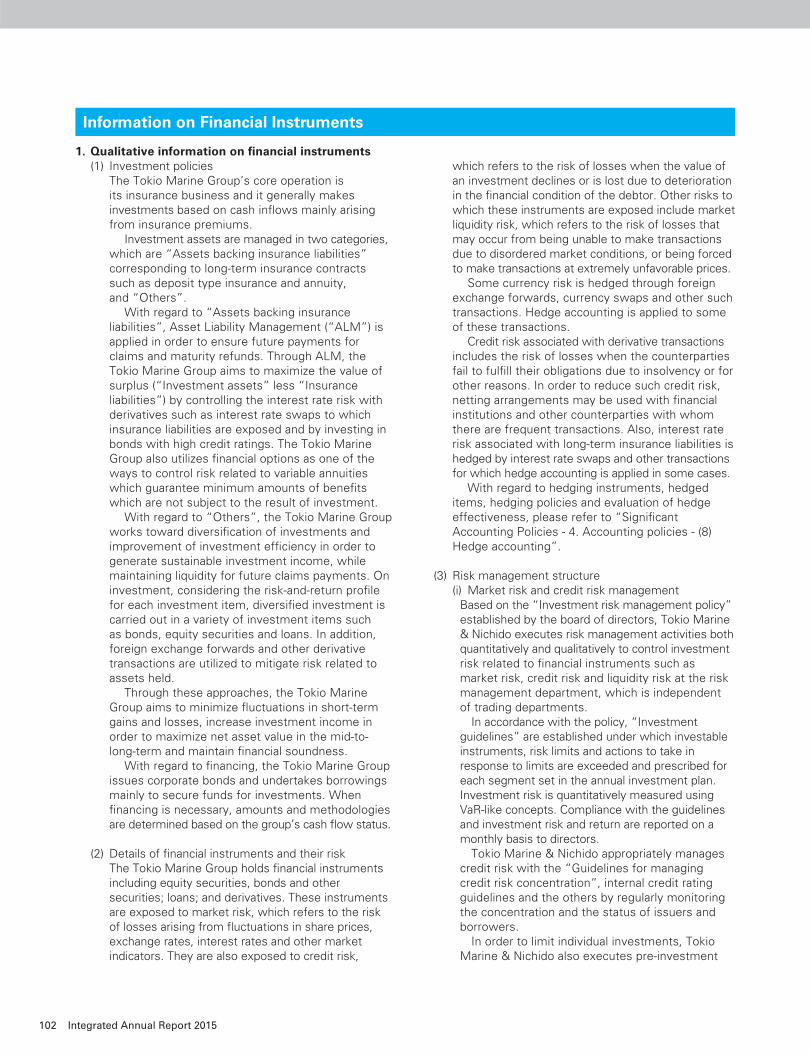
1. Qualitative information on fi nancial instruments(1) Investment policies
The Tokio Marine Group’s core operation is its insurance business and it generally makes investments based on cash infl ows mainly arising from insurance premiums. Investment assets are managed in two categories, which are “Assets backing insurance liabilities” corresponding to long-term insurance contracts such as deposit type insurance and annuity, and “Others”. With regard to “Assets backing insurance liabilities”, Asset Liability Management (“ALM”) is applied in order to ensure future payments for claims and maturity refunds. Through ALM, the Tokio Marine Group aims to maximize the value of surplus (“Investment assets” less “Insurance liabilities”) by controlling the interest rate risk with derivatives such as interest rate swaps to which insurance liabilities are exposed and by investing in bonds with high credit ratings. The Tokio Marine Group also utilizes fi nancial options as one of the ways to control risk related to variable annuities which guarantee minimum amounts of benefi ts which are not subject to the result of investment. With regard to “Others”, the Tokio Marine Group works toward diversifi cation of investments and improvement of investment effi ciency in order to generate sustainable investment income, while maintaining liquidity for future claims payments. On investment, considering the risk-and-return profi le for each investment item, diversifi ed investment is carried out in a variety of investment items such as bonds, equity securities and loans. In addition, foreign exchange forwards and other derivative transactions are utilized to mitigate risk related to assets held. Through these approaches, the Tokio Marine Group aims to minimize fl uctuations in short-term gains and losses, increase investment income in order to maximize net asset value in the mid-to-long-term and maintain fi nancial soundness. With regard to fi nancing, the Tokio Marine Group issues corporate bonds and undertakes borrowings mainly to secure funds for investments. When fi nancing is necessary, amounts and methodologies are determined based on the group’s cash fl ow status.
(2) Details of fi nancial instruments and their risk The Tokio Marine Group holds fi nancial instruments including equity securities, bonds and other securities; loans; and derivatives. These instruments are exposed to market risk, which refers to the risk of losses arising from fl uctuations in share prices, exchange rates, interest rates and other market indicators. They are also exposed to credit risk,
which refers to the risk of losses when the value of an investment declines or is lost due to deterioration in the fi nancial condition of the debtor. Other risks to which these instruments are exposed include market liquidity risk, which refers to the risk of losses that may occur from being unable to make transactions due to disordered market conditions, or being forced to make transactions at extremely unfavorable prices. Some currency risk is hedged through foreign exchange forwards, currency swaps and other such transactions. Hedge accounting is applied to some of these transactions. Credit risk associated with derivative transactions includes the risk of losses when the counterparties fail to fulfi ll their obligations due to insolvency or for other reasons. In order to reduce such credit risk, netting arrangements may be used with fi nancial institutions and other counterparties with whom there are frequent transactions. Also, interest rate risk associated with long-term insurance liabilities is hedged by interest rate swaps and other transactions for which hedge accounting is applied in some cases. With regard to hedging instruments, hedged items, hedging policies and evaluation of hedge effectiveness, please refer to “Signifi cant Accounting Policies - 4. Accounting policies - (8) Hedge accounting”.
(3) Risk management structure(i) Market risk and credit risk management
Based on the “Investment risk management policy” established by the board of directors, Tokio Marine & Nichido executes risk management activities both quantitatively and qualitatively to control investment risk related to fi nancial instruments such as market risk, credit risk and liquidity risk at the risk management department, which is independent of trading departments. In accordance with the policy, “Investment guidelines” are established under which investable instruments, risk limits and actions to take in response to limits are exceeded and prescribed for each segment set in the annual investment plan. Investment risk is quantitatively measured using VaR-like concepts. Compliance with the guidelines and investment risk and return are reported on a monthly basis to directors. Tokio Marine & Nichido appropriately manages credit risk with the “Guidelines for managing credit risk concentration”, internal credit rating guidelines and the others by regularly monitoring the concentration and the status of issuers and borrowers. In order to limit individual investments, Tokio Marine & Nichido also executes pre-investment
Information on Financial Instruments
102 Integrated Annual Report 2015
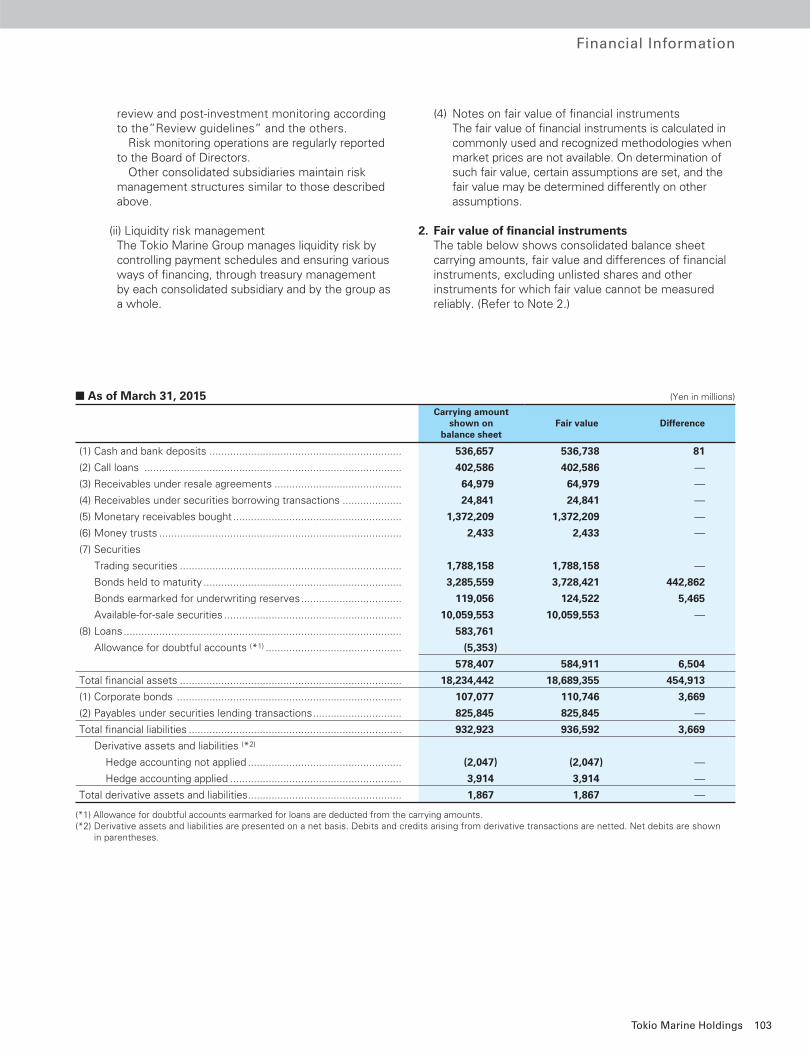
Financial Information
■ As of March 31, 2015 (Yen in millions)
Carrying amount shown on
balance sheetFair value Difference
(1) Cash and bank deposits ................................................................. 536,657 536,738 81
(2) Call loans ....................................................................................... 402,586 402,586 —
(3) Receivables under resale agreements ........................................... 64,979 64,979 —
(4) Receivables under securities borrowing transactions .................... 24,841 24,841 —
(5) Monetary receivables bought ......................................................... 1,372,209 1,372,209 —
(6) Money trusts .................................................................................. 2,433 2,433 —
(7) Securities
Trading securities ........................................................................... 1,788,158 1,788,158 —
Bonds held to maturity ................................................................... 3,285,559 3,728,421 442,862
Bonds earmarked for underwriting reserves .................................. 119,056 124,522 5,465
Available-for-sale securities ............................................................ 10,059,553 10,059,553 —
(8) Loans .............................................................................................. 583,761
Allowance for doubtful accounts (*1) .............................................. (5,353)
578,407 584,911 6,504
Total fi nancial assets ........................................................................... 18,234,442 18,689,355 454,913
(1) Corporate bonds ............................................................................ 107,077 110,746 3,669
(2) Payables under securities lending transactions .............................. 825,845 825,845 —
Total fi nancial liabilities ........................................................................ 932,923 936,592 3,669
Derivative assets and liabilities (*2)
Hedge accounting not applied .................................................... (2,047) (2,047) —
Hedge accounting applied .......................................................... 3,914 3,914 —
Total derivative assets and liabilities .................................................... 1,867 1,867 —
(*1) Allowance for doubtful accounts earmarked for loans are deducted from the carrying amounts.(*2) Derivative assets and liabilities are presented on a net basis. Debits and credits arising from derivative transactions are netted. Net debits are shown
in parentheses.
review and post-investment monitoring according to the”Review guidelines” and the others. Risk monitoring operations are regularly reported to the Board of Directors. Other consolidated subsidiaries maintain risk management structures similar to those described above.
(ii) Liquidity risk managementThe Tokio Marine Group manages liquidity risk by controlling payment schedules and ensuring various ways of fi nancing, through treasury management by each consolidated subsidiary and by the group as a whole.
(4) Notes on fair value of fi nancial instrumentsThe fair value of fi nancial instruments is calculated in commonly used and recognized methodologies when market prices are not available. On determination of such fair value, certain assumptions are set, and the fair value may be determined differently on other assumptions.
2. Fair value of fi nancial instrumentsThe table below shows consolidated balance sheet carrying amounts, fair value and differences of fi nancial instruments, excluding unlisted shares and other instruments for which fair value cannot be measured reliably. (Refer to Note 2.)
103Tokio Marine Holdings
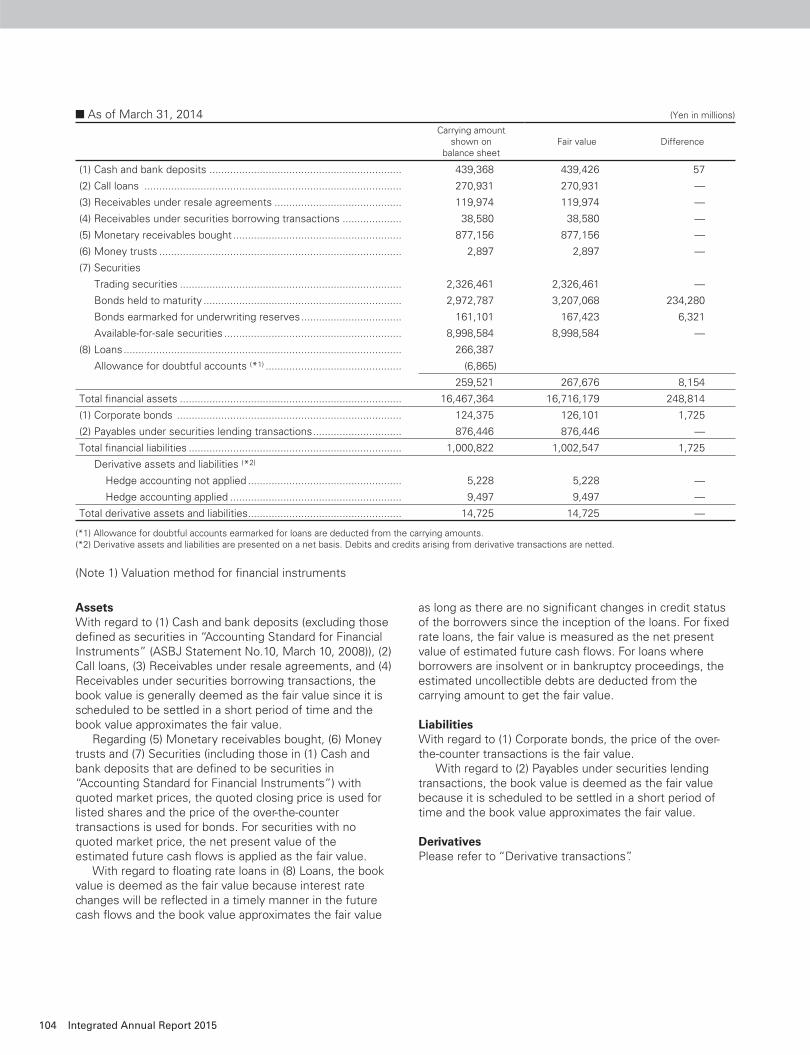
■ As of March 31, 2014 (Yen in millions)
Carrying amountshown on
balance sheetFair value Difference
(1) Cash and bank deposits ................................................................. 439,368 439,426 57
(2) Call loans ....................................................................................... 270,931 270,931 —
(3) Receivables under resale agreements ........................................... 119,974 119,974 —
(4) Receivables under securities borrowing transactions .................... 38,580 38,580 —
(5) Monetary receivables bought ......................................................... 877,156 877,156 —
(6) Money trusts .................................................................................. 2,897 2,897 —
(7) Securities
Trading securities ........................................................................... 2,326,461 2,326,461 —
Bonds held to maturity ................................................................... 2,972,787 3,207,068 234,280
Bonds earmarked for underwriting reserves .................................. 161,101 167,423 6,321
Available-for-sale securities ............................................................ 8,998,584 8,998,584 —
(8) Loans .............................................................................................. 266,387
Allowance for doubtful accounts (*1) .............................................. (6,865)
259,521 267,676 8,154
Total fi nancial assets ........................................................................... 16,467,364 16,716,179 248,814
(1) Corporate bonds ............................................................................ 124,375 126,101 1,725
(2) Payables under securities lending transactions .............................. 876,446 876,446 —
Total fi nancial liabilities ........................................................................ 1,000,822 1,002,547 1,725
Derivative assets and liabilities (*2)
Hedge accounting not applied .................................................... 5,228 5,228 —
Hedge accounting applied .......................................................... 9,497 9,497 —
Total derivative assets and liabilities .................................................... 14,725 14,725 —
(*1) Allowance for doubtful accounts earmarked for loans are deducted from the carrying amounts.(*2) Derivative assets and liabilities are presented on a net basis. Debits and credits arising from derivative transactions are netted.
(Note 1) Valuation method for fi nancial instruments
AssetsWith regard to (1) Cash and bank deposits (excluding those defi ned as securities in “Accounting Standard for Financial Instruments” (ASBJ Statement No.10, March 10, 2008)), (2) Call loans, (3) Receivables under resale agreements, and (4) Receivables under securities borrowing transactions, the book value is generally deemed as the fair value since it is scheduled to be settled in a short period of time and the book value approximates the fair value. Regarding (5) Monetary receivables bought, (6) Money trusts and (7) Securities (including those in (1) Cash and bank deposits that are defi ned to be securities in “Accounting Standard for Financial Instruments”) with quoted market prices, the quoted closing price is used for listed shares and the price of the over-the-counter transactions is used for bonds. For securities with no quoted market price, the net present value of the estimated future cash fl ows is applied as the fair value. With regard to fl oating rate loans in (8) Loans, the book value is deemed as the fair value because interest rate changes will be refl ected in a timely manner in the future cash fl ows and the book value approximates the fair value
as long as there are no signifi cant changes in credit status of the borrowers since the inception of the loans. For fi xed rate loans, the fair value is measured as the net present value of estimated future cash fl ows. For loans where borrowers are insolvent or in bankruptcy proceedings, the estimated uncollectible debts are deducted from the carrying amount to get the fair value.
LiabilitiesWith regard to (1) Corporate bonds, the price of the over-the-counter transactions is the fair value. With regard to (2) Payables under securities lending transactions, the book value is deemed as the fair value because it is scheduled to be settled in a short period of time and the book value approximates the fair value.
DerivativesPlease refer to “Derivative transactions”.
104 Integrated Annual Report 2015
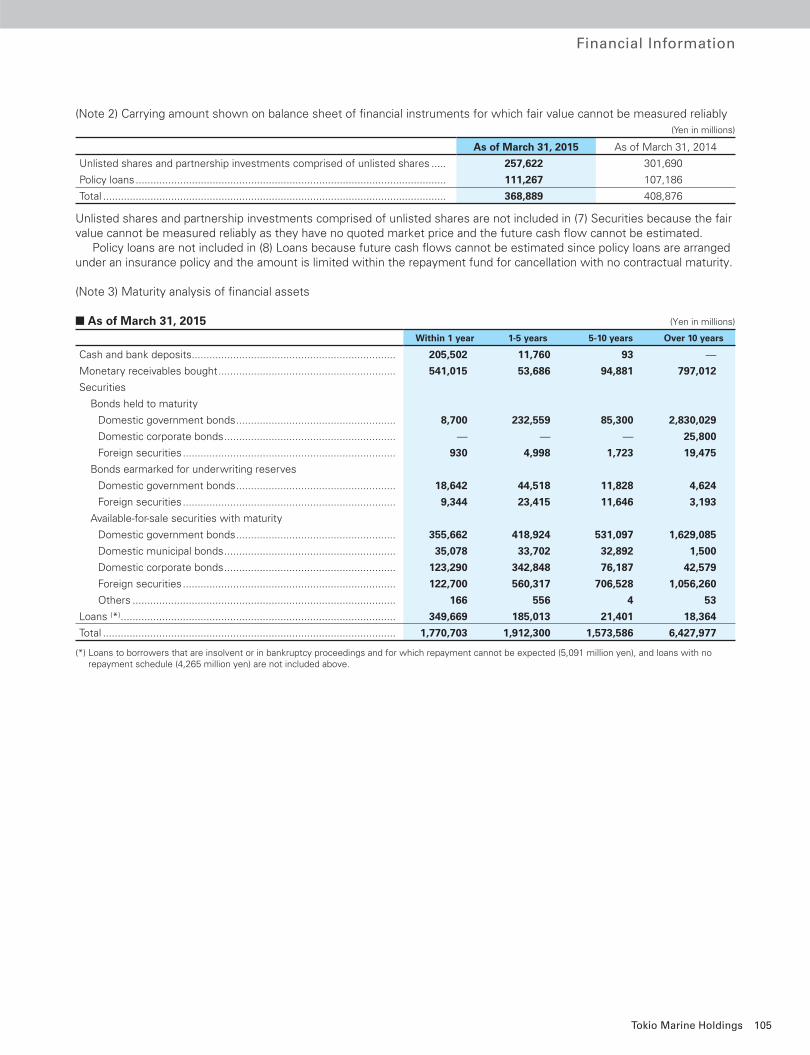
Financial Information
(Note 2) Carrying amount shown on balance sheet of fi nancial instruments for which fair value cannot be measured reliably (Yen in millions)
As of March 31, 2015 As of March 31, 2014
Unlisted shares and partnership investments comprised of unlisted shares ..... 257,622 301,690
Policy loans ......................................................................................................... 111,267 107,186
Total .................................................................................................................... 368,889 408,876
Unlisted shares and partnership investments comprised of unlisted shares are not included in (7) Securities because the fair value cannot be measured reliably as they have no quoted market price and the future cash fl ow cannot be estimated. Policy loans are not included in (8) Loans because future cash fl ows cannot be estimated since policy loans are arranged under an insurance policy and the amount is limited within the repayment fund for cancellation with no contractual maturity.
(Note 3) Maturity analysis of fi nancial assets
■ As of March 31, 2015 (Yen in millions)
Within 1 year 1-5 years 5-10 years Over 10 years
Cash and bank deposits ..................................................................... 205,502 11,760 93 —
Monetary receivables bought ............................................................ 541,015 53,686 94,881 797,012
Securities
Bonds held to maturity
Domestic government bonds ...................................................... 8,700 232,559 85,300 2,830,029
Domestic corporate bonds .......................................................... — — — 25,800
Foreign securities ........................................................................ 930 4,998 1,723 19,475
Bonds earmarked for underwriting reserves
Domestic government bonds ...................................................... 18,642 44,518 11,828 4,624
Foreign securities ........................................................................ 9,344 23,415 11,646 3,193
Available-for-sale securities with maturity
Domestic government bonds ...................................................... 355,662 418,924 531,097 1,629,085
Domestic municipal bonds .......................................................... 35,078 33,702 32,892 1,500
Domestic corporate bonds .......................................................... 123,290 342,848 76,187 42,579
Foreign securities ........................................................................ 122,700 560,317 706,528 1,056,260
Others ......................................................................................... 166 556 4 53
Loans (*) ............................................................................................. 349,669 185,013 21,401 18,364
Total ................................................................................................... 1,770,703 1,912,300 1,573,586 6,427,977
(*) Loans to borrowers that are insolvent or in bankruptcy proceedings and for which repayment cannot be expected (5,091 million yen), and loans with no repayment schedule (4,265 million yen) are not included above.
105Tokio Marine Holdings
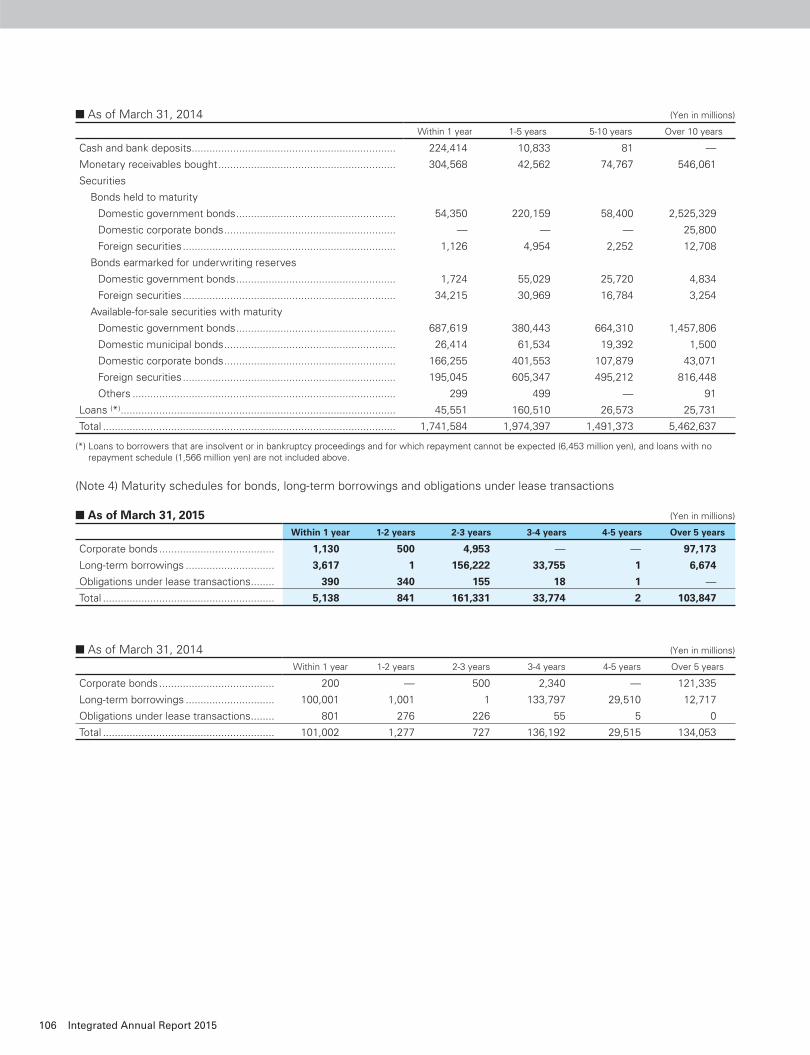
■ As of March 31, 2014 (Yen in millions)
Within 1 year 1-5 years 5-10 years Over 10 years
Cash and bank deposits ..................................................................... 224,414 10,833 81 —
Monetary receivables bought ............................................................ 304,568 42,562 74,767 546,061
Securities
Bonds held to maturity
Domestic government bonds ...................................................... 54,350 220,159 58,400 2,525,329
Domestic corporate bonds .......................................................... — — — 25,800
Foreign securities ........................................................................ 1,126 4,954 2,252 12,708
Bonds earmarked for underwriting reserves
Domestic government bonds ...................................................... 1,724 55,029 25,720 4,834
Foreign securities ........................................................................ 34,215 30,969 16,784 3,254
Available-for-sale securities with maturity
Domestic government bonds ...................................................... 687,619 380,443 664,310 1,457,806
Domestic municipal bonds .......................................................... 26,414 61,534 19,392 1,500
Domestic corporate bonds .......................................................... 166,255 401,553 107,879 43,071
Foreign securities ........................................................................ 195,045 605,347 495,212 816,448
Others ......................................................................................... 299 499 — 91
Loans (*) ............................................................................................. 45,551 160,510 26,573 25,731
Total ................................................................................................... 1,741,584 1,974,397 1,491,373 5,462,637
(*) Loans to borrowers that are insolvent or in bankruptcy proceedings and for which repayment cannot be expected (6,453 million yen), and loans with no repayment schedule (1,566 million yen) are not included above.
(Note 4) Maturity schedules for bonds, long-term borrowings and obligations under lease transactions
■ As of March 31, 2015 (Yen in millions)
Within 1 year 1-2 years 2-3 years 3-4 years 4-5 years Over 5 years
Corporate bonds ....................................... 1,130 500 4,953 — — 97,173
Long-term borrowings .............................. 3,617 1 156,222 33,755 1 6,674
Obligations under lease transactions ........ 390 340 155 18 1 —
Total .......................................................... 5,138 841 161,331 33,774 2 103,847
■ As of March 31, 2014 (Yen in millions)
Within 1 year 1-2 years 2-3 years 3-4 years 4-5 years Over 5 years
Corporate bonds ....................................... 200 — 500 2,340 — 121,335
Long-term borrowings .............................. 100,001 1,001 1 133,797 29,510 12,717
Obligations under lease transactions ........ 801 276 226 55 5 0
Total .......................................................... 101,002 1,277 727 136,192 29,515 134,053
106 Integrated Annual Report 2015
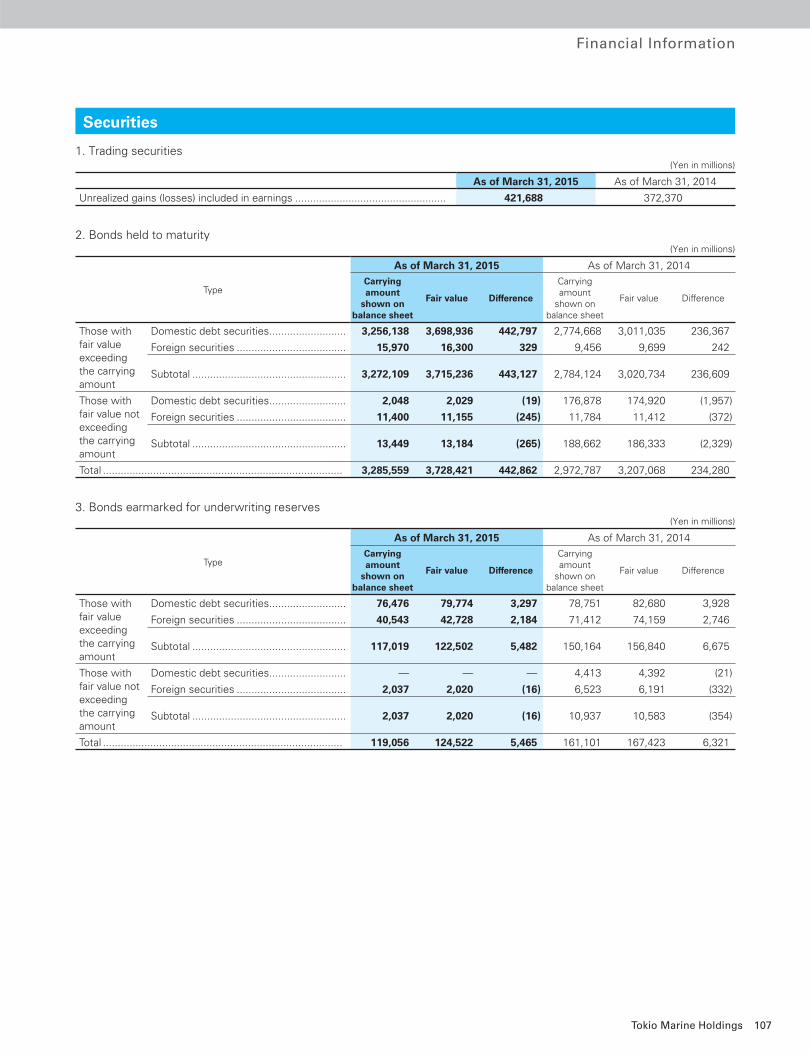
Financial Information
1. Trading securities (Yen in millions)
As of March 31, 2015 As of March 31, 2014
Unrealized gains (losses) included in earnings ................................................... 421,688 372,370
2. Bonds held to maturity (Yen in millions)
Type
As of March 31, 2015 As of March 31, 2014
Carrying amount
shown on balance sheet
Fair value Difference
Carrying amount
shown on balance sheet
Fair value Difference
Those with fair value exceeding the carrying amount
Domestic debt securities .......................... 3,256,138 3,698,936 442,797 2,774,668 3,011,035 236,367
Foreign securities ..................................... 15,970 16,300 329 9,456 9,699 242
Subtotal .................................................... 3,272,109 3,715,236 443,127 2,784,124 3,020,734 236,609
Those with fair value not exceeding the carrying amount
Domestic debt securities .......................... 2,048 2,029 (19) 176,878 174,920 (1,957)
Foreign securities ..................................... 11,400 11,155 (245) 11,784 11,412 (372)
Subtotal .................................................... 13,449 13,184 (265) 188,662 186,333 (2,329)
Total ................................................................................. 3,285,559 3,728,421 442,862 2,972,787 3,207,068 234,280
3. Bonds earmarked for underwriting reserves (Yen in millions)
Type
As of March 31, 2015 As of March 31, 2014
Carrying amount
shown on balance sheet
Fair value Difference
Carrying amount
shown on balance sheet
Fair value Difference
Those with fair value exceeding the carrying amount
Domestic debt securities .......................... 76,476 79,774 3,297 78,751 82,680 3,928
Foreign securities ..................................... 40,543 42,728 2,184 71,412 74,159 2,746
Subtotal .................................................... 117,019 122,502 5,482 150,164 156,840 6,675
Those with fair value not exceeding the carrying amount
Domestic debt securities .......................... — — — 4,413 4,392 (21)
Foreign securities ..................................... 2,037 2,020 (16) 6,523 6,191 (332)
Subtotal .................................................... 2,037 2,020 (16) 10,937 10,583 (354)
Total ................................................................................. 119,056 124,522 5,465 161,101 167,423 6,321
Securities
107Tokio Marine Holdings
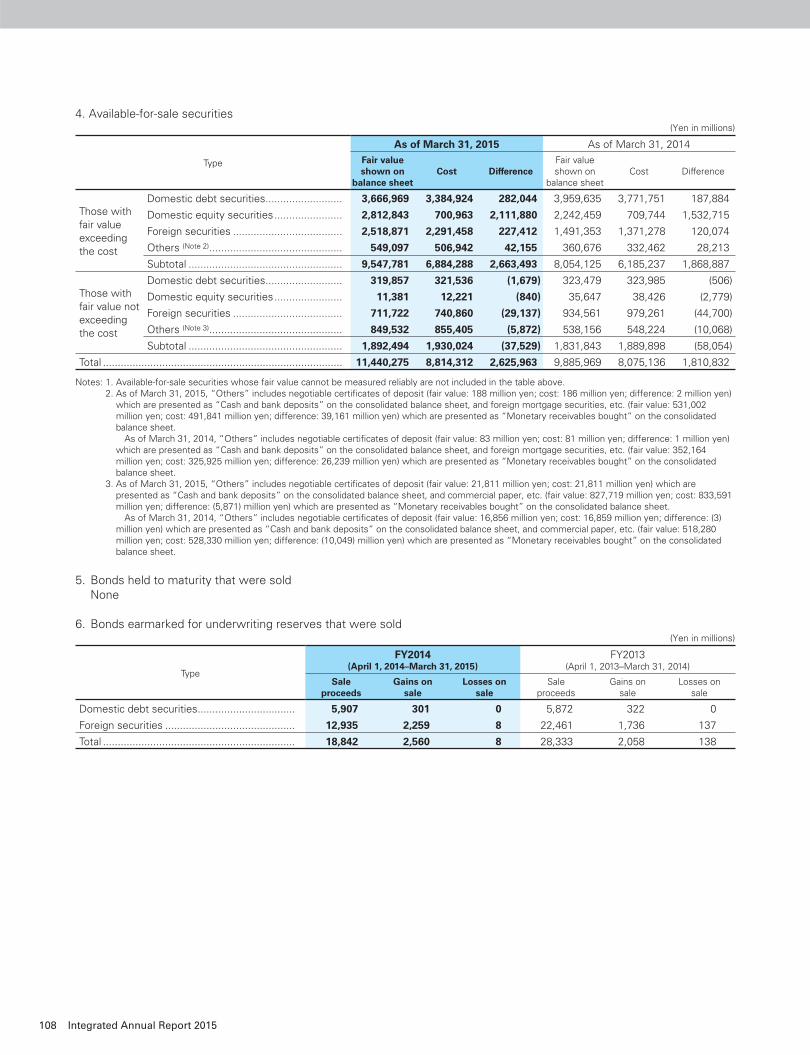
4. Available-for-sale securities (Yen in millions)
Type
As of March 31, 2015 As of March 31, 2014
Fair value shown on
balance sheetCost Difference
Fair value shown on
balance sheetCost Difference
Those with fair value exceeding the cost
Domestic debt securities .......................... 3,666,969 3,384,924 282,044 3,959,635 3,771,751 187,884
Domestic equity securities ....................... 2,812,843 700,963 2,111,880 2,242,459 709,744 1,532,715
Foreign securities ..................................... 2,518,871 2,291,458 227,412 1,491,353 1,371,278 120,074
Others (Note 2) ............................................. 549,097 506,942 42,155 360,676 332,462 28,213
Subtotal .................................................... 9,547,781 6,884,288 2,663,493 8,054,125 6,185,237 1,868,887
Those with fair value not exceeding the cost
Domestic debt securities .......................... 319,857 321,536 (1,679) 323,479 323,985 (506)
Domestic equity securities ....................... 11,381 12,221 (840) 35,647 38,426 (2,779)
Foreign securities ..................................... 711,722 740,860 (29,137) 934,561 979,261 (44,700)
Others (Note 3) ............................................. 849,532 855,405 (5,872) 538,156 548,224 (10,068)
Subtotal .................................................... 1,892,494 1,930,024 (37,529) 1,831,843 1,889,898 (58,054)
Total ................................................................................. 11,440,275 8,814,312 2,625,963 9,885,969 8,075,136 1,810,832
Notes: 1. Available-for-sale securities whose fair value cannot be measured reliably are not included in the table above. 2. As of March 31, 2015, “Others” includes negotiable certifi cates of deposit (fair value: 188 million yen; cost: 186 million yen; difference: 2 million yen)
which are presented as “Cash and bank deposits” on the consolidated balance sheet, and foreign mortgage securities, etc. (fair value: 531,002 million yen; cost: 491,841 million yen; difference: 39,161 million yen) which are presented as “Monetary receivables bought” on the consolidated balance sheet.
As of March 31, 2014, “Others” includes negotiable certifi cates of deposit (fair value: 83 million yen; cost: 81 million yen; difference: 1 million yen) which are presented as “Cash and bank deposits” on the consolidated balance sheet, and foreign mortgage securities, etc. (fair value: 352,164 million yen; cost: 325,925 million yen; difference: 26,239 million yen) which are presented as “Monetary receivables bought” on the consolidated balance sheet.
3. As of March 31, 2015, “Others” includes negotiable certifi cates of deposit (fair value: 21,811 million yen; cost: 21,811 million yen) which are presented as “Cash and bank deposits” on the consolidated balance sheet, and commercial paper, etc. (fair value: 827,719 million yen; cost: 833,591 million yen; difference: (5,871) million yen) which are presented as “Monetary receivables bought” on the consolidated balance sheet.
As of March 31, 2014, “Others” includes negotiable certifi cates of deposit (fair value: 16,856 million yen; cost: 16,859 million yen; difference: (3) million yen) which are presented as “Cash and bank deposits” on the consolidated balance sheet, and commercial paper, etc. (fair value: 518,280 million yen; cost: 528,330 million yen; difference: (10,049) million yen) which are presented as “Monetary receivables bought” on the consolidated balance sheet.
5. Bonds held to maturity that were sold None
6. Bonds earmarked for underwriting reserves that were sold (Yen in millions)
Type
FY2014(April 1, 2014–March 31, 2015)
FY2013(April 1, 2013–March 31, 2014)
Sale proceeds
Gains on sale
Losses on sale
Sale proceeds
Gains on sale
Losses on sale
Domestic debt securities ................................. 5,907 301 0 5,872 322 0
Foreign securities ............................................ 12,935 2,259 8 22,461 1,736 137
Total ................................................................. 18,842 2,560 8 28,333 2,058 138
108 Integrated Annual Report 2015
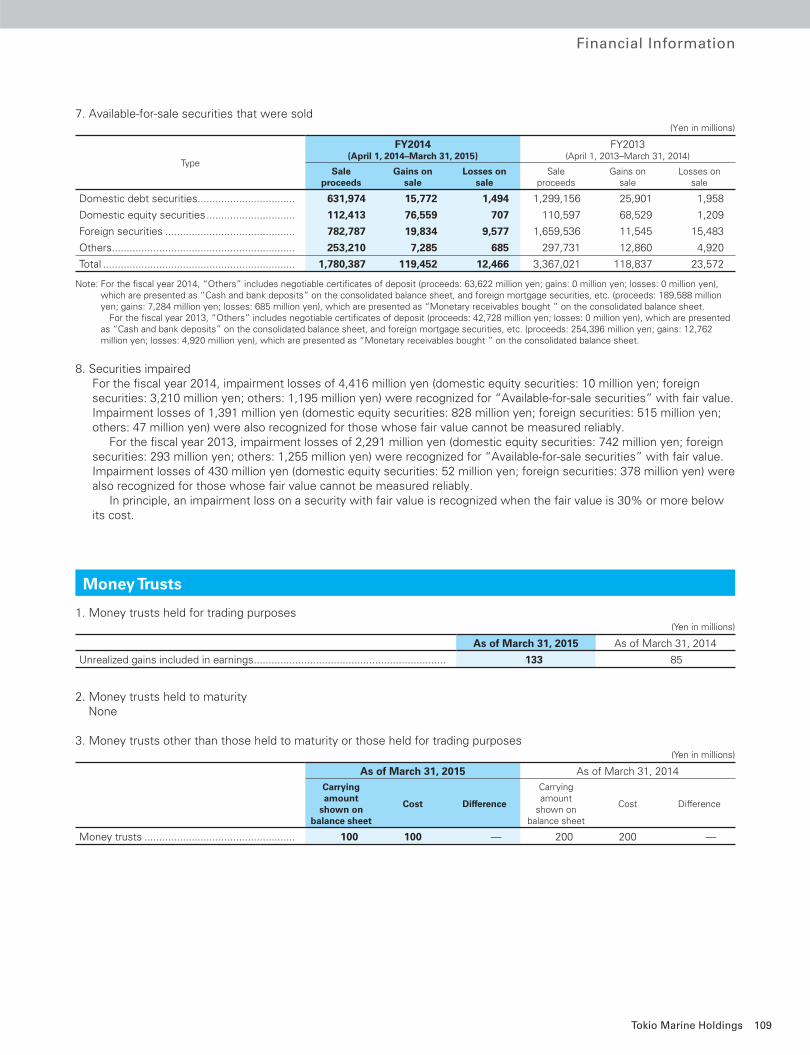
Financial Information
7. Available-for-sale securities that were sold (Yen in millions)
Type
FY2014(April 1, 2014–March 31, 2015)
FY2013(April 1, 2013–March 31, 2014)
Sale proceeds
Gains on sale
Losses on sale
Sale proceeds
Gains on sale
Losses on sale
Domestic debt securities ................................. 631,974 15,772 1,494 1,299,156 25,901 1,958
Domestic equity securities .............................. 112,413 76,559 707 110,597 68,529 1,209
Foreign securities ............................................ 782,787 19,834 9,577 1,659,536 11,545 15,483
Others .............................................................. 253,210 7,285 685 297,731 12,860 4,920
Total ................................................................. 1,780,387 119,452 12,466 3,367,021 118,837 23,572
Note: For the fi scal year 2014, “Others” includes negotiable certifi cates of deposit (proceeds: 63,622 million yen; gains: 0 million yen; losses: 0 million yen), which are presented as “Cash and bank deposits” on the consolidated balance sheet, and foreign mortgage securities, etc. (proceeds: 189,588 million yen; gains: 7,284 million yen; losses: 685 million yen), which are presented as “Monetary receivables bought ” on the consolidated balance sheet. For the fi scal year 2013, “Others” includes negotiable certifi cates of deposit (proceeds: 42,728 million yen; losses: 0 million yen), which are presented as “Cash and bank deposits” on the consolidated balance sheet, and foreign mortgage securities, etc. (proceeds: 254,396 million yen; gains: 12,762 million yen; losses: 4,920 million yen), which are presented as “Monetary receivables bought ” on the consolidated balance sheet.
8. Securities impaired For the fi scal year 2014, impairment losses of 4,416 million yen (domestic equity securities: 10 million yen; foreign
securities: 3,210 million yen; others: 1,195 million yen) were recognized for “Available-for-sale securities” with fair value. Impairment losses of 1,391 million yen (domestic equity securities: 828 million yen; foreign securities: 515 million yen; others: 47 million yen) were also recognized for those whose fair value cannot be measured reliably.
For the fi scal year 2013, impairment losses of 2,291 million yen (domestic equity securities: 742 million yen; foreign securities: 293 million yen; others: 1,255 million yen) were recognized for “Available-for-sale securities” with fair value. Impairment losses of 430 million yen (domestic equity securities: 52 million yen; foreign securities: 378 million yen) were also recognized for those whose fair value cannot be measured reliably.
In principle, an impairment loss on a security with fair value is recognized when the fair value is 30% or more below its cost.
1. Money trusts held for trading purposes (Yen in millions)
As of March 31, 2015 As of March 31, 2014
Unrealized gains included in earnings ................................................................. 133 85
2. Money trusts held to maturityNone
3. Money trusts other than those held to maturity or those held for trading purposes (Yen in millions)
As of March 31, 2015 As of March 31, 2014
Carrying amount
shown on balance sheet
Cost Difference
Carrying amount
shown on balance sheet
Cost Difference
Money trusts ................................................... 100 100 — 200 200 —
Money Trusts
109Tokio Marine Holdings
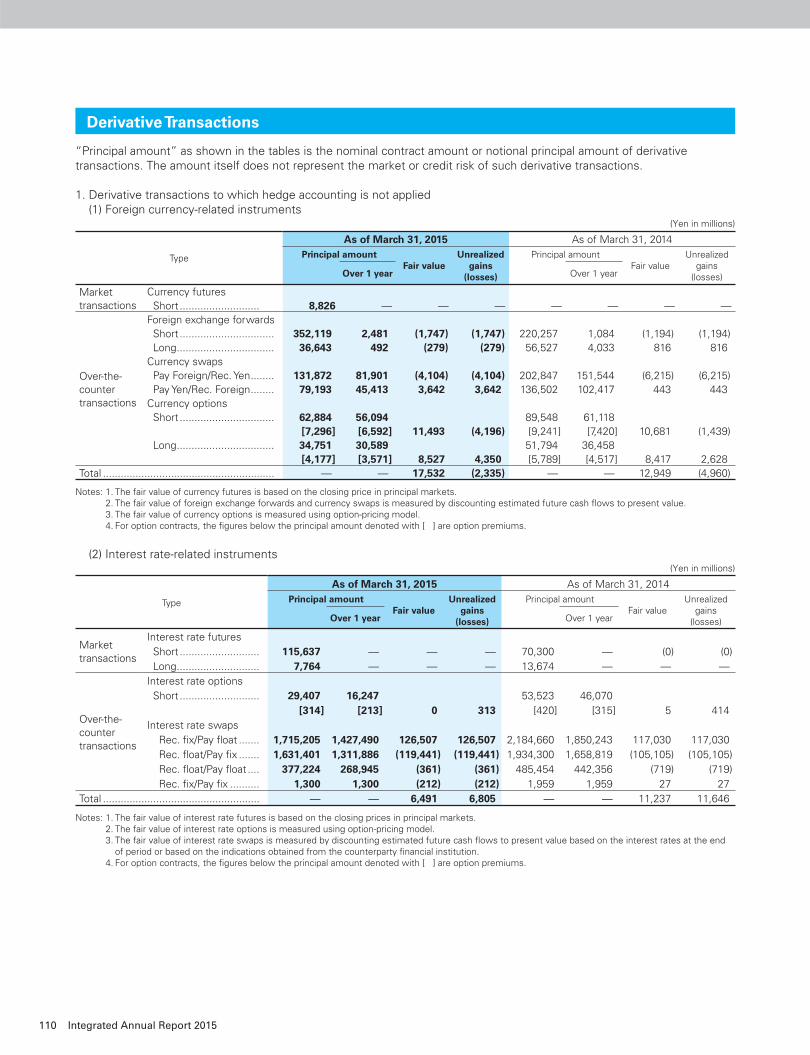
“Principal amount” as shown in the tables is the nominal contract amount or notional principal amount of derivative transactions. The amount itself does not represent the market or credit risk of such derivative transactions.
1. Derivative transactions to which hedge accounting is not applied(1) Foreign currency-related instruments (Yen in millions)
Type
As of March 31, 2015 As of March 31, 2014
Principal amountFair value
Unrealized gains
(losses)
Principal amountFair value
Unrealized gains
(losses)Over 1 year Over 1 year
Market transactions
Currency futures Short ........................... 8,826 — — — — — — —
Over-the-counter transactions
Foreign exchange forwards Short ................................ 352,119 2,481 (1,747) (1,747) 220,257 1,084 (1,194) (1,194) Long ................................. 36,643 492 (279) (279) 56,527 4,033 816 816Currency swaps Pay Foreign/Rec. Yen ........ 131,872 81,901 (4,104) (4,104) 202,847 151,544 (6,215) (6,215) Pay Yen/Rec. Foreign ........ 79,193 45,413 3,642 3,642 136,502 102,417 443 443Currency options Short ................................ 62,884 56,094 89,548 61,118
[7,296] [6,592] 11,493 (4,196) [9,241] [7,420] 10,681 (1,439) Long ................................. 34,751 30,589 51,794 36,458
[4,177] [3,571] 8,527 4,350 [5,789] [4,517] 8,417 2,628Total .......................................................... — — 17,532 (2,335) — — 12,949 (4,960)
Notes: 1. The fair value of currency futures is based on the closing price in principal markets. 2. The fair value of foreign exchange forwards and currency swaps is measured by discounting estimated future cash fl ows to present value. 3. The fair value of currency options is measured using option-pricing model. 4. For option contracts, the fi gures below the principal amount denoted with [ ] are option premiums.
(2) Interest rate-related instruments (Yen in millions)
Type
As of March 31, 2015 As of March 31, 2014
Principal amountFair value
Unrealized gains
(losses)
Principal amountFair value
Unrealized gains
(losses)Over 1 year Over 1 year
Market transactions
Interest rate futures
Short ........................... 115,637 — — — 70,300 — (0) (0)
Long ............................ 7,764 — — — 13,674 — — —
Over-the-counter transactions
Interest rate options
Short ........................... 29,407 16,247 53,523 46,070
[314] [213] 0 313 [420] [315] 5 414
Interest rate swaps
Rec. fi x/Pay fl oat ....... 1,715,205 1,427,490 126,507 126,507 2,184,660 1,850,243 117,030 117,030
Rec. fl oat/Pay fi x ....... 1,631,401 1,311,886 (119,441) (119,441) 1,934,300 1,658,819 (105,105) (105,105)
Rec. fl oat/Pay fl oat .... 377,224 268,945 (361) (361) 485,454 442,356 (719) (719)
Rec. fi x/Pay fi x .......... 1,300 1,300 (212) (212) 1,959 1,959 27 27
Total ..................................................... — — 6,491 6,805 — — 11,237 11,646
Notes: 1. The fair value of interest rate futures is based on the closing prices in principal markets. 2. The fair value of interest rate options is measured using option-pricing model. 3. The fair value of interest rate swaps is measured by discounting estimated future cash fl ows to present value based on the interest rates at the end
of period or based on the indications obtained from the counterparty fi nancial institution. 4. For option contracts, the fi gures below the principal amount denoted with [ ] are option premiums.
Derivative Transactions
110 Integrated Annual Report 2015
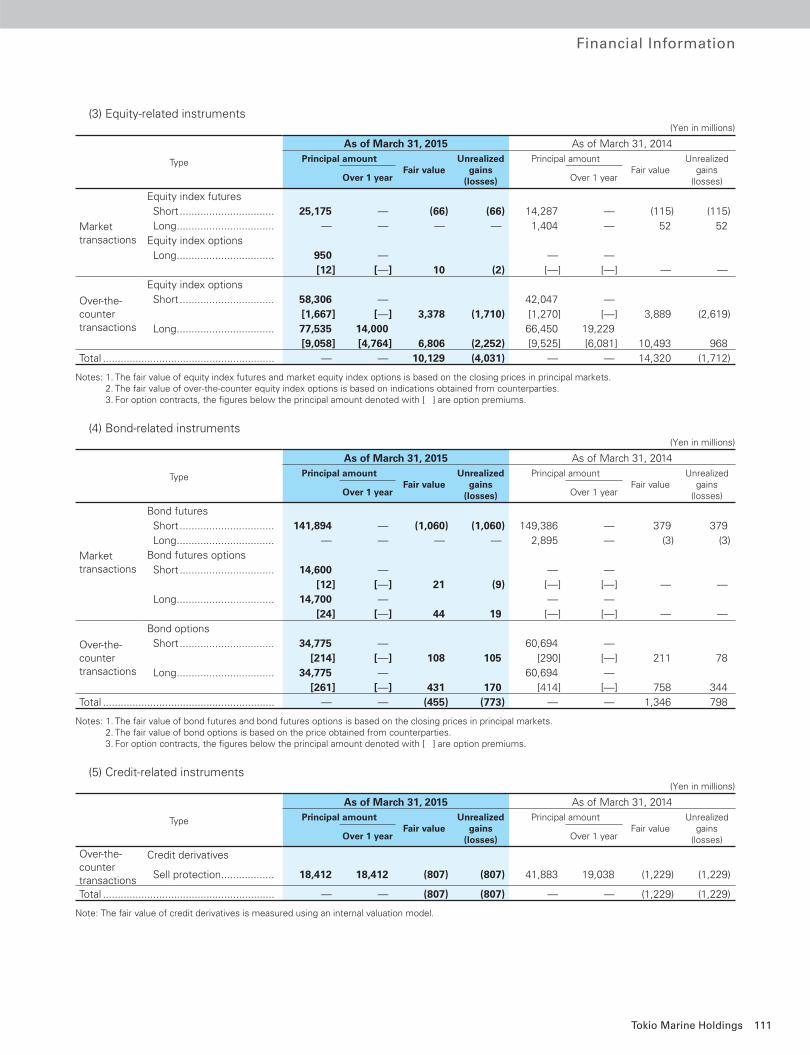
Financial Information
(3) Equity-related instruments (Yen in millions)
Type
As of March 31, 2015 As of March 31, 2014
Principal amountFair value
Unrealized gains
(losses)
Principal amountFair value
Unrealized gains
(losses)Over 1 year Over 1 year
Market transactions
Equity index futures
Short ................................ 25,175 — (66) (66) 14,287 — (115) (115)
Long ................................. — — — — 1,404 — 52 52
Equity index options
Long ................................. 950 — — —
[12] [—] 10 (2) [—] [—] — —
Over-the-counter transactions
Equity index options
Short ................................ 58,306 — 42,047 —
[1,667] [—] 3,378 (1,710) [1,270] [—] 3,889 (2,619)
Long ................................. 77,535 14,000 66,450 19,229
[9,058] [4,764] 6,806 (2,252) [9,525] [6,081] 10,493 968
Total .......................................................... — — 10,129 (4,031) — — 14,320 (1,712)
Notes: 1. The fair value of equity index futures and market equity index options is based on the closing prices in principal markets. 2. The fair value of over-the-counter equity index options is based on indications obtained from counterparties. 3. For option contracts, the fi gures below the principal amount denoted with [ ] are option premiums.
(4) Bond-related instruments (Yen in millions)
Type
As of March 31, 2015 As of March 31, 2014
Principal amountFair value
Unrealized gains
(losses)
Principal amountFair value
Unrealized gains
(losses)Over 1 year Over 1 year
Market transactions
Bond futures
Short ................................ 141,894 — (1,060) (1,060) 149,386 — 379 379
Long ................................. — — — — 2,895 — (3) (3)
Bond futures options
Short ................................ 14,600 — — —
[12] [—] 21 (9) [—] [—] — —
Long ................................. 14,700 — — —
[24] [—] 44 19 [—] [—] — —
Over-the-counter transactions
Bond options
Short ................................ 34,775 — 60,694 —
[214] [—] 108 105 [290] [—] 211 78
Long ................................. 34,775 — 60,694 —
[261] [—] 431 170 [414] [—] 758 344
Total .......................................................... — — (455) (773) — — 1,346 798
Notes: 1. The fair value of bond futures and bond futures options is based on the closing prices in principal markets. 2. The fair value of bond options is based on the price obtained from counterparties. 3. For option contracts, the fi gures below the principal amount denoted with [ ] are option premiums.
(5) Credit-related instruments (Yen in millions)
Type
As of March 31, 2015 As of March 31, 2014
Principal amountFair value
Unrealized gains
(losses)
Principal amountFair value
Unrealized gains
(losses)Over 1 year Over 1 year
Over-the-counter transactions
Credit derivatives
Sell protection .................. 18,412 18,412 (807) (807) 41,883 19,038 (1,229) (1,229)
Total .......................................................... — — (807) (807) — — (1,229) (1,229)
Note: The fair value of credit derivatives is measured using an internal valuation model.
111Tokio Marine Holdings
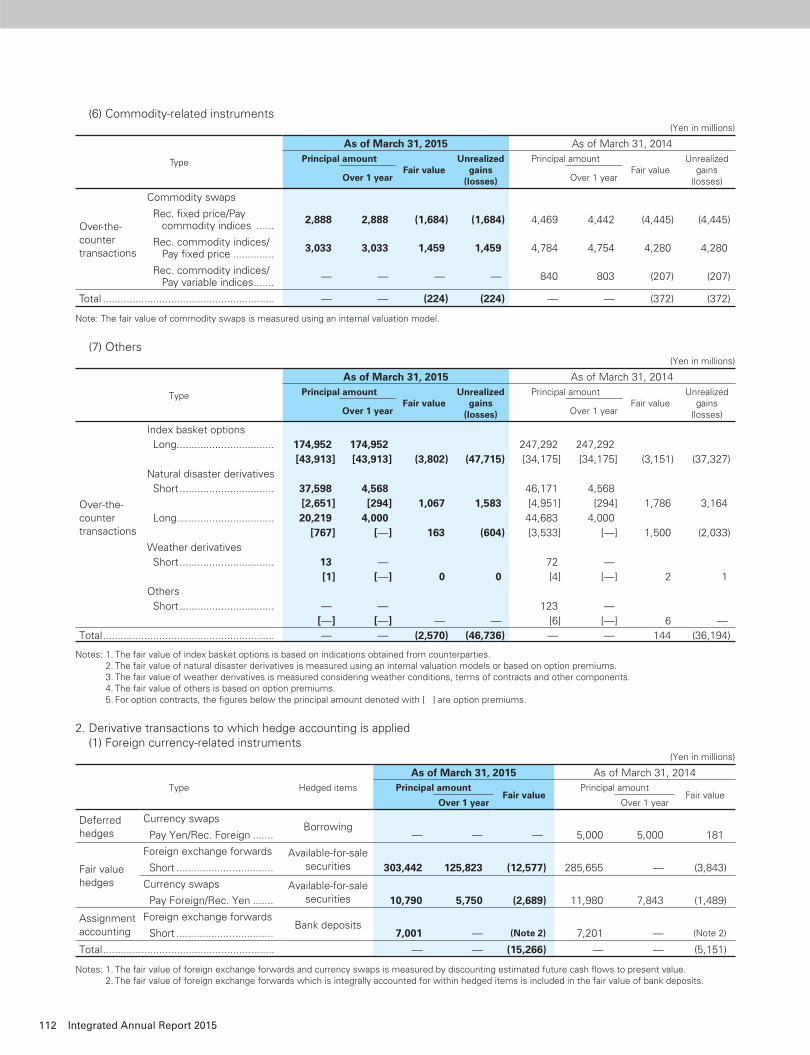
(6) Commodity-related instruments (Yen in millions)
Type
As of March 31, 2015 As of March 31, 2014
Principal amountFair value
Unrealized gains
(losses)
Principal amountFair value
Unrealized gains
(losses)Over 1 year Over 1 year
Over-the-counter transactions
Commodity swaps
Rec. fi xed price/Pay commodity indices ......
2,888 2,888 (1,684) (1,684) 4,469 4,442 (4,445) (4,445)
Rec. commodity indices/ Pay fi xed price ..............
3,033 3,033 1,459 1,459 4,784 4,754 4,280 4,280
Rec. commodity indices/ Pay variable indices .......
— — — — 840 803 (207) (207)
Total .......................................................... — — (224) (224) — — (372) (372)
Note: The fair value of commodity swaps is measured using an internal valuation model.
(7) Others (Yen in millions)
Type
As of March 31, 2015 As of March 31, 2014
Principal amountFair value
Unrealized gains
(losses)
Principal amountFair value
Unrealized gains
(losses)Over 1 year Over 1 year
Over-the-counter transactions
Index basket options
Long................................. 174,952 174,952 247,292 247,292
[43,913] [43,913] (3,802) (47,715) [34,175] [34,175] (3,151) (37,327)
Natural disaster derivatives
Short ................................ 37,598 4,568 46,171 4,568
[2,651] [294] 1,067 1,583 [4,951] [294] 1,786 3,164
Long................................. 20,219 4,000 44,683 4,000
[767] [—] 163 (604) [3,533] [—] 1,500 (2,033)
Weather derivatives
Short ................................ 13 — 72 —
[1] [—] 0 0 [4] [—] 2 1
Others
Short ................................ — — 123 —
[—] [—] — — [6] [—] 6 —
Total .......................................................... — — (2,570) (46,736) — — 144 (36,194)
Notes: 1. The fair value of index basket options is based on indications obtained from counterparties. 2. The fair value of natural disaster derivatives is measured using an internal valuation models or based on option premiums. 3. The fair value of weather derivatives is measured considering weather conditions, terms of contracts and other components. 4. The fair value of others is based on option premiums. 5. For option contracts, the fi gures below the principal amount denoted with [ ] are option premiums.
2. Derivative transactions to which hedge accounting is applied(1) Foreign currency-related instruments (Yen in millions)
Type Hedged items
As of March 31, 2015 As of March 31, 2014
Principal amountFair value
Principal amountFair value
Over 1 year Over 1 year
Deferred hedges
Currency swapsBorrowing
Pay Yen/Rec. Foreign ....... — — — 5,000 5,000 181
Fair value hedges
Foreign exchange forwards Available-for-salesecurities Short ................................. 303,442 125,823 (12,577) 285,655 — (3,843)
Currency swaps Available-for-salesecurities Pay Foreign/Rec. Yen ....... 10,790 5,750 (2,689) 11,980 7,843 (1,489)
Assignment accounting
Foreign exchange forwardsBank deposits
Short ................................. 7,001 — (Note 2) 7,201 — (Note 2)
Total .......................................................... — — (15,266) — — (5,151)
Notes: 1. The fair value of foreign exchange forwards and currency swaps is measured by discounting estimated future cash fl ows to present value. 2. The fair value of foreign exchange forwards which is integrally accounted for within hedged items is included in the fair value of bank deposits.
112 Integrated Annual Report 2015
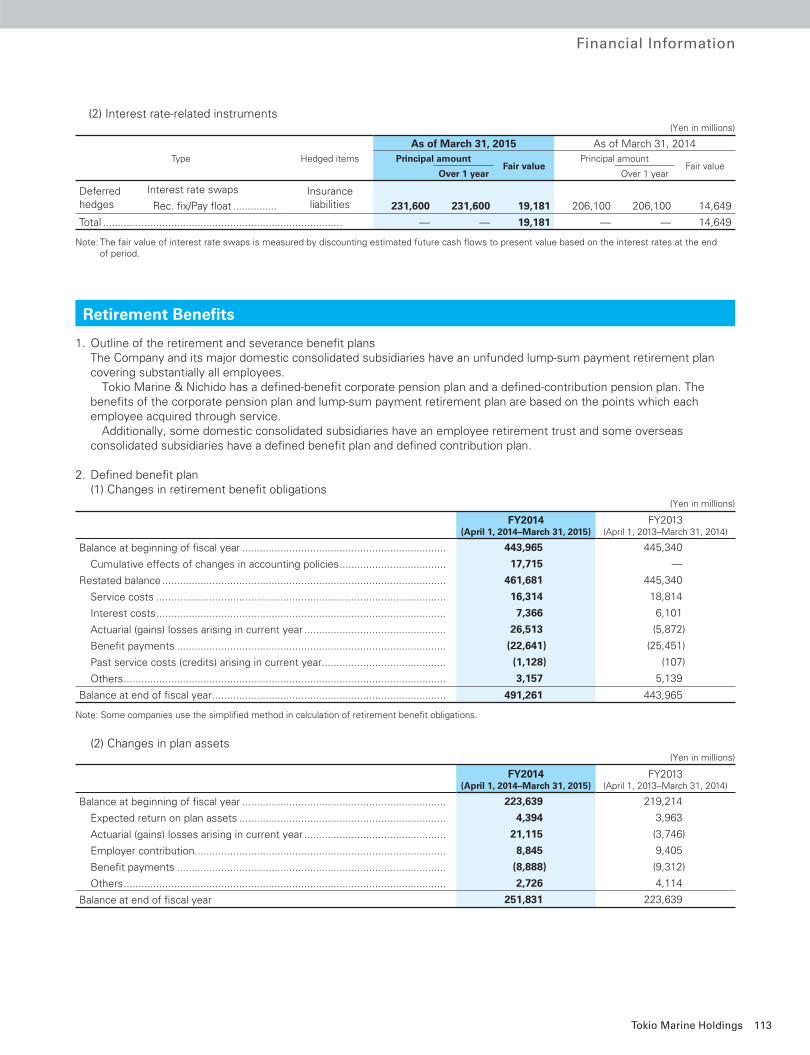
Financial Information
(2) Interest rate-related instruments (Yen in millions)
Type Hedged items
As of March 31, 2015 As of March 31, 2014
Principal amountFair value
Principal amountFair value
Over 1 year Over 1 year
Deferred hedges
Interest rate swaps Insurance liabilities Rec. fi x/Pay fl oat ............... 231,600 231,600 19,181 206,100 206,100 14,649
Total ................................................................................. — — 19,181 — — 14,649
Note: The fair value of interest rate swaps is measured by discounting estimated future cash fl ows to present value based on the interest rates at the end of period.
1. Outline of the retirement and severance benefi t plansThe Company and its major domestic consolidated subsidiaries have an unfunded lump-sum payment retirement plan covering substantially all employees. Tokio Marine & Nichido has a defi ned-benefi t corporate pension plan and a defi ned-contribution pension plan. The benefi ts of the corporate pension plan and lump-sum payment retirement plan are based on the points which each employee acquired through service. Additionally, some domestic consolidated subsidiaries have an employee retirement trust and some overseas consolidated subsidiaries have a defi ned benefi t plan and defi ned contribution plan.
2. Defi ned benefi t plan(1) Changes in retirement benefi t obligations (Yen in millions)
FY2014(April 1, 2014–March 31, 2015)
FY2013(April 1, 2013–March 31, 2014)
Balance at beginning of fi scal year ..................................................................... 443,965 445,340
Cumulative effects of changes in accounting policies .................................... 17,715 —
Restated balance ................................................................................................ 461,681 445,340
Service costs .................................................................................................. 16,314 18,814
Interest costs .................................................................................................. 7,366 6,101
Actuarial (gains) losses arising in current year ................................................ 26,513 (5,872)
Benefi t payments ........................................................................................... (22,641) (25,451)
Past service costs (credits) arising in current year .......................................... (1,128) (107)
Others ............................................................................................................. 3,157 5,139
Balance at end of fi scal year ............................................................................... 491,261 443,965
Note: Some companies use the simplifi ed method in calculation of retirement benefi t obligations.
(2) Changes in plan assets (Yen in millions)
FY2014(April 1, 2014–March 31, 2015)
FY2013(April 1, 2013–March 31, 2014)
Balance at beginning of fi scal year ..................................................................... 223,639 219,214
Expected return on plan assets ...................................................................... 4,394 3,963
Actuarial (gains) losses arising in current year ................................................ 21,115 (3,746)
Employer contribution..................................................................................... 8,845 9,405
Benefi t payments ........................................................................................... (8,888) (9,312)
Others ............................................................................................................. 2,726 4,114
Balance at end of fi scal year 251,831 223,639
Retirement Benefi ts
113Tokio Marine Holdings
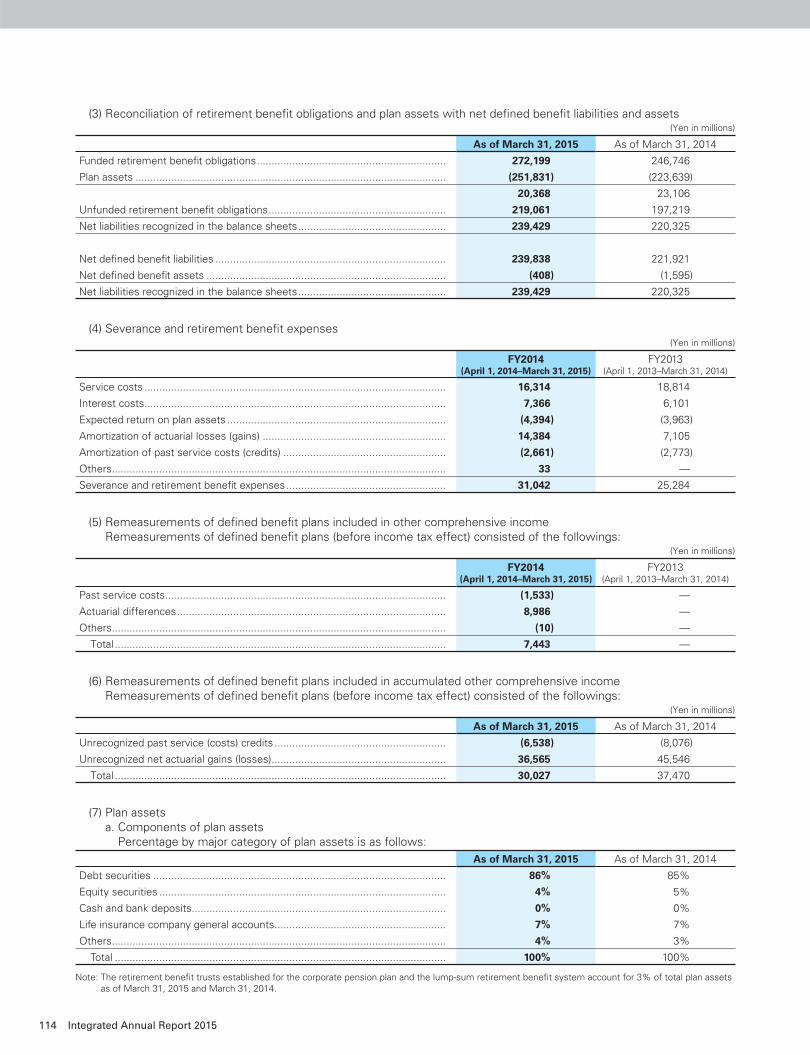
(3) Reconciliation of retirement benefi t obligations and plan assets with net defi ned benefi t liabilities and assets (Yen in millions)
As of March 31, 2015 As of March 31, 2014
Funded retirement benefi t obligations ................................................................ 272,199 246,746
Plan assets ......................................................................................................... (251,831) (223,639)
20,368 23,106
Unfunded retirement benefi t obligations ............................................................ 219,061 197,219
Net liabilities recognized in the balance sheets .................................................. 239,429 220,325
Net defi ned benefi t liabilities .............................................................................. 239,838 221,921
Net defi ned benefi t assets ................................................................................. (408) (1,595)
Net liabilities recognized in the balance sheets .................................................. 239,429 220,325
(4) Severance and retirement benefi t expenses (Yen in millions)
FY2014(April 1, 2014–March 31, 2015)
FY2013(April 1, 2013–March 31, 2014)
Service costs ...................................................................................................... 16,314 18,814
Interest costs ...................................................................................................... 7,366 6,101
Expected return on plan assets .......................................................................... (4,394) (3,963)
Amortization of actuarial losses (gains) .............................................................. 14,384 7,105
Amortization of past service costs (credits) ....................................................... (2,661) (2,773)
Others ................................................................................................................. 33 —
Severance and retirement benefi t expenses ...................................................... 31,042 25,284
(5) Remeasurements of defi ned benefi t plans included in other comprehensive incomeRemeasurements of defi ned benefi t plans (before income tax effect) consisted of the followings:
(Yen in millions)
FY2014(April 1, 2014–March 31, 2015)
FY2013(April 1, 2013–March 31, 2014)
Past service costs ............................................................................................... (1,533) —
Actuarial differences ........................................................................................... 8,986 —
Others ................................................................................................................. (10) —
Total ................................................................................................................ 7,443 —
(6) Remeasurements of defi ned benefi t plans included in accumulated other comprehensive incomeRemeasurements of defi ned benefi t plans (before income tax effect) consisted of the followings:
(Yen in millions)
As of March 31, 2015 As of March 31, 2014
Unrecognized past service (costs) credits .......................................................... (6,538) (8,076)
Unrecognized net actuarial gains (losses) ........................................................... 36,565 45,546
Total ................................................................................................................ 30,027 37,470
(7) Plan assetsa. Components of plan assets
Percentage by major category of plan assets is as follows: As of March 31, 2015 As of March 31, 2014
Debt securities ................................................................................................... 86% 85%
Equity securities ................................................................................................. 4% 5%
Cash and bank deposits ...................................................................................... 0% 0%
Life insurance company general accounts .......................................................... 7% 7%
Others ................................................................................................................. 4% 3%
Total ................................................................................................................ 100% 100%
Note: The retirement benefi t trusts established for the corporate pension plan and the lump-sum retirement benefi t system account for 3% of total plan assets as of March 31, 2015 and March 31, 2014.
114 Integrated Annual Report 2015
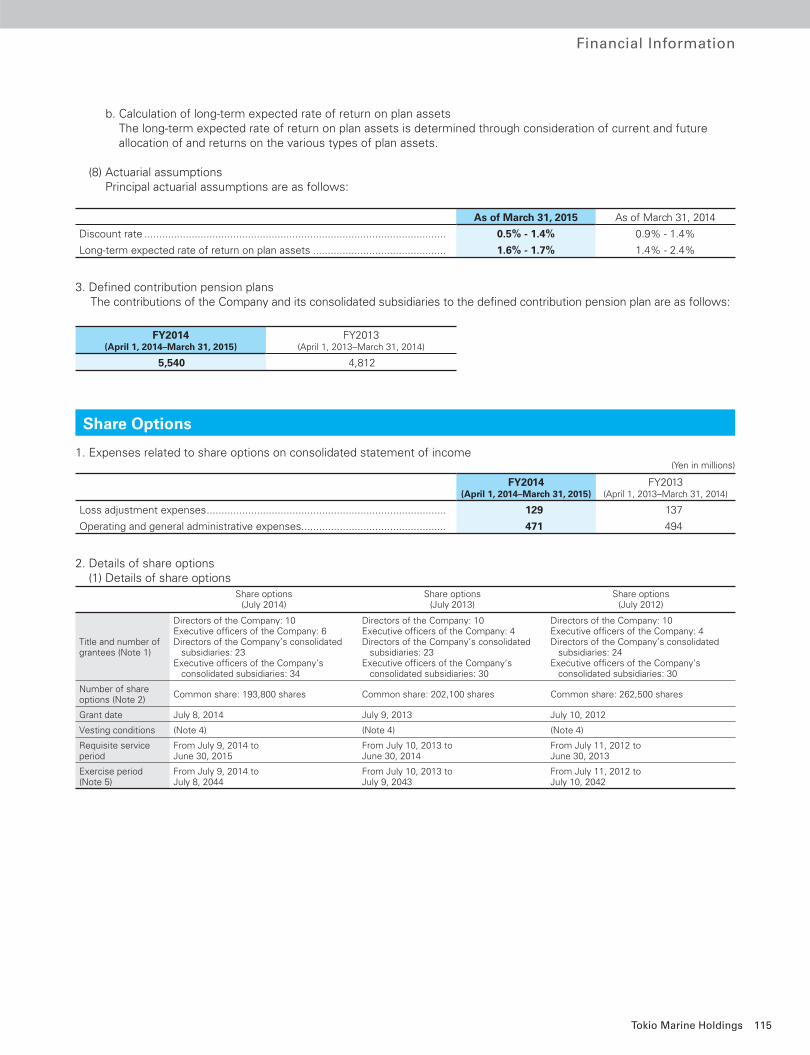
Financial Information
b. Calculation of long-term expected rate of return on plan assetsThe long-term expected rate of return on plan assets is determined through consideration of current and future allocation of and returns on the various types of plan assets.
(8) Actuarial assumptionsPrincipal actuarial assumptions are as follows:
As of March 31, 2015 As of March 31, 2014
Discount rate ...................................................................................................... 0.5% - 1.4% 0.9% - 1.4%
Long-term expected rate of return on plan assets ............................................. 1.6% - 1.7% 1.4% - 2.4%
3. Defi ned contribution pension plans The contributions of the Company and its consolidated subsidiaries to the defi ned contribution pension plan are as follows:
FY2014(April 1, 2014–March 31, 2015)
FY2013(April 1, 2013–March 31, 2014)
5,540 4,812
1. Expenses related to share options on consolidated statement of income (Yen in millions)
FY2014(April 1, 2014–March 31, 2015)
FY2013(April 1, 2013–March 31, 2014)
Loss adjustment expenses ................................................................................. 129 137
Operating and general administrative expenses................................................. 471 494
2. Details of share options(1) Details of share options
Share options(July 2014)
Share options(July 2013)
Share options(July 2012)
Title and number of grantees (Note 1)
Directors of the Company: 10Executive offi cers of the Company: 6Directors of the Company’s consolidated subsidiaries: 23Executive offi cers of the Company’s consolidated subsidiaries: 34
Directors of the Company: 10 Executive offi cers of the Company: 4Directors of the Company’s consolidated subsidiaries: 23 Executive offi cers of the Company’s consolidated subsidiaries: 30
Directors of the Company: 10Executive offi cers of the Company: 4Directors of the Company’s consolidated subsidiaries: 24Executive offi cers of the Company’s consolidated subsidiaries: 30
Number of share options (Note 2)
Common share: 193,800 shares Common share: 202,100 shares Common share: 262,500 shares
Grant date July 8, 2014 July 9, 2013 July 10, 2012
Vesting conditions (Note 4) (Note 4) (Note 4)
Requisite service period
From July 9, 2014 toJune 30, 2015
From July 10, 2013 toJune 30, 2014
From July 11, 2012 to June 30, 2013
Exercise period (Note 5)
From July 9, 2014 toJuly 8, 2044
From July 10, 2013 toJuly 9, 2043
From July 11, 2012 to July 10, 2042
Share Options
115Tokio Marine Holdings
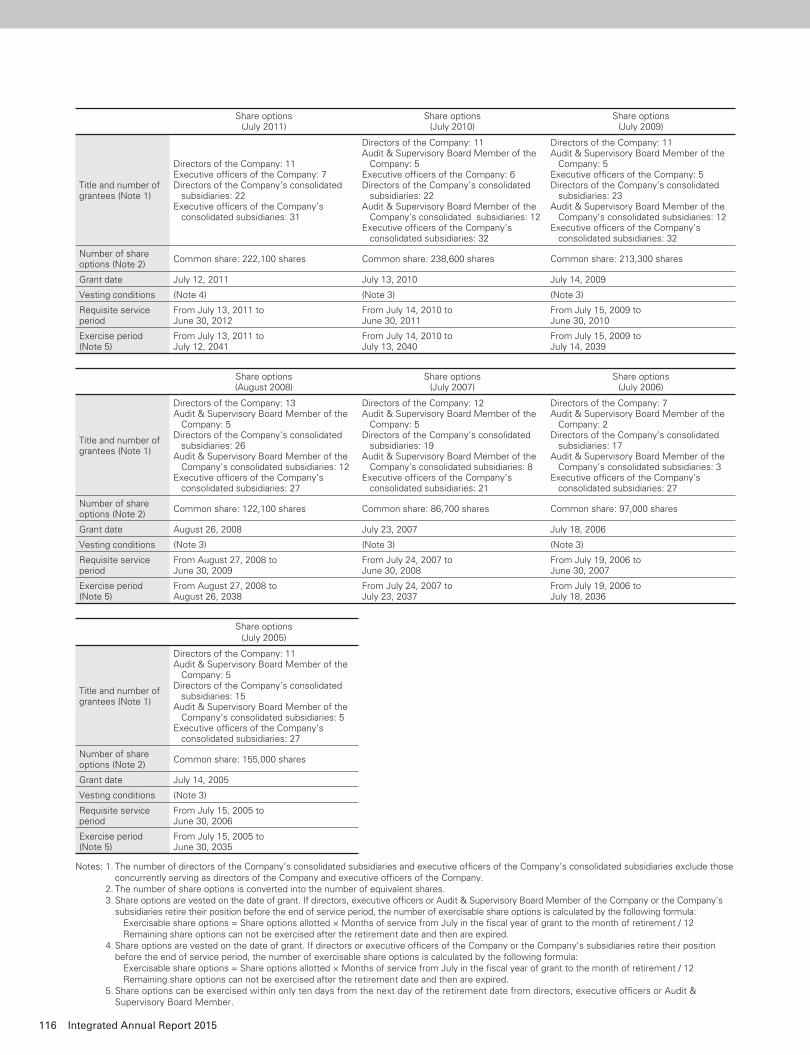
Share options(July 2011)
Share options(July 2010)
Share options(July 2009)
Title and number of grantees (Note 1)
Directors of the Company: 11Executive offi cers of the Company: 7Directors of the Company’s consolidated subsidiaries: 22Executive offi cers of the Company’s consolidated subsidiaries: 31
Directors of the Company: 11Audit & Supervisory Board Member of the Company: 5Executive offi cers of the Company: 6Directors of the Company’s consolidated subsidiaries: 22Audit & Supervisory Board Member of the Company’s consolidated subsidiaries: 12Executive offi cers of the Company’s consolidated subsidiaries: 32
Directors of the Company: 11Audit & Supervisory Board Member of the Company: 5Executive offi cers of the Company: 5Directors of the Company’s consolidated subsidiaries: 23Audit & Supervisory Board Member of the Company’s consolidated subsidiaries: 12Executive offi cers of the Company’s consolidated subsidiaries: 32
Number of share options (Note 2)
Common share: 222,100 shares Common share: 238,600 shares Common share: 213,300 shares
Grant date July 12, 2011 July 13, 2010 July 14, 2009
Vesting conditions (Note 4) (Note 3) (Note 3)
Requisite service period
From July 13, 2011 to June 30, 2012
From July 14, 2010 to June 30, 2011
From July 15, 2009 to June 30, 2010
Exercise period (Note 5)
From July 13, 2011 to July 12, 2041
From July 14, 2010 to July 13, 2040
From July 15, 2009 to July 14, 2039
Share options(August 2008)
Share options(July 2007)
Share options(July 2006)
Title and number of grantees (Note 1)
Directors of the Company: 13Audit & Supervisory Board Member of the Company: 5Directors of the Company’s consolidated subsidiaries: 26Audit & Supervisory Board Member of the Company’s consolidated subsidiaries: 12Executive offi cers of the Company’s consolidated subsidiaries: 27
Directors of the Company: 12Audit & Supervisory Board Member of the Company: 5Directors of the Company’s consolidated subsidiaries: 19Audit & Supervisory Board Member of the Company’s consolidated subsidiaries: 8Executive offi cers of the Company’s consolidated subsidiaries: 21
Directors of the Company: 7Audit & Supervisory Board Member of the Company: 2Directors of the Company’s consolidated subsidiaries: 17Audit & Supervisory Board Member of the Company’s consolidated subsidiaries: 3Executive offi cers of the Company’s consolidated subsidiaries: 27
Number of share options (Note 2)
Common share: 122,100 shares Common share: 86,700 shares Common share: 97,000 shares
Grant date August 26, 2008 July 23, 2007 July 18, 2006
Vesting conditions (Note 3) (Note 3) (Note 3)
Requisite service period
From August 27, 2008 to June 30, 2009
From July 24, 2007 to June 30, 2008
From July 19, 2006 to June 30, 2007
Exercise period (Note 5)
From August 27, 2008 to August 26, 2038
From July 24, 2007 to July 23, 2037
From July 19, 2006 to July 18, 2036
Share options(July 2005)
Title and number of grantees (Note 1)
Directors of the Company: 11Audit & Supervisory Board Member of the Company: 5Directors of the Company’s consolidated subsidiaries: 15Audit & Supervisory Board Member of the Company’s consolidated subsidiaries: 5Executive offi cers of the Company’s consolidated subsidiaries: 27
Number of share options (Note 2)
Common share: 155,000 shares
Grant date July 14, 2005
Vesting conditions (Note 3)
Requisite service period
From July 15, 2005 to June 30, 2006
Exercise period (Note 5)
From July 15, 2005 to June 30, 2035
Notes: 1. The number of directors of the Company’s consolidated subsidiaries and executive offi cers of the Company’s consolidated subsidiaries exclude those concurrently serving as directors of the Company and executive offi cers of the Company.
2. The number of share options is converted into the number of equivalent shares. 3. Share options are vested on the date of grant. If directors, executive offi cers or Audit & Supervisory Board Member of the Company or the Company’s
subsidiaries retire their position before the end of service period, the number of exercisable share options is calculated by the following formula: Exercisable share options = Share options allotted × Months of service from July in the fi scal year of grant to the month of retirement / 12 Remaining share options can not be exercised after the retirement date and then are expired.
4. Share options are vested on the date of grant. If directors or executive offi cers of the Company or the Company’s subsidiaries retire their position before the end of service period, the number of exercisable share options is calculated by the following formula:
Exercisable share options = Share options allotted × Months of service from July in the fi scal year of grant to the month of retirement / 12 Remaining share options can not be exercised after the retirement date and then are expired.
5. Share options can be exercised within only ten days from the next day of the retirement date from directors, executive offi cers or Audit & Supervisory Board Member.
116 Integrated Annual Report 2015
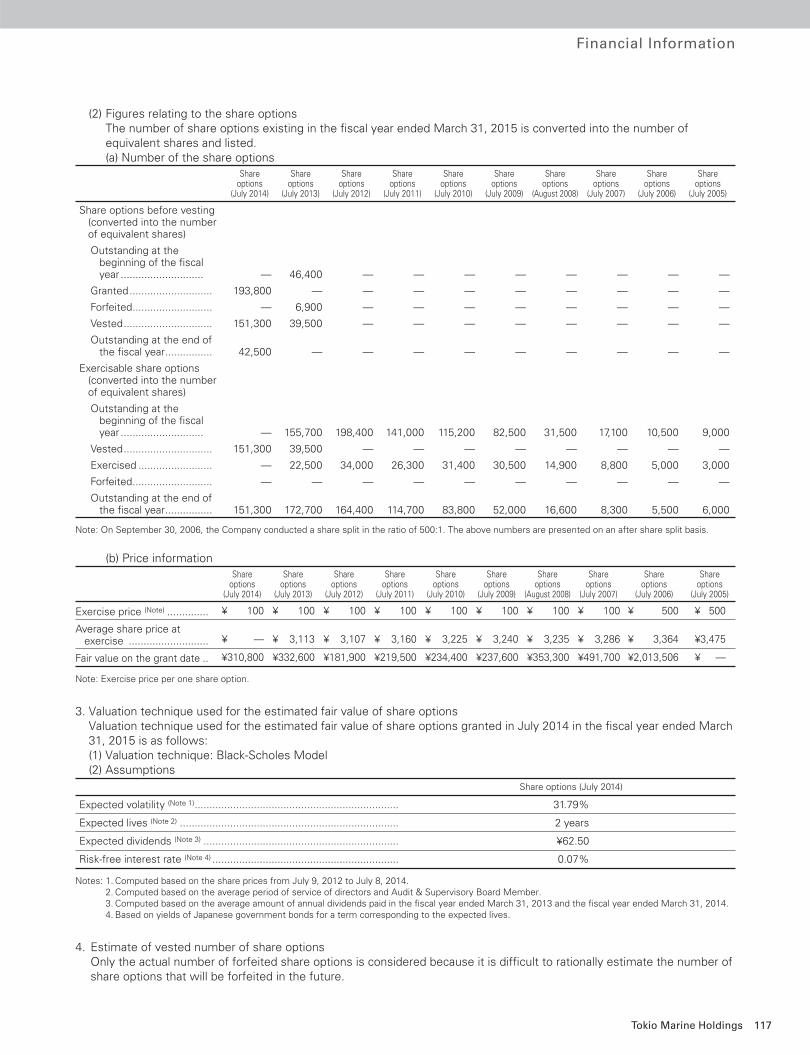
Financial Information
(2) Figures relating to the share optionsThe number of share options existing in the fi scal year ended March 31, 2015 is converted into the number of equivalent shares and listed.(a) Number of the share options
Shareoptions
(July 2014)
Shareoptions
(July 2013)
Shareoptions
(July 2012)
Shareoptions
(July 2011)
Shareoptions
(July 2010)
Shareoptions
(July 2009)
Shareoptions
(August 2008)
Shareoptions
(July 2007)
Shareoptions
(July 2006)
Shareoptions
(July 2005)
Share options before vesting (converted into the number
of equivalent shares)
Outstanding at the beginning of the fi scal
year ............................ — 46,400 — — — — — — — —
Granted ............................ 193,800 — — — — — — — — —
Forfeited ........................... — 6,900 — — — — — — — —
Vested .............................. 151,300 39,500 — — — — — — — —
Outstanding at the end of the fi scal year ................ 42,500 — — — — — — — — —
Exercisable share options (converted into the number
of equivalent shares)
Outstanding at the beginning of the fi scal
year ............................ — 155,700 198,400 141,000 115,200 82,500 31,500 17,100 10,500 9,000
Vested .............................. 151,300 39,500 — — — — — — — —
Exercised ......................... — 22,500 34,000 26,300 31,400 30,500 14,900 8,800 5,000 3,000
Forfeited ........................... — — — — — — — — — —
Outstanding at the end of the fi scal year ................ 151,300 172,700 164,400 114,700 83,800 52,000 16,600 8,300 5,500 6,000
Note: On September 30, 2006, the Company conducted a share split in the ratio of 500:1. The above numbers are presented on an after share split basis.
(b) Price informationShare
options (July 2014)
Shareoptions
(July 2013)
Shareoptions
(July 2012)
Shareoptions
(July 2011)
Shareoptions
(July 2010)
Shareoptions
(July 2009)
Shareoptions
(August 2008)
Shareoptions
(July 2007)
Shareoptions
(July 2006)
Shareoptions
(July 2005)
Exercise price (Note) .............. ¥ 100 ¥ 100 ¥ 100 ¥ 100 ¥ 100 ¥ 100 ¥ 100 ¥ 100 ¥ 500 ¥ 500
Average share price at exercise ........................... ¥ — ¥ 3,113 ¥ 3,107 ¥ 3,160 ¥ 3,225 ¥ 3,240 ¥ 3,235 ¥ 3,286 ¥ 3,364 ¥3,475
Fair value on the grant date .. ¥310,800 ¥332,600 ¥181,900 ¥219,500 ¥234,400 ¥237,600 ¥353,300 ¥491,700 ¥2,013,506 ¥ —
Note: Exercise price per one share option.
3. Valuation technique used for the estimated fair value of share optionsValuation technique used for the estimated fair value of share options granted in July 2014 in the fi scal year ended March 31, 2015 is as follows:(1) Valuation technique: Black-Scholes Model(2) Assumptions
Share options (July 2014)
Expected volatility (Note 1) ..................................................................... 31.79%
Expected lives (Note 2) .......................................................................... 2 years
Expected dividends (Note 3) .................................................................. ¥62.50
Risk-free interest rate (Note 4) ............................................................... 0.07%
Notes: 1. Computed based on the share prices from July 9, 2012 to July 8, 2014. 2. Computed based on the average period of service of directors and Audit & Supervisory Board Member. 3. Computed based on the average amount of annual dividends paid in the fi scal year ended March 31, 2013 and the fi scal year ended March 31, 2014. 4. Based on yields of Japanese government bonds for a term corresponding to the expected lives.
4. Estimate of vested number of share options Only the actual number of forfeited share options is considered because it is diffi cult to rationally estimate the number of share options that will be forfeited in the future.
117Tokio Marine Holdings
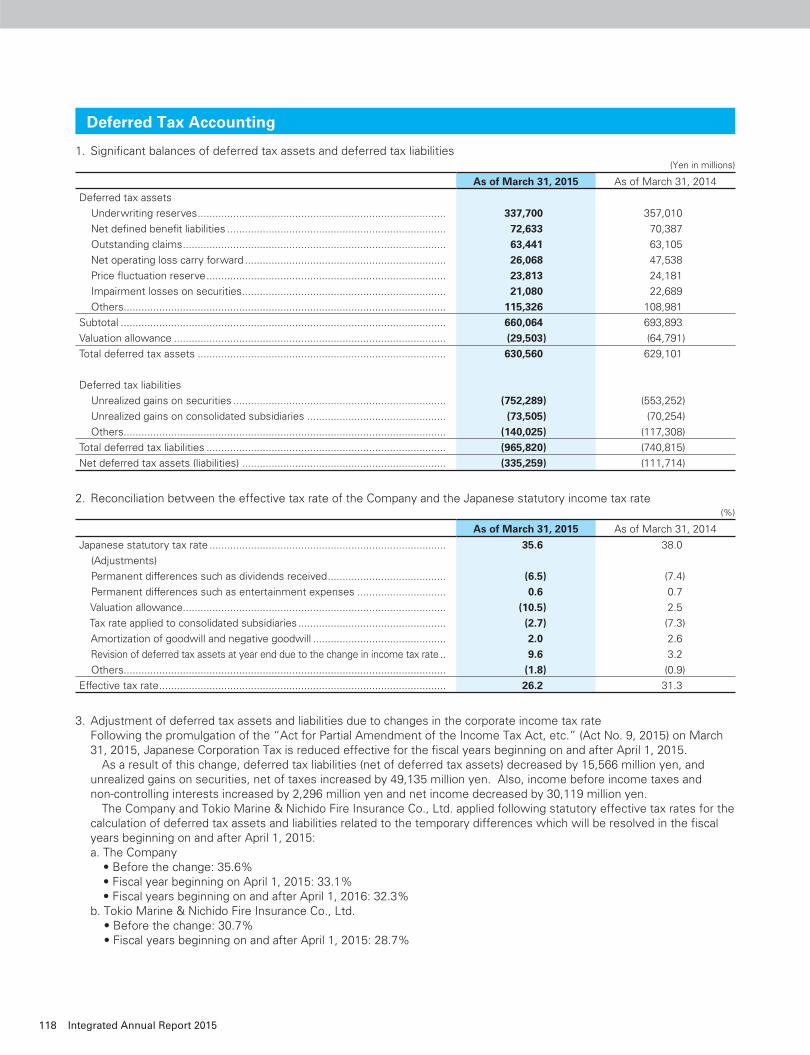
1. Signifi cant balances of deferred tax assets and deferred tax liabilities (Yen in millions)
As of March 31, 2015 As of March 31, 2014
Deferred tax assets
Underwriting reserves .................................................................................... 337,700 357,010
Net defi ned benefi t liabilities .......................................................................... 72,633 70,387
Outstanding claims ......................................................................................... 63,441 63,105
Net operating loss carry forward .................................................................... 26,068 47,538
Price fl uctuation reserve ................................................................................. 23,813 24,181
Impairment losses on securities ..................................................................... 21,080 22,689
Others ............................................................................................................. 115,326 108,981
Subtotal .............................................................................................................. 660,064 693,893
Valuation allowance ............................................................................................ (29,503) (64,791)
Total deferred tax assets .................................................................................... 630,560 629,101
Deferred tax liabilities
Unrealized gains on securities ........................................................................ (752,289) (553,252)
Unrealized gains on consolidated subsidiaries ............................................... (73,505) (70,254)
Others ............................................................................................................. (140,025) (117,308)
Total deferred tax liabilities ................................................................................. (965,820) (740,815)
Net deferred tax assets (liabilities) ..................................................................... (335,259) (111,714)
2. Reconciliation between the effective tax rate of the Company and the Japanese statutory income tax rate (%)
As of March 31, 2015 As of March 31, 2014
Japanese statutory tax rate ................................................................................ 35.6 38.0
(Adjustments)
Permanent differences such as dividends received ........................................ (6.5) (7.4)
Permanent differences such as entertainment expenses .............................. 0.6 0.7
Valuation allowance ......................................................................................... (10.5) 2.5
Tax rate applied to consolidated subsidiaries .................................................. (2.7) (7.3)
Amortization of goodwill and negative goodwill ............................................. 2.0 2.6
Revision of deferred tax assets at year end due to the change in income tax rate .. 9.6 3.2
Others ............................................................................................................. (1.8) (0.9)
Effective tax rate ................................................................................................. 26.2 31.3
3. Adjustment of deferred tax assets and liabilities due to changes in the corporate income tax rate Following the promulgation of the “Act for Partial Amendment of the Income Tax Act, etc.” (Act No. 9, 2015) on March
31, 2015, Japanese Corporation Tax is reduced effective for the fi scal years beginning on and after April 1, 2015. As a result of this change, deferred tax liabilities (net of deferred tax assets) decreased by 15,566 million yen, and unrealized gains on securities, net of taxes increased by 49,135 million yen. Also, income before income taxes and non-controlling interests increased by 2,296 million yen and net income decreased by 30,119 million yen. The Company and Tokio Marine & Nichido Fire Insurance Co., Ltd. applied following statutory effective tax rates for the calculation of deferred tax assets and liabilities related to the temporary differences which will be resolved in the fi scal years beginning on and after April 1, 2015:a. The Company
• Before the change: 35.6%• Fiscal year beginning on April 1, 2015: 33.1%• Fiscal years beginning on and after April 1, 2016: 32.3%
b. Tokio Marine & Nichido Fire Insurance Co., Ltd.• Before the change: 30.7%• Fiscal years beginning on and after April 1, 2015: 28.7%
Deferred Tax Accounting
118 Integrated Annual Report 2015
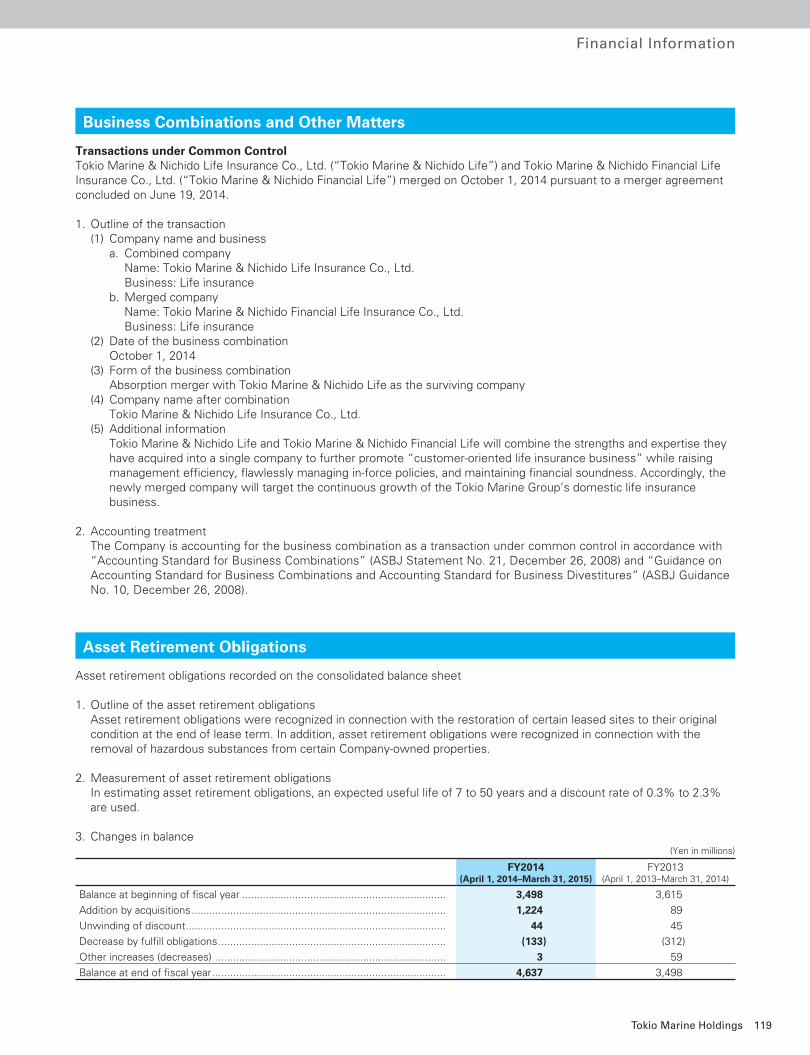
Financial Information
Transactions under Common ControlTokio Marine & Nichido Life Insurance Co., Ltd. (“Tokio Marine & Nichido Life”) and Tokio Marine & Nichido Financial Life Insurance Co., Ltd. (“Tokio Marine & Nichido Financial Life”) merged on October 1, 2014 pursuant to a merger agreement concluded on June 19, 2014.
1. Outline of the transaction(1) Company name and business
a. Combined company Name: Tokio Marine & Nichido Life Insurance Co., Ltd. Business: Life insuranceb. Merged company Name: Tokio Marine & Nichido Financial Life Insurance Co., Ltd. Business: Life insurance
(2) Date of the business combination October 1, 2014(3) Form of the business combination Absorption merger with Tokio Marine & Nichido Life as the surviving company(4) Company name after combination Tokio Marine & Nichido Life Insurance Co., Ltd.(5) Additional information Tokio Marine & Nichido Life and Tokio Marine & Nichido Financial Life will combine the strengths and expertise they
have acquired into a single company to further promote “customer-oriented life insurance business” while raising management effi ciency, fl awlessly managing in-force policies, and maintaining fi nancial soundness. Accordingly, the newly merged company will target the continuous growth of the Tokio Marine Group’s domestic life insurance business.
2. Accounting treatment The Company is accounting for the business combination as a transaction under common control in accordance with
“Accounting Standard for Business Combinations” (ASBJ Statement No. 21, December 26, 2008) and “Guidance on Accounting Standard for Business Combinations and Accounting Standard for Business Divestitures” (ASBJ Guidance No. 10, December 26, 2008).
Asset retirement obligations recorded on the consolidated balance sheet
1. Outline of the asset retirement obligations Asset retirement obligations were recognized in connection with the restoration of certain leased sites to their original
condition at the end of lease term. In addition, asset retirement obligations were recognized in connection with the removal of hazardous substances from certain Company-owned properties.
2. Measurement of asset retirement obligations In estimating asset retirement obligations, an expected useful life of 7 to 50 years and a discount rate of 0.3% to 2.3%
are used.
3. Changes in balance (Yen in millions)
FY2014(April 1, 2014–March 31, 2015)
FY2013(April 1, 2013–March 31, 2014)
Balance at beginning of fi scal year ..................................................................... 3,498 3,615
Addition by acquisitions ...................................................................................... 1,224 89
Unwinding of discount ........................................................................................ 44 45
Decrease by fulfi ll obligations ............................................................................. (133) (312)
Other increases (decreases) .............................................................................. 3 59
Balance at end of fi scal year ............................................................................... 4,637 3,498
Business Combinations and Other Matters
Asset Retirement Obligations
119Tokio Marine Holdings
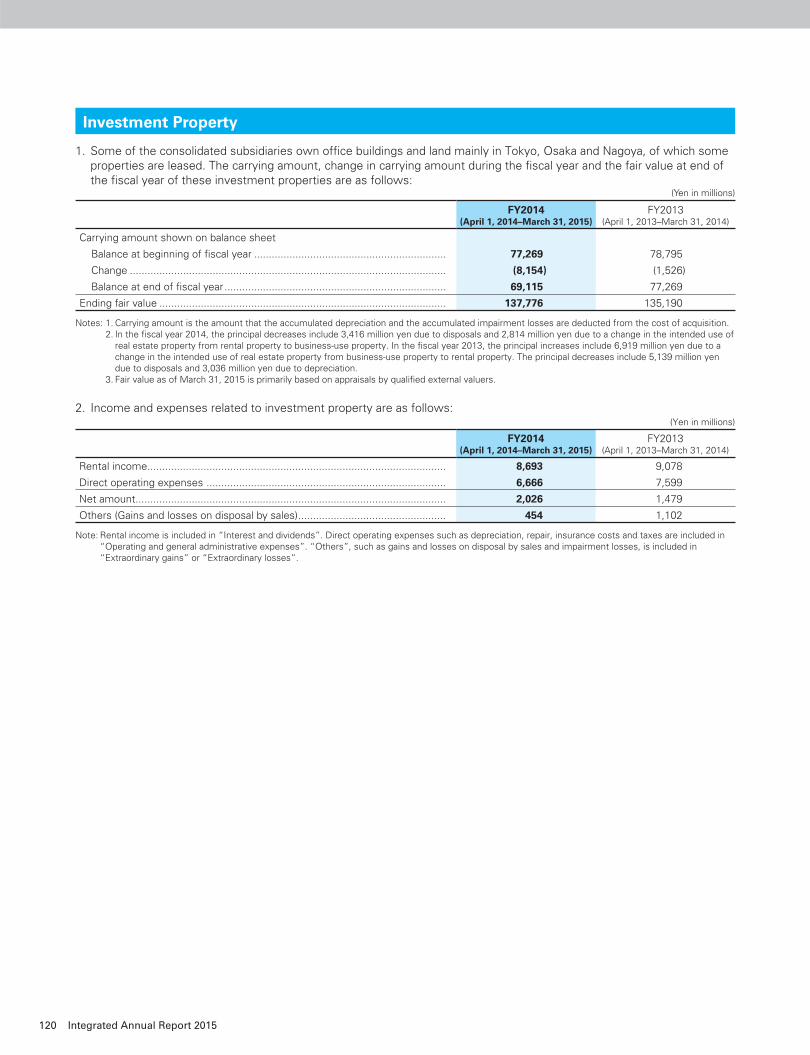
1. Some of the consolidated subsidiaries own offi ce buildings and land mainly in Tokyo, Osaka and Nagoya, of which some properties are leased. The carrying amount, change in carrying amount during the fi scal year and the fair value at end of the fi scal year of these investment properties are as follows:
(Yen in millions)
FY2014(April 1, 2014–March 31, 2015)
FY2013(April 1, 2013–March 31, 2014)
Carrying amount shown on balance sheet
Balance at beginning of fi scal year ................................................................. 77,269 78,795
Change ........................................................................................................... (8,154) (1,526)
Balance at end of fi scal year ........................................................................... 69,115 77,269
Ending fair value ................................................................................................. 137,776 135,190
Notes: 1. Carrying amount is the amount that the accumulated depreciation and the accumulated impairment losses are deducted from the cost of acquisition. 2. In the fi scal year 2014, the principal decreases include 3,416 million yen due to disposals and 2,814 million yen due to a change in the intended use of
real estate property from rental property to business-use property. In the fi scal year 2013, the principal increases include 6,919 million yen due to a change in the intended use of real estate property from business-use property to rental property. The principal decreases include 5,139 million yen due to disposals and 3,036 million yen due to depreciation.
3. Fair value as of March 31, 2015 is primarily based on appraisals by qualifi ed external valuers.
2. Income and expenses related to investment property are as follows: (Yen in millions)
FY2014(April 1, 2014–March 31, 2015)
FY2013(April 1, 2013–March 31, 2014)
Rental income ..................................................................................................... 8,693 9,078
Direct operating expenses ................................................................................. 6,666 7,599
Net amount ......................................................................................................... 2,026 1,479
Others (Gains and losses on disposal by sales) .................................................. 454 1,102
Note: Rental income is included in “Interest and dividends”. Direct operating expenses such as depreciation, repair, insurance costs and taxes are included in “Operating and general administrative expenses”. “Others”, such as gains and losses on disposal by sales and impairment losses, is included in “Extraordinary gains” or “Extraordinary losses”.
Investment Property
120 Integrated Annual Report 2015
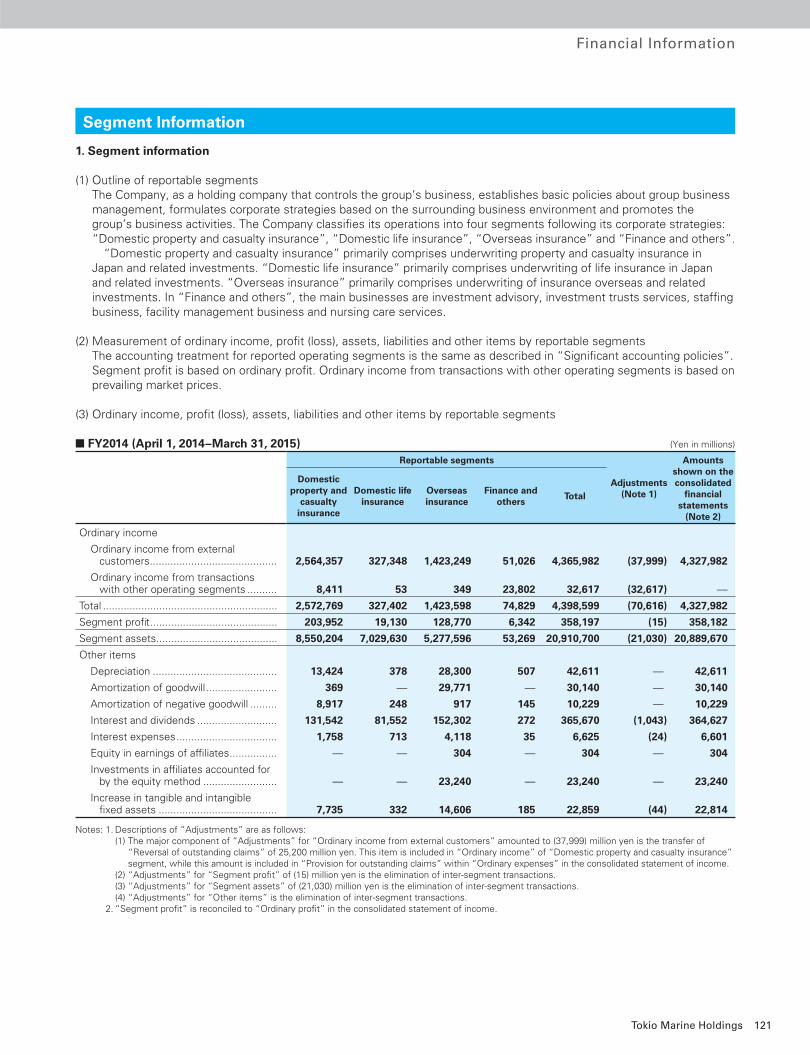
Financial Information
1. Segment information
(1) Outline of reportable segmentsThe Company, as a holding company that controls the group’s business, establishes basic policies about group business management, formulates corporate strategies based on the surrounding business environment and promotes the group’s business activities. The Company classifi es its operations into four segments following its corporate strategies: “Domestic property and casualty insurance”, “Domestic life insurance”, “Overseas insurance” and “Finance and others”. “Domestic property and casualty insurance” primarily comprises underwriting property and casualty insurance in Japan and related investments. “Domestic life insurance” primarily comprises underwriting of life insurance in Japan and related investments. “Overseas insurance” primarily comprises underwriting of insurance overseas and related investments. In “Finance and others”, the main businesses are investment advisory, investment trusts services, staffi ng business, facility management business and nursing care services.
(2) Measurement of ordinary income, profi t (loss), assets, liabilities and other items by reportable segments The accounting treatment for reported operating segments is the same as described in “Signifi cant accounting policies”. Segment profi t is based on ordinary profi t. Ordinary income from transactions with other operating segments is based on prevailing market prices.
(3) Ordinary income, profi t (loss), assets, liabilities and other items by reportable segments
■ FY2014 (April 1, 2014–March 31, 2015) (Yen in millions)
Reportable segments
Adjustments (Note 1)
Amounts shown on the consolidated
fi nancial statements
(Note 2)
Domestic property and
casualty insurance
Domestic life insurance
Overseas insurance
Finance and others
Total
Ordinary income
Ordinary income from external customers ........................................... 2,564,357 327,348 1,423,249 51,026 4,365,982 (37,999) 4,327,982
Ordinary income from transactions with other operating segments .......... 8,411 53 349 23,802 32,617 (32,617) —
Total ........................................................... 2,572,769 327,402 1,423,598 74,829 4,398,599 (70,616) 4,327,982
Segment profi t ........................................... 203,952 19,130 128,770 6,342 358,197 (15) 358,182
Segment assets ......................................... 8,550,204 7,029,630 5,277,596 53,269 20,910,700 (21,030) 20,889,670
Other items
Depreciation .......................................... 13,424 378 28,300 507 42,611 — 42,611
Amortization of goodwill ........................ 369 — 29,771 — 30,140 — 30,140
Amortization of negative goodwill ......... 8,917 248 917 145 10,229 — 10,229
Interest and dividends ........................... 131,542 81,552 152,302 272 365,670 (1,043) 364,627
Interest expenses .................................. 1,758 713 4,118 35 6,625 (24) 6,601
Equity in earnings of affi liates ................ — — 304 — 304 — 304
Investments in affi liates accounted for by the equity method ......................... — — 23,240 — 23,240 — 23,240
Increase in tangible and intangible fi xed assets ........................................ 7,735 332 14,606 185 22,859 (44) 22,814
Notes: 1. Descriptions of “Adjustments” are as follows: (1) The major component of “Adjustments” for “Ordinary income from external customers” amounted to (37,999) million yen is the transfer of
“Reversal of outstanding claims” of 25,200 million yen. This item is included in “Ordinary income” of “Domestic property and casualty insurance” segment, while this amount is included in “Provision for outstanding claims” within “Ordinary expenses” in the consolidated statement of income.
(2) “Adjustments” for “Segment profi t” of (15) million yen is the elimination of inter-segment transactions. (3) “Adjustments” for “Segment assets” of (21,030) million yen is the elimination of inter-segment transactions. (4) “Adjustments” for “Other items” is the elimination of inter-segment transactions. 2. “Segment profi t” is reconciled to “Ordinary profi t” in the consolidated statement of income.
Segment Information
121Tokio Marine Holdings
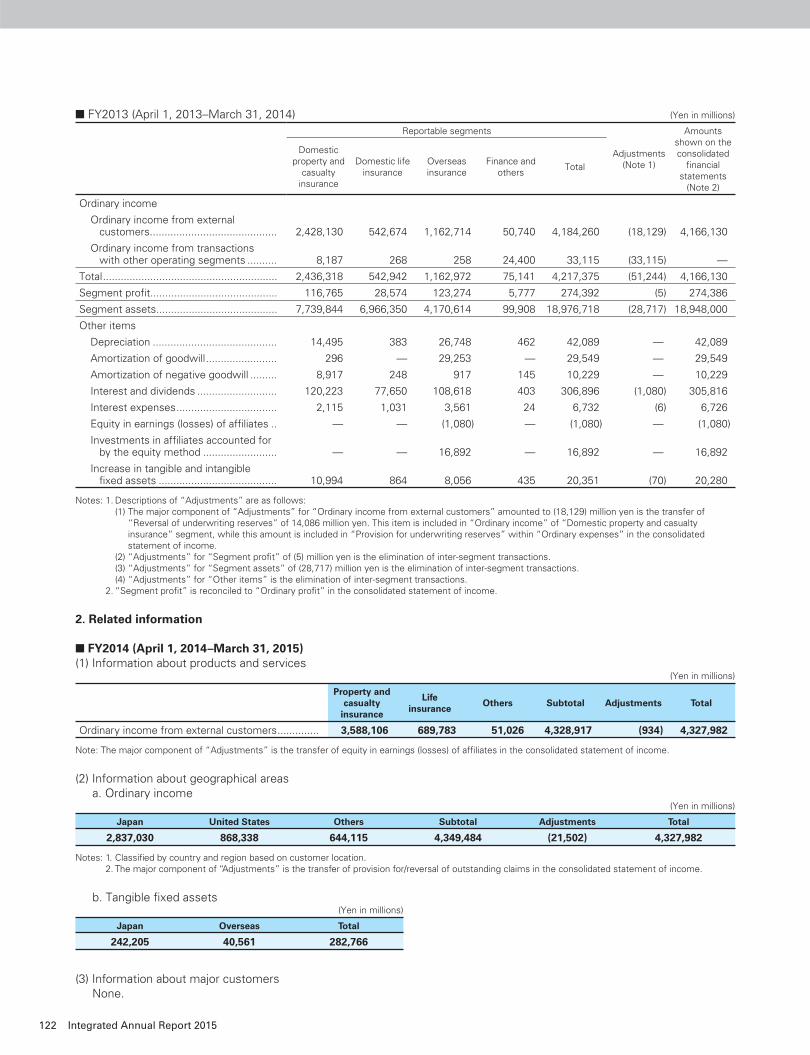
■ FY2013 (April 1, 2013–March 31, 2014) (Yen in millions)
Reportable segments
Adjustments (Note 1)
Amounts shown on the consolidated
fi nancial statements
(Note 2)
Domestic property and
casualty insurance
Domestic life insurance
Overseas insurance
Finance and others
Total
Ordinary income
Ordinary income from external customers ........................................... 2,428,130 542,674 1,162,714 50,740 4,184,260 (18,129) 4,166,130
Ordinary income from transactions with other operating segments .......... 8,187 268 258 24,400 33,115 (33,115) —
Total ........................................................... 2,436,318 542,942 1,162,972 75,141 4,217,375 (51,244) 4,166,130
Segment profi t ........................................... 116,765 28,574 123,274 5,777 274,392 (5) 274,386
Segment assets ......................................... 7,739,844 6,966,350 4,170,614 99,908 18,976,718 (28,717) 18,948,000
Other items
Depreciation .......................................... 14,495 383 26,748 462 42,089 — 42,089
Amortization of goodwill ........................ 296 — 29,253 — 29,549 — 29,549
Amortization of negative goodwill ......... 8,917 248 917 145 10,229 — 10,229
Interest and dividends ........................... 120,223 77,650 108,618 403 306,896 (1,080) 305,816
Interest expenses .................................. 2,115 1,031 3,561 24 6,732 (6) 6,726
Equity in earnings (losses) of affi liates .. — — (1,080) — (1,080) — (1,080)
Investments in affi liates accounted for by the equity method ......................... — — 16,892 — 16,892 — 16,892
Increase in tangible and intangible fi xed assets ........................................ 10,994 864 8,056 435 20,351 (70) 20,280
Notes: 1. Descriptions of “Adjustments” are as follows: (1) The major component of “Adjustments” for “Ordinary income from external customers” amounted to (18,129) million yen is the transfer of
“Reversal of underwriting reserves” of 14,086 million yen. This item is included in “Ordinary income” of “Domestic property and casualty insurance” segment, while this amount is included in “Provision for underwriting reserves” within “Ordinary expenses” in the consolidated statement of income.
(2) “Adjustments” for “Segment profi t” of (5) million yen is the elimination of inter-segment transactions. (3) “Adjustments” for “Segment assets” of (28,717) million yen is the elimination of inter-segment transactions. (4) “Adjustments” for “Other items” is the elimination of inter-segment transactions. 2. “Segment profi t” is reconciled to “Ordinary profi t” in the consolidated statement of income.
2. Related information
■ FY2014 (April 1, 2014–March 31, 2015)(1) Information about products and services (Yen in millions)
Property and casualty
insurance
Life insurance
Others Subtotal Adjustments Total
Ordinary income from external customers .............. 3,588,106 689,783 51,026 4,328,917 (934) 4,327,982
Note: The major component of “Adjustments” is the transfer of equity in earnings (losses) of affi liates in the consolidated statement of income.
(2) Information about geographical areasa. Ordinary income (Yen in millions)
Japan United States Others Subtotal Adjustments Total
2,837,030 868,338 644,115 4,349,484 (21,502) 4,327,982
Notes: 1. Classifi ed by country and region based on customer location. 2. The major component of “Adjustments” is the transfer of provision for/reversal of outstanding claims in the consolidated statement of income.
b. Tangible fi xed assets (Yen in millions)
Japan Overseas Total
242,205 40,561 282,766
(3) Information about major customersNone.
122 Integrated Annual Report 2015
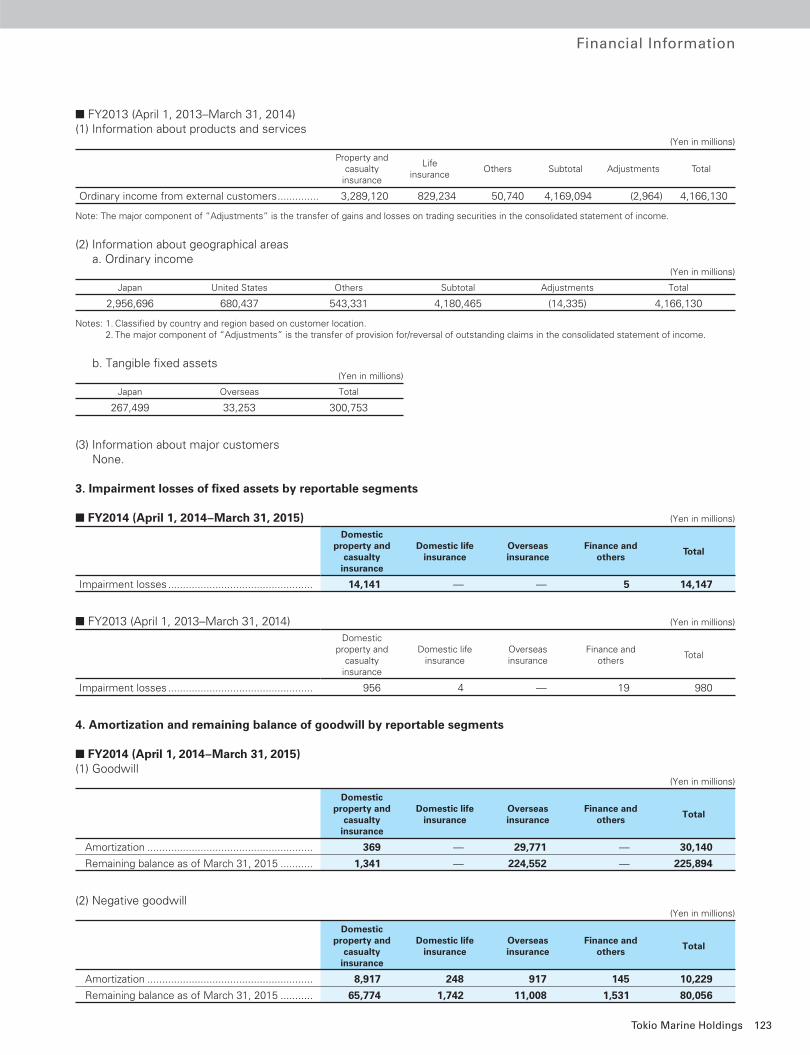
Financial Information
■ FY2013 (April 1, 2013–March 31, 2014)(1) Information about products and services (Yen in millions)
Property and casualty
insurance
Life insurance
Others Subtotal Adjustments Total
Ordinary income from external customers .............. 3,289,120 829,234 50,740 4,169,094 (2,964) 4,166,130
Note: The major component of “Adjustments” is the transfer of gains and losses on trading securities in the consolidated statement of income.
(2) Information about geographical areasa. Ordinary income (Yen in millions)
Japan United States Others Subtotal Adjustments Total
2,956,696 680,437 543,331 4,180,465 (14,335) 4,166,130
Notes: 1. Classifi ed by country and region based on customer location. 2. The major component of “Adjustments” is the transfer of provision for/reversal of outstanding claims in the consolidated statement of income.
b. Tangible fi xed assets (Yen in millions)
Japan Overseas Total
267,499 33,253 300,753
(3) Information about major customersNone.
3. Impairment losses of fi xed assets by reportable segments
■ FY2014 (April 1, 2014–March 31, 2015) (Yen in millions)
Domestic property and
casualty insurance
Domestic life insurance
Overseas insurance
Finance and others
Total
Impairment losses ................................................. 14,141 — — 5 14,147
■ FY2013 (April 1, 2013–March 31, 2014) (Yen in millions)
Domestic property and
casualty insurance
Domestic life insurance
Overseas insurance
Finance and others
Total
Impairment losses ................................................. 956 4 — 19 980
4. Amortization and remaining balance of goodwill by reportable segments
■ FY2014 (April 1, 2014–March 31, 2015)(1) Goodwill (Yen in millions)
Domestic property and
casualty insurance
Domestic life insurance
Overseas insurance
Finance and others
Total
Amortization ........................................................ 369 — 29,771 — 30,140
Remaining balance as of March 31, 2015 ........... 1,341 — 224,552 — 225,894
(2) Negative goodwill (Yen in millions)
Domestic property and
casualty insurance
Domestic life insurance
Overseas insurance
Finance and others
Total
Amortization ........................................................ 8,917 248 917 145 10,229
Remaining balance as of March 31, 2015 ........... 65,774 1,742 11,008 1,531 80,056
123Tokio Marine Holdings
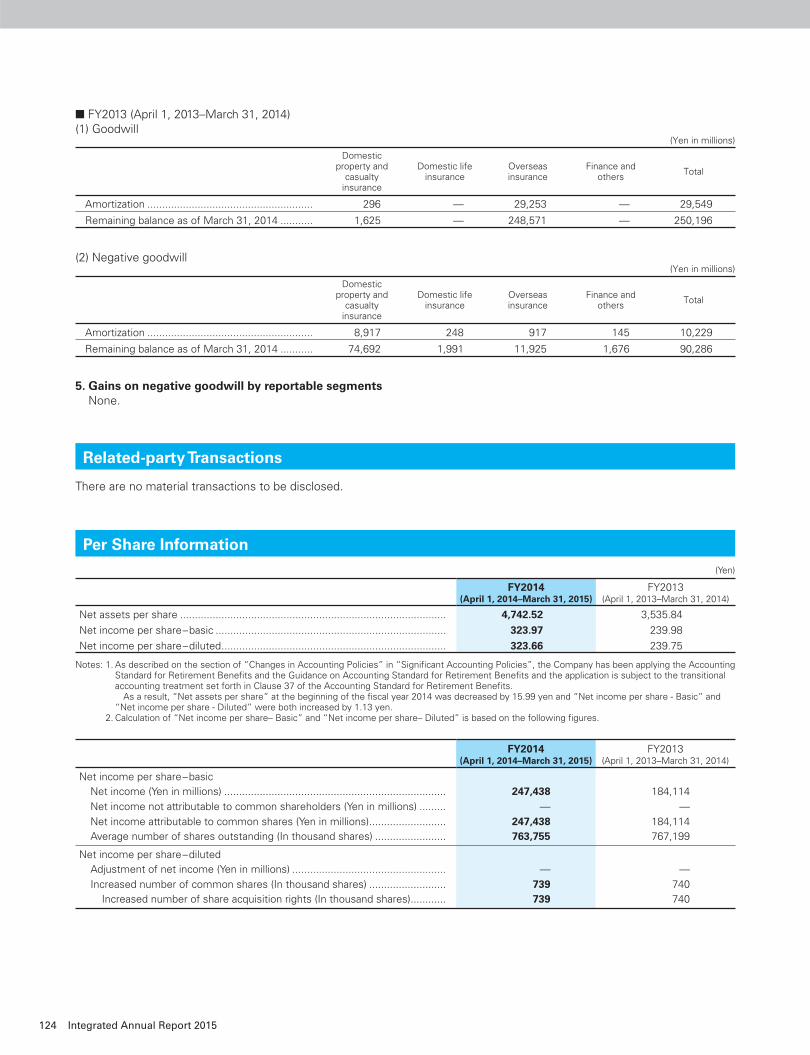
■ FY2013 (April 1, 2013–March 31, 2014)(1) Goodwill (Yen in millions)
Domestic property and
casualty insurance
Domestic life insurance
Overseas insurance
Finance and others
Total
Amortization ........................................................ 296 — 29,253 — 29,549
Remaining balance as of March 31, 2014 ........... 1,625 — 248,571 — 250,196
(2) Negative goodwill (Yen in millions)
Domestic property and
casualty insurance
Domestic life insurance
Overseas insurance
Finance and others
Total
Amortization ........................................................ 8,917 248 917 145 10,229
Remaining balance as of March 31, 2014 ........... 74,692 1,991 11,925 1,676 90,286
5. Gains on negative goodwill by reportable segmentsNone.
There are no material transactions to be disclosed.
(Yen)
FY2014(April 1, 2014–March 31, 2015)
FY2013(April 1, 2013–March 31, 2014)
Net assets per share .......................................................................................... 4,742.52 3,535.84
Net income per share–basic .............................................................................. 323.97 239.98
Net income per share–diluted ............................................................................ 323.66 239.75
Notes: 1. As described on the section of “Changes in Accounting Policies” in “Signifi cant Accounting Policies”, the Company has been applying the Accounting Standard for Retirement Benefi ts and the Guidance on Accounting Standard for Retirement Benefi ts and the application is subject to the transitional accounting treatment set forth in Clause 37 of the Accounting Standard for Retirement Benefi ts.
As a result, “Net assets per share” at the beginning of the fi scal year 2014 was decreased by 15.99 yen and “Net income per share - Basic” and “Net income per share - Diluted” were both increased by 1.13 yen.
2. Calculation of “Net income per share– Basic” and “Net income per share– Diluted” is based on the following fi gures.
FY2014(April 1, 2014–March 31, 2015)
FY2013(April 1, 2013–March 31, 2014)
Net income per share–basic
Net income (Yen in millions) ........................................................................... 247,438 184,114
Net income not attributable to common shareholders (Yen in millions) ......... — —
Net income attributable to common shares (Yen in millions) .......................... 247,438 184,114
Average number of shares outstanding (In thousand shares) ........................ 763,755 767,199
Net income per share–diluted
Adjustment of net income (Yen in millions) .................................................... — —
Increased number of common shares (In thousand shares) .......................... 739 740
Increased number of share acquisition rights (In thousand shares) ............ 739 740
Related-party Transactions
Per Share Information
124 Integrated Annual Report 2015
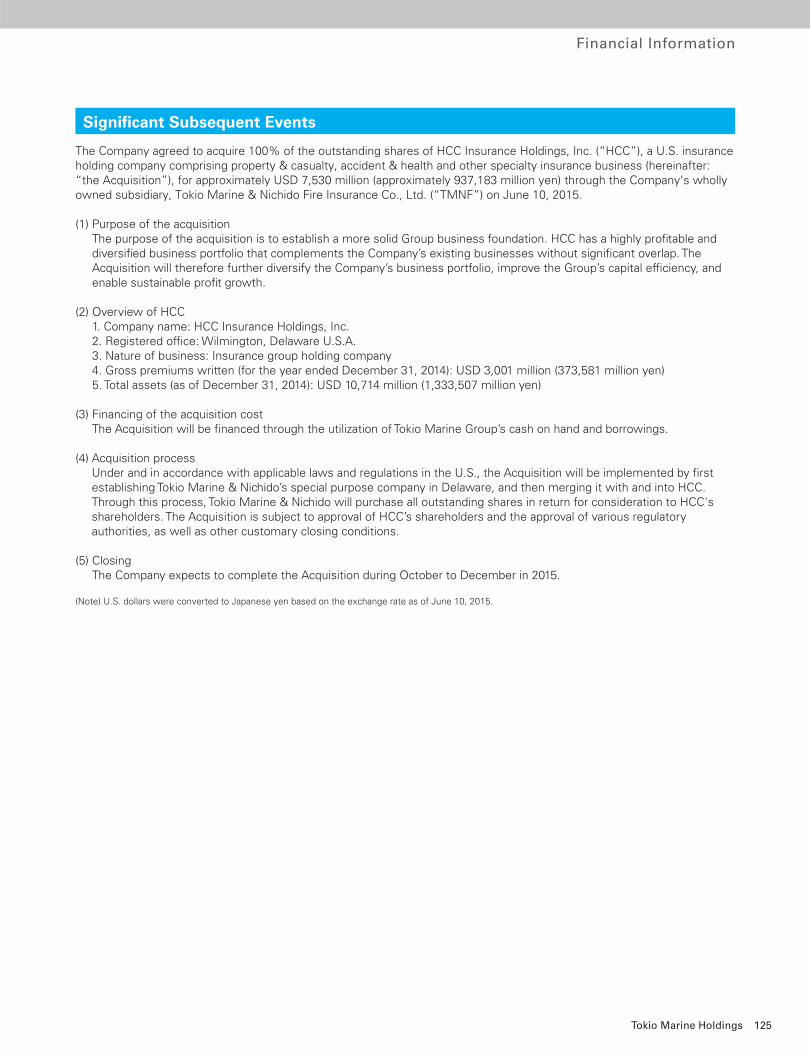
Financial Information
The Company agreed to acquire 100% of the outstanding shares of HCC Insurance Holdings, Inc. (“HCC”), a U.S. insurance holding company comprising property & casualty, accident & health and other specialty insurance business (hereinafter: “the Acquisition”), for approximately USD 7,530 million (approximately 937,183 million yen) through the Company’s wholly owned subsidiary, Tokio Marine & Nichido Fire Insurance Co., Ltd. (“TMNF”) on June 10, 2015.
(1) Purpose of the acquisitionThe purpose of the acquisition is to establish a more solid Group business foundation. HCC has a highly profi table and diversifi ed business portfolio that complements the Company’s existing businesses without signifi cant overlap. The Acquisition will therefore further diversify the Company’s business portfolio, improve the Group’s capital effi ciency, and enable sustainable profi t growth.
(2) Overview of HCC1. Company name: HCC Insurance Holdings, Inc.2. Registered offi ce: Wilmington, Delaware U.S.A.3. Nature of business: Insurance group holding company4. Gross premiums written (for the year ended December 31, 2014): USD 3,001 million (373,581 million yen)5. Total assets (as of December 31, 2014): USD 10,714 million (1,333,507 million yen)
(3) Financing of the acquisition costThe Acquisition will be fi nanced through the utilization of Tokio Marine Group’s cash on hand and borrowings.
(4) Acquisition processUnder and in accordance with applicable laws and regulations in the U.S., the Acquisition will be implemented by fi rst establishing Tokio Marine & Nichido’s special purpose company in Delaware, and then merging it with and into HCC. Through this process, Tokio Marine & Nichido will purchase all outstanding shares in return for consideration to HCC's shareholders. The Acquisition is subject to approval of HCC’s shareholders and the approval of various regulatory authorities, as well as other customary closing conditions.
(5) ClosingThe Company expects to complete the Acquisition during October to December in 2015.
(Note) U.S. dollars were converted to Japanese yen based on the exchange rate as of June 10, 2015.
Signifi cant Subsequent Events
125Tokio Marine Holdings
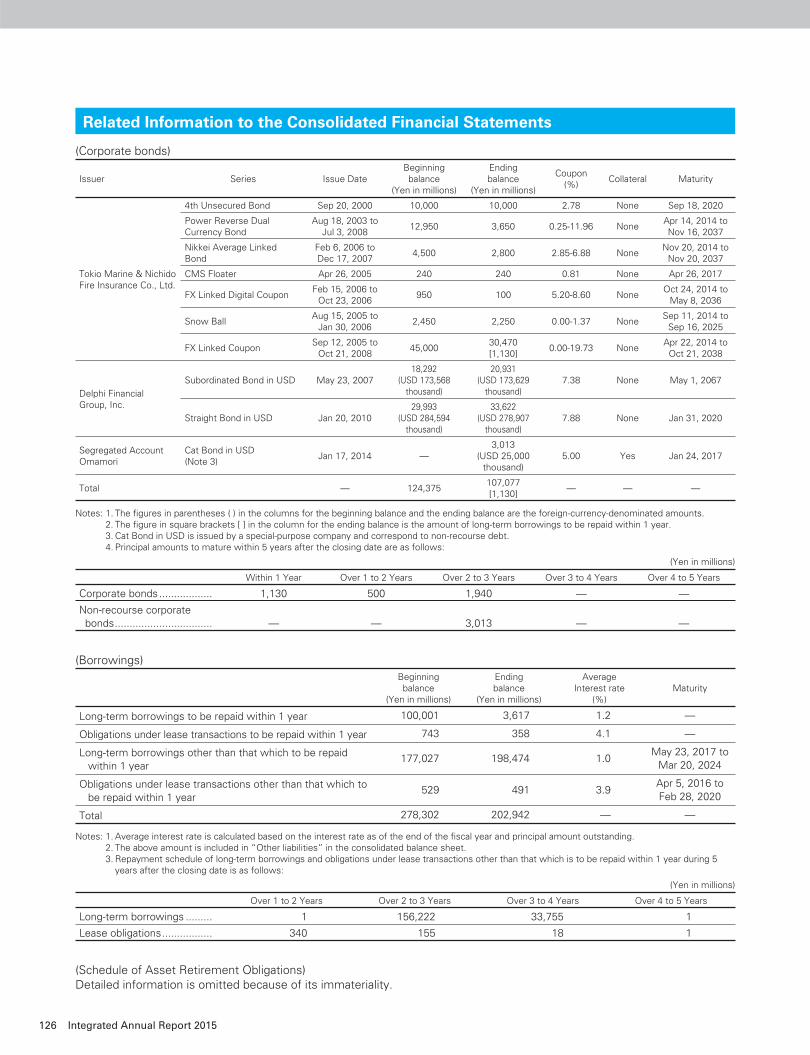
(Corporate bonds)
Issuer Series Issue DateBeginningbalance
(Yen in millions)
Ending balance
(Yen in millions)
Coupon(%)
Collateral Maturity
Tokio Marine & Nichido Fire Insurance Co., Ltd.
4th Unsecured Bond Sep 20, 2000 10,000 10,000 2.78 None Sep 18, 2020
Power Reverse Dual Currency Bond
Aug 18, 2003 toJul 3, 2008
12,950 3,650 0.25-11.96 NoneApr 14, 2014 toNov 16, 2037
Nikkei Average Linked Bond
Feb 6, 2006 toDec 17, 2007
4,500 2,800 2.85-6.88 NoneNov 20, 2014 to
Nov 20, 2037
CMS Floater Apr 26, 2005 240 240 0.81 None Apr 26, 2017
FX Linked Digital CouponFeb 15, 2006 to
Oct 23, 2006950 100 5.20-8.60 None
Oct 24, 2014 toMay 8, 2036
Snow BallAug 15, 2005 to
Jan 30, 20062,450 2,250 0.00-1.37 None
Sep 11, 2014 toSep 16, 2025
FX Linked CouponSep 12, 2005 to
Oct 21, 200845,000
30,470[1,130]
0.00-19.73 NoneApr 22, 2014 toOct 21, 2038
Delphi FinancialGroup, Inc.
Subordinated Bond in USD May 23, 200718,292
(USD 173,568 thousand)
20,931(USD 173,629
thousand)7.38 None May 1, 2067
Straight Bond in USD Jan 20, 201029,993
(USD 284,594 thousand)
33,622(USD 278,907
thousand)7.88 None Jan 31, 2020
Segregated Account Omamori
Cat Bond in USD(Note 3)
Jan 17, 2014 —3,013
(USD 25,000 thousand)
5.00 Yes Jan 24, 2017
Total — 124,375107,077[1,130]
— — —
Notes: 1. The fi gures in parentheses ( ) in the columns for the beginning balance and the ending balance are the foreign-currency-denominated amounts. 2. The fi gure in square brackets [ ] in the column for the ending balance is the amount of long-term borrowings to be repaid within 1 year. 3. Cat Bond in USD is issued by a special-purpose company and correspond to non-recourse debt. 4. Principal amounts to mature within 5 years after the closing date are as follows:
(Yen in millions)
Within 1 Year Over 1 to 2 Years Over 2 to 3 Years Over 3 to 4 Years Over 4 to 5 Years
Corporate bonds .................. 1,130 500 1,940 — —
Non-recourse corporate bonds ................................. — — 3,013 — —
(Borrowings)Beginningbalance
(Yen in millions)
Ending balance
(Yen in millions)
Average Interest rate
(%)Maturity
Long-term borrowings to be repaid within 1 year 100,001 3,617 1.2 —
Obligations under lease transactions to be repaid within 1 year 743 358 4.1 —
Long-term borrowings other than that which to be repaid within 1 year
177,027 198,474 1.0May 23, 2017 to
Mar 20, 2024
Obligations under lease transactions other than that which to be repaid within 1 year
529 491 3.9Apr 5, 2016 toFeb 28, 2020
Total 278,302 202,942 — —
Notes: 1. Average interest rate is calculated based on the interest rate as of the end of the fi scal year and principal amount outstanding. 2. The above amount is included in “Other liabilities” in the consolidated balance sheet. 3. Repayment schedule of long-term borrowings and obligations under lease transactions other than that which is to be repaid within 1 year during 5
years after the closing date is as follows:
(Yen in millions)
Over 1 to 2 Years Over 2 to 3 Years Over 3 to 4 Years Over 4 to 5 Years
Long-term borrowings ......... 1 156,222 33,755 1
Lease obligations ................. 340 155 18 1
(Schedule of Asset Retirement Obligations)Detailed information is omitted because of its immateriality.
Related Information to the Consolidated Financial Statements
126 Integrated Annual Report 2015
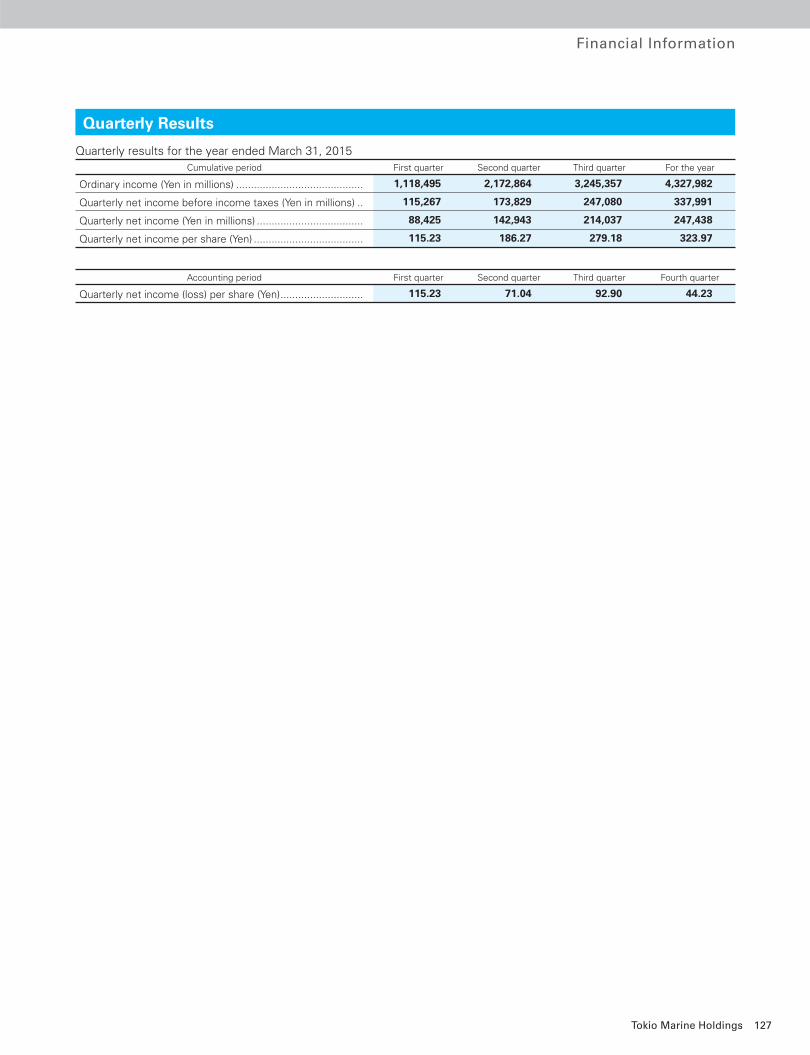
Financial Information
Quarterly results for the year ended March 31, 2015Cumulative period First quarter Second quarter Third quarter For the year
Ordinary income (Yen in millions) ........................................... 1,118,495 2,172,864 3,245,357 4,327,982
Quarterly net income before income taxes (Yen in millions) .. 115,267 173,829 247,080 337,991
Quarterly net income (Yen in millions) .................................... 88,425 142,943 214,037 247,438
Quarterly net income per share (Yen) ..................................... 115.23 186.27 279.18 323.97
Accounting period First quarter Second quarter Third quarter Fourth quarter
Quarterly net income (loss) per share (Yen) ............................ 115.23 71.04 92.90 44.23
Quarterly Results
127Tokio Marine Holdings
128 Integrated Annual Report 2015
Independent Auditor’s Report
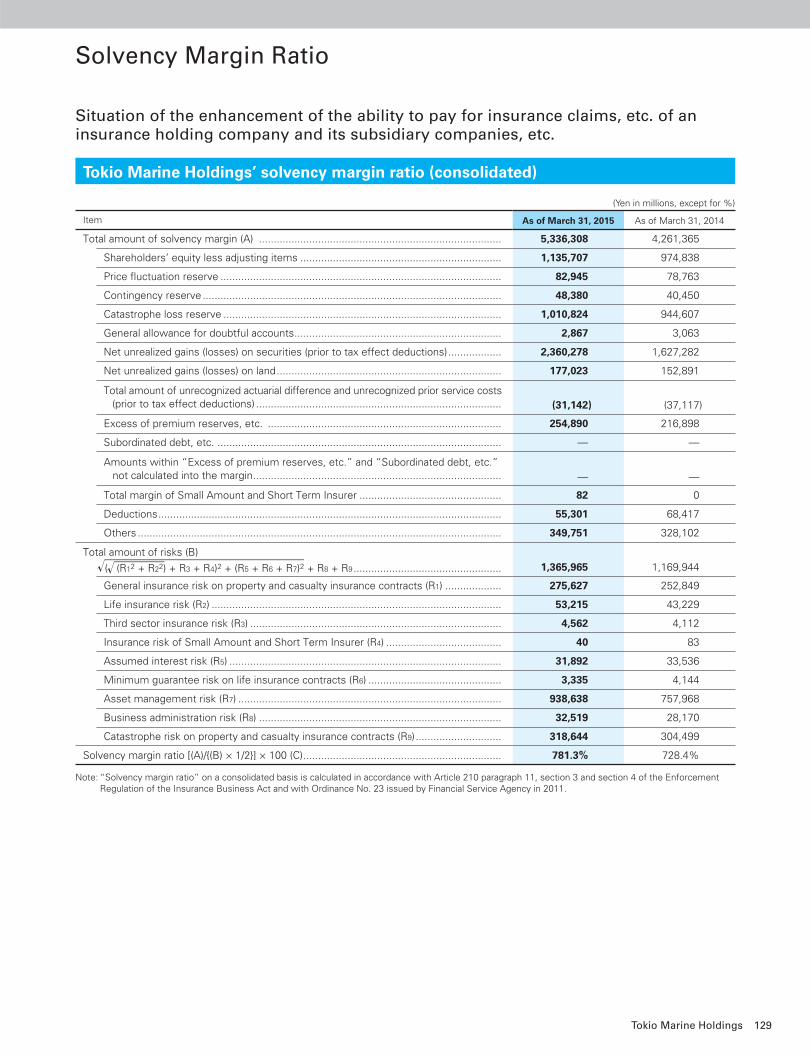
(Yen in millions, except for %)
Item As of March 31, 2015 As of March 31, 2014
Total amount of solvency margin (A) .................................................................................. 5,336,308 4,261,365
Shareholders’ equity less adjusting items .................................................................... 1,135,707 974,838
Price fl uctuation reserve ............................................................................................... 82,945 78,763
Contingency reserve ..................................................................................................... 48,380 40,450
Catastrophe loss reserve .............................................................................................. 1,010,824 944,607
General allowance for doubtful accounts ...................................................................... 2,867 3,063
Net unrealized gains (losses) on securities (prior to tax effect deductions) .................. 2,360,278 1,627,282
Net unrealized gains (losses) on land ............................................................................ 177,023 152,891
Total amount of unrecognized actuarial difference and unrecognized prior service costs (prior to tax effect deductions) ................................................................................... (31,142) (37,117)
Excess of premium reserves, etc. ............................................................................... 254,890 216,898
Subordinated debt, etc. ................................................................................................ — —
Amounts within “Excess of premium reserves, etc.” and “Subordinated debt, etc.” not calculated into the margin .................................................................................... — —
Total margin of Small Amount and Short Term Insurer ................................................ 82 0
Deductions .................................................................................................................... 55,301 68,417
Others ........................................................................................................................... 349,751 328,102
Total amount of risks (B)
( (R12 + R22) + R3 + R4)2 + (R5 + R6 + R7)2 + R8 + R9 .................................................. 1,365,965 1,169,944
General insurance risk on property and casualty insurance contracts (R1) ................... 275,627 252,849
Life insurance risk (R2) .................................................................................................. 53,215 43,229
Third sector insurance risk (R3) ..................................................................................... 4,562 4,112
Insurance risk of Small Amount and Short Term Insurer (R4) ....................................... 40 83
Assumed interest risk (R5) ............................................................................................ 31,892 33,536
Minimum guarantee risk on life insurance contracts (R6) ............................................. 3,335 4,144
Asset management risk (R7) ......................................................................................... 938,638 757,968
Business administration risk (R8) .................................................................................. 32,519 28,170
Catastrophe risk on property and casualty insurance contracts (R9) ............................. 318,644 304,499
Solvency margin ratio [(A)/{(B) × 1/2}] × 100 (C) ................................................................... 781.3% 728.4%
Note: “Solvency margin ratio” on a consolidated basis is calculated in accordance with Article 210 paragraph 11, section 3 and section 4 of the Enforcement Regulation of the Insurance Business Act and with Ordinance No. 23 issued by Financial Service Agency in 2011.
Tokio Marine Holdings’ solvency margin ratio (consolidated)
Situation of the enhancement of the ability to pay for insurance claims, etc. of an insurance holding company and its subsidiary companies, etc.
129Tokio Marine Holdings
Solvency Margin Ratio
Solvency margin ratio (consolidated)
1. Most subsidiaries in Tokio Marine Group engage in the property and casualty insurance business, life insurance business and Small Amount and Short Term insurance business. In addition to reserves to cover claim payments and payments for maturity-refunds of saving type insurance policies, etc., it is necessary for insurance groups to maintain suffi cient solvency in order to cover against risks which may exceed their usual estimates, i.e., the occurrences of catastrophe, a signifi cant decline in value of assets held, etc.
2. The consolidated solvency margin ratio (C), which is calculated in accordance with the Insurance Business Act, is the ratio of “solvency margin of insurance company groups by means of their capital, reserves, etc.” (total amount of solvency margin: (A)) to “risks which will exceed their usual estimates” (total amount of risks: (B)).
3. “Risks which will exceed their usual estimates” (total amount of risks; (B)) is composed of risks described below. (1) General insurance risk on property and casualty insurance contracts, life insurance risk, third sector insurance risk and
insurance risk of Small Amount and Short Term Insurer: risks of occurrence of insurance claims in excess of normal expectations (excluding catastrophe risk on property and casualty insurance contracts)
(2) Assumed interest risk: risks of invested assets failing to yield assumed interest rates due to the aggravation of investment conditions than expected.
(3) Minimum guarantee risk (on life insurance contracts): risks related to the minimum guarantee for benefi ts of insurance contracts which are managed as a separate account.
(4) Asset management risk: risks of retained securities and other assets fl uctuating in prices in excess of expectations. (5) Business administration risk: risks beyond normal expectations arising from business management that does not fall
under other categories (1) to (4) or (6). (6) Catastrophe risk (on property and casualty insurance contracts): risks of the occurrences of major catastrophic losses
in excess of normal expectations occurring. (risks such as the Great Kanto Earthquake or Isewan Typhoon)
4. Subsidiaries that were excluded from the scope of consolidation in preparation of consolidated fi nancial statements due to immateriality were taken into calculation of the consolidated solvency margin ratio.
5. The ability of an insurance company group to pay claims by means of their capital, reserves, etc. (total amount of solvency margin) is the total amount of the Company’s and its subsidiaries’ net assets (excluding amounts appropriated as retained earnings), certain reserves (reserve for price fl uctuations, contingency reserves and catastrophe reserves, etc.) and parts of net unrealized gains on land.
6. The consolidated solvency margin ratio is one of the indicators for the regulatory authorities to supervise insurance company groups. A ratio exceeding 200% indicates adequate ability to meet payments of insurance claims.
130 Integrated Annual Report 2015
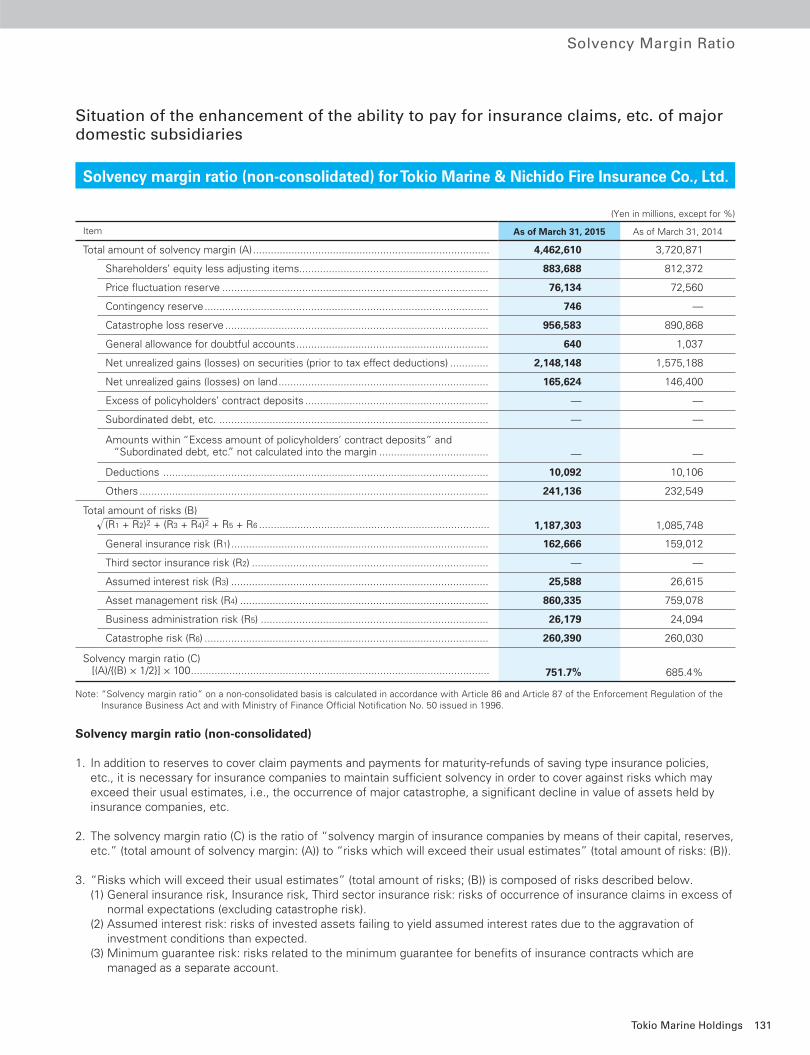
Solvency Margin Ratio
Solvency margin ratio (non-consolidated) for Tokio Marine & Nichido Fire Insurance Co., Ltd.
(Yen in millions, except for %)
Item As of March 31, 2015 As of March 31, 2014
Total amount of solvency margin (A) ................................................................................ 4,462,610 3,720,871
Shareholders’ equity less adjusting items................................................................ 883,688 812,372
Price fl uctuation reserve .......................................................................................... 76,134 72,560
Contingency reserve ................................................................................................ 746 —
Catastrophe loss reserve ......................................................................................... 956,583 890,868
General allowance for doubtful accounts ................................................................. 640 1,037
Net unrealized gains (losses) on securities (prior to tax effect deductions) ............. 2,148,148 1,575,188
Net unrealized gains (losses) on land ....................................................................... 165,624 146,400
Excess of policyholders’ contract deposits .............................................................. — —
Subordinated debt, etc. ........................................................................................... — —
Amounts within “Excess amount of policyholders’ contract deposits” and “Subordinated debt, etc.” not calculated into the margin ..................................... — —
Deductions .............................................................................................................. 10,092 10,106
Others ...................................................................................................................... 241,136 232,549
Total amount of risks (B) (R1 + R2)2 + (R3 + R4)2 + R5 + R6 .............................................................................. 1,187,303 1,085,748
General insurance risk (R1) ....................................................................................... 162,666 159,012
Third sector insurance risk (R2) ................................................................................ — —
Assumed interest risk (R3) ....................................................................................... 25,588 26,615
Asset management risk (R4) .................................................................................... 860,335 759,078
Business administration risk (R5) ............................................................................. 26,179 24,094
Catastrophe risk (R6) ................................................................................................ 260,390 260,030
Solvency margin ratio (C) [(A)/{(B) × 1/2}] × 100 ..................................................................................................... 751.7% 685.4%
Note: “Solvency margin ratio” on a non-consolidated basis is calculated in accordance with Article 86 and Article 87 of the Enforcement Regulation of the Insurance Business Act and with Ministry of Finance Offi cial Notifi cation No. 50 issued in 1996.
Solvency margin ratio (non-consolidated)
1. In addition to reserves to cover claim payments and payments for maturity-refunds of saving type insurance policies, etc., it is necessary for insurance companies to maintain suffi cient solvency in order to cover against risks which may exceed their usual estimates, i.e., the occurrence of major catastrophe, a signifi cant decline in value of assets held by insurance companies, etc.
2. The solvency margin ratio (C) is the ratio of “solvency margin of insurance companies by means of their capital, reserves, etc.” (total amount of solvency margin: (A)) to “risks which will exceed their usual estimates” (total amount of risks: (B)).
3. “Risks which will exceed their usual estimates” (total amount of risks; (B)) is composed of risks described below. (1) General insurance risk, Insurance risk, Third sector insurance risk: risks of occurrence of insurance claims in excess of
normal expectations (excluding catastrophe risk). (2) Assumed interest risk: risks of invested assets failing to yield assumed interest rates due to the aggravation of
investment conditions than expected. (3) Minimum guarantee risk: risks related to the minimum guarantee for benefi ts of insurance contracts which are
managed as a separate account.
Situation of the enhancement of the ability to pay for insurance claims, etc. of major domestic subsidiaries
131Tokio Marine Holdings
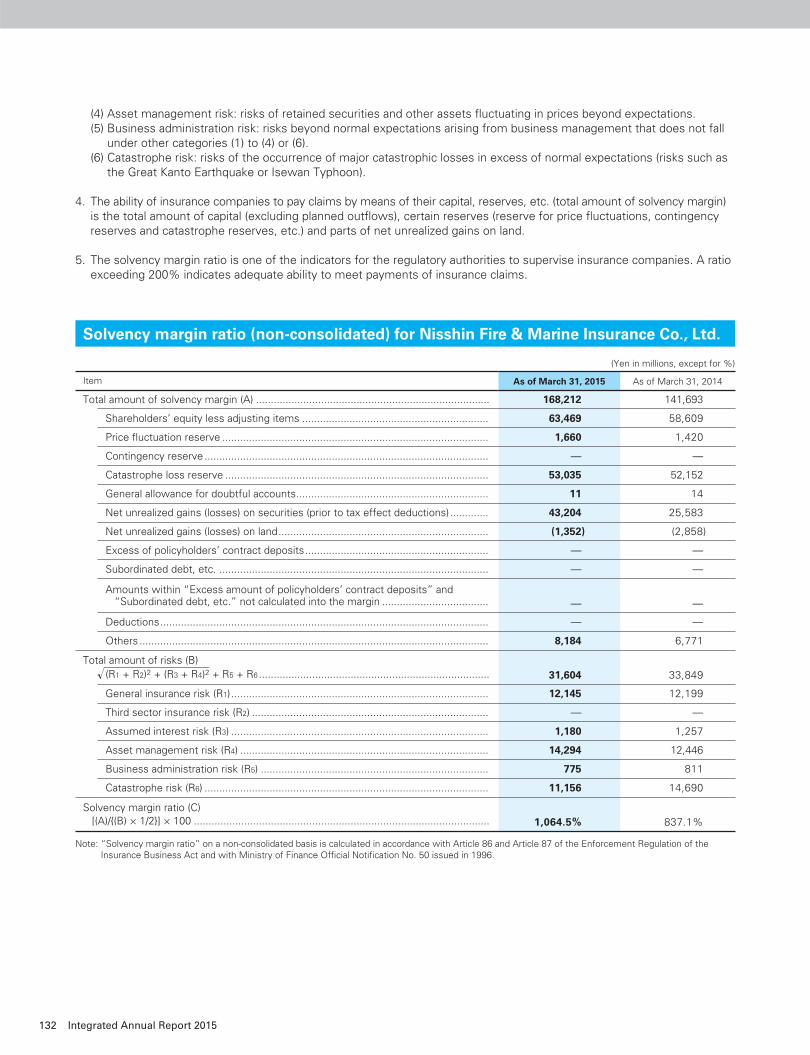
(4) Asset management risk: risks of retained securities and other assets fl uctuating in prices beyond expectations. (5) Business administration risk: risks beyond normal expectations arising from business management that does not fall
under other categories (1) to (4) or (6). (6) Catastrophe risk: risks of the occurrence of major catastrophic losses in excess of normal expectations (risks such as
the Great Kanto Earthquake or Isewan Typhoon).
4. The ability of insurance companies to pay claims by means of their capital, reserves, etc. (total amount of solvency margin) is the total amount of capital (excluding planned outfl ows), certain reserves (reserve for price fl uctuations, contingency reserves and catastrophe reserves, etc.) and parts of net unrealized gains on land.
5. The solvency margin ratio is one of the indicators for the regulatory authorities to supervise insurance companies. A ratio exceeding 200% indicates adequate ability to meet payments of insurance claims.
Solvency margin ratio (non-consolidated) for Nisshin Fire & Marine Insurance Co., Ltd.
(Yen in millions, except for %)
Item As of March 31, 2015 As of March 31, 2014
Total amount of solvency margin (A) ............................................................................... 168,212 141,693
Shareholders’ equity less adjusting items ............................................................... 63,469 58,609
Price fl uctuation reserve .......................................................................................... 1,660 1,420
Contingency reserve ................................................................................................ — —
Catastrophe loss reserve ......................................................................................... 53,035 52,152
General allowance for doubtful accounts ................................................................. 11 14
Net unrealized gains (losses) on securities (prior to tax effect deductions) ............. 43,204 25,583
Net unrealized gains (losses) on land ....................................................................... (1,352) (2,858)
Excess of policyholders’ contract deposits .............................................................. — —
Subordinated debt, etc. ........................................................................................... — —
Amounts within “Excess amount of policyholders’ contract deposits” and “Subordinated debt, etc.” not calculated into the margin .................................... — —
Deductions ............................................................................................................... — —
Others ...................................................................................................................... 8,184 6,771
Total amount of risks (B) (R1 + R2)2 + (R3 + R4)2 + R5 + R6 .............................................................................. 31,604 33,849
General insurance risk (R1) ....................................................................................... 12,145 12,199
Third sector insurance risk (R2) ................................................................................ — —
Assumed interest risk (R3) ....................................................................................... 1,180 1,257
Asset management risk (R4) .................................................................................... 14,294 12,446
Business administration risk (R5) ............................................................................. 775 811
Catastrophe risk (R6) ................................................................................................ 11,156 14,690
Solvency margin ratio (C) [(A)/{(B) × 1/2}] × 100 .................................................................................................... 1,064.5% 837.1%
Note: “Solvency margin ratio” on a non-consolidated basis is calculated in accordance with Article 86 and Article 87 of the Enforcement Regulation of the Insurance Business Act and with Ministry of Finance Offi cial Notifi cation No. 50 issued in 1996.
132 Integrated Annual Report 2015
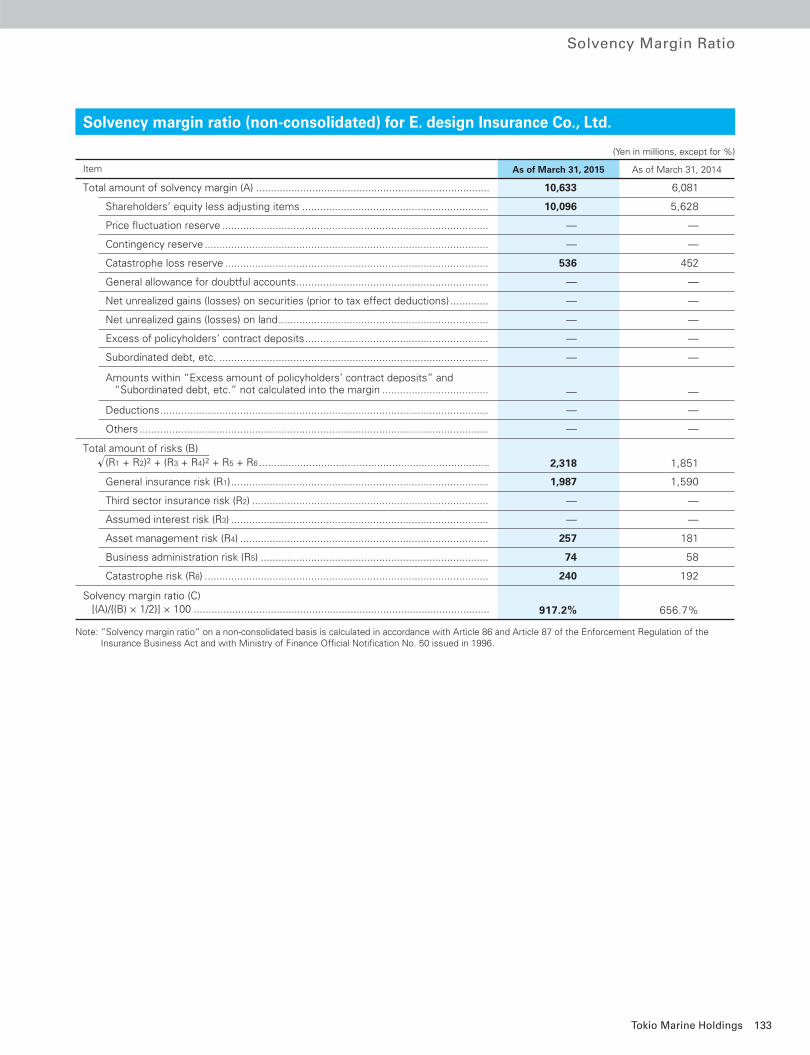
Solvency Margin Ratio
Solvency margin ratio (non-consolidated) for E. design Insurance Co., Ltd. (Yen in millions, except for %)
Item As of March 31, 2015 As of March 31, 2014
Total amount of solvency margin (A) ............................................................................... 10,633 6,081
Shareholders’ equity less adjusting items ............................................................... 10,096 5,628
Price fl uctuation reserve .......................................................................................... — —
Contingency reserve ................................................................................................ — —
Catastrophe loss reserve ......................................................................................... 536 452
General allowance for doubtful accounts ................................................................. — —
Net unrealized gains (losses) on securities (prior to tax effect deductions) ............. — —
Net unrealized gains (losses) on land ....................................................................... — —
Excess of policyholders’ contract deposits .............................................................. — —
Subordinated debt, etc. ........................................................................................... — —
Amounts within “Excess amount of policyholders’ contract deposits” and “Subordinated debt, etc.” not calculated into the margin .................................... — —
Deductions ............................................................................................................... — —
Others ...................................................................................................................... — —
Total amount of risks (B) (R1 + R2)2 + (R3 + R4)2 + R5 + R6 .............................................................................. 2,318 1,851
General insurance risk (R1) ....................................................................................... 1,987 1,590
Third sector insurance risk (R2) ................................................................................ — —
Assumed interest risk (R3) ....................................................................................... — —
Asset management risk (R4) .................................................................................... 257 181
Business administration risk (R5) ............................................................................. 74 58
Catastrophe risk (R6) ................................................................................................ 240 192
Solvency margin ratio (C) [(A)/{(B) × 1/2}] × 100 .................................................................................................... 917.2% 656.7%
Note: “Solvency margin ratio” on a non-consolidated basis is calculated in accordance with Article 86 and Article 87 of the Enforcement Regulation of the Insurance Business Act and with Ministry of Finance Offi cial Notifi cation No. 50 issued in 1996.
133Tokio Marine Holdings
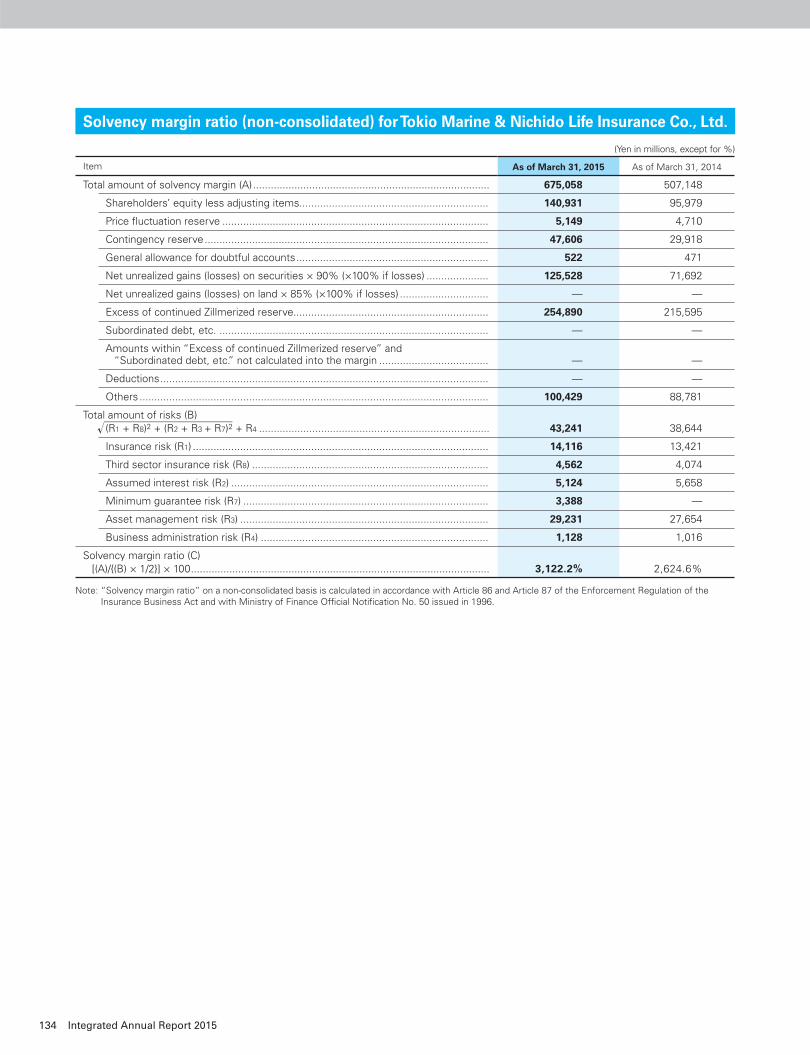
Solvency margin ratio (non-consolidated) for Tokio Marine & Nichido Life Insurance Co., Ltd.
(Yen in millions, except for %)
Item As of March 31, 2015 As of March 31, 2014
Total amount of solvency margin (A) ................................................................................ 675,058 507,148
Shareholders’ equity less adjusting items................................................................ 140,931 95,979
Price fl uctuation reserve .......................................................................................... 5,149 4,710
Contingency reserve ................................................................................................ 47,606 29,918
General allowance for doubtful accounts ................................................................. 522 471
Net unrealized gains (losses) on securities × 90% (×100% if losses) ..................... 125,528 71,692
Net unrealized gains (losses) on land × 85% (×100% if losses) .............................. — —
Excess of continued Zillmerized reserve.................................................................. 254,890 215,595
Subordinated debt, etc. ........................................................................................... — —
Amounts within “Excess of continued Zillmerized reserve” and “Subordinated debt, etc.” not calculated into the margin ..................................... — —
Deductions ............................................................................................................... — —
Others ...................................................................................................................... 100,429 88,781
Total amount of risks (B) (R1 + R8)2 + (R2 + R3 + R7)2 + R4 .............................................................................. 43,241 38,644
Insurance risk (R1) .................................................................................................... 14,116 13,421
Third sector insurance risk (R8) ................................................................................ 4,562 4,074
Assumed interest risk (R2) ....................................................................................... 5,124 5,658
Minimum guarantee risk (R7) ................................................................................... 3,388 —
Asset management risk (R3) .................................................................................... 29,231 27,654
Business administration risk (R4) ............................................................................. 1,128 1,016
Solvency margin ratio (C) [(A)/{(B) × 1/2}] × 100 ..................................................................................................... 3,122.2% 2,624.6%
Note: “Solvency margin ratio” on a non-consolidated basis is calculated in accordance with Article 86 and Article 87 of the Enforcement Regulation of the Insurance Business Act and with Ministry of Finance Offi cial Notifi cation No. 50 issued in 1996.
134 Integrated Annual Report 2015
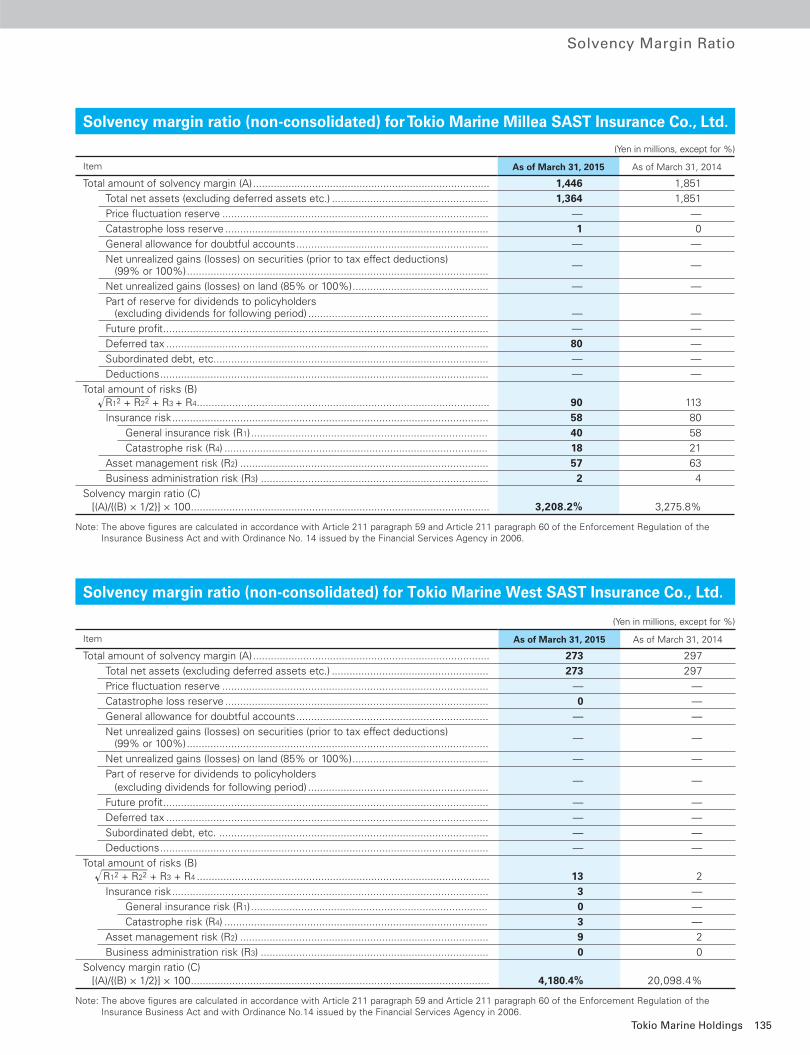
Solvency Margin Ratio
Solvency margin ratio (non-consolidated) for Tokio Marine Millea SAST Insurance Co., Ltd.
(Yen in millions, except for %)
Item As of March 31, 2015 As of March 31, 2014
Total amount of solvency margin (A) ................................................................................ 1,446 1,851
Total net assets (excluding deferred assets etc.) ..................................................... 1,364 1,851
Price fl uctuation reserve .......................................................................................... — —
Catastrophe loss reserve ......................................................................................... 1 0
General allowance for doubtful accounts ................................................................. — —
Net unrealized gains (losses) on securities (prior to tax effect deductions) (99% or 100%) ......................................................................................................
— —
Net unrealized gains (losses) on land (85% or 100%) .............................................. — —
Part of reserve for dividends to policyholders (excluding dividends for following period) ............................................................. — —
Future profi t .............................................................................................................. — —
Deferred tax ............................................................................................................. 80 —
Subordinated debt, etc. ............................................................................................ — —
Deductions ............................................................................................................... — —
Total amount of risks (B) R12 + R22 + R3 + R4 ................................................................................................... 90 113
Insurance risk ........................................................................................................... 58 80
General insurance risk (R1) ................................................................................ 40 58
Catastrophe risk (R4) ......................................................................................... 18 21
Asset management risk (R2) .................................................................................... 57 63
Business administration risk (R3) ............................................................................. 2 4
Solvency margin ratio (C) [(A)/{(B) × 1/2}] × 100 ..................................................................................................... 3,208.2% 3,275.8%
Note: The above fi gures are calculated in accordance with Article 211 paragraph 59 and Article 211 paragraph 60 of the Enforcement Regulation of the Insurance Business Act and with Ordinance No. 14 issued by the Financial Services Agency in 2006.
Solvency margin ratio (non-consolidated) for Tokio Marine West SAST Insurance Co., Ltd. (Yen in millions, except for %)
Item As of March 31, 2015 As of March 31, 2014
Total amount of solvency margin (A) ................................................................................ 273 297
Total net assets (excluding deferred assets etc.) ..................................................... 273 297
Price fl uctuation reserve .......................................................................................... — —
Catastrophe loss reserve ......................................................................................... 0 —
General allowance for doubtful accounts ................................................................. — —
Net unrealized gains (losses) on securities (prior to tax effect deductions) (99% or 100%) ......................................................................................................
— —
Net unrealized gains (losses) on land (85% or 100%) .............................................. — —
Part of reserve for dividends to policyholders (excluding dividends for following period) .............................................................
— —
Future profi t .............................................................................................................. — —
Deferred tax ............................................................................................................. — —
Subordinated debt, etc. ........................................................................................... — —
Deductions ............................................................................................................... — —
Total amount of risks (B) R12 + R22 + R3 + R4 ................................................................................................... 13 2
Insurance risk ........................................................................................................... 3 —
General insurance risk (R1) ................................................................................ 0 —
Catastrophe risk (R4) ......................................................................................... 3 —
Asset management risk (R2) .................................................................................... 9 2
Business administration risk (R3) ............................................................................. 0 0
Solvency margin ratio (C) [(A)/{(B) × 1/2}] × 100 ..................................................................................................... 4,180.4% 20,098.4%
Note: The above fi gures are calculated in accordance with Article 211 paragraph 59 and Article 211 paragraph 60 of the Enforcement Regulation of the Insurance Business Act and with Ordinance No.14 issued by the Financial Services Agency in 2006.
135Tokio Marine Holdings
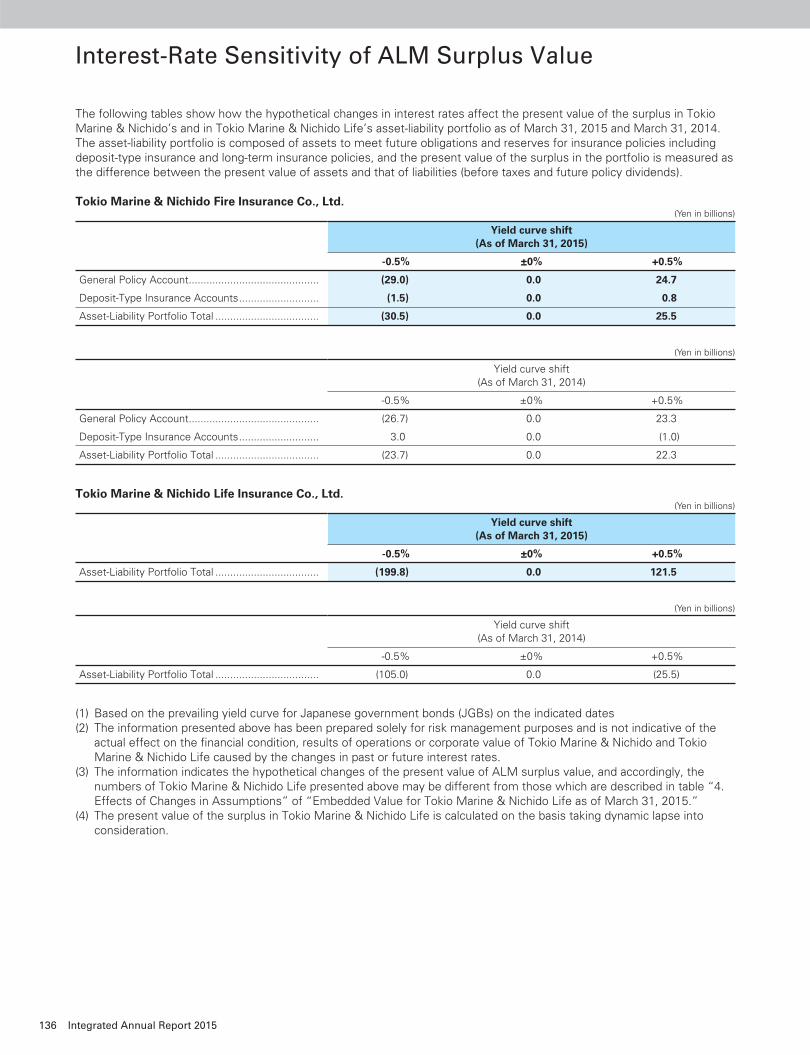
The following tables show how the hypothetical changes in interest rates affect the present value of the surplus in Tokio Marine & Nichido’s and in Tokio Marine & Nichido Life’s asset-liability portfolio as of March 31, 2015 and March 31, 2014. The asset-liability portfolio is composed of assets to meet future obligations and reserves for insurance policies including deposit-type insurance and long-term insurance policies, and the present value of the surplus in the portfolio is measured as the difference between the present value of assets and that of liabilities (before taxes and future policy dividends).
Tokio Marine & Nichido Fire Insurance Co., Ltd. (Yen in billions)
Yield curve shift(As of March 31, 2015)
-0.5% ±0% +0.5%
General Policy Account ............................................ (29.0) 0.0 24.7
Deposit-Type Insurance Accounts ........................... (1.5) 0.0 0.8
Asset-Liability Portfolio Total ................................... (30.5) 0.0 25.5
(Yen in billions)
Yield curve shift(As of March 31, 2014)
-0.5% ±0% +0.5%
General Policy Account ............................................ (26.7) 0.0 23.3
Deposit-Type Insurance Accounts ........................... 3.0 0.0 (1.0)
Asset-Liability Portfolio Total ................................... (23.7) 0.0 22.3
Tokio Marine & Nichido Life Insurance Co., Ltd. (Yen in billions)
Yield curve shift(As of March 31, 2015)
-0.5% ±0% +0.5%
Asset-Liability Portfolio Total ................................... (199.8) 0.0 121.5
(Yen in billions)
Yield curve shift(As of March 31, 2014)
-0.5% ±0% +0.5%
Asset-Liability Portfolio Total ................................... (105.0) 0.0 (25.5)
(1) Based on the prevailing yield curve for Japanese government bonds (JGBs) on the indicated dates(2) The information presented above has been prepared solely for risk management purposes and is not indicative of the
actual effect on the fi nancial condition, results of operations or corporate value of Tokio Marine & Nichido and Tokio Marine & Nichido Life caused by the changes in past or future interest rates.
(3) The information indicates the hypothetical changes of the present value of ALM surplus value, and accordingly, the numbers of Tokio Marine & Nichido Life presented above may be different from those which are described in table “4. Effects of Changes in Assumptions” of “Embedded Value for Tokio Marine & Nichido Life as of March 31, 2015.”
(4) The present value of the surplus in Tokio Marine & Nichido Life is calculated on the basis taking dynamic lapse into consideration.
136 Integrated Annual Report 2015
Interest-Rate Sensitivity of ALM Surplus Value
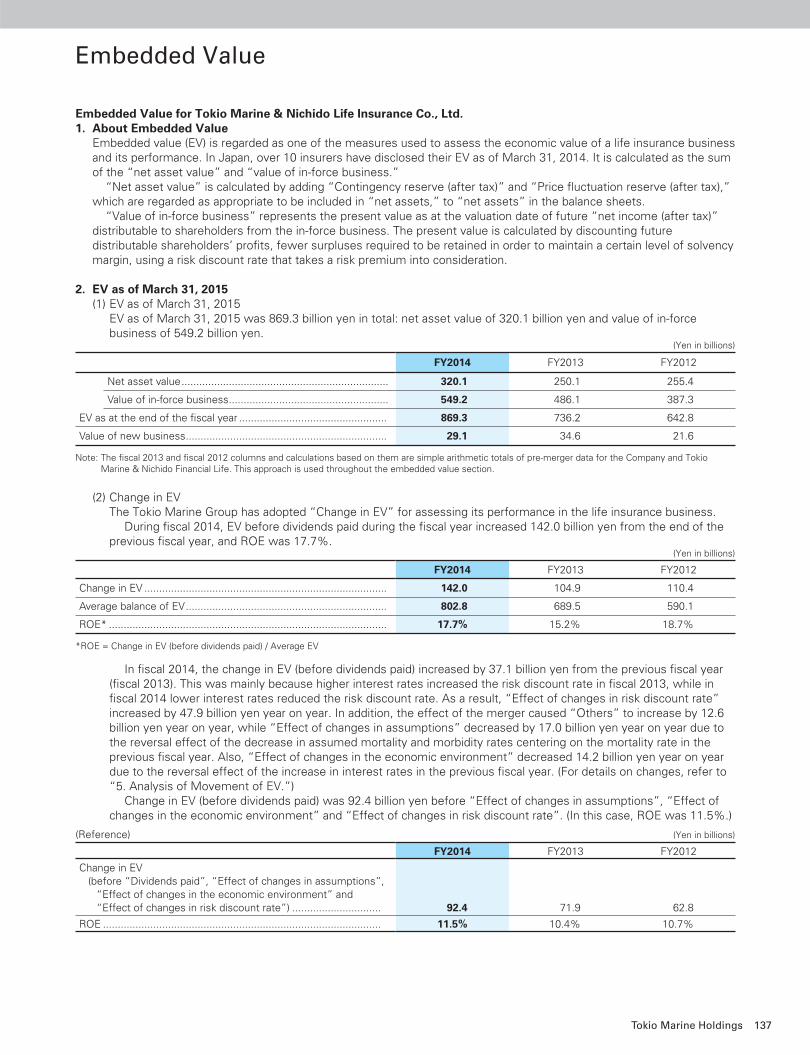
Embedded Value for Tokio Marine & Nichido Life Insurance Co., Ltd.1. About Embedded Value
Embedded value (EV) is regarded as one of the measures used to assess the economic value of a life insurance business and its performance. In Japan, over 10 insurers have disclosed their EV as of March 31, 2014. It is calculated as the sum of the “net asset value” and “value of in-force business.” “Net asset value” is calculated by adding “Contingency reserve (after tax)” and “Price fl uctuation reserve (after tax),” which are regarded as appropriate to be included in “net assets,” to “net assets” in the balance sheets. “Value of in-force business” represents the present value as at the valuation date of future “net income (after tax)” distributable to shareholders from the in-force business. The present value is calculated by discounting future distributable shareholders’ profi ts, fewer surpluses required to be retained in order to maintain a certain level of solvency margin, using a risk discount rate that takes a risk premium into consideration.
2. EV as of March 31, 2015(1) EV as of March 31, 2015
EV as of March 31, 2015 was 869.3 billion yen in total: net asset value of 320.1 billion yen and value of in-force business of 549.2 billion yen.
(Yen in billions)
FY2014 FY2013 FY2012
Net asset value ...................................................................... 320.1 250.1 255.4
Value of in-force business ...................................................... 549.2 486.1 387.3
EV as at the end of the fi scal year .................................................. 869.3 736.2 642.8
Value of new business .................................................................... 29.1 34.6 21.6
Note: The fi scal 2013 and fi scal 2012 columns and calculations based on them are simple arithmetic totals of pre-merger data for the Company and Tokio Marine & Nichido Financial Life. This approach is used throughout the embedded value section.
(2) Change in EVThe Tokio Marine Group has adopted “Change in EV” for assessing its performance in the life insurance business. During fi scal 2014, EV before dividends paid during the fi scal year increased 142.0 billion yen from the end of the previous fi scal year, and ROE was 17.7%.
(Yen in billions)
FY2014 FY2013 FY2012
Change in EV .................................................................................. 142.0 104.9 110.4
Average balance of EV .................................................................... 802.8 689.5 590.1
ROE* .............................................................................................. 17.7% 15.2% 18.7%
*ROE = Change in EV (before dividends paid) / Average EV
In fi scal 2014, the change in EV (before dividends paid) increased by 37.1 billion yen from the previous fi scal year (fi scal 2013). This was mainly because higher interest rates increased the risk discount rate in fi scal 2013, while in fi scal 2014 lower interest rates reduced the risk discount rate. As a result, “Effect of changes in risk discount rate” increased by 47.9 billion yen year on year. In addition, the effect of the merger caused “Others” to increase by 12.6 billion yen year on year, while “Effect of changes in assumptions” decreased by 17.0 billion yen year on year due to the reversal effect of the decrease in assumed mortality and morbidity rates centering on the mortality rate in the previous fi scal year. Also, “Effect of changes in the economic environment” decreased 14.2 billion yen year on year due to the reversal effect of the increase in interest rates in the previous fi scal year. (For details on changes, refer to “5. Analysis of Movement of EV.”) Change in EV (before dividends paid) was 92.4 billion yen before “Effect of changes in assumptions”, “Effect of changes in the economic environment” and “Effect of changes in risk discount rate”. (In this case, ROE was 11.5%.)
(Reference) (Yen in billions)
FY2014 FY2013 FY2012
Change in EV (before “Dividends paid”, “Effect of changes in assumptions”,
“Effect of changes in the economic environment” and “Effect of changes in risk discount rate”) .............................. 92.4 71.9 62.8
ROE .............................................................................................. 11.5% 10.4% 10.7%
137Tokio Marine Holdings
Embedded Value
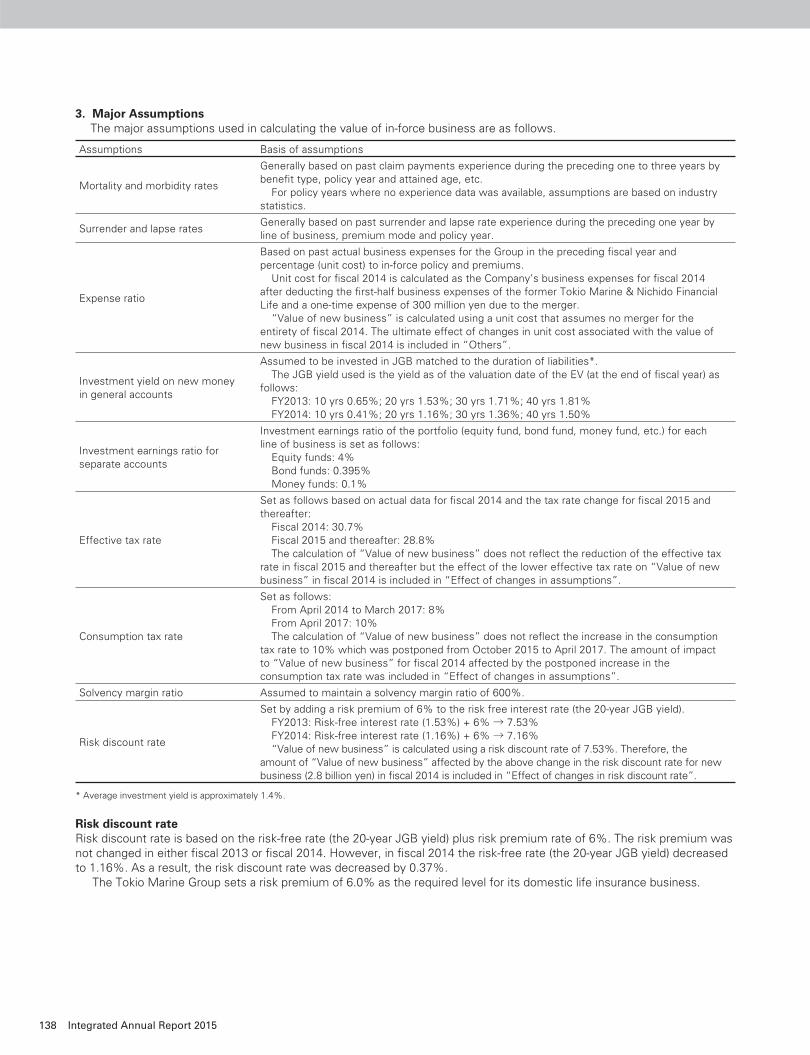
3. Major AssumptionsThe major assumptions used in calculating the value of in-force business are as follows.
Assumptions Basis of assumptions
Mortality and morbidity rates
Generally based on past claim payments experience during the preceding one to three years by benefi t type, policy year and attained age, etc. For policy years where no experience data was available, assumptions are based on industry statistics.
Surrender and lapse ratesGenerally based on past surrender and lapse rate experience during the preceding one year by line of business, premium mode and policy year.
Expense ratio
Based on past actual business expenses for the Group in the preceding fi scal year and percentage (unit cost) to in-force policy and premiums. Unit cost for fi scal 2014 is calculated as the Company’s business expenses for fi scal 2014 after deducting the fi rst-half business expenses of the former Tokio Marine & Nichido Financial Life and a one-time expense of 300 million yen due to the merger. “Value of new business” is calculated using a unit cost that assumes no merger for the entirety of fi scal 2014. The ultimate effect of changes in unit cost associated with the value of new business in fi scal 2014 is included in “Others”.
Investment yield on new money in general accounts
Assumed to be invested in JGB matched to the duration of liabilities*. The JGB yield used is the yield as of the valuation date of the EV (at the end of fi scal year) as follows: FY2013: 10 yrs 0.65%; 20 yrs 1.53%; 30 yrs 1.71%; 40 yrs 1.81% FY2014: 10 yrs 0.41%; 20 yrs 1.16%; 30 yrs 1.36%; 40 yrs 1.50%
Investment earnings ratio for separate accounts
Investment earnings ratio of the portfolio (equity fund, bond fund, money fund, etc.) for each line of business is set as follows: Equity funds: 4% Bond funds: 0.395% Money funds: 0.1%
Effective tax rate
Set as follows based on actual data for fi scal 2014 and the tax rate change for fi scal 2015 and thereafter: Fiscal 2014: 30.7% Fiscal 2015 and thereafter: 28.8% The calculation of “Value of new business” does not refl ect the reduction of the effective tax rate in fi scal 2015 and thereafter but the effect of the lower effective tax rate on “Value of new business” in fi scal 2014 is included in “Effect of changes in assumptions”.
Consumption tax rate
Set as follows: From April 2014 to March 2017: 8% From April 2017: 10% The calculation of “Value of new business” does not refl ect the increase in the consumption tax rate to 10% which was postponed from October 2015 to April 2017. The amount of impact to “Value of new business” for fi scal 2014 affected by the postponed increase in the consumption tax rate was included in “Effect of changes in assumptions”.
Solvency margin ratio Assumed to maintain a solvency margin ratio of 600%.
Risk discount rate
Set by adding a risk premium of 6% to the risk free interest rate (the 20-year JGB yield). FY2013: Risk-free interest rate (1.53%) + 6% → 7.53% FY2014: Risk-free interest rate (1.16%) + 6% → 7.16% “Value of new business” is calculated using a risk discount rate of 7.53%. Therefore, the amount of “Value of new business” affected by the above change in the risk discount rate for new business (2.8 billion yen) in fi scal 2014 is included in “Effect of changes in risk discount rate”.
* Average investment yield is approximately 1.4%.
Risk discount rateRisk discount rate is based on the risk-free rate (the 20-year JGB yield) plus risk premium rate of 6%. The risk premium was not changed in either fi scal 2013 or fi scal 2014. However, in fi scal 2014 the risk-free rate (the 20-year JGB yield) decreased to 1.16%. As a result, the risk discount rate was decreased by 0.37%. The Tokio Marine Group sets a risk premium of 6.0% as the required level for its domestic life insurance business.
138 Integrated Annual Report 2015
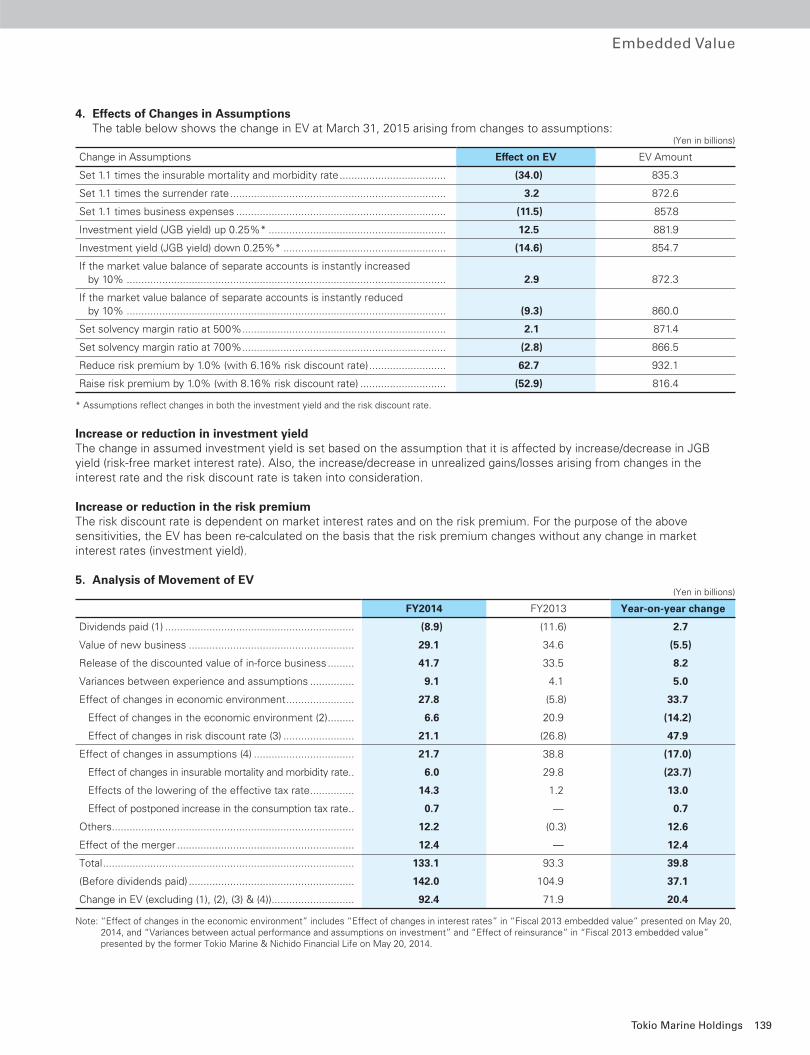
4. Effects of Changes in AssumptionsThe table below shows the change in EV at March 31, 2015 arising from changes to assumptions:
(Yen in billions)
Change in Assumptions Effect on EV EV Amount
Set 1.1 times the insurable mortality and morbidity rate .................................... (34.0) 835.3
Set 1.1 times the surrender rate ......................................................................... 3.2 872.6
Set 1.1 times business expenses ....................................................................... (11.5) 857.8
Investment yield (JGB yield) up 0.25%* ............................................................ 12.5 881.9
Investment yield (JGB yield) down 0.25%* ....................................................... (14.6) 854.7
If the market value balance of separate accounts is instantly increased by 10% ............................................................................................................ 2.9 872.3
If the market value balance of separate accounts is instantly reduced by 10% ............................................................................................................ (9.3) 860.0
Set solvency margin ratio at 500% ..................................................................... 2.1 871.4
Set solvency margin ratio at 700% ..................................................................... (2.8) 866.5
Reduce risk premium by 1.0% (with 6.16% risk discount rate) .......................... 62.7 932.1
Raise risk premium by 1.0% (with 8.16% risk discount rate) ............................. (52.9) 816.4
* Assumptions refl ect changes in both the investment yield and the risk discount rate.
Increase or reduction in investment yieldThe change in assumed investment yield is set based on the assumption that it is affected by increase/decrease in JGB yield (risk-free market interest rate). Also, the increase/decrease in unrealized gains/losses arising from changes in the interest rate and the risk discount rate is taken into consideration.
Increase or reduction in the risk premiumThe risk discount rate is dependent on market interest rates and on the risk premium. For the purpose of the above sensitivities, the EV has been re-calculated on the basis that the risk premium changes without any change in market interest rates (investment yield).
5. Analysis of Movement of EV (Yen in billions)
FY2014 FY2013 Year-on-year change
Dividends paid (1) ................................................................ (8.9) (11.6) 2.7
Value of new business ........................................................ 29.1 34.6 (5.5)
Release of the discounted value of in-force business ......... 41.7 33.5 8.2
Variances between experience and assumptions ............... 9.1 4.1 5.0
Effect of changes in economic environment ....................... 27.8 (5.8) 33.7
Effect of changes in the economic environment (2) ......... 6.6 20.9 (14.2)
Effect of changes in risk discount rate (3) ........................ 21.1 (26.8) 47.9
Effect of changes in assumptions (4) .................................. 21.7 38.8 (17.0)
Effect of changes in insurable mortality and morbidity rate .. 6.0 29.8 (23.7)
Effects of the lowering of the effective tax rate ............... 14.3 1.2 13.0
Effect of postponed increase in the consumption tax rate .. 0.7 — 0.7
Others .................................................................................. 12.2 (0.3) 12.6
Effect of the merger ............................................................ 12.4 — 12.4
Total ..................................................................................... 133.1 93.3 39.8
(Before dividends paid) ........................................................ 142.0 104.9 37.1
Change in EV (excluding (1), (2), (3) & (4))............................ 92.4 71.9 20.4
Note: “Effect of changes in the economic environment” includes “Effect of changes in interest rates” in “Fiscal 2013 embedded value” presented on May 20, 2014, and “Variances between actual performance and assumptions on investment” and “Effect of reinsurance” in “Fiscal 2013 embedded value” presented by the former Tokio Marine & Nichido Financial Life on May 20, 2014.
139Tokio Marine Holdings
Embedded Value
The change in EV consists of two major components, the value of new business (new businesses issued in fi scal 2014) and others.
(1) Value of new businessIn fi scal 2014, the value of new business decreased by 5.5 billion yen year on year to 29.1 billion yen. The amount of new business increased in fi scal 2014, but the value of new business decreased largely because of the increase of the risk discount rate used for the value of new business to 7.53% for fi scal 2014 from 7.0% for fi scal 2013 and the effect of the decrease in interest rates.
(2) Changes other than value of new businessWhile interest rates decreased in fi scal 2014, “Effect of changes in the economic environment” was positive largely because the minimum guarantee liability for variable annuities decreased due to the effect of higher stock prices and the depreciation of the yen. As a result, the total of “Effect of changes in the risk discount rate” and “Effect of changes in the economic environment” was 27.8 billion yen, a positive change of 33.7 billion yen compared with fi scal 2013. In addition, in fi scal 2014 “Others” changed by a positive 12.6 billion yen compared with fi scal 2013 because of the 12.2 billion yen effect of the merger with the former Tokio Marine & Nichido Financial Life. This was mainly the result of the recognition of deferred tax assets that the former Tokio Marine & Nichido Financial Life did not recognize. At the same time, “Effect of changes in assumptions” was 21.7 billion yen in fi scal 2014, a decrease of 17.0 billion yen compared with fi scal 2013 due mainly to the effect of the lower effective tax rate. This decrease was primarily due to the reversal effect of the decrease in assumed mortality and morbidity rates centering on the mortality rate in fi scal 2013.
6. Instruction As EV is calculated based on assumptions including future prospects with risk and uncertainty, actual future results may
differ largely from the assumptions used in EV calculation. Also, since the actual market capital is determined by investors’ judgments based on various information, EV can signifi cantly differ from such information. Therefore, suffi cient consideration needs to be made in using EV.
140 Integrated Annual Report 2015
Explanation of Terms
• Net asset value“Net asset value” is calculated by adding “Contingency reserve (after tax)” and “Price fl uctuation reserve (after tax)”, which are regarded as appropriate to be included in “net assets”, to “net assets” on the balance sheets. These two liabilities are reserves accumulated to assure fi nancial soundness in the event of an unexpected contingency in the future. These are regarded as appropriate to be included in “net assets” because these reserves are not earmarked for any specifi c benefi t payment and have no fi xed future payment date. The amounts of these reserves are calculated after taxes and then added to net assets. In accordance with the rationale underlying the application of Tokio Marine & Nichido Life’s ALM, unrealized gains/losses on held-to-maturity debt securities and debt securities earmarked for policy reserves and unallocated reserves for dividends, which are not included in net assets under fi nancial accounting, are retained for responding to future assumed interest burdens and dividend distribution burdens, and are not included in net asset value. On this basis, the value of in-force business is calculated with an awareness of gains and losses in accordance with future assumed interest burdens and dividend distribution burdens. For unrealized gains/losses on securities, net of taxes and deferred gains/losses on hedge transactions relating to interest swaps, which were once included in net assets, an equivalent amount is retained upon recognizing this will have a minus effect on the calculation of value of in-force business, and there is an awareness of gains and losses in accordance with future assumed interest burdens and dividend distribution burdens.
• Value of in-force business“Value of in-force business” represents the present value as at the valuation date of future “net income (after tax)” under fi nancial accounting that is expected to be generated by the in-force business, excluding the cost of capital mentioned below. To calculate future income, it is necessary to set assumptions for such factors as future mortality and morbidity rates, surrender and lapse rates, business expenses and investment income. There is a risk that these assumptions will differ from actual values in the future. Therefore, present value is calculated by discounting future expected income using a risk discount rate. The minimum amount of capital needed for continuing business (needed for maintaining a certain solvency margin ratio) is calculated and this amount is reinvested and remains invested until no longer needed. For the investment and recovery of this capital, Tokio Marine & Nichido Life maintains an awareness of opportunity cost (cost of capital) by calculating present value using a risk discount rate in the same manner as for income. In this manner, the present value of future distributable shareholders’ profi ts, excluding the amount deducted from net income for reinvestment, represents the value of in-force business.
• Value of new business“Value of new business” is the present value of future income expected from new business acquired in the current year. It is the sum of income/losses (a portion of the above-mentioned net asset value) realized in the current fi scal year resulting from the expenses associated with new business and the present value of future income/losses from the next fi scal year onward. The assumptions for calculating future income/losses are basically the same as for calculating value of in-force business. However, investment yield (interest rate level) is calculated using 1) investment yields at the time of the contract for new business (end of the month) rather than at the end of the fi scal year, and 2) the risk discount rate as of the beginning of the fi scal year (in other words, as of the end of the previous fi scal year). The impact of changes in investment yields between the time new business is contracted and the end of the fi scal year is included in the category “Effect of changes in the economic environment”, and the effect of changes in the risk discount rate on new business is included in “Effect of changes in the risk discount rate”.
141Tokio Marine Holdings
Embedded Value
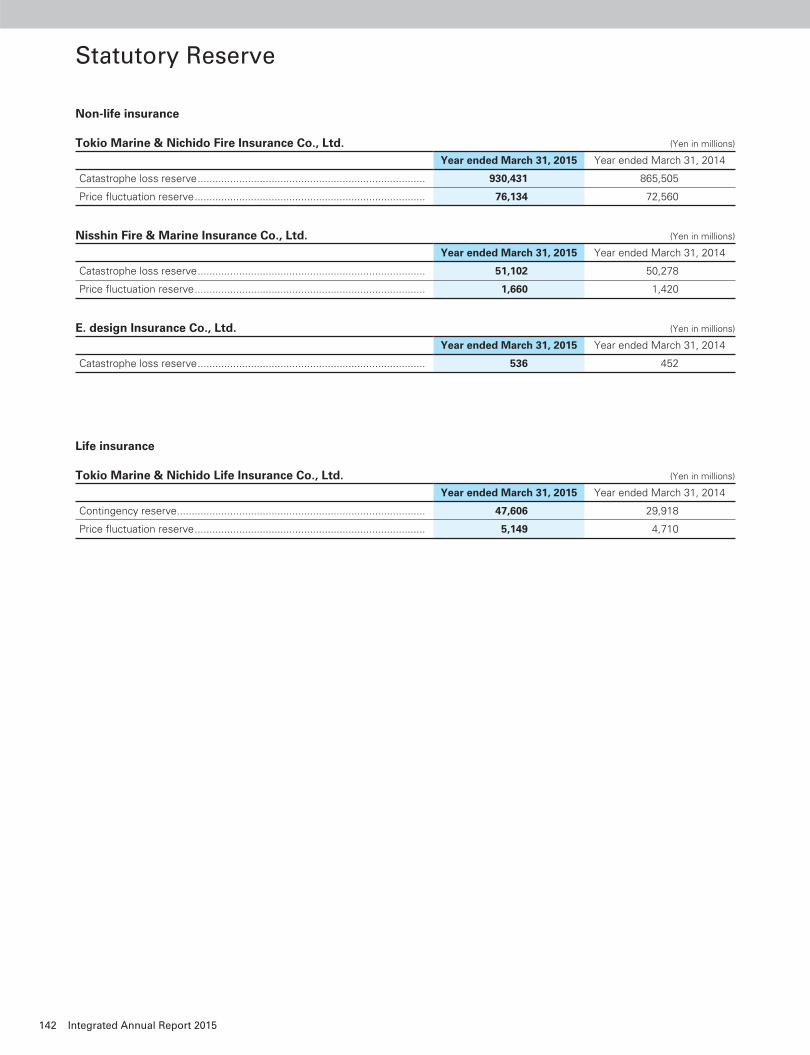
Non-life insurance
Tokio Marine & Nichido Fire Insurance Co., Ltd. (Yen in millions)
Year ended March 31, 2015 Year ended March 31, 2014
Catastrophe loss reserve ............................................................................. 930,431 865,505
Price fl uctuation reserve .............................................................................. 76,134 72,560
Nisshin Fire & Marine Insurance Co., Ltd. (Yen in millions)
Year ended March 31, 2015 Year ended March 31, 2014
Catastrophe loss reserve ............................................................................. 51,102 50,278
Price fl uctuation reserve .............................................................................. 1,660 1,420
E. design Insurance Co., Ltd. (Yen in millions)
Year ended March 31, 2015 Year ended March 31, 2014
Catastrophe loss reserve ............................................................................. 536 452
Life insurance
Tokio Marine & Nichido Life Insurance Co., Ltd. (Yen in millions)
Year ended March 31, 2015 Year ended March 31, 2014
Contingency reserve .................................................................................... 47,606 29,918
Price fl uctuation reserve .............................................................................. 5,149 4,710
142 Integrated Annual Report 2015
Statutory Reserve
143Tokio Marine HoldingsTokio Marine Holdings 143
Corporate Overview 144
Facilities 149
Stock Information 152
Corporate Data
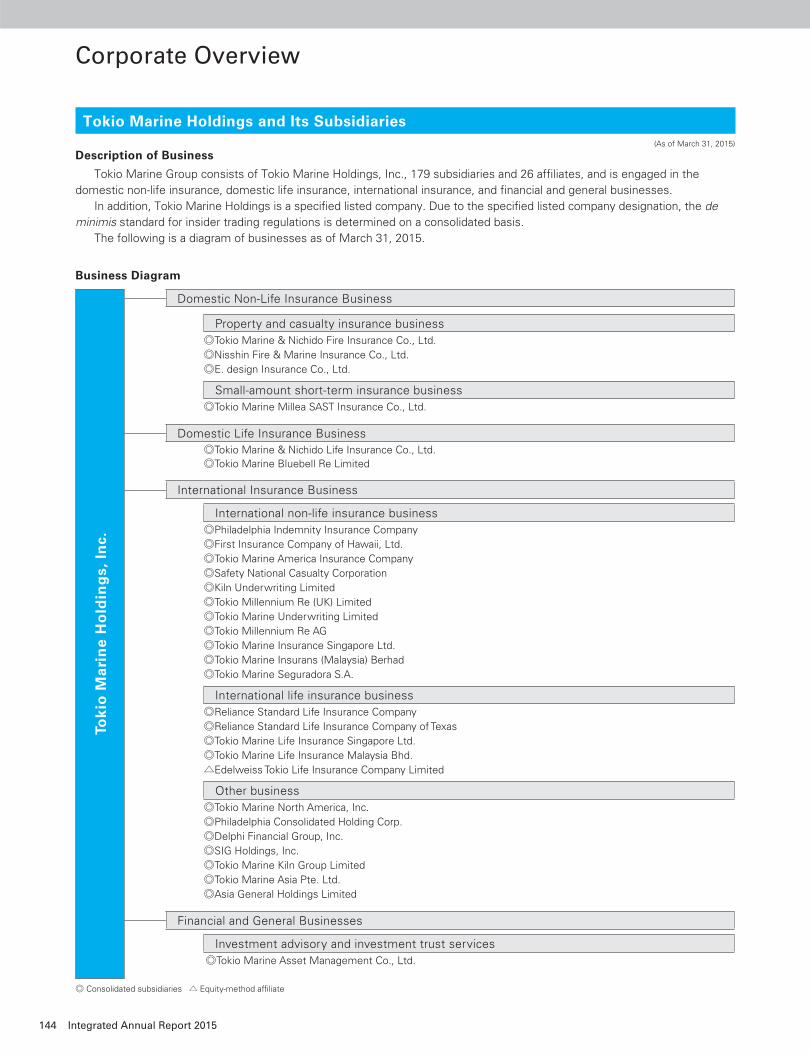
144 Integrated Annual Report 2015
Corporate Overview
Tokio Marine Holdings and Its Subsidiaries (As of March 31, 2015)
Description of Business
Tokio Marine Group consists of Tokio Marine Holdings, Inc., 179 subsidiaries and 26 affi liates, and is engaged in the
domestic non-life insurance, domestic life insurance, international insurance, and fi nancial and general businesses.
In addition, Tokio Marine Holdings is a specifi ed listed company. Due to the specifi ed listed company designation, the de minimis standard for insider trading regulations is determined on a consolidated basis.
The following is a diagram of businesses as of March 31, 2015.
Business Diagram
Domestic Non-Life Insurance Business
Property and casualty insurance business
◎Tokio Marine & Nichido Fire Insurance Co., Ltd.
◎Nisshin Fire & Marine Insurance Co., Ltd.
◎E. design Insurance Co., Ltd.
Small-amount short-term insurance business
◎Tokio Marine Millea SAST Insurance Co., Ltd.
Domestic Life Insurance Business◎Tokio Marine & Nichido Life Insurance Co., Ltd.◎Tokio Marine Bluebell Re Limited
International Insurance Business
International non-life insurance business
◎Philadelphia Indemnity Insurance Company
◎First Insurance Company of Hawaii, Ltd.
◎Tokio Marine America Insurance Company
◎Safety National Casualty Corporation
◎Kiln Underwriting Limited
◎Tokio Millennium Re (UK) Limited
◎Tokio Marine Underwriting Limited
◎Tokio Millennium Re AG
◎Tokio Marine Insurance Singapore Ltd.
◎Tokio Marine Insurans (Malaysia) Berhad
◎Tokio Marine Seguradora S.A.
International life insurance business
◎Reliance Standard Life Insurance Company
◎Reliance Standard Life Insurance Company of Texas
◎Tokio Marine Life Insurance Singapore Ltd.
◎Tokio Marine Life Insurance Malaysia Bhd.
△Edelweiss Tokio Life Insurance Company Limited
Other business
◎Tokio Marine North America, Inc.
◎Philadelphia Consolidated Holding Corp.
◎Delphi Financial Group, Inc.
◎SIG Holdings, Inc.
◎Tokio Marine Kiln Group Limited
◎Tokio Marine Asia Pte. Ltd.
◎Asia General Holdings Limited
Financial and General Businesses
Investment advisory and investment trust services
◎Tokio Marine Asset Management Co., Ltd.
◎ Consolidated subsidiaries △ Equity-method affiliate
Tok
io M
ari
ne
Ho
ldin
gs,
In
c.
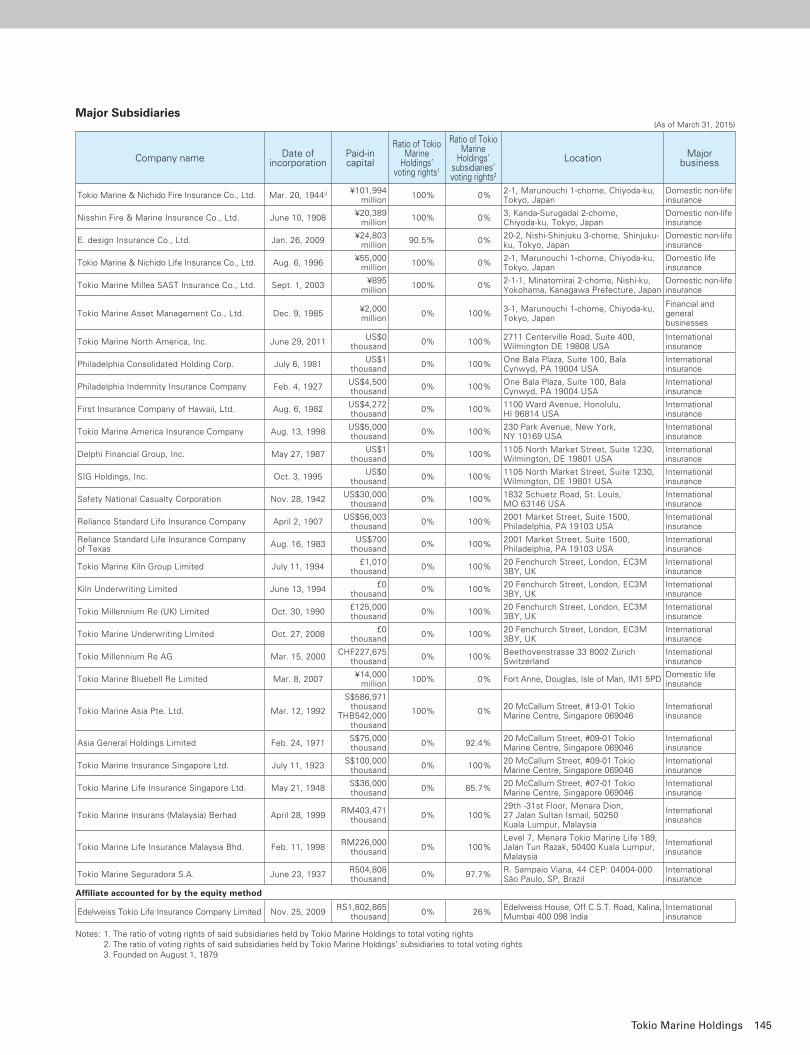
145Tokio Marine Holdings
Major Subsidiaries (As of March 31, 2015)
Company name Date of incorporation
Paid-in capital
Ratio of Tokio Marine
Holdings’ voting rights1
Ratio of Tokio Marine
Holdings’ subsidiaries’ voting rights2
Location Major business
Tokio Marine & Nichido Fire Insurance Co., Ltd. Mar. 20, 19443 ¥101,994 million
100% 0%2-1, Marunouchi 1-chome, Chiyoda-ku, Tokyo, Japan
Domestic non-life insurance
Nisshin Fire & Marine Insurance Co., Ltd. June 10, 1908¥20,389
million100% 0%
3, Kanda-Surugadai 2-chome, Chiyoda-ku, Tokyo, Japan
Domestic non-life insurance
E. design Insurance Co., Ltd. Jan. 26, 2009¥24,803
million90.5% 0%
20-2, Nishi-Shinjuku 3-chome, Shinjuku-ku, Tokyo, Japan
Domestic non-life insurance
Tokio Marine & Nichido Life Insurance Co., Ltd. Aug. 6, 1996¥55,000
million100% 0%
2-1, Marunouchi 1-chome, Chiyoda-ku, Tokyo, Japan
Domestic life insurance
Tokio Marine Millea SAST Insurance Co., Ltd. Sept. 1, 2003¥895
million100% 0%
2-1-1, Minatomirai 2-chome, Nishi-ku, Yokohama, Kanagawa Prefecture, Japan
Domestic non-life insurance
Tokio Marine Asset Management Co., Ltd. Dec. 9, 1985¥2,000 million
0% 100%3-1, Marunouchi 1-chome, Chiyoda-ku, Tokyo, Japan
Financial and general businesses
Tokio Marine North America, Inc. June 29, 2011US$0
thousand0% 100%
2711 Centerville Road, Suite 400, Wilmington DE 19808 USA
International insurance
Philadelphia Consolidated Holding Corp. July 6, 1981US$1
thousand 0% 100%
One Bala Plaza, Suite 100, Bala Cynwyd, PA 19004 USA
International insurance
Philadelphia Indemnity Insurance Company Feb. 4, 1927US$4,500 thousand
0% 100%One Bala Plaza, Suite 100, Bala Cynwyd, PA 19004 USA
International insurance
First Insurance Company of Hawaii, Ltd. Aug. 6, 1982US$4,272 thousand
0% 100%1100 Ward Avenue, Honolulu, HI 96814 USA
International insurance
Tokio Marine America Insurance Company Aug. 13, 1998US$5,000 thousand
0% 100%230 Park Avenue, New York, NY 10169 USA
International insurance
Delphi Financial Group, Inc. May 27, 1987US$1
thousand 0% 100%
1105 North Market Street, Suite 1230, Wilmington, DE 19801 USA
International insurance
SIG Holdings, Inc. Oct. 3, 1995US$0
thousand0% 100%
1105 North Market Street, Suite 1230, Wilmington, DE 19801 USA
International insurance
Safety National Casualty Corporation Nov. 28, 1942US$30,000
thousand0% 100%
1832 Schuetz Road, St. Louis, MO 63146 USA
International insurance
Reliance Standard Life Insurance Company April 2, 1907US$56,003
thousand0% 100%
2001 Market Street, Suite 1500, Philadelphia, PA 19103 USA
International insurance
Reliance Standard Life Insurance Company of Texas
Aug. 16, 1983US$700
thousand0% 100%
2001 Market Street, Suite 1500, Philadelphia, PA 19103 USA
International insurance
Tokio Marine Kiln Group Limited July 11, 1994£1,010
thousand0% 100%
20 Fenchurch Street, London, EC3M 3BY, UK
International insurance
Kiln Underwriting Limited June 13, 1994£0
thousand0% 100%
20 Fenchurch Street, London, EC3M 3BY, UK
International insurance
Tokio Millennium Re (UK) Limited Oct. 30, 1990£125,000 thousand
0% 100%20 Fenchurch Street, London, EC3M 3BY, UK
International insurance
Tokio Marine Underwriting Limited Oct. 27, 2008£0
thousand0% 100%
20 Fenchurch Street, London, EC3M 3BY, UK
International insurance
Tokio Millennium Re AG Mar. 15, 2000CHF227,675
thousand0% 100%
Beethovenstrasse 33 8002 Zurich Switzerland
International insurance
Tokio Marine Bluebell Re Limited Mar. 8, 2007¥14,000
million100% 0% Fort Anne, Douglas, Isle of Man, IM1 5PD
Domestic life insurance
Tokio Marine Asia Pte. Ltd. Mar. 12, 1992
S$586,971 thousand
THB542,000 thousand
100% 0%20 McCallum Street, #13-01 Tokio Marine Centre, Singapore 069046
International insurance
Asia General Holdings Limited Feb. 24, 1971S$75,000 thousand
0% 92.4%20 McCallum Street, #09-01 Tokio Marine Centre, Singapore 069046
International insurance
Tokio Marine Insurance Singapore Ltd. July 11, 1923S$100,000
thousand0% 100%
20 McCallum Street, #09-01 Tokio Marine Centre, Singapore 069046
International insurance
Tokio Marine Life Insurance Singapore Ltd. May 21, 1948S$36,000 thousand
0% 85.7%20 McCallum Street, #07-01 Tokio Marine Centre, Singapore 069046
International insurance
Tokio Marine Insurans (Malaysia) Berhad April 28, 1999RM403,471
thousand0% 100%
29th -31st Floor, Menara Dion, 27 Jalan Sultan Ismail, 50250 Kuala Lumpur, Malaysia
International insurance
Tokio Marine Life Insurance Malaysia Bhd. Feb. 11, 1998RM226,000
thousand0% 100%
Level 7, Menara Tokio Marine Life 189, Jalan Tun Razak, 50400 Kuala Lumpur, Malaysia
International insurance
Tokio Marine Seguradora S.A. June 23, 1937R504,808 thousand
0% 97.7%R. Sampaio Viana, 44 CEP: 04004-000 São Paulo, SP, Brazil
International insurance
Affiliate accounted for by the equity method
Edelweiss Tokio Life Insurance Company Limited Nov. 25, 2009RS1,802,865
thousand0% 26%
Edelweiss House, Off C.S.T. Road, Kalina, Mumbai 400 098 India
International insurance
Notes: 1. The ratio of voting rights of said subsidiaries held by Tokio Marine Holdings to total voting rights 2. The ratio of voting rights of said subsidiaries held by Tokio Marine Holdings’ subsidiaries to total voting rights 3. Founded on August 1, 1879
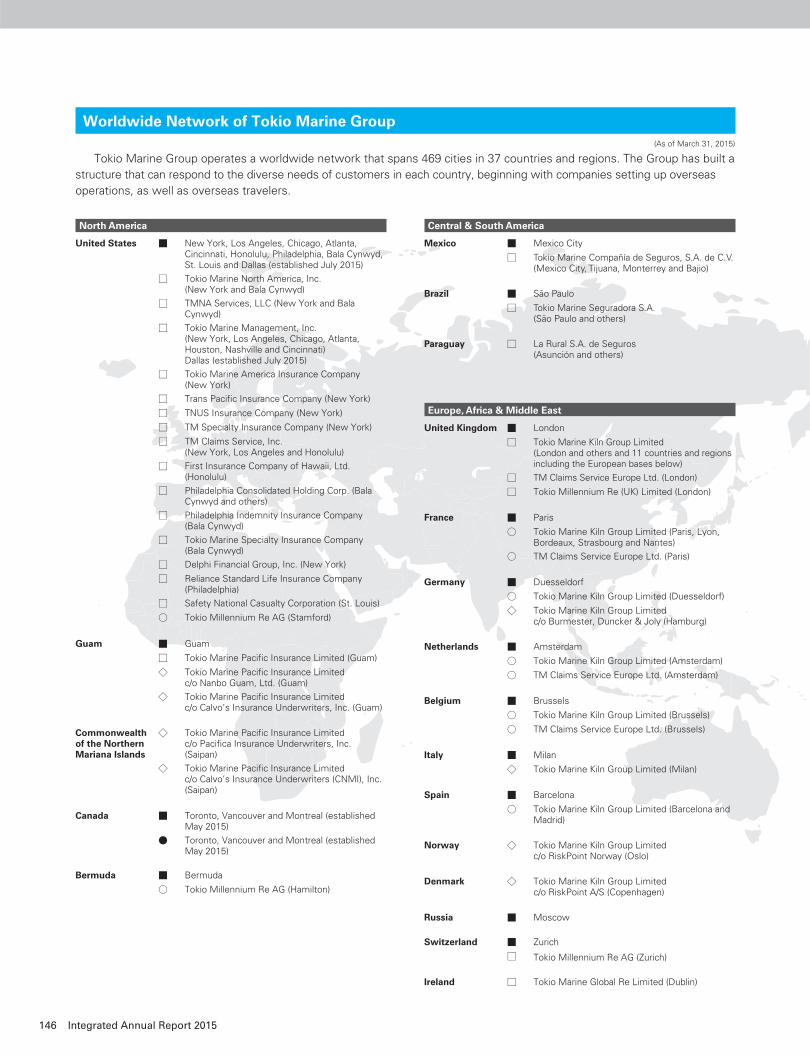
146 Integrated Annual Report 2015
Worldwide Network of Tokio Marine Group (As of March 31, 2015)
Tokio Marine Group operates a worldwide network that spans 469 cities in 37 countries and regions. The Group has built a
structure that can respond to the diverse needs of customers in each country, beginning with companies setting up overseas
operations, as well as overseas travelers.
North America
United States ■ New York, Los Angeles, Chicago, Atlanta, Cincinnati, Honolulu, Philadelphia, Bala Cynwyd, St. Louis and Dallas (established July 2015)
□ Tokio Marine North America, Inc.(New York and Bala Cynwyd)
□ TMNA Services, LLC (New York and Bala Cynwyd)
□ Tokio Marine Management, Inc.(New York, Los Angeles, Chicago, Atlanta, Houston, Nashville and Cincinnati)Dallas (established July 2015)
□ Tokio Marine America Insurance Company (New York)
□ Trans Pacifi c Insurance Company (New York)
□ TNUS Insurance Company (New York)
□ TM Specialty Insurance Company (New York)
□ TM Claims Service, Inc.(New York, Los Angeles and Honolulu)
□ First Insurance Company of Hawaii, Ltd.(Honolulu)
□ Philadelphia Consolidated Holding Corp. (Bala Cynwyd and others)
□ Philadelphia Indemnity Insurance Company (Bala Cynwyd)
□ Tokio Marine Specialty Insurance Company (Bala Cynwyd)
□ Delphi Financial Group, Inc. (New York)
□ Reliance Standard Life Insurance Company (Philadelphia)
□ Safety National Casualty Corporation (St. Louis)
○ Tokio Millennium Re AG (Stamford)
Guam ■ Guam
□ Tokio Marine Pacifi c Insurance Limited (Guam)
◇ Tokio Marine Pacifi c Insurance Limitedc/o Nanbo Guam, Ltd. (Guam)
◇ Tokio Marine Pacifi c Insurance Limitedc/o Calvo’s Insurance Underwriters, Inc. (Guam)
Commonwealth of the Northern Mariana Islands
◇ Tokio Marine Pacifi c Insurance Limitedc/o Pacifi ca Insurance Underwriters, Inc.(Saipan)
◇ Tokio Marine Pacifi c Insurance Limitedc/o Calvo’s Insurance Underwriters (CNMI), Inc.(Saipan)
Canada ■ Toronto, Vancouver and Montreal (established May 2015)
● Toronto, Vancouver and Montreal (established May 2015)
Bermuda ■ Bermuda
○ Tokio Millennium Re AG (Hamilton)
Central & South America
Mexico ■ Mexico City
□ Tokio Marine Compañía de Seguros, S.A. de C.V.(Mexico City, Tijuana, Monterrey and Bajio)
Brazil ■ São Paulo
□ Tokio Marine Seguradora S.A.(São Paulo and others)
Paraguay □ La Rural S.A. de Seguros(Asunción and others)
Europe, Africa & Middle East
United Kingdom ■ London
□ Tokio Marine Kiln Group Limited(London and others and 11 countries and regions including the European bases below)
□ TM Claims Service Europe Ltd. (London)
□ Tokio Millennium Re (UK) Limited (London)
France ■ Paris
○ Tokio Marine Kiln Group Limited (Paris, Lyon, Bordeaux, Strasbourg and Nantes)
○ TM Claims Service Europe Ltd. (Paris)
Germany ■ Duesseldorf
○ Tokio Marine Kiln Group Limited (Duesseldorf)
◇ Tokio Marine Kiln Group Limitedc/o Burmester, Duncker & Joly (Hamburg)
Netherlands ■ Amsterdam
○ Tokio Marine Kiln Group Limited (Amsterdam)
○ TM Claims Service Europe Ltd. (Amsterdam)
Belgium ■ Brussels
○ Tokio Marine Kiln Group Limited (Brussels)
○ TM Claims Service Europe Ltd. (Brussels)
Italy ■ Milan
◇ Tokio Marine Kiln Group Limited (Milan)
Spain ■ Barcelona
○ Tokio Marine Kiln Group Limited (Barcelona and Madrid)
Norway ◇ Tokio Marine Kiln Group Limitedc/o RiskPoint Norway (Oslo)
Denmark ◇ Tokio Marine Kiln Group Limitedc/o RiskPoint A/S (Copenhagen)
Russia ■ Moscow
Switzerland ■ Zurich
□ Tokio Millennium Re AG (Zurich)
Ireland □ Tokio Marine Global Re Limited (Dublin)
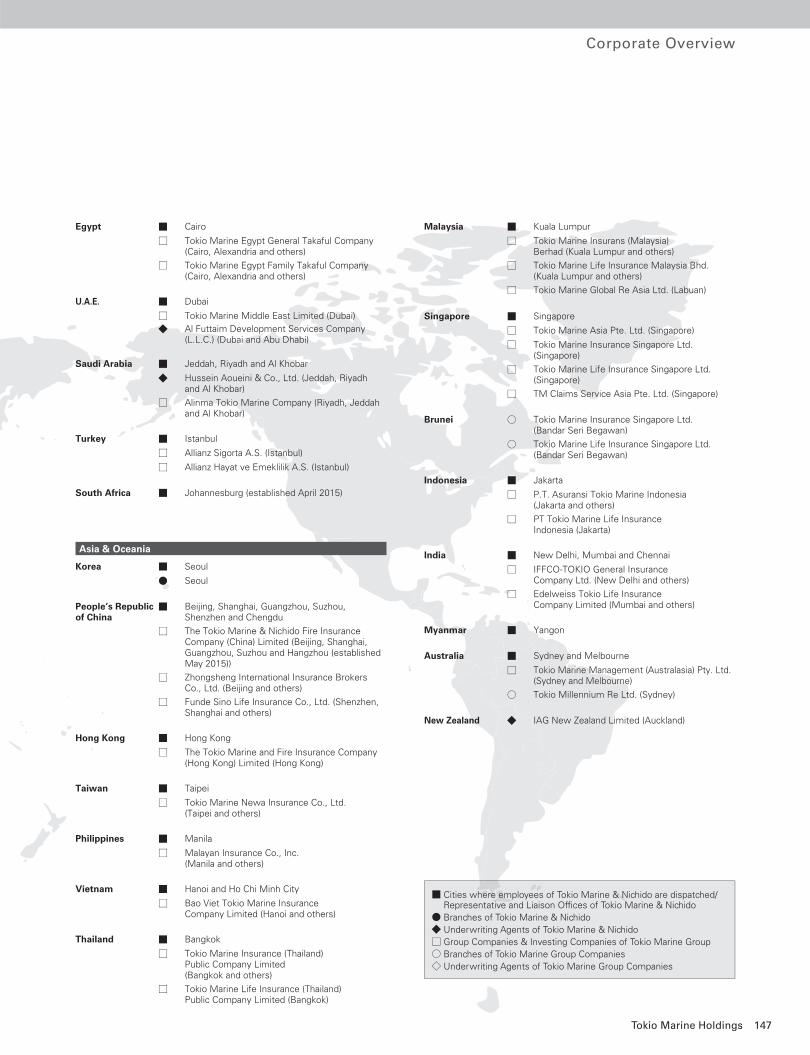
147Tokio Marine Holdings
Egypt ■ Cairo
□ Tokio Marine Egypt General Takaful Company(Cairo, Alexandria and others)
□ Tokio Marine Egypt Family Takaful Company(Cairo, Alexandria and others)
U.A.E. ■ Dubai
□ Tokio Marine Middle East Limited (Dubai)
◆ Al Futtaim Development Services Company (L.L.C.) (Dubai and Abu Dhabi)
Saudi Arabia ■ Jeddah, Riyadh and Al Khobar
◆ Hussein Aoueini & Co., Ltd. (Jeddah, Riyadh and Al Khobar)
□ Alinma Tokio Marine Company (Riyadh, Jeddah and Al Khobar)
Turkey ■ Istanbul
□ Allianz Sigorta A.S. (Istanbul)
□ Allianz Hayat ve Emeklilik A.S. (Istanbul)
South Africa ■ Johannesburg (established April 2015)
Asia & Oceania
Korea ■ Seoul
● Seoul
People’s Republic of China
■ Beijing, Shanghai, Guangzhou, Suzhou, Shenzhen and Chengdu
□ The Tokio Marine & Nichido Fire Insurance Company (China) Limited (Beijing, Shanghai,Guangzhou, Suzhou and Hangzhou (established May 2015))
□ Zhongsheng International Insurance Brokers Co., Ltd. (Beijing and others)
□ Funde Sino Life Insurance Co., Ltd. (Shenzhen, Shanghai and others)
Hong Kong ■ Hong Kong
□ The Tokio Marine and Fire Insurance Company(Hong Kong) Limited (Hong Kong)
Taiwan ■ Taipei
□ Tokio Marine Newa Insurance Co., Ltd.(Taipei and others)
Philippines ■ Manila
□ Malayan Insurance Co., Inc.(Manila and others)
Vietnam ■ Hanoi and Ho Chi Minh City
□ Bao Viet Tokio Marine Insurance Company Limited (Hanoi and others)
Thailand ■ Bangkok
□ Tokio Marine Insurance (Thailand)Public Company Limited(Bangkok and others)
□ Tokio Marine Life Insurance (Thailand)Public Company Limited (Bangkok)
Malaysia ■ Kuala Lumpur
□ Tokio Marine Insurans (Malaysia) Berhad (Kuala Lumpur and others)
□ Tokio Marine Life Insurance Malaysia Bhd.(Kuala Lumpur and others)
□ Tokio Marine Global Re Asia Ltd. (Labuan)
Singapore ■ Singapore
□ Tokio Marine Asia Pte. Ltd. (Singapore)
□ Tokio Marine Insurance Singapore Ltd.(Singapore)
□ Tokio Marine Life Insurance Singapore Ltd.(Singapore)
□ TM Claims Service Asia Pte. Ltd. (Singapore)
Brunei ○ Tokio Marine Insurance Singapore Ltd.(Bandar Seri Begawan)
○ Tokio Marine Life Insurance Singapore Ltd.(Bandar Seri Begawan)
Indonesia ■ Jakarta
□ P.T. Asuransi Tokio Marine Indonesia(Jakarta and others)
□ PT Tokio Marine Life Insurance Indonesia (Jakarta)
India ■ New Delhi, Mumbai and Chennai
□ IFFCO-TOKIO General Insurance Company Ltd. (New Delhi and others)
□ Edelweiss Tokio Life Insurance Company Limited (Mumbai and others)
Myanmar ■ Yangon
Australia ■ Sydney and Melbourne
□ Tokio Marine Management (Australasia) Pty. Ltd.(Sydney and Melbourne)
○ Tokio Millennium Re Ltd. (Sydney)
New Zealand ◆ IAG New Zealand Limited (Auckland)
■ Cities where employees of Tokio Marine & Nichido are dispatched/Representative and Liaison Offices of Tokio Marine & Nichido
● Branches of Tokio Marine & Nichido◆ Underwriting Agents of Tokio Marine & Nichido□ Group Companies & Investing Companies of Tokio Marine Group○ Branches of Tokio Marine Group Companies◇ Underwriting Agents of Tokio Marine Group Companies
Corporate Overview
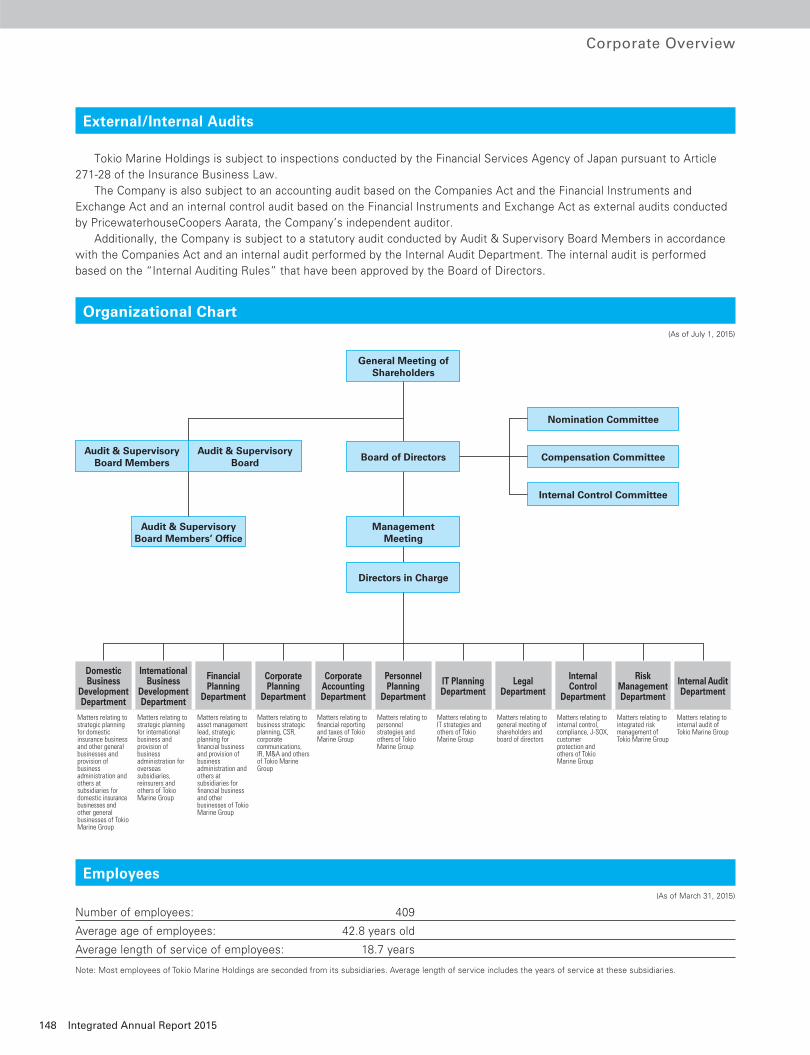
148 Integrated Annual Report 2015
Domestic Business
Development Department
International Business
Development Department
Financial Planning
Department
Corporate Planning
Department
Corporate Accounting Department
Personnel Planning
Department
IT Planning Department
Legal Department
InternalControl
Department
Risk Management Department
Internal Audit Department
Matters relating to strategic planning for domestic insurance business and other general businesses and provision of business administration and others at subsidiaries for domestic insurance businesses and other general businesses of Tokio Marine Group
Matters relating to strategic planning for international business and provision of business administration for overseas subsidiaries, reinsurers and others of Tokio Marine Group
Matters relating to asset management lead, strategic planning for financial business and provision of business administration and others at subsidiaries for financial business and other businesses of Tokio Marine Group
Matters relating to business strategic planning, CSR, corporate communications, IR, M&A and others of Tokio Marine Group
Matters relating to financial reporting and taxes of Tokio Marine Group
Matters relating to personnel strategies and others of Tokio Marine Group
Matters relating to IT strategies and others of Tokio Marine Group
Matters relating to general meeting of shareholders and board of directors
Matters relating to internal control, compliance, J-SOX, customer protection and others of Tokio Marine Group
Matters relating to integrated risk management of Tokio Marine Group
Matters relating to internal audit of Tokio Marine Group
Organizational Chart (As of July 1, 2015)
General Meeting of Shareholders
Board of Directors Compensation Committee
Internal Control Committee
Nomination Committee
Management Meeting
Directors in Charge
Audit & Supervisory Board Members’ Offi ce
Employees (As of March 31, 2015)
Number of employees: 409
Average age of employees: 42.8 years old
Average length of service of employees: 18.7 years
Note: Most employees of Tokio Marine Holdings are seconded from its subsidiaries. Average length of service includes the years of service at these subsidiaries.
External/Internal Audits
Tokio Marine Holdings is subject to inspections conducted by the Financial Services Agency of Japan pursuant to Article
271-28 of the Insurance Business Law.
The Company is also subject to an accounting audit based on the Companies Act and the Financial Instruments and
Exchange Act and an internal control audit based on the Financial Instruments and Exchange Act as external audits conducted
by PricewaterhouseCoopers Aarata, the Company’s independent auditor.
Additionally, the Company is subject to a statutory audit conducted by Audit & Supervisory Board Members in accordance
with the Companies Act and an internal audit performed by the Internal Audit Department. The internal audit is performed
based on the “Internal Auditing Rules” that have been approved by the Board of Directors.
Corporate Overview
Audit & Supervisory Board Members
Audit & Supervisory Board
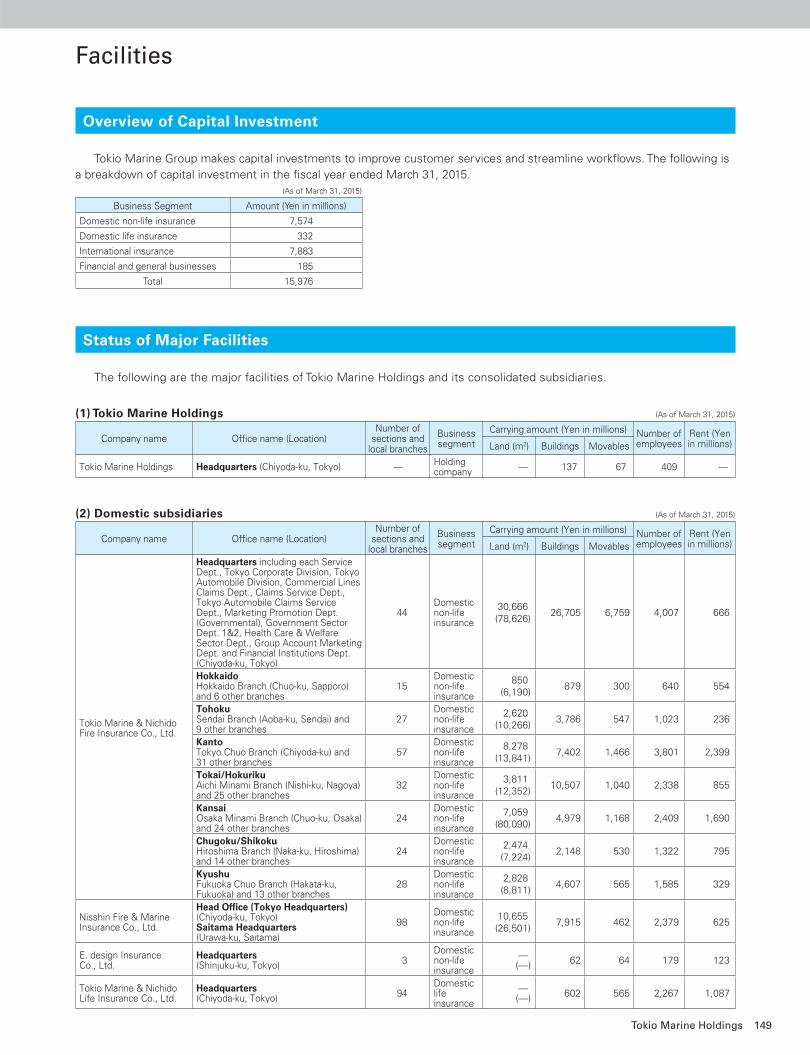
149Tokio Marine Holdings
Overview of Capital Investment
Tokio Marine Group makes capital investments to improve customer services and streamline workfl ows. The following is
a breakdown of capital investment in the fi scal year ended March 31, 2015. (As of March 31, 2015)
Business Segment Amount (Yen in millions)
Domestic non-life insurance 7,574
Domestic life insurance 332
International insurance 7,883
Financial and general businesses 185
Total 15,976
Status of Major Facilities
The following are the major facilities of Tokio Marine Holdings and its consolidated subsidiaries.
(1) Tokio Marine Holdings (As of March 31, 2015)
Company name Office name (Location)Number of
sections and local branches
Business segment
Carrying amount (Yen in millions) Number of employees
Rent (Yen in millions)Land (m2) Buildings Movables
Tokio Marine Holdings Headquarters (Chiyoda-ku, Tokyo) — Holding company — 137 67 409 —
(2) Domestic subsidiaries (As of March 31, 2015)
Company name Office name (Location)Number of
sections and local branches
Business segment
Carrying amount (Yen in millions) Number of employees
Rent (Yen in millions)Land (m2) Buildings Movables
Tokio Marine & Nichido Fire Insurance Co., Ltd.
Headquarters including each Service Dept., Tokyo Corporate Division, Tokyo Automobile Division, Commercial Lines Claims Dept., Claims Service Dept., Tokyo Automobile Claims Service Dept., Marketing Promotion Dept. (Governmental), Government Sector Dept. 1&2, Health Care & Welfare Sector Dept., Group Account Marketing Dept. and Financial Institutions Dept. (Chiyoda-ku, Tokyo)
44Domestic non-life insurance
30,666(78,626)
26,705 6,759 4,007 666
HokkaidoHokkaido Branch (Chuo-ku, Sapporo) and 6 other branches
15Domestic non-life insurance
850(6,190)
879 300 640 554
TohokuSendai Branch (Aoba-ku, Sendai) and 9 other branches
27Domestic non-life insurance
2,620(10,266)
3,786 547 1,023 236
KantoTokyo Chuo Branch (Chiyoda-ku) and 31 other branches
57Domestic non-life insurance
8,278(13,841)
7,402 1,466 3,801 2,399
Tokai/HokurikuAichi Minami Branch (Nishi-ku, Nagoya) and 25 other branches
32Domestic non-life insurance
3,811(12,352)
10,507 1,040 2,338 855
KansaiOsaka Minami Branch (Chuo-ku, Osaka) and 24 other branches
24Domestic non-life insurance
7,059(80,090)
4,979 1,168 2,409 1,690
Chugoku/ShikokuHiroshima Branch (Naka-ku, Hiroshima) and 14 other branches
24Domestic non-life insurance
2,474(7,224)
2,148 530 1,322 795
KyushuFukuoka Chuo Branch (Hakata-ku, Fukuoka) and 13 other branches
28Domestic non-life insurance
2,828(8,811)
4,607 565 1,585 329
Nisshin Fire & Marine Insurance Co., Ltd.
Head Office (Tokyo Headquarters) (Chiyoda-ku, Tokyo)Saitama Headquarters(Urawa-ku, Saitama)
98Domestic non-life insurance
10,655(26,501)
7,915 462 2,379 625
E. design Insurance Co., Ltd.
Headquarters(Shinjuku-ku, Tokyo) 3
Domestic non-life insurance
—(—) 62 64 179 123
Tokio Marine & Nichido Life Insurance Co., Ltd.
Headquarters (Chiyoda-ku, Tokyo) 94
Domestic life insurance
—(—) 602 565 2,267 1,087
Facilities
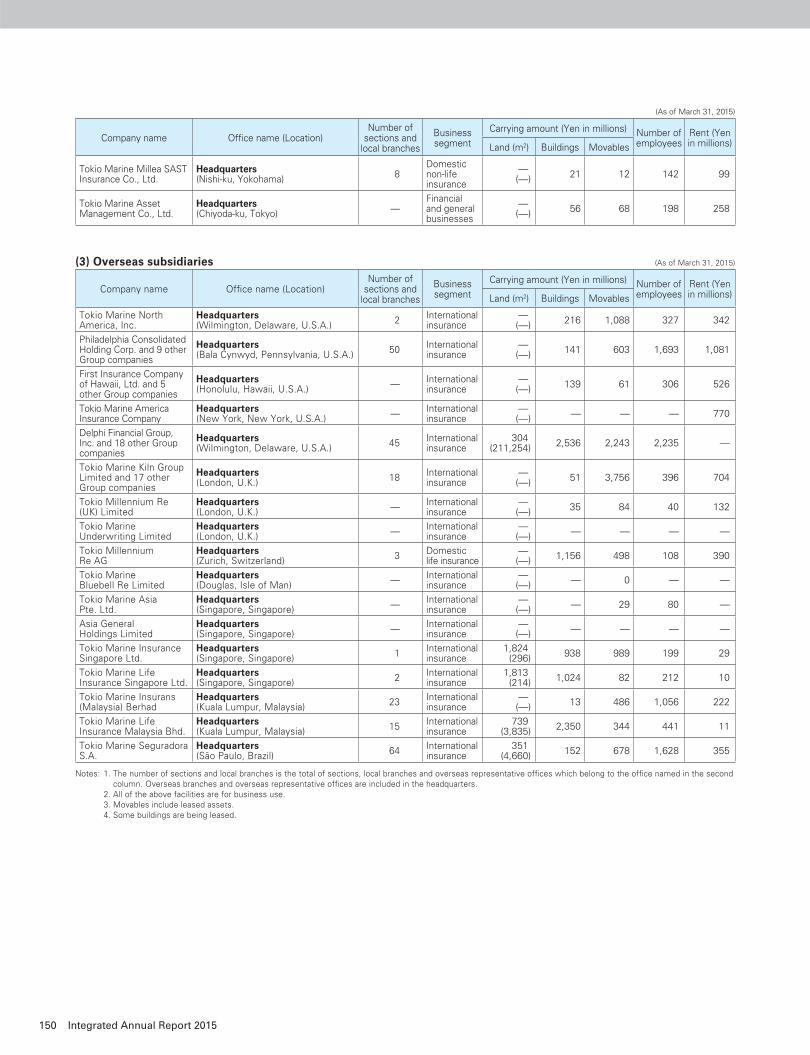
150 Integrated Annual Report 2015
(As of March 31, 2015)
Company name Office name (Location)Number of
sections and local branches
Business segment
Carrying amount (Yen in millions) Number of employees
Rent (Yen in millions)Land (m2) Buildings Movables
Tokio Marine Millea SAST Insurance Co., Ltd.
Headquarters (Nishi-ku, Yokohama) 8
Domestic non-life insurance
—(—) 21 12 142 99
Tokio Marine Asset Management Co., Ltd.
Headquarters (Chiyoda-ku, Tokyo) —
Financial and general businesses
—(—) 56 68 198 258
(3) Overseas subsidiaries (As of March 31, 2015)
Company name Office name (Location)Number of
sections and local branches
Business segment
Carrying amount (Yen in millions) Number of employees
Rent (Yen in millions)Land (m2) Buildings Movables
Tokio Marine North America, Inc.
Headquarters (Wilmington, Delaware, U.S.A.) 2 International
insurance—
(—) 216 1,088 327 342
Philadelphia Consolidated Holding Corp. and 9 other Group companies
Headquarters (Bala Cynwyd, Pennsylvania, U.S.A.) 50 International
insurance—
(—) 141 603 1,693 1,081
First Insurance Company of Hawaii, Ltd. and 5 other Group companies
Headquarters(Honolulu, Hawaii, U.S.A.) — International
insurance—
(—) 139 61 306 526
Tokio Marine America Insurance Company
Headquarters(New York, New York, U.S.A.) — International
insurance—
(—) — — — 770
Delphi Financial Group, Inc. and 18 other Group companies
Headquarters (Wilmington, Delaware, U.S.A.) 45 International
insurance304
(211,254) 2,536 2,243 2,235 —
Tokio Marine Kiln Group Limited and 17 other Group companies
Headquarters(London, U.K.) 18 International
insurance—
(—) 51 3,756 396 704
Tokio Millennium Re (UK) Limited
Headquarters(London, U.K.) — International
insurance—
(—) 35 84 40 132
Tokio Marine Underwriting Limited
Headquarters(London, U.K.) — International
insurance—
(—) — — — —
Tokio Millennium Re AG
Headquarters(Zurich, Switzerland) 3 Domestic
life insurance—
(—) 1,156 498 108 390
Tokio Marine Bluebell Re Limited
Headquarters(Douglas, Isle of Man) — International
insurance—
(—) — 0 — —
Tokio Marine Asia Pte. Ltd.
Headquarters (Singapore, Singapore) — International
insurance—
(—) — 29 80 —
Asia General Holdings Limited
Headquarters(Singapore, Singapore) — International
insurance—
(—) — — — —
Tokio Marine Insurance Singapore Ltd.
Headquarters(Singapore, Singapore) 1 International
insurance1,824
(296) 938 989 199 29
Tokio Marine Life Insurance Singapore Ltd.
Headquarters(Singapore, Singapore) 2 International
insurance1,813
(214) 1,024 82 212 10
Tokio Marine Insurans (Malaysia) Berhad
Headquarters(Kuala Lumpur, Malaysia) 23 International
insurance—
(—) 13 486 1,056 222
Tokio Marine Life Insurance Malaysia Bhd.
Headquarters(Kuala Lumpur, Malaysia) 15 International
insurance739
(3,835) 2,350 344 441 11
Tokio Marine Seguradora S.A.
Headquarters(São Paulo, Brazil) 64 International
insurance351
(4,660) 152 678 1,628 355
Notes: 1. The number of sections and local branches is the total of sections, local branches and overseas representative offices which belong to the office named in the second column. Overseas branches and overseas representative offices are included in the headquarters.
2. All of the above facilities are for business use. 3. Movables include leased assets. 4. Some buildings are being leased.
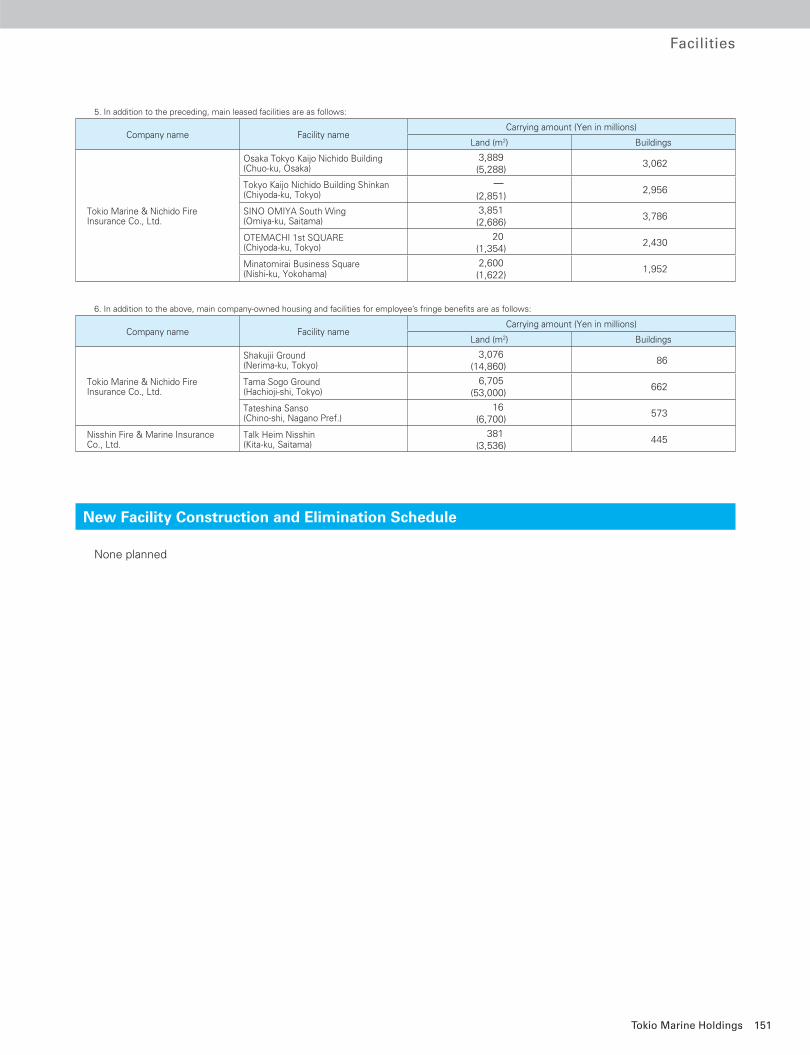
151Tokio Marine Holdings
5. In addition to the preceding, main leased facilities are as follows:
Company name Facility nameCarrying amount (Yen in millions)
Land (m2) Buildings
Tokio Marine & Nichido Fire Insurance Co., Ltd.
Osaka Tokyo Kaijo Nichido Building (Chuo-ku, Osaka)
3,889(5,288)
3,062
Tokyo Kaijo Nichido Building Shinkan (Chiyoda-ku, Tokyo)
―(2,851)
2,956
SINO OMIYA South Wing (Omiya-ku, Saitama)
3,851(2,686)
3,786
OTEMACHI 1st SQUARE(Chiyoda-ku, Tokyo)
20(1,354)
2,430
Minatomirai Business Square (Nishi-ku, Yokohama)
2,600(1,622)
1,952
6. In addition to the above, main company-owned housing and facilities for employee’s fringe benefits are as follows:
Company name Facility nameCarrying amount (Yen in millions)
Land (m2) Buildings
Tokio Marine & Nichido Fire Insurance Co., Ltd.
Shakujii Ground(Nerima-ku, Tokyo)
3,076(14,860)
86
Tama Sogo Ground (Hachioji-shi, Tokyo)
6,705(53,000)
662
Tateshina Sanso(Chino-shi, Nagano Pref.)
16(6,700)
573
Nisshin Fire & Marine Insurance Co., Ltd.
Talk Heim Nisshin(Kita-ku, Saitama)
381(3,536)
445
New Facility Construction and Elimination Schedule
None planned
Facilities
152 Integrated Annual Report 2015
Stock and Shareholder Information
Stock Information (As of July 1, 2015)
Stock issued by Tokio Marine Holdings is common stock and the total number of authorized shares is 3.3 billion shares
with the total number of shares outstanding at 757,524,375 shares.
a. The Ordinary General Meeting of Shareholders is held within three months of the end of each fiscal year.
b. Accounting period: Ends March 31
c. Share registrar: The Mitsubishi UFJ Trust and Banking Corporation
d. Record date: Ordinary General Meeting of Shareholders: March 31
Year-end dividend: March 31
Interim dividend: September 30
e. Public notice will be electronically published.
(http://www.pronexus.co.jp/koukoku/8766/8766.html)
However, in the event that public notice cannot be electronically published due to an accident or other compelling reason,
a notification shall be published in the Tokyo issue of the Nihon Keizai Shimbun.
f. Number of shares constituting one unit: 100
g. Stock listing: Tokyo Stock Exchange
Matters for the General Meeting of Shareholders The 13th General Meeting of Shareholders was held on June 29, 2015. The items reported and the proposals acted upon
were as follows:
Items reported1. Business report, consolidated financial statements and the audit reports on consolidated financial statements prepared
by the independent auditor and the Audit & Supervisory Board, respectively, for the fiscal year ended March 31, 2015 (April
1, 2014 to March 31, 2015)
2. Non-consolidated financial statements for the fiscal year ended March 31, 2015 (April 1, 2014 to March 31, 2015)
Proposals acted upon1. Appropriation of Surplus
2. Election of Ten (10) Directors
3. Election of Two (2) Audit & Supervisory Board Members
4. Change in Remuneration to Directors
The proposals have been approved as proposed.
Dividend Policy With respect to the appropriation of surplus, the Company seeks to improve shareholder returns by distributing stable
dividends on its common stock after taking into consideration the business results and expected future environment of the
Company, subject to the Company having provided sufficient capital to meet the business needs of Tokio Marine Group.
Based on this policy, taking various circumstances into consideration, the Company paid a year-end dividend of 55.00
yen per share for the fi scal year ended March 31, 2015.
The Company also paid an interim dividend of 40.00 yen per share, resulting in total dividends for the year of 95.00 yen
per share. This was an increase of 25.00 yen per share compared with total annual dividends of 70.00 yen per share in the
previous fi scal year.
CapitalDate Equity capital
April 2, 2002 ¥150 billion
March 31, 2015 ¥150 billion
Stock Information
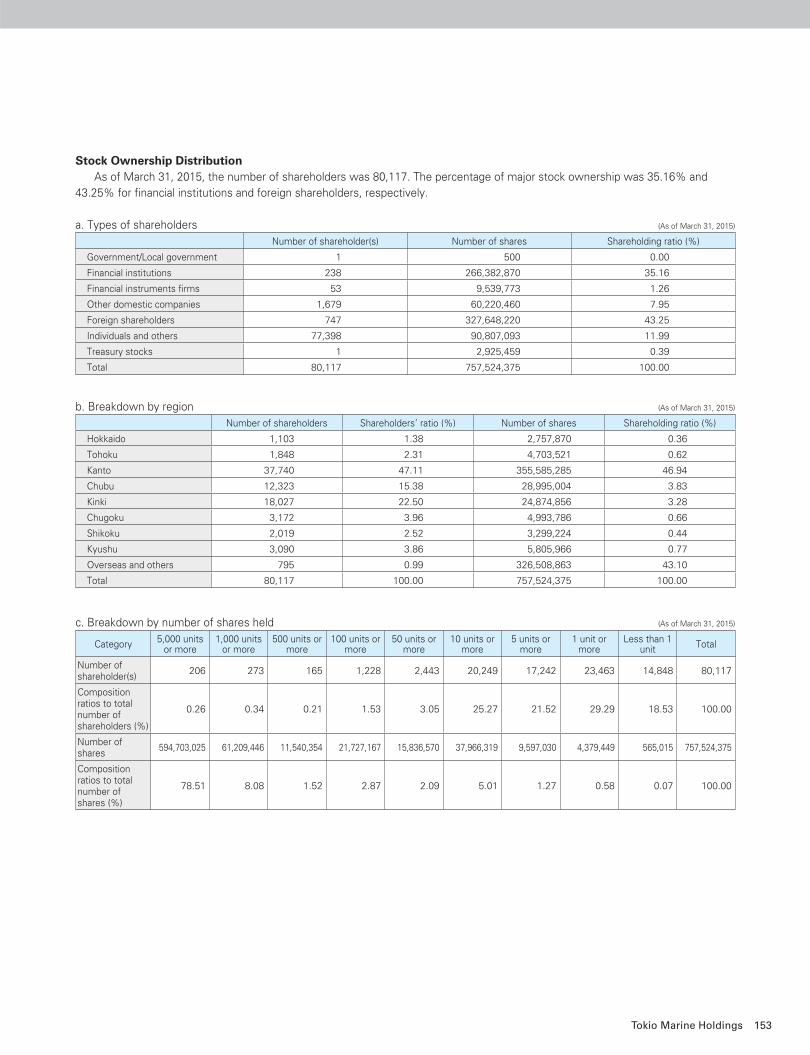
153Tokio Marine Holdings
Stock Ownership Distribution As of March 31, 2015, the number of shareholders was 80,117. The percentage of major stock ownership was 35.16% and
43.25% for financial institutions and foreign shareholders, respectively.
a. Types of shareholders (As of March 31, 2015)
Number of shareholder(s) Number of shares Shareholding ratio (%)
Government/Local government 1 500 0.00
Financial institutions 238 266,382,870 35.16
Financial instruments firms 53 9,539,773 1.26
Other domestic companies 1,679 60,220,460 7.95
Foreign shareholders 747 327,648,220 43.25
Individuals and others 77,398 90,807,093 11.99
Treasury stocks 1 2,925,459 0.39
Total 80,117 757,524,375 100.00
b. Breakdown by region (As of March 31, 2015)
Number of shareholders Shareholders’ ratio (%) Number of shares Shareholding ratio (%)
Hokkaido 1,103 1.38 2,757,870 0.36
Tohoku 1,848 2.31 4,703,521 0.62
Kanto 37,740 47.11 355,585,285 46.94
Chubu 12,323 15.38 28,995,004 3.83
Kinki 18,027 22.50 24,874,856 3.28
Chugoku 3,172 3.96 4,993,786 0.66
Shikoku 2,019 2.52 3,299,224 0.44
Kyushu 3,090 3.86 5,805,966 0.77
Overseas and others 795 0.99 326,508,863 43.10
Total 80,117 100.00 757,524,375 100.00
c. Breakdown by number of shares held (As of March 31, 2015)
Category 5,000 units or more
1,000 units or more
500 units or more
100 units or more
50 units or more
10 units or more
5 units or more
1 unit or more
Less than 1 unit Total
Number of shareholder(s)
206 273 165 1,228 2,443 20,249 17,242 23,463 14,848 80,117
Composition ratios to total number of shareholders (%)
0.26 0.34 0.21 1.53 3.05 25.27 21.52 29.29 18.53 100.00
Number of shares
594,703,025 61,209,446 11,540,354 21,727,167 15,836,570 37,966,319 9,597,030 4,379,449 565,015 757,524,375
Composition ratios to total number of shares (%)
78.51 8.08 1.52 2.87 2.09 5.01 1.27 0.58 0.07 100.00
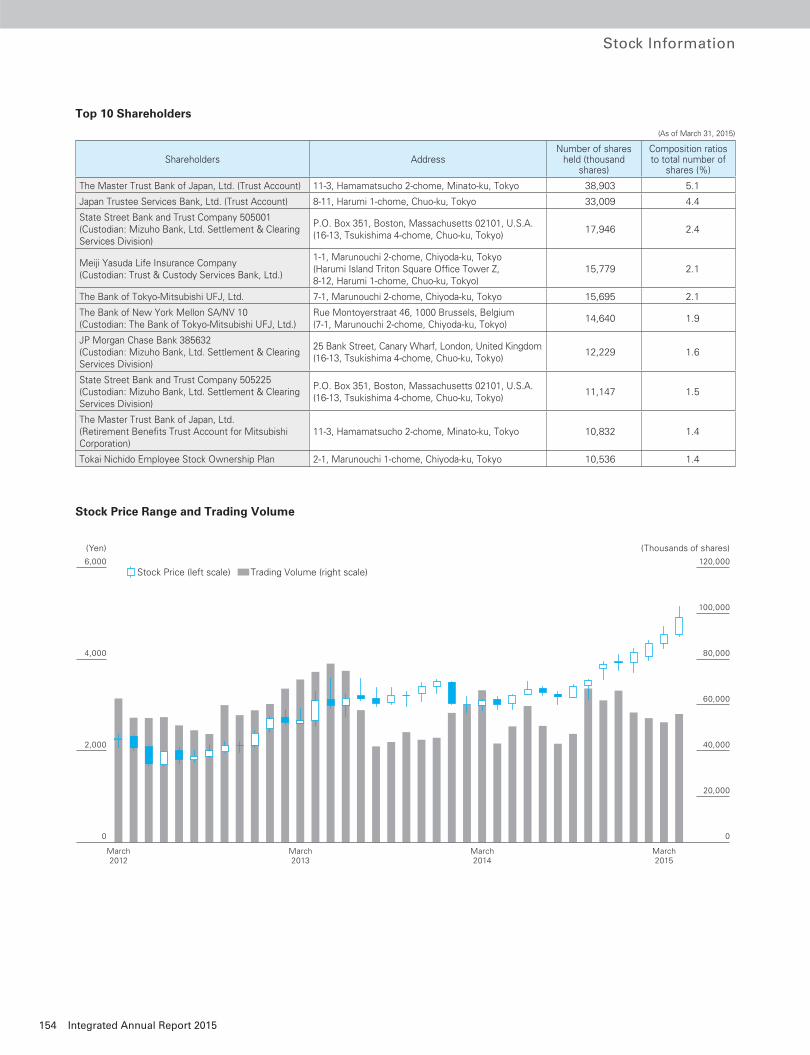
154 Integrated Annual Report 2015
6,000 120,000
100,000
80,000
60,000
40,000
20,000
March2012
March2013
March2014
March2015
4,000
2,000
0 0
(Yen) (Thousands of shares)
Stock Price (left scale) Trading Volume (right scale)
Top 10 Shareholders
(As of March 31, 2015)
Shareholders AddressNumber of shares
held (thousand shares)
Composition ratiosto total number of
shares (%)
The Master Trust Bank of Japan, Ltd. (Trust Account) 11-3, Hamamatsucho 2-chome, Minato-ku, Tokyo 38,903 5.1
Japan Trustee Services Bank, Ltd. (Trust Account) 8-11, Harumi 1-chome, Chuo-ku, Tokyo 33,009 4.4
State Street Bank and Trust Company 505001(Custodian: Mizuho Bank, Ltd. Settlement & Clearing Services Division)
P.O. Box 351, Boston, Massachusetts 02101, U.S.A.(16-13, Tsukishima 4-chome, Chuo-ku, Tokyo)
17,946 2.4
Meiji Yasuda Life Insurance Company (Custodian: Trust & Custody Services Bank, Ltd.)
1-1, Marunouchi 2-chome, Chiyoda-ku, Tokyo(Harumi Island Triton Square Offi ce Tower Z,8-12, Harumi 1-chome, Chuo-ku, Tokyo)
15,779 2.1
The Bank of Tokyo-Mitsubishi UFJ, Ltd. 7-1, Marunouchi 2-chome, Chiyoda-ku, Tokyo 15,695 2.1
The Bank of New York Mellon SA/NV 10 (Custodian: The Bank of Tokyo-Mitsubishi UFJ, Ltd.)
Rue Montoyerstraat 46, 1000 Brussels, Belgium(7-1, Marunouchi 2-chome, Chiyoda-ku, Tokyo)
14,640 1.9
JP Morgan Chase Bank 385632 (Custodian: Mizuho Bank, Ltd. Settlement & Clearing Services Division)
25 Bank Street, Canary Wharf, London, United Kingdom(16-13, Tsukishima 4-chome, Chuo-ku, Tokyo)
12,229 1.6
State Street Bank and Trust Company 505225(Custodian: Mizuho Bank, Ltd. Settlement & Clearing Services Division)
P.O. Box 351, Boston, Massachusetts 02101, U.S.A.(16-13, Tsukishima 4-chome, Chuo-ku, Tokyo)
11,147 1.5
The Master Trust Bank of Japan, Ltd.(Retirement Benefi ts Trust Account for Mitsubishi Corporation)
11-3, Hamamatsucho 2-chome, Minato-ku, Tokyo 10,832 1.4
Tokai Nichido Employee Stock Ownership Plan 2-1, Marunouchi 1-chome, Chiyoda-ku, Tokyo 10,536 1.4
Stock Price Range and Trading Volume
Stock Information

This integrated annual report has been printed with vegetable oil ink that is free of volatile organic compounds (VOCs).
Tokio Marine Nichido Building Shinkan,2-1, Marunouchi 1-chome, Chiyoda-ku,Tokyo 100-0005, JapanTel: +81-3-6212-3333