2020 integrated annual report
TRANSCRIPT


Table of contents
Core report . . . . . . . . . . . . . . . . . . . . . . . . . . . . . . . 1
01 Barco at a glance . . . . . . . . . . . . . . . . . . . . . . . . . . . . . . . . . . .3
02 Our company . . . . . . . . . . . . . . . . . . . . . . . . . . . . . . . . . . . . . .9
03 How we create value . . . . . . . . . . . . . . . . . . . . . . . . . . . . . .18
04 Shaping our strategy . . . . . . . . . . . . . . . . . . . . . . . . . . . . . 22
05 Our technology . . . . . . . . . . . . . . . . . . . . . . . . . . . . . . . . . . .37
06 Our markets . . . . . . . . . . . . . . . . . . . . . . . . . . . . . . . . . . . . . 42
07 Our results . . . . . . . . . . . . . . . . . . . . . . . . . . . . . . . . . . . . . . . .55
Governance & risk report . . . . . . . . . . . . . . . . . 71
01 Corporate governance . . . . . . . . . . . . . . . . . . . . . . . . CGR/3
01 Risk management and control processes . . . . . CGR/38
Report on planet - people - communities 127
01 Our sustainability ambition statement . . . . . . . . . . PPC/3
02 Our sustainability strategy . . . . . . . . . . . . . . . . . . . . . PPC/4
03 Our sustainability performance . . . . . . . . . . . . . . . PPC/11
04 Managing sustainability . . . . . . . . . . . . . . . . . . . . . .PPC/68
Financial report . . . . . . . . . . . . . . . . . . . . . . . . 203
01 Barco consolidated . . . . . . . . . . . . . . . . . . . . . . . . . . . . .FIN/6
02 Information about the share . . . . . . . . . . . . . . . . . . FIN/94
Assurance report . . . . . . . . . . . . . . . . . . . . . . . 305
GRI Content index . . . . . . . . . . . . . . . . . . . . . .312
Glossary . . . . . . . . . . . . . . . . . . . . . . . . . . . . . . . 320
CORE
MORE
• Governance & risk report
• Report on planet - people - communities
• Financial report
ANNEX
• Assurance report
• GRI Content index
• GlossaryAll definitions for alternative performance measures (APM’s) as used in this report are available in the glossary as available on Barco’s investor portal and in Annex of
the Annual Report
Barco
Inte
grate
d re
po
rt 20
20
2
CO
RE
Re
po
rt
01 BARCO AT A GLANCE
02 OUR COMPANY
04 SHAPING OUR STRATEGY
03 HOW WE CREATE VALUE
05 OUR TECHNOLOGY
06 OUR MARKETS
07 OUR RESULTS

On the road to integrated reporting
Since 2017, Barco has been on a mission to enable bright
outcomes. In line with that mission, we are happy to present
our very first integrated report. It highlights our commit-
ment to financial as well as non-financial outcomes, value
and impact. Beyond accountability and reporting, we also
consider integrated reporting a driving force for value creation
and innovation. It will guide us further on our road to enabling
bright outcomes – for customers, business partners, employ-
ees, shareholders and every other stakeholder.
Barco
Inte
grate
d re
po
rt 20
20
3
CO
RE
Re
po
rt
01 BARCO AT A GLANCE
02 OUR COMPANY
04 SHAPING OUR STRATEGY
03 HOW WE CREATE VALUE
05 OUR TECHNOLOGY
06 OUR MARKETS
07 OUR RESULTS

What really marked 2020 was the
agility, creativity and resilience shown
by each of us, individually and as a
company.
Message from the CEO
Dear customers, business partners,
employees and shareholders,
A year to forget? An unforgettable year? Whatever option you
choose, 2020 was an unprecedented year for each and every
one of us.
Just like at many other organizations, the entire Barco team
worked extraordinarily hard to navigate the human and busi-
ness impacts of the covid-19 crisis. In spite of our efforts
and the many measures we took, we could not prevent our
results from dropping steeply, as disruptions in our markets
knocked demand off balance. But we are confidently poised for
renewed growth when our key markets in their “new normal”
become fully active again.
A spirit of agility, creativity and resilience
When we’ll look back upon 2020 within a decade, I hope we’ll
remember how we managed to turn that massive challenge
into meaningful choices. To me, what really marked 2020 was
the agility, creativity and resilience shown by each of us, indi-
vidually and as a company. Many Barco employees shifted
from office to remote working in no time. Others focused on
keeping our factories and offices open for business, combining
lots of creativity with timely, pragmatic safety protocols. We
adjusted cost levels, redeployed teams to respond to market
realities and ensured continuity towards our customers, helping
them navigate through the market shocks.
Building on solid foundations
2020 confirmed the importance of a strong company culture.
Our values, beliefs and attitude have guided us through the
crisis.
Of course, it takes more than that to keep a business sailing
through the heavy winds 2020 brought. While we were ini-
tially preparing for strong growth in 2020, the Barco ship was
also ready for rough weather when the coronavirus hit, as we
are a fit and lean company. Between 2016 and 2019, we had
intensively focused on performance, boosting operational and
commercial excellence, ensuring cost efficiency and building
out our commercial footprint while we shaped our organiza-
tion, product portfolio and product-market strategies. In last
year’s annual report, I wrote how pleased I was that Barco had
a healthy, resilient platform for future growth. While the covid-
19 virus left no room for growth, these solid foundations did
support us in these heavy winds.
Barco
Inte
grate
d re
po
rt 20
20
4
CO
RE
Re
po
rt
01 BARCO AT A GLANCE
02 OUR COMPANY
04 SHAPING OUR STRATEGY
03 HOW WE CREATE VALUE
05 OUR TECHNOLOGY
06 OUR MARKETS
07 OUR RESULTS

Facing head- as well as tailwinds
All three Barco markets have been impacted by the covid-19
crisis, with varying degrees of severity. We experienced some
tailwinds but many headwinds. As cinemas closed down and
events got cancelled, our Entertainment business faced sig-
nificant downturn. In Healthcare, the pressure on hospitals
initially sent demand for our diagnostic displays and remote
diagnostic tools soaring. This growth, however, was offset by
lower demand for healthcare solutions in the second half of
the year, as elective procedures in hospitals were postponed.
Enterprise sales also declined as offices locked down, but
began to show signs of recovery with steady progress in the
second half of the year.
Navigating through the crisis: defense and offense
Facing diminishing sales in a number of our markets, we
decided to combine both offensive and defensive plays during
the crisis. Variable cost structures, cost control measures and
government support all helped keep our business running.
To ensure a strong rebound from the downturn – or rather,
to make sure we emerge from the pandemic even stronger –
we kept investing in research and development, continued to
launch new products and stepped up well defined investments
in customer engagement in 2020.
Recipe for recovery
We are confident that we will harvest the fruits of that
approach. After all, our markets hold promising opportunities
for growth in 2021 and beyond:
• Our strong healthcare visualization solutions perfectly
cater to the need for increased care capacity and to
elective surgery once it returns to normal levels;
• Clickshare Conference meets the needs of corporates
who are now looking for the right technology to enable
their hybrid workplaces;
• Our next-generation laser projection technologies will
help cinema exhibitors differentiate themselves from the
competition while saving costs.
In addition, we have reinforced our commercial footprint and
our In China For China position, thus increasing our competi-
tive strength across the globe. Last but not least, the covid-19
crisis has pushed Barco to operate in new ways, accelerating
digitization. We’re shifting gears in that respect too. By wel-
coming Marc Spenlé, our new Chief Digital and Information
Officer, as well several other new colleagues with seasoned
technology experience and skills, we will create value through
digital innovation.
Continued focus on sustainability
While 2020 was a very different year for our entire business,
Barco stuck to its sustainability commitments. Since 2017,
when we decided to integrate sustainability into every aspect
of our business, sustainability has been increasingly pervad-
ing everything that Barco does. In 2020, we made progress
in various new domains and reached our 2020 targets for
‘planet’, among other achievements. To highlight our dedi-
This Integrated report underlines the
fact that sustainability-linked factors are
just as important as financial factors in
helping us create value.
To ensure we’d emerge even stronger
from the downturn we kept investing
in research and development, kept
launching new products and invested
big in customer engagement in 2020.
cation to sustainability, we replaced our familiar Annual and
Sustainability reports by this Integrated report. It underlines the
fact that sustainability-linked factors are just as important as
financial factors in determining our performance and helping
us create value.
Thank you!
This year, more than ever, I want to close my message with
a big thank you. Thanks to all our colleagues who adapted
rapidly to the new reality. Thank you to our clients, suppli-
ers, investors and our Board of Directors, for supporting us
and maintaining trust in our long-term potential. It has been
a tough year and we are not at the end of this marathon yet,
but we look towards the future with confidence and are com-
mitted to keeping Barco’s performance on track.
Thanks for you continued support.
Jan De Witte
CEO
Since the outbreak of the covid-19 pandemic, we at Barco have been continuously adjusting to face the challenges posed by
the virus. Read more about our approach
Barco
Inte
grate
d re
po
rt 20
20
5
CO
RE
Re
po
rt
01 BARCO AT A GLANCE
02 OUR COMPANY
04 SHAPING OUR STRATEGY
03 HOW WE CREATE VALUE
05 OUR TECHNOLOGY
06 OUR MARKETS
07 OUR RESULTS

Key figures
Percentage of
new product releases
with a Barco ECO label
Barco’s standard customer
experience metric, measured
quarterly
(upper quartile industry performance)
NPS (Net Promoter Score)
Eco score
EmployeesReported in heads, excluding temporary workforce
(Database Corporate Associates per 31/12/2020)
Sales(in millions of euro)
1,0
28
.52
018
1.0
82
.62
019
770
.12
02
0100
200
300
400
500
600
700
800
900
1, 000
1, 100
Ebitda(in millions of euro)
12.1
%
14.1
%
7.0
%
124
.52
018
153
.02
019
53
.62
02
020
40
60
80
100
120
140
160
180
200
% of sales
48%
47
Gross profit(in millions of euro)
413
40
.1%
39
.7%
36
.9%
20
18
42
9.3
20
19
28
3.8
20
20
% of sales
100
150
250
350
450
550
50
200
300
400
600
500
2018 3,664
2019 3,636
2020 3,303
Barco
Inte
grate
d re
po
rt 20
20
6
CO
RE
Re
po
rt
01 BARCO AT A GLANCE
02 OUR COMPANY
04 SHAPING OUR STRATEGY
03 HOW WE CREATE VALUE
05 OUR TECHNOLOGY
06 OUR MARKETS
07 OUR RESULTS

Highlights
JANUARY
Demetra wins Henry van de Velde
Gold Award for Business Innovation 2020
More than revolutionizing skin imaging, our
Demetra platform also excels in design. We were
honored to receive Belgium’s most prestigious
design recognition – the Henry van de Velde
Gold Award in 2020.
Read more
JANUARY
Traffic management center
keeps 335,000 vehicles moving 24/7
at the Frankfurter Kreuz interchange
At the Hessen Traffic Center in Germany, a giant
Barco UniSee LCD video wall (39 panels) provides
a continuous overview of the traffic on no less
than 2,000 km of highway. Our TransForm N
controller secures the collection and distribution
of all media sources to all the workstations.
Read more
FEBRUARY
New ClickShare Conference
brings wireless conferencing to the workplace
The new ClickShare Conference works
seamlessly – and wirelessly – together with
videoconferencing software and any type
of meeting room hardware to make remote
meetings truly intuitive – just what users need in
today’s hybrid workplace.
Read more
MARCH
Barco stays open for business – also
during the covid-19 pandemic
Throughout the covid-19 crisis, Barco focused
on business continuity, keeping our production
operational, reaching out to customers and
implementing strict measures to safeguard the
well-being of our people.
Read more
JUNE
New presentation switcher meets the needs of
both live events industry and corporate meeting
spaces
The PDS-4K full-screen presentation switcher is
a new member of our industry-leading image
processing platform. More than ensuring
high-quality visual experiences, it also responds
to users’ demands for flexible, long-lasting and
easy-to-use solutions.
Read more
Barco
Inte
grate
d re
po
rt 20
20
7
CO
RE
Re
po
rt
01 BARCO AT A GLANCE
02 OUR COMPANY
04 SHAPING OUR STRATEGY
03 HOW WE CREATE VALUE
05 OUR TECHNOLOGY
06 OUR MARKETS
07 OUR RESULTS

Highlights
SEPTEMBER
Revealing immersive showpiece with
Culturespaces: Bassins de Lumières
In Bordeaux (France), Culturespaces opened Bas-
sins de Lumières: an amazing exposition that brings
the fine art of Gustav Klimt and Paul Klee to life in
a former World War II submarine base – thanks to
over 100 Barco projectors.
Read more
SEPTEMBER
Achieving our first target to reduce carbon
footprint of own operations one year in advance
In 2016, Barco had set a number of ambitious
sustainability goals to be achieved by 2020. Thanks
to our dedication to sustainability, we reduced the
carbon footprint of our own operations by 20% in
2019, achieving our target one year in advance.
Read more
OCTOBER
Barco Insights: broadening our IoT-platform for
projectors
No complex setup or network configuration, no
local host PC and no software to install: Barco
Insights, our new IoT-enabled cloud platform,
makes the remote monitoring and serviceability of
projectors easy.
Read more
OCTOBER
Enabling virtual presence for the digital operating
room with Caresyntax
Together with Caresyntax, our Healthcare division
launched a virtual presence technology for the
digital operation room, meeting the global surge of
remote work and remote collaboration.
Read more
NOVEMBER
Virtual classrooms: delivering world-class
business education
When Mays Business School at Texas A&M
University (US) decided to embrace online teaching,
they chose weConnect. “Unlike other solutions, this
is really a teaching platform. It lets me truly engage
with participants,” said senior advisor Jared Bleak.
Read more
Barco
Inte
grate
d re
po
rt 20
20
8
CO
RE
Re
po
rt
01 BARCO AT A GLANCE
02 OUR COMPANY
04 SHAPING OUR STRATEGY
03 HOW WE CREATE VALUE
05 OUR TECHNOLOGY
06 OUR MARKETS
07 OUR RESULTS

Our company
CO
RE
Re
po
rtB
arcoIn
teg
rated
rep
ort 2
02
0
9
01 BARCO AT A GLANCE
02 OUR COMPANY
04 SHAPING OUR STRATEGY
03 HOW WE CREATE VALUE
05 OUR TECHNOLOGY
06 OUR MARKETS
07 OUR RESULTS

Barco’s mission is to enable bright outcomes by transforming content into
insight and emotion.
Our mission statement
Imagine a way to see, sense, and share the intangible. It’s what
happens when big data becomes knowledge. When images
become insight. And when experiences come to life.
That’s what Barco is all about. In a world where data and rich
content are expanding exponentially, we empower you with
inspired sight, sound and sharing solutions to help you make
meaningful connections.
For us, it’s you - our customer - that counts. We help you
achieve your goals, whether it’s protecting the health and
safety of millions, creating unforgettable experiences, or sup-
porting people to work smarter together. We help you get the
most out of what you do every day. So together, we create
brighter outcomes, around the world.
CO
RE
Re
po
rt
05 OUR TECHNOLOGY
06 OUR MARKETS
07 OUR RESULTS
Barco
Inte
grate
d re
po
rt 20
20
10
01 BARCO AT A GLANCE
02 OUR COMPANY
04 SHAPING OUR STRATEGY
03 HOW WE CREATE VALUE
05 OUR RESULTS

Regions
• Sales & marketing
• Customer service & projects
Geographical breakdown of sales
General Services
• Human resources
• Finance, strategy & legal
• Information technologies
• Corporate marketing
Operations
• Manufacturing
• Supply chain
• Facilities, health & Safety
• Quality
Innovation & technology
• Technology office
• Research & development
• Product management
Our organisation
39%The Americas
36%EMEA
25%Asia-Pacific
38%Entertainment
28%Enterprise
34%Healthcare
Organigram
Entertainment Enterprise Healthcare
The Americas EMEA Asia-Pacific
Divisions
Sales per division
Barco
Inte
grate
d re
po
rt 20
20
11
CO
RE
Re
po
rt
01 BARCO AT A GLANCE
02 OUR COMPANY
04 SHAPING OUR STRATEGY
03 HOW WE CREATE VALUE
05 OUR TECHNOLOGY
06 OUR MARKETS
07 OUR RESULTS

Geographical footprint The people of Barco
Our people are the driving force to our success. A team of over 3,300 employees, located
around the globe, all join forces to enable bright outcomes;
AMERICAS
• Brazil
• Canada
• Colombia
• Mexico
• United States
ASIA-PACIFIC
• Australia
• China
• Hong Kong
• India
• Japan
• Malaysia
• Singapore
• South Korea
• Taiwan
EUROPE & MIDDLE EAST
• Belgium
• France
• Germany
• Italy
• The Netherlands
• Norway
• Poland
• Russia
• Spain
• Sweden
• Turkey
• United Arab Emirates
• United Kingdom
Sites
R&D and/or manufacturing facilities
72% male
28% female
12.1% The Americas
54.4% EMEA
Number of employees
Gender
Geographical
Per functional group
3,6642018
3,6362019
3,3032020
Reported in heads, excluding temporary workforce (Database Corporate Associates per 31/12/2020)
16.7% Sales
28.5% Research & development
1.4% Quality, supply chain & support
1.8% Procurement
29.6% Manufacturing & logistics
4.9% Marketing
8.9% Customer service
0.7% Customer projects
7.5% Administration
33.5% Asia-Pacific Barco
Inte
grate
d re
po
rt 20
20
12
CO
RE
Re
po
rt
01 BARCO AT A GLANCE
02 OUR COMPANY
04 SHAPING OUR STRATEGY
03 HOW WE CREATE VALUE
05 OUR TECHNOLOGY
06 OUR MARKETS
07 OUR RESULTS

Leadership
Barco believes that the role of its leadership team and its Board
of Directors is not only to protect the corporation but also to
ensure that Barco is able to create value for society at large.
While Barco’s Board of Directors sets, steers and monitors
our strategic direction, our Core Leadership Team (‘CLT’) is
responsible for implementing our group strategy and policies
and achieving our objectives and results. In this way, all gover-
nance bodies contribute to value creation at Barco.
14
1819
2021
1
2
3
56
7
8
9
10
13
15
17
16
114
12
MATERIAL TOPICS
Barco
Inte
grate
d re
po
rt 20
20
13
CO
RE
Re
po
rt
01 BARCO AT A GLANCE
02 OUR COMPANY
04 SHAPING OUR STRATEGY
03 HOW WE CREATE VALUE
05 OUR TECHNOLOGY
06 OUR MARKETS
07 OUR RESULTS

The composition of the Board of Directors meets the gender
diversity requirements. All directors hold or have held senior
positions in leading international companies or organizations.
See our Corporate Governance section for the biographies.
Board of Directors
4
Directors with
5 years of seniority
Female members of
the Board
2
Independent
directors
3
Charles Beauduin
Chairman
Ashok K. Jain
Jan De Witte
CEO
Hilde Laga
Frank Donck
An Steegen
In 2020, Mr Luc Missorten resigned from the Board of Direc-
tors, reducing the number of Board members from 7 to 6.
Barco
Inte
grate
d re
po
rt 20
20
14
CO
RE
Re
po
rt
01 BARCO AT A GLANCE
02 OUR COMPANY
04 SHAPING OUR STRATEGY
03 HOW WE CREATE VALUE
05 OUR TECHNOLOGY
06 OUR MARKETS
07 OUR RESULTS

The CLT, which operates under the chairmanship of the Chief
Executive Officer, comprises key officers from functions, busi-
nesses and regions.
Our Core Leadership Team
Jan De Witte
CEO
Stijn Henderickx
EMEA
Anthony Huyghebaert
Chief HR Officer
George Stromeyer
GM Enterprise
Wim Buyens
CEO Cinionic
Rob Jonckheere
Global Operations
Iain Urquhart
Americas
6
CLT members with 5 years
of Barco seniority
Female CLT
member
1
Non-Belgian CLT
members
7
Olivier Croly
APAC
Kenneth Wang
MD Barco China
Nicolas Vanden Abeele
GM Entertainment
Gerwin Damberg
Chief Technology Officer
Filip Pintelon
GM Healthcare
Kurt Verheggen
General Counsel
Ann Desender
Chief Financial Officer
Marc Spenlé
Chief Digital &
Information Officer
Anthony Huyghebaert, Marc Spenlé and Kenneth Wang are
the new faces in Barco’s CLT in 2021.
See our Corporate Gover-
nance for the biographies
and the description of the
changes in the CLT.
Barco
Inte
grate
d re
po
rt 20
20
15
CO
RE
Re
po
rt
01 BARCO AT A GLANCE
02 OUR COMPANY
04 SHAPING OUR STRATEGY
03 HOW WE CREATE VALUE
05 OUR TECHNOLOGY
06 OUR MARKETS
07 OUR RESULTS

Culture & ethics
Every organization has a culture; implicit or explicit. It is its
personality – a set of unwritten rules on how an organiza-
tion behaves. And it reveals itself in many different forms. In
2019, Barco rejuvenated its corporate culture, defining the
cultural traits that Barco must embrace to continue leading
in its dynamic markets. For years, ethical behavior has been
deeply embedded in the Barco culture.
Barco culture: how we live our DNA
Corporate culture is everywhere. It comes alive in how we act
towards our customers and how we talk and listen to them. It
becomes visible in the way we design our processes: have we
designed them from our perspective or from the perspectives
of those who are affected by them? It guides us in creating
teams, but also in how we treat each other as team members.
Culture even comes alive in our decision of how to greet each
other in the morning. And above all, it defines how we execute
our strategy. Culture is how we live our DNA.
To come to a common understanding of the culture we
envision, we have looked inside the company and reverse
engineered the Barco culture. This ‘meeting of minds’ has
crystallized into how we can live our DNA with 5 building
blocks as the key elements of our Barco culture.
Read more on the culture blocks
14
1819
2021
1
2
3
56
7
8
9
10
12
13
15
17
16
114
MATERIAL TOPICS
Barco
Inte
grate
d re
po
rt 20
20
16
CO
RE
Re
po
rt
01 BARCO AT A GLANCE
02 OUR COMPANY
04 SHAPING OUR STRATEGY
03 HOW WE CREATE VALUE
05 OUR TECHNOLOGY
06 OUR MARKETS
07 OUR RESULTS
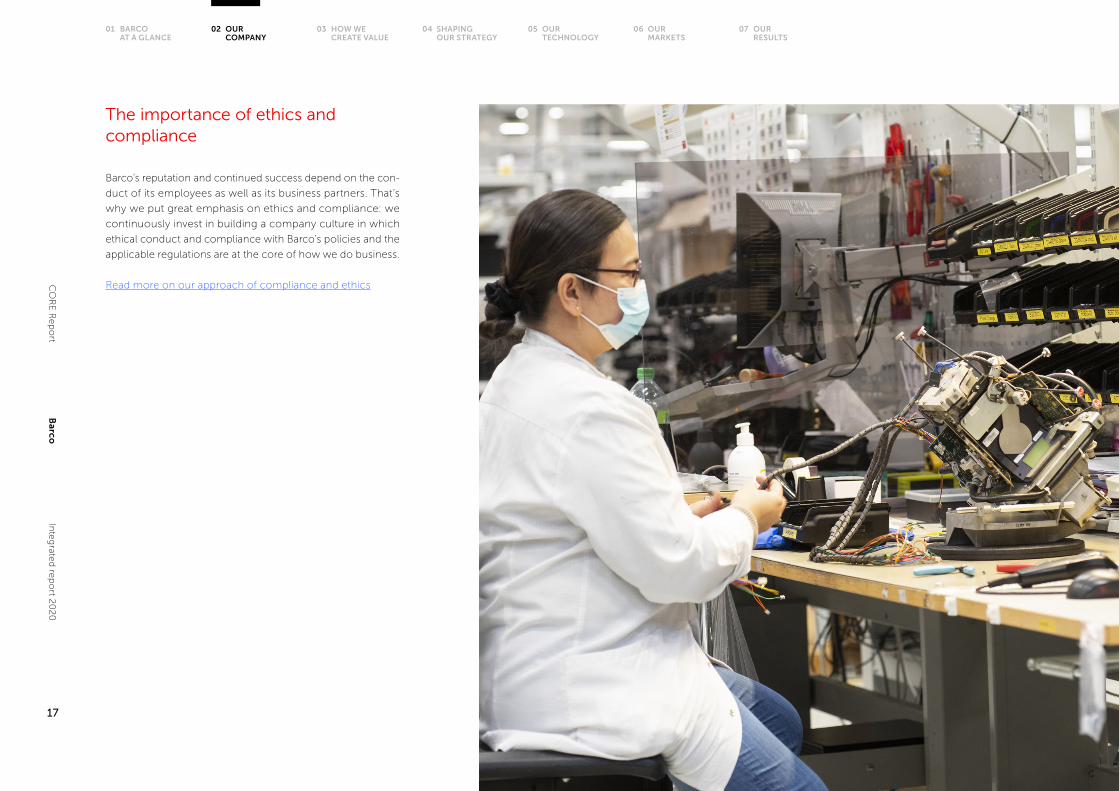
The importance of ethics and compliance
Barco’s reputation and continued success depend on the con-
duct of its employees as well as its business partners. That’s
why we put great emphasis on ethics and compliance: we
continuously invest in building a company culture in which
ethical conduct and compliance with Barco’s policies and the
applicable regulations are at the core of how we do business.
Read more on our approach of compliance and ethics
Barco
Inte
grate
d re
po
rt 20
20
17
CO
RE
Re
po
rt
01 BARCO AT A GLANCE
02 OUR COMPANY
04 SHAPING OUR STRATEGY
03 HOW WE CREATE VALUE
05 OUR TECHNOLOGY
06 OUR MARKETS
07 OUR RESULTS

How we create value
Barco
Inte
grate
d re
po
rt 20
20
18
CO
RE
Re
po
rt
01 BARCO AT A GLANCE
02 OUR COMPANY
04 SHAPING OUR STRATEGY
03 HOW WE CREATE VALUE
05 OUR TECHNOLOGY
06 OUR MARKETS
07 OUR RESULTS

PeoplePeople
PlanetPlanet
CommunitiesCommunities
ManufacturedManufactured
IntellectualIntellectual
FinancialFinancial
Advanced visualisation& collaboration solutions
A global player, equally represented across regions
INPUTS OUTPUTS
Enterprise division
Hea
lth
care
div
ision
Entertainment d
ivision
One culture, five building blocks
Sustain
able
Performance
Inn
ova
tion
Outcome-based
Enabling bright
outcomes
Value creationmodel
The concept of ‘value creation’ fits perfectly with Barco’s mis-
sion of enabling bright outcomes for its stakeholders.
In the above “Value creation model” we describe our inputs
and explain how, through our business model, we convert
these to outputs that ensure sustainable value to all our stake-
holders.
Barco
Inte
grate
d re
po
rt 20
20
19
CO
RE
Re
po
rt
01 BARCO AT A GLANCE
02 OUR COMPANY
04 SHAPING OUR STRATEGY
03 HOW WE CREATE VALUE
05 OUR TECHNOLOGY
06 OUR MARKETS
07 OUR RESULTS

Inputs
92%iGemba improvement
suggestions implemented
2.3Inventory turns
3%ROCE
9Number of new patent filings
461Number of patents at year-end
Outputs
-0.05Earnings per share
(€)
7%EBITDA margin
-35.9Free cash flow
(mio €)
770.1Group sales
(mio €)
69.6%Make
(over hardware revenues)
1.9%Capex
(in % of sales)
4Countries with a
manufacturing facility
142Number of key(+) & core suppliers
(covering 81% of material cost)
28.5%Employees in R&D
13.30%R&D spend
(in % of sales)
193.5Net cash(mio €)
68.5%Equity as percentageof balance sheet total
34%Opex
(in % of sales)
Inte
llec
tual
Man
ufa
ctu
red
Fin
anci
al
INPUTS OUTPUTSEnabling
bright outcomes
All definitions for alternative performance measures (APM’s) are available in the glossary
Barco
Inte
grate
d re
po
rt 20
20
20
CO
RE
Re
po
rt
01 BARCO AT A GLANCE
02 OUR COMPANY
04 SHAPING OUR STRATEGY
03 HOW WE CREATE VALUE
05 OUR TECHNOLOGY
06 OUR MARKETS
07 OUR RESULTS

INPUTS OUTPUTSEnabling
bright outcomes
Pla
net
Co
mm
un
itie
s
17%Women in senior
management
20%Internal mobility
(% of vacancies filled internally)
2 .44Lost time injury frequency rate
47Customer Net Promotor Score
(relationship NPS)
43%Key+ and core suppliers with
sustainability score higher than 80%
2Number of product lines
in scope of ISO 27001
34%Carbon footprint reduction of own
operations (vs 2015)
27%Energy footprint reduction of sold
products (vs 2015)
48%New products released with
Barco ECO label
23%Revenues from products with
Barco ECO label
Pe
op
le
3,303Number of employees
(# heads)
11 .3Average training hours per employee
(# hours)
374Number of new(external) hires
(# heads)
98%Employees trained in
Standards@Work
1,184Number of certified dealers/partners
98%Key(+) and core suppliers that signed
declaration of compliance with RBA Code of Conduct (Responsible
Business Alliance)
34 .3Total energy consumption
(MWh/mio € revenues) (of which 53.5% renewable)
4%New products released with recycled plastics
Inputs Outputs
All definitions for alternative performance measures (APM’s) are available in the glossary
Barco
Inte
grate
d re
po
rt 20
20
21
CO
RE
Re
po
rt
01 BARCO AT A GLANCE
02 OUR COMPANY
04 SHAPING OUR STRATEGY
03 HOW WE CREATE VALUE
05 OUR TECHNOLOGY
06 OUR MARKETS
07 OUR RESULTS

Shaping our strategy
Barco
Inte
grate
d re
po
rt 20
20
22
CO
RE
Re
po
rt
01 BARCO AT A GLANCE
02 OUR COMPANY
04 SHAPING OUR STRATEGY
03 HOW WE CREATE VALUE
05 OUR TECHNOLOGY
06 OUR MARKETS
07 OUR RESULTS

On a mission to enabling bright outcomes
Barco is on a mission to enable bright outcomes by transform-
ing content into insight and emotion. To guide us in pursuing
that mission, we introduced a new strategy in 2017. Building
on our strengths and inspired by a series of technological and
socio-economic trends, our strategy outlines how we plan to
maintain and build on our role in today’s digitally accelerating
world.
Three time horizions
The Barco strategy is a work in progress. It aims to maximize
our business opportunities across three time horizons in three
‘chapters’. Since 2019, we have been focusing on growth and
expanding our hardware, software and service capabilities.
Disruptions like the 2020 covid-19 pandemic, market dynam-
ics, materiality and evolving risks are constantly shaping our
strategy. Although they may impact the progress and timing
of some strategic objectives, they will not change the course
of our strategy
• Objective: focus on
performance and shape the
organization, product portfolio
and market strategies to build
a healthier, more resilient
platform for future growth.
• Target: EBITDA from 8% in
2016 to 12% in 2018, with a flat
top-line
• Objective: focus on growth
by further expanding our
capabilities, footprint, skills
and portfolio while keeping
our focus on operational
efficiency.
• Target: efficient sales growth
(mid + single digit per year)
and EBITDA margin between
14% and 17%
• Objective: focus on enabling
bright outcomes by delivering
a combination of hardware,
software and services via new
business models.
• Target: growth in recurring
revenues and sustained topline
and profit growth
Chapter 2: 2019 - 2023
Chapter 3: 2023 and beyond
Chapter 1: 2016 - 2018
Barco
Inte
grate
d re
po
rt 20
20
23
CO
RE
Re
po
rt
01 BARCO AT A GLANCE
02 OUR COMPANY
04 SHAPING OUR STRATEGY
03 HOW WE CREATE VALUE
05 OUR TECHNOLOGY
06 OUR MARKETS
07 OUR RESULTS

On a mission to enabling bright outcomes
Four strategic levers
To cater to the rapid changes in today’s markets, Barco is evolv-
ing from being a tech ‘specs’ vendor into a partner that enables
bright outcomes. The commitment to outcomes is one of the
four levers of the Barco strategy. It is intertwined with a zeal for
innovation, a characteristic that has been shaping Barco since
its earliest days, a permanent focus on performance and the
resolute choice to go for sustainable impact.
1. Innovate for impact
2. Focus on performance
3. Offer outcome-based solutions
4. Go for sustainable impact
Barco
Inte
grate
d re
po
rt 20
20
24
CO
RE
Re
po
rt
01 BARCO AT A GLANCE
02 OUR COMPANY
04 SHAPING OUR STRATEGY
03 HOW WE CREATE VALUE
05 OUR TECHNOLOGY
06 OUR MARKETS
07 OUR RESULTS

Focus areas Proof points in 2020
Continuing to invest
in R&D
• 13.3% of sales spent on R&D, balancing long- and short-term R&D.
• The global software development structure was further strengthened with
GEAX, our Globally Empowered to Accelerate Experience team.
Innovation at Barco
is innovation for
impact
• Innovation award winner ClickShare Conference facilitates the hybrid meetings
which will take a central role in the new way of working and collaborating.
• WallConnect Cloud allows remote monitoring and diagnosing of video walls –
boosting efficiency, problem-solving and wall uptime.
• NexxisCare software helps hospitals manage ORs in multiple facilities remotely
– to anticipate on issues and improve efficiency in surgical environments.
• Barco Insights, our cloud-based IoT solution for enhanced projector manage-
ment, simplifies and facilitates remote monitoring and serviceability.
• With the new SP2k, the Barco Series 4 projector for smaller screens (6,000 to
15,000 lumens), Cinionic makes its laser solutions accessible for every theater.
• New XT-series of LED tiles meet the varying needs in our core segments:
control rooms, television studios , meeting rooms and 3D visualization.
• UDM projector series expanded to meet the requirements of the events and
ProAV market: brightness in a light, compact design.
• SecureStream allows secure and user-friendly streaming outside the control
room.
Innovation is more
than introducing new
products
• weConnect, Demetra and Synergi target the new markets of education, der-
matology and oncology, respectively.
• Demetra skin imaging platform officially launched in the US market as SaaS
solution.
• Cinionic launches new business models, in addition to Laser as a Service:
Cinema as a Service and Premium as a Service.
• ClickShare Alliance Program: integrating ClickShare Conference with meeting
room technology of other leading players (Jabra, Logitech, Vaddio, Yamaga) to
improve the hybrid meeting room experience.
Raising the return
on our innovation
investments by
enhancing processes
and organization
• New Chief Digital & Information Officer Mark Spenlé appointed.
• Further strengthening the global software development structure with GEAX,
Barco’s Globally Empowered to Accelerate Experience team.
Strategic levers
1. Innovate for impact
More than launching innovative products, innovation at Barco
aims to deliver impact, i.e. added value for our customers,
often in mission-critical areas. By analyzing our innovation
plans, discussing them with customers and de-risking them,
we want to ensure solid returns on our innovation investments.
To keep fueling the innovation that is typical for a technology
leader like Barco, we invest heavily in R&D, balancing long- and
short-term initiatives. Rather than innovating just to create new
digital visualization products and services, however, we focus
on innovation for impact, i.e. innovation that solves custom-
ers’ real challenges and creates real value in mission-critical
areas. Moreover, we also apply innovation practices to change
our way of working and doing business. By sharpening our
innovation processes, we want to raise the returns on our
innovation investments.
14
1819
2021
1
2
3
56
7
8
9
10
12
13
15
17
16
114
MATERIAL TOPICS
Barco
Inte
grate
d re
po
rt 20
20
25
CO
RE
Re
po
rt
01 BARCO AT A GLANCE
02 OUR COMPANY
04 SHAPING OUR STRATEGY
03 HOW WE CREATE VALUE
05 OUR TECHNOLOGY
06 OUR MARKETS
07 OUR RESULTS
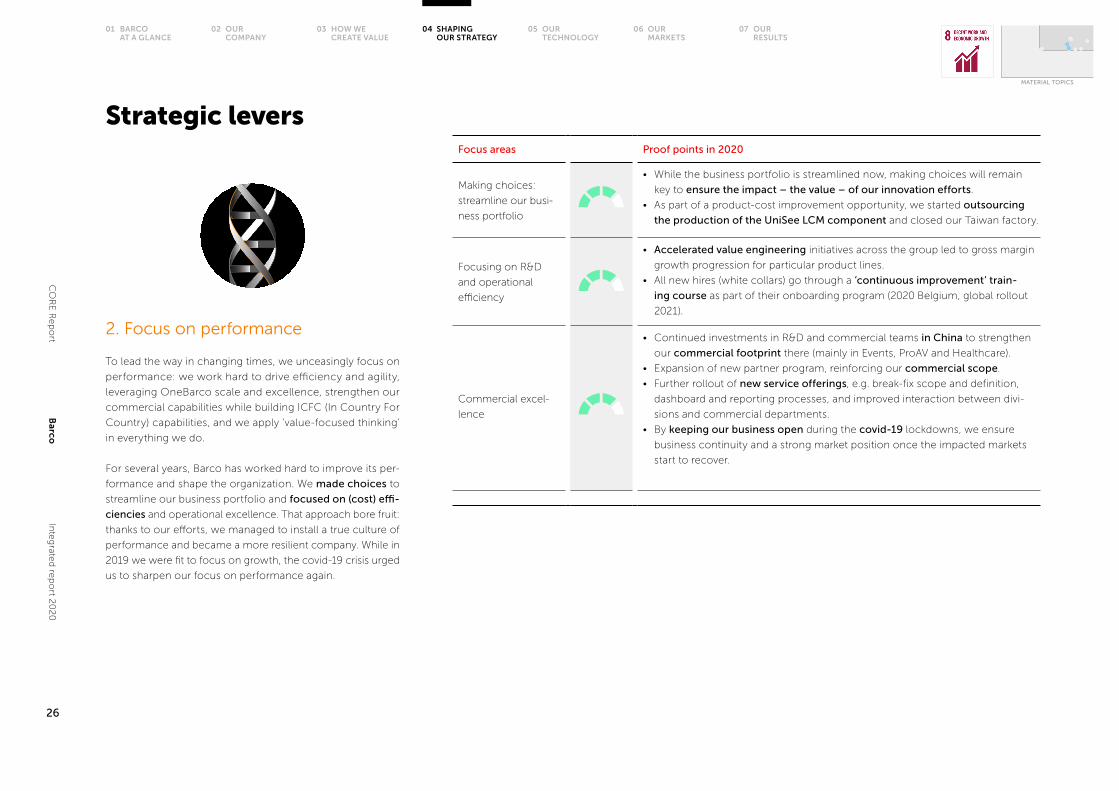
Strategic levers
2. Focus on performance
To lead the way in changing times, we unceasingly focus on
performance: we work hard to drive efficiency and agility,
leveraging OneBarco scale and excellence, strengthen our
commercial capabilities while building ICFC (In Country For
Country) capabilities, and we apply ‘value-focused thinking’
in everything we do.
For several years, Barco has worked hard to improve its per-
formance and shape the organization. We made choices to
streamline our business portfolio and focused on (cost) effi-
ciencies and operational excellence. That approach bore fruit:
thanks to our efforts, we managed to install a true culture of
performance and became a more resilient company. While in
2019 we were fit to focus on growth, the covid-19 crisis urged
us to sharpen our focus on performance again.
Focus areas Proof points in 2020
Making choices:
streamline our busi-
ness portfolio
• While the business portfolio is streamlined now, making choices will remain
key to ensure the impact – the value – of our innovation efforts.
• As part of a product-cost improvement opportunity, we started outsourcing
the production of the UniSee LCM component and closed our Taiwan factory.
Focusing on R&D
and operational
efficiency
• Accelerated value engineering initiatives across the group led to gross margin
growth progression for particular product lines.
• All new hires (white collars) go through a ‘continuous improvement’ train-
ing course as part of their onboarding program (2020 Belgium, global rollout
2021).
Commercial excel-
lence
• Continued investments in R&D and commercial teams in China to strengthen
our commercial footprint there (mainly in Events, ProAV and Healthcare).
• Expansion of new partner program, reinforcing our commercial scope.
• Further rollout of new service offerings, e.g. break-fix scope and definition,
dashboard and reporting processes, and improved interaction between divi-
sions and commercial departments.
• By keeping our business open during the covid-19 lockdowns, we ensure
business continuity and a strong market position once the impacted markets
start to recover.
14
1819
2021
1
2
3
56
7
8
9
10
12
13
15
17
16
411
MATERIAL TOPICS
Barco
Inte
grate
d re
po
rt 20
20
26
CO
RE
Re
po
rt
01 BARCO AT A GLANCE
02 OUR COMPANY
04 SHAPING OUR STRATEGY
03 HOW WE CREATE VALUE
05 OUR TECHNOLOGY
06 OUR MARKETS
07 OUR RESULTS

Strategic levers
3. Deliver outcome-based solutions
We want to be a reliable partner that provides its customers
with outcome-based solutions instead of just products. That
implies a step-change in the way we work: we have to evolve
from a tech ‘specs’ vendor into a partner that delivers out-
comes through hardware, software and services.
Traditionally a tech ‘specs’ vendor, we are now strengthening
our capabilities and organization to combine hardware with
software and services. Doing so is a multi-year journey, but
as our technology is mission critical, the potential is huge.
More than constantly improving customer services, delivering
outcome-based solutions will also help us achieve predictable,
recurring revenues. Step by step, we are making progress in
this field.
Focus areas Proof points in 2020
Strengthening
capabilities and
organization
• New initiatives and actions, incl. Standards@Work training, taken to further
boost security awareness throughout the organization.
• Continued build-out of software and digital business capabilities.
• Appointment of Marc Spenlé as the new Chief Digital & Information Officer.
• Barco’s software organization was further strengthened.
• Progress on subscription-based services (SaaS, incl. subscription, registration
and license management), such as weConnect, Demetra and Synergi.
• XMS Cloud Management Platform for remote control of the ClickShare and
wePresent devices includes analytics to drive the digital workplace.
Exploring and
launching out-
come-based
solutions, in new
business models
• NexxisCare helps hospitals manage ORs in multiple facilities remotely – to
anticipate on issues and improve efficiency in surgical environments.
• Cinionic introduces ‘Cinema as a Service’ and ‘Platform as a Service’ and
launches new, flexible payment models.
• The cloud-based Barco Insights IoT solution for projector management simpli-
fies and facilitates remote monitoring and serviceability.
14
19
2021
56
7
8
9
10
12
13
15
17
16
11418
1
2
3
MATERIAL TOPICS
Barco
Inte
grate
d re
po
rt 20
20
27
CO
RE
Re
po
rt
01 BARCO AT A GLANCE
02 OUR COMPANY
04 SHAPING OUR STRATEGY
03 HOW WE CREATE VALUE
05 OUR TECHNOLOGY
06 OUR MARKETS
07 OUR RESULTS

Strategic levers
4. Go for sustainable impact
Barco is convinced that sustainable business is good business.
That’s why our sustainability strategy is an integral part of our
corporate strategy. When deciding how to execute our strategy,
we decided to work with respect for the planet, our people
and the communities we operate in. For each of these three
domains, which we call our sustainability pillars, we defined
an overall ambition statement as well as several focus areas.
Year after year, our commitment to ‘go for sustainable impact’
becomes more deeply embedded in Barco’s corporate DNA.
Focus areas Proof points in 2020
Strengthening
governance and
organization
• Strong overall directional management and clear accountability with
workstream leaders.
• We set up a strong organization to prepare future external assurance of
sustainability KPIs.
• Barco joined the Science Based Targets initiative, a global movement of lead-
ing companies that align their businesses with the most ambitious aim of the
Paris Agreement.
Sustainability strategy
• Kick-off of integrated reporting at Barco.
• 2020 materiality assessment: more than 110 stakeholders and 70 Barco lead-
ers participated.
• Science-based targets defined (currently under validation) to further solidify
our ambitious sustainability goals.
Improving sustaina-
bility performance in
the domains of planet,
people and commu-
nities
• Full focus on the health, safety and wellbeing of our employees during the
covid-19 crisis.
• Upgraded from A to AA in MSCI ESG rating, ranking among the top 12% of the
Electronic Equipment, Instruments & Components industry.
• Sustainalytics ranking 3rd out of 110 in the Electronics equipment subindustry.
• We reached the 2020 target to reduce carbon footprint of own operations one
year in advance.
• 2020 targets on product energy footprint and ecodesign achieved.
• Flagship product releases in 2020 received an A or even A+ ecoscore.
• Barco’s customer Net Promotor Score (NPS) rose from 37 to 47 in 2020, high-
lighting the increasing satisfaction/loyalty of Barco customers.
• Customer journey managers in each division will support Barco’s transforma-
tion towards increased customer centricity.
• Five new e-learning courses on Standards@Work (ethics and compliance)
were launched.
2021
56
7
8
9
10
12
15
17
16
11
14
18
1
2
3419
13
MATERIAL TOPICS
CO
RE
Re
po
rtB
arcoIn
teg
rated
rep
ort 2
02
0
28
01 BARCO AT A GLANCE
02 OUR COMPANY
04 SHAPING OUR STRATEGY
03 HOW WE CREATE VALUE
05 OUR TECHNOLOGY
06 OUR MARKETS

Marketdynamics
Materiality Risks
Keeping our strategy in shapeOur world and our markets are changing faster than ever. As
these changes largely impact our customers’ businesses as
well as ours, it is key to understand today’s dynamics and
take them into account when implementing our strategy and
monitoring process.
We also consider and keep track of evolutions in the material
topics and risks that possibly affect Barco and Barco’s capa-
bilities to execute its strategy.
Barco
Inte
grate
d re
po
rt 20
20
29
CO
RE
Re
po
rt
01 BARCO AT A GLANCE
02 OUR COMPANY
04 SHAPING OUR STRATEGY
03 HOW WE CREATE VALUE
05 OUR TECHNOLOGY
06 OUR MARKETS
07 OUR RESULTS

Market dynamics
We considered the prevailing market dynamics when we
defined our new mission statement and strategy three years
ago, and continue to take these into account as the topics
evolve and we step up our strategy.
Technological as well as global socio-economic trends affect
our roadmap for the future.
Barco
Inte
grate
d re
po
rt 20
20
30
CO
RE
Re
po
rt
01 BARCO AT A GLANCE
02 OUR COMPANY
04 SHAPING OUR STRATEGY
03 HOW WE CREATE VALUE
05 OUR TECHNOLOGY
06 OUR MARKETS
07 OUR RESULTS

Internet of Things (IoT) – sensors
IoT solutions have reached maturity. Used in
a growing number of applications in every
industry, they now deliver tangible business
benefits, from creating new data sources to
providing real-time performance updates.
Cloud computing
Cloud computing has been around for many
years now. Today, almost everything is con-
nected to the cloud in one way or another.
According to Gartner, the proportion of IT
spending that is shifting to the cloud will
increase in the aftermath of the covid-19
crisis.
Analytics and AI
Leading organizations aim to become data
driven as a way to accelerate business. Tech-
nologies like AI, machine learning and natural
language processing have huge disruptive
power, offering intelligence that may well
surpass human insight.
Security and data protection
In today’s digital, increasingly connected
society, systems, networks and data must be
protected from the rapidly accelerating threat
of increasingly sophisticated cyberattacks,
while also complying with data protection
regulations.
80% 3.9million
of consumer or industrial products
containing electronics will perform
on-device analysis by 2025
(source: Gartner, 100 data and analytics
predictions through 2024)
USD is the average
cost of a data breach
(source: IBM, 2020 Cost of a Data Breach Report)
61% 14.2%
of enterprises show a high degree
of IoT maturity
(source: Gartner, 2019)
of the total global enterprise
IT budget will be spent on cloud
computing in 2024, up from 9.1% in
2020
(source: Gartner, November 2020)
Technological trends
The rapidly accelerating pace of digitization While digitization was already high on the agendas of most organizations, the covid-19 pan-
demic accelerated the paradigm shift towards digitization and servitization of the economy in
2020. In the heat of the crisis, operating digitally was the only way to stay in business. Digital
services, remote working and e-commerce are now here to stay. Trends that are bound to gain
importance in the coming years include:
Barco
Inte
grate
d re
po
rt 20
20
31
CO
RE
Re
po
rt
01 BARCO AT A GLANCE
02 OUR COMPANY
04 SHAPING OUR STRATEGY
03 HOW WE CREATE VALUE
05 OUR TECHNOLOGY
06 OUR MARKETS
07 OUR RESULTS

Socio-economic trends
345 billion
USD will be the value of the
as-a-service market by 2026
(source: Research Insights)
Everything comes as a service
The advent of the cloud triggered a new busi-
ness model: a rising number of services and
applications are now available as a service,
i.e. on demand over the internet, instead of
delivered using on-premise hardware and
software. Businesses are adopting the on-de-
mand offering as it allows them to acquire
new technology quickly with fewer up-front
costs.
The shortening product life cycle
With the rapid advancement of technology
and globalization and with the resulting
tighter competition, product life cycles have
been shortening significantly over the past
few years. As a result, companies are under
constant pressure to rapidly develop and
launch new products and optimize revenue
and profit.
The rise of emerging economies
By 2050, up to six of what are currently
known as emerging nations could be among
the seven largest economies in the world,
according to projections by PwC and oth-
ers. Among them is China, which is steadily
assuming a new role at the epicenter of global
technology and innovation.
The quest for sustainability
‘Creating a more sustainable world’ – and bal-
ancing that quest with economic interests
– may well be one of the biggest challenges
of today’s society.
50% 25% x 3
of annual company revenues are
derived from new products launched
within the past 3 years
of the world’s largest companies is
from emerging markets today
(vs. 4% in 1995)
(source: www.agility.com)
Human consumption of the earth’s
natural resources more than tri-
pled between 1970 and 2015 and
is expected to more than double
between now and 2050
(source: ‘The World Counts’)
Read our ‘markets’ section to discover trends in events (Entertainment), in meeting rooms and
in control rooms (Enterprise) as well as in radiology and operating rooms (Healthcare)
Barco
Inte
grate
d re
po
rt 20
20
32
CO
RE
Re
po
rt
01 BARCO AT A GLANCE
02 OUR COMPANY
04 SHAPING OUR STRATEGY
03 HOW WE CREATE VALUE
05 OUR TECHNOLOGY
06 OUR MARKETS
07 OUR RESULTS

Materiality
A materiality assessment helps organizations understand what
topics matter most to its business and stakeholders. Barco
regularly updates its materiality assessment to make sure it
reflects changes in its business and the external environment.
Our 2020 materiality assessment
In 2020, we conducted a new, extensive materiality assess-
ment, based upon and aligned with our integrated reporting
approach, considering the six capitals. The resulting mate-
riality matrix has three categories – low, medium and high
materiality topics. The illustration reflects our medium and
high material topics.
IMPACT ON LONG-TERM SUCCESS OF BARCO
IMP
OR
TA
NC
E T
O S
TA
KE
HO
LDE
RS
High materiality
Medium materiality
1819
2021
1
2
3
56
7
8
9
10
12
13
15
17
16
14
11
4
Communities
1. Customer engagement
2. Product quality safety & security
3. Information security & data protection
4. Business ethics
5. Corporate governance
6. Responsible supply chain management
7. Community engagement
Intellectual
8. Innovation management
9. Brand
Financial
10. Financial resilience
11. Sustained profitable growth
12. Market reach
People
13. Employee engagement
14. Employee health, safety & wellbeing
15. Labor practices & human rights
16. Learning & development
17. Diversity & inclusion
Planet
18. Product stewardship
19. Climate change & energy
20. Waste management
Manufactured
21. Long-term asset performance
Read more on our materiality assessment
Barco
Inte
grate
d re
po
rt 20
20
33
CO
RE
Re
po
rt
01 BARCO AT A GLANCE
02 OUR COMPANY
04 SHAPING OUR STRATEGY
03 HOW WE CREATE VALUE
05 OUR TECHNOLOGY
06 OUR MARKETS
07 OUR RESULTS

Defined in 2015 by the United Nations General Assembly, the
Sustainable Development Goals (SDGs) consist of 17 global
goals with a 2030 deadline.
We realize these goals cannot be met without support from
the global business community. Our approach to supporting
the SDGs is to focus on the goals where we can have the
most impact, while screening and implementing actions that
contribute to the other goals as well.
We have selected six SDGs that are closely linked to Barco’s
high material topics and the overall Barco strategy:
• SDG 3: Good health & well-being: Ensure healthy lives
and promote well-being for all at all ages
• SDG 7: Affordable and clean energy: Ensure access to
affordable, reliable, sustainable and modern energy for all
• SDG 8: Decent work and economic growth: Promote
sustained, inclusive and sustainable economic growth, full
and productive employment and decent work for all
• SDG 9: Industry, innovation and infrastructure: Build
resilient infrastructure, promote inclusive and sustainable
industrialization and foster innovation
• SDG 12: Responsible consumption and production:
Ensure sustainable consumption and production patterns
• SDG 13: Climate action: Take urgent action to combat
climate change and its impacts
How the UN SDGsguide our strategy
8. Innovation management
10. Financial resilience
11. Sustained profitable growth
1. Customer engagement
2. Product quality safety & security
3. Information security & data protection
18. Product stewardship
1. Customer engagement
2. Product quality safety & security
3. Information security & data protection
4. Business ethics
13. Employee engagement
18. Product stewardship
19. Climate change & energy
Innovatefor impact
Focus onperformance
O�er outcome-basedsolutions
Go for sustainable impact
UN
SD
Gs
HIG
H M
AT
ER
IAL
TO
PIC
S
Barco
Inte
grate
d re
po
rt 20
20
34
CO
RE
Re
po
rt
01 BARCO AT A GLANCE
02 OUR COMPANY
04 SHAPING OUR STRATEGY
03 HOW WE CREATE VALUE
05 OUR TECHNOLOGY
06 OUR MARKETS
07 OUR RESULTS

Stakeholderengagement
Barco attaches great importance to stakeholder engagement.
After all, outside views help us identify and prioritize emerging
issues and better align our strategy, actions and policies with
the interests of our society and planet. In addition, stakeholders
can provide valuable feedback on our performance and other
aspects, like transparency.
2020 stakeholder engagement process
In 2020, we organized a comprehensive stakeholder
engagement process, involving external as well as internal
stakeholders, as input for our materiality assessment. In total,
111 stakeholders participated in surveys and interviews.
Top 5 material topics by stakeholder group (2020 assessment)
Read more on our stakeholder engagement approach
Customers Employees Investors Suppliers (Non-) governmen-
tal organizations
1 Customer
engagement
Customer
engagement
Financial resilience Innovation manage-
ment
Climate change &
energy
2 Product quality,
safety & security
Employee
engagement
Sustained profitable
growth
Product quality,
safety & security
Information security
& data protection
3 Innovation man-
agement
Product quality,
safety & security
Market reach Business ethics Innovation manage-
ment
4 Financial resilience Innovation
management
Product quality,
safety & security
Customer engage-
ment
Product stewardship
5 Information
security & data
protection
Brand Corporate
governance
Financial resilience /
Sustained profitable
growth
Employee health,
safety & wellbeing
Barco
Inte
grate
d re
po
rt 20
20
35
CO
RE
Re
po
rt
01 BARCO AT A GLANCE
02 OUR COMPANY
04 SHAPING OUR STRATEGY
03 HOW WE CREATE VALUE
05 OUR TECHNOLOGY
06 OUR MARKETS
07 OUR RESULTS

Risks
Within the context of its business operations, Barco is exposed
to a wide variety of risks that can affect its ability to achieve its
objectives and to execute its strategy successfully. To antic-
ipate, identify, prioritize, manage and monitor the risks that
impact its organization, Barco puts a sound risk management
and control system into place, which is actively supported by
the Board of Directors.
Risk management process
Risk management is firmly embedded into Barco’s processes,
at all levels. For every key management, assurance and sup-
porting process, Barco has developed and implemented a
systematic risk management approach that consists of five
steps: identification, analysis, evaluation, response and mon-
itoring.
Risk Trend Material topics Strategic levers
1 Macroeconomic,
geopolitics and
market
• Market reach
• Brand
• Focus on performance
2 Information
security
• Information security and data protection
• Product quality, safety and security
• Focus on performance
• Go for sustainable impact
3 Digital
transformation and
new technologies
• Innovation management
• Learning and development
• Innovate for impact
• Offer outcome based solutions
4 Human capital and
talent management
• Employee engagement
• Learning and development
• Employee health, safety and wellbeing
• Diversity and inclusion
• Focus on performance
• Go for sustainable impact
5 Product quality • Product quality, safety and security
• Customer engagement
• Brand
• Innovate for impact
• Offer outcome based solutions
6 Data governance
and privacy
• Innovation management
• Information security and data protection
• Go for sustainable impact
7 Supply chain and
‘Nth’ party risk
• Responsible supply chain management
• Sustained profitable growth
• Product quality, safety and security
• Focus on performance
• Go for sustainable impact
2020: main risks
Every year in the fourth quarter, Barco performs a company-
wide risk assessment and compliance gap analysis. In 2020,
13 risks were identified and evaluated by CLT members and
senior managers via an online questionnaire. The assessment
and evaluation led to the following top risks:
Read more on Barco’s risk management
Barco
Inte
grate
d re
po
rt 20
20
36
CO
RE
Re
po
rt
01 BARCO AT A GLANCE
02 OUR COMPANY
04 SHAPING OUR STRATEGY
03 HOW WE CREATE VALUE
05 OUR TECHNOLOGY
06 OUR MARKETS
07 OUR RESULTS

Our technology
Barco
Inte
grate
d re
po
rt 20
20
37
CO
RE
Re
po
rt
01 BARCO AT A GLANCE
02 OUR COMPANY
04 SHAPING OUR STRATEGY
03 HOW WE CREATE VALUE
05 OUR TECHNOLOGY
06 OUR MARKETS
07 OUR RESULTS

Barco is and has always been a true technology company.
Building on decades of experience and expertise in imaging
and visualization, we continue to invest strong (on average 11%
to 12% of turnover) in R&D in order to meet the rapidly evolving
market demands. A disciplined and well-governed approach
ensures that our innovation efforts pay off and can be turned
into commercial reality.
Technology: approach
Successful innovation is innovation that creates both value
for the customer and true business value. Barco increasingly
adopts a disciplined approach to innovation, ensuring that our
ideas are tightly connected to our strategy and can be turned
into both revenue growth potential and brighter outcomes
for our customers.
Barco as a technology
company invests generously
in innovation: every year more
than 10% of our top-line sales
are reinvested in R&D.
Our technology
14
1819
2021
1
2
3
56
7
8
9
10
12
13
15
17
16
114
MATERIAL TOPICS
Barco
Inte
grate
d re
po
rt 20
20
38
CO
RE
Re
po
rt
01 BARCO AT A GLANCE
02 OUR COMPANY
04 SHAPING OUR STRATEGY
03 HOW WE CREATE VALUE
05 OUR TECHNOLOGY
06 OUR MARKETS
07 OUR RESULTS

INTERVIEW WITH GERWIN DAMBERG,
CHIEF TECHNOLOGY OFFICER
Innovate for impact: how do we do that at Barco?
Barco has adopted an increasingly disciplined approach to
investing in innovation in order to balance risk and poten-
tial returns. Part of the innovation process is validating that
our programs and initiatives are focused on uncovering and
solving real customer pain
points, have a clear path to
revenue growth potential
and are tightly connected
to our technology strat-
egy. CTO Gerwin Damberg
explains.
In 2019, Barco reviewed its
technology portfolio. Why
the change?
While hardware-centric
solutions such as display
and projection applications are still at the core of many of
our businesses, connectivity, workflow improvements and
content insights are becoming increasingly important in almost
all of Barco’s product offerings. As such, Barco took action to
broaden and deepen our expertise in some of the younger
fields such as computational optics and photonics as well as
rendering, parallel computing, and machine learning. In 2019
we took the strategic decision to review our technology tool
chest and include a broader range of building blocks to cover
all those enabling technologies. This was complemented with
some finetuning of our overall approach to innovation to link
new ideas even closer to customer and business. 2020 of
course was a challenging year, but in spite of the changes in
some of our markets we were able to accelerate the innovation
pace to come out as a stronger technology company when
the markets bounce back.
What’s new in Barco’s approach to innovation?
Barco as a technology company invests generously in inno-
vation: every year more than 10% of our top-line sales are
reinvested in R&D. Yet, fast-paced and focused innovation
in product development
requi res a d iscip l ined,
well-governed approach
to innovation investments,
especially for early innova-
tion. So, we took a step back
and thought about how to
approach R&D and tackle
innovation at Barco in a
more structured way, both
for our existing portfolio and
for the brand-new technolo-
gies, solutions and services
in the works. When it comes to the latter, we want to instill
elements of a start-up and VC-like investment mentality.
What marks a start-up approach?
Start-ups need investors, so they adopt a holistic approach
to innovation. First, they gauge the desires of the customer,
exploring what the customer really needs, what problem(s)
need solving. You’d be surprised at how much customer needs
can differ from the features that tech innovators have in mind!
A second criterium is early validation points of business value:
how can this idea can help us grow our company? Last but
not least, new ideas have to be technologically feasible and
align with the overall Barco strategy.
Fast-paced and focused innovation
in product development requires a
disciplined, well-governed approach
to innovation investments across
time horizons.
Barco
Inte
grate
d re
po
rt 20
20
39
CO
RE
Re
po
rt
01 BARCO AT A GLANCE
02 OUR COMPANY
04 SHAPING OUR STRATEGY
03 HOW WE CREATE VALUE
05 OUR TECHNOLOGY
06 OUR MARKETS
07 OUR RESULTS

In 2020, we rolled out an innovation approach that takes into
account these steps: innovators come up with an idea and
pitch it, we check if it ticks all the boxes (desirability, viability,
feasibility and strategy) and only then will we work on a proof
of concept in Barco Labs. The next, sometimes challenging
step is to maintain this startup pace and mentality all the way
through the different growth stages until an initiative is suc-
cessful enough to stand on
its own feet or as part of a
product division.
How does this approach
differ from innovation of
existing solutions?
When upgrading existing
solutions or adding new
solutions to an existing
stack, you build on a lot of
experience, existing cus-
tomers and well-known
expectations. The most important thing here is not to fall into
the trap of investing too heavily in product maintenance and
updates but maintain a fast pace in evolving and disrupting our
own product portfolios. We have to keep challenging ourselves
to prevent competitors from passing us: we encourage our
teams to identify disruptive solutions to our own product lines.
Does Barco need new technology skills to retain the
innovation dynamics?
When I joined Barco, I was impressed with the broad technol-
ogy expertise present across the company. We can tap into a
wide pool of engineers with deep expertise, particularly in dis-
play, projection, networking and imaging technology. In other
fields there is a lot of healthy curiosity and eagerness to learn.
So, we’re harnessing all our
in-house talent and scout-
ing for new people across
all our technology domains,
with a focus on new fields
like computational optics or
video analytics.
How do you see Barco
developing in the coming
five years?
Our goal is to remain a
global technology leader
that delivers innovation with impact. To achieve that, we
approach innovation much more systematically, always keep-
ing the customer and business value in mind from the moment
our innovation ideas surface. The steps we have taken in the
past year are a solid starting point. If we continue along this
road, we will be able to innovate for true impact and enable
ever-brighter outcomes for our employees, our customers
and our investors!
13.3%R&D spend
(in % of sales)in 2020
461Number of patents
at year-end
28.5%of employees
in R&D
To remain a technology leader,
we have to approach innovation
more systematically, always keeping
the customer and business value
in mind from the moment our
innovation ideas surface.
Barco
Inte
grate
d re
po
rt 20
20
40
CO
RE
Re
po
rt
01 BARCO AT A GLANCE
02 OUR COMPANY
04 SHAPING OUR STRATEGY
03 HOW WE CREATE VALUE
05 OUR TECHNOLOGY
06 OUR MARKETS
07 OUR RESULTS

Advanced display & projection
The display and projection technology that
lies at the heart of Barco’s visualization solu-
tions include optics, electronics and signal
processing, manufacturing and calibration
techniques related to projection systems and
direct view display technologies, including
LCD and LED. This advanced technology
powers a wide range of advanced display
solutions for use in demanding markets
– from cinema projectors and high-resolu-
tion medical displays to video walls for large
screen visualization.
Image processing & insights
Professional visualization requires both
classical image processing algorithms and
data-driven approaches. Barco’s ‘image pro-
cessing & insights’ technology domain covers
image and video capture, enhancements,
processing, understanding and rendering as
well as techniques to enhance human-ma-
chine interaction. Increasingly important is
the implementation of high-performance
software solutions on modern hardware such
as graphics processing units.
Connectivity & data analytics
Technology that enables connectivity is at
the core of Barco’s visualization solutions, as
it allows the real-time monitoring of devices
or the local or remote streaming of audio
and video data. The connectivity platforms
that power Barco solutions are always highly
optimized for the professional application
at hand, whether that is live entertainment,
diagnosis or surgery in healthcare settings
or sharing content in the workplace. On top
of enabling connectivity, Barco increasingly
helps customers understand the data trans-
mitted, thus providing trustworthy, actionable
insights and boosting productivity, collabora-
tion and engagement.
Computational optics
Computational optical technology exploits
the properties of light to enable visual
experiences that cannot be delivered using
traditional optical systems alone. This tech-
nology opens the door to a spectrum of
new solutions with functionalities or value
that cannot be delivered by other visualiza-
tion or imaging techniques. Examples include
Demetra, Barco’s multispectral skin imaging
platform and the high dynamic range (HDR)
light-steering technology that uses real-time
programmable lasers and lenses to shape
light into high-contrast, high-brightness
images on screen.
Technology: domains
In 2019, Barco reorganized its technology map. Four key
domains now form the foundation for Barco’s innovation for
impact in the future.
Barco
Inte
grate
d re
po
rt 20
20
41
CO
RE
Re
po
rt
01 BARCO AT A GLANCE
02 OUR COMPANY
04 SHAPING OUR STRATEGY
03 HOW WE CREATE VALUE
05 OUR TECHNOLOGY
06 OUR MARKETS
07 OUR RESULTS

Our markets
Barco
Inte
grate
d re
po
rt 20
20
42
CO
RE
Re
po
rt
01 BARCO AT A GLANCE
02 OUR COMPANY
04 SHAPING OUR STRATEGY
03 HOW WE CREATE VALUE
05 OUR TECHNOLOGY
06 OUR MARKETS
07 OUR RESULTS

Barco’s business activities focus on three core markets: Enter-
prise, Healthcare and Entertainment, which are managed in
three different divisions. While each division has its own goals,
targets and focus areas, they are all committed to Barco’s
corporate strategy – in order the enable bright outcomes.
Entertainment division
Enterprise division
Healthcare division
Sales per division
38%Entertainment
28%Enterprise
34%Healthcare
Our markets
14
1819
2021
1
3
56
7
8
9
10
13
15
17
16
114
2
12
MATERIAL TOPICS
Barco
Inte
grate
d re
po
rt 20
20
43
CO
RE
Re
po
rt
01 BARCO AT A GLANCE
02 OUR COMPANY
04 SHAPING OUR STRATEGY
03 HOW WE CREATE VALUE
05 OUR TECHNOLOGY
06 OUR MARKETS
07 OUR RESULTS

Entertainment
Creating moments, enriching lives
Respective weight in the group 2020 sales
Approximate subsegment distribution based on sales
Whether in cinemas, concert halls or museums; at theme
parks, music festivals or corporate events: Barco’s enter-
tainment solutions are designed to turn heads and create
compelling moments. By providing our customers with the
most advanced projectors, LED displays and image processing
solutions, we help them capture fans rather than audiences.
Our increasing focus on convenience and services further
helps them build that fan base and grow their businesses.
38%Entertainment
50%Cinema
50%Venues & Hospitality
Barco
Inte
grate
d re
po
rt 20
20
44
CO
RE
Re
po
rt
01 BARCO AT A GLANCE
02 OUR COMPANY
04 SHAPING OUR STRATEGY
03 HOW WE CREATE VALUE
05 OUR TECHNOLOGY
06 OUR MARKETS
07 OUR RESULTS

In spite of the current
challenges, we keep
investing in technology –
and ever more services – to
retain our market leadership.
AN INTERVIEW WITH NICOLAS VANDEN ABEELE, GENERAL MANAGER ENTERTAINMENT
People will always want to be entertained. We are in pole position to cater to those needs
When the covid-19 pandemic impacted every industry in
2020, it sent – and continues to send – immense earthquakes
through the entertainment world. “2020 was a reset,” says
Nicolas Vanden Abeele, General Manager of our Entertainment
division, but he sees many prospects for the future.
You joined Barco at the end of 2017 with a clear ambition
to boost topline growth. What were your focal points?
Well, 2018 was a milestone year as it marked the launch of
Cinionic. All our cinema-related sales and services activities are
now delivered through the sub-
sidiary, which is totally dedicated
to the cinema market. Thanks
to Cinionic, we have been able
to strengthen our ties with our
cinema customer/partners and
excel in what we do best: selling
and servicing our projectors, and
developing our new businesses.
For Venues & Hospitality, our
other entertainment markets,
we sharpened our go-to-market
strategy and made clear portfolio
choices. All these decisions led to solid growth for cinema,
Venues & Hospitality in 2019 – which gave us the resilience to
survive the challenging year of 2020.
With many movie theaters still closed and events
cancelled, what is the way forward?
We firmly believe that our markets are resilient and we expect
to see the start of the bounce back in 2021, and that Barco
has a leading role to play in entertainment. So, in spite of the
challenges, we keep investing big in technology to retain our
market leadership. Our laser projection portfolio, for exam-
ple, is unequaled in the world. In 2020, we further stepped
up our laser offering with the Series 4 cinema projectors. In
addition, we expanded our popular and versatile UDX and
UDM laser phosphor platforms for Venues & Hospitality. That
portfolio is also now the broadest on the market. In addi-
tion, we keep upgrading our image processing solutions
and launching services to make our customers’ lives easier.
Insights, the IoT-enabled projec-
tor management platform that we
introduced in 2020, is a perfect
example of that.
What about technologies that
are relatively new to Barco, like
LED and light steering?
Here, too: as a technology leader,
we must keep innovating – even
in challenging times. That’s why
we are building further on our
partnership with Unilumen to drive our LED efforts forward. I
see opportunities for LED in many places, yet our main focus
is now on large video walls, while we will also explore LED
in cinema. Moreover, we are keeping up our research efforts
in HDR light steering technology, as it has huge potential to
completely overhaul the cinema experience and set the new
standard for cinema. There is a lot more to come on HDR light
steering in 2021 and 2022.
Barco
Inte
grate
d re
po
rt 20
20
45
CO
RE
Re
po
rt
01 BARCO AT A GLANCE
02 OUR COMPANY
04 SHAPING OUR STRATEGY
03 HOW WE CREATE VALUE
05 OUR TECHNOLOGY
06 OUR MARKETS
07 OUR RESULTS

China and the entire Asian
continent will be a growth
driver in the coming years, for
cinema as well as for venues
and hospitality.
With the meteoric rise of streaming, does cinema still have
a future?
Cinema is here to stay. After all, it is the most affordable out-
side-of-home entertainment experience and completely
different than streaming a film from home. Yet, when people
go to the movies, they expect a
premium experience – so exhib-
itors must ensure outstanding
image quality, among other
things, to differentiate themselves
from home entertainment. Of
course, when cinemas reopen,
streaming will coexist. But it’s an
and-and story, not an or-or story.
Chinese cinemas opened pretty
quickly after the lockdown. Is
China a focus market for the
Entertainment division?
The covid-19 pandemic battered China’s movie industry in early
2020, but rebounded strongly in the second half of the year.
We expect the same to happen around the world: the movie
industry’s revenue will rebound over 2021 and we expect
strong growth to previous levels in 2022. That said, in China,
the cinema market has been in transition for a while, with
growth shifting to multiplexes in smaller cities. The potential
for Barco remains big, though, both for replacement and for
new projectors. Our ‘in China for China’ strategy, which helps
us strengthen our sales, R&D and manufacturing capabilities
in this country, helps us to further capitalize on those oppor-
tunities. China and the entire Asian continent will be a growth
driver for Barco in the coming years, for cinema as well as for
events and hospitality.
Where do you see the Entertainment business in three
years?
Our strategy still stands: after this crisis, people will want
to be entertained again and our entertainment markets are
resilient. In cinema, I expect a delay of one to two years:
the replacement wave that had
started in 2019 will resume by
late 2021., We expect events and
hospitality to pick up somewhat
sooner, particularly the fixed install
market and markets in China and
the APAC region. What I do know
is that the winners of this crisis
will be the companies that are
able to leverage their offerings
to deliver distinct entertainment
experiences at competitive cost.
In addition, the number of hybrid
events is sure to climb. Barco is
in pole position to cater to all these trends. So, we’ll keep
investing in state-of-the-art projectors with a focus on laser
and the 4K series, in our outstanding imaging solutions, and
in ever more services to help Barco and our customers stay
ahead of the curve – while strictly managing cost, of course.
2020 has shown us that we must never lose our focus on
growth and performance.
The winners of this crisis will be the
companies that are able to leverage
their offerings to deliver distinct
entertainment experiences.
Barco
Inte
grate
d re
po
rt 20
20
46
CO
RE
Re
po
rt
01 BARCO AT A GLANCE
02 OUR COMPANY
04 SHAPING OUR STRATEGY
03 HOW WE CREATE VALUE
05 OUR TECHNOLOGY
06 OUR MARKETS
07 OUR RESULTS
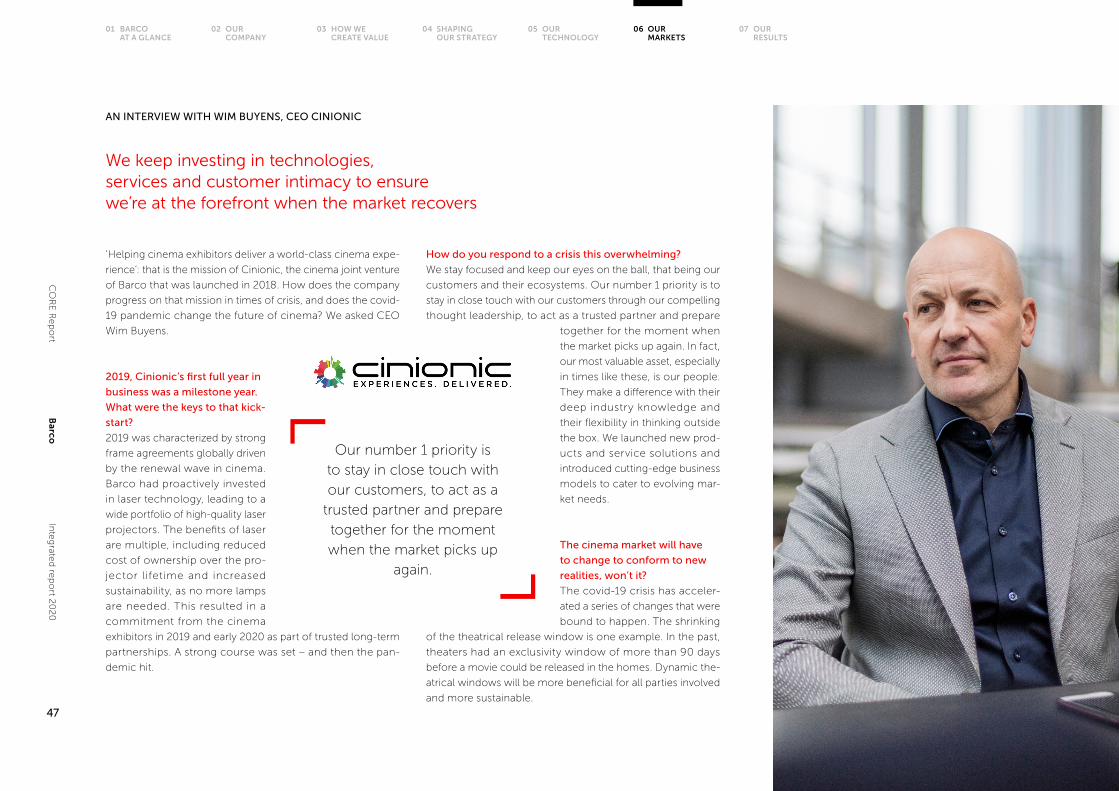
Our number 1 priority is
to stay in close touch with
our customers, to act as a
trusted partner and prepare
together for the moment
when the market picks up
again.
AN INTERVIEW WITH WIM BUYENS, CEO CINIONIC
We keep investing in technologies, services and customer intimacy to ensure we’re at the forefront when the market recovers
‘Helping cinema exhibitors deliver a world-class cinema expe-
rience’: that is the mission of Cinionic, the cinema joint venture
of Barco that was launched in 2018. How does the company
progress on that mission in times of crisis, and does the covid-
19 pandemic change the future of cinema? We asked CEO
Wim Buyens.
2019, Cinionic’s first full year in
business was a milestone year.
What were the keys to that kick-
start?
2019 was characterized by strong
frame agreements globally driven
by the renewal wave in cinema.
Barco had proactively invested
in laser technology, leading to a
wide portfolio of high-quality laser
projectors. The benefits of laser
are multiple, including reduced
cost of ownership over the pro-
jector lifetime and increased
sustainability, as no more lamps
are needed. This resulted in a
commitment from the cinema
exhibitors in 2019 and early 2020 as part of trusted long-term
partnerships. A strong course was set – and then the pan-
demic hit.
How do you respond to a crisis this overwhelming?
We stay focused and keep our eyes on the ball, that being our
customers and their ecosystems. Our number 1 priority is to
stay in close touch with our customers through our compelling
thought leadership, to act as a trusted partner and prepare
together for the moment when
the market picks up again. In fact,
our most valuable asset, especially
in times like these, is our people.
They make a difference with their
deep industry knowledge and
their flexibility in thinking outside
the box. We launched new prod-
ucts and service solutions and
introduced cutting-edge business
models to cater to evolving mar-
ket needs.
The cinema market will have
to change to conform to new
realities, won’t it?
The covid-19 crisis has acceler-
ated a series of changes that were
bound to happen. The shrinking
of the theatrical release window is one example. In the past,
theaters had an exclusivity window of more than 90 days
before a movie could be released in the homes. Dynamic the-
atrical windows will be more beneficial for all parties involved
and more sustainable.
Barco
Inte
grate
d re
po
rt 20
20
47
CO
RE
Re
po
rt
01 BARCO AT A GLANCE
02 OUR COMPANY
04 SHAPING OUR STRATEGY
03 HOW WE CREATE VALUE
05 OUR TECHNOLOGY
06 OUR MARKETS
07 OUR RESULTS

How big a threat is streaming?
Streaming is a new trend in the consumption of entertainment
content, but it is not a threat to cinema. People cook dinners at
home but still go to restaurants because it is a totally different
experience. The same comparison can be made for streaming
versus cinema. When the lockdowns end, people will be crav-
ing out-of-home entertainment and social contact. Cinemas
will, however, have to reinvent themselves to motivate people
to get off of their couches. Going to the movies must be a
really exciting night out, hence the importance of delivering
a premium cinema experience.
How does Cinionic cater to that trend?
We can deliver technology and services for the full premium
cinema experience based on bright laser technology and
immersive sound for every size of screen. In addition, we offer
exhibitors flexible financing, ranging from upfront payment and
vendor financing to monthly installments, thus providing peace
of mind. This model also works for so-called micro-cinemas
to deliver a boutique cinema experience where moviegoers
can watch content on demand with their friends or families.”
Is the market ready for these business models?
The cinema market has traditionally been a conservative
market. It took some time for customers to embrace laser-as-a-
service, but it is now gaining momentum. The same thing goes
for our other cinema- and premium-as-a-service solutions. The
changed market reality has resulted in huge benefits for the
exhibitor. Cinionic is leading with a major shift in the industry,
which I believe is a crucial, valuable investment in our future.”
How will that future look for Cinionic and your customers?
People want to consume entertainment outside of their
homes, so the moviegoing business will recover. Once it
bounces back, 100,000 screens will be ready for a technol-
ogy renewal. By staying close to the cinema industry and its
ecosystem, we will be ready to deliver renewed innovative
experiences. The key for all of us right now is to be patient,
stay hungry and remain innovative…
Going to the movies must be a
really exciting night out, hence the
importance of delivering a premium
cinema experience.
A short recap: why Cinionic?
Wim Buyens: “Over the past few years, the cinema market
has been changing rapidly. It switched from analog to
digital, reaching full digital conversion. We understood
that the future of cinema would be completely different.
Innovative cinema technologies at a low cost of own-
ership were a must to provide the audience with wow
experiences in a post-VPF (Virtual Print Fee) world.
While Barco had been delivering state-of-the-art digital
cinema projectors for over decades, we knew we had
to expand the product offering with a full solutions and
services approach. In other words: we needed new busi-
ness models too. That’s why Cinionic was born.”
Barco
Inte
grate
d re
po
rt 20
20
48
CO
RE
Re
po
rt
01 BARCO AT A GLANCE
02 OUR COMPANY
04 SHAPING OUR STRATEGY
03 HOW WE CREATE VALUE
05 OUR TECHNOLOGY
06 OUR MARKETS
07 OUR RESULTS

Enterprise
Engaging you to unleash the power of shared knowledge
Every Barco enterprise solution is designed to help people
collaborate better by ensuring engaging experiences. From
boardrooms and workplaces to control rooms and classrooms:
all our solutions help people unleash the power of shared
knowledge – for brighter ideas and, ultimately, better results.
Approximate subsegment distribution based on sales
28%Enterprise
51%Corporate
49%Control rooms
Respective weight in the group 2020 sales
Barco
Inte
grate
d re
po
rt 20
20
49
CO
RE
Re
po
rt
01 BARCO AT A GLANCE
02 OUR COMPANY
04 SHAPING OUR STRATEGY
03 HOW WE CREATE VALUE
05 OUR TECHNOLOGY
06 OUR MARKETS
07 OUR RESULTS

The pandemic has now
accelerated the need
for remote and hybrid
collaboration. That is right
up our alley.
AN INTERVIEW WITH GEORGE STROMEYER
With a focus on ‘collaboration’ and ‘connectivity’, our solutions are more than relevant in the new, hybrid normal
Enabling collaboration in order to improve productivity: that
is at the core of everything our Enterprise division does. In
2020, the word ‘collaboration’ got a whole new dimension,
as meeting rooms and classrooms moved to bedrooms and
living rooms. Is our Enterprise team ready to facilitate collabo-
ration in the new normal? We asked general manager George
Stromeyer.
The covid-19 crisis accelerated
the need for collaboration
– and in new forms. Is that
good news for the Enterprise
division?
In the past few years, we have
f inetuned our purpose and
strategy as well as our product
portfolio. And indeed, collab-
oration with enhanced visualization is really at the core of
our business – in workplaces as well as in classrooms and
control rooms. The pandemic has now accelerated the need
for remote and hybrid collaboration. That too, is right up our
alley, as our solutions include (cloud) connectivity to provide
the enterprise market with more engaging and futureproof
collaboration experiences. So, in fact, the crisis validated our
business: all that we do is really relevant.
Nevertheless, 2020 was challenging, wasn’t it?
We can’t look away from the impact of the crisis. No mat-
ter how relevant our offering is, as offices closed, demand
for our ClickShare presentation system plummeted. That is
tough, as ClickShare has been the star of our business for
years. ClickShare Conference, the brand-new wireless con-
ferencing system that that we had
announced in early 2020, was, we
have to admit, a bit slow off the
mark with covid-19 being thrown
in the game. It is an ideal solution
for unified communications and
collaboration and for hybrid meet-
ings but it was ready for launch
just when the pandemic hit and
everyone started to work from
home...
The ease of accommodating hybrid meetings must hold
huge potential for the future of ClickShare Conference?
The product is really fantastic and interest clearly rose when
people started returning to their offices. The market is pretty
crowded: many organizations are jumping on this opportu-
nity, including the world’s leading tech companies. There is,
however, definitely a place for ClickShare Conference in the
market. Its major trump card is that it’s technology agnostic:
it works seamlessly with all major collaboration platforms and
together with most meeting room peripherals, such as micro-
phones, displays, etc., We’re building an ecosystem around it
in order to broaden our reach. In addition, just like ClickShare,
ClickShare Conference ensures an awesome user experience,
which is simply essential for a successful workplace solution.
Barco
Inte
grate
d re
po
rt 20
20
50
CO
RE
Re
po
rt
01 BARCO AT A GLANCE
02 OUR COMPANY
04 SHAPING OUR STRATEGY
03 HOW WE CREATE VALUE
05 OUR TECHNOLOGY
06 OUR MARKETS
07 OUR RESULTS

The main action point is to
do more with what we have
and shape our own destiny.
What about the control room business, how did that fare
in 2020?
We had returned to profitability in 2019, thanks to a sharp
focus on performance and the success of professional-quality
products like the UniSee LCD video wall. In this market, our
triple-play display strategy is key: by combining our existing
rear-projection offering with LCD and LED, we can address
all market segments and tech-
nology preferences. In 2020, the
control room business was more
resilient than we had expected.
Projects were pushed out in
time or reduced in scope but not
cancelled. We even managed
to gain market share – and are
determined to fuel that trend. For
example, in China we delivered
our largest by far deployment of OpSpace operator work-
stations for a large new airport control center. And the new
solutions that we launched for control rooms, like WallConnect
and Secure Stream, help us extend our offering: they meet
demand for remote display management.
‘Remote’ is also the new normal in education now. Did
weConnect gain traction?
While business picked up more slowly than we had hoped,
2020 was marked by several very prominent wins which are
making us a reference in this market. Let me highlight that
weConnect doesn’t target high schools and universities but
rather business schools and corporate learning and develop-
ment centers. There too, it was all hands-on deck to switch
to remote learning in record time. We expect demand for
weConnect to pick up in the post-pandemic world, when
people are looking for a remote learning solution that really
replicates the classroom and enables true interaction between
teachers and students.
In summary: the potential and opportunities look huge.
How do you want to capitalize on them?
The main action point is to do more with what we have.
We have a great, broad and relevant portfolio of top-notch
solutions and services, so there’s an offer for every need and
preference. Of course, we’ll keep investing in these. Exciting
new products for the control rooms market are planned for the
first half of 2021, for example. But
in addition, we have to advance
sales and marketing by shifting
our commercial skills to higher
levels, widening our markets to
include the workplace experience,
embracing an omnichannel busi-
ness model, tapping into virtual
selling to improve our go-to-mar-
ket, etc. Between 2018 and 2020,
we mapped the customer journey, so we know how we can
further elevate customer satisfaction. That will also be a focus
moving forward. In addition, we will accelerate our work on
outcome-based solutions. We’ve taken steps forward in all
these fields in the past but accelerating these initiatives will
definitely help us seize the opportunities of the new, hybrid
normal.
Just like ClickShare, ClickShare
Conference ensures an awesome
user experience, which is
simply essential for a successful
workplace solution.
Barco
Inte
grate
d re
po
rt 20
20
51
CO
RE
Re
po
rt
01 BARCO AT A GLANCE
02 OUR COMPANY
04 SHAPING OUR STRATEGY
03 HOW WE CREATE VALUE
05 OUR TECHNOLOGY
06 OUR MARKETS
07 OUR RESULTS

Healthcare
Enabling better healthcare outcomes for more people
We connect healthcare professionals at almost every patient
touch point, from the imaging room, to radiology, during
specialist consultations and in the surgical suite. By providing
medical staff with the complete and most accurate picture,
we enable more informed decisions, when and where it mat-
ters most.
Approximate subsegment distribution based on sales
34%Healthcare
74%Diagnostic imaging
26%Surgical
Respective weight in the group 2020 sales
Barco
Inte
grate
d re
po
rt 20
20
52
CO
RE
Re
po
rt
01 BARCO AT A GLANCE
02 OUR COMPANY
04 SHAPING OUR STRATEGY
03 HOW WE CREATE VALUE
05 OUR TECHNOLOGY
06 OUR MARKETS
07 OUR RESULTS

For a couple of years, we’d
seen a growing trend for
radiologists in the US to
read medical images from
home. When covid-19
hit, European radiologists
quickly embraced our
solution.
FILIP PINTELON, GENERAL MANAGER OF BARCO HEALTHCARE SHARES HIS VISION AND FUTURE OUTLOOK
We have all the right solutions and services to prosper in a post-pandemic world
Much more than being a display manufacturer, our Health-
care division is committed to helping solve healthcare issues.
Never before has this mission sounded more relevant than it
was in 2020. When the covid-19 crisis hit, part of the business
increased sharply, yet another part suffered. General manager
Filip Pintelon is confident about the future, though: “This cri-
sis created new opportunities to
innovate and new ways to create
value in this evolving healthcare
world.”
How did the pandemic impact
Barco’s healthcare business?
Well, initially demand for our
diagnostic display systems sky-
rocketed as hospitals converted
floors or even operating rooms
into dedicated units for covid-19
patients. The upsurge took us by
surprise and components were
hard to get, yet we successfully
met the needs of our customers thanks to the resilience
and flexibility of everyone involved in our supply chain. In
the meantime, demand for our mammography displays and
modality solutions declined. That trend persisted through-
out the third quarter due to strained hospital finances and a
sharp drop in volumes of surgery procedures and diagnostic
screenings. On the other hand, as many radiologists started
working from home, there was an upswing in demand for the
remote radiology reading solution we had launched in 2019.
2019, a year before the teleworking trend?
In the US, a growing number of radiologists were already read-
ing medical images from home in 2019. To respond to their
needs, we built a solution based on an innovative graphics
box that ensures the same quality, security and performance
radiologists get inside the hospital reading room – but at home.
It soon found its way to European
radiologists too during the covid-
19 crisis. Today, no one doubts
that this trend is here to stay.
Remote working requires good
connectivity, more than good
hardware?
We’ve made giant leaps forward in
the field of software and services
in the past few years. In 2020, we
launched three new connected
services: Barco DisplayCare and
Barco ManagedCare help hospi-
tals manage their display fleets via
virtual onboarding, online training sessions, remote support
and checks, etc. NexxisCare supports OR integrators in mon-
itoring and managing operating rooms remotely.
Talking surgical: in 2018 and 2019 you had high
expectations for the surgical business. Did the covid-19
crisis stand in the way?
Our Nexxis digital operating room solution gained global
access, but mainly in the fourth quarter. This trend towards
Barco
Inte
grate
d re
po
rt 20
20
53
CO
RE
Re
po
rt
01 BARCO AT A GLANCE
02 OUR COMPANY
04 SHAPING OUR STRATEGY
03 HOW WE CREATE VALUE
05 OUR TECHNOLOGY
06 OUR MARKETS
07 OUR RESULTS

Opening a healthcare hub in
China was a smart decision.
We’ll keep increasing
our investments and
strengthening our footprint
there to support further
growth.
digital ORs was also accelerated by the pandemic. In the
midst of the crisis, operating rooms had to be converted into
emergency Covid-19 centers. Hospitals understood that digital
ORs are more flexible. Moreover, thanks to our years of solid
investments in Nexxis, the healthcare industry sees Barco as
the reference when it comes to solutions for the digital OR.
Is China ready for digital ORs as well?
The Chinese healthcare market is booming enormously and
looking to upgrade its infrastructure. Our diagnostic business
grew, and indeed, our surgical
solutions started gaining traction
there in 2020 as hospitals are
leaning towards digital solutions..
Opening a healthcare hub in
Suzhou was really a smart deci-
sion. We’ll keep increasing our
investments and strengthening
our footprint there to support
further growth.
Did the division keep its R&D
spend up in spite of the crisis?
Absolutely. One result of these
efforts is the Nio 12MP that we launched in January 2021.
The new display system is a bit less high-end than Coronis
Uniti™ but enables 12MP and multimodality imaging: just what
radiologists need to optimize their workflows and ensure con-
fident diagnosis. I am sure it will appeal to many radiologists,
who are reading more and more images from home. Apart
from that, we kept investing in both Synergi™, our cloud-based
collaboration technology, and our Demetra skin scanner. 2020
was not the ideal year to commercialize these solutions, but
their potential is big in a post-pandemic world. While Synergi™
supports remote collaboration between specialists, the images
scanned by Demetra can easily be read by a dermatologist
working remotely. In 2021, we absolutely want to sharpen
the go-to-market strategy for Demetra and raise awareness
around the globe.
It sounds like the health crisis created a heap of
opportunities for the Healthcare division?
I’d say that it has turbocharged many trends, like the trend
towards ‘remote everything’. Yet, it also raised a series of con-
cerns and awareness around the importance of healthcare.
Will authorities prioritize spend in healthcare infrastructure?
Will hospitals adapt to this ‘new normal’ or try to go back to
the ‘old ways’? Will they remember the importance of flexibility
and the need to raise productivity? Barco has the right solutions
and services to increase flexibility and productivity, enabling
hospitals to respond to the shortage of healthcare workers.
What sets Barco apart from its
competitors?
We understand the market really
well, which is reflected in every
Barco medical solution. Apart
from that, hospitals choose Barco
because they love our services.
Moreover, we work hard to put
our customers at the heart of
everything we do. The efforts that
we made to meet peak demand
at the start of the crisis, for exam-
ple, have helped us build trust and loyalty. You do need solid
resources, both the financials and the people, to be able to
go that extra mile, as well as a great deal of resilience. We are
fortunate to have all that. I am sure we’ll emerge from this crisis
much stronger, leaving quite a few competitors behind us.
We understand the market really
well, which is reflected in every
Barco medical solution.
Barco
Inte
grate
d re
po
rt 20
20
54
CO
RE
Re
po
rt
01 BARCO AT A GLANCE
02 OUR COMPANY
04 SHAPING OUR STRATEGY
03 HOW WE CREATE VALUE
05 OUR TECHNOLOGY
06 OUR MARKETS
07 OUR RESULTS

Our results
CO
RE
Re
po
rtB
arcoIn
teg
rated
rep
ort 2
02
0
55
01 BARCO AT A GLANCE
02 OUR COMPANY
04 SHAPING OUR STRATEGY
03 HOW WE CREATE VALUE
05 OUR TECHNOLOGY
06 OUR MARKETS
07 OUR RESULTS

Group results
Sales(in millions of euro)
1,0
28
.52
018
1.0
82
.62
019
770
.12
02
0100
200
300
400
500
600
700
800
900
1, 000
1, 100
Ebitda(in millions of euro)
12.1
%
14.1
%
7.0
%
124
.52
018
153
.02
019
53
.62
02
0
20
40
60
80
100
120
140
160
% of sales
Percentage of
new product releases
with a Barco ECO label
Barco’s standard customer
experience metric, measured
quarterly
(upper quartile industry performance)
NPS (Net Promoter Score)
Eco score
48%
47
Gross profit(in millions of euro)
413
40
.1%
39
.7%
36
.9%
20
18
42
9.3
20
19
28
3.8
20
20
% of sales
100
50
200
300
400
500
600
550
450
350
250
150
Distribution based on sales
38% Entertainment
28% Enterprise
34% Healthcare
Barco
Inte
grate
d re
po
rt 20
20
56
CO
RE
Re
po
rt
01 BARCO AT A GLANCE
02 OUR COMPANY
04 SHAPING OUR STRATEGY
03 HOW WE CREATE VALUE
05 OUR TECHNOLOGY
06 OUR MARKETS
07 OUR RESULTS

Comments on the group results
Group topline
Sales for the year were € 770 million, down 29%, reflecting
the covid-19 pandemic impacts on our end-markets across
all regions.
Profitability & free cash flow
Gross profit margin for the year declined 3 percentage points
to 37% mainly due to unfavorable product mix. As operat-
ing expenses for 2020 were managed down to 20% below
2019, while sustaining investments in priority projects, EBITDA
amounted to 54 million euro for a 7% EBITDA margin.
Over the second half the company continued to execute on
its plan to reset indirect costs for 2021 to levels below 2019,
resulting in a full year restructuring and impairment charge
of 15 million euro.
Free cash flow for 2020 was -36 million euro, reflecting lower
EBITDA, cash-outlays associated with the restructuring actions
and higher working capital compared to 2019. Working capital
improved in second half versus first half, with a second half
free cash flow of +15 million euro.
(1) All definitions for alternative performance measures (APM’s) are available in the glossary
Sales for the year of € 770 million, EBITDA margin of 7%
Encouraging improvements in Q4 across all divisions
Financial highlights fiscal year 2020 and 4Q20(1)
• Orders FY20 of € 746.0 million, -32.3% versus FY19
• Sales FY20 at € 770.1 million, -28.9% versus FY19
• Year-end orderbook at € 281.5 million down 13% versus FY19
• FY20 EBITDA of € 53.6 million versus € 153 million in 2019
• FY20 EBITDA margin at 7.0% of sales versus 14.1% in 2019
• FY20 Adjusted EBIT of € 10.2 million, resulting in full year
net loss of € -4.4 million, after € 14.5 million restructuring and impairment
charges
• Orders 4Q20 versus 3Q20, increased by +20.3%
• Sales 4Q20 versus 3Q20 increased by +16.7%
Barco
Inte
grate
d re
po
rt 20
20
57
CO
RE
Re
po
rt
01 BARCO AT A GLANCE
02 OUR COMPANY
04 SHAPING OUR STRATEGY
03 HOW WE CREATE VALUE
05 OUR TECHNOLOGY
06 OUR MARKETS
07 OUR RESULTS
Staying the strategic course
Despite the covid-19 impact, Barco continued to invest in stra-
tegic and commercial initiatives, including next generation
technologies, channel expansion and building out its China
presence. This positions the company to strengthen its lead-
ership when markets recover.
Additionally, for 2020, Barco delivered on its sustainability tar-
gets: the operations carbon footprint as well as the product
energy footprint were reduced by more than the stated goals
of -20% and -25% versus the 2015 baseline, and multiple new
products with the Barco ECO label rating were launched in
each division.
Outlook 1H21
The following statements are forward looking, and actual
results may differ materially.
Management expects business conditions to be defined by the
pandemic for at least the first half of the year and therefore
does not have visibility to offer quantitative guidance for 2021
at this time.
If we assume a recovery for Entertainment only to start in
the second half, a steady dynamic in Healthcare and a stron-
ger back-to-office activity leading to improved demand for
ClickShare as of the second quarter, then topline for the first
semester will move toward the first half of last year.
Under this assumption, and given the reset of Barco’s cost
structure, management expects a mid-plus single digit EBITDA
margin for the first half of 2021.
Dividend
Barco’s Board of Directors will propose to the General Assem-
bly to distribute a gross dividend of 0.378 euro per share.
Barco’s shareholders will be offered the choice between
payment in cash or dividend in shares, enabling Barco’s share-
holders to reinvest in the company.
Chairman of the board, Mr. Charles Beauduin and director, Mr.
Frank Donck, have confirmed the intent of respectively Titan
Baratto NV and 3D NV, to opt for the stock dividend.
Barco
Inte
grate
d re
po
rt 20
20
58
CO
RE
Re
po
rt
01 BARCO AT A GLANCE
02 OUR COMPANY
04 SHAPING OUR STRATEGY
03 HOW WE CREATE VALUE
05 OUR TECHNOLOGY
06 OUR MARKETS
07 OUR RESULTS

Order intake
IN MILLIONS OF EURO FY20 FY19 CHANGE
Order intake 746.0 1,102.2 -32.3%
Order intake at constant currencies -31.8%
Order book
IN MILLIONS OF EURO 31 DEC 2020 31 DEC 2019 CHANGE
Order book 281.5 322.3 -12.7%
Order intake by division
IN MILLIONS OF EURO FY20 FY19 CHANGE
Entertainment 268.7 491.0 -45%
Enterprise 215.2 350.9 -39%
Healthcare 262.1 260.2 +1%
Group 746.0 1,102.2 -32%
Order intake breakdown by region
IN MILLIONS OF EURO FY20 FY19 CHANGE*
The Americas 39% 41% -37%
EMEA 35% 36% -33%
APAC 26% 23% -23%
Global 100% 100% -32%
Consolidated results for the fiscal year 2020
Order intake
Order intake was 746.0 million euro, a decrease of 32% compared to last year reflecting material
impact of the pandemic in Entertainment as well as in Enterprise, mainly in the Americas and
EMEA region. Order intake for Healthcare was flat year-over-year.
Order book
Order book at year end was 281.5 million euro, compared to 322.2 at FY19 year-end, a decrease
of 12.7% mainly driven by order book decreases in the Entertainment division.
* Change in nominal value
Barco
Inte
grate
d re
po
rt 20
20
59
CO
RE
Re
po
rt
01 BARCO AT A GLANCE
02 OUR COMPANY
04 SHAPING OUR STRATEGY
03 HOW WE CREATE VALUE
05 OUR TECHNOLOGY
06 OUR MARKETS
07 OUR RESULTS

Sales
IN MILLIONS OF EURO FY20 FY19 CHANGE
Order intake 770.1 1,082.6 -28.9%
Order intake at constant currencies -28.4%
Sales by division
IN MILLIONS OF EURO FY20 FY19 CHANGE
Entertainment 291.4 455.1 -36%
Enterprise 216.8 358.7 -39%
Healthcare 261.9 268.8 -3%
Group 770.1 1,082.6 -29%
Sales by region
IN MILLIONS OF EURO FY20 FY19 CHANGE*
The Americas 39% 39% -30%
EMEA 36% 37% -30%
APAC 25% 24% -24%
Global 100% 100% -29%
Sales
Full year sales decreased 29% driven by the Entertainment and Enterprise divisions. Healthcare
was slightly down mainly as a result of a soft 3rd quarter.
After decreasing 18% in the first semester, sales fell 38% in comparison with a strong 2H19, as
a result of the global spreading and deepening of the pandemic.
Sales declined in all regions.
* Change in nominal value
Barco
Inte
grate
d re
po
rt 20
20
60
CO
RE
Re
po
rt
01 BARCO AT A GLANCE
02 OUR COMPANY
04 SHAPING OUR STRATEGY
03 HOW WE CREATE VALUE
05 OUR TECHNOLOGY
06 OUR MARKETS
07 OUR RESULTS

Profitability
Gross profit
After 5 years of continued profit improvement, gross profit dropped with 34% to 283.8 million on
a sales decline of 29% reflecting adverse impacts of the pandemic. Gross profit margin declined
2.8 percentage points to 36.9% from 39.7% last year reflecting mainly unfavorable product mix,
a spike in logistics cost and indirect overhead weighing on lower volumes.
Indirect expenses & other operating results
Total indirect expenses decreased 17% to 265.3 million euro compared to 319.5 million euro a
year earlier. The Entertainment and the Enterprise divisions accounted for most of the variance.
As a percentage of sales, indirect expenses were 34.5% of sales compared to 29.5% for 2019.
• Research & development expenses decreased to 102.6 million euro compared to 119.4
million euro last year, reflecting a more selective approach. As percentage of sales, R&D
expenses were 13.3% compared to 11.0% a year earlier.
• Sales & marketing expenses decreased to 112.3 million euro compared to 142.5 million
euro for 2019, in part reflecting the impact of the covid-19 pandemic on the company’s
sales and part reflecting actions taken to align spending to revenue generation. As a
percent of sales, sales & marketing expenses were 14.6% of sales compared to 13.2% in
2019.
• General & administration expenses amounted to 50.4 million euro compared to 57.6
million euro last year and were 6.5% as a percentage of sales compared to 5.3% in 2019.
Other operating results were a negative of 8.3 million euro versus a positive of 0.3 million euro
in 2019 mainly driven by lower results in the joint venture BarcoCFG and by increased bad debt
and other provisions.
EBITDA & adjusted EBIT
The reduction in operating expenses partially offset the decrease in gross profit and as a result
EBITDA was 53.6 million euro compared to 153.0 million euro for the prior year, and EBITDA
margin was 7.0% versus 14.1% for 2019.
EBITDA margin declined by approximately 10 percentage points in both Entertainment and
Enterprise driven by negative operational leverage. Healthcare maintained profitability in line
with 2019.
EBITDA by division 2020 versus 2019 is as follows:
Adjusted EBIT was 10.2 million euro or 1.3% of sales compared to 110.0 million euro, or 10.2%
of sales for 2019.
As a result of cost adjustment actions in both the first half (outsourcing the UniSee LCM-com-
ponent and closing the Taiwan factory) and the second half (mainly related to reorganizations in
Entertainment and Enterprise), Barco booked 14.5 million euro restructuring and impairments.
As a result, EBIT was -4.3 million euro.
FY20 IN MILLIONS OF EURO SALES EBITDA EBITDA %
Entertainment 291.4 0.3 0.1%
Enterprise 216.8 18.2 8.4%
Healthcare 261.9 35.0 13.4%
Group 770.1 53.6 7.0%
IN MILLIONS OF EURO FY20 FY19 CHANGE
Entertainment 0.3 43;3 -99.3%
Enterprise 18.2 74.0 -75.4%
Healthcare 35.0 35.7 -1.9%
Group 53.6 153.0 -65.0%
Barco
Inte
grate
d re
po
rt 20
20
61
CO
RE
Re
po
rt
01 BARCO AT A GLANCE
02 OUR COMPANY
04 SHAPING OUR STRATEGY
03 HOW WE CREATE VALUE
05 OUR TECHNOLOGY
06 OUR MARKETS
07 OUR RESULTS

Income taxes
Taxes in 2020 are zero on a pre-tax negative result, compared to an effective tax rate of 18%
in 2019.
Net income
Full year net income attributable to the equity holders was -4.4 million euro.
Net income per ordinary share (EPS) was -0.05 euro versus a 1.09 euro in 2019. Fully diluted
earnings per share were also -0.05 euro compared to 1.07 in 2019*.
* Earnings per share, restated for the stock split as implemented on 1/07/2020.
Cash flow & balance sheet
Free cash flow and working capital
Free cash flow for 2020 was -36 million euro reflecting lower EBITDA, cash-outlays associated
with the restructuring and working capital, while reduced compared to 1H20, still higher than
end of year 2019 at approximately 10% of sales.
IN MILLIONS OF EURO FY20 FY19 FY18
Gross operating free cash flow 43.9 139.8 120.9
Changes in trade receivables 41.4 -32.2 -11.2
Changes in inventory -12.3 -33.0 0.3
Changes in trade payables -59.9 23.4 -1.3
Other changes in net working capital -24 15.6 -12.7
Change in net working capital -54.8 -26.1 -24.9
Net operating free cash flow -10.8 113.7 96.0
Interest income/expense -0.1 5.8 4.3
Income taxes -10.4 -13.1 -12.5
Free cash flow from operating activities -21.4 106.4 87.9
Purchase of tangible and intangible FA -15 -20.2 -25.6
Proceeds on disposal of tangible and intangible FA 0.5 2.4 0.9
Free cash flow from investing -14.5 -17.8 -24.7
FREE CASH FLOW -35.9 88.7 63.2
Barco
Inte
grate
d re
po
rt 20
20
62
CO
RE
Re
po
rt
01 BARCO AT A GLANCE
02 OUR COMPANY
04 SHAPING OUR STRATEGY
03 HOW WE CREATE VALUE
05 OUR TECHNOLOGY
06 OUR MARKETS
07 OUR RESULTS

Working capital
Inventory + Accounts Receivables – Accounts Payables over sales was 32.6% compared to 21.7%
in 2019. Net working capital was 10% of sales compared to 3% in 2019.
While year-end working capital was higher than 2019, it improved relative to 108 million euro at
mid-year reflecting reduced inventory levels and reduced DSO from 82 days sales outstanding
to 67 at the end of the year.
Capital expenditure
Capital expenditure was 15 million euro compared to 20.2 million euro in 2019 as the company
saw the timeline of a number of investment projects or phases pushed out as a result of pan-
demic lock-downs and shifted priority on selected projects.
ROCE
ROCE for the year was 3% versus 25% for 2019.
IN MILLIONS OF EURO FY20 FY19 FY18
Trade Receivables 146.1 195.4 161.8
DSO 67 55 52
Inventory 175.4 169.0 135.1
Inventory turns 2.3 3.2 3.8
Trade Payables -70.3 -128.9 -105.1
DPO 53 71 59
Other Working Capital -170.6 -205.2 -189.3
TOTAL WORKING CAPITAL 80.6 30.2 2.5
Goodwill
Goodwill on group level remained at 105.6 million euro, equal to the end of 2019.
Cash position
Net financial cash position, including net cash held in Cinionic, was 193.5 million euro compared
to 329.4 million euro end of 2019.
The direct available net cash position amounted to 127.7 million euro compared to 253.4 million
euro last year, reflecting negative free cash flow (35.9 million euro), distributed dividends (33.4
million euro), investments (55.5 million euro) and currency impact.
These investments are related to acquired minority stakes and are measured at market price.
The remeasurement at fair value at the end of 2020 amounted to 18.3 million euro in 2020 and
is reflected in other comprehensive income.
Barco
Inte
grate
d re
po
rt 20
20
63
CO
RE
Re
po
rt
01 BARCO AT A GLANCE
02 OUR COMPANY
04 SHAPING OUR STRATEGY
03 HOW WE CREATE VALUE
05 OUR TECHNOLOGY
06 OUR MARKETS
07 OUR RESULTS

Divisional results for the fiscal year 2020
Barco’s organizational structure
Barco is a global technology company developing solutions for three main markets, which is
also reflected in its divisional structure: Entertainment, Enterprise and Healthcare.
• Entertainment: The Entertainment division is the combination of the Cinema and Venues &
Hospitality activities, which includes Professional AV, Events and Simulation activities.
• Enterprise: The Enterprise division is the combination of the Control Rooms activities and
the Corporate activities. ClickShare is the main contributor to the Corporate activity.
• Healthcare: The Healthcare division includes the activities in Diagnostic Imaging
(Diagnostic and Modality Imaging) and in Surgical.
Entertainment division
Enterprise division
Healthcare division
Barco
Inte
grate
d re
po
rt 20
20
64
CO
RE
Re
po
rt
01 BARCO AT A GLANCE
02 OUR COMPANY
04 SHAPING OUR STRATEGY
03 HOW WE CREATE VALUE
05 OUR TECHNOLOGY
06 OUR MARKETS
07 OUR RESULTS

* Entertainment sales 2018 are restated for BarcoCFG
Results of the Entertainment division
Percentage of new
product releases with
a Barco ECO label
Customer net promoter score
Approximate subsegment distribution based on sales
Eco score
67%
30
50%Cinema
50%Venues & Hospitality
Sales(in millions of euro)
40
8.1
20
18*
45
5.1
20
19
29
1.4
20
2050
100
150
200
250
300
350
400
450
500
Ebitda(in millions of euro)
7.3
%
9.5
%
0.1
%
32
.92
018
43
.32
019
% of sales
10
20
30
40
50
60
70
80
20
20
0.3
Gross profit(in millions of euro)
143
.33
2%
31.
5%
28
.4%
20
18
143
.22
019
82
.82
02
0
% of sales
50
25
100
75
150
125
175
200
Barco’s standard customer
experience metric, measured
quarterly
(upper quartile industry performance)
Barco
Inte
grate
d re
po
rt 20
20
65
CO
RE
Re
po
rt
01 BARCO AT A GLANCE
02 OUR COMPANY
04 SHAPING OUR STRATEGY
03 HOW WE CREATE VALUE
05 OUR TECHNOLOGY
06 OUR MARKETS
07 OUR RESULTS

IN MILLIONS OF EURO FY20 FY19CHANGE VS
FY19
Orders 268.7 491.0 -45.3%
Sales 291.4 455.1 -36.0%
EBITDA 0.3 43.3 -99.3%
EBITDA margin 0.1% 9.5%
As a result of contractions in business activity in all regions related to the pandemic beginning
in Q2, sales declined 36% for the year.
The fourth quarter topline reflects marked recovery mainly driven by projects in the ProAV and
Cinema-market led by China.
The Cinema activity accounted for approximately 50% of the divisional sales in 2020 down
from 58% in 2019.
Within Cinema, the primary causes of weakness were material push-outs of replacement proj-
ects as a result of cinema lock-downs and movie slate push outs. This subsegment activity is
expected to remain soft for the next few quarters. While many replacement contracts have
been pushed out, no contract has been cancelled.
New build projects in EMEA and China resumed gradually in the second half of the year.
During the first half of the year, the division expanded its market share and technology leadership
position, with one of its competitors exiting the cinema market, and gaining solid traction with
its laser-based projection solutions.
Quarter-over-quarter sales
The topline of the Venues and Hospitality subsegments was particularly impacted by weakened
demand in the events market resulting from event cancellations related to covid lockdown
measures. Barco expanded its product portfolio in the ProAV (fixed install) subsegment with
selected product releases, including a new compact laser-based UDM and G-100 series-projector
and new LED-solutions. The combination of an expanded product portfolio and an intensified
commercial focus, resulted in a recovery beginning in the third quarter. While sales for the
Simulation segment were slightly down, order intake was flat year-over-year and sizeable long-
term frame-agreements with reference customers indicate a strengthening market position.
In line with the corporate strategy to expand share of wallet with our installed base through
services offerings, the division launched and started selling “Insights-connectivity services”, a
cloud-based solution for enhanced and remote projector management.
EBITDA was break-even on the decline in gross profit and a negative operating leverage effect
on fixed costs due to weaker divisional sales.
Entertainment division
IN MILLIONS OF EURO 4Q20 3Q20 2Q20 1Q20CHANGE 3Q
VS 4Q
Sales 77.3 58.0 56.5 99.7 +33.3%
2020 was a reset but we firmly believe that
our markets are resilient and we expect to
see the start of the bounce back in 2021.
Nicolas Vanden AbeeleGM Barco Entertainment
Barco
Inte
grate
d re
po
rt 20
20
66
CO
RE
Re
po
rt
01 BARCO AT A GLANCE
02 OUR COMPANY
04 SHAPING OUR STRATEGY
03 HOW WE CREATE VALUE
05 OUR TECHNOLOGY
06 OUR MARKETS
07 OUR RESULTS

Results of the Enterprise division
Customer net promoter score
Eco score
Sales(in millions of euro)
33
5.9
20
18
35
8.7
20
19
216
.82
02
050
100
150
200
250
300
350
400
450
500
43%
48
Ebitda(in millions of euro)
18.1
%
20
.6%
8.4
%
60
.92
018
74.0
20
19
% of sales
20
20
18.2
Gross profit(in millions of euro)
171.
751.
1%
51.
1%
48
.5%
20
18
183
.32
019
105
.22
02
0
% of sales
100
75
50
125
175
150
25
20051%Corporate
49%Control rooms
10
20
30
40
50
60
70
80
Percentage of new
product releases with
a Barco ECO label
Approximate subsegment distribution based on sales
Barco’s standard customer
experience metric, measured
quarterly
(upper quartile industry performance)
Barco
Inte
grate
d re
po
rt 20
20
67
CO
RE
Re
po
rt
01 BARCO AT A GLANCE
02 OUR COMPANY
04 SHAPING OUR STRATEGY
03 HOW WE CREATE VALUE
05 OUR TECHNOLOGY
06 OUR MARKETS
07 OUR RESULTS

IN MILLIONS OF EURO FY20 FY19 FY18CHANGE VS
FY19
Orders 215.2 350.9 336.6 -38.7%
Sales 216.8 358.7 335.9 -39.6%
EBITDA 18.2 74.0 60.9 -75.4%
EBITDA margin 8.4% 20.6% 18.1%
The Enterprise division posted a 40% decline in sales and orders for the year and an 8% EBITDA
margin down from 22%. Enterprise sales began to recover in the third and fourth quarter with
gradual pick-up in both the Control Rooms and the Corporate subsegments.
In terms of the sales mix, the Corporate activity accounted for about 51% of Enterprise sales for
2020 versus 58% of Enterprise sales for 2019.
Demand for the ClickShare portfolio fell steeply in the second quarter as a result of pandemic
related lockdowns and offices being closed. Activity began to resume in the summer in certain
geographies as some offices and organizations re-opened and installed hybrid workplace prac-
tices after the first lock-down wave. While staff at many companies worked remotely intermittently
during the 2nd half of the year, the division’s efforts to build awareness for the value proposition of
ClickShare Conference which was launched in January began to bear fruit, especially in EMEA.
The new ClickShare Conference has created a new industry category, perfectly positioned for
the hybrid way of working, as testified by industry awards, contract wins with reference cus-
tomers and good initial demand with almost 20.000 units shipped and installed during the year.
ClickShare Conference accounted for 25% of the ClickShare sales in the second half of 2020.
Barco strengthened and broadened its channels, trained more resellers and expanded coverage
in selected regions and purchasing routes. The division also established an industry-wide alliance
program with 20+ leading meeting room equipment vendors including Logitech, Vaddio, Jabra
to create interoperable bundles of offers for the equipping of meeting rooms.
Quarter-over-quarter sales
The company continued to invest strongly in market awareness around ClickShare Conference,
to ensure the solution further penetrates the market as corporates start to bring people back
to office.
Control rooms started the year with a weak first quarter and full year sales fell below last year,
due to project push-outs and installation delays resulting from the pandemic mainly in the
Oil & Gas and Corporate markets. After the first quarter, however, the topline improved quar-
ter-over-quarter as customers responded favorably to the strengthening value proposition of
the expanded product portfolio. The subsegment enforced its position with its differentiating
triple-play video-wall hardware strategy (rear-projection, LCD and LED) and is gaining traction
with LED evidenced by first sizeable project wins. The segment also made progress in maturing
and commercializing its software workflow and networking portfolio with remote management
solutions such as Secure Stream and WallConnect Cloud services.
With a growing need for high quality hybrid and remote learning solutions for education and
corporate learning, the Enterprise virtual classroom growth initiative increased its install base
with the addition of distinguished references across regions.
Enterprise division
IN MILLIONS OF EURO 4Q20 3Q20 2Q20 1Q20CHANGE 3Q
VS 4Q
Sales 53.9 50.0 45.6 67.2 +7.8%
We can’t look away from the impact of
the covid-19 crisis. Yet, accelerating all the
initiatives that we initiated will definitely help
us seize the opportunities of the new, hybrid
normal.
George StromeyerGM Barco Enterprise
Barco
Inte
grate
d re
po
rt 20
20
68
CO
RE
Re
po
rt
01 BARCO AT A GLANCE
02 OUR COMPANY
04 SHAPING OUR STRATEGY
03 HOW WE CREATE VALUE
05 OUR TECHNOLOGY
06 OUR MARKETS
07 OUR RESULTS

Results of the Healthcare division
Customer net promoter score
Eco score
Sales(in millions of euro)
Gross profit(in millions of euro)
Ebitda(in millions of euro)
245
.02
018
26
8.8
20
19
26
1.9
20
2050
100
150
200
250
300
350
400
450
500
97.
94
0%
12.5
%
38
.3%
13.3
%
36
.6%
13.4
%
20
18
102
.92
019
95
.72
02
0
30
.62
018
35
.72
019
% of sales % of sales
38%
52 20
20
35
.0
26%Surgical
74%Diagnostic imaging
100
75
50
125
175
150
25
200
10
20
30
40
50
60
70
80
Percentage of new
product releases with
a Barco ECO label
Approximate subsegment distribution based on sales
Barco’s standard customer
experience metric, measured
quarterly
(upper quartile industry performance)
Barco
Inte
grate
d re
po
rt 20
20
69
CO
RE
Re
po
rt
01 BARCO AT A GLANCE
02 OUR COMPANY
04 SHAPING OUR STRATEGY
03 HOW WE CREATE VALUE
05 OUR TECHNOLOGY
06 OUR MARKETS
07 OUR RESULTS

IN MILLIONS OF EURO FY20 FY19 FY18CHANGE VS
FY19
Orders 262.1 260.2 256.9 0.7%
Sales 261.9 268.8 245.0 -2.6%
EBITDA 35.0 35.7 30.6 -1.9%
EBITDA margin 13.4% 13.3% 12.5%
Healthcare posted stable year-over-year results with orders slightly up, sales slightly down and
EBITDA margin essentially flat.
After a strong first half with high single digit growth in sales, the third quarter slowed down as
customers reset delivery schedules based on shifts in hospital spending priorities. The fourth
quarter reflected a rebound driven partially by deployments of projects pushed out from the
third quarter and partially by stabilizing of the Healthcare supply chain.
The diagnostics activity saw mixed results during the year with intensified demand for radiology
and home reading stations offset by softer demand for mammography and modality solutions.
Surgical saw demand picking up in the fourth quarter after a softer Q3. The Nexxis-solution
gained additional global access, expanding the partner-base globally as the operating room
infrastructure market increasingly opens up for digital solutions. Barco also expanded its sur-
gical offering with the addition of Nexxis care, a cloud-based remote management platform.
Quarter-over-quarter sales
Under the “In China for China”-program, the division is expanding its local Healthcare hub in
Suzhou. The hub was initially opened in March 2019, and draws together business development,
product management, research and development and Healthcare display production. As the
healthcare market in China further expands in both the diagnostic and surgical subsegments,
Barco is further increasing investment levels and strengthening its footprint, to support further
market share gains.
At the same time the division also invested in a number of new solutions including the Deme-
tra skin cancer screening solution, which was commercially launched in the US in the fourth
quarter 2020
Healthcare division
IN MILLIONS OF EURO 4Q20 3Q20 2Q20 1Q20CHANGE 3Q
VS 4Q
Sales 64.3 59.3 69.4 68.8 +8.4%
The covid-19 crisis created new
opportunities to innovate and new ways
to create value in this evolving healthcare
world. I am sure we’ll emerge from this crisis
stronger.
Filip PintelonGM Barco Healthcare
Barco
Inte
grate
d re
po
rt 20
20
70
CO
RE
Re
po
rt
01 BARCO AT A GLANCE
02 OUR COMPANY
04 SHAPING OUR STRATEGY
03 HOW WE CREATE VALUE
05 OUR TECHNOLOGY
06 OUR MARKETS
07 OUR RESULTS

2020Integratedannualreport
Governance & Risk Report
ENABLING BRIGHT OUTCOMESbarco.com

01 CORPORATE GOVERNANCE
02 RISK MANAGEMENT
01 CORPORATE GOVERNANCE
02 RISK MANAGEMENT
Table of contents
01 Corporate governance . . . . . . . . . . . . . . . . . . . . . . . . . . . . . .3
Corporate governance statement . . . . . . . . . . . . . . . . . . . . . . 5
Board of Directors & Core Leadership Team . . . . . . . . . . . . . 6
Annual General Meeting . . . . . . . . . . . . . . . . . . . . . . . . . . . . . 16
Activity report & Evaluation of the
Board and its Committees . . . . . . . . . . . . . . . . . . . . . . . . . . . . 17
Remuneration report . . . . . . . . . . . . . . . . . . . . . . . . . . . . . . . . 23
Policies of conduct . . . . . . . . . . . . . . . . . . . . . . . . . . . . . . . . . . 37
01 Risk management and control processes . . . . . . . . . . 38
Risk management process . . . . . . . . . . . . . . . . . . . . . . . . . . . . 39
Control environment & Risk management process . . . . . . . 40
Extra risk section regarding the consequences and impact
of the covid-19 pandemic . . . . . . . . . . . . . . . . . . . . . . . . . . . . 44
Top risks . . . . . . . . . . . . . . . . . . . . . . . . . . . . . . . . . . . . . . . . . . . 46
Risks to be disclosed pursuant to the rules regarding
non-financial information . . . . . . . . . . . . . . . . . . . . . . . . . . . . . 54
Financial risk management and internal control . . . . . . . . . 56
This is the Governance & Risk Report
section of Barco’s 2020 Integrated annual
report. Other sections are available via the
download center at ir .barco .com/2020.
CORE
MORE
• Governance & risk report
• Report on planet - people - communities
• Financial report
ANNEX
• Assurance report
• GRI Content index
• Glossary
Barco
Inte
grate
d re
po
rt 20
20
2
CGR
Go
vern
ance &
Risk R
ep
ort
Barco
Inte
grate
d re
po
rt 20
20
2
CGR
Go
vern
ance &
Risk R
ep
ort

01 CORPORATE GOVERNANCE
02 RISK MANAGEMENT
CorporategovernanceG
ove
rnan
ce &
Risk R
ep
ort
Barco
Inte
grate
d re
po
rt 20
20
3
CGR
Go
vern
ance &
Risk R
ep
ort

01 CORPORATE GOVERNANCE
02 RISK MANAGEMENT
Declaration regarding the information given in the Annual
Report 2020
The undersigned declare that:
• The annual accounts, which are in line with the
standards applicable for annual accounts, give a true
and fair view of the capital, the financial situation and the
results of the issuer and the consolidated companies;
• The annual report gives a true and fair view of the
development and the results of the company and
of the position of the issuer and the consolidated
companies, as well as a description of the main risks and
uncertainties they are faced with .
Jan De Witte, CEO Ann Desender, CFO
Barco
Inte
grate
d re
po
rt 20
20
4
CGR
Go
vern
ance &
Risk R
ep
ort

01 CORPORATE GOVERNANCE
02 RISK MANAGEMENT
In Spring 2019, the Belgian legislator adopted a new Code of Companies and Associations . Further, in the same timeframe,
the Corporate Governance Commission adopted the 2020 Belgian Code on Corporate Governance which the Belgian
legislator subsequently designated as the reference code for listed companies www .corporategovernancecommittee .be .
Both entered into force on 1 January 2020 .
Following this entry into force, Barco has updated its articles of association as well as its corporate governance charter . The
Board of Directors decided not to submit to the shareholders’ approval some of the novelties introduced by the new code,
such as a two-tier governance structure or dual voting rights for certain shareholders . At their meetings of 30 April 2020,
the shareholders have approved the revised drafts of the articles of association and corporate governance charter . Both are
available for download at www .barco .com/corporategovernance .
In accordance with article 3:6, §2 of the Code of Companies and Associations, Barco applies the 2020 Belgian Code on
Corporate Governance .
Barco deviates from the 2020 Belgian Corporate Governance Code as follows:
Corporategovernance statement
Art . 7 .9: The Board of Directors has not set a minimum thres-
hold of shares to be held by the executives as their remu-
neration package is sufficiently balanced with various
components to incentivize the executives to pursue a
strategy of sustainable profitable growth .
Art . 7 .12: The Board of Directors endeavors to insert a ‘claw-
back provision’ in contract of employment with executives to
the extent permissible by the law governing such contract .
Art . 7 .6: The Board of Directors decided not to grant shares
to non-executive board members as part of their remune-
ration . Such grant requires further analysis of the practical
ramifications thereof, both for the company and its board
members .
14
1819
2021
1
2
3
6
7
8
9
10
12
13
15
17
16
114
5
MATERIAL TOPICS
Barco
Inte
grate
d re
po
rt 20
20
5
CGR
Go
vern
ance &
Risk R
ep
ort
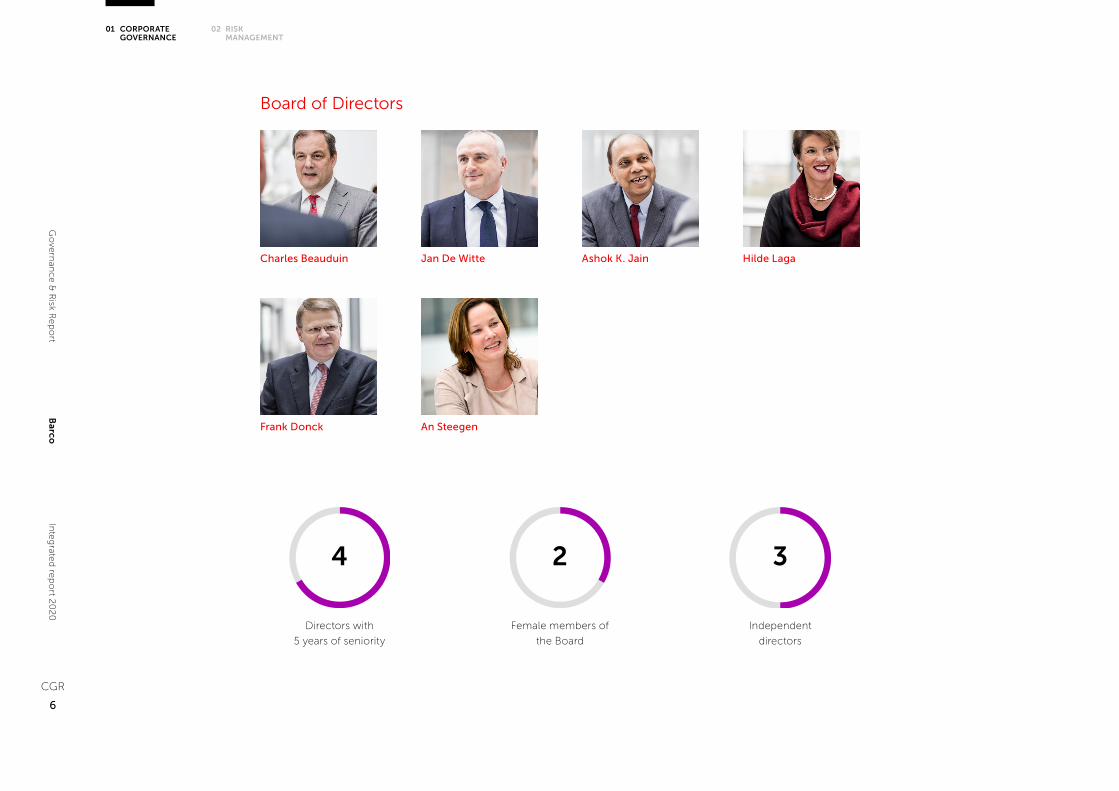
01 CORPORATE GOVERNANCE
02 RISK MANAGEMENT
Board of Directors
Charles Beauduin
Frank Donck
Hilde LagaJan De Witte Ashok K. Jain
An Steegen
4
Directors with
5 years of seniority
Female members of
the Board
2
Independent
directors
3
Barco
Inte
grate
d re
po
rt 20
20
6
CGR
Go
vern
ance &
Risk R
ep
ort

01 CORPORATE GOVERNANCE
02 RISK MANAGEMENT
Charles Beauduin (°1959)
has been CEO and owner of Michel Van de Wiele NV since
1993 . Van de Wiele is an international technology player and
leader in solutions for the textile industry . Mr . Beauduin holds
several positions in trade associations and employer orga-
nizations . He holds a Master of Law from KU Leuven and an
MBA from Harvard Business School .
Mr . Beauduin has broad professional management experi-
ence, including international assignments in Asia and the
United States . He is member of the Board of Directors of
Barco NV since January 2015 .
Jan De Witte (°1964)
is CEO of Barco and member of the Board as of September
2016 . He is a global leader who has served in a variety of
global operational and business leadership roles over the
past 30 years, delivering operational excellence, product
development and growth in services, solutions and software
businesses for technology companies .
Prior to joining Barco, Mr . De Witte was an officer of General
Electric Cy (GE), and CEO of the Software and Solutions busi-
ness in its Healthcare Division . During his 17-year tenure with
GE, he worked in global management roles in manufacturing
supply chain, Quality/Lean Six Sigma, services and software
solutions and lived in Chicago, Milwaukee and Paris .
Prior to GE, Mr . De Witte held operational management
positions in supply chain and manufacturing at Procter &
Gamble in Europe . He also served as Senior Consultant with
McKinsey & Company, serving clients in airline, process and
high-tech industries across Europe . He holds several positions
in educational and business incubation organizations and is
a member of the Board of Directors of ResMed Inc .
Mr . De Witte holds a Master’s degree in Electromechanical
Engineering from KU Leuven (Belgium), and an MBA from
Harvard Business School (USA) .
Ashok K. Jain (°1955)
is member of the Board of Directors of Barco NV since October
2012 . He holds a Master of Technology degree from the
Indian Institute of Technology in Delhi, India . During his
career, Mr . Jain has founded several technology start-ups
and has converted them into successful businesses through
strong leadership coupled with insights into emerging
opportunities and trends in the global economy . Mr . Jain
was founder and Chairman of the Board of IP Video
Systems, which was acquired by Barco in February 2012 . He
is currently a General Partner at Co=Creation=Capital LLC .
Mr . Jain is of Indian origin and has US citizenship .
Hilde Laga (°1956)
holds a PhD in law . She is one of the founding partners of
the law firm Laga, which she led as managing partner and
head of the corporate M&A practice until 2013 . Hilde Laga
joined the Board of Directors of Barco NV and NV Greenyard
Foods in 2014 . In 2015, she joined the Board of Directors
of Agfa-Gevaert NV and of Gimv NV . In 2016, she became
president of Gimv NV . She is a member of the Belgian
Corporate Governance Committee and served as a member
of the supervisory board of the FSMA (formerly CBFA) until
2014 .
Barco
Inte
grate
d re
po
rt 20
20
7
CGR
Go
vern
ance &
Risk R
ep
ort

01 CORPORATE GOVERNANCE
02 RISK MANAGEMENT
Frank Donck (°1965)
has been the managing director of investment holding
company 3D NV since 1998, investing in a mix of long-
term public equity, private equity and real estate . He also
serves as Chairman of Atenor Group NV, as non-executive
director of KBC Group NV and as independent director of
Elia System Operator NV and Luxempart SA . Frank Donck
holds a Master of Law from the University of Ghent and he
obtained a Master of Finance from Vlerick Business School .
He started his career as investment manager for Investco NV
and was a chairman and board member for several listed and
privately owned companies . He is also vice-chairman of
Vlerick Business School and is a member of Belgium’s
Corporate Governance Commission . Mr . Donck is member
of the Board of Directors of Barco NV since April 2015 .
An Steegen (°1971)
is member of the Board of Directors of Barco NV since April
2017 . Dr . Steegen holds a Ph .D . in Material Science and
Electrical Engineering from the Catholic University of Leuven,
KUL, in collaboration with the Interuniversity Microelectronics
Center, imec, in Belgium .
She joined IBM Semiconductor R&D in Fishkill, New York,
in 2000 . As R&D director and executive of IBM’s Interna-
tional Semiconductor Alliance, she was responsible for IBM’s
advanced logic semiconductor technology development
for the mobile and wireless application market . In 2010,
she rejoined imec in Belgium . As Executive Vice President,
she was in charge of imec’s Semiconductor Technology
& Systems division . Dr . Steegen is a recognized leader in
semiconductor R&D and an acclaimed and inspiring thought
leader in innovation in the IoT and digitalization era .
In 2018, Dr . An Steegen joined Umicore as Chief Technology
Officer, responsible for the company’s overall innovation
strategy . She is in charge of Umicore’s R&D in the areas of
clean mobility materials, recycling and sustainability and
she is responsible for Umicore’s new business incubation in
adjacent and new opportunity markets . She is also Executive
Vice President of the Electro-Optical Materials and Metal
Deposition Solutions business units .
Barco
Inte
grate
d re
po
rt 20
20
8
CGR
Go
vern
ance &
Risk R
ep
ort

01 CORPORATE GOVERNANCE
02 RISK MANAGEMENT
The composition of the Board of Directors meets the gender
diversity requirement laid down in article 7:86 of the Code
of Companies and Associations .
All directors hold or have held senior positions in leading
international companies or organizations . Their biographies
can be found here .
Board of Directors
Situation on 8 February 2021
Chairman Charles Beauduin 2023*
Directors Jan De Witte 2023*
An Steegen (1) 2023*
Adisys Corporation (represented by Ashok K. Jain) 2023*
Hilde Laga (1) 2021*
Frank Donck (1) 2023*
Secretary Kurt Verheggen General Counsel
(1) independent directors // * date on which the term of office expires: end of the annual meeting
Changes to the Board of Directors
Mr Luc Missorten decided to resign from the Board of Direc-
tors of Barco in April 2020, while continuing to provide his
support as senior advisor to the company . As a result, the
number of Board members reduced from 7 to 6 .
The General Meeting of 30 april 2020 has re-appointed
Mr . Charles Beauduin, Mr . Jan De Witte, Mr . Frank Donck,
Mrs . An Steegen and Adisys Corporation, represented by
Mr . Ashok Jain, as directors for a period of three (3) years
until the closing of the ordinary General Meeting of 2023 .
Mr . Frank Donck and Mrs . An Steegen are re-appointed as
independent directors .
Barco
Inte
grate
d re
po
rt 20
20
9
CGR
Go
vern
ance &
Risk R
ep
ort

01 CORPORATE GOVERNANCE
02 RISK MANAGEMENT
Core Leadership Team
Jan De Witte
Stijn Henderickx
Wim Buyens Olivier Croly Gerwin Damberg
Ann Desender Anthony Huyghebaert Rob Jonckheere
6
CLT members with 5 years
of Barco seniority
Female CLT
member
1
Non-Belgian CLT
members
7
Barco
Inte
grate
d re
po
rt 20
20
10
CGR
Go
vern
ance &
Risk R
ep
ort

01 CORPORATE GOVERNANCE
02 RISK MANAGEMENT
Marc Spenlé
Kenneth Wang
Filip Pintelon Iain UrquhartGeorge Stromeyer
Nicolas Vanden
Abeele
Kurt Verheggen
Barco
Inte
grate
d re
po
rt 20
20
11
CGR
Go
vern
ance &
Risk R
ep
ort

01 CORPORATE GOVERNANCE
02 RISK MANAGEMENT
Jan De Witte CEO
See biographies of Board of Directors (Page 9)
Wim Buyens (°1966) CEO Cinionic
heads the Cinema Joint Venture, Cinionic . He has held seve-
ral senior management positions in high tech companies
during the past 15 years . He started his career in IT prior to
joining the Danish company Brüel & Kjaer where he occupied
several global senior management positions in sales and
product strategy . Mr . Buyens joined Barco in November
2007 as Vice President Digital Cinema and has been General
Manager of the Barco Entertainment division for 7 years .
He served as Chairman of the Board of Governors of the
Advanced Imaging Society in Hollywood in 2017-2018 . Mr .
Buyens holds a degree in Engineering and obtained his
executive management at Stanford University and IMD in
Lausanne .
Olivier Croly (°1965) APAC
joined Barco in 2017 as Senior Vice President of APAC . Prior
to joining Barco, he held top positions at GE Healthcare &
Philips, leading businesses across EMEA & Asia . After gradu-
ating from the National Telecom Institute with a Master of
Telecommunications & Informatics in 1988, Mr . Croly earned
an MBA from Paris Dauphine University .
Gerwin Damberg (°1978) Chief Technology Officer
joined Barco in 2016 via the acquisition of MTT’s Light Steer-
ing technology where he was co-founder and served as CTO .
Dr . Damberg is an entrepreneur at heart and has advanced
image technologies over the last decade both in start-up and
established technology companies in R&D, business devel-
opment and management roles . He holds a mechatronics
engineering degree from the University of Applied Sciences
in Karlsruhe, Germany as well as a PhD in Computer Science
from the University of British Columbia, Canada .
Ann Desender (°1971) Chief Financial Officer
joined Barco in 2008 and has been leading Barco’s global
finance team since 2010 . Prior to joining Barco, she held
management positions as Corporate Director of Finance
& Reporting at Unilin and was a Senior Audit Manager at
Arthur Andersen and Deloitte . Mrs . Desender holds a Master
of Applied Economic Sciences from the University of Ghent
and completed an advanced management program at IESE
Barcelona .
Stijn Henderickx (°1980) EMEA
joined Barco in 2013 and held several positions in Barco’s
Entertainment Division, including Vice President Cinema and
Vice President Pro AV, Events & Simulation . As of early 2019,
he became Senior Vice President of EMEA .
Prior to joining Barco, Mr . Henderickx led Philips Arena
Solutions, Philips' global business entity focused on stadi-
ums and arenas . Earlier in his career, he took on multiple
strategy assignments, first at The Boston Consulting Group
as Consultant, later on with Philips as Director Corporate
Strategy . He holds a Master in Business Engineering from the
University of Antwerp .
Barco
Inte
grate
d re
po
rt 20
20
12
CGR
Go
vern
ance &
Risk R
ep
ort

01 CORPORATE GOVERNANCE
02 RISK MANAGEMENT
Anthony Huyghebaert (°1974) Chief HR Officer
will join Barco on April 1, 2021 . He started his career as a
lawyer with Landwell and KPMG, before moving to Alcatel-
Lucent and Nokia . He worked in multiple senior HR roles
covering the breadth of functional domains in Human
Resources, working as HR functional expert as well as in HR
business partnership roles across regions, technology and
operational organizations, while being stationed in Belgium
and Singapore .
Mr . Huyghebaert holds a Law Degree from the KU Leuven
and a DES International and European Law from the UC
Louvain .
Rob Jonckheere (°1964) Global Operations
is Senior Vice President Global Operations managing
Barco’s worldwide manufacturing sites as well as the world-
wide Logistics, Procurement, Quality and Facilities teams .
He joined Barco in April 2016 as VP Global Procurement and
brings 30 years of experience across R&D, Program- and
General Management .
Prior to joining Barco he held various positions with increas-
ing responsibility at Philips and TP Vision and was chairman of
the Board of Directors of TP Vision Belgium . Mr . Jonckheere
holds a Master of Science in Electromechanical Engineering
from the University of Louvain .
Filip Pintelon (°1964) GM Healthcare
joined Barco in 2008 and has been successively President of
Avionics & Simulation, President of Media, Entertainment &
Simulation, and COO . As of early 2015, he became General
Manager of the Healthcare division . Prior to joining Barco,
he held top positions at Siemens, Accenture and The Boston
Consulting Group . After graduating from KU Leuven with a
Master of Mathematics & Informatics in 1986, Mr . Pintelon
earned an MBA from Vlerick Leuven Gent Management
School . Mr . Pintelon also holds several positions in industry
advisory boards related to Digital Innovation .
Marc Spenlé (°1972) Chief Digital & Information Officer
joined Barco as Chief Digital & Information Officer in August
2020 . During his 25+ years of international professional expe-
riences in companies like IBM, Vodafone, and smaller IT
service companies, he has lead projects in customer centric
business transformation, operating of SaaS business models,
Software development and IT technology .
Mr . Spenlé holds a degree in Process Engineering from the
University of Applied Sciences in Niederrhein (Germany) .
Barco
Inte
grate
d re
po
rt 20
20
13
CGR
Go
vern
ance &
Risk R
ep
ort

01 CORPORATE GOVERNANCE
02 RISK MANAGEMENT
George Stromeyer GM Enterprise
began his career with Raychem Corporation in 1988 . Since
then, he has assumed roles of increasing responsibility for
global technology commercialization with Scientific Atlanta
Inc ., Cisco Inc . and Harmonic Inc .
Mr . Stromeyer joined Barco in February of 2016 to lead the
Enterprise division, which integrates seven worldwide sites .
A native of Silicon Valley, he has developed a multi-cultural,
multilingual background, with extensive years living and work-
ing in Europe and Latin America . George Stromeyer holds a
Bachelor of Science in Mechanical Engineering from Cornell
University and a Master of Business Administration from the
Tuck School at Dartmouth College .
Iain Urquhart (°1970) Americas
joined Barco in 2019 as Senior Vice President of the Americas .
Prior to joining Barco, he led the cloud transformation of
Oracle America’s SaaS applications channel business . Before
Oracle, Iain held senior leadership roles at Rackspace and
Microsoft, focusing on driving cloud and as-a-service trans-
formation in direct sales, channels and services . Mr . Urquhart
holds a BS in History and Communication from the University
of Missouri-Columbia .
Nicolas Vanden Abeele (°1972) GM Entertainment
joined Barco in December 2017 . Mr . Vanden Abeele has
over 20 years of experience in the technology and process
industry in global leadership roles across the globe, having
been stationed during his career in the Americas, Asia (China/
Singapore) and Europe .
Prior to joining Barco, he was a division head and part of the
Executive Committee of the Etex Group . From 1997 until
2010, he held several top leadership positions in regional
and business divisional roles at Alcatel-Lucent . He started
his career at Arthur Andersen in management and strategy
consulting .
Mr . Vanden Abeele holds a Degree in Business Administra-
tion from KU Leuven, a Masters’ Degree in Business from
the College of Europe and and a Masters’ Degree from the
Solvay School of Management .
Barco
Inte
grate
d re
po
rt 20
20
14
CGR
Go
vern
ance &
Risk R
ep
ort

01 CORPORATE GOVERNANCE
02 RISK MANAGEMENT
Kurt Verheggen (°1970) General Counsel
serves as Company Secretary of the Board . He is the General
Counsel of Barco in charge of legal, risk & compliance mat-
ters . He started his career with the law firm Linklaters and
then worked as legal counsel for CMB, Engie and General
Electric . He holds a Law Degree from KU Leuven, a 'DEUG en
droit' from Université du Havre, a Master of Laws from Tulane
University Law School in New Orleans and a Master of Real
Estate from Antwerp Management School . He is a judge in
entreprise matters with the Enterprise Court in Kortrijk and a
clinical teacher at the law faculty of the KU Leuven .
Changes Core Leadership Team
Barco NV is managed by a Core Leadership Team (‘CLT’)
which comprises certain key officers from functions,
businesses and regions . The CLT operates under the
chairmanship of the Chief Executive Officer and shares
responsibility for the deployment of Barco’s strategy and
policies, and the achievement of its objectives and results .
The CLT composition has gone through a limited number
of changes in 2020:
• An Dewaele, Chief HR Officer, left at the end of 2020 .
Anthony Huyghebaert will join Barco on April, 1st 2021 as
new Chief HR Officer and succeed An Dewaele
• Marc Spenlé joined Barco in August 2020 as Chief
Digital & Information Officer, leading Barco’s Digital
Organization, combining IT and the GEAX organization,
Barco’s global software development team .
• Xavier Bourgois, Senior Vice President Information
Technologies left Barco at the end of January 2021 and
left the CLT in September 2020 . His responsibilities are
taken over by Marc Spenlé .
• Johan Heyman, head of Barco’s Program Management
Office “fit to lead” left the CLT at the end of October
2020 and will be reporting to the Chief HR Officer as
Vice President Organizational excellence .
• Tet Jong Chang, Managing director for Barco China
since 2017, will retire from Barco at the end of the first
quarter 2021 and will be succeeded by Kenneth Wang .
Kenneth Wang (°1972) MD Barco China
rejoins Barco as SVP for the China region as of March 2021 .
He originally joined Barco in 2015 as Sales Director for the
China Entertainment and Clickshare business, and in 2018
moved as General Manager to the CFG-Barco JV in Digital
Cinema for China . Prior to joining Barco, he held several
commercial and business leadership roles in multinational
companies in China including Philips, Dell and British Ameri-
can Tobacco .
Mr . Wang holds an Engineering degree from Beijing Univer-
sity of Technology, and an EMBA from University of Texas
at Arlington .
Barco
Inte
grate
d re
po
rt 20
20
15
CGR
Go
vern
ance &
Risk R
ep
ort

01 CORPORATE GOVERNANCE
02 RISK MANAGEMENT
Annual General Meeting
The annual general meeting (AGM) is held on the last
Thursday of April . Shareholders can normally attend the
meeting in person or vote by proxy . However, due to the
corona virus outbreak in Spring 2020 and the government
imposed measures to combat the epidemic, such as the
prohibition on gathering, the Board of Directors has urged
the individual shareholders not to physically attend the annual
meeting but to submit their voting instructions in writing
to the company secretary . Although the Belgian legislator
exceptionally allowed listed companies to hold the general
meetings behind closed doors, the Board of Directors orga-
nized virtual meetings whereby shareholders could attend
the meetings remotely and ask live questions, using Barco’s
weConnect technology .
Participation rate & Average of "For" votes
Next to the ordinary general meeting, the Board of Directors
also convened an extra-ordinary general meeting to approve
the updated articles of association as well as the split of the
existing share into 7 new shares .
The company is open to discussions with proxy voting
agencies to better understand their policies and align the
company’s governance practices therewith, considering its
size, profile, jurisdiction as well as the geographical scope
of its activities .
Over the last years, shareholders' participation has gradually
increased . Almost two thirds of the shareholders participated
in the 2020 AGM .
91%
2020*
64%
94% 97% 95% 94% 95%
100
2015
42%
2017
56%
2018
54%
2019
58%52%
2016
20
40
60
80
Voting by proxy Physical attendance Average of "For" votes
* In 2020, physical attendance was not possible due to Covid-19 .
Barco
Inte
grate
d re
po
rt 20
20
16
CGR
Go
vern
ance &
Risk R
ep
ort

01 CORPORATE GOVERNANCE
02 RISK MANAGEMENT
Board of Directors
Title 1 and 2 of Barco’s Corporate Governance Charter
describe the responsibilities of the Board of Directors and
its Committees .
The table on the left provides a comprehensive overview of
the directors’ attendance at Board of Directors and Commit-
tee meetings in 2020 .
Intermediate meetings are held via teleconference call if
need be . All the Board of Directors meetings took place in
Belgium with some of the directors attending the meetings
via videoconference due to covid-related travel and sanitary
restrictions .
One meeting was closed with a dinner attended by the
executive management and several of their team members
to foster closer interaction between the directors and the
managers of the company .
At every meeting, the Board of Directors reviewed and dis-
cussed the financial results as well as the short to mid-term
financial forecast of the company . At the beginning of the
year, upon recommendation by the Audit Committee, the
Board approved the financial results of 2019 and proposed
the dividend for approval by the shareholders .
The Board, in close concert with the Core Leadership Team,
reflected on each of the divisions’ strategies for the short to
mid-term, discussed and decided upon the growth initiatives
for the company and approved the 2021 financial budget .
Activity report on Board and Committee meetings
Directors’ attendance at Board and Committee meetings
BOAR
D O
F D
IREC
TORS
AUD
IT
COM
MIT
TEE
REM
UN
ERAT
ION
&
NO
MIN
ATIO
N
COM
MIT
TEE
STRA
TEG
IC &
TE
CHN
OLO
GY
COM
MIT
TEE
ATTE
ND
ANCE
RATE
Charles Beauduin 6 5 4 100%
Jan De Witte 6 7 5 4 100%
Frank Donck (1) 6 7 4 100%
Ashok K. Jain 6 4 100%
Hilde Laga (1) 5 5 5 100%
Luc Missorten 1 1 1 100%
An Steegen (1) 6 6 4 95%
(1) independent directors
99%
Average total
attendance rate
Barco
Inte
grate
d re
po
rt 20
20
17
CGR
Go
vern
ance &
Risk R
ep
ort
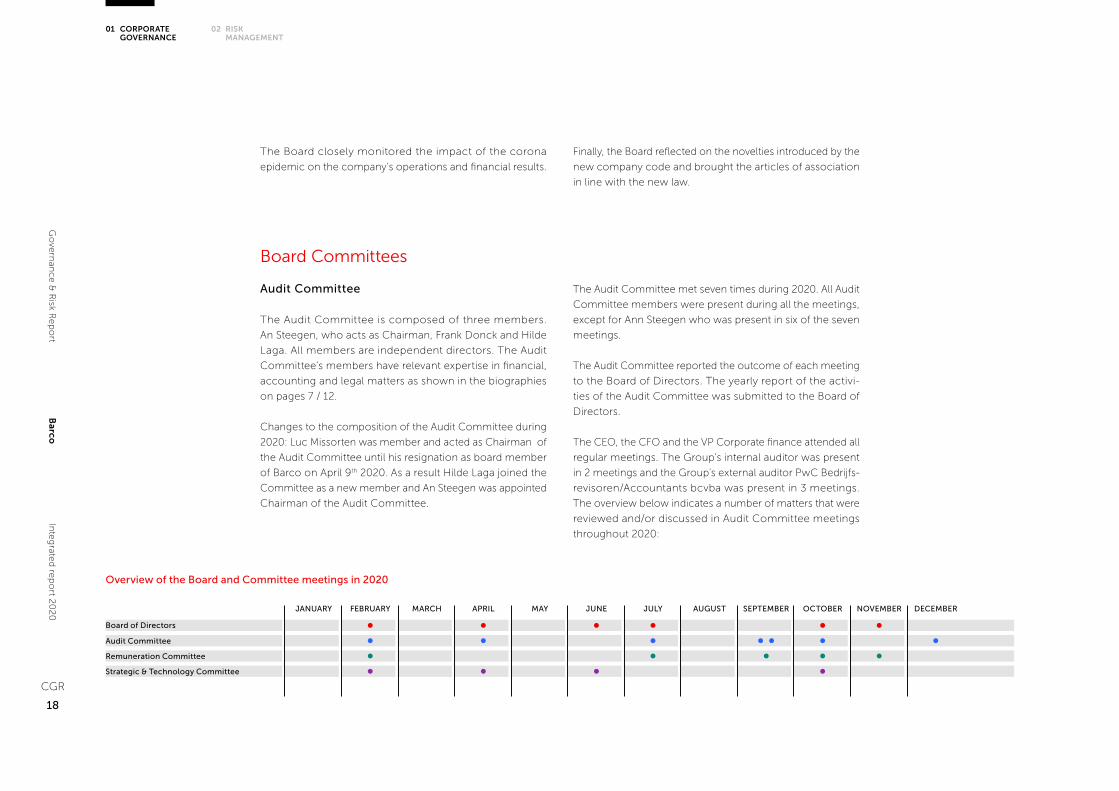
01 CORPORATE GOVERNANCE
02 RISK MANAGEMENT
AUGUST
Audit Committee
The Audit Committee is composed of three members .
An Steegen, who acts as Chairman, Frank Donck and Hilde
Laga . All members are independent directors . The Audit
Committee’s members have relevant expertise in financial,
accounting and legal matters as shown in the biographies
on pages 7 / 12 .
Changes to the composition of the Audit Committee during
2020: Luc Missorten was member and acted as Chairman of
the Audit Committee until his resignation as board member
of Barco on April 9th 2020 . As a result Hilde Laga joined the
Committee as a new member and An Steegen was appointed
Chairman of the Audit Committee .
Board Committees
The Board closely monitored the impact of the corona
epidemic on the company’s operations and financial results .
Finally, the Board reflected on the novelties introduced by the
new company code and brought the articles of association
in line with the new law .
Board of Directors
Audit Committee
Overview of the Board and Committee meetings in 2020
JANUARY MARCH MAY
Remuneration Committee
Strategic & Technology Committee
FEBRUARY APRIL JUNE
The Audit Committee met seven times during 2020 . All Audit
Committee members were present during all the meetings,
except for Ann Steegen who was present in six of the seven
meetings .
The Audit Committee reported the outcome of each meeting
to the Board of Directors . The yearly report of the activi-
ties of the Audit Committee was submitted to the Board of
Directors .
The CEO, the CFO and the VP Corporate finance attended all
regular meetings . The Group’s internal auditor was present
in 2 meetings and the Group’s external auditor PwC Bedrijfs-
revisoren/Accountants bcvba was present in 3 meetings .
The overview below indicates a number of matters that were
reviewed and/or discussed in Audit Committee meetings
throughout 2020:
DECEMBERSEPTEMBERJULY OCTOBER NOVEMBER
Barco
Inte
grate
d re
po
rt 20
20
18
CGR
Go
vern
ance &
Risk R
ep
ort

01 CORPORATE GOVERNANCE
02 RISK MANAGEMENT
• With regard to internal audit, the Committee reviewed
and approved the internal audit charter, audit plan, audit
scope and its coverage in relation to the scope of the
external audit, as well as the staffing, independence and
organizational structure of the internal audit function .
• With regard to the external audit, the Committee reviewed
the proposed audit scope, approach and fees, the
independence of the external auditor, non-audit services
provided by the external auditor in conformity with Barco’s
non-audit fee policy . The Committee also reviewed the
key audit matters valuation of goodwill and valuation of
deferred tax assets, as well as the group external auditor’s
management letter, which contained no recommendations
with material impact .
• For information on the fees of Group auditor, please refer
to note 23 Related party transactions in the Financial
Statements 2020 .
• The Committee reviewed the report from the external
auditor in which the auditor set forth its findings and
attention points during the relevant period . The Committee
also assessed the overall performance of the external
auditor . The Committee also reviewed and approved its
updated Audit Committee Charter, including the minor
amendments thereto .
• The Company’s 2019 annual and 2020 interim financial
statements, including non-financial information, prior to
publication thereof . The Committee also assessed in its
quarterly meetings the adequacy and appropriateness of
internal control policies and internal audit programs and
their findings .
• Matters relating to accounting policies, financial risks .
and compliance with accounting standards . Compliance
with statutory and legal requirements and regulations,
particularly in the financial domain, was also reviewed .
Important findings, Barco’s major areas of risk (including
the internal auditor’s reporting thereon, as well as the
review of litigation and other claims), follow-up actions
and appropriate measures were examined thoroughly .
• Quarterly review of critical accounting judgements and
uncertainties, including potential impact of covid-19 .
• Each quarter, the Committee reviewed the Company’s free
cash flow generation and working capital ratios .
• The Committee monitored potential impairment indi-
cators, reviewed the goodwill impairment test performed,
financial impact of strategic investments and risk mana-
gement (covid-19, cyber security, global and Healthcare
compliance, currency & treasury instruments, health, safety
& environmental, insurance, GDPR, sustainability program) .
Barco
Inte
grate
d re
po
rt 20
20
19
CGR
Go
vern
ance &
Risk R
ep
ort

01 CORPORATE GOVERNANCE
02 RISK MANAGEMENT
Remuneration and Nomination Committee
The Board of Directors has combined the Remuneration
Committee and the Nomination Committee into a single
committee .
The composition of the Remuneration & Nomination Com-
mittee has been reviewed . Effective April 9, Mr . Luc Missorten
has resigned as director and Mr . Frank Donck has joined the
Committee as a new member, next to Mr . Charles Beauduin,
who continues to act as Chairman and Mrs . Hilde Laga .
The Committee has the necessary expertise to perform its
mission
The Remuneration and Nomination Committee fulfills the
mission imposed on it by law and meets at least three times
per year, as well as whenever the Committee needs to
address imminent topics within the scope of its responsibi-
lities . The CEO is invited to meetings, except for matters that
concern him personally . The meetings are prepared by the
Chief HR Officer, who attends the meetings .
The Committee gives its opinion on appointments to the
Board of Directors (Chairman, new members, renewals and
committees) and to Core Leadership Team positions . Other
topics for the agenda of the committee typically are remu-
neration policies, senior leadership remuneration, critical
successions and nominations . In fulfilling its responsibilities,
the Remuneration and Nomination Committee has access
to all resources that it deems appropriate, including external
advice .
The Committee is aware of the importance of diversity in
the composition of the Board of Directors in general and of
cul- tural and gender diversity in particular . For further ref-
erence on how the company deals with diversity and equal
oppor- tunities we refer to Report on Planet, people and
communities . .
In 2020, the Remuneration and Nomination Committee met
six times .
In 2019, the Board of Directors instructed a reputable con-
sultancy firm to conduct an in-depth board review and to
prepare a report with recommendations on how to further
improve the effectiveness of the Board of Directors and the
different Committees . On the first meeting of the Remu-
neration and Nomination Committee in February 2020, the
findings of the review on the functioning of the Remuner-
ation and Nomination Committee was presented by the
Chairman and discussed, resulting in an agreement about
a few adjustments .
The Remuneration and Nomination Committee has reviewed
the results on the 2019 bonus targets, for Barco, Core Leader-
ship Team and CEO . For the Core Leadership Team, the
evaluation on the individual bonus criteria was discussed and
Barco
Inte
grate
d re
po
rt 20
20
20
CGR
Go
vern
ance &
Risk R
ep
ort

01 CORPORATE GOVERNANCE
02 RISK MANAGEMENT
an overall assessment on the performance was done linked
with the salary review . The members of the Remuneration
and Nomination Committee received detailed data for each
individual CLT member before giving final approval on bonus
and merit .
The allocations of Stock Options for 2020 has been prepared
and brought to the Board for approval .
As from Q2, an update was given at each Remuneration and
Nomination Committee meeting about the covid-19 crisis
where topics such as employee health and wellbeing, tem-
porary and structural measures taken and impact on short
and long term incentives were discussed .
The Remuneration and Nomination Committee discussed
and decided to use the legal options available for payback in
case of fraud or other types of misconduct or irregularities in
the results of the Company would be discovered in a period
of 2 years following the payment of the bonus .
The Committee has discussed how the Core Leadership
Team and the N-2 position holders have been assessed
as part of the yearly Talent Review process in Barco and
reviewed the talent vitality situation .
The Remuneration and Nomination Committee was infor-
med and discussed about the Barco Culture Journey that has
started, as an important element to support us in executing
our strategy successfully .
Related to some shifts in the Core Leadership Team through-
out the year, the new appointments were discussed by the
Remuneration and Nomination Committee .
Technology Committee
The Technology Committee is an advisory body to the Board
of Directors . The Committee is composed of four members .
Charles Beauduin, who acts as Chairman, Ashok Jain, An
Steegen and Jan De Witte .
The Technology Committee assists the Board of Directors
in fulfilling its oversight responsibilities by preparing techno-
logy related matters that could influence Barco’s strategy,
such as the identification of major investment opportunities
in future technologies through internal resources or techno-
logy acquisitions, technology roadmap strategy, operational
performance and technology trends that may affect portfolio
performance .
Major technology investments relate to investments running
over a number of years that involve a minimum commitment
by the company of 10 million euro over the entire duration of
the project . The investments might also include technology
acquisitions .
In 2020, the Technology Committee met four times . The
Committee organized specific working sessions by division,
thus ensuring appropriate depth and focus for each of
Barco’s divisions . The Committee also performed the annual
general review of foundational technologies as included
in its strategic plan update presented to the Board .
Barco
Inte
grate
d re
po
rt 20
20
21
CGR
Go
vern
ance &
Risk R
ep
ort

01 CORPORATE GOVERNANCE
02 RISK MANAGEMENT
Evaluation of the Board of Directors and its Committees
Regularly assessing the size, composition, functioning and
performance of the Board of Directors and its Committees
as well as the interaction with the executive management is
an essential element of corporate governance .
The principle of Board assessment is laid down in the
Corporate Governance Code as well as Title 1 (1 .5) of the
company’s Corporate Governance Charter .
See www .barco .com/corporategovernance
End of 2019, the Board of Directors had instructed a repu-
table consultancy firm to conduct an in-depth board
review consisting of an online, tailormade questionnaire,
to be completed by all directors, the CFO and the Com-
pany Secretary, and personal interviews of each respondent .
The Board review covers topics like the quality of the inter-
actions within the Board (the relationship between the indi-
vidual Board members and between the Board members
and the Chairman) and between the members of the Board
and the executive management; the quality and timing of
the information and documents submitted to the Board; the
preparation of the Board meetings; the quality of the discus-
sions and decision-making of the Board; the extent to which
all relevant strategic, organizational and managerial issues
are addressed by the Board and the contribution of each
Board member to the decision-making process of the Board .
In February 2020, the consultancy firm presented its find-
ings to the Remuneration and Nomination Committee, and
subsequently to the Board of Directors .
It concluded that the company has a well-functioning and
cohesive board, adding real value to the company and oper-
ating in an atmosphere of trust and good collaboration . It
also identified a few actions to further improve the function-
ing of the Board of Directors, which meanwhile have been
implemented to the extent possible .
In 2020, the Audit Committee instructed the secretary of
the Audit Committee to gather self-review feedback with
the members of the audit committee and management . The
feedback was gathered using an audit committee self-review
questionnaire from PwC . The results of this questionnaire
were shared in the Audit Committee meeting of July 2020 .
The conclusion of both the members as well as management
were very positive on the functioning of the Audit Commit-
tee, which is operating in an atmosphere of mutual trust and
good collaboration . A couple of recommendations linked to
non-finance and compliance topics were agreed upon and
implemented to the extent possible .
Barco
Inte
grate
d re
po
rt 20
20
22
CGR
Go
vern
ance &
Risk R
ep
ort

01 CORPORATE GOVERNANCE
02 RISK MANAGEMENT
Remuneration report for financial year 2020
General introduction
By law of 28 April 2020, new rules have been introduced
in Belgian company law, implementing the EU Directive
2017/828 as regards the encouragement of long-term share-
holder engagement .
These new rules require inter alia the company to have a
remuneration policy, on which the shareholders have the
right to vote at the general meeting . At the time of prepa-
ration of this report the company’s remuneration policy, as
historically grown, is spread over several policy documents .
These will be combined into one remuneration policy which
will be submitted to the shareholders for their approval at
the general meeting of 29 April 2021 .
Where the new rules require the remuneration report to
link up with the remuneration policy, such link will for this
transition year be made to the various policy documents in
existence at the time of the preparation of this report .
Also in the context of the transition, the company has
decided to provide the information required in the remu-
neration report with respect to previous years only to the
extent that this information was readily available .
This report covers the 2020 remuneration of the non-
executive board members (Part A), of the Chief Executive
Officer (CEO), who is also a member of the board and thus
an executive director (Part B) and other members of the
Core Leadership Team (CLT) who are not members of the
board (Part C) .
Barco
Inte
grate
d re
po
rt 20
20
23
CGR
Go
vern
ance &
Risk R
ep
ort

01 CORPORATE GOVERNANCE
02 RISK MANAGEMENT
Part 1 :Introduction to the 2020 remuneration report
The covid-19 pandemic had wide-ranging impacts on our
company, our markets and our people . Our remuneration
policy was also directly impacted by the crisis, with conse-
quences for executive pay (management, CEO and CLT) as
well as on the wages of the wider workforce .
In response to the crisis, Barco took a number of measures
to reset expense levels, such as relying on temporary unem-
ployment, redeploying people, a continued discretionary
spending stop, hiring freezes and scaling back . While the
impact on fixed remuneration was limited, we took salary/
bonus actions and decided not to raise short-term incentive
payment regardless of the achievements of group, divisional,
regional, functional or individual targets . Also the long-term
incentive cash bonus was affected by the pandemic, as it
is directly linked to the annual business objectives, which
Barco had defined .
Part 2 :Remuneration report on the non-executive board members, CEO and CLT-members
Part 2, A
Remuneration of the non-executive board members
On 30 April 2020, pursuant to article 17 of the Articles of
Association, the General Meeting set the aggregate annual
remuneration of the entire Board of Directors at 2,144,575
euro for the year 2020 . Next to the board fees of the non-
executive directors this amount includes the remuneration
package of the CEO . Details on the CEO’s remuneration are
provided in section 2, B hereinafter .
Barco
Inte
grate
d re
po
rt 20
20
24
CGR
Go
vern
ance &
Risk R
ep
ort

01 CORPORATE GOVERNANCE
02 RISK MANAGEMENT
TABEL 1 - TOATAL REMUNERATION NON-EXECUTIVE DIRECTORS
Name - Position
FIXED REMUNERATION VARIABLE REMUNERATION EXTRA- ORDINARY
ITEMS
PENSION EXPENSE
TOTAL REMUNE- RATION
PROPORTION OFFIXED AND VARIABLE
REMUNERATION
BASECOMPENSATION
ATTENDANCEFEES
OTHERBENEFITS
ONE-YEARVARIABLE
MULTI-YEARVARIABLE FIXED VARIABLE
Charles Beauduin
Chairman of the Board€120,000 €0,00 NA NA NA NA NA €120,000 100% 0%
Frank Donck
Member of the Board€30,000 €40,800 NA NA NA NA NA €70,800 100% 0%
Ashok K . Jain
Member of the Board€30,000 €21,300 NA NA NA NA NA €51,300 100% 0%
Hilde Laga
Member of the Board€30,000 €38,250 NA NA NA NA NA €68,250 100% 0%
Luc Missorten
Member of the Board *7€,500 €10,225 NA NA NA NA NA €17,725 100% 0%
An Steegen
Member of the Board€30,000 €44,350 NA NA NA NA NA €74,350 100% 0%
Total €247,500 €154,925 NA NA NA NA NA €402,425 100% 0%
Part 2, A, 1
Total remuneration
(*) resigned from the Board with effect as of 9 April 2020
Barco
Inte
grate
d re
po
rt 20
20
25
CGR
Go
vern
ance &
Risk R
ep
ort

01 CORPORATE GOVERNANCE
02 RISK MANAGEMENT
The remuneration paid to non-executive directors consists
solely of an annual fixed component plus the fee received
for each meeting attended . Considering the substantial time
he devotes to the ongoing supervision of Barco group affairs,
the Chairman of the Board receives a different remuneration
package that comprises solely a fixed component, which is
set separately by the Remuneration and Nomination Com-
mittee and approved by the Board .
The 2020 director’s pay consists of:
• an annual gross fixed compensation of 120,000 euro
for the Chairman of the Board
• an annual gross fixed compensation of 30,000 euro
per director to non-executive directors and additionally
an individual attendance fee of 2,550 euro gross per
Board meeting attended
• 2,550 euro gross for members of the Audit Committee
and 5,125 euro gross for its Chairman for each meeting
of the committee attended
• 2,550 euro gross for members of the Remuneration
and Nomination Committee for each meeting of the
committee attended
• 2,550 euro gross per full day and 1,500 euro gross per
half day for members of the Technology Committee for
each meeting of the committee attended
• the Chairman of the Board, the CEO and the members
of the CLT do not receive attendance fees for taking
part in meetings of the Board and the committees
At the company’s request, the following directors have
taken up specific punctual assignments outside the scope
of their directorship for which they have been compensated
as described hereafter:
• Adisys Corporation, represented by Ashok K Jain:
based on its director’s extensive experience in Silicon
Valley, Adisys Corporation is requested to invest
additional time in technology assessments and
potential M&A identification as well as contract
initiation: 3,000 euro (2 days at 1,500 euro per day)
Non-executive directors do not receive any variable compen-
sation linked to results or other performance criteria . They
are not entitled to stock options or shares (see comment in
the Corporate Governance statement on page 7 regarding
the application of Principle 7 of the 2020 Belgian Corporate
Governance Code), nor to any supplementary pension
scheme .
Part 2, B
Remuneration of the CEO
Part 2, B, 1
Total remuneration
The remuneration package of the CEO consists of a base
salary, a variable remuneration, stock options, a pension
contribution, and other components . There were no shares
granted (see comment in the Corporate Governance state-
ment on on page 7 regarding the application of Principle 7
of the 2020 Belgian Corporate Governance Code) .
The remuneration package aims to be competitive and is
aligned with the responsibilities of a CEO leading a globally
operating industrial group with various business platforms .
Barco
Inte
grate
d re
po
rt 20
20
26
CGR
Go
vern
ance &
Risk R
ep
ort

01 CORPORATE GOVERNANCE
02 RISK MANAGEMENT
The amount of the remuneration and other benefits granted directly or indirectly to the CEO, by the Company or its
subsidiaries, in respect of 2020 for his CEO role is set forth below .
Base Salary
The base salary of the CEO consists of the actual salary paid by
the company as well as of a fixed director’s fee paid by Barco,
Inc . and by Barco China (Holding) Ltd .
Variable remuneration
The variable remuneration of the CEO consists of an annual
bonus . The CEO is, contrary to other members of the CLT,
not entitled to a long term incentive (LTI), other than stock
options (see below) .
Variable remuneration, if any, vests on 31 December of the
performance year . Therefore such variable remuneration is
reported for the year it vests and not for the (subsequent)
year it is paid .
The amount of annual bonus is paid in cash and is subject to a
deferral period of three years, i .e . the bonus for performance
year N is paid out as follows:
• 50% during N+1
• 25% during N+2
• 25% during N+3
The deferred amounts are subject to the achievement of the
Company’s sustained EBITDA performance over the deferral
periods and are therefore subject to upwards or downwards
and capped at 130% (upwards) and 70% (downwards) . These
parts are reported as multi-year variable .
For the reasons explained in Part 1 of this report and in align-
ment with the different salary actions, and cost reduction
measures, taken across Barco’s workforce over 2020, the CEO
base salary was reduced versus 2019 and the CEO renounced
his bonus for 2020 . No bonus for 2020 was vested in the
hands of the CEO on 31 December 2020, except for the
deferred payments of 2018 and 2019 . Given the exceptional,
and largely exogenous, impact of the Covid-19 pandemic on
Barco’s results the Board of Directors decided to not apply the
adjustments to the 2018 and 2019 deferred payments .
Pension
The pension benefit of the CEO is an individual defined con-
tribution pension arrangement, which also includes a death
cover .
TABEL 1 - TOTAL REMUNERATION OF CEO
Name - Position
FIXED REMUNERATION VARIABLE REMUNERATIONEXTRA-
ORDINARY ITEMS
PENSION EXPENSE
TOTAL REMUNE-
RATION
PROPORTION OFFIXED AND VARIABLE
REMUNERATION
BASESALARY
FOREIGN DIRECTOR
FEESOTHER
BENEFITSONE-YEARVARIABLE
MULTI-YEARVARIABLE FIXED VARIABLE
Jan De Witte
CEO€339,500 €240,000 €56,510 €0,00 €339,000 NA €287,673 €1,262,683 73 .15% 26 .85%
Other components of remuneration
The other components comprise the total cost of ownership
of a company car, a hospitalization insurance as well as a
guaranteed income insurance in case of disability .
Relative weight of base pay and variable remuneration
Following what is stated above, the CEO’s entire 2020 pay
consisted of 73 .15% fixed remuneration and 26 .85% (deferred)
variable remuneration . This relative weight is exceptional as
it is heavily impacted by the fact that no STI vested for 2020 .
Barco
Inte
grate
d re
po
rt 20
20
27
CGR
Go
vern
ance &
Risk R
ep
ort

01 CORPORATE GOVERNANCE
02 RISK MANAGEMENT
Part 2, B, 2
Share based remuneration
In line with the company’s stock option policy, stock options were offered to the CEO during 2020 as detailed in the table
below . The stock options granted under the 2017 scheme vested in the course of 2020 . No stock options were exercised
during 2020 . For more detail, see the table below .
Since the grant nor the exercise of the stock options is linked
to performance conditions, this item of compensation is
not considered as variable remuneration in the sense of the
Belgian Corporate Governance Code . Therefore, it is also
not included in the calculation of the above relative weight
of base pay and variable remuneration .
TABLE 2 - STOCK OPTIONS
MAIN PROVISIONS OF THE STOCK OPTION PLAN INFORMATION RELATED TO THE FINANCIAL YEAR 2020
NamePosition PLAN
IDENTI-FICATION
GRANTDATE
VESTING DATE
END OFRETEN-
TION PERIOD
EXERCISE PERIOD
EXERCISE PRICE
A) NUMBEROF OPTIONS
GRANTEDB) VALUE UNDER-LYING SHARES @
GRANT DATE
A) NUMBER OF OPTIONS VESTED
B) VALUE @EXCERSISE PRICE
A) NUMBER OF OPTIONS
EXERCISEDB) DATE OF
EXERCISE
NUMBER OF
OPTIONS EXPIRED
Jan De Witte
CEO
SOP
2020-CEO29/10/20 31/12/23 NA
1/01/2024-
28/10/203012 .76 €
a) 182,000
b) 2,322,320 €
SOP
2017-CEO20/10/17 31/12/20 NA
1/01/2021-
19/10/202712 .54 €
a) 210,000
b) 2,633,400 €
Barco
Inte
grate
d re
po
rt 20
20
28
CGR
Go
vern
ance &
Risk R
ep
ort

01 CORPORATE GOVERNANCE
02 RISK MANAGEMENT
Part 2, C
Remuneration of the CLT-members
The Core Leadership Team under analysis of this chapter
includes 15 persons .
The CLT-members are employed by local Barco companies
in their respective countries of residence . Their compensa-
tion package therefor takes local market remuneration and
benefit practice into account .
NAME POSITION EMPLOYER LEGAL ENTITY JOINED/LEFT CLT 2020
Xavier Bourgois CIO Barco nv (BE) left CLT : 30/09/2020
Tet Jong Chang SVP China Barco Visual Electronics Co., Ltd. (CN)
Olivier Croly SVP APAC Barco Singapore Pte Ltd. (SG)
Gerwin Damberg CTO MTT Innovation Inc. (CA)
Ann Desender CFO Barco nv (BE)
An Dewaele CHRO Barco nv (BE) left CLT : 31/12/2020
Stijn Henderickx SVP EMEA Barco nv (BE)
Johan Heyman SVP Organizational Excellence Barco nv (BE) left CLT : 30/09/2020
Rob Jonckheere SVP Operations Barco nv (BE)
Filip Pintelon SVP Healthcare Division Barco nv (BE)
Marc Spenlé CDIO Barco nv (BE) joined CLT : 15/08/2020
George Stromeyer SVP Enterprise Division Barco Inc. (USA)
Iain Urquhart SVP Americas Barco Inc. (USA)
Nicolas Vanden Abeele SVP Entertainment Division Barco nv (BE)
Kurt Verheggen General Counsel Barco nv (BE)
Part 2, C, 1
Total remuneration
The remuneration package of the Core Leadership Team
members other than the Chief Executive Officer consists of
a base remuneration, a short-term variable remuneration, a
long-term variable bonus, stock options, a pension contri-
bution and various other components . The remuneration
package aims to be competitive and is aligned with the role
and responsibilities of each CLT member, being a member
of a team leading a globally operating industrial group in the
technology market space with various business platforms .
There were no shares granted .
Barco
Inte
grate
d re
po
rt 20
20
29
CGR
Go
vern
ance &
Risk R
ep
ort

01 CORPORATE GOVERNANCE
02 RISK MANAGEMENT
The amount of the remuneration and other benefits granted directly or indirectly to the CLT-members, by the Company or
its subsidiaries, in respect of 2020 is set forth below .
Base Salary
The base salary reflects role responsibilities, job characteris-
tics, experience and skill sets .
Variable salary
Variable salary consists of an STI component and a Long
Term Incentive (LTI) component, both delivered in cash .
Variable remuneration, if any, vests on 31 December of the
performance year . Therefore such variable remuneration is
reported for the year it vests and not for the (subsequent)
year it is paid .
Annual Bonus
It is Barco’s ambition to continue to build a culture where
group, team and individual performance make a difference
and are truly recognized and rewarded with an annual bonus
as set forward by the global Barco Bonus Policy . The indi-
vidual bonus for the CLT members is governed by the same
policy .
The main conditions for the annual bonus are (i) the creation
of the bonus pool and (ii) the achievement of bonus targets:
• Profitability of the Barco group is the base for creating
the bonus pool . A minimum of 70% of the 2020 Profit
Plan EBITDA (excluding results on divestments and
discontinued operations and excluding growth
initiatives) should be achieved on group level before
bonuses are paid .
• A strong focus on performance at Group, divisional/
regional/functional and individual level is reflected in
the annual Barco bonus program, which is directly
linked to the annual business objectives .
Payment is capped at 150% of the target award .
TABLE 1 - TOTAL REMUNERATION OF CLT (EXCLUDING CEO)
Name - Position
FIXED REMUNERATION VARIABLE REMUNERATIONEXTRA-
ORDINARY ITEMS
PENSION EXPENSE
TOTAL REMUNE-
RATION
PROPORTION OFFIXED AND VARIABLE
REMUNERATION
BASESALARY
FOREIGN DIRECTOR
FEESOTHER
BENEFITS
ONE-YEAR
VARIABLE
MULTI- YEAR
VARIABLE FIXED VARIABLE
Core Leadership
Team€3,686,339 €150,000 €325,019 €0,00 €0,00 €256,326 €401,461 €4,819,145 100% 0%
Barco
Inte
grate
d re
po
rt 20
20
30
CGR
Go
vern
ance &
Risk R
ep
ort

01 CORPORATE GOVERNANCE
02 RISK MANAGEMENT
As explained in Part 1 of this report, no 2020 STI was
vested in the hands of the CLT on 31 December 2020 as
the condition for creating the bonus pool was not met .
Long-term incentive Plan
In 2018 Barco implemented its revised LTI policy that exists
of a combination of a LTI Cash Plan and stock options . The
latter are dealt with in section 2, C, 2 below .
The LTI Cash Plan incentivizes and rewards engagement and
leadership in driving the performance of Barco’s business in
accordance with its long-term strategic goals .
The long-term incentive cash bonus is a conditional right
to receive a cash payment upon the achievement of certain
long-term company performance indicators as determined
by the Board: sales CAGR, EBITDA margin increase and
cumulated net earnings over the respective plan period
comprising 3 financial years (2018, 2019, 2020) and continued
employment on the last day of the plan period . Payment is
capped at 150% of the target award .
For the reasons set out in Part 1 above, no STI was earned
in 2020 . For the same reasons, the LTI under the 2018-
2020 LTI plan did not vest . As the Board of Directors feels
that it is important to still incentivize executives for leading
performance over a multi-year period, the vesting period for
the 2018-2020 LTI, has been exceptionally extended with
an additional year (thus extending the vesting period till 31
December 2021) . No change was made to the performance
criteria . This extension coincides with the start of the new
2021-2023 LTI plan .
BONUSTARGET CLUSTERS WEIGHT BUSINESS DIVIONS
REGIONAL SALES & SERVICE ORGANISATIONS FUNCTIONAL DEPARTMENTS
1) Threshold for
bonus pool100% 70% of Group Ebitda PP target : yes / no
2) bonus targets
company 20% Ebitda
20% FCF
business 30%
- Division EBITDA- Division Sales- Division Working Capital %
- Regional Sales - Regional Sales Cost vs Sales %
- Group Sales- WW functional budget
individual 30%Individual performance targets:
operational excellence, people leadership (engagement, culture), personal development
total 100%
Barco
Inte
grate
d re
po
rt 20
20
31
CGR
Go
vern
ance &
Risk R
ep
ort

01 CORPORATE GOVERNANCE
02 RISK MANAGEMENT
Pension
The CLT is entitled to a complementary pension benefit on
the basis of the provisions of the defined contribution plans
for senior executives in their base countries .
Other components of remuneration
The main other components for all CLT-members are
company car or car allowance, hospitalization or medical
insurance and a guaranteed income insurance in case of
disability, next to occasional local benefits in accordance
with local market practice .
Relative part of base pay and variable pay
Following what is stated above, the CLT’s entire 2020 pay
consisted only of fixed remuneration and no variable remu-
neration . This relative weight is exceptional as it is heavily
impacted by the fact that no STI nor LTI vested for 2020 .
Part 2, C, 2
Share based remuneration
As stated above, part of the LTI is delivered as stock options .
No shares were granted to the CLT-members, nor was any
other share based remuneration provided to the CLT-mem-
bers, during 2020 . Reference is made to the explanation
given in the Corporate Governance Statement on page 7
above regarding the reason for this deviation from article 7 .9
of the Belgian Corporate Governance Code .
In 2020, following authorization by the general meeting
and at the proposal of the Remuneration and Nomination
Committee, the Board of Directors allotted stock options to
12 members of the CLT . The exercise price amounts to EUR
12,76 per option, with a three-year vesting period . The num-
ber of options to be offered to each individual beneficiary is
variable in part . The options are offered to the beneficiaries
for no consideration .
220,650 stock options were granted to and accepted by the
members of the CLT .
Barco
Inte
grate
d re
po
rt 20
20
32
CGR
Go
vern
ance &
Risk R
ep
ort

01 CORPORATE GOVERNANCE
02 RISK MANAGEMENT
All details on the stock options granted, vested and exercised are provided in the table below .
TABLE 2 - STOCK OPTIONS
MAIN PROVISIONS OF THE STOCK OPTION PLAN INFORMATION RELATED TO THE FINANCIAL YEAR 2020
NamePosition PLAN
IDENTI-FICATION
GRANTDATE
VESTING DATE
END OFRETEN-
TION PERIOD
EXERCISE PERIOD
EXERCISE PRICE
A) NUMBEROF OPTIONS
GRANTEDB) VALUE UNDER-LYING SHARES @
GRANT DATE
A) NUMBER OF OPTIONS VESTED
B) VALUE @EXCERSISE PRICE
A) NUMBER OF OPTIONS
EXERCISEDB) DATE OF
EXERCISE
NUMBER OF
OPTIONS EXPIRED
Ann Desender,
CFO
SOP
2020-P29/10/20 31/12/23 NA
1/01/2024-
28/10/203012 .76 €
a) 29,400
b) 375,144 €
SOP
2017-EEA20/10/17 31/12/20 NA
1/01/2021-
19/10/202712 .54 €
a) 42,000
b) 526,680 €
Marc Spenlé,
CDIO
SOP
2020-P29/10/20 31/12/23 NA
1/01/2024-
28/10/203012 .76 €
a) 19,600
b) 250,096 €
Filip Pintelon,
SVP Healthcare Division
SOP
2020-P29/10/20 31/12/23 NA
1/01/2024-
28/10/203012 .76 €
a) 16,100
b) 205,436 €
SOP
2017-EEA20/10/17 31/12/20 NA
1/01/2021-
19/10/202712 .54 €
a) 35,000
b) 438,900 €
George Stromeyer,
SVP Enterprise Division
SOP
2020-P29/10/20 31/12/23 NA
1/01/2024-
28/10/203012 .76 €
a) 21,000
b) 267,960 €
Nicolas Vanden Abeele,
SVP Entertainment Division
SOP
2020-P29/10/20 31/12/23 NA
1/01/2024-
28/10/203012 .76 €
a) 21,700
b) 276,892 €
Tet Jong Chang,
SVP China
SOP
2020-P29/10/20 31/12/23 NA
1/01/2024-
28/10/203012 .76 €
a) 14,000
b) 178,640 €
Olivier Croly,
SVP APAC
SOP
2020-P29/10/20 31/12/23 NA
1/01/2024-
28/10/203012 .76 €
a) 21,000
b) 267,960 €
SOP
2017-EEA20/10/17 31/12/20 NA
1/01/2021-
19/10/202712 .54 €
a) 28,000
b) 351,120 €
Stijn Henderickx,
SVP EMEA
SOP
2020-P29/10/20 31/12/23 NA
1/01/2024-
28/10/203012 .76 €
a) 15,500
b) 197,780 €
SOP
2017-EEA20/10/17 31/12/20 NA
1/01/2021-
19/10/202712 .54 €
a) 4,200
b) 52,668 €
Barco
Inte
grate
d re
po
rt 20
20
33
CGR
Go
vern
ance &
Risk R
ep
ort

01 CORPORATE GOVERNANCE
02 RISK MANAGEMENT
TABLE 2 - STOCK OPTIONS
MAIN PROVISIONS OF THE STOCK OPTION PLAN INFORMATION RELATED TO THE FINANCIAL YEAR 2020
NamePosition PLAN
IDENTI-FICATION
GRANTDATE
VESTING DATE
END OFRETEN-
TION PERIOD
EXERCISE PERIOD
EXERCISE PRICE
A) NUMBEROF OPTIONS
GRANTEDB) VALUE UNDER-LYING SHARES @
GRANT DATE
A) NUMBER OF OPTIONS VESTED
B) VALUE @EXCERSISE PRICE
A) NUMBER OF OPTIONS EXERCISED
B) DATE OF EXERCISE
NUMBER OF
OPTIONS EXPIRED
Iain Urquhart,
SVP Americas
SOP
2020-P29/10/20 31/12/23 NA
1/01/2024-
28/10/203012 .76 €
a) 21,150
b) 269,874 €
An Dewaele,
CHRO
SOP
2017-EEA20/10/17 31/12/20 NA
1/01/2021-
19/10/202712 .54 €
a) 28,000
b) 351,120 €
Gerwin Damberg
CTO
SOP
2020-P29/10/20 31/12/23 NA
1/01/2024-
28/10/203012 .76 €
a) 16,100
b) 205,436 €
Rob Jonckeere,
SVP Operations
SOP
2020-P29/10/20 31/12/23 NA
1/01/2024-
28/10/203012 .76 €
a) 12,500
b) 159,500 €
Johan Heyman,
SVP Organizational Excellence
SOP
2017-EEA20/10/17 31/12/20 NA
1/01/2021-
19/10/202712 .54 €
a) 3,500
b) 43,890 €
SOP
2016-EEA24/10/16 31/12/19 NA
1/01/2020-
23/10/202610 .40 €
a) 2,100
b) 19 and 20 May
Kurt Verheggen
SOP
2020-P29/10/20 31/12/23 NA
1/01/2024-
28/10/203012 .76 €
a) 12,600
b) 160,775 €
SOP
2017-EEA20/10/17 31/12/20 NA
1/01/2021-
19/10/202712 .54 €
a) 21,000
b) 263,340 €
Reference is made to page 66-69 in the Financial Statements for an overview of the stock options exercisable under the stock option plans .
Barco
Inte
grate
d re
po
rt 20
20
34
CGR
Go
vern
ance &
Risk R
ep
ort

01 CORPORATE GOVERNANCE
02 RISK MANAGEMENT
Part 3
Redundancy payments
No such payments were made to the CEO nor to other
CLT-members during 2020 .
Part 4
Use of the right to reclaim
There was no reason for the board to reclaim any previ-
ously paid variable remuneration to CEO or to any of the
CLT-members .
Part 5
Deviations from the remuneration policy
All of the above was determined and paid in line with the
existing company reward policies . It also reflects the mea-
sures taken by the Board of Directors at the initiative of the
Remuneration and Nomination Committee as stated in Part
1 above .
In alignment with these measures the CEO renounced his
bonus for 2020 and the Board of Directors decided to not
apply the adjustments to the 2018 and 2019 CEO bonus
deferrals and pay the deferred bonus parts at 100% .
With reference to the LTI Plan for CLT, the board has excep-
tionally extended the plan with an additional year (thus
extending the vesting period till 31 December 2021) as stated
above .
Barco
Inte
grate
d re
po
rt 20
20
35
CGR
Go
vern
ance &
Risk R
ep
ort

01 CORPORATE GOVERNANCE
02 RISK MANAGEMENT
Part 6
Evolution of remuneration and company performance
IN THOUSANDS OF EURO 2015 2016 2017 2018 2019 2020
Remuneration of Non-Executive Directors (1)
Total annual remuneration 483,667 499,175 512,725 430,449 416,825 402,425
Year-on-year difference (%) 3% 3% -16% -3% -3%
Number of Non-Executive Directors under review 9 9 11 9 6 6
Remuneration of CEO
Jan De Witte
Total annual remuneration (EUR) 1,209,183 1,424,544 1,672,362 1,262,683
Year-on-year difference (%) - 18% 17% -24%
CEO remuneration
Total annual remuneration (EUR) 1,587,988 1,600,800 1,209,183 1,424,544 1,672,362 1,262,683
Year-on-year difference (%) 1% -24% 18% 17% -24%
Remuneration of CLT
Total annual remuneration (EUR) 3,683,587 4,169,396 4,570,778 5,866,025 6,163,243 4,819,145
Year-on-year difference (%) 13% 10% 28% 5% -22%
Number of CLT Members under review 9 10 14 13 15 15
Barco Group Performance
NET SALES (M euro) 1,029,969 1,102,342 1,084,706 1,028,531 1,082,570 770,083
Year-on-year difference (%) 7% -2% -5% 5% -29%
EBITDA (M euro) 74,080 88,002 107,126 124,466 153,022 53,563
Year-on-year difference (%) 19% 22% 16% 23% -65%
"Net income attributable -29,563 11,023 24,776 74,965 95,363 -4,393
Year-on-year difference (%) 137% 125% 203% 27% -105%
Average remuneration per FTE employee (2)
average employee cost per FTE (EUR) 76,316 76,316 76,821 76,505 77,192 65,570
Year-on-year difference (%) 0.0% 0.7% -0.4% 0.9% -15.1%
(1) as indicated in Part 2,A of the Remuneration Report the remuneration for non-executive directors is depending only on the number of meetings and is reported
aggregated for this table
(2) Average remuneration of employees is calculated on basis of "wages and direct social benefits", including company cars, divided by the number of employees
on year over year bases
Barco
Inte
grate
d re
po
rt 20
20
36
CGR
Go
vern
ance &
Risk R
ep
ort

01 CORPORATE GOVERNANCE
02 RISK MANAGEMENT
Transparency of transactions involving shares or other financial instruments of Barco
The company has issued a Market Abuse Prevention Policy
which is being enforced as part of its compliance mana-
gement program, available for review on the company’s
website (www .barco .com/corporategovernance) . It meets
the requirements of the EU Regulation of 16 April, 2014 n°
596/2014 on market abuse . Persons discharging mana-
gerial responsibilities and persons closely associated with
them must notify the Financial Services Market Authority
(“FSMA”) of any transactions involving shares or other finan-
cial instruments of Barco within three business days after
the transaction . Such transactions are made public on the
website of the FSMA (www .fsma .be) as well as the company’s
website, the latter on an aggregate basis .
Conflicts of interest
The company has laid down the rules for conflicts of inte-
rest, applicable to its directors and executive managers, in
its Corporate Governance Charter .
These rules complement the procedures set by the Code
of Companies and Associations for conflicts of interest of a
financial nature and related party transactions (Article 7:96
and 7:97 CCA) .
In 2020, no conflicts of interest of a financial nature or related
party transactions falling within the scope of these proce-
dures arose .
Policies of conduct
Managing sustainability
Barco refers to note 23 Related party transactions in Financial
Statements 2020 .
Statutory auditor
As requested by the Belgian Company Law, Barco reports
the pay ratio of the CEO remuneration versus the lowest
FTE employee remuneration in its legal entity Barco nv . The
2020 pay ratio is 29 .97 .
Part 7
Vote of the shareholder
As no comments were made to the previous remuneration
report in the general meeting of 30 April 2020, during which
that report was approved, there were no such comments to
be considered for the remuneration paid or vested during
2020 .
At Barco, we see sustainability as one of the drivers of our
corporate strategy . We design and act towards sustainable
outcomes for our planet, the community we operate in and
our colleagues . Governance keeps our corporate sustain-
ability strategy on track, ensuring that our strategy remains
effective, and that accountability for our results sits right
at the top of our company . A more detailed description
of our sustainability governance is available in our Planet-
People-Communities chapter .
Barco
Inte
grate
d re
po
rt 20
20
37
CGR
Go
vern
ance &
Risk R
ep
ort

01 CORPORATE GOVERNANCE
02 RISK MANAGEMENT
Risk management and control processes
Barco
Inte
grate
d re
po
rt 20
20
38
CGR
Barco
Inte
grate
d re
po
rt 20
20
38
CGR
Go
vern
ance &
Risk R
ep
ort

01 CORPORATE GOVERNANCE
02 RISK MANAGEMENT
Within the context of its business operations, Barco is exposed to a wide variety of risks
that can affect its ability to achieve its objectives and to execute its strategy successfully .
To anticipate, identify, prioritize, manage and monitor the risks that impact its organiza-
tion, Barco put a sound risk management and control system into place in accordance
with the Code of Companies and Associations and the 2020 Corporate Governance
Code . Our risk management and control processes are actively supported by the Board
of Directors . They understand the risks that Barco faces, and assure that these risks are
effectively managed by requiring that the CEO and the Core Leadership Team (CLT) are
fully engaged in risk management . Risk control is a core task of the executive manage-
ment and all employees with managerial responsibilities .
Objectives
Barco’s risk management and control system was set up to
achieve the following objectives:
The principles of the COSO reference framework and
the ISO 31000 risk management standard have served as
sources of inspiration to Barco in setting up its risk manage-
ment and control system .
Objectives
Correct and timelyfinancial reporting
Compliance with allapplicable laws and
regulations
Operational andstrategic objectives
Operationalexcellence
Riskmanagementand control
system
ControlEnvironment
Objectives
Identification
Riskresponse
Controlactivities
Information &communication
Monitoring
Analysis &evaluation
Barco
Inte
grate
d re
po
rt 20
20
39
CGR
Go
vern
ance &
Risk R
ep
ort

01 CORPORATE GOVERNANCE
02 RISK MANAGEMENT
Control environment
Barco strives for a strong compliance culture and risk aware-
ness attitude by defining clear roles and responsibilities in
all relevant domains . In this way, the company fosters an
environment in which it pursues its business objectives
and strategy in a controlled manner . This environment is
created by implementing various company-wide policies and
procedures, such as:
• The Code of Ethics
• Decision and signature authority rules
• The Barco culture building blocks
• Quality and other management systems
• Risk profiling, reporting and mitigation processes
Risk management process
Risk management is firmly embedded into Barco’s processes,
at all levels . For every key management, assurance and sup-
porting process, Barco has developed and implemented a
systematic risk management approach . It consists of five
steps: identification, analysis, evaluation, response and
monitoring.
The CLT fully endorses this approach . Employees are
regularly informed and trained on these subjects to ensure
sufficient risk management and control at all levels and in all
areas of the organization .
Every year in the fourth quarter, Barco performs a company-
wide risk assessment and compliance gap analysis . This
exercise, which involves the CLT members, the manag-
ers of the subsidiaries and other key employees, aims to
strengthen and formalize risk awareness throughout Barco .
It encourages the employees with managerial responsibilities
to actively think about the risks that impact our business and
provides them with a clear view on how their peers around
the world perceive risk .
The Risk Manager and the Global Compliance Manager,
supported by Internal Audit, are in charge of the yearly risk
assessment and compliance gap analysis .
Identification .
Barco identifies the risks to its organization based on risk
interviews, market research, the results of the material assess-
ment and the outcome of earlier risk assessments .
For 2020, the results were consolidated in 13 well-defined
risks for Barco .
Barco
Inte
grate
d re
po
rt 20
20
40
CGR
Go
vern
ance &
Risk R
ep
ort

01 CORPORATE GOVERNANCE
02 RISK MANAGEMENT
Analysis Once identified, the risks are scored using inherent risk
(‘likelihood’ and ‘impact) and control level scales . The scales
for impact, likelihood and control level are based on the
acceptable level of risk exposure determined by the Board of
Directors and laid down in the Barco corporate risk evalua-
tion system .
In 2020, the scoring of Barco's risks was done via an online
questionnaire, which was completed by all 15 CLT members
as well as 20 senior managers from different subsidiaries .
Barco risk universe:
The following risks are taken into consideration .
FRE
QU
EN
TR
AR
ELY
DESTRUCTIVENEGLIGIBLE
Evaluation In the ‘evaluation’ phase, a risk matrix is drawn up, resulting
in Barco’s inherent and residual risk profile .
To set the right priorities, the risk is first evaluated in terms
of impact and likelihood . The resulting inherent risk does not
yet consider any management activities or control measures
developed to mitigate it .
Barco risk
universe
• Information security
• Business Ethics
• Product quality
• Supply chain & ‘Nth’ party
• Financial & liquidity risk
• Data governance & privacy
• Macroeconomic, geopolitics and market
• Human capital & talent management
• Contingency & crisis response
• Local compliance & regulatory change
• Corporate governance & strategy
• Sustainability & environmental impact
• Digital transformation & new technologies
* Nth' party risk: An order of magnitude broader than the traditional
third-party risk . Every party that a company utilizes is likely to have a large
number of other parties of its own . This becomes a chain of downstream
relationships with fourth, fifth parties, and Nth parties, introducing a new
risk factor to the ecosystem .
Barco
Inte
grate
d re
po
rt 20
20
41
CGR
Go
vern
ance &
Risk R
ep
ort
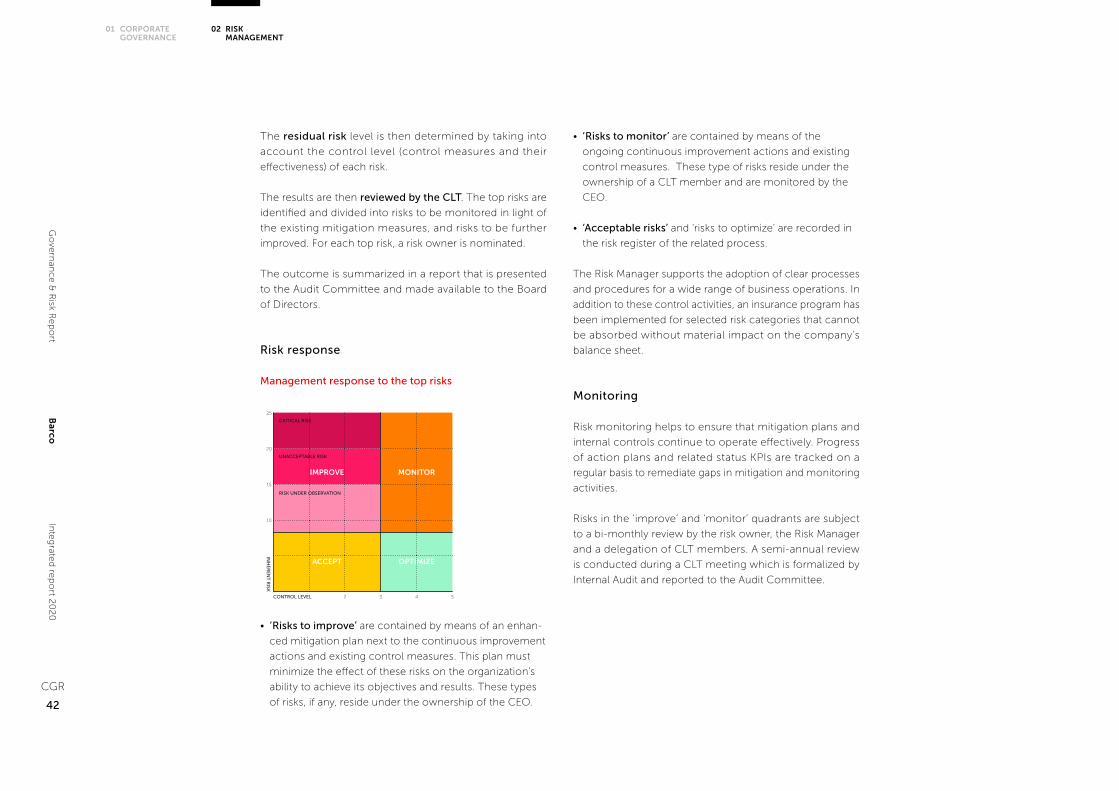
01 CORPORATE GOVERNANCE
02 RISK MANAGEMENT
The residual risk level is then determined by taking into
account the control level (control measures and their
effectiveness) of each risk .
The results are then reviewed by the CLT . The top risks are
identified and divided into risks to be monitored in light of
the existing mitigation measures, and risks to be further
improved . For each top risk, a risk owner is nominated .
The outcome is summarized in a report that is presented
to the Audit Committee and made available to the Board
of Directors .
Risk response
Management response to the top risks
• ‘Risks to improve’ are contained by means of an enhan-
ced mitigation plan next to the continuous improvement
actions and existing control measures . This plan must
minimize the effect of these risks on the organization’s
ability to achieve its objectives and results . These types
of risks, if any, reside under the ownership of the CEO .
INH
ER
EN
T R
ISK
ACCEPT
MONITORIMPROVE
OPTIMIZE
2
10
15
20
25
3 4 5CONTROL LEVEL
RISK UNDER OBSERVATION
UNACCEPTABLE RISK
CRITICAL RISK
• ‘Risks to monitor’ are contained by means of the
ongoing continuous improvement actions and existing
control measures . These type of risks reside under the
ownership of a CLT member and are monitored by the
CEO .
• ‘Acceptable risks’ and ‘risks to optimize’ are recorded in
the risk register of the related process .
The Risk Manager supports the adoption of clear processes
and procedures for a wide range of business operations . In
addition to these control activities, an insurance program has
been implemented for selected risk categories that cannot
be absorbed without material impact on the company’s
balance sheet .
Monitoring Risk monitoring helps to ensure that mitigation plans and
internal controls continue to operate effectively . Progress
of action plans and related status KPIs are tracked on a
regular basis to remediate gaps in mitigation and monitoring
activities .
Risks in the ‘improve’ and ‘monitor’ quadrants are subject
to a bi-monthly review by the risk owner, the Risk Manager
and a delegation of CLT members . A semi-annual review
is conducted during a CLT meeting which is formalized by
Internal Audit and reported to the Audit Committee .
Barco
Inte
grate
d re
po
rt 20
20
42
CGR
Go
vern
ance &
Risk R
ep
ort

01 CORPORATE GOVERNANCE
02 RISK MANAGEMENT
Control activities
The continuity and the quality of Barco’s risk management
and control system is assessed by following actors:
• Internal Auditor – the tasks and responsibilities
assigned to Internal Audit are recorded in the internal
audit charter, which has been approved by the Audit
Committee . The key mission of internal audit as
defined in the internal audit charter is “to add value to
the organization by applying a systematic, disciplined
approach to evaluating the internal control system and
providing recommendations to improve it” .
• External Auditor – in the context of the external audit
review of the annual accounts and their assessment of
key internal controls .
• Compliance Officer – within the framework of the
company’s Corporate Governance charter .
• Risk Manager – plays a pivotal role in the organization
by ensuring appropriate coordination and follow-up of
risk management activities .
• Global Compliance Manager – coordinates between
different compliance roles, functionally and regionally .
The compliance status and gaps are mapped on a
regular basis in order to define compliance risks,
priorities and mitigations as needed .
• Audit Committee – the Board of Directors, assisted by
its Audit Committee has the final responsibility with
respect to internal control and risk management .
Information and communication
A timely, complete and accurate information flow – both
top-down and bottom-up – is a cornerstone of effective
risk management .
In operational domains, Barco has implemented a mana-
gement control and reporting system (MCRS) to support
efficient management and reporting of business trans-
actions and risks . This system enables Barco’s management
to capture relevant information on particular areas of business
operations at regular time intervals . The process enforces the
clear assignment of roles and responsibilities, thus ensur-
ing consistent communication to all stakeholders regarding
external and internal changes or risks impacting their areas
of responsibility .
In addition to the MCRS, the company has put several
measures into place to ensure the security of confidential
information and to provide a communication channel for
employees to report any (suspected) violation of laws, regu-
lations, or the company’s code of ethics or policies .
Barco
Inte
grate
d re
po
rt 20
20
43
CGR
Go
vern
ance &
Risk R
ep
ort

01 CORPORATE GOVERNANCE
02 RISK MANAGEMENT
Since Q1 2020, the covid-19 pandemic has been affecting
businesses all over the world – including Barco .
Risk descriptionThe public health crisis caused by the covid-19 pandemic,
as well as measures taken in response to contain or mitigate
the pandemic, have had, and are expected to continue to
have, certain negative impacts on Barco’s business inclu-
ding, without limitation, the following:
• The demand, reflected by impact on orders and sales
mainly in Barco’s Entertainment and Enterprise division
• The profit and loss and operating results
• The financial condition
• Cash flows
Approach:
In this section, Barco addresses its risk mitigation plan
related to the covid-19 pandemic impact .
Overall approach
Since the start of the corona virus outbreak (in China in
January 2020) Barco has set up a dedicated global response
team that is monitoring and supporting Barco’s operations
and is focusing both on the safety and health of its
employees, as well as on ensuring business continuity .
Measures to keep employees safe
• Hygiene, social distancing and track-and-trace
measures
As of February-March 2020 timeframe and taking into
account local or regional sanitary & health regulations,
the company strengthened personal hygiene measures
throughout the organization, as well as business travel
restrictions . Barco also expanded its home-work
protocol and implemented social distancing measures
for employees in all its facilities . In addition, a track-
and-trace system has been put in place to slow down a
possible future spread of the virus . In 2020, Barco registered
approximately 110 infected cases among its global
employee force for which none of the infection sources
appear to be within the company . All related people have
meanwhile recovered .
• Hybrid way of working
Some of Barco’s offices have been closed for short periods
during the year but have gradually reopened . As far as
regulations and the local situation allowed, the company
applied unlocking measures and started bringing back
employees while still taking into account local or regional
regulations and recommendations . The company
implemented a hybrid way of working with an alternate
home-work protocol for its white collars . All offices have
been updated according to the strengthened social
distancing and sanitary measures to ensure a covid-proof
and flexible work environment .
Operations and supply chain
Mainly in the first half of 2020, Barco has experienced
disruptions to its ability to operate its production facilities
in some countries, and in the future, further disruptions to
Barco’s ability to operate production facilities or distribution
operations cannot be excluded as a result of regulatory
restrictions, safety protocols and heightened sanitation
measures .
While the Company experienced disruptions, Barco’s
proactive approach limited the delays towards our customers .
• Barco’s parts supply base, its subcontractor operations and
the logistics chain has seen disruption mainly in the months
March and April 2020 but recovered near full operational
capacity .
Extra risk section regarding the consequences and impact of the covid-19 pandemic
Barco
Inte
grate
d re
po
rt 20
20
44
CGR
Go
vern
ance &
Risk R
ep
ort

01 CORPORATE GOVERNANCE
02 RISK MANAGEMENT
• For Barco’s operations:
- In China, operations were disrupted during February but
recovered to near full capacity by the end of the first
quarter 2020 .
- For the manufacturing sites in Europe, the operations
team has organized production in order to match
regulatory requirements with the objective of ensuring
manufacturing capacity needed to support market
demand . The respective logistics teams were able to
secure a continued receiving of components and shipping
of finished goods .
- The India site (manufacturing of videowalls) was closed
for a limited number of weeks in 2020 as a result of the
regulatory lockdown-measures but production recovered
and was able to meet market demand .
Business health
In the first quarter and as a result of lockdowns in China,
Barco’s sales in China were halted during February and
gradually resumed as of March . Since then, the covid-19
pandemic has spread internationally, with negative effects
mainly in Barco’s Entertainment and Enterprise markets .
The negative impact was caused by both the economic impact
of the pandemic on some of its markets as well as by the
lockdown measures and related restrictions .
Barco remained focused on business continuity and
protection of the business health .
The company executed on a plan to align both its activity rate
and spending with the impacts of the pandemic by resetting
indirect cost levels, next to temporary measures and resource
redeployments .
• Aligning activity rate with market realities and
customer demand
Consequently, the company has implemented temporary
work arrangements and economic unemployment mea-
sures for both white and blue collars, in conformity with
country specific legal frameworks, support mechanisms
and regulations .
The new work conditions varied depending on the re-
gion, and Barco’s covid-19 response team reviewed the
situation site by site, with the same objective to ensure
business continuity while also considering all applicable
covid regulations .
The activity rate and cost containment measures also
include ensuring a strong commitment to our customers
through sales and servicing .
• Adjusting the cost base and discipline
in discretionary spending
These measures – which can be adjusted again in line with
future changes in the pandemic situation - also entail
shifts in the planned investment patterns on selected
long-term initiatives and a sustained strict discipline on
discretionary spending .
The Company made deliberate choices on the continua-
tion and timetable of selected development projects
based on current needs in the market and adjusting
internal support levels in function of the focus shift .
Furthermore, the Company was able to apply for wage
subsidies under the newly enacted covid-19 relief legis-
lation in APAC, Canada and Cinionic US .
Strong funding and liquidity structure in place
Barco has a strong balance sheet and ample liquidity . We
refer to note 14 for more details on Barco’s net cash position .
Barco has sufficient headroom to enable it to conform to
covenants on its existing borrowings . The Group complied
with all requirements of the loan covenants on its available
credit facilities throughout the reporting period .
While the future may still bring some levels of headwind,
Barco’s strong funding and liquidity structure in place should
be more than sufficient to ensure the going concern of the
company . In addition, we refer to note 8 where we explain
how we tested goodwill and all other non-current assets
for impairment and concluded no impairment losses need
to be recognized .
Barco
Inte
grate
d re
po
rt 20
20
45
CGR
Go
vern
ance &
Risk R
ep
ort

01 CORPORATE GOVERNANCE
02 RISK MANAGEMENT
Top risks
Below are the top risks identified by the 2020 risk management process, along with the trends and related material topic/
strategic lever . Certain risks are slightly regrouped and renamed compared to last year following the most recent risk identi-
fication process and market intelligence .
RISK TREND MATERIAL TOPIC STRATEGIC LEVER
MACROECONOMIC, GEOPOLITICS AND MARKET
p Market Reach
Brand
Focus to perform
INFORMATION SECURITY Information security and data
protection
Product quality, safety
and security
Focus to Perform & Go for sustainable
impact
DIGITAL TRANSFORMATION AND NEW TECHNOLOGIES
p p Innovation management
Learning and development
Innovate for Impact & Offer outcome-
based solutions
HUMAN CAPITAL AND TALENT MANAGEMENT
p Employee engagement
Learning and development
Employee health, safety and wellbeing
Diversity and inclusion
Focus to Perform & Go for sustainable
impact
PRODUCT QUALITY = Product quality, Safety and security
Customer engagement
Brand
Innovate for Impact & Offer outcome-
based solutions
DATA GOVERNANCE AND PRIVACY
= Innovation management
Information security and data
protection
Go for sustainable impact
SUPPLY CHAIN AND‘Nth’ PARTY RISK
= Responsible supply chain
management
Sustained profitable growth
Product quality, safety and security
Focus to Perform & Go for sustainable
impact
Barco
Inte
grate
d re
po
rt 20
20
46
CGR
Go
vern
ance &
Risk R
ep
ort

01 CORPORATE GOVERNANCE
02 RISK MANAGEMENT
Macroeconomic, geopolitics & market risk
Risk description
All Barco divisions face competition due to lower barriers
for entry following the further globalization of our markets .
Competitors could outperform Barco in terms of product
innovation, time to market, product quality, cost price or
new business models, leading to loss of revenue, margins
and profit . Moreover, Barco's competencies could be per-
ceived as less valuable to its customers compared to those of
other players on the market . Competition risk could also be
impacted by prospects for additional government stimuli and
any provisions that would benefit an organization or sector .
In addition, serious political and (macro) economic evolu-
tions and fluctuations can heavily impact the investment
climate and could even completely stop business in a country
or region . Geopolitical tensions, deteriorating trade relations
and trade policy uncertainties impact global economic activ-
ity and could translate into constraints to Barco's operations
(tariffs, intellectual property restrictions, data ownership,
investment restrictions, staff mobility restrictions due to travel
limitations but also quarantine restrictions impacting the
company and its people) .
Trend:
Market/competition risk and geopolitics/macroeconomic
risk were identified as main risks in 2019 and topped the risk
ranking in 2020 driven by covid-19 which has since priorities
in 2020 as a result of the covid-19 impact . Since 1Q2020,
the covid-19 impact has been affecting business all over the
world – including Barco . We refer to the separate chapter
‘Extra Risk-section regarding the consequences and impact of
the covid-19 pandemic’ in the beginning of this risk chapter .
2020 main actions:
• Barco developed a strategic management plan
(SMP), a roadmap on how to further roll out the
customer journey program across all divisions .
• We increased our focus on market and competitor
insights to face and outperform competition .
• We regularly assess supply chain flexibility by
considering the manufacturing footprint of Barco and
its suppliers to enable risk spreading for any critical
event that could cause business interruption .
14
1819
2021
1
2
3
56
7
8
9
10
12
13
15
17
16
114
MATERIAL TOPICS
Barco
Inte
grate
d re
po
rt 20
20
47
CGR
Go
vern
ance &
Risk R
ep
ort

01 CORPORATE GOVERNANCE
02 RISK MANAGEMENT
Information security
Risk description
Barco relies considerably on its IT systems: infrastructure,
networks, operating systems, applications and databases .
Failure of an information technology system due to an inter-
nal or external event (terrorism, crime, violence, vandalism,
theft or human error) could impact employees, sites, assets,
critical information, or intellectual property and have nega-
tive consequences for the business (business interruption,
reputational damage and/or liability claims) .
Ensuring information security includes, among others,
processes that:
• protect IT infrastructure, IT governance, prevention
and remediation of IT failure and security awareness;
• ensure the development and sale of secure products .
Trend:
Cyber risk was identified as a main risk in 2019 and remained
a top priority in 2020, bearing in mind the increasing number
of cyberattacks and threats .
2020 main actions:
To mitigate the higher inherent risk, Barco increased its con-
trol level via diverse security improvements:
• Expansion of the Barco Security Council – a multi-
disciplinary council of experts who coordinate,
monitor and manage all information security efforts –
with representatives of the divisions .
• Raising security levels to adapt to the new normal
with safe remote working through VPN and multi-
factor authentication (MFA) for all employees .
• Finalizing the IT disaster recovery plan and making it
available to ensure Barco is well prepared in case of
an emergency due to an information security
incident .
• Closing an updated agreement with Microsoft to
enable additional security via its Microsoft365 toolset,
including cloud solutions .
• Extending ISO27001 certification for ClickShare
products to cloud-related products .
• Launching several initiatives to educate employees
on information security, such as a cyber hygiene
e-learning course and one covering fake phishing
emails .
• Highlighting challenges through a red team and the
use of penetration tests . Periodic external reviews of
the cybersecurity risk showed improvements over the
past year on diverse identified weaknesses .
Read more on “Corporate security and data privacy” and
“Customer and product responsibility”
14
1819
2021
1
3
56
7
8
9
10
12
13
15
17
16
114
2
MATERIAL TOPICS
Barco
Inte
grate
d re
po
rt 20
20
48
CGR
Go
vern
ance &
Risk R
ep
ort

01 CORPORATE GOVERNANCE
02 RISK MANAGEMENT
Digital transformation & new technologies
Risk description
The inability to embrace technological advancements
quickly could impact Barco’s ability to accelerate growth .
Technologies such as machine learning, robotics, artificial
intelligence and the use of big data and analytics can improve
business processes and increase efficiency . The failure to
adopt these will impair operational resilience and the abil-
ity to face current and future challenges and may result in
missed revenue and missed business opportunities . In Barco’s
environment, a rapid time to market is the key to ensuring
competitiveness .
Trend:
The covid-19 pandemic has increased the importance of
digital transformation and new technologies, which was
already identified as a risk in 2019 .
2020 main actions:
• Our organizational structure was transformed by
merging the software and IT departments into one
Digital Organization .
• The role of Chief Digital & Information Officer
(‘CDIO’) was created and filled through external
recruitment . The new CDIO has extensive experience
in operating SaaS models, software development,
data management and analytics, IT technology,
cross-functional business transformation and change
leadership .
• The new CDIO further identifies and integrates digital
skills and competences via cross-functional teams
within the Digital Organization, which is responsible
for accelerating our offering of true end-to-end
experiences for our customers and end users .
• In response to the growing number of people
working and learning remotely to combat the
covid-19 pandemic, Barco repositioned its product
offerings and accelerated its marketing campaigns
for conferencing and digital technologies like Click-
Share Conference and weConnect .
The ongoing engagement, commitment and sense of
urgency in converting strategic decisions into practice will
help Barco in this journey .
14
1819
2021
1
2
3
56
7
8
9
10
12
13
15
17
16
114
MATERIAL TOPICS
Barco
Inte
grate
d re
po
rt 20
20
49
CGR
Go
vern
ance &
Risk R
ep
ort

01 CORPORATE GOVERNANCE
02 RISK MANAGEMENT
Human capital & talent mamagement
Risk description
A skilled workforce and agile organization are essential for the
continued success of our business . Difficulties in attracting,
retaining and developing employees could lead to continued
vacancies in certain critical areas, higher employee dissatis-
faction and turnover, lower performance and underutilization
of existing skills . Staffing issues could result in a skillset
not able to meet all competency requirements in view of
rapidly moving technologies, changing business models and
operational agility .
In times when employees are required to work from home
and may become disconnected from the work environment,
leading to mental fatigue, stress and anxiety, it is crucial to
protect employees’ health and wellbeing to avoid labor
incidents, burnouts and long-term sickness .
Trend:
Human resources management was identified as an increas-
ingly important risk in 2019 and was confirmed as one of the
main risks in 2020 .
2020 main actions:
• Timely and emphatic communication and a solid
company culture, employee-manager relationships
and remote digital working conditions became key
to ensuring employee wellbeing during the covid-19
pandemic .
• The broader human resources action plan consists
of 3 main pillars: ‘attract’, ‘develop & retain’ and
‘reward’ with ‘strengthen the foundation as general
support base for all pillars . In 2020, Barco’s HR team
focused primarily on ‘strengthening the foundation’
by communicating candidly and in a timely way
about the impact of the pandemic, offering support
and insights on how to engage in strong employee-
manager relationships and staying connected with(in)
the teams in a remote or hybrid work system .
• Barco increased internal mobility and redeployment
to create individual opportunities and to adapt to
changing market conditions .
• To boost efficiency in the recruitment process and
better engage hiring managers in the total flow, the
recruitment flow is now integrated in new integrated
human capital management software .
• In the field of learning, we increased learning
posibilities via Barco University through remote
training sessions .
• Two new ‘Pulse’ surveys were launched to measure
employee engagement and to identify critical areas
that require further actions .
• To gain insight into capability needs for the short
and long term, human resources is more involved
in Barco’s strategic management plan .
This proactive position seeks to enable a healthy
organizational design where people with the right
skillsets can be found both through internal
development and external recruitment .
• The culture rejuvenation project to revive Barco’s
DNA via five building blocks was successfully
introduced and implemented before the global
lockdowns, helping the organization to be more
resilient in crisis situations .
Read more in the “Report on People”
1819
2021
1
2
3
56
7
8
9
10
12
13
15
17
114
14
16
MATERIAL TOPICS
Barco
Inte
grate
d re
po
rt 20
20
50
CGR
Go
vern
ance &
Risk R
ep
ort

01 CORPORATE GOVERNANCE
02 RISK MANAGEMENT
Product quality
Risk description
Barco’s reputation as a business partner relies heavily on its
ability to supply high quality products . Failure to comply
with the development process and stage gate requirements
can lead to the market introduction of immature products
– resulting in loss of sales and market share, additional cost
and reputational damage . Product quality issues and delivery
issues such as the inability to fulfill orders in a timely way
lead to reputational damage, customer dissatisfaction and
loss of business .
Trend:
Quality – new product introduction (NPI) was one of our
main risks in 2019 and remains so in 2020 .
2020 main actions:
Five focus areas had to ensure that our product quality was
and remained at the desired level .
• We took efforts to safeguard product reliability:
the reliability of the deviating products was brought
to the desired level and the reliability of new products
was assured .
• Software quality assurance was fully integrated
in the software development teams . Cyber security
expertise was in-sourced and we achieved IEC62304
certification in Noida, India .
• We strengthened adherence to processes and
quality requirements in new product introduction
stage gates and global process owners were coached
on to integrate processes within the quality
management system (QMS) and take up the correct
level of process accountability .
• Key performance indicator (KPI) dashboards
were monitored and missing dashboards were
implemented . The global audit program was
monitored to have better control over the overdue
actions .
• A quality assurance and regulatory assurance
organization and process was developed for our
new medical device product base in Suzhou, China .
Read more on “Customer and product responsibility”
14
1819
2021
1
3
56
7
8
9
10
12
13
15
17
16
114
2
MATERIAL TOPICS
Barco
Inte
grate
d re
po
rt 20
20
51
CGR
Go
vern
ance &
Risk R
ep
ort

01 CORPORATE GOVERNANCE
02 RISK MANAGEMENT
Data governance & privacy
Risk description
Insufficient governance regarding data assets, data confi-
dentiality and data ownership could lead to loss or improper
use of business-critical or personal data, causing a loss of
process efficiency, vulnerabilities, prosecution, fines and
reputational damage .
As a technology company, Barco may fail to register intel-
lectual property rights in a timely manner or fail to protect
its critical patents . Patents can be challenged and invalidated
after they are granted .
Insufficient IP awareness and a lack of IP strategy can lead
to the inability to safeguard and monetize our IP and a dis-
connected strategy towards filing and protection . Other risks
could come from IP infringements by suppliers or unclear IP
agreements . Critical IP or know-how may get lost when key
employees or consultants leave the organization .
Barco monitors changes in intellectual property rights .
However, it cannot exclude the possibility of inadvertently
infringing on a party’s intellectual property rights, which
could result in claims and litigation .
Trend:
Data protection was one of our main risks in 2019 and ranks
among the top risks in 2020 .
2020 main actions:
• We implemented a simplified and strengthened
innovation process for new technologies, including
increased focus on early-stage patenting in a more
strategic way .
• Patent delegates ensure better visibility and tracking
of the IP status for new innovations .
• We continued to invest in awareness on the
importance of data and IP governance . To further
highlight the importance of confidentiality and the
value of IP, we developed and refreshed role-based
courses that touch on our IP rights (principle aspects,
incl . non-disclosure agreements (NDAs), confidential
information, patents, trademarks, copyrights, design
rights, trade secrets and know-how) . Designated
training plans are being developed through Barco
University to provide tailored key learnings by target
group .
• Data governance and data strategy are key in Barco’s
digital business transformation journey .
Read more on “Corporate security and data Privacy”
14
1819
2021
1
2
3
56
7
8
9
10
12
13
15
17
16
114
MATERIAL TOPICS
Barco
Inte
grate
d re
po
rt 20
20
52
CGR
Go
vern
ance &
Risk R
ep
ort

01 CORPORATE GOVERNANCE
02 RISK MANAGEMENT
Supply chain & 'Nth' party risk
Risk description
A strong dependency on suppliers, manufacturers, or the
technology or knowledge of consultants and suppliers, part-
ners, integrators, distributors or end customers creates a
vulnerability that might impact our product portfolio and
the competitive pricing of Barco products, disruptions in the
supply chain, market share and profitability of our business .
The covid-19 pandemic has put high pressure on the global
supply chain and caused financial constraints, forcing some
suppliers to phase out products or even relocate activities .
This caused an additional burden on Barco’s resources and
inventory .
Trend:
Dependency and contingency risks were identified as main
risks in 2019 and remained important in 2020, especially in
light of the trade wars and regional/global lockdowns .
2020 main actions:
• War rooms and day-to-day alignment processes
across our global operations were installed to ensure
business continuity .
• The procurement team further improved and
extended the supplier contingency plans for its key
and core suppliers, including those which are ‘single
source’ . The covid-19 pandemic urged the team
to bring the plans, which include financial exposure,
back-up suppliers and decision trees defining the way
forward in case of failure, to life . We took advantage
of strategic stock, consignment models, liabilities in
different parts of the product lifecycle and regional
and global dual sourcing .
• Geopolitical risks and trade wars leading to additional
certifications and regionalization requirements have
pushed us to rethink our supply base in certain
segments . We enabled multi-site production for our
main products, of which the manufacturing is out-
sourced, also addressing the certification require-
ments of specific countries .
• To foster ‘early supplier involvement’ (ESI) in the intro-
duction stage of any new products, we extended the
involvement of supplier quality assurance (SQA) in
the new product introduction process . We added the
supplier readiness assessment as part of the review
criteria to underpin output, quality and yield .
• Business review meetings (BRM) and supplier perfor-
mance ratings (SPR) were enhanced with sustaina-
bility and cyber security ratings . To date, the cyber-
security behavior of more than 60 key and core
Barco suppliers has been monitored by using external
cybersecurity screening data and consumer audits .
The audits did not highlight any major findings .
More information can be found in “Supply chain responsibility”
14
1819
2021
1
2
3
56
7
8
9
10
12
13
15
17
16
411
MATERIAL TOPICS
Barco
Inte
grate
d re
po
rt 20
20
53
CGR
Go
vern
ance &
Risk R
ep
ort

01 CORPORATE GOVERNANCE
02 RISK MANAGEMENT
Environmental impact
Risk description
Climate transition and the environmental footprint in general
holds a series of risks for Barco . The inability to meet (future)
environmental legislation to limit CO2 emissions and increase
energy and material efficiency could lead to regulatory fines
(such as a carbon tax) . More importantly, failure to adapt to
changing customer behavior and address environmental
concerns could negatively impact Barco’s reputation with
customers and investors, thus leading to loss in sales or
even capital . Physical climate change risks include impacts
of extreme weather events on production facilities and/or
equipment and disruptions in the supply chain due to these
events .
Approach:
• Barco has set ambitious targets to reduce green-
house gas emissions, increase the energy efficiency
of its products and increase revenues from products
with improved eco-design .
• To highlight our dedication to improving sustainabil-
ity, we joined the Science Based Targets initiative and
signed the business ambition for 1 .5°C commitment .
• Each year, we respond to the CDP Climate Change
questionnaire, disclosing our climate transition risks
and low carbon opportunities .
Read more in the Report on planet, people and communities
Business ethics
Risk description
Insufficient fair practice and business behavior (according
to the ethical standards and principles set by the Barco Code
of Ethics), including fraud, corruption, bribery, abuse and
violations of human rights leads to reputational damage,
decrease of sales and legal investigations and prosecutions .
Barco is directly exposed to risks in the area of human rights
as an employer in the first place, but also through its opera-
tions in the regions where it conducts business . Barco may
source raw materials from suppliers which may not respect
their employees’ human rights, such as the freedom of asso-
ciation .
The increased pressure on management and employees
could raise the temptation to deal with unscreened partners
without any diligence procedures . The inability to foster an
environment of equality and equal opportunities regardless
of gender, race, ethnicity, age or sex could harm Barco's
reputation and could lead to noncompliance with applicable
laws and regulations .
Approach:
Code of Ethics:
• Barco’s Code of Ethics is fully endorsed and applies
to everyone employed by Barco and its partners,
regardless of position and level of responsibility .
• The mandatory training on “Standards at Work”
help educate our people and remind them about the
Group’s ethical principles and values .
• The ethics mailbox is available to everyone who
wishes to report, even anonymously, any issue to the
Ethics Committee .
Risks to be disclosed pursuant to the rules regarding non-financial information.
14
1819
2021
1
2
3
56
7
8
9
10
12
13
17
16
114
15
MATERIAL TOPICS
14
1819
2021
1
2
3
56
7
8
9
10
12
13
15
17
16
114
MATERIAL TOPICS
Barco
Inte
grate
d re
po
rt 20
20
54
CGR
Go
vern
ance &
Risk R
ep
ort

01 CORPORATE GOVERNANCE
02 RISK MANAGEMENT
Supplier assurance:
• Our suppliers must comply with the Responsible
Business Alliance (RBA) code of Conduct, including
labor, ethics and health and safety standards . Before
engaging in a business relationship, we screen new
suppliers, considering the risk profile and reputation
of each partner as well as their adherence to ethical
standards . Existing key partners are screened
periodically . Key principles such as the four-eyes
principles ensure segregation of duties in our
procurement and buying processes .
Human rights and anti-discrimination:
• Barco applies a human rights policy in line with
the standards and policies set by the Universal
Declaration of Human Rights and the International
Labor Organization (ILO) . Our anti-discrimination
policy is available on our intranet (BarcoZone) and
governed by the HR department .
• Both the HR department in the headquarters and the
Internal Audit team -regularly check labor practices
and human rights with the local HR teams .
• Barco includes all employees in collective bargaining
agreements by complying with all necessary local
workforce regulations in the countries where Barco
operates . Barco handles specific workforce-related
topics by closing off company-specific collective
bargaining agreements . Where applicable, Barco
organizes workers’ councils (both national and inter-
national) .
• We promote equal opportunity and do not discrim-
inate against any employee, candidate, contractor or
supplier based on nationality, race, age, physical
disability, social, political or religious preference or
other personal characteristics . Barco encourages
social and cultural diversity, and our recruitment,
remuneration, evaluation and supplier tender proces-
ses are based solely on professional qualifications .
Anti-corruption:
• In order to limit the risk of money laundering,
a process to screen incoming payments is in place
under the Payment Processing Policy .
Read more on “Ethics and compliance” and “Supplier
assurance”
Barco
Inte
grate
d re
po
rt 20
20
55
CGR
Go
vern
ance &
Risk R
ep
ort

01 CORPORATE GOVERNANCE
02 RISK MANAGEMENT
Financial risk management and internal control
• Finance and accounting manuals, which are available
to key accounting sections, ensure the accurate and
consistent application of accounting rules throughout
the company .
• Specifically within the financial domain, a quarterly
bottom-up risk analysis is conducted to identify and
document current risk factors . Action plans are defined
for all key risks . The results of the analysis are discussed
with the statutory auditor .
• The accounting teams are responsible for producing
the accounting figures (closing books, reconciliations,
etc .), whereas the controlling teams check the validity
of these figures . These checks include coherence tests
by comparison with historical and budget figures as
well as sample checks of transactions according to their
materiality .
• All material areas of the financial statements concerning
critical accounting judgments and uncertainties are
periodically reported to the Audit Committee .
• Specific internal control activities concerning financial
reporting are in place, including the use of a periodic
closing and reporting checklist . This checklist assures
clear communication of timelines, completeness of
tasks, and clear assignment of responsibilities . Specific
identification procedures for financial risks are in place to
assure the completeness of financial accruals .
• Uniform reporting throughout the organization ensures
a consistent flow of financial information, which allows
the detection of potential anomalies .
• To provide Barco’s stakeholders with the information
necessary for making sound business decisions, financial
reporting is shared with the outside world . The external
financial calendar is planned in consultation with the
Board of Directors and the CLT and then announced to
external stakeholders .
Barco
Inte
grate
d re
po
rt 20
20
56
CGR
Go
vern
ance &
Risk R
ep
ort

2020Integratedannualreport
Report on planet - people - communities
ENABLING BRIGHT OUTCOMESbarco.com

Table of contents
01 Our sustainability ambition statement . . . . . . . . . . . . . . .3
02 Our sustainability strategy . . . . . . . . . . . . . . . . . . . . . . . . . .4
Go for sustainable impact . . . . . . . . . . . . . . . . . . . . . . . . . . . . . 5
Materiality . . . . . . . . . . . . . . . . . . . . . . . . . . . . . . . . . . . . . . . . . . . 6
How the UN Sustainable Development Goals
guide Barco’s strategy . . . . . . . . . . . . . . . . . . . . . . . . . . . . . . . . 10
03 Our sustainability performance . . . . . . . . . . . . . . . . . . . .11
Planet . . . . . . . . . . . . . . . . . . . . . . . . . . . . . . . . . . . . . . . . . . . . . . 12
People . . . . . . . . . . . . . . . . . . . . . . . . . . . . . . . . . . . . . . . . . . . . . 33
Communities . . . . . . . . . . . . . . . . . . . . . . . . . . . . . . . . . . . . . . . 47
04 Managing sustainability . . . . . . . . . . . . . . . . . . . . . . . . . . 68
Sustainability governance and responsibility . . . . . . . . . . . . 69
Stakeholder engagement . . . . . . . . . . . . . . . . . . . . . . . . . . . . . 71
External initiatives (platforms and commitments) . . . . . . . . 73
Certifications . . . . . . . . . . . . . . . . . . . . . . . . . . . . . . . . . . . . . . . 74
External evaluations . . . . . . . . . . . . . . . . . . . . . . . . . . . . . . . . . 75
This is the planet - people -
communities section of Barco’s 2020
Integrated annual report. Other
sections are available via the download
center at ir.barco.com/2020.
CORE
MORE
• Governance & risk report
• Report on planet - people - communities
• Financial report
ANNEX
• Assurance report
• GRI Content index
• Glossary
Barco
Inte
grate
d re
po
rt 20
20
2PPC
Plan
et - P
eo
ple
- Co
mm
un
ities
01 SUSTAINABILITY AMBITION STATEMENT
02 SUSTAINABILITY STRATEGY
04 MANAGING SUSTAINABILITY
03 SUSTAINABILITY PERFORMANCE

In line with our ambition to fully integrate sustainability into our
corporate DNA, Barco designs and acts towards sustainable
outcomes for our planet, people and communities .
1 . We will lower our own environmental footprint and those
of our customers .
2 . We will invest in sustainable employability by encouraging
our people to learn and develop themselves and by
creating the conditions for a healthy working environment
– both physically and mentally . We engage in creating an
inclusive workplace that embraces the diversity of our
people .
3 . We will play an active role in the communities we operate
in by upholding the highest ethical and quality standards
and expecting the same from our business partners .
We always aim to deliver added value to our customers
through our solutions, services and capabilities . In
addition, we help ensure more people can participate in
and benefit from the innovation society .
Barco is ready to gear up and move forward towards a more
sustainable future .
Jan De Witte
CEO Barco
Our sustainability ambition statement
Barco
Inte
grate
d re
po
rt 20
20
3PPC
Plan
et - P
eo
ple
- Co
mm
un
ities
01 SUSTAINABILITY AMBITION STATEMENT
02 SUSTAINABILITY STRATEGY
04 MANAGING SUSTAINABILITY
03 SUSTAINABILITY PERFORMANCE

Our sustainability strategy
Barco
Inte
grate
d re
po
rt 20
20
4PPC
Plan
et - P
eo
ple
- Co
mm
un
ities
01 SUSTAINABILITY AMBITION STATEMENT
02 SUSTAINABILITY STRATEGY
04 MANAGING SUSTAINABILITY
03 SUSTAINABILITY PERFORMANCE
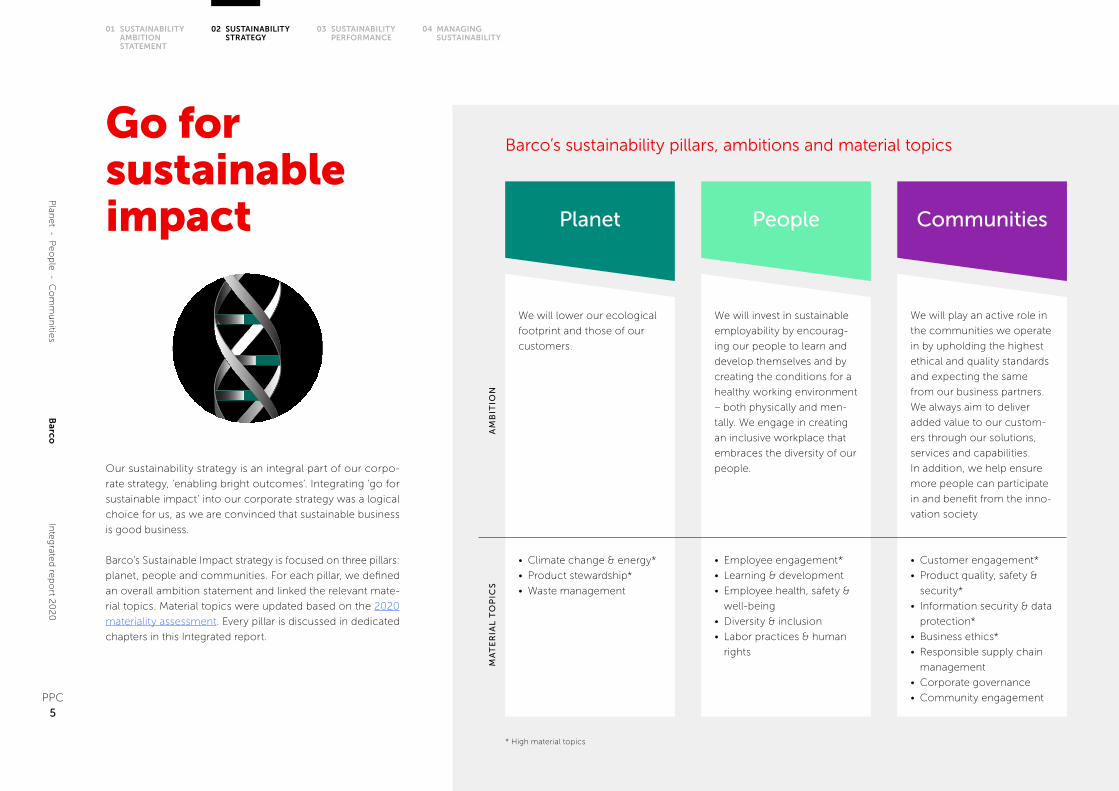
Our sustainability strategy is an integral part of our corpo-
rate strategy, ‘enabling bright outcomes’ . Integrating ‘go for
sustainable impact’ into our corporate strategy was a logical
choice for us, as we are convinced that sustainable business
is good business .
Barco’s Sustainable Impact strategy is focused on three pillars:
planet, people and communities . For each pillar, we defined
an overall ambition statement and linked the relevant mate-
rial topics . Material topics were updated based on the 2020
materiality assessment . Every pillar is discussed in dedicated
chapters in this Integrated report .
MA
TE
RIA
L T
OP
ICS
AM
BIT
ION
Barco’s sustainability pillars, ambitions and material topics
We will lower our ecological
footprint and those of our
customers .
• Climate change & energy*
• Product stewardship*
• Waste management
We will invest in sustainable
employability by encourag-
ing our people to learn and
develop themselves and by
creating the conditions for a
healthy working environment
– both physically and men-
tally . We engage in creating
an inclusive workplace that
embraces the diversity of our
people .
• Employee engagement*
• Learning & development
• Employee health, safety &
well-being
• Diversity & inclusion
• Labor practices & human
rights
• Customer engagement*
• Product quality, safety &
security*
• Information security & data
protection*
• Business ethics*
• Responsible supply chain
management
• Corporate governance
• Community engagement
We will play an active role in
the communities we operate
in by upholding the highest
ethical and quality standards
and expecting the same
from our business partners .
We always aim to deliver
added value to our custom-
ers through our solutions,
services and capabilities .
In addition, we help ensure
more people can participate
in and benefit from the inno-
vation society
Planet People Communities
* High material topics
Go for sustainable impact
Barco
Inte
grate
d re
po
rt 20
20
5PPC
Plan
et - P
eo
ple
- Co
mm
un
ities
01 SUSTAINABILITY AMBITION STATEMENT
02 SUSTAINABILITY STRATEGY
04 MANAGING SUSTAINABILITY
03 SUSTAINABILITY PERFORMANCE

Materiality
A materiality assessment helps organizations understand what
topics matter most to its business and stakeholders . Every three
to four years, Barco conducts a comprehensive materiality
assessment to make sure it reflects the latest developments
in its business and external environment and reflects these in
the strategy, risk and business process of the company .
A topic is material to Barco if it meets two
conditions:
• it impacts Barco’s business significantly in terms
of growth, cost or risk (X-axis of the materiality
matrix);
• it is important to Barco’s stakeholders –
customers, investors, (non-) governmental
organizations, suppliers and employees (Y-axis
of the matrix) .
In determining if a topic is material, we consider
Barco’s impacts across the value chain .
2020 materiality assessment: a 3-step approach
Composing a longlist of
potential material topics
through desk research
covering the UN Sustain-
able Development Goals,
reporting standards (GRI,
SASB), ESG ratings, sector
federations and Barco’s own
risk assessment .
Reducing the longlist to a
shortlist by gathering direct
feedback through employee
surveys, external stakeholder
surveys and interviews,
including a survey distributed
among the top 100 Barco
leaders .
Review and validation of
the results by the Execu-
tive Sustainability Steering
Committee and the Core
Leadership Team .
1. Longlist 2. Shortlist 3. Review
In 2020, we conducted a new, extensive materiality
assessment, based upon and aligned with our inte-
grated reporting approach, considering the six capitals .
Compared to the previous materiality assessment, a
number of topic names have changed, or topics have
been added to cover all capitals .
Barco
Inte
grate
d re
po
rt 20
20
6PPC
Plan
et - P
eo
ple
- Co
mm
un
ities
01 SUSTAINABILITY AMBITION STATEMENT
02 SUSTAINABILITY STRATEGY
04 MANAGING SUSTAINABILITY
03 SUSTAINABILITY PERFORMANCE

Barco’s materiality matrix has three categories – low, medium
and high material topics . The illustration reflects our medium
and high material topics .
Changes compared to the previous materiality
• In the previous annual report, materiality only included
topics of the natural, human and social and relationship
capitals (Planet, People, Communities) . In line with our
step-up to integrated reporting, we included topics
of the three other capitals (financial, intellectual and
manufactured) too .
• People: ‘Labor practices & human rights’ is new .
• Planet:
- ‘Climate change & energy’ replaces ‘Greenhouse gas
emissions’ and ‘Energy efficiency of operations’
- ‘Product stewardship’ replaces ‘Energy efficiency of
products’
- ‘Circular economy’ is replaced by ‘Product stewardship’
and ‘Waste management’ .
• Communities: ‘Corporate governance’, ‘Information
security & data protection’ and ‘Product quality, safety &
security’ are new topics .
IMPACT ON LONG-TERM SUCCESS OF BARCO
IMP
OR
TA
NC
E T
O S
TA
KE
HO
LDE
RS
High materiality
Medium materiality
1819
2021
1
2
3
56
7
8
9
10
12
13
15
17
16
14
11
4
Communities
1 . Customer engagement
2 . Product quality safety
& security
3 . Information security & data
protection
4 . Business ethics
5 . Corporate governance
6 . Responsible supply chain
management
7 . Community engagement
Intellectual
8 . Innovation management
9 . Brand
Financial
10 . Financial resilience
11 . Sustained profitable growth
12 . Market reach
People
13 . Employee engagement
14 . Employee health, safety
& well-being
15 . Labor practices & human rights
16 . Learning & development
17 . Diversity & inclusion
Planet
18 . Product stewardship
19 . Climate change & energy
20 . Waste management
Manufactured
21 . Long-term asset performance
2020 materiality matrix
Overview of the topics that might affect Barco’s ability to create value for its stakeholders - linked to the six capitals of integrated reporting
Barco
Inte
grate
d re
po
rt 20
20
7PPC
Plan
et - P
eo
ple
- Co
mm
un
ities
01 SUSTAINABILITY AMBITION STATEMENT
02 SUSTAINABILITY STRATEGY
04 MANAGING SUSTAINABILITY
03 SUSTAINABILITY PERFORMANCE

Description of the medium and high material topics
FINANCIAL
Financial resilience (high) 10 Solvency, long-term financial stability, the capacity to withstand
market-related or financial headwinds .
Market reach (medium) 12
The company’s ability to reach its customers across the globe
through channels, indirect or direct sales and services . This
topic also covers the company’s competitive position in its
different markets .
Sustained profitable growth (high) 11
The company’s ability to deliver structural growth in combi-
nation with profitability ensures healthy cash flow generation .
MANUFACTURED
Long-term asset performance (medium) 21
Performance of fixed assets such as the company’s property,
buildings, equipment and infrastructure, but can also include
other assets such as long-term investments or patents .
INTELLECTUAL
Innovation management (high) 8
Management focus, effectiveness and efficiency of Barco’s
innovation process (including but not limited to R&D and prod-
uct management) to ensure outcome-based solutions and
safeguard intellectual property (IP) .
Brand (medium) 9
The company’s brand is an intangible asset distinguishing its
solutions from others . It builds on a combination of factors
such as name, term, design, symbol or any other features,
and determines how the organization is perceived by those
who experience it .
PLANET
Climate change and energy (high) 19
Addressing risks and opportunities related to climate change .
It includes but is not limited to reduction of greenhouse gas
emissions, implementing energy efficiency measures and
working towards a low carbon footprint .
Product stewardship (high) 18
Incorporating criteria into the design, development and life
cycle management of products, services and business mod-
els to reduce the environmental footprint . It includes energy
efficiency, material use intensity, management of hazardous
substances, packaging and end-of life optimization (including
circularity) .
Waste management (medium) 20
Reducing, appropriately disposing of and optimizing oppor-
tunities for recovery, recycling and re-use of solid waste in
operations . It does not include waste from end-of-life of
products .
PEOPLE
Diversity and inclusion (medium) 17
Diversity is representation of gender and minority groups at
all levels of the organization . An inclusive workplace is one
where individuals from different backgrounds are culturally
and socially accepted and equally treated .
Employee engagement (high) 13
The level of enthusiasm and dedication an employee feels
toward their job, the organization and its goals, and the effect
it has on well-being and productivity .
Employee health, safety and well-being (medium) 14
Occupational health and safety and promotion of well-being
of Barco’s employees .
Labor practices and human rights (medium) 15
Promoting fair labor practices, decent working conditions
and respect for human rights . It includes but is not limited to
prohibiting child, forced or bonded labor, ensuring fair wages
and overtime pay, minimum wages, provision of benefits and
freedom of association .
Learning and development (medium) 16
Training and upgrading the capabilities, skills and compe-
tencies of employees based on the strategic needs of the
organization, employee performance and career development
reviews .
Barco
Inte
grate
d re
po
rt 20
20
8PPC
Plan
et - P
eo
ple
- Co
mm
un
ities
01 SUSTAINABILITY AMBITION STATEMENT
02 SUSTAINABILITY STRATEGY
04 MANAGING SUSTAINABILITY
03 SUSTAINABILITY PERFORMANCE

COMMUNITIES
Business ethics (high) 4
Promoting high ethical standards and combating corruption
in business interactions, including in joint ventures and with
business partners, customers, suppliers, and distributors .
Community engagement (medium) 7
Supporting employee volunteering and charitable giving, and
providing corporate financial and in-kind contributions for
communities in which the company has a presence or impact .
Corporate governance (medium) 5
Conducting operations in accordance with internationally
accepted principles of good governance and best practice .
These include but are not limited to the roles and responsibili-
ties, transparent reporting and remuneration of the supervisory
and managing boards, board independence and the positions
and rights of shareholders .
Customer engagement (high) 1
Meeting or surpassing customer expectations, building suc-
cessful relationships with customers, encouraging co-creation .
Information security and data protection (high) 3
Protecting the collection, analysis, use, storage, transfer, and
sharing of information from unwanted parties, unauthorized
access, and security threats, including cyberattacks . Collecting,
using, storing, transferring and sharing information in ways
that uphold the right to privacy and personal data protection .
Product quality, safety and security (high) 2
Offering solutions and services that are healthy, safe and secure
to use . It includes but is not limited to liability, management of
recalls, product testing to eliminate risk of injury or damage
and integrating security controls .
Responsible supply chain management (medium) 6
Management of environmental, social and governance risks in
the supply chain . It includes but is not limited to labor practices
and human rights, business ethics, energy and climate change
and waste management . It also includes the management of
supply chain disruptions and conflict minerals .
Barco
Inte
grate
d re
po
rt 20
20
9PPC
Plan
et - P
eo
ple
- Co
mm
un
ities
01 SUSTAINABILITY AMBITION STATEMENT
02 SUSTAINABILITY STRATEGY
04 MANAGING SUSTAINABILITY
03 SUSTAINABILITY PERFORMANCE

8. Innovation management
10. Financial resilience
11. Sustained profitable growth
1. Customer engagement
2. Product quality safety & security
3. Information security & data protection
18. Product stewardship
1. Customer engagement
2. Product quality safety & security
3. Information security & data protection
4. Business ethics
13. Employee engagement
18. Product stewardship
19. Climate change & energy
Innovatefor impact
Focus onperformance
O�er outcome-basedsolutions
Go for sustainable impact
How the UN Sus-tainable Development Goals guide Barco’s strategyWe use the United Nations Sustainable Development Goals
(SDGs) as a guideline to shape our strategy and ambitions .
Defined in 2015 by the United Nations General Assembly, the
SDGs consist of 17 global goals with a 2030 deadline . All 193
countries in the UN General Assembly adopted this resolution .
We realize these goals cannot be met without support from
the global business community . Our approach to supporting
the SDGs is to focus on the goals where we can have the
most impact, while screening and implementing actions that
contribute to the other goals as well .
To identify the SDGs where Barco can make the most impact-
ful difference, we start from Barco’s strategy and material
topics . We have selected six SDGs that are closely linked to
Barco’s high material topics and the overall Barco strategy:
• SDG 3: Good health & well-being: Ensure healthy lives
and promote well-being for all at all ages
• SDG 7: Affordable and clean energy: Ensure access to
affordable, reliable, sustainable and modern energy for all
• SDG 8: Decent work and economic growth: Promote
sustained, inclusive and sustainable economic growth, full
and productive employment and decent work for all
• SDG 9: Industry, innovation and infrastructure: Build
resilient infrastructure, promote inclusive and sustainable
industrialization and foster innovation
• SDG 12: Responsible consumption and production:
Ensure sustainable consumption and production patterns
• SDG 13: Climate action: Take urgent action to combat
climate change and its impacts
UN
SD
Gs
HIG
H M
AT
ER
IAL
TO
PIC
S
Barco
Inte
grate
d re
po
rt 20
20
10PPC
Plan
et - P
eo
ple
- Co
mm
un
ities
01 SUSTAINABILITY AMBITION STATEMENT
02 SUSTAINABILITY STRATEGY
04 MANAGING SUSTAINABILITY
03 SUSTAINABILITY PERFORMANCE

Our sustainability performance
Barco
Inte
grate
d re
po
rt 20
20
11PPC
Plan
et - P
eo
ple
- Co
mm
un
ities
01 SUSTAINABILITY AMBITION STATEMENT
02 SUSTAINABILITY STRATEGY
04 MANAGING SUSTAINABILITY
03 SUSTAINABILITY PERFORMANCE

Planet
Our ambition
We will reduce our environmental footprint
and those of our customers.
1. Targets 2020
Targets & KPIsReduce the carbon
footprint of our own
operations by 20%
(baseline 2015)
Reduce the energy
footprint of our products
by 25% (baseline 2015)
Ensure that at least 25% of
new products* released have
the Barco ECO label**
+ 100% of new products released
will be ecoscored
+ no new products will have a
D score
-20% -25% 25%
ST
AT
US
20
20
-34%Achieved
-27%Achieved
48%Achieved
* Products = hardware products ** ECO label = products with A ecoscore or higher
14
1819
2021
1
2
3
56
7
8
9
10
12
13
15
17
16
114
12
MATERIAL TOPICS
Barco
Inte
grate
d re
po
rt 20
20
12PPC
Plan
et - P
eo
ple
- Co
mm
un
ities
01 SUSTAINABILITY AMBITION STATEMENT
02 SUSTAINABILITY STRATEGY
04 MANAGING SUSTAINABILITY
03 SUSTAINABILITY PERFORMANCE

2. New targets 2023
Reduce
the carbon footprint of our
own operations by 35%
(baseline 2015)
• Reduce the
energy use
of our own
operations by
15% (baseline
2015)
• Zero waste to
landfill
• 80% recycling
rate in own
operations
• 75% of new
products**
released have
a Barco ECO
label***
Reduce
the energy footprint of
our products by 25%
(baseline 2015)
Ensure that at
least 70% of our revenues****
comes from products with
the Barco ECO label***
-35% -25%* 70%
PR
IMA
RY
TA
RG
ET
SS
TA
TU
S2
02
0S
UP
PO
RT
ING
TA
RG
ET
S
-34% -27% 23%
* This target remains the same for 2023 as for 2020 . We recognize that, in the near
future, it will be hard to further reduce the energy footprint of our product base,
as the adoption of laser projectors will slow down, and customers tend to prefer
video wall technology that is less energy efficient .
Commitment to Science Based Targets
Barco is committed to setting Science Based Tar-
gets as a way to further solidify our ambitious
sustainability goals . We commit to aligning our
business with the most ambitious aim of the Paris
Agreement: to limit the global temperature rise
to 1 .5°C above pre-industrial levels . Our carbon
reduction targets have been submitted to and are
currently under validation by the Science Based
Targets initiative .
-22% 48%
STATUS2020
STATUS2020
29%
52%
** Products = hardware products
*** ECO label = products with A ecoscore or higher
**** Revenues from hardware products
14
1819
2021
1
2
3
56
7
8
9
10
12
13
15
17
16
114
12
MATERIAL TOPICS
Barco
Inte
grate
d re
po
rt 20
20
13PPC
Plan
et - P
eo
ple
- Co
mm
un
ities
01 SUSTAINABILITY AMBITION STATEMENT
02 SUSTAINABILITY STRATEGY
04 MANAGING SUSTAINABILITY
03 SUSTAINABILITY PERFORMANCE

3. Planet (key) performance indicators*
MATERIAL TOPIC INDICATOR UNITTARGET
2023TARGET
2020 2020 2019 2018
Climate change & energy
Greenhouse gas emissions** of our own operations tCO2e/mio € revenues 52.3 64.4 53.4 64.3 67.9
Energy consumption MWh/mio € revenues 37.6 34.3 33.7 41.1
% energy consumption from renewable sources % 53.5 28.9 28.8
% electricity use from renewable sources % 97.0 52.7 57.3
Renewable electricity production MWh/mio € revenues 0.79 0.30 0.36
Waste management
Total solid waste tonnes/mio € revenues 2.52 2.32 1.54
% hazardous waste of solid waste % 1.16 1.73 0.60
Recycling & composting rate of solid waste % 80 52 61 70
% of solid waste to landfill % 0 29 26 14
Water withdrawal m3/ mio € revenues 50.2 47.5 NA
Product stewardship
% ecoscored products of total new products released % 100 100 100 80 ***
% of new products released with Barco ECO label (hardware) % 75 25 48 23 ***
% revenues from products with Barco ECO label (hardware) % 70 23 NA ***
% of active components covered by Full Material Declarations % 82 82 NA
Energy efficiency index of sold products # 0.75 0.75 0.73 0.80 0.86
Greenhouse gas emissions** of sold products (i .e . Product use emissions) tCO2e/mio € revenues 306.7 359.0 480.9
% of new products released with recycled plastics (hardware) % 4 NA NA
% of countries where products are sold with Barco return and recycling programs % 26 NA NA
* For definitions on indicators: see glossary
** Calculation of greenhouse gas emissions is explained on the next page
*** Ecoscoring has been rolled out in 2019, therefore 2018 data are not available
Barco
Inte
grate
d re
po
rt 20
20
14PPC
Plan
et - P
eo
ple
- Co
mm
un
ities
01 SUSTAINABILITY AMBITION STATEMENT
02 SUSTAINABILITY STRATEGY
04 MANAGING SUSTAINABILITY
03 SUSTAINABILITY PERFORMANCE

4. Other indicators
MATERIAL TOPIC INDICATOR UNIT
TARGET 2023
TARGET 2020 2020 2019 2018
Climate change &
energy
greenhouse gas emissions scope 1 tCO2e/mio € revenues 4.1 3.7 5.0
greenhouse gas emissions scope 2 tCO2e/mio € revenues 0.3 4.7 4.5
greenhouse gas emissions scope 3 incl product use emissions tCO2e/mio € revenues 355.8 414.8 539.3
Total greenhouse gas emissions tCO2e/mio € revenues 360.1 423.3 548.8
Total greenhouse gas emissions tCO2e 277,335 458,441 564,753
MEASURING CARBON FOOTPRINT OF OUR OWN OPERATIONS
Methodology • Bilan Carbone® methodology
• Compliant with ISO 14064 standard
• Sources of emission factors: emission factors from internationally recognized emission
factor databases, ADEME, GHG Protocol, IEA, suppliers specific for electricity
Scope • Technical: all GHG such as carbon dioxide (CO2), methane (CH
4), nitrous oxide (N
2O), refrig-
erants (HFCs, PFCs, CFCs) are converted into CO2 equivalents using Intergovernmental Panel
on Climate Change (IPCC) 100-year global warming potential (GWP) coefficients
• Boundaries: operational (vs . equity) approach, as it better defines the boundaries of influence
• Geographical scope: main production facilities and offices in Belgium, China, Italy, Germany,
India, Norway, Taiwan and US, accounting for 85% of Barco’s total headcount (3,211 FTEs) in
2020
Baseline • For targets and performance comparison, Barco selects FY 2015 as a baseline
MEASURING OUR CARBON FOOTPRINT RELATED TO PRODUCT USE EMISSIONS
Methodology • GHG Protocol Methodology
Formula to be used: ∑ (total lifetime expected uses of product × number sold in
reporting period × electricity consumed per use (kWh) × emission factor for electricity
(kg CO2 e/kWh))
Scope • Emissions based solely on the energy consumption of the product (excluding the embodied
energy of components, end-of-life emissions, etc .)
• Approx . 90% of the products covered (in terms of sales volume) in 2020
Barco
Inte
grate
d re
po
rt 20
20
15PPC
Plan
et - P
eo
ple
- Co
mm
un
ities
01 SUSTAINABILITY AMBITION STATEMENT
02 SUSTAINABILITY STRATEGY
04 MANAGING SUSTAINABILITY
03 SUSTAINABILITY PERFORMANCE

Our roadmap towards sustainable impact: key initiatives and action plans
2020 is the first year that Barco is taking an integrated approach
to reporting, explaining how the organization creates value
over time – in a wide range of fields . To ensure that our 2020
Integrated report includes the 2020 results for each and every
capital described, we decided to accelerate data collection
and processing on our performance relating to ‘planet’ .
Thanks to these efforts, the 2020 results for planet were
available upon drafting the 2020 Integrated report – while
in previous years, we always reported on the year before .
Below is an overview of our results for planet in 2019 as well
as 2020 . From 2021 onwards, planet results will be on par
with all the other financial and non-financial results in the
Integrated report .
Barco
Inte
grate
d re
po
rt 20
20
16PPC
Plan
et - P
eo
ple
- Co
mm
un
ities
01 SUSTAINABILITY AMBITION STATEMENT
02 SUSTAINABILITY STRATEGY
04 MANAGING SUSTAINABILITY
03 SUSTAINABILITY PERFORMANCE

1. Footprint of our own operations
201544.2
Energy consumption, split by source (2020)
Energy consumption in own operations (MWh/mio € revenues)
10
20
30
40
201639.9
201741.7
201841.1
201933.7
202034.3
TARGET202337.6
54% renewable
46% non-renewable
In the beginning of 2020, we switched to renewable elec-
tricity at the majority of our sites . The result: 97% of our total
electricity consumption is from renewable sources - a major
improvement compared to 2019 (53% renewable) . When look-
ing at Barco’s total energy consumption (elecricity and fuel
use) 54% is from renewable sources .
In 2020, the company fleet’s fuel use dropped significantly, as
working from home became the norm in the covid-19 context .
We realize that fuel use will go up again after the pandemic,
but expect that hybrid working is here to stay, which will result
in reduced fuel use in the future .
We closed 2020 with energy consumption (including fuel use
for company cars) amounting to 34,3 MWh/mio € revenues .
That is a 22% decrease compared to our 2015 baseline, mean-
ing we have already reached our target of 15% reduced energy
consumption by 2023 .
2020 carbon footprint reduction target for own
operations achieved in 2019
In 2016, Barco set an ambitious sustainability goal:
to reduce the carbon footprint of our own opera-
tions by 20% compared by 2020 . We reached that
goal one year in advance .
In 2019, we managed to strongly reduce our car-
bon emissions in mobility and infrastructure, with a
year-on-year reduction of 13% and 12% respectively
compared to 2018 . The main drivers are a strong
reduction of business travel and the centralization
of manufacturing activities (including the reloca-
tion of production activities to the state-of-the-art
factory in Kortrijk) .
97%
of Barco’s electricity consumption is
from renewable sources
TARGET -15%
1.1 Energy use in our own operations
In 2019, Barco drastically its energy consumption in Belgium
due to the move of our production activities from an older site
to the state-of-the-art factory in Kortrijk . Also in our US offices,
several measures were taken to cut energy consumption, such
as installing LED lighting, implementing motion-activated light
switches, enabling sleep and power-saving modes on most
of the demo equipment and using smart power strips that
turn off equipment when not in use . More than investing in
eco-friendly equipment, we also work on raising awareness
and train our employees on the importance of energy savings .
Through our internal communication channels, employees
regularly receive tips on how to save energy . Energy is also a
topic in the mandatory Sustainability Standards@work training
and the Compliance Challenge .
Barco
Inte
grate
d re
po
rt 20
20
17PPC
Plan
et - P
eo
ple
- Co
mm
un
ities
01 SUSTAINABILITY AMBITION STATEMENT
02 SUSTAINABILITY STRATEGY
04 MANAGING SUSTAINABILITY
03 SUSTAINABILITY PERFORMANCE

1.2 Greenhouse gas emissions due to our own operations
There are three main sources of greenhouse gas emissions
in our own operations: logistics, mobility and infrastructure .
On this page we share the consolidated numbers for our own
operations . On the following pages, we zoom in on the num-
bers by source and on the actions for each source .
We are proud that Barco achieved the -20% target by 2020
(baseline 2015) in 2019 .
2020 was an exceptional year, with different impacts on our
greenhouse gas emissions (see the following pages) as well
as on our revenues . The overall relative reduction in green-
house gas emissions from our own operations is -34% versus
the 2015 baseline .
TARGET
-35%
Carbon footprint of own operations
2015–2020, inl. 2023 target(All figures in tCO
2e/mio € revenues)
202352.3
TARGET
201580.5
10
20
30
40
50
60
70
80
201673.1
201770.6
201867.9
201964.3
202053.4
-34%
Greenhouse gas emissions from our own
operations (in tCO2e/mio € revenues)
decreased by 34% between 2015–2020
Logistics Mobility Infrastructure
Barco
Inte
grate
d re
po
rt 20
20
18PPC
Plan
et - P
eo
ple
- Co
mm
un
ities
01 SUSTAINABILITY AMBITION STATEMENT
02 SUSTAINABILITY STRATEGY
04 MANAGING SUSTAINABILITY
03 SUSTAINABILITY PERFORMANCE

1.2.1 Greenhouse gas emissions from logistics
The major source of greenhouse gas emissions from our own
operations is related to logistics, i .e . the transport of incoming
goods and outgoing finished products .
In 2019, we accelerated the following initiatives:
• Healthcare division: by moving medical display
manufacturing for the Chinese market from Italy to our
new manufacturing plant in China, CO2 emissions drop .
• Entertainment division: to avoid long-haul air transport,
projector engines for US customers are repaired locally in
our Atlanta facility instead of in Belgium .
• Enterprise division: by opening a new bonded warehouse
hub in Taiwan, we can store our latest LCD displays
until there is enough demand to fill a sea container . The
displays are closer to our APAC customers too .
In 2020, the covid-19 pandemic disrupted our supply chain,
but we managed to keep our relative CO2 emissions at the
same level as 2019 . The split between air and see shipments
was the same as in 2019:
• 56% of Barco’s total tkms (Metric tonnes * distance
shipped) has been shipped by plane .
• 41% of Barco’s total tkms is transported via deep-sea
shipping, which is responsible for less than 1% of the CO2
footprint in logistics .
Logistics was responsible for 77% of Barco’s own CO2 emis-
sions in 2020 . Overall logistics related greenhouse gas
emissions dropped by 21% between 2015 and 2020 .
Other initiatives in logistics:
Next to avoiding transport and shifting towards more environ-
mentally friendly transport modes, we continue to work on:
• Re-designing packaging for logistics: when designing
new products, we aim to design smaller and lighter
packaging, in order to reduce the volume and/or the
weight of high-running appliances . Packaging/logistics is
one of the four domains in our ecodesign program .
• Modular product design: as more new Barco products
are built on existing platforms, only the final customization
has to be done in a local warehouse . In this way, we can
ship larger volumes to overseas destinations up front by
sea .
• Every transport and warehousing tender includes a
sustainability clause: logistics suppliers are expected to
inform us about their sustainability plans and initiatives .
This information is considered in the overall decision
matrix and, as such, in our supplier selection procedure .
In addition, we add sustainability clauses to contracts,
driving our suppliers to advance their efforts to cut carbon
emissions .
Carbon footprint of logistics 2015-2020, incl. 2023 targetAll figures in tCO
2e/mio € revenues
TARGET -35%
Breakdown of logistics emissions by source (2020)
202334.0
TARGET
201552.2
10
20
30
40
50
201645.3
201743.0
201841.6
201941.4
202041.3
89% Air (long haul > 4000 km)
7% Air (middle haul)
3% Air (short haul < 1000 km)
0.6% Sea
0.5% Road
0% Rail
-21%
Logistics related greenhouse gas
emissions dropped by 21% between
2015–2020
Barco
Inte
grate
d re
po
rt 20
20
19PPC
Plan
et - P
eo
ple
- Co
mm
un
ities
01 SUSTAINABILITY AMBITION STATEMENT
02 SUSTAINABILITY STRATEGY
04 MANAGING SUSTAINABILITY
03 SUSTAINABILITY PERFORMANCE

1.2.2 Greenhouse gas emissions from mobility
The second-largest source of greenhouse gas emissions from
our own operations is mobility . This includes business travel,
the use of company cars and commuting .
In 2019 the share of mobility in Barco’s CO2 emissions from
own operations was 24% - most of which was caused by busi-
ness travel . We managed to further cut back on business travel
by promoting virtual collaboration and training and invested
firmly in our hybrid working capabilities by, for example, install-
ing Clickshare Conference in many of our meeting rooms . In
that sense, we were well prepared for the lockdown in 2020 .
2020 was an exceptional year featuring severe travel restric-
tions, resulting in a large drop in our mobility related emissions .
The share of mobility in Barco’s own CO2 emissions was only
16% in 2020 . Overall mobility related greenhouse gas emissions
dropped by 56% between 2015 and 2020 . We realize that this
is a temporary picture as business travel and commuting will
increase again .
In order to be prepared for a future where our employees
will commute again more regularly, we took the first steps in
electrifying our fleet in Belgium .
201519.1
202314.8
TARGET
201618.9
201817.7
201915.4
20208.3
10
20
201719.3
Carbon footprint of mobility 2015-2020, incl. 2023 targetAll figures in tCO
2e/mio € revenues
Breakdown of mobility emissions by source (2020)
TARGET - 23%
38% Business travel
32% Home-work commuting
30% Company cars
-56%
Mobility related greenhouse gas
emissions dropped by 56% between
2015–2020
Barco
Inte
grate
d re
po
rt 20
20
20PPC
Plan
et - P
eo
ple
- Co
mm
un
ities
01 SUSTAINABILITY AMBITION STATEMENT
02 SUSTAINABILITY STRATEGY
04 MANAGING SUSTAINABILITY
03 SUSTAINABILITY PERFORMANCE

Training during travel bans? Yes, we can, thanks to weConnect
In 2020, severe travel restrictions had a positive impact on
our carbon footprint . Yet, engaging with our partners and
resellers became difficult .As they were no longer able to visit
our training centers or the number of participants to in-person
courses was very limited in 2020, we brought our courses to
them: thanks to the weConnect platform, Barco University
successfully offered a substantial part of its course offering in
the form of shorter, topical virtual classes .
Participants are impressed and feel truly ‘connected’ with both
the teacher and their fellow participants:
• direct visual and audio connectivity with all participants
ensures a ‘near in-class’ experience, enabling teachers to
guide participants through hands-on parts of the training;
• whiteboarding and annotation and quick polling/quizzing
make sessions interactive;
• thanks to multiple camera feeds, students get a clear view
of more practical aspects, for example, when we cover
more hardware-related training topics .
In 2020, over 2,000 external participants from our worldwide
partner and reseller network took Barco University courses via
weConnect . The virtual approach helps us keep our partners
and resellers “connected” with Barco as well as keeping them
“competent” when it comes to the Barco-powered solutions
they keep introducing to their markets!
2,000+
participants from our worldwide partner and
reseller network followed virtual courses via
weConnect, thus restricting business travel.
Barco
Inte
grate
d re
po
rt 20
20
21PPC
Plan
et - P
eo
ple
- Co
mm
un
ities
01 SUSTAINABILITY AMBITION STATEMENT
02 SUSTAINABILITY STRATEGY
04 MANAGING SUSTAINABILITY
03 SUSTAINABILITY PERFORMANCE

1.2.3 Greenhouse gas emissions from infrastructure
The third source of greenhouse gas emissions from our own
operations is infrastructure . This includes emissions from
the use of electricity, fossil fuels (excl . company cars), the
treatment of waste and the leakage of refrigerant gases from
cooling equipment .
In 2019 we took several measures to further reduce the carbon
footprint of our facilities:
• Centralizing manufacturing activities: in Belgium, we
finalized the relocation of our production activities from
the old Kuurne site to our state-of-the-art, energy-efficient
manufacturing plant in Kortrijk .
• Switching to green electricity at our site in Atlanta .
In 2020 our emissions decreased drastically because
• We extended the renewable electricity procurement
program to the majority of our sites, including US, China,
India, Italy and Norway .
• We installed solar panels on the roof of our R&D site in
Germany .
• We took several measures to reduce energy consumption
in the US sites, such as enabling sleep and power saving
modes on most of the demo equipment, implementing
motion light switches, using smart power strips that turn
off equipment when not in use and installing LED lighting
in most locations
In 2020, the share of infrastructure in Barco’s own CO2 emis-
sions was 7%, which was mainly attributable to the use of
fossil fuels . Overall infrastructure related greenhouse gas emis-
sions dropped by 59% between 2015 and 2020 .
Plans to further reduce emissions from infrastructure in 2021
include moving to more energy-efficient buildings .
20159.2
20233.1
TARGET
20168.9
20178.3
20188.5
20197.5
20203.8
5
10
Carbon footprint of infrastructure 2015-2020, incl. 2023 targetAll figures in ton tCO
2e/mio € revenues
TARGET - 66%
Breakdown of infrastructure emissions by source (2020)
20% Electricity
43% Fossil fuels
18% Refrigerant losses
18% Waste
-59%
Infrastructure related greenhouse gas
emissions dropped by 59% between
2015–2020
Barco
Inte
grate
d re
po
rt 20
20
22PPC
Plan
et - P
eo
ple
- Co
mm
un
ities
01 SUSTAINABILITY AMBITION STATEMENT
02 SUSTAINABILITY STRATEGY
04 MANAGING SUSTAINABILITY
03 SUSTAINABILITY PERFORMANCE

1.3 Circularity in our own operations
First and foremost, we aim to keep waste from operations to
a minimum, especially non-sorted waste .
Our employees are trained on how to separate waste using
different bins . Waste recycling is part of our 5S audit sys-
tem, where the presence of the different waste collectors is
checked . We also work hard to reduce the amount of waste
generated by the packaging of incoming components and
products . Suppliers receive guidance on how to reduce pack-
aging and which packaging materials Barco prefers in order
to raise recycling rates .
By the end of 2020, total solid waste was 2 .5 tonnes/mio €
revenues, with a recycling rate of 52% . The negative evolution
in both figures compared to 2019 (in 2019 total waste was 2 .3
tonnes/mio € revenues and recycling rate was 61%) is mainly
caused by construction works at our US sites and new local
depot repair activities at the Atlanta site .
By 2023, we aim to:
• recycle 80% of operational waste
• send zero operational waste to landfills
In 2021, we aim to reduce landfilling by 50% compared to
previous years .
iGemba: employee-driven improvement ideas to continuously enhance our environmental footprint in operations
One of our culture blocks is “We look for the better
way” . So, continuous improvement is very important
at Barco . It is also a requirement of the ISO 14001
Environmental Management System* .
In 2020, we celebrated the 10th anniversary of iGemba,
a program that fits perfectly within our ‘continuous
improvement’ commitment, as it encourages oper-
ators to share their own improvement ideas . “These
employee-driven improvements (EDIs) boost quality,
safety and efficiency and play an important role in
decreasing our environmental footprint,” explains Marc
Cattoir, Continuous Improvement Coach .
How iGemba works
Marc: “Operators fill in an EDI card on which they
describe their challenge and proposed solution .
Every quarter, the three best ideas are displayed on
the production floor . In this way, we create a culture
of continuous improvement and inspire each other
to share new ideas .”
New Barco employees are immersed in the philoso-
phy of iGemba during initial training . Every two weeks
during team meetings, everyone is encouraged to
share their ideas or proposals with their colleagues
and managers .
A couple of examples
“The Enigma boards, which are mounted onto the
HD-SDI boards, lose power when the projectors run,
which reduces their lifetime. Until recently, there was
no way to recharge the Enigma. When it reached end
of life, we had to dispose of the battery and replace
the board. So, I developed a power supply to charge
the board and re-use it over and over again.”
Steven Christiaens, Repair specialist, Kortrijk
“We came up with a very simple solution to safely
remove residues of glue from our digital mirror device
(DMD). By using a caliper when scraping the surface,
our hand now rests on the table. That’s safer, more
ergonomic and the glue is more easily removed.”
Vanessa Sabbe, Mount optical assemblies, Kortrijk
* Barco obtained the ISO 14001 certificate for Barco sites in Belgium,
China, India and Italy
Barco
Inte
grate
d re
po
rt 20
20
23PPC
Plan
et - P
eo
ple
- Co
mm
un
ities
01 SUSTAINABILITY AMBITION STATEMENT
02 SUSTAINABILITY STRATEGY
04 MANAGING SUSTAINABILITY
03 SUSTAINABILITY PERFORMANCE

2.1 Energy performance of our products
The energy our products consume on our customers’ prem-
ises has a major impact on the environment . Improving the
energy performance of our products is therefore one of our
main priorities .
At the same time, market trends and customer preferences are
shifting towards ever-higher performance (brightness, resolu-
tion, etc .), which requires higher energy consumption . That’s
why we measure energy consumption relative to brightness,
resolution, luminance, etc . as watt/delivered capability .*
In 2016, we set the target of reducing the energy footprint
of our products by 25% by 2020 (compared to 2015) . We
have reached that target: the average energy efficiency index
decreased by 27% between 2015 (baseline) and 2020, The
dominant driver of this reduction is the growing adoption of
laser projectors, which consume far less power (-50% to -150%)
than traditional lamp-based systems .
We recognize that, in the near future, it will be hard to fur-
ther reduce the energy footprint of our product base, as the
adoption of laser projectors will slow down, and customers
tend to prefer video wall technology that is less energy effi-
cient . Both trends will probably negatively impact the energy
efficiency index . That is why our target for 2023 stays at -25%
compared to 2015 .
2. Footprint of our products
Exceeding 2020 targets on energy footprint and
product ecodesign
Our focus on improving the environmental foot-
prints of our products stayed sharp in 2020 . Thanks
to the full implementation of ecodesign in our New
Product Introduction process and the high engage-
ment of our R&D teams, 48% of new products bore
the Barco ECO label upon launch – an impressive
increase compared to 2019 and also exceeding the
2020 target of 25% .
In addition, a favorable product mix with a high
proportion of laser projectors and laser rear-pro-
jection video walls led to a 27% drop in the energy
footprint of our products versus base year 2015 .
This too is exceeding the 2020 target (25%) .
of new products released in 2020
have the Barco ECO label
48%
* For definition of energy efficiency index: see glossary
TARGET
-25%
Energy efficiency index* of sold products
20230.75
TARGET
20151
0.25
0.50
0.75
1
20161.04
20170.95
20180.86
20190.80
20200.73
-27%
The average energy footprint of sold
products fell by 27% between 2015–2020
Barco
Inte
grate
d re
po
rt 20
20
24PPC
Plan
et - P
eo
ple
- Co
mm
un
ities
01 SUSTAINABILITY AMBITION STATEMENT
02 SUSTAINABILITY STRATEGY
04 MANAGING SUSTAINABILITY
03 SUSTAINABILITY PERFORMANCE

2.2 Greenhouse gas emissions of our products (product use emissions)
Product use emissions are emissions resulting from the energy
use of sold Barco products on our customers’ premises . They
are by far the largest source of emissions for Barco .
In 2020, total product use emissions amounted to 307 tCO2e/
mio € revenues . This is 85% of our total carbon footprint . The
largest portion of product use emissions is generated by our
projectors (Entertainment division) . Product use emissions
decreased by 56% between 2015 and 2020 . In 2020, the Enter-
tainment division was hit heavily by the covid-19 crisis, resulting
in less sales of projectors . In 2021 we expect product use
emissions to increase again due to the higher projector sales .
Breakdown of total emissions of Barco by source (2020)
15% Own operations emissions
85% Product use emissions
2015698.6
Product use emissionsAll figures in tCO
2e/mio € revenues
600
100
200
300
400
500
700
2016704.7
2017590.1
2018480.9
2019359.0
2020306.7
Breakdown of product use emissions by division (2020)
34% Enterprise
48% Entertainment
18% Healthcare
Barco
Inte
grate
d re
po
rt 20
20
25PPC
Plan
et - P
eo
ple
- Co
mm
un
ities
01 SUSTAINABILITY AMBITION STATEMENT
02 SUSTAINABILITY STRATEGY
04 MANAGING SUSTAINABILITY
03 SUSTAINABILITY PERFORMANCE

2.3 Ecodesign
Improving the energy performance is just one way of lower-
ing the ecological footprints of our products . Apart from this,
we aim to improve our products on other aspects as well:
use low-impact materials, opt for ecofriendly packaging, and
improve the way our products can be maintained, refurbished,
upgraded and eventually recycled . We drive eco-friendliness
in product creation through our ecodesign program .
TARGET
70%
Ensure that at least 70% of our
revenues*** comes from products
with the Barco ECO label**
+ 75% of new products* released
have a Barco ECO label**
23% of our revenues*** comes
from products with the Barco
ECO label**
* Products = hardware products
** ECO label = products with A ecoscore or higher
*** Revenues from hardware products
2.3.1 Barco’s ecodesign journey
2015–2018
• Adopt the Barco Substances List
• Ensure 100% of Barco’s products
comply with REACH and RoHS
• Reduce the use of halogens and
PVC
• Start the ecoscoring initiative
(3 pilot projects)
2019–2020
• Implement power management
solutions in all product types
• Pro-actively enforce RoHS 10
compliance down our supply
chain
• Actively phase out phthalates,
beryllium, arsenic and antimony
• Validate our ecoscoring
methodology by a third party
• Fully roll out ecoscoring across
Barco
• Start using plastics that contain
post-consumer recycled content
• Embed revised EU ecodesign
requirements for electronic
displays and for computer servers
and data storage products
2021
• Proactively select parts that do not
employ RoHS 10 exemptions .
• Create products that meet the
objective upgradability and
circularity criteria in the ecoscore
tool V5
Continuous endeavors
• We proactively update our Barco Substances List with
substances to be declared, phased out, or banned,
ahead of regulations . This includes substances used in
our products as well as packaging . A team of in-house
experts checks the list and challenges and corrects
suppliers when needed . The list of substances, which
is frequently updated, can be found on our website . In
2020 we put special emphasis on the use of chemicals
in adhesives .
• We proactively look for opportunities in ecodesign
such as low-impact materials, energy-efficiency
improvements, enhancing repairability, modularity etc .
• We train internal and external stakeholders (R&D, NPI
project managers, product managers, suppliers) in
ecodesign and the ecoscoring tool .
23%
Barco
Inte
grate
d re
po
rt 20
20
26PPC
Plan
et - P
eo
ple
- Co
mm
un
ities
01 SUSTAINABILITY AMBITION STATEMENT
02 SUSTAINABILITY STRATEGY
04 MANAGING SUSTAINABILITY
03 SUSTAINABILITY PERFORMANCE

2.3.2 Ecoscoring: the tool to evaluate the eco-friendliness
of our new products
In 2017, we continued and refined our ecodesign journey by
devising an objective scoring methodology to determine the
environmental performance of new products . The next year,
we launched a first pilot project .
To improve the value of our tool for external stakeholders, we
submitted it to an external audit under the framework of the
ISO 14021:2006 standard (limited assurance) in 2019 . In this
way, we aim to ensure that our ecoscoring methodology is
complete, reliable, objective and based on relevant product
aspects .
In 2020, the tool was updated to the more stringent V5 ver-
sion – with more objective criteria – and revalidated under
ISO 14021:2006 . Highlights of the new tool include: push for
bulk shipment, increased transparency on presence of critical
raw materials (as defined by the European Commission), EU
conflict minerals regulation, halogen-free materials, minimum
content of recycled metals and further alignment with external
ecolabels and competition .
Ecoscoring has now become an integral part of our NPI (New
Product Introduction) process . At the start of each new
project, multidisciplinary teams define ecoscore product spec-
ifications, which are then assessed at predefined stage gates .
In 2020 we successfully ecoscored 100% of newly devel-
oped platforms across all Barco R&D development centers
worldwide . No products where scored D, and 48% of new
products released received the Barco ECO label . This means
that we reached the 2020 target to have at least 25% of prod-
ucts launched with the Barco ECO label . And we continue
to raise the bar . Our target for 2023 is that at least 75% of
new product releases should have the Barco ECO label and
that at least 70% of our hardware revenues comes from Barco
ECO labeled products . In 2020, revenues coming from these
products was 23% .
How ecoscore works
The ecoscore is divided into four environmental
domains:
• Energy
• Material use
• Packaging & logistics
• End-of-life optimization.
For each domain, a score is calculated assessing the
product on several relevant topics . The assessment is
performed against objective criteria inspired by future
regulations, industry standards, customer expectations
and voluntary ecolabels . The domain score ranges
from D (lowest score) to A (highest score) .
Based on the four domain scores, the product receives
a final score ranging from D to A++ . The Barco ECO
label is granted to products with an A++, A+ or A
ecoscore. These products have:
• an A subscore on energy, and on at least one
other domain
• no domains with a D subscore
• in case one domain has a C subscore, the three
other domains need to have an A score
MATERIALUSE
• Full Material
Declarations
• Critical Raw Materials
• Halogens
• Product weight
• Recycled materials
PACKAGING& LOGISTICS
• Recyclability
• Recycled content
• Optimized packaging
design
• Optimized logistics
& stacking
• Limit accessories waste
ENERGY
• Power supply e�ciency
• Performance e�ciency
• Standby mode
• Power management
END-OF-LIFEOPTIMIZATION
• Lifetime extension
• Repairability
(service model, spare
parts)
• Design for
disassembly/repair
• Modularity/
upgradeability
Learn more about our ecoscoring methodology on our website
Barco
Inte
grate
d re
po
rt 20
20
27PPC
Plan
et - P
eo
ple
- Co
mm
un
ities
01 SUSTAINABILITY AMBITION STATEMENT
02 SUSTAINABILITY STRATEGY
04 MANAGING SUSTAINABILITY
03 SUSTAINABILITY PERFORMANCE

Enabling eco-conscious cinema experiences with new A+ projector range
The Barco projection division is on a roll when it comes to
sustainability . The new SP2K laser projector is the second
projector range to receive an A+ ecoscore . More than bringing
numerous benefits to enhance the moviegoer experience and
creating peace of mind for exhibitors, the projector series also
meets high eco requirements:
• Energy A : The SP2K smartly manages its power
consumption and is an energy-efficient product thanks to
its low-power standby-mode and ECO-mode – great for
the environment, but also for the utility bills .
• Packaging B : The packaging of the projector and its
peripherals is kept to a minimum . Moreover, the design is
further optimized for efficient logistics and transport .
• Materials A : After the release of the other Series 4
projectors, Barco raised the bar even more in its use
of eco-friendly materials . The SP2K projector is the
first Barco cinema product with a housing that’s made
of halogen-free plastics and contains post-consumer
recycled plastics .
• End-of-life optimization A : Just like its 4K nephews,
the SP2K is designed with maximum modularity in mind
to enable serviceability, upgradeability and lifetime
extension .
The SP2K projector is the
first Barco cinema product
with a housing that contains
recycled plastics .ENERGY-EFFICIENCY
A
MATERIALUSE
A
B
END-OF-LIFEOPTIMIZATION
PACKAGING& LOGISTICS
A
A++
A+
A
B
C
D
Barco
Inte
grate
d re
po
rt 20
20
28PPC
Plan
et - P
eo
ple
- Co
mm
un
ities
01 SUSTAINABILITY AMBITION STATEMENT
02 SUSTAINABILITY STRATEGY
04 MANAGING SUSTAINABILITY
03 SUSTAINABILITY PERFORMANCE

First A+ ecoscore for a Barco medical display system
The A+ ecoscore obtained by the new Nio Fusion 12MP
demonstrates that Barco is advancing well in making sus-
tainability a core aspect of our product development . The
following aspects contributed to the score:
• Energy A : The Nio Fusion 12MP is praised for its overall
energy efficiency and has a power management function
enabled by default .
• Packaging A : Optimized for transport and customer
experience, the contents of each package is adapted to
the destination region, reducing carbon footprint and
waste .
• Materials B : We strive to avoid using materials that are
harmful to people and nature . Only halogen-free materials
are used .
• End-of-life optimization B : Although it lasts for many
years, the Nio Fusion 12MP is designed with eventual
disassembly in mind, contributing to an environmentally
friendly end-of-life .
Albert Xthona, product manager diagnostic displays, com-
ments: “We strive to incorporate learnings from previous
medical devices, such as the Coronis Fusion 6MP which
received an A ecoscore, and then add further improvements,
such as those found in the Nio Fusion 12MP . Our focus on the
unboxing experience and reducing discarded components
was hard work, but produced a result that each customer
actually feels .”
ENERGY-EFFICIENCY
A
MATERIALUSE
A
B
END-OF-LIFEOPTIMIZATION
PACKAGING& LOGISTICS
A
A++
A+
A
B
C
D
Our focus on the unboxing
experience and reducing
discarded components was
hard work, but produced a
result that each customer
actually feels .
Albert XthonaProduct manager diagnostic displays
Barco
Inte
grate
d re
po
rt 20
20
29PPC
Plan
et - P
eo
ple
- Co
mm
un
ities
01 SUSTAINABILITY AMBITION STATEMENT
02 SUSTAINABILITY STRATEGY
04 MANAGING SUSTAINABILITY
03 SUSTAINABILITY PERFORMANCE

Latest laser technology further optimizes the ecoscore of RGB Laser ODL video walls
RGB Laser projection is the most energy-efficient technology
for rear-projection cube (RPC) video walls . That is why Barco’s
ODL range was already a high-runner when it comes to ecode-
sign . With the introduction of the latest generation of RGB
lasers, performance got even better, resulting in an A ecoscore .
• Energy A : With highly energy-efficient laser projection
technology, backed by the needed design optimizations
(including a standby/off-mode, a power management
function and a high power supply efficiency), the ODL
engine minimizes energy consumption .
• Packaging B : The packaging design was optimized, and
only the essentials are shipped – which reduces the size of
the packaging .
• Materials B : The ODL range excels in the use of
recycled materials .
• End-of-life optimization A : An ODL video wall is easily
repairable, has all spare parts available for a long time, and
can drastically extend its lifetime by simply introducing a
new projection engine . Long-term maintenance contracts
(up to 10 years) are available for RGB laser RPC video
walls .
ENERGY-EFFICIENCY
A
MATERIALUSE
A
B
END-OF-LIFEOPTIMIZATION
PACKAGING& LOGISTICS
A
A++
A+
A
B
C
D
An ODL video wall has a
really long lifetime: simply
introduce a new projection
engine and the video wall
will last for many more
years .
Barco
Inte
grate
d re
po
rt 20
20
30PPC
Plan
et - P
eo
ple
- Co
mm
un
ities
01 SUSTAINABILITY AMBITION STATEMENT
02 SUSTAINABILITY STRATEGY
04 MANAGING SUSTAINABILITY
03 SUSTAINABILITY PERFORMANCE

2.4 Circular solutions
The circular economy is a focus area in Barco’s sustainability
strategy . Through smart design and services, we always aim
to reduce waste and retain the highest utility and value of
products and components .
2.4.1 Circular product design
To enable circular solutions for our customers, we engage in
circular design . Several criteria are embedded in the ecodesign
program to improve the circularity of our products, such as
longevity, repairability and recyclability, as well as on material
efficiency . In 2020, we ramped up the use of post-consumer
recycled plastics in our products . 4% of new products launched
contained post-consumer recycled plastics, and we aim to
increase that figure significantly in the coming years .
The ecodesign program also focuses on improving circularity
of packaging . Product packaging is evaluated against criteria
such a recyclability and (re)use of recycled materials .
Next to our internal circular design efforts, we are active in the
CEN-CENELEC Joint Technical Committee 10 on energy-re-
lated products . The goal of this committee is to establish an
objective measuring methodology for repairability and recy-
clability of products . As an active member, we contribute to
future standards that will improve the circularity performance
of products in Europe . Barco fully supports setting out clear,
objective criteria that drive the industry toward more circular
products .
2.4.2 Product recycling services
Dealing with electronic waste is a concern for industry and
society . E-waste is one of the fastest growing waste streams,
making it important for our products to be recycled at end
of life . This is the very basic first step in a circular economy .
For every product, we provide a user manual, which includes
information for customers on how to handle the product at
end-of-life stage, and a recycling passport, which offers recy-
cling information to recyclers .
We allow our customers to turn in their used products free
of charge to our recycling partners . This offering was started
up in Europe in accordance with WEEE legislation and has
been expanded into important markets in Canada and the US .
We participate in and offer product collection and recycling
programs in 26% of the countries in which we sell products .
Where no structured program is in place yet, we offer ad hoc
recycling and collection services . We demand that all our
recycling partners are ISO 14001 certified and comply with
legislation regarding the prohibition of e-waste export . Read
more on our website .
In 2019, we started a pilot project on the SCIP database (Sub-
stances of Concern In articles as such or in complex objects
(Products)) reporting of ECHA (the European Chemicals
Agency), which became mandatory in 2021 under the EU
Waste Framework Directive (WFD) . This publicly accessible
database gives recyclers insights about which substances are
used and provides market safety authorities with policy guide-
lines . Barco was proactively involved in testing the prototype
database through the SCIP IT user group and our industry
partners . 208 product families were registered prior to the
deadline, making Barco a pioneering company when it comes
to providing transparent and up-to-date info to customers
and regulators .
2.4.3 Extending circular service offerings
We realize that before products are recycled, more valuable cir-
cular opportunities need to be grasped . That’s why we’re also
looking into solutions for product life extensions, including
upgrades and predictive maintenance options . In addition, we
are starting to explore offerings where customers get access
to – rather than ownership of – products . This opens new
opportunities for the circular economy .
4%
4% of new products launched in 2020
contained postconsumer recycled plastics. We
aim to increase that number significantly in the
coming years.
Barco
Inte
grate
d re
po
rt 20
20
31PPC
Plan
et - P
eo
ple
- Co
mm
un
ities
01 SUSTAINABILITY AMBITION STATEMENT
02 SUSTAINABILITY STRATEGY
04 MANAGING SUSTAINABILITY
03 SUSTAINABILITY PERFORMANCE

Circularity in action: Barco’s rear-projection cube video wall upgrades
Rear-projection video walls consist of multiple cubes stacked
in a matrix structure . Each cube contains a projector (fac-
ing upwards), a mirror reflecting the image, and a projection
screen integrated in a mechanical structure . While electronic
parts, cooling units and light sources (although they can be
separately replaced) age, the mechanical structure, mirror
and screens can last a lot longer . That is why Barco offers
its customers the possibility to introduce a new projection
module into their legacy video walls . This not only upgrades
the system to the latest solid-state projection technology, but
also minimizes waste and effort by leaving the mechanics,
screens and mirrors untouched . This fast, easy and low-cost
operation is offered in both CAPEX and OPEX models .
In 2020, 25% of installations were upgrades of existing rear-pro-
jection cubes . What’s more, the legacy projection engine and
lenses are, under certain conditions, also being refurbished . For
example, in 2020, 148 lenses were refurbished from rear-pro-
jection cubes .
25%
of video wall installations in 2020 were
upgrades of existing rear-projection cubes.
Barco
Inte
grate
d re
po
rt 20
20
32PPC
Plan
et - P
eo
ple
- Co
mm
un
ities
01 SUSTAINABILITY AMBITION STATEMENT
02 SUSTAINABILITY STRATEGY
04 MANAGING SUSTAINABILITY
03 SUSTAINABILITY PERFORMANCE

People
Our ambition
We invest in sustainable employability by
creating the right conditions for our employees
to have an engaging, enriching and healthy
career at Barco. We do this by encouraging our
people to learn and develop themselves and by
creating the conditions for a healthy working
environment – both physically and mentally. We
engage in creating an inclusive workplace that
embraces the diversity of our people.
Targets and KPIs
72% male
28% female
12.1% The Americas
54.4% EMEA
Number of employees*
Gender
Geographical
Per functional group
3,6642018
3,6362019
3,3032020
* Reported in heads, excluding temporary workforce(Database Corporate Associates per 31/12/2020)
16.7% Sales
28.5% Research & development
1.4% Quality, supply chain & support
1.8% Procurement
29.6% Manufacturing & logistics
4.9% Marketing
8.9% Customer service
0.7% Customer projects
7.5% Administration
33.5% Asia-Pacific
1819
2021
1
2
3
56
7
8
9
10
12
13114
12
15
17
16
14
MATERIAL TOPICS
Barco
Inte
grate
d re
po
rt 20
20
33PPC
Plan
et - P
eo
ple
- Co
mm
un
ities
01 SUSTAINABILITY AMBITION STATEMENT
02 SUSTAINABILITY STRATEGY
04 MANAGING SUSTAINABILITY
03 SUSTAINABILITY PERFORMANCE

1. People (key) performance indicators*
MATERIAL TOPIC INDICATOR UNIT 2020 2019 2018
Employee engagement
Voluntary turnover rate % 9.6 9.1 9.1
Number of iGemba improvement suggestions # 3,485 6,079 6,031
Number of iGemba improvement suggestions per operator # 4.1 6 7.3
% implementation % 92 94 86
Employee net promotor score (NPS) # NA NA NA
Learning & development
% of vacancies filled internally % 20 24 25
% of employees receiving training % 85 61 68
Average training hours/employee hours 11.3 13.2 16.9
Average training investment/employee € 354 354 NA
% of leaders in annual talent development review % 30 44 NA
Employee health, safety & well-being
% of employees in long-term sick leave (> 1 yr) % 0.7 0.5 0.6
Lost time injury frequency rate # 2.4 2.7 3.0
Lost time injury severity rate # 0.07 0.05 NA
Diversity & inclusion
% women Barco overall % 27.6 28.4 28.1
% women senior mgt % 17.0 15.0 16.6
% employees <30 yrs % 9 10 10
% employees between 30 and 50 % 67 69 69
% employees > 50 % 24 22 21
Number of nationalities at headquarters # 24 25 26
Labor practices & human rights % of employees covered by formal collective agreements % 100 100 100
* Figures reported are in heads (not FTE), Cinionic employees are excluded . For definitions on indicators: see glossary
Barco
Inte
grate
d re
po
rt 20
20
34PPC
Plan
et - P
eo
ple
- Co
mm
un
ities
01 SUSTAINABILITY AMBITION STATEMENT
02 SUSTAINABILITY STRATEGY
04 MANAGING SUSTAINABILITY
03 SUSTAINABILITY PERFORMANCE

To me, what really marked
2020 was the agility,
creativity and resilience
shown by of each of
us, individually and as a
company .
Jan De WitteCEO
Our roadmap towards sustainable impact: key initiatives and action plans
Introduction
People are key to the success of our company . This is a truth
that is even more important in challenging times . As the entire
world was hit by covid-19 in 2020, so were the many Barco
teams around the world . But we all try to move beyond this
massive disruption as well as possible . Minimizing and bal-
ancing the impact of the corona crisis on our employees has
been a global priority of the whole company in general, and
the HR department in particular .
HR invested heavily in timely communication, in offering
support and insights on how to engage in strong employ-
ee-manager relations, and in staying connected with(in) teams
in a remote and/or hybrid work system . In addition, everyone
worked hard to ensure both the safety and the well-being (both
physically and mentally) of our
employees during the pandemic
– without, of course, neglecting
running projects .
With many challenges still ahead,
we want to keep delivering the
best possible working condi-
tions to our people . This means
ensuring employee engagement,
providing a safe and healthy
workspace, offering continuous
training and development oppor-
tunities and making diversity and
inclusion priorities .
A human-centered approach to reorganizations
More than complying with legal reg-
ulations when terminating a contract,
Barco always tries to exceed these,
taking a human-centric approach to
reorganizations – in line with our ‘we
care’ company culture . We follow best
practices and ensure a fair approach,
which varies according to the region .
In many cases, we offer our former
employees help with their career
transitions or provide outplacement
services, guiding them towards new
jobs outside the company .
In spite of our efforts to use tem-
porary work arrangements and
economic unemployment measures
for both white and blue collars where
possible, the covid-19 crisis led to a
reduction in our workforce . Between
150 to 200 people were impacted, of
which approximately 50 people were
redeployed within the company . In
addition, the Barco factory in Taiwan,
where approximately 250 people were
employed, was closed, as we decided
to outsource the UniSee LCM compo-
nent that was produced there .
We communicated transparently on
the why, what and how of the changes
via meetings, our intranet and other
dedicated channels, taking care to
always inform internal stakeholders
first . Only after explaining the back-
ground, the content and the scope
of the program to social partners did
we make announcements public . We
ensured a timely engagement with
employee representatives around the
world to start constructive dialogues .
Aware of the impact that eventual lay-
offs have on our people, we always try
to restrict the number of job losses
to the absolute minimum . In 2020, all
impacted employees received a sev-
erance package in line with or above
the (legal) standards .
Barco
Inte
grate
d re
po
rt 20
20
35PPC
Plan
et - P
eo
ple
- Co
mm
un
ities
01 SUSTAINABILITY AMBITION STATEMENT
02 SUSTAINABILITY STRATEGY
04 MANAGING SUSTAINABILITY
03 SUSTAINABILITY PERFORMANCE

During the 2020 covid-19 pandemic, it was a priority to keep
employees engaged and connected to our company and
each other, as many were working from home for a significant
amount of the time . We therefore continuously invested in
initiatives that maximize employee engagement . Pulse sur-
veys to measure employee engagement during the covid-19
lockdown allowed us to understand how our employees were
feeling and enabled us to identify concrete actions we needed
to take to work on to retain a motivating working atmosphere .
1.1 Culture journey
Scope: worldwide
What: in 2019, Barco embarked upon a journey to rejuvenate
its culture – in order to keep leading the pack in today’s rapidly
changing world . The journey continued in 2020, despite the
difficult circumstances .
Status and result: a large group of employees worldwide
attended workshops on the five culture building blocks, and
we continue to use these building blocks in the internal com-
munication channels and in company-wide training sessions .
Culture workshops were temporary suspended during the
covid-19 lockdown, but will start up again in 2021 .
1. Employee engagement
Next to ‘we care, we grow’, my favourite block
is ‘we team up to win globally’ because I’m a
firm believer in global thinking and local action .
This leads to real value when combined with our
cohesive culture and our focus on diversity and
inclusion . For me, the words ‘team’ and ‘globally’
are the keys to this building block .
Anthony HuyghebaertChief HR Officer
We care, we grow
It all starts with us . We support each other to be the
best we want to be . We build upon our talent to be
ready for tomorrow . We ask and give feedback to
become stronger . We leave room for vulnerability
and expect authenticity and integrity . We learn from
each other and invest in our growth, enabled by our
leaders .
We own our results
We get energy from moving forward and winning .
We agree on goals and bring together the means
to drive for full implementation, in a decisive and
transparent way . We include the right people at the
right time to make the best call along the journey .
We are self-empowered to make a positive impact .
We team up to win, globally
We build the best team to take the leap from
ideas to proof points, to execution . We truly
understand what it is we want to achieve
together . We regard diversity of background,
experience and skills as our strength . We
focus on helping each other, across regions
& functions, to reach our goals . We celebrate
success together and have fun while getting
there . That’s how we live our DNA .
We look for the better way
Continuous improvement brings us where it matters . We
are creative and stay curious . We reflect, coach, share to be
the leader in our markets . We take time to learn from each
other, our mistakes and the world around us . We challenge
ourselves and the status quo . We take down obstacles and
don’t fear change .
We think with the customer
Our customer is everywhere . It ’s our
end-users, our resellers, our colleagues
who depend on us to deliver . We prioritize
customer value & experience in everything
we do . To do so, we embrace our suppli-
ers & partners as part of our eco system .
We are empowered to explore ideas
beyond today’s market needs . We look for
scalable & innovative solutions that add
value for our customer, be it an internal
or an external customer .
Living our DNA: Barco’s five culture building blocks
Barco
Inte
grate
d re
po
rt 20
20
36PPC
Plan
et - P
eo
ple
- Co
mm
un
ities
01 SUSTAINABILITY AMBITION STATEMENT
02 SUSTAINABILITY STRATEGY
04 MANAGING SUSTAINABILITY
03 SUSTAINABILITY PERFORMANCE

1.2. A new way to measure employee satisfaction
Scope: All employees
What: in early 2020, Barco moved away from biannual
employee satisfaction surveys and introduced ‘Pulse surveys’
instead . These short polls allow us to measure employee sat-
isfaction multiple times a year, so we know exactly what lives
in the company at a certain point in time .
Status and result: the Pulse surveys proved to be a very handy
tool to keep up to date on employee engagement during the
covid-19 crisis, when many people were working remotely . We
conducted two surveys: a worldwide survey linked to the first
covid-19 outbreak (April 2020) and a survey for EMEA related
upon the return to the office (end of June 2020) . The response
rate for the global survey was over 70% and the outcome was
very positive: although 75% of respondents worked from home
for 100% of the time, engagement and connection to the
company was still very high – 85% of our employees indicated
they were doing okay or great .
iGemba: driving engagement in operations
For the 10th year in a row, Barco encouraged operators
to share their improvement ideas via the iGemba pro-
gram . iGemba’s goal has remained unaltered since the
establishment of the program: to establish a culture of
continuous improvement . Improvement ideas can be
in many domains: quality, safety, ergonomics, environ-
ment, … every suggestion that moves the organization
forward is welcomed .
In 2020, 3,485 suggestions were made (4 per opera-
tor), of which 3,206 were implemented . The drop in
suggestions compared to 2019 (6,079) is largely due
to the covid-19 situation .
3,485
improvement suggestions were made
in 2020 – 4 per operator
85%
of our employees participating in the
worldwide Pulse survey said they were
‘doing okay or great’ during the covid-19
lockdown
Covid-19
Barco
Inte
grate
d re
po
rt 20
20
37PPC
Plan
et - P
eo
ple
- Co
mm
un
ities
01 SUSTAINABILITY AMBITION STATEMENT
02 SUSTAINABILITY STRATEGY
04 MANAGING SUSTAINABILITY
03 SUSTAINABILITY PERFORMANCE

Barco India certified as a ‘Great Place to Work’ for two years in a row
In 2020, the Great Place to Work® Institute certified
Barco India as one of the ‘Great Places to Work’ in
the high-tech category for the second year in a row .
“In today’s turbulent times, we believe it’s more
important than ever to create a working environment
in which people feel safe and cared for . Our team
continues to live by our culture building blocks,” said
Rajiv Bhalla, managing director of Barco India, upon
receiving the award . “This certification confirms that
we are moving in the right direction in many of the
initiatives taken .”
Caring about people is in our company’s DNA . We aim to
establish a culture that places top priority on safety and on
health, as is declared in our Environment, Health, Safety and
Security Pledge . In 2020, our focus was inevitably on covid-19 .
Furthermore, Barco also engages in health and safety man-
agement activities in line with relevant laws, regulations and
company-specific issues .
2. Employee health, safety & well-being
In today’s turbulent times, we believe it’s more important than ever to create a working envi-ronment in which people feel safe and cared for . Our team
continues to live by our culture building blocks .
Rajiv BhallaManaging director, Barco India
PPC
Plan
et - P
eo
ple
- Co
mm
un
ities
38
01 INTRODUCTION 02 OUR SUSTAINABILITY STRATEGY
04 MANAGING SUSTAINABILITY
03 OUR SUSTAINABILITY PERFORMANCE

2.1 Making all workplaces safe during the covid-19 pandemic
Scope: worldwide
What: ensuring health and safety in the working environment
has been a top priority in 2020 . Because Barco is a global
company, with offices and production sites around the world,
not every site was in the same phase of the covid-19 outbreak .
This enabled us to learn from the experiences of other sites
and prepare all needed measures in an agile, upfront way . A
global response team was set up which reviewed the world-
wide pandemic impact, the legal obligations and the global
communication on measures taken within the Barco premises .
This team focused on:
• Guaranteeing compliance with the (constantly changing)
legal requirements in the different countries, e .g . working
from home;
• Constantly monitoring infected employees, and tracing
who they could have contacted within the company;
• Guaranteeing the supply of protective equipment (e .g .
hand gels, mouth masks);
• Organizing work in the office in line with social distancing
rules;
• Updating travel advice in function of the different rules in
the different countries;
• Regularly communicating with employees .
Result: preparing and transforming the sites in a fast way
allowed us to keep all branches open . Thanks to a wide range
of measures aimed at avoiding the spread of the covid-19 virus
and warning employees in the case of an infection – from fol-
lowing up on people’s health status and continuous tracing to
quarantining – contact tracing did not reveal any transmissions
of the covid-19 virus on the Barco premises .
Barco
Inte
grate
d re
po
rt 20
20
39PPC
Plan
et - P
eo
ple
- Co
mm
un
ities
01 SUSTAINABILITY AMBITION STATEMENT
02 SUSTAINABILITY STRATEGY
04 MANAGING SUSTAINABILITY
03 SUSTAINABILITY PERFORMANCE

2.2 Continuous improvement
Scope: worldwide
What: In line with our ambition for zero accidents, each Barco
site creates a Plan-Do-Check-Act cycle based on the group’s
requirements for safety and health management . This includes,
among other relevant activities, the development of a manage-
ment framework in each site governed by a safety and health
supervisor, and the implementation of risk assessments . Some
important actions for the mid-term are:
• Preparing for a health and safety management system
in the corporate headquarters: Barco Belgium has
started taking the necessary preparations to achieve the
ISO45001 standard . The first step was a gap analysis on
legislation for health and well-being and an ‘EHS Zero
Audit’ conducted by Agoria, the Belgian federation for the
technology industry .
• Chemical safety is a top priority throughout Barco.
Every person using the chemical lab needs to take a
training course on chemical safety . All chemicals used
must be screened by the chemical safety committee
and get a specific Barco number . In this way, we avoid
any unapproved chemicals from entering operations .
Workstations are equipped with safety instructions which
contain the information about chemical substances
provided by suppliers . These instructions present the
info in a clear and straightforward way, so employees
know what the risks are and which safety equipment they
should be wearing during their task . For every chemical
needed, we look for the safest and healthiest option
available . All information about chemicals is available on
our BarcoZone intranet .
• Ensuring laser safety. The laser safety committee ensures
that the strict laser safety procedures are respected and
that laser technology is always handled in dedicated
rooms .
• Placing the safety of Barco operators at the heart of
improvement ideas through the iGemba program: for
over ten years now, our iGemba program has encouraged
Barco operators around the globe to continuously
improve processes . iGemba promotes a safety culture as
one of the most important values .
2.3 Training and communication
Scope: worldwide
What: Barco employees and subcontractors working on Barco
premises are properly informed and trained for the tasks they
are performing – not only on a technical level, but also when it
comes to health, safety and well-being . We also actively com-
municate on the subject with employees through meetings
with labor unions and the joint management-worker Health
and Safety Committee at the headquarters .
Status and result: a specific mandatory Standards@Work
e-learning session on safety was launched in 2020 . 99% of
white collar employees followed the course .
2.4 Monitoring and measuring
Scope: worldwide
What: the Health & Safety Office at the Barco headquarters
regularly collects data on occupational accidents (lost-time
injury frequency rate + severity rate) at Barco manufacturing
and R&D sites . This allows Barco to have a full overview of
safety at the company, enabling a global and focused strategy .
The data is aggregated in a scorecard, which is presented to
the Audit Committee . Next to the metrics, information on the
health and safety activities carried out at our sites is collected,
providing insights into best practices .
Status and result: in 2020, the worldwide lost-time injury fre-
quency rate was 2 .4 and the lost-time injury severity rate 0 .07 .
Barco
Inte
grate
d re
po
rt 20
20
40PPC
Plan
et - P
eo
ple
- Co
mm
un
ities
01 SUSTAINABILITY AMBITION STATEMENT
02 SUSTAINABILITY STRATEGY
04 MANAGING SUSTAINABILITY
03 SUSTAINABILITY PERFORMANCE

2.5 Promoting mental health and well-being
Scope: worldwide
What: multiple actions are undertaken to promote the health
and well-being of all Barco employees:
• Barco offers multiple means to help employees balance
their time at work and their time at home within the
limits of business organization and local legislation . This
can include the more flexible organization of working
time or a flexible combination of working from home and
at the office . Depending on local legislation, Barco also
facilitates additional parental leave and short-term leave
to enable employees to care for family members during
sickness or to educate themselves .
• To uncover and mitigate psychosocial risks, we apply
the Health & Well-being Survey . It enables us to assess
departments or groups on their potential for psychosocial
risks and provides input for action plans . Through
dedicated training courses, we help supervisors and HR
business partners develop their coaching and leadership
skills so they can motivate their teams, communicate
openly and spot the warning signs of stress .
• At several Barco sites, employees can approach trained
confidants at all times . They are the primary go-to people
in case of problems with supervisors, psychosocial issues,
sexual discrimination and harassment, etc .
• Belgian employees and their family members struggling
with psychosocial issues can get free professional
advice and counsel through the employee assistance
program . In times of crisis, they can call a dedicated
hotline 24/7 and reach out to a competent professional
to receive discrete and confidential advice or support
with professional or personal questions or difficulties . In
addition, we also offer the ‘FitForLife’ training program,
which provides tips and tricks (via Skype or phone) to deal
with stress in a proactive manner .
• As an organization, Barco has established a clear
vision and policy regarding the reintegration of
employees after long-term sickness . From the moment
the employee reports an illness to the moment of
reintegration he or she can rely on internal support .
When the employee is (partly) fit for work again, the
reintegration process starts, which consists of different
steps and includes close follow-up by the manager,
HR business partner and occupational physician . In the
context of the reintegration, Barco’s health & well-being
officer convenes the welfare working group . This group
elaborates the reintegration policy and carries out an
annual evaluation . In addition, the health & well-being
officer is part of the Social Medical Team (SMT) . Together
with the occupational physician and HR business partner,
they investigate which of the employees in long-term
illness can resume work .
Status and result: also in 2020, people with psychosocial issues
were able to follow virtual guidance sessions, in accordance
with government advice to restrict physical presence . In the
worldwide Pulse survey (April 2020), 90% of all respondents
said they have access to and are satisfied with the information
on health and well-being . 87% considered communication to
be very good . 0 .7% of employees were on long-term sick leave
(i .e . > 1 year) in 2020 .
Barco
Inte
grate
d re
po
rt 20
20
41PPC
Plan
et - P
eo
ple
- Co
mm
un
ities
01 SUSTAINABILITY AMBITION STATEMENT
02 SUSTAINABILITY STRATEGY
04 MANAGING SUSTAINABILITY
03 SUSTAINABILITY PERFORMANCE

Maximizing the talent of our people is one of the main focus
points of Barco’s HR department . We invest in hiring, devel-
oping and retaining talented employees, with a focus on
sustainable employability .
Our mission is to promote and support employee development
and organizational effectiveness by providing high-quality
training programs and development opportunities that are
aligned with the strategic needs of the company . Training
sessions are designed to meet individual, group or depart-
mental, and company needs and objectives . We investigate
optimal channels for learning and development by offering
online and hybrid training courses and by investing equally in
job-related experiential learning and learning via interactions
with others . This includes promoting internal mobility, creating
a feedback culture, investing in people leadership, mentoring
and coaching . If a contract ends, Barco supports employees
as well as possible to find a new challenge .
In spite of the restrictions that the covid-19 pandemic imposed
in 2020, Barco kept investing in employee learning and devel-
opment, replacing our in-person courses with remote, virtual
training sessions .
3. Employee learning and development
3.1 Adapting training programs to strategic needs
Scope: all employees worldwide
What: in today’s continuously transforming business envi-
ronment, it is key to ensure that learning and development
initiatives proactively support employee development and
organizational effectiveness . Barco University therefore reg-
ularly adapts its training plans, taking into account urgently
needed skills and competences in different job domains
throughout the organization . Plans are drafted with input from
different ‘Governance Boards’, which consist of Barco stake-
holders from different regions and divisions . Together, they
identify the most important strategic needs our businesses are
facing and translate these into relevant learning and develop-
ment programs . With this approach, we can train, reskill and
recruit our people in a more focused and proactive way . The
Governance Boards also follow up on the balance between
the effort, cost and effectiveness of these programs .
In a growing number of Barco divisions, new organizational
blueprints lead to newly defined roles and positions, which
require new skill sets . Barco University enlists the training
courses – internal courses, Barco University courses, and exter-
nal trainings – that individual employees and teams need to
meet future requirements .
Status and result: 85% of Barco employees took training
courses in 2020 . On average, they received 11 .3 hours of train-
ing . The average amount spent per employee on training was
€354 . Leveraging our weConnect virtual training solution,
many in-person courses were replaced with remote, virtual
courses . Moreover, an increasing number of employees in
remote offices participated in trainings through either weCon-
nect or via other virtual training platforms .
3.2 Promoting internal mobility
Scope: all employees
What: whenever a vacancy occurs, the job is posted internally
and where relevant, Barco’s internal mobility forum actively
looks for an internal candidate with the needed skillset – in line
with Barco’s internal recruitment policy . In this way, we strive to
keep talent in-house . Internal mobility is not bound to a cer-
tain site, but is instead company-wide, enabling employees to
move to other countries to pursue their ambitions within Barco .
Status and result: the covid-19 pandemic triggered some unex-
pected circumstances in 2020 . While some divisions and job
functions saw an increase in demand and activities, others
faced a significant decrease . This allowed Barco to leverage
opportunities for internal mobility and redeployment, either
on a temporary or a permanent basis . In addition, it opened
up opportunities to further invest in development and attract
new talent . Globally, 20% of vacancies were filled internally in
2020 . This number does not take into account the temporary
redeployment resulting from covid-19 .
20%
of vacancies were filled
internally in 2020
Barco
Inte
grate
d re
po
rt 20
20
42PPC
Plan
et - P
eo
ple
- Co
mm
un
ities
01 SUSTAINABILITY AMBITION STATEMENT
02 SUSTAINABILITY STRATEGY
04 MANAGING SUSTAINABILITY
03 SUSTAINABILITY PERFORMANCE

3.3 Fostering a frequent feedback culture
Scope: all employees
What: at Barco, we invest in a culture of frequent feedback
because we believe this increases engagement, motivation
and performance . Feedback helps people understand how
they can contribute to the achievement of a shared goal, get
a feel for where they are and where they are heading, and
ensures that people feel connected . This means we encourage
and support managers in giving feedback to their employees
on a frequent, consistent and open basis, and we encourage
employees to give and ask feedback to their managers, peers
and project teams . Feedback moments include check-ins to
set performance expectations and to evaluate the performance
of the employee .
Status and result: despite the challenging working environ-
ment in 2020, which involved plenty of remote working, the
frequent feedback culture and frequent check-ins still flour-
ished . Based on – mostly virtual – evaluations and in close
cooperation with their direct leaders and HR business partners,
employees were able to define their personal development
plans, training needs and career paths .
3.4 Leadership development
Scope: worldwide, focus on current leaders, future leaders
and newly promoted leaders .
What: Barco leaders participate in an annual talent review that
assesses their performance and potential over the years, which
leads to a personal development plan . The Barco Leadership
Compass provides the worldwide framework for this by outlin-
ing clear expectations in three domains: thought leadership,
result leadership and people leadership . In this way, all leaders
at Barco know what is expected from them and can develop
their leadership skills based on a set of well-defined compe-
tences . Employees who are not yet in a leadership position
but have strong leadership talent and ambition are invited to
apply for the global emerging leadership program . The pro-
gram enables them to develop their skills in various aspects
of business and leadership, creating a strong foundation for
them to develop into the leaders of tomorrow .
Status and result: in spite of the covid-19 crisis, we were able
to assess 30% of Barco leaders during the annual talent review
and offer a personal set of practical tools to help them sharpen
their skills and capabilities . When life returns to normal after
the pandemic, it is Barco’s ambition to drastically expand this
group . 30 emerging leaders graduated from the emerging
leadership program in 2020 – which was redesigned to comply
with a 100%-digital format, after a face-to-face kick-off week in
February . Our ambition for 2021 is to further foster leadership
development, also bringing senior leaders into programs that
focus on resilience, change and adaptability .
BARCO LEADERSHIPCOMPASS
Barco
Inte
grate
d re
po
rt 20
20
43PPC
Plan
et - P
eo
ple
- Co
mm
un
ities
01 SUSTAINABILITY AMBITION STATEMENT
02 SUSTAINABILITY STRATEGY
04 MANAGING SUSTAINABILITY
03 SUSTAINABILITY PERFORMANCE

Leveraging our virtual education possibilities
In 2020, we made full use of weConnect, our own
powerful platform for virtual and hybrid education,
for our own training sessions . Most of the Barco
University courses as well as other programs like the
onboarding ‘Welcome Day’ for new employees were
organized using weConnect . The virtual platform also
made it easier for employees from remote teams to be
involved in training sessions . During the covid-19 pan-
4. Diversity & inclusion
At Barco, every employee is valued for their merits . For us,
equality is not a hollow phrase and we take measures to ensure
a balanced workforce . We strive for diverse teams and keep an
eye on the equal pay monitor to optimize equality . A dedicated
‘Women in Technology’ campaign continued to encourage
girls to pursue technical careers to ensure a better gender
balance in the future . Barco also works towards zero dis-
crimination and harassment . Our Code of Ethics is a formal
document that describes proper behavior, which all Barco
employees have pledged to honor .
demic, we opened our virtual classrooms to Belgian
organizations, companies, universities and schools,
supporting them to offer remote training opportunities
to their students, colleagues and employees . This way
we helped organizations in our community and made
them aware of the opportunities and added value of a
virtual classroom . The returns of these sessions were
donated to charity .
Barco
Inte
grate
d re
po
rt 20
20
44PPC
Plan
et - P
eo
ple
- Co
mm
un
ities
01 SUSTAINABILITY AMBITION STATEMENT
02 SUSTAINABILITY STRATEGY
04 MANAGING SUSTAINABILITY
03 SUSTAINABILITY PERFORMANCE

4.1 Diversifying teams
Scope: all employees
What: to build an inclusive working culture and leverage the
diversity we have in our teams, we offer a number of tools and
workshops that help people discover their styles, strengths
and the value they bring to the team . This not only leads to
self-awareness and self-understanding, but also helps people
to understand others and make the most of the relationships
that impact them in the workplace . When selecting participants
for specific programs (e .g . the emerging leadership program),
Barco always strives for a diverse and balanced mix that rep-
resents the Barco population worldwide . We also steer actively
towards diversity within the highest governance bodies . We
monitor, assess and evaluate gaps and areas for improvement
in the composition of our Board of Directors and of the Core
Leadership Team in terms of gender, age, capabilities, exper-
tise, educational and professional experience as well as
nationality .
Status and result: the covid-19 pandemic had a positive effect
on the inclusiveness of our teams . Team spirit and proximity
between team members in different locations improved as
we embraced videoconferencing and started to use a default
meeting tool .
28%
of Barco employees
are women
33%
of Board of Directors
are women
17%
of senior managers are
women
24nationalities
employed in our headquarters
Diversity by nationality
Diversity by gender Diversity by age
9% under 30 years
67% between 30 and 50
24% above 50 years
Barco
Inte
grate
d re
po
rt 20
20
45PPC
Plan
et - P
eo
ple
- Co
mm
un
ities
01 SUSTAINABILITY AMBITION STATEMENT
02 SUSTAINABILITY STRATEGY
04 MANAGING SUSTAINABILITY
03 SUSTAINABILITY PERFORMANCE

4.2 Equal pay monitoring
Scope: Belgium
What: Barco values equality between men and women and
believes this should be reflected in rewards . Our Job Grad-
ing Policy dictates that the salaries be based on a function
level and not assigned individually, ensuring that the wage
gap between women and men is negligible . Furthermore,
promotions and new hires are a shared responsibility between
the HR department and the managers . This extra pair of eyes
watching over all processes is another sanity check for equal
payment . Annually, a sanity check is done on the salaries of
men and women, monitoring the equal pay strategy per func-
tion level
Status and result: the pay gap between men and women in
an equal grade is below national average .
4.3 Working towards zero discrimination and harassment
Scope: all employees
What: Barco’s Code of Ethics is a formal description of how
employees are expected to behave . This includes a clear and
extensive indication that we do not allow any form of harass-
ment or discrimination . Well-known by all employees, this
code not only serves as a guide for proper behavior, but is also
an element of different policies, for example, in recruitment
and internal mobility . If the code is violated, employees can
confidentially report any case of (suspected) harassment or
discrimination to the whistleblower e-mail address of the
ethics department . Every occurrence is investigated with nec-
essary urgency and respect . A remediation procedure in line
with national legislation is foreseen, if applicable .
Status and result: in 2020, 98% of Barco white collar employ-
ees were trained on the Code of Ethics, which is a part of the
Standards@Work program . All senior managers sign off the
Code of Ethics annually .
Women in technology campaign
In 2019, Barco introduced a campaign encouraging
girls and women to pursue careers in technology .
We expanded the campaign in 2020, launching a
series of video testimonials on social media .
Meet Carla, Evelien, Jana and Melanie – our tech
girls
Barco
Inte
grate
d re
po
rt 20
20
46PPC
Plan
et - P
eo
ple
- Co
mm
un
ities
01 SUSTAINABILITY AMBITION STATEMENT
02 SUSTAINABILITY STRATEGY
04 MANAGING SUSTAINABILITY
03 SUSTAINABILITY PERFORMANCE

Communities1. TargetsOur ambition
We will play an active role in the communities
we operate in by upholding the highest ethical
and quality standards and expecting the same
from our business partners. We always aim to
deliver added value to our customers through
our solutions, services and capabilities. In
addition, we help ensure more people can
participate in and benefit from the innovation
society.
Targets & KPIs
* RBA: Responsible Business Alliance
100% of our employees
are trained in Barco’s
Standards@Work
100% of our key(+) and
core suppliers have signed
the declaration of compli-
ance with the RBA* Code of
Conduct
100% 100%
ST
AT
US
20
20
Reach a customer Net
Promotor Score (NPS) of 50
by 2022
50
4798%98%
14
1819
2021
1
3
56
7
8
9
10
12
13
15
17
16
114
2
MATERIAL TOPICS
Barco
Inte
grate
d re
po
rt 20
20
47PPC
Plan
et - P
eo
ple
- Co
mm
un
ities
01 SUSTAINABILITY AMBITION STATEMENT
02 SUSTAINABILITY STRATEGY
04 MANAGING SUSTAINABILITY
03 SUSTAINABILITY PERFORMANCE

2. Communities (key) performance indicators*
MATERIAL TOPIC INDICATOR UNIT TARGET 2020 2019 2018
Customer engagement
Customer loyalty index # NA NA 83
Customer Net Promotor Score (NPS) # 50 47 NA NA
Number of certified dealers/partners # 1,184 579 555
Product quality, safety & security
Number of product lines in scope of ISO 27001 # 2 1 NA
Business ethics % of employees trained in Barco’s Standards@Work** % 100 98 99 94
Responsible supply chain management
% of key(+) and core suppliers that signed declaration of compliance
with RBA Code of Conduct
% 100 98 98 95
% in-scope suppliers that responded to Conflict Minerals Reporting Template
(CMRT)
% 100 100 NA
% of key+ and core suppliers who received sustainability score in Supplier
Performance Review
% 78 NA NA
% of key+ and core suppliers with sustainability score higher than 80% % 43 NA NA
Number of supplier quality audits # 35 38 30
% of procurement employees trained in sustainable procurement % 100 NA NA
Community engagementCommunity investment € 141,920 163,400 102,000
Community involvement # heads +130 +230 +100
* For definitions of indicators: see glossary
** Standards@Work modules covered in 2020: Ethics, Cybersecurity, Quality, Safety, Sustainability, Data protection
Barco
Inte
grate
d re
po
rt 20
20
48PPC
Plan
et - P
eo
ple
- Co
mm
un
ities
01 SUSTAINABILITY AMBITION STATEMENT
02 SUSTAINABILITY STRATEGY
04 MANAGING SUSTAINABILITY
03 SUSTAINABILITY PERFORMANCE

Our roadmap towards sustainable impact: key initiatives and action plans
1. Customer engagement
“We think with the customer” is one of Barco’s core culture building blocks.
And rightly so: to succeed in our mission of enabling bright outcomes, we
have to fully understand what our customers want and offer the relevant
value propositions to deliver outstanding customer experiences. That’s why
we put great focus on becoming a more customer-centric company.
1.1 Kicking off our customer journey program
In 2018, we kicked off a customer journey program in the
Enterprise division, mapping the customers’ experience at
every phase of their journey with Barco: from the moment
they discover our products and decide to buy them, all the
way to renewal and services . These efforts led to really pos-
itive results .
In 2020, we started rolling out the customer journey program
in the entire Barco organization . In spite of the covid-19 crisis
in 2020, we managed to accelerate our efforts to drive cus-
tomer centricity across Barco .
No matter how good our solutions are, we have to offer mind-blowing services and build and foster outstanding cus-
tomer relationships to retain our position in today’s rapidly evolving markets .
Marc SpenléChief Digital and Information Officer
A great willingness to make the customers and their needs a priority
Marc Spenlé traded his role of CIO at Vodaphone for that of Barco’s Chief
Digital and Information Officer in the summer of 2020 . A true believer in
the importance and impact of customer centricity, he will help Barco to
put customers firmly at the heart of our organization: “No matter how
good our solutions are, we have to offer mind-blowing services and build
and foster outstanding customer relationships to retain our position in
today’s rapidly evolving markets .”
When asked about Barco’s customer experience roadmap, he is positive:
“Things are really moving . The transformation will take time, but from
what I see now, there’s a great willingness to make the customers and
their needs a priority in what we do .”
Barco
Inte
grate
d re
po
rt 20
20
49PPC
Plan
et - P
eo
ple
- Co
mm
un
ities
01 SUSTAINABILITY AMBITION STATEMENT
02 SUSTAINABILITY STRATEGY
04 MANAGING SUSTAINABILITY
03 SUSTAINABILITY PERFORMANCE
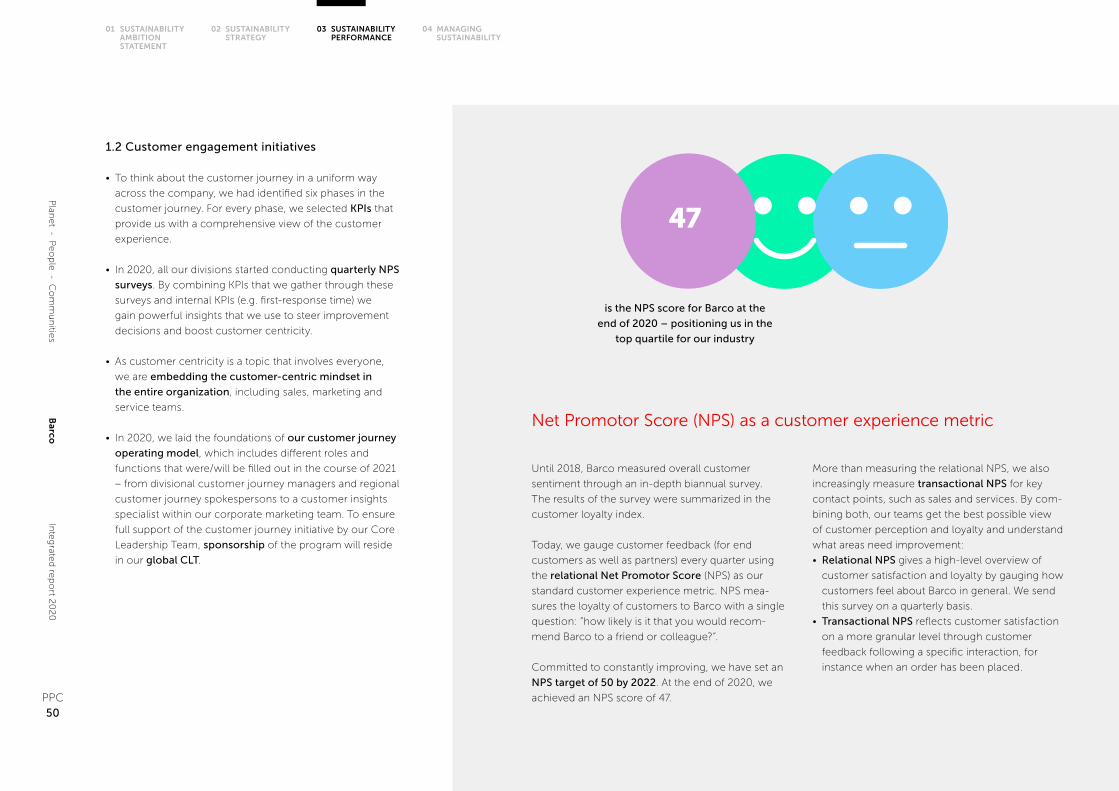
Net Promotor Score (NPS) as a customer experience metric
Until 2018, Barco measured overall customer
sentiment through an in-depth biannual survey .
The results of the survey were summarized in the
customer loyalty index .
Today, we gauge customer feedback (for end
customers as well as partners) every quarter using
the relational Net Promotor Score (NPS) as our
standard customer experience metric . NPS mea-
sures the loyalty of customers to Barco with a single
question: “how likely is it that you would recom-
mend Barco to a friend or colleague?” .
Committed to constantly improving, we have set an
NPS target of 50 by 2022 . At the end of 2020, we
achieved an NPS score of 47 .
More than measuring the relational NPS, we also
increasingly measure transactional NPS for key
contact points, such as sales and services . By com-
bining both, our teams get the best possible view
of customer perception and loyalty and understand
what areas need improvement:
• Relational NPS gives a high-level overview of
customer satisfaction and loyalty by gauging how
customers feel about Barco in general . We send
this survey on a quarterly basis .
• Transactional NPS reflects customer satisfaction
on a more granular level through customer
feedback following a specific interaction, for
instance when an order has been placed .
1.2 Customer engagement initiatives
• To think about the customer journey in a uniform way
across the company, we had identified six phases in the
customer journey . For every phase, we selected KPIs that
provide us with a comprehensive view of the customer
experience .
• In 2020, all our divisions started conducting quarterly NPS
surveys . By combining KPIs that we gather through these
surveys and internal KPIs (e .g . first-response time) we
gain powerful insights that we use to steer improvement
decisions and boost customer centricity .
• As customer centricity is a topic that involves everyone,
we are embedding the customer-centric mindset in
the entire organization, including sales, marketing and
service teams .
• In 2020, we laid the foundations of our customer journey
operating model, which includes different roles and
functions that were/will be filled out in the course of 2021
– from divisional customer journey managers and regional
customer journey spokespersons to a customer insights
specialist within our corporate marketing team . To ensure
full support of the customer journey initiative by our Core
Leadership Team, sponsorship of the program will reside
in our global CLT .
47
is the NPS score for Barco at the
end of 2020 – positioning us in the
top quartile for our industry
Barco
Inte
grate
d re
po
rt 20
20
50PPC
Plan
et - P
eo
ple
- Co
mm
un
ities
01 SUSTAINABILITY AMBITION STATEMENT
02 SUSTAINABILITY STRATEGY
04 MANAGING SUSTAINABILITY
03 SUSTAINABILITY PERFORMANCE

Virtual forums with customers and consultants
More than gauging customer needs through sur-
veys, we want to keep up with market trends,
developments and needs by meeting up with
our ecosystem of customers and partners . In
addition to the partner summits, we launched
several new initiatives to collect customer and
user feedback . In EMEA, for example, 40 of our
core end customers regularly get together in
the ‘inner circle forum’ to discuss trends and
roadmaps . In the US, consultant round tables
help us understand the needs of our markets .
1.3 Outlook for 2021 and beyond
In 2021 and beyond, we will accelerate all the above efforts
to further boost customer engagement . 2021 focus areas
include:
• Further rollout of the customer journey operating model .
• Installing a customer journey report to retain an overview
of KPIs, actions taken and progress made .
• Expanding the use of transactional NPS measurements .
• Putting a powerful marketing database into place
based on real-time, high-quality data in order to refine
segmentation and targeting .
• Further digitizing the end-to-end customer engagement
process .
Barco
Inte
grate
d re
po
rt 20
20
51PPC
Plan
et - P
eo
ple
- Co
mm
un
ities
01 SUSTAINABILITY AMBITION STATEMENT
02 SUSTAINABILITY STRATEGY
04 MANAGING SUSTAINABILITY
03 SUSTAINABILITY PERFORMANCE

Quality management system
The drive to realize our quality policy and ensure that every
product – hardware and software – that we launch is of the
highest quality, is ingrained in a company-wide quality man-
agement system .
This system defines the standard Barco processes – from prod-
uct planning, design and development, manufacturing and
sales all the way to customer service . One of the key aspects
of the system is the definition of clear roles and responsibili-
ties and the authority of those responsible for product quality
throughout the product life cycle .
Barco’s quality management system is audited annually and
certified according to international certification standards:
• ISO 9001 quality management system (for Barco sites in
US, Germany, India, Italy, China, Norway and Belgium);
• ISO 13485 quality management system specifically for
the medical device industry (for Barco sites in US, China,
Belgium, Italy and South Korea) .
2. Customer and product responsibility
As a high-tech company, we have a duty to our customers to ensure that
the products we develop and bring into the world are high-quality, safe
and secure.
Barco’s global Quality Policy
At Barco we are committed to
• delivering innovative and highly reliable out-
come-based solutions that meet customer,
legal, regulatory and security requirements;
• inspiring and engaging our people through
clear roles and responsibilities, with focus on
performance and customer satisfaction;
• continually monitoring and improving the
speed, efficiency and effectiveness of our
processes throughout the organization .
Quality organization
Our commitment to quality and customer satisfaction is also
reflected in Barco’s quality organizational structure . Each
division has dedicated quality assurance responsibles who
supervise process and product quality . In close collaboration
with the divisional management teams, they monitor quali-
ty-related indicators and spearhead improvement initiatives
to enhance the quality of our products and services . Together
with the quality responsibles assigned to each manufactur-
ing plant and the supplier quality responsibles, they form an
engaged team that is wholeheartedly committed to continu-
ously improving product quality for all our customers .
Quality by design
The sustained product quality levels are a result of Barco’s
standardized product design processes, focusing on:
• Compliance with the applicable standards, laws and
regulations, even exceeding them;
• “Security by design principle” to ensure protection
against the rising number of cyberattacks;
• Agile software development principles to ensure that
high-quality software is delivered at the right cadence;
• Close monitoring of key product quality indicators during
the different design stages;
• Early and automated product integration and validation;
• Reliable and mature supplier management and
manufacturing processes .
2.1 Product quality
In line with our mission to enable bright outcomes, Barco
aims to offer products and solutions that ensure top quality
over their entire lifetimes . Barco has always been considered
an A brand that delivers quality, yet we want to continuously
raise the bar in order to consistently meet and even exceed
customers’ quality expectations . That commitment is strongly
expressed in our global Quality Policy .
Barco
Inte
grate
d re
po
rt 20
20
52PPC
Plan
et - P
eo
ple
- Co
mm
un
ities
01 SUSTAINABILITY AMBITION STATEMENT
02 SUSTAINABILITY STRATEGY
04 MANAGING SUSTAINABILITY
03 SUSTAINABILITY PERFORMANCE

Closing the loop
The quality journey continues after product launch through a
set of different processes and initiatives to integrate feedback
into existing and new products, including:
• iGemba initiatives initiated by employees to raise product
quality;
• The monitoring of customer feedback and satisfaction by
the divisional and regional service team;
• Regular cross-functional quality meetings between
quality, R&D, procurement and service to monitor
and assess product quality indicators . When needed,
improvement activities are initiated in response to quality-
related issues;
• A monthly quality dashboard visualizing overall quality
performance and customer feedback .
Main achievements of 2020
• Gradual transition to one Barco-wide multisite ISO 9001
certificate;
• Successful completion of ISO 13485 certification in
Suzhou;
• IEC 62304 certification in Noida, ensuring compliance
with medical device regulations for software
development;
• Transition of the medical devices to the new EU medical
device regulation (MDR) . We are on track to ensure
business continuity when the MDR comes into force in
May 2021 .
2.2 Product safety
All Barco products are assessed, tested and certified to elim-
inate risk of injury or damage . However, technology evolves
rapidly these days – faster than the applicable standards that
are currently in place to ensure the safe use and servicing of
our products . New design methods merge various functional-
ities into the same product . That is why, in the past few years,
Barco has set up a major program to ensure that our complete
active product database complies with the hazard-based
safety standard that covers an integrated way of assessing
joint functionalities and risks .
Software as a potential critical component
By assessing software as a potential critical component in
product safety, we ensure the correct design, implementation
and updates of software by integrating it into software life cycle
processes and assessments .
Safety throughout the product lifecycle
As early as the concept and prototyping phase, we review the
applicable safety standards . The result of this review is a list
of requirements for critical components, suppliers, product
design, use cases, and manufacturing, obsolescence, and
component change management .
Throughout all product lifecycle stages, our product safety
engineers provide necessary input and execute tests against
the applicable standards in our company lab, according to the
ISO 17025 standard for test laboratories . The assessment is
successful only when the product passes on each requirement
and the test reports are approved by our external certification
partners . As a consequence, we CE-label our products with
the support of a third-party certification mark such as CEBEC
or DEMKO .
As long as our products are manufactured and/or sold, we
ensure compliance with updated safety standards and require-
ments . During that time, reports and certification marks serve
as proof that our products adhere to the latest iterations of
continuously evolving safety standards .
Production process safety
The activities of our in-house safety lab also support product
safety protocols regarding production processes . Proce-
dures concerning the control of nonconformity and corrective
and preventive actions are in place, thus meeting one of the
requirements of the ISO 9001 certification that Barco holds .
Our employees are continuously trained on safety aspects
of the new technologies that Barco uses in its products, as
well as on changing regulatory requirements .
Barco
Inte
grate
d re
po
rt 20
20
53PPC
Plan
et - P
eo
ple
- Co
mm
un
ities
01 SUSTAINABILITY AMBITION STATEMENT
02 SUSTAINABILITY STRATEGY
04 MANAGING SUSTAINABILITY
03 SUSTAINABILITY PERFORMANCE

Next to that, we also implement privacy controls in our prod-
ucts to comply with and allow our customers to comply with
privacy regulations, such as the General Data Protection Reg-
ulation (GDPR) and HIPAA .
Software updates and patches
Just like other professional software firms, we provide regular
software updates and patches . Patched security vulnerabilities
in each release are communicated in the release notes, which
can be found on our corporate website . If there are public
references (Common Vulnerabilities and Exposures (CVE)
identifiers) defined for the patched vulnerabilities, they are
also added to the release notes . Customers can subscribe to
receive news alerts about the products they are interested in .
Responsible disclosure policy
While we believe our security performance is above average
and despite our efforts to ensure that Barco products are as
secure as possible, vulnerabilities can still be present in our
products .
That is why our corporate website includes a responsible dis-
closure policy, which provides security researchers with clear
guidelines on how to reach out to us about security vulner-
abilities detected in our products . The feedback is carefully
handled using a risk-based approach by our product security
incident response team (PSIRT) . In 2020, we received 116 noti-
fications about potential vulnerabilities (including duplicates) in
products or services, reported by customers, ethical hackers
and third-party pen-testers contracted by Barco .
ISO/IEC 27001 certificationIn 2019, Barco obtained its first ISO/IEC 27001:
2013 certificate . It covers business processes,
infrastructure and tools related to software devel-
opment, sales, deployment and support of our
ClickShare wireless collaboration product line in
our Kortrijk, Noida and Taipei locations . In 2020,
the XMS cloud platform to manage the ClickShare
install base has been added to the scope of the
certificate .
2.3. Product security
With the number of cyberattacks rising exponentially and the
attacks getting increasingly sophisticated, it is vital to embed
product security in every step of a product’s lifecycle – from
design and development through to support and maintenance .
At Barco, product security architects and experts are the first
line of defense within the product business unit . They are
responsible for closely monitoring the implementation of tech-
nical security controls in products and improvements of the
secure software development lifecycle .
Secure software development
Our secure software development lifecycle follows the shift-
left security approach: we aim to integrate security controls
as early as possible in the design and development phases
of our products . This is industry best practice and becoming
increasingly important in complying with regulations that focus
on security by design, such as the United States Health Insur-
ance Portability and Accountability Act (HIPAA) and Medical
Device Regulation (MDR) .
To integrate these security controls, Barco uses source code
management platforms, bug tracking systems, threat model-
ing, static application security testing, open source security
and compliance management tools, dynamic application
security testing and vulnerability scanners . Furthermore, we
work together with independent security experts to train our
developers and test the security of our products . Thanks to
these efforts, we increasingly embrace the ‘security by design’
principle .
Read more on our security-by-design approach
Barco
Inte
grate
d re
po
rt 20
20
54PPC
Plan
et - P
eo
ple
- Co
mm
un
ities
01 SUSTAINABILITY AMBITION STATEMENT
02 SUSTAINABILITY STRATEGY
04 MANAGING SUSTAINABILITY
03 SUSTAINABILITY PERFORMANCE

3. Corporate security, data governance and privacy
As a technology leader that develops devices capable of connecting to the
internet and related software solutions, Barco is fully aware of the growing
importance of corporate security. In addition, we set great store by proper
data governance, in order to protect our data and that of our customers
and comply with regulations like GDPR and similar data privacy legislation
outside the EU.
3.1 Corporate security
Increasing security threats urge us to take all possible mea-
sures to keep our IT network, products and data, particularly
personal data, secure from inadvertent transfers, leaks and
cyberattacks . Moreover, legislative initiatives in this area have
increased with the GDPR, the directive on security of network
and information systems (NIS Directive), MDR, HIPAA and the
EU Cybersecurity Act, among others . Barco has a clear lead-
ership commitment to cybersecurity, which translates into
a Security Organization that operates along three lines of
defense .
THIRDLINE OF DEFENSE
= CYBERSECURITY AUDIT
• Risk assurances based on
the highest level of
independence and
objectivity
• Barco-wide security
programs
• Governance, policies
& controls
• Cyber risk assessment
• Promote awareness
• Monitor & evaluate
FIRSTLINE OF DEFENSE
= OPERATIONAL SECURITY
• Own and manage
operational risks
• Implement risk treatments
in processes & controls
• Maintain e�ective internal
controls
SECONDLINE OF DEFENSE
= SECURITY OFFICE
BARCOMANAGEMENT
Barco
Inte
grate
d re
po
rt 20
20
55PPC
Plan
et - P
eo
ple
- Co
mm
un
ities
01 SUSTAINABILITY AMBITION STATEMENT
02 SUSTAINABILITY STRATEGY
04 MANAGING SUSTAINABILITY
03 SUSTAINABILITY PERFORMANCE

Security Office
Barco’s Security Office, the second line of defense, is headed
by our chief information security officer (CISO) and drives
our cybersecurity program . At the core of this program is the
cybersecurity roadmap developed in line with Barco’s secu-
rity objectives . To identify new and remaining security gaps,
we regularly perform cybersecurity maturity assessments
using the NIST Cybersecurity Framework (CSF) . Our roadmap
is continuously evolving due to ever-changing threats (e .g .
ransomware attacks) and findings from internal and external
security audits and security tests conducted using a risk-based
approach . In addition, we take into account (potential) security
incidents reported by Barco employees . In 2020, they reported
a high number of potential phishing incidents .
The number of registered potential phishing inci-
dents rose by 50% in 2020 compared to 2019 . This
rise can be explained by an increase in external
threats as well as by the growing security awareness
of Barco employees, based on the knowledge they
obtained during our periodic phishing simulation
tests .
+50%
Information security management system
Barco has an information security management system
(ISMS) which complies with the ISO 27001 standard, cover-
ing policies, management involvement, business processes,
technology, compliance with local laws, security awareness
and security best practices . In collaboration with the data
protection officer, we assess a growing number of high-risk
third parties based on security and privacy requirements . In
addition, we continuously monitor our key vendors’ external
security activities . We are gradually working to contain all pro-
cesses, locations and products within the scope of our ISMS
and ISO/IEC 27001:2013 certification .
In 2020, we extended the scope of our ISO 27001 certificate
successfully with our eXperience Management Suite (XMS)
cloud offering, including additional controls from the ISO/IEC
27017:2015 and ISO/IEC 27018:2019 .
Ensuring secure remote working in 2020
The properly prepared move of collaboration tools to the cloud
allowed us to work securely and efficiently, even though an
unprecedented number of employees worked remotely in
2020 . The linked security risks were properly assessed before-
hand and mitigated by numerous additional controls, such
as the enforcement of multi-factor authentication (MFA) for
all Barco employees and additional security awareness about
cyber hygiene at home .
The scope of Barco’sISO/IEC 27001:2013 certificate has been
extended to include the eXperience Management
Suite (XMS) .
Raising employee awareness about security
In addition to the Standards@Work e-learning, Barco
also organizes the annual Cybersecurity Month .
Throughout the month, we provide ad hoc security
tips and offer voluntary online courses .
Barco
Inte
grate
d re
po
rt 20
20
56PPC
Plan
et - P
eo
ple
- Co
mm
un
ities
01 SUSTAINABILITY AMBITION STATEMENT
02 SUSTAINABILITY STRATEGY
04 MANAGING SUSTAINABILITY
03 SUSTAINABILITY PERFORMANCE
3.2 Data governance and privacy
Barco prioritizes the protection and management of personal
data in accordance with GDPR and similar data privacy legis-
lation outside the EU . Our data protection officer is in charge
of managing our data privacy compliance program, which is
governed by several procedures and frameworks .
Highlights in 2020 included:
• HIPAA compliance
As our healthcare offering includes a growing number
of connected services and software, we must step up
our efforts to remain compliant with the United States
Health Insurance Portability and Accountability Act
(HIPAA) and its related regulations . Barco is strengthening
its compliance efforts: several administrative, physical
and technical measures are required to assure the
confidentiality, integrity and availability of electronically
protected health information .
• Data privacy breaches
Since May 2018, an incident procedure has been in place
related to data privacy breaches . It includes details on how
and when to communicate with the impacted individuals,
affected customers and relevant authorities . Barco did
not receive any formal complaints from outside parties or
regulatory bodies concerning customer privacy breaches .
• Sub-processors of personal data
Barco ensures that sub-processors involved in the
processing of personal data comply with the minimum
data privacy and security requirements . The Security
Office, together with the data protection officer,
evaluate sub-processors based on security and privacy
requirements . Numerous data processing agreements
have been signed with sub-processors . These agreements
are required to pass the data protection requirements on
to these sub-processors .
• Product privacy statement
Barco’s product privacy statement explains what data
Barco may collect through its products and how Barco
uses that data . When Barco processes personal data on
behalf of its customers in providing online services to
these customers, this is governed by a data processing
addendum to ensure the data receives the appropriate
level of protection . Both the product privacy statement
and data processing addendum are available on the Barco
website .
• Privacy policy
Individuals using Barco products and individuals visiting
the Barco website can exercise their privacy rights in
accordance with the privacy policy on our website .
In 2020, we established a document retention policy,
which provides guidelines for the retention and
destruction of records in compliance with regulatory and
management requirements . Implementation of this policy
is scheduled for 2021 .
Barco
Inte
grate
d re
po
rt 20
20
57PPC
Plan
et - P
eo
ple
- Co
mm
un
ities
01 SUSTAINABILITY AMBITION STATEMENT
02 SUSTAINABILITY STRATEGY
04 MANAGING SUSTAINABILITY
03 SUSTAINABILITY PERFORMANCE

4. Ethics and compliance
Excellent financial performance does not conflict with high ethical
standards. The DNA that drives business efficiency and compliance is the
same: 100% say-do ratio, focus on solving issues rather than pushing them
out or cutting corners, and a relentless drive for process improvement.
Barco’s reputation and continued success depend on the conduct of
its employees as well as its business partners. That’s why we put great
emphasis on building a company culture in which ethical conduct and
compliance with Barco’s policies and the applicable regulations are at the
core of how we do business.
4.1 Building a true ethics and compliance culture
Barco continuously invests in building a structured, compa-
ny-wide compliance program . Its foundation is based on our
Code of Ethics, which outlines the basic principles of com-
pliant and ethical behavior when dealing with colleagues,
business partners, company assets, information, infrastruc-
ture, etc . Every manager is required to sign off on the Code
of Ethics annually .
4.2 Compliance Awareness Month
To raise awareness about the Code of Ethics, Barco organizes
a series of activities in the month of June – which is called
‘Compliance Awareness Month’ . We distribute posters in all
our facilities and offices and publish blog posts covering eth-
ical topics on the intranet . In addition, the compliance officer
shares the ‘Compliance Year in Review’ letter with employees
around the world . Translated into the most important lan-
guages, the letter contains a high-level overview of all the
ethics and compliance issues the company faced in the past
year .
Last but not least, we also organize the Compliance Challenge,
a live quiz with compliance-related questions . Over 50% of all
white-collar workers participate in the quiz each year . The team
with the highest score can proudly exhibit the Compliance
Cup in its office . Unfortunately, the covid-19 crisis prevented
us from organizing the Challenge in 2020 .
Barco
Inte
grate
d re
po
rt 20
20
58PPC
Plan
et - P
eo
ple
- Co
mm
un
ities
01 SUSTAINABILITY AMBITION STATEMENT
02 SUSTAINABILITY STRATEGY
04 MANAGING SUSTAINABILITY
03 SUSTAINABILITY PERFORMANCE

4.3 New global compliance manager
In January 2020, Barco designated a global compliance man-
ager tasked with implementing, monitoring and continuously
fine-tuning the company-wide compliance management sys-
tem . During the past year, she mapped the achievements,
weaknesses and improvement actions for each pillar of the
compliance management system and launched different
initiatives across the company to implement compliance
strengthening measures in each of the pillars .
4.4 Company-wide Standards@Work training
As part of its compliance program, Barco has developed a
company-wide training program hosted by Barco University,
its in-house training and development center . A consistent and
uniform set of e-learning courses covering cybersecurity, data
protection, sustainability, quality, safety, ethics and continuous
improvement has been developed . Every two months, a new
course is rolled out .
During these courses, Barco employees learn the standards
they must adhere to every day, hence the name of the program
– Standards@Work . Every employee must take these courses
within the deadlines set . We strive for a 100% participation rate
and actively follow up on employees with overdue learning
assignments . The e-learning courses achieve completion rates
well above 98% . Only employees who are on long-term sick
leave or will leave Barco in the near future did not take these
courses . In mid 2020, an updated series of e-learning courses
was launched .
Data Protection
Quality
Ethics
Safety
Sustainability Cyberse
curity
Continuous
improvement
Data Protection
Quality
Ethics
Safety
Sustainability Cyberse
curity
Continuous
improvement
Barco’s Standards@Work
Barco
Inte
grate
d re
po
rt 20
20
59PPC
Plan
et - P
eo
ple
- Co
mm
un
ities
01 SUSTAINABILITY AMBITION STATEMENT
02 SUSTAINABILITY STRATEGY
04 MANAGING SUSTAINABILITY
03 SUSTAINABILITY PERFORMANCE

4.5 Promoting a ‘speak up’ culture
Barco wants to actively promote a genuine ‘speak up’ culture
where ethical questions or dilemmas can be raised without fear
of retaliation . Employees who have questions or want to raise
concerns or issues can do so via several channels . Their direct
supervisor or HR business partner is the first line of contact .
In addition, any employee can reach out to a member of the
Legal, Risk & Compliance team or the Internal Audit team .
Questions and/or concerns can also be communicated via
the Ethics mailbox (ethics@barco .com) .
All questions or concerns addressed to the Ethics mailbox
are reviewed by the Ethics Committee, which consists of the
general counsel, the chief HR officer and the internal auditor .
This committee reviews incoming questions or concerns, and
assigns them to one of its members, depending on the subject
matter . This member is responsible for analyzing the question
or concern and proposing a satisfactory solution to the other
committee members . The Ethics Committee decides on the
solution, any remedial actions that may need to be taken and
prepares a response to the person that raised the question
or concern . Appropriate records are kept of all questions and
concerns raised via the Ethics mailbox .
4.6 Governmental investigations
Since Barco conducts business across the world, its opera-
tions are scrutinized by governmental authorities in different
countries from time to time .
• In India, the Directorate of Revenue Intelligence is
investigating the export of components from Barco’s
factory in India, which allegedly fall under the scope of
Indian SCOMET export regulations and would require
an export license . Barco contests the applicability of
SCOMET export regulations and filed a writ with the High
Court of Delhi . Due to the covid-19 epidemic, the hearing
has been repeatedly delayed .
4.7 Membership of associations
Barco is strongly integrated into local and professional initia-
tives as well as communities that are relevant for its activities .
It supports these initiatives and communities in various ways
– as a founding partner, through directorship, delegation of
employees to work groups, membership fees, etc . Below is a
non-exhaustive list of the various organizations and associa-
tions we are a member of:
• industry and trade associations and professional
networks:
Agoria, Society of Motion Picture and Television Engineers
(SMPTE), Radio Equipment Directive Compliance
Assocation (REDCA), Committee of European Accredited
Bodies and Laboratories in Electrotechnics (CE- ABLE),
Belgisch Elektrotechnisch Comité (BEC), Deutsches
Flachdisplay Forum, Techwatch, European University
Information Systems (EUNIS), Manufacturers Association
for Information Technology (MAIT), National Association
of Software and Service Companies (NASSCOM), EIT
Health, Society for Imaging science & technology, COCIR,
Laser Illuminated Projector Association (LIPA), Inter
Society Digital Cinema Forum, International Association
Of Amusement Parks, Themed Entertainment Association,
Belir, Belrim, Beltug, IBJ, VONK, Kortrijk IN, Executive
Global Network, Guberna, Communication Community .
Overview of the matters addressed via the Ethics mailbox in 2020
Data privacy 1
Inappropriate behavior 4
Conflicts of interest 4
Diversity 1
Total 10
Resolved: 7
Unresolved: 1
Closed: 2
Barco
Inte
grate
d re
po
rt 20
20
60PPC
Plan
et - P
eo
ple
- Co
mm
un
ities
01 SUSTAINABILITY AMBITION STATEMENT
02 SUSTAINABILITY STRATEGY
04 MANAGING SUSTAINABILITY
03 SUSTAINABILITY PERFORMANCE

• non-profit organizations supporting:
- local entrepreneurship, like Hangar K Start-up Incuba-
tor;
- innovative research within technology or sustainability
sector, like Flanders Make, Medtech Flanders, The Shift
and Valipac;
- international exchange and trade: Flemish-Chinese,
American, Belgo-Indian, Gwinnet County, Metro
Atlanta, Belgian American Chambers of Commerce,
Belgian Luxembourg Chamber of Commerce for Rus-
sia & Belarus and CanCham Belux;
• advocacy organizations, like Voka .
The membership fees for most of the above organizations and
associations range from €250 to €5,000 . Only a few require
membership fees ranging between €20,000 and €30,000 .
The largest contribution amounts to €50,000, the required
capital contribution for a founding member of the local non-
profit organization Hangar K, a joint initiative with education
institutions and the city of Kortrijk that supports start-ups and
young entrepreneurs in the educational and gaming tech-
nology domain .
Barco does not make donations or other contributions of any
kind to political parties .
5. Supply chain responsibility
In order to meet our customers’ expectations for high-quality, innovative
products, we rely on service and manufacturing partners from around the
world. Together, we continue to drive responsible and ethical behavior and
high standards across our supply chain.
In 2020, Barco had 142 core, key+ and key
group level suppliers, covering 81% of our
total direct spend for components and fin-
ished products . Up to 60% of our direct
spend is located in APAC, 27% in Europe
and 13% in the rest of the world .
5.1 Barco’s supply base
At Barco, we buy a wide range of components, from plastics,
electronic components and sheet metal to finished products,
from many different suppliers . Because we deal with so many
suppliers, we have categorized them into four categories: core,
key+, key and non-key suppliers, based upon spend and their
strategic technology importance to Barco . The categorization
enables us to define a clear scope and supplier management
activities for each category . For each category, we have estab-
lished different levels of engagement .
2020: a test for supply chain resilience
2020 proved to be a real test for Barco’s supply chain resil-
ience, given the trade wars and regional/global lockdowns
resulting from the covid-19 pandemic . All in all, Barco was able
to weather the storm, thanks to our agile reaction to sudden
changes in demand, logistics and suppliers . By taking advan-
tage of strategic stock and consignment models and regional
and global dual sourcing, we put our contingency plans to the
test . Our strong, long-term supplier relationships contributed
to the success of that approach .
The pandemic gave us insights into new opportunities to
enhance our supply base resilience, resulting in a number of
new initiatives in our risk management strategy .
81%142 suppliers
APAC: 60%
Europe: 27%
Rest of the
world: 13%
Barco
Inte
grate
d re
po
rt 20
20
61PPC
Plan
et - P
eo
ple
- Co
mm
un
ities
01 SUSTAINABILITY AMBITION STATEMENT
02 SUSTAINABILITY STRATEGY
04 MANAGING SUSTAINABILITY
03 SUSTAINABILITY PERFORMANCE

5.2 Setting clear standards for our suppliers
The key to a high standard supply chain is ensuring that our
suppliers know our expectations, including those in the field
of sustainability . We adhere to three important sustainability
standards: the RBA Code of Conduct, the Product Compliance
Requirements and the Responsible Minerals Policy .
RBA Code of Conduct
We require all our suppliers to comply with the RBA Code of
Conduct (Responsible Business Alliance) . Formerly known as
the EICC Code of Conduct, the RBA Code of Conduct is a set
of standards covering social, environmental and ethical topics
relevant to the electronics industry supply chain . The Code is
aligned with international norms and standards including the
Universal Declaration of Human Rights, ILO International Labor
Standards, OECD Guidelines for Multinational Enterprises, ISO
and SA standards . Topics covered include:
• Labor and human rights: freely chosen employment,
humane treatment, non-discrimination, freedom of
association, . . . .
• Health and safety: occupational safety, machine safety,
health and safety communication, . . .
• Environment: greenhouse gas emissions, hazardous
substances, environmental permits and reporting, . . .
• Ethics: business integrity, fair business, advertising and
competition, responsible sourcing of materials and
privacy .
The share of key(+) and core suppliers (which account for
more than 80% of the direct spend) who have committed to
the RBA Code of Conduct or have a similar code, is tracked
as a monthly KPI in the Global Procurement dashboard . In
2020, 98% key(+) and core suppliers signed the declaration of
compliance with the RBA Code of Conduct . A new version of
the code will be applicable in 2021, which will trigger suppliers
to renew their commitments to the code .
Product Compliance Requirements
Every component that our suppliers deliver to Barco must
comply with the Barco Product Compliance Requirements
(available on our website), which includes compliance with
worldwide regulations (such as RoHS10 and REACH, ecodesign
requirements, WEEE), industry standards and additional criteria
that we have defined . Barco also requires compliance with the
Barco substance list, in which we restrict the use of specific
chemicals or require declaration of specific substances . With
the implementation of the Barco substance list, we go beyond
current legislation .
In 2020, we rolled out a worldwide chemical substances
risk managing process with the purpose of safeguarding our
employees and the environment from harmful adhesives . The
process also validates chemicals that are defined by Barco
to be used at our assembly suppliers, phasing out high-risk
chemicals and providing safe use instructions .
We strongly urge suppliers to provide full material declarations
(FMDs) of their supplied components so that we can guaran-
tee future compliance of our products with environmental
regulations worldwide, including the forthcoming SCIP ECHA
database (database for information on Substances of Concern
In articles as such or in complex objects (Products)) . Thanks
to our large coverage of FMDs (82% of active components in
2020) and RoHS certificates with the applicable exemptions
we are able to upload our product families on time in the SCIP
database . In addition, the database helps us proactively phase
out substances from our products in line with our ecodesign
program and industry initiatives . A team of in-house experts
performs risk-based assessments of compliance data pro-
vided by suppliers and requires in-depth compliance data for
high-risk parts .
Responsible Minerals Policy
Managing our obligations in the field of conflict minerals is
part of Barco’s corporate responsibility . We and many of our
stakeholders are concerned about human rights violations in
different forms (child labor, human trafficking, forced labor etc .)
as well as armed conflicts causing extreme violence across
so-called “conflict-affected and high-risk areas” (CAHRAs) .
We recognize the risk related to illegal extraction and trade
of materials such as tin, tungsten, tantalum, gold and cobalt .
We align our Responsible Minerals Policy and practices with
the “OECD Due Diligence Guidance for Responsible Chains of
Minerals from Conflict-Affected and High-Risk Areas” (OECD
Due Diligence Guidance) . In addition, Barco has obligations
addressed by the legislators in various regions, including the
US and the European Union .
We support and comply with the OECD Due Diligence
Guidance for Responsible Supply Chains of Minerals from
Conflict-Affected and High-Risk Areas affected by the risks
defined in Annex 2 of the OECD Due Diligence Guidance . We
are committed to avoiding the purchase of products and mate-
rials containing conflict minerals directly from conflict mines .
Furthermore, we rolled out a uniform and enterprise-wide pro-
cess to determine the use, source and origin of the relevant
minerals in our supply chain (“Supply Chain Due Diligence”),
including “Responsible Minerals Assurance Process” (RMAP)
in line with the OECD guidelines .
We engage with suppliers in order to remediate risks and
perform additional due diligence so that we can continue to
source responsibly and safeguard the supply chain .
Barco
Inte
grate
d re
po
rt 20
20
62PPC
Plan
et - P
eo
ple
- Co
mm
un
ities
01 SUSTAINABILITY AMBITION STATEMENT
02 SUSTAINABILITY STRATEGY
04 MANAGING SUSTAINABILITY
03 SUSTAINABILITY PERFORMANCE

Our in-scope suppliers (i .e . . suppliers of components contain-
ing the minerals tungsten, tantalum, tin or gold) are expected
to source from responsible sources and start actively cascading
this request to the next tiers of Barco supply chain . We require
our suppliers to establish and maintain a publicly available
Responsible Minerals Sourcing Policy that aligns with the
OECD Guidelines .
In following the OECD Due Diligence Guidance, we request
our in-scope suppliers to investigate their supply chains to
determine the origins of metals contained in products sup-
plied to Barco . In-scope suppliers are required to complete
the Conflict Minerals Reporting Template (CMRT) of the
Responsible Mineral Initiative (RMI) . Our supply chain is very
responsive . Nevertheless, a dedicated escalation flow involving
procurement is available, forcing actors in the supply chain to
provide the required data . In 2020, 100% of in-scope suppliers
responded to the CMRT . We perform a detailed conflict miner-
als risk analysis on the data received through cross referencing
and close collaboration with members of the RMI .
In 2020, we started mapping the transparency of our supply
chain regarding cobalt in anticipation of future regulation and
customer expectations .
5.3 Further embedding sustainability in the procurement process
We encourage our suppliers to share our values and require for
them to meet our mandatory ethical, labor and environmental
standards . In order to ensure the level of engagement required,
we have further integrated sustainability into every step of the
procurement process .
a. Supplier scouting
The supplier self-assessment document includes sustainabil-
ity-related questions, which are reviewed and form the basis
for open discussions when a gap between supplier behavior
and our expectations is detected at first glance .
b. Supplier onboarding
In 2020, more sustainability criteria were added to the new
supplier selection report for new component suppliers .
c. Purchase contracts
Sustainability clauses are part of Barco’s terms and conditions
(T&Cs) for purchase as well as our master supply agreements
(MSAs) (i .e . contracts with key and core suppliers) . 100% of
key(+) and core suppliers signed contracts with sustainability
clauses, i .e . MSAs or signed T&Cs, in 2020 .
SCOUTING ONBOARDING PURCHASEPERFORMANCE MONITORING
CAPACITYBUILDING
Scope All potential
component
suppliers
New critical
component
suppliers
All suppliers All key+ & core
suppliers
All key(+) & core
suppliers
Tools Supplier self
assessment
document including
sustainability
questions
New supplier
selection report
including mandatory
sustainability criteria
Terms & conditions
of Purchase including
sustainability clause (all
purchase orders)
Contract including
sustainability clause (for
important spends)
Supplier
Performance
Review including
sustainability score
Webinars and
e-learnings
Supplier innovation
days
Barco
Inte
grate
d re
po
rt 20
20
63PPC
Plan
et - P
eo
ple
- Co
mm
un
ities
01 SUSTAINABILITY AMBITION STATEMENT
02 SUSTAINABILITY STRATEGY
04 MANAGING SUSTAINABILITY
03 SUSTAINABILITY PERFORMANCE

d. Supplier performance monitoring
78% of our targeted key+ and core suppliers received a sus-
tainability score in their performance review in 2020: suppliers
are scored on their performance in sustainability domains such
as product compliance requirements, adherence to RBA Code
of Conduct and transparency (the provision of CMRTs and
FMDs) . In 2020, 43% of our key+ and core suppliers in scope
for sustainability performance reviews got a score of >80%,
which is the requirement to be a Barco preferred supplier .
The sustainability score is communicated to suppliers during
business review meetings . Dedicated improvement actions
are agreed upon and tracked by the procurement delegate .
During these meetings, sustainability is a fixed topic of the
agenda: we share our sustainability ambitions and highlight
how important it is for our suppliers to help us achieve our
targets . Suppliers are encouraged to proactively share their
progress regarding sustainability in their operations and supply
chains, and to share innovations that could help us improve
the sustainability impact of our products .
e. Capacity building
We also want to ensure that our suppliers understand our sus-
tainability standards and learn how to act upon them . Through
different communication channels, we train suppliers and
inform them about developments in several sustainability
domains, such as environmental compliance, ecodesign and
conflict minerals .
5.4 Training our staff
In 2020, we organized a dedicated training course for our
procurement team on the Barco sustainability program, the
roadmap to a sustainable supply chain and the RBA Code of
Conduct . 100% of our procurement colleagues completed
the training .
5.5 Plans for 2021 and beyond
In 2020, we drafted a sustainable procurement policy, which
will be published in early 2021 . Activities in 2021 will still focus
on increasing awareness of sustainability within the global
procurement team as well among our suppliers . We continue
our journey from awareness to cooperative improvement of
the sustainability performance of our suppliers . The under-
writing of the new RBA Code of Conduct will facilitate the
discussion with our suppliers .
Our ambition for 2021 and beyond is to upgrade our supplier
sustainability program to an advanced level, as defined in our
sustainability roadmap .
Barco
Inte
grate
d re
po
rt 20
20
64PPC
Plan
et - P
eo
ple
- Co
mm
un
ities
01 SUSTAINABILITY AMBITION STATEMENT
02 SUSTAINABILITY STRATEGY
04 MANAGING SUSTAINABILITY
03 SUSTAINABILITY PERFORMANCE

Opening up our weConnect virtual classroom to other organizations during lockdowns
In March 2020, when the first confinement measures
and travel bans came into play, a lot of organizations
were forced to find alter-
natives for their on-site
training courses and edu-
cational programs . Barco
immediately decided to
open up its weConnect
virtual classroom so that
local companies could
stay in touch with their
employees around the
globe, for a small rental
fee . In addition, we also
made the virtual class-
room available to surrounding schools and universities .
The benefits were legion! All 497 virtual attendees who
participated in the virtual sessions were enthusiastic
about this unique oppor-
tunity . For Barco, this was
a great chance to receive
insightful feedback on
our weConnect solution .
Moreover, the proceeds
from the use of the virtual
classrooms went entirely
to charity: in November
2020, we donated €9,500
to AZ Groeninge hospital
in Kortrijk . The hospital will
use the funds to purchase
telemedicine equipment which allows healthcare pro-
fessionals to remotely monitor blood pressure, weight
or other patient parameters from home .
6. Community engagement
At Barco, it is our ambition to help ensure
more people can participate in and benefit
from a prospering society, regardless of their
backgrounds. We focus our support on the
areas of education and entrepreneurship.
We therefore connect our employees with
purpose, leveraging their engagement, expertise
and skills, and partner with non-profits and
social enterprises, targeting long-lasting
impact. Beneficiary groups are young and
underserved people, with the prime focus on
the communities where we live and work.
6.1 2020: an unequaled year that called for special support
With the coronavirus raging across the globe, we saw heart-
warming solidarity at many Barco sites . From donating medical
display systems and personal protective equipment in order
to help healthcare professionals battle the virus through to
installing a rental program for our virtual classrooms, here’s a
brief overview of some of the initiatives we launched:
• In Italy, we donated about 150 white suits and other
protective clothing to two nearby care centers .
• Barco Belgium raised money to buy protective clothing,
gloves and goggles for two Chinese hospitals .
• 38 medical display systems were donated to hospitals in
Beijing and in the provinces of Hebei and Hubei (China) .
• In Belgium, we bought cloth face masks from Think Pink,
the Belgian national breast cancer campaign . More than
protecting our people, the comfort masks showcase our
commitment to supporting the fight against breast cancer .
€9,500was raised through our virtual classroom rental
initiative during the covid-19 lockdown .
Barco
Inte
grate
d re
po
rt 20
20
65PPC
Plan
et - P
eo
ple
- Co
mm
un
ities
01 SUSTAINABILITY AMBITION STATEMENT
02 SUSTAINABILITY STRATEGY
04 MANAGING SUSTAINABILITY
03 SUSTAINABILITY PERFORMANCE

• In 2017, Sakshi, an Indian NGO concentrating on
education, health and community development,
founded Barco Sakshi Education Center – a new school
for underprivileged children in Noida, where our site is
located . Barco supported the foundation and continues
helping the school through various initiatives . In 2020, 28
Barco associates provided virtual classes for the school
children .
• Through the iGemba Scholarship Fund, Barco India is
giving back to its employees (blue collar in particular),
giving their children access to the innovation society
through good education . The concept is simple: for each
improvement suggestion that operators make through
our iGemba program, Barco contributes €3, which is
collected in a scholarship fund . Since the start of the pro-
6.2 Closing the education gap aroundthe world
Education is one of the keys to escaping poverty . Over the past
decade, major progress was made on increasing access to
education and school enrollment rates around the globe, yet
there is still a long way to go . Barco helps close the education
gap in order to improve the lives of underprivileged children
in a number of ways:
• Indus Action, a non-governmental organization
anchored in New Delhi, India, truly believes that when
children from different backgrounds and abilities study
together in one classroom, they can achieve their
highest potential . Currently active in 19 states, the
organization focuses on a mix of technology-based
interventions and policy advocacy to provide disad-
vantaged children with legitimate access to education .
Next to contributing financially to Indus Action, Barco
volunteers, particularly from the software team, also help
them design and test their software .
gram in 2014, 84 children of Barco employees received
the scholarship till date .
• For its emerging leadership program, Barco partners up
with StreetwiZe, a unique talent development provider
that develops high-impact learning products to com-
panies, inspired by the complex and competitive reality
of street communities . StreetwiZe invests 100% of their
profits in Mobile School, an organization that provides
non-formal education to street youth and helps them
grow into positive contributors to society .
• On the occasion of the ‘All In Virtual’ event, Barco US
donated $500 to Girls Who Code, an organization that
is committed to closing the gender gap in tech jobs
around the world .
Barco Play Day – a 2020 alternative
Each year since 2013, Barco has been organizing Barco Play
Day – a day of fun, games and workshops for underprivi-
leged children at Barco offices – first in Belgium and later
also in India and Germany .
“More than offering the children a fun day away from their
worries, we introduce them to the world of technology,”
explains Elsje Declercq, who is one of the driving forces
behind the initiative in Belgium . “By giving them a glimpse
behind the scenes of our company, we hope to inspire these
children to seek education in technology . It’s so rewarding
to hear that some of them have actually chosen a STEM
(science, technology, engineering and mathematics) edu-
cation because we inspired them and they would love to
work here .”
The success of Barco Play Day is due to the hard work of
many volunteers and contributions from a series of organi-
zations, including Barco . While the pandemic prevented the
team from organizing Barco Play Day in 2020, Elsje and her
Belgian colleagues decided to still collect money as well as
children’s clothes, toys and school equipment among Barco
colleagues – to help local organizations improve the lives
of vulnerable children in the neighborhood .
Barco
Inte
grate
d re
po
rt 20
20
66PPC
Plan
et - P
eo
ple
- Co
mm
un
ities
01 SUSTAINABILITY AMBITION STATEMENT
02 SUSTAINABILITY STRATEGY
04 MANAGING SUSTAINABILITY
03 SUSTAINABILITY PERFORMANCE

6.3 Ensuring healthy lives and promoting well-being
More than ensuring good health outcomes by delivering first-
class healthcare solutions and services, Barco wants to help
provide access to good healthcare services around the world .
In addition to the covid-19-related support, we supported the
following initiatives in 2020:
• We provided financial aid to CanSupport, India’s largest
free home-based palliative care program . The money
is used to fund mobile teams, each comprising a doctor,
a nurse and a counselor . In addition, Barco colleagues
volunteer at CanSupport daycare centers or organize fun
activities with young cancer patients .
• We also keep contributing financially to Urja Energy.
The NGO tries to eradicate the taboo of menstruation,
by educating women about menstrual hygiene . In
addition, they opened a unit for the production of 100%
biodegradable sanitary pads, where local women are
employed .
• In Norway, we supported organizations like Blue Cross,
which helps people with drug related problems, and the
National Association for Stopping Child Violence .
Closing the education gap with refurbished IT equipment
With access to a computer and digital literacy
training, children benefit from international
sources of information, helping them become
global citizens and stimulating entrepreneur-
ship . That’s why Barco decided to support Close
the Gap, a Belgian social enterprise that was
founded over 15 years ago with the aim of bridg-
ing the digital divide in developing and emerging
countries . One of the activities of Close the Gap
is collecting laptops, desktops, displays, servers,
etc . and refurbishing them for reuse in educa-
tional, medical and social projects, mostly in
developing and emerging countries .
Since the start of our partnership with Close the
Gap, Barco has donated over 6,500 pieces of IT
equipment . In 2020, we donated approximately
200 laptops and computers to Digital For Youth,
a Belgian organization founded by Close the Gap
and DNS that collects laptops from companies,
refurbishes them and distributes them to vul-
nerable young people . The computers were
donated to secondary school children to help
them take online courses during the covid-19
lockdown .
200 laptops and com-puters were donated to secondary school children to help them follow online courses during the covid-19
lockdown .
Barco
Inte
grate
d re
po
rt 20
20
67PPC
Plan
et - P
eo
ple
- Co
mm
un
ities
01 SUSTAINABILITY AMBITION STATEMENT
02 SUSTAINABILITY STRATEGY
04 MANAGING SUSTAINABILITY
03 SUSTAINABILITY PERFORMANCE

Managingsustainability
PPC
Barco
Inte
grate
d re
po
rt 20
20
68
Plan
et - P
eo
ple
- Co
mm
un
ities
01 SUSTAINABILITY AMBITION STATEMENT
02 SUSTAINABILITY STRATEGY
04 MANAGING SUSTAINABILITY
03 SUSTAINABILITY PERFORMANCE

Sustainability governance and responsibility
Governance keeps our corporate sustainability
strategy on track. It ensures that our strategy
remains effective, and that accountability for
our results sits right at the top of our company
Board of Directors - Audit Committee
At least once a year, sustainability is on the agenda of Barco’s
Audit Committee . The committee shares and discusses strate-
gic progress on Barco’s overall sustainability program as it is an
integral part of Barco’s corporate strategy . The committee also
reviews sustainability-related risks as part of it risk management
process and is informed about the issues and concerns raised
via the Ethics mailbox . In case the Audit Committee consid-
ers it appropriate, they further report issues and topics to the
Board of Directors . In 2020, the Audit Committee discussed
sustainability during the December meeting .
Core leadership team (CLT)
At least twice a year, sustainability is on the CLT meeting’s
agenda . The sustainability strategy and progress status are
shared and discussed .
Executive sustainability steering committee
The members of this committee are our Chief Executive Offi-
cer, Chief Human Resources Officer, Chief Financial Officer,
Group General Counsel, Senior Vice President Healthcare,
Senior Vice President Operations and Senior Vice President
Organizational Excellence . They review the corporate sustain-
ability strategy, approve targets and monitor execution, helping
SUSTAINABILITYWORKSTREAMS &
AMBASSADORS GROUPS
SUSTAINABILITYOFFICE
BOARD OF DIRECTORSAUDIT COMMITTEE
CORELEADERSHIP TEAM
SUSTAINABILITYWORKSTREAMS &
AMBASSADOR GROUPS
SUSTAINABILITYOFFICE
SUSTAINABILITYOFFICE
EXECUTIVE SUSTAINABILITY STEERING COMMITTEE
Barco
Inte
grate
d re
po
rt 20
20
69PPC
Plan
et - P
eo
ple
- Co
mm
un
ities
01 SUSTAINABILITY AMBITION STATEMENT
02 SUSTAINABILITY STRATEGY
04 MANAGING SUSTAINABILITY
03 SUSTAINABILITY PERFORMANCE

to ensure that sustainability is integrated into our business –
supporting Barco’s overall goals . The committee meets at least
once every quarter . The sustainability office reports directly
to this committee .
Sustainability office
The sustainability office, which is part of the finance depart-
ment, champions our company-wide commitment to
sustainability performance and transparency towards stake-
holders . The office conducts reporting activities and engages
with internal and external stakeholders to assess, prioritize, and
monitor sustainability focus areas . The office establishes the
corporate sustainability strategy, drives processes for sustain-
ability governance, and provides guidance and coordination
across business functions . It also sets corporate sustainability
targets based on the targets set by the business functions .
Sustainability workstreams
Sustainability focus areas are owned by the business . Within the
relevant business functions, sustainability workstream leaders
are responsible for delivering sustainability targets, managing
the sustainability plans and measuring performance . They
ensure that sustainability is integrated into Barco’s ongoing
business strategy and planning . Each workstream leader is
supported by a sponsor, i .e . a senior manager who serves as
a sounding board, facilitates decision-making and removes
obstacles for the workstream leader . The workstream leaders
share progress on sustainability focus areas to the Executive
sustainability steering committee .
Sustainability ambassador groups
The ambassador groups are cross-functional groups of highly
motivated employees, including the sustainability workstream
leaders . They discuss ongoing initiatives and partnerships,
suggest new ideas, etc . Led by the sustainability office, they
meet at least once every quarter . They also communicate and
amplify the accomplishment of key initiatives to all relevant
stakeholders .
SUSTAINABILITYWORKSTREAMS &
AMBASSADORS GROUPS
SUSTAINABILITYOFFICE
BOARD OF DIRECTORSAUDIT COMMITTEE
CORELEADERSHIP TEAM
SUSTAINABILITYWORKSTREAMS &
AMBASSADOR GROUPS
SUSTAINABILITYOFFICE
SUSTAINABILITYOFFICE
EXECUTIVE SUSTAINABILITY STEERING COMMITTEE
Barco
Inte
grate
d re
po
rt 20
20
70PPC
Plan
et - P
eo
ple
- Co
mm
un
ities
01 SUSTAINABILITY AMBITION STATEMENT
02 SUSTAINABILITY STRATEGY
04 MANAGING SUSTAINABILITY
03 SUSTAINABILITY PERFORMANCE

Stakeholder engagement
Barco attaches great importance to stakeholder engagement .
After all, external perspectives help us identify and prioritize
emerging issues and better align our strategy, actions and
policies with the interests of society and the planet . In addition,
stakeholders can provide valuable feedback on our perfor-
mance and other aspects of our activities, like transparency .
In short: stakeholder engagement supports our long-term
success .
Dedicated channels and processes
We have set up a series of dedicated channels and processes
to ensure we meet the expectations of all our key stakehold-
ers: customers, employees, investors, suppliers and (non-)
governmental organizations . By continuing to standardize
the process of interacting with our stakeholders, we can mit-
igate risks, identify new business opportunities and improve
financial results .
2020 stakeholder engagement process
In 2020, we organized a comprehensive stakeholder engage-
ment process, involving external stakeholders of all categories
as well as internal stakeholders as input for our materiality
assessment . Through one-on-one interviews and online sur-
veys, we reviewed stakeholder expectations to develop Barco’s
materiality matrix . The results are also being used to shape
our activities in 2021 and beyond . In total, 111 stakeholders
participated in the surveys and interviews .
Customers Employees Investors Suppliers (Non-) governmental
organizations
1 Customer
engagement
Customer
engagement
Financial resilience Innovation man-
agement
Climate change &
energy
2 Product quality,
safety & security
Employee
engagement
Sustained profitable
growth
Product quality,
safety & security
Information security
& data protection
3 Innovation man-
agement
Product quality,
safety & security
Market reach Business ethics Innovation manage-
ment
4 Financial resilience Innovation
management
Product quality,
safety & security
Customer engage-
ment
Product stewardship
5 Information
& data
protection
Brand Corporate
governance
Financial resilience /
Sustained profitable
growth
Employee health,
safety & well-being
Top 5 material topics by stakeholder group (2020 assessment)
A description of these topics can be found the ‘materiality’ section of our Integrated report .
Barco
Inte
grate
d re
po
rt 20
20
71PPC
Plan
et - P
eo
ple
- Co
mm
un
ities
01 SUSTAINABILITY AMBITION STATEMENT
02 SUSTAINABILITY STRATEGY
04 MANAGING SUSTAINABILITY
03 SUSTAINABILITY PERFORMANCE

Continuous stakeholder interaction
Our day-to-day activities also enable stakeholder interaction .
At Barco, every department is responsible for identifying and
engaging with its stakeholders (i .e . those they affect or are
affected by) . Barco’s corporate functions provide the depart-
ments with a framework for stakeholder engagement (i .e .
stakeholder identification and classification, guidelines for
stakeholder communication, etc .) . From informal dialogues to
contractual partnerships, our engagement with stakeholders
takes many different forms .
Customers
“We think with the customer” is one of Barco’s core cultural
building blocks . To succeed in our mission of enabling bright
outcomes, we have to fully understand what our customers
want and offer the relevant value propositions to deliver out-
standing customer experiences . That’s why we are constantly
raising the bar on customer experience – to become a truly
customer-centric company .
We engage with our customers via:
• NPS (Net Promotor Score) surveys;
• Daily contacts in the field (sales, segment marketing,
customer service, …);
• (Virtual or live) events and partner summits;
• Digital interaction via social media, website, etc .;
• Press releases .
Read more about our 2020 activities in the field of customer
engagement
Employees
People are key to the success of our company . We want to
deliver the best-possible working conditions to our people .
This means ensuring employee engagement, providing a
safe and healthy workspace, offering continuous training and
development opportunities and making diversity and inclusion
priorities .
We engage with our employees via:
• Townhall meetings and Q&A sessions for all employees;
• Regular updates on internal news portals (BarcoZone
intranet, Yammer and video walls in our offices);
• Inspiration sessions on several topics (including
sustainability);
• Frequent feedback sessions .
In case an employee wishes to report or discuss an issue,
even anonymously:
• They can talk to trained confidants;
• They can report the issue to the Ethics mailbox .
Read more about our 2020 employee engagement activities
Investors
We value the essential role that our capital providers play in
the success and prosperity of the company, as they allow
us to pursue long-term value creation . This should also lead
to a continuous increase of the company’s valuation for the
benefit of its shareholders . We actively seek engagement with
investors, as well as with financial advisors who cover Barco on
behalf of their financial market clients and ESG rating agencies .
We engage with investors via:
• The investor relations section on the company website;
• The Annual General Meeting of Shareholders;
• Events like the Capital Markets Day, investor conferences
and roadshows;
• Quarterly conference calls, one-on-one telephone and
video calls .
Suppliers
In order to meet our customers’ expectations for high-quality,
innovative products, we rely on service and manufacturing
partners from around the world . Barco maintains frequent
contact with suppliers, evaluates and trains them to ensure
that we continue to drive responsible and ethical behavior
and high standards across our supply chain .
We engage with suppliers via:
• Clear communication about our standards and their
updates (RBA Code of Conduct, Product Compliance
Requirements and the Responsible Minerals Policy);
• Monitoring and audit system to evaluate supplier
performance;
• Business reviews with key+ and core suppliers;
• Trainings (webinars and e-learnings);
• Supplier innovation days .
Read more about our 2020 efforts to ensure supplier engage-
ment
(Non-) governmental organizations
Barco is a member of several associations that operate on
global, regional, and national levels and enters into dialogue
with public authorities, policymakers, etc .
We engage with associations via:
• Participation in working groups of policymakers;
• Meetings, roundtables and conferences;
• Participation in global networks;
• Internships and lectures .
More information about our memberships can be found in
‘ethics & compliance’
In addition, we contribute to various charitable institutions and
community projects around the globe . Structural partnerships
include those with Close the Gap, Sakshi, Indusaction, Can-
Support and Urja Energy .
Discover our 2020 charity initiatives
Barco
Inte
grate
d re
po
rt 20
20
72PPC
Plan
et - P
eo
ple
- Co
mm
un
ities
01 SUSTAINABILITY AMBITION STATEMENT
02 SUSTAINABILITY STRATEGY
04 MANAGING SUSTAINABILITY
03 SUSTAINABILITY PERFORMANCE

External initiatives (platforms and commitments)
Science Based Targets initiative
The Science Based Targets initiative (SBTi) is a collaboration
between CDP, the United Nations Global Compact, World
Resources Institute (WRI) and the World Wildlife Fund (WWF) .
The SBTi is the only global initiative that directly links a com-
pany’s carbon-emission targets to the Paris Agreement and
associated global efforts, in order to keep the rise in global
temperature below 1 .5°C . Barco has signed the Business Ambi-
tion for 1 .5°C Commitment Letter in 2020 . Targets are currently
under validation .
Belgian Alliance for Climate Action
In 2020, Barco joined the Belgian Alliance for Climate Action
(BACA), a collective of organizations that commit to aligning
their activities with the goals of the Paris Agreement: to keep
global warming under 2°C and pursue efforts to limit it to 1 .5°C .
The Belgian Alliance for Climate Action is an initiative of WWF
Belgium and The Shift . It unites many Belgian organizations
that pledge to take the necessary steps towards a CO2-neutral
economy . This entails lowering the emission of greenhouse
gases, show more climate ambitions, and use Science Based
Targets (SBT) to reach the sustainability goals .
We Mean Business
A coalition of organizations working with thousands of the
world’s most influential businesses and investors to accelerate
the transition to a low-carbon economy . As a member, Barco
is committed to the initiatives and commitments put forward
by the We Mean Business Coalition .
The Shift
Barco is a member of The Shift, Belgium’s largest corporate
sustainability network . The aim of the organization is to realize
the transition to a more sustainable society and economy .
Biodiversity Green Deal
A Green Deal is a voluntary partnership between (private)
companies and the Government of Flanders (Belgium) who
commit themselves to setting up a green project together . This
particular Green Deal aims to increase biodiversity in business
parks and to rally public support for the initiative . More than
60 companies and organizations have already signed up to
participate in this Green Deal, including Barco .
Barco
Inte
grate
d re
po
rt 20
20
73PPC
Plan
et - P
eo
ple
- Co
mm
un
ities
01 SUSTAINABILITY AMBITION STATEMENT
02 SUSTAINABILITY STRATEGY
04 MANAGING SUSTAINABILITY
03 SUSTAINABILITY PERFORMANCE

Be The Change
What will our labor market look like in 2030? In the study ‘Shap-
ing the future of work’, Belgian technology sector federation
Agoria defined four strategies for a sustainable labor market .
These four strategies can be categorized as: activating unem-
ployed people or students, upskilling and retraining employees
and further developing and investing in technology . In 2019,
Barco endorsed the Be The Change Charter, committing to
adapting its personnel policy to the challenges of the labor
market of tomorrow . We took on four challenges:
• Mapping travel and travel time from employees
to customers, suppliers and within the company
and reducing these trips by at least 20% by 2022
(technology) .
• Investing at least 1/5th of our R&D resources in
technological solutions to facilitate remote services in
healthcare, education or companies (technology) .
• Sponsoring and having Barco employees take part in the
‘Take the Lead’ program to encourage and stimulate the
digital transformation in the company (upskilling and
technology) .
• Organizing company visits and technology workshops
for at least 15 teachers and students in three levels of
education, on a yearly basis (activation and upskilling) .
Certifications
In order to assure our stakeholders that our management sys-
tems meet international industry-specific standards, we have
obtained the following ISO certifications:
• ISO 9001 quality management system (for Barco sites in
US, Germany, India, Italy, China, Norway and Belgium)
• ISO 13485 quality management system specifically for
the medical devices industry (for Barco sites in US, China,
Belgium, Italy and South Korea)
• ISO 14001 environment management system (for Barco
sites in Belgium, China, India and Italy)
• ISO 27001 information security management system (for
Barco sites in Belgium, India and Taiwan)
During 2020 Barco was able to deliver on three of the four
challenges and is now in the running to apply for “Employer
ready for the future of work” .
Take the Lead
Vlerick Business School and business newspapers De Tijd &
L’Echo joined forces in developing Take the Lead as a social
commitment to respond to the increasing need for digital
knowledge in the business world . It is a learning program that
aims to create digital leaders . Barco is a partner in this program,
enabling it to be offered to a maximum number of participants .
Hangar K
Barco is a proud partner of Hangar K, a co-creation hub that
was inaugurated in October 2017 in Kortrijk, Belgium . More
than just a workspace, Hangar K is a competence center as well
as an incubator: a place where start-ups, scale-ups, established
companies and the academic world come together to inspire
each other and embrace the opportunities of the digital age
to build new, successful businesses .
Barco
Inte
grate
d re
po
rt 20
20
74PPC
Plan
et - P
eo
ple
- Co
mm
un
ities
01 SUSTAINABILITY AMBITION STATEMENT
02 SUSTAINABILITY STRATEGY
04 MANAGING SUSTAINABILITY
03 SUSTAINABILITY PERFORMANCE
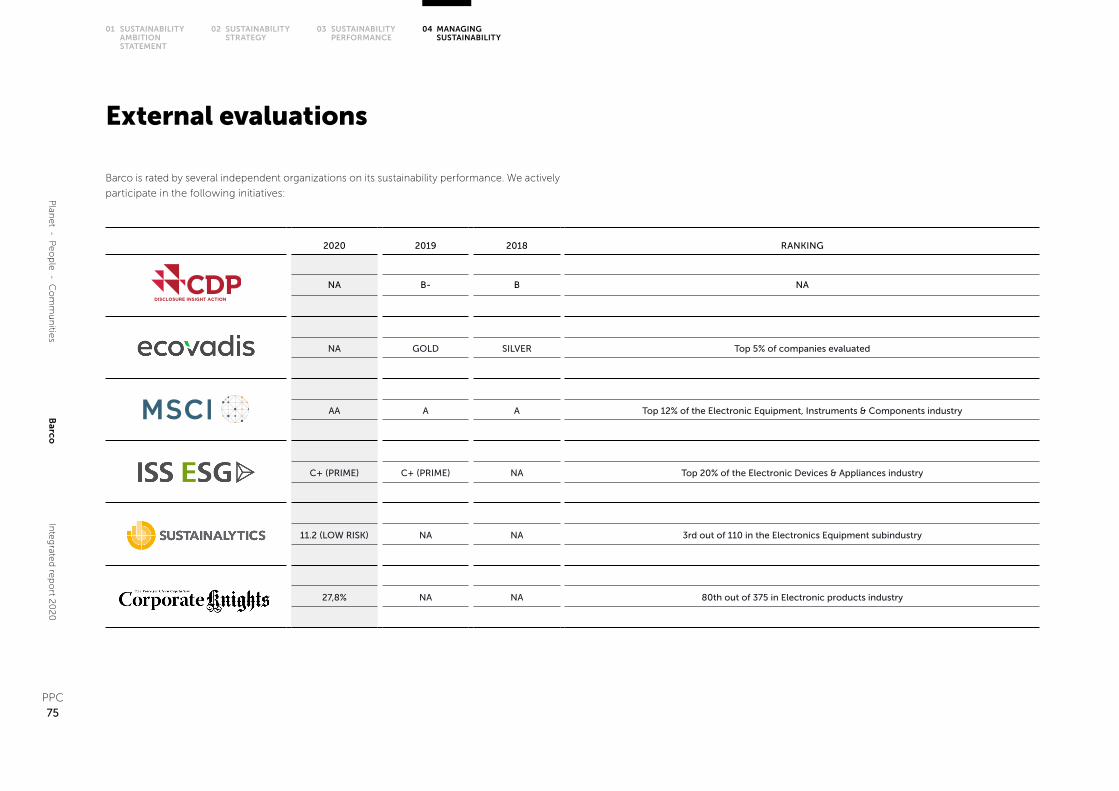
2020 2019 2018 RANKING
NA B- B NA
NA GOLD SILVER Top 5% of companies evaluated
AA A A Top 12% of the Electronic Equipment, Instruments & Components industry
C+ (PRIME) C+ (PRIME) NA Top 20% of the Electronic Devices & Appliances industry
11.2 (LOW RISK) NA NA 3rd out of 110 in the Electronics Equipment subindustry
27,8% NA NA 80th out of 375 in Electronic products industry
External evaluations
Barco is rated by several independent organizations on its sustainability performance . We actively
participate in the following initiatives:
Barco
Inte
grate
d re
po
rt 20
20
75PPC
Plan
et - P
eo
ple
- Co
mm
un
ities
01 SUSTAINABILITY AMBITION STATEMENT
02 SUSTAINABILITY STRATEGY
04 MANAGING SUSTAINABILITY
03 SUSTAINABILITY PERFORMANCE
CDP
CDP, the former Carbon Disclosure Project, runs the global
disclosure system that enables companies, cities, states and
regions to measure and manage their environmental impacts .
They have built a comprehensive global collection of self-re-
ported environmental data . By scoring businesses from A to
D, they take organizations on a journey from disclosure to
awareness, management, and finally leadership, on several
environmental topics such as climate change .
Every year, Barco measures and reports its carbon footprint
to CDP, benchmarking its sustainability performance to peer
groups suggested by CDP . We commit to the feedback pro-
gram as organized by CPD and set up action plans to mitigate
the risks and capitalize on the opportunities that CPD points
out . Barco received a B- score on its 2019 data .
EcoVadis
In recognition of its commitment to corporate social respon-
sibility (CSR), Barco has been awarded the Gold Rating by
EcoVadis in November 2019, placing us among the top 5% of
companies evaluated . The 2020 rating will be announced in
the course of 2021 .
EcoVadis’ independent sustainability rating platform mon-
itors and improves the environmental, ethical and social
performance of companies worldwide . EcoVadis provides
sustainability performance audits for 75,000+ companies
across 200+ sectors and in more than 160 countries .
MSCI
MSCI ESG ratings help investors identify ESG risks and opportu-
nities within their portfolio . They research and rate companies
on a ‘AAA’ to ‘CCC’ scale according to their exposure to indus-
try specific ESG risks and their ability to manage those risks
compared to peers . We have an AA score and rank among the
top 12% of the Electronic Equipment, Instruments & Com-
ponents industry .
ISS ESG
ISS ESG is one of the world’s leading rating agencies for
sustainable investments . The ISS ESG rating considers envi-
ronmental, social and governance (ESG) aspects by evaluating
more than 100 industry-specific indicators with grades from
A+ (best grade) to D- . Companies that achieve the best ESG
scores among their sector peers are recognized as ‘Prime’ .
Barco was evaluated for the first time in 2019 . We have a C+
score and are rated as a Prime company . With that result, we
rank among the top 20% companies of the Electronic Devices
& Appliances industry.
Sustainalytics
Sustainalytics’ ESG risk ratings measure how exposed a com-
pany is to industry-specific ESG risks and how well it deals with
these risks . The rating scale is made up of 5 risk levels ranging
from severe risk to negligible risk . Based on the latest update
(March 2020), the Barco rating is 11 .2 (low risk) . We rank 3rd
out of 110 in the Electronics Equipment subindustry .
Corporate knights
Corporate Knights is a Canadian media and research com-
pany producing rankings and financial product ratings based
on corporate sustainability performance . The annual Global
100, launched in 2005, recognizes successful corporations
that have been world leaders in environmental, social, and
governance issues . For this Corporate Knights analyzes 8080
publicly-trading corporations with a revenue of more than
USD $1 billion and applies 21 red flags and 24 key indicators
including the percentage of clean revenue and investment, as
well as carbon productivity .
Barco
Inte
grate
d re
po
rt 20
20
76PPC
Plan
et - P
eo
ple
- Co
mm
un
ities
01 SUSTAINABILITY AMBITION STATEMENT
02 SUSTAINABILITY STRATEGY
04 MANAGING SUSTAINABILITY
03 SUSTAINABILITY PERFORMANCE

2020Integratedannualreport
Financial report
ENABLING BRIGHT OUTCOMESbarco.com

Table of contents
This is the Governance & Risk Report
section of Barco’s 2020 Integrated annual
report. Other sections are available via the
download center at ir.barco.com/2020.
CORE
MORE
• Governance & risk report
• Report on planet - people - communities
• Financial report
ANNEX
• Assurance report
• GRI Content index
• Glossary
01 Barco consolidated . . . . . . . . . . . . . . . . . . . . . . . . . . . . . . . . .6
Notes to the consolidated financial statements. . . . . . . . . . 26
Supplementary statements . . . . . . . . . . . . . . . . . . . . . . . . . . . 87
Barco NV. . . . . . . . . . . . . . . . . . . . . . . . . . . . . . . . . . . . . . . . . . . 89
02 Information about the share . . . . . . . . . . . . . . . . . . . . . . 94
Key figures for the shareholder . . . . . . . . . . . . . . . . . . . . . . . . 95
Shareholder structure. . . . . . . . . . . . . . . . . . . . . . . . . . . . . . . . 99
Barco’s investment case. . . . . . . . . . . . . . . . . . . . . . . . . . . . . 101
14
1819
2021
1
2
3
56
7
8
9
10
12
13
15
17
16
411
MATERIAL TOPICS
Barco
Inte
grate
d re
po
rt 20
20
2
FIN
Finan
cial re
po
rt
01 BARCO CONSOLIDATED
02 INFORMATION ABOUT THE SHARE

IFRS Financial Statements
This chapter of the Annual Report contains the IFRS audited
consolidated financial statements including the notes
thereon, prepared in accordance with the International
Financial Reporting Standards as adopted by the European
Union.
The chapter ‘Our results’ provides an analysis of trends and
results of the 2020 financial year, and is based on the IFRS
consolidated financial statements and should be read in con-
junction with these statements.
14
1819
2021
1
2
3
56
7
8
9
10
12
13
15
17
16
411
MATERIAL TOPICS
Barco
Inte
grate
d re
po
rt 20
20
3
FIN
Finan
cial re
po
rt
01 BARCO CONSOLIDATED
02 INFORMATION ABOUT THE SHARE

Table of contents
Barco Consolidated
Consolidated statement of income . . . . . . . . . . . . . . . . . . . . . . . . . . . . . . . . . . . . . . . . . . . . . . . . . . . . . . . . . . . . . . . . . . . . . . . . . . 6
Statement of comprehensive income . . . . . . . . . . . . . . . . . . . . . . . . . . . . . . . . . . . . . . . . . . . . . . . . . . . . . . . . . . . . . . . . . . . . . . . . 7
Consolidated balance sheet. . . . . . . . . . . . . . . . . . . . . . . . . . . . . . . . . . . . . . . . . . . . . . . . . . . . . . . . . . . . . . . . . . . . . . . . . . . . . . . . . 8
Consolidated statement of cash flow. . . . . . . . . . . . . . . . . . . . . . . . . . . . . . . . . . . . . . . . . . . . . . . . . . . . . . . . . . . . . . . . . . . . . . . . . 9
Consolidated statement of changes in equity . . . . . . . . . . . . . . . . . . . . . . . . . . . . . . . . . . . . . . . . . . . . . . . . . . . . . . . . . . . . . . . . 11
Significant IFRS accounting principles . . . . . . . . . . . . . . . . . . . . . . . . . . . . . . . . . . . . . . . . . . . . . . . . . . . . . . . . . . . . . . . . . . . . . . . 13
IFRS accounting standards adopted as of 2020 . . . . . . . . . . . . . . . . . . . . . . . . . . . . . . . . . . . . . . . . . . . . . . . . . . . . . . . . . . . . . . . 21
IFRS accounting standards issued but not yet effective as of 2020. . . . . . . . . . . . . . . . . . . . . . . . . . . . . . . . . . . . . . . . . . . . . . . 21
Critical accounting judgments and key sources of estimation uncertainty. . . . . . . . . . . . . . . . . . . . . . . . . . . . . . . . . . . . . . . . 22
Notes to the consolidated financial statements
1. Consolidated companies . . . . . . . . . . . . . . . . . . . . . . . . . . . . . . . . . . . . . . . . . . . . . . . . . . . . . . . . . . . . . . . . . . . . . . . . . . . . 25
2. Operating Segments information . . . . . . . . . . . . . . . . . . . . . . . . . . . . . . . . . . . . . . . . . . . . . . . . . . . . . . . . . . . . . . . . . . . . . 28
3. Income from operations (EBIT) . . . . . . . . . . . . . . . . . . . . . . . . . . . . . . . . . . . . . . . . . . . . . . . . . . . . . . . . . . . . . . . . . . . . . . . 37
4. Revenues and expenses by nature . . . . . . . . . . . . . . . . . . . . . . . . . . . . . . . . . . . . . . . . . . . . . . . . . . . . . . . . . . . . . . . . . . . . 42
5. Restructuring and impairment costs . . . . . . . . . . . . . . . . . . . . . . . . . . . . . . . . . . . . . . . . . . . . . . . . . . . . . . . . . . . . . . . . . . 44
6. Income taxes . . . . . . . . . . . . . . . . . . . . . . . . . . . . . . . . . . . . . . . . . . . . . . . . . . . . . . . . . . . . . . . . . . . . . . . . . . . . . . . . . . . . . . 45
7. Earnings per share . . . . . . . . . . . . . . . . . . . . . . . . . . . . . . . . . . . . . . . . . . . . . . . . . . . . . . . . . . . . . . . . . . . . . . . . . . . . . . . . . . 46
8. Goodwill . . . . . . . . . . . . . . . . . . . . . . . . . . . . . . . . . . . . . . . . . . . . . . . . . . . . . . . . . . . . . . . . . . . . . . . . . . . . . . . . . . . . . . . . . . 47
9. Other intangible and tangible fixed assets. . . . . . . . . . . . . . . . . . . . . . . . . . . . . . . . . . . . . . . . . . . . . . . . . . . . . . . . . . . . . . 50
10. Deferred tax assets – deferred tax liabilities. . . . . . . . . . . . . . . . . . . . . . . . . . . . . . . . . . . . . . . . . . . . . . . . . . . . . . . . . . . . . 55
11. Investments and interest in associates . . . . . . . . . . . . . . . . . . . . . . . . . . . . . . . . . . . . . . . . . . . . . . . . . . . . . . . . . . . . . . . . 57
12. Inventory . . . . . . . . . . . . . . . . . . . . . . . . . . . . . . . . . . . . . . . . . . . . . . . . . . . . . . . . . . . . . . . . . . . . . . . . . . . . . . . . . . . . . . . . . . 59
13. Amounts receivable and other non-current assets . . . . . . . . . . . . . . . . . . . . . . . . . . . . . . . . . . . . . . . . . . . . . . . . . . . . . .60
14. Net financial cash/debt . . . . . . . . . . . . . . . . . . . . . . . . . . . . . . . . . . . . . . . . . . . . . . . . . . . . . . . . . . . . . . . . . . . . . . . . . . . . . . 62
15. Other long-term liabilities. . . . . . . . . . . . . . . . . . . . . . . . . . . . . . . . . . . . . . . . . . . . . . . . . . . . . . . . . . . . . . . . . . . . . . . . . . . . 66
16. Equity attributable to equity holders of the parent. . . . . . . . . . . . . . . . . . . . . . . . . . . . . . . . . . . . . . . . . . . . . . . . . . . . . . . 67
17. Non-controlling interest . . . . . . . . . . . . . . . . . . . . . . . . . . . . . . . . . . . . . . . . . . . . . . . . . . . . . . . . . . . . . . . . . . . . . . . . . . . . . 71
Barco
Inte
grate
d re
po
rt 20
20
4
FIN
Finan
cial re
po
rt
01 BARCO CONSOLIDATED
02 INFORMATION ABOUT THE SHARE

18. Trade payables and advances received from customers . . . . . . . . . . . . . . . . . . . . . . . . . . . . . . . . . . . . . . . . . . . . . . . . . 73
19. Provisions . . . . . . . . . . . . . . . . . . . . . . . . . . . . . . . . . . . . . . . . . . . . . . . . . . . . . . . . . . . . . . . . . . . . . . . . . . . . . . . . . . . . . . . . . 73
20. Risk management - derivative financial instruments . . . . . . . . . . . . . . . . . . . . . . . . . . . . . . . . . . . . . . . . . . . . . . . . . . . . . 77
21. Operating leases . . . . . . . . . . . . . . . . . . . . . . . . . . . . . . . . . . . . . . . . . . . . . . . . . . . . . . . . . . . . . . . . . . . . . . . . . . . . . . . . . . . 82
22. Rights and commitments not reflected in the balance sheet . . . . . . . . . . . . . . . . . . . . . . . . . . . . . . . . . . . . . . . . . . . . . 83
23. Related party transactions . . . . . . . . . . . . . . . . . . . . . . . . . . . . . . . . . . . . . . . . . . . . . . . . . . . . . . . . . . . . . . . . . . . . . . . . . . . 84
24. Cash flow statement: effect of acquisitions and disposals . . . . . . . . . . . . . . . . . . . . . . . . . . . . . . . . . . . . . . . . . . . . . . . . 84
25. Events subsequent to the balance sheet date. . . . . . . . . . . . . . . . . . . . . . . . . . . . . . . . . . . . . . . . . . . . . . . . . . . . . . . . . . . 86
Supplementary statements . . . . . . . . . . . . . . . . . . . . . . . . . . . . . . . . . . . . . . . . . . . . . . . . . . . . . . . . . . . . . . . . . . . . . . . . . . . . . . . . . . .87
Free Cash Flow . . . . . . . . . . . . . . . . . . . . . . . . . . . . . . . . . . . . . . . . . . . . . . . . . . . . . . . . . . . . . . . . . . . . . . . . . . . . . . . . . . . . . . . . 87
Return on Operating Capital Employed . . . . . . . . . . . . . . . . . . . . . . . . . . . . . . . . . . . . . . . . . . . . . . . . . . . . . . . . . . . . . . . . . . .88
Supplementary information. . . . . . . . . . . . . . . . . . . . . . . . . . . . . . . . . . . . . . . . . . . . . . . . . . . . . . . . . . . . . . . . . . . . . . . . . . . . . . . . . . 89
Barco NV
Balance sheet after appropriation . . . . . . . . . . . . . . . . . . . . . . . . . . . . . . . . . . . . . . . . . . . . . . . . . . . . . . . . . . . . . . . . . . . . . . . .90
Income statement . . . . . . . . . . . . . . . . . . . . . . . . . . . . . . . . . . . . . . . . . . . . . . . . . . . . . . . . . . . . . . . . . . . . . . . . . . . . . . . . . . . . . 92
Proposed appropriation of Barco NV result . . . . . . . . . . . . . . . . . . . . . . . . . . . . . . . . . . . . . . . . . . . . . . . . . . . . . . . . . . . . . . . . 93
Barco
Inte
grate
d re
po
rt 20
20
5
FIN
Finan
cial re
po
rt
01 BARCO CONSOLIDATED
02 INFORMATION ABOUT THE SHARE

IN THOUSANDS OF EURO NOTE 2020 2019 2018
Sales 3 770,083 1,082,570 1,028,531
Cost of goods sold 3 -486,300 -653,274 -615,578
Gross profit 3 283,783 429,295 412,953
Research and development expenses 3(a) -102,610 -119,389 -120,279
Sales and marketing expenses 3(b) -112,329 -142,517 -147,723
General and administration expenses 3(c) -50,362 -57,632 -57,464
Other operating income (expense) - net 3(d) -8,302 280 2,488
Adjusted EBIT (a) 3 10,180 110,038 89,974
Restructuring and impairments 5 -14,513 - -17,000
Gain on change in control - - 16,384
EBIT 3 -4,332 110,038 89,358
Interest income 1,845 7,648 5,915
Interest expense -1,965 -1,866 -1,566
Income before taxes 6 -4,453 115,820 93,708
Income taxes 6 - -20,848 -16,586
Result after taxes -4,453 94,973 77,121
Share in the result of joint ventures and associates 11 -276 1,566 191
Net income -4,729 96,539 77,312
Net income attributable to non-controlling interest 17 -335 1,176 2,347
Net income attributable to the equity holder of the parent -4,393 95,363 74,965
Earnings per share (in euro) (b) 7 -0.05 1.09 0.86
Diluted earnings per share (in euro) 7 -0.05 1.07 0.85
Consolidated Statement of Income
(a) Management considers adjusted EBIT to be a relevant performance
measure in order to compare results over the period 2018 to 2020, as it
excludes adjusting items. Adjusting items include restructuring costs and
impairments and one-time gains such as on the sale of 9% shares of
BarcoCFG in 2018. We refer to note 5 restructuring and impairment costs.
(b) Earnings per share, restated for the stock split as implemented on 1/07/2020.
Barco
Inte
grate
d re
po
rt 20
20
6
FIN
Finan
cial re
po
rt
01 BARCO CONSOLIDATED
02 INFORMATION ABOUT THE SHARE

IN THOUSANDS OF EURO 2020 2019 2018
Net income -4,729 96,539 77,312
Exchange differences on translation of foreign operations (a) -29,625 5,250 952
Cash flow hedges
Net gain/(loss) on cash flow hedges 62 -165 95
Income tax -15 30 -17
Net gain/(loss) on cash flow hedges, net of tax 46 -135 78
Other comprehensive income/(loss) to be recycled through profit and loss in subsequent periods -29,579 5,114 1,031
Remeasurement gains/(losses) on defined benefit plans 19 37 -11,337 -5,676
Deferred tax on remeasurement gains/(losses) on defined benefit plans 10 -9 2,834 1,419
Actuarial gains or losses, net of tax 28 -8,503 -4,256
Changes in the fair value of equity investments through other comprehensive income 11 18,331 1,852
Other comprehensive income/(loss) not to be reclassified to profit or loss in subsequent periods 18,358 -6,650 -4,256
Other comprehensive income/(loss) for the period, net of tax effect -11,221 -1,536 -3,226
Attributable to equity holder of the parent -8,764 -1,075 -3,303
Attributable to non-controlling interest -2,457 -461 77
Total comprehensive income/(loss) for the year, net of tax -15,950 95,003 74,086
Attributable to equity holder of the parent -13,157 94,288 71,662
Attributable to non-controlling interest -2,793 715 2,424
Statement of comprehensive income
(a) Translation exposure gives rise to non-cash exchange gains/losses. Examples are foreign equity and other long-term investments abroad. These long-term
investments give rise to periodic translation gains/losses that are non-cash in nature until the investment is realized or liquidated. The comprehensive income
line commonly shows a positive result in case the foreign currency appreciates versus the Euro in countries where investments were made and a negative result
in case the foreign currency depreciates.
In 2020, the negative exchange differences in the comprehensive income line were mainly booked on foreign operations held in Hong Kong Dollar, US Dollar,
Indian Rupee and Norwegian Krone (see note 16.4). In 2019, the positive exchange differences in the comprehensive income line were mainly booked on foreign
operations held in US Dollar, Chinese Yuan and Hong Kong Dollar. In 2018, the positive exchange differences in the comprehensive income line were mainly
booked on foreign operations held in US Dollar and Hong Kong Dollar.
The accompanying notes are an integral part of this income statement.
Barco
Inte
grate
d re
po
rt 20
20
7
FIN
Finan
cial re
po
rt
01 BARCO CONSOLIDATED
02 INFORMATION ABOUT THE SHARE

IN THOUSANDS OF EURO NOTE 31 DEC 2020 31 DEC 2019 31 DEC 2018
Assets
Goodwill 8 105,612 105,612 105,612
Other intangible assets 9.1 28,952 44,469 47,397
Land and buildings 9.1 74,220 83,665 57,777
Other tangible assets 9.1 49,254 51,804 51,003
Investments and interest in associates 11 106,942 43,288 19,105
Deferred tax assets 10 62,811 60,116 67,478
Other non-current assets 13 5,870 4,018 9,732
Non-current assets 433,662 392,972 358,103
Inventory 12 175,390 168,983 135,111
Trade debtors 13 146,138 195,358 161,787
Other amounts receivable 13 17,789 25,669 19,567
Short term investments 14 3,175 24,748 112,795
Cash and cash equivalents 14 235,402 357,035 251,807
Prepaid expenses and accrued income 6,646 9,409 8,131
Current assets 584,542 781,203 689,197
Total assets 1,018,203 1,174,176 1,047,301
Equity and liabilities
Equity attributable to equityholders of the parent 16 659,309 700,060 633,267
Non-controlling interests 17 37,798 40,590 1,777
Equity 697,107 740,650 635,044
Long-term debts 14 35,854 40,225 29,882
Deferred tax liabilities 10 4,745 7,575 3,140
Other long-term liabilities 15 43,286 27,031 24,557
Long-term provisions 19 40,156 42,428 34,265
Non-current liabilities 124,042 117,259 91,845
Current portion of long-term debts 14 9,187 12,469 7,500
Short-term debts 14 86 - 686
Trade payables 18 70,299 128,914 105,148
Advances received from customers 18 42,375 69,515 53,747
Tax payables 7,478 9,893 11,370
Employee benefit liabilities (a) 32,284 54,652 51,314
Other current liabilities (b) 8,980 13,268 48,532
Accrued charges and deferred income 12,646 8,795 10,082
Short-term provisions 19 13,720 18,759 32,032
Current liabilities 197,054 316,266 320,412
Total equity and liabilities 1,018,203 1,174,176 1,047,301
Consolidated balance sheet
The accompanying notes are an integral part of this statement.
(a) Employee benefit liabilities are short term obligations and consist mainly of salaries, bonuses and holiday payments.
(b) In 2018, other current liabilities include the contribution of the three minority shareholders in the capital of Cinionic Ltd., totaling 45% of the total capital
contributions of USD 100 million. We refer to note 1.1 and the consolidated statement of cash flow for further information.
Barco
Inte
grate
d re
po
rt 20
20
8
FIN
Finan
cial re
po
rt
01 BARCO CONSOLIDATED
02 INFORMATION ABOUT THE SHARE

Consolidated statement of cash flow
IN THOUSANDS OF EURO NOTE 2020 2019 2018
Cash flow from operating activities
Adjusted EBIT 10,180 110,038 89,974
Restructuring 5 -9,536 -13,717 -2,882
Gain on sale of divestments 3(d) - - -743
Depreciation of tangible and intangible fixed assets 3,9 43,383 42,984 34,492
(Gain)/Loss on tangible fixed assets 170 -1,024 -149
Share options recognized as cost 3(d), 16 2,907 2,147 2,050
Share in the profit/(loss) of joint ventures and associates 11 -276 1,566 191
Gross operating cash flow 46,829 141,995 122,933
Changes in trade receivables 41,391 -32,160 -11,209
Changes in inventory -12,260 -32,989 334
Changes in trade payables -59,936 23,404 -1,306
Other changes in net working capital -23,960 15,618 -12,722
Change in net working capital -54,764 -26,126 -24,903
Net operating cash flow -7,936 115,868 98,030
Interest received 1,845 7,648 5,915
Interest paid -1,965 -1,866 -1,566
Income taxes (a) -10,398 -13,053 -12,460
Cash flow from operating activities -18,454 108,597 89,919
Cash flow from investing activities
Purchases of tangible and intangible fixed assets -14,980 -20,169 -25,627
Proceeds on disposals of tangible and intangible fixed assets 488 2,379 922
Proceeds from (+), payments for (-) short term investments 14 21,573 88,047 -112,795
Acquisition of Group companies, net of acquired cash 1.3, 24 - -3,272 -5,621
Disposal of Group companies, net of disposed cash 1.3, 24 - - -32,558
Other investing activities (b) -55,530 -41,285 -2,972
Dividends from joint ventures and associates 2,492 7,284 10,499
Cash flow from investing activities (including acquisitions and divestments) -45,958 32,982 -168,152
Barco
Inte
grate
d re
po
rt 20
20
9
FIN
Finan
cial re
po
rt
01 BARCO CONSOLIDATED
02 INFORMATION ABOUT THE SHARE

IN THOUSANDS OF EURO NOTE 2020 2019 2018
Cash flow from financing activities
Dividends paid -33,354 -28,680 -25,975
Capital increase 482 360 132
Sale of own shares 2,371 6,428 5,928
Payments (-) of long-term liabilities 20 -11,235 -22,359 -8,363
Proceeds from (+), payments of (-) short-term liabilities 20 2,103 3,033 -4,430
Advances on capital contribution from non-controlling interest (c) - - 37,906
Cash flow from financing activities -39,634 -41,218 5,198
Net increase (decrease) in cash and cash equivalents -104,045 100,362 -73,035
Cash and cash equivalents at beginning of period 357,035 251,807 321,514
Cash and cash equivalents (CTA) -17,588 4,866 3,328
Cash and cash equivalents at end of period 235,402 357,035 251,807
The accompanying notes are an integral part of this statement.
(a) In 2020 € 5.9m withholding taxes were paid on dividends distributed from subsidiaries of Barco.
(b) ‘Other investing activities’ relate mainly to investments in entities in which Barco owns less than 20% of the shares (55.5 million euro in 2020, 41.3 million euro
in 2019 and 3.0 million euro in 2018) (see note 11 and 9.1).
(c) We refer to notes 1.1 for the explanation on the cash contribution of the three minority shareholders in Barco Ltd.
Barco
Inte
grate
d re
po
rt 20
20
10
FIN
Finan
cial re
po
rt
01 BARCO CONSOLIDATED
02 INFORMATION ABOUT THE SHARE

IN THOUSANDS OF EUROShare capital
and premiumRetained earnings
Share-based payments
Cumulative translation
adjustment
Cash flow hedge
reserve Own shares
Equityattributable to equityholders of the parent
Non-controlling
interest Equity
Balance on 1 January 2018 201,908 457,053 7,511 -43,717 -1,100 -42,205 579,449 14,065 593,514
Net income - 74,965 - - - - 74,965 2,347 77,312
Dividend - -25,955 - - - - -25,955 - -25,955
Dividend distributed to non controlling interest
- - - - - - - -7,724 -7,724
Capital and share premium increase 132 - - - - - 132 4 136
Other comprehensive income (loss)for the period, net of tax
- -4,256 - 875 78 - -3,303 77 -3,226
Share-based payment - - 2,050 - - - 2,050 - 2,050
Exercise of options - - -515 - - 6,443 5,928 - 5,928
Gain on change in control - - - - - - - -6,992 -6,992
Balance on 31 December 2018 202,041 501,807 9,046 -42,842 -1,022 -35,762 633,267 1,777 635,044
Balance on 1 January 2019 202,041 501,807 9,046 -42,842 -1,022 -35,762 633,267 1,777 635,044
Net income - 95,363 - - - - 95,363 1,176 96,539
Dividend - -28,680 - - - - -28,680 - -28,680
Capital and share premium increase 360 - - - - - 360 - 360
Other comprehensive income (loss)for the period, net of tax
- -6,260 - 5,320 -135 - -1,075 -461 -1,536
Deferred tax liability recognized onadoption IFRIC23 (a)
- -6,500 - - - - -6,500 - -6,500
Share-based payment - - 2,147 - - - 2,147 - 2,147
Exercise of options (b) - - - - - 6,428 6,428 - 6,428
Dividend received - 366 - - - - 366 - 366
Increase in ownership interest,without change in control (c)
- -1,617 - - - - -1,617 -1,815 -3,431
Decrease in ownership interest,without change in control (d)
- - - - - - - 39,913 39,913
Balance on 31 December 2019 202,401 554,479 11,193 -37,522 -1,157 -29,334 700,060 40,590 740,650
Consolidated statement of changes in equity
-
Barco
Inte
grate
d re
po
rt 20
20
11
FIN
Finan
cial re
po
rt
01 BARCO CONSOLIDATED
02 INFORMATION ABOUT THE SHARE
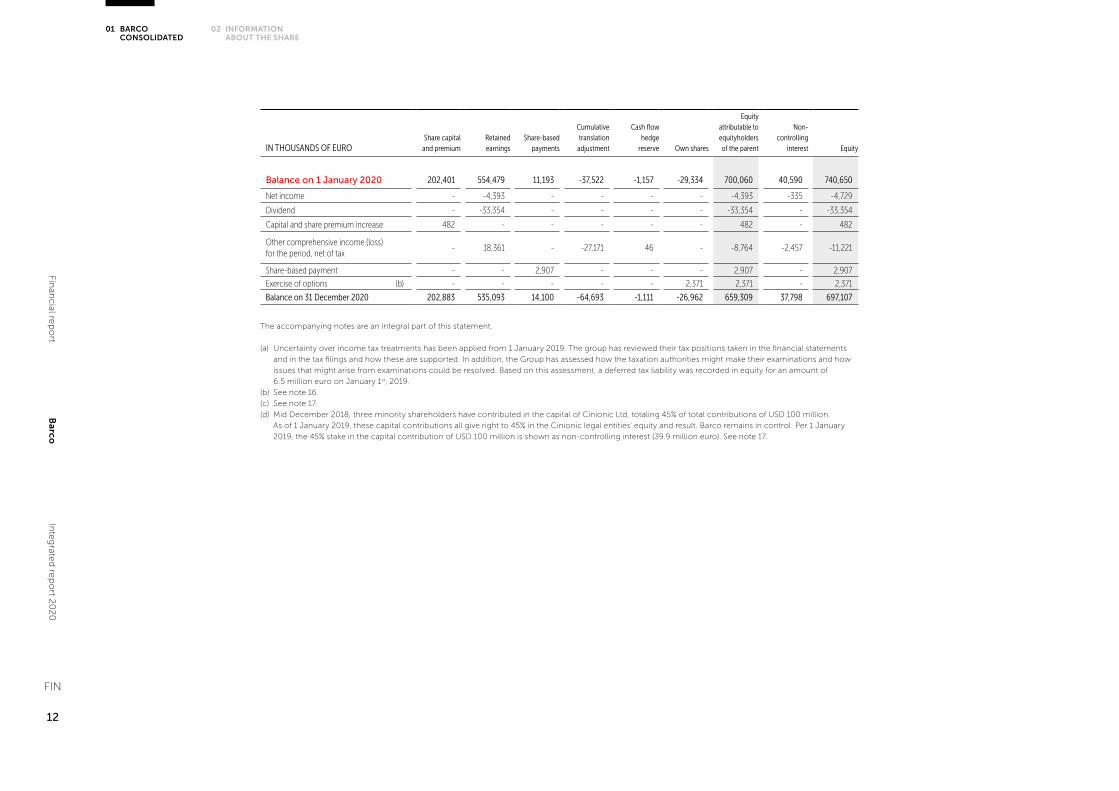
The accompanying notes are an integral part of this statement.
(a) Uncertainty over income tax treatments has been applied from 1 January 2019. The group has reviewed their tax positions taken in the financial statements
and in the tax filings and how these are supported. In addition, the Group has assessed how the taxation authorities might make their examinations and how
issues that might arise from examinations could be resolved. Based on this assessment, a deferred tax liability was recorded in equity for an amount of
6.5 million euro on January 1st, 2019.
(b) See note 16.
(c) See note 17.
(d) Mid December 2018, three minority shareholders have contributed in the capital of Cinionic Ltd, totaling 45% of total contributions of USD 100 million.
As of 1 January 2019, these capital contributions all give right to 45% in the Cinionic legal entities’ equity and result. Barco remains in control. Per 1 January
2019, the 45% stake in the capital contribution of USD 100 million is shown as non-controlling interest (39.9 million euro). See note 17.
IN THOUSANDS OF EUROShare capital
and premiumRetained earnings
Share-based payments
Cumulative translation
adjustment
Cash flow hedge
reserve Own shares
Equityattributable to equityholders of the parent
Non-controlling
interest Equity
Balance on 1 January 2020 202,401 554,479 11,193 -37,522 -1,157 -29,334 700,060 40,590 740,650
Net income - -4,393 - - - - -4,393 -335 -4,729
Dividend - -33,354 - - - - -33,354 - -33,354
Capital and share premium increase 482 - - - - - 482 - 482
Other comprehensive income (loss)for the period, net of tax
- 18,361 - -27,171 46 - -8,764 -2,457 -11,221
Share-based payment - - 2,907 - - - 2,907 - 2,907
Exercise of options (b) - - - - - 2,371 2,371 - 2,371
Balance on 31 December 2020 202,883 535,093 14,100 -64,693 -1,111 -26,962 659,309 37,798 697,107
Barco
Inte
grate
d re
po
rt 20
20
12
FIN
Finan
cial re
po
rt
01 BARCO CONSOLIDATED
02 INFORMATION ABOUT THE SHARE

1. Accounting principles
1.1. Statement of compliance and basis of presentation
The consolidated financial statements of the Barco Group
have been prepared in accordance with International Finan-
cial Reporting Standards (IFRS), as adopted for use by the EU.
All standards and interpretations issued by the International
Accounting Standards Board (IASB) and the International
Financial Reporting Interpretations Committee (IFRIC) effec-
tive year-end 2019 and adopted by the European Union are
applied by Barco.
The consolidated financial statements are presented in
thousands of euro and are prepared under the historical
cost convention, except for the measurement at fair value
of investments, pension estimates and derivative financial
instruments. The financial statements were authorized for
issue by the board of directors on 8 February 2021. The
chairman has the power to amend the financial statements
until the shareholders’ meeting of 29 April 2021.
1.2. Principles of consolidation
General
The consolidated financial statements comprise the financial
statements of the parent company, Barco NV (registered
office: 35 President Kennedypark, 8500, Kortrijk, Belgium),
and its controlled subsidiaries and joint ventures, after the
elimination of all intercompany transactions.
Subsidiaries
Subsidiaries are consolidated from the date the parent obtains
control until the date control ceases. Acquisitions of sub-
sidiaries are accounted for using the purchase method of
accounting. Control exists when Barco is exposed, or has
rights, to variable returns from its involvement with the
investee and has the ability to affect those returns through
its power over the investee. The financial statements of sub-
sidiaries are prepared according to the parent’s company
reporting schedule, using consistent IFRS accounting policies.
Significant IFRS accounting principles
Non-controlling interest
Non-controlling interests represent the portion of profit or
loss and net assets not held by the Group and are presented
separately in the income statement and within equity in the
consolidated balance sheet, separately from shareholder’s
equity.
Investments in associated companies and joint ventures
The company has investment in joint ventures when it shares
joint control with other investments, and it has rights to the
net assets of these joint ventures. Investments in associated
companies over which the company has significant influence
(typically those that are 20-50% owned) and joint ventures
are accounted for under the equity method of accounting
and are initially recognized at cost. Thereafter the carrying
amount of the investment is adjusted to recognize changes
in the Group’s share of net assets of the associate since the
acquisition date. The statement of profit or loss reflects the
Group’s share of the results of operations of the associate,
in ‘other operating income’ for associated companies and
joint ventures with closely related business and in the line
‘share in the result of joint ventures and associates’ for all
other associated companies and joint ventures. Investments
in associated companies and joint ventures are presented as
non-current asset on the face of the balance sheet on the
line 'investments and interest in associates'.
2. Goodwill
Goodwill represents the excess of the cost of the acquisition
over the fair value of identifiable net assets and contingent
liabilities of a subsidiary or associated company at the date of
acquisition. Goodwill is carried at cost less any accumulated
impairment losses.
3. Research and development costs
Research and development costs are expensed as incurred,
except for development costs, which relate to the design and
Barco
Inte
grate
d re
po
rt 20
20
13
FIN
Finan
cial re
po
rt
01 BARCO CONSOLIDATED
02 INFORMATION ABOUT THE SHARE

testing of new or improved materials, products or technolo-
gies, which are capitalized to the extent that it is expected
that such assets will generate future economic benefits and
the recognition criteria of IAS38 are met. Shorter life cycles,
unpredictability of which development projects will be suc-
cessful, and the volatility of technologies and the markets in
which Barco operates led the Board of Directors to conclude
that Barco’s development expenses since 2015 no longer
meet the criteria of IAS38.57. As the criteria of IAS38.57 are
no longer fulfilled, capitalization of development expenses
as of 2015 was not allowed.
4. Other intangible assets
Intangible assets acquired separately are capitalized at cost.
Intangible assets acquired as part of a business combination
are capitalized at fair value separately from goodwill if the fair
value can be measured reliably upon initial recognition and
are amortized over their economic lifetimes. Other intangible
assets are amortized on a straight-line basis not exceeding
7 years.
5. Property, plant and equipment
Property, plant and equipment are stated at cost less accu-
mulated depreciation and accumulated impairment losses.
Generally, depreciation is computed on a straight-line basis
over the estimated useful life of the asset. When there is an
indication that the item of property, plant and equipment
is impaired, the carrying amounts are reviewed to assess
whether they are recorded in excess of their recoverable
amounts, and where carrying values exceed this estimated
recoverable amount, assets are written down to their recov-
erable amount.
Estimated useful life is:
- buildings 20 years
- installations 10 years
- production machinery 5 years
- measurement equipment 4 years
- tools and models 3 years
- furniture 10 years
- office equipment 5 years
- computer equipment 3 years
- vehicles 5 years
- demo material 1 to 3 years
- leasehold improvements and finance leases: cfr under-
lying asset, limited to outstanding period of lease contract
A property, plant or equipment item is derecognized upon
disposal or when no future economic benefits are expected
from its use or disposal. Any gain or loss arising on de-
recognition of the asset is included in profit or loss in the
year the asset is derecognized.
6. Leases
The Group has adopted IFRS 16 Leases on the Group’s finan-
cial statements from 1 January 2019 and has applied the
modified retrospective approach from 1 January 2019.
Assets, representing the right to use the underlying leased
asset, are capitalized as property, plant and equipment at
cost, comprising the amount of the initial measurement of
lease liability, any lease payments made at or before the
commencement date less any lease incentives received, any
initial direct costs and restoration costs. The corresponding
lease liabilities, representing the net present value of the lease
payments, are recognized as long-term or current liabilities
depending on the period in which they are due. Leased assets
and liabilities are recognized for all leases with a term of more
than 12 months, unless the underlying asset is of low value.
Barco
Inte
grate
d re
po
rt 20
20
14
FIN
Finan
cial re
po
rt
01 BARCO CONSOLIDATED
02 INFORMATION ABOUT THE SHARE

The lease payments are discounted using the lessee’s incre-
mental borrowing rate, being the rate that the lessee would
have to pay to borrow the funds necessary to obtain an asset
of similar value in a similar economic environment with simi-
lar terms and conditions. The interest rate implicit in the lease
could not be determined.
Lease interest is charged to the income statement as an
interest expense.
Leased assets are depreciated, using straight-line deprecia-
tion over the lease term, including the period of renewable
options, in case it is probable that the option will be exer-
cised.
Accounting principle applied until 31/12/2018
Finance leases, which effectively transfer to the Group sub-
stantially all risks and benefits incidental to ownership of the
leased item, are capitalized as property, plant and equip-
ment at the fair value of the leased property, or, if lower,
at the present value of the minimum lease payments. The
corresponding liabilities are recorded as long-term or cur-
rent liabilities depending on the period in which they are
due. Lease interest is charged to the income statement as a
financial cost using the effective interest method. Capitalized
leased assets are depreciated over the shorter of the esti-
mated useful life of the asset and the lease term, if there is
no reasonable certainty that the Group will obtain ownership
by the end of the lease term.
Operating leases, where the lessor effectively retains sub-
stantially all the risks and benefits of ownership over the
lease term, are classified as operating leases. Operating
lease payments are expressed in the income statement on
a straight-line basis over the lease term.
7. Investments - financial assets at fair value through
profit and loss or other comprehensive income
Investments are treated as financial assets at fair value
through profit and loss or other comprehensive income
and are initially recognized at cost, being the fair value of
the consideration given. Subsequent fair value recognition
through profit and loss or other comprehensive income is
determined at moment of initial recognition. For investments
quoted in an active market, the quoted market price is the
best measure of fair value. For investments not quoted in an
active market, the carrying amount is the historical cost, if a
reliable estimate of the fair value cannot be made. An impair-
ment loss is recorded when the carrying amount exceeds
the estimated recoverable amount. These investments are
presented on the balance sheet on the line 'Investments and
interest in associates'.
Short-term investments are cash deposits with a maturity at
inception in excess of 3 months and are intended to be held
to maturity less than one year (solely payment of principle
and interest). They are recognized at amortized cost, with
the associated revenue in interest income.
8. Other non-current assets
Other non-current assets include long-term interest-bearing
receivables and cash guarantees. Such long-term receivables
are accounted for as loans and receivables originated by the
company and are carried at amortized cost. An impairment
loss is recorded when the carrying amount exceeds the
estimated recoverable amount.
9. Financial assets
The Group classifies its financial assets in the following cat-
egories: financial assets at fair value and financial assets at
amortized cost. The classification depends on the entity’s
business model for managing the financial assets and the
contractual terms of the cash flows. Management determines
the classification of its financial assets at initial recognition.
Barco
Inte
grate
d re
po
rt 20
20
15
FIN
Finan
cial re
po
rt
01 BARCO CONSOLIDATED
02 INFORMATION ABOUT THE SHARE

Regular purchases and sales of financial assets are recognized
on the trade date – the date on which the Group commits
to purchase or sell an asset.
At initial recognition, the Group measures a financial asset
at its fair value plus, in the case of a financial asset not at fair
value through profit or loss, transaction costs that are directly
attributable to the acquisition of the financial asset. Trans-
action costs of financial assets carried at fair value through
profit or loss are expensed in profit or loss.
Financial assets (such as loans, trade and other receivables,
cash and cash equivalents) are subsequently measured at
amortized cost using the effective interest method, less any
impairment if they are held for collection of contractual cash
flows where those cash flows represent solely payments of
principal and interest.
Trade and other receivables after and within one year are
recognized initially at fair value and subsequently measured
at amortized cost, i.e. at the net present value of the receiv-
able amount, using the effective interest rate method, less
allowances for impairment. The Group assesses on a for-
ward-looking basis the expected credit loss associated with
its financial assets carried at amortized cost. For trade receiv-
ables, the Group applies the simplified approach permitted
by IFRS 9 Financial instruments, which requires expected
lifetime losses to be recognized from initial recognition of
the receivables.
The amount of the allowance is deducted from the carrying
amount of the asset and is recognized in the income state-
ment within other operating income.
10. Inventories
Inventories are stated at the lower of cost or net realizable
value. Cost is determined on a first in first out (FIFO) or
weighted average basis. Net realizable value is the estimated
selling price in the ordinary course of business less the
estimated costs of completion and the estimated costs of
completing the sale.
In addition to the cost of materials and direct labor, the
relevant proportion of production overhead is included in
the inventory values. Write offs on inventories are applied on
slow-moving inventory. The calculation of the allowance is
based on consistently applied write off rules, which depend
on both historical and future demand, of which the latter is
subject to uncertainty due to rapid technological changes.
11. Revenue recognition
We apply the five-step model to account for revenue arising
from contracts with customers. Revenue is recognized at an
amount that reflects the consideration to which we expect
to be entitled in exchange for transferring goods or services
to a customer.
(a) Sale of goods
Contracts with customers to sell equipment has only one
performance obligation. Revenue recognition occurs at a
point in time, when control of the asset is transferred to the
customer, generally on delivery of the goods. The Group
has following warranty options: the Group provides warran-
ties for general repairs of which the Group determined that
such warranties are assurance-type warranties which are
accounted for under IAS 37 Provisions, Contingent Liabilities
and Contingent Assets.
(b) Rendering of services
The Group provides services within all segments. These
services are sold either on their own in contracts with the
customers or bundled together with the sale of equipment
to a customer. The Group accounts for the equipment and
service as separate deliverables of bundled sales and allocates
consideration between these deliverables using the relative
Barco
Inte
grate
d re
po
rt 20
20
16
FIN
Finan
cial re
po
rt
01 BARCO CONSOLIDATED
02 INFORMATION ABOUT THE SHARE

stand-alone selling prices. The Group recognizes service
revenue by reference to the stage of completion. The Group
recognizes the services over time given that the customer
simultaneously receives and consumes the benefits provided
by the Group. Consequently, the Group recognizes revenue
for these service contracts/service components of bundled
contracts over time rather than at a point of time.
(c) Projects
For revenue out of projects, the percentage of completion
method is used, provided that the outcome of the project
can be assessed with reasonable certainty. These projects
generally have a lifetime of less than one year.
The Group adopted IFRS 15 as from 1 January 2018, using
the full retrospective method. The transition to IFRS 15 has
not had a significant impact.
12. Government grants
Government grants related to research and development
projects and other forms of government assistance are
recognized as income upon irreversible achievement and by
reference to the relevant expenses incurred.
13. Trade debtors and other amounts receivable
Trade debtors and other amounts receivable are shown on
the balance sheet at amortized cost (in general, the original
amount invoiced) less an allowance for doubtful debts and
less an amount for expected credit losses. The allowance
for doubtful debts is recorded in operating income when it
is probable that the company will not be able to collect all
amounts due. Allowances are calculated on an individual
basis, based on an aging analysis of the trade debtors. For
the determination of the expected credit loss, the Group has
applied the simplified approach and records lifetime expected
losses on all trade receivables. This amount is determined
on a portfolio basis.
4. Cash and cash equivalents
Cash and cash equivalents consist of cash on hand and
balances with banks and short-term investments with an
original maturity date or notice period of three months or
less. It is the Group’s policy to hold investments to maturity.
All investments are initially recognized at fair value, which is
the cost at recognition date.
15. Provisions
Provisions are recorded when the Group has a present legal
or constructive obligation as a result of a past event, it is
probable that an outflow of resources embodying economic
benefits will be required to settle the obligation and a reliable
estimate can be made to the amount of the obligation.
The Group recognizes the estimated liability to repair or
replace products still under warranty at the balance sheet
date. The provision is calculated based on historical expe-
rience of the level of repairs and replacements. A provision
for restructuring is only recognized when the Group has
approved a detailed and formal restructuring plan, and the
restructuring has either commenced or has been announced
to those affected by the plan before the balance sheet date.
On the line item ‘Long-term provisions’, the company pres-
ents the net liability relating to the post-retirement benefit
obligations which includes the Belgian defined-contribution
pension plans that are by law subject to minimum guaranteed
rates of return. Pension legislation was amended at the end
of 2015 and defines the minimum guaranteed rate of return
as a variable percentage linked to government bond yields
observed in the market as from 1 January 2016 onwards. For
2020 the minimum guaranteed rate of return remains the
same as in 2019 and 2018, i.e. 1.75% on employer contribu-
tions and employee contributions. We refer to note 19 for
more detailed information. As a consequence, the defined
contribution plans have been accounted for as defined
benefit plan.
Barco
Inte
grate
d re
po
rt 20
20
17
FIN
Finan
cial re
po
rt
01 BARCO CONSOLIDATED
02 INFORMATION ABOUT THE SHARE

16. Equity – costs of an equity transaction
The transaction costs of an equity transaction are accounted
for as a deduction from equity, net of any related income
tax benefit.
17. Interest-bearing loans and borrowings
All loans and borrowings are initially recognized at cost, being
the fair value of the consideration received net of issue costs
associated with the loan/borrowing. Subsequent to initial
recognition, interest-bearing loans and borrowings are stated
at amortized cost using the effective interest rate method.
Amortized cost is calculated by taking into account any issue
costs and any discount or premium on settlement.
The effective interest method is a method of calculating the
amortized cost of a financial liability and of allocating interest
expense over the relevant period. The effective interest rate
is the rate that exactly discounts estimated future cash pay-
ments (including all fees and points paid or received that form
an integral part of the effective interest rate, transaction costs
and other premiums or discounts) through the expected
life of the financial liability, or (where appropriate) a shorter
period, to the net carrying amount on initial recognition.
When a financial liability measured at amortized cost is
modified without this resulting in derecognition, a gain or
loss is recognized in profit or loss. The gain or loss is calcu-
lated as the difference between the original contractual cash
flows and the modified cash flows discounted at the original
effective interest rate.
18. Trade and other payables
Trade and other payables are stated at amortized cost, which
is the cost at recognition date. This is an approximation of
the fair value.
19. Employee benefits
Employee benefits are recognized as an expense when the
Group consumes the economic benefit arising from service
provided by an employee in exchange for employee benefits,
and as a liability when an employee has provided service in
exchange for employee benefits to be paid in the future.
20. Transactions in foreign currencies
Transactions in foreign currencies are recorded at the rates of
exchange prevailing at the date of transaction or at the end
of the month before the date of the transaction. At the end
of the accounting period the unsettled balances on foreign
currency receivables and liabilities are valued at the rates of
exchange prevailing at the end of the accounting period.
Foreign exchange gains and losses are recognized in the
income statement in the period in which they arise.
21. Foreign Group companies
In the consolidated accounts, all items in the profit and loss
accounts of foreign subsidiaries are translated into euro at
the average exchange rates for the accounting period. The
balance sheets of foreign group companies are translated
into euro at the rates of exchange ruling at the year-end. The
resulting exchange differences are classified in a separate
component of ‘other comprehensive income’, until disposal
of the investment.
DECEMBER 31, 2020 DECEMBER 31, 2019 DECEMBER 31, 2018
CURRENCYCLOSING
RATEAVERAGE
RATE YEARCLOSING
RATEAVERAGE
RATE YEARCLOSING
RATEAVERAGE
RATE YEAR
CNY 8.02 7.88 7.81 7.73 7.87 7.81
INR 89.66 84.74 80.08 78.83 79.80 80.72
USD 1.23 1.14 1.12 1.12 1.15 1.18
Barco
Inte
grate
d re
po
rt 20
20
18
FIN
Finan
cial re
po
rt
01 BARCO CONSOLIDATED
02 INFORMATION ABOUT THE SHARE

22. Derivative financial instruments
Derivative financial instruments are recognized initially at cost,
which is the fair value of the consideration given (in the case of
an asset) or received (in the case of a liability) for it. Subsequent
to initial recognition, derivative financial instruments are stated
at fair value. The fair values of derivative interest contracts are
estimated by discounting expected future cash flows using
current market interest rates and yield curve over the remaining
term of the instrument. The fair value of forward exchange
contracts is estimated using valuation techniques which include
forward pricing and swap models at the balance sheet date.
Derivative financial instruments that are either hedging instru-
ments that are not designated or do not qualify as hedges
are carried at fair value with changes in value included in the
income statement.
Where a derivative financial instrument is designated as a hedge
of the variability in cash flows of a recognized asset or liability,
or a highly probable forecasted transaction, the effective part
of any gain or loss on the derivative financial instrument is
recognized directly in ‘other comprehensive income’ with the
ineffective part recognized directly in profit and loss.
Financial assets and liabilities are offset and the net amount is
reported in the balance sheet when there is a legally enforce-
able right to offset the recognized amounts and there is an
intention to settle on a net basis or realize the asset and settle
the liability simultaneously.
23. Income taxes
Current taxes are based on the results of the Group compa-
nies and are calculated according to local tax rules. Deferred
tax assets and liabilities are determined, using the liability
method, for all temporary differences arising between the
tax basis of assets and liabilities and their carrying values for
financial reporting purposes. Tax rates used are expected to
apply to the period when the asset is realized or the liability
is settled, based on tax rates and tax laws that have been
enacted or substantially enacted at the balance sheet date.
Deferred tax assets are recognized for all deductible tem-
porary differences, carry-forward of unused tax credits and
unused tax losses, to the extent that it is probable that taxable
profit will be available against which the deductible tempo-
rary differences, carry-forward of unused tax credits and
tax losses can be utilized. The carrying amount of deferred
income tax assets is reviewed at each balance sheet date
and reduced to the extent that it is no longer probable that
sufficient taxable profit will be available to allow all or part
of the deferred income tax asset to be utilized.
Deferred income tax assets and deferred income tax liabil-
ities are offset, if a legally enforceable right exists to set off
current tax assets against current income tax liabilities and
the deferred income taxes relate to the same taxable entity
and the same taxation authority.
The Group reviews their tax positions taken in the financial
statements and in the tax filings and how these are sup-
ported. In addition, the Group assesses how the taxation
authorities might make their examinations and how issues
that might arise from examinations could be resolved. Based
on this assessment, a deferred tax liability is determined in
line with IFRIC 23.
24. Impairment of assets
Goodwill is reviewed for impairment at least annually. For
other tangible and intangible assets, at each balance sheet
date, an assessment is made as to whether any indication
exists that assets may be impaired. If any such indication
exists, an impairment test is carried out in order to determine
if and to what extent an impairment is necessary to reduce
the asset to its recoverable amount (which is the higher of (i)
value in use and (ii) fair value less costs to sell). The fair value
Barco
Inte
grate
d re
po
rt 20
20
19
FIN
Finan
cial re
po
rt
01 BARCO CONSOLIDATED
02 INFORMATION ABOUT THE SHARE

less costs to sell is determined as (i) the fair value (that is the
price that would be received to sell an asset in an orderly
transaction in the principal market at the measurement date
under current market conditions) less (ii) the costs to sell
while value in use is the present value of the future cash
flows expected to be derived from an asset. Recoverable
amounts are estimated for individual assets or, if this is not
possible, for the cash-generating unit (CGU) to which the
assets belong. An impairment loss is recognized whenever
the carrying amount of an asset or its cash-generating unit
exceeds its recoverable amount.
Impairment losses are recognized in the income statement.
Reversal of impairment losses recognized in prior years is
included as income when there is an indication that the
impairment losses recognized for the asset are no longer
needed or the need has decreased, except for impairment
losses on goodwill, which are never reversed.
25. Share-based payment
Barco created warrants for staff and non-executive directors
as well as for individuals who play an important role in the
company. According to the publication of IFRS 2, the cost of
share-based payment transactions is reflected in the income
statement. The warrants are measured at grant date, based
on the share price at grant date, exercise price, expected
volatility, dividend estimates, and interest rates. Warrant cost
is taken into result on a straight-line basis from the grant date
until the end of the vesting period.
26. Earnings per share
The Group calculates both basic and diluted earnings per
share in accordance with IAS 33, Earnings per share. Under
IAS 33, basic earnings per share are computed using the
weighted average number of shares outstanding during the
period. Diluted earnings per share are computed using the
weighted average number of shares outstanding during the
period plus the dilutive effect of warrants outstanding during
the period. As diluted earnings per share cannot be higher
than basic earnings per share, diluted earnings per share are
kept equal to basic earnings per share in case of negative
net earnings.
27. Discontinued operations and non-current assets
held for sale
A discontinued operation is a component of the Group that
either has been disposed of, or is classified as held for sale
and represents a separate major line of business and is part
of a single coordinated plan to dispose of a separate major
line of business or is a subsidiary acquired exclusively with
a view to resale.
The Group classifies a non-current asset (or disposal group)
as held for sale if its carrying amount will be recovered
principally through a sale transaction rather than through
continuing use. The criteria for held for sale classification is
regarded as met only when the sale is highly probable and
the asset or disposal group is available for immediate sale
in its present condition. Management must be committed
to the sale expected within one year from the date of the
classification. Property, plant and equipment and intangible
assets are not depreciated or amortized once classified as
held for sale.
Immediately before classification as held for sale, the Group
measures the carrying amount of the asset (or all the assets
and liabilities in the disposal group) in accordance with appli-
cable IFRS. Then, on initial classification as held for sale,
non-current assets and disposal groups are recognized at
the lower of their carrying amounts and fair value less costs
to sell. Impairment losses are recognized for any initial or
subsequent write-down of the asset (or disposal group) to
fair value less costs to sell.
Barco
Inte
grate
d re
po
rt 20
20
20
FIN
Finan
cial re
po
rt
01 BARCO CONSOLIDATED
02 INFORMATION ABOUT THE SHARE

IFRS accounting standards adopted as of 2020
The Group applied for the first time certain standards and
amendments, which are effective for annual periods begin-
ning on or after 1 January 2020. The Group has not early
adopted any other standard, interpretation or amendment
that has been issued but is not yet effective.
• Amendments to References to the Conceptual
Framework in IFRS Standards, effective 1 January 2020
• Amendments to the guidance of IFRS 3 Business
Combinations, effective 1 January 2020
• Amendments to the definition of material in IAS 1 and
IAS 8, effective 1 January 2020
• Amendments to IFRS 9, IAS 39 and IFRS 7, effective
1 January 2020
• Amendment to IFRS 16 Leases Covid 19-Related Rent
Concessions, effective 1 June 2020, with early
application permitted
None of these IFRS standards issued have an impact on
Barco’s financials.
IFRS accounting standards issued but not yet effective as of 2020
Standards issued but not yet effective
The standards and interpretations that are issued, but not yet
effective, up to the date of issuance of the Group’s financial
statements are disclosed below. The Group intends to adopt
these standards and interpretations, if applicable, when they
become effective.
• Amendments to IFRS 9, IAS 39, IFRS 7, IFRS 4 and IFRS
16 Interest Rate Benchmark Reform – Phase 2, effective
1 January 2021. These amendments address issues
that might affect financial reporting after the reform of
an interest rate benchmark, including its replacement
with alternative benchmark rates. The amendments are
effective for annual periods beginning on or after
1 January 2021, with earlier application permitted.
• Amendments to IAS 1 ‘Presentation of Financial
Statements: Classification of Liabilities as current or
non-current’1, effective 1 January 2022
• Amendments to IFRS 3 Business Combinations; IAS 16
Property, Plant and Equipment; IAS 37 Provisions,
Contingent Liabilities and Contingent Assets as well as
Annual Improvements1, effective 1 January 2022
None of the IFRS standards issued, but not yet effective are
expected to have a material impact on Barco’s financials
1 Not yet endorsed by the European Union as at 31 December 2020
Barco
Inte
grate
d re
po
rt 20
20
21
FIN
Finan
cial re
po
rt
01 BARCO CONSOLIDATED
02 INFORMATION ABOUT THE SHARE

Critical accounting judgments and key sources of estimation uncertainty
General business risks
We refer to the chapter ‘Risk management and control pro-
cesses’ for an overview of the risks affecting businesses of the
Barco Group. Over the year 2020, the economic impact of
the pandemic related to the covid-19 virus has been affecting
businesses all over the world – Barco included and is there-
fore being addressed as additional risk.
The risks described in this chapter are not the only risks facing
the Company. Additional risks and uncertainties not cur-
rently known to the Company or that the Company currently
deems to be immaterial also may materially adversely affect
its business, financial condition and/or operating results.
Since Q1 2020, the covid-19 pandemic has been affecting
businesses all over the world – including Barco.
Risk descriptionThe public health crisis caused by the covid-19 pandemic,
as well as measures taken in response to contain or mitigate
the pandemic, have had, and are expected to continue to
have, certain negative impacts on Barco’s business inclu-
ding, without limitation, the following:
• The demand, reflected by impact on orders and sales
mainly in Barco’s Entertainment and Enterprise division
• The profit and loss and operating results
• The financial condition
• Cash flows
Approach:
In this section, Barco addresses its risk mitigation plan
related to the covid-19 pandemic impact.
Overall approach
Since the start of the corona virus outbreak (in China in
January 2020) Barco has set up a dedicated global response
team that is monitoring and supporting Barco’s operations
and is focusing both on the safety and health of its
employees, as well as on ensuring business continuity.
Measures to keep employees safe
• Hygiene, social distancing and track-and-trace
measures
As of February-March 2020 timeframe and taking into
account local or regional sanitary & health regulations,
the company strengthened personal hygiene measures
throughout the organization, as well as business travel
restrictions. Barco also expanded its home-work protocol
and implemented social distancing measures for employ-
ees in all its facilities. In addition, a track-and-trace system
has been put in place to slow down a possible future spread
of the virus. In 2020, Barco registered approximately 110
infected cases among its global employee force for which
none of the infection sources appear to be within the com-
pany. All related people have meanwhile recovered.
Extra risk section regarding the consequences and impact of the covid-19 pandemic
Barco
Inte
grate
d re
po
rt 20
20
22
FIN
Finan
cial re
po
rt
01 BARCO CONSOLIDATED
02 INFORMATION ABOUT THE SHARE

• Hybrid way of working
Some of Barco’s offices have been closed for short periods
during the year but have gradually reopened. As far as
regulations and the local situation allowed, the com-
pany applied unlocking measures and started bringing
back employees while still taking into account local or
regional regulations and recommendations. The company
implemented a hybrid way of working with an alternate
home-work protocol for its white collars. All offices have
been updated according to the strengthened social dis-
tancing and sanitary measures to ensure a covid-proof
and flexible work environment.
Operations and supply chain
Mainly in the first half of 2020, Barco has experienced disrup-
tions to its ability to operate its production facilities in some
countries, and in the future, further disruptions to Barco’s
ability to operate production facilities or distribution opera-
tions cannot be excluded as a result of regulatory restrictions,
safety protocols and heightened sanitation measures.
While the Company experienced disruptions, Barco’s pro-
active approach limited the delays towards our customers.
• Barco’s parts supply base, its subcontractor operations and
the logistics chain has seen disruption mainly in the months
March and April 2020 but recovered near full operational
capacity.
• For Barco’s operations:
- In China, operations were disrupted during February but
recovered to near full capacity by the end of the first
quarter 2020.
- For the manufacturing sites in Europe, the operations
team has organized production in order to match
regulatory requirements with the objective of ensuring
manufacturing capacity needed to support market
demand. The respective logistics teams were able to
secure a continued receiving of components and shipping
of finished goods.
- The India site (manufacturing of videowalls) was closed
for a limited number of weeks in 2020 as a result of the
regulatory lockdown-measures but production recovered
and was able to meet market demand.
Business health
In the first quarter and as a result of lockdowns in China,
Barco’s sales in China were halted during February and gradu-
ally resumed as of March. Since then, the covid-19 pandemic
has spread internationally, with negative effects mainly in
Barco’s Entertainment and Enterprise markets.
The negative impact was caused by both the economic impact
of the pandemic on some of its markets as well as by the
lockdown measures and related restrictions.
Barco remained focused on business continuity and protec-
tion of the business health.
The company executed on a plan to align both its activity rate
and spending with the impacts of the pandemic by resetting
indirect cost levels, next to temporary measures and resource
redeployments.
• Aligning activity rate with market realities and
customer demand
Consequently, the company has implemented temporary
work arrangements and economic unemployment mea-
sures for both white and blue collars, in conformity with
country specific legal frameworks, support mechanisms
and regulations.
The new work conditions varied depending on the re-
gion, and Barco’s covid-19 response team reviewed the
Barco
Inte
grate
d re
po
rt 20
20
23
FIN
Finan
cial re
po
rt
01 BARCO CONSOLIDATED
02 INFORMATION ABOUT THE SHARE

situation site by site, with the same objective to ensure
business continuity while also considering all applicable
covid regulations.
The activity rate and cost containment measures also
include ensuring a strong commitment to our customers
through sales and servicing.
• Adjusting the cost base and discipline
in discretionary spending
These measures – which can be adjusted again in line with
future changes in the pandemic situation - also entail
shifts in the planned investment patterns on selected
long-term initiatives and a sustained strict discipline on
discretionary spending.
The Company made deliberate choices on the continua-
tion and timetable of selected development projects
based on current needs in the market and adjusting
internal support levels in function of the focus shift.
Furthermore, the Company was able to apply for wage
subsidies under the newly enacted covid-19 relief legis-
lation in APAC, Canada and Cinionic US.
Strong funding and liquidity structure in place
Barco has a strong balance sheet and ample liquidity. We
refer to note 14 for more details on Barco’s net cash position.
Barco has sufficient headroom to enable it to conform to
covenants on its existing borrowings. The Group complied
with all requirements of the loan covenants on its available
credit facilities throughout the reporting period.
While the future may still bring some levels of headwind,
Barco’s strong funding and liquidity structure in place should
be more than sufficient to ensure the going concern of the
company. In addition, we refer to note 8 where we explain
how we tested goodwill and all other non-current assets
for impairment and concluded no impairment losses need
to be recognized.
Key sources of estimation uncertaintyIn view of the ongoing uncertainty surrounding the covid-19
global pandemic and the extent and duration of the
impacts that it may have in particular on the global cinema,
events and Enterprise business as well as the Company’s
customers, suppliers and employees, there is heightened
potential for future credit losses on receivables, inventory
write downs, impairments of goodwill (see note 8) and
valuation allowances against deferred tax assets that are
based on future performance of the Company’s business.
• Deferred tax assets are recognized for the carry-forward
of unused tax losses and unused tax credits to the extent
that it is probable that future taxable profit will be available
against which the unused tax losses and unused tax cred-
its can be utilized. In making its judgment, management
considers elements such as long-term business strategy
and tax planning opportunities (see note 10 ‘Deferred tax
assets – deferred tax liabilities’).
• Uncertain tax positions: The Group reviews their tax
positions taken in the financial statements and in the tax
filings and how these are supported. In addition, the Group
assesses how the taxation authorities might make their
examinations and how issues that might arise from exam-
inations could be resolved. Based on this assessment, a
deferred tax liability is determined in line with IFRIC 23.
(see note 10 ‘ Deferred tax assets – deferred tax liabilities’).
• Impairment of goodwill: the Group tests the goodwill
for impairment annually or more frequently if there are
indications that goodwill might be impaired. As a result
of the events and factors described above, the Company
performed a quantitative goodwill impairment test in June
2020 and the annual impairment test in the last quarter of
2020. (see note 8.’Goodwill’)
Barco
Inte
grate
d re
po
rt 20
20
24
FIN
Finan
cial re
po
rt
01 BARCO CONSOLIDATED
02 INFORMATION ABOUT THE SHARE

• Write offs on inventories: Inventories are stated at the lower
of cost or net realizable value. The calculation of the allow-
ance for slow-moving inventory is based on consistently
applied write off rules, which depend on both historical
and future demand, of which the latter is subject to uncer-
tainty due to rapid technological changes. On top of the
minimum rules, more severe rules are applied in case of
for example the decision to stop a business unit or product
line. The remaining inventory on hand is in that case ana-
lyzed and reserved as appropriate. Inventory allowances
are only reversed in case the above rules no longer apply
or the written off inventory is sold or scrapped. (see note
12. Inventory)
• Current expected credit losses: The Group assesses on a
forward-looking basis the expected credit loss associated
with its financial assets carried at amortized cost. For trade
receivables, the Group applies the simplified approach
permitted by IFRS 9 Financial instruments, which requires
expected lifetime losses to be recognized from initial rec-
ognition of the receivables. The ability of the Company to
collect its accounts receivable balances is dependent on
the viability and solvency of its business partners, distribu-
tors and resellers, which is influenced by business behavior,
which is on its turn influenced by consumer behavior and
general economic conditions. Customers may experience
financial difficulties that could cause them to be unable to
fulfill their payment obligations to the Company.
The Company develops its estimate of credit losses by type
of business and customer type, number of days overdue
and historical loss rates which are then adjusted for specific
receivables that are judged to have a higher than normal
risk profile after taking into account management’s internal
credit assessment, as well as macro-economic and industry
risk factors. Moreover, the Company has a credit insurance
in place for specific higher risk cinema contracts.
For most of its cinema customers the Company was able to
reach extended payment plans which most of its customers
were honoring.
For the year ended December 31, 2020, the Company
recorded a provision for current expected credit losses of
1.5 million euro reflecting a reduction in the credit quality
of specific cinema customers related accounts receivable
as a result of the covid-19 global pandemic. Management’s
judgements regarding expected credit losses are based on
the facts available to management.
Accounting treatment of development expensesShorter life cycles, unpredictability of which development
projects will be successful, and the volatility of technologies
(more and more software development) and markets in
which Barco operates led the Board of Directors to con-
clude that Barco’s development expenses do not meet the
criteria of IAS 38.57. As the criteria of IAS 38.57 are not ful-
filled, our accounting policy, with respect to research and
development costs, does not allow the capitalization of
development expenses.
Defined benefit obligationsDefined benefits: the cost of the defined benefit pension
plan (see note 19) and the present value of the pension
obligation are determined using actuarial valuations. An
actuarial valuation involves making various assumptions
that may differ from actual developments in the future.
These include the determination of the discount rate,
future salary increases, mortality rates and future pension
increases. Due to the complexities involved in the valuation,
and its long-term nature, a defined obligation is highly
sensitive to changes in these assumptions. All assumptions
are reviewed on reporting date.
Barco
Inte
grate
d re
po
rt 20
20
25
FIN
Finan
cial re
po
rt
01 BARCO CONSOLIDATED
02 INFORMATION ABOUT THE SHARE

Notes to the consolidated financial statements
1. Consolidated companies
1.1. List of consolidated companies on 31 December 2020
COUNTRYOF INCORPORATION LEGAL ENTITY REGISTERED OFFICE %
Europe, Middle-East and Africa
BELGIUM Barco Coordination Center NV Beneluxpark 21, 8500 Kortrijk BELGIUM 100
BELGIUM Barco Integrated Solutions NV Beneluxpark 21, 8500 Kortrijk BELGIUM 100
BELGIUM Cinionic bv Beneluxpark 21, 8500 Kortrijk BELGIUM 55
FRANCE Barco SAS 177 avenue Georges Clémenceau, Immeuble "Le Plein Ouest", 92000 Nanterre FRANCE 100
GERMANY Barco Control Rooms GmbH Greschbachstrasse 5 a, 76229 Karlsruhe GERMANY 100
GERMANY Barco GmbH Greschbachstrasse 5 a, 76229 Karlsruhe GERMANY 100
ITALY Barco S.r.l. Via Monferrato 7, 20094 Corsico-MI ITALY 100
ITALY FIMI S.r.l. c/o Studio Ciavarella, via Vittor Pisani n. 6, 20124 Milano ITALY 100
NETHERLANDS Barco B.V. Zuidplein 126, WTC Tower H, Floor 15, 1077XV Amsterdam NETHERLANDS 100
NORWAY Barco Fredrikstad AS Habornveien 53, 1630 Gamle Fredrikstad NORWAY 100
POLAND Barco Sp. z o.o. Annopol 17, 03-236 Warsaw POLAND 100
RUSSIA Barco Services OOO Office 1, Floor 3, Kondratyuka str., 3, 129515 Moscow RUSSIAN FEDERATION 100
SPAIN Barco Electronic Systems, S.A. Travessera de les Corts 241, Entlo. 3a, 08028 Barcelona SPAIN 100
SWEDEN Barco Sverige AB c/o Grant Thornton, Box 2230, 403 14 Göteborg SWEDEN 100
UNITED ARAB EMIRATES*
Barco Middle East L.L.C. Concord Tower, Suite 1212, PO Box 487786, Dubai Media City, Dubai UNITED ARAB EMIRATES 49
UNITED KINGDOM Barco Ltd. Building 329, Doncastle Road, RG12 8PE Bracknell, Berkshire UNITED KINGDOM 100
Americas
BRAZIL Barco Ltda. Av. Ibirapuera, 2332, 8° andar, conj 82, Torre II, Moema, 04028-002 São Paulo BRAZIL 100
CANADA MTT Innovation Incorporated Suite 2400, 745 Thurlow Street, V6E 0C5 Vancouver, BC CANADA 100
COLOMBIA Barco Colombia SAS Carrera 15, n° 88-64, Torre Zimma Oficina 610, 110221 Bogota COLOMBIA 100
MEXICOBarco Cine Appo Mexico, S.A. de C.V.
Mariano Escobedo No. 476 Piso 10 Col. Anzures, C.P. 11590 D.F. México MEXICO 55
MEXICO Barco Visual Solutions S.A. de C.V. Mariano Escobedo No. 476 Piso 10 Col. Anzures, C.P. 11590 D.F. México MEXICO 100
UNITED STATES Barco, Inc. 1209 Orange Street, 19801 Wilmington DE UNITED STATES 100
UNITED STATES Cinionic Inc. 3078 Prospect Park Drive, 95670 Rancho Cordova CA UNITED STATES 55
*
Barco
Inte
grate
d re
po
rt 20
20
26
FIN
Finan
cial re
po
rt
01 BARCO CONSOLIDATED
02 INFORMATION ABOUT THE SHARE

COUNTRYOF INCORPORATION LEGAL ENTITY REGISTERED OFFICE %
Asia-Pacific
AUSTRALIA Barco Systems Pty. Ltd. 2 Rocklea Drive, VIC 3207 Port Melbourne AUSTRALIA 100
CHINA Barco Trading (Shanghai) Co., Ltd. Room 702, No. 138, Fenyang Road, 200031 Shanghai CHINA 100
CHINA Barco Visual (Beijing) Electronics Co., Ltd.. No. 16 Changsheng Road, Zhong Guan Cun Science Park, Chang Ping District, 102200 Beijing CHINA 100
CHINA Barco Visual (Beijing) Trading Co., Ltd.. No. 16 Changsheng Road, Chang Ping Park, Zhong Guan Cun Science Park, Chang Ping District, 102200 Beijing CHINA 100
CHINABarco China Electronic Visualization Technology (Nanjing) Co., Ltd.
No.1, Hengtong Road, Nanjing development zone, 210038 Nanjing, Jiangsu CHINA 100
CHINABarco Visual (Suzhou) Electronics Co., Ltd .
Room 402, No. 179, Suhong West Road, Suzhou Industrial Park, 215021 Suzhou CHINA 100
HONG KONG Barco Ltd. Suite 2607-2610, 26/F, Prosperity Center, 25 Chong Yip Street, Kwun Tong, Kowloon HONG KONG 100
HONG KONG Barco Visual Electronics Co., Ltd. Suite 2607-2610, 26/F, Prosperity Center, 25 Chong Yip Street, Kwun Tong, Kowloon HONG KONG 100
HONG KONG Barco China (Holding) Ltd. Suite 2607-2610, 26/F, Prosperity Center, 25 Chong Yip Street, Kwun Tong, Kowloon HONG KONG 100
HONG KONG Cinionic Limited Suite 2607-2610, 26/F, Prosperity Center, 25 Chong Yip Street, Kwun Ton, Kowloon HONG KONG 55
HONG KONG Barco CEC (Hong Kong) Limited Suite 2607-2610, 26/F, Prosperity Center, 25 Chong Yip Street, Kwun Ton, Kowloon HONG KONG 100
INDIA Barco Electronic Systems Pvt. Ltd.c/o Perfect Accounting & Shared Services P.Ltd., E-20, 1st & 2nd Floor, Main Market, Hauz Khas, 110016 New Delhi INDIA
100
JAPAN Barco Co., Ltd. Yamato International Bldg 8F, 5-1-1 Heiwajima, Ota-ku, 143-0006 Tokyo JAPAN 100
MALAYSIA Barco Sdn. Bhd. No. 13A, Jalan SS21/56B, Damansara Utama, 47400 Petaling Jaya, Selangor MALAYSIA 100
SINGAPORE Barco Singapore Private Limited 100G Pasir Panjang Road Interlocal Center, 118523 Singapore SINGAPORE 100
SOUTH KOREA Barco Korea Ltd. 42 Youngdong-daero 106-gil, Gangnam-gu, 06172 Seoul KOREA, REPUBLIC OF 100
TAIWAN Barco Limited 33F., No. 16, Xinzhan Rd., Banqiao Dist., 220 New Taipei City TAIWAN, PROVINCE OF CHINA 100
TAIWAN Barco Taiwan Technology Ltd. No. 5, Ti Tang Gang Rd., Feng Hua Village, Xin Shi District, 74148 Tainan City TAIWAN, PROVINCE OF CHINA 100
(*) Barco has control over the relevant activities of the entity by virtue of a contractual agreement with the local investor
Barco
Inte
grate
d re
po
rt 20
20
27
FIN
Finan
cial re
po
rt
01 BARCO CONSOLIDATED
02 INFORMATION ABOUT THE SHARE

1.2. List of equity accounted companies on 31 December 2020
Exemption of publishing financial statements and management report according German legislation §264 Abs. 3 HGB :
Following subsidiary-companies will be released of publishing
their financial statements and management report 2020:
• Barco GmbH
• Barco Control Rooms GmbH
These companies are included in the consolidation scope
of Barco Consolidated 2020 as listed above.
Exemption of publishing Financial Statements and management report according UK legislation section 479A of the Companies Act 2006:
Following subsidiary-companies will be released of publishing
their financial statements and management report 2020:
• Barco Ltd.
COUNTRYOF INCORPORATION LEGAL ENTITY REGISTERED OFFICE %
Americas
UNITED STATES CCO Barco Airport Venture LLC Corporation Trust Center, 1209 Orange Street, 19801 Wilmington DE UNITED STATES 35
Asia-Pacific
CHINA CFG Barco (Beijing) Electronics Co., Ltd. - No. 16 Changsheng Road, Chang Ping Park, Zhong Guan Cun Science Park, Chang Ping District, 102200 Beijing CHINA
49
Barco
Inte
grate
d re
po
rt 20
20
28
FIN
Finan
cial re
po
rt
01 BARCO CONSOLIDATED
02 INFORMATION ABOUT THE SHARE

1.3. Acquisitions/investments and divestments
2020 and 2019
Barco did not close any acquisition or divestment agreements
in 2020 and 2019.
2018
Divestment of X2O Media
On March 28th, 2018 Barco reached an agreement with
US-based market leader in digital signage Stratacache to sell
100% of its shares in the Montréal-based X2O Media entity for
an amount of 0.9 million US dollar (0.8 million euro), of which
0.3 million US dollar (0.2 million euro) was put in escrow over
a period of twenty-four months (with projected full release
on April 2020). This escrow amount was not recognized in
profit and loss in 2018. Closing of the transaction happened
on April 13, 2018. The transaction was cash and debt free.
The purchase agreement includes a price correction linked
to the closing net working capital for a calculated total of
0.9 million euro. The operating results of the X2O Media
(part of the Enterprise division) entity including the gain on
the transaction resulted in 0.5 million euro result in 2018.
We refer to note 24 'Cash flow statement: effect of acquisi-
tions and disposals' for impact on the cash flow of the Group.
Barco
Inte
grate
d re
po
rt 20
20
29
FIN
Finan
cial re
po
rt
01 BARCO CONSOLIDATED
02 INFORMATION ABOUT THE SHARE

2.1. Basis of operating segments information
Barco is a global technology company developing solutions
for three main markets, which is also reflected in its divisional
structure: Entertainment, Enterprise and Healthcare.
- Entertainment1: the Entertainment division is the combi-
nation of the Cinema and Venues & Hospitality activities,
which includes Professional AV, Events and Simulation
activities.
- Enterprise: the Enterprise division is the combination of
the Control Rooms activities and the Corporate activities.
ClickShare is the main contributor to the Corporate activity.
- Healthcare: the Healthcare division includes the activities
in Diagnostic Imaging (Diagnostic and Modality Imaging)
and in Surgical.
No operating segments have been aggregated to form the
above reportable operating segments.
2. Operating segments information
1 The projection activity related to virtual reality solutions has been transferred from the Enterprise division to the Entertainment division to further optimize
the development and commercialization. With a sales contribution of approximately 8 million euro per semester, this transfer is not considered material,
and therefore the 2019 financials are not restated.
The CEO and his core leadership team monitor the results of
each of the three divisions separately, so as to make decisions
about resource allocation and performance assessment and
consequently, the divisions qualify as operating segments.
These operating segments do not show similar economic
characteristics and do not exhibit similar long-term financial
performance, therefore cannot be aggregated into report-
able segments. Division performance is evaluated based on
EBITDA. Group financing (including finance costs and finance
revenue) and income taxes are managed on a group basis
and are not allocated to the operating divisions.
Transfer prices between operating segments are on an arm’s
length basis in a manner similar to transactions with third
parties.
We refer to 'Our markets' for more explanation on the activ-
ities performed by each division.
Barco
Inte
grate
d re
po
rt 20
20
30
FIN
Finan
cial re
po
rt
01 BARCO CONSOLIDATED
02 INFORMATION ABOUT THE SHARE

IN THOUSANDS OF EURO 2020 2019 2018Variance
2020 - 2019Variance
2019 - 2018
Net sales 291,433 100.0% 455,125 100.0% 447,611 100.0% -36.0% 1.7%
Cost of goods sold -208,584 -71.6% -311,955 -68.5% -304,273 -68.0% -33.1% 2.5%
Gross profit 82,849 28.4% 143,170 31.5% 143,337 32.0% -42.1% -0.1%
EBITDA 287 0.1% 43,310 9.5% 32,879 7.3% -99.3% 31.7%
Depreciation TFA and (acquired) intangibles
19,989 6.9% 18,292 4.0% 15,906 3.6% 9.3% 15.0%
Adjusted EBIT -19,702 -6.8% 25,019 5.5% 16,974 3.8% -178.7% 47.4%
Capital expenditures TFA and software 8,177 2.8% 7,515 1.7% 11,445 2.6% 8.8% -34.3%
Interest in associates 19,713 20,073 18,927
Segment assets 285,370 307,832 239,194
Segment liabilities 117,648 169,700 140,225
2.2. Entertainment
As a result of contractions in business activity in all regions
related to the pandemic beginning in Q2, Entertainment
sales declined 36% for the year. The fourth quarter topline
evolution however reflects first signs of recovery mainly
driven by projects in the ProAV and Cinema-market led
by China. During 2020, the Cinema activity accounted for
approximately 50% of the divisional sales down from 58% in
2019. EBITDA for 2020 was break-even, as the lower topline
has led to a decline in gross profit and a negative operating
leverage effect on fixed costs.
We refer to 'Our results' and 'Risk management and control
processes' for more explanation.
As of the second half year of 2018 BarcoCFG is no longer
consolidated. Projector sales of Barco to BarcoCFG are as of 1
July 2018, part of sales, while the external sales of BarcoCFG
to their customers are no longer included (impact of 39.5
million euro lower sales in 2019 compared to 2018; exclud-
ing this impact Entertainment sales in 2019 are 11.5% higher
than in 2018). As of July 1st, 2018, the results of BarcoCFG are
accounted for under the equity method and are presented
as part of the Group and Entertainment EBITDA (2020: 3.5
million euro, 2019: 6.2 million euro, 2H18: 2.8 million euro
(49% of net result BarcoCFG).
For the investments in associates we refer to note 11.
In 2018, Barco took a strategic decision to strengthen the
cinema of the future by moving global, excluding China,
cinema related sales, marketing and service activities to
Cinionic. We refer to note 1.1 for the Cinionic legal entities
incorporated in 2018. Mid December 2018, three minority
shareholders have contributed in the capital of Barco Ltd.
Hong Kong, totaling 45% of the total contributions of USD
100 million. As of 1 January 2019, these capital contributions
all give right to 45% in the Cinionic legal entities’ equity and
result. Barco remains in control. Therefore, the non-China
cinema sales, marketing and service activities remain con-
solidated in the Entertainment results in 2019. The 45% stake
is shown as non-controlling interest as of 1 January 2019.
Barco
Inte
grate
d re
po
rt 20
20
31
FIN
Finan
cial re
po
rt
01 BARCO CONSOLIDATED
02 INFORMATION ABOUT THE SHARE

2.4. Healthcare
IN THOUSANDS OF EURO 2020 2019 2018Variance
2020 - 2019Variance
2019 - 2018
Net sales 261,856 100.0% 268,774 100.0% 245,006 100.0% -2.6% 9,7%
Cost of goods sold -166,115 -63.4% -165,918 -61.7% -147,070 -60.0% 0.1% 12,8%
Gross profit 95,741 36.6% 102,856 38.3% 97,936 40.0% -6.9% 5,0%
EBITDA 35,030 13.4% 35,660 13.3% 30,642 12.5% -1.8% 16,4%
Depreciation TFA and (acquired) intangibles
13,362 5.1% 9,354 3.5% 5,062 2.1% 42.9% 84,8%
Adjusted EBIT 21,668 8.3% 26,307 9.8% 25,580 10.4% -17.6% 2,8%
Capital expenditures TFA and software 3,368 1.3% 4,225 1.6% 5,745 2.3% -20.3% -26,5%
Segment assets 127,180 126,199 107,725
Segment liabilities 49,398 60,913 56,149
2.3. Enterprise
IN THOUSANDS OF EURO 2020 2019 2018Variance
2020 - 2019Variance
2019 - 2018
Net sales 216,794 100.0% 358,671 100.0% 335,914 100.0% -39.6% 6.8%
Cost of goods sold -111,601 -51.5% -175,402 -48.9% -164,237 -48.9% -36.4% 6.8%
Gross profit 105,193 48.5% 183,269 51.1% 171,677 51.1% -42.6% 6.8%
EBITDA 18,246 8.4% 74,051 20.6% 60,944 18.1% -75.4% 21.5%
Depreciation TFA and (acquired) intangibles
10,033 4.6% 15,339 4.3% 13,525 4.0% -34.6% 13.4%
Adjusted EBIT 8,214 3.8% 58,712 16.4% 47,420 14.1% -86.0% 23.8%
Capital expenditures TFA and software 3,436 1.6% 8,428 2.3% 8,436 2.5% -59.2% -0.1%
Segment assets 137,786 168,275 158,563
Segment liabilities 53,299 78,147 81,605
The Enterprise division posted a 40% decline in sales and orders for the year and an 8% EBITDA margin down from 22%. While
Control Rooms started the first half weaker due to project delays and a softer Oil & Gas market, demand for the ClickShare
portfolio fell steeply in the second quarter as a result of pandemic related lockdowns and offices being closed. Overall Enter-
prise sales began to recover in the third and fourth quarter with gradual pick-up in both the Control Rooms and the Corporate
subsegments. In terms of the sales mix, the Corporate activity accounted for about 51% of Enterprise sales for 2020 versus
58% of Enterprise sales for 2019.
Healthcare posted stable year-over-year results with orders slightly up, sales slightly down and EBITDA margin essentially flat.
After a strong first half with high single digit growth in sales, the third quarter slowed down as customers reset delivery sched-
ules based on shifts in hospital spending priorities. The fourth quarter reflected a rebound driven partially by deployments of
projects pushed out from the third quarter and partially by stabilizing of the Healthcare markets.
Barco
Inte
grate
d re
po
rt 20
20
32
FIN
Finan
cial re
po
rt
01 BARCO CONSOLIDATED
02 INFORMATION ABOUT THE SHARE

2.5. Reconciliation of segment information with group information
IN THOUSANDS OF EURO 2020 2019 2018
External sales
Entertainment 291,433 455,125 447,611
At a point in time 255,694 88% 410,883 90% 407,677 91%
Over time 35,739 12% 44,242 10% 39,934 9%
Enterprise 216,794 358,671 335,914
At a point in time 153,435 71% 271,956 76% 222,793 66%
Over time 63,359 29% 86,715 24% 113,121 34%
Healthcare 261,856 268,774 245,006
At a point in time 258,026 99% 264,580 98% 240,327 98%
Over time 3,830 1% 4,193 2% 4,679 2%
Total external sales segments 770,083 1,082,570 1,028,531
At a point in time 667,155 87% 947,420 88% 870,797 85%
Over time 102,928 13% 135,150 12% 157,734 15%
Net Income
EBITDA
Entertainment 287 43,310 32,879
Enterprise 18,246 74,051 60,944
Healthcare 35,030 35,660 30,642
Depreciation and other amortizations
Entertainment 19,989 18,292 15,906
Enterprise 10,033 15,339 13,525
Healthcare 13,362 9,354 5,062
Adjusted EBIT
Entertainment -19,702 25,019 16,974
Enterprise 8,214 58,712 47,420
Healthcare 21,668 26,307 25,580
Total adjusted EBIT 10,180 110,038 89,974
Restructuring and impairments -14,513 - -17,000
Gain on change in control - - 16,384
Impact of covid-19 on Healthcare topline was limited, fueled by sustained demand in diagnostic imaging, while hospitals
postponed elective surgeries and surgical investments. We refer to ‘Our results’ and ‘Risk management and control processes’
for more explanation.
Barco
Inte
grate
d re
po
rt 20
20
33
FIN
Finan
cial re
po
rt
01 BARCO CONSOLIDATED
02 INFORMATION ABOUT THE SHARE

The total over time revenues relate to project sales mainly in the Enterprise division (Control Rooms activities)
and to recurring service revenues generated on maintenance contracts.
IN THOUSANDS OF EURO 2020 2019 2018
EBIT -4,332 110,038 89,358
Interest income (expense) - net -121 5,782 4,350
Income/(loss) before taxes -4,453 115,820 93,708
Income taxes - -20,848 -16,586
Result after taxes -4,453 94,973 77,121
Share in the result of joint ventures and associates -276 1,566 191
Net income -4,729 96,539 77,312
Net income attributable to non-controlling interest -335 1,176 2,347
Net Income attributable to the equity holder of the parent -4,393 95,363 74,965
Barco
Inte
grate
d re
po
rt 20
20
34
FIN
Finan
cial re
po
rt
01 BARCO CONSOLIDATED
02 INFORMATION ABOUT THE SHARE

IN THOUSANDS OF EURO 2020 2019 2018
Assets
Segment assets
Entertainment 285,370 307,832 239,194
Enterprise 137,786 168,275 158,563
Healthcare 127,180 126,199 107,725
Total segment assets 550,336 602,306 505,482
Deferred tax assets 62,811 60,116 67,478
Short term investments 3,175 24,748 112,795
Cash and cash equivalents 235,402 357,035 251,807
Other non-allocated assets 166,479 129,971 109,740
Total assets 1,018,203 1,174,176 1,047,301
Liabilities
Segment liabilities
Entertainment 117,648 169,700 140,225
Enterprise 53,299 78,147 81,605
Healthcare 49,398 60,913 56,149
Total segment liabilities 220,344 308,760 277,979
Equity attributable to equityholders of the parent 659,309 700,060 633,267
Non-controlling interest 37,798 40,590 1,777
Long-term debts 35,854 40,225 29,882
Deferred tax liabilities 4,745 7,575 3,140
Current portion of long-term debts 9,187 12,469 7,500
Short-term debts 86 - 686
Other non-allocated liabilities 50,880 64,496 93,070
Total equity and liabilities 1,018,203 1,174,176 1,047,301
Barco
Inte
grate
d re
po
rt 20
20
35
FIN
Finan
cial re
po
rt
01 BARCO CONSOLIDATED
02 INFORMATION ABOUT THE SHARE

2.6. Geographic information
Management monitors sales of the Group based on the
regions to which the goods are shipped or the services are
rendered in three geographical regions Europe, Americas
(North-America and LATAM) and Asia-Pacific (APAC).
We refer to the ‘Comments on the group results’ for a split of
revenue from external customers based on the geographical
location of the customers to whom the invoice is issued.
There is no significant (i.e. representing more than 10% of
the Group’s revenue) concentration of Barco’s revenues with
one customer.
Sales to Belgium represent 23 million euro of the Group
revenues in 2020 versus 36 million euro in 2019 and 32.3
million in 2018.
In 2020, non-current assets in Belgium amount to 158.5
million euro (rest of the world 275.1 million euro); in 2019
165.5 million euro (rest of the world 227.3 million euro) and in
2018 163.2 million euro (rest of the world 195.2 million euro).
Below table gives an overview of the assets per region and
the most important capital expenditures in non-current assets
per region:
IN THOUSANDS OF EURO 2020 2019 2018
Net sales
Europe 280,280 36.4% 402,149 37.1% 367,488 35.7%
Americas 296,942 38.6% 426,806 39.4% 369,834 36.0%
Asia-Pacific 192,862 25.0% 253,614 23.4% 291,210 28.3%
Total 770,083 100% 1,082,570 100% 1,028,531 100%
Total assets
Europe 455,930 44.8% 513,884 43.8% 451,713 43.1%
Americas 222,214 21.8% 247,345 21.1% 200,037 19.1%
Asia-Pacific 340,059 33.4% 412,947 35.2% 395,551 37.8%
Total 1,018,203 100% 1,174,176 100% 1,047,301 100%
Purchases of tangible and intangible fixed assets (excl. IFRS 16)
Europe 7,315 48.8% 9,977 49.5% 16,898 71.0%
Americas 1,441 9.6% 3,546 17.6% 2,234 9.4%
Asia-Pacific 6,224 41.5% 6,645 32.9% 4,677 19.6%
Total 14,980 100% 20,169 100% 23,809 100%
Barco
Inte
grate
d re
po
rt 20
20
36
FIN
Finan
cial re
po
rt
01 BARCO CONSOLIDATED
02 INFORMATION ABOUT THE SHARE

3. Income from operations (EBIT)
IN THOUSANDS OF EURO 2020 2019 2018
Sales 770,083 1,082,570 1,028,531
Cost of goods sold -486,300 -653,274 -615,578
Gross profit 283,783 429,295 412,953
Gross profit as % of sales 36.9% 39.7% 40.1%
Indirect costs -265,300 -319,538 -325,467
Other operating income (expenses) - net -8,302 280 2,488
Adjusted EBIT 10,180 110,038 89,974
Adjusted EBIT as % of sales 1.3% 10.2% 8.7%
Restructuring and impairments -14,513 - -17,000
Gain on change in control - - 16,384
EBIT -4,332 110,038 89,358
EBIT as % of sales -0.6% 10.2% 8.7%
The low 2020 topline (-28.9% year-over-year) is caused by
the negative impact of the covid-19 pandemic on Barco’s
Entertainment and Enterprise markets. The lower gross profit
margin in 2020, down with 2.8 percentage points versus
2019 is primarily resulting from negative mix effect (lower
sales Enterprise), higher logistics costs and indirect overhead
costs weighing on the lower topline. Lower indirect costs (-54
million euro), as a result of measures taken to align the activity
rate with market realities and customer demand, could not
compensate for the 145 million euro margin losses, resulting
in an adjusted EBIT margin of 1.3% in 2020.
2019 sales were 5.3% higher than 2018 sales. The slightly
lower gross profit margin in 2019 compared to 2018 is due
to cost of quality related to factory transfers and volume
ramp-up transition costs, in Entertainment and Healthcare.
The solid gross profits together with lower indirect costs, as
a result of the execution of the in 2018 announced restruc-
turing plan, resulted in an EBIT margin of 10.2% in 2019, a
step-up of 1.5 percentage points versus 2018 (2018: 8.7%)
EBIT in 2020 includes restructuring costs related to the clo-
sure of the Taiwanese Unisee Liquid Crystal Module (LCM)
production factory and to reorganizations in the Entertain-
ment and Enterprise divisions caused by the economic
impact of the covid-19 pandemic (14.5 million euro).
EBIT in 2019 does not include any adjusting items. In 2018
EBIT included following adjusting items: restructuring costs
(17 million euro) and gain realized on the sale of 9% of the
shares of BarcoCFG (16.4 million euro), totaling net -0.6 mil-
lion euro.
For more details on adjusting items we refer to note 5.
Restructuring and impairment.
Barco
Inte
grate
d re
po
rt 20
20
37
FIN
Finan
cial re
po
rt
01 BARCO CONSOLIDATED
02 INFORMATION ABOUT THE SHARE

The negative impact of the pandemic on the company’s
topline and gross profit margins has halted the past years
trajectory of continued profit improvement, with an EBITDA
margin up 2 percentage points in both 2019 and 2018 ver-
sus the year before. In 2020 EBITDA margin is 7% on sales,
compared to 14.1% in 2019 and 12.1% in 2018.
IN THOUSANDS OF EURO 2020 2019 2018
Product sales 639,667 83% 905,366 84% 835,779 81%
Project sales 55,743 7% 75,776 7% 96,382 9%
Service sales 74,673 10% 101,428 9% 96,369 9%
Sales 770,083 1,082,570 1,028,531
Major part of the sales relates to product sales (in 2020: 83%,
in 2019: 84%, in 2018: 81%). Project sales include combined
sales from products, installations and services and were
declining from 2018 to 2019 as a result of declining project
sales in the control rooms business after the launch of Unisee
(product sales) in 2018. In 2020 the share of project sales
remains stable compared to 2019.
Most of these project sales have a lifetime of less than one
year. The share of service sales in 2020 is 10% of total sales
(2019, 2018: 9%).
We refer to note 2.Segment Information and to the chapter
‘Our results’ for more explanation on sales and income from
operations.
IN THOUSANDS OF EURO NOTE 2020 2019 2018
Adjusted EBIT 10,180 110,038 89,974
Depreciations and amortizations 9 43,383 42,984 34,492
EBITDA 53,563 153,022 124,466
EBITDA as % of sales 7.0% 14.1% 12.1%
Barco
Inte
grate
d re
po
rt 20
20
38
FIN
Finan
cial re
po
rt
01 BARCO CONSOLIDATED
02 INFORMATION ABOUT THE SHARE

Indirect costs and other operating income (expenses) - net
IN THOUSANDS OF EURO 2020 2019 2018
Research and development expenses (a) -102,610 -119,389 -120,279
Sales and marketing expenses (b) -112,329 -142,517 -147,723
General and administration expenses ( c ) -50,362 -57,632 -57,464
Indirect costs -265,300 -319,538 -325,467
Other operating income (expenses) - net (d) -8,302 280 2,488
Indirect costs and other operating income (expenses) - net -273,603 -319,258 -322,979
Indirect costs are significantly lower in 2020 compared to
2019 as a result of measures taken to align the activity rate
with market realities and customer demand. The company
has implemented temporary work arrangements and eco-
nomic unemployment measures for both white and blue
collars, in conformity with country specific legal frameworks,
support mechanisms and regulations. These measures also
entailed shifts in the planned investment patterns on selected
long-term initiatives and a sustained strict discipline on dis-
cretionary spending.
Furthermore, the company was able to apply for wage sub-
sidies under the newly enacted Covid-19 relief legislation in
the APAC region, Canada and Cinionic US. The total impact
on the 2020 full year result of those subsidies received
amounts 3.4 million euro.
The negative impact on the company’s topline was higher
than the reduction in indirect costs via cost measures could
compensate for. Consequently, indirect costs as percentage
of sales, despite a decline of 54.2 million euro, increased over
the last year representing 34.5% of sales in 2020 versus 29.5%
of sales in 2019 and 31.6 % of sales in 2018.
Research and development activities are spread over the divisions as follows:
(a) Research and development expenses
IN THOUSANDS OF EURO 2020 % of sales 2019 % of sales 2018 % of sales
Entertainment 40,533 14% 49,398 11% 49,216 11%
Enterprise 30,582 14% 42,137 12% 43,751 13%
Healthcare 31,495 12% 27,853 10% 27,312 11%
Total Research & development expenses 102,610 119,389 120,279
In 2020 research and development expenses represent 13.3% of sales in 2020 (11.0% in 2019; 11.7% in 2018). The relative
increase is explained by the lower 2020 sales, which cost saving measures could not fully compensate.
Barco
Inte
grate
d re
po
rt 20
20
39
FIN
Finan
cial re
po
rt
01 BARCO CONSOLIDATED
02 INFORMATION ABOUT THE SHARE

(c) General and administration expenses
IN THOUSANDS OF EURO 2020 % of sales 2019 % of sales 2018 % of sales
General and administration expenses 50,362 6.5% 57,632 5.3% 57,464 5.6%
General and administration expenses include the costs
related to information technology, finance and accounting,
general and divisional management, human resources, legal
and investor relations. Expenses have decreased with 7.3
million euro as a result of the covid-related measures taken.
As percentage of sales, expenses have increased to 6.5% of
sales as the topline decrease exceeded the impact of the cost
measures. In 2019, general and administration cost amounted
to 5.3% of sales, a year-over-year decrease, resulting from
further investing in IT infrastructure and executing the 2018
restructuring plan (2018: 5.6%). Steady investments in IT sys-
tems over the past years have led to IT costs (including also
amortizations on SAP ERP system) representing the major
part of G&A expenses (2020: 45%, 2019: 40%).
Sales and marketing expenses include all indirect costs
related to the sales and customer service organization which
are not billed as part of a product or service to the customer
as well as the costs related to regional or divisional marketing
activities.
In 2020 the relative increase and absolute decrease in sales
and marketing expenses is explained by the impact of the
covid-19 pandemic on the company’s sales and related cost
measures taken.
In 2019, decreased sales and marketing expenses are a result
of the executed restructuring plan in the areas of product
management and commercial and service delivery pro-
cesses.
(b) Sales and marketing expenses
IN THOUSANDS OF EURO 2020 % of sales 2019 % of sales 2018 % of sales
Sales and marketing expenses 112,329 14.6% 142,517 13.2% 147,723 14.4%
Barco
Inte
grate
d re
po
rt 20
20
40
FIN
Finan
cial re
po
rt
01 BARCO CONSOLIDATED
02 INFORMATION ABOUT THE SHARE

(d) Other operating income (expense) – net
(a) As of July 2018, BarcoCFG is accounted for under the equity method. The 49% share in the net result of BarcoCFG is represented in EBITDA. See note 11.
As a result of the covid-19 global pandemic impact on the cinema business, also the results of the Chinese cinema joint-venture are in 2020 lower than in
2019 and 2018. In 2018 only half year result is included in other operating income, as until June 2018, the results of BarcoCFG were consolidated.
(b) For the year ended December 31, 2020, the Company recorded a provision for current expected credit losses of 1.5 million euro reflecting mainly a reduction
in the credit quality of specific cinema customers related accounts receivable as a result of the covid-19 global pandemic.
(c) We refer to note 19.Provisions
(d) In 2018 gain on divestment relates to the sale of X2O Media. We refer to note 1.3. Acquisitions and divestments for more explanation.
IN THOUSANDS OF EURO NOTE 2020 2019 2018
Share in the result of BarcoCFG (a) 3,507 6,296 2,799
Bad debt provisions (net of write-offs and reversals of write-offs) (b) -1,697 103 996
Cost of share-based payments -2,907 -2,147 -2,050
Exchange gains and losses (net) -3,109 -3,319 -794
Other provisions (net of additions and reversals of provisions) (c) -4,609 502 782
Bank charges -902 -759 -728
Customer financial discounts -628 -773 -762
Gain on divestments (d) - - 743
Gains/(Loss) on disposal of tangible fixed assets 14 1,349 529
Other (net) 2,029 -972 866
Total -8,302 280 2,488
Barco
Inte
grate
d re
po
rt 20
20
41
FIN
Finan
cial re
po
rt
01 BARCO CONSOLIDATED
02 INFORMATION ABOUT THE SHARE

The table below provides information on the major items contributing to the adjusted EBIT, categorized by nature.
Personnel cost in 2020 is 51.9 million euro lower than 2019
as a result of temporary measures and executed restruc-
turing lay-offs (see note 5. Restructuring and impairments)
to align costs with lower demand as a result of the impact
of the covid-19 pandemic on the company’s markets. The
company has implemented temporary work arrangements
and economic unemployment measures for both white and
blue collars, in conformity with country specific legal frame-
works, support mechanisms and regulations. The lower 2020
personnel costs is in part explained by the fact that there is
no bonus included (see ‘Remuneration report for financial
year 2020’).
These measures also entailed shifts in the planned investment
patterns on selected long-term initiatives and a sustained
strict discipline on discretionary spending (e.g. travel, mar-
keting spend, consulting, ...). The company made deliberate
choices on the continuation and timetable of selected
development projects based on current needs in the market
and future opportunities and adjusted internal support
levels in function of the focus shift. This has resulted in 32.7
million lower services and other costs.
Furthermore, the company was able to apply for wage sub-
sidies under the newly enacted Covid-19 relief legislation in
the APAC region, Canada and Cinionic US. The total impact on
the 2020 full year result of those subsidies received amounts
3.4 million euro.
IN THOUSANDS OF EURO 2020 2019 2018VARIANCE 2020-2019
VARIANCE 2019-2018
Sales 770,083 1,082,570 1,028,531 -29% 5%
Material cost -393,761 -51% -530,733 -49% -501,664 -49% -26% 6%
Services and other costs -79,065 -10% -111,772 -10% -122,953 -12% -29% -9%
Personnel cost (a) -235,392 -31% -287,323 -27% -281,936 -27% -18% 2%
Depreciation property, plant, equipment and software -43,383 -6% -42,984 -4% -34,492 -3% 1% 25%
Other operating income (expense) - net (note 3(d)) -8,302 -1% 280 0% 2,488 0%
Adjusted EBIT 10,180 1% 110,038 10% 89,974 9% -91% 22%
4. Revenues and expenses by nature
Barco
Inte
grate
d re
po
rt 20
20
42
FIN
Finan
cial re
po
rt
01 BARCO CONSOLIDATED
02 INFORMATION ABOUT THE SHARE

IN THOUSANDS OF EURO 2020 2019 2018
Wages and salaries -189,654 -231,990 -227,808
Social security contributions -25,494 -28,829 -28,213
Pension expense for defined benefit plans -13,339 -14,643 -13,870
Temporary labour -2,388 -5,318 -4,319
Recruiting expenses -1,552 -3,231 -2,486
Other personnel cost -2,966 -3,312 -5,240
Personnel cost -235,392 -287,323 -281,936
2020 2019 2018
Barco NV (parent company) 1,282 1,190 1,242
Other subsidiaries 2,237 2,400 2,350
Total average number of full time equivalents 3,519 3,590 3,592
(a) Personnel cost
Personnel cost includes the cost for temporary personnel
for an amount of 2.4 million euro (in 2019: 5.3 million euro,
in 2018: 4.3 million euro).
The average number of full time equivalents can be split
as follows:
Average number of employees in 2020 was 3,519 (versus
3,590 in 2019; 3,592 in 2018), including 2,738 white-collars
(in 2019: 2,688, in 2018: 2,715) and 781 blue-collars (in 2019:
902, in 2018: 877).
Full time equivalents at year end 2020 was 3,317 (versus 3,646
end of 2019; 3,563 end of 2018), including 2,671 white collars
(2019: 2,728, 2018: 2,699) and 646 blue collars (in 2019: 918,
in 2018: 864).
Barco
Inte
grate
d re
po
rt 20
20
43
FIN
Finan
cial re
po
rt
01 BARCO CONSOLIDATED
02 INFORMATION ABOUT THE SHARE
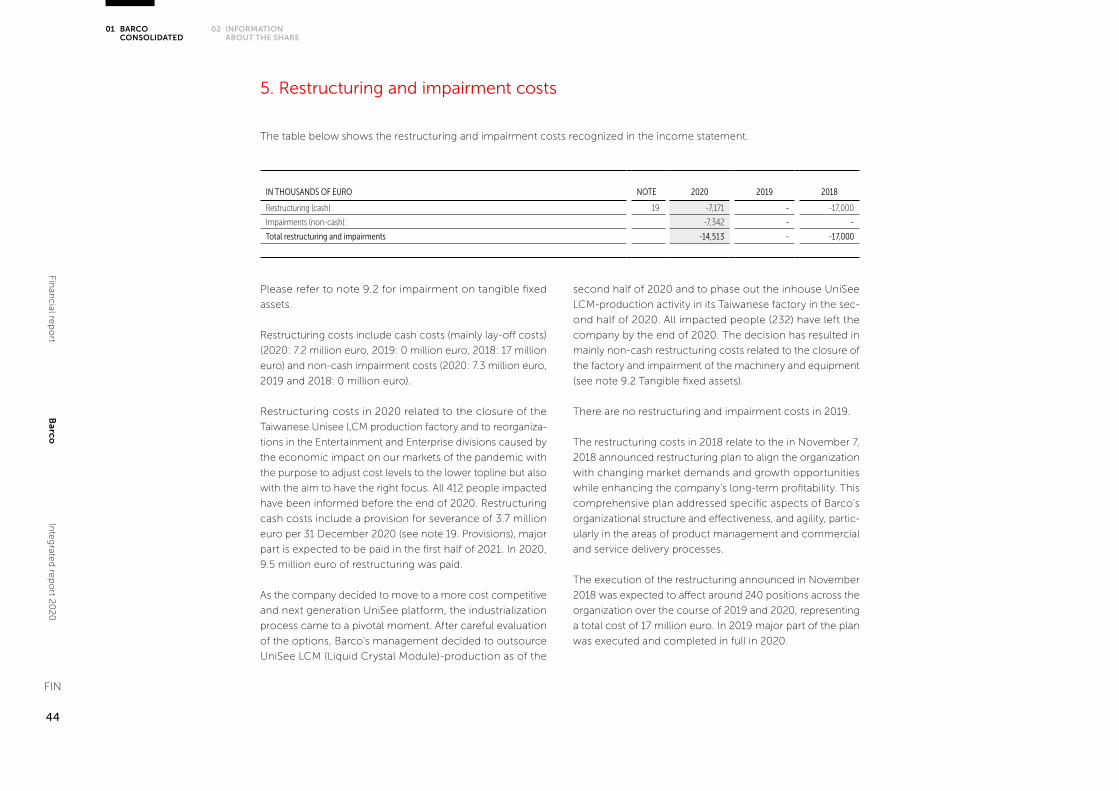
The table below shows the restructuring and impairment costs recognized in the income statement.
Please refer to note 9.2 for impairment on tangible fixed
assets.
Restructuring costs include cash costs (mainly lay-off costs)
(2020: 7.2 million euro, 2019: 0 million euro, 2018: 17 million
euro) and non-cash impairment costs (2020: 7.3 million euro,
2019 and 2018: 0 million euro).
Restructuring costs in 2020 related to the closure of the
Taiwanese Unisee LCM production factory and to reorganiza-
tions in the Entertainment and Enterprise divisions caused by
the economic impact on our markets of the pandemic with
the purpose to adjust cost levels to the lower topline but also
with the aim to have the right focus. All 412 people impacted
have been informed before the end of 2020. Restructuring
cash costs include a provision for severance of 3.7 million
euro per 31 December 2020 (see note 19. Provisions), major
part is expected to be paid in the first half of 2021. In 2020,
9.5 million euro of restructuring was paid.
As the company decided to move to a more cost competitive
and next generation UniSee platform, the industrialization
process came to a pivotal moment. After careful evaluation
of the options, Barco’s management decided to outsource
UniSee LCM (Liquid Crystal Module)-production as of the
second half of 2020 and to phase out the inhouse UniSee
LCM-production activity in its Taiwanese factory in the sec-
ond half of 2020. All impacted people (232) have left the
company by the end of 2020. The decision has resulted in
mainly non-cash restructuring costs related to the closure of
the factory and impairment of the machinery and equipment
(see note 9.2 Tangible fixed assets).
There are no restructuring and impairment costs in 2019.
The restructuring costs in 2018 relate to the in November 7,
2018 announced restructuring plan to align the organization
with changing market demands and growth opportunities
while enhancing the company’s long-term profitability. This
comprehensive plan addressed specific aspects of Barco’s
organizational structure and effectiveness, and agility, partic-
ularly in the areas of product management and commercial
and service delivery processes.
The execution of the restructuring announced in November
2018 was expected to affect around 240 positions across the
organization over the course of 2019 and 2020, representing
a total cost of 17 million euro. In 2019 major part of the plan
was executed and completed in full in 2020.
IN THOUSANDS OF EURO NOTE 2020 2019 2018
Restructuring (cash): 19 -7,171 - -17,000
Impairments (non-cash): -7,342 - -
Total restructuring and impairments -14,513 - -17,000
5. Restructuring and impairment costs
Barco
Inte
grate
d re
po
rt 20
20
44
FIN
Finan
cial re
po
rt
01 BARCO CONSOLIDATED
02 INFORMATION ABOUT THE SHARE

6. Income taxes
IN THOUSANDS OF EURO NOTE 2020 2019 2018
Current versus deferred income taxes
Current income taxes -6,886 -12,394 -9,409
Deferred income taxes 10 6,886 -8,454 -7,177
Income taxes 0 -20,848 -16,586
Income taxes versus income before taxes
EBIT -4,332 110,038 89,358
Interest income (expense) - net -121 5,782 4,350
Income before taxes -4,453 115,820 93,708
Income taxes 0 -20,848 -16,586
Effective income tax rate % 0.0% 18.0% 17.7%
Income before taxes -4,453 115,820 93,708
Theoretical tax rate 25% 30% 30%
Theoretical tax credit/(cost) 1,113 -34,260 -27,719
Innovation income deduction (IID) 5,302 7,398 7,291
Effect of different tax rates in foreign companies 968 4,772 3,452
Changes in deferred tax on undistributed earnings (a) - -2,100 -
Uncertain tax treatment (b) 1,840 1,260 -
Income not taxed
Gain on sold shares (c) - - 3,719
Other income exempt from tax (mainly government grants) 2,141 2,068 1,390
Non deductible expenses
Dividends received (d) -4,265 -3,595 -1,574
Other non-deductible expenses -2,042 -2,440 -1,829
Effect of change in expected tax rate on deferred taxes - 291 -1,055
Tax adjustments related to prior periods 1,029 2,155 -495
Deferred tax assets, derecognized in current year (e) -6,895 -102 -335
Set-up/use of deferred tax assets, not recognized in prior years (f) 809 3,688 270
Investment allowances - - 211
Notional interest deduction (NID) 0 19 89
Taxes related to current income before taxes 0 -20,848 -16,586
Barco
Inte
grate
d re
po
rt 20
20
45
FIN
Finan
cial re
po
rt
01 BARCO CONSOLIDATED
02 INFORMATION ABOUT THE SHARE

7. Earnings per share
IN THOUSANDS OF EURO 2020 2019 2018
Net income/(loss) attributable to the equity holder of the parent -4,393 95,363 74,965
Weighted average of shares 88,265,478 87,836,593 87,060,073
Basic earnings per share -0.05 1.09 0.86
Net income/(loss) attributable to the equity holder of the parent -4,393 95,363 74,965
Weighted average of shares (diluted) 88,693,611 88,859,469 87,719,091
Diluted earnings per share (a) -0.05 1.07 0.85
(a) The difference between the weighted average of shares and weighted average of shares (diluted) is due to exercisable warrants, which are in the money
(which means that the closing rate of the Barco share was higher than the exercise price). For more detailed information concerning the shares and warrants,
we refer to note 16.
At Barco’s Extraordinary General Shareholder’s Meeting, of 30 April 2020, the shareholders have approved the share split by a factor seven (7), effective as of
1 July 2020. The purpose of the share split is to enhance accessibility and to improve the liquidity of the Barco share. As a result of this share split, Barco’s total
capital shall be represented by 91,487,438 shares as from 1 July 2020. Each of these shares confers one voting right at the General Meeting. The new split
shares (please note: new ISIN code BE0974362940) are traded on the Euronext Brussels regulated market from 1 July 2020 onwards. Therefore, the earnings
and diluted earnings per share as of 31 December 2019 and 2018 are for comparison reasons recalculated for the new number of shares.
(a) Deferred tax recognized on undistributed earnings of subsidiaries
which are expected to be distributed in the foreseeable future.
(b) Tax positions taken in the financial statements and in the tax filings
and how these are supported, as well as how the taxation authorities
might make their examinations and how issues that might arise from
examinations could be resolved, are reviewed. Based on this asses-
ment, a deferred tax liability is determined in line with IFRIC 23.
A reversal on the deferred tax liability is taken when the uncertain tax
position is no longer in place as a result of an occurred tax examination
or expiration of the examination period.
(c) In 2018, the gain realized on the sale of the 9% shares of BarcoCFG
was tax exempt.
(d) Withholding taxes on dividends received.
(e) Deferred tax assets not recognized on tax losses or tax losses carried
forward when assessment shows it is not probable that these tax
benefits can be utilized in the near future. In 2020, this also relates to
an impairment on the deferred tax assets, resulting from tax losses
carried forward in Barco Taiwan Technology Ltd., due to the decision
to close the factory (see note 5. Restructuring and impairments) and
liquidate the legal entity.
(f) In 2019, new deferred tax assets set-up on uncapped or faster
deductible tax credits in Belgium, in combination with higher than
anticipated taxable results in Belgium.
Barco
Inte
grate
d re
po
rt 20
20
46
FIN
Finan
cial re
po
rt
01 BARCO CONSOLIDATED
02 INFORMATION ABOUT THE SHARE
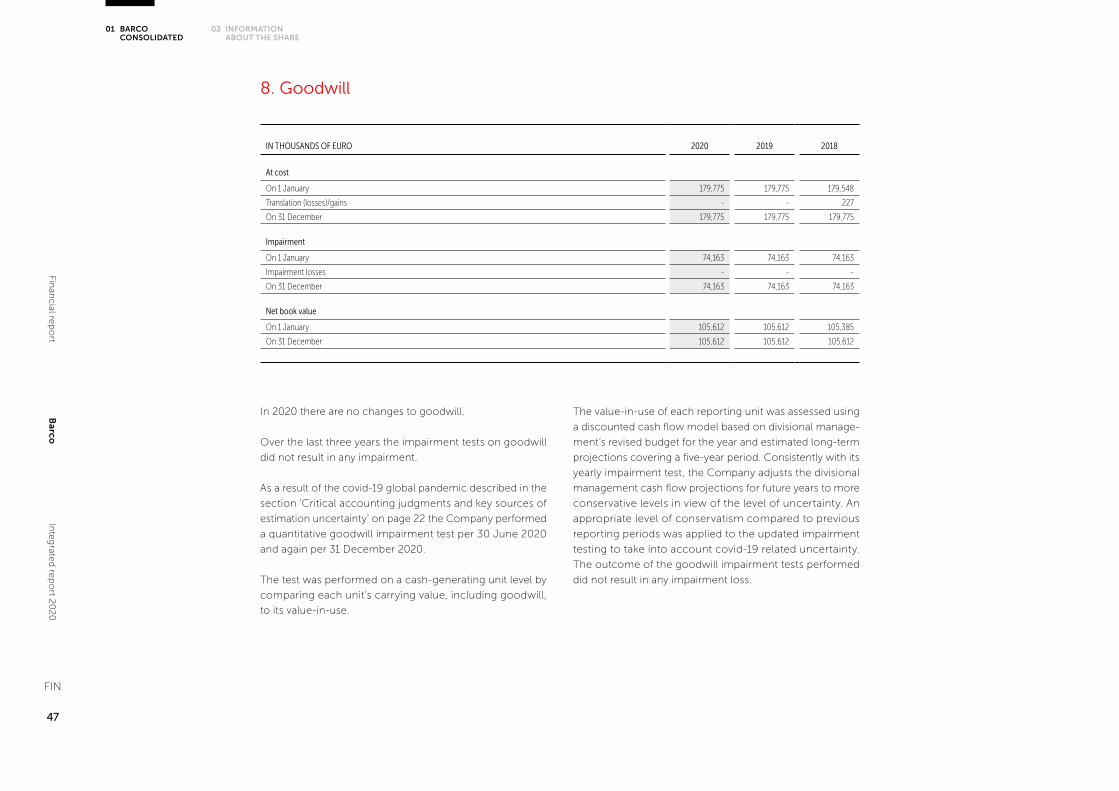
8. Goodwill
IN THOUSANDS OF EURO 2020 2019 2018
At cost
On 1 January 179,775 179,775 179,548
Translation (losses)/gains - - 227
On 31 December 179,775 179,775 179,775
Impairment
On 1 January 74,163 74,163 74,163
Impairment losses - - -
On 31 December 74,163 74,163 74,163
Net book value
On 1 January 105,612 105,612 105,385
On 31 December 105,612 105,612 105,612
In 2020 there are no changes to goodwill.
Over the last three years the impairment tests on goodwill
did not result in any impairment.
As a result of the covid-19 global pandemic described in the
section ‘Critical accounting judgments and key sources of
estimation uncertainty’ on page 22 the Company performed
a quantitative goodwill impairment test per 30 June 2020
and again per 31 December 2020.
The test was performed on a cash-generating unit level by
comparing each unit’s carrying value, including goodwill,
to its value-in-use.
The value-in-use of each reporting unit was assessed using
a discounted cash flow model based on divisional manage-
ment’s revised budget for the year and estimated long-term
projections covering a five-year period. Consistently with its
yearly impairment test, the Company adjusts the divisional
management cash flow projections for future years to more
conservative levels in view of the level of uncertainty. An
appropriate level of conservatism compared to previous
reporting periods was applied to the updated impairment
testing to take into account covid-19 related uncertainty.
The outcome of the goodwill impairment tests performed
did not result in any impairment loss.
Barco
Inte
grate
d re
po
rt 20
20
47
FIN
Finan
cial re
po
rt
01 BARCO CONSOLIDATED
02 INFORMATION ABOUT THE SHARE

Goodwill by cash-generating unit
On acquisition, goodwill acquired in a business combina-
tion is allocated to the cash-generating units which are
expected to benefit from that business combination. These
cash-generating units correspond to the division level for
Entertainment, Healthcare and Enterprise. Therefore, impair-
ment testing is performed at the level of the cash-generating
units as presented below.
See below for explanations on the impairment testing performed.
Cash generating units
IN THOUSANDS OF EURO 2020 2019 2018
Entertainment 35,564 35,564 35,564
Healthcare 28,263 28,263 28,263
Enterprise 41,785 41,785 41,785
Total goodwill (net book value) 105,612 105,612 105,612
The carrying amount of goodwill (after impairment) has been allocated to the cash-generating units as follows:
The Group performed its annual impairment test in the fourth
quarter of 2020 consistently with prior years.
The Group looks at the relationship between its market cap-
italization and its book value, amongst other factors, when
reviewing the indicators of impairment. At 31 December
2020, the market capitalization of the Group was more than
two times the amount of equity of the Group. As such, this
general test does not show an indication for impairment.
The annual impairment tests were performed for each
cash-generating unit. The recoverable amount for each of
the cash-generating units has been determined based on a
value-in-use calculation using cash flow projections gener-
ated by divisional management covering a five-year period.
Due to the level of uncertainty of future years, these financial
projections have been adjusted to more conservative levels
for the purpose of our impairment testing. The pre-tax dis-
count rate applied to projected cash flows is 8.7% (2019: 6.5%,
2018: 8.9%) and cash flows beyond the five-year period are
extrapolated using a conservative growth rate of 0% (2019:
0%, 2018: 0%). The amount by which the unit’s recoverable
amount exceeds its carrying amount is 27 million euro in
Entertainment (188 million euro in 2019), 214 million euro
in Enterprise (590 million euro in 2019) and 179 million euro
(260 million euro in 2019) in Healthcare. The lower headroom
in all three divisions is explained by the consistent level of
conservatism applied starting from covid impacted 2020
results (see Sales growth rate used during the projection
period in Key assumptions used in value-in-use calculations).
In 2019 and 2020, the carrying amounts include the impact
of the right-of-use assets resulting from the application of
IFRS 16 as of 2019.
A sensitivity analysis is performed on all cash-generating units
with respect to the discount rate (see Sensitivity to changes
in assumptions – Discount rate). For forward looking state-
ments on sales and EBITDA, we refer to the core report of
this annual report.
Barco
Inte
grate
d re
po
rt 20
20
48
FIN
Finan
cial re
po
rt
01 BARCO CONSOLIDATED
02 INFORMATION ABOUT THE SHARE

ENTER- TAINMENT
HEALTH- CARE
ENTER- PRISE
Sales growth rate used during the projection period
0.0% 0.0% 0.0%
EBITDA as % of sales 5.8% 13.4% 16.5%
Growth rate estimates 0.0% 0.0% 0.0%
Discount rates 8.7% 8.7% 8.7%
The assumptions of the annual impairment test are consistent
with external sources.
For none of the cash-generating units management identified
an impairment loss after the impairment test.
Key assumptions used in value-in-use calculations
The calculation of value-in-use for all cash-generating units
is most sensitive to the following assumptions:
• Sales growth rate used during the projection period;
• EBITDA;
• Growth rate used to extrapolate cash flows beyond the
budget period;
• Discount rates;
The assumptions are shown in below table:
Sales growth rate used during the projection period – Sales
growth rate used over the projected period has been kept
conservatively at zero percent for all cash-generating units,
since even then there is no risk for impairment.
EBITDA as percentage of sales – EBITDA as percentage of
sales is based on average percentages over the three years
preceding the start of the budget period for all divisions. The
EBITDA percentage has been kept conservatively flat over the
projected period, except for Entertainment, where it is more
realistic to take an average of the pre-covid EBITDA level of
2018 and 2019 as of 2022.
Growth rate estimates – The long-term rate used to extrap-
olate the projection has been kept conservatively at zero %
for all cash-generating units.
Discount rates – Discount rates reflect the current market
assessment of the risks specific to Barco Group. The discount
rate was estimated based on a (long-term) pre-tax cost of
capital, the risks being implicit in the cash flows. It was deter-
mined on group level.
Sensitivity to changes in assumptions
Per 31 December 2020, only a change in EBITDA margin
could result in impairment losses. The implications of the
key assumptions for the recoverable amount are discussed
below:
EBITDA percentage on sales – Management has considered
the possibility of lower than projected EBITDA percentages
on sales.
For Entertainment, Enterprise and Healthcare a reduction
of the EBITDA percentage in the last year of the projected
period of respectively more than 1.6%, 13% and 9% would
result in an impairment.
Discount rates – Management has considered the possibil-
ity of a significant higher weighted average cost to test the
sensitivity. For none of the cash-generating units this leads
to an impairment.
Growth rate estimate (beyond the projection period) – For
all divisions, no reasonable possible change in the growth
rate, used to extrapolate beyond the projection period, would
result in an impairment.
Barco
Inte
grate
d re
po
rt 20
20
49
FIN
Finan
cial re
po
rt
01 BARCO CONSOLIDATED
02 INFORMATION ABOUT THE SHARE

Barco’s intangibles mainly include SAP ERP software and
intangibles acquired through acquisitions.
In 2020, capital expenditures for intangible assets amount to
2 million euro (2019: 3.1 million euro, 2018: 3.7 million euro),
mainly related to SAP ERP software licenses (2019: 1 million
euro; 2018: 1.5 million euro).
IN THOUSANDS OF EURO 2020 2019 2018
SOFTWARE
CUSTOMER
RELATIONS KNOW HOW
OTHER INTAN-
GIBLE ASSETS
OTHER INTANGIBLE
ASSETS UNDER CONSTRUC-
TION TOTAL TOTAL TOTAL
At cost
On 1 January 70,436 21,541 54,979 10,191 104 157,250 143,696 145,300
Expenditure 1,690 - - 8 252 1,951 3,122 3,710
Sales and disposals -6,869 -1,054 - -142 - -8,064 -929 -4,581
Acquisition of subsidiaries - - - - - - 8,900 -
Disposal of subsidiaries - - - - - - - -405
Transfers 109 - - - -109 - - -
Translation (losses)/gains -44 -6,067 -10,382 -36 - -16,529 2,461 -329
On 31 December 65,323 14,420 44,597 10,020 247 134,608 157,250 143,696
Amortizationand impairment
On 1 January 43,406 21,541 38,082 9,753 - 112,781 96,299 81,939
Amortization 7,889 - 5,471 28 - 13,388 15,523 19,032
Impairment - - 3,500 - - 3,500 - -
Sales and disposals -6,862 -1,054 - -37 - -7,953 -670 -4,554
Disposal of subsidiaries - - - - - - - -153
Transfers - - -6 6 - - - -
Translation (losses)/gains -129 -6,067 -9,840 -24 - -16,061 1,629 35
On 31 December 44,303 14,420 37,206 9,726 - 105,655 112,781 96,299
Carrying amount
On 1 January 27,031 - 16,897 438 104 44,469 47,397 63,361
On 31 December 21,020 - 7,391 295 247 28,952 44,469 47,397
9. Other intangible assets and tangible fixed assets
9.1 Other intangible assets
Barco
Inte
grate
d re
po
rt 20
20
50
FIN
Finan
cial re
po
rt
01 BARCO CONSOLIDATED
02 INFORMATION ABOUT THE SHARE

Disposals in 2020 relate to fully amortized IT software which
is no longer used.
In 2019, the acquired know how for caresyntax (8.9 million
euro) is included in the table above in the line 'acquisition
of subsidiaries'. On April 9th, 2019 Barco announced a joint
development, a software distribution and integrator agree-
ment, with caresyntax®, leader in vendor-neutral software
solutions for surgical automation, analytics and AI, along-
side participating in the company’s round of growth equity
financing.
The investment payment was recorded as an intangible
asset (acquired know-how) and is amortized over 5 years.
No equity instrument has been recognized because of the
premium paid over the fair value of the shares.
The Group performed its annual impairment review on
acquired intangibles in the fourth quarter of 2020 consistently
with prior years. Special attention was paid to the poten-
tial impact of covid-19. The impairment test resulted in an
impairment of 3.5 million euro on the acquired know how
for caresyntax. The impairment cost is included in research
and development expenses.
Barco does not hold intangible assets with indefinite lifetime.
Barco
Inte
grate
d re
po
rt 20
20
51
FIN
Finan
cial re
po
rt
01 BARCO CONSOLIDATED
02 INFORMATION ABOUT THE SHARE

IN THOUSANDS OF EURO 2020 2019 2018
LAND AND
BUILDINGS
PLANT,
MACHINERY
AND
EQUIPMENT
FURNITURE,
OFFICE
EQUIPMENT
AND VEHICLES
OTHER
PROPERTY,
PLANT AND
EQUIPMENT
ASSETS
UNDER CON-
STRUCTION
TOTAL OTHER
TANGIBLE
ASSETS TOTAL TOTAL TOTAL
At cost
On 1 January 127,520 90,335 43,474 13,670 1,862 149,342 276,862 240,011 237,667
Expenditure * 7,878 2,530 5,678 1,144 9,283 18,635 26,513 21,745 20,099
Sales and disposals -7,229 -15,490 -3,759 -3,340 -29 -22,619 -29,847 -19,854 -15,820
Change in accounting principle (IFRS 16)
- - - - - - - 33,438
Disposal of subsidiaries - - - - - - - - -1,990
Transfers -386 3,585 395 1,499 -5,094 386 - - -
Translation (losses)/gains -3,260 -1,475 -1,005 -607 -77 -3,163 -6,423 1,522 55
On 31 December 124,524 79,485 44,784 12,366 5,945 142,580 267,104 276,861 240,011
Depreciation and impairment
On 1 January 43,855 56,491 30,376 10,670 - 97,537 141,393 131,231 132,337
Depreciation 12,233 7,495 5,701 1,066 - 14,262 26,495 27,466 15,458
Impairment - 5,136 - 621 - 5,757 5,757 - -
Sales and disposals -4,342 -15,363 -3,574 -3,067 - -22,004 -26,346 -18,048 -15,075
Disposal of subsidiaries - - - - - - - - -1,460
Transfers - 2 9 -11 - - - - -
Translation (losses)/gains -1,443 -1,076 -749 -401 - -2,226 -3,669 743 -29
On 31 December 50,304 52,686 31,763 8,877 - 93,326 143,630 141,393 131,231
Carrying amount
On 1 January 83,665 33,843 13,098 3,000 1,862 51,805 135,469 108,780 105,330
On 31 December 74,220 26,799 13,020 3,490 5,945 49,254 123,473 135,467 108,779
9.2 Tangible fixed assets
(*) Expenditures in 2020 also includes the additions for IFRS 16.
Barco
Inte
grate
d re
po
rt 20
20
52
FIN
Finan
cial re
po
rt
01 BARCO CONSOLIDATED
02 INFORMATION ABOUT THE SHARE

Capital expenditures for tangible assets in 2020, excluding
the impact of IFRS16, amount to 15.5 million euro. Major
facility related investments concern the new factory in
China, Suzhou (2020: 3.3 million euro; 2019: 0.8 million
euro), the new software lab in Noida (1.9 million euro) and
heating, ventilation and airco investments in its Kortrijk and
Duluth facilities (1.1 million euro). The facility related capex
in 2018 and 2019 were in Barco’s headquarters and extended
operations facility (2019: 1.4 million euro, 2018: 8.2 million
euro) and the Taiwan factory (2019: 4.1 million euro; 2018:
2.1 million euro).
In addition, capital expenditures include machinery and tool-
ing linked to new development projects (2020: 3.6 million
euro; 2019: 1.5 million euro) and the renovation of the Duluth
facility in the US (2019: 2 million euro, 2018: 1.6 million euro).
Disposals in 2020 mainly relate to the closure of the Taiwan
factory (impairment of 5.8 million euro), together with old
machinery. The main capex on the balance sheet, realized in
the period 2015 – 2019 relates to the headquarters of Barco
and the extended operations facility for 79.1 million euro.
The closure of the Taiwanese Unisee LCM-production factory
in the second half of 2020 resulted in an impairment of 5.8
million euro mainly related to the machinery and equipment
(see note 5. Restructuring and impairments). The closure was
linked to the decision to outsource the Unisee LCM panels.
The Company considered the potential impact of covid-19
on the utilization levels of its factories and potential impair-
ment of its machinery and equipment. The analysis did not
conclude an impairment. See ‘Critical accounting judge-
ments and key sources of estimation uncertainty’ for more
explanation on the impact of covid-19 on Barco’s operations.
Disposals in 2019 mainly relate to old machinery & equip-
ment, which are no longer in use and to the sale of the
remaining part of the land and building in Poperinge.
Barco
Inte
grate
d re
po
rt 20
20
53
FIN
Finan
cial re
po
rt
01 BARCO CONSOLIDATED
02 INFORMATION ABOUT THE SHARE

IN THOUSANDS OF EURO 31 DEC 2020 31 DEC 2019
Buildings -7,944 -7,702
Vehicles -2,390 -2,281
Total depreciation charge of right-of-use assets -10,334 -9,983
Interest expense (included in finance cost) -1,000 -1,085
Expense relating to short-term leases -41 -509
Expense relating to leases of low-value assets that are not shown above as short-term leases -26 -23
(*) Until 31 December 2018, the Group only recognized lease assets and lease liabilities in relation to leases that were classified as ‘finance leases’ under IAS 17
Leases. The assets were presented in property, plant and equipment and the liabilities as part of the Group’s borrowings. For adjustments recognized on
adoption of IFRS 16 on 1 January 2019, please refer to note IFRS accounting standards adopted as of 2019 in the annual report of 2019.
IN THOUSANDS OF EURO 2020 2019
BUILDINGS VEHICLES TOTAL TOTAL
On 1 January 30,884 7,081 37,965 33,438
New leases or extensions of currentleases 7,602 3,399 11,000 4,647
Termination of leases -7,226 -1,064 -8,290 -165
Translation (losses)/gains -1,653 -10 -1,663 44
On 31 December 29,607 9,406 39,013 37,965
Depreciation and impairment
On 1 January -7,674 -2,275 -9,948 -
Depreciation -7,944 -2,390 -10,334 -9,983
Termination of leases 4,339 1,033 5,372 50
Translation (losses)/gains 489 6 495 -15
On 31 December -10,790 -3,625 -14,415 -9,948
Right-of-use assets
On 1 January 23,210 4,807 28,017 33,438
On 31 December 18,817 5,781 24,598 28,017 (*)
We refer to note 14 for more information on the lease liabilities.
The statement of profit or loss shows the following amounts relating to leases:
Leases
This note provides more information for leases where the Group is a lessee.
The balance sheet shows the following amounts relating to leases:
The total cash outflow for leases in 2020 was 10.8 million euro (2019: 10.6 million euro).
Additions to the right-of-use assets during 2020 were 11 million euro (2019: 4.4 million euro) split over leased buildings (7.6
million euro) and leased vehicles (3.4 million euro). The additions are both renewals of existing lease agreements as well as
new lease agreements in Singapore, China and India over a lease period of respectively 5 years, 5 years and 8 years.
Barco
Inte
grate
d re
po
rt 20
20
54
FIN
Finan
cial re
po
rt
01 BARCO CONSOLIDATED
02 INFORMATION ABOUT THE SHARE

10. Deferred tax assets – deferred tax liabilities
IN THOUSANDS OF EURO ASSETS LIABILITIES NET ASSET/(LIABILITY)
2020 2019 2018 2020 2019 2018 2020 2019 2018
Tax value of loss carry forwards 22,854 22,622 20,367 - - - 22,854 22,622 20,367
Tax value of tax credits 13,616 11,505 18,980 - - - 13,616 11,505 18,980
Provisions 12,197 14,689 13,430 -142 - -2,336 12,054 14,689 11,094
Inventory 9,133 10,247 12,001 - -353 -278 9,133 9,894 11,723
Deferred revenue 5,082 3,825 4,805 -442 -979 -1,518 4,640 2,845 3,287
Tangible fixed assets and software 1,734 1,766 1,741 -925 -960 -836 809 806 905
Employee benefits 843 1,207 1,388 -525 -1,000 -8 318 207 1,380
Other investments 797 558 408 - - - 797 558 408
Trade debtors 407 401 231 - - -4 407 401 228
Uncertain tax treatment (IFRIC 23) - - - -3,400 -5,240 - -3,400 -5,240 -
Patents, licenses, ... - - - -3,688 -4,013 -4,159 -3,688 -4,013 -4,159
Other items 589 -1,561 293 -64 -173 -170 525 -1,734 124
Gross tax assets/(liabilities) 67,253 65,260 73,646 -9,187 -12,719 -9,308 58,066 52,541 64,338
Offset of tax -4,441 -5,143 -6,169 4,441 5,143 6,169 - - -
Net tax assets/(liabilities) 62,811 60,116 67,478 -4,745 -7,575 -3,140 58,066 52,541 64,338
The deferred tax asset and liability balance comprises temporary differences attributable to:
Movements in the deferred tax assets / (liabilities) arise from the following:
IN THOUSANDS OF EUROAS AT
1 JANUARY
RECOGNIZED THROUGH
INCOME STATEMENT
"RECOGNIZED THROUGH
EQUITY
EXCHANGE GAINS AND
LOSSESAS AT
31 DECEMBER
Tax value of loss carry forwards 22,622 274 - -43 22,854
Tax value of tax credits 11,505 2,131 - -20 13,616
Patents, licenses, ... -4,013 126 - 199 -3,688
Tangible fixed assets and software 806 126 - -123 809
Other investments 558 303 - -64 797
Inventory 9,894 -193 - -568 9,133
Trade debtors 401 42 - -36 407
Provisions 14,689 -2,378 -9 -247 12,054
Employee benefits 207 165 - -54 318
Deferred revenue 2,845 2,172 - -377 4,640
Other items -1,734 2,278 - -19 525
Uncertain tax treatment (IFRIC 23) -5,240 1,840 - - -3,400
Net deferred tax 52,541 6,886 -9 -1,352 58,066
Barco
Inte
grate
d re
po
rt 20
20
55
FIN
Finan
cial re
po
rt
01 BARCO CONSOLIDATED
02 INFORMATION ABOUT THE SHARE
On top of the tax losses and tax credits for which a net
deferred tax is recognized (net deferred tax asset of respec-
tively 22.9 million euro and 13.6 million euro), the Group
owns tax losses carried forward and other temporary dif-
ferences on which no deferred tax asset is recognized
amounting to 42 million euro as of 31 December 2020 (32.3
million euro in 2019) (resulting in a non-recognized deferred
tax asset of 11.5 million euro (9.2 million euro in 2019)) and
unutilized capital losses carried forward in the US on which
no deferred tax asset is recognized amounting to 30.5 million
euro (29.4 million euro in 2019) (resulting in a non-recog-
nized deferred tax asset of 7.4 million euro (7.3 million euro
in 2019)). Deferred tax assets have not been recognized on
these items because it is not probable that taxable profit will
be available in the near future against which the benefits
can be utilized, or that tax assets will be utilized within their
statue of limitations. The tax losses carried forward and other
temporary differences on which no deferred tax asset is recog-
nized have no expiration date, except for capital losses carried
forward which will expire in 2023.
Deferred tax assets recognized primarily relate to the tax
value of loss carry forwards and tax credits and almost fully
relate to Belgium. In assessing the realization of deferred tax
assets, management considers whether it is probable that
some portion or all of the deferred tax assets will be realized
within the foreseeable future.
The ultimate realization of deferred tax assets is depen-
dent upon the generation of future taxable profit during
the periods in which those temporary differences become
deductible. Management considers the scheduled reversal of
deferred tax liabilities, projected future taxable profit and tax
planning strategies in making this assessment. In 2020, the
covid-19 impact on future taxable profit was factored in in the
realization assessment. A time period of 5 years is considered.
In order to fully realize the deferred tax asset, the Group will
need to generate future taxable profit in the countries where
the net operating losses were incurred. Based upon the level
of historical taxable income and projections for future taxable
profit over the periods in which the deferred tax assets are
deductible, management believes as at 31 December 2020,
it is probable that the Group will be able to recover these
deductible temporary differences.
Barco has not recognized income taxes on undistributed
earnings of its subsidiaries which will not be distributed in the
foreseeable future. The cumulative amount of undistributed
earnings on which the Group has not recognized income
taxes was approximately 478 million euro at December 31,
2020 (2019: 491 million euro, 2018: 460 million euro).
Barco
Inte
grate
d re
po
rt 20
20
56
FIN
Finan
cial re
po
rt
01 BARCO CONSOLIDATED
02 INFORMATION ABOUT THE SHARE

Investments include entities in which Barco owns less than
20% of the shares. These are accounted for as fair value
through profit and loss or other comprehensive income
instruments, as determined at moment of initial recognition,
which implies that the Group measures these investments
on a fair value basis with differences in fair value reflected in
profit and loss or other comprehensive income. Interest in
associates represents entities in which Barco owns between
20% and 50% of the shares. Interest in associates are fully
allocated to the Entertainment division.
The increase in investments from 2018 to 2020 is related
to acquired minority stakes, below regulatory disclosure
threshold levels. The investments are measured at market
price. For investments that are publicly quoted in an active
market, the quoted market price is the best measure of fair
value. The remeasurement at fair value per 31 December
2020 versus the carrying amount, amounted to 18.3 million
euro and is reflected in other comprehensive income (2019:
1.9 million euro).
11. Investments and interest in associates
IN THOUSANDS OF EURO 2020 2019 2018
Investments 87,228 23,215 178
Interest in associates 19,713 20,073 18,927
Investments and interest in associates 106,942 43,288 19,105
IN THOUSANDS OF EURO 2020 2019
Opening net assets 1 January 23,215 178
Additions 52,273 21,185
Other comprehensive income 18,331 1,852
Translation losses -6,591
Closing net assets 31 December 87,228 23,215
Investments
Interest in associates
Interest in associates, in 2020 and 2019, reflects the equity
investment in BarcoCFG and CCO.
Barco
Inte
grate
d re
po
rt 20
20
57
FIN
Finan
cial re
po
rt
01 BARCO CONSOLIDATED
02 INFORMATION ABOUT THE SHARE

The Group has no contingent liabilities or capital commitments in relation to its associates as at 31 December 2020 and 2019.
For all equity accounted investments, the parent’s or other investor’s consent is required to distribute its profits; which is not
decided at the reporting date. The equity accounted investments did not recognize items in other comprehensive income.
SUMMARIZED BALANCE SHEETIN THOUSANDS OF EURO
BARCO CFG31 DEC 2020
CCO31 DEC 2020
TOTAL31 DEC 2020
BARCO CFG31 DEC 2019
CCO31 DEC 2019
TOTAL31 DEC 2019
Cash and cash equivalents 21,441 18,423 39,864 44,828 12,924 57,752
Other current assets 52,472 3,335 55,807 51,365 9,625 60,990
Total current assets 73,913 21,758 95,671 96,193 22,548 118,741
Non-current assets 7,943 10,535 18,479 7,994 15,602 23,595
Other current liabilities 59,532 7,217 66,749 83,356 9,853 93,209
Total current liabilities 59,532 7,217 66,749 83,356 9,853 93,209
Other non-current liabilities - 7 7 - 13 13
Total non-current liabilities - 7 7 - 110 110
Net assets 22,324 25,070 47,394 20,831 28,187 49,018
Reconciliation to carrying amounts:
Opening net assets 1 January 20,831 28,187 49,018 21,998 23,279 45,277
Profit/loss for the period 7,156 -788 6,369 12,849 4,476 17,325
Other comprehensive income (CTA) -578 -2,329 -2,908 161 433 593
Dividends paid -5,085 - -5,085 -14,178 - -14,178
Closing net assets 22,324 25,070 47,394 20,831 28,187 49,018
Group's share in % 49% 35% 49% 35%
Group's share 10,939 8,775 19,713 10,207 9,866 20,073
Carrying amount 10,939 8,775 19,713 10,207 9,866 20,073
SUMMARIZED STATEMENT OF COMPREHENSIVE INCOMEIN THOUSANDS OF EURO
BARCO CFG31 DEC 2020
CCO31 DEC 2020
TOTAL31 DEC 2020
BARCO CFG31 DEC 2019
CCO31 DEC 2019
TOTAL31 DEC 2019
Profit/loss for the period 7,156 -788 6,369 12,849 4,476 17,325
Other comprehensive income (CTA) -578 -2,329 -2,908 161 433 593
Total comprehensive income 6,578 -3,117 3,461 13,010 4,908 17,918
Group's share in % 49% 35% 49% 35%
Group's share in profit/(loss) for the period 3,507 -276 3,231 6,296 1,566 7,863
Share in the result of joint ventures and associates - -276 -276 - 1,566 1,566
Included in other operating income 3,507 3,507 6,296 6,296
The Group’s share of the assets and liabilities as at 31 December 2020 and 2019 and income and expenses of the joint
ventures and associates for the year ended 31 December 2020 and 2019, which are accounted for using the equity method:
Barco
Inte
grate
d re
po
rt 20
20
58
FIN
Finan
cial re
po
rt
01 BARCO CONSOLIDATED
02 INFORMATION ABOUT THE SHARE

12. Inventory
Inventory levels in the company vary depending on the oper-
ating segment within Barco. Operating segments selling more
hardware products compared to software or project sales
generally have higher inventory levels.
As a result of the covid pandemic crisis in 2020 the company
experienced disruptions to its ability to operate production
facilities in some countries in the months of March and April
but recovered near full operational capacity afterwards.
In order to anticipate on potential disruptions, safety stocks
were temporarily increased. As from the second quarter
onwards, the covid-19 pandemic started to spread interna-
tionally and impacted most of the markets Barco operates
in, resulting in a lower and changing customer demand. As
a result of the lock-down measures and related restrictions
predictability of customer demand dropped.
IN THOUSANDS OF EURO 2020 2019 2018
Raw materials andconsumables
68,053 68,868 66,498
Work in progress 57,972 61,560 54,122
Finished goods 122,408 112,871 96,930
Write-off on inventories -73,043 -74,316 -82,439
Inventory 175,390 168,983 135,111
Inventory turns 2.3 3.2 3.8
IN THOUSANDS OF EURO 2020 Turns 2019 Turns 2018 Turns
Entertainment 96,429 1.8 95,354 2.9 72,802 3.7
Enterprise 33,863 2.6 34,419 3.7 27,014 4.3
Healthcare 45,098 3.1 39,211 3.6 35,295 3.5
Total inventory and turns 175,390 2.3 168,983 3.2 135,111 3.8
While the Company has decelerated significantly on its pur-
chases (see note 18), the combination of these impacts has
resulted in high year-end inventory levels and lower inven-
tory turns especially in the Entertainment division, where the
cinema and events business were impacted the most. Inven-
tory turns decreased to 2.3, compared to 3.2 in 2019.
Increased inventory in the Healthcare division is linked to
customer committed orders for the China region for which
the supplier decided to stop
the production of raw mate-
rials and the Company there-
fore purchased the raw mate-
rials upfront under the form
of a last-time buy order.
We refer to chapter ‘Critical accounting judgements and key
sources of estimation uncertainty’ for more explanation on
the impact of covid-19.
Inventories are stated at the lower of cost or net realizable
value. The calculation of the allowance for slow-moving
inventory is based on consistently applied write off rules,
which depend on both historical and future demand, both are
impacted by the covid-19 pandemic in 2020 and resulted in
higher write-offs recognized as expense in 2020: 11.6 million
euro or 1.5% of sales (2019: 4.4 million euro; 0.4% of sales,
2018: 6.1 million euro; 0.6% of sales). The write-off balance
remained stable in 2020, as the higher write-offs in profit and
loss were offset by scrapped inventories.
The inventory turns decreased to 3.2 in 2019 compared to
3.8 in 2018, mainly impacted by the launch and ramp-up of
new products in Entertainment.
Barco
Inte
grate
d re
po
rt 20
20
59
FIN
Finan
cial re
po
rt
01 BARCO CONSOLIDATED
02 INFORMATION ABOUT THE SHARE

Per 31 December 2020, the number of days sales outstanding
is at 67 days (55 days in 2019 and 52 in 2018). The increase
in number of days sales outstanding is the result of higher
overdues, mainly from cinema customers, caused by the
covid-19 global impact on the cinema markets.
For the year ended December 31, 2020, the Company
recorded a provision for current expected credit losses of
1.5 million euro reflecting a reduction in the credit quality of
specific cinema customers related accounts receivable as a
result of the covid-19 global pandemic.
The bad debt reserve in proportion to the gross amount of
trade debtors has increased to 2.9% (2019: 1.4%, 2018: 2.1%).
(a) Movement in bad debt reserve:
IN THOUSANDS OF EURO 2020 2019 2018
On 1 January -2,874 -3,413 -4,481
Additional provisions -2,341 -720 -1,922
Amounts used 100 332 548
Amounts unused 645 972 2,458
Translation (losses) / gains 156 -45 -15
On 31 December -4,314 -2,874 -3,413
13. Amounts receivable and other non-current assets
IN THOUSANDS OF EURO 2020 2019 2018
Trade debtors - gross 150,452 198,232 165,201
Trade debtors - bad debt reserve ( a ) -4,314 -2,874 -3,413
Trade debtors - net ( b ) 146,138 195,358 161,787
V.A.T. Receivable 5,358 8,574 7,054
Taxes receivable 5,744 3,266 3,313
Interest receivable 24 1,860 943
Currency rate swap (note 20) 5,345 5,879 2,380
Other 1,319 6,090 5,876
Other amounts receivable 17,789 25,669 19,567
Other non-current assets ( c ) 5,870 4,018 9,732
Number of days sales outstanding (DSO) 67 55 52
Barco
Inte
grate
d re
po
rt 20
20
60
FIN
Finan
cial re
po
rt
01 BARCO CONSOLIDATED
02 INFORMATION ABOUT THE SHARE

(b) At 31 December 2020, the aging analysis of trade receivables is as follows:
IN THOUSANDS OF EURO 2020 2019 2018
Not due 111,020 168,432 139,634
Overdue less than 30 days 12,282 15,654 16,918
Overdue between 30 and 90 days 6,246 9,220 5,171
Overdue between 90 days and 180 days 12,899 2,904 1,042
Overdue more than 180 days 8,005 2,022 2,437
Total gross 150,452 198,232 165,201
Bad debt reserve -4,314 -2,874 -3,413
Total 146,138 195,358 161,787
In 2020, total overdue trade receivables amount to 39.4 mil-
lion euro (2019: 29.8 million euro, 2018: 25.6 million euro),
resulting in 19 days overdue DSO (2019: 9 days). The increase
in overdue amounts and long outstanding overdues is mainly
from the Company’s cinema customers. The Company has
a credit insurance in place for specific higher risk cinema
contracts and for cinema customers with overdues. The
Company was able to reach extended payment plans which
are closely monitored. Part of the overdue amounts are linked
to service contracts, for which payments are delayed or ser-
vice period was extended in view of the cinemas being closed
for business. Potential payment risk and the actual service
period were considered when recognizing revenue out of
these service contracts.
In assessing the potential credit risk and the need for
recording a bad debt reserve on expected credit losses, the
Company has taken into account the credit insurance in
place, payment plans being honored and revenue recogni-
tion, which explains the bad debt reserve in 2020 amounting
to 54% of the trade receivables overdue more than 180 days
(2019: 142%, 2018: 140%).
As of 2018, the Group applied the IFRS 9 simplified approach
to measure expected credit losses which uses a lifetime
expected loss allowance for all trade receivables based on
historical losses. The Group analyzed the impact of IFRS 9
and concluded there was no material impact on the bad
debt reserve booked. The Group also assessed whether the
historic pattern would change materially in the future and
expected no significant impact.
(c) Other non-current assets
The other non-current assets include cash guarantees for
an amount of 5 million euro (2019: 3 million euro, 2018: 3.4
million euro).
In 2018, the non-current assets also include long-term receiv-
ables in the frame of vendor financing programs, amounting
to 5.4 million euro, of which 5.4 million euro (see note 14)
offset by long term debt of the same amount. As this long-
term receivable expired in 2020, 3.2 million euro is included
in other receivables in 2019.
Barco
Inte
grate
d re
po
rt 20
20
61
FIN
Finan
cial re
po
rt
01 BARCO CONSOLIDATED
02 INFORMATION ABOUT THE SHARE

The net financial cash at the end of 2020 amounts to 193.5
million euro, 135.9 million euro lower compared to end 2019,
a result of the negative free cash flow (-36 million euro), div-
idends paid out (-33 million euro), investments (-55 million
euro) and currency impact. We refer to the supplementary
statements, note 16 and note 11 for more explanation. Of
the total net financial cash, 235 million euro is cash on the
balance sheet. Additional financial flexibility is provided with
75 million euro of unused bilateral committed credit facilities
with a selected group of commercial banks (see further c).
In addition to significant liquidity, Barco has a well-balanced
debt profile with debt limited to 45 million euro of which 9
million euro near-term maturities.
The direct available net cash, excluding the cash contributed
by Barco and the minority shareholders of Cinionic (65.7
million euro)) amounts to 127.7 million euro.
The net financial cash in 2019 decreased slightly with 2.6 mil-
lion euro, versus 2018, mainly due to the IFRS16 related debt
of 33.4 million euro added in 2019. The net cash was also
impacted by investments (21.1 million euro) and the increase
in ownership in BTT and Barco BCV CEC Panda to 100%.
14. Net financial cash/debt
IN THOUSANDS OF EURO 2020 2019 2018
Short term investments (a) 3,175 24,748 112,795
Deposits (a) 79,911 176,438 114,901
Cash at bank (b) 155,426 180,532 136,832
Cash in hand 65 65 74
Cash and cash equivalents 235,402 357,035 251,807
Long-term financial receivables - 277 5,430
Long-term debts (c) -35,854 -40,225 -29,882
Current portion of long-term debts (c) -9,187 -12,469 -7,500
Short-term debts (d) -86 - -686
Net financial cash/(debt) 193,450 329,366 331,964
Barco
Inte
grate
d re
po
rt 20
20
62
FIN
Finan
cial re
po
rt
01 BARCO CONSOLIDATED
02 INFORMATION ABOUT THE SHARE

IN THOUSANDS OF EURO 2020AVERAGE
INTEREST RATE 2019AVERAGE
INTEREST RATE 2018AVERAGE
INTEREST RATE
- deposits in USD 71,839 0.70% 120,666 1.73% 107,291 2.36%
- deposits in CNY 6,232 1.88% 53,622 4.06% 96,170 3.57%
- deposits in INR 3,175 3.61% 24,309 7.48% 21,709 7.20%
- deposits in other currencies 1,839 2,589 2,526
Total short term investments and deposits 83,086 201,186 227,696
(a) Short term investments and deposits
Short term investments are convertible to known amounts
of cash between three and twelve months from inception.
Deposits are short term (between zero and three months),
highly liquid investments, which are readily convertible to
known amounts of cash.
The short term investments and deposits do not carry a
material risk of change in valuation.
At closing date, all short term investments and deposits
include:
(b) Cash at bank
Cash at bank is immediately available. It is denominated in the following currencies:
2020 2019 2018
- EUR 34.7% 41.4% 49.4%
- HKD 28.8% 2.4% 4.4%
- CNY 15.3% 30.7% 17.1%
- USD 8.6% 12.7% 15.1%
- Others 12.5% 12.7% 13.9%
The decrease in foreign currency deposits in CNY and INR in 2020 compared to 2019, is a result of dividents distributed from
the Company's affiliates in China and India. In view of the low interest rates on deposits, those dividends were kept in cash
in Euro and Hong Kong Dollar (see b).
Barco
Inte
grate
d re
po
rt 20
20
63
FIN
Finan
cial re
po
rt
01 BARCO CONSOLIDATED
02 INFORMATION ABOUT THE SHARE

IN THOUSANDS OF EURO 2020 2019 2018
- EUR 31,348 35,366 31,000
- USD 4,098 8,328 1,261
- INR 4,162 1,381
- Other 5,434 7,620 5,121
Total 45,042 52,695 37,382
(c) Long-term financial debts
The Barco Group has a total of 95 million euro committed
credit facilities available. The portfolio consists of 2 major
tranches:
• Barco NV and Barco Coordination Center NV (as co-
obligors) signed a number of bilateral committed credit
facilities with a selected group of commercial banks for a
total amount of 75 million euro. The credit facilities have
an availability period till December 2023. Drawings under
the facilities have a short-term tenor.
• Barco NV signed a number of bilateral committed credit
facilities totaling 28 million euro, aiming at financing Barco’s
new headquarters campus project. Drawings have a long-
term tenor of 15 years following the end of the availability
period (as of the end of 2015). An amount of 20 million
euro is outstanding per end of 2020. These commitments
carry either a variable interest rate or have been swapped
via derivatives into fixed rate character.
Barco is meeting all requirements of the loan covenants on
its available credit facilities.
The below table summarizes the long-term financial debts,
including the current portion of long-term financial debts,
per currency:
The below table gives an overview of the long-term financial debts including the current portion of long-term financial debts,
per type of interest rate:
TYPE OF INTEREST RATE MATURITY 31 DEC 2020 31 DEC 2019 31 DEC 2018
Real estate financing:
- variable, swapped into fixed (EU) Later than 2025 10,838 12,113 13,388
- variable (EU) Later than 2025 9,163 9,888 10,613
- variable, swapped into fixed (US) Later than 2025 - 888 871
Research Development Innovation (RDI) financing:
- fixed, European Investment Bank 2020 - 1,500 7,000
Vendor financing (offset by long-term receivable) - - 5,430
Leasing (IFRS 16) 24,929 28,259 -
Other 113 47 81
Total long-term financial debts 45,042 52,695 37,382
Barco
Inte
grate
d re
po
rt 20
20
64
FIN
Finan
cial re
po
rt
01 BARCO CONSOLIDATED
02 INFORMATION ABOUT THE SHARE

The long-term debts (including interests due), excluding the current portion of the long-term debts, are payable as follows:
The lease liabilites per 31 december are as follows:
PER 31 DECEMBER 2020 PER 31 DECEMBER 2019 PER 31 DECEMBER 2018
Payable in 2022 9,883 Payable in 2021 10,003 Payable in 2020 9,540
Payable in 2023 7,034 Payable in 2022 7,081 Payable in 2021 2,545
Payable in 2024 6,214 Payable in 2023 6,259 Payable in 2022 2,476
Payable in 2025 5,083 Payable in 2024 5,133 Payable in 2023 3,300
Later 13,168 Later 15,468 Later 15,352
Total long-term debts 41,381 Total long-term debts 43,945 Total long-term debts 33,213
IN THOUSANDS OF EURO 2020 2019
On 1 January 28,259 33,438
New leases or extensions of current leases 11,000 4,647
Payments or termination of leases -13,132 -9,855
Translation (losses)/gains -1,199 28
Total lease liabilities on 31 December 24,929 28,259
Current 7,187 8,969
Non-current 17,742 19,290
Barco
Inte
grate
d re
po
rt 20
20
65
FIN
Finan
cial re
po
rt
01 BARCO CONSOLIDATED
02 INFORMATION ABOUT THE SHARE

15. Other long-term liabilities
IN THOUSANDS OF EURO 2020 2019 2018
Other amounts payable 75 106 -
Accrued charges 3,058 5,146 1,526
Deferred Income (a) 40,016 21,676 22,097
Prepayment customers LT 138 103 934
Other long-term liabilities 43,286 27,031 24,557
(a) Deferred income which will be recognized in revenue over a longer period
than one year, is shown in other long-term liabilities. It concerns mainly
maintenance contracts sold in the Entertainment division which cover a
long-term liability. The contracts start at the end of the two years standard
warranty period. The increase in 2020, is caused by some large cinema
contracts concluded in 2019 and 2020, for which major part of the extended
warranty period will be recognized in revenue as of 2022. Some of these
customers concluded yearly service contracts in the past, which were
replaced by long term service contracts. Due to the impact of covid-19 on
cinema markets globally, less one-year contracts were concluded in 2020.
The available 75 million euro bilateral credit facilities that
when used translate in a short term debt position are
undrawn per end of December 2020.
(d) Short-term financial debts
The below table gives an overview of the short-term financial debts on 31 December:
IN THOUSANDS OF EURO 2020 2019 2018
EFFECTIVE INTEREST RATE
BALANCEEFFECTIVE
INTEREST RATEBALANCE
EFFECTIVE INTEREST RATE
BALANCE
- Other 0.0% 86 0.0% 0 0.0% 686
Total 86 0 686
Barco
Inte
grate
d re
po
rt 20
20
66
FIN
Finan
cial re
po
rt
01 BARCO CONSOLIDATED
02 INFORMATION ABOUT THE SHARE

16. Equity attributable to equity holders of the parent
IN THOUSANDS OF EURO 2020 2019 2018
Share capital 55,879 55,876 55,869
Share premium 147,003 146,524 146,171
Share-based payments 14,100 11,193 9,046
Acquired own shares -26,962 -29,334 -35,762
Retained earnings 535,093 554,479 501,807
Cumulative translation adjustment -64,693 -37,522 -42,842
Derivatives -1,111 -1,157 -1,022
Equity attributable to equity holders of the parent 659,309 700,060 633,267
1. Share capital, share premium and own shares
A small capital increase took place in 2020 through the exer-
cise of 5,250 warrants into the same number of new shares
on 23 June 2020 with a resulting increase of the statutory
capital of 3 (‘000) euro and an increase of the share premium
account of 35 (‘000) euro.
As a result, the company’s share capital amounts to 55.9
million euro on 31 December 2020, consisting of 91,487,438
fully paid shares.
Since 2016, Barco did not acquire own shares. In total, Barco
owns now 3,160,032 own shares.
In 2020, Barco sold in total 216,614 own shares upon the
exercise of 216,614 stock options with a resulting decrease
of the own shares of 2,372 (‘000) euro and an increase of
the share premium account of 444 (‘000).
As a result, thereof the company’s share premium account
amounts to 147 million euro, the share-based payments
amount to 14.1 million euro and the number of own shares
acquired by Barco NV up to 31 December 2020 therefore
decreased to 3,160,032 own shares (2019:3,376,646; 2018:
4,184,530 own shares).
Barco
Inte
grate
d re
po
rt 20
20
67
FIN
Finan
cial re
po
rt
01 BARCO CONSOLIDATED
02 INFORMATION ABOUT THE SHARE

2. Share-based payments
On 29 October 2020, 2 new option plans have been
approved by the Board of Directors. These 2 option plans
entitle the granting of maximum 424,000 stock options
before 31 December 2020. Each stock option gives right
to the acquisition of one (1) share. In 2020, 424,000 stock
options have been granted to employees and management
of the group based upon these option plans. On 31 Decem-
ber 2020, no options remained available for distribution
under the 2020 stock option schemes given the expiry dates
of the plans per 31 December 2020.
Warrants exercisable under the warrant
and stock option plans
The total number of outstanding warrants on 31 December
2020 amounted to 0. Since 2010, stock options have been
granted. The total number of outstanding stock options on 31
December 2020 amounted to 2,727,834. The company’s own
shares will be used under the outstanding stock option plan
to fulfill the commitment. During 2020, 5,250 warrants and
216,614 stock options have been exercised (in 2019, 11,200
warrants and 807,884 stock options).
These warrants and stock options may be exercised the ear-
liest 3 years after the allocation date (i.e. the vesting period)
over a period of maximum 10 years and during a couple
of fixed periods over the year. The cost of the awards is
recognized over the vesting period on a straight-line basis.
Below is an overview given of the outstanding warrant and
stock option plans:
Table on warrants
ALLOCATION DATE ENDTERM
EXERCISE PRICE
(IN EURO)
BALANCE ON 31 DEC 2019
GRANTED IN 2020
EXERCISED IN 2020
CANCELLED IN 2020
EXPIRED IN 2020
BALANCE ON 31 DEC 2020
Warrants
11/12/071 11/11/17 7.24 6,300 - -5,250 - -1,050 0
Total number of warrants 6,300 - -5,250 - -1,050 0
(1) For a number of warrants this last exercise date was extended with three (3) years according to article 407 of the law of 24 December 2002
Barco
Inte
grate
d re
po
rt 20
20
68
FIN
Finan
cial re
po
rt
01 BARCO CONSOLIDATED
02 INFORMATION ABOUT THE SHARE

The cost of these warrant/stock option plans is included
in the income statement in other operating expense. The
warrants/stock options are measured at grant date, based
on the share price at grant date, exercise price, expected
volatility, dividend estimates and interest rates.
The warrant/stock option cost is taken into result on a
straight-line basis from the grant date until the first exercise
date. The share-based payment expenses amounted to 2.9
million euro in 2020 (2019: 2.1 million euro; 2018: 2.1 million
euro).
(2) Deviation of exercise price as a result of the implementation of the US sub plan
Table on warrants
ALLOCATION DATE ENDTERM
EXERCISE PRICE
(IN EURO)
BALANCE ON 31 DEC 2019
GRANTED IN 2020
EXERCISED IN 2020
CANCELLED IN 2020
EXPIRED IN 2020
BALANCE ON 31 DEC 2020
Stock options
10/28/10 10/27/20 5.12 2,800 - -1,400 - -1,400 0
10/28/11 10/27/21 5.24 3,500 - - - - 3,500
10/31/12 10/30/22 7.48 5,600 - -1,400 - - 4,200
10/31/12 10/30/20 7.48 18,900 - -8,050 - -10,850 0
10/31/122 10/30/20 7.57 19,950 - -12,950 - -7,000 0
10/21/13 10/20/23 8.43 11,060 - - - - 11,060
10/21/13 10/20/21 8.43 28,700 - - - - 28,700
10/21/132 10/20/21 8.71 28,350 - -5,250 - - 23,100
10/23/14 10/22/24 7.86 23,100 - -2,800 - - 20,300
10/23/14 10/22/22 7.86 26,439 - -700 - - 25,739
10/23/142 10/22/22 7.91 22,274 - -1,771 - - 20,503
10/22/15 10/21/25 8.16 23,450 - -7,000 - - 16,450
10/22/15 10/21/23 8.16 40,425 - -700 - - 39,725
10/22/152 10/21/23 8.26 31,850 - -3,500 - - 28,350
10/24/16 10/23/26 10.40 498,610 - -87,500 - - 411,110
10/24/16 10/23/24 10.40 42,917 - - - - 42,917
10/24/162 10/23/24 10.61 45,178 - -14,693 - - 30,485
10/20/17 10/16/27 12.54 605,675 - - - - 605,675
10/20/17 10/16/25 12.54 88,200 - -15,350 - - 72,850
10/20/172 10/16/25 12.67 207,900 - -53,550 - -2,100 152,250
10/23/18 10/22/28 14.40 424,900 - - -7,000 - 417,900
10/11/19 10/10/29 24.83 349,020 - - 349,020
10/29/20 10/28/30 12.76 - 424,000 - - - 424,000
Total number of stockoptions 2,548,798 424,000 -216,614 -7,000 -21,350 2,727,834
Barco
Inte
grate
d re
po
rt 20
20
69
FIN
Finan
cial re
po
rt
01 BARCO CONSOLIDATED
02 INFORMATION ABOUT THE SHARE

3. Retained earnings
The change in retained earnings includes the net income
of 2020, actuarial losses, change in the fair value of equity
investments, and the distribution of 33.4 million euro divi-
dend, as approved by the general shareholders meeting of 30
April 2020. The board of directors of Barco NV will propose
in the shareholders meeting of April 2021 a gross dividend
of 0.378 euro per share out of the available reserves per 31
December 2020. In 2020 a gross dividend of 0.378 euro
per share was paid out on the results of 2019; in 2019 0.329
euro was paid out.
4. Cumulative translation adjustment
In 2020, the exchange differences on translation of foreign
operations have a net negative impact of 30 million euro,
mainly relating to foreign balances held in Hong Kong Dollar
(-12.9 million euro), US Dollar (-7.8 million euro), Indian Rupee
(-3.6 million euro), Chinese Yuan (-1.9 million euro) and
Norwegian Krone (-1.3 million euro).
5. Derivatives
Derivative financial instruments are disclosed in note 20.
6. Main shareholders
BEFORE DILUTION
Public 63,798,580 69.73%
Titan Baratto NV 16,819,089 18.38%
Norges Bank 4,102,042 4.48%
3D NV 3,607,695 3.94%
Barco NV 3,160,032 3.45%
Total 91,487,438 100.00%
Barco
Inte
grate
d re
po
rt 20
20
70
FIN
Finan
cial re
po
rt
01 BARCO CONSOLIDATED
02 INFORMATION ABOUT THE SHARE

17. Non-controlling interest
NAME
COUNTRY OFINCORPORATION AND OPERATION 2020 2019 2018
Cinionic, Ltd Hong Kong 45% 45% -
Barco Taiwan Technology Ltd. Taiwan - - 10%
Barco China Electronic Visualization Technology China - - 35%
Barco CEC (HK), Ltd China - - 35%
IN THOUSANDS OF EURO 2020 2019 2018
Cinionic Ltd. 37,798 40,590 -
Barco Taiwan Technology Ltd. - - -1,085
Barco China Electronic Visualization Technology - - 2,819
Barco CEC (HK), Ltd - - 43
Total equity attributable to non-controlling interest 37,798 40,590 1,777
The below table represents the proportion of equity interest held by non-controlling interests
Overview of the equity attributable to non-controlling interest:
In the course of 2019, Barco acquired the remaining shares in Barco Taiwan Technology Ltd, Barco China Electronic
Visualization Technology and Barco CEC (HK), Ltd from their minority shareholders.
The remaining contributor to the non-controlling interest in
2019 and 2020 is Cinionic Ltd. In 2018, Barco decided to set
up a strategic partnership, whereby global, excluding China,
cinema related sales, marketing and service activities were
moved to Cinionic. We refer to note 1.1 for the Cinionic legal
entities incorporated. Mid December 2018, three minority
shareholders have contributed in the capital of Cinionic Ltd,
totaling 45% of total contributions of USD 100 million.
As of 1 January 2019, these capital contributions all give
right to 45% in the Cinionic legal entities’ equity and result.
Barco remains in control. Therefore, the non-China cinema
sales, marketing and service activities remain consolidated
in the Entertainment results in 2019 and 2020. The 45% stake
is shown as non-controlling interest as of 1 January 2019.
Barco
Inte
grate
d re
po
rt 20
20
71
FIN
Finan
cial re
po
rt
01 BARCO CONSOLIDATED
02 INFORMATION ABOUT THE SHARE

IN THOUSANDS OF EURO 2020 2019
Total non-current assets 4,901 1,929
Total current assets 107,537 140,080
Total assets 112,438 142,009
Equity attributable to equityholders of the parent 46,197 49,610
Equity attributable to non-controlling interest 37,798 40,590
Total equity 83,995 90,201
Total non-current liabilities 24,420 6,601
Total current liabilities 24,186 61,139
Total liabilities 132,601 157,941
IN THOUSANDS OF EURO% non-
controlling 2020 2019 2018
Cinionic Ltd. 618 592 -
Cinionic bvba -741 867 -
Cinionic Inc. -389 1,123 -
Barco Cine Appo Mexico, S.A. de C.V. -233 32 -
CFG Barco (Beijing) Electronics Co., Ltd * - - 6,640
Barco Taiwan Technology Ltd. - - -6,926
Barco China Electronic Visualization Technology - - 563
Barco CEC (HK), Ltd - - 107
Net income -745 2,614 384
Cinionic Ltd. 45% 278 45% 267 -
Cinionic bvba 45% -334 45% 390 -
Cinionic Inc. 45% -175 45% 505 -
Barco Cine Appo Mexico, S.A. de C.V. 45% -105 45% 14 -
CFG Barco (Beijing) Electronics Co., Ltd * 0% - 0% - 42% 2,805
Barco Taiwan Technology Ltd. 0% - 0% - 10% -693
Barco China Electronic Visualization Technology 0% - 0% - 35% 197
Barco CEC (HK), Ltd 0% - 0% - 35% 37
Net income attributable to non-controlling interest -335 1,176 2,347
Overview of the net income attributable to non-controlling interest:
(*) 42% non-controlling interest on BarcoCFG included until June 30th, 2018.
Other comprehensive income/(loss) for the period, net of tax
effect, part attributable to non-controlling interest amounts
to -2.5 million euro in 2020, -0.5 million euro in 2019 and 0.1
million euro in 2018. Total comprehensive income for the
year, net of tax, part attributable to non-controlling interest
amounts to -2.8 million euro in 2020, 0.7 million euro in 2019
and 2.4 million euro in 2018.
Below is the consolidated balance sheet of the Cinionic legal entities as at 31 December 2020 and 2019.
We refer to note 1.1 for more details on the Cinionic legal entities: Cinionic Limited, Cinionic bvba,
Barco CineAppo Mexico, S.A. de C.V. and Cinionic Inc.
ASSETS AND LIABILITIES CINIONIC JV
Barco
Inte
grate
d re
po
rt 20
20
72
FIN
Finan
cial re
po
rt
01 BARCO CONSOLIDATED
02 INFORMATION ABOUT THE SHARE

18. Trade payables and advances received from customers
IN THOUSANDS OF EURO 2020 2019 2018
Trade payables (a) 70,299 128,914 105,148
Days payable outstanding (DPO) 53 71 59
Advances received from customers (b) 42,375 69,515 53,747
(a) Decreased trade payables in 2020 compared to 2019 is the result of significant lower purchases, linked to the lower demand over 2020. Increased trade
payables in 2019 compared to 2018 is the combined effect of higher fourth quarter purchases, as a result of increased sales volume, together with longer
payment terms obtained from our suppliers.
(b) The lower cinema sales and the financial impact on the Company’s cinema customers of the closed cinemas worldwide as a result of the covid-19 pandemic
have resulted in lower advances received in 2020. In 2019, the higher sales and renewed large cinema contracts in Cinionic have resulted in higher advances
received from customers. Most payment terms of customers define that 30% of the total invoice needs to be prepaid before delivery of the goods. All prepaid
amounts are expected to be recognized in revenues over the coming 12 months.
19. Provisions
IN THOUSANDS OF EURO
BALANCESHEET2020
ADDITIONALPROVISIONS
MADE
AMOUNTSUSED
UNUSEDAMOUNTSREVERSED
TRANSFERS REMEASUREMENT GAINS/(LOSSES)
ON DBO
TRANSLATION (LOSSES) /
GAINS
BALANCESHEET2019
BALANCE SHEET
208
Total long-term provision 40,156 3,330 -1,474 -5,392 1,766 37 -539 42,428 34,265
Defined benefit obligations (b) 31,282 3,331 -600 -1,199 - 37 -112 29,826 18,757
Technical warranty (a) 8,857 - -874 -4,192 1,766 - -419 12,577 14,097
Other claims and risks (d) 18 - - - - - -8 25 1,412
Total short-term provision 13,720 13,884 -11,201 -5,739 -1,766 - -217 18,759 32,032
Technical warranty (a) 4,922 - - -1,926 -1,766 - -185 8,799 8,092
Restructuring provision (c) 3,743 9,882 -10,425 -2,711 - - - 6,997 20,714
Other claims and risks (d) 5,055 4,002 -777 -1,103 - - -31 2,963 3,226
Provisions 53,876 17,214 -12,676 -11,131 - 37 -756 61,187 66,298
(a) Technical warrantyProvisions for technical warranty are based on historical data
of the cost incurred for repairs and replacements. Additional
provisions are set up when a technical problem is detected.
There are three different technical warranty provisions:
provisions related to ‘normal’ (mostly 2 years) warranty
period, provisions related to extended warranty periods and
provisions for specific claims/issues.
Barco
Inte
grate
d re
po
rt 20
20
73
FIN
Finan
cial re
po
rt
01 BARCO CONSOLIDATED
02 INFORMATION ABOUT THE SHARE

(b) Defined benefit obligationsAs per 31 December 2020, 2019 and 2018, the defined benefit
obligations are composed of:
Belgian regulations require as from 2016 onwards that the mini-
mum guaranteed rate of return on employer and participant
contributions is 1.75% and is annually recalculated based on
a risk-free rate of 10-year government bonds. According to
IAS 19, Belgian defined contribution plans that guarantee a
specified return on contributions are defined benefit plans,
as the employer is not responsible for the contribution pay-
ments but has to cover the investment risk until the legal
minimum rates applicable. The returns guaranteed by the
insurance companies are in most cases lower than or equal
to the minimum return guaranteed by law. As a result, the
Group has not fully hedged its return risk through an insur-
ance contract and a provision needs to be accounted for.
The plans at Barco are financed through group insurance
contracts. The contracts are benefiting from a contractual
interest rate granted by the insurance company. When there is
underfunding, this will be covered by the financing fund and
in case this is insufficient, additional employer contributions
will be requested.
IN THOUSANDS OF EURO 2020 2019 2018
Pension plans in Belgium 26,190 24,231 13,143
Early retirement plans in Belgium 213 166 783
Local legal requirements (mainly Italy,
Korea, Japan, Germany, France) 4,754 5,136 4,580
A small number of individual plans 125 294 251
Total 31,282 29,826 18,757
IAS 19 requires an entity to recognize a liability when an
employee has provided service in exchange for employee
benefits to be paid in the future. Therefore, pension pro-
visions are setup. The obligations are measured on a
discounted basis because they are settled many years after
the employees render the related service. A qualified actuary
has determined the present value of the defined benefit
obligations and the fair value of the plan assets. These assets
are held by an insurance company. The projected unit credit
method was used to estimate the defined benefit obligations,
the defined benefit cost and the re-measurements of the
net liability.
There are 15 defined benefit plans in Barco Belgium, for
which we show below the aggregated view as these do not
differ materially from geographical location, characteristics,
regulatory environment, reporting segment or funding
arrangement. In accordance with IAS 19 the disclosure is in
the form of a weighted average.
Barco
Inte
grate
d re
po
rt 20
20
74
FIN
Finan
cial re
po
rt
01 BARCO CONSOLIDATED
02 INFORMATION ABOUT THE SHARE
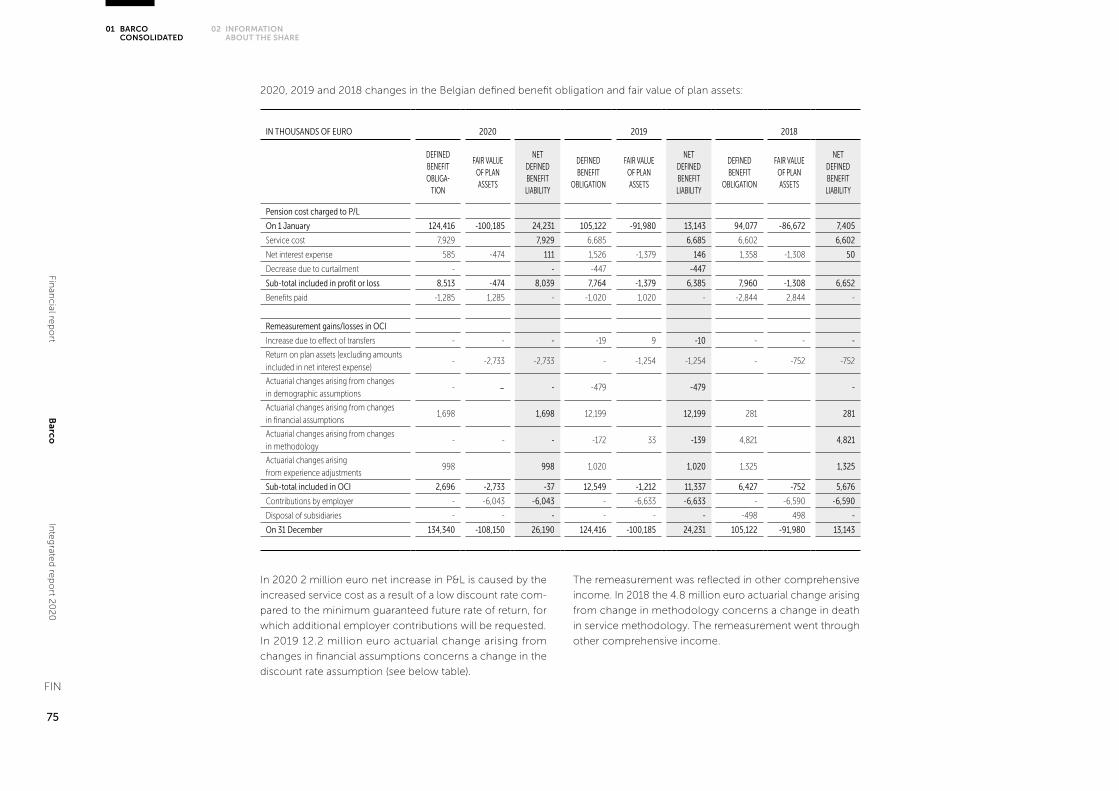
IN THOUSANDS OF EURO 2020 2019 2018
DEFINEDBENEFITOBLIGA-
TION
FAIR VALUEOF PLAN ASSETS
NET DEFINED BENEFITLIABILITY
DEFINEDBENEFIT
OBLIGATION
FAIR VALUEOF PLAN ASSETS
NET DEFINED BENEFITLIABILITY
DEFINEDBENEFIT
OBLIGATION
FAIR VALUEOF PLAN ASSETS
NET DEFINED BENEFITLIABILITY
Pension cost charged to P/L
On 1 January 124,416 -100,185 24,231 105,122 -91,980 13,143 94,077 -86,672 7,405
Service cost 7,929 7,929 6,685 6,685 6,602 6,602
Net interest expense 585 -474 111 1,526 -1,379 146 1,358 -1,308 50
Decrease due to curtailment - - -447 -447
Sub-total included in profit or loss 8,513 -474 8,039 7,764 -1,379 6,385 7,960 -1,308 6,652
Benefits paid -1,285 1,285 - -1,020 1,020 - -2,844 2,844 -
Remeasurement gains/losses in OCI
Increase due to effect of transfers - - - -19 9 -10 - - -
Return on plan assets (excluding amounts included in net interest expense)
- -2,733 -2,733 - -1,254 -1,254 - -752 -752
Actuarial changes arising from changes in demographic assumptions
- - - -479 -479 -
Actuarial changes arising from changesin financial assumptions
1,698 1,698 12,199 12,199 281 281
Actuarial changes arising from changesin methodology
- - - -172 33 -139 4,821 4,821
Actuarial changes arising from experience adjustments
998 998 1,020 1,020 1,325 1,325
Sub-total included in OCI 2,696 -2,733 -37 12,549 -1,212 11,337 6,427 -752 5,676
Contributions by employer - -6,043 -6,043 - -6,633 -6,633 - -6,590 -6,590
Disposal of subsidiaries - - - - - - -498 498 -
On 31 December 134,340 -108,150 26,190 124,416 -100,185 24,231 105,122 -91,980 13,143
2020, 2019 and 2018 changes in the Belgian defined benefit obligation and fair value of plan assets:
In 2020 2 million euro net increase in P&L is caused by the
increased service cost as a result of a low discount rate com-
pared to the minimum guaranteed future rate of return, for
which additional employer contributions will be requested.
In 2019 12.2 million euro actuarial change arising from
changes in financial assumptions concerns a change in the
discount rate assumption (see below table).
The remeasurement was reflected in other comprehensive
income. In 2018 the 4.8 million euro actuarial change arising
from change in methodology concerns a change in death
in service methodology. The remeasurement went through
other comprehensive income.
Barco
Inte
grate
d re
po
rt 20
20
75
FIN
Finan
cial re
po
rt
01 BARCO CONSOLIDATED
02 INFORMATION ABOUT THE SHARE

The sensitivity analyses above have been determined based
on a method that extrapolates the impact on the defined
benefit obligation as a result of reasonable changes in key
assumptions occurring at the end of the reporting period.
The sensitivity analyses are based on a change in a significant
assumption, keeping all other assumptions constant. These
may not be representative for an actual change in the defined
benefit obligation, as it is unlikely that changes in assumptions
would occur in isolation of one another.
IN THOUSANDS OF EURO 2020 2019 2018
Within the next 12 months 3,197 3,071 3,926
Between 2 and 5 years 20,865 24,802 17,893
Between 5 and 10 years 46,857 42,210 22,915
Total expected payments 70,919 70,083 44,734
IN THOUSANDS OF EURO 2020 2019 2018
Discount rate:
0.25% decrease 3,324 3,190 2,537
0.25% increase -3,868 -3,033 -2,384
Future salary change:
0.25% decrease -1,212 -1,181 -924
0.25% increase 596 1,268 989
Future consumer price index change:
0.25% decrease -711 -680 -519
0.25% increase 735 702 535
The following payments are the expected benefit payments
from the plan assets:
The average duration of the defined benefit plan obligation
at the end of the reporting period is 12.6 years (12.5 years in
2019 and 13.7 years in 2018). The expected employer contri-
butions to the plan for the next annual reporting period
amounts to 7.1 million euro (6.6 million euro in 2019 and
6.2 million euro in 2018); the employee contributions are
expected to amount to 1.2 million euro (1.1 million euro
in 2019 and 2018). Early retirement plans are recognized
as liability and expensed when the company is committed
to terminate the employment of the employees affected
before the normal retirement date.In Belgium, a multi-em-
ployer plan exists for some blue collars where payments
go into a sectoral fund. As Barco does not have access to
information about the plan that satisfies the requirements
of the standard, the plan is further classified as a defined
contribution plan and expensed as incurred.
(c) Restructuring provisionSee note 5 Restructuring and impairments. We refer to the
accounting standards on provisions including provisions on
restructuring.
d) Other claims and risksThis provision relates to disputes with suppliers, pending
litigations and specific customer warranty disputes. Barco
cannot provide details on the specific cases, as this could
cause considerable harm to Barco in the particular disputes.
With respect to the contingent liabilities related to former
acquisitions, there is one earn-out capped at 15 million euro
linked to the retention of the former shareholders and future
results for which the future results could not be reliably esti-
mated at acquisition. The earn-outs will flow through profit
and loss at moment of payment over the earn-out period,
until May 25, 2026. Per end 2020, no payments occurred
under this earn-out.
The following overview summarizes the sensitivity analysis
performed for significant assumptions as at 31 December.
The figures show the impact on the defined benefit obligation.
2020 2019 2018
Discount rate 0.29% 0.42% 1.30%
Future salary increases 2.44% 2.59% 2.58%
Future consumer price index increases 1.75% 1.75% 1.90%
The fair value of the plan assets (108.2 million euro) are fully
invested in insurance policies. In 2020, the target asset mix
consists of 67.50% government bonds (66.5% in 2019), 14%
real estate (16% in 2019), 7.5% corporate bonds (7.5% in 2019),
6% corporate loans (6% in 2019) and 5% shares (4% in 2019).
The principal assumptions used in determining pension
obligations for the Group's plans are shown below:
Barco
Inte
grate
d re
po
rt 20
20
76
FIN
Finan
cial re
po
rt
01 BARCO CONSOLIDATED
02 INFORMATION ABOUT THE SHARE

20. Risk management - derivative financial instruments
General risk factors are described in the director’s report
“Risk Factors”.
Derivative financial instruments are used to reduce the expo-
sure to fluctuations in foreign exchange rates and interest
rates. These instruments are subject to the risk of market rates
changing subsequent to acquisition. These changes are gen-
erally offset by opposite effects on the item being hedged.
Foreign currency risk
Recognized assets and liabilities
Barco incurs foreign currency risk on recognized assets and
liabilities when they are denominated in a currency other
than the company’s local currency. Such risks may be natu-
rally covered when a monetary item at the asset side (such
as a trade receivable or cash deposit) in a given currency is
matched with a monetary item at the liability side (such as a
trade payable or loan) in the same currency.
Forward exchange contracts and selectively option contracts
are used to manage the currency risk arising from recognized
receivables and payables, which are not naturally hedged.
The balances on foreign currency monetary items are valued
at the rates of exchange prevailing at the end of the account-
ing period. Derivative financial instruments that are used
to reduce the exposure of these balances are rated in the
balance sheet at fair value. Both changes in foreign currency
balances and in fair value of derivative financial instruments
are recognized in the income statement.
Forecasted transactions
Barco selectively designates forward contracts to forecasted
sales. Hedge accounting is applied to these contracts. The
portion of the gain or loss on the hedging instrument that will
be determined as an effective hedge is recognized directly in
comprehensive income. As at 31 December 2020, there were
no forward contracts outstanding under hedge accounting
treatment.
Estimated sensitivity to currency fluctuations
Sensitivity to currency fluctuations is mainly related to the
evolution of a portfolio of foreign currencies (mainly USD
and CNY) versus the euro. This sensitivity is caused by the
following factors:
- The fair value of foreign currency monetary items is
impacted by currency fluctuations. In order to eliminate
most of these effects in foreign currencies, Barco uses
monetary items and/or derivative financial instruments as
described above, which are meant to offset the impact of
such results to a major extent.
- As the Company has no cash flow hedges in place that aim
at hedging forecasted transactions, a similar fluctuation in
foreign currencies would not have any effect on the equity
position of Barco.
- Profit margins may be negatively affected because an
important part of sales are realized in foreign currencies,
while costs are incurred in a smaller part in these curren-
cies. Barco has done great efforts throughout the years
to increase its natural hedging ratio in USD (being its main
foreign currency in terms of sales) by increasing its opera-
tional costs and by purchasing more components in this
currency. Impact on adjusted EBIT is currently estimated
at -0.5 million euro when the weighted average rate of a
foreign currency basket that has an overall overweight of
USD, CNY and NOK changes by 10% versus the euro in a
year. The overall natural hedge ratio of foreign currencies
reached a level of 85% in 2020.
- Another impact is the fact that some of Barco’s main com-
petitors are USD-based. Whenever the USD decreases in
value against the euro, these competitors have a world-
wide competitive advantage over Barco. This impact on
operating result cannot be measured reliably.
Barco
Inte
grate
d re
po
rt 20
20
77
FIN
Finan
cial re
po
rt
01 BARCO CONSOLIDATED
02 INFORMATION ABOUT THE SHARE

Interest rate risk
Barco uses following hedging instruments to manage its
interest rate risk:
Swap on outstanding or anticipated borrowing
Barco concluded a series of interest rate swaps with an out-
standing notional amount of 12.1 million euro by means of
a partial hedge for the bilateral real estate leasing (currently
outstanding at 20.0 million euro) for the financing of Barco's
HQ campus starting in 2016. This instrument swaps the vari-
able interest rate into a fixed 1.76%.
These swaps are determined as an effective hedge of out-
standing or anticipated borrowings and meet the hedging
requirements of IAS 39. The fair values of the effective portion
of the hedging instrument are therefore recognized directly in
comprehensive income under hedge accounting treatment.
Estimated sensitivity to interest rate fluctuations
Management doesn’t expect the short-term interest rate to
increase significantly in the immediate foreseeable future,
which limits the interest exposure on the short-term debt
portfolio.
With reference to the Fair Values table below, just over 55%
of Barco’s outstanding long-term debt portfolio has a fixed
interest rate character, which again limits the exposure of the
company to interest rate fluctuations. This ratio increases to
79% when including the swap instruments disclosed above.
Credit risk
Credit risk on accounts receivable
Credit evaluations are performed on all customers requiring
credit over a certain amount. The credit risk is monitored
on a continuous basis. In a number of cases collateral is
being requested before a credit risk is accepted. Specific
trade finance instruments such as letters of credit and bills of
exchange are regularly used in order to minimize the credit
risk.
In 2020, Barco continued to conclude credit insurances in
order to cover credit risks on specific customers or large
contracts on a case by case basis.
Credit risk on liquid securities and short-term
investments
A policy defining acceptable counter parties and the maxi-
mum risk per counter party is in place. Short-term invest-
ments are made in marketable securities, cash holdings or
in fixed term deposits with reputable banks.
Barco
Inte
grate
d re
po
rt 20
20
78
FIN
Finan
cial re
po
rt
01 BARCO CONSOLIDATED
02 INFORMATION ABOUT THE SHARE

IN THOUSANDS OF EURO 2020 2019 2018
Carrying amount/Fair value (approx.)
Financial assets
Investments at fair value through equity 86,651 23,038 -
Trade receivables 146,138 195,358 161,787
Other receivables 17,789 25,669 19,567
Loan and other receivables 12,420 17,930 15,386
Interest rate receivable 24 1,860 1,800
Currency rate swap 5,345 5,879 2,380
Other non-current assets 5,870 4,018 9,732
Other short term investments 3,175 24,748 112,795
Cash and cash equivalents 235,402 357,035 251,807
Total 495,026 629,866 555,688
Financial liabilities
Financial debts 20,000 45,390 28,583
Floating rate borrowings 10,838 26,258 26,615
Fixed rate borrowings 9,163 19,132 1,967
Other long-term liabilities 43,286 27,031 24,557
Short-term debts 86 - 686
Trade payables 70,299 128,914 105,148
Other current liabilities 8,980 13,268 48,532
Other short term amounts payable 80 2,825 42,066
Dividends payable 2,290 2,301 2,323
Currency rate Swap 5,529 7,016 2,541
Interest rate swap 1,080 1,126 1,663
Total 142,650 214,603 207,506
Fair values
Set out below is an overview of the carrying amounts of the Group’s financial instruments that are shown in the financial
statements. In general, the carrying amounts are assumed to be a close approximation of the fair value.
The fair value of the financial assets and liabilities is defined as the amount at which the instrument could be exchanged in a
current transaction between willing parties, other than in a forced or liquidation sale.
Barco
Inte
grate
d re
po
rt 20
20
79
FIN
Finan
cial re
po
rt
01 BARCO CONSOLIDATED
02 INFORMATION ABOUT THE SHARE

The following methods and assumptions were used to
estimate the fair values:
- Cash and cash equivalents and short-term investments,
trade receivables, trade payables, and other current liabili-
ties approximate their carrying amounts largely due to the
short-term maturities of these instruments.
- Investments are measured at market price. For investments
that are publicly quoted in an active market, the quoted
market price is the best measure of the fair value. The
remeasurement at fair value per 31 December 2020 versus
the carrying amount is reflected in other comprehensive
income.
- Long term fixed rate and variable rate other assets are
evaluated by the Group based on parameters such as
interest rates, specific country risk factors, individual credit-
worthiness of the customer and the risk characteristics
of the financed project. Based on this evaluation, allow-
ances are made to account for the expected losses of these
receivables. As at 31 December 2020, the carrying amounts
of such receivables, net of allowances, are assumed not
IN THOUSANDS OF EURO 2020 2019 2018
Assets measured at fair value
Financial assets at fair value through profit or loss
Foreign exchange contracts - non-hedged 5,345 5,879 2,380
Financial assets at fair value through equity
Investments 86,651 23,038 -
Liabilities measured at fair value
Financial liabilities at fair value through profit or loss
Foreign exchange contracts - non-hedged 5,529 7,016 2,541
Interest rate swap - 888 673
Financial liabilities at fair value through equity
Interest rate swap 1,080 1,126 991
Fair value hierarchy
As at 31 December 2020, the Group held the following financial instruments measured at fair value:
to be materially different from their calculated fair values.
- The fair value of unquoted instruments, loans from banks
and other financial liabilities, obligations under finance
leases as well as other non-current financial liabilities is
estimated by discounting future cash flows using the
effective interest rates currently available for debt on
similar terms, credit risk and remaining maturities. As of
31 December 2020, the effective interest rate is not materi-
ally different from the nominal interest rate of the financial
obligation.
- The Group enters into derivative financial instruments with
various counterparties, principally financial institutions with
investment grade credit ratings. Derivatives valued using
valuation techniques with market observable inputs are
mainly interest rate (cap/floor) swaps and foreign exchange
forward contracts. The most frequently applied valuation
techniques include forward pricing and swap models, using
present value calculations. The models incorporate various
inputs including foreign exchange spot and forward rates
and interest rate curves.
Barco
Inte
grate
d re
po
rt 20
20
80
FIN
Finan
cial re
po
rt
01 BARCO CONSOLIDATED
02 INFORMATION ABOUT THE SHARE

The Group uses the following hierarchy for determining and
disclosing the fair value of financial instruments by valuation
technique:
Level 1: quoted (unadjusted) prices in active markets for iden-
tical assets or liabilities
Level 2: other techniques for which all inputs which have a
significant effect on the recorded fair value are observable,
either directly or indirectly.
Level 3: techniques that use inputs having a significant effect
on the recorded fair value that are not based on observable
market data.
All fair values mentioned in the above table relate to Level 2,
except for the investments which were based on level 1 input.
During the reporting period ending 31 December 2020, there
were no transfers between Level 1 and Level 2 fair value
measurements, and no transfers into and out of Level 3 fair
value measurements.
IN THOUSANDS OF EURO NOTE 2020 2019 2018
Net financial cash/(debt) 14 193,527 329,366 331,964
Equity 697,107 740,650 635,044
% Net financial cash (debt)/equity 27.8% 44.5% 52.3%
IN THOUSANDS OF EURO 2020 2019 2018
Equity 697,107 740,650 635,044
Total equity and liabilities 1,018,203 1,174,176 1.047,301
% Equity/Total equity and liabilities 68.5% 63.1% 60.6%
Capital Management
Management evaluates its capital needs based on following
data:
In 2020, the net cash position ended at a level of 193.5 million
euro compared to 329.4 million euro as per end of 2019.
The solvency position and other current ratios continue to
consolidate at healthy levels. Together with the existing com-
mitted credit facilities, management considers that it has
secured a healthy liquidity profile and strong capital base for
the further development of the group.We refer to note 14 for the details on the movement.
Barco
Inte
grate
d re
po
rt 20
20
81
FIN
Finan
cial re
po
rt
01 BARCO CONSOLIDATED
02 INFORMATION ABOUT THE SHARE

21. Operating leases
IN THOUSANDS OF EURO 2018
Non-cancellable operating leases are payable as follows:
Less than one year 8,723
Between one and five years 20,608
More than five years 1,567
Total 30,897
Non-cancellable operating leases in 2018 mainly relate to
leases of factory facilities and warehouses and sales offices.
During 2018 the total rent expenses recognized in the income
statement amounted to 20 million euro, of which 9.1 million
euro relating to rent of buildings.
As of 1 January 2019, Barco has applied IFRS 16 Leases. We
refer to the chapter of Significant IFRS accounting principles
and IFRS standards applied as of 2019.
Changes in liabilities arising from financing activities
IN THOUSANDS OF EURO NON-CASH CHANGES
1 January2020 Cash flows
IFRS 16movements
Foreign exchange
movement31 December,
2020
Long-term borrowings 20,888 -2,871 - -16 18,000
Short-term borrowings 12,469 2,103 - -5,299 9,273
Lease liabilities 19,337 -8,364 8,083 -1,202 17,854
Total liabilities from financing activities 52,695 -9,133 8,083 -6,517 45,127
The long-term borrowings and lease liabilities are together the long-term debts as shown in the balance sheet. The short-
term borrowings are the total of current portion of long-term debts and short-term debts, as shown in the balance sheet.
The non-cash changes include impacts from fluctuations in the translation of foreign operations balances, including inter-
company borrowings of which the balances are eliminated at Group level.
Barco
Inte
grate
d re
po
rt 20
20
82
FIN
Finan
cial re
po
rt
01 BARCO CONSOLIDATED
02 INFORMATION ABOUT THE SHARE
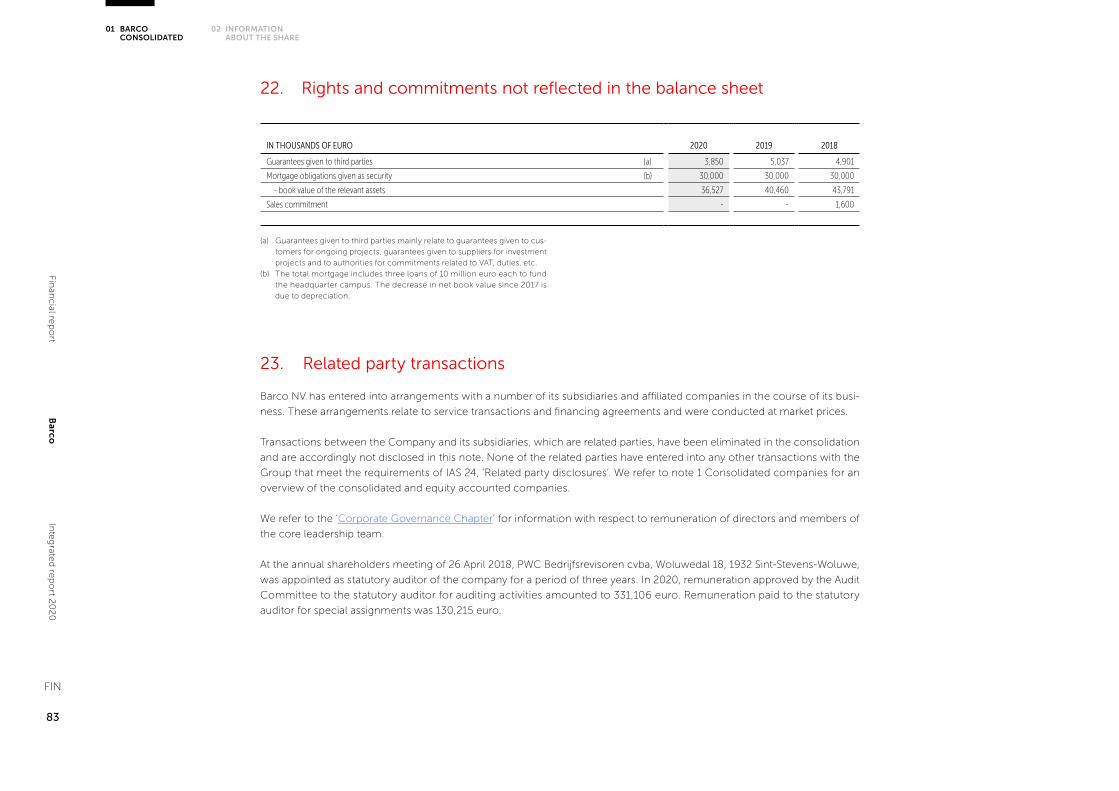
23. Related party transactions
Barco NV has entered into arrangements with a number of its subsidiaries and affiliated companies in the course of its busi-
ness. These arrangements relate to service transactions and financing agreements and were conducted at market prices.
Transactions between the Company and its subsidiaries, which are related parties, have been eliminated in the consolidation
and are accordingly not disclosed in this note. None of the related parties have entered into any other transactions with the
Group that meet the requirements of IAS 24, ‘Related party disclosures’. We refer to note 1 Consolidated companies for an
overview of the consolidated and equity accounted companies.
We refer to the ‘Corporate Governance Chapter’ for information with respect to remuneration of directors and members of
the core leadership team.
At the annual shareholders meeting of 26 April 2018, PWC Bedrijfsrevisoren cvba, Woluwedal 18, 1932 Sint-Stevens-Woluwe,
was appointed as statutory auditor of the company for a period of three years. In 2020, remuneration approved by the Audit
Committee to the statutory auditor for auditing activities amounted to 331,106 euro. Remuneration paid to the statutory
auditor for special assignments was 130,215 euro.
22. Rights and commitments not reflected in the balance sheet
IN THOUSANDS OF EURO 2020 2019 2018
Guarantees given to third parties (a) 3,850 5,037 4,901
Mortgage obligations given as security (b) 30,000 30,000 30,000
- book value of the relevant assets 36,527 40,460 43,791
Sales commitment - - 1,600
(a) Guarantees given to third parties mainly relate to guarantees given to cus-
tomers for ongoing projects, guarantees given to suppliers for investment
projects and to authorities for commitments related to VAT, duties, etc.
(b) The total mortgage includes three loans of 10 million euro each to fund
the headquarter campus. The decrease in net book value since 2017 is
due to depreciation.
Barco
Inte
grate
d re
po
rt 20
20
83
FIN
Finan
cial re
po
rt
01 BARCO CONSOLIDATED
02 INFORMATION ABOUT THE SHARE

24. Cash flow statement: effect of acquisitions and disposals
The following table shows the effect of acquisitions and
disposals on the balance sheet movement of the Group.
IN THOUSANDS OF EURO ACQUISITIONS DIVESTMENTS
2019 2018 2018
Non-current assets - - 139
Software - - 3
Tangible assets and other intangible assets - - 136
Current assets - - 1,486
Trade debtors & other receivables - - 1,486
Current liabilities 3,272 5,621 1,019
Trade payables - - 217
Other payables 3,272 5,621 802
Net-identifiable assets and liabilities -3,272 -5,621 605
Net assets held for sale (9% BarcoCFG) - - 5,819
Gain on sale of divestments - - 17,127
Acquired/(sold) cash - - -56,669
Received consideration / Cash sold (net) - - -32,558
Purchase price 3,272 5,621 -
Barco
Inte
grate
d re
po
rt 20
20
84
FIN
Finan
cial re
po
rt
01 BARCO CONSOLIDATED
02 INFORMATION ABOUT THE SHARE

There were no acquisitions and disposals in 2020.
The total purchase price in 2019 relates to the last deferred
consideration and payment of the last two patent earn-outs
on the 2016 MTT acquisition.
The total purchase price in 2018 relates to the second
deferred consideration and the payment of earn-outs on
the issuance of four patents on the 2016 MTT acquisition.
The received consideration in 2018 contains mainly
the 22.2 million euro received for the sale of the 9%
shares in BarcoCFG, resulting in a change in control and
corresponding deconsolidation of the underlying net
assets. The cash flow statement ‘disposal of group com-
panies’ shows net of disposed cash, since as a result of the
deconsolidation, the BarcoCFG cash of 56.7 million euro is
disposed. Next to the BarcoCFG transaction, 1.3 million euro
was received on the sale of the X2O Media entity.
We refer to the Cash flow statement and note 1.3 on acqui-
sitions and divestments.
Goodwill and fair value adjustments arising on the acquisition
of a foreign entity are carried in terms of historical cost using
the exchange rate at the date of the acquisition.
Barco
Inte
grate
d re
po
rt 20
20
85
FIN
Finan
cial re
po
rt
01 BARCO CONSOLIDATED
02 INFORMATION ABOUT THE SHARE

25. Events subsequent to the balance sheet date
There are no major events subsequent to the balance sheet
date which have a major impact on the further evolution of
the company.
Barco
Inte
grate
d re
po
rt 20
20
86
FIN
Finan
cial re
po
rt
01 BARCO CONSOLIDATED
02 INFORMATION ABOUT THE SHARE

IN THOUSANDS OF EURO 2020 2019 2018
Adjusted EBIT 10,180 110,038 89,974
Restructuring -9,536 -13,717 -2,882
Gain on sale of divestments - - -743
Depreciation of tangible and intangible fixed assets 43,383 42,984 34,492
Gain/(Loss) on tangible fixed assets 170 -1,024 -149
Share in the profit/(loss) of joint ventures and associates -276 1,566 191
Gross operating Free Cash Flow 43,921 139,848 120,882
Changes in trade receivables 41,391 -32,160 -11,209
Changes in inventory -12,260 -32,989 334
Changes in trade payables -59,936 23,404 -1,306
Other changes in net working capital -23,960 15,618 -12,722
Change in net working capital -54,764 -26,126 -24,903
Net operating Free Cash Flow -10,843 113,721 95,979
Interest received 1,845 7,648 5,915
Interest paid -1,965 -1,866 -1,566
Income taxes -10,398 -13,053 -12,460
Free Cash flow from operating activities -21,361 106,451 87,869
Purchases of tangible & intangible FA -14,980 -20,169 -25,627
Proceeds on disposals of tangible & intangible fixed assets 488 2,379 922
Free Cash flow from investing activities -14,493 -17,790 -24,705
FREE CASH FLOW -35,854 88,661 63,164
Supplementary statements
Free cash flow for 2020 was -36 million euro reflecting lower
EBITDA, cash-outlays associated with the restructuring and
working capital, while reduced compared to 1H20, still higher
than end of year 2019 at approximately 10% of sales.
Free Cash Flow
At the end of December 2020, Barco’s net cash position
reaches 193.5 million euro, a decrease compared to last year
(2019: 329.4 million euro, 2018: 332 million euro) as a result
of the negative free cash flow (-36 million euro), dividends
paid out (-33 million euro), investments (-55 million euro)
and currency impact.
Barco
Inte
grate
d re
po
rt 20
20
87
FIN
Finan
cial re
po
rt
01 BARCO CONSOLIDATED
02 INFORMATION ABOUT THE SHARE

IN THOUSANDS OF EURO 2020 2019 2018
Trade debtors 146,138 195,358 161,787
Inventory 175,390 168,983 135,111
Trade payables -70,299 -128,914 -105,148
Other working capital -170,620 -205,246 -189,289
Working capital 80,610 30,181 2,462
Other long term assets & liabilities 210,493 232,479 220,515
Operating capital employed 291,102 262,661 222,977
Goodwill 105,612 105,612 105,612
Operating capital employed (incl goodwill) 396,714 368,272 328,589
Adjusted EBIT 10,180 110,038 89,974
ROCE after tax (%) (a) 3% 25% 23%
Return on Operating Capital Employed
(a) Tax rate used is the effective tax rate (in 2020: 0%; 2019: 18% and 2018: 17.7%).
The return on capital employed is at 3% in 2020 (2019: 25%,
2018: 23%), due to the lower operational result and increased
working capital, both impacted by the global covid-19
pandemic.
Balance Sheet
Inventory + accounts receivable – accounts payable over
sales was 32.6% compared to 21.7% in 2019. Net working
capital was 10% of sales compared to 3% in 2019.
While year-end working capital was higher than 2019, it
improved relative to 108 million euro at mid-year reflecting
reduced inventory levels and reduced DSO from 82 days
sales outstanding to 67 at the end of the year.
Inventory levels remained high in 2020, mainly in Entertain-
ment, a combined effect of build-up safety stocks at the
start of and lower and changing customer demand after the
international spread of the covid-19 pandemic.
Barco
Inte
grate
d re
po
rt 20
20
88
FIN
Finan
cial re
po
rt
01 BARCO CONSOLIDATED
02 INFORMATION ABOUT THE SHARE

Supplementary information
Barco NV
Summary version of statutory accounts Barco NV
The financial statements of the parent company, Barco NV,
are presented below in a condensed form.
The accounting principles used for the statutory annual
accounts of Barco NV differ from the accounting principles
used for the consolidated annual accounts: the statutory
annual accounts follow the Belgian legal requirements,
while the consolidated annual accounts follow the Interna-
tional Financial Reporting Standards. Only the consolidated
annual financial statements as set forth in the preceding
pages present a true and fair view of the financial position
and performance of the Barco Group.
The management report of the Board of Directors to the
Annual General Meeting of Shareholders and the annual
accounts of Barco NV, as well as the Auditor’s Report,
will be filed with the National Bank of Belgium within the
statutory periods. These documents are available upon
request from Barco’s Investor Relations department, and at
www.barco.com.
The statutory auditor’s report is unqualified and certifies that
the non-consolidated financial statements of Barco NV for
the year ended 31 December 2020 gives a true and fair view
of the financial position and results of the company in accor-
dance with all legal and regulatory dispositions.
Barco
Inte
grate
d re
po
rt 20
20
89
FIN
Finan
cial re
po
rt
01 BARCO CONSOLIDATED
02 INFORMATION ABOUT THE SHARE

Balance sheet after appropriation
IN THOUSANDS OF EURO 2020 2019 2018
Fixed assets 362,928 414,029 449,835
Intangible fixed assets 27,260 40,540 41,612
Tangible fixed assets 67,267 71,092 74,363
Financial fixed assets 268,401 302,397 333,860
Current assets 255,249 320,602 278,871
Amounts receivable after more than one year - - 390
Inventory 109,712 104,210 70,228
Amounts receivable within one year 109,517 173,061 156,383
Investments (own shares) 27,143 28,991 35,943
Cash and cash equivalents 295 933 1,435
Deferred charges and accrued income 8,582 13,407 14,492
Total assets 618,177 734,631 728,706
Capital and reserves 276,033 326,746 336,693
Capital 55,880 55,877 55,870
Share premium account 146,776 146,741 146,663
Reserves 34,207 36,054 42,156
Accumulated profits 38,977 87,771 91,373
Investment grants 193 303 631
Provisions 11,739 15,818 24,059
Provisions for liabilities and charges 11,739 15,818 24,059
Creditors 330,404 392,066 367,954
Amounts payable after more than one year 18,000 20,000 23,890
Amounts payable within one year 312,404 372,066 344,064
Total Iiabilities 618,177 734,631 728,706
Intangible fixed assets relate mainly to the implementation
cost of SAP ERP software. These SAP capital expenditures
are amortized over 7 years.
The main capex realized in 2018 and 2019 related to the
extended operations facility at the headquarters in Kortrijk.
Financial fixed assets in 2020 decreased 34 million euro,
as a result of statutory impairments on the participations in
Barco Ltd. (Taiwan) and in Barco Fredrikstad AS (Norway),
both as a result of the integration of the business into Barco
NV, and on Barco Taiwan Technology Ltd (Taiwan) because
of the closure of the Taiwan factory and the decision to
liquidate the legal entity.
Barco
Inte
grate
d re
po
rt 20
20
90
FIN
Finan
cial re
po
rt
01 BARCO CONSOLIDATED
02 INFORMATION ABOUT THE SHARE
The increase of inventory in 2019 is the result of the trans-
fer of business from Norway and the launch and ramp-up
of new products. Inventory levels remained high in 2020,
mainly in Entertainment, a combined effect of build-up of
safety stocks at the start of and lower and changing cus-
tomer demand after the international spread of the covid-19
pandemic. Amounts receivables are lower in 2020 because
of the lower sales.
Amounts payable are lower in 2020 due to braked purchases
as a result of the lower demand.
Barco
Inte
grate
d re
po
rt 20
20
91
FIN
Finan
cial re
po
rt
01 BARCO CONSOLIDATED
02 INFORMATION ABOUT THE SHARE
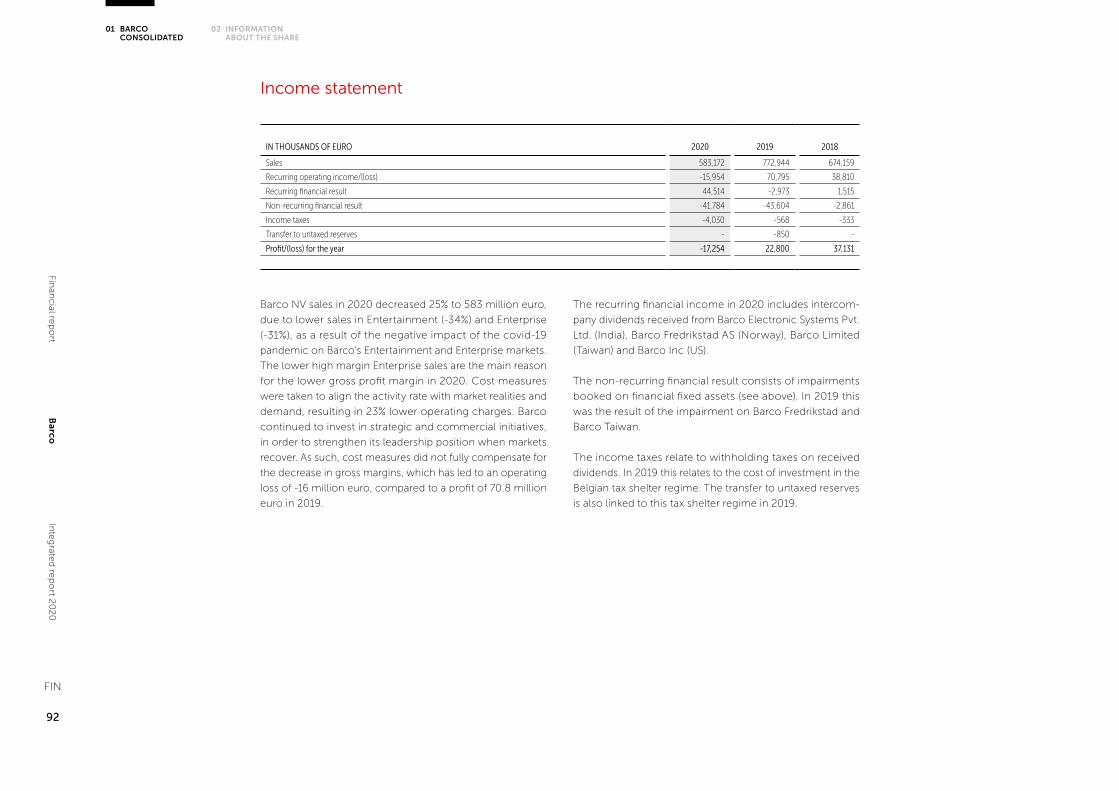
IN THOUSANDS OF EURO 2020 2019 2018
Sales 583,172 772,944 674,159
Recurring operating income/(loss) -15,954 70,795 38,810
Recurring financial result 44,514 -2,973 1,515
Non-recurring financial result -41,784 -43,604 -2,861
Income taxes -4,030 -568 -333
Transfer to untaxed reserves - -850 -
Profit/(loss) for the year -17,254 22,800 37,131
Income statement
Barco NV sales in 2020 decreased 25% to 583 million euro,
due to lower sales in Entertainment (-34%) and Enterprise
(-31%), as a result of the negative impact of the covid-19
pandemic on Barco’s Entertainment and Enterprise markets.
The lower high margin Enterprise sales are the main reason
for the lower gross profit margin in 2020. Cost measures
were taken to align the activity rate with market realities and
demand, resulting in 23% lower operating charges. Barco
continued to invest in strategic and commercial initiatives,
in order to strengthen its leadership position when markets
recover. As such, cost measures did not fully compensate for
the decrease in gross margins, which has led to an operating
loss of -16 million euro, compared to a profit of 70.8 million
euro in 2019.
The recurring financial income in 2020 includes intercom-
pany dividends received from Barco Electronic Systems Pvt.
Ltd. (India), Barco Fredrikstad AS (Norway), Barco Limited
(Taiwan) and Barco Inc (US).
The non-recurring financial result consists of impairments
booked on financial fixed assets (see above). In 2019 this
was the result of the impairment on Barco Fredrikstad and
Barco Taiwan.
The income taxes relate to withholding taxes on received
dividends. In 2019 this relates to the cost of investment in the
Belgian tax shelter regime. The transfer to untaxed reserves
is also linked to this tax shelter regime in 2019.
Barco
Inte
grate
d re
po
rt 20
20
92
FIN
Finan
cial re
po
rt
01 BARCO CONSOLIDATED
02 INFORMATION ABOUT THE SHARE

IN THOUSANDS OF EURO 2020 2019 2018
Profit/(loss) for the year for appropriation -17,254 22,800 37,131
Profit brought forward 87,771 91,374 76,480
Profit to be appropriated 70,517 114,174 113,611
Transfer from other reserves -1,848 -6,951 -6,443
Profit to be carried forward 38,977 87,771 91,374
Gross dividends 33,388 33,354 28,680
Total 70,517 114,174 113,611
Proposed appropriation of Barco NV result
The board of directors of Barco NV will propose to the
General Assembly to distribute a gross dividend of 0.378 euro
per share. Barco’s shareholders will be offered the choice
between payment in cash or dividend in shares, enabling
Barco’s shareholders to reinvest in the company.
Barco
Inte
grate
d re
po
rt 20
20
93
FIN
Finan
cial re
po
rt
01 BARCO CONSOLIDATED
02 INFORMATION ABOUT THE SHARE

Information aboutthe share
Barco
Inte
grate
d re
po
rt 20
20
94
FIN
Finan
cial re
po
rt
01 BARCO CONSOLIDATED
02 INFORMATION ABOUT THE SHARE
Barco
Inte
grate
d re
po
rt 20
20
94
FIN
Finan
cial re
po
rt

Barco
Inte
grate
d re
po
rt 20
20
95
FIN
Finan
cial re
po
rt
01 BARCO CONSOLIDATED
02 INFORMATION ABOUT THE SHARE
Key figures for the shareholder
(a) Gross dividend / share price at year-end closing date
(b) Increase or decrease share price + gross dividend paid out in the year, divided by closing share price of previous year
(c) Gross dividend number of shares on 31 December / net income attributable to the equity holder of the parent
(d) Share price 31 December / earnings per share
Number of shares (in thousands): 91,487 91,482 91,471
PER SHARE (IN EURO) 2020 2019 2018
EPS -0.05 1.09 0.86
Diluted EPS -0.05 1.07 0.85
Gross dividend 0.378 0.378 0.329
Net dividend 0.26 0.26 0.23
Return on Equity (ROE) -0.7% 13.0% 12%
Gross dividend yield (a) 2.1% 1.2% 2.3%
Yearly return (b) -41.8% 123.8% 13.2%
Pay-out ratio (c) -787.1% 36.3% 40.1%
Price/earnings ratio (d) -358.0 28.8 16.4
Values for 2018 & 2019 restated following to the 7:1 share split, see press release
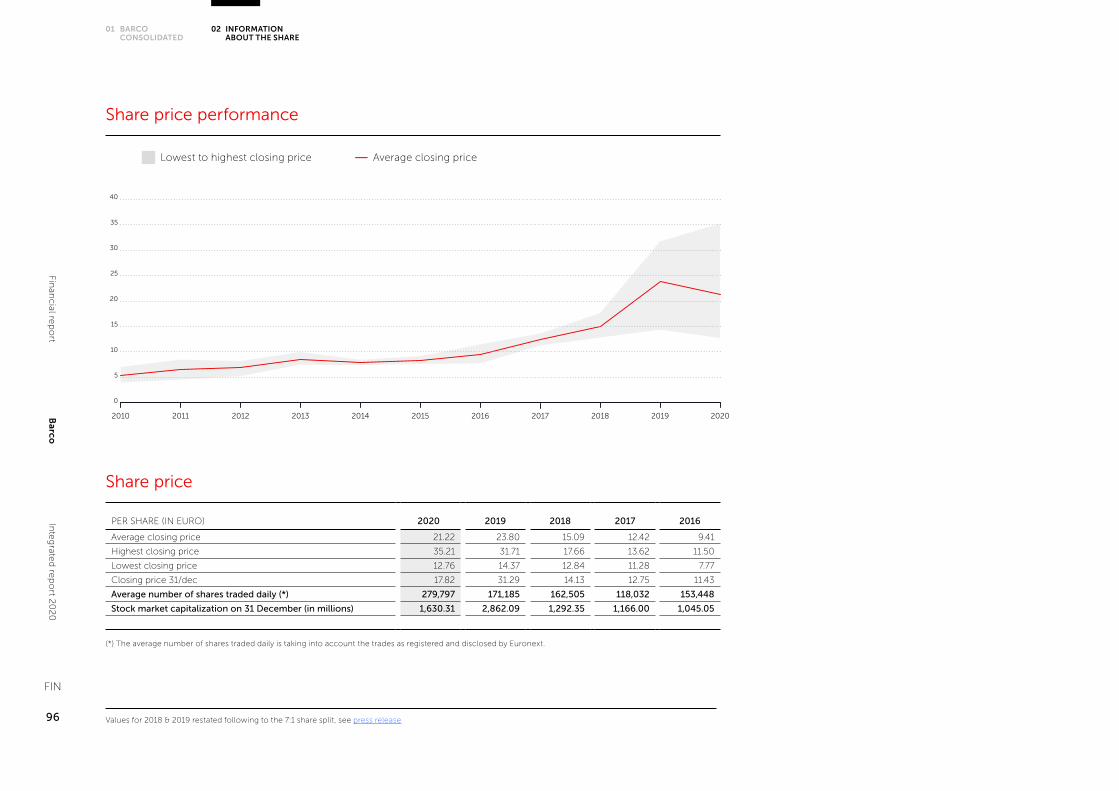
Barco
Inte
grate
d re
po
rt 20
20
96
FIN
Finan
cial re
po
rt
01 BARCO CONSOLIDATED
02 INFORMATION ABOUT THE SHARE
Share price performance
0
5
10
20
25
30
35
40
15
2010 2011 2012 2013 2014 2015 2016 2019 202020182017
Lowest to highest closing price Average closing price
Values for 2018 & 2019 restated following to the 7:1 share split, see press release
Share price
PER SHARE (IN EURO) 2020 2019 2018 2017 2016
Average closing price 21.22 23.80 15.09 12.42 9.41
Highest closing price 35.21 31.71 17.66 13.62 11.50
Lowest closing price 12.76 14.37 12.84 11.28 7.77
Closing price 31/dec 17.82 31.29 14.13 12.75 11.43
Average number of shares traded daily (*) 279,797 171,185 162,505 118,032 153,448
Stock market capitalization on 31 December (in millions) 1,630.31 2,862.09 1,292.35 1,166.00 1,045.05
(*) The average number of shares traded daily is taking into account the trades as registered and disclosed by Euronext.
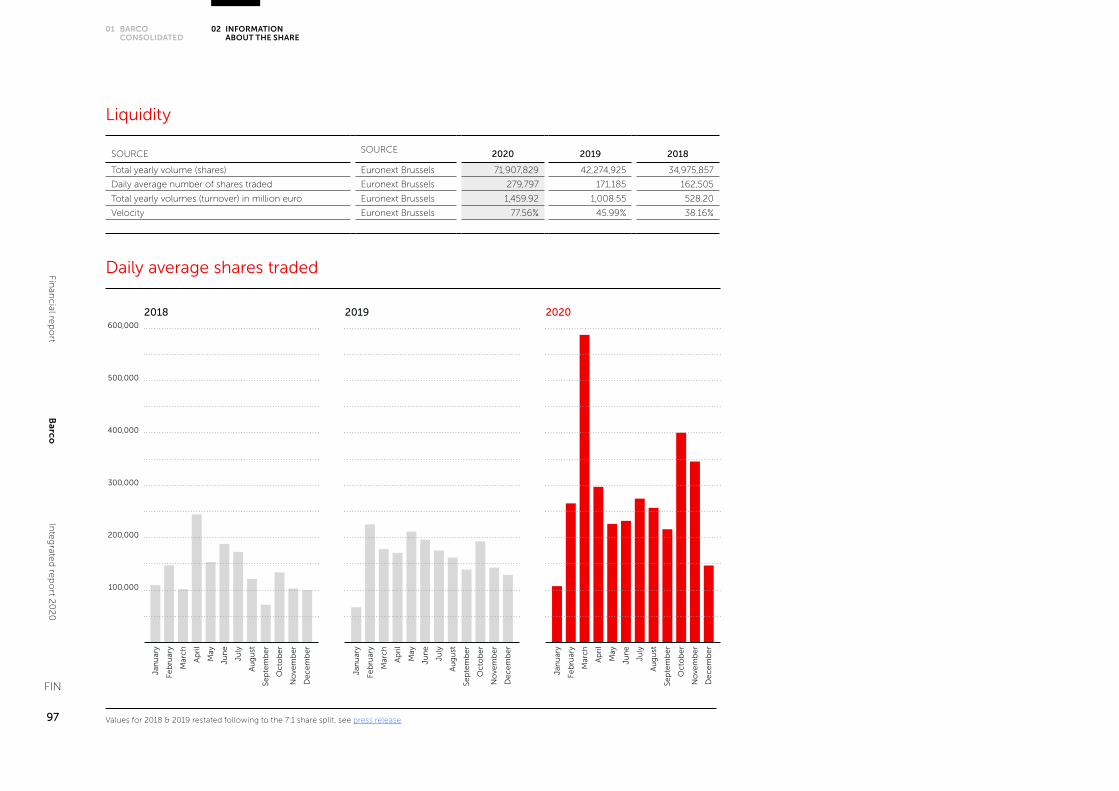
Barco
Inte
grate
d re
po
rt 20
20
97
FIN
Finan
cial re
po
rt
01 BARCO CONSOLIDATED
02 INFORMATION ABOUT THE SHARE
Jan
uar
y
Feb
ruar
y
Mar
ch
Ap
ril
May
Jun
e
July
Au
gu
st
Sep
tem
be
r
Oc
tob
er
No
vem
be
r
De
ce
mb
er
Jan
uar
y
Feb
ruar
y
Mar
ch
Ap
ril
May
Jun
e
July
Au
gu
st
Sep
tem
be
r
Oc
tob
er
No
vem
be
r
De
ce
mb
er
Jan
uar
y
Feb
ruar
y
Mar
ch
Ap
ril
May
Jun
e
July
Au
gu
st
Sep
tem
be
r
Oc
tob
er
No
vem
be
r
De
ce
mb
er
100,000
200,000
300,000
500,000
600,000
400,000
2018 2019 2020
Liquidity
SOURCE SOURCE 2020 2019 2018
Total yearly volume (shares) Euronext Brussels 71,907,829 42,274,925 34,975,857
Daily average number of shares traded Euronext Brussels 279,797 171,185 162,505
Total yearly volumes (turnover) in million euro Euronext Brussels 1,459.92 1,008.55 528.20
Velocity Euronext Brussels 77.56% 45.99% 38.16%
Daily average shares traded
Values for 2018 & 2019 restated following to the 7:1 share split, see press release

Barco
Inte
grate
d re
po
rt 20
20
98
FIN
Finan
cial re
po
rt
01 BARCO CONSOLIDATED
02 INFORMATION ABOUT THE SHARE
Barco share price 2020
Barco share price 2020
10
20
00
30
40
02-01 01-0301-02 01-04 01-05 01-06 01-07 01-08 01-09 01-10 01-11 01-12
-40
-20
20
0%
40
60
02-01 01-0301-02 01-04 01-05 01-06 01-07 01-08 01-09 01-10 01-11 01-12
Barco Bel 20 Next 150
Barco / Bel 20 / Next 150
Barco Eurostoxx 50 Eurostoxx technology Nasdaq - 100
Barco / Eurostoxx 50 / Eurostoxx Technology / Nasdaq - 100
Barco
-60
-40
-20
20
0%
40
60
02-01 01-0301-02 01-04 01-05 01-06 01-07 01-08 01-09 01-10 01-11 01-12
-60
50
60

Barco
Inte
grate
d re
po
rt 20
20
99
FIN
Finan
cial re
po
rt
01 BARCO CONSOLIDATED
02 INFORMATION ABOUT THE SHARE
Shareholder structure
Shareholders
A study of Barco’s global shareholdership, carried in Decem-
ber 2020, plotted almost 98% of the company’s shareholder
composition(1), compared to 97% a year earlier.
Identified institutional investors hold almost 75% of all shares
(compared to 76% the year before). Treasury shares held by the
company are good for 3.5% of the shares and approximately
14.5% of the shares are held by retail investors, up from 13%
a year ago.
Geographic distribution
Belgium remains the dominant investment region in Barco’s
institutional shareholder base, with a strong proportional rep-
resentation versus peers and industry averages. Over 2020
domestic investors were net buyers of the stock, fueled by
some new entrants, to hold now 45% of the institutional shares
compared to 40% at the end of 2019. US remain the second
largest region in institutional ownership with a 21%, down from
25% the year before. The decline was partly influenced by the
exit of some quant driven funds. France jumped over the UK
to become the third region of institutional investors, increasing
their exposure with 2.5 percentage points. United Kingdom
was a net seller with ownership moving from 9% in 2019 to
7.7% at the of 2020.
Compared to the Nasdaq Belgian client base benchmark, Bel-
gium and Norway continue to show overweight position driven
by the domestic reference shareholder and Norges Bank, bal-
anced by underweight positions for US, UK and France.
Investment style
Especially in the first half of the year value type ownership give
in to land at 14% from 20% a year before.
While a number of growth oriented investors featured amongst
the top buyers and sellers and were the most active in the
panel, growth ownership remained quiet stable at 17.6%; com-
pared to 18% a year ago. GARP-type investors strengthened
their position from 11% to hold approximately 13% at the end
of 2020.
As the company has a large proportion of “other investment
style” owners, all other main categories remain underweight
when compared to Nasdaq Technology Base benchmark.
Index type investors decreased their position, compared to
the year before, owning now almost 7% compared to 8 % the
year before.
Investing responsibly
According to the analysis, 20% of the institutional shares is held
by SRI (Social Responsible Investment) funds (mainly Europe
and mainly Core SRI), an increase of 10 percentage points
compared to 2019 and 2018 levels. Core SRI are investors with
an outstanding level of commitment to investing responsibly
which have achieved a full integration of ESG performance
factors in their investment decisions models. These investors
include the most progressive pension fund managers and
specialist SRI investment advisors.
Concentration
Overall concentration level amongst Barco top holders
increased over 2020 with the major shifts taking place in the
first half of the year.
All categories (Top-10, 25 and 50) increased over this analysis
period.
The categories now account for:
• Top 10: 51 % compared to 45%
• Top 25: 73% compared to 61%
• Top 50: 88% compared to 69%
Compared to the average observed in the mid cap client base
benchmark, Barco’s concentration levels are slightly over-
weight on the top 50 and 25 and underweight compared to
top 10.
(1) Shareholder analysis performed by Nasdaq Advisory services in December 2020 and January 2021

Barco
Inte
grate
d re
po
rt 20
20
100
FIN
Finan
cial re
po
rt
01 BARCO CONSOLIDATED
02 INFORMATION ABOUT THE SHARE
Shareholder structure
Geographic distribution
Investment style
74.2%
14.4%
3.5%
5.7%
2.2%
13.3%
20.3%
13.1%
7.7%
1.1%
44.6%
45.4%
21%
11.5%
7.7%
3.4%
10.7%
<1%
Value
Growth
GARP
Index
Hedge Fund
Other
Belgium
United States
France
United Kingdom
Norway
Rest of Europe
Rest of world
Institutional
Retail
Company-related
Brokerage/trading
Miscellaneous
Ownership of Barco’s shares 2020(per 31 December 2020)
Titan Baratto NV
Norges Bank (Central Bank of Norway)
3D NV
Barco NV
Public
TOTAL
18.38%
4.48%
3.94%
3.45%
100.00%
69.73%
91,487,438 total amount of shares

Barco
Inte
grate
d re
po
rt 20
20
101
FIN
Finan
cial re
po
rt
01 BARCO CONSOLIDATED
02 INFORMATION ABOUT THE SHARE
Shareholder remuneration
Dividend
Barco’s board of directors will propose to the General Assembly
to distribute a gross dividend of 0.378 euro per share. Barco’s
shareholders will be offered the choice between payment in
cash or dividend in shares, enabling Barco’s shareholders to
reinvest in the company.
Chairman of the board, Mr. Charles Beauduin and director,
Mr. Frank Donck, have confirmed the intent of respectively
Titan Baratto NV and 3D D NV, to opt for the stock dividend.
This is year-over-year a stable dividend. Modalities for the
dividend as well as ex-, record and payment date will be
announced at the latest with the convening of the Annual
General Assembly 2021.
Dividend policy
The dividend is set by the Board of Directors and subsequently
proposed at the Annual General Meeting of shareholders at
the end of each fiscal year.
• Board believes that consistency and reliability towards the
investment community is key, and considers a consistent
dividend pay-out as a key contributor, reflecting the long
term confidence in the company & its future growth and
opportunities
• The Board wants to also protect the strong balance sheet of
the company and Barco’s capability to invest in the future.
Barco’s investment case
Strong foundation with technology & market leadership in
healthy markets
Backed by over 85 years of experience, Barco is a strong brand
known for its technology leadership in three solid and healthy
markets: Entertainment, Enterprise and Healthcare. Building on
sustainable advantages, Barco has established global leader-
ship positions in all of these markets. The solutions delivered
to these markets are mostly mission-critical with a real effec-
tive need for high-performance and reliable technology.
Based on a solid experience, a thorough understanding of
customer needs, advanced know-how in developing differ-
entiated technology and delivering value-add solutions and
a well-developed go-to-market network, Barco continues to
lead in these markets.
Focused strategy
The company is implementing its “enabling bright out-
comes”-strategy, building capabilities to become a successful
hardware + software + service company, to capture more of
the lifecycle opportunity of its solutions and as a result enhance
the relationships with its customer base and strengthen the
contribution of recurring revenues.
Solid financial results
Over the past years, Barco has streamlined its organization,
and continues to sharpen the focus of its activities.
Since introducing the ‘focus to perform’ program in 2016, as
part of the ‘enabling bright outcomes’ strategy, Barco has made
measurable and steady progress primarily by rationalizing the
business portfolio and part of the footprint and by implement-
ing value engineering initiatives. As a result EBITDA margin
expanded from 8% in 2016 to 12% in 2018 and net earnings
grew to 7% of sales. In 2019 the company resumed topline
growth (+9%) with sales increases in all divisions and further
strengthened its EBITDA margin to 14%. In 2020 the company
faced a weak year due to pandemic-impacts resulting in a
strong decline of sales and profits. The company is confident
to recapture growth again in its markets when the recovery
sets in and to get back to its path towards its long-term finan-
cial objectives.
Except for 2020, Barco booked year-on-year net cash positive
results. The company follows a conservative course in man-
aging its financials and net cash position.
A strong & reliable leadership team
With some new experienced leaders, Barco’s leadership team
became more global and diversified over the past couple of
years and allowed to blend insights of new members with the
strong potential and competencies available at Barco. The
team delivered on its promises in line with its stated Say.Do
objective.
Confident that Barco has the required assets to further deliver
sustainable profitable growth, the company implemented its ‘fit
to lead’ program, a capability building and efficiency plan and
is determined to resume topline growth across the different
business segments when the recovery sets in.
Shareholder trust
Barco has a stable international shareholder base with a pre-
dominance of value-oriented investors. Since 2015, both Titan
Barato NV and 3D NV are represented in the Board of Directors.
Together, they now own more than 22% of Barco’s shares.
Board believes that consistency and reliability towards the
investment community is key, and considers a consistent div-
idend pay-out as a key contributor, reflecting the long term
confidence in the company & its future growth and oppor-
tunities.

Barco
Inte
grate
d re
po
rt 20
20
102
FIN
Finan
cial re
po
rt
01 BARCO CONSOLIDATED
02 INFORMATION ABOUT THE SHARE
Analysts covering Barco
Bank Degroof Petercam sa Kris Kippers
Berenberg Trion Reid
De Belegger Geert Smet
Flemish Federation of Investors and Investor Club Gert De Mesure
ING Marc Hesselink
KBC Securities Guy Sips
Kempen & Co N.V. Christophe Beghin
Kepler Cheuvreux Matthias Maenhaut
Announcement of results 4Q20 and FY20 Tuesday 26 January 2021
Trading update 1Q21 Wednesday 21 April 2021
Extra-ordinary shareholders meeting Friday 26 March 2021
Annual general and extra-ordinary shareholders meeting Thursday 29 April 2021
Announcement of results 1H21 Monday 19 July 2021
Trading update 3Q21 Wednesday 20 October 2021
Barco share BAR ISIN BE0974362940
Reuters BARBt.BR
Bloomberg BAR BB
Financial calendar 2021
Share info
More info including the quarterly consensus update, reports, reference to conference, roadshows and relevant tradeshows are
available on Barco’s investor portal
www.barco.com/investors

BARCO NV
Statutory auditor's report to the general shareholders’ meeting on the consolidated accounts for the year ended 31 December 2020
10 February 2021

PwC Bedrijfsrevisoren BV - PwC Reviseurs d'Entreprises SRL - Financial Assurance Services Maatschappelijke zetel/Siège social: Woluwe Garden, Woluwedal 18, B-1932 Sint-Stevens-Woluwe Vestigingseenheid/Unité d'établissement: Sluisweg 1 bus 8, B-9000 Gent T: +32 (0)9 268 82 11, F: +32 (0)9 268 82 99, www.pwc.com BTW/TVA BE 0429.501.944 / RPR Brussel - RPM Bruxelles / ING BE43 3101 3811 9501 - BIC BBRUBEBB / BELFIUS BE92 0689 0408 8123 - BIC GKCC BEBB
STATUTORY AUDITOR'S REPORT TO THE GENERAL SHAREHOLDERS’ MEETING OF THE COMPANY BARCO NV ON THE CONSOLIDATED ACCOUNTS FOR THE YEAR ENDED 31 DECEMBER 2020
We present to you our statutory auditor’s report in the context of our statutory audit of the consolidated accounts of Barco NV (the “Company”) and its subsidiaries (jointly “the Group”). This report includes our report on the consolidated accounts, as well as the other legal and regulatory requirements. This forms part of an integrated whole and is indivisible.
We have been appointed as statutory auditor by the general meeting d.d. 26 April 2018, following the proposal formulated by the board of directors and following the recommendation by the audit committee and the proposal formulated by the works’ council. Our mandate will expire on the date of the general meeting which will deliberate on the annual financial statements for the year ended 31 December 2020. We have performed the statutory audit of the consolidated financial statements of Barco NV for 3 consecutive years.
Report on the consolidated accounts
Unqualified opinion
We have performed the statutory audit of the Group’s consolidated accounts, which comprise the consolidated balance sheet as at 31 December 2020, the consolidated statement of income, the statement of comprehensive income, the consolidated statement of changes in equity and the consolidated statement of cash flow for the year then ended, and notes to the consolidated financial statements, including a summary of significant accounting policies and other explanatory information, and which is characterised by a consolidated balance sheet total of EUR ‘000 1,018,203 and a net loss attributable to the equity holder of the parent of EUR ‘000 4,393.
In our opinion, the consolidated accounts give a true and fair view of the Group’s net equity and consolidated financial position as at 31 December 2020, and of its consolidated financial performance and its consolidated cash flows for the year then ended, in accordance with International Financial Reporting Standards as adopted by the European Union and with the legal and regulatory requirements applicable in Belgium.
Basis for unqualified opinion
We conducted our audit in accordance with International Standards on Auditing (ISAs) as applicable in Belgium. Furthermore, we have applied the International Standards on Auditing (ISAs) as approved by the IAASB which are applicable to the year- end and which are not yet approved at the national level. Our responsibilities under those standards are further described in the “Statutory auditor’s responsibilities for the audit of the consolidated accounts” section of our report. We have fulfilled our ethical responsibilities in accordance with the ethical requirements that are relevant to our audit of the consolidated financial statements in Belgium, including the requirements related to independence.
We have obtained from the board of directors and Company officials the explanations and information necessary for performing our audit.
We believe that the audit evidence we have obtained is sufficient and appropriate to provide a basis for our opinion.
3 of 7
Key audit matters
Key audit matters are those matters that, in our professional judgment, were of most significance in our audit of the consolidated accounts of the current period. These matters were addressed in the context of our audit of the consolidated accounts as a whole, and in forming our opinion thereon, and we do not provide a separate opinion on these matters.
Impairment testing of goodwill - Note 8
Description of key audit matter
The carrying value of the Group’s goodwill amounts to EUR’000 105,612 at 31 December 2020.
These assets are subject to impairment testing on an annual basis or more frequently if there are indicators of impairment.
We consider this matter as key to our audit because the determination of whether or not an impairment charge is necessary involves significant judgement in estimating the future results of the business.
How our audit addressed the key audit matter
We evaluated the appropriateness of the Group’s accounting policies and assessed compliance with the policies in accordance with IFRS.
We evaluated management’s annual impairment testing and assessment of the indicators of impairment and challenged impairment calculations by assessing the future cash flow forecasts used in the models, and the process by which they were drawn up, including comparing them to the latest budgets approved by the board of directors.
We understood and challenged:
● Assumptions used in the Group’s budget and internal forecasts and the long-term growth ratesby comparing them to economic and industry forecasts;
● The discount rate by assessing the cost of capital and other inputs including benchmarkingwith comparable organizations;
● The historical accuracy of budgets to actual results to determine whether cash flow forecastsare reliable based on past experience;
● The mechanics of the underlying calculations.
In performing the above work, we utilized our internal valuation experts to provide challenge and external market data to assess the reasonableness of the assumptions used by management.
We evaluated the sensitivity analysis around the key drivers within the cash flow forecasts to ascertain the extent of change in those assumptions and also considered the likelihood of such a movement in those key assumptions arising.
Whilst recognizing that cash flow forecasting, impairment modeling and valuations are all inherently judgmental, we found that the assumptions used by management were within an acceptable range of reasonable estimates.

4 of 7
Valuation of deferred taxes and valuation allowance on deferred tax assets related to tax losses carried forward - Note 10
Description of key audit matter
Deferred tax assets on tax losses carried forward and tax credits amounts to EUR’000 36,470 (note 10). The valuation of the deferred tax positions at Barco involved significant judgement, more specifically in the determination of the recognition of deferred tax assets related to tax losses carried forward. The estimation of the future taxable basis is highly judgemental as well as the assessment of the impact of tax laws and regulations, tax planning action and strategies, rulings and transfer pricing.
The valuation and recoverability of deferred tax assets is key to our audit due to the magnitude of the amount recognized for these assets and because the assessment requires management estimates, mainly on the assumptions regarding expected future market and economic conditions and tax laws and regulation.
How our audit addressed the key audit matter
We challenged the assumptions made to assess the recoverability of deferred tax assets related to tax losses carried forward and the timing of the reversal of deferred tax positions. During our procedures, we used amongst others budgets, forecasts and tax laws and in addition we assessed the historical accuracy of management’s assumptions. We involved tax specialists in our audit. An important management judgement was the period over which taxable profits can be reliably estimated and consequently, no deferred tax assets are recognised for tax losses used in any period beyond. We verified that the deferred tax position was calculated at the enacted tax rate for the year in which the deferred tax position is expected to reverse.
We also assessed the adequacy and completeness of the Company’s disclosure included in Note 10 in respect of deferred taxes.
We found management’s judgements in respect of the Group’s deferred tax positions to be consistent and in line with our expectations.
Responsibilities of the board of directors for the preparation of the consolidated accounts
The board of directors is responsible for the preparation of consolidated accounts that give a true and fair view in accordance with International Financial Reporting Standards as adopted by the European Union and with the legal and regulatory requirements applicable in Belgium, and for such internal control as the board of directors determines is necessary to enable the preparation of consolidated financial statements that are free from material misstatement, whether due to fraud or error.
In preparing the consolidated accounts, the board of directors is responsible for assessing the Group’s ability to continue as a going concern, disclosing, as applicable, matters related to going concern and using the going concern basis of accounting unless the board of directors either intends to liquidate the Group or to cease operations, or has no realistic alternative but to do so.

5 of 7
Statutory auditor’s responsibilities for the audit of the consolidated accounts
Our objectives are to obtain reasonable assurance about whether the consolidated accounts as a whole are free from material misstatement, whether due to fraud or error, and to issue an auditor’s report that includes our opinion. Reasonable assurance is a high level of assurance, but is not a guarantee that an audit conducted in accordance with ISAs will always detect a material misstatement when it exists. Misstatements can arise from fraud or error and are considered material if, individually or in the aggregate, they could reasonably be expected to influence the economic decisions of users taken on the basis of these consolidated accounts.
In performing our audit, we comply with the legal, regulatory and normative framework applicable to the audit of the consolidated accounts in Belgium. A statutory audit does not provide any assurance as to the Group’s future viability nor as to the efficiency or effectiveness of the board of directors’ current or future business management at Group level.
As part of an audit in accordance with ISAs, we exercise professional judgment and maintain professional skepticism throughout the audit. We also:
• Identify and assess the risks of material misstatement of the consolidated accounts, whether dueto fraud or error, design and perform audit procedures responsive to those risks, and obtain auditevidence that is sufficient and appropriate to provide a basis for our opinion. The risk of notdetecting a material misstatement resulting from fraud is higher than for one resulting from error,as fraud may involve collusion, forgery, intentional omissions, misrepresentations, or the overrideof internal control;
• Obtain an understanding of internal control relevant to the audit in order to design auditprocedures that are appropriate in the circumstances, but not for the purpose of expressing anopinion on the effectiveness of the Group’s internal control;
• Evaluate the appropriateness of accounting policies used and the reasonableness of accountingestimates and related disclosures made by the board of directors;
• Conclude on the appropriateness of the board of directors’ use of the going concern basis ofaccounting and, based on the audit evidence obtained, whether a material uncertainty existsrelated to events or conditions that may cast significant doubt on the Group’s ability to continueas a going concern. If we conclude that a material uncertainty exists, we are required to drawattention in our statutory auditor’s report to the related disclosures in the consolidated accountsor, if such disclosures are inadequate, to modify our opinion. Our conclusions are based on theaudit evidence obtained up to the date of our statutory auditor’s report. However, future events orconditions may cause the Group to cease to continue as a going concern;
• Evaluate the overall presentation, structure and content of the consolidated accounts, includingthe disclosures, and whether the consolidated accounts represent the underlying transactionsand events in a manner that achieves fair presentation;
• Obtain sufficient and appropriate audit evidence regarding the financial information of the entitiesor business activities within the Group to express an opinion on the consolidated financialstatements. We are responsible for the direction, supervision and performance of the Groupaudit. We remain solely responsible for our audit opinion.

6 of 7
We communicate with the audit committee regarding, among other matters, the planned scope and timing of the audit and significant audit findings, including any significant deficiencies in internal control that we identify during our audit.
We also provide the audit committee with a statement that we have complied with relevant ethical requirements regarding independence, and to communicate with them all relationships and other matters that may reasonably be thought to bear on our independence, and where applicable, related safeguards.
From the matters communicated with the audit committee, we determine those matters that were of most significance in the audit of the consolidated accounts of the current period and are therefore the key audit matters. We describe these matters in our auditor’s report unless law or regulation precludes public disclosure about the matter.
Other legal and regulatory requirements
Responsibilities of the board of directors
The board of directors is responsible for the preparation and the content of the directors’ report on the consolidated accounts, the separate report on non-financial information and the other information included in the report on the consolidated financial statements.
Statutory auditor’s responsibilities
In the context of our mandate and in accordance with the Belgian standard which is complementary to the International Standards on Auditing (ISAs) as applicable in Belgium, our responsibility is to verify, in all material respects, the directors’ report on the consolidated accounts, the separate report on non-financial information and the other information included in the report on the consolidated accounts and to report on these matters.
Aspects related to the directors’ report on the consolidated financial statements and to the other information included in the annual report on the consolidated financial statements
In our opinion, after having performed specific procedures in relation to the directors’ report on the consolidated accounts, this report is consistent with the consolidated accounts for the year under audit, and it is prepared in accordance with article 3:32 of the Companies’ and Associations’ Code.
In the context of our audit of the consolidated financial statements, we are also responsible for considering, in particular based on the knowledge acquired resulting from the audit, whether the directors’ report is materially misstated or contains information which is inadequately disclosed or otherwise misleading. In light of the procedures we have performed, there are no material misstatements we have to report to you.
The non-financial information required by virtue of article 3:32, §2 of the Companies’ and Associations’ Code is included in the directors’ report on the consolidated accounts. The Company has prepared the non-financial information, based on Global Reporting Initiative Standards. However, in accordance with article 3:80, §1, 5° of the Companies’ and Associations’ Code, we do not express an opinion as to whether the non-financial information has been prepared in accordance with the Global Reporting Initiative Standards as disclosed in the consolidated accounts.

7 of 7
Statement related to independence
● Our registered audit firm and our network did not provide services which are incompatible with thestatutory audit of the consolidated financial statements, and our registered audit firm remainedindependent of the Group in the course of our mandate.
● The fees for additional services which are compatible with the statutory audit of the consolidatedfinancial statements referred to in article 3:65 of the Companies’ and Associations’ Code arecorrectly disclosed and itemized in the notes to the consolidated financial statements.
Other statements
● This report is consistent with the additional report to the audit committee referred to in article 11 ofthe Regulation (EU) N° 537/2014.
Ghent, 10 February 2021
The statutory auditor PwC Reviseurs d'Entreprises SRL / PwC Bedrijfsrevisoren BV Represented by
Lien Winne Peter Opsomer Réviseur d’Entreprises / Bedrijfsrevisor Réviseur d’Entreprises / Bedrijfsrevisor

2020Integratedannualreport
GRI Content index
ENABLING BRIGHT OUTCOMESbarco.com

Reporting period, cycle and scope
This integrated report provides an overview of our most
relevant intentions, achievements and objectives in 2020,
unless stated otherwise. The scope of the report is Barco
worldwide, unless stated otherwise. The report is published
annually. Date of previous report: Febuary 2020.
GRI standards
This report has been prepared in accordance with the GRI
Standards: ‘Core option’.
GRI Content index
Pages without prefix refer to the Core integrated report. PPC
refers Planet-People-Communities report. FIN refers to Finan-
cial report. CCG refers to Corporate governance report. GRI
refers to GRI index. GLO refers to the Glossary. ASR refers to
Assurance report.
GRI Content index
This is the GRI Content index of Barco’s
2020 Integrated annual report. Other
sections are available via the download
center at ir.barco.com/2020.
CORE
MORE
• Governance & risk report
• Report on planet - people - communities
• Financial report
ANNEX
• Assurance report
• GRI Content
• Glossary
Barco
Inte
grate
d re
po
rt 20
20
2
GR
I Co
nte
nt in
de
x
GRI
GRI CONTENTINDEX

DISCLOSURE PAGE
GRI 100 UNIVERSAL STANDARDS
GRI 102 General Disclosures 2016
102-1 Name of the organization 9, 71
102-2 Activities, brands, products and services 11, 19, 37-41, 42-54
102-3 Location of headquarters 71
102-4 Location of operations 12
102-5 Ownership and legal form FIN/26-27
102-6 Markets served 11, 42-54, FIN/30-36
102-7 Scale of the organization 11-12, 20-21, 42-54, 55-70, FIN/6
102-8 Information on employees and other workers 12, PPC/33
102-9 Supply chain CGR/53, PPC/61
102-10 Significant changes to the organization's size, structure, ownership or supply chain FIN/22-25, FIN/29, FIN/30-41
102-11 Precautionary Principle or approach CGR/40-43
102-12 External initiatives PPC/73-74
102-13 Membership of associations PPC/60-61
102-14 Statement from senior decision-maker 4-5, 58, PPC/3
102-15 Key impacts, risks, and opportunities 29-36, CGR/38-56, PPC/6-9, FIN/22-25
102-16 Values, principles, standards, and norms of behavior 16-17, PPC/36-38, PPC/58-61
102-17 Mechanisms for advice and concerns about ethics PPC/60
102-18 Governance structure 13-15, CGR/6-15, CGR/17-21
102-19 Delegating authority PPC/68-70
102-20 Executive-level responsibility for economic, environmental, and social topics PPC/68-70
Barco
Inte
grate
d re
po
rt 20
20
3
GR
I Co
nte
nt in
de
x
GRI
GRI CONTENTINDEX
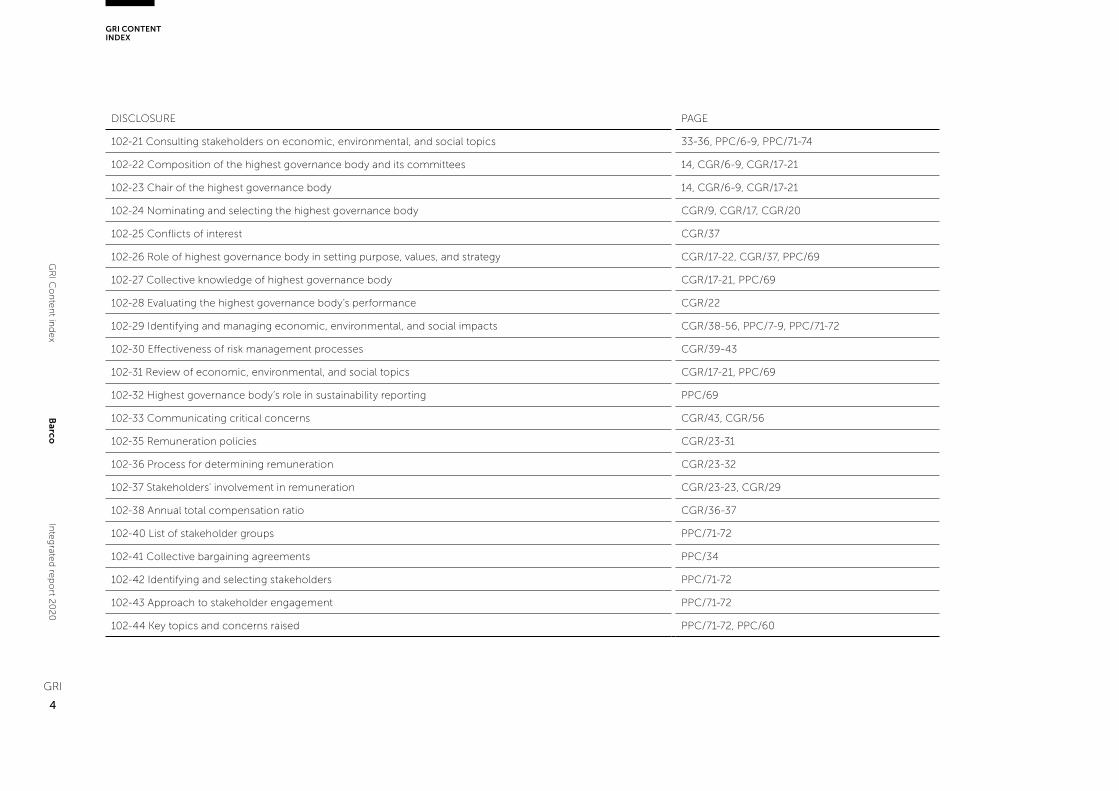
Barco
Inte
grate
d re
po
rt 20
20
4
GR
I Co
nte
nt in
de
x
GRI
GRI CONTENTINDEX
DISCLOSURE PAGE
102-21 Consulting stakeholders on economic, environmental, and social topics 33-36, PPC/6-9, PPC/71-74
102-22 Composition of the highest governance body and its committees 14, CGR/6-9, CGR/17-21
102-23 Chair of the highest governance body 14, CGR/6-9, CGR/17-21
102-24 Nominating and selecting the highest governance body CGR/9, CGR/17, CGR/20
102-25 Conflicts of interest CGR/37
102-26 Role of highest governance body in setting purpose, values, and strategy CGR/17-22, CGR/37, PPC/69
102-27 Collective knowledge of highest governance body CGR/17-21, PPC/69
102-28 Evaluating the highest governance body’s performance CGR/22
102-29 Identifying and managing economic, environmental, and social impacts CGR/38-56, PPC/7-9, PPC/71-72
102-30 Effectiveness of risk management processes CGR/39-43
102-31 Review of economic, environmental, and social topics CGR/17-21, PPC/69
102-32 Highest governance body’s role in sustainability reporting PPC/69
102-33 Communicating critical concerns CGR/43, CGR/56
102-35 Remuneration policies CGR/23-31
102-36 Process for determining remuneration CGR/23-32
102-37 Stakeholders’ involvement in remuneration CGR/23-23, CGR/29
102-38 Annual total compensation ratio CGR/36-37
102-40 List of stakeholder groups PPC/71-72
102-41 Collective bargaining agreements PPC/34
102-42 Identifying and selecting stakeholders PPC/71-72
102-43 Approach to stakeholder engagement PPC/71-72
102-44 Key topics and concerns raised PPC/71-72, PPC/60

DISCLOSURE PAGE
102-45 Entities included in the consolidated financial statements FIN/26
102-46 Defining report content and topic Boundaries PPC/6
102-47 List of material topics PPC/7
102-48 Restatements of information N/A
102-49 Changes in reporting PPC/6
102-50 Reporting period GRI/2
102-51 Date of most recent report GRI/2
102-52 Reporting cycle GRI/2
102-53 Contact point for questions regarding the report 71
102-54 Claims of reporting in accordance with the GRI Standards GRI/2
102-55 GRI Content Index GRI
102-56 External assurance ASR
GRI 103 Management approach 2016
103-1 Explanation of the material topic and its Boundary PPC/7-9
103-2 The management approach and its components CGR/5, CGR/48-56, PPC/11-70
103-3 Evaluation of the management approach PPC/60, PPC/74-76, CGR/17-37
GRI 200 ECONOMIC TOPICS
GRI 201 Economic Performance 2016
201-1 Direct economic value generated and distributed FIN/6, FIN/30-33, FIN/37-41
201-4 Financial assistance received from government FIN/41, FIN/44, FIN/45
GRI 205 Anti-corruption 2016
205-2 Communication and training about anti-corruption policies and procedures CGR/55, PPC/58-59, PPC/64
Barco
Inte
grate
d re
po
rt 20
20
5
GR
I Co
nte
nt in
de
x
GRI
GRI CONTENTINDEX
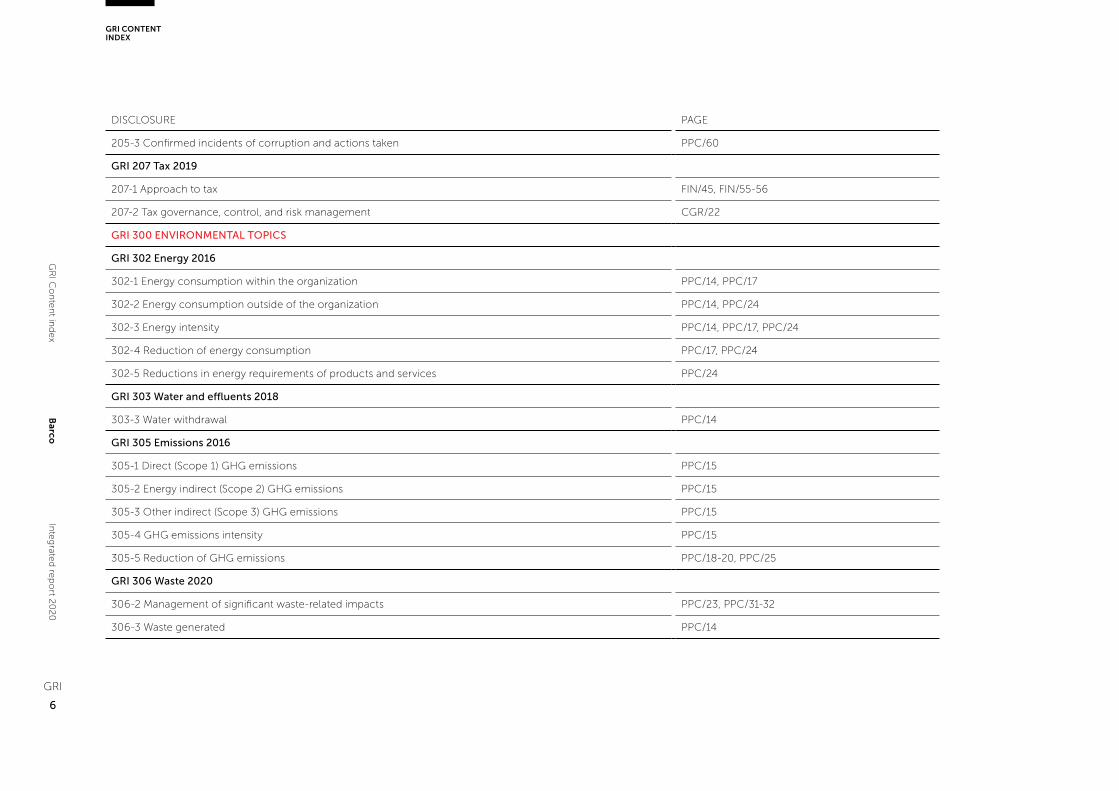
DISCLOSURE PAGE
205-3 Confirmed incidents of corruption and actions taken PPC/60
GRI 207 Tax 2019
207-1 Approach to tax FIN/45, FIN/55-56
207-2 Tax governance, control, and risk management CGR/22
GRI 300 ENVIRONMENTAL TOPICS
GRI 302 Energy 2016
302-1 Energy consumption within the organization PPC/14, PPC/17
302-2 Energy consumption outside of the organization PPC/14, PPC/24
302-3 Energy intensity PPC/14, PPC/17, PPC/24
302-4 Reduction of energy consumption PPC/17, PPC/24
302-5 Reductions in energy requirements of products and services PPC/24
GRI 303 Water and effluents 2018
303-3 Water withdrawal PPC/14
GRI 305 Emissions 2016
305-1 Direct (Scope 1) GHG emissions PPC/15
305-2 Energy indirect (Scope 2) GHG emissions PPC/15
305-3 Other indirect (Scope 3) GHG emissions PPC/15
305-4 GHG emissions intensity PPC/15
305-5 Reduction of GHG emissions PPC/18-20, PPC/25
GRI 306 Waste 2020
306-2 Management of significant waste-related impacts PPC/23, PPC/31-32
306-3 Waste generated PPC/14
Barco
Inte
grate
d re
po
rt 20
20
6
GR
I Co
nte
nt in
de
x
GRI
GRI CONTENTINDEX

DISCLOSURE PAGE
306-4 Waste diverted from disposal PPC/14
GRI 308 Supplier Environmental Assessment 2016 PPC/14
GRI 400 SOCIAL TOPICS
GRI 401: Employment 2016
401-1 New employee hires and employee turnover 21, PPC/34
GRI 403 Occupational Health & Safety 2018
403-1 Occupational health and safety management system PPC/38, PPC/40
403-2 Hazard identification, risk assessment, and incident investigation PPC/38, PPC/37
403-3 Occupational health services PPC/41
403-4 Worker participation, consultation, and communication on occupational health and safety PPC/40
403-5 Worker training on occupational health and safety PPC/40
403-6 Promotion of worker health PPC/41
403-7 Prevention and mitigation of occupational health and safety impacts directly
linked by business relationshipsPPC/53
403-9 Work-related injuries PPC/34, GLO/6
GRI 404 Training and Education 2016
404-1 Average hours of training per year per employee PPC/34, GLO/4
404-2 Programs for upgrading employee skills and transition assistance programs PPC/35, PPC/42-43
GRI 405 Diversity and equal opportunity 2016
405-1 Diversity of governance bodies and employees PPC/45
GRI 407 Freedom of association and collective bargaining 2016
407-1 Operations and suppliers in which the right to freedom of association and
collective bargaining may be at riskCGR/55
Barco
Inte
grate
d re
po
rt 20
20
7
GR
I Co
nte
nt in
de
x
GRI
GRI CONTENTINDEX

Barco
Inte
grate
d re
po
rt 20
20
8
GR
I Co
nte
nt in
de
x
GRI
GRI CONTENTINDEX
DISCLOSURE PAGE
GRI 412 Human rights assessment 2016
412-2 Employee training on human rights policies or procedures PPC/59
412-3 Significant investment agreements and contracts that include human rights clauses
or that underwent human rights screeningPPC/63
GRI 413 Local communities 2016
413-1 Operations with local community engagement, impact assessments,
and development programsPPC/65-67
GRI 414 Supplier social assessment 2016
GRI 416: Customer health and safety 2016
416-1 Assessment of the health and safety impacts of product and service categories PPC/53
GRI 418: Customer privacy 2016
418-1 Substantiated complaints concerning breaches of customer privacy and losses
of customer data PPC/57

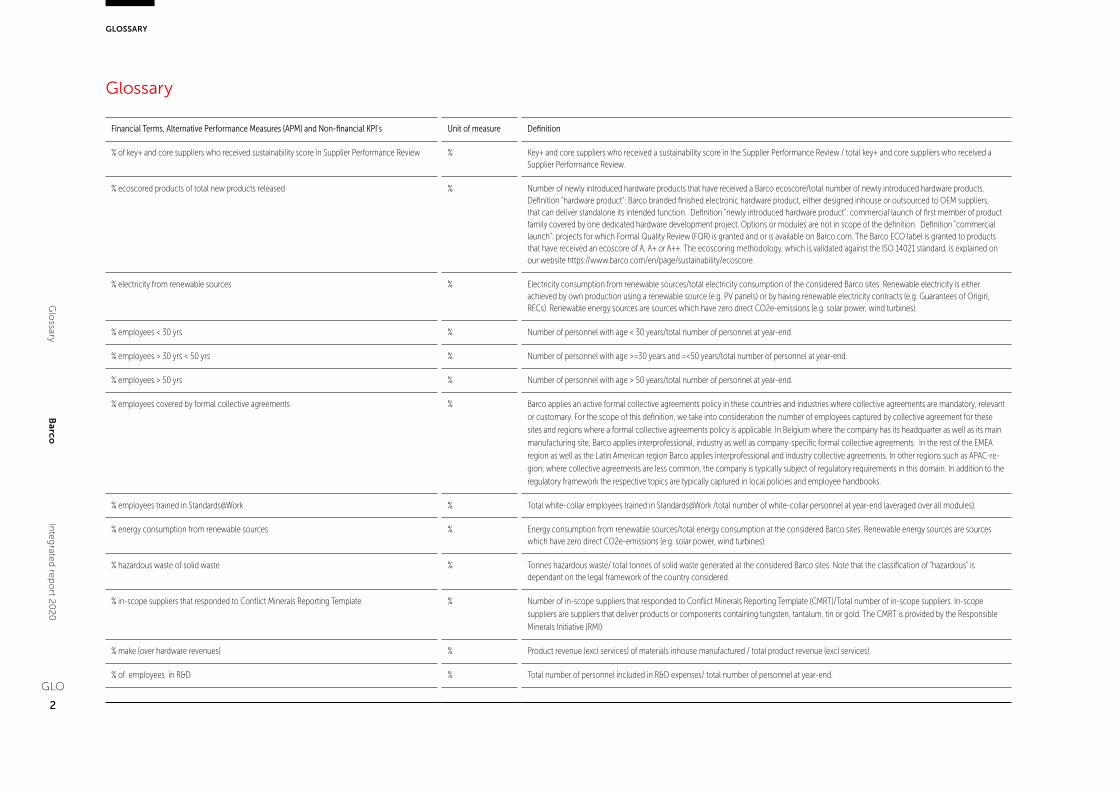
Glossary
Financial Terms, Alternative Performance Measures (APM) and Non-financial KPI's Unit of measure Definition
% of key+ and core suppliers who received sustainability score in Supplier Performance Review % Key+ and core suppliers who received a sustainability score in the Supplier Performance Review / total key+ and core suppliers who received a Supplier Performance Review.
% ecoscored products of total new products released % Number of newly introduced hardware products that have received a Barco ecoscore/total number of newly introduced hardware products. Definition "hardware product": Barco branded finished electronic hardware product, either designed inhouse or outsourced to OEM suppliers, that can deliver standalone its intended function. Definition "newly introduced hardware product": commercial launch of first member of product family covered by one dedicated hardware development project. Options or modules are not in scope of the definition. Definition "commercial launch": projects for which Formal Quality Review (FQR) is granted and or is available on Barco.com. The Barco ECO label is granted to products that have received an ecoscore of A, A+ or A++. The ecoscoring methodology, which is validated against the ISO 14021 standard, is explained on our website https://www.barco.com/en/page/sustainability/ecoscore.
% electricity from renewable sources % Electricity consumption from renewable sources/total electricity consumption of the considered Barco sites. Renewable electricity is either achieved by own production using a renewable source (e.g. PV panels) or by having renewable electricity contracts (e.g. Guarantees of Origin, RECs). Renewable energy sources are sources which have zero direct CO2e-emissions (e.g. solar power, wind turbines).
% employees < 30 yrs % Number of personnel with age < 30 years/total number of personnel at year-end.
% employees > 30 yrs < 50 yrs % Number of personnel with age >=30 years and =<50 years/total number of personnel at year-end.
% employees > 50 yrs % Number of personnel with age > 50 years/total number of personnel at year-end.
% employees covered by formal collective agreements % Barco applies an active formal collective agreements policy in these countries and industries where collective agreements are mandatory, relevant
or customary. For the scope of this definition, we take into consideration the number of employees captured by collective agreement for these
sites and regions where a formal collective agreements policy is applicable. In Belgium where the company has its headquarter as well as its main
manufacturing site, Barco applies interprofessional, industry as well as company-specific formal collective agreements. In the rest of the EMEA
region as well as the Latin American region Barco applies interprofessional and industry collective agreements. In other regions such as APAC-re-
gion; where collective agreements are less common, the company is typically subject of regulatory requirements in this domain. In addition to the
regulatory framework the respective topics are typically captured in local policies and employee handbooks.
% employees trained in Standards@Work % Total white-collar employees trained in Standards@Work /total number of white-collar personnel at year-end (averaged over all modules).
% energy consumption from renewable sources % Energy consumption from renewable sources/total energy consumption at the considered Barco sites. Renewable energy sources are sources which have zero direct CO2e-emissions (e.g. solar power, wind turbines).
% hazardous waste of solid waste % Tonnes hazardous waste/ total tonnes of solid waste generated at the considered Barco sites. Note that the classification of "hazardous" is dependant on the legal framework of the country considered.
% in-scope suppliers that responded to Conflict Minerals Reporting Template % Number of in-scope suppliers that responded to Conflict Minerals Reporting Template (CMRT)/Total number of in-scope suppliers. In-scope
suppliers are suppliers that deliver products or components containing tungsten, tantalum, tin or gold. The CMRT is provided by the Responsible
Minerals Initiative (RMI).
% make (over hardware revenues) % Product revenue (excl services) of materials inhouse manufactured / total product revenue (excl services).
% of employees in R&D % Total number of personnel included in R&D expenses/ total number of personnel at year-end.
Barco
Inte
grate
d re
po
rt 20
20
2
Glo
ssary
GLO
GLOSSARY

Financial Terms, Alternative Performance Measures (APM) and Non-financial KPI's Unit of measure Explanation
% of active components covered by Full Material Declarations % Number of active components that are coverd by FMD-A or FMD-B material declarations/total number of active components.
% of countries where products are sold with Barco
dedicated return and recycling programs
% Number of countries to which products were shipped where specific structural extended producer responsibility measures have been implemented like take back and WEEE reporting / total number of countries to which products were shipped.
% of employees having received training % Number of employees who had followed a training course within the year/ total number of personnel at year end.
% of employees in long-term sick leave (>1 yr) % Number of personnel on long term sick leave (> 1 year)/total number of personnel at year-end.
% of iGemba improvement suggestions implemented % Implemented suggestions/total improvement suggestions. iGemba is the name of Barco's continuous improvement system. An improvement suggestion is an idea, improvement, solution, ... that is registered by an operator on an iGemba improvement card.
% of key(+) and core suppliers who signed declaration of compliance with RBA Code of Conduct
(Responsible Business Alliance)
% Number of key/key+/core component suppliers that have commited formally to the RBA code of conduct or equivalent.
% of key+ and core suppliers with sustainability score higher than 80% % Key+ and core suppliers who received a sustainability score of >80% in the Supplier Performance Review / total key+
and core suppliers who were scored on sustainability.
% of leaders in Annual Talent Development Review % Number of leaders in annual talent development review/total number of leaders. Leaders are employees with direct reports.
A talent development review maps the individual’s sustained contribution and behavior and his/her potential and identifies actions needed with
regards to development, career paths and internal moves.
% of new products released with Barco ECO label (hardware) % Number of newly introduced hardware products that have received the Barco ECO label/total number of newly introduced hardware products.
Definition "hardware product": Barco branded finished electronic hardware product, either designed inhouse or outsourced to OEM suppliers,
that can deliver standalone its intended function. Definition "newly introduced hardware product": commercial launch of first member of product
family covered by one dedicated hardware development project. Options or modules are not in scope of the definition. Definition "commercial
launch": projects for which Formal Quality Review (FQR) is granted and or is available on Barco.com. The ecoscoring methodology, which is
validated against the ISO 14021 standard, is explained on our website https://www.barco.com/en/page/sustainability/ecoscore.
% of new products released with recycled plastics (hardware) % Number of newly introduced hardware products containing recycled plastics/total number of newly introduced hardware products. Definition
"hardware product": Barco branded finished electronic hardware product, either designed inhouse or outsourced to OEM suppliers, that can
deliver standalone its intended function. Definition "newly introduced hardware product": commercial launch of first member of product family
covered by one dedicated hardware development project. Options or modules are not in scope of the definition. Definition "commercial launch":
projects for which Formal Quality Review (FQR) is granted and or is available on Barco.com. Definition "containing recycled plastics": product
containing a minimum mass percentage recycled content in plastic parts larger than 25 grams. The minimum mass percentage is defined in the
applied Barco ecoscore tool version.
% of procurement employees trained in sustainable procurement # Number of employees within the worldwide functional domain of procurement (Function-Subfunction=PRO-* ) who completed the training 'Sustainable Procurement' / total number of employees within the worldwide procurement team.
% revenues from products with Barco ECO label (hardware) % Revenues from hardware products that received the Barco ECO label/ total hardware product revenues. Definition ""hardware product"": Barco branded finished electronic hardware product either designed inhouse or outsourced to OEM suppliers, that can deliver standalone its intended function. The Barco ECO label is granted to products that have received an ecoscore of A, A+ or A++. The ecoscoring methodology, which is validated against the ISO 14021 standard, is explained on our website https://www.barco.com/en/page/sustainability/ecoscore.
% waste to landfill % Tonnes of waste sent to landfill/total tonnes of solid waste generated at the considered Barco sites.
Barco
Inte
grate
d re
po
rt 20
20
3
Glo
ssary
GLO
GLOSSARY

Financial Terms, Alternative Performance Measures (APM) and Non-financial KPI's Unit of measure Explanation
% women Barco overall % Number of female personnel/total number of personnel at year-end.
% women in senior management % Number of female personnel with hay grade >= 18/total number of personnel with hay grade >= 18 at year-end.
Adjusted EBIT EBIT excluding restructuring costs and impairments relating to reorienting or stopping certain activities, business or product lines, as well as impairments on goodwill and revenues resulting from a single material transaction not linked to current business activities (e.g. change of control in a subsidiary). Results out of divestments or acquisitions are included in EBIT(DA).Reconciliation from EBIT to adjusted EBIT can be found in the income statement.
Adjusted return on operating capital employed (ROCE) Adjusted EBIT after tax relative to operating capital employed (including goodwill). ROCE = (Adjusted) EBIT*(1- tax rate)/Operating capital employed (including goodwill).
Associates Companies in which Barco has a significant influence, generally reflected by an interest of at least 20%. Associates are accounted for using the equity method.
Average training hours per employee # hours Total hours or learning /total number of personnel at year end.
Average training investment per employee € Total 'out of pocket' expenses for learning & development / total number of personnel at year end.
BarcoCFG Full name is CFG Barco (Beijing) Electronics Co., Ltd. BarcoCFG is the entity where Barco joined forces with China Film Group to address the Chinese cinema market. Barco holds a 49% stake in this entity at the end of December 2020.
Book value per share Equity attributable to the Group divided by number of shares outstanding at balance sheet date.
Capital ratio Equity relative to total assets.
Community investment € The expenses related to charity projects, in €. It does not include in-kind donations.
Community involvement # heads The number of Barco volunteers who participated in charity projects.
Customer Net Promotor Score (relationship NPS) # Calculation of the Net Promotor Score is based on the answer of customers to the question: "On a scale from 0-10, how likely are you to
recommend Barco to a friend or colleague?" Detractors score 0-6, passives score 7-8, promotors score 9-10.
Calculation of NPS result = % promotors - % detractors.
Direct available net cash Net financial cash excluding the cash in Cinionic.
Dividend yield Gross dividend as a percentage of the share price on 31 December.
DPO Days payable outstanding calculated as Trade Payables / (Material cost + Services and other costs) x 365
DSO Days sales outstanding calculated as ((Trade debtors / (sales past quarter)) * 90
Earnings per share (€) € Net income/(loss) attributable to the equity holder of the parent divided by weighted average of shares
Barco
Inte
grate
d re
po
rt 20
20
4
Glo
ssary
GLO
GLOSSARY

Financial Terms, Alternative Performance Measures (APM) and Non-financial KPI's Unit of measure Explanation
EBIT Operating result (earnings before interest and taxes), calculated as gross profit less research & development expenses, sales and marketing
expenses, general and administration expenses, other operating income (expense) - net and plus or minus adjusting items.
EBITDA Adjusted EBIT + depreciation, amortization and impairments (if any).
EBITDA margin % EBITDA as percentage of sales.
EMEA Europe, Middle-East and Africa.
Employees per functional group % Personnel at year-end (in heads) per functional group (9 functional groups).
Employees per region % Personnel at year-end (in heads) per region (3 regions).
Energy efficiency index of sold products (#) # The energy efficiency index of our products is calculated by taking into account the energy consumption/delivered capability of the most important product groups in terms of energy consumption: projectors & LED products in the Entertainmaint division and large video walls from the Enterprise division. The energy performance of these product groups is calculated and formulated as Watt/delivered capability. Within the Entertainment division the average energy use/delivered capability is weighted on revenues from the considered product groups (i.e. projectors & LED since 2018). Within each division the energy performance is normalised versus the 2015 baseline value (which has the default value 1,0). The final energy efficiency index is then calculated by weighing the average of the Entertainment division's and the Enterprise division's normalized energy performance. The weighing is done on revenues per division.
Equity method Method of accounting whereby an investment (in an associate) is initially recognized at cost and subsequently adjusted for any changes in the
investor’s share of the associate’s net assets (i.e. equity). The income statement reflects the investor’s share in the net result of the investee.
Free cash flow Gross operating cash flow excluding share options recognized as cost + change in net working capital + Interest (expense)/income + income taxes + purchase of tangible and intangible fixed assets + proceeds on disposals of tangible and intangible fixed assets.
Greenhouse gas emissions infrastructure Tonnes CO2 e /mio € revenues
Total Greenhouse gas emissions of the considered Barco sites covering own operations emissions from infrastructure in tonnes of CO2e per turnover (mio € revenues). Infrastructure covers total emissions from infrastructure energy, refrigerant losses and waste generated at the facilities. All Kyoto & Non-Kyoto greenhouse gases are accounted for and converted to CO2-equivalents.
Greenhouse gas emissions logistics Tonnes CO2 e /mio € revenues
Total Greenhouse gas emissions of the considered Barco sites covering own operations emissions from logistics in tonnes of CO2e per turnover
(mio € revenues). Logistics covers all emissions from transport of goods (in- & outbound) paid for by Barco. All Kyoto & Non-Kyoto greenhouse
gases are accounted for and converted to CO2-equivalents.
Greenhouse gas emissions mobility Tonnes CO2 e /mio € revenues
Total Greenhouse gas emissions of the considered Barco sites covering own operations emissions from mobility in tonnes of CO2e per turnover (mio € revenues). Mobility covers owned/leased fleet emissions, commuting and business travel emissions. All Kyoto & Non-Kyoto greenhouse gases are accounted for and converted to CO2-equivalents.
Barco
Inte
grate
d re
po
rt 20
20
5
Glo
ssary
GLO
GLOSSARY

Financial Terms, Alternative Performance Measures (APM) and Non-financial KPI's Unit of measure Explanation
Greenhouse gas emissions of our own operations Tonnes CO2 e /mio € revenues
Total Greenhouse gas emissions of the considered Barco sites covering own operations emissions from infrastructure, mobility and logistics in
tonnes of CO2e per turnover (mio € revenues). Infrastructure covers total energy emissions from infrastructure energy, refrigerant losses and
waste generated at the facilities; mobility covers owned/leased fleet emissions, commuting and business travel emissions; Logistics covers all
emissions from transport of goods (in- & outbound) paid for by Barco. All Kyoto & Non-Kyoto greenhouse gases are accounted for and converted
to CO2-equivalents.
Greenhouse gas emissions of sold products (product use emissions) Tonnes CO2 e /mio € revenues
Total Greenhouse Gas emissions of the considered Barco sold products in tonnes of CO2e per turnover (mio € revenues). All Kyoto & Non-Kyoto
greenhouse gases are accounted for and converted to CO2-equivalents.
Greenhouse gas emissions scope 1 Tonnes CO2 e /mio € revenues
Total Greenhouse gas emissions of the considered Barco sites covering scope 1 as defined by the Greenhouse Gas Protocol in tonnes of CO2e
per turnover (mio € revenues). Scope 1 covers the direct emissions from combustion of fossil fuels on site and by company vehicles and emissions
from refrigerant losses. All Kyoto & Non-Kyoto greenhouse gases are accounted for and converted to CO2-equivalents.
Greenhouse gas emissions scope 2 Tonnes CO2 e /mio € revenues
Total Greenhouse gas emissions of the considered Barco sites covering scope 2 as defined by the Greenhouse Gas Protocol in tonnes of CO2e per turnover (mio € revenues). Scope 2 covers the direct emissions from purchased electricity or district heating. Note that the market based approach is used here. All Kyoto & Non-Kyoto greenhouse gases are accounted for and converted to CO2-equivalents.
Greenhouse gas emissions scope 3 incl. product use emissions Tonnes CO2 e /mio € revenues
Total Greenhouse gas emissions of the considered Barco sites and Barco sold products covering scope 3 as defined by the Greenhouse Gas Protocol in tonnes of CO2e per turnover (mio € revenues). Scope 3 covers the direct emissions from waste generated on site, home-work commuting, business travel, logistics operations and product use emissions. All Kyoto & Non-Kyoto greenhouse gases are accounted for and converted to CO2-equivalents.
Indirect costs/expenses Research & development expenses, sales and marketing expenses and general and administration expenses; including depreciations and amortizations.
Indirect expenses (internally – OPEX%) % (Research & development expenses, sales and marketing expenses and general and administration expenses; including depreciations and amortizations) as percentage of sales.
Innovation awards # Awards are registered throughout the year via publications on the newsroom site and / or press releases. Some awards are noted on the product page of the specific product.
Internal mobility (% of vacancies filled internally) % Number of internally recruited filled in vacancies/total number of vacancies filled.
Inventory turns # Inventory turns = 12 / [Inventory / (average monthly sales last 12 months x material cost of goods sold %)].
Lost Time Injury Frequency rate # Number of lost-time injuries multiplied with 1,000,000 and divided by total hours worked by all employees. Lost-time injuries are accidents that result in at least one lost day of work. When recording lost-time injuries, we use applicable national definitions for incidents as work-related.
Lost Time Injury Severity rate # Number of lost days of work of all employees multiplied with 1,000 and divided by total hours worked by all employees.
Net financial cash/(debt) Short term investments + Cash and cash equivalents + long-term financial receivables - long-term debts - current portion of long-term debts -
short-term debts.
New product releases (FQRs - hardware) # Commercial launch of the first member of a product family covered by one dedicated hardware development project. Options or modules are not in scope of the definition. Definition "commercial launch": projects for which Formal Quality Review (FQR) is granted and or is available on Barco.com
Barco
Inte
grate
d re
po
rt 20
20
6
Glo
ssary
GLO
GLOSSARY

Financial Terms, Alternative Performance Measures (APM) and Non-financial KPI's Unit of measure Explanation
New software releases (MRDs) # Commercial launch of a software product. Definition "commercial launch": projects for which Formal Quality Review (FQR) or Market Review
Decision (MRD) is granted.
Non-recurring tax items Effect of change in expected tax rate on deferred taxes + innovation income deduction (IID) + tax adjustments related to prior periods + capital loss
carried back/gain on sold share deal entities.
Nth party risk An order of magnitude broader than the traditional third-party risk. Every party that a company utilizes is likely to have a large number of other parties of its own. This becomes a chain of downstream relationships with fourth, fifth parties, and Nth parties, introducing a new risk factor to the ecosystem.
Number of certified dealers/partners # Number of SAP accounts for which one or more employees have followed a Barco University certified training course. Definition "Partner": Barco recognized account through which we place products into the market ; Definition "Certified": can be based on a test at the end or throughout the instructer-lead training course or as having completed an E-learning on a particular (range of) product(s) in full.
Number of employees (FTEs) # FTEs Number of personnel at year-end, in fulltime equivalents.
Number of employees (heads) # heads Number of personnel at year-end, in heads
Number of iGemba improvement suggestions # Total number of iGemba improvement suggestions received in the considered year. iGemba is the name of Barco's continuous improvement system. An improvement suggestions is an idea, improvement, solution, ... that is registered by an operator on an iGemba improvement card.
Number of iGemba improvement suggestions per operator # Total number of iGemba improvement suggestions received in the considered year/total number of operators. iGemba is the name of Barco's continuous improvement system. An improvement suggestions is an idea, improvement, solution, ... that is registered by an operator on an iGemba improvement card. An operator is a blue-collar employee.
Number of key(+) & core suppliers (covering X% of material cost) # Number of key, key+ and core suppliers registered in Barco. Total material cost equals the total direct spend. Differentiations between key/Key+
and core is done based upon annual spend and technological/quality importance to Barco.
Number of new (external) hires # heads Number of externally recruited filled in vacancies.
Number of new patent filings # New patent applications filed in the indicated year.
Number of patents at year-end # Total number of granted patents at year-end (of the indicated year).
Number of product lines in scope of ISO 27001 # Product lines are products found on the public Barco.com website.
Number of supplier quality audits # Number of supplier quality audits performed during reporting year.
Operating capital employed (including goodwill) Operating capital employed + goodwill.
Operating capital employed (OCE) Working capital + other long term assets and liabilities
Operating expenses (OPEX) Research & development expenses, sales and marketing expenses and general and administration expenses; excluding depreciations
and amortizations
Barco
Inte
grate
d re
po
rt 20
20
7
Glo
ssary
GLO
GLOSSARY

Financial Terms, Alternative Performance Measures (APM) and Non-financial KPI's Unit of measure Explanation
Order An order can only be recognized if a valid purchase order has been received from the invoice-to customer.
An order is only valid if it is:
- In writing. This includes electronic version of the purchase order out of the customer’s ERP system.
- The contract needs to be signed by an authorized person from the business partner.
Next to this, a minimum number of fields need to be mentioned on the order like customer name, address, reference to sales quotation or
business partner sales agreement of Barco, etc.
Orderbook Orderbook are previously received orders, which still fulfill all the conditions of an order, but are not deliverd yet and hence not taken in revenue.
Other long term assets and liabilities Other long term assets & liabilities include the sum of other intangible assets, land and buildings, other tangible assets, deferred tax assets (net).
We refer to note 9 and 10 for the amounts.
Other working capital Other working capital includes the net of other non-current assets, other amounts receivable, prepaid expenses and accrued income and other long term liabilities, advances received from customers, tax payables, employee benefits liabilities, other current liabilities, accrued charges and deferred income and provisions; See remark on the 2018 other working capital in definition of 'Return on operating capital employed (ROCE)'.
R&D spend (in % of sales) % R&D spend in percentage of sales.
Recycling & composting rate of solid waste (%) % Tonnes recycled or composted waste/ total tonnes of solid waste generated at the considered Barco sites.
Regional spread of key(+) & core suppliers (% spend of material cost) % % Spend of material cost per region (in SAP)
Renewable electricity production MWh/mio € revenues
Renewable electricity generated at the considered Barco sites (e.g. PV panels) in MWh per turnover (mio € revenues).
Return on operating capital employed (ROCE) Adjusted EBIT after tax relative to operating capital employed (including goodwill). ROCE = EBIT*(1- effective tax rate)/Operating capital employed
(including goodwill). In the 2018 calculation of return on operating capital employed, the other working capital doesn't include the other current
liabilities related to the contribution of the three minority shareholders in the capital of BarcoCineAppo Limited Hong Kong.
ROCE % Return on operating capital employed. EBIT after tax relative to operating capital employed (including goodwill). ROCE = EBIT*(1- effective tax rate)/Operating capital employed (including goodwill). In the 2018 calculation of return on operating capital employed, the other working capital doesn't include the other current liabilities related to the contribution of the three minority shareholders in the capital of BarcoCine Appo Limited Hong Kong.
Sales per region (growth) mio € Sales per region.
Split of shares per July20 At Barco’s Extraordinary General Shareholder’s Meeting, of 30 April 2020, the shareholders have approved the share split by a factor seven (7), effective as of 1 July 2020. The purpose of the share split is to enhance accessibility and to improve the liquidity of the Barco share. As a result of this share split, Barco’s total capital shall be represented by 91,487,438 shares as from 1 July 2020. Each of these shares confers one voting right at the General Meeting. The new split shares (please note: new ISIN code BE0974362940) are traded on the Euronext Brussels regulated market from 1 July 2020 onwards. Therefore, the earnings and diluted earnings per share as of 31 December 2019 and 2018 are for comparison reasons recalculated for the new number of shares.
Subsidiaries Companies in which Barco exercises control.
Barco
Inte
grate
d re
po
rt 20
20
8
Glo
ssary
GLO
GLOSSARY

Financial Terms, Alternative Performance Measures (APM) and Non-financial KPI's Unit of measure Explanation
TFA Tangible fixed assets.
Theoretical tax rate The theoretical tax rate is the corporate tax rate applied in the country of origin of the parent legal entity (i.e. Belgium). The Belgian corporate tax
rate as of 2020 is 25% (2019 & 2018: 29.58%).
Total energy consumption MWh/mio € revenues
Total energy consumption (MWh) per turnover (mio € revenues) of the considered Barco sites, covering both infrastructure energy consumption
and owned/leased fleet energy consumption. Regarding infrastructure energy this covers both fossil fuel consumption (natural gas, fuel),
purchased energy (grey or green electricity, district heating) as well as produced renewable electricity (e.g. by means of PV panels).
Total greenhouse gas emissions Tonnes CO2 e /mio € revenues
Total Greenhouse Gas emissions of the considered Barco sites and Barco sold products for the complete covered scope (own operations
emissions + product use emissions) in tonnes of CO2e per turnover (mio € revenues). All Kyoto & Non-Kyoto greenhouse gases are accounted for
and converted to CO2-equivalents.
Total greenhouse gas emissions Tonnes CO2 e Total Greenhouse Gas emissions of the considered Barco sites and Barco sold products for the complete covered scope (own operations
emissions + product use emissions) in tonnes of CO2e. All Kyoto & Non-Kyoto greenhouse gases are accounted for and converted to
CO2-equivalents.
Total solid waste Tonnes/mio € revenues
Total amount of solid waste generated at the considered Barco sites in tonnes of waste per turnover (mio € revenues). Solid waste is all reported waste at the Barco sites in solid state, excluding liquid waste streams such as wastewater.
Voluntary turnover rate % Number of voluntary exits/total number of personnel at year-end.
Water withdrawal m³/mio € revenues Direct purchased water at the considered Barco sites in m³ per turnover (mio € revenues). Typically this is called "city water", "tap water", "mains water". It excludes water use from other sources (e.g. captured rainfall or groundwater).
Working capital (net) Trade debtors + inventory - trade payables - other working capital.
Barco
Inte
grate
d re
po
rt 20
20
9
Glo
ssary
GLO
GLOSSARY

Barco
Inte
grate
d re
po
rt 20
20
10
Glo
ssary
GLO
barco.com ENABLING BRIGHT OUTCOMES
Group management
Beneluxpark 21
BE-8500 Kortrijk
Tel.: +32 (0)56 23 32 11
Registered office
President Kennedypark 35
BE-8500 Kortrijk
Tel.: +32 (0)56 23 32 11
Stock exchange
Euronext Brussels
Financial information
More information is available from the
Group’s Investor Relations Department:
Carl Vanden Bussche
Vice President Investor Relations
Tel.: +32 (0)56 26 23 22
E-mail: [email protected]
Copyright © 2021 Barco NV
All rights reserved
Realization
Barco Corporate Marketing & Investor Relations Office
Focus Advertising
Barco
Beneluxpark 21
8500 Kortrijk – Belgium