annual report 2015
TRANSCRIPT
ab Asset managementUBS Funds
Annual Report 2015
Investment Company under Luxembourg Law (SICAV)
R.C.S. Luxembourg N° B 115 477
Audited annual report as of 31 December 2015
UBS (Lux) Institutional SICAVUBS (Lux) Institutional SICAV – Emerging Markets Equity PassiveUBS (Lux) Institutional SICAV – Global Allocation Europe


1
Audited annual report as of 31 December 2015
Table of contents Page ISIN
Management and Administration 2Features of the Company 3Independent auditor’s report 5
UBS (Lux) Institutional SICAV 7UBS (Lux) Institutional SICAV – Emerging Markets Equity Passive 9 AA LU0322728865 BA LU0322729327 FA LU0322728352 XA LU0322730093UBS (Lux) Institutional SICAV – Global Allocation Europe 25 BA LU0260667190
Notes to the Financial Statements 27Global Exposure (unaudited) 33Facts and conditions (unaudited) 34
Sales restrictions
Shares of this Company may not be offered, sold ordelivered within the United States of America.

2
UBS (Lux) Institutional SICAVAnnual Report as of 31 December 2015
Management and Administration
Registered office
33A, avenue J.F. Kennedy,L-1855 LuxembourgR.C.S. Luxembourg N° B 115 477
Board of Directors
Tobias Meyer, ChairmanExecutive Director, UBS AG, Basel and Zurich
Kai Gammelin, MemberExecutive Director, UBS AG, Basel and Zurich
Thomas Portmann, MemberExecutive Director, UBS Fund Management(Switzerland) AG, Basel
Management Company
UBS Fund Management (Luxembourg) S.A.,33A, avenue J.F. Kennedy,L-1855 LuxembourgR.C.S. Luxembourg N° B 154 210
Portfolio Manager
UBS (Lux) Institutional SICAV– Emerging Markets Equity PassiveUBS AG, UBS Asset Management, Basel and Zurich
Custodian bank and main paying agent
UBS (Luxembourg) S.A.,33A, avenue J.F. Kennedy,L-1855 Luxembourg
Administrative agent
UBS Fund Services (Luxembourg) S.A.,33A, avenue J.F. Kennedy,L-1855 Luxembourg
Independent Auditor of the Company and the Management Company
ERNST & YOUNG S.A.,35E, avenue J.F. Kennedy,L-1855 Luxembourg
The sales prospectus, the KIID, the articles of association of the Company, annual and semi-annual reports as well as the portfolio movements of the Company mentioned in this publication are avail-able free of charge at the sales agencies and at the registered office of the Company.

3
UBS (Lux) Institutional SICAVAnnual Report as of 31 December 2015
Features of the Company
UBS (Lux) Institutional SICAV (hereinafter called the “Company”) was incorporated on 30 March 2006 as an open-ended investment fund in the form of a “Société d’Investissement à Capital Variable” (SICAV) pursuant to Part I of the Luxembourg law relating to Undertak-ings for Collective Investment of 17 December 2010 as amended.
The Articles of Association were published in the ”Mémorial, Recueil des Sociétés et Associations”, herein-after called ”Mémorial”, the official gazette of the Grand Duchy of Luxembourg, on 14 April 2006 and deposited at the Commercial and Company Register of the District Court in Luxembourg for inspection. Each amendment will be published in the “Mémorial”. Such amendments become legally binding in respect of all shareholders subsequent to their approval by the general meeting of shareholders.
The Company can offer to investors various subfunds (“umbrella construction”), which invest in accordance with the investment policy described in the sales pro-spectus. The specific details on each subfund are defined in the prospectus, which will be updated on the incep-tion of each new subfund.
With effect from 16 May 2011, the Company has appointed UBS Fund Management (Luxembourg) S.A. as its Management Company.
The Company can issue several share classes for each of the subfunds. In general, all share classes presently in issue are reserved to institutional investors having concluded an agreement (such as, but not limited to a portfolio management agreement) with UBS Asset Management or one of its authorised delegates. This does explicitly not apply to share classes RA and RD which can be offered to the public as well.
Currently, the following share classes are offered: – Share classes AA, AA-T1, AD-UK, AD-T2, CA, RA and RD, for which the flat fee is directly deducted from the subfund’s NAV and covers all expenses.
– Share classes BA, DA and BD-UK, for which the portfolio management and distribution fees are charged outside the Company, directly at the level of the agreement concluded by the investor. The share classes only bear operational and administrative expenses such as administration and Custodian fees.
– Share classes EM and EP for which the flat fee is directly deducted from the subfund’s NAV and covers all expenses. These shares will have an issue price of 100 000 (in each subfund’s reference currency). This class aims exclusively at financial products (i.e. fund-of-funds or other pooled structures according to various legislations). This share class has a high initial value aim-ing at facilitating day-to-day operations of these pooled structures.
– Share class FA, for which the portfolio management, distribution, custody and administration fees are charged outside the Company, directly at the level of the agreement concluded by the investor. These shares will have an issue price of 10 000 (in each subfund’s ref-erence currency). This class aims exclusively at financial products (i.e. fund-of-funds or other pooled structures according to various legislations). This share class has a high initial value aiming at facilitating day-to-day opera-tions of these pooled structures. In addition, it features the same characteristics as the share class XA.
– Share classes XA, YD and YA, for which the portfolio management, distribution, custody and administration fees are charged outside the Company, directly at the level of the agreement concluded by the investor.
The share classes offered have the following character-istics: – Share classes DA, CA, YD and YA hedge the foreign currency exposure of the respective subfund against their respective reference currency.
– Share classes AA, BA, CA, DA, EM, EP, FA, XA, YA, AA-T1 and RA are reinvesting their dividends and other income, rather than distributing it on a regular basis.
– Shares of classes AD, AD-T2, YD and RD are distribut-ing shares, which entitle the shareholder to a periodic, usually annual, distribution of income and/or capital gains.
– Shares of classes BD-UK and AD-UK are distributing shares, which entitle the shareholder to a periodic, usually annual, distribution of income and/or capital gains and for which the members of the Board of Directors intend to apply to the British tax authorities HM Revenue and Customs that this share class should be approved as “distributing share classes” for the purposes of Part XVII, Section V of the Income and Corporation Taxes Act 1988 (“Offshore Funds”) for all “settlement periods”.

4
UBS (Lux) Institutional SICAVAnnual Report as of 31 December 2015
– All share classes will be issued in registered form only, except for the share classes AA-T1 and AD-T2, which will be issued as bearer shares only. However, begin-ning from September 2012, the Board of Directors reserves the right to issue registered shares only and upon an appropriate circular resolution, to convert the share classes AA-T1 and AD-T2 issued in bearer form into the shares in the registered form. Any certificates in circulation at the time of the conversion certifying the investor’s ownership of the bearer shares shall become certificates certifying the right of the relevant investor to convert his bearer shares into registered shares and will be withdrawn by the Company upon redemption by the investor. The share-holders shall not be allowed to request the conversion of registered shares into bearer shares.
– The Administrative Agent will ensure that bearer shares can be issued and transferred only to institu-tional investors.
Generally, the shareholder may convert any time into another subfund or share class of the same subfund. However, the following exceptions apply: – The conversion is only possible into shares issued; no conversion is possible if the issue of shares by the subfund has been suspended.
– The right to convert shares is subject to compliance with any conditions applicable to the share class or cat-egory of share into which conversion is to be effected.
– The conversion of RA and RD shares into other classes of shares is not permitted.
– Conversions can only be made for a definite number of shares.
– Due to technical restrictions conversions from the fol-lowing classes: AA, CA, BA, DA, YA and XA shares into the following classes: AA-T1 and AD-T2 shares are not possible.
– Conversions into Classes BA, DA, XA and AA-T1 and AD-T2 shares will only be executed at the Company’s discretion, under the condition that the investor has signed an agreement with UBS Asset Management.
The entirety of the individual subfunds’ net assets forms the total net assets of the Company, which at any time correspond to the share capital of the Company and consist of fully paid-in and non-par-value shares (the “shares”).
At general meetings, the shareholder has the right to one vote per share held, irrespective of the difference in value of shares in the respective subfunds. Shares of a particular subfund carry the right of one vote per share held when voting at meetings affecting this subfund.
The Company is a single legal entity. With respect to the shareholders, each subfund is regarded as being sepa-rate from the others. The assets of a subfund can only be used to offset the liabilities which the subfund con-cerned has assumed.
The Board of Directors of the Company is empow-ered at any time to establish new subfunds and/or to liquidate existing ones, as well as to establish different share classes with specific characteristics within these subfunds. The sales prospectus will be updated each time a new subfund or an additional equity class is issued.
The Company is unlimited with regard to duration and total assets.
The financial year of the Company ends on 31 December.
The ordinary general meeting takes place annually on 20 March at 10 a.m. at the registered office of the Company. If 20 March is not a business day in Luxembourg, the ordinary general meeting will take place on the next business day.
Only the information contained in the sales prospectus and in one of the documents referred to therein shall be deemed to be valid.
Information on whether a subfund of the Company is listed on the Luxembourg Stock Exchange can be obtained from the Administrative Agent or the Luxembourg Stock Exchange website (www.bourse.lu).
The issue and redemption of shares of the Company are subject to the regulations prevailing in the country concerned.
The annual and semi-annual reports are available free of charge to shareholders at the registered office of the Company and the Custodian Bank.
No subscription may be accepted on the basis of the financial reports. Subscriptions are accepted only on the basis of the current prospectus accompanied by the latest annual report and the latest semi-annual report if available.
The figures stated in the report are historical and not necessarily indicative of future performance.

UBS (Lux) Institutional SICAVAnnual Report as of 31 December 2015
5
Independent auditor’s report
To the Shareholders of
UBS (Lux) Institutional SICAV33A, avenue J.F. Kennedy,L-1855 Luxembourg
We have audited the accompanying financial statements of UBS (Lux) Institutional SICAV and of each of its subfunds, which comprise the statement of net assets and the statement of investments in securities and other net assets as of 31 December 2015 and the statement of operations and the statement of changes in net assets for the year then ended, and a summary of significant accounting policies and other explanatory notes to the financial statements.
Board of Directors of the SICAV responsibility for the financial statements
The Board of Directors of the SICAV is responsible for the preparation and fair presentation of these financial statements in accordance with Luxembourg legal and regulatory requirements relating to the preparation and presentation of the financial statements and for such internal control as the Board of Directors of the SICAV determines is necessary to enable the preparation and presentation of financial statements that are free from material misstatement, whether due to fraud or error.
Responsibility of the “réviseur d’entreprises agréé”
Our responsibility is to express an opinion on these financial statements based on our audit. We conducted our audit in accordance with International Standards on Auditing as adopted for Luxembourg by the “Commis-sion de Surveillance du Secteur Financier”. Those stan-dards require that we comply with ethical requirements and plan and perform the audit to obtain reasonable assurance about whether the financial statements are free from material misstatement.
An audit involves performing procedures to obtain audit evidence about the amounts and disclosures in the financial statements. The procedures selected depend on the judgement of the “réviseur d’entreprises agréé”, including the assessment of the risks of material misstate-ment of the financial statements, whether due to fraud or error. In making those risk assessments, the “réviseur d’entreprises agréé” considers internal control relevant to the entity’s preparation and fair presentation of the financial statements in order to design audit procedures that are appropriate in the circumstances, but not for the purpose of expressing an opinion on the effectiveness of the entity’s internal control. An audit also includes eval-uating the appropriateness of accounting policies used and the reasonableness of accounting estimates made by the Board of Directors of the SICAV, as well as evaluating the overall presentation of the financial statements.
We believe that the audit evidence we have obtained is sufficient and appropriate to provide a basis for our audit opinion.
UBS (Lux) Institutional SICAVAnnual Report as of 31 December 2015
6
Opinion
In our opinion, the financial statements give a true and fair view of the financial position of UBS (Lux) Institutional SICAV and of each of its subfunds as of 31 December 2015, and of the results of their operations and changes in their net assets for the year then ended in accordance with Luxembourg legal and regulatory requirements relating to the preparation and presentation of the financial statements.
Other matter
Supplementary information included in the annual report has been reviewed in the context of our mandate but has not been subject to specific audit procedures carried out in accordance with the standards described above. Con-sequently, we express no opinion on such information. However, we have no observation to make concerning such information in the context of the financial statements taken as a whole.
Luxembourg, 9 March 2016
ERNST & YOUNGSociété AnonymeCabinet de révision agréé
Nadia Faber

The notes are an integral part of the fi nancial statements. 7
UBS (Lux) Institutional SICAVAnnual Report as of 31 December 2015
Consolidated Statement of Net Assets EURAssets 31.12.2015Investments in securities, cost 339 610 991.48Investments in securities, unrealized appreciation (depreciation) -39 691 340.35Total investments in securities (Note 1) 299 919 651.13Cash at banks, deposits on demand and deposit accounts 932 934.67Other liquid assets (Margins) 5 053.85Receivable on securities sales (Note 1) 180 000.00Receivable on dividends 698 695.76Unrealized gain (loss) on financial futures (Note 1) 23 115.16Total Assets 301 759 450.57
LiabilitiesBank overdraft -66.45Payable on securities purchases (Note 1) -362 451.12Payable on redemptions -20 472.21Provisions for flat fee (Note 2) -25 332.76Provisions for taxe d’abonnement (Note 3) -7 532.72Provisions for other commissions and fees (Note 2) -35 307.13Total provisions -68 172.61Total Liabilities -451 162.39
Net assets at the end of the financial year 301 308 288.18
UBS (Lux) Institutional SICAV

8 The notes are an integral part of the fi nancial statements.
UBS (Lux) Institutional SICAVAnnual Report as of 31 December 2015
Consolidated Statement of Operations EURIncome 1.1.2015-31.12.2015Interest on liquid assets 9 372.30Interest on securities 60 926.77Dividends 9 530 625.48Income on securities lending 862.48Other income (Note 4) 420 845.32Total income 10 022 632.35
ExpensesFlat fee (Note 2) -412 857.05Taxe d’abonnement (Note 3) -36 875.60Other commissions and fees (Note 2) -24 967.84Cost on securities lending -344.99Interest on cash and bank overdraft -4 663.44Total expenses -479 708.92
Net income (loss) on investments 9 542 923.43
Realized gain (loss) (Note 1)Realized gain (loss) on market-priced securities without options -2 557 806.96Realized gain (loss) on options 6 157.44Realized gain (loss) on yield-evaluated securities and money market instruments -472.82Realized gain (loss) on financial futures -307 910.18Realized gain (loss) on forward foreign exchange contracts -1 919 454.39Realized gain (loss) on foreign exchange 45 965.31Total realized gain (loss) -4 733 521.60
Net realized gain (loss) of the financial year 4 809 401.83
Changes in unrealized appreciation (depreciation) (Note 1)Unrealized appreciation (depreciation) on market-priced securities without options -58 837 749.64Unrealized appreciation (depreciation) on options 2 436.22Unrealized appreciation (depreciation) on yield-evaluated securities and money market instruments 240.92Unrealized appreciation (depreciation) on financial futures -286 538.25Unrealized appreciation (depreciation) on forward foreign exchange contracts 687 210.95Total changes in unrealized appreciation (depreciation) -58 434 399.80
Net increase (decrease) in net assets as a result of operations -53 624 997.97

The notes are an integral part of the fi nancial statements. 9
UBS (Lux) Institutional SICAV – Emerging Markets Equity PassiveAnnual Report as of 31 December 2015
UBS (Lux) Institutional SICAV– Emerging Markets Equity Passive
Three-year comparison
ISIN 31.12.2015 31.12.2014 31.12.2013Net assets in USD 327 311 193.46 458 089 669.28 543 616 722.34Class AA LU0322728865Shares outstanding 116 230.0010 140 556.5350 141 179.3150Net asset value per share in USD 81.41 96.33 99.03Class BA LU0322729327Shares outstanding 1 620 563.5350 2 313 513.3050 3 117 635.7730Net asset value per share in USD 88.41 104.11 106.55Class FA LU0322728352Shares outstanding 1 581.0000 3 214.0000 4 235.0000Net asset value per share in USD 8 964.51 10 538.13 10 765.03Class XA LU0322730093Shares outstanding 1 923 462.8170 1 732 148.7600 1 516 507.1230Net asset value per share in USD 83.40 98.04 100.15

10 The notes are an integral part of the fi nancial statements.
UBS (Lux) Institutional SICAV – Emerging Markets Equity PassiveAnnual Report as of 31 December 2015
Report of the Portfolio Manager
The reporting year, from 1 January 2015 to 31 December 2015, marked another difficult year for emerging market equities which posted negative returns and underper-formed developed markets. The main drag was currency losses which came on the back of weak growth, falling commodity prices and large outflows. Weakness was seen across the board although Asian markets fared bet-ter. Outside Asia, markets grappled with domestic and external headwinds.
In the reporting year, the subfund performed in line with its benchmark, the MSCI Emerging Markets (net div. reinv.). This is a passive subfund which aims to replicate the performance of the index, and no active investment decisions are applied. The performance of the subfund reflects the performance of its benchmark.
Structure of the Securities Portfolio
Geographical Breakdown as a % of net assetsChina 19.94South Korea 15.61Taiwan 12.23India 8.65Hong Kong 6.48South Africa 6.18Brazil 5.47Mexico 4.45Russian Federation (CIS) 3.44Malaysia 3.25Indonesia 2.57Thailand 1.99Philippines 1.58Poland 1.31Turkey 1.30Chile 1.12Qatar 0.93United Arab Emirates 0.86Colombia 0.43Greece 0.41Netherlands 0.35Hungary 0.24Bermuda 0.18Czech Republic 0.16Egypt 0.15Malta 0.11United States 0.10Isle Of Man 0.03Peru 0.02Total 99.54
Economic Breakdown as a % of net assetsBanks & credit institutions 14.08Electronics & semiconductors 10.41Finance & holding companies 8.22Telecommunications 7.29Internet, software & IT services 6.88Petroleum 5.26Insurance 4.10Vehicles 3.75Pharmaceuticals, cosmetics & medical products 3.61Chemicals 3.14Real Estate 2.98Energy & water supply 2.76Food & soft drinks 2.55Miscellaneous services 2.31Building industry & materials 2.27Retail trade, department stores 2.26Tobacco & alcohol 1.95Mining, coal & steel 1.85Traffic & transportation 1.77Graphic design, publishing & media 1.73Computer hardware & network equipment providers 1.47Electrical devices & components 1.22Lodging, catering & leisure 1.02Miscellaneous unclassified companies 0.84Mechanical engineering & industrial equipment 0.81Textiles, garments & leather goods 0.67Non-ferrous metals 0.63Forestry, paper & pulp products 0.63Agriculture & fishery 0.57Miscellaneous trading companies 0.47Photographic & optics 0.34Precious metals & stones 0.29Aerospace industry 0.27Healthcare & social services 0.26Miscellaneous consumer goods 0.22Rubber & tyres 0.19Packaging industry 0.18Mortgage & funding institutions 0.11Various capital goods 0.10Investment funds 0.08Total 99.54
The notes are an integral part of the fi nancial statements. 11
UBS (Lux) Institutional SICAV – Emerging Markets Equity PassiveAnnual Report as of 31 December 2015
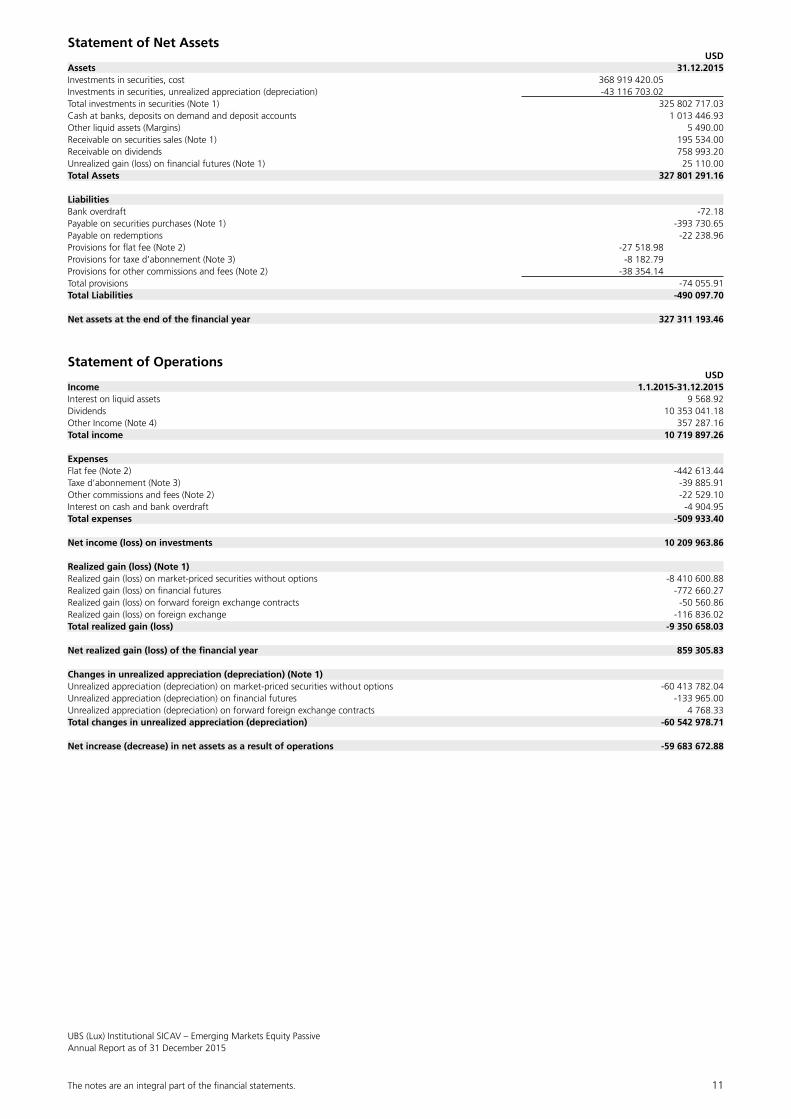
Statement of Net Assets USDAssets 31.12.2015Investments in securities, cost 368 919 420.05Investments in securities, unrealized appreciation (depreciation) -43 116 703.02Total investments in securities (Note 1) 325 802 717.03Cash at banks, deposits on demand and deposit accounts 1 013 446.93Other liquid assets (Margins) 5 490.00Receivable on securities sales (Note 1) 195 534.00Receivable on dividends 758 993.20Unrealized gain (loss) on financial futures (Note 1) 25 110.00Total Assets 327 801 291.16
LiabilitiesBank overdraft -72.18Payable on securities purchases (Note 1) -393 730.65Payable on redemptions -22 238.96Provisions for flat fee (Note 2) -27 518.98Provisions for taxe d’abonnement (Note 3) -8 182.79Provisions for other commissions and fees (Note 2) -38 354.14Total provisions -74 055.91Total Liabilities -490 097.70
Net assets at the end of the financial year 327 311 193.46
Statement of Operations USDIncome 1.1.2015-31.12.2015Interest on liquid assets 9 568.92Dividends 10 353 041.18Other Income (Note 4) 357 287.16Total income 10 719 897.26
ExpensesFlat fee (Note 2) -442 613.44Taxe d’abonnement (Note 3) -39 885.91Other commissions and fees (Note 2) -22 529.10Interest on cash and bank overdraft -4 904.95Total expenses -509 933.40
Net income (loss) on investments 10 209 963.86
Realized gain (loss) (Note 1)Realized gain (loss) on market-priced securities without options -8 410 600.88Realized gain (loss) on financial futures -772 660.27Realized gain (loss) on forward foreign exchange contracts -50 560.86Realized gain (loss) on foreign exchange -116 836.02Total realized gain (loss) -9 350 658.03
Net realized gain (loss) of the financial year 859 305.83
Changes in unrealized appreciation (depreciation) (Note 1)Unrealized appreciation (depreciation) on market-priced securities without options -60 413 782.04Unrealized appreciation (depreciation) on financial futures -133 965.00Unrealized appreciation (depreciation) on forward foreign exchange contracts 4 768.33Total changes in unrealized appreciation (depreciation) -60 542 978.71
Net increase (decrease) in net assets as a result of operations -59 683 672.88

12 The notes are an integral part of the fi nancial statements.
UBS (Lux) Institutional SICAV – Emerging Markets Equity PassiveAnnual Report as of 31 December 2015
Statement of Changes in Net Assets USD 1.1.2015-31.12.2015Net assets at the beginning of the financial year 458 089 669.28Subscriptions 40 535 392.33Redemptions -111 630 195.27Total net subscriptions (redemptions) -71 094 802.94Net income (loss) on investments 10 209 963.86Total realized gain (loss) -9 350 658.03Total changes in unrealized appreciation (depreciation) -60 542 978.71Net increase (decrease) in net assets as a result of operations -59 683 672.88Net assets at the end of the financial year 327 311 193.46
Changes in the Number of Shares outstanding
1.1.2015-31.12.2015Class AANumber of shares outstanding at the beginning of the financial year 140 556.5350Number of shares issued 0.0000Number of shares redeemed -24 326.5340Number of shares outstanding at the end of the financial year 116 230.0010Class BANumber of shares outstanding at the beginning of the financial year 2 313 513.3050Number of shares issued 7 466.8690Number of shares redeemed -700 416.6390Number of shares outstanding at the end of the financial year 1 620 563.5350Class FANumber of shares outstanding at the beginning of the financial year 3 214.0000Number of shares issued 1 561.0000Number of shares redeemed -3 194.0000Number of shares outstanding at the end of the financial year 1 581.0000Class XANumber of shares outstanding at the beginning of the financial year 1 732 148.7600Number of shares issued 249 769.6280Number of shares redeemed -58 455.5710Number of shares outstanding at the end of the financial year 1 923 462.8170

The notes are an integral part of the fi nancial statements. 13
UBS (Lux) Institutional SICAV – Emerging Markets Equity PassiveAnnual Report as of 31 December 2015
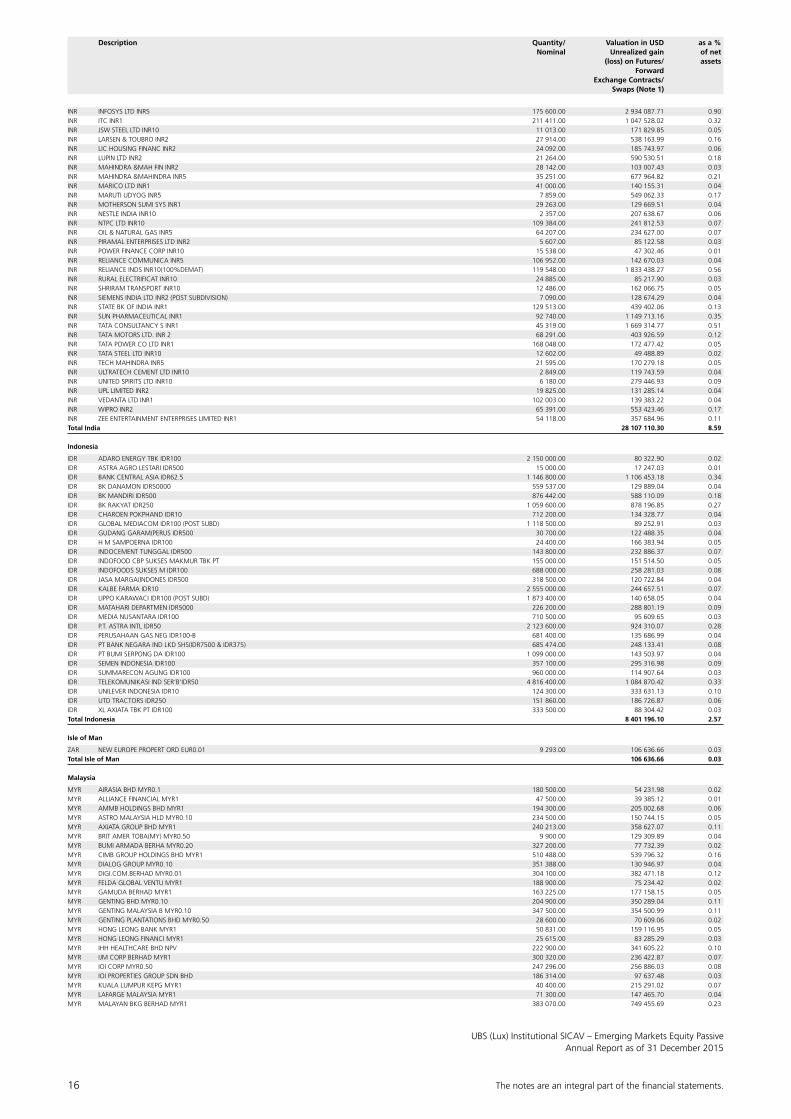
Statement of Investments in Securities and other Net Assets as of 31 December 2015
Description Quantity/ Valuation in USD as a % Nominal Unrealized gain of net (loss) on Futures/ assets Forward Exchange Contracts/ Swaps (Note 1)
Transferable securities and money market instruments listed on an official stock exchange
Bearer shares
Bermuda
USD CREDICORP COM USD5 6 134.00 596 960.88 0.18Total Bermuda 596 960.88 0.18
Brazil
BRL AMBEV SA COM NPV 433 948.00 1 957 907.56 0.60BRL BB SEGURIDADE PART COM NPV 65 700.00 404 039.43 0.12BRL BCO BRADESCO SA COM NPV 71 648.00 371 256.62 0.11BRL BCO DO BRASIL SA COM NPV 73 700.00 274 587.80 0.08BRL BMFBOVESPA S.A. BO COM NPV 154 212.00 424 484.97 0.13BRL BR MALLS PARTICIPA COM NPV 29 600.00 83 048.34 0.03BRL BRF SA 62 806.00 879 482.44 0.27BRL CCR SA COM NPV 65 700.00 208 413.27 0.06BRL CETIP SA-MERCADOS COM NPV 18 038.00 170 976.30 0.05BRL CIELO SA COM NPV 81 844.00 694 885.30 0.21BRL COSAN SA INDUSTRIA COM NPV 16 175.00 103 029.38 0.03BRL CPFL ENERGIA SA COM NPV 19 136.00 73 424.20 0.02BRL DURATEX SA COM NPV 39 784.00 59 330.33 0.02BRL EMBRAER SA COM NPV 66 200.00 505 169.79 0.16BRL ENERGIAS DO BRASIL COM NPV 31 100.00 94 646.19 0.03BRL EQUATORIAL ENERGIA COM NPV 11 900.00 102 990.46 0.03BRL ESTACIO PARTICIPAC COM NPV 35 300.00 124 470.14 0.04BRL FIBRIA CELULOS SA 22 750.00 298 387.99 0.09BRL HYPERMARCAS SA COM NPV 28 800.00 158 040.57 0.05BRL JBS SA COM NPV 78 472.00 244 961.57 0.08BRL KROTON EDUCACIONAL COM NPV 123 612.00 297 762.37 0.09BRL LOCALIZA RENT A CA COM NPV 19 750.00 123 903.95 0.04BRL LOJAS AMERICANAS S COM NPV 25 375.00 79 981.36 0.03BRL LOJAS RENNER SA COM NPV 69 015.00 298 301.80 0.09BRL M DIAS BRANCO SA I COM NPV 4 200.00 70 597.16 0.02BRL MULTIPLAN EMPREEND COM STK NPV 10 500.00 100 853.08 0.03BRL NATURA COSMETICOS COM NPV 14 000.00 83 124.17 0.03BRL ODONTOPREV SA COM NPV 46 900.00 112 026.54 0.04BRL PETROL BRASILEIROS COM NPV 272 805.00 590 948.21 0.18BRL PORTO SEGURO SA COM NPV 18 300.00 133 170.81 0.04BRL QUALICORP SA COM NPV 20 400.00 72 859.91 0.02BRL RAIA DROGASIL SA COM NPV 23 200.00 208 059.65 0.06BRL SABESP CIA SANEAME COM NPV 50 592.00 242 074.33 0.07BRL SIDER NACIONAL CIA COM NPV 57 588.00 58 224.83 0.02BRL SUZANO PAPEL E CEL PRF’A’NPV 25 200.00 119 049.10 0.04BRL TIM PARTICIPACOES COM NPV 72 591.00 125 870.27 0.04BRL TOTVS SA COM NPV 17 900.00 140 394.82 0.04BRL TRACTEBEL ENERGIA COM NPV 20 800.00 176 073.81 0.05BRL ULTRAPAR PARTICIPA COM NPV 34 300.00 524 091.00 0.16BRL VALE SA COM NPV 119 700.00 394 234.69 0.12BRL WEG SA COM NPV 60 380.00 228 165.81 0.07Total Brazil 11 413 300.32 3.49
Chile
CLP AES GENER SA COM NPV 337 882.00 149 934.55 0.05CLP AGUAS ANDINAS S.A. COM NPV SER’A’ 362 969.00 186 238.04 0.06CLP BCO CREDITO INVERS NPV 4 141.00 156 207.93 0.05CLP BCO DE CHILE ORD NPV 2 510 941.00 255 771.57 0.08CLP BCO SANTANDER-CHIL COM NPV 6 482 153.00 290 809.56 0.09CLP CENCOSUD SA COM NPV 106 357.00 212 383.80 0.06CLP COLBUN S.A. NPV 645 749.00 154 192.40 0.05CLP COMPANIA CERVECERI COM NPV 10 402.00 115 088.46 0.03CLP CORPBANCA COM NPV 10 850 210.00 87 248.80 0.03CLP EMP NAC ELECTRICID NPV 302 685.00 375 306.36 0.11CLP EMPRESAS CMPC NPV 114 193.00 246 386.80 0.07CLP EMPRESAS COPEC SA NPV 36 064.00 309 602.79 0.09CLP ENERSIS SA NPV 1 430 524.00 345 356.70 0.11CLP ENTEL EMP NAC TELE NPV 13 116.00 117 372.10 0.04CLP LATAM AIRLINES GRO NPV 30 147.00 158 341.96 0.05CLP QUIMICA Y MINERA PRF SER’B’ 7 503.00 140 911.56 0.04CLP S A C I FALABELLA COM NPV 36 846.00 234 824.37 0.07Total Chile 3 535 977.75 1.08
China
HKD AAC TECHNOLOGIES H USD0.01 73 000.00 476 139.17 0.15HKD AGRICULTURAL BK CH ‘H’CNY1 2 440 000.00 998 019.39 0.31HKD AIR CHINA LTD ‘H’CNY1 160 000.00 126 139.49 0.04HKD ALUMINIUM CORP CHN ‘H’ CNY1 414 000.00 137 285.08 0.04HKD ANHUI CONCH CEMENT ‘H’CNY1 130 500.00 351 080.30 0.11HKD ANTA SPORTS PRODUC HKD0.10 109 000.00 299 568.40 0.09HKD AVICHINA INDUSTRY ‘H’CNY1 236 000.00 185 751.24 0.06HKD BANK OF CHINA LTD ‘H’HKD1 7 656 300.00 3 418 101.33 1.04HKD BANK OF COMMUNICAT ‘H’CNY1 785 965.00 553 714.30 0.17HKD BEIJING CAP INTL A ‘H’CNY1 156 000.00 168 476.74 0.05HKD BELLE INTERNATIONA HKD0.01 429 000.00 322 158.93 0.10HKD BYD CO ‘H’CNY1 69 000.00 379 715.23 0.12HKD CGN POWER CO LTD CNY1 803 000.00 300 471.60 0.09HKD CHINA CINDA ASSET ‘H’CNY1 829 000.00 306 991.48 0.09HKD CHINA CITIC BK COR ‘H’CNY1 876 800.00 567 929.14 0.17HKD CHINA COAL ENERGY ‘H’CNY1 355 000.00 136 042.53 0.04HKD CHINA COMM SERVICE ‘H’CNY1 394 000.00 147 937.78 0.05HKD CHINA COMMUNICATIONS CONSTRUCTION COMPANY LTD-H 485 000.00 495 629.12 0.15

14 The notes are an integral part of the fi nancial statements.
UBS (Lux) Institutional SICAV – Emerging Markets Equity PassiveAnnual Report as of 31 December 2015
HKD CHINA CONCH VENTUR HKD0.01 117 500.00 243 485.61 0.07HKD CHINA CONST BK ‘H’CNY1 7 969 320.00 5 460 163.89 1.67HKD CHINA COSCO HLDGS ‘H’CNY1 290 500.00 131 940.67 0.04HKD CHINA EVERBRIGHT B ‘H’CNY1 239 000.00 116 259.69 0.04HKD CHINA GALAXY SECUR CNY1 H 297 000.00 272 085.06 0.08HKD CHINA HUISHAN DAIR HKD0.1 456 000.00 174 747.59 0.05HKD CHINA INTL MARINE ‘H’CNY1 42 200.00 77 210.89 0.02HKD CHINA LIFE INSURAN ‘H’CNY1 748 000.00 2 417 682.24 0.74HKD CHINA LONGYUAN POW ‘H’CNY1 345 936.00 261 120.83 0.08HKD CHINA MEDICAL SYS USD0.005(POST BOARD LOT) 81 000.00 119 355.11 0.04HKD CHINA MERCHANTS BK ‘H’CNY1 443 570.00 1 047 377.28 0.32HKD CHINA MINSHENG BAN ‘H’CNY1 574 500.00 569 299.95 0.17HKD CHINA NATIONAL BUI ‘H’CNY1 316 000.00 151 677.06 0.05HKD CHINA OILFIELD SER ‘H’CNY1 160 000.00 137 700.56 0.04HKD CHINA PACIFIC INSU ‘H’CNY1 258 800.00 1 065 233.58 0.33HKD CHINA PETROLEUM & ‘H’CNY1 2 554 400.00 1 542 498.15 0.47HKD CHINA RAILWAY CONS ‘H’CNY1 165 500.00 205 216.03 0.06HKD CHINA RAILWAY GROU ‘H’CNY1 435 000.00 330 593.60 0.10HKD CHINA SHENHUA ENER ‘H’CNY1.00 345 000.00 542 195.96 0.17HKD CHINA SHIPPING CON ‘H’CNY1 519 000.00 144 647.52 0.04HKD CHINA STHN AIRLINE ‘H’CNY1 104 000.00 80 246.19 0.02HKD CHINA TELECOM CORP ‘H’CNY1 1 470 000.00 690 412.44 0.21HKD CHINA VANKE CO ‘H’CNY1 145 940.00 431 220.82 0.13HKD CHONGQING RURAL CO CNY1 H SHARE 219 500.00 132 830.33 0.04HKD CITIC SECURITIES CNY1 ‘H’ 186 000.00 434 871.58 0.13HKD DALIAN WANDA COML NPV 54 500.00 318 203.52 0.10HKD DATANG INTL POWER ‘H’CNY1 456 000.00 138 856.67 0.04HKD DONGFENG MOTOR GRO ‘H’CNY1 276 000.00 368 942.54 0.11HKD ENN ENERGY HOLDINGS LTD 80 000.00 426 830.45 0.13HKD EVERGRANDE REAL ES USD0.01 436 000.00 383 672.57 0.12HKD FOSUN INTL NPV 215 172.00 335 939.46 0.10HKD GF SECURITIES CO CNY1 H 76 400.00 191 834.22 0.06HKD GREAT WALL MOTOR ‘H’CNY1 256 000.00 298 275.52 0.09HKD GUANGZHOU AUTOMOBI ‘H’ CNY1 219 883.00 196 046.73 0.06HKD GUANGZHOU R&F PROP ‘H’CNY0.25(POST SUBD) 136 400.00 168 076.75 0.05HKD HAITIAN INTL HLDGS HKD0.10 82 000.00 119 770.59 0.04HKD HAITONG SECURITIES ‘H’CNY1 320 000.00 565 666.47 0.17HKD HUADIAN POWER INTL ‘H’CNY1 158 000.00 102 952.85 0.03HKD HUANENG POWER INTL ‘H’CNY1 360 000.00 310 755.28 0.10HKD HUANENG RENEWABLES CNY1 H 288 000.00 86 212.52 0.03HKD HUATAI SECURITIES ‘H’CNY1 62 600.00 146 036.92 0.05HKD INDUSTRIAL & COM B ‘H’CNY1 7 006 030.00 4 230 656.23 1.29HKD JIANGSU EXPRESSWAY ‘H’CNY1 164 000.00 221 342.81 0.07HKD JIANGXI COPPER CO ‘H’CNY1 90 000.00 106 720.52 0.03HKD KINGSOFT CORP USD0.0005 68 000.00 166 530.97 0.05HKD LENOVO GROUP LTD HKD0.025 644 000.00 653 958.96 0.20HKD LONGFOR PROPERTIES 141 500.00 211 059.14 0.06HKD LUYE PHARMA GP LTD USD0.02 128 000.00 133 447.74 0.04HKD NEW CHINA LIFE INS ‘H’CNY1 69 800.00 293 154.33 0.09HKD PEOPLE’S INSURANCE ‘H’CNY1 589 000.00 288 794.41 0.09HKD PETROCHINA CO ‘H’CNY1 1 950 000.00 1 278 168.81 0.39HKD PICC PROPERTY & CA ‘H’CNY1 362 055.00 720 358.72 0.22HKD PING AN INSURANCE ‘H’CNY1 510 000.00 2 829 622.65 0.86HKD SEMICONDUCTOR MFG USD0.0004 1 598 000.00 162 889.75 0.05HKD SHANDONG WEIGAO GP ‘H’CNY0.1 160 000.00 110 036.58 0.03HKD SHANGHAI ELECTRIC ‘H’CNY1 296 000.00 156 972.45 0.05HKD SHANGHAI FOSUN PHA CNY1 ‘H’ 38 000.00 110 320.45 0.03HKD SHANGHAI PHARMACEU CNY1 H 83 100.00 179 921.42 0.06HKD SHENZHOU INTERNATI HKD0.10 52 000.00 298 910.34 0.09HKD SHIMAO PROPERTY HO HKD0.10 149 000.00 264 926.49 0.08HKD SHUI ON LAND LTD USD0.0025 558 158.00 153 400.46 0.05HKD SIHUAN PHARM HLDG HKD0.01 494 000.00 0.64 0.00HKD SINO-OCEAN LAND HL HKD0.80 325 764.00 208 905.26 0.06HKD SINOPEC ENGINEERIN CNY1 H 142 500.00 121 720.22 0.04HKD SINOPEC S/PETROCHE ‘H’CNY1 357 000.00 142 336.60 0.04HKD SINOPHARM GROUP CO CNY1 126 400.00 507 221.15 0.16HKD SINOTRANS LIMITED ‘H’CNY1 188 000.00 101 154.17 0.03HKD SOHO CHINA LIMITED HKD0.02 194 000.00 94 119.47 0.03HKD SUN ART RETAIL GRO HKD0.30 191 500.00 144 548.82 0.04HKD SUNAC CHINA HLDGS HKD0.10 ‘REG S’ 134 000.00 103 739.93 0.03HKD TENCENT HLDGS LIMI HKD0.00002 492 100.00 9 683 070.65 2.96HKD TINGYI(CAYMAN ISL) USD 0.005 190 000.00 271 143.14 0.08HKD TSINGTAO BREWERY ‘H’CNY1 34 000.00 153 984.12 0.05HKD WANT WANT CHINA HO USD0.02 593 000.00 441 489.52 0.14HKD WEICHAI POWER CO ‘H’CNY1 144 800.00 160 304.51 0.05HKD YANZHOU COAL MININ ‘H’CNY1 150 000.00 70 063.16 0.02HKD ZHEJIANG EXPRESS ‘H’CNY1 126 000.00 151 522.23 0.05HKD ZHUZHOU CSR TIMES ‘H’CNY1 44 500.00 258 669.19 0.08HKD ZIJIN MINING GROUP ‘H’CNY0.1 369 000.00 96 652.32 0.03HKD ZTE CORP ‘H’CNY1 84 748.00 193 331.05 0.06Total China 55 784 466.32 17.04
Colombia
COP CEMENTOS ARGOS SA COP6 52 903.00 161 983.65 0.05COP CORFICOLOMBIANA COP10 (PRO RATA 2016) 104.00 1 260.65 0.00COP CORFICOLOMBIANA COP10 (RFD 2016 CASH OPT) 11 305.00 138 459.08 0.04COP ECOPETROL SA COM COP250 296 171.00 103 559.54 0.03COP GPO DE INVERSIONES COP187.50 21 538.00 242 213.42 0.07COP GRUPO ARGOS SA COP62.5 35 778.00 182 581.05 0.06COP INTERCONEXION ELEC COM COP32.8 50 202.00 116 708.37 0.04Total Colombia 946 765.76 0.29
Czech Republic
CZK CEZ CZK100 12 586.00 224 799.69 0.07CZK KOMERCNI BANKA CZK500 1 576.00 313 612.30 0.09Total Czech Republic 538 411.99 0.16
Description Quantity/ Valuation in USD as a % Nominal Unrealized gain of net (loss) on Futures/ assets Forward Exchange Contracts/ Swaps (Note 1)

The notes are an integral part of the fi nancial statements. 15
UBS (Lux) Institutional SICAV – Emerging Markets Equity PassiveAnnual Report as of 31 December 2015
Greece
EUR EUROBANK ERGASIAS EUR0.30 8 624.00 9 742.98 0.00EUR FOLLI FOLLIE GROUP EUR0.30 (CR) 6 150.00 115 576.89 0.04EUR JUMBO SA EUR1.19 7 912.00 83 369.61 0.03EUR NATL BK OF GREECE EUR0.30 288 356.00 107 441.71 0.03EUR OPAP(ORG OF FOOTB) EUR0.30 (CR) 30 113.00 264 965.19 0.08EUR OTE(HELLENIC TLCM) EUR2.83(CR) 21 967.00 220 491.83 0.07EUR PIRAEUS BK SA EUR0.30 (REG SHS) 512 764.00 154 850.32 0.05EUR TITAN CEMENT CO EUR4.00 4 138.00 79 158.88 0.02Total Greece 1 035 597.41 0.32
Hong Kong
HKD ALIBABA HEALTH INF HKD0.01 202 000.00 139 703.10 0.04HKD ALIBABA PICTURES G HKD0.25 890 000.00 220 486.06 0.07HKD BEIJING ENT WATER HKD0.10 440 000.00 308 277.90 0.09HKD BEIJING ENTER. INV HKD0.1 39 500.00 239 288.92 0.07HKD BRILLIANCE CHINA USD0.01 302 000.00 379 928.13 0.12HKD CHINA EVER INTL HKD0.10 215 000.00 276 304.33 0.08HKD CHINA EVERBRIGHT HKD1 116 000.00 266 720.00 0.08HKD CHINA GAS HOLDINGS HKD0.01 188 000.00 271 199.91 0.08HKD CHINA JINMAO HOLDI NPV 566 000.00 193 531.74 0.06HKD CHINA MENGNIU DAIR HKD0.1 244 000.00 397 948.43 0.12HKD CHINA MERCHANT HLD HKD0.10 127 207.00 404 592.50 0.12HKD CHINA MOBILE LTD NPV 579 500.00 6 542 615.30 2.00HKD CHINA O/SEAS LAND HKD0.10 385 440.00 1 352 743.88 0.41HKD CHINA POWER INTL HKD1 223 000.00 128 905.89 0.04HKD CHINA RES ENT NPV 120 828.00 258 800.77 0.08HKD CHINA RES GAS GP L HKD0.10 100 000.00 298 703.90 0.09HKD CHINA RES LAND HKD0.10 276 222.00 805 483.40 0.25HKD CHINA RES PWR HLDG HKD1 177 659.00 345 683.34 0.11HKD CHINA STATE CONSTR HKD0.025 184 000.00 319 560.27 0.10HKD CHINA TAIPING INSURANCE HOLDINGS CO LTD HKD0.05 159 930.00 495 257.51 0.15HKD CHINA UNICOM (HK)L HKD0.10 569 464.00 694 365.24 0.21HKD CITIC LIMITED NPV 433 000.00 766 534.84 0.23HKD CNOOC LTD HKD0.02 1 682 000.00 1 751 416.42 0.54HKD COSCO PACIFIC HKD0.10 211 668.00 233 239.97 0.07HKD COUNTRY GARDEN HLD HKD0.10 509 153.00 208 912.93 0.06HKD CSPC PHARMACEUTICA HKD0.10 370 000.00 378 108.81 0.12HKD FAR EAST HORIZON L HKD0.01 97 000.00 90 239.54 0.03HKD GCL-POLY ENERGY HL HKD0.1 1 242 000.00 185 895.76 0.06HKD GEELY AUTOMOBILE H HKD0.02 505 000.00 269 110.92 0.08HKD GOLDIN PROPERTIES NPV 126 000.00 145 344.28 0.04HKD GOME ELECTRICAL AP HKD0.025 1 383 446.00 230 272.36 0.07HKD GUANGDONG INVEST HKD0.50 276 000.00 391 022.11 0.12HKD HAIER ELECTRONICS HKD0.1 (POST CONS) 133 000.00 269 770.26 0.08HKD HANERGY THIN FILM HKD0.0025 1 386 000.00 1.79 0.00HKD HENGAN INTL HKD0.10 69 500.00 656 426.00 0.20HKD KUNLUN ENERGY COMP HKD0.01 324 000.00 288 458.93 0.09HKD NEW WORLD CHINA LT HKD1.0 274 000.00 219 549.30 0.07HKD NINE DRAGONS PAPER HKD0.1 228 127.00 135 107.44 0.04HKD SHANGHAI IND HLDGS HKD0.10 31 000.00 81 398.42 0.03HKD SINO BIOPHAMACEUTI HKD0.025 432 000.00 393 530.45 0.12HKD YUEXIU PROPERTY COMPANY HKD0.10 1 048 040.00 181 205.99 0.06Total Hong Kong 21 215 647.04 6.48
Hungary
HUF GEDEON RICHTER PLC HUF100 10 677.00 201 794.69 0.06HUF MOL HUNGARIAN OIL HUF1000 3 320.00 162 690.08 0.05HUF OTP BANK HUF100 20 767.00 428 332.25 0.13Total Hungary 792 817.02 0.24
India
INR ACC LTD INR10 7 521.00 154 686.04 0.05INR ADANI PORTS & SPECIAL ECONOMIC ZONE LTD INR2 77 570.00 305 912.34 0.09INR ADITYA BIRLA NUVO INR10 4 980.00 163 135.11 0.05INR AMBUJA CEMENTS LTD INR2 57 100.00 175 254.11 0.05INR APOLLO HOSPITALS INR5 11 687.00 259 059.44 0.08INR ASIAN PAINTS LTD INR1 24 336.00 325 019.52 0.10INR AUROBINDO PHARMA INR1 25 716.00 340 495.87 0.10INR BAJAJ AUTO LTD INR10 8 333.00 318 929.14 0.10INR BHARAT FORGE INR2 7 188.00 96 917.46 0.03INR BHARAT HEAVY ELECT INR2 78 952.00 201 866.50 0.06INR BHARAT PETROL CORP INR10 13 018.00 175 583.73 0.05INR BHARTI AIRTEL LTD INR5 118 428.00 609 358.77 0.19INR BHARTI INFRATEL LT INR10 38 927.00 251 898.33 0.08INR BOSCH LTD INR10 857.00 241 568.91 0.07INR CAIRN INDIA INR10 50 052.00 104 482.66 0.03INR CIPLA INR2 38 361.00 376 760.47 0.12INR COAL INDIA LTD INR10 76 369.00 380 712.27 0.12INR CONTAINER CORP INR10 6 700.00 132 974.59 0.04INR DABUR INDIA LTD INR1 53 061.00 222 129.34 0.07INR DIVI’S LABORATORIE INR2.00 10 016.00 174 843.31 0.05INR DR REDDYS LABS INR5 7 507.00 352 744.60 0.11INR EICHER MOTORS INR10 1 288.00 328 161.71 0.10INR GAIL INDIA LTD INR10 37 829.00 214 487.03 0.07INR GLAXOSMITHKLINE CO INR10 1 556.00 150 674.31 0.05INR GLENMARK PHARM INR1.00 14 087.00 196 305.04 0.06INR GODREJ CONSUMER PR INR1 12 204.00 243 392.84 0.07INR HCL TECHNOLOGIES INR2 59 200.00 765 187.26 0.23INR HERO MOTOCORP INR2 4 944.00 201 335.93 0.06INR HINDALCO INDS INR1 131 287.00 168 186.27 0.05INR HINDUSTAN UNILEVER INR1 73 732.00 961 546.08 0.29INR HOUSING DEVEL FIN INR2 143 011.00 2 731 868.13 0.84INR ICICI BANK INR2 95 781.00 378 382.46 0.12INR IDEA CELLULAR LTD INR10 85 964.00 186 660.04 0.06INR INDIABULLS HOUSING INR2 30 955.00 344 707.39 0.11
Description Quantity/ Valuation in USD as a % Nominal Unrealized gain of net (loss) on Futures/ assets Forward Exchange Contracts/ Swaps (Note 1)
16 The notes are an integral part of the fi nancial statements.
UBS (Lux) Institutional SICAV – Emerging Markets Equity PassiveAnnual Report as of 31 December 2015
Description Quantity/ Valuation in USD as a % Nominal Unrealized gain of net (loss) on Futures/ assets Forward Exchange Contracts/ Swaps (Note 1)
INR INFOSYS LTD INR5 175 600.00 2 934 087.71 0.90INR ITC INR1 211 411.00 1 047 528.02 0.32INR JSW STEEL LTD INR10 11 013.00 171 829.85 0.05INR LARSEN & TOUBRO INR2 27 914.00 538 163.99 0.16INR LIC HOUSING FINANC INR2 24 092.00 185 743.97 0.06INR LUPIN LTD INR2 21 264.00 590 530.51 0.18INR MAHINDRA &MAH FIN INR2 28 142.00 103 007.43 0.03INR MAHINDRA &MAHINDRA INR5 35 251.00 677 964.82 0.21INR MARICO LTD INR1 41 000.00 140 155.31 0.04INR MARUTI UDYOG INR5 7 859.00 549 062.33 0.17INR MOTHERSON SUMI SYS INR1 29 263.00 129 669.51 0.04INR NESTLE INDIA INR10 2 357.00 207 638.67 0.06INR NTPC LTD INR10 109 384.00 241 812.53 0.07INR OIL & NATURAL GAS INR5 64 207.00 234 627.00 0.07INR PIRAMAL ENTERPRISES LTD INR2 5 607.00 85 122.58 0.03INR POWER FINANCE CORP INR10 15 538.00 47 302.46 0.01INR RELIANCE COMMUNICA INR5 106 952.00 142 670.03 0.04INR RELIANCE INDS INR10(100%DEMAT) 119 548.00 1 833 438.27 0.56INR RURAL ELECTRIFICAT INR10 24 885.00 85 217.90 0.03INR SHRIRAM TRANSPORT INR10 12 486.00 162 066.75 0.05INR SIEMENS INDIA LTD INR2 (POST SUBDIVISION) 7 090.00 128 674.29 0.04INR STATE BK OF INDIA INR1 129 513.00 439 402.06 0.13INR SUN PHARMACEUTICAL INR1 92 740.00 1 149 713.16 0.35INR TATA CONSULTANCY S INR1 45 319.00 1 669 314.77 0.51INR TATA MOTORS LTD. INR 2 68 291.00 403 926.59 0.12INR TATA POWER CO LTD INR1 168 048.00 172 477.42 0.05INR TATA STEEL LTD INR10 12 602.00 49 488.89 0.02INR TECH MAHINDRA INR5 21 595.00 170 279.18 0.05INR ULTRATECH CEMENT LTD INR10 2 849.00 119 743.59 0.04INR UNITED SPIRITS LTD INR10 6 180.00 279 446.93 0.09INR UPL LIMITED INR2 19 825.00 131 285.14 0.04INR VEDANTA LTD INR1 102 003.00 139 383.22 0.04INR WIPRO INR2 65 391.00 553 423.46 0.17INR ZEE ENTERTAINMENT ENTERPRISES LIMITED INR1 54 118.00 357 684.96 0.11Total India 28 107 110.30 8.59
Indonesia
IDR ADARO ENERGY TBK IDR100 2 150 000.00 80 322.90 0.02IDR ASTRA AGRO LESTARI IDR500 15 000.00 17 247.03 0.01IDR BANK CENTRAL ASIA IDR62.5 1 146 800.00 1 106 453.18 0.34IDR BK DANAMON IDR50000 559 537.00 129 889.04 0.04IDR BK MANDIRI IDR500 876 442.00 588 110.09 0.18IDR BK RAKYAT IDR250 1 059 600.00 878 196.85 0.27IDR CHAROEN POKPHAND IDR10 712 200.00 134 328.77 0.04IDR GLOBAL MEDIACOM IDR100 (POST SUBD) 1 118 500.00 89 252.91 0.03IDR GUDANG GARAM(PERUS IDR500 30 700.00 122 488.35 0.04IDR H M SAMPOERNA IDR100 24 400.00 166 383.94 0.05IDR INDOCEMENT TUNGGAL IDR500 143 800.00 232 886.37 0.07IDR INDOFOOD CBP SUKSES MAKMUR TBK PT 155 000.00 151 514.50 0.05IDR INDOFOODS SUKSES M IDR100 688 000.00 258 281.03 0.08IDR JASA MARGA(INDONES IDR500 318 500.00 120 722.84 0.04IDR KALBE FARMA IDR10 2 555 000.00 244 657.51 0.07IDR LIPPO KARAWACI IDR100 (POST SUBD) 1 873 400.00 140 658.05 0.04IDR MATAHARI DEPARTMEN IDR5000 226 200.00 288 801.19 0.09IDR MEDIA NUSANTARA IDR100 710 500.00 95 609.65 0.03IDR P.T. ASTRA INTL IDR50 2 123 600.00 924 310.07 0.28IDR PERUSAHAAN GAS NEG IDR100-B 681 400.00 135 686.99 0.04IDR PT BANK NEGARA IND LKD SHS(IDR7500 & IDR375) 685 474.00 248 133.41 0.08IDR PT BUMI SERPONG DA IDR100 1 099 000.00 143 503.97 0.04IDR SEMEN INDONESIA IDR100 357 100.00 295 316.98 0.09IDR SUMMARECON AGUNG IDR100 960 000.00 114 907.64 0.03IDR TELEKOMUNIKASI IND SER’B’IDR50 4 816 400.00 1 084 870.42 0.33IDR UNILEVER INDONESIA IDR10 124 300.00 333 631.13 0.10IDR UTD TRACTORS IDR250 151 860.00 186 726.87 0.06IDR XL AXIATA TBK PT IDR100 333 500.00 88 304.42 0.03Total Indonesia 8 401 196.10 2.57
Isle of Man
ZAR NEW EUROPE PROPERT ORD EUR0.01 9 293.00 106 636.66 0.03Total Isle of Man 106 636.66 0.03
Malaysia
MYR AIRASIA BHD MYR0.1 180 500.00 54 231.98 0.02MYR ALLIANCE FINANCIAL MYR1 47 500.00 39 385.12 0.01MYR AMMB HOLDINGS BHD MYR1 194 300.00 205 002.68 0.06MYR ASTRO MALAYSIA HLD MYR0.10 234 500.00 150 744.15 0.05MYR AXIATA GROUP BHD MYR1 240 213.00 358 627.07 0.11MYR BRIT AMER TOBA(MY) MYR0.50 9 900.00 129 309.89 0.04MYR BUMI ARMADA BERHA MYR0.20 327 200.00 77 732.39 0.02MYR CIMB GROUP HOLDINGS BHD MYR1 510 488.00 539 796.32 0.16MYR DIALOG GROUP MYR0.10 351 388.00 130 946.97 0.04MYR DIGI.COM.BERHAD MYR0.01 304 100.00 382 471.18 0.12MYR FELDA GLOBAL VENTU MYR1 188 900.00 75 234.42 0.02MYR GAMUDA BERHAD MYR1 163 225.00 177 158.15 0.05MYR GENTING BHD MYR0.10 204 900.00 350 289.04 0.11MYR GENTING MALAYSIA B MYR0.10 347 500.00 354 500.99 0.11MYR GENTING PLANTATIONS BHD MYR0.50 28 600.00 70 609.06 0.02MYR HONG LEONG BANK MYR1 50 831.00 159 116.95 0.05MYR HONG LEONG FINANCI MYR1 25 615.00 83 285.29 0.03MYR IHH HEALTHCARE BHD NPV 222 900.00 341 605.22 0.10MYR IJM CORP BERHAD MYR1 300 320.00 236 422.87 0.07MYR IOI CORP MYR0.50 247 296.00 256 886.03 0.08MYR IOI PROPERTIES GROUP SDN BHD 186 314.00 97 637.48 0.03MYR KUALA LUMPUR KEPG MYR1 40 400.00 215 291.02 0.07MYR LAFARGE MALAYSIA MYR1 71 300.00 147 465.70 0.04MYR MALAYAN BKG BERHAD MYR1 383 070.00 749 455.69 0.23
The notes are an integral part of the fi nancial statements. 17
UBS (Lux) Institutional SICAV – Emerging Markets Equity PassiveAnnual Report as of 31 December 2015
Description Quantity/ Valuation in USD as a % Nominal Unrealized gain of net (loss) on Futures/ assets Forward Exchange Contracts/ Swaps (Note 1)
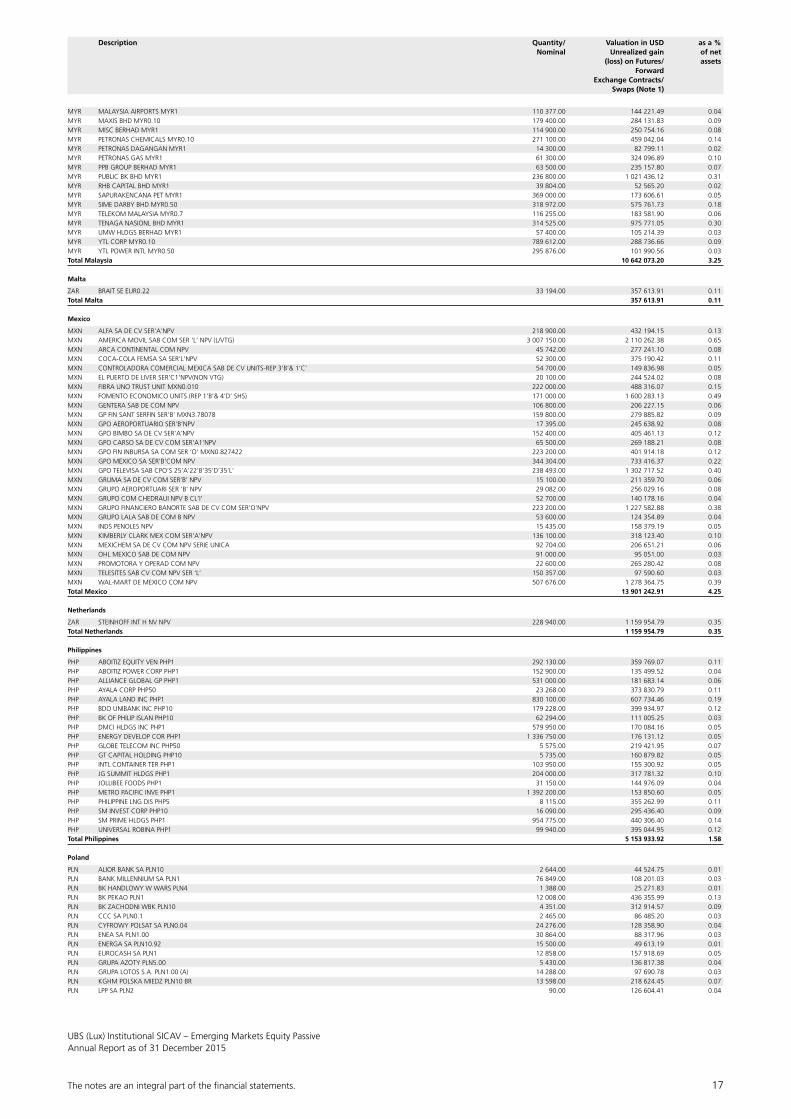
MYR MALAYSIA AIRPORTS MYR1 110 377.00 144 221.49 0.04MYR MAXIS BHD MYR0.10 179 400.00 284 131.83 0.09MYR MISC BERHAD MYR1 114 900.00 250 754.16 0.08MYR PETRONAS CHEMICALS MYR0.10 271 100.00 459 042.04 0.14MYR PETRONAS DAGANGAN MYR1 14 300.00 82 799.11 0.02MYR PETRONAS GAS MYR1 61 300.00 324 096.89 0.10MYR PPB GROUP BERHAD MYR1 63 500.00 235 157.80 0.07MYR PUBLIC BK BHD MYR1 236 800.00 1 021 436.12 0.31MYR RHB CAPITAL BHD MYR1 39 804.00 52 565.20 0.02MYR SAPURAKENCANA PET MYR1 369 000.00 173 606.61 0.05MYR SIME DARBY BHD MYR0.50 318 972.00 575 761.73 0.18MYR TELEKOM MALAYSIA MYR0.7 116 255.00 183 581.90 0.06MYR TENAGA NASIONL BHD MYR1 314 525.00 975 771.05 0.30MYR UMW HLDGS BERHAD MYR1 57 400.00 105 214.39 0.03MYR YTL CORP MYR0.10 789 612.00 288 736.66 0.09MYR YTL POWER INTL MYR0.50 295 876.00 101 990.56 0.03Total Malaysia 10 642 073.20 3.25
Malta
ZAR BRAIT SE EUR0.22 33 194.00 357 613.91 0.11Total Malta 357 613.91 0.11
Mexico
MXN ALFA SA DE CV SER’A’NPV 218 900.00 432 194.15 0.13MXN AMERICA MOVIL SAB COM SER ‘L’ NPV (L/VTG) 3 007 150.00 2 110 262.38 0.65MXN ARCA CONTINENTAL COM NPV 45 742.00 277 241.10 0.08MXN COCA-COLA FEMSA SA SER’L’NPV 52 300.00 375 190.42 0.11MXN CONTROLADORA COMERCIAL MEXICA SAB DE CV UNITS-REP 3’B’& 1’C’ 54 700.00 149 836.98 0.05MXN EL PUERTO DE LIVER SER’C1’NPV(NON VTG) 20 100.00 244 524.02 0.08MXN FIBRA UNO TRUST UNIT MXN0.010 222 000.00 488 316.07 0.15MXN FOMENTO ECONOMICO UNITS (REP 1’B’& 4’D’ SHS) 171 000.00 1 600 283.13 0.49MXN GENTERA SAB DE COM NPV 106 800.00 206 227.15 0.06MXN GP FIN SANT SERFIN SER’B’ MXN3.78078 159 800.00 279 885.82 0.09MXN GPO AEROPORTUARIO SER’B’NPV 17 395.00 245 638.92 0.08MXN GPO BIMBO SA DE CV SER’A’NPV 152 400.00 405 461.13 0.12MXN GPO CARSO SA DE CV COM SER’A1’NPV 65 500.00 269 188.21 0.08MXN GPO FIN INBURSA SA COM SER ‘O’ MXN0.827422 223 200.00 401 914.18 0.12MXN GPO MEXICO SA SER’B’COM NPV 344 304.00 733 416.37 0.22MXN GPO TELEVISA SAB CPO’S 25’A’22’B’35’D’35’L’ 238 493.00 1 302 717.52 0.40MXN GRUMA SA DE CV COM SER’B’ NPV 15 100.00 211 359.70 0.06MXN GRUPO AEROPORTUARI SER ‘B’ NPV 29 082.00 256 029.16 0.08MXN GRUPO COM CHEDRAUI NPV B CL’I’ 52 700.00 140 178.16 0.04MXN GRUPO FINANCIERO BANORTE SAB DE CV COM SER’O’NPV 223 200.00 1 227 582.88 0.38MXN GRUPO LALA SAB DE COM B NPV 53 600.00 124 354.89 0.04MXN INDS PENOLES NPV 15 435.00 158 379.19 0.05MXN KIMBERLY CLARK MEX COM SER’A’NPV 136 100.00 318 123.40 0.10MXN MEXICHEM SA DE CV COM NPV SERIE UNICA 92 704.00 206 651.21 0.06MXN OHL MEXICO SAB DE COM NPV 91 000.00 95 051.00 0.03MXN PROMOTORA Y OPERAD COM NPV 22 600.00 265 280.42 0.08MXN TELESITES SAB CV COM NPV SER ‘L’ 150 357.00 97 590.60 0.03MXN WAL-MART DE MEXICO COM NPV 507 676.00 1 278 364.75 0.39Total Mexico 13 901 242.91 4.25
Netherlands
ZAR STEINHOFF INT H NV NPV 228 940.00 1 159 954.79 0.35Total Netherlands 1 159 954.79 0.35
Philippines
PHP ABOITIZ EQUITY VEN PHP1 292 130.00 359 769.07 0.11PHP ABOITIZ POWER CORP PHP1 152 900.00 135 499.52 0.04PHP ALLIANCE GLOBAL GP PHP1 531 000.00 181 683.14 0.06PHP AYALA CORP PHP50 23 268.00 373 830.79 0.11PHP AYALA LAND INC PHP1 830 100.00 607 734.46 0.19PHP BDO UNIBANK INC PHP10 179 228.00 399 934.97 0.12PHP BK OF PHILIP ISLAN PHP10 62 294.00 111 005.25 0.03PHP DMCI HLDGS INC PHP1 579 950.00 170 084.16 0.05PHP ENERGY DEVELOP COR PHP1 1 336 750.00 176 131.12 0.05PHP GLOBE TELECOM INC PHP50 5 575.00 219 421.95 0.07PHP GT CAPITAL HOLDING PHP10 5 735.00 160 879.82 0.05PHP INTL CONTAINER TER PHP1 103 950.00 155 300.92 0.05PHP JG SUMMIT HLDGS PHP1 204 000.00 317 781.32 0.10PHP JOLLIBEE FOODS PHP1 31 150.00 144 976.09 0.04PHP METRO PACIFIC INVE PHP1 1 392 200.00 153 850.60 0.05PHP PHILIPPINE LNG DIS PHP5 8 115.00 355 262.99 0.11PHP SM INVEST CORP PHP10 16 090.00 295 436.40 0.09PHP SM PRIME HLDGS PHP1 954 775.00 440 306.40 0.14PHP UNIVERSAL ROBINA PHP1 99 940.00 395 044.95 0.12Total Philippines 5 153 933.92 1.58
Poland
PLN ALIOR BANK SA PLN10 2 644.00 44 524.75 0.01PLN BANK MILLENNIUM SA PLN1 76 849.00 108 201.03 0.03PLN BK HANDLOWY W WARS PLN4 1 388.00 25 271.83 0.01PLN BK PEKAO PLN1 12 008.00 436 355.99 0.13PLN BK ZACHODNI WBK PLN10 4 351.00 312 914.57 0.09PLN CCC SA PLN0.1 2 465.00 86 485.20 0.03PLN CYFROWY POLSAT SA PLN0.04 24 276.00 128 358.90 0.04PLN ENEA SA PLN1.00 30 864.00 88 317.96 0.03PLN ENERGA SA PLN10.92 15 500.00 49 613.19 0.01PLN EUROCASH SA PLN1 12 858.00 157 918.69 0.05PLN GRUPA AZOTY PLN5.00 5 430.00 136 817.38 0.04PLN GRUPA LOTOS S.A. PLN1.00 (A) 14 288.00 97 690.78 0.03PLN KGHM POLSKA MIEDZ PLN10 BR 13 598.00 218 624.45 0.07PLN LPP SA PLN2 90.00 126 604.41 0.04

18 The notes are an integral part of the fi nancial statements.
UBS (Lux) Institutional SICAV – Emerging Markets Equity PassiveAnnual Report as of 31 December 2015
PLN MBANK SA PLN4 1 217.00 96 769.52 0.03PLN ORANGE POLSKA SA PLN3 60 152.00 99 924.57 0.03PLN PGE POLSKA GRUPA PLN10.00 87 719.00 284 107.42 0.09PLN PKN ORLEN PLN1.25 29 054.00 499 199.51 0.15PLN POL GORN NAFT I GA PLN1 227 235.00 295 771.76 0.09PLN POWSZECHNA KASA OS PLN1 61 071.00 422 661.83 0.13PLN PZU GR PLN1 48 450.00 417 394.24 0.13PLN SYNTHOS S.A PLN0.03 62 101.00 59 915.88 0.02PLN TAURON POLSKA ENER PLN5.00 137 225.00 100 079.26 0.03Total Poland 4 293 523.12 1.31
Qatar
QAR BARWA REAL ESTATE QAR10 8 312.00 91 282.98 0.03QAR COMM BK OF QATAR QAR10 15 699.00 197 837.66 0.06QAR DOHA BANK QAR10 9 114.00 111 350.79 0.03QAR EZDAN HOLDING GP QAR10 95 813.00 418 259.53 0.13QAR INDUSTRIES OF QATA QAR10 14 092.00 429 844.11 0.13QAR MASRAF AL-RAYAN QAR10 36 179.00 373 481.15 0.11QAR OOREDOO QAR10 8 657.00 178 259.62 0.06QAR QATAR ELECT & WATER QAR10 1 868.00 110 983.50 0.03QAR QATAR INSURANCE CO QAR10 6 508.00 146 516.21 0.05QAR QATAR ISLAMIC BANK QAR10 4 323.00 126 640.89 0.04QAR QATAR NATIONAL BK QAR10 16 602.00 797 669.06 0.24QAR VODAFONE QATAR QAR10 19 377.00 67 563.87 0.02Total Qatar 3 049 689.37 0.93
Russian Federation (CIS)
USD LUKOIL OIL COMPANY RUB0.025 48 511.00 1 555 348.28 0.48USD MMC NORILSK NICKEL RUB1(RUB) 2 424.00 303 131.89 0.09USD MMC NORILSK NICKEL RUB1(RUB) 2 849.00 356 929.55 0.11USD SEVERSTAL PAO RUB0.01(RUB) 391.00 3 257.08 0.00USD SEVERSTAL PAO RUB0.01(RUB) 19 526.00 162 950.60 0.05Total Russian Federation (CIS) 2 381 617.40 0.73
South Africa
ZAR AFRICAN BANK INV ZAR0.025 209 515.00 0.14 0.00ZAR ANGLO PLATINUM LTD ZAR0.10 4 015.00 48 022.98 0.01ZAR ASPEN PHARMACARE ZAR0.1390607 32 308.00 645 263.45 0.20ZAR BARCLAYS AFRICA GR ZAR2 28 045.00 259 699.72 0.08ZAR BARLOWORLD LTD ZAR0.05 23 561.00 94 225.75 0.03ZAR BIDVEST GROUP ZAR0.05 27 607.00 584 743.54 0.18ZAR CAPITEC BANK HLDGS ZAR0.01 2 000.00 69 511.79 0.02ZAR CORONATION FUND MA ZAR0.0001 24 490.00 83 606.27 0.02ZAR DISCOVERY LIMITED ZAR0.001 38 432.00 329 743.11 0.10ZAR EXXARO RESOURCES ZAR0.01 24 171.00 68 696.77 0.02ZAR FIRSTRAND LTD ZAR0.01 318 994.00 872 238.76 0.27ZAR FOSCHINI GP (THE) ZAR0.0125 25 622.00 201 364.73 0.06ZAR GOLD FIELDS ZAR0.50 104 295.00 284 034.01 0.09ZAR GROWTHPOINT PROPS NPV (POST DELINKING) 182 742.00 273 956.74 0.08ZAR HYPROP INVESTMENTS NPV 17 616.00 117 493.05 0.04ZAR IMPALA PLATINUM ZAR0.025 62 000.00 100 189.09 0.03ZAR IMPERIAL HLDGS ZAR0.04 16 615.00 127 983.38 0.04ZAR INVESTEC LIMITED ZAR0.0002 24 895.00 175 922.20 0.05ZAR LIBERTY HLDGS NPV 16 548.00 123 003.36 0.04ZAR LIFE HEALTHCARE GR ZAR0.000001 83 846.00 189 763.43 0.06ZAR MASSMART HOLDINGS ZAR0.01 6 858.00 44 258.01 0.01ZAR MEDICLINIC INTL ZAR0.10 41 395.00 317 899.07 0.10ZAR MMI HOLDINGS LIMIT ZAR0.000001 106 654.00 151 423.83 0.05ZAR MONDI LTD NPV 9 337.00 185 149.24 0.06ZAR MR PRICE GROUP ZAR0.025 22 279.00 287 554.45 0.09ZAR MTN GROUP LTD ZAR0.0001 155 542.00 1 333 934.13 0.41ZAR NASPERS ‘N’ ZAR0.02 37 665.00 5 153 096.06 1.57ZAR NEDBANK GROUP LTD ZAR1 13 748.00 167 339.57 0.05ZAR NETCARE LTD ZAR0.01 106 581.00 233 170.66 0.07ZAR PICK’N PAY STORES ZAR0.0125 28 124.00 117 973.61 0.04ZAR PIONEER FOOD GROUP ZAR0.10 8 291.00 85 074.31 0.03ZAR PSG GROUP LTD ZAR0.01 8 500.00 122 600.11 0.04ZAR RAND MERCHANT INSU NPV 73 990.00 184 837.72 0.06ZAR REDEFINE PROPS LTD NPV (POST CONVERSION) 348 245.00 217 997.26 0.07ZAR REMGRO ZAR0.01 48 371.00 765 451.45 0.23ZAR RESILIENT PROPERTY NPV 20 431.00 152 288.12 0.05ZAR RMB HLDGS ZAR0.01 63 948.00 229 495.55 0.07ZAR SANLAM ZAR0.01 176 990.00 691 489.44 0.21ZAR SAPPI ZAR1 69 118.00 291 093.59 0.09ZAR SASOL NPV 52 901.00 1 431 814.36 0.44ZAR SHOPRITE HLDGS LTD ZAR0.01134 39 786.00 367 832.10 0.11ZAR SPAR GROUP LIMITED NPV 17 797.00 211 443.82 0.06ZAR STANDARD BANK GROUP 0.1 116 996.00 856 961.44 0.26ZAR TELKOM SA SOC LTD ZAR10 22 864.00 94 920.53 0.03ZAR TIGER BRANDS ZAR0.10 13 553.00 276 771.41 0.08ZAR TRUWORTHS INTERNAT ZAR0.00015 41 363.00 243 311.76 0.07ZAR VODACOM GROUP LIMI ZAR0.01 35 170.00 345 923.64 0.10ZAR WOOLWORTHS HLDGS ZAR0.0015 85 952.00 555 522.11 0.17Total South Africa 19 766 089.62 6.04
South Korea
KRW AMOREPACIFIC (NEW) KRW5000 3 110.00 1 099 394.49 0.34KRW AMOREPACIFIC (NEW) PFD KRW5000 500.00 98 076.84 0.03KRW AMOREPACIFIC GROUP KRW500 3 049.00 384 846.70 0.12KRW BGF RETAIL CO LTD KRW1000 649.00 94 924.31 0.03KRW BNK FINANCIAL GROU KRW5000 16 239.00 116 611.13 0.04KRW CELLTRION INC KRW1000 6 172.79 444 843.08 0.14KRW CHEIL WORLDWIDE KRW200 8 311.00 146 720.99 0.05KRW CJ CHEILJEDANG KRW5000 877.00 282 348.30 0.09KRW CJ CORP KRW5000 1 672.00 357 913.95 0.11KRW CJ KOREA EXPRESS C KRW5000 641.00 104 414.31 0.03
Description Quantity/ Valuation in USD as a % Nominal Unrealized gain of net (loss) on Futures/ assets Forward Exchange Contracts/ Swaps (Note 1)

The notes are an integral part of the fi nancial statements. 19
UBS (Lux) Institutional SICAV – Emerging Markets Equity PassiveAnnual Report as of 31 December 2015
KRW COWAY CO LTD KRW500 5 317.00 381 356.62 0.12KRW DAELIM INDUSTRIAL KRW5000 2 811.00 160 861.46 0.05KRW DAEWOO ENGINEERING KRW5000 12 820.00 61 227.24 0.02KRW DAEWOO INTERNATION KRW5000 4 004.00 55 831.65 0.02KRW DAEWOO SECURITIES KRW5000 25 864.00 208 888.39 0.06KRW DGB FINANCIAL GROU KRW5000 21 916.00 187 843.42 0.06KRW DONGBU INSURANCE KRW500 3 333.00 199 829.35 0.06KRW DOOSAN HEAVY IND KRW5000 7 950.00 139 669.95 0.04KRW DOOSAN KRW5000 884.00 66 721.25 0.02KRW E-MART CO LTD KRW5000 1 932.00 311 413.59 0.10KRW GS ENGINEERING & C KRW5000 4 366.00 73 539.30 0.02KRW GS HOLDINGS CORP KRW5000 5 531.00 239 155.43 0.07KRW HANA FINANCIAL GRP KRW5000 28 502.00 573 661.85 0.18KRW HANKOOK TIRE CO LT KRW500 8 380.00 336 257.73 0.10KRW HANMI PHARM CO LTD KRW2500 484.50 300 811.05 0.09KRW HANMI SCIENCE KRW500 969.00 106 606.12 0.03KRW HANON SYSTEMS KRW500 3 246.00 143 676.09 0.04KRW HANSSEM CO KRW1000 1 200.00 236 919.54 0.07KRW HANWHA CHEMICAL KRW5000 10 230.00 237 308.43 0.07KRW HANWHA CORP KRW5000 4 734.00 159 071.77 0.05KRW HANWHA LIFE INSURAN KRW5000 16 286.00 102 642.57 0.03KRW HOTEL SHILLA KRW5000 2 882.00 189 994.97 0.06KRW HYOSUNG KRW5000 2 969.00 297 520.36 0.09KRW HYUNDAI DEPT STORE KRW5000 2 604.00 280 931.30 0.09KRW HYUNDAI DEVELOPMEN KRW5000 6 209.00 205 457.51 0.06KRW HYUNDAI ENG & CONS KRW5000 5 926.00 144 290.05 0.04KRW HYUNDAI GLOVIS KRW500 1 596.00 262 699.25 0.08KRW HYUNDAI HEAVY INDS KRW5000 3 765.00 281 921.45 0.09KRW HYUNDAI MARINE&FIR KRW500 4 650.00 142 964.05 0.04KRW HYUNDAI MOBIS KRW5000 6 461.00 1 358 267.46 0.42KRW HYUNDAI MOTOR CO KRW5000 14 379.00 1 827 189.47 0.56KRW HYUNDAI STEEL KRW5000 8 262.00 351 956.76 0.11KRW HYUNDAI WIA CORP KRW5000 2 367.00 226 091.85 0.07KRW INDL BANK OF KOREA KRW5000 25 400.00 267 528.04 0.08KRW KAKAO CORP 2 921.00 288 475.38 0.09KRW KANGWON LAND INC KRW500 11 413.00 373 765.90 0.11KRW KB FINANCIAL GROUP KRW5000 34 561.00 977 098.76 0.30KRW KCC CORPORATION KRW5000 533.00 189 780.82 0.06KRW KEPCO PLANT SERVIC KRW200 1 900.00 144 215.60 0.04KRW KIA MOTORS CORP KRW5000 25 766.00 1 155 849.73 0.35KRW KOREA AEROSPACE IN KRW5000 4 825.00 321 378.62 0.10KRW KOREA ELEC POWER KRW5000 25 013.00 1 066 606.97 0.33KRW KOREA GAS KRW5000 3 400.00 106 852.59 0.03KRW KOREA INVESTMENT H KRW5000 4 335.00 183 189.84 0.06KRW KOREA ZINC KRW5000 856.00 342 385.40 0.10KRW KOREAN AIR LINES KRW5000 2 655.00 62 720.99 0.02KRW KT CORPORATION KRW5000 3 224.00 77 675.15 0.02KRW KT&G CORPORATION KRW5000 10 945.00 975 440.28 0.30KRW KUMHO PETRO CHEM KRW5000 2 510.00 111 527.01 0.03KRW LG CHEMICAL KRW5000 4 361.00 1 221 771.78 0.37KRW LG CORP KRW5000 8 755.00 528 637.59 0.16KRW LG DISPLAY CO LTD KRW5000 23 278.00 487 377.85 0.15KRW LG ELECTRONICS INC KRW5000 10 847.00 497 691.87 0.15KRW LG HOUSEHOLD&HEALT KRW5000 938.00 839 964.18 0.26KRW LG INNOTEK CO KRW5000 1 958.00 164 481.69 0.05KRW LG UPLUS CORP KRW5000 23 285.00 206 527.65 0.06KRW LOTTE CHEMICAL CO KRW5000 1 656.00 343 896.64 0.11KRW LOTTE CONFECT KRW5000 37.00 71 914.20 0.02KRW LOTTE SHOPPING CEN KRW5000 1 001.00 198 484.07 0.06KRW MIRAE ASSET SECURI KRW5000 8 999.00 165 774.08 0.05KRW NAVER CORP KRW500 2 768.00 1 553 318.84 0.47KRW NCSOFT CORPN KRW500 1 331.00 241 783.29 0.07KRW NH INVESTMENT & SE KRW5000 9 887.00 85 163.70 0.03KRW OCI COMPANY LTD KRW5000 1 466.00 93 769.99 0.03KRW ORION KRW5000 286.00 284 402.37 0.09KRW POSCO KRW5000 6 218.00 882 944.87 0.27KRW S-OIL CORP KRW2500 4 384.00 296 865.47 0.09KRW S1 CORP KRW500 1 948.00 165 635.24 0.05KRW SAMSUNG C&T CORPOR KRW100 7 104.00 848 202.64 0.26KRW SAMSUNG CARD KRW5000 2 771.00 72 905.51 0.02KRW SAMSUNG ELEC MECH KRW5000 5 507.00 295 416.23 0.09KRW SAMSUNG ELECTRONIC KRW5000 10 430.00 11 207 880.31 3.42KRW SAMSUNG FIRE & MAR KRW500 3 431.00 899 776.13 0.28KRW SAMSUNG HEAVY KRW5000 21 459.00 198 567.35 0.06KRW SAMSUNG LIFE INSUR KRW500 7 643.00 717 009.94 0.22KRW SAMSUNG SDI KRW5000 5 588.00 543 287.71 0.17KRW SAMSUNG SDS CO LTD KRW500 3 260.00 706 187.37 0.22KRW SAMSUNG SECURITIES KRW5000 5 027.00 178 992.15 0.05KRW SHINHAN FIN GROUP KRW5000 39 074.00 1 317 962.31 0.40KRW SHINSEGAE CO KRW5000 784.00 153 784.49 0.05KRW SK HOLDINGS CO LTD KRW200 3 378.00 692 856.60 0.21KRW SK HYNIX INC KRW5000 53 541.00 1 404 107.08 0.43KRW SK INNOVATION CO KRW5000 6 338.00 702 690.72 0.21KRW SK NETWORKS CO LTD KRW2500 1 604.00 7 510.09 0.00KRW SK TELECOM KRW500 1 039.00 190 955.18 0.06KRW WOORI BANK KRW5000 29 854.00 224 563.80 0.07KRW YUHAN CORP KRW5000 766.00 178 018.00 0.05Total South Korea 48 498 241.44 14.82
Taiwan
TWD ACER INC TWD10 395 068.00 145 533.01 0.04TWD ADVANCED SEMICONDT TWD10 (ASE) 569 611.00 658 970.93 0.20TWD ADVANTECH CO LTD TWD10 35 864.00 230 926.29 0.07TWD ASIA CEMENT CORP TWD10 205 992.00 171 832.46 0.05TWD ASUSTEK COMPUTER TWD10 64 000.00 529 972.30 0.16TWD AU OPTRONICS CORP TWD10 698 461.00 206 899.43 0.06
Description Quantity/ Valuation in USD as a % Nominal Unrealized gain of net (loss) on Futures/ assets Forward Exchange Contracts/ Swaps (Note 1)
20 The notes are an integral part of the fi nancial statements.
UBS (Lux) Institutional SICAV – Emerging Markets Equity PassiveAnnual Report as of 31 December 2015
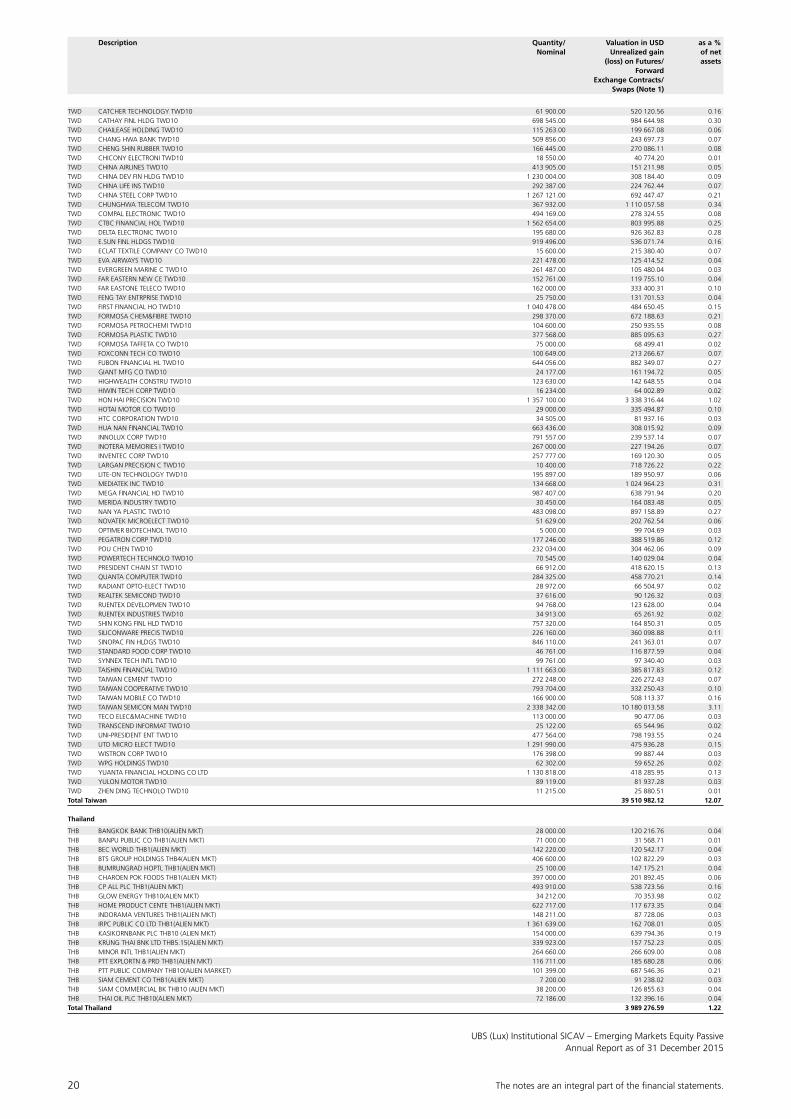
TWD CATCHER TECHNOLOGY TWD10 61 900.00 520 120.56 0.16TWD CATHAY FINL HLDG TWD10 698 545.00 984 644.98 0.30TWD CHAILEASE HOLDING TWD10 115 263.00 199 667.08 0.06TWD CHANG HWA BANK TWD10 509 856.00 243 697.73 0.07TWD CHENG SHIN RUBBER TWD10 166 445.00 270 086.11 0.08TWD CHICONY ELECTRONI TWD10 18 550.00 40 774.20 0.01TWD CHINA AIRLINES TWD10 413 905.00 151 211.98 0.05TWD CHINA DEV FIN HLDG TWD10 1 230 004.00 308 184.40 0.09TWD CHINA LIFE INS TWD10 292 387.00 224 762.44 0.07TWD CHINA STEEL CORP TWD10 1 267 121.00 692 447.47 0.21TWD CHUNGHWA TELECOM TWD10 367 932.00 1 110 057.58 0.34TWD COMPAL ELECTRONIC TWD10 494 169.00 278 324.55 0.08TWD CTBC FINANCIAL HOL TWD10 1 562 654.00 803 995.88 0.25TWD DELTA ELECTRONIC TWD10 195 680.00 926 362.83 0.28TWD E.SUN FINL HLDGS TWD10 919 496.00 536 071.74 0.16TWD ECLAT TEXTILE COMPANY CO TWD10 15 600.00 215 380.40 0.07TWD EVA AIRWAYS TWD10 221 478.00 125 414.52 0.04TWD EVERGREEN MARINE C TWD10 261 487.00 105 480.04 0.03TWD FAR EASTERN NEW CE TWD10 152 761.00 119 755.10 0.04TWD FAR EASTONE TELECO TWD10 162 000.00 333 400.31 0.10TWD FENG TAY ENTRPRISE TWD10 25 750.00 131 701.53 0.04TWD FIRST FINANCIAL HO TWD10 1 040 478.00 484 650.45 0.15TWD FORMOSA CHEM&FIBRE TWD10 298 370.00 672 188.63 0.21TWD FORMOSA PETROCHEMI TWD10 104 600.00 250 935.55 0.08TWD FORMOSA PLASTIC TWD10 377 568.00 885 095.63 0.27TWD FORMOSA TAFFETA CO TWD10 75 000.00 68 499.41 0.02TWD FOXCONN TECH CO TWD10 100 649.00 213 266.67 0.07TWD FUBON FINANCIAL HL TWD10 644 056.00 882 349.07 0.27TWD GIANT MFG CO TWD10 24 177.00 161 194.72 0.05TWD HIGHWEALTH CONSTRU TWD10 123 630.00 142 648.55 0.04TWD HIWIN TECH CORP TWD10 16 234.00 64 002.89 0.02TWD HON HAI PRECISION TWD10 1 357 100.00 3 338 316.44 1.02TWD HOTAI MOTOR CO TWD10 29 000.00 335 494.87 0.10TWD HTC CORPORATION TWD10 34 505.00 81 937.16 0.03TWD HUA NAN FINANCIAL TWD10 663 436.00 308 015.92 0.09TWD INNOLUX CORP TWD10 791 557.00 239 537.14 0.07TWD INOTERA MEMORIES I TWD10 267 000.00 227 194.26 0.07TWD INVENTEC CORP TWD10 257 777.00 169 120.30 0.05TWD LARGAN PRECISION C TWD10 10 400.00 718 726.22 0.22TWD LITE-ON TECHNOLOGY TWD10 195 897.00 189 950.97 0.06TWD MEDIATEK INC TWD10 134 668.00 1 024 964.23 0.31TWD MEGA FINANCIAL HD TWD10 987 407.00 638 791.94 0.20TWD MERIDA INDUSTRY TWD10 30 450.00 164 083.48 0.05TWD NAN YA PLASTIC TWD10 483 098.00 897 158.89 0.27TWD NOVATEK MICROELECT TWD10 51 629.00 202 762.54 0.06TWD OPTIMER BIOTECHNOL TWD10 5 000.00 99 704.69 0.03TWD PEGATRON CORP TWD10 177 246.00 388 519.86 0.12TWD POU CHEN TWD10 232 034.00 304 462.06 0.09TWD POWERTECH TECHNOLO TWD10 70 545.00 140 029.04 0.04TWD PRESIDENT CHAIN ST TWD10 66 912.00 418 620.15 0.13TWD QUANTA COMPUTER TWD10 284 325.00 458 770.21 0.14TWD RADIANT OPTO-ELECT TWD10 28 972.00 66 504.97 0.02TWD REALTEK SEMICOND TWD10 37 616.00 90 126.32 0.03TWD RUENTEX DEVELOPMEN TWD10 94 768.00 123 628.00 0.04TWD RUENTEX INDUSTRIES TWD10 34 913.00 65 261.92 0.02TWD SHIN KONG FINL HLD TWD10 757 320.00 164 850.31 0.05TWD SILICONWARE PRECIS TWD10 226 160.00 360 098.88 0.11TWD SINOPAC FIN HLDGS TWD10 846 110.00 241 363.01 0.07TWD STANDARD FOOD CORP TWD10 46 761.00 116 877.59 0.04TWD SYNNEX TECH INTL TWD10 99 761.00 97 340.40 0.03TWD TAISHIN FINANCIAL TWD10 1 111 663.00 385 817.83 0.12TWD TAIWAN CEMENT TWD10 272 248.00 226 272.43 0.07TWD TAIWAN COOPERATIVE TWD10 793 704.00 332 250.43 0.10TWD TAIWAN MOBILE CO TWD10 166 900.00 508 113.37 0.16TWD TAIWAN SEMICON MAN TWD10 2 338 342.00 10 180 013.58 3.11TWD TECO ELEC&MACHINE TWD10 113 000.00 90 477.06 0.03TWD TRANSCEND INFORMAT TWD10 25 122.00 65 544.96 0.02TWD UNI-PRESIDENT ENT TWD10 477 564.00 798 193.55 0.24TWD UTD MICRO ELECT TWD10 1 291 990.00 475 936.28 0.15TWD WISTRON CORP TWD10 176 398.00 99 887.44 0.03TWD WPG HOLDINGS TWD10 62 302.00 59 652.26 0.02TWD YUANTA FINANCIAL HOLDING CO LTD 1 130 818.00 418 285.95 0.13TWD YULON MOTOR TWD10 89 119.00 81 937.28 0.03TWD ZHEN DING TECHNOLO TWD10 11 215.00 25 880.51 0.01Total Taiwan 39 510 982.12 12.07
Thailand
THB BANGKOK BANK THB10(ALIEN MKT) 28 000.00 120 216.76 0.04THB BANPU PUBLIC CO THB1(ALIEN MKT) 71 000.00 31 568.71 0.01THB BEC WORLD THB1(ALIEN MKT) 142 220.00 120 542.17 0.04THB BTS GROUP HOLDINGS THB4(ALIEN MKT) 406 600.00 102 822.29 0.03THB BUMRUNGRAD HOPTL THB1(ALIEN MKT) 25 100.00 147 175.21 0.04THB CHAROEN POK FOODS THB1(ALIEN MKT) 397 000.00 201 892.45 0.06THB CP ALL PLC THB1(ALIEN MKT) 493 910.00 538 723.56 0.16THB GLOW ENERGY THB10(ALIEN MKT) 34 212.00 70 353.98 0.02THB HOME PRODUCT CENTE THB1(ALIEN MKT) 622 717.00 117 673.35 0.04THB INDORAMA VENTURES THB1(ALIEN MKT) 148 211.00 87 728.06 0.03THB IRPC PUBLIC CO LTD THB1(ALIEN MKT) 1 361 639.00 162 708.01 0.05THB KASIKORNBANK PLC THB10 (ALIEN MKT) 154 000.00 639 794.36 0.19THB KRUNG THAI BNK LTD THB5.15(ALIEN MKT) 339 923.00 157 752.23 0.05THB MINOR INTL THB1(ALIEN MKT) 264 660.00 266 609.00 0.08THB PTT EXPLORTN & PRD THB1(ALIEN MKT) 116 711.00 185 680.28 0.06THB PTT PUBLIC COMPANY THB10(ALIEN MARKET) 101 399.00 687 546.36 0.21THB SIAM CEMENT CO THB1(ALIEN MKT) 7 200.00 91 238.02 0.03THB SIAM COMMERCIAL BK THB10 (ALIEN MKT) 38 200.00 126 855.63 0.04THB THAI OIL PLC THB10(ALIEN MKT) 72 186.00 132 396.16 0.04Total Thailand 3 989 276.59 1.22
Description Quantity/ Valuation in USD as a % Nominal Unrealized gain of net (loss) on Futures/ assets Forward Exchange Contracts/ Swaps (Note 1)

The notes are an integral part of the fi nancial statements. 21
UBS (Lux) Institutional SICAV – Emerging Markets Equity PassiveAnnual Report as of 31 December 2015
Description Quantity/ Valuation in USD as a % Nominal Unrealized gain of net (loss) on Futures/ assets Forward Exchange Contracts/ Swaps (Note 1)
Turkey
TRY AKBANK TRY1 181 978.33 417 717.53 0.13TRY ANADOLU EFES TRY1 17 935.00 116 070.42 0.03TRY ARCELIK TRY1 21 093.00 100 953.87 0.03TRY BIM BIRLESIK MAGAZ TRY1 20 338.00 357 797.18 0.11TRY COCA-COLA ICECEK TRY1 11 055.00 140 665.91 0.04TRY EMLAK KONUT GYO TRY1 84 575.00 75 336.18 0.02TRY ENKA INSAAT TRY1 58 041.00 89 879.69 0.03TRY EREGLI DEMIR CELIK TRY1 139 033.00 144 803.71 0.04TRY FORD OTOSAN TRY1 2 074.00 21 515.57 0.01TRY KOC HLDG TRY1 92 790.00 347 463.80 0.11TRY SABANCI HOLDINGS TRY1 89 234.00 253 133.09 0.08TRY T IS BANKASI SER’C’TRY1 127 977.00 201 687.03 0.06TRY T SISE VE CAM FABR TRY1 60 932.00 66 592.35 0.02TRY TAV HAVALIMANLARI TRY1 24 518.00 152 793.88 0.05TRY TOFAS OTOMOBIL FAB TRY1 13 382.00 86 879.73 0.03TRY TUPRAS(T PETR RAF) TRY1 10 637.00 253 639.34 0.08TRY TURK HAVA YOLLARI TRY1 35 098.00 88 861.78 0.03TRY TURK TELEKOMUNIKAS TRY1 86 030.00 160 927.69 0.05TRY TURKCELL ILETISIM TRY1 93 040.00 315 568.12 0.10TRY TURKIYE HALK BANKA TRY1 71 252.00 253 630.12 0.08TRY TURKIYE VAKIFLAR TRY1 62 349.00 81 811.90 0.01TRY YAPI KREDI BANKASI TRY1 38 526.00 43 424.82 0.01Total Turkey 3 771 153.71 1.15
United Arab Emirates
AED ABU DHABI COMM.BK. AED1 231 642.00 415 605.98 0.13AED ALDAR PROPERTIES AED1 321 948.00 203 354.03 0.06AED ARABTEC HOLDING P. AED1 188 375.00 64 108.02 0.02USD DP WORLD USD2.00 16 980.00 344 694.00 0.10AED DUBAI FINANCIAL AED1 91 849.00 30 758.04 0.01AED DUBAI ISLAMIC BANK AED1 96 714.00 162 725.98 0.05AED EMAAR MALLS GROUP AED1 125 509.00 94 311.15 0.03AED EMAAR PROPERTIES AED1 312 825.00 484 610.47 0.15AED ETISALAT AED1 129 192.00 566 292.19 0.17AED FIRST GULF BANK AED1 77 903.00 268 301.92 0.08AED NATIONAL BANK OF ABU DHABI AED1 88 995.00 192 866.92 0.06Total United Arab Emirates 2 827 628.70 0.86
United States
USD SOUTHERN COPPER CO COM USD0.01 12 127.00 316 757.24 0.10Total United States 316 757.24 0.10
Total Bearer shares 292 094 665.59 89.24
Participation certificates
Mexico
MXN CEMEX SAB DE CV CPO NPV(REP 2’A’ & 1’B’) 1 185 600.00 647 334.31 0.20Total Mexico 647 334.31 0.20
Total Participation certificates 647 334.31 0.20
Other shares
Brazil
BRL BANCO SANTANDER(BR UNITS (COMB OF COM+PRF+REC) 58 800.00 238 395.45 0.07BRL KLABIN SA UNITS (1 COM & 4 PRF) 41 600.00 246 576.94 0.08BRL SUL AMERICA SA UNITS (1 COM SHS & 2 PREFS) 21 842.00 102 743.66 0.03BRL TRANSMISSORA ALIAN UNITS (1 COM & 2 PRF) 15 200.00 64 353.87 0.02Total Brazil 652 069.92 0.20
Total Other shares 652 069.92 0.20
Preference shares
Brazil
BRL BCO BRADESCO SA PRF NPV 225 878.00 1 100 771.65 0.34BRL BRASKEM S.A. PRF’A’ NPV 8 600.00 60 039.68 0.02BRL CEMIG CIA ENERG MG PRF BRL0.01 74 480.00 115 402.82 0.03BRL CENTRAIS ELETRICAS BRASILEIRAS SA PRF’B’NPV 37 553.00 99 097.21 0.03BRL CESP CIA ENERGETICA DE SAN PAOLO SA-B 21 900.00 74 176.30 0.02BRL CIA BRAS DE DISTRI PRF NPV 13 489.00 142 723.42 0.04BRL COPEL PARANA ENERG PRF’B’NPV 15 500.00 95 203.79 0.03BRL GERDAU SA SIDERURG PRF NPV 87 304.00 102 613.23 0.03BRL ITAU UNIBANCO HOLDING SA PRF NPV 278 110.00 1 850 903.33 0.57BRL ITAUSA INV ITAU SA PRF NPV 334 199.00 581 178.92 0.18BRL LOJAS AMERICANAS S PRF NPV 48 291.00 236 801.36 0.07BRL PETROL BRASILEIROS PRF NPV 348 236.00 589 745.64 0.18BRL REFINARIA PETROLEO IPIRANGA PRF NPV 474.00 119.81 0.00BRL TELEFONICA BRASIL PRF NPV 36 011.00 325 407.46 0.10BRL VALE SA PRF’A’NPV 179 997.00 466 342.94 0.14Total Brazil 5 840 527.56 1.78
Chile
CLP EMBOTELLA ANDINA PRF’B’NPV 40 870.00 121 571.82 0.04Total Chile 121 571.82 0.04
Colombia
COP BANCOLOMBIA SA-PREF 31 171.00 212 094.35 0.06COP GPO DE INVERSIONES PRF STK COP187.50 15 832.00 173 556.00 0.05COP GRUPO AVAL ACCIONE PRF COP1 252 978.00 86 862.81 0.03Total Colombia 472 513.16 0.14

22 The notes are an integral part of the fi nancial statements.
UBS (Lux) Institutional SICAV – Emerging Markets Equity PassiveAnnual Report as of 31 December 2015
Description Quantity/ Valuation in USD as a % Nominal Unrealized gain of net (loss) on Futures/ assets Forward Exchange Contracts/ Swaps (Note 1)
India
INR ZEE ENTERTAIN ENT 6% CUM RED NON-CONV PRF 1 627 668.00 22 143.05 0.01Total India 22 143.05 0.01
South Korea
KRW HYUNDAI MOTOR CO 2ND PRF KRW5000 3 830.00 342 970.45 0.11KRW HYUNDAI MOTOR CO PRF KRW5000 3 150.00 276 704.62 0.08KRW LG CHEMICAL PRF KRW5000 805.00 169 574.86 0.05KRW SAMSUNG ELECTRONIC PFD KRW5000 1 933.00 1 798 561.26 0.55Total South Korea 2 587 811.19 0.79
Total Preference shares 9 044 566.78 2.76
Registered shares
South Africa
ZAR ANGLOGOLD ASHANTI ZAR0.25 42 408.00 290 811.79 0.09Total South Africa 290 811.79 0.09
Thailand
THB ADVANCED INFO SERV THB1(ALIEN MKT) 108 885.00 459 928.30 0.14THB PTT GLOBAL PUBLIC CO LTD THB10(ALIEN MKT) 184 104.00 255 806.59 0.08Total Thailand 715 734.89 0.22
Turkey
TRY T GARANTI BANKASI TRY1 203 602.00 496 649.79 0.15Total Turkey 496 649.79 0.15
Total Registered shares 1 503 196.47 0.46
Depository receipts
China
USD 58.COM INC ADR EACH REPR 2 COM 2 900.00 191 284.00 0.06USD ALIBABA GROUP HLDG SPON ADS EACH REP ONE ORD-ADR 46 500.00 3 779 055.00 1.16USD BAIDU INC ADS EACH REPR 10 ORD CLS’A 12 800.00 2 419 712.00 0.74USD CTRIP.COM INTL LTD ADS EA REP 0.25 ORD USD0.01 11 800.00 546 694.00 0.17USD JD.COM INC ADS EA REPR 2 COM ‘A’ SHS 11 200.00 361 368.00 0.11USD NETEASE INC ADR REP 25 COM USD0.0001 3 500.00 634 340.00 0.19USD NEW ORIENTAL ED & TECH GRP INC SPON ADR 3 400.00 106 658.00 0.03USD QIHOO 360 TECHNOLO ADS EA REPR 2 CL’A’ ORD 3 900.00 283 959.00 0.09USD SOUFUN HLDGS LTD ADR EACH REPR 4 CL A ORD SH 14 800.00 109 372.00 0.03USD VIPSHOP HLDGS LTD SPON ADR EA REPR 2 ORD SHS 12 300.00 187 821.00 0.06USD YOUKU TUDOU INC SPON ADR EA REPR 18 CL A 5 300.00 143 789.00 0.04Total China 8 764 052.00 2.68
Egypt
USD COMMERCIAL INTL BK GDR REP 1 ORD EGP10 (REG’S)-GDR 104 593.00 449 749.90 0.14USD GLOBAL TELECOM HLD GDR EA REP 5 EGP1 REG’S’ 32 578.00 42 351.40 0.01Total Egypt 492 101.30 0.15
India
USD DR REDDYS LABS ADS EACH REPR 1 ORD INR5 3 800.00 175 902.00 0.05Total India 175 902.00 0.05
Peru
USD COMPANIA DE MINAS BUENAVENTURA SPONSORED ADR 13 528.00 57 899.84 0.02Total Peru 57 899.84 0.02
Russian Federation (CIS)
USD JSFC SISTEMA SPON GDR REG S 26 665.00 157 323.50 0.05USD MAGNIT GDR(5 GDRS REP 1 ORD) REGS 25 550.00 1 027 621.00 0.31USD MEGAFON(OJSC) GDR EACH REPR 1 ORD REG S 7 294.00 84 975.10 0.03USD MOBILE TELESYSTEMS OJSC SPONSORED ADR 55 950.00 345 771.00 0.11USD NOVATEK OAO GDR EACH REPR 10 SHS’REG S’ 8 732.00 717 333.80 0.22USD ROSTELECOM ADR EA REP 6 RUB LEV II 9 370.00 69 216.19 0.02Total Russian Federation (CIS) 2 402 240.59 0.74
Thailand
THB AIRPORTS OF THAILA THB10(NVDR) 38 700.00 372 105.04 0.11THB BANGKOK DUSIT MEDI THB0.1(NVDR) 382 000.00 236 726.41 0.07THB BANPU PUBLIC CO THB1(NVDR) 104 800.00 46 597.19 0.02THB CENT PATTANA PUB THB0.5(NVDR) 219 000.00 286 035.85 0.09THB SIAM CEMENT CO THB1(NVDR) 28 600.00 365 596.78 0.11THB SIAM COMMERCIAL BK THB10 (NVDR) 107 735.00 357 769.42 0.11THB TRUE CORPORATION THB10 (NVDR) 762 000.00 141 875.78 0.04Total Thailand 1 806 706.47 0.55
Total Depository receipts 13 698 902.20 4.19
Investment funds, closed end
South Africa
ZAR FORTRESS INCOME FUND LTD-B ZAR 68 886.00 154 838.46 0.05Total South Africa 154 838.46 0.05
Total Investment funds, closed end 154 838.46 0.05
Rights
Brazil
BRL BANCO BRADESCO SA RIGHTS 05.02.16 2 347.00 771.21 0.00BRL BANCO BRADESCO SA RIGHTS 05.02.16 7 399.00 3 871.33 0.00Total Brazil 4 642.54 0.00
The notes are an integral part of the fi nancial statements. 23
UBS (Lux) Institutional SICAV – Emerging Markets Equity PassiveAnnual Report as of 31 December 2015
Description Quantity/ Valuation in USD as a % Nominal Unrealized gain of net (loss) on Futures/ assets Forward Exchange Contracts/ Swaps (Note 1)
Hong Kong
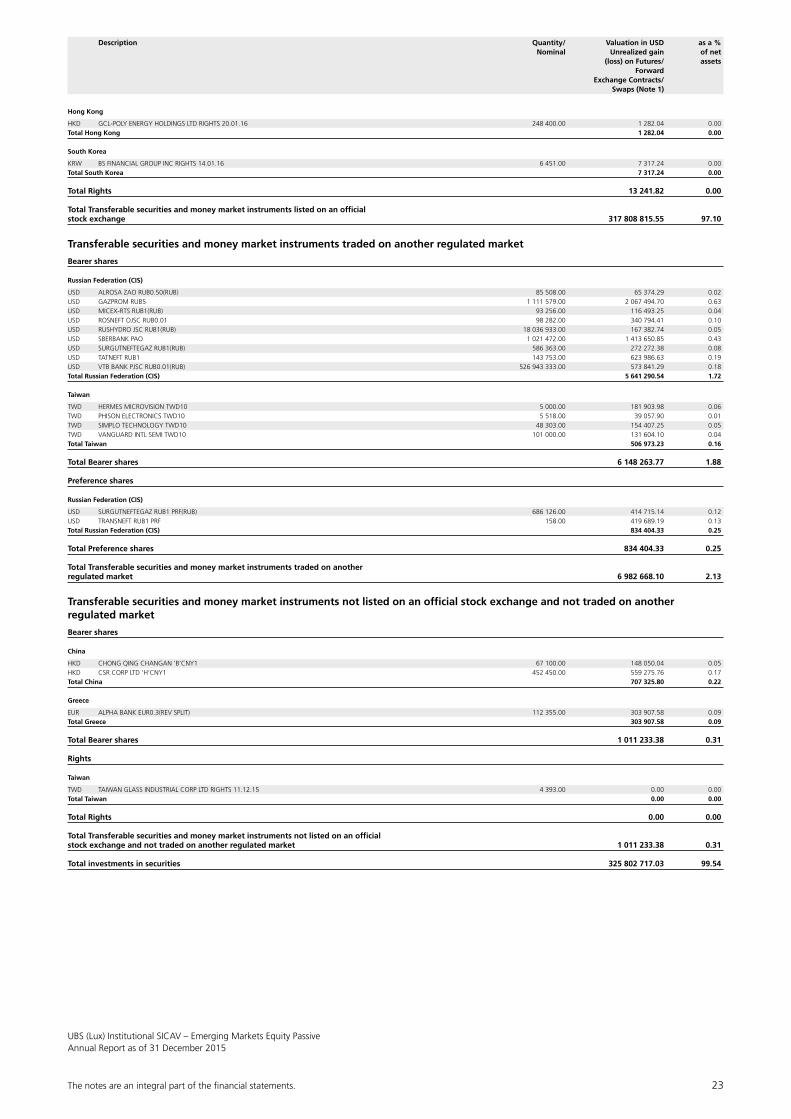
HKD GCL-POLY ENERGY HOLDINGS LTD RIGHTS 20.01.16 248 400.00 1 282.04 0.00Total Hong Kong 1 282.04 0.00
South Korea
KRW BS FINANCIAL GROUP INC RIGHTS 14.01.16 6 451.00 7 317.24 0.00Total South Korea 7 317.24 0.00
Total Rights 13 241.82 0.00
Total Transferable securities and money market instruments listed on an official stock exchange 317 808 815.55 97.10
Transferable securities and money market instruments traded on another regulated market
Bearer shares
Russian Federation (CIS)
USD ALROSA ZAO RUB0.50(RUB) 85 508.00 65 374.29 0.02USD GAZPROM RUB5 1 111 579.00 2 067 494.70 0.63USD MICEX-RTS RUB1(RUB) 93 256.00 116 493.25 0.04USD ROSNEFT OJSC RUB0.01 98 282.00 340 794.41 0.10USD RUSHYDRO JSC RUB1(RUB) 18 036 933.00 167 382.74 0.05USD SBERBANK PAO 1 021 472.00 1 413 650.85 0.43USD SURGUTNEFTEGAZ RUB1(RUB) 586 363.00 272 272.38 0.08USD TATNEFT RUB1 143 753.00 623 986.63 0.19USD VTB BANK PJSC RUB0.01(RUB) 526 943 333.00 573 841.29 0.18Total Russian Federation (CIS) 5 641 290.54 1.72
Taiwan
TWD HERMES MICROVISION TWD10 5 000.00 181 903.98 0.06TWD PHISON ELECTRONICS TWD10 5 518.00 39 057.90 0.01TWD SIMPLO TECHNOLOGY TWD10 48 303.00 154 407.25 0.05TWD VANGUARD INTL SEMI TWD10 101 000.00 131 604.10 0.04Total Taiwan 506 973.23 0.16
Total Bearer shares 6 148 263.77 1.88
Preference shares
Russian Federation (CIS)
USD SURGUTNEFTEGAZ RUB1 PRF(RUB) 686 126.00 414 715.14 0.12USD TRANSNEFT RUB1 PRF 158.00 419 689.19 0.13Total Russian Federation (CIS) 834 404.33 0.25
Total Preference shares 834 404.33 0.25
Total Transferable securities and money market instruments traded on another regulated market 6 982 668.10 2.13
Transferable securities and money market instruments not listed on an official stock exchange and not traded on another regulated market
Bearer shares
China
HKD CHONG QING CHANGAN ‘B’CNY1 67 100.00 148 050.04 0.05HKD CSR CORP LTD ‘H’CNY1 452 450.00 559 275.76 0.17Total China 707 325.80 0.22
Greece
EUR ALPHA BANK EUR0.3(REV SPLIT) 112 355.00 303 907.58 0.09Total Greece 303 907.58 0.09
Total Bearer shares 1 011 233.38 0.31
Rights
Taiwan
TWD TAIWAN GLASS INDUSTRIAL CORP LTD RIGHTS 11.12.15 4 393.00 0.00 0.00Total Taiwan 0.00 0.00
Total Rights 0.00 0.00
Total Transferable securities and money market instruments not listed on an official stock exchange and not traded on another regulated market 1 011 233.38 0.31
Total investments in securities 325 802 717.03 99.54

24 The notes are an integral part of the fi nancial statements.
UBS (Lux) Institutional SICAV – Emerging Markets Equity PassiveAnnual Report as of 31 December 2015
Description Quantity/ Valuation in USD as a % Nominal Unrealized gain of net (loss) on Futures/ assets Forward Exchange Contracts/ Swaps (Note 1)
Derivative instruments
Derivative instruments listed on an official stock exchange
Financial Futures on Indices
USD MINI MSCI EMERGING MARKETS INDEX FUTURE 18.03.16 18.00 25 110.00 0.01Total Financial Futures on Indices 25 110.00 0.01
Total Derivative instruments listed on an official stock exchange 25 110.00 0.01
Total Derivative instruments 25 110.00 0.01
Cash at banks deposits on demand and deposit accounts and other liquid assets 1 018 936.93 0.31Bank overdraft and other short-term liabilities -72.18 0.00Other assets and liabilities 464 501.68 0.14
Total net assets 327 311 193.46 100.00
The notes are an integral part of the fi nancial statements. 25
UBS (Lux) Institutional SICAV – Global Allocation EuropeAnnual Report as of 31 December 2015
Most important figures
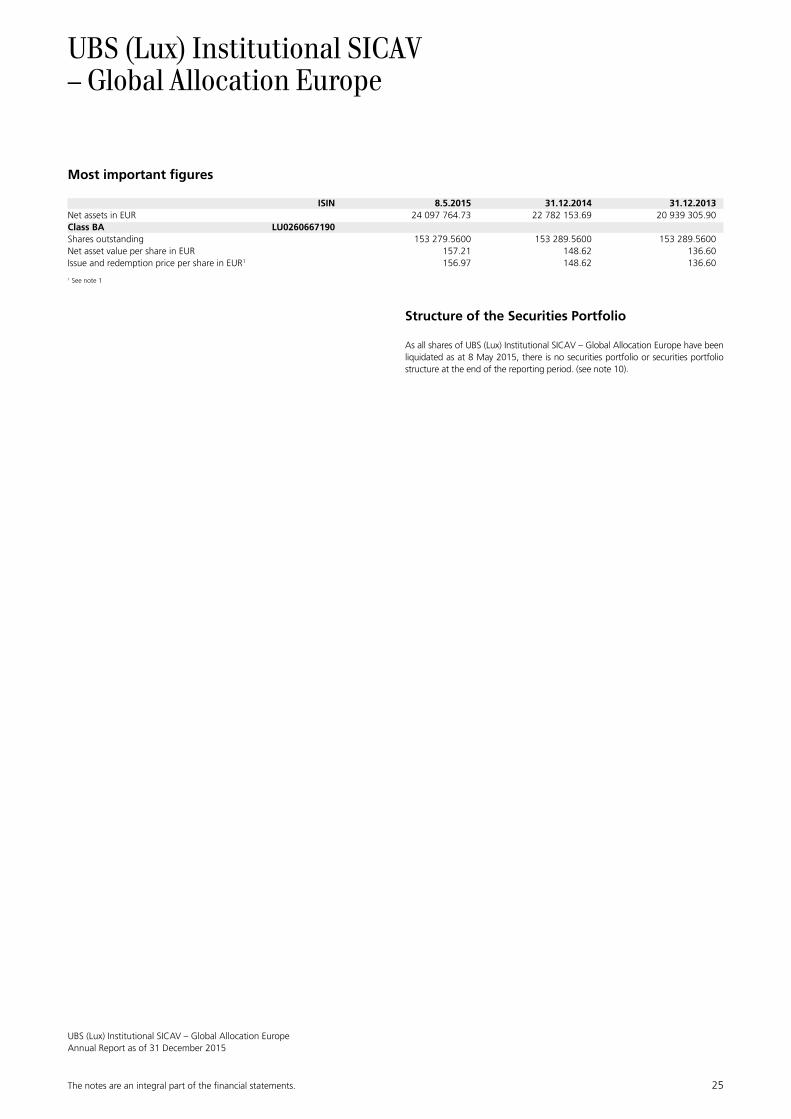
ISIN 8.5.2015 31.12.2014 31.12.2013Net assets in EUR 24 097 764.73 22 782 153.69 20 939 305.90Class BA LU0260667190Shares outstanding 153 279.5600 153 289.5600 153 289.5600Net asset value per share in EUR 157.21 148.62 136.60Issue and redemption price per share in EUR1 156.97 148.62 136.60
1 See note 1
Structure of the Securities Portfolio
As all shares of UBS (Lux) Institutional SICAV – Global Allocation Europe have been liquidated as at 8 May 2015, there is no securities portfolio or securities portfolio structure at the end of the reporting period. (see note 10).
UBS (Lux) Institutional SICAV– Global Allocation Europe

26 The notes are an integral part of the fi nancial statements.
UBS (Lux) Institutional SICAV – Global Allocation EuropeAnnual Report as of 31 December 2015
Statement of Operations EURIncome 1.1.2015-31.12.2015Interest on liquid assets 563.57Interest on securities 60 926.77Dividends 71.14Income on securities lending 862.48Other income (Note 4) 91 942.48Total income 154 366.44
ExpensesFlat fee (Note 2) -5 406.59Taxe d’abonnement (Note 3) -158.38Other commissions and fees (Note 2) -4 228.54Cost on securities lending -344.99Interest on cash and bank overdraft -148.16Total expenses -10 286.66
Net income (loss) on investments 144 079.78
Realized gain (loss) (Note 1)Realized gain (loss) on market-priced securities without options 5 184 622.28Realized gain (loss) on options 6 157.44Realized gain (loss) on yield-evaluated securities and money market instruments -472.82Realized gain (loss) on financial futures 403 366.88Realized gain (loss) on forward foreign exchange contracts -1 872 910.29Realized gain (loss) on foreign exchange 153 519.41Total realized gain (loss) 3 874 282.90
Net realized gain (loss) of the financial year 4 018 362.68
Changes in unrealized appreciation (depreciation) (Note 1)Unrealized appreciation (depreciation) on market-priced securities without options -3 223 479.15Unrealized appreciation (depreciation) on options 2 436.22Unrealized appreciation (depreciation) on yield-evaluated securities and money market instruments 240.92Unrealized appreciation (depreciation) on financial futures -163 215.97Unrealized appreciation (depreciation) on forward foreign exchange contracts 682 821.44Total changes in unrealized appreciation (depreciation) -2 701 196.54
Net increase (decrease) in net assets as a result of operations 1 317 166.14
Statement of Changes in Net Assets EUR 1.1.2015-31.12.2015Net assets at the beginning of the financial year 22 782 153.69Redemptions -24 099 319.83 Total net subscriptions (redemptions) -24 099 319.83Net income (loss) on investments 144 079.78Total realized gain (loss) 3 874 282.90Total changes in unrealized appreciation (depreciation) -2 701 196.54 Net increase (decrease) in net assets as a result of operations 1 317 166.14Net assets at the end of the financial year 0.00
Changes in the Number of Shares outstanding
1.1.2015-31.12.2015Class BANumber of shares outstanding at the beginning of the financial year 153 289.5600Number of shares issued 0.0000Number of shares redeemed -153 289.5600Number of shares outstanding at the end of the financial year 0.0000

The notes are an integral part of the fi nancial statements. 27
UBS (Lux) Institutional SICAVAnnual Report as of 31 December 2015
Note 1 – Summary of significant accountingpolicies
The financial statements have been prepared in accor-dance with the generally accepted accounting principles for investment funds in Luxembourg. The significant accounting policies are summarised as follows:
a) Calculation of the Net Asset ValueThe net asset value and the issue and redemption price per share of the different classes of any subfund are expressed in the currency of account of the subfund or the share class concerned and are calculated every business day by dividing the overall net assets of the subfund to which the respective share class is assigned by the number of shares outstanding in the relevant class of this subfund.
In this context, “business day” refers to the normal bank business days (i.e. each day on which banks are open during normal business hours) in Luxembourg, except individual, non-statutory rest days and days on which stock exchanges in the main countries in which the subfund invests are closed or 50% or more subfund investments cannot be adequately valued. “Non-statutary rest days” are days, on which several banks and financial institutions are closed.
The percentage of the overall net asset value to be assigned to a subfund’s share class is determined by the relationship between the shares issued in each class and the total number of shares issued by the subfund. This percentage rate changes in accordance with distributions made and the issue and redemption of shares as follows: – Each time a distribution is made on shares of the follow-ing classes “AD-T2”, the net asset value and issue and redemption price of shares in this class are reduced by the amount of the distribution (which leads to a reduction in the percentage of the net asset value attributed to the class concerned). Meanwhile the net asset value of the other share classes remains the same (leading to an increase in the percentage of the net asset value attributed to these classes).
– Each time shares are issued or redeemed, the net asset value attributable to the share class concerned is increased or reduced by the amount received or paid out.
If the total subscriptions or redemptions affecting all share classes of a subfund on a single trading day comes to a net capital inflow or outflow, the net asset value of the subfund may be increased or reduced respectively
(Swinging Single Pricing, “SSP”). The maximum adjust-ment amounts to 2% of the net asset value. Esti-mated transaction costs and tax charges that may be incurred by the subfund as well as the estimated bid/offer spread of the assets in which the subfunds invests may be taken into account. The adjustment leads to an increase in net asset value if the net movements result in a rise in all shares of a subfund. It results in a reduc-tion of net asset value if the net movements bring about a fall in the shares. This consists of the net movement on a trading day in relation to the net assets of the subfund concerned. The net asset value would be adjusted only if this threshold was to be passed on a trad-ing day. When deciding about the introduction of SSP, the board of directors shall decide which subfunds will be affected. subfund for which SSP is introduced will not have transaction fees payable and vice-versa.
b) Valuation principles – The value of any cash is deemed to be the full amount thereof, unless in any case the same is unlikely to be paid or received in full, in which case the value thereof is arrived at after making such discount as may be considered appropriate in such case to reflect the true value thereof.
Securities, derivatives and other investments listed on an official stock exchange are valued at the last known market prices. If the same security, derivative or other investment is quoted on several stock exchanges, the last available quotation on the stock exchange that represents the major market for this investment will apply.
– In the case of securities, derivatives and other investments where trading of these assets on the stock exchange is thin but which are traded between securities dealers on a secondary market using stan-dard market price formation methods, the Company can use the prices on this secondary market as the basis for their valuation of these securities and other investments. Securities, derivatives and other investments that are not listed on a stock exchange, but that are traded on another regulated market which is recognised, open to the public and operates regularly, in a due and orderly fashion, are valued at the last available price on this market.
– Securities and other investments that are not listed on a stock exchange or traded on any other regulated market, and for which no reliable and appropriate price can be obtained, will be valued by the Company according to other principles chosen by it in good faith on the basis of the likely sales prices.
Notes to the Financial Statements

28 The notes are an integral part of the fi nancial statements.
UBS (Lux) Institutional SICAVAnnual Report as of 31 December 2015
– The valuation of derivatives that are not listed on a stock exchange (OTC derivatives) is made by reference to independent pricing sources. In case only one independent pricing source of a derivative is available, the plausibility of the valuation price obtained will be verified by employing methods of calculation recognised by the Company, based on the market value of the underlying instrument from which the derivative has been derived.
– Units or shares of other undertakings for collective investment in transferable securities (“UCITS”) and/or undertakings for collective investment (“UCIs”) will be valued at their last net asset value. Certain units or shares of other UCITS and/or UCIs may be valued based on an estimate of the value provided by a reliable price provider independent from the target fund’s investment manager or investment adviser (Estimated Pricing).
– The value of money market instruments which are not listed on a stock exchange or traded on another regulated market open to the public is based on the appropriate curves. The valuation based on the curves refers to the interest rate and credit spread components. The following principles are applied in this process: for each money market instrument, the interest rates nearest the residual maturity are interpolated. The interest rate calculated in this way is converted into a market price by adding a credit spread that reflects the underlying borrower. This credit spread is adjusted if there is a significant change in the credit rating of the borrower.
Interest income earned by subfunds between the Order Date concerned and the respective Settlement Date is included in the valuation of the assets of the subfunds concerned. The asset value per share on a given valuation date therefore includes projected interest earnings.
– Securities, money market instruments, derivatives and other investments that are denominated in a currency other than the currency of account of the relevant subfund and which are not hedged by means of currency transactions are valued at the middle currency rate (midway between the bid and offer rate) known in Luxembourg or, if not available, on the most representative market for this currency.
– Time deposits and fiduciary investments are valued at their nominal value plus accumulated interest.
– The value of swap transactions is calculated by an external service provider, and a second independent valuation is made available by another external service provider. The calculation is based on the net present value of all cash flows, both inflows and outflows. In some specific cases, internal calculations based on models and market data available from Bloomberg and/or broker statement valuations may be used. The valuation methods depend on the respective security and are determined pursuant to the UBS Global Valuation Policy.
The Company is authorised to apply other generally recognized and auditable valuation criteria in order to achieve an appropriate valuation of the net assets if, due to extraordinary circumstances, a valuation in accordance with the above-mentioned regulations proves to be unfeasible or inaccurate.
In the case of extraordinary circumstances, additional valuations, which will affect the prices of the shares to be subsequently issued or redeemed, may be carried out within one day.
c) Valuation of forward foreign exchange contractsThe unrealized gain (loss) of outstanding forward foreign exchange contracts is valued on the basis of the forward exchange rates prevailing at valuation date.
d) Valuation of financial futures contractsFinancial futures contracts are valued based on the lat-est available published price applicable on the valuation date. Realized gains and losses and the changes in unre-alized gains and losses are recorded in the statement of operations. The realized gains and losses are calculated in accordance with the FIFO method, i.e. the first contracts acquired are regarded as the first to be sold.
e) Net realized gains (losses) on sales of securitiesThe realized gains or losses on the sales of securities are calculated on the basis of the average cost of the securities sold.
f) Conversion of foreign currenciesBank accounts, other net assets and the valuation of the investments in securities, derivatives and other investments held denominated in currencies other than the reference currency of the different subfunds are converted at the mid closing spot rates on the valuation date. Income and expenses denominated in currencies other than the currency of the different subfunds are converted at the mid closing spot rates at payment date. Gain or loss on foreign exchange is included in the statement of operations.
The cost of securities denominated in currencies other than the reference currency of the different subfunds is converted at the mid closing spot rate on the day of acquisition.
g) Accounting of securities’ portfolio transactionsThe securities’ portfolio transactions are accounted for the bank business day following the transaction dates.
h) Consolidated financial statementsThe consolidated financial statements are expressed in EUR. The various items of the consolidated statement of net assets and the consolidated statement of operations at 31 December 2015 of the investment company are equal to the sum of the corresponding items in the financial statements of each subfund converted into EUR at the following exchange rates.

The notes are an integral part of the fi nancial statements. 29
UBS (Lux) Institutional SICAVAnnual Report as of 31 December 2015
The following exchange rate was used for the conversion of the consolidated financial statements as of 31 December 2015:
Exchange rate
EUR 1 = USD 1.086300
For the liquidated or merged subfunds, the exchange rate used for the conversion of the consolidated financial statements is the one as at liquidation or merger date.
i) Receivable on securities sales,Payable on securities purchasesThe account ”Receivable on securities sales” can also include receivables from foreign currency transactions. The account ”Payable on securities purchases” can also include payables from foreign currency transactions.
j) Income recognitionDividends, net of withholding taxes, are recognized as income on the date upon which the relevant securities are first listed as “ex-dividend”. Interest income is accrued on a daily basis.
k) SwapsThe Company may enter into interest rate swap contracts, forward rate agreements on interest rates swaptions and credit default swaps, if they are executed with first-class financial institutions that specialize in transactions of this kind.
The valuation methods depend on the respective security and are determined pursuant to the UBS Global Valuation Policy. This valuation method is approved by the Board of Directors of the Management Company. Changes in unrealized profits and losses are reflected in the statement of operations under “Unrealized apprecia-tion (depreciation) on Swaps”.
Gains or losses on swaps incurred when closed-out or matured are recorded as “Realized gain (loss) on Swaps” in the statement of operations. The Management Company is authorised to apply other generally recognised and auditable valuation criteria in good faith in order to achieve an appropriate determination of the valuation of the net asset value if, due to extraor-dinary circumstances, a valuation in accordance with the aforementioned regulations proves to be unfeasible or inaccurate.
Note 2 – Expenses paid by the Company
The Company will bear all the costs incurred in connec-tion with the management, administration, portfolio management, distribution and safekeeping of the subfunds’ assets and the sale of the subfunds as listed below:
UBS (Lux) Institutional Share classes Maximum Fee TransactionSICAV per annum4) fee
– Emerging Markets AA1) and AA-T11) max. 0.63% max. 1.00%5)
Equity Passive* BA2) and BD-UK2) max. 0.18% max. 1.00%5)
FA3) and XA3) none max. 1.00%5)
– Global Allocation Europe AA1) and AA-T11) max. 0.915% none BA2) max. 0.065% none FA3) and XA3) none none AD-T21) max. 0.665% none
* Costs in connection to the index license payments may occur and will be charged at subfund’s level.
1) For these share classes, the portfolio management, the custodian and distribution fees are charged at the subfund’s level, in addition to operational and administrative expenses, calculated on the average net assets attributable to the relevant share class and payable monthly.
2) For these share classes, the portfolio management and distribution fees are charged outside the Company, directly at the level of the agreement concluded by the investor with UBS Asset Management or one of its authorised delegates. Share classes BA and BD-UK only bear operational and administrative expenses. If a shareholder terminates the agreement with UBS Asset Management or one of its authorised delegates, the net asset value of the shares will be redeemed to the shareholder.
3) For these share classes, the fees for portfolio management, distribution, custody and administration are charged outside the Company, directly at the level of the agreement concluded by the investor with UBS Asset Management or one of its authorised delegates. If a shareholder terminates the agreement with UBS Asset Management or one of its authorised delegates, the net asset value of the shares will be redeemed to the shareholder.
4) Calculated on the average total net assets of the share-classes and paid monthly.5) Instead of a swinging single pricing the investors are subject to a transaction fee on all purchases and
redemptions of shares. The proceeds of the transaction fee are retained by the subfund to offset trading costs associated with purchase and redemptions to protect the other clients from asset dilution. The transaction fee will be waived in case of a subscription or redemption in kind.
The fee rates mentioned above are those effective at year end.
In addition, the Company shall bear the following expenses: – all taxes which may be payable on the net assets or income and especially the “taxe d’abonnement”;
– the customary commissions usually incurred on security transactions;
– the costs which may be incurred for extraordinary steps or measures in particular expert opinions or lawsuits which might be necessary for the protection of the net assets;
– all costs relating to the setting-up of the Company; – the cost of preparing, depositing and publishing agree-ments and other documents concerning the Company, including fees for the notification of and registration with all authorities, the cost of preparing, translating, printing and distributing the periodical publications and all other documents which are required by the rel-evant legislation or regulations, the cost of preparing and distributing notifications to shareholders, the fees for the Auditor and legal advisers and all other similar expenses.
From 1 April 2015, the following regulations shall replace the respective provisions:
1. For the management, portfolio management and dis-tribution of the Company (if applicable), as well as for all the tasks of the Custodian Bank, such as the safe-keeping and supervision of the Company’s assets, the handling of payment transactions and all other tasks listed in the section “Custodian Bank and main pay-ing agent” of the sales prospectus, the Management Company receives from the Company’s assets a maximum flat fee based on the net asset value of the Company. This fee is charged to the Company’s assets on a pro rata basis upon every calculation of the net asset value and is paid on a monthly basis (maximum flat fee).

30 The notes are an integral part of the fi nancial statements.
UBS (Lux) Institutional SICAVAnnual Report as of 31 December 2015
2. The maximum flat fee does not include the following fees and additional expenses which are also charged to the Company:a) all additional expenses related to management of
the Company’s assets for the sale and purchase of assets (bid/offer spread, brokerage fees in line with the market, commissions, fees, etc.). These expenses are generally calculated upon the purchase or sale of the respective assets. In derogation hereto, these additional expenses, which arise through the sale and purchase of assets in connection with the sett-lement of the issue and redemption of units, are covered by the application of the single swing pri-cing principle pursuant to the section “Net asset value, issue, redemption and conversion price” of the sales prospectus;
b) fees of the supervisory authority for the establish-ment, modification, liquidation and merger of the Company, as well as all fees of the supervisory authorities and any stock exchanges on which the subfunds are listed;
c) auditor’s fees for the annual audit and certification in connection with the establishment, modification, liquidation and merger of the Company, as well as any other fees paid to the auditor for the services it provides in relation to the administration of the Fund and as permissible by law;
d) fees for legal and tax advisers, as well as notaries, in connection with the establishment, registration in distribution countries, modification, liquidation and merger of the Company, as well as for the general safeguarding of the interests of the Company and its investors, insofar as this is not expressly prohibi-ted by law;
e) costs for the publication of the Company’s net asset value and all costs for notices to investors, including translation costs;
f) costs for the Company’s legal documents (prospectu-ses, KIID, annual and semi-annual reports, as well as all other documents legally required in the countries of domiciliation and distribution);
g) costs for the Company’s registration with any foreign supervisory authorities, if applicable, including fees, translation costs and fees for the foreign representa-tive or paying agent;
h) expenses incurred through use of voting or creditors’ rights by the Company, including fees for external advisers;
i) costs and fees related to any intellectual property registered in the Company’s name or usufructuary rights of the Company;
j) all expenses arising in connection with any extraordi-nary measures taken by the Management Company, Portfolio Manager or Custodian Bank for protecting the interests of the investors;
k) if the Management Company participates in class-action suits in the interests of investors, it may charge the Company’s assets for the expenses arising in connection with third parties (e.g. legal and Custo-dian Bank costs). Furthermore, the Management Company may charge for all administrative costs, provided these are verifiable and disclosed, and taken into account in the disclosure of the Company’s total expense ratio (TER).
3. The Management Company may pay retrocessions in order to cover the distribution activities of the Company.
The costs involved in launching new subfunds will be writ-ten off over a period of up to five years in the respective subfunds only.
Operational and administrative expenses are allocated among the subfunds, the categories and the classes of shares pro rata to their respective net assets (or in a fair and reasonable manner as determined by the Company).
In the subfunds that may invest in existing funds, there may be charges at the level of the investment fund concerned as well as at the level of the subfund. The maximum fee, which can be charged at the level of the investment fund and of the Company is listed below:
UBS (Lux) Institutional SICAV Share Maximum classes Fee p.a.– Global Allocation Europe AA, AA-T1 1.5% BA 1.5% FA, XA 1.5% AD-T2 1.5%
When investing in shares of funds which are managed by UBS AG or a Company it controls, no issue or redemption commission is chargeable on subscription to or redemp-tion of these shares.
If subfunds invest in funds which refund either entirely or partly the fees charged to their assets by means of payment, such payments will be added in full to the assets of the subfunds concerned.
The details of expenses paid by the relevant subfunds are disclosed in the KIID.
Note 3 – Taxe d’abonnement
In accordance with the law and the regulations currently in force, the Company is subject to a subscription tax at the annual rate of 0.01%, payable quarterly and calculated on the basis of the net assets at the end of each quarter.
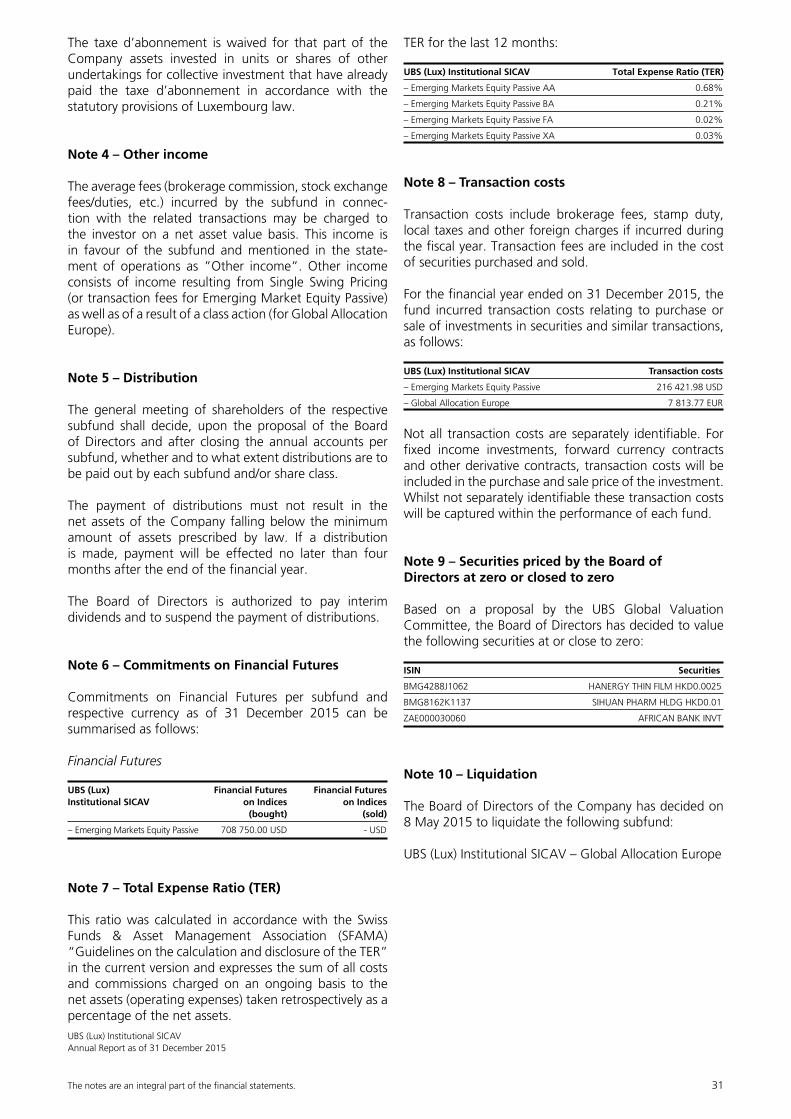
The notes are an integral part of the fi nancial statements. 31
UBS (Lux) Institutional SICAVAnnual Report as of 31 December 2015
The taxe d’abonnement is waived for that part of the Company assets invested in units or shares of other undertakings for collective investment that have already paid the taxe d’abonnement in accordance with the statutory provisions of Luxembourg law.
Note 4 – Other income
The average fees (brokerage commission, stock exchange fees/duties, etc.) incurred by the subfund in connec-tion with the related transactions may be charged to the investor on a net asset value basis. This income is in favour of the subfund and mentioned in the state-ment of operations as ”Other income”. Other income consists of income resulting from Single Swing Pricing (or transaction fees for Emerging Market Equity Passive) as well as of a result of a class action (for Global Allocation Europe).
Note 5 – Distribution
The general meeting of shareholders of the respective subfund shall decide, upon the proposal of the Board of Directors and after closing the annual accounts per subfund, whether and to what extent distributions are to be paid out by each subfund and/or share class.
The payment of distributions must not result in the net assets of the Company falling below the minimum amount of assets prescribed by law. If a distribution is made, payment will be effected no later than four months after the end of the financial year.
The Board of Directors is authorized to pay interim dividends and to suspend the payment of distributions.
Note 6 – Commitments on Financial Futures
Commitments on Financial Futures per subfund and respective currency as of 31 December 2015 can be summarised as follows:
Financial Futures
UBS (Lux) Financial Futures Financial FuturesInstitutional SICAV on Indices on Indices (bought) (sold)
– Emerging Markets Equity Passive 708 750.00 USD - USD
Note 7 – Total Expense Ratio (TER)
This ratio was calculated in accordance with the Swiss Funds & Asset Management Association (SFAMA) “Guidelines on the calculation and disclosure of the TER” in the current version and expresses the sum of all costs and commissions charged on an ongoing basis to the net assets (operating expenses) taken retrospectively as a percentage of the net assets.
TER for the last 12 months:
UBS (Lux) Institutional SICAV Total Expense Ratio (TER)
– Emerging Markets Equity Passive AA 0.68%
– Emerging Markets Equity Passive BA 0.21%
– Emerging Markets Equity Passive FA 0.02%
– Emerging Markets Equity Passive XA 0.03%
Note 8 – Transaction costs
Transaction costs include brokerage fees, stamp duty, local taxes and other foreign charges if incurred during the fiscal year. Transaction fees are included in the cost of securities purchased and sold.
For the financial year ended on 31 December 2015, the fund incurred transaction costs relating to purchase or sale of investments in securities and similar transactions, as follows:
UBS (Lux) Institutional SICAV Transaction costs
– Emerging Markets Equity Passive 216 421.98 USD
– Global Allocation Europe 7 813.77 EUR
Not all transaction costs are separately identifiable. For fixed income investments, forward currency contracts and other derivative contracts, transaction costs will be included in the purchase and sale price of the investment. Whilst not separately identifiable these transaction costs will be captured within the performance of each fund.
Note 9 – Securities priced by the Board of Directors at zero or closed to zero
Based on a proposal by the UBS Global Valuation Committee, the Board of Directors has decided to value the following securities at or close to zero:
ISIN Securities
BMG4288J1062 HANERGY THIN FILM HKD0.0025
BMG8162K1137 SIHUAN PHARM HLDG HKD0.01
ZAE000030060 AFRICAN BANK INVT
Note 10 – Liquidation
The Board of Directors of the Company has decided on 8 May 2015 to liquidate the following subfund:
UBS (Lux) Institutional SICAV – Global Allocation Europe

32 The notes are an integral part of the fi nancial statements.
UBS (Lux) Institutional SICAVAnnual Report as of 31 December 2015
Note 11 – Applicable law, place of performance and authoritative language
The Luxembourg District Court is the place of perfor-mance for all legal disputes between the shareholders, the Company and the custodian bank. Luxembourg law applies. However, in matters concerning the claims of investors from other countries, the Company and/or the custodian bank can elect to make themselves and the Company subject to the jurisdiction of the countries in which the Company shares were bought and sold.
The English version of these financial statements is the authoritative version and only this version was audited from the independent auditor. However, in the case of shares sold to investors from the other countries in which Company shares can be bought and sold, the Company and the custodian bank may recognise approved transla-tions (i.e. approved by the Company and the custodian bank) into the languages concerned as binding upon themselves and the Company.

UBS (Lux) Institutional SICAVAnnual Report as of 31 December 2015
33
Risk managementRisk management in accordance with the commitment approach and the value-at-risk approach is applied pursuant to the applicable laws and regulatory provisions.
LeverageLeverage is defined pursuant to the applicable ESMA directives as the total of the notional values of the derivatives used by the respective subfund. According to this definition, leverage may result in artificially increased leverage amounts, as some derivatives that can be used for hedging purposes may be included in the calculation. Conse-quently, this information does not necessarily reflect the precise actual leverage risk that the investor is exposed to.
UBS (Lux) Institutional SICAV Global risk calculation method
– Emerging Markets Equity Passive Commitment approach
Global Exposure (unaudited)

UBS (Lux) Institutional SICAVAnnual Report as of 31 December 2015
34
Facts and conditions (unaudited)
Valid as at 31 December 2015
All information subject to change at any time.
Keys to and explanations of the tables can be found on the following pages.
Flat fee
The flat fee covers all costs incurred in connection with asset management, distribution and fund administration (including fund management company, administrator and custodian bank), with the exception of the costs specified below, which are additionally charged to the subfunds. TTC (transaction and tax costs) and Other costs.
TTC (transaction and tax costs)
Estimated transaction and tax costs of transactions not created through subscriptions and redemptions. These costs also include well-founded estimates of implicit costs (e.g. bid/ask – difference).
Other costs
Costs charged directly to the subfunds (e.g. audit costs, supervisory fees, licence fees).
TER target funds
Total expense ratio (TER) of the underlying target funds as defined by the SFAMA.
Audited TER
Total expense ratio (TER) as defined by the SFAMA.
S / R method
Method used in subscriptions and redemptions of subfund units.
1) NAV Issue price = redemption price = NAV (NAV = net asset value).
2) Dil. protection = Protection against dilution - Issue price = NAV plus protection against dilution - Redemption price = NAV minus protection against dilution - Difference with NAV (= protection against dilution) always in favour of the subfund, in full, i.e. in favour of performance for investors.
3) SSP (swinging single pricing) - Issue price = redemption price = NAV plus swing factor if net subscriptions on the day of trading - Issue price = redemption price = NAV minus swing factor if net redemptions on the day of trading - Difference with NAV always in favour of the subfund, in full, i.e. in favour of performance for investors. - The swing factors are geared to the brokerage charged by third-party brokers, taxes and duties as well as the difference calculated between the bid/ask rates of transactions resulting in subscriptions or redemptions. A UBS committee comprising financial experts monitors the market on an ongoing basis and adjusts the swing factors where necessary. If the swing factors for net subscriptions and net redemptions are different, the mean is used.

UBS (Lux) Institutional SICAVAnnual Report as of 31 December 2015
35
S / R - In basis points
Difference between the issue (= subscription) price or redemption price and the NAV as a percentage of the NAV (application of dilution protection or swing factor).
Cut-off time
Point at which subscription and redemption of units close.
Forward pricing method
Forward Pricing 1 (FP 1) Forward Pricing 2 (FP 2)
Order entry day X (e.g. Monday) day X (e.g. Monday)
Closing prices on stock exchange day X (Monday) day X + 1 (Tuesday)
Price fixing and settlement day X + 1 (Tuesday) day X + 2 (Wednesday)Value date day X + 3 (Thursday) day X + 4 (Friday)
Other TER Audited S / R Forward Flat fee costs target funds TER TTC Total fees S / R in basis Cut-off pricingClass ISIN in % p.a. in % p.a. in % p.a. in % p.a. in % p.a. in% p.a. method points time method
UBS (Lux) Institutional SICAV – Emerging Markets Equity Passive Benchmark: MSCI EMMA Index
AA LU0322728865 0.6300 0.00 0.00 0.68 0.03 0.7100 VWS 31/33 15.00h Forward Pricing 2BA LU0322729327 0.1800 0.00 0.00 0.21 0.03 0.2400 VWS 31/33 15.00h Forward Pricing 2FA LU0322728352 0.0000 0.00 0.00 0.02 0.03 0.0500 VWS 31/33 15.00h Forward Pricing 2XA LU0322730093 0.0000 0.00 0.00 0.03 0.03 0.0600 VWS 31/33 15.00h Forward Pricing 2


ab © U
BS 2
015.
The
key
sym
bol a
nd U
BS a
re a
mon
g th
e re
gist
ered
and
unr
egis
tere
d tr
adem
arks
of
UBS
. All
right
s re
serv
ed.