instrumental method of analysi
TRANSCRIPT
Online Study Material for B.Pharm VIIth Semester
(As Per PCI, New Delhi Syllabus)
Subject Name: Instrumental Method of Analysis
Subject Code: BP701T
Prepared by:
Mr. Sagar Suman Panda, (Ph.D.),
Asst. Professor,
Roland Institute of Pharmaceutical Sciences, Berhampur
(Affiliated to BPUT, Odisha)
Unit –II
Chapter-1
Infrared (IR) Spectroscopy
1.0. Learning Outcome(s):
After studying the chapter, the students will be able to:
1. Define infrared spectroscopy
2. Describe the principle involved in IR measurements
3. Enumerate the factors that affect vibrational frequencies
4. Remember the difference between “Finger print region” and “Group region”
5. Explain the instrumental components and their working
6. Apply the knowledge in pharmaceutical quality control
1.1. Introduction
The infrared (IR) spectroscopy deals with the study of absorption of infrared radiation by
chemical compounds.
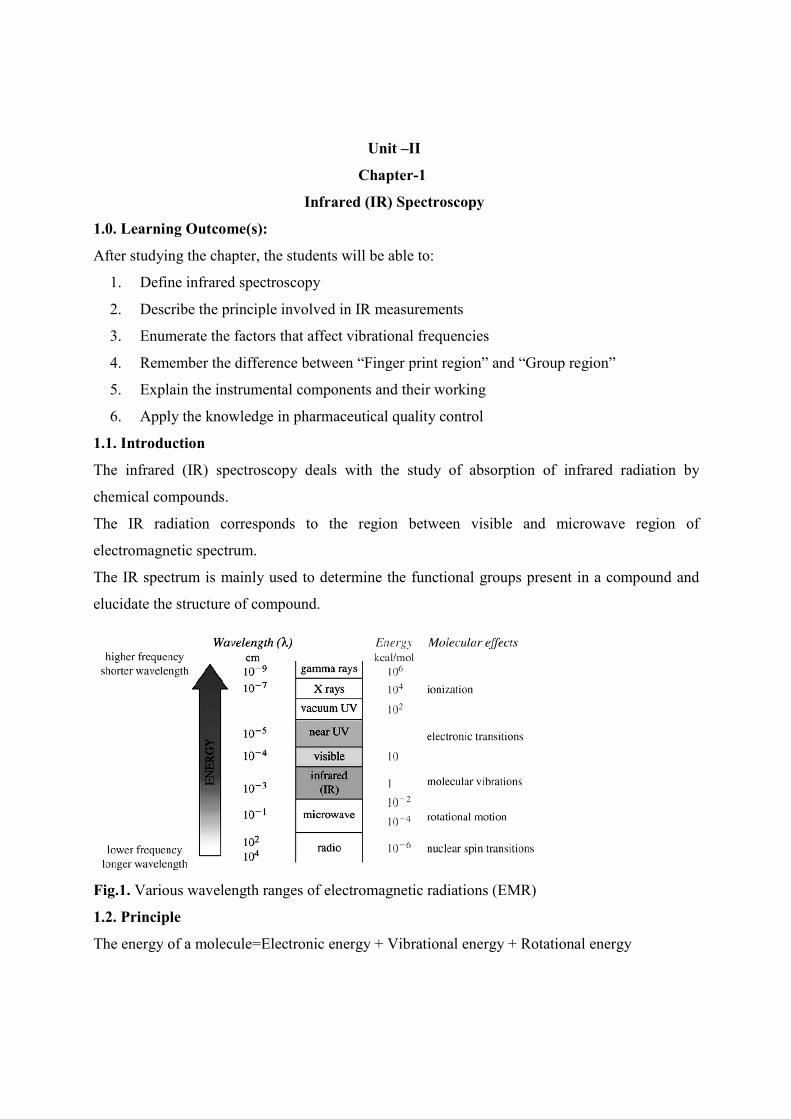
The IR radiation corresponds to the region between visible and microwave region of
electromagnetic spectrum.
The IR spectrum is mainly used to determine the functional groups present in a compound and
elucidate the structure of compound.
Fig.1. Various wavelength ranges of electromagnetic radiations (EMR)
1.2. Principle
The energy of a molecule=Electronic energy + Vibrational energy + Rotational energy
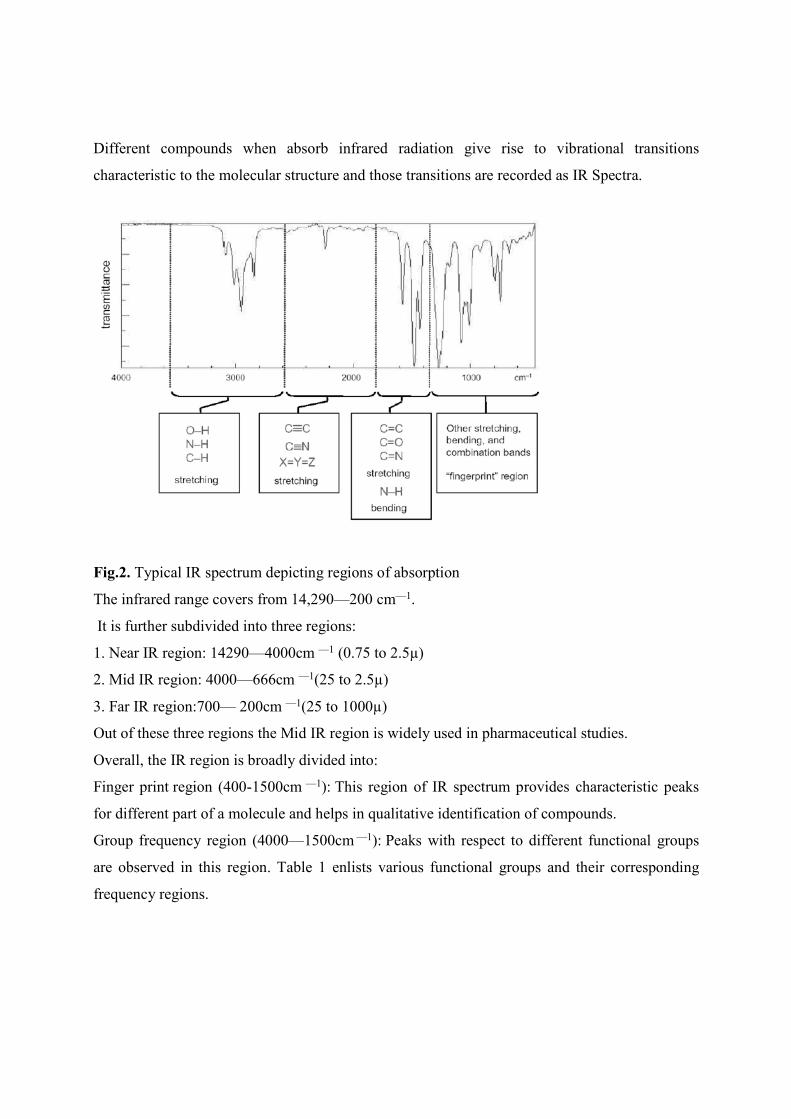
Different compounds when absorb infrared radiation give rise to vibrational transitions
characteristic to the molecular structure and those transitions are recorded as IR Spectra.
Fig.2. Typical IR spectrum depicting regions of absorption
The infrared range covers from 14,290—200 cm—1.
It is further subdivided into three regions:
1. Near IR region: 14290—4000cm —1 (0.75 to 2.5µ)
2. Mid IR region: 4000—666cm —1(25 to 2.5µ)
3. Far IR region:700— 200cm —1(25 to 1000µ)
Out of these three regions the Mid IR region is widely used in pharmaceutical studies.
Overall, the IR region is broadly divided into:
Finger print region (400-1500cm —1): This region of IR spectrum provides characteristic peaks
for different part of a molecule and helps in qualitative identification of compounds.
Group frequency region (4000—1500cm —1): Peaks with respect to different functional groups
are observed in this region. Table 1 enlists various functional groups and their corresponding
frequency regions.
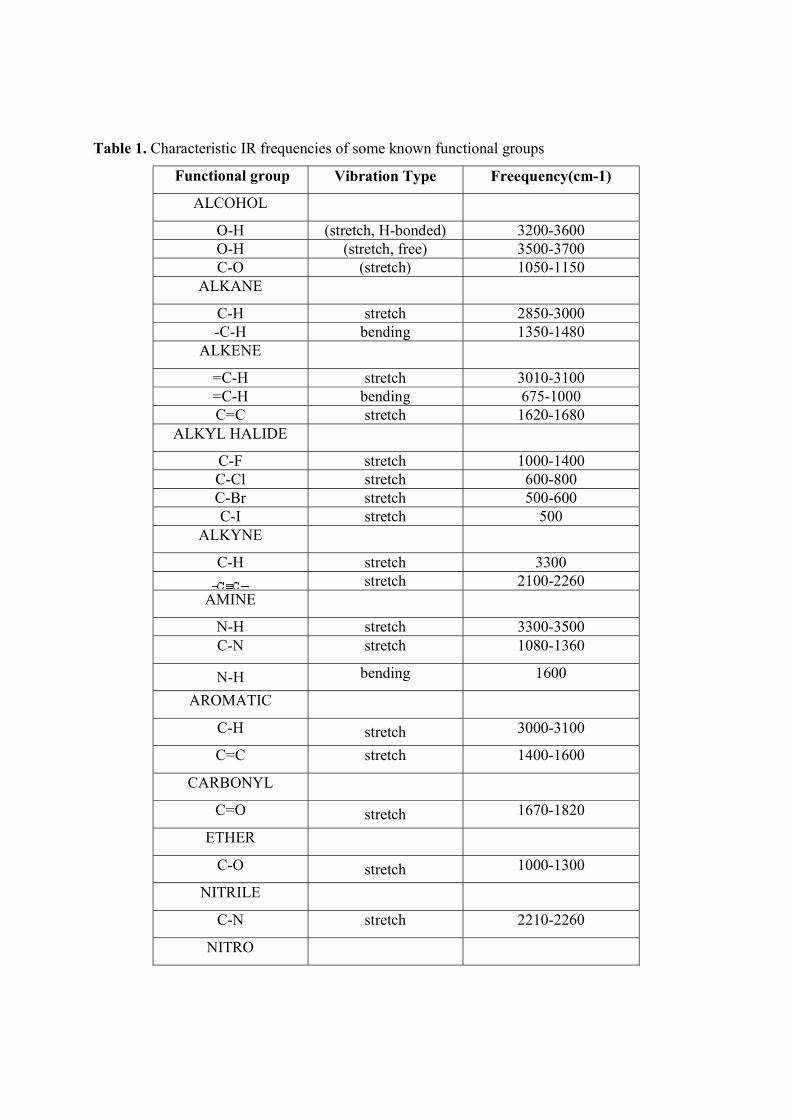
Table 1. Characteristic IR frequencies of some known functional groups
Functional group Vibration Type Freequency(cm-1)
ALCOHOL
O-H (stretch, H-bonded) 3200-3600 O-H (stretch, free) 3500-3700 C-O (stretch) 1050-1150
ALKANE
C-H stretch 2850-3000 -C-H bending 1350-1480
ALKENE
=C-H stretch 3010-3100 =C-H bending 675-1000 C=C stretch 1620-1680
ALKYL HALIDE
C-F stretch 1000-1400 C-Cl stretch 600-800 C-Br stretch 500-600 C-I stretch 500
ALKYNE
C-H stretch 3300
stretch 2100-2260 AMINE
N-H stretch 3300-3500 C-N stretch 1080-1360
N-H bending 1600
AROMATIC
C-H stretch 3000-3100
C=C stretch 1400-1600
CARBONYL
C=O stretch 1670-1820
ETHER
C-O stretch 1000-1300
NITRILE
C-N stretch 2210-2260
NITRO
N-O stretch 1515-1560 & 1345-1385
1.3. Principle
Molecules consist of atoms or group of atoms that are connected by bonds which are analogous
to springs. These bonds are flexible in nature in the molecules and they move continuously
to gain vibrations having some frequency. This frequency of vibration is characteristic to the
different parts of the molecule and hence, it can be called as the natural frequency of vibration.
When we apply an external infrared frequency and it matches the natural frequency of vibration
within a molecule the applied energy is then absorbed by the molecule and an infrared peak is
observed. These peaks are characteristic to different functional group and parts of the molecule
and they are unique for every molecule. Hence the IR spectroscopy is considered as the
fingerprint analysis of a molecule.
The IR region is measured in terms of Wavenumber and it is expressed as:
“It is the number of waves present per cm i.e. Wavenumber = 1/Wavelength (µm) × 104
A compound can be analyzed by IR radiation only if:
1. There is a change in dipole movement
2. There should be a resonance in applied and natural IR frequency
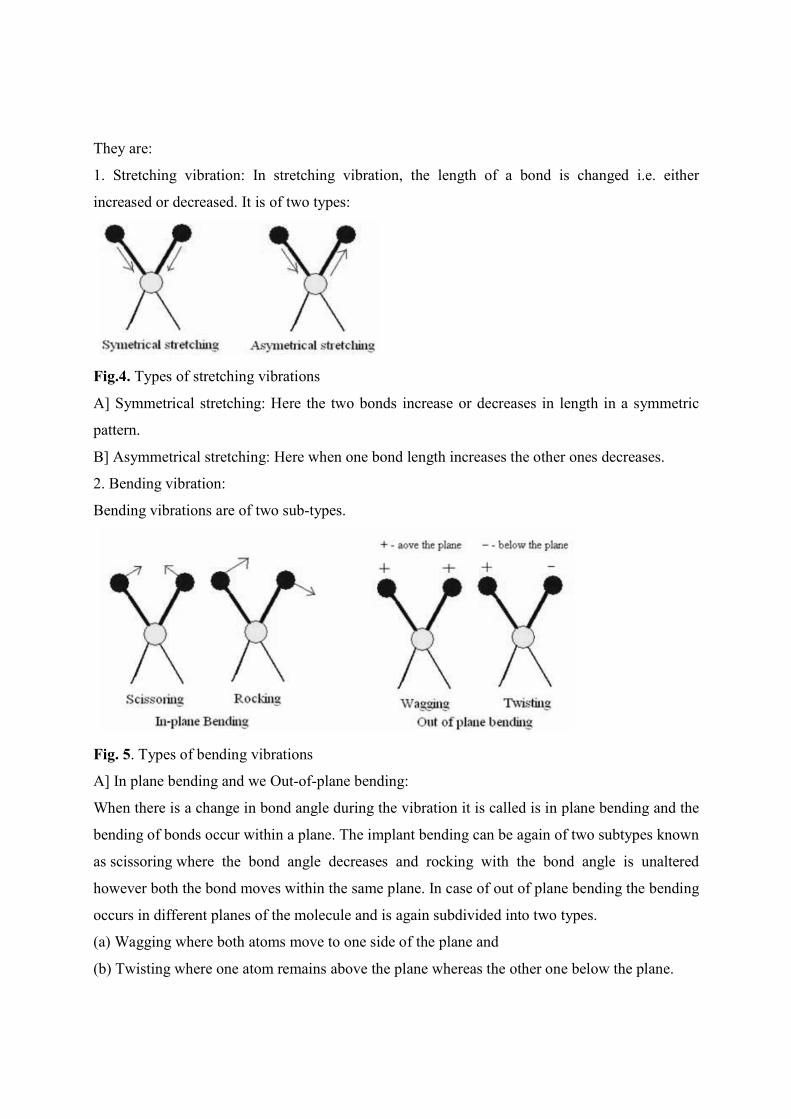
1.4. Fundamental modes of vibrations in a polyatomic molecule
There are mainly two types of vibrations that are present within a molecule.
Fig. 3. Overall classification of molecular vibrations
They are:
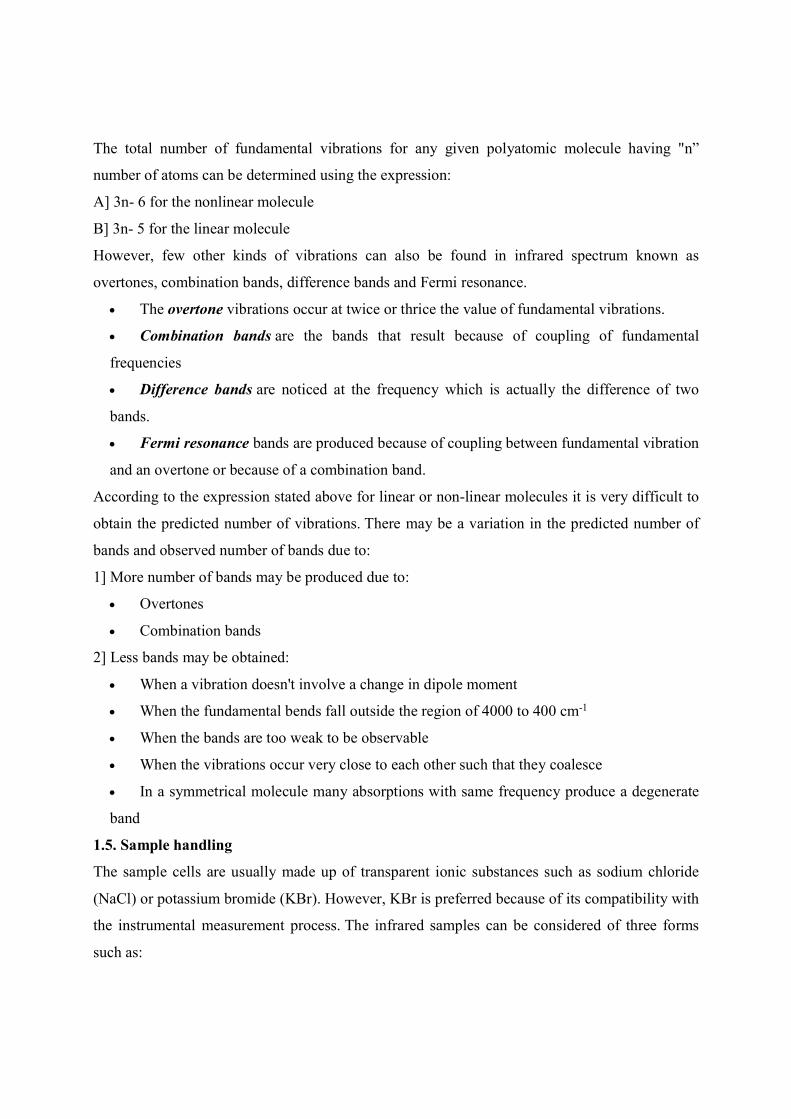
1. Stretching vibration: In stretching vibration, the length of a bond is changed i.e. either
increased or decreased. It is of two types:
Fig.4. Types of stretching vibrations
A] Symmetrical stretching: Here the two bonds increase or decreases in length in a symmetric
pattern.
B] Asymmetrical stretching: Here when one bond length increases the other ones decreases.
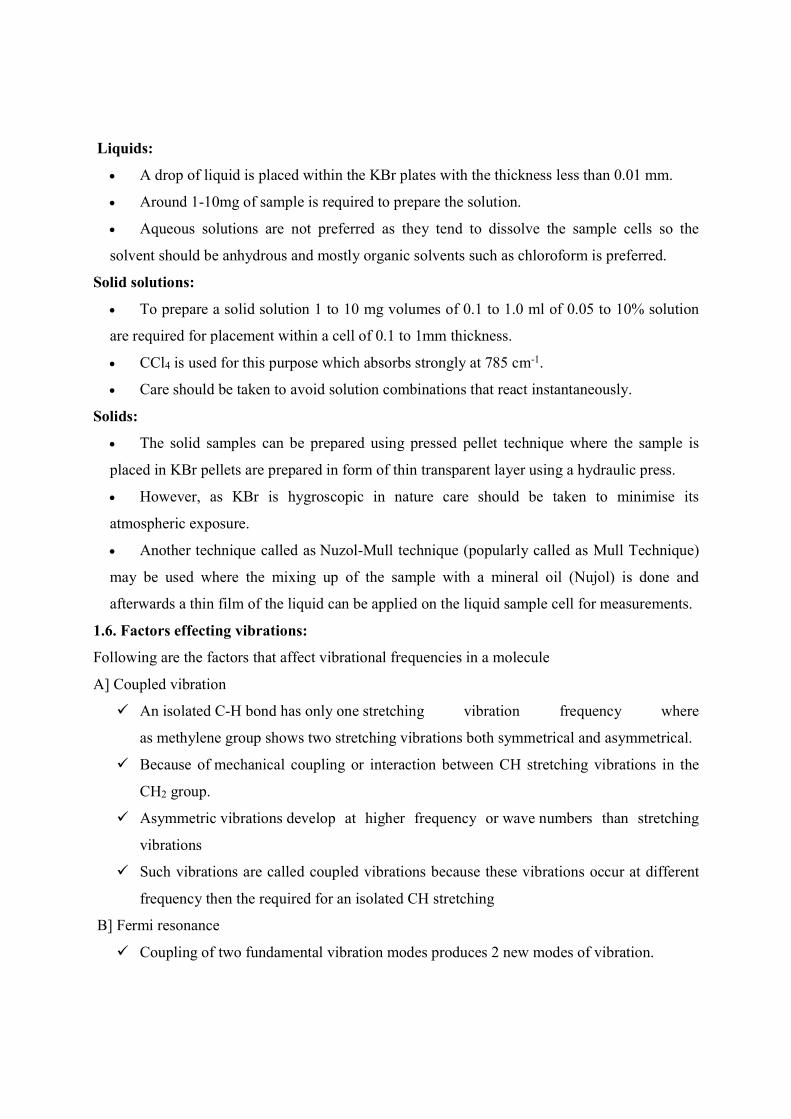
2. Bending vibration:
Bending vibrations are of two sub-types.
Fig. 5. Types of bending vibrations
A] In plane bending and we Out-of-plane bending:
When there is a change in bond angle during the vibration it is called is in plane bending and the
bending of bonds occur within a plane. The implant bending can be again of two subtypes known
as scissoring where the bond angle decreases and rocking with the bond angle is unaltered
however both the bond moves within the same plane. In case of out of plane bending the bending
occurs in different planes of the molecule and is again subdivided into two types.
(a) Wagging where both atoms move to one side of the plane and
(b) Twisting where one atom remains above the plane whereas the other one below the plane.
The total number of fundamental vibrations for any given polyatomic molecule having "n”
number of atoms can be determined using the expression:
A] 3n- 6 for the nonlinear molecule
B] 3n- 5 for the linear molecule
However, few other kinds of vibrations can also be found in infrared spectrum known as
overtones, combination bands, difference bands and Fermi resonance.
The overtone vibrations occur at twice or thrice the value of fundamental vibrations.
Combination bands are the bands that result because of coupling of fundamental
frequencies
Difference bands are noticed at the frequency which is actually the difference of two
bands.
Fermi resonance bands are produced because of coupling between fundamental vibration
and an overtone or because of a combination band.
According to the expression stated above for linear or non-linear molecules it is very difficult to
obtain the predicted number of vibrations. There may be a variation in the predicted number of
bands and observed number of bands due to:
1] More number of bands may be produced due to:
Overtones
Combination bands
2] Less bands may be obtained:
When a vibration doesn't involve a change in dipole moment
When the fundamental bends fall outside the region of 4000 to 400 cm-1
When the bands are too weak to be observable
When the vibrations occur very close to each other such that they coalesce
In a symmetrical molecule many absorptions with same frequency produce a degenerate
band
1.5. Sample handling
The sample cells are usually made up of transparent ionic substances such as sodium chloride
(NaCl) or potassium bromide (KBr). However, KBr is preferred because of its compatibility with
the instrumental measurement process. The infrared samples can be considered of three forms
such as:
Liquids:
A drop of liquid is placed within the KBr plates with the thickness less than 0.01 mm.
Around 1-10mg of sample is required to prepare the solution.
Aqueous solutions are not preferred as they tend to dissolve the sample cells so the
solvent should be anhydrous and mostly organic solvents such as chloroform is preferred.
Solid solutions:
To prepare a solid solution 1 to 10 mg volumes of 0.1 to 1.0 ml of 0.05 to 10% solution
are required for placement within a cell of 0.1 to 1mm thickness.
CCl4 is used for this purpose which absorbs strongly at 785 cm-1.
Care should be taken to avoid solution combinations that react instantaneously.
Solids:
The solid samples can be prepared using pressed pellet technique where the sample is
placed in KBr pellets are prepared in form of thin transparent layer using a hydraulic press.
However, as KBr is hygroscopic in nature care should be taken to minimise its
atmospheric exposure.
Another technique called as Nuzol-Mull technique (popularly called as Mull Technique)
may be used where the mixing up of the sample with a mineral oil (Nujol) is done and
afterwards a thin film of the liquid can be applied on the liquid sample cell for measurements.
1.6. Factors effecting vibrations:
Following are the factors that affect vibrational frequencies in a molecule
A] Coupled vibration
An isolated C-H bond has only one stretching vibration frequency where
as methylene group shows two stretching vibrations both symmetrical and asymmetrical.
Because of mechanical coupling or interaction between CH stretching vibrations in the
CH2 group.
Asymmetric vibrations develop at higher frequency or wave numbers than stretching
vibrations
Such vibrations are called coupled vibrations because these vibrations occur at different
frequency then the required for an isolated CH stretching
B] Fermi resonance
Coupling of two fundamental vibration modes produces 2 new modes of vibration.
With frequencies higher and lower than the observed in absence of interaction.
This interaction takes place between fundamental vibrations and overtones or
combination tone vibration and they are collectively called us Fermi resonance.
In Fermi resonance molecule transfer energy from fundamental vibrations into overtone
or combination level and back.
The resonance pushes the two levels apart and mixes their character and each
level has some amount of fundamental and some amount of overtone or combination
tone characters.
C] Electronic effects
Changing the absorption frequencies for a particular group takes place when the
substituent in the neighbourhood of the particular group is changed.
They include
Inductive effect: Inclusion of alkyl group gives +ve Inductive effect producing
decreased absorption frequency. Adding an electronegative atom or group
produces –ve inductive effect leading to increased absorption frequency.
Mesomeric effect: It produces lengthening or weakening of a bond leading to
lowering of absorption frequency.
Field effect: In ortho substituted compounds, the lone pair of electrons on two
atoms influence each other through space interactions and change the vibrational
frequencies of both the groups. Example: Ortho halo acetophenone. This is called
field effect.
D] Hydrogen bonding
It occurs in any system having a proton donor group and a proton acceptor. If theS-
orbital of the proton effectively overlaps the P or 𝜋 orbital of the acceptor group.
The stronger the hydrogen bond, the longer the OH bond, the lower the vibration
frequency and broader and more intense will be the absorption.
Intermolecular bonds produce broad bands whereas intramolecular hydrogen bonds
produce sharp and well defined bands.
1.7. Instrumentation
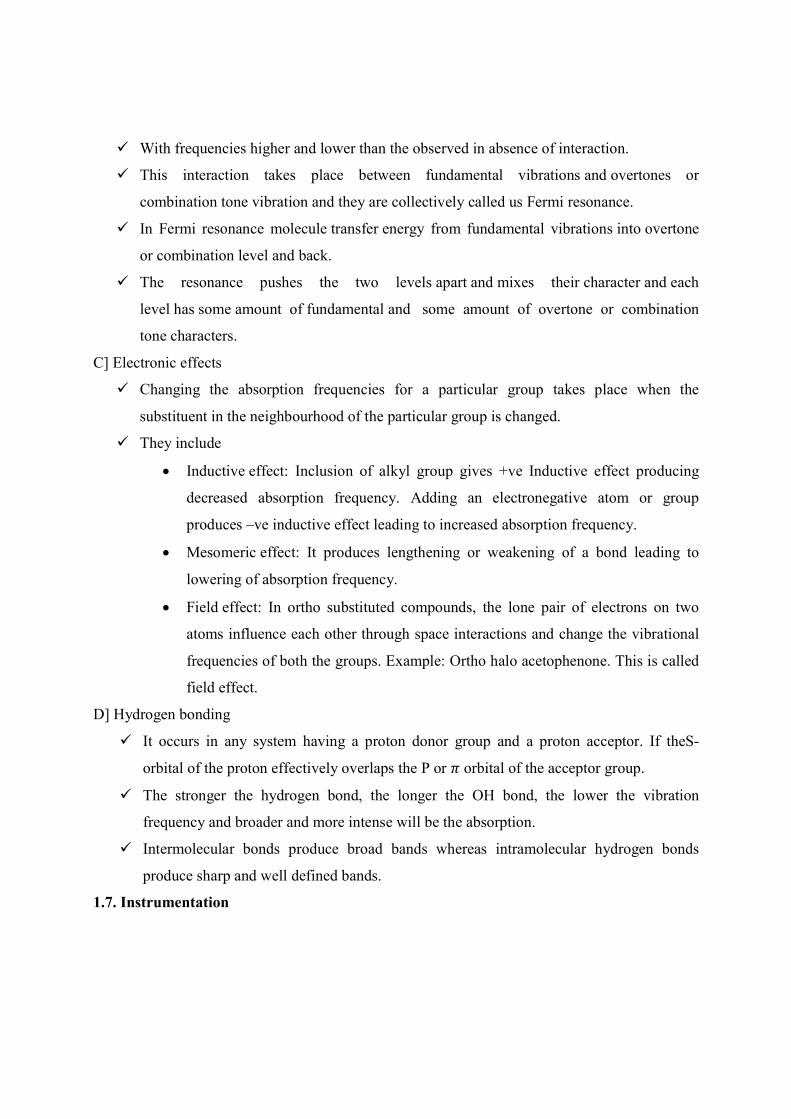
Fig. 6. Schematic representation of IR spectrometer
1.7.1. Sources of radiation
The source of energy should produce very narrow beam of IR radiation
The radiation should be intense enough to detect the analyte
It should be steady
It should cover the desired wavelength range
Following are some of the sources of IR radiation used in IR spectrophotometer:
1.Incandescent lamp
This lamp is particularly used in near IR instruments. However, it is least preferred over
other sources as it has a low spectral emission.
2. Nernst Glower
It contains a hollow rod composed of rare earth oxides such as is it zirconia, yttria and
thoria.
It is in non-conducting at room temperature and requires heating by external means to
bring it to a conducting state.
The glower is heated to a temperature within the range of 1000-1800° C.
It gives a maximum radiation of 7100 cm-1
It has a disadvantage of frequent mechanical failure
3.Globar source
It is a rod prepared from centred Silicon carbide
it is heated up to a temperature between 1300-1700°C
it emits maximum radiation at 5200cm-1

It has a disadvantage that its radiation is less intense then Nernst glower
4. Mercury arc lamp
It is a device made up of quartz-jacketed tube containing mercury vapour inside it at a
pressure greater than 1 atmosphere.
It is highly effective in the far-IR region where the other sources of radiation fail to
provide continuous radiation.
1.7.2. Wavelength selectors
They help in selecting a continuous IR radiation in the desired wavelength region.
They generally contain a chopper and a complex system of monochromators.
The choppers are generally used to enhance the signal to noise ratio of the instrument and
they also moderate the intensity of radiation that reaches to the detector.
The monochromator is used to select it desired frequency of radiation which will be then
allowed to incident on the detector.
These monochromators are of two types:
1. Prismatic monochromator: They are made up of glass/quartz and coated with
alkyl halides.
A] Mono Pass (Radiation passes only once through the prism)
B] Double Pass (Radiation passes twice through the prism)
2. Grating monochromator: They are grooves made up of aluminium and provide
better dispersion of radiation than prisms.
A] Reflection gratings
B] Transmittance grating
1.7.3. Detectors
1. Golay cell
It contains a small metal cylinder which is closed which is closed by black metal plate at
one end and buy a flexible metal die programme at the other end
The cylinder is filled with xenon and sealed.
When IR radiation is allowed to fall on the black metal plate it heats the gas which
expands it.
The signal detected by the photo tube is then modulated according to the power of radiant
beam.
2. Bolometer
It is made up of a thin metal conductor.
When radiation falls on this conductor its temperature changes as the resistance of a
metallic conductor changes with temperature the degree of change in resistance is regarded as
the measurer amount of radiation that is incident on the bolometer.
It follows the principle of Wheatstone bridge.
When there is no radiation incident on the bolometer the bridge remains balanced and in
case a radiation is incident on the bolometer the bridge becomes unbalanced due to the
changes in electrical resistance and there is a flow of current through the galvano meter.
3. Thermocouple
It is based on the principle that electric current flows when there are two dissimilar metal
wires connected together at both the ends and a temperature difference is present between the
two ends.
The end exposed to the IR spectrometer is called the Hot junction.
To increase the energy gathering efficiency it is usually made up of black body.
The other connection i.e. Cold junction is thermally insulated and carefully protected
from stray light.
The electricity flowing through is directly proportional to the energy difference between
the two connections.
4. Thermistor
Thermistors are usually made up of fused mixture of metallic oxides.
As the temperature of the mixture increases its electrical resistance decreases and
accordingly the measurements are performed in the higher spectrophotometer.
5. Pyroelectric detector
The pyroelectric detector is a thermal sensor of infra-red radiation requiring no bias.
While in principle a pure capacitor (hence theoretically noiseless), the detector has a
varying noise contribution as a function of frequency due to a load resistor, series loss
resistance, and amplifier.
The actual sensor is a pyroelectric crystal exhibiting spontaneous polarization.
The spontaneous polarization and dielectric constant of the crystal are temperature-
dependent.
A change in incident power raises the detector temperature causing an electric charge to
appear across the electrode surfaces cut perpendicular to the crystal's ferroelectric axis.
The evacuated detector package incorporates an electroded flake of
triglycine sulfate mounted on a substrate of low thermal and electrical conductivity, a field
effect transistor, load resistor, and an infrared transparent window.
1.8. Applications
IR spectroscopy is applied for qualitative as well as quantitative analysis of drugs in
Pharmaceutical industry.
It is used for identification of drug substances
It identifies the impurities present in a drug sample
It helps in study of hydrogen bonding both intermolecular and intramolecular type
It is widely used in study of polymers
It helps determining issue of Cis- Trans isomers present in a mixture of compounds
It elucidates reaction mechanisms
It is a great tool investigation of rotational isomerism
It identifies functional groups present in any sample
It estimates relative stability of confirmation
It distinguishes between Sis and trance I so much
It can predict the keto-enol tautomerism
It helps in establishing quality of tea leaves

Chapter-2
Flame Photometry
2.0. Learning Outcome(s):
After studying the chapter, the students will be able to:
1. Define flame photometry
2. Describe the principle involved in flame photometry
3. Enumerate the interferences that affect flame photometric measurements
4. Explain the instrumental components and their working
5. Apply the knowledge in pharmaceutical quality control of drugs having metallic ions
2.1. Principle
Flame photometry is a type of atomic emission spectroscopy where atomic emission is measured
using a spectrophotometer when a metallic space is introduced into the flame. The metal salt is
burnt emitting certain colour wavelength and this instrument is based on measurement of
intensity of colour generated by different elements. Each metal gives characteristic colour and
the intensity of colour depict the amount or quantity of metal present. Hence, we identify the
metal present in the unknown sample with respect to the colour developed. It was first developed
by Murray Nelson A. in 1955 and he received a patent for the Flame Photometry in 1958.
The detailed principle can be summarised as:
A liquid sample containing metal salt solution is introduced into a flame.
The solvent is then vaporised leaving particles of solid salt.
The salt is vaporized into the gaseous state.
These gaseous molecules dissociate to give the neutral atoms which are converted into
the unstable excited atoms using the thermal energy of the flame.
These excited atoms emit photons while returning to the lower energy state.
Measurement of emitted photons forms the basis of flame photometry using a
photomultiplier tube detector.
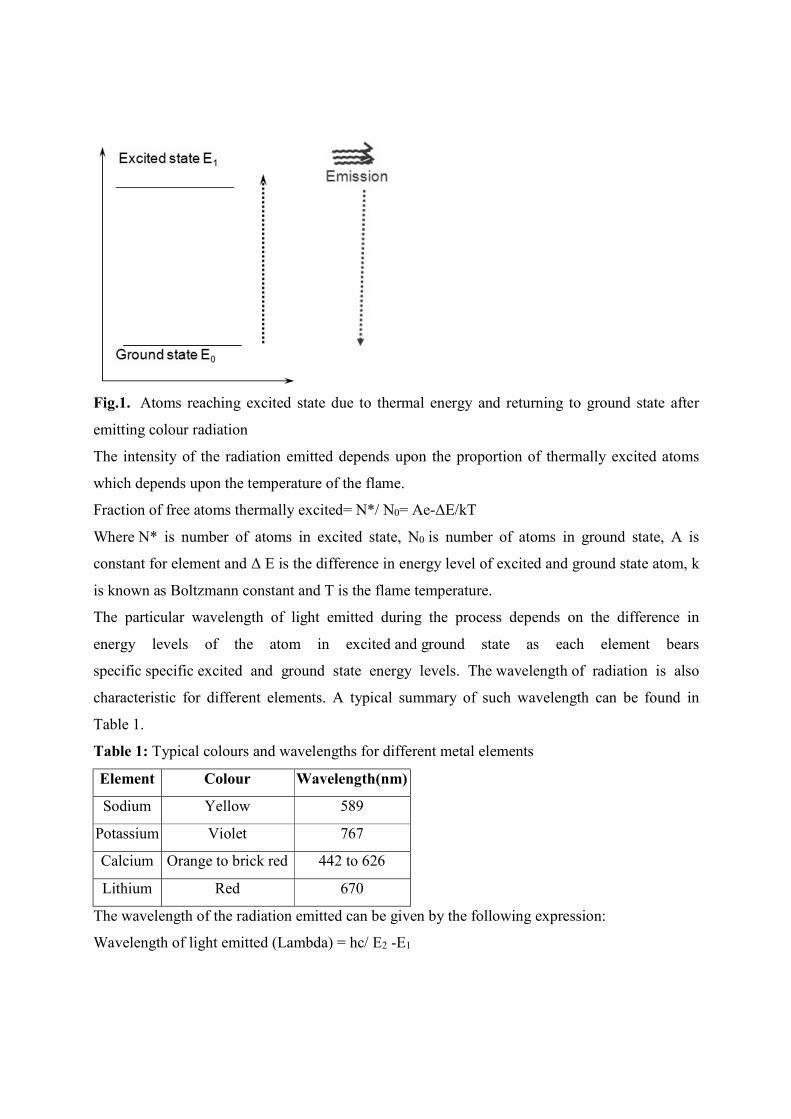
Fig.1. Atoms reaching excited state due to thermal energy and returning to ground state after
emitting colour radiation
The intensity of the radiation emitted depends upon the proportion of thermally excited atoms
which depends upon the temperature of the flame.
Fraction of free atoms thermally excited= N*/ N0= Ae-ΔE/kT
Where N* is number of atoms in excited state, N0 is number of atoms in ground state, A is
constant for element and Δ E is the difference in energy level of excited and ground state atom, k
is known as Boltzmann constant and T is the flame temperature.
The particular wavelength of light emitted during the process depends on the difference in
energy levels of the atom in excited and ground state as each element bears
specific specific excited and ground state energy levels. The wavelength of radiation is also
characteristic for different elements. A typical summary of such wavelength can be found in
Table 1.
Table 1: Typical colours and wavelengths for different metal elements
Element Colour Wavelength(nm)
Sodium Yellow 589
Potassium Violet 767
Calcium Orange to brick red 442 to 626
Lithium Red 670
The wavelength of the radiation emitted can be given by the following expression:
Wavelength of light emitted (Lambda) = hc/ E2 -E1
Where h = Plank’s constant, c= Velocity of light, E2 and E1 = energy levels of excited in ground
state, respectively.
The intensity of radiation emitted dependent on the concentration of the element present in the
solution. With high concentration the flame intensity is more and with low concentration the
intensity is less.
2.2. Interferences
The flame photometry has several limitations which needs critical attention.
1] The temperature of measurement is not high enough to excite transition metals. Hence, it is
only selective towards detecting alkaline earth metals.
2] The relatively low energy available in the flame leads to relatively low intensity of the
radiation arising from the metal atoms.
3] Low temperature renders to cause interference and the stability of the flame and aspiration
conditions are affected.
4] Higher chances of unavoidable interference by other elements.
Out of the several limitations of flame photometry, the various types of interferences needs
sufficient knowledge in order to minimise their incident and to know the proper cause behind the
interference.
The interferences can be of three types. They are:
1] Spectral interference: When two elements present similar spectra which are overlapping
each other and both emit radiation at same particular wavelength it is known as spectral
interference / cation-cation interference / molecular spectral interference.
Example:
Na and K mixtures interfere with each other.
Al interferes with emission lines of Ca and Mg
Solution:
Extraction of interfering material
Calibration curve of interfering material
Use of gratings instead of prisms or filters in the instrument
Also, there is another type of spectral interference where the spectral lines of two or more
elements are close enough but they do not overlap each other.
Solution:
The problem can be reduced by increasing the resolution of the spectral isolation system.
2] Vaporization interference: This type of interference is caused due to presence of acids which
affects the dissociation with other metals. Also, high viscosity presents interferences
in vaporization process affecting the overall atomization process.
Solution:
Suitable flames/burners/atomisers and additives can be chosen.
Addition of Strontium/Lanthanum as ionization suppressant for phosphate ions.
Addition of EDTA to mask ca ions along with phosphates.
3] Ionisation interference: High temperature flames cause ionization of some of the metal
atoms present in both ground and excited state decreasing overall method sensitivity.
Solution:
Addition of easily ionizable ions Cs, Sr, K which have low ionization potential and
ionized over the analyte elements.
2.3. Instrumentation
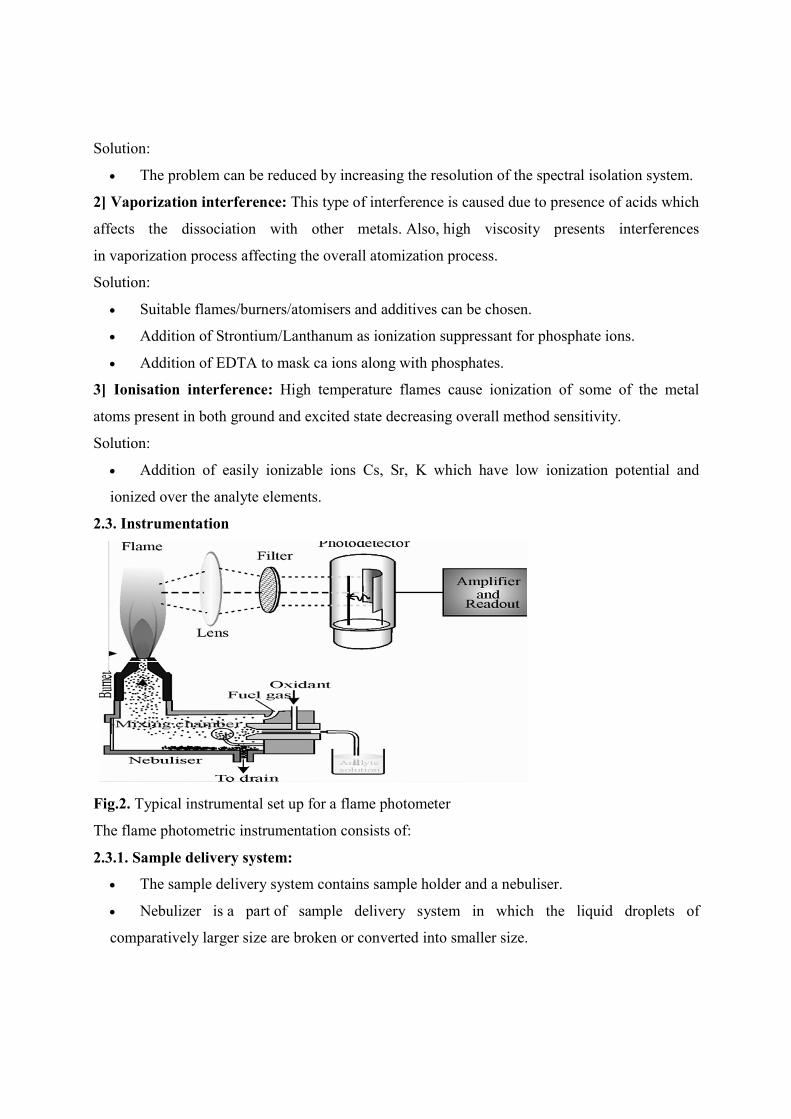
Fig.2. Typical instrumental set up for a flame photometer
The flame photometric instrumentation consists of:
2.3.1. Sample delivery system:
The sample delivery system contains sample holder and a nebuliser.
Nebulizer is a part of sample delivery system in which the liquid droplets of
comparatively larger size are broken or converted into smaller size.
The process of conversion of sample into a mist of very fine droplets through the aid of
jets of compressed gas is called his nebulization.
Hence, this part of the sample delivery system is called as nebuliser.
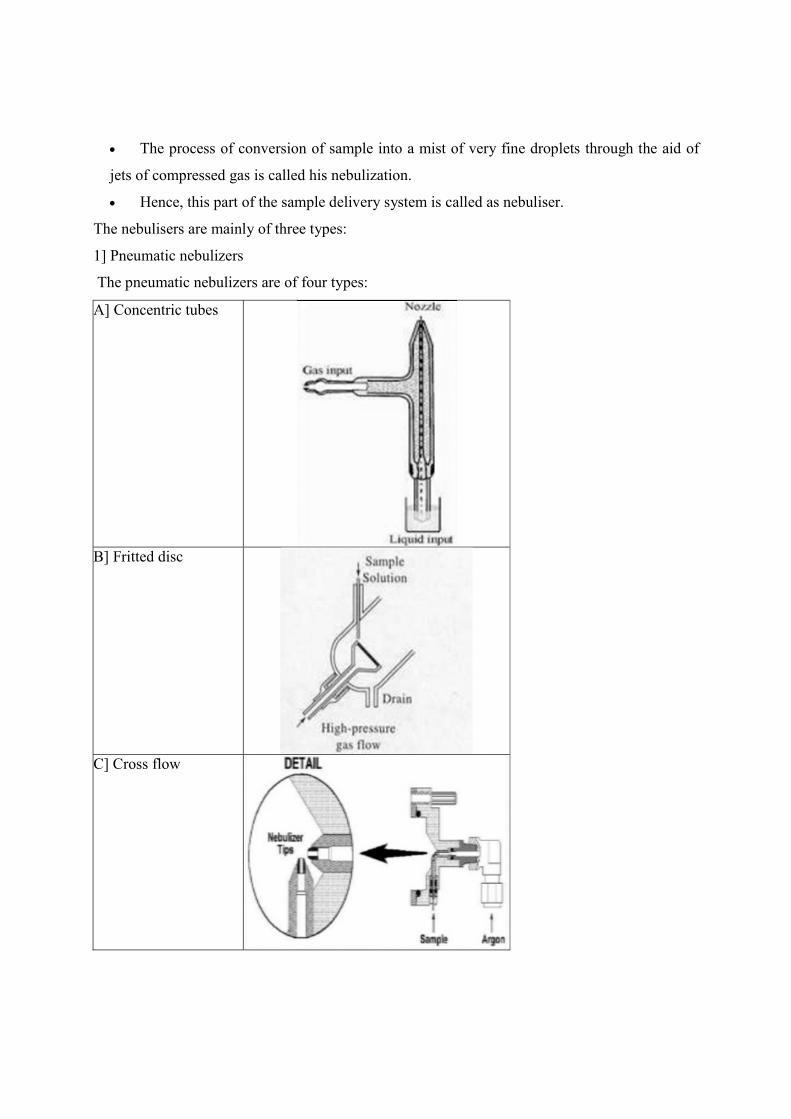
The nebulisers are mainly of three types:
1] Pneumatic nebulizers
The pneumatic nebulizers are of four types:
A] Concentric tubes
B] Fritted disc
C] Cross flow
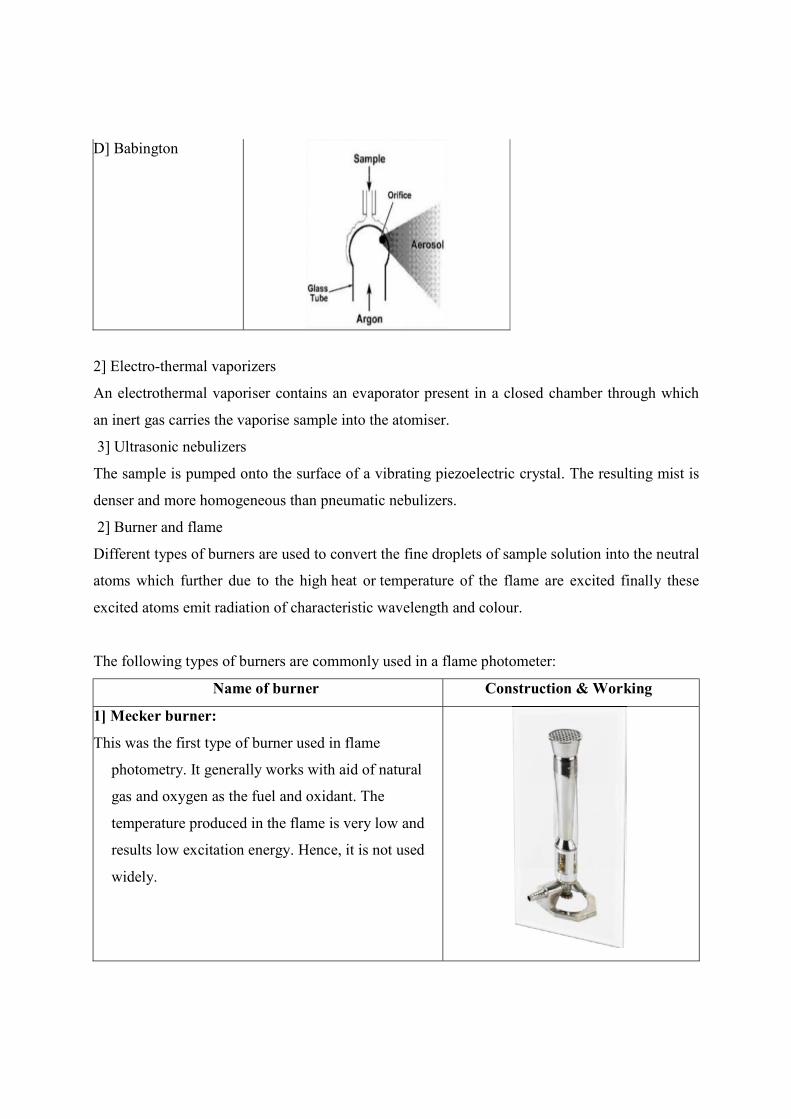
D] Babington
2] Electro-thermal vaporizers
An electrothermal vaporiser contains an evaporator present in a closed chamber through which
an inert gas carries the vaporise sample into the atomiser.
3] Ultrasonic nebulizers
The sample is pumped onto the surface of a vibrating piezoelectric crystal. The resulting mist is
denser and more homogeneous than pneumatic nebulizers.
2] Burner and flame
Different types of burners are used to convert the fine droplets of sample solution into the neutral
atoms which further due to the high heat or temperature of the flame are excited finally these
excited atoms emit radiation of characteristic wavelength and colour.
The following types of burners are commonly used in a flame photometer:
Name of burner Construction & Working
1] Mecker burner:
This was the first type of burner used in flame
photometry. It generally works with aid of natural
gas and oxygen as the fuel and oxidant. The
temperature produced in the flame is very low and
results low excitation energy. Hence, it is not used
widely.
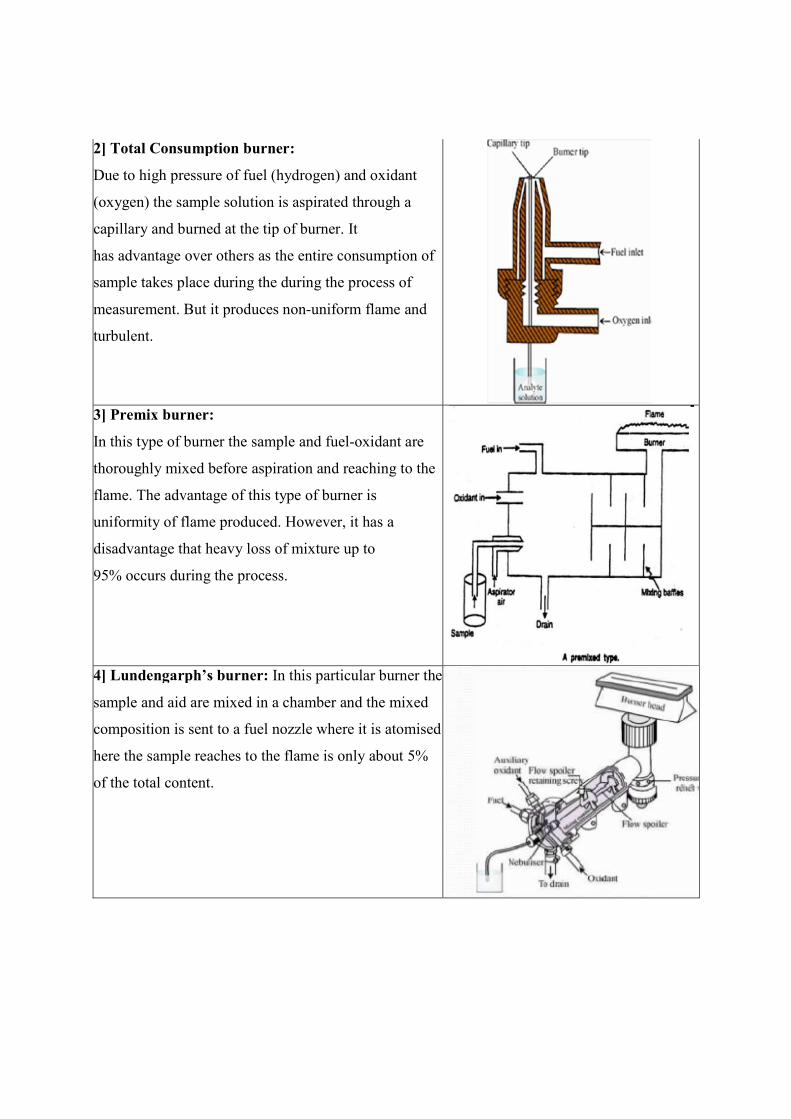
2] Total Consumption burner:
Due to high pressure of fuel (hydrogen) and oxidant
(oxygen) the sample solution is aspirated through a
capillary and burned at the tip of burner. It
has advantage over others as the entire consumption of
sample takes place during the during the process of
measurement. But it produces non-uniform flame and
turbulent.
3] Premix burner:
In this type of burner the sample and fuel-oxidant are
thoroughly mixed before aspiration and reaching to the
flame. The advantage of this type of burner is
uniformity of flame produced. However, it has a
disadvantage that heavy loss of mixture up to
95% occurs during the process.
4] Lundengarph’s burner: In this particular burner the
sample and aid are mixed in a chamber and the mixed
composition is sent to a fuel nozzle where it is atomised
here the sample reaches to the flame is only about 5%
of the total content.
5] Shielded burner:
In this burner the flame is shielded from the ambient
atmosphere by a stream of inert gas ceiling is required
to get better analytical sensitivity during the
measurement process following results are obtained
with sale did
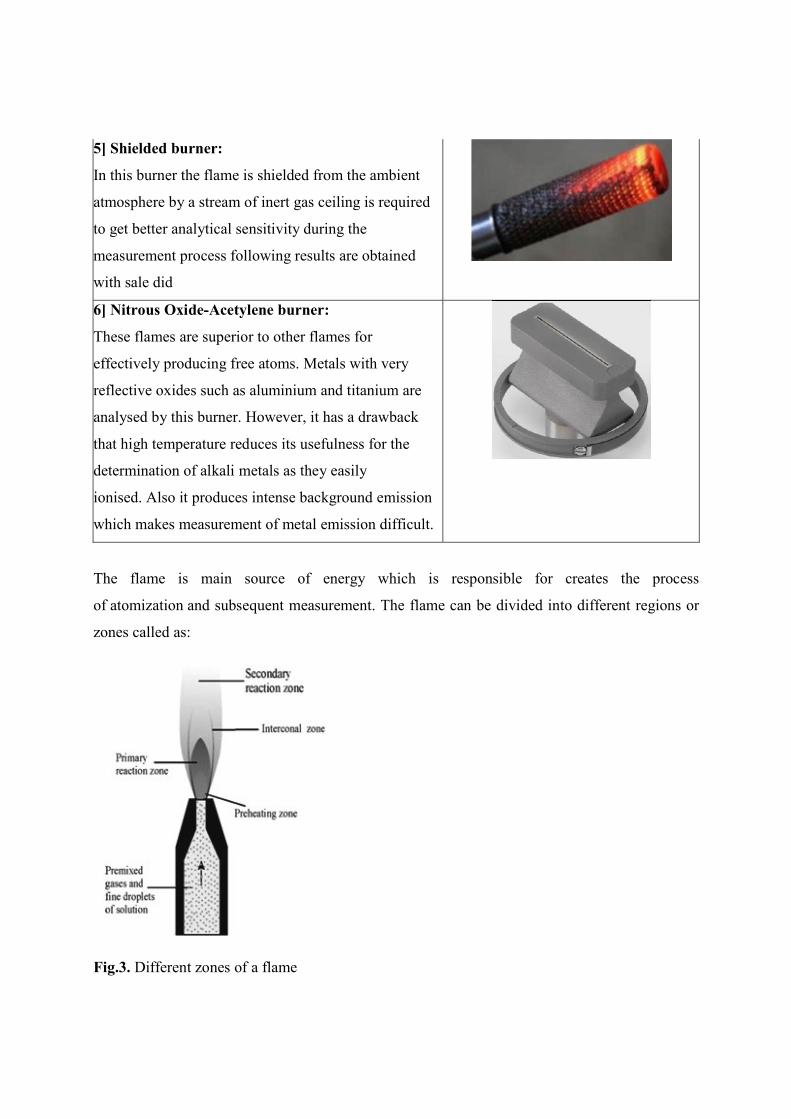
6] Nitrous Oxide-Acetylene burner:
These flames are superior to other flames for
effectively producing free atoms. Metals with very
reflective oxides such as aluminium and titanium are
analysed by this burner. However, it has a drawback
that high temperature reduces its usefulness for the
determination of alkali metals as they easily
ionised. Also it produces intense background emission
which makes measurement of metal emission difficult.
The flame is main source of energy which is responsible for creates the process
of atomization and subsequent measurement. The flame can be divided into different regions or
zones called as:
Fig.3. Different zones of a flame
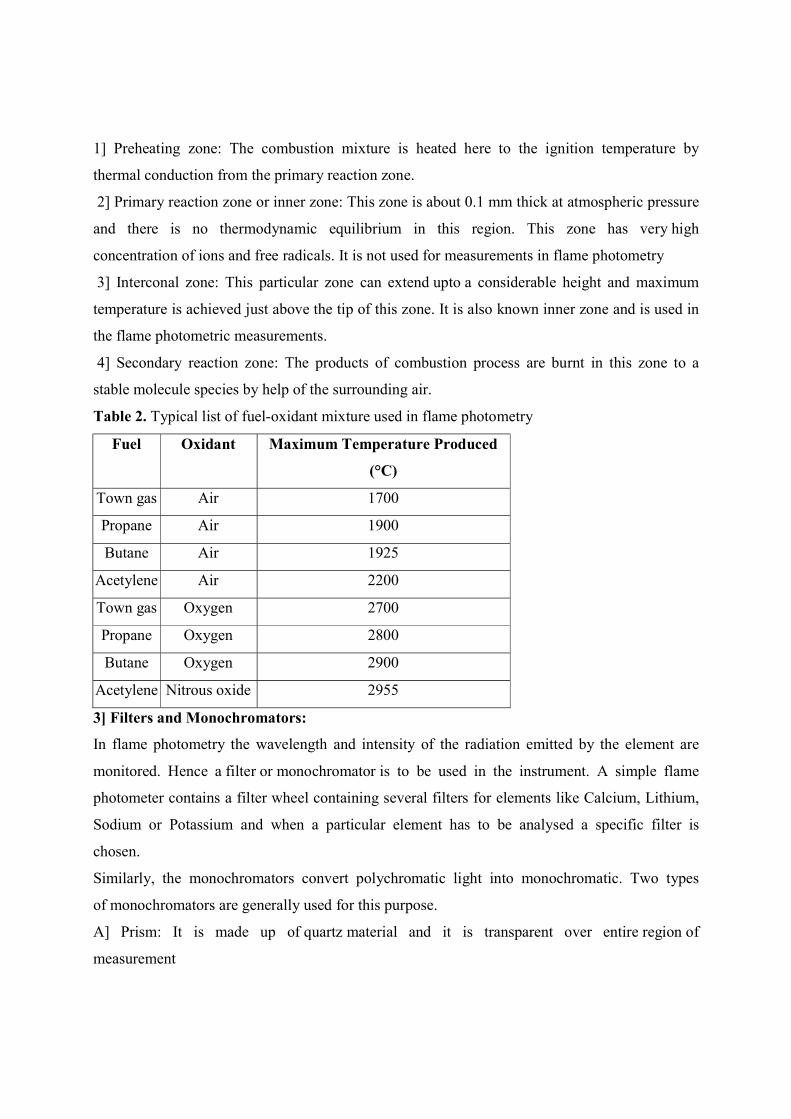
1] Preheating zone: The combustion mixture is heated here to the ignition temperature by
thermal conduction from the primary reaction zone.
2] Primary reaction zone or inner zone: This zone is about 0.1 mm thick at atmospheric pressure
and there is no thermodynamic equilibrium in this region. This zone has very high
concentration of ions and free radicals. It is not used for measurements in flame photometry
3] Interconal zone: This particular zone can extend upto a considerable height and maximum
temperature is achieved just above the tip of this zone. It is also known inner zone and is used in
the flame photometric measurements.
4] Secondary reaction zone: The products of combustion process are burnt in this zone to a
stable molecule species by help of the surrounding air.
Table 2. Typical list of fuel-oxidant mixture used in flame photometry
Fuel Oxidant Maximum Temperature Produced
(°C)
Town gas Air 1700
Propane Air 1900
Butane Air 1925
Acetylene Air 2200
Town gas Oxygen 2700
Propane Oxygen 2800
Butane Oxygen 2900
Acetylene Nitrous oxide 2955
3] Filters and Monochromators:
In flame photometry the wavelength and intensity of the radiation emitted by the element are
monitored. Hence a filter or monochromator is to be used in the instrument. A simple flame
photometer contains a filter wheel containing several filters for elements like Calcium, Lithium,
Sodium or Potassium and when a particular element has to be analysed a specific filter is
chosen.
Similarly, the monochromators convert polychromatic light into monochromatic. Two types
of monochromators are generally used for this purpose.
A] Prism: It is made up of quartz material and it is transparent over entire region of
measurement
B] Grating: It employs the grating which is a series of parallel straight lines cut into a plane
surface.
4] Detectors
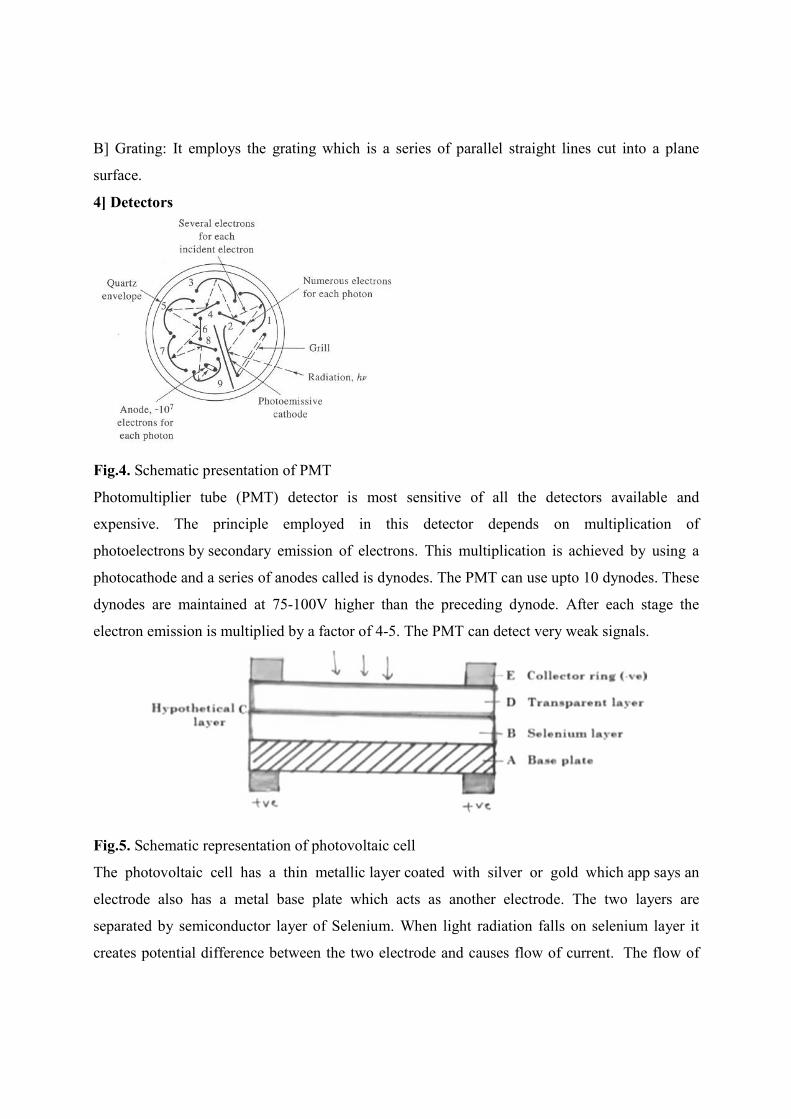
Fig.4. Schematic presentation of PMT
Photomultiplier tube (PMT) detector is most sensitive of all the detectors available and
expensive. The principle employed in this detector depends on multiplication of
photoelectrons by secondary emission of electrons. This multiplication is achieved by using a
photocathode and a series of anodes called is dynodes. The PMT can use upto 10 dynodes. These
dynodes are maintained at 75-100V higher than the preceding dynode. After each stage the
electron emission is multiplied by a factor of 4-5. The PMT can detect very weak signals.
Fig.5. Schematic representation of photovoltaic cell
The photovoltaic cell has a thin metallic layer coated with silver or gold which app says an
electrode also has a metal base plate which acts as another electrode. The two layers are
separated by semiconductor layer of Selenium. When light radiation falls on selenium layer it
creates potential difference between the two electrode and causes flow of current. The flow of
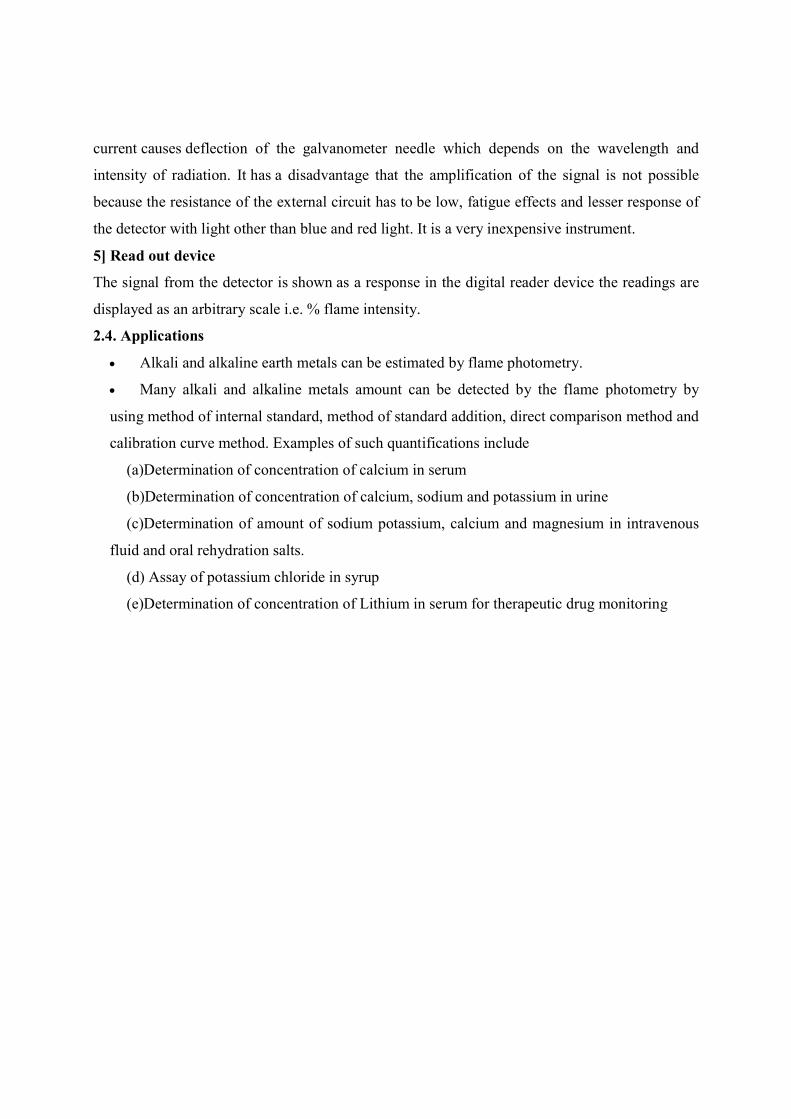
current causes deflection of the galvanometer needle which depends on the wavelength and
intensity of radiation. It has a disadvantage that the amplification of the signal is not possible
because the resistance of the external circuit has to be low, fatigue effects and lesser response of
the detector with light other than blue and red light. It is a very inexpensive instrument.
5] Read out device
The signal from the detector is shown as a response in the digital reader device the readings are
displayed as an arbitrary scale i.e. % flame intensity.
2.4. Applications
Alkali and alkaline earth metals can be estimated by flame photometry.
Many alkali and alkaline metals amount can be detected by the flame photometry by
using method of internal standard, method of standard addition, direct comparison method and
calibration curve method. Examples of such quantifications include
(a)Determination of concentration of calcium in serum
(b)Determination of concentration of calcium, sodium and potassium in urine
(c)Determination of amount of sodium potassium, calcium and magnesium in intravenous
fluid and oral rehydration salts.
(d) Assay of potassium chloride in syrup
(e)Determination of concentration of Lithium in serum for therapeutic drug monitoring
Chapter-3
Atomic Absorption spectroscopy
3.0. Learning Outcome(s):
After studying the chapter, the students will be able to:
1.Define atomic absorption spectroscopy (AAS)
2.Describe the principle involved in AAS
3.Enumerate the interferences that affect AAS
4.Explain the instrumental components and their working
5.Apply the knowledge in pharmaceutical quality control of drugs
3.1. Principle
Atomic-absorption spectroscopy (AAS) uses the absorption of light to measure the concentration
of gas-phase atoms. Since samples are usually liquids or solids, the analyte atoms or ions must be
vaporized in a flame or graphite furnace. The atoms absorb ultraviolet or visible light and make
transitions to higher electronic energy levels. The analyte concentration is determined from the
amount of absorption. Applying the Beer-Lambert law directly in AAS is difficult due to
variations in the atomization efficiency from the sample matrix, and non-uniformity of
concentration and path length of analyte atoms (in graphite furnace AAS). Concentration
measurements are usually determined from a working curve after calibrating the instrument with
standards of known concentration.
“Atomic Absorption Spectroscopy is an absorption method where radiation is absorbed by non-
excited atoms in the vapour phase i.e. nebulized state.”
The principle of AAS is based on the absorption of energy by ground state atoms in the gaseous
state.
When a solution having metal is introduced to flame the vapour of metal is obtained.
Then some metal atoms may get raised to higher levels of energy to emit the radiations. But
majority of atoms remain unexcited. When a light of specific resonance wavelength is passed
through a flame having atoms of the metallic species, part of light will be absorbed & absorption
will be proportional to the density of atoms in flame.
Therefore, the total amount of light absorbed is
= (e / mc) Nf
Where, e= charge on electrons
m=mass of light
N=total no. of atoms that can absorb at frequency ‘v’ in light path
f= oscillar strength
c=speed of light.
From the above expression we can conclude that, absorption of light by an atom is
independent of wavelength of absorption and the temperature of the atoms. But temperature
effects the efficiency at which atoms are produced from a sample. The temperature of ignition is
2100° – 2800° C. The characteristic / specific resonance wavelength is obtained from a lamp
whose cathode is made up of the same element that is to be determined. A Photomultiplier tube
is used to detect the reduction in intensity of light. The AAS is also called as Atomic Flame
Photometry as sample solution is sprayed into the flame the whole technique is carried out in the
UV-regions.
3.2. Interferences
AAS is less liable to be affected by interferences then compared to flame photometric techniques
this technique is especially free from cationic interferences because the absorption of resonance
lines from hollow cathode lamp. However it has the following
interferences which needs deep knowledge and practise.
Since the concentration of the analyte element is considered to be proportional to the ground
state atom population in the flame, any factor that affects the ground state population of the
analyte element can be classified as interference. Factors that may affect the ability of the
instrument to read this parameter can also be classified as interference.
The following are the most common interferences:
A) Spectral interferences are due to radiation overlapping that of the light source. The
interference radiation may be an emission line of another element or compound, or general
background radiation from the flame, solvent, or analytical sample. This usually occurs when
using organic solvents, but can also happen when determining sodium with magnesium present,
iron with copper or iron with nickel.
B) Formation of compounds that do not dissociate in the flame. The most common example is
the formation of calcium and strontium phosphates.

C) Ionization of the analyte reduces the signal. This is commonly happens to barium, calcium,
strontium, sodium and potassium.
D) Matrix interferences due to differences between surface tension and viscosity of test solutions
and standards.
E) Broadening of a spectral line, which can occur due to a number of factors. The most common
line width broadening effects are:
1. Doppler effect
This effect arises because atoms will have different components of velocity along the line of
observation.
2. Lorentz effect
This effect occurs as a result of the concentration of foreign atoms present in the environment of
the emitting or absorbing atoms. The magnitude of the broadening varies with the pressure of the
foreign gases and their physical properties.
3. Quenching effect
In a low-pressure spectral source, quenching collision can occur in flames as the result of the
presence of foreign gas molecules with vibration levels very close to the excited state of the
resonance line.
4. Self-absorption effect
The atoms of the same kind as that emitting radiation will absorb maximum radiation at
the center of the line than at the wings, resulting in the change of shape of the line as well as its
intensity. This effect becomes serious if the vapor, which is absorbing radiation is considerably
cooler than that which is emitting radiation.
3.3. Instrumentation
A typical AAS has the following instrumental components in it.
1) Radiation Source
2)Flame Neublization Unit (Atomizer)
3)Monochromator & Filter
4)Detector
5)Amplifier & Read out Devices
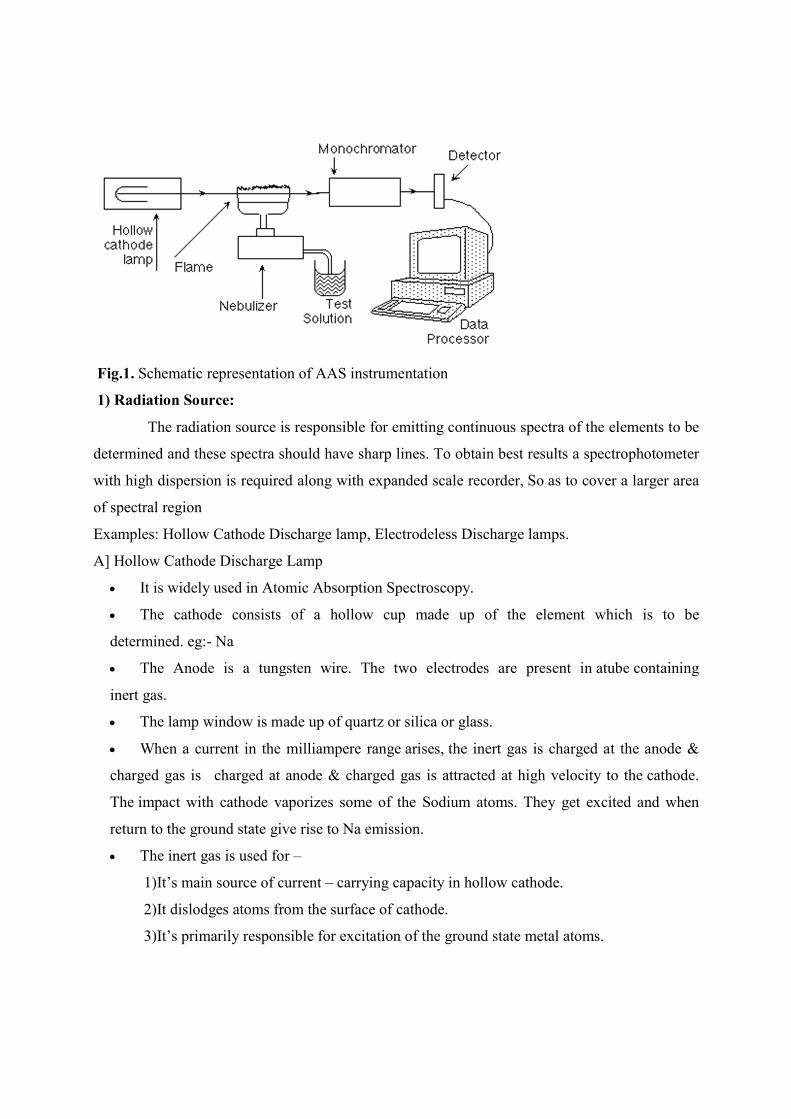
Fig.1. Schematic representation of AAS instrumentation
1) Radiation Source:
The radiation source is responsible for emitting continuous spectra of the elements to be
determined and these spectra should have sharp lines. To obtain best results a spectrophotometer
with high dispersion is required along with expanded scale recorder, So as to cover a larger area
of spectral region
Examples: Hollow Cathode Discharge lamp, Electrodeless Discharge lamps.
A] Hollow Cathode Discharge Lamp
It is widely used in Atomic Absorption Spectroscopy.
The cathode consists of a hollow cup made up of the element which is to be
determined. eg:- Na
The Anode is a tungsten wire. The two electrodes are present in atube containing
inert gas.
The lamp window is made up of quartz or silica or glass.
When a current in the milliampere range arises, the inert gas is charged at the anode &
charged gas is charged at anode & charged gas is attracted at high velocity to the cathode.
The impact with cathode vaporizes some of the Sodium atoms. They get excited and when
return to the ground state give rise to Na emission.
The inert gas is used for –
1)It’s main source of current – carrying capacity in hollow cathode.
2)It dislodges atoms from the surface of cathode.
3)It’s primarily responsible for excitation of the ground state metal atoms.
Removal of atoms by positive ions of inert gas that is bombarded on the cathode is
called as Sputtering. The pressure is maintained at 1-5 torr, as higher pressure leads to unstable
discharge and in lower Pressure vaporization of cathode metal increases & the operating
temperature also increases.
1.IONIZATION 2. SPUTTERING 3. EXCITATION 4. EMISSION
In Atomic Absorption Spectrometry, the line spectrum of the element being analyzed is
emitted from a HCL and passes through the optics of the instrument. The atomized sample is
introduced into the flame and absorbs resonance lines from the line spectra of the element.
The decrease in the light intensity of the resonance lines is related to the concentration of the
analyte by the Beer-Lambert Law in a similar fashion to other absorption methods, that is,
A = -log T = kc
As the name suggests the lamp consists of 2 parts (anode and cathode) and is filled with an inert
gas (generally Ar or Ne). The HCL is connected to a regulated low voltage low current DC
power supply. The flowing electrical current causes excitation of the element present on the
cathode and generates the characteristic line spectra of that element. The shape and configuration
of the HCL helps to focus the radiation into the optical path of the instrument. Generally, one
uses the specific HCL for the element being analyzed. Each specific HCL has specified current
settings, so be sure to adjust the DC power supply to be within the operational parameters of that
lamp. The reason for using the line source of the element for the radiation source is its very
narrow and well-defined lines. The bandwidth of a selected line may approach 0.005 nm,
something that most monochromators could not accomplish.
B] Electrodeless Discharge Lamps:
Electrodeless discharge lamps (EDLs) are source of atomic line spectra and provides
radiant intensities of order one to two orders of magnitude greater than hollow cathode lamps
.The lamp is constructed from a sealed quartz tube containing little amount of inert gases like
Argon & a small amount of metal / salt to be anlysed .The lamp contains an intense field of
microwave radiation instead of any electrodes. The inert gas Argon is ionized & the ions are
accelerated by high-freequency component of the field until they have sufficient energy to excite
the atoms of the metal. They are available for more than 15 elements.
Signal Modulation by Chopper:
In AAS to avoid interferences caused by emission of radiation by flame, the output of the source
must be modulated to provide a fluctuating intensity at a constant rate. The detector receives two
types of signal, an alternating one from the source and a continuous one from the flame. Later
they are converted into the corresponding types of electrical responses. To achieve these kind of
signal modification a circular metal disc or chopper is interposed in between the source and
the flame. Alternate quadrants of the disk are removed to permit passage of light. Rotation of the
disk at constant known rate produces a beam that is chopped to the desired frequency.
2) Flame Neublizer(Atomizer) :
In AAS to achieve absorption of atoms of the sample sample is reduced
to it’s corresponding atomic state. This process of converting the sample into a atomic state is
called Atomization or Neublization
.It can be achieved by the following equipments –
a) Ovens : The sample is brought rapidlyat high temperature .
b)Electric Arcs and Sparks : Here a high current or high voltage alternatively current spark is
applied to solid / liquid samples .
c)Sputtering Devices : In this , the sample held on a cathode is bombarded by positive ions of an
inert gas .
d)Flame Atomizers : Here the liquid sample is converted into gaseous state by use of a
flame.
The fuel & oxidant gas are fed into a mixing chamber , where they proceed through series
of baffles to the burner head . The flame orifice is in form of a long narrow slot , so that ribbon
flame is produced .The sample in solution is aspired into the mixing chamber by a small air jet
into a premixed gas air burner designed for a long path length. The radiation is passed into the
monochromator and measured at the detector . The amount of radiation absorbed is passed into
the concentration of the element in the sample .A calibration curve is prepared by measuring the
absorbance of series of standard solutions.
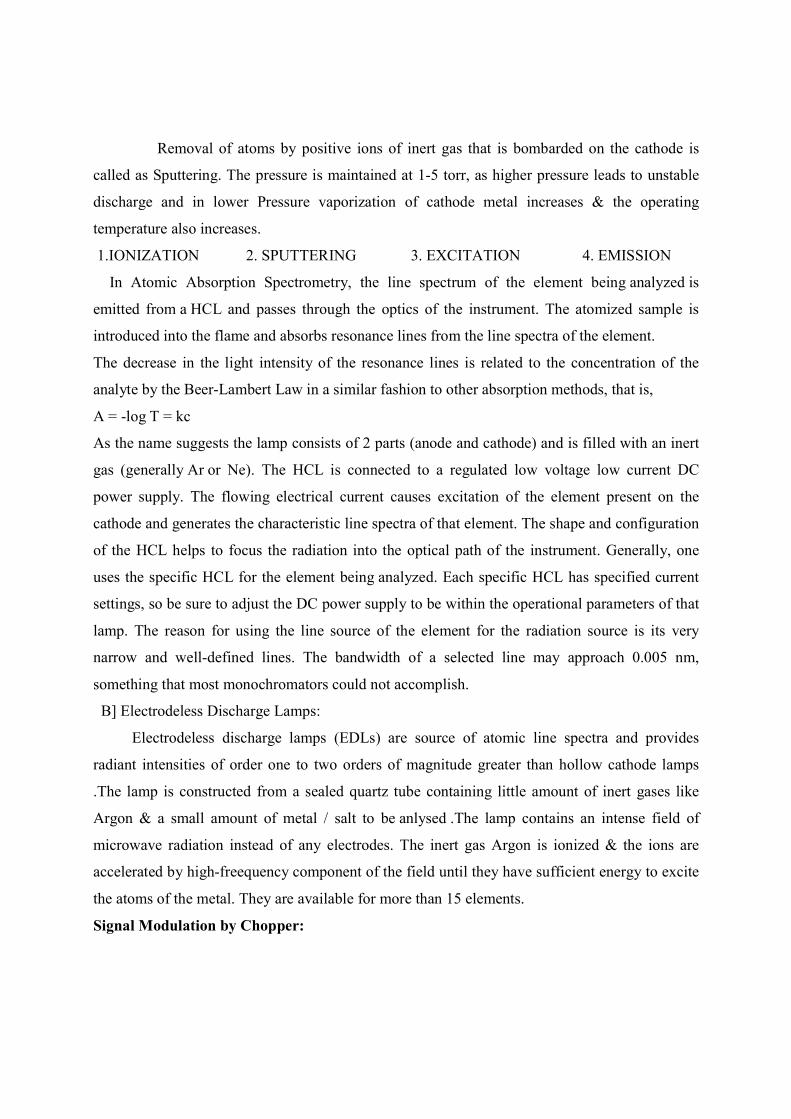
Flame in AAS:
Some of the commonly used fuels and their relative data:
Fuel Oxidant Temperature °C Maximum Burning
Velocity(cm/s)
Natural gas Air 1700-1900 39-43
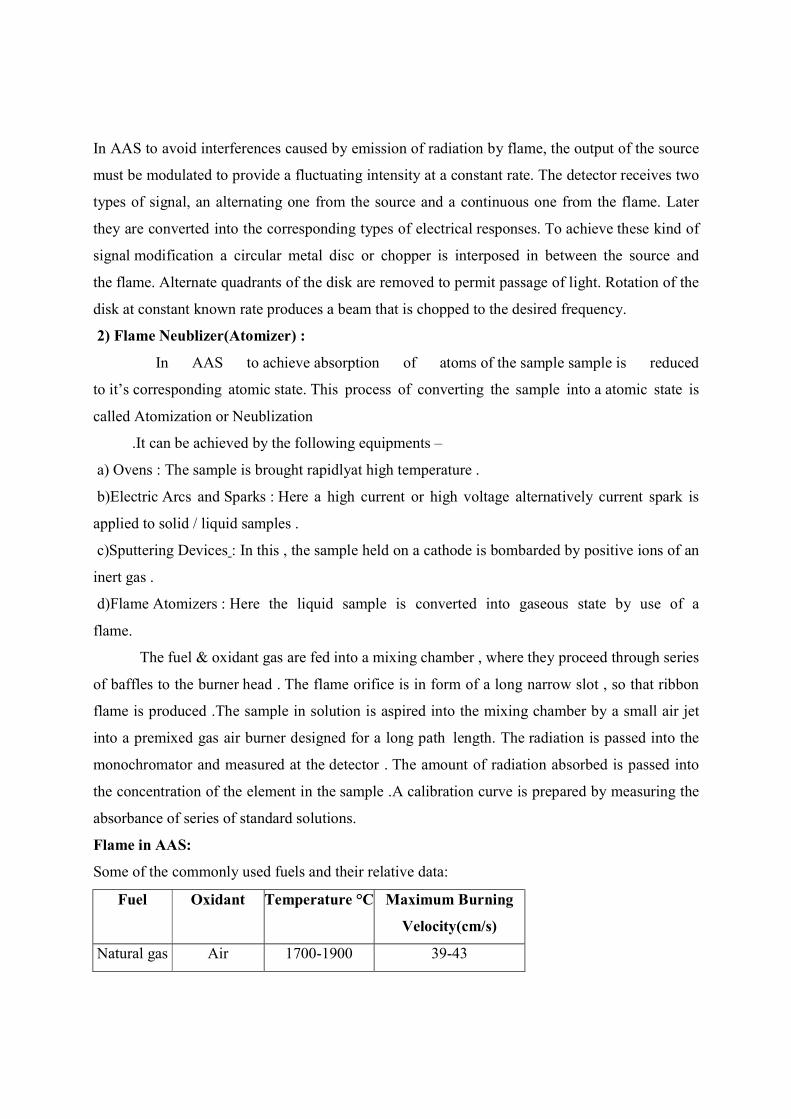
Acetylene Air 2100-2400 158-266
Acetylene Nitrous oxide 2600-2800 285
Hydrogen Oxygen 2550-2770 900-1400
Types of burners used in Atomic Absorption:
There are 2 types of burners used in Flame Absorption method:-
1)Total Consumption Burner: In Total Consumption Burner the liquid sample ,the fuel &
oxidizing agents are passed through separate passages to meet at the opening of the base of
the flame . It uses hydrogen with oxygen or acetylene to give very hot flames.
Advantages:
Representative sample reaches the flame.
As amount of sample in flame is large, the sensitivity increases.
There is no explosion hazards.
Disadvantages:
Short path leads to lower sensitivity.
Poor reproducibility results because of non uniform droplet size.
Large droplets may clog as they are not completely decomposed.
2)Premixed Burner: In premixed burner, a mixture of the sample & premixed gases is allowed to
enter the instrument. Which later passes to the flame region and atomization takes place.
Advantages:
Long path provides sensitivity.
It has a very little tendency to clog.
Only small drops reach flame so better reproducibility is obtained.
Disadvantages:
Rate of introduction of sample is low.
Chances of explosion in mixing chamber.
Analytical errors are caused due to selective evaporation of mixed solvents.
Flame aspiration :
Ethyne/air (giving a flame with a temperature of 2200–2400°C) or ethyne/dinitrogen oxide
(2600–2800°C) are often used. A flexible capillary tube connects the solution to the nebuliser. At
the tip of the capillary, the solution is ‘nebulised’ – ie broken into small drops. The larger drops
fall out and drain off while smaller ones vaporise in the flame.
Advantages of Flame Atomizers :
1.They are convenient ,reliable and relatively free of memory effects.
2.Most of the flames used are noiseless and safe to operate.
3.Burner systems are small ,inexpensive and durable.
4.Sample solutions are easily handled with simple neublisers.
5.A variety of flames can be used to select optimum working conditions for a wide variety of
elements.
Disadvantages of Flame Atomizers :
1.The sample volume available may be less than 3-10ml.Theanalyte concentration may be too
low to allow dilution of the sample .
2.Pneumatic neublisers are only capable of introducing 10% of the sample into the flame.
3.Flames are rarely able to atomise solid samples or viscous liquid samlples directly .
4.Flame background absorption and emission often requires some sort of correction procedure.
Electrothermal atomization :
It provides enhanced sensitivity as the entire sample is atomized in a short period and
the average residence time of the atoms in the optical path is a second or more. A hollow
graphite tube with a platform.25 µl of sample is placed through the sample hole and onto the
platform from an automated micropipette and sample changer. The tube is heated electrically by
passing a current through it in a pre-programmed series of steps. The details will vary with the
sample but typically they might be 30–40 seconds at 150°C to evaporate the solvent, 30 seconds
at 600°C to drive off any volatile organic material and char the sample to ash, and with a very
fast heating rate (1500 °C s) to 2000–2500°C for 5–10 seconds to vaporise and atomised
elements (including the element being analysed).Finally heating the tube to a still higher
temperature(2700°C) cleans it ready for the next sample. During this heating cycle the graphite
tube is flushed with argon gas to prevent the tube burning away. In electrothermal atomisation
almost 100% of the sample is atomised. This makes the technique much more sensitive than
flame AAS.
Advantages of Electrothermal Atomisers :
1.Unusually high sensitivity for small samples(0.5-10mg/ml)
2.Decreased sample size.
3.In situ sample treatment.
4.Direct analysis of solid samples.
5.Unattended operation ,safety of operation.
Disadvantages of Electrothermal Atomisers :
1.Relatively poor precision compared to flame techniques(<1%).
2.Furnace techniques are slow(5-10 min.s)per sample.
3.Small samples are not easily detected.
4.More chances of interferences.
3) Monochromator & Filter:
The monochromator is used to select a given line in the emission spectrum of the light
source and isolate it from all other lines. eg :- Prisms & Gratings.
For AAS the instrument should produce a sufficiently narrow band width to separate the
line chosen for determination from other undesirable lines that may either interface with the
measurement or decrease the sensitivity of the analysis. For alkali metals having a few widely
spaced resonance lines in visible region a glass filter is used .
4) Detectors:
For AAS; Photomultiplier Tube (PMT) is used .It has a good stability when used with a
stable power supply. In PMT, there is an evacuated envelope which contains a photo cathode, a
series of electrodes called dynodes and an anode. The photocathode is fixed to the terminal of
power supply .When photon strikes the photocathode , an electron is dislodged and the photon is
accelerated to dynode 1 ,which gives 2 or more electrons from dynode 1 .Electron from dynode 1
are accelerated to dynode 2, which further gives more electrons . Thus the current multiplied at
each dynode and the resultant electron current is received by the anode to produce an EMF
across the circuit which goes to the external amplifier & read out system.
5)Amplifier & Reader :
The PMT output is taken to an amplifier which itself operates
at the source modification frequency .It includes digital displays & often graphical presentation
of data is seen on video display unit or external computers. A hard copy can also be made on
chart recorders.
But care3 should be taken to prevent the use of highly luminous flames should always
avoided;otherwisw the detector may be saturated due to continuous signal increase .
3.4. Applications
The following are the some of the important applications seen recent days in then field of Atomic
Absorption Spectroscopy :-
1) Qualitative Analysis: Due to requirement of separate hollow cathode lamp for each sample it
is rarely used for Qualitative analysis.
2)Quantitative Analysis: The AAS is very sensitive and is accurate than any other technique.
The different factors effecting quantitative determination are –
a)Flame System ,b)Wavelength Selection ,c) Solution.
3)Simultaneous Multicomponent Analysis : If a multi-element emission source is available
,then multi-component analysis can be carried out.
4)Determination of metallic Elements in Biological Materials
5)Determination of Metallic Elements in Food Industry:
The toxic levels of Co,Ni&Zn levels in food items are detected by AAS.
6)Determination of Clacium ,Magnesium,Sodium & Potassium in Blood Serum
7)Determination of Lead in Petrol : Tetra ethyl & Tetra methyl lead are present in petrol or the
combination is present which is checked by AAS.
8)Determination of low levels of arsenic using FlameAAS &ultraAA Lamps.
9)Extending analysis range of Gold using ultrAA Lamps.
10)Analysis of Iron ores.
11)Analysis of Cement.
12) Determination of Calcium in Saliva
13)Application of atomic-absorption spectroscopy in physics research
14)Determination of Cobalt in Steel, Alloy Steel and Nickel
Chapter-4
Nepheloturbidometry
4.0. Learning Outcome(s)
After studying the chapter, the students will be able to:
1.Define nepheloturbidometry
2.Describe the principle involved in nepheloturbidometry
3.Enumerate the factors that affect uniform turbidity, scattering of light and quantitative
mesurements
4.Explain the instrumental components and their working
5.Apply the knowledge in pharmaceutical quality control of suspensions
4.1. Introduction:
Nephelometric and turbidometric methods depend on the scattering of light by particle
suspended in a liquid. The suspended particles have refractive index values different from the
suspending medium. The overall effect mimics Tyndal effect.
Nephelometry is the measurement of scattered light as a function of concentration of suspended
particles where the concentration is less than 100 mg/ litre. Turbidometry is the measurement of
transmitted light as a function of concentration of suspended particles where the concentration is
more than 100 mg/litre that is high concentration samples.
4.2. Principle
At lower concentration of the suspension uniform scattering of particles is noticed. So the
intensity of scattered light is directly proportional to the concentration of solute. The intensity of
scattered light can be measured at 45°, 60°, 90° and 135°also.
For higher concentration suspensions scattering is non uniform and light becomes scattered in all
possible directions. Hence, it is difficult to measure the intensity of scatter radiation at specific
angles. So, the intensity of transmitted light (that is unscattered) direction is measured at 180°.
The intensity of transmitted light (It) is a function of concentration i.e. when the concentration
increases the intensity of transmitted light is less and when concentration is less the intensity in
high. Depending on the sample concentration of the suspension either nephelometry or
turbidometry is chosen. Suspensions with lower concentration nephelometry and for higher
concentration turbidometry are utilised.
Factors that produce uniform turbidity:
1] Order and rate of mixing of substances
2] Agitation of suspension
3] Temperature; as it affects solubility and viscosity of medium
4] Presence or absence of inert electrolyte and protective colloids such as gelatin, accacia etc. 5]
Concentrations of solutions mixed
Factors that produce scattered radiation:
1] Number of suspended particles
2] Size and shape of particles
3] Wavelength of radiation used
4] Difference in refractive index of particles and medium.
Factor affecting quantitative measurements:
The amount of radiation removed or deviated from the primary radiation beam depends on the
following factors:
1. Concentration
Nephelometry: Turbidimetry:
Is = Ks Io C
Is = scattered intensity
Ks= empirical constant
Io = Incident intensity
c = concentration of suspended material
S = log I/Io= kbc
T=Transmittance = I/Io
S = turbidence due to scattering
k = turbidity constant
b= path length
c = concentration of suspended material
2. Effect of Particle Size on Scattering
Size and the shape of the particles responsible for the scattering.
Because most analytical applications involve the generation of a colloidally dispersed
phase in a solution, those variables that influence particle size during precipitation also affect
both turbidimetric and nephelometric measurements.
4.3. Instrumentation
There are separate instruments available as nephelometer and turbidimeter. Also, they are
combined to form a Nephloturbidometer. Following are the common instrumental components:
4.3.1. Source of light:
Tungsten lamp is used when a polychromatic light is necessary and a Mercury arc lamp is used
when a monochromatic light is necessary.
4.3.2. Filters and Monochromators:
Wrhen polychromatic light is used filters and monochromators are not required but when
monochromatic light is necessary a filters or monochromator is used. In turbidimeter blue filter o
530 nm is used and in a nephelometer visible filter is used as a secondary filter.
4.3.3. Sample cells: Various shapes of sample cells are used in a nepheloturbidimetry. They
may be cylindrical with the path length of 1 cm. Also they may be rectangular cells but the cell
walls may be coated with black to avoid any reflection that may interact detector response. Cells
can also be prepared as per need to measure the scattered light at different angles of 45°, 90°,
135° and 180°. These cells are made up of glass.
4.3.4. Detectors: Photometric detectors like photovoltaic cells photomultiplier tubes are used in
such instruments. Photovoltaic cell or phototubes are used in turbidimeter. Whereas in
nephelometer photomultiplier tubes are used as the scatter radiation is weak.
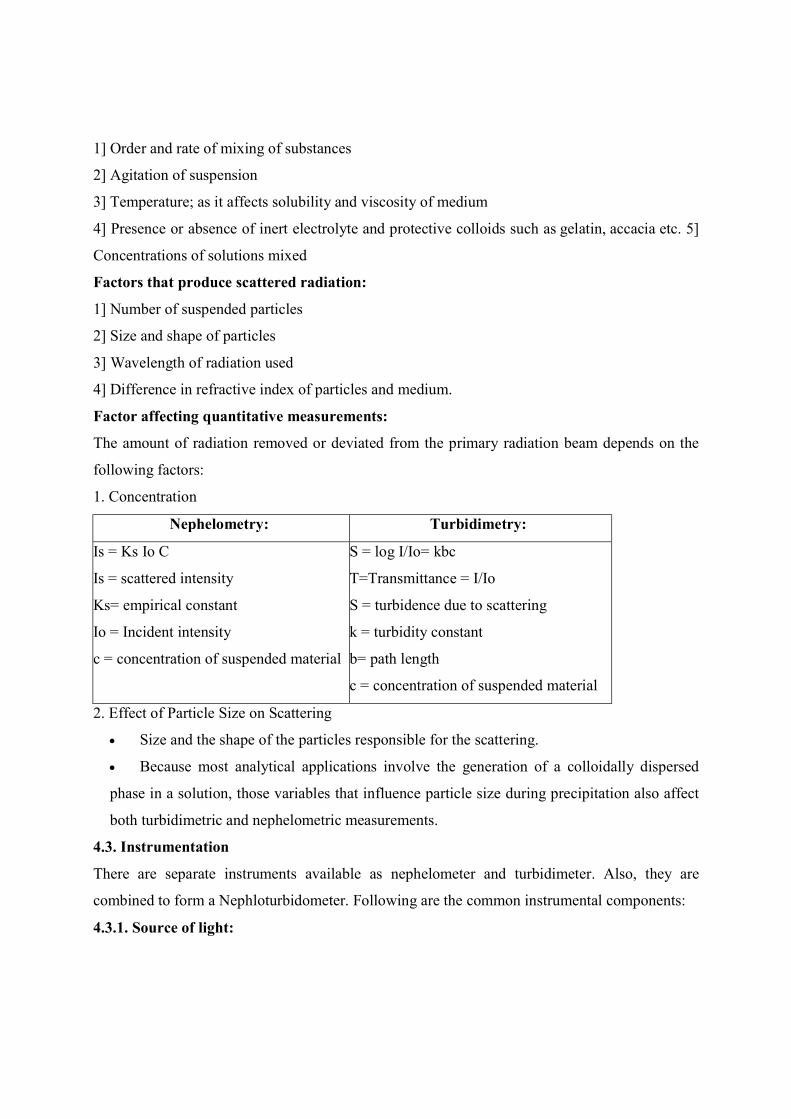
4.3.5. Nephelometer
It contains a tungsten lamp as the source of light and the sample cell is placed on the top of the
source. Light passing through filter falls on the suspended particles and these particles scattered
the light. These scattered lights are collected by optical system and reflected to a photovoltaic
cell which is kept at the bottom of the instrument. It's a very simple and inexpensive and easy to
handle method and has good precision and accuracy.
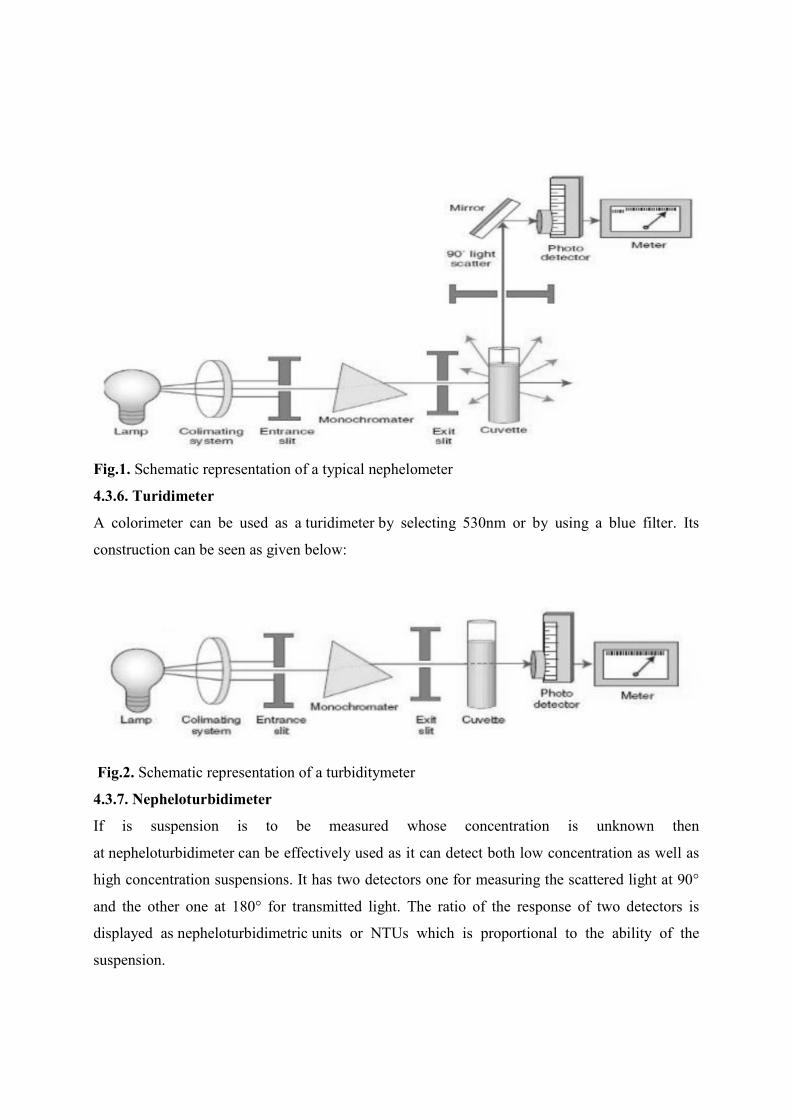
Fig.1. Schematic representation of a typical nephelometer
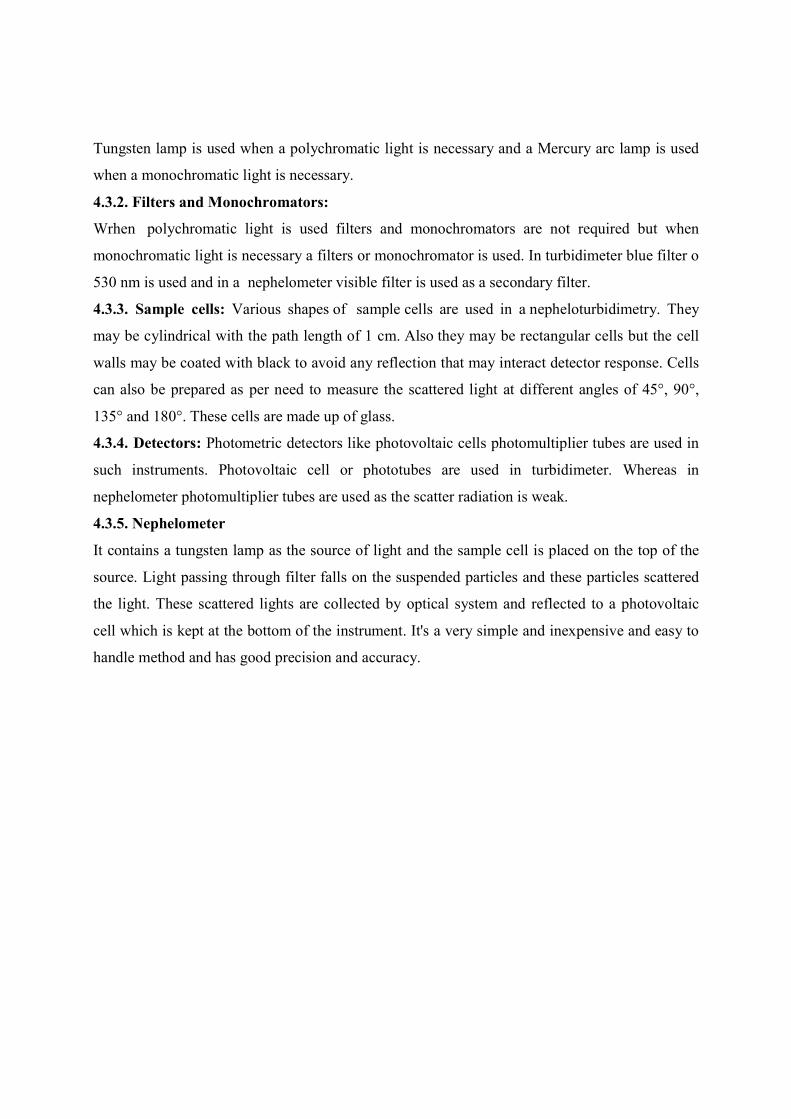
4.3.6. Turidimeter
A colorimeter can be used as a turidimeter by selecting 530nm or by using a blue filter. Its
construction can be seen as given below:
Fig.2. Schematic representation of a turbiditymeter
4.3.7. Nepheloturbidimeter
If is suspension is to be measured whose concentration is unknown then
at nepheloturbidimeter can be effectively used as it can detect both low concentration as well as
high concentration suspensions. It has two detectors one for measuring the scattered light at 90°
and the other one at 180° for transmitted light. The ratio of the response of two detectors is
displayed as nepheloturbidimetric units or NTUs which is proportional to the ability of the
suspension.
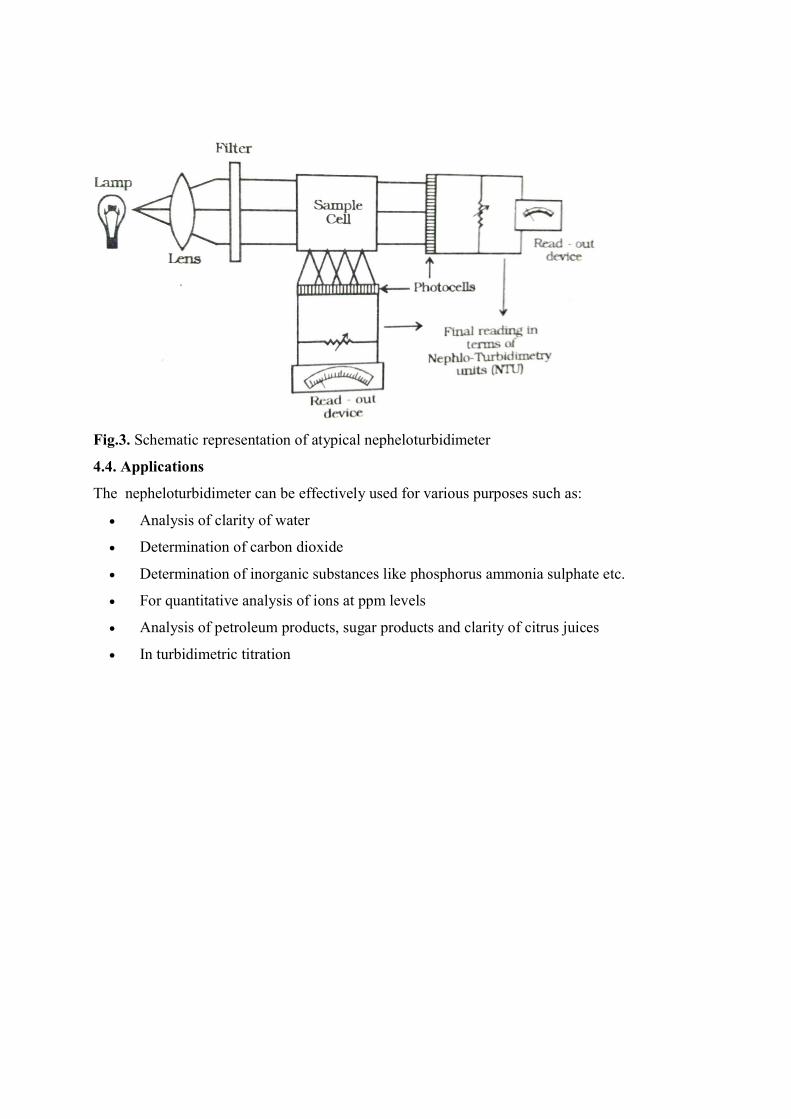
Fig.3. Schematic representation of atypical nepheloturbidimeter
4.4. Applications
The nepheloturbidimeter can be effectively used for various purposes such as:
Analysis of clarity of water
Determination of carbon dioxide
Determination of inorganic substances like phosphorus ammonia sulphate etc.
For quantitative analysis of ions at ppm levels
Analysis of petroleum products, sugar products and clarity of citrus juices
In turbidimetric titration
References
1. Deewan SK. Organic spectroscopy (N.M.R., I.R., Mass and UV).New Delhi:CBS Publishers
and Distributors Pvt. Ltd.; 2010.
2. William K. Organic Spectroscopy. Macmillan: Macmillan Chemistry Text; 1991.
3. Beckett AH, Stenlake JB. Practical Pharmaceutical Chemistry: Part-II. London:The Athlone
Press; 1988.
4. Verma RM, Analytical Chemistry:Theory and Practice. Third Edition. New Delhi: CBS
Publishers and Distributors Pvt. Ltd.; 2006.
5. Ravi Sankar S., Text Book of Pharmaceutical Analysis, Tiruneliveli:Rx Publications: 2006.