insar permanent scatterer analysis reveals fault re-activation during inflation and deflation...
TRANSCRIPT
Remote Sensing of Environment 114 (2010) 2373–2383
Contents lists available at ScienceDirect
Remote Sensing of Environment
j ourna l homepage: www.e lsev ie r.com/ locate / rse
InSAR Permanent Scatterer analysis reveals fault re-activation during inflation anddeflation episodes at Campi Flegrei caldera
G. Vilardo a, R. Isaia a, G. Ventura b,⁎, P. De Martino a, C. Terranova a
a Istituto Nazionale di Geofisica e Vulcanologia, Osservatorio Vesuviano, Napoli, Italyb Istituto Nazionale di Geofisica e Vulcanologia, Roma, Italy
⁎ Corresponding author.E-mail address: [email protected] (G. Ventura).
0034-4257/$ – see front matter © 2010 Elsevier Inc. Aldoi:10.1016/j.rse.2010.05.014
a b s t r a c t
a r t i c l e i n f oArticle history:Received 11 December 2009Received in revised form 6 May 2010Accepted 12 May 2010
Keywords:PSInSARFault re-activationCalderaVolcanism
Permanent Scatterers Synthetic Aperture Radar Interferometry (PSInSAR) and Global Position System (GPS)are applied to investigate the most recent surface deformation of the Campi Flegrei caldera. The PSInSARanalysis, based on SAR data acquired by ERS-1/2 sensors during the 1992–2001 time interval and by theRadarsat sensor during 2003–2007, identifies displacement patterns over wide areas with high spatialresolution. GPS data acquired by the Neapolitan Volcanic Continuous GPS network provide detailed groundvelocity information of specific sites. The satellite-derived data allow us to characterize the deformationpattern that affected the Campi Flegrei caldera during two recent subsidence (1992–1999) and uplift (2005–2006) phases. PSInSAR results show the re-activation of the caldera ring-faults, intra-caldera faults, anderuptive fissures. We discuss the results in the light of the available volcanological, structural andgeophysical data and propose a relationship between the structures activated during the recent unrestepisodes and those responsible for the recent (b3.8–4 ka) volcanism. The combined interpretation of thecollected data show that (a) the caldera consists of two sectors separated by a N–S striking faulting zone and(b) the intra-caldera NW–SE faults and eruptive fissures in the central-eastern sector re-activated during thestudied unrest episodes and represent possible pathways for the ascent of magma and/or gas to the surface.In this sector, maximum horizontal strain, recent volcanism (3.8–4 ka), active degassing and seismicityconcentrate. The fault re-activation is related to the dynamics of the caldera and not to tectonic stress. Thedeformation fields of the uplift and subsidence episodes are consistent with hydrothermal processes anddegassing from a magmatic reservoir that is significantly smaller than the large (∼40 km3) magma chamberresponsible for the caldera formation. We provide evidence that the monitoring of the horizontal and verticalcomponents of deformation improves the identification of active, aseismic faults. Accordingly, we suggestthat future ground deformation models should include the re-activation of the detected structures.
l rights reserved.
© 2010 Elsevier Inc. All rights reserved.
1. Introduction
Spaceborn interferometric synthetic aperture radar (InSAR)technique is increasingly used to monitor volcanic deformation(Ohkura & Shimada, 2001; Lundren et al., 2001; Kwoun et al.,2006a,b; Manzo et al., 2006; Wicks et al., 2006; Tizzani et al., 2007;Trasatti et al., 2008; Finnegan & Pritchard, 2009). The high spatio-temporal sampling achieved by this technique increases the chancesto detect and analyze ground deformation signals. In volcanic areas,this is particularly important because ground deformation may reflectchanges in the magmatic system related to an increased potential foreruption. Moreover, the improvement of the resolution in measuringthe surface deformation patterns at different spatio-temporal scales isrelevant to understand the surface and inner structure of activevolcanoes, and to decipher the precursor signals of an eruption.
Campi Flegrei (Italy), Long Valley (California), and Rabaul (PapuaNew Guinea) were restless in 1980s and affected by ground uplift,earthquakes and increased degassing (Lowenstern et al., 2006).Rabaul did not erupt until September 1994, whereas Campi Flegreiand Long Valley caldera experienced further unrest episodes withouterupting. At Rabaul, intra-caldera faults and ring-faults were activatedbefore the eruption (Saunders, 2005). At Campi Flegrei, the role ofring-faults in accommodating the uplift and subsidence during unrestepisodes is a still open question (De Natale & Pingue, 1993; Orsi et al.,1999; Amoruso et al., 2007; Trasatti et al., 2008). Such exampleshighlight (a) the ambiguity of precursor signals (e.g. uplift) of aneruption, which reflects the complexity of volcanic systems, and (b)the need of well constrained structural models for volcanoes.
Campi Flegrei caldera is listed among the supervolcanoes of theworld (Sparks et al., 2005), lastly erupted in 1538 AD, and sufferedongoing unrest episodes. Studies on Campi Flegrei and other calderasare abundant (e.g., Rosi & Sbrana, 1987; Orsi et al., 1999; Lowensternet al., 2006; Bodnar et al., 2007; Gottsmann & Battaglia, 2008, andreferences therein), however, an integration of geological,

2374 G. Vilardo et al. / Remote Sensing of Environment 114 (2010) 2373–2383
volcanological, and deformation data from satellite platforms is, inmany cases, lacking.
In this study, wemerge structural, volcanological, geophysical, andsatellite data with the aim to: (a) detect the structures activatedduring uplift and subsidence episodes: (b) recognize sectors of thecaldera characterized by a different eruptive and deformationbehaviour: and (c) provide a structural and volcanological frameworkfor the unrest episodes. The results prove that this approach providesinformation on the short and long term dynamics of volcanic areas.We demonstrate that both the caldera ring-faults and the intra-caldera faults were re-activated during uplift and subsidence. Resultsput constraints on the still debated question on whether pre-existingstructures respond to inflation and deflation episodes in calderasettings (e.g. Saunders, 2005; Geyer & Martì, 2009), and, in particular,on how the tectonic structures that affect a caldera may react toinflation and deflation episodes originated by a magmatic/hydrother-mal system clearly different from the one that originated the calderastructure.
2. Volcanological setting and recent dynamics
The Campi Flegrei caldera was defined after the CampanianIgnimbrite (40 ka) and the Neapolitan Yellow Tuff eruptions(15 ka), which produced sub-circular collapses (Fig. 1). NW–SE, NE–SW, and N–S striking faults occur within the Neapolitan Yellow Tuffcaldera (NYTC) (Fig. 1). The NW–SE and NE–SW strikes are those ofthe main regional lineaments of the area (Rosi & Sbrana, 1987; Orsiet al., 1999; Bruno, 2004; Acocella, 2008). N–S and NW–SE eruptivefissures younger than 15 ka are concentrated in the westernmost andeastern NYTC sectors, respectively (Fig. 1). Faults and eruptive fissureswith a preferred NW–SE strike concentrate in the central-easternsector (CES) of NYTC, whereas fewer NE–SW striking faults affect thecentral-western sector (CWS) (Fig. 1). The N–S striking faults outcropin the central and westernmost sectors of the caldera.
In the last 15 ka, 70 eruptions occurred in distinct epochs ofactivity up to the last event of Monte Nuovo (1538 AD) (Fig. 1; Di Vitoet al., 1999; Isaia et al., 2009). Within the CES, multiple plinian to
Fig. 1. Structural sketch map of the Campi Flegrei caldera. In the figure are also shown: theepisodes in 2000 and 2005–2006; and the area of higher attenuation values for the upperm
strombolian, phreatomagmatic and lava dome events eruptedmagmas of different composition (shoshonite, latite, trachyte, andtrachyphonolite; D'Antonio et al., 1999; Di Vito et al., 1999). CWS wascharacterized by scarce and lower energy eruptions of trachytic totrachyphonolitic magmas. In particular, 14 of the 16 eruptions of thelast 4 ka occurred from the CES (Isaia et al., 2009). The other twoeruptions were phreatomagmatic events from the CWS.
Offshore, CES and CWS are separated by a set of structuraldiscontinuities (Sacchi et al., 2009) whose on-land propagation ishighlighted by N–S and NNE–SSW striking faults located in the centralsector of NYTC (Fig. 1). These faults overlap a high, N–S elongated, upto 2 km deep, Qp anomaly that is associated with the intensehydrothermal alteration (de Lorenzo et al., 2001). A high Vp/Vsanomaly also characterizes the upper 2 km in this area and reflects theoccurrence of fluids due to steam condensation. Below, at 3 km depth,is characterized by a low Vp/Vs anomaly, which suggests a gas-richrock volume (Chiarabba &Moretti, 2006). The preferred orientation ofthe fast S waves polarization indicates that this volume is affected byN–S striking cracks (Bianco & Zaccarelli, 2009).
NYTC suffered repeated ground deformations that are morepronounced in the central sector (La Starza marine terrace; Fig. 1),where an uplift of at least 100 mwas estimated in the last 10 ka. Slowground movements (bradyseism) periodically occurred during thelast 2000 years. Two significant historic unrests (1970–72 and 1982–84) occurred in the last 40 years. A ground uplift of 3.5 m between1970 and 1984 was accompanied by thousands of earthquakes, whileonly part of the displacement (b1 m) was aseismically recoveredthroughout the subsequent ground subsidence. After the 1982–84crisis, the general subsidence was interrupted by episodes of ‘micro-uplift’ with displacement of a few cm. This last occurred in 2004–2006.
Geochemical and geophysical data show that peaks in CO2/CH4 infumaroles during micro-uplifts occurred some months after shallow(b3 km depth), long-period and volcano-tectonic earthquakes. Theepicenters of these earthquakes roughly aligned along a NNW–SSE toNW–SE strike (Fig. 1; Cusano et al., 2008; Chiodini, 2009). A decreaseof CO2/CH4 accompanied the subsidence phase. Migration of
eruptive vents for the four main activity epochs; the seismicity associated with upliftost 2 km. The preferred orientation of the fast S-wave polarization is also reported.

Table 1ERS and Radarsat-1 tracks, frames, incidence angle, and scene utilized for SAR imageprocessing and PS extraction.
Satellite and orbit Track/frame Incidenceangle
Usedscenes
Time range
ERS ascendingdataset
129/819 22° 69 14 Jun 1992–13 Dec2000
ERS descendingdataset
36/2781 23° 79 8 Jun 1992–11 Jan2001
Radarsat ascendingdataset
104/S3 34° 52 04Mar 2003–15 Sep2007
Radarsat descendingdataset
11/S3 32° 51 22 Mar 2003–16Aug 2007
111/S3 33° 51 05 Mar 2003–23Aug 2007
2375G. Vilardo et al. / Remote Sensing of Environment 114 (2010) 2373–2383
magmatic/hydrothermal fluids, which mainly occurred along NW–SEfaults and fractures located in the Solfatara–Agnano–Astroni area ofCES (Fig. 1), are responsible for the uplift episodes (Chiodini et al.,2001), also corroborated by the modeling of geodetic data (Battaglia
Fig. 2. Map view of the PS range-change rate measurements computed from the: (A) ascen(C) ascending, and (D) descending Radarsat data acquired between October 2005 and Novempoints on the ground). The insets show the satellite flight direction (black arrow) and the l
et al., 2006). The subsequent subsidence is associated to pore (gas)pressure decrease and compaction of soft pyroclastic layers.
3. The Campi Flegrei PSInSAR data
Permanent scatterer synthetic aperture radar (PSInSAR) data wereexploited in order to characterize the ground displacement velocitypattern during subsidence and micro-uplift episodes at NYTC.
Here, we use ERS 1, ERS 2 and Radarsat 1 (Beam S3) satellite SARscenes collected from the ESA archive and interferometricallyprocessed by means of the PSinSAR™ standard (SPSA) technique(Ferretti et al., 2001). SPSA analysis was performed by T.R.E. s.r.l., aPOLIMI spin-off company, using: a) SAR images acquired by ascendingand descending orbits of ERS-1 and ERS-2 missions during June 1992–January 2001 period; b) SAR images acquired by ascending anddescending orbits of Radarsat-1 (Beam S3) mission during March2003–August 2007 period (Table 1). The results of the PSinSAR™processing, which also concerned the estimate and removal of thedifferent contributions due to atmospheric anomaly, topographic
ding, and (B) descending ERS data acquired between June 1992 and December 1999;ber 2006. Positive values indicate a decrease in the range (distance from the satellite toook direction (red arrow); the number (degree) refers to the incidence angle.

Fig. 3. Interpolated LOS deformation velocity maps from PS in Fig. 1. (A) ERS ascending orbit; (B) ERS descending orbit; (C) Radarsat ascending orbit; and (D) Radarsat descendingorbit. The insets show the satellite flight direction (black arrow) and the look direction (red arrow); the number (degree) refers to the incidence angle.
2376 G. Vilardo et al. / Remote Sensing of Environment 114 (2010) 2373–2383
effects and orbital ramps (Ferretti et al., 2001; Lu et al., 2007, Rott,2009, Vasco et al., 2010), consisted of a time series of the variation inthe sensor-target distance over the two whole ERS and Radarsatacquisition periods of a set of PS with coherence higher than 0.65. Theprecision on single PS LOS measurements depends on both thenumber of available SAR images and the PS multi-interferogramcoherence (Rocca et al., 2000). The great amount of SAR images usedin this study (Table 1), allowed accurate measurement of the PSmovements along the SAR LOS, which, for a 0.65 coherence thresholdhave been appreciated at millimetre accuracy (Rocca et al., 2000;Ferretti et al., 2000, 2001, 2007; Colesanti et al., 2003; Lu et al., 2007;Massironi et al, 2009).
The PS yearly average displacement velocities in the line of sight(LOS)were calculated by linear fit of the variation in distance betweenthe target and the radar antenna on board the orbiting platform. Thefinal result is an accurate measurement of the PS annual meanvelocities within 1.0 mm/yr of accuracy (Colesanti et al., 2003; Ferrettiet al., 2007; Lu et al., 2007; Massironi et al, 2009). For the subsidence
episode, the period June 1992–December 1999 (ERS data) was takeninto account. For the micro-uplift episode, the period October 2005–November 2006 (Radarsat data) was selected. The yearly LOS averagedisplacement velocities of PS used in this study are shown in Fig. 2.The mean displacement rates were used to derive the yearly averageground deformation velocity maps in SAR coordinates for ascendingand descending orbits of both ERS and Radarsat data by inversedistance interpolation weighted method. We used a quadraticweighting power 2 within a 500 m radius neighbourhood to obtain50 m regularly spaced grids, which are referenced to UTM zone 33 andto WGS-84 (Fig. 3). The next processing stage concerned the estimateof the vertical and the East–West components of the deformationvelocity for both the subsidence and the uplift episodes. Theavailability of both ascending and descending datasets allowed us toseparate the vertical and East–West components of the deformationfor the sampled areas that are common to both the acquisitiongeometries. However, the data do not provide information about theNorth–South component. In fact, due to the viewing geometry of the

Fig. 4.Mean deformation velocities estimated using SAR data. (A) and (B) show, respectively, the vertical and East–West components of the average deformation velocity generatedfrom the 1992–1999 ERS data. (C) and (D) provide the overall pictures of the vertical and East–West components of the average deformation velocity generated from the 2005–2006Radarsat data. The superimposed boundaries and faults (black lines) are from Fig. 1. The trace of the SW–NE profile depicted in Fig. 6 is also reported in D.
2377G. Vilardo et al. / Remote Sensing of Environment 114 (2010) 2373–2383
radar satellite, range-change rates recorded by the PSInSAR mea-surements include the contributions of the vertical and the East–West motions projected into the radar line of sight vector, but cannotdetect displacements in the North–South direction being this latterroughly parallel to the orbit track. To separate the vertical and East–West components of the deformation it is assumed that theascending and descending radar LOS directions belong to the East-Zplane and the look-angle are the same for both ascending anddescending geometries. Based on these assumptions, simple geo-metric considerations allow us to retrieve the vertical and the East–West displacement components on pixels that are common to bothascending and descending LOS mean displacement velocity maps(Lundgren et al., 2004; Manzo et al., 2006; Lanari et al, 2007; Vilardoet al., 2009).
Mean deformation velocity components for the subsidence phaseduring June 1992–December 1999 (Fig. 4A, B) were computed fromthe ascending and descending LOS velocities maps obtained byprocessing ERS data (Fig. 3A, B). The radar LOS mean displacementvelocity maps computed from the Radarsat ascending and descendingorbits (Fig. 3C, D) allowed us to estimate the vertical and East–West
components for the October 2005–November 2006 micro-upliftepisode (Fig. 4C, D).
4. The GPS data
To compare SAR data with those from independent methodolo-gies, we performed a GPS analysis of data acquired by the NeapolitanVolcanic Continuous GPS network (NeVoCGPS). The NeVoCGPSnetwork is a part of the Neapolitan volcanoes (Vesuvius, CampiFlegrei caldera and Ischia Island volcanoes) geodetic monitoringsystem operating at INGV — Osservatorio Vesuviano. The dataprocessing is performed by the Bernese Processing Engine (BPE) ofthe Bernese GPS software v. 5.0 (Dach et al., 2007) in doubledifferencemode. IGS final orbits and Earth rotation parameters (ERPs)are introduced into the analysis. The elevation cut-off is set at 15° andthe IGS absolute phase center variations (APCVs) for the satellite andreceiver antennas are applied. To maximize the number of observa-tions, the independent baselines are created using the OBSMAXstrategy and the ambiguity resolution is performed using the QuasiIonosphere Free (QIF) method. The daily station coordinates are

Fig. 5. Horizontal (blue arrows) and vertical (red arrows) GPS velocity vectors from GPS data in: (A) January 2001–December 2002; and (B) October 2005–November 2006.
2378 G. Vilardo et al. / Remote Sensing of Environment 114 (2010) 2373–2383
estimated, together with the troposphere, in the final ionospheric freeL3 solution. The troposphere is modelled using the dry-Niell a priorimodel and estimating the trophosphere zenith delay (TZD) para-meters each hour at each site using the wet-Niell mapping function.The datum definition is realized by three no-net-translation condi-tions (minimal constraint) imposed on a set of six IGS05 fiducial sites,which are included in the processing. In order to get homogeneousresults, all the GPS data collected before the introduction of the newrealisation of the International Terrestrial Reference System (IGS05)in November 2006 have been processed using the orbits and ERPsobtained by the GPS reprocessing project GPS-PDR (Steigenbergeret al. 2006). These products are in IGb00 reference system and areestimated applying the APCVs. To minimize the tectonic movementscontribution, the GPS velocities are estimated relative to the stablestation located outside the volcanic area.
GPS stations at Campi Flegrei are operative from 2000; thus, dataare not available for the 1992–1999 subsidence phase. Consequently,in order to show the pattern of GPS velocities during a subsidencephase, we selected the time interval from January 2001 to December2002 (Fig. 5A), following the 2000 micro-uplift episode. The GPShorizontal and vertical velocities for the uplift phase were estimatedfor the same time interval sampled by the SAR images (October 2005–November 2006) (Fig. 5B).
5. InSAR and GPS results
5.1. The subsidence phase
The vertical deformation velocity pattern obtained fromERS data andassociatedwith the deflation phase (Fig. 4A) at the Campi Flegrei calderais essentially radially symmetric and it is bounded by the NYTC ring-faults. In addition, the area with highest vertical velocity (N15 mm/yr) isbounded by a NE–SW striking fault (to the west) and by NW–SE strikingfaults and eruptive fissure (to the east) (Fig. 4A). The maximum verticalvelocity computed by PS technique for the subsidence is −33 mm/yr(Fig. 4A), in fully agreementwith−33 mm/yr from leveling data (Lanariet al., 2004).
The east–west velocity field by PS processing (Fig. 4B) shows aroughly N–S striking major discontinuity. In the NYTC central sector,such discontinuity overlaps the NNE–SSW striking eruptive fissureand faults crossing the Solfatara crater.Westward velocitiesN5 mm/yrare to the east of such discontinuity, in correspondence of the NW–SEfaults system affecting the CES. Eastward velocitiesN5 mm/yr occur inCWS and are bounded, to the East, by the main N–S fault affecting the
NYTC central sector and, to the North-West, by the NE–SW strikingfault bordering the southern Mt. Nuovo crater rim.
Even if not comparable with the previously reported East–Westvelocity estimates from PS data, the GPS stations located in CES andCWS show horizontal velocity vectors associated with the consideredsubsidence phase (Fig. 5A) with a predominant east–west componentand opposite trends (see GPS stations BAIA, ARFE ACAE and IPPO inFig. 5A), according to the east–west velocity pattern from SAR(Fig. 4B).
The presence of discontinuities in both the vertical and east–westvelocity pattern is well illustrated in Fig. 6B and C, where E–Wprofilesof both vertical and east–west velocity during subsidence (ERS data inFig. 4A, B) are shown. Both the vertical and east–west profile revealthat the velocity values are similar in CES and CWS. Some spikes in thevelocity pattern occur in correspondence of eruptive fissures or faults.This observation suggests that the NE–SW striking faults located inCWS and the NW–SE faults of CES, as well as the N–S discontinuitycrossing the central NYTC sector, are re-activated during subsidence.Analyses of the LOS deformation time series of PS with coher-ence≥0.90 located near the eruptive fissures and faults in the areaaffected by themaximum ground deformation (Fig. 7) further confirmthe re-activation of these structures during subsidence. In fact, theplots of Fig. 7 show that, for both ascending and descending orbits, therate of deformation for PS located on the opposite sides of the selectedstructures was significantly different (Table 2).
5.2. The uplift phase
For the uplift episode, PS data provide a maximum vertical groundvelocity of 26 mm/yr (Fig. 4C), a value reasonably consistent with thatobtained from GPS (RITE=39±2 mm/yr; ACAE=33±2 mm/yr;Fig. 5B) and leveling data (36±5mm/yr; Ricco et al., 2007). To furthervalidate the PSInSAR products we carried out a comparison betweenthe LOS deformation time series obtained by PSInSAR method and thecorresponding daily time series of the GPS measurements projected onthe ascending and descending radar line of sight by using the satelliteincidence and track angles (Fig. 8). Specifically, by assuming the GPSdata as a reference, we compared the LOS projected time series of theGPS deformation vectors for the RITE, ACAE and ARFE stations (Fig. 5)with the LOS displacement time series of the PS with coherence≥0.90nearest located to each GPS benchmark. The comparison results (Fig. 8)clearly show the good agreement between the GPS and PSInSARdeformation measurements.

Fig. 6. E–Wprofile of: (A) topography; (B) vertical and (C) east–west component of thevelocity during the January 2001–December 2002 subsidence (ERS data) and theOctober 2005–November 2006 uplift (Radarsat data). The trace of the profile is inFig. 4D. Grey vertical bars indicate spikes or changes in the trend of velocity patternoccurring in correspondence of faults and fissures. (D) Horizontal strain calculated fromthe east–west component of velocity for the October 2005–November 2006 uplift (datafrom Fig. 4D) within an 11×2 km area containing the profile. Blue is extension, red iscompression. The main structural feature is from Fig. 1.
2379G. Vilardo et al. / Remote Sensing of Environment 114 (2010) 2373–2383
Following the PSInSAR products validation, the interpretation ofthe achieved results indicates that the vertical deformation velocitypattern obtained from Radarsat data (Fig. 4C) for the uplift phaseshows an essentially radial symmetry. As for the subsidence, the upliftarea with highest vertical velocity (N5 mm/yr) is bounded by NE–SWstriking faults (to thewest) and by NW–SE faults and eruptives fissure(to the east) (Fig. 4C).
The east–west velocity pattern (Fig. 4D) gives evidence ofextension during uplift and, as for the subsidence, of a N–Sdiscontinuity located in the NYTC central sector.
The GPS horizontal velocity vectors associated to the uplift phases(Fig. 5B) show a predominant east–west component, but withopposite trends with respect the subsidence phase (see GPS stationsBAIA, ARFE ACAE and IPPO in Fig. 5B).
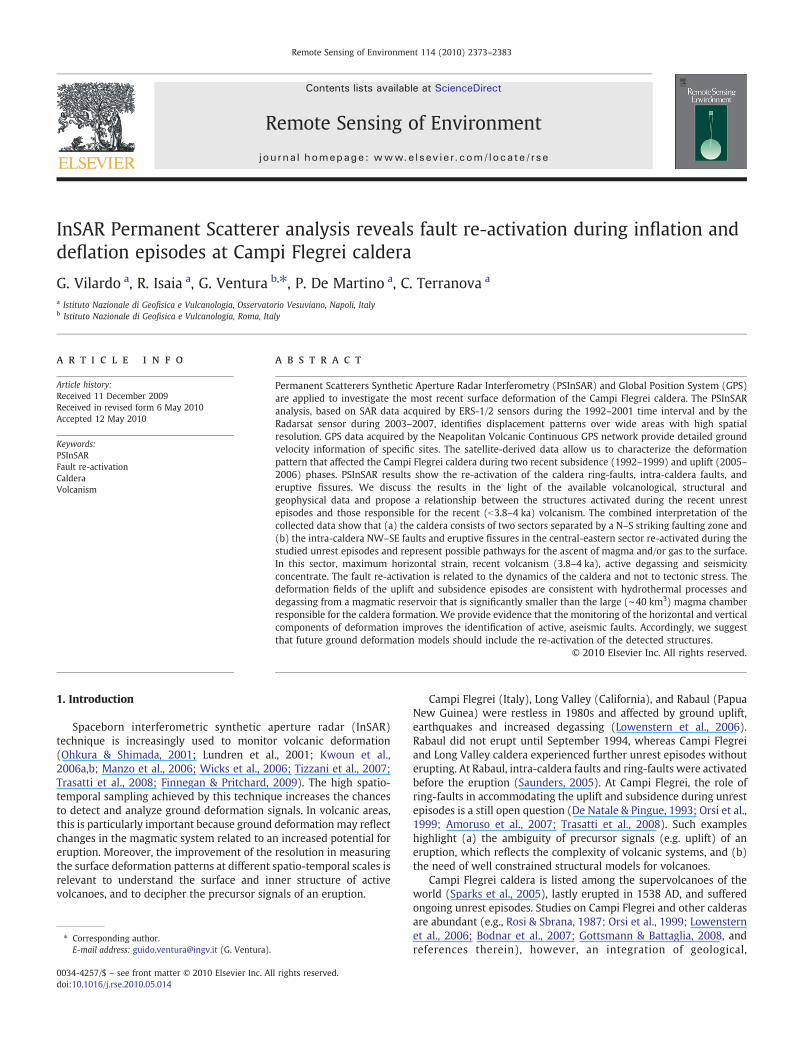
The LOS deformation time series of PS with coherence≥0.90located nearby the N–S fault separating CES from CWS (Fig. 9A) andthe estimated vertical and east–west components of the velocity(Table 3) show the different deformation rates of the opposite sides of
this fault during the uplift phase. The NW–SE striking fault crossingSolfatara volcano is also characterized by different displacementvelocities of the blocks (Fig. 9B; Table 3). These data indicate thatduring uplift, as for subsidence, the pre-existing structures are re-activated. The correlation of deformation with faulting activity wasalready revealed by previous authors, which highlighted the occur-rence of breaks on the ground elevation profiles from precisionleveling (1982–1984) coincident with structural lineaments (Orsiet al., 1999). The recent vertical ground deformation at Campi Flegreimeasured by precision leveling lines also shows the same spatialcorrelation (Ricco et al., 2007).
The eastward and westward components of the velocity duringmicro-uplift show a different pattern in CES and CWS. In CWS, the E–W profile of the horizontal component of velocity (Radarsat data inFig. 6) illustrates that, thewestward velocity is always b5 mm/yr (avg.1.5 mm/yr), whereas in CES, the eastward velocity reaches 5 mm/yrwith an average of 4.4 mm/yr. Therefore, CES typically moveshorizontally with a velocity ∼2.9 times larger than CWS. This impliesthat CES is affected by a larger horizontal extension. To corroboratethis conclusion, we determined the horizontal strain with theGrid_strain software (Teza et al., 2008) by inputting the horizontaldeformation information deduced from the Radarsat data (Fig. 4D).We obtained the eigenvectors and eigenvalues within a selected areaand reported the output as vectors. We selected an E–W striking area,2×10 km strip, overlapping CWS and CES and crossing the NYTCcentral sector. According to the GPS data (Fig. 5B), this strip wasselected considering that the E–W component of the velocity ismaximized along an E–W strike crossing the central sector of thecaldera. Results of the strain calculations at NYCT are reported inFig. 6D and show that the maximum horizontal strain occurs in CES,where the NW–SE striking faults and the younger (b4 ka) vents ofSolfatara and Astroni are located.
6. Discussion and conclusions
We discuss in detail the results obtained from SAR and GPS data inlight of the available volcanological and geophysical information.
The subsidence area shows an elliptic shape and it is bounded bythe NYTC ring-faults (Fig. 4A). This deformation field is consistentwith results from experimental and numerical models on grounddeformations at calderas (Martí et al., 1994; Folch & Gottsmann,2006). These models demonstrate that, in absence of tectonic stress,the deformation concentrates inside the caldera area and may beaccommodated by ring-faults.
The east–west velocity field (Fig. 4B) indicates that, duringsubsidence, the NYTC central sector was affected by compression. Asobserved in other caldera settings, e.g. Ischia Island, Italy (Sepe et al.,2007) and Aniakchak Caldera, Alaska (Kwoun et al., 2006a,b), thiscompression is related to deflation processes.
The collected data indicate that during subsidence the NYTC ring-faults, the intra-caldera faults, and the eruptive fissures are aseismi-cally re-activated. The intra-caldera structures also activated duringmicro-uplift, whereas the NYTC ring-faults were locked. Thisconclusion contrast with previous interpretations from other authors(e.g., Amoruso et al., 2007), who propose that faults do not activateduring micro-uplift episodes. According to Milano et al. (2004), whopointed out the lack of tectonic stress in the Campi Flegrei area, the re-activation of pre-existing structures at NYCT during subsidence ormicro-uplift phases were related only to the caldera dynamics.
Our results (Figs. 1, 4B and D) and previous structural andgeophysical data (see Section 2) highlight an active, major N–Sstriking faulting zone within NYTC. Such zone separates sectorscharacterized by a different evolution of the volcanism, compositionof the erupted products, and structural arrangement. With respect tothe CWS, CES is subjected to a larger horizontal extension (Figs. 4D, 6),which can account for the variation in style, frequency and magmatic

Fig. 7. PSInSAR LOS deformation time series for different sets of selected PS, identified by ERS data processing (coherenceN0.90) located on the opposite sides of the geologicalstructures highlighted in the insets. Positive values indicate movement towards the satellite along its L.O.S., while negative values indicate movement away from the sensor.
2380 G. Vilardo et al. / Remote Sensing of Environment 114 (2010) 2373–2383

Table 2Vertical and east–west components of the yearly average velocity on the opposite sidesof selected structures shown in Fig. 4 (A–D), obtained combining the radar LOS meandisplacement velocity estimated from both the ascending and descending ERS PS timeseries. Negative VE–W values indicate movement towards the West.
Structure Strike Sector VZ (mm/yr) VE–W (mm/yr)
A NW–SE NE −10 −12SW −16 −12
B NW–SE NE −4 −3SW −13 −7
C NW–SE NE −6 −2SW −20 −26
D NE–SW SE −6 −7NW −12 −15
2381G. Vilardo et al. / Remote Sensing of Environment 114 (2010) 2373–2383
signature of the eruptions occurred in the two sectors of the caldera.This larger extension could also explain why the increase in CO2
output during uplift preferentially occurs in CES along the NW–SEstriking faults affecting the Solfatara area (Chiodini et al., 2001). Themore recent (b4 ka) NYTC volcanism also concentrates along thesefaults, which in part acted as eruptive fissures (e.g., Astroni volcano;Fig. 1) and along which lava domes also emplaced. Therefore, theNW–SE faults and fissures represent an important pathway for theuprising of gases and magmas on time scales in the order 1–10 yearsand 102–103 years, respectively. We underline that the NYTC sectorwhere the active degassing is located, uplift-related seismicity, andthe more recent volcanism is concentrated and overlaps with the areaof maximum horizontal deformation and only in part that ofmaximum vertical uplift. On the basis of deformation models, thesource of uplift is consistent with a shallow, 2–3 km deep, fluidpressurized horizontal crack (Amoruso et al., 2007). This feature
Fig. 8. Comparison between GPS time series measurements projected on the ascending andtime series (blue squares). GPS time series have been assumed as reference. The LOS mean vreported.
suggests that pressurization processes, which take place in the area ofmaximum extensional strain and seismicity (Figs. 1 and 6) andprecede the peaks in CO2/CH4, i.e. fluid-injection episodes, could beresponsible for fault re-activation. Faults also move aseismicallyduring subsidence due to a prevailing ductile deformation associatedto fluid-filled fractures (Orsi et al., 1999), suggesting that the recoveryof the deformation may partly occur along the intra-calderastructures.
The recent (b4 ka) volcanic evolution of NYTC and the detecteddeformation velocity pattern (Figs. 4, 6) were produced by a sourcedifferent from that originating the caldera, which was a single, large(∼40 km3 DRE) magma chamber (D'Antonio et al., 1999). Thepresent-day source includes a deep mafic magmatic system possiblylocated at 8–9 km depth (Mangiacapra et al., 2008), and a shallower,about 3 km deep, storage zone refilled by mafic magmas from thedeeper reservoir in the Solfatara area (Isaia et al., 2009). Therefore, theNYTC unrest episodes may result from the active degassing of amagmatic source that involves also the shallow hydrothermal system(Chiodini et al., 2001), whose dynamics account for the verticaldeformations (Battaglia et al., 2006). The output of magmatic CO2
concentrates along the NW–SE intra-caldera faults and fissures of CES.Our study re-enforces the interpretation proposed by Geyer & Martì(2009) that current magmatic unrest episodes in calderas can beaccommodated by a structural framework different from the systemresponsible for the caldera formation.
The analyses of spatially distributed PSinSAR, combined withvolcanological and structural data highlight the relationships betweenthe structural pattern related to the widespread recent (b4 ka)volcanism and the present-day dynamics of the caldera. The abovediscussed results can provide relevant information for the hazardassessment of calderas, and in particular suggest that (a) the
descending Radarsat LOS (red dots) and the corresponding PSInSAR LOS deformationelocities (mm/yr) measured by GPS and PSInSAR and their standard deviations are also
Fig. 9. PSInSAR LOS deformation time for different sets of selected PS identified by Radarsat data processing (coherenceN0.90) located on the opposite sides of the geologicalstructures highlighted in the insets. Positive values indicate movement towards the satellite along its L.O.S., while negative values indicate movement away from the sensor. Greyboxes highlight the October 2005–November 2006 uplift phase.
2382 G. Vilardo et al. / Remote Sensing of Environment 114 (2010) 2373–2383
monitoring of individual faults and of the horizontal deformationcould give important information on the dynamics of intra-calderastructures, and (b) at CF caldera, the NW–SE faults and cracksrepresent a preferential pathway for the ascent of gas and magma tothe surface.
Acknowledgments
We would like to express particular thanks to Alessandro Ferretti(Tele-Rilevamento Europa — T.R.E. s.r.l.) for his valuable support onPSInSAR product and processing description. This manuscript benefit-ed from the thorough revision of J. Martì and two anonymousreviewers, and from an edit of V. Smith (Oxford University, UK). Thisstudy has been supported by the TELLUS project (TelerilevamentoLaboratori Unità di Supporto), which has been developed in theframework of the PODIS project (Progetto Operativo Difesa Suolo) ofthe Ministero dell'Ambiente e per la Tutela del Territorio e del Mare,and has been funded by the European Union QCS 2000–2006 PON-ATAS, by INGV-Osservatorio Vesuviano, and by ‘Creep’ IYPE-UNESCOproject.
Table 3Vertical and east–west components of the yearly average velocity on the opposite sidesof selected structures shown in Fig. 8 (A–B), obtained combining the radar LOS meandisplacement velocity estimated from both the ascending and descending Radarsat PStime series. Positive VE–W values indicate movement towards the East.
Structure Strike Sector VZ (mm/yr) VE–W (mm/yr)
A N–S E 27 5W 15 −3
B NW–SE NE 16 9SW 25 7
References
Acocella, V. (2008). Activating and reactivating pairs of nested collapses during caldera-forming eruptions: Campi Flegrei (Italy). Geophysical Research Letters, 35, L17304,doi:10.1029/2008GL035078.
Amoruso, A., Crescentini, L., Linde, A. T., Sacks, I. S., Scarpa, R., & Romano, P. (2007). Ahorizontal crack in a layered structure satisfies deformation for the 2004–2006uplift of Campi Flegrei. Geophysical Research Letters, 34, L22313, doi:10.1029/2007GL031644.
Battaglia, M., Troise, C., Obrizzo, F., Pingue, F., & De Natale, G. (2006). Evidence for fluidmigration as the source of deformation at Campi Flegrei caldera (Italy). GeophysicalResearch Letters, 33, L01307.
Bianco, F., & Zaccarelli, L. (2009). A reappraisal of shear wave splitting parameters fromItalian active volcanic areas through a semiautomatic algorithm. Journal ofSeismology, 13, 253−266.
Bodnar, R., Cannatelli, C., De Vivo, B., Lima, A., Belkin, H., & Milia, A. (2007). Quantitativemodel for magma degassing and ground deformation (bradyseism) at CampiFlegrei. Italy, Geology, 35, 791−794.
Bruno, P. P. (2004). Structure and evolution of the Bay of Pozzuoli (Italy) using marineseismic reflection data: Implications for collapse of the Campi Flegrei caldera.Bulletin of Volcanology, 66, 342−355.
Chiarabba, C., & Moretti, M. (2006). An insight into the unrest phenomena at the CampiFlegrei caldera from Vp and Vp/Vs tomography. Terra Nova, 18, 373−379.
Chiodini, G. (2009). CO2/CH4 ratio in fumaroles a powerful tool to detect magmadegassing episodes at quiescent volcanoes. Geophysical Research Letters, 36, L02302.
Chiodini, G., Frondini, F., Cardellini, C., Granieri, D., Marini, L., & Ventura, G. (2001). CO2
degassing and energy release at Solfatara volcano, Campi Flegrei, Italy. Journal ofGeophysical Research, 106, 16213−16222.
Colesanti, C., Ferretti, A., Locatelli, R., Novali, F., & Savio, G. (2003). PermanentScatterers: Precision assessment and multi-platform analysis. IGARSS 2003, Tolosa(pp. 1−3).
Cusano, P., Petrosino, S., & Saccorotti, G. (2008). Hydrothermal origin for sustainedlong-period (LP) activity at Campi Flegrei Volcanic Complex Italy. Journal ofVolcanology and Geothermal Research, 177, 1035−1044.
D'Antonio, M., Civetta, L., Orsi, G., Pappalardo, L., Piochi, M., Carandente, A., de Vita, S., DiVito, M. A., & Isaia, R. (1999). The present state of the magmatic system of theCampi Flegrei caldera based on a reconstruction of its behavior in the past 12 ka.Journal of Volcanology and Geothermal Research, 91, 247−268.
Dach, R., Hugentobler, U., Fridez, P., & Meindl, M. (Eds.). (2007). Bernese GPS SoftwareVersion 5.0, Astronomical Institute, University of Bern, Switzerland (pp. 1−612)..
de Lorenzo, S., Gasparini, P., Mongelli, F., & Zollo, A. (2001). Thermal state of the CampiFlegrei caldera inferred from seismic attenuation tomography. Journal of geody-namics, 32, 467−487.

2383G. Vilardo et al. / Remote Sensing of Environment 114 (2010) 2373–2383
De Natale, G., & Pingue, F. (1993). Ground deformations in collapsed caldera structures.Journal of Volcanology and Geothermal Research, 57, 19−38.
Di Vito, M. A., Isaia, R., Orsi, G., Southon, J., de Vita, S., D'Antonio, M., Pappalardo, L., &Piochi, M. (1999). Volcanism and deformation since 12000 years at the CampiFlegrei caldera (Italy). Journal of Volcanology and Geothermal Research, 91,221−246.
Ferretti, A., Prati, C., & Rocca, F. (2000). Nonlinear subsidence rate estimation usingPermanent Scatterers in differential SAR interferometry. IEEE Transactions onGeosciences and Remote Sensing, 38, 2202−2212.
Ferretti, A., Prati, C., & Rocca, F. (2001). Permanent Scatters in SAR Interferometry. IEEETransactions on Geosciences and Remote Sensing, 39, 8−20.
Ferretti, A., Savio, G., Barzaghi, R., Borghi, A., Musazzi, S., Novali, F., Prati, C., & Rocca, F.(2007). Submillimeter accuracy of InSAR time series: Experimental validation. IEEETransactions on Geoscience and Remote Sensing, 45(5), 1142−1153.
Finnegan, N. J., & Pritchard, M. E. (2009). Magnitude and duration of surface uplift abovethe Socorro magma body. Geology, 37(no. 3), 231−234, doi:10.1130/G25132A.1.
Folch, A., & Gottsmann, J. (2006). Faults and ground uplift at active calderas. In C. Troise,G. De Natale, & C. R. J. Kilburn (Eds.), Mechanisms of Activity and Unrest at LargeCalderasGeological Society of London. (pp. 109−120).
Geyer, A., & Martì, J. (2009). Stress fields controlling the formation of nested andoverlapping calderas, Implications for the understanding of caldera unrest. Journalof Volcanology and Geothermal Research, 181, 185−195.
Gottsmann, J., & Battaglia, M. (2008). Deciphering causes of unrest at explosive collapsecalderas, Recent advances and future challenges of joint time-lapse gravimetric andground deformation studies. In J. Gottsmann, & M. Marti (Eds.), Caldera Volcanism,Analysis, Modeling and Response, Developments in Volcanology, 10. (pp. 418−446):Elsevier.
Isaia, R., Marianelli, P., & Sbrana, A. (2009). Caldera unrest prior to intense volcanism inCampi Flegrei (Italy) at 4.0 ka B.P.: Implications for caldera dynamics and futureeruptive scenarios. Geophysical Research Letters, doi:10.1029/2009GL040513.
Kwoun, O., Lu, Z., Neal, C., & Wicks, C. (2006). Quiescent deformation of the AniakchakCaldera, Alaska, mapped by InSAR. Geology, 34(1), 5−8, doi:10.1130/G22015.1.
Kwoun, O. I., Lu, Z., Neal, C., Jr., & Wicks, C. (2006). Quiescent deformation of theAniakchak Caldera, Alaska, mapped by InSAR. Geology, 34, 5−8.
Lanari, R., Berardino, P., Borgstrom, S., Del Gaudio, C., De Martino, P., Fornaro, G.,Guarino, S., Ricciardi, G. P., Sansosti, E., & Lundgren, P. (2004). The use of IFSAR andclassical geodetic techniques in civil protection scenarios, Application to the CampiFlegrei uplift event of 2000. Journal of Volcanology and Geothermal Research, 133,247−260.
Lanari, R., Casu, F., Manzo, M., Zeni, G., Berardino, P., Manunta, M., et al. (2007). Anoverview of the Small Baseline subset algorithm: A DInSAR technique for surfacedeformation analysis. Pure and Applied Geophysics, 164, 637−661.
Lowenstern, J. B., Smith, R. B., & Hill, D. P. (2006). Monitoring super-volcanoes,geophysical and geochemical signals at Yellowstone and other large calderasystems. Philosophical Transactions of the Royal Society A, 364, 2055−2072.
Lu, Z., Kwoun, O., & Rykus, R. (2007). Interferometric syntetic aperture radar (InSAR):Its past, present and future. Photogrammetric Engineering & Remote Sensing, 73(3),217−221.
Lundgren, P., Casu, F., Manzo, M., Pepe, A., Berardino, P., Sansosti, E., & Lanari, R. (2004).Gravity and magma induced spreading of Mount Etna volcano revealed by satelliteradar interferometry. Geophysical Research Letters , 31 , L04602, doi:10.1029/2003GL018736.
Mangiacapra, A., Moretti, R., Rutherford, M., Civetta, L., Orsi, G., & Papale, P. (2008). Thedeep magmatic system of the Campi Flegrei caldera (Italy). Geophysical ResearchLetters, 35, L21, doi:10.1029/2008GL035550.
Manzo, M., Ricciardi, G. P., Casu, F., Ventura, G., Zeni, G., Borgström, S., Berardino, P., DelGaudio, C., & Lanari, R. (2006). Surface deformation analysis in the Ischia island(Italy) based on spaceborne radar interferometry. Journal of Volcanology andGeothermal Research, 151, 399−416.
Martí, J., Ablay, G. J., Redshaw, L. T., & Sparks, R. S. J. (1994). Experimental studies ofcollapse calderas. Journal of the Geological Society of London, 151, 919−929.
Massironi, M., Zampieri, D., Bianchi, M., Schiavo, A., & Franceschini, A. (2009). Use ofPSInSAR™ data to infer active tectonics: Clues on the differential uplift across theGiudicarie belt (Central-Eastern Alps, Italy). Tectonophysics, 476, 297−303, doi:10.1016/j.tecto.2009.05.025.
Milano, G., Petrazzuoli, S., & Ventura, G. (2004). Effects of the hydrothermal circulationon the strain field of the Campanian Plain (southern Italy). Terra Nova, 16,205−209.
Ohkura, H., & Shimada, M. (2001). InSAR analysis of Miyakejima Volcano withRADARSAT images. Proceedings IGARSS 2001, Sydney July 9–13, 5pp.
Orsi, G., Civetta, L., Del Gaudio, C., De Vita, S., Di Vito, M. A., Isaia, R., Petrazzuoli, S.,Ricciardi, G. P., & Ricco, C. (1999). Short-term ground deformations and seismicityin the nested Campi Flegrei caldera (Italy). Journal of Volcanology and GeothermalResearch, 91, 415−451.
Ricco, C., Aquino, I., Borgstrom, S., & Del Gaudio, C. (2007). A study of tilt changerecorded from July to October 2006 at the Phlegraean Fields (Naples, Italy). Annalsof Geophysics, 50, 661−674.
Rocca, F., Prati, C., Monti Guarnieri, A., & Ferretti, A. (2000). SAR interferometry and itsapplications. Surveys in Geophysics, 21, 159−176.
Rosi, M., & Sbrana, A. (1987). The Phlegraean fields. Quaderni de "La ricerca Scientifica"CNR, 114, 1−175.
Rott, H. (2009). Advances in interferometric synthetic aperture radar (InSAR) in earthsystem science. Progress in Physical Geography, 33(6), 769−791, doi:10.1177/0309133309350263.
Sacchi, M., Alessio, G., Aquino, I., Esposito, E., Molosso, F., Nappi, R., Porfido, S., & Violante,C. (2009). Risultati preliminari della campagna oceanografica CAFE_07-Leg 3 nei Golfidi Napoli e Pozzuoli, Mar Tirreno Orientale. Quaderni di Geofisica, 64, 1−28.
Saunders, S. J. (2005). The possible contribution of circumferential fault intrusion tocaldera resurgence. Bulletin of Volcanology, 67, 57−71.
Sepe, V., Atzori, S., & Ventura, G. (2007). Subsidence due to crack closure anddepressurization of hydrothermal systems: A case study from Mt. Epomeo (IschiaIsland, Italy). : Terra Nova, doi:10.1111/j.1365-3121.2006.00727.x.
Sparks, R. S. J., Self, S., Grattan, J. P., Oppenheimer, C., Pyle, D. M., & Rymer, H. (2005).Supereruptions, global effects and future threats. Report of a Geological Society ofLondon Working Group (pp. 24). London: The Geological Society.
Steigenberger, P., Rothacher, M., Dietrich, R., Fritsche, M., Rülke, A., & Vey, S. (2006).Reprocessing of a global GPS network. Journal of Geophysical Research, 111, B05402,doi:10.1029/2005JB003747.
Teza, G., Pesci, A., & Galgaro, A. (2008). Grid_strain and grid_strain3, Software packagesfor strain field computation in 2D and 3D environments. Computers & Geosciences,34, 1142−1153.
Tizzani, P., Berardino, P., Casu, F., Euillades, P., Manzo, M., Ricciardi, G. P., Zeni, G., &Lanari, R. (2007). Surface deformation of Long Valley caldera and Mono Basin,California, investigated with the SBAS-InSAR approach. Remote Sensing ofEnvironment, 108, 277−289, doi:10.1016/j.rse.2006.11.015.
Trasatti, E., Casu, F., Giunchi, C., Pepe, S., Solaro, G., Tagliaventi, S., Berardino, P., Manzo,M., Pepe, A., Ricciardi, G. P., Sansosti, E., Tizzani, P., Zeni, G., & Lanari, R. (2008). The2004–2006 uplift episode at Campi Flegrei caldera (Italy), Constraints from SBAS-DInSAR ENVISAT data and Bayesian source inference. Geophysical Research Letters,35, L07308, doi:10.1029/2007GL033091.
Vasco, D.W., Rucci, A., Ferretti, A., Novali, F., Bissell, R. C., Ringrose, P. S., Mathieson, A. S.,&Wright, I. W. (2010). Satellite-basedmeasurements of surface deformation revealfluid flow associated with the geological storage of carbon dioxide. Geophys. Res.Lett., 37, L03303, doi:10.1029/2009GL041544.
Vilardo, G., Ventura, G., Terranova, C., Matano, F., & Nardò, S. (2009). Grounddeformation due to tectonic, hydrothermal, gravity, hydrogeological, and anthropicprocesses in the Campania Region (Southern Italy) from Permanent ScatterersSynthetic Aperture Radar Interferometry. Remote Sensing of Environment, 113,197−212.
Wicks, C. W., Thatcher, W., Dzurisin, D., & Svarc, J. (2006). Uplift, thermal unrest andmagma intrusion at yellowstone caldera. Nature, 440(7080), 72−75, doi:10.1038/nature04507.