infrared light curves of type ia supernovae
TRANSCRIPT
arX
iv:a
stro
-ph/
0211
100v
1 6
Nov
200
2
Infrared Light Curves of Type Ia Supernovae
M. M. Phillips1, K. Krisciunas2, N. B. Suntzeff2, M. Roth1, L. Germany3,P. Candia2, S. Gonzalez1, M. Hamuy4, W. L. Freedman4, S. E. Persson4, P. E.Nugent5, G. Aldering5, and A. Conley5
1 Las Campanas Observatory, Carnegie Observatories, Casilla 601, La Serena, Chile2 Cerro Tololo Inter-American Observatory, Casilla 603, La Serena, Chile3 European Southern Observatory, Casilla 19001, Santiago 19, Chile4 Observatories of the Carnegie Institution of Washington, 813 Santa Barbara Street,
Pasadena, CA 911015 Lawrence Berkeley National Laboratory, Mail Stop 50-232, 1 Cyclotron Road,
Berkeley, CA 94720
1 Introduction
Beginning in March 1999, we have carried out four major observing campaignswith the Swope 1.0 m and du Pont 2.5 m telescopes at the Las Campanas Ob-servatory (LCO) to obtain near-IR light curves of supernovae (SNe) of all types.Data have been obtained for a total of 25 events, with approximately half of thesecorresponding to Type Ia supernovae (SNe Ia). These observations are part of along-term collaborative program at LCO and Cerro Tololo Inter-American Ob-servatory to investigate in detail the photometric properties of SNe Ia in thenear-IR. These data will be used to study the physics of the explosions and torefine the usage of these objects as cosmological standard candles.
2 JHK Light Curve Morphology
Since the pioneering work of Elias and collaborators[1,2], the JHK light curvesof SNe Ia have been known to be double-peaked. The secondary maximum oc-curs ∼30 days after the first maximum, and is most prominent in the J band.This double-peaked morphology is also observed in the I band[3], and is a func-tion of the decline rate parameter ∆m15(B)[15] in the sense that the secondarymaximum occurs later and also is generally stronger in the slowest-decliningSNe Ia[6,18,10]. Except for the very fastest-declining events, the primary maxi-mum in I occurs a few days before B maximum[6].
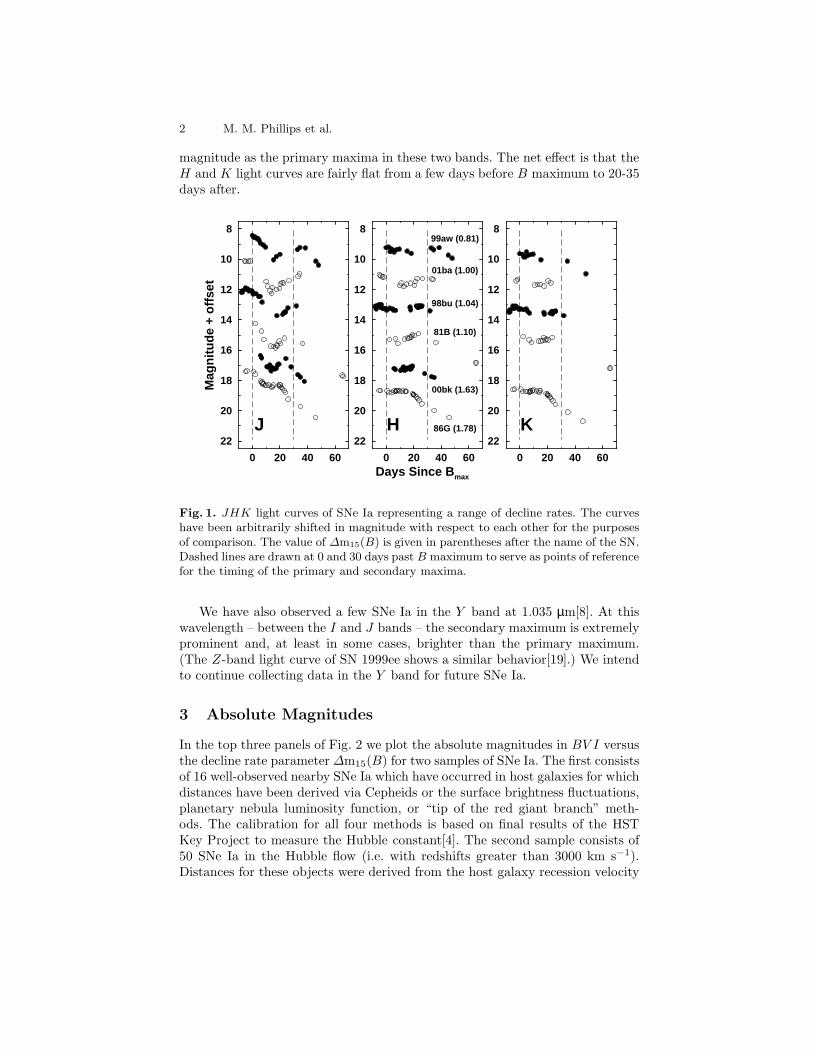
Fig. 1 shows plots of the JHK light curves of six SNe Ia covering a rangeof decline rates. Data for three of these SNe (1999aw, 2000bk, and 2001ba)were obtained as part of our observing program; photometry for the other three(1981B, 1986G, and 1998bu) are taken from the literature[1,5,12,7,9]. As in the I
band, we see that 1) the secondary maximum occurs later for the slower-decliningevents, and 2) the primary maximum occurs a few days before B maximum. Thedip between the primary and secondary maxima is much less pronounced in theH and K bands than in J , and the secondary maxima reach nearly the same
2 M. M. Phillips et al.
magnitude as the primary maxima in these two bands. The net effect is that theH and K light curves are fairly flat from a few days before B maximum to 20-35days after.
0 20 40 60
8
10
12
14
16
18
20
22
Mag
nitu
de +
offs
et
J
0 20 40 60Days Since B max
8
10
12
14
16
18
20
22H
99aw (0.81)
01ba (1.00)
98bu (1.04)
81B (1.10)
00bk (1.63)
86G (1.78)
0 20 40 60
8
10
12
14
16
18
20
22K
Fig. 1. JHK light curves of SNe Ia representing a range of decline rates. The curveshave been arbitrarily shifted in magnitude with respect to each other for the purposesof comparison. The value of ∆m15(B) is given in parentheses after the name of the SN.Dashed lines are drawn at 0 and 30 days past B maximum to serve as points of referencefor the timing of the primary and secondary maxima.
We have also observed a few SNe Ia in the Y band at 1.035 µm[8]. At thiswavelength – between the I and J bands – the secondary maximum is extremelyprominent and, at least in some cases, brighter than the primary maximum.(The Z-band light curve of SN 1999ee shows a similar behavior[19].) We intendto continue collecting data in the Y band for future SNe Ia.
3 Absolute Magnitudes
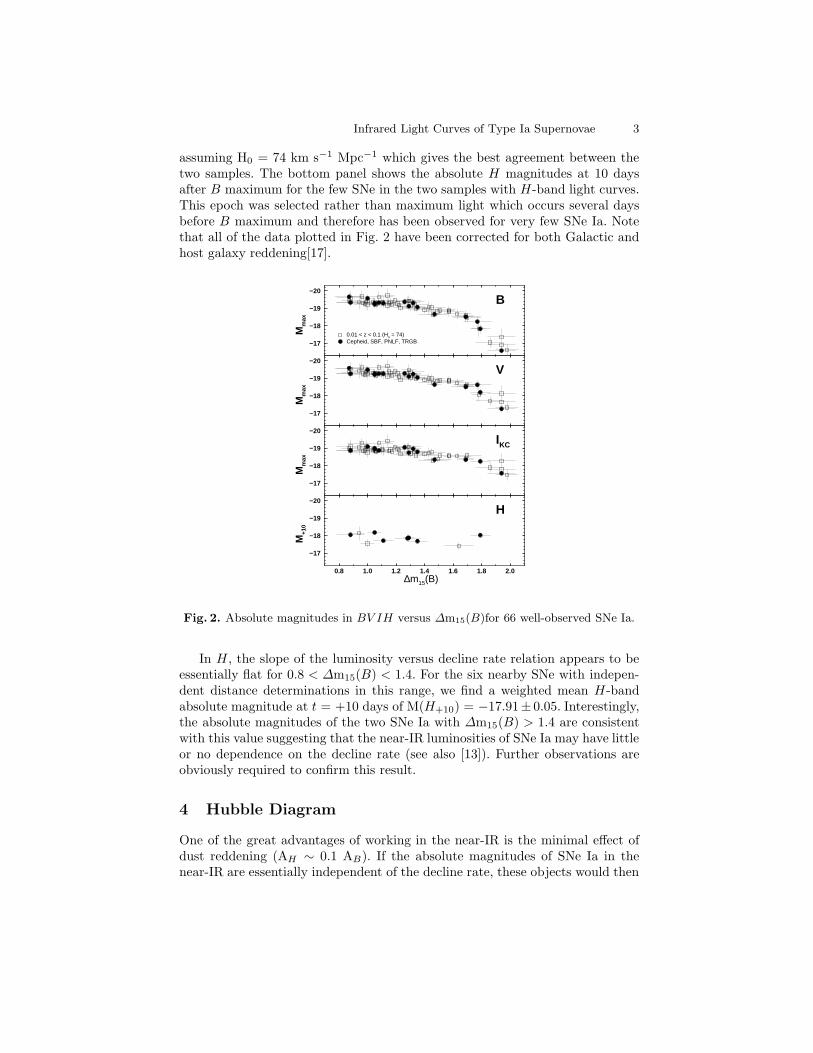
In the top three panels of Fig. 2 we plot the absolute magnitudes in BV I versusthe decline rate parameter ∆m15(B) for two samples of SNe Ia. The first consistsof 16 well-observed nearby SNe Ia which have occurred in host galaxies for whichdistances have been derived via Cepheids or the surface brightness fluctuations,planetary nebula luminosity function, or “tip of the red giant branch” meth-ods. The calibration for all four methods is based on final results of the HSTKey Project to measure the Hubble constant[4]. The second sample consists of50 SNe Ia in the Hubble flow (i.e. with redshifts greater than 3000 km s−1).Distances for these objects were derived from the host galaxy recession velocity
Infrared Light Curves of Type Ia Supernovae 3
assuming H0 = 74 km s−1 Mpc−1 which gives the best agreement between thetwo samples. The bottom panel shows the absolute H magnitudes at 10 daysafter B maximum for the few SNe in the two samples with H-band light curves.This epoch was selected rather than maximum light which occurs several daysbefore B maximum and therefore has been observed for very few SNe Ia. Notethat all of the data plotted in Fig. 2 have been corrected for both Galactic andhost galaxy reddening[17].
0.8 1.0 1.2 1.4 1.6 1.8 2.0∆m15(B)
−20
−19
−18
−17
M+1
0
−20
−19
−18
−17
Mm
ax
−20
−19
−18
−17
Mm
ax
−20
−19
−18
−17
Mm
ax
0.01 < z < 0.1 (Ho = 74) Cepheid, SBF, PNLF, TRGB
B
V
IKC
H
Fig. 2. Absolute magnitudes in BV IH versus ∆m15(B)for 66 well-observed SNe Ia.
In H , the slope of the luminosity versus decline rate relation appears to beessentially flat for 0.8 < ∆m15(B) < 1.4. For the six nearby SNe with indepen-dent distance determinations in this range, we find a weighted mean H-bandabsolute magnitude at t = +10 days of M(H+10) = −17.91± 0.05. Interestingly,the absolute magnitudes of the two SNe Ia with ∆m15(B) > 1.4 are consistentwith this value suggesting that the near-IR luminosities of SNe Ia may have littleor no dependence on the decline rate (see also [13]). Further observations areobviously required to confirm this result.
4 Hubble Diagram
One of the great advantages of working in the near-IR is the minimal effect ofdust reddening (AH ∼ 0.1 AB). If the absolute magnitudes of SNe Ia in thenear-IR are essentially independent of the decline rate, these objects would then
4 M. M. Phillips et al.
be nearly perfect standard candles at these wavelengths. Hubble diagrams in V
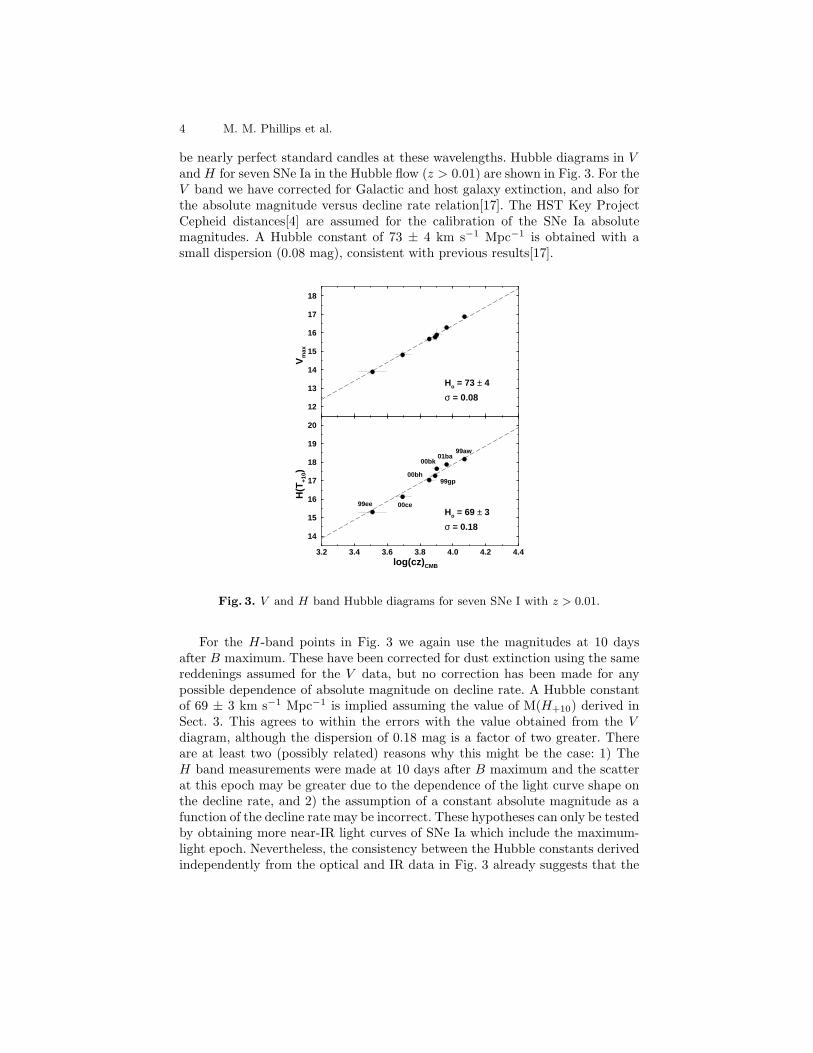
and H for seven SNe Ia in the Hubble flow (z > 0.01) are shown in Fig. 3. For theV band we have corrected for Galactic and host galaxy extinction, and also forthe absolute magnitude versus decline rate relation[17]. The HST Key ProjectCepheid distances[4] are assumed for the calibration of the SNe Ia absolutemagnitudes. A Hubble constant of 73 ± 4 km s−1 Mpc−1 is obtained with asmall dispersion (0.08 mag), consistent with previous results[17].
3.2 3.4 3.6 3.8 4.0 4.2 4.4log(cz) CMB
14
15
16
17
18
19
20
H(T
+10) 00bh
99aw
00bk01ba
99ee
99gp
00ceHo = 69 ± 3
σ = 0.18
12
13
14
15
16
17
18V
max
Ho = 73 ± 4
σ = 0.08
Fig. 3. V and H band Hubble diagrams for seven SNe I with z > 0.01.
For the H-band points in Fig. 3 we again use the magnitudes at 10 daysafter B maximum. These have been corrected for dust extinction using the samereddenings assumed for the V data, but no correction has been made for anypossible dependence of absolute magnitude on decline rate. A Hubble constantof 69 ± 3 km s−1 Mpc−1 is implied assuming the value of M(H+10) derived inSect. 3. This agrees to within the errors with the value obtained from the V
diagram, although the dispersion of 0.18 mag is a factor of two greater. Thereare at least two (possibly related) reasons why this might be the case: 1) TheH band measurements were made at 10 days after B maximum and the scatterat this epoch may be greater due to the dependence of the light curve shape onthe decline rate, and 2) the assumption of a constant absolute magnitude as afunction of the decline rate may be incorrect. These hypotheses can only be testedby obtaining more near-IR light curves of SNe Ia which include the maximum-light epoch. Nevertheless, the consistency between the Hubble constants derivedindependently from the optical and IR data in Fig. 3 already suggests that the
Infrared Light Curves of Type Ia Supernovae 5
methods developed for correcting the optical data for host galaxy reddening anddecline rate effects are basically sound.
5 Interesting Objects
5.1 SN 1999ac
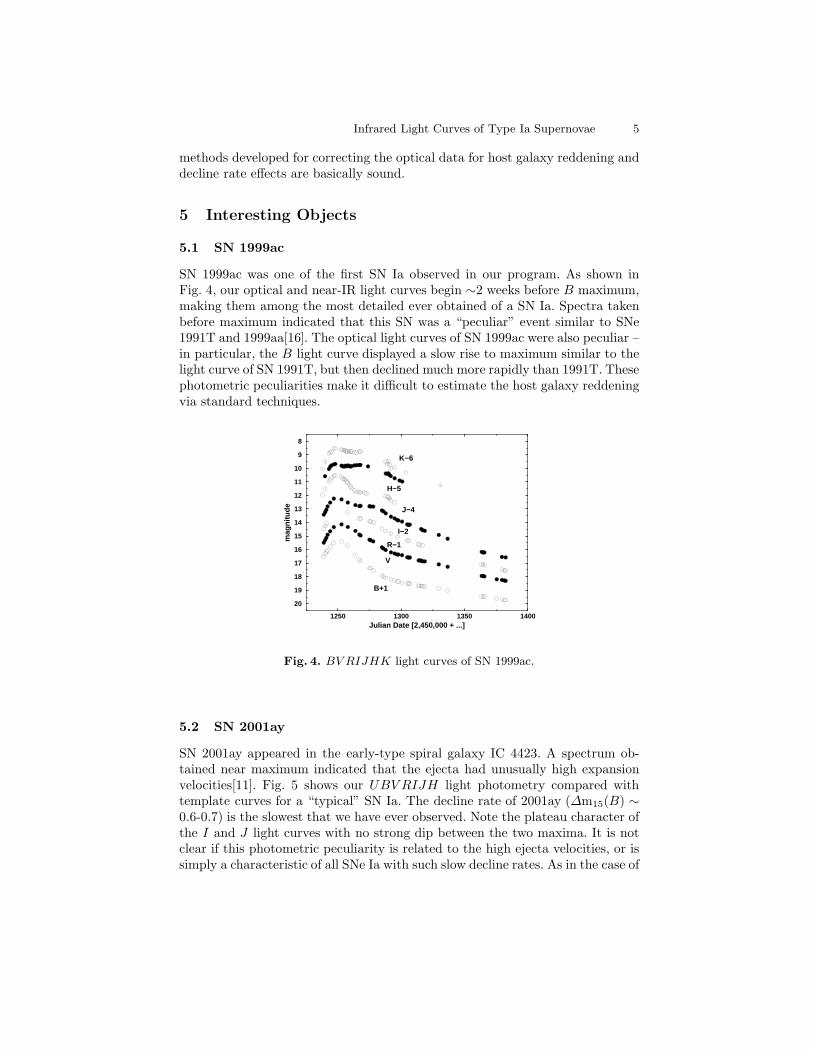
SN 1999ac was one of the first SN Ia observed in our program. As shown inFig. 4, our optical and near-IR light curves begin ∼2 weeks before B maximum,making them among the most detailed ever obtained of a SN Ia. Spectra takenbefore maximum indicated that this SN was a “peculiar” event similar to SNe1991T and 1999aa[16]. The optical light curves of SN 1999ac were also peculiar –in particular, the B light curve displayed a slow rise to maximum similar to thelight curve of SN 1991T, but then declined much more rapidly than 1991T. Thesephotometric peculiarities make it difficult to estimate the host galaxy reddeningvia standard techniques.
1250 1300 1350 1400Julian Date [2,450,000 + ...]
8
9
10
11
12
13
14
15
16
17
18
19
20
mag
nitu
de
K−6
H−5
J−4
I−2
R−1
V
B+1
Fig. 4. BV RIJHK light curves of SN 1999ac.
5.2 SN 2001ay
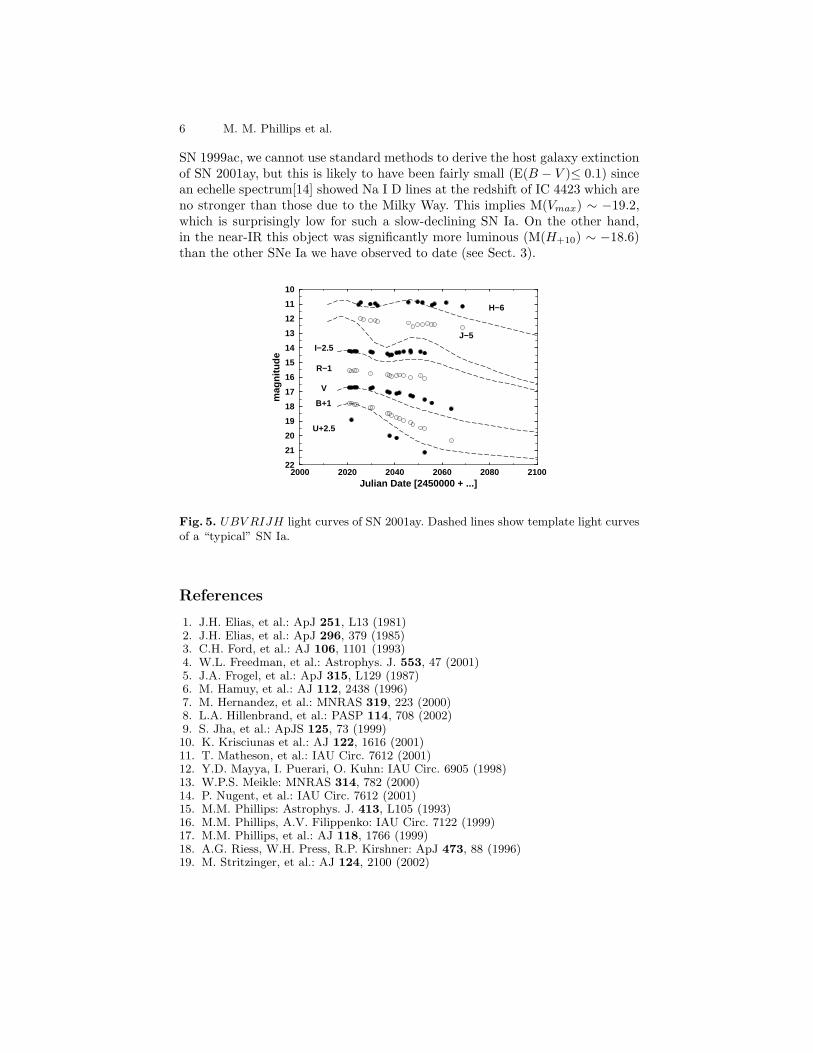
SN 2001ay appeared in the early-type spiral galaxy IC 4423. A spectrum ob-tained near maximum indicated that the ejecta had unusually high expansionvelocities[11]. Fig. 5 shows our UBV RIJH light photometry compared withtemplate curves for a “typical” SN Ia. The decline rate of 2001ay (∆m15(B) ∼0.6-0.7) is the slowest that we have ever observed. Note the plateau character ofthe I and J light curves with no strong dip between the two maxima. It is notclear if this photometric peculiarity is related to the high ejecta velocities, or issimply a characteristic of all SNe Ia with such slow decline rates. As in the case of
6 M. M. Phillips et al.
SN 1999ac, we cannot use standard methods to derive the host galaxy extinctionof SN 2001ay, but this is likely to have been fairly small (E(B − V )≤ 0.1) sincean echelle spectrum[14] showed Na I D lines at the redshift of IC 4423 which areno stronger than those due to the Milky Way. This implies M(Vmax) ∼ −19.2,which is surprisingly low for such a slow-declining SN Ia. On the other hand,in the near-IR this object was significantly more luminous (M(H+10) ∼ −18.6)than the other SNe Ia we have observed to date (see Sect. 3).
2000 2020 2040 2060 2080 2100Julian Date [2450000 + ...]
10
11
12
13
14
15
16
17
18
19
20
21
22
mag
nitu
de
H−6
J−5I−2.5
R−1
V
B+1
U+2.5
Fig. 5. UBV RIJH light curves of SN 2001ay. Dashed lines show template light curvesof a “typical” SN Ia.
References
1. J.H. Elias, et al.: ApJ 251, L13 (1981)2. J.H. Elias, et al.: ApJ 296, 379 (1985)3. C.H. Ford, et al.: AJ 106, 1101 (1993)4. W.L. Freedman, et al.: Astrophys. J. 553, 47 (2001)5. J.A. Frogel, et al.: ApJ 315, L129 (1987)6. M. Hamuy, et al.: AJ 112, 2438 (1996)7. M. Hernandez, et al.: MNRAS 319, 223 (2000)8. L.A. Hillenbrand, et al.: PASP 114, 708 (2002)9. S. Jha, et al.: ApJS 125, 73 (1999)10. K. Krisciunas et al.: AJ 122, 1616 (2001)11. T. Matheson, et al.: IAU Circ. 7612 (2001)12. Y.D. Mayya, I. Puerari, O. Kuhn: IAU Circ. 6905 (1998)13. W.P.S. Meikle: MNRAS 314, 782 (2000)14. P. Nugent, et al.: IAU Circ. 7612 (2001)15. M.M. Phillips: Astrophys. J. 413, L105 (1993)16. M.M. Phillips, A.V. Filippenko: IAU Circ. 7122 (1999)17. M.M. Phillips, et al.: AJ 118, 1766 (1999)18. A.G. Riess, W.H. Press, R.P. Kirshner: ApJ 473, 88 (1996)19. M. Stritzinger, et al.: AJ 124, 2100 (2002)