income replacement in retirement: longitudinal evidence from income tax records
TRANSCRIPT
S E D A PA PROGRAM FOR RESEARCH ON
SOCIAL AND ECONOMICDIMENSIONS OF AN AGING
POPULATION
Income Replacement in Retirement:Longitudinal Evidence from Income Tax Records
Frank T. DentonRoss Finnie
Byron G. Spencer
SEDAP Research Paper No. 261
For further information about SEDAP and other papers in this series, see our web site: http://socserv.mcmaster.ca/sedap
Requests for further information may be addressed to:Secretary, SEDAP Research Program
Kenneth Taylor Hall, Room 426McMaster University
Hamilton, Ontario, CanadaL8S 4M4
FAX: 905 521 8232e-mail: [email protected]
November 2009
The Program for Research on Social and Economic Dimensions of an Aging Population (SEDAP) is aninterdisciplinary research program centred at McMaster University with co-investigators at seventeen otheruniversities in Canada and abroad. The SEDAP Research Paper series provides a vehicle for distributingthe results of studies undertaken by those associated with the program. Authors take full responsibility forall expressions of opinion. SEDAP has been supported by the Social Sciences and Humanities ResearchCouncil since 1999, under the terms of its Major Collaborative Research Initiatives Program. Additionalfinancial or other support is provided by the Canadian Institute for Health Information, the CanadianInstitute of Actuaries, Citizenship and Immigration Canada, Indian and Northern Affairs Canada, ICES:Institute for Clinical Evaluative Sciences, IZA: Forschungsinstitut zur Zukunft der Arbeit GmbH (Institutefor the Study of Labour), SFI: The Danish National Institute of Social Research, Social DevelopmentCanada, Statistics Canada, and participating universities in Canada (McMaster, Calgary, Carleton,Memorial, Montréal, New Brunswick, Queen’s, Regina, Toronto, UBC, Victoria, Waterloo, Western, andYork) and abroad (Copenhagen, New South Wales, University College London).
This paper is cross-classified as No. 436 in the McMaster University QSEP Research Report Series.
Income Replacement in Retirement:Longitudinal Evidence from Income Tax Records
Frank T. DentonRoss Finnie
Byron G. Spencer
SEDAP Research Paper No. 261
Abstract
We analyse a large longitudinal data file to determine who has retired and to assess
how successful they are in maintaining their incomes after retirement. Our main
conclusions are as follows. First, in the two years immediately after retirement the after-
tax income replacement ratios average about two-thirds when calculated across all
ages of retirement. Second, the ratios tend to increase with the age of retirement. Third,
the ratios increase with years in retirement, at least in the first few years. Finally, income
replacement ratios are highest in the lowest income quartile and generally decline as
income increases; within each quartile the replacement ratios are higher for those who
retired later than for those retired earlier.
Keywords: income replacement, retirement
JEL Classification: J26, D31, J14
Résumé
Nous analysons les données d’un important fichier longitudinal afin de déterminer qui a
pris sa retraite et d'évaluer dans quelle mesure ces retraités arrivent à maintenir leur
niveau de revenus une fois partis à la retraite. Nous principales conclusions sont les
suivantes. Après les deux années qui suivent le départ à la retraite le taux de
remplacement moyen calculé pour tous les âges du départ à la retraite représente
environ deux-tiers du revenu disponible. Ce ratio a tendance à augmenter avec l'âge du
départ à la retraite. De plus, il augmente avec le nombre d’années qui ont suivi le départ
à la retraite, au moins dans les premières années. Enfin, les taux de remplacement des
revenus sont plus élevés dans le dernier quartile des revenus et diminuent
généralement avec l'augmentation de ces derniers; au sein de chaque quartile, plus les
individus retardent leur départ à la retraite plus les taux de remplacement de leurs
revenus sont élevés.

* We thank Human Resources and Skills Development Canada (HRSDC) for itsfinancial support, including the arrangements for access to the LongitudinalAdministrative Databank (LAD) files at Statistics Canada. We are grateful to SSHRC forits support of the SEDAP (Social and Economic Dimensions of an Aging Population)Research Program through its Major Collaborative Research Initiative. We thank YanZhang, who worked with the LAD files at Statistics Canada to provide the basictabulations, and Christine Feaver, who produced all the final figures and tables andcommented on the interpretation of results. We are grateful also for helpful commentsreceived from participants at the conference “Transition to Retirement and Income inRetirement,” Ottawa, Feb 27, 2009, organized by HRSDC, and from an anonymousreferee.
2
Income Replacement in Retirement:
Longitudinal Evidence from Income Tax Records
Frank T. Denton, Ross Finnie, and Byron G Spencer*
1. Introduction
What is usually thought of as “retirement” is accompanied by a cessation of income
from employment, or at least a major reduction. That may be offset in part by increases in
income from other sources. The purpose of this study is to provide evidence on the extent
to which retirees are able to maintain their pre-retirement income levels, whether through
access to pensions, investment returns, or even continued (but reduced) employment.
Our concern here is not with the entire population of older people at different ages (as
in many other studies), but specifically with those who have retired, using a strict earnings-
based definition of the term. We limit our attention to individuals for whom there is evidence
of significant labour force attachment when they were in their early fifties, retirement then
being characterised by a subsequent cessation or loosening of that attachment, as
indicated by a substantial and sustained drop in earnings. Our attention is focussed mostly
on the extent to which income is replaced on average, but we consider also how
replacement ratios differ by level of pre-retirement income distribution.
3
We draw on a large longitudinal data base of tax records to obtain measures of income
before and after retirement. The data base provides detailed and accurate information on
the incomes of almost five million individuals for periods as long as 25 years. It thus makes
possible for us a new perspective on retirement. First, we are able to identify those who
have actually retired, rather than relying on age alone or receipt of pension income as an
indicator. Armed with knowledge of who has retired, we are then able to assess how
income replacement varies with age at the time of retirement, and subsequently with the
length of time since retiring. Furthermore, we can observe how patterns of income
replacement differ among successive cohorts and how they vary across the income
distribution.
2. Measures of Income Replacement
The reduction in earnings associated typically with retirement may be offset in greater
or lesser degree by income in the form of pension benefits (whether through public or
private plans) or income from other sources. However, the underlying concern is with
consumption in retirement, or standard of living. One might accumulate assets (through
saving) before retirement when income is high and then draw them down (through
dissaving) after retirement, when income is reduced. That is the behaviour suggested by
the basic life cycle model that originated with Modigliani and Brumsberg (1954), according
to which one would expect to observe a relatively constant level of consumption before and
after retirement even though income may be lower after retirement.
The life cycle model in its simplest form assumes perfect foresight about future income
levels and expenditure requirements at each age, and the date of death; it assumes also
that capital markets make it possible to borrow against future income. With those
assumptions the level of consumption at each age can be shown to be independent of the
level of income at that age, and measures of income replacement would not have particular
meaning. However, as Smith (2003) observes, uncertainty about future income, health, and
life expectancy, and limits on the ability to borrow, would induce a greater temporal

1 A natural question to ask, then, is whether people (by rules of thumb orotherwise) do save enough during the working years to maintain consumption levels inthe retirement years (e.g., Skinner, 2007). We are not able to address that questiondirectly with the data available to us.
4
alignment of consumption with income. Indeed, much empirical research indicates that
consumption does fall after retirement (e.g., Bernheim, Skinner, and Weinberg, 2001;
Denton, Mountain, and Spencer, 2006), perhaps by as much as the decline in disposable
income (e.g., Banks, Blundell, and Tanner, 1998; Schwerdt, 2005). In that case the focus
on measures of income replacement is indeed meaningful, and indicative of welfare loss.
That view gains further support from Benartzi and Thaler (2007), who argue that few
people, economists included, “spend much time calculating a personal optimal savings
rate”; instead “most people cope by adopting simple ... rules of thumb”.1
Income-based replacement ratios are widely used, in part because income is observed
more readily, and also probably measured more accurately than consumption. A variety of
such ratios are reported in the literature. (See Smith, 2003, and Hurd and Rohwedder,
2006, for reviews.) Some researchers focus on the fraction of before-retirement income that
is replaced, others on after-tax income. Some work with family or household units, with or
without adjustment for family size, others with individuals. In all cases, however, the
underlying idea is to have an indicator of how well off individuals are after retirement as
compared to when they were working.
It is usually argued that a somewhat lower level of income after retirement is consistent
with maintaining one’s pre-retirement standard of living. That is because various costs
associated with employment (such as suitable attire and commuting to work) no longer
apply, and other advantages may (e.g., tax rates may be lower, age-related tax credits may
apply, employer deductions for future pensions and employment insurance would have
ended, seniors’ discounts on consumer purchases would apply, and there may be fewer
dependents to support since children would usually have left home, and perhaps have
completed postsecondary studies). Furthermore, one would no longer need to accumulate
2 Of related interest, Alan, Atalay and Crossley (2007) have used evidence fromhousehold surveys to assess how well-off retired people think they are and whether ornot they had sufficient means to maintain consumption levels; they conclude that mostretired persons think of themselves as better off than standard economic measuresindicate.
5
more private savings for retirement. Beyond that, time is freed up for more home production
that can add to one’s well-being even if it is not included in income, as measured. A
replacement ratio of about 70 percent is often said to be sufficient to allow one’s standard
of living to be maintained in retirement. At the same time it is not obvious whether any such
ratio should be based on income before or after tax; we provide both measures in what
follows, and anticipate that those with lower levels of income before retirement (and
correspondingly fewer assets) would need a somewhat higher replacement ratio than
others with higher incomes.
Two Canadian studies that measure income replacement in retirement are those of
Gower (1998) and LaRochelle-Côté, Myles and Picot (2008). Even though they employ
quite different concepts, both refer to similar target replacement ratios: LaRochelle-Côté
et al., referring to Schulz (1992, p 99), state that “Policy makers in the rich democracies
have typically set a target replacement rate of from 65% to 75% for the average worker”.
Gower (1998, p 18) quotes the Canadian Department of Finance in stating that “between
60% and 70% of pre-retirement earnings is generally considered to be sufficient to avoid
serious disruption of living standards”.2 Both studies draw too on the same longitudinal
data base as we use in this study. Gower (1998) limits his analysis to those aged 55 and
older in 1992 who had retired by 1995. He classifies as retired those whose total income
in 1992 was derived mostly from employment, and who had some employment income in
1993 and none in 1995, and defines their replacement ratios as the ratios of after-
retirement income, in 1995, to pre-retirement income, in 1992. His ratios are calculated
separately for men and women, and (like ours) relate only to their individual incomes, not
to family or household units. By contrast, the concern of LaRochelle-Côté et al. is with
income replacement ratios for families; their analysis is limited to families in which at least
3 The following description is drawn largely from Statistics Canada’s LongitudinalAdministrative Data Dictionary (catalogue no. 12-585-XIE).
6
one individual had substantial employment income while of “prime age” (defined as having
average annual earnings of at least $10,000, measured in 2005 constant dollars, when
aged 54 to 56). However, they do not impose a retirement test. Instead, they calculate
replacement ratios for successive cohorts that compare (adult-equivalent adjusted) family
total income at later ages with income at prime age, using after-tax measures of income
in each case. Allowance is made for changes in family composition, including death of
family members, by comparing adult-equivalent adjusted measures of family income. The
presumption is that an increasing fraction of each cohort would have retired as age
increases, such that the ratios at sufficiently old ages would include few who had not
retired.
It is not surprising that a study based on after-tax size-adjusted family income should
find replacement ratios that are higher (close to 80 percent) than one based on the before-
tax income of individuals (about 58 percent). We observe that both studies find, as
expected, that replacement ratios vary inversely with the level of income before retirement,
with many in the lowest income groups having replacement ratios in excess of 1.
3. Data and the Definition of Retirement
The analysis that follows is based on Statistics Canada’s Longitudinal Administrative
Databank, commonly known as the LAD. It consists of a random 20 percent sample of all
taxpayers who filed Canadian income tax returns in any year, starting in 1980.3 Information
is added each year as new returns are filed, and the sample is augmented with 20 percent
of first-time tax filers. Individuals are included for all years in which they filed tax returns.
By 2006, the most recent year for which we have data from this source, there were more
than 4.9 million individuals in the sample. Our concern here is with information at the
4 There are three such levels: spouse/parent, family, and child(ren).
5 Some information is drawn from other administrative files, but nothing ofparticular relevance for the work reported here.
6 There is an important exception. For immigrants who arrived in Canada in 1980 or later, the records include further information about their characteristics and intendeddestinations at the time of arrival. In addition, the main and secondary principal industrysubsectors of employers have been included in the file starting in 2000, but noinformation is available relating to occupations of the employees.
7
individual level, but other levels are available.4
The LAD contains mostly information taken directly from the tax returns.5 That means
that there is a detailed year-by-year record for each person of how much income of each
type was received. From the returns we know also (as of December 31 of a tax year) age,
sex, marital status, and place of residence – but little else.6 For some purposes there is
clearly more that one would like to know about the characteristics of those approaching
retirement – level of education, industry of employment, occupation, etc. – but such
information is not available in the LAD. Even so, the LAD has much to recommend it.
Indeed, the very large sample size, its longitudinal nature, and the detailed and accurate
information about income that it provides make it an appealing foundation for the analysis
of income-based measures of retirement and well-being – of how well-off individuals are
after retirement as compared to the period when they were working, how the patterns of
retirement have changed over time for successive cohorts, and how they vary by level of
income. We note that the LAD has been used to investigate a wide range of topics,
including the distribution of earnings, poverty dynamics, and interprovincial mobility, among
others, and in the two studies of income replacement mentioned above (Gower, 1998, and
LaRochelle-Côté et al., 2008).
Our approach to the choice of observations is as follows. We take the notion of
retirement to be irrelevant before the age of 50. We first select all tax filers aged 50 in 1982,
and follow them until 2006 if they survived and continued to file income tax returns, or until
7 For this analysis income information is imputed for those few (about 0.8 percentof the sample) who failed to file income tax returns for either a single year or two yearsin a row, but then filed again. The imputation is based on a simple averaging of eachcomponent of the income information, including the total, as reported in the yearpreceding and the year following missing value(s). This is done to reduce possiblesample selection bias related to occasional failure to file returns. Such imputation wouldbe inappropriate if the typical reason for not filing was a much lower than average levelof income in the affected year but we have no way of assessing whether that was thecase.
8 All income measures are adjusted for inflation using the consumer price indexand expressed in dollars of 2006. Employment income includes net income from self-employment.
8
they died or were otherwise lost from the sample because they failed to file returns.7 We
then do the same for tax filers aged 50 in 1983, tax filers aged 50 in 1984, and so on, thus
building up income histories for a series of successive cohorts, each identified by the year
in which it reached the age of 50. We exclude those few who died or were lost before
reaching age 52. We exclude also individuals who had any income from farming or fishing
at ages 50, 51, or 52, since the notion of retirement is conspicuously vague for those
occupations. For each tax filer remaining in our observation set, average income from
employment at ages 50 to 52 is then calculated as the arithmetic mean of the incomes at
those three ages. In order to limit the analysis to individuals with significant labour market
attachment, we exclude those for whom this average is less than $10,000, in constant
dollar terms.8 That figure is arbitrary, but it may be thought of as representing about the
amount that would be earned by someone working roughly half-time at the minimum wage
rate.
The next step is to identify those who have retired, as indicated by a major and
sustained reduction in employment income. For each tax filer the ratio of employment
income at each subsequent age to average employment income at ages 50-52, denoted
by R, is calculated for each year for the maximum period permitted by the data. A tax filer
is said to have retired at the age at which R first falls below a critical level, R*, provided that

9 Note that this calculation tells us the age reached during the first full year ofretirement, not age at the exact date of retirement within a year. A tax filer would bedeemed to be retired at the youngest age x at which the specified condition is satisfied.By way of example, a person would be deemed to have retired at 63 if the retirementcondition is satisfied at each of ages 63, 64, and 65. In addition, a person would bedeemed to have retired at age 63 if the condition is satisfied at age 63 and the person isdead or lost from the sample at age 64, or it is satisfied at ages 63 and 64 and theperson is dead or lost at age 65.
9
that condition continues to be satisfied in each of the subsequent two years.9 In earlier work
several values of R* were considered, ranging from 0.00 to 0.50. (See Denton, Finnie and
Spencer, 2009; see also Denton and Spencer, 2009, for a review of measures of
retirement.) Thus, at one extreme, a person is deemed to have retired only if he/she has
no income from employment (R* = 0.00); at the other, the same person could be classified
as retired even if income from employment was as much as half as great as its average
level when he/she was 50-52 (R*#0.50). We have found that while the overall proportion
retired was sensitive to the value of R*, the age pattern of retirement was not. In
consequence we focus attention on R* = 0.10, and continue with that criterion throughout
the paper. Thus, a person is deemed to have retired when his or her (real) income from
employment falls below 10 percent of what it was at ages 50-52, and remains below for the
following two years.
We note and emphasise that what we measure here is first retirement. It is possible that
an individual may retire by our criterion, but subsequently return to work. However, the
criterion is rather demanding, inasmuch as earned income must remain below the threshold
ratio for three successive years. Analyses of multiple retirements, of bridging between “full
employment” and “full retirement”, and other dynamic aspects of retirement behaviour could
be considered in further work. We note also that we are unable to distinguish whether
retirement, as we measure it, is voluntary or involuntary.
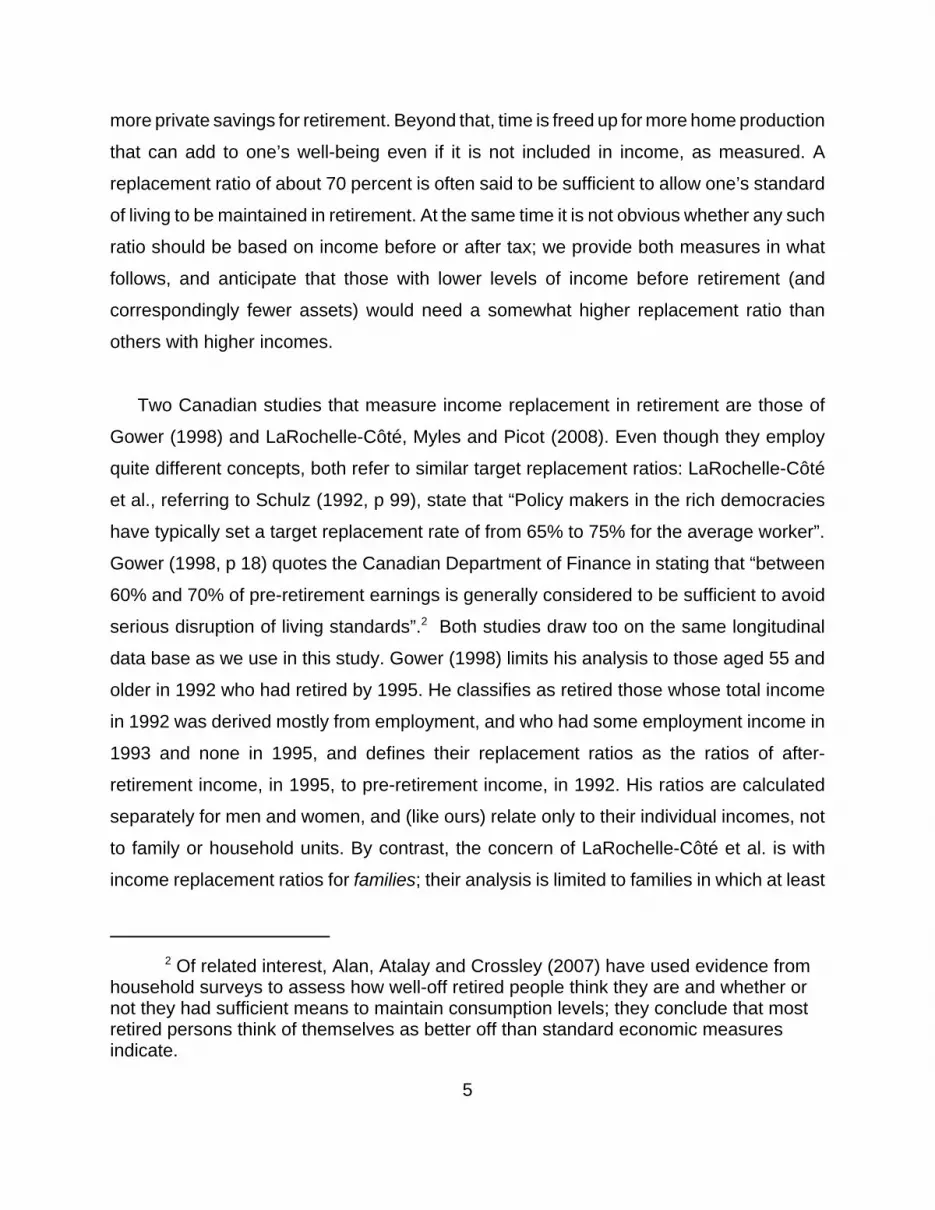
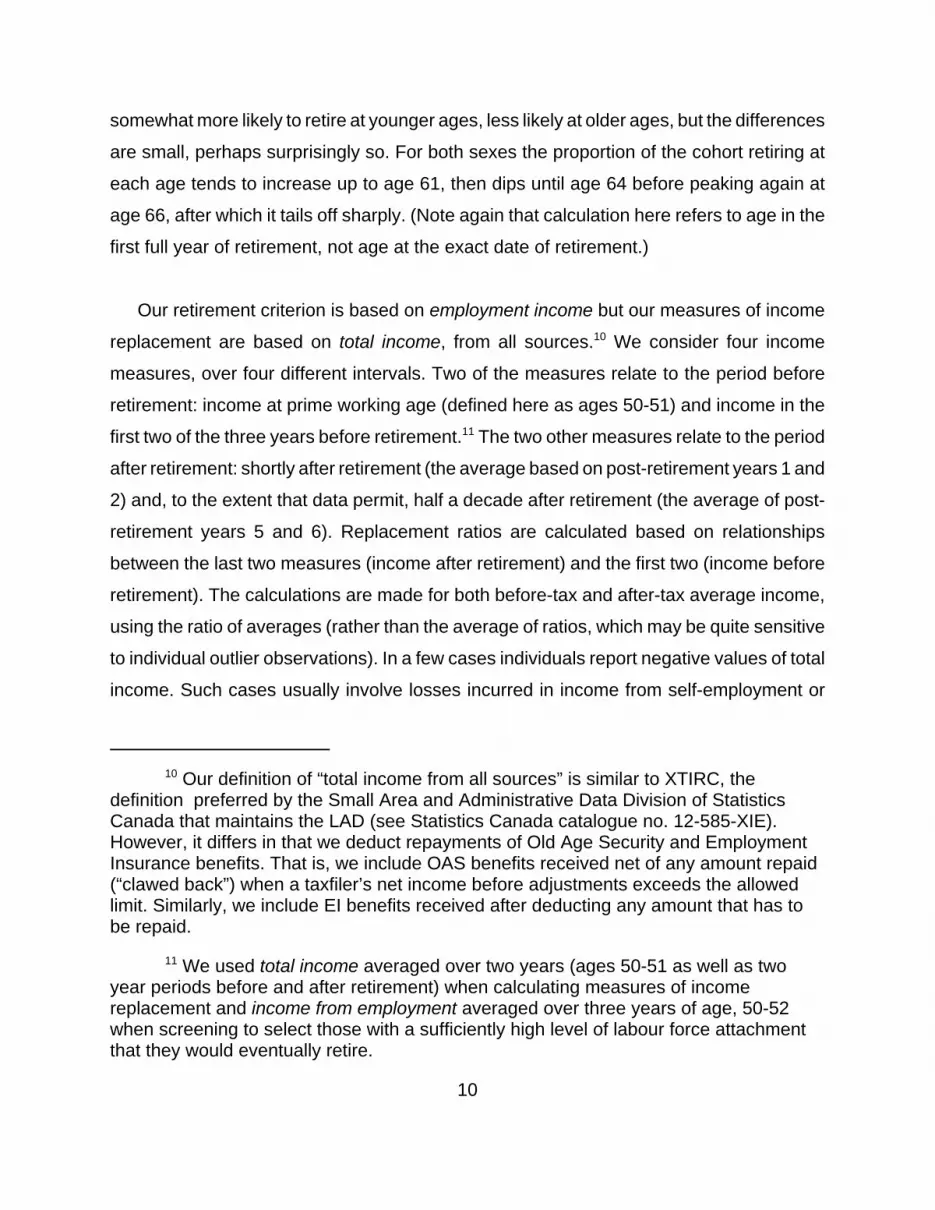
Figure 1 shows the distribution of retirement ages for the 1982 cohort (the cohort that
was 50 in 1982, that is). Among those who were employed at ages 50-52, women are
10 Our definition of “total income from all sources” is similar to XTIRC, thedefinition preferred by the Small Area and Administrative Data Division of StatisticsCanada that maintains the LAD (see Statistics Canada catalogue no. 12-585-XIE).However, it differs in that we deduct repayments of Old Age Security and EmploymentInsurance benefits. That is, we include OAS benefits received net of any amount repaid(“clawed back”) when a taxfiler’s net income before adjustments exceeds the allowedlimit. Similarly, we include EI benefits received after deducting any amount that has tobe repaid.
11 We used total income averaged over two years (ages 50-51 as well as twoyear periods before and after retirement) when calculating measures of incomereplacement and income from employment averaged over three years of age, 50-52when screening to select those with a sufficiently high level of labour force attachmentthat they would eventually retire.
10
somewhat more likely to retire at younger ages, less likely at older ages, but the differences
are small, perhaps surprisingly so. For both sexes the proportion of the cohort retiring at
each age tends to increase up to age 61, then dips until age 64 before peaking again at
age 66, after which it tails off sharply. (Note again that calculation here refers to age in the
first full year of retirement, not age at the exact date of retirement.)
Our retirement criterion is based on employment income but our measures of income
replacement are based on total income, from all sources.10 We consider four income
measures, over four different intervals. Two of the measures relate to the period before
retirement: income at prime working age (defined here as ages 50-51) and income in the
first two of the three years before retirement.11 The two other measures relate to the period
after retirement: shortly after retirement (the average based on post-retirement years 1 and
2) and, to the extent that data permit, half a decade after retirement (the average of post-
retirement years 5 and 6). Replacement ratios are calculated based on relationships
between the last two measures (income after retirement) and the first two (income before
retirement). The calculations are made for both before-tax and after-tax average income,
using the ratio of averages (rather than the average of ratios, which may be quite sensitive
to individual outlier observations). In a few cases individuals report negative values of total
income. Such cases usually involve losses incurred in income from self-employment or
12 We have also excluded from analysis the much smaller number reporting atotal income level of zero . The number excluded varies with the measure of incomereplacement that is used but is always small. As an indication, using the before-taxversion of the second measure described below (i.e., income after retirement relative toincome shortly before), we find that 1.5 percent of the 1982 cohort was excluded. Thatproportion increases steadily for later (i.e., younger) cohorts, for which progressivelysmaller fractions have retired, and reaches 7.5 percent for the 2001 cohort. Aninteresting observation is that there is a strong association between the age ofretirement and the proportion having at least one year of negative income: the youngerthe age at which people retire the higher the proportion. That holds true for everycohort. A likely explanation is that earlier retirements are associated with subsequentself-employment and attendant losses, a hypothesis that could be investigated in furtherwork.
13 We have undertaken some preliminary work based on individual rather thancohort replacement ratios, and also considered medians based on such calculations. Indoing so we were reassured to find that the main results reported here are not sensitiveto the measures used. Future work may focus on modelling individual replacementratios, and how they have changed. We observe also that separate treatment of theself-employed may be warranted in future research. Alternative definitions of retirementcould be considered to accommodate the fact that negative income levels are notuncommon among people who are self-employed, as perhaps are sustained periods oflow income, at least as compared to the employed. Related to this point, one might alsowish to assess the extent of returning to employment, post-retirement.
11
from the rental of property; expenses incurred can exceed income in such cases. We have
removed from our sample all individuals who reported negative incomes in any year of our
data period.12 That restriction resulted in a loss of about two percent of the 1982 cohort,
three percent of the 1987 cohort and four percent of the 1992 cohort. Restricting the
sample to those reporting positive income levels in all years, as we do here, has little
impact on the age pattern of retirement, as shown in Figure 1.13
4. Income Replacement: The 1982 Male Cohort
We now consider how income changes after retirement, making comparisons based on
before- and after-retirement levels.
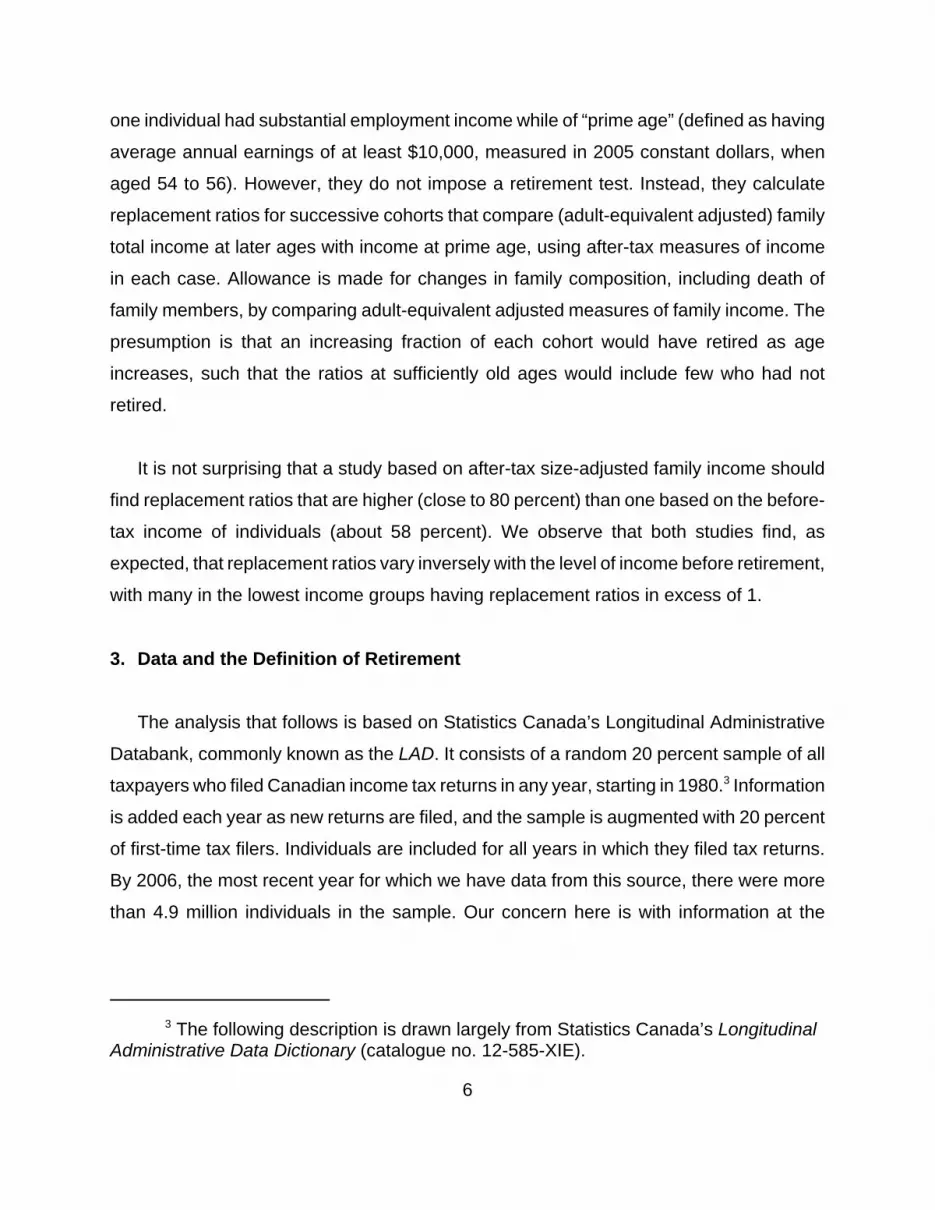
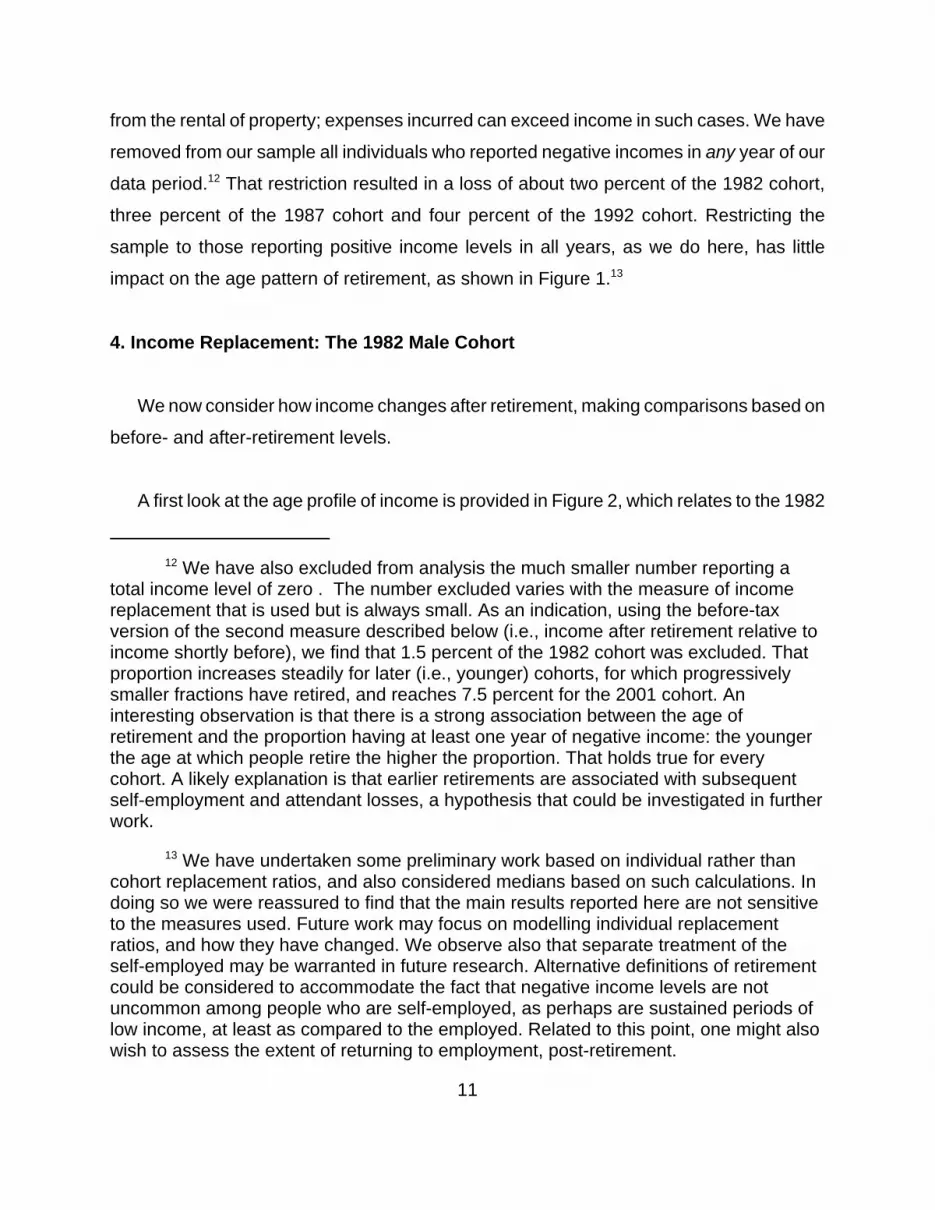
A first look at the age profile of income is provided in Figure 2, which relates to the 1982

14 The plot for those who retired at age 54 is excluded; this group includes asmall number of individuals whose income levels were extremely high at older ages,and hence had a marked impact on the average. Such outliers are not representative ofthe typical situation.
12
male cohort – males of age 50 in 1982. The figure shows the average income before tax
at each age, from 50 through 74, by age of retirement. Some in this cohort retired as young
as 53, others at 54, and so on. The oldest age of retirement in the figure is 70. It is only
because the sample on which this analysis is based is so large that we are able to provide
income measures in such fine age detail. For example, the age patterns of income for
those who retired at the youngest ages, 53 through 55, are based on almost 300
observations at each age, in most cases; even at the oldest ages they are based on well
over 100 observations. In total there are more than 16,000 retirees in the cohort. Even so,
caution should be exercised in interpreting the results; a small number of individuals with
especially high income levels can have a large effect on an average.14 Such effects are
evident in the figure, but do not obscure the broad patterns.
The figure shows a sharp drop in (real) income immediately after retirement. Of
particular interest, the decline appears to be about the same for those who retired in their
mid-50s as for those who worked a decade longer. It appears also that there is a small but
fairly persistent increase in the level of income in the years after retirement, a feature that
again is largely independent of the age at which people retired. Finally, and perhaps
surprisingly, while the circumstances may differ greatly among individuals, it appears that
average income in the years just before retirement is also largely independent of the age
of retirement. We explore these impressions in what follows and find that some important
qualifications apply.
Table 1 provides further information. The columns labelled a through d record our four
measures of average before-tax income for each age of retirement. Column a shows the
average at ages 50-51. The second measure, in column b, shows average income in the
first two of the three years preceding retirement (e.g., ages 60-61 for those who retired at
13
63) – a measure referred to hereafter as “income before retirement”. (Only the first two of
the three years are included in the calculation since the retirement may have commenced
during the third year, in which case annual income in that year would likely have been
reduced.) Column c shows average income in the two years after retirement (e.g., ages 64-
65 for those who retired at 63), hereafter referred to as “income after retirement”. Finally,
column d shows the average income 5 and 6 years after retirement. The measures in
columns c and d are not available at the oldest ages.
We note first some interesting features relating to pre-retirement income. Consider
average income at ages 50-51, a measure at “prime age” that can be compared
consistently across the various ages because it is observed at the same age for all
individuals, regardless of when they retired. Based on the averages shown at the bottom
of the table, for the 1982 male cohort we see that later retirement is associated with lower
incomes at prime age, at least for those who retire before the age of 70. For example,
average incomes at prime age are about 3 percent lower for those who retired at ages 65-
69 than for those who retired ten years younger.
That result may seem surprising in that those with higher levels of education (and
hence, typically, higher levels of income) generally have higher rates of labour force
participation at each age. However, retirement is related not to the participation rates
themselves but rather to changes in those rates. Using income as a rough reflection of
education level, that suggests that changes in the rates are similar across education
groups, but slightly higher for those with higher levels of education. The implication
regarding education cannot be tested with the LAD, since level of education is not known,
but we note that a similar result was found for the UK and Italy in a study which concluded
that “in both countries high earners retire relatively early while those in the lowest income
groups tend to retire later” (Gough, Adami, and Waters, 2008, p 167). While the differences
here are not great – as stated, the prime age incomes of early retirees are only 3 percent
higher than those of later retirees, on average.
15 We have classified as self-employed those who had any income from self-employment at ages 50-52 (the age interval used in our work to assess who hasretired). Using that definition almost one-third of males who retired after age 70 hadbeen classified as self-employed, and almost 20 percent of females. At the same time,excluding the self-employed from Table 1 has only a modest impact on the averageincome values shown. However, it could be that the proportion with income from self-employment increases with age among those still classified as not retired: at older agesthe self-employed might be increasingly drawn from the ranks of those who left careerjobs as employees.
14
Interestingly enough, the situation is quite different for those who retired later, at ages
70-74: they had prime age incomes over 30 percent higher than the all-ages average. It
seems likely that a selection process is at work: the late retirees may consist of a relatively
high proportion of self-employed individuals, including those who became self-employed
after retiring as career employees.15
A further observation is that income before retirement, at whatever age that occurs,
tends to be lower (in real terms) than at prime age. That is true at almost all ages of
retirement and, on average, the ratio b/a (shown in column e) decreases with age, at least
for those who retire before their early 70s. We note that this does not necessarily indicate
an age-related decline in income from employment since the comparison is not with
earnings but with income from all sources. It may instead reflect a gradual withdrawal from
income-earning activity as retirement approaches, with the extent of withdrawal increasing
with the age of retirement. That is another matter that could be addressed in further
research.
The last three columns of Table 1 show our measures of income replacement. The first,
column f, shows the ratios of income after retirement to income at prime age. The last two
(columns g and h) show ratios of income soon after retirement and half a decade after
retirement to income before retirement. The first measure, in column f, has the lowest
values, 0.57 when averaged over all ages of retirement. The next two measures, in g and
h, are only slightly higher. We can see too that the replacement ratios generally increase
with age of retirement, at least up to age 70. (They are especially low for those who retired
15
before age 56.)
Table 2 provides the same measures as Table 1, but based on income after tax rather
than before. The after-tax ratios are higher, as expected, given the progressive income tax,
and the difference increases with the length of the period of retirement.
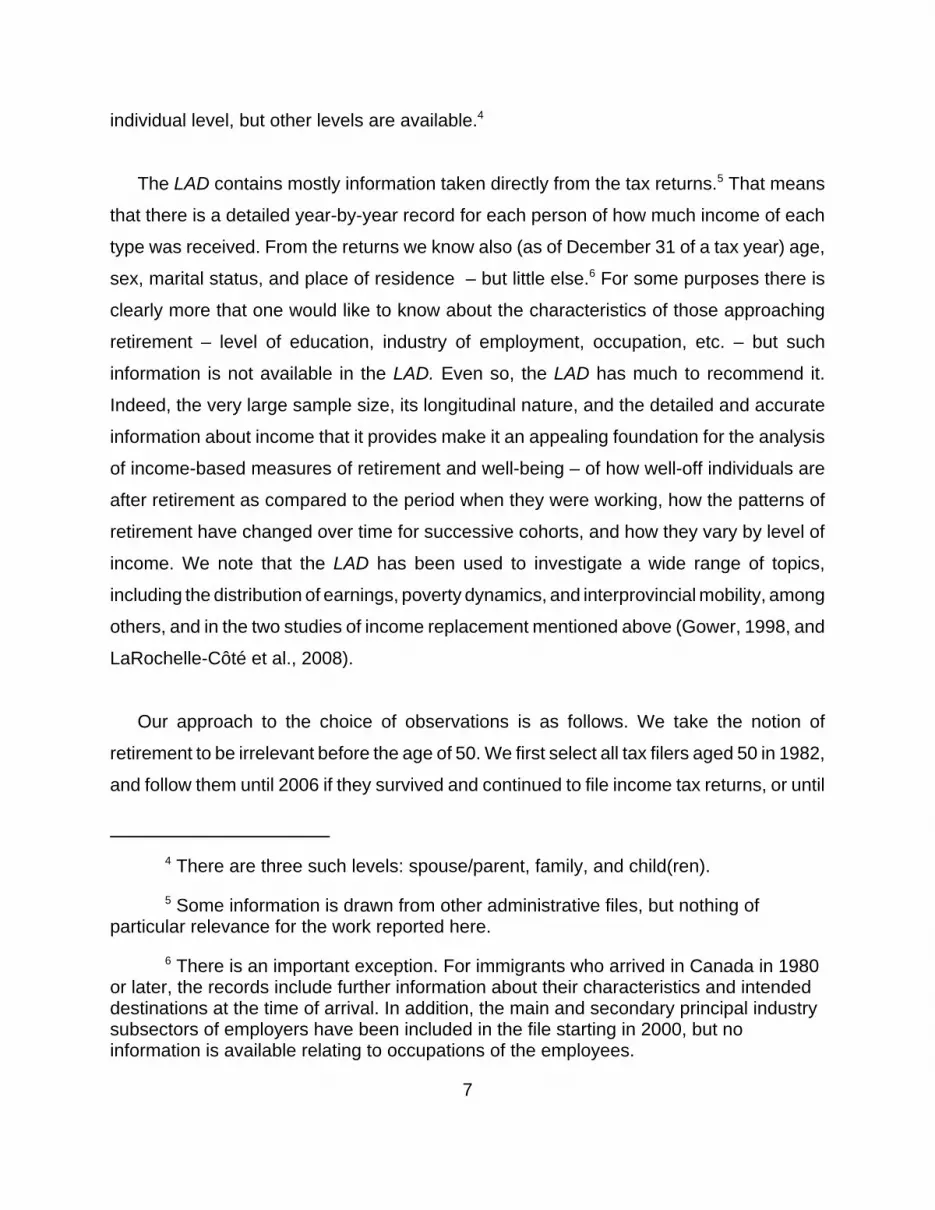
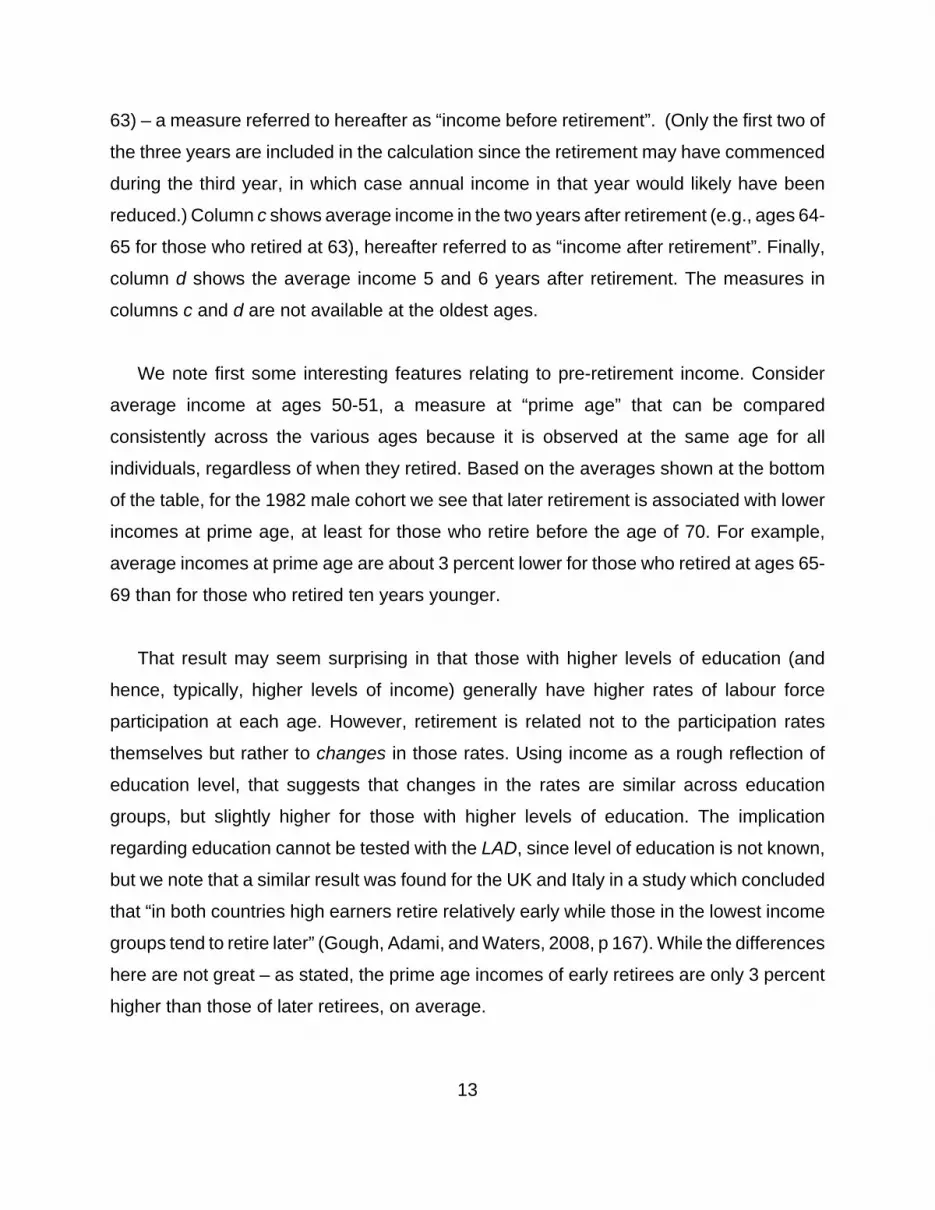
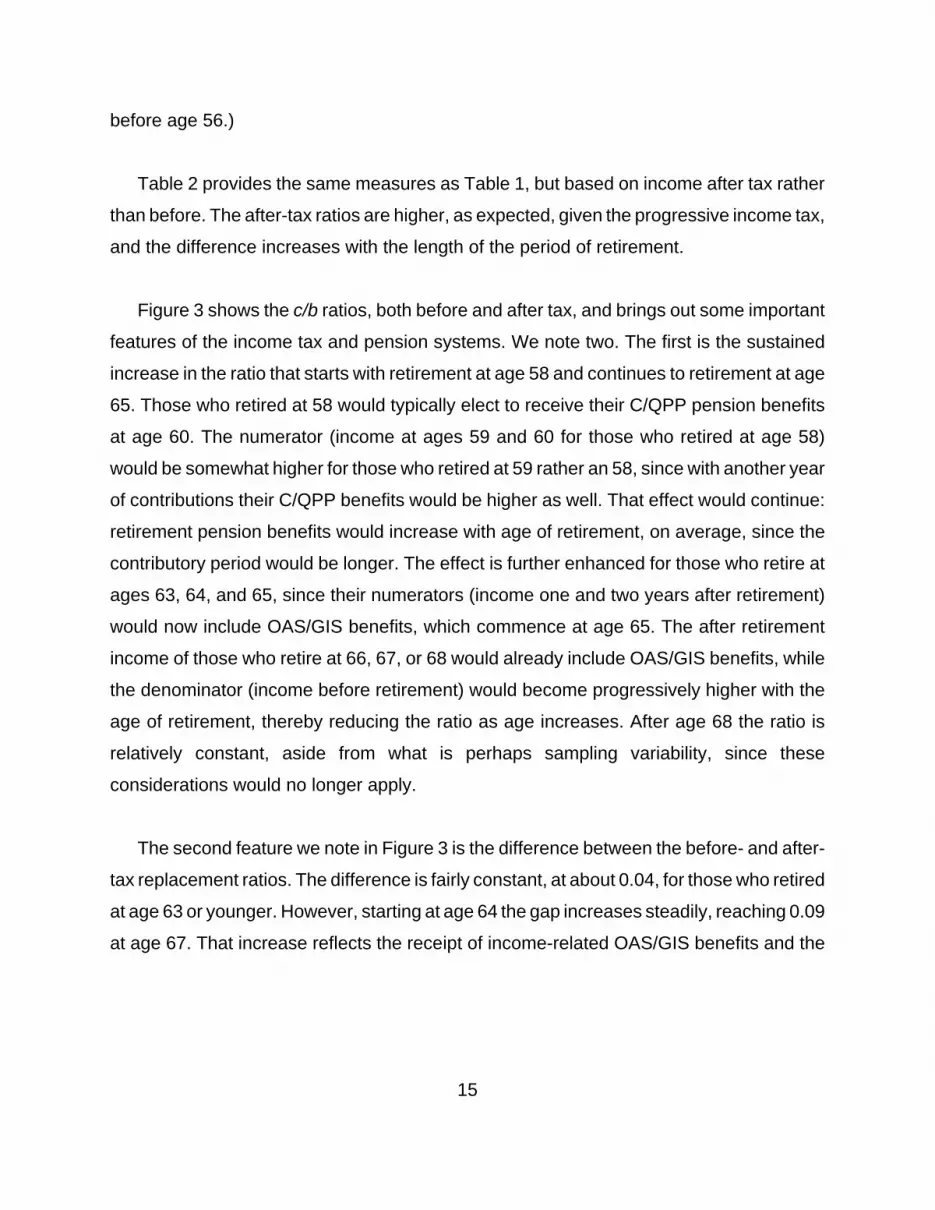
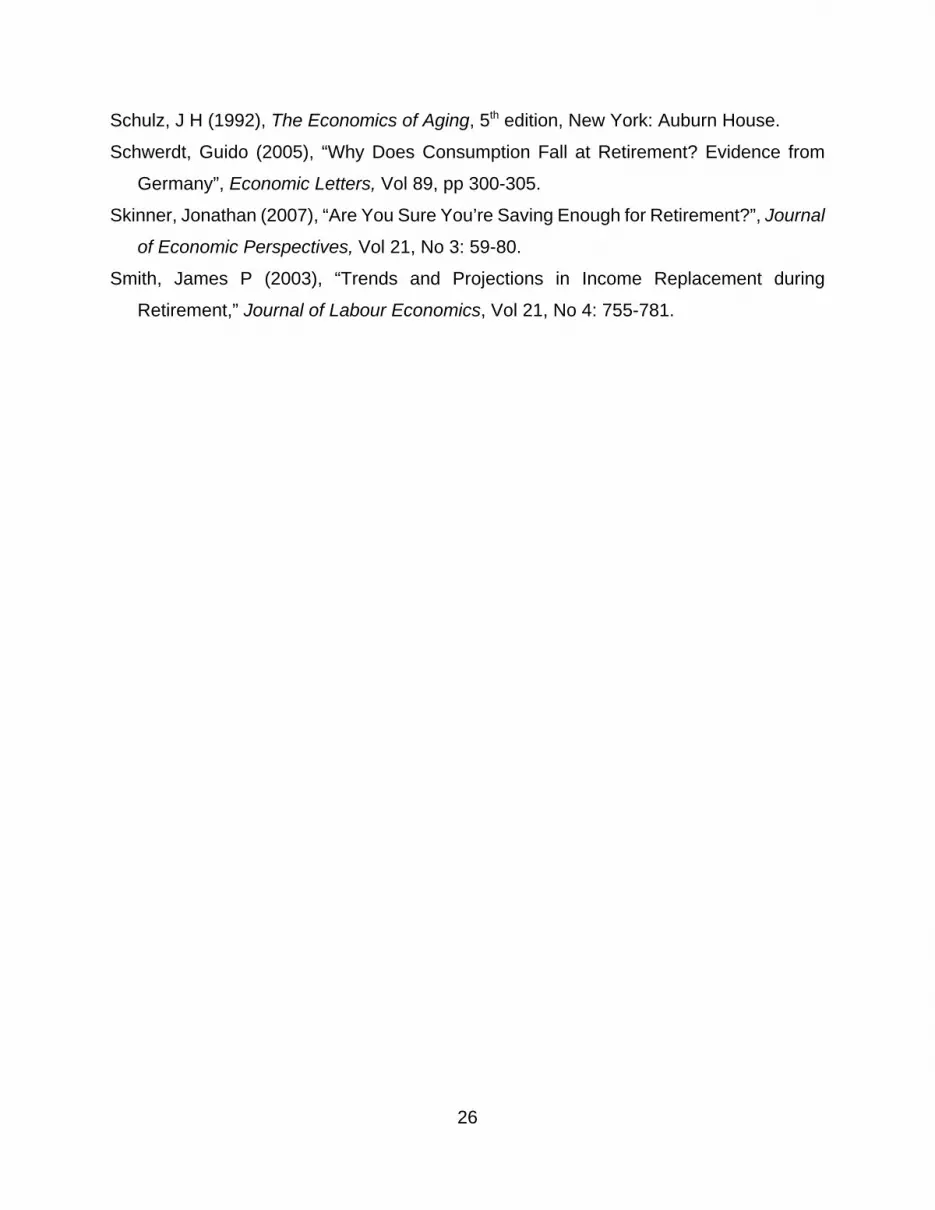
Figure 3 shows the c/b ratios, both before and after tax, and brings out some important
features of the income tax and pension systems. We note two. The first is the sustained
increase in the ratio that starts with retirement at age 58 and continues to retirement at age
65. Those who retired at 58 would typically elect to receive their C/QPP pension benefits
at age 60. The numerator (income at ages 59 and 60 for those who retired at age 58)
would be somewhat higher for those who retired at 59 rather an 58, since with another year
of contributions their C/QPP benefits would be higher as well. That effect would continue:
retirement pension benefits would increase with age of retirement, on average, since the
contributory period would be longer. The effect is further enhanced for those who retire at
ages 63, 64, and 65, since their numerators (income one and two years after retirement)
would now include OAS/GIS benefits, which commence at age 65. The after retirement
income of those who retire at 66, 67, or 68 would already include OAS/GIS benefits, while
the denominator (income before retirement) would become progressively higher with the
age of retirement, thereby reducing the ratio as age increases. After age 68 the ratio is
relatively constant, aside from what is perhaps sampling variability, since these
considerations would no longer apply.
The second feature we note in Figure 3 is the difference between the before- and after-
tax replacement ratios. The difference is fairly constant, at about 0.04, for those who retired
at age 63 or younger. However, starting at age 64 the gap increases steadily, reaching 0.09
at age 67. That increase reflects the receipt of income-related OAS/GIS benefits and the
16 OAS benefits are “clawed back” for those with higher incomes and benefitsreceived are taxable. Tax-free GIS benefits are paid only to OAS recipients with lowincomes.
16
“age amount” allowance, both of which take effect at 65.16 They affect the numerator
(income after retirement) starting at age 63. The gap diminishes steadily after age 67, as
the gains are reflected more fully in the denominator (income before retirement). That these
measures should reflect so effectively these aspects of the tax and transfer system attests
to the quality of the data that underlie them.
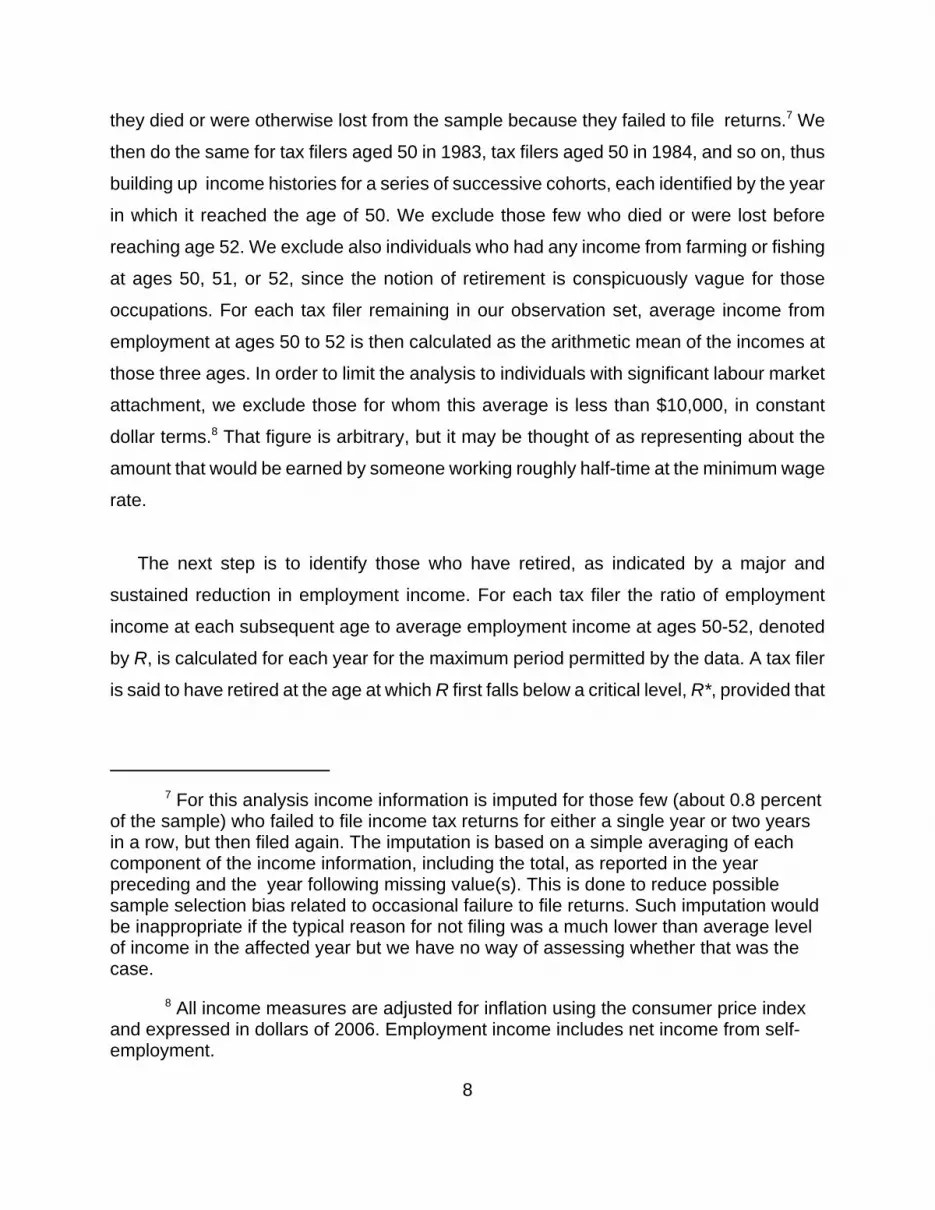
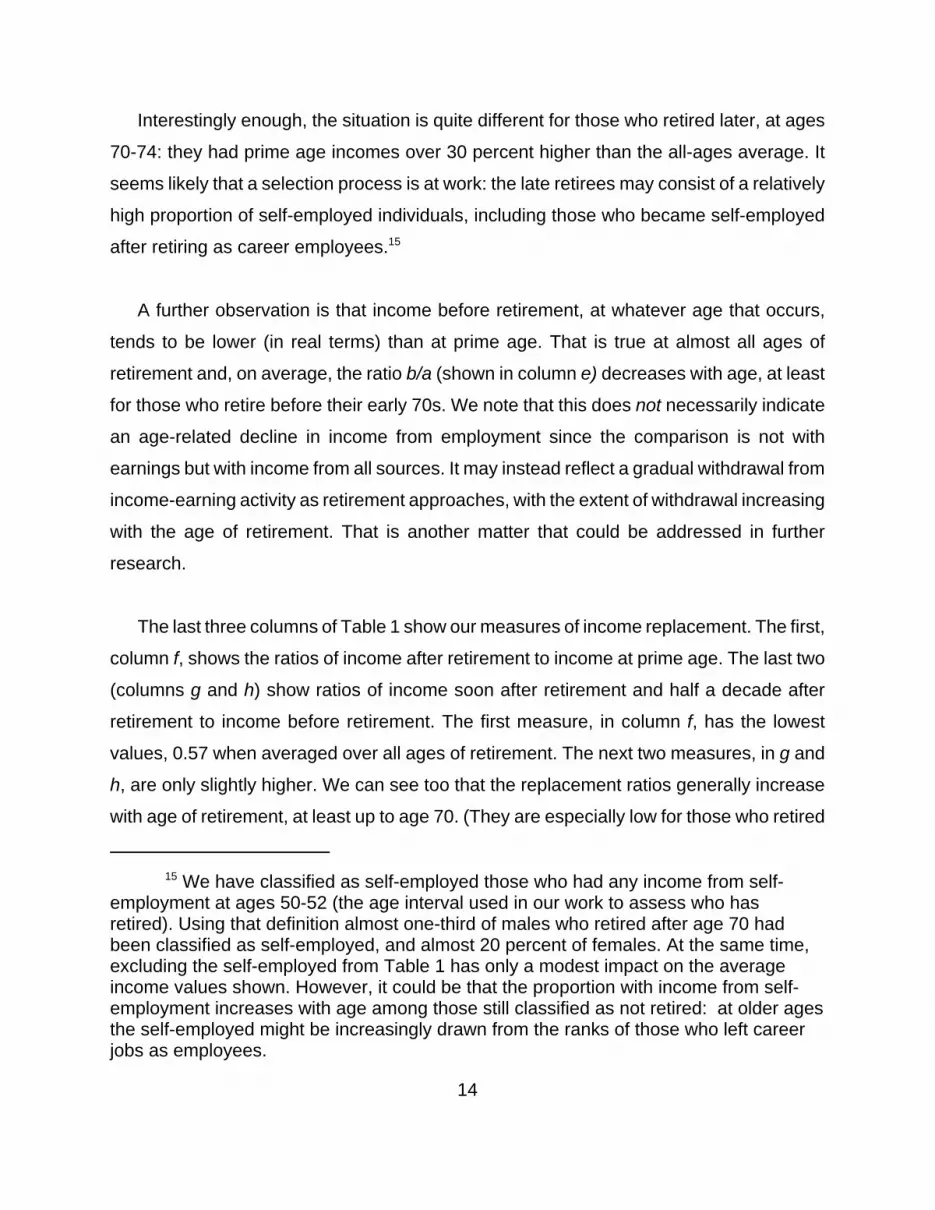
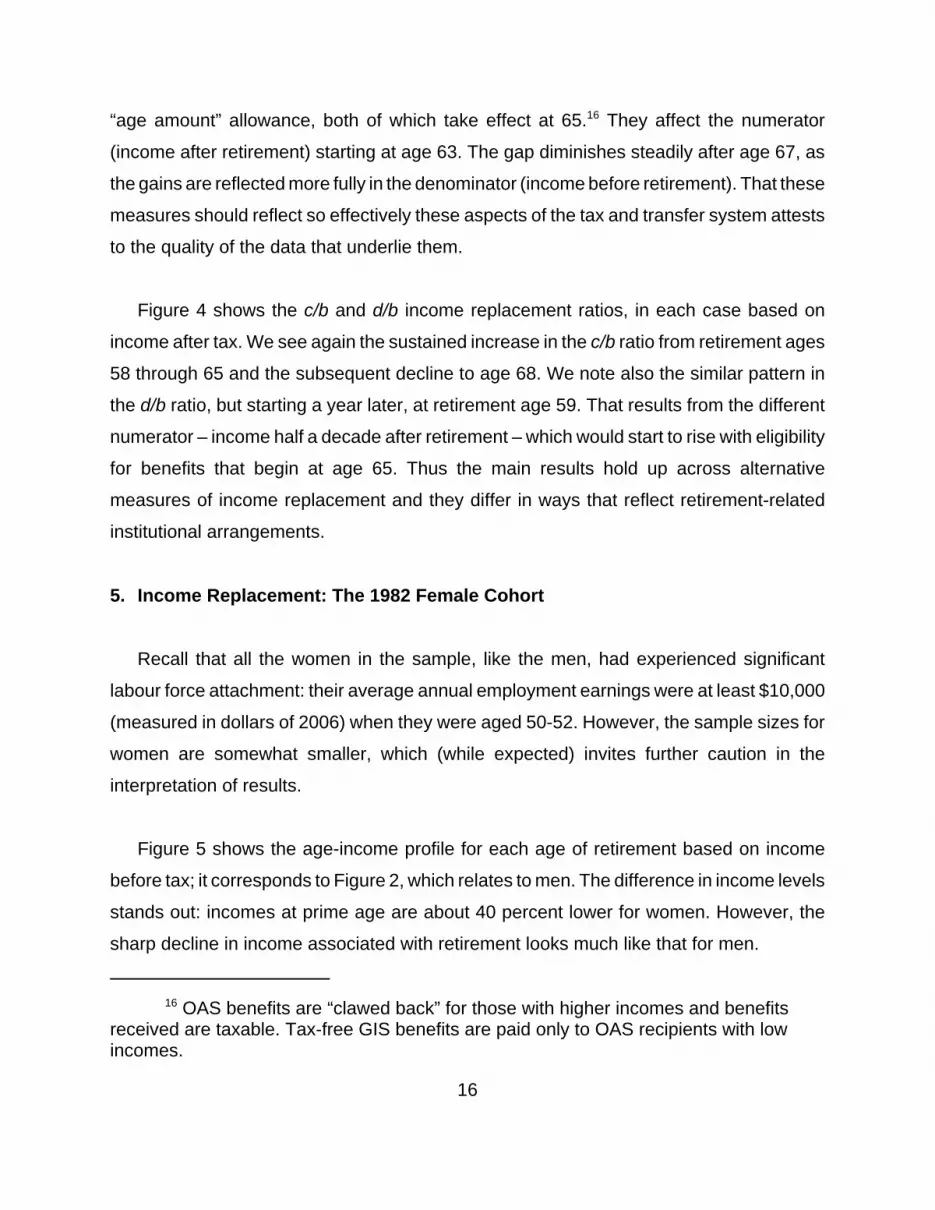
Figure 4 shows the c/b and d/b income replacement ratios, in each case based on
income after tax. We see again the sustained increase in the c/b ratio from retirement ages
58 through 65 and the subsequent decline to age 68. We note also the similar pattern in
the d/b ratio, but starting a year later, at retirement age 59. That results from the different
numerator – income half a decade after retirement – which would start to rise with eligibility
for benefits that begin at age 65. Thus the main results hold up across alternative
measures of income replacement and they differ in ways that reflect retirement-related
institutional arrangements.
5. Income Replacement: The 1982 Female Cohort
Recall that all the women in the sample, like the men, had experienced significant
labour force attachment: their average annual employment earnings were at least $10,000
(measured in dollars of 2006) when they were aged 50-52. However, the sample sizes for
women are somewhat smaller, which (while expected) invites further caution in the
interpretation of results.
Figure 5 shows the age-income profile for each age of retirement based on income
before tax; it corresponds to Figure 2, which relates to men. The difference in income levels
stands out: incomes at prime age are about 40 percent lower for women. However, the
sharp decline in income associated with retirement looks much like that for men.

17
Tables 3 and 4 show the before- and after-tax measures for the 1982 female cohort. We
find for males that income tends to decline somewhat after prime age, a difference that
increases with age of retirement. For women we see the opposite: incomes are generally
higher shortly before retirement than at prime age. The explanation for the difference is not
clear. However, it may be associated with work histories: women in the 1982 cohort would,
on average, have had much less labour force experience at age 50 than men, hence be
much younger in a career sense, and therefore continue to experience gains in earnings.
It may be associated also with a transition towards more full-time and less part-time work
as their children come to need less care. Whatever the reason, we see that women who
retired in their late 60s had incomes before retirement 9 percent above those in prime age,
on average, while men had incomes 6 percent below.
As with men, before age 70 there is an inverse relationship for women between prime
age income and age of retirement. The relationship is somewhat stronger for women than
for men.
While women’s average earnings before retirement are more than 40 percent lower than
those of men, their replacement ratios, c/b and d/b, are somewhat higher. Even so, the age
patterns are generally similar, as shown in Figures 6 and 7. The higher replacement ratios
for women reflect the characteristics of the public-source income support system, which is
geared to providing relatively high levels of support for those with lower incomes. Aside
from level, the major difference is that the ratios increase more strongly with age of
retirement for women. That is reflected in the differences between the male and female
ratios; for example, for women the after-tax d/b ratio rises from 0.64 for those who retired
before 60 to 0.84 for those who retired at ages 65-69. The corresponding rate for men rises
from 0.61 to 0.70.
6. Income Replacement for Later Cohorts
We consider now the patterns of income replacement of later cohorts, and how they

17 We note, however, that the tendency towards earlier retirement within thegroup of “early retirees” had little impact on the median age of retirement; see Denton,Finnie and Spencer (2009).
18
differ from those the 1982 cohort. For this purpose we select those cohorts that reached
age 50 five and ten years later – that is, in 1987 and 1992. The choice is arbitrary but it
allows us to follow cohorts from age 50 to retirement at ages as old as 69 (the 1987 cohort)
or 64 (the 1992 cohort).
We start by comparing the age distributions of retirement, as shown in Figure 8. The
upper panel relates to the 1982 cohort, the middle panel to the 1987 cohort, and the bottom
one to the 1992 cohort. To facilitate comparisons we show the age distribution of retirement
over three age ranges: 53-64, 53-69, and 53-74. (Note that the horizontal scale changes
from one vertical panel to the next.) Comparisons across all three cohorts are possible for
the age range 53-64.
The first observation is that the age distributions of retirement for men and women are
similar in each of the cohorts – remarkably so. The second is the notable trend in the age
patterns towards earlier retirement among those who retired before age 65: for those in the
1982 cohort retirements at ages 61 through 64 accounted for just over 50 percent of all
retirements, while for the 1987 and 1992 cohorts the proportion was only 40 percent. The
peak for early retirement was clearly age 61 for the 1982 cohort, but for the 1992 cohort
there was a second peak, at 56, and also “upticks” at both 53 and 64. This change in
patterns is something that might be expected to have an impact on replacement ratios.17
What of the relationship between income before- and after-retirement and the age of
retirement? Figures 9 and 10 show the profiles for all three cohorts, separately for men and
women. The oldest observed age of retirement for all three cohorts is 69. Full tabular
information for the two later cohorts is provided in Tables 5 through 12.
The evidence from the later male and female cohorts appears to be generally consistent

19
with our observations for the 1982 cohorts. We see the sharp drop in income associated
precisely with age of retirement. We see also that for both males and females, at least
those who retired before age 70, there is evidence in all three cases of an inverse
relationship between age of retirement and prime-age income. The relationship is
somewhat stronger for women: within each female cohort, income at prime age is a little
higher for those who retired before age 60 rather than 60-64, and also for 65-69 rather than
60-64.
But what of income replacement? The replacement ratios for all cohorts fluctuate
somewhat from one age of retirement to the next; averaging them within broader groups,
as shown in the bottom panel of the tables, reduces the sampling variability. Generally
speaking, the income replacement ratios tend to rise with age of retirement. That is true for
both men and women in all cohorts, with the exception of the oldest (70-74) male age-of-
retirement group. At the same time male replacement ratios tend to be somewhat lower
than female ratios, especially for those who retired after age 59 or 60, when the public
programs would have had immediate effect.
Figures 11 and 12 display the after-tax c/b and d/b ratios. The tendency for each of the
replacement ratios to increase with age of retirement is evident, but much more strongly
so for women than for men. Also clear in the case of women is the impact that features of
the Canadian income support system have on the age pattern of replacement ratios. That
impact appeared to be strong also for men in the 1982 cohort, but is less evident in the
later cohorts. Further research is needed to understand the differences.
The male-female differences in replacement ratios are evident in Figure 13, as is their
persistence from one cohort to another. The differences are quite small for those who retire
before age 60, but otherwise tend to increase with age of retirement, again reflecting the
extent to which the public income support system is directed towards older people with
lower incomes.

20
7. Income Replacement Across the Income Distribution
To assess how retirement patterns vary with the pre-retirement level of income we
classified those in our sample into income quartiles based on average employment income
when aged 50-52. Table 13 provides a summary of how the income replacement ratio c/b
varies by quartile. Average values of the ratios are shown separately for males and females
for each of four groupings of the age of retirement – 53-59, 60-64, 65-69, and 70+ – and
for all ages combined. The upper panel provides before-tax ratios, the middle panel after-
tax ratios, and the lower panel shows the upper bounds of the ages 50-52 average
employment income quartiles. Figure 14 plots the ratios calculated on an after-tax basis.
We would expect to find that replacement ratios generally decline with income, and that
is typically what we see. Men in the first quartile had after-tax replacement ratios that were
12 to 26 percent higher than those in the fourth quartile, depending on the year and the age
of retirement; for women the differences are less clear, especially for those retiring at the
youngest ages. We would expect also to see that, within each quartile, the replacement
ratios would be higher for those who retired later; that, too, is generally what we find. We
find also that the difference in the ratios between retirement at, say, 65-69 and 53-59,
diminishes as income increases.
Since women in each quartile had lower earnings than men, on average, we might
expect to find that they would have higher replacement ratios. That, too, is what we find in
most cases. While there are exceptions, especially for those who retired at the youngest
ages, the replacement ratios for women generally exceed those for men, often by a wide
margin.
8. Concluding Remarks
It is generally accepted that people prefer a constant standard of living to one that
fluctuates. That preference applies to the years in retirement, when maintaining the pre-

21
retirement standard is desired. Whether that goal is achieved may depend on the extent
to which income is reduced at retirement, and the reduction may be greater than expected
if there is an unanticipated decline in the value of income-producing assets accumulated
while working. It may depend also on the ability or willingness of individuals to draw down
their assets, a major component of which is typically owned housing. Beyond that, many
have few assets on which to draw. Measures of income replacement, ratios of pre-
retirement to post-retirement incomes, therefore provide useful information about well-
being in retirement as compared to the period just before retirement.
Our concern here is not with the older population as a whole, but rather with those who
have retired, and how successful they have been in maintaining their incomes (and hence
their standards of living) after retirement. In that regard we are fortunate in being able to
draw on a longitudinal data file that provides us with the basis for identifying those who
have retired, the age at which their retirements took place, and their income levels year-by-
year for an extended period, both before and after the retirement event. Furthermore, the
file is large enough to permit analyses of how cohort retirement patterns and income
replacement ratios have evolved over time, to allow us to consider men and women
separately, and to examine differences across the income distribution.
We have restricted our measure of retirement to those who had significant labour force
attachment when they were in their early 50s, as indicated by their level of earnings at that
time. Their retirement is indicated by a substantial and sustained drop in earned income.
Using that criterion we have found that the age distribution of retirement is similar for men
and women, perhaps remarkably so. Age 66 was the most popular age of retirement ( the
first full year of retirement, that is) among those aged 50 in 1982, with an “early retirement”
peak at age 61. That pattern continued for later cohorts, but the proportion waiting until 66
declined somewhat, and a further early retirement peak emerged at age 56. Women tend
to retire a little younger than men, but the differences are small. A full analysis of the
evolving patterns of retirement across successive cohorts is provided in Denton, Finnie and
Spencer (2009).

22
Our major findings relate, however, to income replacement ratios, ratios of real (i.e.,
price deflated) incomes. We focus on these ratios for individuals, not families or
households. In that way we are able to relate the measure of income replacement to those
who have, in fact, retired. While our findings are largely descriptive, they provide, for the
first time, basic information comparing income in retirement to income in the pre-retirement
years, and show how patterns of income replacement differ, depending on gender, age at
retirement, number of years in retirement, and the pre-retirement level of income. Future
work may provide a deeper understanding of why the patterns have evolved as they have;
at this stage our explanations are necessarily somewhat speculative.
Our main conclusions are as follows. First, in the two years immediately after retirement
the after-tax income replacement ratios average about two-thirds when calculated across
all ages of retirement. That is true of the oldest cohort, for which information about
retirement is most complete, and a similar pattern appears to be sustained among younger
cohorts, at least up to those ages at which retirement can be observed in the data. Our two-
thirds ratio is somewhat lower than reported in the recent Canadian study by LaRochelle-
Coté et al. (2008). In part that is because our ratios relate only to those who had significant
labour force attachment when they were in their early 50s and had subsequently retired.
By contrast, LaRochelle-Côté et al. report ratios that relate to age alone, and are not
restricted to those who had in fact retired. But perhaps more importantly, our ratios are
lower because the replacement measures relate to individual rather than family income.
The majority of households, including those with retired people, have two or more persons.
The ratios would be higher if allowance were made for economies of scale, reflecting the
old (if somewhat hackneyed) idea that “two can live as cheaply as one”. Both types of
ratios are informative, in our view, and complement each other.
Our second finding, and one with no counterpart in the literature, is that the ratios tend
to increase with the age of retirement. That is true for both men and women, with the
exception of the oldest male age-of-retirement group (those who retired after 70; for them
the ratios are about the same as for those who retired at ages 65-69). As one example,

23
for the cohorts aged 50 in 1982 and in 1987 the after-tax replacement ratios for those who
retired between 65 and 69 are 12 to 17 percent higher than for those who retired before
age 60. Our third major finding, also new, is that the ratios increase with years in
retirement, at least in the first few years. Half a decade after retirement the average
replacement ratio for men is about 5 percent higher than it was after two years; for women
it is more than 10 percent higher. (All income measures are adjusted for inflation, so the
gains are real, not nominal.)
Our fourth main finding relates to how replacement ratios vary across the income
distribution. We find that they are highest in the lowest income quartile and generally
decline as income increases; that is as one would expect with a public income security
system that directs support to those with lower income levels. For example, in the lowest
quartile the after-tax income replacement ratio that compares income shortly after
retirement to shortly before averages about 0.74 for women and 0.68 for men, exceeding
the ratio for those in the highest income quartile by about 14 percent for women and 15 for
men. We find also that within each quartile the replacement ratios are higher for those who
retired later than for those retired earlier.
What explains these patterns? As stated, any explanation at this stage is somewhat
speculative, but it appears that they reflect, in large part, features of our income support
system, especially those relating to the age of eligibility for C/QPP pension benefits and
OAS/GIS benefits. Features of the system explain also why the replacement ratios for
women are higher than for men: the public income support system is designed to provide
relatively larger transfers to those whose pre-retirement income levels are lower. These
findings point to the importance of the system in maintaining post-retirement incomes in old
age. We observe also that the (somewhat surprising) post-retirement increase in the
replacement ratio could be explained in part by the delayed receipt of pensions, and/or by
our focus on individual rather than household ratios. For example, survivor pension benefits
and the income from assets previously in the hands of a now-deceased spouse would
increase the income of the survivor. Future work may assess the importance of the death
24
of a spouse in this regard.
We conclude by noting two other of the many topics that could be addressed in future
research. While we have focussed attention on the average income from all sources, or
average total income. It is evident that the sources of income change after retirement, since
income from employment may be greatly reduced, to zero in many cases, while income in
the form of pension benefits will increase and income from investments may play a larger
role. Future work might explore how the composition of total income changes in the years
after retirement for those who have in fact retired, and how it differs by age of retirement
and position in the income distribution. The fine quality of the income information in the LAD
and the sheer size of the sample should facilitate this kind of analysis.
In addition, our concern so far has been to provide a description of how income changes
at retirement, how replacement rates change with age in the post-retirement period, and
whether the patterns differ across cohorts. Another direction for future research would be
the modelling of these processes to address the question of why the changes have
occurred, taking into account the inevitably endogenous relationship between age of
retirement and income in retirement. That is a possible extension of our work in a broader
research agenda.
25
REFERENCESAlan, Sule, Kadir Atalay, and Thomas F Crossley (2008), “The Adequacy of Retirement
Savings: Subjective Survey Reports by Retired Canadians,” Canadian Public Policy,
XXXIV Supplement, November, S95-S118.
Banks, James, Richard Blundell, and Sarah Tanner (1998), “Is There a retirement-Savings
Puzzle?” American Economic Review, Vol 88, No 4: 769-788.
Benartzi, Shlomo and Richard H Thaler (2007), “Heuristics and Biases in Retirement
Savings Behaviour,” Journal of Economic Perspectives, Vol 21, No 3: 223-238.
Bernheim, Douglas, Jonathan Skinner, and Steven Weinberg (2001), “What Accounts for
the Variation in Retirement Wealth among U.S. Households?” American Economic
Review, Vol 91, No 4: 832-857.
Denton, Frank T, Ross Finnie, and Byron G Spencer (2009), “Patterns of Retirement as
Reflected in Income Tax Records for Older Workers,” SEDAP Research Paper No. 257,
McMaster University.
Denton, Frank T, Dean Mountain, and Byron G Spencer (2006), “Age, Retirement, and
Expenditure Patterns: An Econometric Study of Older Households”, Atlantic Economic
Journal, Vol 34, No. 4: 421-434.
Denton, Frank T and Byron G Spencer (2009), “What Is Retirement? A Review and
Assessment of Alternative Concepts and Measures”, Canadian Journal on Aging, Vol
28, No 1: 63-76.
Gough, Orla, Roberta Adami, and James Waters (2008), “The effects of age and income
on retirement decisions: a comparative analysis between Italy and the UK,” Pensions,
Vol 13, pp 167-175.
Gower, Dave (1998), “Income Transition Upon Retirement,” Perspectives on Labour and
Income, Winter, pp 18-23. Statistics Canada, catalogue no 75-001-XPE.
Hurd, Michael D and Susann Rohwedder (2006), “Alternative Measures of Replacement
Rates,” Michigan Retirement Research Center Research Paper No. WP 2006-132.
LaRochelle-Côté, Sébastian, John Myles, and Garnett Picot (2008), “Income Security and
Stability During Retirement in Canada,” in Michael G Abbott, Charles M Beach, Robin
W Boadway and James G MacKinnon, editors, Retirement Policy Issues in Canada,
McGill-Queen’s University Press. – also available as SEDAP Research Paper 236.
26
Schulz, J H (1992), The Economics of Aging, 5th edition, New York: Auburn House.
Schwerdt, Guido (2005), “Why Does Consumption Fall at Retirement? Evidence from
Germany”, Economic Letters, Vol 89, pp 300-305.
Skinner, Jonathan (2007), “Are You Sure You’re Saving Enough for Retirement?”, Journal
of Economic Perspectives, Vol 21, No 3: 59-80.
Smith, James P (2003), “Trends and Projections in Income Replacement during
Retirement,” Journal of Labour Economics, Vol 21, No 4: 755-781.

Figure 1: Distribution of Age at Retirement, 1982 Cohort
Figure 2: Average Income Before Tax, by Age and Age of Retirement, 1982 Cohort, Males
Note: Income is in constant dollars, using 2006 as the base. The plot for those who retired at age 54 is excluded.
0
2
4
6
8
10
12
14
53 56 59 62 65 68 71 74
Males Females
%
50 53 56 59 62 65 68 71 74
5357
6165
69
0
10,000
20,000
30,000
40,000
50,000
60,000
70,000
80,000
Age
Age of Ret.
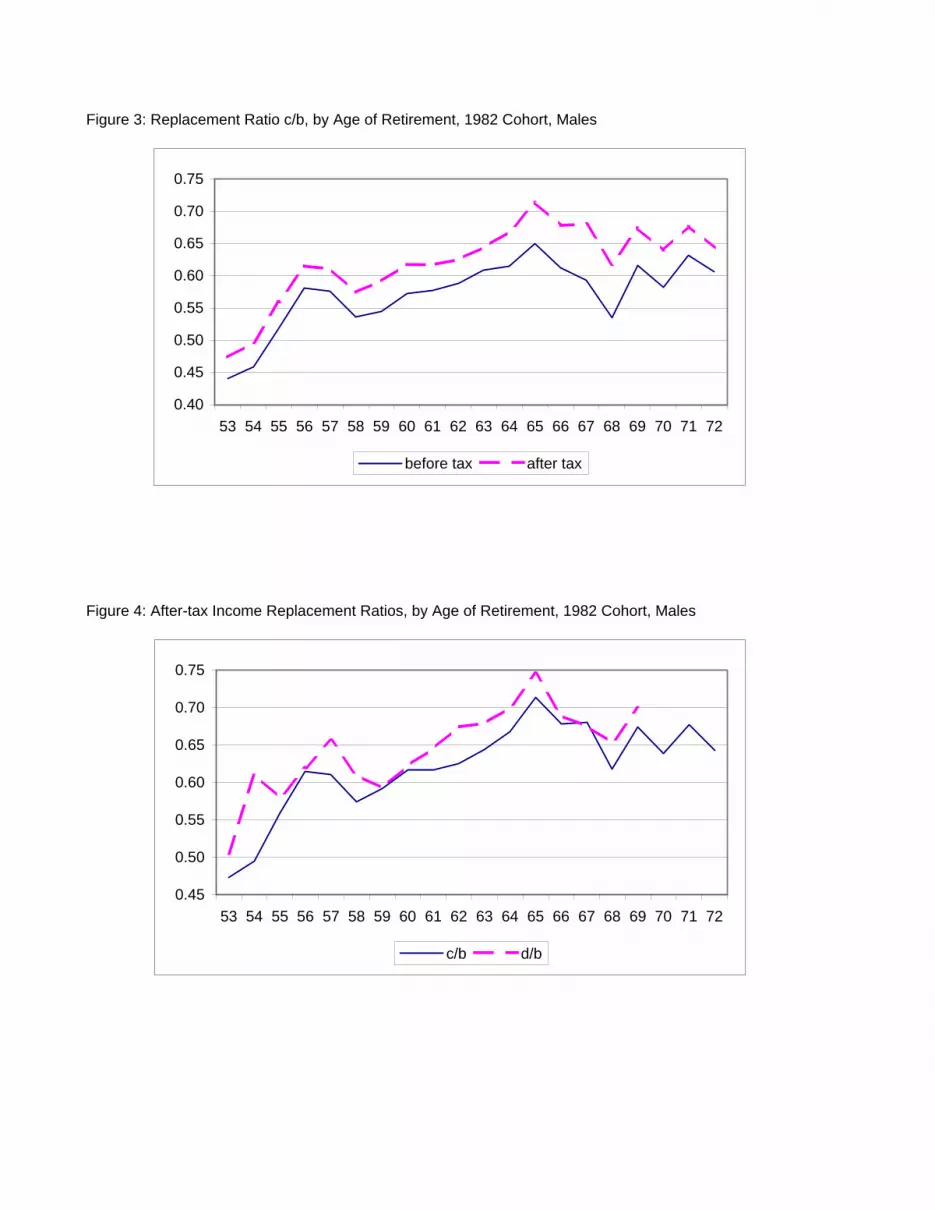
Figure 3: Replacement Ratio c/b, by Age of Retirement, 1982 Cohort, Males
Figure 4: After-tax Income Replacement Ratios, by Age of Retirement, 1982 Cohort, Males
0.45
0.50
0.55
0.60
0.65
0.70
0.75
53 54 55 56 57 58 59 60 61 62 63 64 65 66 67 68 69 70 71 72
c/b d/b
0.40
0.45
0.50
0.55
0.60
0.65
0.70
0.75
53 54 55 56 57 58 59 60 61 62 63 64 65 66 67 68 69 70 71 72
before tax after tax
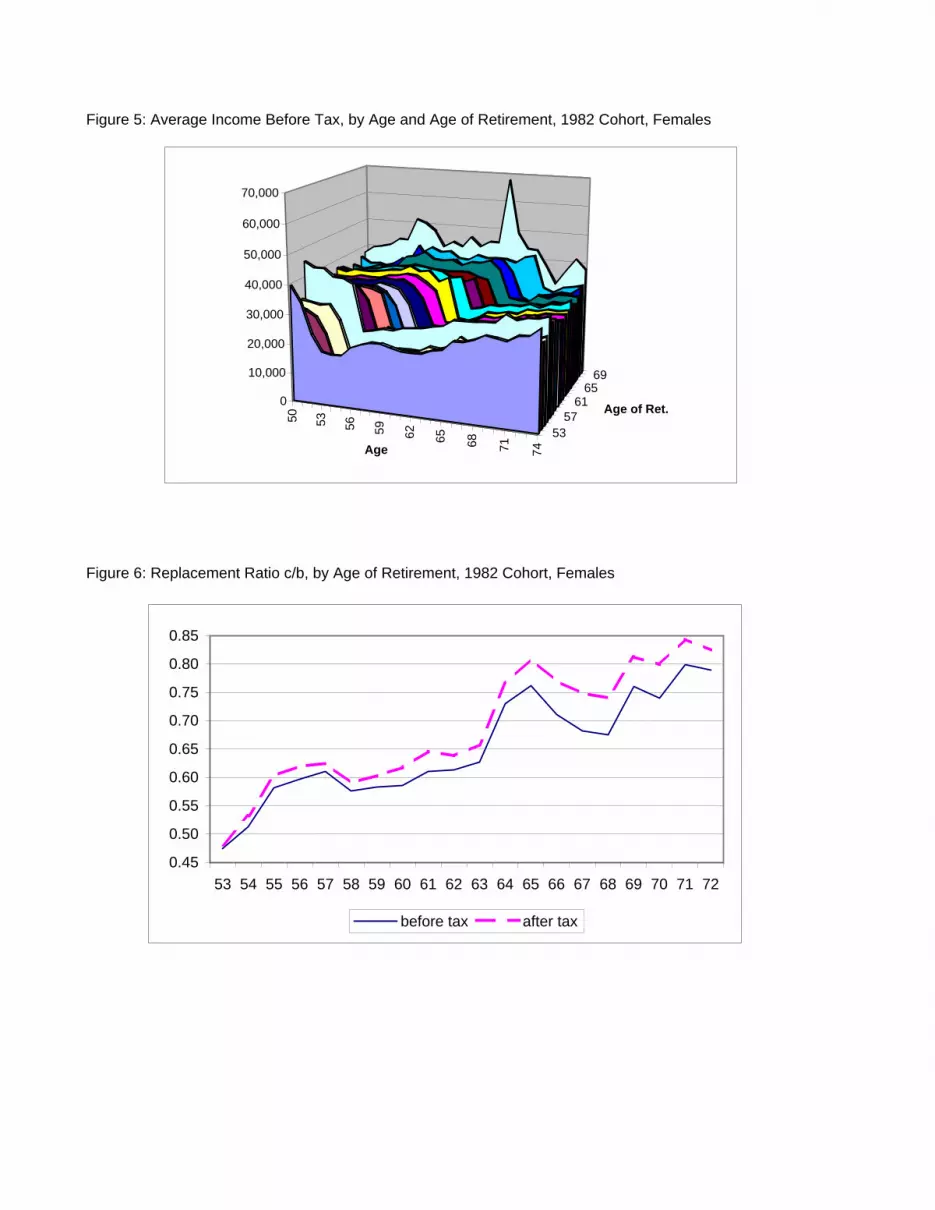
Figure 5: Average Income Before Tax, by Age and Age of Retirement, 1982 Cohort, Females
Figure 6: Replacement Ratio c/b, by Age of Retirement, 1982 Cohort, Females
50 53 56 59 62 65 68 71 74
5357
6165
69
0
10,000
20,000
30,000
40,000
50,000
60,000
70,000
Age
Age of Ret.
0.45
0.50
0.55
0.60
0.65
0.70
0.75
0.80
0.85
53 54 55 56 57 58 59 60 61 62 63 64 65 66 67 68 69 70 71 72
before tax after tax

Figure 7: After-tax Income Replacement Ratios, by Age of Retirement, 1982 Cohort, Females
0.40
0.50
0.60
0.70
0.80
0.90
1.00
53 54 55 56 57 58 59 60 61 62 63 64 65 66 67 68 69 70 71 72
c/b d/b
Figure 8: Distribution of Age at Retirement by Sex, Selected Cohorts
1982 1982 1982
1987 1987
1992
Ages 53-64 Ages 53-69 Ages 53-74
0
2
4
6
8
10
12
14
53 56 59 62 65 68
%
0
3
6
9
12
15
18
53 55 57 59 61 63
%
0
2
4
6
8
10
12
14
53 56 59 62 65 68
%
0
2
4
6
8
10
12
14
53 56 59 62 65 68 71 74
%
0
3
6
9
12
15
18
53 55 57 59 61 63
%
0
3
6
9
12
15
18
53 55 57 59 61 63
%
Male
Female
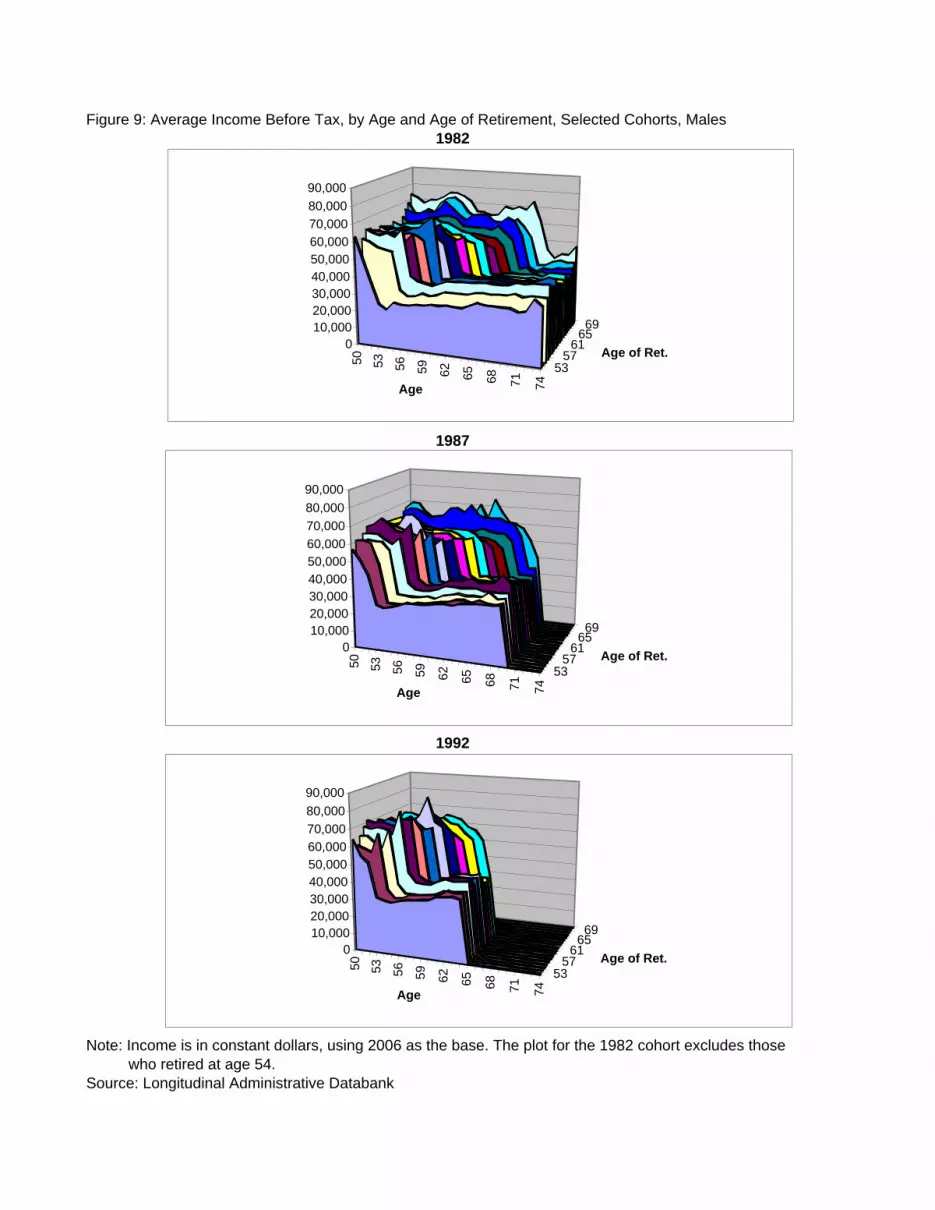
Figure 9: Average Income Before Tax, by Age and Age of Retirement, Selected Cohorts, Males1982
1987
1992
Note: Income is in constant dollars, using 2006 as the base. The plot for the 1982 cohort excludes those who retired at age 54.Source: Longitudinal Administrative Databank
50 53 56 59 62 65 68 71 74
5357
616569
010,00020,00030,00040,00050,00060,00070,00080,00090,000
Age
Age of Ret.50 53 56 59 62 65 68 71 74
5357
616569
010,00020,00030,00040,00050,00060,00070,00080,00090,000
Age
Age of Ret.
50 53 56 59 62 65 68 71 74
5357
616569
010,00020,00030,00040,00050,00060,00070,00080,00090,000
Age
Age of Ret.

Figure 10: Average Income Before Tax, by Age and Age of Retirement, Selected Cohorts, Females1982
1987
1992
Note: Income is in constant dollars, using 2006 as the base.Source: Longitudinal Administrative Databank
50 53 56 59 62 65 68 71 74
5357
616569
010,00020,00030,00040,00050,00060,00070,00080,00090,000
Age
Age of Ret.50 53 56 59 62 65 68 71 74
5357
616569
010,00020,00030,00040,00050,00060,00070,00080,00090,000
Age
Age of Ret.
50 53 56 59 62 65 68 71 74
5357
616569
010,00020,00030,00040,00050,00060,00070,00080,00090,000
Age
Age of Ret.
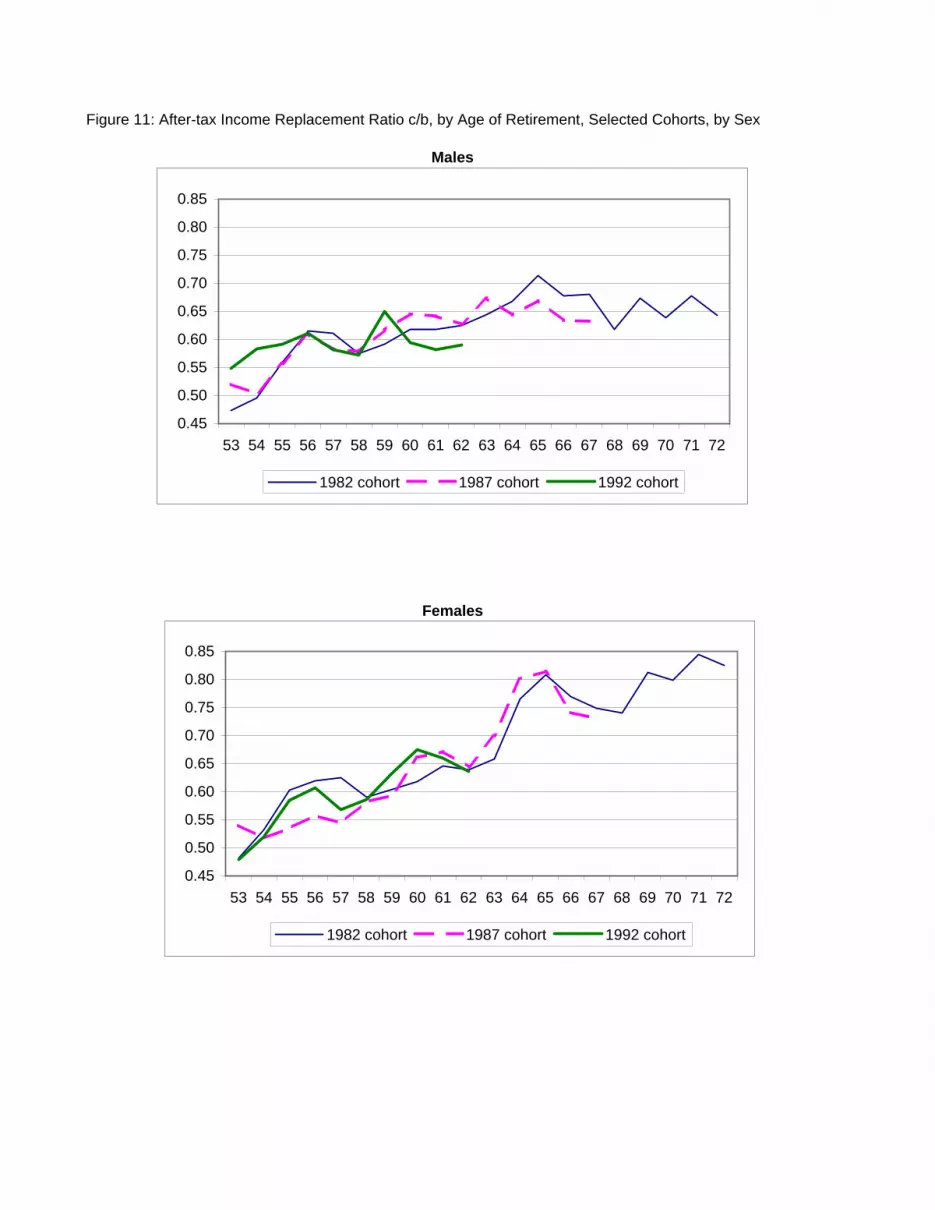
Figure 11: After-tax Income Replacement Ratio c/b, by Age of Retirement, Selected Cohorts, by Sex
Males
Females
0.45
0.50
0.55
0.60
0.65
0.70
0.75
0.80
0.85
53 54 55 56 57 58 59 60 61 62 63 64 65 66 67 68 69 70 71 72
1982 cohort 1987 cohort 1992 cohort
0.45
0.50
0.55
0.60
0.65
0.70
0.75
0.80
0.85
53 54 55 56 57 58 59 60 61 62 63 64 65 66 67 68 69 70 71 72
1982 cohort 1987 cohort 1992 cohort
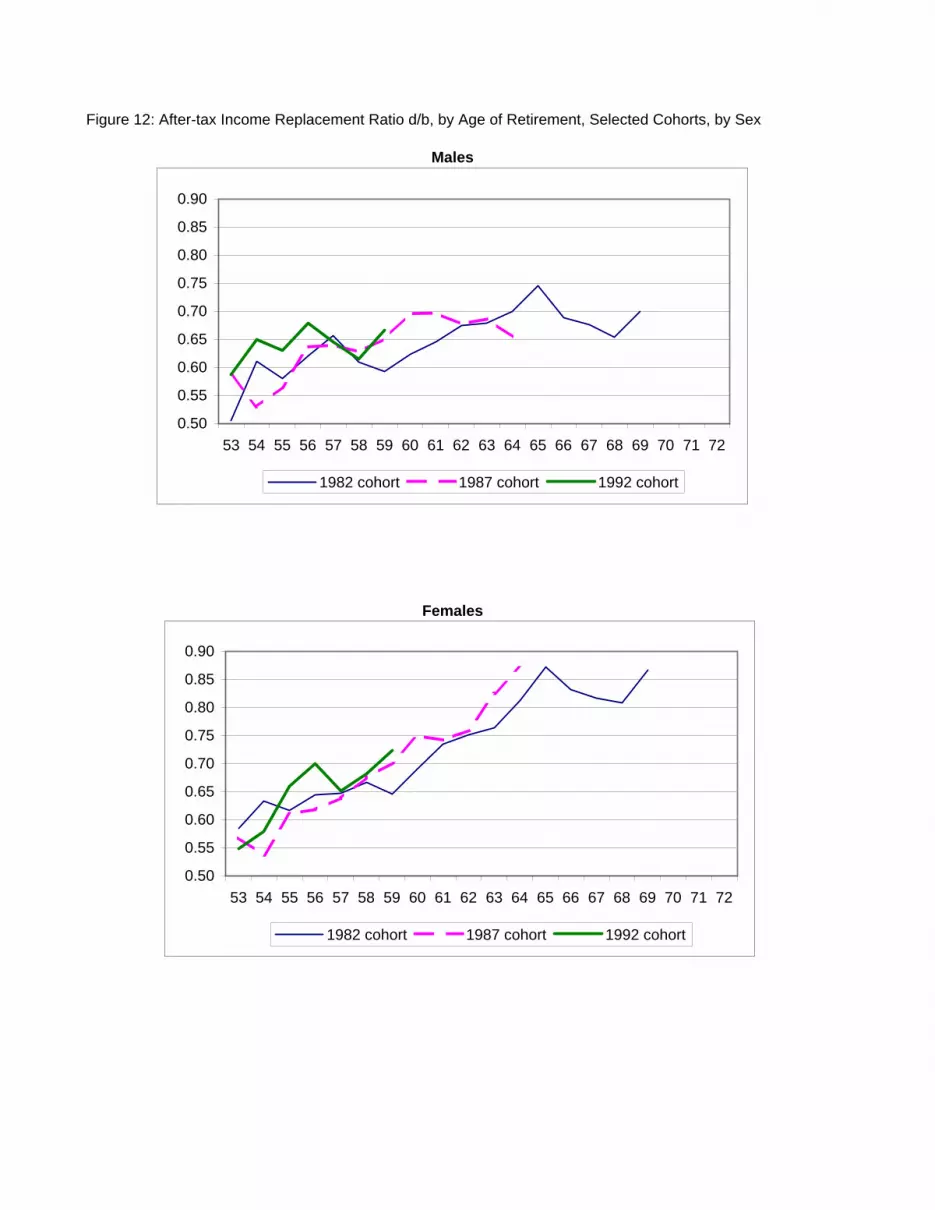
Figure 12: After-tax Income Replacement Ratio d/b, by Age of Retirement, Selected Cohorts, by Sex
Males
Females
0.50
0.55
0.60
0.65
0.70
0.75
0.80
0.85
0.90
53 54 55 56 57 58 59 60 61 62 63 64 65 66 67 68 69 70 71 72
1982 cohort 1987 cohort 1992 cohort
0.50
0.55
0.60
0.65
0.70
0.75
0.80
0.85
0.90
53 54 55 56 57 58 59 60 61 62 63 64 65 66 67 68 69 70 71 72
1982 cohort 1987 cohort 1992 cohort

Figure 13: After-tax Income Replacement Ratios, by Age of Retirement, Selected Cohorts, Male-Female Comparisons
c/b ratios d/b ratios
1982 cohort
0.40
0.50
0.60
0.70
0.80
0.90
53 56 59 62 65 68 71
M F
1982 cohort
0.40
0.50
0.60
0.70
0.80
0.90
53 56 59 62 65 68 71
M F
1987 cohort
0.40
0.50
0.60
0.70
0.80
0.90
53 56 59 62 65 68 71
M F
1987 cohort
0.40
0.50
0.60
0.70
0.80
0.90
53 56 59 62 65 68 71
M F
1992 cohort
0.40
0.50
0.60
0.70
0.80
0.90
53 56 59 62 65 68 71
M F
1992 cohort
0.40
0.50
0.60
0.70
0.80
0.90
53 56 59 62 65 68 71
M F
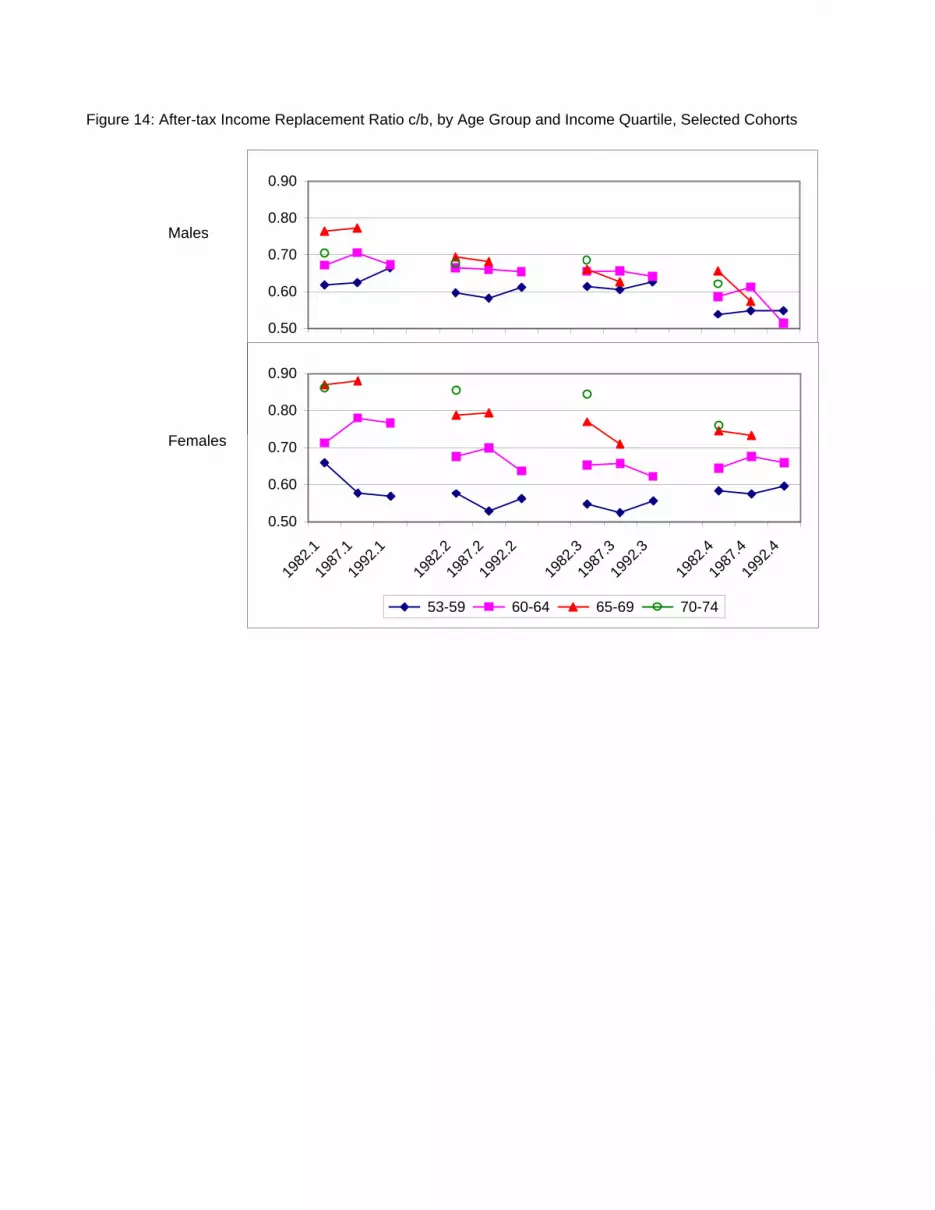
Figure 14: After-tax Income Replacement Ratio c/b, by Age Group and Income Quartile, Selected Cohorts
Males
Females
0.50
0.60
0.70
0.80
0.90
1982
.1
1987
.1
1992
.1
1982
.2
1987
.2
1992
.2
1982
.3
1987
.3
1992
.3
1982
.4
1987
.4
1992
.4
53-59 60-64 65-69 70-74
0.50
0.60
0.70
0.80
0.90
1982
.1
1987
.1
1992
.1
1982
.2
1987
.2
1992
.2
1982
.3
1987
.3
1992
.3
1982
.4
1987
.4
1992
.4
53-59 60-64 65-69 70-74
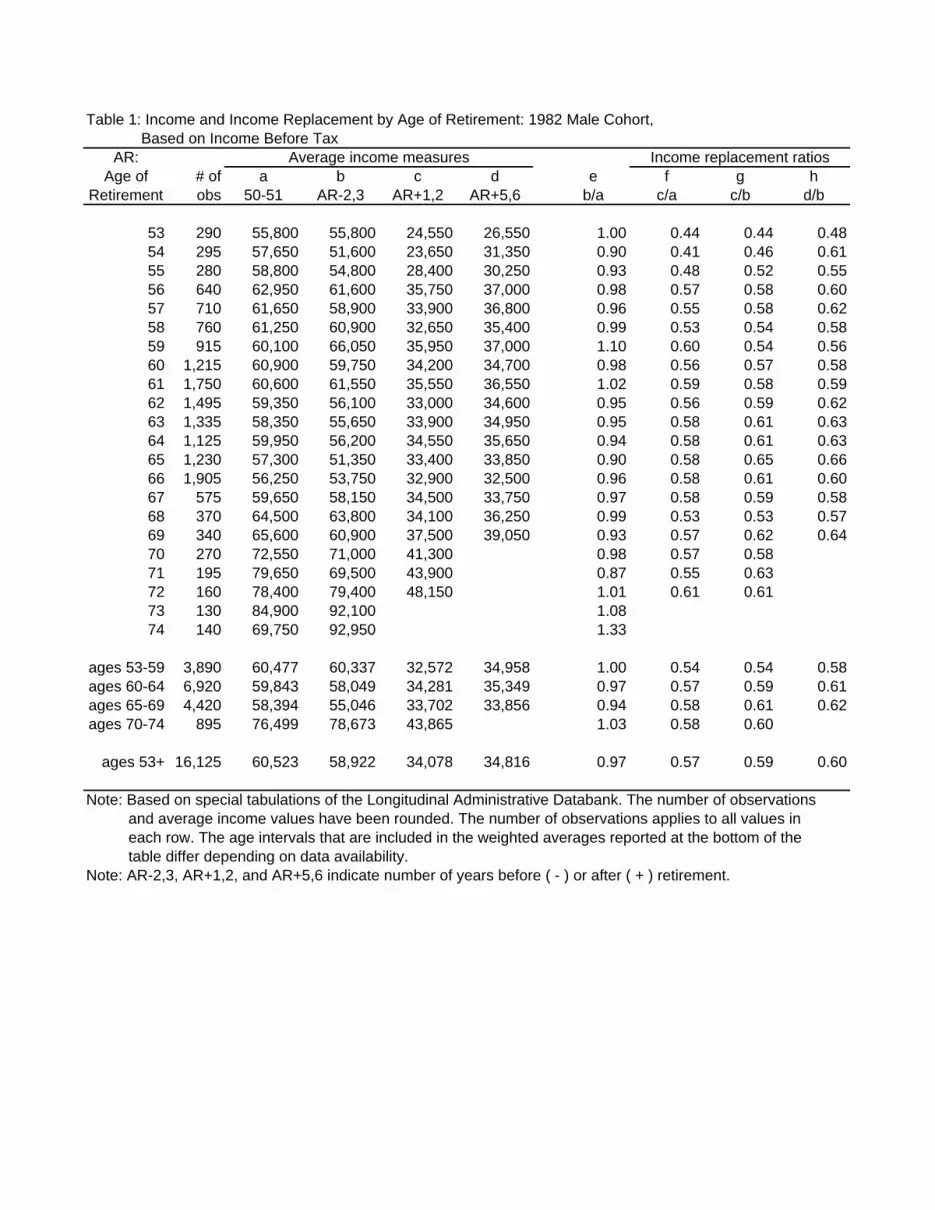
Table 1: Income and Income Replacement by Age of Retirement: 1982 Male Cohort, Based on Income Before Tax
AR:Age of # of a b c d e f g h
Retirement obs 50-51 AR-2,3 AR+1,2 AR+5,6 b/a c/a c/b d/b
53 290 55,800 55,800 24,550 26,550 1.00 0.44 0.44 0.4854 295 57,650 51,600 23,650 31,350 0.90 0.41 0.46 0.6155 280 58,800 54,800 28,400 30,250 0.93 0.48 0.52 0.5556 640 62,950 61,600 35,750 37,000 0.98 0.57 0.58 0.6057 710 61,650 58,900 33,900 36,800 0.96 0.55 0.58 0.6258 760 61,250 60,900 32,650 35,400 0.99 0.53 0.54 0.5859 915 60,100 66,050 35,950 37,000 1.10 0.60 0.54 0.5660 1,215 60,900 59,750 34,200 34,700 0.98 0.56 0.57 0.5861 1,750 60,600 61,550 35,550 36,550 1.02 0.59 0.58 0.5962 1,495 59,350 56,100 33,000 34,600 0.95 0.56 0.59 0.6263 1,335 58,350 55,650 33,900 34,950 0.95 0.58 0.61 0.6364 1,125 59,950 56,200 34,550 35,650 0.94 0.58 0.61 0.6365 1,230 57,300 51,350 33,400 33,850 0.90 0.58 0.65 0.6666 1,905 56,250 53,750 32,900 32,500 0.96 0.58 0.61 0.6067 575 59,650 58,150 34,500 33,750 0.97 0.58 0.59 0.5868 370 64,500 63,800 34,100 36,250 0.99 0.53 0.53 0.5769 340 65,600 60,900 37,500 39,050 0.93 0.57 0.62 0.6470 270 72,550 71,000 41,300 0.98 0.57 0.5871 195 79,650 69,500 43,900 0.87 0.55 0.6372 160 78,400 79,400 48,150 1.01 0.61 0.6173 130 84,900 92,100 1.0874 140 69,750 92,950 1.33
ages 53-59 3,890 60,477 60,337 32,572 34,958 1.00 0.54 0.54 0.58ages 60-64 6,920 59,843 58,049 34,281 35,349 0.97 0.57 0.59 0.61ages 65-69 4,420 58,394 55,046 33,702 33,856 0.94 0.58 0.61 0.62ages 70-74 895 76,499 78,673 43,865 1.03 0.58 0.60
ages 53+ 16,125 60,523 58,922 34,078 34,816 0.97 0.57 0.59 0.60
Note: Based on special tabulations of the Longitudinal Administrative Databank. The number of observations and average income values have been rounded. The number of observations applies to all values in each row. The age intervals that are included in the weighted averages reported at the bottom of the table differ depending on data availability. Note: AR-2,3, AR+1,2, and AR+5,6 indicate number of years before ( - ) or after ( + ) retirement.
Average income measures Income replacement ratios
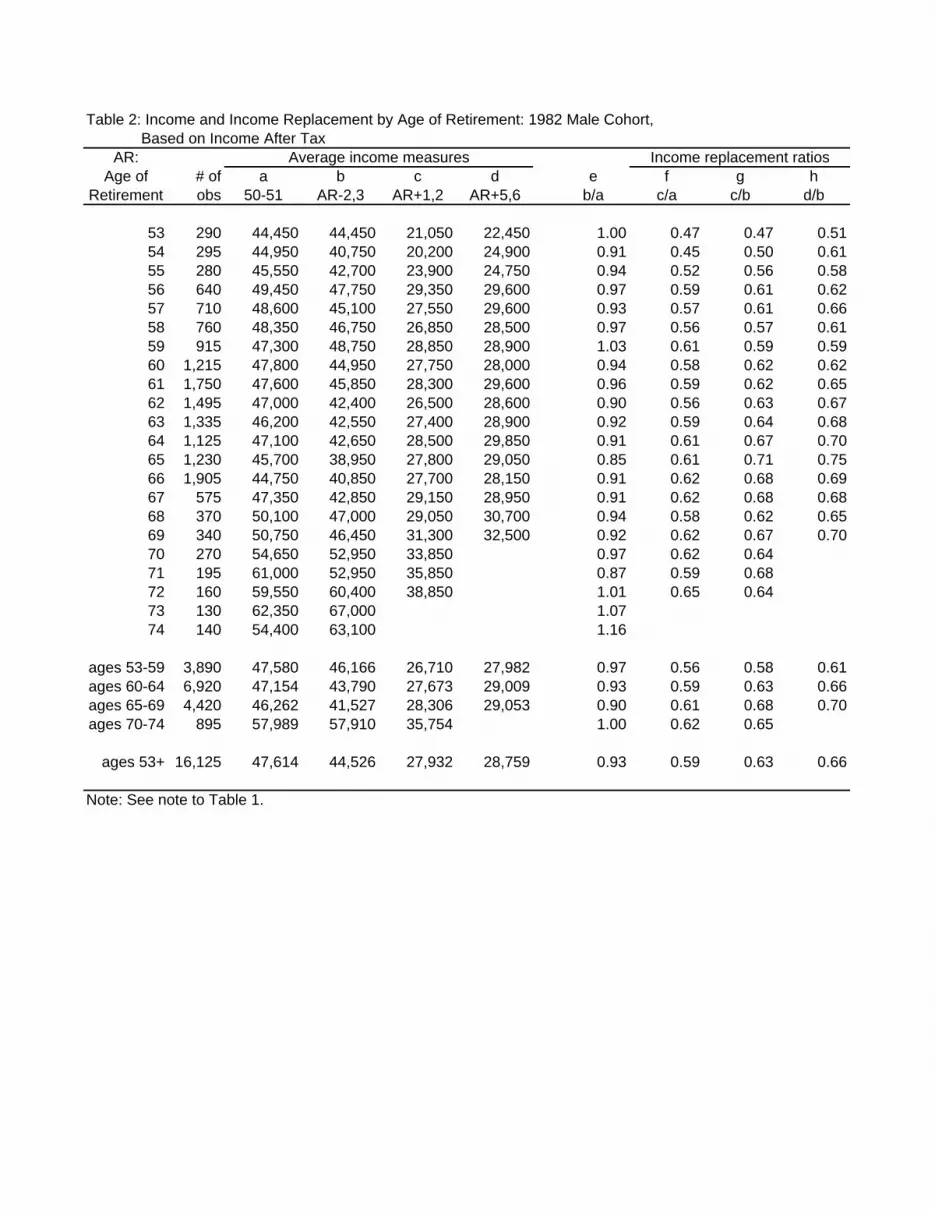
Table 2: Income and Income Replacement by Age of Retirement: 1982 Male Cohort, Based on Income After Tax
AR:Age of # of a b c d e f g h
Retirement obs 50-51 AR-2,3 AR+1,2 AR+5,6 b/a c/a c/b d/b
53 290 44,450 44,450 21,050 22,450 1.00 0.47 0.47 0.5154 295 44,950 40,750 20,200 24,900 0.91 0.45 0.50 0.6155 280 45,550 42,700 23,900 24,750 0.94 0.52 0.56 0.5856 640 49,450 47,750 29,350 29,600 0.97 0.59 0.61 0.6257 710 48,600 45,100 27,550 29,600 0.93 0.57 0.61 0.6658 760 48,350 46,750 26,850 28,500 0.97 0.56 0.57 0.6159 915 47,300 48,750 28,850 28,900 1.03 0.61 0.59 0.5960 1,215 47,800 44,950 27,750 28,000 0.94 0.58 0.62 0.6261 1,750 47,600 45,850 28,300 29,600 0.96 0.59 0.62 0.6562 1,495 47,000 42,400 26,500 28,600 0.90 0.56 0.63 0.6763 1,335 46,200 42,550 27,400 28,900 0.92 0.59 0.64 0.6864 1,125 47,100 42,650 28,500 29,850 0.91 0.61 0.67 0.7065 1,230 45,700 38,950 27,800 29,050 0.85 0.61 0.71 0.7566 1,905 44,750 40,850 27,700 28,150 0.91 0.62 0.68 0.6967 575 47,350 42,850 29,150 28,950 0.91 0.62 0.68 0.6868 370 50,100 47,000 29,050 30,700 0.94 0.58 0.62 0.6569 340 50,750 46,450 31,300 32,500 0.92 0.62 0.67 0.7070 270 54,650 52,950 33,850 0.97 0.62 0.6471 195 61,000 52,950 35,850 0.87 0.59 0.6872 160 59,550 60,400 38,850 1.01 0.65 0.6473 130 62,350 67,000 1.0774 140 54,400 63,100 1.16
ages 53-59 3,890 47,580 46,166 26,710 27,982 0.97 0.56 0.58 0.61ages 60-64 6,920 47,154 43,790 27,673 29,009 0.93 0.59 0.63 0.66ages 65-69 4,420 46,262 41,527 28,306 29,053 0.90 0.61 0.68 0.70ages 70-74 895 57,989 57,910 35,754 1.00 0.62 0.65
ages 53+ 16,125 47,614 44,526 27,932 28,759 0.93 0.59 0.63 0.66
Note: See note to Table 1.
Average income measures Income replacement ratios
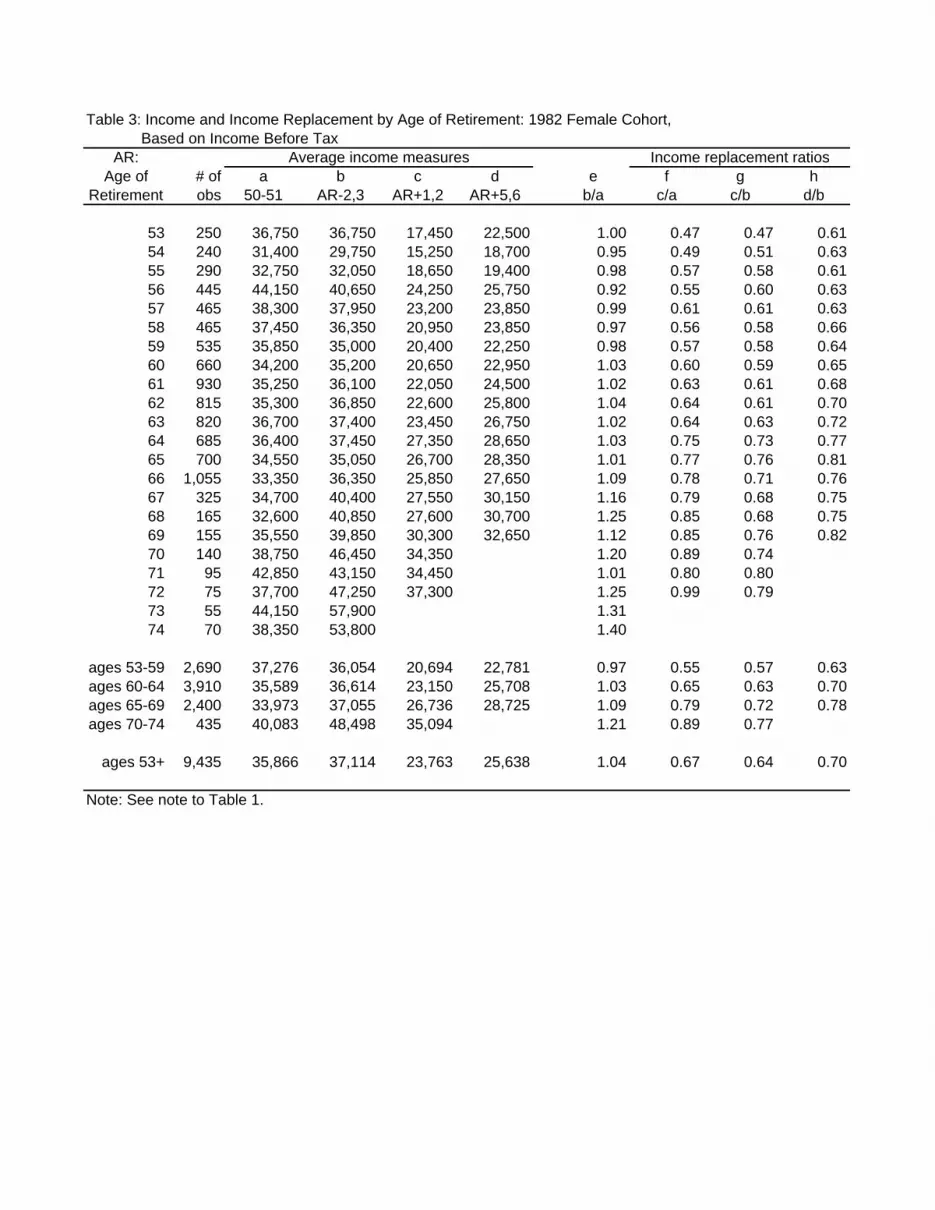
Table 3: Income and Income Replacement by Age of Retirement: 1982 Female Cohort, Based on Income Before Tax
AR:Age of # of a b c d e f g h
Retirement obs 50-51 AR-2,3 AR+1,2 AR+5,6 b/a c/a c/b d/b
53 250 36,750 36,750 17,450 22,500 1.00 0.47 0.47 0.6154 240 31,400 29,750 15,250 18,700 0.95 0.49 0.51 0.6355 290 32,750 32,050 18,650 19,400 0.98 0.57 0.58 0.6156 445 44,150 40,650 24,250 25,750 0.92 0.55 0.60 0.6357 465 38,300 37,950 23,200 23,850 0.99 0.61 0.61 0.6358 465 37,450 36,350 20,950 23,850 0.97 0.56 0.58 0.6659 535 35,850 35,000 20,400 22,250 0.98 0.57 0.58 0.6460 660 34,200 35,200 20,650 22,950 1.03 0.60 0.59 0.6561 930 35,250 36,100 22,050 24,500 1.02 0.63 0.61 0.6862 815 35,300 36,850 22,600 25,800 1.04 0.64 0.61 0.7063 820 36,700 37,400 23,450 26,750 1.02 0.64 0.63 0.7264 685 36,400 37,450 27,350 28,650 1.03 0.75 0.73 0.7765 700 34,550 35,050 26,700 28,350 1.01 0.77 0.76 0.8166 1,055 33,350 36,350 25,850 27,650 1.09 0.78 0.71 0.7667 325 34,700 40,400 27,550 30,150 1.16 0.79 0.68 0.7568 165 32,600 40,850 27,600 30,700 1.25 0.85 0.68 0.7569 155 35,550 39,850 30,300 32,650 1.12 0.85 0.76 0.8270 140 38,750 46,450 34,350 1.20 0.89 0.7471 95 42,850 43,150 34,450 1.01 0.80 0.8072 75 37,700 47,250 37,300 1.25 0.99 0.7973 55 44,150 57,900 1.3174 70 38,350 53,800 1.40
ages 53-59 2,690 37,276 36,054 20,694 22,781 0.97 0.55 0.57 0.63ages 60-64 3,910 35,589 36,614 23,150 25,708 1.03 0.65 0.63 0.70ages 65-69 2,400 33,973 37,055 26,736 28,725 1.09 0.79 0.72 0.78ages 70-74 435 40,083 48,498 35,094 1.21 0.89 0.77
ages 53+ 9,435 35,866 37,114 23,763 25,638 1.04 0.67 0.64 0.70
Note: See note to Table 1.
Average income measures Income replacement ratios

Table 4: Income and Income Replacement by Age of Retirement: 1982 Female Cohort, Based on Income After Tax
AR:Age of # of a b c d e f g h
Retirement obs 50-51 AR-2,3 AR+1,2 AR+5,6 b/a c/a c/b d/b
53 250 30,850 30,850 14,850 18,050 1.00 0.48 0.48 0.5954 240 26,700 25,350 13,500 16,050 0.95 0.51 0.53 0.6355 290 28,050 27,100 16,350 16,700 0.97 0.58 0.60 0.6256 445 35,500 32,750 20,300 21,100 0.92 0.57 0.62 0.6457 465 31,800 30,650 19,150 19,850 0.96 0.60 0.62 0.6558 465 31,250 29,450 17,400 19,650 0.94 0.56 0.59 0.6759 535 30,050 28,500 17,200 18,400 0.95 0.57 0.60 0.6560 660 28,900 28,250 17,450 19,500 0.98 0.60 0.62 0.6961 930 29,500 28,700 18,550 21,100 0.97 0.63 0.65 0.7462 815 29,800 29,600 18,900 22,250 0.99 0.63 0.64 0.7563 820 30,650 30,100 19,800 23,000 0.98 0.65 0.66 0.7664 685 30,400 30,100 23,050 24,450 0.99 0.76 0.77 0.8165 700 29,050 28,250 22,850 24,650 0.97 0.79 0.81 0.8766 1,055 28,500 29,350 22,600 24,400 1.03 0.79 0.77 0.8367 325 29,250 31,850 23,850 26,000 1.09 0.82 0.75 0.8268 165 27,850 32,950 24,400 26,650 1.18 0.88 0.74 0.8169 155 30,200 32,300 26,250 28,000 1.07 0.87 0.81 0.8770 140 32,100 36,600 29,250 1.14 0.91 0.8071 95 35,100 34,950 29,500 1.00 0.84 0.8472 75 32,250 38,200 31,500 1.18 0.98 0.8273 55 35,650 44,100 1.2474 70 32,000 42,650 1.33
ages 53-59 2,690 31,021 29,525 17,444 18,888 0.95 0.56 0.59 0.64ages 60-64 3,910 29,860 29,351 19,488 22,055 0.98 0.65 0.66 0.75ages 65-69 2,400 28,827 29,806 23,202 25,077 1.03 0.80 0.78 0.84ages 70-74 435 33,214 38,437 29,871 1.16 0.91 0.82
ages 53+ 9,435 30,083 29,935 20,200 21,914 1.00 0.67 0.68 0.74
Note: See note to Table 1.
Average income measures Income replacement ratios
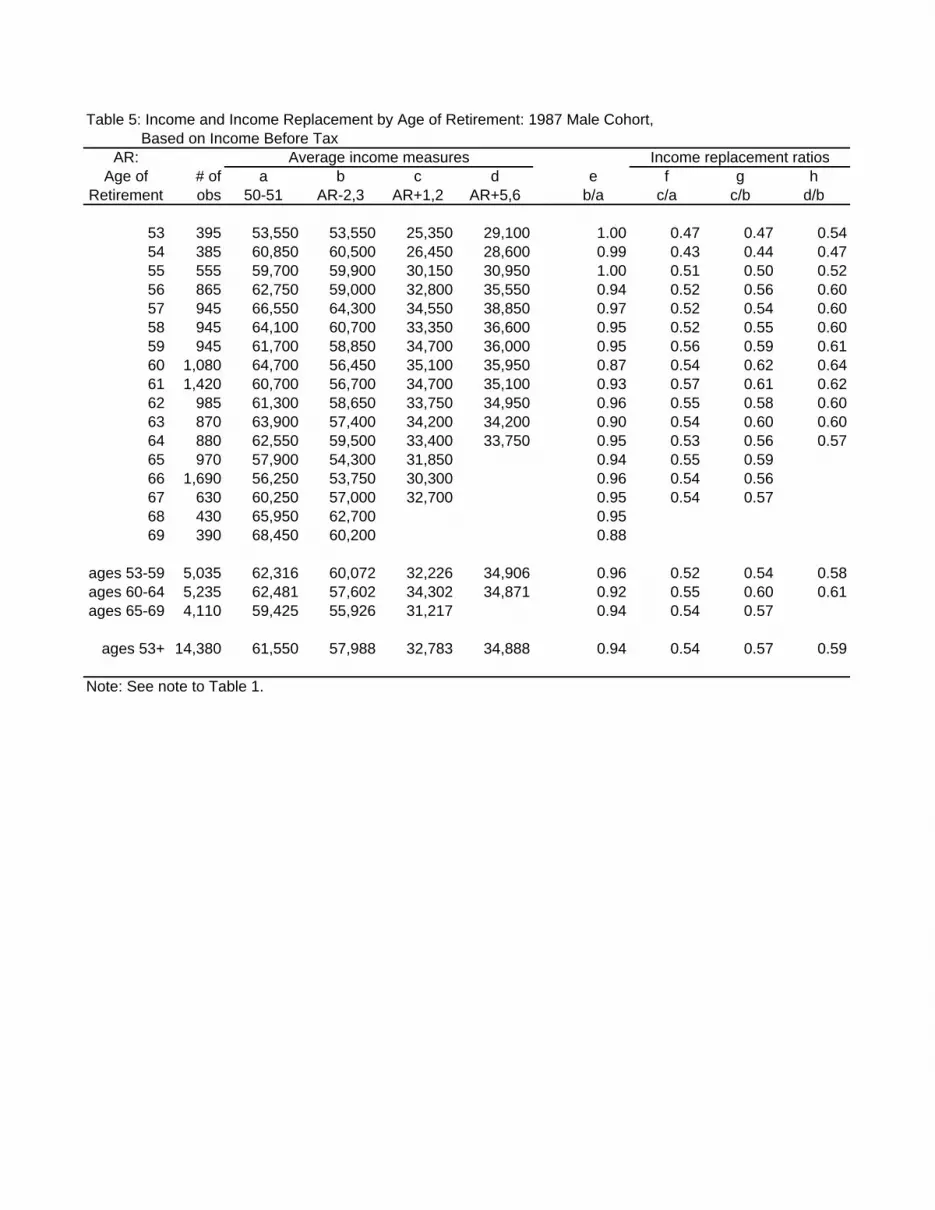
Table 5: Income and Income Replacement by Age of Retirement: 1987 Male Cohort, Based on Income Before Tax
AR:Age of # of a b c d e f g h
Retirement obs 50-51 AR-2,3 AR+1,2 AR+5,6 b/a c/a c/b d/b
53 395 53,550 53,550 25,350 29,100 1.00 0.47 0.47 0.5454 385 60,850 60,500 26,450 28,600 0.99 0.43 0.44 0.4755 555 59,700 59,900 30,150 30,950 1.00 0.51 0.50 0.5256 865 62,750 59,000 32,800 35,550 0.94 0.52 0.56 0.6057 945 66,550 64,300 34,550 38,850 0.97 0.52 0.54 0.6058 945 64,100 60,700 33,350 36,600 0.95 0.52 0.55 0.6059 945 61,700 58,850 34,700 36,000 0.95 0.56 0.59 0.6160 1,080 64,700 56,450 35,100 35,950 0.87 0.54 0.62 0.6461 1,420 60,700 56,700 34,700 35,100 0.93 0.57 0.61 0.6262 985 61,300 58,650 33,750 34,950 0.96 0.55 0.58 0.6063 870 63,900 57,400 34,200 34,200 0.90 0.54 0.60 0.6064 880 62,550 59,500 33,400 33,750 0.95 0.53 0.56 0.5765 970 57,900 54,300 31,850 0.94 0.55 0.5966 1,690 56,250 53,750 30,300 0.96 0.54 0.5667 630 60,250 57,000 32,700 0.95 0.54 0.5768 430 65,950 62,700 0.9569 390 68,450 60,200 0.88
ages 53-59 5,035 62,316 60,072 32,226 34,906 0.96 0.52 0.54 0.58ages 60-64 5,235 62,481 57,602 34,302 34,871 0.92 0.55 0.60 0.61ages 65-69 4,110 59,425 55,926 31,217 0.94 0.54 0.57
ages 53+ 14,380 61,550 57,988 32,783 34,888 0.94 0.54 0.57 0.59
Note: See note to Table 1.
Average income measures Income replacement ratios
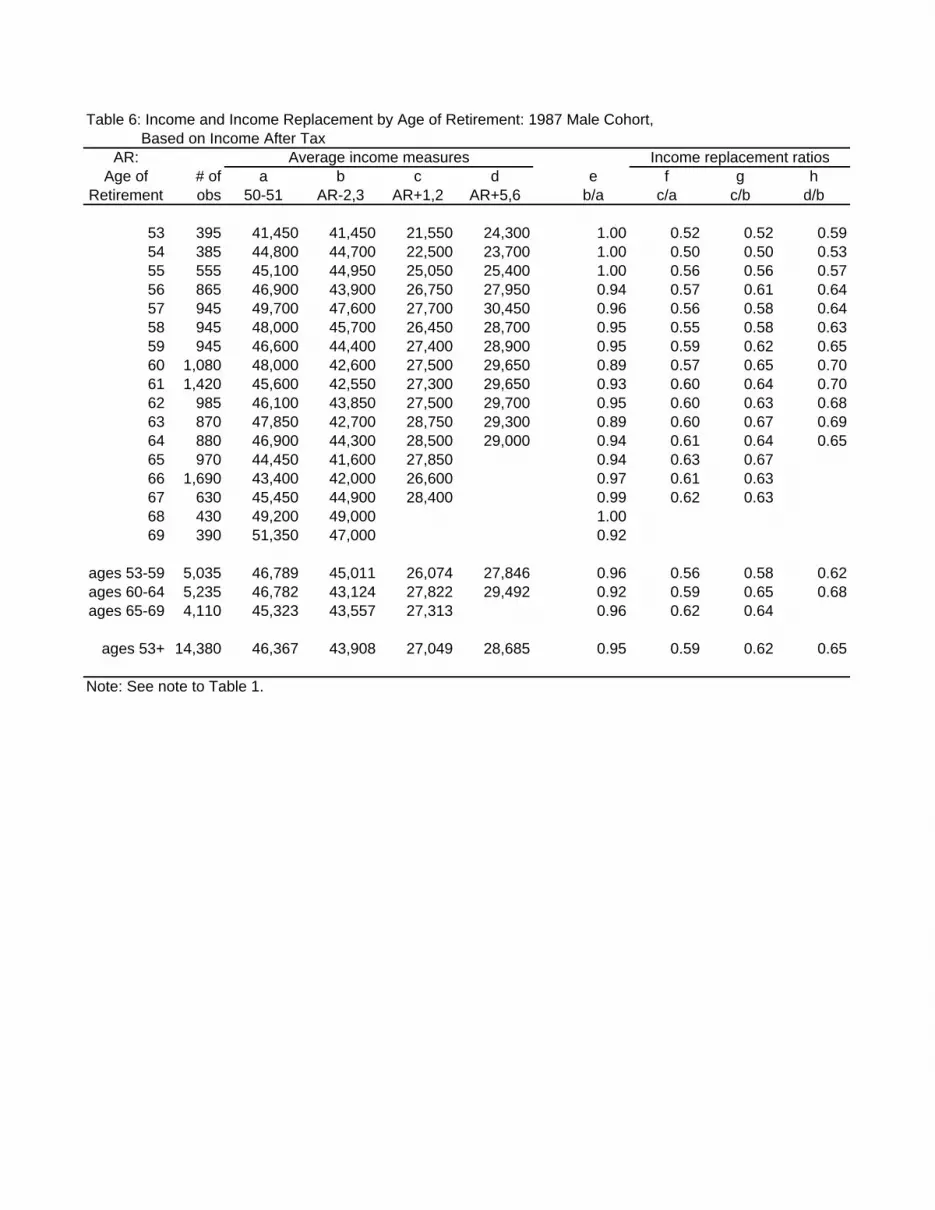
Table 6: Income and Income Replacement by Age of Retirement: 1987 Male Cohort, Based on Income After Tax
AR:Age of # of a b c d e f g h
Retirement obs 50-51 AR-2,3 AR+1,2 AR+5,6 b/a c/a c/b d/b
53 395 41,450 41,450 21,550 24,300 1.00 0.52 0.52 0.5954 385 44,800 44,700 22,500 23,700 1.00 0.50 0.50 0.5355 555 45,100 44,950 25,050 25,400 1.00 0.56 0.56 0.5756 865 46,900 43,900 26,750 27,950 0.94 0.57 0.61 0.6457 945 49,700 47,600 27,700 30,450 0.96 0.56 0.58 0.6458 945 48,000 45,700 26,450 28,700 0.95 0.55 0.58 0.6359 945 46,600 44,400 27,400 28,900 0.95 0.59 0.62 0.6560 1,080 48,000 42,600 27,500 29,650 0.89 0.57 0.65 0.7061 1,420 45,600 42,550 27,300 29,650 0.93 0.60 0.64 0.7062 985 46,100 43,850 27,500 29,700 0.95 0.60 0.63 0.6863 870 47,850 42,700 28,750 29,300 0.89 0.60 0.67 0.6964 880 46,900 44,300 28,500 29,000 0.94 0.61 0.64 0.6565 970 44,450 41,600 27,850 0.94 0.63 0.6766 1,690 43,400 42,000 26,600 0.97 0.61 0.6367 630 45,450 44,900 28,400 0.99 0.62 0.6368 430 49,200 49,000 1.0069 390 51,350 47,000 0.92
ages 53-59 5,035 46,789 45,011 26,074 27,846 0.96 0.56 0.58 0.62ages 60-64 5,235 46,782 43,124 27,822 29,492 0.92 0.59 0.65 0.68ages 65-69 4,110 45,323 43,557 27,313 0.96 0.62 0.64
ages 53+ 14,380 46,367 43,908 27,049 28,685 0.95 0.59 0.62 0.65
Note: See note to Table 1.
Average income measures Income replacement ratios
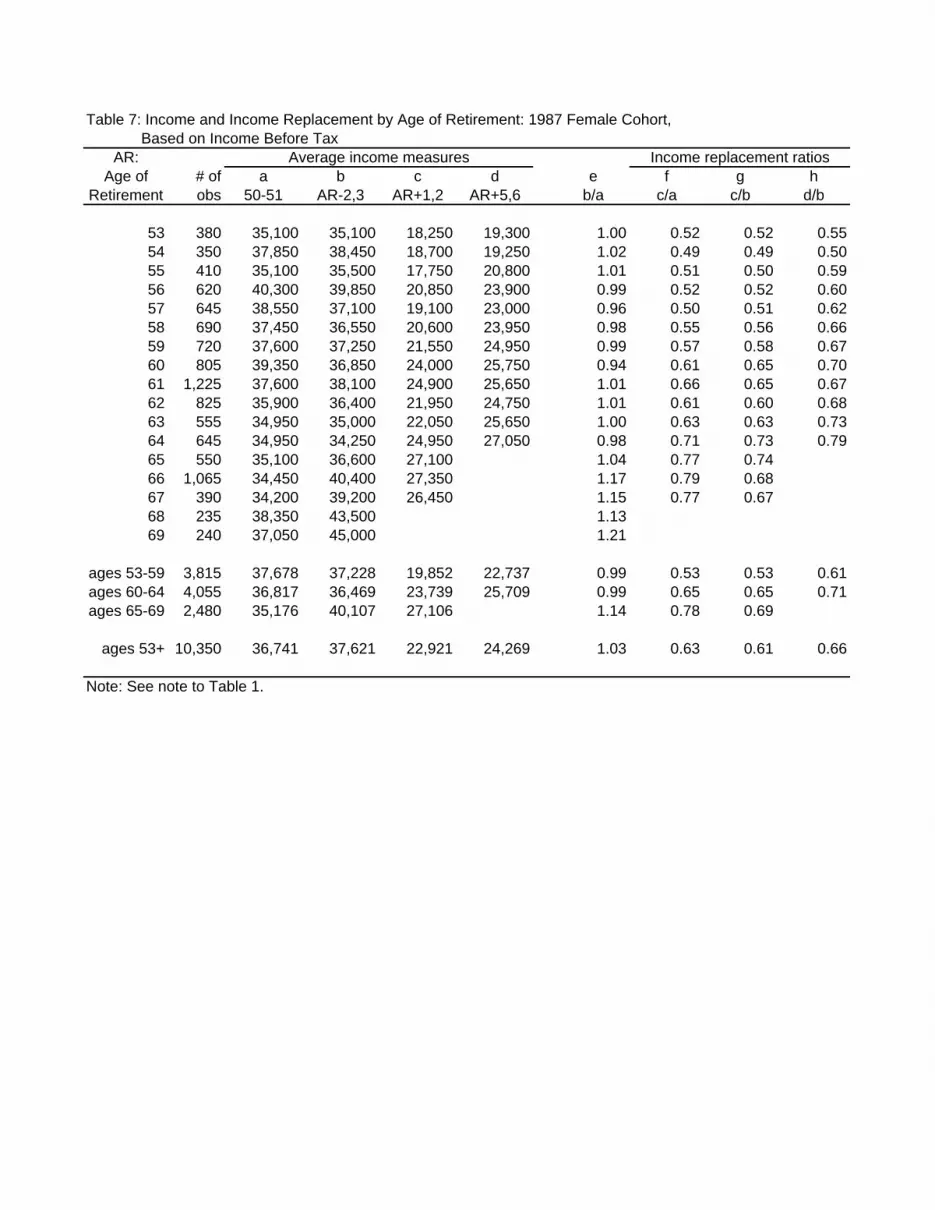
Table 7: Income and Income Replacement by Age of Retirement: 1987 Female Cohort, Based on Income Before Tax
AR:Age of # of a b c d e f g h
Retirement obs 50-51 AR-2,3 AR+1,2 AR+5,6 b/a c/a c/b d/b
53 380 35,100 35,100 18,250 19,300 1.00 0.52 0.52 0.5554 350 37,850 38,450 18,700 19,250 1.02 0.49 0.49 0.5055 410 35,100 35,500 17,750 20,800 1.01 0.51 0.50 0.5956 620 40,300 39,850 20,850 23,900 0.99 0.52 0.52 0.6057 645 38,550 37,100 19,100 23,000 0.96 0.50 0.51 0.6258 690 37,450 36,550 20,600 23,950 0.98 0.55 0.56 0.6659 720 37,600 37,250 21,550 24,950 0.99 0.57 0.58 0.6760 805 39,350 36,850 24,000 25,750 0.94 0.61 0.65 0.7061 1,225 37,600 38,100 24,900 25,650 1.01 0.66 0.65 0.6762 825 35,900 36,400 21,950 24,750 1.01 0.61 0.60 0.6863 555 34,950 35,000 22,050 25,650 1.00 0.63 0.63 0.7364 645 34,950 34,250 24,950 27,050 0.98 0.71 0.73 0.7965 550 35,100 36,600 27,100 1.04 0.77 0.7466 1,065 34,450 40,400 27,350 1.17 0.79 0.6867 390 34,200 39,200 26,450 1.15 0.77 0.6768 235 38,350 43,500 1.1369 240 37,050 45,000 1.21
ages 53-59 3,815 37,678 37,228 19,852 22,737 0.99 0.53 0.53 0.61ages 60-64 4,055 36,817 36,469 23,739 25,709 0.99 0.65 0.65 0.71ages 65-69 2,480 35,176 40,107 27,106 1.14 0.78 0.69
ages 53+ 10,350 36,741 37,621 22,921 24,269 1.03 0.63 0.61 0.66
Note: See note to Table 1.
Average income measures Income replacement ratios

Table 8: Income and Income Replacement by Age of Retirement: 1987 Female Cohort, Based on Income After Tax
AR:Age of # of a b c d e f g h
Retirement obs 50-51 AR-2,3 AR+1,2 AR+5,6 b/a c/a c/b d/b
53 380 28,700 28,700 15,500 16,300 1.00 0.54 0.54 0.5754 350 30,400 30,350 15,700 16,300 1.00 0.52 0.52 0.5455 410 28,500 28,400 15,200 17,350 1.00 0.53 0.54 0.6156 620 32,100 31,300 17,450 19,350 0.98 0.54 0.56 0.6257 645 30,950 29,750 16,200 19,000 0.96 0.52 0.54 0.6458 690 30,250 29,550 17,200 19,950 0.98 0.57 0.58 0.6859 720 30,400 30,100 17,850 21,100 0.99 0.59 0.59 0.7060 805 31,300 29,500 19,500 22,100 0.94 0.62 0.66 0.7561 1,225 30,050 30,450 20,450 22,600 1.01 0.68 0.67 0.7462 825 29,100 29,250 18,850 22,200 1.01 0.65 0.64 0.7663 555 28,400 28,300 19,800 23,350 1.00 0.70 0.70 0.8364 645 28,400 27,900 22,350 24,300 0.98 0.79 0.80 0.8765 550 28,700 29,600 24,100 1.03 0.84 0.8166 1,065 28,350 32,850 24,350 1.16 0.86 0.7467 390 28,000 32,450 23,700 1.16 0.85 0.7368 235 31,200 36,050 1.1669 240 29,850 37,600 1.26
ages 53-59 3,815 30,369 29,837 16,672 18,931 0.98 0.55 0.56 0.63ages 60-64 4,055 29,617 29,317 20,149 22,792 0.99 0.68 0.69 0.78ages 65-69 2,480 28,788 32,829 24,155 1.14 0.85 0.76
ages 53+ 10,350 29,695 30,350 19,619 20,921 1.02 0.66 0.65 0.71
Note: See note to Table 1.
Average income measures Income replacement ratios
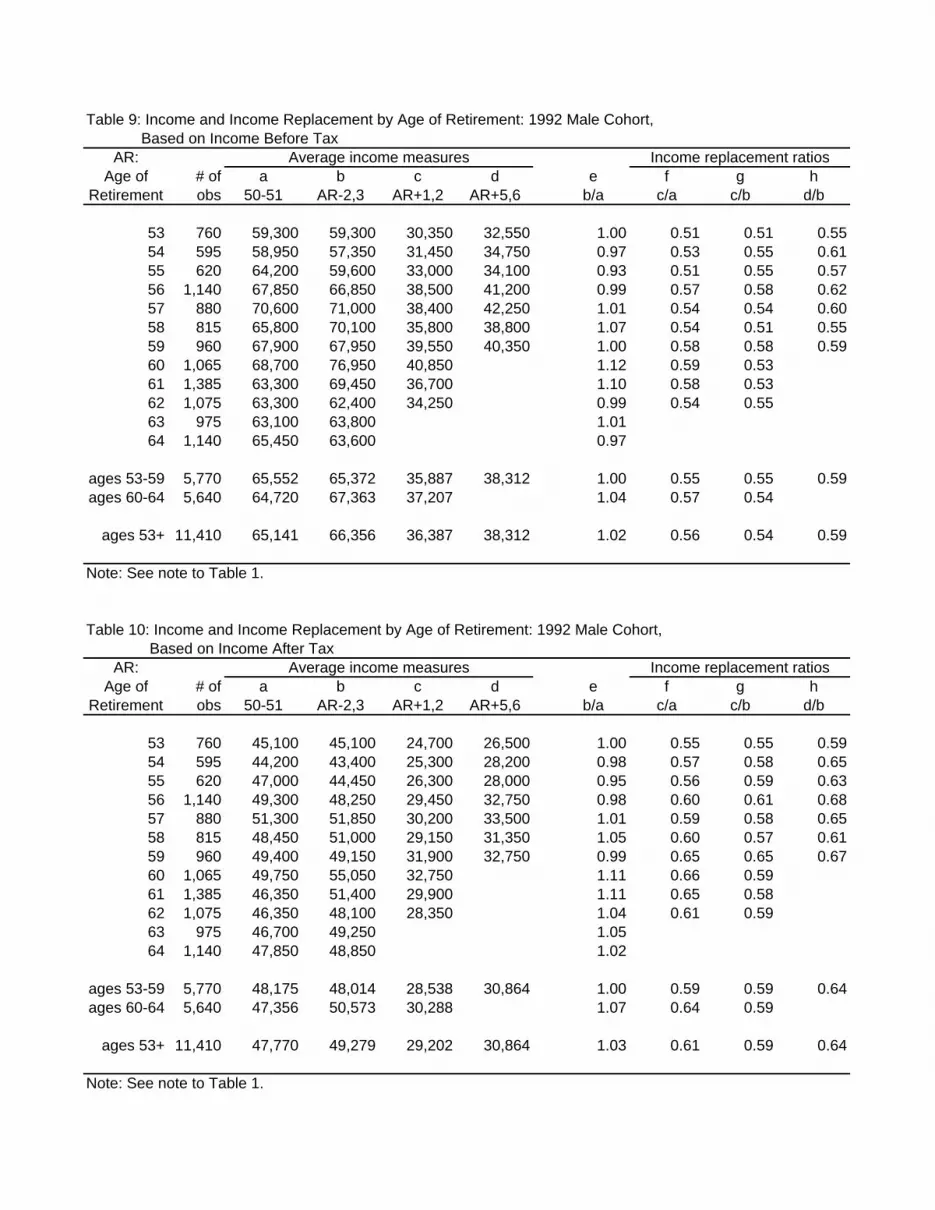
Table 9: Income and Income Replacement by Age of Retirement: 1992 Male Cohort, Based on Income Before Tax
AR:Age of # of a b c d e f g h
Retirement obs 50-51 AR-2,3 AR+1,2 AR+5,6 b/a c/a c/b d/b
53 760 59,300 59,300 30,350 32,550 1.00 0.51 0.51 0.5554 595 58,950 57,350 31,450 34,750 0.97 0.53 0.55 0.6155 620 64,200 59,600 33,000 34,100 0.93 0.51 0.55 0.5756 1,140 67,850 66,850 38,500 41,200 0.99 0.57 0.58 0.6257 880 70,600 71,000 38,400 42,250 1.01 0.54 0.54 0.6058 815 65,800 70,100 35,800 38,800 1.07 0.54 0.51 0.5559 960 67,900 67,950 39,550 40,350 1.00 0.58 0.58 0.5960 1,065 68,700 76,950 40,850 1.12 0.59 0.5361 1,385 63,300 69,450 36,700 1.10 0.58 0.5362 1,075 63,300 62,400 34,250 0.99 0.54 0.5563 975 63,100 63,800 1.0164 1,140 65,450 63,600 0.97
ages 53-59 5,770 65,552 65,372 35,887 38,312 1.00 0.55 0.55 0.59ages 60-64 5,640 64,720 67,363 37,207 1.04 0.57 0.54
ages 53+ 11,410 65,141 66,356 36,387 38,312 1.02 0.56 0.54 0.59
Note: See note to Table 1.
Table 10: Income and Income Replacement by Age of Retirement: 1992 Male Cohort, Based on Income After Tax
AR:Age of # of a b c d e f g h
Retirement obs 50-51 AR-2,3 AR+1,2 AR+5,6 b/a c/a c/b d/b
53 760 45,100 45,100 24,700 26,500 1.00 0.55 0.55 0.5954 595 44,200 43,400 25,300 28,200 0.98 0.57 0.58 0.6555 620 47,000 44,450 26,300 28,000 0.95 0.56 0.59 0.6356 1,140 49,300 48,250 29,450 32,750 0.98 0.60 0.61 0.6857 880 51,300 51,850 30,200 33,500 1.01 0.59 0.58 0.6558 815 48,450 51,000 29,150 31,350 1.05 0.60 0.57 0.6159 960 49,400 49,150 31,900 32,750 0.99 0.65 0.65 0.6760 1,065 49,750 55,050 32,750 1.11 0.66 0.5961 1,385 46,350 51,400 29,900 1.11 0.65 0.5862 1,075 46,350 48,100 28,350 1.04 0.61 0.5963 975 46,700 49,250 1.0564 1,140 47,850 48,850 1.02
ages 53-59 5,770 48,175 48,014 28,538 30,864 1.00 0.59 0.59 0.64ages 60-64 5,640 47,356 50,573 30,288 1.07 0.64 0.59
ages 53+ 11,410 47,770 49,279 29,202 30,864 1.03 0.61 0.59 0.64
Note: See note to Table 1.
Average income measures
Average income measures
Income replacement ratios
Income replacement ratios
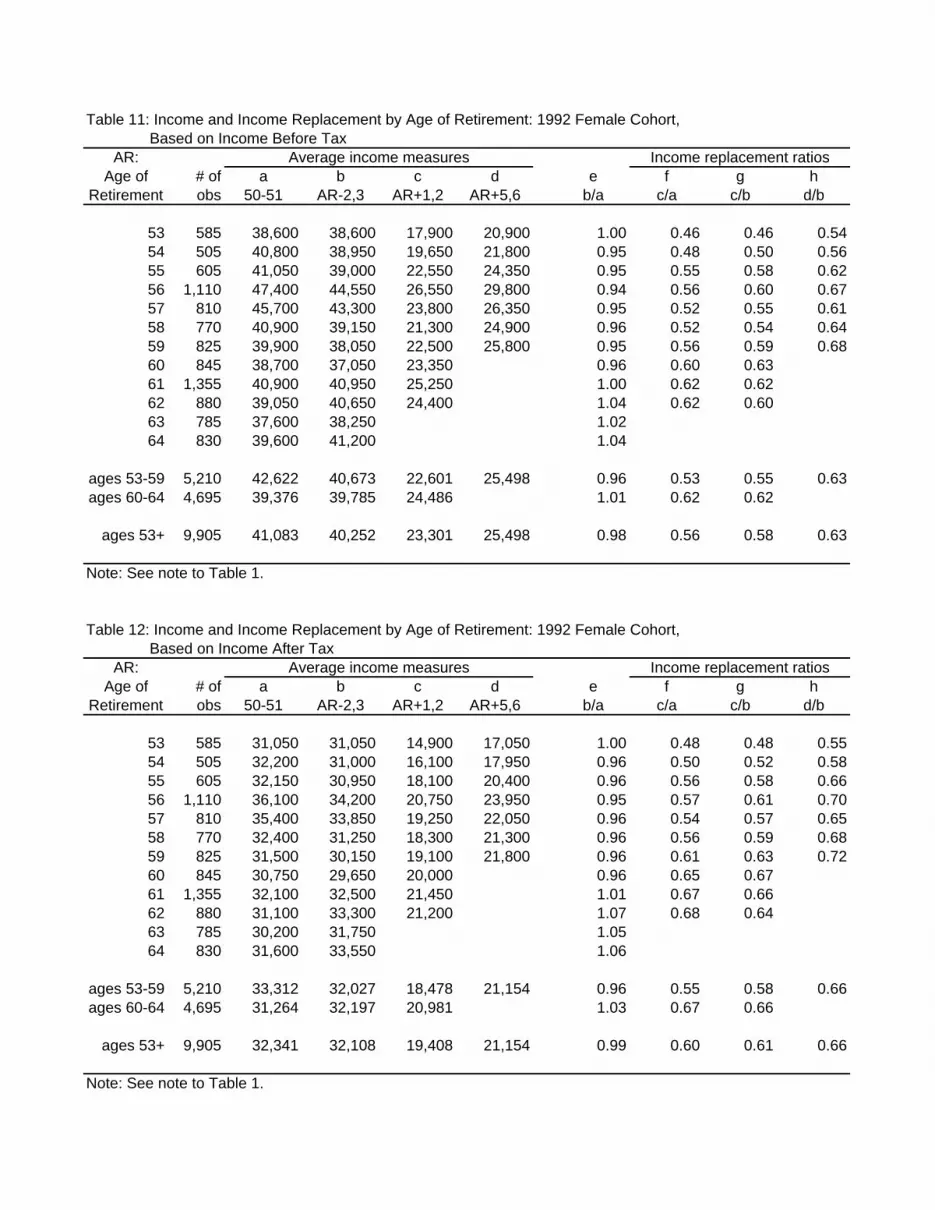
Table 11: Income and Income Replacement by Age of Retirement: 1992 Female Cohort, Based on Income Before Tax
AR:Age of # of a b c d e f g h
Retirement obs 50-51 AR-2,3 AR+1,2 AR+5,6 b/a c/a c/b d/b
53 585 38,600 38,600 17,900 20,900 1.00 0.46 0.46 0.5454 505 40,800 38,950 19,650 21,800 0.95 0.48 0.50 0.5655 605 41,050 39,000 22,550 24,350 0.95 0.55 0.58 0.6256 1,110 47,400 44,550 26,550 29,800 0.94 0.56 0.60 0.6757 810 45,700 43,300 23,800 26,350 0.95 0.52 0.55 0.6158 770 40,900 39,150 21,300 24,900 0.96 0.52 0.54 0.6459 825 39,900 38,050 22,500 25,800 0.95 0.56 0.59 0.6860 845 38,700 37,050 23,350 0.96 0.60 0.6361 1,355 40,900 40,950 25,250 1.00 0.62 0.6262 880 39,050 40,650 24,400 1.04 0.62 0.6063 785 37,600 38,250 1.0264 830 39,600 41,200 1.04
ages 53-59 5,210 42,622 40,673 22,601 25,498 0.96 0.53 0.55 0.63ages 60-64 4,695 39,376 39,785 24,486 1.01 0.62 0.62
ages 53+ 9,905 41,083 40,252 23,301 25,498 0.98 0.56 0.58 0.63
Note: See note to Table 1.
Table 12: Income and Income Replacement by Age of Retirement: 1992 Female Cohort, Based on Income After Tax
AR:Age of # of a b c d e f g h
Retirement obs 50-51 AR-2,3 AR+1,2 AR+5,6 b/a c/a c/b d/b
53 585 31,050 31,050 14,900 17,050 1.00 0.48 0.48 0.5554 505 32,200 31,000 16,100 17,950 0.96 0.50 0.52 0.5855 605 32,150 30,950 18,100 20,400 0.96 0.56 0.58 0.6656 1,110 36,100 34,200 20,750 23,950 0.95 0.57 0.61 0.7057 810 35,400 33,850 19,250 22,050 0.96 0.54 0.57 0.6558 770 32,400 31,250 18,300 21,300 0.96 0.56 0.59 0.6859 825 31,500 30,150 19,100 21,800 0.96 0.61 0.63 0.7260 845 30,750 29,650 20,000 0.96 0.65 0.6761 1,355 32,100 32,500 21,450 1.01 0.67 0.6662 880 31,100 33,300 21,200 1.07 0.68 0.6463 785 30,200 31,750 1.0564 830 31,600 33,550 1.06
ages 53-59 5,210 33,312 32,027 18,478 21,154 0.96 0.55 0.58 0.66ages 60-64 4,695 31,264 32,197 20,981 1.03 0.67 0.66
ages 53+ 9,905 32,341 32,108 19,408 21,154 0.99 0.60 0.61 0.66
Note: See note to Table 1.
Average income measures
Average income measures
Income replacement ratios
Income replacement ratios
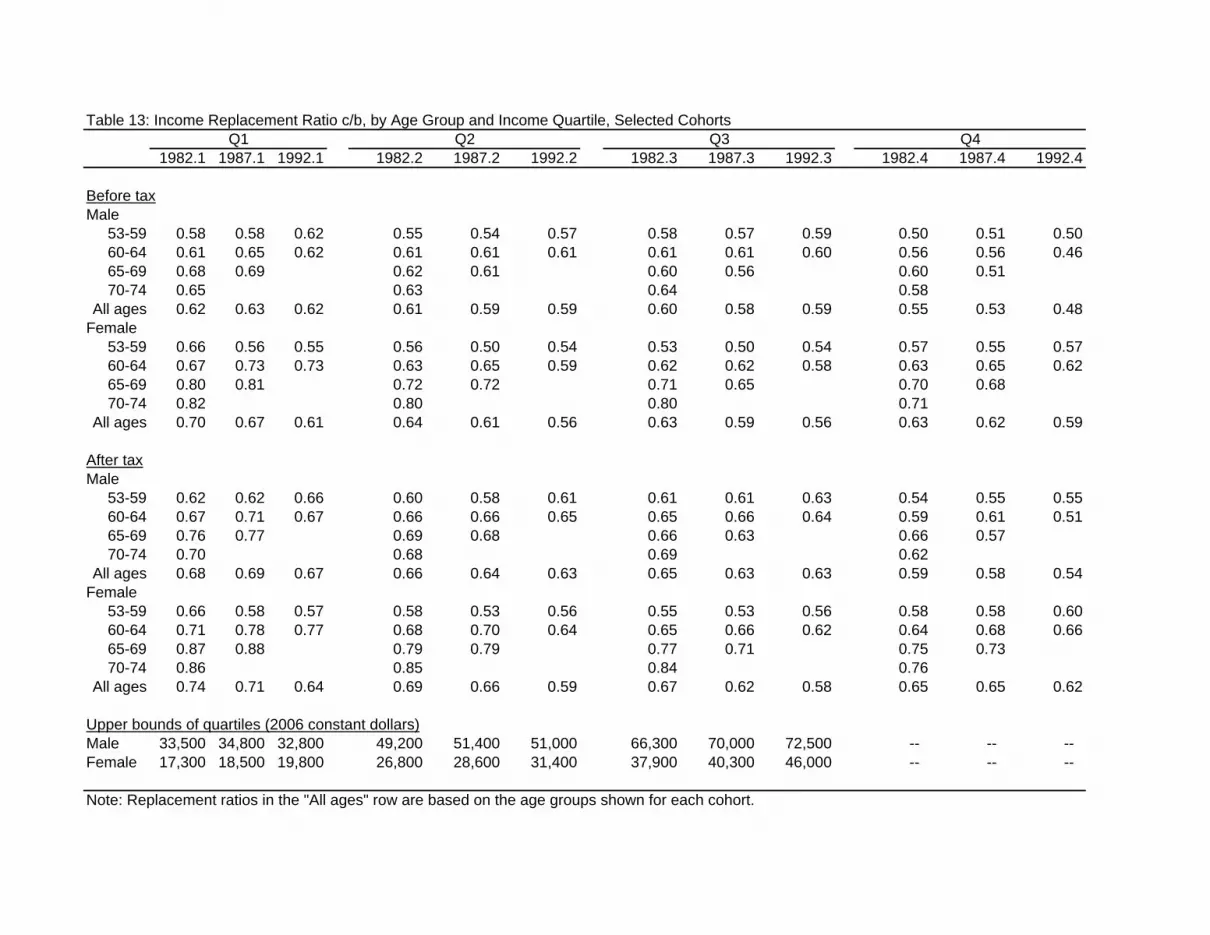
Table 13: Income Replacement Ratio c/b, by Age Group and Income Quartile, Selected Cohorts
1982.1 1987.1 1992.1 1982.2 1987.2 1992.2 1982.3 1987.3 1992.3 1982.4 1987.4 1992.4
Before taxMale
53-59 0.58 0.58 0.62 0.55 0.54 0.57 0.58 0.57 0.59 0.50 0.51 0.50 60-64 0.61 0.65 0.62 0.61 0.61 0.61 0.61 0.61 0.60 0.56 0.56 0.46 65-69 0.68 0.69 0.62 0.61 0.60 0.56 0.60 0.51 70-74 0.65 0.63 0.64 0.58
All ages 0.62 0.63 0.62 0.61 0.59 0.59 0.60 0.58 0.59 0.55 0.53 0.48Female
53-59 0.66 0.56 0.55 0.56 0.50 0.54 0.53 0.50 0.54 0.57 0.55 0.57 60-64 0.67 0.73 0.73 0.63 0.65 0.59 0.62 0.62 0.58 0.63 0.65 0.62 65-69 0.80 0.81 0.72 0.72 0.71 0.65 0.70 0.68 70-74 0.82 0.80 0.80 0.71
All ages 0.70 0.67 0.61 0.64 0.61 0.56 0.63 0.59 0.56 0.63 0.62 0.59
After taxMale
53-59 0.62 0.62 0.66 0.60 0.58 0.61 0.61 0.61 0.63 0.54 0.55 0.55 60-64 0.67 0.71 0.67 0.66 0.66 0.65 0.65 0.66 0.64 0.59 0.61 0.51 65-69 0.76 0.77 0.69 0.68 0.66 0.63 0.66 0.57 70-74 0.70 0.68 0.69 0.62
All ages 0.68 0.69 0.67 0.66 0.64 0.63 0.65 0.63 0.63 0.59 0.58 0.54Female
53-59 0.66 0.58 0.57 0.58 0.53 0.56 0.55 0.53 0.56 0.58 0.58 0.60 60-64 0.71 0.78 0.77 0.68 0.70 0.64 0.65 0.66 0.62 0.64 0.68 0.66 65-69 0.87 0.88 0.79 0.79 0.77 0.71 0.75 0.73 70-74 0.86 0.85 0.84 0.76
All ages 0.74 0.71 0.64 0.69 0.66 0.59 0.67 0.62 0.58 0.65 0.65 0.62
Upper bounds of quartiles (2006 constant dollars)Male 33,500 34,800 32,800 49,200 51,400 51,000 66,300 70,000 72,500 -- -- -- Female 17,300 18,500 19,800 26,800 28,600 31,400 37,900 40,300 46,000 -- -- --
Note: Replacement ratios in the "All ages" row are based on the age groups shown for each cohort.
Q1 Q2 Q3 Q4

SEDAP RESEARCH PAPERS: Recent Releases
Number Title Author(s)
49
(2007)
No. 168: Health human resources planning and the production of health:Development of an extended analytical framework for needs-based health human resources planning
S. BirchG. KephartG. Tomblin-MurphyL. O’Brien-PallasR. AlderA. MacKenzie
No. 169: Gender Inequality in the Wealth of Older Canadians M. DentonL. Boos
No. 170: The Evolution of Elderly Poverty in Canada K. Milligan
No. 171: Return and Onwards Migration among Older Canadians:Findings from the 2001 Census
K.B. Newbold
No. 172: Le système de retraite américain: entre fragmentation etlogique financière
D. Béland
No. 173: Entrepreneurship, Liquidity Constraints and Start-up Costs R. FonsecaP.-C. MichaudT. Sopraseuth
No. 174: How did the Elimination of the Earnings Test above theNormal Retirement Age affect Retirement Expectations?
P.-C. MichaudA. van Soest
No. 175: The SES Health Gradient on Both Sides of the Atlantic J. BanksM. MarmotZ. OldfieldJ.P. Smith
No. 176: Pension Provision and Retirement Saving: Lessons from theUnited Kingdom
R. DisneyC. EmmersonM. Wakefield
No. 177: Retirement Saving in Australia G. BarrettY.-P. Tseng
No. 178: The Health Services Use Among Older Canadians in Ruraland Urban Areas
H. CondeJ.T. McDonald
No. 179: Older Workers and On-the-Job Training in Canada:Evidence from the WES data
I.U. ZeytinogluG.B. CookeK. Harry
No. 180: Private Pensions and Income Security in Old Age:An Uncertain Future – Conference Report
M. HeringM. Kpessa
SEDAP RESEARCH PAPERS: Recent Releases
Number Title Author(s)
50
No. 181: Age, SES, and Health: A Population Level Analysis of HealthInequalitites over the Life Course
S. Prus
No. 182: Ethnic Inequality in Canada: Economic and HealthDimensions
E.M. GeeK.M. KobayashiS.G. Prus
No. 183: Home and Mortgage Ownership of the Dutch Elderly:Explaining Cohort, Time and Age Effects
A. van der SchorsR.J.M. AlessieM. Mastrogiacomo
No. 184: A Comparative Analysis of the Nativity Wealth Gap T.K. BauerD.A. Cobb-ClarkV. HildebrandM. Sinning
No. 185: Cross-Country Variation in Obesity Patterns among OlderAmericans and Europeans
P.C. MichaudA. van SoestT. Andreyeva
No. 186: Which Canadian Seniors Are Below the Low-IncomeMeasure?
M.R. Veall
No. 187: Policy Areas Impinging on Elderly Transportation Mobility:An Explanation with Ontario, Canada as Example
R. MercadoA. PáezK. B. Newbold
No. 188: The Integration of Occupational Pension Regulations: Lessonsfor Canada
M. HeringM. Kpessa
No. 189: Psychosocial resources and social health inequalities inFrance: Exploratory findings from a general population survey
F. JusotM. GrignonP. Dourgnon
No. 190: Health-Care Utilization in Canada: 25 Years of Evidence L.J. CurtisW.J. MacMinn
No. 191: Health Status of On and Off-reserve Aboriginal Peoples:Analysis of the Aboriginal Peoples Survey
L.J. Curtis
No. 192: On the Sensitivity of Aggregate Productivity Growth Rates toNoisy Measurement
F.T. Denton
No. 193: Initial Destination Choices of Skilled-worker Immigrants fromSouth Asia to Canada: Assessment of the Relative Importanceof Explanatory Factors
L. XuK.L. Liaw
No. 194: Problematic Post-Landing Interprovincial Migration of theImmigrants in Canada: From 1980-83 through 1992-95
L. XuK.L. Liaw

SEDAP RESEARCH PAPERS: Recent Releases
Number Title Author(s)
51
No. 195: Inter-CMA Migration of the Immigrants in Canada: 1991-1996 and 1996-2001
L. Xu
No. 196: Characterization and Explanation of the 1996-2001 Inter-CMA Migration of the Second Generation in Canada
L. Xu
No. 197: Transitions out of and back to employment among older menand women in the UK
D. Haardt
No. 198: Older couples’ labour market reactions to family disruptions D. Haardt
No. 199: The Adequacy of Retirement Savings: Subjective SurveyReports by Retired Canadians
S. AlanK. AtalayT.F. Crossley
No. 200: Underfunding of Defined Benefit Pension Plans and BenefitGuarantee Insurance - An Overview of Theory and Empirics
M. Jametti
No. 201: Effects of ‘authorized generics’ on Canadian drug prices P. Grootendorst
No. 202: When Bad Things Happen to Good People: The EconomicConsequences of Retiring to Caregive
P.L. McDonaldT. SussmanP. Donahue
No. 203: Relatively Inaccessible Abundance: Reflections on U.S.Health Care
I.L. Bourgeault
No. 204: Professional Work in Health Care Organizations: TheStructural Influences of Patients in French, Canadian andAmerican Hospitals
I.L. BourgeaultI. SainsaulieuP. KhokherK. Hirschkorn
No. 205: Who Minds the Gate? Comparing the role of non physicianproviders in the primary care division of labour in Canada &the U.S.
I.L. Bourgeault
No. 206: Immigration, Ethnicity and Cancer in U.S. Women J.T. McDonaldJ. Neily
No. 207: Ordinary Least Squares Bias and Bias Corrections for iidSamples
L. Magee
No. 208: The Roles of Ethnicity and Language Acculturation inDetermining the Interprovincial Migration Propensities inCanada: from the Late 1970s to the Late 1990s
X. MaK.L. Liaw
No. 209: Aging, Gender and Neighbourhood Determinants of DistanceTraveled: A Multilevel Analysis in the Hamilton CMA
R. MercadoA. Páez
SEDAP RESEARCH PAPERS: Recent Releases
Number Title Author(s)
52
No. 210: La préparation financière à la retraite des premiers boomers :une comparaison Québec-Ontario
L. MoJ. Légaré
No. 211: Explaining the Health Gap between Canadian- and Foreign-Born Older Adults: Findings from the 2000/2001 CanadianCommunity Health Survey
K.M. KobayashiS. Prus
No. 212: “Midlife Crises”: Understanding the Changing Nature ofRelationships in Middle Age Canadian Families
K.M. Kobayashi
No. 213: A Note on Income Distribution and Growth W. Scarth
No. 214: Is Foreign-Owned Capital a Bad Thing to Tax? W. Scarth
No. 215: A review of instrumental variables estimation in the appliedhealth sciences
P. Grootendorst
No. 216: The Impact of Immigration on the Labour Market Outcomesof Native-born Canadians
J. Tu
No. 217: Caregiver Employment Status and Time to Institutionalizationof Persons with Dementia
M. OremusP. Raina
No. 218: The Use of Behaviour and Mood Medications by Care-recipients in Dementia and Caregiver Depression andPerceived Overall Health
M. OremusH. YazdiP. Raina
No. 219: Looking for Private Information in Self-Assessed Health J. BanksT. CrossleyS. Goshev
No. 220: An Evaluation of the Working Income Tax Benefit W. ScarthL. Tang
No. 221: The life expectancy gains from pharmaceutical drugs: acritical appraisal of the literature
P. GrootendorstE. PiérardM. Shim
No. 222: Cognitive functioning and labour force participation amongolder men and women in England
D. Haardt
No. 223: Creating the Canada/Quebec Pension Plans: An Historical andPolitical Analysis
K. BabichD. Béland
No. 224: Assessing Alternative Financing Methods for the CanadianHealth Care System in View of Population Aging
D. Andrews
No. 225: The Role of Coping Humour in the Physical and MentalHealth of Older Adults
E. MarzialiL. McDonaldP. Donahue

SEDAP RESEARCH PAPERS: Recent Releases
Number Title Author(s)
53
No. 226: Exploring the Effects of Aggregation Error in the Estimationof Consumer Demand Elasticities
F.T. DentonD.C. Mountain
(2008)
No. 227: Using Statistics Canada LifePaths Microsimulation Model toProject the Health Status of Canadian Elderly
J. LégaréY. Décarie
No. 228: An Application of Price and Quantity Indexes in the Analysisof Changes in Expenditures on Physician Services
F.T. DentonC.H. FeaverB.G. Spencer
No. 229: Age-specific Income Inequality and Life Expectancy: NewEvidence
S. PrusR.L. Brown
No. 230: Ethnic Differences in Health: Does Immigration StatusMatter?
K.M. KobayashiS. PrusZ. Lin
No. 231: What is Retirement? A Review and Assessment of AlternativeConcepts and Measures
F.T. DentonB.G. Spencer
No. 232: The Politics of Social Policy Reform in the United States: TheClinton and the W. Bush Presidencies Reconsidered
D. BélandA. Waddan
No. 233: Grand Coalitions for Unpopular Reforms: Building a Cross-Party Consensus to Raise the Retirement Age
M. Hering
No. 234: Visiting and Office Home Care Workers’ OccupationalHealth: An Analysis of Workplace Flexibility and WorkerInsecurity Measures Associated with Emotional and PhysicalHealth
I.U. ZeytinogluM. DentonS. DaviesM.B. SeatonJ. Millen
No. 235: Policy Change in the Canadian Welfare State: Comparing theCanada Pension Plan and Unemployment Insurance
D. BélandJ. Myles
No. 236: Income Security and Stability During Retirement in Canada S. LaRochelle-CôtéJ. MylesG. Picot
No. 237: Pension Benefit Insurance and Pension Plan Portfolio Choice T.F. CrossleyM. Jametti
No. 238: Determinants of Mammography Usage across Rural andUrban Regions of Canada
J.T. McDonaldA. Sherman

SEDAP RESEARCH PAPERS: Recent Releases
Number Title Author(s)
54
(2009)
No. 239: Negative Effects of the Canadian GIS Clawback and PossibleMitigating Alternatives
D. ChisholmR.L. Brown
No. 240: Basic Living Expenses for the Canadian Elderly B.-J. MacDonaldD. AndrewsR.L. Brown
No. 241: Financial security of elders in China Y. ChengM.W. Rosenberg
No. 242: The Impact of Skill Mismatch among Migrants on RemittanceBehaviour
J.T. McDonaldM.R. Valenzuela
No. 243: Car Driving and Public Transit Use in Canadian MetropolitanAreas: Focus on Elderly and Role of Health and SocialNetwork Factors
R.G. MercadoK.B. Newbold
No. 244: Where Would You Turn for Help? Older Adults’ Knowledgeand Awareness of Community Support Services
M. DentonJ. PloegJ. TindaleB. HutchisonK. BrazilN. Akhtar-DaneshM. Quinlan
No. 245: New Evidence on Taxes and Portfolio Choice S. AlanK. AtalayT.F. CrossleyS.H. Jeon
No. 246: How should we support pharmaceutical innovation? P. Grootendorst
No. 247: Cohort Working Life Tables for Older Canadians F.T. DentonC.H. FeaverB.G. Spencer
No. 248: Cancer-related health behaviors and health service use amongInuit and other residents of Canada’s north
J.T. McDonaldR. Trenholm
No. 249: Older Aboriginal Peoples in Canada - Demographics, HealthStatus and Access to Health Care
M.W. RosenbergK. WilsonS. AbonyiA. WiebeK. BeachR. Lovelace

SEDAP RESEARCH PAPERS: Recent Releases
Number Title Author(s)
55
No. 250: Patents, Public-Private Partnerships or Prizes: How should wesupport pharmaceutical innovations?
P. Grootendorst
No. 251: Les besoins non comblés de services à domicile chez les aînéscanadiens
M.A. Busque
No. 252: La «migration de remplacement» au Québec: à quel pointpeut-on compter sur l’immigration pour contrer les problèmesdémographiques appréhendés?
G. Marois
No. 253: Le vieillissement de la population carcérale sousresponsabilité fédérale au Canada: Vers de «pénitenciers-hospices» ?
A.L. Tesseron
No. 254: International Differences in Longevity and Health and theirEconomic Consequences
P.-C. MichaudD. GoldmanD. LakdawallaA. GaileyY. Zheng
No. 255: Understanding the Economic Consequences of Shifting Trendsin Population Health
P.-C. MichaudD. GoldmanD. LakdawallaY. ZhengA. Gailey
No. 256: Population Aging, Older Workers, and Canada’s Labour Force F.T. DentonB.G. Spencer
No. 257: Patterns of Retirement as Reflected in Income Tax Records forOlder Workers
F.T. DentonRoss FinnieB.G. Spencer
No. 258: Reproductive Contributions of Foreign Wives in Taiwan:Similarities and Differences among Major Source Countries
K.-L. LiawJ.-P. LinC.-C. Liu
No. 259: Chronic Health Conditions: Changing Prevalence in an AgingPopulation and Some Implications for the Delivery of HealthCare Services
F.T. DentonB.G. Spencer
No. 260: Portfolio Allocation in the Face of a Means-Tested PublicPension
D.A. Cobb-ClarkV. Hildebrand
No. 261: Income Replacement in Retirement: Longitudinal Evidencefrom Income Tax Records
F.T. DentonR. FinnieB.G. Spencer