transition from work to retirement
TRANSCRIPT
Transition from work to retirement
Evaluation of the 2012 labour force survey ad hoc module
Transition from work to retirement. Evaluation of the 2012 module Page 2
Preface
This report evaluates the 2012 labour force survey (LFS) ad hoc module (AHM), which examined the
transition from work to retirement. The main objective of the report is to assess the way in which the
module was conducted, by providing information on the quality of the data set and presenting preliminary
results. Recommendations relating to a possible repeat of the module as part of a future survey are also
included.
The EU LFS is a large-sample survey of private households, which provides detailed quarterly and annual
data on employment, unemployment and economic inactivity. The LFS was established by Council
Regulation (EC) No 577/98 of 9 March 1998 on the organisation of a labour force sample survey in the
European Union. This Regulation and its amendments set out provisions for the design, characteristics
and decision-making process of the survey. The transition from work to retirement was the subject of the
2006 LFS ad hoc module, and the same topic was chosen again for 2012 (Regulation No 365/20081). The
2012 proposal was prepared in the light of lessons learnt during the course of the 2006 LFS ad hoc
module and, where possible, appropriate changes were made. The involvement of a large number of
labour market specialists from national statistical offices, Eurostat and other Commission Directorate-
Generals also played an important role in the planning of the 2012 module. The national statistical offices
all contributed to a documentation exercise, for which each of them drafted a mapping between the
possible responses for the PENSTYPE variable (the type of pension the person is currently receiving) and
their national pension system. The evaluation of the 2006 module and the documentation produced in
preparing the 2012 module are publicly available.2 Both are designed to make it easier for researchers and
the public to understand and use AHM data. Administrative differences between the pension systems in
different countries are highlighted, and the areas in which, as a result, comparison between countries is
not possible, are made clear.
The first chapter of this document gives general information on AHM 2012. Subsequent chapters then
provide a detailed description of each variable, together with information as to the comparability of this
variable both across countries and between 2006 and 2012, and other information on data collection. The
annexes to the document include country abbreviations, the list of tables proposed for online publication
and the text of Regulation No 365/2008 with the list of variables.
This document is based on data sent to Eurostat before the end of 2013. Although minor revisions of the
data set may have happened after this date, the data was considered stable enough for analysis and
interpretation. The quality reports provided by participating countries were particularly useful in helping
Eurostat to interpret certain values and have also contributed to ideas for a potential repeat of the module.
Colleagues from many national statistical offices provided Eurostat with insight into the national
circumstances, explaining specific results that did not fit patterns seen in other countries. Eurostat would
like to thank all contributors.
This report was prepared by Diana Ivan and Håvard Lien of Eurostat’s unit working on labour market
statistics (F3).
Luxembourg, March 2014
1 http://eur-lex.europa.eu/LexUriServ/LexUriServ.do?uri=OJ:L:2008:112:0022:0024:EN:PDF
2 http://ec.europa.eu/eurostat/statistics-explained/index.php/EU_labour_force_survey_-_ad_hoc_modules
Transition from work to retirement. Evaluation of the 2012 module Page 3
Table of contents
Preface ......................................................................................................................... 2 Table of contents .......................................................................................................... 3 Chapter 1: General information on the module.............................................................. 5
Executive summary for researchers .......................................................................................... 5 Recommendations relating to a repeat of the module ............................................................... 6 Description of the module .......................................................................................................... 6
Aims of the module and main findings .................................................................................................. 6 Participating countries ........................................................................................................................... 7 Target population .................................................................................................................................. 7 Main findings ......................................................................................................................................... 9 Description of the variables ................................................................................................................... 9 Links with AHM 2006 ............................................................................................................................ 9 Links with the core LFS ....................................................................................................................... 10
General issues relating to data collection ................................................................................ 10 Sample size ........................................................................................................................................ 10 Non-response rates ............................................................................................................................ 11 Other measurement issues ................................................................................................................. 12
Chapter 2: Quality analysis by variable ....................................................................... 14
1. PENSION: Person receives or does not receive a pension ................................................ 14 Short description ................................................................................................................................. 14 Filter conditions and codes ................................................................................................................. 14 Analysis of the questionnaires ............................................................................................................ 14 Analysis of the results ......................................................................................................................... 15 Conclusions and recommendations .................................................................................................... 22
2. PENSTYPE: Type of pension(s) currently received ............................................................ 23 Short description ................................................................................................................................. 23 Filter conditions and codes ................................................................................................................. 23 Analysis of the questionnaires ............................................................................................................ 24 Analysis of the results ......................................................................................................................... 24 Conclusions and recommendations .................................................................................................... 28
3. EARLYRET: Incidence of early retirement .......................................................................... 29 Short description ................................................................................................................................. 29 Filter conditions and codes ................................................................................................................. 30 Analysis of the questionnaires ............................................................................................................ 30 Analysis of the results ......................................................................................................................... 30 Conclusions and recommendations .................................................................................................... 33
4. AGEPENS: Age at which a person first received an old-age pension ................................ 34 Short description ................................................................................................................................. 34 Filter conditions and codes ................................................................................................................. 34 Analysis of the questionnaires ............................................................................................................ 34 Analysis of the results ......................................................................................................................... 34 Conclusions and recommendations .................................................................................................... 42
5. REASNOT: Main reason for not remaining in employment longer ...................................... 42 Short description ................................................................................................................................. 42 Filter conditions and codes ................................................................................................................. 42 Analysis of the questionnaires ............................................................................................................ 43 Analysis of the results ......................................................................................................................... 44 Conclusions and recommendations .................................................................................................... 45
6. WORKLONG: Wish to remain in employment longer .......................................................... 46 Short description ................................................................................................................................. 46 Filter conditions and codes ................................................................................................................. 46 Analysis of the questionnaires ............................................................................................................ 46 Analysis of the results ......................................................................................................................... 47 Conclusions and recommendations .................................................................................................... 48
Transition from work to retirement. Evaluation of the 2012 module Page 4
7. REDUCHRS: Reduced working hours as a step towards full retirement ............................ 48 Short description ................................................................................................................................. 48 Filter conditions and codes ................................................................................................................. 49 Analysis of the questionnaires ............................................................................................................ 49 Analysis of the results ......................................................................................................................... 49 Conclusions and recommendations .................................................................................................... 52
8. STAYWORK: Main reason for remaining in employment .................................................... 52 Short description ................................................................................................................................. 52 Filter conditions and codes ................................................................................................................. 52 Analysis of the questionnaires ............................................................................................................ 52 Analysis of the results ......................................................................................................................... 52 Conclusions and recommendations .................................................................................................... 55
9. PLANSTOP: Plans to stop working in the future ................................................................. 55 Short description ................................................................................................................................. 55 Filter conditions and codes ................................................................................................................. 55 Analysis of the questionnaires ............................................................................................................ 56 Analysis of the results ......................................................................................................................... 56 Conclusions and recommendations .................................................................................................... 57
10. BUILDPEN: Information on pension rights built up to date ............................................... 57 Short description ................................................................................................................................. 57 Filter conditions and codes ................................................................................................................. 57 Analysis of the questionnaires ............................................................................................................ 57 Analysis of the results ......................................................................................................................... 58 Conclusions and recommendations .................................................................................................... 58
11. CONTWORK: Expectations of continuing working or looking for a job after starting to receive an old-age pension ...................................................................................................... 59
Short description ................................................................................................................................. 59 Filter conditions and codes ................................................................................................................. 59 Analysis of the questionnaires ............................................................................................................ 59 Analysis of the results ......................................................................................................................... 59 Conclusions and recommendations .................................................................................................... 61
Annexes...................................................................................................................... 62
Annex 1: Abbreviations ............................................................................................................ 62 Annex 2: Main AHM 2012 tables ............................................................................................. 63 Annex 3: Commission Regulation (EU) No 249/2011 ............................................................. 64
Transition from work to retirement. Evaluation of the 2012 module Page 5
Chapter 1: General information on the module
Executive summary for researchers
The EU LFS sample size is about 1.5 million people and surveys are carried out every quarter. Only
private households are included. The survey is conducted by means of interviews with each individual in
the sample. The interview method varies across countries. In most countries, proxy interviews with
another person in the household are allowed. Interviews are generally conducted in person, at least for the
first wave, but subsequent follow-up interviews can be conducted by phone. Participation in the survey3 is
compulsory in seven EU countries and in two of the participating European Free Trade Association
countries.
The variables on which the LFS collects data will be referred to in this document as core LFS variables,
to distinguish them from the AHM variables. Their list is available as an annex to Regulation 377/20084
on codification and filters. Explanatory notes on each of the variables are also available5. Regulations on
multi-annual programmes of ad hoc modules and Regulations defining the list of variables to be collected
in a specific year provide further legal basis6 for the LFS AHMs.
Commission Regulation (EU) No 249/2011 adopting the specifications of the 2012 ad hoc module
defines the eleven variables on which data was collected in AHM 2012 and describes the target
population of the module and of each variable. A task force was commissioned to define a proposed list
of variables to be collected and to provide explanatory notes to accompany them. A document has been
prepared giving answers to frequently asked questions on the concepts covered by the variables. These
are all publicly available. This document summarises their main elements, and adds further information
on data comparability between countries and between surveys.
The first chapter explains in detail the structure of the target population of AHM 2012. It sets out which
populations are included and which are excluded from the module. Since the module focuses on people
involved in the transition from work to retirement, not all potential respondents aged 50-69 were
interviewed. The main side effect of the choice of target population for this survey is that analysis by
gender is limited, because the labour market participation rate is different for men and women.
The AHM 2012 database does not include a ‘non-applicable’ field (which applies to those not in the
AHM target population) for all countries for which data was collected. For this report, the size of the
‘non-applicable’ category for Germany, France, Austria, Sweden and Switzerland was estimated by
crossing the AHM data with the core LFS data.
Non-response rates by variable and country are also included in the first chapter. Any non-response rate
higher than 15 % will be systematically flagged in this document, as this is the level considered to make
the remaining data for that question and population unreliable. The reader is therefore made aware of the
limits of the data quality for specific countries and/or specific variables of the module.
The second chapter presents each variable in detail, from a data collection perspective as well as with a
view to a possible repeat of the module. At a glance, the quality of each variable can be summarised as
follows:
a good level of comparability: PENSION and AGEPENS;
comparison is possible, but analysis should take into account the specific differences existing at
national level: PENSTYPE, EARLYRET, WORKLONG, REASNOT, REDUCHRS and
STAYWORK; and
3 See table 3 for information on participation at AHM 2012 by country
4 http://eur-lex.europa.eu/LexUriServ/LexUriServ.do?uri=OJ:L:2008:114:0057:0084:EN:PDF
5 http://ec.europa.eu/eurostat/statistics-explained/index.php/EU_labour_force_survey_-_methodology#LFS_explanatory_notes
6 http://ec.europa.eu/eurostat/statistics-explained/index.php/EU_labour_force_survey_%E2%80%93_main_features_and_legal_basis
Transition from work to retirement. Evaluation of the 2012 module Page 6
lowest quality variables whose use should be confined to national analysis (provided response
rates are sufficient): PLANSTOP, BUILDPEN and CONTWORK.
Please note that names of variables will always be given in capital letters. Definitions and code lists of the
variables are available in the subchapters of chapter 2.
With the exception of table 2 on sample size, table 4.1 and related graphs on percentile and mode, all data
is weighted.
Recommendations relating to a repeat of the module
Were a module with the same (or a similar) topic to be run again, a number of recommendations made in
the light of the 2012 experience should be taken into account. These recommendations were formulated
by experts from the national statistical institutes based on their experience of the data collection and
analysis conducted at national level, and by Eurostat based on their experience of analysing the dataset
for all countries.
(1) Consider changing the topic of the module from the transition from work to retirement to an
analysis of the whole population within a certain age group. In general, it is considered difficult
to collect detailed information on a complex phenomenon such as the transition from work to
retirement by means of a small number of questions that assume a linear progression from work
to retirement, because in practice the transition may be longer and atypical. A module focussing
on a transition of any kind will inevitably involve retrospective questions and questions about
future intentions. Experience, including from AHM 2012, has shown that these questions are
most difficult to deal with in an AHM.
(2) Choose simpler filters, both for the module and for each of the variables. Complex filters are
difficult to manage during the preparation of the survey, interviewing, data processing and data
analysis. For example, it would have been easier to collect comparable data across all countries
for an AHM whose only filter was age. Moreover, users would have benefited from a richer
dataset, allowing detailed analysis by gender and by country. A broader filter also reduces the
risk of the target population being too small. The drawback of this approach would be a slight
increase in the response burden but the effect of this could be mitigated throughout the module if
simpler variables were used.
(3) Reconsider the definition of a pension in the context of the module. Due to specific national
legal provisions, it is not always easy to distinguish between pensions and other social benefits
and this can often lead to a situation where similar social schemes are considered as a pension in
one country and as a different kind of benefit in another. The 2012 AHM included a proposal to
supplement the data collection with mappings of the pension systems in each country. This
approach has the advantage of offering greater transparency of data collection. Little can be done
however to improve the comparability at European level of any PENSTYPE data collected for
this module. Moreover, the documentation and updating of administrative information involved
in this exercise placed a considerable burden on participating countries.
Description of the module
Aims of the module and main findings
The aim of this AHM was to analyse:
how people leave the labour market;
why they leave the labour market;
why they do not remain in the labour market longer; and
for how long the active population aged 50 to 69 expects to be in the labour market.
The results were intended to be used to prepare the joint report on social protection and social inclusion,
and in the areas covered by the open method of coordination in the field of pensions and the Europe 2020
Transition from work to retirement. Evaluation of the 2012 module Page 7
Strategy, and in particular for monitoring the guideline on increasing labour market participation.
Participating countries
The module was carried out in all EU countries (27 in 2012), Croatia, Iceland, Norway and Switzerland.
The aggregated EU totals include all 28 current EU Member States (i.e. the 27 Member States as of 2012
and Croatia). Annex 1 gives the country abbreviations used in this report.
Target population
The target population of AHM 2012 is people aged 50-69 either currently working or having worked
beyond age 50. The target population is the same as for the AHM 2006 on the transition from work to
retirement.
The target group excludes people who have not worked beyond age 50 on the basis of their reduced
proximity to the labour market and in order to reduce the volume of responses to be handled. It is
however important to verify whether excluding these respondents had any negative effects on data
analysis.
It was often difficult to identify the exact target population of the module at the point of collecting data.
In particular, some of the countries using paper questionnaires (Bulgaria, Greece and Hungary) reported
significant difficulties in ensuring that respondents respected the conditions imposed by each of the
filters. Many countries (including Malta and Switzerland, and a number of the countries using paper
questionnaires) had difficulties in extracting data on experiences of working beyond age 50 from the core
LFS, and had to collect the relevant information on age, work history and working life beyond age 50
again. In these cases, three extra questions were usually added to the interview as a check. There were
also instances of filters being applied when coding the data, rather than at the point of collecting the data.
This affected the data in the ‘non-answering’ category and in some cases resulted in the data not being
able to be used in the module. As noted in the Austrian report, having additional filters reduced the
number of observations of more narrowly defined variables. Filtering for a very specific target population
makes both understanding and communication of the data more difficult. It also limits the analysis of the
data, by precluding certain breakdowns, including by gender.
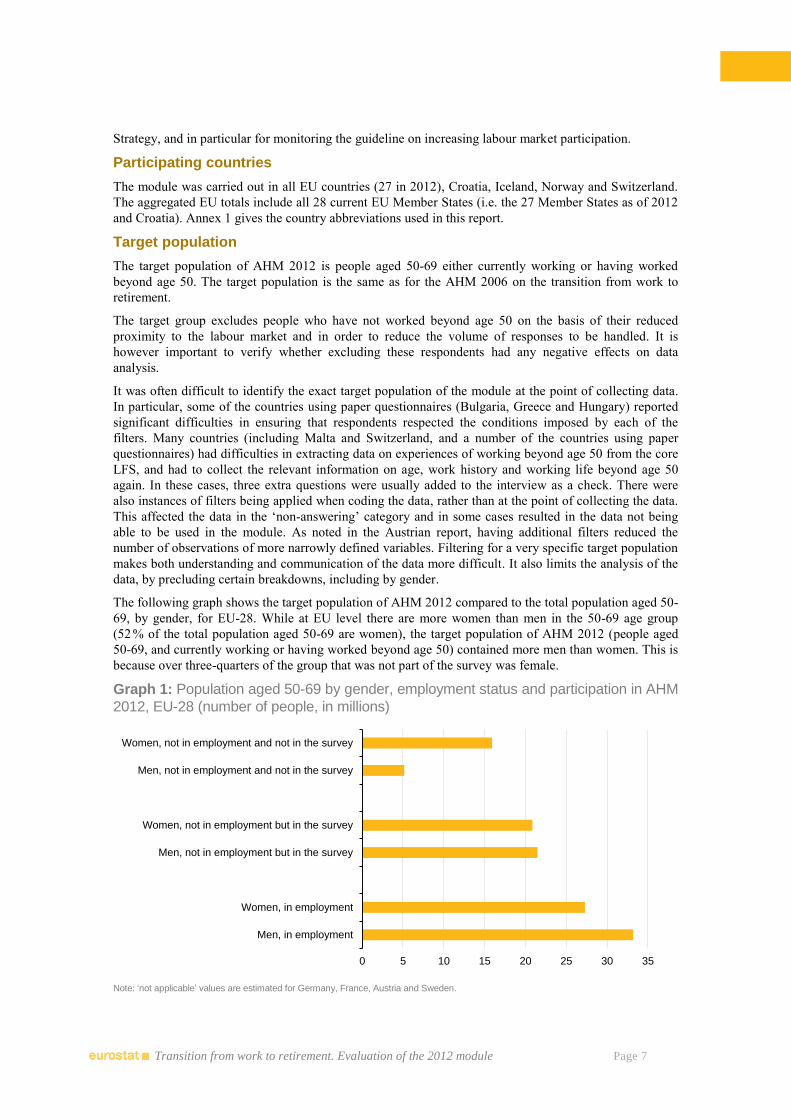
The following graph shows the target population of AHM 2012 compared to the total population aged 50-
69, by gender, for EU-28. While at EU level there are more women than men in the 50-69 age group
(52 % of the total population aged 50-69 are women), the target population of AHM 2012 (people aged
50-69, and currently working or having worked beyond age 50) contained more men than women. This is
because over three-quarters of the group that was not part of the survey was female.
Graph 1: Population aged 50-69 by gender, employment status and participation in AHM
2012, EU-28 (number of people, in millions)
Note: ‘not applicable’ values are estimated for Germany, France, Austria and Sweden.
0 5 10 15 20 25 30 35
Men, in employment
Women, in employment
Men, not in employment but in the survey
Women, not in employment but in the survey
Men, not in employment and not in the survey
Women, not in employment and not in the survey
Transition from work to retirement. Evaluation of the 2012 module Page 8
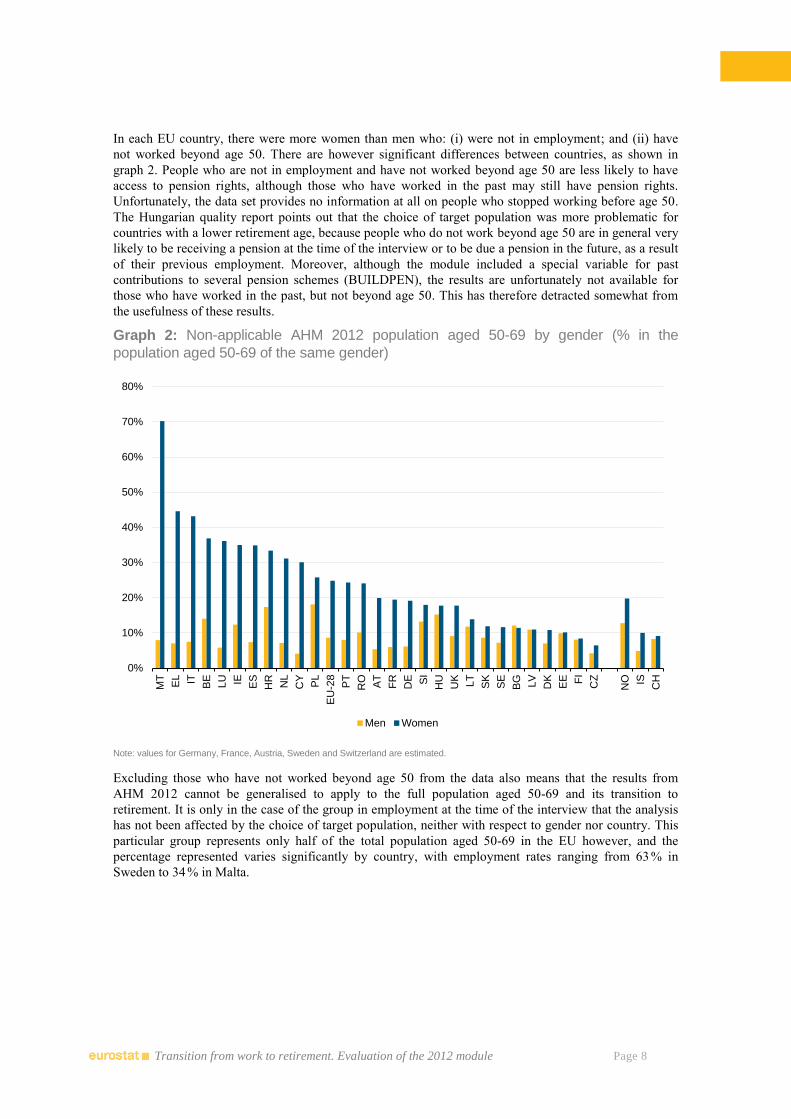
In each EU country, there were more women than men who: (i) were not in employment; and (ii) have
not worked beyond age 50. There are however significant differences between countries, as shown in
graph 2. People who are not in employment and have not worked beyond age 50 are less likely to have
access to pension rights, although those who have worked in the past may still have pension rights.
Unfortunately, the data set provides no information at all on people who stopped working before age 50.
The Hungarian quality report points out that the choice of target population was more problematic for
countries with a lower retirement age, because people who do not work beyond age 50 are in general very
likely to be receiving a pension at the time of the interview or to be due a pension in the future, as a result
of their previous employment. Moreover, although the module included a special variable for past
contributions to several pension schemes (BUILDPEN), the results are unfortunately not available for
those who have worked in the past, but not beyond age 50. This has therefore detracted somewhat from
the usefulness of these results.
Graph 2: Non-applicable AHM 2012 population aged 50-69 by gender (% in the
population aged 50-69 of the same gender)
Note: values for Germany, France, Austria, Sweden and Switzerland are estimated.
Excluding those who have not worked beyond age 50 from the data also means that the results from
AHM 2012 cannot be generalised to apply to the full population aged 50-69 and its transition to
retirement. It is only in the case of the group in employment at the time of the interview that the analysis
has not been affected by the choice of target population, neither with respect to gender nor country. This
particular group represents only half of the total population aged 50-69 in the EU however, and the
percentage represented varies significantly by country, with employment rates ranging from 63 % in
Sweden to 34 % in Malta.
0%
10%
20%
30%
40%
50%
60%
70%
80%
MT
EL IT BE
LU IE ES
HR
NL
CY
PL
EU
-28
PT
RO
AT
FR
DE SI
HU
UK
LT
SK
SE
BG LV
DK
EE FI
CZ
NO IS
CH
Men Women

Transition from work to retirement. Evaluation of the 2012 module Page 9
Main findings
Amongst the target population at EU level:
• the average age at which respondents receive an old-age pension for the first time is 59 years, for
both women and men;
• 42 % are currently receiving a pension;
• the statutory old-age pension is by far the most common type of pension, with 81 % of those
receiving some form of pension receiving a statutory old-age pension;
• approximately four in 10 people receiving an old-age pension had taken early retirement; and
• the two most frequently cited main reasons for not remaining in employment for longer were
reaching eligibility for a pension and the respondent’s own health problems or disability (reasons
given by 37 % and 21 %, respectively, of economically inactive people receiving a pension).
Description of the variables
A full description of the variables, filters and coding, as defined in Commission Regulation (EU) No
249/2011, is available in Annex 3. The module contains the following 11 variables:
PENSION Person receives a pension
PENSTYPE Type of pension(s)
EARLYRET Early retirement
AGEPENS Age at which person first received an old-age pension
REASNOT Main reason for not remaining in employment longer
WORKLONG Wish to remain in employment longer
REDUCHRS Reduced working hours as a step towards full retirement
STAYWORK Main reason for remaining in employment (for respondents already receiving a
pension)
PLANSTOP Plans to stop working in the future (for respondents already receiving a
pension)
BUILDPEN Pension rights built-up to date
CONTWORK Expects to continue working or looking for a job after starting to receive an
old-age pension.
Links with AHM 2006
The policy background for AHM 2012 is similar to that of AHM 2006, namely monitoring participation
in the labour market. There are however no variables which are completely and directly comparable
between the two surveys. The evaluation of AHM 20067 made the following recommendations for
changes to be made to the variables were the module to be repeated. We have included only the six
variables that, in principle, cover the same content in 2012 as in 2006.
(1) REDUCHRS caused problems for respondents in 2006 because it asked about their future plans, when
in many cases they had not made such plans at the time of the interview, due in particular to changes in
the pensions regulation. The response item ‘progressive retirement schemes’8 was not used in several
countries because the concept itself was unfamiliar. The 2006 task force’s recommendation to simplify
7 The publication is available at http://ec.europa.eu/eurostat/product?code=KS-RA-08-012
8 “Progressive retirement scheme/part-time pension” was defined in the Transition from work into retirement publication, on page 48, as follows: 'this measure concerns older employees in some countries. This is part of measures to keep older employees in employment (incentives to stay at work). To avoid the exit from work, in case the employee wishes to decrease his/her working time before retiring, he/she could take a part-time job for example. It could be a “classic” part-time or what is called a “progressive retirement scheme/part-time pension”. The latter ensures a better remuneration than the “classic” part-time (e.g. 50% work paid 80%). In other words, it corresponds to a reduction of the number of hours worked with a less than proportional reduction in salary (e.g. 50% work paid 80%)'
Transition from work to retirement. Evaluation of the 2012 module Page 10
this variable was followed in 2012.
(2) PLAGESTP (corresponding to AHM 2012 variable PLANSTOP) caused problems for the same
reason as REDUCHRS. Unfortunately, the fine-tunings proposed for 2012 did not solve the original
problem of people finding it difficult to answer questions about their future plans.
(3) REASRET (corresponding to AHM 2012 REASNOT) was reported to have too many response items
each of which was too detailed. This made it difficult to distinguish between several of the items.
Changes to this variable were proposed but not such as would necessarily simplify it.
(4) AGEPENS caused problems due to difficulties in understanding the expression ‘individual retirement
pensions’. Accordingly, this was changed to ‘old-age pension’ for 2012.
(5) OTHBENF (corresponding to AHM 2012 PENSTYPE) caused problems due to the interpretation of
the term ‘individual benefits’ in the explanatory notes. The 2012 survey asks for broad categories of
pension types.
(6) FININCTV (corresponding to AHM 2012 STAYWORK) had many missing values in its data set due
to the filter conditions being too restrictive in 2006. The advice relating to this variable was followed in
2012.
Links with the core LFS
The target population of the module is in part based on the International Labour Organisation (ILO)
employment status, which has three main subgroups: employed, unemployed, and economically inactive.
While the ILO status is obtained from a combination of several core variables (WSTATOR,
SEEKWORK, AVAILBLE, METHODA to METHODM), the AHM 2012 status is based on a simplified
version, derived from only two variables in the core LFS: WSTATOR (labour status during the reference
week) and SEEKWORK (seeking employment during the previous four weeks), in the following way:
Employed: WSTATOR (1, 2);
Unemployed (simplified): WSTATOR (3, 5) and SEEKWORK (1, 2, 4); and
Inactive (simplified): WSTATOR (3, 5) and SEEKWORK (3).
In the schematic overview of the relation between the variables, given on the last page of the explanatory
notes, the basic ILO terminology is used, without a clear indication of the intended simplification (in
respect of SEEKWORK). Whilst this is not ideal, the Regulation takes precedence over the addendum to
the explanatory notes, so the omission is not of material consequence.
The fact that the scheme does not include all WSTATOR categories does not have any impact on the
module, as those not included refer to people who are either younger than 15 years, older than 75 years,
or engaged in compulsory military service. None of these people are in the 50-69 years target group.
YEARPR (year in which person last worked) and YEARBIR (year of birth) are used in combination to
define the target population of the module.
General issues relating to data collection
This section gives detailed information on sample sizes and non-response rates. It also includes
information on differences in interviewing methods and experiences between countries.
Sample size
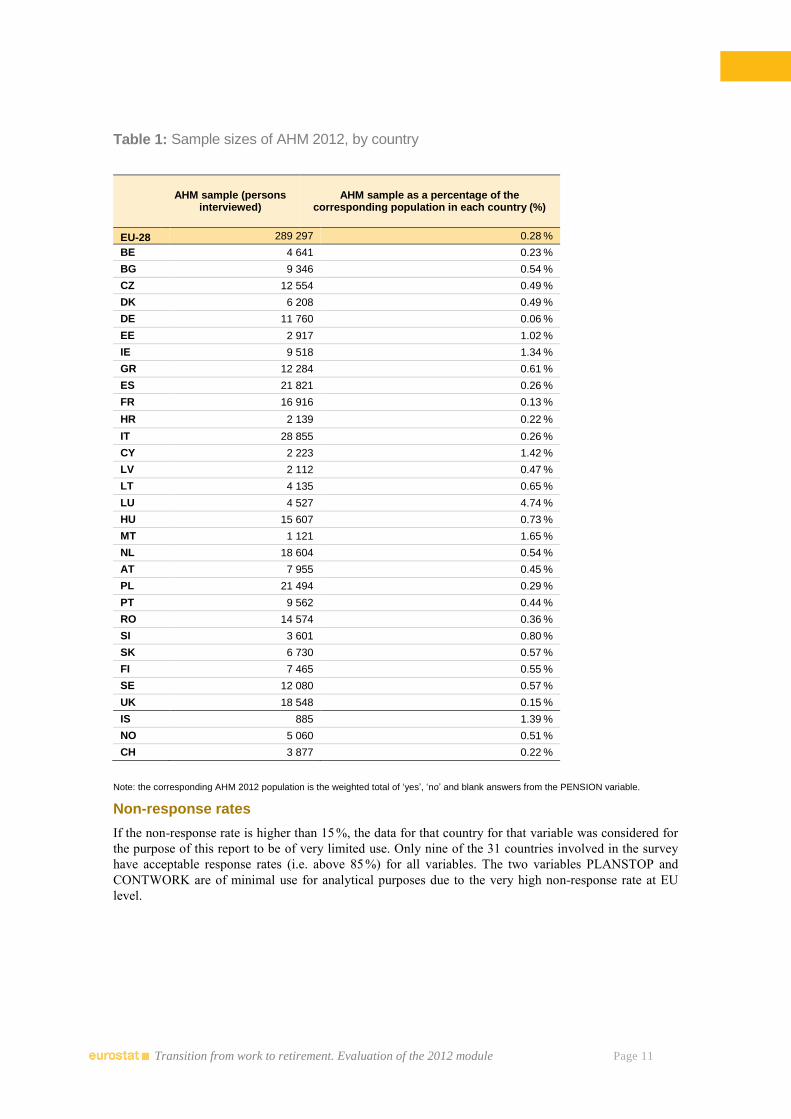
The sample size of AHM 2012 is determined by the number of people interviewed during the labour force
survey in the specific 2012 quarter(s).9 Only people aged 50 to 69 and meeting specific requirements
relating to labour market status (see the target population chapter for more details) were interviewed. The
following table shows, for each country, the number of interviews conducted and the percentage of the
target group population that this number of interviews represents.
9 See the reference period of the module (in table 3) for the specific quarter(s) by country.
Transition from work to retirement. Evaluation of the 2012 module Page 11
Table 1: Sample sizes of AHM 2012, by country
AHM sample (persons interviewed)
AHM sample as a percentage of the corresponding population in each country (%)
EU-28 289 297 0.28 %
BE 4 641 0.23 %
BG 9 346 0.54 %
CZ 12 554 0.49 %
DK 6 208 0.49 %
DE 11 760 0.06 %
EE 2 917 1.02 %
IE 9 518 1.34 %
GR 12 284 0.61 %
ES 21 821 0.26 %
FR 16 916 0.13 %
HR 2 139 0.22 %
IT 28 855 0.26 %
CY 2 223 1.42 %
LV 2 112 0.47 %
LT 4 135 0.65 %
LU 4 527 4.74 %
HU 15 607 0.73 %
MT 1 121 1.65 %
NL 18 604 0.54 %
AT 7 955 0.45 %
PL 21 494 0.29 %
PT 9 562 0.44 %
RO 14 574 0.36 %
SI 3 601 0.80 %
SK 6 730 0.57 %
FI 7 465 0.55 %
SE 12 080 0.57 %
UK 18 548 0.15 %
IS 885 1.39 %
NO 5 060 0.51 %
CH 3 877 0.22 %
Note: the corresponding AHM 2012 population is the weighted total of ‘yes’, ‘no’ and blank answers from the PENSION variable.
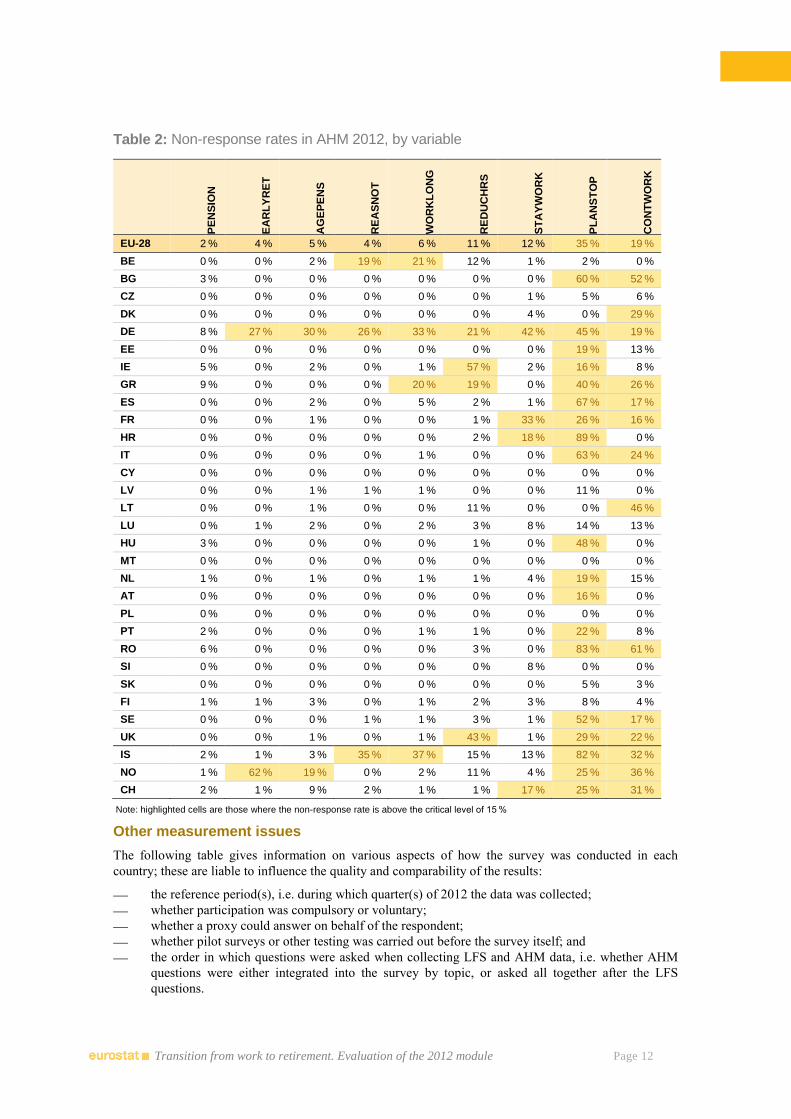
Non-response rates
If the non-response rate is higher than 15 %, the data for that country for that variable was considered for
the purpose of this report to be of very limited use. Only nine of the 31 countries involved in the survey
have acceptable response rates (i.e. above 85 %) for all variables. The two variables PLANSTOP and
CONTWORK are of minimal use for analytical purposes due to the very high non-response rate at EU
level.
Transition from work to retirement. Evaluation of the 2012 module Page 12
Table 2: Non-response rates in AHM 2012, by variable
PE
NS
ION
EA
RL
YR
ET
AG
EP
EN
S
RE
AS
NO
T
WO
RK
LO
NG
RE
DU
CH
RS
ST
AY
WO
RK
PL
AN
ST
OP
CO
NT
WO
RK
EU-28 2 % 4 % 5 % 4 % 6 % 11 % 12 % 35 % 19 %
BE 0 % 0 % 2 % 19 % 21 % 12 % 1 % 2 % 0 %
BG 3 % 0 % 0 % 0 % 0 % 0 % 0 % 60 % 52 %
CZ 0 % 0 % 0 % 0 % 0 % 0 % 1 % 5 % 6 %
DK 0 % 0 % 0 % 0 % 0 % 0 % 4 % 0 % 29 %
DE 8 % 27 % 30 % 26 % 33 % 21 % 42 % 45 % 19 %
EE 0 % 0 % 0 % 0 % 0 % 0 % 0 % 19 % 13 %
IE 5 % 0 % 2 % 0 % 1 % 57 % 2 % 16 % 8 %
GR 9 % 0 % 0 % 0 % 20 % 19 % 0 % 40 % 26 %
ES 0 % 0 % 2 % 0 % 5 % 2 % 1 % 67 % 17 %
FR 0 % 0 % 1 % 0 % 0 % 1 % 33 % 26 % 16 %
HR 0 % 0 % 0 % 0 % 0 % 2 % 18 % 89 % 0 %
IT 0 % 0 % 0 % 0 % 1 % 0 % 0 % 63 % 24 %
CY 0 % 0 % 0 % 0 % 0 % 0 % 0 % 0 % 0 %
LV 0 % 0 % 1 % 1 % 1 % 0 % 0 % 11 % 0 %
LT 0 % 0 % 1 % 0 % 0 % 11 % 0 % 0 % 46 %
LU 0 % 1 % 2 % 0 % 2 % 3 % 8 % 14 % 13 %
HU 3 % 0 % 0 % 0 % 0 % 1 % 0 % 48 % 0 %
MT 0 % 0 % 0 % 0 % 0 % 0 % 0 % 0 % 0 %
NL 1 % 0 % 1 % 0 % 1 % 1 % 4 % 19 % 15 %
AT 0 % 0 % 0 % 0 % 0 % 0 % 0 % 16 % 0 %
PL 0 % 0 % 0 % 0 % 0 % 0 % 0 % 0 % 0 %
PT 2 % 0 % 0 % 0 % 1 % 1 % 0 % 22 % 8 %
RO 6 % 0 % 0 % 0 % 0 % 3 % 0 % 83 % 61 %
SI 0 % 0 % 0 % 0 % 0 % 0 % 8 % 0 % 0 %
SK 0 % 0 % 0 % 0 % 0 % 0 % 0 % 5 % 3 %
FI 1 % 1 % 3 % 0 % 1 % 2 % 3 % 8 % 4 %
SE 0 % 0 % 0 % 1 % 1 % 3 % 1 % 52 % 17 %
UK 0 % 0 % 1 % 0 % 1 % 43 % 1 % 29 % 22 %
IS 2 % 1 % 3 % 35 % 37 % 15 % 13 % 82 % 32 %
NO 1 % 62 % 19 % 0 % 2 % 11 % 4 % 25 % 36 %
CH 2 % 1 % 9 % 2 % 1 % 1 % 17 % 25 % 31 %
Note: highlighted cells are those where the non-response rate is above the critical level of 15 %
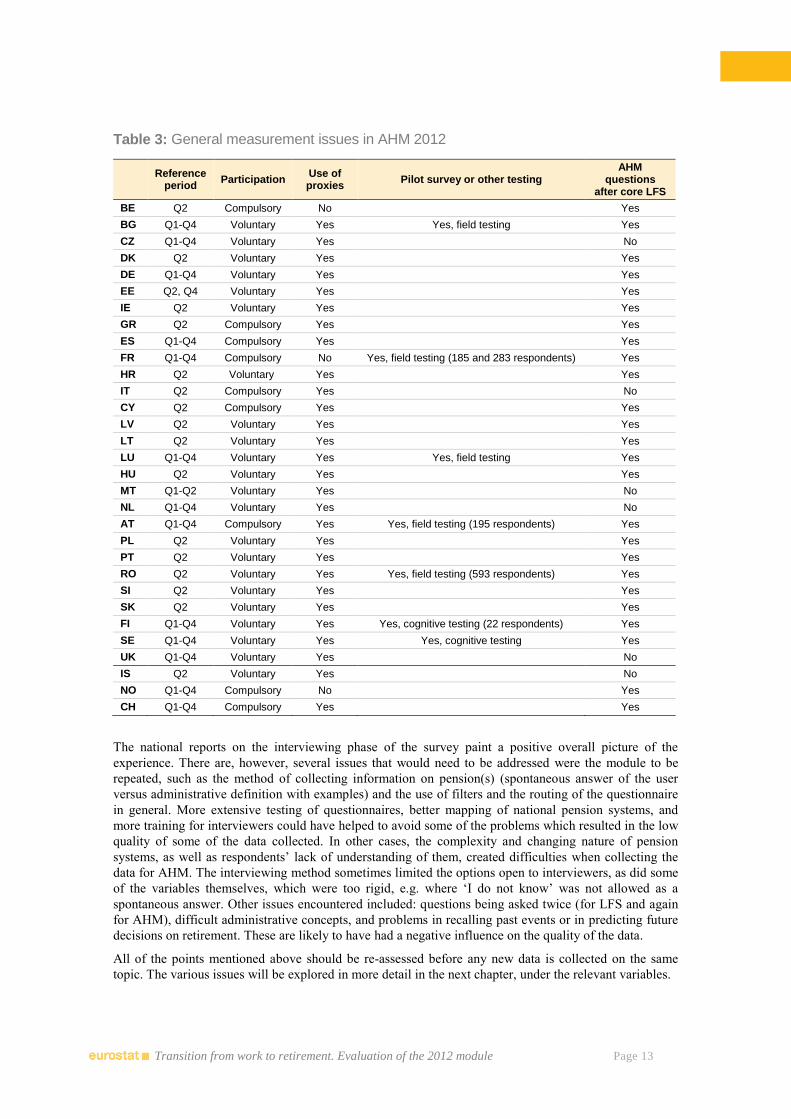
Other measurement issues
The following table gives information on various aspects of how the survey was conducted in each
country; these are liable to influence the quality and comparability of the results:
the reference period(s), i.e. during which quarter(s) of 2012 the data was collected;
whether participation was compulsory or voluntary;
whether a proxy could answer on behalf of the respondent;
whether pilot surveys or other testing was carried out before the survey itself; and
the order in which questions were asked when collecting LFS and AHM data, i.e. whether AHM
questions were either integrated into the survey by topic, or asked all together after the LFS
questions.
Transition from work to retirement. Evaluation of the 2012 module Page 13
Table 3: General measurement issues in AHM 2012
Reference period
Participation Use of proxies
Pilot survey or other testing AHM
questions after core LFS
BE Q2 Compulsory No Yes
BG Q1-Q4 Voluntary Yes Yes, field testing Yes
CZ Q1-Q4 Voluntary Yes No
DK Q2 Voluntary Yes Yes
DE Q1-Q4 Voluntary Yes Yes
EE Q2, Q4 Voluntary Yes Yes
IE Q2 Voluntary Yes Yes
GR Q2 Compulsory Yes Yes
ES Q1-Q4 Compulsory Yes Yes
FR Q1-Q4 Compulsory No Yes, field testing (185 and 283 respondents) Yes
HR Q2 Voluntary Yes Yes
IT Q2 Compulsory Yes No
CY Q2 Compulsory Yes Yes
LV Q2 Voluntary Yes Yes
LT Q2 Voluntary Yes Yes
LU Q1-Q4 Voluntary Yes Yes, field testing Yes
HU Q2 Voluntary Yes Yes
MT Q1-Q2 Voluntary Yes No
NL Q1-Q4 Voluntary Yes No
AT Q1-Q4 Compulsory Yes Yes, field testing (195 respondents) Yes
PL Q2 Voluntary Yes Yes
PT Q2 Voluntary Yes Yes
RO Q2 Voluntary Yes Yes, field testing (593 respondents) Yes
SI Q2 Voluntary Yes Yes
SK Q2 Voluntary Yes Yes
FI Q1-Q4 Voluntary Yes Yes, cognitive testing (22 respondents) Yes
SE Q1-Q4 Voluntary Yes Yes, cognitive testing Yes
UK Q1-Q4 Voluntary Yes No
IS Q2 Voluntary Yes No
NO Q1-Q4 Compulsory No Yes
CH Q1-Q4 Compulsory Yes Yes
The national reports on the interviewing phase of the survey paint a positive overall picture of the
experience. There are, however, several issues that would need to be addressed were the module to be
repeated, such as the method of collecting information on pension(s) (spontaneous answer of the user
versus administrative definition with examples) and the use of filters and the routing of the questionnaire
in general. More extensive testing of questionnaires, better mapping of national pension systems, and
more training for interviewers could have helped to avoid some of the problems which resulted in the low
quality of some of the data collected. In other cases, the complexity and changing nature of pension
systems, as well as respondents’ lack of understanding of them, created difficulties when collecting the
data for AHM. The interviewing method sometimes limited the options open to interviewers, as did some
of the variables themselves, which were too rigid, e.g. where ‘I do not know’ was not allowed as a
spontaneous answer. Other issues encountered included: questions being asked twice (for LFS and again
for AHM), difficult administrative concepts, and problems in recalling past events or in predicting future
decisions on retirement. These are likely to have had a negative influence on the quality of the data.
All of the points mentioned above should be re-assessed before any new data is collected on the same
topic. The various issues will be explored in more detail in the next chapter, under the relevant variables.
Transition from work to retirement. Evaluation of the 2012 module Page 14
Chapter 2: Quality analysis by variable
This chapter assesses AHM 2012 in more detail, with analysis of each variable. The eleven variables
included in the module are presented in the same order as in the Regulation. This is the order of columns
in the database,10 but it does not imply that variables were collected in this order in all countries. The
questionnaires used in each country to collect the AHM 2012 data are available,11 often in several
languages.
1. PENSION: Person receives or does not receive a pension
Short description
The purpose of the variable is to split the target population into two groups: those currently receiving a
pension and those not currently receiving a pension.
Respondents were expected to decide, based on their own judgment, whether the type of benefit they
receive is a pension. The general condition for a payment to be considered as a pension was that it had to
be a regular and periodic benefit received in cash, other than a salary or wage. Lump-sum payments and
benefits in kind were excluded from the definition.12 A list of benefits which are not considered as
pensions was also drawn up13. Symbolic payments, even if labelled as pensions, were excluded.14
Filter conditions and codes
This question was asked to all respondents, i.e. people aged 50-69 who are either currently working
(WSTATOR = 1, 2) or have worked beyond the age of 50 (WSTATOR = 3, 5 and (YEARPR -
YEARBIR) > 49)). See the target population section for more information.
Analysis of the questionnaires
This variable is of particular importance: firstly, because it distinguishes between those receiving and not
receiving a pension; and secondly, because it acts as a filter for the rest of the module.
Ideally, the same question would have been used in all countries, to minimise the risk of introducing
national differences in a variable whose output was crucial for the whole AHM. In general, the
recommendation of asking respondents to judge for themselves whether they receive a pension was
followed. In some questionnaires however (the Belgian and Swiss questionnaires, for example), this
question was repeated for several types of pensions — mainly the ones from the PENSTYPE variable —
while in others (Spain, Portugal and Romania) additional types of pensions were already given as
examples in the opening question. In Bulgaria and Hungary, the interviewer first checked whether
respondents were receiving an old-age pension, and then asked about other types of pensions. It can be
assumed that these variations would not have fundamentally affected the comparability of the data but the
actual impact cannot be measured.
This variable played an important role in the routing of the questionnaire. Those answering ‘no’ (code 2)
10 AHM 2012 columns ranged from 197 to 218, with one or more digits per variable.
11 See description of the 2012 AHM at http://ec.europa.eu/eurostat/statistics-explained/index.php/EU_labour_force_survey_-_ad_hoc_modules
12 Explanatory notes, page 4.
13 Explanatory notes, page 6.
14 Frequently asked questions, page 4.
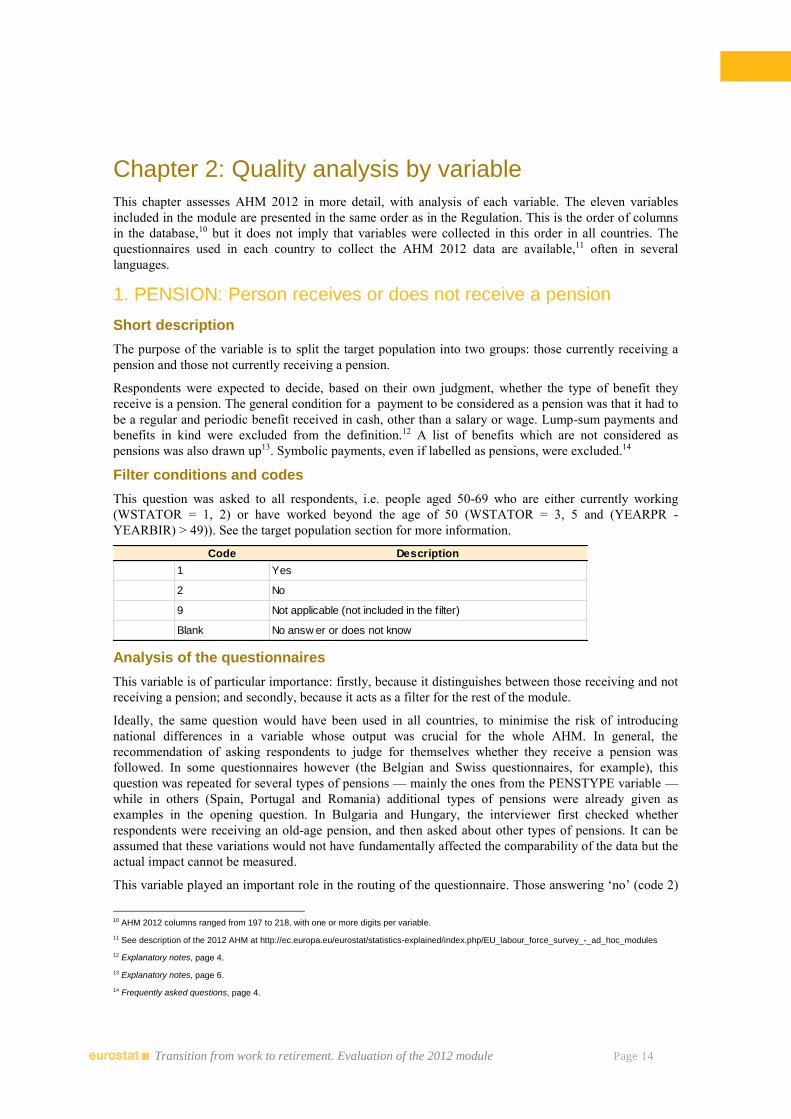
Code Description
1 Yes
2 No
9 Not applicable (not included in the filter)
Blank No answ er or does not know
Transition from work to retirement. Evaluation of the 2012 module Page 15
were routed outside the variables PENSTYPE, EARLYRET, AGEPENS, REASNOT, WORKLONG,
STAYWORK, and PLANSTOP. They were routed instead to REDUCHRS (if in employment),
BUILDPEN and CONTWORK. In most cases, those who wrongly answered ‘no’ to the first open-ended
question did not receive follow-up questions on the same topic. Those who answered ‘yes’ (code 1) were
routed towards the PENSTYPE question. The combination of an open-ended variable (PENSION) and a
yes/no variable (PENSTYPE), the latter based on a pre-determined list of administrative schemes and not
allowing ‘do not know’ answers, was not ideal in all cases. When faced with inconsistencies in a
respondent’s answers to the two questions, interviewers are likely to have made an ‘on the spot’ decision
and, as a result, the routing of the questionnaire was not always as consistent as might have been hoped.
Data was not collected for the variable PENSION in 2006, as a result of which we do not have any time
series data with which to compare the 2012 data. The results were, however, compared to the LFS
variables MAINSTAT (respondents’ own view of their main labour status)15 and LEAVREAS (main
reason for leaving last job or closing business). The testing of the model questionnaire had predicted that
data obtained for this variable would be of high quality and would be useful as a starting point for the
module. Results from the full survey generally confirm this.
Analysis of the results
The response rate was good in all participating countries.
Univariate analysis of a categorical variable offers limited options in terms of methods, but we can see
that this variable has the highest response rate out of all variables included in the module, at 98 % (table
2). The impact of the target population on any potential interpretation of the data is also evident.
Analysing the existence of pension rights based on a subgroup of the population aged 50-69 (moreover a
subgroup with an unequal gender distribution) is not without risks. This issue was discussed in the target
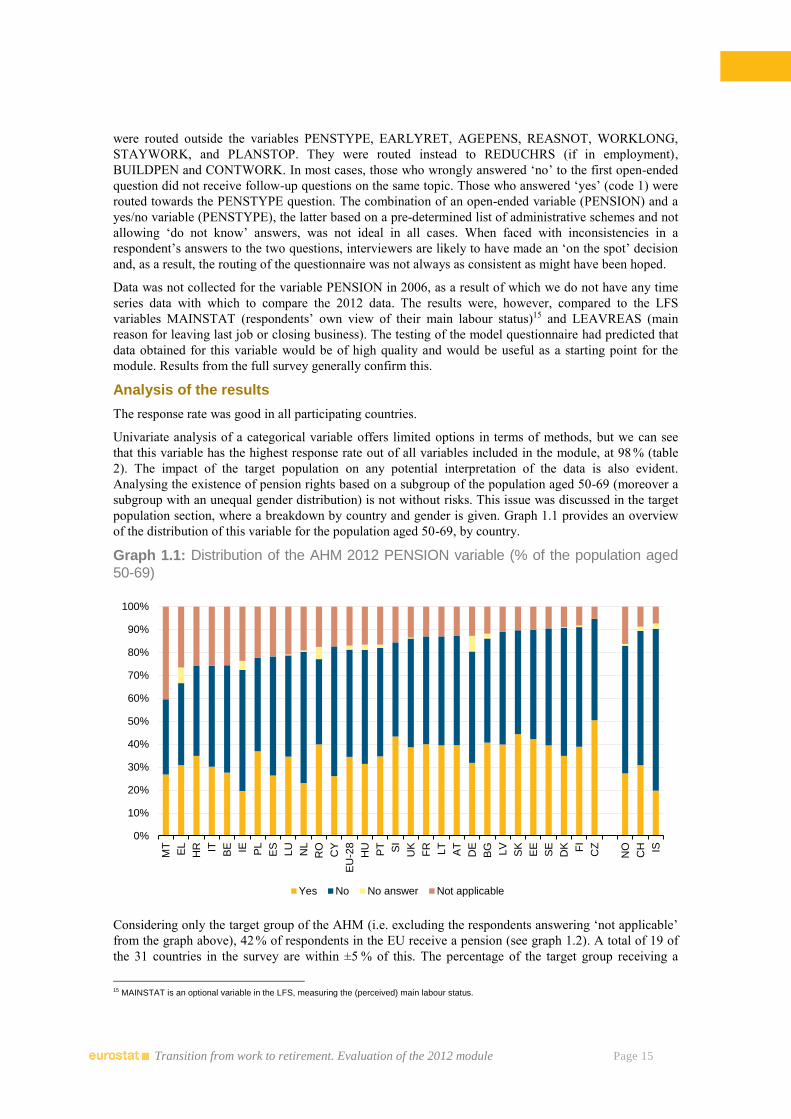
population section, where a breakdown by country and gender is given. Graph 1.1 provides an overview
of the distribution of this variable for the population aged 50-69, by country.
Graph 1.1: Distribution of the AHM 2012 PENSION variable (% of the population aged
50-69)
Considering only the target group of the AHM (i.e. excluding the respondents answering ‘not applicable’
from the graph above), 42 % of respondents in the EU receive a pension (see graph 1.2). A total of 19 of
the 31 countries in the survey are within ±5 % of this. The percentage of the target group receiving a
15 MAINSTAT is an optional variable in the LFS, measuring the (perceived) main labour status.
0%
10%
20%
30%
40%
50%
60%
70%
80%
90%
100%
MT
EL
HR IT BE IE PL
ES
LU
NL
RO
CY
EU
-28
HU
PT SI
UK
FR LT
AT
DE
BG LV
SK
EE
SE
DK FI
CZ
NO
CH IS
Yes No No answer Not applicable
Transition from work to retirement. Evaluation of the 2012 module Page 16
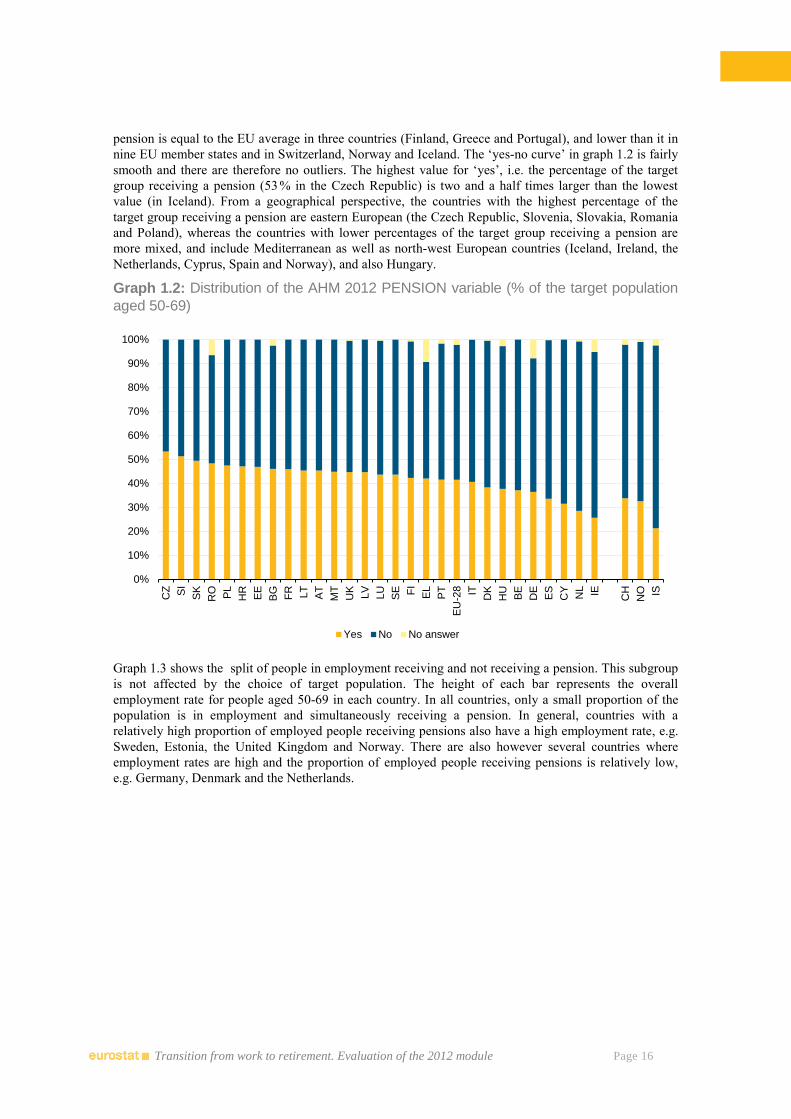
pension is equal to the EU average in three countries (Finland, Greece and Portugal), and lower than it in
nine EU member states and in Switzerland, Norway and Iceland. The ‘yes-no curve’ in graph 1.2 is fairly
smooth and there are therefore no outliers. The highest value for ‘yes’, i.e. the percentage of the target
group receiving a pension (53 % in the Czech Republic) is two and a half times larger than the lowest
value (in Iceland). From a geographical perspective, the countries with the highest percentage of the
target group receiving a pension are eastern European (the Czech Republic, Slovenia, Slovakia, Romania
and Poland), whereas the countries with lower percentages of the target group receiving a pension are
more mixed, and include Mediterranean as well as north-west European countries (Iceland, Ireland, the
Netherlands, Cyprus, Spain and Norway), and also Hungary.
Graph 1.2: Distribution of the AHM 2012 PENSION variable (% of the target population
aged 50-69)
Graph 1.3 shows the split of people in employment receiving and not receiving a pension. This subgroup
is not affected by the choice of target population. The height of each bar represents the overall
employment rate for people aged 50-69 in each country. In all countries, only a small proportion of the
population is in employment and simultaneously receiving a pension. In general, countries with a
relatively high proportion of employed people receiving pensions also have a high employment rate, e.g.
Sweden, Estonia, the United Kingdom and Norway. There are also however several countries where
employment rates are high and the proportion of employed people receiving pensions is relatively low,
e.g. Germany, Denmark and the Netherlands.
0%
10%
20%
30%
40%
50%
60%
70%
80%
90%
100%
CZ SI
SK
RO PL
HR
EE
BG
FR LT
AT
MT
UK
LV
LU
SE FI
EL
PT
EU
-28 IT
DK
HU
BE
DE
ES
CY
NL IE
CH
NO IS
Yes No No answer
Transition from work to retirement. Evaluation of the 2012 module Page 17
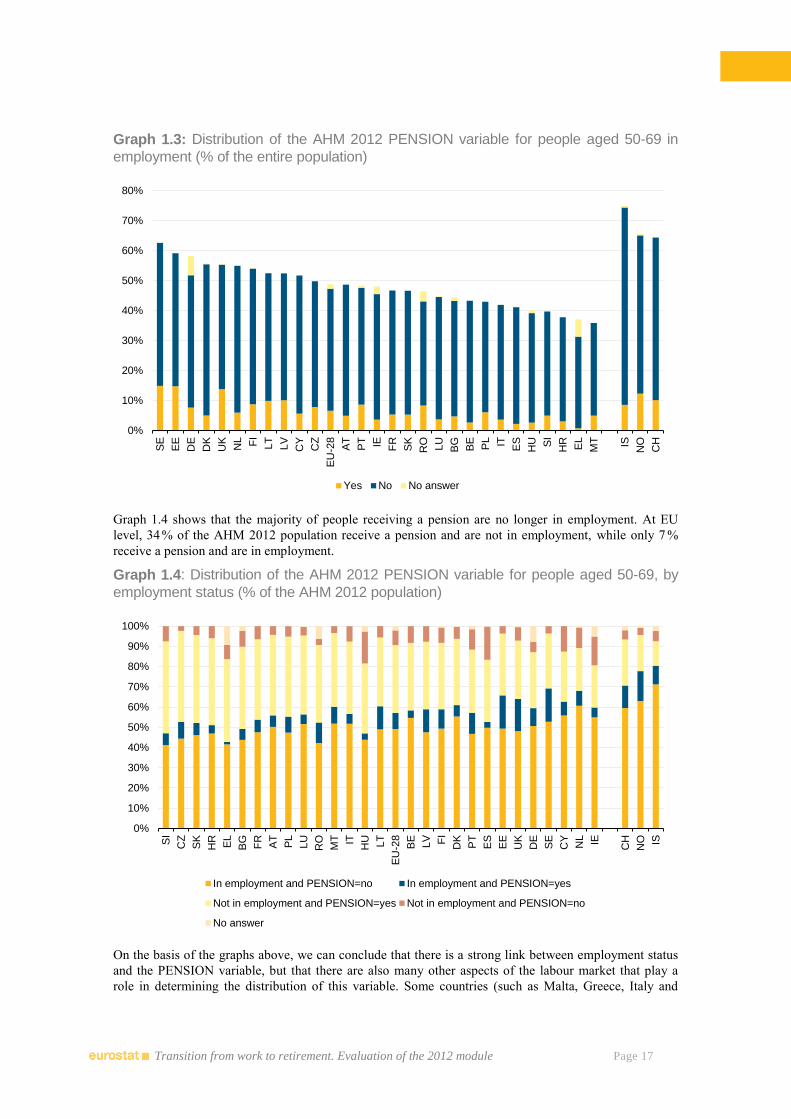
Graph 1.3: Distribution of the AHM 2012 PENSION variable for people aged 50-69 in
employment (% of the entire population)
Graph 1.4 shows that the majority of people receiving a pension are no longer in employment. At EU
level, 34 % of the AHM 2012 population receive a pension and are not in employment, while only 7 %
receive a pension and are in employment.
Graph 1.4: Distribution of the AHM 2012 PENSION variable for people aged 50-69, by
employment status (% of the AHM 2012 population)
On the basis of the graphs above, we can conclude that there is a strong link between employment status
and the PENSION variable, but that there are also many other aspects of the labour market that play a
role in determining the distribution of this variable. Some countries (such as Malta, Greece, Italy and
0%
10%
20%
30%
40%
50%
60%
70%
80%
SE
EE
DE
DK
UK
NL FI
LT
LV
CY
CZ
EU
-28
AT
PT IE FR
SK
RO
LU
BG
BE
PL IT ES
HU SI
HR
EL
MT IS
NO
CH
Yes No No answer
0%
10%
20%
30%
40%
50%
60%
70%
80%
90%
100%
SI
CZ
SK
HR
EL
BG
FR
AT
PL
LU
RO
MT IT
HU LT
EU
-28
BE
LV FI
DK
PT
ES
EE
UK
DE
SE
CY
NL IE
CH
NO IS
In employment and PENSION=no In employment and PENSION=yes
Not in employment and PENSION=yes Not in employment and PENSION=no
No answer
Transition from work to retirement. Evaluation of the 2012 module Page 18
Belgium — see graph 2) have a significant population who have not worked beyond age 50, and this
population was not interviewed. In other countries (such as Sweden, Estonia and the United Kingdom —
see graph 1.3) a high proportion of the population are in employment and receiving a pension, but in
general, those receiving a pension are no longer in employment, as seen in graph 1.4. Among those
receiving a pension, there are significant variations in their employment status at country level: over a
third of those receiving a pension are still in employment in Sweden, Estonia and the United Kingdom,
while only 3 % of those receiving a pension are still in employment in Greece. Finally (see graph 1.2),
more than half of respondents in the Czech Republic and Slovenia do receive a pension, while in Ireland
and the Netherlands fewer than 30 % do.
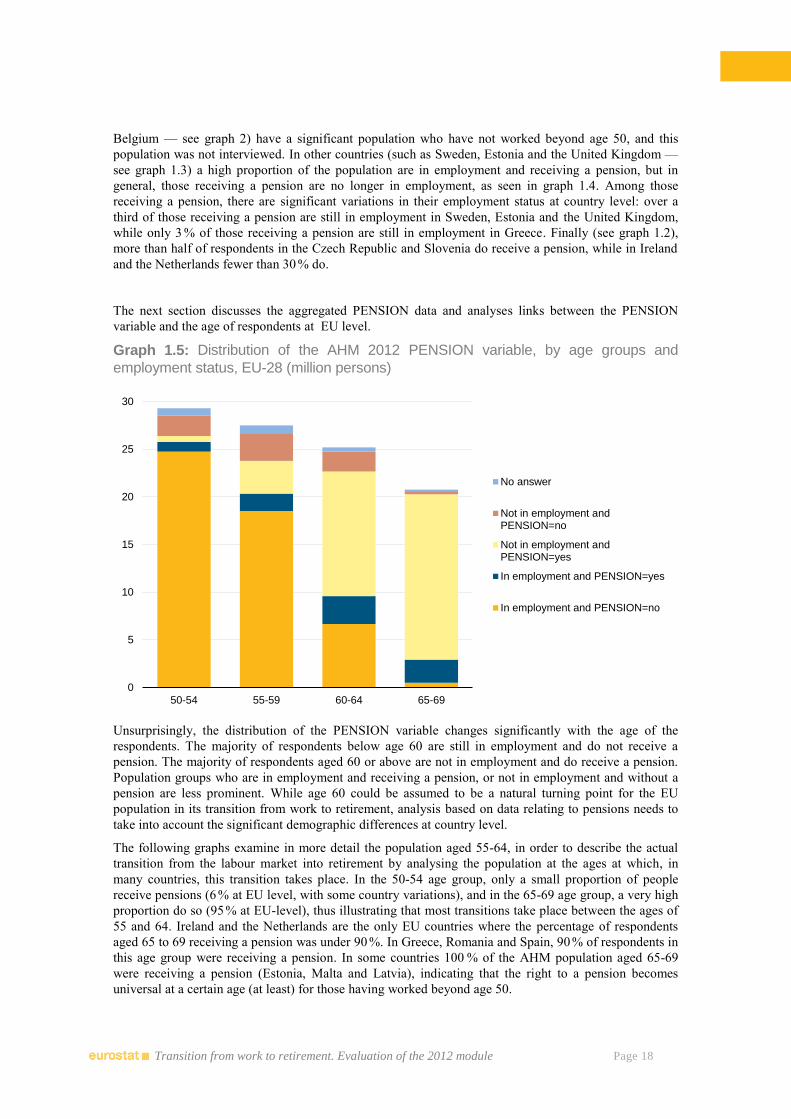
The next section discusses the aggregated PENSION data and analyses links between the PENSION
variable and the age of respondents at EU level.
Graph 1.5: Distribution of the AHM 2012 PENSION variable, by age groups and
employment status, EU-28 (million persons)
Unsurprisingly, the distribution of the PENSION variable changes significantly with the age of the
respondents. The majority of respondents below age 60 are still in employment and do not receive a
pension. The majority of respondents aged 60 or above are not in employment and do receive a pension.
Population groups who are in employment and receiving a pension, or not in employment and without a
pension are less prominent. While age 60 could be assumed to be a natural turning point for the EU
population in its transition from work to retirement, analysis based on data relating to pensions needs to
take into account the significant demographic differences at country level.
The following graphs examine in more detail the population aged 55-64, in order to describe the actual
transition from the labour market into retirement by analysing the population at the ages at which, in
many countries, this transition takes place. In the 50-54 age group, only a small proportion of people
receive pensions (6 % at EU level, with some country variations), and in the 65-69 age group, a very high
proportion do so (95 % at EU-level), thus illustrating that most transitions take place between the ages of
55 and 64. Ireland and the Netherlands are the only EU countries where the percentage of respondents
aged 65 to 69 receiving a pension was under 90 %. In Greece, Romania and Spain, 90 % of respondents in
this age group were receiving a pension. In some countries 100 % of the AHM population aged 65-69
were receiving a pension (Estonia, Malta and Latvia), indicating that the right to a pension becomes
universal at a certain age (at least) for those having worked beyond age 50.
0
5
10
15
20
25
30
50-54 55-59 60-64 65-69
No answer
Not in employment andPENSION=no
Not in employment andPENSION=yes
In employment and PENSION=yes
In employment and PENSION=no
Transition from work to retirement. Evaluation of the 2012 module Page 19
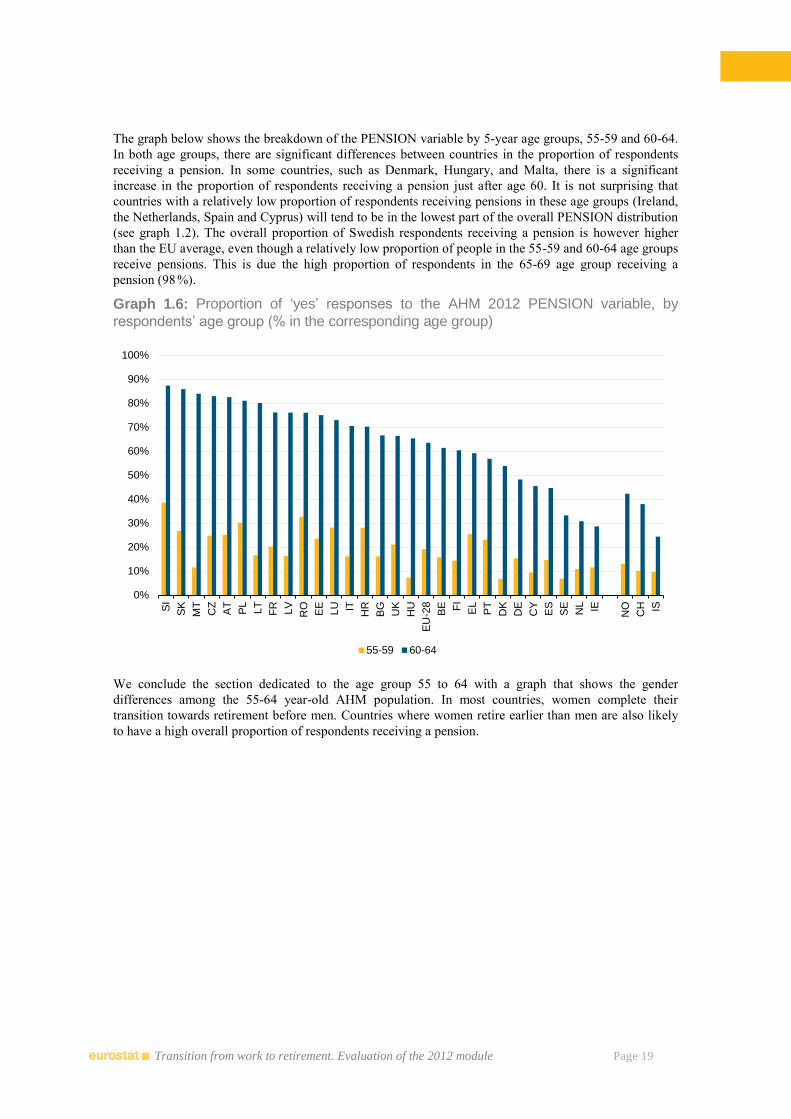
The graph below shows the breakdown of the PENSION variable by 5-year age groups, 55-59 and 60-64.
In both age groups, there are significant differences between countries in the proportion of respondents
receiving a pension. In some countries, such as Denmark, Hungary, and Malta, there is a significant
increase in the proportion of respondents receiving a pension just after age 60. It is not surprising that
countries with a relatively low proportion of respondents receiving pensions in these age groups (Ireland,
the Netherlands, Spain and Cyprus) will tend to be in the lowest part of the overall PENSION distribution
(see graph 1.2). The overall proportion of Swedish respondents receiving a pension is however higher
than the EU average, even though a relatively low proportion of people in the 55-59 and 60-64 age groups
receive pensions. This is due the high proportion of respondents in the 65-69 age group receiving a
pension (98 %).
Graph 1.6: Proportion of ‘yes’ responses to the AHM 2012 PENSION variable, by
respondents’ age group (% in the corresponding age group)
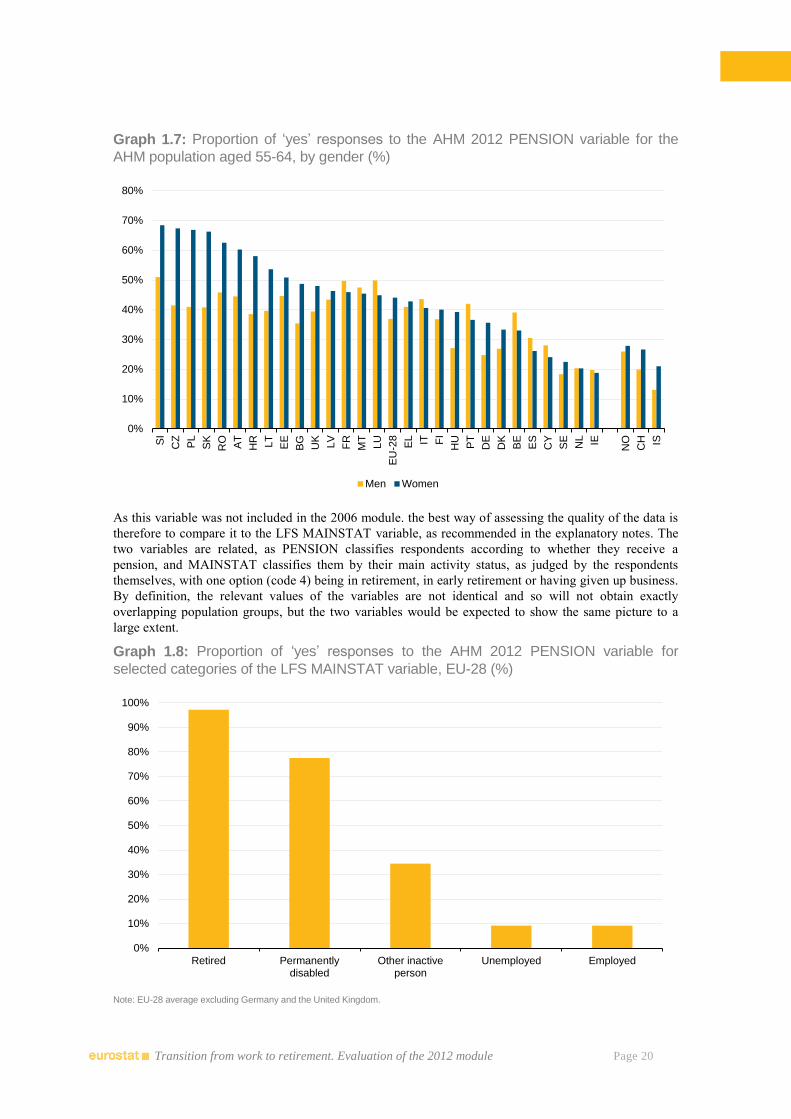
We conclude the section dedicated to the age group 55 to 64 with a graph that shows the gender
differences among the 55-64 year-old AHM population. In most countries, women complete their
transition towards retirement before men. Countries where women retire earlier than men are also likely
to have a high overall proportion of respondents receiving a pension.
0%
10%
20%
30%
40%
50%
60%
70%
80%
90%
100%
SI
SK
MT
CZ
AT
PL
LT
FR
LV
RO
EE
LU IT
HR
BG
UK
HU
EU
-28
BE FI
EL
PT
DK
DE
CY
ES
SE
NL IE
NO
CH IS
55-59 60-64
Transition from work to retirement. Evaluation of the 2012 module Page 20
Graph 1.7: Proportion of ‘yes’ responses to the AHM 2012 PENSION variable for the
AHM population aged 55-64, by gender (%)
As this variable was not included in the 2006 module. the best way of assessing the quality of the data is
therefore to compare it to the LFS MAINSTAT variable, as recommended in the explanatory notes. The
two variables are related, as PENSION classifies respondents according to whether they receive a
pension, and MAINSTAT classifies them by their main activity status, as judged by the respondents
themselves, with one option (code 4) being in retirement, in early retirement or having given up business.
By definition, the relevant values of the variables are not identical and so will not obtain exactly
overlapping population groups, but the two variables would be expected to show the same picture to a
large extent.
Graph 1.8: Proportion of ‘yes’ responses to the AHM 2012 PENSION variable for
selected categories of the LFS MAINSTAT variable, EU-28 (%)
Note: EU-28 average excluding Germany and the United Kingdom.
0%
10%
20%
30%
40%
50%
60%
70%
80%
SI
CZ
PL
SK
RO
AT
HR LT
EE
BG
UK
LV
FR
MT
LU
EU
-28
EL IT FI
HU
PT
DE
DK
BE
ES
CY
SE
NL IE
NO
CH IS
Men Women
0%
10%
20%
30%
40%
50%
60%
70%
80%
90%
100%
Retired Permanentlydisabled
Other inactiveperson
Unemployed Employed
Transition from work to retirement. Evaluation of the 2012 module Page 21
Graph 1.8 confirms these expectations, with most of those who define themselves as retired also receiving
a pension, while people in employment or those unemployed are less likely to receive a pension. It also
shows that, at EU level, there are more respondents in PENSION = 1 than in MAINSTAT = 4 (i.e. more
people receiving a pension than who would describe themselves as in retirement, in early retirement or
having ceased business activities).
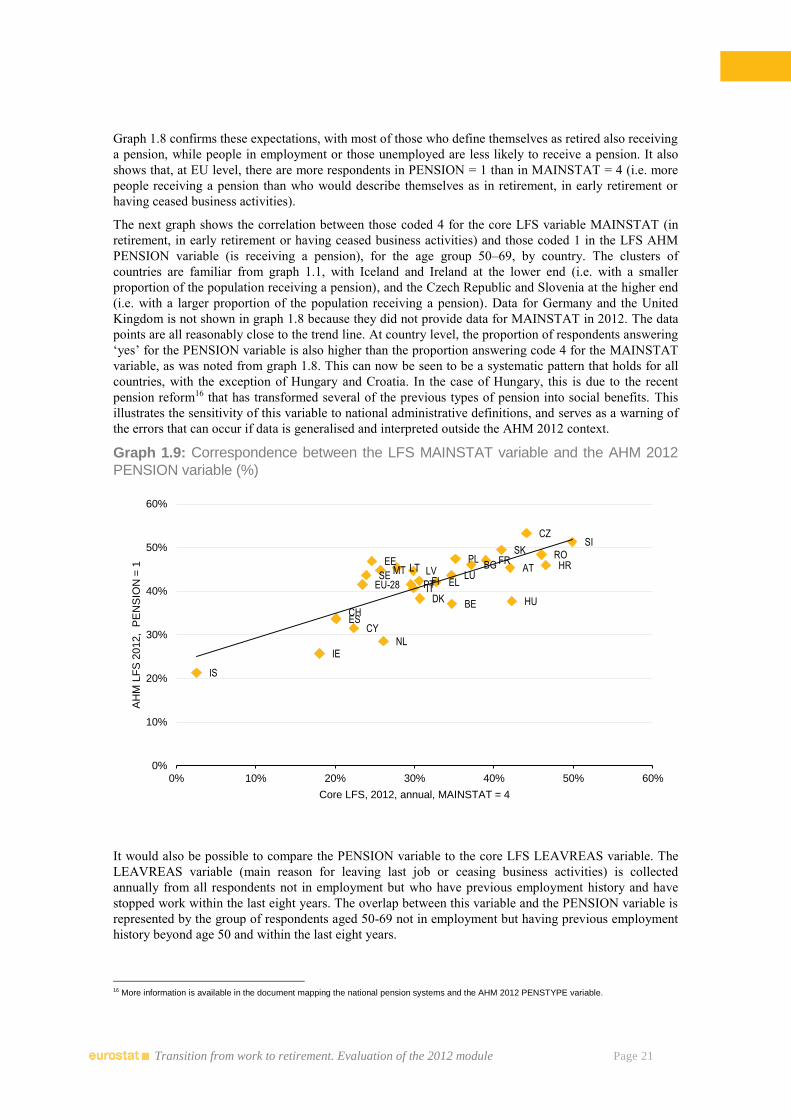
The next graph shows the correlation between those coded 4 for the core LFS variable MAINSTAT (in
retirement, in early retirement or having ceased business activities) and those coded 1 in the LFS AHM
PENSION variable (is receiving a pension), for the age group 50–69, by country. The clusters of
countries are familiar from graph 1.1, with Iceland and Ireland at the lower end (i.e. with a smaller
proportion of the population receiving a pension), and the Czech Republic and Slovenia at the higher end
(i.e. with a larger proportion of the population receiving a pension). Data for Germany and the United
Kingdom is not shown in graph 1.8 because they did not provide data for MAINSTAT in 2012. The data
points are all reasonably close to the trend line. At country level, the proportion of respondents answering
‘yes’ for the PENSION variable is also higher than the proportion answering code 4 for the MAINSTAT
variable, as was noted from graph 1.8. This can now be seen to be a systematic pattern that holds for all
countries, with the exception of Hungary and Croatia. In the case of Hungary, this is due to the recent
pension reform16 that has transformed several of the previous types of pension into social benefits. This
illustrates the sensitivity of this variable to national administrative definitions, and serves as a warning of
the errors that can occur if data is generalised and interpreted outside the AHM 2012 context.
Graph 1.9: Correspondence between the LFS MAINSTAT variable and the AHM 2012
PENSION variable (%)
It would also be possible to compare the PENSION variable to the core LFS LEAVREAS variable. The
LEAVREAS variable (main reason for leaving last job or ceasing business activities) is collected
annually from all respondents not in employment but who have previous employment history and have
stopped work within the last eight years. The overlap between this variable and the PENSION variable is
represented by the group of respondents aged 50-69 not in employment but having previous employment
history beyond age 50 and within the last eight years.
16 More information is available in the document mapping the national pension systems and the AHM 2012 PENSTYPE variable.
EU-28
BE
BG
CZ
DK
EE
IE
EL
ES
HR FR
IT
CY
LV LT LU
HU
MT
NL
AT PL
PT
RO
SI SK
FI SE
IS
CH
0%
10%
20%
30%
40%
50%
60%
0% 10% 20% 30% 40% 50% 60%
AH
M L
FS
2012,
PE
NS
ION
= 1
Core LFS, 2012, annual, MAINSTAT = 4
Transition from work to retirement. Evaluation of the 2012 module Page 22
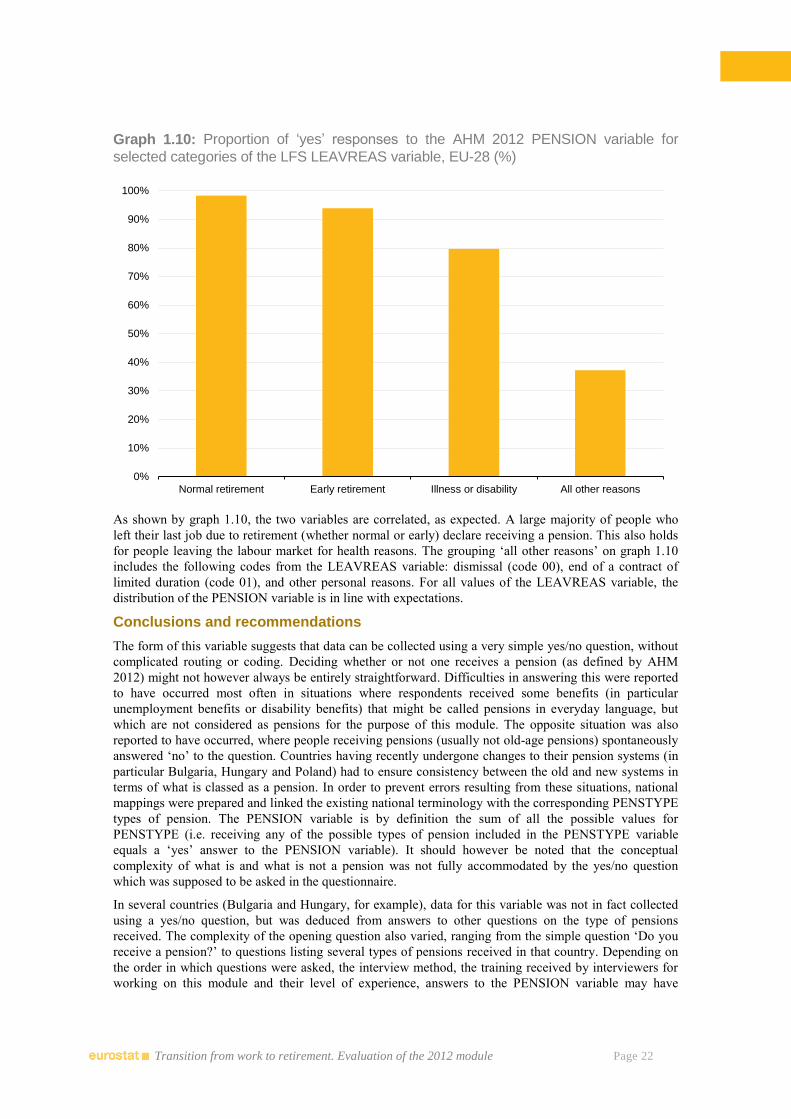
Graph 1.10: Proportion of ‘yes’ responses to the AHM 2012 PENSION variable for
selected categories of the LFS LEAVREAS variable, EU-28 (%)
As shown by graph 1.10, the two variables are correlated, as expected. A large majority of people who
left their last job due to retirement (whether normal or early) declare receiving a pension. This also holds
for people leaving the labour market for health reasons. The grouping ‘all other reasons’ on graph 1.10
includes the following codes from the LEAVREAS variable: dismissal (code 00), end of a contract of
limited duration (code 01), and other personal reasons. For all values of the LEAVREAS variable, the
distribution of the PENSION variable is in line with expectations.
Conclusions and recommendations
The form of this variable suggests that data can be collected using a very simple yes/no question, without
complicated routing or coding. Deciding whether or not one receives a pension (as defined by AHM
2012) might not however always be entirely straightforward. Difficulties in answering this were reported
to have occurred most often in situations where respondents received some benefits (in particular
unemployment benefits or disability benefits) that might be called pensions in everyday language, but
which are not considered as pensions for the purpose of this module. The opposite situation was also
reported to have occurred, where people receiving pensions (usually not old-age pensions) spontaneously
answered ‘no’ to the question. Countries having recently undergone changes to their pension systems (in
particular Bulgaria, Hungary and Poland) had to ensure consistency between the old and new systems in
terms of what is classed as a pension. In order to prevent errors resulting from these situations, national
mappings were prepared and linked the existing national terminology with the corresponding PENSTYPE
types of pension. The PENSION variable is by definition the sum of all the possible values for
PENSTYPE (i.e. receiving any of the possible types of pension included in the PENSTYPE variable
equals a ‘yes’ answer to the PENSION variable). It should however be noted that the conceptual
complexity of what is and what is not a pension was not fully accommodated by the yes/no question
which was supposed to be asked in the questionnaire.
In several countries (Bulgaria and Hungary, for example), data for this variable was not in fact collected
using a yes/no question, but was deduced from answers to other questions on the type of pensions
received. The complexity of the opening question also varied, ranging from the simple question ‘Do you
receive a pension?’ to questions listing several types of pensions received in that country. Depending on
the order in which questions were asked, the interview method, the training received by interviewers for
working on this module and their level of experience, answers to the PENSION variable may have
0%
10%
20%
30%
40%
50%
60%
70%
80%
90%
100%
Normal retirement Early retirement Illness or disability All other reasons
Transition from work to retirement. Evaluation of the 2012 module Page 23
sometimes been re-coded in light of the information collected for the PENSTYPE variable. In other cases
however, it may not have been possible to ensure fully consistent coding.
Very few of the participating countries reported any problems in collecting data for this variable and the
response rate was good. The Netherlands report explained that their data would underestimate the number
of pensioners because it was difficult in some cases to make the respondents understand the module’s
broad definition of pensions. The report from Greece highlighted a situation which can arise in their
system where an individual is formally entitled to a pension, but the actual payment is delayed for more
than a year, thus making it difficult to know whether to answer ‘yes’ or ‘no’ to the question of receiving a
pension. Moreover, no country reported that their definition of the variable in the module differed from
the definition included in the Commission Regulation (249/2011). The response rate was good, there
were no outliers, and there was also strong correlation with MAINSTAT and LEAVREAS. We can
therefore conclude that the quality of data for the variable is good. The variable is however based on
national definitions and classifications of pensions and other social benefits. Conceptually its
comparability is unfortunately limited at any level higher than country level.
Should the module be repeated, consideration should be given to the question of whether one single
variable is sufficient for the purpose of dividing the target population into two groups: those receiving
and those not receiving a pension. Were a similar variable to be used again as a filter for the rest of the
module, the risk of inconsistencies or errors and their impact on the overall data set should also be
assessed. Moreover, the concept of a pension was defined in 2012 at national level, as a specific provision
entitling an individual to selected social benefits. Possible ways of improving its comparability at
European level could be analysed in more detail.
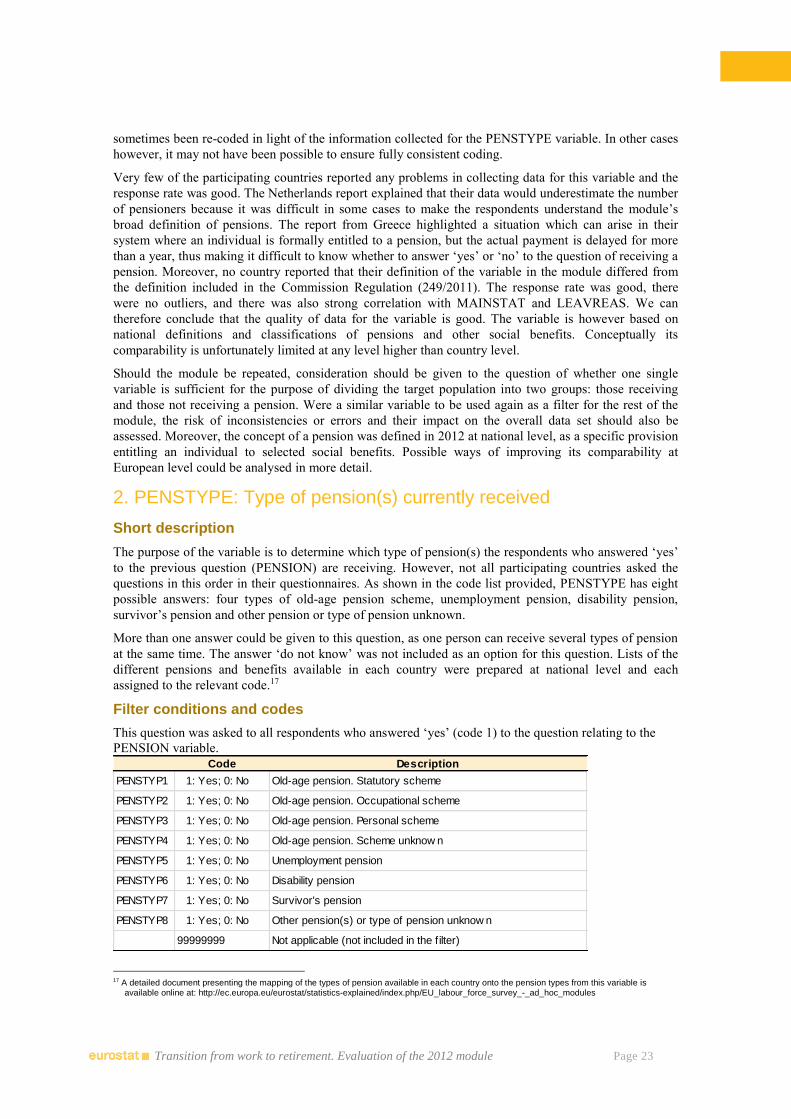
2. PENSTYPE: Type of pension(s) currently received
Short description
The purpose of the variable is to determine which type of pension(s) the respondents who answered ‘yes’
to the previous question (PENSION) are receiving. However, not all participating countries asked the
questions in this order in their questionnaires. As shown in the code list provided, PENSTYPE has eight
possible answers: four types of old-age pension scheme, unemployment pension, disability pension,
survivor’s pension and other pension or type of pension unknown.
More than one answer could be given to this question, as one person can receive several types of pension
at the same time. The answer ‘do not know’ was not included as an option for this question. Lists of the
different pensions and benefits available in each country were prepared at national level and each
assigned to the relevant code.17
Filter conditions and codes
This question was asked to all respondents who answered ‘yes’ (code 1) to the question relating to the
PENSION variable.
17 A detailed document presenting the mapping of the types of pension available in each country onto the pension types from this variable is
available online at: http://ec.europa.eu/eurostat/statistics-explained/index.php/EU_labour_force_survey_-_ad_hoc_modules
Code Description
PENSTYP1 1: Yes; 0: No Old-age pension. Statutory scheme
PENSTYP2 1: Yes; 0: No Old-age pension. Occupational scheme
PENSTYP3 1: Yes; 0: No Old-age pension. Personal scheme
PENSTYP4 1: Yes; 0: No Old-age pension. Scheme unknow n
PENSTYP5 1: Yes; 0: No Unemployment pension
PENSTYP6 1: Yes; 0: No Disability pension
PENSTYP7 1: Yes; 0: No Survivor's pension
PENSTYP8 1: Yes; 0: No Other pension(s) or type of pension unknow n
99999999 Not applicable (not included in the filter)
Transition from work to retirement. Evaluation of the 2012 module Page 24
Analysis of the questionnaires
Countries were advised to ask the PENSTYPE question only after the PENSION question. Most countries
followed this advice and collected information on whether pension benefits were received at all first, and
then asked about the type of pensions received. Some countries, including Belgium, Lithuania and
Switzerland, used a slightly different questionnaire structure. The risk of inconsistencies between the two
variables and the implications of this for the overall questionnaire were discussed in the PENSION
section.
For the PENSTYPE variable, mappings of pensions available in each country were prepared at national
level. These were helpful but required substantial documentation. Where national systems are extremely
complex (e.g. in Denmark and Italy) or undergoing changes (e.g. in Hungary and Poland), countries
reported difficulties in ensuring that all eight components of the variable were well defined and distinct.
Bulgaria and Sweden reported minor deviations in the implementation of this variable. In the case of
Bulgaria, this is due to a change made to the social security code in 2012, which separated social
disability pensions from disability pensions (PENSTYP6), with an estimated impact on the results of
PENSTYP6 of 12 %. Sweden reported that it did not use PENSTYP4, and that it included the data which
would have taken this value in PENSTYP8 instead, i.e. it combined the two codes as PENSTYP8.
In some countries (Finland and the Netherlands), the terminology of this AHM was not always familiar
and respondents had difficulty answering the question. For example, in Finnish, the concept of an old-age
pension is not always understood correctly. In some situations (reported in Finland and Italy and likely to
have occurred in other countries as well), the respondent received a benefit whose ‘label’ had changed at
some point in time, e.g. when a disability pension was automatically converted into an old-age pension at
a certain age. In these cases, respondents were not always able to indicate accurately the correct type of
pension they received. Errors in the PENSTYPE variable had an impact on the overall routing of the
questionnaire, as well as on the accuracy of the AGEPENS variable. It can however be assumed that the
impact of these cases on the overall data set was not significant.
A somewhat similar variable was collected in 2006, as discussed in the chapter on links with the AHM
2006. In Hungary, there was a major overhaul of the pension system in 2012, making any attempt at
comparison to the 2006 module meaningless.
Analysis of the results
This variable is defined as eight separate variables collated together. Each of the eight sub-variables
allowed yes and no answers, and, as a result, multiple types of pensions could be selected by each
respondent. Respondents receiving two (or more) types of pension are therefore counted as many times as
they receive pension types.
Unfortunately, the data for this variable is not easy to interpret at EU level, as very similar types of
pension could be classified in different countries as being under different schemes. Moreover, for some
types of pension (PENSTYP 5 or 6), similar social rights are classified as pension schemes in some
countries and social benefits (not included in the module) in others.
The table below shows the percentage of ‘yes’ answers out of the total number of answers for each
subcategory of the PENSTYPE variable, at EU level and by country.
Transition from work to retirement. Evaluation of the 2012 module Page 25
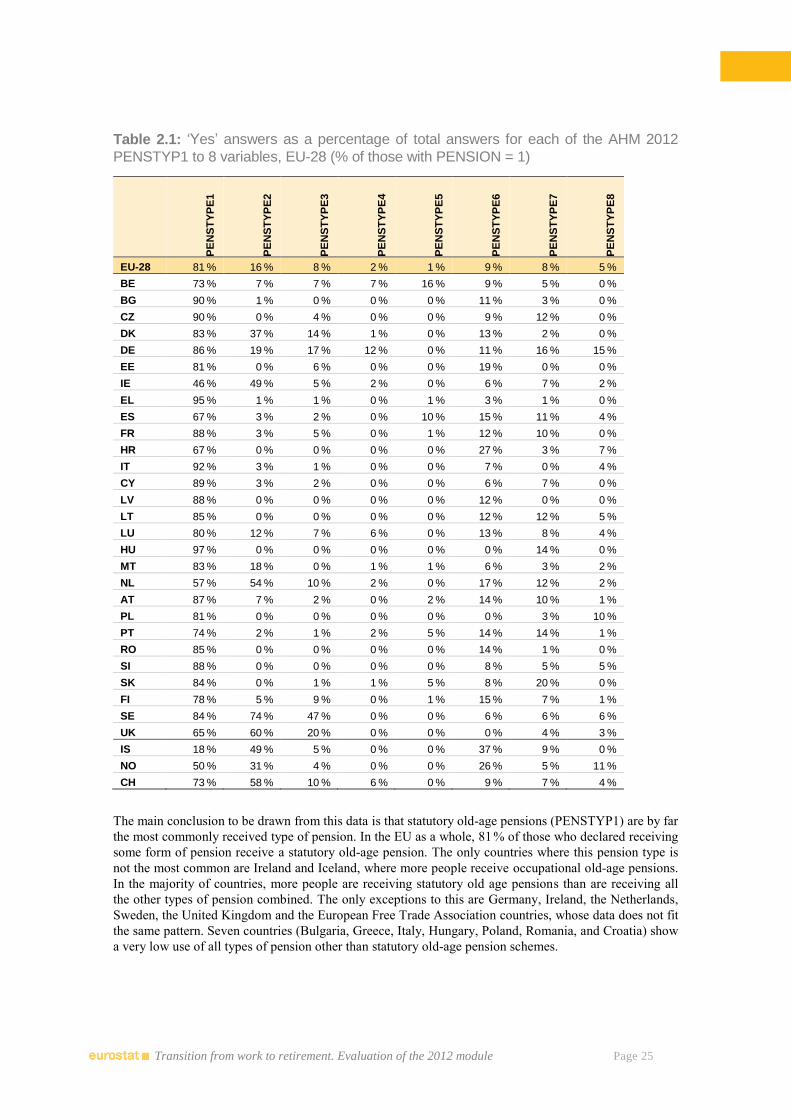
Table 2.1: ‘Yes’ answers as a percentage of total answers for each of the AHM 2012
PENSTYP1 to 8 variables, EU-28 (% of those with PENSION = 1)
PE
NS
TY
PE
1
PE
NS
TY
PE
2
PE
NS
TY
PE
3
PE
NS
TY
PE
4
PE
NS
TY
PE
5
PE
NS
TY
PE
6
PE
NS
TY
PE
7
PE
NS
TY
PE
8
EU-28 81 % 16 % 8 % 2 % 1 % 9 % 8 % 5 %
BE 73 % 7 % 7 % 7 % 16 % 9 % 5 % 0 %
BG 90 % 1 % 0 % 0 % 0 % 11 % 3 % 0 %
CZ 90 % 0 % 4 % 0 % 0 % 9 % 12 % 0 %
DK 83 % 37 % 14 % 1 % 0 % 13 % 2 % 0 %
DE 86 % 19 % 17 % 12 % 0 % 11 % 16 % 15 %
EE 81 % 0 % 6 % 0 % 0 % 19 % 0 % 0 %
IE 46 % 49 % 5 % 2 % 0 % 6 % 7 % 2 %
EL 95 % 1 % 1 % 0 % 1 % 3 % 1 % 0 %
ES 67 % 3 % 2 % 0 % 10 % 15 % 11 % 4 %
FR 88 % 3 % 5 % 0 % 1 % 12 % 10 % 0 %
HR 67 % 0 % 0 % 0 % 0 % 27 % 3 % 7 %
IT 92 % 3 % 1 % 0 % 0 % 7 % 0 % 4 %
CY 89 % 3 % 2 % 0 % 0 % 6 % 7 % 0 %
LV 88 % 0 % 0 % 0 % 0 % 12 % 0 % 0 %
LT 85 % 0 % 0 % 0 % 0 % 12 % 12 % 5 %
LU 80 % 12 % 7 % 6 % 0 % 13 % 8 % 4 %
HU 97 % 0 % 0 % 0 % 0 % 0 % 14 % 0 %
MT 83 % 18 % 0 % 1 % 1 % 6 % 3 % 2 %
NL 57 % 54 % 10 % 2 % 0 % 17 % 12 % 2 %
AT 87 % 7 % 2 % 0 % 2 % 14 % 10 % 1 %
PL 81 % 0 % 0 % 0 % 0 % 0 % 3 % 10 %
PT 74 % 2 % 1 % 2 % 5 % 14 % 14 % 1 %
RO 85 % 0 % 0 % 0 % 0 % 14 % 1 % 0 %
SI 88 % 0 % 0 % 0 % 0 % 8 % 5 % 5 %
SK 84 % 0 % 1 % 1 % 5 % 8 % 20 % 0 %
FI 78 % 5 % 9 % 0 % 1 % 15 % 7 % 1 %
SE 84 % 74 % 47 % 0 % 0 % 6 % 6 % 6 %
UK 65 % 60 % 20 % 0 % 0 % 0 % 4 % 3 %
IS 18 % 49 % 5 % 0 % 0 % 37 % 9 % 0 %
NO 50 % 31 % 4 % 0 % 0 % 26 % 5 % 11 %
CH 73 % 58 % 10 % 6 % 0 % 9 % 7 % 4 %
The main conclusion to be drawn from this data is that statutory old-age pensions (PENSTYP1) are by far
the most commonly received type of pension. In the EU as a whole, 81 % of those who declared receiving
some form of pension receive a statutory old-age pension. The only countries where this pension type is
not the most common are Ireland and Iceland, where more people receive occupational old-age pensions.
In the majority of countries, more people are receiving statutory old age pensions than are receiving all
the other types of pension combined. The only exceptions to this are Germany, Ireland, the Netherlands,
Sweden, the United Kingdom and the European Free Trade Association countries, whose data does not fit
the same pattern. Seven countries (Bulgaria, Greece, Italy, Hungary, Poland, Romania, and Croatia) show
a very low use of all types of pension other than statutory old-age pension schemes.
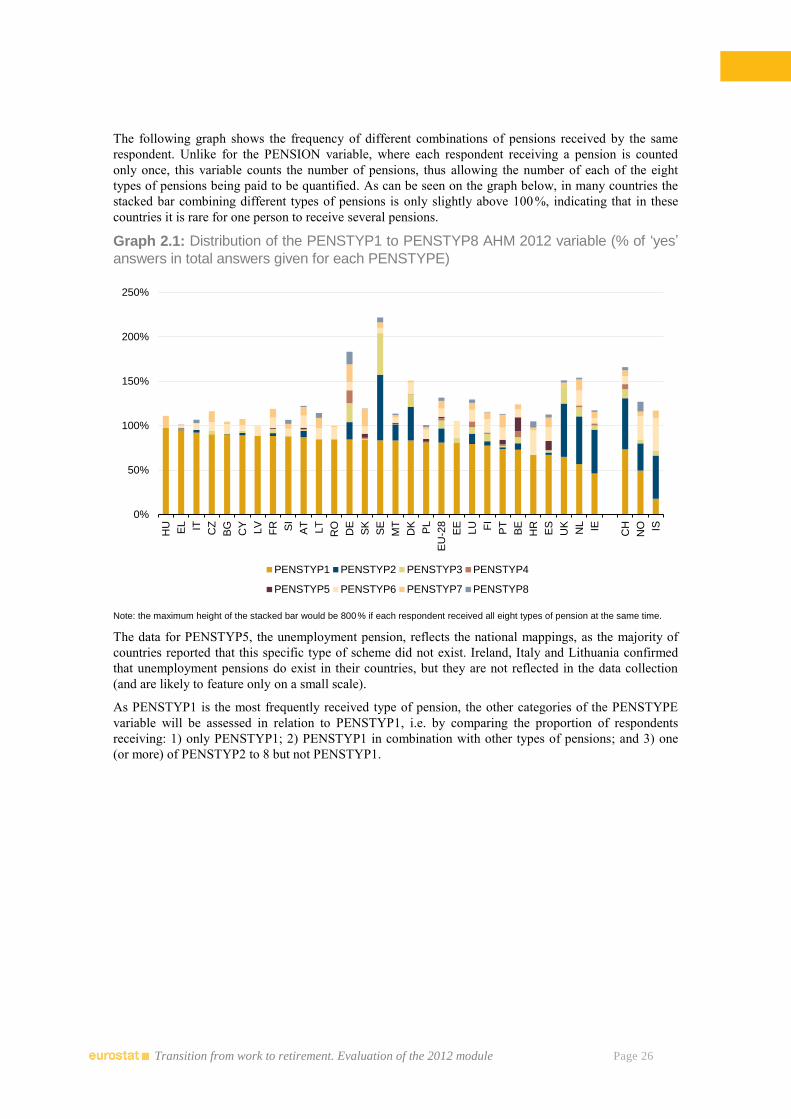
Transition from work to retirement. Evaluation of the 2012 module Page 26
The following graph shows the frequency of different combinations of pensions received by the same
respondent. Unlike for the PENSION variable, where each respondent receiving a pension is counted
only once, this variable counts the number of pensions, thus allowing the number of each of the eight
types of pensions being paid to be quantified. As can be seen on the graph below, in many countries the
stacked bar combining different types of pensions is only slightly above 100 %, indicating that in these
countries it is rare for one person to receive several pensions.
Graph 2.1: Distribution of the PENSTYP1 to PENSTYP8 AHM 2012 variable (% of ‘yes’
answers in total answers given for each PENSTYPE)
Note: the maximum height of the stacked bar would be 800 % if each respondent received all eight types of pension at the same time.
The data for PENSTYP5, the unemployment pension, reflects the national mappings, as the majority of
countries reported that this specific type of scheme did not exist. Ireland, Italy and Lithuania confirmed
that unemployment pensions do exist in their countries, but they are not reflected in the data collection
(and are likely to feature only on a small scale).
As PENSTYP1 is the most frequently received type of pension, the other categories of the PENSTYPE
variable will be assessed in relation to PENSTYP1, i.e. by comparing the proportion of respondents
receiving: 1) only PENSTYP1; 2) PENSTYP1 in combination with other types of pensions; and 3) one
(or more) of PENSTYP2 to 8 but not PENSTYP1.
0%
50%
100%
150%
200%
250%
HU
EL IT CZ
BG
CY
LV
FR SI
AT
LT
RO
DE
SK
SE
MT
DK
PL
EU
-28
EE
LU FI
PT
BE
HR
ES
UK
NL IE
CH
NO IS
PENSTYP1 PENSTYP2 PENSTYP3 PENSTYP4
PENSTYP5 PENSTYP6 PENSTYP7 PENSTYP8
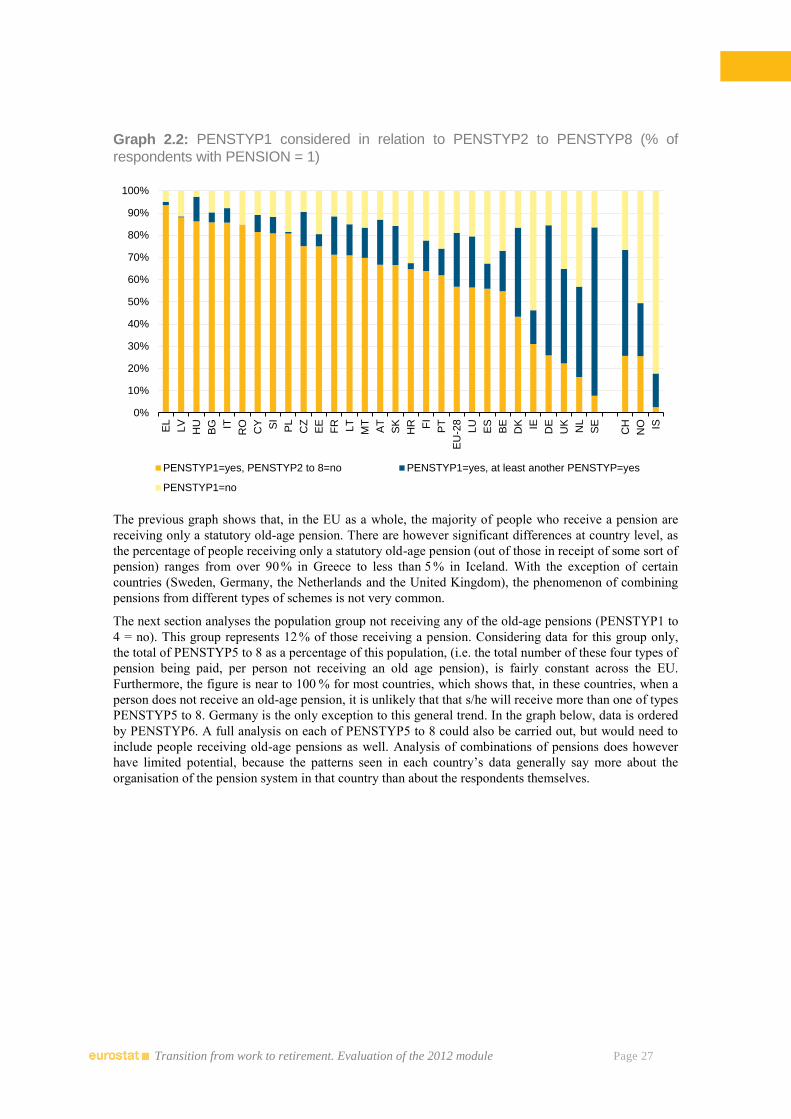
Transition from work to retirement. Evaluation of the 2012 module Page 27
Graph 2.2: PENSTYP1 considered in relation to PENSTYP2 to PENSTYP8 (% of
respondents with PENSION = 1)
The previous graph shows that, in the EU as a whole, the majority of people who receive a pension are
receiving only a statutory old-age pension. There are however significant differences at country level, as
the percentage of people receiving only a statutory old-age pension (out of those in receipt of some sort of
pension) ranges from over 90 % in Greece to less than 5 % in Iceland. With the exception of certain
countries (Sweden, Germany, the Netherlands and the United Kingdom), the phenomenon of combining
pensions from different types of schemes is not very common.
The next section analyses the population group not receiving any of the old-age pensions (PENSTYP1 to
4 = no). This group represents 12 % of those receiving a pension. Considering data for this group only,
the total of PENSTYP5 to 8 as a percentage of this population, (i.e. the total number of these four types of
pension being paid, per person not receiving an old age pension), is fairly constant across the EU.
Furthermore, the figure is near to 100 % for most countries, which shows that, in these countries, when a
person does not receive an old-age pension, it is unlikely that that s/he will receive more than one of types
PENSTYP5 to 8. Germany is the only exception to this general trend. In the graph below, data is ordered
by PENSTYP6. A full analysis on each of PENSTYP5 to 8 could also be carried out, but would need to
include people receiving old-age pensions as well. Analysis of combinations of pensions does however
have limited potential, because the patterns seen in each country’s data generally say more about the
organisation of the pension system in that country than about the respondents themselves.
0%
10%
20%
30%
40%
50%
60%
70%
80%
90%
100%
EL
LV
HU
BG IT
RO
CY SI
PL
CZ
EE
FR LT
MT
AT
SK
HR FI
PT
EU
-28
LU
ES
BE
DK IE DE
UK
NL
SE
CH
NO IS
PENSTYP1=yes, PENSTYP2 to 8=no PENSTYP1=yes, at least another PENSTYP=yes
PENSTYP1=no
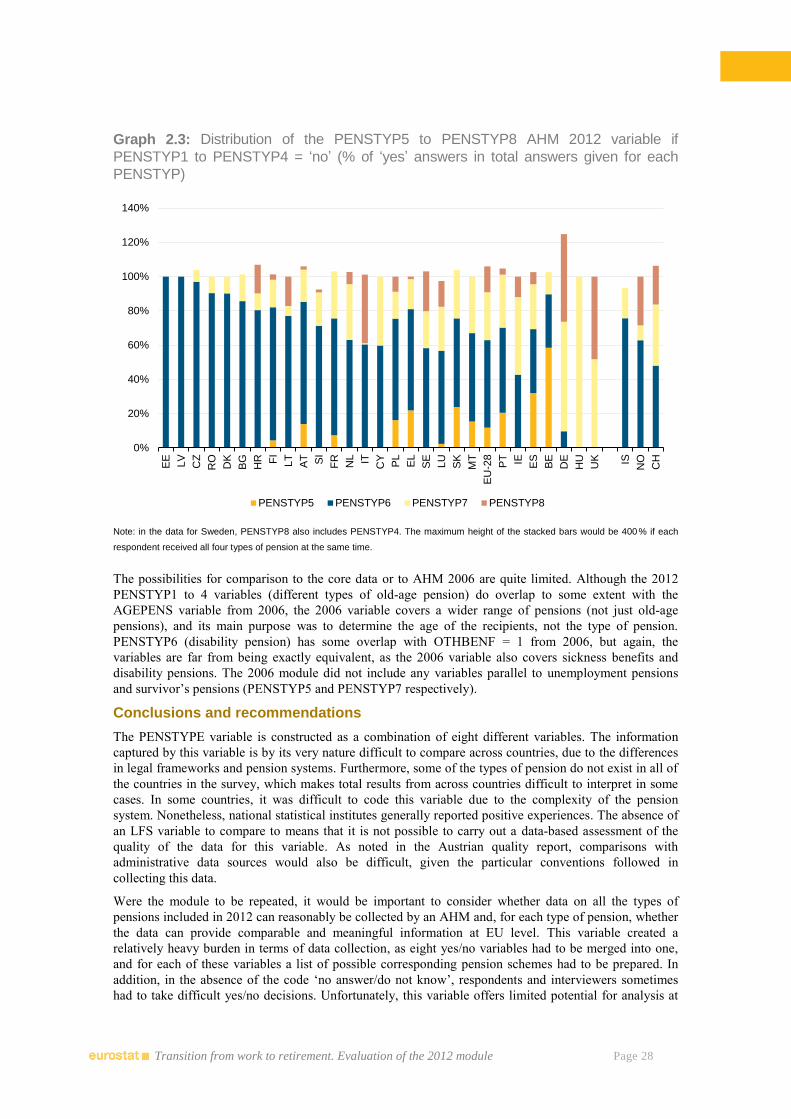
Transition from work to retirement. Evaluation of the 2012 module Page 28
Graph 2.3: Distribution of the PENSTYP5 to PENSTYP8 AHM 2012 variable if
PENSTYP1 to PENSTYP4 = ‘no’ (% of ‘yes’ answers in total answers given for each
PENSTYP)
Note: in the data for Sweden, PENSTYP8 also includes PENSTYP4. The maximum height of the stacked bars would be 400 % if each
respondent received all four types of pension at the same time.
The possibilities for comparison to the core data or to AHM 2006 are quite limited. Although the 2012
PENSTYP1 to 4 variables (different types of old-age pension) do overlap to some extent with the
AGEPENS variable from 2006, the 2006 variable covers a wider range of pensions (not just old-age
pensions), and its main purpose was to determine the age of the recipients, not the type of pension.
PENSTYP6 (disability pension) has some overlap with OTHBENF = 1 from 2006, but again, the
variables are far from being exactly equivalent, as the 2006 variable also covers sickness benefits and
disability pensions. The 2006 module did not include any variables parallel to unemployment pensions
and survivor’s pensions (PENSTYP5 and PENSTYP7 respectively).
Conclusions and recommendations
The PENSTYPE variable is constructed as a combination of eight different variables. The information
captured by this variable is by its very nature difficult to compare across countries, due to the differences
in legal frameworks and pension systems. Furthermore, some of the types of pension do not exist in all of
the countries in the survey, which makes total results from across countries difficult to interpret in some
cases. In some countries, it was difficult to code this variable due to the complexity of the pension
system. Nonetheless, national statistical institutes generally reported positive experiences. The absence of
an LFS variable to compare to means that it is not possible to carry out a data-based assessment of the
quality of the data for this variable. As noted in the Austrian quality report, comparisons with
administrative data sources would also be difficult, given the particular conventions followed in
collecting this data.
Were the module to be repeated, it would be important to consider whether data on all the types of
pensions included in 2012 can reasonably be collected by an AHM and, for each type of pension, whether
the data can provide comparable and meaningful information at EU level. This variable created a
relatively heavy burden in terms of data collection, as eight yes/no variables had to be merged into one,
and for each of these variables a list of possible corresponding pension schemes had to be prepared. In
addition, in the absence of the code ‘no answer/do not know’, respondents and interviewers sometimes
had to take difficult yes/no decisions. Unfortunately, this variable offers limited potential for analysis at
0%
20%
40%
60%
80%
100%
120%
140%
EE
LV
CZ
RO
DK
BG
HR FI
LT
AT SI
FR
NL IT
CY
PL
EL
SE
LU
SK
MT
EU
-28
PT IE ES
BE
DE
HU
UK IS
NO
CH
PENSTYP5 PENSTYP6 PENSTYP7 PENSTYP8
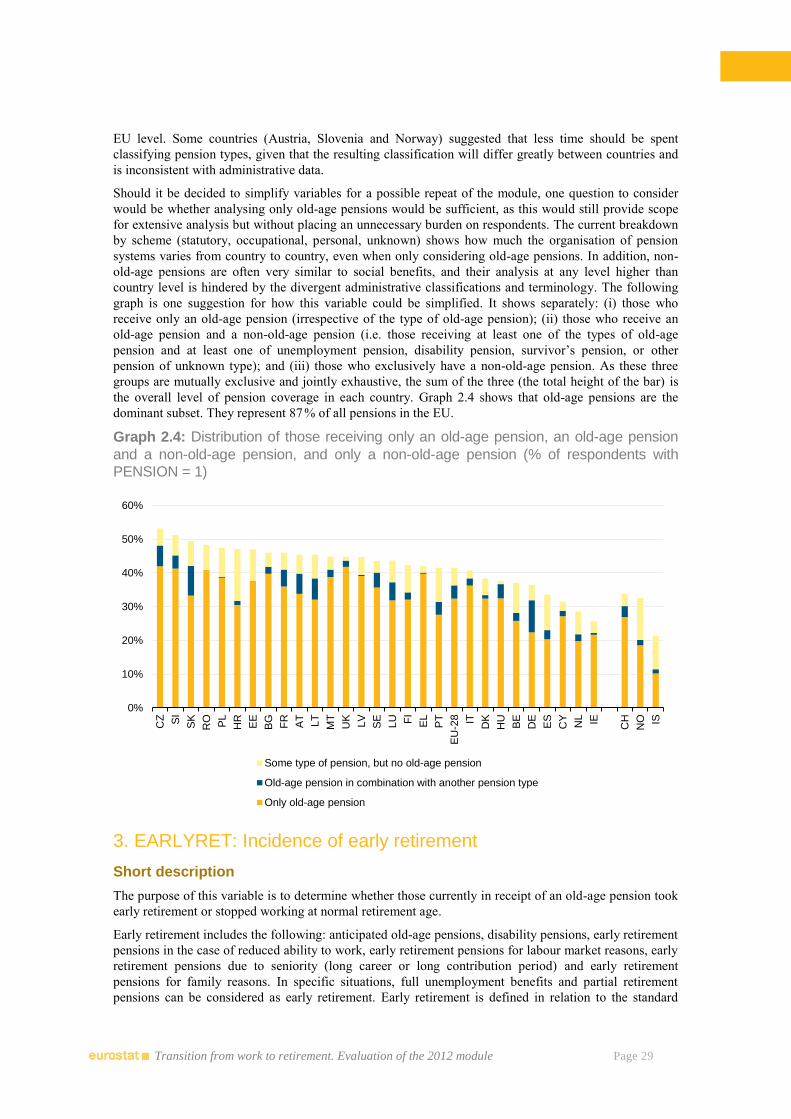
Transition from work to retirement. Evaluation of the 2012 module Page 29
EU level. Some countries (Austria, Slovenia and Norway) suggested that less time should be spent
classifying pension types, given that the resulting classification will differ greatly between countries and
is inconsistent with administrative data.
Should it be decided to simplify variables for a possible repeat of the module, one question to consider
would be whether analysing only old-age pensions would be sufficient, as this would still provide scope
for extensive analysis but without placing an unnecessary burden on respondents. The current breakdown
by scheme (statutory, occupational, personal, unknown) shows how much the organisation of pension
systems varies from country to country, even when only considering old-age pensions. In addition, non-
old-age pensions are often very similar to social benefits, and their analysis at any level higher than
country level is hindered by the divergent administrative classifications and terminology. The following
graph is one suggestion for how this variable could be simplified. It shows separately: (i) those who
receive only an old-age pension (irrespective of the type of old-age pension); (ii) those who receive an
old-age pension and a non-old-age pension (i.e. those receiving at least one of the types of old-age
pension and at least one of unemployment pension, disability pension, survivor’s pension, or other
pension of unknown type); and (iii) those who exclusively have a non-old-age pension. As these three
groups are mutually exclusive and jointly exhaustive, the sum of the three (the total height of the bar) is
the overall level of pension coverage in each country. Graph 2.4 shows that old-age pensions are the
dominant subset. They represent 87 % of all pensions in the EU.
Graph 2.4: Distribution of those receiving only an old-age pension, an old-age pension
and a non-old-age pension, and only a non-old-age pension (% of respondents with
PENSION = 1)
3. EARLYRET: Incidence of early retirement
Short description
The purpose of this variable is to determine whether those currently in receipt of an old-age pension took
early retirement or stopped working at normal retirement age.
Early retirement includes the following: anticipated old-age pensions, disability pensions, early retirement
pensions in the case of reduced ability to work, early retirement pensions for labour market reasons, early
retirement pensions due to seniority (long career or long contribution period) and early retirement
pensions for family reasons. In specific situations, full unemployment benefits and partial retirement
pensions can be considered as early retirement. Early retirement is defined in relation to the standard
0%
10%
20%
30%
40%
50%
60%
CZ SI
SK
RO PL
HR
EE
BG
FR
AT
LT
MT
UK
LV
SE
LU FI
EL
PT
EU
-28 IT
DK
HU
BE
DE
ES
CY
NL IE
CH
NO IS
Some type of pension, but no old-age pension
Old-age pension in combination with another pension type
Only old-age pension
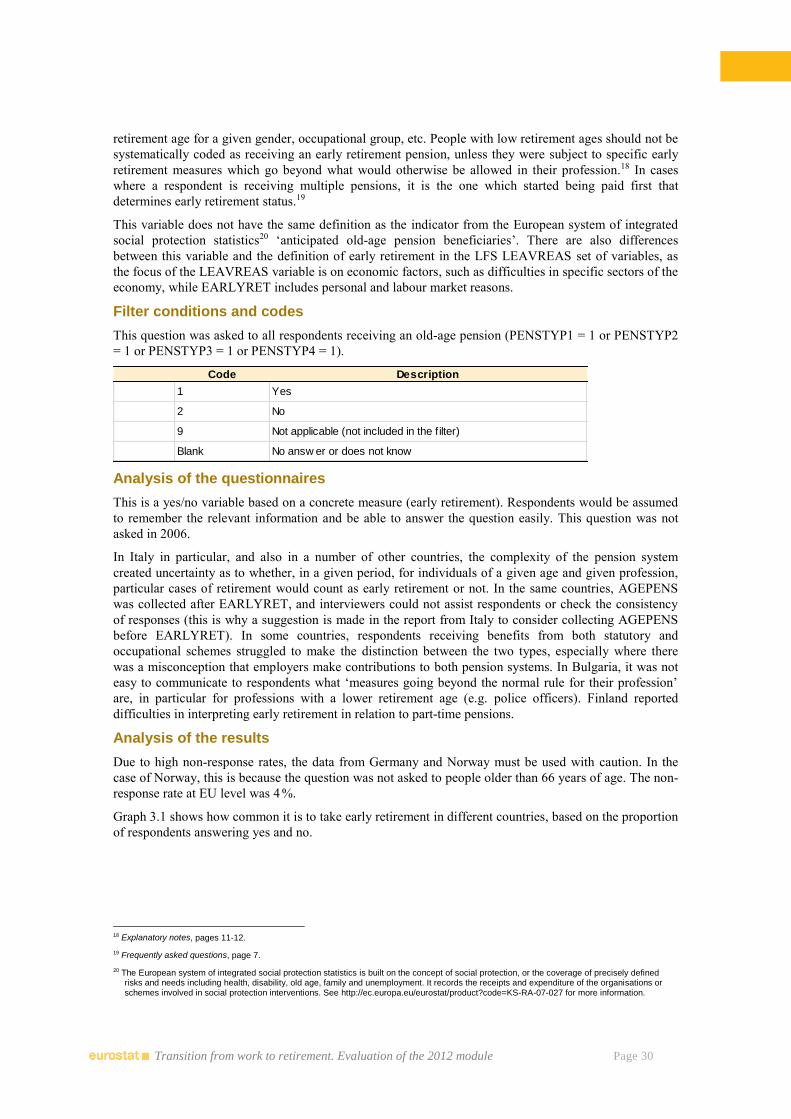
Transition from work to retirement. Evaluation of the 2012 module Page 30
retirement age for a given gender, occupational group, etc. People with low retirement ages should not be
systematically coded as receiving an early retirement pension, unless they were subject to specific early
retirement measures which go beyond what would otherwise be allowed in their profession.18 In cases
where a respondent is receiving multiple pensions, it is the one which started being paid first that
determines early retirement status.19
This variable does not have the same definition as the indicator from the European system of integrated
social protection statistics20 ‘anticipated old-age pension beneficiaries’. There are also differences
between this variable and the definition of early retirement in the LFS LEAVREAS set of variables, as
the focus of the LEAVREAS variable is on economic factors, such as difficulties in specific sectors of the
economy, while EARLYRET includes personal and labour market reasons.
Filter conditions and codes
This question was asked to all respondents receiving an old-age pension (PENSTYP1 = 1 or PENSTYP2
= 1 or PENSTYP3 = 1 or PENSTYP4 = 1).
Analysis of the questionnaires
This is a yes/no variable based on a concrete measure (early retirement). Respondents would be assumed
to remember the relevant information and be able to answer the question easily. This question was not
asked in 2006.
In Italy in particular, and also in a number of other countries, the complexity of the pension system
created uncertainty as to whether, in a given period, for individuals of a given age and given profession,
particular cases of retirement would count as early retirement or not. In the same countries, AGEPENS
was collected after EARLYRET, and interviewers could not assist respondents or check the consistency
of responses (this is why a suggestion is made in the report from Italy to consider collecting AGEPENS
before EARLYRET). In some countries, respondents receiving benefits from both statutory and
occupational schemes struggled to make the distinction between the two types, especially where there
was a misconception that employers make contributions to both pension systems. In Bulgaria, it was not
easy to communicate to respondents what ‘measures going beyond the normal rule for their profession’
are, in particular for professions with a lower retirement age (e.g. police officers). Finland reported
difficulties in interpreting early retirement in relation to part-time pensions.
Analysis of the results
Due to high non-response rates, the data from Germany and Norway must be used with caution. In the
case of Norway, this is because the question was not asked to people older than 66 years of age. The non-
response rate at EU level was 4 %.
Graph 3.1 shows how common it is to take early retirement in different countries, based on the proportion
of respondents answering yes and no.
18 Explanatory notes, pages 11-12.
19 Frequently asked questions, page 7.
20 The European system of integrated social protection statistics is built on the concept of social protection, or the coverage of precisely defined risks and needs including health, disability, old age, family and unemployment. It records the receipts and expenditure of the organisations or schemes involved in social protection interventions. See http://ec.europa.eu/eurostat/product?code=KS-RA-07-027 for more information.
Code Description
1 Yes
2 No
9 Not applicable (not included in the filter)
Blank No answ er or does not know
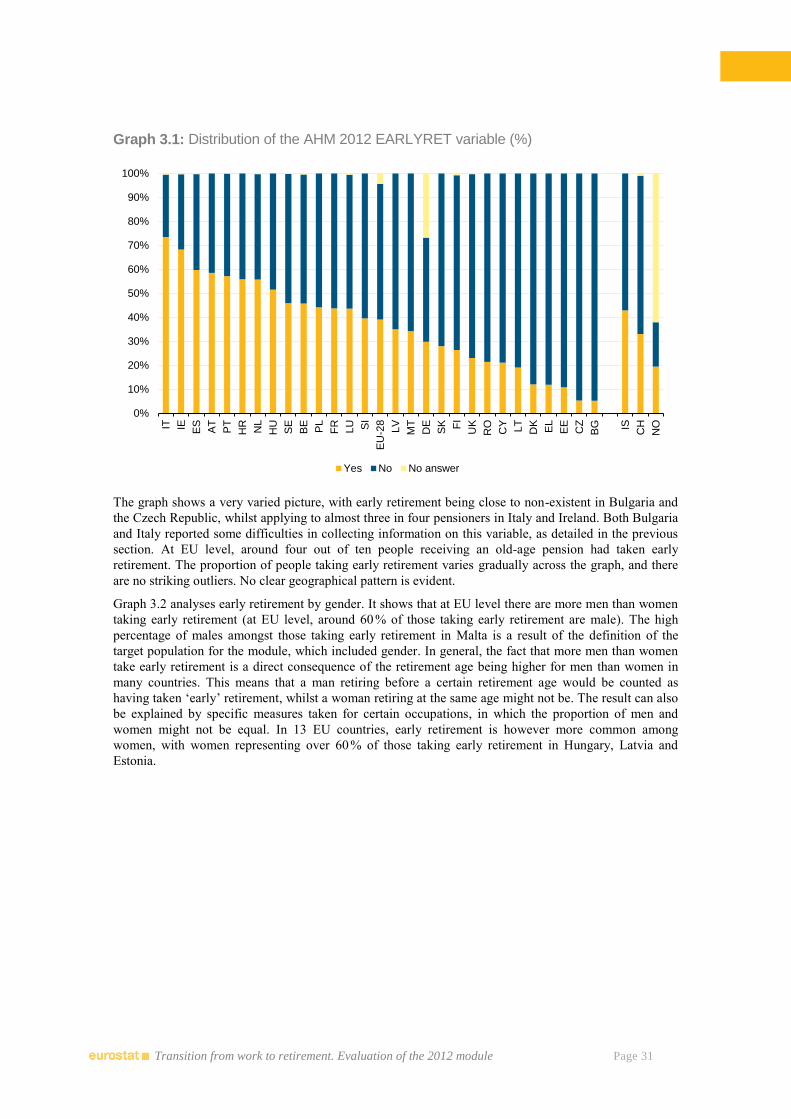
Transition from work to retirement. Evaluation of the 2012 module Page 31
Graph 3.1: Distribution of the AHM 2012 EARLYRET variable (%)
The graph shows a very varied picture, with early retirement being close to non-existent in Bulgaria and
the Czech Republic, whilst applying to almost three in four pensioners in Italy and Ireland. Both Bulgaria
and Italy reported some difficulties in collecting information on this variable, as detailed in the previous
section. At EU level, around four out of ten people receiving an old-age pension had taken early
retirement. The proportion of people taking early retirement varies gradually across the graph, and there
are no striking outliers. No clear geographical pattern is evident.
Graph 3.2 analyses early retirement by gender. It shows that at EU level there are more men than women
taking early retirement (at EU level, around 60 % of those taking early retirement are male). The high
percentage of males amongst those taking early retirement in Malta is a result of the definition of the
target population for the module, which included gender. In general, the fact that more men than women
take early retirement is a direct consequence of the retirement age being higher for men than women in
many countries. This means that a man retiring before a certain retirement age would be counted as
having taken ‘early’ retirement, whilst a woman retiring at the same age might not be. The result can also
be explained by specific measures taken for certain occupations, in which the proportion of men and
women might not be equal. In 13 EU countries, early retirement is however more common among
women, with women representing over 60 % of those taking early retirement in Hungary, Latvia and
Estonia.
0%
10%
20%
30%
40%
50%
60%
70%
80%
90%
100%IT IE ES
AT
PT
HR
NL
HU
SE
BE
PL
FR
LU SI
EU
-28
LV
MT
DE
SK FI
UK
RO
CY
LT
DK
EL
EE
CZ
BG IS
CH
NO
Yes No No answer
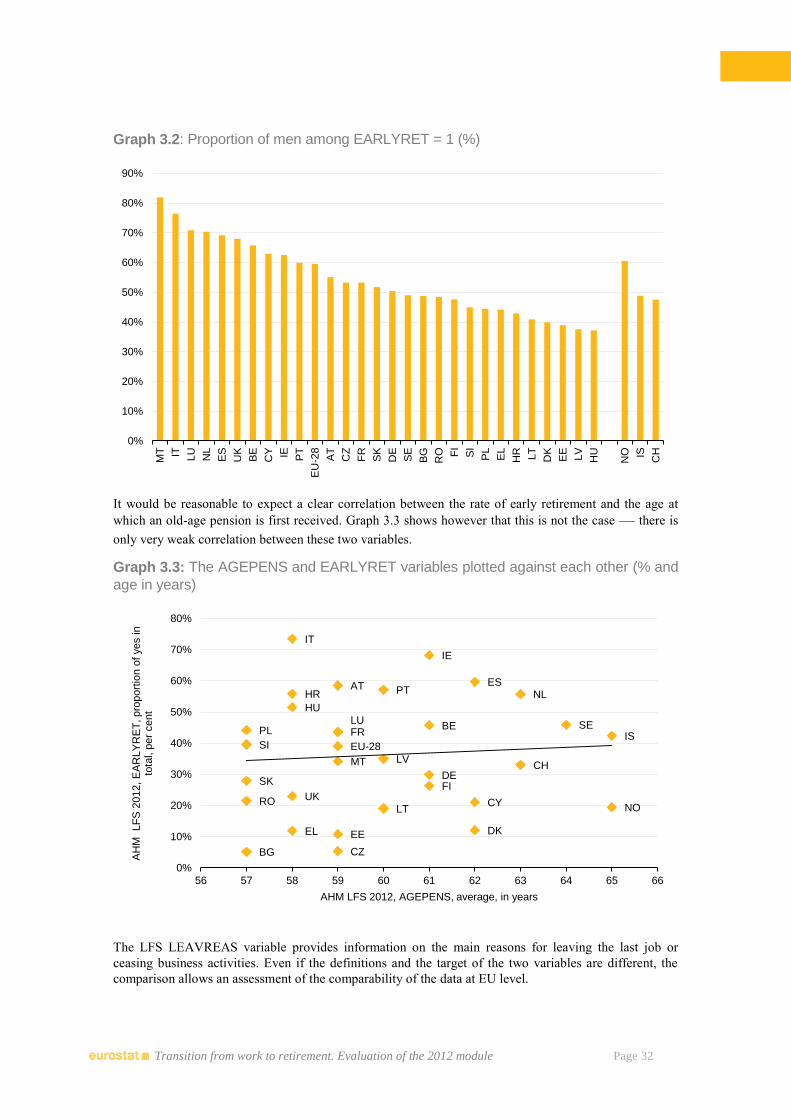
Transition from work to retirement. Evaluation of the 2012 module Page 32
Graph 3.2: Proportion of men among EARLYRET = 1 (%)
It would be reasonable to expect a clear correlation between the rate of early retirement and the age at
which an old-age pension is first received. Graph 3.3 shows however that this is not the case — there is
only very weak correlation between these two variables.
Graph 3.3: The AGEPENS and EARLYRET variables plotted against each other (% and
age in years)
The LFS LEAVREAS variable provides information on the main reasons for leaving the last job or
ceasing business activities. Even if the definitions and the target of the two variables are different, the
comparison allows an assessment of the comparability of the data at EU level.
0%
10%
20%
30%
40%
50%
60%
70%
80%
90%
MT IT LU
NL
ES
UK
BE
CY IE PT
EU
-28
AT
CZ
FR
SK
DE
SE
BG
RO FI
SI
PL
EL
HR LT
DK
EE
LV
HU
NO IS
CH
AT
BE
BG
CH
CY
CZ
DE
DK EE
ES
EU-28
FI
FR
EL
HR
HU
IE
IS
IT
LT
LU
LV MT
NL
NO
PL
PT
RO
SE
SI
SK
UK
0%
10%
20%
30%
40%
50%
60%
70%
80%
56 57 58 59 60 61 62 63 64 65 66
AH
M LF
S 2
012, E
AR
LY
RE
T, pro
port
ion o
f yes in
to
tal, p
er
cent
AHM LFS 2012, AGEPENS, average, in years
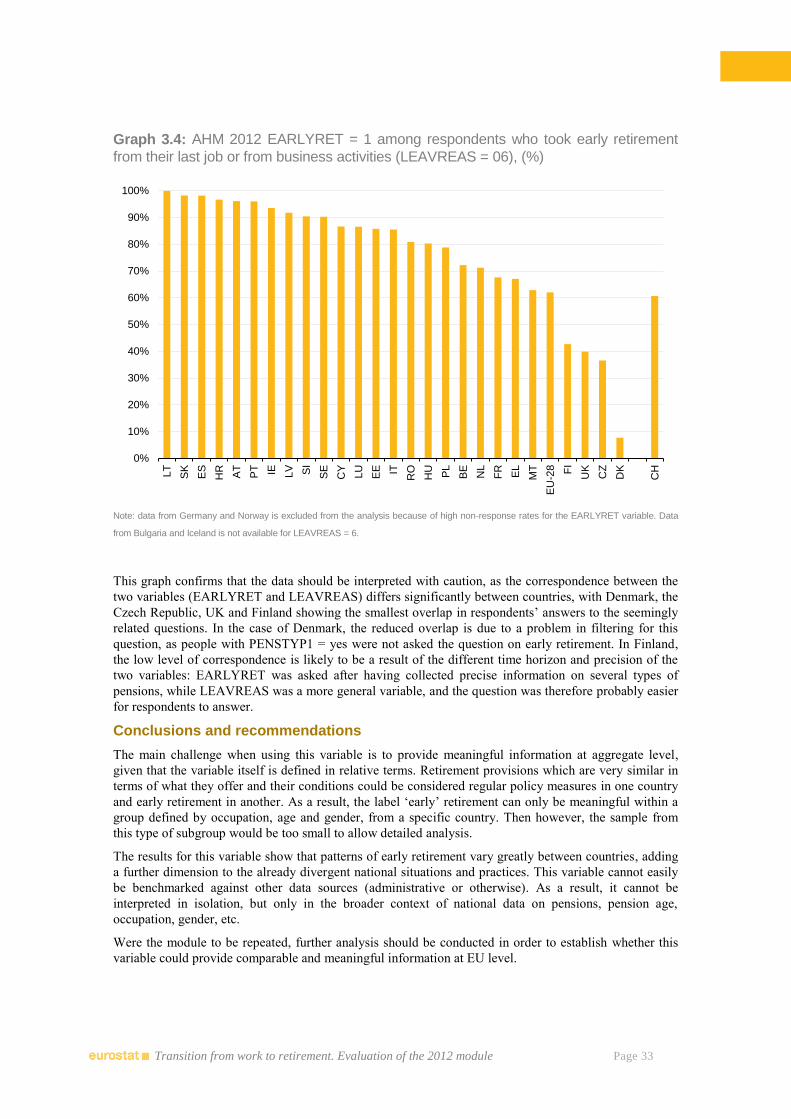
Transition from work to retirement. Evaluation of the 2012 module Page 33
Graph 3.4: AHM 2012 EARLYRET = 1 among respondents who took early retirement
from their last job or from business activities (LEAVREAS = 06), (%)
Note: data from Germany and Norway is excluded from the analysis because of high non-response rates for the EARLYRET variable. Data
from Bulgaria and Iceland is not available for LEAVREAS = 6.
This graph confirms that the data should be interpreted with caution, as the correspondence between the
two variables (EARLYRET and LEAVREAS) differs significantly between countries, with Denmark, the
Czech Republic, UK and Finland showing the smallest overlap in respondents’ answers to the seemingly
related questions. In the case of Denmark, the reduced overlap is due to a problem in filtering for this
question, as people with PENSTYP1 = yes were not asked the question on early retirement. In Finland,
the low level of correspondence is likely to be a result of the different time horizon and precision of the
two variables: EARLYRET was asked after having collected precise information on several types of
pensions, while LEAVREAS was a more general variable, and the question was therefore probably easier
for respondents to answer.
Conclusions and recommendations
The main challenge when using this variable is to provide meaningful information at aggregate level,
given that the variable itself is defined in relative terms. Retirement provisions which are very similar in
terms of what they offer and their conditions could be considered regular policy measures in one country
and early retirement in another. As a result, the label ‘early’ retirement can only be meaningful within a
group defined by occupation, age and gender, from a specific country. Then however, the sample from
this type of subgroup would be too small to allow detailed analysis.
The results for this variable show that patterns of early retirement vary greatly between countries, adding
a further dimension to the already divergent national situations and practices. This variable cannot easily
be benchmarked against other data sources (administrative or otherwise). As a result, it cannot be
interpreted in isolation, but only in the broader context of national data on pensions, pension age,
occupation, gender, etc.
Were the module to be repeated, further analysis should be conducted in order to establish whether this
variable could provide comparable and meaningful information at EU level.
0%
10%
20%
30%
40%
50%
60%
70%
80%
90%
100%
LT
SK
ES
HR
AT
PT IE LV SI
SE
CY
LU
EE IT
RO
HU
PL
BE
NL
FR
EL
MT
EU
-28 FI
UK
CZ
DK
CH
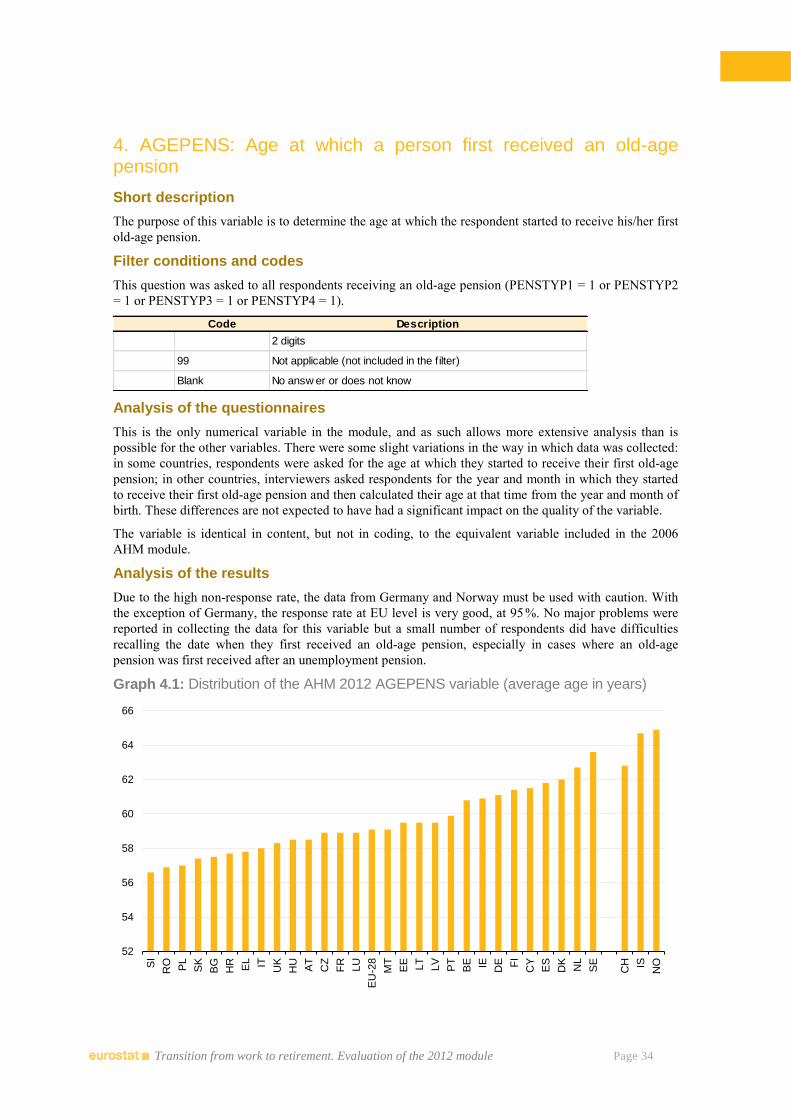
Transition from work to retirement. Evaluation of the 2012 module Page 34
4. AGEPENS: Age at which a person first received an old-age pension
Short description
The purpose of this variable is to determine the age at which the respondent started to receive his/her first
old-age pension.
Filter conditions and codes
This question was asked to all respondents receiving an old-age pension (PENSTYP1 = 1 or PENSTYP2
= 1 or PENSTYP3 = 1 or PENSTYP4 = 1).
Analysis of the questionnaires
This is the only numerical variable in the module, and as such allows more extensive analysis than is
possible for the other variables. There were some slight variations in the way in which data was collected:
in some countries, respondents were asked for the age at which they started to receive their first old-age
pension; in other countries, interviewers asked respondents for the year and month in which they started
to receive their first old-age pension and then calculated their age at that time from the year and month of
birth. These differences are not expected to have had a significant impact on the quality of the variable.
The variable is identical in content, but not in coding, to the equivalent variable included in the 2006
AHM module.
Analysis of the results
Due to the high non-response rate, the data from Germany and Norway must be used with caution. With
the exception of Germany, the response rate at EU level is very good, at 95 %. No major problems were
reported in collecting the data for this variable but a small number of respondents did have difficulties
recalling the date when they first received an old-age pension, especially in cases where an old-age
pension was first received after an unemployment pension.
Graph 4.1: Distribution of the AHM 2012 AGEPENS variable (average age in years)
Code Description
2 digits
99 Not applicable (not included in the filter)
Blank No answ er or does not know
52
54
56
58
60
62
64
66
SI
RO PL
SK
BG
HR
EL IT
UK
HU
AT
CZ
FR
LU
EU
-28
MT
EE
LT
LV
PT
BE IE DE FI
CY
ES
DK
NL
SE
CH IS
NO
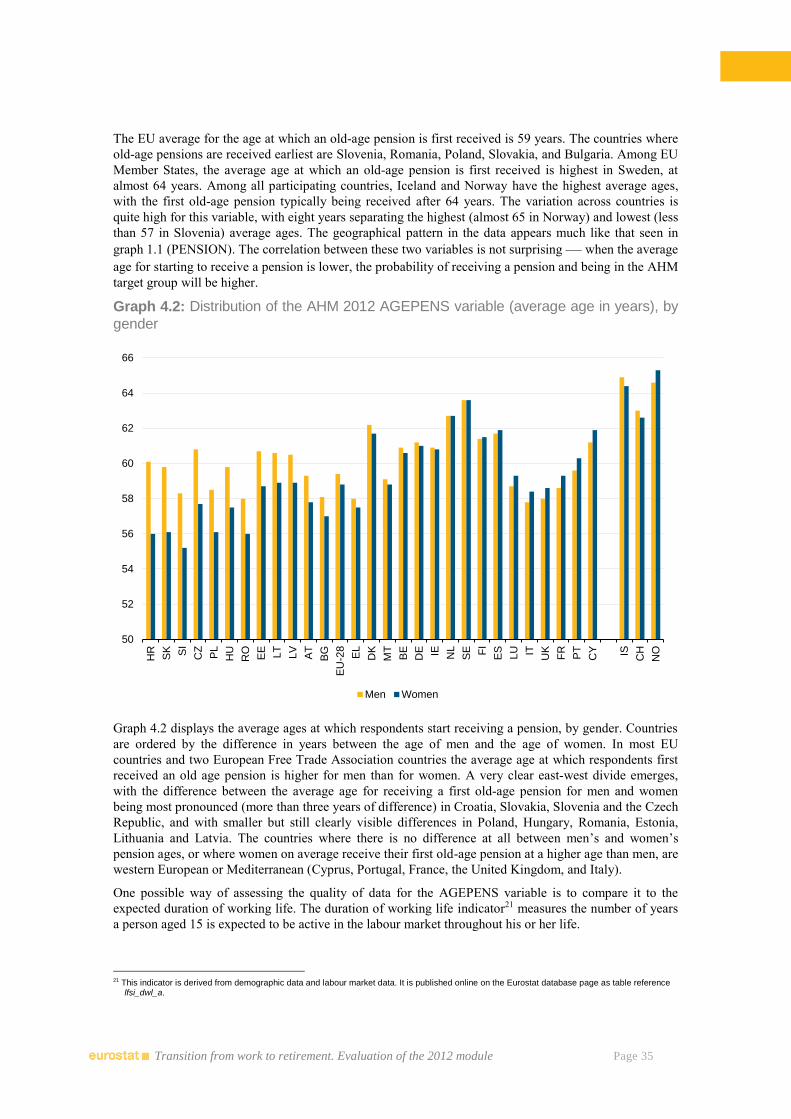
Transition from work to retirement. Evaluation of the 2012 module Page 35
The EU average for the age at which an old-age pension is first received is 59 years. The countries where
old-age pensions are received earliest are Slovenia, Romania, Poland, Slovakia, and Bulgaria. Among EU
Member States, the average age at which an old-age pension is first received is highest in Sweden, at
almost 64 years. Among all participating countries, Iceland and Norway have the highest average ages,
with the first old-age pension typically being received after 64 years. The variation across countries is
quite high for this variable, with eight years separating the highest (almost 65 in Norway) and lowest (less
than 57 in Slovenia) average ages. The geographical pattern in the data appears much like that seen in
graph 1.1 (PENSION). The correlation between these two variables is not surprising — when the average
age for starting to receive a pension is lower, the probability of receiving a pension and being in the AHM
target group will be higher.
Graph 4.2: Distribution of the AHM 2012 AGEPENS variable (average age in years), by
gender
Graph 4.2 displays the average ages at which respondents start receiving a pension, by gender. Countries
are ordered by the difference in years between the age of men and the age of women. In most EU
countries and two European Free Trade Association countries the average age at which respondents first
received an old age pension is higher for men than for women. A very clear east-west divide emerges,
with the difference between the average age for receiving a first old-age pension for men and women
being most pronounced (more than three years of difference) in Croatia, Slovakia, Slovenia and the Czech
Republic, and with smaller but still clearly visible differences in Poland, Hungary, Romania, Estonia,
Lithuania and Latvia. The countries where there is no difference at all between men’s and women’s
pension ages, or where women on average receive their first old-age pension at a higher age than men, are
western European or Mediterranean (Cyprus, Portugal, France, the United Kingdom, and Italy).
One possible way of assessing the quality of data for the AGEPENS variable is to compare it to the
expected duration of working life. The duration of working life indicator21 measures the number of years
a person aged 15 is expected to be active in the labour market throughout his or her life.
21 This indicator is derived from demographic data and labour market data. It is published online on the Eurostat database page as table reference
lfsi_dwl_a.
50
52
54
56
58
60
62
64
66
HR
SK SI
CZ
PL
HU
RO
EE
LT
LV
AT
BG
EU
-28
EL
DK
MT
BE
DE IE NL
SE FI
ES
LU IT
UK
FR
PT
CY IS
CH
NO
Men Women
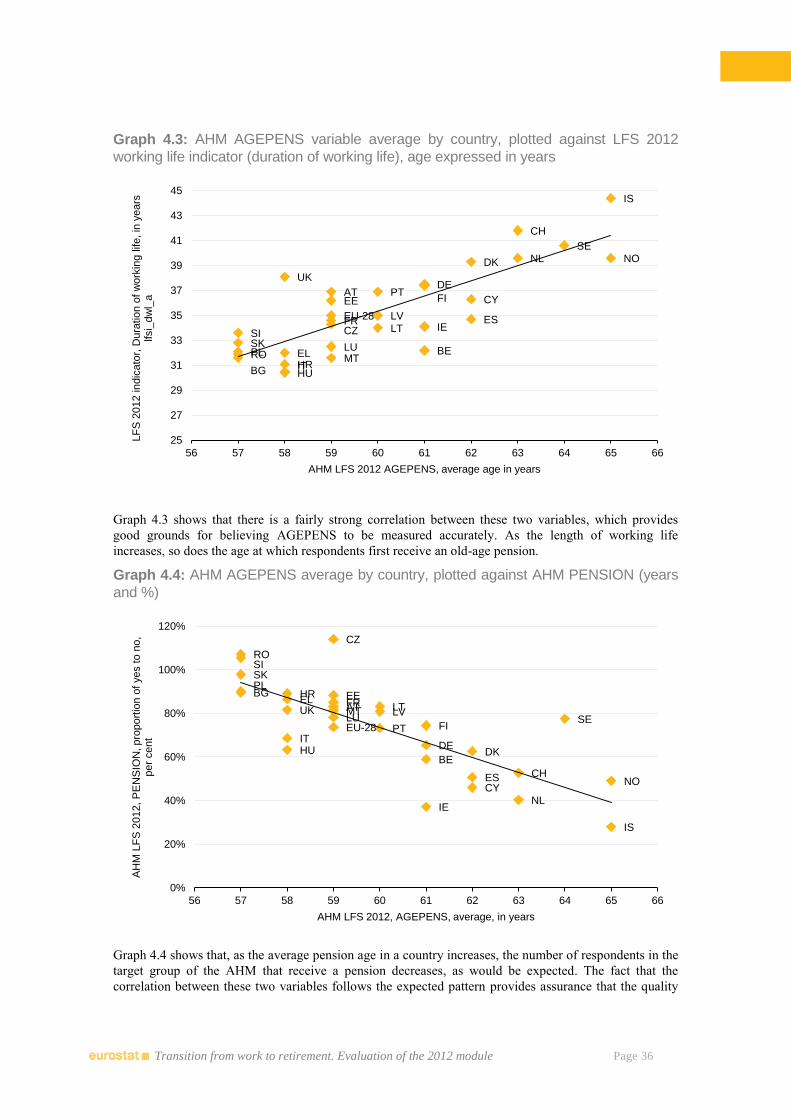
Transition from work to retirement. Evaluation of the 2012 module Page 36
Graph 4.3: AHM AGEPENS variable average by country, plotted against LFS 2012
working life indicator (duration of working life), age expressed in years
Graph 4.3 shows that there is a fairly strong correlation between these two variables, which provides
good grounds for believing AGEPENS to be measured accurately. As the length of working life
increases, so does the age at which respondents first receive an old-age pension.
Graph 4.4: AHM AGEPENS average by country, plotted against AHM PENSION (years
and %)
Graph 4.4 shows that, as the average pension age in a country increases, the number of respondents in the
target group of the AHM that receive a pension decreases, as would be expected. The fact that the
correlation between these two variables follows the expected pattern provides assurance that the quality
AT
BE
BG
CH
CY
CZ
DE
DK
EE
ES EU-28
FI
FR
EL HR HU
IE
IS
IT
LT
LU
LV
MT
NL NO
PL
PT
RO
SE
SI SK
UK
25
27
29
31
33
35
37
39
41
43
45
56 57 58 59 60 61 62 63 64 65 66
LF
S 2
012 in
dic
ato
r, D
ura
tio
n o
f w
ork
ing life, in
years
lfsi_
dw
l_a
AHM LFS 2012 AGEPENS, average age in years
BG PL
RO SI SK
EL HR
HU IT
UK AT
CZ
EE
EU-28
FR
LU MT LT LV
PT
BE
DE
FI
IE
CY
DK
ES CH
NL
SE
IS
NO
0%
20%
40%
60%
80%
100%
120%
56 57 58 59 60 61 62 63 64 65 66
AH
M L
FS
2012,
PE
NS
ION
, pro
port
ion o
f yes to n
o,
per
cent
AHM LFS 2012, AGEPENS, average, in years
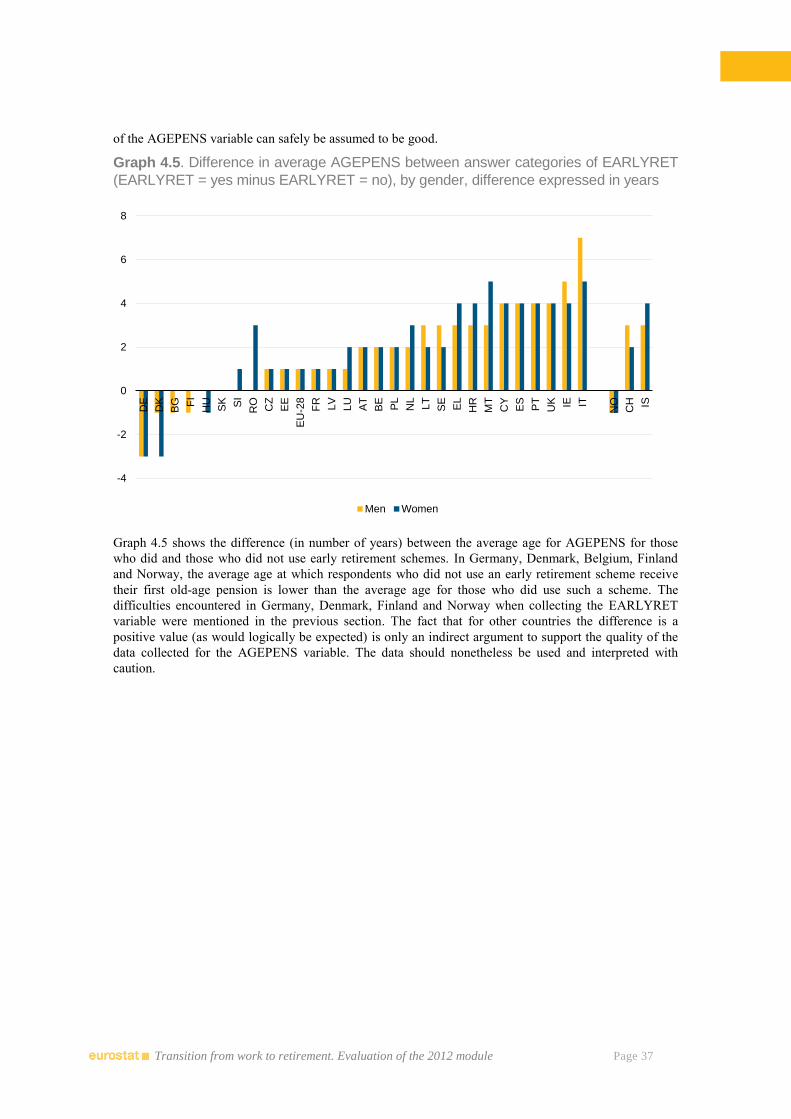
Transition from work to retirement. Evaluation of the 2012 module Page 37
of the AGEPENS variable can safely be assumed to be good.
Graph 4.5. Difference in average AGEPENS between answer categories of EARLYRET
(EARLYRET = yes minus EARLYRET = no), by gender, difference expressed in years
Graph 4.5 shows the difference (in number of years) between the average age for AGEPENS for those
who did and those who did not use early retirement schemes. In Germany, Denmark, Belgium, Finland
and Norway, the average age at which respondents who did not use an early retirement scheme receive
their first old-age pension is lower than the average age for those who did use such a scheme. The
difficulties encountered in Germany, Denmark, Finland and Norway when collecting the EARLYRET
variable were mentioned in the previous section. The fact that for other countries the difference is a
positive value (as would logically be expected) is only an indirect argument to support the quality of the
data collected for the AGEPENS variable. The data should nonetheless be used and interpreted with
caution.
-4
-2
0
2
4
6
8
DE
DK
BG FI
HU
SK SI
RO
CZ
EE
EU
-28
FR
LV
LU
AT
BE
PL
NL
LT
SE
EL
HR
MT
CY
ES
PT
UK IE IT
NO
CH IS
Men Women
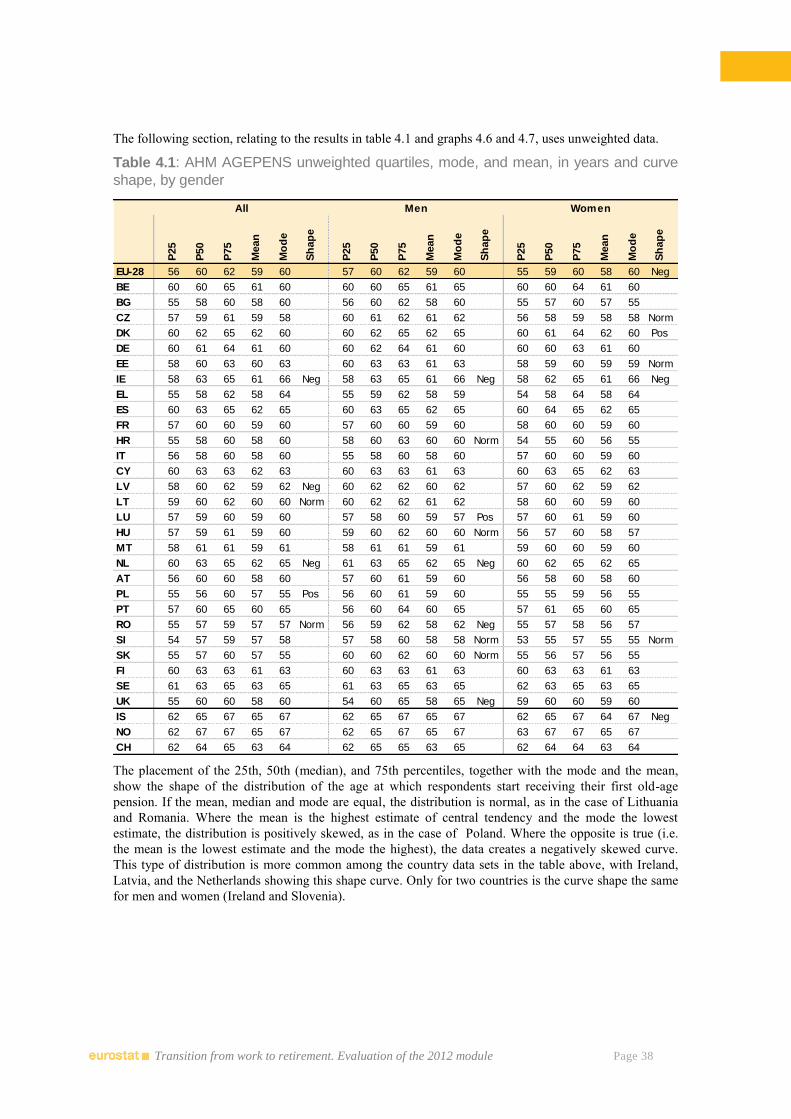
Transition from work to retirement. Evaluation of the 2012 module Page 38
The following section, relating to the results in table 4.1 and graphs 4.6 and 4.7, uses unweighted data.
Table 4.1: AHM AGEPENS unweighted quartiles, mode, and mean, in years and curve
shape, by gender
The placement of the 25th, 50th (median), and 75th percentiles, together with the mode and the mean,
show the shape of the distribution of the age at which respondents start receiving their first old-age
pension. If the mean, median and mode are equal, the distribution is normal, as in the case of Lithuania
and Romania. Where the mean is the highest estimate of central tendency and the mode the lowest
estimate, the distribution is positively skewed, as in the case of Poland. Where the opposite is true (i.e.
the mean is the lowest estimate and the mode the highest), the data creates a negatively skewed curve.
This type of distribution is more common among the country data sets in the table above, with Ireland,
Latvia, and the Netherlands showing this shape curve. Only for two countries is the curve shape the same
for men and women (Ireland and Slovenia).
P25
P50
P75
Mean
Mo
de
Sh
ap
e
P25
P50
P75
Mean
Mo
de
Sh
ap
e
P25
P50
P75
Mean
Mo
de
Sh
ap
e
EU-28 56 60 62 59 60 57 60 62 59 60 55 59 60 58 60 Neg
BE 60 60 65 61 60 60 60 65 61 65 60 60 64 61 60
BG 55 58 60 58 60 56 60 62 58 60 55 57 60 57 55
CZ 57 59 61 59 58 60 61 62 61 62 56 58 59 58 58 Norm
DK 60 62 65 62 60 60 62 65 62 65 60 61 64 62 60 Pos
DE 60 61 64 61 60 60 62 64 61 60 60 60 63 61 60
EE 58 60 63 60 63 60 63 63 61 63 58 59 60 59 59 Norm
IE 58 63 65 61 66 Neg 58 63 65 61 66 Neg 58 62 65 61 66 Neg
EL 55 58 62 58 64 55 59 62 58 59 54 58 64 58 64
ES 60 63 65 62 65 60 63 65 62 65 60 64 65 62 65
FR 57 60 60 59 60 57 60 60 59 60 58 60 60 59 60
HR 55 58 60 58 60 58 60 63 60 60 Norm 54 55 60 56 55
IT 56 58 60 58 60 55 58 60 58 60 57 60 60 59 60
CY 60 63 63 62 63 60 63 63 61 63 60 63 65 62 63
LV 58 60 62 59 62 Neg 60 62 62 60 62 57 60 62 59 62
LT 59 60 62 60 60 Norm 60 62 62 61 62 58 60 60 59 60
LU 57 59 60 59 60 57 58 60 59 57 Pos 57 60 61 59 60
HU 57 59 61 59 60 59 60 62 60 60 Norm 56 57 60 58 57
MT 58 61 61 59 61 58 61 61 59 61 59 60 60 59 60
NL 60 63 65 62 65 Neg 61 63 65 62 65 Neg 60 62 65 62 65
AT 56 60 60 58 60 57 60 61 59 60 56 58 60 58 60
PL 55 56 60 57 55 Pos 56 60 61 59 60 55 55 59 56 55
PT 57 60 65 60 65 56 60 64 60 65 57 61 65 60 65
RO 55 57 59 57 57 Norm 56 59 62 58 62 Neg 55 57 58 56 57
SI 54 57 59 57 58 57 58 60 58 58 Norm 53 55 57 55 55 Norm
SK 55 57 60 57 55 60 60 62 60 60 Norm 55 56 57 56 55
FI 60 63 63 61 63 60 63 63 61 63 60 63 63 61 63
SE 61 63 65 63 65 61 63 65 63 65 62 63 65 63 65
UK 55 60 60 58 60 54 60 65 58 65 Neg 59 60 60 59 60
IS 62 65 67 65 67 62 65 67 65 67 62 65 67 64 67 Neg
NO 62 67 67 65 67 62 65 67 65 67 63 67 67 65 67
CH 62 64 65 63 64 62 65 65 63 65 62 64 64 63 64
All Men Women
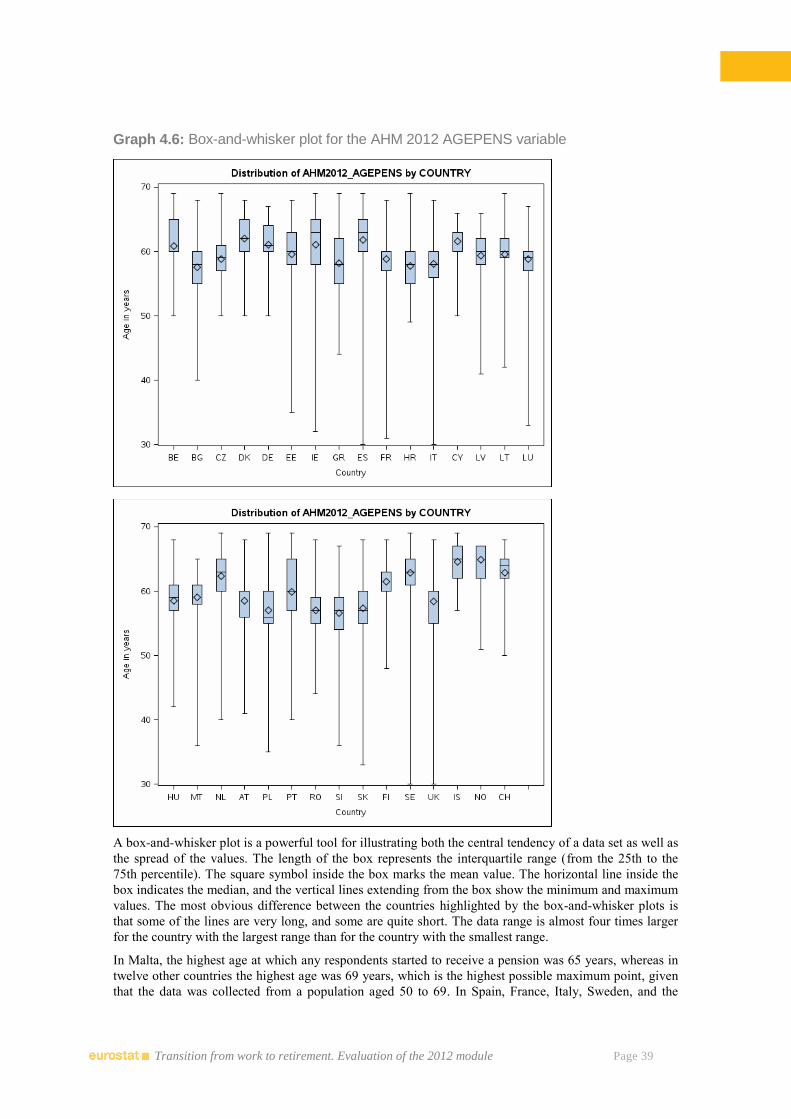
Transition from work to retirement. Evaluation of the 2012 module Page 39
Graph 4.6: Box-and-whisker plot for the AHM 2012 AGEPENS variable
A box-and-whisker plot is a powerful tool for illustrating both the central tendency of a data set as well as
the spread of the values. The length of the box represents the interquartile range (from the 25th to the
75th percentile). The square symbol inside the box marks the mean value. The horizontal line inside the
box indicates the median, and the vertical lines extending from the box show the minimum and maximum
values. The most obvious difference between the countries highlighted by the box-and-whisker plots is
that some of the lines are very long, and some are quite short. The data range is almost four times larger
for the country with the largest range than for the country with the smallest range.
In Malta, the highest age at which any respondents started to receive a pension was 65 years, whereas in
twelve other countries the highest age was 69 years, which is the highest possible maximum point, given
that the data was collected from a population aged 50 to 69. In Spain, France, Italy, Sweden, and the
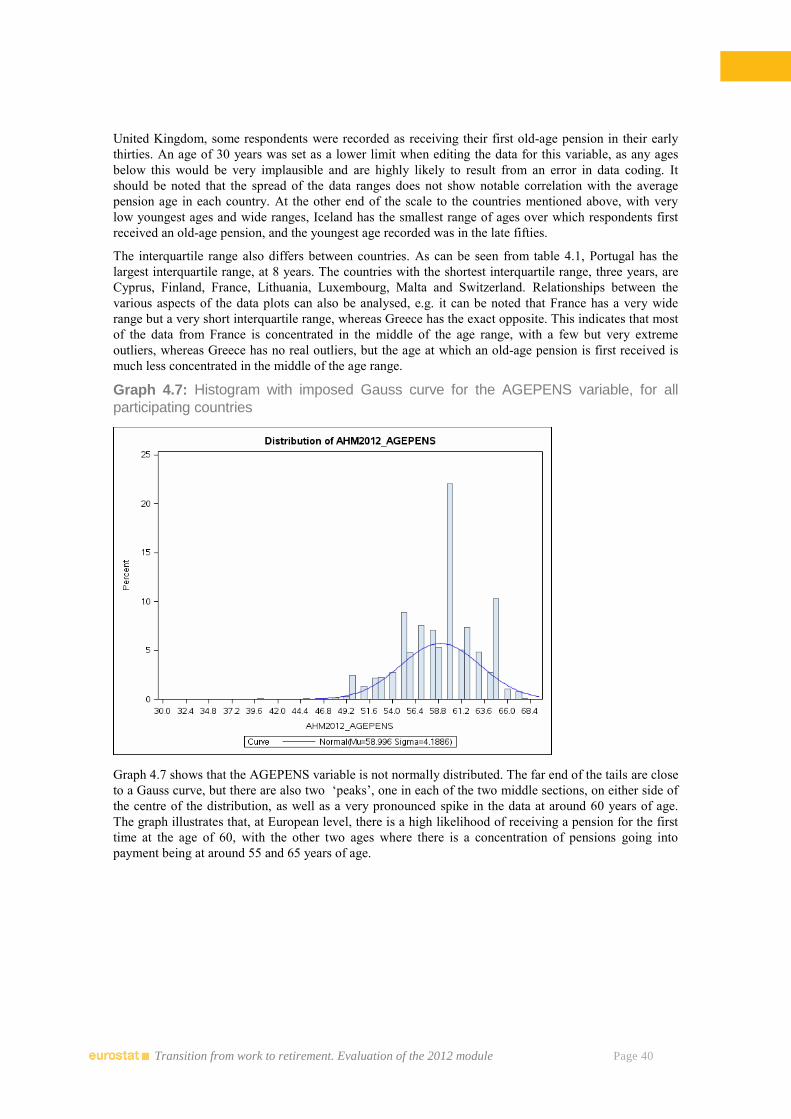
Transition from work to retirement. Evaluation of the 2012 module Page 40
United Kingdom, some respondents were recorded as receiving their first old-age pension in their early
thirties. An age of 30 years was set as a lower limit when editing the data for this variable, as any ages
below this would be very implausible and are highly likely to result from an error in data coding. It
should be noted that the spread of the data ranges does not show notable correlation with the average
pension age in each country. At the other end of the scale to the countries mentioned above, with very
low youngest ages and wide ranges, Iceland has the smallest range of ages over which respondents first
received an old-age pension, and the youngest age recorded was in the late fifties.
The interquartile range also differs between countries. As can be seen from table 4.1, Portugal has the
largest interquartile range, at 8 years. The countries with the shortest interquartile range, three years, are
Cyprus, Finland, France, Lithuania, Luxembourg, Malta and Switzerland. Relationships between the
various aspects of the data plots can also be analysed, e.g. it can be noted that France has a very wide
range but a very short interquartile range, whereas Greece has the exact opposite. This indicates that most
of the data from France is concentrated in the middle of the age range, with a few but very extreme
outliers, whereas Greece has no real outliers, but the age at which an old-age pension is first received is
much less concentrated in the middle of the age range.
Graph 4.7: Histogram with imposed Gauss curve for the AGEPENS variable, for all
participating countries
Graph 4.7 shows that the AGEPENS variable is not normally distributed. The far end of the tails are close
to a Gauss curve, but there are also two ‘peaks’, one in each of the two middle sections, on either side of
the centre of the distribution, as well as a very pronounced spike in the data at around 60 years of age.
The graph illustrates that, at European level, there is a high likelihood of receiving a pension for the first
time at the age of 60, with the other two ages where there is a concentration of pensions going into
payment being at around 55 and 65 years of age.
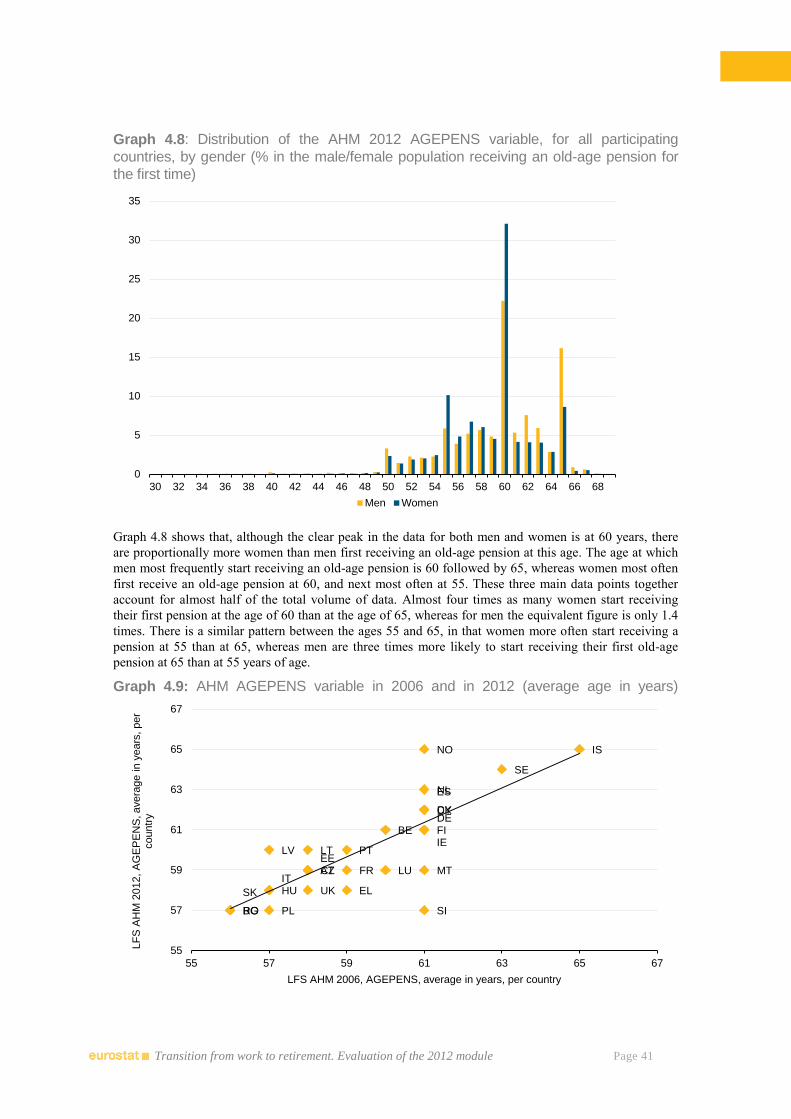
Transition from work to retirement. Evaluation of the 2012 module Page 41
Graph 4.8: Distribution of the AHM 2012 AGEPENS variable, for all participating
countries, by gender (% in the male/female population receiving an old-age pension for
the first time)
Graph 4.8 shows that, although the clear peak in the data for both men and women is at 60 years, there
are proportionally more women than men first receiving an old-age pension at this age. The age at which
men most frequently start receiving an old-age pension is 60 followed by 65, whereas women most often
first receive an old-age pension at 60, and next most often at 55. These three main data points together
account for almost half of the total volume of data. Almost four times as many women start receiving
their first pension at the age of 60 than at the age of 65, whereas for men the equivalent figure is only 1.4
times. There is a similar pattern between the ages 55 and 65, in that women more often start receiving a
pension at 55 than at 65, whereas men are three times more likely to start receiving their first old-age
pension at 65 than at 55 years of age.
Graph 4.9: AHM AGEPENS variable in 2006 and in 2012 (average age in years)
0
5
10
15
20
25
30
35
30 32 34 36 38 40 42 44 46 48 50 52 54 56 58 60 62 64 66 68
Men Women
AT
BE
BG
CY
CZ
DE
DK
EE
ES FI
FR
EL HU
IE
IS
IT
LT
LU
LV
MT
NL
NO
PL
PT
RO
SE
SI
SK
UK
55
57
59
61
63
65
67
55 57 59 61 63 65 67
LF
S A
HM
2012,
AG
EP
EN
S, avera
ge in
years
, per
countr
y
LFS AHM 2006, AGEPENS, average in years, per country
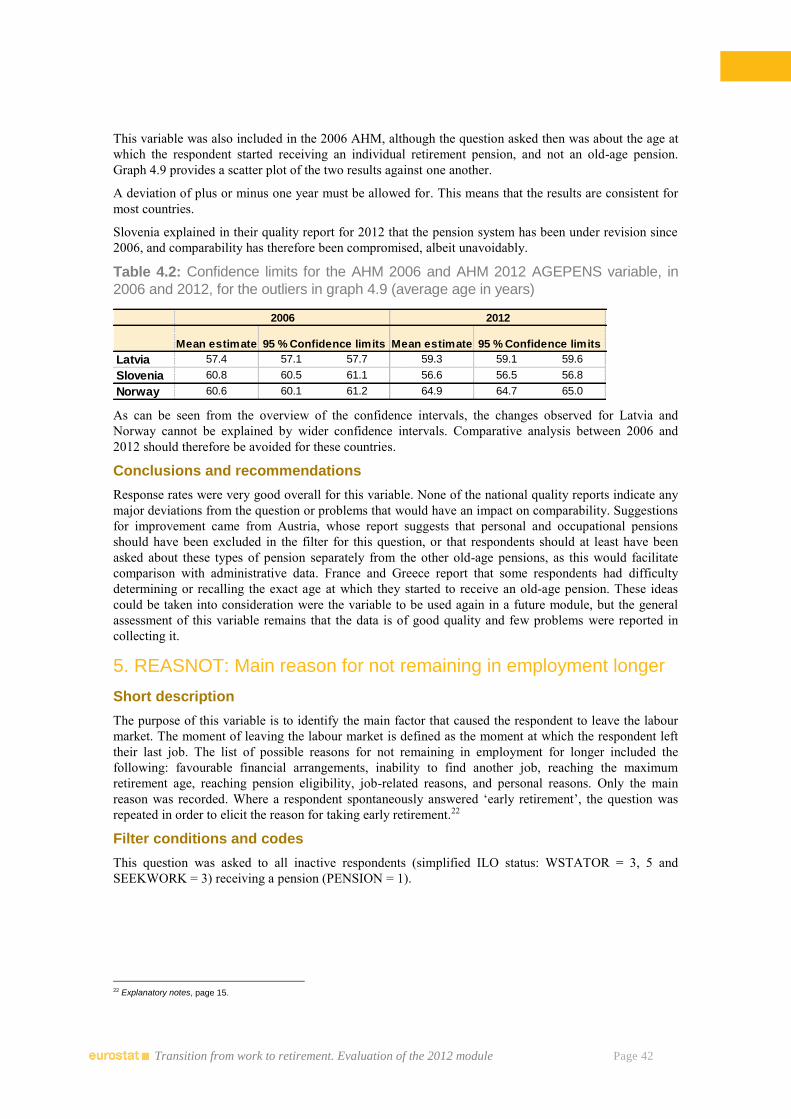
Transition from work to retirement. Evaluation of the 2012 module Page 42
This variable was also included in the 2006 AHM, although the question asked then was about the age at
which the respondent started receiving an individual retirement pension, and not an old-age pension.
Graph 4.9 provides a scatter plot of the two results against one another.
A deviation of plus or minus one year must be allowed for. This means that the results are consistent for
most countries.
Slovenia explained in their quality report for 2012 that the pension system has been under revision since
2006, and comparability has therefore been compromised, albeit unavoidably.
Table 4.2: Confidence limits for the AHM 2006 and AHM 2012 AGEPENS variable, in
2006 and 2012, for the outliers in graph 4.9 (average age in years)
As can be seen from the overview of the confidence intervals, the changes observed for Latvia and
Norway cannot be explained by wider confidence intervals. Comparative analysis between 2006 and
2012 should therefore be avoided for these countries.
Conclusions and recommendations
Response rates were very good overall for this variable. None of the national quality reports indicate any
major deviations from the question or problems that would have an impact on comparability. Suggestions
for improvement came from Austria, whose report suggests that personal and occupational pensions
should have been excluded in the filter for this question, or that respondents should at least have been
asked about these types of pension separately from the other old-age pensions, as this would facilitate
comparison with administrative data. France and Greece report that some respondents had difficulty
determining or recalling the exact age at which they started to receive an old-age pension. These ideas
could be taken into consideration were the variable to be used again in a future module, but the general
assessment of this variable remains that the data is of good quality and few problems were reported in
collecting it.
5. REASNOT: Main reason for not remaining in employment longer
Short description
The purpose of this variable is to identify the main factor that caused the respondent to leave the labour
market. The moment of leaving the labour market is defined as the moment at which the respondent left
their last job. The list of possible reasons for not remaining in employment for longer included the
following: favourable financial arrangements, inability to find another job, reaching the maximum
retirement age, reaching pension eligibility, job-related reasons, and personal reasons. Only the main
reason was recorded. Where a respondent spontaneously answered ‘early retirement’, the question was
repeated in order to elicit the reason for taking early retirement.22
Filter conditions and codes
This question was asked to all inactive respondents (simplified ILO status: WSTATOR = 3, 5 and
SEEKWORK = 3) receiving a pension (PENSION = 1).
22 Explanatory notes, page 15.
Mean estimate Mean estimate
Latvia 57.4 57.1 57.7 59.3 59.1 59.6
Slovenia 60.8 60.5 61.1 56.6 56.5 56.8
Norway 60.6 60.1 61.2 64.9 64.7 65.0
2006 2012
95 % Confidence limits 95 % Confidence limits
Transition from work to retirement. Evaluation of the 2012 module Page 43
Analysis of the questionnaires
Data on a similar question was collected in 2006, under the AHM 2006 REASRET variable. Despite the
difference in name (‘Main reason for not remaining longer in employment’ for REASNOT in 2012 and
‘Main reason for retirement or early retirement’ for REASRET in 2006), the objective of the 2006
variable23 was the same as that of the 2012 variable, namely to establish the main factor that caused the
respondent to stop working, using a choice of responses better suited to older people. In 2006 however,
exit from the labour market was understood as being the time of retirement, which could affect the
comparability of the two sets of data.
The fact that this variable refers to the moment of leaving the last job detaches it to a certain extent from
the analysis of pensions, and could theoretically render the data less sensitive to variations resulting from
national definitions of pensions. For example, respondents who continued working after starting to
receive a pension from their ‘main employment’, e.g. taking a small part-time job or casual work, should
have referred to the moment of leaving their last job in their answer, even if the moment of retirement
could have been defined as the moment of starting to receive a pension. This nuance limits the
comparability of the 2006 and 2012 modules to those respondents who stopped work at the same age as
when they first received a pension. As seen at the end of the section on the AGEPENS variable, only
seven of the 31 participating countries show no difference between the average age of leaving the last job
(core 2012 data) and the age of first receiving a pension (AHM 2012 data). In practice however, the
overlap between the 2006 and 2012 variables might have been greater than intended — given that, in
most countries, questions on the age at which respondents first received a pension and on the reason for
leaving their last job were asked consecutively, and because several of the possible responses referred to
pensions and retirement, it is likely that some respondents were actually answering in reference to the
moment of leaving the job that provided them access to a pension.
The purpose of the 2012 variable is therefore identical to the LFS LEAVREAS variable on the main
reason for leaving the last job or ceasing business activities. The only slight difference is in the
populations being asked this question. For those respondents answering both the LFS LEAVREAS
variable and the AHM REASNOT variable, in is understandable that there may have been some
confusion.
A number of questions were raised during the planning24 of the module on the difference between codes 3
and 4. The intention of codes 3 and 4 was to distinguish between those who are forced to leave the labour
market because of their age and those who leave the labour market as soon as their age allows it. In
several countries, for example the Czech Republic, code 3 was not relevant. Most countries have however
included the response category in their questionnaire, because it could in principle have been applicable
to a small minority of respondents, or in specific sectors of activity or occupations, for example as a result
23 http://ec.europa.eu/eurostat/product?code=KS-RA-08-012
24 Frequently asked questions, page 11.
Code Description
1 Favourable financial arrangements to leave
2 Lost job and/or could not f ind a job
3 Had reached the maximum retirement age
4 Had reached eligibility for a pension
5 Other job-related reasons
6 Ow n health or disability
7 Family or care-related reasons
8 Other
9 Not applicable (not included in the filter)
Blank No answ er or does not know
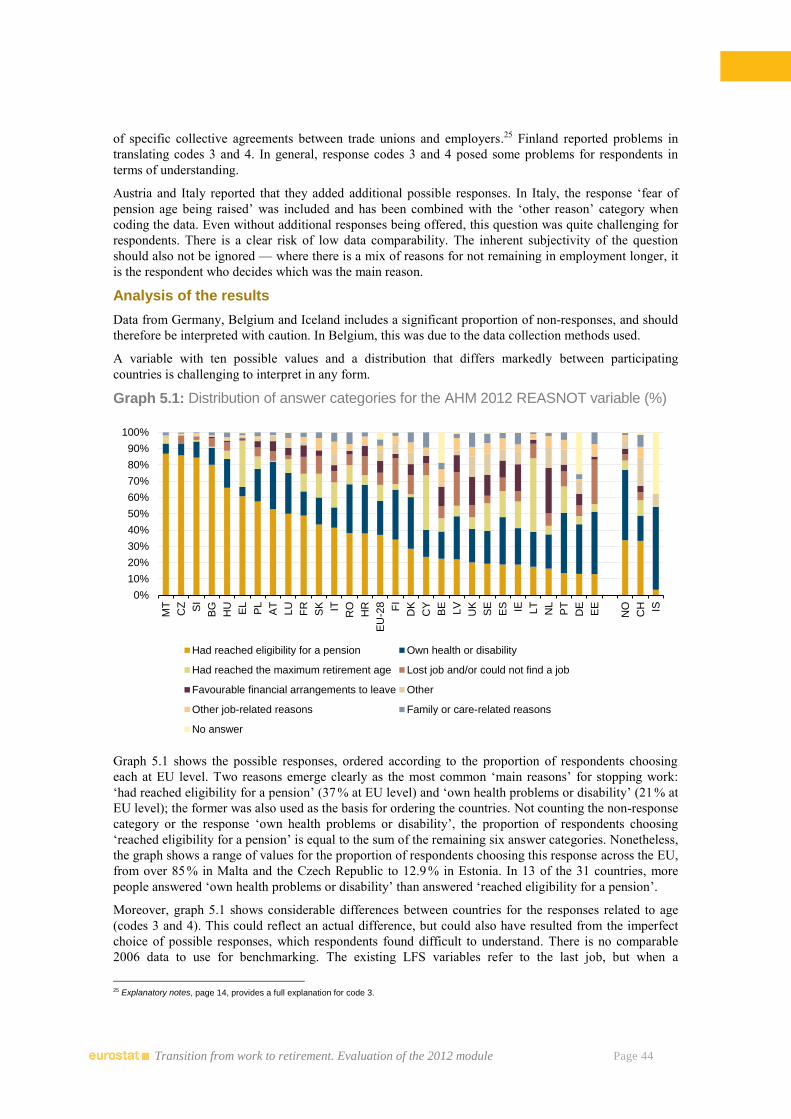
Transition from work to retirement. Evaluation of the 2012 module Page 44
of specific collective agreements between trade unions and employers.25 Finland reported problems in
translating codes 3 and 4. In general, response codes 3 and 4 posed some problems for respondents in
terms of understanding.
Austria and Italy reported that they added additional possible responses. In Italy, the response ‘fear of
pension age being raised’ was included and has been combined with the ‘other reason’ category when
coding the data. Even without additional responses being offered, this question was quite challenging for
respondents. There is a clear risk of low data comparability. The inherent subjectivity of the question
should also not be ignored — where there is a mix of reasons for not remaining in employment longer, it
is the respondent who decides which was the main reason.
Analysis of the results
Data from Germany, Belgium and Iceland includes a significant proportion of non-responses, and should
therefore be interpreted with caution. In Belgium, this was due to the data collection methods used.
A variable with ten possible values and a distribution that differs markedly between participating
countries is challenging to interpret in any form.
Graph 5.1: Distribution of answer categories for the AHM 2012 REASNOT variable (%)
Graph 5.1 shows the possible responses, ordered according to the proportion of respondents choosing
each at EU level. Two reasons emerge clearly as the most common ‘main reasons’ for stopping work:
‘had reached eligibility for a pension’ (37 % at EU level) and ‘own health problems or disability’ (21 % at
EU level); the former was also used as the basis for ordering the countries. Not counting the non-response
category or the response ‘own health problems or disability’, the proportion of respondents choosing
‘reached eligibility for a pension’ is equal to the sum of the remaining six answer categories. Nonetheless,
the graph shows a range of values for the proportion of respondents choosing this response across the EU,
from over 85 % in Malta and the Czech Republic to 12.9 % in Estonia. In 13 of the 31 countries, more
people answered ‘own health problems or disability’ than answered ‘reached eligibility for a pension’.
Moreover, graph 5.1 shows considerable differences between countries for the responses related to age
(codes 3 and 4). This could reflect an actual difference, but could also have resulted from the imperfect
choice of possible responses, which respondents found difficult to understand. There is no comparable
2006 data to use for benchmarking. The existing LFS variables refer to the last job, but when a
25 Explanatory notes, page 14, provides a full explanation for code 3.
0%
10%
20%
30%
40%
50%
60%
70%
80%
90%
100%
MT
CZ SI
BG
HU
EL
PL
AT
LU
FR
SK IT
RO
HR
EU
-28 FI
DK
CY
BE
LV
UK
SE
ES IE LT
NL
PT
DE
EE
NO
CH IS
Had reached eligibility for a pension Own health or disability
Had reached the maximum retirement age Lost job and/or could not find a job
Favourable financial arrangements to leave Other
Other job-related reasons Family or care-related reasons
No answer
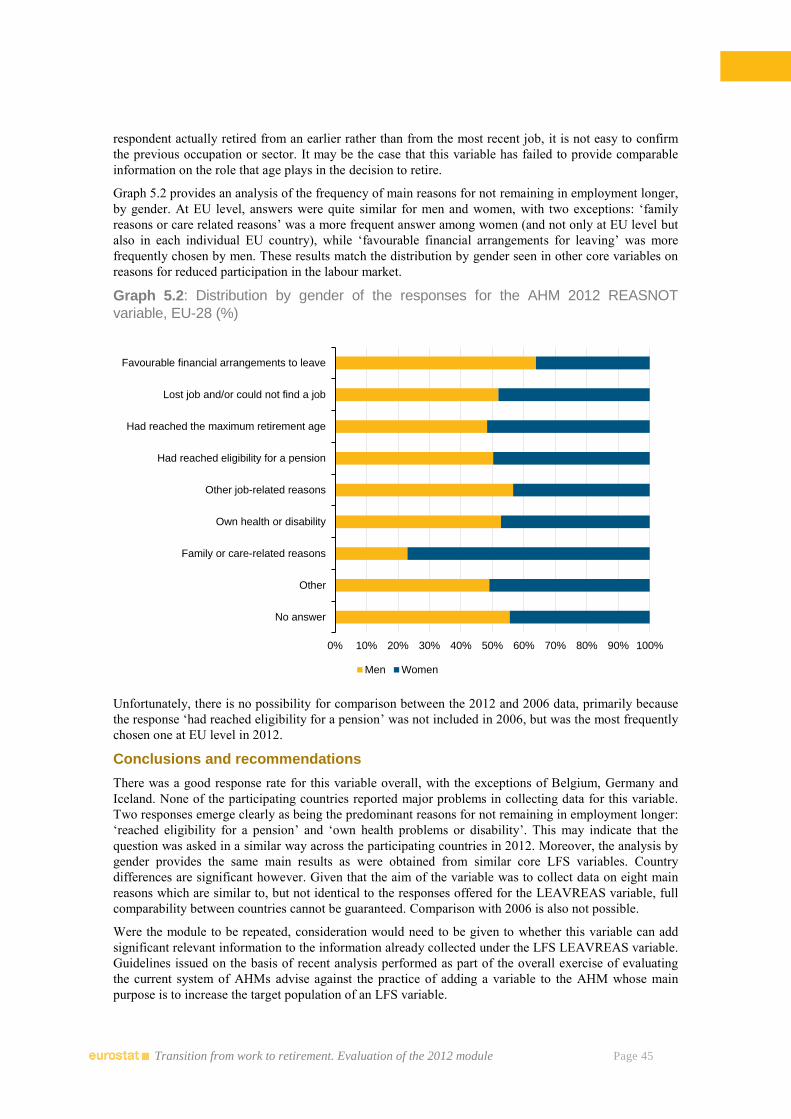
Transition from work to retirement. Evaluation of the 2012 module Page 45
respondent actually retired from an earlier rather than from the most recent job, it is not easy to confirm
the previous occupation or sector. It may be the case that this variable has failed to provide comparable
information on the role that age plays in the decision to retire.
Graph 5.2 provides an analysis of the frequency of main reasons for not remaining in employment longer,
by gender. At EU level, answers were quite similar for men and women, with two exceptions: ‘family
reasons or care related reasons’ was a more frequent answer among women (and not only at EU level but
also in each individual EU country), while ‘favourable financial arrangements for leaving’ was more
frequently chosen by men. These results match the distribution by gender seen in other core variables on
reasons for reduced participation in the labour market.
Graph 5.2: Distribution by gender of the responses for the AHM 2012 REASNOT
variable, EU-28 (%)
Unfortunately, there is no possibility for comparison between the 2012 and 2006 data, primarily because
the response ‘had reached eligibility for a pension’ was not included in 2006, but was the most frequently
chosen one at EU level in 2012.
Conclusions and recommendations
There was a good response rate for this variable overall, with the exceptions of Belgium, Germany and
Iceland. None of the participating countries reported major problems in collecting data for this variable.
Two responses emerge clearly as being the predominant reasons for not remaining in employment longer:
‘reached eligibility for a pension’ and ‘own health problems or disability’. This may indicate that the
question was asked in a similar way across the participating countries in 2012. Moreover, the analysis by
gender provides the same main results as were obtained from similar core LFS variables. Country
differences are significant however. Given that the aim of the variable was to collect data on eight main
reasons which are similar to, but not identical to the responses offered for the LEAVREAS variable, full
comparability between countries cannot be guaranteed. Comparison with 2006 is also not possible.
Were the module to be repeated, consideration would need to be given to whether this variable can add
significant relevant information to the information already collected under the LFS LEAVREAS variable.
Guidelines issued on the basis of recent analysis performed as part of the overall exercise of evaluating
the current system of AHMs advise against the practice of adding a variable to the AHM whose main
purpose is to increase the target population of an LFS variable.
0% 10% 20% 30% 40% 50% 60% 70% 80% 90% 100%
No answer
Other
Family or care-related reasons
Own health or disability
Other job-related reasons
Had reached eligibility for a pension
Had reached the maximum retirement age
Lost job and/or could not find a job
Favourable financial arrangements to leave
Men Women
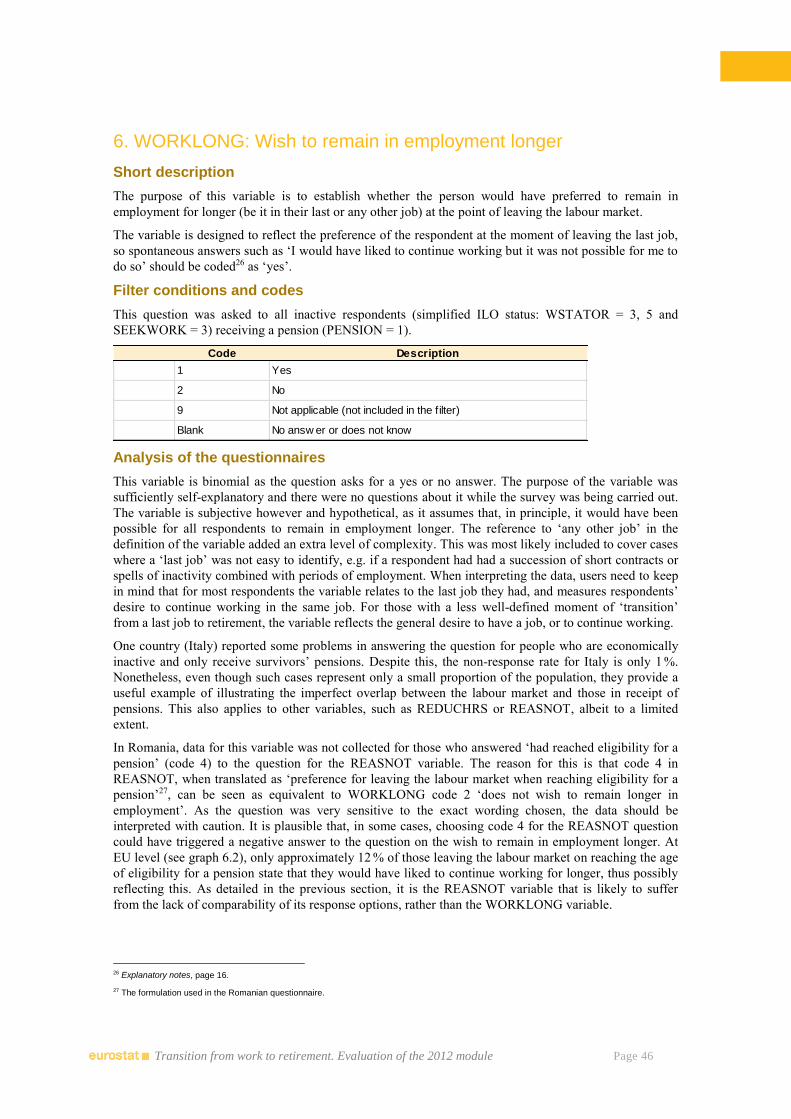
Transition from work to retirement. Evaluation of the 2012 module Page 46
6. WORKLONG: Wish to remain in employment longer
Short description
The purpose of this variable is to establish whether the person would have preferred to remain in
employment for longer (be it in their last or any other job) at the point of leaving the labour market.
The variable is designed to reflect the preference of the respondent at the moment of leaving the last job,
so spontaneous answers such as ‘I would have liked to continue working but it was not possible for me to
do so’ should be coded26 as ‘yes’.
Filter conditions and codes
This question was asked to all inactive respondents (simplified ILO status: WSTATOR = 3, 5 and
SEEKWORK = 3) receiving a pension (PENSION = 1).
Analysis of the questionnaires
This variable is binomial as the question asks for a yes or no answer. The purpose of the variable was
sufficiently self-explanatory and there were no questions about it while the survey was being carried out.
The variable is subjective however and hypothetical, as it assumes that, in principle, it would have been
possible for all respondents to remain in employment longer. The reference to ‘any other job’ in the
definition of the variable added an extra level of complexity. This was most likely included to cover cases
where a ‘last job’ was not easy to identify, e.g. if a respondent had had a succession of short contracts or
spells of inactivity combined with periods of employment. When interpreting the data, users need to keep
in mind that for most respondents the variable relates to the last job they had, and measures respondents’
desire to continue working in the same job. For those with a less well-defined moment of ‘transition’
from a last job to retirement, the variable reflects the general desire to have a job, or to continue working.
One country (Italy) reported some problems in answering the question for people who are economically
inactive and only receive survivors’ pensions. Despite this, the non-response rate for Italy is only 1 %.
Nonetheless, even though such cases represent only a small proportion of the population, they provide a
useful example of illustrating the imperfect overlap between the labour market and those in receipt of
pensions. This also applies to other variables, such as REDUCHRS or REASNOT, albeit to a limited
extent.
In Romania, data for this variable was not collected for those who answered ‘had reached eligibility for a
pension’ (code 4) to the question for the REASNOT variable. The reason for this is that code 4 in
REASNOT, when translated as ‘preference for leaving the labour market when reaching eligibility for a
pension’27, can be seen as equivalent to WORKLONG code 2 ‘does not wish to remain longer in
employment’. As the question was very sensitive to the exact wording chosen, the data should be
interpreted with caution. It is plausible that, in some cases, choosing code 4 for the REASNOT question
could have triggered a negative answer to the question on the wish to remain in employment longer. At
EU level (see graph 6.2), only approximately 12 % of those leaving the labour market on reaching the age
of eligibility for a pension state that they would have liked to continue working for longer, thus possibly
reflecting this. As detailed in the previous section, it is the REASNOT variable that is likely to suffer
from the lack of comparability of its response options, rather than the WORKLONG variable.
26 Explanatory notes, page 16.
27 The formulation used in the Romanian questionnaire.
Code Description
1 Yes
2 No
9 Not applicable (not included in the filter)
Blank No answ er or does not know
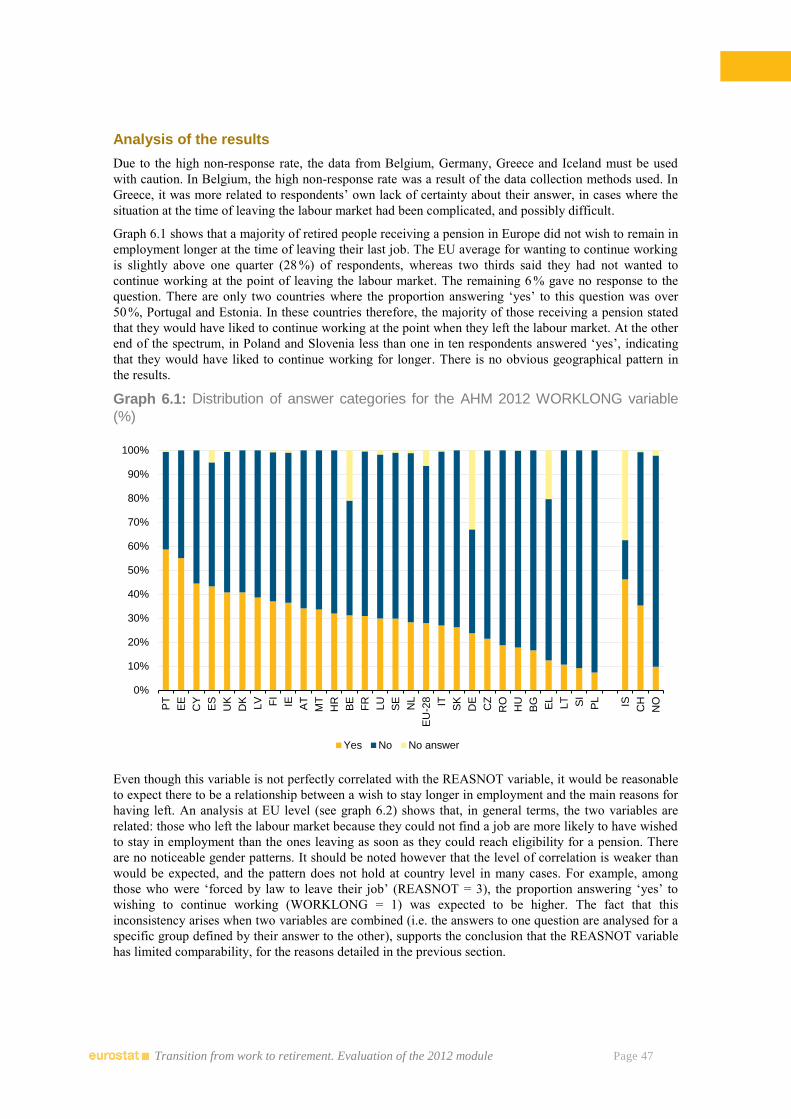
Transition from work to retirement. Evaluation of the 2012 module Page 47
Analysis of the results
Due to the high non-response rate, the data from Belgium, Germany, Greece and Iceland must be used
with caution. In Belgium, the high non-response rate was a result of the data collection methods used. In
Greece, it was more related to respondents’ own lack of certainty about their answer, in cases where the
situation at the time of leaving the labour market had been complicated, and possibly difficult.
Graph 6.1 shows that a majority of retired people receiving a pension in Europe did not wish to remain in
employment longer at the time of leaving their last job. The EU average for wanting to continue working
is slightly above one quarter (28 %) of respondents, whereas two thirds said they had not wanted to
continue working at the point of leaving the labour market. The remaining 6 % gave no response to the
question. There are only two countries where the proportion answering ‘yes’ to this question was over
50 %, Portugal and Estonia. In these countries therefore, the majority of those receiving a pension stated
that they would have liked to continue working at the point when they left the labour market. At the other
end of the spectrum, in Poland and Slovenia less than one in ten respondents answered ‘yes’, indicating
that they would have liked to continue working for longer. There is no obvious geographical pattern in
the results.
Graph 6.1: Distribution of answer categories for the AHM 2012 WORKLONG variable
(%)
Even though this variable is not perfectly correlated with the REASNOT variable, it would be reasonable
to expect there to be a relationship between a wish to stay longer in employment and the main reasons for
having left. An analysis at EU level (see graph 6.2) shows that, in general terms, the two variables are
related: those who left the labour market because they could not find a job are more likely to have wished
to stay in employment than the ones leaving as soon as they could reach eligibility for a pension. There
are no noticeable gender patterns. It should be noted however that the level of correlation is weaker than
would be expected, and the pattern does not hold at country level in many cases. For example, among
those who were ‘forced by law to leave their job’ (REASNOT = 3), the proportion answering ‘yes’ to
wishing to continue working (WORKLONG = 1) was expected to be higher. The fact that this
inconsistency arises when two variables are combined (i.e. the answers to one question are analysed for a
specific group defined by their answer to the other), supports the conclusion that the REASNOT variable
has limited comparability, for the reasons detailed in the previous section.
0%
10%
20%
30%
40%
50%
60%
70%
80%
90%
100%
PT
EE
CY
ES
UK
DK
LV FI
IE AT
MT
HR
BE
FR
LU
SE
NL
EU
-28 IT SK
DE
CZ
RO
HU
BG EL
LT SI
PL IS
CH
NO
Yes No No answer
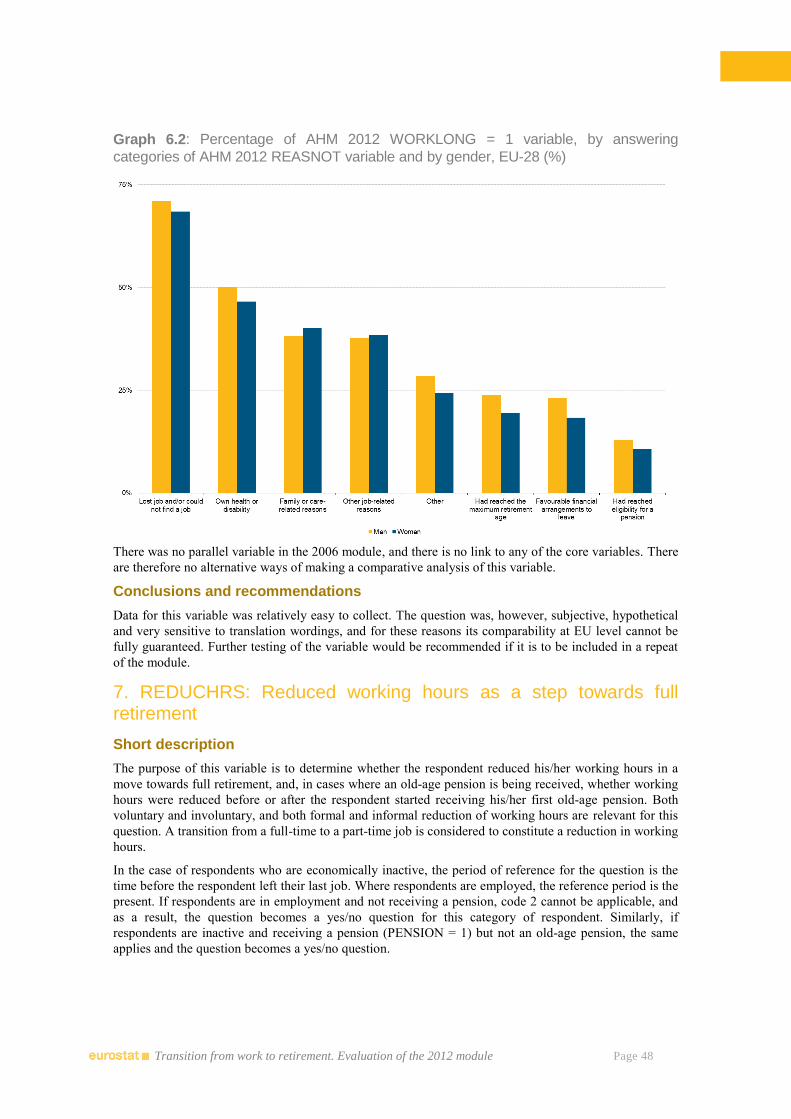
Transition from work to retirement. Evaluation of the 2012 module Page 48
Graph 6.2: Percentage of AHM 2012 WORKLONG = 1 variable, by answering
categories of AHM 2012 REASNOT variable and by gender, EU-28 (%)
There was no parallel variable in the 2006 module, and there is no link to any of the core variables. There
are therefore no alternative ways of making a comparative analysis of this variable.
Conclusions and recommendations
Data for this variable was relatively easy to collect. The question was, however, subjective, hypothetical
and very sensitive to translation wordings, and for these reasons its comparability at EU level cannot be
fully guaranteed. Further testing of the variable would be recommended if it is to be included in a repeat
of the module.
7. REDUCHRS: Reduced working hours as a step towards full retirement
Short description
The purpose of this variable is to determine whether the respondent reduced his/her working hours in a
move towards full retirement, and, in cases where an old-age pension is being received, whether working
hours were reduced before or after the respondent started receiving his/her first old-age pension. Both
voluntary and involuntary, and both formal and informal reduction of working hours are relevant for this
question. A transition from a full-time to a part-time job is considered to constitute a reduction in working
hours.
In the case of respondents who are economically inactive, the period of reference for the question is the
time before the respondent left their last job. Where respondents are employed, the reference period is the
present. If respondents are in employment and not receiving a pension, code 2 cannot be applicable, and
as a result, the question becomes a yes/no question for this category of respondent. Similarly, if
respondents are inactive and receiving a pension (PENSION = 1) but not an old-age pension, the same
applies and the question becomes a yes/no question.
Transition from work to retirement. Evaluation of the 2012 module Page 49
Filter conditions and codes
This question was asked to all respondents who were employed (ILO status: WSTATOR = 1, 2) and aged
55-69, and to all respondents who were inactive (simplified ILO status: WSTATOR = 3, 5 and
SEEKWORK = 3), receiving a pension (PENSION = 1) and aged 50-69.
Analysis of the questionnaires
In reviewing the survey, it became apparent that the wording of the variable had been too complicated,
and that the filter applied for the variable was also too difficult to manage. It was often difficult to
translate the phrase ‘in a move towards full retirement’, and this sometimes resulted in an expression
being used which was too abstract for respondents to understand. In Slovakia, Latvia and Croatia, the
possibility of reducing working hours as a way of leaving the labour market more gradually does not
exist, and therefore the answer was automatically code 3. Furthermore, respondents sometimes struggled
in distinguishing between codes 1 and 2, the correct choice being dependent on the moment at which a
respondent starts receiving his/her first old-age pension.
This question was asked to employed respondents with or without a pension, aged 55-69, and to inactive
respondents, with a pension, aged 50-69. The possible responses offered should have been different for
those receiving an old-age pension, and those not receiving a pension or receiving a pension other than an
old-age pension. Managing these filters proved to be difficult. It was suggested that the filters (age and
type of pension) could be expanded in order to facilitate data collection.
Analysis of the results
Due to the high non-response rate, data from Germany, Ireland, Greece and the United Kingdom must be
used with caution. The high non-response rate in Ireland was due to a problem with filtering which meant
that respondents who were working but not receiving a pension were not asked the question. The high
non-response rate in the United Kingdom was also due to a problem with filtering which meant that
inactive respondents were excluded. The overall non-response rate at EU level is relatively high at 11 %.
Reducing working hours as a step towards full retirement is not a common practice at EU level, with a
large majority of respondents answering ‘no’ to this question. The next most frequent of the responses
was ‘don’t know or no answer’. In view of this, any further breakdown of the ‘yes’ answers would be
problematic. The remaining categories are so small as to be almost meaningless to analyse. The data
should therefore be interpreted with care.
Code Description
1 Yes, before receiving the first old-age pension
2 Yes, since or after receiving the first old-age pension
3 No
9 Not applicable (not included in the filter)
Blank No answ er or does not know
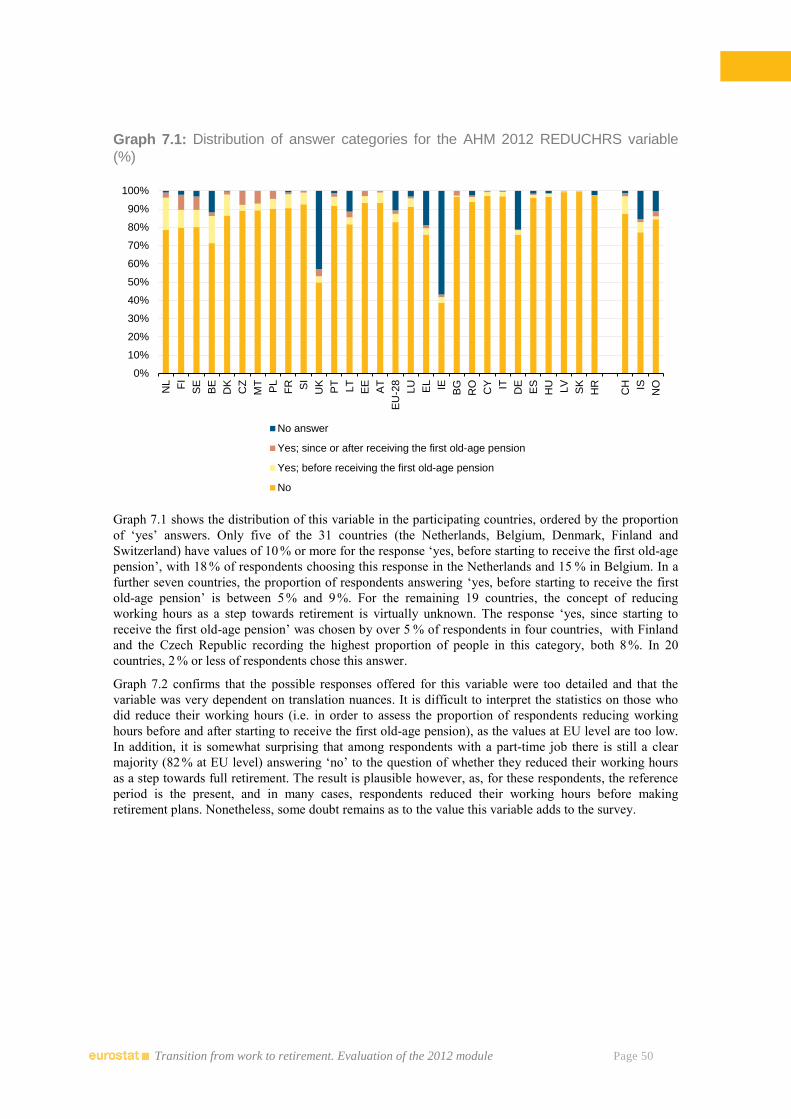
Transition from work to retirement. Evaluation of the 2012 module Page 50
Graph 7.1: Distribution of answer categories for the AHM 2012 REDUCHRS variable
(%)
Graph 7.1 shows the distribution of this variable in the participating countries, ordered by the proportion
of ‘yes’ answers. Only five of the 31 countries (the Netherlands, Belgium, Denmark, Finland and
Switzerland) have values of 10 % or more for the response ‘yes, before starting to receive the first old-age
pension’, with 18 % of respondents choosing this response in the Netherlands and 15 % in Belgium. In a
further seven countries, the proportion of respondents answering ‘yes, before starting to receive the first
old-age pension’ is between 5 % and 9 %. For the remaining 19 countries, the concept of reducing
working hours as a step towards retirement is virtually unknown. The response ‘yes, since starting to
receive the first old-age pension’ was chosen by over 5 % of respondents in four countries, with Finland
and the Czech Republic recording the highest proportion of people in this category, both 8 %. In 20
countries, 2 % or less of respondents chose this answer.
Graph 7.2 confirms that the possible responses offered for this variable were too detailed and that the
variable was very dependent on translation nuances. It is difficult to interpret the statistics on those who
did reduce their working hours (i.e. in order to assess the proportion of respondents reducing working
hours before and after starting to receive the first old-age pension), as the values at EU level are too low.
In addition, it is somewhat surprising that among respondents with a part-time job there is still a clear
majority (82 % at EU level) answering ‘no’ to the question of whether they reduced their working hours
as a step towards full retirement. The result is plausible however, as, for these respondents, the reference
period is the present, and in many cases, respondents reduced their working hours before making
retirement plans. Nonetheless, some doubt remains as to the value this variable adds to the survey.
0%
10%
20%
30%
40%
50%
60%
70%
80%
90%
100%
NL FI
SE
BE
DK
CZ
MT
PL
FR SI
UK
PT
LT
EE
AT
EU
-28
LU
EL IE
BG
RO
CY IT
DE
ES
HU
LV
SK
HR
CH IS
NO
No answer
Yes; since or after receiving the first old-age pension
Yes; before receiving the first old-age pension
No
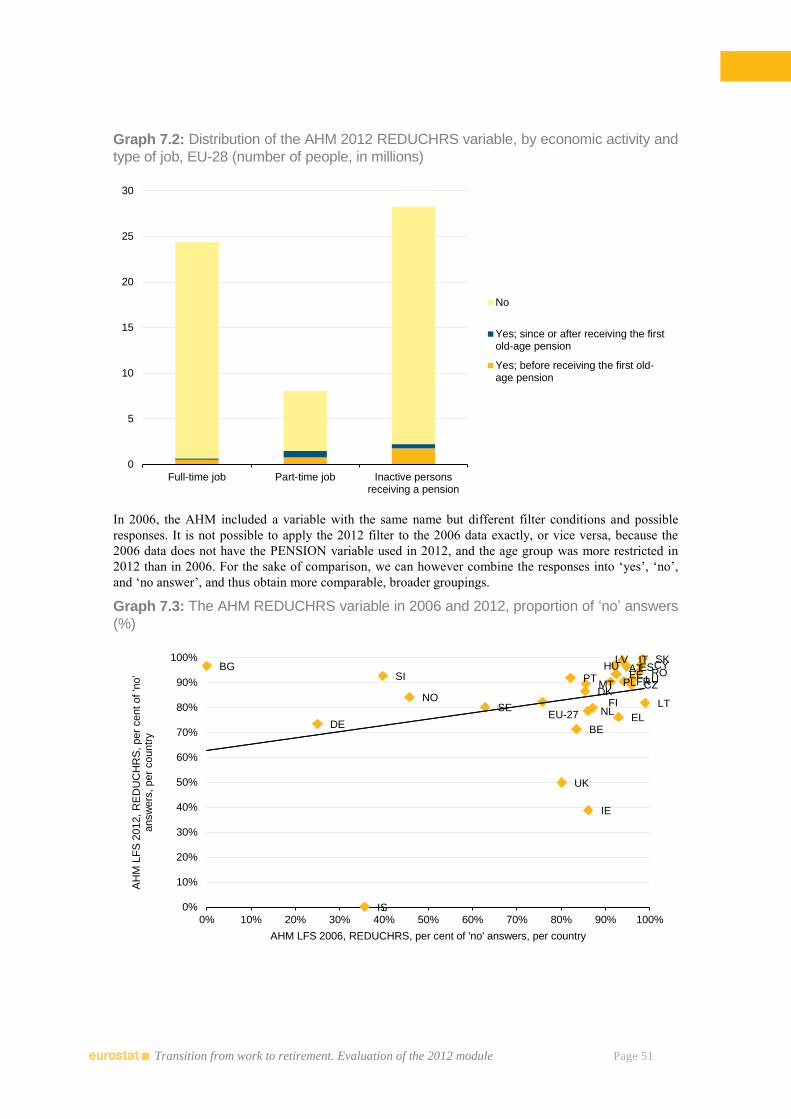
Transition from work to retirement. Evaluation of the 2012 module Page 51
Graph 7.2: Distribution of the AHM 2012 REDUCHRS variable, by economic activity and
type of job, EU-28 (number of people, in millions)
In 2006, the AHM included a variable with the same name but different filter conditions and possible
responses. It is not possible to apply the 2012 filter to the 2006 data exactly, or vice versa, because the
2006 data does not have the PENSION variable used in 2012, and the age group was more restricted in
2012 than in 2006. For the sake of comparison, we can however combine the responses into ‘yes’, ‘no’,
and ‘no answer’, and thus obtain more comparable, broader groupings.
Graph 7.3: The AHM REDUCHRS variable in 2006 and 2012, proportion of ‘no’ answers
(%)
0
5
10
15
20
25
30
Full-time job Part-time job Inactive personsreceiving a pension
No
Yes; since or after receiving the firstold-age pension
Yes; before receiving the first old-age pension
EU-27
BE
BG
CZ DK
DE
EE
IE
EL
ES
FR
IT
CY LV
LT
LU
HU
MT
NL
AT PL PT
RO SI
SK
FI SE
UK
IS
NO
0%
10%
20%
30%
40%
50%
60%
70%
80%
90%
100%
0% 10% 20% 30% 40% 50% 60% 70% 80% 90% 100%
AH
M L
FS
2012,
RE
DU
CH
RS
, per
cent of 'n
o'
answ
ers
, per
countr
y
AHM LFS 2006, REDUCHRS, per cent of 'no' answers, per country
Transition from work to retirement. Evaluation of the 2012 module Page 52
There is a clear cluster in the upper right corner, which simply confirms the rarity of the practice of
reducing working hours as a step towards retirement at EU level, both in 2006 and in 2012. However,
there are also some significant outliers (Bulgaria, Island, Germany, Slovenia, Norway, Ireland and the
United Kingdom, confirming that comparison of this variable over time should be avoided.
Conclusions and recommendations
This variable provides very little comparable information at EU level. The form in which the variable was
set up was clearly not adapted to the actual distribution of the variable. Were this variable to be included
in a repeat of the module, it would be advisable to restructure it.
8. STAYWORK: Main reason for remaining in employment
Short description
The purpose of this variable is to identify the main factor causing a person who receives a pension to
remain in employment.
Filter conditions and codes
This question was asked to all respondents who were employed (ILO status: WSTATOR = 1, 2) and
receiving a pension (PENSION = 1).
Analysis of the questionnaires
The purpose of this variable is to find out why people receiving a pension want to continue working. In
several countries, the question on the main reason for staying at work was asked without giving any
explanation of its purpose, and, as a result, most respondents could not see the link between the question
and the fact that they had already declared receiving a pension. In other countries (Austria, Cyprus,
Germany, Spain, Hungary, Italy, Luxembourg, the Netherlands, Portugal, Romania and Switzerland) the
context of the question was clearly explained, and the question was formulated as follows, or similarly:
‘you are receiving a pension or a pension-type benefit. Why are you still working?’. In Estonia, the
question was formulated differently, as: ‘Do you have a financial incentive for continuing to work now
that you are receiving a pension? If yes, please give details’. It can therefore be concluded that the
questionnaires are not fully comparable between countries, and this can be expected to have an effect on
the answers.
The possible reasons proposed to the respondents are classified either as being of a financial nature
(codes 1 to 3) or of a non-financial nature (code 4).
No countries reported significant problems with this variable, but there was a suggestion that code 4
should have been split, with personal fulfilment offered as a separate answer.
Analysis of the results
Due to the high non-response rate, the data from Germany, France, Croatia and Switzerland must be used
with caution. At EU level, the non-response rate is 11 %, which signals that the data should be analysed
with care.
Graphs 1.3 and 1.4 showed the proportion of respondents who are both employed and receiving a
pension, at EU level and at country level. Less than 7 % of the EU population aged 50-69 is in
employment while at the same time receiving a pension. Out of the total population of the module, 8 %
Code Description
1 To establish or increase future retirement pension entitlements
2 To provide sufficient personal/household income
3 Combination of 1 and 2
4 Non-financial reasons, e.g. w ork satisfaction
9 Not applicable (not included in the filter)
Blank No answ er or does not know
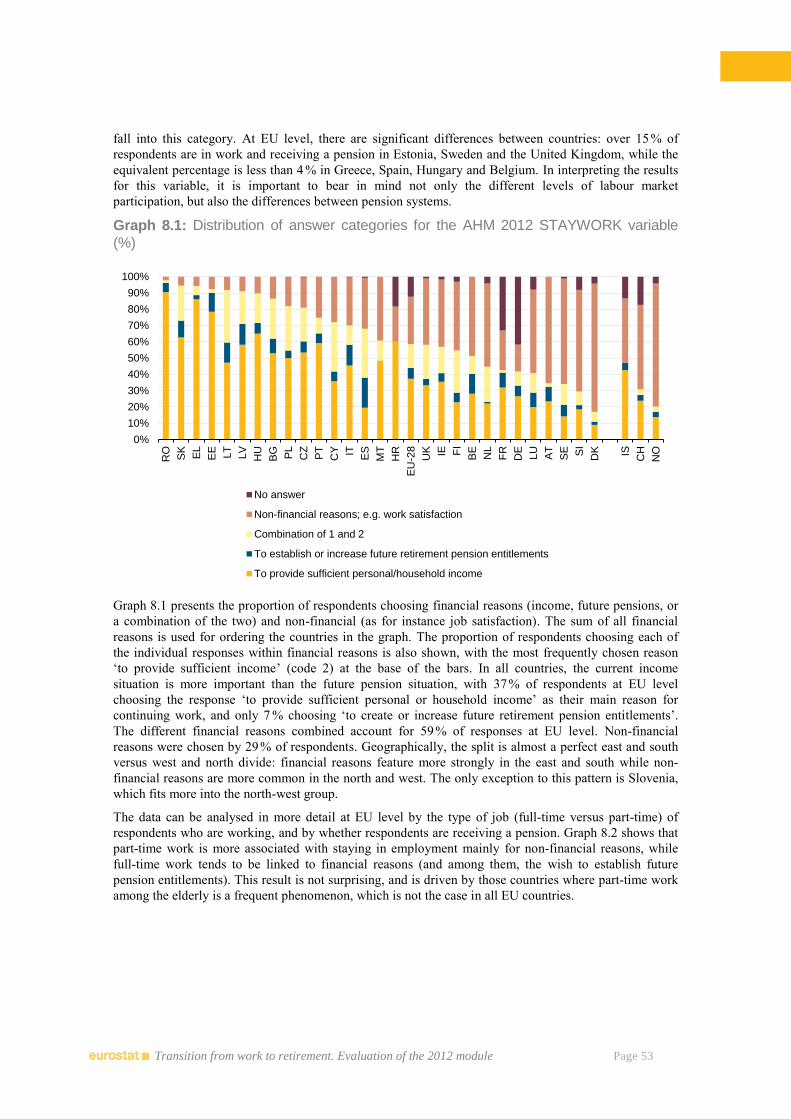
Transition from work to retirement. Evaluation of the 2012 module Page 53
fall into this category. At EU level, there are significant differences between countries: over 15 % of
respondents are in work and receiving a pension in Estonia, Sweden and the United Kingdom, while the
equivalent percentage is less than 4 % in Greece, Spain, Hungary and Belgium. In interpreting the results
for this variable, it is important to bear in mind not only the different levels of labour market
participation, but also the differences between pension systems.
Graph 8.1: Distribution of answer categories for the AHM 2012 STAYWORK variable
(%)
Graph 8.1 presents the proportion of respondents choosing financial reasons (income, future pensions, or
a combination of the two) and non-financial (as for instance job satisfaction). The sum of all financial
reasons is used for ordering the countries in the graph. The proportion of respondents choosing each of
the individual responses within financial reasons is also shown, with the most frequently chosen reason
‘to provide sufficient income’ (code 2) at the base of the bars. In all countries, the current income
situation is more important than the future pension situation, with 37 % of respondents at EU level
choosing the response ‘to provide sufficient personal or household income’ as their main reason for
continuing work, and only 7 % choosing ‘to create or increase future retirement pension entitlements’.
The different financial reasons combined account for 59 % of responses at EU level. Non-financial
reasons were chosen by 29 % of respondents. Geographically, the split is almost a perfect east and south
versus west and north divide: financial reasons feature more strongly in the east and south while non-
financial reasons are more common in the north and west. The only exception to this pattern is Slovenia,
which fits more into the north-west group.
The data can be analysed in more detail at EU level by the type of job (full-time versus part-time) of
respondents who are working, and by whether respondents are receiving a pension. Graph 8.2 shows that
part-time work is more associated with staying in employment mainly for non-financial reasons, while
full-time work tends to be linked to financial reasons (and among them, the wish to establish future
pension entitlements). This result is not surprising, and is driven by those countries where part-time work
among the elderly is a frequent phenomenon, which is not the case in all EU countries.
0%
10%
20%
30%
40%
50%
60%
70%
80%
90%
100%
RO
SK
EL
EE
LT
LV
HU
BG PL
CZ
PT
CY IT ES
MT
HR
EU
-28
UK IE FI
BE
NL
FR
DE
LU
AT
SE SI
DK IS
CH
NO
No answer
Non-financial reasons; e.g. work satisfaction
Combination of 1 and 2
To establish or increase future retirement pension entitlements
To provide sufficient personal/household income
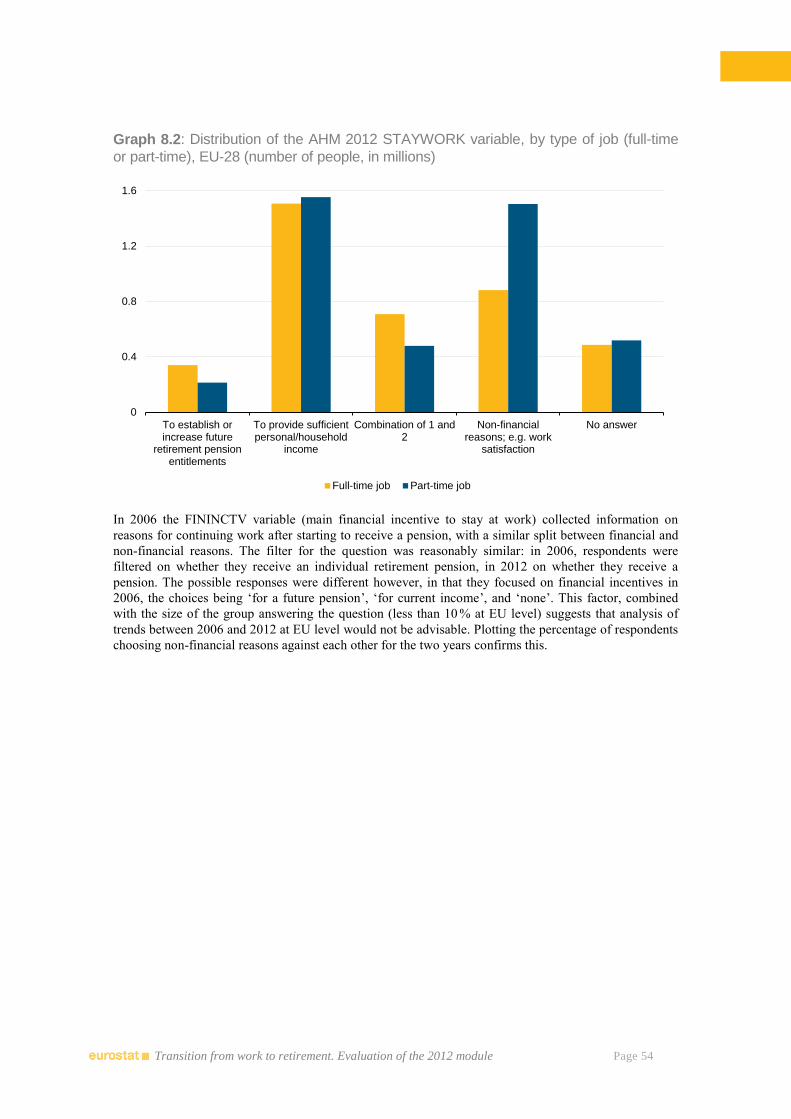
Transition from work to retirement. Evaluation of the 2012 module Page 54
Graph 8.2: Distribution of the AHM 2012 STAYWORK variable, by type of job (full-time
or part-time), EU-28 (number of people, in millions)
In 2006 the FININCTV variable (main financial incentive to stay at work) collected information on
reasons for continuing work after starting to receive a pension, with a similar split between financial and
non-financial reasons. The filter for the question was reasonably similar: in 2006, respondents were
filtered on whether they receive an individual retirement pension, in 2012 on whether they receive a
pension. The possible responses were different however, in that they focused on financial incentives in
2006, the choices being ‘for a future pension’, ‘for current income’, and ‘none’. This factor, combined
with the size of the group answering the question (less than 10 % at EU level) suggests that analysis of
trends between 2006 and 2012 at EU level would not be advisable. Plotting the percentage of respondents
choosing non-financial reasons against each other for the two years confirms this.
0
0.4
0.8
1.2
1.6
To establish orincrease future
retirement pensionentitlements
To provide sufficientpersonal/household
income
Combination of 1 and2
Non-financialreasons; e.g. work
satisfaction
No answer
Full-time job Part-time job
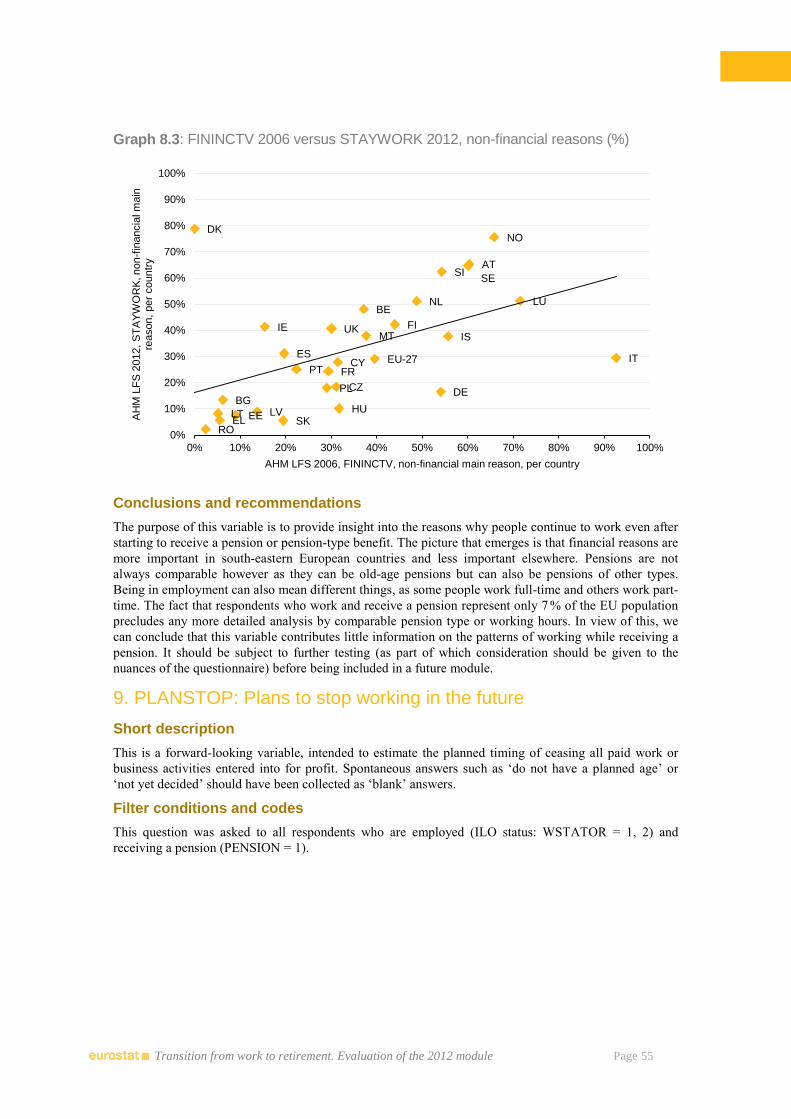
Transition from work to retirement. Evaluation of the 2012 module Page 55
Graph 8.3: FININCTV 2006 versus STAYWORK 2012, non-financial reasons (%)
Conclusions and recommendations
The purpose of this variable is to provide insight into the reasons why people continue to work even after
starting to receive a pension or pension-type benefit. The picture that emerges is that financial reasons are
more important in south-eastern European countries and less important elsewhere. Pensions are not
always comparable however as they can be old-age pensions but can also be pensions of other types.
Being in employment can also mean different things, as some people work full-time and others work part-
time. The fact that respondents who work and receive a pension represent only 7 % of the EU population
precludes any more detailed analysis by comparable pension type or working hours. In view of this, we
can conclude that this variable contributes little information on the patterns of working while receiving a
pension. It should be subject to further testing (as part of which consideration should be given to the
nuances of the questionnaire) before being included in a future module.
9. PLANSTOP: Plans to stop working in the future
Short description
This is a forward-looking variable, intended to estimate the planned timing of ceasing all paid work or
business activities entered into for profit. Spontaneous answers such as ‘do not have a planned age’ or
‘not yet decided’ should have been collected as ‘blank’ answers.
Filter conditions and codes
This question was asked to all respondents who are employed (ILO status: WSTATOR = 1, 2) and
receiving a pension (PENSION = 1).
EU-27
BE
BG
CZ
DK
DE
EE
IE
EL
ES
FR
IT CY
LV LT
LU
HU
MT
NL
AT
PL
PT
RO
SI
SK
FI
SE
UK IS
NO
0%
10%
20%
30%
40%
50%
60%
70%
80%
90%
100%
0% 10% 20% 30% 40% 50% 60% 70% 80% 90% 100%
AH
M L
FS
2012,
ST
AY
WO
RK
, non
-fin
ancia
l m
ain
re
ason, per
countr
y
AHM LFS 2006, FININCTV, non-financial main reason, per country
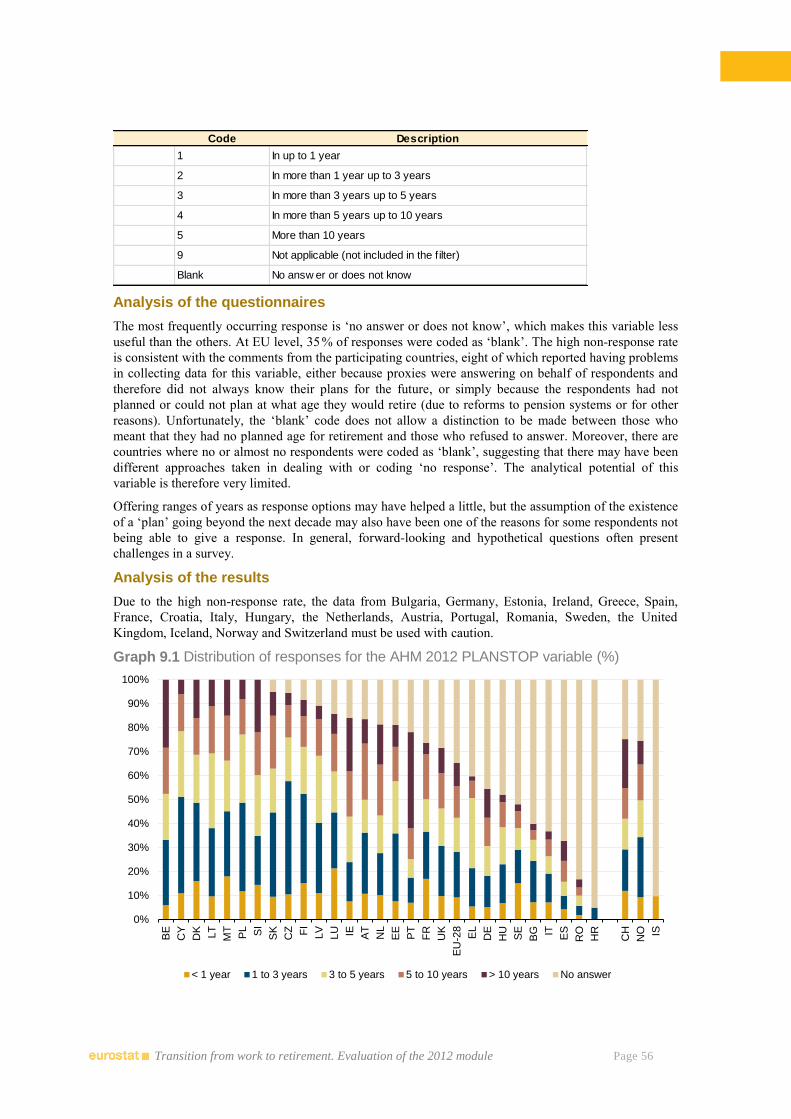
Transition from work to retirement. Evaluation of the 2012 module Page 56
Analysis of the questionnaires
The most frequently occurring response is ‘no answer or does not know’, which makes this variable less
useful than the others. At EU level, 35 % of responses were coded as ‘blank’. The high non-response rate
is consistent with the comments from the participating countries, eight of which reported having problems
in collecting data for this variable, either because proxies were answering on behalf of respondents and
therefore did not always know their plans for the future, or simply because the respondents had not
planned or could not plan at what age they would retire (due to reforms to pension systems or for other
reasons). Unfortunately, the ‘blank’ code does not allow a distinction to be made between those who
meant that they had no planned age for retirement and those who refused to answer. Moreover, there are
countries where no or almost no respondents were coded as ‘blank’, suggesting that there may have been
different approaches taken in dealing with or coding ‘no response’. The analytical potential of this
variable is therefore very limited.
Offering ranges of years as response options may have helped a little, but the assumption of the existence
of a ‘plan’ going beyond the next decade may also have been one of the reasons for some respondents not
being able to give a response. In general, forward-looking and hypothetical questions often present
challenges in a survey.
Analysis of the results
Due to the high non-response rate, the data from Bulgaria, Germany, Estonia, Ireland, Greece, Spain,
France, Croatia, Italy, Hungary, the Netherlands, Austria, Portugal, Romania, Sweden, the United
Kingdom, Iceland, Norway and Switzerland must be used with caution.
Graph 9.1 Distribution of responses for the AHM 2012 PLANSTOP variable (%)
Code Description
1 In up to 1 year
2 In more than 1 year up to 3 years
3 In more than 3 years up to 5 years
4 In more than 5 years up to 10 years
5 More than 10 years
9 Not applicable (not included in the filter)
Blank No answ er or does not know
0%
10%
20%
30%
40%
50%
60%
70%
80%
90%
100%
BE
CY
DK
LT
MT
PL SI
SK
CZ FI
LV
LU IE AT
NL
EE
PT
FR
UK
EU
-28
EL
DE
HU
SE
BG IT ES
RO
HR
CH
NO IS
< 1 year 1 to 3 years 3 to 5 years 5 to 10 years > 10 years No answer
Transition from work to retirement. Evaluation of the 2012 module Page 57
Graph 9.1 shows that the most common response is not an actual answer but is the ‘blank’ code. Croatia
has the highest non-response rate, at 95 %, followed by Romania, at 83 %. Only twelve of the
participating countries have a response rate higher than 85 %. It is clear that analysis is, at best, only
possible at country level.
Conclusions and recommendations
One in three respondents in the EU has chosen not to answer the question about future retirement plans,
either because they do not have a plan or because they did not feel comfortable talking about such plans.
The problems with this question could also have been due to a badly chosen target group. The report from
Italy suggested that the question should be asked to all respondents currently in employment, and not just
to those receiving a pension. This is clearly the least successful variable in the module, and should
therefore not be repeated. As a general rule, variables on respondents’ future plans should be avoided.
10. BUILDPEN: Information on pension rights built up to date
Short description
The purpose of this variable is to collect information on the pension rights built up by the respondent to
date. The criterion measured by the variable is whether or not the person has either built up or is currently
building up pension rights (of one or more of the types indicated in the variable). If this is the case, an
affirmative answer should be given to this question even if the respondent does not yet have the right to
receive the pension.
Filter conditions and codes
This question was asked to all respondents aged 50-69 who are not currently receiving an old-age pension
(PENSION = 2, blank or (PENSTYP1 to PENSTYP4 = 0)), and who are either working currently or have
worked beyond age 50.
Analysis of the questionnaires
Several of the participating countries commented on the complexity of measuring this variable and
reported difficulties in collecting the data. The most problematic aspect lies in the understanding of the
phrase ‘pension rights the person has acquired so far’. The intention was to collect information on any
contributions made in the past for a pension that is to be paid in the future. When analysing the
questionnaires used in different countries it became apparent that the wording used differed considerably.
For example, in Belgium, Denmark, and Luxembourg, the question referred to ‘acquired pension rights’.
The UK questionnaire asked about the respondent’s expectation of future pension rights. In Bulgaria,
Spain, France, and Portugal, the intended question was asked, i.e. referring to contributions to the pension
system. In Poland, the question asked related to ‘being able to retire at the time of the question’ rather
than to ‘having built up pension rights (for future retirement)’, which of course had a major impact on the
results. Some respondents thought that pension rights were in force only at the moment when a pension is
received. The question was however asked to all those not receiving an old-age pension. Other
respondents did not know whether their past contributions would actually give them any pension rights.
There were also some respondents who took the view that the uncertainty surrounding pension systems
meant that the rights they had built up were not guaranteed.
The breakdown of the variable by scheme type was detailed and it was difficult to collect data as
respondents often did not know what type of pension rights they had (in particular in Bulgaria, Greece
and Lithuania). In some countries (the Czech Republic, the United Kingdom and Greece), several of the
Code Description
BUILDPEN1 1: Yes; 0: No Old-age pension. Statutory scheme
BUILDPEN2 1: Yes; 0: No Old-age pension. Occupational scheme
BUILDPEN3 1: Yes; 0: No Old-age pension. Personal scheme
BUILDPEN4 1: Yes; 0: No Old-age pension. Scheme unknow n
9999 Not applicable (not included in the filter)
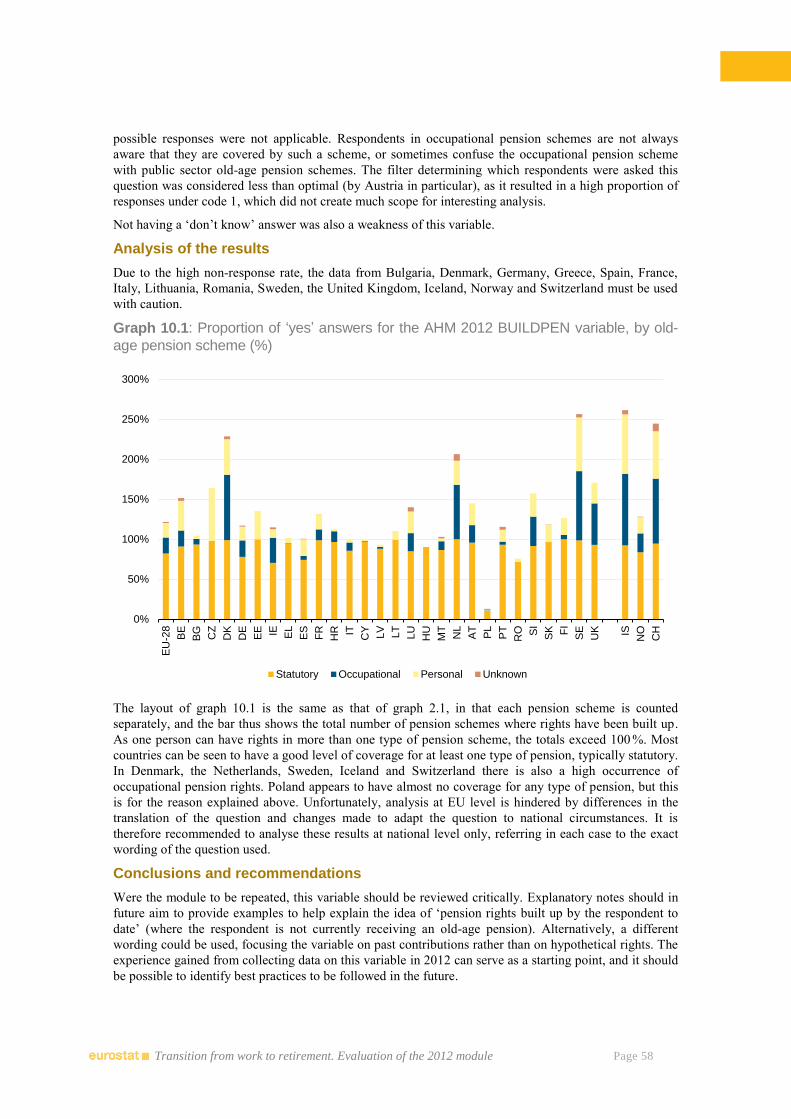
Transition from work to retirement. Evaluation of the 2012 module Page 58
possible responses were not applicable. Respondents in occupational pension schemes are not always
aware that they are covered by such a scheme, or sometimes confuse the occupational pension scheme
with public sector old-age pension schemes. The filter determining which respondents were asked this
question was considered less than optimal (by Austria in particular), as it resulted in a high proportion of
responses under code 1, which did not create much scope for interesting analysis.
Not having a ‘don’t know’ answer was also a weakness of this variable.
Analysis of the results
Due to the high non-response rate, the data from Bulgaria, Denmark, Germany, Greece, Spain, France,
Italy, Lithuania, Romania, Sweden, the United Kingdom, Iceland, Norway and Switzerland must be used
with caution.
Graph 10.1: Proportion of ‘yes’ answers for the AHM 2012 BUILDPEN variable, by old-
age pension scheme (%)
The layout of graph 10.1 is the same as that of graph 2.1, in that each pension scheme is counted
separately, and the bar thus shows the total number of pension schemes where rights have been built up.
As one person can have rights in more than one type of pension scheme, the totals exceed 100 %. Most
countries can be seen to have a good level of coverage for at least one type of pension, typically statutory.
In Denmark, the Netherlands, Sweden, Iceland and Switzerland there is also a high occurrence of
occupational pension rights. Poland appears to have almost no coverage for any type of pension, but this
is for the reason explained above. Unfortunately, analysis at EU level is hindered by differences in the
translation of the question and changes made to adapt the question to national circumstances. It is
therefore recommended to analyse these results at national level only, referring in each case to the exact
wording of the question used.
Conclusions and recommendations
Were the module to be repeated, this variable should be reviewed critically. Explanatory notes should in
future aim to provide examples to help explain the idea of ‘pension rights built up by the respondent to
date’ (where the respondent is not currently receiving an old-age pension). Alternatively, a different
wording could be used, focusing the variable on past contributions rather than on hypothetical rights. The
experience gained from collecting data on this variable in 2012 can serve as a starting point, and it should
be possible to identify best practices to be followed in the future.
0%
50%
100%
150%
200%
250%
300%
EU
-28
BE
BG
CZ
DK
DE
EE IE EL
ES
FR
HR IT
CY
LV
LT
LU
HU
MT
NL
AT
PL
PT
RO SI
SK FI
SE
UK IS
NO
CH
Statutory Occupational Personal Unknown
Transition from work to retirement. Evaluation of the 2012 module Page 59
It is also worth emphasising once again the point made in the introductory chapter about the target
population: the choice of target population for this variable has additional disadvantages for analysis of
countries with a lower retirement age. This is because people who did not work after the age of 50 and
who are therefore excluded by the filter for this question, nevertheless have reasonable chances of
receiving a pension, either at the time of the interview or in the future, on the basis of their employment
before the age of 50. It is therefore unfortunate that the survey excluded these respondents from the
analysis of contributions to the pension system.
11. CONTWORK: Expectations of continuing working or looking for a job after starting to receive an old-age pension
Short description
This variable is forward-looking and examines whether those respondents currently building up old-age
pension rights expect to continue working or looking for work when they start receiving a pension. For
those respondents who expect to continue working or looking for work, the variable also distinguishes
between those who expect to need to work for financial reasons and those who wish to continue working
for non-financial reasons.
Filter conditions and codes
This question was asked to all active respondents (simplified ILO status: WSTATOR = 1, 2 or
(WSTATOR = 3, 5 and SEEKWORK = 1, 2, 4)) who are either building up or have built up old-age
pension rights (BUILDPEN ≠ 0000, 9999), and who are not currently receiving a pension (PENSION = 2,
blank).
Analysis of the questionnaires
A number of countries (Bulgaria, Switzerland, Estonia, Italy, the Netherlands and Slovakia) reported
difficulties in collecting information on expectations to continue working, because the question was
hypothetical and, in many cases, proved impossible to answer. Furthermore, the variable was intended to
combine not only the intention to work, but also the intention to look for work, which created further
difficulties. The complicated filter for the question added to the problems experienced in collecting data
for this variable.
Analysis of the results
There were high non-response rates for this variable in many countries: the non-response rate was 19 % at
EU level, with values above 50 % in two EU countries, Romania (61 %) and Bulgaria (52 %). The
following countries also recorded non-response rates higher than 15 %: Lithuania, Iceland, Norway,
Switzerland, Denmark, Greece, Italy, the United Kingdom, Germany, Spain, Sweden and France.
Code Description
1 Yes, for f inancial reasons
2 Yes, for other reasons
3 No, stop immediately w hen receiving old-age pension
4 No, stop before receiving old-age pension
9 Not applicable (not included in the filter)
Blank No answ er or does not know
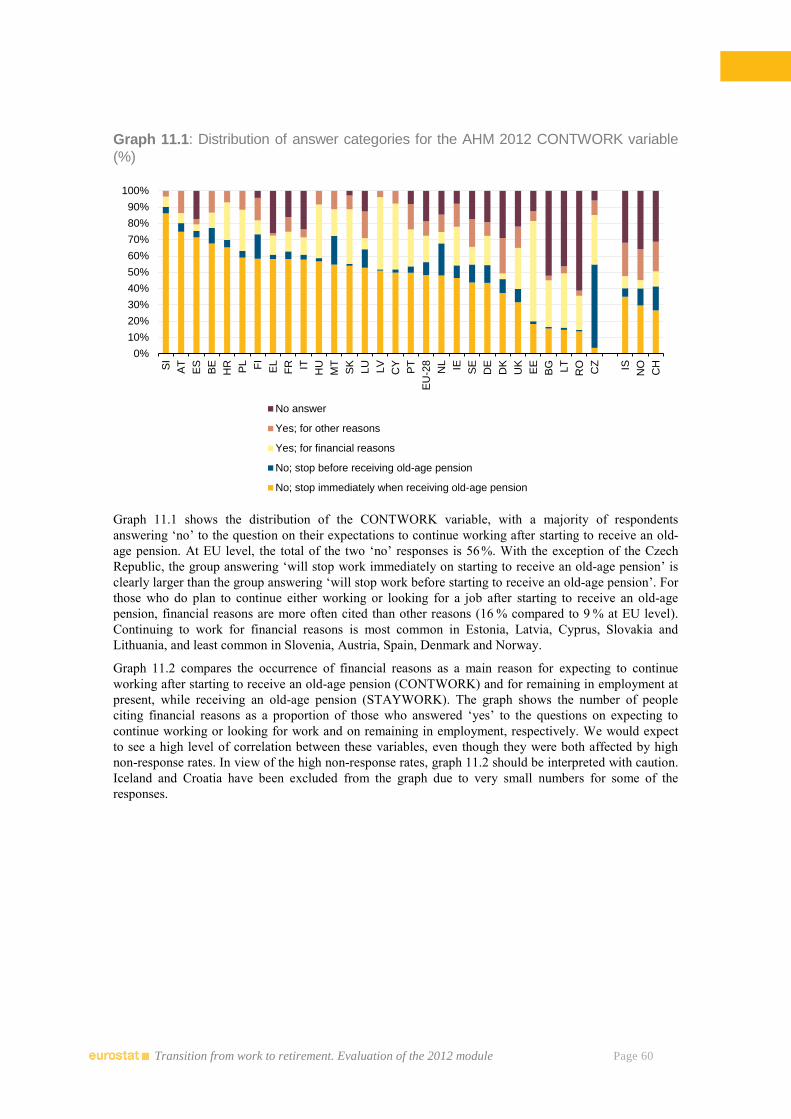
Transition from work to retirement. Evaluation of the 2012 module Page 60
Graph 11.1: Distribution of answer categories for the AHM 2012 CONTWORK variable
(%)
Graph 11.1 shows the distribution of the CONTWORK variable, with a majority of respondents
answering ‘no’ to the question on their expectations to continue working after starting to receive an old-
age pension. At EU level, the total of the two ‘no’ responses is 56 %. With the exception of the Czech
Republic, the group answering ‘will stop work immediately on starting to receive an old-age pension’ is
clearly larger than the group answering ‘will stop work before starting to receive an old-age pension’. For
those who do plan to continue either working or looking for a job after starting to receive an old-age
pension, financial reasons are more often cited than other reasons (16 % compared to 9 % at EU level).
Continuing to work for financial reasons is most common in Estonia, Latvia, Cyprus, Slovakia and
Lithuania, and least common in Slovenia, Austria, Spain, Denmark and Norway.
Graph 11.2 compares the occurrence of financial reasons as a main reason for expecting to continue
working after starting to receive an old-age pension (CONTWORK) and for remaining in employment at
present, while receiving an old-age pension (STAYWORK). The graph shows the number of people
citing financial reasons as a proportion of those who answered ‘yes’ to the questions on expecting to
continue working or looking for work and on remaining in employment, respectively. We would expect
to see a high level of correlation between these variables, even though they were both affected by high
non-response rates. In view of the high non-response rates, graph 11.2 should be interpreted with caution.
Iceland and Croatia have been excluded from the graph due to very small numbers for some of the
responses.
0%
10%
20%
30%
40%
50%
60%
70%
80%
90%
100%
SI
AT
ES
BE
HR
PL FI
EL
FR IT
HU
MT
SK
LU
LV
CY
PT
EU
-28
NL IE SE
DE
DK
UK
EE
BG LT
RO
CZ IS
NO
CH
No answer
Yes; for other reasons
Yes; for financial reasons
No; stop before receiving old-age pension
No; stop immediately when receiving old-age pension
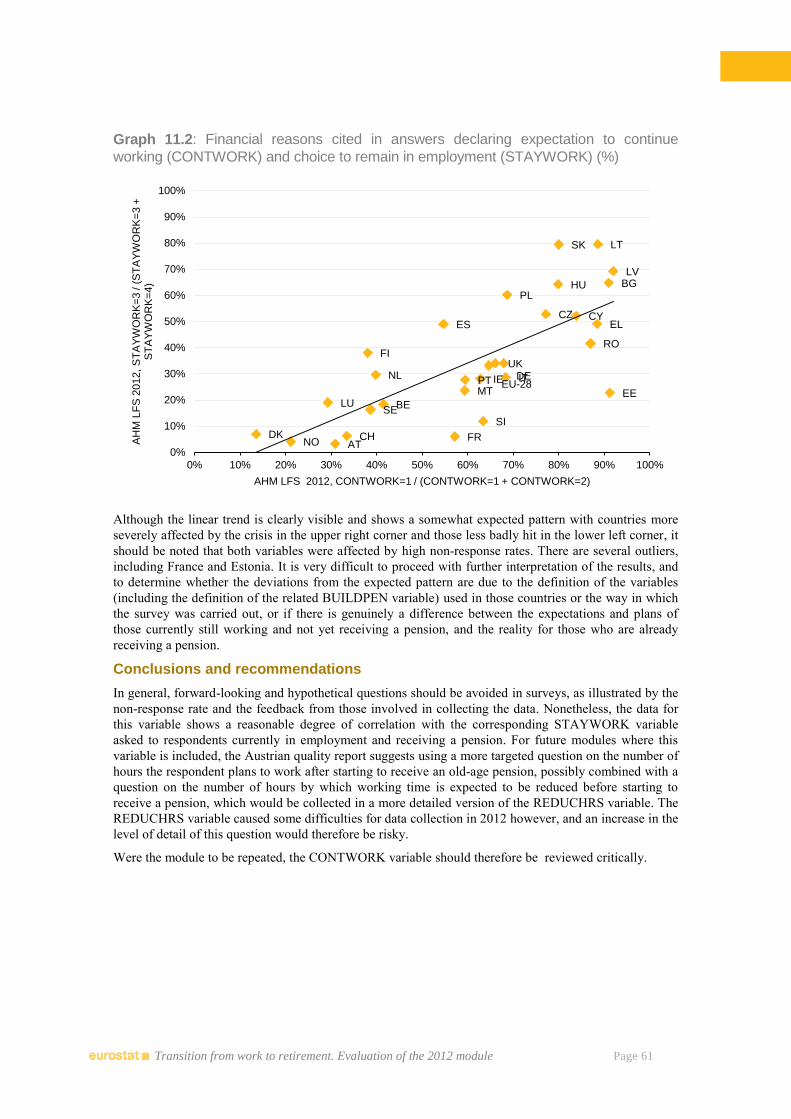
Transition from work to retirement. Evaluation of the 2012 module Page 61
Graph 11.2: Financial reasons cited in answers declaring expectation to continue
working (CONTWORK) and choice to remain in employment (STAYWORK) (%)
Although the linear trend is clearly visible and shows a somewhat expected pattern with countries more
severely affected by the crisis in the upper right corner and those less badly hit in the lower left corner, it
should be noted that both variables were affected by high non-response rates. There are several outliers,
including France and Estonia. It is very difficult to proceed with further interpretation of the results, and
to determine whether the deviations from the expected pattern are due to the definition of the variables
(including the definition of the related BUILDPEN variable) used in those countries or the way in which
the survey was carried out, or if there is genuinely a difference between the expectations and plans of
those currently still working and not yet receiving a pension, and the reality for those who are already
receiving a pension.
Conclusions and recommendations
In general, forward-looking and hypothetical questions should be avoided in surveys, as illustrated by the
non-response rate and the feedback from those involved in collecting the data. Nonetheless, the data for
this variable shows a reasonable degree of correlation with the corresponding STAYWORK variable
asked to respondents currently in employment and receiving a pension. For future modules where this
variable is included, the Austrian quality report suggests using a more targeted question on the number of
hours the respondent plans to work after starting to receive an old-age pension, possibly combined with a
question on the number of hours by which working time is expected to be reduced before starting to
receive a pension, which would be collected in a more detailed version of the REDUCHRS variable. The
REDUCHRS variable caused some difficulties for data collection in 2012 however, and an increase in the
level of detail of this question would therefore be risky.
Were the module to be repeated, the CONTWORK variable should therefore be reviewed critically.
EU-28
BE
BG
CZ
DK
DE
EE
IE
EL ES
FR
IT
CY
LV
LT
LU
HU
MT
NL
AT
PL
PT
RO
SI
SK
FI
SE
UK
NO CH
0%
10%
20%
30%
40%
50%
60%
70%
80%
90%
100%
0% 10% 20% 30% 40% 50% 60% 70% 80% 90% 100%
AH
M L
FS
2012,
ST
AY
WO
RK
=3 / (
ST
AY
WO
RK
=3 +
S
TA
YW
OR
K=
4)
AHM LFS 2012, CONTWORK=1 / (CONTWORK=1 + CONTWORK=2)
Transition from work to retirement. Evaluation of the 2012 module Page 62
Annexes
Annex 1: Abbreviations
EU-28 European Union of 28 Member States:
BE Belgium
BG Bulgaria
CZ the Czech Republic
DK Denmark
DE Germany
EE Estonia
IE Ireland
EL Greece
ES Spain
FR France
HR Croatia
IT Italy
CY Cyprus
LV Latvia
LT Lithuania
LU Luxembourg
HU Hungary
MT Malta
NL the Netherlands
AT Austria
PL Poland
PT Portugal
RO Romania
SI Slovenia
SK Slovakia
FI Finland
SE Sweden
UK the United Kingdom
IS Iceland
NO Norway
CH Switzerland

Transition from work to retirement. Evaluation of the 2012 module Page 63
Annex 2: Main AHM 2012 tables
Several online tables presenting AHM 2012 data are available on the Eurostat website, at:
http://ec.europa.eu/eurostat/web/lfs/data/database
Respondents who receive a pension (PENSION/COL. 197)
This table shows the numbers of people (in thousands) who receive a pension and who do not receive a
pension. It also shows the number of people who were not in the target population of the survey (the
‘non-applicable’ group, by country). Results are shown by 5-year age brackets, by gender, and by
employment status.
Respondents who receive a pension, by type of pension (PENSTYPE/COL. 198-205)
The table shows the percentage of those receiving a certain type of pension in the target population of the
survey. Three breakdowns are available: respondents receiving any type of pension, those receiving an
old-age pension irrespective of the type and those receiving statutory old-age pensions only.
Age at which the respondent first received an old-age pension (AGEPENS/COL. 207-208)
This table shows mean and median ages (expressed in years) at which respondents received an old-age
pension for the first time. Results are shown by gender.
Early retirement among respondents who receive an old-age pension (EARLYRET/COL. 206)
The table shows the proportion of respondents who used an early retirement scheme out of those who
receive an old-age pension. The proportion not using an early retirement scheme and the proportion not
answering is also shown. Results are shown by gender. Results for Germany and Norway have been
excluded due to the high non-response rate.
Respondents who reduced their working hours as a step towards retirement (REDUCHRS/COL.
211)
The question was asked to two different sub-populations: 1) employed respondents; and 2) economically
inactive respondents receiving a pension. Please note that the target population is different to that of the
other questions in the survey as it includes respondents aged 55–69. The table shows those who reduced
their working hours in a gradual move towards full retirement as a percentage of the total number of
respondents to this question. Results are shown by gender and employment status. Results for Ireland and
the UK have been excluded due to incomplete data collection.
Economically inactive respondents who receive a pension who would have wished to remain longer
in employment (WORKLONG/COL. 210)
This variable gives information on the proportion of respondents, out of those who receive a pension and
are at the same time economically inactive, who would have wanted to remain longer in employment at
the time of leaving employment. Results are expressed as percentages and are shown by gender.
Main reason for respondents who receive a pension to continue working (STAYWORK/COL. 212)
This table shows the reasons for which respondents already receiving a pension remain in employment. In
cases where more than one reason applied, only the main reason was recorded. Results are shown by
current working arrangement (full-time or part-time).
Main reason for economically inactive respondents receiving a pension to stop working
(REASNOT/COL. 209)
Economically inactive respondents who receive a pension were asked for the main reason for which they
left employment. They were provided with eight possible responses. Results are provided by gender.
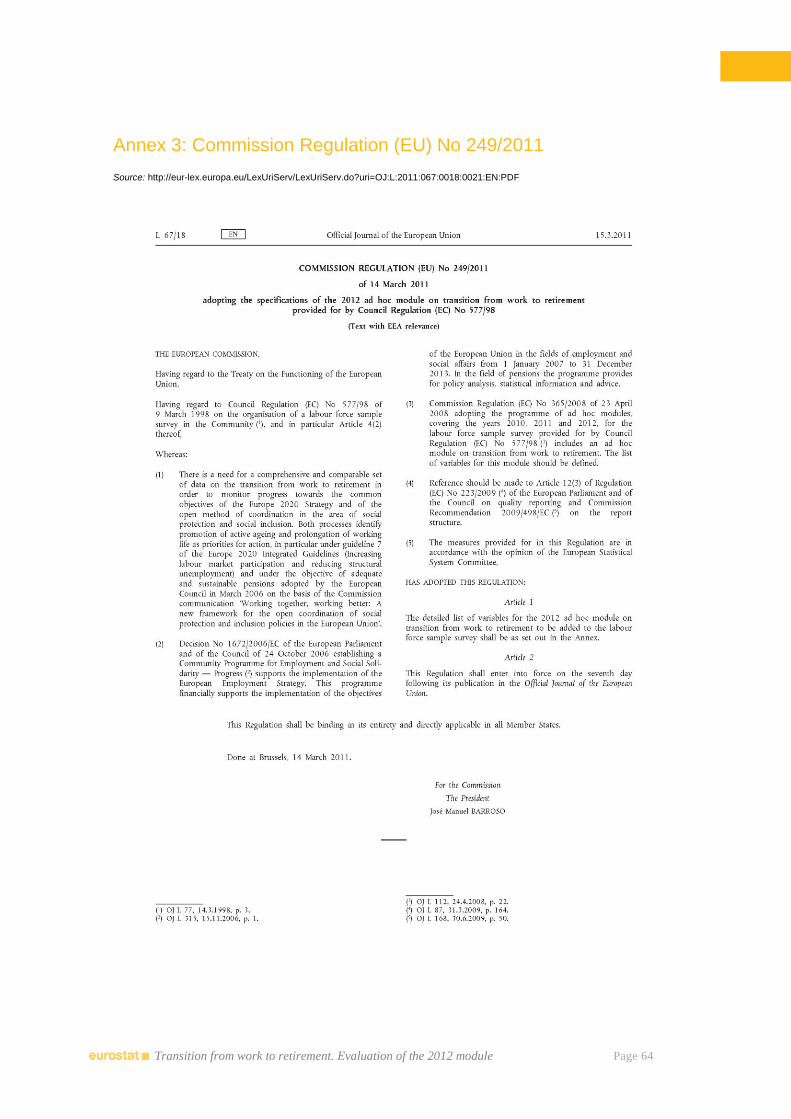
Transition from work to retirement. Evaluation of the 2012 module Page 64
Annex 3: Commission Regulation (EU) No 249/2011
Source: http://eur-lex.europa.eu/LexUriServ/LexUriServ.do?uri=OJ:L:2011:067:0018:0021:EN:PDF
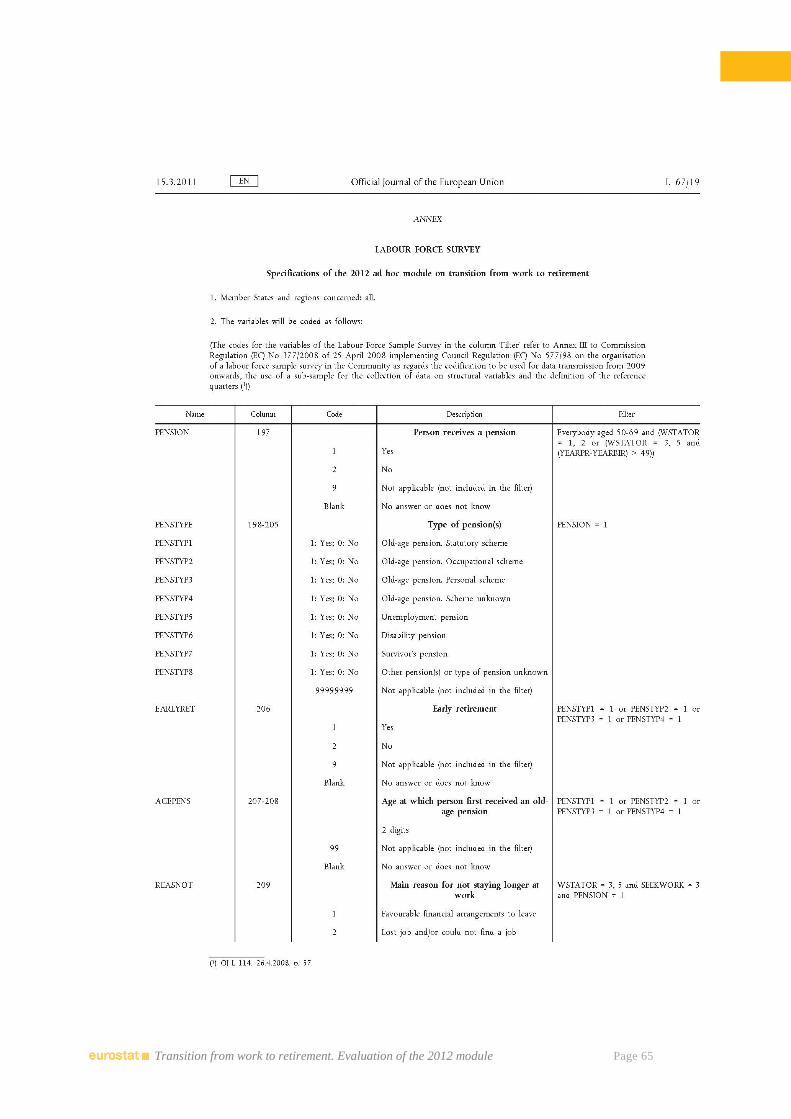
Transition from work to retirement. Evaluation of the 2012 module Page 65
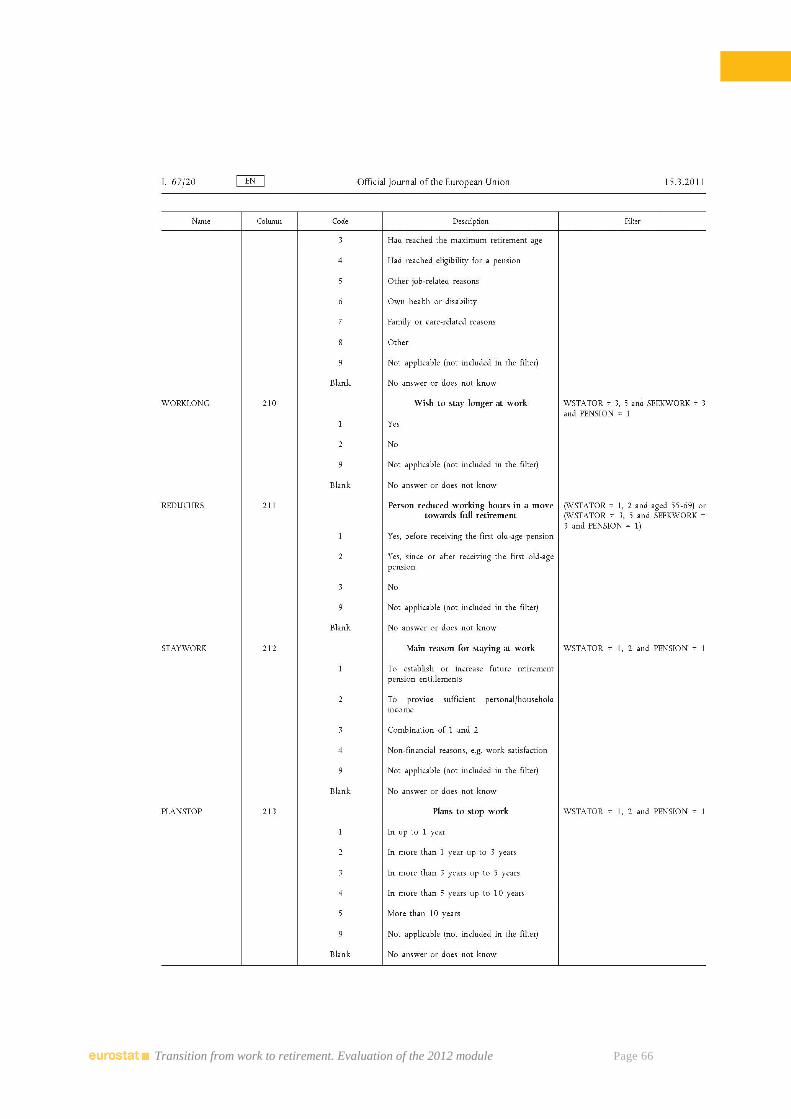
Transition from work to retirement. Evaluation of the 2012 module Page 66
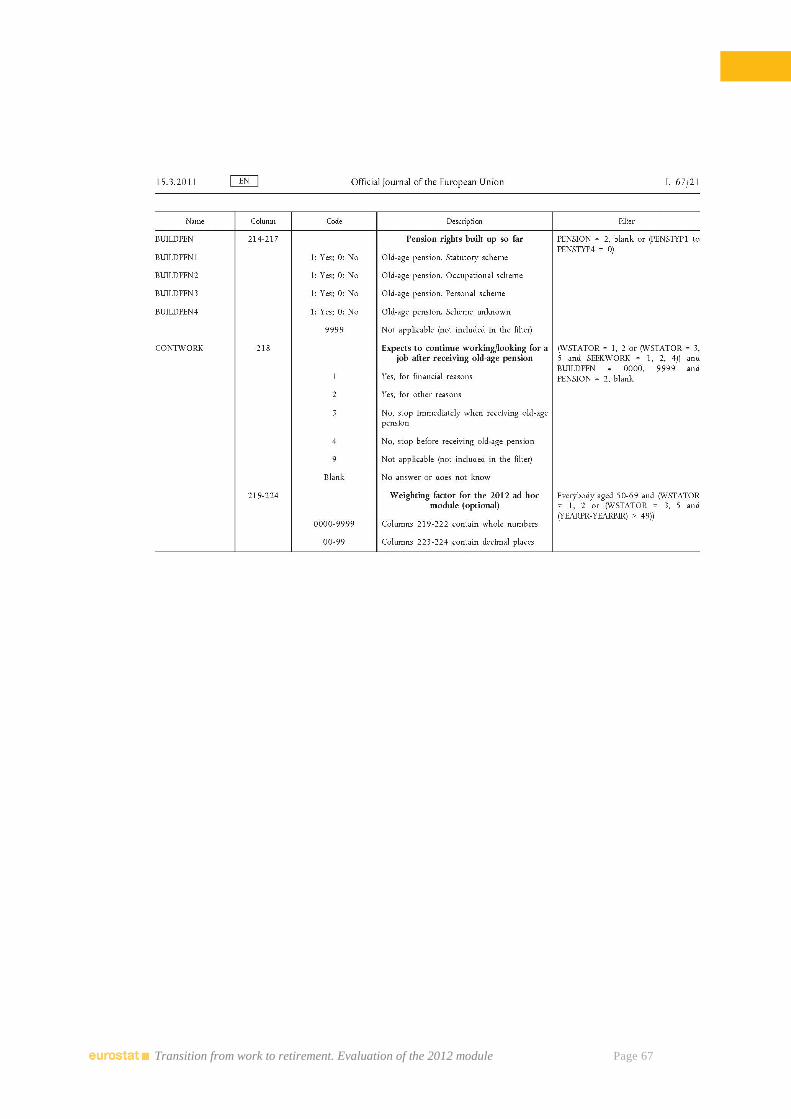
Transition from work to retirement. Evaluation of the 2012 module Page 67