retirement board meeting
TRANSCRIPT
The Retirement Board will provide reasonable accommodations for persons with disabilities planning to attend Board meetings who contact the Retirement Office at least 24 hours before a meeting.
RETIREMENT BOARD MEETING Retirement Board Conference Room SECOND MONTHLY MEETING The Willows Office Park 8:30 a.m. 1355 Willow Way, Suite 221 October 23, 2013 Concord, California THE RETIREMENT BOARD MAY DISCUSS AND TAKE ACTION ON THE FOLLOWING:
1. Pledge of Allegiance.
2. Accept comments from the public.
3. Approve the minutes from the September 4 and 11, 2013 meetings.
4. Update from investment consultant regarding the finalists for the International Value Equity Manager search.
5. Manager presentations:
8:45 – 9:30 MFS Investment Management 9:35 – 10:20 Schroders Investment Manager 10:20 - 10:35 Break
10:35 – 11:20 Pyrford International Ltd.
6. Consider and take possible action on International Value Equity Manager. CLOSED SESSION
6.
** 7. The Board will go into closed session under Gov. Code Section 54957 to consider recommendations from the Medical Advisor and/or staff regarding the following disability retirement applications:
Member Type Sought Recommendation
a. Marie Espaniola Non Service Connected Non Service Connected b. Lisa Beaty Service Connected Service Connected
8. The Board will continue in closed session under Gov. Code Section 54959 to consider
recommendation from the Hearing Officer regarding the disability application of Shirley Guyer.

The Retirement Board will provide reasonable accommodations for persons with disabilities planning to attend Board meetings who contact the Retirement Office at least 24 hours before a meeting.
OPEN SESSION
9. Presentation by Transwestern on the Willows Office Building. 10. Consider and take possible action regarding repairs and upgrades to the Willows Office
Building as recommended by Transwestern.
11. Miscellaneous a. Staff Report b. Outside Professionals’ Report c. Trustees’ comments

RETIREMENT BOARD MEETING MINUTES
REGULAR BOARD MEETING 9:00 a.m.
September 4, 2013
Retirement Board Conference Room The Willows Office Park
1355 Willow Way, Suite 221 Concord, California
Present: Debora Allen, Richard Cabral, Scott Gordon, Brian Hast, Jerry Holcombe, Louie Kroll,
Karen Mitchoff, John Phillips, Gabe Rodrigues, Jerry Telles, and Rusty Watts Absent: None Staff: Marilyn Leedom, Retirement Chief Executive Officer; Kurt Schneider, Retirement
Deputy Chief Executive Officer; Timothy Price, Retirement Chief Investment Officer; Karen Levy, Retirement General Counsel; Vickie Kaplan, Retirement Accounting Manager; and Christina Dunn, Retirement Administration Manager
Outside Professional Support: Representing:
Harvey Leiderman Reed Smith LLP 1. Pledge of Allegiance
Hast led all in the Pledge of Allegiance.
2. Accept comments from the public
No members of the public offered comment.
3. Approval of Minutes
It was M/S/C to approve the minutes of the June 26, 2013 meeting. (Yes: Cabral, Hast, Holcombe Mitchoff, Phillips, Rodrigues, Telles and Watts. Abs.: Gordon)
Allen was present for subsequent discussion and voting.
It was M/S/C to approve the minutes of the July 10, 2013 meeting with an amendment to add Rebecca Byrnes, County Counsel, as an Outside Professional in attendance. (Yes: Allen, Cabral, Gordon, Hast, Mitchoff, Phillips, Rodrigues, Telles and Watts)
4. Routine Items
It was M/S/C to approve the routine items of the September 4, 2013 Board meeting. (Yes: Allen, Cabral, Gordon, Hast, Mitchoff, Phillips, Rodrigues, Telles and Watts)
CLOSED SESSION The Board moved into closed session pursuant to Govt. Code Section 54957, 54956.9(a) and 54956.9(b).
Page 2 September 4, 2013
The Board moved into open session. 5. It was M/S/C to accept the Medical Advisor’s recommendation and grant the service connected
disability retirement for Julie Raner. (Yes: Allen, Cabral, Gordon, Hast, Mitchoff, Phillips, Rodrigues, Telles and Watts)
6. There was no reportable action related to Govt. Code Section 54956.9(a).
7. There was no reportable action related to Govt. Code Section 54956.9(b).
8. Consider and take possible action to direct staff regarding pay items beyond base pay for PEPRA tiers
Levy gave an update regarding possible legislation and CalPERS’ current implementation of “pensionable compensation” under the Public Employees' Pension Reform Act of 2013 ("PEPRA") statute.
Levy reported that, as directed by the Board, CCCERA staff met with employers and interested parties to discuss specific pay items beyond base pay and is recommending some modifications to the preliminary analysis and pay item spreadsheets presented to the Board in April based on information obtained through this process.
After a lengthy discussion, it was M/S to exclude bilingual pay differential from pensionable compensation.
In public comment, Rollie Katz, Local 1, urged the Board to continue to include bilingual pay as pensionable compensation.
In public comment, Joe Young, member of the public, asked the Board to be conservative and include only base pay in pensionable compensation.
In public comment, Bill Cullen, retiree, stated that bilingual pay differential should be included in base pay. He also stated that everyone who is eligible to receive any differentials beyond base pay should have the differentials included in pensionable compensation and not be penalized.
After discussion, a substitute motion was M/S to use base pay only for pensionable compensation for PEPRA members and to exclude all other special pay items.
The original motion and second were withdrawn.
After a lengthy discussion, the question was called.
It was M/S/C to call for the question. (Yes: Allen, Gordon, Hast, Mitchoff, Phillips, Telles and Watts. No: Cabral and Rodrigues)
It was M/S/C to use base pay only for purposes of pensionable compensation for PEPRA members and to exclude all other special compensation. (Yes: Allen, Gordon, Mitchoff, Phillips and Watts. No: Cabral, Rodrigues and Telles. Abs.: Hast). Hast noted that his reason for abstaining is that he agrees with making it more simplistic for employers and employees, but he feels it provides a deterrent to employees and the services they provide and would hope in the future they would eliminate differentials and create different classifications which would include the differentials in the employee’s base salaries.
Hast announced that the vote would be taken and recorded again after Public Comment.

Page 3 September 4, 2013
In public comment, Vince Wells, President Local 1230, urged the Board to consider the reason why the differentials were put into place and wanted to remind the Board that differentials benefit the employer by saving the employer money.
In public comment, Joe Young, member of the public, expressed his desire for getting back to base pay only since that is what the public wants and what they voted for.
In public comment, Rollie Katz, Local 1, stated he doesn’t remember the public voting on this matter. He doesn’t feel employers are going to agree to pay all employees in a classification an extra 10% because some of the employees deserve it. He also stated he thinks it’s a mistake to think that the base salary matter will be resolved in negotiations.
In public comment, Steve Anderson, board member of a special district in the County but speaking as a private citizen, stated that since we are talking about new employees he does not think there is anything being taken away. He stated that the survival of many special districts is predicated on what the Board decides since including additional pay items in pensionable compensation could make the difference between closing a fire station or not.
In public comment, Alex Aliferis, Contra Costa Taxpayers Association, urged the Board to continue with pension reform. He feels people are leaving California due to the high cost of living. Continued reform will help the state.
It was M/S/C to use base pay only for purposes of pensionable compensation for PEPRA members and to exclude all other special compensation beyond base pay. (Yes: Allen, Gordon, Mitchoff, Phillips and Watts. No: Cabral, Rodrigues and Telles. Abs.: Hast).
Levy asked for clarification on two pay items for the Moraga-Orinda Fire District. The Board clarified that FLSA Pay and Fire Retirement Allotment would be excluded from pensionable compensation because they are beyond base pay and directed staff to notify the Moraga Orinda Fire District and all employers of the Board's determination.
9. Consider and take possible action to direct staff regarding pay items used to enhance the final retirement benefit
Schneider reported the Board had requested information regarding certain pay items which were the focus of recent media reports, including on-call pay reportedly paid to members who volunteered to work additional on-call hours during their final compensation period and additional on-call pay reportedly paid to physicians who did not provide on-call services for the time paid. He reviewed his memo on the compensation policy, pay items and compensation enhancements.
Schneider reviewed an example of a compensation enhancement using on-call pay. Leiderman stated it would not be known whether these types of enhancements to compensation can be revisited by the Board until we know the outcome of the AB 197 litigation.
Mitchoff was no longer present for subsequent discussion and voting.
There was a lengthy discussion on on-call pay, call-back pay and spiking.
It was M/S/C to direct staff to calculate this member's retirement benefit without on-call pay and send a letter to the member explaining that CCCERA is reviewing the on-call pay further. (Yes: Allen, Cabral, Gordon, Hast, Holcombe, Phillips, Telles and Watts. Abs.: Rodrigues)
In public comment, Rollie Katz, Local 1, stated that on-call pay has always been compensable and now it is an item of concern. He doesn’t think the Board should deny the on-call pay as pensionable to the member used in the example.

Page 4 September 4, 2013
There was further discussion regarding voluntary and mandatory on-call pay.
In public comment, Rollie Katz, Local 1, asked the Board to be careful comparing what they consider voluntary to what the employers and the unions consider as voluntary.
10. Consider and take possible action to cause an election to be held to fill the vacancy in the seventh member seat
Leedom reported the Board has the authority to call an election to fill the vacancy of the seventh (Safety) member seat. The nomination period would be from September 30 through October 25, 2013. The ballots will be mailed on December 23rd with an election on January 21, 2014.
It was M/S/C to hold an election at the earliest possible date in order to fill the vacancy in the seventh safety member seat. (Yes: Allen, Cabral, Gordon, Hast, Holcombe, Phillips, Rodrigues, Telles and Watts)
11. Consider and take possible action regarding the investment consultant for CCCERA
Price reported the Board Chair requested that staff prepare a memo with options for the Board to consider regarding how to respond to personnel changes recently announced by Milliman.
The Board discussed different options including implementing a policy to review investment consultants, the possibility of having a separate investment consultant and a separate real estate consultant, and the amount of time needed to issue an RFP.
The Board directed staff to conduct an on-site visit to the Milliman office.
12. Presentation of Administrative expenses: Budget vs. Actual as of June 30, 2013
Leedom distributed a detailed report of the budget, noting we are currently at 75% of budget. She will present the 2014 budget for approval at a meeting in November or December.
It was M/S/C to accept the Budget vs. Actual Report as of June 30, 2013. (Yes: Allen, Cabral, Gordon, Hast, Holcombe, Phillips, Rodrigues, Telles and Watts).
13. SACRS Voting Proxy
It was M/S/C to appoint Jerry Telles as CCCERA’s Voting Delegate and Gabe Rodrigues as the Alternate Voting Delegate at the upcoming SACRS Conference. (Yes: Allen, Cabral, Gordon, Hast, Holcombe, Phillips, Rodrigues, Telles and Watts).
Telles was no longer present for subsequent discussion and voting.
14. Consider and take possible action to reschedule the October 9, 2013 Board meeting
It was M/S/C to reschedule the October 9, 2013 meeting to Wednesday, October 2, 2013. (Yes: Allen, Cabral, Gordon, Hast, Holcombe, Kroll, Phillips, Rodrigues, and Watts)
15. Conference Seminar Attendance
a. It was M/S/C to authorize the attendance of 2 Board members at the Investment Fundamentals, PIMCO, September 19-20, 2013, Newport Beach, CA. (Yes: Allen, Cabral, Gordon, Hast, Holcombe, Kroll, Phillips, Rodrigues and Watts)
Page 5 September 4, 2013
b. It was M/S/C to authorize the attendance of 1 Board member at the Fall Conference, CRCEA, October 21-23, 2013, Fresno, CA. (Yes: Allen, Cabral, Gordon, Hast, Holcombe, Kroll, Phillips, Rodrigues and Watts)
c. It was M/S/C to authorize the attendance of all Board members and all appropriate staff members at the Fall Conference, SACRS, November 12-15, 2013, Indian Wells, CA. (Yes: Allen, Cabral, Gordon, Hast, Holcombe, Kroll, Phillips, Rodrigues and Watts)
16. Miscellaneous
(a) Staff Report – Leedom reported the agenda packets including the quarterly information for the September 11, 2013 meeting have been distributed to Board members. She noted a dry rot problem with The Willows Office building. The property manager will present information to the Board at a future meeting. Leedom reported Brown Armstrong will begin training the accounting staff on the new GASB reporting requirements. Schneider reported progress has been made on the transition from the old retirement software system to the new retirement software system.
Price reported Long Wharf is selling a number of properties in Fund III so there will be some returns coming in soon. He reported at the next meeting Paulson will be presenting on a possible real estate investment opportunity. He reported he will be attending an on-site at Aether in Denver on October 28 and 29, 2013.
(b) Outside Professionals’ Report - None
(c) Trustees’ comments – Phillips reported he attended the Harvard course. Cabral corrected a comment from the previous meeting noting Rebecca Byrnes has never been a County employee and does not collect a CCCERA pension.
Rodrigues reported some DSA members feel the Board is a pro-employer board and not supportive of employees. He questioned if there was a way to get information to members informing them why decisions are made by the Board.
It was M/S/C to adjourn the meeting. (Yes: Allen, Cabral, Gordon, Hast, Holcombe, Kroll, Phillips, Rodrigues, and Watts) Brian Hast, Chairman Jerry Telles, Secretary

RETIREMENT BOARD MEETING MINUTES
SECOND MONTHLY BOARD MEETING 9:00 a.m.
September 11, 2013
Retirement Board Conference Room The Willows Office Park
1355 Willow Way, Suite 221 Concord, California
Present: Brice Bins, Scott Gordon, Brian Hast, Jerry Holcombe, Louie Kroll, Karen Mitchoff,
John Phillips, Gabe Rodrigues and Jerry Telles Absent: Debora Allen and Richard Cabral Staff: Marilyn Leedom, Retirement Chief Executive Officer; Timothy Price, Retirement Chief
Investment Officer; and Christina Dunn, Retirement Administration Manager Outside Professional Support: Representing:
Bob Helliesen Milliman Marty Dirks Milliman
1. Pledge of Allegiance
Hast led all in the Pledge of Allegiance.
2. Accept comments from the public
No members of the public offered comment.
3. Review of total portfolio performance
Dirks discussed the key points of the quarterly report noting the CCCERA Total Fund returned 0.3% for the second quarter. He stated the CCCERA Total Fund performance has been first quartile over the trailing one through ten year periods. He also reviewed the cumulative performance statistics for all funds.
It was M/S/C to accept the Quarterly Report presented by Milliman. (Yes: Bins, Gordon, Hast, Holcombe, Mitchoff, Phillips, Rodrigues and Telles)
a. Consideration of any managers already under review or to be placed under review
Dirks reported on the managers on the Watch List.
b. Consideration of any changes in allocations to managers
There were no changes in allocations to managers.

Page 2 September 11, 2013
4. Consider and take possible action on the International Value Equity Semi-Finalist Report
Dirks gave an overview of the search process to replace GMO as the International Value Equity Manager. He reported six firms were selected as semi-finalist candidates.
The Board discussed the availability of video conferencing for the initial interview.
After a discussion on the pros and cons of each of the semi-finalist managers, it was M/S/C to interview MFS Investment Management, Pyrford International and Schroders Investment Management. (Yes: Bins, Gordon, Hast, Holcombe, Mitchoff, Phillips, Rodrigues and Telles)
The interviews will be held at the October 23, 2013 Board meeting. It was noted that the October 23, 2013 Board meeting will start at 8:30 am.
5. Consider and take possible action on the Small to Mid-cap Private Equity Semi-Finalist Report
Dirks gave an overview of the search process to increase the allocation to private equity investments. He reported seven firms were selected as semi-finalist candidates.
After a discussion on the pros and cons of each of the semi-finalist managers, it was M/S/C to interview Bay Hills, Horsley Bridge, Sigular Guff and J.P. Morgan. (Yes: Bins, Gordon, Hast, Holcombe, Mitchoff, Phillips, Rodrigues and Telles)
The interviews will be held at a special meeting on October 30, 2013.
6. Presentation from Paulson & Co. Inc. Real Estate Fund II – Mike Barr, Stephanie Schulman
Price gave an overview of the background of investing in additional distressed real estate funds noting there is a $25 million allocation still available to be committed to this fund.
Barr gave an overview of the firm and a summary of the Real Estate Fund II noting that this fund is focused on residential land. He reviewed the terms for the Real Estate Fund II. The expected final close is the end of October to the beginning of November.
7. Consider and take possible action on staff recommendation regarding Paulson & Co, Inc. Real Estate Fund II
After a lengthy discussion, it was M/S/C to invest a target of $25 million, but no less than $20 million, to Paulson and Co, Inc. Real Estate Fund II subject to due diligence, on-site visits, legal review and authorize the CEO to sign the contracts. (Yes: Bins, Gordon, Hast, Holcombe, Mitchoff, Phillips, Rodrigues and Telles)
8. Conference Seminar Attendance
a. It was M/S/C to authorize the attendance of 1 Board member at the Trustees’ Roundtable, CALAPRS, September 13, 2013, San Jose, CA. (Yes: Bins, Gordon, Hast, Holcombe, Mitchoff, Phillips, Rodrigues and Telles)
b. There was no action taken on the 23rd Annual Northern California Public Retirement Seminar, The Public Retirement Journal, September 26, 2013, Sacramento, CA.
9. Miscellaneous

Page 3 September 11, 2013
(a) Staff Report – Leedom reported she will bring investment guidelines back to be updated. She is planning a fiduciary education presentation at the October 2, 2013 meeting. She reported one of CCCERA’s investments’ is the Willows Office Park and on October 23rd both the leasing agent and the property manager will give updates on The Willows. She and Schneider are meeting with the East County Fire finance committee and other employers regarding the drop in the assumed rate and the changes to the contribution rates. Leedom informed the Board that if they have a new iPad or an existing iPad and want to work with IT on setting up dropbox to please let staff know. Price noted that he will be scheduling a cash overlay educational presentation within the next three months.
Price reported Invesco came back on Fund III asking for a revision to the guidelines from a 25% cap to a 30% cap. He is going visit one of their construction projects to review and report back. He will also visit Artisan. Price received a notice from Lord Abbett that their Chief Compliance Officer is retiring at the end of October.
(b) Outside Professionals’ Report - None
(c) Trustees’ comments –
Rodrigues asked about reserves for building maintenance at the Willows Office Park. Holcombe noted this is the 12th Anniversary of 9/11 and asked to adjourn the meeting in memory of those who lost their lives, most especially the first responders.
It was M/S/C to adjourn the meeting in memory of those who lost their lives, most especially the first responders, on this 12th Anniversary of 9/11. (Yes: Bins, Gordon, Hast, Holcombe, Mitchoff, Phillips, Rodrigues and Telles) Brian Hast, Chairman Jerry Telles, Secretary
International Value Equity Manager Search
Finalist Report
For
Contra Costa County Employees’ Retirement Association
October 23, 2013
Milliman
650 California Street, 17th
Floor
San Francisco, CA 94108-2702
(415) 403-1333
This report was prepared using data from third parties and other sources including but not limited to Milliman
computer software and databases. Reasonable care has been taken to assure the accuracy of the data contained
in this report, and comments are objectively stated and are based on facts gathered in good faith. Nothing in
this report should be construed as investment advice or recommendations with respect to the purchase, sale or
disposition of particular securities. Past performance is no guarantee of future results. We take care to assure
the accuracy of the data contained in this report, and we strive to make our reports as error-free as possible.
Milliman disclaims responsibility, financial or otherwise, for the accuracy and completeness of this report to
the extent any inaccuracy or incompleteness in the report results from information received from a third party
or the client on the client’s behalf.
This analysis is for the sole use of the Milliman client for whom it was prepared, and may not be provided to
third parties without Milliman's prior written consent except as required by law. Milliman does not intend to
benefit any third party recipient of this report, even if Milliman consents to its release.
There should be no reliance on Milliman to report changes to manager rankings, ratings or opinions on a daily
basis. Milliman services are not intended to monitor investment manager compliance with individual security
selection criteria, limits on security selection and/or prohibitions to the holding of certain securities or security
types.
The indices designed, calculated and published by Barclays Capital are registered trademarks.
MSCI is a service mark of Morgan Stanley Capital International Inc. Morgan Stanley Capital International,
MSCI®, ACWI and EAFE® are the exclusive property of MSCI or its affiliates. All MSCI indices are the
exclusive property of MSCI.
Frank Russell Company is the source and owner of the Russell Index data contained or reflected in this
material and all related trademarks and copyrights. The material is intended for the sole use of the intended
recipient. This is a Milliman, Inc. presentation of the data. Frank Russell Company is not responsible for the
formatting or configuration of this material or for any inaccuracy in its presentation.
Standard & Poor's and S&P are trademarks of The McGraw-Hill Companies, Inc.
The Wilshire IndexesSM
are calculated and distributed by Wilshire Associates Incorporated. Wilshire® is a
registered service mark of Wilshire Associates Incorporated, Santa Monica, California.
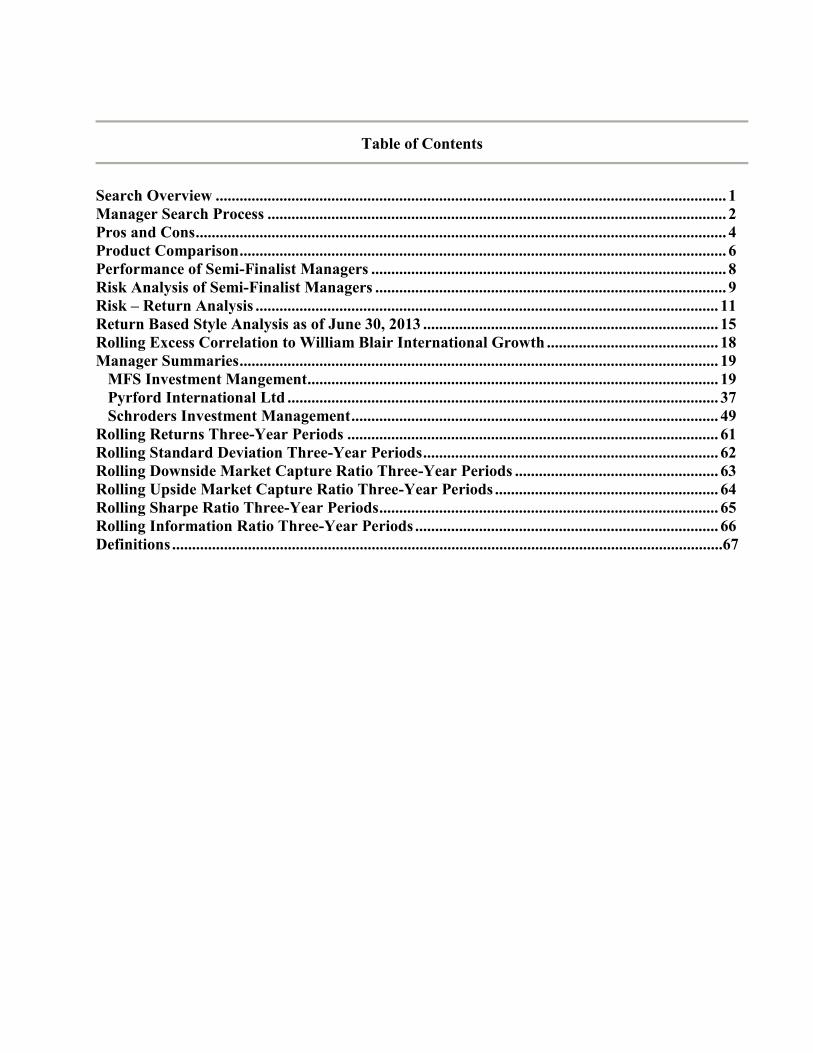
Table of Contents
Search Overview ................................................................................................................................ 1 Manager Search Process ................................................................................................................... 2 Pros and Cons ..................................................................................................................................... 4 Product Comparison .......................................................................................................................... 6 Performance of Semi-Finalist Managers ......................................................................................... 8 Risk Analysis of Semi-Finalist Managers ........................................................................................ 9 Risk – Return Analysis .................................................................................................................... 11 Return Based Style Analysis as of June 30, 2013 .......................................................................... 15 Rolling Excess Correlation to William Blair International Growth ........................................... 18 Manager Summaries ........................................................................................................................ 19 MFS Investment Mangement....................................................................................................... 19 Pyrford International Ltd ............................................................................................................ 37 Schroders Investment Management ............................................................................................ 49 Rolling Returns Three-Year Periods ............................................................................................. 61 Rolling Standard Deviation Three-Year Periods .......................................................................... 62 Rolling Downside Market Capture Ratio Three-Year Periods ................................................... 63 Rolling Upside Market Capture Ratio Three-Year Periods ........................................................ 64 Rolling Sharpe Ratio Three-Year Periods ..................................................................................... 65 Rolling Information Ratio Three-Year Periods ............................................................................ 66 Definitions ..........................................................................................................................................67

Contra Costa County Employees’ Retirement Association International Value Equity Manager Search Introduction and Summary
Milliman has conducted a search to identify a replacement for GMO the international value equity
manager. This manager will complement the international growth strategy managed by William Blair.
This mandate is intended to act as an alpha engine to generate superior long-term results within the
overall international equity program. Milliman submitted a semi-finalist report on September 11,
2013 - discussed at the meeting - in which we presented six firms for the Board’s consideration. The
Board selected three firms as finalists. These firms will be interviewed at CCCERA’s offices on Oct
23, 2013. Firms will have 45 minutes each for their presentations, including questions.
The interview schedule is as follows:
8:30 – 8:45 am Introduction and Overview
8:45 – 9:30 am MFS
9:35 – 10:20 am Pyrford
10:20 – 10:35 am Break
10:35 – 11:20 am Schroders
In this report we include a search overview, with tables that outline the pros and cons, product
characteristics and investment process characteristics of each strategy. We also show a presentation
and analysis of comparative performance and other quantitative measures for each of the finalist
managers, updated through Septembers 30, 2013. A detailed summary of each manager’s investment
philosophy and approach follows. Finally, a glossary of the financial terms used in this report is
included at the end of the report.
We will be prepared to discuss this report and answer any questions at the October 23, 2013
Board Meeting prior to the investment manager presentations.
International Value Equity Manager Search Milliman, Inc.
Introduction Page 1
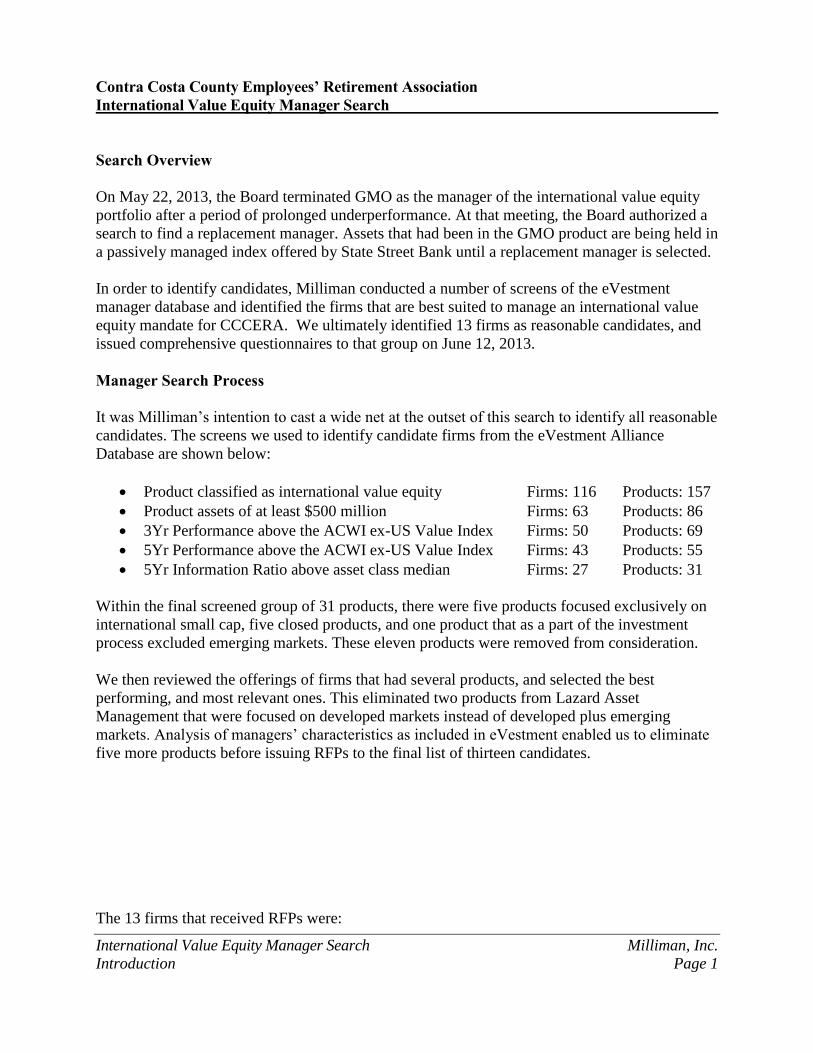
Contra Costa County Employees’ Retirement Association International Value Equity Manager Search Search Overview
On May 22, 2013, the Board terminated GMO as the manager of the international value equity
portfolio after a period of prolonged underperformance. At that meeting, the Board authorized a
search to find a replacement manager. Assets that had been in the GMO product are being held in
a passively managed index offered by State Street Bank until a replacement manager is selected.
In order to identify candidates, Milliman conducted a number of screens of the eVestment
manager database and identified the firms that are best suited to manage an international value
equity mandate for CCCERA. We ultimately identified 13 firms as reasonable candidates, and
issued comprehensive questionnaires to that group on June 12, 2013.
Manager Search Process
It was Milliman’s intention to cast a wide net at the outset of this search to identify all reasonable
candidates. The screens we used to identify candidate firms from the eVestment Alliance
Database are shown below:
Product classified as international value equity Firms: 116 Products: 157
Product assets of at least $500 million Firms: 63 Products: 86
3Yr Performance above the ACWI ex-US Value Index Firms: 50 Products: 69
5Yr Performance above the ACWI ex-US Value Index Firms: 43 Products: 55
5Yr Information Ratio above asset class median Firms: 27 Products: 31
Within the final screened group of 31 products, there were five products focused exclusively on
international small cap, five closed products, and one product that as a part of the investment
process excluded emerging markets. These eleven products were removed from consideration.
We then reviewed the offerings of firms that had several products, and selected the best
performing, and most relevant ones. This eliminated two products from Lazard Asset
Management that were focused on developed markets instead of developed plus emerging
markets. Analysis of managers’ characteristics as included in eVestment enabled us to eliminate
five more products before issuing RFPs to the final list of thirteen candidates.
The 13 firms that received RFPs were:
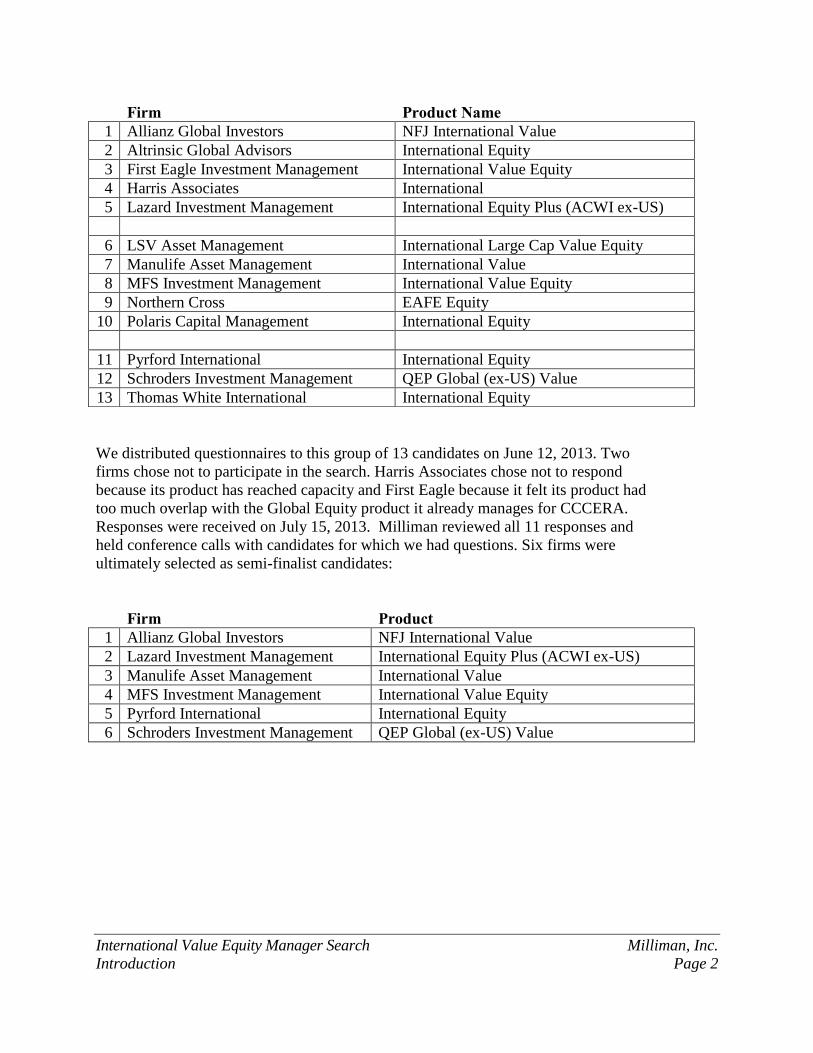
International Value Equity Manager Search Milliman, Inc.
Introduction Page 2
We distributed questionnaires to this group of 13 candidates on June 12, 2013. Two
firms chose not to participate in the search. Harris Associates chose not to respond
because its product has reached capacity and First Eagle because it felt its product had
too much overlap with the Global Equity product it already manages for CCCERA.
Responses were received on July 15, 2013. Milliman reviewed all 11 responses and
held conference calls with candidates for which we had questions. Six firms were
ultimately selected as semi-finalist candidates:
Firm Product 1 Allianz Global Investors NFJ International Value
2 Lazard Investment Management International Equity Plus (ACWI ex-US)
3 Manulife Asset Management International Value
4 MFS Investment Management International Value Equity
5 Pyrford International International Equity
6 Schroders Investment Management QEP Global (ex-US) Value
Firm Product Name 1 Allianz Global Investors NFJ International Value
2 Altrinsic Global Advisors International Equity
3 First Eagle Investment Management International Value Equity
4 Harris Associates International
5 Lazard Investment Management International Equity Plus (ACWI ex-US)
6 LSV Asset Management International Large Cap Value Equity
7 Manulife Asset Management International Value
8 MFS Investment Management International Value Equity
9 Northern Cross EAFE Equity
10 Polaris Capital Management International Equity
11 Pyrford International International Equity
12 Schroders Investment Management QEP Global (ex-US) Value
13 Thomas White International International Equity
International Value Equity Manager Search Milliman, Inc.
Introduction Page 3
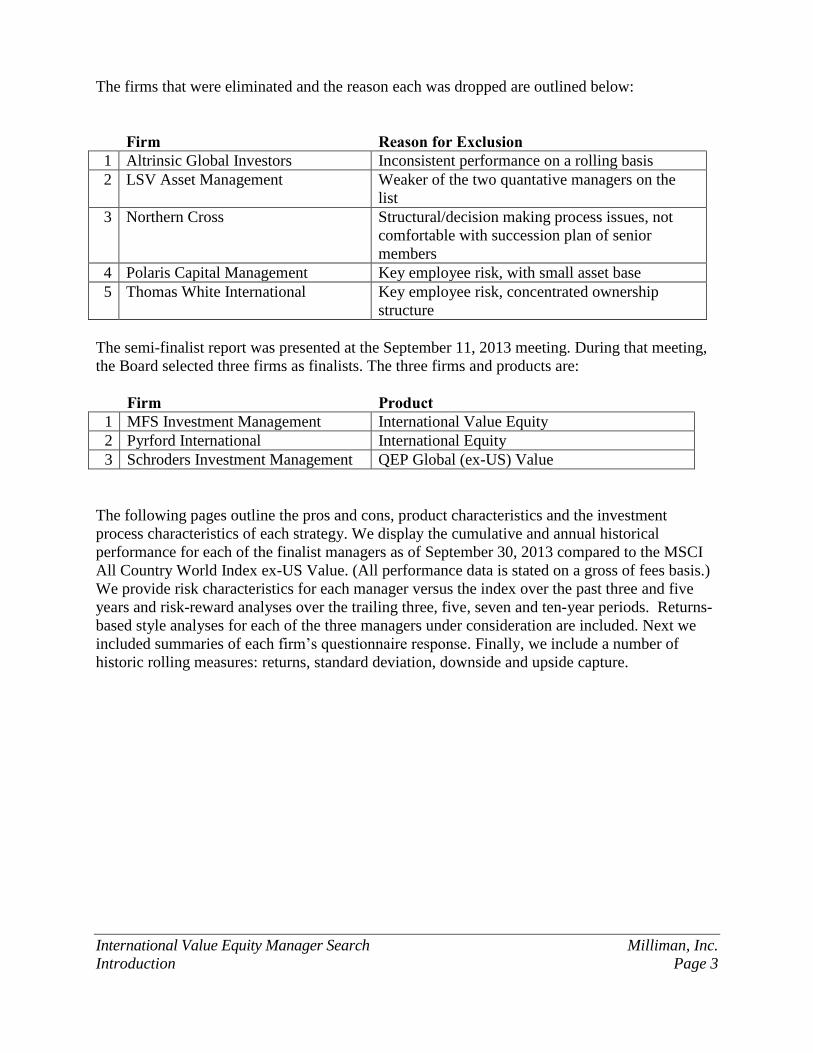
The firms that were eliminated and the reason each was dropped are outlined below:
Firm Reason for Exclusion 1 Altrinsic Global Investors Inconsistent performance on a rolling basis
2 LSV Asset Management Weaker of the two quantative managers on the
list
3 Northern Cross Structural/decision making process issues, not
comfortable with succession plan of senior
members
4 Polaris Capital Management Key employee risk, with small asset base
5 Thomas White International Key employee risk, concentrated ownership
structure
The semi-finalist report was presented at the September 11, 2013 meeting. During that meeting,
the Board selected three firms as finalists. The three firms and products are:
Firm Product 1 MFS Investment Management International Value Equity
2 Pyrford International International Equity
3 Schroders Investment Management QEP Global (ex-US) Value
The following pages outline the pros and cons, product characteristics and the investment
process characteristics of each strategy. We display the cumulative and annual historical
performance for each of the finalist managers as of September 30, 2013 compared to the MSCI
All Country World Index ex-US Value. (All performance data is stated on a gross of fees basis.)
We provide risk characteristics for each manager versus the index over the past three and five
years and risk-reward analyses over the trailing three, five, seven and ten-year periods. Returns-
based style analyses for each of the three managers under consideration are included. Next we
included summaries of each firm’s questionnaire response. Finally, we include a number of
historic rolling measures: returns, standard deviation, downside and upside capture.
International Value Equity Manager Search Milliman, Inc.
Comparison Page 4
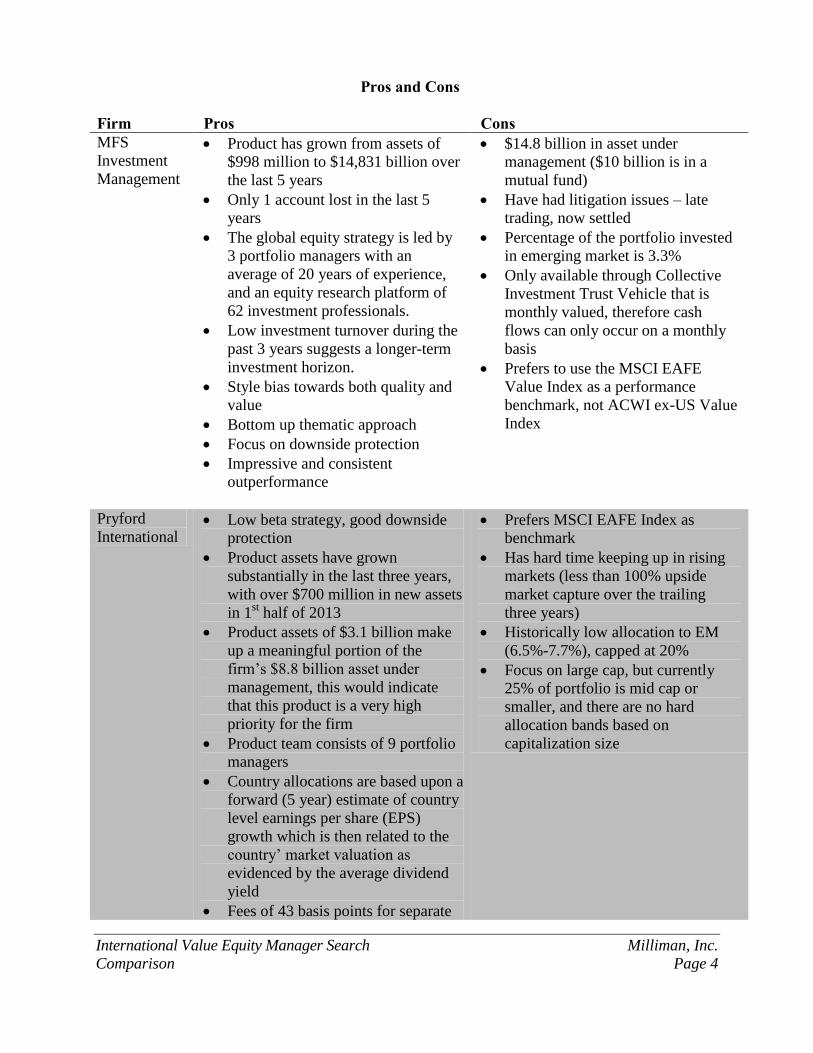
Pros and Cons Firm Pros Cons MFS
Investment
Management
Product has grown from assets of
$998 million to $14,831 billion over
the last 5 years
Only 1 account lost in the last 5
years
The global equity strategy is led by
3 portfolio managers with an
average of 20 years of experience,
and an equity research platform of
62 investment professionals.
Low investment turnover during the
past 3 years suggests a longer-term
investment horizon.
Style bias towards both quality and
value
Bottom up thematic approach
Focus on downside protection
Impressive and consistent
outperformance
$14.8 billion in asset under
management ($10 billion is in a
mutual fund)
Have had litigation issues – late
trading, now settled
Percentage of the portfolio invested
in emerging market is 3.3%
Only available through Collective
Investment Trust Vehicle that is
monthly valued, therefore cash
flows can only occur on a monthly
basis
Prefers to use the MSCI EAFE
Value Index as a performance
benchmark, not ACWI ex-US Value
Index
Pryford
International Low beta strategy, good downside
protection
Product assets have grown
substantially in the last three years,
with over $700 million in new assets
in 1st half of 2013
Product assets of $3.1 billion make
up a meaningful portion of the
firm’s $8.8 billion asset under
management, this would indicate
that this product is a very high
priority for the firm
Product team consists of 9 portfolio
managers
Country allocations are based upon a
forward (5 year) estimate of country
level earnings per share (EPS)
growth which is then related to the
country’ market valuation as
evidenced by the average dividend
yield
Fees of 43 basis points for separate
Prefers MSCI EAFE Index as
benchmark
Has hard time keeping up in rising
markets (less than 100% upside
market capture over the trailing
three years)
Historically low allocation to EM
(6.5%-7.7%), capped at 20%
Focus on large cap, but currently
25% of portfolio is mid cap or
smaller, and there are no hard
allocation bands based on
capitalization size
International Value Equity Manager Search Milliman, Inc.
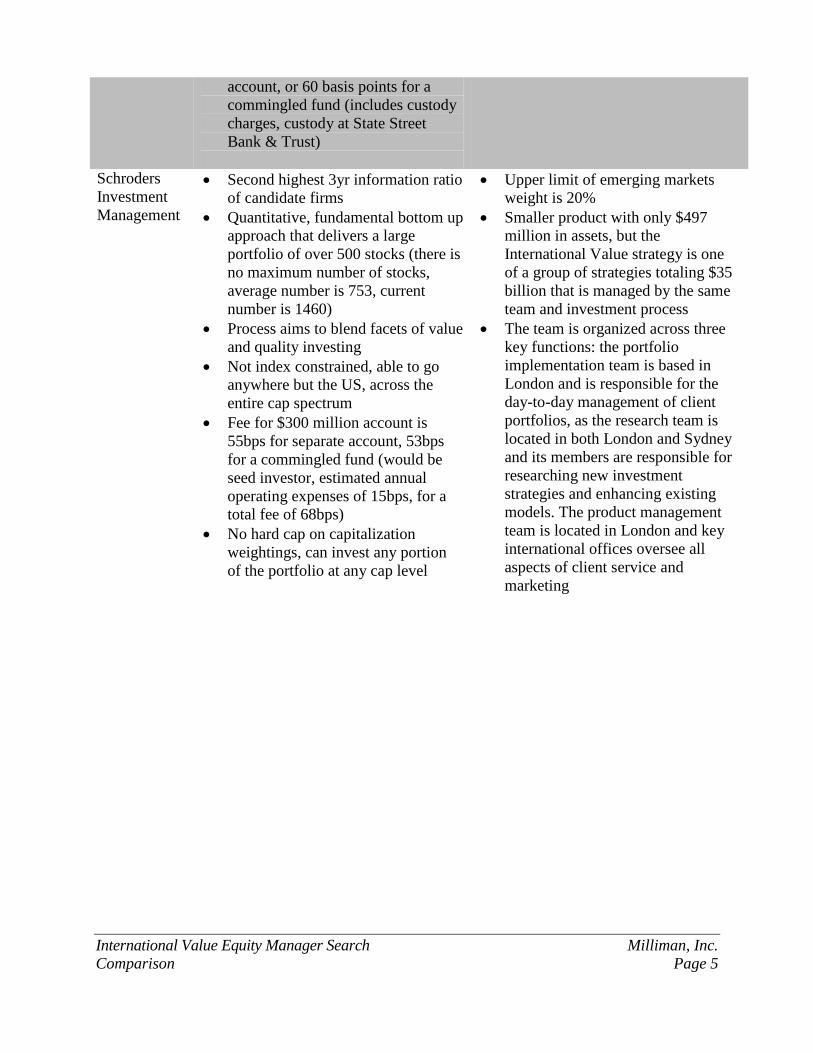
Comparison Page 5
account, or 60 basis points for a
commingled fund (includes custody
charges, custody at State Street
Bank & Trust)
Schroders
Investment
Management
Second highest 3yr information ratio
of candidate firms
Quantitative, fundamental bottom up
approach that delivers a large
portfolio of over 500 stocks (there is
no maximum number of stocks,
average number is 753, current
number is 1460)
Process aims to blend facets of value
and quality investing
Not index constrained, able to go
anywhere but the US, across the
entire cap spectrum
Fee for $300 million account is
55bps for separate account, 53bps
for a commingled fund (would be
seed investor, estimated annual
operating expenses of 15bps, for a
total fee of 68bps)
No hard cap on capitalization
weightings, can invest any portion
of the portfolio at any cap level
Upper limit of emerging markets
weight is 20%
Smaller product with only $497
million in assets, but the
International Value strategy is one
of a group of strategies totaling $35
billion that is managed by the same
team and investment process
The team is organized across three
key functions: the portfolio
implementation team is based in
London and is responsible for the
day-to-day management of client
portfolios, as the research team is
located in both London and Sydney
and its members are responsible for
researching new investment
strategies and enhancing existing
models. The product management
team is located in London and key
international offices oversee all
aspects of client service and
marketing
International Value Equity Manager Search Milliman, Inc.
Comparison Page 6
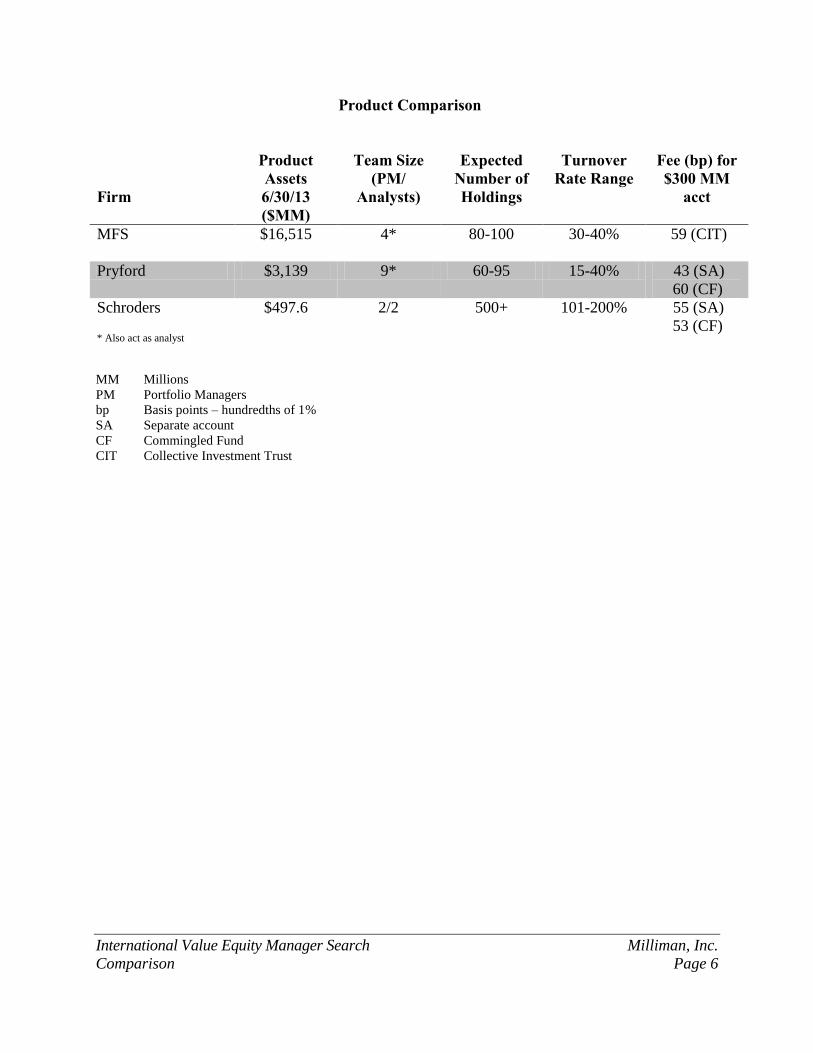
Product Comparison
Firm
Product Assets 6/30/13 ($MM)
Team Size (PM/
Analysts)
Expected Number of Holdings
Turnover Rate Range
Fee (bp) for $300 MM
acct
MFS $16,515 4* 80-100 30-40% 59 (CIT)
Pryford $3,139 9* 60-95 15-40% 43 (SA)
60 (CF)
Schroders * Also act as analyst
$497.6 2/2 500+ 101-200% 55 (SA)
53 (CF)
MM Millions
PM Portfolio Managers
bp Basis points – hundredths of 1%
SA Separate account
CF Commingled Fund
CIT Collective Investment Trust
International Value Equity Manager Search Milliman, Inc.
Comparison Page 7
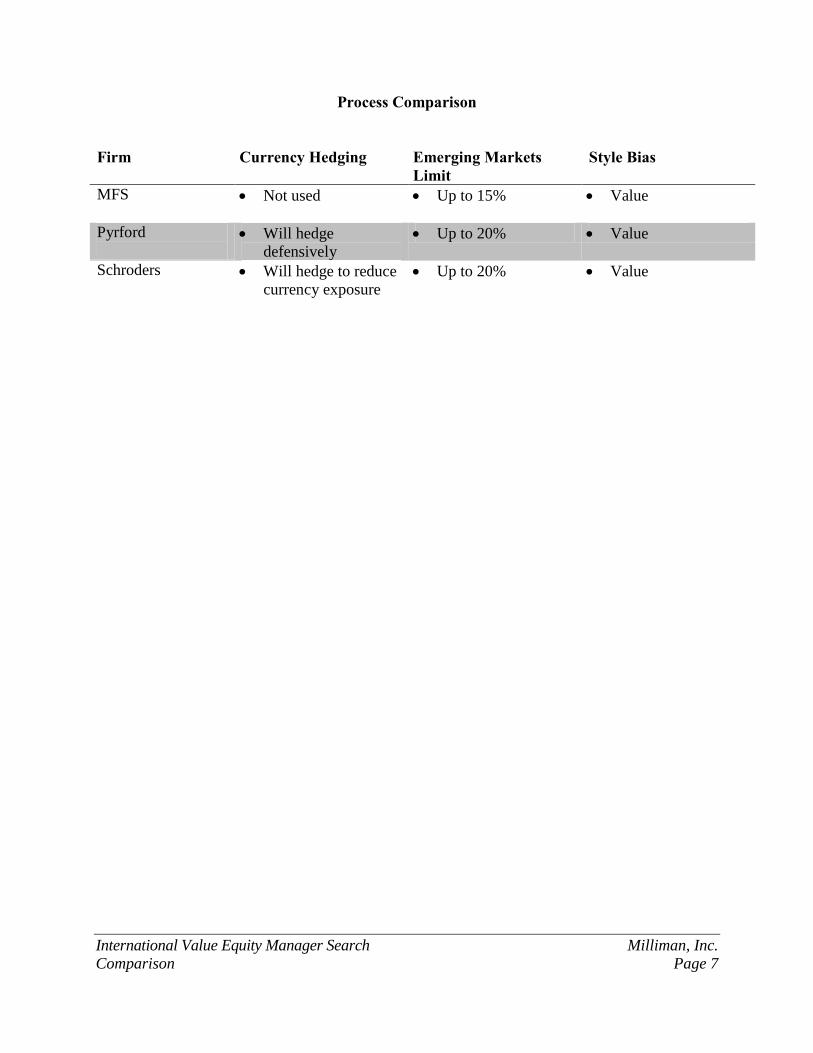
Process Comparison
Firm Currency Hedging
Emerging Markets Limit
Style Bias
MFS Not used
Up to 15% Value
Pyrford
Will hedge
defensively
Up to 20% Value
Schroders Will hedge to reduce
currency exposure
Up to 20% Value
International Value Equity Manager Search Milliman, Inc.
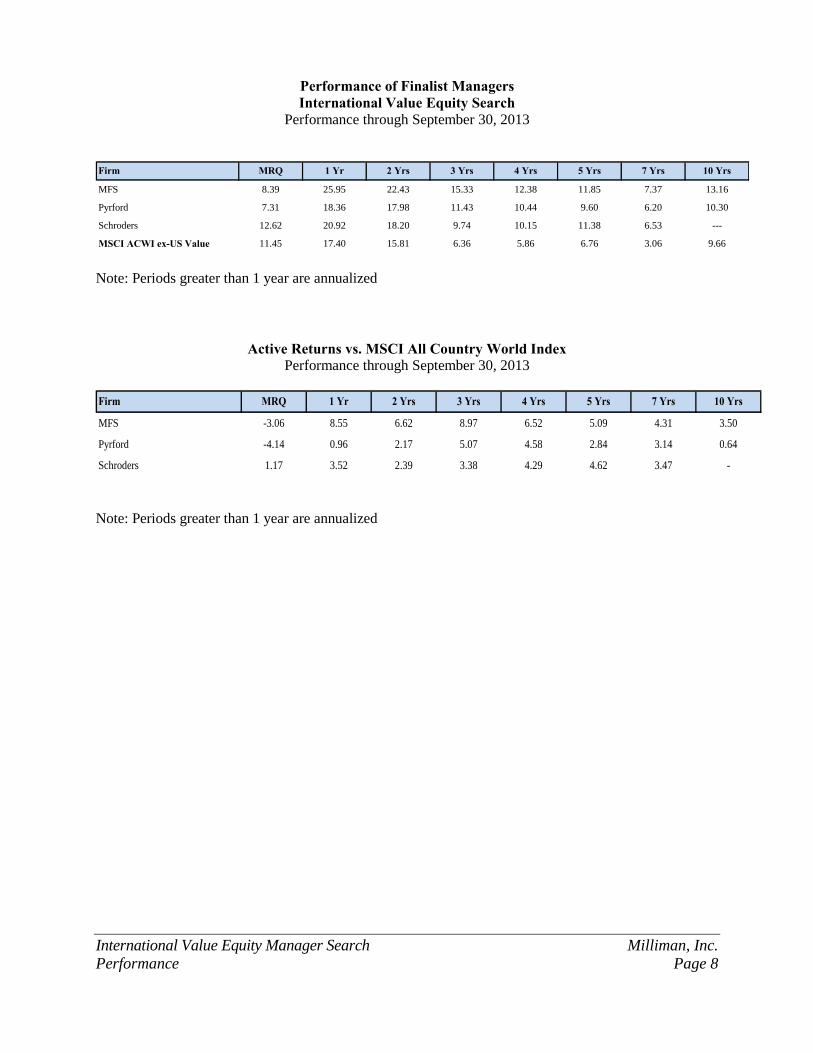
Performance Page 8
Performance of Finalist Managers International Value Equity Search
Performance through September 30, 2013
Firm MRQ 1 Yr 2 Yrs 3 Yrs 4 Yrs 5 Yrs 7 Yrs 10 Yrs
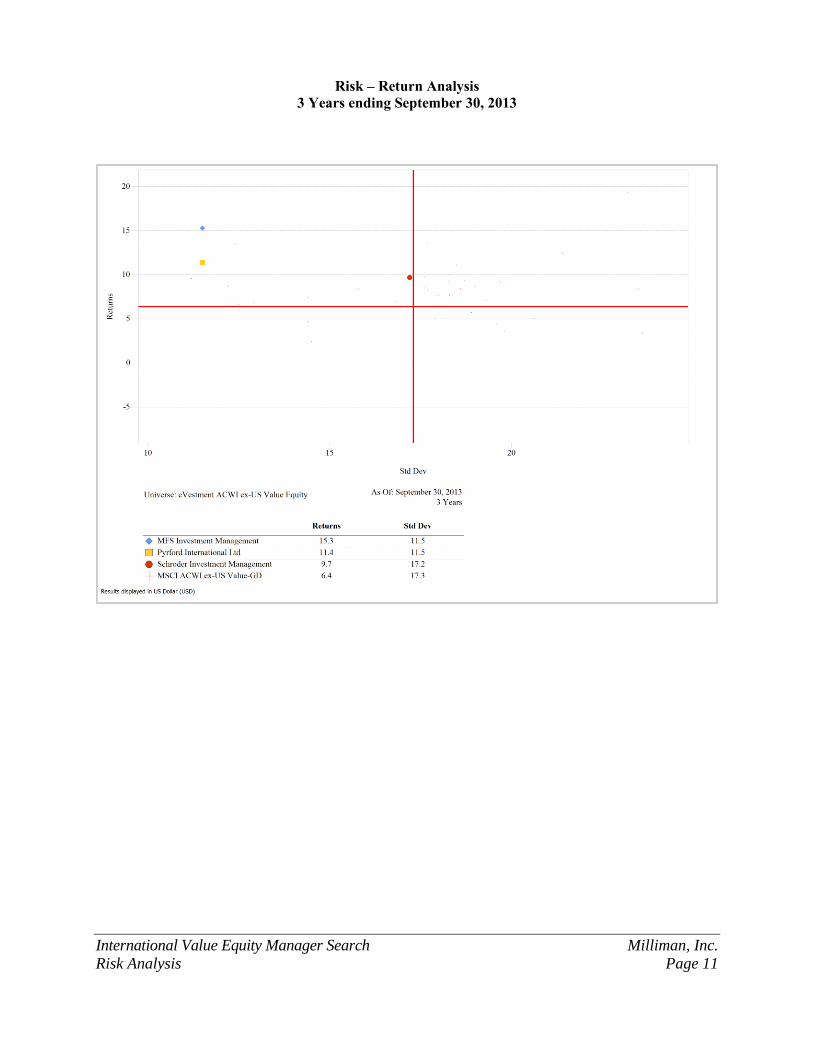
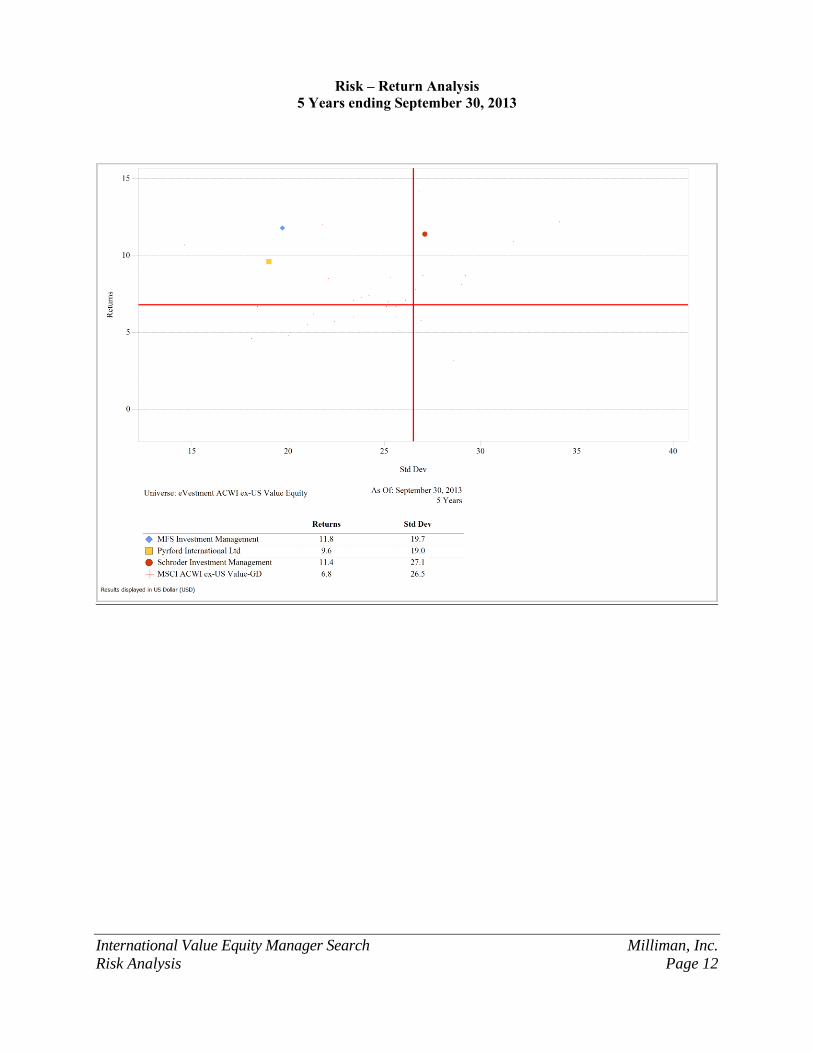
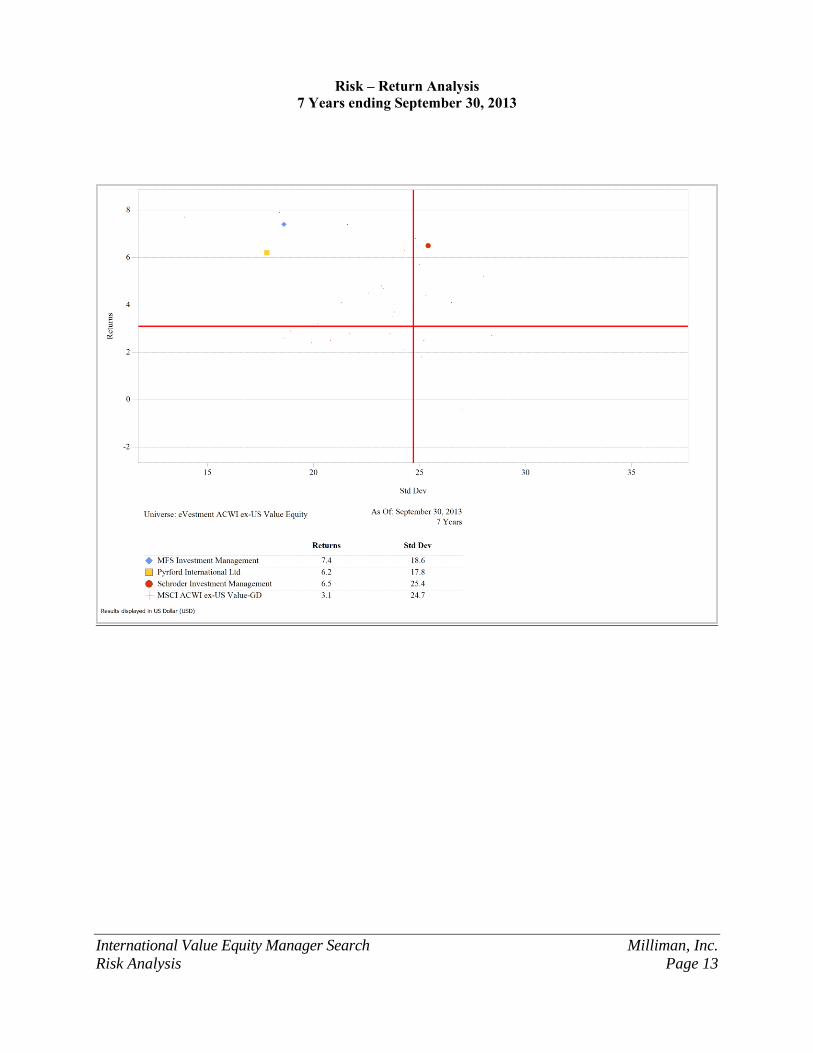
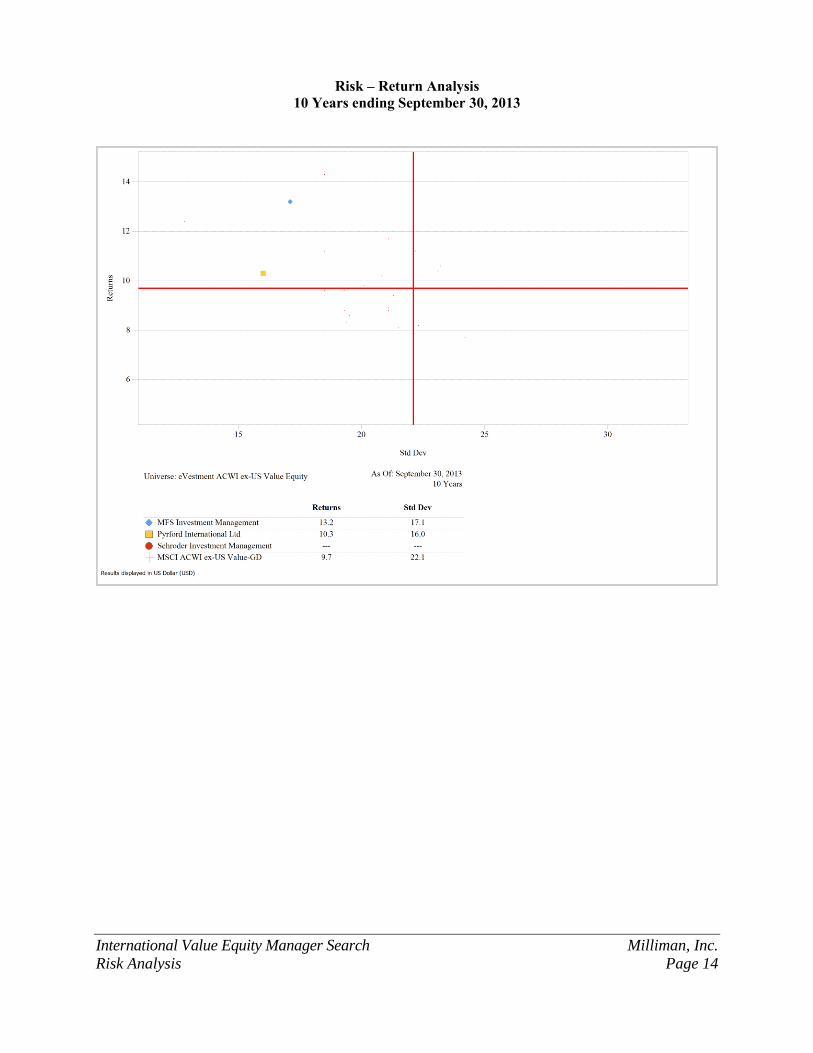
MFS 8.39 25.95 22.43 15.33 12.38 11.85 7.37 13.16
Pyrford 7.31 18.36 17.98 11.43 10.44 9.60 6.20 10.30
Schroders 12.62 20.92 18.20 9.74 10.15 11.38 6.53 ---
MSCI ACWI ex-US Value 11.45 17.40 15.81 6.36 5.86 6.76 3.06 9.66
Note: Periods greater than 1 year are annualized
Active Returns vs. MSCI All Country World Index
Performance through September 30, 2013
Firm MRQ 1 Yr 2 Yrs 3 Yrs 4 Yrs 5 Yrs 7 Yrs 10 Yrs
MFS -3.06 8.55 6.62 8.97 6.52 5.09 4.31 3.50
Pyrford -4.14 0.96 2.17 5.07 4.58 2.84 3.14 0.64
Schroders 1.17 3.52 2.39 3.38 4.29 4.62 3.47 -
Note: Periods greater than 1 year are annualized
International Value Equity Manager Search Milliman, Inc.
Performance Page 9
Performance of Finalist Managers (cont.) Annual Performance
Year to Date Ending September 30, 2013
Firm YTD 2012 2011 2010 2009 2008 2006 2007
MFS 22.60 17.26 -0.65 10.60 26.48 -30.85 8.76 30.24
Pyrford 13.11 17.19 -1.77 9.51 31.54 -32.91 10.13 27.95
Schroders 14.22 20.02 -11.39 18.17 55.94 -44.93 11.90 ---
MSCI ACWI ex-US Value 10.22 17.68 -12.71 8.40 45.14 -45.10 12.87 30.41
Annual Performance Active Returns vs. MSCI All Country World Index
Year to Date Ending September 30, 2013
Firm YTD 2012 2011 2010 2009 2008 2006 2007
MFS 12.38 -0.42 12.06 2.20 -18.66 14.25 -4.11 -0.17
Pyrford 2.89 -0.49 10.94 1.11 -13.60 12.19 -2.74 -2.46
Schroders 4.00 2.34 1.32 9.77 10.80 0.17 -0.97 ---
International Value Equity Manager Search Milliman, Inc.
Performance Page 10
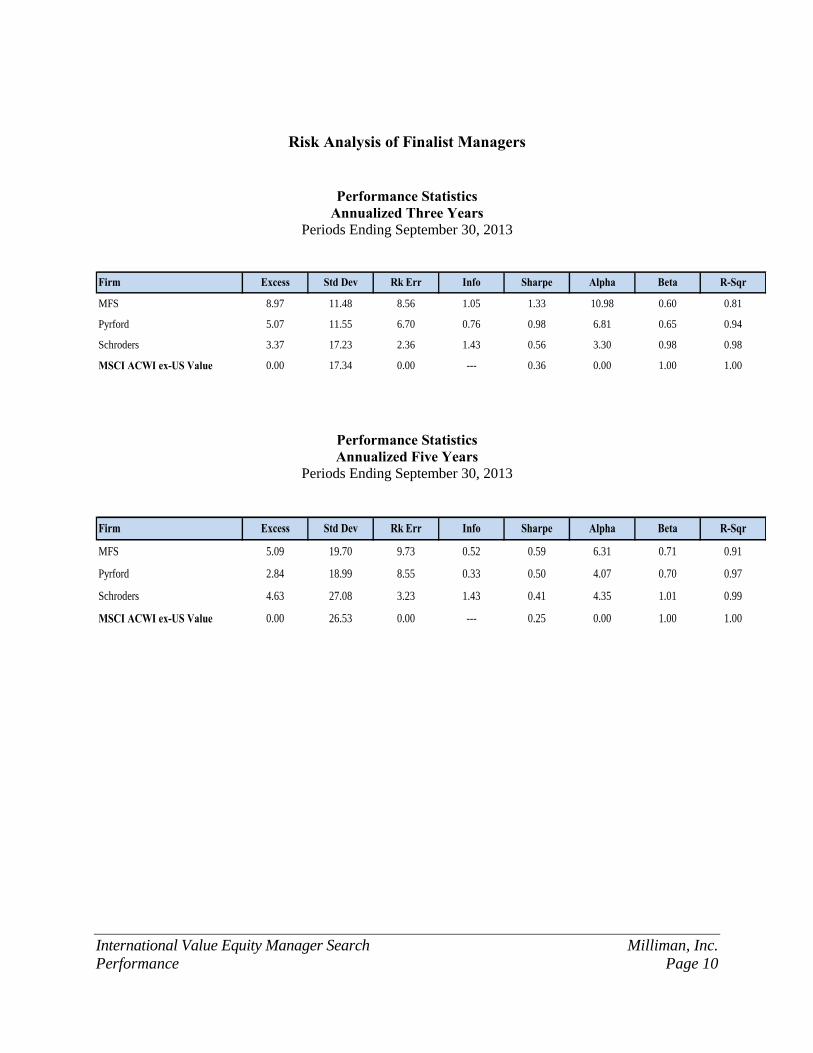
Risk Analysis of Finalist Managers
Performance Statistics Annualized Three Years
Periods Ending September 30, 2013
Firm Excess Std Dev Rk Err Info Sharpe Alpha Beta R-Sqr
MFS 8.97 11.48 8.56 1.05 1.33 10.98 0.60 0.81
Pyrford 5.07 11.55 6.70 0.76 0.98 6.81 0.65 0.94
Schroders 3.37 17.23 2.36 1.43 0.56 3.30 0.98 0.98
MSCI ACWI ex-US Value 0.00 17.34 0.00 --- 0.36 0.00 1.00 1.00
Performance Statistics Annualized Five Years
Periods Ending September 30, 2013
Firm Excess Std Dev Rk Err Info Sharpe Alpha Beta R-Sqr
MFS 5.09 19.70 9.73 0.52 0.59 6.31 0.71 0.91
Pyrford 2.84 18.99 8.55 0.33 0.50 4.07 0.70 0.97
Schroders 4.63 27.08 3.23 1.43 0.41 4.35 1.01 0.99
MSCI ACWI ex-US Value 0.00 26.53 0.00 --- 0.25 0.00 1.00 1.00
International Value Equity Manager Search Milliman, Inc.
Risk Analysis Page 11
Risk – Return Analysis 3 Years ending September 30, 2013
International Value Equity Manager Search Milliman, Inc.
Risk Analysis Page 12
Risk – Return Analysis 5 Years ending September 30, 2013
International Value Equity Manager Search Milliman, Inc.
Risk Analysis Page 13
Risk – Return Analysis 7 Years ending September 30, 2013
International Value Equity Manager Search Milliman, Inc.
Risk Analysis Page 14
Risk – Return Analysis 10 Years ending September 30, 2013
International Value Equity Manager Search Milliman, Inc.
Style Analysis Page 15
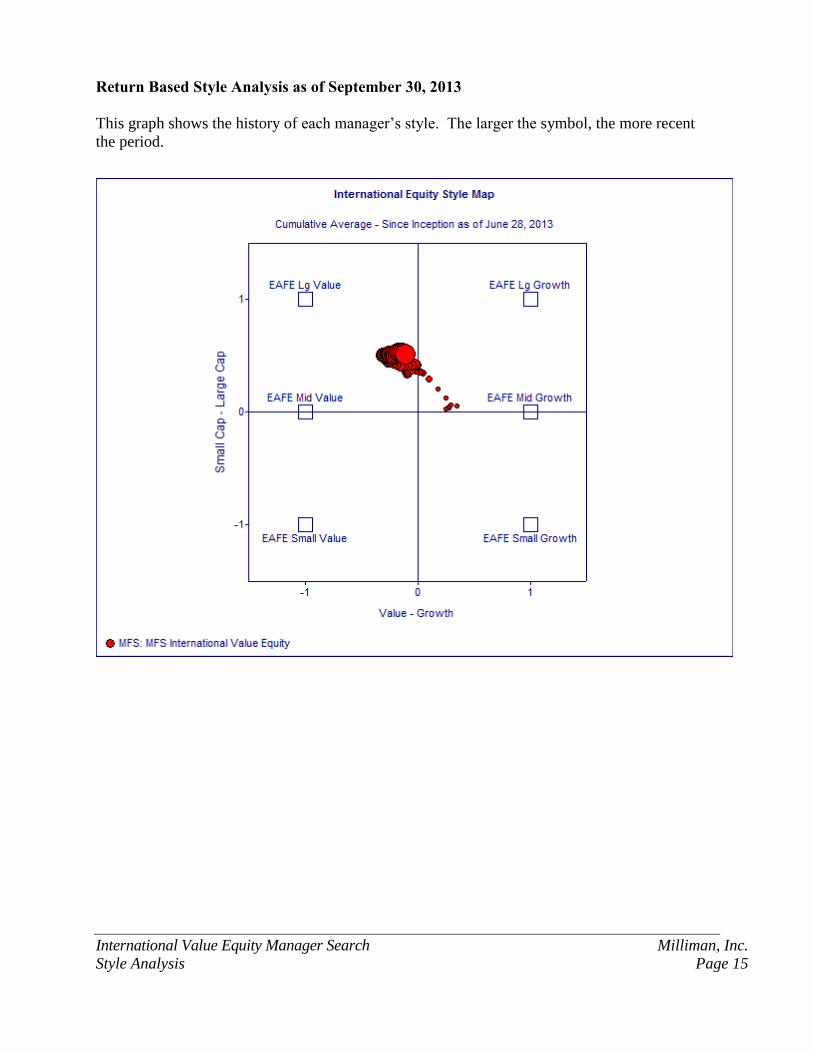
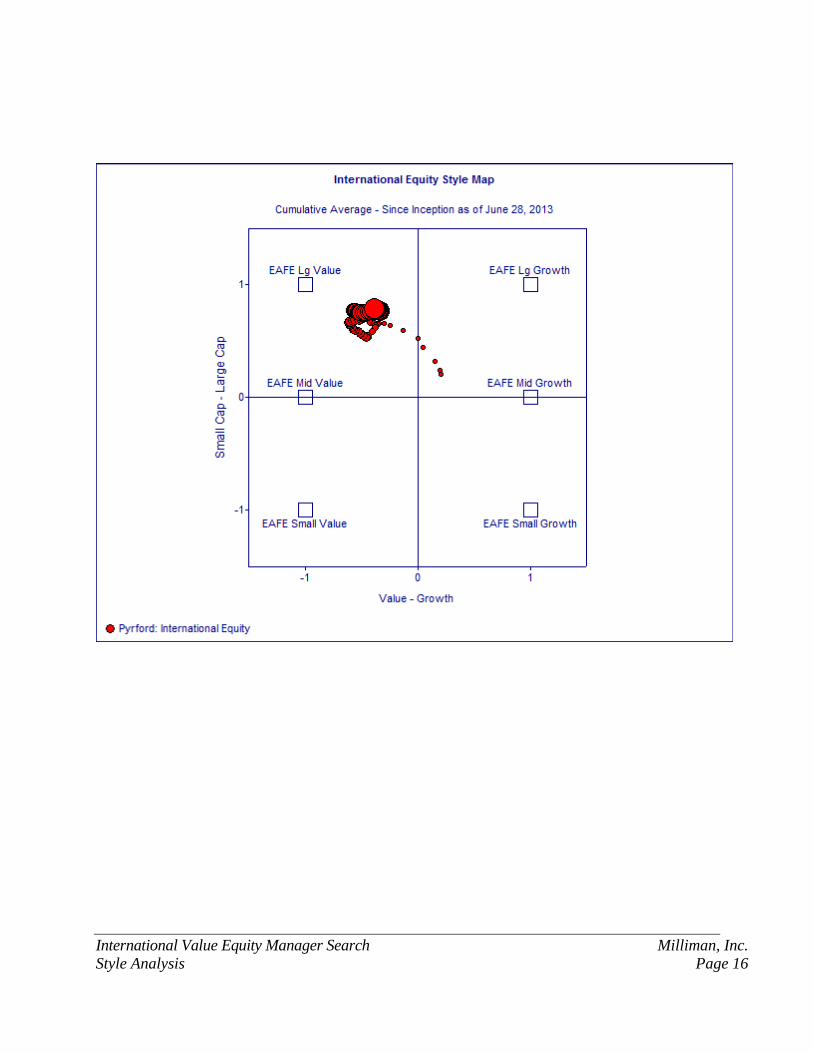
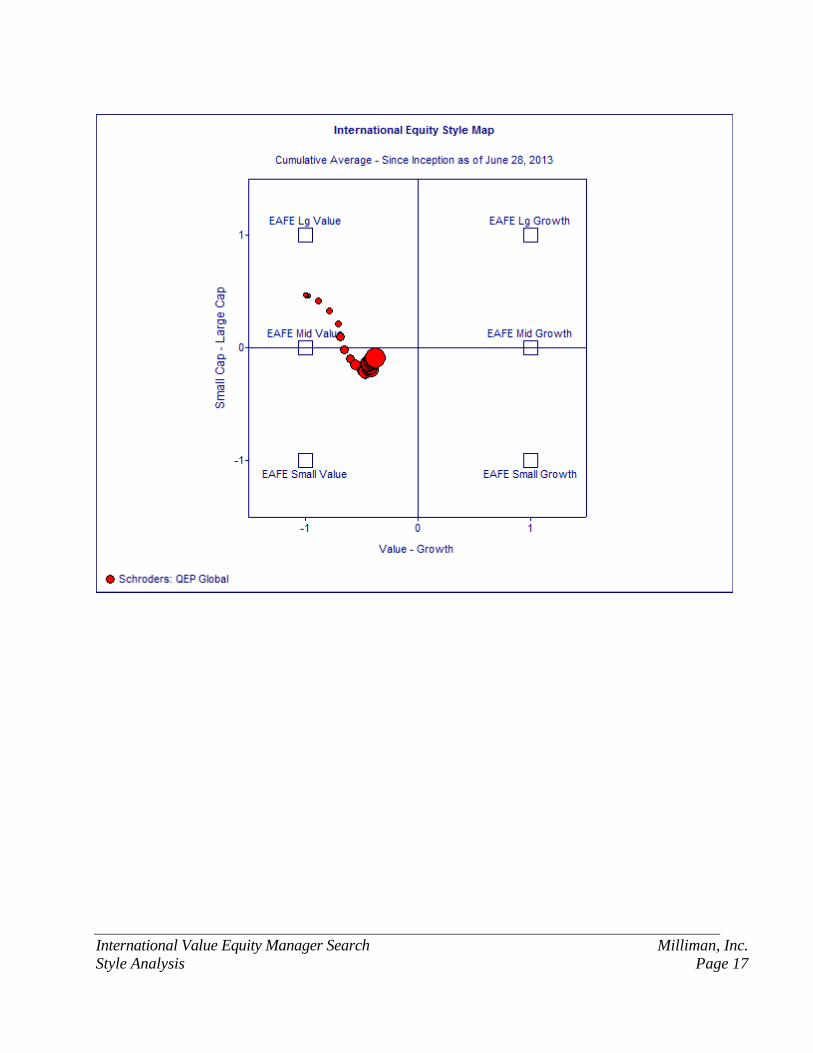
Return Based Style Analysis as of September 30, 2013
This graph shows the history of each manager’s style. The larger the symbol, the more recent
the period.
International Value Equity Manager Search Milliman, Inc.
Style Analysis Page 16
International Value Equity Manager Search Milliman, Inc.
Style Analysis Page 17
International Value Equity Manager Search Milliman, Inc.
Page 18
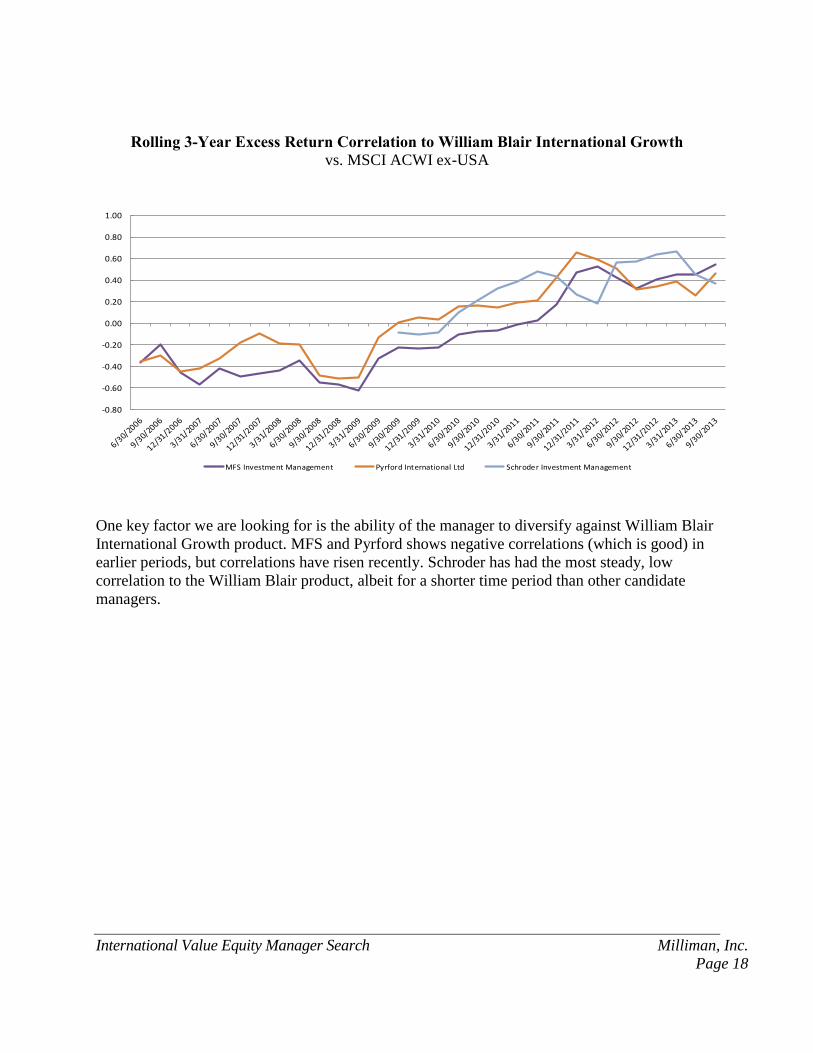
Rolling 3-Year Excess Return Correlation to William Blair International Growth
vs. MSCI ACWI ex-USA
-0.80
-0.60
-0.40
-0.20
0.00
0.20
0.40
0.60
0.80
1.00
MFS Investment Management Pyrford International Ltd Schroder Investment Management
One key factor we are looking for is the ability of the manager to diversify against William Blair
International Growth product. MFS and Pyrford shows negative correlations (which is good) in
earlier periods, but correlations have risen recently. Schroder has had the most steady, low
correlation to the William Blair product, albeit for a shorter time period than other candidate
managers.
International Value Equity Manager Search Milliman, Inc.
Response Summary- MFS Page 19
INTERNATIONAL VALUE EQUITY INVESTMENT MANAGER QUESTIONNAIRE
As of June 30, 2013
Organizational Background
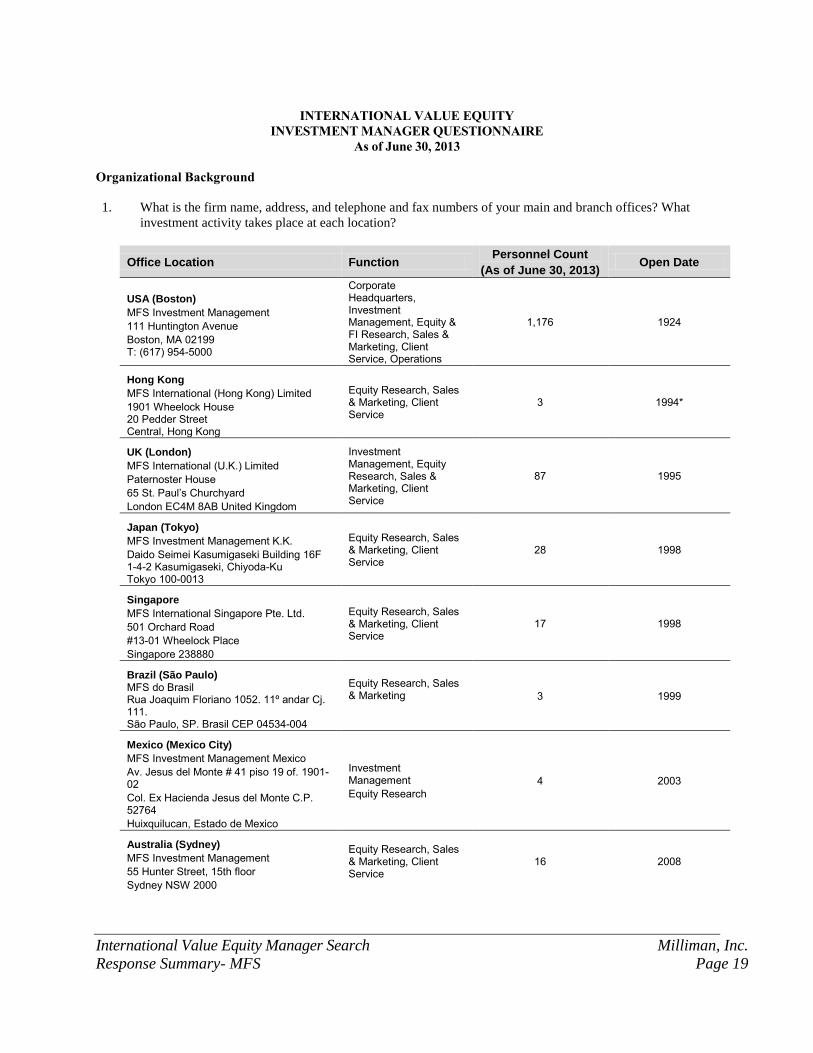
1. What is the firm name, address, and telephone and fax numbers of your main and branch offices? What
investment activity takes place at each location?
Office Location Function Personnel Count
(As of June 30, 2013) Open Date
USA (Boston)
MFS Investment Management
111 Huntington Avenue
Boston, MA 02199 T: (617) 954-5000
Corporate Headquarters, Investment Management, Equity & FI Research, Sales & Marketing, Client Service, Operations
1,176 1924
Hong Kong
MFS International (Hong Kong) Limited
1901 Wheelock House 20 Pedder Street Central, Hong Kong
Equity Research, Sales & Marketing, Client Service
3 1994*
UK (London)
MFS International (U.K.) Limited
Paternoster House
65 St. Paul’s Churchyard
London EC4M 8AB United Kingdom
Investment Management, Equity Research, Sales & Marketing, Client Service
87 1995
Japan (Tokyo)
MFS Investment Management K.K.
Daido Seimei Kasumigaseki Building 16F 1-4-2 Kasumigaseki, Chiyoda-Ku Tokyo 100-0013
Equity Research, Sales & Marketing, Client Service
28 1998
Singapore
MFS International Singapore Pte. Ltd.
501 Orchard Road
#13-01 Wheelock Place
Singapore 238880
Equity Research, Sales & Marketing, Client Service
17 1998
Brazil (São Paulo) MFS do Brasil Rua Joaquim Floriano 1052. 11º andar Cj. 111. São Paulo, SP. Brasil CEP 04534-004
Equity Research, Sales & Marketing
3 1999
Mexico (Mexico City)
MFS Investment Management Mexico
Av. Jesus del Monte # 41 piso 19 of. 1901-02
Col. Ex Hacienda Jesus del Monte C.P. 52764
Huixquilucan, Estado de Mexico
Investment Management
Equity Research
4 2003
Australia (Sydney)
MFS Investment Management
55 Hunter Street, 15th floor
Sydney NSW 2000
Equity Research, Sales & Marketing, Client Service
16 2008
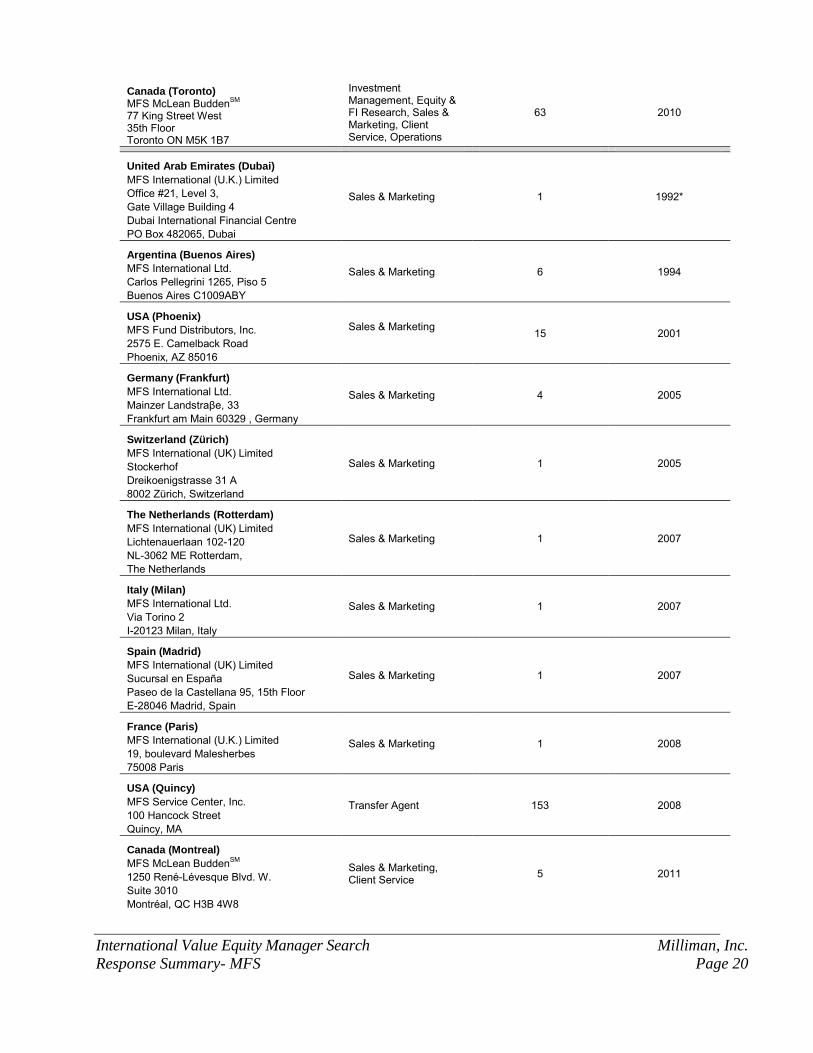
International Value Equity Manager Search Milliman, Inc.
Response Summary- MFS Page 20
Canada (Toronto) MFS McLean Budden
SM
77 King Street West 35th Floor Toronto ON M5K 1B7
Investment Management, Equity & FI Research, Sales & Marketing, Client Service, Operations
63 2010
United Arab Emirates (Dubai)
MFS International (U.K.) Limited
Office #21, Level 3,
Gate Village Building 4
Dubai International Financial Centre
PO Box 482065, Dubai
Sales & Marketing 1 1992*
Argentina (Buenos Aires)
MFS International Ltd.
Carlos Pellegrini 1265, Piso 5
Buenos Aires C1009ABY
Sales & Marketing 6 1994
USA (Phoenix)
MFS Fund Distributors, Inc.
2575 E. Camelback Road
Phoenix, AZ 85016
Sales & Marketing
15 2001
Germany (Frankfurt)
MFS International Ltd.
Mainzer Landstraβe, 33
Frankfurt am Main 60329 , Germany
Sales & Marketing 4 2005
Switzerland (Zürich)
MFS International (UK) Limited
Stockerhof
Dreikoenigstrasse 31 A
8002 Zürich, Switzerland
Sales & Marketing 1 2005
The Netherlands (Rotterdam)
MFS International (UK) Limited
Lichtenauerlaan 102-120
NL-3062 ME Rotterdam,
The Netherlands
Sales & Marketing 1 2007
Italy (Milan)
MFS International Ltd.
Via Torino 2
I-20123 Milan, Italy
Sales & Marketing 1 2007
Spain (Madrid)
MFS International (UK) Limited
Sucursal en España
Paseo de la Castellana 95, 15th Floor
E-28046 Madrid, Spain
Sales & Marketing 1 2007
France (Paris)
MFS International (U.K.) Limited
19, boulevard Malesherbes
75008 Paris
Sales & Marketing 1 2008
USA (Quincy)
MFS Service Center, Inc.
100 Hancock Street
Quincy, MA
Transfer Agent 153 2008
Canada (Montreal)
MFS McLean BuddenSM
1250 René-Lévesque Blvd. W.
Suite 3010
Montréal, QC H3B 4W8
Sales & Marketing, Client Service
5 2011
International Value Equity Manager Search Milliman, Inc.
Response Summary- MFS Page 21
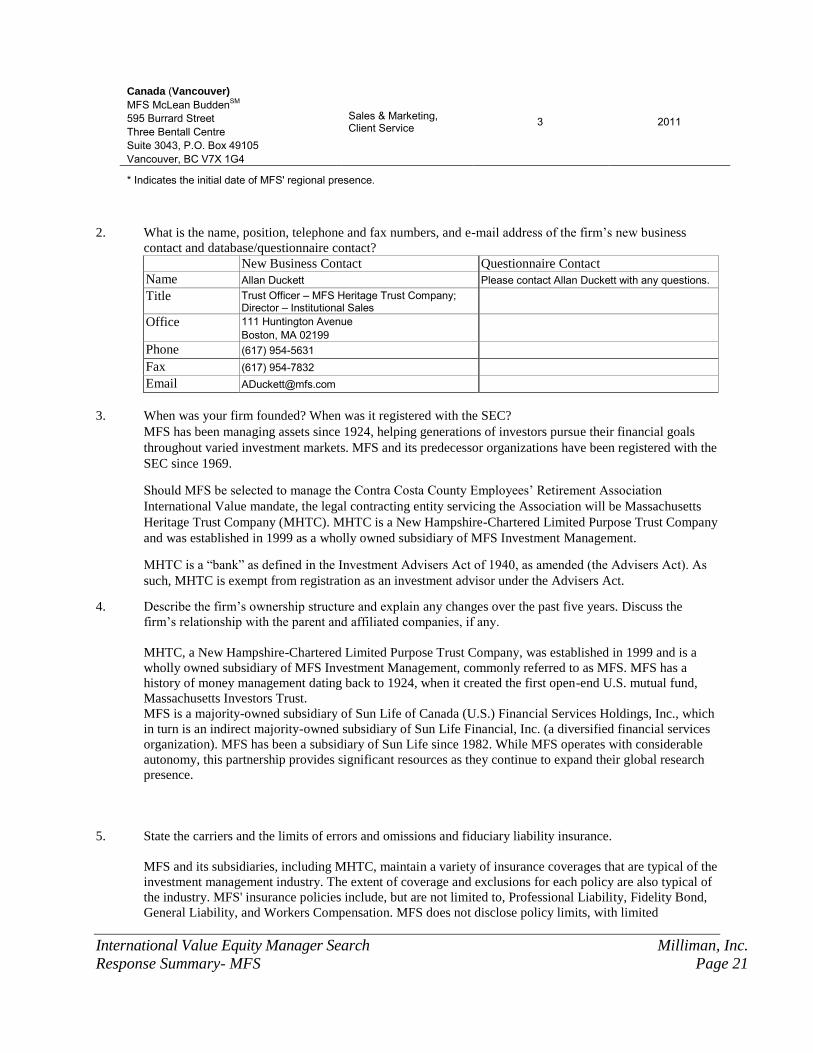
Canada (Vancouver)
MFS McLean BuddenSM
595 Burrard Street
Three Bentall Centre
Suite 3043, P.O. Box 49105
Vancouver, BC V7X 1G4
Sales & Marketing, Client Service
3 2011
* Indicates the initial date of MFS' regional presence.
2. What is the name, position, telephone and fax numbers, and e-mail address of the firm’s new business
contact and database/questionnaire contact?
New Business Contact Questionnaire Contact
Name Allan Duckett Please contact Allan Duckett with any questions.
Title Trust Officer – MFS Heritage Trust Company; Director – Institutional Sales
Office 111 Huntington Avenue
Boston, MA 02199
Phone (617) 954-5631
Fax (617) 954-7832
Email [email protected]
3. When was your firm founded? When was it registered with the SEC?
MFS has been managing assets since 1924, helping generations of investors pursue their financial goals
throughout varied investment markets. MFS and its predecessor organizations have been registered with the
SEC since 1969.
Should MFS be selected to manage the Contra Costa County Employees’ Retirement Association
International Value mandate, the legal contracting entity servicing the Association will be Massachusetts
Heritage Trust Company (MHTC). MHTC is a New Hampshire-Chartered Limited Purpose Trust Company
and was established in 1999 as a wholly owned subsidiary of MFS Investment Management.
MHTC is a “bank” as defined in the Investment Advisers Act of 1940, as amended (the Advisers Act). As
such, MHTC is exempt from registration as an investment advisor under the Advisers Act.
4. Describe the firm’s ownership structure and explain any changes over the past five years. Discuss the
firm’s relationship with the parent and affiliated companies, if any.
MHTC, a New Hampshire-Chartered Limited Purpose Trust Company, was established in 1999 and is a
wholly owned subsidiary of MFS Investment Management, commonly referred to as MFS. MFS has a
history of money management dating back to 1924, when it created the first open-end U.S. mutual fund,
Massachusetts Investors Trust.
MFS is a majority-owned subsidiary of Sun Life of Canada (U.S.) Financial Services Holdings, Inc., which
in turn is an indirect majority-owned subsidiary of Sun Life Financial, Inc. (a diversified financial services
organization). MFS has been a subsidiary of Sun Life since 1982. While MFS operates with considerable
autonomy, this partnership provides significant resources as they continue to expand their global research
presence.
5. State the carriers and the limits of errors and omissions and fiduciary liability insurance.
MFS and its subsidiaries, including MHTC, maintain a variety of insurance coverages that are typical of the
investment management industry. The extent of coverage and exclusions for each policy are also typical of
the industry. MFS' insurance policies include, but are not limited to, Professional Liability, Fidelity Bond,
General Liability, and Workers Compensation. MFS does not disclose policy limits, with limited
International Value Equity Manager Search Milliman, Inc.
Response Summary- MFS Page 22
exceptions, or claims information with respect to its insurance policies. MFS will however, produce
certificates of insurance upon request. More specifically, MFS maintains
• A Directors and Officers/Errors and Omissions policy with a primary limit of liability in excess of
US$10 million. The primary carrier on the policy is ICI Mutual Insurance Company. This policy expires in
November and is renewed annually.
• A Domestic Fidelity Bond with a primary limit in excess of US$10 million. The primary layer on
the Bond is a co-surety arrangement between ICI Mutual Insurance Company and Chubb Insurance
Company. This policy expires in November and is renewed annually.
• General Liability coverage with limits of US$1 million per occurrence and US$2 million in the
aggregate. The carrier on the policy is Chubb Insurance Company. This policy expires in March and is
renewed annually.
• A U.S. Workers Compensation policy with statutory limits. The carrier on the policy is Sentry.
This policy expires in April and is renewed annually.
MFS does not have separate fiduciary liability coverage for third parties. Fiduciary coverage is included in
MFS' professional liability coverage that is provided by ICI Mutual Insurance Company.
6. Describe any litigation regarding your firm’s investment activities over the past 5 years. Is the firm
expecting new litigation?
MHTC has not been subject to litigation in the past five years.
Pending litigation
MHTC’s parent company, MFS, is not currently the subject of any material litigation. However, from time
to time, MFS and its subsidiaries are named as defendants in litigation that MFS believes is not likely to
have a material adverse impact on the financial position of the company or its ability to provide services to
clients.
Concluded litigation
Over the past five years, MFS has also been involved in the following material, or potentially material,
litigation or legal proceedings, all of which are now concluded:
In December 2003, MFS, MFS Fund Distributors Inc., Sun Life Financial Inc. (MFS’ parent company),
various MFS funds, the trustees of these MFS funds, and certain officers of MFS were named as defendants
in multiple lawsuits filed in federal and state courts relating to market timing and/or late trading. The
lawsuits generally alleged that some or all of the defendants permitted or acquiesced in market timing
and/or late trading in some of the MFS funds, inadequately disclosed MFS’ internal policies concerning
market timing and such matters, received excessive compensation as fiduciaries to the MFS funds, and
should not have imposed contingent deferred sales charges (CDSC) on certain redemptions. These lawsuits
related to pre-2004 events. MFS (and related parties) entered into agreements with the plaintiffs to settle
these actions. The settlements were given final approval by the court in October 2010.
On July 28, 2008, a class action lawsuit was filed against MFS and MFS Fund Distributors, Inc., alleging
that the disclosure in certain MFS fund prospectuses concerning the value and performance of Class A
shares relative to other share classes was misleading. The complaint alleged that the prospectus omitted
information that might have led certain investors to invest in other share classes. After MFS filed a motion
to dismiss, the plaintiff voluntarily dismissed the case with prejudice on March 5, 2009.
In 2004, MFS, MFD, Sun Life Financial, Inc., various MFS funds, the trustees of these funds, and certain
officers of MFS were named as defendants in lawsuits filed in (or transferred to) the United States District
Court for the District of Massachusetts. The lawsuits alleged generally that the defendants received
excessive fees, permitted or acquiesced in the improper use of fund assets by MFS to support the
distribution of fund shares, and inadequately disclosed MFS’ use of fund assets in this manner. Those
lawsuits were settled by agreement of the parties and dismissed by court orders in 2007 and 2008.
In March 2004, Premium Plus Partners, L.P. filed a class action in federal court in Chicago against MFS
International Value Equity Manager Search Milliman, Inc.
Response Summary- MFS Page 23
and several other defendants, generally alleging that MFS’ purchase of 30-year U.S. Treasury bonds on
October 31, 2001, was made while in possession of nonpublic information. Plaintiffs alleged that such
purchase, prior to the Treasury’s announcement that it would no longer issue 30-year Treasury bonds,
restricted the supply of available 30-year Treasury bonds and caused those who held short positions to
cover those positions at higher prices. On July 30, 2008, the court granted summary judgment in favor of
MFS and this decision was not appealed.
In addition, from time to time, MFS has been a party to immaterial litigation or other disputes.
7. Describe any judgments against your firm by governmental and regulatory agencies over the past 5 years.
Also describe any current investigations.
There have been no judgments against MHTC or MFS by governmental or regulatory agencies over the
past five years. From time to time, MFS and its subsidiaries receive subpoenas, inquiries, and other
information requests from governmental or regulatory bodies, to which they respond. They consider such
subpoenas, inquiries, and requests to be confidential.
8. Please provide copies of your firm’s Form ADV Parts I and II.
As a New Hampshire-chartered, non-depository trust company, MFS Heritage Trust Company (MHTC) is
a "bank" as defined in the Investment Advisers Act of 1940, as amended (the Advisers Act). Therefore,
MHTC is excluded from the definition of "investment adviser" under the Advisers Act and, accordingly, is
not required to file Form ADV, Parts 1 and 2.
MFS' Form ADV Parts 1 and 2A are provided in Appendix I.
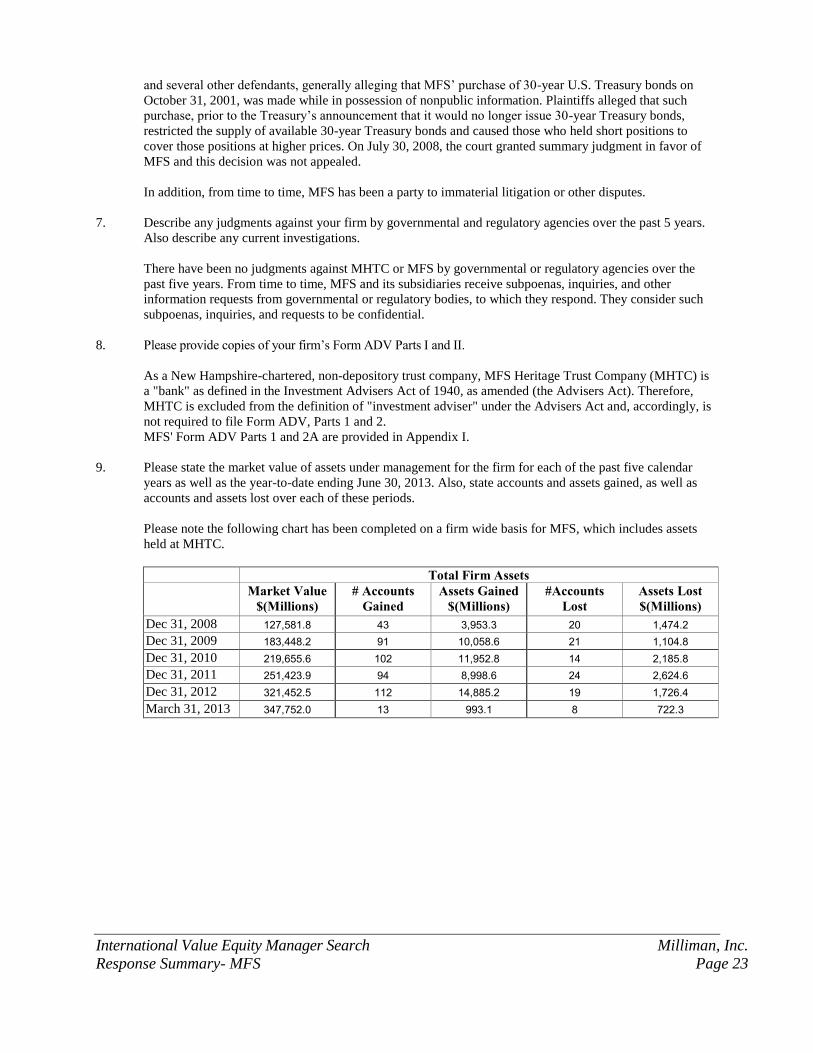
9. Please state the market value of assets under management for the firm for each of the past five calendar
years as well as the year-to-date ending June 30, 2013. Also, state accounts and assets gained, as well as
accounts and assets lost over each of these periods.
Please note the following chart has been completed on a firm wide basis for MFS, which includes assets
held at MHTC.
Total Firm Assets Market Value
$(Millions) # Accounts
Gained Assets Gained
$(Millions) #Accounts
Lost Assets Lost $(Millions)
Dec 31, 2008 127,581.8 43 3,953.3 20 1,474.2
Dec 31, 2009 183,448.2 91 10,058.6 21 1,104.8
Dec 31, 2010 219,655.6 102 11,952.8 14 2,185.8
Dec 31, 2011 251,423.9 94 8,998.6 24 2,624.6
Dec 31, 2012 321,452.5 112 14,885.2 19 1,726.4
March 31, 2013 347,752.0 13 993.1 8 722.3
International Value Equity Manager Search Milliman, Inc.
Response Summary- MFS Page 24
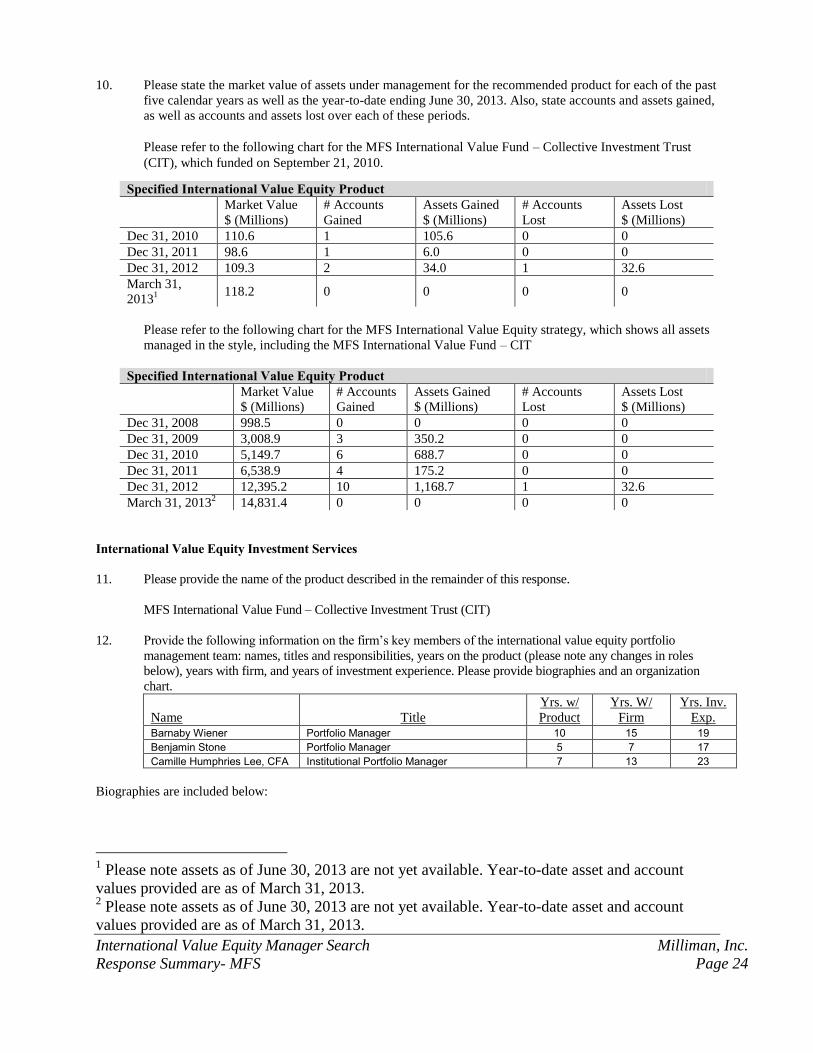
10. Please state the market value of assets under management for the recommended product for each of the past
five calendar years as well as the year-to-date ending June 30, 2013. Also, state accounts and assets gained,
as well as accounts and assets lost over each of these periods.
Please refer to the following chart for the MFS International Value Fund – Collective Investment Trust
(CIT), which funded on September 21, 2010.
Specified International Value Equity Product Market Value
$ (Millions)
# Accounts
Gained
Assets Gained
$ (Millions)
# Accounts
Lost
Assets Lost
$ (Millions)
Dec 31, 2010 110.6 1 105.6 0 0
Dec 31, 2011 98.6 1 6.0 0 0
Dec 31, 2012 109.3 2 34.0 1 32.6
March 31,
20131
118.2 0 0 0 0
Please refer to the following chart for the MFS International Value Equity strategy, which shows all assets
managed in the style, including the MFS International Value Fund – CIT
Specified International Value Equity Product Market Value
$ (Millions)
# Accounts
Gained
Assets Gained
$ (Millions)
# Accounts
Lost
Assets Lost
$ (Millions)
Dec 31, 2008 998.5 0 0 0 0
Dec 31, 2009 3,008.9 3 350.2 0 0
Dec 31, 2010 5,149.7 6 688.7 0 0
Dec 31, 2011 6,538.9 4 175.2 0 0
Dec 31, 2012 12,395.2 10 1,168.7 1 32.6
March 31, 20132 14,831.4 0 0 0 0
International Value Equity Investment Services
11. Please provide the name of the product described in the remainder of this response.
MFS International Value Fund – Collective Investment Trust (CIT)
12. Provide the following information on the firm’s key members of the international value equity portfolio
management team: names, titles and responsibilities, years on the product (please note any changes in roles
below), years with firm, and years of investment experience. Please provide biographies and an organization
chart.
Name
Title
Yrs. w/
Product
Yrs. W/
Firm
Yrs. Inv.
Exp. Barnaby Wiener Portfolio Manager 10 15 19
Benjamin Stone Portfolio Manager 5 7 17
Camille Humphries Lee, CFA Institutional Portfolio Manager 7 13 23
Biographies are included below:
1 Please note assets as of June 30, 2013 are not yet available. Year-to-date asset and account
values provided are as of March 31, 2013. 2 Please note assets as of June 30, 2013 are not yet available. Year-to-date asset and account
values provided are as of March 31, 2013.
International Value Equity Manager Search Milliman, Inc.
Response Summary- MFS Page 25
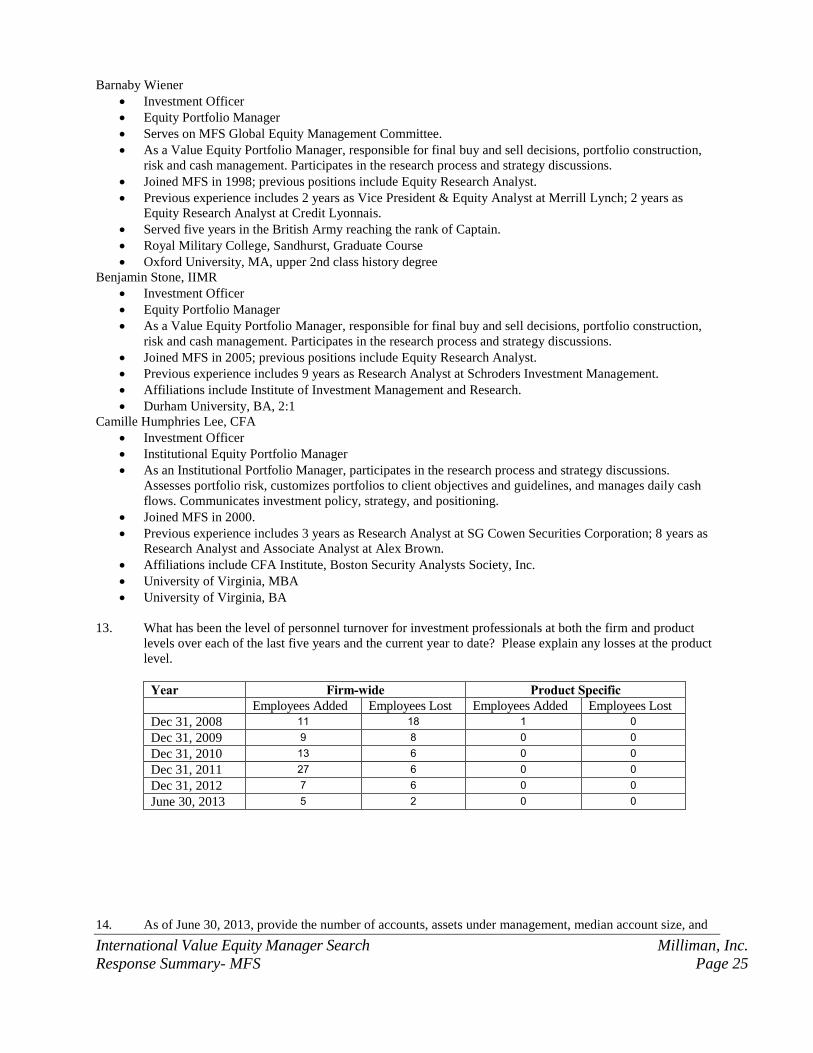
Barnaby Wiener
Investment Officer
Equity Portfolio Manager
Serves on MFS Global Equity Management Committee.
As a Value Equity Portfolio Manager, responsible for final buy and sell decisions, portfolio construction,
risk and cash management. Participates in the research process and strategy discussions.
Joined MFS in 1998; previous positions include Equity Research Analyst.
Previous experience includes 2 years as Vice President & Equity Analyst at Merrill Lynch; 2 years as
Equity Research Analyst at Credit Lyonnais.
Served five years in the British Army reaching the rank of Captain.
Royal Military College, Sandhurst, Graduate Course
Oxford University, MA, upper 2nd class history degree
Benjamin Stone, IIMR
Investment Officer
Equity Portfolio Manager
As a Value Equity Portfolio Manager, responsible for final buy and sell decisions, portfolio construction,
risk and cash management. Participates in the research process and strategy discussions.
Joined MFS in 2005; previous positions include Equity Research Analyst.
Previous experience includes 9 years as Research Analyst at Schroders Investment Management.
Affiliations include Institute of Investment Management and Research.
Durham University, BA, 2:1
Camille Humphries Lee, CFA
Investment Officer
Institutional Equity Portfolio Manager
As an Institutional Portfolio Manager, participates in the research process and strategy discussions.
Assesses portfolio risk, customizes portfolios to client objectives and guidelines, and manages daily cash
flows. Communicates investment policy, strategy, and positioning.
Joined MFS in 2000.
Previous experience includes 3 years as Research Analyst at SG Cowen Securities Corporation; 8 years as
Research Analyst and Associate Analyst at Alex Brown.
Affiliations include CFA Institute, Boston Security Analysts Society, Inc.
University of Virginia, MBA
University of Virginia, BA
13. What has been the level of personnel turnover for investment professionals at both the firm and product
levels over each of the last five years and the current year to date? Please explain any losses at the product
level.
Year Firm-wide Product Specific Employees Added Employees Lost Employees Added Employees Lost
Dec 31, 2008 11 18 1 0
Dec 31, 2009 9 8 0 0
Dec 31, 2010 13 6 0 0
Dec 31, 2011 27 6 0 0
Dec 31, 2012 7 6 0 0
June 30, 2013 5 2 0 0
14. As of June 30, 2013, provide the number of accounts, assets under management, median account size, and
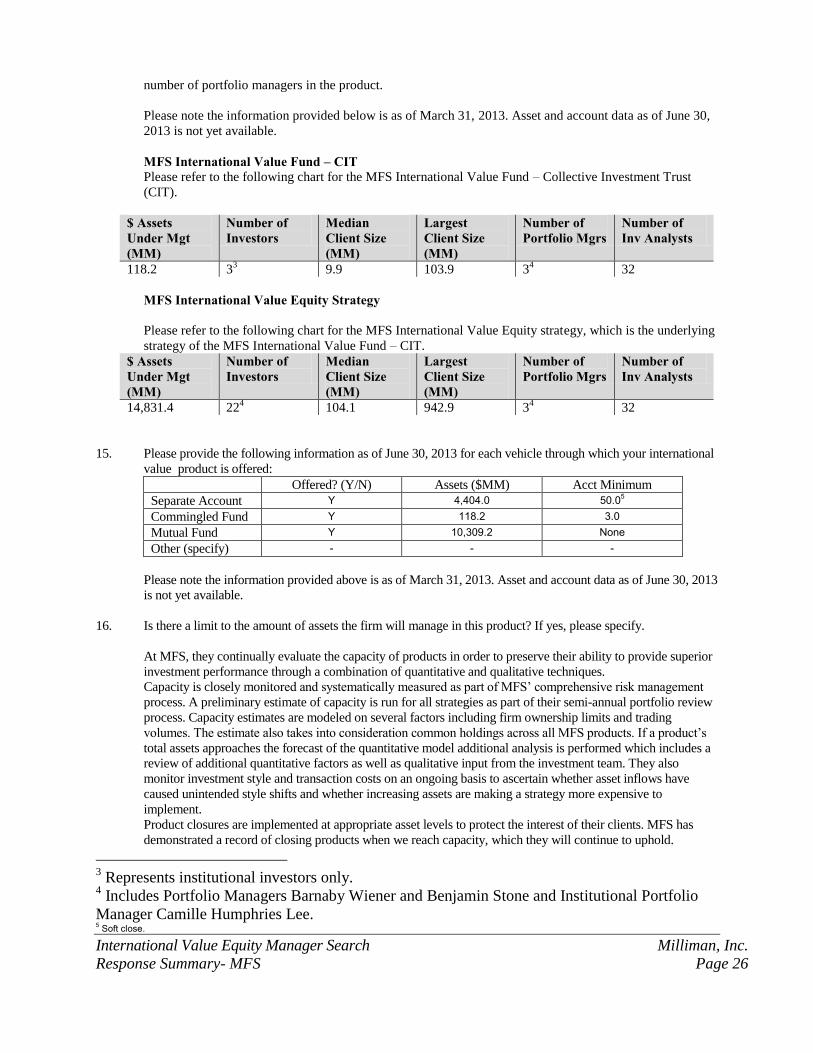
International Value Equity Manager Search Milliman, Inc.
Response Summary- MFS Page 26
number of portfolio managers in the product.
Please note the information provided below is as of March 31, 2013. Asset and account data as of June 30,
2013 is not yet available.
MFS International Value Fund – CIT Please refer to the following chart for the MFS International Value Fund – Collective Investment Trust
(CIT).
$ Assets Under Mgt (MM)
Number of Investors
Median Client Size (MM)
Largest Client Size (MM)
Number of Portfolio Mgrs
Number of Inv Analysts
118.2 33 9.9 103.9 3
4 32
MFS International Value Equity Strategy
Please refer to the following chart for the MFS International Value Equity strategy, which is the underlying
strategy of the MFS International Value Fund – CIT.
$ Assets Under Mgt (MM)
Number of Investors
Median Client Size (MM)
Largest Client Size (MM)
Number of Portfolio Mgrs
Number of Inv Analysts
14,831.4 224 104.1 942.9 3
4 32
15. Please provide the following information as of June 30, 2013 for each vehicle through which your international
value product is offered:
Offered? (Y/N) Assets ($MM) Acct Minimum
Separate Account Y 4,404.0 50.05
Commingled Fund Y 118.2 3.0
Mutual Fund Y 10,309.2 None
Other (specify) - - -
Please note the information provided above is as of March 31, 2013. Asset and account data as of June 30, 2013
is not yet available.
16. Is there a limit to the amount of assets the firm will manage in this product? If yes, please specify.
At MFS, they continually evaluate the capacity of products in order to preserve their ability to provide superior
investment performance through a combination of quantitative and qualitative techniques.
Capacity is closely monitored and systematically measured as part of MFS’ comprehensive risk management
process. A preliminary estimate of capacity is run for all strategies as part of their semi-annual portfolio review
process. Capacity estimates are modeled on several factors including firm ownership limits and trading
volumes. The estimate also takes into consideration common holdings across all MFS products. If a product’s
total assets approaches the forecast of the quantitative model additional analysis is performed which includes a
review of additional quantitative factors as well as qualitative input from the investment team. They also
monitor investment style and transaction costs on an ongoing basis to ascertain whether asset inflows have
caused unintended style shifts and whether increasing assets are making a strategy more expensive to
implement.
Product closures are implemented at appropriate asset levels to protect the interest of their clients. MFS has
demonstrated a record of closing products when we reach capacity, which they will continue to uphold.
3 Represents institutional investors only.
4 Includes Portfolio Managers Barnaby Wiener and Benjamin Stone and Institutional Portfolio
Manager Camille Humphries Lee. 5 Soft close.
International Value Equity Manager Search Milliman, Inc.
Response Summary- MFS Page 27
Based on their ongoing evaluation of capacity across the firm, they implemented a soft close of their
International Value Equity strategy to new separate accounts in November 2012. Taking into account the
current assets under management and anticipated flows, they believe this was an appropriate time to begin to
limit flows into the strategy. Pooled vehicles designed for institutional investors and the retail mutual fund have
remained open to new and existing clients.
17. What internal controls are in place to monitor market timing activity in particular and late trading in your
firm’s funds? Who monitors these activities? Have there been any trading policy violations over the past
five years?
The company has in place a policy on market timing that is designed to protect the interests of long-term
shareholders of MFS funds. According to the current policy, investors are restricted as to the number of times
they may exchange out of a fund during a calendar quarter (subject to certain dollar limits).
Additional information on MFS retail mutual funds and their prospectus disclosure on market timing can be
found at their website, www.mfs.com.
There have been no trading policy violations over the past five years.
Please note these policies pertain to registered mutual funds offered by MFS and do not specifically pertain to
the MHTC collective investment trust.
International Value Equity Investment Philosophy
18. Briefly describe the investment philosophy/strategy, style and distinguishing characteristics of this product.
Investment Philosophy They believe:
Most market participants speculate on near-term information and overreact to short-term news flow.
They invest on a three- to five-year time horizon. Their global research platform, collaborative investment
process, and compensation structure are all aligned with this time frame.
Most market participants attach too much weight to forecasts, which often prove inaccurate, particularly at
inflection points.
They seek an analytical advantage by evaluating the long-term quality, sustainability, improvement potential,
and intrinsic value of businesses.
Most market participants overemphasize upside potential versus downside risk.
They manage client capital by avoiding stocks with substantial downside risk and only invest where valuations
more than compensate for inherent risks.
Style They would describe the style of the CIT as international all-cap value equity.
Distinguishing characteristics They believe the competitive advantages of International Value include
Integrated global research platform
collaborative culture critical to process
combines equity, fixed-income, and quantitative analysis
Disciplined, consistent strategy
seek sustainable returns in various market environments
assess investment opportunities in context of three- to five-year time horizon
Rigorous valuation discipline
patient, contrarian approach
focus on downside risk management
19. Does your firm’s international value equity discipline have a growth, value or core style bias?
The MFS International Value Fund – CIT has a value style bias.
20. Explain the firm’s portfolio approach to the level of cash and equivalent holdings. Specify the normal,
maximum and minimum levels of cash holdings.
International Value Equity Manager Search Milliman, Inc.
Response Summary- MFS Page 28
Generally, the fund has been fully invested. Cash levels have been the result of buy/sell transactions, rather
than a reflection of their optimism/pessimism regarding international equity markets.
Generally, the maximum of cash that has been committed to the fund is 10%. However, the percentage of
cash has typically been less than 5%.
21. Briefly state how your firm defines an investable international value equity market for the purposes of this
product.
The investable universe for the strategy has included all securities included in the MSCI All County World
ex US Index.
22. How does your firm assess the liquidity of individual equity markets?
Liquidity risk comprises market liquidity and settlement liquidity. Market liquidity is the risk that a
transaction cannot be unwound because of inadequate market depth, while settlement liquidity is the risk
that an investment manager will not be able to meet its obligations resulting from a transaction.
The MFS Investment Management Committee considers market depth as part of the criteria for approval of
a new instrument and in its periodic evaluation of existing instruments.
Prior to investment, portfolio managers consider the relationship between liquidity and size of the position.
The Compliance team uses an internal compliance system to monitor positions based on Information
Memorandum, Trust Deed, and internal guidelines.
The Quantitative Solutions team, portfolio managers, and the Investment Management Committee
semiannually review capacity liquidity analysis on equity portfolios by quantifying the number of days of
trading volume held by portfolio and the complexity for each security.
Through various sources including other MFS departments, the MFS Investment Compliance Group
receives and reviews information regarding newly acquired restricted/illiquid securities. In addition, these
securities may be deemed liquid under approved procedures. This information is used to monitor and to
report applicable limitation requirements.
Certain security types are automatically considered illiquid unless deemed liquid. Board-approved
procedures exist for deeming certain securities to be liquid. These include 144A securities, municipal lease
securities, 4(2) commercial paper, bank loans, and private placements.
In addition, portfolio managers are responsible for reviewing the trading markets of their securities and for
evaluating a number of factors to determine liquidity, such as frequency of trades, number of dealers
making a market in the security, and whether the security can be disposed of in the ordinary course of
business within seven days.
23. Will your firm invest in emerging equity markets in this investment discipline? If yes, specify the typical
portfolio percentage as well as maximum and current (6/30/2013) percentage.
Yes. While they consider International Value's primary universe to be any stock that is a member of the
MSCI EAFE Index, the fund may invest in emerging equity markets. Historically, the fund's emerging
markets limit has not exceeded 15%.
As of March 31, 2013, the current emerging markets exposure in the fund was 1.6%. Since the fund’s
inception in 2010, the maximum emerging markets exposure in the fund has been 4.4% (December 2010,
January 2011). The average emerging markets exposure from September 2010 to March 2013 was 3.3%.
Please note that due to MFS’ holdings policy, portfolio characteristics for pooled vehicles cannot be
released prior to the 15th
day following quarter-end. As such, emerging markets exposure as of June 30,
2013 is not yet available.
24. What securities other than common stock and cash equivalents will be held?
International Value Equity Manager Search Milliman, Inc.
Response Summary- MFS Page 29
In addition to common stock and cash equivalents, the fund may invest in ADR versions of stocks in which
the ordinary shares are a component of the MSCI EAFE Index.
25. Does your firm engage in currency hedging in this strategy? If yes, is there a maximum hedge ratio for
major currencies?
Currency derivatives may be used in the fund purely for defensive purposes if the fund is overweight or
underweight a country or region, with the objective of providing downside risk management in the event of
a significant move in currency exchange rates.
In November 2009, they purchased yen put options to hedge part of the portfolio's exposure to the yen.
Considering their overweight in Japan and exposure to a number of domestic Japanese companies,
combined with the strength of the yen relative to other currencies, they were concerned that a possible
sharp decline in the value of yen could detract from portfolio returns.
They do not have a maximum hedge ratio for major currencies.
26. State typical benchmark(s) used to measure the fund’s performance. Which do you believe is best?
The MFS International Value Fund – CIT has sought to outperform the MSCI EAFE Value Index (Europe,
Australia, Far East) (net dividends reinvested) over a full market cycle. The MSCI EAFE (Europe,
Australia, Far East) (net of dividends reinvested) is a secondary benchmark.
Their "best-fit" analysis reveals that the MSCI EAFE Value Index is most suitable, and, in their view, can
best help investors understand the potential return patterns of International Value over time. A broader
index, such as the MSCI EAFE, is also appropriate, however, given the diversified nature of International
Value, its reliance on stock picking as the primary driver of security selection, and the portfolio
management team's comfort with broader benchmarks.
27. What is the expected tracking error of this product compared to the MSCI ACWI ex-US Value Index?
The MFS International Value Fund – CIT, while benchmark aware, has been primarily structured as a stock
picking strategy where the benchmark does not guide security selection. As noted above, MFS International
Value is benchmarked against the MSCI EAFE Value (primary) and MSCI EAFE (secondary) indices.
Given the strategies underweight to Emerging Markets versus the MSCI ACWI ex-US Value, it would not
be an appropriate benchmark.
Tracking error has generally fallen within a range of 3% – 8% on a prospective basis relative to both the
MSCI EAFE Value and MSCI EAFE indices. They monitor predicted tracking error regularly to ensure
that they understand the sources of risk in their fund, and that they are not taking any unintended positions
relative to the benchmark. They do not, however, tactically shift their portfolio positioning (relative sector
and country weightings) to increase or decrease the portfolio's tracking error.
28. Does this product target a particular level of volatility (index-relative or absolute)? If so, please describe
how the volatility target is implemented.
The fund’s goal is to outperform the MSCI EAFE Value Index over full market cycles with below average
volatility. While the fund has not targeted a particular level of volatility, volatility is controlled through
stock selection. Most market participants attach too much weight to forecasts, which often prove
inaccurate, particularly at inflection points. They seek an analytical advantage by evaluating the long-term
quality, sustainability, improvement potential, and intrinsic value of businesses. Most market participants
overemphasize upside potential versus downside risk. They manage client capital by avoiding stocks with
substantial downside risk and only invest where valuations more than compensate for inherent risks.
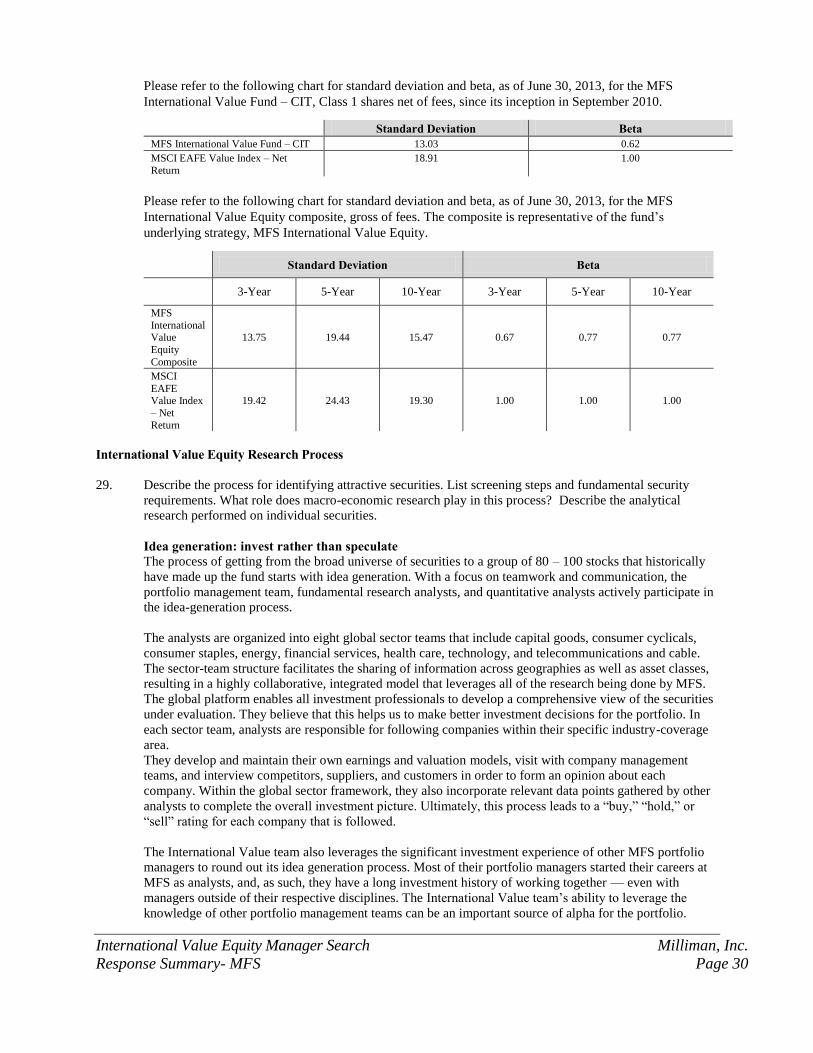
International Value Equity Manager Search Milliman, Inc.
Response Summary- MFS Page 30
Please refer to the following chart for standard deviation and beta, as of June 30, 2013, for the MFS
International Value Fund – CIT, Class 1 shares net of fees, since its inception in September 2010.
Standard Deviation Beta MFS International Value Fund – CIT 13.03 0.62
MSCI EAFE Value Index – Net
Return
18.91 1.00
Please refer to the following chart for standard deviation and beta, as of June 30, 2013, for the MFS
International Value Equity composite, gross of fees. The composite is representative of the fund’s
underlying strategy, MFS International Value Equity.
Standard Deviation Beta
3-Year 5-Year 10-Year 3-Year 5-Year 10-Year
MFS
International Value
Equity
Composite
13.75 19.44 15.47 0.67 0.77 0.77
MSCI
EAFE Value Index
– Net
Return
19.42 24.43 19.30 1.00 1.00 1.00
International Value Equity Research Process
29. Describe the process for identifying attractive securities. List screening steps and fundamental security
requirements. What role does macro-economic research play in this process? Describe the analytical
research performed on individual securities.
Idea generation: invest rather than speculate The process of getting from the broad universe of securities to a group of 80 – 100 stocks that historically
have made up the fund starts with idea generation. With a focus on teamwork and communication, the
portfolio management team, fundamental research analysts, and quantitative analysts actively participate in
the idea-generation process.
The analysts are organized into eight global sector teams that include capital goods, consumer cyclicals,
consumer staples, energy, financial services, health care, technology, and telecommunications and cable.
The sector-team structure facilitates the sharing of information across geographies as well as asset classes,
resulting in a highly collaborative, integrated model that leverages all of the research being done by MFS.
The global platform enables all investment professionals to develop a comprehensive view of the securities
under evaluation. They believe that this helps us to make better investment decisions for the portfolio. In
each sector team, analysts are responsible for following companies within their specific industry-coverage
area.
They develop and maintain their own earnings and valuation models, visit with company management
teams, and interview competitors, suppliers, and customers in order to form an opinion about each
company. Within the global sector framework, they also incorporate relevant data points gathered by other
analysts to complete the overall investment picture. Ultimately, this process leads to a “buy,” “hold,” or
“sell” rating for each company that is followed.
The International Value team also leverages the significant investment experience of other MFS portfolio
managers to round out its idea generation process. Most of their portfolio managers started their careers at
MFS as analysts, and, as such, they have a long investment history of working together — even with
managers outside of their respective disciplines. The International Value team’s ability to leverage the
knowledge of other portfolio management teams can be an important source of alpha for the portfolio.
International Value Equity Manager Search Milliman, Inc.
Response Summary- MFS Page 31
Finally, as a complement to their fundamental research efforts, the firm also has significant in-house
quantitative research capabilities that have grown over the last several years in scale and scope. The
quantitative research team has been helpful in generating new ideas by running screens based on
International Value's investment criteria to stimulate discussion around ideas currently owned or not
owned. This team is generally viewed as another resource for the portfolio management team to utilize in
coordination with their fundamental, bottom-up process in evaluating potential investment ideas.
The International Value portfolio management team collaborates on an ongoing basis with the analysts
throughout their research process, accompanying them on company visits, working through their financial
models, valuation framework, and other parts of their investment thesis. Interaction with the analyst teams,
both formally and informally, results in highly collaborative discussions to select appropriate ideas for
inclusion within the portfolio. Analysts and portfolio managers also exchange ideas and information in
formal weekly meetings. However, much of the communication among the members of the investment
team takes place on an informal basis through face-to-face discussions, voicemail/e-mail, and an online
notes system through which team members post reports and ratings for companies followed.
Stock analysis: analyze rather than forecast Once an idea has been generated, the next step is for the team to decide whether the idea is a good fit for
the fund. The team is focused on assessing the durability of returns and intrinsic value. The following
investment issues are addressed:
Evaluate quality: The team defines quality as a company's ability to generate returns above its cost of
capital on a sustainable basis. As part of the team’s analysis, the following questions are considered: How
sustainable is the company's business model? How fast is the industry growing? How cyclical is the
industry and what risks are involved? What is the strength of the management team? How does it allocate
capital?
Determine appropriate valuation: The team looks for stocks that are cheap on a wide range of valuation
metrics, believing that in some cases, valuation alone can be the catalyst. Multiple valuation measures are
evaluated in making their assessment: cash flow, book value or total capital employed, earnings, sales,
dividend yield, as well as the company’s cash flow return on investment (CFROI). The team then considers
how these valuation measures compare versus the company’s history, its peers, and the overall market.
Assess improvement potential: The team believes that the market often overlooks the potential value that
can be created by companies vis-à-vis improving structural conditions, including changes in
supply/demand, relative profitability and restructuring potential, and analysis of changes in management
Using a longer-term investment framework enables the team to fully assess the potential impact of future
fundamental improvements on a company's sustainable returns, cash flows, margins, etc. that may result
from changing structural conditions.
30. What is the number of securities regularly followed by security analysts and/or portfolio managers?
Analysts typically cover two industries and have active ratings on 30-40 securities.
31. Describe any processes in place to detect accounting irregularities at companies held in the portfolio.
Assessing the quality of a company's underlying earnings and understanding the potential for corporate
financial statement irregularities require one to be diligent in analyzing the integrity of accounting reports
issued by the company. Their fundamental, bottom-up research process involves a diligent review of a
company's financial statements.
They place particular emphasis on the free cash flow that is generated by the company — which is typically
less subject to accounting manipulation than income statement items — and how it relates the net income
reported by the company. Over time, there should be a consistent relationship between the cash flows of the
business and its net income. Poor free cash flow conversion or inconsistencies in this ratio can be one indication
that a company's earnings may be of lower quality or that its accounting policies may not match its underlying
International Value Equity Manager Search Milliman, Inc.
Response Summary- MFS Page 32
business economics. In addition, having their equity and fixed income analysts working in close collaboration
with each other as they analyze companies is also helpful in noting potential problem areas.
Their analysts create proprietary financial models on all companies that they follow — including income
statements, statements of cash flows, and balance sheets. They believe understanding how a business operates
and comparing it to similar companies within the same industry segment or sector can also help to highlight
potential areas of concern with respect to both earnings quality or fraudulent accounting practices.
Finally, they have raised their internal awareness on where reporting segment irregularities are most prevalent
and which industries and events (such as acquisitions) warrant heightened scrutiny.
32. Does your firm use any technical and/or price momentum research? If so, how and why?
No. The primary driver of stock ratings and purchase and sell decisions is fundamental analysis. Additionally,
their analysts and portfolio managers have access to several quantitative systems that allow them to monitor
technical and price factors for the securities followed and owned in the fund. While analysts are aware of
technical research, the basic driver of an investment thesis is fundamental analysis.
Portfolio Construction and Management 33. Describe in detail the portfolio construction and management process. If a team approach is used, state the
names of the team members and explain the role(s) of each team member.
The International Value team includes Portfolio Managers Barnaby Wiener and Benjamin Stone and
Institutional Portfolio Manager Camille Humphries Lee. Barnaby and Benjamin participate in the research
process and strategy discussions and maintain overall responsibility for portfolio construction, final buy
and sell decisions, and risk management for the fund. Institutional Portfolio Manager Camille Lee
participates in the research process, portfolio construction discussions, assesses risk, manages daily cash
flows, and communicates investment policy, strategy, and tactics.
As the team evaluates all of the potential investment opportunities, it is guided by a common investment
philosophy and framework. Potential ideas are evaluated and compared based on valuation, business
characteristics, balance sheet, normalized cash flow generation, sustainable returns, and risk/return
opportunity, etc. The portfolio construction process is highly collaborative and is conducted based on
bottom-up, fundamental research. Position size within the fund has been determined by the level of
conviction in the idea (e.g., the upside potential/downside risk) and liquidity of the company. Sector,
industry, country, and regional weightings have generally been the residual of the bottom-up, stock
selection process, rather than the result of any top-down, macroeconomic outlook.
Generally, no more than 5% has been held in a single issue at purchase, and no more than 25% has been
allocated to any one industry. Generally, the fund's emerging markets limit has not exceeded 15%. The
fund has typically held 80 – 100 holdings, the majority of which were buy-rated securities. All final buy
and sell decisions are made by Portfolio Managers Barnaby Wiener and Benjamin Stone.
34. What is the current number, typical number and range of securities held in the product?
As of June 30, 2013 Typical Number Range 93 90 80 - 100
35. As of June 30, 2013, state the typical portfolio allocation to equities in the market capitalization ranges
shown below. Also, please specify the possible ranges and typical allocations for each category.
International Value is an all-cap value investment approach. They generally have invested in companies
with a market capitalization that is greater than US$1 billion at the time of purchase. They do not have
predefined targets for exposure across small-, mid-, or large-cap segments of the market.
Please note the information provided below is as of March 31, 2013. Due to MFS’ holdings policy,
portfolio characteristics for pooled vehicles cannot be released prior to the 15th
day following quarter-end.
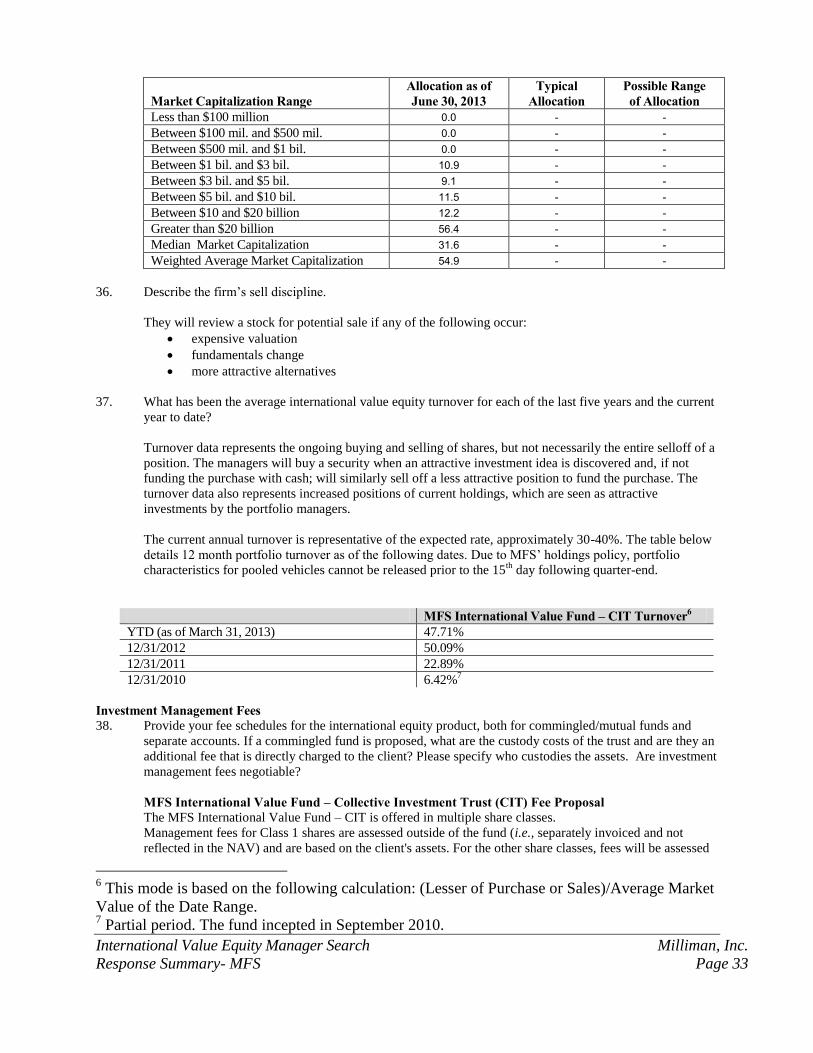
International Value Equity Manager Search Milliman, Inc.
Response Summary- MFS Page 33
Market Capitalization Range
Allocation as of June 30, 2013
Typical Allocation
Possible Range of Allocation
Less than $100 million 0.0 - -
Between $100 mil. and $500 mil. 0.0 - -
Between $500 mil. and $1 bil. 0.0 - -
Between $1 bil. and $3 bil. 10.9 - -
Between $3 bil. and $5 bil. 9.1 - -
Between $5 bil. and $10 bil. 11.5 - -
Between $10 and $20 billion 12.2 - -
Greater than $20 billion 56.4 - -
Median Market Capitalization 31.6 - -
Weighted Average Market Capitalization 54.9 - -
36. Describe the firm’s sell discipline.
They will review a stock for potential sale if any of the following occur:
expensive valuation
fundamentals change
more attractive alternatives
37. What has been the average international value equity turnover for each of the last five years and the current
year to date?
Turnover data represents the ongoing buying and selling of shares, but not necessarily the entire selloff of a
position. The managers will buy a security when an attractive investment idea is discovered and, if not
funding the purchase with cash; will similarly sell off a less attractive position to fund the purchase. The
turnover data also represents increased positions of current holdings, which are seen as attractive
investments by the portfolio managers.
The current annual turnover is representative of the expected rate, approximately 30-40%. The table below
details 12 month portfolio turnover as of the following dates. Due to MFS’ holdings policy, portfolio
characteristics for pooled vehicles cannot be released prior to the 15th
day following quarter-end.
MFS International Value Fund – CIT Turnover6 YTD (as of March 31, 2013) 47.71%
12/31/2012 50.09%
12/31/2011 22.89%
12/31/2010 6.42%7
Investment Management Fees 38. Provide your fee schedules for the international equity product, both for commingled/mutual funds and
separate accounts. If a commingled fund is proposed, what are the custody costs of the trust and are they an
additional fee that is directly charged to the client? Please specify who custodies the assets. Are investment
management fees negotiable?
MFS International Value Fund – Collective Investment Trust (CIT) Fee Proposal The MFS International Value Fund – CIT is offered in multiple share classes.
Management fees for Class 1 shares are assessed outside of the fund (i.e., separately invoiced and not
reflected in the NAV) and are based on the client's assets. For the other share classes, fees will be assessed
6 This mode is based on the following calculation: (Lesser of Purchase or Sales)/Average Market
Value of the Date Range. 7 Partial period. The fund incepted in September 2010.
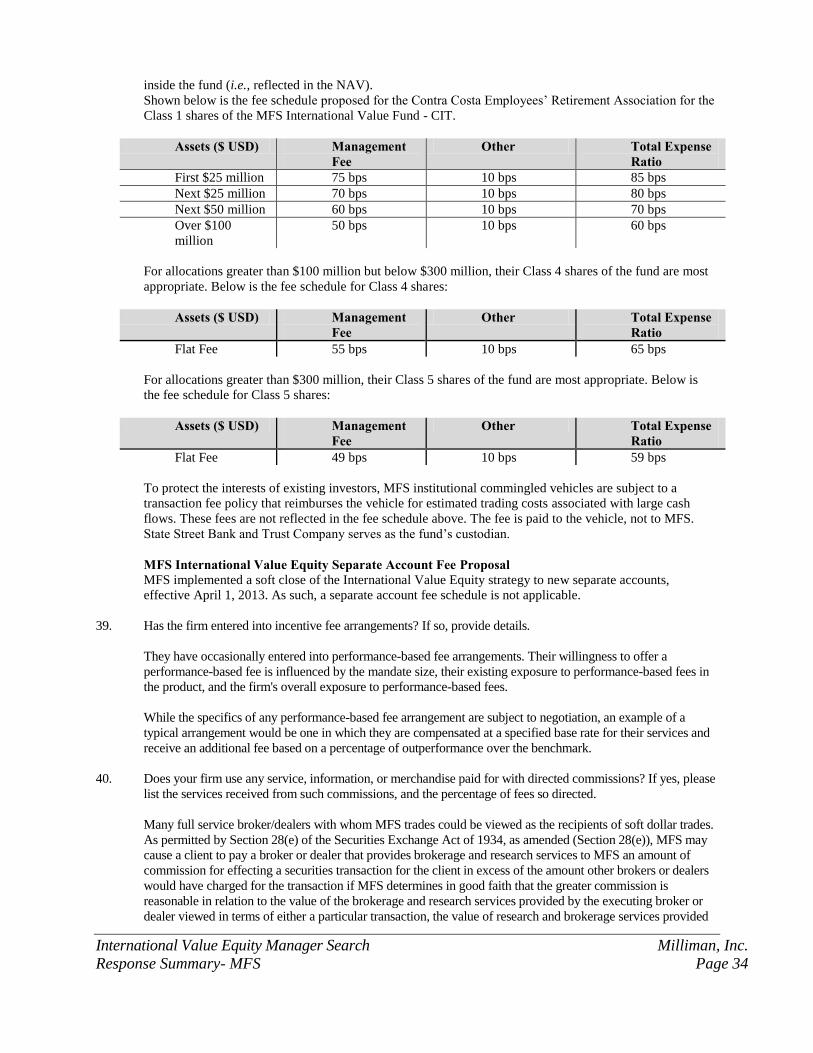
International Value Equity Manager Search Milliman, Inc.
Response Summary- MFS Page 34
inside the fund (i.e., reflected in the NAV).
Shown below is the fee schedule proposed for the Contra Costa Employees’ Retirement Association for the
Class 1 shares of the MFS International Value Fund - CIT.
Assets ($ USD) Management Fee
Other Total Expense Ratio
First $25 million 75 bps 10 bps 85 bps
Next $25 million 70 bps 10 bps 80 bps
Next $50 million 60 bps 10 bps 70 bps
Over $100
million
50 bps 10 bps 60 bps
For allocations greater than $100 million but below $300 million, their Class 4 shares of the fund are most
appropriate. Below is the fee schedule for Class 4 shares:
Assets ($ USD) Management Fee
Other Total Expense Ratio
Flat Fee 55 bps 10 bps 65 bps
For allocations greater than $300 million, their Class 5 shares of the fund are most appropriate. Below is
the fee schedule for Class 5 shares:
Assets ($ USD) Management Fee
Other Total Expense Ratio
Flat Fee 49 bps 10 bps 59 bps
To protect the interests of existing investors, MFS institutional commingled vehicles are subject to a
transaction fee policy that reimburses the vehicle for estimated trading costs associated with large cash
flows. These fees are not reflected in the fee schedule above. The fee is paid to the vehicle, not to MFS.
State Street Bank and Trust Company serves as the fund’s custodian.
MFS International Value Equity Separate Account Fee Proposal MFS implemented a soft close of the International Value Equity strategy to new separate accounts,
effective April 1, 2013. As such, a separate account fee schedule is not applicable.
39. Has the firm entered into incentive fee arrangements? If so, provide details.
They have occasionally entered into performance-based fee arrangements. Their willingness to offer a
performance-based fee is influenced by the mandate size, their existing exposure to performance-based fees in
the product, and the firm's overall exposure to performance-based fees.
While the specifics of any performance-based fee arrangement are subject to negotiation, an example of a
typical arrangement would be one in which they are compensated at a specified base rate for their services and
receive an additional fee based on a percentage of outperformance over the benchmark.
40. Does your firm use any service, information, or merchandise paid for with directed commissions? If yes, please
list the services received from such commissions, and the percentage of fees so directed.
Many full service broker/dealers with whom MFS trades could be viewed as the recipients of soft dollar trades.
As permitted by Section 28(e) of the Securities Exchange Act of 1934, as amended (Section 28(e)), MFS may
cause a client to pay a broker or dealer that provides brokerage and research services to MFS an amount of
commission for effecting a securities transaction for the client in excess of the amount other brokers or dealers
would have charged for the transaction if MFS determines in good faith that the greater commission is
reasonable in relation to the value of the brokerage and research services provided by the executing broker or
dealer viewed in terms of either a particular transaction, the value of research and brokerage services provided
International Value Equity Manager Search Milliman, Inc.
Response Summary- MFS Page 35
in connection with MFS’ overall relation with the broker or dealer or MFS' overall responsibilities to the client
and its other clients. Although commissions paid on every transaction will, in the judgment of MFS, be
reasonable in relation to the value of the brokerage and research services provided, commissions exceeding
those which another broker might charge may be paid to broker/dealers who were selected to execute
transactions on behalf of the client and MFS' other clients in part for providing such brokerage and research
services.
MFS has entered into Client Commission Agreements (CCAs) with broker/dealers that execute, clear, or settle
securities transactions on behalf of clients (executing brokers) that provide for the executing brokers to pool a
portion of the commissions paid by registrant’s clients for securities transactions (pooled commissions) to
providers of research (research providers). Such research providers produce research for the benefit of the
registrant. Because a research provider may play no role in executing client securities transactions, any research
prepared by that research provider may constitute third-party research. The registrant may use brokerage
commissions, including pooled commissions, from the clients’ portfolio transactions to acquire research,
subject to the procedures and limitations described in this discussion.
Please refer to the following chart for a percentage of trades executed that were tied to soft dollar relationships
for the past three years, ending December 31, 2012.
Calendar Year-end (1/1-12/31) Percentage of Trades tied to Soft Dollars 2012 14.3%
2011 12.6%
20108 12.7%
41. Please provide copies of your firm’s Form ADV Parts I and II.
As a New Hampshire-chartered, non-depository trust company, MFS Heritage Trust Company (MHTC) is a
"bank" as defined in the Investment Advisers Act of 1940, as amended (the Advisers Act). Therefore, MHTC is
excluded from the definition of "investment adviser" under the Advisers Act and, accordingly, is not required to
file Form ADV, Parts 1 and 2.
MFS' Form ADV Parts 1 and 2A are provided in Appendix I.
International value Equity Investment Performance
42. Provide quarterly historical performance for your product using the attached form. Do not include any
simulated data. Returns should be total portfolio, time-weighted rates of return both gross and net of
investment management fees. For year-end periods, also provide the market value of assets and number of
accounts. If you offer both a commingled product and separate accounts, provide performance for both.
Please refer to Appendix II.
43. Please specify the methodology for constructing the firm’s composite performance.
As a general rule, a new account is added to a composite in the second full month of the account’s performance
history and has a minimum of $5 million in net assets for fixed-income composites. For equity composites, the
general rule is an account is added to a composite in the first full month of the account’s performance history
8 Partial period. The fund incepted in September 2010.
International Value Equity Manager Search Milliman, Inc.
Response Summary- MFS Page 36
and has a minimum of $2 million in net assets. However, there are exceptions to the above rules for specific
composites.
All terminated accounts remain in the composite's history. The terminated account ceases to be a component in
the month they lose discretion.
Portfolios in their composites are size weighted. Since inception, this policy has been consistently applied.
44. Are returns audited? By whom? Are returns CFAI/AIMR compliant? For what time period? Please provide the
most recent statement of verification by an independent third party.
MFS claims compliance with the Global Investment Performance Standards (GIPS®). All composite
performance data supplied in this response are taken from reports constructed to be strictly compliant with
the requirements of those standards. MFS engages Deloitte & Touche to conduct an annual verification
examination of firmwide compliance plus performance reviews of selected composites

International Value Equity Manager Search Milliman, Inc.
Response Summary- Pyrford Page 37
INTERNATIONAL VALUE EQUITY
INVESTMENT MANAGER QUESTIONNAIRE As of June 30, 2013
Organizational Background
1. What is the firm name, address, and telephone and fax numbers of your main and branch offices? What
investment activity takes place at each location?
Name of firm: Pyrford International Ltd.
Address: 79 Grosvenor Street
London
W1K 3JU
United Kingdom
Telephone: +44 20 7495 4641
Fax: +44 20 7399 2205
E-mail: [email protected]
2. What is the name, position, telephone and fax numbers, and e-mail address of the firm’s new business
contact and database/questionnaire contact?
New Business Contact Questionnaire Contact
Name Mark Osterkamp Simon Phillips Title Relationship Manager, Institutional Sales,
BMO Global Asset Management RFP Manager
Office BMO Asset Management US, 79 Grosvenor Street, London UK Phone 310 321 7852 +44 20 7399 2242 Fax 310 321 7810 +44 20 7399 2205 Email [email protected] [email protected]
3. When was your firm founded? When was it registered with the SEC?
Pyrford was founded in 1987 and was registered with the SEC in 1989.
4. Describe the firm’s ownership structure and explain any changes over the past five years. Discuss the
firm’s relationship with the parent and affiliated companies, if any.
Pyrford is 100% owned by Bank of Montreal Capital Markets (Holdings) Limited, a company within the
BMO Financial Group (being Bank of Montreal and its subsidiaries). There have been no ownership
changes during the last five years.
5. State the carriers and the limits of errors and omissions and fiduciary liability insurance.
Pyrford carries the following insurance coverage for its business:
Public Liability Insurance Name of underwriter Chubb Insurance Company of Canada
Policy number 35347551 (Primary Commercial General Liability)
Expiry Date April 30th
, 2014
Level of coverage C$1,000,000
Amount deductible C$100,000
Name of underwriter Chubb Insurance Company of Canada
Policy number 79733428 (Excess & Umbrella Liability)
Expiry Date April 30th
2014
International Value Equity Manager Search Milliman, Inc.
Response Summary- Pyrford Page 38
Level of coverage C$10,000,000 (excess of C$1,000,000)
Amount deductible C$100,000
Employers’ Liability Insurance Name of underwriter Amlin Insurance Services
Policy number L10000023822
Expiry Date March 31st 2014
Level of coverage £5,000,000
Amount deductible None.
Professional Indemnity Insurance Name of underwriter Travelers Insurance Company Ltd.
Policy number KK325610j001
Expiry Date March 4th
2014
Level of coverage £10,000,000
Amount deductible £75,000
Additionally, the SEC sets out a minimum requirement to hold an appropriate ERISA bond. Pyrford holds
this through Hartford Fire Insurance Corp. for an amount of US$500,000.
6. Describe any litigation regarding your firm’s investment activities over the past 5 years. Is the firm
expecting new litigation?
There are no litigation issues applicable.
7. Describe any judgments against your firm by governmental and regulatory agencies over the past 5 years.
Also describe any current investigations.
There are no such judgements applicable.
8. Please provide copies of your firm’s Form ADV Parts I and II.
Please refer to Appendix 1.
9. Please state the market value of assets under management for the firm for each of the past five calendar
years as well as the year-to-date ending June 30, 2013. Also, state accounts and assets gained, as well as
accounts and assets lost over each of these periods.
Total Firm Assets Market Value
$(Millions) # Accounts
Gained Assets Gained
$(Millions) #Accounts
Lost Assets Lost $(Millions)
Dec 31, 2008 $2,009.10m 11 $253.1m 8 $566.7m Dec 31, 2009 $2,583.46m 7 $154.9m 3 $36.8m Dec 31, 2010 $3,122.55m 11 $358.0m 1 $35.2m Dec 31, 2011 $3,509.70m 17 $515.1m 2 $173.6m Dec 31, 2012 $7,263,48m 33 $3,002.1m 0 0 June 30, 2013 $8,840.30m 15 $1,150.7m 1 $28.7m
International Value Equity Manager Search Milliman, Inc.
Response Summary- Pyrford Page 39
10. Please state the market value of assets under management for the recommended product for each of the past
five calendar years as well as the year-to-date ending June 30, 2013. Also, state accounts and assets gained,
as well as accounts and assets lost over each of these periods.
Specified International Value Equity Product Market Value
(Millions) Accounts Gained
Assets Gained (Millions)
Accounts Lost
Assets Lost (Millions)
Dec 31, 2008 $808.25m 7 $168.7m 8 $566.7m Dec 31, 2009 $1,218.62m 6 $154.9m 3 $36.8m Dec 31, 2010 $1,489.73m 5 $108.2m 0 0 Dec 31, 2011 $1,544.74m 8 $254.3m 1 $163.8m Dec 31, 2012 $2,478.37m 7 $593.2m 0 0 June 30, 2013 $3,139.85m 4 $729.9m 1 $28.7m
International Value Equity Investment Services
11. Please provide the name of the product described in the remainder of this response.
International Equity.
12. Provide the following information on the firm’s key members of the international value equity portfolio
management team: names, titles and responsibilities, years on the product (please note any changes in roles
below), years with firm, and years of investment experience. Please provide biographies and an organization
chart.
Name
Title
Yrs. w/
Product
Yrs. W/
Firm
Yrs. Inv.
Exp.
Bruce Campbell Investment Chairman 26 26 43
Tony Cousins CFA Chief Executive Officer and Chief Investment Officer
24 24 28
Paul Simons CFA Head of Portfolio Management, Asia Pacific
17 17 17
Daniel McDonagh CFA Head of Portfolio Management, Europe & UK
16 16 16
Geraldine Arrigoni CFA Portfolio Manager, Asia Pacific 10 10 12
Jun Yu CFA Portfolio Manager, Asia Pacific 5 5 13
Stefan Bain ASIP Portfolio Manager, Asia Pacific 1 1 12
Peter Moran CFA Portfolio Manager, Europe 10 10 10
Nabil Irfan CFA Portfolio Manager, Europe 8 8 13
Bruce Campbell B Com (Hons)
Investment Chairman Bruce has over 40 years’ experience in the international investment industry. After graduating from
Melbourne University in 1969 Bruce managed the investment operations of an Australian based general
insurance company for 12 years and then founded the predecessor company to Pyrford in Melbourne in
1982 – at that stage as part of the multi-national Elders IXL group. In 1987 Bruce moved the investment
operations to London and in 1991 headed the buy-out of the investment management subsidiary from the
Elders organisation. At that time the company’s name was changed to Pyrford International.
Bruce remained Chief Executive and Chief Investment Officer until 31st December 2010 at which time he
took up the role of Investment Chairman.
International Value Equity Manager Search Milliman, Inc.
Response Summary- Pyrford Page 40
Tony Cousins MA (Hons), CFA
Chief Executive Officer/Chief Investment Officer Tony assumed the role of Chief Executive Officer and Chief Investment Officer on 1
st January 2011.
Tony joined Pyrford in 1989 and was Director of Portfolio Management for Europe/UK until his promotion
as Joint Chief Investment Officer in November 2009.
After graduating from Cambridge University in 1985 with a Bachelor of Arts, Tony joined Daiwa
International Capital Management in London as an Equity Portfolio Manager having obtained his Master of
Arts and CFA in 1990.
Paul Simons MA (Hons), CFA
Head of Portfolio Management, Asia Pacific Paul joined Pyrford’s Asia team in 1996 after graduating from Oxford University with a degree in
geography. He spent seven years covering South East Asia, Hong Kong, Taiwan, Korea, Australia and
New Zealand before being promoted to the role of Portfolio Manager for Australia and New Zealand in
2003. Paul became a CFA charter holder in 2000, as well being awarded his Master of Arts. Paul was
appointed Head of the Asia Pacific team and a member of the Investment Strategy Committee in 2008.
Daniel McDonagh MA (Hons), CFA
Head of Portfolio Management, Europe/UK Daniel started at Pyrford in October 1997 after graduating from Oxford University with a degree in Politics
and Economics. Daniel worked as a Portfolio Manager and Senior Research Analyst within the European
portfolio management team until his appointment as head of the team in November 2009. He became a
CFA charter holder in 2000.
Geraldine Arrigoni BSc (Hons), CFA
Portfolio Manager Geraldine joined Pyrford in June 2003 to work as a Research Analyst within the Asia portfolio
management team. Prior to joining Pyrford, Geraldine worked for Cazenove Fund Management in London
as an Investment Analyst (Asian region) for two years and before that she was employed as a Trainee
Actuary at PricewaterhouseCoopers. Geraldine is a Maths graduate from the University of Wales (Cardiff)
and became a CFA charter holder in July 2003.
Stefan Bain MSc, ASIP
Portfolio Manager Stefan joined Pyrford in June 2012 as a Portfolio Manager covering Japanese and South Korean companies
within the Asian portfolio management team. Prior to joining Pyrford Stefan worked for F&C Fund
Management in London for five years as a Director of Japanese Equities, and at Royal London for six years
as Japanese fund manager. Stefan has a degree in Investment Analysis from the University of Stirling and
is an Associate of the Institute of Investment Management and Research.
Peter Moran MA (Hons), CFA
Portfolio Manager Peter started at Pyrford in October 2003, having spent 8 months with Merrill Lynch. In 2001 he graduated
from Oxford University with a degree in History. Peter is a Portfolio Manager within the European
portfolio management team. Peter became a CFA charter holder in 2007.
Nabil Irfan BSc (Hons), CFA
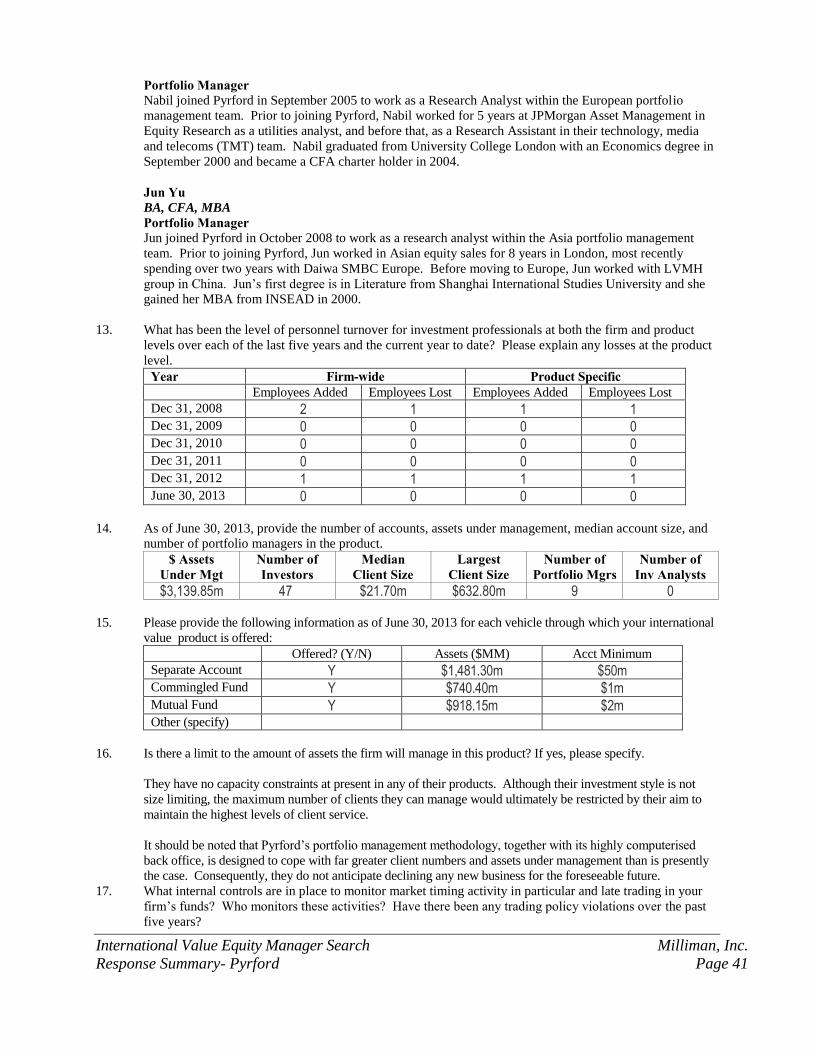
International Value Equity Manager Search Milliman, Inc.
Response Summary- Pyrford Page 41
Portfolio Manager Nabil joined Pyrford in September 2005 to work as a Research Analyst within the European portfolio
management team. Prior to joining Pyrford, Nabil worked for 5 years at JPMorgan Asset Management in
Equity Research as a utilities analyst, and before that, as a Research Assistant in their technology, media
and telecoms (TMT) team. Nabil graduated from University College London with an Economics degree in
September 2000 and became a CFA charter holder in 2004.
Jun Yu BA, CFA, MBA
Portfolio Manager Jun joined Pyrford in October 2008 to work as a research analyst within the Asia portfolio management
team. Prior to joining Pyrford, Jun worked in Asian equity sales for 8 years in London, most recently
spending over two years with Daiwa SMBC Europe. Before moving to Europe, Jun worked with LVMH
group in China. Jun’s first degree is in Literature from Shanghai International Studies University and she
gained her MBA from INSEAD in 2000.
13. What has been the level of personnel turnover for investment professionals at both the firm and product
levels over each of the last five years and the current year to date? Please explain any losses at the product
level.
Year Firm-wide Product Specific Employees Added Employees Lost Employees Added Employees Lost
Dec 31, 2008 2 1 1 1 Dec 31, 2009 0 0 0 0 Dec 31, 2010 0 0 0 0 Dec 31, 2011 0 0 0 0 Dec 31, 2012 1 1 1 1 June 30, 2013 0 0 0 0
14. As of June 30, 2013, provide the number of accounts, assets under management, median account size, and
number of portfolio managers in the product.
$ Assets Under Mgt
Number of Investors
Median Client Size
Largest Client Size
Number of Portfolio Mgrs
Number of Inv Analysts
$3,139.85m 47 $21.70m $632.80m 9 0
15. Please provide the following information as of June 30, 2013 for each vehicle through which your international
value product is offered:
Offered? (Y/N) Assets ($MM) Acct Minimum
Separate Account Y $1,481.30m $50m Commingled Fund Y $740.40m $1m Mutual Fund Y $918.15m $2m Other (specify)
16. Is there a limit to the amount of assets the firm will manage in this product? If yes, please specify.
They have no capacity constraints at present in any of their products. Although their investment style is not
size limiting, the maximum number of clients they can manage would ultimately be restricted by their aim to
maintain the highest levels of client service.
It should be noted that Pyrford’s portfolio management methodology, together with its highly computerised
back office, is designed to cope with far greater client numbers and assets under management than is presently
the case. Consequently, they do not anticipate declining any new business for the foreseeable future.
17. What internal controls are in place to monitor market timing activity in particular and late trading in your
firm’s funds? Who monitors these activities? Have there been any trading policy violations over the past
five years?
International Value Equity Manager Search Milliman, Inc.
Response Summary- Pyrford Page 42
For mutual funds sub-advised by Pyrford, the Mutual Fund Board has approved policies that seek to discourage
frequent purchases and redemptions and curb the disruptive effects of frequent trading (the Market Timing
Policy). Pursuant to the Market Timing Policy, a Fund may decline to accept an application or may reject a
purchase request, including an exchange, from an investor who, in the sole judgment of the Adviser, has a
pattern of short-term or excessive trading or whose trading has been or may be disruptive to the Fund. The
Funds, the Adviser, and affiliates thereof are prohibited from entering into arrangements with any shareholder
or other person to permit frequent purchases and redemptions of Fund shares.
The Market Timing Policy does not apply to the money market funds, which are typically used for cash
management purposes and invest in highly liquid securities. However, the Adviser seeks to prevent the use of
the money market funds to facilitate frequent trading in other BMO Funds in violation of the Market Timing
Policy.
Each Fund monitors and enforces the Market Timing Policy through:
• the termination of a shareholder’s purchase and/or exchange privileges.
• selective monitoring of trade activity.
• the imposition of a 2.00% short-term redemption fee for redemptions or exchanges of shares of a
Fund, if applicable to such Fund, within 30 days after purchase of such shares, determined on a first-
in, first-out basis.
They confirm there have been no significant trading policy violations over the past five years.
International Value Equity Investment Philosophy
18. Briefly describe the investment philosophy/strategy, style and distinguishing characteristics of this product.
Their investment philosophy is based on a quality and value-driven, absolute return approach, with both top-
down and bottom-up elements included. At the country level they seek to invest in countries that offer an
attractive market valuation relative to their long-term prospects (as determined by their research) and avoid
countries that do not. At the stock level they identify companies that offer excellent value relative to their in-
house forecast of long-term (5 years) earnings growth. This approach produces long-term investment returns
characterised by low absolute volatility and excellent downside protection.
They believe their product has the following competitive advantages:
Pyrford has a highly experienced and stable investment team with an average tenure at Pyrford of
nearly 12 years. Four of the five senior investment professionals have worked together at Pyrford for
over 15 years.
Pyrford has an extremely disciplined and proven investment methodology rooted in fundamentals
and common sense.
Pyrford’s approach is risk averse – it is only concerned with absolutes, not relatives. By diligently
adhering to this approach the ‘relatives’ take care of themselves over the long-term.
Pyrford invests a great deal of its time in macro-economic research and analysis - this is becoming a
rarity in the investment management industry. This research plays a key role in helping Pyrford’s
clients minimise downside risk by allowing sensible strategic moves.
Pyrford has the advantage of operating as a ‘boutique’ but the ability to tap the wider and extensive
fund management and research capabilities of its parent as required.
19. Does your firm’s international value equity discipline have a growth, value or core style bias?
Their product has a quality and value style bias.
International Value Equity Manager Search Milliman, Inc.
Response Summary- Pyrford Page 43
20. Explain the firm’s portfolio approach to the level of cash and equivalent holdings. Specify the normal,
maximum and minimum levels of cash holdings.
Cash is used purely for working capital purposes and typically ranges between 2 and 6% of the portfolio
value. The maximum allowable holding of cash is 10% and the minimum is 0%.
21. Briefly state how your firm defines an investable international value equity market for the purposes of this
product.
The main criteria used to determine whether a market is of institutional quality are as follows:
Generally accepted accounting principles.
Adequate market regulation and protection for minority investors.
Reliability of transaction settlement and dividend receipt.
Absence of sovereign risk.
Adequate trading liquidity.
Accurate and transparent pricing information source.
Pyrford is only interested in investing in markets of sound institutional quality. For a new market to be
added to Pyrford's investible universe, the relevant regional specialist portfolio manager must justify its
inclusion to Pyrford's Investment Strategy Committee.
22. How does your firm assess the liquidity of individual equity markets?
One of the factors always considered when deciding to include a market in their universe is whether the
market has sufficient liquidity for their purposes. A market would not be in the investable universe if they
believe liquidity constraints would hamper their country allocation strategy.
For each market they have a minimum market capitalisation which companies must meet in order to qualify
for their universe. The exact cut-off for each country is specific to each market but will be limited to
medium and large companies in that country. In addition, the company will only be included in their
universe if they can make a meaningful investment on behalf of their clients without owning more than 2%
of the free float of that company. This combination of market capitalisation and free float criteria ensures
that they are not invested in illiquid securities.
23. Will your firm invest in emerging equity markets in this investment discipline? If yes, specify the typical
portfolio percentage as well as maximum and current (6/30/2013) percentage.
Their investment universe includes the following emerging market territories:
Malaysia.
Taiwan.
Thailand.
Indonesia.
South Korea.
Their portfolio currently invests in Malaysia and Taiwan and the current holding as at 30th
June 2013 is
7.69%.
The maximum holding in emerging market territories is 20% and the average for 3 years to 30th
June 2013
is 6.54%. The highest holding during that period was 7.71%.
24. What securities other than common stock and cash equivalents will be held?
International Value Equity Manager Search Milliman, Inc.
Response Summary- Pyrford Page 44
The portfolio contains only ordinary shares with some frictional cash balances.
25. Does your firm engage in currency hedging in this strategy? If yes, is there a maximum hedge ratio for
major currencies?
Hedging is initiated when destination currencies become more than 25% overvalued versus the portfolio
base currency on a purchasing power parity (PPP) basis. Calculations of PPP are prepared internally using
wholesale prices and regression analysis over the very long-term - typically around 40 years. They find
this a very powerful and predictive tool. Hedges are removed when the destination currency falls to the 5%
overvaluation level on the same basis. This policy is subject to overriding considerations of data
veracity/reliability, liquidity, client guidelines and other pertinent investment issues - in particular they take
into account the direct cost of hedging.
The goal of the strategy is to capture the upside in a currency but avoid the downside - in keeping with
Pyrford’s overall capital preservation philosophy.
The maximum hedge in the portfolio is 50%.
26. State typical benchmark(s) used to measure the fund’s performance. Which do you believe is best?
They have always used the MSCI EAFE index for the strategy and their clients have typically agreed to
adopt this benchmark measure. They believe that this index is the most representative indicator for
investment in the International Equity product. However, they would be happy to be measured against
another index such as MSCI ACWI ex-US Index or a value index.
27. What is the expected tracking error of this product compared to the MSCI ACWI ex-US Value Index?
They do not set any targets in respect of tracking error. However, they expect tracking error to range
between 5 and 8% per annum.
28. Does this product target a particular level of volatility (index-relative or absolute)? If so, please describe
how the volatility target is implemented.
They do not target levels of volatility for their strategies. Their quality and value orientation generally leads to
low levels of absolute volatility. Absolute volatility since inception to 30th June 2013 was 14.20%.
International Value Equity Research Process
29. Describe the process for identifying attractive securities. List screening steps and fundamental security
requirements. What role does macro-economic research play in this process? Describe the analytical
research performed on individual securities.
The process for identifying suitable securities for the portfolio is in three stages, as follows:
a) Investment Universe Screening The universe for the strategy comprises 2,760 stocks, made up as follows:
European region 600 stocks (DJStoxx 600),
Asia Pacific region 2,160 stocks (various indices in the region),
During the stock selection process they look for the following features of a company before they consider
investing:
Firstly, they will only consider stocks that fulfil these requirements:
International Value Equity Manager Search Milliman, Inc.
Response Summary- Pyrford Page 45
Market cap minima - US$2bn (Europe) or US$1bn (Asia Pacific).
Interest cover minimum of 3x.
Secondly, they narrow down the list of stocks by assessing the following quantitative factors:
Return on Equity (ROE).
Debt/equity ratio
Dividend Yield.
Once a manageable list of stocks is produced, Pyrford’s fundamental research is undertaken. They focus
on companies with sustainably high ROE.
b) Top-Down Country Allocation
Country allocations are based upon a forward (5 year) estimate of country level earnings per share (EPS)
growth which is then related to the ‘country’ market valuation as evidenced by the average dividend yield.
The theory is quite simple – at the country (or stock) level the return is made up of the dividend yield + the
long term EPS movement + the movement in the price earnings ratio. The critical part of the analysis is
therefore Pyrford’s evaluation of the potential for EPS growth over its 5-year time horizon. This is the
principal function of the Investment Strategy Committee which meets at a minimum once each week.
30. What is the number of securities regularly followed by security analysts and/or portfolio managers?
From the universe detailed in the above response, the Portfolio Managers will closely follow approximately 250
companies.
31. Describe any processes in place to detect accounting irregularities at companies held in the portfolio.
During the stock selection process, they conduct rigorous analysis of accounting data produced by the
companies they are investigating. Whilst they believe that the role of the auditor is to provide the primary
quality control on the accounting records of the company, they would track extraordinary occurrences, for
example excessive changes in accounting policies which might be indicative of undesirable practices.
32. Does your firm use any technical and/or price momentum research? If so, how and why?
This is not applicable to their process.
Portfolio Construction and Management 33. Describe in detail the portfolio construction and management process. If a team approach is used, state the
names of the team members and explain the role(s) of each team member.
The first stage of the portfolio construction process is the country/currency allocation decision, which is
taken by the Investment Strategy Committee, as detailed in the response to question 29. Once securities
have been identified as suitable for investment, stock weights within each country portfolio are determined
after further consideration of the following:
the long-term value assessment for each stock (dividend yield plus Pyrford’s forecast five year EPS
growth).
the confidence levels around forecasts made.
the liquidity of each stock.
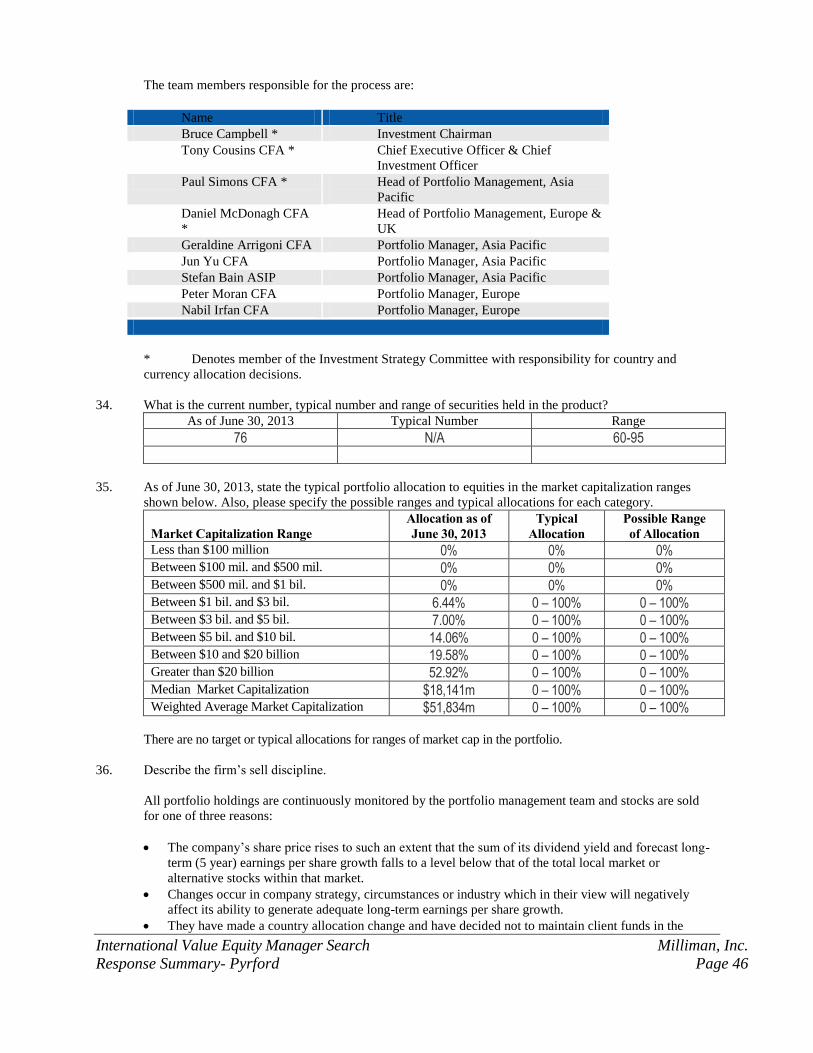
International Value Equity Manager Search Milliman, Inc.
Response Summary- Pyrford Page 46
The team members responsible for the process are:
Name Title
Bruce Campbell * Investment Chairman
Tony Cousins CFA * Chief Executive Officer & Chief
Investment Officer
Paul Simons CFA * Head of Portfolio Management, Asia
Pacific
Daniel McDonagh CFA
*
Head of Portfolio Management, Europe &
UK
Geraldine Arrigoni CFA Portfolio Manager, Asia Pacific
Jun Yu CFA Portfolio Manager, Asia Pacific
Stefan Bain ASIP Portfolio Manager, Asia Pacific
Peter Moran CFA Portfolio Manager, Europe
Nabil Irfan CFA Portfolio Manager, Europe
* Denotes member of the Investment Strategy Committee with responsibility for country and
currency allocation decisions.
34. What is the current number, typical number and range of securities held in the product?
As of June 30, 2013 Typical Number Range
76 N/A 60-95
35. As of June 30, 2013, state the typical portfolio allocation to equities in the market capitalization ranges
shown below. Also, please specify the possible ranges and typical allocations for each category.
Market Capitalization Range
Allocation as of June 30, 2013
Typical Allocation
Possible Range of Allocation
Less than $100 million 0% 0% 0% Between $100 mil. and $500 mil. 0% 0% 0% Between $500 mil. and $1 bil. 0% 0% 0% Between $1 bil. and $3 bil. 6.44% 0 – 100% 0 – 100% Between $3 bil. and $5 bil. 7.00% 0 – 100% 0 – 100% Between $5 bil. and $10 bil. 14.06% 0 – 100% 0 – 100% Between $10 and $20 billion 19.58% 0 – 100% 0 – 100% Greater than $20 billion 52.92% 0 – 100% 0 – 100% Median Market Capitalization $18,141m 0 – 100% 0 – 100% Weighted Average Market Capitalization $51,834m 0 – 100% 0 – 100%
There are no target or typical allocations for ranges of market cap in the portfolio.
36. Describe the firm’s sell discipline.
All portfolio holdings are continuously monitored by the portfolio management team and stocks are sold
for one of three reasons:
The company’s share price rises to such an extent that the sum of its dividend yield and forecast long-
term (5 year) earnings per share growth falls to a level below that of the total local market or
alternative stocks within that market.
Changes occur in company strategy, circumstances or industry which in their view will negatively
affect its ability to generate adequate long-term earnings per share growth.
They have made a country allocation change and have decided not to maintain client funds in the
International Value Equity Manager Search Milliman, Inc.
Response Summary- Pyrford Page 47
country or have reduced the allocation to a country.
37. What has been the average international value equity turnover for each of the last five years and the current
year to date?
Year Turnover (annual) 2008 33.17% 2009 32.80% 2010 26.59% 2011 20.91% 2012 18.71% YTD 11.90%
Investment Management Fees 38. Provide your fee schedules for the international equity product, both for commingled/mutual funds and
separate accounts. If a commingled fund is proposed, what are the custody costs of the trust and are they an
additional fee that is directly charged to the client? Please specify who custodies the assets. Are investment
management fees negotiable?
Separate Account (minimum investment $50m)
Market Value Fee in Percent First $50m 0.70% Next $50m 0.50% Over $100m 0.35%
The above fees do not include custody charges which are payable by the client direct to its appointed custodian.
Commingled Fund (minimum investment $1m) Market Value Fee in Percent
First $5m 1.00%
Next $15m 0.95%
Next $80m 0.75%
Over $100m 0.50%
The above fees are inclusive of custody charges. Custody is provided by State Street Bank & Trust Company.
BMO Pyrford International Stock Fund (minimum investment US$2m) – ticker MISNX A mutual fund offered through their partnership with BMO Funds. The management fee is a flat 0.80% per
annum, whilst the total expense ratio (TER) is capped at a maximum of 0.99% per annum.
In terms of negotiating management fees, they would be pleased to discuss alternative fee options once they
understand specific portfolio requirements and have confirmed the expected size of investment. They are open
to negotiating fees to the extent that their fees must be consistent across clients. As the potential account value
increases, they would be able to show greater flexibility in this regard.
39. Has the firm entered into incentive fee arrangements? If so, provide details.
Pyrford is not a strong believer in performance related fees as it suggests that a manager can ‘try harder’ if it is
remunerated on an incentive basis. It is their belief that they should be paid a fair fee for the work they
perform. However, if a client specifically requires this element in the fee structure, they would be happy to
discuss this further.
International Value Equity Manager Search Milliman, Inc.
Response Summary- Pyrford Page 48
40. Does your firm use any service, information, or merchandise paid for with directed commissions? If yes, please
list the services received from such commissions, and the percentage of fees so directed.
Pyrford has a policy of not using soft dollars as a method of payment for any services.
41. Please provide copies of your firm’s Form ADV Parts I and II.
Please refer to Appendix 1.
International value Equity Investment Performance
42. Provide quarterly historical performance for your product using the attached form. Do not include any
simulated data. Returns should be total portfolio, time-weighted rates of return both gross and net of
investment management fees. For year-end periods, also provide the market value of assets and number of
accounts. If you offer both a commingled product and separate accounts, provide performance for both.
Quarterly performance returns have been added to the table in the following section. The performance returns
are representative of both separate accounts and their pooled/mutual fund.
43. Please specify the methodology for constructing the firm’s composite performance.
Performance measurement and attribution is managed by Nicholas Miller, Senior Performance Analyst.
Nicholas conducts a full reconciliation of the valuation and transaction data between the accounting system
(FMC) and the performance system (supplied by BiSam) on a monthly basis.
44. Are returns audited? By whom? Are returns CFAI/AIMR compliant? For what time period? Please provide the
most recent statement of verification by an independent third party.
Pyrford’s performance returns have been audited as GIPS compliant by Grant Thornton LLP as at 30th
September 2012. A copy of the relevant verification letter is attached as Appendix 2.
International Value Equity Manager Search Milliman, Inc.
Response Summary- Schroders Page 49
INTERNATIONAL VALUE EQUITY INVESTMENT MANAGER QUESTIONNAIRE
As of June 30, 2013
Organizational Background
1. What is the firm name, address, and telephone and fax numbers of your main and branch offices? What
investment activity takes place at each location?
Schroders plc.
31 Gresham Street
London, EC2V 7QA
United Kingdom
Main: +44 (0)20 7658 6000
Fax: +44 (0)20 7658 6965
Schroder Investment Management North America Inc.
875 Third Ave
New York, NY 10022
Main: (212) 641-3800
Fax: (212) 632-2954
They operate on a global scale with 34 offices in 27 countries. Schroders accesses clients in the traditional
areas of the UK, Europe, North America and Japan, where the demand for asset management services is
long established, as well as the fast-growing savings pools in emerging and more recently developed
economies in the Middle East, Asia Pacific and Latin America.
Key members of the QEP Investment Team are located in their London office. However, please note the
client service team for this mandate is located in their New York Office.
2. What is the name, position, telephone and fax numbers, and e-mail address of the firm’s new business
contact and database/questionnaire contact?
New Business Contact Questionnaire Contact
Name Jamie Macmillan Same
Title US Institutional Business Development Director
Same
Office Schroder Investment Management North America Inc.
Same
Phone (347) 558-5165 Same
Fax (212) 632-2954 Same
Email [email protected] Same
3. When was your firm founded? When was it registered with the SEC?
Schroders plc, founded in 1804, is a global asset management company with more than 200 years of
experience in world financial markets.
Schroder Investment Management North America Inc. became an SEC-registered Investment Adviser in
1980 through its SEC-registered predecessor firm, Schroder Capital Management International Inc.
4. Describe the firm’s ownership structure and explain any changes over the past five years. Discuss the
firm’s relationship with the parent and affiliated companies, if any.
Schroders is one the largest asset managers listed on the London Stock Exchange. Their shares have been
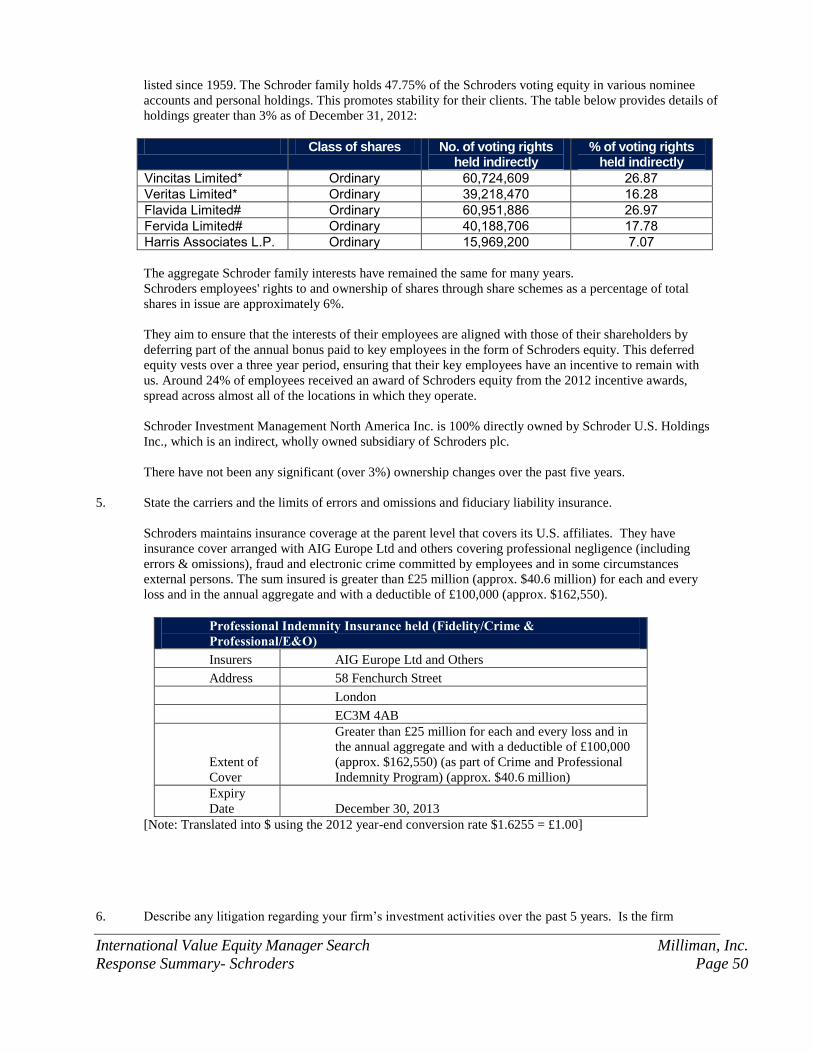
International Value Equity Manager Search Milliman, Inc.
Response Summary- Schroders Page 50
listed since 1959. The Schroder family holds 47.75% of the Schroders voting equity in various nominee
accounts and personal holdings. This promotes stability for their clients. The table below provides details of
holdings greater than 3% as of December 31, 2012:
Class of shares No. of voting rights held indirectly
% of voting rights held indirectly
Vincitas Limited* Ordinary 60,724,609 26.87
Veritas Limited* Ordinary 39,218,470 16.28
Flavida Limited# Ordinary 60,951,886 26.97
Fervida Limited# Ordinary 40,188,706 17.78
Harris Associates L.P. Ordinary 15,969,200 7.07
The aggregate Schroder family interests have remained the same for many years.
Schroders employees' rights to and ownership of shares through share schemes as a percentage of total
shares in issue are approximately 6%.
They aim to ensure that the interests of their employees are aligned with those of their shareholders by
deferring part of the annual bonus paid to key employees in the form of Schroders equity. This deferred
equity vests over a three year period, ensuring that their key employees have an incentive to remain with
us. Around 24% of employees received an award of Schroders equity from the 2012 incentive awards,
spread across almost all of the locations in which they operate.
Schroder Investment Management North America Inc. is 100% directly owned by Schroder U.S. Holdings
Inc., which is an indirect, wholly owned subsidiary of Schroders plc.
There have not been any significant (over 3%) ownership changes over the past five years.
5. State the carriers and the limits of errors and omissions and fiduciary liability insurance.
Schroders maintains insurance coverage at the parent level that covers its U.S. affiliates. They have
insurance cover arranged with AIG Europe Ltd and others covering professional negligence (including
errors & omissions), fraud and electronic crime committed by employees and in some circumstances
external persons. The sum insured is greater than £25 million (approx. $40.6 million) for each and every
loss and in the annual aggregate and with a deductible of £100,000 (approx. $162,550).
Professional Indemnity Insurance held (Fidelity/Crime & Professional/E&O) Insurers AIG Europe Ltd and Others
Address 58 Fenchurch Street
London
EC3M 4AB
Extent of
Cover
Greater than £25 million for each and every loss and in
the annual aggregate and with a deductible of £100,000
(approx. $162,550) (as part of Crime and Professional
Indemnity Program) (approx. $40.6 million)
Expiry
Date December 30, 2013
[Note: Translated into $ using the 2012 year-end conversion rate $1.6255 = £1.00]
6. Describe any litigation regarding your firm’s investment activities over the past 5 years. Is the firm
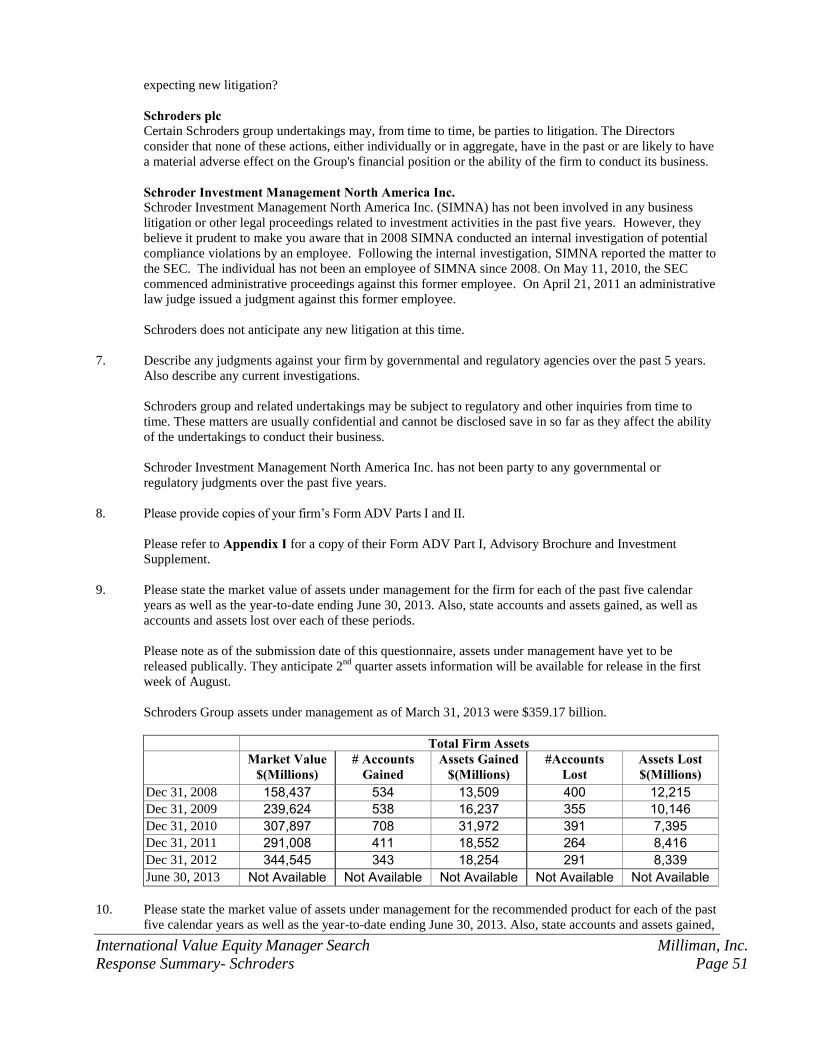
International Value Equity Manager Search Milliman, Inc.
Response Summary- Schroders Page 51
expecting new litigation?
Schroders plc Certain Schroders group undertakings may, from time to time, be parties to litigation. The Directors
consider that none of these actions, either individually or in aggregate, have in the past or are likely to have
a material adverse effect on the Group's financial position or the ability of the firm to conduct its business.
Schroder Investment Management North America Inc. Schroder Investment Management North America Inc. (SIMNA) has not been involved in any business
litigation or other legal proceedings related to investment activities in the past five years. However, they
believe it prudent to make you aware that in 2008 SIMNA conducted an internal investigation of potential
compliance violations by an employee. Following the internal investigation, SIMNA reported the matter to
the SEC. The individual has not been an employee of SIMNA since 2008. On May 11, 2010, the SEC
commenced administrative proceedings against this former employee. On April 21, 2011 an administrative
law judge issued a judgment against this former employee.
Schroders does not anticipate any new litigation at this time.
7. Describe any judgments against your firm by governmental and regulatory agencies over the past 5 years.
Also describe any current investigations.
Schroders group and related undertakings may be subject to regulatory and other inquiries from time to
time. These matters are usually confidential and cannot be disclosed save in so far as they affect the ability
of the undertakings to conduct their business.
Schroder Investment Management North America Inc. has not been party to any governmental or
regulatory judgments over the past five years.
8. Please provide copies of your firm’s Form ADV Parts I and II.
Please refer to Appendix I for a copy of their Form ADV Part I, Advisory Brochure and Investment
Supplement.
9. Please state the market value of assets under management for the firm for each of the past five calendar
years as well as the year-to-date ending June 30, 2013. Also, state accounts and assets gained, as well as
accounts and assets lost over each of these periods.
Please note as of the submission date of this questionnaire, assets under management have yet to be
released publically. They anticipate 2nd
quarter assets information will be available for release in the first
week of August.
Schroders Group assets under management as of March 31, 2013 were $359.17 billion.
Total Firm Assets Market Value
$(Millions) # Accounts
Gained Assets Gained
$(Millions) #Accounts
Lost Assets Lost $(Millions)
Dec 31, 2008 158,437 534 13,509 400 12,215
Dec 31, 2009 239,624 538 16,237 355 10,146
Dec 31, 2010 307,897 708 31,972 391 7,395
Dec 31, 2011 291,008 411 18,552 264 8,416
Dec 31, 2012 344,545 343 18,254 291 8,339
June 30, 2013 Not Available Not Available Not Available Not Available Not Available
10. Please state the market value of assets under management for the recommended product for each of the past
five calendar years as well as the year-to-date ending June 30, 2013. Also, state accounts and assets gained,
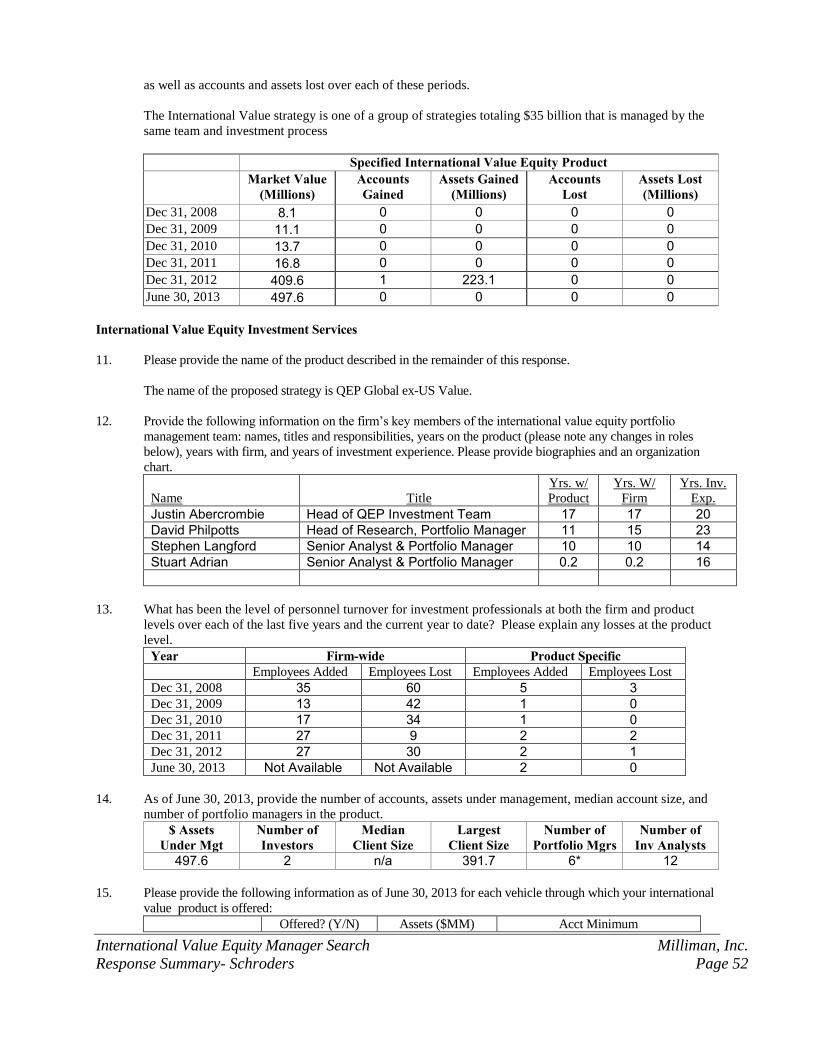
International Value Equity Manager Search Milliman, Inc.
Response Summary- Schroders Page 52
as well as accounts and assets lost over each of these periods.
The International Value strategy is one of a group of strategies totaling $35 billion that is managed by the
same team and investment process
Specified International Value Equity Product Market Value
(Millions) Accounts Gained
Assets Gained (Millions)
Accounts Lost
Assets Lost (Millions)
Dec 31, 2008 8.1 0 0 0 0
Dec 31, 2009 11.1 0 0 0 0
Dec 31, 2010 13.7 0 0 0 0
Dec 31, 2011 16.8 0 0 0 0
Dec 31, 2012 409.6 1 223.1 0 0
June 30, 2013 497.6 0 0 0 0
International Value Equity Investment Services
11. Please provide the name of the product described in the remainder of this response.
The name of the proposed strategy is QEP Global ex-US Value.
12. Provide the following information on the firm’s key members of the international value equity portfolio
management team: names, titles and responsibilities, years on the product (please note any changes in roles
below), years with firm, and years of investment experience. Please provide biographies and an organization
chart.
Name
Title
Yrs. w/
Product
Yrs. W/
Firm
Yrs. Inv.
Exp.
Justin Abercrombie Head of QEP Investment Team 17 17 20
David Philpotts Head of Research, Portfolio Manager 11 15 23
Stephen Langford Senior Analyst & Portfolio Manager 10 10 14
Stuart Adrian Senior Analyst & Portfolio Manager 0.2 0.2 16
13. What has been the level of personnel turnover for investment professionals at both the firm and product
levels over each of the last five years and the current year to date? Please explain any losses at the product
level.
Year Firm-wide Product Specific Employees Added Employees Lost Employees Added Employees Lost
Dec 31, 2008 35 60 5 3
Dec 31, 2009 13 42 1 0
Dec 31, 2010 17 34 1 0
Dec 31, 2011 27 9 2 2
Dec 31, 2012 27 30 2 1
June 30, 2013 Not Available Not Available 2 0
14. As of June 30, 2013, provide the number of accounts, assets under management, median account size, and
number of portfolio managers in the product.
$ Assets Under Mgt
Number of Investors
Median Client Size
Largest Client Size
Number of Portfolio Mgrs
Number of Inv Analysts
497.6 2 n/a 391.7 6* 12
15. Please provide the following information as of June 30, 2013 for each vehicle through which your international
value product is offered:
Offered? (Y/N) Assets ($MM) Acct Minimum
International Value Equity Manager Search Milliman, Inc.
Response Summary- Schroders Page 53
Separate Account Y 391.7 $100 Million
Commingled Fund Y* - $1 Million
Mutual Fund Y 105.9
$250,000 (Investor Shares) $2,500 (Advisor Shares)
Other (specify) - - -
16. Is there a limit to the amount of assets the firm will manage in this product? If yes, please specify.
The QEP Global ex-US Value strategy is highly scalable on account of its diversified approach and broad
investment universe. They estimate that the strategy has at least $10 billion in capacity and is not currently
constrained.
17. What internal controls are in place to monitor market timing activity in particular and late trading in your
firm’s funds? Who monitors these activities? Have there been any trading policy violations over the past
five years?
Provided below are their Procedures to Discourage Market Timing.
Introduction/General Policy The Funds and Schroder Investment Management North America Inc. (SIMNA) believe it is in the best
interests of shareholders to maintain policies and procedures to discourage short-term trading by those seeking
to benefit from pricing and market inefficiencies at the expense of long-term investors. The Funds have adopted
the following procedures to monitor trading in the Funds.
Procedures ― The Board has imposed redemption fees of 2% for redemptions within 2 months of purchase of funds in
instances where it believes that short term trading may adversely affect management of the fund or otherwise
harm long term holders.
― The Board has determined to utilize a third party service provider to provide data concerning fair valuation of
foreign securities held by international funds. That data will be used to fair value securities under circumstances
approved by the Trustees.
― SIMNA and the Funds’ distributor review reports of large trades ($50,000 and up) from the Funds’ transfer
agent, and perform surveillance of multiple trade activities from specific dealers and suspicious trades through
omnibus accounts.
― SIMNA and the Fund’s distributor may ban, suspend, or place limitations on, any timing activity, if, following
investigation, it believes that the trading activity in the account may adversely affect management of the fund or
otherwise harm long term holders.
― No Later than the effective date of Rule 22c-2, SIMNA or the distributor for the Funds will on behalf of the
Funds enter into a written agreement with each dealer or other financial intermediary, requiring that dealer or
intermediary to:
• Provide, promptly upon request by the Funds, the taxpayer Identification relating to all shareholders that
purchased, redeemed, transferred, or exchanged shares held through an account with the dealer or intermediary,
and the amount and dates of such shareholder purchases, redemptions, transfers, and exchanges; and
• Carry out any instructions from the Funds or its distributor to restrict or prohibit further purchases or exchanges
of fund shares by any shareholder who the Fund or their distributor has identified as having engaged in
transactions in Fund shares that violate this policy.
• SIMNA and the Distributor for the funds will retain on behalf of the Funds the current written agreements
entered into pursuant to this policy and any other agreement in effect at any time within the prior six years in an
easily accessible place.
The Trust recognizes that SIMNA and the distributor for the Funds may not always be able to detect or prevent
all market timing activity or other trading activity that may disadvantage the Funds or their shareholders.
The CCO will report to the Board no less often than annually on the status and effectiveness of the procedures
International Value Equity Manager Search Milliman, Inc.
Response Summary- Schroders Page 54
to discourage market timing.
International Value Equity Investment Philosophy
18. Briefly describe the investment philosophy/strategy, style and distinguishing characteristics of this product.
Schroder QEP Global ex-US Value is an active, index-unconstrained, value-based strategy designed to deliver
higher long-run returns with low stock-specific risk. Analyzing a universe of around 12,000 stocks, the team
uses a bottom-up process to construct a highly diversified portfolio typically containing over 500 stocks.
Stock selection for this strategy is grounded in the analysis of company fundamentals indicating Value
(dividends, cashflow, sales, assets and earnings). Portfolios will exhibit a style bias towards these factors.
They believe that Value outperforms over the long term but investment decisions are also informed by the
team’s analysis of business quality (determined on measures of Profitability, Stability and Financial Strength).
This helps to minimize exposure to ‘value traps’ or, in other words, stocks which may be cheap for good
reason.
They believe that intelligent portfolio construction can greatly enhance the ability to generate repeatable long-
run returns. They reduce stock specific risk by building a highly diversified portfolio, but with no less
conviction. Recognizing the limitations of market cap-weighted indices, they take an index-unconstrained
approach which enables us to invest wherever they find the best value opportunities and to capitalize upon
those which may be missed by other global managers, including those at the lower end of the market cap
spectrum and across emerging markets.
19. Does your firm’s international value equity discipline have a growth, value or core style bias?
As noted in their response to question 18 above, QEP Global ex-US Value is a value-based strategy.
20. Explain the firm’s portfolio approach to the level of cash and equivalent holdings. Specify the normal,
maximum and minimum levels of cash holdings.
They typically pursue a fully invested policy and cash usually represents less than 1% of their portfolios.
Cash is kept to the minimum required for efficient portfolio management and is not used as a tactical asset.
21. Briefly state how your firm defines an investable international value equity market for the purposes of this
product.
They invest from the broadest possible universe of stocks while screening for sufficient liquidity to trade
without undue market impact. For this strategy the universe consists of around 12,000 companies of all
sizes across approximately 40 countries, including both developed and emerging markets.
22. How does your firm assess the liquidity of individual equity markets?
Awareness of liquidity considerations is built into the QEP investment process at every stage. Liquidity
risk is managed via their proprietary Market Impact Model, which adjusts the weights for stocks in more
illiquid markets or which are smaller or more volatile. They further manage liquidity risk by typically only
investing in stocks which have traded an average of $100,000 per day over the preceding 100 days and
generally restricting a single trade to a maximum of 20% of the Average Daily Volume (ADV) traded.
23. Will your firm invest in emerging equity markets in this investment discipline? If yes, specify the typical
portfolio percentage as well as maximum and current (6/30/2013) percentage.
As an unconstrained strategy, QEP Global ex-US Value can invest right across their stock universe (with
the exception of America), which covers around 40 countries. One of the strengths of their approach is that
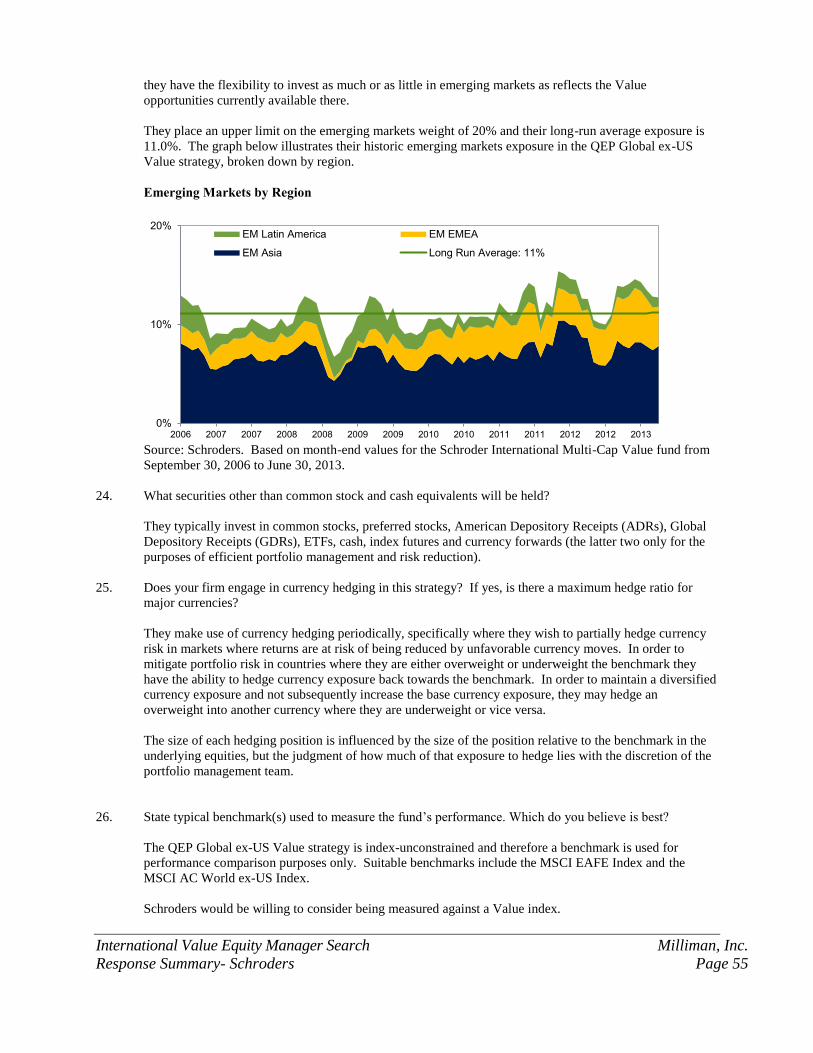
International Value Equity Manager Search Milliman, Inc.
Response Summary- Schroders Page 55
they have the flexibility to invest as much or as little in emerging markets as reflects the Value
opportunities currently available there.
They place an upper limit on the emerging markets weight of 20% and their long-run average exposure is
11.0%. The graph below illustrates their historic emerging markets exposure in the QEP Global ex-US
Value strategy, broken down by region.
Emerging Markets by Region
0%
10%
20%
2006 2007 2007 2008 2008 2009 2009 2010 2010 2011 2011 2012 2012 2013
EM Latin America EM EMEA
EM Asia Long Run Average: 11%
Source: Schroders. Based on month-end values for the Schroder International Multi-Cap Value fund from
September 30, 2006 to June 30, 2013.
24. What securities other than common stock and cash equivalents will be held?
They typically invest in common stocks, preferred stocks, American Depository Receipts (ADRs), Global
Depository Receipts (GDRs), ETFs, cash, index futures and currency forwards (the latter two only for the
purposes of efficient portfolio management and risk reduction).
25. Does your firm engage in currency hedging in this strategy? If yes, is there a maximum hedge ratio for
major currencies?
They make use of currency hedging periodically, specifically where they wish to partially hedge currency
risk in markets where returns are at risk of being reduced by unfavorable currency moves. In order to
mitigate portfolio risk in countries where they are either overweight or underweight the benchmark they
have the ability to hedge currency exposure back towards the benchmark. In order to maintain a diversified
currency exposure and not subsequently increase the base currency exposure, they may hedge an
overweight into another currency where they are underweight or vice versa.
The size of each hedging position is influenced by the size of the position relative to the benchmark in the
underlying equities, but the judgment of how much of that exposure to hedge lies with the discretion of the
portfolio management team.
26. State typical benchmark(s) used to measure the fund’s performance. Which do you believe is best?
The QEP Global ex-US Value strategy is index-unconstrained and therefore a benchmark is used for
performance comparison purposes only. Suitable benchmarks include the MSCI EAFE Index and the
MSCI AC World ex-US Index.
Schroders would be willing to consider being measured against a Value index.
International Value Equity Manager Search Milliman, Inc.
Response Summary- Schroders Page 56
27. What is the expected tracking error of this product compared to the MSCI ACWI ex-US Value Index?
The strategy does not explicitly target tracking error, but they anticipate that the long run ex post figure will
typically be around 4% to 5% p.a. when measured against the MSCI EAFE Index. When measured against
the MSCI ACWI ex-US Value Index, the strategy has seen an ex post (realised) tracking error of 3.65%
p.a.* over the past five years.
28. Does this product target a particular level of volatility (index-relative or absolute)? If so, please describe
how the volatility target is implemented.
The QEP Global ex-US Value strategy does not target volatility specifically and it will vary over time with the
opportunities available.
International Value Equity Research Process
29. Describe the process for identifying attractive securities. List screening steps and fundamental security
requirements. What role does macro-economic research play in this process? Describe the analytical
research performed on individual securities.
Stage 1. Global Value Rank To maximize the potential investment opportunity, the team analyses as broad a universe as possible -
12,000 stocks of all sizes (screened for liquidity) across around 40 countries (excluding the US), including
both developed and emerging markets. Each stock is assigned a Global Value Rank, determined by
dividend forecast, cashflow, earnings, sales and assets.
The team will invest in stocks in the cheapest third of the Global Value Rank.
Stage 2. Stock Selection The most significant aspects of their security selection process are their Market Impact Model and their
calculation of each stock’s probability of Value being realized.
They determine security weights by establishing an equilibrium weight for each stock in the universe.
Stage 3. Portfolio Construction A disciplined and sophisticated approach to portfolio construction is one of the team’s most significant
competitive advantages. Portfolio construction issues are integrated at all stages of the investment process,
including at a research level.
The strategy is managed with an entirely bottom-up approach, with no top-down constraints imposed at the
country, sector or stock level. They do, however, limit overall exposure to emerging markets to 20%.
30. What is the number of securities regularly followed by security analysts and/or portfolio managers?
In their approach, analysts focus on researching new investment strategies and enhancing their existing models,
rather than covering securities individually. Therefore each analyst works on projects, which may be focused
on one sector, country or region, but they are not assigned to areas of the market in the way that traditional
analysts would be. They maintain considerable flexibility within the research team to allocate resources
effectively as projects and other demands change.
Please refer back to their answer to question 29 for details on the universe covered and number of securities
held.
31. Describe any processes in place to detect accounting irregularities at companies held in the portfolio.
As mentioned above their researches role is unlike that of a “traditional analyst” covering a sample of stocks.
There are members of the research team, who focus more on accounting aspects. They ensure that a large part
of the research effort is focused on data quality as, ultimately, the analysts, as the biggest users of the data, are
best placed to check incoming data and recommend enhancements to this process.
International Value Equity Manager Search Milliman, Inc.
Response Summary- Schroders Page 57
32. Does your firm use any technical and/or price momentum research? If so, how and why?
No. they do not use external research into technical or momentum indicators but incorporate their own
proprietary research into these factors and how they relate to other factors within their process.
Their research methodology is distinguished from the majority of managers by focusing on identifying factors
and patterns that indicate likely outperformance for a group of stocks, rather than looking at companies one by
one. This lends scalability, consistency and efficiency to their process.
The direction of their research is driven by the observations and insights of experienced investors, who are
constantly looking to identify future opportunities and risks. They have great flexibility to allocate research
resources wherever the team sees the greatest potential for adding value for their clients. Their research on
financial quality described above is a good example of the way the team is always looking to develop new
research insights according to changing market conditions.
Portfolio Construction and Management 33. Describe in detail the portfolio construction and management process. If a team approach is used, state the
names of the team members and explain the role(s) of each team member.
Please refer to their response to question 29 above, for full details on their portfolio construction process.
Provided below are details on the investment management team.
The team is organized across three key functions. The portfolio implementation team is based in London
and is responsible for the day-to-day management of client portfolios. The research team is located in both
London and Sydney and its members are responsible for researching new investment strategies and
enhancing existing models. A product management team located in London and key international offices
oversees all aspects of client service and marketing. Additionally, the QEP Investment Team utilizes
Schroders’ global resources for Trading, IT, Risk and Compliance.
Portfolio Management Role They adopt a team approach to portfolio management. Portfolio managers are responsible for the day-to-
day management of each client portfolio. In essence, the role of portfolio managers is three-fold:
1) No “black box”. Having experienced investors review every trade recommended by their allocator tool
provides an important sense-check that the process is working as it should, guarding against unexpected or
anomalous outputs.
2) Risk budgeting. Portfolio managers are responsible for shaping portfolios that are positioned to add value
for their clients, by monitoring a range of characteristics and ensuring that risk profiles remain appropriate.
3) Forward-looking research. Portfolio manager insights into future opportunities and risks in global
markets are a key source of idea generation for their research team, who investigate how to incorporate
these insights in order to enhance their investment process.
Research Analyst Role The QEP Investment Team consists of 27 members*, located in London and Sydney, and is led by Justin
Abercrombie, supported by David Philpotts (Head of Research) and Stephen Langford and Stuart Adrian
(Senior Analysts & Portfolio Managers).
34. What is the current number, typical number and range of securities held in the product?
As of June 30, 2013 Typical Number Range
1460 Typically holds at least 500 stocks and there is no maximum number.
Average number of holdings: 753*
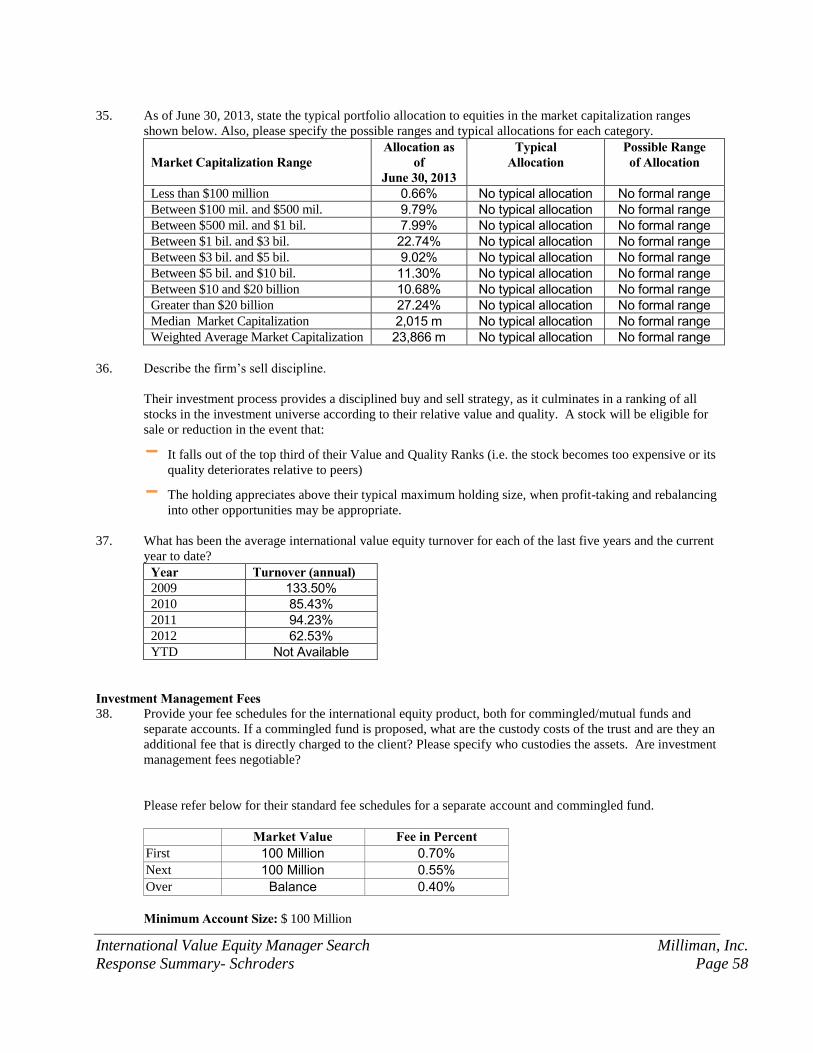
International Value Equity Manager Search Milliman, Inc.
Response Summary- Schroders Page 58
35. As of June 30, 2013, state the typical portfolio allocation to equities in the market capitalization ranges
shown below. Also, please specify the possible ranges and typical allocations for each category.
Market Capitalization Range
Allocation as of
June 30, 2013
Typical Allocation
Possible Range of Allocation
Less than $100 million 0.66% No typical allocation No formal range
Between $100 mil. and $500 mil. 9.79% No typical allocation No formal range
Between $500 mil. and $1 bil. 7.99% No typical allocation No formal range
Between $1 bil. and $3 bil. 22.74% No typical allocation No formal range
Between $3 bil. and $5 bil. 9.02% No typical allocation No formal range
Between $5 bil. and $10 bil. 11.30% No typical allocation No formal range
Between $10 and $20 billion 10.68% No typical allocation No formal range
Greater than $20 billion 27.24% No typical allocation No formal range
Median Market Capitalization 2,015 m No typical allocation No formal range
Weighted Average Market Capitalization 23,866 m No typical allocation No formal range
36. Describe the firm’s sell discipline.
Their investment process provides a disciplined buy and sell strategy, as it culminates in a ranking of all
stocks in the investment universe according to their relative value and quality. A stock will be eligible for
sale or reduction in the event that:
It falls out of the top third of their Value and Quality Ranks (i.e. the stock becomes too expensive or its
quality deteriorates relative to peers)
The holding appreciates above their typical maximum holding size, when profit-taking and rebalancing
into other opportunities may be appropriate.
37. What has been the average international value equity turnover for each of the last five years and the current
year to date?
Year Turnover (annual) 2009 133.50%
2010 85.43%
2011 94.23%
2012 62.53%
YTD Not Available
Investment Management Fees 38. Provide your fee schedules for the international equity product, both for commingled/mutual funds and
separate accounts. If a commingled fund is proposed, what are the custody costs of the trust and are they an
additional fee that is directly charged to the client? Please specify who custodies the assets. Are investment
management fees negotiable?
Please refer below for their standard fee schedules for a separate account and commingled fund.
Market Value Fee in Percent First 100 Million 0.70%
Next 100 Million 0.55%
Over Balance 0.40%
Minimum Account Size: $ 100 Million
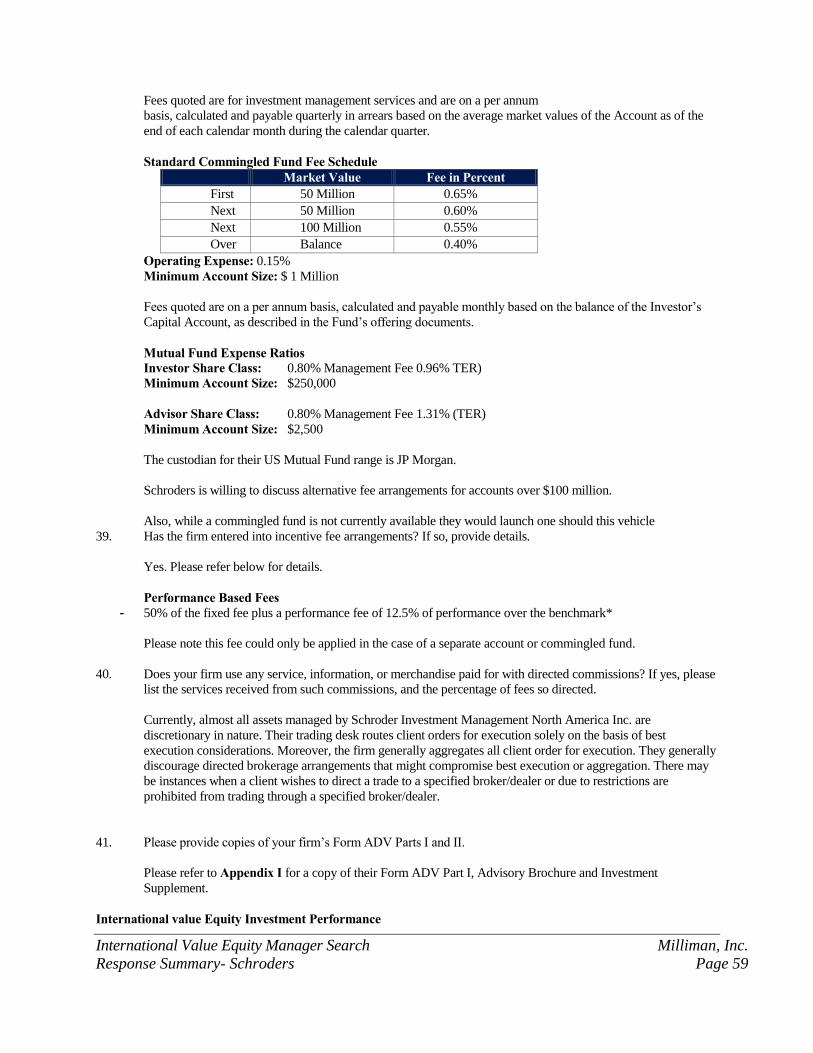
International Value Equity Manager Search Milliman, Inc.
Response Summary- Schroders Page 59
Fees quoted are for investment management services and are on a per annum
basis, calculated and payable quarterly in arrears based on the average market values of the Account as of the
end of each calendar month during the calendar quarter.
Standard Commingled Fund Fee Schedule
Market Value Fee in Percent First 50 Million 0.65%
Next 50 Million 0.60%
Next 100 Million 0.55%
Over Balance 0.40%
Operating Expense: 0.15%
Minimum Account Size: $ 1 Million
Fees quoted are on a per annum basis, calculated and payable monthly based on the balance of the Investor’s
Capital Account, as described in the Fund’s offering documents.
Mutual Fund Expense Ratios Investor Share Class: 0.80% Management Fee 0.96% TER)
Minimum Account Size: $250,000
Advisor Share Class: 0.80% Management Fee 1.31% (TER)
Minimum Account Size: $2,500
The custodian for their US Mutual Fund range is JP Morgan.
Schroders is willing to discuss alternative fee arrangements for accounts over $100 million.
Also, while a commingled fund is not currently available they would launch one should this vehicle
39. Has the firm entered into incentive fee arrangements? If so, provide details.
Yes. Please refer below for details.
Performance Based Fees - 50% of the fixed fee plus a performance fee of 12.5% of performance over the benchmark*
Please note this fee could only be applied in the case of a separate account or commingled fund.
40. Does your firm use any service, information, or merchandise paid for with directed commissions? If yes, please
list the services received from such commissions, and the percentage of fees so directed.
Currently, almost all assets managed by Schroder Investment Management North America Inc. are
discretionary in nature. Their trading desk routes client orders for execution solely on the basis of best
execution considerations. Moreover, the firm generally aggregates all client order for execution. They generally
discourage directed brokerage arrangements that might compromise best execution or aggregation. There may
be instances when a client wishes to direct a trade to a specified broker/dealer or due to restrictions are
prohibited from trading through a specified broker/dealer.
41. Please provide copies of your firm’s Form ADV Parts I and II.
Please refer to Appendix I for a copy of their Form ADV Part I, Advisory Brochure and Investment
Supplement.
International value Equity Investment Performance
International Value Equity Manager Search Milliman, Inc.
Response Summary- Schroders Page 60
42. Provide quarterly historical performance for your product using the attached form. Do not include any
simulated data. Returns should be total portfolio, time-weighted rates of return both gross and net of
investment management fees. For year-end periods, also provide the market value of assets and number of
accounts. If you offer both a commingled product and separate accounts, provide performance for both.
Please refer to the table below for composite returns
43. Please specify the methodology for constructing the firm’s composite performance.
Composite Construction New accounts are included from the beginning of the first full month of management on a discretionary basis.
Terminated accounts are excluded from the end of the last full month of discretionary management. This
Composite has no minimum asset level for inclusion.
The composite currency is US Dollar
Composite Inception Date: 08/31/2006
Composite Creation Date: 11/01/2006
Performance Calculation The portfolio returns are time-weighted rates of return that are adjusted for cash flows. Portfolio returns are
combined using beginning of period asset weights to produce the composite return. Periodic returns are
geometrically linked to produce annual returns.
Dividends on equities are recognized net of irrecoverable withholding tax. Since January 1999 dividends have
been recognized as of the ex-dividend date having previously been recognized on a cash basis. Performance
results are presented before the deduction of management fees and custodian fees but after trading expenses.
44. Are returns audited? By whom? Are returns CFAI/AIMR compliant? For what time period? Please provide the
most recent statement of verification by an independent third party.
Yes. All composite returns are audited by their external auditor Ernst & Young on an annual basis.
Please refer to Appendix II for a copy of the most recent GIPS verification.
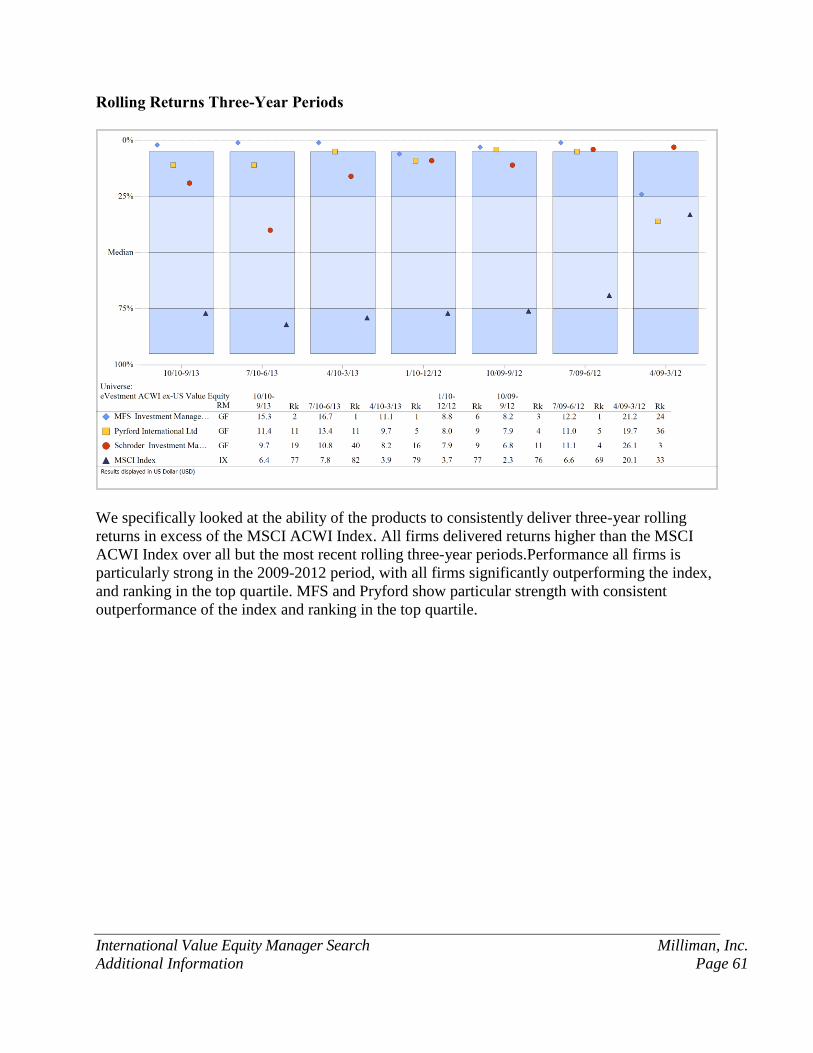
International Value Equity Manager Search Milliman, Inc.
Additional Information Page 61
Rolling Returns Three-Year Periods
We specifically looked at the ability of the products to consistently deliver three-year rolling
returns in excess of the MSCI ACWI Index. All firms delivered returns higher than the MSCI
ACWI Index over all but the most recent rolling three-year periods.Performance all firms is
particularly strong in the 2009-2012 period, with all firms significantly outperforming the index,
and ranking in the top quartile. MFS and Pryford show particular strength with consistent
outperformance of the index and ranking in the top quartile.
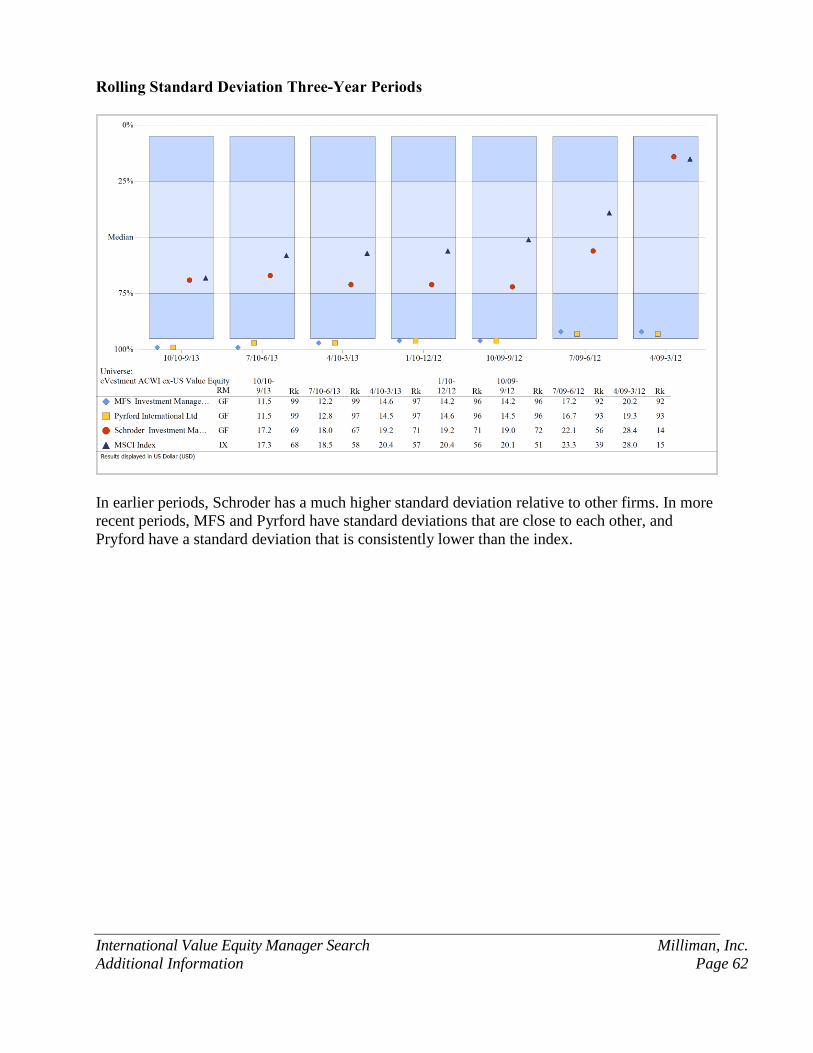
International Value Equity Manager Search Milliman, Inc.
Additional Information Page 62
Rolling Standard Deviation Three-Year Periods
In earlier periods, Schroder has a much higher standard deviation relative to other firms. In more
recent periods, MFS and Pyrford have standard deviations that are close to each other, and
Pryford have a standard deviation that is consistently lower than the index.
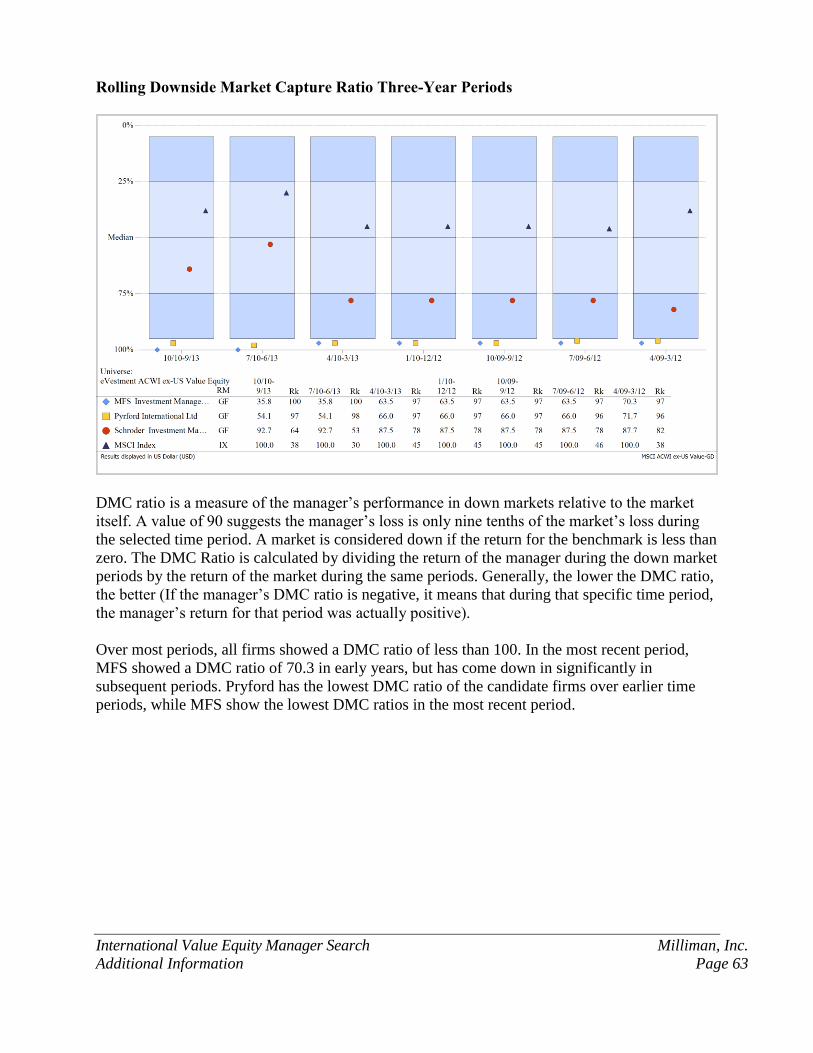
International Value Equity Manager Search Milliman, Inc.
Additional Information Page 63
Rolling Downside Market Capture Ratio Three-Year Periods
DMC ratio is a measure of the manager’s performance in down markets relative to the market
itself. A value of 90 suggests the manager’s loss is only nine tenths of the market’s loss during
the selected time period. A market is considered down if the return for the benchmark is less than
zero. The DMC Ratio is calculated by dividing the return of the manager during the down market
periods by the return of the market during the same periods. Generally, the lower the DMC ratio,
the better (If the manager’s DMC ratio is negative, it means that during that specific time period,
the manager’s return for that period was actually positive).
Over most periods, all firms showed a DMC ratio of less than 100. In the most recent period,
MFS showed a DMC ratio of 70.3 in early years, but has come down in significantly in
subsequent periods. Pryford has the lowest DMC ratio of the candidate firms over earlier time
periods, while MFS show the lowest DMC ratios in the most recent period.
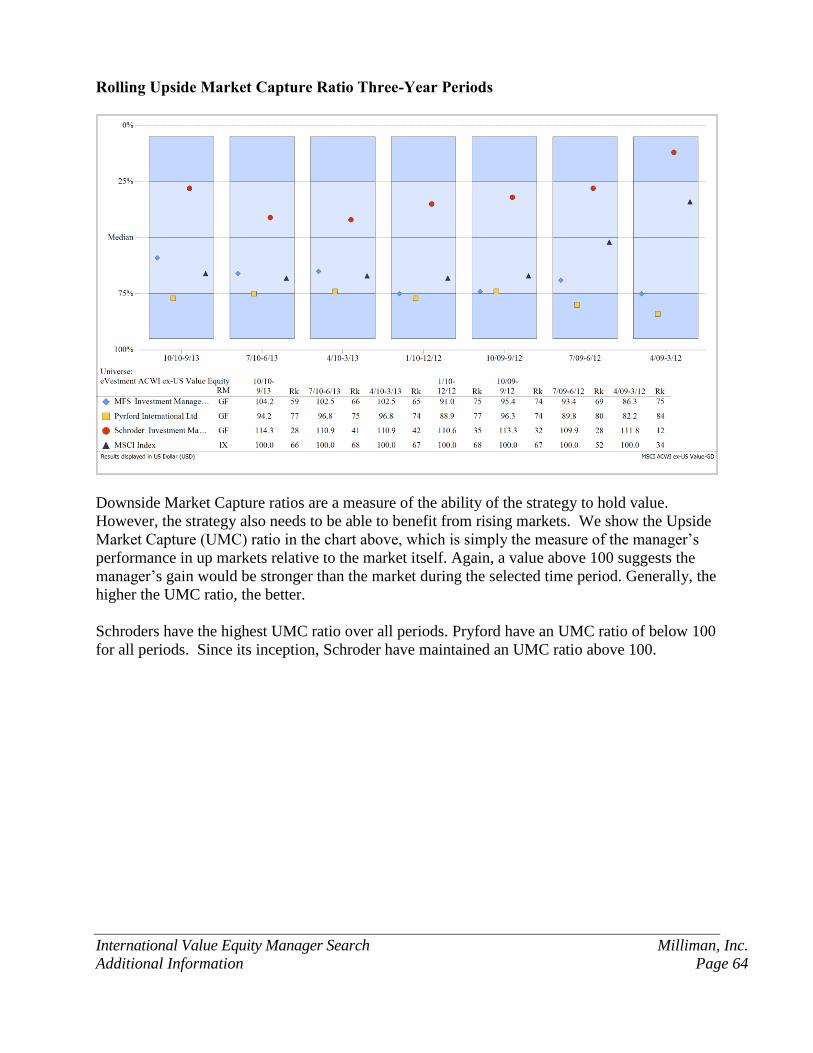
International Value Equity Manager Search Milliman, Inc.
Additional Information Page 64
Rolling Upside Market Capture Ratio Three-Year Periods
Downside Market Capture ratios are a measure of the ability of the strategy to hold value.
However, the strategy also needs to be able to benefit from rising markets. We show the Upside
Market Capture (UMC) ratio in the chart above, which is simply the measure of the manager’s
performance in up markets relative to the market itself. Again, a value above 100 suggests the
manager’s gain would be stronger than the market during the selected time period. Generally, the
higher the UMC ratio, the better.
Schroders have the highest UMC ratio over all periods. Pryford have an UMC ratio of below 100
for all periods. Since its inception, Schroder have maintained an UMC ratio above 100.

International Value Equity Manager Search Milliman, Inc.
Additional Information Page 65
Rolling Sharpe Ratio Three-Year Periods
While it is informative to look at return, risk and performance in up and down markets in
isolation, we are ultimately seeking to identify a manager that can use its risk budget
appropriately to add value over a market cycle. All strategies under consideration show higher
Sharpe ratios (defined as the return above cash divided the portfolio’s standard deviation) than
the index. All three strategies are reasonable on this measure, and most generally have a Sharpe
ratio only slightly better than the Index.
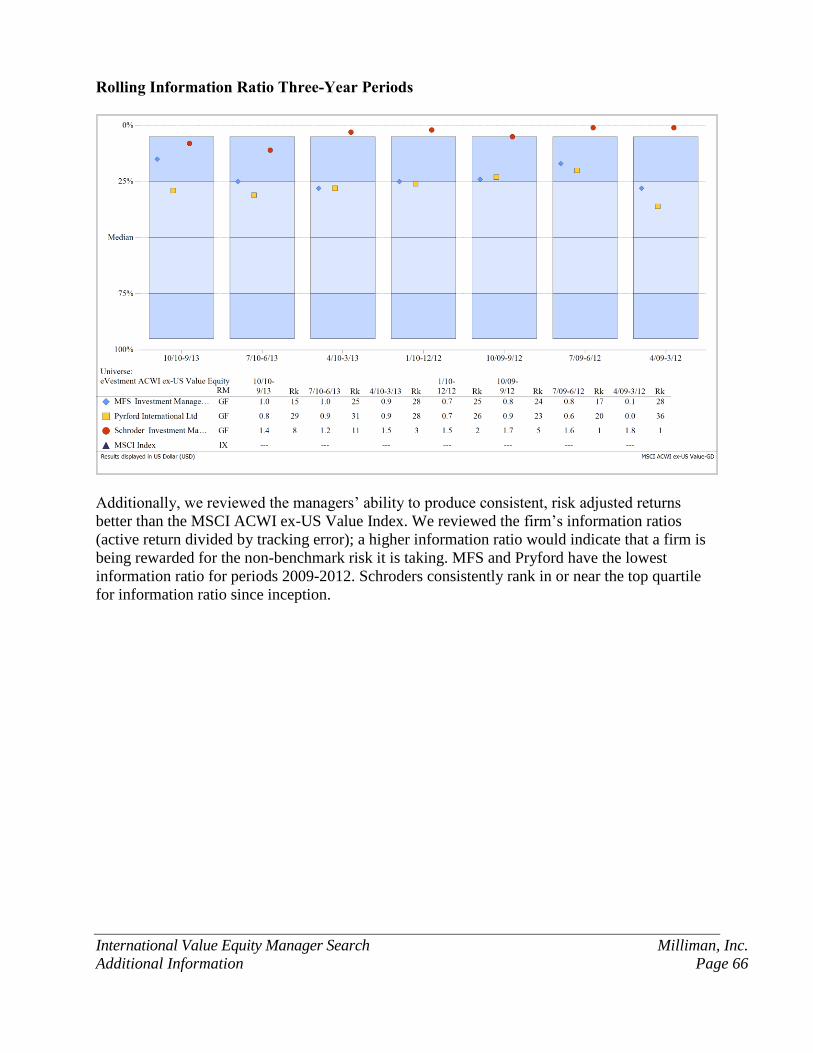
International Value Equity Manager Search Milliman, Inc.
Additional Information Page 66
Rolling Information Ratio Three-Year Periods
Additionally, we reviewed the managers’ ability to produce consistent, risk adjusted returns
better than the MSCI ACWI ex-US Value Index. We reviewed the firm’s information ratios
(active return divided by tracking error); a higher information ratio would indicate that a firm is
being rewarded for the non-benchmark risk it is taking. MFS and Pryford have the lowest
information ratio for periods 2009-2012. Schroders consistently rank in or near the top quartile
for information ratio since inception.
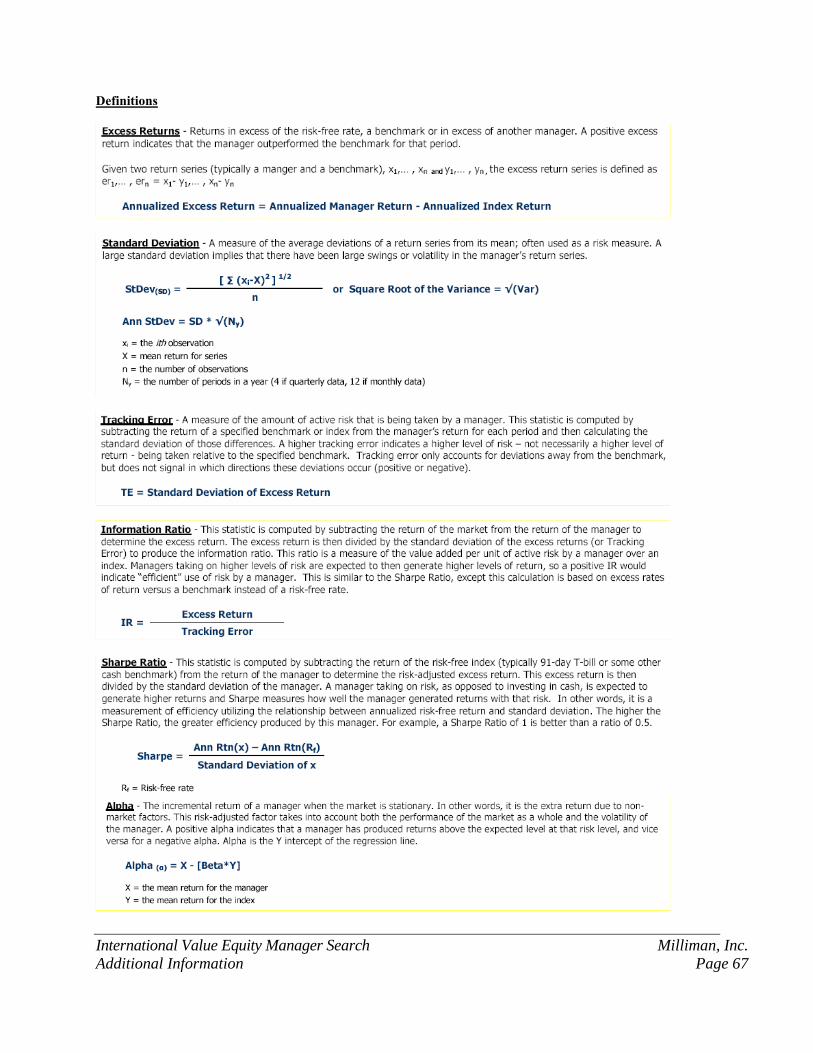
International Value Equity Manager Search Milliman, Inc.
Additional Information Page 67
Definitions
International Value Equity Manager Search Milliman, Inc.
Additional Information Page 68
FOR INSTITUTIONAL USE ONLY MFS Institutional Advisors, Inc.
October 23, 2013
MFS® INTERNATIONAL VALUE EQUITY
Presented to:
The Contra Costa County Employees' Retirement Association


Presenters
Camille Humphries Lee, CFA - Investment Officer- Institutional Equity Portfolio Manager- As an Institutional Portfolio Manager, participates in the research process and strategy discussions.
Assesses portfolio risk, customizes portfolios to client objectives and guidelines, and manages daily cashflows. Communicates investment policy, strategy, and positioning.
- Joined MFS in 2000.- Previous experience includes 3 years as Research Analyst at SG Cowen Securities Corporation; 8 years as
Research Analyst and Associate Analyst at Alex Brown.- Affiliations include CFA Institute, Boston Security Analysts Society, Inc.- University of Virginia, MBA- University of Virginia, BA
Allan Duckett - Director, Institutional Sales- Joined MFS in 2008.- Previous experience includes 7 years as Vice President, Manager - Client Relations at AllianceBernstein; 1
year as Consultant at Spherion, Inc.- University of California, Berkeley, MBA- University of Wisconsin, BBA

MFS® International Value Equity IV-S-MT-USD-US-3Q13.3
Table of contents
Contents Tab
Corporate organization 1
Investment overview 2
Appendix 3

MFS® overview
We apply a uniquely collaborative approach to build better insights for our clients
Integrated ResearchWe look at investment opportunities across the globe byintegrating fundamental equity, quantitative and creditdisciplines in our analysis.
Global CollaborationOur team philosophy and incentive structure ensure strong collaboration across the firm.
Active Risk ManagementWe take a holistic approach to actively managing risk withreviews in place at security, portfolio and firm levels and aclear focus on generating alpha for our clients.
1738-I-C-GG-8Aug13.1MFS® Global Growth
1
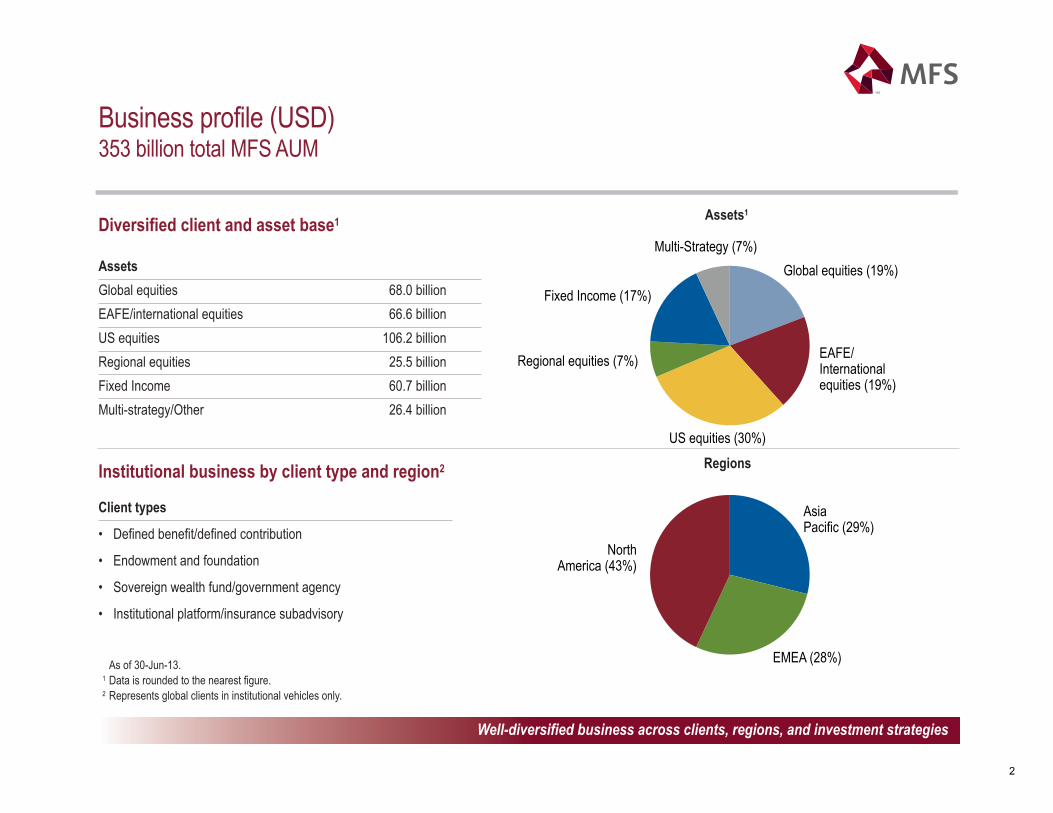
2738-I-C-GG-8Aug13.2MFS® Global Growth
Business profile (USD)353 billion total MFS AUM
Global equities (19%)
EAFE/International equities (19%)
US equities (30%)
Regional equities (7%)
Fixed Income (17%)
Multi-Strategy (7%)
Asia Pacific (29%)
EMEA (28%)
North America (43%)
RegionsInstitutional business by client type and region2
Client types
• Defined benefit/defined contribution
• Endowment and foundation
• Sovereign wealth fund/government agency
• Institutional platform/insurance subadvisory
Well-diversified business across clients, regions, and investment strategies
Diversified client and asset base1
AssetsGlobal equities 68.0 billionEAFE/international equities 66.6 billionUS equities 106.2 billionRegional equities 25.5 billionFixed Income 60.7 billionMulti-strategy/Other 26.4 billion
Assets1
As of 30-Jun-13.1 Data is rounded to the nearest figure. 2 Represents global clients in institutional vehicles only.
2
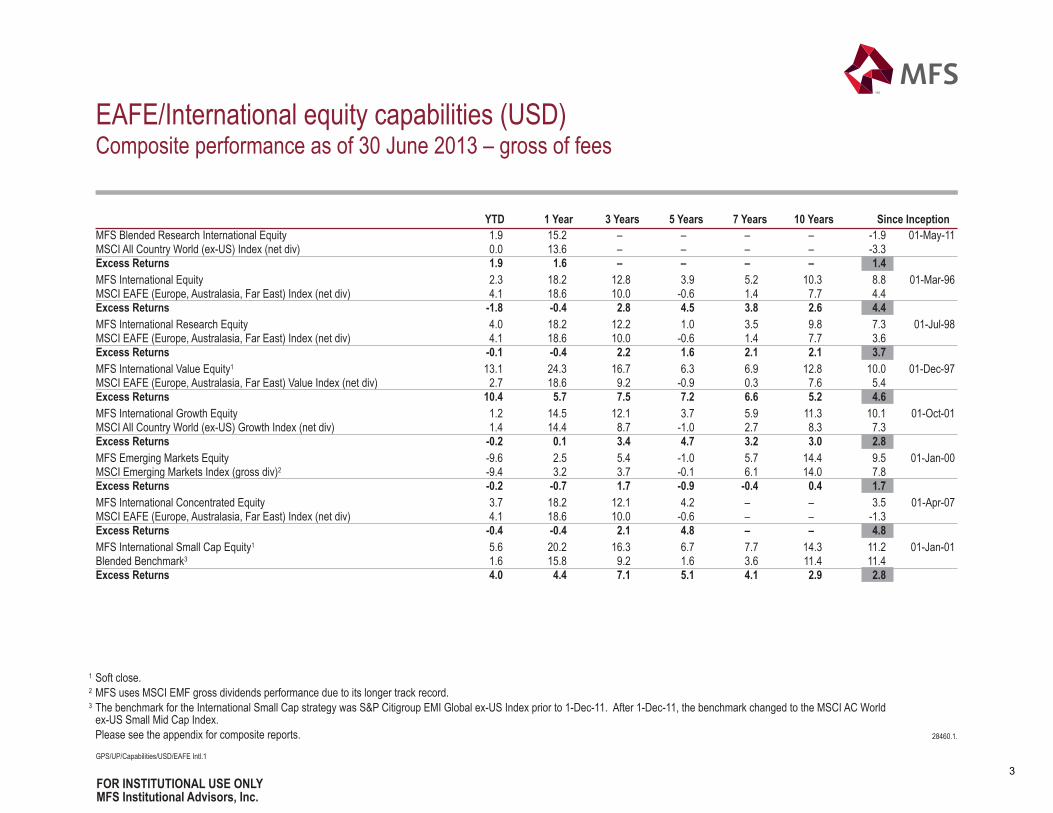
GPS/UP/Capabilities/USD/EAFE Intl.1
FOR INSTITUTIONAL USE ONLYMFS Institutional Advisors, Inc.
28460.1.
1 Soft close.2 MFS uses MSCI EMF gross dividends performance due to its longer track record.3 The benchmark for the International Small Cap strategy was S&P Citigroup EMI Global ex-US Index prior to 1-Dec-11. After 1-Dec-11, the benchmark changed to the MSCI AC World
ex-US Small Mid Cap Index. Please see the appendix for composite reports.
EAFE/International equity capabilities (USD)Composite performance as of 30 June 2013 – gross of fees
YTD 1 Year 3 Years 5 Years 7 Years 10 Years Since Inception MFS Blended Research International Equity 1.9 15.2 – – – – -1.9 01-May-11MSCI All Country World (ex-US) Index (net div) 0.0 13.6 – – – – -3.3Excess Returns 1.9 1.6 – – – – 1.4MFS International Equity 2.3 18.2 12.8 3.9 5.2 10.3 8.8 01-Mar-96MSCI EAFE (Europe, Australasia, Far East) Index (net div) 4.1 18.6 10.0 -0.6 1.4 7.7 4.4Excess Returns -1.8 -0.4 2.8 4.5 3.8 2.6 4.4MFS International Research Equity 4.0 18.2 12.2 1.0 3.5 9.8 7.3 01-Jul-98MSCI EAFE (Europe, Australasia, Far East) Index (net div) 4.1 18.6 10.0 -0.6 1.4 7.7 3.6Excess Returns -0.1 -0.4 2.2 1.6 2.1 2.1 3.7MFS International Value Equity1 13.1 24.3 16.7 6.3 6.9 12.8 10.0 01-Dec-97MSCI EAFE (Europe, Australasia, Far East) Value Index (net div) 2.7 18.6 9.2 -0.9 0.3 7.6 5.4Excess Returns 10.4 5.7 7.5 7.2 6.6 5.2 4.6MFS International Growth Equity 1.2 14.5 12.1 3.7 5.9 11.3 10.1 01-Oct-01MSCI All Country World (ex-US) Growth Index (net div) 1.4 14.4 8.7 -1.0 2.7 8.3 7.3Excess Returns -0.2 0.1 3.4 4.7 3.2 3.0 2.8MFS Emerging Markets Equity -9.6 2.5 5.4 -1.0 5.7 14.4 9.5 01-Jan-00MSCI Emerging Markets Index (gross div)2 -9.4 3.2 3.7 -0.1 6.1 14.0 7.8Excess Returns -0.2 -0.7 1.7 -0.9 -0.4 0.4 1.7MFS International Concentrated Equity 3.7 18.2 12.1 4.2 – – 3.5 01-Apr-07MSCI EAFE (Europe, Australasia, Far East) Index (net div) 4.1 18.6 10.0 -0.6 – – -1.3Excess Returns -0.4 -0.4 2.1 4.8 – – 4.8MFS International Small Cap Equity1 5.6 20.2 16.3 6.7 7.7 14.3 11.2 01-Jan-01Blended Benchmark3 1.6 15.8 9.2 1.6 3.6 11.4 11.4Excess Returns 4.0 4.4 7.1 5.1 4.1 2.9 2.8
3
Representative MFS institutional client list1Serving over 300 institutional clients globally
Corporate • American Airlines • Bristol-Myers Squibb• CenturyLink• Chrysler • Google• MeadWestvaco Corporation• Mitsubishi Electric Pension Fund• Nestle• Panasonic Pension Fund (Japan)• PepsiCo Inc• Robert Bosch GmbH• Toyota Motor Corporation (Japan)• U.S. Airways
Non-profit• Archdiocese of New York• California Academy of Sciences• CERN Pension Fund• Children’s Hospital of Pittsburgh• Community Hospital of the Monterey Peninsula• Furman University• National Gallery of Art• North Shore Long Island Jewish Health System• Providence College• Texas A&M Foundation• Trinity University• Virginia Tech
Public funds & Taft Hartley• Andra AP-Fonden• City of Phoenix• County of Los Angeles• Lærernes Pension• Federation of National Public Service Workers
Personnel Mutual Aid Associations, Japan• Government Pension Investment Fund
of Japan• London Pensions Fund Authority• Lønmodtagernes Dyrtidsfond• LSR (The Pension Fund for State Employees
in Iceland)• Massachusetts Water Resources Authority• Nebraska Investment Council• Oregon and Southwest Washington Painters• Parliamentary Contributory Pension Fund• State of Oregon• UFCW Tri-State Pension
• ING Investment Management• GuideStone Capital Management
• NTUC Income Insurance Co-Operative Ltd.• Russell Investment Group
Sub-advised accounts
1 As of 30-Jun-13. This does not represent a complete list of MFS’ institutional clients. The selection of clients represents a sampling of those who have agreed to the use of their names. It is not known whether the listed clients approve or disapprove of MFS Institutional Advisors Inc. or the advisory service provided. The criteria used to include the above listed clients are amix of investment style, type of client, and other considerations.
Commitment to world class client service results in enduring relationships
4
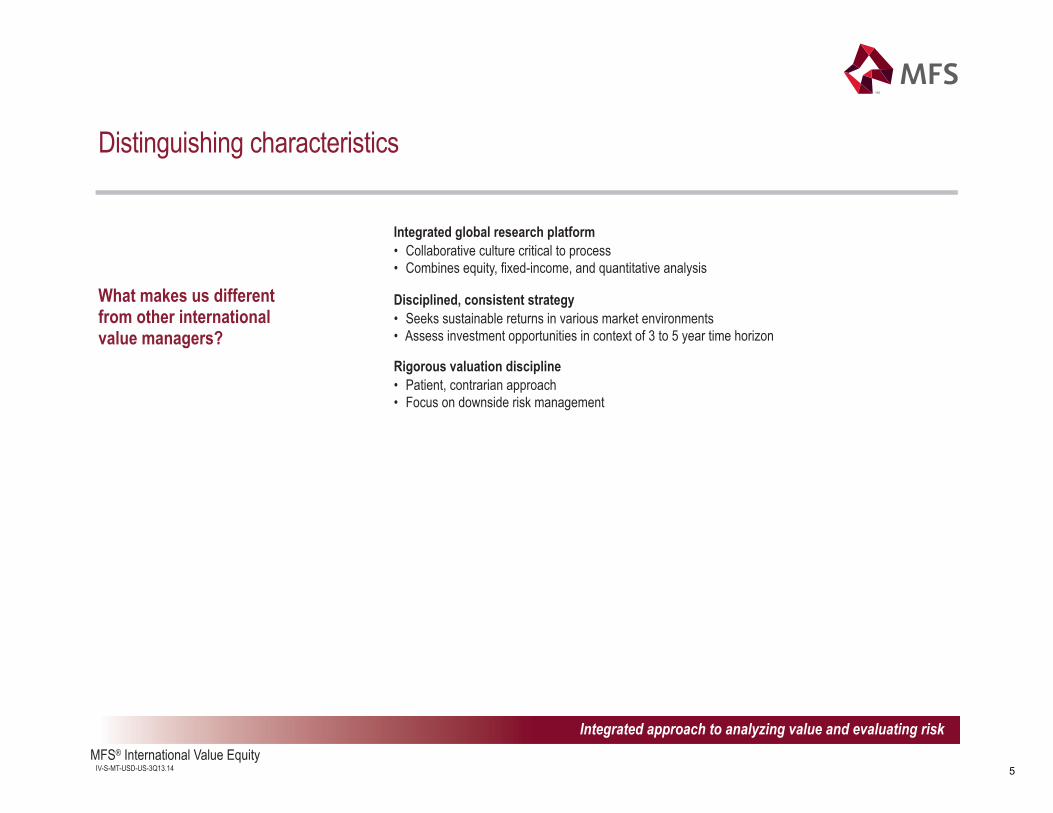
MFS® International Value Equity IV-S-MT-USD-US-3Q13.14
What makes us different from other international value managers?
Integrated global research platform• Collaborative culture critical to process• Combines equity, fixed-income, and quantitative analysis
Disciplined, consistent strategy• Seeks sustainable returns in various market environments• Assess investment opportunities in context of 3 to 5 year time horizon
Rigorous valuation discipline• Patient, contrarian approach• Focus on downside risk management
Distinguishing characteristics
Integrated approach to analyzing value and evaluating risk
5
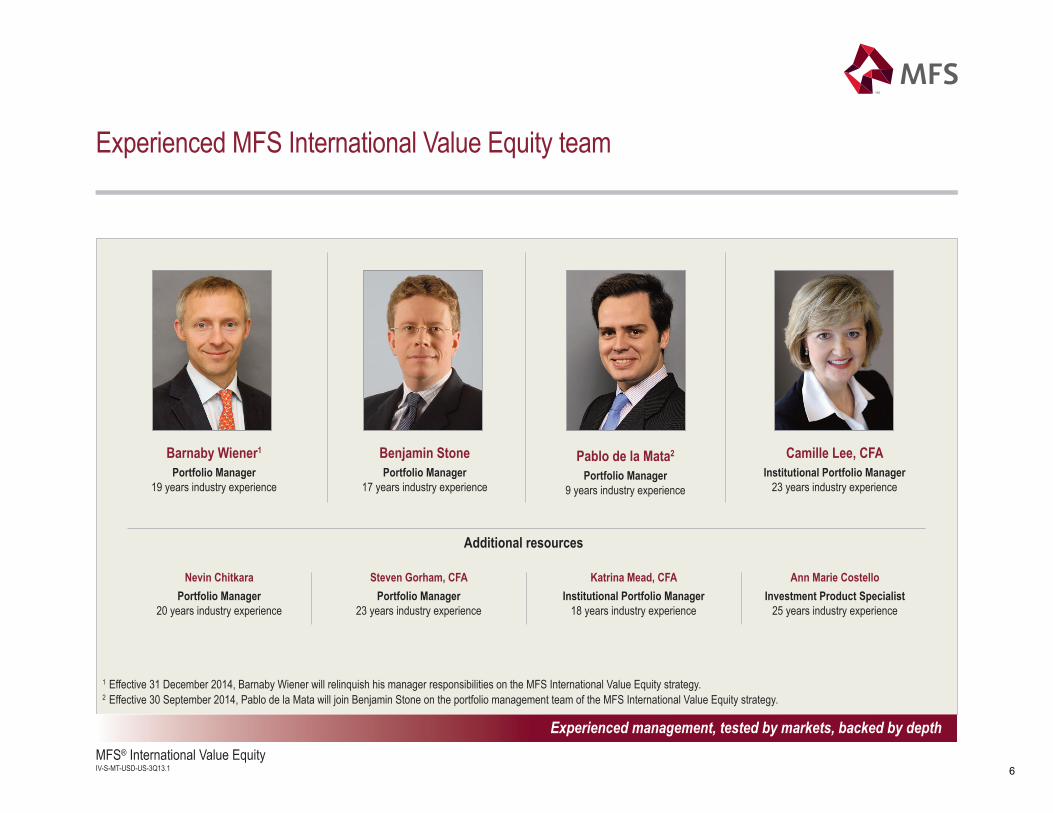
1MFS® International Value Equity IV-S-MT-USD-US-3Q13.1
Barnaby Wiener1
Portfolio Manager19 years industry experience
Benjamin StonePortfolio Manager
17 years industry experience
Camille Lee, CFAInstitutional Portfolio Manager
23 years industry experience
Pablo de la Mata2
Portfolio Manager9 years industry experience
Experienced MFS International Value Equity team
Experienced management, tested by markets, backed by depth
Ann Marie CostelloInvestment Product Specialist
25 years industry experience
Nevin ChitkaraPortfolio Manager
20 years industry experience
Steven Gorham, CFAPortfolio Manager
23 years industry experience
Katrina Mead, CFAInstitutional Portfolio Manager
18 years industry experience
Additional resources
1 Effective 31 December 2014, Barnaby Wiener will relinquish his manager responsibilities on the MFS International Value Equity strategy.2 Effective 30 September 2014, Pablo de la Mata will join Benjamin Stone on the portfolio management team of the MFS International Value Equity strategy.
6
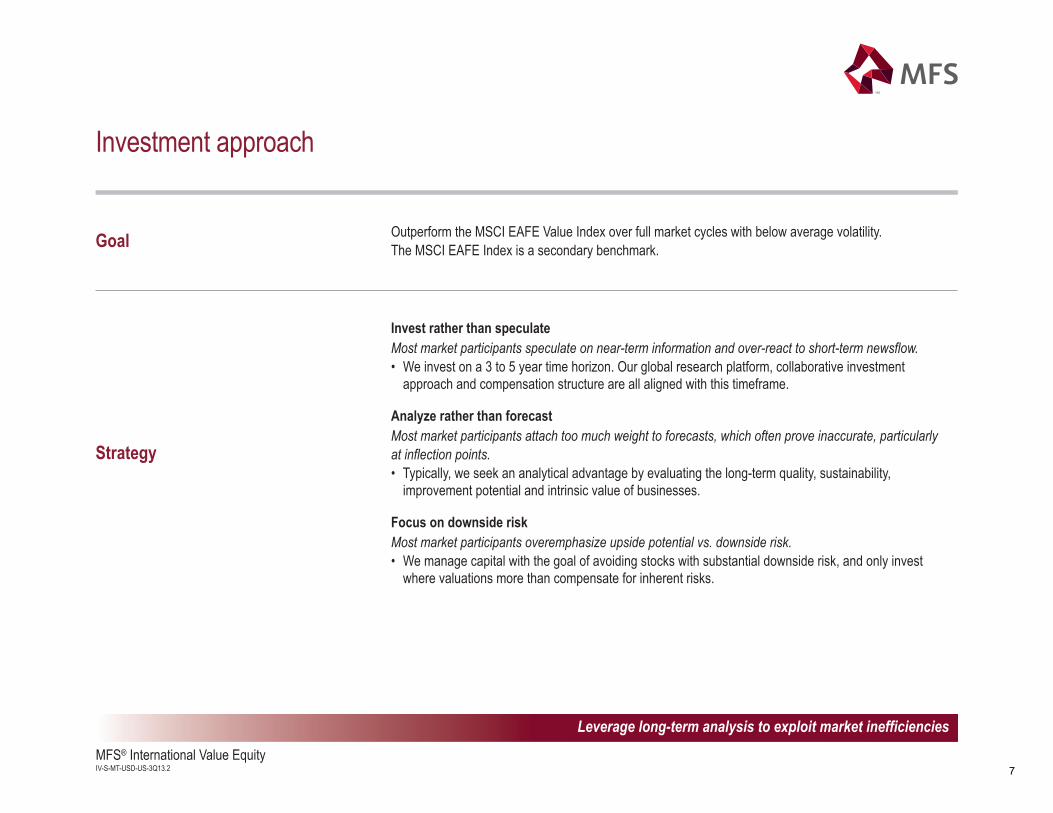
2MFS® International Value Equity IV-S-MT-USD-US-3Q13.2
Goal Outperform the MSCI EAFE Value Index over full market cycles with below average volatility. The MSCI EAFE Index is a secondary benchmark.
Strategy
Invest rather than speculateMost market participants speculate on near-term information and over-react to short-term newsflow. • We invest on a 3 to 5 year time horizon. Our global research platform, collaborative investment
approach and compensation structure are all aligned with this timeframe.
Analyze rather than forecastMost market participants attach too much weight to forecasts, which often prove inaccurate, particularly at inflection points.• Typically, we seek an analytical advantage by evaluating the long-term quality, sustainability,
improvement potential and intrinsic value of businesses.
Focus on downside riskMost market participants overemphasize upside potential vs. downside risk.• We manage capital with the goal of avoiding stocks with substantial downside risk, and only invest
where valuations more than compensate for inherent risks.
Investment approach
Leverage long-term analysis to exploit market inefficiencies
7
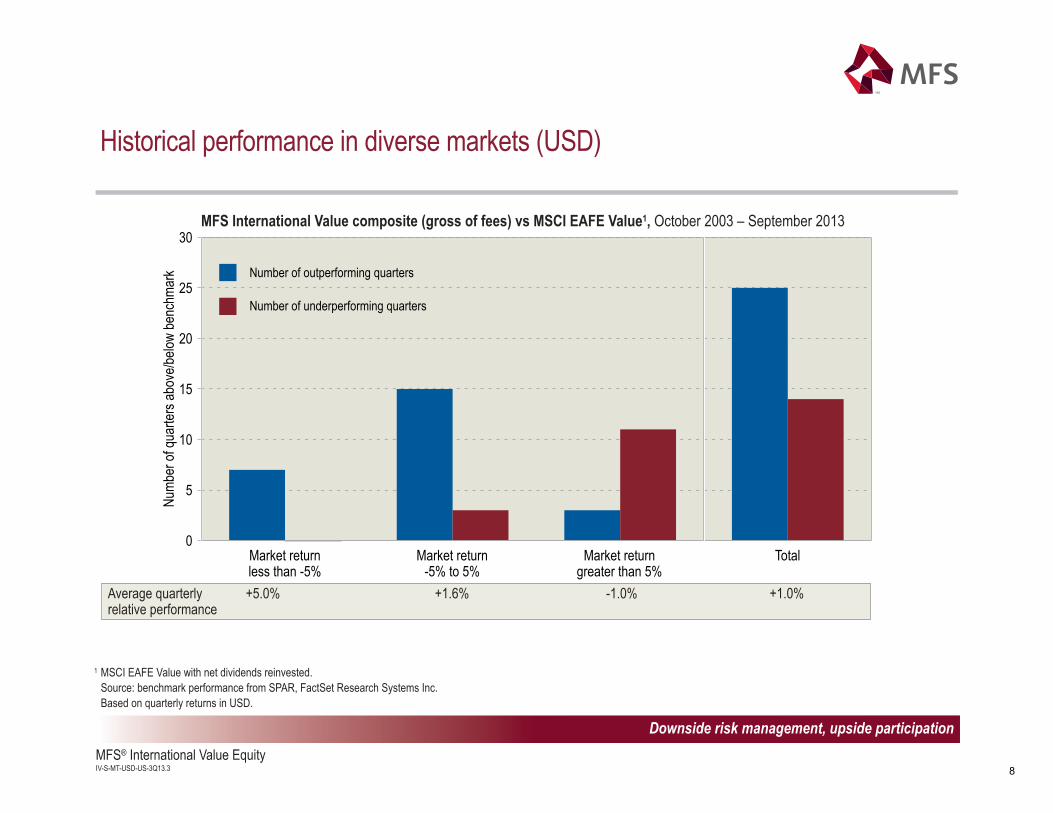
3MFS® International Value Equity IV-S-MT-USD-US-3Q13.3
Historical performance in diverse markets (USD)
1 MSCI EAFE Value with net dividends reinvested.Source: benchmark performance from SPAR, FactSet Research Systems Inc.Based on quarterly returns in USD.
Market return less than -5%
Market return -5% to 5%
Market return greater than 5%
Total0
5
10
15
20
25
30
Num
ber o
f qua
rters
abo
ve/b
elow
ben
chm
ark Number of outperforming quarters
Number of underperforming quarters
MFS International Value composite (gross of fees) vs MSCI EAFE Value1, October 2003 – September 2013
Downside risk management, upside participation
Average quarterly +5.0% +1.6% -1.0% +1.0%relative performance
8
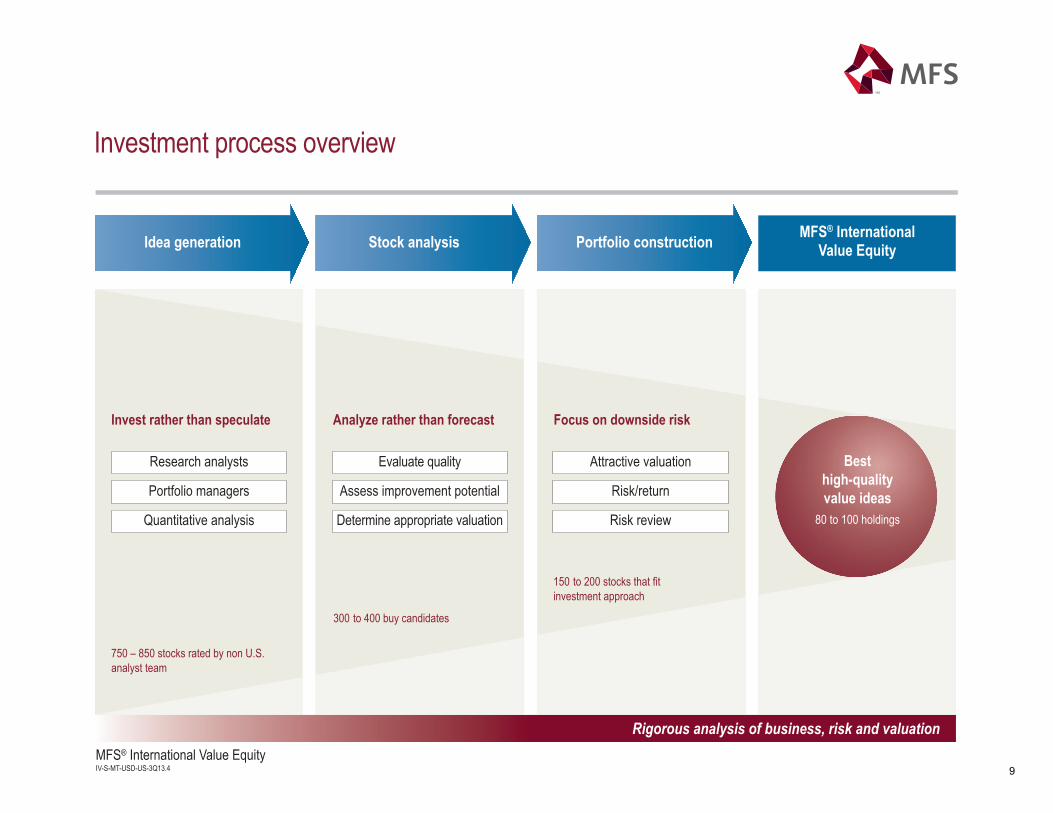
4MFS® International Value Equity IV-S-MT-USD-US-3Q13.4
Investment process overview
Portfolio constructionStock analysisIdea generation MFS® International Value Equity
Invest rather than speculate Focus on downside risk
Research analysts
Portfolio managers
Attractive valuation
Risk/return
Risk review
Analyze rather than forecast
Evaluate quality
Determine appropriate valuation
Assess improvement potential
750 – 850 stocks rated by non U.S.analyst team
300 to 400 buy candidates
150 to 200 stocks that fit investment approach
Quantitative analysis
Besthigh-quality value ideas
80 to 100 holdings
Rigorous analysis of business, risk and valuation
9
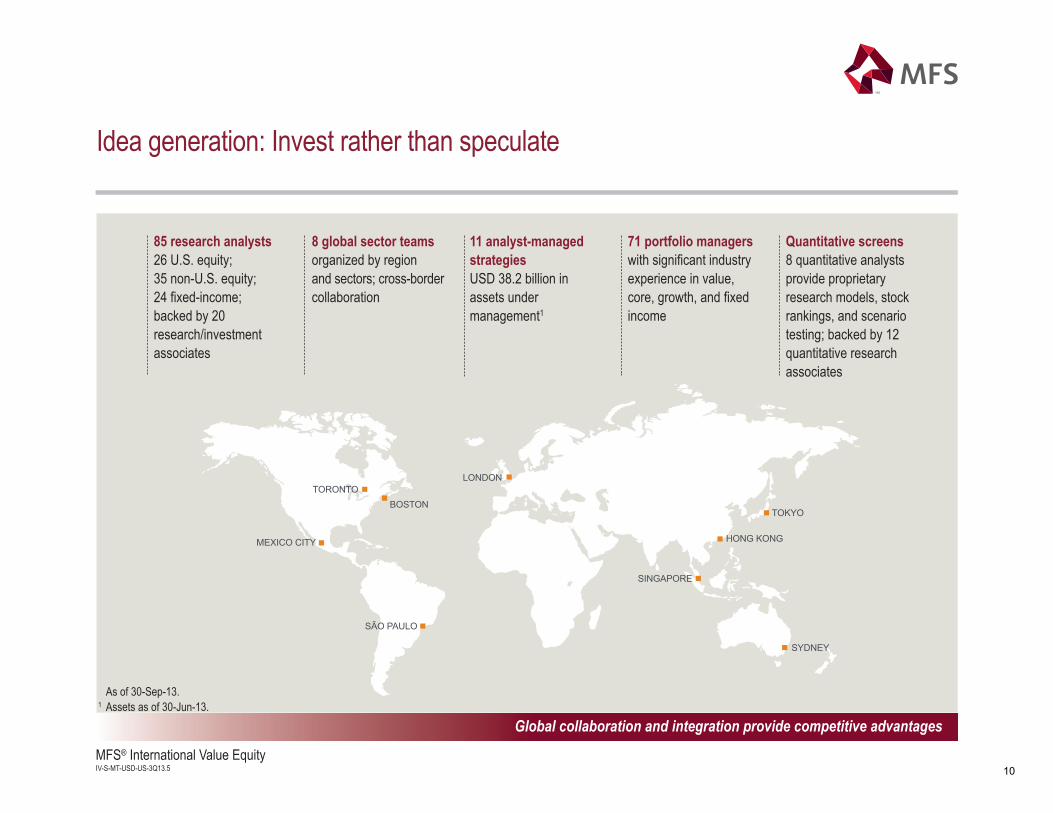
5MFS® International Value Equity IV-S-MT-USD-US-3Q13.5
Idea generation: Invest rather than speculate
BOSTONTORONTO
MEXICO CITY
SÃO PAULO
SYDNEY
SINGAPORE
HONG KONG
TOKYO
LONDON
85 research analysts26 U.S. equity; 35 non-U.S. equity; 24 fixed-income; backed by 20research/investmentassociates
8 global sector teamsorganized by region and sectors; cross-bordercollaboration
11 analyst-managedstrategiesUSD 38.2 billion inassets undermanagement1
71 portfolio managerswith significant industryexperience in value,core, growth, and fixedincome
Quantitative screens8 quantitative analystsprovide proprietaryresearch models, stockrankings, and scenariotesting; backed by 12quantitative researchassociates
Global collaboration and integration provide competitive advantages
As of 30-Sep-13.1 Assets as of 30-Jun-13.
10
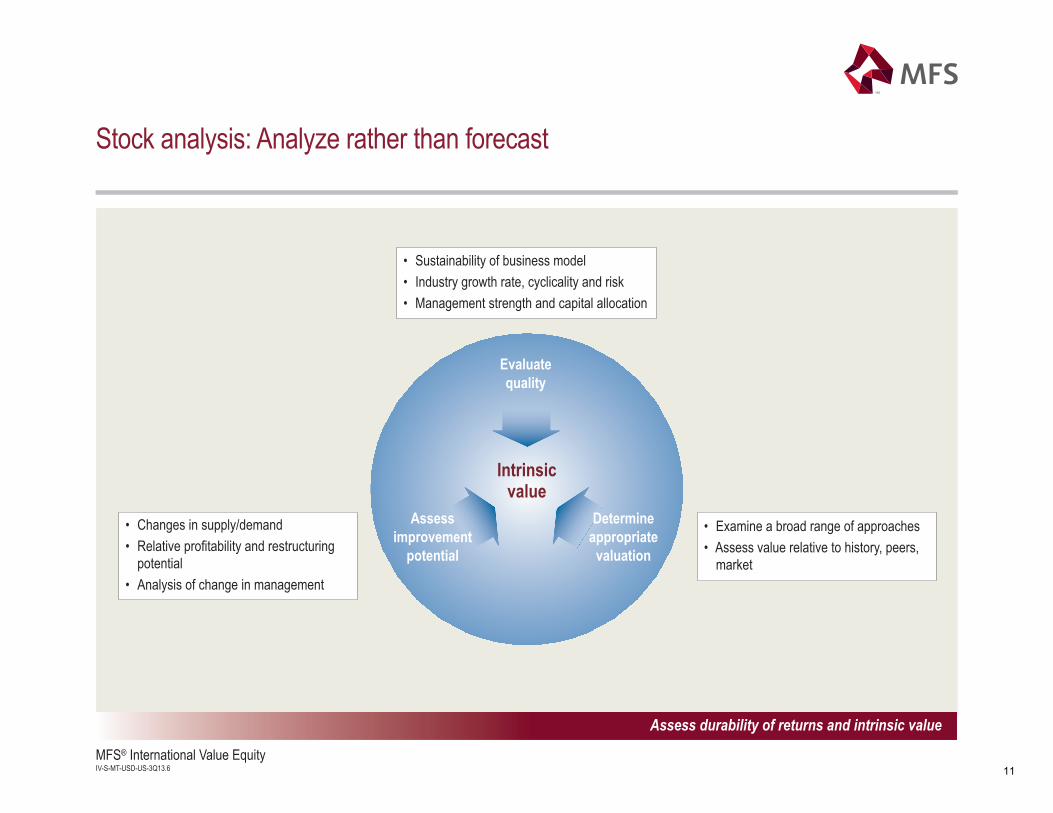
6MFS® International Value Equity IV-S-MT-USD-US-3Q13.6
Assess durability of returns and intrinsic value
Stock analysis: Analyze rather than forecast
Intrinsicvalue
Evaluatequality
Determineappropriatevaluation
Assessimprovement
potential
• Changes in supply/demand• Relative profitability and restructuring
potential• Analysis of change in management
• Examine a broad range of approaches • Assess value relative to history, peers,
market
• Sustainability of business model• Industry growth rate, cyclicality and risk• Management strength and capital allocation
11
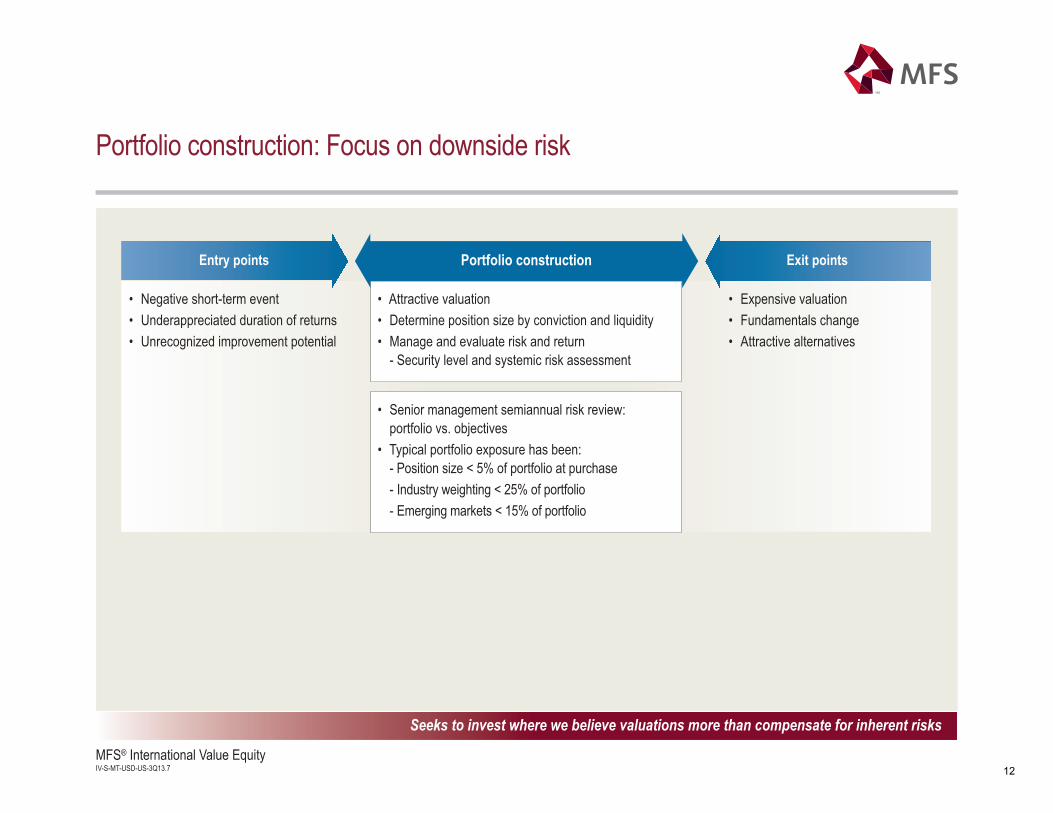
7MFS® International Value Equity IV-S-MT-USD-US-3Q13.7
Portfolio construction: Focus on downside risk
Entry points
• Negative short-term event• Underappreciated duration of returns• Unrecognized improvement potential
Exit points
• Expensive valuation• Fundamentals change• Attractive alternatives
Portfolio construction
• Attractive valuation• Determine position size by conviction and liquidity• Manage and evaluate risk and return
- Security level and systemic risk assessment
Seeks to invest where we believe valuations more than compensate for inherent risks
• Senior management semiannual risk review: portfolio vs. objectives
• Typical portfolio exposure has been:- Position size < 5% of portfolio at purchase- Industry weighting < 25% of portfolio- Emerging markets < 15% of portfolio
12
8MFS® International Value Equity IV-S-MT-USD-US-3Q13.8
Sector weights
As of 30-Sep-13
Con
sum
erSt
aple
s
Fina
ncia
lSe
rvic
es
Hea
lth C
are
Tech
nolo
gy
Util
ities
&C
omm
unic
atio
ns
Spec
ial P
rodu
cts
& Se
rvic
es
Indu
stria
l Goo
ds&
Serv
ices
Leis
ure
Ener
gy
Basi
c M
ater
ials
Tran
spor
tatio
n
Auto
s &
Hou
sing
Ret
ailin
g
20.5
1.2
9.2
18.4
35.8
25.2
11.3
6.0
9.9 9.3
4.5 4.8
8.6
14.8
9.27.7
3.3 3.4 4.5 4.4
7.2
3.51.0
2.6 3.4
10.4
6.8
2.8
8.0 7.7
1.9 2.1 2.4 1.7
5.8 6.6
1.7 2.75.0
MFS International Value Equity MSCI EAFE Value MSCI EAFE
Relative exposure to:
19.311.3
-17.4-6.8
5.31.4
4.84.5
-6.2-0.6
4.44.3
0.1-2.7
2.50.9
-7.0-3.4
-5.2-4.9
-0.2-0.5
-4.1-4.9
-1.0-3.3
MSCI EAFE ValueMSCI EAFE
4.6% cash and other assets are less liabilities; this may include derivative offsets.
13
9MFS® International Value Equity IV-S-MT-USD-US-3Q13.9
Region and country weights
Portfolio (%)Underweight/overweight (%)
4.6% cash and other assets are less liabilities; this may include derivative offsets. Portfolio does not own securities in the Developed - Middle East/Africa region (0.5%).1 Portfolio does not own securities in the following country: Israel 0.5%; and 5 other countries with weights less than 0.5% totaling 1.1%.
Underweight/overweightas of 30-Sep-13 (%)
MSCI EAFE ValueIndex (%)
Europe ex-U.K. 40.4 42.4 -2.0Switzerland 12.4 3.5 8.9Netherlands 3.8 2.2 1.6Denmark 1.3 0.4 0.9Finland 1.4 1.2 0.2Ireland 0.2 0.3 -0.1Norway 1.1 1.5 -0.4Sweden 2.4 2.8 -0.4Italy 1.5 2.7 -1.2Germany 8.5 10.5 -2.0Spain 1.7 5.3 -3.6France 6.0 11.0 -5.0Other 1 0.0 1.0 -1.0
United Kingdom 24.7 23.6 1.1Japan 26.9 21.2 5.7Asia/Pacific ex-Japan 2.0 12.4 -10.4
Singapore 0.3 1.6 -1.3Hong Kong 0.5 2.8 -2.3Australia 1.2 7.9 -6.7Other 1 0.0 0.1 -0.1
Emerging Markets 1.4 0.0 1.4Taiwan 1.2 0.0 1.2China 0.2 0.0 0.2
-2.0
1.1
5.7
-10.4
1.4
Europeex-U.K.
UnitedKingdom
Japan
Asia/Pacificex-Japan
EmergingMarkets
14
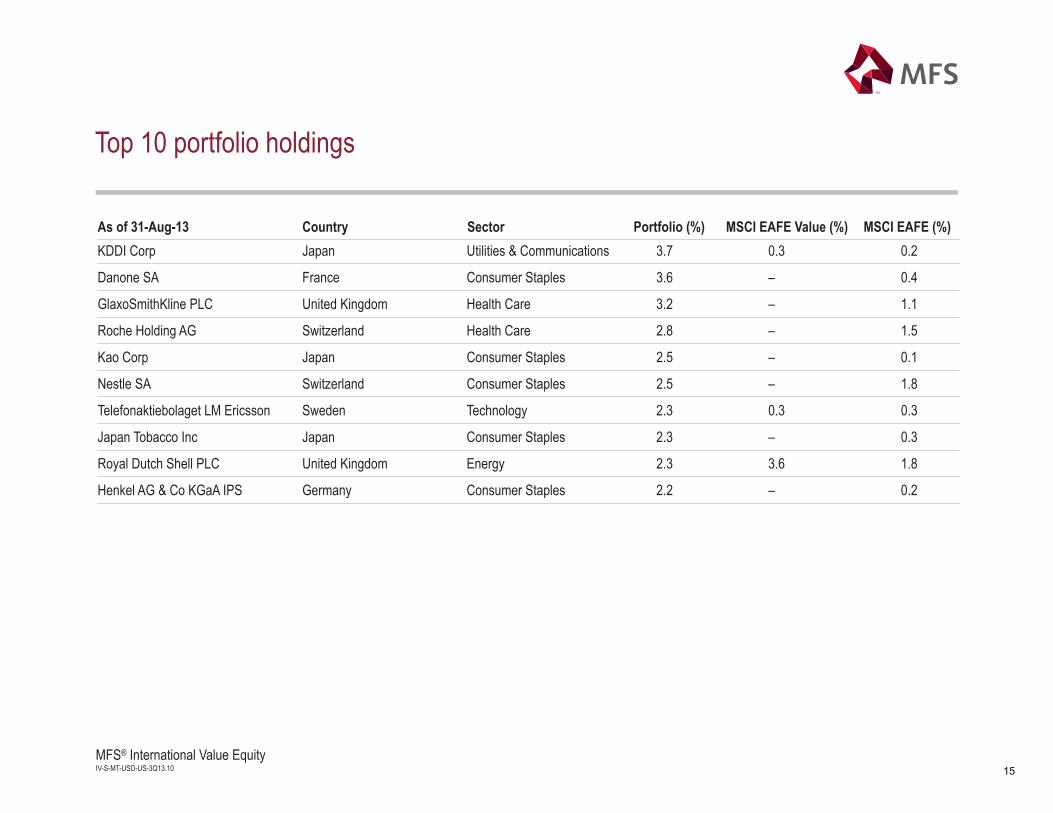
10MFS® International Value Equity IV-S-MT-USD-US-3Q13.10
KDDI Corp Japan Utilities & Communications 3.7 0.3 0.2
Danone SA France Consumer Staples 3.6 – 0.4
GlaxoSmithKline PLC United Kingdom Health Care 3.2 – 1.1
Roche Holding AG Switzerland Health Care 2.8 – 1.5
Kao Corp Japan Consumer Staples 2.5 – 0.1
Nestle SA Switzerland Consumer Staples 2.5 – 1.8
Telefonaktiebolaget LM Ericsson Sweden Technology 2.3 0.3 0.3
Japan Tobacco Inc Japan Consumer Staples 2.3 – 0.3
Royal Dutch Shell PLC United Kingdom Energy 2.3 3.6 1.8
Henkel AG & Co KGaA IPS Germany Consumer Staples 2.2 – 0.2
Top 10 portfolio holdings
As of 31-Aug-13 Country Sector Portfolio (%) MSCI EAFE Value (%) MSCI EAFE (%)
15
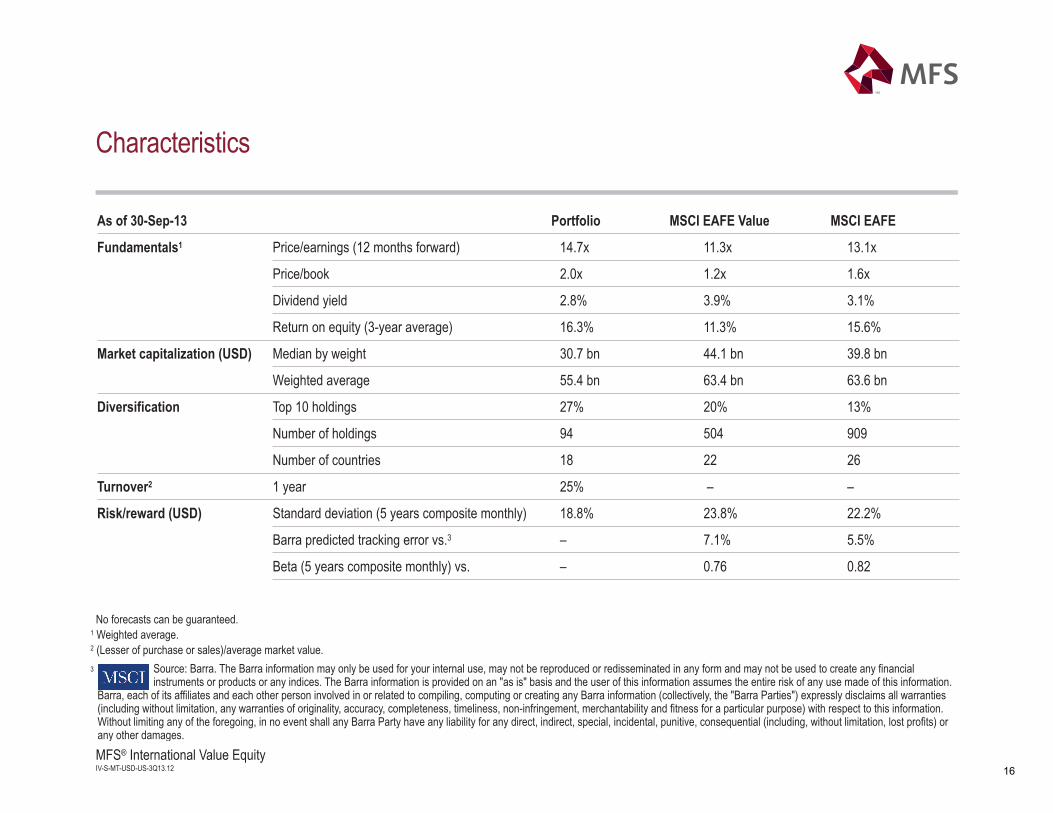
12MFS® International Value Equity IV-S-MT-USD-US-3Q13.12
Characteristics
No forecasts can be guaranteed.1 Weighted average.2 (Lesser of purchase or sales)/average market value.
Source: Barra. The Barra information may only be used for your internal use, may not be reproduced or redisseminated in any form and may not be used to create any financial instruments or products or any indices. The Barra information is provided on an "as is" basis and the user of this information assumes the entire risk of any use made of this information.
Barra, each of its affiliates and each other person involved in or related to compiling, computing or creating any Barra information (collectively, the "Barra Parties") expressly disclaims all warranties(including without limitation, any warranties of originality, accuracy, completeness, timeliness, non-infringement, merchantability and fitness for a particular purpose) with respect to this information.Without limiting any of the foregoing, in no event shall any Barra Party have any liability for any direct, indirect, special, incidental, punitive, consequential (including, without limitation, lost profits) orany other damages.
3
As of 30-Sep-13 Portfolio MSCI EAFE Value MSCI EAFE
Fundamentals1 Price/earnings (12 months forward) 14.7x 11.3x 13.1x
Price/book 2.0x 1.2x 1.6x
Dividend yield 2.8% 3.9% 3.1%
Return on equity (3-year average) 16.3% 11.3% 15.6%
Market capitalization (USD) Median by weight 30.7 bn 44.1 bn 39.8 bn
Weighted average 55.4 bn 63.4 bn 63.6 bn
Diversification Top 10 holdings 27% 20% 13%
Number of holdings 94 504 909
Number of countries 18 22 26
Turnover2 1 year 25% – –
Risk/reward (USD) Standard deviation (5 years composite monthly) 18.8% 23.8% 22.2%
Barra predicted tracking error vs.3 – 7.1% 5.5%
Beta (5 years composite monthly) vs. – 0.76 0.82
16
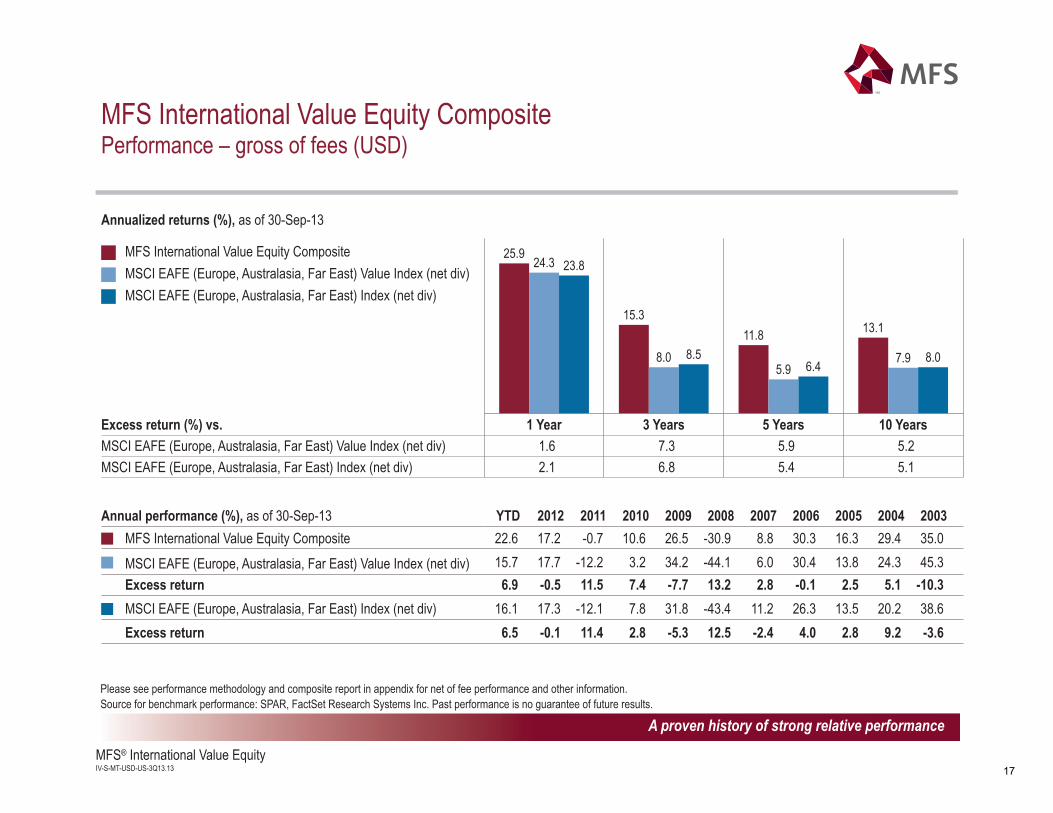
13MFS® International Value Equity IV-S-MT-USD-US-3Q13.13
A proven history of strong relative performance
MFS International Value Equity CompositePerformance – gross of fees (USD)
Annualized returns (%), as of 30-Sep-13
Annual performance (%), as of 30-Sep-13 YTD 2012 2011 2010 2009 2008 2007 2006 2005 2004 2003
MFS International Value Equity CompositeMSCI EAFE (Europe, Australasia, Far East) Value Index (net div)MSCI EAFE (Europe, Australasia, Far East) Index (net div)
25.9
15.311.8 13.1
24.3
8.05.9
7.9
23.8
8.56.4
8.0
1 Year 3 Years 5 Years 10 YearsExcess return (%) vs.MSCI EAFE (Europe, Australasia, Far East) Value Index (net div) 1.6 7.3 5.9 5.2MSCI EAFE (Europe, Australasia, Far East) Index (net div) 2.1 6.8 5.4 5.1
MFS International Value Equity Composite 22.6 17.2 -0.7 10.6 26.5 -30.9 8.8 30.3 16.3 29.4 35.0 MSCI EAFE (Europe, Australasia, Far East) Value Index (net div) 15.7 17.7 -12.2 3.2 34.2 -44.1 6.0 30.4 13.8 24.3 45.3 Excess return 6.9 -0.5 11.5 7.4 -7.7 13.2 2.8 -0.1 2.5 5.1 -10.3MSCI EAFE (Europe, Australasia, Far East) Index (net div) 16.1 17.3 -12.1 7.8 31.8 -43.4 11.2 26.3 13.5 20.2 38.6 Excess return 6.5 -0.1 11.4 2.8 -5.3 12.5 -2.4 4.0 2.8 9.2 -3.6
Please see performance methodology and composite report in appendix for net of fee performance and other information.Source for benchmark performance: SPAR, FactSet Research Systems Inc. Past performance is no guarantee of future results.
17
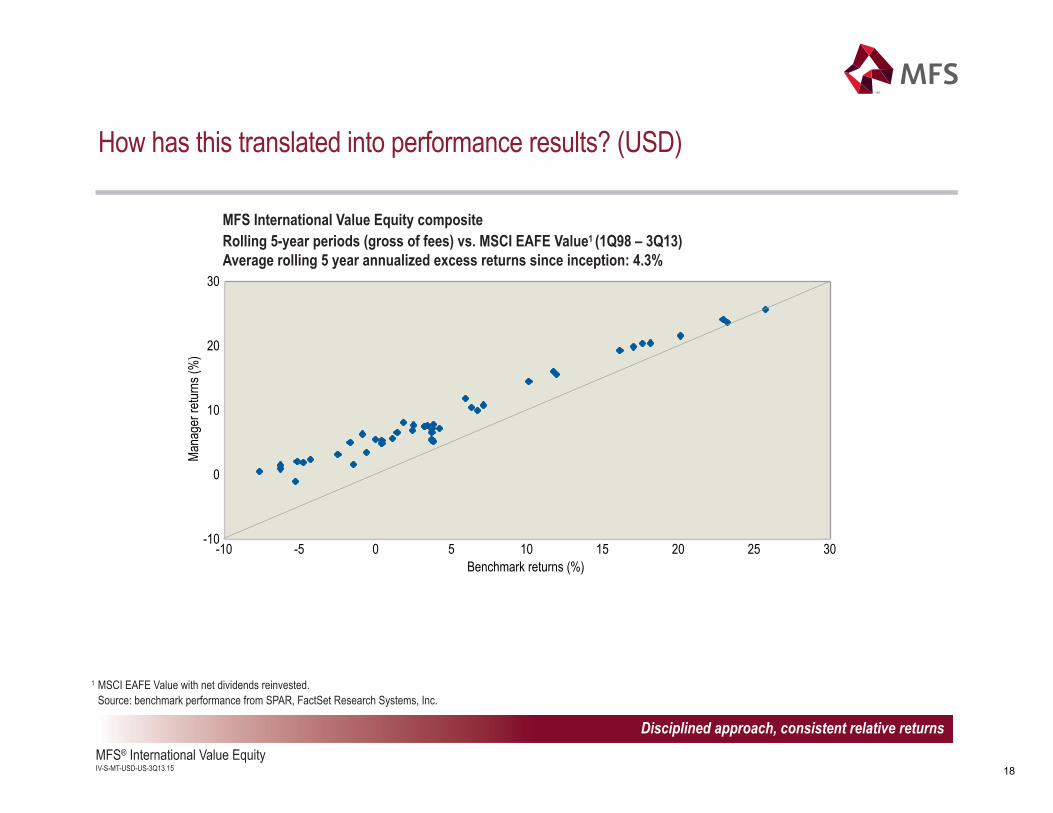
15MFS® International Value Equity IV-S-MT-USD-US-3Q13.15
How has this translated into performance results? (USD)
MFS International Value Equity composite Rolling 5-year periods (gross of fees) vs. MSCI EAFE Value1 (1Q98 – 3Q13)Average rolling 5 year annualized excess returns since inception: 4.3%
1 MSCI EAFE Value with net dividends reinvested. Source: benchmark performance from SPAR, FactSet Research Systems, Inc.
Disciplined approach, consistent relative returns
-10
0
10
20
30
-10 -5 0 5 10 15 20 25 30
Man
ager
retu
rns
(%)
Benchmark returns (%)
18
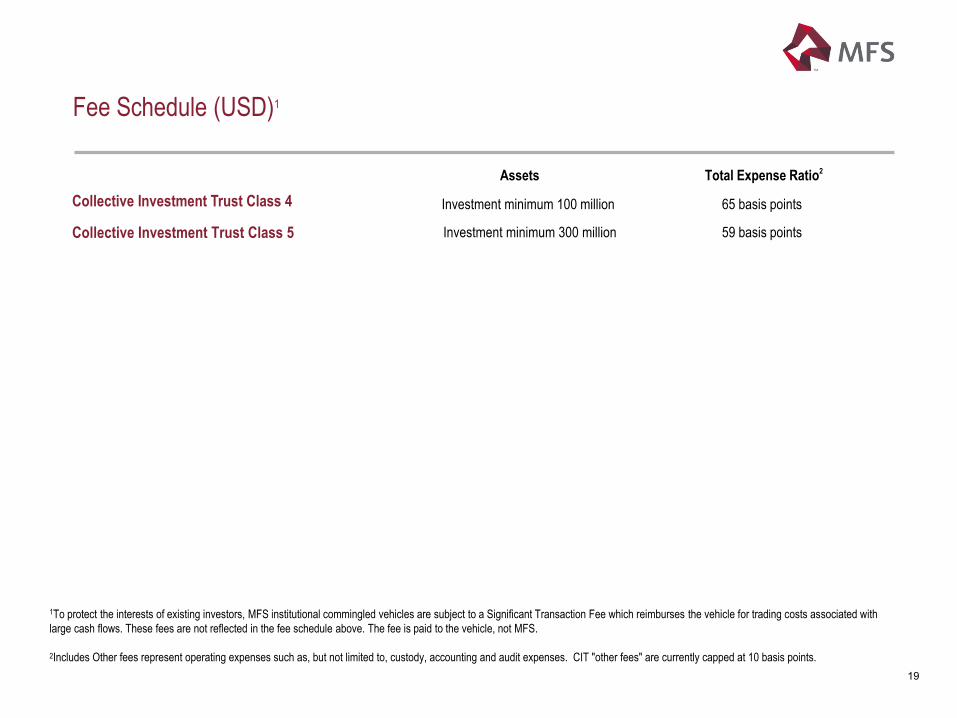
Fee Schedule (USD)1
Assets Total Expense Ratio2
Investment minimum 100 million 65 basis points
Investment minimum 300 million 59 basis points
Collective Investment Trust Class 4
Collective Investment Trust Class 5
1To protect the interests of existing investors, MFS institutional commingled vehicles are subject to a Significant Transaction Fee which reimburses the vehicle for trading costs associated with large cash flows. These fees are not reflected in the fee schedule above. The fee is paid to the vehicle, not MFS. 2Includes Other fees represent operating expenses such as, but not limited to, custody, accounting and audit expenses. CIT "other fees" are currently capped at 10 basis points.
19
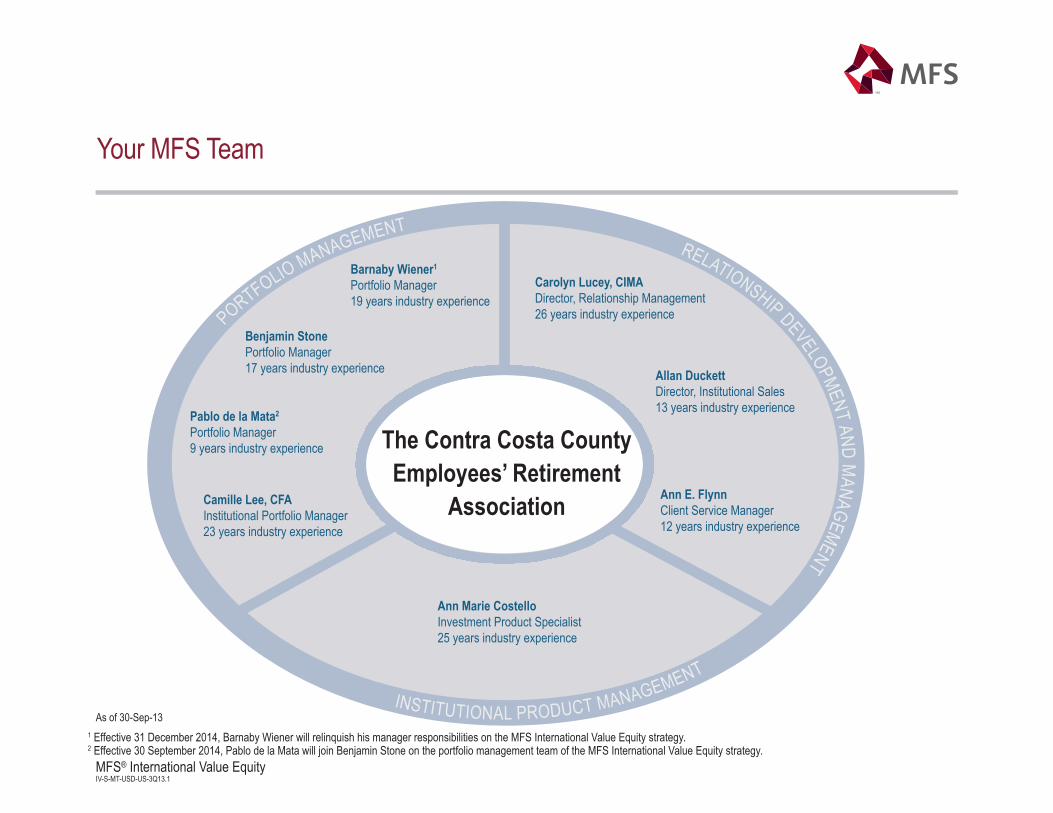
1MFS® International Value Equity IV-S-MT-USD-US-3Q13.1
Your MFS Team
PORTFOLIO MANAGEMENTRELATIONSHIP DEVELOPMENT AND
MANAGEMENT
INSTITUTIONAL PRODUCT MANAGEMENT
The Contra Costa CountyEmployees’ Retirement
Association
Barnaby Wiener1
Portfolio Manager19 years industry experience
Benjamin StonePortfolio Manager17 years industry experience
Pablo de la Mata2
Portfolio Manager9 years industry experience
Ann E. FlynnClient Service Manager12 years industry experience
Ann Marie CostelloInvestment Product Specialist25 years industry experience
Camille Lee, CFAInstitutional Portfolio Manager23 years industry experience
Allan DuckettDirector, Institutional Sales13 years industry experience
Carolyn Lucey, CIMADirector, Relationship Management26 years industry experience
As of 30-Sep-131 Effective 31 December 2014, Barnaby Wiener will relinquish his manager responsibilities on the MFS International Value Equity strategy.2 Effective 30 September 2014, Pablo de la Mata will join Benjamin Stone on the portfolio management team of the MFS International Value Equity strategy.
16MFS® International Value Equity IV-S-MT-USD-US-3Q13.16
Appendix
Contents Page
MFS International Value Equity team 22
Historical portfolio weights 26
Region and country weights vs. MSCI EAFE 27
Market capitalization (USD) 28
MFS International Value ïinvesting for the long term 31
MFS International Value Equity Composite quarterly and annual performance summary – gross of fees (USD) 29
MFS International Value Equity Composite performance – net of fees (USD) 30
Composite report (USD) 32
21
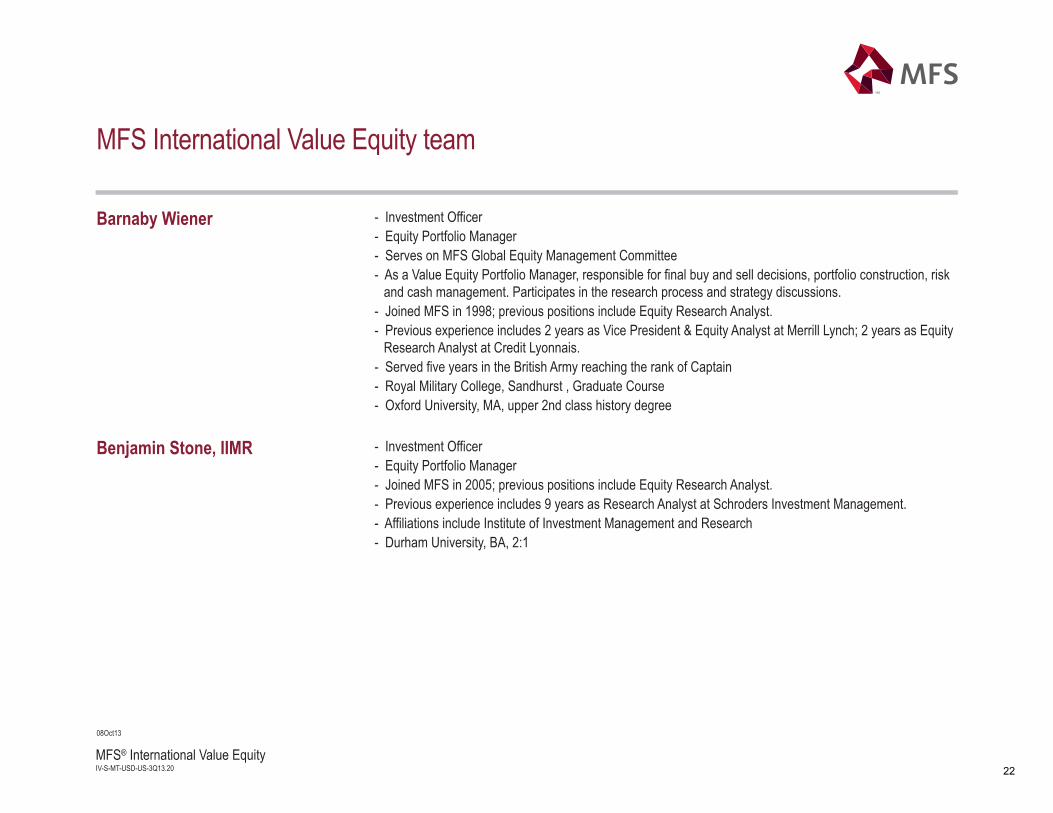
MFS International Value Equity team
08Oct13
Barnaby Wiener - Investment Officer- Equity Portfolio Manager- Serves on MFS Global Equity Management Committee- As a Value Equity Portfolio Manager, responsible for final buy and sell decisions, portfolio construction, risk
and cash management. Participates in the research process and strategy discussions.- Joined MFS in 1998; previous positions include Equity Research Analyst.- Previous experience includes 2 years as Vice President & Equity Analyst at Merrill Lynch; 2 years as Equity
Research Analyst at Credit Lyonnais.- Served five years in the British Army reaching the rank of Captain- Royal Military College, Sandhurst , Graduate Course- Oxford University, MA, upper 2nd class history degree
Benjamin Stone, IIMR - Investment Officer- Equity Portfolio Manager- Joined MFS in 2005; previous positions include Equity Research Analyst.- Previous experience includes 9 years as Research Analyst at Schroders Investment Management.- Affiliations include Institute of Investment Management and Research- Durham University, BA, 2:1
20MFS® International Value Equity IV-S-MT-USD-US-3Q13.20 22
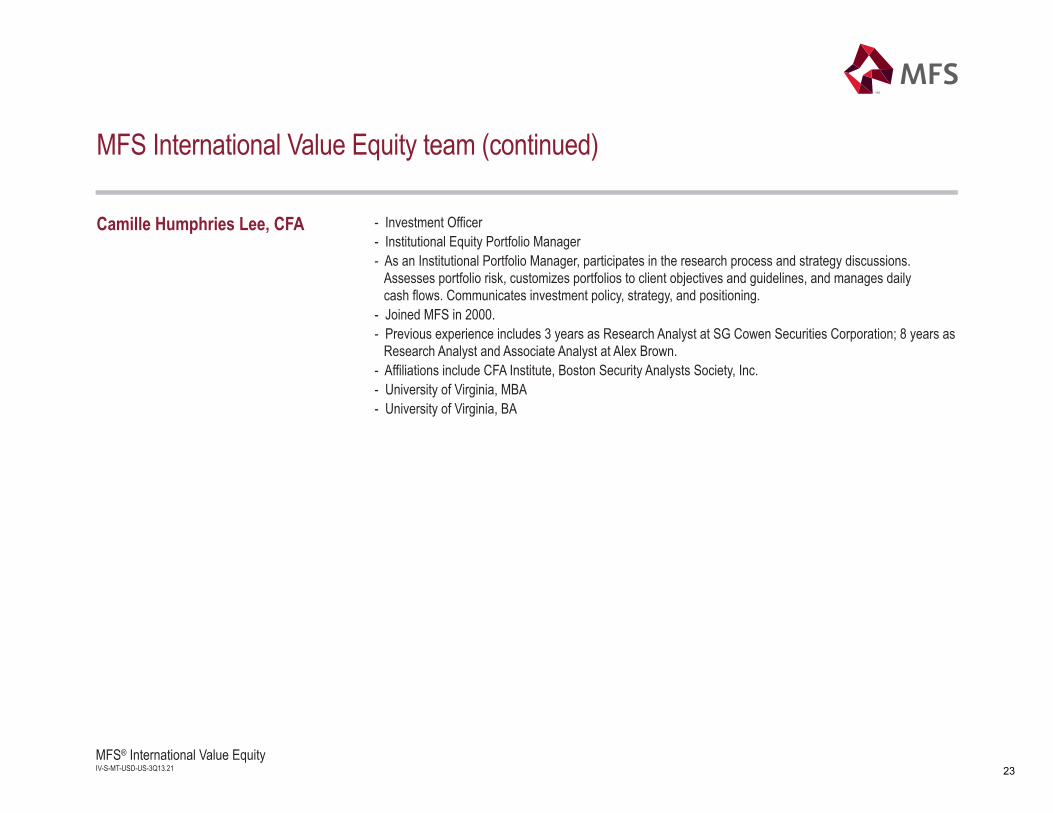
21MFS® International Value Equity IV-S-MT-USD-US-3Q13.21
MFS International Value Equity team (continued)
Camille Humphries Lee, CFA - Investment Officer- Institutional Equity Portfolio Manager- As an Institutional Portfolio Manager, participates in the research process and strategy discussions.
Assesses portfolio risk, customizes portfolios to client objectives and guidelines, and manages daily cash flows. Communicates investment policy, strategy, and positioning.
- Joined MFS in 2000.- Previous experience includes 3 years as Research Analyst at SG Cowen Securities Corporation; 8 years as
Research Analyst and Associate Analyst at Alex Brown.- Affiliations include CFA Institute, Boston Security Analysts Society, Inc.- University of Virginia, MBA- University of Virginia, BA
23
22MFS® International Value Equity IV-S-MT-USD-US-3Q13.22
MFS International Value Equity team additional resources
Nevin P. Chitkara - Investment Officer- Equity Portfolio Manager- As a Value Equity Portfolio Manager, responsible for final buy and sell decisions, portfolio construction, risk
and cash management. Participates in the research process and strategy discussions.- Joined MFS in 1997; previous positions include Equity Research Analyst.- Previous experience includes 5 years as Analyst, Acquisition Associate and Manager at
General Electric Company.- Massachusetts Institute of Technology, MBA- Boston University, BS, magna cum laude
Steven R. Gorham, CFA - Investment Officer- Equity Portfolio Manager- Serves on MFS Global Equity Management Committee- As a Value Equity Portfolio Manager, responsible for final buy and sell decisions, portfolio construction, risk
and cash management. Participates in the research process and strategy discussions.- Joined MFS in 1989; previous positions include Equity Research Analyst; Marketing Representative;
Teleservices Representative.- Affiliations include CFA Institute, Boston Security Analysts Society, Inc.- Boston College, MBA- University of New Hampshire, BS
24
23MFS® International Value Equity IV-S-MT-USD-US-3Q13.23
MFS International Value Equity team additional resources (continued)
Katrina Mead, CFA - Investment Officer- Institutional Equity Portfolio Manager- As an Institutional Portfolio Manager, participates in the research process and strategy discussions.
Assesses portfolio risk, customizes portfolios to client objectives and guidelines, and manages daily cash flows. Communicates investment policy, strategy, and positioning.
- Joined MFS in 1997; previous positions include Equity Research Analyst.- Previous experience includes 2 years as Financial Analyst - Real Estate Advisory Services at Coopers &
Lybrand, Financial Advisory Services.- Affiliations include CFA Institute, Boston Security Analysts Society, Inc.- University of Pennsylvania, MBA- Villanova University, BS, magna cum laude
Ann Marie Costello - Managing Director, Investment Product Specialist- As an Investment Product Specialist, communicates investment policy, strategy and tactics, performs
portfolio analysis and leads product development.- Joined MFS in 2001.- Previous experience includes 13 years as Senior Product Manager, Investment Specialist, Senior Statistical
Analyst - Performance and Analytics, and Supervisor - Institutional Accounting at Putnam Investments.- Suffolk University, MBA- University of Massachusetts, BS
25
24MFS® International Value Equity IV-S-MT-USD-US-3Q13.24
Historical portfolio weightsFive years as of 30 September 2013
Sector weights Max Min AvgAutos & Housing 3.7 1.1 1.8Basic Materials 4.0 2.4 3.2Consumer Staples 21.1 11.2 18.1Energy 9.7 3.4 6.1Financial Services 20.2 14.6 17.3Health Care 15.9 9.9 12.9Industrial Goods & Services 7.8 4.4 5.7Leisure 6.9 2.1 3.9Retailing 3.1 1.7 2.2Special Products & Services 7.7 1.9 4.7Technology 9.4 6.1 7.7Transportation 3.6 1.3 2.4Utilities & Communications 12.7 8.5 9.9
Developed markets weights Max Min AvgNorth America 0.6 – 0.1Canada 0.0 – 0.0United States 0.6 – 0.1Europe ex U.K. 47.1 35.6 41.0Austria -- -- --Belgium 0.2 -- 0.0Denmark 1.3 -- 0.6Finland 2.2 -- 1.0France 11.4 5.9 8.0Germany 9.6 6.1 7.6Ireland 1.4 -- 0.3Italy 2.0 0.8 1.3Netherlands 9.2 3.8 6.4Norway 2.8 0.7 1.1Spain 2.6 -- 1.3Sweden 2.4 1.1 1.8Switzerland 12.7 9.8 11.6U.K. 27.9 14.7 23.7Japan 29.0 21.8 25.5Asia Pacific ex Japan 4.0 1.6 2.0Australia 2.3 – 0.8Hong Kong 1.1 0.2 0.7New Zealand 0.5 – 0.1Singapore 0.9 0.3 0.5
Emerging markets weights Max Min AvgAsia Pacific ex JapanChina 0.6 0.2 0.4South Korea 2.7 0.3 1.4Taiwan 2.8 0.9 1.6Thailand 1.1 – 0.3Europe/Middle EastCzech Republic – – –Israel – – – Latin AmericaBrazil 0.7 – 0.1Mexico 0.6 – 0.1Total Emerging Markets 6.9 1.4 3.6
Data prior to 30-Jun-10 reflects market value, and is not based on equivalent exposure, which may differ.
Based on the MFS representative account for the strategy.
26
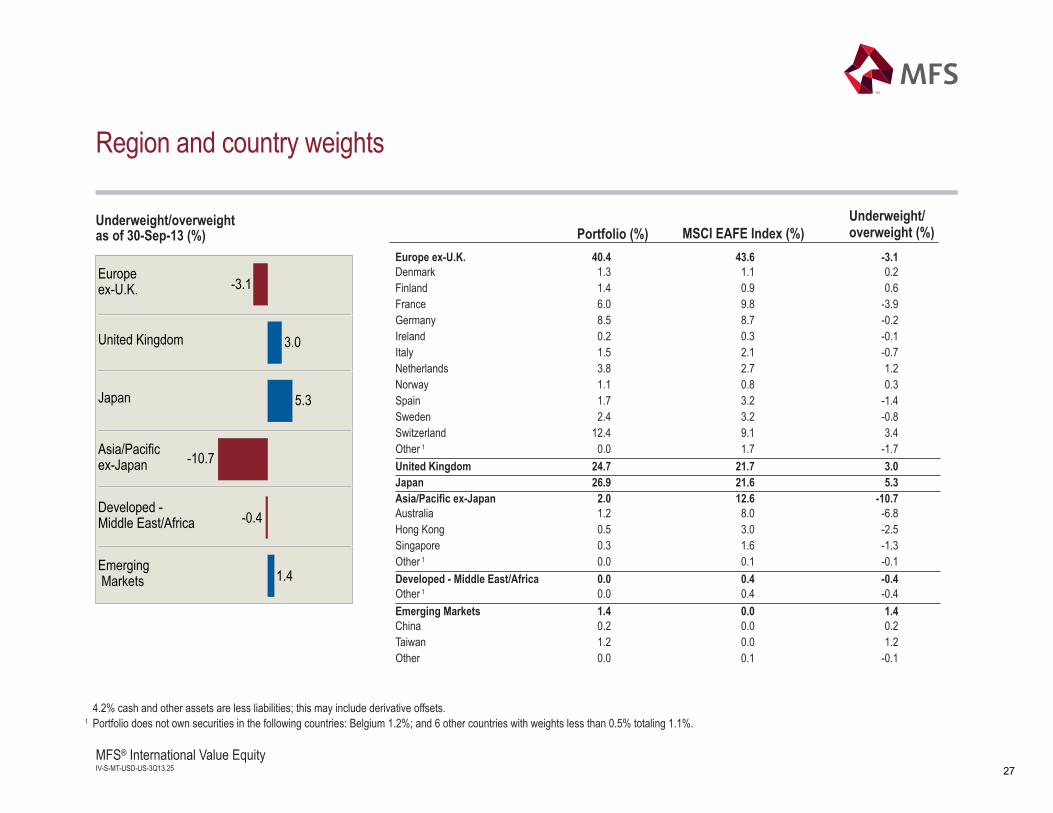
25MFS® International Value Equity IV-S-MT-USD-US-3Q13.25
Region and country weights
Emerging Markets
Developed -Middle East/Africa
Asia/Pacificex-Japan
Japan
United Kingdom
Europeex-U.K. -3.1
3.0
5.3
-10.7
-0.4
1.4
Underweight/overweight (%)
4.2% cash and other assets are less liabilities; this may include derivative offsets.1 Portfolio does not own securities in the following countries: Belgium 1.2%; and 6 other countries with weights less than 0.5% totaling 1.1%.
Underweight/overweightas of 30-Sep-13 (%) MSCI EAFE Index (%)
Europe ex-U.K. 40.4 43.6 -3.1Denmark 1.3 1.1 0.2Finland 1.4 0.9 0.6France 6.0 9.8 -3.9Germany 8.5 8.7 -0.2Ireland 0.2 0.3 -0.1Italy 1.5 2.1 -0.7Netherlands 3.8 2.7 1.2Norway 1.1 0.8 0.3Spain 1.7 3.2 -1.4Sweden 2.4 3.2 -0.8Switzerland 12.4 9.1 3.4Other 1 0.0 1.7 -1.7United Kingdom 24.7 21.7 3.0Japan 26.9 21.6 5.3Asia/Pacific ex-Japan 2.0 12.6 -10.7Australia 1.2 8.0 -6.8Hong Kong 0.5 3.0 -2.5Singapore 0.3 1.6 -1.3Other 1 0.0 0.1 -0.1Developed - Middle East/Africa 0.0 0.4 -0.4Other 1 0.0 0.4 -0.4Emerging Markets 1.4 0.0 1.4China 0.2 0.0 0.2Taiwan 1.2 0.0 1.2Other 0.0 0.1 -0.1
Portfolio (%)
27
26MFS® International Value Equity IV-S-MT-USD-US-3Q13.26
Based on the MFS representative account for the strategy.
Market capitalization (USD)
As of 30-Sep-13
0 – 1 bn 1 – 5 bn 5 – 10 bn 10 – 50 bn 50 – 100 bn 100 bn +
% o
f por
tfolio
0.0 0.0 0.0
16.2
5.5 4.5
12.310.1 11.6
37.6 38.041.4
10.2
25.621.0 19.0 20.9 21.4
Portfolio MSCI EAFE Value MSCI EAFE
Small-cap Mid-cap Large-cap
Weighted average market cap (USD billions)Portfolio 55.4MSCI EAFE Value 63.4MSCI EAFE 63.6
28
27MFS® International Value Equity IV-S-MT-USD-US-3Q13.27
1 MSCI EAFE Value with net dividends reinvested.2 MSCI EAFE with net dividends reinvested.
Please see appendix for net-of-fees performance, composite report, and other information. Source: benchmark performance from SPAR, FactSet Research Systems, Inc. Past performance is no guarantee of future results.
MFS International Value Equity CompositeQuarterly and annual performance summary – gross of fees (USD)
1Q 2Q 3Q 4Q Year2013 MFS International Value Equity 8.5% 4.3% 8.4%2013 MSCI EAFE Value1 3.5 -0.7 12.62013 MSCI EAFE2 5.1 -1.0 11.62012 MFS International Value Equity 9.3 -2.3 6.9 2.7% 17.2%2012 MSCI EAFE Value1 9.7 -7.1 7.5 7.4 17.72012 MSCI EAFE2 10.9 -7.1 6.9 6.6 17.32011 MFS International Value Equity 2.6 4.6 -11.2 4.3 -0.72011 MSCI EAFE Value1 4.5 1.0 -19.0 2.7 -12.22011 MSCI EAFE2 3.4 1.6 -19.0 3.3 -12.12010 MFS International Value Equity 1.8 -9.9 12.2 7.4 10.62010 MSCI EAFE Value1 -0.2 -15.5 16.4 5.3 3.22010 MSCI EAFE2 0.9 -14.0 16.5 6.6 7.82009 MFS International Value Equity -14.7 23.1 19.3 1.0 26.52009 MSCI EAFE Value1 -15.5 29.7 22.1 0.3 34.22009 MSCI EAFE2 -13.9 25.4 19.5 2.2 31.82008 MFS International Value Equity -4.5 -1.7 -16.0 -12.4 -30.92008 MSCI EAFE Value1 -9.7 -4.6 -19.1 -19.8 -44.12008 MSCI EAFE2 -8.9 -2.3 -20.6 -20.0 -43.42007 MFS International Value Equity 3.2 5.6 1.4 -1.5 8.82007 MSCI EAFE Value1 3.2 6.1 0.0 -3.3 6.02007 MSCI EAFE2 4.1 6.4 2.2 -1.8 11.22006 MFS International Value Equity 11.4 1.8 5.0 9.5 30.32006 MSCI EAFE Value1 9.8 1.1 5.5 11.3 30.42006 MSCI EAFE2 9.4 0.7 3.9 10.4 26.32005 MFS International Value Equity 2.2 -1.0 11.7 2.9 16.32005 MSCI EAFE Value1 0.5 -1.1 10.3 3.8 13.82005 MSCI EAFE2 -0.2 -1.0 10.4 4.1 13.5
29
28MFS® International Value Equity IV-S-MT-USD-US-3Q13.28
MFS International Value Equity CompositePerformance – net of fees (USD)
Annualized returns (%), as of 30-Sep-13
Source for benchmark performance: SPAR, FactSet Research Systems Inc. Past performance is no guarantee of future results.
Perce
nt (%
)
MFS International Value Equity CompositeMSCI EAFE (Europe, Australasia, Far East) Value Index (net div)MSCI EAFE (Europe, Australasia, Far East) Index (net div)
25.0
14.5
11.012.3
24.3
8.05.9
7.9
23.8
8.56.4
8.0
1 Year 3 Years 5 Years 10 Years
30
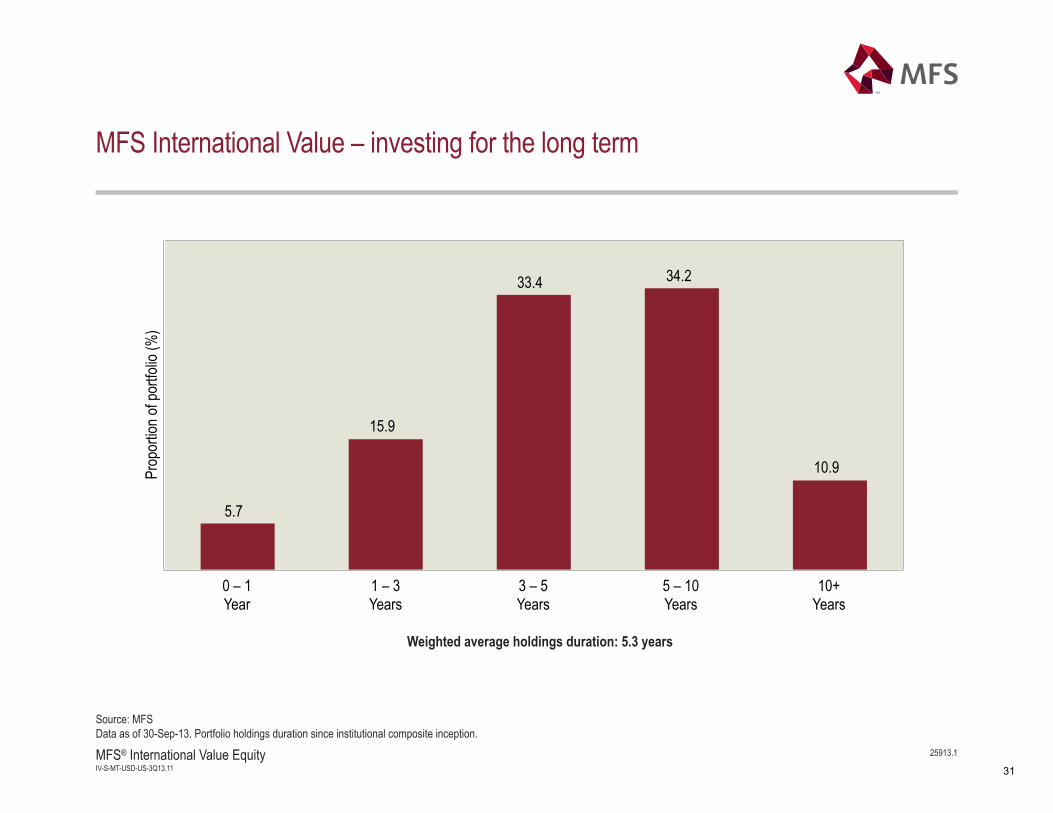
11MFS® International Value Equity IV-S-MT-USD-US-3Q13.11
MFS International Value – investing for the long term
0 – 1Year
1 – 3Years
3 – 5Years
5 – 10Years
10+Years
Prop
ortio
n of
por
tfolio
(%)
5.7
15.9
33.4 34.2
10.9
Weighted average holdings duration: 5.3 years
Source: MFSData as of 30-Sep-13. Portfolio holdings duration since institutional composite inception.
25913.1
31
29MFS® International Value Equity IV-S-MT-USD-US-3Q13.29
Additional disclosures
Portfolio characteristics are based on equivalent exposure, which measures how a portfolio's value would change due to price changes in an asset held either directly or, in the case of a derivative contract, indirectly. The market value of the holdingmay differ.
Issued in the United States by MFS Institutional Advisors, Inc., a U.S.-based investment advisor and subsidiary of MassachusettsFinancial Services Company ("MFS"). Issued in Canada by MFS McLean Budden Limited. No securities commission or similarregulatory authority in Canada has reviewed this communication. Issued by MFS International (U.K.) Limited ("MIL UK"), a privatelimited company registered in England and Wales with the company number 03062718, and authorised and regulated in theconduct of investment business by the UK Financial Conduct Authority. MIL UK, an indirect subsidiary of MFS, has its registeredoffice at Paternoster House, 65 St. Paul's Churchyard, London,EC4M 8AB and provides products and investment services toinstitutional investors globally. Issued in Hong Kong by MFS International (Hong Kong) Limited ("MIL HK"), a private limitedcompany licensed and regulated by the Hong Kong Securities and Futures Commission (the "SFC"). MIL HK is a wholly-owned,indirect subsidiary of Massachusetts Financial Services Company, a US based investment adviser and fund sponsor registeredwith the US Securities and Exchange Commission. MIL HK is approved to engage in dealing in securities and asset managementregulated activities and may provide certain investment services to "professional investors" as defined in the Securities andFutures Ordinance ("SFO").
For investors in Australia: MFS Institutional Advisors, Inc. ("MFSI") and MFS International (U.K.) Limited ("MIL UK") are exemptfrom the requirement to hold an Australian financial services license under the Corporations Act 2001 in respect of the financialservices they provide. In Australia and New Zealand: MFSI is regulated by the SEC under US laws and MIL UK is regulated bythe UK Financial Conduct Authority under UK laws, which differ from Australian and New Zealand laws. Unless otherwiseindicated, logos, product and services names are trademarks of MFS and its affiliates and may be registered in certain countries.
32
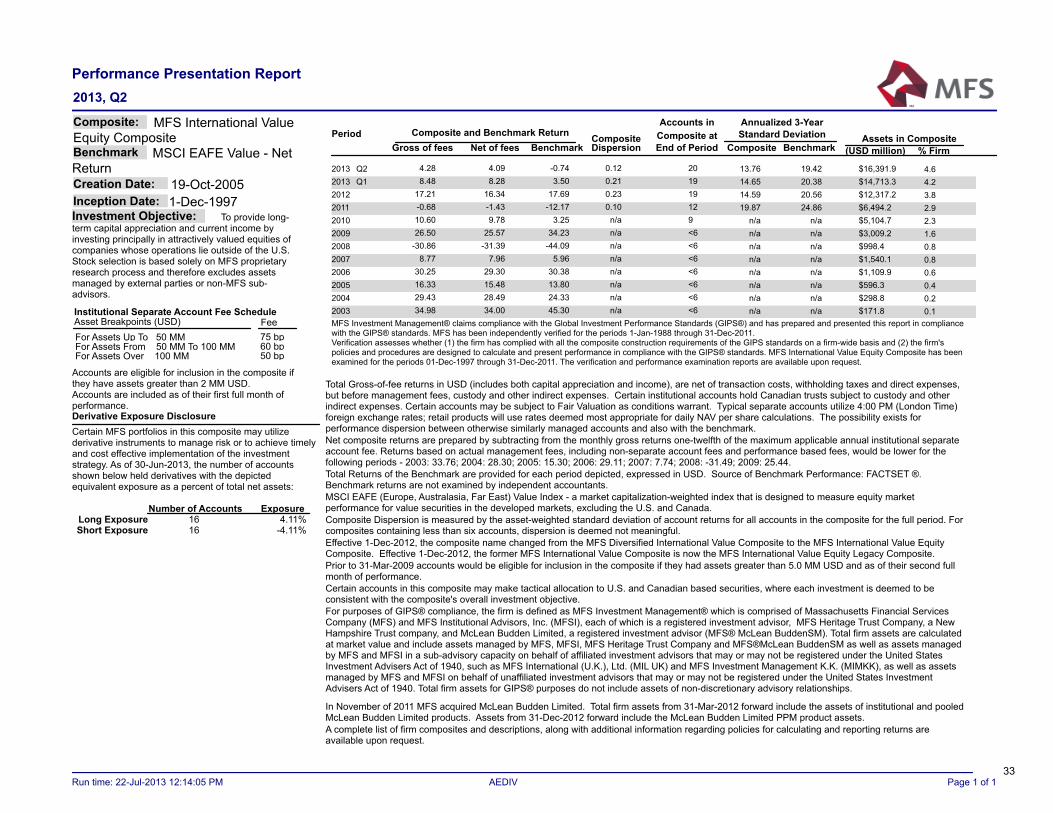
End of PeriodGross of fees Net of fees BenchmarkPeriod Composite Assets in CompositeComposite and Benchmark Return
(USD million) % Firm
Accounts inComposite at
Composite
Annualized 3-YearStandard Deviation
BenchmarkDispersion
16,391.94.28Q22013 -0.74 $0.12 13.76 19.42 4.64.09 2014,713.38.48Q12013 3.50 $0.21 14.65 20.38 4.28.28 1912,317.217.212012 17.69 $0.23 14.59 20.56 3.816.34 196,494.2-0.682011 -12.17 $0.10 19.87 24.86 2.9-1.43 125,104.710.602010 3.25 $n/a n/a n/a 2.39.78 93,009.226.502009 34.23 $n/a n/a n/a 1.625.57 <6998.4-30.862008 -44.09 $n/a n/a n/a 0.8-31.39 <61,540.18.772007 5.96 $n/a n/a n/a 0.87.96 <61,109.930.252006 30.38 $n/a n/a n/a 0.629.30 <6596.316.332005 13.80 $n/a n/a n/a 0.415.48 <6298.829.432004 24.33 $n/a n/a n/a 0.228.49 <6171.834.982003 45.30 $n/a n/a n/a 0.134.00 <6
MFS Investment Management® claims compliance with the Global Investment Performance Standards (GIPS®) and has prepared and presented this report in compliancewith the GIPS® standards. MFS has been independently verified for the periods 1-Jan-1988 through 31-Dec-2011.Verification assesses whether (1) the firm has complied with all the composite construction requirements of the GIPS standards on a firm-wide basis and (2) the firm'spolicies and procedures are designed to calculate and present performance in compliance with the GIPS® standards. MFS International Value Equity Composite has beenexamined for the periods 01-Dec-1997 through 31-Dec-2011. The verification and performance examination reports are available upon request.
Total Gross-of-fee returns in USD (includes both capital appreciation and income), are net of transaction costs, withholding taxes and direct expenses,but before management fees, custody and other indirect expenses. Certain institutional accounts hold Canadian trusts subject to custody and otherindirect expenses. Certain accounts may be subject to Fair Valuation as conditions warrant. Typical separate accounts utilize 4:00 PM (London Time)foreign exchange rates; retail products will use rates deemed most appropriate for daily NAV per share calculations. The possibility exists forperformance dispersion between otherwise similarly managed accounts and also with the benchmark.Net composite returns are prepared by subtracting from the monthly gross returns one-twelfth of the maximum applicable annual institutional separateaccount fee. Returns based on actual management fees, including non-separate account fees and performance based fees, would be lower for thefollowing periods - 2003: 33.76; 2004: 28.30; 2005: 15.30; 2006: 29.11; 2007: 7.74; 2008: -31.49; 2009: 25.44.Total Returns of the Benchmark are provided for each period depicted, expressed in USD. Source of Benchmark Performance: FACTSET ®.Benchmark returns are not examined by independent accountants.MSCI EAFE (Europe, Australasia, Far East) Value Index - a market capitalization-weighted index that is designed to measure equity marketperformance for value securities in the developed markets, excluding the U.S. and Canada.Composite Dispersion is measured by the asset-weighted standard deviation of account returns for all accounts in the composite for the full period. Forcomposites containing less than six accounts, dispersion is deemed not meaningful.Effective 1-Dec-2012, the composite name changed from the MFS Diversified International Value Composite to the MFS International Value EquityComposite. Effective 1-Dec-2012, the former MFS International Value Composite is now the MFS International Value Equity Legacy Composite.Prior to 31-Mar-2009 accounts would be eligible for inclusion in the composite if they had assets greater than 5.0 MM USD and as of their second fullmonth of performance.Certain accounts in this composite may make tactical allocation to U.S. and Canadian based securities, where each investment is deemed to beconsistent with the composite's overall investment objective.For purposes of GIPS® compliance, the firm is defined as MFS Investment Management® which is comprised of Massachusetts Financial ServicesCompany (MFS) and MFS Institutional Advisors, Inc. (MFSI), each of which is a registered investment advisor, MFS Heritage Trust Company, a NewHampshire Trust company, and McLean Budden Limited, a registered investment advisor (MFS® McLean BuddenSM). Total firm assets are calculatedat market value and include assets managed by MFS, MFSI, MFS Heritage Trust Company and MFS®McLean BuddenSM as well as assets managedby MFS and MFSI in a sub-advisory capacity on behalf of affiliated investment advisors that may or may not be registered under the United StatesInvestment Advisers Act of 1940, such as MFS International (U.K.), Ltd. (MIL UK) and MFS Investment Management K.K. (MIMKK), as well as assetsmanaged by MFS and MFSI on behalf of unaffiliated investment advisors that may or may not be registered under the United States InvestmentAdvisers Act of 1940. Total firm assets for GIPS® purposes do not include assets of non-discretionary advisory relationships.
In November of 2011 MFS acquired McLean Budden Limited. Total firm assets from 31-Mar-2012 forward include the assets of institutional and pooledMcLean Budden Limited products. Assets from 31-Dec-2012 forward include the McLean Budden Limited PPM product assets.A complete list of firm composites and descriptions, along with additional information regarding policies for calculating and reporting returns areavailable upon request.
MSCI EAFE Value - NetReturn
MFS International ValueEquity CompositeComposite:
Investment Objective: To provide long-term capital appreciation and current income byinvesting principally in attractively valued equities ofcompanies whose operations lie outside of the U.S.Stock selection is based solely on MFS proprietaryresearch process and therefore excludes assetsmanaged by external parties or non-MFS sub-advisors.
Creation Date:
Benchmark
19-Oct-2005Inception Date: 1-Dec-1997
Institutional Separate Account Fee ScheduleAsset Breakpoints (USD) FeeFor Assets Up To 50 MM 75 bpFor Assets From 50 MM To 100 MM 60 bpFor Assets Over 100 MM 50 bp
Accounts are eligible for inclusion in the composite ifthey have assets greater than 2 MM USD.Accounts are included as of their first full month ofperformance.Derivative Exposure DisclosureCertain MFS portfolios in this composite may utilizederivative instruments to manage risk or to achieve timelyand cost effective implementation of the investmentstrategy. As of 30-Jun-2013, the number of accountsshown below held derivatives with the depictedequivalent exposure as a percent of total net assets:
Long ExposureShort Exposure
Number of Accounts Exposure1616
4.11%-4.11%
Performance Presentation Report2013, Q2
Page 1 of 1AEDIVRun time: 22-Jul-2013 12:14:05 PM33
1
Schroder QEP Global ex US ValuePresentation to Contra Costa County Employees’ Retirement Association
For Institutional*, Consultant and Financial Intermediary Use Only – Not for Redistribution under any circumstances
*Only for use in face-to-face meetings
Schroder Investment Management North America Inc.
875 Third Avenue, New York, NY 10022
Telephone: (212) 641-3800
Representing Schroders:
Justin Abercrombie – Head of QEP Investment Team
Stephen Kwa – Senior Client Portfolio Manager, QEP
Jamie Macmillan – US Institutional Business Development Director
Agenda
1
1) Firm ownership and organizational structure
2) Investment management and client service personnel
3) Investment philosophy
4) Investment process
- Research, risk management and portfolio construction
5) Portfolio/account monitoring
6) Performance and fees
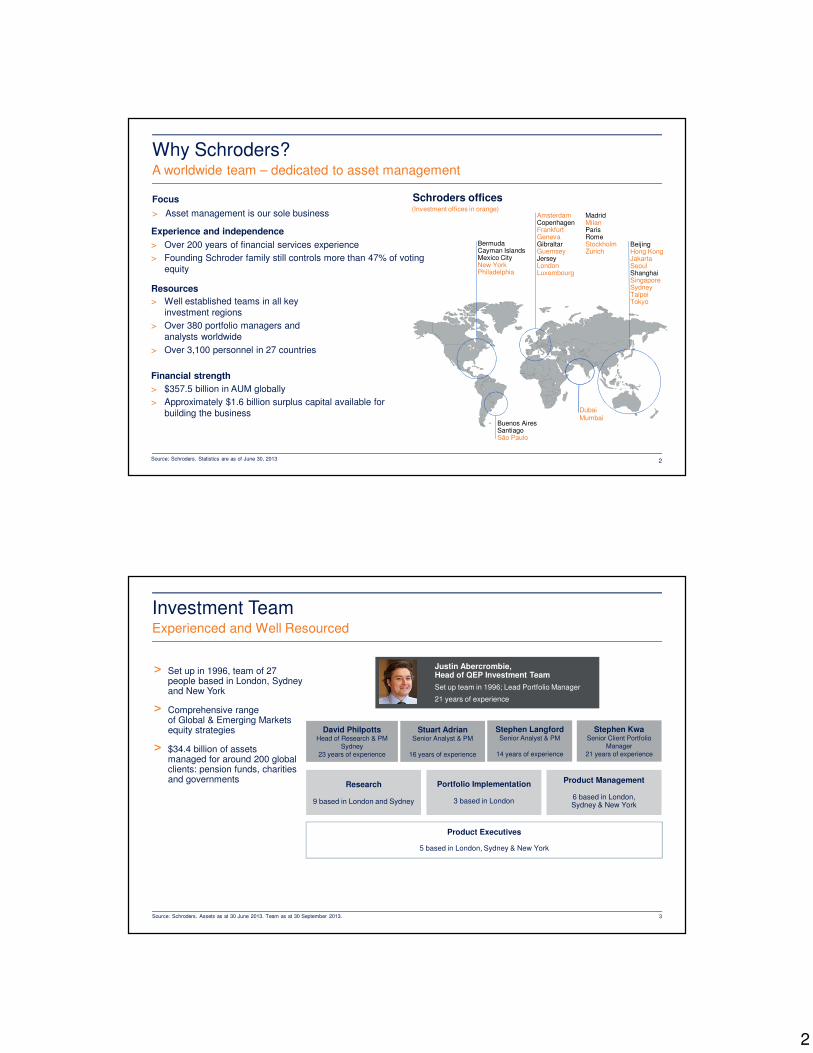
2
Focus
Why Schroders?A worldwide team – dedicated to asset management
> Asset management is our sole business
Experience and independence
> Over 200 years of financial services experience
> Founding Schroder family still controls more than 47% of voting
equity
Resources
> Well established teams in all key
investment regions
> Over 380 portfolio managers and
analysts worldwide
> Over 3,100 personnel in 27 countries
Financial strength
> $357.5 billion in AUM globally
> Approximately $1.6 billion surplus capital available for
building the business
Source: Schroders. Statistics are as of June 30, 2013 2
BermudaCayman IslandsMexico CityNew YorkPhiladelphia
AmsterdamCopenhagenFrankfurtGenevaGibraltarGuernseyJerseyLondonLuxembourg
MadridMilanParisRomeStockholmZurich
BeijingHong KongJakartaSeoulShanghaiSingaporeSydneyTaipeiTokyo
Buenos AiresSantiagoSão Paulo
Dubai
Mumbai
Schroders offices(Investment offices in orange)
Investment Team
3
Experienced and Well Resourced
Source: Schroders. Assets as at 30 June 2013. Team as at 30 September 2013.
Research
9 based in London and Sydney
Portfolio Implementation
3 based in London
Product Management
6 based in London, Sydney & New York
Justin Abercrombie,
Head of QEP Investment Team
Set up team in 1996; Lead Portfolio Manager
21 years of experience
> Set up in 1996, team of 27 people based in London, Sydney and New York
> Comprehensive range of Global & Emerging Markets equity strategies
> $34.4 billion of assets managed for around 200 global clients: pension funds, charities and governments
Product Executives
5 based in London, Sydney & New York
David Philpotts
Head of Research & PM
Sydney
23 years of experience
Stephen Langford
Senior Analyst & PM
14 years of experience
Stuart Adrian
Senior Analyst & PM
16 years of experience
Stephen Kwa
Senior Client Portfolio
Manager
21 years of experience
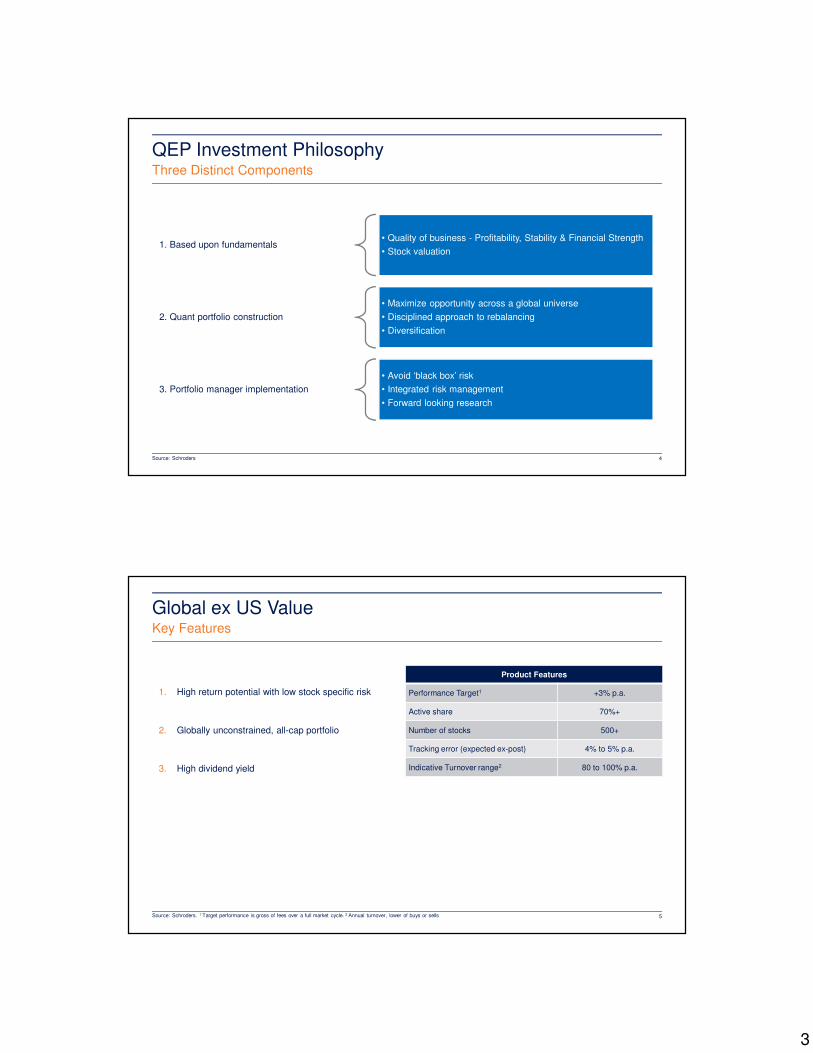
3
QEP Investment Philosophy
4
Three Distinct Components
Source: Schroders
1. Based upon fundamentals• Quality of business - Profitability, Stability & Financial Strength
• Stock valuation
2. Quant portfolio construction
• Maximize opportunity across a global universe
• Disciplined approach to rebalancing
• Diversification
3. Portfolio manager implementation
• Avoid ‘black box’ risk
• Integrated risk management
• Forward looking research
Global ex US Value
5
Key Features
Product Features
Performance Target1 +3% p.a.
Active share 70%+
Number of stocks 500+
Tracking error (expected ex-post) 4% to 5% p.a.
Indicative Turnover range2 80 to 100% p.a.
Source: Schroders. 1 Target performance is gross of fees over a full market cycle. 2 Annual turnover, lower of buys or sells
1. High return potential with low stock specific risk
2. Globally unconstrained, all-cap portfolio
3. High dividend yield
4
Global ex US Value
6
Performance
Source: Schroders – Performance represents Schroder Global ex US Value composites, gross of fees in USD terms since inception 31 August 2006 to 31 August 2013. MSCI benchmarks are shown Net
Dividends Re-invested (NDR). Past performance is not a guarantee of future results. The value of your investment can go down as well as up and is not guaranteed. Please see the performance notes at the
end of this presentation for composite disclosures
13.8% 11.9%
-44.9%
55.9%
18.2%
-11.4%
20.0%
6.5% 5.6%
46.4%
-60%
-40%
-20%
0%
20%
40%
60%
80%
2006
(Aug -
Dec)
2007 2008 2009 2010 2011 2012 2013
YTD-Aug
Since
Inception
(% p.a.)*
Since
Inception
(% total)*
Global Value ex US Performance (%) - USD
Global (ex US) Value MSCI ACWI ex US IMI MSCI ACWI ex US IMI Value
Relative to MSCI ACWI ex US IMI +2.4 -4.2 +1.1 +12.4 +5.4 +2.9 +3.0 +3.2 +3.3 +29.2 3.5 0.9
Relative to MSCI ACWI ex US IMI
Value+1.2 +0.1 +0.7 +9.6 +8.6 +2.6 +2.7 +3.7 +3.7 +32.4 3.1 1.2
Since
Inception
TE
Since
Inception
IR
Sector vs. MSCI AC World ex US
Global ex US ValueGross Performance Attribution Since Inception
7Source: Schroders – Schroder International Multi-Cap Value Fund (representative) gross of fees relative performance since inception 31 August 2006 to 30 September 2013. Attribution analysis was generated
by Factset and should be considered indicative. Past performance is not a guarantee of future results. Sectors & regions mentioned are shown for illustrative purposes only and should not be viewed as a
recommendation to buy/sell.
Region vs. MSCI AC World ex US
Stock Selection (%) Asset Allocation (%)
-5% 0% 5% 10% 15%
Utilities
Staples
Cons Discretionary
Health
Teleco
Energy
Tech
Materials
Industrials
Financials
-5% 0% 5% 10% 15%
Emerging LatAm
Emerging EMEA
North America
Pacific ex Japan
Pan Europe
Emerging Asia
Japan
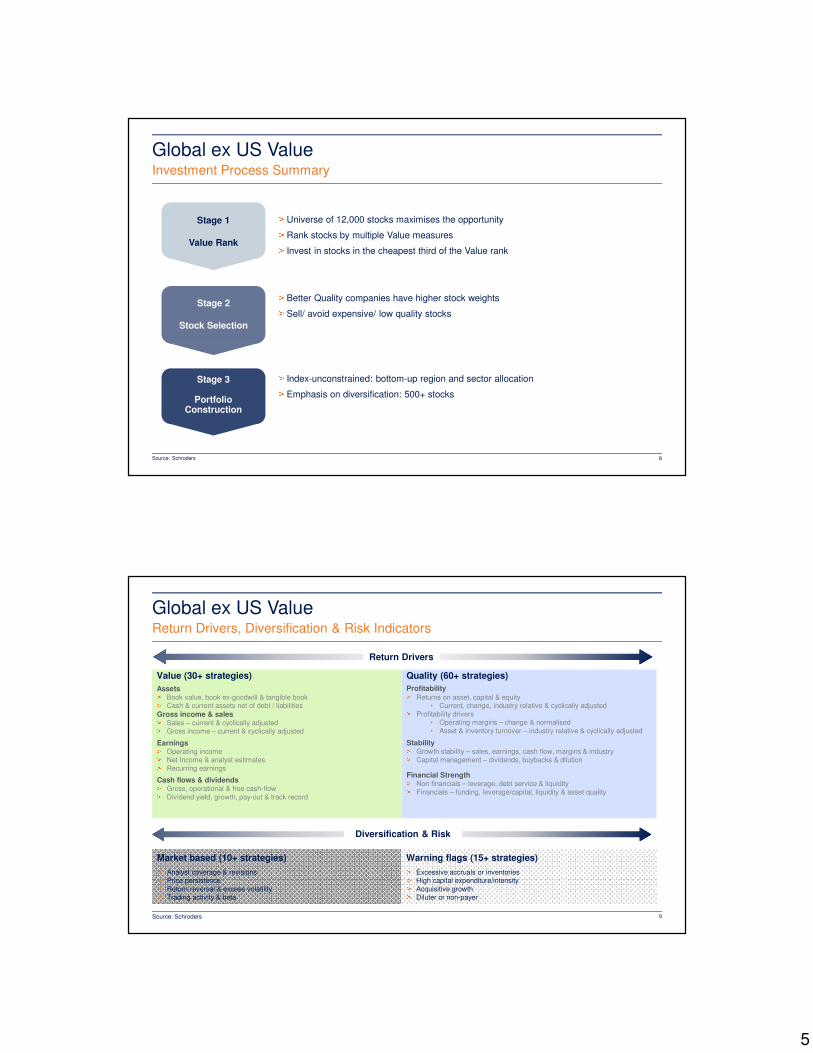
5
Stage 1
Value Rank
Stage 2
Stock Selection
Stage 3
Portfolio
Construction
> Universe of 12,000 stocks maximises the opportunity> Rank stocks by multiple Value measures> Invest in stocks in the cheapest third of the Value rank
> Index-unconstrained: bottom-up region and sector allocation > Emphasis on diversification: 500+ stocks
> Better Quality companies have higher stock weights> Sell/ avoid expensive/ low quality stocks
Global ex US Value
8
Investment Process Summary
Source: Schroders
Global ex US Value
9
Return Drivers, Diversification & Risk Indicators
Source: Schroders
Value (30+ strategies)
Assets> Book value, book ex-goodwill & tangible book> Cash & current assets net of debt / liabilities
Gross income & sales> Sales – current & cyclically adjusted> Gross income – current & cyclically adjusted
Earnings> Operating income> Net Income & analyst estimates> Recurring earnings
Cash flows & dividends> Gross, operational & free cash-flow> Dividend yield, growth, pay-out & track record
Warning flags (15+ strategies)> Excessive accruals or inventories > High capital expenditure/intensity> Acquisitive growth> Diluter or non-payer
Market based (10+ strategies)> Analyst coverage & revisions> Price persistence> Return reversal & excess volatility> Trading activity & beta
Quality (60+ strategies)
Profitability> Returns on asset, capital & equity
• Current, change, industry relative & cyclically adjusted> Profitability drivers
• Operating margins – change & normalised
• Asset & inventory turnover – industry relative & cyclically adjusted
Stability> Growth stability – sales, earnings, cash flow, margins & industry> Capital management – dividends, buybacks & dilution
Financial Strength> Non financials – leverage, debt service & liquidity> Financials – funding, leverage/capital, liquidity & asset quality
Diversification & Risk
Return Drivers
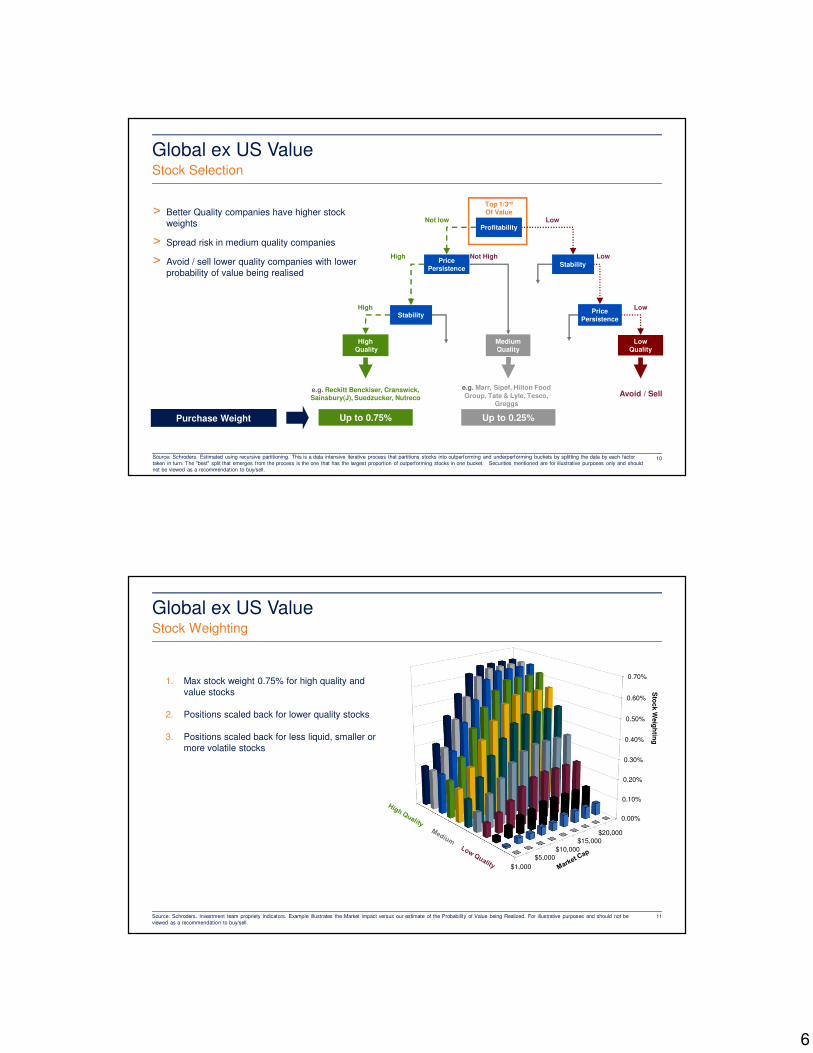
6
Global ex US Value
10
Stock Selection
Source: Schroders. Estimated using recursive partitioning. This is a data intensive iterative process that partitions stocks into outperforming and underperforming buckets by splitting the data by each factor
taken in turn. The "best" split that emerges from the process is the one that has the largest proportion of outperforming stocks in one bucket. Securities mentioned are for illustrative purposes only and should
not be viewed as a recommendation to buy/sell.
> Better Quality companies have higher stock
weights
> Spread risk in medium quality companies
> Avoid / sell lower quality companies with lower
probability of value being realised
Top 1/3rd
Of Value
Low
High
Stability
LowNot low
Profitability
Stability
Price
Persistence
Not HighPrice
Persistence
Low
Quality
Medium
Quality
High
Quality
High
Low
Avoid / Sell
Up to 0.25%Purchase Weight
e.g. Reckitt Benckiser, Cranswick,
Sainsbury(J), Suedzucker, Nutreco
e.g. Marr, Sipef, Hilton Food
Group, Tate & Lyle, Tesco,
Greggs
Up to 0.75%
0%
20%
40%
60%
80%
100%
0.00%
0.10%
0.20%
0.30%
0.40%
0.50%
0.60%
0.70%
$20,000
$15,000
$10,000
$5,000
$1,000
Sto
ck W
eig
htin
g
Global ex US Value
11
Stock Weighting
Source: Schroders. Investment team propriety indicators. Example illustrates the Market impact versus our estimate of the Probability of Value being Realized. For illustrative purposes and should not be
viewed as a recommendation to buy/sell.
1. Max stock weight 0.75% for high quality and
value stocks
2. Positions scaled back for lower quality stocks
3. Positions scaled back for less liquid, smaller or
more volatile stocks
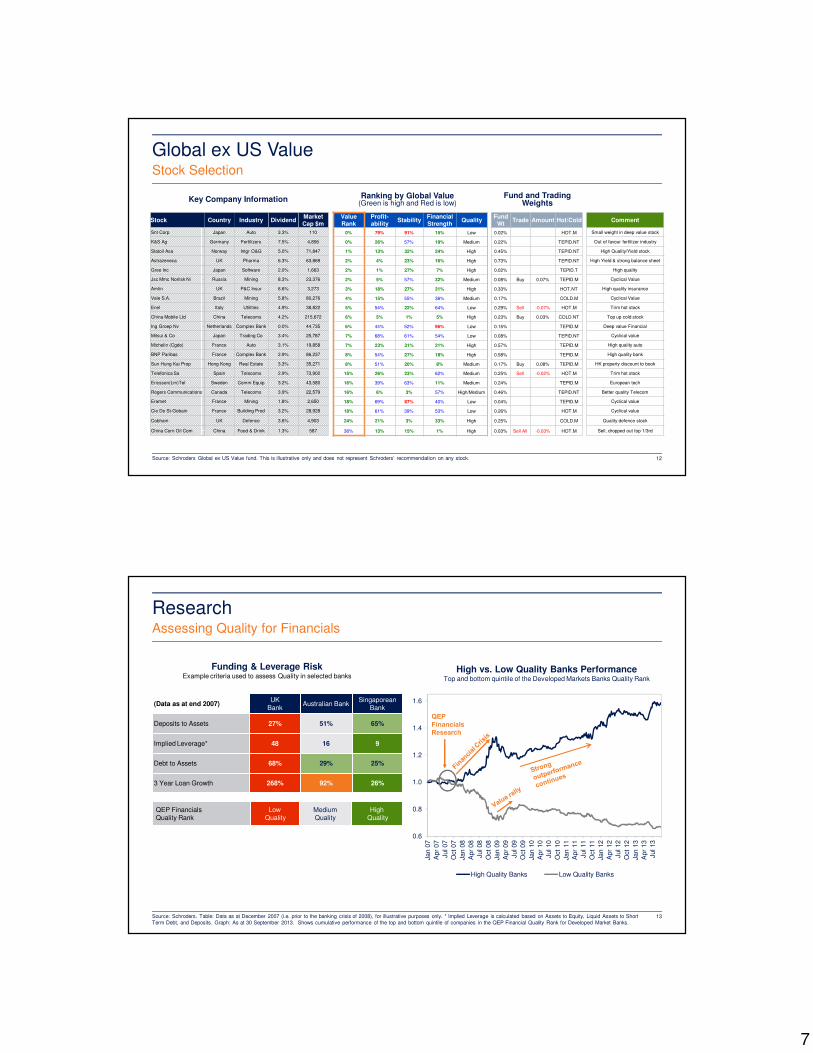
7
Ranking by Global Value(Green is high and Red is low)
Fund and Trading
WeightsKey Company Information
Global ex US Value
12
Stock Selection
Source: Schroders Global ex US Value fund. This is illustrative only and does not represent Schroders’ recommendation on any stock.
Stock Country Industry DividendMarket
Cap $m
Value
Rank
Profit-
abilityStability
Financial
Strength Quality
Fund
WtTrade Amount Hot/Cold Comment
Snt Corp Japan Auto 3.3% 110 0% 79% 91% 15% Low 0.02% HOT.M Small weight in deep value stock
K&S Ag Germany Fertilizers 7.5% 4,856 0% 26% 57% 19% Medium 0.22% TEPID.NT Out of favour fertilizer industry
Statoil Asa Norway Intgr O&G 5.0% 71,847 1% 13% 32% 24% High 0.45% TEPID.NT High Quality/Yield stock
Astrazeneca UK Pharma 6.3% 63,869 2% 4% 23% 16% High 0.73% TEPID.NT High Yield & strong balance sheet
Gree Inc Japan Software 2.0% 1,663 2% 1% 27% 7% High 0.02% TEPID.T High quality
Jsc Mmc Norilsk Ni Russia Mining 8.3% 23,376 2% 5% 57% 32% Medium 0.08% Buy 0.07% TEPID.M Cyclical Value
Amlin UK P&C Insur 6.6% 3,273 3% 18% 27% 31% High 0.33% HOT.NT High quality insurance
Vale S.A. Brazil Mining 5.8% 80,276 4% 15% 55% 36% Medium 0.17% COLD.M Cyclical Value
Enel Italy Utilities 4.9% 38,822 5% 54% 22% 64% Low 0.29% Sell -0.07% HOT.M Trim hot stock
China Mobile Ltd China Telecoms 4.2% 215,672 6% 5% 1% 5% High 0.23% Buy 0.03% COLD.NT Top up cold stock
Ing Groep Nv Netherlands Complex Bank 0.0% 44,735 6% 44% 52% 96% Low 0.15% TEPID.M Deep value Financial
Mitsui & Co Japan Trading Co 3.4% 25,787 7% 68% 61% 54% Low 0.08% TEPID.NT Cyclical value
Michelin (Cgde) France Auto 3.1% 19,858 7% 23% 31% 21% High 0.57% TEPID.M High quality auto
BNP Paribas France Complex Bank 2.9% 86,237 8% 54% 27% 18% High 0.58% TEPID.M High quality bank
Sun Hung Kai Prop Hong Kong Real Estate 3.3% 35,271 8% 51% 20% 8% Medium 0.17% Buy 0.08% TEPID.M HK property discount to book
Telefonica Sa Spain Telecoms 2.9% 73,902 15% 26% 23% 62% Medium 0.25% Sell -0.02% HOT.M Trim hot stock
Ericsson(Lm)Tel Sweden Comm Equip 3.2% 43,580 16% 39% 63% 11% Medium 0.24% TEPID.M European tech
Rogers Communications Canada Telecoms 3.9% 22,579 16% 6% 3% 57% High/Medium 0.46% TEPID.NT Better quality Telecom
Eramet France Mining 1.8% 2,650 18% 69% 87% 40% Low 0.04% TEPID.M Cyclical value
Cie De St-Gobain France Building Prod 3.2% 28,928 18% 61% 39% 53% Low 0.26% HOT.M Cyclical value
Cobham UK Defence 3.6% 4,903 24% 21% 3% 33% High 0.25% COLD.M Quality defence stock
China Corn Oil Com China Food & Drink 1.3% 587 36% 13% 15% 1% High 0.03% Sell All -0.03% HOT.M Sell, dropped out top 1/3rd
Research
13
Assessing Quality for Financials
Source: Schroders. Table: Data as at December 2007 (i.e. prior to the banking crisis of 2008), for illustrative purposes only. * Implied Leverage is calculated based on Assets to Equity, Liquid Assets to Short
Term Debt, and Deposits. Graph: As at 30 September 2013. Shows cumulative performance of the top and bottom quintile of companies in the QEP Financial Quality Rank for Developed Market Banks.
Funding & Leverage RiskExample criteria used to assess Quality in selected banks
High vs. Low Quality Banks PerformanceTop and bottom quintile of the Developed Markets Banks Quality Rank
(Data as at end 2007)UK
BankAustralian Bank
Singaporean
Bank
Deposits to Assets 27% 51% 65%
Implied Leverage* 48 16 9
Debt to Assets 68% 29% 25%
3 Year Loan Growth 268% 92% 26%
QEP Financials
Quality Rank
Low
Quality
Medium
Quality
High
Quality
0.6
0.8
1.0
1.2
1.4
1.6
Jan 0
7
Apr
07
Jul 07
Oct 0
7
Jan 0
8
Apr
08
Jul 08
Oct 0
8
Jan 0
9
Apr
09
Jul 09
Oct 0
9
Jan 1
0
Apr
10
Jul 10
Oct 1
0
Jan 1
1
Apr
11
Jul 11
Oct 1
1
Jan 1
2
Apr
12
Jul 12
Oct 1
2
Jan 1
3
Apr
13
Jul 13
High Quality Banks Low Quality Banks
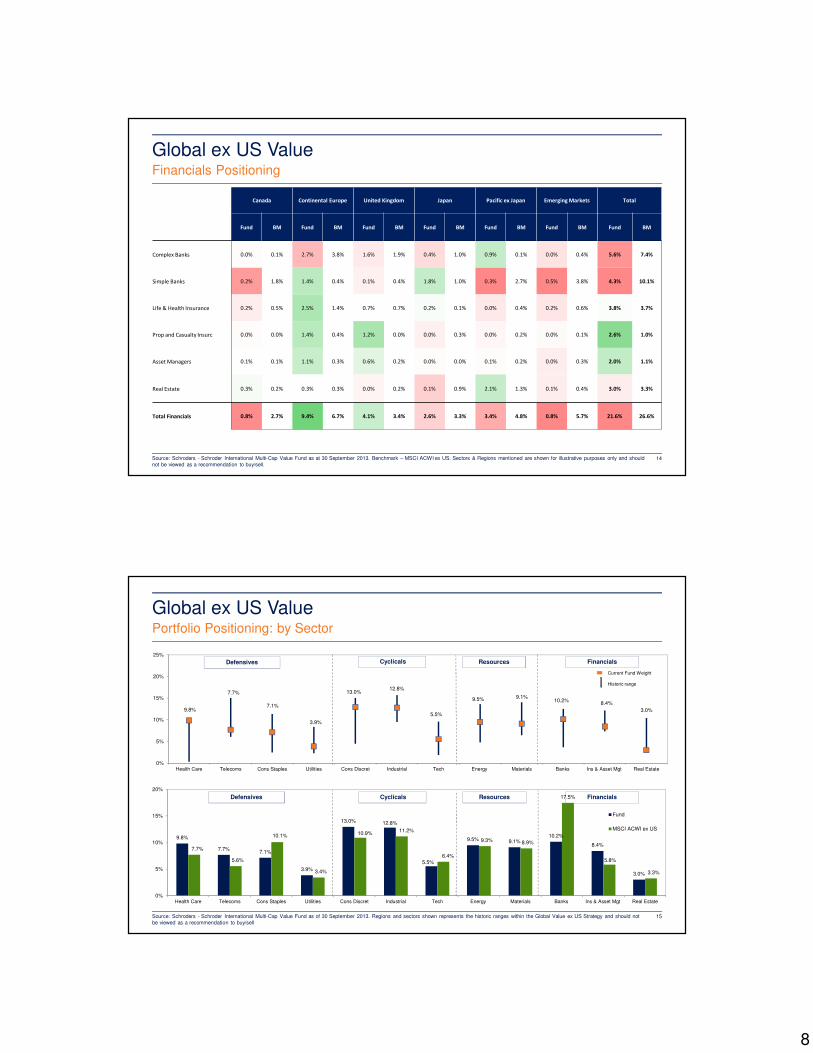
8
14
Financials Positioning
Source: Schroders - Schroder International Multi-Cap Value Fund as at 30 September 2013. Benchmark – MSCI ACWI ex US. Sectors & Regions mentioned are shown for illustrative purposes only and should
not be viewed as a recommendation to buy/sell.
Global ex US Value
Canada Continental Europe United Kingdom Japan Pacific ex Japan Emerging Markets Total
Fund BM Fund BM Fund BM Fund BM Fund BM Fund BM Fund BM
Complex Banks 0.0% 0.1% 2.7% 3.8% 1.6% 1.9% 0.4% 1.0% 0.9% 0.1% 0.0% 0.4% 5.6% 7.4%
Simple Banks 0.2% 1.8% 1.4% 0.4% 0.1% 0.4% 1.8% 1.0% 0.3% 2.7% 0.5% 3.8% 4.3% 10.1%
Life & Health Insurance 0.2% 0.5% 2.5% 1.4% 0.7% 0.7% 0.2% 0.1% 0.0% 0.4% 0.2% 0.6% 3.8% 3.7%
Prop and Casualty Insurc 0.0% 0.0% 1.4% 0.4% 1.2% 0.0% 0.0% 0.3% 0.0% 0.2% 0.0% 0.1% 2.6% 1.0%
Asset Managers 0.1% 0.1% 1.1% 0.3% 0.6% 0.2% 0.0% 0.0% 0.1% 0.2% 0.0% 0.3% 2.0% 1.1%
Real Estate 0.3% 0.2% 0.3% 0.3% 0.0% 0.2% 0.1% 0.9% 2.1% 1.3% 0.1% 0.4% 3.0% 3.3%
Total Financials 0.8% 2.7% 9.4% 6.7% 4.1% 3.4% 2.6% 3.3% 3.4% 4.8% 0.8% 5.7% 21.6% 26.6%
Defensives Cyclicals Resources Financials
Defensives Cyclicals Resources Financials
Global ex US Value
15
Portfolio Positioning: by Sector
Source: Schroders - Schroder International Multi-Cap Value Fund as of 30 September 2013. Regions and sectors shown represents the historic ranges within the Global Value ex US Strategy and should not
be viewed as a recommendation to buy/sell
9.8%
7.7%
7.1%
3.9%
13.0%12.8%
5.5%
9.5% 9.1%10.2%
8.4%
3.0%
0%
5%
10%
15%
20%
25%
Health Care Telecoms Cons Staples Utilities Cons Discret Industrial Tech Energy Materials Banks Ins & Asset Mgt Real Estate
Current Fund Weight
Historic range
9.8%
7.7%7.1%
3.9%
13.0% 12.8%
5.5%
9.5% 9.1%10.2%
8.4%
3.0%
7.7%
5.6%
10.1%
3.4%
10.9%11.2%
6.4%
9.3% 8.9%
17.5%
5.8%
3.3%
0%
5%
10%
15%
20%
Health Care Telecoms Cons Staples Utilities Cons Discret Industrial Tech Energy Materials Banks Ins & Asset Mgt Real Estate
Fund
MSCI ACWI ex US
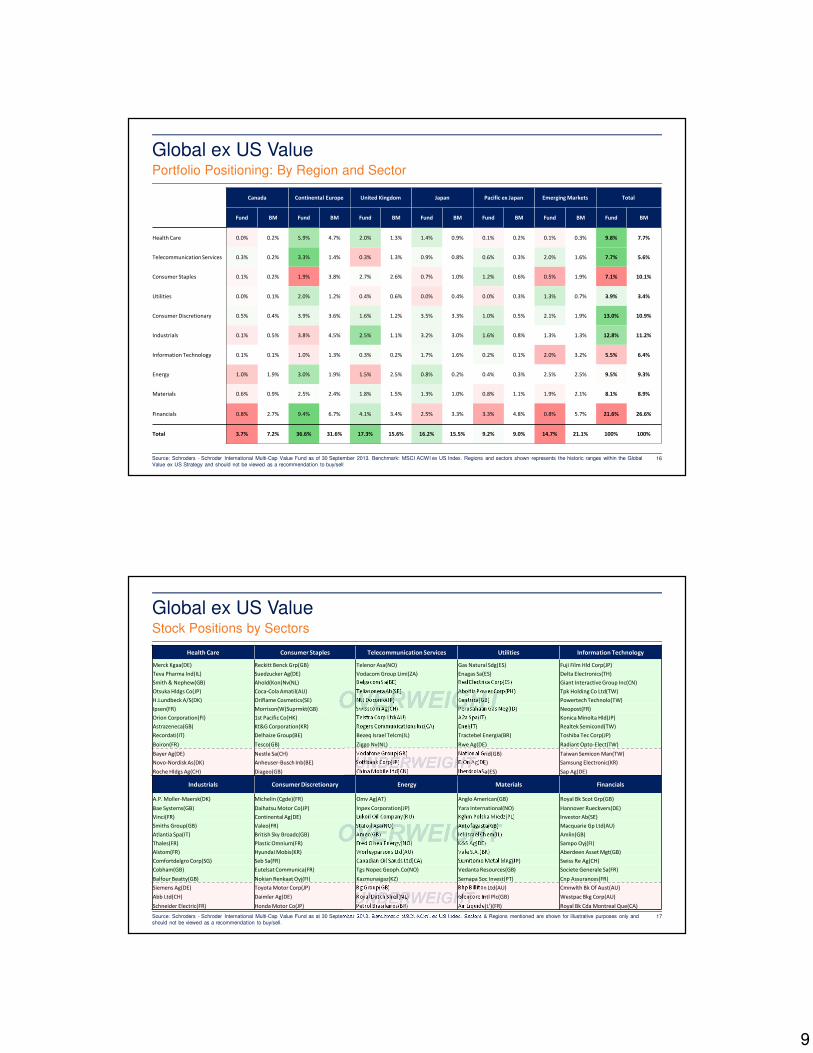
9
16
Portfolio Positioning: By Region and Sector
Source: Schroders - Schroder International Multi-Cap Value Fund as of 30 September 2013. Benchmark: MSCI ACWI ex US Index. Regions and sectors shown represents the historic ranges within the Global
Value ex US Strategy and should not be viewed as a recommendation to buy/sell
Global ex US Value
Canada Continental Europe United Kingdom Japan Pacific ex Japan Emerging Markets Total
Fund BM Fund BM Fund BM Fund BM Fund BM Fund BM Fund BM
Health Care 0.0% 0.2% 5.9% 4.7% 2.0% 1.3% 1.4% 0.9% 0.1% 0.2% 0.1% 0.3% 9.8% 7.7%
Telecommunication Services 0.3% 0.2% 3.3% 1.4% 0.3% 1.3% 0.9% 0.8% 0.6% 0.3% 2.0% 1.6% 7.7% 5.6%
Consumer Staples 0.1% 0.2% 1.9% 3.8% 2.7% 2.6% 0.7% 1.0% 1.2% 0.6% 0.5% 1.9% 7.1% 10.1%
Utilities 0.0% 0.1% 2.0% 1.2% 0.4% 0.6% 0.0% 0.4% 0.0% 0.3% 1.3% 0.7% 3.9% 3.4%
Consumer Discretionary 0.5% 0.4% 3.9% 3.6% 1.6% 1.2% 3.5% 3.3% 1.0% 0.5% 2.1% 1.9% 13.0% 10.9%
Industrials 0.1% 0.5% 3.8% 4.5% 2.5% 1.1% 3.2% 3.0% 1.6% 0.8% 1.3% 1.3% 12.8% 11.2%
Information Technology 0.1% 0.1% 1.0% 1.3% 0.3% 0.2% 1.7% 1.6% 0.2% 0.1% 2.0% 3.2% 5.5% 6.4%
Energy 1.0% 1.9% 3.0% 1.9% 1.5% 2.5% 0.8% 0.2% 0.4% 0.3% 2.5% 2.5% 9.5% 9.3%
Materials 0.6% 0.9% 2.5% 2.4% 1.8% 1.5% 1.3% 1.0% 0.8% 1.1% 1.9% 2.1% 8.1% 8.9%
Financials 0.8% 2.7% 9.4% 6.7% 4.1% 3.4% 2.5% 3.3% 3.3% 4.8% 0.8% 5.7% 21.6% 26.6%
Total 3.7% 7.2% 36.6% 31.6% 17.3% 15.6% 16.2% 15.5% 9.2% 9.0% 14.7% 21.1% 100% 100%
Health Care Consumer Staples Telecommunication Services Utilities Information Technology
Merck Kgaa(DE) Reckitt Benck Grp(GB) Telenor Asa(NO) Gas Natural Sdg(ES) Fuji Film Hld Corp(JP)
Teva Pharma Ind(IL) Suedzucker Ag(DE) Vodacom Group Limi(ZA) Enagas Sa(ES) Delta Electronics(TH)
Smith & Nephew(GB) Ahold(Kon)Nv(NL) Belgacom Sa(BE) Red Electrica Corp(ES) Giant Interactive Group Inc(CN)
Otsuka Hldgs Co(JP) Coca-Cola Amatil(AU) Teliasonera Ab(SE) Aboitiz Power Corp(PH) Tpk Holding Co Ltd(TW)
H.Lundbeck A/S(DK) Oriflame Cosmetics(SE) Ntt Docomo(JP) Centrica(GB) Powertech Technolo(TW)
Ipsen(FR) Morrison(W)Suprmkt(GB) Swisscom Ag(CH) Perusahaan Gas Neg(ID) Neopost(FR)
Orion Corporation(FI) 1st Pacific Co(HK) Telstra Corp Ltd(AU) A2a Spa(IT) Konica Minolta Hld(JP)
Astrazeneca(GB) Kt&G Corporation(KR) Rogers Communications Inc(CA) Enel(IT) Realtek Semicond(TW)
Recordati(IT) Delhaize Group(BE) Bezeq Israel Telcm(IL) Tractebel Energia(BR) Toshiba Tec Corp(JP)
Boiron(FR) Tesco(GB) Ziggo Nv(NL) Rwe Ag(DE) Radiant Opto-Elect(TW)
Bayer Ag(DE) Nestle Sa(CH) Vodafone Group(GB) National Grid(GB) Taiwan Semicon Man(TW)
Novo-Nordisk As(DK) Anheuser-Busch Inb(BE) Softbank Corp(JP) E.On Ag(DE) Samsung Electronic(KR)
Roche Hldgs Ag(CH) Diageo(GB) China Mobile Ltd(CN) Iberdrola Sa(ES) Sap Ag(DE)
Industrials Consumer Discretionary Energy Materials Financials
A.P. Moller-Maersk(DK) Michelin (Cgde)(FR) Omv Ag(AT) Anglo American(GB) Royal Bk Scot Grp(GB)
Bae Systems(GB) Daihatsu Motor Co(JP) Inpex Corporation(JP) Yara International(NO) Hannover Rueckvers(DE)
Vinci(FR) Continental Ag(DE) Lukoil Oil Company(RU) Kghm Polska Miedz(PL) Investor Ab(SE)
Smiths Group(GB) Valeo(FR) Statoil Asa(NO) Antofagasta(GB) Macquarie Gp Ltd(AU)
Atlantia Spa(IT) British Sky Broadc(GB) Amec(GB) Icl-Israel Chem(IL) Amlin(GB)
Thales(FR) Plastic Omnium(FR) Fred Olsen Energy(NO) K&S Ag(DE) Sampo Oyj(FI)
Alstom(FR) Hyundai Mobis(KR) Worleyparsons Ltd(AU) Vale S.A.(BR) Aberdeen Asset Mgt(GB)
Comfortdelgro Corp(SG) Seb Sa(FR) Canadian Oil Sands Ltd(CA) Sumitomo Metal Mng(JP) Swiss Re Ag(CH)
Cobham(GB) Eutelsat Communica(FR) Tgs Nopec Geoph.Co(NO) Vedanta Resources(GB) Societe Generale Sa(FR)
Balfour Beatty(GB) Nokian Renkaat Oyj(FI) Kazmunaigaz(KZ) Semapa Soc Invest(PT) Cnp Assurances(FR)
Siemens Ag(DE) Toyota Motor Corp(JP) Bg Group(GB) Bhp Billiton Ltd(AU) Cmnwlth Bk Of Aust(AU)
Abb Ltd(CH) Daimler Ag(DE) Royal Dutch Shell(NL) Glencore Intl Plc(GB) Westpac Bkg Corp(AU)
Schneider Electric(FR) Honda Motor Co(JP) Petrol Brasileiros(BR) Air Liquide(L')(FR) Royal Bk Cda Montreal Que(CA)
17
Stock Positions by Sectors
Source: Schroders - Schroder International Multi-Cap Value Fund as at 30 September 2013. Benchmark: MSCI ACWI ex US Index. Sectors & Regions mentioned are shown for illustrative purposes only and
should not be viewed as a recommendation to buy/sell.
Global ex US Value
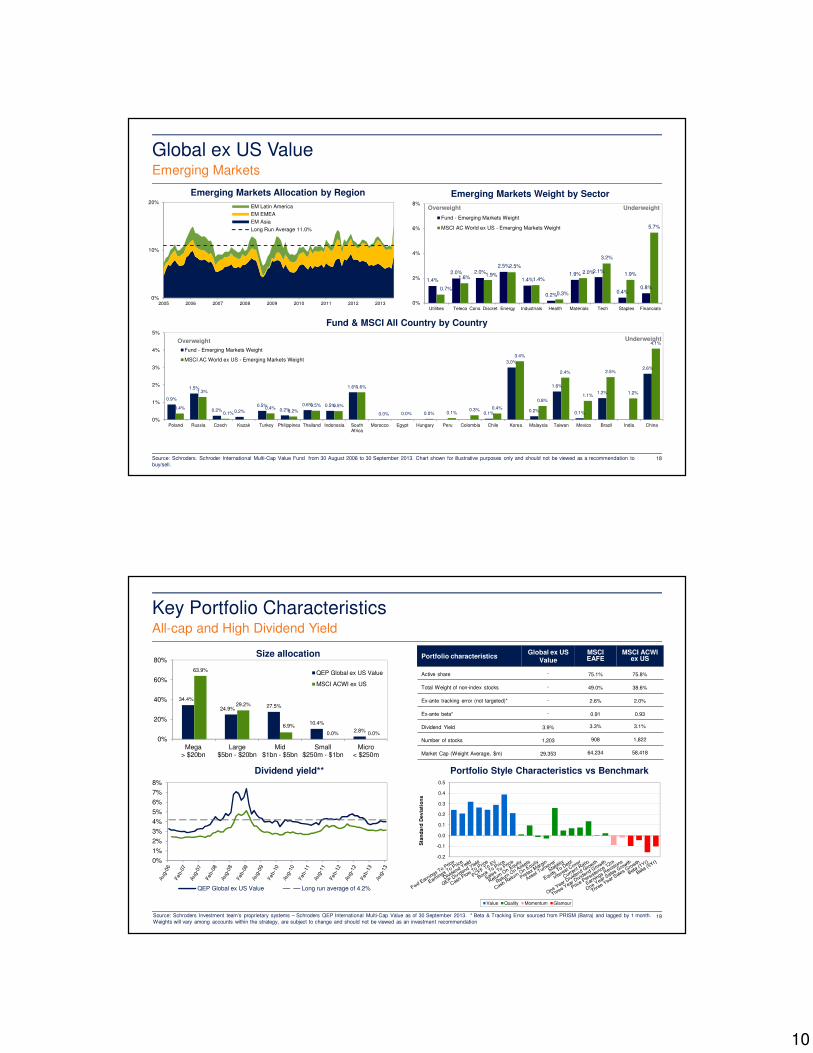
10
Emerging Markets Weight by Sector
1.4%
2.0% 2.0%
2.5%
1.4%
0.2%
1.9%2.1%
0.4%0.8%0.7%
1.6%1.9%
2.5%
1.4%
0.3%
2.0%
3.2%
1.9%
5.7%
0%
2%
4%
6%
8%
Utilities Teleco Cons. Discret. Energy Industrials Health Materials Tech Staples Financials
Fund - Emerging Markets Weight
MSCI AC World ex US - Emerging Markets Weight
Emerging Markets Allocation by Region
Fund & MSCI All Country by Country
Underweight Overweight
Global ex US Value
18
Emerging Markets
Source: Schroders. Schroder International Multi-Cap Value Fund from 30 August 2006 to 30 September 2013. Chart shown for illustrative purposes only and should not be viewed as a recommendation to
buy/sell.
0.9%
1.5%
0.2% 0.2%
0.5%0.2%
0.6% 0.5%
1.6%
0.1%
3.0%
0.2%
1.6%
0.1%
1.2%
2.6%
0.4%
1.3%
0.1%
0.4%0.2%
0.5% 0.5%
1.6%
0.0% 0.0% 0.0% 0.1%0.3% 0.4%
3.4%
0.8%
2.4%
1.1%
2.5%
1.2%
4.1%
0%
1%
2%
3%
4%
5%
Poland Russia Czech Kazak Turkey Philippines Thailand Indonesia South
Africa
Morocco Egypt Hungary Peru Colombia Chile Korea Malaysia Taiwan Mexico Brazil India China
Fund - Emerging Markets Weight
MSCI AC World ex US - Emerging Markets Weight
Underweight Overweight
0%
10%
20%
2005 2006 2007 2008 2009 2010 2011 2012 2013
EM Latin America
EM EMEA
EM Asia
Long Run Average 11.0%
Size allocation
Dividend yield**
Key Portfolio Characteristics
Source: Schroders Investment team’s proprietary systems – Schroders QEP International Multi-Cap Value as of 30 September 2013. * Beta & Tracking Error sourced from PRISM (Barra) and lagged by 1 month.
Weights will vary among accounts within the strategy, are subject to change and should not be viewed as an investment recommendation
Portfolio Style Characteristics vs Benchmark
19
All-cap and High Dividend Yield
34.4%
24.9%27.5%
10.4%
2.8%
63.9%
29.2%
6.9%
0.0% 0.0%
0%
20%
40%
60%
80%
Mega
> $20bn
Large
$5bn - $20bn
Mid
$1bn - $5bn
Small
$250m - $1bn
Micro
< $250m
QEP Global ex US Value
MSCI ACWI ex US
0%
1%
2%
3%
4%
5%
6%
7%
8%
QEP Global ex US Value Long run average of 4.2%
Portfolio characteristicsGlobal ex US
Value
MSCI EAFE
MSCI ACWI ex US
Active share - 75.1% 75.8%
Total Weight of non-index stocks - 49.0% 38.6%
Ex-ante tracking error (not targeted)* - 2.6% 2.0%
Ex-ante beta* - 0.91 0.93
Dividend Yield 3.9% 3.3% 3.1%
Number of stocks 1,203 908 1,822
Market Cap (Weight Average, $m) 29,353 64,234 58,418
-0.2
-0.1
0.0
0.1
0.2
0.3
0.4
0.5
Sta
nd
ard
De
via
tio
ns
Value Quality Momentum Glamour
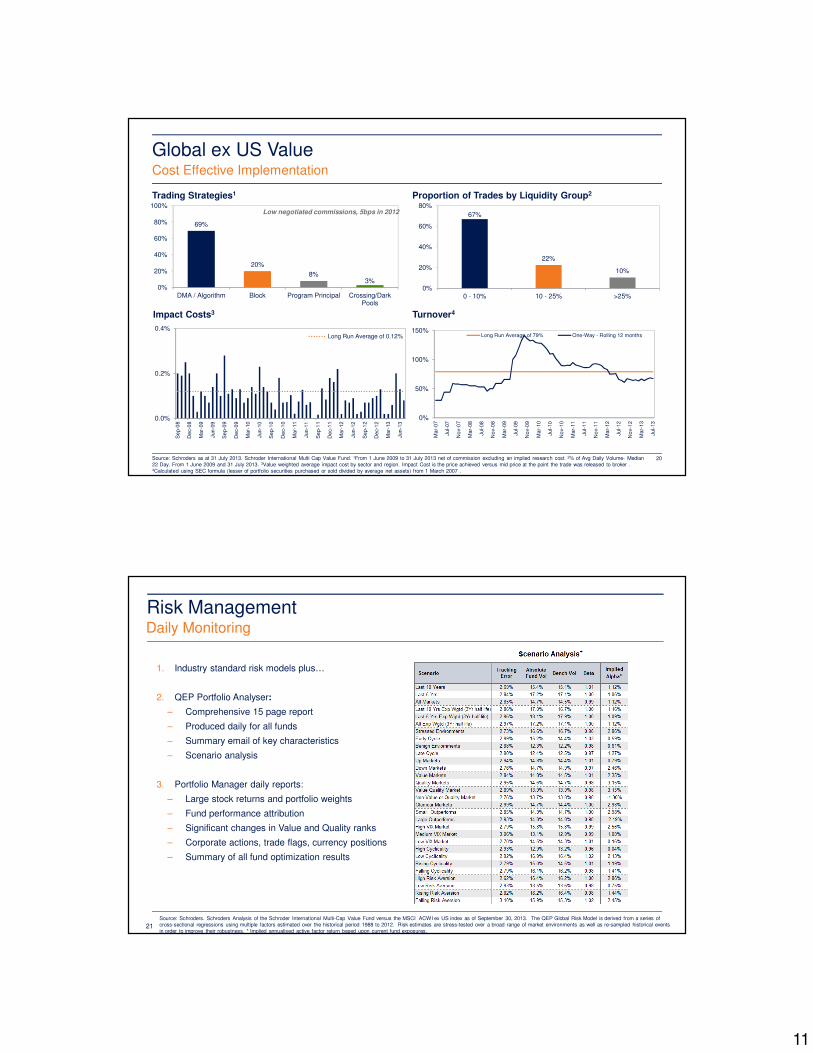
11
67%
22%
10%
0%
20%
40%
60%
80%
0 - 10% 10 - 25% >25%
3%8%
20%
69%
0%
20%
40%
60%
80%
100%
Crossing/Dark
Pools
Program PrincipalBlockDMA / Algorithm
Trading Strategies1 Proportion of Trades by Liquidity Group2
Global ex US ValueCost Effective Implementation
20Source: Schroders as at 31 July 2013. Schroder International Multi Cap Value Fund. 1From 1 June 2009 to 31 July 2013 net of commission excluding an implied research cost. 2% of Avg Daily Volume- Median
22 Day. From 1 June 2009 and 31 July 2013. 3Value weighted average impact cost by sector and region. Impact Cost is the price achieved versus mid price at the point the trade was released to broker . 4Calculated using SEC formula (lesser of portfolio securities purchased or sold divided by average net assets) from 1 March 2007 .
Impact Costs3 Turnover4
Low negotiated commissions, 5bps in 2012
0.0%
0.2%
0.4%
Se
p-0
8
De
c-0
8
Mar-
09
Jun
-09
Se
p-0
9
De
c-0
9
Mar-
10
Jun
-10
Se
p-1
0
De
c-1
0
Mar-
11
Jun
-11
Se
p-1
1
De
c-1
1
Mar-
12
Jun
-12
Se
p-1
2
De
c-1
2
Mar-
13
Jun
-13
Long Run Average of 0.12%
0%
50%
100%
150%
Mar-
07
Jul-
07
No
v-0
7
Mar-
08
Jul-
08
No
v-0
8
Mar-
09
Jul-
09
No
v-0
9
Mar-
10
Jul-
10
No
v-1
0
Mar-
11
Jul-
11
No
v-1
1
Mar-
12
Jul-
12
No
v-1
2
Mar-
13
Jul-
13
Long Run Average of 79% One-Way - Rolling 12 months
Risk ManagementDaily Monitoring
21
Source: Schroders. Schroders Analysis of the Schroder International Multi-Cap Value Fund versus the MSCI ACWI ex US index as of September 30, 2013. The QEP Global Risk Model is derived from a series of
cross-sectional regressions using multiple factors estimated over the historical period 1988 to 2012. Risk estimates are stress-tested over a broad range of market environments as well as re-sampled historical events
in order to improve their robustness. * Implied annualised active factor return based upon current fund exposures.
1. Industry standard risk models plus…
2. QEP Portfolio Analyser:
– Comprehensive 15 page report
– Produced daily for all funds
– Summary email of key characteristics
– Scenario analysis
3. Portfolio Manager daily reports:
– Large stock returns and portfolio weights
– Fund performance attribution
– Significant changes in Value and Quality ranks
– Corporate actions, trade flags, currency positions
– Summary of all fund optimization results
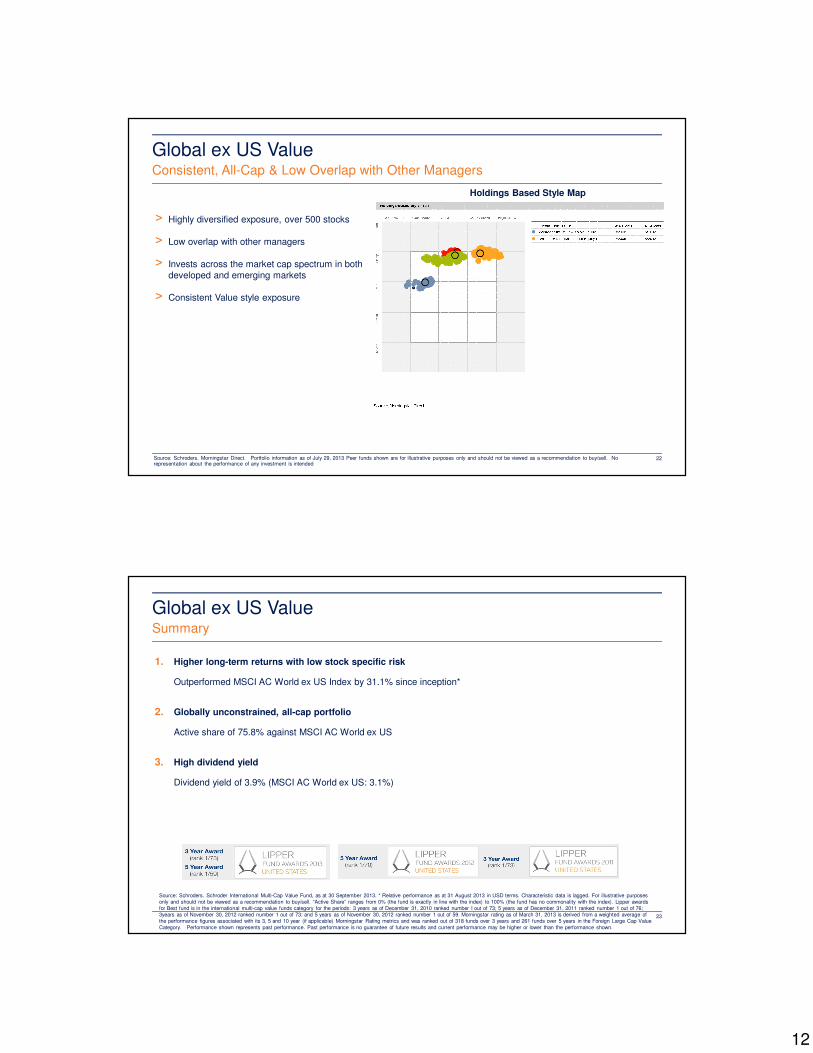
12
Global ex US Value
22
Consistent, All-Cap & Low Overlap with Other Managers
Holdings Based Style Map
> Highly diversified exposure, over 500 stocks
> Low overlap with other managers
> Invests across the market cap spectrum in both
developed and emerging markets
> Consistent Value style exposure
Source: Schroders. Morningstar Direct. Portfolio information as of July 29, 2013 Peer funds shown are for illustrative purposes only and should not be viewed as a recommendation to buy/sell. No representation about the performance of any investment is intended
Global ex US Value
23
Summary
Source: Schroders. Schroder International Multi-Cap Value Fund, as at 30 September 2013. * Relative performance as at 31 August 2013 in USD terms. Characteristic data is lagged. For illustrative purposes
only and should not be viewed as a recommendation to buy/sell. “Active Share” ranges from 0% (the fund is exactly in line with the index) to 100% (the fund has no commonality with the index). Lipper awards
for Best fund is in the international multi-cap value funds category for the periods: 3 years as of December 31, 2010 ranked number I out of 73; 5 years as of December 31, 2011 ranked number 1 out of 76;
3years as of November 30, 2012 ranked number 1 out of 73; and 5 years as of November 30, 2012 ranked number 1 out of 59. Morningstar rating as of March 31, 2013 is derived from a weighted average of
the performance figures associated with its 3, 5 and 10 year (if applicable) Morningstar Rating metrics and was ranked out of 318 funds over 3 years and 261 funds over 5 years in the Foreign Large Cap Value
Category. Performance shown represents past performance. Past performance is no guarantee of future results and current performance may be higher or lower than the performance shown.
1. Higher long-term returns with low stock specific risk
Outperformed MSCI AC World ex US Index by 31.1% since inception*
2. Globally unconstrained, all-cap portfolio
Active share of 75.8% against MSCI AC World ex US
3. High dividend yield
Dividend yield of 3.9% (MSCI AC World ex US: 3.1%)
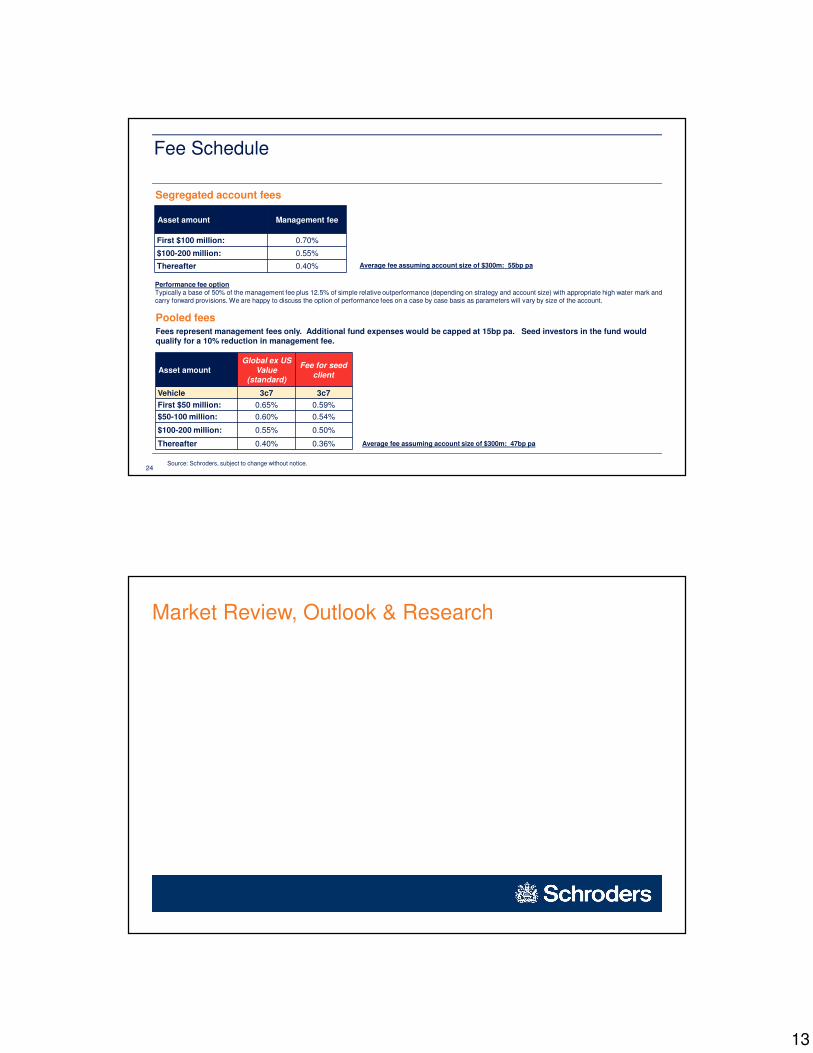
13
24
Asset amount Management fee
First $100 million: 0.70%
$100-200 million: 0.55%
Thereafter 0.40%
Fee Schedule
Segregated account fees
Average fee assuming account size of $300m: 55bp pa
Asset amount
Global ex US
Value
(standard)
Fee for seed
client
Vehicle 3c7 3c7
First $50 million: 0.65% 0.59%
$50-100 million: 0.60% 0.54%
$100-200 million: 0.55% 0.50%
Thereafter 0.40% 0.36%
Pooled fees
Fees represent management fees only. Additional fund expenses would be capped at 15bp pa. Seed investors in the fund would
qualify for a 10% reduction in management fee.
Source: Schroders, subject to change without notice.
Performance fee option
Typically a base of 50% of the management fee plus 12.5% of simple relative outperformance (depending on strategy and account size) with appropriate high water mark and
carry forward provisions. We are happy to discuss the option of performance fees on a case by case basis as parameters will vary by size of the account.
Average fee assuming account size of $300m: 47bp pa
Market Review, Outlook & Research
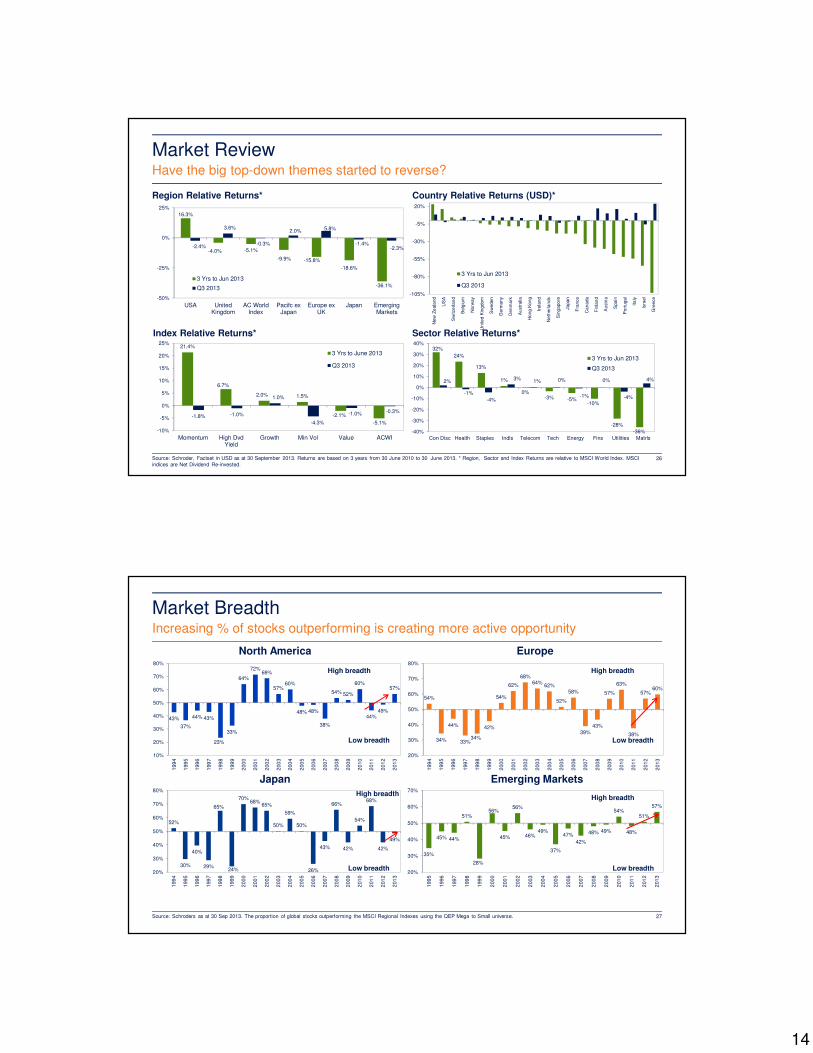
14
21.4%
6.7%
2.0% 1.5%
-2.1%
-5.1%
-1.8% -1.0%
1.0%
-4.3%
-1.0%-0.3%
-10%
-5%
0%
5%
10%
15%
20%
25%
Momentum High Dvd
Yield
Growth Min Vol Value ACWI
3 Yrs to June 2013
Q3 2013
Region Relative Returns* Country Relative Returns (USD)*
Market ReviewHave the big top-down themes started to reverse?
26
Index Relative Returns*
-105%
-80%
-55%
-30%
-5%
20%
New
Ze
ala
nd
US
A
Sw
itzerlan
d
Belg
ium
Norw
ay
United K
ingdom
Sw
eden
Germ
any
Den
mark
Austr
alia
Hon
g K
ong
Ire
land
Neth
erlan
ds
Sin
gapore
Japan
Fra
nce
Can
ada
Fin
lan
d
Austr
ia
Spain
Port
ugal
Ita
ly
Isra
el
Gre
ece
3 Yrs to Jun 2013
Q3 2013
16.3%
-4.0% -5.1%
-9.9% -15.8%
-18.6%
-36.1%
-2.4%
3.6%
-0.3%
2.0%5.8%
-1.4%-2.3%
-50%
-25%
0%
25%
USA United
Kingdom
AC World
Index
Pacifc ex
Japan
Europe ex
UK
Japan Emerging
Markets
3 Yrs to Jun 2013
Q3 2013
Source: Schroder, Factset in USD as at 30 September 2013. Returns are based on 3 years from 30 June 2010 to 30 June 2013. * Region, Sector and Index Returns are relative to MSCI World Index. MSCI
indices are Net Dividend Re-invested.
Sector Relative Returns*
32%
24%
13%
1%
0%-3% -5%
-10%
-28%
-36%
2%
-1%
-4%
3%1% 0%
-1%
0%
-4%
4%
-40%
-30%
-20%
-10%
0%
10%
20%
30%
40%
Con Disc Health Staples Indls Telecom Tech Energy Fins Utilities Matrls
3 Yrs to Jun 2013
Q3 2013
Europe
Emerging Markets
Market Breadth
27
Increasing % of stocks outperforming is creating more active opportunity
Source: Schroders as at 30 Sep 2013. The proportion of global stocks outperforming the MSCI Regional Indexes using the QEP Mega to Small universe.
54%
34%
44%
33%34%
42%
54%
62%
68%
64%62%
52%
58%
39%
43%
57%
63%
38%
57%60%
20%
30%
40%
50%
60%
70%
80%
199
4
199
5
199
6
199
7
199
8
199
9
200
0
200
1
200
2
200
3
200
4
200
5
200
6
200
7
200
8
200
9
201
0
201
1
201
2
201
3
High breadth
Low breadth
35%
45% 44%
51%
28%
56%
45%
56%
46%49%
37%
47%
42%
48% 49%
54%
48%
51%
57%
20%
30%
40%
50%
60%
70%
199
5
199
6
199
7
199
8
199
9
200
0
200
1
200
2
200
3
200
4
200
5
200
6
200
7
200
8
200
9
201
0
201
1
201
2
201
3
High breadth
Low breadth
North America
Japan
43%
37%
44% 43%
23%
33%
64%
72%69%
57%60%
48% 48%
38%
54% 52%
60%
44%49%
57%
10%
20%
30%
40%
50%
60%
70%
80%
199
4
199
5
199
6
199
7
199
8
199
9
200
0
200
1
200
2
200
3
200
4
200
5
200
6
200
7
200
8
200
9
201
0
201
1
201
2
201
3
High breadth
Low breadth
52%
30%
40%
29%
65%
24%
70%68%
65%
50%
59%
50%
26%
43%
66%
42%
54%
68%
42%
49%
20%
30%
40%
50%
60%
70%
80%
199
4
199
5
199
6
199
7
199
8
199
9
200
0
200
1
200
2
200
3
200
4
200
5
200
6
200
7
200
8
200
9
201
0
201
1
201
2
201
3
High breadth
Low breadth
15
Which strategies have been the most successful?High quality, momentum and low beta are now reversing
28Source: Schroders. All global stocks (including emerging markets) market impact weighted expressed relative p.a. to a market impact weighted universe expressed in USD currency terms (2011 to June 2013). All stocks are ranked on each factor taken in turn and the top (bottom) third of the global rank forms the factor portfolio (e.g. stocks ranked in the top third of both Momentum and Value form the “Cheap & High Momentum” portfolio.
-10%
-8%
-6%
-4%
-2%
0%
2%
4%
6%
Annualised Return (%)
2011 to June 2013
July to September 2013
Value InvestingReturns are cyclical and volatile
Source: Schroders, French, NBER as at December 2012 in USD. Performance of High Book Yield is based on a market capitalisation weighted strategy formed from the top 1/3 of a Book Yield Rank.
Performance for High Composite Value is based on the average return of a market capitalisation weighted strategy of the top 1/3 of Book, Earnings, Cashflow and Dividend Yield ranks. Returns are relative to
S&P500 or equivalent market capitalisation weighted index. Grey Bars denote US Recessions.
Rolling 3 Year relative performance of Value strategies (US data)
-60%
-40%
-20%
0%
20%
40%
60%
80%
100%
120%
140%
160%
29 32 35 38 41 44 47 50 53 56 59 62 65 68 71 74 77 80 83 86 89 92 95 98 01 04 07 10
Recessions
High Book Yield
High Composite Value
29
16
Value InvestingHistoric relative drawdowns
Source: Schroders, French, as at end Mar 2013 in USD. Performance of High Book Yield is based on a market capitalisation weighted strategy formed from the top 1/3 of a Book Yield Rank and returns are
relative to S&P500 or equivalent market capitalisation weighted index. Global numbers (Grey bars) are based on a high composite value measure formed from the top 1/3 of several value terms ranks including
Book, Earnings, Cash Flows and Dividend and returns are relative to MSCI World.
Historic drawdowns of a High Book Yield (Composite Value Grey bars) Strategy since 1926
(% USD relative returns, months of drawdown in brackets)
-9.3%
-70%
-60%
-50%
-40%
-30%
-20%
-10%
0%
Global DataUS Data
30
-10.1%
Value InvestingFlavour of Value can lead to significant variation in risk and return
Source: Schroders, MSCI. Value returns based on the top third of universe by FY1 Earnings, Earnings, Cashflow, Book, Dividend yield or a composite value rank, relative returns to a market-cap weighted index.
Stock weights are based on liquidity and capped at 0.75%. Beta estimated using all observation since 1988 to Sep 2013.
Relative performance and Beta of Global Value factors since 1988 (p.a.)
0.85
0.90
0.95
1.00
1.05
0%
1%
2%
3%
4%
5%
6%
Book Yield Cash Flow Yield Earnings Yield Forward 12 Mth
Earnings Yield
Dividend Yield Composite Value
Relative Performance since 1988 (LHS) Beta (RHS)
31
17
Value InvestingRecent returns have been quite skewed, but are starting to reverse
Source: Schroders, MSCI, Sep 2013. Universe is Mega to Mid stocks. Value Returns based on the top third of universe by FY1 Earnings, Earnings, Cashflow, Book, Dividend yield or a composite value rank
and are Market Impact Weighted relative to a Market Cap Weighted Index. Stock weights are based on liquidity and capped at 0.75% using Local Currency.
Relative performance of Global Value factors since 2011
-14%
-12%
-10%
-8%
-6%
-4%
-2%
0%
2%
4%
6%
Dividend Yield Earnings Yield Forward Earnings
Yield
Cash Flow Yield Book Yield Composite Value
Jan 2011 - July 2012 Aug 2012 - Dec 2012 2013 YTD
32
Defensive Yield
33Source: MSCI, QEP as at 30 Sep 2013. Developed market uses QEP Dividend Yield and MSCI World stocks Weights to calculate the weighted average Dividend Yield of the Index. Developed Cons. Staples
is all consumer staples in the Developed Mega to Small Universe and Dividend Yield is calculated as a weighted average of the QEP Dividend Yield
-1
-0.5
0
0.5
1
1.5
0.0
0.5
1.0
1.5
2.0
2.5
3.0
3.5
4.0
4.5
5.0
1996 1997 1998 1999 2000 2001 2002 2003 2004 2005 2006 2007 2008 2009 2010 2011 2012 2013
%%
Differential: Cons. Staples - Developed Market (RHS)
Developed Market (LHS)
Developed Cons. Staples (LHS)
Consumer Staples still trading at a significant premium
Defensive Yield: currently expensive relative to market
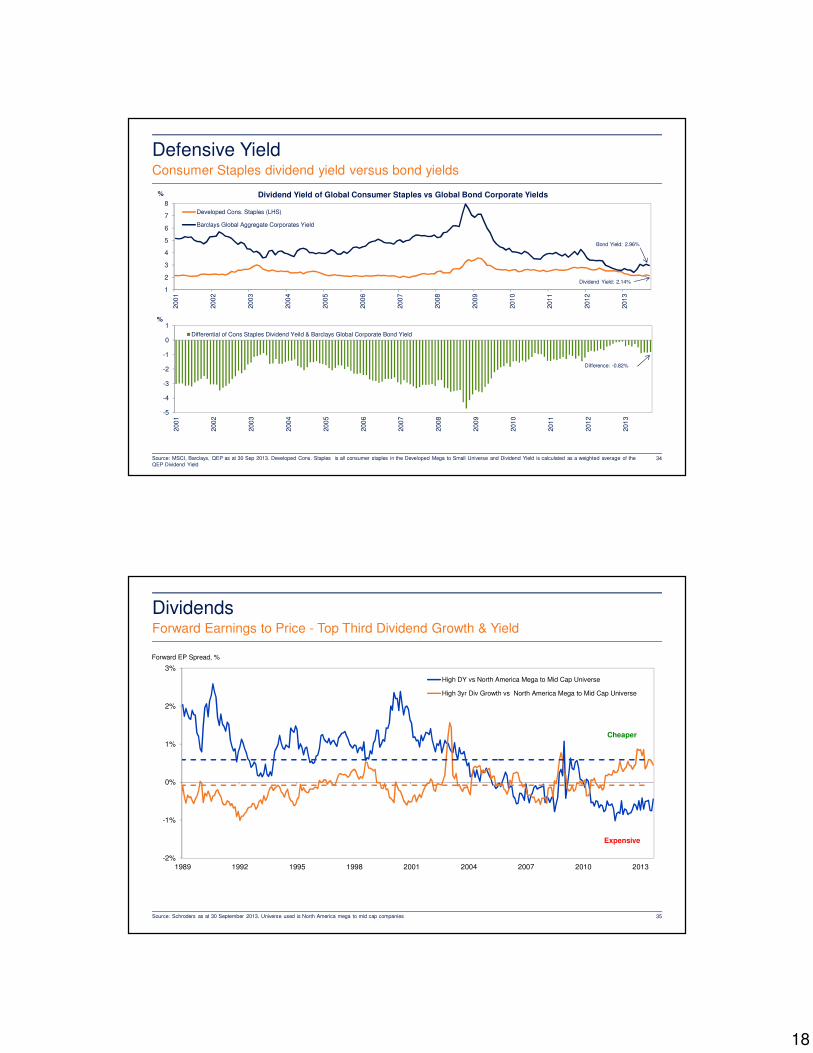
18
Defensive Yield
34
Consumer Staples dividend yield versus bond yields
Source: MSCI, Barclays, QEP as at 30 Sep 2013. Developed Cons. Staples is all consumer staples in the Developed Mega to Small Universe and Dividend Yield is calculated as a weighted average of the
QEP Dividend Yield
Dividend Yield: 2.14%
Bond Yield: 2.96%
1
2
3
4
5
6
7
8
200
1
200
2
200
3
200
4
200
5
200
6
200
7
200
8
200
9
201
0
201
1
201
2
201
3
% Dividend Yield of Global Consumer Staples vs Global Bond Corporate Yields
Developed Cons. Staples (LHS)
Barclays Global Aggregate Corporates Yield
Difference: -0.82%
-5
-4
-3
-2
-1
0
1
200
1
200
2
200
3
200
4
200
5
200
6
200
7
200
8
200
9
201
0
201
1
201
2
201
3
%
Differential of Cons Staples Dividend Yeild & Barclays Global Corporate Bond Yield
Dividends
35
Forward Earnings to Price - Top Third Dividend Growth & Yield
Source: Schroders as at 30 September 2013. Universe used is North America mega to mid cap companies
-2%
-1%
0%
1%
2%
3%
1989 1992 1995 1998 2001 2004 2007 2010 2013
Forward EP Spread, %
High DY vs North America Mega to Mid Cap Universe
High 3yr Div Growth vs North America Mega to Mid Cap Universe
Cheaper
Expensive
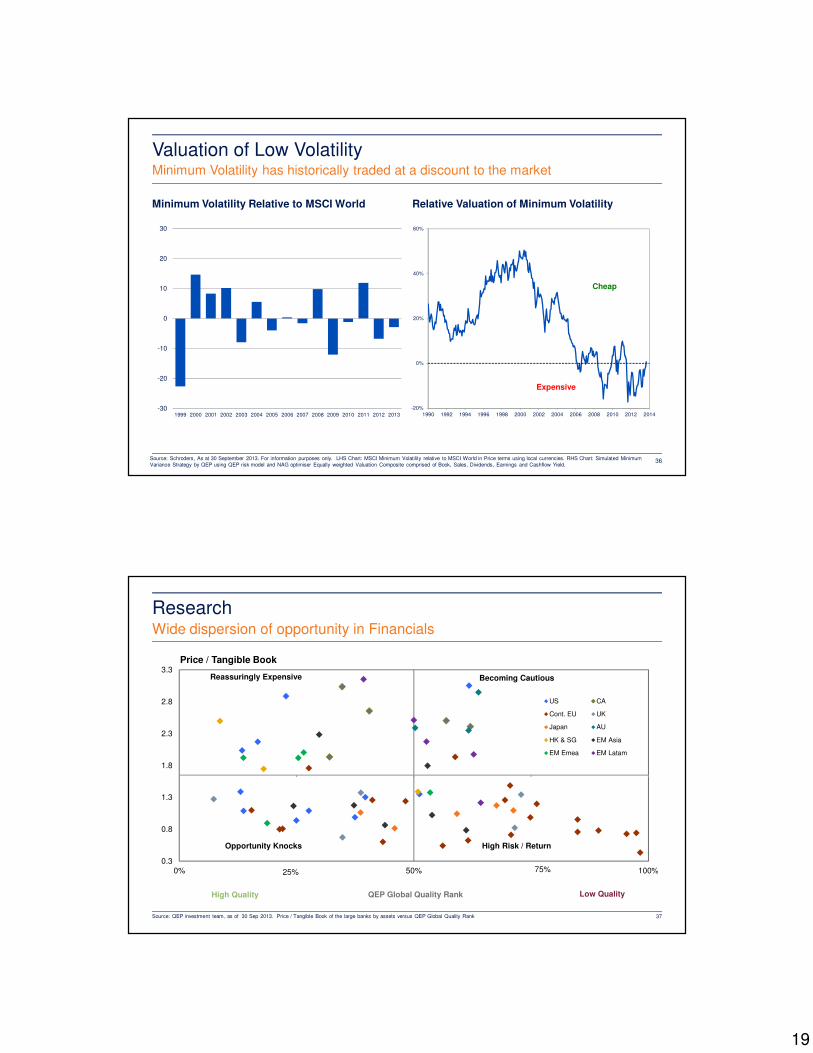
19
-20%
0%
20%
40%
60%
1990 1992 1994 1996 1998 2000 2002 2004 2006 2008 2010 2012 2014
Minimum Volatility Relative to MSCI World Relative Valuation of Minimum Volatility
Valuation of Low VolatilityMinimum Volatility has historically traded at a discount to the market
36Source: Schroders, As at 30 September 2013. For information purposes only. LHS Chart: MSCI Minimum Volatility relative to MSCI World in Price terms using local currencies. RHS Chart: Simulated Minimum
Variance Strategy by QEP using QEP risk model and NAG optimiser Equally weighted Valuation Composite comprised of Book, Sales, Dividends, Earnings and Cashflow Yield.
Cheap
Expensive
-30
-20
-10
0
10
20
30
1999 2000 2001 2002 2003 2004 2005 2006 2007 2008 2009 2010 2011 2012 2013
0.3
0.8
1.3
1.8
2.3
2.8
3.3
0% 50% 100%
Price / Tangible Book
US CA
Cont. EU UK
Japan AU
HK & SG EM Asia
EM Emea EM Latam
75%25%
ResearchWide dispersion of opportunity in Financials
Source: QEP investment team, as of 30 Sep 2013. Price / Tangible Book of the large banks by assets versus QEP Global Quality Rank
QEP Global Quality Rank
Becoming CautiousReassuringly Expensive
High Risk / ReturnOpportunity Knocks
Low QualityHigh Quality
37
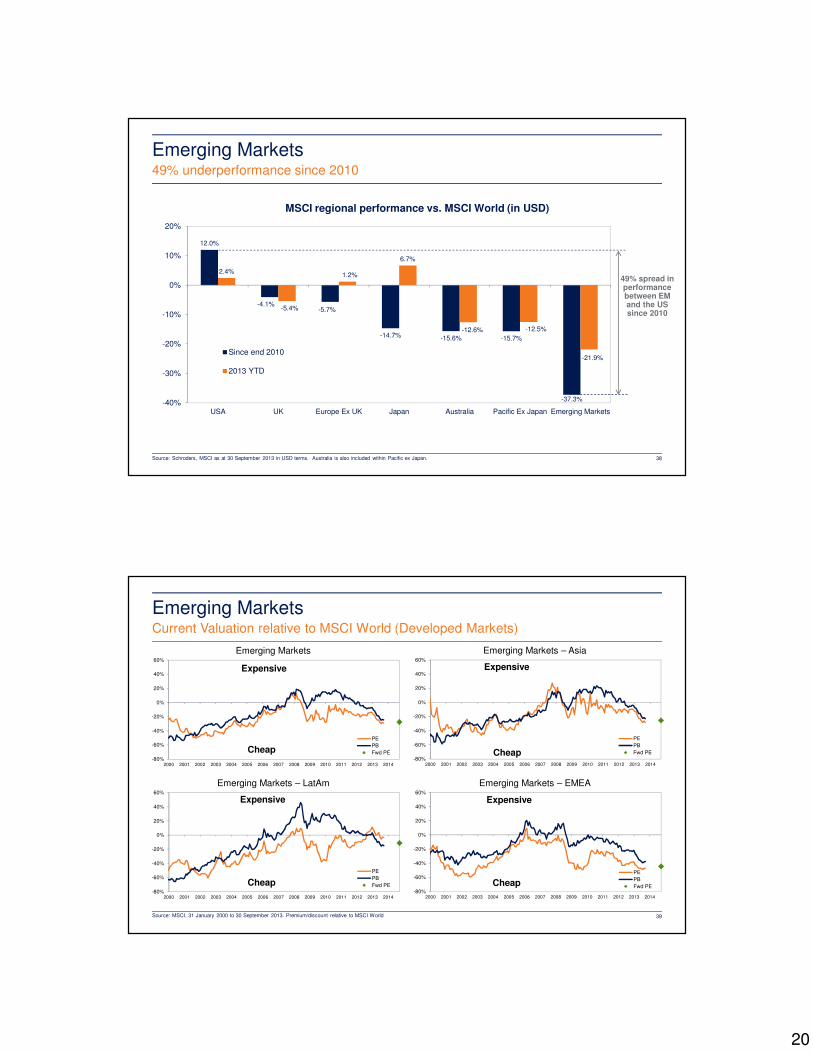
20
Emerging Markets49% underperformance since 2010
38Source: Schroders, MSCI as at 30 September 2013 in USD terms. Australia is also included within Pacific ex Japan.
MSCI regional performance vs. MSCI World (in USD)
12.0%
-4.1%-5.7%
-14.7% -15.6% -15.7%
-37.3%
2.4%
-5.4%
1.2%
6.7%
-12.6% -12.5%
-21.9%
-40%
-30%
-20%
-10%
0%
10%
20%
USA UK Europe Ex UK Japan Australia Pacific Ex Japan Emerging Markets
Since end 2010
2013 YTD
49% spread in
performance
between EM
and the US
since 2010
-80%
-60%
-40%
-20%
0%
20%
40%
60%
2000 2001 2002 2003 2004 2005 2006 2007 2008 2009 2010 2011 2012 2013 2014
PE
PB
Fwd PE
Expensive
Cheap
Emerging Markets
Emerging Markets
39
Current Valuation relative to MSCI World (Developed Markets)
Source: MSCI, 31 January 2000 to 30 September 2013. Premium/discount relative to MSCI World
-80%
-60%
-40%
-20%
0%
20%
40%
60%
2000 2001 2002 2003 2004 2005 2006 2007 2008 2009 2010 2011 2012 2013 2014
PE
PB
Fwd PE
Expensive
Cheap
Emerging Markets – Asia
-80%
-60%
-40%
-20%
0%
20%
40%
60%
2000 2001 2002 2003 2004 2005 2006 2007 2008 2009 2010 2011 2012 2013 2014
PE
PB
Fwd PE
Expensive
Cheap
Emerging Markets – LatAm
-80%
-60%
-40%
-20%
0%
20%
40%
60%
2000 2001 2002 2003 2004 2005 2006 2007 2008 2009 2010 2011 2012 2013 2014
PE
PB
Fwd PE
Expensive
Cheap
Emerging Markets – EMEA
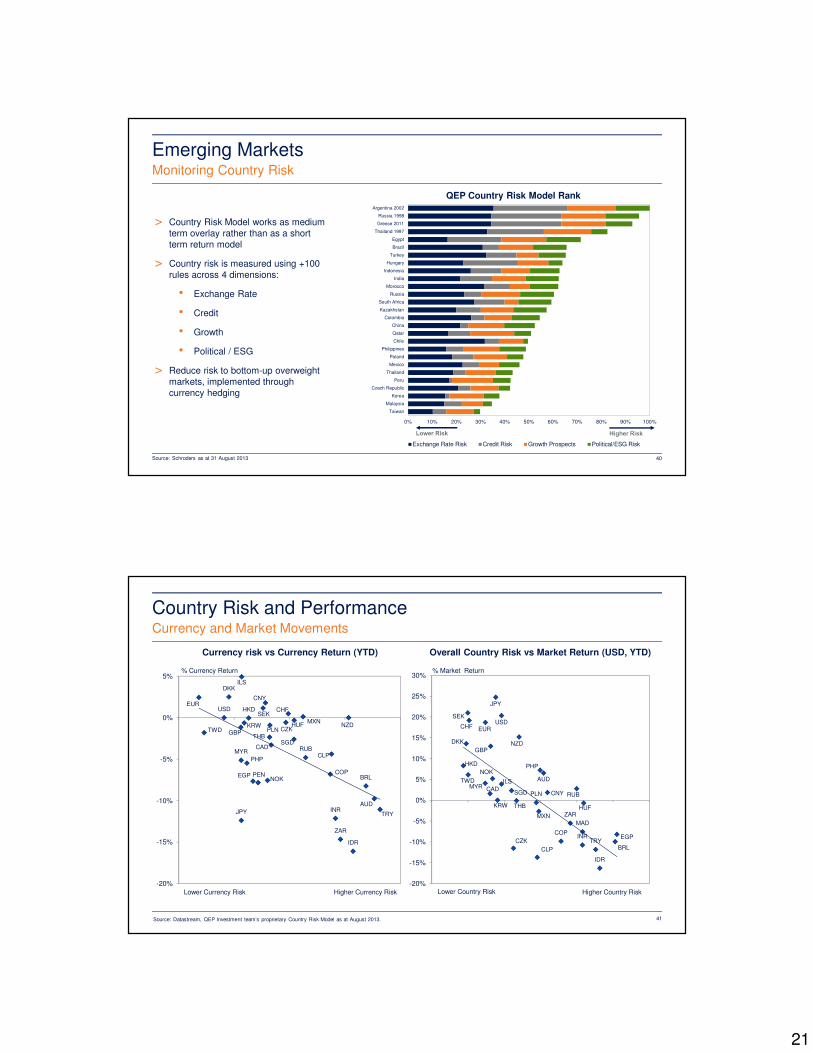
21
0% 10% 20% 30% 40% 50% 60% 70% 80% 90% 100%
Taiwan
Malaysia
Korea
Czech Republic
Peru
Thailand
Mexico
Poland
Philippines
Chile
Qatar
China
Colombia
Kazakhstan
South Africa
Russia
Morocco
India
Indonesia
Hungary
Turkey
Brazil
Egypt
Thailand 1997
Greece 2011
Russia 1998
Argentina 2002
QEP Country Risk Model Rank
Exchange Rate Risk Credit Risk Growth Prospects Political/ESG Risk
Emerging Markets
40
Monitoring Country Risk
Source: Schroders as at 31 August 2013
> Country Risk Model works as medium
term overlay rather than as a short
term return model
> Country risk is measured using +100
rules across 4 dimensions:
• Exchange Rate
• Credit
• Growth
• Political / ESG
> Reduce risk to bottom-up overweight
markets, implemented through
currency hedging
Source: Datastream, QEP Investment team’s proprietary Country Risk Model as at August 2013. 41
USD
CAD
NOK
SEKCHF
GBP
JPY
AUD
HKD
NZD
SGD
ILS
CNY
INR
IDR
KRW
MYR
PHP
TWDTHB
CZK
EGP
HUFPLN
RUB
ZAR
TRY
BRL
CLP
COP
MXN
PEN
DKK
EUR
-20%
-15%
-10%
-5%
0%
5%
Currency risk vs Currency Return (YTD)
USD
CAD
NOK
SEK
CHF
GBP
JPY
AUD
HKD
NZD
SGD
ILS
CNY
INR
IDR
KRW
MYR
PHP
TWD
THB
CZKEGP
HUF
MAD
PLN RUB
ZAR
TRYBRLCLP
COP
MXN
DKK
EUR
-20%
-15%
-10%
-5%
0%
5%
10%
15%
20%
25%
30%
Overall Country Risk vs Market Return (USD, YTD)
% Currency Return % Market Return
Lower Currency Risk Higher Currency Risk Lower Country Risk Higher Country Risk
Country Risk and PerformanceCurrency and Market Movements
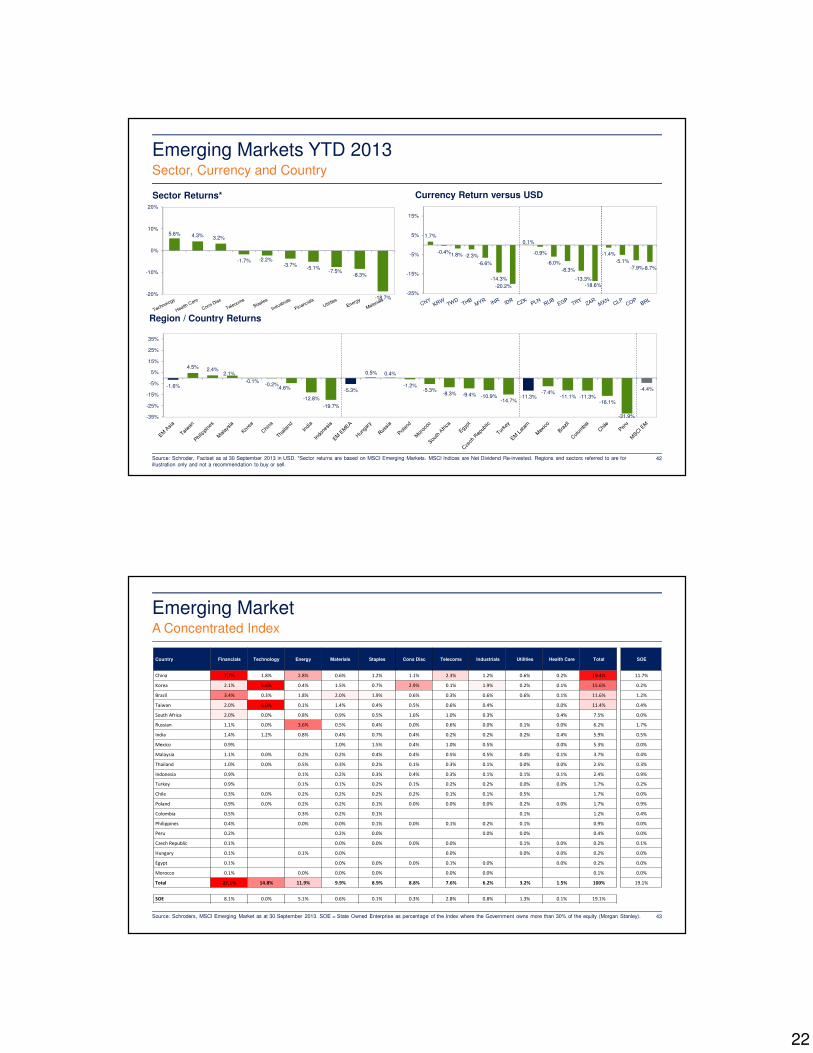
22
Region / Country Returns
Sector Returns*
Emerging Markets YTD 2013Sector, Currency and Country
42
4.5%2.4%
2.1%
-0.1%-0.2%
-4.6%
-12.8%
-19.7%
0.5% 0.4%
-1.2%-5.3%
-8.3% -9.4% -10.9%-14.7%
-7.4%-11.1% -11.3%
-16.1%
-31.9%
-1.6%-5.3%
-11.3%
-4.4%
-35%
-25%
-15%
-5%
5%
15%
25%
35%
Source: Schroder, Factset as at 30 September 2013 in USD. *Sector returns are based on MSCI Emerging Markets. MSCI Indices are Net Dividend Re-invested. Regions and sectors referred to are for
illustration only and not a recommendation to buy or sell.
Currency Return versus USD
5.6% 4.3%3.2%
-1.7% -2.2%-3.7%
-5.1%-7.5%
-8.3%
-18.7%-20%
-10%
0%
10%
20%
1.7%
-0.4%-1.8% -2.3%
-6.6%
-14.3%
-20.2%
0.1%
-0.9%
-6.0%
-8.3%
-13.3%
-18.6%
-1.4%
-5.1%
-7.9%-8.7%
-25%
-15%
-5%
5%
15%
Emerging Market
43
A Concentrated Index
Source: Schroders, MSCI Emerging Market as at 30 September 2013. SOE = State Owned Enterprise as percentage of the Index where the Government owns more than 30% of the equity (Morgan Stanley).
Country Financials Technology Energy Materials Staples Cons Disc Telecoms Industrials Utilities Health Care Total SOE
China 7.7% 1.8% 2.8% 0.6% 1.2% 1.1% 2.3% 1.2% 0.6% 0.2% 19.4% 11.7%
Korea 2.1% 5.6% 0.4% 1.5% 0.7% 2.9% 0.1% 1.9% 0.2% 0.1% 15.6% 0.2%
Brazil 3.4% 0.3% 1.8% 2.0% 1.9% 0.6% 0.3% 0.6% 0.6% 0.1% 11.6% 1.2%
Taiwan 2.0% 6.0% 0.1% 1.4% 0.4% 0.5% 0.6% 0.4% 0.0% 11.4% 0.4%
South Africa 2.0% 0.0% 0.8% 0.9% 0.5% 1.6% 1.0% 0.3% 0.4% 7.5% 0.0%
Russian 1.1% 0.0% 3.6% 0.5% 0.4% 0.0% 0.6% 0.0% 0.1% 0.0% 6.2% 1.7%
India 1.4% 1.2% 0.8% 0.4% 0.7% 0.4% 0.2% 0.2% 0.2% 0.4% 5.9% 0.5%
Mexico 0.9% 1.0% 1.5% 0.4% 1.0% 0.5% 0.0% 5.3% 0.0%
Malaysia 1.1% 0.0% 0.2% 0.2% 0.4% 0.4% 0.5% 0.5% 0.4% 0.1% 3.7% 0.4%
Thailand 1.0% 0.0% 0.5% 0.3% 0.2% 0.1% 0.3% 0.1% 0.0% 0.0% 2.5% 0.3%
Indonesia 0.9% 0.1% 0.2% 0.3% 0.4% 0.3% 0.1% 0.1% 0.1% 2.4% 0.9%
Turkey 0.9% 0.1% 0.1% 0.2% 0.1% 0.2% 0.2% 0.0% 0.0% 1.7% 0.2%
Chile 0.3% 0.0% 0.2% 0.2% 0.2% 0.2% 0.1% 0.1% 0.5% 1.7% 0.0%
Poland 0.9% 0.0% 0.2% 0.2% 0.1% 0.0% 0.0% 0.0% 0.2% 0.0% 1.7% 0.9%
Colombia 0.5% 0.3% 0.2% 0.1% 0.1% 1.2% 0.4%
Philippines 0.4% 0.0% 0.0% 0.1% 0.0% 0.1% 0.2% 0.1% 0.9% 0.0%
Peru 0.2% 0.2% 0.0% 0.0% 0.0% 0.4% 0.0%
Czech Republic 0.1% 0.0% 0.0% 0.0% 0.0% 0.1% 0.0% 0.2% 0.1%
Hungary 0.1% 0.1% 0.0% 0.0% 0.0% 0.0% 0.2% 0.0%
Egypt 0.1% 0.0% 0.0% 0.0% 0.1% 0.0% 0.0% 0.2% 0.0%
Morocco 0.1% 0.0% 0.0% 0.0% 0.0% 0.0% 0.1% 0.0%
Total 27.1% 14.8% 11.9% 9.9% 8.9% 8.8% 7.6% 6.2% 3.2% 1.5% 100% 19.1%
SOE 8.1% 0.0% 5.1% 0.6% 0.1% 0.3% 2.8% 0.8% 1.3% 0.1% 19.1%
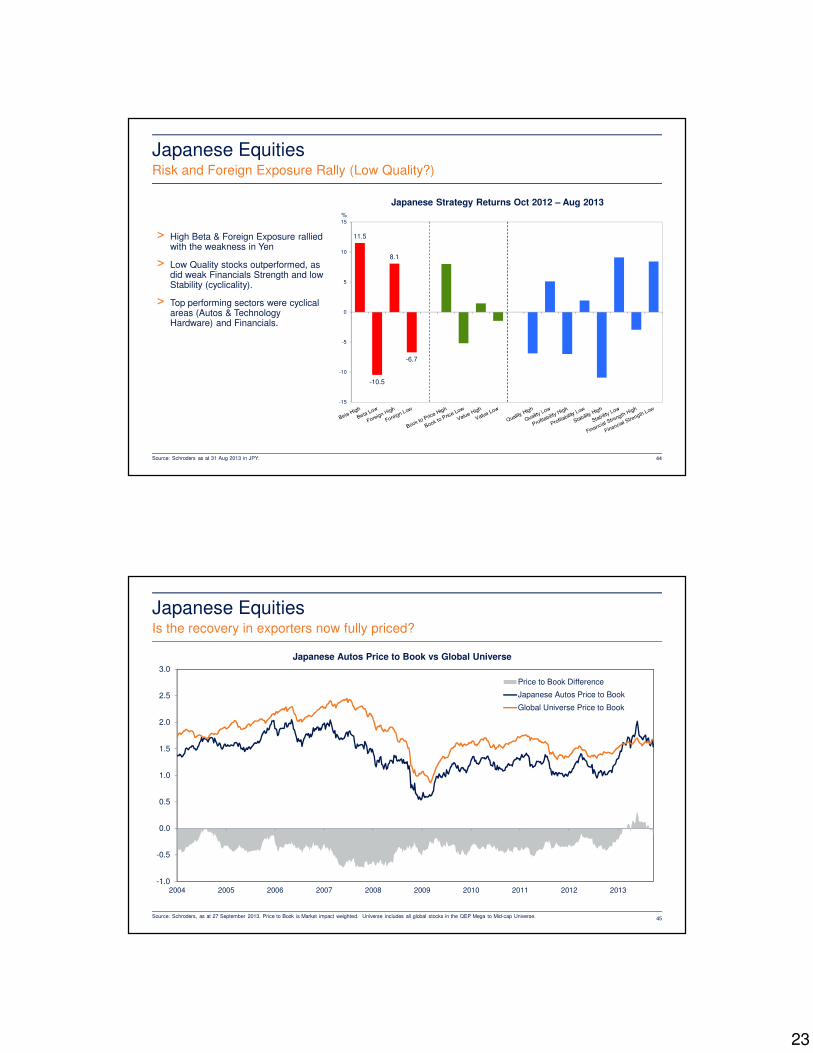
23
Japanese EquitiesRisk and Foreign Exposure Rally (Low Quality?)
44Source: Schroders as at 31 Aug 2013 in JPY.
11.5
-10.5
8.1
-6.7
-15
-10
-5
0
5
10
15
%
Japanese Strategy Returns Oct 2012 – Aug 2013
> High Beta & Foreign Exposure rallied with the weakness in Yen
> Low Quality stocks outperformed, as did weak Financials Strength and low Stability (cyclicality).
> Top performing sectors were cyclical areas (Autos & Technology Hardware) and Financials.
Japanese Autos Price to Book vs Global Universe
Japanese EquitiesIs the recovery in exporters now fully priced?
Source: Schroders, as at 27 September 2013. Price to Book is Market impact weighted. Universe includes all global stocks in the QEP Mega to Mid-cap Universe. 45
-1.0
-0.5
0.0
0.5
1.0
1.5
2.0
2.5
3.0
2004 2005 2006 2007 2008 2009 2010 2011 2012 2013
Price to Book Difference
Japanese Autos Price to Book
Global Universe Price to Book
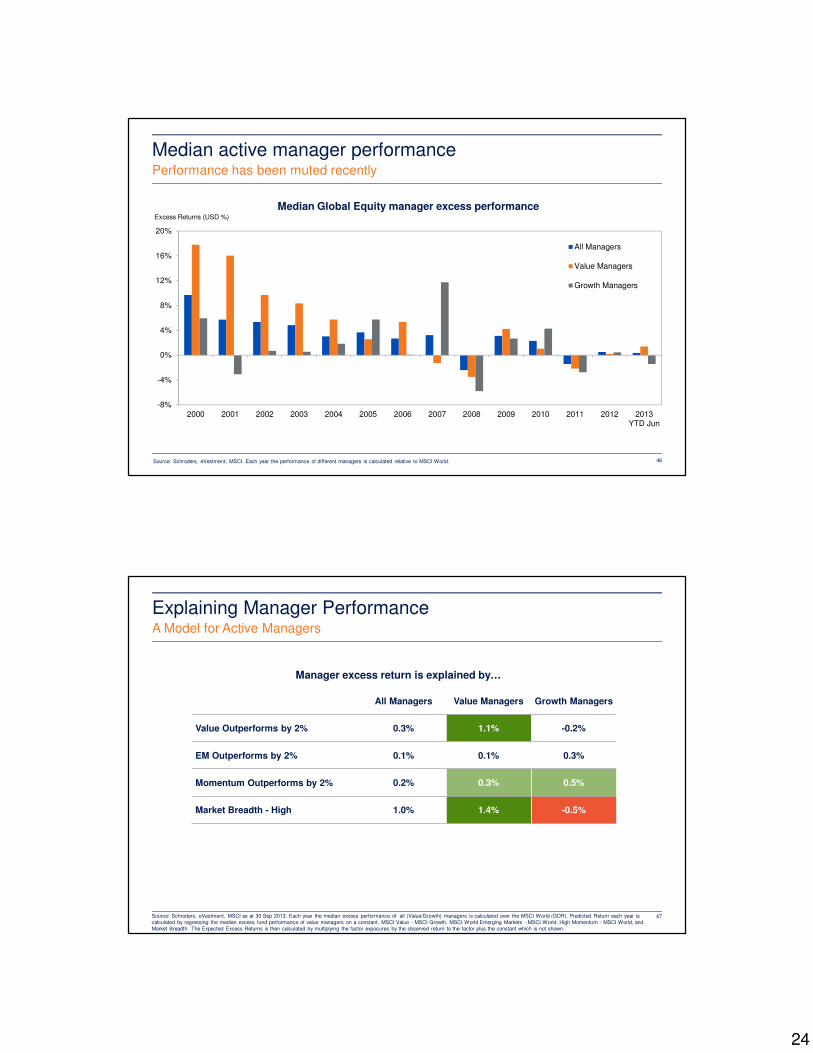
24
Median active manager performancePerformance has been muted recently
Source: Schroders, eVestment, MSCI. Each year the performance of different managers is calculated relative to MSCI World.
-8%
-4%
0%
4%
8%
12%
16%
20%
2000 2001 2002 2003 2004 2005 2006 2007 2008 2009 2010 2011 2012 2013
YTD Jun
All Managers
Value Managers
Growth Managers
Median Global Equity manager excess performanceExcess Returns (USD %)
46
All Managers Value Managers Growth Managers
Value Outperforms by 2% 0.3% 1.1% -0.2%
EM Outperforms by 2% 0.1% 0.1% 0.3%
Momentum Outperforms by 2% 0.2% 0.3% 0.5%
Market Breadth - High 1.0% 1.4% -0.5%
Manager excess return is explained by…
Explaining Manager Performance
47
A Model for Active Managers
Source: Schroders, eVestment, MSCI as at 30 Sep 2013. Each year the median excess performance of all (Value/Growth) managers is calculated over the MSCI World (GDR). Predicted Return each year is
calculated by regressing the median excess fund performance of value managers on a constant, MSCI Value - MSCI Growth, MSCI World Emerging Markets - MSCI World, High Momentum - MSCI World, and
Market Breadth. The Expected Excess Returns is then calculated by multiplying the factor exposures by the observed return to the factor plus the constant which is not shown.
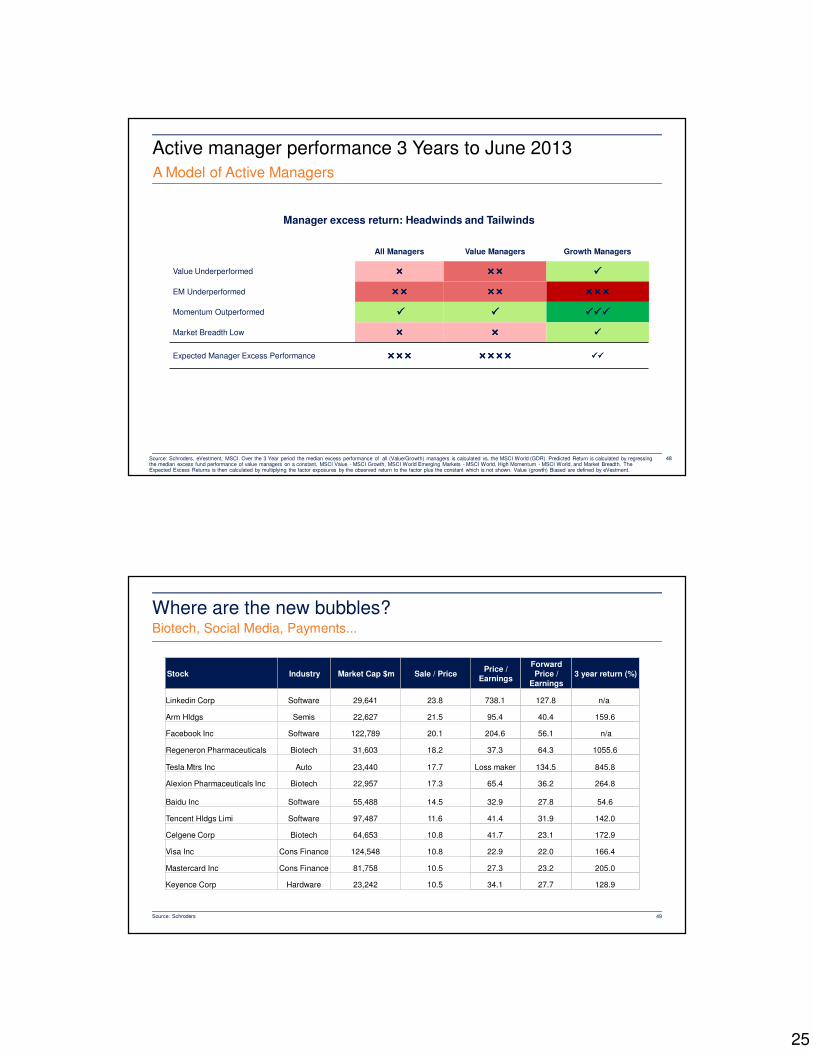
25
Manager excess return: Headwinds and Tailwinds
Active manager performance 3 Years to June 2013
A Model of Active Managers
Source: Schroders, eVestment, MSCI. Over the 3 Year period the median excess performance of all (Value/Growth) managers is calculated vs. the MSCI World (GDR). Predicted Return is calculated by regressing the median excess fund performance of value managers on a constant, MSCI Value - MSCI Growth, MSCI World Emerging Markets - MSCI World, High Momentum - MSCI World, and Market Breadth. The Expected Excess Returns is then calculated by multiplying the factor exposures by the observed return to the factor plus the constant which is not shown. Value (growth) Biased are defined by eVestment.
All Managers Value Managers Growth Managers
Value Underperformed ���� �������� ����
EM Underperformed �������� �������� ������������
Momentum Outperformed ���� ���� ������������
Market Breadth Low ���� ���� ����
Expected Manager Excess Performance ������������ ���������������� ��������
48
Where are the new bubbles?
49
Biotech, Social Media, Payments...
Source: Schroders
Stock Industry Market Cap $m Sale / PricePrice /
Earnings
Forward
Price /
Earnings
3 year return (%)
Linkedin Corp Software 29,641 23.8 738.1 127.8 n/a
Arm Hldgs Semis 22,627 21.5 95.4 40.4 159.6
Facebook Inc Software 122,789 20.1 204.6 56.1 n/a
Regeneron Pharmaceuticals Biotech 31,603 18.2 37.3 64.3 1055.6
Tesla Mtrs Inc Auto 23,440 17.7 Loss maker 134.5 845.8
Alexion Pharmaceuticals Inc Biotech 22,957 17.3 65.4 36.2 264.8
Baidu Inc Software 55,488 14.5 32.9 27.8 54.6
Tencent Hldgs Limi Software 97,487 11.6 41.4 31.9 142.0
Celgene Corp Biotech 64,653 10.8 41.7 23.1 172.9
Visa Inc Cons Finance 124,548 10.8 22.9 22.0 166.4
Mastercard Inc Cons Finance 81,758 10.5 27.3 23.2 205.0
Keyence Corp Hardware 23,242 10.5 34.1 27.7 128.9
26
Appendices
Assets Under Management
51
Consistent Asset Growth
Source: Schroders. Assets & Net New Business in USD terms as at 30 June 2013. Core strategy assets include North America Core ($1.2bn) and Japan Core ($306mn).
6.2 5.6
10.8
20.221.5
31.1
34.4
1.4 1.72.4
5.5
2.3
4.3
0.6
0
10
20
30
40
2007 2008 2009 2010 2011 2012 2013
USD $
Assets Managed
Net New Business
Asset Growth
21%
17%
4%26%
32%
Quality,
$6.9bn
Blend,
$5.5bn
Emerging
Markets,
$1.4bnCore,
$8.9bn
Value,
$10.9bn
Assets By Strategy
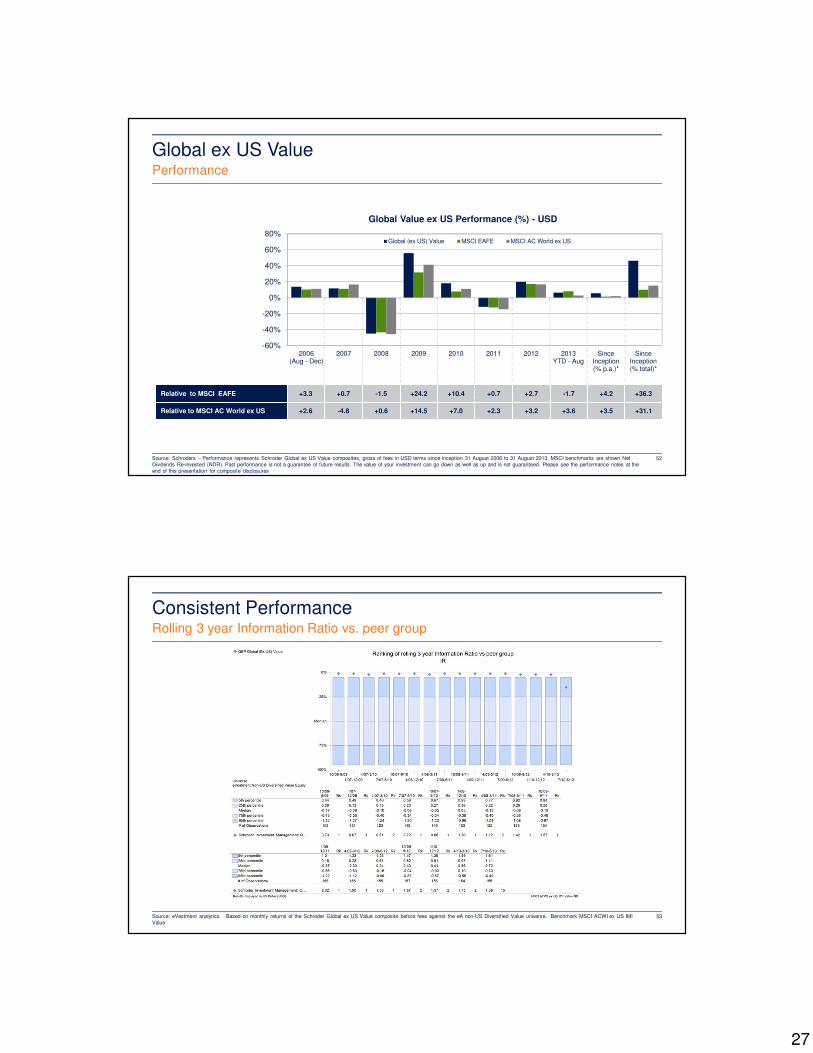
27
-60%
-40%
-20%
0%
20%
40%
60%
80%
2006
(Aug - Dec)
2007 2008 2009 2010 2011 2012 2013
YTD - Aug
Since
Inception
(% p.a.)*
Since
Inception
(% total)*
Global Value ex US Performance (%) - USD
Global (ex US) Value MSCI EAFE MSCI AC World ex US
Global ex US Value
52
Performance
Source: Schroders – Performance represents Schroder Global ex US Value composites, gross of fees in USD terms since inception 31 August 2006 to 31 August 2013. MSCI benchmarks are shown Net
Dividends Re-invested (NDR). Past performance is not a guarantee of future results. The value of your investment can go down as well as up and is not guaranteed. Please see the performance notes at the
end of this presentation for composite disclosures
Relative to MSCI EAFE +3.3 +0.7 -1.5 +24.2 +10.4 +0.7 +2.7 -1.7 +4.2 +36.3
Relative to MSCI AC World ex US +2.6 -4.8 +0.6 +14.5 +7.0 +2.3 +3.2 +3.6 +3.5 +31.1
Consistent Performance
53
Rolling 3 year Information Ratio vs. peer group
Source: eVestment analytics. Based on monthly returns of the Schroder Global ex US Value composite before fees against the eA non-US Diversified Value universe. Benchmark MSCI ACWI ex US IMI
Value
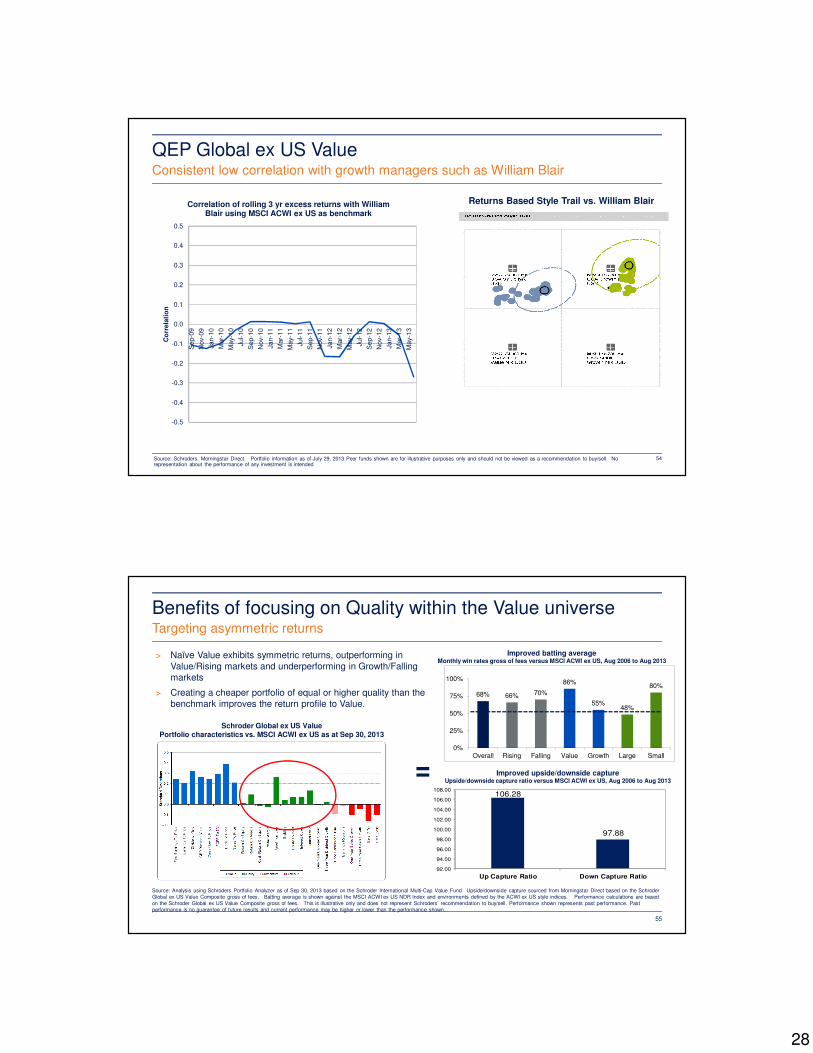
28
QEP Global ex US Value
54
Consistent low correlation with growth managers such as William Blair
Returns Based Style Trail vs. William Blair
Source: Schroders. Morningstar Direct. Portfolio information as of July 29, 2013 Peer funds shown are for illustrative purposes only and should not be viewed as a recommendation to buy/sell. No representation about the performance of any investment is intended
-0.5
-0.4
-0.3
-0.2
-0.1
0.0
0.1
0.2
0.3
0.4
0.5
Sep-0
9
Nov-0
9
Jan-1
0
Mar-
10
May-1
0
Jul-10
Sep-1
0
Nov-1
0
Jan-1
1
Mar-
11
May-1
1
Jul-11
Sep-1
1
Nov-1
1
Jan-1
2
Mar-
12
May-1
2
Jul-12
Sep-1
2
Nov-1
2
Jan-1
3
Mar-
13
May-1
3
Co
rrela
tio
n
Correlation of rolling 3 yr excess returns with William
Blair using MSCI ACWI ex US as benchmark
Benefits of focusing on Quality within the Value universeTargeting asymmetric returns
55
> Naïve Value exhibits symmetric returns, outperforming in
Value/Rising markets and underperforming in Growth/Falling
markets
> Creating a cheaper portfolio of equal or higher quality than the
benchmark improves the return profile to Value.
=
Schroder Global ex US Value
Portfolio characteristics vs. MSCI ACWI ex US as at Sep 30, 2013
Improved batting average
Monthly win rates gross of fees versus MSCI ACWI ex US, Aug 2006 to Aug 2013
106.28
97.88
92.00
94.00
96.00
98.00
100.00
102.00
104.00
106.00
108.00
Up Capture Ratio Down Capture Ratio
Improved upside/downside capture
Upside/downside capture ratio versus MSCI ACWI ex US, Aug 2006 to Aug 2013
Source: Analysis using Schroders Portfolio Analyzer as of Sep 30, 2013 based on the Schroder International Multi-Cap Value Fund. Upside/downside capture sourced from Morningstar Direct based on the Schroder
Global ex US Value Composite gross of fees. Batting average is shown against the MSCI ACWI ex US NDR Index and environments defined by the ACWI ex US style indices. Performance calculations are based
on the Schroder Global ex US Value Composite gross of fees. This is illustrative only and does not represent Schroders’ recommendation to buy/sell. Performance shown represents past performance. Past
performance is no guarantee of future results and current performance may be higher or lower than the performance shown.
68% 66% 70%
86%
55%48%
80%
0%
25%
50%
75%
100%
Overall Rising Falling Value Growth Large Small
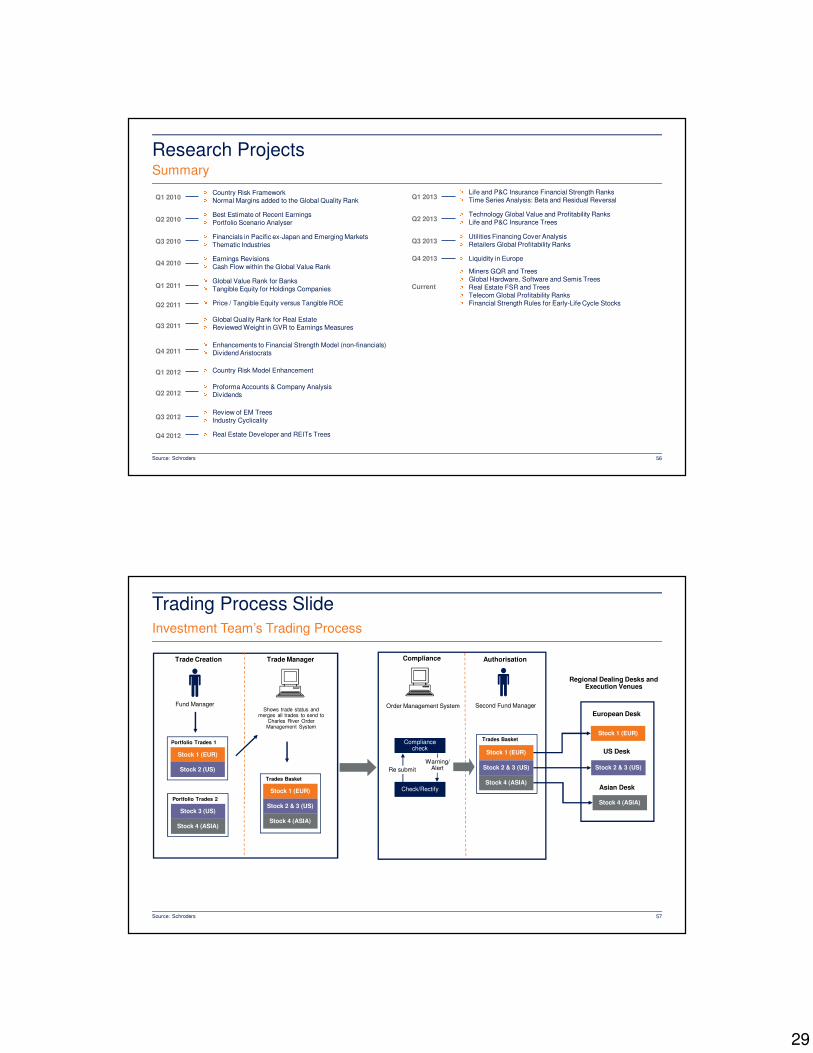
29
Research Projects
56
Summary
Source: Schroders
Q1 2010> Country Risk Framework> Normal Margins added to the Global Quality Rank
Q2 2010> Best Estimate of Recent Earnings> Portfolio Scenario Analyser
Q3 2010> Financials in Pacific ex-Japan and Emerging Markets> Thematic Industries
Q4 2010> Earnings Revisions> Cash Flow within the Global Value Rank
Q1 2011> Global Value Rank for Banks> Tangible Equity for Holdings Companies
Q2 2011 > Price / Tangible Equity versus Tangible ROE
Q3 2011> Global Quality Rank for Real Estate> Reviewed Weight in GVR to Earnings Measures
Q4 2011> Enhancements to Financial Strength Model (non-financials)> Dividend Aristocrats
Q1 2012 > Country Risk Model Enhancement
Q2 2012> Proforma Accounts & Company Analysis> Dividends
Q3 2012> Review of EM Trees> Industry Cyclicality
Q4 2012 > Real Estate Developer and REITs Trees
Q1 2013> Life and P&C Insurance Financial Strength Ranks> Time Series Analysis: Beta and Residual Reversal
Q2 2013> Technology Global Value and Profitability Ranks> Life and P&C Insurance Trees
Q3 2013> Utilities Financing Cover Analysis> Retailers Global Profitability Ranks
Q4 2013 > Liquidity in Europe
Current
> Miners GQR and Trees> Global Hardware, Software and Semis Trees> Real Estate FSR and Trees> Telecom Global Profitability Ranks> Financial Strength Rules for Early-Life Cycle Stocks
Trading Process Slide
Investment Team’s Trading Process
57Source: Schroders
Fund Manager
Trade Manager
Check/Rectify
Compliance check
Re submit
Warning/Alert
Order Management System Second Fund Manager
Trade Creation
Regional Dealing Desks and
Execution Venues
European Desk
US Desk
Asian Desk
Shows trade status and merges all trades to send to
Charles River Order Management System
AuthorisationCompliance
Stock 1 (EUR)
Stock 2 & 3 (US)
Stock 4 (ASIA)
Stock 1 (EUR)
Stock 2 & 3 (US)
Stock 4 (ASIA)
Stock 1 (EUR)
Stock 2 (US)
Stock 3 (US)
Stock 4 (ASIA)
Portfolio Trades 1
Portfolio Trades 2
Trades Basket
Trades Basket
Stock 1 (EUR)
Stock 2 & 3 (US)
Stock 4 (ASIA)
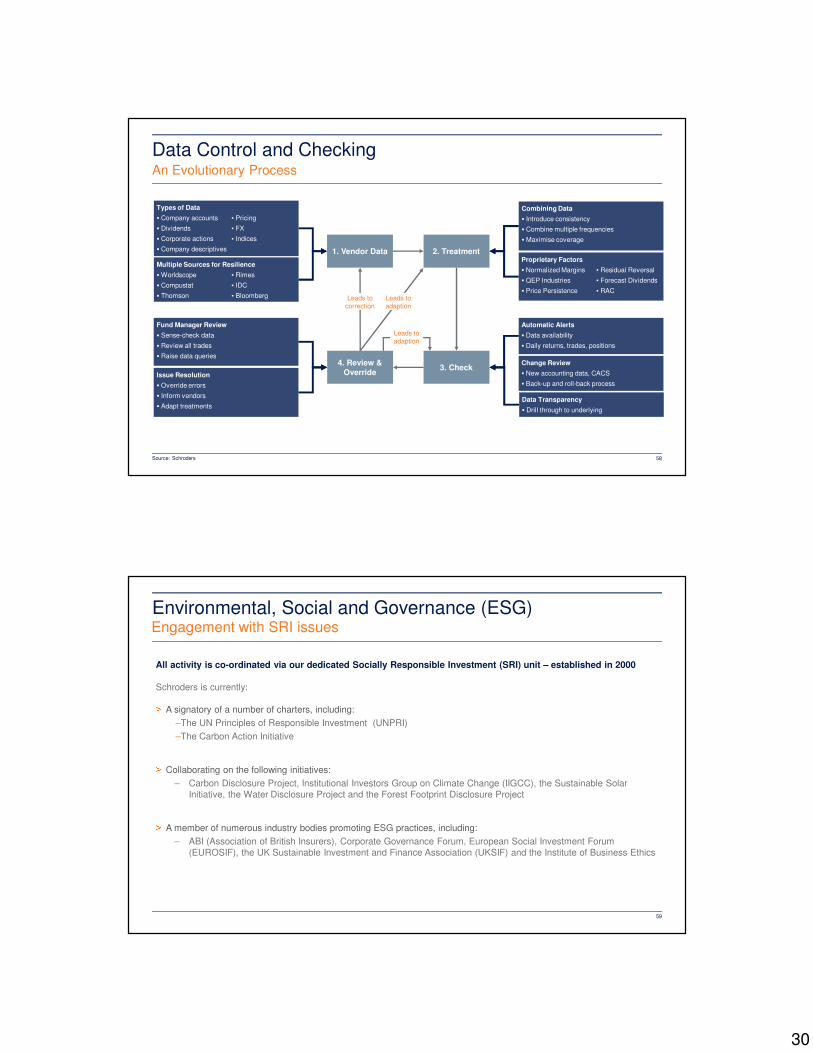
30
1. Vendor Data 2. Treatment
3. Check4. Review &
Override
Combining Data
� Introduce consistency
� Combine multiple frequencies
� Maximise coverage
Proprietary Factors
� Normalized Margins ▪ Residual Reversal
� QEP Industries ▪ Forecast Dividends
� Price Persistence ▪ RAC
Automatic Alerts
� Data availability
� Daily returns, trades, positions
Change Review
� New accounting data, CACS
� Back-up and roll-back process
Data Transparency
� Drill through to underlying
Fund Manager Review
� Sense-check data
� Review all trades
� Raise data queries
Issue Resolution
� Override errors
� Inform vendors
� Adapt treatments
Leads to
correction
Leads to
adaption
Types of Data
� Company accounts ▪ Pricing
� Dividends ▪ FX
� Corporate actions ▪ Indices
� Company descriptives
Multiple Sources for Resilience
� Worldscope ▪ Rimes
� Compustat ▪ IDC
� Thomson ▪ Bloomberg
Leads to
adaption
Data Control and Checking
58
An Evolutionary Process
Source: Schroders
Environmental, Social and Governance (ESG)
59
Engagement with SRI issues
All activity is co-ordinated via our dedicated Socially Responsible Investment (SRI) unit – established in 2000
Schroders is currently:> A signatory of a number of charters, including:
–The UN Principles of Responsible Investment (UNPRI)
–The Carbon Action Initiative > Collaborating on the following initiatives:
– Carbon Disclosure Project, Institutional Investors Group on Climate Change (IIGCC), the Sustainable Solar
Initiative, the Water Disclosure Project and the Forest Footprint Disclosure Project> A member of numerous industry bodies promoting ESG practices, including:
– ABI (Association of British Insurers), Corporate Governance Forum, European Social Investment Forum
(EUROSIF), the UK Sustainable Investment and Finance Association (UKSIF) and the Institute of Business Ethics
31
All voting activity is co-ordinated via our dedicated Corporate Governance team – established in 1998
Schroders voted at over 5,000 meetings in 2012
2012 2011 2010 2009 2008
Meetings 5,633 5,191 4,758 5,032 5,423
Resolutions 49,536 45,350 43,674 46,521 49,360
Votes with management 46,065 42,101 41,497 42,181 47,338
Votes against management 3,471 3,339 2,177 4,340 2,022
Schroders voting activity 2008 – 2012 Breakdown of resolutions voted on by category - 2012
Environmental, Social and Governance (ESG)Using voting rights in the best interests of our clients
60Source: Schroders – International Corporate Governance Policy. As at 31 December 2012. Please note that the figures in the table do not include resolutions or meetings at which we did not vote. We aim to
vote at all meetings except where there are onerous restrictions – for example, where trading is restricted prior to a meeting in shares committed to vote (share blocking), we will usually only vote in cases
where the benefit of voting outweighs the ability to trade. Resolutions by category are defined as per MSCI ISS classifications.
1.0%
8.7%
61.1%
8.9%
0.1%
3.2%14.2%
2.8%
Anti-Takeover Related
Capitalisation
Director Related
Non-Salary Compensation
Prefered & Reorganisation
Reorganisation & Mergers
Routine/ Business
Shareholder
Global Performance
61
Relative Benchmark Performance - Gross of Fees - USD
Source: Schroders – Performance represents QEP composites, gross of fees in USD terms as at 31 August 2013. Please reference the performance notes at the end of this presentation for composite
disclosures. *Partial period. Relative performance for Core is MSCI World, EM is MSCI EM, International Value is MSCI AC World ex US, and remaining are MSCI AC World Net Dividends Re-Invested (NDR)..
Performance shown is past performance and is not necessarily a guide to future performance. The value of your investment can go down as well as up and is not guaranteed.
Relative % Global Core Global Value Global ex US Value Global Value
ExtensionGlobal Quality Global Blend Emerging Markets
2000 2.0* - - - - - -
2001 1.1 - - - - - -
2002 1.0 - - - - - -
2003 0.5 - - - - - -
2004 0.8 1.6* - - - - -
2005 0.6 2.3 - - - - -
2006 0.6 6.2 2.6* - - - -
2007 -0.9 -5.7 -4.8 - 3.9* - -
2008 2.1 -0.4 0.6 5.4* 3.7 0.9* -
2009 2.3 9.6 14.5 19.9 0.3 5.8 -
2010 2.3 3.6 7.0 9.1 5.4 4.4 -
2011 1.7 -1.8 2.9 -0.5 2.9 0.5 -
2012 0.0 -0.3 3.2 0.4 -0.1 0.6 2.4*
2013 YTD - August 0.9 2.6 3.6 4.1 2.7 2.6 4.7
Return – Annualised 1.2 1.5 3.5 6.9 3.6 2.7 5.1
Return – Total 24.6 22.7 31.1 45.8 22.0 18.1 7.1
Tracking Error (ex post) 1.1 3.7 3.8 5.6 3.5 2.3 2.7
Information Ratio 1.1 0.4 0.9 1.2 1.0 1.2 1.9
Benchmark MSCI World MSCI AC World MSCI AC World ex US MSCI AC World MSCI AC World MSCI AC World MSCI EM
Inception 30-Jan-00 29-Oct-04 31-Aug-06 31-Jul-08 31-Oct-07 30-Sep-08 31-Mar-12
Track Record (years, months) 13,7 8,10 7,0 5,1 5,10 4,11 1,5
Return Target +1% +3% +3% +5% +3% +3% +3%
32
Global Performance
62
Composite Versus Benchmark – Gross of Fees – USD
Source: Schroders – Performance represents QEP composites, gross of fees in USD terms as at 31 August 2013. Please reference the performance notes at the end of this presentation for composite
disclosures. *Partial period. MSCI benchmarks are Net Dividends Re-Invested (NDR). Performance shown is past performance and is not necessarily a guide to future performance. The value of your
investment can go down as well as up and is not guaranteed
Absolute %
Global Core Global Value Global ex US ValueGlobal Value
ExtensionGlobal Quality Global Blend
Emerging
Markets
Composite MSCI World CompositeMSCI AC
WorldComposite
MSCI AC
World ex USComposite
MSCI AC
WorldComposite
MSCI AC
WorldComposite
MSCI AC
WorldComposite MSCI EM
2000 -5.9* -7.9* - - - - - - - - - - - -
2001 -15.7 -16.8 - - - - - - - - - - - -
2002 -18.9 -19.9 - - - - - - - - - - - -
2003 33.6 33.1 - - - - - - - - - - - -
2004 15.6 14.7 11.1* 9.5* - - - - - - - - - -
2005 10.1 9.5 13.1 10.8 - - - - - - - - - -
2006 20.6 20.1 27.1 21.0 13.8* 11.2* - - - - - - - -
2007 8.1 9.0 6.0 11.7 11.9 16.7 - - -1.6* -5.5* - - - -
2008 -38.6 -40.7 -42.6 -42.2 -44.9 -45.5 -28.2* -33.5* -38.5 -42.2 -21.5* -22.4* - -
2009 32.3 30.0 44.3 34.6 56.0 41.4 54.5 34.6 34.9 34.6 40.5 34.6 - -
2010 14.0 11.8 16.2 12.7 18.2 11.2 21.8 12.7 18.0 12.7 17.1 12.7 - -
2011 -3.8 -5.5 -9.2 -7.3 -11.4 -13.7 -7.9 -7.3 -4.5 -7.3 -6.9 -7.3 - -
2012 15.9 15.8 15.8 16.1 20.0 16.8 16.5 16.1 16.0 16.1 16.7 16.1 6.0* 3.6*
2013 YTD –
August12.6 11.7 11.4 8.8 6.5 2.9 12.9 8.8 11.5 8.8 11.4 8.8 -5.5 -10.2
Return –
Annualised3.8 2.6 7.6 6.1 5.6 2.0 10.2 3.3 3.0 -0.5 9.5 6.7 0.2 -4.9
Return – Total 66.0 41.4 91.0 68.3 46.4 15.3 63.9 18.0 19.1 -3.0 55.9 37.9 0.2 -6.9
Inception 30-Jan-00 29-Oct-04 31-Aug-06 31-Jul-08 31-Oct-07 30-Sep-08 31-Mar-12
John Marsland
Client Portfolio Manager
John joined Schroders in 2006 as client portfolio manager. Prior to joining Schroders John was
Head of Portfolio Risk Advisory at Commerzbank Securities. John started his investment career in
1992 as a UK economist with UBS Phillips & Drew before moving on to roles in global strategy and
asset allocation. He holds an MA in Economics from Cambridge University and an MSc in
Economics from Birkbeck College, University of London. John is a CFA charterholder and board
member of the CFA Society of the UK.
Justin Abercrombie
Head of QEP Investment Team
Justin joined Schroders in 1996, was a founding member of the QEP team and led
the development of the team and product range. He is the lead fund manager on all
of the team’s global equity strategies. Justin’s investment career commenced in
1993 at quantitative asset manager Pareto Partners, where he developed currency,
bond and equity strategies. He holds a BSc in Business Economics from the
University of Reading and an MSc (distinction) in Econometrics from London
Metropolitan University.
Stephen Langford, CFA
Senior Analyst & Portfolio Manager
Since joining Schroders in 2003, Stephen has played an active role in all parts of the
QEP investment process and in 2011 he was made Deputy Head of Research.
Stephen’s investment career commenced at Quaestor Investment Management in
1999, where he was as a Senior Research Manager and portfolio manager of a
Japanese market-neutral fund. He holds a BSc (Hons) in Chemistry and Molecular
Physics from the University of Nottingham, and a DPhil in Chemical Physics from the
University of Oxford. He is also a CFA charterholder.
David Philpotts
Head of Research, Portfolio Manager
David joined Schroders in London in 1996 as an economist before moving to the
QEP team in 1999 helping to build the team’s stock selection models. David left
Schroders between 2001 and 2003 to run a hedge fund at Quaestor Investment
Management. He then migrated to Australia where he re-joined Schroders in 2004
as Head of QEP Research. His investment career commenced at the Bank of
England in 1990 as an Econometrician. David holds a BSc (first class) and an MSc
(distinction) in Economics from the University of Warwick.
QEP Investment Team
63
Biographies
Tim Matthews
Client Portfolio Manager
Tim joined Schroders in 2009 and is a portfolio manager covering clients in Continental Europe
and the Middle East. Tim has been working in the investment field since 1991. He holds an MEng
in Electronic Engineering from the University of Southampton and an MSc in Applied Statistics and
Stochastic Modelling from Birkbeck, University of London. Tim is an Associate of the CFA Society
of the UK.
Stuart Adrian
Senior Analyst & Portfolio Manager
Stuart joins Schroders in April 2013. Prior to joining Schroders Stuart spent six years as the
Global Equity Strategist at Empirical Research Partners, a firm routinely ranked as one of Wall
Street’s top providers of portfolio strategy and quantitative research. Before that he spent a
decade at Morgan Stanley as a Technology Analyst where he also ranked prominently in investor
surveys. Stuart holds a BSc (Hons) in Economics from Durham University and is a qualified
Chartered Accountant.
Stephen Kwa
Client Portfolio Manager – New York
Stephen has represented the team’s capabilities in the Americas since 2011. He joined Schroders
in 2006 as Head of Product & Marketing and Investment Specialist for QEP in Australia. His
investment career commenced in 1993 and prior to Schroders he held consultant and product roles
at Towers Perrin, BT Funds Management and Deutsche Asset Management in Australia and
Japan. He holds an economics degree majoring in actuarial studies from Macquarie University and
is a Fellow of the Institute of Actuaries of Australia.
33
QEP Investment Team
64
Biographies
Michael O’Brien, PhD
Research
Michael joined Schroders in 2008 and focuses on enhancing QEP’s stock selection modelsand implementing research ideas into the investment process. His investment career startedin 2004 while holding a teaching and research position at the University of Sydney. Michaelholds a BSc in Biochemistry and a Bachelor of Commerce (Hons) in Finance & Economicsfrom the University of Sydney, and a PhD in Finance from the University of Queensland.
Richard Lawson
Research
Richard joined Schroders in 2008 and focuses on sector research and tools to enhanceunderstanding of underlying economic drivers of company profitability. He worked forMacquarie Group as a Quantitative Analyst from 2003. Richard holds a BSc (Hons) inMathematics from the University of Sydney, a DipEd (Secondary) in Education from theUniversity of Sydney, and a Masters of Commerce in Funds Management from the Universityof New South Wales.
Jeremy Humphries
Research
Jeremy joined Schroders in 2011 and is a member of the team that focuses on researchingenhancements to the investment process. His investment career commenced in 2007 atPioneer Investments, where he worked as a Quantitative Equity Analyst responsible forresearch and model development. Jeremy has a BA in Mechanical Engineering from TrinityCollege Dublin, and an MSc in Quantitative Finance from University College Dublin.
Paul Taylor
Research
Paul joined Schroders in 2007. He is experienced in a range of programming languages andis responsible for developing the QEP team's optimisation and simulation systems. He joinedSchroders from Mathworks where he was a Senior MATLAB Applications Engineer from2006. Paul holds a BEng (first class) in Engineering from the University of Queensland.
Ben Corris, CFA
Analyst & Portfolio Manager
Ben joined Schroders in 2008 and is a portfolio manager analyst focusing on enhancements
to the investment process. Ben is a CFA charterholder and has an MPhys (Hons) in Physics
with Astrophysics from UMIST and a PhD in Atmospheric Physics from the University of
Manchester.
Daniel Swift
Research
Daniel joined the QEP research team in March 2013 after a successful internship with theQEP in summer of 2012. Daniel holds a Masters degree in Aeronautical Engineering fromBristol University.
Joel Coriat
Head of QEP Research IT
Joel joined Schroders in 2012 and is a member of the team that focuses on researchingenhancements to the investment process. Before joining Schroders Joel was a SeniorQuantitative Analyst for emerging market equities with State Street Global Advisors in Boston.Joel has a BSc in Biology from the University of Geneva and an MSc in Mathematical andComputational Finance from the University of Montreal.
Michael Furtado
QEP Research IT
Michael joined the QEP team as a graduate trainee in 2007. Today he is a member of theteam which researches enhancements to the investment process with a specific focus onensuring data integrity. He holds a BSc in Econometrics and Operations Research from theErasmus University Rotterdam.
Jasdeep Gill
QEP Research IT
Jasdeep joined Schroders in 2008 and moved onto the QEP Investment Team in 2012. Hefocuses on researching enhancements to the investment process. Jas joined Schroders fromEDS Ltd where his investment career commenced in 2006, working in IT development forABN AMRO. He holds a BSc (Hons) in Computer Science from Aston University.
QEP Investment Team
65
Biographies
Derek Power
Product Manager - London
Derek joined QEP in 2006 and represents the team’s investment capabilities to clients with aspecific focus on the firm’s institutional client base. He works closely with Schroders’regional distribution teams, providing technical input to the sales process and developmentof QEP products globally. His investment career commenced in 1998. Prior to joiningSchroders Derek was primarily focused on client servicing for GLG Partners LP, London andpreviously State Street in Edinburgh.
Amy Dempsey
Product Manager - London
Amy joined QEP in 2011 and represents the team’s investment capabilities to clients with aspecific focus on the firm’s Intermediary client base. She works closely with Schroders’regional distribution teams, providing specialist input on the marketing and communicationof QEP products. Amy joined Schroders in 2005 and holds a BA (Hons) in EnglishLanguage and Literature from Oxford University.
Rupeng Chen
Product Manager - Sydney
Rupeng joined QEP in 2009 and represents our product capabilities in Australia. Prior tojoining Schroders she worked at Mercer Pty as an Actuarial Consultant. Her investmentcareer commenced in 2006 as an Actuarial Analyst with ALEA Actuarial Consulting Pty Ltd.Rupeng holds a double degree in Bachelor of Commerce (Actuarial) and Bachelor of Lawfrom Macquarie University, has completed all the examinations of the CFA and is anAssociate of the Institute of Actuaries of Australia.
Liane Evans
Assistant Portfolio Manager
Liane joined Schroders in 2011 and within QEP is responsible for investment strategyimplementation with a particular focus on trade execution, cash flows, share exchanges andfund launches. She joined Schroders from F&C Investment Management, where sheworked as an Investment Risk Analyst from 2009. Her investment career commenced in2005. Liane holds a BSc (Hons) in Mathematics from the University of Manchester, and is aCFA charterholder and a CAIA charterholder.
James Larkman
Portfolio Manager
James joined Schroders in 2004 and is a portfolio manager. He is also responsible for
ensuring effective implementation of investment strategies across client portfolios, which
encompasses currency management, monitoring fund dispersion and efficient execution of
trades. James holds a BSc in Economics from the University of Bath and an MSc in
International Securities, Investment and Banking from the ICMA Centre at Reading
University.
Ayse Serinturk
Portfolio Manager
Ayse joined the QEP team in 2008 and is a portfolio manager. She is also responsible for
ensuring the effective implementation of investment strategies across client portfolios,
including trade execution and fund launches. Ayse holds a BA (first class) in Philosophy and
an MA in Metaphysics from the University of Nottingham.
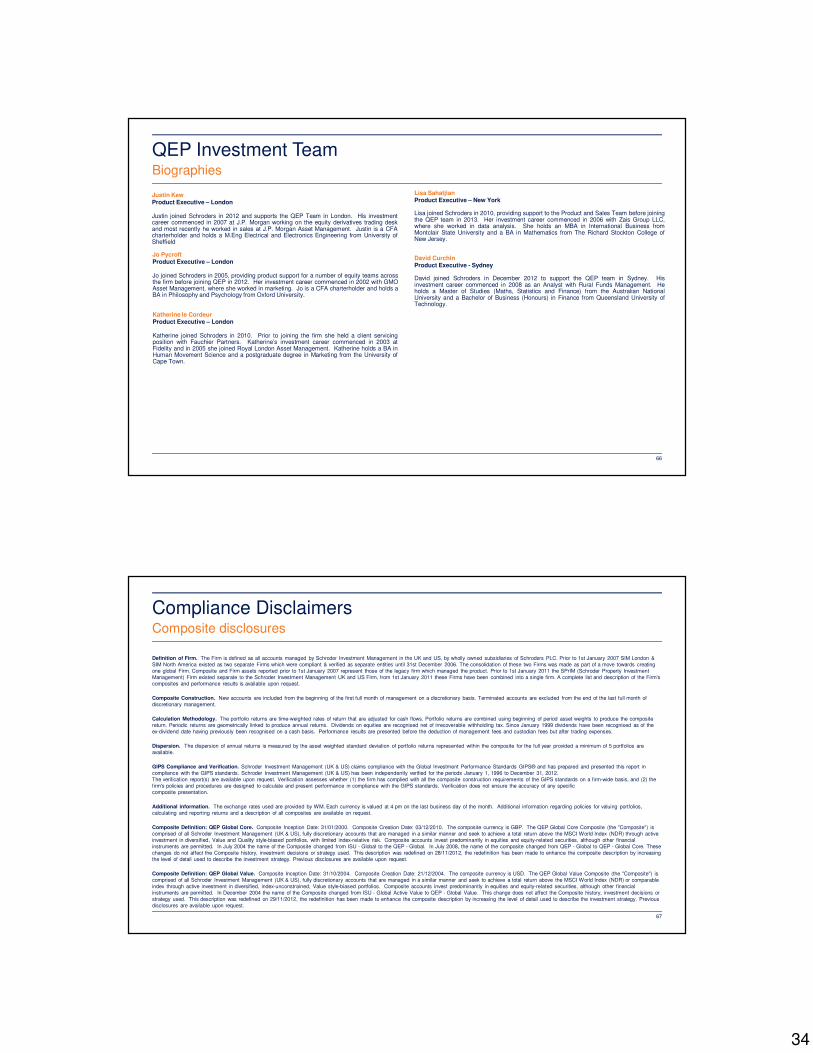
34
Katherine le Cordeur
Product Executive – London
Katherine joined Schroders in 2010. Prior to joining the firm she held a client servicingposition with Fauchier Partners. Katherine’s investment career commenced in 2003 atFidelity and in 2005 she joined Royal London Asset Management. Katherine holds a BA inHuman Movement Science and a postgraduate degree in Marketing from the University ofCape Town.
Jo Pycroft
Product Executive – London
Jo joined Schroders in 2005, providing product support for a number of equity teams acrossthe firm before joining QEP in 2012. Her investment career commenced in 2002 with GMOAsset Management, where she worked in marketing. Jo is a CFA charterholder and holds aBA in Philosophy and Psychology from Oxford University.
Justin Kew
Product Executive – London
Justin joined Schroders in 2012 and supports the QEP Team in London. His investmentcareer commenced in 2007 at J.P. Morgan working on the equity derivatives trading deskand most recently he worked in sales at J.P. Morgan Asset Management. Justin is a CFAcharterholder and holds a M.Eng Electrical and Electronics Engineering from University ofSheffield
QEP Investment Team
66
Biographies
David Curchin
Product Executive - Sydney
David joined Schroders in December 2012 to support the QEP team in Sydney. Hisinvestment career commenced in 2008 as an Analyst with Rural Funds Management. Heholds a Master of Studies (Maths, Statistics and Finance) from the Australian NationalUniversity and a Bachelor of Business (Honours) in Finance from Queensland University ofTechnology.
Lisa Sahatjian
Product Executive – New York
Lisa joined Schroders in 2010, providing support to the Product and Sales Team before joiningthe QEP team in 2013. Her investment career commenced in 2006 with Zais Group LLC,where she worked in data analysis. She holds an MBA in International Business fromMontclair State University and a BA in Mathematics from The Richard Stockton College ofNew Jersey.
Compliance DisclaimersComposite disclosures
67
Definition of Firm. The Firm is defined as all accounts managed by Schroder Investment Management in the UK and US, by wholly owned subsidiaries of Schroders PLC. Prior to 1st January 2007 SIM London &
SIM North America existed as two separate Firms which were compliant & verified as separate entities until 31st December 2006. The consolidation of these two Firms was made as part of a move towards creating
one global Firm. Composite and Firm assets reported prior to 1st January 2007 represent those of the legacy firm which managed the product. Prior to 1st January 2011 the SPrIM (Schroder Property Investment
Management) Firm existed separate to the Schroder Investment Management UK and US Firm, from 1st January 2011 these Firms have been combined into a single firm. A complete list and description of the Firm's
composites and performance results is available upon request.
Composite Construction. New accounts are included from the beginning of the first full month of management on a discretionary basis. Terminated accounts are excluded from the end of the last full month of
discretionary management.
Calculation Methodology. The portfolio returns are time-weighted rates of return that are adjusted for cash flows. Portfolio returns are combined using beginning of period asset weights to produce the composite
return. Periodic returns are geometrically linked to produce annual returns. Dividends on equities are recognised net of irrecoverable withholding tax. Since January 1999 dividends have been recognised as of the
ex-dividend date having previously been recognised on a cash basis. Performance results are presented before the deduction of management fees and custodian fees but after trading expenses.
Dispersion. The dispersion of annual returns is measured by the asset weighted standard deviation of portfolio returns represented within the composite for the full year provided a minimum of 5 portfolios are
available.
GIPS Compliance and Verification. Schroder Investment Management (UK & US) claims compliance with the Global Investment Performance Standards GIPS® and has prepared and presented this report in
compliance with the GIPS standards. Schroder Investment Management (UK & US) has been independently verified for the periods January 1, 1996 to December 31, 2012.
The verification report(s) are available upon request. Verification assesses whether (1) the firm has complied with all the composite construction requirements of the GIPS standards on a firm-wide basis, and (2) the
firm's policies and procedures are designed to calculate and present performance in compliance with the GIPS standards. Verification does not ensure the accuracy of any specific
composite presentation.
Additional information. The exchange rates used are provided by WM. Each currency is valued at 4 pm on the last business day of the month. Additional information regarding policies for valuing portfolios,
calculating and reporting returns and a description of all composites are available on request.
Composite Definition: QEP Global Core. Composite Inception Date: 31/01/2000. Composite Creation Date: 03/12/2010. The composite currency is GBP. The QEP Global Core Composite (the "Composite") is
comprised of all Schroder Investment Management (UK & US), fully discretionary accounts that are managed in a similar manner and seek to achieve a total return above the MSCI World Index (NDR) through active
investment in diversified, Value and Quality style-biased portfolios, with limited index-relative risk. Composite accounts invest predominantly in equities and equity-related securities, although other financial
instruments are permitted. In July 2004 the name of the Composite changed from ISU - Global to the QEP - Global. In July 2008, the name of the composite changed from QEP - Global to QEP - Global Core. These
changes do not affect the Composite history, investment decisions or strategy used. This description was redefined on 28/11/2012, the redefinition has been made to enhance the composite description by increasing
the level of detail used to describe the investment strategy. Previous disclosures are available upon request.
Composite Definition: QEP Global Value. Composite Inception Date: 31/10/2004. Composite Creation Date: 21/12/2004. The composite currency is USD. The QEP Global Value Composite (the "Composite") is
comprised of all Schroder Investment Management (UK & US), fully discretionary accounts that are managed in a similar manner and seek to achieve a total return above the MSCI World Index (NDR) or comparable
index through active investment in diversified, index-unconstrained, Value style-biased portfolios. Composite accounts invest predominantly in equities and equity-related securities, although other financial
instruments are permitted. In December 2004 the name of the Composite changed from ISU - Global Active Value to QEP - Global Value. This change does not affect the Composite history, investment decisions or
strategy used. This description was redefined on 29/11/2012, the redefinition has been made to enhance the composite description by increasing the level of detail used to describe the investment strategy. Previous
disclosures are available upon request.
35
Compliance DisclaimersComposite disclosures (continued)
68
Composite Definition: QEP Global ex-US Value. Composite Inception Date: 31/08/2006. Composite Creation Date: 01/11/2006. The composite currency is USD. The QEP Global ex-US Value Composite (the
"Composite") is comprised of all Schroder Investment Management (UK & US), fully discretionary accounts that are managed in a similar manner and seek to achieve a total return above the MSCI EAFE Index
(NDR) or comparable index through active investment in diversified, index-unconstrained, Value style-biased portfolios. Composite accounts typically do not hold US securities, and invest predominantly in equities
and equity-related securities, although other financial instruments are permitted. This description was redefined on 29/11/2012, the redefinition has been made to enhance the composite description by increasing the
level of detail used to describe the investment strategy. Previous disclosures are available upon request.
Composite Definition: QEP Global Quality. Composite Inception Date: 31/10/2007. Composite Creation Date: 01/02/2008. The composite currency is USD. The QEP Global Quality Composite (the "Composite")
is comprised of all Schroder Investment Management (UK & US), fully discretionary accounts that are managed in a similar manner and seek to achieve a total return above the MSCI World Index (NDR) or
comparable index through active investment in diversified, index-unconstrained, Quality style-biased portfolios. Composite accounts invest predominantly in equities and equity-related securities, although other
financial instruments are permitted. This description was redefined on 29/11/2012, the redefinition has been made to enhance the composite description by increasing the level of detail used to describe the
investment strategy. Previous disclosures are available upon request.
Composite Definition: QEP Global Blend. Composite Inception Date: 30/09/2008. Composite Creation Date: 15/01/2010. The composite currency is USD. The QEP Global Blend Composite (the "Composite") is
comprised of all Schroder Investment Management (UK & US), fully discretionary accounts that are managed in a similar manner and seek to achieve a total return above the MSCI World Index (NDR) or comparable
index through active investment in diversified, index-unconstrained, Value and Quality style-biased portfolios. Composite accounts invest predominantly in equities and equity-related securities, although other
financial instruments are permitted. The composite was redefined on 15 February 2012, to allow only accounts which use Close of Business (COB) pricing to be members of the composite. The redefinition was to
remove the impact that price timing has on particular stocks which can affect dispersion within the composite. This description was redefined on 29/11/2012, the redefinition has been made to enhance the composite
description by increasing the level of detail used to describe the investment strategy. Previous disclosures are available upon request.
Composite Definition: QEP Global Emerging Markets. Composite Inception Date: 31/03/2012. Composite Creation Date: 23/04/2012. The composite currency is USD. The QEP Global Emerging Markets
Composite (the "Composite") is comprised of all Schroder Investment Management (UK & US), fully discretionary accounts that are managed in a similar manner and seek to achieve a total return above the MSCI
Emerging Markets Index (NDR) or comparable index through active investment in diversified, index-unconstrained, Value and Quality style-biased portfolios. Composite accounts invest predominantly in emerging
market countries, and in equities and equity-related securities, although other financial instruments are permitted. This description was redefined on 29/11/2012, the redefinition has been made to enhance the
composite description by increasing the level of detail used to describe the investment strategy. Previous disclosures are available upon request.
Composite Definition: QEP Global Yield. Composite Inception Date: 31/05/2012. Composite Creation Date: 20/07/2012. The composite currency is USD. The QEP Global Yield Composite (the "Composite") is
comprised of all Schroder Investment Management (UK & US), fully discretionary accounts that are managed in a similar manner and seek to achieve a total return above the MSCI ACWI Index (NDR) or MSCI ACWI
High Dividend Yield or comparable index through active investment in diversified, index-unconstrained, Yield-focused portfolios. Composite accounts invest predominantly in equities and equity-related securities,
although other financial instruments are permitted. This description was redefined on 29/11/2012, the redefinition has been made to enhance the composite description by increasing the level of detail used to
describe the investment strategy. Previous disclosures are available upon request.
Composite Definition: QEP Global Value Extension. Composite Inception Date: 31/07/2008. Composite Creation Date: 22/04/2009. The composite currency is USD. The QEP Global Value Extension Composite
(the "Composite") is comprised of all Schroder Investment Management (UK & US), fully discretionary accounts that are managed in a similar manner and seek to achieve a total return above the MSCI World Index
(NDR) or comparable index through active investment in diversified, index-unconstrained, portfolios, style-biased towards Value and away from Low Quality. These portfolios have the added flexibility of shorting, with
a maximum of 150% of NAV in long positions and a maximum of 50% of NAV in short positions. Composite accounts invest predominantly in equities and equity-related securities, although other financial
instruments are permitted. This description was redefined on 29/11/2012, the redefinition has been made to enhance the composite description by increasing the level of detail used to describe the investment
strategy. Previous disclosures are available upon request.
Schroder QEP - Global Core Composite
Composite Performance Results as of: December 31, 2012
Composite: Schroder QEP- Global Core
Benchmark: MSCI World (NDR)
Currency: US Dollar
Gross Returns as of: Dec-31-2012
Firm: Schroders Investment Management–UK North America
69
1. Annualized standard deviation of gross monthly returns for the composite and monthly returns for the benchmark
2. Asset weighted standard deviation of annual gross returns of accounts that have been in the composite for the entire year
3. Since Inception
4. Since December 31, 2003 Total Firm Assets include non-fee paying accounts. 2003 Total Firm Assets value has been restated due to the inclusion of those non-fee paying
accounts. Total Firm Assets from 2007 incorporate the UK & US firm merger as detailed in the Definition of the Firm, from the start of 2011 Schroder Property Investment
Management Multi Manager accounts are included in the Total Firm Assets
N/A - Information is not statistically meaningful due to an insufficient number of portfolios for the entire year
Year
Gross Composite
Return
Net Composite
Return
Benchmark
Return Composite Risk1 Benchmark Risk1
Number of
Portfolios
(throughout
period)
Account
Dispersion2Market Value at
end of Period
Average Account
Value at end of
Period
Percentage of
Firm Assets Total Firm Assets4
2012 15.87% 15.41% 15.83% 13.03% 12.94% 8 (6) 0.19% 5,628,870,717 703,608,840 2.51% 223,940,416,622.14
2011 -3.84% -4.22% -5.54% 17.40% 17.54% 6 (6) 0.27% 3,705,886,798 617,647,800 1.90% 194,958,113,724.01
2010 14.05% 13.59% 11.76% 20.21% 20.52% 6 (4) n/a 3,571,102,348 595,183,725 1.76% 202,946,283,267.48
2009 32.32% 31.80% 29.99% 23.37% 23.45% 5 (5) 0.35% 1,417,655,975 283,531,195 0.88% 161,183,088,769.55
2008 -38.62% -38.86% -40.71% 23.55% 23.81% 5 (5) 0.54% 925,224,765 185,044,953 1.03% 89,646,473,691.69
2007 8.15% 7.72% 9.04% 9.10% 9.42% 5 (5) 0.27% 1,729,347,297 345,869,459 1.07% 161,124,537,714.28
2006 20.65% 20.17% 20.07% 7.23% 7.30% 5 (4) n/a 1,793,558,200 358,711,640 1.43% 125,031,929,762.39
2005 10.09% 9.65% 9.49% 8.07% 8.20% 5 (5) 0.04% 1,349,248,244 269,849,649 1.41% 95,717,167,333.40
2004 15.55% 15.09% 14.72% 8.17% 8.16% 5 (4) n/a 945,678,413 189,135,683 0.92% 102,980,753,667.39
2003 33.59% 33.06% 33.11% 12.62% 12.31% 4 (4) n/a 668,524,793 167,131,198 0.74% 90,920,233,385.14
2002 -18.92% -19.24% -19.89% 19.45% 19.35% 4 (2) n/a 407,747,336 101,936,834 0.56% 73,419,656,617.89
2001 -15.68% -16.02% -16.82% 18.59% 18.18% 2 (1) n/a 400,654,207 200,327,104 #DIV/0! -
Annualized 3 Year 8.31% 7.88% 6.93% 16.82% 16.98%
Annualized 5 Year 0.64% 0.23% -1.18% 20.68% 20.89%
Annualized 7 Year 4.34% 3.93% 3.05% 18.02% 18.23%
Annualized 10 Year 8.63% 8.20% 7.51% 16.06% 16.22%
Annualized S.I.3 3.04% 2.63% 1.84% 16.47% 16.60%
36
Schroder QEP - Global Value Composite
Composite Performance Results as of: December 31, 2012
Composite: Schroder QEP – Global Value
Benchmark: MSCI World (NDR)
Currency: US Dollar
Gross Returns as of: Dec-31-2012
Firm: Schroders Investment Management–UK North America
70
1. Annualized standard deviation of gross monthly returns for the composite and monthly returns for the benchmark
2. Asset weighted standard deviation of annual gross returns of accounts that have been in the composite for the entire year
3. Since Inception
4. Since December 31, 2003 Total Firm Assets include non-fee paying accounts. 2003 Total Firm Assets value has been restated due to the inclusion of those non-fee paying
accounts. Total Firm Assets from 2007 incorporate the UK & US firm merger as detailed in the Definition of the Firm, from the start of 2011 Schroder Property Investment
Management Multi Manager accounts are included in the Total Firm Assets
N/A - Information is not statistically meaningful due to an insufficient number of portfolios for the entire year
Year
Gross Composite
Return
Net Composite
Return
Benchmark
Return
Composite
Risk1Benchmark
Risk1
Number of
Portfolios
(throughout
period)
Account
Dispersion2Market Value at
end of Period
Average
Account Value
at end of Period
Percentage of
Firm Assets Total Firm Assets4
2012 15.79% 14.98% 15.83% 14.98% 12.94% 12 (10) 0.60% 9,386,537,425 782,211,452 4.19% 223,940,416,622.14
2011 -9.19% -9.82% -5.54% 19.31% 17.54% 10 (9) 0.33% 7,855,771,364 785,577,136 4.03% 194,958,113,724.01
2010 16.24% 15.43% 11.76% 19.80% 20.52% 10 (8) 0.69% 7,253,720,984 725,372,098 3.57% 202,946,283,267.48
2009 44.26% 43.26% 29.99% 28.80% 23.45% 10 (8) 1.46% 4,774,576,097 477,457,610 2.96% 161,183,088,769.55
2008 -42.58% -42.98% -40.71% 27.72% 23.81% 8 (7) 0.87% 2,378,011,658 297,251,457 2.65% 89,646,473,691.69
2007 5.97% 5.24% 9.04% 11.07% 9.42% 6 (4) n/a 2,369,540,334 394,923,389 1.47% 161,124,537,714.28
2006 27.11% 26.22% 20.07% 8.68% 7.30% 4 (2) n/a 877,904,628 219,476,157 0.70% 125,031,929,762.39
2005 13.15% 12.36% 9.49% 9.57% 8.20% 2 (1) n/a 167,372,721 83,686,360 0.17% 95,717,167,333.40
Annualized 3 Year 6.92% 6.17% 6.93% 17.95% 16.98%
Annualized 5 Year 0.25% -0.45% -1.18% 23.73% 20.89%
Annualized 7 Year 4.53% 3.80% 3.05% 20.76% 18.23%
Annualized S.I.3 6.83% 6.08% 4.88% 19.63% 17.22%
Schroder QEP – Global ex-US Value Composite
Composite Performance Results as of: December 31, 2012
Composite: Schroder QEP - Global ex-US Value
Benchmark: MSCI EAFE (net dividends re-invested)
Currency: US Dollar
Gross Returns as of: Dec-31-2012
Firm: Schroders Investment Management–UK North America
71
1. Annualized standard deviation of gross monthly returns for the composite and monthly returns for the benchmark
2. Asset weighted standard deviation of annual gross returns of accounts that have been in the composite for the entire year
3. Since Inception
4. Since December 31, 2003 Total Firm Assets include non-fee paying accounts. 2003 Total Firm Assets value has been restated due to the inclusion of those non-fee paying
accounts. Total Firm Assets from 2007 incorporate the UK & US firm merger as detailed in the Definition of the Firm, from the start of 2011 Schroder Property Investment
Management Multi Manager accounts are included in the Total Firm Assets
N/A - Information is not statistically meaningful due to an insufficient number of portfolios for the entire year
Year
Gross Composite
Return
Net Composite
Return
Benchmark
Return
Composite
Risk1Benchmark
Risk1
Number of
Portfolios
(throughout
period)
Account
Dispersion2Market Value at
end of Period
Average
Account Value
at end of Period
Percentage of
Firm Assets Total Firm Assets4
2012 20.02% 19.18% 17.32% 16.40% 16.68% 2 (1) n/a 409,633,510 204,816,755 0.18% 223,940,416,622.14
2011 -11.39% -12.01% -12.14% 18.51% 19.52% 1 (1) n/a 16,845,868 16,845,868 0.01% 194,958,113,724.01
2010 18.17% 17.34% 7.75% 20.37% 22.99% 1 (1) n/a 13,678,517 13,678,517 0.01% 202,946,283,267.48
2009 55.96% 54.88% 31.78% 28.68% 25.62% 1 (1) n/a 11,073,158 11,073,158 0.01% 161,183,088,769.55
2008 -44.92% -45.30% -43.38% 30.77% 27.02% 1 (1) n/a 8,082,917 8,082,917 0.01% 89,646,473,691.69
2007 11.88% 11.11% 11.17% 11.94% 9.62% 1 (1) n/a 13,211,292 13,211,292 0.01% 161,124,537,714.28
Annualized 3 Year 7.91% 7.16% 3.56% 18.42% 19.65%
Annualized 5 Year 1.54% 0.84% -3.69% 24.95% 23.47%
Annualized 7 Year n/a n/a n/a n/a n/a
Annualized 10 Year n/a n/a n/a n/a n/a
Annualized S.I.3 5.16% 4.42% 0.28% 22.75% 21.29%
37
Schroder QEP – Global Quality Composite
Composite Performance Results as of: December 31, 2012
Composite: Schroder QEP – Global Quality
Benchmark: MSCI World (NDR)
Currency: US Dollar
Gross Returns as of: Dec-31-2012
Firm: Schroders Investment Management–UK North America
72
1. Annualized standard deviation of gross monthly returns for the composite and monthly returns for the benchmark
2. Asset weighted standard deviation of annual gross returns of accounts that have been in the composite for the entire year
3. Since Inception
4. Since December 31, 2003 Total Firm Assets include non-fee paying accounts. 2003 Total Firm Assets value has been restated due to the inclusion of those non-fee paying
accounts. Total Firm Assets from 2007 incorporate the UK & US firm merger as detailed in the Definition of the Firm, from the start of 2011 Schroder Property Investment
Management Multi Manager accounts are included in the Total Firm Assets
N/A - Information is not statistically meaningful due to an insufficient number of portfolios for the entire year
Year
Gross Composite
Return
Net Composite
Return
Benchmark
Return
Composite
Risk1Benchmark
Risk1
Number of
Portfolios
(throughout
period)
Account
Dispersion2Market Value at
end of Period
Average
Account Value
at end of Period
Percentage of
Firm Assets Total Firm Assets4
2012 16.05% 15.24% 15.83% 13.26% 12.94% 9 (6) 0.28% 7,160,291,614 795,587,957 3.20% 223,940,416,622.14
2011 -4.46% -5.12% -5.54% 18.45% 17.54% 7 (6) 0.34% 5,514,535,054 787,790,722 2.83% 194,958,113,724.01
2010 18.02% 17.20% 11.76% 17.98% 20.52% 6 (4) n/a 4,898,618,352 816,436,392 2.41% 202,946,283,267.48
2009 34.93% 33.99% 29.99% 19.37% 23.45% 4 (3) n/a 1,793,272,125 448,318,031 1.11% 161,183,088,769.55
2008 -38.54% -38.97% -40.71% 24.20% 23.81% 3 (1) n/a 737,387,685 245,795,895 0.82% 89,646,473,691.69
Annualized 3 Year 9.38% 8.62% 6.93% 16.48% 16.98%
Annualized 5 Year 1.65% 0.94% -1.18% 19.90% 20.89%
Annualized 7 Year n/a n/a n/a n/a n/a
Annualized 10 Year n/a n/a n/a n/a n/a
Annualized S.I.3 1.27% 0.57% -2.18% 19.58% 20.63%
Schroder QEP - Global Blend Composite
Composite Performance Results as of: December 31, 2012
Composite: QEP – Global Blend Composite
Benchmark: MSCI World (NDR)
Currency: US Dollar
Gross Returns as of: Dec-31-2012
Firm: Schroders Investment Management–UK North America
73
1. Annualized standard deviation of gross monthly returns for the composite and monthly returns for the benchmark
2. Asset weighted standard deviation of annual gross returns of accounts that have been in the composite for the entire year
3. Since Inception
4. Since December 31, 2003 Total Firm Assets include non-fee paying accounts. 2003 Total Firm Assets value has been restated due to the inclusion of those non-fee paying
accounts. Total Firm Assets from 2007 incorporate the UK & US firm merger as detailed in the Definition of the Firm, from the start of 2011 Schroder Property Investment
Management Multi Manager accounts are included in the Total Firm Assets
N/A - Information is not statistically meaningful due to an insufficient number of portfolios for the entire year
Year
Gross Composite
Return
Net Composite
Return
Benchmark
Return
Composite
Risk1Benchmark
Risk1
Number of
Portfolios
(throughout
period)
Account
Dispersion2Market Value at
end of Period
Average
Account Value
at end of Period
Percentage of
Firm Assets Total Firm Assets4
2012 16.72% 15.91% 15.83% 14.05% 12.94% 10 (6) 0.47% 5,483,013,462 548,301,346 2.45% 223,940,416,622.14
2011 -6.90% -7.55% -5.54% 18.93% 17.54% 7 (5) 0.35% 3,389,192,464 484,170,352 1.74% 194,958,113,724.01
2010 17.06% 16.25% 11.76% 18.34% 20.52% 6 (6) 1.26% 4,197,209,470 699,534,912 2.07% 202,946,283,267.48
2009 40.45% 39.48% 29.99% 23.64% 23.45% 3 (1) n/a 1,383,308,609 461,102,870 0.86% 161,183,088,769.55
Annualized 3 Year 8.35% 7.60% 6.93% 17.03% 16.98%
Annualized S.I.3 8.28% 7.52% 5.26% 21.66% 20.93%
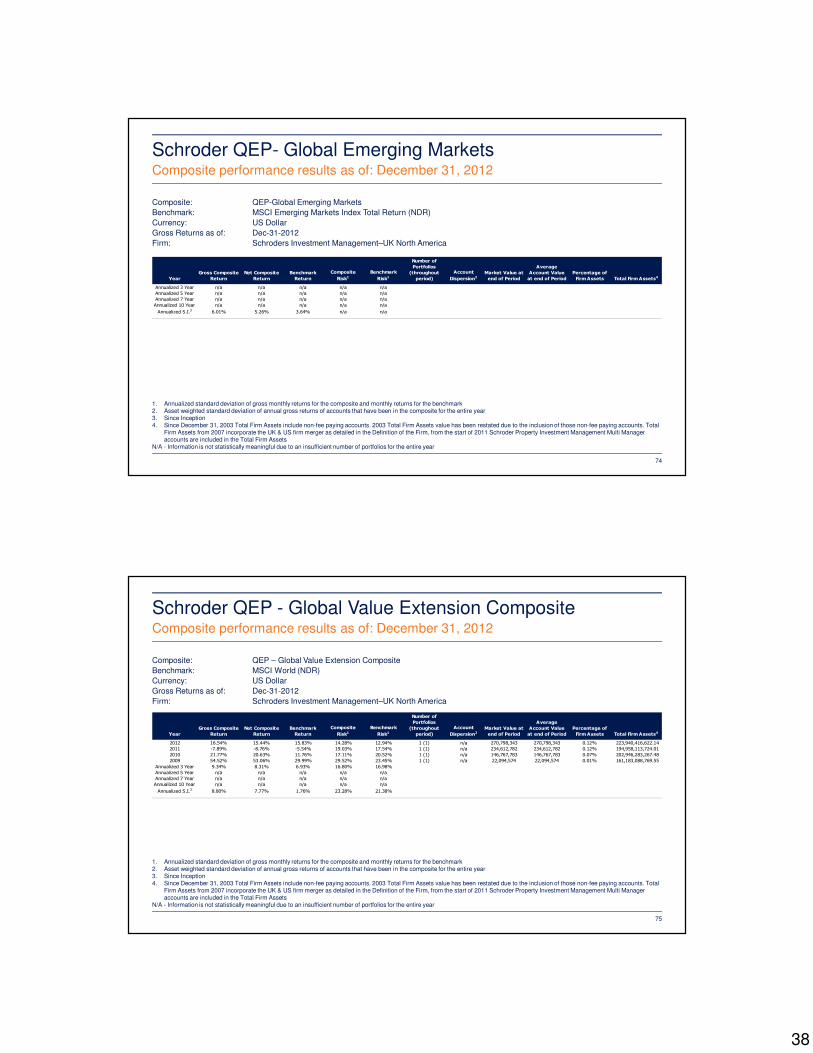
38
Schroder QEP- Global Emerging MarketsComposite performance results as of: December 31, 2012
Composite: QEP-Global Emerging Markets
Benchmark: MSCI Emerging Markets Index Total Return (NDR)
Currency: US Dollar
Gross Returns as of: Dec-31-2012
Firm: Schroders Investment Management–UK North America
74
1. Annualized standard deviation of gross monthly returns for the composite and monthly returns for the benchmark
2. Asset weighted standard deviation of annual gross returns of accounts that have been in the composite for the entire year
3. Since Inception
4. Since December 31, 2003 Total Firm Assets include non-fee paying accounts. 2003 Total Firm Assets value has been restated due to the inclusion of those non-fee paying accounts. Total
Firm Assets from 2007 incorporate the UK & US firm merger as detailed in the Definition of the Firm, from the start of 2011 Schroder Property Investment Management Multi Manager
accounts are included in the Total Firm Assets
N/A - Information is not statistically meaningful due to an insufficient number of portfolios for the entire year
Year
Gross Composite
Return
Net Composite
Return
Benchmark
Return
Composite
Risk1Benchmark
Risk1
Number of
Portfolios
(throughout
period)
Account
Dispersion2Market Value at
end of Period
Average
Account Value
at end of Period
Percentage of
Firm Assets Total Firm Assets4
Annualized 3 Year n/a n/a n/a n/a n/a
Annualized 5 Year n/a n/a n/a n/a n/a
Annualized 7 Year n/a n/a n/a n/a n/a
Annualized 10 Year n/a n/a n/a n/a n/a
Annualized S.I.3 6.01% 5.26% 3.64% n/a n/a
Schroder QEP - Global Value Extension CompositeComposite performance results as of: December 31, 2012
Composite: QEP – Global Value Extension Composite
Benchmark: MSCI World (NDR)
Currency: US Dollar
Gross Returns as of: Dec-31-2012
Firm: Schroders Investment Management–UK North America
75
1. Annualized standard deviation of gross monthly returns for the composite and monthly returns for the benchmark
2. Asset weighted standard deviation of annual gross returns of accounts that have been in the composite for the entire year
3. Since Inception
4. Since December 31, 2003 Total Firm Assets include non-fee paying accounts. 2003 Total Firm Assets value has been restated due to the inclusion of those non-fee paying accounts. Total
Firm Assets from 2007 incorporate the UK & US firm merger as detailed in the Definition of the Firm, from the start of 2011 Schroder Property Investment Management Multi Manager
accounts are included in the Total Firm Assets
N/A - Information is not statistically meaningful due to an insufficient number of portfolios for the entire year
Year
Gross Composite
Return
Net Composite
Return
Benchmark
Return
Composite
Risk1Benchmark
Risk1
Number of
Portfolios
(throughout
period)
Account
Dispersion2Market Value at
end of Period
Average
Account Value
at end of Period
Percentage of
Firm Assets Total Firm Assets4
2012 16.54% 15.44% 15.83% 14.28% 12.94% 1 (1) n/a 270,798,343 270,798,343 0.12% 223,940,416,622.14
2011 -7.89% -8.76% -5.54% 19.03% 17.54% 1 (1) n/a 234,612,782 234,612,782 0.12% 194,958,113,724.01
2010 21.77% 20.63% 11.76% 17.11% 20.52% 1 (1) n/a 146,767,783 146,767,783 0.07% 202,946,283,267.48
2009 54.52% 53.06% 29.99% 29.52% 23.45% 1 (1) n/a 22,094,574 22,094,574 0.01% 161,183,088,769.55
Annualized 3 Year 9.34% 8.31% 6.93% 16.80% 16.98%
Annualized 5 Year n/a n/a n/a n/a n/a
Annualized 7 Year n/a n/a n/a n/a n/a
Annualized 10 Year n/a n/a n/a n/a n/a
Annualized S.I.3 8.80% 7.77% 1.76% 23.28% 21.38%
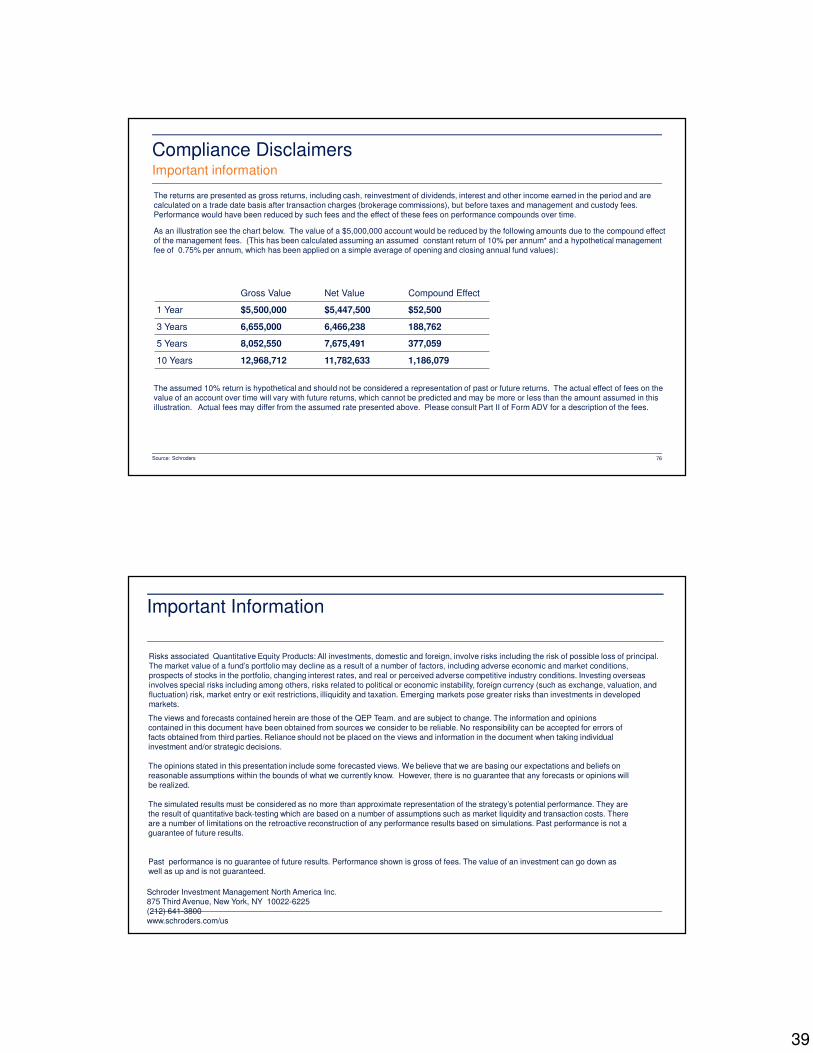
39
The returns are presented as gross returns, including cash, reinvestment of dividends, interest and other income earned in the period and are
calculated on a trade date basis after transaction charges (brokerage commissions), but before taxes and management and custody fees.
Performance would have been reduced by such fees and the effect of these fees on performance compounds over time.
As an illustration see the chart below. The value of a $5,000,000 account would be reduced by the following amounts due to the compound effect
of the management fees. (This has been calculated assuming an assumed constant return of 10% per annum* and a hypothetical management
fee of 0.75% per annum, which has been applied on a simple average of opening and closing annual fund values):
The assumed 10% return is hypothetical and should not be considered a representation of past or future returns. The actual effect of fees on the
value of an account over time will vary with future returns, which cannot be predicted and may be more or less than the amount assumed in this
illustration. Actual fees may differ from the assumed rate presented above. Please consult Part II of Form ADV for a description of the fees.
Gross Value Net Value Compound Effect
1 Year $5,500,000 $5,447,500 $52,500
3 Years 6,655,000 6,466,238 188,762
5 Years 8,052,550 7,675,491 377,059
10 Years 12,968,712 11,782,633 1,186,079
Compliance Disclaimers
76
Important information
Source: Schroders
Important Information
The views and forecasts contained herein are those of the QEP Team. and are subject to change. The information and opinions
contained in this document have been obtained from sources we consider to be reliable. No responsibility can be accepted for errors of
facts obtained from third parties. Reliance should not be placed on the views and information in the document when taking individual
investment and/or strategic decisions.
The opinions stated in this presentation include some forecasted views. We believe that we are basing our expectations and beliefs on
reasonable assumptions within the bounds of what we currently know. However, there is no guarantee that any forecasts or opinions will
be realized.
The simulated results must be considered as no more than approximate representation of the strategy’s potential performance. They are
the result of quantitative back-testing which are based on a number of assumptions such as market liquidity and transaction costs. There
are a number of limitations on the retroactive reconstruction of any performance results based on simulations. Past performance is not a
guarantee of future results.
Past performance is no guarantee of future results. Performance shown is gross of fees. The value of an investment can go down as
well as up and is not guaranteed.
Risks associated Quantitative Equity Products: All investments, domestic and foreign, involve risks including the risk of possible loss of principal.
The market value of a fund’s portfolio may decline as a result of a number of factors, including adverse economic and market conditions,
prospects of stocks in the portfolio, changing interest rates, and real or perceived adverse competitive industry conditions. Investing overseas
involves special risks including among others, risks related to political or economic instability, foreign currency (such as exchange, valuation, and
fluctuation) risk, market entry or exit restrictions, illiquidity and taxation. Emerging markets pose greater risks than investments in developed
markets.
Schroder Investment Management North America Inc.
875 Third Avenue, New York, NY 10022-6225
(212) 641-3800
www.schroders.com/us
Pyrford International Ltd 79 Grosvenor St London W1K 3JU
T: 01144 20 7495 4641 E: [email protected] W: www.pyrford.co.uk
Presentation to: Contra Costa County Employees’ Retirement Association
International Value Equity $US
As at 31 August 2013
Tony Cousins CFA
CEO & CIO
Pyrford International Ltd
T: 01144 20 7399 2210
Mark Osterkamp
Relationship Manager
BMO Global Asset Management
T: 310 321 7852
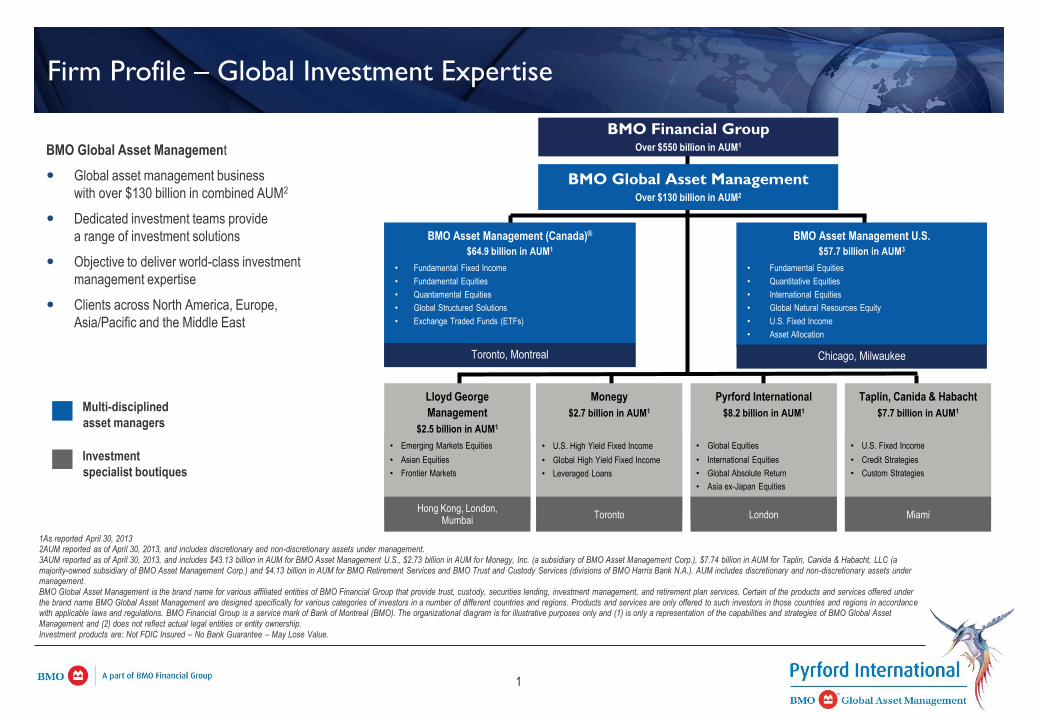
BMO Global Asset Management
Global asset management business
with over $130 billion in combined AUM2
Dedicated investment teams provide
a range of investment solutions
Objective to deliver world-class investment
management expertise
Clients across North America, Europe,
Asia/Pacific and the Middle East
Multi-disciplined
asset managers
Investment
specialist boutiques
BMO Asset Management U.S.
$57.7 billion in AUM3
• Fundamental Equities
• Quantitative Equities
• International Equities
• Global Natural Resources Equity
• U.S. Fixed Income
• Asset Allocation
Chicago, Milwaukee
BMO Asset Management (Canada)®
$64.9 billion in AUM1
• Fundamental Fixed Income
• Fundamental Equities
• Quantamental Equities
• Global Structured Solutions
• Exchange Traded Funds (ETFs)
Toronto, Montreal
BMO Global Asset Management Over $130 billion in AUM2
Lloyd George
Management
$2.5 billion in AUM1
• Emerging Markets Equities
• Asian Equities
• Frontier Markets
Hong Kong, London, Mumbai
Monegy
$2.7 billion in AUM1
• U.S. High Yield Fixed Income
• Global High Yield Fixed Income
• Leveraged Loans
Toronto
Taplin, Canida & Habacht
$7.7 billion in AUM1
• U.S. Fixed Income
• Credit Strategies
• Custom Strategies
Miami
Pyrford International
$8.2 billion in AUM1
• Global Equities
• International Equities
• Global Absolute Return
• Asia ex-Japan Equities
London
BMO Financial Group Over $550 billion in AUM1
1As reported April 30, 2013 2AUM reported as of April 30, 2013, and includes discretionary and non-discretionary assets under management. 3AUM reported as of April 30, 2013, and includes $43.13 billion in AUM for BMO Asset Management U.S., $2.73 billion in AUM for Monegy, Inc. (a subsidiary of BMO Asset Management Corp.), $7.74 billion in AUM for Taplin, Canida & Habacht, LLC (a majority-owned subsidiary of BMO Asset Management Corp.) and $4.13 billion in AUM for BMO Retirement Services and BMO Trust and Custody Services (divisions of BMO Harris Bank N.A.). AUM includes discretionary and non-discretionary assets under management. BMO Global Asset Management is the brand name for various affiliated entities of BMO Financial Group that provide trust, custody, securities lending, investment management, and retirement plan services. Certain of the products and services offered under the brand name BMO Global Asset Management are designed specifically for various categories of investors in a number of different countries and regions. Products and services are only offered to such investors in those countries and regions in accordance with applicable laws and regulations. BMO Financial Group is a service mark of Bank of Montreal (BMO). The organizational diagram is for illustrative purposes only and (1) is only a representation of the capabilities and strategies of BMO Global Asset Management and (2) does not reflect actual legal entities or entity ownership. Investment products are: Not FDIC Insured – No Bank Guarantee – May Lose Value.
Firm Profile – Global Investment Expertise
1
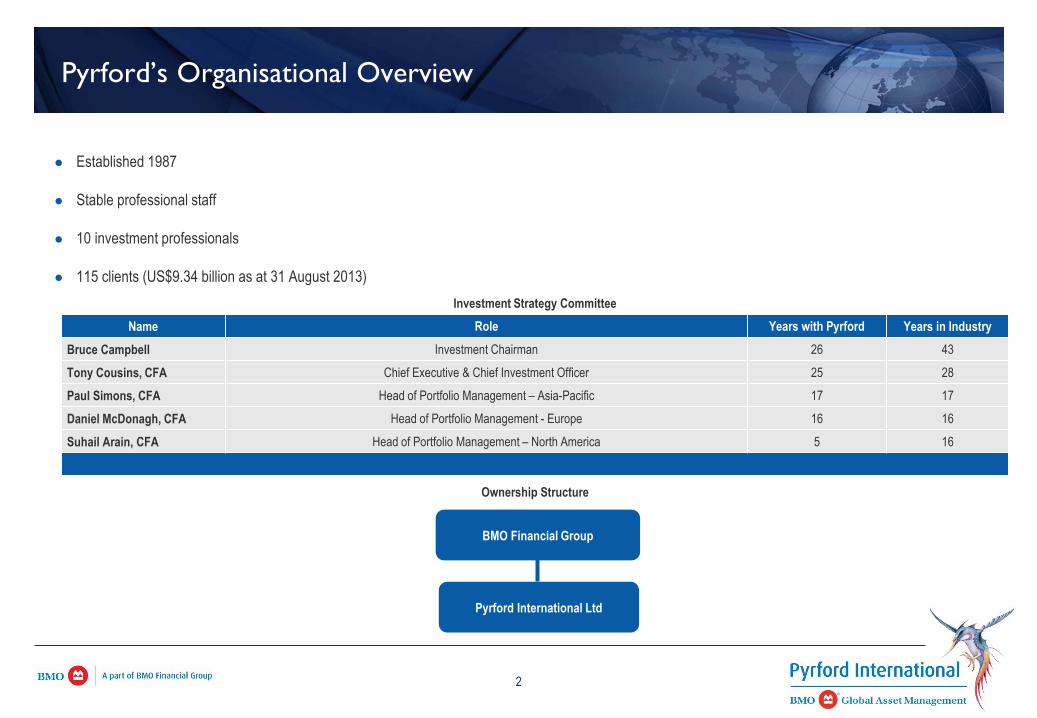
Pyrford’s Organisational Overview
Established 1987
Stable professional staff
10 investment professionals
115 clients (US$9.34 billion as at 31 August 2013)
Investment Strategy Committee
Name Role Years with Pyrford Years in Industry
Bruce Campbell Investment Chairman 26 43
Tony Cousins, CFA Chief Executive & Chief Investment Officer 25 28
Paul Simons, CFA Head of Portfolio Management – Asia-Pacific 17 17
Daniel McDonagh, CFA Head of Portfolio Management - Europe 16 16
Suhail Arain, CFA Head of Portfolio Management – North America 5 16
BMO Financial Group
Pyrford International Ltd
Ownership Structure
2
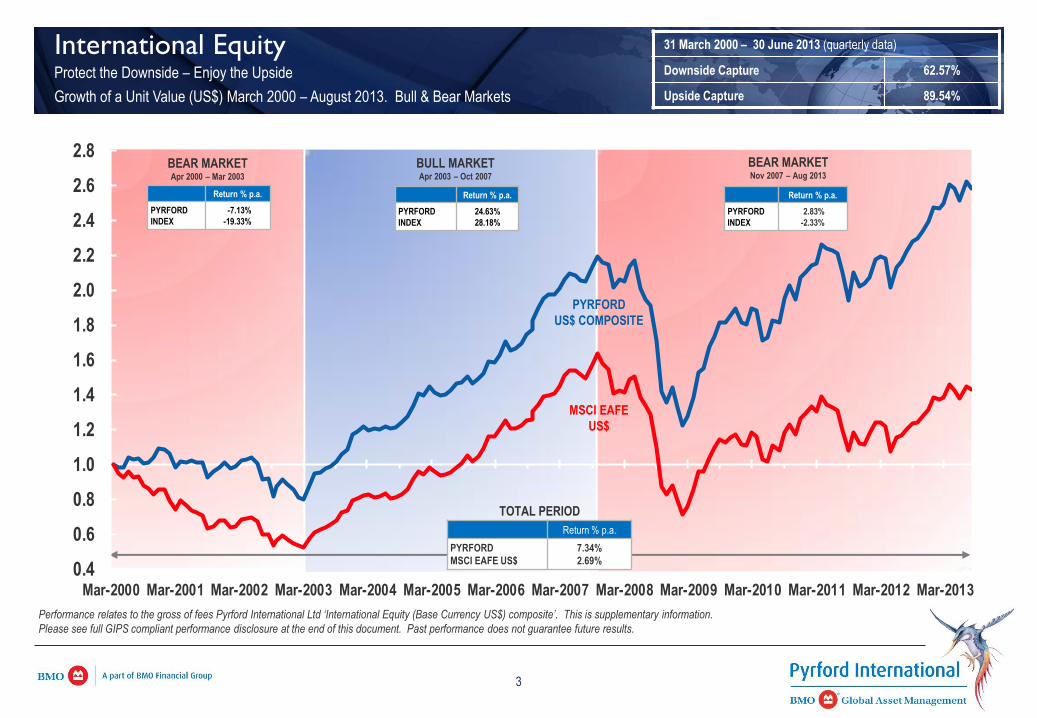
Performance relates to the gross of fees Pyrford International Ltd ‘International Equity (Base Currency US$) composite’. This is supplementary information.
Please see full GIPS compliant performance disclosure at the end of this document. Past performance does not guarantee future results.
International Equity Protect the Downside – Enjoy the Upside
Growth of a Unit Value (US$) March 2000 – August 2013. Bull & Bear Markets
31 March 2000 – 30 June 2013 (quarterly data)
Downside Capture 62.57%
Upside Capture 89.54%
3
BULL MARKET Apr 2003 – Oct 2007
TOTAL PERIOD
Return % p.a.
PYRFORD
MSCI EAFE US$
7.34%
2.69%
PYRFORD
US$ COMPOSITE
MSCI EAFE
US$
BEAR MARKET Apr 2000 – Mar 2003
BEAR MARKET Nov 2007 – Aug 2013
Return % p.a.
PYRFORD
INDEX
-7.13%
-19.33%
Return % p.a.
PYRFORD
INDEX
24.63%
28.18%
Return % p.a.
PYRFORD
INDEX
2.83%
-2.33%
0.4
0.6
0.8
1.0
1.2
1.4
1.6
1.8
2.0
2.2
2.4
2.6
2.8
Mar-2000 Mar-2001 Mar-2002 Mar-2003 Mar-2004 Mar-2005 Mar-2006 Mar-2007 Mar-2008 Mar-2009 Mar-2010 Mar-2011 Mar-2012 Mar-2013
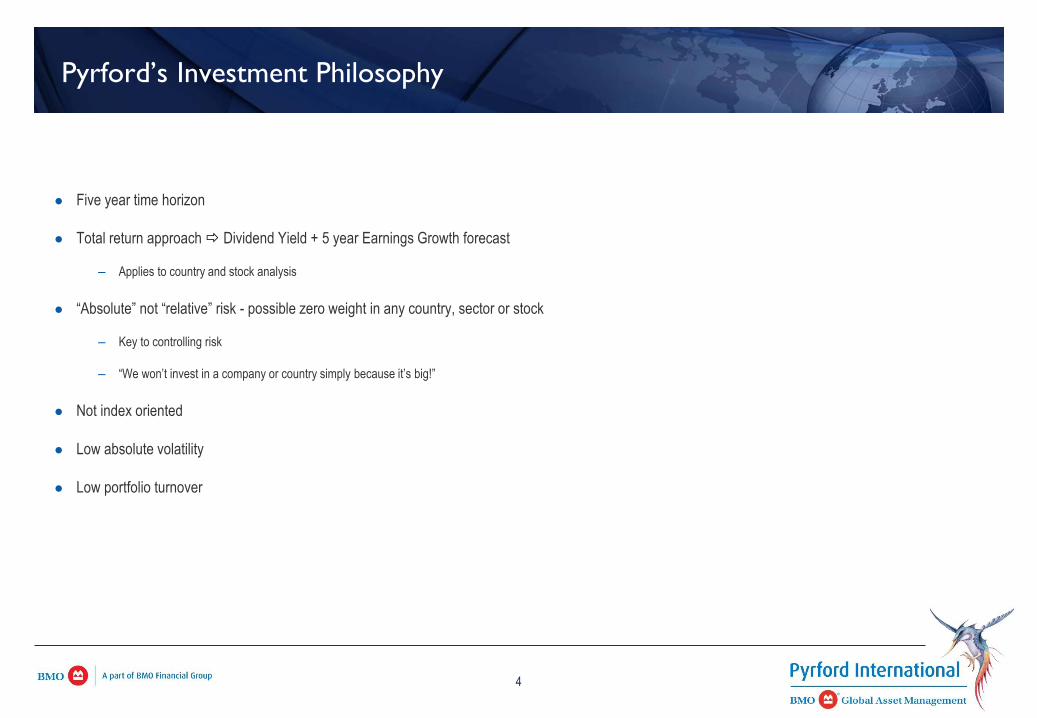
Pyrford’s Investment Philosophy
Five year time horizon
Total return approach Dividend Yield + 5 year Earnings Growth forecast
– Applies to country and stock analysis
“Absolute” not “relative” risk - possible zero weight in any country, sector or stock
– Key to controlling risk
– “We won’t invest in a company or country simply because it’s big!”
Not index oriented
Low absolute volatility
Low portfolio turnover
4
Country Analysis
We embrace macro-economic analysis to assist in portfolio allocation
Total return forecast by country on a five year view
– A combination of top-down and bottom-up analysis
Avoid markets representing poor value
– e.g. Japan in the 1990s
Coverage of 27 countries, including 5 not included in the MSCI ‘EAFE’ Index
Contributes significant percentage of long-term alpha
5
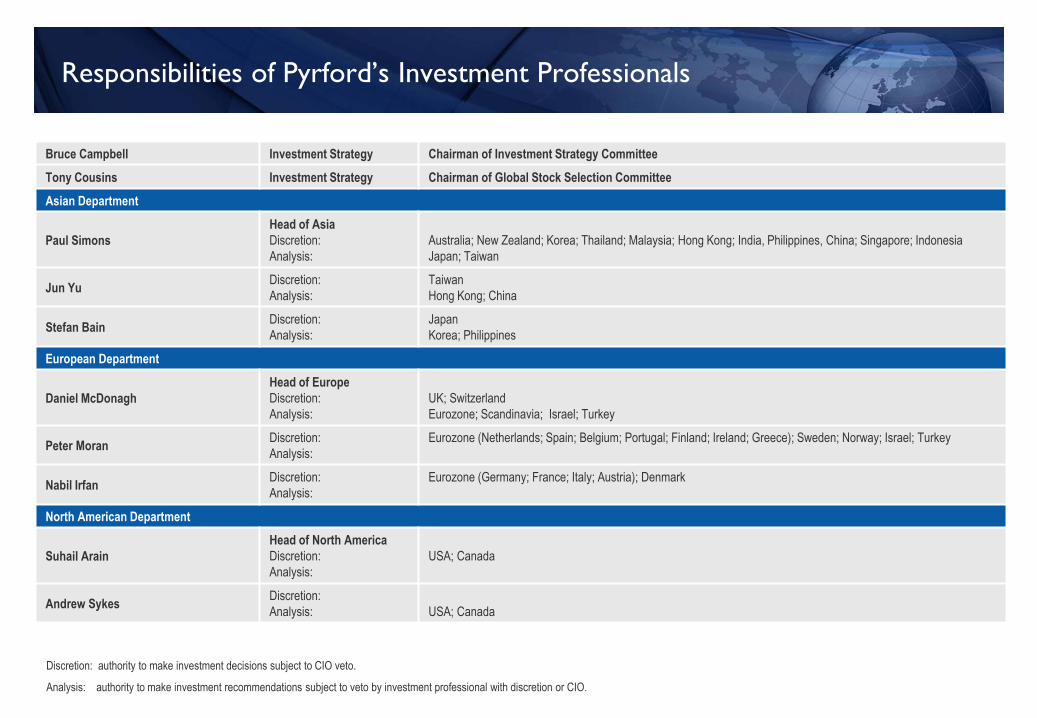
6
Responsibilities of Pyrford’s Investment Professionals
Bruce Campbell Investment Strategy Chairman of Investment Strategy Committee
Tony Cousins Investment Strategy Chairman of Global Stock Selection Committee
Asian Department
Paul Simons
Head of Asia
Discretion:
Analysis:
Australia; New Zealand; Korea; Thailand; Malaysia; Hong Kong; India, Philippines, China; Singapore; Indonesia
Japan; Taiwan
Jun Yu Discretion:
Analysis:
Taiwan
Hong Kong; China
Stefan Bain Discretion:
Analysis:
Japan
Korea; Philippines
European Department
Daniel McDonagh
Head of Europe
Discretion:
Analysis:
UK; Switzerland
Eurozone; Scandinavia; Israel; Turkey
Peter Moran Discretion:
Analysis:
Eurozone (Netherlands; Spain; Belgium; Portugal; Finland; Ireland; Greece); Sweden; Norway; Israel; Turkey
Nabil Irfan Discretion:
Analysis:
Eurozone (Germany; France; Italy; Austria); Denmark
North American Department
Suhail Arain
Head of North America
Discretion:
Analysis:
USA; Canada
Andrew Sykes Discretion:
Analysis:
USA; Canada
Discretion: authority to make investment decisions subject to CIO veto.
Analysis: authority to make investment recommendations subject to veto by investment professional with discretion or CIO.
Selecting the Stocks for your Portfolio
Screening – Which companies should be researched in depth?
– Eliminate small companies and highly leveraged companies
– Rank universe on basis of selected fundamentals (utilising a combination of dividend yield, return on equity and price/earnings ratio)
Stock sheets – Scrutiny of the past assists in evaluating the future
– In-house, from original sources
– Discipline across the regions
– Helps determine long-term sustainable growth rates:
Disaggregation of return on equity – Du Pont analysis
Quality of earnings and balance sheet
5 year earnings per share forecasts
Company interviews – Every company, every year
– Must visit company prior to purchase and annually thereafter – around 430 meetings per year
– Examine the business model and long-term strategy
– Focus on visibility of earnings and sustainability of return on equity
Peer review – All buy and sell ideas are scrutinised by entire investment team
7
Portfolio Construction
Portfolio of 60 - 90 stocks
Country allocation determined by Investment Strategy Committee, comprising Bruce Campbell, Tony Cousins, Paul Simons, Suhail Arain and Daniel
McDonagh
– min. country weight 0%, max. country weight is driven by size and volatility of each market
Stock selection by country
– Country portfolio manager determines stock selection
– New sales and purchases presented to full global investment team
– New positions tend to be small
– Every stock rated buy or sell
All client portfolios identical (subject to specific investment restrictions)
Quarterly rebalancing back to model weightings
Overall “check” by CIO
8
Sell Decisions
Competition of ideas - we need to make space for a stock with better valuation fundamentals.
Valuation - a good stock has become too expensive.
A material change in our assessment of the company’s fundamentals.
An overall change to portfolio positioning - reduce country weight.
9
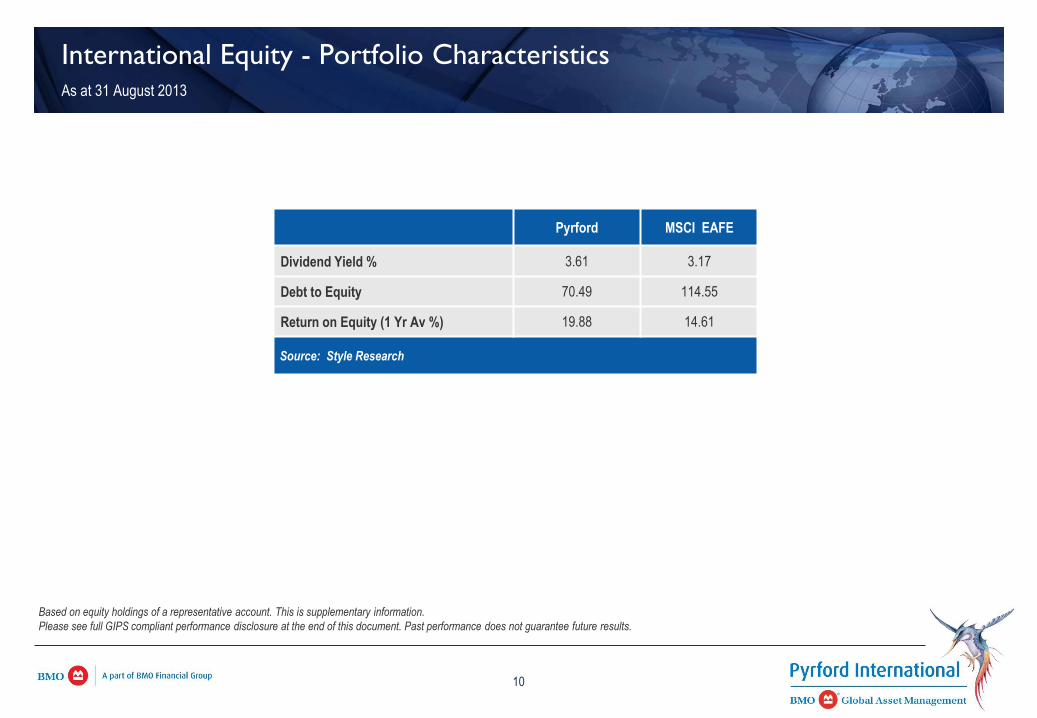
International Equity - Portfolio Characteristics As at 31 August 2013
Pyrford MSCI EAFE
Dividend Yield % 3.61 3.17
Debt to Equity 70.49 114.55
Return on Equity (1 Yr Av %) 19.88 14.61
Source: Style Research
Based on equity holdings of a representative account. This is supplementary information.
Please see full GIPS compliant performance disclosure at the end of this document. Past performance does not guarantee future results.
10
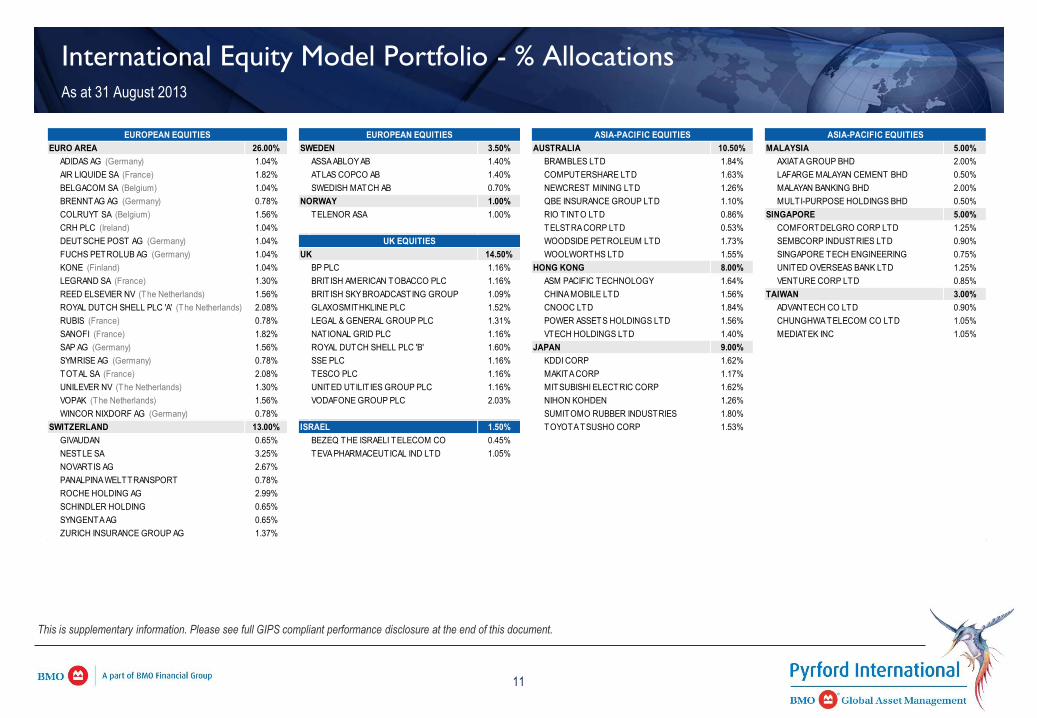
International Equity Model Portfolio - % Allocations As at 31 August 2013
This is supplementary information. Please see full GIPS compliant performance disclosure at the end of this document.
EURO AREA 26.00% SWEDEN 3.50% AUSTRALIA 10.50% MALAYSIA 5.00%
ADIDAS AG (Germany) 1.04% ASSA ABLOY AB 1.40% BRAMBLES LTD 1.84% AXIATA GROUP BHD 2.00%
AIR LIQUIDE SA (France) 1.82% ATLAS COPCO AB 1.40% COMPUTERSHARE LTD 1.63% LAFARGE MALAYAN CEMENT BHD 0.50%
BELGACOM SA (Belgium) 1.04% SWEDISH MATCH AB 0.70% NEWCREST MINING LTD 1.26% MALAYAN BANKING BHD 2.00%
BRENNTAG AG (Germany) 0.78% NORWAY 1.00% QBE INSURANCE GROUP LTD 1.10% MULTI-PURPOSE HOLDINGS BHD 0.50%
COLRUYT SA (Belgium) 1.56% TELENOR ASA 1.00% RIO TINTO LTD 0.86% SINGAPORE 5.00%
CRH PLC (Ireland) 1.04% TELSTRA CORP LTD 0.53% COMFORTDELGRO CORP LTD 1.25%
DEUTSCHE POST AG (Germany) 1.04% WOODSIDE PETROLEUM LTD 1.73% SEMBCORP INDUSTRIES LTD 0.90%
FUCHS PETROLUB AG (Germany) 1.04% UK 14.50% WOOLWORTHS LTD 1.55% SINGAPORE TECH ENGINEERING 0.75%
KONE (Finland) 1.04% BP PLC 1.16% HONG KONG 8.00% UNITED OVERSEAS BANK LTD 1.25%
LEGRAND SA (France) 1.30% BRITISH AMERICAN TOBACCO PLC 1.16% ASM PACIFIC TECHNOLOGY 1.64% VENTURE CORP LTD 0.85%
REED ELSEVIER NV (The Netherlands) 1.56% BRITISH SKY BROADCASTING GROUP 1.09% CHINA MOBILE LTD 1.56% TAIWAN 3.00%
ROYAL DUTCH SHELL PLC 'A' (The Netherlands) 2.08% GLAXOSMITHKLINE PLC 1.52% CNOOC LTD 1.84% ADVANTECH CO LTD 0.90%
RUBIS (France) 0.78% LEGAL & GENERAL GROUP PLC 1.31% POWER ASSETS HOLDINGS LTD 1.56% CHUNGHWA TELECOM CO LTD 1.05%
SANOFI (France) 1.82% NATIONAL GRID PLC 1.16% VTECH HOLDINGS LTD 1.40% MEDIATEK INC 1.05%
SAP AG (Germany) 1.56% ROYAL DUTCH SHELL PLC 'B' 1.60% JAPAN 9.00%
SYMRISE AG (Germany) 0.78% SSE PLC 1.16% KDDI CORP 1.62%
TOTAL SA (France) 2.08% TESCO PLC 1.16% MAKITA CORP 1.17%
UNILEVER NV (The Netherlands) 1.30% UNITED UTILIT IES GROUP PLC 1.16% MITSUBISHI ELECTRIC CORP 1.62%
VOPAK (The Netherlands) 1.56% VODAFONE GROUP PLC 2.03% NIHON KOHDEN 1.26%
WINCOR NIXDORF AG (Germany) 0.78% SUMITOMO RUBBER INDUSTRIES 1.80%
SWITZERLAND 13.00% ISRAEL 1.50% TOYOTA TSUSHO CORP 1.53%
GIVAUDAN 0.65% BEZEQ THE ISRAELI TELECOM CO 0.45%
NESTLE SA 3.25% TEVA PHARMACEUTICAL IND LTD 1.05%
NOVARTIS AG 2.67%
PANALPINA WELTTRANSPORT 0.78%
ROCHE HOLDING AG 2.99%
SCHINDLER HOLDING 0.65%
SYNGENTA AG 0.65%
ZURICH INSURANCE GROUP AG 1.37%
UK EQUITIES
ASIA-PACIFIC EQUITIES ASIA-PACIFIC EQUITIESEUROPEAN EQUITIES EUROPEAN EQUITIES
11
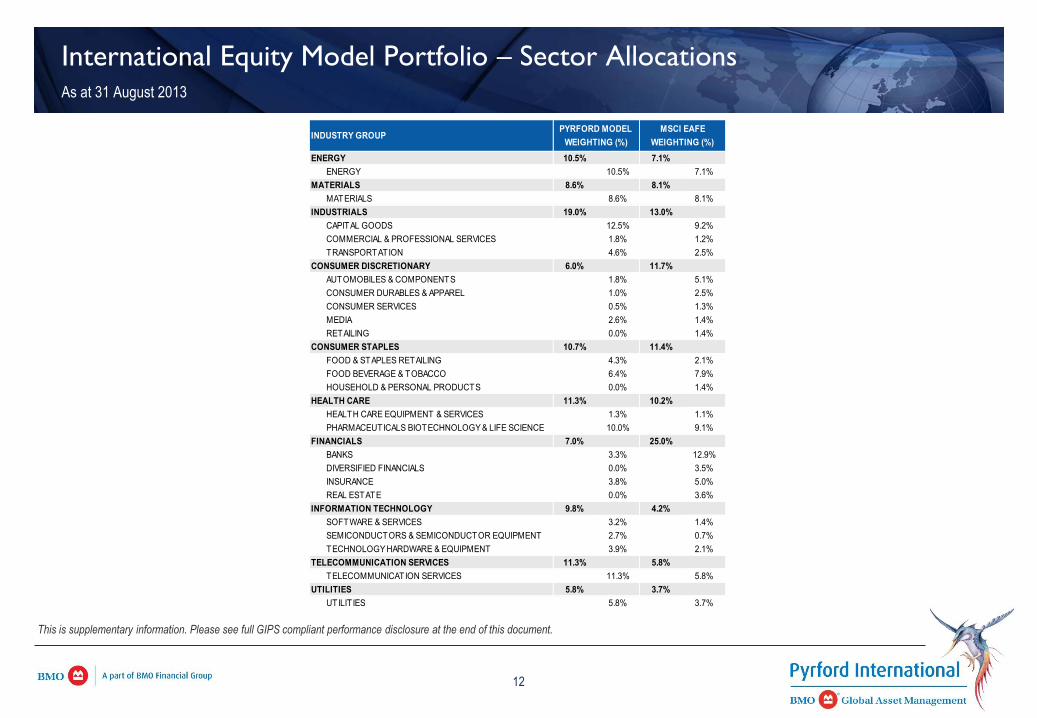
International Equity Model Portfolio – Sector Allocations As at 31 August 2013
This is supplementary information. Please see full GIPS compliant performance disclosure at the end of this document.
INDUSTRY GROUP
ENERGY 10.5% 7.1%
ENERGY 10.5% 7.1%
MATERIALS 8.6% 8.1%
MATERIALS 8.6% 8.1%
INDUSTRIALS 19.0% 13.0%
CAPITAL GOODS 12.5% 9.2%
COMMERCIAL & PROFESSIONAL SERVICES 1.8% 1.2%
TRANSPORTATION 4.6% 2.5%
CONSUMER DISCRETIONARY 6.0% 11.7%
AUTOMOBILES & COMPONENTS 1.8% 5.1%
CONSUMER DURABLES & APPAREL 1.0% 2.5%
CONSUMER SERVICES 0.5% 1.3%
MEDIA 2.6% 1.4%
RETAILING 0.0% 1.4%
CONSUMER STAPLES 10.7% 11.4%
FOOD & STAPLES RETAILING 4.3% 2.1%
FOOD BEVERAGE & TOBACCO 6.4% 7.9%
HOUSEHOLD & PERSONAL PRODUCTS 0.0% 1.4%
HEALTH CARE 11.3% 10.2%
HEALTH CARE EQUIPMENT & SERVICES 1.3% 1.1%
PHARMACEUTICALS BIOTECHNOLOGY & LIFE SCIENCE 10.0% 9.1%
FINANCIALS 7.0% 25.0%
BANKS 3.3% 12.9%
DIVERSIFIED FINANCIALS 0.0% 3.5%
INSURANCE 3.8% 5.0%
REAL ESTATE 0.0% 3.6%
INFORMATION TECHNOLOGY 9.8% 4.2%
SOFTWARE & SERVICES 3.2% 1.4%
SEMICONDUCTORS & SEMICONDUCTOR EQUIPMENT 2.7% 0.7%
TECHNOLOGY HARDWARE & EQUIPMENT 3.9% 2.1%
TELECOMMUNICATION SERVICES 11.3% 5.8%
TELECOMMUNICATION SERVICES 11.3% 5.8%
UTILITIES 5.8% 3.7%
UTILIT IES 5.8% 3.7%
PYRFORD MODEL
WEIGHTING (%)
MSCI EAFE
WEIGHTING (%)
12
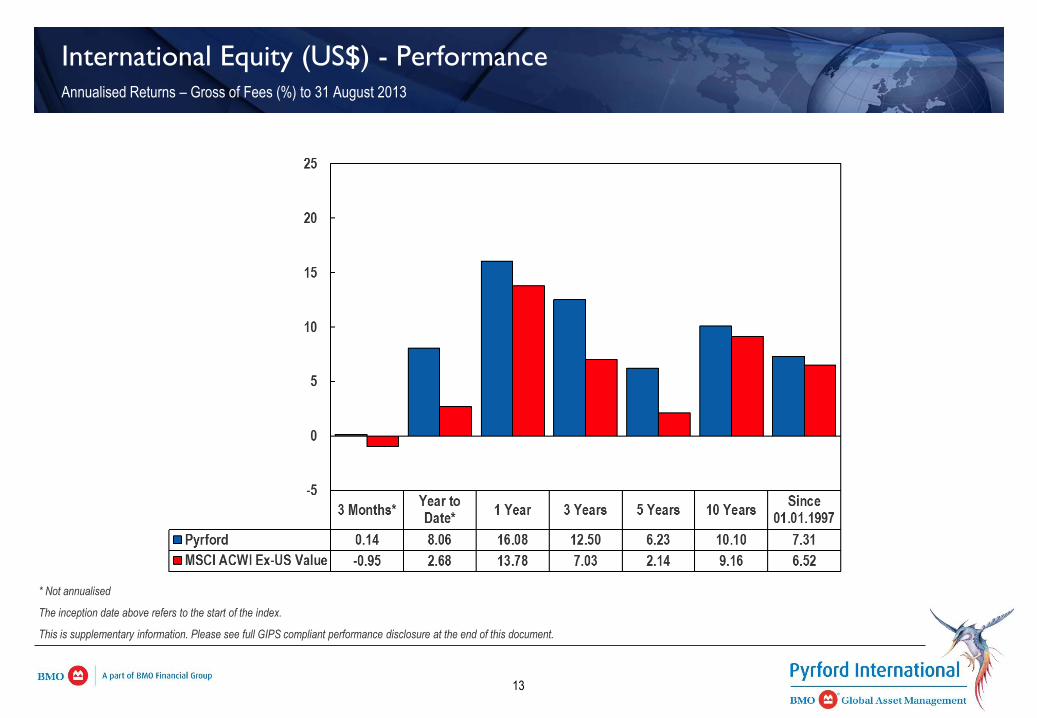
International Equity (US$) - Performance Annualised Returns – Gross of Fees (%) to 31 August 2013
13
* Not annualised
The inception date above refers to the start of the index.
This is supplementary information. Please see full GIPS compliant performance disclosure at the end of this document.
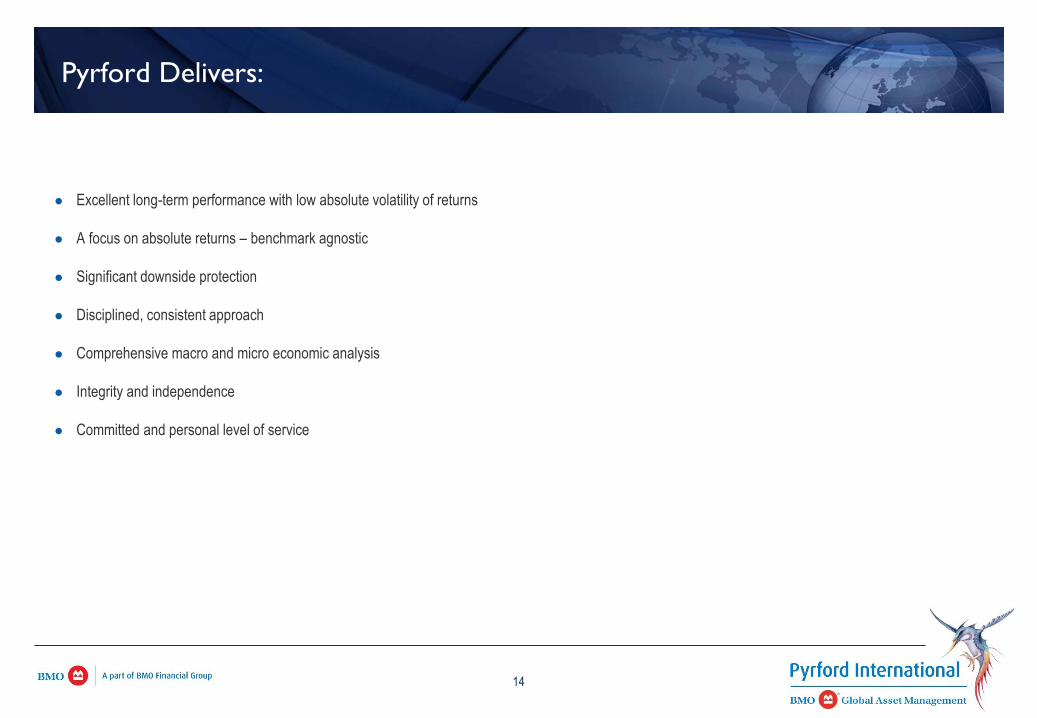
Pyrford Delivers:
Excellent long-term performance with low absolute volatility of returns
A focus on absolute returns – benchmark agnostic
Significant downside protection
Disciplined, consistent approach
Comprehensive macro and micro economic analysis
Integrity and independence
Committed and personal level of service
14
Supplementary Information
INDEX
Pyrford’s Organisation Chart
Pyrford’s Professionals
Assets Under Management Breakdown
Representative Clients
Country Allocation
Pyrford Screening & Stock Selection Process
Sample of Purchasing Power Parity Analysis
Performance - International Equity
Risk/Reward - International Equity
Rolling 5-year Absolute Volatility – International Equity
Attribution Detail by Asset
Current Views
Fees
Sample Stock Sheet
Performance Disclosures
15
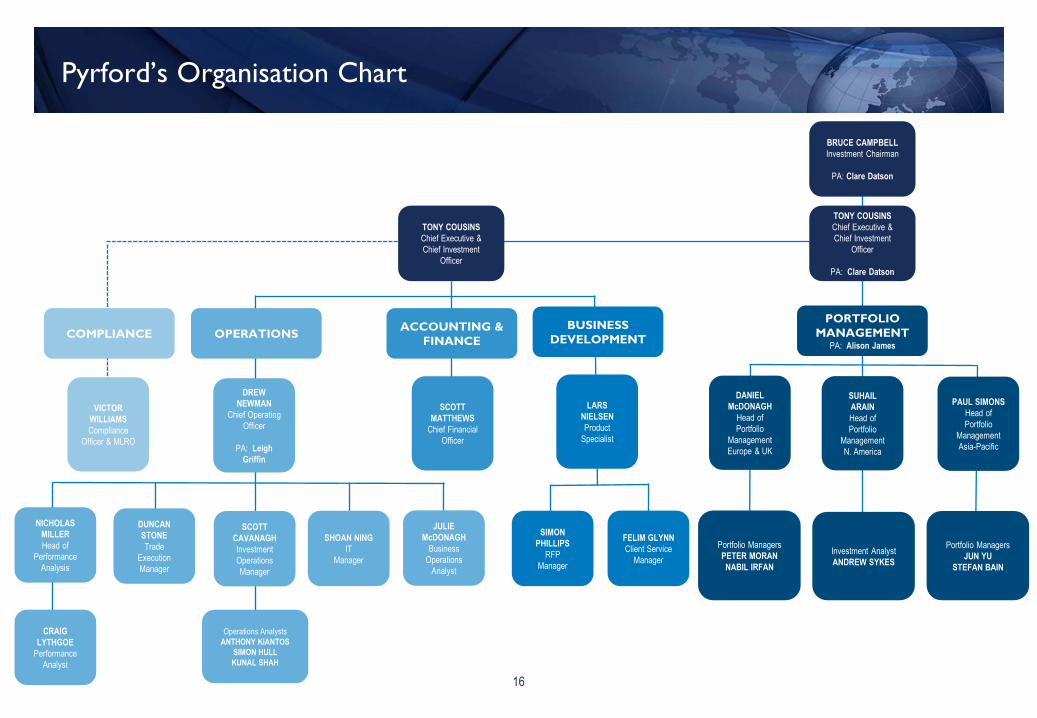
Pyrford’s Organisation Chart
BRUCE CAMPBELL
Investment Chairman
PA: Clare Datson
TONY COUSINS
Chief Executive &
Chief Investment
Officer
PA: Clare Datson
COMPLIANCE OPERATIONS BUSINESS
DEVELOPMENT ACCOUNTING &
FINANCE
PORTFOLIO
MANAGEMENT PA: Alison James
TONY COUSINS
Chief Executive &
Chief Investment
Officer
VICTOR
WILLIAMS
Compliance
Officer & MLRO
DREW
NEWMAN
Chief Operating
Officer
PA: Leigh
Griffin
LARS
NIELSEN
Product
Specialist
SCOTT
MATTHEWS
Chief Financial
Officer
PAUL SIMONS
Head of
Portfolio
Management
Asia-Pacific
DANIEL
McDONAGH
Head of
Portfolio
Management
Europe & UK
SUHAIL
ARAIN
Head of
Portfolio
Management
N. America
DUNCAN
STONE
Trade
Execution
Manager
SCOTT
CAVANAGH
Investment
Operations
Manager
SHOAN NING
IT
Manager
JULIE
McDONAGH
Business
Operations
Analyst
SIMON
PHILLIPS
RFP
Manager
Portfolio Managers
PETER MORAN
NABIL IRFAN
Portfolio Managers
JUN YU
STEFAN BAIN
Operations Analysts
ANTHONY KIANTOS
SIMON HULL
KUNAL SHAH
NICHOLAS
MILLER
Head of
Performance
Analysis
FELIM GLYNN
Client Service
Manager
CRAIG
LYTHGOE
Performance
Analyst
Investment Analyst
ANDREW SYKES
16
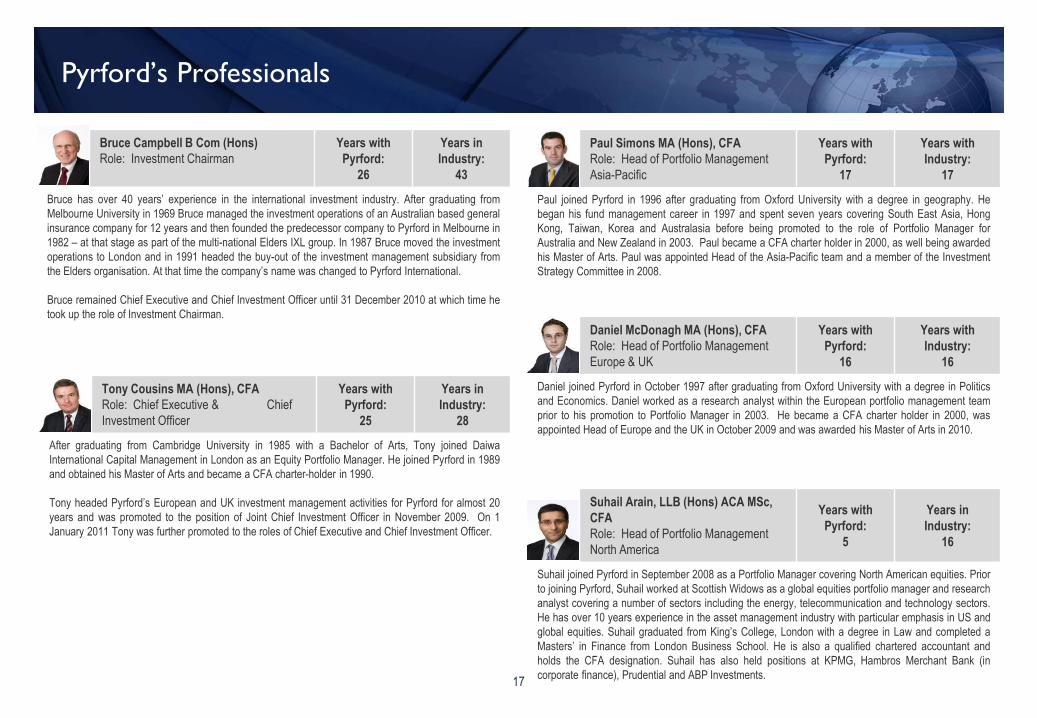
Tony Cousins MA (Hons), CFA
Role: Chief Executive & Chief
Investment Officer
Years with
Pyrford:
25
Years in
Industry:
28
After graduating from Cambridge University in 1985 with a Bachelor of Arts, Tony joined Daiwa
International Capital Management in London as an Equity Portfolio Manager. He joined Pyrford in 1989
and obtained his Master of Arts and became a CFA charter-holder in 1990.
Tony headed Pyrford’s European and UK investment management activities for Pyrford for almost 20
years and was promoted to the position of Joint Chief Investment Officer in November 2009. On 1
January 2011 Tony was further promoted to the roles of Chief Executive and Chief Investment Officer.
Suhail Arain, LLB (Hons) ACA MSc,
CFA
Role: Head of Portfolio Management
North America
Years with
Pyrford:
5
Years in
Industry:
16
Suhail joined Pyrford in September 2008 as a Portfolio Manager covering North American equities. Prior
to joining Pyrford, Suhail worked at Scottish Widows as a global equities portfolio manager and research
analyst covering a number of sectors including the energy, telecommunication and technology sectors.
He has over 10 years experience in the asset management industry with particular emphasis in US and
global equities. Suhail graduated from King’s College, London with a degree in Law and completed a
Masters’ in Finance from London Business School. He is also a qualified chartered accountant and
holds the CFA designation. Suhail has also held positions at KPMG, Hambros Merchant Bank (in
corporate finance), Prudential and ABP Investments.
Paul Simons MA (Hons), CFA
Role: Head of Portfolio Management
Asia-Pacific
Years with
Pyrford:
17
Years with
Industry:
17
Paul joined Pyrford in 1996 after graduating from Oxford University with a degree in geography. He
began his fund management career in 1997 and spent seven years covering South East Asia, Hong
Kong, Taiwan, Korea and Australasia before being promoted to the role of Portfolio Manager for
Australia and New Zealand in 2003. Paul became a CFA charter holder in 2000, as well being awarded
his Master of Arts. Paul was appointed Head of the Asia-Pacific team and a member of the Investment
Strategy Committee in 2008.
Bruce Campbell B Com (Hons)
Role: Investment Chairman
Years with
Pyrford:
26
Years in
Industry:
43
Bruce has over 40 years’ experience in the international investment industry. After graduating from
Melbourne University in 1969 Bruce managed the investment operations of an Australian based general
insurance company for 12 years and then founded the predecessor company to Pyrford in Melbourne in
1982 – at that stage as part of the multi-national Elders IXL group. In 1987 Bruce moved the investment
operations to London and in 1991 headed the buy-out of the investment management subsidiary from
the Elders organisation. At that time the company’s name was changed to Pyrford International.
Bruce remained Chief Executive and Chief Investment Officer until 31 December 2010 at which time he
took up the role of Investment Chairman.
Pyrford’s Professionals
Daniel McDonagh MA (Hons), CFA
Role: Head of Portfolio Management
Europe & UK
Years with
Pyrford:
16
Years with
Industry:
16
Daniel joined Pyrford in October 1997 after graduating from Oxford University with a degree in Politics
and Economics. Daniel worked as a research analyst within the European portfolio management team
prior to his promotion to Portfolio Manager in 2003. He became a CFA charter holder in 2000, was
appointed Head of Europe and the UK in October 2009 and was awarded his Master of Arts in 2010.
17

Lars Nielsen, BSc MSc
Role: Product Specialist
Years with
Pyrford:
5
Years in
Industry:
24
Lars joined Pyrford in November 2008. He has over 20 years experience in the asset management industry. Prior to
joining Pyrford, Lars worked in similar roles at Dalton Strategic Partnership, TT International and Alliance Capital.
Lars started his career in various roles at Barra, one of the world’s leading investment analytics companies. He spent
9 years there and his last position was as a Director for the US equity money manager business. Before going to the
US he held positions in the European part of the business. Lars graduated from Aarhus Business School in his native
Denmark with a MSc and BSc in Business Administration with a concentration in Finance. Also studied at Aarhus
University mathematics department and San Francisco State University MBA program.
Stefan Bain, MSc
Role Portfolio Manager
Team: Asia-Pacific
Years with
Pyrford:
1
Years in
Industry:
12
Stefan joined Pyrford in June 2012 as a Portfolio Manager covering Japanese and South Korean companies within
the Asian portfolio management team. Prior to joining Pyrford Stefan worked for F&C Fund Management in London
for five years as a Director of Japanese Equities, and at Royal London for six years as a Japanese fund manager.
Stefan has a degree in Investment Analysis from the University of Stirling and is an Associate of the Institute of
Investment Management and Research.
Jun Yu BA MBA, CFA
Role: Portfolio Manager
Team: Asia-Pacific
Years with
Pyrford:
5
Years in
Industry:
13
Jun joined Pyrford in October 2008 and is a Portfolio Manager in the Asia portfolio management team with a focus on
stock selection in Hong Kong and Taiwan. She has worked in a number of investment businesses in both China and
London and most recently was an equity sales person for Daiwa SMBC Europe. She has a degree in Literature from
Shanghai International Studies University and an MBA from INSEAD in Paris. She is a native Mandarin speaker.
Nabil Irfan BSc (Hons), CFA
Role: Portfolio Manager
Team: Europe & UK
Years with
Pyrford:
8
Years in
Industry:
13
Nabil joined Pyrford in September 2005 to work as a research analyst within the European portfolio management
team. In November 2009 he was promoted to the position of Portfolio Manager. Prior to joining Pyrford Nabil worked
for 5 years at JPMorgan Asset Management in Equity Research as a Utilities Analyst, and prior to that as a research
assistant in their technology, media and telecoms (TMT) team. Nabil graduated from University College London with
an Economics degree in September 2000 and became a CFA charter holder in 2004.
Pyrford’s Professionals
Peter Moran, MA (Hons), CFA
Role: Portfolio Manager
Team: Europe & UK
Years with
Pyrford:
10
Years in
Industry:
10
Peter joined Pyrford in October 2003 having previously worked for Culross Global Management and Merrill Lynch. In
2001 he graduated from Oxford University with a degree in History. Peter worked as a research analyst within the
European portfolio management team until November 2009 at which time he was promoted to the position of
Portfolio Manager. He became a CFA charter holder in 2007.
Andrew Sykes BA (Hons), CFA
Role: Investment Analyst
Team: North America
Years with
Pyrford:
<1
Years in
Industry:
6
Andrew joined Pyrford in July 2013 as an Investment Analyst covering North America. He has 6 years’ industry
experience, including 3 years in portfolio management roles covering Global markets at Schroders and most recently
Senhouse Capital. He graduated from Oxford University in 2005 with a BA (Hons) degree in Politics, Philosophy &
Economics. Andrew is a CFA Charterholder.
18
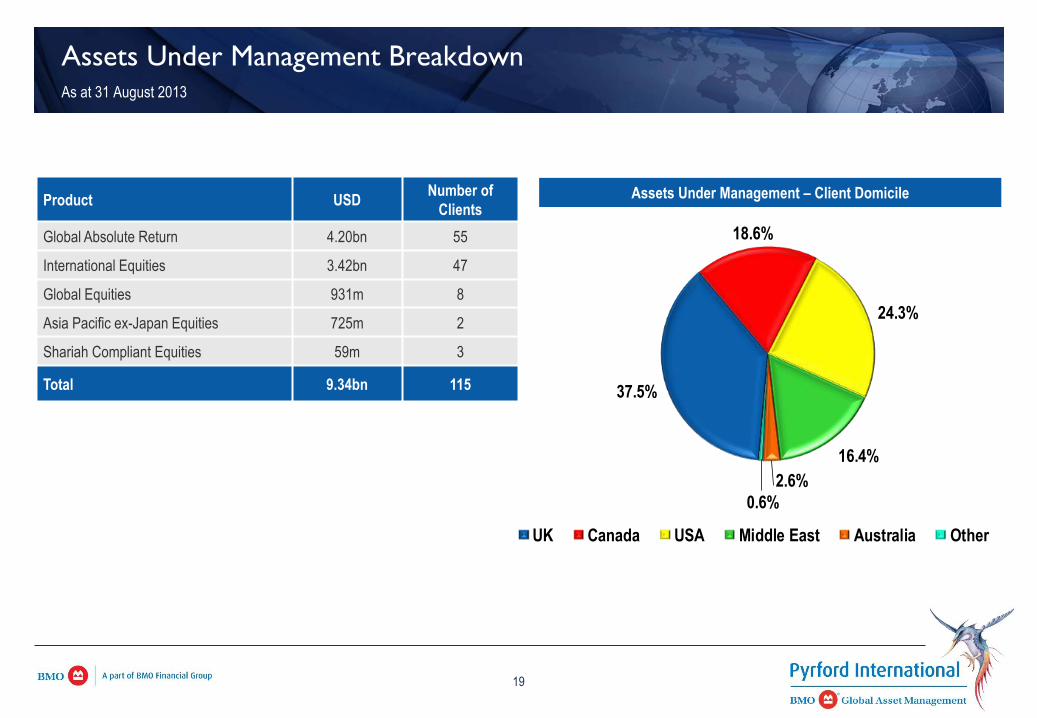
37.5%
18.6%
24.3%
16.4%
2.6%
0.6%
UK Canada USA Middle East Australia Other
Assets Under Management Breakdown As at 31 August 2013
Assets Under Management – Client Domicile Product USD Number of
Clients
Global Absolute Return 4.20bn 55
International Equities 3.42bn 47
Global Equities 931m 8
Asia Pacific ex-Japan Equities 725m 2
Shariah Compliant Equities 59m 3
Total 9.34bn 115
19
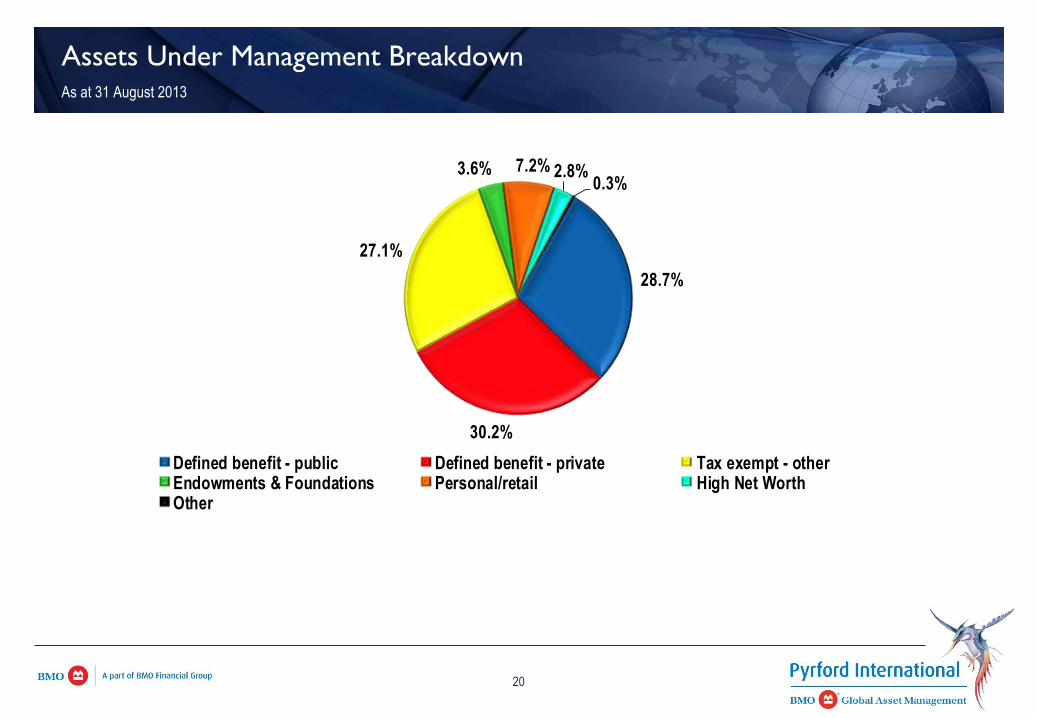
Assets Under Management Breakdown As at 31 August 2013
28.7%
30.2%
27.1%
3.6% 7.2% 2.8%0.3%
Defined benefit - public Defined benefit - private Tax exempt - otherEndowments & Foundations Personal/retail High Net WorthOther
20
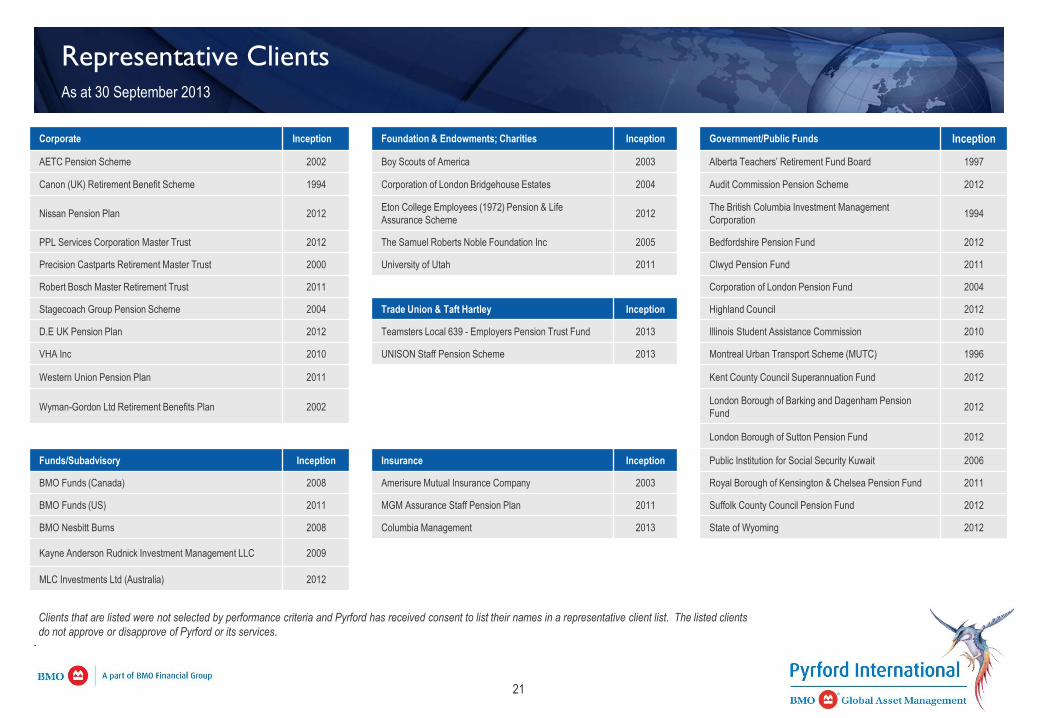
Representative Clients As at 30 September 2013
Corporate Inception Foundation & Endowments; Charities Inception Government/Public Funds Inception
AETC Pension Scheme 2002 Boy Scouts of America 2003 Alberta Teachers’ Retirement Fund Board 1997
Canon (UK) Retirement Benefit Scheme 1994 Corporation of London Bridgehouse Estates 2004 Audit Commission Pension Scheme 2012
Nissan Pension Plan 2012 Eton College Employees (1972) Pension & Life
Assurance Scheme 2012
The British Columbia Investment Management
Corporation 1994
PPL Services Corporation Master Trust 2012 The Samuel Roberts Noble Foundation Inc 2005 Bedfordshire Pension Fund 2012
Precision Castparts Retirement Master Trust 2000 University of Utah 2011 Clwyd Pension Fund 2011
Robert Bosch Master Retirement Trust 2011 Corporation of London Pension Fund 2004
Stagecoach Group Pension Scheme 2004 Trade Union & Taft Hartley Inception Highland Council 2012
D.E UK Pension Plan 2012 Teamsters Local 639 - Employers Pension Trust Fund 2013 Illinois Student Assistance Commission 2010
VHA Inc 2010 UNISON Staff Pension Scheme 2013 Montreal Urban Transport Scheme (MUTC) 1996
Western Union Pension Plan 2011 Kent County Council Superannuation Fund 2012
Wyman-Gordon Ltd Retirement Benefits Plan 2002 London Borough of Barking and Dagenham Pension
Fund 2012
London Borough of Sutton Pension Fund 2012
Funds/Subadvisory Inception Insurance Inception Public Institution for Social Security Kuwait 2006
BMO Funds (Canada) 2008 Amerisure Mutual Insurance Company 2003 Royal Borough of Kensington & Chelsea Pension Fund 2011
BMO Funds (US) 2011 MGM Assurance Staff Pension Plan 2011 Suffolk County Council Pension Fund 2012
BMO Nesbitt Burns 2008 Columbia Management 2013 State of Wyoming 2012
Kayne Anderson Rudnick Investment Management LLC 2009
MLC Investments Ltd (Australia) 2012
Clients that are listed were not selected by performance criteria and Pyrford has received consent to list their names in a representative client list. The listed clients
do not approve or disapprove of Pyrford or its services.
21
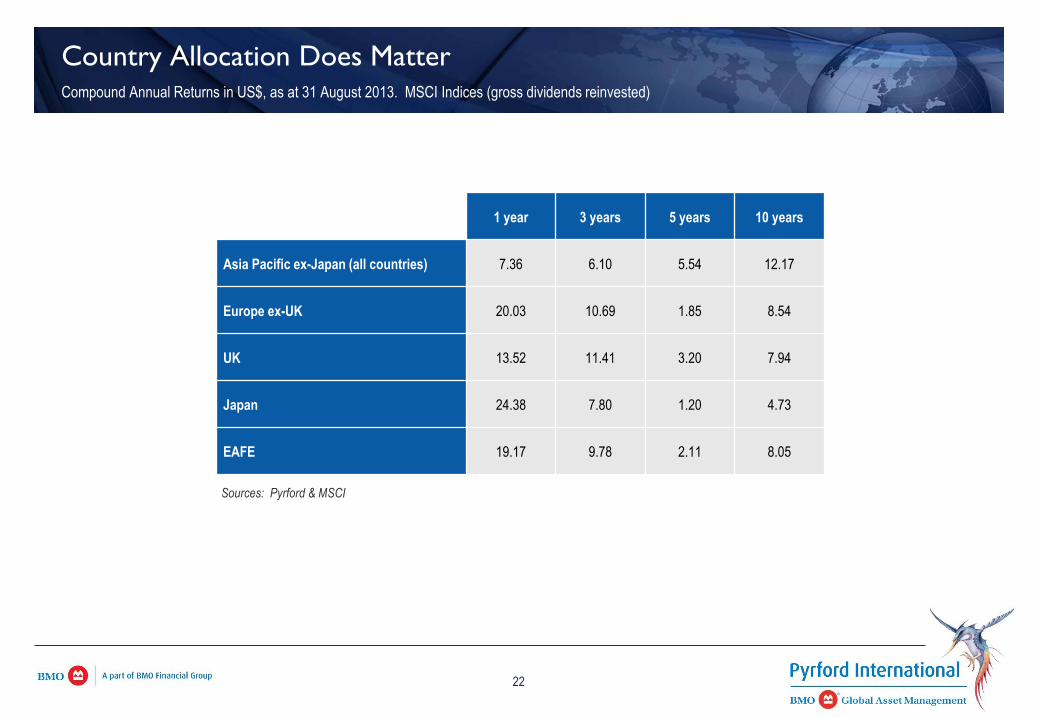
Country Allocation Does Matter Compound Annual Returns in US$, as at 31 August 2013. MSCI Indices (gross dividends reinvested)
1 year 3 years 5 years 10 years
Asia Pacific ex-Japan (all countries) 7.36 6.10 5.54 12.17
Europe ex-UK 20.03 10.69 1.85 8.54
UK 13.52 11.41 3.20 7.94
Japan 24.38 7.80 1.20 4.73
EAFE 19.17 9.78 2.11 8.05
Sources: Pyrford & MSCI
22
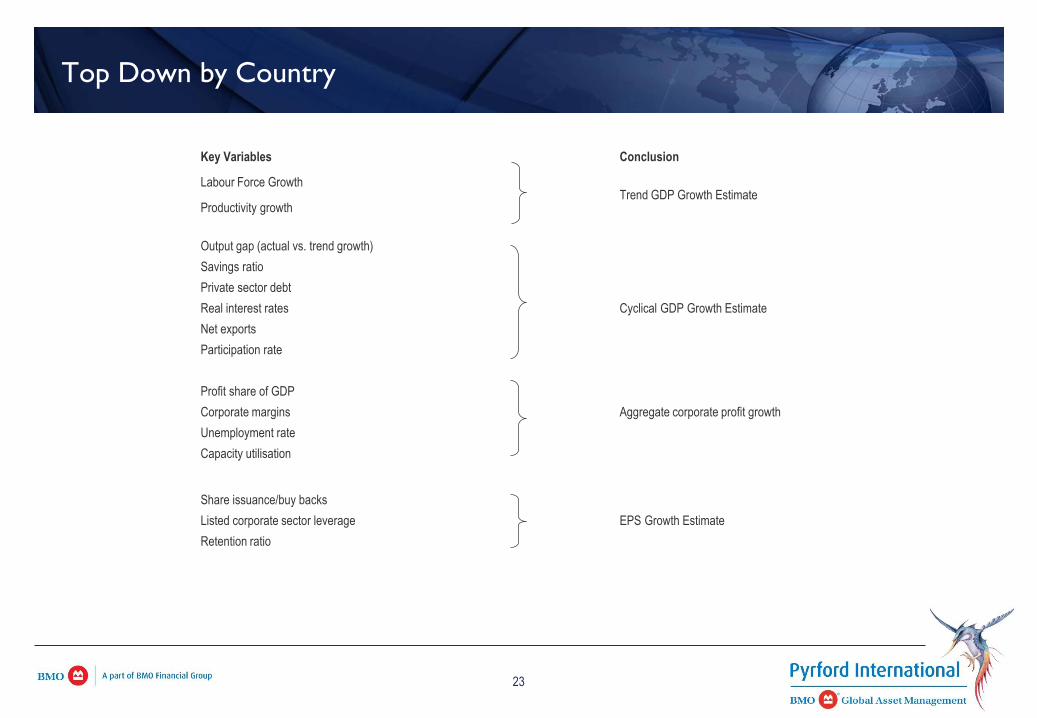
Top Down by Country
Key Variables Conclusion Labour Force Growth Trend GDP Growth Estimate Productivity growth Output gap (actual vs. trend growth)
Savings ratio
Private sector debt
Real interest rates Cyclical GDP Growth Estimate
Net exports
Participation rate
Profit share of GDP
Corporate margins Aggregate corporate profit growth
Unemployment rate
Capacity utilisation
Share issuance/buy backs
Listed corporate sector leverage EPS Growth Estimate
Retention ratio
23
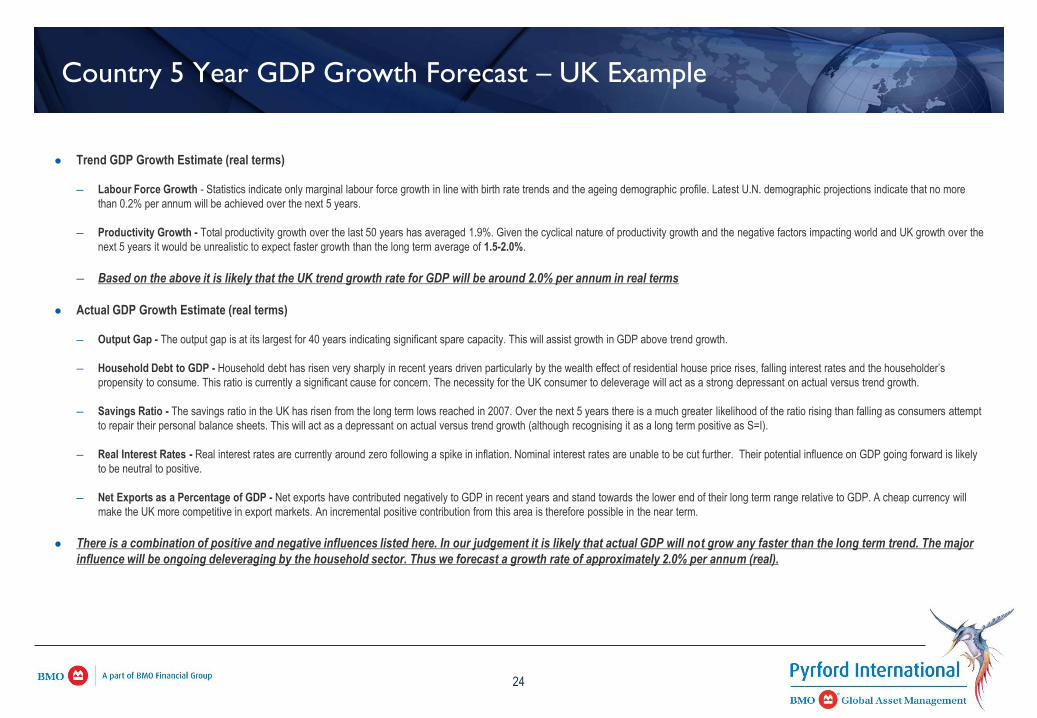
Country 5 Year GDP Growth Forecast – UK Example
Trend GDP Growth Estimate (real terms)
─ Labour Force Growth - Statistics indicate only marginal labour force growth in line with birth rate trends and the ageing demographic profile. Latest U.N. demographic projections indicate that no more
than 0.2% per annum will be achieved over the next 5 years.
─ Productivity Growth - Total productivity growth over the last 50 years has averaged 1.9%. Given the cyclical nature of productivity growth and the negative factors impacting world and UK growth over the
next 5 years it would be unrealistic to expect faster growth than the long term average of 1.5-2.0%.
─ Based on the above it is likely that the UK trend growth rate for GDP will be around 2.0% per annum in real terms
Actual GDP Growth Estimate (real terms)
─ Output Gap - The output gap is at its largest for 40 years indicating significant spare capacity. This will assist growth in GDP above trend growth.
─ Household Debt to GDP - Household debt has risen very sharply in recent years driven particularly by the wealth effect of residential house price rises, falling interest rates and the householder’s
propensity to consume. This ratio is currently a significant cause for concern. The necessity for the UK consumer to deleverage will act as a strong depressant on actual versus trend growth.
─ Savings Ratio - The savings ratio in the UK has risen from the long term lows reached in 2007. Over the next 5 years there is a much greater likelihood of the ratio rising than falling as consumers attempt
to repair their personal balance sheets. This will act as a depressant on actual versus trend growth (although recognising it as a long term positive as S=I).
─ Real Interest Rates - Real interest rates are currently around zero following a spike in inflation. Nominal interest rates are unable to be cut further. Their potential influence on GDP going forward is likely
to be neutral to positive.
─ Net Exports as a Percentage of GDP - Net exports have contributed negatively to GDP in recent years and stand towards the lower end of their long term range relative to GDP. A cheap currency will
make the UK more competitive in export markets. An incremental positive contribution from this area is therefore possible in the near term.
There is a combination of positive and negative influences listed here. In our judgement it is likely that actual GDP will not grow any faster than the long term trend. The major
influence will be ongoing deleveraging by the household sector. Thus we forecast a growth rate of approximately 2.0% per annum (real).
24
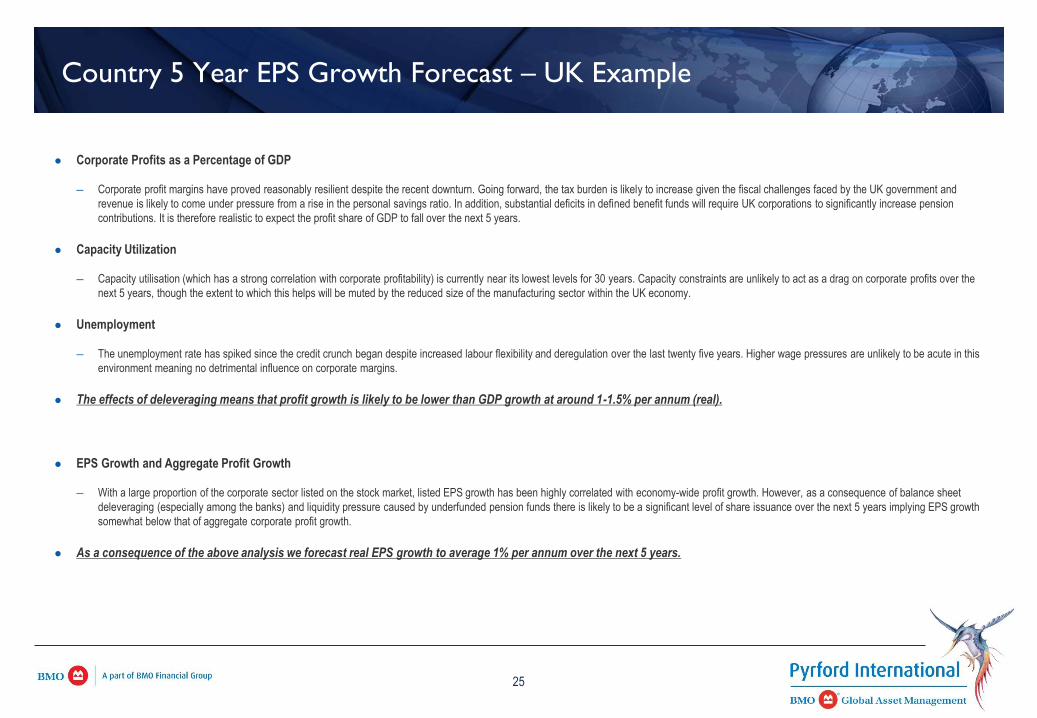
Country 5 Year EPS Growth Forecast – UK Example
Corporate Profits as a Percentage of GDP
─ Corporate profit margins have proved reasonably resilient despite the recent downturn. Going forward, the tax burden is likely to increase given the fiscal challenges faced by the UK government and
revenue is likely to come under pressure from a rise in the personal savings ratio. In addition, substantial deficits in defined benefit funds will require UK corporations to significantly increase pension
contributions. It is therefore realistic to expect the profit share of GDP to fall over the next 5 years.
Capacity Utilization
─ Capacity utilisation (which has a strong correlation with corporate profitability) is currently near its lowest levels for 30 years. Capacity constraints are unlikely to act as a drag on corporate profits over the
next 5 years, though the extent to which this helps will be muted by the reduced size of the manufacturing sector within the UK economy.
Unemployment
─ The unemployment rate has spiked since the credit crunch began despite increased labour flexibility and deregulation over the last twenty five years. Higher wage pressures are unlikely to be acute in this
environment meaning no detrimental influence on corporate margins.
The effects of deleveraging means that profit growth is likely to be lower than GDP growth at around 1-1.5% per annum (real).
EPS Growth and Aggregate Profit Growth
─ With a large proportion of the corporate sector listed on the stock market, listed EPS growth has been highly correlated with economy-wide profit growth. However, as a consequence of balance sheet
deleveraging (especially among the banks) and liquidity pressure caused by underfunded pension funds there is likely to be a significant level of share issuance over the next 5 years implying EPS growth
somewhat below that of aggregate corporate profit growth.
As a consequence of the above analysis we forecast real EPS growth to average 1% per annum over the next 5 years.
25
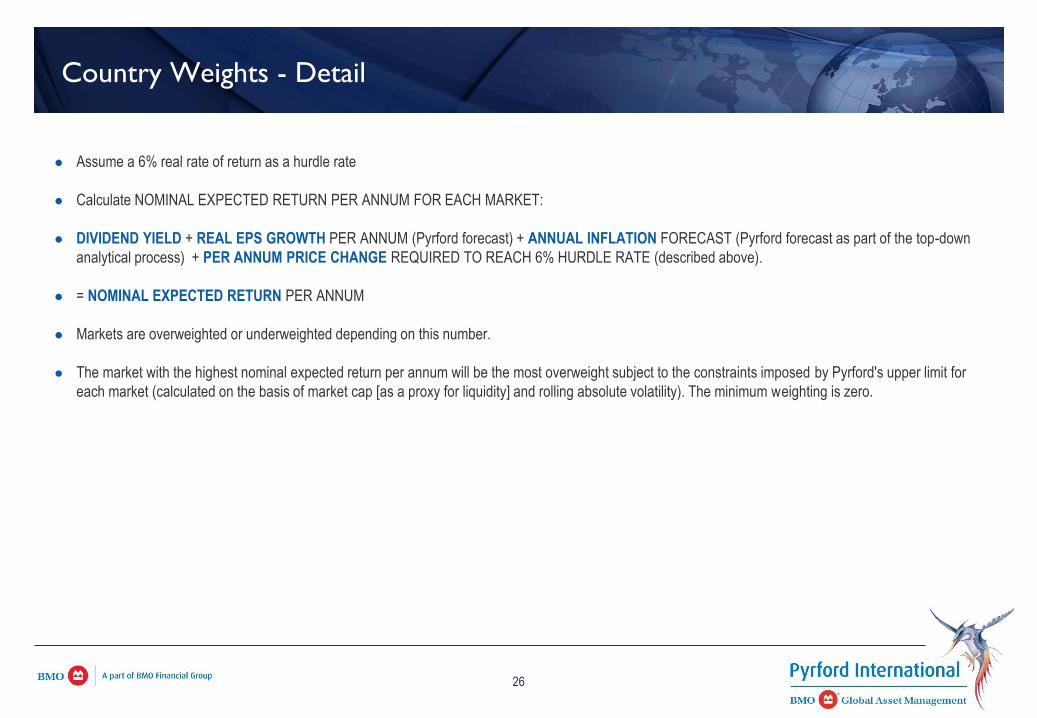
Country Weights - Detail
Assume a 6% real rate of return as a hurdle rate
Calculate NOMINAL EXPECTED RETURN PER ANNUM FOR EACH MARKET:
DIVIDEND YIELD + REAL EPS GROWTH PER ANNUM (Pyrford forecast) + ANNUAL INFLATION FORECAST (Pyrford forecast as part of the top-down
analytical process) + PER ANNUM PRICE CHANGE REQUIRED TO REACH 6% HURDLE RATE (described above).
= NOMINAL EXPECTED RETURN PER ANNUM
Markets are overweighted or underweighted depending on this number.
The market with the highest nominal expected return per annum will be the most overweight subject to the constraints imposed by Pyrford's upper limit for
each market (calculated on the basis of market cap [as a proxy for liquidity] and rolling absolute volatility). The minimum weighting is zero.
26
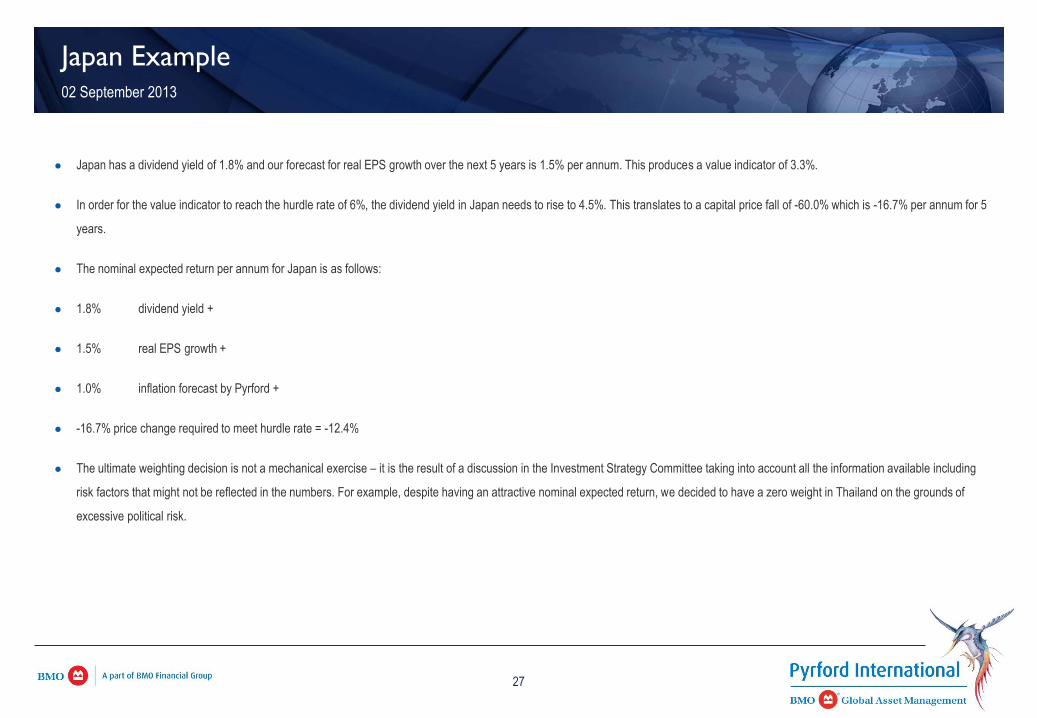
Japan Example 02 September 2013
Japan has a dividend yield of 1.8% and our forecast for real EPS growth over the next 5 years is 1.5% per annum. This produces a value indicator of 3.3%.
In order for the value indicator to reach the hurdle rate of 6%, the dividend yield in Japan needs to rise to 4.5%. This translates to a capital price fall of -60.0% which is -16.7% per annum for 5
years.
The nominal expected return per annum for Japan is as follows:
1.8% dividend yield +
1.5% real EPS growth +
1.0% inflation forecast by Pyrford +
-16.7% price change required to meet hurdle rate = -12.4%
The ultimate weighting decision is not a mechanical exercise – it is the result of a discussion in the Investment Strategy Committee taking into account all the information available including
risk factors that might not be reflected in the numbers. For example, despite having an attractive nominal expected return, we decided to have a zero weight in Thailand on the grounds of
excessive political risk.
27
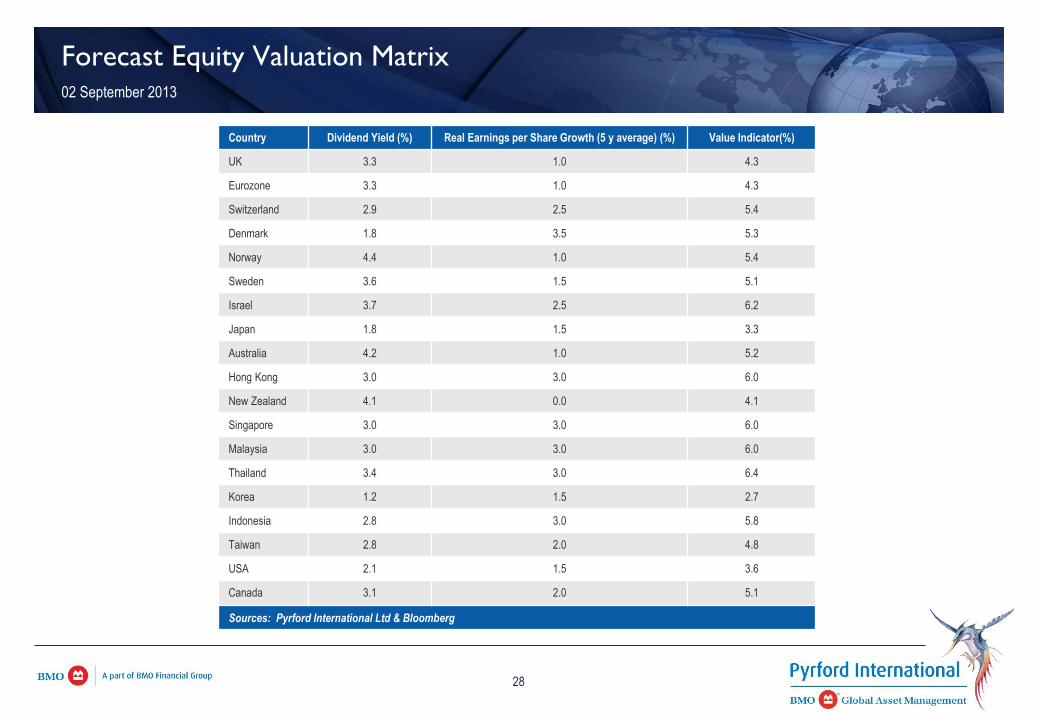
Forecast Equity Valuation Matrix 02 September 2013
Country Dividend Yield (%) Real Earnings per Share Growth (5 y average) (%) Value Indicator(%)
UK 3.3 1.0 4.3
Eurozone 3.3 1.0 4.3
Switzerland 2.9 2.5 5.4
Denmark 1.8 3.5 5.3
Norway 4.4 1.0 5.4
Sweden 3.6 1.5 5.1
Israel 3.7 2.5 6.2
Japan 1.8 1.5 3.3
Australia 4.2 1.0 5.2
Hong Kong 3.0 3.0 6.0
New Zealand 4.1 0.0 4.1
Singapore 3.0 3.0 6.0
Malaysia 3.0 3.0 6.0
Thailand 3.4 3.0 6.4
Korea 1.2 1.5 2.7
Indonesia 2.8 3.0 5.8
Taiwan 2.8 2.0 4.8
USA 2.1 1.5 3.6
Canada 3.1 2.0 5.1
Sources: Pyrford International Ltd & Bloomberg
28
International Equity - Country Limits 30 June 2013 (quarterly data)
Country Maximum allocation %
Australia 23.3
Denmark 6.1
Eurozone 48.1
Hong Kong 15.5
Indonesia 11.0
Israel 11.5
Japan 47.6
Malaysia 16.0
New Zealand 11.1
Norway 6.8
Singapore 14.2
South Korea 11.0
Sweden 10.6
Switzerland 24.1
Taiwan 11.0
Thailand 11.0
United Kingdom 41.5
29
Source: Pyrford
International Equity Composite - Country Allocation 31 August 2013
PYRFORD MODEL MSCI EAFE OVER / UNDERWEIGHT
EUROPE 58.0 65.0 -7.0
Euro Area 26.0 29.0 -3.0
Switzerland 13.0 9.0 4.0
UK 14.5 21.8 -7.3
Scandinavia 4.5 5.2 -0.7
ASIA-PACIFIC 40.5 34.5 6.0
Australasia 10.5 8.4 2.1
Hong Kong 8.0 3.0 5.0
Japan 9.0 21.6 -12.6
Korea 0.0 0.0 0.0
Malaysia 5.0 0.0 5.0
Singapore 5.0 1.5 3.5
Taiwan 3.0 0.0 3.0
Thailand 0.0 0.0 0.0
MIDDLE EAST 1.5 0.5 1.0
Israel 1.5 0.5 1.0
100.0 100.0 0.0
Sources: Pyrford & MSCI
30
Pyrford Screening & Stock Selection Process
BASIC RANKING
• Combination of:
• Dividend Yield
• ROE
• P/E
‘TURN-AROUND’ SITUATIONS
• Combination of:
• OPM/ 5 Year
• Price to Book Ratio
• Stock Price – relative
underperformance
FUNDAMENTAL CRITERIA
Interest Cover >3x
Market Cap:
>$1bn
RANKED COMPANIES OF
INTEREST
IN-DEPTH ANALYSIS
+
Company Meetings
a
5 Year EPS Forecast
a
Total Return Forecast
‘BUY’ DECISION
GLOBAL STOCK SELECTION
COMMITTEE
31
Selecting Stocks for your Portfolio
Focus on sustainable ROE
Appropriate accounting adjustments to raw numbers
Du Pont analysis
Focus on healthy sources of profitability
5 Year Growth in
Earnings per Share
=
Retention Ratio
x
Return on Equity
Return on Equity
=
Sales/Assets
x
Assets/Equity
x
Net Income/Sales
Long Term Value
=
Dividend Yield
+
5 Year Growth in
Earnings per Share
Net Income/Sales
=
Ebit/Sales
x
1 - (interest
expense/Ebit)
x
1 - (Tax
Expense/Pre-tax
Income)
32
Fundamental Company Analysis
Emphasis on company visits and management interviews
In-depth analysis of industry competitive framework and structural corporate competitive advantage
Sustainability of ROE
“Porter Analysis”
Degree of Rivalry and Pricing
Discipline between Competitors
Bargaining Power of Buyers
Bargaining Power of Suppliers
(including Labour)
Threat of Substitution
Barriers to New Entrants
33
0.2
0.4
0.6
0.8
1.0
1.2
1.4
1.6
1.8
2.0
72 75 78 80 83 86 89 92 95 97 00 03 06 09 12
PPP value
Source: Thomson Datastream & Pyrford International
“Aussie”
spot value
Australian Dollar Overvalued
Australian Dollar Undervalued
Sample of US Dollar/Australian Dollar Purchasing Power Parity Analysis As at 31 August 2013 (monthly data)
Note: Shaded area represents 25% above and below the PPP value
34
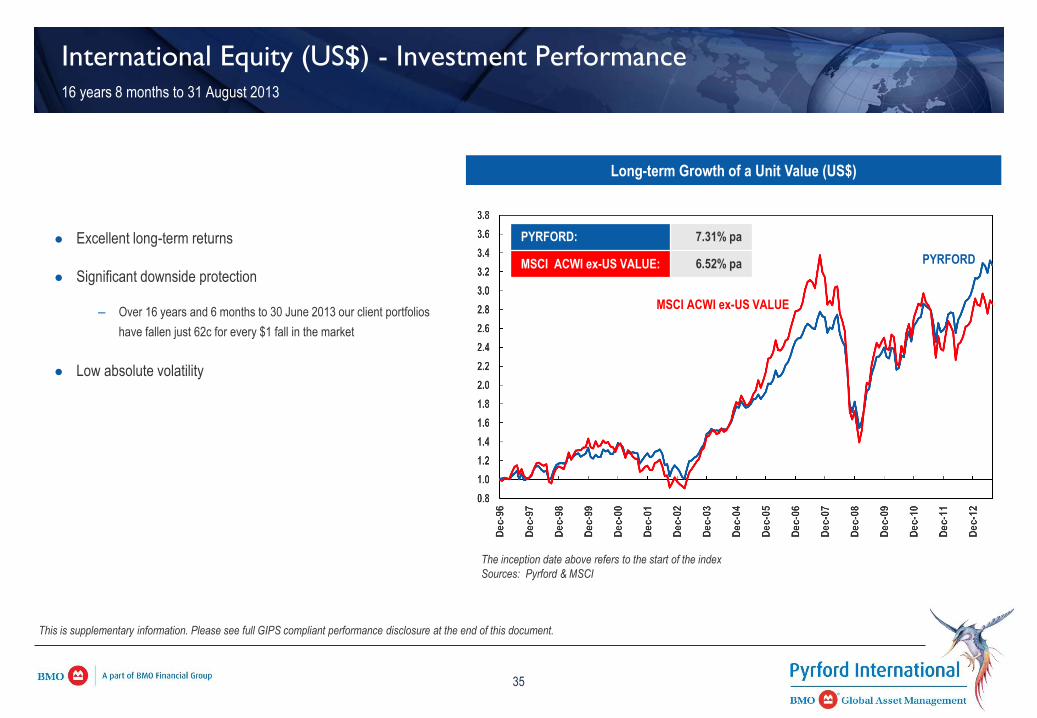
International Equity (US$) - Investment Performance 16 years 8 months to 31 August 2013
Excellent long-term returns
Significant downside protection
– Over 16 years and 6 months to 30 June 2013 our client portfolios
have fallen just 62c for every $1 fall in the market
Low absolute volatility
Long-term Growth of a Unit Value (US$)
PYRFORD
MSCI ACWI ex-US VALUE
PYRFORD: 7.31% pa
MSCI ACWI ex-US VALUE: 6.52% pa
This is supplementary information. Please see full GIPS compliant performance disclosure at the end of this document.
The inception date above refers to the start of the index
Sources: Pyrford & MSCI
35
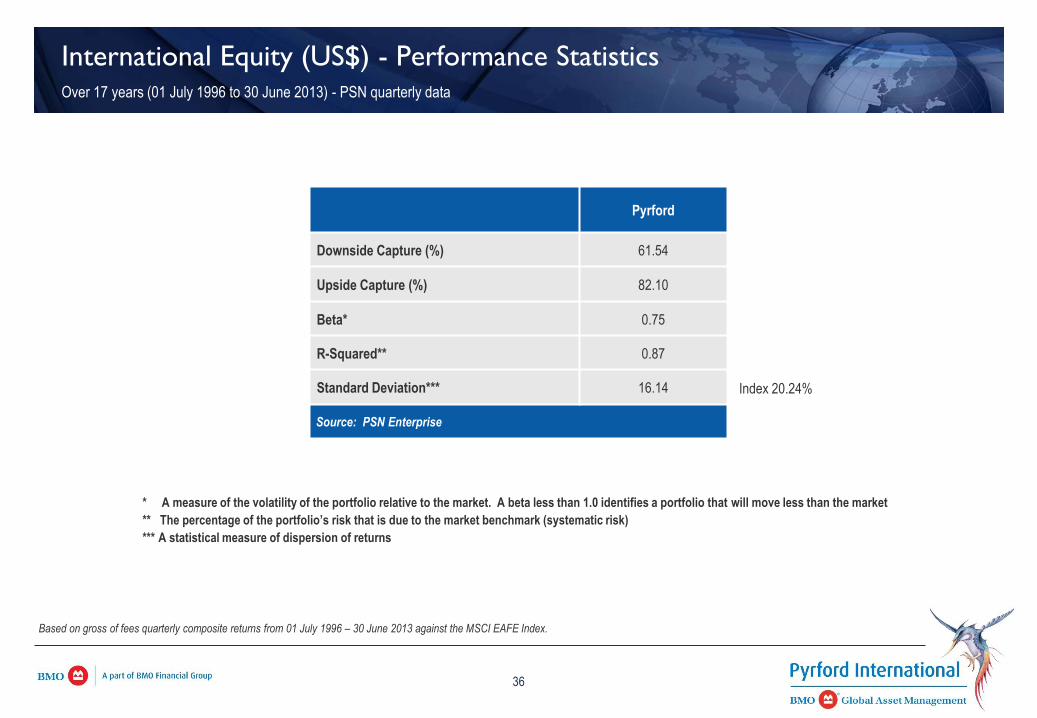
Pyrford
Downside Capture (%) 61.54
Upside Capture (%) 82.10
Beta* 0.75
R-Squared** 0.87
Standard Deviation*** 16.14
Source: PSN Enterprise
International Equity (US$) - Performance Statistics Over 17 years (01 July 1996 to 30 June 2013) - PSN quarterly data
Index 20.24%
* A measure of the volatility of the portfolio relative to the market. A beta less than 1.0 identifies a portfolio that will move less than the market
** The percentage of the portfolio’s risk that is due to the market benchmark (systematic risk)
*** A statistical measure of dispersion of returns
Based on gross of fees quarterly composite returns from 01 July 1996 – 30 June 2013 against the MSCI EAFE Index.
36
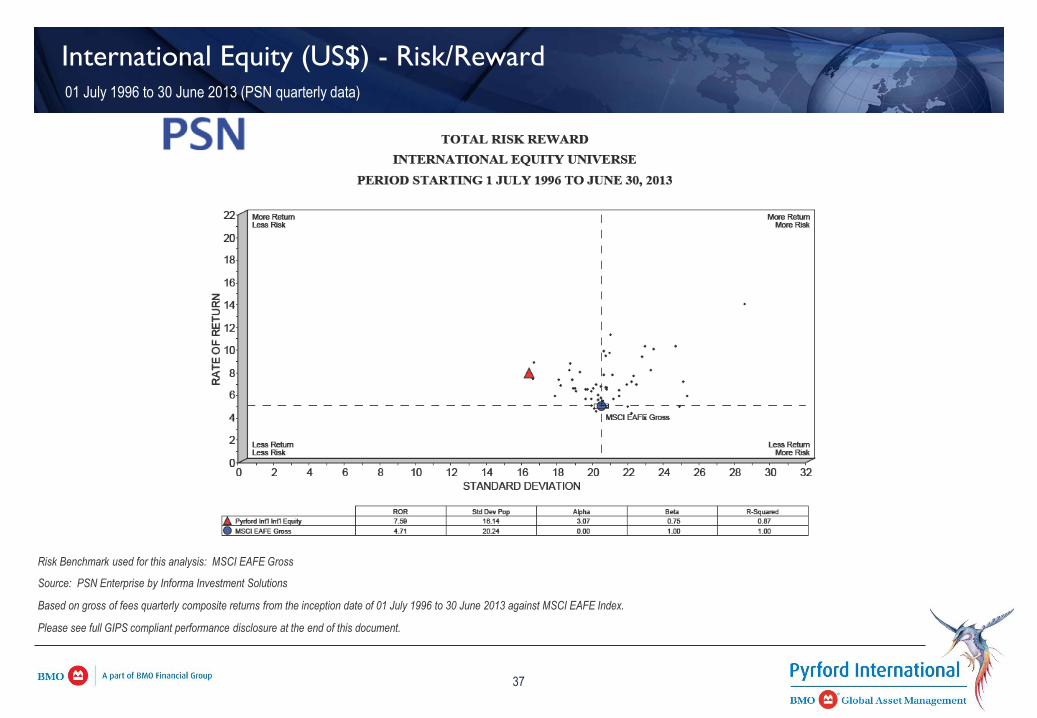
International Equity (US$) - Risk/Reward 01 July 1996 to 30 June 2013 (PSN quarterly data)
Risk Benchmark used for this analysis: MSCI EAFE Gross
Source: PSN Enterprise by Informa Investment Solutions
Based on gross of fees quarterly composite returns from the inception date of 01 July 1996 to 30 June 2013 against MSCI EAFE Index.
Please see full GIPS compliant performance disclosure at the end of this document.
37
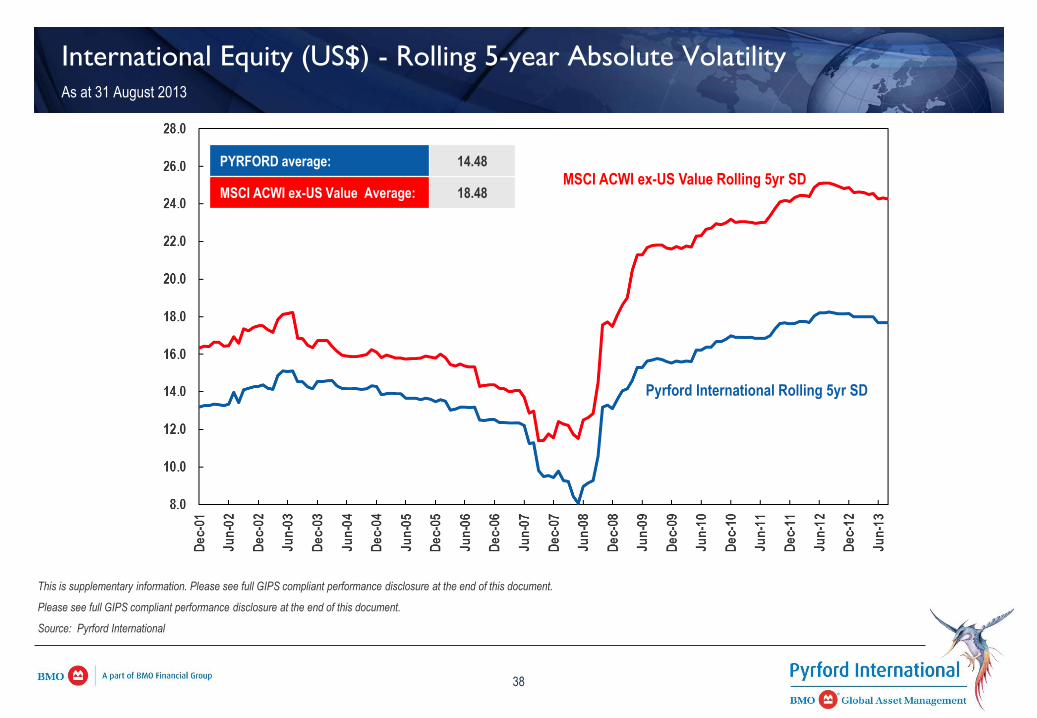
International Equity (US$) - Rolling 5-year Absolute Volatility As at 31 August 2013
Pyrford International Rolling 5yr SD
MSCI ACWI ex-US Value Rolling 5yr SD PYRFORD average: 14.48
MSCI ACWI ex-US Value Average: 18.48
This is supplementary information. Please see full GIPS compliant performance disclosure at the end of this document.
Please see full GIPS compliant performance disclosure at the end of this document.
Source: Pyrford International
38
Attribution Detail by Asset Annualised 5 years to 31 August 2013 (US$)
Policy benchmark MSCI EAFE
39
Current Views
The eurozone is dysfunctional. Break-up, in some form, is desirable and probably inevitable.
Central Bank ‘printing’ has propped markets.
It will end.
Despite the ‘prop’ provided by Central Banks, growth has been poor since the end of the recession.
Deleveraging will continue in most developed markets.
Global consumption growth is weak.
Banks need more capital.
Demographics provides a long-term headwind.
Productivity growth is weak.
Chinese growth is 2-3% (per annum) below the average of the last 10 years. Rebalancing towards consumption is required.
The Chinese currency is overvalued.
Bond yields, which have begun to ‘normalise’, remain too low.
Investment returns over the next 50 years will not match those of the last 50.
Emerging Asia provides the most attractive long-term opportunities, but volatility will provide investment challenges.
Client Service Team
41
Dave Majewski
Head of Client Service
T: 312 461 5656
Dave’s responsibilities include managing the client service effort in the U.S., supporting and managing client relationships, and managing the BMO Global Asset
Management U.S. sales and service support team.
Dave began his financial services experience in 1984 and joined BMO Asset Management U.S. in mid-2011. Prior to joining BMO Asset Management U.S., he
managed Russell Investments’ Midwest Institutional client service team, providing support to corporate and public pensions, endowments and foundations
representing over $15 billion in assets. Prior to Russell, Dave managed global pension investments and served in various domestic and international treasury roles
with Hewlett Packard/Compaq. He started his career serving in several accounting and treasury roles with Electronic Data Systems.
He holds an MBA in International Business from Kingston University in London and a BS in Finance from the University of Wisconsin – Eau Claire.
Kevin Gergits
Relationship Management
T: 312 461 6250
Kevin is a key advisor to the firms’ clients, managing and expanding relationships across all asset classes. He joined BMO Asset Management U.S. in 2007 and began
his investment experience in 1998.
Prior to joining the firm, he was a Director in the Institutional Asset Management division of UBS (formerly Brinson Partners) and served as a key liaison for institutional
clients and related business groups. His responsibilities included relationship management to existing clients and developing new business opportunities.
He holds an MBA in Finance from DePaul University and a BS in Finance from Eastern Illinois University.
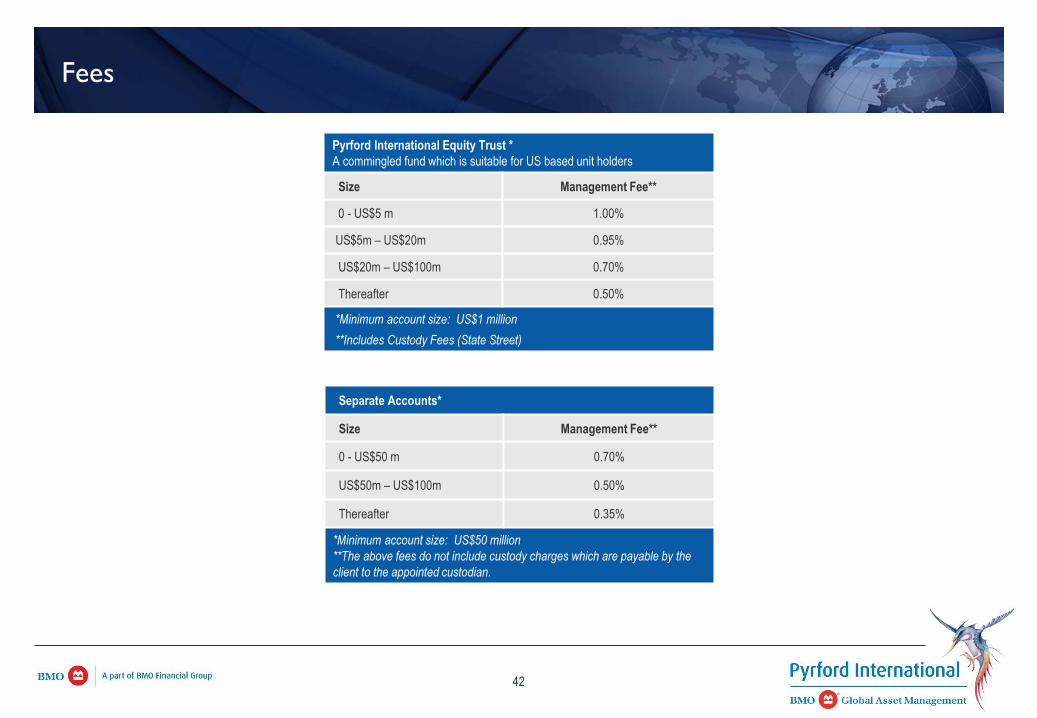
Fees
Separate Accounts*
Size Management Fee**
0 - US$50 m 0.70%
US$50m – US$100m 0.50%
Thereafter 0.35%
*Minimum account size: US$50 million
**The above fees do not include custody charges which are payable by the
client to the appointed custodian.
Pyrford International Equity Trust *
A commingled fund which is suitable for US based unit holders
Size Management Fee**
0 - US$5 m 1.00%
US$5m – US$20m 0.95%
US$20m – US$100m 0.70%
Thereafter 0.50%
•*Minimum account size: US$1 million
•**Includes Custody Fees (State Street)
42
43
Sample Stock Sheet
43
44
Sample Stock Sheet
44
45
Sample Stock Sheet
45
46
Sample Stock Sheet
46
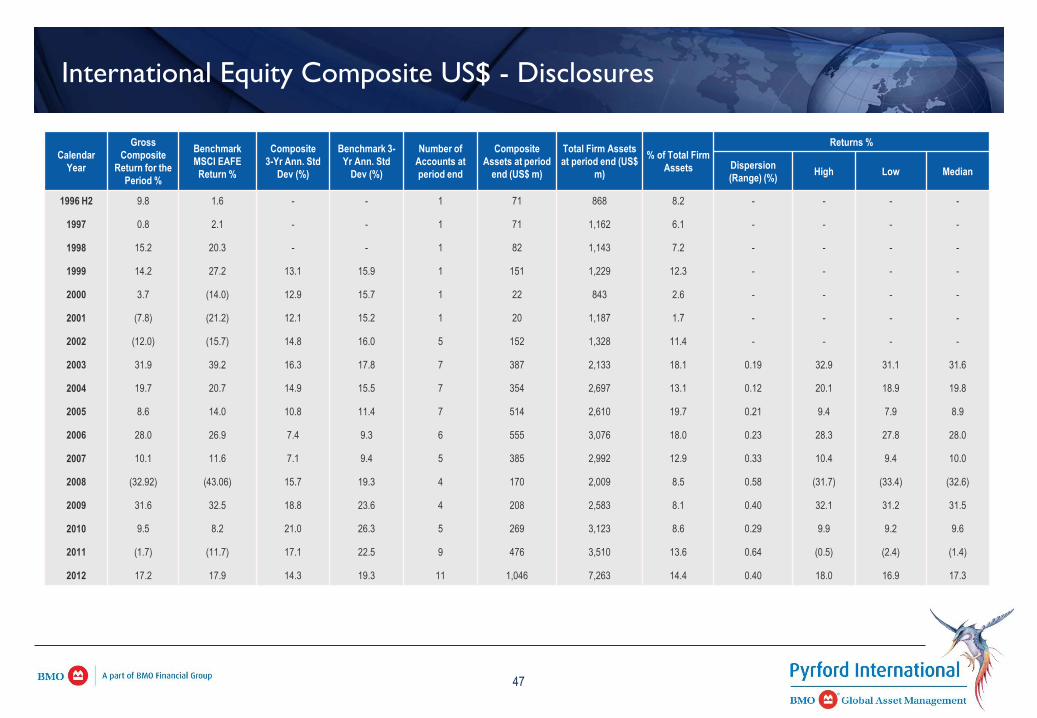
International Equity Composite US$ - Disclosures
Calendar
Year
Gross
Composite
Return for the
Period %
Benchmark
MSCI EAFE
Return %
Composite
3-Yr Ann. Std
Dev (%)
Benchmark 3-
Yr Ann. Std
Dev (%)
Number of
Accounts at
period end
Composite
Assets at period
end (US$ m)
Total Firm Assets
at period end (US$
m)
% of Total Firm
Assets
Returns %
Dispersion
(Range) (%) High Low Median
1996 H2
1997
1998
1999
2000
2001
2002
2003
2004
2005
2006
2007
2008
2009
2010
2011
2012
9.8
0.8
15.2
14.2
3.7
(7.8)
(12.0)
31.9
19.7
8.6
28.0
10.1
(32.92)
31.6
9.5
(1.7)
17.2
1.6
2.1
20.3
27.2
(14.0)
(21.2)
(15.7)
39.2
20.7
14.0
26.9
11.6
(43.06)
32.5
8.2
(11.7)
17.9
-
-
-
13.1
12.9
12.1
14.8
16.3
14.9
10.8
7.4
7.1
15.7
18.8
21.0
17.1
14.3
-
-
-
15.9
15.7
15.2
16.0
17.8
15.5
11.4
9.3
9.4
19.3
23.6
26.3
22.5
19.3
1
1
1
1
1
1
5
7
7
7
6
5
4
4
5
9
11
71
71
82
151
22
20
152
387
354
514
555
385
170
208
269
476
1,046
868
1,162
1,143
1,229
843
1,187
1,328
2,133
2,697
2,610
3,076
2,992
2,009
2,583
3,123
3,510
7,263
8.2
6.1
7.2
12.3
2.6
1.7
11.4
18.1
13.1
19.7
18.0
12.9
8.5
8.1
8.6
13.6
14.4
-
-
-
-
-
-
-
0.19
0.12
0.21
0.23
0.33
0.58
0.40
0.29
0.64
0.40
-
-
-
-
-
-
-
32.9
20.1
9.4
28.3
10.4
(31.7)
32.1
9.9
(0.5)
18.0
-
-
-
-
-
-
-
31.1
18.9
7.9
27.8
9.4
(33.4)
31.2
9.2
(2.4)
16.9
-
-
-
-
-
-
-
31.6
19.8
8.9
28.0
10.0
(32.6)
31.5
9.6
(1.4)
17.3
47
Performance Disclosures (continued…)
Pyrford International Ltd has prepared and presented this report in compliance with the Global Investment Performance Standards (GIPS®).
Notes to the performance presentation
Pyrford International, a wholly owned subsidiary of the Bank of Montreal, is an investment management firm based in the United Kingdom providing international asset management services for its clients. Pyrford is part of BMO’s private client group which provides
wealth management services in North America and the markets in which Pyrford additionally operates: Middle East, UK and Europe. As at 31 August 2013 Pyrford International Ltd had total assets under management and administration and term investments of
US$9,341m. For the purpose of measuring and presenting investment performance, all discretionary fee paying accounts of Pyrford International Ltd are allocated to a composite and a complete list and description of the composites is available on request. Additional
information regarding the firm’s policies and procedures for calculating and reporting performance returns is available upon request.
The Pyrford International Ltd “International Equity (Base Currency US$) composite” comprises all fully discretionary, international equity accounts with a market value greater than US$10m, a base currency of US$ and no hedging restrictions. The benchmark for the
composite is the MSCI EAFE index. The composite was first created on July 1, 1996. On April 1, 2002 the composite construction criteria were redefined to allow the inclusion of pooled funds, taxable funds and funds of between US$10 – 15 million on the basis that
these do not materially impact the returns generated.
All returns are calculated in US$ terms on a time-weighted basis based on monthly valuations using modified Dietz. Composites have been asset weighted, where applicable, using the beginning of month market value adjusted for day weighted net inflows.
Where there are more than four accounts in the composite over a full year, dispersion is measured as the asset weighted standard deviation of asset weighted portfolio returns of all accounts in the composite for the full year.
The three-year annualised standard deviation measures the variability of the composite returns over the preceding 36-month period.
The accounts in this composite are unleveraged and derivatives are used solely for currency hedging purposes.
As at 31 August 2013, 7.0% of the composite assets were invested in Malaysia, Thailand and Taiwan which are not included in the MSCI EAFE Index. Historically the composite has invested between 2.4% and 13.0% in these countries.
Performance results are presented gross of management and custodial fees, but net of transaction costs and before taxes (except for non-reclaimable withholding tax). The standard management fee schedule for segregated management is as follows: 0.70% per
annum on the first US$50 million; 0.50% on the next US$50 million, and thereafter 0.35% per annum.
There have been no significant events within the firm (such as ownership or personnel changes) which have materially impacted the historical investment performance.
Verification statement
Pyrford International Ltd has been verified for the period from January 1, 1994 to September 30, 2012 by Grant Thornton UK LLP. Copies of the verification report are available on request.
All requests for further information should be sent to Nicholas Miller, 79 Grosvenor Street, London, W1K 3JU ([email protected])
Disclaimer
This document is issued in the United Kingdom by Pyrford International Ltd which is authorised and regulated by The Financial Services Authority. It is for distribution in or from the United Kingdom and is directed only at those persons who have been categorised as
‘Eligible Counterparties’ or ‘Professional Clients’ in accordance with FSA COBS 4. Whilst the information contained in this document is believed to be reliable, no guarantee is given that it is accurate or complete. Pyrford International Ltd and its directors and
employees disclaims all liability of any kind whatever in respect of any error or omission or misstatement, whether or not negligent, contained in this document and any person receiving this document should rely and act on it only on that basis and entirely at his/her
own risk.
48
10/17/2013
1
CONCORD
OFFICE MARKET
SNAPSHOT
1
www.transwestern.net/walnutcreek
MATT HURD
Vice President, Walnut Creek
SCOTT ELLIS
Senior Vice President,
Walnut Creek
2
www.transwestern.net/walnutcreek
Pleasant Hill
BART
InventoryQtr Net
Absorption
YTD Net
AbsorptionDirect Vacancy
Sublease
Vacancy
3Q13 Total
Vacancy
3Q12 Total
Vacancy
Weighted
Asking Rate
3,351,738 5,609 59,887 13.3% 0.0% 13.3% 16.5% $1.75-$2.25 FS
MARKET OVERVIEWCLASS A CONCORD MARKET
3Q 2013 Statistics
CONCORD OFFICE MARKET SNAPSHOT
WILLOWS OFFICE PARK
10/17/2013
2
3
www.transwestern.net/walnutcreek
Pleasant Hill
BART
InventoryQtr Net
Absorption
YTD Net
AbsorptionDirect Vacancy
Sublease
Vacancy
3Q13 Total
Vacancy
3Q12 Total
Vacancy
Weighted
Asking Rate
655,461 15,338 43,730 25.4% 0.0% 25.4% 35.5% $1.25-$1.60 FS
MARKET OVERVIEWCLASS B CONCORD MARKET
3Q 2013 Statistics
CONCORD OFFICE MARKET SNAPSHOT
WILLOWS OFFICE PARK
4
www.transwestern.net/walnutcreek
Pleasant Hill
BART
InventoryQtr Net
Absorption
YTD Net
AbsorptionDirect Vacancy
Sublease
Vacancy
3Q13 Total
Vacancy
3Q12 Total
Vacancy
Weighted
Asking Rate
4,007,199 20,947 103,617 15.3% 0.0% 15.3% 19.6% $1.25-$2.25 FS
MARKET OVERVIEWOVERALL CONCORD MARKET
3Q 2013 Statistics
CONCORD OFFICE MARKET SNAPSHOT
WILLOWS OFFICE PARK

10/17/2013
3
THE WILLOWS
OFFICE PARK
5
CLASS B BUILDING
BUILT IN 1979
84,715 SQUARE FEET
OWNED SINCE 1989
93.6% LEASED
HIGHLIGHTS
CONCORD OFFICE MARKET SNAPSHOT
WILLOWS OFFICE PARK
CITY NAME OVERVIEW 6

10/17/2013
4
CITY NAME OVERVIEW 7
8CONCORD OFFICE MARKET SNAPSHOT
WILLOWS OFFICE PARK

10/17/2013
5
9CONCORD OFFICE MARKET SNAPSHOT
WILLOWS OFFICE PARK
CONCORD OFFICE MARKET SNAPSHOT
WILLOWS OFFICE PARK
10
10/17/2013
6
11CONCORD OFFICE MARKET SNAPSHOT
WILLOWS OFFICE PARK
CONCORD VACANCY &
ASKING RENTS
12
Source: Transwestern
$-
$0.50
$1.00
$1.50
$2.00
$2.50
$3.00
0.0%
5.0%
10.0%
15.0%
20.0%
25.0%
19
97
1Q
19
97
3Q
19
98
1Q
19
98
3Q
19
99
1Q
19
99
3Q
20
00
1Q
20
00
3Q
20
01
1Q
20
01
3Q
20
02
1Q
20
02
3Q
20
03
1Q
20
03
3Q
20
04
1Q
20
04
3Q
20
05
1Q
20
05
3Q
20
06
1Q
20
06
3Q
20
07
1Q
20
07
3Q
20
08
1Q
20
08
3Q
20
09
1Q
20
09
3Q
20
10
1Q
20
10
3Q
20
11
1Q
20
11
3Q
20
12
1Q
20
12
3Q
20
13
1Q
20
13
3Q
Direct Average Rate Direct Vacant % Sublet Vacant % Total Vacant %
CONCORD OFFICE MARKET SNAPSHOT
WILLOWS OFFICE PARK
10/17/2013
7
1355 WILLOW WAY VACANCY
& ASKING RENTS
13
Source: Transwestern
0.0%
5.0%
10.0%
15.0%
20.0%
25.0%
30.0%
$1.00
$1.20
$1.40
$1.60
$1.80
$2.00
$2.20
$2.401
99
7 1
Q
19
97
3Q
19
98
1Q
19
98
3Q
19
99
1Q
19
99
3Q
20
00
1Q
20
00
3Q
20
01
1Q
20
01
3Q
20
02
1Q
20
02
3Q
20
03
1Q
20
03
3Q
20
04
1Q
20
04
3Q
20
05
1Q
20
05
3Q
20
06
1Q
20
06
3Q
20
07
1Q
20
07
3Q
20
08
1Q
20
08
3Q
20
09
1Q
20
09
3Q
20
10
1Q
20
10
3Q
20
11
1Q
20
11
3Q
20
12
1Q
20
12
3Q
20
13
1Q
20
13
3Q
Total Asking Rent Total Vacant %
CONCORD OFFICE MARKET SNAPSHOT
WILLOWS OFFICE PARK
VACANCY COMPARISON
14
Source: Transwestern
0.0%
5.0%
10.0%
15.0%
20.0%
25.0%
30.0%
2009
1Q
2009
2Q
2009
3Q
2009
4Q
2010
1Q
2010
2Q
2010
3Q
2010
4Q
2011
1Q
2011
2Q
2011
3Q
2011
4Q
2012
1Q
2012
2Q
2012
3Q
2012
4Q
2013
1Q
2013
2Q
2013
3Q
Concord Class B Vacant % 1355 Willows Vacant %
10/17/2013
8
RENTAL RATE COMPARISON
15
Source: Transwestern
$1.00
$1.20
$1.40
$1.60
$1.80
$2.00
$2.20
2009
1Q
2009
2Q
2009
3Q
2009
4Q
2010
1Q
2010
2Q
2010
3Q
2010
4Q
2011
1Q
2011
2Q
2011
3Q
2011
4Q
2012
1Q
2012
2Q
2012
3Q
2012
4Q
2013
1Q
2013
2Q
2013
3Q
Concord Class B Direct Average Rate 1355 Willow Direct Average Rate
16CONCORD OFFICE MARKET SNAPSHOT
WILLOWS OFFICE PARK
10/17/2013
9
17CONCORD OFFICE MARKET SNAPSHOT
WILLOWS OFFICE PARK
18CONCORD OFFICE MARKET SNAPSHOT
WILLOWS OFFICE PARK

10/17/2013
10
MATT HURD
Vice President, Walnut Creek
SCOTT ELLIS
Senior Vice President, Walnut Creek
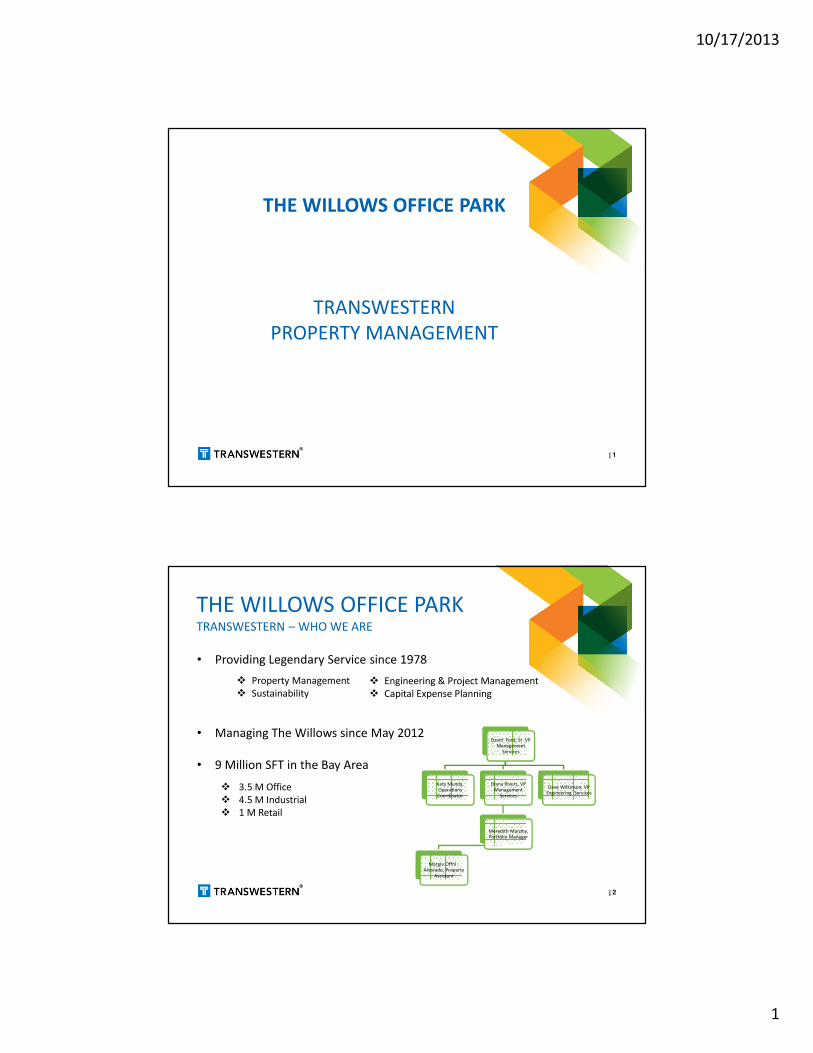
10/17/2013
1
THE WILLOWS OFFICE PARK
TRANSWESTERN
PROPERTY MANAGEMENT
1
THE WILLOWS OFFICE PARKTRANSWESTERN – WHO WE ARE
2
• Providing Legendary Service since 1978
• Managing The Willows since May 2012
• 9 Million SFT in the Bay Area
� 3.5 M Office
� 4.5 M Industrial
� 1 M Retail
� Property Management
� Sustainability
� Engineering & Project Management
� Capital Expense Planning
David Ford, Sr. VP Management
Services
Katy Mundy, Operations Coordinator
Diana Rivers, VP Management
Services
Meredith Murphy, Portfolio Manager
Margie Offril -Alvarado, Property
Assistant
Dave Wilkinson, VP Engineering Services

10/17/2013
2
THE WILLOWS OFFICE PARKPROPERTY OVERVIEW
3
• The Willows Office Park, completed 1984
• CCERA purchased the property in 1988
• Historical Operating Expenses – The Willows Office Park
• Competitive buildings average $10.89 PSF
2011 933,000$ 11.03$
2012 863,000$ 10.20$
2013 851,675$ 10.07$
2014 850,000$ 10.05$
Operating Expense Totals & PSF
THE WILLOWS OFFICE PARKCOMPLETED CAPITAL IMPROVEMENTS
4
• New Common Area Carpet and Furniture – 2012� Total Cost - $114,000
• HVAC Upgrades – 2012 & 2013
� Total Cost:
$114,400 in 2012
$200,000 in 2013

10/17/2013
3
THE WILLOWS OFFICE PARKPROPOSED CAPITAL PROJECTS - 2014
5
• HVAC Replacements – 2014
� Total Cost: $300,000
• Exterior Siding & Window Replacement
� Estimated Cost: $837,000