inclusive growth and informal food vending in nairobi, kenya
TRANSCRIPT
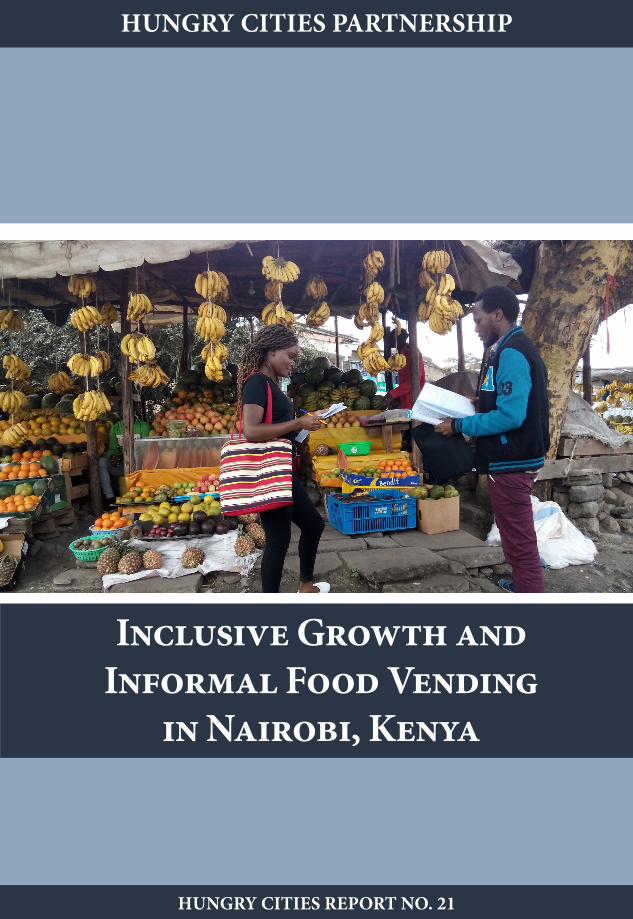
Inclusive Growth and Informal Food Vending
in Nairobi, Kenya
HUNGRY CITIES REPORT NO. 21
HUNGRY CITIES PARTNERSHIP
INCLUSIVE GROWTH AND INFORMAL FOOD VENDING
IN NAIROBI, KENYA
SAMUEL OWUOR
SERIES EDITORS: PROF JONATHAN CRUSH AND DR LIAM RILEY
HUNGRY CITIES PARTNERSHIP
HUNGRY CITIES REPORT NO. 21

ACKNOWLEDGEMENTS
The research and publication of this report was funded by the Social Sci-ences and Humanities Research Council (SSHRC) and the International Development Research Centre (IDRC) under the International Partner-ships for Sustainable Societies (IPaSS) Program.
© The author
© Photos, including cover photo: Samuel Owuor
Published by the Hungry Cities Partnership Cape Town, South Africa, and Waterloo, Canada hungrycities.net
First published 2020
ISBN 978-1-920597-48-1
Production by Bronwen Dachs Muller, Cape Town
All rights reserved

AUTHOR
Samuel Owuor is Associate Professor in the Department of Geography and Environmental Studies, University of Nairobi, Kenya.
Previous Publications in the Hungry Cities Report Series
No 1 The Urban Food System of Nanjing, China No 2 The Urban Food System of Maputo, Mozambique No 3 The Urban Food System of Cape Town, South Africa No 4 The Urban Food System of Kingston, Jamaica No 5 The Urban Food System of Bangalore, India No 6 The Urban Food System of Nairobi, Kenya No 7 The Urban Food System of Mexico City, Mexico No 8 The Urban Food System of Windhoek, Namibia No 9 The State of Household Food Security in Nanjing, China No 10 The State of Household Food Security in Maputo, Mozambique No 11 The State of Household Food Security in Nairobi, Kenya No 12 The State of Household Food Security in Cape Town, South Africa No 13 The State of Household Food Security in Mexico City, Mexico No 14 The State of Household Food Security in Bangalore, India No 15 The State of Household Food Security in Kingston, Jamaica No 16 Inclusive Growth and the Informal Food Sector in Cape Town, South Africa No 17 Inclusive Growth and Small-Scale Food Vending in Nanjing, China No 18 Inclusive Growth and Informal Vending in Maputo’s Food Markets No 19 Inclusive Growth and the Informal Food Sector in Kingston, Jamaica No 20 Inclusive Growth and the Informal Food Sector in Bangalore, India

CONTENTS PAGE
Preface 1
1. Introduction 2
2. Survey Methodology 3
3. Vendor Demographic Profile 6 3.1 Gender and Age of Vendors 6 3.2 Educational Level of Vendors 7 3.3 Migrant Status of Vendors 7 3.4 Other Occupations 8
4. Starting an Informal Food Business 9 4.1 Reasons for Entry into Informal Sector 9 4.2 Year of Starting Business 11 4.3 Tenure Status of Business Premises 11 4.4 Sources of Business Start-Up Capital 12 4.5 Business Licensing 13
5. Running an Informal Food Enterprise 14 5.1 Types of Foods Sold 14 5.2 Sources of Stock 18 5.3 Business Expenses 19 5.4 Net Monthly Profit 20 5.5 Current Value of Enterprise 21 5.6 Family Dependence on Informal Vendor Revenue 22 5.7 Access to Business Infrastructure and Services 24 5.8 Employment Creation 25
6. Food Vendor Strategies 25 6.1 Locational Strategies 25 6.2 Pricing Strategies 27 6.3 Other Business Strategies 27 6.4 Financial Inclusion 29
7. Operating Challenges 31 7.1 Competition 32 7.2 Operational Challenges 32
7.3 Threats to Safety and Security 32 7.4 Other Operating Challenges 32
8. Future Plans 33
9. Conclusion 33
References 35
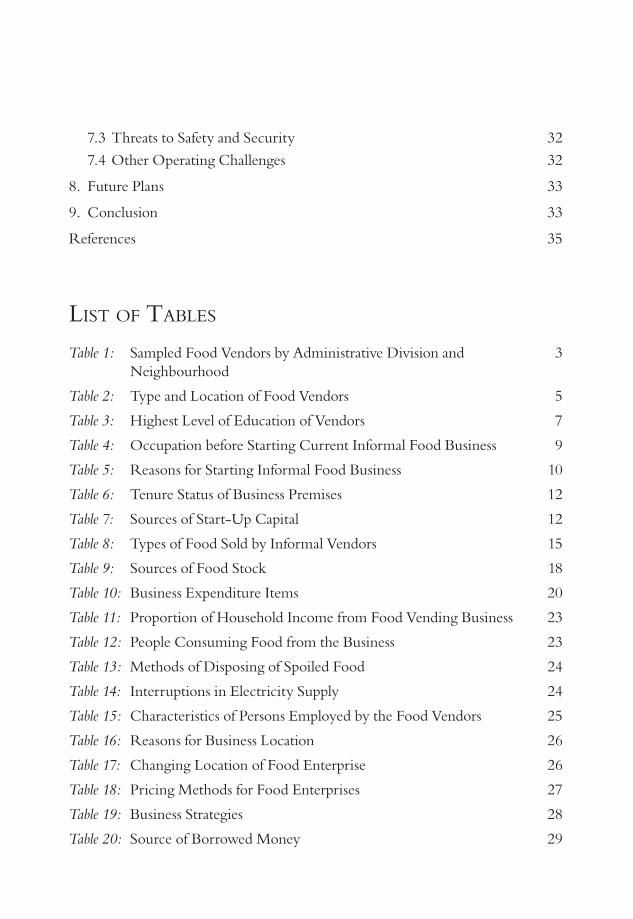
LIST OF TABLES
Table 1: Sampled Food Vendors by Administrative Division and 3 Neighbourhood
Table 2: Type and Location of Food Vendors 5
Table 3: Highest Level of Education of Vendors 7
Table 4: Occupation before Starting Current Informal Food Business 9
Table 5: Reasons for Starting Informal Food Business 10
Table 6: Tenure Status of Business Premises 12
Table 7: Sources of Start-Up Capital 12
Table 8: Types of Food Sold by Informal Vendors 15
Table 9: Sources of Food Stock 18
Table 10: Business Expenditure Items 20
Table 11: Proportion of Household Income from Food Vending Business 23
Table 12: People Consuming Food from the Business 23
Table 13: Methods of Disposing of Spoiled Food 24
Table 14: Interruptions in Electricity Supply 24
Table 15: Characteristics of Persons Employed by the Food Vendors 25
Table 16: Reasons for Business Location 26
Table 17: Changing Location of Food Enterprise 26
Table 18: Pricing Methods for Food Enterprises 27
Table 19: Business Strategies 28
Table 20: Source of Borrowed Money 29

Table 21: Vendor Perceptions of Lack of Access to Bank Loans 30
Table 22: Disposal of Daily Earnings 30
Table 23: Operating Challenges 31
Table 24: Food Vendor Aspirations 33
LIST OF FIGURES
Figure 1: Spatial Distribution of Sampled Food Vendors 5
Figure 2: Age of Vendors 6
Figure 3: Place of Birth of Vendors 8
Figure 4: Year of Starting Business 11
Figure 5: Amount of Start-Up Capital 13
Figure 6: Net Profit 21
Figure 7: Current Net Worth 21
Figure 8: Business Start-Up Capital and Current Net Worth 22
Figure 9: Number of People Dependent on Food Vending Business 23

HUNGRY CITIES REPORT NO. 21 1
PREFACE
The food retail, distribution, and preparation sector is a major component of urban informality in the Global South. The informal food economy comprises a dense and diverse network of informal markets, suppliers, transporters, mobile traders, hawkers, retailers, and street food vendors making food more accessible and affordable in low-income areas. The informal food sector is thus critical to the food security of poor urban households in rapidly growing towns and cities in the Global South. While the vibrancy of the sector is everywhere apparent, research on the structure, organization, dynamics, and impacts of informal food systems under conditions of hyper-urbanization has been limited. What is clear is that the informal food sector is both diverse and complex. By working in an interdisciplinary context with mixed methodologies and across different cities, the Hungry Cities Partnership (HCP) aims to add considerably to our under-standing of common elements and differences across the Global South.
The informal food sector represents an “urban laboratory” for examining wheth-er and how inclusive growth strategies can positively affect entrepreneurship and incomes, and help in alleviating poverty and mitigating the crisis of food insecu-rity. Fast-growing cities in Africa, Asia, Latin America, and the Caribbean are characterized by expanding degrees of informality. The definition of informality has been a source of debate since the 1970s. Broadly understood, informality has become the defining feature of the landscape, politics, and economy of the contemporary city in the South. As a result, efforts to secure livelihoods depend heavily on informalized activity. The Organization for Economic Cooperation and Development (OECD) has noted that “it would be misleading to address food security without taking into account a large part of the economy that pro-vides jobs, incomes and essential services for the urban population. Despite its important role, the informal economy is still poorly defined, poorly measured and consequently poorly taken into account in food security policies” (Hitimana et al 2011: 1).
The literature on informal sector activity generally takes one of two positions. The first is a survivalist position, which suggests that unemployed individuals are pushed into the sector because they are desperate to provide for themselves and their dependants (Berner et al 2012). The corollary is that they will leave the sector as soon as formal job opportunities are available. A second, oppor-tunistic, position is that informal sector vendors are motivated more by choice than necessity and see opportunities for economic and social advancement in the sector (Williams and Gurtoo 2012). An inclusive growth perspective asks how opportunists can maximize their outcomes and how survivalists can be support-ed to become more opportunistic (Knox et al 2019, Margolis 2014). As such, this perspective requires a focus on the enterprise rather than the individual and

2 HUNGRY CITIES PARTNERSHIP
INCLUSIVE GROWTH AND INFORMAL FOOD VENDING IN NAIROBI, KENYA
on entrepreneurship, innovation, and job creation. Studies of the informal sec-tor suggest that opportunities and obstacles vary considerably by enterprise size, type, and location, as well as vendors’ gender, migrant status, ethnicity, caste, and access to microfinance, markets, and support programs.
National, regional, and municipal policies towards informality and informal entrepreneurship are highly variable (Young and Crush 2019). Policies towards the informal food economy span the spectrum from complete non-interven-tionism to draconian attempts to control and even eliminate informality. The pathologizing of the informal food sector is especially common at municipal level. Regulation through various legal and policy instruments is also a perva-sive response to informality. If the informal food sector is to thrive, and provide opportunities for innovation and entrepreneurship, then an enabling policy envi-ronment is essential. The survey results presented and discussed in this report add significantly to the evidence base on which supportive policies can be con-structed.
1. INTRODUCTION
This report presents and analyzes the findings of a city-wide informal food ven-dors survey conducted by the Hungry Cities Partnership (HCP) in Nairobi, Kenya, in October 2019. It builds on, and should be read in conjunction with previous HCP reports on Nairobi: HCP Report No. 6: The Urban Food System of Nairobi, Kenya (Owuor et al 2017) and HCP Report No. 11, The State of Household Food Security in Nairobi, Kenya (Owuor 2018). This report, which is divided into nine sections, provides an up-to-date overview of the informal food sector in Nairobi’s food system. The next section describes the survey methodology and the third section analyzes the demographic characteristics of the sampled food vendors including gender, age, education level, migrant status, and occupations. The fourth section looks at starting an informal food busi-ness in terms of the reasons for entering the informal sector, when the business was started, business premises, sources of start-up capital, and business licensing. The fifth describes the types of foods sold, sources of stock, business expenses, net monthly profit, current value of enterprise, family dependence on informal vendor revenue, access to infrastructure and services, and employment creation. Section six is focused on food vendor strategies such as their locational prefer-ences, setting of prices, business strategies, and financial inclusion, while section seven concentrates on operating challenges including competition, and threats to safety and security. Section eight explores the future plans of informal food vendors. The last section presents the summary of findings and conclusions.
HUNGRY CITIES REPORT NO. 21 3
2. SURVEY METHODOLOGY
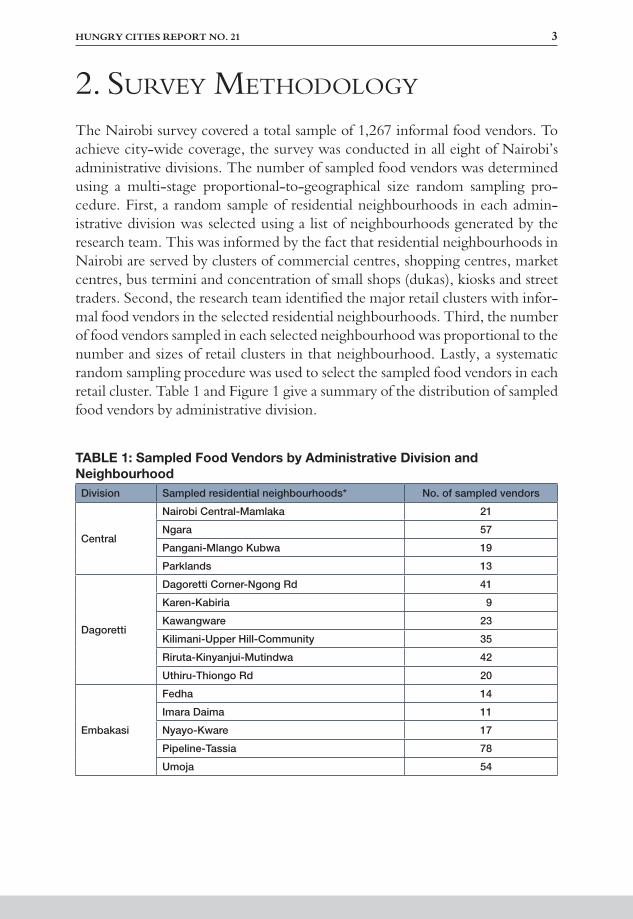
The Nairobi survey covered a total sample of 1,267 informal food vendors. To achieve city-wide coverage, the survey was conducted in all eight of Nairobi’s administrative divisions. The number of sampled food vendors was determined using a multi-stage proportional-to-geographical size random sampling pro-cedure. First, a random sample of residential neighbourhoods in each admin-istrative division was selected using a list of neighbourhoods generated by the research team. This was informed by the fact that residential neighbourhoods in Nairobi are served by clusters of commercial centres, shopping centres, market centres, bus termini and concentration of small shops (dukas), kiosks and street traders. Second, the research team identified the major retail clusters with infor-mal food vendors in the selected residential neighbourhoods. Third, the number of food vendors sampled in each selected neighbourhood was proportional to the number and sizes of retail clusters in that neighbourhood. Lastly, a systematic random sampling procedure was used to select the sampled food vendors in each retail cluster. Table 1 and Figure 1 give a summary of the distribution of sampled food vendors by administrative division.
TABLE 1: Sampled Food Vendors by Administrative Division and NeighbourhoodDivision Sampled residential neighbourhoods* No. of sampled vendors
Central
Nairobi Central-Mamlaka 21
Ngara 57
Pangani-Mlango Kubwa 19
Parklands 13
Dagoretti
Dagoretti Corner-Ngong Rd 41
Karen-Kabiria 9
Kawangware 23
Kilimani-Upper Hill-Community 35
Riruta-Kinyanjui-Mutindwa 42
Uthiru-Thiongo Rd 20
Embakasi
Fedha 14
Imara Daima 11
Nyayo-Kware 17
Pipeline-Tassia 78
Umoja 54

4 HUNGRY CITIES PARTNERSHIP
INCLUSIVE GROWTH AND INFORMAL FOOD VENDING IN NAIROBI, KENYA
Kasarani
Garden Estate-Roasters 20
Githurai-Zimmerman 28
Kahawa Sukari-Wendani 53
Kahawa West 33
Mwiki 74
Ngumba-Kasarani Area 45
Roysambu-Mrema 15
Santon-Phase 3 68
Kibera
Ayany-Kianda 19
Karanja Road 19
Kibera Villages 16
Olympic 12
Woodley 17
Makadara
Bahati-Maringo-Mbotela 34
Buru Buru 62
Kaloleni-Makongeni 65
Viwandani Villages 46
Makadara-Jericho 17
Shauri Moyo 27
South B 29
Pumwani
California 15
Kanuku-Kinyango Villages 17
Majengo 9
Old Race Course 9
Westlands
Kangemi 39
Loresho-Mountain View 15
Westlands Area 10
Total 1,267
* As defined by the research team

HUNGRY CITIES REPORT NO. 21 5
FIGURE 1: Spatial Distribution of Sampled Food Vendors
Given the absence of a sampling frame of residential neighbourhoods and retail clusters, full representativeness of the sample cannot be guaranteed. In addition, the final selection of food vendors was, in some instances, influenced by external factors such as the form and density of the food cluster, geographic location and security considerations, determination of spatial coverage area in the residential neighbourhood, and willingness to participate in the survey. For security rea-sons, the survey could only take place during daylight hours and the study may therefore have missed businesses operating solely at night.
The HCP food vendor questionnaire was loaded onto tablets and administered by a team of 23 students from the University of Nairobi led by the HCP’s Nai-robi city case study coordinator. The research team took 14 days to complete the survey. To be eligible for inclusion in the study, the enterprise had to be selling food and employing fewer than five people. The respondents were the business owners as they were best positioned to provide in-depth and accurate informa-tion.
At the end of the survey, the sample included mobile vendors, as well as ven-dors conducting business at the roadside, in a shop, at a bus terminus, from a vehicle, at home, in a market, with a handcart or wheelbarrow, at a taxi rank, at a craft market, next to an institution, in a customer’s home, and in a food court (kibanda) (Table 2).
TABLE 2: Type and Location of Food VendorsNo. % of vendors
Temporary stall on the street/roadside 697 55.0
Permanent stall on the street/roadside 234 18.5
No fixed location/mobile 177 14.0
Workshop or shop 76 6.0
Bus terminal 42 3.3
Vehicle (car, truck, motor bike, bike) 33 2.6
In my home 28 2.2
Permanent stall in a market 16 1.3
Handcart (mkokoteni) or wheelbarrow 15 1.2
Taxi (boda boda) rank 10 0.8
Craft market 10 0.8
Next to an institution 10 0.8
In customer’s home 9 0.7
Food court (kibanda) 8 0.6
Note: Multiple-response question

6 HUNGRY CITIES PARTNERSHIP
INCLUSIVE GROWTH AND INFORMAL FOOD VENDING IN NAIROBI, KENYA
HCP/Nairobi Research Team Members
3. VENDOR DEMOGRAPHIC PROFILE
3.1 Gender and Age of Vendors
There were roughly equal numbers of men and women among the vendors, with women making up 51% of the sample. Nearly two-thirds of the sampled vendors were under 35 years of age (Figure 2). Using the Kenyan definition of youth as those under 35 (Kenya 2010), this suggests that the food sector in Nairobi is dominated by young people. Only 5% of the sample were over the age of 50. The high proportion of young people in the informal food sector is unsurprising given that the burden of unemployment in Nairobi is disproportionately concen-trated on the youth.
FIGURE 2: Age of Vendors
HUNGRY CITIES REPORT NO. 21 7
3.2 Educational Level of Vendors
Table 3 shows the highest level of education attained by the sampled food ven-dors. Very few (1.8%) had no formal schooling and 20% had attended primary school. Around 42% had completed high school and 20% had advanced to ter-tiary education (with 11% having completed their degrees or diplomas). This suggests that those involved in the informal food sector in Nairobi are relative-ly well-educated and that the informal food sector is an important source of employment for educated but formally unemployed youth.
TABLE 3: Highest Level of Education of VendorsNo. %
No formal education 22 1.8
Some primary school 67 5.4
Primary school completed 186 14.9
Some high school 206 16.5
High school completed 523 41.8
Some university/college 114 9.1
University/college completed 133 10.6
Total 1,251 100
3.3 Migrant Status of Vendors
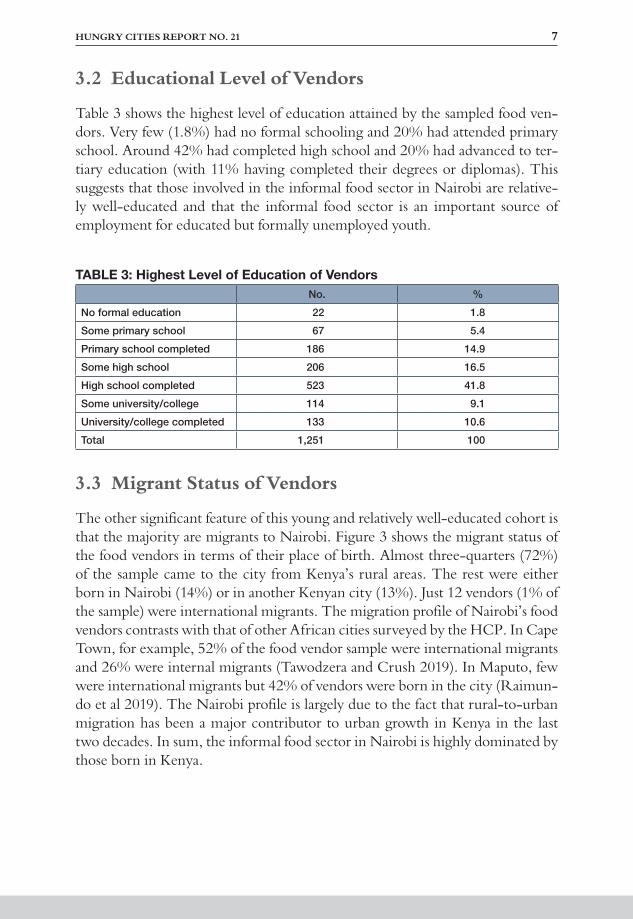
The other significant feature of this young and relatively well-educated cohort is that the majority are migrants to Nairobi. Figure 3 shows the migrant status of the food vendors in terms of their place of birth. Almost three-quarters (72%) of the sample came to the city from Kenya’s rural areas. The rest were either born in Nairobi (14%) or in another Kenyan city (13%). Just 12 vendors (1% of the sample) were international migrants. The migration profile of Nairobi’s food vendors contrasts with that of other African cities surveyed by the HCP. In Cape Town, for example, 52% of the food vendor sample were international migrants and 26% were internal migrants (Tawodzera and Crush 2019). In Maputo, few were international migrants but 42% of vendors were born in the city (Raimun-do et al 2019). The Nairobi profile is largely due to the fact that rural-to-urban migration has been a major contributor to urban growth in Kenya in the last two decades. In sum, the informal food sector in Nairobi is highly dominated by those born in Kenya.
8 HUNGRY CITIES PARTNERSHIP
INCLUSIVE GROWTH AND INFORMAL FOOD VENDING IN NAIROBI, KENYA
FIGURE 3: Place of Birth of Vendors
3.4 Other Occupations
More than half (58%) of the vendors indicated that they had a main occupation before starting their current informal food business. Table 4 shows that almost one-third had worked in the informal sector (21% running an enterprise and 11% as employees). Another one-third had worked in unskilled or low-skilled jobs. These figures suggest that most food vendors had not moved from the for-mal to the informal sector. However, around 25% did have formal sector jobs prior to starting their current business. Around one-quarter of these vendors (and 15% of the total number of vendors) said they had other occupations (i.e. in addition to their main occupation). About 20% of those with other occupations were involved in the informal sector as owners or employees. In sum, around 20% of the food vendors had already gained some experience in the informal sector before starting their current food business.
Only 13% of the sampled vendors were engaged in other occupations at the same time as running their food businesses. This means that a large majority of the vendors relied solely on their informal business enterprises for income. Of the small number who had concurrent occupations, around one-quarter had other informal sector businesses or were employed in this sector.

HUNGRY CITIES REPORT NO. 21 9
TABLE 4: Occupation before Starting Current Informal Food BusinessMain prior occupation
Other prior occupation
Other concurrent occupation
No. % No. % No. %
Informal sector
Operated own informal sector business (different activity) 126 17.2 20 10.7 39 17.7
Employed in informal sector 79 10.8 10 5.3 6 2.7
Operated own informal sector business (same activity) 26 3.6 6 3.2 12 5.5
Lower-skilled
Manual worker (unskilled) 113 15.5 15 8.0 25 11.4
Hotel/restaurant worker 78 10.7 17 9.1 22 10.0
Agricultural worker 43 5.9 21 11.2 21 9.5
Domestic worker 41 5.6 9 4.8 3 1.4
Higher-skilled
Manual worker (skilled) 51 7.0 9 4.8 15 6.8
Business person (self-employed) 41 5.6 42 22.5 46 20.9
Office worker 38 5.2 4 2.1 1 0.5
Professional (e.g. lawyer, doctor, academic, engineer) 31 4.2 3 1.6 1 0.5
Police/military/security 13 1.8 3 1.6 2 0.9
Teacher 4 0.5 1 0.5 1 0.5
Employer/manager 1 0.1 1 0.5 0 0.0
Health worker 1 0.1 0 0.0 0 0.0
Mine worker 1 0.1 0 0.0 1 0.5
Other
Scholar/student 33 4.5 23 12.3 21 9.5
Other 11 1.5 3 1.6 4 1.8
Total 731 100 187 100 220 100
4. STARTING AN INFORMAL FOOD BUSINESS
4.1 Reasons for Entry into Informal Sector
In seeking to find out whether informal food vendors in Nairobi are survival-ists or opportunists or a combination of the two, the HCP adapted a scale from the small-business literature that focuses on the reason(s) why individuals start a business. This scale – labelled an entrepreneurial motivation or orientation scale – presents respondents with a set of possible reasons or motivations and asks them to rate each on a Likert-scale from 1 (no importance) to 5 (extremely important).

10 HUNGRY CITIES PARTNERSHIP
INCLUSIVE GROWTH AND INFORMAL FOOD VENDING IN NAIROBI, KENYA
Mean scores for the sample as a whole are then calculated for each reason or motivation.
Table 5 presents a summary of the entrepreneurial motivations of sampled food vendors in Nairobi. It is evident that economic survival is a major motivation for entry into informal food vending, as shown by the relatively high means of needing money to survive (4.19), giving the family greater financial security (3.87), and being unemployed or unable to find a job (3.27). Other economic motivations (including support of relatives in rural areas and having unsatisfac-tory jobs) were less important. A desire to provide employment, products and services to others ranked very low (with 5 of the 6 indicators scoring less than 2.00). Although these results suggest that most vendors are survivalists who enter the informal food sector because they have no choice, various entrepreneurial and business experience motivations come into play and should not be dismissed. These factors include wanting to be their own boss (3.96), wanting to run their own business (3.87), and having the right personality to run a business (3.05).
TABLE 5: Reasons for Starting Informal Food BusinessMotivation Mean score
Economic survival and financial support of dependants
I needed money just to survive 4.19
I wanted to give my family greater financial security 3.87
I was unemployed and unable to find a job 3.27
I wanted to make more money to send to my family in my home area 2.63
I had a job but it did not pay enough 2.40
I had a job but it did not suit my qualifications and experience 1.43
Providing employment, product and/or service
I wanted to provide a service/product to consumers in my neighbourhood 2.52
I wanted to contribute to the development of this country 1.92
I wanted to provide a service/product to consumers in other parts of this city 1.67
I wanted to provide employment to members of my family 1.48
I wanted to provide employment for other people 1.30
I wanted to provide employment for people from my home area 1.25
Business experience or appeal
I wanted more control over my own time/to be my own boss 3.96
I have always wanted to run my own business 3.87
My family has always been involved in business 1.70
Support and help in starting my business was available from other people 1.68
I decided to go into business in partnership with others 1.20
Entrepreneurial orientation
I have the right personality to run my own business 3.05
I wanted to do something new and challenging 2.58
I like to challenge myself 2.53
I like to learn new skills 2.44

HUNGRY CITIES REPORT NO. 21 11
I enjoy taking risks 2.36
I wanted to increase my status in the community 2.11
I wanted to compete with others and be the best 1.41
4.2 Year of Starting Business
One of the surveyed businesses had been in operation since 1983, but this was one of only 28 (2%) that were established before 2000 (Figure 4). Another 11% were established from 2000 to 2009. Most of the vendors had started their busi-nesses in the last decade, with more than half (58%) having been in business for less than five years (i.e. 2016-2019). While this start-up profile is related to the relatively young age of most vendors and ease of entry, it may also reflect high business turnover as a result of intense competition and challenges.
FIGURE 4: Year of Starting Business
4.3 Tenure Status of Business Premises
Regarding tenure status, similar numbers of vendors fell into three categories: 32% were owners or part-owners of the premises on which they did business, 30% paid rent to the owner, and 33% conducted their businesses without paying rent (Table 6). Although the survey did not probe further on ownership, the last figure may be due to the significant number of vendors operating temporary and/or permanent stalls on the street or roadside. Very few (less than 4%) paid rent to the local government. These are vendors that operate from Nairobi City County designated stalls and markets. Lastly, sharing spaces with others was rare.

12 HUNGRY CITIES PARTNERSHIP
INCLUSIVE GROWTH AND INFORMAL FOOD VENDING IN NAIROBI, KENYA
TABLE 6: Tenure Status of Business PremisesNo. %
I own it/I am part owner 400 31.8
Pay rent to private owner 375 29.9
Rent-free without permission 257 20.5
Rent-free with permission 154 12.3
Pay rent to council/municipality 46 3.7
Share space/premises with others 18 1.4
Other 6 0.5
Total 1,256 100
4.4 Sources of Business Start-Up Capital
The respondents mentioned a wide range of sources of business start-up capital. The most common was personal savings, mentioned by 83% (Table 7). Some of the surveyed food vendors also obtained funds from relatives (8% gifts and 4% loans). Loans from financial institutions were rare, with less than 2% rely-ing on banks and micro-finance institutions. Loans from other sources, such as informal financial institutions, religious institutions, government agencies and non-relatives, were used by less than 3% of the vendors. Slightly more (but still only 6%) opted to borrow money from informal money lenders (usurers).
TABLE 7: Sources of Start-Up CapitalNo. % of vendors
Personal savings 1,046 82.6
Gift from relatives 98 7.7
Usurers (money lenders) 72 5.7
Loan from non-relatives 50 3.9
Loan from relatives in Kenya 44 3.5
Loan from informal financial institution 30 2.4
Loan from bank 23 1.8
Loan from micro-finance institution 19 1.5
Loan from religious institution 3 0.2
Loan from government agency 3 0.2
Money from relatives in another country 2 0.2
Goods on credit 2 0.2
Other 18 1.4
Note: Multiple-response question
Other sources of capital included the sale of assets, money from merry-go-round groups (chamas), gifts from non-relatives, loans from phone-based facilities (such as KCB Mtaani, Tala, M-Shwari), loans from Savings and Credit Co-operatives (SACCO), and money from well-wishers.

HUNGRY CITIES REPORT NO. 21 13
The vast majority (over 90%) of the informal food vendors reported that they started their vending business on their own or purchased it. The rest inherited or were given the business. As many as 1,117 vendors disclosed the amount of their start-up capital. Most started with small amounts. Over half had less than KES5,000 (USD47) to start their enterprises and 12% had less than KES1,000 (USD9) (Figure 5). Fifteen percent had between KES5,001 and KES10,000 (USD47-94), while 13% used between KES10,001 and KES20,000 (USD94-188). Only 16% had more than KES20,000.
FIGURE 5: Amount of Start-Up Capital
4.5 Business Licensing
The most common business permit in Nairobi is the Single Business Permit issued annually by the Nairobi City County. The Nairobi City County Trade Licensing Act of 2019 lists categories of trade licences. According to Section 10 (1) of the Act, “no person shall trade as a hawker or a street vendor unless he or she is in possession of a valid hawker or street vendor’s licence granted to him or her for that purpose by the Directorate unless they operate a business exempted from licensing under this Act”. Where applicable, other permits may include health certificates and a food hygiene certificate.
The licensing categories that affect informal sectors traders are: 2/far away
location;2;

14 HUNGRY CITIES PARTNERSHIP
INCLUSIVE GROWTH AND INFORMAL FOOD VENDING IN NAIROBI, KENYA
-porary building; and
The fee for these annual single business permits range from KES2,000 (USD19) to KES15,000 (USD142) per year. The Act also lists monthly fees for hawkers (KES500 or USD5), weekly fees for kiosks (KES250-500 or USD2-5), and daily fees for hawkers outside the Central Business District (KES30 or USD0.3).
Despite this regulatory framework, only 15% of the sampled vendors indicated that they paid trade licences and permits to Nairobi City County to operate their businesses. More than three-quarters of these opt for the annual single business permit.
5. RUNNING AN INFORMAL FOOD ENTERPRISE
5.1 Types of Foods Sold
The informal food vendors surveyed in Nairobi sell a wide range of products. Broadly categorized, these are (1) fruits and vegetables; (2) cereals, roots, and tubers; (3) meat, fish, chicken, and eggs; (4) cooked meals and snacks; and (5) processed foods. These categories are not mutually exclusive or exhaustive. Table 8 shows the types of food sold in the month prior to the survey.
It is clear from the results that most of the surveyed informal food vendors sold fruits and vegetables. Nearly one-quarter stocked fresh fruits, followed by leafy and other fresh vegetables. These are all fast-moving foodstuffs, bought by many households on a daily basis (Owuor 2018). Foods sold by more than 10% of the vendors included eggs, cooked snacks, cooked meals, and processed foods. Ready-for-eating cooked snacks and meals are emerging as a significant alterna-tive to cooking at home in Nairobi. These meals are also bought by workers as reasonably-priced lunches. Other food items sold by between 5% and 10% of the vendors included roots and tubers, fresh milk, bread, maize, wheat flour, beverages, and condiments such as sugar.

HUNGRY CITIES REPORT NO. 21 15
TABLE 8: Types of Food Sold by Informal VendorsNo. % of vendors
Fruits and vegetables
Fresh fruits 314 24.8
Fresh other vegetables 218 17.2
Fresh leafy vegetables 201 15.9
Cereals, roots, and tubers
Roots and tubers 126 9.9
Dry cereals 69 5.4
Meat, fish, chicken, and eggs
Eggs 161 12.7
Fish (fresh, fried, dry) 53 4.2
Meat (excluding organs) 37 2.9
Chicken (live, slaughtered) 36 2.8
Livers, kidneys and other meat organs 27 2.1
Cooked meals and snacks
Cooked snacks (e.g. smokies) 183 14.4
Cooked meal (e.g. githeri) 173 13.7
Chips or bhajia 69 5.4
Processed food
Other processed food 167 13.2
Fresh milk 123 9.7
Bread 123 9.7
Maize, wheat flour 97 7.7
Beverages (e.g. tea) 94 7.4
Condiments (e.g. sugar) 89 7.0
Sour milk 38 3.0
Note: Multiple-response question
A temporary stall on the roadside selling fruits
16 HUNGRY CITIES PARTNERSHIP
INCLUSIVE GROWTH AND INFORMAL FOOD VENDING IN NAIROBI, KENYA
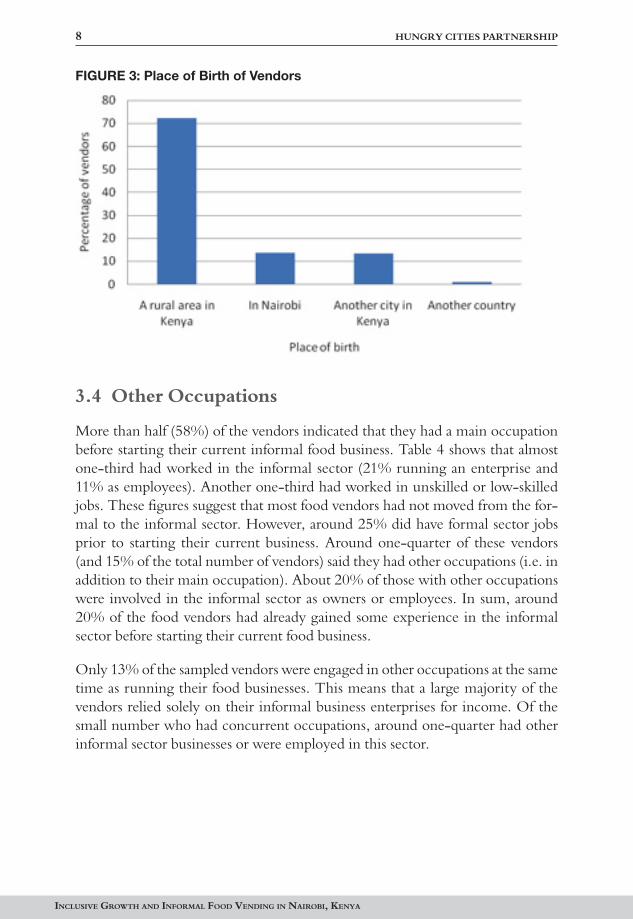
A stall at an open-air market selling leafy vegetables
A stall at an open-air market selling tomatoes
HUNGRY CITIES REPORT NO. 21 17
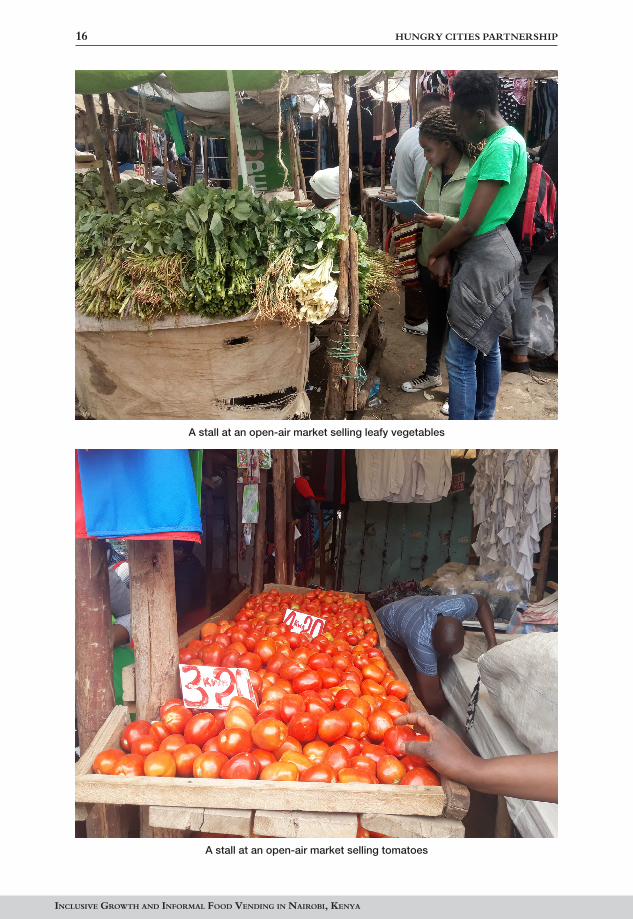
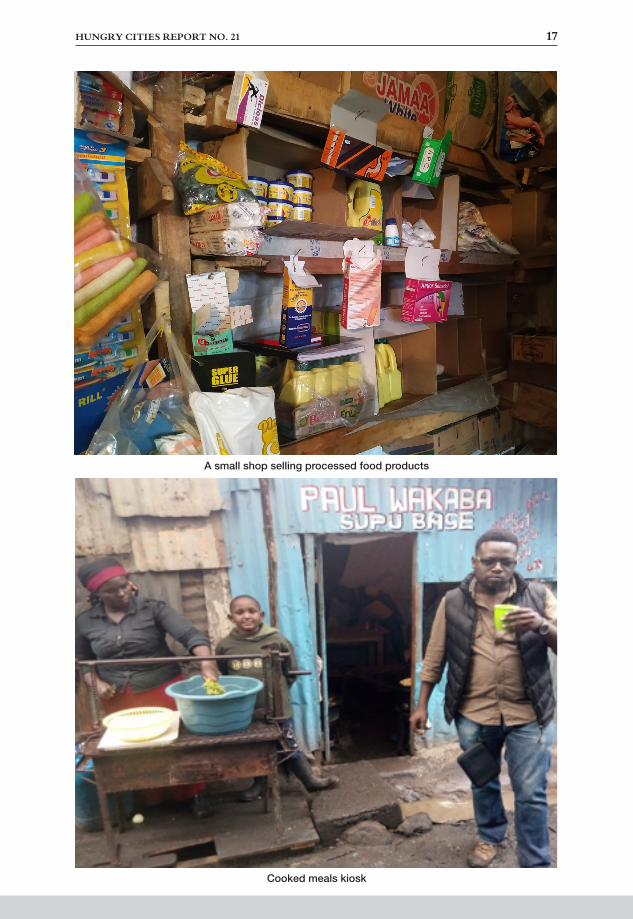
A small shop selling processed food products
Cooked meals kiosk

18 HUNGRY CITIES PARTNERSHIP
INCLUSIVE GROWTH AND INFORMAL FOOD VENDING IN NAIROBI, KENYA
5.2 Sources of Stock
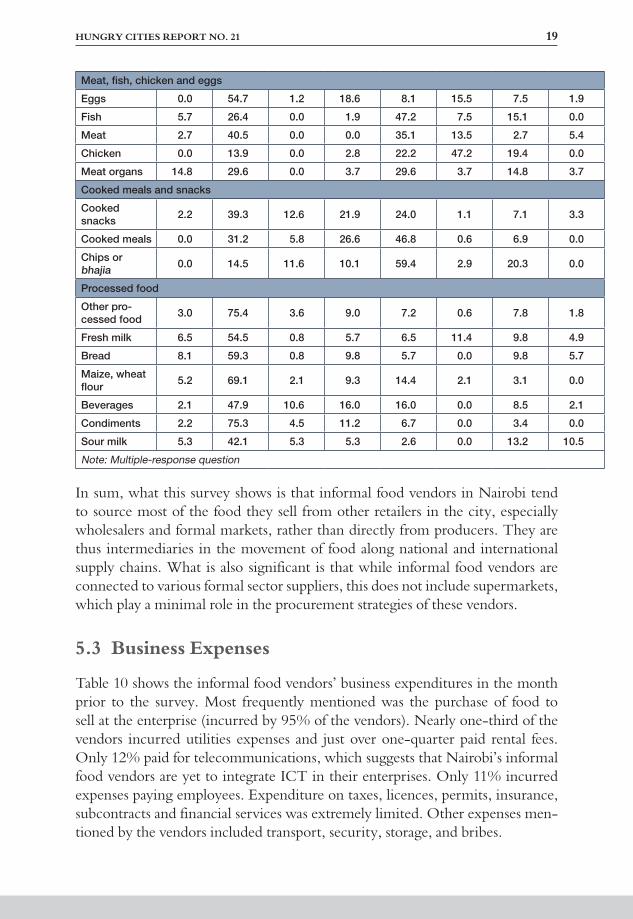
Nairobi’s informal food vendors obtain their stock from several formal and infor-mal sources. Table 9 shows where vendors normally purchase a range of products and demonstrates the following patterns:
a few (less than 10%) source items such as milk, maize, wheat flour, bread, beverages, condiments such as sugar and other edible processed foods this way. The 15% who obtain meat organs from factories do so from abattoirs.
-ents for cooking snacks and meals. Wholesalers are the primary source of all processed food products including condiments (75%), flour (69%), bread (59%), and milk (55%).
only products that more than 10% source from supermarkets are beverages, chips, bhajia, and ingredients for cooked snacks.
-dients for cooked snacks and meals.
(80% of the vendors), leafy vegetables (76%), other fresh vegetables (78%), roots and tubers (73%), dry cereals (46%), fish (47%), meat (35%), chips, bhajia, and ingredients for cooked meals.
source for only chicken.
producers and retailers, between 15% and 20% sourced chicken and fish in this way.
TABLE 9: Sources of Food StockFacto-
riesWhole-salers
Super-markets
Small shops
Formal markets Farms Informal
sector Other
% of vendors for each food item
Fruits and vegetables
Fresh fruits 0.0 9.9 0.6 1.3 79.6 8.6 4.5 1.0
Fresh leafy vegetables 0.0 10.9 0.5 0.5 75.6 9.0 7.5 1.0
Other fresh vegetables 0.0 12.8 0.5 0.5 78.4 4.1 6.4 0.5
Cereals, roots and tubers
Roots and tubers 0.0 14.3 1.6 0.8 73.0 12.7 4.0 0.0
Dry cereals 0.0 43.5 0.0 5.8 46.4 7.2 1.4 0.0
HUNGRY CITIES REPORT NO. 21 19
Meat, fish, chicken and eggs
Eggs 0.0 54.7 1.2 18.6 8.1 15.5 7.5 1.9
Fish 5.7 26.4 0.0 1.9 47.2 7.5 15.1 0.0
Meat 2.7 40.5 0.0 0.0 35.1 13.5 2.7 5.4
Chicken 0.0 13.9 0.0 2.8 22.2 47.2 19.4 0.0
Meat organs 14.8 29.6 0.0 3.7 29.6 3.7 14.8 3.7
Cooked meals and snacks
Cooked snacks 2.2 39.3 12.6 21.9 24.0 1.1 7.1 3.3
Cooked meals 0.0 31.2 5.8 26.6 46.8 0.6 6.9 0.0
Chips or bhajia 0.0 14.5 11.6 10.1 59.4 2.9 20.3 0.0
Processed food
Other pro-cessed food 3.0 75.4 3.6 9.0 7.2 0.6 7.8 1.8
Fresh milk 6.5 54.5 0.8 5.7 6.5 11.4 9.8 4.9
Bread 8.1 59.3 0.8 9.8 5.7 0.0 9.8 5.7
Maize, wheat flour 5.2 69.1 2.1 9.3 14.4 2.1 3.1 0.0
Beverages 2.1 47.9 10.6 16.0 16.0 0.0 8.5 2.1
Condiments 2.2 75.3 4.5 11.2 6.7 0.0 3.4 0.0
Sour milk 5.3 42.1 5.3 5.3 2.6 0.0 13.2 10.5
Note: Multiple-response question
In sum, what this survey shows is that informal food vendors in Nairobi tend to source most of the food they sell from other retailers in the city, especially wholesalers and formal markets, rather than directly from producers. They are thus intermediaries in the movement of food along national and international supply chains. What is also significant is that while informal food vendors are connected to various formal sector suppliers, this does not include supermarkets, which play a minimal role in the procurement strategies of these vendors.
5.3 Business Expenses
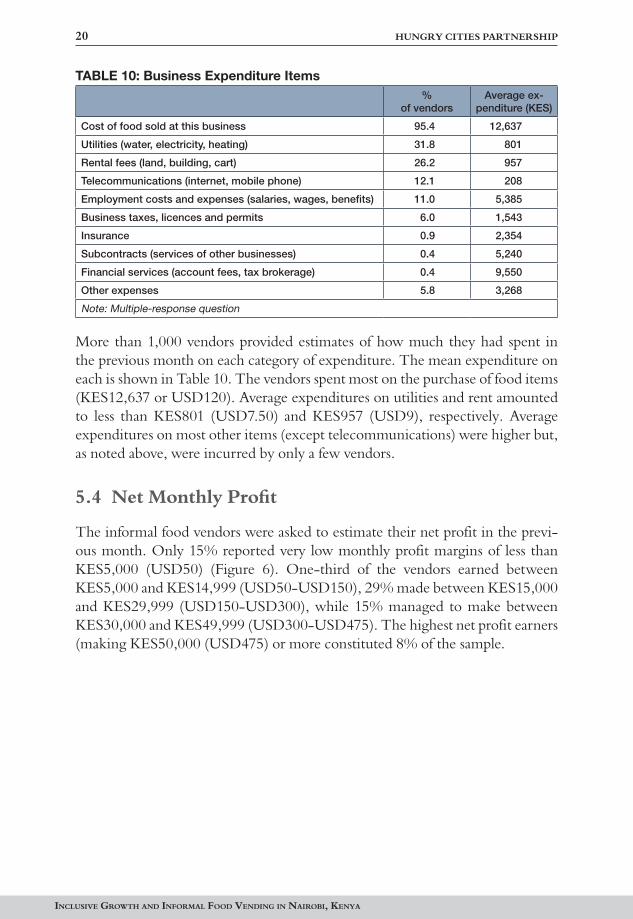
Table 10 shows the informal food vendors’ business expenditures in the month prior to the survey. Most frequently mentioned was the purchase of food to sell at the enterprise (incurred by 95% of the vendors). Nearly one-third of the vendors incurred utilities expenses and just over one-quarter paid rental fees. Only 12% paid for telecommunications, which suggests that Nairobi’s informal food vendors are yet to integrate ICT in their enterprises. Only 11% incurred expenses paying employees. Expenditure on taxes, licences, permits, insurance, subcontracts and financial services was extremely limited. Other expenses men-tioned by the vendors included transport, security, storage, and bribes.
20 HUNGRY CITIES PARTNERSHIP
INCLUSIVE GROWTH AND INFORMAL FOOD VENDING IN NAIROBI, KENYA
TABLE 10: Business Expenditure Items%
of vendorsAverage ex-
penditure (KES)
Cost of food sold at this business 95.4 12,637
Utilities (water, electricity, heating) 31.8 801
Rental fees (land, building, cart) 26.2 957
Telecommunications (internet, mobile phone) 12.1 208
Employment costs and expenses (salaries, wages, benefits) 11.0 5,385
Business taxes, licences and permits 6.0 1,543
Insurance 0.9 2,354
Subcontracts (services of other businesses) 0.4 5,240
Financial services (account fees, tax brokerage) 0.4 9,550
Other expenses 5.8 3,268
Note: Multiple-response question
More than 1,000 vendors provided estimates of how much they had spent in the previous month on each category of expenditure. The mean expenditure on each is shown in Table 10. The vendors spent most on the purchase of food items (KES12,637 or USD120). Average expenditures on utilities and rent amounted to less than KES801 (USD7.50) and KES957 (USD9), respectively. Average expenditures on most other items (except telecommunications) were higher but, as noted above, were incurred by only a few vendors.
5.4 Net Monthly Profit
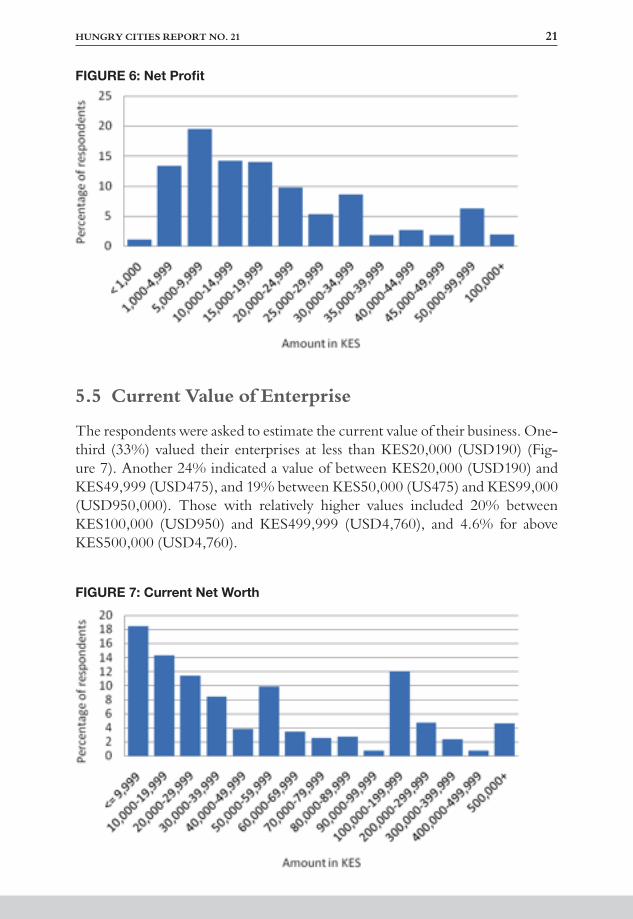
The informal food vendors were asked to estimate their net profit in the previ-ous month. Only 15% reported very low monthly profit margins of less than KES5,000 (USD50) (Figure 6). One-third of the vendors earned between KES5,000 and KES14,999 (USD50-USD150), 29% made between KES15,000 and KES29,999 (USD150-USD300), while 15% managed to make between KES30,000 and KES49,999 (USD300-USD475). The highest net profit earners (making KES50,000 (USD475) or more constituted 8% of the sample.
HUNGRY CITIES REPORT NO. 21 21
FIGURE 6: Net Profit
5.5 Current Value of Enterprise
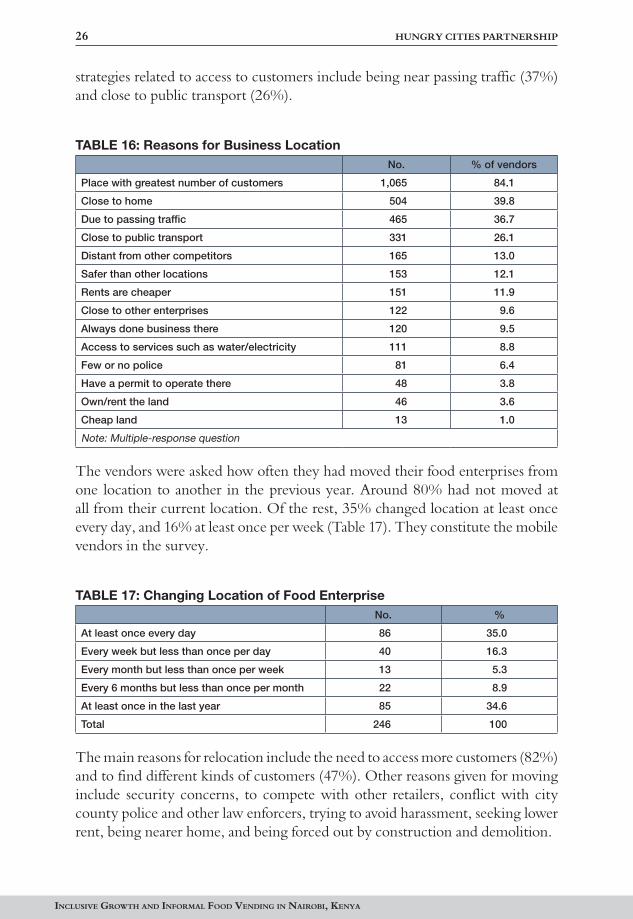
The respondents were asked to estimate the current value of their business. One-third (33%) valued their enterprises at less than KES20,000 (USD190) (Fig-ure 7). Another 24% indicated a value of between KES20,000 (USD190) and KES49,999 (USD475), and 19% between KES50,000 (US475) and KES99,000 (USD950,000). Those with relatively higher values included 20% between KES100,000 (USD950) and KES499,999 (USD4,760), and 4.6% for above KES500,000 (USD4,760).
FIGURE 7: Current Net Worth

22 HUNGRY CITIES PARTNERSHIP
INCLUSIVE GROWTH AND INFORMAL FOOD VENDING IN NAIROBI, KENYA
An indication of business growth over time is presented in Figure 8. This is achieved by comparing the number of business enterprises in the same category of start-up capital and estimated current net worth. In total, only 926 vendors provided information on both the amount of start-up capital they invested and the estimated value of their business at the time of the survey. The general trend is that many vendors have been able to grow their net worth over time in varying degrees. The number of business enterprises with an estimated current value above KES10,000 (USD95) is relatively higher than that of business enterprises with the same category of start up capital.
FIGURE 8: Business Start-Up Capital and Current Net Worth
5.6 Family Dependence on Informal Vendor Revenue
The amount of profit that can be re-invested in the business is limited by the fact that these enterprises are a major source of household income and of household food for those involved. Figure 9 shows that 95% of the vendors have at least one dependant who is reliant on their food vending business. Just over two-thirds have between one and four dependants, while one-quarter reported five to 10 dependants. Fourteen enterprises had more than 10 dependants.
Table 11 shows the proportion of household income derived from food vend-ing business profits. More than one-quarter (29%) of the vendors derived all their household income from their business. Another one-quarter were getting between 70% and 99% of their income from food vending. A further 27% of enterprises contributed between 50% and 69% of household income. In other words, 80% of the food vending enterprises contributes more than half of house-hold income.

HUNGRY CITIES REPORT NO. 21 23
FIGURE 9: Number of People Dependent on Food Vending Business
TABLE 11: Proportion of Household Income from Food Vending Business% contribution to household income No. %
0-19 49 4.2
20-29 53 4.5
30-39 48 4.1
40-49 85 7.2
50-59 165 14.0
60-69 148 12.6
70-79 92 7.8
80-89 124 10.5
90-99 75 6.4
100 339 28.8
Total 1,178 100
Only 208 vendors (16%) said that the food sold at their retail outlets was wholly consumed by their customers. As shown in Table 12, the food was also consumed by the vendors themselves (75%), their families (65%), neighbours (13%), other people (8%), and their employees (7%).
TABLE 12: People Consuming Food from the BusinessNo. % of vendors
Myself 951 75.1
My family 828 65.4
My neighbours 158 12.5
Other people 106 8.4
My employees 88 6.9
Note: Multiple-response question

24 HUNGRY CITIES PARTNERSHIP
INCLUSIVE GROWTH AND INFORMAL FOOD VENDING IN NAIROBI, KENYA
5.7 Access to Business Infrastructure and Services
Because so many vendors sell fresh produce, they inevitably have unsold produce to dispose of. Asked how they did this disposal of spoiled food, respondents told of methods including taking waste to a dump site away from the retail outlet (54% of vendors), using waste collection points at the retail outlet (34%), and/or selling the products at a reduced price (11%) (Table 13). Other methods of waste disposal included using their own dustbin; using, giving or selling the food waste as animal feed; collection by urban farmers; open dumping; consumption by animals; and using it at home.
TABLE 13: Methods of Disposing of Spoiled Food No. % of vendors
I dispose at a dump site away from this retail outlet 688 54.3
I dispose at this retail outlet 433 34.2
I sell to customers at a reduced price 142 11.2
Other 101 8.0
Note: Multiple-response question
Less than half (40%) of the informal food vendors indicated that they store their food items at the business location or enterprise. This means that most have to transport their stock to the place of sale on a daily basis. Those who store food on-site have access to a limited number of food storage facilities including locked boxes (53%), refrigerators (24%), and freezers (11%). Other innovative ways of food storage include using nearby on-site rented stores; covering the products with sacks and polythene papers; and taking the goods home. Those with shops, lockable kiosks and business premises secured these simply by locking them up.
Only 40% of the surveyed vendors had access to electricity at their business premises in the previous year. And for these businesses, the supply was not always consistent. Only 7% said there were never interruptions in electricity supply (Table 14). As many as 41% had gone without electricity more than 10 times, while another 38% had experienced interruptions between three and 10 times.
TABLE 14: Interruptions in Electricity SupplyNo. %
Never gone without electricity in the last year 36 7.3
Gone without 1 to 2 times in the last year at this location 72 14.1
Gone without 3 to 10 times in the last year at this location 193 37.9
Gone without more than 10 times in the last year at this location 207 40.7
Total 509 100

HUNGRY CITIES REPORT NO. 21 25
5.8 Employment Creation
Most of the informal food vendors surveyed were single-person operations. Only 201 food vendors (16%) had staff at the time of this survey. Of these, most employed only one person. In total, there were 271 persons employed by these vendors. Majority of the employees were male (53.9%); youth aged below 35 years (91.5%); and who were not related to the vendor (69.7%) (Table 15). In addition, they were engaged on full-time (68.3%), part time (22.5%), and on casual (9.2%) basis with a most of them (80.1%) taking home a monthly income of more than KES5,000 (USD50). Some of the part-time and casual employ-ees (n=56) are working in another part-time job (44.6%), enrolled in university (33.9%), or running another informal sector business (17.9%).
TABLE 15: Characteristics of Persons Employed by the Food VendorsNo. %
GenderFemale 125 46.1
Male 146 53.9
Age (in years)17-34 236 91.5
35+ 22 8.5
Is employee vendor’s family member
No 189 69.7
Yes 82 30.3
Type of engagement
Casual wage work 25 9.2
Full-time wage work 185 68.3
Part-time wage work 61 22.5
Monthly pay (in KES)
Less than 5,000 44 19.9
5,000-10,000 127 57.5
More than 10,000 50 22.6
6. FOOD VENDOR STRATEGIES
6.1 Locational Strategies
The major locational strategy of informal food vendors in Nairobi is to operate in a place that attracts the most customers. Eight out of every 10 food vendors surveyed said this was the primary reason for their current location (Table 16). This helps account for the high numbers of temporary and permanent stalls on the streets or roadsides, as well as mobile vendors. In residential neighbourhoods, informal food vendors tend to be in strategic places, such as at a bus terminus, to capture the attention of people returning from work. Proximity to home, which reduces daily transport costs, is an important locational factor for 40%. Other
26 HUNGRY CITIES PARTNERSHIP
INCLUSIVE GROWTH AND INFORMAL FOOD VENDING IN NAIROBI, KENYA
strategies related to access to customers include being near passing traffic (37%) and close to public transport (26%).
TABLE 16: Reasons for Business LocationNo. % of vendors
Place with greatest number of customers 1,065 84.1
Close to home 504 39.8
Due to passing traffic 465 36.7
Close to public transport 331 26.1
Distant from other competitors 165 13.0
Safer than other locations 153 12.1
Rents are cheaper 151 11.9
Close to other enterprises 122 9.6
Always done business there 120 9.5
Access to services such as water/electricity 111 8.8
Few or no police 81 6.4
Have a permit to operate there 48 3.8
Own/rent the land 46 3.6
Cheap land 13 1.0
Note: Multiple-response question
The vendors were asked how often they had moved their food enterprises from one location to another in the previous year. Around 80% had not moved at all from their current location. Of the rest, 35% changed location at least once every day, and 16% at least once per week (Table 17). They constitute the mobile vendors in the survey.
TABLE 17: Changing Location of Food EnterpriseNo. %
At least once every day 86 35.0
Every week but less than once per day 40 16.3
Every month but less than once per week 13 5.3
Every 6 months but less than once per month 22 8.9
At least once in the last year 85 34.6
Total 246 100
The main reasons for relocation include the need to access more customers (82%) and to find different kinds of customers (47%). Other reasons given for moving include security concerns, to compete with other retailers, conflict with city county police and other law enforcers, trying to avoid harassment, seeking lower rent, being nearer home, and being forced out by construction and demolition.
HUNGRY CITIES REPORT NO. 21 27
6.2 Pricing Strategies
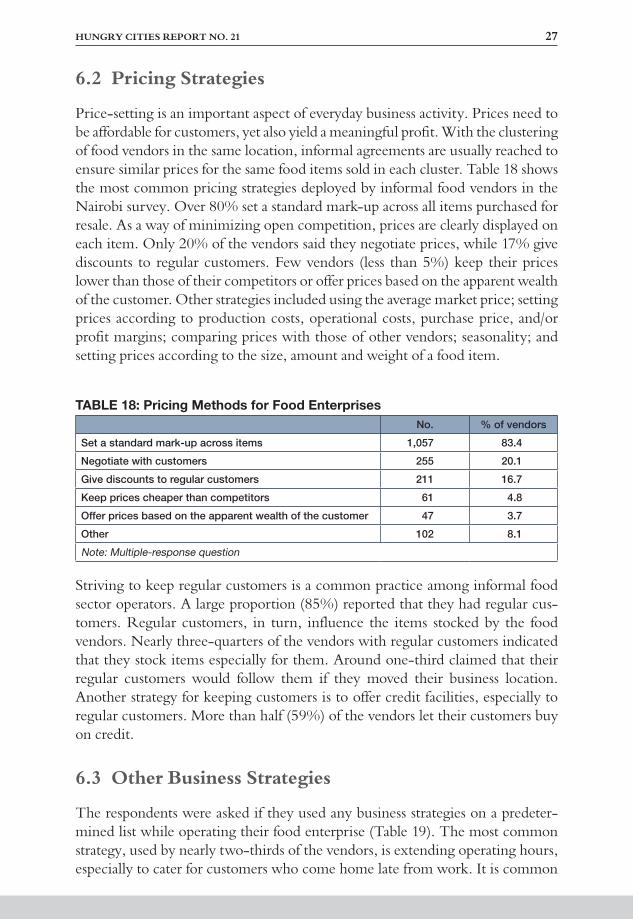
Price-setting is an important aspect of everyday business activity. Prices need to be affordable for customers, yet also yield a meaningful profit. With the clustering of food vendors in the same location, informal agreements are usually reached to ensure similar prices for the same food items sold in each cluster. Table 18 shows the most common pricing strategies deployed by informal food vendors in the Nairobi survey. Over 80% set a standard mark-up across all items purchased for resale. As a way of minimizing open competition, prices are clearly displayed on each item. Only 20% of the vendors said they negotiate prices, while 17% give discounts to regular customers. Few vendors (less than 5%) keep their prices lower than those of their competitors or offer prices based on the apparent wealth of the customer. Other strategies included using the average market price; setting prices according to production costs, operational costs, purchase price, and/or profit margins; comparing prices with those of other vendors; seasonality; and setting prices according to the size, amount and weight of a food item.
TABLE 18: Pricing Methods for Food EnterprisesNo. % of vendors
Set a standard mark-up across items 1,057 83.4
Negotiate with customers 255 20.1
Give discounts to regular customers 211 16.7
Keep prices cheaper than competitors 61 4.8
Offer prices based on the apparent wealth of the customer 47 3.7
Other 102 8.1
Note: Multiple-response question
Striving to keep regular customers is a common practice among informal food sector operators. A large proportion (85%) reported that they had regular cus-tomers. Regular customers, in turn, influence the items stocked by the food vendors. Nearly three-quarters of the vendors with regular customers indicated that they stock items especially for them. Around one-third claimed that their regular customers would follow them if they moved their business location. Another strategy for keeping customers is to offer credit facilities, especially to regular customers. More than half (59%) of the vendors let their customers buy on credit.
6.3 Other Business Strategies
The respondents were asked if they used any business strategies on a predeter-mined list while operating their food enterprise (Table 19). The most common strategy, used by nearly two-thirds of the vendors, is extending operating hours, especially to cater for customers who come home late from work. It is common

28 HUNGRY CITIES PARTNERSHIP
INCLUSIVE GROWTH AND INFORMAL FOOD VENDING IN NAIROBI, KENYA
to see informal food vendors operating as late as 10pm. And to serve customers starting their day early, some shops and outlets open at 6am. Also, half of the vendors purchase their stock in bulk. They do this as individuals rather than in groups, and ensure that they have the exact quantities needed at the required times for their customers. Other significant business strategies include negotiat-ing prices with suppliers (35%) and operating the business only during peak hours (32%), especially in the early morning, lunch time, evening, and week-ends when the demand for food products tends to be high.
TABLE 19: Business Strategies
No. % of vendors
I extend my hours of operation 829 65.4
I purchase stock in bulk myself 635 50.1
I negotiate prices with my suppliers 437 34.5
I open my business only during times of the day when I have more customers 399 31.5
I use mobile phones to receive payments from customers 343 27.1
I use mobile phones to coordinate with suppliers/other vendors 282 22.3
I keep records of my business accounts 222 17.5
I use mobile phones to take orders from customers 218 17.2
I look for cheapest prices of goods by asking other entrepreneurs 129 10.2
I look for cheapest prices of goods by calling suppliers 129 10.2
I pay for security guards 85 6.7
I sell goods more cheaply than my competitors 67 5.3
I charge different prices for different customers 43 3.4
I purchase stock in bulk together with others 28 2.2
I sleep on my business premises 22 1.7
I change what I sell at different times of the year 17 1.3
I look for cheapest prices of goods by consulting the media 7 0.6
I engage in shareholding 5 0.4
I partner with other businesses to distribute risks 4 0.3
I pay the police for protection 4 0.3
I purchase insurance 3 0.2
I pay community leaders for protection 2 0.2
I keep weapons for self-protection 1 0.1
Other 37 2.9
Note: Multiple-response question
Of importance is the increased use of mobile phones by informal food vendors. Some have embraced the use of mobile phones for payments from customers (27%), to coordinate with suppliers and other vendors (22%), and to take cus-tomer orders (17%). More than 10% of the vendors use other strategies includ-ing keeping business records (18%), looking for the cheapest goods by asking

HUNGRY CITIES REPORT NO. 21 29
other vendors, and looking for the cheapest goods by calling suppliers. Other strategies mentioned by some respondents include making sure that they stock fresh and high quality products, good customer service, doing home deliveries, maintaining proper hygiene, honesty, and (online) marketing of products.
6.4 Financial Inclusion
As noted above, very few of the informal food vendors had access to start-up capital from formal financial institutions. The vendors were also asked if they had applied for a bank loan while operating their business. Only 11% had done this, and 80% of them had been successful in obtaining the loan. Those whose applications were rejected said it was because they had insufficient guarantees/collateral, or that their enterprise was deemed unviable by the bank.
The vendors were also asked whether they had borrowed money for their busi-ness operations in the previous 12 months. Nearly one-quarter (24%) had done so. Table 20 shows the sources of the loans. More than half (53%) of those who had borrowed money used informal money lenders (usurers). Other sources of loans included non-relatives, informal financial institutions, and personal sav-ings. Again, borrowing money from formal financial institutions was uncom-mon. Other sources of loans included merry-go-round groups (chamas), gener-ous customers, and Savings and Credit Co-operatives (SACCO).
TABLE 20: Source of Borrowed MoneyNo. %
Usurers (informal money lenders) 160 53.0
Loan from non-relatives 57 18.9
Loan from relatives in Kenya 34 11.3
Loan from informal financial institution 33 10.9
From own personal savings 27 8.9
Loan from a micro-finance institution 21 7.0
Loan from a bank 18 6.0
Getting goods on credit 3 1.0
Other 20 6.6
Note: Multiple-response question
To assess why so few vendors approached banks for loans, the respondents were asked whether they thought banks were reluctant to lend to informal traders. Only one-quarter (27%) of the food vendors take the view that banks are reluc-tant to give loans to informal sector business operators, while the rest either did not (59%) or were not sure (14%). Those who said banks were reluctant were provided with a list of possible reasons and asked to agree or disagree with each statement (Table 21). Most agreed with the various propositions, especially that

30 HUNGRY CITIES PARTNERSHIP
INCLUSIVE GROWTH AND INFORMAL FOOD VENDING IN NAIROBI, KENYA
banks lacked certainty of repayment (92%), that vendors had insufficient guaran-tees/collateral (80%), that banks do not consider informal enterprises to be viable (76%), that banks only lend money to formal businesses (71%), and that infor-mal traders have insufficient initial capital (70%). Other reasons given include that banks do not value informal traders; that they have high interest rates; that most informal businesses are not registered; and that many informal businesses do not have bank accounts.
TABLE 21: Vendor Perceptions of Lack of Access to Bank LoansAgree
(%)Disagree
(%)Neither agree nor
disagree (%)
The banks think that the loan will not be repaid 91.7 1.8 6.5
Because of insufficient guarantees or collateral 79.6 9.7 9.7
They only loan money to formal businesses 71.1 12.1 16.8
The banks believe informal enterprises are not viable 75.8 5.9 17.7
Because they have insufficient initial capital 69.9 16.5 13.6
Lastly, only 25 (2%) of the informal food vendors had accessed government sup-port schemes, such as the Youth Fund, Uwezo Fund, Women Enterprise Fund, and M-Akiba.
Despite the lack of loan support from banks, nearly 40% of the respondents deposited their daily earnings in a bank account (Table 22). Others keep the funds at their homes (59%), use them to purchase stock or supplies (57%), or transfer the earnings to other people (7%). Only 5% keep the money on the business premises. Other practices include depositing the money in M-Pesa or M-Shwari (mobile phone) accounts, merry-go-round (chamas) accounts, and Savings and Credit Co-operatives (SACCO) accounts.
TABLE 22: Disposal of Daily EarningsNo. % of vendors
Transfer earnings to my home 750 59.2
Purchase stock/supplies for the store 727 57.4
Deposit earnings in a bank 480 37.9
Transfer earnings to other people 83 6.6
Keep on business premises 61 4.8
Other 222 17.5
Note: Multiple-response question
HUNGRY CITIES REPORT NO. 21 31
7. OPERATING CHALLENGES
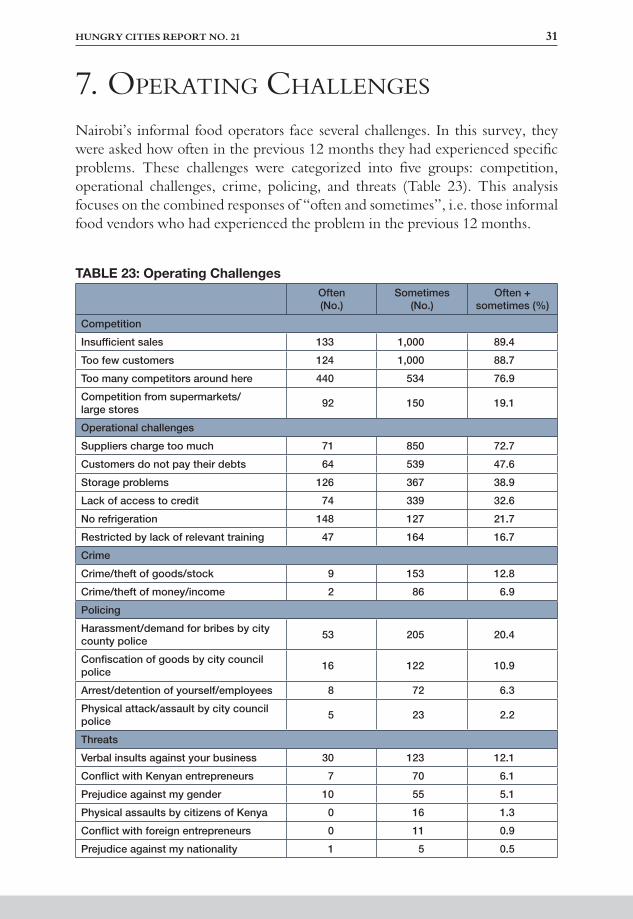
Nairobi’s informal food operators face several challenges. In this survey, they were asked how often in the previous 12 months they had experienced specific problems. These challenges were categorized into five groups: competition, operational challenges, crime, policing, and threats (Table 23). This analysis focuses on the combined responses of “often and sometimes”, i.e. those informal food vendors who had experienced the problem in the previous 12 months.
TABLE 23: Operating ChallengesOften (No.)
Sometimes (No.)
Often + sometimes (%)
Competition
Insufficient sales 133 1,000 89.4
Too few customers 124 1,000 88.7
Too many competitors around here 440 534 76.9
Competition from supermarkets/ large stores 92 150 19.1
Operational challenges
Suppliers charge too much 71 850 72.7
Customers do not pay their debts 64 539 47.6
Storage problems 126 367 38.9
Lack of access to credit 74 339 32.6
No refrigeration 148 127 21.7
Restricted by lack of relevant training 47 164 16.7
Crime
Crime/theft of goods/stock 9 153 12.8
Crime/theft of money/income 2 86 6.9
Policing
Harassment/demand for bribes by city county police 53 205 20.4
Confiscation of goods by city council police 16 122 10.9
Arrest/detention of yourself/employees 8 72 6.3
Physical attack/assault by city council police 5 23 2.2
Threats
Verbal insults against your business 30 123 12.1
Conflict with Kenyan entrepreneurs 7 70 6.1
Prejudice against my gender 10 55 5.1
Physical assaults by citizens of Kenya 0 16 1.3
Conflict with foreign entrepreneurs 0 11 0.9
Prejudice against my nationality 1 5 0.5

32 HUNGRY CITIES PARTNERSHIP
INCLUSIVE GROWTH AND INFORMAL FOOD VENDING IN NAIROBI, KENYA
7.1 Competition
There is competition between the vendors themselves and between the vendors and other retailers, such as supermarkets. More than two-thirds of the vendors said there were too many competitors in the neighbourhood and that this had reduced their number of customers and led to insufficient sales. Of these, com-petition with other vendors for customers’ money was experienced most fre-quently. Competition from supermarkets or other large stores was not seen as a major challenge in Nairobi. Only 19 of the vendors experienced this problem often/sometimes.
7.2 Operational Challenges
The major operational challenge, mentioned by nearly three-quarters (73%) of the vendors, was that suppliers charge too much for stock. This is definitely relat-ed to the high prices of many items, which can be attributed to erratic weather conditions and high cost of production. These high prices are likely to be passed to the consumers, affecting the vendors’ income and profit margins. Some ven-dors experience non-payment of debts by customers (48%), storage problems (39%), lack of access to credit (33%), and lack of refrigeration (22%). Less than 20% felt that they were inhibited by a lack of relevant training.
7.3 Threats to Safety and Security
Crime is not a major problem for the sampled informal food vendors. Only 13% had experienced theft of goods or stock and 7% theft of money/income in the previous year. However, almost one-third (31%) had experienced harass-ment, demands for bribes, and confiscation of goods by city county police (see Dragsted-Mutengwa 2018). A few had been arrested, detained or assaulted by police.
7.4 Other Operating Challenges
Other challenges mentioned by the food vendors include occupational health and hazards; extreme weather conditions; high costs of transport and electric-ity; seasonality of some food products and resultant fluctuating prices; rude and demanding customers who bargain too much; poor-quality stock and delays from suppliers; unconducive environmental conditions; food spoilage and con-tamination; inadequate access roads; demolition of, and eviction from, business premises; competition for space; fire outbreaks; fatigue, especially for mobile vendors; and lack of water, street lights and toilets.

HUNGRY CITIES REPORT NO. 21 33
8. FUTURE PLANS
The informal food vendors were asked about their business aspirations over the next three years. Almost three-quarters (71%) intend to expand and own sev-eral other businesses (Table 24). The rest intend to expand their businesses to other locations within Nairobi. Formalization was not a very popular aspiration, with only 17% of the vendors aiming to move their enterprises into the formal economy. Only 8% wanted to leave their businesses for formal employment. Very few vendors look forward to retiring from the informal sector, returning to their rural homes or relocating the business to another city or country. Preferred cities of relocation for those who do are Mombasa, Kisii, Kisumu, Machakos, Muranga, and Nakuru, while Dubai is the preferred country of relocation.
TABLE 24: Food Vendor Aspirations
No. % of vendors
I intend to expand my business operations and own several businesses 898 70.9
I intend to expand my business to other locations in the city/area 308 24.3
I intend to move my business into the formal economy 216 17.0
I intend to be working in formal employment instead 103 8.1
I intend to retire from running a business 61 4.8
I intend to return to my home area to live 27 2.1
I intend to relocate my business to another city 14 1.1
I intend to move to another country to live 2 0.2
Note: Multiple-response question
9. CONCLUSION
This survey of informal food vendors in Nairobi has confirmed the importance of the sector in providing livelihoods, income and employment opportunities while at the same time coping with a number of challenges. The main findings emanating from the survey are:
males and females; youth aged below 35; relatively well-educated but for-mally unemployed entrepreneurs; and Kenyan migrants from the rural parts of the country. Given their relatively young age and ease of entry into the informal sector, most of the vendors had started their businesses in the last decade, with more than half having been in business for less than five years.
The most cited economic motivations are the need for a source of income to

34 HUNGRY CITIES PARTNERSHIP
INCLUSIVE GROWTH AND INFORMAL FOOD VENDING IN NAIROBI, KENYA
survive, greater financial security, and being unemployed or unable to find a job. Although most vendors are survivalists who enter the informal food sec-tor because they have no choice, various entrepreneurial and business experi-ence motivations such as the desire to “be-my-own-boss” come into play and should not be dismissed as unimportant motivators.
or freely occupied. Most vendors started their business with relatively small amounts of money from their personal savings. Loans from financial insti-tutions were rare, with less than 2% relying on banks and micro-finance institutions. Despite the Nairobi City County Trade Licensing Act of 2019, only 15% of the vendors indicated that they paid trade licences and permits to operate their businesses.
and processed food. Even then, most vendors prefer stocking fast moving fresh produce, especially fruits and vegetables. These are fast-moving fresh produce, bought by many customers on a daily basis. The stock of food sold is largely sourced from other retailers in the city, especially wholesalers and formal markets, rather than directly from producers.
buying stock for sale), net monthly income, estimated current value of enter-prise, and access to infrastructure and services. The findings indicate that there is little integration of ICT in informal food vending enterprises; many vendors have been able to grow their net worth over time; food vending is a major source of household income for those involved; food vending enter-prises lack access to essential infrastructure and services; and most of the informal food vendors are single-person operations.
business strategies in a bid to attract and reach as many customers as possible, as well as to deal with increased competition in the sector. Most of them operate in places that attract the most customers, maintain good business relations with their regular customers, and extend their business operation hours. This increases the supply of food in the residential neighbourhoods.
operations and optimal role in the urban food system. Very few of have access to loans from formal financial institutions due to insufficient guarantees/collateral and the perception that their businesses are not viable for a bank loan. In addition, very few of those sampled had accessed government sup-port schemes, such as the Youth Fund, Uwezo Fund and Women Enterprise Fund. Other challenges are largely operational such as increased business competition, lack of essential infrastructure and services in business loca-tions, high cost of operations, and harassment from city county authorities.

HUNGRY CITIES REPORT NO. 21 35
In conclusion, the informal food sector is an important source of food, and as such making food more accessible and affordable in low-income areas and to food-insecure households in Nairobi. It is also a major source of employment and income for the vendors involved. The sustainability of the informal food economy will help to maintain food prices that are affordable for the urban poor and achieve an increased level of food security. There is therefore an urgent need to pay particular attention to the role of the informal food economy in the urban food system and urban food and nutrition security. City governments and authorities should provide an enabling environment and regulatory frameworks that support the sector’s inclusive growth, innovation and entrepreneurship. This will contribute to alleviating poverty and mitigating the crisis of food insecurity in urban areas.
REFERENCES
1. Berner, E., Gomez, G. and Knorringa, P. (2012). “Helping a Large Num-ber of People Become a Little Less Poor: The Logic of Survival Entrepre-neurs” European Journal of Development Research 24: 382-396.
2. Dragsted-Mutengwa, B. (2018). “Street Traders and “Good Officers”: Crackdowns as a Relational Form of Urban Governance in Nairobi” Arti-culo – Journal of Urban Research 17-18 (2018).
3. Hitimana, L., Allen, T. and Heinrigs, P. (2011). “Informal Economy and Food Security” West African Futures 6, OECD, Paris.
4. Kenya (2010). The Constitution of Kenya, 2010. Nairobi: Government Printers.
5. Knox, A., Bressers, H., Mohlakoana, N. and De Groot, J. (2019). “Aspira-tions to Grow: When Micro- and Informal Enterprises in the Street Food Sector Speak for Themselves” Journal of Global Entrepreneurship Research 9: 38.
6. Margolis, D. (2014). “By Choice and By Necessity: Entrepreneurship and Self-Employment in the Developing World” European Journal of Development Research 26: 419-436.
7. Owuor, S. (2018). The State of Household Food Security in Nairobi, Kenya HCP Report No. 11, Cape Town and Waterloo.
8. Owuor, S., Brown, A., Crush, J., Frayne, B. and Wagner, J. (2017). The Urban Food System of Nairobi, Kenya HCP Report No. 6, Cape Town and Waterloo.

36 HUNGRY CITIES PARTNERSHIP
INCLUSIVE GROWTH AND INFORMAL FOOD VENDING IN NAIROBI, KENYA
9. Raimundo, I., Wagner, J., Crush, J., Abrahamo, E. and McCordic, C. (2019). Inclusive Growth and Informal Vending in Maputo’s Food Markets HCP Report No. 18. Cape Town and Waterloo: Hungry Cities Partnership.
10. Tawodzera, G. and Crush, J. (2019). Inclusive Growth and the Informal Food Sector in Cape Town, South Africa Hungry Cities Report No. 16, Cape Town and Waterloo.
11. Williams, C. and Gurtoo, A. (2012). “Evaluating Competing Theories of Street Entrepreneurship: Some Lessons from a Study of Street Vendors in Bangalore, India” International Entrepreneurship and Management Journal 8: 391-409.
12. Young, G. and Crush, J. (2019). “Governing the Informal Food Sector in Cities of the Global South” HCP Discussion Paper No. 30, Cape Town and Waterloo.

This report presents and analyzes the findings of a city-wide informal food
vendors survey conducted by the Hungry Cities Partnership in Nairobi,
Kenya. The survey findings demonstrate that the informal food sector
makes food more accessible and affordable in low-income areas and to
food-insecure households in Nairobi. It is also a major source of employ-
ment and income for the vendors involved. The food retail, distribution,
and preparation sector is a major component of urban informality in the
Global South. The informal food economy comprises a dense and diverse
network of informal markets, suppliers, transporters, mobile traders,
hawkers, retailers, and street food vendors. Through making food more
accessible and affordable to poor urban households, the informal food
sector is critical to food security in rapidly growing towns and cities in the
Global South. While the vibrancy of the sector is everywhere apparent,
research on the structure, organization, dynamics, and impacts of
informal food systems under conditions of hyper-urbanization has been
limited. What is clear is that the informal food sector is both diverse and
complex. By working in an interdisciplinary context with mixed method-
ologies and across different cities, the Hungry Cities Partnership aims to
add considerably to our understanding of common elements and differ-
ences across the Global South.
HUNGRY CITIES PARTNERSHIP