informal settlements profiling report: nairobi
TRANSCRIPT
1 | P a g e
INFORMAL SETTLEMENTS PROFILING REPORT: NAIROBI
COUNTY
DRAFT REPORT
COMPILED BY:
Slum Dwellers International- Kenya
Muungano wa Wanavijiji
Muungano Support Trust
2 | P a g e
Table of Contents
SETTLEMENT PROFILING OVERVIEW ................................................................................3
Mukuru S.P.A Settlement profiling in 2016 .............................................................................3
Land size, tenure and population of informal settlements in Nairobi county (2014) ..................4
Mukuru Settlements (Viwandani, Kwa Njenga and Kwa Reuben) Profiling in 2016 .............. 11
3 | P a g e
SETTLEMENT PROFILING OVERVIEW
Muungano wa wanavijiji conducted an informal settlement profiling within the larger Nairobi
county, in the year 2014. The aim was to document the total population within these informal
settlements, the basic services (such as water taps and number of toilets) available and their
functionality; and as a tool to inform proper service delivery. The exercise was a community led
action research in response to the following:
Access to land (eviction threat)
Access to services (water and sanitation, electricity, health, education etc)
Livelihood options.
Demand for planning and housing.
As a tool for advocacy.
It was identified, after profiling, that there were 158 informal settlements within the county of
Nairobi. A Household and structure tallying form was used in each settlement to provide
settlement structure and household (population) details.
Mukuru S.P.A Settlement profiling in 2016
A settlement profile of Mukuru, which is situated in Embakasi South and Makadara Sub-counties
in Nairobi County, was conducted in the year 2016. Profiling was conducted in order to get the
total population of mukuru Viwandani, Kwa Reuban and Kwa Njenga settlements, which would
then inform the Integrated Urban development plan for the area. This data was instrumental in
revealing the high population of Mukuru, which is faced by unique challenges of poor and
insufficient infrastructure; overstretched utilities; congestion; poor housing and public health
challenges among others. The settlement’s high population, coupled by the faced challenges led to
the declaration of the area as a Special Planning Area, by the county government of Nairobi in
2017. The County government, Slum Dwellers International (SDI-K), Akiba Mashinani Trust
(AMT) among other partners were therefore tasked to come up with an Integrated Urban
Development Plan for the area within a period of 2 years, in order to improve the livelihoods and
living standards of the residents, and mainstream Mukuru to the benefits accrued by the larger
Nairobi County.
Below is a summary of the total number of households and population per settlement within the
informal settlements, for the year 2014 and 2016 respectively:
4 | P a g e
Land size, tenure and population of informal settlements in Nairobi county (2014)
Constituency Settlement Village No. of structures Land size
(acres)
Household
number
Total population
Mathare Mathare Mathare Village 2 411
22.24 4,991 19,963
Mathare Mathare Kiamutisya 593
12.36 3,786 15,143
Mathare Mathare Kosovo 244
19.77 5,761 23,046
Mathare Mathare Mathare 3B 392
19.77 4,597 18,389
Mathare Mathare Mathare 3C 549
19.77 4,056 16,225
Mathare Mathare Mathare 4A 1007
56.83 8,013 32,057
Mathare Mathare Mathare 4B 410
10 2,483 9,931
Mathare Mathare Mathare no. 10 142
4.94 1,530 6,120
Mathare Mathare Mashimoni 469
18 2,843 11,371
Mathare Mathare Kambi Moto 763
8 6165 36987
Mathare Mathare Gitathuru 621
21 600 3,000
Mathare Mathare Kwa Kariuki 301
14.83 2,995 11,980
Mathare Mathare Mabatini 375
2 465 1,867
Mathare Huruma Gitathuru 379
12.36 2,484 9,936
Mathare Huruma Mahira 161
1.46 808 4,040
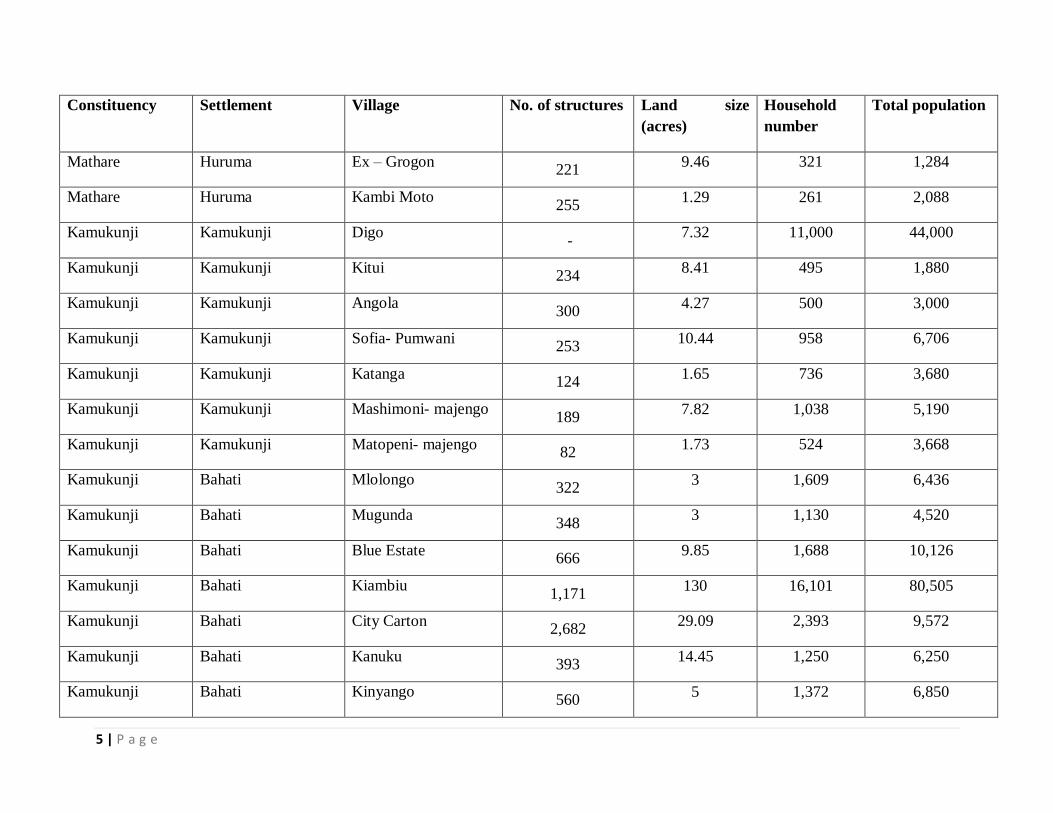
5 | P a g e
Constituency Settlement Village No. of structures Land size
(acres)
Household
number
Total population
Mathare Huruma Ex – Grogon 221
9.46 321 1,284
Mathare Huruma Kambi Moto 255
1.29 261 2,088
Kamukunji Kamukunji Digo -
7.32 11,000 44,000
Kamukunji Kamukunji Kitui 234
8.41 495 1,880
Kamukunji Kamukunji Angola 300
4.27 500 3,000
Kamukunji Kamukunji Sofia- Pumwani 253
10.44 958 6,706
Kamukunji Kamukunji Katanga 124
1.65 736 3,680
Kamukunji Kamukunji Mashimoni- majengo 189
7.82 1,038 5,190
Kamukunji Kamukunji Matopeni- majengo 82
1.73 524 3,668
Kamukunji Bahati Mlolongo 322
3 1,609 6,436
Kamukunji Bahati Mugunda 348
3 1,130 4,520
Kamukunji Bahati Blue Estate 666
9.85 1,688 10,126
Kamukunji Bahati Kiambiu 1,171
130 16,101 80,505
Kamukunji Bahati City Carton 2,682
29.09 2,393 9,572
Kamukunji Bahati Kanuku 393
14.45 1,250 6,250
Kamukunji Bahati Kinyango 560
5 1,372 6,850
6 | P a g e
Constituency Settlement Village No. of structures Land size
(acres)
Household
number
Total population
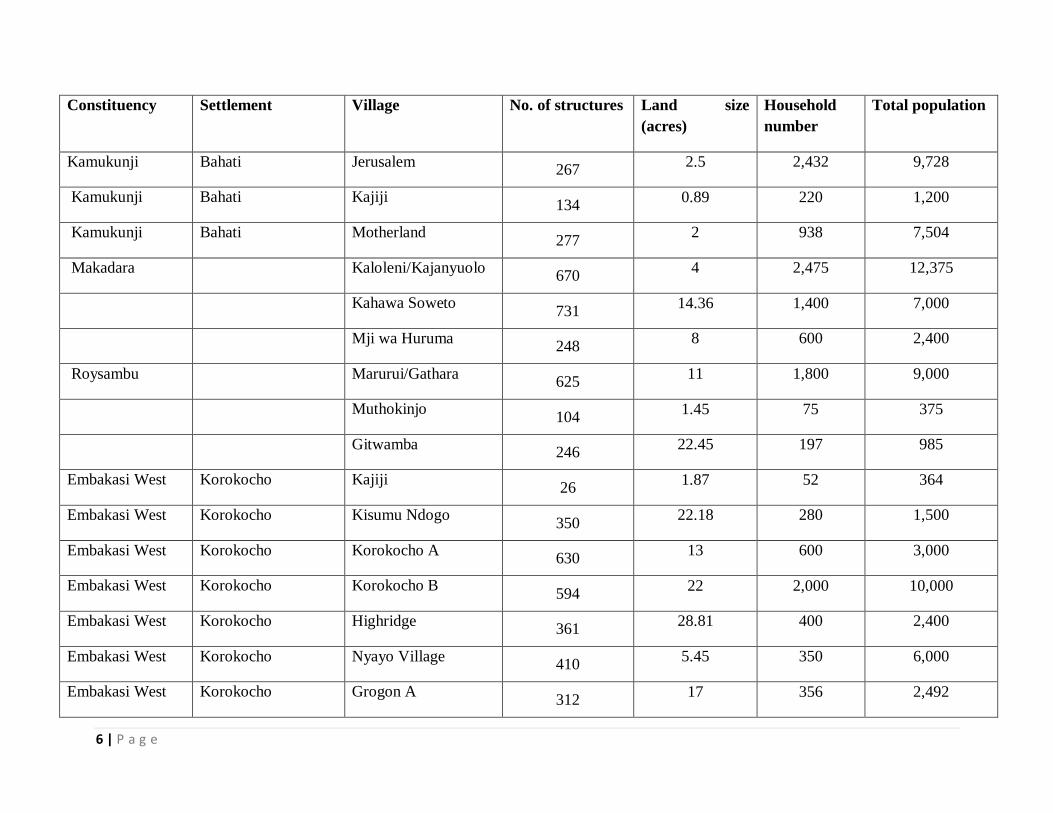
Kamukunji Bahati Jerusalem 267
2.5 2,432 9,728
Kamukunji Bahati Kajiji 134
0.89 220 1,200
Kamukunji Bahati Motherland 277
2 938 7,504
Makadara Kaloleni/Kajanyuolo 670
4 2,475 12,375
Kahawa Soweto 731
14.36 1,400 7,000
Mji wa Huruma 248
8 600 2,400
Roysambu Marurui/Gathara 625
11 1,800 9,000
Muthokinjo 104
1.45 75 375
Gitwamba 246
22.45 197 985
Embakasi West Korokocho Kajiji 26
1.87 52 364
Embakasi West Korokocho Kisumu Ndogo 350
22.18 280 1,500
Embakasi West Korokocho Korokocho A 630
13 600 3,000
Embakasi West Korokocho Korokocho B 594
22 2,000 10,000
Embakasi West Korokocho Highridge 361
28.81 400 2,400
Embakasi West Korokocho Nyayo Village 410
5.45 350 6,000
Embakasi West Korokocho Grogon A 312
17 356 2,492
7 | P a g e
Constituency Settlement Village No. of structures Land size
(acres)
Household
number
Total population
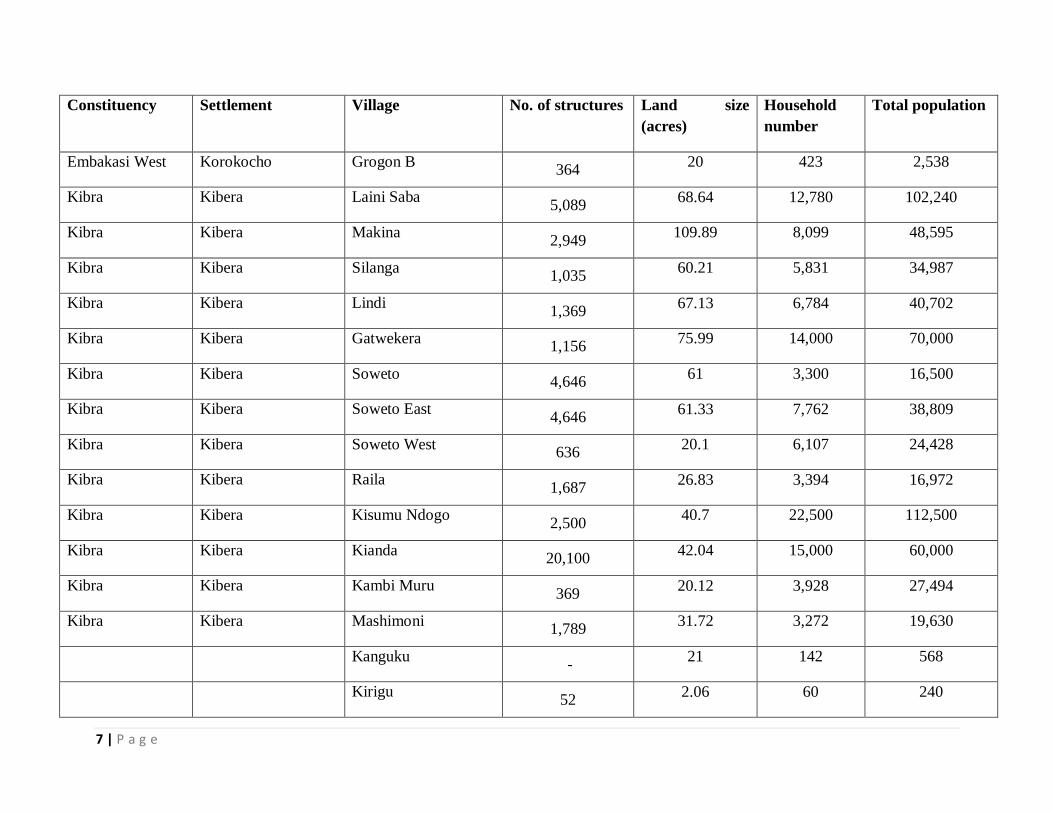
Embakasi West Korokocho Grogon B 364
20 423 2,538
Kibra Kibera Laini Saba 5,089
68.64 12,780 102,240
Kibra Kibera Makina 2,949
109.89 8,099 48,595
Kibra Kibera Silanga 1,035
60.21 5,831 34,987
Kibra Kibera Lindi 1,369
67.13 6,784 40,702
Kibra Kibera Gatwekera 1,156
75.99 14,000 70,000
Kibra Kibera Soweto 4,646
61 3,300 16,500
Kibra Kibera Soweto East 4,646
61.33 7,762 38,809
Kibra Kibera Soweto West 636
20.1 6,107 24,428
Kibra Kibera Raila 1,687
26.83 3,394 16,972
Kibra Kibera Kisumu Ndogo 2,500
40.7 22,500 112,500
Kibra Kibera Kianda 20,100
42.04 15,000 60,000
Kibra Kibera Kambi Muru 369
20.12 3,928 27,494
Kibra Kibera Mashimoni 1,789
31.72 3,272 19,630
Kanguku -
21 142 568
Kirigu 52
2.06 60 240
8 | P a g e
Constituency Settlement Village No. of structures Land size
(acres)
Household
number
Total population
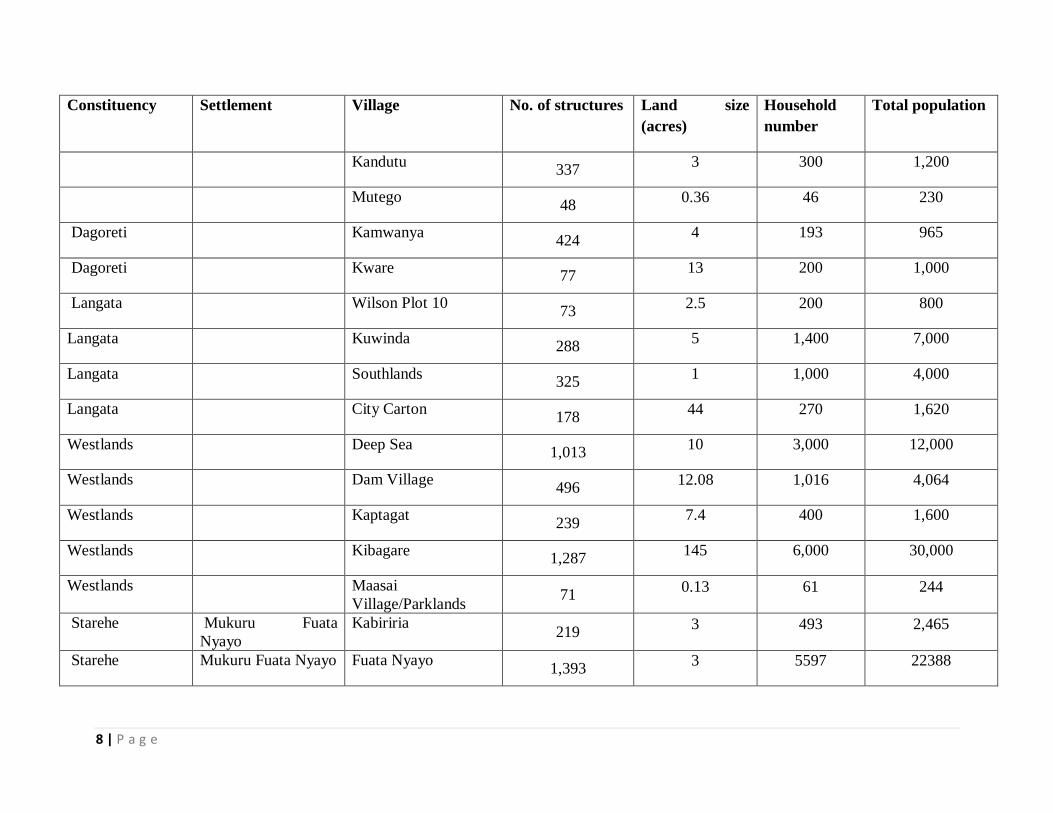
Kandutu 337
3 300 1,200
Mutego 48
0.36 46 230
Dagoreti Kamwanya 424
4 193 965
Dagoreti Kware 77
13 200 1,000
Langata Wilson Plot 10 73
2.5 200 800
Langata Kuwinda 288
5 1,400 7,000
Langata Southlands 325
1 1,000 4,000
Langata City Carton 178
44 270 1,620
Westlands Deep Sea 1,013
10 3,000 12,000
Westlands Dam Village 496
12.08 1,016 4,064
Westlands Kaptagat 239
7.4 400 1,600
Westlands Kibagare 1,287
145 6,000 30,000
Westlands Maasai
Village/Parklands 71
0.13 61 244
Starehe Mukuru Fuata
Nyayo
Kabiriria 219
3 493 2,465
Starehe Mukuru Fuata Nyayo Fuata Nyayo 1,393
3 5597 22388
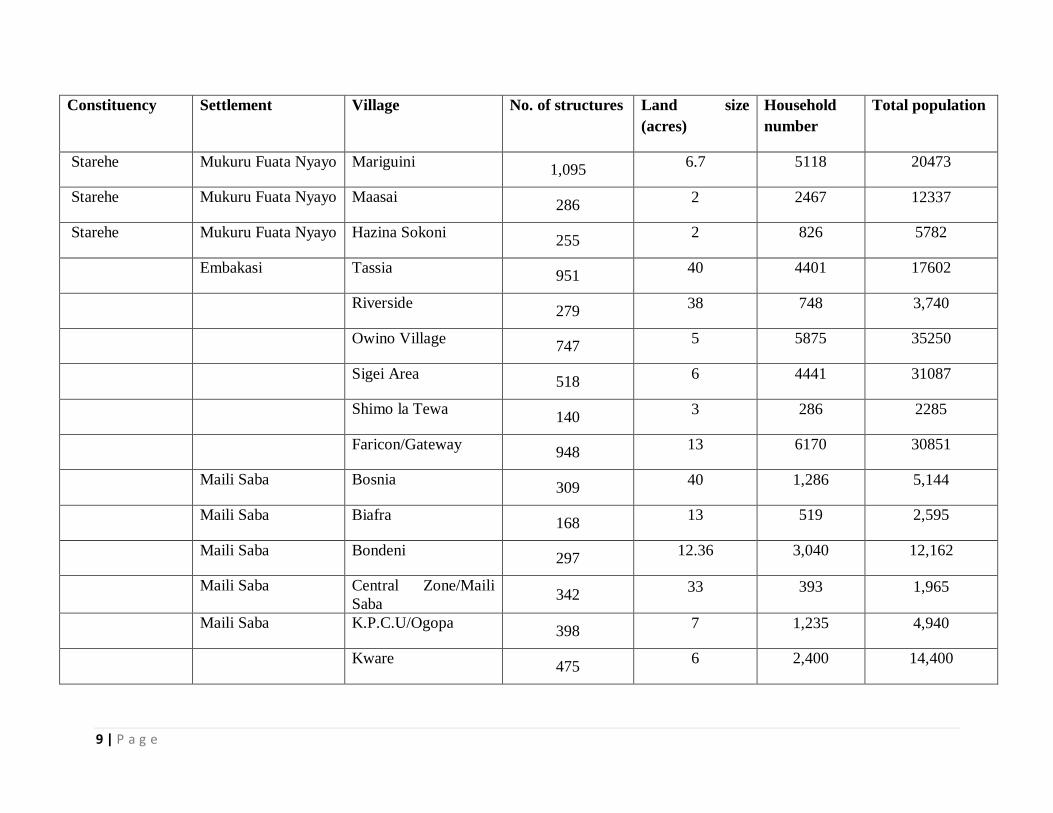
9 | P a g e
Constituency Settlement Village No. of structures Land size
(acres)
Household
number
Total population
Starehe Mukuru Fuata Nyayo Mariguini 1,095
6.7 5118 20473
Starehe Mukuru Fuata Nyayo Maasai 286
2 2467 12337
Starehe Mukuru Fuata Nyayo Hazina Sokoni 255
2 826 5782
Embakasi Tassia 951
40 4401 17602
Riverside 279
38 748 3,740
Owino Village 747
5 5875 35250
Sigei Area 518
6 4441 31087
Shimo la Tewa 140
3 286 2285
Faricon/Gateway 948
13 6170 30851
Maili Saba Bosnia 309
40 1,286 5,144
Maili Saba Biafra 168
13 519 2,595
Maili Saba Bondeni 297
12.36 3,040 12,162
Maili Saba Central Zone/Maili
Saba 342
33 393 1,965
Maili Saba K.P.C.U/Ogopa 398
7 1,235 4,940
Kware 475
6 2,400 14,400
10 | P a g e
Constituency Settlement Village No. of structures Land size
(acres)
Household
number
Total population
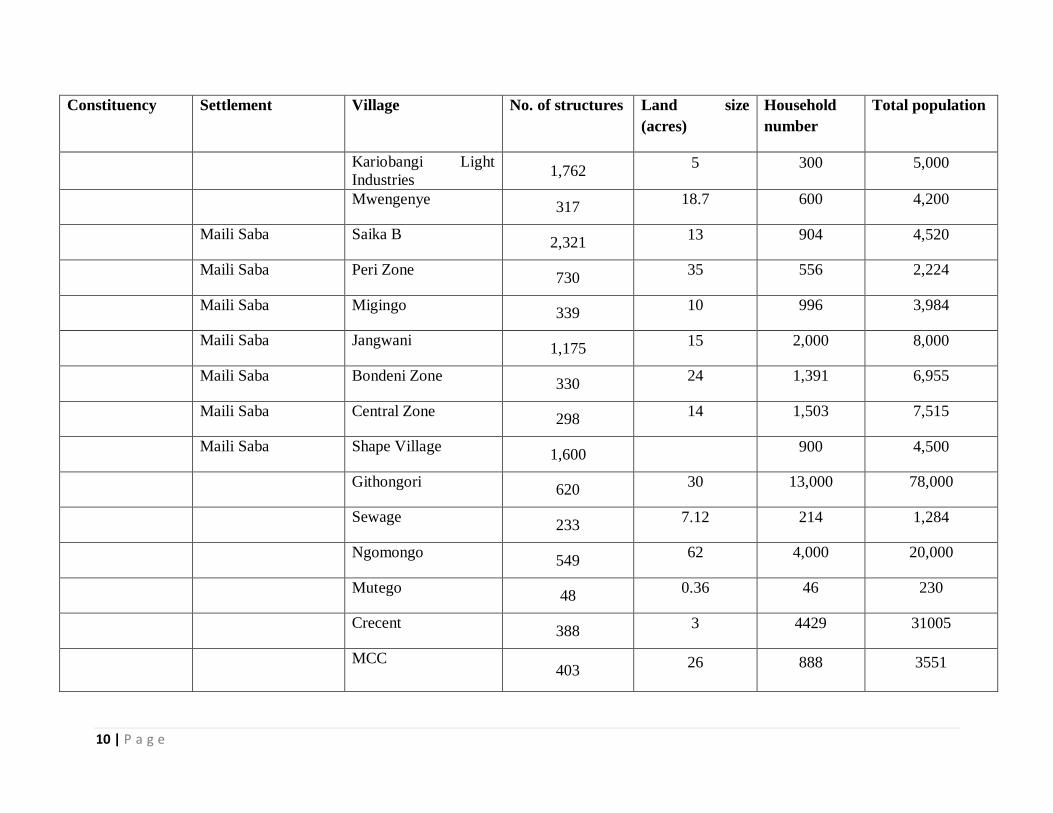
Kariobangi Light
Industries 1,762
5 300 5,000
Mwengenye 317
18.7 600 4,200
Maili Saba Saika B 2,321
13 904 4,520
Maili Saba Peri Zone 730
35 556 2,224
Maili Saba Migingo 339
10 996 3,984
Maili Saba Jangwani 1,175
15 2,000 8,000
Maili Saba Bondeni Zone 330
24 1,391 6,955
Maili Saba Central Zone 298
14 1,503 7,515
Maili Saba Shape Village 1,600
900 4,500
Githongori 620
30 13,000 78,000
Sewage 233
7.12 214 1,284
Ngomongo 549
62 4,000 20,000
Mutego 48
0.36 46 230
Crecent 388
3 4429 31005
MCC 403
26 888 3551
11 | P a g e
Constituency Settlement Village No. of structures Land size
(acres)
Household
number
Total population
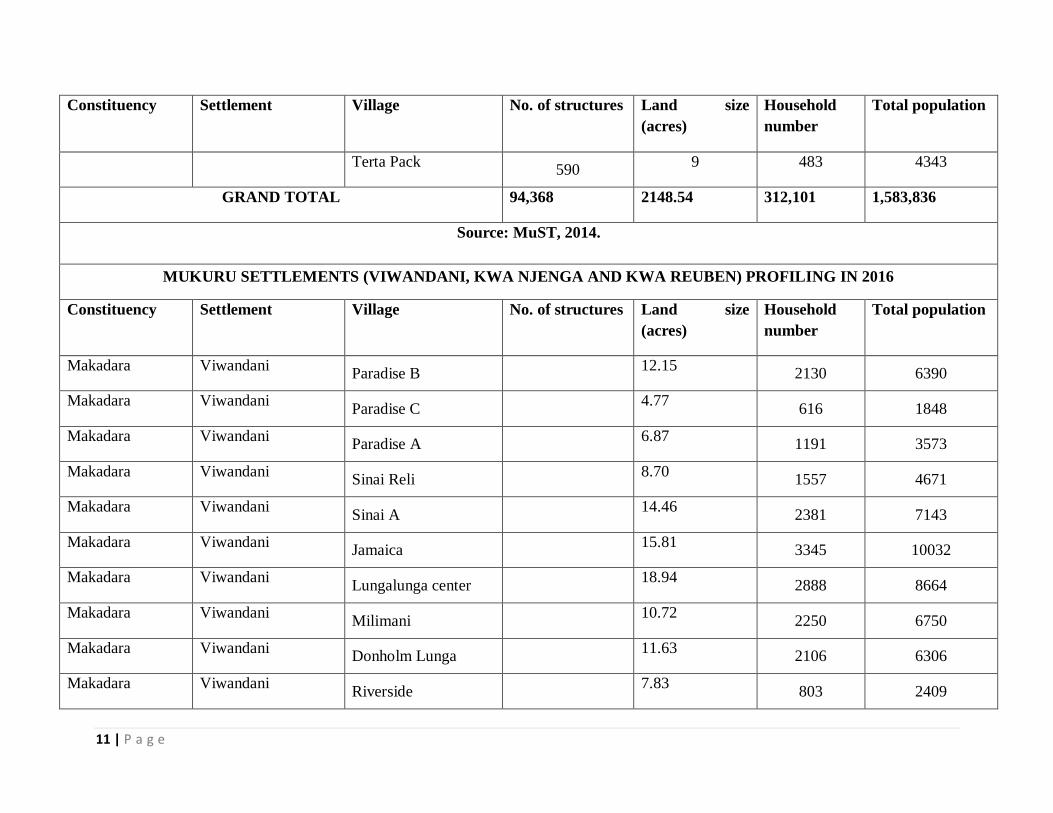
Terta Pack 590
9 483 4343
GRAND TOTAL 94,368 2148.54 312,101 1,583,836
Source: MuST, 2014.
MUKURU SETTLEMENTS (VIWANDANI, KWA NJENGA AND KWA REUBEN) PROFILING IN 2016
Constituency Settlement Village No. of structures Land size
(acres)
Household
number
Total population
Makadara Viwandani Paradise B
12.15 2130 6390
Makadara Viwandani Paradise C
4.77 616 1848
Makadara Viwandani Paradise A
6.87 1191 3573
Makadara Viwandani Sinai Reli
8.70 1557 4671
Makadara Viwandani Sinai A
14.46 2381 7143
Makadara Viwandani Jamaica
15.81 3345 10032
Makadara Viwandani Lungalunga center
18.94 2888 8664
Makadara Viwandani Milimani
10.72 2250 6750
Makadara Viwandani Donholm Lunga
11.63 2106 6306
Makadara Viwandani Riverside
7.83 803 2409
12 | P a g e
Constituency Settlement Village No. of structures Land size
(acres)
Household
number
Total population
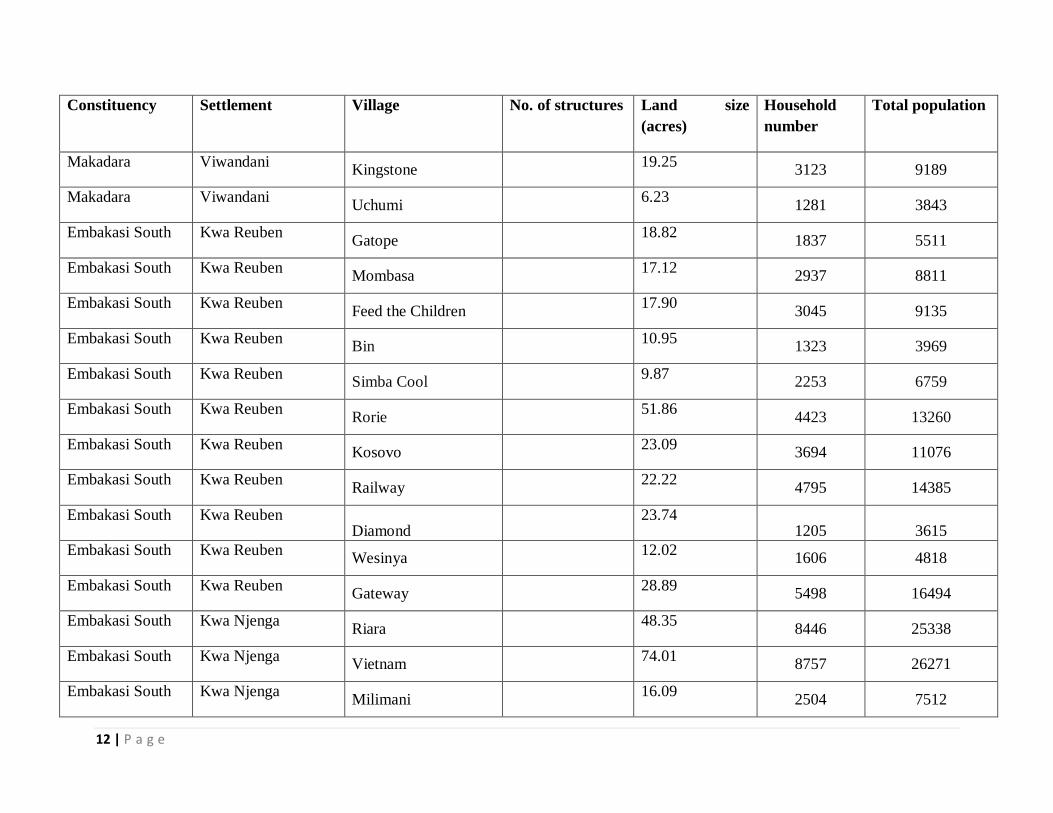
Makadara Viwandani Kingstone
19.25 3123 9189
Makadara Viwandani Uchumi
6.23 1281 3843
Embakasi South Kwa Reuben Gatope
18.82 1837 5511
Embakasi South Kwa Reuben Mombasa
17.12 2937 8811
Embakasi South Kwa Reuben Feed the Children
17.90 3045 9135
Embakasi South Kwa Reuben Bin
10.95 1323 3969
Embakasi South Kwa Reuben Simba Cool
9.87 2253 6759
Embakasi South Kwa Reuben Rorie
51.86 4423 13260
Embakasi South Kwa Reuben Kosovo
23.09 3694 11076
Embakasi South Kwa Reuben Railway
22.22 4795 14385
Embakasi South Kwa Reuben Diamond
23.74 1205 3615
Embakasi South Kwa Reuben Wesinya
12.02 1606 4818
Embakasi South Kwa Reuben Gateway
28.89 5498 16494
Embakasi South Kwa Njenga Riara
48.35 8446 25338
Embakasi South Kwa Njenga Vietnam
74.01 8757 26271
Embakasi South Kwa Njenga Milimani
16.09 2504 7512
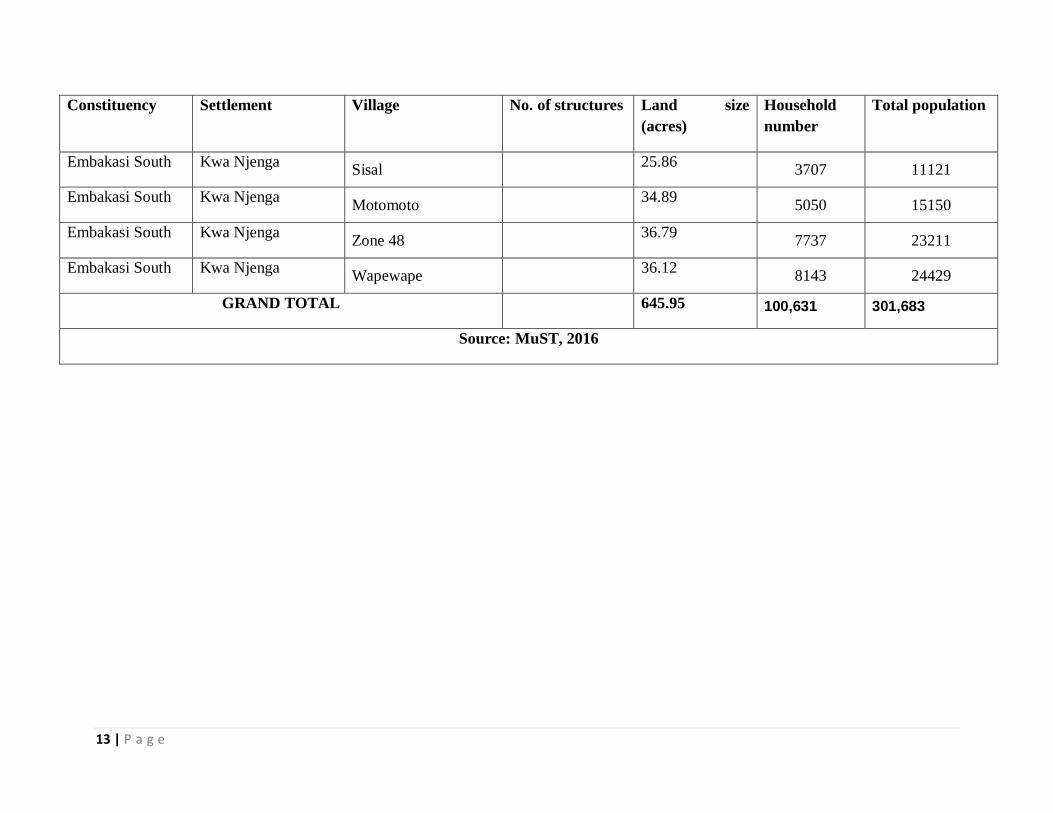
13 | P a g e
Constituency Settlement Village No. of structures Land size
(acres)
Household
number
Total population
Embakasi South Kwa Njenga Sisal
25.86 3707 11121
Embakasi South Kwa Njenga Motomoto
34.89 5050 15150
Embakasi South Kwa Njenga Zone 48
36.79 7737 23211
Embakasi South Kwa Njenga Wapewape
36.12 8143 24429
GRAND TOTAL 645.95 100,631 301,683
Source: MuST, 2016