improvement of crack-detection accuracy using a novel crack defragmentation technique in image-based...
TRANSCRIPT

Improvement of Crack-Detection Accuracy Using aNovel Crack Defragmentation Technique in
Image-Based Road AssessmentLiuliu Wu, S.M.ASCE1; Soroush Mokhtari, S.M.ASCE2; Abdenour Nazef, M.ASCE3;
Boohyun Nam, A.M.ASCE4; and Hae-Bum Yun, M.ASCE5
Abstract: A common problem of crack-extraction algorithms is that extracted crack image components are usually fragmented in theircrack paths. A novel crack-defragmentation technique, MorphLink-C, is proposed to connect crack fragments for road pavement. It consistsof two subprocesses, including fragment grouping using the dilation transform and fragment connection using the thinning transform. Theproposed fragment connection technique is self-adaptive for different crack types, without involving time-consuming computations of crackorientation, length, and intensity. The proposed MorphLink-C is evaluated using realistic flexible pavement images collected by the FloridaDepartment of Transportation (FDOT). Statistical hypothesis tests are conducted to analyze false positive and negative errors in crack/no-crack classification using an artificial neural network (ANN) classifier associated with feature subset selection methods. The results showthat MorphLink-C improves crack-detection accuracy and reduces classifier training time for all 63 combinations of crack feature subsets thatwere tested. The proposed method provides an effective way of computing averaged crack width that is an important measure in road ratingapplications. DOI: 10.1061/(ASCE)CP.1943-5487.0000451. © 2014 American Society of Civil Engineers.
Author keywords: Crack; Road pavement; Image processing; Automated crack detection; Non-destructive evaluation; Bottom-hattransform; Dilation transform; Thinning transform.
Introduction
Effective maintenance of aging road pavement is a great engineer-ing challenge for road maintenance authorities. The road networkin the U.S. includes more than 4 million miles of public roadways.According to the ASCE (2013), 32% of America’s major roads arein poor or mediocre condition, costing U.S. motorists who travel ondeficient pavement $67 billion per year in additional repairs andoperating costs. It is estimated that $101 billion in annual capitalinvestment is needed to maintain the current pavement conditionbetween 2008 and 2028, and $170 billion per year to improvethe current mediocre condition. However, federal, state, and localgovernments are spending only $91 billion per year due to budgetlimitations. It is established that current pavement maintenance
approaches are not sustainable, and will lead to rapid decreaseof pavement condition and performance due to underfundingmaintenance.
Pavement preventive maintenance has received increasing atten-tion by many road maintenance agencies as an effort to improveroad maintenance efficiency under current budget conditions(Federal Highway Administration 2001). Pavement preventivemaintenance is defined by AASHTO’s leading team for pavementpreservation as “applying the right treatment to the right pavementat the right time.” Therefore, accurate pavement condition assess-ment is vital for effective pavement prevention maintenance.Accurate condition assessment capability also is necessary topredict future deterioration rates and to establish rehabilitationstrategies and budgets.
Image-processing techniques to assess road conditions areconsidered as a promising non-destructive method to quantifypavement distresses by analyzing pavement surface images. Cracksdetected via computer vision can be defined as a group of low-intensity pixels compared to neighboring pixels, which form anarbitrary line shape with length, width, and directionality (at thecrack-pixel level). One or more crack pixels can form into a com-plicated crack network of a single line, branched line, or polygon,which are not necessarily continuous in their line paths due to frag-mentation of the crack pixels (at the crack-network level). To dealwith the multilevel topological shapes of crack images, the follow-ing four-level image-processing approach needs to be integratedand employed for computer-aided crack recognition: (1) crackextraction, (2) crack grouping, (3) crack detection, and (4) crackclassification. A description of each image-processing level isshown in Fig. 1.
For the crack-extraction process (Level 1), many crack-extraction algorithms have been developed. In early research, mostcrack-detection approaches were statistical thresholding methods.
1Graduate Student, Dept. of Civil, Environmental, and ConstructionEngineering, Univ. of Central Florida, 4000 Central Florida Blvd., Orlando,FL 32816. E-mail: [email protected]
2Graduate Student, Dept. of Civil, Environmental, and ConstructionEngineering, Univ. of Central Florida, 4000 Central Florida Blvd., Orlando,FL 32816. E-mail: [email protected]
3Pavement Materials Systems Engineer, Florida Dept. of Transporta-tion, 5007 N.E. 39th Ave., Gainesville, FL 32609. E-mail: [email protected]
4Assistant Professor, Dept. of Civil, Environmental, and ConstructionEngineering, Univ. of Central Florida, 4000 Central Florida Blvd., Orlando,FL 32816. E-mail: [email protected]
5Assistant Professor, Dept. of Civil, Environmental, and ConstructionEngineering, Univ. of Central Florida, 4000 Central Florida Blvd., Orlando,FL 32816 (corresponding author). E-mail: [email protected]
Note. This manuscript was submitted on March 11, 2014; approved onSeptember 29, 2014; published online on November 14, 2014. Discussionperiod open until April 14, 2015; separate discussions must be submittedfor individual papers. This paper is part of the Journal of Computing inCivil Engineering, © ASCE, ISSN 0887-3801/04014118(19)/$25.00.
© ASCE 04014118-1 J. Comput. Civ. Eng.
J. Comput. Civ. Eng.
Dow
nloa
ded
from
asc
elib
rary
.org
by
Uni
vers
ity o
f C
entr
al F
lori
da o
n 05
/14/
15. C
opyr
ight
ASC
E. F
or p
erso
nal u
se o
nly;
all
righ
ts r
eser
ved.

For example, Koutsopoulos and Downey (1993) compared fourintensity-thresholding methods, including Otsu’s method (Otsu1979), regression-based histogram method, relaxation method,and Kittler’s method (Kittler and Illingworth 1986). They observedthat the regression-based histogram method provided the bestresults for pavement crack detection. Oliveira and Correia (2009)calculated the difference between a modified Otsu’s method (Donget al. 2008) and half of the standard deviation of all image pixelintensities as the threshold to separate pixels into non-cracksand potential cracks. In Nguyen et al. (2011), the connected pixelsin four orientations (0°, 45°, 90°, and 135°) with the smallestsummed intensity constructed four minimal paths. Pavement sur-face texture, crack shapes, and pixel intensity have been used ascrack features to improve crack-detection accuracy. Song et al.(1995), Petrou et al. (1996), and Hu and Zhao (2010) used textureanalysis to abstract the crack information. Yan et al. (2007), andSun and Qiu (2007) used shape information and morphological fil-ters to identify crack locations. Another popular approach for crackextraction uses edge-detection methods. Tsao et al. (1994), Li(2003), and Ayenu-Prah and Attoh-Okine (2008) applied the tradi-tional Sobel edge-detection method to identify pavement cracklocations. Tsai et al. (2010) found that the dynamic optimizationmethod for pavement crack detection outperformed six differentmethods, including statistical thresholding, Canny edge-detection,multiscale wavelet, crack-seed identification, iterative clipping, anddynamic optimization methods. Seed-growing methods havegained attention recently for pavement crack extraction. In this ap-proach, seed pixels are usually selected for local minimum intensitypixels. When a seed pixel is connected to neighboring low-intensitypixels, the connected lines form a crack shape. Crack-seed verifi-cation (Huang and Xu 2006), F� seed growing (Li et al. 2011),CrackTree (Zou et al. 2012), and tensor voting (Huang et al.2014) are some extensions of the seed-growing-based algorithms.Morphological methods that process images using structural ele-ments have been employed for pavement crack extraction. Thestructuring element is a binary image component with a certainshape and size, which is used to manipulate images. In Yan et al.(2007), crack edges were obtained by applying a morphologicaldilation transform subtracted from a morphological erosion trans-form. Sun et al. (2009) used dilation and erosion transforms to fillgaps between crack disjoints. Then, two crack objects were con-nected together if their endpoints were in the same neighbor area
(i.e., 4 rows and 20 columns for a horizontal crack). Jing and Aiqin(2010) used a morphological opening transform to remove isolatedcrack noise. Mancini et al. (2013) extracted crack componentsusing a top-hat transform. Different pavement distress types, suchas potholes, were studied by Koch and Brilakis (2011) and Kochet al. (2013). Golparvar-Fard et al. (2012) extended their image-based studies for the recognition of various highway assets usingthree-dimensional (3D) laser scanning point-cloud data combinedwith a semantic texton forests approach.
A technical challenge in the crack-extraction process (Level 1)is that cracks should be extracted from random pavement back-ground due to large variations of texture, roughness, intensity,spots, stains, oil, water spilling, and road markings. In addition,pavement cracks vary greatly in their shapes, sizes, and widths,and multiple cracks can form a more complicated crack network,such as branched, block, and alligator cracks. The resulting crackimages usually include many non-crack objects due to randombackground noise. Therefore, an effective crack-detection process(Level 3) is necessary to remove non-crack objects to increase crackrecognition accuracy. Another problem in Level 1 is that crackimage components are usually fragmented and have (multiple)disjoints in their crack paths. Hence, a crack-grouping process(Level 2) should be employed because crack fragmentation canobscure crack features, which reduces crack-recognition accuracy.
The first objective of this study is to propose an automatedimage-processing method that integrates the crack-extraction,crack-grouping, and crack-detection processes. To validate the pro-posed method, flexible pavement surface images are used, whichhave been collected with a laser road imaging system (LRIS) by theFDOT. The morphological bottom-hat transform (Salembier 1990)is used to extract crack images. The bottom-hat transform caneffectively extract crack image components by removing variousrandom pavement backgrounds, including pixel-level intensitynoise due to rough pavement texture and regional-level noisedue to partial surface wetness. Although the bottom-hat transformcan extract crack components from flexible pavement images, theyare usually fragmented in their crack paths. Thus, it is necessary toemploy a crack-grouping algorithm. In this study, a novel crack-grouping algorithm, called MorphLink-C, is proposed for de-fragmentation after the crack-extraction process. This algorithm isbased on the morphological technique, and consists of the follow-ing two steps: (1) fragment grouping using the dilation transform,
Fig. 1. Levels of crack recognition in road-rating applications
© ASCE 04014118-2 J. Comput. Civ. Eng.
J. Comput. Civ. Eng.
Dow
nloa
ded
from
asc
elib
rary
.org
by
Uni
vers
ity o
f C
entr
al F
lori
da o
n 05
/14/
15. C
opyr
ight
ASC
E. F
or p
erso
nal u
se o
nly;
all
righ
ts r
eser
ved.
and (2) fragment connection using the thinning transform. Theadvantages of the proposed MorphLink-C algorithm include thefollowing:1. It can be used with an arbitrary crack-extraction method;2. The connection of crack fragments is self-adaptive and does
not involve complicated calculations of crack orientation,length, and intensity for arbitrary crack types, such as single,branched, block, and alligator cracks; and
3. It provides a simple and accurate way to measure crack width,which is an important measure in road-rating applications.
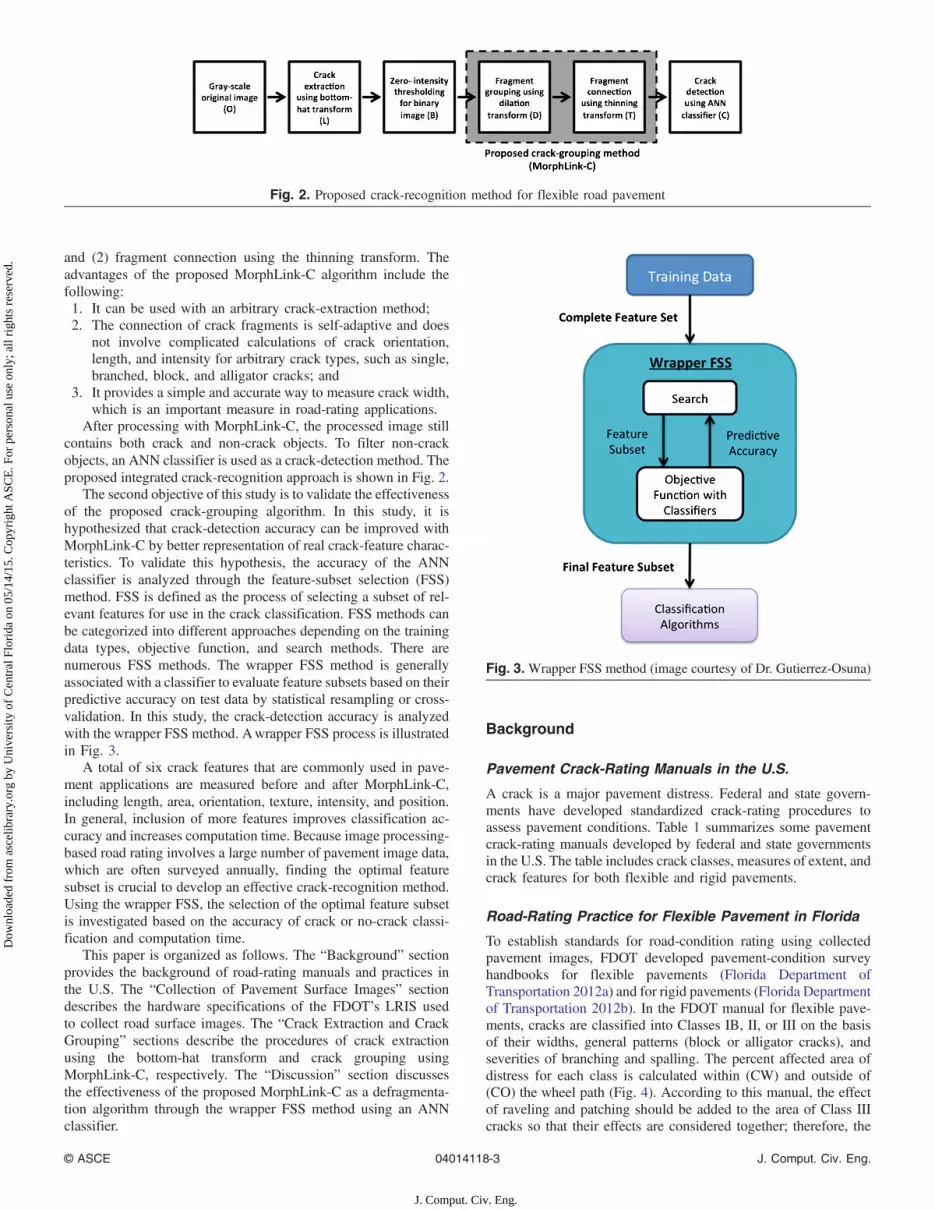
After processing with MorphLink-C, the processed image stillcontains both crack and non-crack objects. To filter non-crackobjects, an ANN classifier is used as a crack-detection method. Theproposed integrated crack-recognition approach is shown in Fig. 2.
The second objective of this study is to validate the effectivenessof the proposed crack-grouping algorithm. In this study, it ishypothesized that crack-detection accuracy can be improved withMorphLink-C by better representation of real crack-feature charac-teristics. To validate this hypothesis, the accuracy of the ANNclassifier is analyzed through the feature-subset selection (FSS)method. FSS is defined as the process of selecting a subset of rel-evant features for use in the crack classification. FSS methods canbe categorized into different approaches depending on the trainingdata types, objective function, and search methods. There arenumerous FSS methods. The wrapper FSS method is generallyassociated with a classifier to evaluate feature subsets based on theirpredictive accuracy on test data by statistical resampling or cross-validation. In this study, the crack-detection accuracy is analyzedwith the wrapper FSS method. Awrapper FSS process is illustratedin Fig. 3.
A total of six crack features that are commonly used in pave-ment applications are measured before and after MorphLink-C,including length, area, orientation, texture, intensity, and position.In general, inclusion of more features improves classification ac-curacy and increases computation time. Because image processing-based road rating involves a large number of pavement image data,which are often surveyed annually, finding the optimal featuresubset is crucial to develop an effective crack-recognition method.Using the wrapper FSS, the selection of the optimal feature subsetis investigated based on the accuracy of crack or no-crack classi-fication and computation time.
This paper is organized as follows. The “Background” sectionprovides the background of road-rating manuals and practices inthe U.S. The “Collection of Pavement Surface Images” sectiondescribes the hardware specifications of the FDOT’s LRIS usedto collect road surface images. The “Crack Extraction and CrackGrouping” sections describe the procedures of crack extractionusing the bottom-hat transform and crack grouping usingMorphLink-C, respectively. The “Discussion” section discussesthe effectiveness of the proposed MorphLink-C as a defragmenta-tion algorithm through the wrapper FSS method using an ANNclassifier.
Background
Pavement Crack-Rating Manuals in the U.S.
A crack is a major pavement distress. Federal and state govern-ments have developed standardized crack-rating procedures toassess pavement conditions. Table 1 summarizes some pavementcrack-rating manuals developed by federal and state governmentsin the U.S. The table includes crack classes, measures of extent, andcrack features for both flexible and rigid pavements.
Road-Rating Practice for Flexible Pavement in Florida
To establish standards for road-condition rating using collectedpavement images, FDOT developed pavement-condition surveyhandbooks for flexible pavements (Florida Department ofTransportation 2012a) and for rigid pavements (Florida Departmentof Transportation 2012b). In the FDOT manual for flexible pave-ments, cracks are classified into Classes IB, II, or III on the basisof their widths, general patterns (block or alligator cracks), andseverities of branching and spalling. The percent affected area ofdistress for each class is calculated within (CW) and outside of(CO) the wheel path (Fig. 4). According to this manual, the effectof raveling and patching should be added to the area of Class IIIcracks so that their effects are considered together; therefore, the
Fig. 2. Proposed crack-recognition method for flexible road pavement
Fig. 3. Wrapper FSS method (image courtesy of Dr. Gutierrez-Osuna)
© ASCE 04014118-3 J. Comput. Civ. Eng.
J. Comput. Civ. Eng.
Dow
nloa
ded
from
asc
elib
rary
.org
by
Uni
vers
ity o
f C
entr
al F
lori
da o
n 05
/14/
15. C
opyr
ight
ASC
E. F
or p
erso
nal u
se o
nly;
all
righ
ts r
eser
ved.

Table 1. Summary of Crack-Rating Manuals for Flexible and Rigid Pavements Developed by Federal and State Governments in the United States
Agent Pavement type Crack class Crack severity and extent Assessed crack features
AmericanAssociation of StateHighway andTransportationOfficials (1993)
Flexible Alligator or fatiguecrack
Severity: low, medium, and high Pattern, width, and spalling conditionExtent: area Area
Block crack Severity: low, medium, and high Pattern, width, and spalling and sealingcondition
Extent: area AreaJoint-reflection crackfrom plain cement
concrete slab
Severity: low, medium, and high Spalling and sealing condition, width, bumpoccurrence, and vicinity to random cracks
Extent: length LengthLongitudinal andtransverse crack
Severity: low, medium, and high Spalling and sealing condition, width, vicinityto random cracks, and bump occurrence
Extent: length LengthSlippage crack Severity: not defined —
Extent: area AreaRigid (JCPor CRCP)
Corner break Severity: low, medium, and high Spalling, faulting, break-up, and widthExtent: number Number
D-crack Severity: low, medium, and high Width of affected area, pattern, spalling, andpatching
Extent: number NumberLongitudinal crack Severity: low, medium, and high Width, faulting, and spalling
Extent: length LengthTransverse anddiagonal cracks
Severity: low, medium, and high Width, spalling, faulting, and sealingcondition
Extent: number NumberFederal HighwayAdministration(2003)
Flexible Fatigue crack Severity: low, moderate, and high Physical characteristicsExtent: area Area
Block crack Severity: low, moderate, and high Width, size of blocks, and visualcharacteristics
Extent: area AreaEdge crack Severity: low, moderate, and high Physical properties
Extent: length Length of cracksLongitudinal crack Severity: low, moderate, and high Width and vicinity to other cracks
Extent: length Length of cracksTransverse crack Severity: low, moderate, and high Width, area, and vicinity to other cracks
Extent: length and number Length and number of cracksRigid (RC) D-crack Severity: low, moderate, and high Visual characteristics
Extent: number Number and area of D-crackingLongitudinal crack Severity: low, moderate, and high Width, spalling condition, and visual
characteristicsExtent: length Length of cracks
Transverse crack Severity: low, moderate, and high Width, spalling condition, and faultingdepth
Extent: number and length Length and number of cracksCorner breaking Severity: low, moderate, and high Length of spalling, depth of faulting, and
patching conditionExtent: number Number at each segment
Florida Departmentof Transportation(2012a)
Flexible Crack Type: Class IB, Class II, andClass III
Width, depth, and pattern
Extent: % Percentage of affected areaRigid Transverse crack Severity: light, moderate, and
severeWidth and physical properties
Extent: number Number of cracksLongitudinal crack Severity: light, moderate, and
severeWidth and physical properties
Extent: number Number of cracksCorner crack Severity: light, moderate, and
severeWidth and physical properties
Extent: number Number of cracksIllinois Departmentof Transportation(2004)
Flexible and rigid Condition ratingsurvey
— Comparison with reference pictures
Kansas Departmentof Transportation(2013)
Flexible Fatigue crack Severity: Fc1, Fc2, Fc3, and Fc4 Physical characteristicsExtent: length Length of cracking
Transverse crack Severity: T0, T1, T2, and T3 Width, length, and visual propertiesExtent: 1- or 2-digit number Number of full-width cracks
Block crack Severity: 1, 2, 3, and 4 Block size and presence of secondarycracking
© ASCE 04014118-4 J. Comput. Civ. Eng.
J. Comput. Civ. Eng.
Dow
nloa
ded
from
asc
elib
rary
.org
by
Uni
vers
ity o
f C
entr
al F
lori
da o
n 05
/14/
15. C
opyr
ight
ASC
E. F
or p
erso
nal u
se o
nly;
all
righ
ts r
eser
ved.

total percentage of affected area can be calculated as presented inEq. (1).
Total percent affected area ¼ Class IBþ Class IIþ Class III
þ Ravelingþ Patching ð1Þ
To determine the predominant crack type, the percent affectedarea of the three classes should be compared. The predominantclass has the largest percent area. The percent area of each cracktype is used to calculate the deduction values from the providedstandard tables, and the crack rating is calculated using Eq. (2).
Crack rating ðflexible pavementÞ ¼ 10 − CWþ CO ð2Þ
where CW and CO are the percent affected area of all crack typesinside and outside of the wheel path, respectively. The overalldefect rating of rigid pavements can be calculated using Eq. (3).
Defect rating ðrigid pavementÞ¼ 100 − summation of deduction values ð3Þ
Collection of Pavement Surface Images
The FDOT conducts annual pavement-condition surveys as a partof the pavement-management system (Florida Department ofTransportation 2013). In 2006, FDOT acquired a multipurposesurvey vehicle (MPSV) to capture pavement images at highwayspeed, which is a van equipped with an inertial profiler system,an inertial navigation system, a laser rut-measurement system(LRMS), and a laser road-imaging system (LRIS). The LRIS iscomposed of two high-resolution linescan cameras and laserilluminators that are configured to image up to 4 m of transverseroad section with approximately 1-mm resolution at speeds of96.6 km=h ð60mi=hÞ. The camera has a 20-mm focal length andis mounted 1,960 mm above the road surface. The image-sensorpixel size is 0.01 mm. Thus, the image resolution of the LRISused in this study is 0.98 mm per pixel. Sample flexible pavementimages are shown in Fig. 5.
Data on ride quality and rut depth are collected automatically,whereas evaluation of surface distress such as cracking is on the basisof a manual windshield survey. This manual distress evaluation iscurrently used for network and project-level pavement-condition
Table 1. (Continued.)
Agent Pavement type Crack class Crack severity and extent Assessed crack features
New York StateDepartment ofTransportation(2010)
Flexible and rigid General condition Scale between 1–10 Comparison with reference picturesFaulting In presence Visual inspectionSpalling Isolated or general Percentage of the total length of the segment
Alligator crack Isolated or general Percentage of the total lengthWidening drop-off Low or high Visual inspection
Texas Department ofTransportation(2010)
Flexible Block crack In percentage Pattern, area, and lengthAlligator crack In percentage Pattern and length
Longitudinal crack In percentage Orientation, width, pattern, and lengthTransverse crack In percentage Orientation, width, pattern, and length
Rigid (CRCP) Average crackspacing
In number Average crack spacing (transverse)
Spalled crack In number Length and space of cracksRigid (JCP) Corner breaks In number Length and visual inspection
D-cracking In number Crack spacing and physical patternSpalls: number In number Length and width
Washington StateDepartment ofTransportation(1992)
Flexible Alligator crack Severity: low, medium, and high Width and patternExtent: % Percentage of wheel paths length
Longitudinal crack Severity: low, medium, and high Width and patternExtent: % Percentage of segment length
Transverse crack Severity: low, medium, and high Width and patternExtent: frequency per 100 ft Frequency per 100 ft
Block crack Severity: low, medium, and high Size of blocks and width of cracksExtent: length Full length of segment
Rigid (RCP) Crack Severity: low, medium, and high Number per panelExtent: % Area percentage
Note: CRCP = continuously reinforced concrete; JCP = jointed concrete pavement; PCC = plain cement concrete; RC = reinforced concrete.
Fig. 4. Schematic designation of wheel path (CW) and outside of wheel path (CO) according to FDOT requirements for crack rating of flexiblepavements
© ASCE 04014118-5 J. Comput. Civ. Eng.
J. Comput. Civ. Eng.
Dow
nloa
ded
from
asc
elib
rary
.org
by
Uni
vers
ity o
f C
entr
al F
lori
da o
n 05
/14/
15. C
opyr
ight
ASC
E. F
or p
erso
nal u
se o
nly;
all
righ
ts r
eser
ved.

surveys. However, manual distress surveys introduce exposure tohazardous conditions, subjectivity, and bias into the rating pro-cedure. To process the large volume of pavement-image data sur-veyed annually, FDOT needed a computer application that couldaccurately and efficiently detect and quantify cracks from pavementimages with minimal human intervention. Therefore, FDOT spon-sored a research project to evaluate potential computer-based appli-cations for crack detection and quantification from pavement-surfaceimages. The results from the study identified two commerciallyavailable software packages that were compatible with the MPSVLRIS. Of the two software packages evaluated, the results indicatedthat the crack-quantification accuracy of both applications was lim-ited, and was satisfactory only when computer-based manual evalu-ation was used (Gunaratne et al. 2008).
Crack Extraction Using the Bottom-Hat Transform
The morphological image-processing technique uses mathematicalmorphology as a tool for extracting image components that are usefulin the representation and description of various region shapes suchas boundaries, skeletons, and convex hulls (Gonzalez et al. 2009).
The mathematical foundation of the morphological technique ison the basis of the theory of set algebra by Minkowski (1903)and the theory of topology by Matheron (1975) (Jahanshahi et al.2009; Pratt 2001). A general description of the morphologicalimage-processing technique can be found in Dougherty and Lotufo(2003).
Let fpg be the set of pixels in a two-dimensional digital image.Thus, fpg partitions the xy-plane into a grid, and the coordinatesof the center of each grid are a pair of elements (x; y) from theCartesian coordinate. A function fðx; yÞ is considered as a digitalimage if (x; y) are integers from fpg and f is a mapping that assignsan intensity value to each distinct pair of (x; y). The morphologicalimage-processing technique applies a shape of the binary image(referred to as a structuring element) on an input image. The struc-turing element is a binary image component whose shape can bedesigned for different purposes of image manipulation. The centerof the structuring element is called the pixel of interest (POI). Thepixels within the structuring-element boundary are assigned a valueof one, and the remaining pixels have a value of zero. Fig. 6(a)shows an example of a gray-scale input image with a diamond-shaped structuring element. In the morphological technique, dila-tion and erosion transforms are two basic operators to manipulate
60 68 126 159 15 21 53 122
62 64 5 146 19 15 21 122
15 21 53 135
122 15 19 57
17 19 15 167 122 25 122 57
253 122 15 148 62 147 14 60
5 77 56 125 11 156 62 60
16 45 46 136 126 159 15 15
13 85 123 149 19 15 167 165
5
(a) (b)
Fig. 6. Morphological erosion transform of a gray scale image: (a) input image and structuring element; (b) output image
1000 2000(a) (b)
3000 4000
500
1000
1500
2000
2500
3000
3500
4000
4500
5000
1000 2000 3000 4000
500
1000
1500
2000
2500
3000
3500
4000
4500
5000
Fig. 5. Sample flexible-pavement images collected with the laser road imaging system (LRIS); x- and y-axis represent pixel numbers: (a) severe crackwith partial wetness; (b) severe crack without wetness
© ASCE 04014118-6 J. Comput. Civ. Eng.
J. Comput. Civ. Eng.
Dow
nloa
ded
from
asc
elib
rary
.org
by
Uni
vers
ity o
f C
entr
al F
lori
da o
n 05
/14/
15. C
opyr
ight
ASC
E. F
or p
erso
nal u
se o
nly;
all
righ
ts r
eser
ved.

fðx; yÞ. The dilation transform is an operation that expands or thick-ens objects in an image, whereas the erosion transform is anoperation that shrinks or thins objects in an image. It is a commonconvention in image processing that dilation and erosion of theoriginal image (O) with the structuring element (S) are expressedas O� S and O⊖ S, respectively. An advantage of the morphologi-cal technique is that multiple basic operators can form another oper-ation for more sophisticated image processing. For example, twocommonly used operations are opening and closing, which includeO ∘ S ¼ ðO⊖ SÞ � S and O • S ¼ ðO� SÞ⊖ S, respectively.
Crack extraction is a pixel-level operation that detects crack-likeobjects in a pavement image by removing random background.For flexible pavements, the random background usually includesasphalt types, pavement coating, surface texture and roughness,pavement aging and raveling, spots, stains, scratches, oil, water,and road markings. Salembier (1990) and Jahanshahi et al. (2009)proposed the modified bottom-hat and top-hat transforms todetect black and white cracks as presented in Eqs. (4) and (5),respectively.
Lb ¼ max½ðO ∘ Sf0°; 45°; 90°; 135°gÞ • Sf0°; 45°; 90°; 135°g;O� −O ð4Þ
Lt ¼ O −min½ðO • Sf0°; 45°; 90°; 135°gÞ ∘ Sf0°; 45°; 90°; 135°g;O� ð5Þ
where L = gray-scale image as the output of the morphologicaltransforms; O = original gray-scale image; Sf0°; 45°; 90°; 135°g =line-shape structuring element rotating 0°, 45°, 90°, and 135°;° = opening transform; and • = closing transform.
To demonstrate how a crack is detected using the bottom-hattransform, an example is shown in Fig. 7. Fig. 7(a) shows an origi-nal gray-scale image with white and black horizontal cracks of10 different crack widths from 10 to 100 pixels with a 10-pixelincrement. The goal in this example is to differentiate only blackcracks that are less than 50 pixels wide from the gray background.For this example, a structuring element was designed to be a ver-tical line with the size of 50 × 1. Figs. 7(b–d) illustrate the step-by-step procedures of the bottom-hat transform. The resulting image ofthe bottom-hat transform is shown in Fig. 7(e). Only black crackswith less than 50-pixel crack widths are detected as required. Thedetected cracks, which were originally black, are converted to gray,and the background, which was originally gray, is now converted toblack after the bottom-hat transform. However, the absolute inten-sity differences of the detected cracks from the background remainthe same before and after the transform.
This example shows several advantages of the bottom-hat trans-form for pavement-crack extraction. By accurately designing thestructuring-element shape (i.e., vertical line for horizontal cracks),size (i.e., 50 pixels), and combination of morphological operators(i.e., bottom-hat transform), one can selectively detect pavementcracks on the basis of their shape (e.g., horizontal crack), size(e.g., 50-pixel crack width), and intensity (e.g., black crack).Another advantage is that the bottom-hat transform uses a relativelysmall number of user-defined parameters. In this example, only oneparameter is required of the structuring element length to detectblack cracks with less than 50-pixel crack width by employing avertical line as the structuring element. Minimizing user interven-tion by reducing the number of user-defined parameters isimportant to develop a fully automated system. Because mostpavement-maintenance agencies specify the size of crack widthto be considered in pavement assessment, the length of thestructuring element can be designed on the basis of their manualsas shown in Table 1.
The bottom-hat transform is advantageous to recognize anddifferentiate dark cracks from random pavement background. To
validate this, the bottom-hat transform was applied to theflexible-pavement images collected by FDOT. The FDOT manual(Florida Department of Transportation 2012a) specifies that theClass III crack width is 25.4 mm (1.0 in.) or larger. In this study,the line-shape structuring element with 100-pixel length was usedin the analysis, which is equivalent to 98.0 mm (3.86 in.). There-fore, the structuring element was designed to be approximately fourtimes larger than the minimum Class III crack width to ensure thatall crack classes specified in the manual are detected. Rotating thestructuring element by 0°, 45°, 90°, and 135°, enables detection ofcracks with arbitrary line orientations.
Fig. 8(a) shows that the original gray-scale pavement image(O) has severe alligator cracks with some spallings. The cracksare observed in random asphalt background, which is due tothe aged pavement surface texture and nonuniform partial wetnessin the top-right corner. The bottom-hat transform result is shownin Fig. 8(b). To demonstrate the effectiveness of backgroundremoval, the result (B) is compared with two histogram-basedintensity-thresholding methods for pavement crack detection,Otsu’s intensity-thresholding method (Otsu 1979) and theneighboring-difference histogram method (Li and Liu 2008),which are shown in Figs. 8(c and d), respectively. In the originalpavement image (O) in Fig. 8(a), the surface roughness and partialwetness cause different random backgrounds. The surface rough-ness causes pixel-level intensity variations due to the randomnessof the pavement surface texture. The partial wetness causes regionalintensity variations due to low intensity in the wet area in the top-right corner. Therefore, as a global intensity-thresholding method,Otsu’s method is affected by both surface roughness and surfacewetness [Fig. 8(c)]. Using the neighboring-difference histogrammethod, background removal is improved by reducing the effectof the roughness; however, the wetness variation is not removedeffectively [Fig. 8(d)]. Fig. 8(b) shows that both surface roughnessand surface wetness are effectively removed using the bottom-hattransform.
Crack Grouping Using MorphLink-C
In this study, MorphLink-C is proposed as a novel crack-groupingmethod to segment crack fragments after crack extraction. It con-sists of two steps as follows:1. Apply the morphological dilation transform to the binary
image of B that contains crack fragments as
D ¼ B� SD ð6Þwhere SD = structuring element of the dilation transform; � =morphological dilation operator; and D = resulting binaryimage after the dilation transform. The dilation transform is animage operation that expands or thickens image components,which are fragmented crack pixels in this case. SD is selectedto be a square structuring element.
2. Apply the morphological thinning transform to D to connectthe fragments as a continuous crack line within a dilationboundary as
T ¼ D − hit-and-missðD; STÞ ð7Þwhere hit-and-miss is the morphological hit-and-miss opera-tor; ST = structuring element for skeletonization; and T =resulting binary image after the thinning transform.
After MorphLink-C, grouped crack fragments are labeled pereach dilation boundary and the corresponding crack features canbe measured, which represent different characterizations of realcracks. An advantage of the proposed MorphLink-C is that it
© ASCE 04014118-7 J. Comput. Civ. Eng.
J. Comput. Civ. Eng.
Dow
nloa
ded
from
asc
elib
rary
.org
by
Uni
vers
ity o
f C
entr
al F
lori
da o
n 05
/14/
15. C
opyr
ight
ASC
E. F
or p
erso
nal u
se o
nly;
all
righ
ts r
eser
ved.

200 400 600 800 1000 1200 1400
200
400
600
800
1000
1200
1400
1600
Structuring element, S
200 400 600 800 1000 1200 1400
200
400
600
800
1000
1200
1400
1600
200 400 600 800 1000 1200 1400
200
400
600
800
1000
1200
1400
1600
200 400 600 800 1000 1200 1400
200
400
600
800
1000
1200
1400
1600
200 400 600 800 1000 1200 1400
200
400
600
800
1000
1200
1400
1600
(a) (b)
(c) (d)
(e)
Fig. 7. Morphological operation procedures designed to detect black cracks from a gray-scale image. The x- and y-axis represent pixels. Gray-scaleoriginal image (O) containing white and black horizontal cracks with 10 different crack widths from 10 to 100 pixels. The structuring element (S) isdesigned as a vertical line of 50 × 1 pixels. The operation procedure includes: (a) original image (O); (b) opening operation (O ∘ S); (c) closingoperation [ðO ∘ SÞ • S]; (d) finding maximum {max½ðO ∘ SÞ • S�}; (e) final result by subtracting the original {L ¼ max½ðO ∘ SÞ • S� −O}
© ASCE 04014118-8 J. Comput. Civ. Eng.
J. Comput. Civ. Eng.
Dow
nloa
ded
from
asc
elib
rary
.org
by
Uni
vers
ity o
f C
entr
al F
lori
da o
n 05
/14/
15. C
opyr
ight
ASC
E. F
or p
erso
nal u
se o
nly;
all
righ
ts r
eser
ved.

provides a simple and accurate way to measure averaged crackwidth per grouped fragments as
ðAverage crackwidthÞk ¼P
i ðArea of framented crack pixelsÞkPi ðLength of the connected crack lineÞk
ð8Þ
whereP
i ðArea of framented crack pixelsÞk = summation of thetotal areas of the fragmented crack pixels within the k-th dilationboundary; i = index of the fragmented objects in the k-th dilationboundary; and
Pi ðLength of the connected crack lineÞk = summa-
tion of the total lengths of connected crack lines within the k-thdilation boundary. Crack width is an important factor in pavementroad rating because the severity of crack deterioration is often con-trolled by the maximum crack width. For example, FDOT classifiespavement conditions on the basis of crack widths in road ratings:hairline cracks ≤ 3.18 mm (1=8 in:) for Class IB; cracks > 3.18 mm(1=8 in:) for Class II; and cracks > 6.35 mm (1=4 in:) for Class III(Florida Department of Transportation 2012a).
The proposed MorphLink-C algorithm was used for thecrack-grouping process using FDOT’s flexible-pavement im-ages. A sample result of a single vertical crack is shown in Fig. 9.The binary image after the bottom-hat transform (B) is shown inFig. 9(b). The numbers shown in the figure are the pixel countsof 8-connected neighborhood pixel clusters. Although the
bottom-hat transform effectively extracts crack components froma flexible-pavement image, two problems can be observed. First,the extracted crack objects are fragmented with (multiple) dis-joints in their crack paths. Although the image B is representa-tional for crack shapes with great local details, the vertical crackhas multiple disjoints in its crack path. Therefore, the crack areasof the 8-connected pixels measured in Fig. 9(b) are not a goodrepresentation of the area of real vertical cracks. Second, the re-sulting image B still contains non-crack objects after removingpavement background. One can recognize from Fig. 9(b) that avertical crack exists in the middle surrounded by false cracks.That is, the pixel clusters along the vertical crack approximatelyin the range of 75 < x < 175 and 45 < y < 350 can be consideredas crack objects. Although the pixel clusters are discontinuous atseveral locations in the crack’s vertical path, one could judgethat the crack is a single vertical crack. The remaining pixel clus-ters around the vertical crack can be judged to be non-crackobjects.
Fig. 9(c) shows the result of the fragment grouping using thedilation transform. The boundary range is determined on the basisof the relative proximity between the fragments, which can bespecified by the SD size. In this study, a square structuring element,SD, is used, which has the size of 10 × 10 pixels (9.8 × 9.8 mm2).The numbers shown in Fig. 9(c) are the summations of the pixelcounts of pixel clusters in each boundary. After MorphLink-C, one
Fig. 8. Binary images using different intensity-thresholding methods: (a) original image (O); (b) bottom-hat transform method with intensitythreshold at zero; (c) neighboring difference histogram method; (d) Otsu’s intensity-thresholding method
© ASCE 04014118-9 J. Comput. Civ. Eng.
J. Comput. Civ. Eng.
Dow
nloa
ded
from
asc
elib
rary
.org
by
Uni
vers
ity o
f C
entr
al F
lori
da o
n 05
/14/
15. C
opyr
ight
ASC
E. F
or p
erso
nal u
se o
nly;
all
righ
ts r
eser
ved.

Fig. 9. Proposed crack-grouping method: (a) original image (O); (b) fragmented object after crack extraction using the bottom-hat transform (B);(c) fragment grouping using the dilation transform (D); (d) fragment connection using the thinning transform (T)
© ASCE 04014118-10 J. Comput. Civ. Eng.
J. Comput. Civ. Eng.
Dow
nloa
ded
from
asc
elib
rary
.org
by
Uni
vers
ity o
f C
entr
al F
lori
da o
n 05
/14/
15. C
opyr
ight
ASC
E. F
or p
erso
nal u
se o
nly;
all
righ
ts r
eser
ved.

can observe that the defragmented area in Fig. 9(c) represents thereal vertical crack more accurately than the fragmented areas inFig. 9(b). For example, the largest boundary containing the verticalcrack includes 12 pixel clusters. The pixel count in the largestboundary is 1,842 pixels, which is the summation of pixel countsof the 12 clusters. The smallest true crack in the largest boundaryhas 10 pixels at (95, 260). Without the boundary, this crack wouldbe easily misclassified as a non-crack object because the largestnon-crack object in Fig. 9(b) has 44 pixels at (160, 20). Hence,the accuracy of the crack-classification result is improved withMorphLink-C.
Fig. 9(d) shows the result of the fragment connection usingthe thinning transform. The numbers shown in the figure are thelengths of the thinned lines that have the width of one pixel. Theconnection of crack fragments is self-adaptive and does not involvecomplicated calculations of crack orientation, length, and intensityfor arbitrary crack types, such as single, branched, block, and alli-gator cracks.
Discussion
Effects of MorphLink-C on Crack-Detection Accuracy
Six features were extracted to evaluate the effect of MorphLink-Con classification accuracy. These features have been commonlyused in the literature, including area, length, orientation, texture,intensity, and location. For a comparison, the six features weremeasured before and after MorphLink-C. Before MorphLink-C,the six features were measured for the fragments of 8-connectedpixels in image B. After MorphLink-C, the six features were mea-sured for the grouped fragments of the dilation boundaries in im-ages D and T. The feature-extraction procedures for the six featuresare described in Table 2.
The texture feature was considered because rough pavementsurface has higher potential for developing cracks. The texture fea-ture was calculated using the co-occurrence matrix, which canquantify the surface roughness in different regions of the pavementsurface. The co-occurrence matrix, first defined by Haralick et al.(1973), is on the basis of the vicinity (offset) of pixels with certainintensities. The mathematical expression of the co-occurrencematrix is as follows:
CΔx;Δyði;jÞ
¼Xnp¼1
Xmq¼1
�1 if Iðp;qÞ¼ i and IðpþΔx;qþΔyÞ¼ j
0 otherwiseð9Þ
where C = co-occurrence matrix; i and j are the gray levels; Δx andΔy describe the offset between the pixels; and Iðp; qÞ = intensity ofthe image at ðp; qÞ in a ðm × nÞ pixel segment of the image. In sim-ple words, the co-occurrence matrix presents the occurrence fre-quency of two intensity values at a given offset. In this study, theco-occurrence matrix was calculated using a binary image, whichis a symmetrical 2 × 2 matrix in which element Cð0,0Þ representsthe co-occurrence frequency of two non-crack pixels next to eachother and Cð1,0Þ or Cð0,1Þ represent the co-occurrence frequency ofneighboring crack and non-crack pixels, respectively. The value ofCð1,1Þ, which represents the co-occurrence frequency of neighboringcrack pixels, is considered as the co-occurrence index of the region ofinterest. A region with a higher value for the co-occurrence index canbe considered to be rougher than a region with a lower index value.Detailed background information and mathematical formulation ofthe co-occurrence matrix is presented in Kaseko and Ritchie (1993).The co-occurrence matrix method is a region-based method asopposed to a pixel-based method. Thus, to obtain the co-occurrencematrix in this study, each image was divided into regions with200 × 200 pixels, and the co-occurrence matrix was calculated foreach region. Then, the co-occurrence index of each region was nor-malized by dividing by the number of pixels in that region.
The position feature was employed to incorporate the wheel-path designation for road rating. According to FDOT (2012a),flexible-pavement regions confined to the wheel path are subjectedto more frequent traffic loading than regions outside of the wheelpath (Fig. 4). Consequently, CW has higher potential for develop-ing fatigue cracks than CO. To obtain the position features beforeand after MorphLink-C, the lane markers were detected from theroad image, and the CWand CO regions were separated on the basisof the ratios of the distance between left and right lane markers asfollows: CO∶CW∶CO∶CW∶CO ¼ 1∶2∶2∶2∶1. Then, image compo-nents in CWwere assigned a value of two, image components in COwere assigned a value of one, and image components on and outsidethe lane markers were assigned a value of zero. When only one lanemarker can be observed in the road image, CW and CO were deter-mined on the basis of the distances from inside the lane marker(CO∶CW∶CO∶CW∶CO ¼ 0.46∶0.91∶0.91∶0.91∶0.46 m) because the
Table 2. Description of Feature-Extraction Procedures before and after MorphLink-C
Feature Before MorphLink-C After MorphLink-C
Area (mm2) Area is measured for the fragments of 8-connected pixels inimage B
Area is measured by summing fragment areas within thesame dilation boundary in image D
Length (mm) Length is measured per the thinned line of fragments,which is obtained with the thinning transform of image B
Length is measured for the thinned line of the dilationboundary in image T
Orientation (degree) Orientation is measured for the fragments of 8-connectedpixels in image B. Orientation angle is measured betweenthe x-axis and the major axis of the ellipse that contains the8-connected fragments. The orientation angle rangesbetween −90 and 90°, and the counterclockwise is thepositive direction
Orientation is measured per the dilated segment in imageD. Orientation angle is measured between the x-axis andthe major axis of the ellipse that contains the dilatedsegment
Texture (co-occurrenceindex)
Texture is measured using the co-occurrence index of a200 × 200 pixels subimage tile using image B
Texture is measured using the co-occurrence index of a200 × 200 pixels subimage tile using image D
Intensity (8-bit scale) Intensity is calculated by averaging the intensities of theoriginal gray scale image O per the 8-connected pixels
Intensity is calculated by the summation of the intensity ofthe original gray scale image O weighted by fragment areain each dilation boundary
Wheel path designation(0, 1, and 2)
CW ¼ 2, CO ¼ 1, and outside of lane markers = 0 inimage B
CW ¼ 2, CO ¼ 1, and outside of lane markers = 0 inimage D
© ASCE 04014118-11 J. Comput. Civ. Eng.
J. Comput. Civ. Eng.
Dow
nloa
ded
from
asc
elib
rary
.org
by
Uni
vers
ity o
f C
entr
al F
lori
da o
n 05
/14/
15. C
opyr
ight
ASC
E. F
or p
erso
nal u
se o
nly;
all
righ
ts r
eser
ved.

distance can be measured on the basis of the pixel resolution(e.g., 0.98 mm per pixel in this study). When both lane markersare not visible in the pavement image, CWand CO were determinedon the basis of the distances from the centerline of the image byassuming the center of the lane was located at the image centerline.
To find the optimal crack-feature subset, an ANN classifier wasemployed, which is one of most popularly used supervised classi-fication methods for crack detection. The ANN is a network of sim-ple processing units called neurons, which are connected using a setof weights and biases. The ANN classifier that was used in thisstudy contained a seven-layer feed-forward network that includedone input layer and one output layer. Each hidden layer contained10 neurons. Tangent-sigmoid and linear transfer functions wereused in the hidden and outputs layers, respectively. The six featureswere used as input for the classifier. As the linear function was inthe output layer, the classifier output was a real number that rangedbetween 0 and 1 because the output was a non-crack object with avalue near 0 or a crack object with a value near 1. Therefore, athreshold should be set between 0 and 1 to classify an image objectas non-crack when its output is less than threshold or crack when itsoutput is greater than or equal to threshold. A schematic of theANN configuration is shown in Fig. 10.
As a supervised machine-learning method, training the ANNclassifier involves adjusting the weights and biases so that the clas-sifier produces desirable network outputs. For network optimiza-tion, the Levenberg-Marquardt learning method was used, whichuses a mean-square-error (MSE) function to minimize the errorbetween the network output and target output
MSEðOÞ ¼ 1
n
Xni¼1
ðT −OÞ2 ð10Þ
where O ¼ ðn × 1Þ output vector of neural network; T ¼ ðn × 1Þvector of target values; and n = number of data points.
The ANN classifier requires a training dataset for optimizing thevalues of weights and biases. Training datasets were preparedthrough manual selection of true cracks in a total of 26 flexible-pavement images; thus, unselected pixels were categorized intofalse cracks. Correspondingly, target outputs for crack and non-crack objects were considered to be 1 and 0, respectively. A sum-mary of selected images along with the total number and length ofimage components is shown in Table 3. Before MorphLink-C, atotal of 512,731 objects were extracted, including 26,656 (5.20%)crack and 486,075 (94.80%) non-crack objects. The total length of
Fig. 10. A schematic of the ANN configuration
Table 3. Training Datasets for ANN Classification before and after MorphLink-C Algorithm; All Objects Include Both Crack and Non-Crack ImageComponents
Image #
Before the proposed crack-grouping method(without MorphLink-C)
After the proposed crack-grouping method(with MorphLink-C)
Cracks (#) Cracks (mm) All objects (#) All objects (mm) Cracks (#) Cracks (mm) All objects (#) All objects (mm)
1 22 325 15,780 255,569 3 273 7,519 149,9792 64 849 15,486 268,241 13 905 7,345 149,7013 481 8,980 16,802 212,659 60 7,718 8,498 128,7594 536 12,715 18,504 239,567 70 10,876 9,138 138,9945 190 2,766 19,978 219,915 15 2,984 10,991 129,5656 317 4,069 19,742 209,313 50 4,625 10,865 129,3127 476 5,700 18,673 202,897 94 6,280 10,685 118,4948 402 6,876 20,072 225,010 42 7,244 10,800 132,7379 465 10,403 20,571 253,828 57 8,888 10,429 141,40310 185 2,360 21,063 258,457 38 2,586 10,108 150,85911 0 0 20,269 239,926 0 0 10,008 143,11612 1,062 23,217 19,967 274,102 141 17,584 9,934 162,64013 1,410 27,231 19,310 276,034 151 20,726 10,396 151,45114 1,455 28,456 19,716 259,098 116 23,428 10,477 151,65215 81 1,140 21,339 233,896 2 1,214 12,184 153,60516 11 173 20,689 229,400 2 203 12,035 145,01317 2,448 41,169 21,711 257,300 310 40,253 10,937 170,58118 1,489 30,906 21,852 257,122 144 29,242 11,122 166,11419 1,434 23,436 21,906 260,571 212 22,422 10,705 166,81720 1,779 31,985 19,770 277,335 183 26,962 10,230 157,48221 2,257 39,468 19,637 303,304 213 33,843 9,843 173,98122 2,020 34,204 19,818 291,783 252 27,005 10,156 167,41023 2,014 39,459 21,672 259,987 219 38,955 10,984 168,92224 1,876 32,760 21,508 260,848 239 34,580 11,072 166,83325 3,006 58,015 20,959 276,174 320 55,307 10,219 179,09126 1,176 20,542 15,937 197,481 144 20,203 8,301 120,591Sum 26,656 487,204 512,731 6,499,817 3,090 444,306 264,981 3,915,102Mean 1,025.2 18,738.6 19,720.4 249,993.0 118.8 17,088.7 10,191.6 150,580.8SD 890.2 16,481.4 1,870.9 27,345.4 99.6 15,288.2 1,189.5 17,061.2
© ASCE 04014118-12 J. Comput. Civ. Eng.
J. Comput. Civ. Eng.
Dow
nloa
ded
from
asc
elib
rary
.org
by
Uni
vers
ity o
f C
entr
al F
lori
da o
n 05
/14/
15. C
opyr
ight
ASC
E. F
or p
erso
nal u
se o
nly;
all
righ
ts r
eser
ved.
the objects was 6,499.8 m, including 487.2 m (7.50%) for crack and6,012.6 m (92.50%) for non-crack objects. After MorphLink-C, atotal of 264,981 objects were extracted, including 3,090 (1.17%)crack and 261,891 (98.83%) non-crack objects. The total lengthof the object was 3,915.1 m, including 444.3 m (11.35%) for crackand 3,470.8 m (88.65%) for non-crack objects. Therefore, one canobserve that the ratio of the crack and non-crack objects is unbal-anced both in the number and length.
After crack extraction before and after MorphLink-C, all six fea-tures were measured from the image objects. Because the datasetswere extracted from 26 images, all image objects were randomlyshuffled to avoid image bias, and partitioned into 60% for training,20% for validation, and 20% for testing to compare two ANN clas-sifier models trained before and after MorphLink-C.
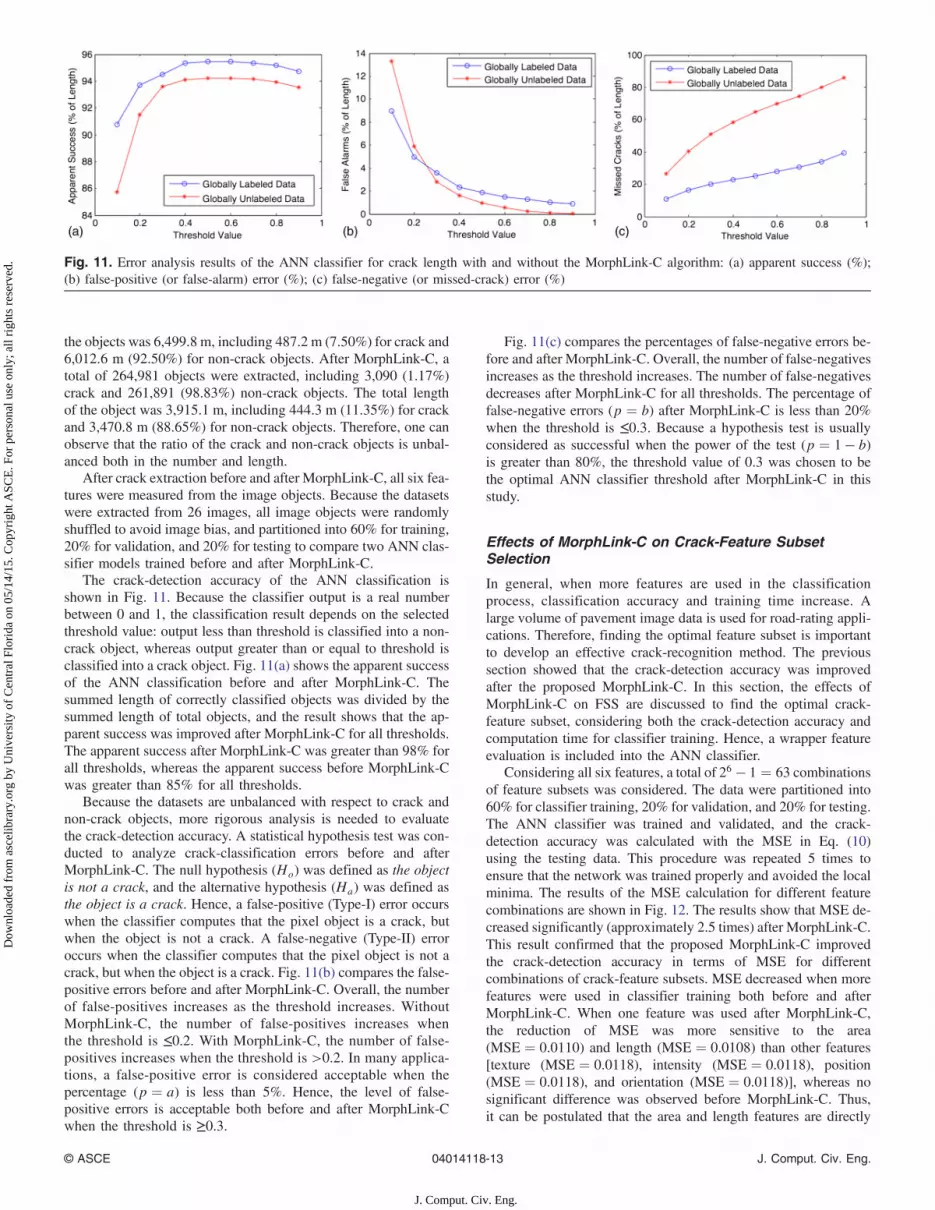
The crack-detection accuracy of the ANN classification isshown in Fig. 11. Because the classifier output is a real numberbetween 0 and 1, the classification result depends on the selectedthreshold value: output less than threshold is classified into a non-crack object, whereas output greater than or equal to threshold isclassified into a crack object. Fig. 11(a) shows the apparent successof the ANN classification before and after MorphLink-C. Thesummed length of correctly classified objects was divided by thesummed length of total objects, and the result shows that the ap-parent success was improved after MorphLink-C for all thresholds.The apparent success after MorphLink-C was greater than 98% forall thresholds, whereas the apparent success before MorphLink-Cwas greater than 85% for all thresholds.
Because the datasets are unbalanced with respect to crack andnon-crack objects, more rigorous analysis is needed to evaluatethe crack-detection accuracy. A statistical hypothesis test was con-ducted to analyze crack-classification errors before and afterMorphLink-C. The null hypothesis (Ho) was defined as the objectis not a crack, and the alternative hypothesis (Ha) was defined asthe object is a crack. Hence, a false-positive (Type-I) error occurswhen the classifier computes that the pixel object is a crack, butwhen the object is not a crack. A false-negative (Type-II) erroroccurs when the classifier computes that the pixel object is not acrack, but when the object is a crack. Fig. 11(b) compares the false-positive errors before and after MorphLink-C. Overall, the numberof false-positives increases as the threshold increases. WithoutMorphLink-C, the number of false-positives increases whenthe threshold is ≤0.2. With MorphLink-C, the number of false-positives increases when the threshold is >0.2. In many applica-tions, a false-positive error is considered acceptable when thepercentage (p ¼ a) is less than 5%. Hence, the level of false-positive errors is acceptable both before and after MorphLink-Cwhen the threshold is ≥0.3.
Fig. 11(c) compares the percentages of false-negative errors be-fore and after MorphLink-C. Overall, the number of false-negativesincreases as the threshold increases. The number of false-negativesdecreases after MorphLink-C for all thresholds. The percentage offalse-negative errors (p ¼ b) after MorphLink-C is less than 20%when the threshold is ≤0.3. Because a hypothesis test is usuallyconsidered as successful when the power of the test (p ¼ 1 − b)is greater than 80%, the threshold value of 0.3 was chosen to bethe optimal ANN classifier threshold after MorphLink-C in thisstudy.
Effects of MorphLink-C on Crack-Feature SubsetSelection
In general, when more features are used in the classificationprocess, classification accuracy and training time increase. Alarge volume of pavement image data is used for road-rating appli-cations. Therefore, finding the optimal feature subset is importantto develop an effective crack-recognition method. The previoussection showed that the crack-detection accuracy was improvedafter the proposed MorphLink-C. In this section, the effects ofMorphLink-C on FSS are discussed to find the optimal crack-feature subset, considering both the crack-detection accuracy andcomputation time for classifier training. Hence, a wrapper featureevaluation is included into the ANN classifier.
Considering all six features, a total of 26 − 1 ¼ 63 combinationsof feature subsets was considered. The data were partitioned into60% for classifier training, 20% for validation, and 20% for testing.The ANN classifier was trained and validated, and the crack-detection accuracy was calculated with the MSE in Eq. (10)using the testing data. This procedure was repeated 5 times toensure that the network was trained properly and avoided the localminima. The results of the MSE calculation for different featurecombinations are shown in Fig. 12. The results show that MSE de-creased significantly (approximately 2.5 times) after MorphLink-C.This result confirmed that the proposed MorphLink-C improvedthe crack-detection accuracy in terms of MSE for differentcombinations of crack-feature subsets. MSE decreased when morefeatures were used in classifier training both before and afterMorphLink-C. When one feature was used after MorphLink-C,the reduction of MSE was more sensitive to the area(MSE ¼ 0.0110) and length (MSE ¼ 0.0108) than other features[texture (MSE ¼ 0.0118), intensity (MSE ¼ 0.0118), position(MSE ¼ 0.0118), and orientation (MSE ¼ 0.0118)], whereas nosignificant difference was observed before MorphLink-C. Thus,it can be postulated that the area and length features are directly
Fig. 11. Error analysis results of the ANN classifier for crack length with and without the MorphLink-C algorithm: (a) apparent success (%);(b) false-positive (or false-alarm) error (%); (c) false-negative (or missed-crack) error (%)
© ASCE 04014118-13 J. Comput. Civ. Eng.
J. Comput. Civ. Eng.
Dow
nloa
ded
from
asc
elib
rary
.org
by
Uni
vers
ity o
f C
entr
al F
lori
da o
n 05
/14/
15. C
opyr
ight
ASC
E. F
or p
erso
nal u
se o
nly;
all
righ
ts r
eser
ved.

affected by grouping crack fragments after MorphLink-C, whichimproves crack-detection accuracy.
Table 4 summarizes the averaged MSE and training times of theANN classification for different numbers of crack-feature combi-nations. In the analysis, the image resolution was 5,940 × 4,044,and the image size was approximately 5.75 MB. The computerwas equipped with an Intel Core i7 – 2,600, 3.40 GHz CPU,and 16 GB RAM. Overall, as more features are used in training,the training time increases and the MSE decreases both beforeand after MorphLink-C. However, the training time extrema showfluctuations, whereas MSE is relatively stable. Thus, longer train-ing time does not necessarily yield a more accurate crack-detectionresult. Fluctuations in training times are largely affected by the ini-tial biases and weights of the ANN classifier. Using MorphLink-C,both MSE and training time are reduced to approximately 69.3 and76.52%, respectively, for all combinations of feature subsets.Therefore, the results show that the proposed MorphLink-C im-proves detection accuracy in terms of MSE. Reduced training timewith MorphLink-C is practically important when a large number of
pavement images need to be trained, which is true in many road-rating applications.
Computation times of the proposed crack-recognition approachwere measured using 100 flexible images, and the computation
Fig. 12. Mean-square-errors (MSE) for different feature-subset combinations. The y-axis shows the crack area (A), length (L), texture (T), intensity(I), wheel-path location (L), and orientation (O): (a) before MorphLink-C; (b) after MorphLink-C
Table 4. Averaged Mean-Square-Error (MSE) and Training Time of ANN Classification before and after MorphLink-C
Number offeatures
Before MorphLink-C After MorphLink-C
AverageMSE
MaximumMSE
MinimumMSE
Averagetime (min)
Maximumtime (min)
Minimumtime (min)
AverageMSE
MaximumMSE
MinimumMSE
Averagetime (min)
Maximumtime (min)
Minimumtime (min)
1 0.0483 0.0492 0.0471 63.1 209.9 4.8 0.0115 0.0118 0.0108 16.8 50.9 2.12 0.0467 0.0488 0.0431 209.2 466.9 16.8 0.0110 0.0118 0.0096 57.3 158.2 7.53 0.0447 0.0478 0.0407 316.4 852.2 2.0 0.0104 0.0117 0.0095 90.3 260.1 11.94 0.0426 0.0459 0.0393 382.2 608.3 70.5 0.0098 0.0114 0.0093 105.6 247.8 25.85 0.0414 0.0434 0.0390 289.4 428.3 213.3 0.0096 0.0099 0.0095 83.2 116.7 37.26 0.0391 0.0391 0.0391 371.0 371.0 371.0 0.0094 0.0094 0.0094 167.1 167.1 167.1
Table 5. Computational Times for the Proposed Morphological Crack-Quantification Method
Level of crackrecognition
Averagetime (s)
Maximumtime (s)
Minimumtime (s)
Numberof images
Crack extractionusing bottom-hattransform
33.37 34.15 32.63 100
Fragment groupingusing dilationtransform
0.04 0.05 0.03
Fragment connectionusing thinningtransform
0.76 1.42 0.41
© ASCE 04014118-14 J. Comput. Civ. Eng.
J. Comput. Civ. Eng.
Dow
nloa
ded
from
asc
elib
rary
.org
by
Uni
vers
ity o
f C
entr
al F
lori
da o
n 05
/14/
15. C
opyr
ight
ASC
E. F
or p
erso
nal u
se o
nly;
all
righ
ts r
eser
ved.

times for different levels of crack recognition are summarized inTable 5. The average computation times for fragment groupingand fragment connection are 0.04 and 0.76 s, respectively. There-fore, the computation time of the proposed MorphLink-C is signifi-cantly shorter than that of crack extraction using the bottom-hattransform. The computation time could be further reduced by im-plementing the algorithms using compiled language, such as C orC++, because the tested algorithm was coded using a script lan-guage in MATLAB.
To demonstrate the effects of FSS, the classification resultsusing all six features are compared with the results using threefeatures. First, the classification result using all six features for
different thresholds is shown in Fig. 13. The number of falselydetected objects (red) increases when the threshold is close to zero,whereas the number of falsely filtered objects (pink) increaseswhen the threshold is close to one. Fig. 14 shows the classificationresult using the three-feature subset containing length, texture, andposition. When the threshold is 0.1, the result is similar to the resultwith six features shown in Fig. 13(a), except for the number offalsely detected objects on the lane marker in the lower left corner.When the threshold is 0.5, the vertical crack in the left wheel path isfalsely filtered compared to the result with six features shown inFig. 13(b). When the threshold is 0.9, the number of falsely filteredobjects increases, including the alligator crack in the mid-left of the
Fig. 13. Sample classification results using all six features after MorphLink-C. Correctly detected objects are shown in dark gray (or blue); correctlyfiltered objects are shown in light gray (or green); falsely detected objects are shown in medium-dark gray (or red); and falsely filtered objects areshown in medium-light gray (or pink)
Fig. 14. Sample classification results using three features including length, texture, and position after MorphLink-C. Correctly detected objects areshown in dark gray (or blue); correctly filtered objects are shown in light gray (or green); falsely detected objects are shown in medium-dark gray(or red); and falsely filtered objects are shown in medium-light gray (or pink)
© ASCE 04014118-15 J. Comput. Civ. Eng.
J. Comput. Civ. Eng.
Dow
nloa
ded
from
asc
elib
rary
.org
by
Uni
vers
ity o
f C
entr
al F
lori
da o
n 05
/14/
15. C
opyr
ight
ASC
E. F
or p
erso
nal u
se o
nly;
all
righ
ts r
eser
ved.

image. The MSE of the six-feature subset is 0.0094, whereas theMSE of the three-feature subset is 0.0105.
Fig. 15 shows sample results of crack extraction using thebottom-hat transform and crack detection using the ANN classifiercombined with MorphLink-C. The results show that the proposedcrack-recognition method accurately detects cracks and success-fully rejects non-crack pavement background.
Self-Adaptive Property of MorphLink-C
Fig. 16 shows the self-adaptive property of the proposedMorphLink-C. The effects of SD size are investigated, whichdetermines the level of crack-line abstraction after the thinning
transform. An original gray-scale pavement image is shown inFig. 16(a). The image shows severe alligator cracks and some localspallings. The pavement surface was smeared due to partial wetnessin the top-left corner and along some parts of the cracks and spal-lings. The image T was obtained through the crack-recognitionprocedures proposed in Fig. 2. The results of crack-line abstractionare shown in Figs. 16(b–g) for increasing SD sizes from 1 × 1 to20 × 20 pixels.
Some horizontal cracks in wet areas are not detected with astructuring element smaller than 5 × 5 pixels. In the original image,one can observe that the horizontal cracks in wet areas are less dis-tinguishable than cracks in the dry areas; thus, the ANN classifiermisses those cracks when a small dilation boundary is used. When
Fig. 15. Sample crack-classification results using the ANN classifier: (a) original (branched cracks); (b) after bottom-hat transform (branched cracks);(c) after MorphLink-C (branched cracks); (d) original (branched cracks with white lane marker); (e) after bottom-hat transform (branched cracks withwhite lane marker); (f) after MorphLink-C (branched cracks with white lane marker); (g) original (manhole); (h) after bottom-hat transform(manhole); (i) after MorphLink-C (manhole)
© ASCE 04014118-16 J. Comput. Civ. Eng.
J. Comput. Civ. Eng.
Dow
nloa
ded
from
asc
elib
rary
.org
by
Uni
vers
ity o
f C
entr
al F
lori
da o
n 05
/14/
15. C
opyr
ight
ASC
E. F
or p
erso
nal u
se o
nly;
all
righ
ts r
eser
ved.

the SD size increases, the small cracks that are previously unde-tected can be detected; this improves the crack-classificationaccuracy. It is recommended that the square structuring elementsize is between 10 and 20 mm for flexible pavements. For a smallerstructuring element, the crack lines are discontinuous and more rep-resentational for local details (e.g., the local spallings). When theSD size increases, the disjointed crack lines in Fig. 11(b) areself-adaptively connected without using complicated computationsof crack-path orientations, lengths, and intensities. The level ofcrack-line abstraction also increases with a larger SD size.
The SD size can be determined on the basis of the proximitylimit to neighboring cracks. The SD size determines the proximitylimit of neighboring cracks. For example, with a 15-pixel (14.7-mm2) structuring element, neighboring cracks within a 29.4-mmrange will be considered as a part of the same crack. The selection
of the SD size depends on the application. In this study, an SD of10 × 10 pixels (9.8 × 9.8 mm2) was used.
Conclusions
An automated crack-recognition method is proposed, which con-sists of crack-extraction, crack-grouping, and crack-detectionmethods to address multilevel image-processing goals in road-rating applications. The MorphLink-C algorithm is proposed asa novel crack-grouping method. It contains two sub-processes,including fragment grouping using the dilation transform and frag-ment connection using the thinning transform. The proposed crack-grouping method is different from that of He et al. (2011) andHuang and Zhang (2012), which also utilize dilation and thinning
Fig. 16. Self-adaptive mechanism of the proposed fragment-connection approach for different SD sizes: (a) original; (b) 1 pixel (0.98 mm); (c) 2 pixels(1.96 mm); (d) 5 pixels (4.90 mm); (e) 7 pixels (6.86 mm); (f) 10 pixels (9.80 mm); (g) 15 pixels (14.7 mm); (h) 17 pixels (16.7 mm); (i) 20 pixels(19.6 mm)
© ASCE 04014118-17 J. Comput. Civ. Eng.
J. Comput. Civ. Eng.
Dow
nloa
ded
from
asc
elib
rary
.org
by
Uni
vers
ity o
f C
entr
al F
lori
da o
n 05
/14/
15. C
opyr
ight
ASC
E. F
or p
erso
nal u
se o
nly;
all
righ
ts r
eser
ved.

transforms. In those studies, the dilation transform was appliedmultiple times to crack fragments until they were connected to eachother. Then, the thinning transform was applied to obtain crackskeleton. This method has two drawbacks. First, the stopping cri-terion of multiple dilation transforms is not clear, particularly whennoise is located close to the crack. Second, the method did notprovide a way to measure crack width, which is an important meas-urement in road-rating applications.
The effects of the crack-grouping process on crack-detection ac-curacy and feature-subset selection were evaluated. These havebeen rarely discussed in the existing literature. The following con-clusions can be drawn from the results using the ANN classifier:1. A common problem of crack-extraction algorithms is that
extracted crack-image components are usually fragmented,with (multiple) disjoints in their crack paths. The proposedMorphLink-C improves overall crack-recognition performanceby grouping crack fragments, which enables better characteri-zation of crack features. It can be used with any crack-extractionalgorithm as a crack defragmentation technique.
2. MorphLink-C increases the crack-detection accuracy by redu-cing the false-negative error. Reduction of the false-negativeerror is important in pavement crack recognition because theimage after crack extraction usually includes a relatively smallnumber of crack objects compared with non-crack objects.
3. Using MorphLink-C, the crack-detection accuracy increasesfor all 63 tested combinations of crack-feature subsets, andthe classification training time decreases. A reduction in thetraining time with reduced feature subsets is advantageous forroad-rating applications, which involves a large number ofpavement images.
4. The proposed fragment-connection method is self-adaptive fordifferent crack types, including single, branched, blocked, andalligator cracks, and does not require time-consuming compu-tations of crack orientation, length, and intensity.
5. MorphLink-C provides an accurate way of computing aver-aged crack width, which is an important measurement in road-rating applications. Crack width cannot be determined usingexisting crack-segmentation algorithms, such as seed growing(Li et al. 2011), crack tree (Zou et al. 2012), and tensor voting(Huang et al. 2014), although these algorithms have beeneffectively used to connect adjacent crack fragments.
6. Although the wrapper FSS method is used in this study to eval-uate crack-detection accuracy associated with a classifier fordifferent combinations of crack-feature subsets, the relevance,irrelevance, and redundancy of the features are not known.Correlational statistics of crack features are important tounderstand the severity and patterns of road deterioration, andfuture studies are necessary. The filter FSS method could beused in these future studies to evaluate feature subsets by theirstatistical information content, such as interclass distance, sta-tistical dependence, entropy, or information-theoretic measures.
Acknowledgments
The authors thank International Cybernetics, Largo, Florida fortheir technical communication and support in providing the pave-ment images used in this paper. The content of this paper reflectsthe views of the authors, who are solely responsible for the facts,data accuracy, opinions, findings and conclusions presented herein.The contents do not necessarily reflect the official views or policiesof the Florida Department of Transportation. This paper does notconstitute a standard, specification, or regulation. In addition, theabove-listed agency assumes no liability for the content of thispaper or use thereof.
References
AASHTO. (1993). “AASHTO guide for design of pavement structures.”AASHTO, Washington, DC.
ASCE. (2013). “2013 report card for America’s infrastructure.” ASCE,Washington, DC, 1–74.
Ayenu-Prah, A., and Attoh-Okine, N. (2008). “Evaluating pavement crackswith bidimensional empirical mode decomposition.” EURASIP J. Adv.Signal Process., 2008(1), 1–7.
Dong, L., Yu, G., Ogunbona, P., and Li, W. (2008). “An efficient iterativealgorithm for image thresholding.” Pattern Recognit. Lett., 29(9),1311–1316.
Dougherty, E. R., and Lotufo, R. A. (2003). Hands-on morphologicalimage processing, The Society of Photo-Optical InstrumentationEngineers (SPIE), Bellingham, Washington, DC.
Federal Highway Administration. (2001). “Pavement preventive mainte-nance guidelines.” ⟨http://www.mdt.mt.gov/publications/docs/brochures/research/toolbox/FHWA/PavPrevMainGuides.pdf⟩ (Feb. 2, 2014).
Federal Highway Administration. (2003). “Distress identification manualfor the long-term pavement performance program.” FHA, McLean, VA.
Florida Department of Transportation. (2012a). “Flexible pavement conditionsurvey.” Tallahassee, FL, ⟨http://www.dot.state.fl.us/statematerialsoffice/administration/resources/library/publications/researchreports/pavement/flexiblehandbook.pdf⟩ (Feb. 2, 2014).
Florida Department of Transportation. (2012b). “Rigid pavement conditionsurvey.” Tallahassee, FL, ⟨http://www.dot.state.fl.us/statematerialsoffice/pavement/performance/pcs/⟩ (Feb. 2, 2014).
Florida Department of Transportation. (2013). “History of Floridapavement condition survey.” Tallahassee, FL, 1973–2013.
Golparvar-Fard, M., Balali, V., and de la Garza, J. (2012). “Segmentationand recognition of highway assets using image-based 3D point cloudsand semantic texton forests.” J. Comput. Civ. Eng., 10.1061/(ASCE)CP.1943-5487.0000283, 04014023.
Gonzalez, R. C., Woods, R. E., and Eddins, S. L. (2009). Digital imageprocessing using Matlab, 2nd Ed., Gatesmark Publishing, Upper SaddleRiver, NJ.
Gunaratne, M., Amarasiri, S., and Nasseri, S. (2008). “Investigation of au-tomated and interactive crack measurement systems.” No. BD544-36,Florida Dept. of Transportation, Tallahassee, FL.
Haralick, R. M., Shanmugam, K., and Dinstein, I. (1973). “Texturalfeatures for image classification.” IEEE Trans. Syst. Man Cybern., 3(6),610–621.
He, Y., Qiu, H., Wang, J., Zhang, W., and Xie, J. (2011). “Studying of roadcrack image detection method based on the mathematical morphology.”4th Int. Congress on Image and Signal Processing, IEEE, Piscataway,NJ, 967–969.
Hu, Y., and Zhao, C. (2010). “A local binary pattern based methods forpavement crack detection.” J. Pattern Recognit. Res., 5(1), 140–147.
Huang, J., Liu, W., and Sun, X. (2014). “A pavement crack detectionmethod combining 2D with 3D information based on Dempster-Shafertheory.” Comput.-Aided Civ. Infrastruct. Eng., 29(4), 299–313.
Huang, W., and Zhang, N. (2012). “A novel road crack detection and iden-tification method using digital image processing techniques.” 7th Int.Conf. on Computing and Convergence Technology (ICCCT), IEEE,Piscataway, NJ, 397–400.
Huang, Y., and Xu, B. (2006). “Automatic inspection of pavement crackingdistress.” J. Electron. Imaging, 15(1), 013017.
Illinois Department of Transportation. (2004). “Condition rating surveymanual.” Springfield, IL.
Jahanshahi, M. R., Kelly, J. S., Masri, S. F., and Sukhatme, G. S. (2009).“A survey and evaluation of promising approaches for automatic image-based defect detection of bridge structures.” Struct. Infrastruct. Eng.,5(6), 455–486.
Jing, L., and Aiqin, Z. (2010). “Pavement crack distress detection based onimage analysis.” 2010 Int. Conf. on Machine Vision and Human-Machine Interface, IEEE, Piscataway, NJ, 576–579.
Kansas Department of Transportation. (2013). “Pavement managementinformation system.” Topeka, KS.
© ASCE 04014118-18 J. Comput. Civ. Eng.
J. Comput. Civ. Eng.
Dow
nloa
ded
from
asc
elib
rary
.org
by
Uni
vers
ity o
f C
entr
al F
lori
da o
n 05
/14/
15. C
opyr
ight
ASC
E. F
or p
erso
nal u
se o
nly;
all
righ
ts r
eser
ved.
Kaseko, M. S., and Ritchie, S. G. (1993). “A neural network-based meth-odology for pavement crack detection and classification.” Transp. Res.Part C Emerg. Technol., 1(4), 275–291.
Kittler, J., and Illingworth, J. (1986). “Minimum error thresholding.”Pattern Recognit., 19(1), 41–47.
Koch, C., and Brilakis, I. (2011). “Pothole detection in asphalt pavementimages.” Adv. Eng. Inf., 25(3), 507–515.
Koch, C., Jog, G. M., and Brilakis, I. (2013). “Automated pothole distressassessment using asphalt pavement video data.” J. Comput. Civ. Eng.,10.1061/(ASCE)CP.1943-5487.0000232, 370–378.
Koutsopoulos, H. N., and Downey, A. B. (1993). “Primitive-based classi-fication on pavement cracking images.” J. Transp. Eng., 10.1061/(ASCE)0733-947X(1993)119:3(402), 402–418.
Li, J. (2003). “Image processing algorithm for detecting the pavement crackdiseases.” Comput. Eng. Appl., 35, 211–213.
Li, Q., and Liu, X. (2008). “Novel approach to pavement image segmen-tation based on neighboring difference histogram method.” Congress onImage and Signal Processing, IEEE, Piscataway, NJ, 792–796.
Li, Q., Zou, Q., Zhang, D., and Mao, Q. (2011). “FoSA: F� seed-growingapproach for crack-line detection from pavement images.” Image VisionComput., 29(12), 861–872.
Mancini, A., Frontoni, E., and Zingaretti, P. (2013). “Road pavement crackautomatic detection by MMS images.” 21st Mediterranean Conf. onControl & Automation, IEEE, Piscataway, NJ, 1589–1596.
Matheron, G. (1975). Random sets and integral geometry, Wiley,New York.
Minkowski, H. (1903). “Volumen und oberfläche.” Mathema- TischeAnnalen, 57(4), 447–495 (in German).
New York State Department of Transportation. (2010). “Pavement condi-tion assessment.” Albany, NY.
Nguyen, T. S., Begot, S., Duculty, F., and Avila, M. (2011). “Free-formanisotropy: A new method for crack detection on pavement surfaceimages.” 18th IEEE Int. Conf. on Image Processing, IEEE, Piscataway,NJ, 1093–1096.
Oliveira, H., and Correia, P. L. (2009). “Automatic road crack segmentationusing entropy and image dynamic thresholding.” 17th European
Signal Processing Conf. (EUSIPCO’09), IEEE, Piscataway, NJ,622–626.
Otsu, N. (1979). “A threshold selection method from gray-levelhistograms.” IEEE Trans. Syst. Man Cybern., 9(1), 62–66.
Petrou, M., Kittler, J., and Song, K. Y. (1996). “Materials processingtechnology.” J. Mater. Process. Technol., 56(1–4), 158–167.
Pratt, W. K. (2001). Digital image processing, 3rd Ed., Wiley, New York.Salembier, P. (1990). “Comparison of some morphological segmentation
algorithms based on contrast enhancement. Application to automaticdefect detection.” Proc., 5th European Signal Processing Conf., IEEE,Piscataway, NJ, 833–836.
Song, K. Y., Petrou, M., and Kittler, J. (1995). “Texture crack detection.”Mach. Vision Appl., 8(1), 63–75.
Sun, B., and Qiu, Y. (2007). “Automatic identification of pavement cracksusing mathematic morphology.” Int. Conf. on Transportation Engineer-ing (ICTE), ASCE, Reston, VA, 1783–1788.
Sun, Y., Salari, E., and Chou, E. (2009). “Automated pavement distressdetection using advanced image processing techniques.” 2009 IEEEInt. Conf. on Electro/Information Technology, IEEE, Piscataway, NJ,373–377.
Texas Department of Transportation. (2010). “Pavement managementinformation system.” Austin, TX.
Tsai, Y.-C., Kaul, V., and Mersereau, R. M. (2010). “Critical assessment ofpavement distress segmentation methods.” J. Transp. Eng., 10.1061/(ASCE)TE.1943-5436.0000051, 11–19.
Tsao, S., Kehtarnavaz, N., Chan, P., and Lytton, R. (1994). “Image-basedexpert-system approach to distress detection on CRC pavement.”J. Transp. Eng., 10.1061/(ASCE)0733-947X(1994)120:1(52), 52–64.
Washington State Department of Transportation. (1992). “Pavementsurface condition rating manual.” Olympia, WA.
Yan, M., Bo, S., Xu, K., and He, Y. (2007). “Pavement crack detection andanalysis for high-grade highway.” 8th Int. Conf. on Electronic Measure-ment and Instruments, IEEE, Piscataway, NJ, 548–552.
Zou, Q., Cao, Y., Li, Q., Mao, Q., and Wang, S. (2012). “Crack tree:Automatic crack detection from pavement images.” Pattern Recognit.Lett., 33(3), 227–238.
© ASCE 04014118-19 J. Comput. Civ. Eng.
J. Comput. Civ. Eng.
Dow
nloa
ded
from
asc
elib
rary
.org
by
Uni
vers
ity o
f C
entr
al F
lori
da o
n 05
/14/
15. C
opyr
ight
ASC
E. F
or p
erso
nal u
se o
nly;
all
righ
ts r
eser
ved.