impact of using updated seismic information on seismic hazard in western canada
TRANSCRIPT

Impact of using updated seismic information onseismic hazard in western Canada
K. Goda, H.P. Hong, and G.M. Atkinson
Abstract: This study provides a preliminary assessment of the impact of new seismological information on the existingseismic hazard model, as implemented in the 2005 National building code of Canada (NBCC); this seismic hazard modelwas actually developed in the early 1990s, and thus there is significant new information available in the literature sincethen. A reassessment of seismic hazard is carried out by updating magnitude-recurrence relations based on the earthquakecatalog up to the end of 2006, including conversion of all earthquake magnitudes to a homogenous moment magnitudescale. The recent ground-motion prediction equations, which update the knowledge base used in the 2005 NBCC, are alsoused. Focusing on Vancouver and Victoria, sensitivity analyses are carried out to investigate both individual and combinedimpacts of these updates on the uniform hazard spectra. The proposed model can be used as a guide to the direction inwhich future seismic hazard models for western Canada may move.
Key words: probabilistic seismic hazard analysis, uniform hazard spectra, western Canada.
Resume : Cette etude fournit une premiere evaluation de l’impact de nouvelles informations sismologiques dans le modeleexistant de risques sismiques tel qu’implante dans le Code national du batiment du Canada (CNBC). Ce modele de risquessismiques a ete developpe au debut des annees 1990; beaucoup de nouvelles informations sont donc disponibles. Le risquesismique est reevalue par une mise a jour des relations magnitude-recurrence en se basant sur le catalogue des seismes jus-qu’a la fin de 2006, incluant la conversion de toutes les magnitudes de seismes en une echelle homogene de magnitude demoment. Les equations recentes de prevision du mouvement du sol, qui mettent a jour la base de connaissances utiliseedans le CNBC 2005, sont egalement utilisees. Des analyses de sensibilite cibles sur Vancouver et Victoria ont ete realiseesafin d’examiner les impacts individuels et combines de ces mises a jour sur les spectres de risques uniformes. Le modelepropose peut etre utilise comme guide des directions possibles des futurs modeles de risques sismiques pour l’Ouest cana-dien.
Mots-cles : analyse probabiliste des risques sismiques, spectres de dangers uniformes, Ouest canadien.
[Traduit par la Redaction]
1. Introduction
Seismic hazard assessments are usually based on theprobabilistic seismic hazard analysis (PSHA) (Cornell 1968;McGuire 2004). Results of the assessments are most oftenpresented in terms of the uniform hazard (response) spectra(UHS), which plot the expected response spectra values fora given probability of exceedance (or return period) in termsof the natural vibration period, Tn. A national seismic-hazardmodel for Canada including estimates of the 5%-dampedhorizontal component pseudo-spectral acceleration (PSA)
for a 2% probability of exceedence in 50 years (i.e., 2475-year return period), developed by the Geological Survey ofCanada (GSC) (Adams and Halchuk 2003), forms the basisfor the seismic provisions of the 2005 National buildingcode of Canada (NBCC).
The GSC seismic hazard model (hereafter referred to asthe GSC model), as described by Adams and Halchuk(2003), contains information on seismicity and ground mo-tions on a regional level across Canada, which was thestate-of-the-art at the time it was developed (early 1990s).However, significant new information is available in the lit-erature that warrants a reevaluation; in particular, improve-ments can be readily made with regard to the earthquakecatalog, magnitude-recurrence relations for different types ofearthquakes, ground-motion prediction equations (GMPE),use of an extended source model rather than a point sourcemodel, and adoption of mean estimates versus median esti-mates. In this study, we examine the impact of the most sig-nificant aspects of the GSC model that could be improved.
More specifically, the earthquake catalog used in the GSCmodel is complete only up to 1991; currently, the SeismicHazard Earthquake Epicenter File (SHEEF) catalog up tothe end of 2006 is available.2 It is noted that magnitudes re-ported in the SHEEF catalog are based on a number of mag-nitude scales, while the moment magnitude, Mw, is the
Received 4 July 2008. Revision accepted 24 November 2009.Published on the NRC Research Press Web site at cjce.nrc.ca on14 April 2010.
K. Goda and G.M. Atkinson. Department of Earth Sciences,The University of Western Ontario, London, ON N6A 5B7,Canada.H.P. Hong.1 Department of Civil and EnvironmentalEngineering, The University of Western Ontario, London, ONN6A 5B9, Canada.
Written discussion of this article is welcomed and will bereceived by the Editor until 31 August 2010.
1Corresponding author (e-mail: [email protected]).2Halchuk, S. 2007. Personal communication.
562
Can. J. Civ. Eng. 37: 562–575 (2010) doi:10.1139/L09-170 Published by NRC Research Press
parameter used in developing GMPEs. The conversions ofmagnitude amongst various scales in the catalog were notcarried out for the GSC model, though it is recognized thatthe use of mixed magnitude scales in PSHA could result inbiased assessments of magnitude-recurrence relations. Thereare currently a number of magnitude conversion equationsthat can be applied to convert earthquake catalogs to a uni-form moment magnitude standard (Ristau et al. 2003, 2005;Atkinson and McCartney 2005).
The GMPEs used in the GSC model for western Canadaare those given by Boore et al. (1997) and Youngs et al.(1997). The availability of extensive databases for strongground-motion records has prompted the development ofnew GMPEs over the last 10 years (Atkinson and Boore2003; Kanno et al. 2006; Hong and Goda 2007; Boore andAtkinson 2008). These new GMPEs have significant impli-cations for seismic hazard estimates in western Canada. Fur-thermore, all GMPEs used for western Canada employdistance measures based on an extended source model (i.e.,closest horizontal distance to surface projection of a fault onthe Earth or Joyner-Boore distance, rjb, and closest distanceto a rupture plane, rrup), rather than those based on a pointsource model (i.e., epicentral distance, repi, and hypocentraldistance, rhypo). However, the GSC model does not makesuch a distinction, which can lead to biased estimates(Scherbaum et al. 2004). Finally, the GSC model provides‘‘median’’ estimates of seismic hazard; the discussions onthe adoption of ‘‘median’’ versus ‘‘mean’’, which are valua-ble and philosophically challenging (Abrahamson andBommer 2005; McGuire et al. 2005), are outside the scopeof this study. The use of ‘‘mean-hazard’’ ground-motion es-timates is of advantage because the exceedance probabilityis defined for the ‘‘mean ground-motion’’ motions, whichcannot be inferred directly if the ‘‘median’’ is used.
One more note related to the modeling of the Cascadiasubduction events is in order. The GSC model treated theseevents as a deterministic scenario event with Mw equal to8.2 and a specified rupture front location. However, Hy-ndman and Wang (1995) and Satake et al. (1996) suggestedthat the magnitude of such events can be as large as 9.0, andMazzotti and Adams (2004) indicated that they occur quasi-periodically. This warrants the consideration of the probabil-istic characteristics in recurrence, magnitude, and rupture
front location of the Cascadia subduction events for assess-ing a UHS.
In this study, an updated seismic hazard model for westernCanada is developed by incorporating the following improve-ments: (1) use of a uniform moment magnitude scale for theearthquake catalog, (2) reevaluation of the magnitude-recur-rence relations for different types of earthquake, (3) use ofrecently developed GMPEs, and (4) use of an extendedsource model rather than a point source model, and (5) con-sideration of probabilistic scenarios for the Cascadia subduc-tion events. The updated model could be of benefit to theNBCC committees and seismic risk management agencies.The updates should be viewed as complementary to the exist-ing GSC model, and the use of ‘‘mean’’ seismic hazard esti-mates reported hereafter reflects the authors’ preference. Itshould be noted that this study is not a comprehensive reeval-uation of seismic hazard in western Canada. There are signif-icant aspects of the GSC model that we have not reevaluatedherein. In particular, the seismic source zones and their boun-daries as defined in the GSC model are retained, with noevaluation as to what improvements could be made in this re-gard. Rather, we focus on the most clear and significant up-dates that can be made at present as a guide to the directionin which future more detailed re-evaluations may move. Weemphasize that these estimates are provisional guides, ratherthan specific recommendations.
2. Updated seismic hazard model
2.1 ApproachThe most popular PSHA procedure for characterizing
seismic hazard is the Cornell–McGuire method (Cornell1968; McGuire 2004). The Cornell–McGuire method, whichis adopted by Adams and Halchuk (2003), is considered inthe present study. It combines the earthquake occurrencemodel, seismic source-zone model, magnitude-recurrence re-lation, and GMPE through the total probability theorem toassess seismic hazard at sites of interest, as explained in thefollowing.
Consider that the seismic ground-motion measure, Y, rep-resents the peak ground acceleration (PGA) and (or) thePSA. The cumulative distribution function (CDF) of Y,FY(y), can be expressed as
½1� FYðyÞ ¼ 1�Xns
zone; i¼1
Z
UXEU;i
�lMmin ;i
Z
Ui
½1� FYjM;R;iðyÞ� fM;R;iðm; rÞdmdr�
fXEU;iðxEUÞdxEU
where the summation considers earthquakes originatingfrom ns seismic source zones; lMmin,i is the occurrence rateof seismic events with magnitudes greater than or equal toMmin; for the i-th source zone, fM,R,i(m) denotes the jointprobability density function (PDF) of the earthquake magni-tude measure M and the distance measure R, and Ui denotesthe domain of M and R for the i-th source zone; FY|M,R,i(y)is the CDF of Y conditioned on M, R, and the i-th sourcezone; XEU,i represents the epistemic random variables forthe i-th source zone whose joint PDF is given by fXEU,i(xEU);and UXEU,i denotes the domain of XEU for the i-th source
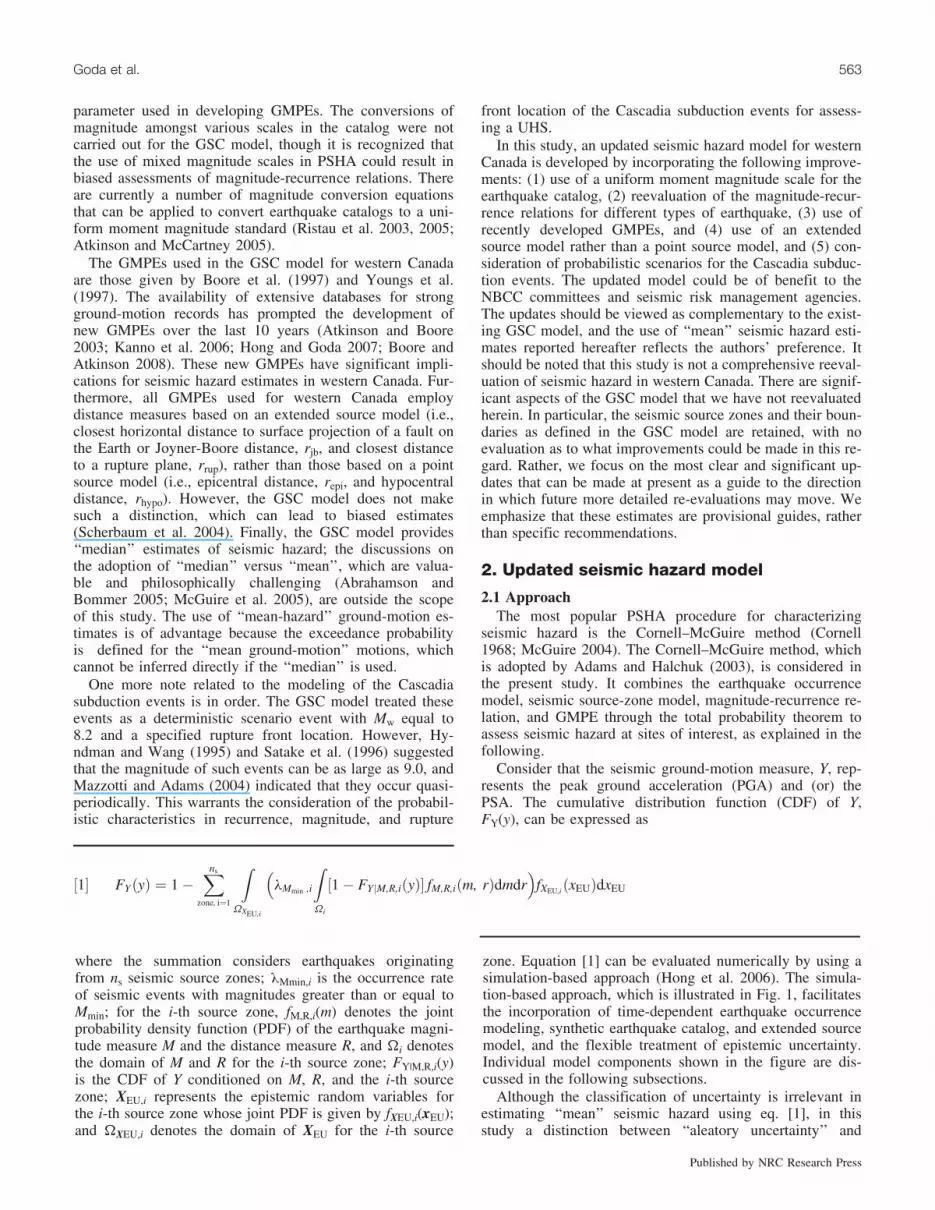
zone. Equation [1] can be evaluated numerically by using asimulation-based approach (Hong et al. 2006). The simula-tion-based approach, which is illustrated in Fig. 1, facilitatesthe incorporation of time-dependent earthquake occurrencemodeling, synthetic earthquake catalog, and extended sourcemodel, and the flexible treatment of epistemic uncertainty.Individual model components shown in the figure are dis-cussed in the following subsections.
Although the classification of uncertainty is irrelevant inestimating ‘‘mean’’ seismic hazard using eq. [1], in thisstudy a distinction between ‘‘aleatory uncertainty’’ and
Goda et al. 563
Published by NRC Research Press
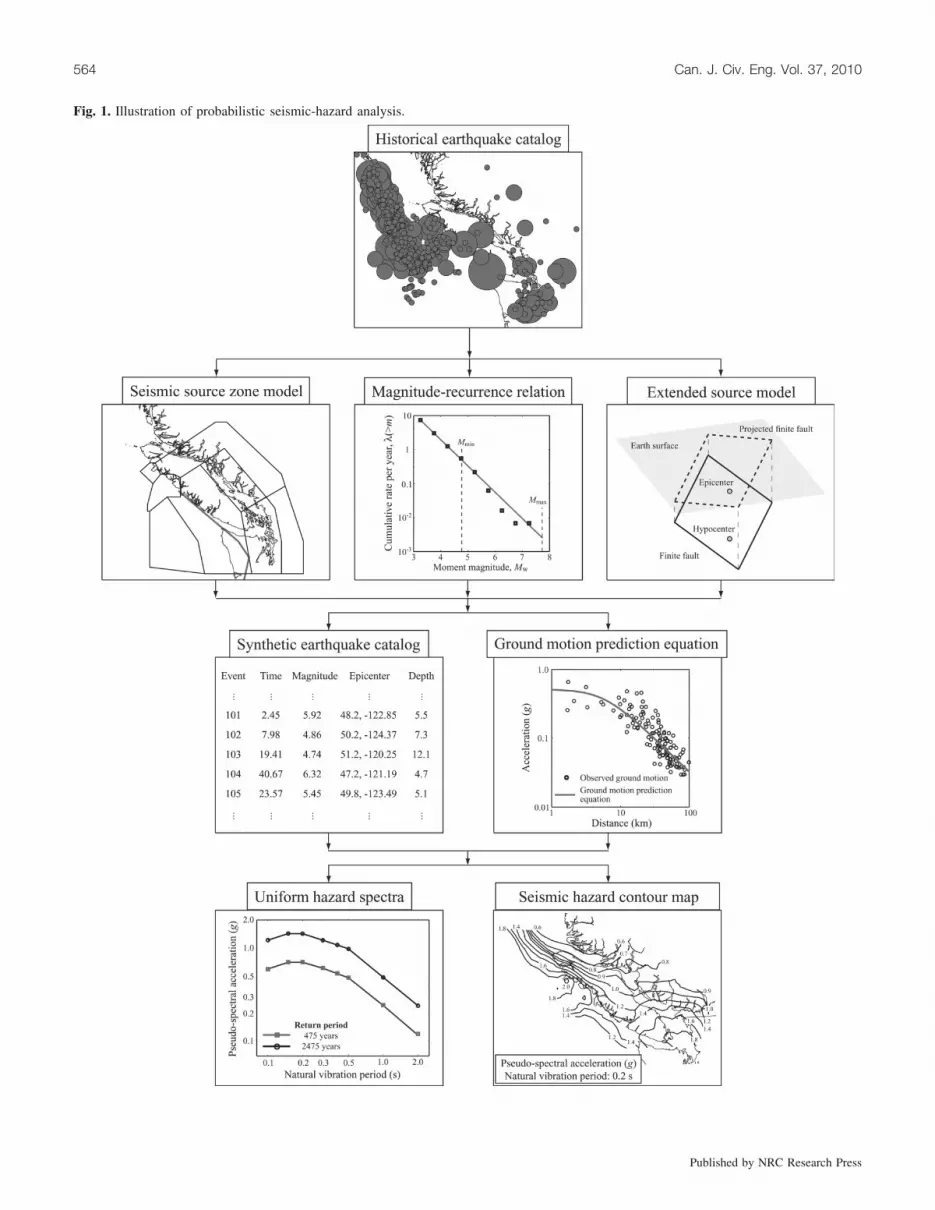
Fig. 1. Illustration of probabilistic seismic-hazard analysis.
564 Can. J. Civ. Eng. Vol. 37, 2010
Published by NRC Research Press

‘‘epistemic uncertainty’’ is made to follow current mainstreampractice. The former represents intrinsic physical variability,whereas the latter is related to the uncertainty concerning thecorrectness of alternative models.
2.2 Seismic source zones and magnitude-recurrencerelations
Historical seismic events observed in western Canada areused to define seismic source zones that reflect the geologi-cal and seismological features of the considered regions.Within each source zone, the spatial distribution of seismicevents is assumed to be random and the same magnitude-recurrence relation and GMPE are used. The GSC source-zone model was developed based on the SHEEF catalog upto 1991 (Adams and Halchuk 2003), and two alternativesource-zone models were considered: the historical (H)model and the regional (R) model. These two models areadopted in this study for simplicity. It should be pointed outthat these source-zone models are not exhaustive, and amore comprehensive or site-specific study should considerother alternatives. In this study, the combination of the Hand R models is considered by assigning relative weights tothe models. This differs from the Adams and Halchuk’s‘‘robust’’ approach, which adopted the higher of the twoseismic hazard estimates from the H and R models.
The magnitude-recurrence relation characterizes the fre-quency of earthquake occurrence of different magnitudes,and it is often modeled by the truncated exponential distri-bution with both minimum and maximum earthquake mag-nitudes, Mmin and Mmax. For a given seismic source zone,the annual occurrence rate of earthquakes with magnitudesgreater than or equal to Mmin, lMmin, is given by
½2� lMmin¼ N0
exp ð�bMmin Þ � exp ð�bMmax Þ1� exp ð�bMmax Þ
where b and N0 are the magnitude-recurrence parameters,and the GSC model adopts Mmin equal to 4.75.
The SHEEF catalog reports seismic events with mixedmagnitude scales, such as the local magnitude ML, body-wave magnitude mb, coda duration magnitude Mc, and surfacemagnitude Ms. Using the inconsistent magnitude scales in de-veloping magnitude-recurrence relations is likely to result inbiased assessments of magnitude-recurrence parameters b
and N0 and increased uncertainty (Atkinson and McCartney2005). A reassessment of magnitude-recurrence parameters isthus warranted by using the modified SHEEF catalog with allearthquake magnitudes converted to Mw. This conversion iscarried out by using the reported Mw values where available(see Atkinson (2005) and Atkinson and McCartney (2005)).For events with no reported Mw values, we use empiricalmagnitude conversion equations to estimate Mw. The usedconversion equations are given as follows for the continentalevents and for the offshore events, respectively:
½3a� Mw ¼ ML
Mw ¼ ML þ 0:6 ð3 < ML < 6Þ
for ML (Ristau et al. 2003, 2005; Atkinson and McCartney 2005)
½3b� Mw ¼ mb þ 0:46 ð4 < mb < 7Þ
for mb (Braunmiller and Nabelek 2002)
½3c� Mw ¼ 0:96Mc þ 0:19
for Mc (Dewberry and Crosson 1995) and
½3d� Mw ¼ 0:64Ms þ 2:18 ðMs � 6:1Þ
for Ms (Braunmiller et al. 2005).The magnitude-recurrence parameters b and N0 for each
source zone are determined from the earthquake catalog byusing the maximum likelihood method (Weichert 1980).The time period over which the catalog is complete varieswith magnitude; therefore, we adopt the completeness inter-vals given by Adams and Halchuk (2003). As an illustration,the magnitude-recurrence relation for the Cascade MountainR (CASR) source zone (see Adams and Halchuk 2003) is
Fig. 2. Magnitude-recurrence relation for the Cascade Mountain R(CASR) seismic-source zone.
Fig. 3. Fault geometry for an extended earthquake source model.
Goda et al. 565
Published by NRC Research Press

determined by considering a magnitude bin size equal to 0.5and Mmax equal to 7.75; the results are illustrated in Fig. 2together with those of Adams and Halchuk (2003) and At-kinson and McCartney (2005) for the same source zone. Inthis study, two curves are developed based on different as-sumptions in converting events with ML to Mw: Mw = ML(generally applies to continental events) and Mw = ML + 0.6(generally applies to offshore events). Note that data pointsfor the two cases, shown in Fig. 2 with a circle and a square,coincide in the range of Mw greater than 6.0. The CASRmagnitude-recurrence relation fits the data well for the en-tire magnitude range, if seismic events are converted to Mwusing Mw = ML + 0.6. The obtained magnitude-recurrence
relations are close to those suggested by Atkinson andMcCartney (2005). Note also that the CASR magnitude-re-currence relations given by Adams and Halchuk (2003)show significantly different slopes for smaller and largermagnitude ranges. The difference can be attributed to theuse of mixed magnitude scales in the earthquake catalog(Atkinson and McCartney 2005).
For other source zones in western Canada, the same analysisis carried out, and the obtained parameters b and N0 are listedin Table 1 and used for the sensitivity analysis in Sect. 3.
2.3 Extended earthquake source modelHistorical seismicity compiled in the SHEEF catalog cor-
Table 1. Modified magnitude-recurrence parameters for seismic source zones in western Canada.
Source zone* Mw-ML conversion equation Mmin{ Mmax
{ b N0
H model: CASH Mw = ML 3.25 7.25 1.849 653Mw = ML + 0.6 3.25 7.25 1.876 2379
H model: PUG Mw = ML 3.25 7.25 0.992 18.4H model: JDF Mw = ML 3.25 7.75 1.327 26.0
Mw = ML + 0.6 3.25 7.75 1.743 366H model: NJFP Mw = ML + 0.6 3.75 7.25 1.318 46.3H model: GEO{ — — — 2.250 85.0H model: SCM Mw = ML 3.25 7.25 1.923 276
Mw = ML + 0.6 3.25 7.25 1.785 432R model: CASR Mw = ML 3.25 7.75 1.694 571
Mw = ML + 0.6 3.25 7.75 1.779 2404R model: GSP Mw = ML 3.25 7.25 1.018 20.2R model: JDFN Mw = ML 3.25 7.25 0.919 3.63R model: JDFF Mw = ML + 0.6 3.25 7.25 1.797 185
*For the definition of the source zones, see Adams and Halchuk (2003).{Events within Mmin and Mmax are used to estimate the magnitude-recurrence parameters.{The parameters for the GEO are adopted from those by Adams and Halchuk (2003) because of the very limited
number of earthquakes in the source zone.
Table 2. Summary of probabilistic information for fault geometry parameters.
Fault geometry parameter Probability distribution Mean and standard deviation Lower and upper boundsFault width (km): log10W Normal 0.32Mw - 1.01 and 0.15* —Fault length (km): log10L Normal 0.59Mw - 2.44 and 0.16* —Focal depth (km): H Truncated normal Shallow events: 0.61Mw+7.08 and 4.55{ 3 and 25{
Deep events: 50 and 25 35 and 100Dip (8): d Truncated normal 65 and 20{ 40 and 90{
Strike (8): f Uniform — 0 and 360
*Wells and Coppersmith (1994).{Scherbaum et al. (2004).
Table 3. Model coefficients for the mean and coefficient of variation of distance gap data (eqs. [4] and [5]) for shallowand deep events.
Mean (eq. [4])
Distance gap data a1 a2 a3 a4 a5 a6 a7
Shallow events: repi–rjb (R = repi) 0.458 –0.0549 1.046 –0.0361 –1.297 –0.138 0.105Shallow events: rhypo–rrup (R = rhypo) 0.363 –0.0437 0.978 –0.0256 –1.213 –0.149 0.104Deep events: rhypo–rrup (R = rhypo) 0.103 –0.0120 1.278 –0.0518 –1.201 –0.170 0.109
Coefficient of variation (eq. [5])
Distance gap data b1 b2 b3 b4 b5 b6
Shallow events: repi–rjb (R = repi) 0.227 –0.0448 1.921 –0.0566 –2.109 0.331Shallow events: rhypo–rrup (R = rhypo) 0.181 –0.0560 1.239 –0.1013 –1.561 0.275Deep events: rhypo–rrup (R = rhypo) –0.078 –0.0237 1.394 –0.0644 –0.889 0.242
566 Can. J. Civ. Eng. Vol. 37, 2010
Published by NRC Research Press

responds to locations of epicenters of seismic events; conse-quently, the developed seismic source-zone model is also re-lated to the spatial distribution of epicenters. However, allcurrent GMPEs for western North America are developedby adopting distance measures based on an extended sourcemodel, such as rjb and rrup, rather than those based on apoint source model, such as repi and rhypo (see Fig. 3 forschematic illustration of different distance measures associ-ated with a fault plane). The distance measure used to de-velop the GMPEs should be applied in PSHA, as the use ofinconsistent distance measures results in biased (underesti-mated) seismic hazard assessments (Scherbaum et al. 2004).An efficient and practical way to achieve this is by develop-ing equations that relate rjb and (or) rrup to repi and rhypo, re-spectively, and then using a point source model in PSHA.
Equations relating different distance measures are devel-oped as follows. Fault geometry is simulated for each gener-ated seismic event by following the simulation proceduresuggested by Scherbaum et al. (2004), and the simulatedfault geometry is used to calculate different distance meas-ures for a site of interest. The considered fault model is il-lustrated in Fig. 3, and the following fault model parametersare treated as random variables: fault width W (km), faultlength L (km), focal depth H (km), dip angle d, and strikeangle f. Their probabilistic information employed in thisstudy is summarized in Table 2. The focal depth of shallowevents is modeled according to Scherbaum et al. (2004),whereas that of deep events is modeled as a normal variatewith mean equal to 50 km and standard deviation equal to25 km, truncated at the lower and upper bounds of 35 and
100 km, respectively (see Table 2). The statistical informa-tion is considered suitable for earthquakes in western Can-ada (note: we examined the focal depth distribution ofseismic events included in the SHEEF catalog; however, wewere unable to conclude that the assumed depth informationis consistent with the actual focal-depth distribution owingto the poor quality of depth information). Based on simula-tion results, conversion equations from repi to rjb or fromrhypo to rrup, which are needed in PSHA and are not availablein the literature, are developed by characterizing the proba-bility distribution and the mean and the coefficient of varia-tion (cov) of the simulated distance gap data repi–rjb or rhypo–rrup, as a function of a distance measure repi or rhypo. Notethat Scherbaum et al. (2004) modeled the distance gap repi–rjb conditioned on rjb, as a gamma variate.
A detailed statistical analysis is carried out for the assess-ment,; as an illustration, the probability mass functions ofrepi–rjb and rhypo–rrup conditioned on repi and rhypo rangingfrom 0 to 10 km for shallow events are shown in Fig. 4, to-gether with fitted gamma distributions based on the maxi-mum likelihood method. The results shown in Fig. 4 indicatethat repi–rjb and rhypo–rrup can be modeled as a gamma variate.This conclusion is valid for values of repi and rhypo greaterthan 10 km as well as for deep events. Moreover, the meanand cov of the distance gap data (i.e., repi–rjb or rhypo–rrup)are functions of the selected distance measure (i.e., repi orrhypo) and Mw. To develop prediction equations for the meanand cov of repi–rjb conditioned on repi or of rhypo–rrup condi-tioned on rhypo, nonlinear least-squares fitting is performedby using the following functional forms:
½4� mGap ¼�
1� exp ½�ða1 þ a2MwÞRa3þa4Mw ��
exp ða5 þ a6Mw þ a7M2wÞ
Fig. 4. Probability distribution of distance gap data conditioned on the distance measure ranging from 0 to 10 km for shallow events withMw = 6.0 and 7.0: (a) repi–rjb; (b) rhypo–rrup
Goda et al. 567
Published by NRC Research Press

for the mean of the distance gap data, and
½5� nGap ¼ ½1þ ðb1 þ b2MwÞexpðb3Rb4Þ�expðb5 þ b6MwÞ
for the cov of the distance gap data, where R represents repior rhypo and ai, (i = 1,. . .,7), and bi, (i = 1,. . .,6), are the modelcoefficients. For shallow and deep events, the obtained coef-ficients for the mean and cov of the distance gap data aresummarized in Table 3, and for shallow events, the adequacyof the fit is illustrated in Fig. 5. The developed equations forthe statistics of the distance gap data along with the assump-tion that the distance gap data is a gamma variate can be usedto convert probabilistically one distance measure (i.e., repi orrhypo) to another (i.e., rjb or rrup) in PSHA.
Fig. 5. Statistics of distance gap data rhypo–rrup for shallow events:(a) Mean; (b) Coefficient of variation.
Fig. 6. Ground-motion prediction equations for the reference groundcondition (Vs30 = 555 (m/s)): (a) Shallow crustal earthquakes (Mw =7.0); (b) In-slab subduction earthquakes (H = 50 (km) and Mw = 7.5);(c) Interface subduction earthquakes (H = 20 (km) and Mw = 8.5).
568 Can. J. Civ. Eng. Vol. 37, 2010
Published by NRC Research Press

2.4 Ground-motion prediction equationsTwo GMPEs were adopted in the GSC model for western
Canada: the BJF97 relation (Boore et al. 1997) for shallowcrustal earthquakes and the YCSH97 relation (Youngs et al.1997) for both deep in-slab and shallow interface subductionearthquakes (see Adams and Halchuk (2003) for details).Several more recent GMPEs that can be used for PSHA inwestern Canada have been developed based on a larger setof strong ground-motion records (Atkinson and Boore 2003;Atkinson 2005; Hong and Goda 2007; Boore and Atkinson2008). The GMPEs that are developed for other regions,such as the one given by Kanno et al. (2006), could also beconsidered, particularly for in-slab subduction earthquakesin the Cascadia region.
In the present study, multiple GMPEs for each earthquaketype are considered and weighted. That is, in place of theBJF97 relation and the YCSH97 relation, the followingGMPEs are considered: the A05 relation (Atkinson 2005),the HG07 relation (Hong and Goda 2007), and the BA08 re-lation (Boore and Atkinson 2008) for shallow crustal earth-quakes; the AB03 relation (Atkinson and Boore 2003) andthe KNMFF06 relation (Kanno et al. 2006) for deep in-slabsubduction earthquakes; and the GSWY02 relation (Gregoret al. 2002), the AB03 relation, and the AM09 relation (At-kinson and Macias 2009) for interface subduction earth-quakes. The reference site condition used with theserelations is the NEHRP site class C (i.e., average shear-wave velocity in the uppermost 30 m Vs30 equal to 555 m/s). The use of a limited set of GMPEs is intended to illus-trate the effects of using recent GMPEs on seismic hazardestimates. In adopting these GMPEs, several comments arewarranted. For the A05, GSWY02, and AM09 relations, thesoil amplification factors given by Boore and Atkinson(2008) are used to adjust peak ground motions and responsespectra for different soil conditions. For the HG07 relation,an anelastic term is included for rjb greater than 100 km(Adams and Halchuk 2003). The AB03 relation is appliedwith the coefficient developed for the Cascadia region (At-kinson and Boore 2003). It is noted that there is an erratumto the AB03 relation that affects interface events (Atkinsonand Boore 2008). However, the use of the Cascadia modifi-cation factors in this study implicitly corrects the underlyingdatabase error in the AB03 relation, since the Cascadia dataused in deriving those factors (i.e., the Cape Mendocino re-cords) do not have any database errors. The KNMFF06 rela-tion, which was developed based on the peak square root of
the sum of squares of two horizontal components in the timedomain, is applied together with empirical factors that con-vert from the peak square root response to the geometricmean response. The conversion factors were developed us-ing Japanese ground-motion data (Goda and Atkinson 2009)and range from 1.2 to 1.3 for the PGA and the PSA at thevibration periods between 0.1 and 3.0 s. A beneficial featureof new GMPEs is that they allow one to carry out seismichazard assessments for various soil conditions.
The GMPEs used in this study are shown in Fig. 6; theBJF97 and YCSH97 relations are also included for compar-ison. Inspection of Fig. 6a indicates that for shallow crustalearthquakes the BJF97, HG07, and BA08 relations are simi-lar, whereas the A05 relation lies above the other three rela-tions. For Mw > 7.0, the BA08 relation lies below the BJF97and HG07 relations, since the BA08 relation incorporatesthe saturation effects for magnitude scaling, whereas theother two relations do not. Inspection of Fig. 6b shows thatGMPEs for deep in-slab earthquakes (Mw = 7.5) vary signif-icantly. This is due to the differences in the employed data-sets and functional forms. For example, the AB03 relationhas a steeper slope than the YCSH97 and KNMFF06 rela-tions, which results in significantly different predictedground-motion levels. The comparison shown in Fig. 6c in-dicates that GMPEs for interface subduction earthquakes(Mw = 8.5) differ significantly in the predicted ground-mo-tion levels as well as the slope of GMPEs in terms of dis-tance.
In summary, for the sets of GMPEs under consideration,pronounced differences among GMPEs are observed espe-cially for in-slab and interface subduction earthquakes. Suchdifferences partly arise from competing assumptions aboutGMPEs and considered records. Thus, they need to be incor-porated in PSHA as an important component of epistemicuncertainty. In this study, we have used the expediency ofrepresenting this epistemic uncertainty by selecting a few al-ternative equations. This is not necessarily the best approach,and a future study should address the more fundamentalquestion as to how to quantify epistemic uncertainty in se-lecting GMPEs.
Finally, it is emphasized that the sets of GMPEs that areconsidered in this study are not comprehensive, and morecareful reviews are required in determining which GMPEsare indeed adequate for assessing seismic hazard in westernCanada, as they have the most significant impact on seismichazard estimates (as will be highlighted in Sect. 3). For such
Table 4. Scenario events for the interface Cascadia subduction earthquakes.
Scenario Inter-arrival time model Magnitude Ground-motion prediction equation*Case 1 EXP(600){ 8.2 YCSH97 (1.0)Case 2 LN(500/600, 0.25/0.5, 308){ 8.2 YCSH97 (1.0)Case 3 LN(500/600, 0.25/0.5, 308) N(8.5, 0.5, 8.0, 9.0)§ YCSH97 (1.0)Case 4 LN(500/600, 0.25/0.5, 308) N(8.5, 0.5, 8.0, 9.0) AB03 (1.0)Case 5 LN(500/600, 0.25/0.5, 308) N(8.5, 0.5, 8.0, 9.0) [YCSH97 (0.2), GSWY02 (0.2), AB03 (0.4), AM09 (0.2)]
*The number inside the brackets represents the assigned weight, and if a single GMPE is used, the GSC approach to capture epistemic uncertainty isconsidered (see Sect. 3.4).
{EXP(m) indicates that the inter-arrival time is modeled by the exponential distribution with the mean recurrence period of m years.{LN(m, n, tE) indicates that the inter-arrival time is modeled by the truncated lognormal distribution with the mean recurrence period of m years, the
coefficient of variation of n, and the elapsed time of tE years since the last occurrence.§N(m, s, Mmin, Mmax) indicates that the characteristic magnitude is modeled by the truncated normal distribution with the mean of m, the standard deviation
of s, and the lower and upper bounds of Mmin and Mmax.
Goda et al. 569
Published by NRC Research Press

determination and selection, it is important to achieve goodbalance and consistency between the past and current practi-ces and the proposed future practices so that drastic changesof seismic hazard estimates (using newer GMPEs) do notcause unduly low seismic safety margins to structures andinfrastructure that are designed according to updated seismichazard estimates. It is also important to address what is thebest way of modeling epistemic uncertainty in GMPEs, asthis may not be entirely captured simply by using a rangeof alternative equations.
2.5 Interface Cascadia subduction earthquakeThe GSC model treats the interface Cascadia subduction
earthquakes as a deterministic scenario event, and the seismichazard due to such events was combined with those based onthe H and R models through the ‘‘robust’’ approach by takingthe largest of the seismic hazard estimates. Consequently, theCascadia hazard did not affect final seismic hazard estimatesat most sites in western Canada. However, strictly speaking,they should be integrated directly in the H and R models forPSHA, since the Cascadia hazard is additive to those due tocrustal earthquakes and in-slab earthquakes.
It has been observed that earthquakes from identifiedfaults and subduction zones often show quasi-periodic recur-rence (Matthews et al. 2002; Mazzotti and Adams 2004). Ifsuch quasi-periodic recurrence is modeled by a renewalprocess with an assigned probability distribution for the in-ter-arrival time, time-dependent characteristics of the Casca-dia subduction events can be incorporated in PSHA using asimulation-based approach. The elapsed time since the lastmajor earthquake needs to be considered for the renewalmodel. For the inter-arrival time distribution, the lognormaldistribution, which provides reasonable behavior with math-ematical simplicity, and the inverse Gaussian distribution,which mimics physical process of loading and unloadingstress along rupture plane (Matthews et al. 2002), can beconsidered, as well as the exponential distribution (i.e., ho-mogeneous Poisson process).
Another important aspect in characterizing the Cascadiasubduction events is to define their magnitudes and occur-rence locations. These might be related to their occurrencetimes, but they are treated separately herein because of thelimited knowledge. By comparison, the GSC model consid-ered a deterministic scenario event of Mw equal to 8.2 anddepth equal to 25 km with a specified fault rupture front.For the United States seismic-hazard map projects (Petersenet al. 2002), several scenarios for the Cascadia events wereconsidered by varying Mw (i.e., Mw equal to 8.3 and 9.0) andlocations of the rupture front within the transition zone,where the event with Mw = 8.3 was considered to float alongthe entire rupture front that could extend more than1000 km. Other hypotheses, such as a bi-modal occurrenceprocess with different characteristic magnitudes (Mazzottiand Adams 2004), could be used.
Based on the above discussion, several possible scenarioevents for the interface Cascadia subduction events are con-structed and listed in Table 4 for sensitivity analysis.
2.6 Simulation algorithmA simulation approach (Hong et al. 2006) is employed to
carry out PSHA. The approach was validated by checking
that the values of seismic hazard estimate for a number ofsites across Canada based on simulation match the resultspublished by the GSC to within a few percentage, when thesame input models and assumptions were used (Goda andHong 2009). Note that the GSC computations are based onan entirely different algorithm, the FRISK88 program ofRisk Engineering, Inc.
Three layers of epistemic uncertainty are considered: seis-mic source-zone models, magnitude-recurrence parameters,and applicable GMPEs. This treatment was limited, as alter-native models considered are not exhaustive. For the Casca-dia subduction events, time-dependent models and multiplescenario events are taken into account. To reduce computa-tion time and to incorporate an extended source model, thedeveloped conversion equations for different distance meas-ures based on the location of epicenter and (or) hypocentercan be used.
3. Sensitivity analysisThis section presents PSHA results in the form of UHS
for Vancouver [49.28N, 123.28W] and Victoria [48.58N,123.38W], using the results based on the GSC model (i.e.,robust approach) as a reference. The sensitivity analysis ad-dresses the use of mean or median seismic hazard estimates,the effects of the updated magnitude-recurrence relations,the effects of an extended source model, the effects of usingnewly available GMPEs, the impact of the Cascadia subduc-tion events, and their combined influence on the PSHA re-sults.
For the assessment, seismic events with magnitudesgreater than or equal to 4.75 (i.e., Mmin = 4.75) within a ra-dius of 200 km from the site are included. The reference soilcondition represented by Vs30 equal to 555 m/s is considered.Simulation is carried out to produce a 5-million-year catalogof the annual maximum ground motion. In the updated seis-mic hazard model, an equal weight is assigned to the H andR models. In Sects. 3.1 to 3.4, the Cascadia subductionevents are not included to facilitate the direct comparisonbetween the GSC model and the updated model.
3.1 Mean and median seismic hazard estimatesIt must be emphasized that for the reasons mentioned pre-
viously, the present study reports ‘‘mean’’ seismic hazard es-timates, unless otherwise indicated, whereas those given byAdams and Halchuk (2003) are ‘‘median’’ estimates.
To investigate the difference between the mean and me-dian UHS, PSHA is carried out by considering the same in-formation as contained in the GSC model (i.e., source zones,magnitude-recurrence parameters, and GMPEs); the obtainedmean UHS for the return periods of 475 and 2475 years(i.e., 10% and 2% probabilities of exceedance in 50 years,respectively) are shown in Fig. 7. The results based on theGSC model (Adams and Halchuk 2003) are also shown inthe figures. Figure 7 indicates that for all cases, mean seis-mic hazard estimates are greater than median seismic hazardestimates by a factor of 1.11–1.47, depending on details ofthe considered seismic hazard models as well as probabilitylevels of interest. The differences are mainly attributed toepistemic uncertainty associated with GMPEs specified inthe GSC model.
570 Can. J. Civ. Eng. Vol. 37, 2010
Published by NRC Research Press
3.2 Effects of the modified magnitude-recurrencerelations
To investigate the effects of the modified magnitude-recur-rence relations on UHS, PSHA is carried out by using themodified magnitude-recurrence parameters shown in Table 1and calculated in Sect. 2.2 while holding all other parametersat the values used in the GSC model. To take into accountthe range of possibilities for the ML–Mw conversion equa-tions (i.e., equations for ‘‘offshore’’ events and ‘‘continental’’events), two sets of the modified magnitude-recurrence rela-
tions, each with the same weight, are considered for the‘‘CASH’’, ‘‘JDF’’, ‘‘SCM’’, and ‘‘CASR’’ source zones.
The UHS based on the modified parameters are shown inFig. 7 for Vancouver and Victoria. The results indicate thatthe use of the modified relations leads to an increase in UHSby a factor of about 1.0–1.1 (on average, a factor of 1.05).
3.3 Effects of an extended source modelTo investigate the effects of using an extended source
Fig. 7. Mean and median uniform hazard (response) spectra (UHS)based on the Geological Survey of Canada (GSC) model and meanUHS based on the modified magnitude-recurrence relations for thereturn periods of 475 and 2475 years: (a) Vancouver; (b) Victoria.
Fig. 8. Mean uniform hazard (response) spectra (UHS) based on thenewly selected sets of ground-motion prediction equations(GMPEs) and the mean and median UHS based on the GeologicalSurvey of Canada (GSC) model for the return periods of 475 and2475 years: (a) Vancouver; (b) Victoria.
Goda et al. 571
Published by NRC Research Press
model on UHS, PSHA is carried out by taking fault geome-try for each simulated seismic event into account. For thisinvestigation, three cases are considered: ‘‘GSC approxima-tion’’ adopts repi & rjb and rhypo & rrup and the deterministicdepth of 50 km for deep earthquakes, noting that depth isnot a parameter for shallow crustal earthquakes as theGMPEs for these events are based on rjb (note: the BJF97relation adopts a fictitious depth h along with rjb, where h isdetermined through regression analysis (i.e., regression coef-ficient)); ‘‘exact distance’’ generates an extended fault ge-ometry for each event and calculates the required distancemeasures exactly; and ‘‘distance conversion’’ adopts theconversion equations between various distance measures.
The UHS for the return periods of 475 and 2475 yearsbased on ‘‘GSC approximation’’, ‘‘exact distance’’, and ‘‘dis-tance conversion’’ are calculated for Vancouver and Victo-ria. The obtained results indicate that the UHS based on‘‘GSC approximation’’ are smaller than those based on‘‘exact distance’’ and ‘‘distance conversion’’, which is ex-pected, since repi ‡ rjb and rhypo ‡ rrup. The ratios of theUHS based on ‘‘GSC approximation’’ to those based on‘‘exact distance’’ or ’’distance conversion’’ are about 1.1–1.3 (on average, a factor of 1.18). The UHS based on ‘‘exactdistance’’ and ‘‘distance conversion’’ match closely, whichvalidates the accuracy and usefulness of the developed dis-tance conversion equations.
3.4 Effects of ground-motion prediction equationsThe PSHA is carried out to investigate the sensitivity of
UHS to the adopted GMPEs. The preliminary results indi-cate that for shallow crustal earthquakes, the impact of usingthe BJF97, HG07, or BA08 relation on UHS is not signifi-cant, whereas the A05 relation increases UHS at short peri-ods. For in-slab subduction earthquakes, the impact of usingthe YCSH97 or AB03 relation is significant.
Based on the preliminary analysis results, a set of GMPEsis selected: for shallow crustal earthquakes, the A05, HG07,and BA08 relations are adopted with an equal weight of 1/3,and for in-slab subduction earthquakes, the YCSH97, AB03,
and KNMFF06 relations are adopted with weights of 0.25,0.50, and 0.25, respectively. For in-slab subduction earth-quakes, a greater weight is given to the AB03 relation, sincethis relation is based on a more extensive strong ground-motion database than the YCSH97 relation, and is calibratedfor the Cascadia region.
The UHS based on the newly selected sets of GMPEs areshown in Fig. 8 and are compared with those based on theGSC model. It is observed that the ratios of mean UHSbased on the new GMPE sets to mean UHS based on theGSC model range from 0.54 to 0.80 (on average about0.64) and the ratios of mean UHS based on the new GMPEsets to median UHS based on the GSC model (i.e., seismichazard estimates used in the 2005 NBCC) range from 0.70to 1.14 (on average about 0.84), depending on Tn. The re-sults highlight the importance of including multiple GMPEsin PSHA to reflect valid and diverse assumptions onGMPEs. They indicate that a more detailed treatment ofepistemic uncertainty for GMPEs is warranted in futurestudies.
3.5 Effect of the Cascadia subduction eventsThe occurrence of a mega-thrust Cascadia subduction
event would be a major potential disaster in southwesternBritish Columbia. Based on the information discussed inSect. 2.5 and preliminary investigations, five scenario casesshown in Table 4 are selected. These scenario cases areformed by considering different combinations of time-dependent occurrences, magnitudes, and GMPEs. Moreoverto incorporate a range of possible scenarios for the faultplane, three rupture front locations (i.e., the rupture front lo-cation considered by Adams and Halchuk (2003), and twoshifted locations to the westward or eastward direction byabout 15 km) with weights of 0.5, 0.25, and 0.25, and fourdepths of 15, 20, 25, and 30 km with an equal weight of0.25 are considered. Note that the variations of the faultplane do not affect UHS for Vancouver and Victoria signifi-cantly. Case 1 corresponds to the GSC model (yet here theevents are treated probabilistically); case 2 incorporates
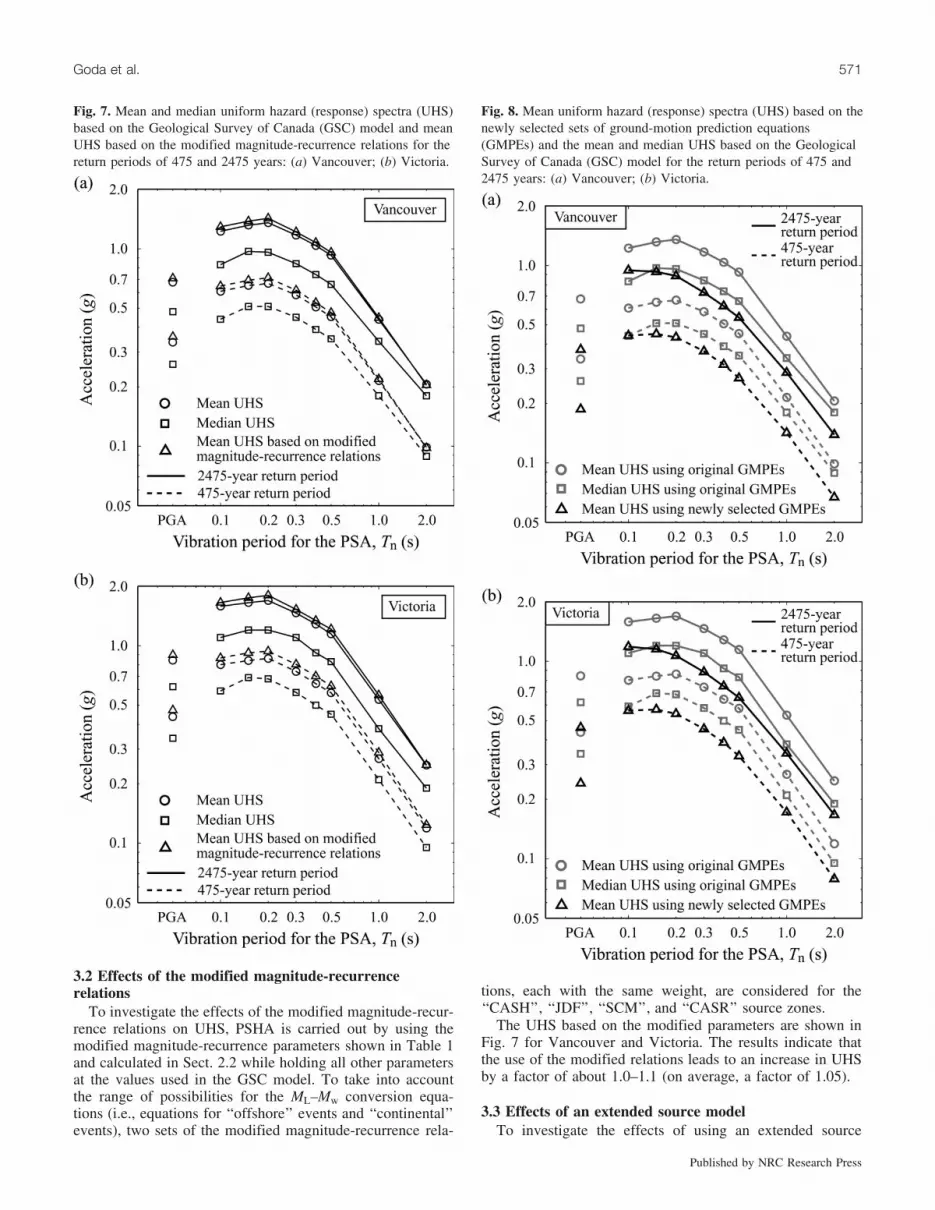
Table 5. Mean uniform hazard (response) spectra (UHS) for Vancouver and Victoria for the return period of 2475 yearsconsidering the Cascadia scenario events.
GSC model* Updated model{
Site Scenario case PGA (g)PSA (g) atTn = 0.2 (s)
PSA (g) atTn = 1.0 (s) PGA (g)
PSA (g) atTn = 0.2 (s)
PSA (g) atTn = 1.0 (s)
Vancouver Case 0{ 0.676 1.354 0.438 0.484 1.118 0.362Case 1 0.681 1.370 0.456 0.497 1.146 0.388Case 2 0.680 1.369 0.454 0.494 1.142 0.385Case 3 0.687 1.388 0.471 0.503 1.167 0.403Case 4 0.678 1.369 0.533 0.489 1.143 0.478Case 5 0.677 1.366 0.476 0.487 1.135 0.409
Victoria Case 0 0.842 1.693 0.534 0.610 1.414 0.460Case 1 0.866 1.749 0.579 0.649 1.495 0.527Case 2 0.863 1.746 0.577 0.643 1.491 0.517Case 3 0.878 1.785 0.599 0.657 1.528 0.545Case 4 0.846 1.718 0.645 0.619 1.459 0.600Case 5 0.849 1.728 0.596 0.622 1.464 0.541
*The ‘‘GSC model’’ indicates that seismic hazard assessments for the rest of areas are based on the GSC model.{The ‘‘updated model’’ indicates that seismic hazard assessments for the rest of areas are based on the updated model.{Case 0 indicates that the Cascadia subduction events are not included in assessing seismic hazard.
572 Can. J. Civ. Eng. Vol. 37, 2010
Published by NRC Research Press
time-dependent occurrence characteristics with a determinis-tic magnitude of 8.2; and cases 3–5 consider both time-dependent occurrence modeling and probabilistic magni-tudes. Cases 3–5 differ in selecting GMPEs: Case 3 usesthe YCSH97 relation, case 4 uses the AB03 relation, andcase 5 uses four equations, the YCSH97, GSWY02, AB03,and AM09 relations with assigned weights of 0.2, 0.2, 0.4,and 0.2, respectively. Our rational for assigning a greaterweight to the AB03 relation than other relations is that thisrelation is based on extensive strong ground-motion data and
is calibrated for the Cascadia region. For cases 1–4, theepistemic uncertainty as in the GSC model is included sincea single GMPE is employed, whereas for case 5, the use ofthe four equations is considered to be adequate to captureepistemic uncertainty associated with the choice of GMPEsfor the Cascadia events. For the time-dependent occurrencemodeling, the elapsed time since the last major event is con-sidered to be 308 years (Satake et al. 1996).
The UHS for the return period of 2475 years are calcu-lated by considering cases 1–5; two sets of results are sum-marized in Table 5 for Vancouver and Victoria. For seismicsources other than the Cascadia events, the first set consid-ers the GSC model, whereas the second set considers the up-dated seismic hazard model that incorporates modifiedmagnitude-recurrence relations (Sect. 3.2) and newly se-lected sets of GMPEs based on an extended source model(Sects. 3.3 and 3.4). Comparison of UHS for different casesindicates that the Cascadia events affect the UHS signifi-cantly, particularly at long periods (case 0 versus cases 1–5), and that at the present time, the use of the exponentialdistribution or the lognormal distribution does not affectUHS significantly (case 1 versus case 2), although this willnot be the case as the elapsed time since the last major eventchanges. The consideration of probabilistic magnitudes witha higher expected value increases the UHS slightly (case 2versus case 3), whereas the selection of multiple GMPEscan affect the UHS significantly, depending on Tn. Thesame conclusions are drawn if the inverse Gaussian distribu-tion instead of the lognormal distribution is considered forthe inter-arrival time distribution. If case 5 is taken as a rep-resentative scenario case, the ratio of mean UHS with theCascadia events to those without the Cascadia events isabout 1.0–1.03 for the PGA and PSA at short periods and isabout 1.1–1.2 for the PSA at long periods. Therefore, it is ofimportance to take into account the Cascadia subductionevents in assessing seismic hazard and risk.
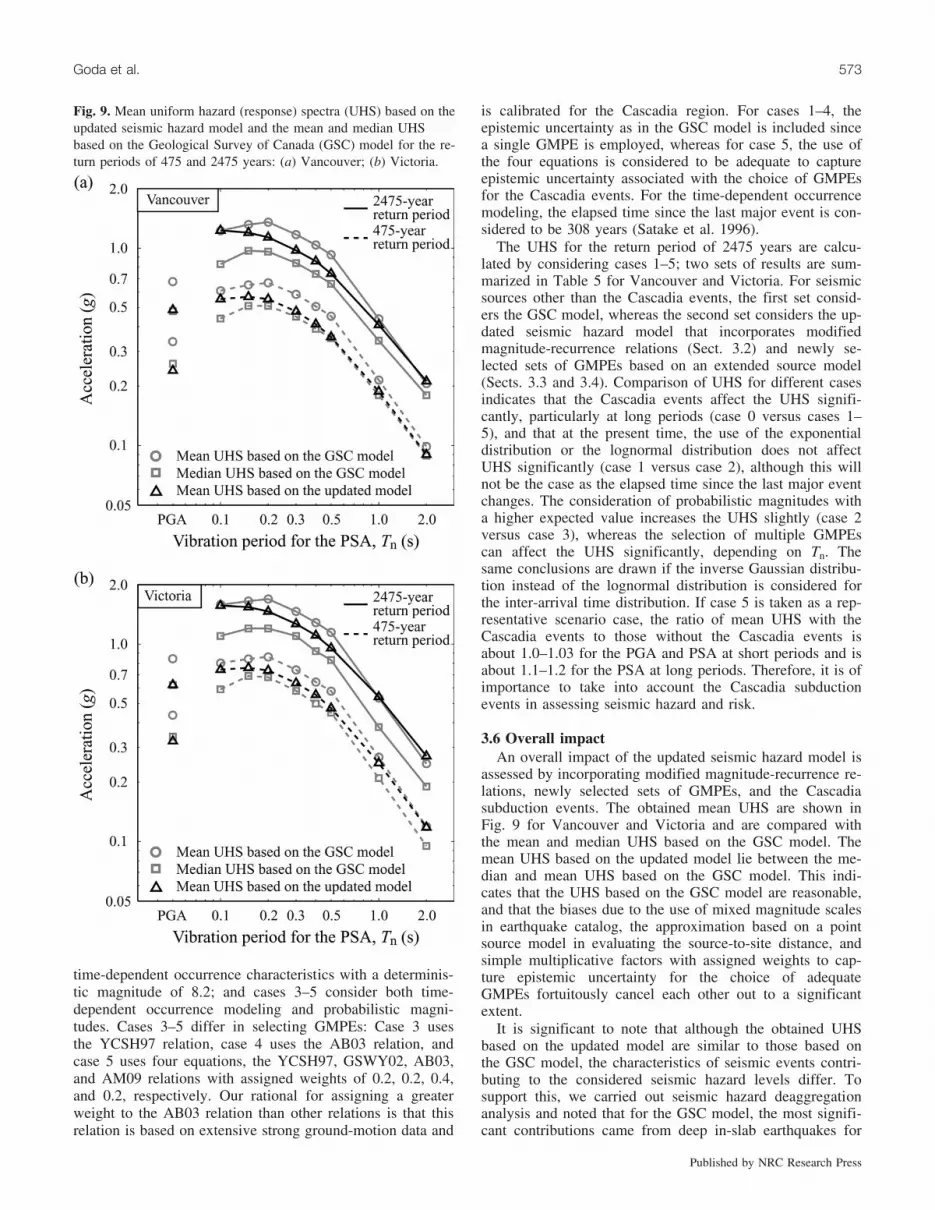
3.6 Overall impactAn overall impact of the updated seismic hazard model is
assessed by incorporating modified magnitude-recurrence re-lations, newly selected sets of GMPEs, and the Cascadiasubduction events. The obtained mean UHS are shown inFig. 9 for Vancouver and Victoria and are compared withthe mean and median UHS based on the GSC model. Themean UHS based on the updated model lie between the me-dian and mean UHS based on the GSC model. This indi-cates that the UHS based on the GSC model are reasonable,and that the biases due to the use of mixed magnitude scalesin earthquake catalog, the approximation based on a pointsource model in evaluating the source-to-site distance, andsimple multiplicative factors with assigned weights to cap-ture epistemic uncertainty for the choice of adequateGMPEs fortuitously cancel each other out to a significantextent.
It is significant to note that although the obtained UHSbased on the updated model are similar to those based onthe GSC model, the characteristics of seismic events contri-buting to the considered seismic hazard levels differ. Tosupport this, we carried out seismic hazard deaggregationanalysis and noted that for the GSC model, the most signifi-cant contributions came from deep in-slab earthquakes for
Fig. 9. Mean uniform hazard (response) spectra (UHS) based on theupdated seismic hazard model and the mean and median UHSbased on the Geological Survey of Canada (GSC) model for the re-turn periods of 475 and 2475 years: (a) Vancouver; (b) Victoria.
Goda et al. 573
Published by NRC Research Press
both short and long periods, whereas for the updated model,significant contributions came from shallow crustal earth-quakes and the Cascadia subduction earthquakes, in additionto those from in-slab earthquakes. It is thus prudent to con-sider all three earthquake types as scenario events ratherthan in-slab subduction earthquakes alone.
4. ConclusionsAn updated seismic hazard model for western Canada is
developed by incorporating new information on earthquakeoccurrence rates and ground-motion prediction equations(GMPE), and improved computational treatment of some as-pects of earthquake source and propagation. The updatedmodel is compared with the model developed by the Geo-logical Survey of Canada (GSC) for the 2005 Nationalbuilding code of Canada (Adams and Halchuk 2003). Theproposed model is intended for sensitivity analysis of seis-mic hazard in western Canada to key model components,which should not be taken as a comprehensive site-specificstudy. Based on the analysis results focusing on Vancouverand Victoria, the following conclusions are drawn:
1. For the GSC model, the mean uniform hazard spectra(UHS) are greater than the median UHS by a factor ofabout 1.1–1.5, depending on the vibration period, Tn,site, and considered return period level.
2. The mean UHS based on modified magnitude-recurrencerelations are greater than those based on the GSC modelby a factor of about 1.0–1.1.
3. The mean UHS based on an extended source model aregreater than those based on a point source model by afactor of 1.1–1.3. The developed distance conversionequations can be used to take an extended source repre-sentation into account.
4. The mean UHS based on newly selected sets of GMPEsare less than those based on the GSC model by a factorof about 0.6–0.8.
5. The incorporation of the Cascadia subduction events inPSHA increases mean UHS by a factor of about 1.0–1.2,depending on Tn. The impact is especially significant forthe PSA at long periods.
6. The ratio of mean UHS based on the updated model tothose based on the GSC model ranges from 0.7 to 1.1,depending on Tn, site, and return period level.
AcknowledgmentsThe financial support of the Natural Sciences and Engi-
neering Research Council of Canada (NSERC) is gratefullyacknowledged. The NSERC postdoctoral fellowship awardfor the first author is gratefully acknowledged. The authorsare thankful to S. Halchuk and J. Adams for providing theSHEEF catalog.
ReferencesAbrahamson, N.A., and Bommer, J.J. 2005. Probability and uncer-
tainty in seismic hazard analysis. Earthquake Spectra, 21(2):603–607. doi:10.1193/1.1899158.
Adams, J., and Halchuk, S. 2003. Fourth generation seismic hazardmaps of Canada: values for over 650 Canadian localities in-tended for the 2005 National Building Code of Canada. Open-
File 4459, Geological Survey of Canada, Ottawa, Ontario, Ca-nada.
Atkinson, G.M. 2005. Ground motions for earthquakes in south-western British Columbia and northwestern Washington: crustal,in-slab, and offshore events. Bulletin of the Seismological So-ciety of America, 95(3): 1027–1044. doi:10.1785/0120040182.
Atkinson, G.M., and Boore, D.M. 2003. Empirical ground-motionrelations for subduction-zone earthquakes and their applicationto Cascadia and other regions. Bulletin of the Seismological So-ciety of America, 93(4): 1703–1729. doi:10.1785/0120020156.
Atkinson, G.M., and Boore, D.M. 2008. Erratum to empiricalground-motion relations for subduction-zone earthquakes andtheir application to Cascadia and other regions. Bulletin of theSeismological Society of America, 98(5): 2567–2569. doi:10.1785/0120080108.
Atkinson, G.M., and Macias, M. 2009. Predicted ground motionsfor great interface earthquakes in the Cascadia subduction zone.Bulletin of the Seismological Society of America, 99(3): 1552–1578. doi:10.1785/0120080147.
Atkinson, G.M., and McCartney, S.E. 2005. A revised magnitude-recurrence relation for shallow crustal earthquakes in southwes-tern British Columbia: considering the relationships betweenmoment magnitude and regional magnitudes. Bulletin of theSeismological Society of America, 95(1): 334–340. doi:10.1785/0120040095.
Boore, D.M., and Atkinson, G.M. 2008. Ground-motion predictionequations for the average horizontal component of PGA, PGV,and 5%-damped PSA at spectral periods between 0.01 s and10.0 s. Earthquake Spectra, 24(1): 99–138. doi:10.1193/1.2830434.
Boore, D.M., Joyner, W.B., and Fumal, T.E. 1997. Equations forestimating horizontal response spectra and peak accelerationfrom western North America. Seismological Research Letters,68(1): 128–153.
Braunmiller, J., and Nabelek, J. 2002. Seismotectonics of the Ex-plorer region. Journal of Geophysical Research, 107(B10):2208. doi:10.1029/2001JB000220.
Braunmiller, J., Deichmann, N., Giardini, D., and Wiemer, S., andthe SED Magnitude Working Group. 2005. Homogenous mo-ment-magnitude calibration in Switzerland. Bulletin of the Seis-mological Society of America, 95(1): 58–74. doi:10.1785/0120030245.
Cornell, C.A. 1968. Engineering seismic risk analysis. Bulletin ofthe Seismological Society of America, 58(5): 1583–1606.
Dewberry, S., and Crosson, R. 1995. Source scaling and momentestimation for the Pacific Northwest seismograph network usingS-Coda amplitudes. Bulletin of the Seismological Society ofAmerica, 85(5): 1309–1326.
Goda, K., and Atkinson, G.M. 2009. Probabilistic characterizationof spatially correlated response spectra for earthquakes in Japan.Bulletin of the Seismological Society of America, 99(5): 3003–3020. doi:10.1785/0120090007.
Goda, K., and Hong, H.P. 2009. Optimal decision-making for cata-strophic earthquakes: seismic hazard modeling and seismic lossestimation. VDM Verlag, Saarbrucken, Germany.
Gregor, N., Silva, W.J., Wong, I.G., and Youngs, R.R. 2002.Ground-motion attenuation relationships for Cascadia subduc-tion zone mega thrust earthquakes based on a stochastic finite-fault model. Bulletin of the Seismological Society of America,92(5): 1923–1932. doi:10.1785/0120000260.
Hong, H.P., and Goda, K. 2007. Orientation-dependent ground mo-tion measure for seismic hazard assessment. Bulletin of the Seis-mological Society of America, 97(5): 1525–1538. doi:10.1785/0120060194.
574 Can. J. Civ. Eng. Vol. 37, 2010
Published by NRC Research Press
Hong, H.P., Goda, K., and Davenport, A.G. 2006. Seismic hazardanalysis: a comparative study. Canadian Journal of Civil Engi-neering, 33(9): 1156–1171. doi:10.1139/L06-062.
Hyndman, R.D., and Wang, K. 1995. The rupture zone of Cascadiagreat earthquakes from current deformation and the thermal re-gime. Journal of Geophysical Research, 100(B11): 22133–22154. doi:10.1029/95JB01970.
Kanno, T., Narita, A., Morikawa, N., Fujiwara, H., and Fukushima,Y. 2006. A new attenuation relation for strong ground motion inJapan based on recorded data. Bulletin of the Seismological So-ciety of America, 96(3): 879–897. doi:10.1785/0120050138.
Matthews, M.V., Ellsworth, W.L., and Reasenberg, P.A. 2002. ABrownian model for recurrent earthquakes. Bulletin of the Seis-mological Society of America, 92(6): 2233–2250. doi:10.1785/0120010267.
Mazzotti, S., and Adams, J. 2004. Variability of near-term prob-ability for the next great earthquake on the Cascadia subductionzone. Bulletin of the Seismological Society of America, 94(5):1954–1959. doi:10.1785/012004032.
McGuire, R.K. 2004. Seismic hazard and risk analysis. EarthquakeEngineering Research Institute, Oakland, Calif.
McGuire, R.K., Cornell, C.A., and Toro, G.R. 2005. The case forusing mean seismic hazard. Earthquake Spectra, 21(3): 879–886. doi:10.1193/1.1985447.
Petersen, M.D., Cramer, C.H., and Frankel, A.D. 2002. Simulationsof seismic hazard for the Pacific northwest of the United Statesfrom earthquakes associated with the Cascadia subduction zone.Pure and Applied Geophysics, 159(9): 2147–2168. doi:10.1007/s00024-002-8728-5.
Ristau, J., Rogers, G.C., and Cassidy, J.F. 2003. Moment magni-tude-local magnitude calibration for earthquakes off Canada’swest coast. Bulletin of the Seismological Society of America,93(5): 2296–2300. doi:10.1785/0120030035.
Ristau, J., Rogers, G.C., and Cassidy, J.F. 2005. Moment magni-tude-local magnitude calibration for earthquakes in western Ca-nada. Bulletin of the Seismological Society of America, 95(5):1994–2000. doi:10.1785/0120050028.
Satake, K., Shimazaki, K., Tsuji, Y., and Ueda, K. 1996. Time andsize of a giant earthquake in Cascadia inferred from Japanesetsunami records of January 1700. Nature, 379(6562): 246–249.doi:10.1038/379246a0.
Scherbaum, F., Schmedes, J., and Cotton, F. 2004. On the conver-sion of source-to-site distance measures for extended earthquakesource models. Bulletin of the Seismological Society of Amer-ica, 94(3): 1053–1069. doi:10.1785/0120030055.
Weichert, D.H. 1980. Estimation of earthquake recurrence para-meters for unequal observation periods for different magnitudes.Bulletin of the Seismological Society of America, 70(4): 1337–1356.
Wells, D.L., and Coppersmith, K.J. 1994. New empirical relationsamong magnitude, rupture length, rupture width, rupture area,and surface displacement. Bulletin of the Seismological Societyof America, 84(4): 974–1002.
Youngs, R.R., Silva, W.J., and Humphrey, J.R. 1997. Strongground motion attenuation relationships for subduction zoneearthquakes. Seismological Research Letters, 68(1): 58–72.
Goda et al. 575
Published by NRC Research Press