seismic hazard assessment for derivation of earthquake scenarios in risk-ue
TRANSCRIPT
Bull Earthquake EngDOI 10.1007/s10518-006-9021-2
O R I G I NA L R E S E A R C H PA P E R
Seismic hazard assessment for derivation of earthquakescenarios in Risk-UE
Ezio Faccioli
Received: 1 April 2005 / Accepted: 15 July 2006© Springer Science+Business Media B.V. 2006
Abstract The main features of the Risk-UE project approach to assessing theground-shaking (and related hazards) distribution within urban areas are described,as a basis for developing seismic damage scenarios for European cities. Emphasis wasplaced in the project on adoption of homogeneous criteria in the quantitative treat-ment of seismicity and in constructing the ground-shaking scenarios, despite widedifferences in amount and quality of data available for the cities involved. The ini-tial steps of the approach include treatment of the regional seismotectonic settingand the geotechnical zonation of the urban area, while the hazard assessment itselftakes the form of both a deterministic analysis, and of a probabilistic, constant-hazardspectra analysis. Systematic 1D site response analyses were used, mostly in the softersoil zones, to modify (when needed) the obtained ground motion maps. Earthquakeinduced hazard effects, such as liquefaction and landsliding, are also briefly dealt withat the end.
Keywords Attenuation relation · Constant-hazard scenario · Deterministic seismichazard evaluation · Geotechnical zonation · Seismotectonic setting · Seismic scenario
1 Introduction
This article describes the Risk-UE approach to estimating the earthquake ground-shaking hazard (and induced effects) in urban areas, and to representing it in wayssuitable for the derivation of damage scenarios. The methods adopted for tacklingthe different steps involved are presented in the following sections, illustrating in fewcases applications to some of the cities involved in the project, namely Barcelona
E. Faccioli (B)Department of Structural Engineering, Politecnico di MilanoPiazza Leonardo da Vinci 32, 20133 Milano, Italye-mail: [email protected]
Bull Earthquake Eng
(Spain), Bitola (FYROM1), Bucharest (Rumania), Catania (Italy), Nice (France),Sofia (Bulgaria), and Thessaloniki (Greece).
While emphasis was placed on adopting homogeneous criteria in the quantitativetreatment of seismicity and in the construction of ground-shaking scenarios, it mustbe mentioned that the work done for cities such as Catania and Thessaloniki, charac-terised by high levels of hazard, has been more thorough and detailed, chiefly becausethe results of previous scenario studies were available.
Early in the project, it was debated whether or not to aim at the creation of a“European HAZUS”. As it is known, HAZUS (http://www.fema.gov/hazus/) is acode developed on behalf of the US Federal Emergency Management Administra-tion and designed to create damage scenarios for US cities; it contains the basic inputdata files, including inventories of elements at risk in urban areas.
Such a goal has been recognised as unattainable in Risk-UE, because of lack offunding, time, or widespread lack of building stock inventories, as well as of otherelements at risk. More specific reasons include a very limited knowledge on seismi-cally active faults and their earthquake generating potential. The latter, we remind,is the key input to creating ground motion scenarios through HAZUS. However, areliable seismic hazard evaluation was recognised to be feasible for most Europeancities, the generally good knowledge of historical seismicity in many European regionsproviding a valuable asset for this purpose.
A less ambitious approach was therefore preferred, relying on a combination ofgenerally available input data, and established methods and computer codes, betteradapted to the vastly different city situations. Thus, rather than by the ambition toproduce original results, the work on seismic hazard in Risk-UE was guided by theperception that usable, realistic ground motion maps had in the end to be producedfor European cities.
The pre-requisites for the development of both deterministic and constant-hazard2
ground motion maps, stipulated in the Risk-UE work programme before initiatingthe project, included:
– “Identification of the tectonic feature(s) capable of generating the scenario earth-quake (. . .), and representation of seismic sources for the different methods ofanalysis;
– Definition of a protocol for geotechnical characterization (. . .) of the studied area;– Selection of ground-shaking parameters of interest, such as peak ground acceler-
ation (amax), or (. . .) response spectral ordinates at given vibration periods;– Elaboration of local/regional attenuation relationships, or calibration of Euro-
pean-based relationships with the definition of a catalogue of European relation-ships”.
As to the selection of the method itself, it should be consistent with “. . . seismicitylevel, documented earthquake history and required level of accuracy. In medium andhigh seismicity regions, priority will be given to a deterministic approach; in zones withmore complex or uncertain seismicity patterns, a constant hazard ground-shaking sce-nario will also be evaluated and compared with the previous one”. A broader view was
1 Former Yugoslav Republic Of Macedonia.2 By “constant hazard” representation is meant herein a probabilistic hazard analysis yieldingresponse spectrum ordinates corresponding to a specified probability of exceedence in a given expo-sure time, typically 10% in 50 years for consistency with the design earthquake assumed in currentseismic codes such as Eurocode 8 (CEN 2004).
Bull Earthquake Eng
actually taken in the project, i.e. developing both a deterministic and constant-hazardscenarios for all the cities, and introducing comparisons between the two (for adiscussion on methods preferable for hazard scenarios see e.g. Bommer 2002).
Also pointed out in the work programme was the need for a “. . . cross-validationof the local ground-shaking representations obtained through the use of differentmethods (. . .)like (H/V) spectral analysis of microtremors recorded on various soiltypes, and numerical models in 1D (Shake, CyberQuake) or 2D ”.
To put the last statement into focus, it is anticipated that the basic (determin-istic) ground-shaking representation for a city was to be produced through a GIS,by combining the features of the scenario seismic source(s), appropriate attenuationrelations, and a geological or geotechnical zonation of the zone of interest. As shownin a later section the validation of the GIS generated map could be fully implementedonly for the aspect of 1D numerical simulations in city zones susceptible of high soilamplification.
The quoted statements from the Risk-UE work programme outline the contentsof the following sections, that is:
– Aspects related with the seismo-tectonic setting and its treatment.– Geologic and geotechnical zonation of city areas.– Deterministic and constant-hazard evaluation methods.– Validation of ground motion estimations using 1D site response analyses.– Induced hazard effects.– Conclusions.
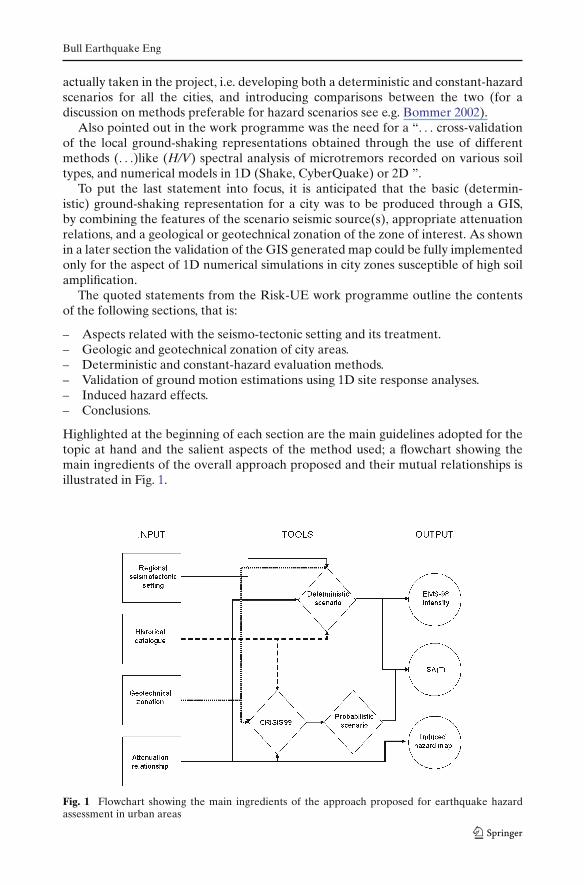
Highlighted at the beginning of each section are the main guidelines adopted for thetopic at hand and the salient aspects of the method used; a flowchart showing themain ingredients of the overall approach proposed and their mutual relationships isillustrated in Fig. 1.
Fig. 1 Flowchart showing the main ingredients of the approach proposed for earthquake hazardassessment in urban areas
Bull Earthquake Eng
2 Treatment of the seismo-tectonic setting
Suitable representations of the regional seismo-tectonic setting were required as inputto computing the two types of ground-shaking scenarios required for each city. In thefirst one, i.e. deterministic scenarios, a magnitude or epicentral intensity is normallyassociated to individual sources, be it faults or extended seismic source zones (SSZs),in order to compute, through appropriate attenuation relations, the ground motionin the city area at study. An intensity scenario obtained in this way is of specialinterest when maximum felt intensities are not clearly provided by the historicalrecord.
In the second type, i.e. constant-hazard scenarios, a standard probabilistic hazardanalysis following the Cornell (1968) method with some integrations is carried out tocompute at different points in the city area the ground motions for a chosen excee-dance probability, e.g. 0.10 in 50 years. In this case, to each SSZ (point, line, or area)is associated a geometric description, a magnitude probability distribution (includingmaximum magnitude), the representative parameters of the earthquake time-occur-rence process (e.g. Poisson or characteristic earthquake), and attenuation relations(that may differ from zone to zone).
Since seismo-tectonic investigations were not a primary target in Risk-UE, exist-ing seismic source zonations and seismo-tectonic maps were to be judiciously reliedupon, integrated when possible on the basis of the most recent studies. As a startingpoint, the use was recommended of earthquake source models used for the zona-tion attached to the national seismic code, if available. Source representations interms of SSZs more or less suitable for seismic hazard analysis are currently availablefor several European countries, including those where Risk-UE cities are located(García Mayordomo et al. 2004). Note that the formulation of a logic tree for theseismic hazard analysis of each city, whereby one could handle and weigh differentassumptions concerning earthquake source zones and their activity, was regarded tobe beyond the project scope. It was also recognised that SSZs needed for creating (orinterpreting) deterministic earthquake scenarios could differ from those suitable forconstant-hazard, probabilistic scenarios.
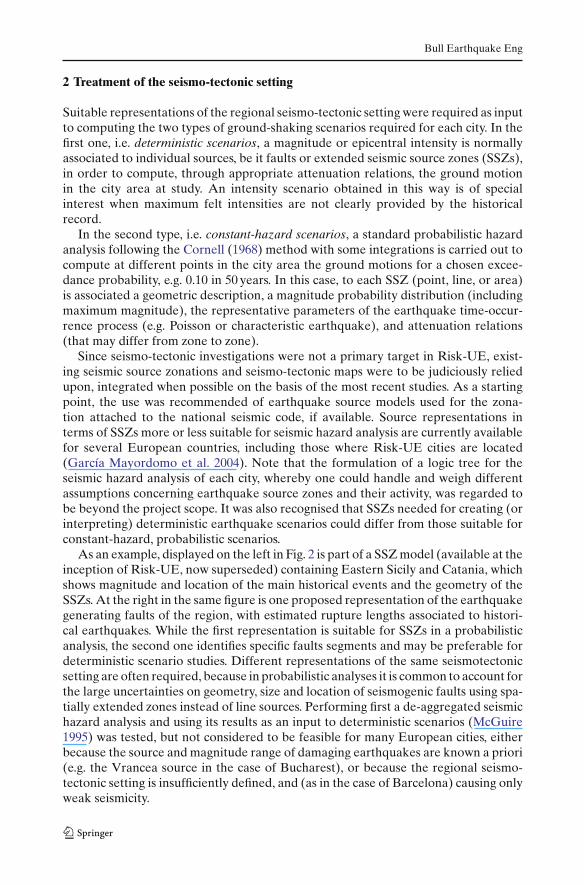
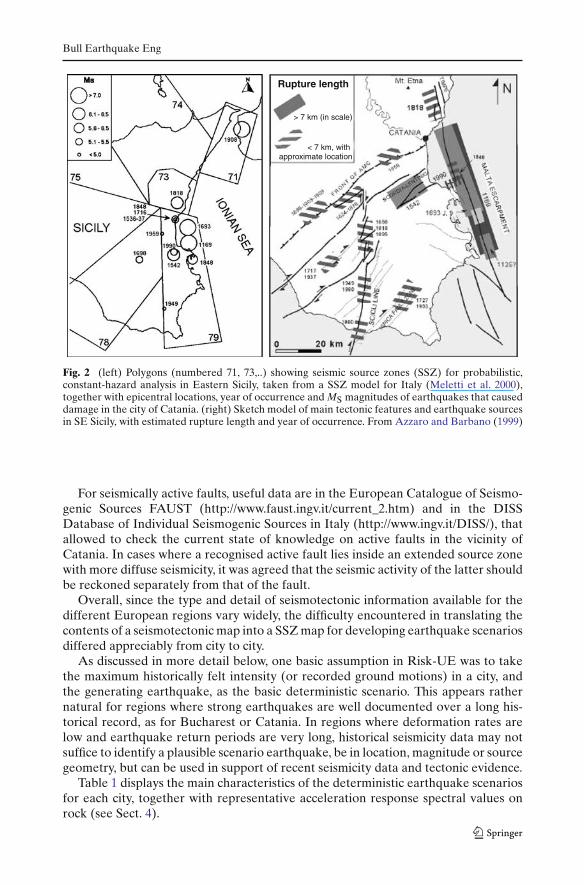
As an example, displayed on the left in Fig. 2 is part of a SSZ model (available at theinception of Risk-UE, now superseded) containing Eastern Sicily and Catania, whichshows magnitude and location of the main historical events and the geometry of theSSZs. At the right in the same figure is one proposed representation of the earthquakegenerating faults of the region, with estimated rupture lengths associated to histori-cal earthquakes. While the first representation is suitable for SSZs in a probabilisticanalysis, the second one identifies specific faults segments and may be preferable fordeterministic scenario studies. Different representations of the same seismotectonicsetting are often required, because in probabilistic analyses it is common to account forthe large uncertainties on geometry, size and location of seismogenic faults using spa-tially extended zones instead of line sources. Performing first a de-aggregated seismichazard analysis and using its results as an input to deterministic scenarios (McGuire1995) was tested, but not considered to be feasible for many European cities, eitherbecause the source and magnitude range of damaging earthquakes are known a priori(e.g. the Vrancea source in the case of Bucharest), or because the regional seismo-tectonic setting is insufficiently defined, and (as in the case of Barcelona) causing onlyweak seismicity.
Bull Earthquake Eng
Rupture length
> 7 km (in scale)
< 7 km, with approximate location
Fig. 2 (left) Polygons (numbered 71, 73,..) showing seismic source zones (SSZ) for probabilistic,constant-hazard analysis in Eastern Sicily, taken from a SSZ model for Italy (Meletti et al. 2000),together with epicentral locations, year of occurrence and MS magnitudes of earthquakes that causeddamage in the city of Catania. (right) Sketch model of main tectonic features and earthquake sourcesin SE Sicily, with estimated rupture length and year of occurrence. From Azzaro and Barbano (1999)
For seismically active faults, useful data are in the European Catalogue of Seismo-genic Sources FAUST (http://www.faust.ingv.it/current_2.htm) and in the DISSDatabase of Individual Seismogenic Sources in Italy (http://www.ingv.it/DISS/), thatallowed to check the current state of knowledge on active faults in the vicinity ofCatania. In cases where a recognised active fault lies inside an extended source zonewith more diffuse seismicity, it was agreed that the seismic activity of the latter shouldbe reckoned separately from that of the fault.
Overall, since the type and detail of seismotectonic information available for thedifferent European regions vary widely, the difficulty encountered in translating thecontents of a seismotectonic map into a SSZ map for developing earthquake scenariosdiffered appreciably from city to city.
As discussed in more detail below, one basic assumption in Risk-UE was to takethe maximum historically felt intensity (or recorded ground motions) in a city, andthe generating earthquake, as the basic deterministic scenario. This appears rathernatural for regions where strong earthquakes are well documented over a long his-torical record, as for Bucharest or Catania. In regions where deformation rates arelow and earthquake return periods are very long, historical seismicity data may notsuffice to identify a plausible scenario earthquake, be in location, magnitude or sourcegeometry, but can be used in support of recent seismicity data and tectonic evidence.
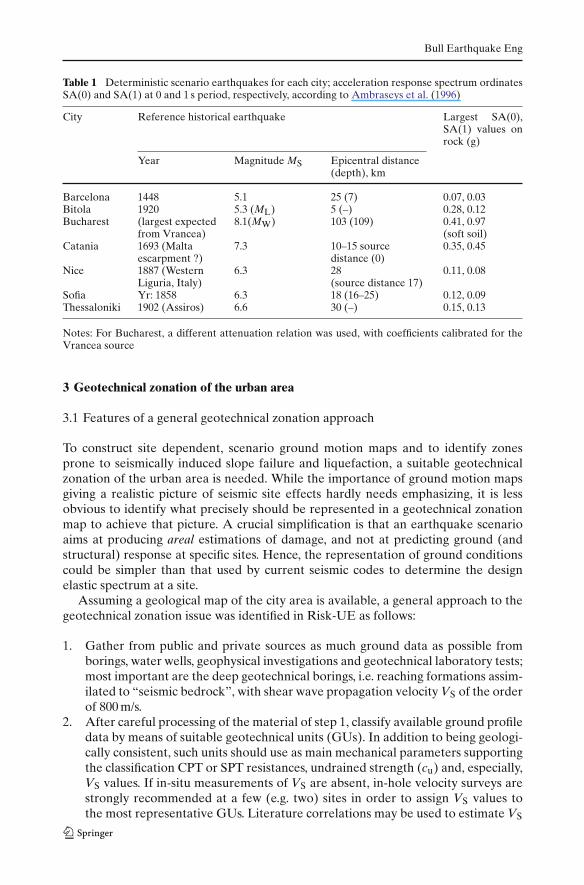
Table 1 displays the main characteristics of the deterministic earthquake scenariosfor each city, together with representative acceleration response spectral values onrock (see Sect. 4).
Bull Earthquake Eng
Table 1 Deterministic scenario earthquakes for each city; acceleration response spectrum ordinatesSA(0) and SA(1) at 0 and 1 s period, respectively, according to Ambraseys et al. (1996)
City Reference historical earthquake Largest SA(0),SA(1) values onrock (g)
Year Magnitude MS Epicentral distance(depth), km
Barcelona 1448 5.1 25 (7) 0.07, 0.03Bitola 1920 5.3 (ML) 5 (–) 0.28, 0.12Bucharest (largest expected
from Vrancea)8.1(MW) 103 (109) 0.41, 0.97
(soft soil)Catania 1693 (Malta
escarpment ?)7.3 10–15 source
distance (0)0.35, 0.45
Nice 1887 (WesternLiguria, Italy)
6.3 28(source distance 17)
0.11, 0.08
Sofia Yr: 1858 6.3 18 (16–25) 0.12, 0.09Thessaloniki 1902 (Assiros) 6.6 30 (–) 0.15, 0.13
Notes: For Bucharest, a different attenuation relation was used, with coefficients calibrated for theVrancea source
3 Geotechnical zonation of the urban area
3.1 Features of a general geotechnical zonation approach
To construct site dependent, scenario ground motion maps and to identify zonesprone to seismically induced slope failure and liquefaction, a suitable geotechnicalzonation of the urban area is needed. While the importance of ground motion mapsgiving a realistic picture of seismic site effects hardly needs emphasizing, it is lessobvious to identify what precisely should be represented in a geotechnical zonationmap to achieve that picture. A crucial simplification is that an earthquake scenarioaims at producing areal estimations of damage, and not at predicting ground (andstructural) response at specific sites. Hence, the representation of ground conditionscould be simpler than that used by current seismic codes to determine the designelastic spectrum at a site.
Assuming a geological map of the city area is available, a general approach to thegeotechnical zonation issue was identified in Risk-UE as follows:
1. Gather from public and private sources as much ground data as possible fromborings, water wells, geophysical investigations and geotechnical laboratory tests;most important are the deep geotechnical borings, i.e. reaching formations assim-ilated to “seismic bedrock”, with shear wave propagation velocity VS of the orderof 800 m/s.
2. After careful processing of the material of step 1, classify available ground profiledata by means of suitable geotechnical units (GUs). In addition to being geologi-cally consistent, such units should use as main mechanical parameters supportingthe classification CPT or SPT resistances, undrained strength (cu) and, especially,VS values. If in-situ measurements of VS are absent, in-hole velocity surveys arestrongly recommended at a few (e.g. two) sites in order to assign VS values tothe most representative GUs. Literature correlations may be used to estimate VS
Bull Earthquake Eng
from SPT resistance or other geotechnical parameters for units with no velocitymeasurements.
3. Create a GIS-supported, geotechnical database of all borehole data in which theoriginal ground profile description has been re-cast in terms of the GUs intro-duced in step 2, with the VS profile.
4. Draw geotechnical cross-sections across the urban area, depicting the GUs, high-lighting the VS values, and extended in depth to reach bedrock wherever feasible.
5. Compute along each cross-section the distribution of the weighted-average value,VS30, in the uppermost 30 m of the ground, following the Eurocode 8 (CEN 2004,Table 3.1) formula
VS30 = 30∑
i=1,N
hi
Vi
. (1)
6. Arrange the VS30 values by ground classes as in Eurocode 8; the first four classes(labelled A, B, C, and D) are in particular retained as they are consistent with thesimplified site classification of state-of-art attenuation relations used for groundmotion mapping (see Sect. 4).
7. Guided by the geological map (possibly at a scale not less than 1:10,000), draw theVS30 contours throughout the zone at study using the results of step 6 as a basis.
3.2 Levels of zonation and key factors
The approach just described is clearly susceptible of simplifications and variations,depending on the scope of the scenario, the quantity and quality of data available,etc. In particular, should the effort of creating a geotechnical database (step 3 in par.3.1) prove beyond reach, one may recur to more elementary and/or faster zonationapproaches. Quite popular are nowadays the instrumental surveys of seismic noiseon a grid of observation points, and ensuing identification of the frequencies of thedominant peak in spectral ratios of horizontal to vertical motion, commonly referredto as Nakamura’s or H/V method (Nakamura 1989)3. This method is not one ofgeotechnical zonation, but it leads directly to mapping a response parameter (dom-inant frequency of ground motion) that controls the shape of the elastic responsespectrum. Nakamura’s method can be efficiently applied side-by-side with the geo-technical zonation, and later used as a validation tool, provided a sufficient velocitycontrast occurs between near-surface and underlying materials.
A key factor in the zonation context is seismic bedrock. While this may in principlebe identified as ground class A of Eurocode 8 (VS30 > 800 m/s), the crucial parameterat play is the velocity contrast with respect to the overlying soil: if the latter is a lowvelocity material (e.g. class D), even a type B ground with VS30 of 500–600 m/s maybe legitimately assimilated to seismic bedrock. Bedrock depth needs be identifiedmore accurately when the near-surface soil deposits are less than few tens of m thick,because the peak ground response periods tend to be in the range of fundamental
3 Experience has shown that, provided a sufficient velocity contrast occurs between near-surface andunderlying materials, the frequency of the fundamental H/V peak at a site is closely related to thethickness of the surface layers and the S wave propagation velocity and, hence, it is a good indicatorof local seismic response.
Bull Earthquake Eng
vibration periods of common building structures. Bedrock depths from several tens tohundreds of m, especially in valley- or basin-like configurations will affect the surfaceground response at longer periods (typically exceeding 1 s), which are of interest onlyfor the taller and more flexible structures (more than, say, 10–12 stories in height), thatare in fact present in significant number in some of the studied cities. As the lessonof the 1995 Kobe earthquake has shown, in the presence of basin-like configurationsthe deeper geological structure must be carefully considered, because it may generatecomplex (“basin edge”) effects leading to strong ground motion amplification andcatastrophic damage in limited portions of the urban area (Nagakawa et al. 1996).Only deep reflection geophysical surveys, if feasible, can in such cases resolve thedeeper geological structure.
As to VS30 as key factor, this parameter, first introduced by Joyner and Fumal(1984), should not be regarded as a panacea for predicting local ground responsethrough a geotechnical zonation. VS30 is a synthetic expression of a ground profiledynamic properties, apt for quantifying the statistical influence of site conditions onthe elastic response spectrum, but may not actually control local response in severalsituations. Among these one has, on one side, ground class E of Eurocode 8, sinceaveraging out the VS values over 30 m would clearly conceal the crucial velocity con-trast and, on the opposite side, the deep, basin-like configurations. In the latter thecrucial parameters affecting the response (substantial thickness of soil deposits withsoil–rock contrast at depths larger than 30 m) would not be reflected in VS30. In caseswhere ground class E is present, one could use, in some urban areas, a VS value aver-aged over a depth smaller than 30 m, e.g. 10–20 m. In general, however, the treatmentof class E ground profiles would require more accurate characterisation and moredetailed studies.
3.3 Some examples
Only for Catania and Thessaloniki the existing data allowed to thoroughly apply thegeneral zonation approach outlined in 3.1. For the remaining five cities of Risk-UE thesituation was very diversified, ranging from absence of a zonation (either geologicalor geotechnical) tout court, as in the case of Bitola, to a zonation based only on obser-vations from records of recent earthquakes, as in the case of Bucharest. Thus, whileall the cities were asked to produce a VS30 map in order to allow proper comparisons,this proved possible only in a few cases.
3.3.1 Geology-based zonation
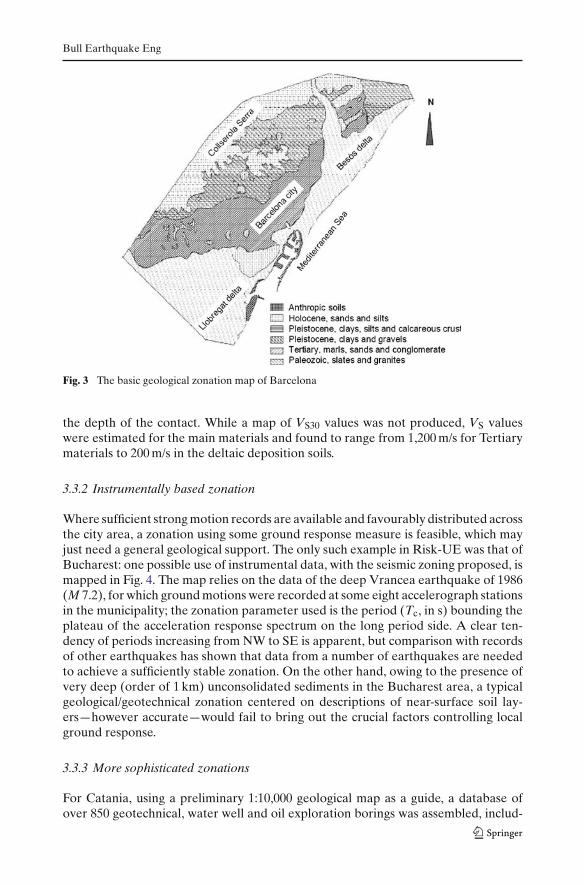
A type of zonation resting mostly on a geological characterisation of the area is thatof Barcelona. The basic geological map in Fig. 3 shows that the city centre lies onPleistocene materials and on softer Holocene deposits. A description of the differ-ent formations in terms of dynamic properties was obtained by selecting some 70representative soil columns (mostly < 20 m deep) from as many geotechnical bor-ings in the city, and by estimating VS from measured NSPT values along each columnthrough standard empirical correlations (and applying a correction factor for Pleisto-cene materials). Close to the coastline, geotechnical investigations do not reach theunderlying Tertiary formations, and inversion of gravimetric data was used to estimate
Bull Earthquake Eng
Fig. 3 The basic geological zonation map of Barcelona
the depth of the contact. While a map of VS30 values was not produced, VS valueswere estimated for the main materials and found to range from 1,200 m/s for Tertiarymaterials to 200 m/s in the deltaic deposition soils.
3.3.2 Instrumentally based zonation
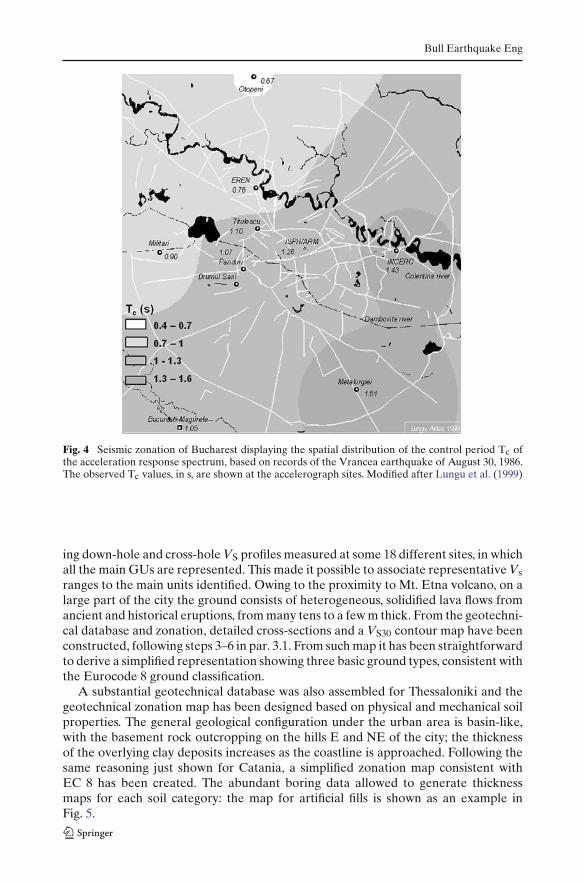
Where sufficient strong motion records are available and favourably distributed acrossthe city area, a zonation using some ground response measure is feasible, which mayjust need a general geological support. The only such example in Risk-UE was that ofBucharest: one possible use of instrumental data, with the seismic zoning proposed, ismapped in Fig. 4. The map relies on the data of the deep Vrancea earthquake of 1986(M 7.2), for which ground motions were recorded at some eight accelerograph stationsin the municipality; the zonation parameter used is the period (Tc, in s) bounding theplateau of the acceleration response spectrum on the long period side. A clear ten-dency of periods increasing from NW to SE is apparent, but comparison with recordsof other earthquakes has shown that data from a number of earthquakes are neededto achieve a sufficiently stable zonation. On the other hand, owing to the presence ofvery deep (order of 1 km) unconsolidated sediments in the Bucharest area, a typicalgeological/geotechnical zonation centered on descriptions of near-surface soil lay-ers—however accurate—would fail to bring out the crucial factors controlling localground response.
3.3.3 More sophisticated zonations
For Catania, using a preliminary 1:10,000 geological map as a guide, a database ofover 850 geotechnical, water well and oil exploration borings was assembled, includ-
Bull Earthquake Eng
Fig. 4 Seismic zonation of Bucharest displaying the spatial distribution of the control period Tc ofthe acceleration response spectrum, based on records of the Vrancea earthquake of August 30, 1986.The observed Tc values, in s, are shown at the accelerograph sites. Modified after Lungu et al. (1999)
ing down-hole and cross-hole VS profiles measured at some 18 different sites, in whichall the main GUs are represented. This made it possible to associate representative Vsranges to the main units identified. Owing to the proximity to Mt. Etna volcano, on alarge part of the city the ground consists of heterogeneous, solidified lava flows fromancient and historical eruptions, from many tens to a few m thick. From the geotechni-cal database and zonation, detailed cross-sections and a VS30 contour map have beenconstructed, following steps 3–6 in par. 3.1. From such map it has been straightforwardto derive a simplified representation showing three basic ground types, consistent withthe Eurocode 8 ground classification.
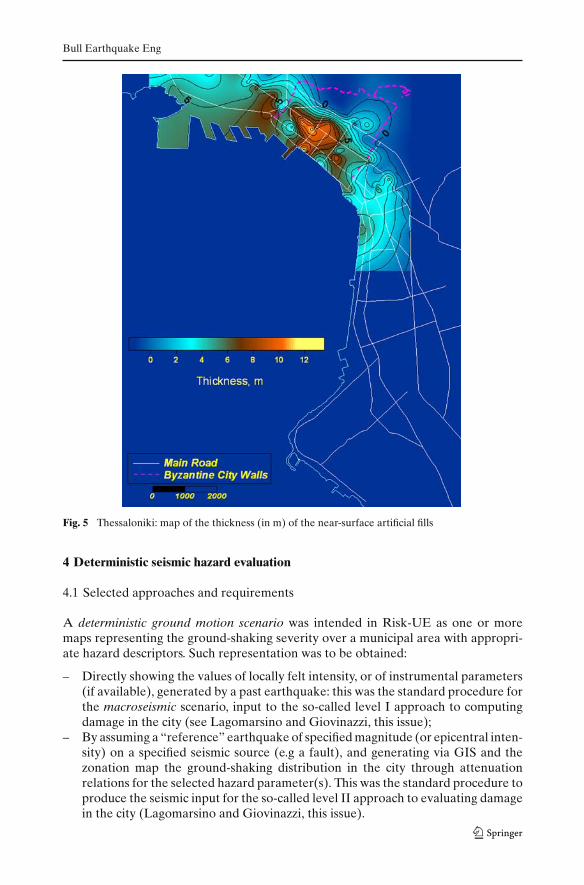
A substantial geotechnical database was also assembled for Thessaloniki and thegeotechnical zonation map has been designed based on physical and mechanical soilproperties. The general geological configuration under the urban area is basin-like,with the basement rock outcropping on the hills E and NE of the city; the thicknessof the overlying clay deposits increases as the coastline is approached. Following thesame reasoning just shown for Catania, a simplified zonation map consistent withEC 8 has been created. The abundant boring data allowed to generate thicknessmaps for each soil category: the map for artificial fills is shown as an example inFig. 5.
Bull Earthquake Eng
Fig. 5 Thessaloniki: map of the thickness (in m) of the near-surface artificial fills
4 Deterministic seismic hazard evaluation
4.1 Selected approaches and requirements
A deterministic ground motion scenario was intended in Risk-UE as one or moremaps representing the ground-shaking severity over a municipal area with appropri-ate hazard descriptors. Such representation was to be obtained:
– Directly showing the values of locally felt intensity, or of instrumental parameters(if available), generated by a past earthquake: this was the standard procedure forthe macroseismic scenario, input to the so-called level I approach to computingdamage in the city (see Lagomarsino and Giovinazzi, this issue);
– By assuming a “reference” earthquake of specified magnitude (or epicentral inten-sity) on a specified seismic source (e.g a fault), and generating via GIS and thezonation map the ground-shaking distribution in the city through attenuationrelations for the selected hazard parameter(s). This was the standard procedure toproduce the seismic input for the so-called level II approach to evaluating damagein the city (Lagomarsino and Giovinazzi, this issue).
Bull Earthquake Eng
In the first case, the scenario would typically show one or few EMS98 intensity value(s)concisely describing the effects of the selected historical earthquake(s). In the sec-ond case, the acceleration (or displacement) response spectrum ordinates at vibrationperiods T = 0.0, 0.3, 0.6, 1.0 and 2.0 s4 were in principle to be computed by theattenuation relationship of Ambraseys et al. (1996), hereinafter denoted as AMB96.If feasible and justified, the results were to be compared with those yielded by region-ally available relationships. Also, the spectral response scenario had to include siteeffects: the standard way for doing this was through the geotechnical zonation (Sect.3) and the attenuation relation, integrated by additional site response analysis in thepresence of unconsolidated soil deposits (as explained in Sect. 5).
A strong requirement was that the reference earthquake for the deterministic sce-nario should be the “true” maximum historical earthquake affecting the city. Thischoice differs substantially from that of the maximum credible earthquake, typicallyadopted in single-site deterministic hazard evaluations of critical structures such asnuclear power plants, dams, etc. Stated differently, the use of seismotectonic criteriato “shift” the epicentres of historical earthquakes nearest to city to derive MaximumCredible Earthquake effects, or the like, was not seen as recommendable for a dam-age scenario of a European city. Although the historical record was in some casesrecognised to be insufficiently long, the maximum historical earthquake was regardedin all cases as preferable, to avoid in the first place overly conservative scenario earth-quakes. With average slip rates on active faults well below 1 mm/yr in most seismicregions of Europe, maximum credible earthquakes would typically have recurrenceperiods in the thousands of years (see e.g. the quoted DISS database for seismogenicareas of Italy), and were felt to be difficult to handle by most city administrations forcivil defence purposes. Second, the lack of reliable tectonic constraints recognised formost of the project cities would make the determination of the maximum credibleearthquake parameters extremely uncertain.
Also, if the city at study had historically been exposed to earthquakes of signifi-cantly different intensity, e.g. both destructive and damaging events (as in the case ofCatania), two different deterministic scenarios were considered desirable. However,for any given scenario the preferred hypothesis for the seismic source had to be clearlyindicated and justified. Finally, to provide a feeling on the return periods implied bythe deterministic scenario earthquake for a representative city site, the correspondingresponse spectrum was to be compared (on the same plot) with the constant-hazard(probabilistic) spectra for different return periods.
4.2 On the choice of reference earthquakes and “macroseismic” scenarios
The maximum felt intensity for the city was chosen as the basis of the macroseis-mic scenario, so as to reduce the arbitrariness associated with other options, such asthe maximum credible earthquake (MCE)5 and the problems arising from the vastlydifferent time spans of the historical records of each city.
While Barcelona had the lowest felt intensity (IS =VI–VII), other cities experi-enced intensities as high as VIII or IX, with Catania at the highest level with X–XI
4 If necessary to better describe the plateau of the spectra, the values could be changed: e.g. spectraof low-magnitude earthquakes are better described using T = 0.2 s.5 The choice of the maximum credible event was considered admissible only if constrained by goodpaleo-seismic data in addition to a long and reliable historical catalogue. This choice was adopted forthe city of Nice.
Bull Earthquake Eng
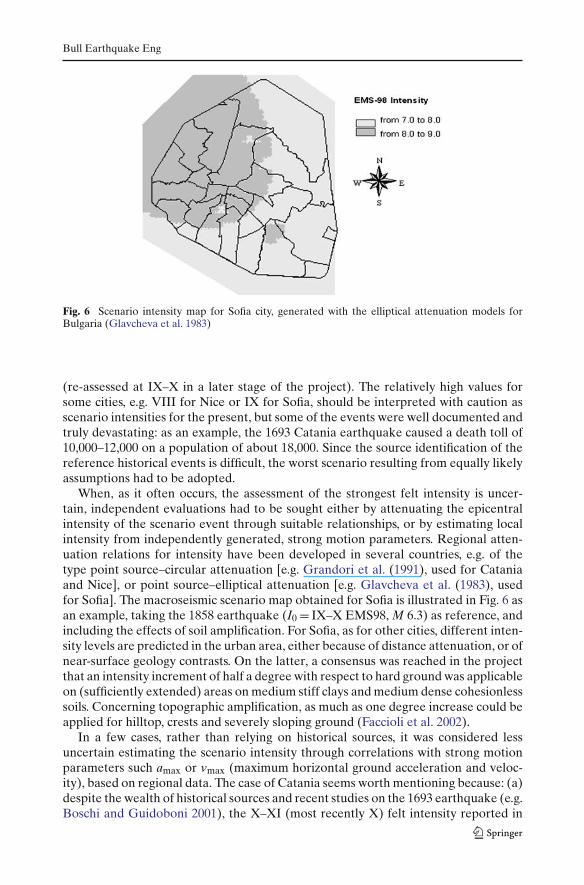
Fig. 6 Scenario intensity map for Sofia city, generated with the elliptical attenuation models forBulgaria (Glavcheva et al. 1983)
(re-assessed at IX–X in a later stage of the project). The relatively high values forsome cities, e.g. VIII for Nice or IX for Sofia, should be interpreted with caution asscenario intensities for the present, but some of the events were well documented andtruly devastating: as an example, the 1693 Catania earthquake caused a death toll of10,000–12,000 on a population of about 18,000. Since the source identification of thereference historical events is difficult, the worst scenario resulting from equally likelyassumptions had to be adopted.
When, as it often occurs, the assessment of the strongest felt intensity is uncer-tain, independent evaluations had to be sought either by attenuating the epicentralintensity of the scenario event through suitable relationships, or by estimating localintensity from independently generated, strong motion parameters. Regional atten-uation relations for intensity have been developed in several countries, e.g. of thetype point source–circular attenuation [e.g. Grandori et al. (1991), used for Cataniaand Nice], or point source–elliptical attenuation [e.g. Glavcheva et al. (1983), usedfor Sofia]. The macroseismic scenario map obtained for Sofia is illustrated in Fig. 6 asan example, taking the 1858 earthquake (I0 = IX–X EMS98, M 6.3) as reference, andincluding the effects of soil amplification. For Sofia, as for other cities, different inten-sity levels are predicted in the urban area, either because of distance attenuation, or ofnear-surface geology contrasts. On the latter, a consensus was reached in the projectthat an intensity increment of half a degree with respect to hard ground was applicableon (sufficiently extended) areas on medium stiff clays and medium dense cohesionlesssoils. Concerning topographic amplification, as much as one degree increase could beapplied for hilltop, crests and severely sloping ground (Faccioli et al. 2002).
In a few cases, rather than relying on historical sources, it was considered lessuncertain estimating the scenario intensity through correlations with strong motionparameters such amax or vmax (maximum horizontal ground acceleration and veloc-ity), based on regional data. The case of Catania seems worth mentioning because: (a)despite the wealth of historical sources and recent studies on the 1693 earthquake (e.g.Boschi and Guidoboni 2001), the X–XI (most recently X) felt intensity reported in
Bull Earthquake Eng
catalogues remains possibly too high6 for an event with estimated M 7.1–7.3, assumedon the offshore Malta Escarpment at 12–15 km distance from the city, and (b) anintensity X would result in a scenario of widespread destruction, unlikely for the cityof today. Hence, to obtain an independent intensity assessment, it was considered thatan empirical correlation between intensity and vmax, using mostly data from Italianearthquakes, would be sufficiently stable and less dispersed than with respect to amax;other correlations, such as intensity vs. EPA (effective peak acceleration) or vs. somespectral ordinate would likely be suitable, but were not explored within Risk-UE. Forthe purpose of constructing the correlation, EMS98 was roughly assumed equivalentto MSK 64 and MCS (used for Italian data) intensities between degrees V and IX.The following expression was obtained:
IEMS = 8.69 log vmax(m/s) + 1.80 R2 = 0.61; σ = 0.71 (2)
applicable from IEMS IV to IX. The calibration data set included 75 observed inten-sities (mostly MCS), and as many vmax values, from 23 earthquakes of Italy, Turkey(only Izmit 1999) and few other European Countries. Since the 1693 ground motionscenario gives vmax values between about 35 and 50 cm/s in Catania, Eq. (2) would givean intensity of VIII–IX, i.e. over one degree less than the historically based assess-ment. The value assumed in the end for the actual scenario was IX–X, intermediatebetween the previous one and the historical one.
4.3 Attenuation of instrumental ground motion parameters for level II damageassessment
As mentioned, the strong motion attenuation relation AMB96 was adopted to gener-ate input ground motion maps for level II damage evaluations. AMB96 is calibratedmostly on European data and makes no distinction among types of source mechanism.In addition, it covers large ranges in distance (up to 200 km) and magnitude (MS 4.0–7.5), and uses a simplified ground classification i. e. four ground classes (from rock tovery soft soil) almost coincident with the eurocode 8 ground classification (CEN 2004).AMB96 was the basic relation used for the project most important shaking scenarios(acceleration spectral ordinates), and since it uses MS, the surface wave magnitudewas selected as the reference magnitude scale for the scenario earthquakes whereverpossible.
Some cities, like Bucharest, lie in regions where AMB96 is not applicable; for thedeep earthquakes of the Vrancea region that have historically damaged Bucharest anad hoc relationship was developed, based on 71 three-component or two-componentaccelerograms recorded at 47 free-field stations in Romania. Elsewhere the appli-cation of AMB96 had to be checked against local data, because the seismic regimemay not be adequately represented in the European database, as e.g. in the case ofCatalonia, in Spain, characterised by low level seismicity. In such cases, AMB96 couldbe substituted by local relationships; note, however, that for Spain no strong motionrecord for earthquakes bigger that M 5 exists at the moment, an this constitutes animportant limitation for deriving this type of relationships. Only a strong motionmodel in terms of PGA is published (Cabañas et al. 1999).
Finally, for hazard maps in terms of vmax, or maximum ground displacement, dmax,significant for estimating damage to underground lifelines, the relationships proposed
6 Most likely because of cumulative damage effects: the event in question occurred 2 days after afirst, strong shock (M ∼ 6) that had already caused significant damage in the city.
Bull Earthquake Eng
LegendRing Road
Determ.Assiros_0 (PGA-T=0sec)HIgh : 206.61galMedium : 166.62galLow : 126.63gal
LegendRing Road
Determ.Assiros_1 (PSA-T=1.0sec)
HIgh : 187.80galMedium : 148.36galLow : 108.91gal
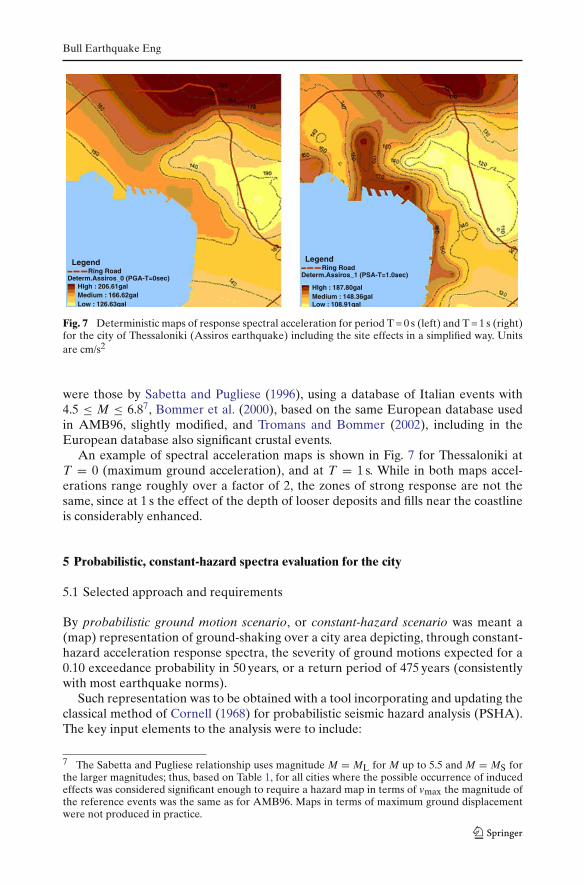
Fig. 7 Deterministic maps of response spectral acceleration for period T = 0 s (left) and T = 1 s (right)for the city of Thessaloniki (Assiros earthquake) including the site effects in a simplified way. Unitsare cm/s2
were those by Sabetta and Pugliese (1996), using a database of Italian events with4.5 ≤ M ≤ 6.87, Bommer et al. (2000), based on the same European database usedin AMB96, slightly modified, and Tromans and Bommer (2002), including in theEuropean database also significant crustal events.
An example of spectral acceleration maps is shown in Fig. 7 for Thessaloniki atT = 0 (maximum ground acceleration), and at T = 1 s. While in both maps accel-erations range roughly over a factor of 2, the zones of strong response are not thesame, since at 1 s the effect of the depth of looser deposits and fills near the coastlineis considerably enhanced.
5 Probabilistic, constant-hazard spectra evaluation for the city
5.1 Selected approach and requirements
By probabilistic ground motion scenario, or constant-hazard scenario was meant a(map) representation of ground-shaking over a city area depicting, through constant-hazard acceleration response spectra, the severity of ground motions expected for a0.10 exceedance probability in 50 years, or a return period of 475 years (consistentlywith most earthquake norms).
Such representation was to be obtained with a tool incorporating and updating theclassical method of Cornell (1968) for probabilistic seismic hazard analysis (PSHA).The key input elements to the analysis were to include:
7 The Sabetta and Pugliese relationship uses magnitude M = ML for M up to 5.5 and M = MS forthe larger magnitudes; thus, based on Table 1, for all cities where the possible occurrence of inducedeffects was considered significant enough to require a hazard map in terms of vmax the magnitude ofthe reference events was the same as for AMB96. Maps in terms of maximum ground displacementwere not produced in practice.
Bull Earthquake Eng
– A regional model of SSZs, see Sect. 2. Seismic activity in each SSZ was to bequantified in terms of activity rates and maximum magnitude, based on the bestavailable earthquake catalogues and regional seismo-tectonic models.
– Attenuation relations for the selected hazard parameter(s): being the same as forthe deterministic scenarios in Sect. 4, these will not be further considered here.
The probabilistic hazard description had to satisfy the level II damage scenariorequirements (see Lagomarsino and Giovinazzi this issue); as for the determinis-tic case, a separate map had to be produced for each spectral ordinate at the specifiedperiod values. A rather uncommon requirement was that each spectral response mapwas to be obtained by interpolating values computed for the target probability ofexceedence over a sufficiently dense grid of points covering the city area of interest.The treatment of the site effects would have to follow the same lines as in the deter-ministic maps, i.e. through the zonation and the ground classes of the attenuationrelation, supported by more refined evaluations based on 1D site response analysesfor zones on soft deposits (see Sect. 6).
Fundamental requirements for the probabilistic evaluation were the uniformity ofthe method and flexibility and efficiency of the computational tool of analysis, consid-ering that the construction of hazard maps through a sufficiently dense grid of pointswould be computationally heavy.
Concerning the computational tool, a code was chosen with enough flexibility tomatch the generality8 requirements of Risk-UE. After some tests, CRISIS (version1999), a code developed by Ordaz and co-workers of Mexico City UNAM was foundsatisfactory for the purpose9. The theoretical background for the code, following theprobabilistic formulation of Esteva (1970) integrated with a description of the char-acteristic–earthquake occurrence process, may be found in Ordaz et al. (1991). Assetsof CRISIS include: the option of treating the occurrence process as Poissonian or as acharacteristic–earthquake model for any SSZ, the freedom in describing the geome-try of any SSZ (e.g. an inclined plane), and—in its most recent (2003) version—threeoptions for the source-to-site distance: hypocentral, epicentral, and fault distance.
Since the performance of CRISIS99 had not been widely documented before,extensive tests were carried out to check its sensitivity and stability to the choice ofkey computation parameters. These included:
– The minimum size of the triangles by which the SSZs are discretised, and the ratiotriangle-to-site distance/triangle size; the choice is important for the sites close tothe source. Triangle sizes of the order of 5 km and ratios of 5–10 were found togive very stable results.
– The uncertainty in the attenuation relation; the residuals of the estimate of e.g.amax are assumed as lognormally distributed with median value amax and standarddeviation σlog(a). The attenuation relation is input in the code as a table, where eachrow corresponds to a magnitude and each column to a hypocentral distance. In thecurrent version, introducing in the table the parameter N, the code performs theintegration from 0 to log(amax) + Nσlog A, and the function will be re-normalised
8 For instance, evaluation of seismic hazard for a city like Bucharest requires introducing a SSZlike Vrancea lying deep below the Earth surface and having the geometry of an inclined plane. Thisrepresentation is not directly feasible with the well known code SEISRISKIII.9 To obtain the current (2006), updated version of the code (CRISIS2003, version 3.0.1), interestedreaders should address Professor M. Ordaz, Instituto de Ingenieria, UNAM, Mexico City.
Bull Earthquake Eng
in order to obtain unity in the full range. The tests showed that, as |N| decreases,the hazard curves for a given site tend to the curve free of uncertainty.
– The shortest distance required by the code: when a city area lies inside the surfaceprojection of a SSZ, the lowest distance used in the attenuation table plays animportant role on its seismic hazard assessment. This is because, if such distance isnot close enough to 0, the code must extrapolate values introducing errors in thecalculations. For instance, it was found for Barcelona that the smallest distanceshould be ≤ 1 km.
5.2 Source-to-site-distances introduced in the calculations
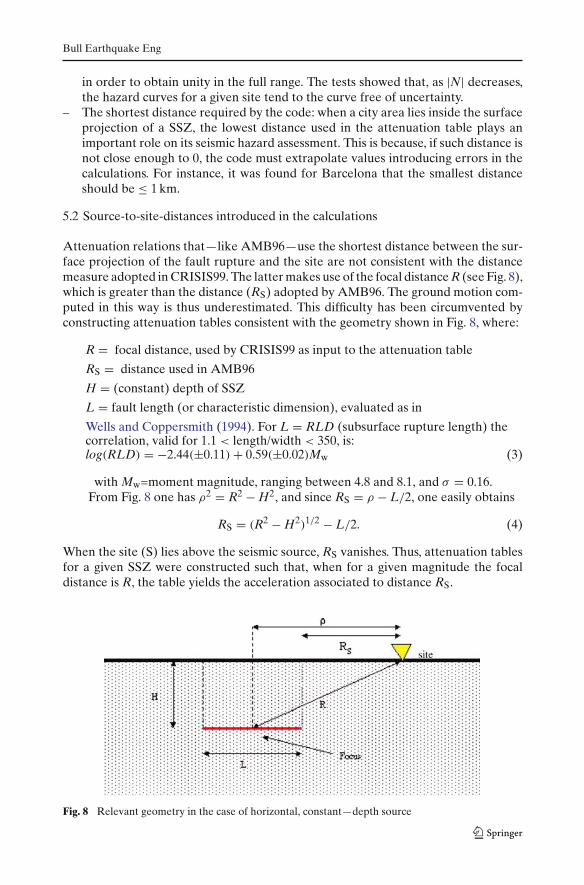
Attenuation relations that—like AMB96—use the shortest distance between the sur-face projection of the fault rupture and the site are not consistent with the distancemeasure adopted in CRISIS99. The latter makes use of the focal distance R (see Fig. 8),which is greater than the distance (RS) adopted by AMB96. The ground motion com-puted in this way is thus underestimated. This difficulty has been circumvented byconstructing attenuation tables consistent with the geometry shown in Fig. 8, where:
R = focal distance, used by CRISIS99 as input to the attenuation table
RS = distance used in AMB96
H = (constant) depth of SSZ
L = fault length (or characteristic dimension), evaluated as in
Wells and Coppersmith (1994). For L = RLD (subsurface rupture length) thecorrelation, valid for 1.1 < length/width < 350, is:log(RLD) = −2.44(±0.11) + 0.59(±0.02)Mw (3)
with Mw=moment magnitude, ranging between 4.8 and 8.1, and σ = 0.16.From Fig. 8 one has ρ2 = R2 − H2, and since RS = ρ − L/2, one easily obtains
RS = (R2 − H2)1/2 − L/2. (4)
When the site (S) lies above the seismic source, RS vanishes. Thus, attenuation tablesfor a given SSZ were constructed such that, when for a given magnitude the focaldistance is R, the table yields the acceleration associated to distance RS.
Fig. 8 Relevant geometry in the case of horizontal, constant—depth source
Bull Earthquake Eng
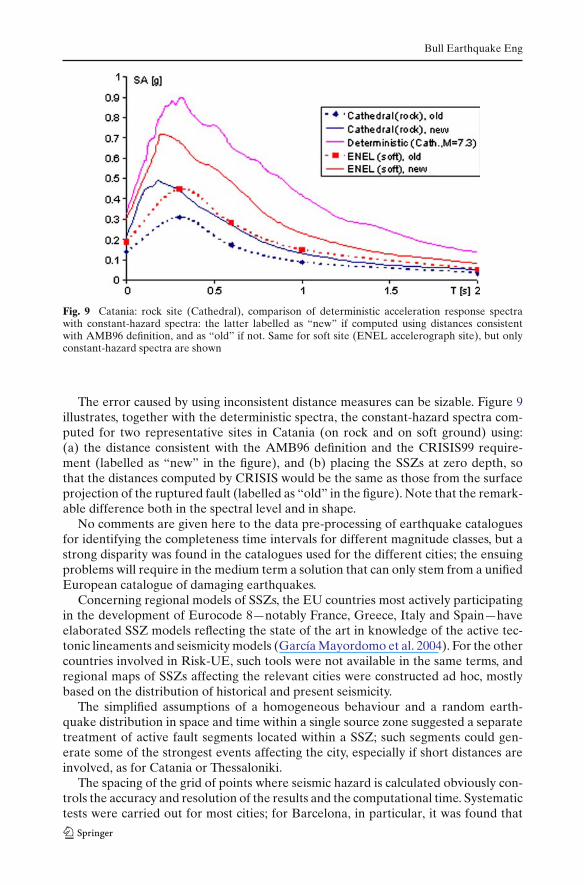
Fig. 9 Catania: rock site (Cathedral), comparison of deterministic acceleration response spectrawith constant-hazard spectra: the latter labelled as “new” if computed using distances consistentwith AMB96 definition, and as “old” if not. Same for soft site (ENEL accelerograph site), but onlyconstant-hazard spectra are shown
The error caused by using inconsistent distance measures can be sizable. Figure 9illustrates, together with the deterministic spectra, the constant-hazard spectra com-puted for two representative sites in Catania (on rock and on soft ground) using:(a) the distance consistent with the AMB96 definition and the CRISIS99 require-ment (labelled as “new” in the figure), and (b) placing the SSZs at zero depth, sothat the distances computed by CRISIS would be the same as those from the surfaceprojection of the ruptured fault (labelled as “old” in the figure). Note that the remark-able difference both in the spectral level and in shape.
No comments are given here to the data pre-processing of earthquake cataloguesfor identifying the completeness time intervals for different magnitude classes, but astrong disparity was found in the catalogues used for the different cities; the ensuingproblems will require in the medium term a solution that can only stem from a unifiedEuropean catalogue of damaging earthquakes.
Concerning regional models of SSZs, the EU countries most actively participatingin the development of Eurocode 8—notably France, Greece, Italy and Spain—haveelaborated SSZ models reflecting the state of the art in knowledge of the active tec-tonic lineaments and seismicity models (García Mayordomo et al. 2004). For the othercountries involved in Risk-UE, such tools were not available in the same terms, andregional maps of SSZs affecting the relevant cities were constructed ad hoc, mostlybased on the distribution of historical and present seismicity.
The simplified assumptions of a homogeneous behaviour and a random earth-quake distribution in space and time within a single source zone suggested a separatetreatment of active fault segments located within a SSZ; such segments could gen-erate some of the strongest events affecting the city, especially if short distances areinvolved, as for Catania or Thessaloniki.
The spacing of the grid of points where seismic hazard is calculated obviously con-trols the accuracy and resolution of the results and the computational time. Systematictests were carried out for most cities; for Barcelona, in particular, it was found that
Bull Earthquake Eng
good accuracy and stability in the computed amax values could be achieved with areceiver grid spacing of 0.1◦ with a medium computational effort. The grid spacingsactually used ranged between less than 0.01◦ and 0.1◦ (about 1–10 Km), depending onthe extension of the city and other factors.
5.3 Constant-hazard vs. deterministic spectra
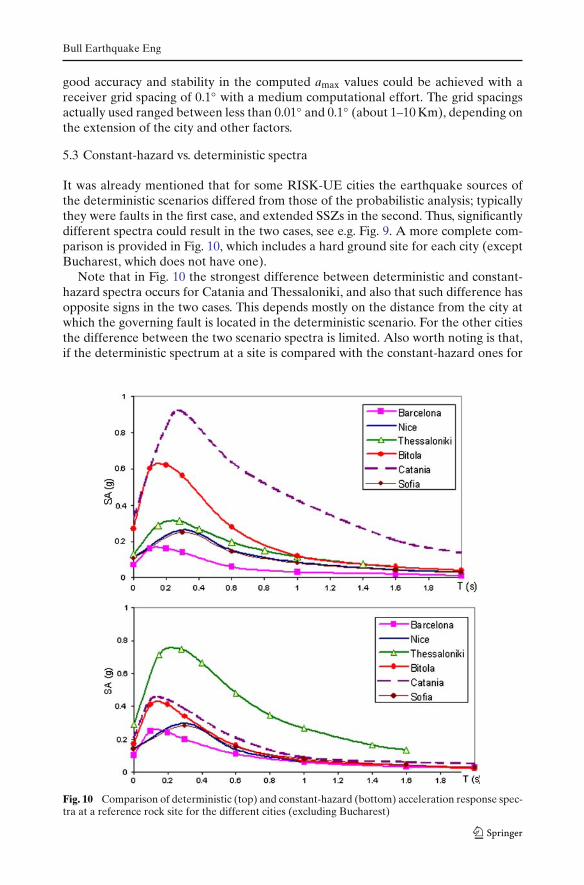
It was already mentioned that for some RISK-UE cities the earthquake sources ofthe deterministic scenarios differed from those of the probabilistic analysis; typicallythey were faults in the first case, and extended SSZs in the second. Thus, significantlydifferent spectra could result in the two cases, see e.g. Fig. 9. A more complete com-parison is provided in Fig. 10, which includes a hard ground site for each city (exceptBucharest, which does not have one).
Note that in Fig. 10 the strongest difference between deterministic and constant-hazard spectra occurs for Catania and Thessaloniki, and also that such difference hasopposite signs in the two cases. This depends mostly on the distance from the city atwhich the governing fault is located in the deterministic scenario. For the other citiesthe difference between the two scenario spectra is limited. Also worth noting is that,if the deterministic spectrum at a site is compared with the constant-hazard ones for
Fig. 10 Comparison of deterministic (top) and constant-hazard (bottom) acceleration response spec-tra at a reference rock site for the different cities (excluding Bucharest)
Bull Earthquake Eng
different return periods, the former tends to match the latter at long vibration peri-ods and at the longer return periods (e.g. 1,000 years), as a result of the statisticallystronger dependence on magnitude of the long period spectral ordinates.
6 Modification of scenario ground motions through site response analyses
Due to scarcity of data in the calibration set, and the complexity of site effects, theevaluations of seismic response yielded by the site-dependent AMB96 attenuationrelation were judged to be too crude for zones on soft soil deposits or artificial fills.Hence, additional verifications were required on such zones, complying with the fol-lowing criteria:
– Sufficient 1D response analyses had to be performed on soft deposits, using avail-able ground profiles down to depths including either local bedrock or materialswith VS ≥ 700 m/s; the deposits referred to would typically include ground classesD, E, F of Eurocode 8.
– The 1D analyses were to use as input 5 real accelerograms recorded on hardground, in tectonic environments and at distances comparable to those pertinentfor the city at study. In addition, for such input waveforms:
– Amplitude scaling factors were allowed, within ±1σ of the attenuation relation;– The average response spectrum of scaled waveforms should indicatively dif-
fer by not more than 20% from the scenario spectrum on hard ground at theprescribed vibration periods;
– In the 0.3–1 s period range, the H/V ratios of input response spectra should beapproximately constant;
– The spatially averaged surface spectra computed from 1D analyses were to providethe basis for appropriate correction factors (if any) to be applied to the originalscenario spectra.
– Alternatively, if the seismic zonation of a city was directly based on the simula-tion of local effects (as for Barcelona), and if the zones with similar behaviourwere characterised by a transfer function and by an amplification factor for amax,the previous validation procedure could involve the confirmation of the spectralamplification factors.
While the tool more readily available for the 1D calculations was the linear equivalentEERA code (Bardet et al. 2000), other codes were used such as CYBERQUAKE(http://www.brgm.fr/logiciels.htm) for Nice.
The supplementary 1D analyses seemed especially appropriate for Thessaloniki,due to steeply irregular bedrock morphology, Catania (complex geological setting),Sofia (presence of deep Neogene and Quaternary deposits), and Nice. For Bitolaand Bucharest, instead, such analyses were not possible either due to the scarcity ofavailable geotechnical borings, or the very large thickness of the sediments. Where acomprehensive 3D subsoil model was available, as in the case of Nice and Thessalo-niki, the validation could have been performed at any site; although sophisticated 3Danalyses were carried out for Nice, their results could not be used within Risk-UE.
Where the geotechnical zonation was supported by advanced data (depth contourlines of bedrock, thickness of each soil formation, and dense 2D cross-sections), thegrid resolution of 1D analyses could be increased in the most interesting zones: this
Bull Earthquake Eng
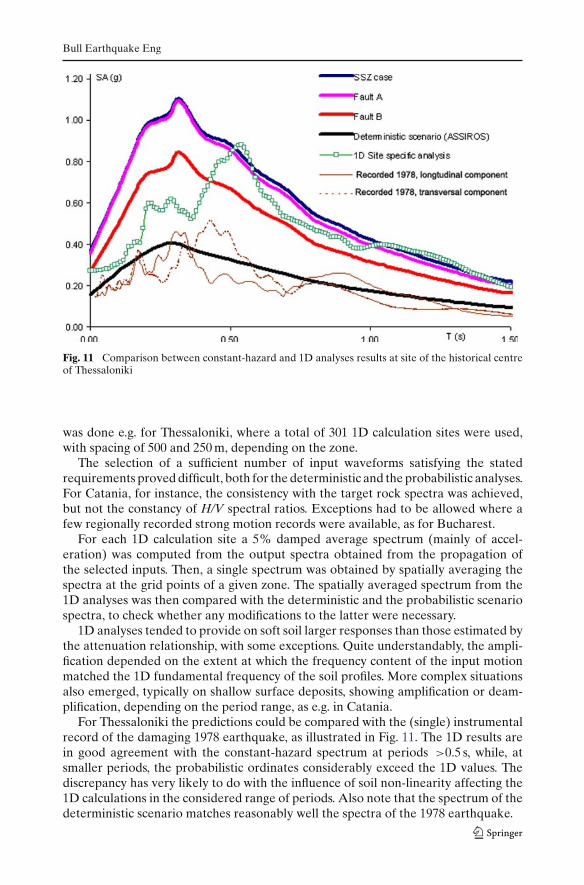
Fig. 11 Comparison between constant-hazard and 1D analyses results at site of the historical centreof Thessaloniki
was done e.g. for Thessaloniki, where a total of 301 1D calculation sites were used,with spacing of 500 and 250 m, depending on the zone.
The selection of a sufficient number of input waveforms satisfying the statedrequirements proved difficult, both for the deterministic and the probabilistic analyses.For Catania, for instance, the consistency with the target rock spectra was achieved,but not the constancy of H/V spectral ratios. Exceptions had to be allowed where afew regionally recorded strong motion records were available, as for Bucharest.
For each 1D calculation site a 5% damped average spectrum (mainly of accel-eration) was computed from the output spectra obtained from the propagation ofthe selected inputs. Then, a single spectrum was obtained by spatially averaging thespectra at the grid points of a given zone. The spatially averaged spectrum from the1D analyses was then compared with the deterministic and the probabilistic scenariospectra, to check whether any modifications to the latter were necessary.
1D analyses tended to provide on soft soil larger responses than those estimated bythe attenuation relationship, with some exceptions. Quite understandably, the ampli-fication depended on the extent at which the frequency content of the input motionmatched the 1D fundamental frequency of the soil profiles. More complex situationsalso emerged, typically on shallow surface deposits, showing amplification or deam-plification, depending on the period range, as e.g. in Catania.
For Thessaloniki the predictions could be compared with the (single) instrumentalrecord of the damaging 1978 earthquake, as illustrated in Fig. 11. The 1D results arein good agreement with the constant-hazard spectrum at periods >0.5 s, while, atsmaller periods, the probabilistic ordinates considerably exceed the 1D values. Thediscrepancy has very likely to do with the influence of soil non-linearity affecting the1D calculations in the considered range of periods. Also note that the spectrum of thedeterministic scenario matches reasonably well the spectra of the 1978 earthquake.
Bull Earthquake Eng
In general, the verifications through the 1D simulations indicated that, if groundmotion amplification occurs on soft soil, a correction of the values predicted by theattenuation relation can be reasonably applied, using the approach just illustrated.
7 Induced hazard effects: limitations and basic criteria
Only in few regions of Europe did historical earthquakes produce strong impact interms of induced permanent deformations, such as ground settlement and rupturedue to liquefaction and lateral soil spreading, or even rock- and land-slides; when theimpact was massive, as in the destructive Calabria (Southern Italy) earthquakes of1783, the affected zones were for the most part sparsely populated. In most cases, thepaucity of ground deformation phenomena is related to the limited magnitude of theevents. The same can be said for co-seismic surface fault rupture. Indeed, also forthe Risk-UE cities, observed cases of induced hazard effects were very few. Hence,earthquake induced permanent ground movements were not dealt with extensively inRisk-UE; only some general guidelines and criteria were provided, aimed at balancingthe effective demand of protection against induced hazard effects and the resourcesneeded for carrying out the analysis. The low emphasis placed on this topic was alsomotivated by the fact that in many cities the data required for proper analysis (digitalthematic maps and databases, DEMs) are lacking.
The following general criteria were formulated, mainly with reference to the Risk-UE task dealing with vulnerability assessment of lifelines:
– Historical evidence of earthquake induced liquefaction and landslides within, ornear, the urban area should be regarded as the most important indicator, justifyingfurther studies. The locations and nature of historically documented ground rup-tures should be mapped and taken into careful consideration in connection withthe lifeline damage assessment.
– Loose water saturated artificial fillings of old river (or creek) beds, characterisedby the presence of 3–4 m or more of soft soil, should be accurately mapped, seeEurocode 8 ground category S2, as potentially very vulnerable sites to permanentground deformation and soil failures.
– Where vmax values in excess of, say, >0.15 m/s were expected, a vmax map had tobe produced for lifeline hazard assessment, because this parameter is an indicatorof seismically induced ground strains at shallow depth.
– Based on extensive literature analyses, it was stressed that:
– Since few places are likely to suffer soil failure caused by lateral spreading, theweight of the analysis was shifted to a realistic case-by-case assessment of localsituations;
– As a general criterion, earthquake induced landslides deserved attention froma scenario viewpoint provided: (i) there was evidence of seismically triggeredlandslides within the city area in past earthquakes, (ii) slopes are predomi-nantly subject to frictional types of failures and, (iii) a DEM of the terrain isavailable.
Bull Earthquake Eng
8 Conclusions
The main conclusions of the effort deployed in Risk-UE in the realm of seismic hazardassessment in urban areas can be outlined as follows:
• It was not considered feasible in this project to create a self-contained tool toconstruct earthquake ground motion scenarios for European cities, as HAZUSdoes for US cities. However, substantial progress was made in identifying theappropriate tools, and one further European project focused on this topic wouldconceivably bring the goal within reach in the near future.
• Lack of homogeneity in knowledge and data on seismotectonic setting and soilcharacterisation at city scale led to adopting a blend of state-of-art instrumentsof analysis apt to ensure flexibility vis-a-vis the different situations. The basicapproach to the creation of ground motion scenarios combines, in GIS environ-ment, the source-to-city geometry, the strength of the earthquake source(s), and asimplified description of near-surface geology in the city area through appropriateattenuation relations.
• Ground motion scenarios should be both of the deterministic and the constant-hazard type, adapted for intensity based damage assessments using damage prob-ability matrices, and also for more sophisticated assessments based on capacitycurves for different classes of buildings.
• Since identification of earthquake sources for deterministic scenarios is difficult,the relevant event was chosen as the “true” strongest historical earthquake affect-ing the city.
• Models of seismic source zonation in different European countries appear suffi-ciently homogeneous to grant the use of probabilistic (constant-hazard) scenarios.In the latter, spectral ordinates are generated on a grid of points covering the cityarea and accounting for soil conditions through the attenuation relation. A single,efficient computational tool was used for this purpose for all cities.
• In city areas with significant incidence of soft/deep soil deposits, the simplified GISapproach was considered unsatisfactory: to improve the evaluation of site effects,systematic 1D response analyses are performed using available soil profiles.
• The results and scenario maps obtained for the seven different cities of the Risk-UE project provide a wide ranging framework of reference for many other Euro-pean cities that may perform similar earthquake scenario assessments in the future.While, for the 475-year recurrence interval, amax values on rock were found torange between 0.15 (Nice) and 0.30 g, for longer periods the spread is much larger:at 1.0 s period the range is from 0.08 to 0.97 g (Bucharest).
• The problem of exposure to liquefaction hazard and to other induced deforma-tion effects was not overemphasized. Among the project cities, only Catania andBucharest seems to have suffered significant liquefaction phenomena in their sur-roundings during the strongest historical earthquakes.
Acknowledgements I am grateful to Vera Pessina, who extensively cooperated in preparing theRisk-UE Project report on Seismic Hazard Assessment, from which this article has been derived.I am also indebted to all the partner teams of Risk-UE for providing illustrative material from thetechnical reports prepared for the single cities. Such material is not individually acknowledged in thefigures of this article. I also express my gratitude to Mario Ordaz for many valuable suggestions andhis assistance in the use of CRISIS99.
Bull Earthquake Eng
References
Ambraseys N, Simpson K, Bommer J (1996) Prediction of horizontal response spectra in Europe.Earthquake Eng Struct Dyn 25:371–400
Azzaro R, Barbano MS (1999) Seismogenic features of SE Sicily and scenario earthquake for Catania.In: Faccioli E, Pessina V (eds) The Catania project: earthquake damage scenarios for a high riskarea in the Mediterranean. CNR-GNDT, Rome, pp 9–13
Bardet JP, Ichii K, Lin CH (2000) EERA: a computer program for equivalent-linear earthquakesite response analyses of layered soil deposits. University of Southern California. http://www.geoi-nfo.usc.edu/gees
Bommer J, Elnashai A, Weir A (2000) Compatible acceleration and displacement spectra for seis-mic design code. In: 12th World Conference on Earthquake Engineering. Auckland, New Zeland,Paper 744 no. 207
Bommer J (2002) Deterministic vs. probabilistic seismic hazard assessment: an exaggerated andobstructive dichotomy. J Earthquake Eng 6 (Special Issue 1):43–73
Boschi E, Guidoboni E (2001) Catania terremoti e lave dal mondo antico alla fine del Novecento.Istituto Nazionale di Geofisica e Vulcanologia – SGA Storia Geofisica e Ambiente, Bologna, Italy
Cabañas L, Benito B, Cabañas C, López M, Gómez P, Jiménez ME, Alvarez S (1999) Caracterizacióndel movimiento del suelo en ingeniería sísmica. Fisica de la Tierra vol 11 (Ingeniería Sísmica), edComplutense
CEN (Comité Européen de Normalisation) (2004) Eurocode 8: design of structures for earthquakeresistance – Part 1: general rules, seismic actions and rules for buildings. Brussels, May
Cornell A (1968) Engineering seismic risk analysis. Bull Seism Soc Am 58:1583–1606Esteva L (1970) Seismic risk and seismic design decisions. In: Hansen RJ (ed) Seismic design of
nuclear power plants. MIT Press, Cambridge, Massachusetts, USAFaccioli E, Vanini M, Frassine L (2002) “Complex” site effects in earthquake ground motion, including
topography. In: 12th European Conference on Earthquake Engineering. Paper 844García Mayordomo J, Faccioli E, Paolucci R (2004) Comparative study of the seismic hazard assess-
ments in European national seismic codes. Bull Earthquake Eng 2:51–73Glavcheva R, Simeonova S, Hristova Tz, Solakov D (1983) Generalized isoseismals of the high
intensities for earthquakes in Bulgaria. Bulgarian Geophys J 9(3):69–77Grandori G, Drei A, Perotti F, Tagliani A (1991) Macroseismic intensity versus epicentral distance:
the case of central Italy. Tectonophysics 193:165–171Joyner W, Fumal T (1984) Use of measured shear-wave velocity for predicting geologic site effects on
strong ground motion. In: Proc. Eighth World Conference on Earthquake Engineering, vol. 2. SanFrancisco, pp 777–783
Lungu D, Cornea C, Demetriu S, Aldea A (1999) Microzonage sismique de la ville de Bucarest. Cin-quième Colloque National, Génie Parasismique et Réponse Dynamique des Ouvrages, AssociationFrançaise du Génie Parasismique AFPS, Cachan, 19–21 October, pp 99–111
McGuire R (1995) Probabilistic seismic hazard analysis and design earthquakes: closing the loop. BullSeism Soc Am 85:1275–1284
Meletti C, Patacca E, Scandone P (2000) Construction of a seismotectonic model: the case of Italy.PAGEOPH 157(1–2):11–35
Nagakawa K, Shiono K, Inoue N, Sano M (1996) Geological characteristics and problems in andaround Osaka basin as a basis for assessment of seismic hazard. In: Special issue of Soils andFoundations. Japanese Geotechnical Society, Tokyo, pp 15–28
Nakamura Y (1989) A method for dynamic characteristic estimation of subsurface using microtremoron the ground surface. Rep Railway Tech Res Inst Jpn 30(1):25–33
Ordaz M, Jara JM, Singh SK (1991) Riesgo sísmico y espectros de diseño en el estado de Guerrero.Technical Report, Instituto de Ingenieria, UNAM, Mexico City
Sabetta F, Pugliese A (1996) Estimation of response spectra and simulation of nonstationary earth-quake ground motions. Bull Seism Soc Am 86:337–352
Tromans I, Bommer J (2002) The attenuation of strong-motion peaks in Europe. In: Proceedings 12thEuropean Conference on Earthquake Engineering, London. CD Rom, Paper no. 394
Wells D, Coppersmith K (1994) New empirical relationships among magnitude, rupture length, rup-ture width, rupture area and surface displacement. Bull Seism Soc Am 84(4):974–1002