a scoring test on probabilistic seismic hazard estimates in italy
TRANSCRIPT

NHESSD2, 5721–5757, 2014
A scoring test onprobabilistic seismichazard estimates in
Italy
D. Albarello et al.
Title Page
Abstract Introduction
Conclusions References
Tables Figures
J I
J I
Back Close
Full Screen / Esc
Printer-friendly Version
Interactive Discussion
Discussion
Paper
|D
iscussionP
aper|
Discussion
Paper
|D
iscussionP
aper|
Nat. Hazards Earth Syst. Sci. Discuss., 2, 5721–5757, 2014www.nat-hazards-earth-syst-sci-discuss.net/2/5721/2014/doi:10.5194/nhessd-2-5721-2014© Author(s) 2014. CC Attribution 3.0 License.
This discussion paper is/has been under review for the journal Natural Hazards and EarthSystem Sciences (NHESS). Please refer to the corresponding final paper in NHESS if available.
A scoring test on probabilistic seismichazard estimates in Italy
D. Albarello1, L. Peruzza2, and V. D’Amico3
1Dipartimento di Scienze Fisiche, della Terra e dell’Ambiente, Università degli Studi di Siena,Siena, Italy2OGS (Istituto Nazionale di Oceanografia e di Geofisica Sperimentale), Trieste, Italy3Istituto Nazionale di Geofisica e Vulcanologia, Pisa, Italy
Received: 1 July 2014 – Accepted: 3 August 2014 – Published: 8 September 2014
Correspondence to: L. Peruzza ([email protected])
Published by Copernicus Publications on behalf of the European Geosciences Union.
5721

NHESSD2, 5721–5757, 2014
A scoring test onprobabilistic seismichazard estimates in
Italy
D. Albarello et al.
Title Page
Abstract Introduction
Conclusions References
Tables Figures
J I
J I
Back Close
Full Screen / Esc
Printer-friendly Version
Interactive Discussion
Discussion
Paper
|D
iscussionP
aper|
Discussion
Paper
|D
iscussionP
aper|
Abstract
Probabilistic estimates of seismic hazard represent a basic element for planningseismic risk reduction strategies and they are key elements of seismic regulation.Due to its importance, it is mandatory to select most effective estimates among theavailable ones. A possible empirical scoring strategy is described here and is applied5
to a number of time-independent hazard estimates available in Italy both at national andregional scale. Scoring is based on the comparison of outcomes provided by availablecomputational models at a number of accelerometric sites where observations areavailable for 25 years. This comparison also allows identifying computational modelsproviding outcomes that contrast observations and thus should be discarded. The10
analysis shows that most of hazard estimates so far proposed for Italy do not contrastwith observations and some computational models perform significantly better than theothers do. Furthermore, one can see that, at least locally, older estimates can performbetter that the most recent ones. Finally, since the same computational model canperform differently depending on the region considered and on average return time of15
concern, no single model can be considered as the best performing one. This impliesthat time-by-time, the most suitable model must be selected by considering the specificproblem of concern.
1 Introduction
Seismic hazard assessment is a basic tool for risk estimates necessary to20
develop effective preventive strategies against seismic damage. Being in essencea forecasting of future ground shaking, uncertainty is a basic element of seismichazard and this requires specific formalizations based on a probabilistic formalism(probabilistic seismic hazard assessment or PSHA) to manage available informationby providing likelihood estimates for each possible ground-shaking level (hazard25
curve). Information considered on purpose includes deterministic (e.g., geometry of
5722

NHESSD2, 5721–5757, 2014
A scoring test onprobabilistic seismichazard estimates in
Italy
D. Albarello et al.
Title Page
Abstract Introduction
Conclusions References
Tables Figures
J I
J I
Back Close
Full Screen / Esc
Printer-friendly Version
Interactive Discussion
Discussion
Paper
|D
iscussionP
aper|
Discussion
Paper
|D
iscussionP
aper|
seismogenic structures or seismic waves propagation patterns) and statistical (e.g.average seismicity rates) elements. The last ones aim at managing the lack ofinformation about important elements of seismic hazard (e.g., seismogenic activity ofthe faults) that results into an intrinsic aleatory character of seismic occurrences (theso called “aleatory uncertainty”). Actually, many PSHA procedures exist that mainly5
differentiate for the relative roles played by deterministic and statistical elements.Procedures span from purely deterministic approaches assuming a nearly completeknowledge of the seismic process (e.g., Peresan et al., 2011) to purely statisticalanalyses assuming a nearly complete ignorance of underlying physical processes (e.g.,Kagan and Jackson, 1994; Frankel, 1995; Albarello and Mucciarelli, 2002), including10
balanced combinations of deterministic and statistical elements to manage aleatoryuncertainty (e.g., Cornell, 1968; McGuire, 1978). Outcomes of these approachesmay present strong differences and this makes mandatory any evaluation of therespective heuristic value and effectiveness. Arrogating ageless Shakespeare’s words“Shall I compare thee to a summer’s day”, comparison of subjects with different15
nature is always difficult. Actually, effectiveness of any considered procedure (whichincludes both computational aspects and data used to feed the model) is uncertain(an “epistemic uncertainty”) and this is managed by associating to each procedurea degree of “belief” (again in the form of a probability). Being hazard estimatesultimately the combination of relevant uncertainties (and complementarily of lack of20
uncertainty about deterministic elements), both aleatory and epistemic uncertaintieshave to be considered and contribute to the estimate of the hazard curve.
While each PSHA procedure is on purpose determined to manage the relevantaleatory uncertainty via probabilistic modelling, assessment and management ofepistemic uncertainty are more controversial topics. Given any i th PSHA model Hi ,25
epistemic uncertainty can be defined as the probability P (Hi ) expressing the degree ofbelief in the effectiveness of that model. This formalization allows the managementof epistemic uncertainty within a coherent frame (Albarello and D’Amico, 2014).A key aspect is the way to assess P (Hi ), i.e., scoring Hi . Two general approaches
5723

NHESSD2, 5721–5757, 2014
A scoring test onprobabilistic seismichazard estimates in
Italy
D. Albarello et al.
Title Page
Abstract Introduction
Conclusions References
Tables Figures
J I
J I
Back Close
Full Screen / Esc
Printer-friendly Version
Interactive Discussion
Discussion
Paper
|D
iscussionP
aper|
Discussion
Paper
|D
iscussionP
aper|
exist on purpose. The first one relies on “ex-ante” expert evaluations of the actualreliability (in terms of internal robustness or coherency with current knowledge aboutunderlying physical process) of the elements constituting the relevant PSHA procedureHi (e.g., the geometry of considered seismic sources, the ground-motion attenuationrelationship, etc.): these evaluations are combined in the frame of a “logic tree” (e.g.,5
SSHAC, 1997). The second kind of approach is “ex-post” and considers a comparisonof procedure outcomes (“forecasts”) with observations. Examples of empirical testingprocedures have been provided by Mucciarelli et al. (2000), Albarello and D’Amico(2005, 2008), Beauval (2011) and recently by Tasan et al. (2014). Ex-ante and ex-postapproaches can be seen as complementary in the frame of a Bayesian view (Albarello10
and D’Amico, 2014).Only the ex-post approach only will be considered here to score on empirical basis
a number of PSHA models available for the Italian area by the use of a simpleprocedure described in the next section. Then the data set of observations used forscoring the PSHA models will be described. The scoring test has been performed in15
the frame of the research agreement between the National Civil Defence Department(DPC) and the National Institute of Geophysics and Volcanology (INGV), namelythe S2-2012 Project (https://sites.google.com/site/ingvdpc2012progettos2/home), afterthat observed maximum peak ground acceleration (PGA) values at a subset ofavailable accelerometric stations were provided for a long time window (Pacor et al.,20
2013), and a repository of released PSHA results has been compiled too (Faccioliand Vanini, 2013). The data used in this study are given as supplementary material tostimulate alternative analyses and/or methodological comparisons.
2 Empirical scoring and testing
The bulk of any empirical scoring procedure is the evaluation of a probability25
L= P (E |Hi ) that expresses the degree of belief (likelihood L) that a set of observedseismic occurrences E (“evidence”) will verify in the case that the PSHA computational
5724

NHESSD2, 5721–5757, 2014
A scoring test onprobabilistic seismichazard estimates in
Italy
D. Albarello et al.
Title Page
Abstract Introduction
Conclusions References
Tables Figures
J I
J I
Back Close
Full Screen / Esc
Printer-friendly Version
Interactive Discussion
Discussion
Paper
|D
iscussionP
aper|
Discussion
Paper
|D
iscussionP
aper|
model Hi provides a correct hazard estimate (Albarello and D’Amico, 2008). Given themodel Hi and the set of sites E∆t∗ where ground shaking has been monitored duringthe control interval ∆t∗ of duration equal to the hazard exposure time ∆t, the model’slikelihood Li can be estimated from the control sample E∆t∗ . If the seismic occurrenceses are mutually independent (in the PSHA computational model considered) and if,5
over the duration of the control interval, a total of N∗ out of S sites have experiencedground shaking above any threshold g0, then we have
Li = P(E |Hi ,∆t
)={∏N∗
s=1P(es|Hi ,∆t
)}{∏S
s=N∗+1
[1− P
(es|Hi ,∆t
)]}, (1)
where each value P (eS |H i ) is the hazard estimated (i.e., the exceedance probabilityfor g0) by the i th model at the sth site for the exposure time ∆t = ∆t∗. In the case that10
time stationarity is assumed in the relevant PSHA model, the overall duration of theexposure time is of concern only; this is not true when time-dependent PSHA modelsare considered. Of course one should account that several possible combinationssites/events may exist that result in the same configuration of the available evidence:all sites characterized in Hi by the same exceedance probability are equivalent. It is15
worth to note, however, that likelihood value in Eq. (1) also depends on the number ofsites considered and on the P values of concern: this implies that comparison amongdifferent models by using respective likelihoods should be performed by consideringthe same values for S and P . When this is not the case, any kind of “rescaling” isnecessary. This rescaling could be performed by considering instead of Eq. (1) the20
“support” function l that is the log-likelihood ratio as defined by Edwards (1972) in theform
li ={∑N∗
s=1ln[P(es|Hi ,∆t
)]+∑S
s=N∗+1ln[1− P
(es|Hi ,∆t
)]}− r
[P(es|Hi ,∆t
),S
],
(2)
where r is a reference log-likelihood value computed as in Appendix A as a function ofP (eS |H i ) and S.25
5725

NHESSD2, 5721–5757, 2014
A scoring test onprobabilistic seismichazard estimates in
Italy
D. Albarello et al.
Title Page
Abstract Introduction
Conclusions References
Tables Figures
J I
J I
Back Close
Full Screen / Esc
Printer-friendly Version
Interactive Discussion
Discussion
Paper
|D
iscussionP
aper|
Discussion
Paper
|D
iscussionP
aper|
It can be seen (Kagan and Jackson, 1994) that probability distribution of the supportl is nearly normal. This formulation allows using the reference value in the Appendix Aand the relevant standard deviation to compute a studentized form of l as
Zi =∣∣li/σi (P ,S)
∣∣ , (3)
where the denominator is provided in Eq. (A5). In general, values of Zi near 05
indicate best performing models while Zi > 2 indicate models providing outcomessignificantly different from observations. In this case, the model should be consideredas “unreliable”. In this frame, the value Zi can be considered as the “score” of the i thmodel: smaller is Z better is the computational model.
Other possibilities exist for testing any PSHA procedure against the evidence E (e.g.,10
Schorlemmer and Gerstenberger, 2007; Schorlemmer et al., 2007). Counting is oneof these procedures. In this case, a binary variable es(g0) is defined which assumesthe value of 1 if during the control interval ∆t∗ (which has the same extension as thehazard exposure time ∆t) at least one earthquake occurred producing a ground motionin excess of g0 at the sth site; otherwise es(g0) = 0. We define the “control sample” E∆t∗15
as the set of S realizations of the variable es(g0) at S sites. The i th considered PSHAcomputational model Hi provides a probability Psi for the event es(g0) = 1 given by
Psi = P(es|Hi
), (4)
where the dependence on g0 and ∆t is omitted to simplify the notation. Expectation µsiand standard deviation σsi relative to the Bernoulli variable es result to be20
µsi = µ(es|Hi
)= Psi (5)
and
σsi =√Psi (1− Psi) (6)
5726

NHESSD2, 5721–5757, 2014
A scoring test onprobabilistic seismichazard estimates in
Italy
D. Albarello et al.
Title Page
Abstract Introduction
Conclusions References
Tables Figures
J I
J I
Back Close
Full Screen / Esc
Printer-friendly Version
Interactive Discussion
Discussion
Paper
|D
iscussionP
aper|
Discussion
Paper
|D
iscussionP
aper|
respectively. The number N∗ of sites out of the S sites considered for testing thatexperienced at least one earthquake during ∆t∗ with ground shaking greater than g0 is
N∗ =∑S
s=1es. (7)
In terms of probabilistic forecasts provided by the Hi PSHA computational model, N∗5
is a random variate with expectation
µi (N∗) =
∑S
s=1µi (es) =
∑S
s=1P(es|Hi
). (8)
In the hypothesis that es are independent realizations of the stochastic processmodelized in the PSHA computations, one can assume that
Pi(es|ez
)= Pi (es) , (9)10
where es and ez are the realizations of the Bernoulli variable defined above at twogeneric sth and zth sites. In this case, the standard deviation of the random variableN∗ is
σi (N∗) =
√∑S
s=1Psi (1− Psi). (10)
When S is relatively large, the Lyapunov variant of the Central Limit Theorem (e.g.,15
Gnedenko, 1976) implies that
prob[|N∗ −µi (N
∗)| ≥ 2σi (N∗)] ∼= 0.05. (11)
Equation (11) allows us to evaluate whether a potential disagreement between theexperimental value N∗ and the “forecast” µi (N
∗) is statistically significant, thus makingthe Hi PSHA computational model “not confirmed” by the set of S observations.20
5727

NHESSD2, 5721–5757, 2014
A scoring test onprobabilistic seismichazard estimates in
Italy
D. Albarello et al.
Title Page
Abstract Introduction
Conclusions References
Tables Figures
J I
J I
Back Close
Full Screen / Esc
Printer-friendly Version
Interactive Discussion
Discussion
Paper
|D
iscussionP
aper|
Discussion
Paper
|D
iscussionP
aper|
3 Evidence: long lasting accelerometric recordings
Selection of observed data to be used for scoring PSHA models is a key element of thepresent analysis. The Italian accelerometric database ITACA (Luzi et al., 2008; Pacoret al., 2011), reporting records of accelerometric stations operating in Italy since 1974,has been considered for our purpose. A number of accelerometric sites continuously5
operating for long times were selected by considering available station books (courtesyof F. Pacor and R. Puglia from INGV-Milan and A. Gorini, Dept. of National CivilDefence, Fig. 1). Finally, we selected 71 stations operating during the time span 1979–2004. These time boundaries were chosen in order to maximize the number of stationscontemporaneously active. These stations are unevenly distributed all over the Italian10
area (Fig. 2) and are located both on rock or different kind of soils classified by followingthe National Seismic Code NTC08 (NTC, 2008). In particular: 25 stations are locatedon A type soil (V s30 > 800m s−1, where V s30 is the average shear-wave velocity in theuppermost 30 m of underground), 30 on B type soil (V s30 in the range 360–800 m s−1),13 on C type soil (V s30 in the range 180–360 m s−1), 1 on D type soil (V s30 < 180m s−1)15
and 2 on E type soil (i.e., C and D type soils, but with seismic bedrock at a depth inthe range 3–20 m from the surface). Most of the stations (52) lay on a flat outcrop (T1type topography by following the NTC08 code), 14 on smooth morphology (T2 type,i.e., on a surface dipping in the range 15–30◦) and 5 on rough topography (T3 type,i.e. surface dipping more than 30◦). Note that the site classification based on V s3020
mimics the one adopted by the EuroCode EC8. One can see that most of stationslay on stratigraphic/geomorphological configurations different from the “reference” one(i.e., flat outcrop of a rigid bedrock with V s30 > 800m s−1) generally considered forseismic hazard estimates. This implies that, in order to compare hazard outcomeswith observations, some correction terms should be considered to “reduce” observed25
accelerometric data to “reference” values. In the present study, such a correction termhas been assumed equal to the amplification factor stated by the NTC08 regulationcode, which includes both stratigraphic and topographic effects: it assumes values
5728

NHESSD2, 5721–5757, 2014
A scoring test onprobabilistic seismichazard estimates in
Italy
D. Albarello et al.
Title Page
Abstract Introduction
Conclusions References
Tables Figures
J I
J I
Back Close
Full Screen / Esc
Printer-friendly Version
Interactive Discussion
Discussion
Paper
|D
iscussionP
aper|
Discussion
Paper
|D
iscussionP
aper|
depending on the soil type and topographic class at the site, but also on the hazardestimated on the reference outcrop. The relevant correction coefficients computedat the 71 accelerometric stations considered for testing (Fig. 2) are reported in theSupplement File A; details are given in Sect. 3.2.3 of NTC08. These coefficientsrepresent a first approximation to site-specific hazard, coherent with the common5
practice for buildings that do not require specific studies; they have been used to correctmaximum PGA values observed on horizontal components in the time interval 1979–2004.
About available recordings, on 71 stations, 12 have no records at all, for this 25 yearlong period. In these cases, we assumed the sensitivity threshold of the early deployed10
accelerometers (0.01 g, i.e. 9.8 cm s−2) as the maximum “observed” value. We checkedpossible problems with data completeness that nevertheless we acknowledge theycannot be properly fixed. For this purpose, PGA values expected at all the sites due tothe occurrence of nearby earthquakes have been computed (synthetic “observations”),on the basis of epicentral information (CPTI11 earthquake catalogue, Rovida et al.,15
2011) and the Ground Motion Prediction Equation (GMPE) ITA10 by Bindi et al. (2011).In particular, synthetic PGA values have been considered potential observations atthe relevant site if they exceed the sensitivity trigger threshold. Synthetic PGA valuesobtained at ALT (Auletta, Salerno) and PTL (Pietralunga, Perugia) stations are plottedin Fig. 3, and compared with effective recorded data: note that even if some data20
are possibly missing (blue circles in Fig. 1 correspond to values above the sensitivitythreshold of the accelerometric network), on average, the maximum observed valuesin the time window considered for the analysis is coherent with the expectations.We estimated that missing maximum PGA should have occurred on less than 5 %of stations, thus not affecting the results obtained. This analysis also suggested that25
completeness problems should be critical if testing were performed on the wholesequence of observations instead of only maximum observed PGA.
On the subset of selected stations, the observed maximum PGA values span fromabout 1 cm s−2 for M < 4.5 earthquakes at about 40–60 km distance (e.g. at ARI Ariano
5729

NHESSD2, 5721–5757, 2014
A scoring test onprobabilistic seismichazard estimates in
Italy
D. Albarello et al.
Title Page
Abstract Introduction
Conclusions References
Tables Figures
J I
J I
Back Close
Full Screen / Esc
Printer-friendly Version
Interactive Discussion
Discussion
Paper
|D
iscussionP
aper|
Discussion
Paper
|D
iscussionP
aper|
Irpino, Avellino) to the 490 cm s−2 at NCR (Nocera Umbra, Perugia) for the main shockof the long lasting Colfiorito Umbria-Marche sequence (26 September 1997, Mw =6.0 at 11 km distance). Station code, coordinates, site conditions and the maximumregistered PGA values are given in the Supplement File A.
4 Models: PSHA in Italy5
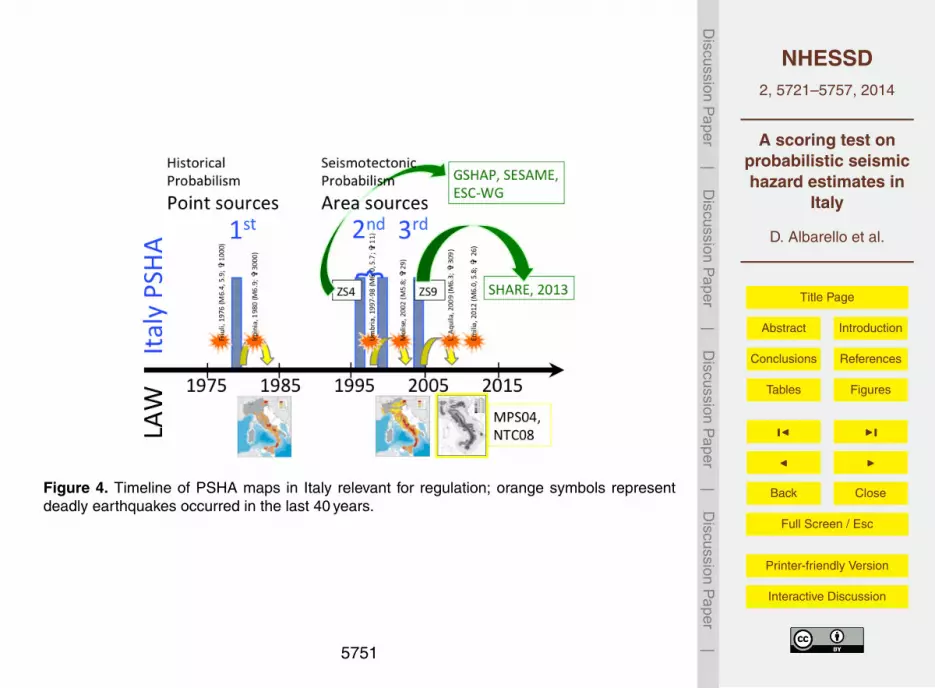
Italy has three maps, or groups of maps, of PSHA which have been turned intoregulation acts, therefore having an impact on society: as shown in Fig. 4, these mapswere released in 1979, 1996–1999 and 2004, and they were adopted by laws withsome delays from their release, always after deadly earthquakes.
The 1979 map (Gruppo di Lavoro Scuotibilità, 1979) is expressed in terms10
of macroseismic intensity and belongs to the so-called generation of “historicalprobabilism”: essentially an earthquake catalogue, a given relationship for attenuatingintensity (without uncertainties) and Gumbel type I statistics of shakings at thesites (Gumbel, 1958). The map was translated into seismic categories with givenprescription rules after the 1980 Irpinia Mw = 6.9 earthquake (about 3000 casualties),15
and municipalities entered into regulation by a series of acts, from 1981 to 1984 (Petriniet al., 1980; Slejko, 1993).
The other maps belong conceptually to the generation of the “seismotectonicprobabilism” (Muir Wood, 1993). The second group of maps was released in 1996(Slejko et al., 1998), and refined in 1998–1999 (Albarello et al., 2000): they are maps20
in terms of macroseismic intensity and PGA (for additional details refer to Table 1,Project frame GNDT). The refinements, mostly due to changes in seismicity ratesinterpolation and GMPEs, came after the long and highly damaging Umbria-Marchesequence (known as Colfiorito sequence, 11 casualties) in 1997–1998. These mapswere the basis of the revision of seismic code approved in 2003, after the collapse25
of a school in San Giuliano of Puglia (2002 Molise earthquake) that killed 27 pupils
5730

NHESSD2, 5721–5757, 2014
A scoring test onprobabilistic seismichazard estimates in
Italy
D. Albarello et al.
Title Page
Abstract Introduction
Conclusions References
Tables Figures
J I
J I
Back Close
Full Screen / Esc
Printer-friendly Version
Interactive Discussion
Discussion
Paper
|D
iscussionP
aper|
Discussion
Paper
|D
iscussionP
aper|
and their teacher. The same code (Ord. 3274/03) stated the rules for preparing a newreference national hazard map.
The third and ultimate map was released in 2004 (Gruppo di Lavoro MPS, 2004)and it was provided by supplementary elaborations (maps for PGA and spectralaccelerations for several return periods) in the following years (see MPS04 and S15
2004–2006 in Table 1, Montaldo et al., 2007; Stucchi et al., 2011); it became the officialreference document for seismic reclassification in 2006 (Ord. 3519/06), and later itwas fully embedded together with the supplementary elaborations in the building codeNTC08 (NTC, 2008). After some years of partial application, compulsory rules for itsadoption have been stated after the 2009 L’Aquila Mw = 6.3 earthquake (about 30010
deaths).Both the 1996–1999 and 2004 results are based on the Cornell’s approach (Cornell,
1968) to PSHA and area source models; these models entered into the Europeanhazard maps too, respectively ZS4 (Meletti et al., 2000) in GSHAP (Giardini et al.,1999) and ESC-Sesame (Jimenez et al., 2001) elaborations, and ZS9 (Meletti et al.,15
2008) with some modifications in the SHARE model (Giardini et al., 2013). After2004, other maps and prototypal elaborations have been realized and published,referring to similar datasets but using alternative methodologies (e.g. seismic sitehistories, D’Amico and Albarello, 2008; fault-based time dependency, Peruzza, 2006),and updating the model components (databases, GMPEs or seismogenic sources),20
mostly at the regional scale (e.g. Pace et al., 2006; Akinci et al., 2009).In the frame of the S2-2012 annual project funded under the decennial agreement
of DPC and INGV, a research team (Politecnico of Milan, Faccioli and Vanini, 2013)acted to collect and to make available the PSHA results to public accessibility; selecteddata are stored after the compilation of an online form, by the upload of electronic25
files or worksheets; data, summary list and a short report are freely available at https://sites.google.com/site/ingvdpc2012progettos2/deliverables/d1-1.
The PSHA outcomes are mostly provided in terms of PGA values and it is the onlyshaking parameter considered for scoring by now. Models are released by referring to
5731

NHESSD2, 5721–5757, 2014
A scoring test onprobabilistic seismichazard estimates in
Italy
D. Albarello et al.
Title Page
Abstract Introduction
Conclusions References
Tables Figures
J I
J I
Back Close
Full Screen / Esc
Printer-friendly Version
Interactive Discussion
Discussion
Paper
|D
iscussionP
aper|
Discussion
Paper
|D
iscussionP
aper|
one or a limited number of return periods (i.e. thresholds of exceedance probabilityin given exposure time). Figure 5 shows the comparison of expected PGA valuesfor the models having approximately the same return period (i.e., 475 years, or 10 %probability of exceedance in 50 years) at two localities, in Northern (Modena) andSouthern Italy (Potenza); remarkably, the Po Plain and Southern Apennines have been5
set as priority regions by the first year of DPC-INGV research agreement. As time-dependent models (blue labels in Fig. 5) refer to origin time set up in 2010, they cannotbe used in our retrospective testing. In Tables 1 and 2 the list of selected models andtheir references are given; a synoptic graphical representation of results referred to thewhole Italy is given in Fig. 6. Individual pictures are given in the Supplement File B.10
The SHARE model (Giardini et al., 2013, represented in Fig. 6 by ID 9 frame)has not been stored in the repository of S2-2012 project. SHARE results have beenprogressively released since 2013, and are available at the SHARE Portal http://www.efehr.org:8080/jetspeed/portal/hazard.psml.
All the PGA values used for the scoring test are given in an excel file15
(Supplement File A). The values refer to the computation node nearest to the selectedaccelerometric sites previously described. These data are provided for stimulatingadditional testing by the scientific community.
5 Results
In order to compare observations and predictions provided by each PSHA model, the20
time span covered by both should be the same. In general, PSHA outcomes have theform of a PGA value g0 characterized by a fixed exceedance probability in a time spanof duration ∆t (the exposure time) at the sth site (see above). Actually, being all theconsidered PSHA models based on the assumption that the seismogenic process isPoissonian, the following relation holds25
Psi = P(es|Hi ,∆t
)= 1−e−λsi(g0)∆t, (12)
5732

NHESSD2, 5721–5757, 2014
A scoring test onprobabilistic seismichazard estimates in
Italy
D. Albarello et al.
Title Page
Abstract Introduction
Conclusions References
Tables Figures
J I
J I
Back Close
Full Screen / Esc
Printer-friendly Version
Interactive Discussion
Discussion
Paper
|D
iscussionP
aper|
Discussion
Paper
|D
iscussionP
aper|
where λsi(g0) is the annual rate of exceedance for the threshold g0 and P isthe exceedance probability at the sth site, for the relevant exposure time ∆t andacceleration threshold g0 if the i th model is considered.
In the case we are considering, ∆t lasts 25 years (i.e., the time span contemporarycovered by 71 accelerometric observations, see above). However, most of the PSHA5
models provide hazard values for a different exposure time ∆t′ (in general 30 or50 years), i.e. P
(es|Hi ,∆t
′). Thus, in order to apply Eqs. (1)–(11), some conversion toolis necessary to compare hazard estimates and observations. This conversion takesadvantage of the stationary Poissonian character of seismic occurrences assumed byconsidered PSHA models. In this case, in fact, one has that10
P ′si = P
(es|Hi ,∆t
′) = 1−e− ln[1−P (es |Hi ,∆t)]∆t ∆t′ . (13)
The above formula can be used to compute the exceedance probability relative tothe acceleration threshold g0 for a given exposure time (∆t′) when the exceedanceprobability is supplied for another exposure time (∆t). The value P ′
si is then consideredfor testing.15
Since some models also provide g0 values corresponding to different exceedanceprobabilities, they were scored by considering each realization as an independent“forecast”. In general, since in the same model lower exceedance probabilitiescorrespond to longer return times and to higher g0 values, different scoring can beattributed to different parts of the hazard curve.20
Thus, for each PSHA model, a set of P ′si values is computed for the sites considered
for testing, for ∆t = 25 years. Consequently, the binary variable eS (g0) is computed:equal to 1 when at the sth site the value g0 was exceeded in the time interval 1979–2004, and to 0 otherwise.
On this basis, the score Z (Eq. 3) was computed for each PSHA model. This value is25
considered as the empirical score of the model: as lower is Z as most effective resultsthe relevant model. The overall number of exceedances (Eq. 6) was also comparedwith the values expected in the relevant PSHA model (Eq. 8): if this difference exceeds
5733

NHESSD2, 5721–5757, 2014
A scoring test onprobabilistic seismichazard estimates in
Italy
D. Albarello et al.
Title Page
Abstract Introduction
Conclusions References
Tables Figures
J I
J I
Back Close
Full Screen / Esc
Printer-friendly Version
Interactive Discussion
Discussion
Paper
|D
iscussionP
aper|
Discussion
Paper
|D
iscussionP
aper|
two times the relevant standard deviation (Eq. 10), the PSHA model is considered tobe not compatible with observations (Eq. 11).
5.1 Scoring models at the national scale
Except ID 7 and 8, all models have nation-wide coverage, thus allowing the scoringon the full set of 71 selected accelerometric stations. Some models have been given5
for different return periods; they give a final set of 12 realizations from 7 models.Comparison of expected vs. observed occurrences, are shown in Fig. 7; models aresorted accordingly to the relevant return period.
Despite of the fact that some models tend to slightly underestimate the observednumber of exceedances, in all the cases these discrepancies are not significant10
by following Eq. (11). This, however, does not mean that all the models equally fitobservations. In fact, when the score factor Z is considered (Fig. 7b), one can seethat significant differences exist in the performances of the considered models at thedifferent return times.
The best performing model is the 1996 GNDT model at intermediate return time (ID15
1, RT = 284years) followed by the MPS04-like area-based source model using Cauzziand Faccioli (2008) GMPE (ID 5) for 984 year return period; notably, models obtainedunder different theoretical assumptions or computational choices behave nearly thesame: as an example one can see the results provided by the ID6 model (smoothedseismicity approach by Akinci et al., 2010), the ID5 one (the one provided by Meletti20
et al., 2009 with the standard Cornell-McGuire approach, by considering the samesingle Ground Motion Prediction Equation used in ID5), and ID9 (produced in the frameof the SHARE project). On the other hand, same model performs in different ways atdifferent return times of 94 years: e.g. see the ID 1 best performing at a return timeof 284 years and providing a worse performance at a shorter return time (Fig. 7b).25
As models that explore different parts of the hazard curve have controversial scoring(i.e., different scores for different return times), it is not easy to identify a single “best”performing model.
5734

NHESSD2, 5721–5757, 2014
A scoring test onprobabilistic seismichazard estimates in
Italy
D. Albarello et al.
Title Page
Abstract Introduction
Conclusions References
Tables Figures
J I
J I
Back Close
Full Screen / Esc
Printer-friendly Version
Interactive Discussion
Discussion
Paper
|D
iscussionP
aper|
Discussion
Paper
|D
iscussionP
aper|
5.2 Scoring models at the regional scale
The same test has been performed at the regional scale, for the two selectedpriority regions of Southern Apennines and Po Plain, for which ad hoc regional PSHestimates have been released during the S2-2012 project (Fig. 8). Thus, the samesubset of accelerometric stations on national and regional PSHA models have been5
manually selected and controlled to exclude sites not considered for the relevant hazardestimate.
In Southern Apennines, all the models provide results that are compatible withobservations that refer to 21 sites (Fig. 9a). When the score factor Z is considered(Fig. 9b) the best performing models at about 480 years are the ones derived from10
smoothed seismicity model (ID 6), and the MPS04 model (ID 3). Similarly, the bestperforming model at the shortest times of 30 years is the one provided by Akinci et al.,2013 (ID 7). Thus, some PSHA evaluations seem to be more adequate to representthe observed shakings on that Southern region. Note the scoring positions of the long-term predictions of the MPS04 model (ID 4) T2475 now aligned with the ones provided15
by Akinci et al., 2013 (ID 7).The same analysis performed for the Po Plain area uses only 12 stations; again
it indicates that all except the ID 8 computational models provide results that arecompatible with observations (Fig. 9c). In this case the scoring indicates several bestperforming (i.e., MPS04, ID 4, at RT = 2475 years; smoothed seismicity and MPS04-20
like models ID 6 and ID 5, at RT = 984 years; SHARE, MPS04-like and GNDT 1996results, ID 9, 6 and 1, at RT = 475 years). Note also the underestimate of resultsreleased in the frame of the S2-2012 project (ID 8) gives Z values higher than 3.
In order to better visualize the impact of scoring in hazard estimates, the PGA valuesprovided by the models at different return times are labelled with their relevant Z values25
(Fig. 10), for the cities of Potenza (Southern Apennines) and Modena (Po Plain). Webelieve this kind of analyses should help in defining a comprehensive PSHA, no more
5735

NHESSD2, 5721–5757, 2014
A scoring test onprobabilistic seismichazard estimates in
Italy
D. Albarello et al.
Title Page
Abstract Introduction
Conclusions References
Tables Figures
J I
J I
Back Close
Full Screen / Esc
Printer-friendly Version
Interactive Discussion
Discussion
Paper
|D
iscussionP
aper|
Discussion
Paper
|D
iscussionP
aper|
based on logic tree procedures, or expert elicitation, but on the strength of observationdata.
6 Conclusions
Nowadays, the scientific community has been looking for a coherent, formal and robustprocedure for testing probabilistic seismic hazard estimates. As for weather forecast,5
the availability of observational data of the last years is not comparable with theprevious decades and probably it is going to produce faster changes of approachesto seismic hazard than ever before. An extensive empirical test of seismic hazardestimates in Italy has been carried out by evaluating quantitatively their performances.In particular, an empirical scoring procedure has been applied to a number of PSHA10
computational models in the frame of the DPC-INGV S2-2012 seismological researchproject; many of the considered models provided outcomes that were included in theItalian Seismic Regulation Code and this fact strengthens the importance of evaluatingtheir actual reliability. Twelve realizations from seven time-independent PSHA modelsavailable at the national scale plus six maps from two models at the regional scale15
have been collected; a set of accelerometric stations continuously operating in thetime interval 1979–2004 has been analysed, using the maximum observed PGA ateach station like the testing parameter. Site-specific corrections were applied for PGAvalues at accelerometric stations where possible amplification effects are expecteddue to the local soil conditions. These correction coefficients are the ones set up in the20
Italian seismic code (NTC08). The scoring results obtained suggest some preliminaryconclusions as it follows:
1. Nearly all the considered models provide outcomes that are compatible withavailable observations;
2. The most recent models are not necessarily the best performing ones;25
5736

NHESSD2, 5721–5757, 2014
A scoring test onprobabilistic seismichazard estimates in
Italy
D. Albarello et al.
Title Page
Abstract Introduction
Conclusions References
Tables Figures
J I
J I
Back Close
Full Screen / Esc
Printer-friendly Version
Interactive Discussion
Discussion
Paper
|D
iscussionP
aper|
Discussion
Paper
|D
iscussionP
aper|
3. None of the considered models can be considered as the best performing at allthe considered return times;
4. Testing done on sub-regions reveals different features with respect to the nationalscale, but the reasons should be investigated with other cases;
5. GMPEs could hamper the differences of alternative source modeling, but this is5
not a general rule.
This study focuses some open questions to be addressed in the future, like:
1. Site-specific PSHA or calibrated amplification functions at the accelerometricstations are necessary to avoid the over-simplification here adopted; they mayplay a key role in scoring results: specific activities have been planned on these10
subject in the prosecution of S2 Project started in 2014 (see Tasks 2 and 4, athttps://sites.google.com/site/ingvdpc2014progettos2/);
2. Completeness of accelerometric records relative to accelerometric sites isa critical aspect for validation; we overcome the problems by considering themaximum PGA in a quite long time period, but further analyses are needed to15
fully exploit the observations provided by the actual Italian databases.
This study shows that the likelihood estimates accompanied by other testingprocedures are able to provide useful indications about performances of competingmodels and could represent a basic tool for driving new researches devoted to a bestpractice for hazard assessment.20
Appendix
Being r the reference log-likelihood computed by considering a set of S observationsrelative to sites characterized by an exceedance probability P , one has
r = N∗ ln (P )+ (S −N∗) ln(1− P ) , (A1)5737

NHESSD2, 5721–5757, 2014
A scoring test onprobabilistic seismichazard estimates in
Italy
D. Albarello et al.
Title Page
Abstract Introduction
Conclusions References
Tables Figures
J I
J I
Back Close
Full Screen / Esc
Printer-friendly Version
Interactive Discussion
Discussion
Paper
|D
iscussionP
aper|
Discussion
Paper
|D
iscussionP
aper|
where N∗ is the number of sites where the ground-motion threshold characterizedby the exceedance probability P has been exceeded during the control intervalconsidered. One has has
r = N∗ (ln(P )− ln (1− P ))+S ln (1− P ) . (A2)
Sampling properties of r only depend on the random variate N∗ (being all the other5
parameters fixed). This variable N∗ is the sum of S realization of a binomial variablecharacterized by a probability P of occurrence. The expected value of N∗ is then SP ,while its variance is P (1− P ).
Thus, the expected value µ (r) of r is
µ (r) = SP ln (P )+S (1− P ) ln(1− P ) = S [P ln (P )+ (1− P ) ln(1− P )] . (A3)10
One can see that µ (r) monotonically increases with S, is a symmetric function of Pwith a minimum for P = 0.5 and values 0 for P = 1 and P = 0, respectively. The relevantsampling variance is
σ2 (r) = SP (1− P ) [ln(P )− ln (1− P )]2 (A4)
with a standard deviation equal to15
σ (r) = [ln (P )− ln (1− P )]√SP (1− P ). (A5)
The Supplement related to this article is available online atdoi:10.5194/nhessd-2-5721-2014-supplement.
Acknowledgements. This study has benefited from funding provided by the Italian Presidenzadel Consiglio dei Ministri – Dipartimento della Protezione Civile (DPC), Project S2-2012. This20
paper does not necessarily represent DPC official opinion and policies.5738

NHESSD2, 5721–5757, 2014
A scoring test onprobabilistic seismichazard estimates in
Italy
D. Albarello et al.
Title Page
Abstract Introduction
Conclusions References
Tables Figures
J I
J I
Back Close
Full Screen / Esc
Printer-friendly Version
Interactive Discussion
Discussion
Paper
|D
iscussionP
aper|
Discussion
Paper
|D
iscussionP
aper|
References
Akkar, S. and Bommer, J. J.: Empirical equations for the prediction of PGA, PGV, and spectralaccelerations in Europe, the Mediterranean region, and the Middle East, Seismol. Res. Lett.,81, 195–206, 2010.
Akinci, A.: HAZGRIDX: earthquake forecasting model for ML ≥ 5.0 earthquakes in Italy based5
on spatially smoothed seismicity, Ann. Geophys.-Italy, 53, 51–56, doi:10.4401/ag-4811,2010.
Akinci, A.: D5.2 – Seismic Hazard Maps From New Models in Priority Areas – The SouthernApennines. Internal Report of DPC-INGV S2-2012 Project “Constraining observationsinto Seismic Hazard”, available at: https://sites.google.com/site/ingvdpc2012progettos2/10
deliverables/d5_2, last access: July 2014, 2013.Akinci, A., Galadini, F., Pantosti, D., Petersen, M., Malagnini, L., and Perkins, D.: Effect of
time dependence on probabilistic seismic-hazard maps and deaggregation for the CentralApennines, Italy, B. Seismol. Soc. Am., 99, 585–610, 2009.
Albarello, D. and D’Amico, V: Validation of intensity attenuation relationships, B. Seismol. Soc.15
Am., 95, 719–72, 2005.Albarello, D. and D’Amico, V.: Testing probabilistic seismic hazard estimates by comparison
with observations: an example in Italy, Geophys. J. Int., 175, 1088–1094, 2008.Albarello D. and D’Amico, V.: Scoring and testing procedures devoted to Probabilistic Seismic
Hazard Assessment, Surv. Geophys., submitted, 2014.20
Albarello D. and Mucciarelli, M.: Seismic hazard estimates from ill-defined macroseismic dataat a site, Pure Appl. Geophys., 159, 1289–130, 2002.
Albarello, D., Bosi, V., Bramerini, F., Lucantoni, A., Naso, G., Peruzza, L., Rebez, A., Sabetta,F., and Slejko, D.: Carte di pericolosità sismica del territorio nazionale, Quaderni di Geofisica,12, 1–7, 2000.25
Ambraseys N. N.: The Prediction of Earthquake Peak Ground Acceleration in Europe, Earthq.Eng. Struct. D., 24, 467–490, 1995.
Ambraseys, N. N., Simpson, K. A., and Bommer, J. J.: Prediction of horizontal response spectrain Europe, Earthq. Eng. Struct. D., 25, 371–400, 1996.
Beauval, C.: On the use of observations for constraining probabilistic seismic hazard estimates30
– brief review of existing methods, International Conference on Applications of Statistics andProbability in Civil Engineering, 1–4 August, Zurich, 10291, 5 pp., 2011.
5739

NHESSD2, 5721–5757, 2014
A scoring test onprobabilistic seismichazard estimates in
Italy
D. Albarello et al.
Title Page
Abstract Introduction
Conclusions References
Tables Figures
J I
J I
Back Close
Full Screen / Esc
Printer-friendly Version
Interactive Discussion
Discussion
Paper
|D
iscussionP
aper|
Discussion
Paper
|D
iscussionP
aper|
Bender, B. and Perkins, D. M.: SEISRISK III: a computer program for seismic hazard estimation,USGS Bulletin, 1772, 48 pp., 1987.
Bindi, D., Pacor, F., Luzi, L., Puglia, R., Massa, M., Ameri, G., and Paolucci, R.: Ground MotionPrediction Equations Derived from the Italian Strong Motion Data Base, B. Earthq. Eng., 9,1899–1920, 2011.5
Boore, D. M. and Atkinson, G. M.: Ground-motion prediction equations for the averagehorizontal component of PGA, PGV, and 5 %-damped PSA at spectral periods between0.01 s and 10.0 s, Earthq. Spectra, 24, 99–138, 2008.
Camassi, R. and Stucchi, M.: NT4.1 un catalogo parametrico di terremoti di area italiana al disopra della soglia del danno, Consiglio Nazionale delle Ricerche – Gruppo Nazionale per la10
Difesa dai Terremoti (CNR–GNDT), Milano, Italy, 86 pp., 1997 (in Italian).Cauzzi, C. and Faccioli, E.: Broadband (0.05 to 20 s) prediction of displacement response
spectra based on worldwide digital records, J. Seismol., 12, 453–475, 2008.Cornell C. A.: Engineering seismic risk analysis, B. Seismol. Soc. Am., 58, 1583–160, 1968.D’Amico V. and Albarello D.: SASHA: a computer program to assess seismic hazard from15
intensity data, Seismol. Res. Lett., 79, 663–671, 2008.De Natale, G., Faccioli, E., and Zollo, A.: Scaling of peak ground motion from digital recordings
of small earthquakes at Campi Flegrei, southern Italy, Pure Appl. Geophys., 128, 37–53,1988.
DISS Working Group: Database of Individual Seismogenic Sources (DISS), Version 3.1.1:20
a compilation of potential sources for earthquakes larger than M 5.5 in Italy and surroundingareas, available at: http://diss.rm.ingv.it/diss/, © INGV 2010 – Istituto Nazionale di Geofisicae Vulcanologia – All rights reserved; doi:10.6092/INGV.IT-DISS3.1.1, last access: July 2014,2010.
Edwards, A. W. F.: Likelihood, The Johns Hopkins Univ. Press., Baltimore, 275 pp., 1972.25
Faccioli, E. and Vanini E.: D1.1 – PSHA Repository; Internal Report of DPC-INGV S2–2012Project “Constraining observations into Seismic Hazard”, available at: https://sites.google.com/site/ingvdpc2012progettos2/deliverables/d1-1, last access: July 2014, 2013.
Frankel, A.: Mapping seismic hazard in the Central and Eastern United States, Seismol. Res.Lett., 66, 8–2, 1995.30
Giardini, D., Grünthal, G., Shedlock, K. M., and Zhang, P.: The GSHAP global seismic hazardmap, Ann. Geophys.-Italy, 42, 1225–1228, doi:10.4401/ag-3784, 1999.
5740

NHESSD2, 5721–5757, 2014
A scoring test onprobabilistic seismichazard estimates in
Italy
D. Albarello et al.
Title Page
Abstract Introduction
Conclusions References
Tables Figures
J I
J I
Back Close
Full Screen / Esc
Printer-friendly Version
Interactive Discussion
Discussion
Paper
|D
iscussionP
aper|
Discussion
Paper
|D
iscussionP
aper|
Giardini D., Woessner, J., Danciu, L., Crowley, H., Cotton, F., Grünthal, G., Pinho, R.,Valensise, G., Akkar, S., Arvidsson, R., Basili, R., Cameelbeeck, T., Campos-Costa, A.,Douglas, J., Demircioglu, M. B., Erdik, M., Fonseca, J., Glavatovic, B., Lindholm, C.,Makropoulos, K., Meletti, C., Musson, R., Pitilakis, K., Sesetyan, K., Stromeyer, D.,Stucchi, M., and Rovida, A.: Seismic Hazard Harmonization in Europe (SHARE): Online5
Data Resource, ETH, Zurich, doi:10.12686/SED-00000001-SHARE, 2013.Gnedenko, B.V.: The theory of probability, Mir publisher, Moscow, 392 pp., 1976.Gruppo di Lavoro Scuotibilità: Carte preliminari di scuotibilità del territorio nazionale, Esa, CNR
PF Geodinamica, Roma, 1979.Gruppo di Lavoro CPTI: Catalogo Parametrico dei Terremoti Italiani, version 2004 (CPTI04),10
Istituto Nazionale di Geofisica e Vulcanologia (INGV), Milano, Italy, available at: http://emidius.mi.ingv.it/CPTI04/, last access: July 2014, 2004.
Gruppo di Lavoro MPS: Redazione della mappa di pericolosità sismica prevista dall’OrdinanzaPCM 3274 del 20 marzo 2003, Rapporto conclusivo per il dipartimento di Protezione Civile,INGV, Milano – Roma, 65 pp. +5 appendici., available at: http://zonesismiche.mi.ingv.it/15
elaborazioni/, last access: July 2014, 2004 (in Italian).Gumbel, E. J.: Statistics of Extreme, Columbia Univ. Press, New York, 375 pp., 1958.Jiménez, M. J., Giardini, D., Grünthal, G. and the SESAME Working Group: Unified seismic
hazard modelling throughout the Mediterranean region, B. Geofis. Teor. Appl., 42, 3–18,2001.20
Kagan Y. Y. and Jackson, D. D.: Long-term probabilistic forecasting of earthquakes, J. Geophys.Res., 99, 13685–13700, 1994.
Luzi, L., Hailemikael, S., Bindi, D. D, Pacor, F., Mele, F., and Sabetta, F.: ITACA (ITalianACcelerometric Archive): A web portal for the dissemination of Italian strong-motion data,Seismol. Res. Lett., 79, 716–722, doi:10.1785/gssrl.79.5.716, 2008.25
Malagnini, L., Herrmann, R. B., and Di Bona, M.: Ground motion scaling in the Apennines(Italy), B. Seismol. Soc. Am., 90, 1062–1081, 2000.
Malagnini, L., Akinci, A., Herrmann, R. B., Pino, N. A., and Scognamiglio, L.: Characteristics ofthe ground motion in northeastern Italy, B. Seismol. Soc. Am., 92, 2186–2204, 2002.
McGuire R. K.: FRISK: Computer Program for Seismic Risk Analysis Using Faults as30
Earthquake Sources, USGS Open File Report, 78–100, 1978.
5741

NHESSD2, 5721–5757, 2014
A scoring test onprobabilistic seismichazard estimates in
Italy
D. Albarello et al.
Title Page
Abstract Introduction
Conclusions References
Tables Figures
J I
J I
Back Close
Full Screen / Esc
Printer-friendly Version
Interactive Discussion
Discussion
Paper
|D
iscussionP
aper|
Discussion
Paper
|D
iscussionP
aper|
Meletti, C. and Montaldo, V.: Stime di pericolosità sismica per diverse probabilità disuperamento in 50 anni: valori di ag. Progetto DPC-INGV S1, Deliverable D2, available at:http://esse1.mi.ingv.it/d2.html, last access: July 2014, 2007.
Meletti, C., Patacca, E., and Scandone, P.: Construction of a seismotectonic model: the caseof Italy, Pure Appl. Geophys., 157, 11–35, 2000.5
Meletti, C., Galadini, F., Valensise, G., Stucchi, M., Basili, R., Barba, S., Vannucci, G., andBoschi, E.: A seismic source zone model for the seismic hazard assessment of the Italianterritory, Tectonophysics, 450, 85–108, 2008.
Meletti, C., D’Amico, V., and Martinelli, F.: Module for ER model based on Poisson applied toZS9, Deliverable # D2.1, available at: http://nuovoprogettoesse2.stru.polimi.it/, last access:10
July 2014, 2009.Montaldo, V., Meletti, C., Martinelli, F., Stucchi, M., and Locati, M.: On-Line seismic
hazard data for the new Italian building code, J. Earthq. Eng., 11, 119–132,doi:10.1080/13632460701280146, 2007.
Morasca, P., Malagnini, L., Akinci, A., Spallarossa, D., and Herrman, R. B.: Ground motion15
scaling in the western Alps, J. Seismol., 10, 315–333, doi:10.1007/s10950-006-9019-x,2006.
Mucciarelli, M., Peruzza, L., and Caroli, P.: Tuning of seismic hazard estimates by means ofobserved site intensities, J. Earthq. Eng., 4, 141–159, 2000.
Muir Wood, R.: From global seismotectonics to global seismic hazard, Ann. Geofis., 36, 153–20
168, 1993.NTC: Norme tecniche per le costruzioni, Decreto Ministeriale del 14 gennaio 2008,
Supplemento ordinario alla G. U. n. 29 del 4 febbraio 2008, Ministero delle Infrastrutturee dei Trasporti, Rome, 2008.
Ordaz, M., Martinelli, F., D’Amico, V., and Meletti, C.: CRISIS2008: A flexible tool to perform25
probabilistic seismic hazard assessment, Seismol. Res. Lett., 84, 495–504, 2013.Pace, B., Peruzza, L., Lavecchia, G., and Boncio, P.: Layered seismogenic source model and
probabilistic seismic-hazard analyses in central Italy, B. Seismol. Soc. Am., 96, 107–132,2006.
Pacor, F., Paolucci, R., Luzi, L., Sabetta, F., Spinelli, A., Gorini, A., Nicoletti, M., Marcucci, S.,30
Filippi, L., and Dolce, M.: Overview of the Italian strong motion database ITACA 1.0, B.Earthq. Eng., 9, 1723–1739, doi:10.1007/s10518-011-9327-6, 2011.
5742

NHESSD2, 5721–5757, 2014
A scoring test onprobabilistic seismichazard estimates in
Italy
D. Albarello et al.
Title Page
Abstract Introduction
Conclusions References
Tables Figures
J I
J I
Back Close
Full Screen / Esc
Printer-friendly Version
Interactive Discussion
Discussion
Paper
|D
iscussionP
aper|
Discussion
Paper
|D
iscussionP
aper|
Pacor, F., Luzi, L., Puglia, R., D’Amico, M., and Bindi, D.: D2.3 – Strong motionparameters of selected events (update the national database ITACA v1.1), revisedGMPE, Internal Report of DPC-INGV S2-2012 Project “Constraining observationsinto Seismic Hazard”, available at: https://sites.google.com/site/ingvdpc2012progettos2/deliverables/d2-3-updated-strong-motion-data last access: July 2014, 2013.5
Patanè, D., Ferrucci, F., and Gresta, S.: Spectral features of microearthquakes in volcanicareas: attenuation in the crust and amplitude response of the site at Mt. Etna (Italy), B.Seismol. Soc. Am., 84, 1842–1860, 1994.
Peresan, A., Zuccolo, E., Vaccari, F., Gorshkov, A., and Panza, G. F.: Neo-deterministic seismichazard and pattern recognition techniques: time dependent scenarios for North-Eastern Italy,10
Pure Appl. Geophys., 168, 583–607, doi:10.1007/s00024-010-0166-1, 2011.Peruzza, L.: Earthquake probabilities and probabilistic shaking in Italy in 50 years since 2003:
trials and ideas for the 3rd generation of Italian seismic hazard maps, B. Geofis. Teor. Appl.,47, 515–548, 2006.
Petrini, V., Bosi, C., Bigi, G., Eva, C., Iaccarino, E., Luongo, G., Postpischl, D., Praturlon,15
A., Riuscetti, M., Scandone, P., Scarpa, R., Stucchi, M., and Vezzani, L.: Proposta diriclassificazione sismica del territorio nazionale, ESA, Rome, 1980.
Rovida A., Camassi, R., Gasperini, P., and Stucchi, M. (eds.): CPTI11, the 2011 version of theParametric Catalogue of Italian Earthquakes, Milano, Bologna, available at: http://emidius.mi.ingv.it/CPTI, last access: July 2014, doi:10.6092/INGV.IT-CPTI11, 2011.20
Sabetta, F. and Pugliese, A.: Estimation of response spectra and simulation of nonstationaryearthquake ground motions, B. Seismol. Soc. Am., 86, 337–352, 1996.
Schorlemmer D. and Gerstenberger, M. C.: RELM Testing Center, Seismol. Res. Lett., 78, 30–36, 2007.
Schorlemmer D., Gerstenberger, M. C., Wiemer, S, Jackson, D. D., and Rhoades, D. A.:25
Earthquake likelihood model testing, Seismol. Res. Lett., 78, 17–29, 2007.Senior Seismic Hazard Analysis Committee – SSHAC: Recommendations for probabilistic
seismic hazard analysis: guidance on uncertainties and use of experts, Report NUREG-CR-6372, in 2 volumes, US Nuclear Regulatory Commission, Washington D. C., 1997.
Slejko, D.: Considerations on the seismic risk, Ann. Geofis., 36, 169–175, 1993.30
Slejko, D., Peruzza, L., and Rebez, A.: Seismic hazard maps of Italy, Ann. Geofis., 41, 183–214,1998.
5743

NHESSD2, 5721–5757, 2014
A scoring test onprobabilistic seismichazard estimates in
Italy
D. Albarello et al.
Title Page
Abstract Introduction
Conclusions References
Tables Figures
J I
J I
Back Close
Full Screen / Esc
Printer-friendly Version
Interactive Discussion
Discussion
Paper
|D
iscussionP
aper|
Discussion
Paper
|D
iscussionP
aper|
Stucchi, M., Meletti, C., Montaldo, V., Crowley, H., Calvi, G. M., and Boschi, E.: Seismic hazardassessment (2003–2009) for the Italian building code, B. Seismol. Soc. Am., 101, 1885–1911, 2011.
Tasan H., Beauval, C., Helmstetter, A., Sandikkaya, A., and Guéguen, P.: Testing probabilisticseismic hazard estimates against accelerometric data in two countries: France and Turkey,5
GJI, in press, 2014.
5744

NHESSD2, 5721–5757, 2014
A scoring test onprobabilistic seismichazard estimates in
Italy
D. Albarello et al.
Title Page
Abstract Introduction
Conclusions References
Tables Figures
J I
J I
Back Close
Full Screen / Esc
Printer-friendly Version
Interactive Discussion
Discussion
Paper
|D
iscussionP
aper|
Discussion
Paper
|D
iscussionP
aper|
Table 1. List of selected PSHA models.
Projectframe
ModelID
Filename of PSHA results Description∗
GN
DT
1 PS4_1996_PGA_10–30-50y First PSH map for Italy using seismotectonicprobabilism. Catalogue of declustered eventstill 1980 (NT4.1), area sources (ZS4), GMPEon undifferentiated soil condition (Amb95). PGAvalues computed on a 0.1◦ grid. Exceedance prob.of 10 % in 10, 30 and 50 years
2 SSN-GNDT99_PGA Consensus map refining the previous model; logictree for GMPE (Amb96, SP96). PGA given onirregular grid (communes), exceedance probabilityof 10 % in 50 years, 50 percentile
MP
S04
–S
120
04–2
006
3Appennino_Meridionale_MPS04_ag_002 Italian PSH map developed on rules stated by law
(Ord. 3274/03). PGA values computed on a 0.02◦
step grid. Catalogue of declustered events till2002 (CPTI04), area sources (ZS9), logic treeincluding alternative GMPEs (Amb96, SP96,REG.A, REG.B). Exceedance prob. of 10 % in50 years, percentile 16, 50 and 84. Data pointscollected by S2-2012 Project refer only to thepriority areas of Po Plain and SouthernApennines: the data sampled on a 0.05◦ grid onthe whole country here used are available athttp://zonesismiche.mi.ingv.it/
Pianura_Padana_MPS04_ag_002
4 S1_2004-2006_SA_0.0s_D2_39-2 Same approach and input data of previous model3, MPS04, additional probabilities of exceedancein 50 years have been computed during the projectS1 (2004–2006): 2 and 39 % are selected in thisanalysis. PGA values on a 0.05◦ step grid for allItaly. 16, 50 and 84 percentile
5745

NHESSD2, 5721–5757, 2014
A scoring test onprobabilistic seismichazard estimates in
Italy
D. Albarello et al.
Title Page
Abstract Introduction
Conclusions References
Tables Figures
J I
J I
Back Close
Full Screen / Esc
Printer-friendly Version
Interactive Discussion
Discussion
Paper
|D
iscussionP
aper|
Discussion
Paper
|D
iscussionP
aper|
Table 1. Continued.
Projectframe
ModelID
Filename of PSHA results Description∗
S2
2008
–201
0
5 S2_2008-2010_SA_0.0s_MPS04_D2.1 MPS04-like model using different software (CRISIS vs.SEISRISKIII used by mod.1–4) and GMPE (CF08, nologic tree). Gridded seismicity based on ZS9. PGA (SAat T = 0s) values on a 0.1◦ step grid for the whole ofItaly, for 3 and 6 % exceedance probability in 30 years.
6 S2_2008–2010_SA_0.0s_HAZGRID_D2.2 Zone free smoothed seismicity, based on CPTI04 andinstrumental datasets: same GMPE, sampling andreturn period of the previous model 5.
S2
2012
7 S2_2012-2013_SA_0-1_TimeIndep_AppMerid_D5.2
PSH estimates developed by the S2-2012 project, forpriority area Southern Italy. Combination of smoothedseismicity approach (CPTI11, instrumental datasets)and characteristic model on faults (DISS3.1.1), underPoissonian assumption, GMPE logic tree (AB10,BA08, ITA10, CF08). Spectral acceleration at 0 (PGA)and 1 s. Probability of exceedance of 2, 5, 10 and 81 %in 50 years.
8 S2_2012-2013_SA_0-2_PianuraPadana_D4.1
PSH estimates developed by the S2-2012 project,for priority area Po Plain. It derives from model 5for several spectral accelerations (0–2 s). Rock andsite specific conditions, implemented by regulationamplification factors on 1:100 000 scale soil map.
SH
AR
E
9 Latest PSHA for Europe, first regional project in GEM initiative (http://www.globalquakemodel.org/). New European historical and instrumental catalogues, full logic-tree of GMPE set ontectonic regionalization, combination of area sources, distributed seismicity and larger eventsconcentrated on faults, with new maximum magnitude scheme for the whole region. Resultsprogressively released via the SHARE portal.
∗ For the explanation of acronyms refer to the references listed in Table 2.
5746

NHESSD2, 5721–5757, 2014
A scoring test onprobabilistic seismichazard estimates in
Italy
D. Albarello et al.
Title Page
Abstract Introduction
Conclusions References
Tables Figures
J I
J I
Back Close
Full Screen / Esc
Printer-friendly Version
Interactive Discussion
Discussion
Paper
|D
iscussionP
aper|
Discussion
Paper
|D
iscussionP
aper|
Table 2. List of references for the selected PSHA models.
Model ID References
1 Slejko et al. (1998)NT4.1 = Camassi and Stucchi (1997)ZS4 = Meletti et al. (2000)Amb95 =Ambraseys (1995)
2 Albarello et al. (2000)Amb96 = Ambraseys et al. (1996)SP96 =Sabetta and Pugliese (1996)
3 Gruppo di Lavoro MPS (2004); Stucchi et al. (2011)CPTI04 = Gruppo di Lavoro CPTI (2004)ZS9 = Meletti et al. (2008)REG.A, REG.B = two combinations of regionalized GMPEs (i.e.,Malagnini et al., 2000, 2002; Morasca et al., 2006; De Natale et al., 1988;Patanè et al., 1994).
4 Meletti and Montaldo (2007)
5 Meletti et al. (2009)CRISIS = Ordaz et al. (2013)SEISRISKIII =Bender and Perkins (1987)CF08 = Cauzzi and Faccioli (2008)
6 Akinci (2010)
7 Akinci (2013) and annexed files athttps://sites.google.com/site/ingvdpc2012progettos2/deliverables/d5_2CPTI11 = Rovida et al. (2011)DISS3.1.1 = DISS Working Group (2010)AB10 = Akkar and Bommer (2010)BA08 = Boore and Atkinson (2008)ITA10 = Bindi et al. (2011)
8 Task 4 Working Group (2013) and annexed files athttps://sites.google.com/site/ingvdpc2012progettos2/deliverables/d4-1
9 Giardini et al. (2013)http://www.efehr.org:8080/jetspeed/portal/hazard.psmlData downloaded in September 2013
5747

NHESSD2, 5721–5757, 2014
A scoring test onprobabilistic seismichazard estimates in
Italy
D. Albarello et al.
Title Page
Abstract Introduction
Conclusions References
Tables Figures
J I
J I
Back Close
Full Screen / Esc
Printer-friendly Version
Interactive Discussion
Discussion
Paper
|D
iscussionP
aper|
Discussion
Paper
|D
iscussionP
aper|
Scoring test on PSHA in Italy
submitted to NHESS 23
1973 1975 1977 1979 1981 1983 1985 1987 1989 1991 1993 1995 1997 1999 2001 2003 2005 2007 2009 2011 2013ALFALTARIASGATNBGIBNVBRCBRMBRNBRSBRZBSSBVGBVNCGLCLTCNGCRDCSCCSDCSTCTSDMNFRNGLDGRRGSNLNGLRSMAIMLCMLDMNDMNFMNSMRNMRTMSCMTLMZRNASNCRNCSNRNNVLNZZPGGPNRPNTPTLRCCRNCSCFSDMSGRSNGSNNSRLSRPSRTSSVSTRSTSTDGTLM1TLM2TRRTRTVLS2
1
Figure 1. ON-‐OFF status for accelerometric stations declared to be continuously operating for at least 30 years, 2 as reported on ITACA V1.1 database (Pacor at al., 2011, Pacor et al., 2013). Blue circles show potential 3 triggering conditions, computed as (mean PGA + 1 sd) > 0.01 g, using CPTI11 earthquake catalogue (Rovida et 4 al., 2011) and ITA10 GMPE (Bindi et al., 2011); black plusses are the effective recordings available. Data 5 acquired on continuous-‐mode recording in 2009-‐2011 have not been considered for the existing time gap 6 between the analogical and new digital equipments. 7
8
Figure 1. ON-OFF status for accelerometric stations declared to be continuously operating forat least 30 years, as reported on ITACA V1.1 database (Pacor at al., 2011, 2013). Blue circlesshow potential triggering conditions, computed as (mean PGA + 1 SD) > 0.01g, using CPTI11earthquake catalogue (Rovida et al., 2011) and ITA10 GMPE (Bindi et al., 2011); black plussesare the effective recordings available. Data acquired on continuous-mode recording in 2009–2011 have not been considered for the existing time gap between the analogical and new digitalequipments.
5748

NHESSD2, 5721–5757, 2014
A scoring test onprobabilistic seismichazard estimates in
Italy
D. Albarello et al.
Title Page
Abstract Introduction
Conclusions References
Tables Figures
J I
J I
Back Close
Full Screen / Esc
Printer-friendly Version
Interactive Discussion
Discussion
Paper
|D
iscussionP
aper|
Discussion
Paper
|D
iscussionP
aper|
Scoring test on PSHA in Italy
submitted to NHESS 24
1
Figure 2. Location of the accelerometric stations considered for empirical testing. Dotted pins refer to stations 2 on A or A* (* for hypothesized conditions) type soil in Eurocode classification, pins colour represents a 3 simplified amplification factor for PGA (NTC, 2008) used to accomplish stratigraphic and topographic site 4 response: green=1, yellow=1.2-‐1.35, violet=1.5. See Appendix A and supplementary material for details. The 5 stations in small turquoise pins, in the list of stations in Figure 1, have been discarded in this analysis as they do 6 not satisfy the ON status in the 1979-‐2004 time window. 7
8
Figure 2. Location of the accelerometric stations considered for empirical testing. Dotted pinsrefer to stations on A or A* (* for hypothesized conditions) type soil in Eurocode classification,pins colour represents a simplified amplification factor for PGA (NTC, 2008) used to accomplishstratigraphic and topographic site response: green = 1, yellow = 1.2–1.35, violet = 1.5. SeeAppendix A and Supplement for details. The stations in small turquoise pins, in the list ofstations in Fig. 1, have been discarded in this analysis as they do not satisfy the ON statusin the 1979–2004 time window.
5749

NHESSD2, 5721–5757, 2014
A scoring test onprobabilistic seismichazard estimates in
Italy
D. Albarello et al.
Title Page
Abstract Introduction
Conclusions References
Tables Figures
J I
J I
Back Close
Full Screen / Esc
Printer-friendly Version
Interactive Discussion
Discussion
Paper
|D
iscussionP
aper|
Discussion
Paper
|D
iscussionP
aper|
Scoring test on PSHA in Italy
submitted to NHESS 25
1
10
100
1975 1980 1985 1990 1995 2000 2005
ALT
PGA
(cm
/s2)
a1
10
100
1975 1980 1985 1990 1995 2000 2005
PTL
PGA
(cm
/s2)
b 1
Figure 3. Observed and synthetic PGA values at two stations in the time span 1975-‐2004. a) observed (b/w 2 symbols, values as reported in ITACA 1.1. database and Pacor et al., 2013) and computed PGA values at ALT 3 (Auletta, Salerno) station, in Southern Apennines; b) PTL (Pietralunga, Perugia) station in Central Italy. Mean +/-‐ 4 1 standard deviation computed values, represented respectively by green circle, red and blue triangles, have 5 been obtained by ITA10 GMPE applied to CPTI11 earthquake catalogue; synthetic PGA are plotted if 6 MeanPGA+1sd is greater than 0.01 g, as in Fig. 1. 7
8
9
10
Figure 3. Observed and synthetic PGA values at two stations in the time span 1975–2005.(a) observed (b/w symbols, values as reported in ITACA 1.1. database and Pacor et al., 2013)and computed PGA values at ALT (Auletta, Salerno) station, in Southern Apennines; (b) PTL(Pietralunga, Perugia) station in Central Italy. Mean ±1 standard deviation computed values,represented respectively by green circle, red and blue triangles, have been obtained by ITA10GMPE applied to CPTI11 earthquake catalogue; synthetic PGA are plotted if MeanPGA+1sdis greater than 0.01 g, as in Fig. 1.
5750
NHESSD2, 5721–5757, 2014
A scoring test onprobabilistic seismichazard estimates in
Italy
D. Albarello et al.
Title Page
Abstract Introduction
Conclusions References
Tables Figures
J I
J I
Back Close
Full Screen / Esc
Printer-friendly Version
Interactive Discussion
Discussion
Paper
|D
iscussionP
aper|
Discussion
Paper
|D
iscussionP
aper|
Scoring test on PSHA in Italy
submitted to NHESS 26
1
Figure 4. 2 Timeline of PSHA maps in Italy relevant for regulation; orange symbols represent deadly earthquakes occurred 3 in the last 40 years. 4
5
Figure 4. Timeline of PSHA maps in Italy relevant for regulation; orange symbols representdeadly earthquakes occurred in the last 40 years.
5751

NHESSD2, 5721–5757, 2014
A scoring test onprobabilistic seismichazard estimates in
Italy
D. Albarello et al.
Title Page
Abstract Introduction
Conclusions References
Tables Figures
J I
J I
Back Close
Full Screen / Esc
Printer-friendly Version
Interactive Discussion
Discussion
Paper
|D
iscussionP
aper|
Discussion
Paper
|D
iscussionP
aper|
Scoring test on PSHA in Italy
submitted to NHESS 27
1 Figure 5. Comparison at two sites of expected PGA values (with 10% probability of exceedance in 50 years) 2 from collected PSHA models (redrawn from Faccioli and Vanini, 2013). Modena is located in the Po Plain, at 3 about 20-‐30 km distance from the main earthquakes of the 2012 Emilia sequence; Potenza is at about 90 km 4 distance from the recursive sequences that affected the border of Calabria and Basilicata Regions, in Southern 5 Apennines, since 2011. Time-‐dependent models listed in this graph (labels in blue) have not been used in this 6 analysis. 7
8
Figure 5. Comparison at two sites of expected PGA values (with 10 % probability ofexceedance in 50 years) from collected PSHA models (redrawn from Faccioli and Vanini, 2013).Modena is located in the Po Plain, at about 20–30 km distance from the main earthquakes ofthe 2012 Emilia sequence; Potenza is at about 90 km distance from the recursive sequencesthat affected the border of Calabria and Basilicata Regions, in Southern Apennines, since 2011.Time-dependent models listed in this graph (labels in blue) have not been used in this analysis.
5752

NHESSD2, 5721–5757, 2014
A scoring test onprobabilistic seismichazard estimates in
Italy
D. Albarello et al.
Title Page
Abstract Introduction
Conclusions References
Tables Figures
J I
J I
Back Close
Full Screen / Esc
Printer-friendly Version
Interactive Discussion
Discussion
Paper
|D
iscussionP
aper|
Discussion
Paper
|D
iscussionP
aper|
Scoring test on PSHA in Italy
submitted to NHESS 28
1
2
Figure 6. Synoptic view of PSHA maps collected by S2-‐2012 Project at the national scale. Model ID refers to 3 Table 1, the vertical axis shows approximately the return period the elaborations refer to; on x-‐axis, a rough 4 timeline of results release (from 1996 till 2013). The colour scale is automatically adjusted on values (in 5 particular the SHARE model have extremely high values out of the represented are); all the maps and graphic 6 details are given in Supplementary File B. 7
8
Figure 6. Synoptic view of PSHA maps collected by S2-2012 Project at the national scale.Model ID refers to Table 1, the vertical axis shows approximately the return period theelaborations refer to; on x axis, a rough timeline of results release (from 1996 till 2013).The colour scale is automatically adjusted on values (in particular the SHARE model haveextremely high values out of the represented are); all the maps and graphic details are given inSupplement File B.
5753

NHESSD2, 5721–5757, 2014
A scoring test onprobabilistic seismichazard estimates in
Italy
D. Albarello et al.
Title Page
Abstract Introduction
Conclusions References
Tables Figures
J I
J I
Back Close
Full Screen / Esc
Printer-friendly Version
Interactive Discussion
Discussion
Paper
|D
iscussionP
aper|
Discussion
Paper
|D
iscussionP
aper|
Scoring test on PSHA in Italy
submitted to NHESS 29
a b 1
Figure 7. Results of scoring for national based PSHA models. a) Observed versus computed number of stations 2 exceeding the predicted PGA values g0. Results are sorted according to the return period and subordinately on 3 model IDs. b) Final scores, the y-‐axis represents the absolute value of Z score as given in eq. [3]; the lower the 4 best. Model IDs are given in Table 1; Tyear indicates the mean return time the elaboration refers to. 5
6
Figure 7. Results of scoring for national based PSHA models. (a) Observed vs. computednumber of stations exceeding the predicted PGA values g0. Results are sorted according tothe return period and subordinately on model IDs. (b) Final scores, the y axis represents theabsolute value of Z score as given in Eq. (3); the lower the best. Model IDs are given in Table 1;Tyear indicates the mean return time the elaboration refers to.
5754

NHESSD2, 5721–5757, 2014
A scoring test onprobabilistic seismichazard estimates in
Italy
D. Albarello et al.
Title Page
Abstract Introduction
Conclusions References
Tables Figures
J I
J I
Back Close
Full Screen / Esc
Printer-friendly Version
Interactive Discussion
Discussion
Paper
|D
iscussionP
aper|
Discussion
Paper
|D
iscussionP
aper|
Scoring test on PSHA in Italy
submitted to NHESS 30
1 Figure 8. Synoptic view of regional PSHA maps collected by S2-‐2012 project. Model IDs refer to Table 1; the 2 vertical axis shows approximately the return period the elaborations refer to. The colour scale is automatically 3 adjusted on values; all the maps and graphic details are given in Supplementary File B. 4
5
Figure 8. Synoptic view of regional PSHA maps collected by S2-2012 project. Model IDs referto Table 1; the vertical axis shows approximately the return period the elaborations refer to. Thecolour scale is automatically adjusted on values; all the maps and graphic details are given inSupplement File B.
5755

NHESSD2, 5721–5757, 2014
A scoring test onprobabilistic seismichazard estimates in
Italy
D. Albarello et al.
Title Page
Abstract Introduction
Conclusions References
Tables Figures
J I
J I
Back Close
Full Screen / Esc
Printer-friendly Version
Interactive Discussion
Discussion
Paper
|D
iscussionP
aper|
Discussion
Paper
|D
iscussionP
aper|
Scoring test on PSHA in Italy
submitted to NHESS 31
a b 1
c d 2
Figure 9. Results of scoring for sub-‐regions in Italy, as in Figure 7: a) – b) Southern Apennines; c) – d) Po Plain). 3
4
Figure 9. Results of scoring for sub-regions in Italy, as in Fig. 7: (a) and (b) SouthernApennines; (c) and (d) Po Plain.
5756

NHESSD2, 5721–5757, 2014
A scoring test onprobabilistic seismichazard estimates in
Italy
D. Albarello et al.
Title Page
Abstract Introduction
Conclusions References
Tables Figures
J I
J I
Back Close
Full Screen / Esc
Printer-friendly Version
Interactive Discussion
Discussion
Paper
|D
iscussionP
aper|
Discussion
Paper
|D
iscussionP
aper|
Scoring test on PSHA in Italy
submitted to NHESS 32
0
50
100
150
200
250
300
10 100 1000 10000
Modena
ID nID 8
0.015
0.335
1.574
0.744
1.823
0.703
1.539
0.790
0.1710.790
0.9310.874
1.079
0.014
1.794
1.327
2.639
2.451
0.001
1.338
0.0040.014
0.0040.014
PGA
(cm
/s2)
Return Period (years)
4
1
1
1
3
6
2
5
9
6
5
4
1
3.951
3.951
a1
0
100
200
300
400
500
10 100 1000 10000
Potenza
ID nID 7
0.335
0.015
1.574
0.744
1.823
0.703
1.539
0.790
0.171
0.790
0.931
0.874
0.601
0.987
1.062
0.070
1.267
0.461
1.051
0.734
0.050
0.734
1.062
PGA
(cm
/s2)
Return Period (years)
4
1
11
362
5
9
6
5
4
1
0.059
1.062
0.734
0.461
1.062
b 2 Figure 10. PSHA and scores at two selected sites. a) Modena, in the Po Plain; b) Potenza in the Southern 3 Apennines. Red dots and b/w diamonds represent the national and regional models, black and blue labels 4 respectively the absolute Z values (eq. [3]) on the whole set and regional subsets of stations. 5
6
Figure 10. PSHA and scores at two selected sites. (a) Modena, in the Po Plain; (b) Potenzain the Southern Apennines. Red dots and b/w diamonds represent the national and regionalmodels, black and blue labels respectively the absolute Z values (Eq. 3) on the whole set andregional subsets of stations.
5757