impact evaluation of a conditional cash transfer program: the nicaraguan red de protección social
TRANSCRIPT
Impact Evaluation of a Conditional
Cash Transfer Program
The Nicaraguan Red de Protección Social
John A. MaluccioRafael Flores
RESEARCHREPORT 141INTERNATIONAL FOOD POLICY RESEARCH INSTITUTEWASHINGTON, DC
Copyright © 2005 International Food Policy Research Institute. All rights reserved.
Sections of this material may be reproduced for personal and not-for-profit use
without the express written permission of but with acknowledgment to IFPRI. To
reproduce the material contained herein for profit or commercial use requires express
written permission. To obtain permission, contact the Communications Division
International Food Policy Research Institute
2033 K Street, NW
Washington, DC 20006-1002 USA
Telephone +1-202-862-5600
www.ifpri.org
Library of Congress Cataloging-in-Publication Data
Maluccio, John, 1964–
Impact evaluation of a conditional cash transfer program : the Nicaraguan Red de
Protección Social / John A. Maluccio and Rafael Flores.
p. ; cm. — (Research report ; 141)
Includes bibliographical references.
ISBN 0-89629-146-4 (alk. paper)
1. Red de Protección Social (Nicaragua)—Evaluation. 2. Economic assistance,
Domestic—Nicaragua—Evaluation. 3. Public welfare—Nicaragua. 4. Child wel-
fare—Nicaragua. 5. Poverty—Nicaragua. I. Flores, Rafael. II. International
Food Policy Research Institute. III. Title. IV. Research report (International Food
Policy Research Institute) ; 141.
[DNLM: 1. Red de Protección Social (Nicaragua) 2. Nutrition Policy—
economics—Nicaragua. 3. Food Services—economics—Nicaragua. 4. Child
Welfare—economics—Nicaragua. 5. Health Status—Nicaragua. 6. Poverty—
Nicaragua. 7. Financial Support—Nicaragua. WA 695 M261i 2005]
HC146.Z9P639 2005
362.5'82'097285—dc22
2005018545
Contents
List of Tables iv
List of Figures vi
Foreword vii
Acknowledgments viii
Summary ix
1. Introduction 1
2. Design and Implementation of the Red de Protección Social 4
3. Design of the Evaluation, Methodology, and Validity 11
4. The Effects of Conditional Cash Transfers: The Red de Protección Social 26
5. Conclusions 56
Appendix A—Descriptive Chronology of RPS Program Activities in Phase I 59
Appendix B—Household Targeting in Geographically Targeted Areas 61
Appendix C—Contractual Indicators for One-Year RPS Evaluation in IADB Loan Contract 62
References 63
iii
Tables
2.1 Nicaraguan RPS eligibility and benefits in Phase I 7
2.2 Nicaraguan RPS beneficiary co-responsibilities monitored in Phase I 9
3.1 Calculation of the double-difference estimate of average program effect 12
3.2 Survey non-response and subsequent attrition 20
3.3 Comparison of intervention and control comarcas at baseline 2000 22
3.4 Percentage of households benefiting from development programs and services 25
4.1 RPS average effect on annual total household expenditures 27
4.2 RPS average effect on per capita annual total household expenditures 29
4.3 RPS average effect on per capita annual food expenditures 30
4.4 RPS average effect on food shares (percentage) 31
4.5 RPS average effect on the composition of food expenditures 32
4.6 RPS average effect on hours worked last week: Women 34
4.7 RPS average effect on hours worked last week: Men 35
4.8 RPS average effect on enrollment, children age 7–13 in first to fourth grades 38
4.9 RPS average effect (2000–02) on school advancement, children age 7–13 in first to fourth grades, by starting grade in 2000 42
4.10 RPS average effect on school advancement, children age 7–13 in first to fourth grades (2000–02), by poverty group 43
4.11 RPS average effect on working, children age 7–13 in first to fourth grades 44
4.12 RPS average effect on percentage of children age newborn to 3 years taken to health control in past 6 months 45
4.13 RPS average effect on percentage of children age newborn to 3 years taken to health control and weighed in past 6 months 45
4.14 RPS average effect on percentage of children age newborn to 3 years taken to health control and weighed in past 6 months, by poverty group 46
4.15 RPS average effect on percentage of children age 12–23 months with updated vaccination 47
4.16 Malnutrition in Central American countries 50
iv
4.17 RPS effect on percentage of children under age 5 who are stunted (HAZ < –2.00) 51
4.18 RPS effect on percentage of children under age 5 who are wasted(WHZ < –2.00) 52
4.19 RPS effect on percentage of children under age 5 who are underweight (WAZ < –2.00) 53
4.20 RPS effect on HAZ for children younger than age 5 53
4.21 RPS average effect on percentage of children age 6–59 months given iron supplement (ferrous sulfate) in past 4 months 54
4.22 RPS effect on percentage of children age 6–59 months with anemia 54
4.23 RPS effect on average hemoglobin for children age 6–59 months 54
TABLES v
Figures
3.1 Illustration of the double-difference estimate of average program effect 13
4.1 Density function of per capita annual total expenditures in 2002: Control versus intervention 30
4.2a Enrollment in 2000 for 7- to 13-year-olds who had not completed fourth grade, by age 36
4.2b Enrollment in 2000 for 7- to 13-year-olds who had not completed fourth grade, by poverty group and by sex 36
4.3a Current attendance in 2000 for 7- to 13-year-olds who had not completed fourth grade, by age 37
4.3b Current attendance in 2000 for 7- to 13-year-olds who had not completed fourth grade, by poverty group and by sex 37
4.4a RPS average effect (2000–02) on enrollment for 7- to 13-year-olds who had not completed fourth grade, by age 39
4.4b RPS average effect (2000–02) on enrollment for 7- to 13-year-olds who had not completed fourth grade, by poverty group and by sex 39
4.5a RPS average effect (2000–02) on current attendance for 7- to 13-year-olds who had not completed fourth grade, by age 41
4.5b RPS average effect (2000–02) on current attendance for 7- to 13-year-olds who had not completed fourth grade, by poverty group and by sex 41
vi
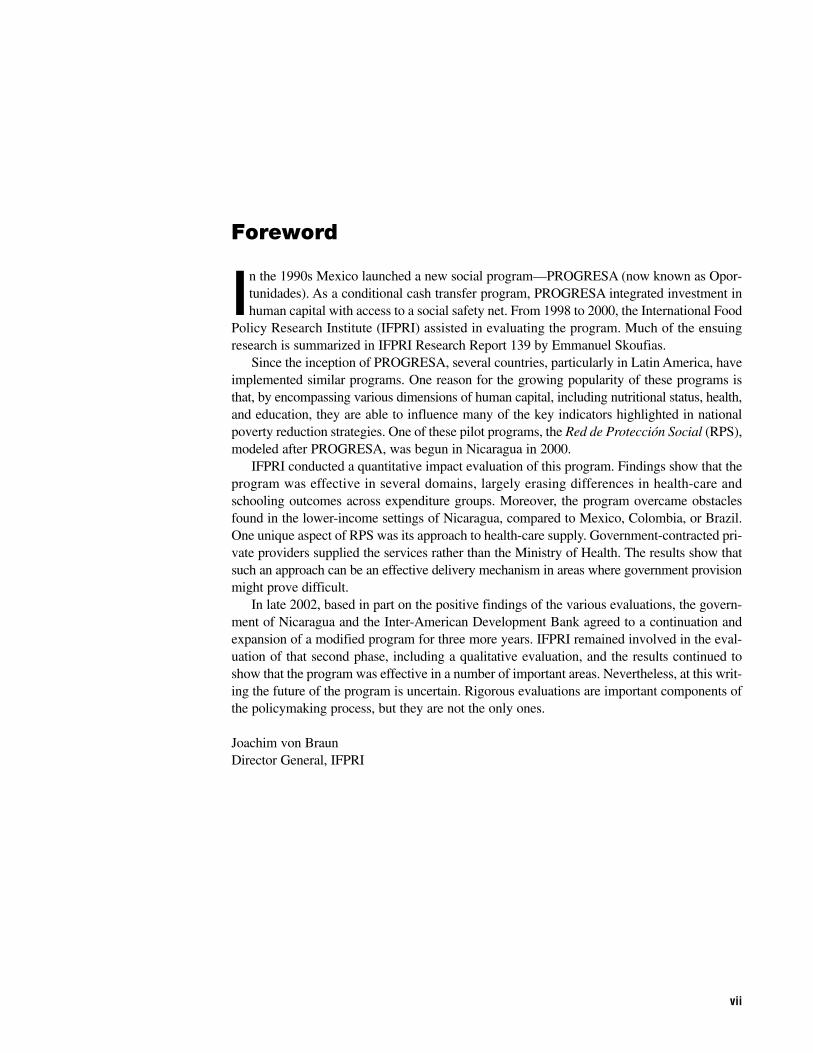
Foreword
In the 1990s Mexico launched a new social program—PROGRESA (now known as Opor-tunidades). As a conditional cash transfer program, PROGRESA integrated investment inhuman capital with access to a social safety net. From 1998 to 2000, the International Food
Policy Research Institute (IFPRI) assisted in evaluating the program. Much of the ensuingresearch is summarized in IFPRI Research Report 139 by Emmanuel Skoufias.
Since the inception of PROGRESA, several countries, particularly in Latin America, haveimplemented similar programs. One reason for the growing popularity of these programs isthat, by encompassing various dimensions of human capital, including nutritional status, health,and education, they are able to influence many of the key indicators highlighted in nationalpoverty reduction strategies. One of these pilot programs, the Red de Protección Social (RPS),modeled after PROGRESA, was begun in Nicaragua in 2000.
IFPRI conducted a quantitative impact evaluation of this program. Findings show that theprogram was effective in several domains, largely erasing differences in health-care andschooling outcomes across expenditure groups. Moreover, the program overcame obstaclesfound in the lower-income settings of Nicaragua, compared to Mexico, Colombia, or Brazil.One unique aspect of RPS was its approach to health-care supply. Government-contracted pri-vate providers supplied the services rather than the Ministry of Health. The results show thatsuch an approach can be an effective delivery mechanism in areas where government provisionmight prove difficult.
In late 2002, based in part on the positive findings of the various evaluations, the govern-ment of Nicaragua and the Inter-American Development Bank agreed to a continuation andexpansion of a modified program for three more years. IFPRI remained involved in the eval-uation of that second phase, including a qualitative evaluation, and the results continued toshow that the program was effective in a number of important areas. Nevertheless, at this writ-ing the future of the program is uncertain. Rigorous evaluations are important components ofthe policymaking process, but they are not the only ones.
Joachim von BraunDirector General, IFPRI
vii
Acknowledgments
T his research was carried out under the evaluation of the Nicaraguan Red de ProtecciónSocial by the International Food Policy Research Institute for the Nicaraguan Govern-ment and in part draws from reports prepared under that project. We thank the Red de
Protección Social team, particularly Leslie Castro, Tránsito Gómez, Carold Herrera, CarlosLacayo, and Mireille Vijil, for continued support during the evaluation. We also thank NatàliaCaldés, Oscar Neidecker-Gonzalez, Alexis Murphy, and Jane Rhode for research assistanceand Michelle Adato, David Coady, Peter Orazem, Ferdinando Regalía, Marie Ruel, LisaSmith, Máximo Torero, and two anonymous referees for many helpful comments.
viii
ERRATA: The correct Acknowledgments for this research report (#141) is as follows:
Summary
In recent years, investing in the human capital of the poor has been seen as crucial to alle-viating long-term poverty. Concomitantly there is growing recognition of the need for so-cial safety nets to protect poorer households from poverty and its consequences during the
push for economic growth. Not only are the stimulation of economic growth and investmentin social safety nets both important strategies for economic development, they are also poten-tially complementary, because effective social safety nets may contribute directly to economicgrowth via improved human capital.
Consistent with this view, several Latin American countries have introduced conditionalcash transfer programs that integrate investment in human capital with access to a social safetynet. The primary objective of these programs is to generate a sustained decrease in poverty insome of the most disadvantaged areas. And their basic premise is that a major cause of theintergenerational transmission of poverty is the inability of poor households to invest in thehuman capital of their children.
These programs target the poorest communities and households and condition the cashtransfers on attendance at school and health clinics. This effectively transforms cash transfersinto human capital subsidies for poor households. By encompassing various dimensions ofhuman capital, including nutritional status, health, and education, these programs have beenable to influence many of the key indicators highlighted in national poverty reduction strate-gies. One early such program was PROGRESA in Mexico, begun in 1997.
Nicaragua’s RPSModeled after PROGRESA, the Nicaraguan Red de Protección Social (RPS) or “Social SafetyNet” is designed to address both current and future poverty via cash transfers targeted tohouseholds living in poverty in rural Nicaragua. By targeting the transfers to poor households,the program alleviates short-term poverty. By linking the transfers to investments in humancapital, the program addresses long-term poverty. The transfers are conditional, and house-holds are monitored to ensure that they undertake prescribed actions intended to improve theirchildren’s human capital. RPS’s specific objectives include supplementing household incomefor up to three years to increase expenditures on food, reducing school dropout rates duringthe first four years of primary school, and increasing the health care and nutritional status ofchildren under five years of age.
Piloted in 2000, RPS had a budget of $11 million, representing approximately 0.2 percentof Nicaragua’s gross domestic product or 2 percent of annual recurring government spendingon health and education. Based in part on a quantitative impact evaluation conducted by theInternational Food Policy Research Institute, the Inter-American Development Bank and thegovernment of Nicaragua expanded the program in 2002 with a $22 million budget intendedto continue the program for an additional three years.
ix
Findings of the Impact EvaluationThis research report presents the main findings of a quantitative impact evaluation of RPSagainst its primary objectives. To the authors’ knowledge, this RPS study is the first rigorous,experimental evaluation of a government program in Nicaragua, and as such the maincontributions of the research are empirical. The evaluation design is based on a randomized,community-based intervention with measurements before and after the intervention in bothtreatment and control communities.
In its pilot phase, RPS had positive and significant effects on a broad range of indicatorsand outcomes. Where it did not, the lack of such effects was often due to improvements in thecontrol group. Nearly all estimated effects were larger for the extremely poor, often reflectingtheir lower starting points. As a result, the program reduced the inequality of most outcomesacross expenditure classes.
On average, RPS supplemented total annual per capita household expenditures by 18 per-cent, and most of this increase was spent on food. The program resulted in an average increaseof 640 Nicaraguan córdobas in annual per capita food expenditures and an improvement in thediet of beneficiary households. Expenditures on education also increased significantly, thoughthere was no discernible effect on other types of investment expenditures. The economic cri-sis experienced by these communities during the period studied enabled RPS to operate some-what like a traditional social safety net, aiding households during a downturn.
RPS produced a massive average net increase in school enrollment of 13 percentage pointsand an even larger effect of 20 percentage points on current attendance for the target popula-tion. The number of children in grades 1–4 who advanced two grades between 2000 and 2002increased by 7.3 percentage points, despite the fact that advancement past the fourth grade wasnot a formal requirement of the program. In tandem with the increased schooling, the percent-age of working children aged 7–13 declined by 5.6 percentage points.
Furthermore, the impact evaluation revealed an average net increase of 16 percentage pointsin the participation of children under age 3 in VPCD, the health-care program. At the sametime, the services provided by the program, as measured by process indicators (includingwhether the child was weighed and whether the child’s health card was updated), improvedeven more. Participation by children ages 3–5 also increased substantially. As with the effectsfor expenditures and schooling, average program effects for VPCD measures are larger amongpoorer households.
While it was not possible to demonstrate statistically that RPS increased vaccination cov-erage for children ages 12–23 months in the intervention group, vaccination rates did climb 30percentage points in the intervention and control areas at a time when they were, on average,decreasing in rural areas nationally.
Finally, the more varied household diet and increased use of preventive health-care servicesfor children were accompanied by an improvement in the nutritional status of beneficiary chil-dren under age 5. The net effect was a decline of 5.5 percentage points in the number of stuntedchildren. This decline was more than 1.7 times faster than the rate of annual improvement seenat the national level between 1998 and 2001. Despite improvements in the distribution of ironsupplements to these same children, however, RPS was unable to improve hemoglobin levelsor lower rates of anemia.
ConclusionRPS has improved a number of the indicators included in the Nicaraguan national poverty re-duction strategy, at a time when many of them were not on track to achieve the goals set out
x SUMMARY

in that plan. The evidence from the evaluation strongly suggests that, if the program were tobe expanded elsewhere in the poor rural areas of Nicaragua (as it was in 2003), it would beeffective. As such, RPS could prove to be an important component of Nicaragua’s overallpoverty reduction policy.
SUMMARY xi

C H A P T E R 1
Introduction
In recent years, increasing emphasis has been placed on the importance of human capital instimulating economic growth and social development. Consequently, investing in the humancapital of the poor is widely seen as crucial to alleviating poverty, particularly in the long
term. There is also growing recognition of the need for social safety nets to protect householdsfrom poverty and its consequences during the push for economic growth (World Bank 1997).Although at first glance stimulating economic growth and investing in social safety nets ap-pear to be different strategies for economic development, both are important. They are alsopotentially complementary, as effective social safety nets may directly contribute to economicgrowth via improved human capital, particularly in the long term (Morley and Coady 2003).
Consistent with this view, several Latin American countries have introduced conditionalcash transfer programs that integrate investing in human capital with access to a social safetynet. One reason for the growing popularity of these programs is that by encompassing variousdimensions of human capital, including nutritional status, health, and education, they are ableto influence many of the key indicators highlighted in national poverty reduction strategies.One of the first, and largest, programs was the Programa Nacional de Educación, Salud yAlimentación (PROGRESA) in Mexico, begun in 1997. Another large program is Bolsa Ali-mentação, a nutrition-oriented cash transfer program in Brazil. A third large program is thePrograma de Asignación Familiar (PRAF) in Honduras. In this report, we examine a fourthsuch program, the Nicaraguan Red de Protección Social (RPS) or “Social Safety Net.”
In 2003, the Inter-American Development Bank (IADB), a key actor in promoting and fi-nancing this type of program, indicated that “conditional cash transfer programs (CCTs) havereplaced unrestricted cash payments and price subsidies in several Latin American countries”(IDEA 2003, p. 1). Nancy Birdsall, president of the Center for Global Development, states: “Ithink these programs are as close as you can come to a magic bullet in development. . . . They’recreating an incentive for families to invest in their own children’s futures. Every decade or so,we see something that can really make a difference, and this is one of those things.”1
The primary objective of these programs is to generate a sustained decrease in poverty insome of the most disadvantaged regions in their respective countries. Their basic premise isthat a major cause of the intergenerational transmission of poverty is the inability of poorhouseholds to invest in the human capital of their children. Supply-side interventions, whichincrease the availability and quality of education and health-care services, are often ineffec-tive in resolving this problem, since the resource constraints facing poor households precludethem from incurring the private costs associated with utilizing these services (e.g., travel costs
1“To help poor be pupils, not wage earners, Brazil pays parents,” New York Times, January 3, 2004.
1
and the opportunity cost of women’s andchildren’s time). These programs attack thisproblem by targeting transfers to the poor-est communities and households and condi-tioning the transfers on actions intended toimprove children’s human capital develop-ment. This effectively transforms cash trans-fers into human capital subsidies for poorhouseholds.
Modeled after PROGRESA, RPS isdesigned to address both current and futurepoverty via cash transfers targeted to poorhouseholds in rural Nicaragua. The transfersare conditional, and households are moni-tored to ensure that, among other stipula-tions, their children are attending schooland making visits to preventive health-careproviders. When households fail to fulfillthose obligations, they lose their eligibility.By targeting the transfers to poor house-holds, the program alleviates short-termpoverty. By linking the transfers to invest-ments in human capital, the program ad-dresses long-term poverty. RPS’s specificobjectives include:� Supplementing household income for
up to 3 years to increase expenditureson food
� Reducing dropout rates during the first4 years of primary school
� Increasing the health-care and nutri-tional status of children under age 5
RPS comprised two phases over 5 years,starting in 2000. The pilot phase (or Phase I)lasted 3 years and had a budget of US$11million, representing approximately 0.2percent of gross domestic product (GDP) or2 percent of annual recurring government
spending on health and education (WorldBank 2001, annex 21). As a condition of theIADB loan financing the program, and toassess whether the program merited expan-sion in the same or in an altered form, theGovernment of Nicaragua solicited variousexternal evaluations of Phase I. The Interna-tional Food Policy Research Institute (IFPRI)conducted the quantitative impact evalua-tion, using a randomized community-baseddesign. In late 2002, based in part on the pos-itive findings of the various evaluations,2
the Government of Nicaragua and IADBagreed to a continuation and expansion ofthe program, known as Phase II, for threemore years with a budget of US$22 million.
This report presents the principal find-ings from the quantitative impact evaluationof Phase I of RPS for a wide range of out-comes related to the program’s objectives,including (1) household (food) expenditures,(2) child schooling and child labor, (3) pre-ventive health care of children under age 5,and (4) nutritional status of children youngerthan 5 years of age.3 Although they have along history and are widely used in devel-oped countries, rigorous, large-scale, ran-domized evaluations of social programs suchas the one reported on have been rare indeveloping countries (Newman, Rawlings,and Gertler 1994; National Research Coun-cil 2001). Such studies have been increasingin popularity recently, however, after thewidely cited case of PROGRESA (Raw-lings and Rubio 2005; Skoufias 2005).
Although not new, the methodology em-ployed in this report is generally considered“best practice” for evaluations. Moreover,to our knowledge, this research is the first
2 CHAPTER 1
2The findings are summarized in a policy brief available in English and Spanish (Maluccio et al. 2005). Resultsreported there differ slightly from those presented in this report because of minor differences in the sample ana-lyzed and in the methodology employed.
3In 2003, IFPRI was commissioned to carry out a qualitative evaluation. Adato and Roopnaraine (2004) presentthat evaluation which includes results on many (social) dimensions of the program not contemplated here, in-cluding program communication, empowerment, social effects of targeting, and relationships within householdsand communities. The focus in the present research report is on the earlier quantitative evaluation, although wedraw on the qualitative work in some instances where the two overlap.
rigorous, experimental evaluation of a gov-ernment program in Nicaragua. The maincontributions of the research, then, are em-pirical. The results demonstrate that theprogram was effective in several domains.Indeed, it largely erased differences inhealth-care and schooling outcomes acrossexpenditure groups. Nicaragua is a lower-income country when compared to Mexico,Columbia, or Brazil, where much of theresearch on conditional cash transfer pro-grams has been done. As a result, there wasskepticism about capacity to implement theprogram. Moreover, certain design featuresneeded to be modified for the Nicaraguan
setting. For example, because schoolingoutcomes are lower, the targeted populationfor school transfers was different from thatused in PROGRESA. The results showthat a conditional cash transfer program canbe effective in a low-income setting. Oneunique aspect of RPS relative to most otherprograms of this type was its approach tohealth-care supply, in which services wereprovided by government-contracted non-governmental organizations (NGOs) ratherthan directly by the Ministry of Health. Theresults show that such an approach can bean effective delivery mechanism.
INTRODUCTION 3
C H A P T E R 2
Design and Implementation of the Red de Protección Social
To permit an assessment of how RPS altered behavior, it is first necessary to describehow the program operates and how it has evolved.4
Program TargetingIn the design phase of RPS, rural areas in all 17 departments of Nicaragua were eligible forthe program. The focus on rural areas reflects the distribution of poverty in Nicaragua—of the48 percent of Nicaraguans designated as poor in 1998, 75 percent resided in rural areas (WorldBank 2001). For Phase I of RPS, the Government of Nicaragua selected the departments ofMadriz and Matagalpa from the northern part of the Central Region, on the basis of povertylevel as well as on their capacity to implement the program. This region was the only one thatshowed worsening poverty between 1998 and 2001, a period during which both urban andrural poverty rates were declining nationally (World Bank 2003). In 1998, approximately 80percent of the rural population of Madriz and Matagalpa was poor, and half of these peoplewere extremely poor (IFPRI 2002). In addition, these departments had easy physical accessand communication (including being less than a one-day drive from the capital, Managua,where RPS is headquartered), relatively strong institutional capacity and local coordination,and reasonably good coverage of health posts and schools (Arcia 1999). By targeting purpo-sively, RPS avoided devoting a disproportionate share of its resources in Phase I to increasingthe supply of educational and health-care services.
In the next stage of geographic targeting, all six (out of 20) municipalities that had thesmall-scale participatory development program Microplanificación Participativa (Participa-tory Micro-planning [MP]) run by the national Emergency Social Investment Fund (FISE)were chosen.5 The goal of that program was to develop the capacity of municipal governmentsto select, implement, and monitor social infrastructure projects such as school and health-postconstruction, with an emphasis on local participation. It is possible, then, that the selectedmunicipalities had atypical capacity to carry out RPS, although this may not have been wide-spread, as MP did not completely cover the participant municipalities and it is unclear how
4Appendix A provides a descriptive chronology of activities undertaken during Phase I.
5The six were Totogalpa and Yalagüina municipalities in the department of Madriz, and Ciudad Darío, El Tuma-La Dalia, Esquipulas, and Terrabona municipalities in the department of Matagalpa.
4
successful it was. Regardless of whetherthere was significant preexisting capacity,the six municipalities were well targeted interms of poverty. Between 36 and 61 per-cent of the rural population in each of thechosen municipalities was extremely poorand 78–90 percent was extremely poor orpoor (IFPRI 2002), compared with 21 and45 percent, respectively, for Nicaragua as awhole (World Bank 2003). Although not thepoorest municipalities in the country, or inthe chosen departments for that matter, theproportion of impoverished people living inthese areas was still well above the nationalaverage.
In the last stage of geographic targeting,a marginality index was constructed, basedon information from the 1995 National Pop-ulation and Housing Census, and an indexscore was calculated for all 59 rural censuscomarcas6 in the selected municipalities.The index was the weighted average of aset of comarca-level indicators (with re-spective weights in parentheses) known tobe highly associated with poverty (Arcia1999; Maluccio 2005):1. Average family size (0.1)2. Percentage without piped water in the
home or yard (0.5)3. Percentage without a latrine (0.1)4. Percentage of persons over age 5 who
are illiterate (0.3)
Higher index scores were associated withmore impoverished areas. Since the indexdoes not reliably distinguish between co-marcas with similar scores, the 59 ruralcomarcas were grouped into four priority
levels after the highest index score was re-normalized to 100: a score of above 85 wasgiven highest priority (priority 1); 70–85,priority 2; 60–70, priority 3; and below 60,lowest priority, 4. The 42 comarcas withpriority scores 1 and 2 were eligible for thefirst stage of Phase I.7
Although the initial program designcalled only for geographic targeting (withall resident households eligible) in these 42comarcas, about 6 percent of householdsdeemed to have substantial resources by RPSwere excluded ex ante from the program.8
At the outset, then, just under 90 percent ofhouseholds in intervention comarcas werebeneficiaries. Consequently, the percentageof poor excluded from the program, orundercoverage, was less than 5 percent inthese geographically targeted comarcas.Moreover, because the targeted areas werevery poor, the percentage of beneficiarieswho were non-poor (i.e., leakage) was alsominimal, approximately 15 percent (IFPRI2002). Despite these (quantitative) findingsthat the program was well targeted, therewas substantial confusion at the local levelabout the beneficiary selection process(Adato and Roopnaraine 2004), raising thepossibility of community tension as the re-sult of excluding some families.
Program DesignRPS has two core components: (1) foodsecurity, health, and nutrition and (2) ed-ucation.
Each eligible household9 received a cashtransfer known as the bono alimentario or
DESIGN AND IMPLEMENTATION OF THE RED DE PROTECCIÓN SOCIAL 5
6Census comarcas are administrative areas within municipalities that typically include between one and fivesmall communities averaging 100 households each. They are comprised of census segments and determined bythe National Institute of Statistics and Censuses and in some cases do not coincide with locally defined areas alsoreferred to as comarcas.
7IFPRI (2002) and Maluccio (2005) provide further details on the RPS targeting methodology.
8Appendix B describes how households were determined ineligible.
9RPS defined a household as a group of persons habitually living, eating, and cooking together. The same defi-nition was used in all the survey work.
“food security transfer”10 every other month,contingent on attendance at educationalworkshops held every other month and onbringing their children under age 5 forscheduled preventive (or well child) health-care appointments with specially contractedproviders. The workshops were held withinthe communities and typically includedabout 20 participants. They covered house-hold sanitation and hygiene, nutrition, re-productive health, breastfeeding, and relatedtopics. To ensure adequate supply in thesepoor, rural communities, RPS trained andpaid private providers to deliver the specifichealth-care services required by the pro-gram. RPS adapted the individual counsel-ing material from the Integrated Attention tothe Child (AIN) program in Honduras (VanRoekel et al. 2000). These services, providedfree of charge to beneficiary households, in-cluded growth and development monitoring,vaccination, and provision of antiparasitemedicine, vitamins, and iron supplements.Children younger than age 2 were seenmonthly and those ages 2–5, every othermonth. In practice, mothers brought theirchildren to the local service location (typi-cally a community center or house of one ofthe beneficiaries) to be seen by the health-care team working for the private provider.The prescribed procedure was the follow-ing. First, the professional nurse measuredthe child, inquired about the child’s healthand the caretaker’s caring and feeding prac-tices, and checked the vitamin A supplemen-tation record. Then the doctor examined thechild, prescribing appropriate antiparasitemedicine or iron supplements according tothe Ministry of Health protocol for makingthese prescriptions. If the child was growingwell, the doctor congratulated the caretaker.
Then the caretaker returned to the nurse toreceive individual counseling on how tomaintain or improve growth, with key mes-sages on breastfeeding, child feeding, illnesscare, and hygiene, taking into account sev-eral factors, such as the age of the child,whether the child had gained weight ade-quately the previous month, and whetherthe child had been ill.
Each eligible household also receiveda cash transfer known as the bono escolaror “school attendance transfer” every othermonth, contingent on enrollment and regu-lar school attendance of children ages 7–13who had not completed fourth grade of pri-mary school. In addition, for each eligiblechild, the household received an annual cashtransfer intended for school supplies (in-cluding uniforms and shoes) known as themochila escolar or “school supplies trans-fer,” which was contingent on enrollment.Unlike the school attendance transfer, whichwas a fixed amount per household regard-less of the number of children in school, theschool supplies transfer was for each child.
To provide incentives to the teachers,who had some additional reporting dutiesand were likely to have larger classes afterthe introduction of RPS, and to increaseresources available to the schools, there wasalso a small cash transfer, known as thebono a la oferta or “teacher transfer.”11 Thiswas given to each beneficiary child, who inturn delivered it to the teacher. The teacherkept one half, while the other half was ear-marked for the school. The delivery of thefunds to the teacher was monitored, but nottheir ultimate use.
Table 2.1 summarizes the eligibility re-quirements and demand and supply-side ben-efits of RPS. At the outset, nearly all house-
6 CHAPTER 2
10One common definition for food security is “when all people at all times have both the physical and economicaccess sufficient to meet their dietary needs to lead a healthy and productive life” (USAID 1992). In this report,we do not formally assess food security, however, but focus on indicators of food expenditures that are associatedwith food security.
11In rural Nicaragua, school’s parents’ associations often request small monthly contributions from parents to sup-port the teacher and the school; the teacher transfer was, in part, intended to substitute any such fees.
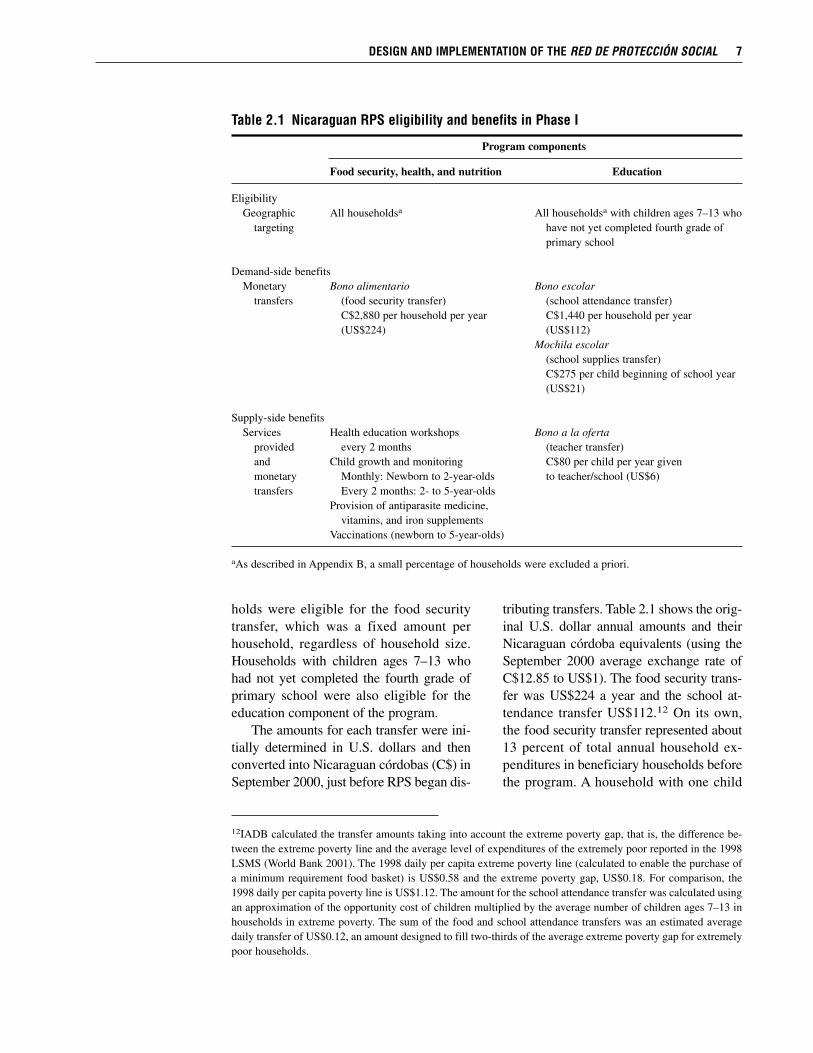
holds were eligible for the food securitytransfer, which was a fixed amount perhousehold, regardless of household size.Households with children ages 7–13 whohad not yet completed the fourth grade ofprimary school were also eligible for theeducation component of the program.
The amounts for each transfer were ini-tially determined in U.S. dollars and thenconverted into Nicaraguan córdobas (C$) inSeptember 2000, just before RPS began dis-
tributing transfers. Table 2.1 shows the orig-inal U.S. dollar annual amounts and theirNicaraguan córdoba equivalents (using theSeptember 2000 average exchange rate ofC$12.85 to US$1). The food security trans-fer was US$224 a year and the school at-tendance transfer US$112.12 On its own,the food security transfer represented about13 percent of total annual household ex-penditures in beneficiary households beforethe program. A household with one child
DESIGN AND IMPLEMENTATION OF THE RED DE PROTECCIÓN SOCIAL 7
12IADB calculated the transfer amounts taking into account the extreme poverty gap, that is, the difference be-tween the extreme poverty line and the average level of expenditures of the extremely poor reported in the 1998LSMS (World Bank 2001). The 1998 daily per capita extreme poverty line (calculated to enable the purchase ofa minimum requirement food basket) is US$0.58 and the extreme poverty gap, US$0.18. For comparison, the1998 daily per capita poverty line is US$1.12. The amount for the school attendance transfer was calculated usingan approximation of the opportunity cost of children multiplied by the average number of children ages 7–13 inhouseholds in extreme poverty. The sum of the food and school attendance transfers was an estimated averagedaily transfer of US$0.12, an amount designed to fill two-thirds of the average extreme poverty gap for extremelypoor households.
Table 2.1 Nicaraguan RPS eligibility and benefits in Phase I
Program components
Food security, health, and nutrition Education
EligibilityGeographic All householdsa All householdsa with children ages 7–13 who
targeting have not yet completed fourth grade of primary school
Demand-side benefitsMonetary Bono alimentario Bono escolar
transfers (food security transfer) (school attendance transfer)C$2,880 per household per year C$1,440 per household per year (US$224) (US$112)
Mochila escolar(school supplies transfer)C$275 per child beginning of school year(US$21)
Supply-side benefitsServices Health education workshops Bono a la oferta
provided every 2 months (teacher transfer)and Child growth and monitoring C$80 per child per year given monetary Monthly: Newborn to 2-year-olds to teacher/school (US$6)transfers Every 2 months: 2- to 5-year-olds
Provision of antiparasite medicine, vitamins, and iron supplements
Vaccinations (newborn to 5-year-olds)
aAs described in Appendix B, a small percentage of households were excluded a priori.
benefiting from the education componentwould have received additional transfers ofabout 8 percent, yielding an average totalpotential transfer of 21 percent of total an-nual household expenditures. Over the 2years, the actual average monetary transfer(excluding the teacher transfer) was approx-imately C$3,500 (US$272 or 17 percent oftotal annual household expenditures). Thisis approximately the same percentage oftotal annual household expenditures as theaverage transfer in PROGRESA, but morethan five times as large as the transfers givenin PRAF (Caldés, Coady, and Maluccio2004). In contrast to PROGRESA, whichindexes transfers to inflation, the nominalvalue of the transfers remained constant forRPS, with the consequence that the realvalue of the transfers declined by about 8percent as a result of inflation over 2 yearsin Phase I. It is possible that any differencesin the effectiveness of RPS over time re-sulted, in part, from a decline in the realvalue of the transfers, although such effectsare likely to be small.
The value of the supply-side services, asmeasured by how much RPS paid to theproviders, was also substantial. On an an-nual basis, the education workshops costapproximately US$50 per beneficiary andthe health-care services for children underage 5, approximately US$110, including thevalue of the vaccines, antiparasite medicine,vitamins, and iron supplements, all of whichwere provided by the Ministry of Health.
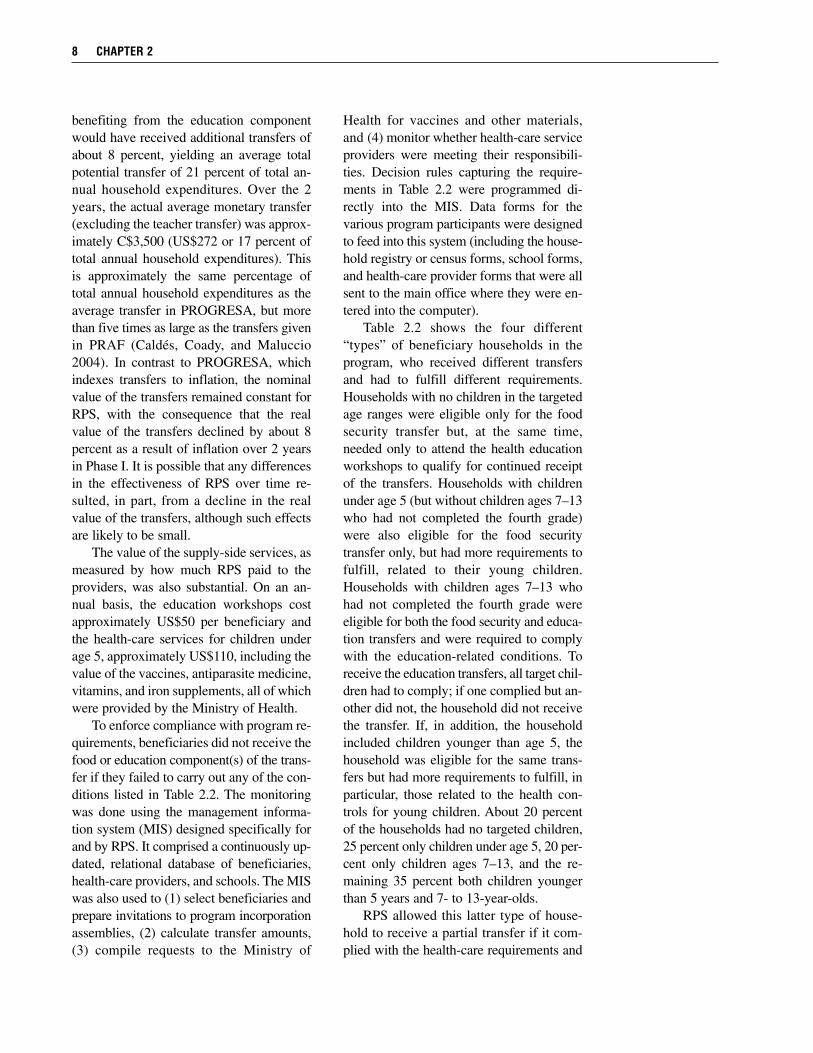
To enforce compliance with program re-quirements, beneficiaries did not receive thefood or education component(s) of the trans-fer if they failed to carry out any of the con-ditions listed in Table 2.2. The monitoringwas done using the management informa-tion system (MIS) designed specifically forand by RPS. It comprised a continuously up-dated, relational database of beneficiaries,health-care providers, and schools. The MISwas also used to (1) select beneficiaries andprepare invitations to program incorporationassemblies, (2) calculate transfer amounts,(3) compile requests to the Ministry of
Health for vaccines and other materials,and (4) monitor whether health-care serviceproviders were meeting their responsibili-ties. Decision rules capturing the require-ments in Table 2.2 were programmed di-rectly into the MIS. Data forms for thevarious program participants were designedto feed into this system (including the house-hold registry or census forms, school forms,and health-care provider forms that were allsent to the main office where they were en-tered into the computer).
Table 2.2 shows the four different“types” of beneficiary households in theprogram, who received different transfersand had to fulfill different requirements.Households with no children in the targetedage ranges were eligible only for the foodsecurity transfer but, at the same time,needed only to attend the health educationworkshops to qualify for continued receiptof the transfers. Households with childrenunder age 5 (but without children ages 7–13who had not completed the fourth grade)were also eligible for the food securitytransfer only, but had more requirements tofulfill, related to their young children.Households with children ages 7–13 whohad not completed the fourth grade wereeligible for both the food security and educa-tion transfers and were required to complywith the education-related conditions. Toreceive the education transfers, all target chil-dren had to comply; if one complied but an-other did not, the household did not receivethe transfer. If, in addition, the householdincluded children younger than age 5, thehousehold was eligible for the same trans-fers but had more requirements to fulfill, inparticular, those related to the health con-trols for young children. About 20 percentof the households had no targeted children,25 percent only children under age 5, 20 per-cent only children ages 7–13, and the re-maining 35 percent both children youngerthan 5 years and 7- to 13-year-olds.
RPS allowed this latter type of house-hold to receive a partial transfer if it com-plied with the health-care requirements and
8 CHAPTER 2
not the education requirements or viceversa. During the first 2 years of transfers,approximately 10 percent of beneficiarieswere penalized at least once and thereforedid not receive, or received only one com-ponent of, their transfer. It was also possiblefor households to be expelled from theprogram. Reasons for expulsion included(1) repeated failure to comply with pro-gram requirements, (2) failure to collect thetransfer in two consecutive periods, (3) morethan 27 unexcused school absences during
the school year per beneficiary child, (4)failure of a beneficiary child to be promotedto the next grade, and (5) discovery of falsereporting of information during any part ofdata collection, including information aboutfulfillment of program responsibilities.13
Fewer than 1 percent of households wereexpelled during the first 2 years of transfers,although approximately 5 percent left theprogram voluntarily, for example, by drop-ping out or migrating out of the programarea.
DESIGN AND IMPLEMENTATION OF THE RED DE PROTECCIÓN SOCIAL 9
13When it was learned that some, but not all, schools practiced automatic promotion, enforcement of the gradepromotion condition was deemed unfair and therefore was never enforced. Similarly, when there were some de-lays in the delivery of vaccines, the up-to-date vaccination condition was also never enforced. A third condition,punishment of children who did not have adequate weight gain, was dropped at the end of the Phase I because ofa concern about the role of measurement error and the finding that the poorest households were more likely to bepunished. These changes highlight the importance of careful consideration of the required responsibilities andhow they are to be monitored during the design of a conditional cash transfer program. They also show the im-portance of flexibility during program implementation.
Table 2.2 Nicaraguan RPS beneficiary co-responsibilities monitored in Phase I
Household type
HouseholdsHouseholds with children
with no Households ages 7–13 who havetargeted with children not completedchildren ages 0–5 fourth grade
Program requirement (A) (B) (C) (B) + (C)
Attend health education workshops every � � � �
2 monthsBring children to prescheduled health- � �
care appointmentsMonthly (0–2 years)Every 2 months (2–5 years)
Adequate weight gain for children � �
younger than 5 yearsa
Enrollment in grades 1–4 of all targeted � �
children in the householdRegular attendance (85 percent, i.e., no � �
more than 5 absences every 2 months without valid excuse) of all targeted children in the household
Promotion at end of school yearb � �
Deliver teacher transfer to teacher � �
Up-to-date vaccination for all children � �
under 5 yearsb
aThe adequate weight gain requirement was discontinued in Phase II starting in 2003.bCondition was not enforced.
Only the designated household repre-sentative could collect the cash transfersand, where possible, RPS designated themother as that representative. The dominantreason for not selecting a woman was thateither she was not living in the household orwas not alive. This strategy mimics the de-sign of PROGRESA and PRAF and is basedon evidence that resources in the hands ofwomen often lead to better outcomes forchild well-being and household food secu-rity (Strauss and Thomas 1995). As a result,more than 95 percent of the householdrepresentatives selected were women. Theserepresentatives attended the health educa-tion workshops and they were responsiblefor ensuring that the requirements for theirhouseholds were fulfilled.
Although centrally administered, withits multisectoral approach across education,health, and nutrition, RPS required bureau-cratic cooperation at the national, municipal,and community levels. Given funding andadministrative oversight from FISE during
Phase I, municipal planning and coordinationwas conducted by committees composedof delegates from the health and educationministries, representatives from civil soci-ety, and RPS personnel. This coordinationproved important in directing supply-sideresponses to increased household demandfor health and schooling services. At thecomarca level, RPS representatives workedwith local volunteer representatives knownas promotoras (beneficiary women chosenby the community), and local schools andhealth-care service providers, to implementthe program. The promotoras were chargedwith keeping beneficiary household rep-resentatives informed about upcominghealth-care appointments for their children,upcoming transfers, and any failures in ful-filling the conditions. Each promotorahad, on average, 17 (SD 6) beneficiaries inher charge, although this average maskedsubstantial variation ranging from 5 to 30beneficiaries.
10 CHAPTER 2
C H A P T E R 3
Design of the Evaluation, Methodology, and Validity
To measure program effects, it is necessary to know what would have happened hadthe program not been implemented. The fundamental problem, of course, is that anindividual, household, or geographic area cannot simultaneously undergo and not un-
dergo an intervention. Therefore, it is necessary to construct a counterfactual measure of whatwould have happened if the program had not been available. The most powerful way to con-struct a valid counterfactual is to randomly select beneficiaries from a pool of equally eligiblecandidates.
Evaluation Design and Double-Difference MethodologyThe evaluation for RPS was based on a randomized, community-based intervention withmeasurements before and after the intervention in both treatment and control communities.One half of the 42 comarcas (targeted in the first stage of Phase I as described in the first sec-tion of Chapter 2) were randomly selected into the program. Thus, there are 21 comarcas inthe intervention group and 21 distinct comarcas in the control group (IFPRI 2001a). Given thegeography of the program area, however, control and intervention comarcas are in some casesadjacent to one another. Including a control from whom treatment was withheld was ethicalbecause the effectiveness of the intervention was unknown and it was uncertain there was suf-ficient capacity to implement the intervention in all areas at once. In this case, random selec-tion would seem to be about as fair as any other arbitrary decision rule for selecting the firstset of beneficiaries.
The selection was done at a public event in which representatives from the comarcas, theGovernment of Nicaragua, IADB, IFPRI, and the media were present. The 42 comarcas wereordered by their marginality index scores and stratified into seven groups of six comarcaseach. Within each stratum, randomization was achieved by blindly drawing one of six coloredballs without replacement (starting with three blue for intervention and three white for con-trol) from a box after the name of each comarca was called out. Thus, three comarcas fromeach group were randomly selected for inclusion in the program, while the other three wereselected as controls. The evaluation was designed to last for 1 year—that is, the control groupwas meant to be a control for only 1 year, after which it was expected there would be capacityto implement the intervention everywhere.14 Because of delays in funding for RPS as a resultof a governmental audit unrelated to the program, incorporation of households in the control
14As a result, another way to describe the experiment is that the program was randomly phased in.
11
comarcas into the program was postponeduntil 2003, extending the possible length ofthe treatment–control evaluation by morethan a year. In the end, control comarcaswaited a little over 2 years before being fullyincorporated into the program during itssecond phase. Even with this extension, how-ever, the evaluation remains an evaluationof the short-term effects of the program(Thomas et al. 2003), although in some casesthe effects on long-term indicators, such aschild anthropometrics, are measured.
During the public selection, local leadersand government officials were informedgenerally about the program. This includedthat they were told that control comarcaswould enter the program after 1 year (al-though as just described, 1 year turned into2). This was done to ensure participation inthe evaluation. While RPS did not publicizethis plan to households in control comarcas,it would be naive to assume that householdsin control areas were entirely unaware of it.Over time they certainly would have learnedabout such a large program in neighboringvillages and may even have been informedby local actors about their eventual possibleparticipation. Some implications of this formof contamination for the experiment and in-terpretation of results are discussed later inthis chapter.
Household and individual level data werecollected in both the intervention and con-trol comarcas before and after RPS wasimplemented. This enables the use of the
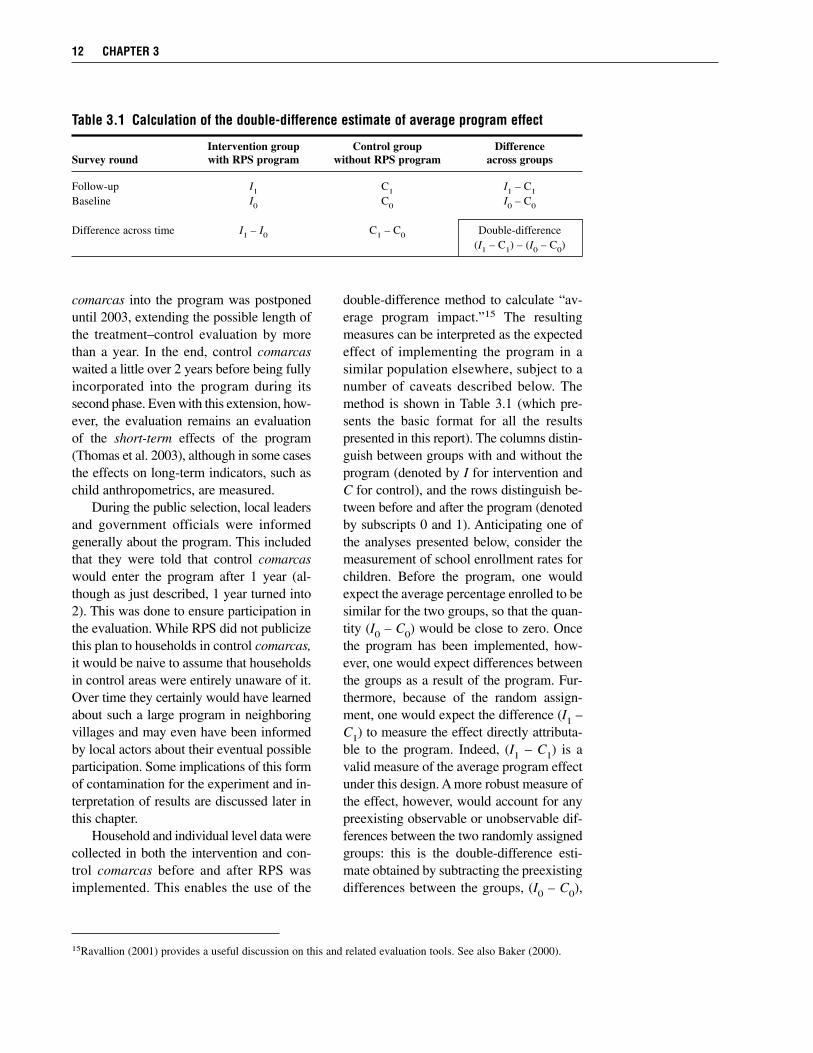
double-difference method to calculate “av-erage program impact.”15 The resultingmeasures can be interpreted as the expectedeffect of implementing the program in asimilar population elsewhere, subject to anumber of caveats described below. Themethod is shown in Table 3.1 (which pre-sents the basic format for all the resultspresented in this report). The columns distin-guish between groups with and without theprogram (denoted by I for intervention andC for control), and the rows distinguish be-tween before and after the program (denotedby subscripts 0 and 1). Anticipating one ofthe analyses presented below, consider themeasurement of school enrollment rates forchildren. Before the program, one wouldexpect the average percentage enrolled to besimilar for the two groups, so that the quan-tity (I0 – C0) would be close to zero. Oncethe program has been implemented, how-ever, one would expect differences betweenthe groups as a result of the program. Fur-thermore, because of the random assign-ment, one would expect the difference (I1 –C1) to measure the effect directly attributa-ble to the program. Indeed, (I1 – C1) is avalid measure of the average program effectunder this design. A more robust measure ofthe effect, however, would account for anypreexisting observable or unobservable dif-ferences between the two randomly assignedgroups: this is the double-difference esti-mate obtained by subtracting the preexistingdifferences between the groups, (I0 – C0),
12 CHAPTER 3
15Ravallion (2001) provides a useful discussion on this and related evaluation tools. See also Baker (2000).
Table 3.1 Calculation of the double-difference estimate of average program effect
Intervention group Control group DifferenceSurvey round with RPS program without RPS program across groups
Follow-up I1 C1 I1 – C1
Baseline I0 C0 I0 – C0
Difference across time I1 – I0 C1 – C0 Double-difference(I1 – C1) – (I0 – C0)
from the difference after the program hasbeen implemented, (I1 – C1).
An alternative interpretation of thedouble-difference estimator emerges if onefirst considers the differences within the (in-tervention or control) groups. This approachbegins with a reflexive estimator of the pro-gram effect, the difference over time for theintervention group, (I1 – I0). It is a poten-tially biased estimator because it includesall changes over time in enrollment rates inthe intervention group, regardless of whatcauses them. For example, if increases inpublic investment nationally were improv-ing school access and leading to changes inenrollment, these effects would show up inthe difference over time in the interventiongroup, in addition to the effects attributableto the program. The obvious measure forthe non-program-related change over timein the intervention group is the change overtime in the control group, (C1 – C0). Thusthe average program effect is estimated byfirst considering the total change over timein the intervention group, and then subtract-ing from this the change over time in the
control group. As above, this yields thedouble-difference estimator.
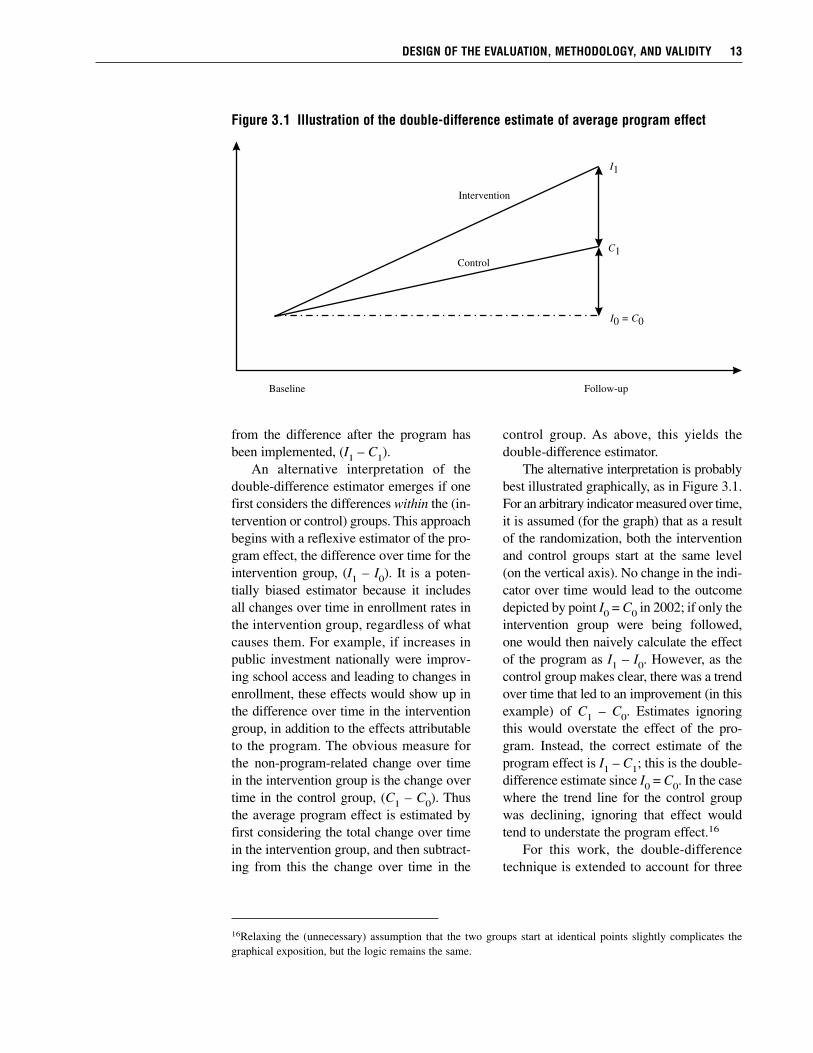
The alternative interpretation is probablybest illustrated graphically, as in Figure 3.1.For an arbitrary indicator measured over time,it is assumed (for the graph) that as a resultof the randomization, both the interventionand control groups start at the same level(on the vertical axis). No change in the indi-cator over time would lead to the outcomedepicted by point I0 = C0 in 2002; if only theintervention group were being followed,one would then naively calculate the effectof the program as I1 – I0. However, as thecontrol group makes clear, there was a trendover time that led to an improvement (in thisexample) of C1 – C0. Estimates ignoringthis would overstate the effect of the pro-gram. Instead, the correct estimate of theprogram effect is I1 – C1; this is the double-difference estimate since I0 = C0. In the casewhere the trend line for the control groupwas declining, ignoring that effect wouldtend to understate the program effect.16
For this work, the double-differencetechnique is extended to account for three
DESIGN OF THE EVALUATION, METHODOLOGY, AND VALIDITY 13
16Relaxing the (unnecessary) assumption that the two groups start at identical points slightly complicates thegraphical exposition, but the logic remains the same.
Figure 3.1 Illustration of the double-difference estimate of average program effect
C1
I1
I = 00 C
Intervention
Control
Baseline Follow-up
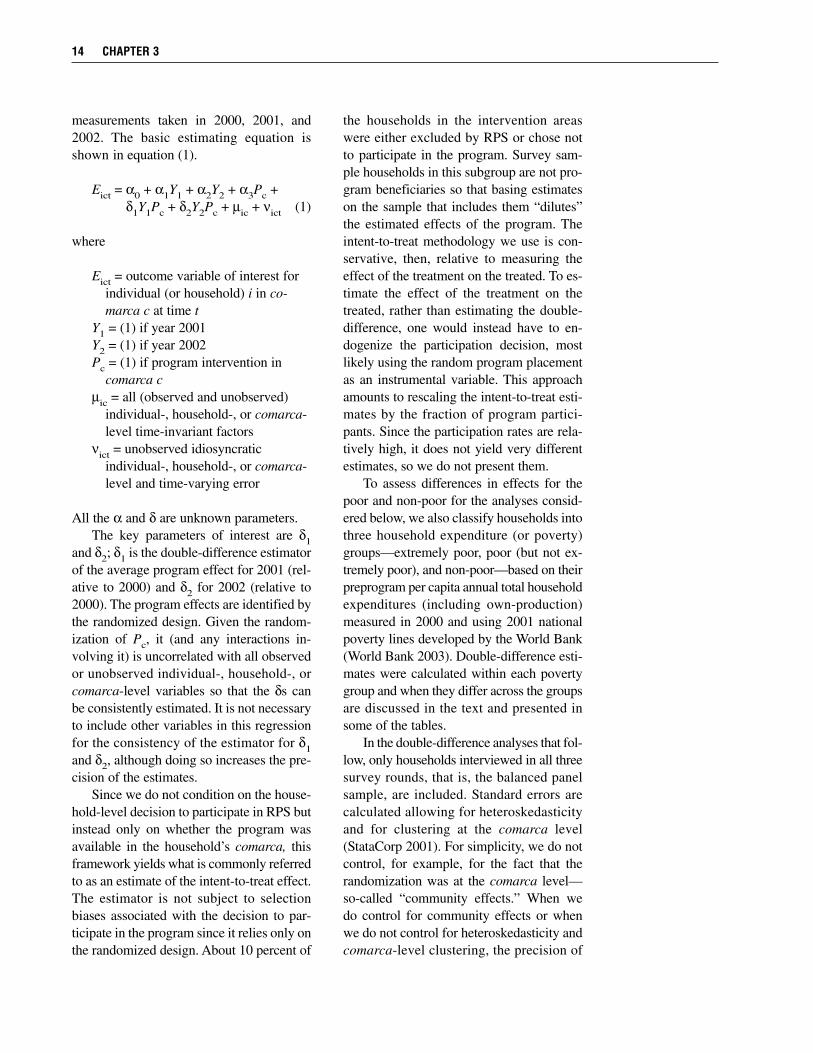
measurements taken in 2000, 2001, and2002. The basic estimating equation isshown in equation (1).
Eict = α0 + α1Y1 + α2Y2 + α3Pc +δ1Y1Pc + δ2Y2Pc + µic + νict (1)
where
Eict = outcome variable of interest forindividual (or household) i in co-marca c at time t
Y1 = (1) if year 2001Y2 = (1) if year 2002Pc = (1) if program intervention in
comarca cµic = all (observed and unobserved)
individual-, household-, or comarca-level time-invariant factors
νict = unobserved idiosyncratic individual-, household-, or comarca-level and time-varying error
All the α and δ are unknown parameters.The key parameters of interest are δ1
and δ2; δ1 is the double-difference estimatorof the average program effect for 2001 (rel-ative to 2000) and δ2 for 2002 (relative to2000). The program effects are identified bythe randomized design. Given the random-ization of Pc, it (and any interactions in-volving it) is uncorrelated with all observedor unobserved individual-, household-, orcomarca-level variables so that the δs canbe consistently estimated. It is not necessaryto include other variables in this regressionfor the consistency of the estimator for δ1and δ2, although doing so increases the pre-cision of the estimates.
Since we do not condition on the house-hold-level decision to participate in RPS butinstead only on whether the program wasavailable in the household’s comarca, thisframework yields what is commonly referredto as an estimate of the intent-to-treat effect.The estimator is not subject to selectionbiases associated with the decision to par-ticipate in the program since it relies only onthe randomized design. About 10 percent of
the households in the intervention areaswere either excluded by RPS or chose notto participate in the program. Survey sam-ple households in this subgroup are not pro-gram beneficiaries so that basing estimateson the sample that includes them “dilutes”the estimated effects of the program. Theintent-to-treat methodology we use is con-servative, then, relative to measuring theeffect of the treatment on the treated. To es-timate the effect of the treatment on thetreated, rather than estimating the double-difference, one would instead have to en-dogenize the participation decision, mostlikely using the random program placementas an instrumental variable. This approachamounts to rescaling the intent-to-treat esti-mates by the fraction of program partici-pants. Since the participation rates are rela-tively high, it does not yield very differentestimates, so we do not present them.
To assess differences in effects for thepoor and non-poor for the analyses consid-ered below, we also classify households intothree household expenditure (or poverty)groups—extremely poor, poor (but not ex-tremely poor), and non-poor—based on theirpreprogram per capita annual total householdexpenditures (including own-production)measured in 2000 and using 2001 nationalpoverty lines developed by the World Bank(World Bank 2003). Double-difference esti-mates were calculated within each povertygroup and when they differ across the groupsare discussed in the text and presented insome of the tables.
In the double-difference analyses that fol-low, only households interviewed in all threesurvey rounds, that is, the balanced panelsample, are included. Standard errors arecalculated allowing for heteroskedasticityand for clustering at the comarca level(StataCorp 2001). For simplicity, we do notcontrol, for example, for the fact that therandomization was at the comarca level—so-called “community effects.” When wedo control for community effects or whenwe do not control for heteroskedasticity andcomarca-level clustering, the precision of
14 CHAPTER 3
nearly all the estimates increases, leading tostronger statistical significance. The estima-tions that follow also ignore the stratifiedsample design which can be corrected forstatistically by using comarca-level sampleweights; correcting for this aspect of thedesign makes no substantive changes to theestimated effects.
Issues and ConcernsRelated to the Experimental DesignThe value of randomized evaluations iswidely recognized. When done well, recipi-ents and nonrecipients will have, on aver-age, the same observed and, more important(since they are more difficult to control for),unobserved, characteristics. As a result, theyestablish a credible basis for comparison,freed from selectivity concerns, and the di-rection of causality is certain. Nonrandom-ized approaches, on the other hand, typicallyrely on assumptions that are often hard tobelieve and almost always hard to verify(Burtless 1995).17 A further advantage to arandomized design is that program impactis easy to calculate and, as a consequence,easier to understand and explain.
Of course, randomized evaluations arenot a panacea. For example, they can becostly (both financially and politically) andoften one must wait years for results, makingthem less useful for pressing policy deci-sions. Moreover, randomized design evalu-ations can provide only partial answers tosome important questions. This is often re-ferred to as their “black box” nature. Theevaluation only allows us to assess mostrigorously the effect of the program (or pro-gram components) that it was explicitly de-
signed to assess.18 Without further model-ing and assumptions (not already explicitto the evaluation design), we are in the darkif we want to consider how even slightlychanging the program alters the effect onthe outcomes under consideration. For ex-ample, RPS provided a package of servicesin which all households were eligible for thefood security transfer, regardless of whetherthey also received the educational transfers.Using only the randomized design on itsown, it is difficult to tease apart the effectsof the education component of the programfrom the nutrition component—all the ob-served effects, even those that pertain specif-ically to educational outcomes, are the re-sult of the program as a whole. Similarly, itis difficult to assess the relative importanceof the demand-side stimulus versus thesupply-side interventions for the observedimprovements in health care—all the ob-served effects reflect the combination ofsupply- and demand-side influences. Norcan we easily and reliably assess what theeffect of the program would be if the size ofany one of the transfers were to change, asthey did when RPS was expanded in 2003.
While in this report we focus primarilyon findings that derive directly from the ex-perimental design, extensions to the analy-sis that begin to address the issues raisedabove or others are possible areas for futureresearch. For example, the design featurethat RPS, in contrast to most other programsof this type, offers household-level educa-tion transfers as opposed to child-level trans-fers, provides the opportunity to explore theeffect of varying the transfer per benefici-ary by comparing households with differentnumbers of school children. Indirectly, thiswould be an assessment of the effect of
DESIGN OF THE EVALUATION, METHODOLOGY, AND VALIDITY 15
17There is a recent increase in non-experimental approaches to evaluation, in particular using propensity scorematching. The evidence is mixed, however, as to whether or not these provide a convincing alternative to exper-imental approaches (Heckman, Lalonde, and Smith 1999; Michalopolous, Bloom, and Hill 2004).
18Furthermore, because by design some members of society remain without the intervention, such evaluations canonly measure partial equilibrium effects of the program, which may be different from the general equilibrium ef-fects, for example, if the program were national (Heckman, Lochner, and Taber 1998).
varying the transfer size. Similarly, the dif-ferent starting dates for the education andhealth components of the program (describedbelow) could be exploited to investigatethe relative importance of each of them.19
Finally, using variation in availability orquality of schooling could provide an op-portunity to separate demand- and supply-side effects on improvements in schooling(Coady and Parker 2004).
Even a well-implemented randomizeddesign, however, is not without potentialweaknesses. Heckman and Smith (1995)highlight that the apparent simplicity canbe deceiving, particularly in poorly designedevaluations where contamination occurs asa result of (1) randomization bias, where theprocess of randomization itself leads to adifferent beneficiary pool than would other-wise have been treated; (2) anticipation ef-fects, where control group behavior changesas the result of changes in expectations; or(3) substitution bias, where nonbeneficiariesobtain similar treatments from differentsources. There is little reason to believe thatthe first consideration (randomization bias)is a concern in the RPS evaluation; for ex-ample, there was no evidence that house-holds moved in part or in whole to obtainthe program (Adato and Roopnaraine 2004).The fourth section of this chapter addressesthe possibility of contamination of thecontrol group suggested by the other twoconcerns.
Another limitation with randomized eval-uations, or nearly any other evaluation forthat matter, is that the results pertain specif-ically to the study population—extrapolatingthem to other populations requires addi-tional assumptions that may not be easy toverify (Burtless 1995). This is typically re-ferred to as the external validity problem. Inthe case of RPS, the purposive selection ofprogram areas may have affected programperformance; the generalizability of the re-sults is therefore less certain. As described
earlier, the selection of municipalities wasconditioned on the likelihood of success, sothat the observed outcomes might exagger-ate the likely outcomes from program ex-pansion to other areas with, for example,weaker institutional capacity to implementthe program. On the other hand, the ob-served outcomes may understate the likelyoutcomes if there was less need for RPS inthese areas because of greater institutionalcapacity.
While it is not possible to claim that the42 selected comarcas are representative ofrural Nicaragua, there is evidence that theyare similar in many key respects to a largenumber of other rural communities in theCentral Region and in the country morebroadly. First, using the marginality indexscores based on the 1975 census (Arcia1999), we estimate that three quarters ofthe approximately 150 rural comarcas in thedepartments of Madriz and Matagalpa havepriority 1 or 2, as do three quarters of theapproximately 1,000 rural comarcas in thecountry as a whole. If instead we considerlevels of extreme poverty, there are morethan 350 comarcas in the country with ex-treme poverty at or above 42 percent, theaverage level in the pilot areas. On thesebroad indicators used for geographical tar-geting, then, there are a large number ofsimilar comarcas, indicating those chosenfor the pilot were not atypical.
A final problem to bear in mind wheninterpreting the results in this analysis is thatthe program was in its pilot phase, and out-comes (and therefore estimated effects) forthe pilot may differ from outcomes for anexpanded or longer-running program. Likemost pilots, RPS underwent an initial learn-ing period (with attendant setbacks) andundertook a variety of activities that mightnot need repeating in an expansion (e.g.,designing the MIS and preparing trainingmaterials for beneficiaries, promotoras, andhealth-care providers). Some of these activ-
16 CHAPTER 3
19We acknowledge an anonymous referee for making this observation.
ities could have reduced the program’seffectiveness during the pilot (Caldés andMaluccio 2005). Moreover, as with any newprogram, there was the potential for ob-served behavioral changes to result, in part,from the novelty of the program or theevaluation—the Hawthorne effect (Krueger1999). There are some patterns consistentwith this phenomenon when we comparethe effects after 1 year (2000–01) with thoseafter 2 years (2000–02). Estimated effectson several outcome indicators were slightlylower in 2002 than in 2001, and not alwaysentirely attributable to improvements in thecontrol group. Unfortunately, we cannotdirectly test how much of this might be dueto a Hawthorne effect, changes in the effec-tiveness of program implementation, or theslight decline in the real value of transfers.Finally, expansion of the program could in-troduce new advantages and disadvantagesassociated with scaling up and economiesof scale. All these factors call for a degree ofcaution in forecasting what would happenwere the program to be extended to othermunicipalities in Nicaragua.
Data CollectionThe data collected for the evaluation werean annual household panel data survey im-plemented in both intervention and controlareas of RPS before the start of the program,in 2000, and after the program began opera-tions, in 2001 and 2002.20 A comprehensivehousehold questionnaire based on the 1998Nicaraguan Living Standards MeasurementSurvey (LSMS) was used (World Bank2001). The LSMS questionnaire was ex-panded in some areas (e.g., child health andeducation) to ensure that all the programindicators were captured, but cut in other
areas (e.g., income from labor and othersources) to minimize respondent burden andensure collection of high-quality data in asingle interview.21 An anthropometric mod-ule for children younger than age 5 was im-plemented in 200022 and 2002, although notin 2001. In this module, height (or length),weight, and hemoglobin (using portableHemocue machines) were measured, follow-ing standard international procedures.
The household survey sample is a strat-ified (at the comarca level) random sampleof all 42 comarcas described above andusing the RPS population census collectedin May 2000 as the sample frame. The areasrepresented comprise a relatively poor partof the rural Central Region in Nicaragua,but the sample is not statistically representa-tive of the six municipalities or other areasof Nicaragua, for that matter. Forty-twohouseholds were randomly selected in eachof the 42 comarcas, yielding an initial targetsample of 1,764 households. The sample sizecalculation was based on assessing the nec-essary sample sizes for the indicators listedin Appendix C. Assuming a random sample,a significance level of 5 percent, and apower of 80 percent, the indicator that re-quired the largest sample size was enroll-ment for grades 1–4. To detect a minimum,statistically significant difference of 8 per-centage points between intervention and con-trol groups, a sample size of 549 studentsfor each group was required. Of course, notall households had children in this agerange. According to the 2000 RPS popula-tion census, 63 percent of households hadat least one child between 6 and 12 yearsof age. Therefore, to obtain a sample of 549children (in different households) it was nec-essary to interview 871 households in eachgroup (549/0.63), or 1,742 in total. Thus,
DESIGN OF THE EVALUATION, METHODOLOGY, AND VALIDITY 17
20Results reported on here are based on the April 2005 release of the Nicaraguan RPS evaluation data, availablefrom IFPRI.
21LSMS surveys are typically implemented in two visits to the household (Grosh and Glewwe 2000).
22About one-half of the 2000 anthropometry survey had to be completed in early October, one month after themain survey, owing to delays in getting all the necessary equipment and supplies for hemoglobin testing.
the target sample was calculated as 1,764households (42 households in each of the 42comarcas).23 The first wave of fieldworkwas carried out in late August and early Sep-tember 2000, without replacement—that is,when it was not possible to interview a se-lected household, another household wasnot substituted.
Although there was a great deal ofprogress in getting RPS started throughout2001, it was not possible to design and im-plement all the components according to theoriginal timelines. In particular, the health-care component was not initiated until June2001. This delay occurred because it tooklonger than originally planned to design theintervention and to select, contract, and trainthe NGO and private health-care providers.There were also delays in the delivery oftransfers to households because of a gov-ernmental audit that effectively froze RPSfunds. As a result, the RPS 2001 follow-upsurvey was delayed until the beginning ofOctober, to allow additional time for theinterventions to take root and for five of thescheduled six transfers to be effected. Ofcourse, the advantage of the original design,with the scheduled RPS follow-up at exactlythe same time of year as the 2000 baseline,was that it would enable one to control bet-ter for possible seasonal variations in con-sumption and health. The change in surveydate should have little effect on schooling,however, since the school year begins inlate January and ends in November. With acontrol group, the possible bias introducedby seasonality is addressed by differencingacross intervention and control groups. Thisdifference in the timing of the survey, then,does not present a serious problem for theestimation of average program effects.
Moreover, the delay in the survey workhad the advantage of giving the programmore time to take effect, thereby providinga more realistic evaluation of program oper-ations, rather than an evaluation of programdelays. In October 2001, then, beneficiarieshad been receiving transfers and the educa-tional components of the program had beenmonitored for 13 months, but had only re-ceived 5 months of the health-care services,including the health education workshops.The unforeseen delay in operations illus-trates the importance of having a crediblecontrol group—without the control it wouldhave been risky to alter the timing of thesurvey and still confidently attribute observedchanges to RPS. The 2002 survey was alsocarried out in October and in the secondyear beneficiaries received all componentsof the program for a full 12 months.
We now document non-response in the2000 baseline survey and attrition and con-tamination in the follow-up surveys. Overall,90 percent (1,581) of the stratified randomsample was interviewed in the first round(see Table 3.2) with slightly lower comple-tion in control comarcas. The principal rea-sons for failure to interview targeted samplehouseholds were that household memberswere temporarily absent (i.e., more than theseveral days the survey team would be inthe area) or that the dwelling appeared to beuninhabited—both of which are likely tobe associated with temporary or permanentmigration. In a handful of comarcas thecoverage was 100 percent, but in six it wasunder 80 percent. For the follow-up surveysin October 2001, the target sample was lim-ited to these 1,581 first-round interviews and1,453 (91.9 percent) were re-interviewed.24
Among those classified as not being re-
18 CHAPTER 3
23IFPRI (2001a) describes the sample size calculations in more detail and IFPRI (2001b, 2003) describe the base-line and follow-up samples in more detail. Since anthropometric measures were not part of the original indicatorlist to be evaluated, they were not used in sample size calculations.
24Where possible, households who had moved within the six program municipalities were traced to their newlocations.
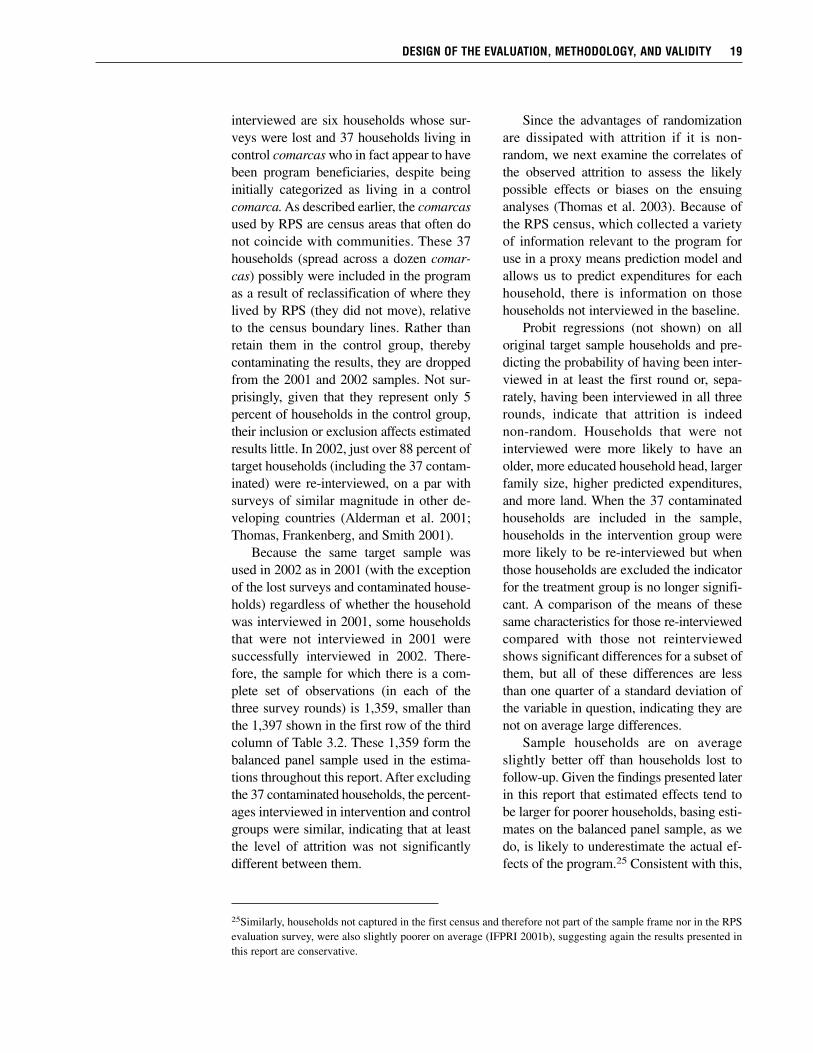
interviewed are six households whose sur-veys were lost and 37 households living incontrol comarcas who in fact appear to havebeen program beneficiaries, despite beinginitially categorized as living in a controlcomarca. As described earlier, the comarcasused by RPS are census areas that often donot coincide with communities. These 37households (spread across a dozen comar-cas) possibly were included in the programas a result of reclassification of where theylived by RPS (they did not move), relativeto the census boundary lines. Rather thanretain them in the control group, therebycontaminating the results, they are droppedfrom the 2001 and 2002 samples. Not sur-prisingly, given that they represent only 5percent of households in the control group,their inclusion or exclusion affects estimatedresults little. In 2002, just over 88 percent oftarget households (including the 37 contam-inated) were re-interviewed, on a par withsurveys of similar magnitude in other de-veloping countries (Alderman et al. 2001;Thomas, Frankenberg, and Smith 2001).
Because the same target sample wasused in 2002 as in 2001 (with the exceptionof the lost surveys and contaminated house-holds) regardless of whether the householdwas interviewed in 2001, some householdsthat were not interviewed in 2001 weresuccessfully interviewed in 2002. There-fore, the sample for which there is a com-plete set of observations (in each of thethree survey rounds) is 1,359, smaller thanthe 1,397 shown in the first row of the thirdcolumn of Table 3.2. These 1,359 form thebalanced panel sample used in the estima-tions throughout this report. After excludingthe 37 contaminated households, the percent-ages interviewed in intervention and controlgroups were similar, indicating that at leastthe level of attrition was not significantlydifferent between them.
Since the advantages of randomizationare dissipated with attrition if it is non-random, we next examine the correlates ofthe observed attrition to assess the likelypossible effects or biases on the ensuinganalyses (Thomas et al. 2003). Because ofthe RPS census, which collected a varietyof information relevant to the program foruse in a proxy means prediction model andallows us to predict expenditures for eachhousehold, there is information on thosehouseholds not interviewed in the baseline.
Probit regressions (not shown) on alloriginal target sample households and pre-dicting the probability of having been inter-viewed in at least the first round or, sepa-rately, having been interviewed in all threerounds, indicate that attrition is indeednon-random. Households that were notinterviewed were more likely to have anolder, more educated household head, largerfamily size, higher predicted expenditures,and more land. When the 37 contaminatedhouseholds are included in the sample,households in the intervention group weremore likely to be re-interviewed but whenthose households are excluded the indicatorfor the treatment group is no longer signifi-cant. A comparison of the means of thesesame characteristics for those re-interviewedcompared with those not reinterviewedshows significant differences for a subset ofthem, but all of these differences are lessthan one quarter of a standard deviation ofthe variable in question, indicating they arenot on average large differences.
Sample households are on averageslightly better off than households lost tofollow-up. Given the findings presented laterin this report that estimated effects tend tobe larger for poorer households, basing esti-mates on the balanced panel sample, as wedo, is likely to underestimate the actual ef-fects of the program.25 Consistent with this,
DESIGN OF THE EVALUATION, METHODOLOGY, AND VALIDITY 19
25Similarly, households not captured in the first census and therefore not part of the sample frame nor in the RPSevaluation survey, were also slightly poorer on average (IFPRI 2001b), suggesting again the results presented inthis report are conservative.
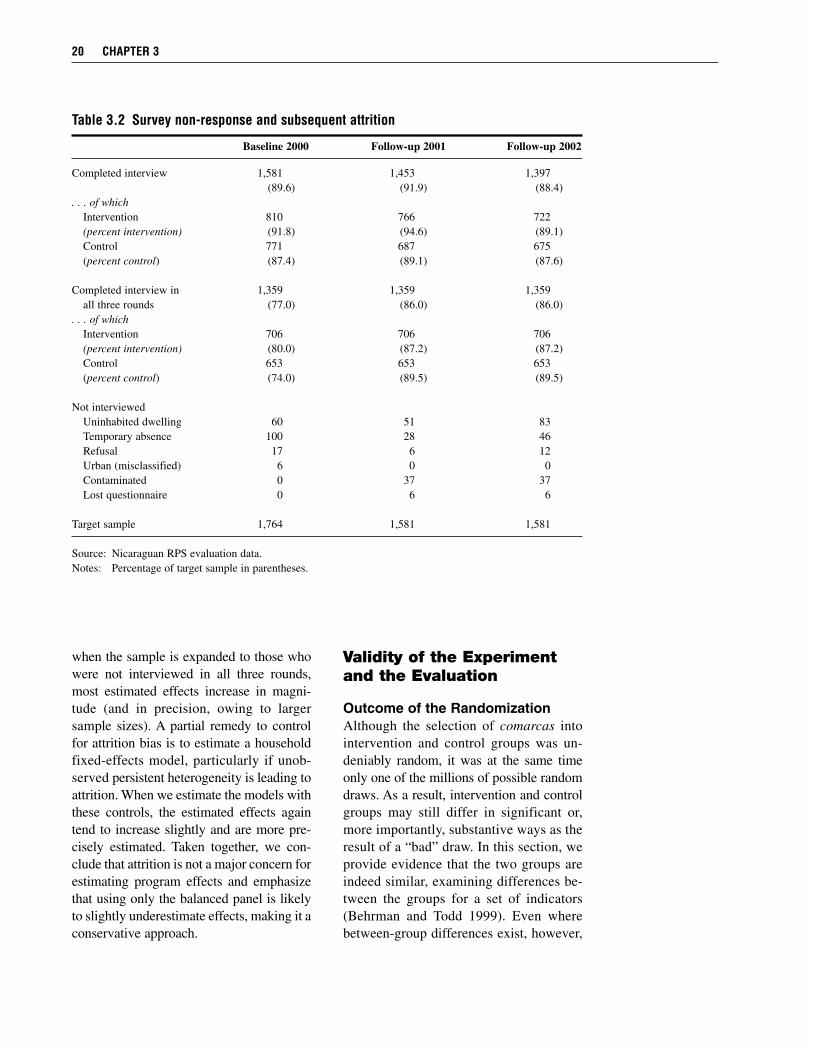
when the sample is expanded to those whowere not interviewed in all three rounds,most estimated effects increase in magni-tude (and in precision, owing to largersample sizes). A partial remedy to controlfor attrition bias is to estimate a householdfixed-effects model, particularly if unob-served persistent heterogeneity is leading toattrition. When we estimate the models withthese controls, the estimated effects againtend to increase slightly and are more pre-cisely estimated. Taken together, we con-clude that attrition is not a major concern forestimating program effects and emphasizethat using only the balanced panel is likelyto slightly underestimate effects, making it aconservative approach.
Validity of the Experimentand the Evaluation
Outcome of the RandomizationAlthough the selection of comarcas intointervention and control groups was un-deniably random, it was at the same timeonly one of the millions of possible randomdraws. As a result, intervention and controlgroups may still differ in significant or,more importantly, substantive ways as theresult of a “bad” draw. In this section, weprovide evidence that the two groups areindeed similar, examining differences be-tween the groups for a set of indicators(Behrman and Todd 1999). Even wherebetween-group differences exist, however,
20 CHAPTER 3
Table 3.2 Survey non-response and subsequent attrition
Baseline 2000 Follow-up 2001 Follow-up 2002
Completed interview 1,581 1,453 1,397(89.6) (91.9) (88.4)
. . . of whichIntervention 810 766 722(percent intervention) (91.8) (94.6) (89.1)Control 771 687 675(percent control) (87.4) (89.1) (87.6)
Completed interview in 1,359 1,359 1,359all three rounds (77.0) (86.0) (86.0)
. . . of whichIntervention 706 706 706(percent intervention) (80.0) (87.2) (87.2)Control 653 653 653(percent control) (74.0) (89.5) (89.5)
Not interviewedUninhabited dwelling 60 51 83Temporary absence 100 28 46Refusal 17 6 12Urban (misclassified) 6 0 0Contaminated 0 37 37Lost questionnaire 0 6 6
Target sample 1,764 1,581 1,581
Source: Nicaraguan RPS evaluation data.Notes: Percentage of target sample in parentheses.
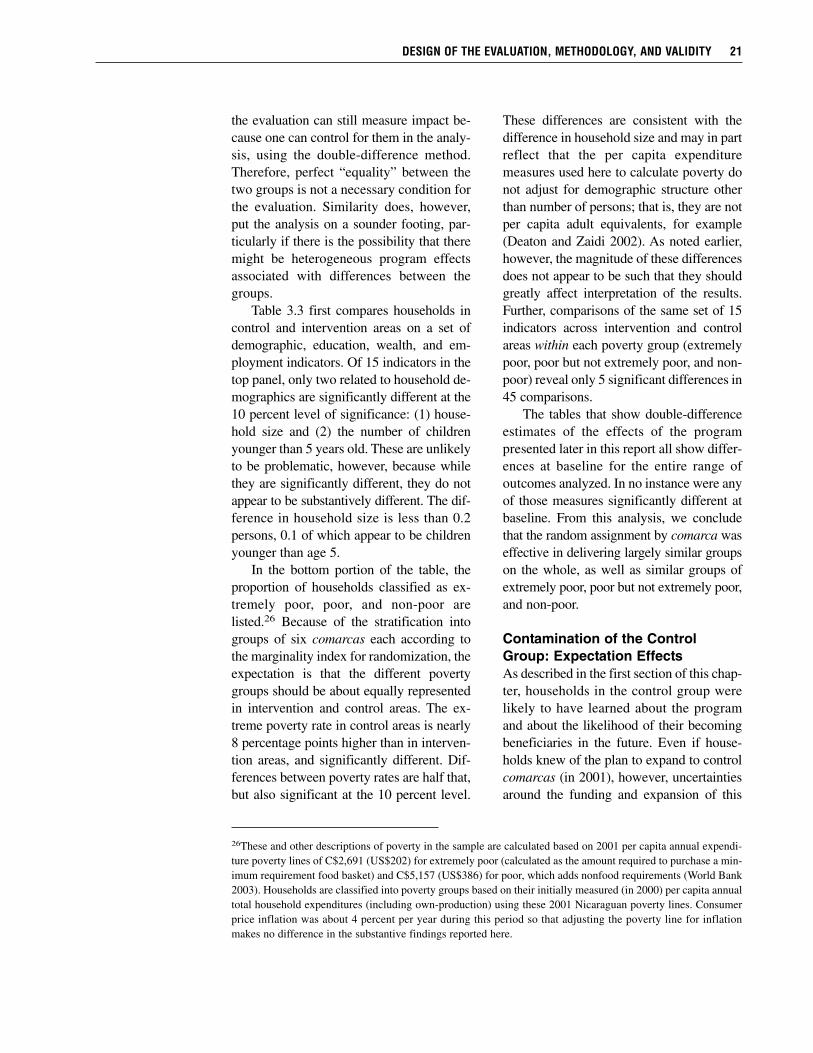
the evaluation can still measure impact be-cause one can control for them in the analy-sis, using the double-difference method.Therefore, perfect “equality” between thetwo groups is not a necessary condition forthe evaluation. Similarity does, however,put the analysis on a sounder footing, par-ticularly if there is the possibility that theremight be heterogeneous program effectsassociated with differences between thegroups.
Table 3.3 first compares households incontrol and intervention areas on a set ofdemographic, education, wealth, and em-ployment indicators. Of 15 indicators in thetop panel, only two related to household de-mographics are significantly different at the10 percent level of significance: (1) house-hold size and (2) the number of childrenyounger than 5 years old. These are unlikelyto be problematic, however, because whilethey are significantly different, they do notappear to be substantively different. The dif-ference in household size is less than 0.2persons, 0.1 of which appear to be childrenyounger than age 5.
In the bottom portion of the table, theproportion of households classified as ex-tremely poor, poor, and non-poor arelisted.26 Because of the stratification intogroups of six comarcas each according tothe marginality index for randomization, theexpectation is that the different povertygroups should be about equally representedin intervention and control areas. The ex-treme poverty rate in control areas is nearly8 percentage points higher than in interven-tion areas, and significantly different. Dif-ferences between poverty rates are half that,but also significant at the 10 percent level.
These differences are consistent with thedifference in household size and may in partreflect that the per capita expendituremeasures used here to calculate poverty donot adjust for demographic structure otherthan number of persons; that is, they are notper capita adult equivalents, for example(Deaton and Zaidi 2002). As noted earlier,however, the magnitude of these differencesdoes not appear to be such that they shouldgreatly affect interpretation of the results.Further, comparisons of the same set of 15indicators across intervention and controlareas within each poverty group (extremelypoor, poor but not extremely poor, and non-poor) reveal only 5 significant differences in45 comparisons.
The tables that show double-differenceestimates of the effects of the programpresented later in this report all show differ-ences at baseline for the entire range ofoutcomes analyzed. In no instance were anyof those measures significantly different atbaseline. From this analysis, we concludethat the random assignment by comarca waseffective in delivering largely similar groupson the whole, as well as similar groups ofextremely poor, poor but not extremely poor,and non-poor.
Contamination of the ControlGroup: Expectation EffectsAs described in the first section of this chap-ter, households in the control group werelikely to have learned about the programand about the likelihood of their becomingbeneficiaries in the future. Even if house-holds knew of the plan to expand to controlcomarcas (in 2001), however, uncertaintiesaround the funding and expansion of this
DESIGN OF THE EVALUATION, METHODOLOGY, AND VALIDITY 21
26These and other descriptions of poverty in the sample are calculated based on 2001 per capita annual expendi-ture poverty lines of C$2,691 (US$202) for extremely poor (calculated as the amount required to purchase a min-imum requirement food basket) and C$5,157 (US$386) for poor, which adds nonfood requirements (World Bank2003). Households are classified into poverty groups based on their initially measured (in 2000) per capita annualtotal household expenditures (including own-production) using these 2001 Nicaraguan poverty lines. Consumerprice inflation was about 4 percent per year during this period so that adjusting the poverty line for inflationmakes no difference in the substantive findings reported here.
22 CHAPTER 3
Table 3.3 Comparison of intervention and control comarcas at baseline 2000
Difference Intervention Control (intervention Total
Indicator (n = 706) (n = 653) – control) (n = 1359)
Household size 5.93 6.12 –0.19* 6.02(2.95) (2.78) [0.10] (2.87)
Number of children <5 years old 1.09 1.19 –0.10** 1.13(1.10) (1.06) [0.04] (1.08)
Number of children <3 years old 0.71 0.77 –0.06 0.74(0.85) (0.82) [0.13] (0.84)
Percentage of female-headed households 13.2 15.3 –2.1 14.2[0.26]
Age of household head 44.6 43.9 0.7 44.3(16.1) (15.3) [0.57] (15.7)
Years of education of household head 1.69 1.60 0.09 1.65(2.17) (2.22) [0.41] (2.20)
Average years of education of adults 2.21 2.23 –0.02 2.22(1.87) (1.85) [0.58] (1.86)
Percentage of children between 7 and 13 years 68.1 68.5 –0.04 68.2of age who matriculated [0.66]
Time it takes to walk to school (minutes) 26.6 21.8 4.8 24.3(34.1) (24.2) [0.13] (29.8)
Number of rooms in the home 1.50 1.53 –0.03 1.51(0.78) (0.84) [0.69] (0.81)
Number of durable goodsa 0.23 0.23 0.00 0.23(0.47) (0.47) [0.86] (0.47)
Size of land owned (hectares) 1.41 1.49 –0.08 1.45(1.47) (1.88) [0.69] (1.68)
Percentage working as agricultural producer 83.1 82.8 0.3 83.0[0.88]
Percentage working in coffee 9.9 8.6 1.3 9.3[0.40]
Percentage using credit 15.3 16.4 –1.1 15.8[0.58]
Expenditure class in baselineExtremely poor 33.9 41.3 –7.5*** 37.5
[<0.01]Poor 75.6 79.5 –3.9* 77.5
[0.09] 22.5Non-poor 24.4 20.5 –3.9*
[0.09]
Source: Nicaraguan RPS evaluation data.Notes: Standard deviation in parentheses and p-values in brackets for test of equality of populations across
groups using two-tailed proportion test for proportions and non-parametric Kruskal-Wallis test for allothers (StataCorp 2001). Analysis based on 706 observations in the intervention group and 653 obser-vations in the control group in each year. Bold indicates significance at *** the 1 percent level, ** the5 percent level, and * the 10 percent level. aIncludes radio/tape recorder, stove, air conditioner, and fan.
government-run program would certainlyhave led them to assign a probability of lessthan one to that eventuality. The uncertaintyis underscored by the fact that the originalplan was in fact not fulfilled, and controlhouseholds did not enter the program untilmore than a year after originally envisioned.Nevertheless, we cannot rule out the pos-sibility that households had expectationsabout receiving the program, and that theychanged their behavior based on thoseexpectations.
Rational households aware of the pro-gram likely would have endeavored to learnabout it, in an effort to better position them-selves as potential beneficiaries. One indi-cator of program knowledge (available in2002) is how well households answered sixtrue-or-false questions about program re-quirements.27 On average, about half of thehouseholds in the control group answeredthat they did not know. Of those who indi-cated they knew, approximately three quar-ters answered each question correctly. Al-though specific knowledge of the programwas not the norm among non-beneficiaries,it appears that approximately one-third wereaware of specific program features.
Thus, contamination of the control groupdue to expectations is a real possibility, al-though it may be limited to only a fractionof the households. The possible effects ofsuch contamination are themselves ambigu-ous, however. Perhaps the largest influenceof this type of contamination would beseen in school enrollment. If there was anexpectation that households would partici-pate in RPS (with its eligibility requirementsaround schooling) 1 or 2 years down theroad, their incentives for current schoolingdecisions would change. There may be aninter-temporal substitution effect, in which
households decrease school enrollment inthe current period while it is unsubsidized,or there may be complementarities betweencurrent and future schooling (if it is costly togo back to school), raising current enroll-ment. There also may be incentives to holdchildren back so that they do not reach fifthgrade before the program begins, althoughthis is less clear in cases where there wereyounger siblings who would be eligible.Clearly, the sum of these possible effects onschooling decisions is ambiguous. It is evenless clear whether and how other behaviors,for example, around care of children youngerthan age 5, might change in anticipation ofthe program. Unfortunately, we can bringlittle additional evidence to bear on theseconcerns.
We therefore emphasize the possibilitythat such contamination may confound someof the double-difference estimates. For ex-ample, in the case of school enrollments,double-difference estimates may tend to un-derstate the effects of the program if controlgroup expectations led to an increase in en-rollment in control areas. Further, it mayconfound comparisons across subgroups tothe extent such contamination was not uni-form, for example, if it affected children ofdifferent ages differently. Therefore, wheninterpreting results such as those around ed-ucational decisions, we consider results thatinclude as well as results that exclude olderchildren who plausibly would have been af-fected differentially by the possible changesin behavior. Finally, in addition to double-difference estimates, the tables presentsingle-difference estimates including reflex-ive differences within intervention comar-cas over time, to permit an assessment of theextent to which such contamination mightbe affecting the double-difference estimates.
DESIGN OF THE EVALUATION, METHODOLOGY, AND VALIDITY 23
27Questions included statements such as: “To be a beneficiary of RPS, the household must take one-year old chil-dren to checkups every two months.” This statement is false, as the requirement for children younger than 2 yearsold is monthly. Adato and Roopnaraine (2004) indicate that beneficiaries knew these requirements very well.
Contamination of the ControlGroup: Other ProgramsA second possible source of contaminationis attributable to other programs, referred toas substitution bias by Heckman and Smith(1995). This occurs when households incontrol comarcas participate in programssimilar or complementary to RPS. The delayby 1 year before the control group was in-cluded may have increased the probabilityof such contamination, as it gave NGOs andothers more time to adjust to the presence ofRPS in intervention comarcas, possibly bypulling their programs out of interventionareas and increasing their efforts in controlareas. While the RPS evaluation was sanc-tioned by the Government of Nicaragua and,therefore, plans were coordinated such thatother large government programs (such asthe Programa de Atención Integral a LaNiñez Nicaragüense [PAININ]) avoidedentering these areas over this period, otheractors less tied to the government were notprohibited from doing so. To the extent otherprograms are not simply reacting to theevaluation itself, this design offers a morereasonable counterfactual compared to onein which no other program was allowed toenter the area.
Potential contamination by other devel-opment programs providing services tohouseholds was monitored in the annualhousehold surveys. These data allow us tocalculate the percentage of households ineach comarca that were benefiting froman array of possible programs and services,and to determine whether or not RPS wasthe provider. Services provided by RPS fallinto three of the dozen categories listed,shown in the top panel of Table 3.4: (1) pro-vision of school supplies (via the educationsupplies transfer), (2) promotion and moni-toring of child growth and development, and(3) food support to families. Table 3.4 showsthat the percentages of households receiving
these services from RPS increased dramati-cally between 2000 and 2001 and, with theexception of food support to families, con-tinued to rise in 2002.28 Receipt of theseservices by intervention-area householdsfrom non-RPS providers fell from 2000 to2002, suggesting that other providers werecrowded out by RPS. This decline was par-ticularly sharp for the provision of schoolsupplies but less so for the two other services,which started at much lower levels. Thiscrowding out effect seems also to have ex-tended to control areas, as the percentage ofhouseholds receiving school supplies theredeclined from 35 percent in 2000 to 11 per-cent in 2001, rebounding in part to 20 percentin 2002. We are unable to determine whetherthese similarly sized parallel changes in thepercentage benefiting from non-RPS pro-vided school supplies in intervention andcontrol areas were due to crowding out orsimply a regional contraction of this pro-gram by the Ministry of Education.
In addition to the services provided byRPS, we also examine the percentages ofbeneficiaries for nine other kinds of pro-grams that, while not actual components ofRPS, may influence some of the same out-comes considered in the evaluation of RPS,such as household expenditures, primaryschool enrollment, or health-care and nutri-tional status of children. Except for schoolfeeding, all of these other programs wereoperating at low levels in these marginal,rural areas, and were approximately equallydistributed across intervention and controlcomarcas. Furthermore, the comarca leveldata show that, if anything, the density ofthese other programs is generally lower incontrol comarcas.
A notable trend in both intervention andcontrol areas was the substantial increase inthe percentage of households whose chil-dren benefited from school feeding. In 2000,11–13 percent of households benefited from
24 CHAPTER 3
28We are unable to explain why there was such a sharp drop in the “food supply” category in 2002 and suspectthere was a problem of interpretation in training or in the field for that question in that survey round.
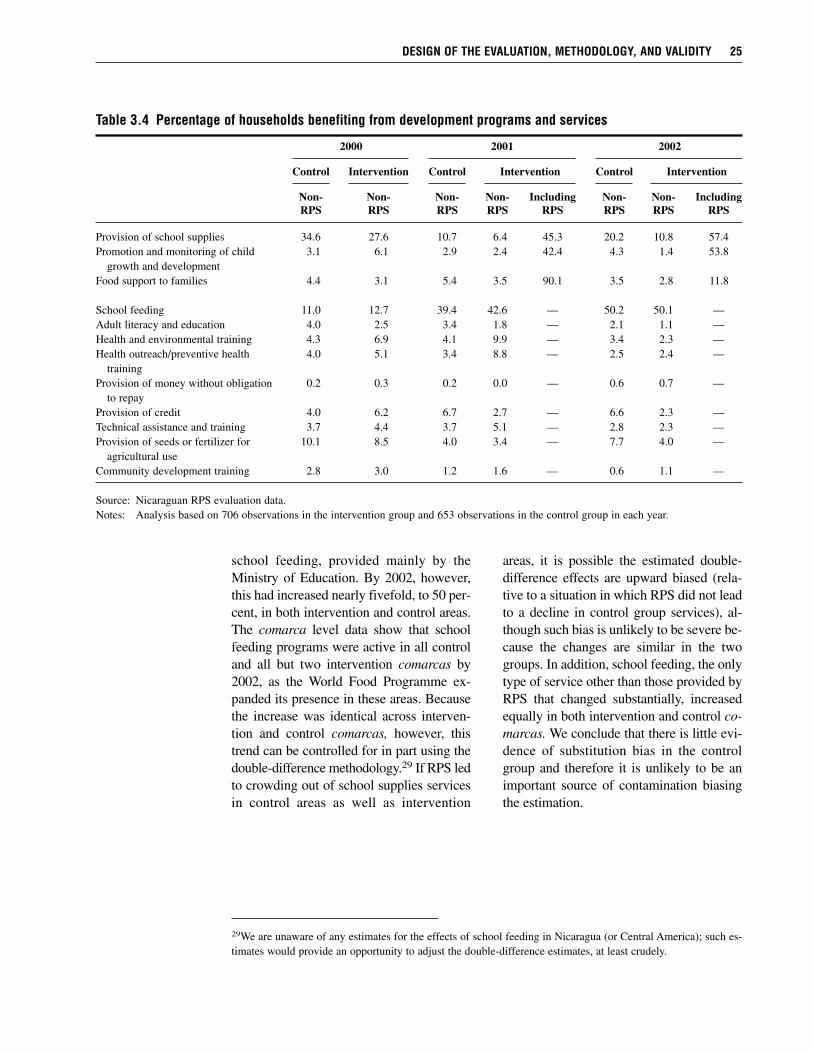
school feeding, provided mainly by theMinistry of Education. By 2002, however,this had increased nearly fivefold, to 50 per-cent, in both intervention and control areas.The comarca level data show that schoolfeeding programs were active in all controland all but two intervention comarcas by2002, as the World Food Programme ex-panded its presence in these areas. Becausethe increase was identical across interven-tion and control comarcas, however, thistrend can be controlled for in part using thedouble-difference methodology.29 If RPS ledto crowding out of school supplies servicesin control areas as well as intervention
areas, it is possible the estimated double-difference effects are upward biased (rela-tive to a situation in which RPS did not leadto a decline in control group services), al-though such bias is unlikely to be severe be-cause the changes are similar in the twogroups. In addition, school feeding, the onlytype of service other than those provided byRPS that changed substantially, increasedequally in both intervention and control co-marcas. We conclude that there is little evi-dence of substitution bias in the controlgroup and therefore it is unlikely to be animportant source of contamination biasingthe estimation.
DESIGN OF THE EVALUATION, METHODOLOGY, AND VALIDITY 25
29We are unaware of any estimates for the effects of school feeding in Nicaragua (or Central America); such es-timates would provide an opportunity to adjust the double-difference estimates, at least crudely.
Table 3.4 Percentage of households benefiting from development programs and services
2000 2001 2002
Control Intervention Control Intervention Control Intervention
Non- Non- Non- Non- Including Non- Non- IncludingRPS RPS RPS RPS RPS RPS RPS RPS
Provision of school supplies 34.6 27.6 10.7 6.4 45.3 20.2 10.8 57.4Promotion and monitoring of child 3.1 6.1 2.9 2.4 42.4 4.3 1.4 53.8
growth and developmentFood support to families 4.4 3.1 5.4 3.5 90.1 3.5 2.8 11.8
School feeding 11.0 12.7 39.4 42.6 — 50.2 50.1 —Adult literacy and education 4.0 2.5 3.4 1.8 — 2.1 1.1 —Health and environmental training 4.3 6.9 4.1 9.9 — 3.4 2.3 —Health outreach/preventive health 4.0 5.1 3.4 8.8 — 2.5 2.4 —
trainingProvision of money without obligation 0.2 0.3 0.2 0.0 — 0.6 0.7 —
to repayProvision of credit 4.0 6.2 6.7 2.7 — 6.6 2.3 —Technical assistance and training 3.7 4.4 3.7 5.1 — 2.8 2.3 —Provision of seeds or fertilizer for 10.1 8.5 4.0 3.4 — 7.7 4.0 —
agricultural useCommunity development training 2.8 3.0 1.2 1.6 — 0.6 1.1 —
Source: Nicaraguan RPS evaluation data.Notes: Analysis based on 706 observations in the intervention group and 653 observations in the control group in each year.
C H A P T E R 4
The Effects of Conditional Cash Transfers:The Red de Protección Social
The IADB loan document contained a set of specific indicators and numerical goals forthe first year of operations as a condition for approval of the second tranche of the loanfinancing RPS (see Appendix C), and these were used in the sample size calculations
described in the first section of Chapter 3. Although the program achieved most of these goalsand the loan extension was approved in 2003, we do not emphasize these specific indicatorsin our analysis because (1) they represent only a subset of the possible effects of the program,(2) they are somewhat arbitrary because there was little information on which to base numer-ical goals during the design stage, and (3) they largely measure process or inputs and did notcapture the underlying objectives of the program such as improved human capital. While thetrend by development institutions to embed project evaluations in projects from the start ispositive, we would caution against overspecifying the goals or holding to them too rigidly, par-ticularly when little evidence of similar programs exists.30 Hence, although we present resultsfor the contractually agreed-to indicators, we do not compare the results with the numericalgoals. Moreover, we present results on a large number of additional indicators including directmeasures of one form of human capital, the nutritional status of children younger than age 5.
Household ExpendituresDespite strong growth in the late 1990s and in 2000 when gross domestic product grew nearly13 percent, Nicaragua had the lowest per capita GDP in Central America in 2000. Subsequentslow growth, however, meant that income per capita was essentially stagnant over the2000–02 period (World Bank 2004). At the outset, 36–61 percent of the rural population ineach of the RPS municipalities was extremely poor and 78–90 percent was extremely poor orpoor, compared with national averages in 1998 of 21 and 45 percent, respectively. Within the42 comarcas selected for the program evaluation, 42 percent of the population was extremelypoor before the program—that is to say, their total expenditures were less than the amountnecessary to purchase a food basket providing minimum caloric requirements (World Bank2003)—and 80 percent extremely poor or poor. Moreover, the majority of the remaininghouseholds, or “non-poor” in the sample, was in the bottom two-thirds of the nationalNicaraguan per capita expenditure distribution and so was near-poor. Clearly there was sub-stantial need, and hence scope for alleviating current poverty, in this population.
30During Phase I, RPS and IADB renegotiated the indicators, indicating they were not rigidly applied in this case.
26
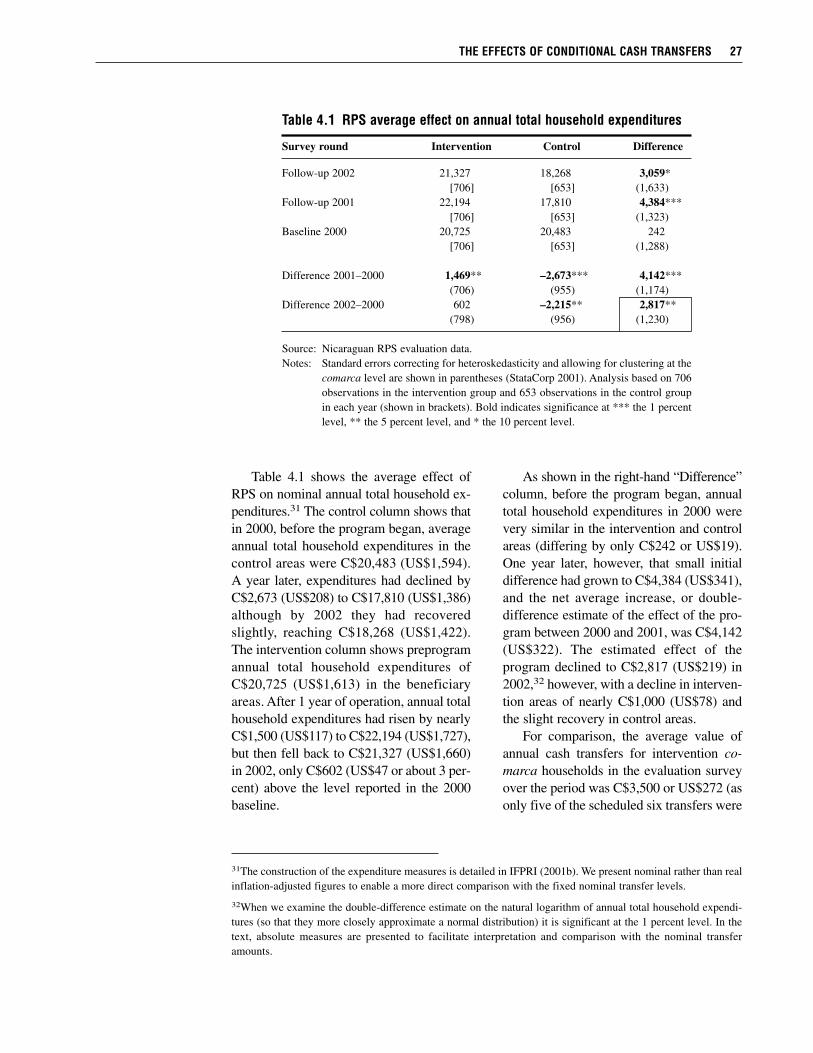
Table 4.1 shows the average effect ofRPS on nominal annual total household ex-penditures.31 The control column shows thatin 2000, before the program began, averageannual total household expenditures in thecontrol areas were C$20,483 (US$1,594).A year later, expenditures had declined byC$2,673 (US$208) to C$17,810 (US$1,386)although by 2002 they had recoveredslightly, reaching C$18,268 (US$1,422).The intervention column shows preprogramannual total household expenditures ofC$20,725 (US$1,613) in the beneficiaryareas. After 1 year of operation, annual totalhousehold expenditures had risen by nearlyC$1,500 (US$117) to C$22,194 (US$1,727),but then fell back to C$21,327 (US$1,660)in 2002, only C$602 (US$47 or about 3 per-cent) above the level reported in the 2000baseline.
As shown in the right-hand “Difference”column, before the program began, annualtotal household expenditures in 2000 werevery similar in the intervention and controlareas (differing by only C$242 or US$19).One year later, however, that small initialdifference had grown to C$4,384 (US$341),and the net average increase, or double-difference estimate of the effect of the pro-gram between 2000 and 2001, was C$4,142(US$322). The estimated effect of theprogram declined to C$2,817 (US$219) in2002,32 however, with a decline in interven-tion areas of nearly C$1,000 (US$78) andthe slight recovery in control areas.
For comparison, the average value ofannual cash transfers for intervention co-marca households in the evaluation surveyover the period was C$3,500 or US$272 (asonly five of the scheduled six transfers were
THE EFFECTS OF CONDITIONAL CASH TRANSFERS 27
31The construction of the expenditure measures is detailed in IFPRI (2001b). We present nominal rather than realinflation-adjusted figures to enable a more direct comparison with the fixed nominal transfer levels.
32When we examine the double-difference estimate on the natural logarithm of annual total household expendi-tures (so that they more closely approximate a normal distribution) it is significant at the 1 percent level. In thetext, absolute measures are presented to facilitate interpretation and comparison with the nominal transferamounts.
Table 4.1 RPS average effect on annual total household expenditures
Survey round Intervention Control Difference
Follow-up 2002 21,327 18,268 3,059*[706] [653] (1,633)
Follow-up 2001 22,194 17,810 4,384***[706] [653] (1,323)
Baseline 2000 20,725 20,483 242[706] [653] (1,288)
Difference 2001–2000 1,469** –2,673*** 4,142***(706) (955) (1,174)
Difference 2002–2000 602 –2,215** 2,817**(798) (956) (1,230)
Source: Nicaraguan RPS evaluation data.Notes: Standard errors correcting for heteroskedasticity and allowing for clustering at the
comarca level are shown in parentheses (StataCorp 2001). Analysis based on 706observations in the intervention group and 653 observations in the control groupin each year (shown in brackets). Bold indicates significance at *** the 1 percentlevel, ** the 5 percent level, and * the 10 percent level.
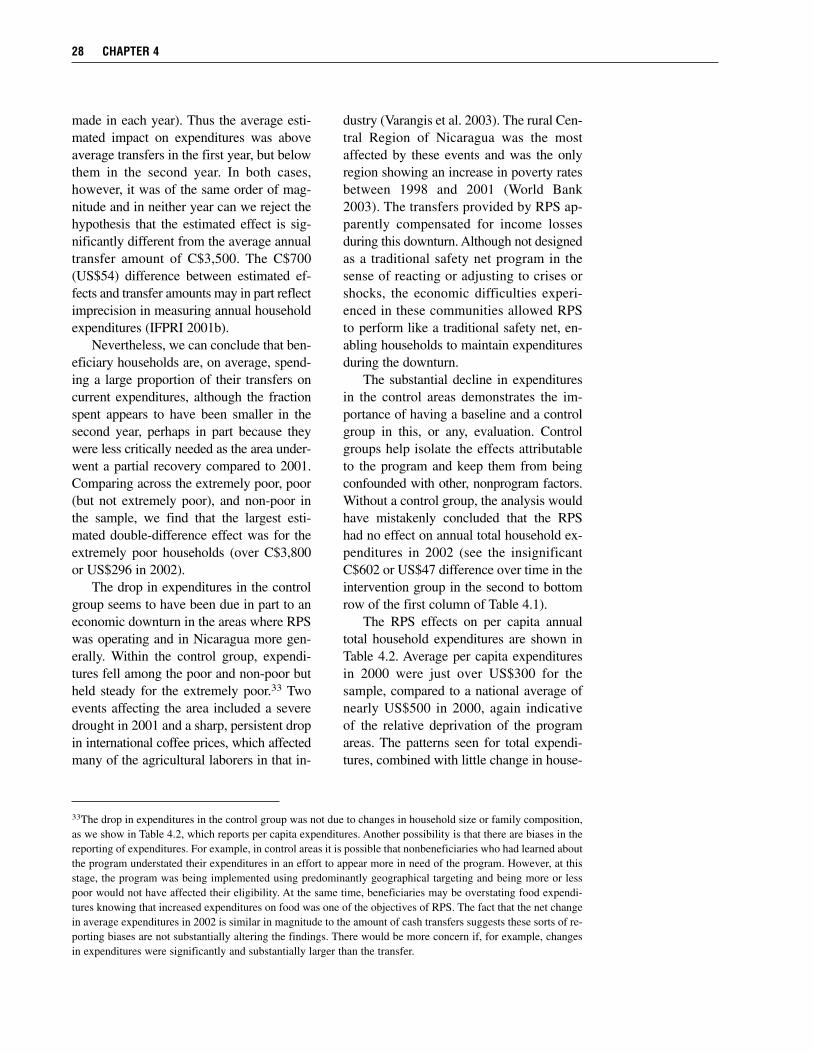
made in each year). Thus the average esti-mated impact on expenditures was aboveaverage transfers in the first year, but belowthem in the second year. In both cases,however, it was of the same order of mag-nitude and in neither year can we reject thehypothesis that the estimated effect is sig-nificantly different from the average annualtransfer amount of C$3,500. The C$700(US$54) difference between estimated ef-fects and transfer amounts may in part reflectimprecision in measuring annual householdexpenditures (IFPRI 2001b).
Nevertheless, we can conclude that ben-eficiary households are, on average, spend-ing a large proportion of their transfers oncurrent expenditures, although the fractionspent appears to have been smaller in thesecond year, perhaps in part because theywere less critically needed as the area under-went a partial recovery compared to 2001.Comparing across the extremely poor, poor(but not extremely poor), and non-poor inthe sample, we find that the largest esti-mated double-difference effect was for theextremely poor households (over C$3,800or US$296 in 2002).
The drop in expenditures in the controlgroup seems to have been due in part to aneconomic downturn in the areas where RPSwas operating and in Nicaragua more gen-erally. Within the control group, expendi-tures fell among the poor and non-poor butheld steady for the extremely poor.33 Twoevents affecting the area included a severedrought in 2001 and a sharp, persistent dropin international coffee prices, which affectedmany of the agricultural laborers in that in-
dustry (Varangis et al. 2003). The rural Cen-tral Region of Nicaragua was the mostaffected by these events and was the onlyregion showing an increase in poverty ratesbetween 1998 and 2001 (World Bank2003). The transfers provided by RPS ap-parently compensated for income lossesduring this downturn. Although not designedas a traditional safety net program in thesense of reacting or adjusting to crises orshocks, the economic difficulties experi-enced in these communities allowed RPSto perform like a traditional safety net, en-abling households to maintain expendituresduring the downturn.
The substantial decline in expendituresin the control areas demonstrates the im-portance of having a baseline and a controlgroup in this, or any, evaluation. Controlgroups help isolate the effects attributableto the program and keep them from beingconfounded with other, nonprogram factors.Without a control group, the analysis wouldhave mistakenly concluded that the RPShad no effect on annual total household ex-penditures in 2002 (see the insignificantC$602 or US$47 difference over time in theintervention group in the second to bottomrow of the first column of Table 4.1).
The RPS effects on per capita annualtotal household expenditures are shown inTable 4.2. Average per capita expendituresin 2000 were just over US$300 for thesample, compared to a national average ofnearly US$500 in 2000, again indicativeof the relative deprivation of the programareas. The patterns seen for total expendi-tures, combined with little change in house-
28 CHAPTER 4
33The drop in expenditures in the control group was not due to changes in household size or family composition,as we show in Table 4.2, which reports per capita expenditures. Another possibility is that there are biases in thereporting of expenditures. For example, in control areas it is possible that nonbeneficiaries who had learned aboutthe program understated their expenditures in an effort to appear more in need of the program. However, at thisstage, the program was being implemented using predominantly geographical targeting and being more or lesspoor would not have affected their eligibility. At the same time, beneficiaries may be overstating food expendi-tures knowing that increased expenditures on food was one of the objectives of RPS. The fact that the net changein average expenditures in 2002 is similar in magnitude to the amount of cash transfers suggests these sorts of re-porting biases are not substantially altering the findings. There would be more concern if, for example, changesin expenditures were significantly and substantially larger than the transfer.
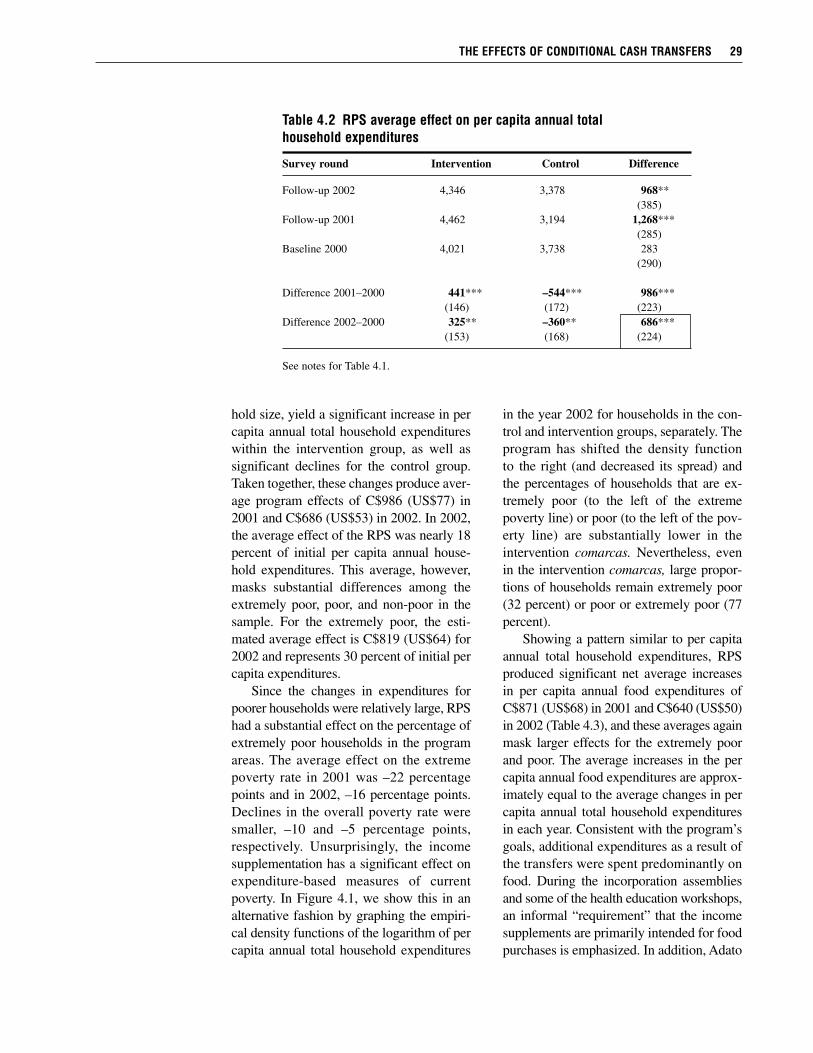
hold size, yield a significant increase in percapita annual total household expenditureswithin the intervention group, as well assignificant declines for the control group.Taken together, these changes produce aver-age program effects of C$986 (US$77) in2001 and C$686 (US$53) in 2002. In 2002,the average effect of the RPS was nearly 18percent of initial per capita annual house-hold expenditures. This average, however,masks substantial differences among theextremely poor, poor, and non-poor in thesample. For the extremely poor, the esti-mated average effect is C$819 (US$64) for2002 and represents 30 percent of initial percapita expenditures.
Since the changes in expenditures forpoorer households were relatively large, RPShad a substantial effect on the percentage ofextremely poor households in the programareas. The average effect on the extremepoverty rate in 2001 was –22 percentagepoints and in 2002, –16 percentage points.Declines in the overall poverty rate weresmaller, –10 and –5 percentage points,respectively. Unsurprisingly, the incomesupplementation has a significant effect onexpenditure-based measures of currentpoverty. In Figure 4.1, we show this in analternative fashion by graphing the empiri-cal density functions of the logarithm of percapita annual total household expenditures
in the year 2002 for households in the con-trol and intervention groups, separately. Theprogram has shifted the density functionto the right (and decreased its spread) andthe percentages of households that are ex-tremely poor (to the left of the extremepoverty line) or poor (to the left of the pov-erty line) are substantially lower in theintervention comarcas. Nevertheless, evenin the intervention comarcas, large propor-tions of households remain extremely poor(32 percent) or poor or extremely poor (77percent).
Showing a pattern similar to per capitaannual total household expenditures, RPSproduced significant net average increasesin per capita annual food expenditures ofC$871 (US$68) in 2001 and C$640 (US$50)in 2002 (Table 4.3), and these averages againmask larger effects for the extremely poorand poor. The average increases in the percapita annual food expenditures are approx-imately equal to the average changes in percapita annual total household expendituresin each year. Consistent with the program’sgoals, additional expenditures as a result ofthe transfers were spent predominantly onfood. During the incorporation assembliesand some of the health education workshops,an informal “requirement” that the incomesupplements are primarily intended for foodpurchases is emphasized. In addition, Adato
THE EFFECTS OF CONDITIONAL CASH TRANSFERS 29
Table 4.2 RPS average effect on per capita annual total household expenditures
Survey round Intervention Control Difference
Follow-up 2002 4,346 3,378 968**(385)
Follow-up 2001 4,462 3,194 1,268***(285)
Baseline 2000 4,021 3,738 283(290)
Difference 2001–2000 441*** –544*** 986***(146) (172) (223)
Difference 2002–2000 325** –360** 686***(153) (168) (224)
See notes for Table 4.1.
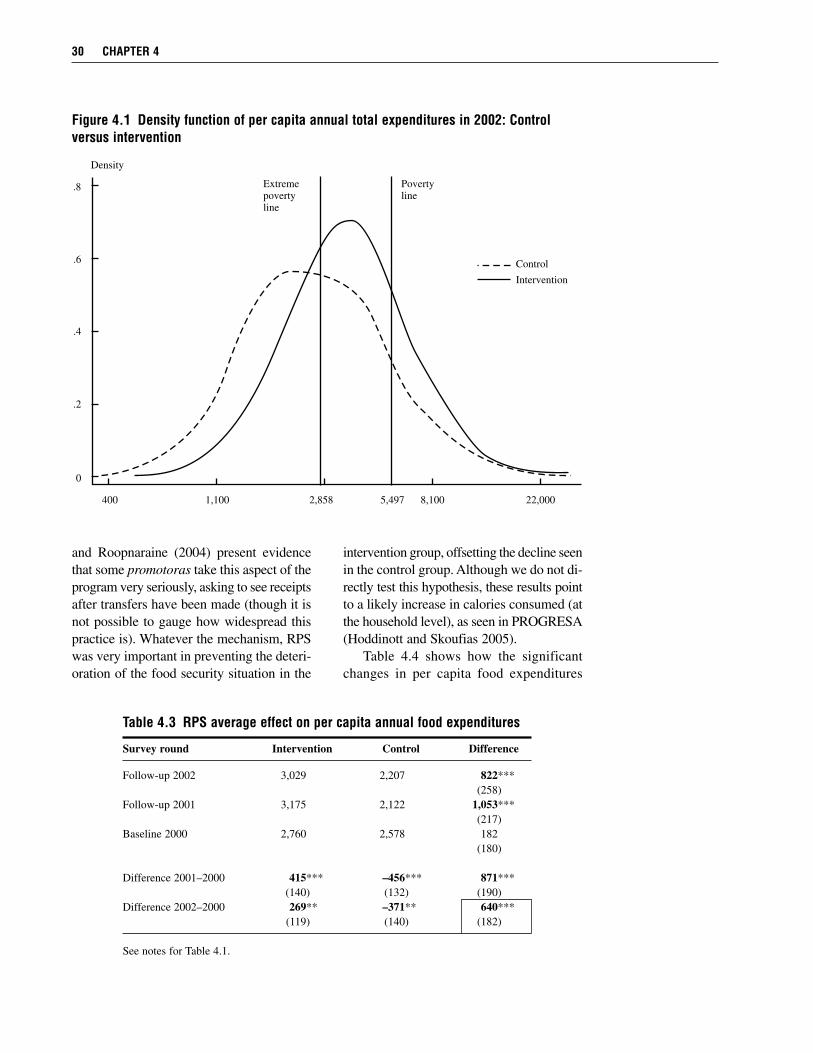
and Roopnaraine (2004) present evidencethat some promotoras take this aspect of theprogram very seriously, asking to see receiptsafter transfers have been made (though it isnot possible to gauge how widespread thispractice is). Whatever the mechanism, RPSwas very important in preventing the deteri-oration of the food security situation in the
intervention group, offsetting the decline seenin the control group. Although we do not di-rectly test this hypothesis, these results pointto a likely increase in calories consumed (atthe household level), as seen in PROGRESA(Hoddinott and Skoufias 2005).
Table 4.4 shows how the significantchanges in per capita food expenditures
30 CHAPTER 4
Figure 4.1 Density function of per capita annual total expenditures in 2002: Controlversus intervention
0
.2
.4
.6
.8
67
400 1,100 2,858 5,497 8,100 22,000
Density
Extremepovertyline
Povertyline
Control
Intervention
Table 4.3 RPS average effect on per capita annual food expenditures
Survey round Intervention Control Difference
Follow-up 2002 3,029 2,207 822***(258)
Follow-up 2001 3,175 2,122 1,053***(217)
Baseline 2000 2,760 2,578 182(180)
Difference 2001–2000 415*** –456*** 871***(140) (132) (190)
Difference 2002–2000 269** –371** 640***(119) (140) (182)
See notes for Table 4.1.
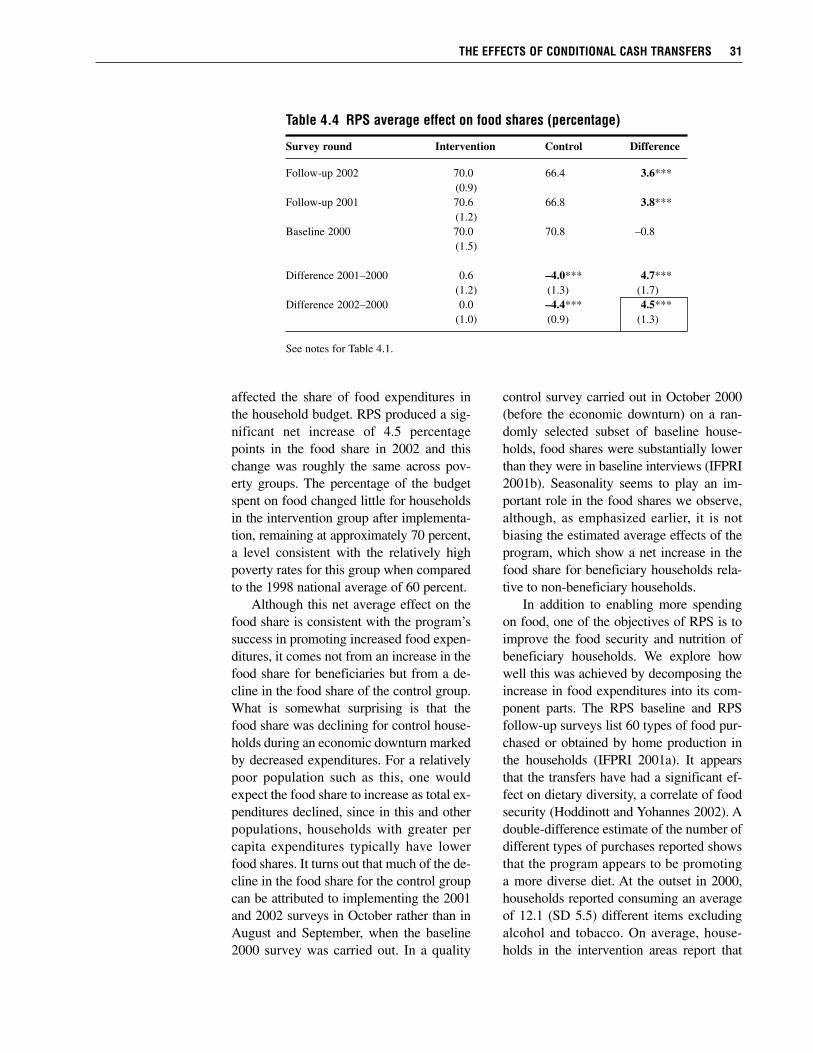
affected the share of food expenditures inthe household budget. RPS produced a sig-nificant net increase of 4.5 percentagepoints in the food share in 2002 and thischange was roughly the same across pov-erty groups. The percentage of the budgetspent on food changed little for householdsin the intervention group after implementa-tion, remaining at approximately 70 percent,a level consistent with the relatively highpoverty rates for this group when comparedto the 1998 national average of 60 percent.
Although this net average effect on thefood share is consistent with the program’ssuccess in promoting increased food expen-ditures, it comes not from an increase in thefood share for beneficiaries but from a de-cline in the food share of the control group.What is somewhat surprising is that thefood share was declining for control house-holds during an economic downturn markedby decreased expenditures. For a relativelypoor population such as this, one wouldexpect the food share to increase as total ex-penditures declined, since in this and otherpopulations, households with greater percapita expenditures typically have lowerfood shares. It turns out that much of the de-cline in the food share for the control groupcan be attributed to implementing the 2001and 2002 surveys in October rather than inAugust and September, when the baseline2000 survey was carried out. In a quality
control survey carried out in October 2000(before the economic downturn) on a ran-domly selected subset of baseline house-holds, food shares were substantially lowerthan they were in baseline interviews (IFPRI2001b). Seasonality seems to play an im-portant role in the food shares we observe,although, as emphasized earlier, it is notbiasing the estimated average effects of theprogram, which show a net increase in thefood share for beneficiary households rela-tive to non-beneficiary households.
In addition to enabling more spendingon food, one of the objectives of RPS is toimprove the food security and nutrition ofbeneficiary households. We explore howwell this was achieved by decomposing theincrease in food expenditures into its com-ponent parts. The RPS baseline and RPSfollow-up surveys list 60 types of food pur-chased or obtained by home production inthe households (IFPRI 2001a). It appearsthat the transfers have had a significant ef-fect on dietary diversity, a correlate of foodsecurity (Hoddinott and Yohannes 2002). Adouble-difference estimate of the number ofdifferent types of purchases reported showsthat the program appears to be promotinga more diverse diet. At the outset in 2000,households reported consuming an averageof 12.1 (SD 5.5) different items excludingalcohol and tobacco. On average, house-holds in the intervention areas report that
THE EFFECTS OF CONDITIONAL CASH TRANSFERS 31
Table 4.4 RPS average effect on food shares (percentage)
Survey round Intervention Control Difference
Follow-up 2002 70.0 66.4 3.6***(0.9)
Follow-up 2001 70.6 66.8 3.8***(1.2)
Baseline 2000 70.0 70.8 –0.8(1.5)
Difference 2001–2000 0.6 –4.0*** 4.7***(1.2) (1.3) (1.7)
Difference 2002–2000 0.0 –4.4*** 4.5***(1.0) (0.9) (1.3)
See notes for Table 4.1.
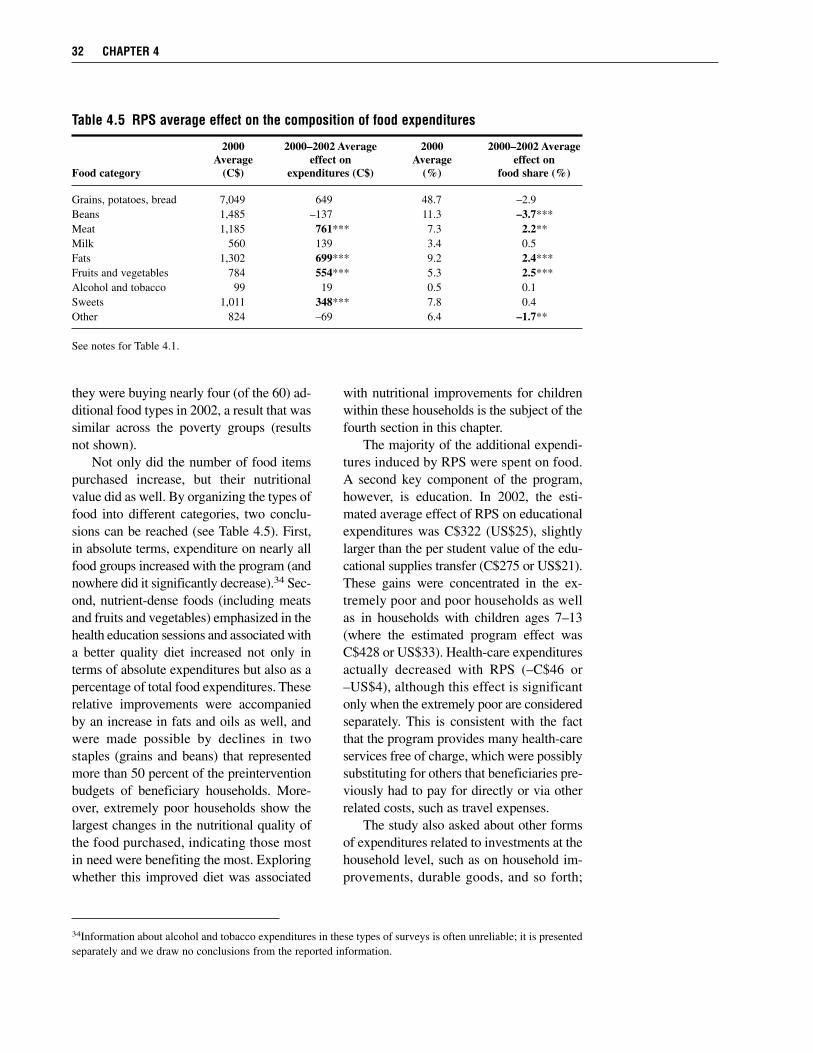
they were buying nearly four (of the 60) ad-ditional food types in 2002, a result that wassimilar across the poverty groups (resultsnot shown).
Not only did the number of food itemspurchased increase, but their nutritionalvalue did as well. By organizing the types offood into different categories, two conclu-sions can be reached (see Table 4.5). First,in absolute terms, expenditure on nearly allfood groups increased with the program (andnowhere did it significantly decrease).34 Sec-ond, nutrient-dense foods (including meatsand fruits and vegetables) emphasized in thehealth education sessions and associated witha better quality diet increased not only interms of absolute expenditures but also as apercentage of total food expenditures. Theserelative improvements were accompaniedby an increase in fats and oils as well, andwere made possible by declines in twostaples (grains and beans) that representedmore than 50 percent of the preinterventionbudgets of beneficiary households. More-over, extremely poor households show thelargest changes in the nutritional quality ofthe food purchased, indicating those mostin need were benefiting the most. Exploringwhether this improved diet was associated
with nutritional improvements for childrenwithin these households is the subject of thefourth section in this chapter.
The majority of the additional expendi-tures induced by RPS were spent on food.A second key component of the program,however, is education. In 2002, the esti-mated average effect of RPS on educationalexpenditures was C$322 (US$25), slightlylarger than the per student value of the edu-cational supplies transfer (C$275 or US$21).These gains were concentrated in the ex-tremely poor and poor households as wellas in households with children ages 7–13(where the estimated program effect wasC$428 or US$33). Health-care expendituresactually decreased with RPS (–C$46 or–US$4), although this effect is significantonly when the extremely poor are consideredseparately. This is consistent with the factthat the program provides many health-careservices free of charge, which were possiblysubstituting for others that beneficiaries pre-viously had to pay for directly or via otherrelated costs, such as travel expenses.
The study also asked about other formsof expenditures related to investments at thehousehold level, such as on household im-provements, durable goods, and so forth;
32 CHAPTER 4
34Information about alcohol and tobacco expenditures in these types of surveys is often unreliable; it is presentedseparately and we draw no conclusions from the reported information.
Table 4.5 RPS average effect on the composition of food expenditures
2000 2000–2002 Average 2000 2000–2002 AverageAverage effect on Average effect on
Food category (C$) expenditures (C$) (%) food share (%)
Grains, potatoes, bread 7,049 649 48.7 –2.9Beans 1,485 –137 11.3 –3.7***Meat 1,185 761*** 7.3 2.2**Milk 560 139 3.4 0.5Fats 1,302 699*** 9.2 2.4***Fruits and vegetables 784 554*** 5.3 2.5***Alcohol and tobacco 99 19 0.5 0.1Sweets 1,011 348*** 7.8 0.4Other 824 –69 6.4 –1.7**
See notes for Table 4.1.
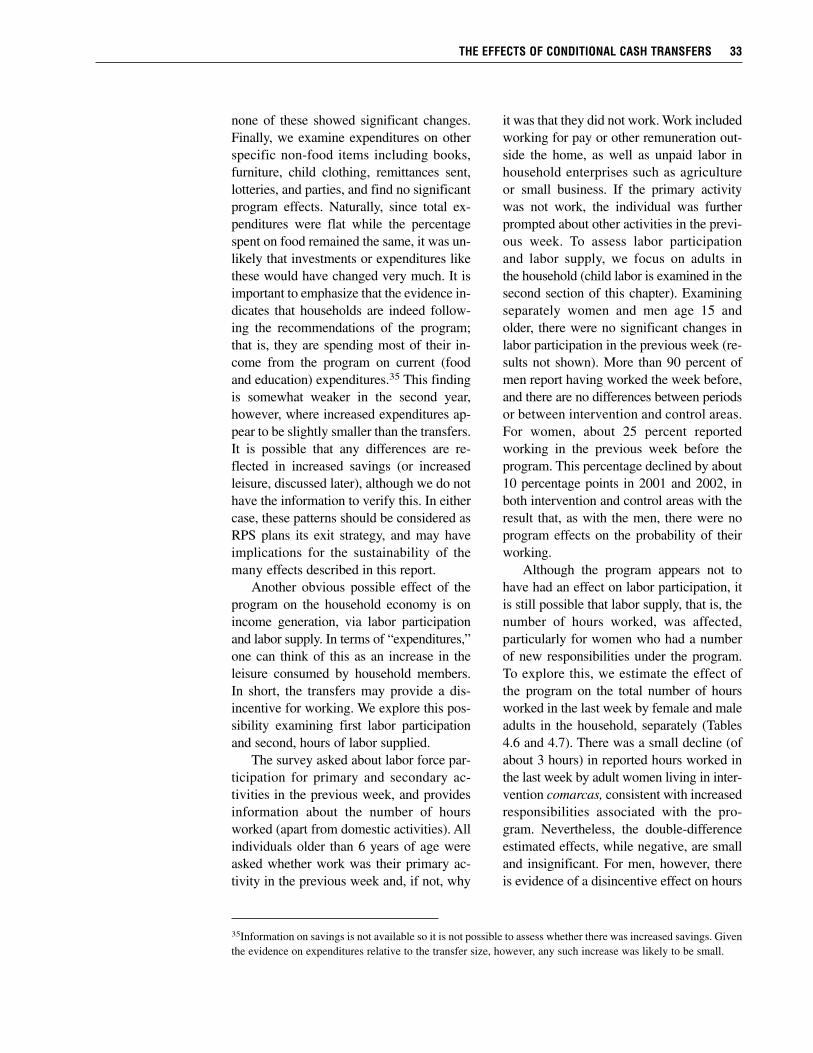
none of these showed significant changes.Finally, we examine expenditures on otherspecific non-food items including books,furniture, child clothing, remittances sent,lotteries, and parties, and find no significantprogram effects. Naturally, since total ex-penditures were flat while the percentagespent on food remained the same, it was un-likely that investments or expenditures likethese would have changed very much. It isimportant to emphasize that the evidence in-dicates that households are indeed follow-ing the recommendations of the program;that is, they are spending most of their in-come from the program on current (foodand education) expenditures.35 This findingis somewhat weaker in the second year,however, where increased expenditures ap-pear to be slightly smaller than the transfers.It is possible that any differences are re-flected in increased savings (or increasedleisure, discussed later), although we do nothave the information to verify this. In eithercase, these patterns should be considered asRPS plans its exit strategy, and may haveimplications for the sustainability of themany effects described in this report.
Another obvious possible effect of theprogram on the household economy is onincome generation, via labor participationand labor supply. In terms of “expenditures,”one can think of this as an increase in theleisure consumed by household members.In short, the transfers may provide a dis-incentive for working. We explore this pos-sibility examining first labor participationand second, hours of labor supplied.
The survey asked about labor force par-ticipation for primary and secondary ac-tivities in the previous week, and providesinformation about the number of hoursworked (apart from domestic activities). Allindividuals older than 6 years of age wereasked whether work was their primary ac-tivity in the previous week and, if not, why
it was that they did not work. Work includedworking for pay or other remuneration out-side the home, as well as unpaid labor inhousehold enterprises such as agricultureor small business. If the primary activitywas not work, the individual was furtherprompted about other activities in the previ-ous week. To assess labor participationand labor supply, we focus on adults inthe household (child labor is examined in thesecond section of this chapter). Examiningseparately women and men age 15 andolder, there were no significant changes inlabor participation in the previous week (re-sults not shown). More than 90 percent ofmen report having worked the week before,and there are no differences between periodsor between intervention and control areas.For women, about 25 percent reportedworking in the previous week before theprogram. This percentage declined by about10 percentage points in 2001 and 2002, inboth intervention and control areas with theresult that, as with the men, there were noprogram effects on the probability of theirworking.
Although the program appears not tohave had an effect on labor participation, itis still possible that labor supply, that is, thenumber of hours worked, was affected,particularly for women who had a numberof new responsibilities under the program.To explore this, we estimate the effect ofthe program on the total number of hoursworked in the last week by female and maleadults in the household, separately (Tables4.6 and 4.7). There was a small decline (ofabout 3 hours) in reported hours worked inthe last week by adult women living in inter-vention comarcas, consistent with increasedresponsibilities associated with the pro-gram. Nevertheless, the double-differenceestimated effects, while negative, are smalland insignificant. For men, however, thereis evidence of a disincentive effect on hours
THE EFFECTS OF CONDITIONAL CASH TRANSFERS 33
35Information on savings is not available so it is not possible to assess whether there was increased savings. Giventhe evidence on expenditures relative to the transfer size, however, any such increase was likely to be small.
worked in the last week, of about 6 hours inboth years. While not significantly depress-ing the labor supply of beneficiaries (whichactually increased from 2000 to 2002) rela-tive to before the program, it significantlyreduced labor supply relative to their coun-terparts without the program.36 The down-turn in the economy appears to have ledto increased labor supply by control grouphouseholds. Crudely approximating thevalue of lost income from this decrease inhours worked at C$20 (US$1.50) per week(taking C$30 or US$2.30 as the daily wage)yields an amount approximately equal to thegap between the estimated increase in ex-penditures in 2002 and the average transfer.Thus, it seems that households took someof their benefits of the program in the formof increased leisure, although this was in-creased leisure relative to the control groupnot relative to before the program.
Last, we assessed the effect of the pro-gram on transfer or remittance behavior;cash transfers may crowd out remittancesreceived by the household (Jensen 2003).The survey indicates that remittances areuncommon in this population, with fewerthan 5 percent of respondents reporting
having received remittances in the previous12 months. For those who receive them,however, they can be substantial, averagingabout C$4,000 (US$311) annually, approxi-mately the same size as the average RPStransfer. Nevertheless, we find no evidenceof crowding out as there are no significantprogram effects on the probability that re-mittances were received or average remit-tances received (results not shown), althoughthis may be due, in part, to the characteristicthat reported remittances were relativelyuncommon in the sample.
Schooling and Child LaborEducation levels in Nicaragua are dismal.One third of adults older than 25 years ofage have no formal education and anotherthird have never completed primary school.Although increasing school coverage andstable political conditions in the 1990s havespurred improvements, at 78 percent thenet primary enrollment ratio remained oneof the lowest in Latin America in the late1990s (World Bank 2001). Not surprisingly,these low enrollment rates are accompaniedby a high incidence of child labor, particu-
34 CHAPTER 4
36Adato and Roopnaraine (2004) found that adult males reported being able to work more often closer to home(e.g., on their own parcels), so it is possible that some of the decrease in labor hours supplied is due to decreasedcommuting time.
Table 4.6 RPS average effect on hours worked last week: Women
Survey round Intervention Control Difference
Follow-up 2002 9.0 13.5 –4.5***(2.0)
Follow-up 2001 8.1 12.8 4.7**(1.9)
Baseline 2000 12.1 14.5 –2.4(1.8)
Difference 2001–2000 –4.0*** –1.7 –2.2(1.0) (1.4) (1.7)
Difference 2002–2000 –3.1*** –1.0 –2.1(0.9) (1.5) (1.7)
See notes for Table 4.1.
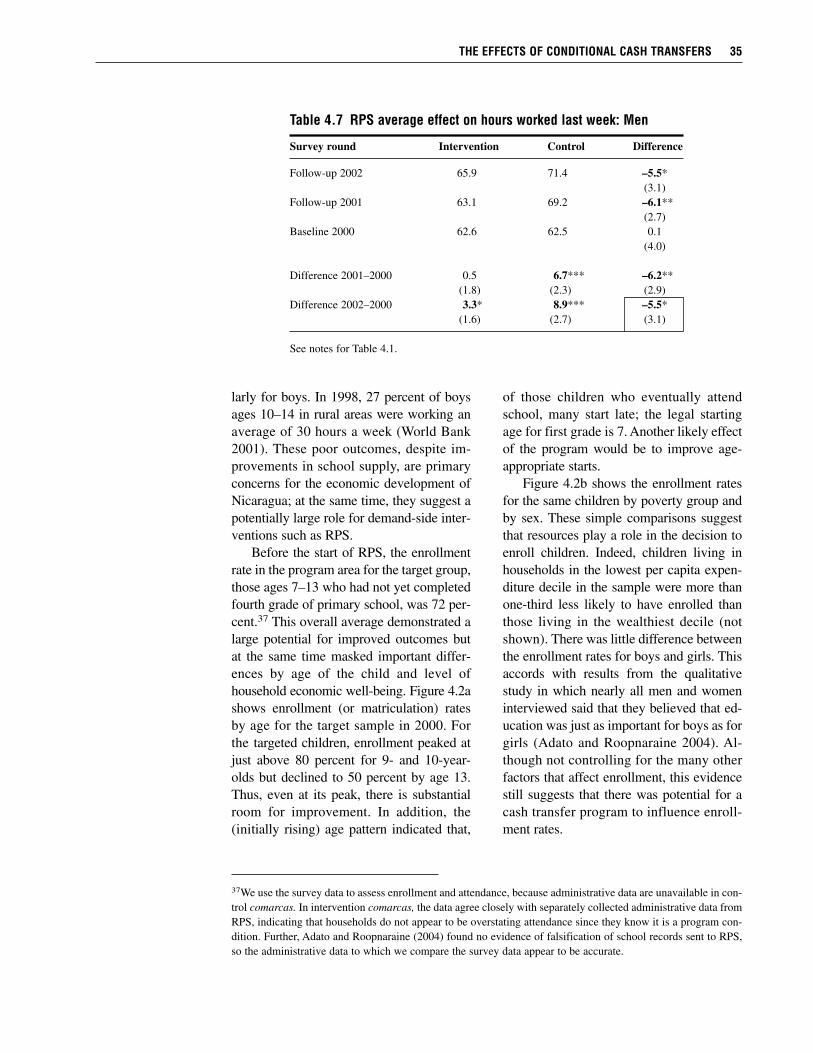
larly for boys. In 1998, 27 percent of boysages 10–14 in rural areas were working anaverage of 30 hours a week (World Bank2001). These poor outcomes, despite im-provements in school supply, are primaryconcerns for the economic development ofNicaragua; at the same time, they suggest apotentially large role for demand-side inter-ventions such as RPS.
Before the start of RPS, the enrollmentrate in the program area for the target group,those ages 7–13 who had not yet completedfourth grade of primary school, was 72 per-cent.37 This overall average demonstrated alarge potential for improved outcomes butat the same time masked important differ-ences by age of the child and level ofhousehold economic well-being. Figure 4.2ashows enrollment (or matriculation) ratesby age for the target sample in 2000. Forthe targeted children, enrollment peaked atjust above 80 percent for 9- and 10-year-olds but declined to 50 percent by age 13.Thus, even at its peak, there is substantialroom for improvement. In addition, the(initially rising) age pattern indicated that,
of those children who eventually attendschool, many start late; the legal startingage for first grade is 7. Another likely effectof the program would be to improve age-appropriate starts.
Figure 4.2b shows the enrollment ratesfor the same children by poverty group andby sex. These simple comparisons suggestthat resources play a role in the decision toenroll children. Indeed, children living inhouseholds in the lowest per capita expen-diture decile in the sample were more thanone-third less likely to have enrolled thanthose living in the wealthiest decile (notshown). There was little difference betweenthe enrollment rates for boys and girls. Thisaccords with results from the qualitativestudy in which nearly all men and womeninterviewed said that they believed that ed-ucation was just as important for boys as forgirls (Adato and Roopnaraine 2004). Al-though not controlling for the many otherfactors that affect enrollment, this evidencestill suggests that there was potential for acash transfer program to influence enroll-ment rates.
THE EFFECTS OF CONDITIONAL CASH TRANSFERS 35
37We use the survey data to assess enrollment and attendance, because administrative data are unavailable in con-trol comarcas. In intervention comarcas, the data agree closely with separately collected administrative data fromRPS, indicating that households do not appear to be overstating attendance since they know it is a program con-dition. Further, Adato and Roopnaraine (2004) found no evidence of falsification of school records sent to RPS,so the administrative data to which we compare the survey data appear to be accurate.
Table 4.7 RPS average effect on hours worked last week: Men
Survey round Intervention Control Difference
Follow-up 2002 65.9 71.4 –5.5*(3.1)
Follow-up 2001 63.1 69.2 –6.1**(2.7)
Baseline 2000 62.6 62.5 0.1(4.0)
Difference 2001–2000 0.5 6.7*** –6.2**(1.8) (2.3) (2.9)
Difference 2002–2000 3.3* 8.9*** –5.5*(1.6) (2.7) (3.1)
See notes for Table 4.1.
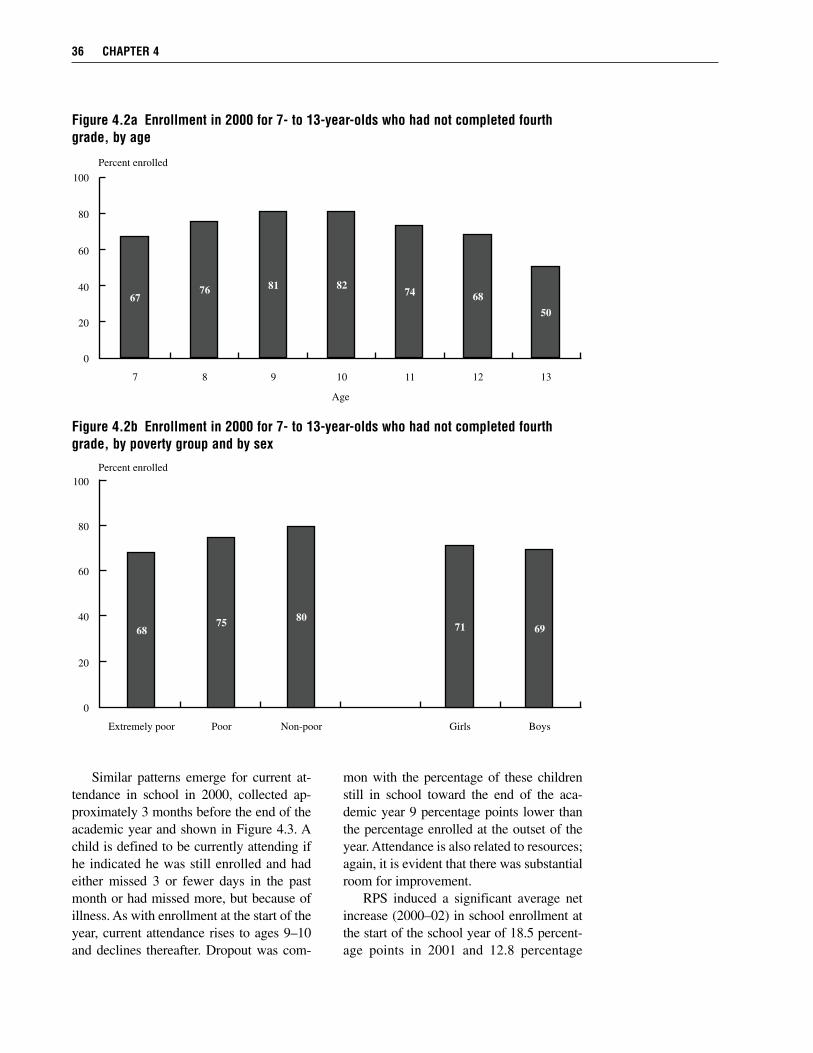
Similar patterns emerge for current at-tendance in school in 2000, collected ap-proximately 3 months before the end of theacademic year and shown in Figure 4.3. Achild is defined to be currently attending ifhe indicated he was still enrolled and hadeither missed 3 or fewer days in the pastmonth or had missed more, but because ofillness. As with enrollment at the start of theyear, current attendance rises to ages 9–10and declines thereafter. Dropout was com-
mon with the percentage of these childrenstill in school toward the end of the aca-demic year 9 percentage points lower thanthe percentage enrolled at the outset of theyear. Attendance is also related to resources;again, it is evident that there was substantialroom for improvement.
RPS induced a significant average netincrease (2000–02) in school enrollment atthe start of the school year of 18.5 percent-age points in 2001 and 12.8 percentage
36 CHAPTER 4
Figure 4.2b Enrollment in 2000 for 7- to 13-year-olds who had not completed fourthgrade, by poverty group and by sex
0
20
40
60
80
100
6875
80
71 69
Extremely poor Poor Non-poor Girls Boys
Percent enrolled
Figure 4.2a Enrollment in 2000 for 7- to 13-year-olds who had not completed fourthgrade, by age
0
20
40
60
80
100
6776
81 8274
68
50
7 8 9 10 11 12 13
Age
Percent enrolled
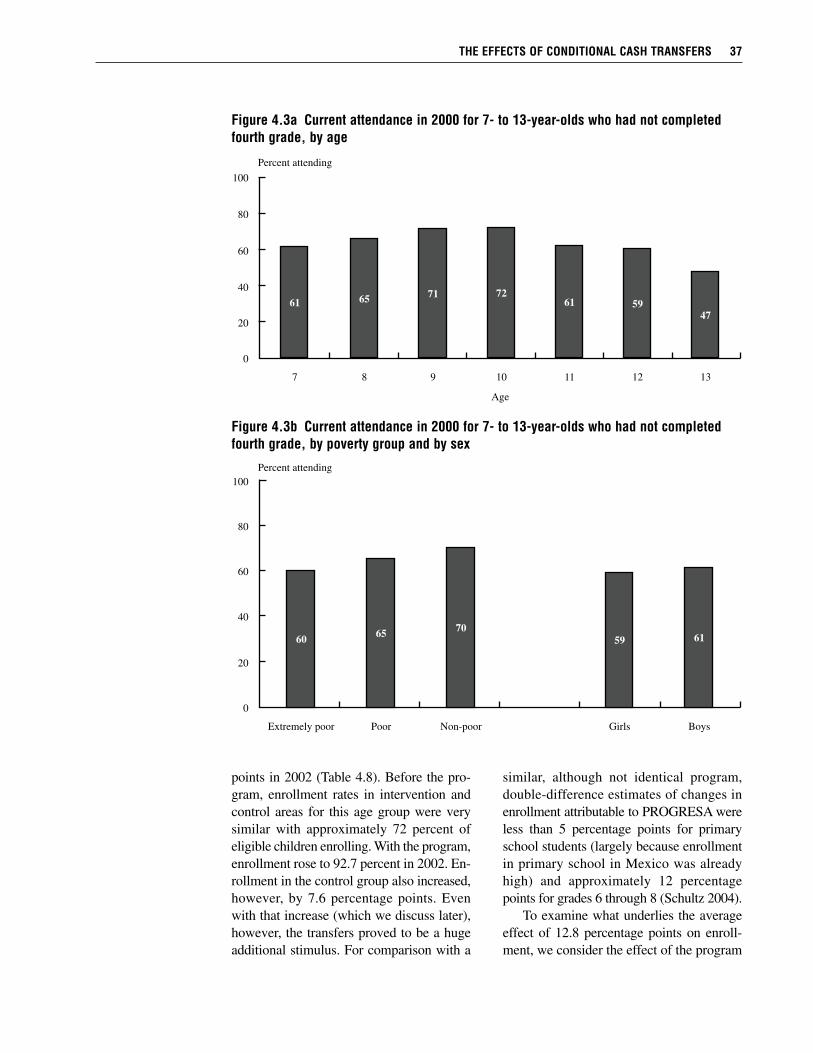
points in 2002 (Table 4.8). Before the pro-gram, enrollment rates in intervention andcontrol areas for this age group were verysimilar with approximately 72 percent ofeligible children enrolling. With the program,enrollment rose to 92.7 percent in 2002. En-rollment in the control group also increased,however, by 7.6 percentage points. Evenwith that increase (which we discuss later),however, the transfers proved to be a hugeadditional stimulus. For comparison with a
similar, although not identical program,double-difference estimates of changes inenrollment attributable to PROGRESA wereless than 5 percentage points for primaryschool students (largely because enrollmentin primary school in Mexico was alreadyhigh) and approximately 12 percentagepoints for grades 6 through 8 (Schultz 2004).
To examine what underlies the averageeffect of 12.8 percentage points on enroll-ment, we consider the effect of the program
THE EFFECTS OF CONDITIONAL CASH TRANSFERS 37
Figure 4.3b Current attendance in 2000 for 7- to 13-year-olds who had not completedfourth grade, by poverty group and by sex
0
20
40
60
80
100
6065
70
59 61
Extremely poor Poor Non-poor Girls Boys
Percent attending
Figure 4.3a Current attendance in 2000 for 7- to 13-year-olds who had not completedfourth grade, by age
0
20
40
60
80
100
6165
71 7261 59
47
7 8 9 10 11 12 13
Age
Percent attending
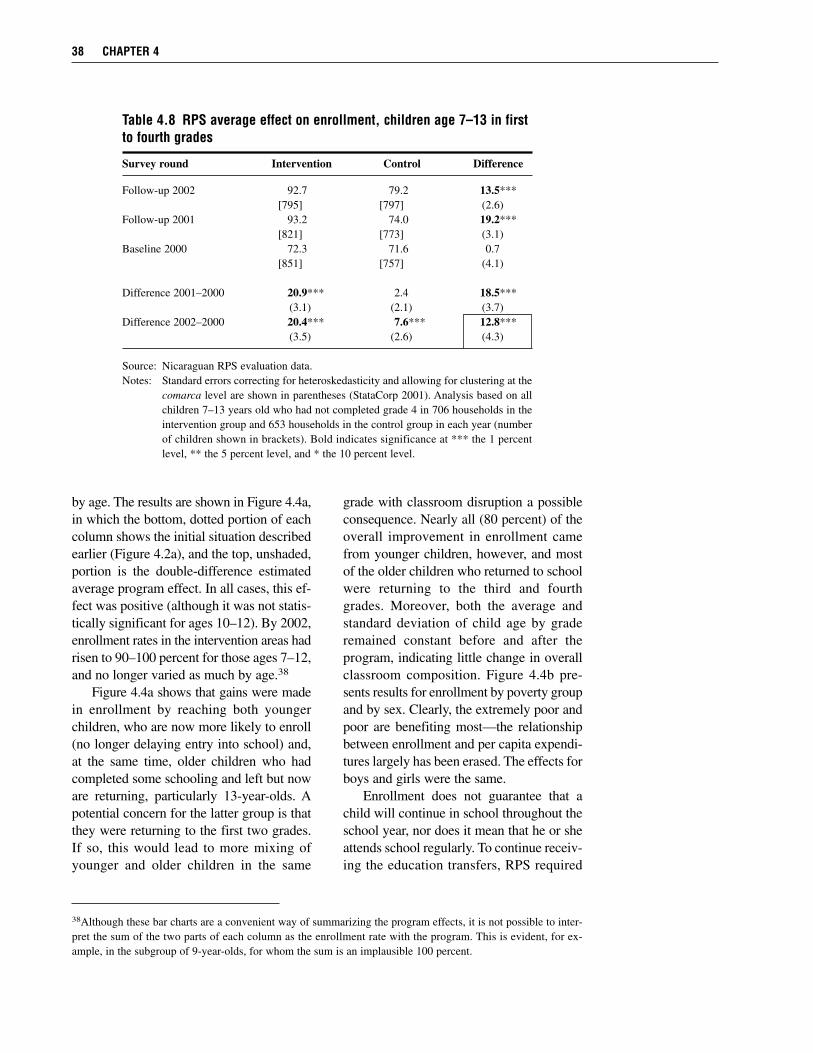
by age. The results are shown in Figure 4.4a,in which the bottom, dotted portion of eachcolumn shows the initial situation describedearlier (Figure 4.2a), and the top, unshaded,portion is the double-difference estimatedaverage program effect. In all cases, this ef-fect was positive (although it was not statis-tically significant for ages 10–12). By 2002,enrollment rates in the intervention areas hadrisen to 90–100 percent for those ages 7–12,and no longer varied as much by age.38
Figure 4.4a shows that gains were madein enrollment by reaching both youngerchildren, who are now more likely to enroll(no longer delaying entry into school) and,at the same time, older children who hadcompleted some schooling and left but noware returning, particularly 13-year-olds. Apotential concern for the latter group is thatthey were returning to the first two grades.If so, this would lead to more mixing ofyounger and older children in the same
grade with classroom disruption a possibleconsequence. Nearly all (80 percent) of theoverall improvement in enrollment camefrom younger children, however, and mostof the older children who returned to schoolwere returning to the third and fourthgrades. Moreover, both the average andstandard deviation of child age by graderemained constant before and after theprogram, indicating little change in overallclassroom composition. Figure 4.4b pre-sents results for enrollment by poverty groupand by sex. Clearly, the extremely poor andpoor are benefiting most—the relationshipbetween enrollment and per capita expendi-tures largely has been erased. The effects forboys and girls were the same.
Enrollment does not guarantee that achild will continue in school throughout theschool year, nor does it mean that he or sheattends school regularly. To continue receiv-ing the education transfers, RPS required
38 CHAPTER 4
38Although these bar charts are a convenient way of summarizing the program effects, it is not possible to inter-pret the sum of the two parts of each column as the enrollment rate with the program. This is evident, for ex-ample, in the subgroup of 9-year-olds, for whom the sum is an implausible 100 percent.
Table 4.8 RPS average effect on enrollment, children age 7–13 in firstto fourth grades
Survey round Intervention Control Difference
Follow-up 2002 92.7 79.2 13.5***[795] [797] (2.6)
Follow-up 2001 93.2 74.0 19.2***[821] [773] (3.1)
Baseline 2000 72.3 71.6 0.7[851] [757] (4.1)
Difference 2001–2000 20.9*** 2.4 18.5***(3.1) (2.1) (3.7)
Difference 2002–2000 20.4*** 7.6*** 12.8***(3.5) (2.6) (4.3)
Source: Nicaraguan RPS evaluation data. Notes: Standard errors correcting for heteroskedasticity and allowing for clustering at the
comarca level are shown in parentheses (StataCorp 2001). Analysis based on allchildren 7–13 years old who had not completed grade 4 in 706 households in theintervention group and 653 households in the control group in each year (numberof children shown in brackets). Bold indicates significance at *** the 1 percentlevel, ** the 5 percent level, and * the 10 percent level.
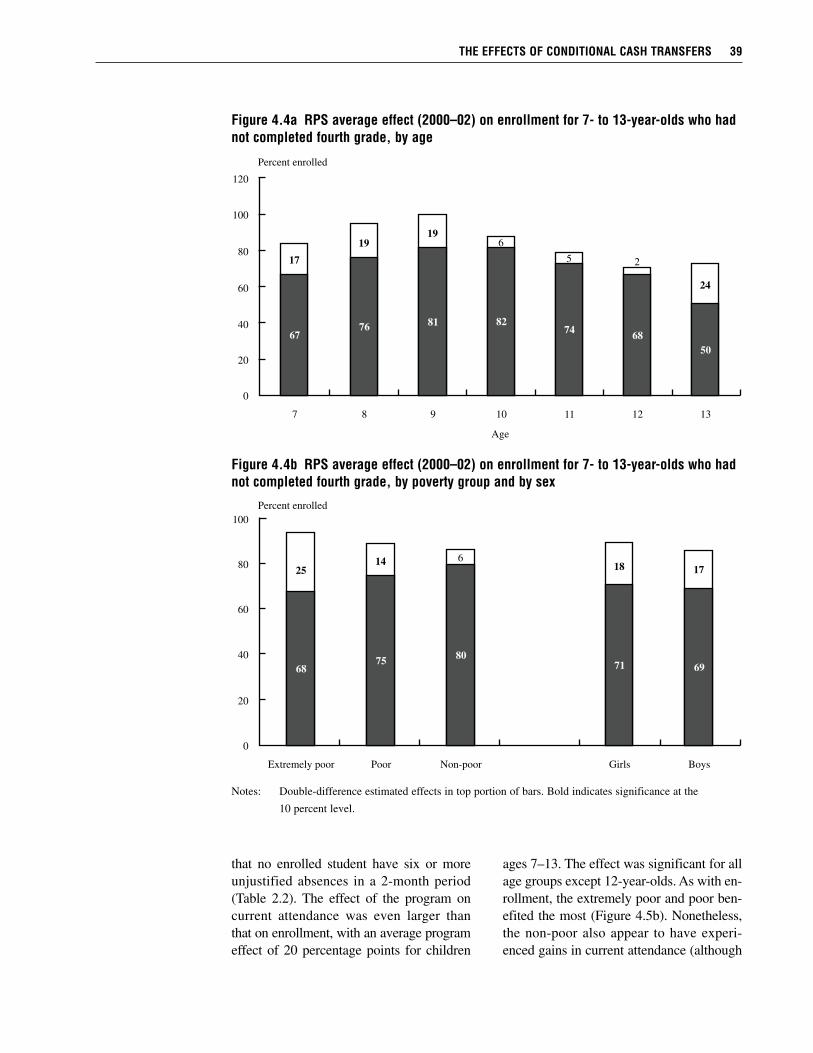
that no enrolled student have six or moreunjustified absences in a 2-month period(Table 2.2). The effect of the program oncurrent attendance was even larger thanthat on enrollment, with an average programeffect of 20 percentage points for children
ages 7–13. The effect was significant for allage groups except 12-year-olds. As with en-rollment, the extremely poor and poor ben-efited the most (Figure 4.5b). Nonetheless,the non-poor also appear to have experi-enced gains in current attendance (although
THE EFFECTS OF CONDITIONAL CASH TRANSFERS 39
Figure 4.4b RPS average effect (2000–02) on enrollment for 7- to 13-year-olds who hadnot completed fourth grade, by poverty group and by sex
Notes: Double-difference estimated effects in top portion of bars. Bold indicates significance at the
10 percent level.
0
20
40
60
80
100
2514 6
18 17
6875
80
71 69
Extremely poor Poor Non-poor Girls Boys
Percent enrolled
Figure 4.4a RPS average effect (2000–02) on enrollment for 7- to 13-year-olds who hadnot completed fourth grade, by age
120
0
20
40
60
80
100
17
19
196
5 2
24
6776
81 8274
68
50
7 8 9 10 11 12 13
Age
Percent enrolled
given the small sample size these are lessprecisely estimated). Boys benefited slightlymore than girls. There have been positiveeffects even for those children who were at-tending school prior to the program, as theyare now attending more regularly.
RPS had a massive effect on enrollmentand current attendance in the interventionareas. Even though only about one-third ofthe rural comarcas in each municipality wereincluded in Phase I, increases in enrollmentcould be seen even in the aggregate munic-ipal-level data compiled by the Ministry ofEducation. In the six municipalities com-bined, there was an increase of about 5 per-centage points in enrollment in grades 1 to4 between 1999 and 2000, before the pro-gram. The increase was nearly 18 percentagepoints between 2000 and 2001, far higherthan what occurred in the rest of the countryduring that period.
Although schools were generally avail-able in RPS program areas as a result of thetargeting described earlier, steps were takento accommodate the large changes in enroll-ment as the program developed. The twoprincipal steps were increasing the numberof sessions per day and increasing the num-ber of teachers. RPS also supported localcommunities in their efforts to solicit ad-ditional teachers from the Ministry of Edu-cation. For most rural schools, this was astraightforward process, because they operateunder an autonomous system with substan-tial local control.39 In one RPS municipalitywith a smaller proportion of autonomousschools, however, it was more difficult toincrease the number of teachers. In somecases, this problem was resolved when ben-eficiary parents agreed, on the suggestion ofRPS, to contribute part of their transfers tohelp pay for a new teacher for the first year.In other cases, staffing problems were notresolved. Possibly reflecting these problems,enrollment rates were the lowest in this
municipality, although they were still 90percent, on average. In sum, the overalllevel of enrollment left little room for im-provement, and supply does not appear tohave been a major constraint. This achieve-ment, however, required active interventionand coordination on the part of RPS. Forschooling outcomes, then, it is particularlyimportant to underscore that we interpretthe estimated effects as the combined effectof demand- and supply-side components ofthe program. Changes in control group en-rollment call into question the validity ofthe experiment for the reasons outlined inChapter 3. The observed increase of 7.6percentage points was greater than the na-tional rural average and appears to havebeen the net effect of several factors pos-sibly contaminating the controls, including(1) increases in school feeding in the area(described in the fourth section of Chapter3), (2) possible crowding out at the schoollevel, (3) improvements in supply as a resultof the program, and (4) changes in expecta-tions in the control group. The expansionof school feeding may have spurred enroll-ment rates (although there is little reason tothink the effects would not have been equalin intervention and control comarcas). In asmall number of areas, individual schoolsserved students in both intervention and con-trol comarcas. This is problematic for theestimated effects because possible crowdingin schools may have led individuals in thecontrol group to be discouraged from at-tending (although given the small numberthis is unlikely to have been a large effect).Offsetting this possible, but likely small,effect, however, is that RPS induced an in-crease in the supply of teachers and gradesoffered in these municipalities (as describedearlier).
In the fourth section of Chapter 3, weargued that the potential effects of expecta-tions on control group schooling decisions
40 CHAPTER 4
39In the early 1990s, a school reform was undertaken to devolve control from the central government to localschools or, in some rural areas, clusters of schools (King, Ozler, and Rawlings 1999).
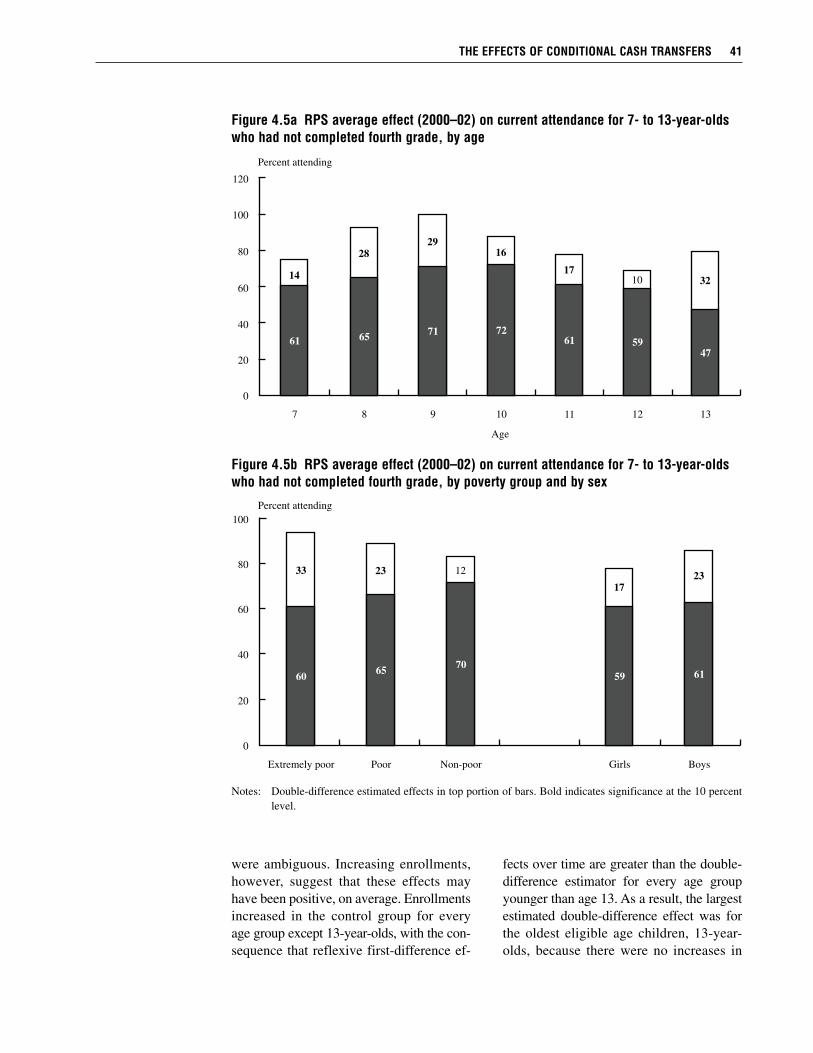
were ambiguous. Increasing enrollments,however, suggest that these effects mayhave been positive, on average. Enrollmentsincreased in the control group for everyage group except 13-year-olds, with the con-sequence that reflexive first-difference ef-
fects over time are greater than the double-difference estimator for every age groupyounger than age 13. As a result, the largestestimated double-difference effect was forthe oldest eligible age children, 13-year-olds, because there were no increases in
THE EFFECTS OF CONDITIONAL CASH TRANSFERS 41
Figure 4.5b RPS average effect (2000–02) on current attendance for 7- to 13-year-oldswho had not completed fourth grade, by poverty group and by sex
Notes: Double-difference estimated effects in top portion of bars. Bold indicates significance at the 10 percentlevel.
0
20
40
60
80
100
33 23 12
17
23
6065
70
59 61
Extremely poor Poor Non-poor Girls Boys
Percent attending
Figure 4.5a RPS average effect (2000–02) on current attendance for 7- to 13-year-oldswho had not completed fourth grade, by age
120
0
20
40
60
80
100
14
28
29
16
17
10 32
6165
71 72
61 59
47
7 8 9 10 11 12 13
Age
Percent attending
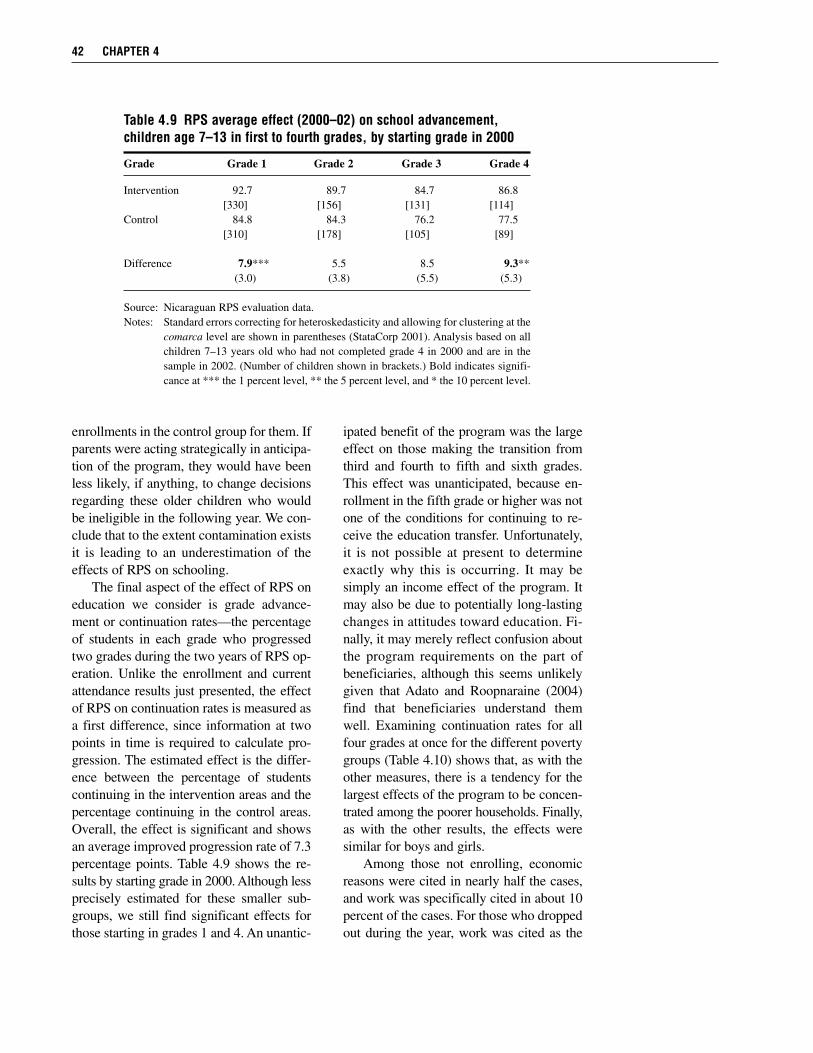
enrollments in the control group for them. Ifparents were acting strategically in anticipa-tion of the program, they would have beenless likely, if anything, to change decisionsregarding these older children who wouldbe ineligible in the following year. We con-clude that to the extent contamination existsit is leading to an underestimation of theeffects of RPS on schooling.
The final aspect of the effect of RPS oneducation we consider is grade advance-ment or continuation rates—the percentageof students in each grade who progressedtwo grades during the two years of RPS op-eration. Unlike the enrollment and currentattendance results just presented, the effectof RPS on continuation rates is measured asa first difference, since information at twopoints in time is required to calculate pro-gression. The estimated effect is the differ-ence between the percentage of studentscontinuing in the intervention areas and thepercentage continuing in the control areas.Overall, the effect is significant and showsan average improved progression rate of 7.3percentage points. Table 4.9 shows the re-sults by starting grade in 2000. Although lessprecisely estimated for these smaller sub-groups, we still find significant effects forthose starting in grades 1 and 4. An unantic-
ipated benefit of the program was the largeeffect on those making the transition fromthird and fourth to fifth and sixth grades.This effect was unanticipated, because en-rollment in the fifth grade or higher was notone of the conditions for continuing to re-ceive the education transfer. Unfortunately,it is not possible at present to determineexactly why this is occurring. It may besimply an income effect of the program. Itmay also be due to potentially long-lastingchanges in attitudes toward education. Fi-nally, it may merely reflect confusion aboutthe program requirements on the part ofbeneficiaries, although this seems unlikelygiven that Adato and Roopnaraine (2004)find that beneficiaries understand themwell. Examining continuation rates for allfour grades at once for the different povertygroups (Table 4.10) shows that, as with theother measures, there is a tendency for thelargest effects of the program to be concen-trated among the poorer households. Finally,as with the other results, the effects weresimilar for boys and girls.
Among those not enrolling, economicreasons were cited in nearly half the cases,and work was specifically cited in about 10percent of the cases. For those who droppedout during the year, work was cited as the
42 CHAPTER 4
Table 4.9 RPS average effect (2000–02) on school advancement,children age 7–13 in first to fourth grades, by starting grade in 2000
Grade Grade 1 Grade 2 Grade 3 Grade 4
Intervention 92.7 89.7 84.7 86.8[330] [156] [131] [114]
Control 84.8 84.3 76.2 77.5[310] [178] [105] [89]
Difference 7.9*** 5.5 8.5 9.3**(3.0) (3.8) (5.5) (5.3)
Source: Nicaraguan RPS evaluation data. Notes: Standard errors correcting for heteroskedasticity and allowing for clustering at the
comarca level are shown in parentheses (StataCorp 2001). Analysis based on allchildren 7–13 years old who had not completed grade 4 in 2000 and are in thesample in 2002. (Number of children shown in brackets.) Bold indicates signifi-cance at *** the 1 percent level, ** the 5 percent level, and * the 10 percent level.
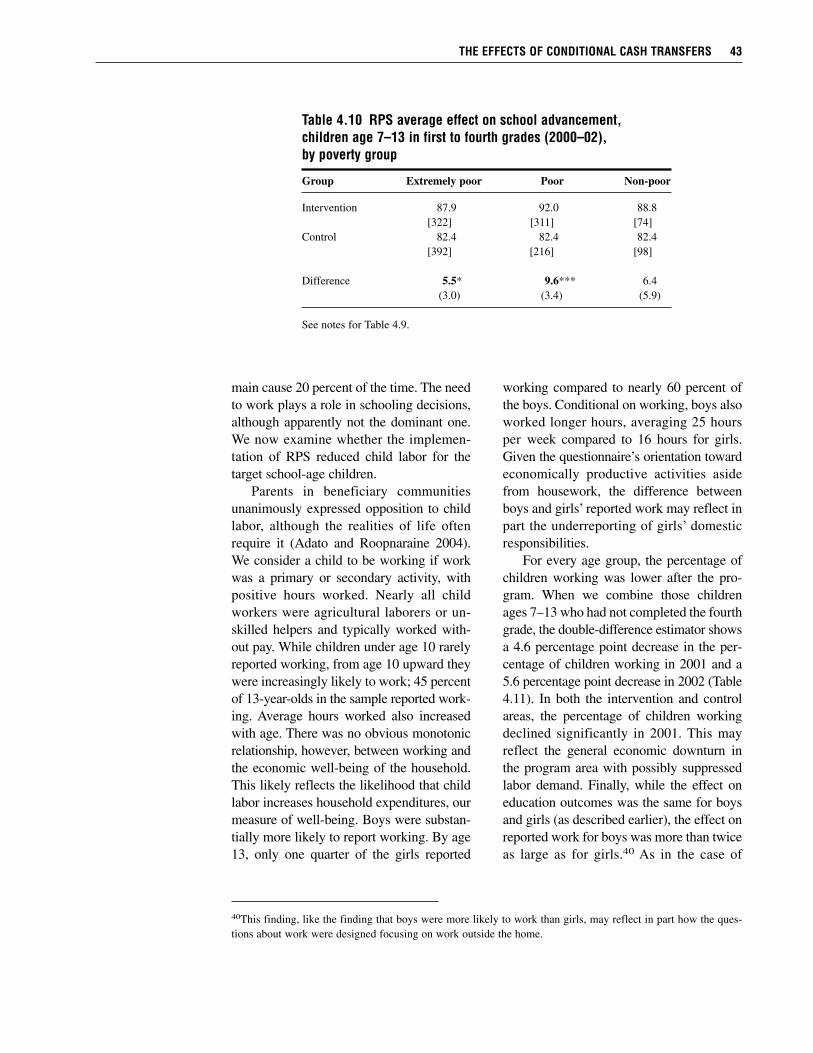
THE EFFECTS OF CONDITIONAL CASH TRANSFERS 43
40This finding, like the finding that boys were more likely to work than girls, may reflect in part how the ques-tions about work were designed focusing on work outside the home.
main cause 20 percent of the time. The needto work plays a role in schooling decisions,although apparently not the dominant one.We now examine whether the implemen-tation of RPS reduced child labor for thetarget school-age children.
Parents in beneficiary communitiesunanimously expressed opposition to childlabor, although the realities of life oftenrequire it (Adato and Roopnaraine 2004).We consider a child to be working if workwas a primary or secondary activity, withpositive hours worked. Nearly all childworkers were agricultural laborers or un-skilled helpers and typically worked with-out pay. While children under age 10 rarelyreported working, from age 10 upward theywere increasingly likely to work; 45 percentof 13-year-olds in the sample reported work-ing. Average hours worked also increasedwith age. There was no obvious monotonicrelationship, however, between working andthe economic well-being of the household.This likely reflects the likelihood that childlabor increases household expenditures, ourmeasure of well-being. Boys were substan-tially more likely to report working. By age13, only one quarter of the girls reported
working compared to nearly 60 percent ofthe boys. Conditional on working, boys alsoworked longer hours, averaging 25 hoursper week compared to 16 hours for girls.Given the questionnaire’s orientation towardeconomically productive activities asidefrom housework, the difference betweenboys and girls’ reported work may reflect inpart the underreporting of girls’ domesticresponsibilities.
For every age group, the percentage ofchildren working was lower after the pro-gram. When we combine those childrenages 7–13 who had not completed the fourthgrade, the double-difference estimator showsa 4.6 percentage point decrease in the per-centage of children working in 2001 and a5.6 percentage point decrease in 2002 (Table4.11). In both the intervention and controlareas, the percentage of children workingdeclined significantly in 2001. This mayreflect the general economic downturn inthe program area with possibly suppressedlabor demand. Finally, while the effect oneducation outcomes was the same for boysand girls (as described earlier), the effect onreported work for boys was more than twiceas large as for girls.40 As in the case of
Table 4.10 RPS average effect on school advancement,children age 7–13 in first to fourth grades (2000–02), by poverty group
Group Extremely poor Poor Non-poor
Intervention 87.9 92.0 88.8[322] [311] [74]
Control 82.4 82.4 82.4[392] [216] [98]
Difference 5.5* 9.6*** 6.4(3.0) (3.4) (5.9)
See notes for Table 4.9.
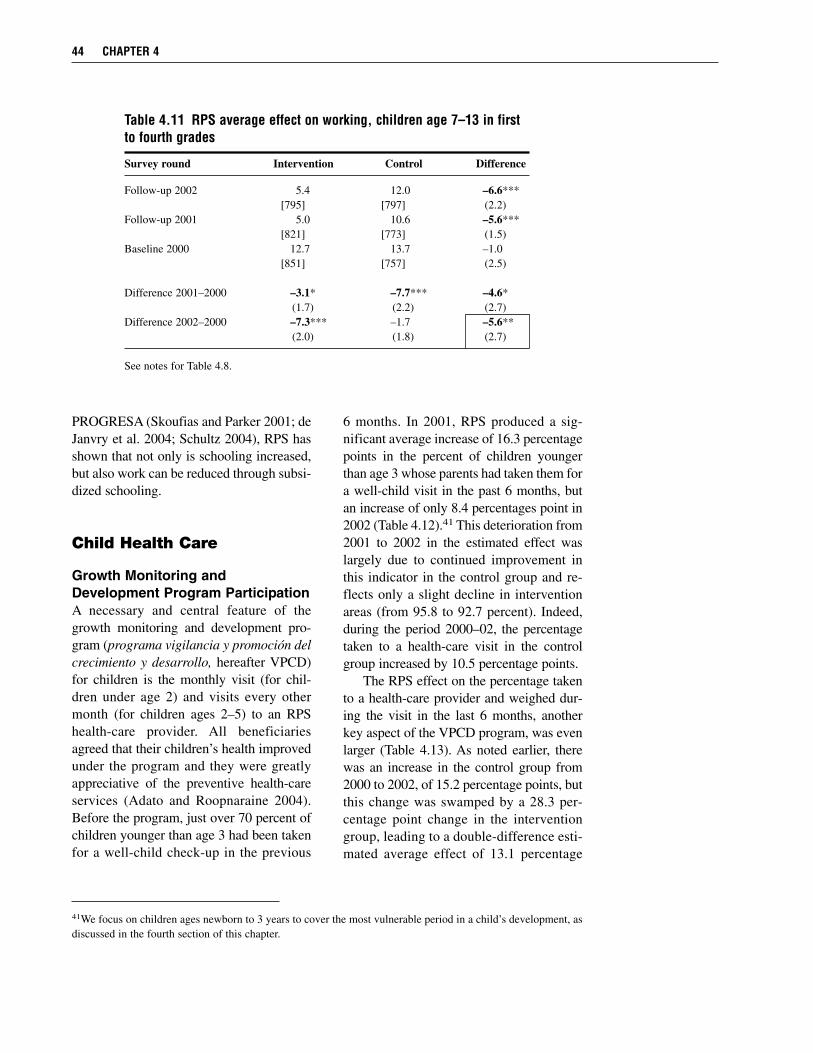
PROGRESA (Skoufias and Parker 2001; deJanvry et al. 2004; Schultz 2004), RPS hasshown that not only is schooling increased,but also work can be reduced through subsi-dized schooling.
Child Health Care
Growth Monitoring andDevelopment Program ParticipationA necessary and central feature of thegrowth monitoring and development pro-gram (programa vigilancia y promoción delcrecimiento y desarrollo, hereafter VPCD)for children is the monthly visit (for chil-dren under age 2) and visits every othermonth (for children ages 2–5) to an RPShealth-care provider. All beneficiariesagreed that their children’s health improvedunder the program and they were greatlyappreciative of the preventive health-careservices (Adato and Roopnaraine 2004).Before the program, just over 70 percent ofchildren younger than age 3 had been takenfor a well-child check-up in the previous
6 months. In 2001, RPS produced a sig-nificant average increase of 16.3 percentagepoints in the percent of children youngerthan age 3 whose parents had taken them fora well-child visit in the past 6 months, butan increase of only 8.4 percentages point in2002 (Table 4.12).41 This deterioration from2001 to 2002 in the estimated effect waslargely due to continued improvement inthis indicator in the control group and re-flects only a slight decline in interventionareas (from 95.8 to 92.7 percent). Indeed,during the period 2000–02, the percentagetaken to a health-care visit in the controlgroup increased by 10.5 percentage points.
The RPS effect on the percentage takento a health-care provider and weighed dur-ing the visit in the last 6 months, anotherkey aspect of the VPCD program, was evenlarger (Table 4.13). As noted earlier, therewas an increase in the control group from2000 to 2002, of 15.2 percentage points, butthis change was swamped by a 28.3 per-centage point change in the interventiongroup, leading to a double-difference esti-mated average effect of 13.1 percentage
44 CHAPTER 4
41We focus on children ages newborn to 3 years to cover the most vulnerable period in a child’s development, asdiscussed in the fourth section of this chapter.
Table 4.11 RPS average effect on working, children age 7–13 in firstto fourth grades
Survey round Intervention Control Difference
Follow-up 2002 5.4 12.0 –6.6***[795] [797] (2.2)
Follow-up 2001 5.0 10.6 –5.6***[821] [773] (1.5)
Baseline 2000 12.7 13.7 –1.0[851] [757] (2.5)
Difference 2001–2000 –3.1* –7.7*** –4.6*(1.7) (2.2) (2.7)
Difference 2002–2000 –7.3*** –1.7 –5.6**(2.0) (1.8) (2.7)
See notes for Table 4.8.
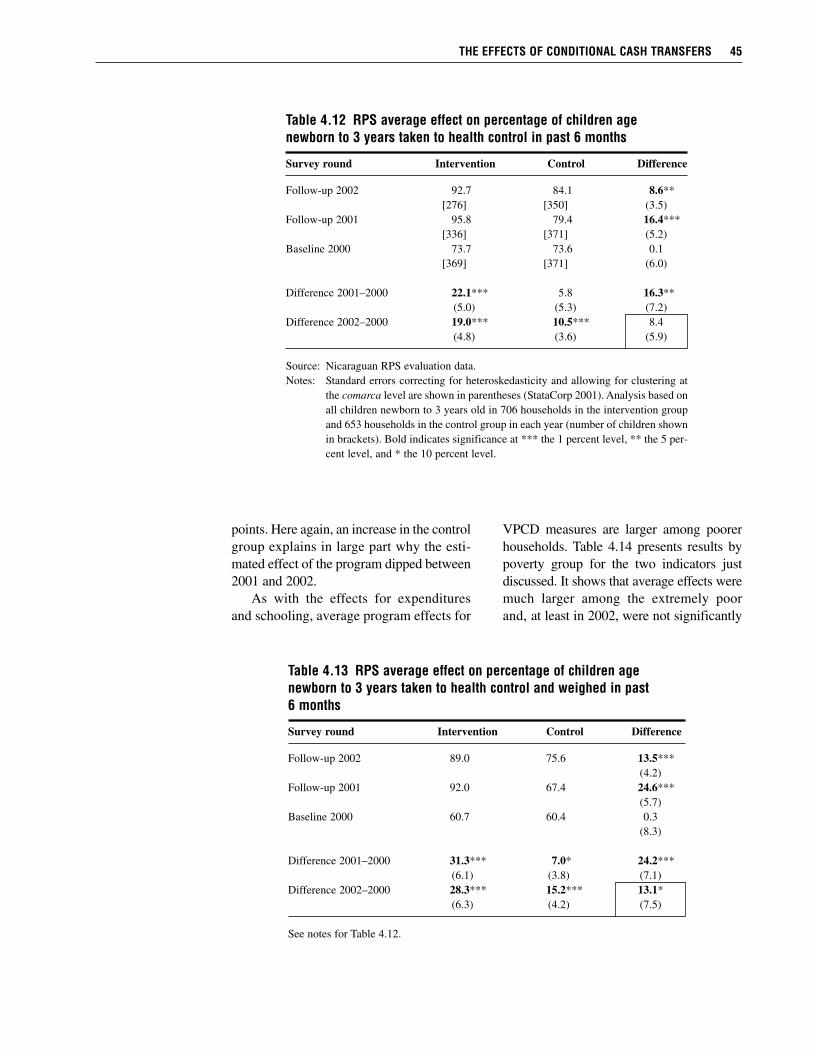
points. Here again, an increase in the controlgroup explains in large part why the esti-mated effect of the program dipped between2001 and 2002.
As with the effects for expendituresand schooling, average program effects for
VPCD measures are larger among poorerhouseholds. Table 4.14 presents results bypoverty group for the two indicators justdiscussed. It shows that average effects weremuch larger among the extremely poorand, at least in 2002, were not significantly
THE EFFECTS OF CONDITIONAL CASH TRANSFERS 45
Table 4.12 RPS average effect on percentage of children agenewborn to 3 years taken to health control in past 6 months
Survey round Intervention Control Difference
Follow-up 2002 92.7 84.1 8.6**[276] [350] (3.5)
Follow-up 2001 95.8 79.4 16.4***[336] [371] (5.2)
Baseline 2000 73.7 73.6 0.1[369] [371] (6.0)
Difference 2001–2000 22.1*** 5.8 16.3**(5.0) (5.3) (7.2)
Difference 2002–2000 19.0*** 10.5*** 8.4(4.8) (3.6) (5.9)
Source: Nicaraguan RPS evaluation data. Notes: Standard errors correcting for heteroskedasticity and allowing for clustering at
the comarca level are shown in parentheses (StataCorp 2001). Analysis based onall children newborn to 3 years old in 706 households in the intervention groupand 653 households in the control group in each year (number of children shownin brackets). Bold indicates significance at *** the 1 percent level, ** the 5 per-cent level, and * the 10 percent level.
Table 4.13 RPS average effect on percentage of children agenewborn to 3 years taken to health control and weighed in past6 months
Survey round Intervention Control Difference
Follow-up 2002 89.0 75.6 13.5***(4.2)
Follow-up 2001 92.0 67.4 24.6***(5.7)
Baseline 2000 60.7 60.4 0.3(8.3)
Difference 2001–2000 31.3*** 7.0* 24.2***(6.1) (3.8) (7.1)
Difference 2002–2000 28.3*** 15.2*** 13.1*(6.3) (4.2) (7.5)
See notes for Table 4.12.
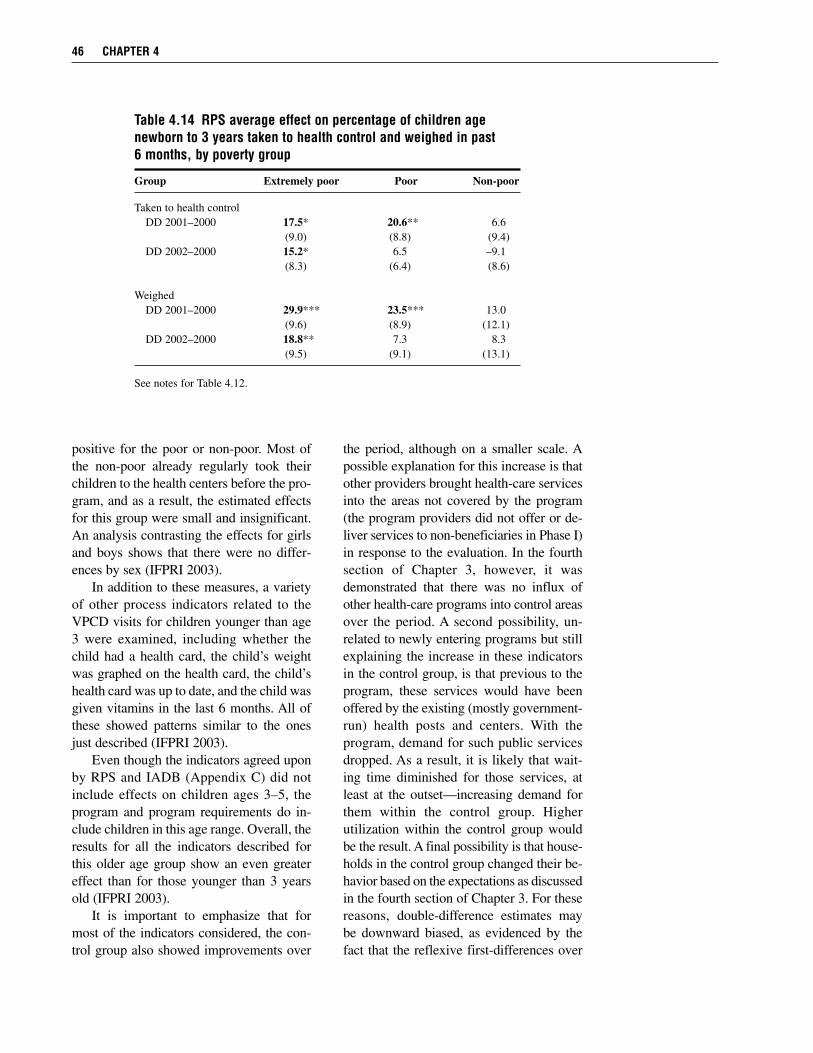
positive for the poor or non-poor. Most ofthe non-poor already regularly took theirchildren to the health centers before the pro-gram, and as a result, the estimated effectsfor this group were small and insignificant.An analysis contrasting the effects for girlsand boys shows that there were no differ-ences by sex (IFPRI 2003).
In addition to these measures, a varietyof other process indicators related to theVPCD visits for children younger than age3 were examined, including whether thechild had a health card, the child’s weightwas graphed on the health card, the child’shealth card was up to date, and the child wasgiven vitamins in the last 6 months. All ofthese showed patterns similar to the onesjust described (IFPRI 2003).
Even though the indicators agreed uponby RPS and IADB (Appendix C) did notinclude effects on children ages 3–5, theprogram and program requirements do in-clude children in this age range. Overall, theresults for all the indicators described forthis older age group show an even greatereffect than for those younger than 3 yearsold (IFPRI 2003).
It is important to emphasize that formost of the indicators considered, the con-trol group also showed improvements over
the period, although on a smaller scale. Apossible explanation for this increase is thatother providers brought health-care servicesinto the areas not covered by the program(the program providers did not offer or de-liver services to non-beneficiaries in Phase I)in response to the evaluation. In the fourthsection of Chapter 3, however, it wasdemonstrated that there was no influx ofother health-care programs into control areasover the period. A second possibility, un-related to newly entering programs but stillexplaining the increase in these indicatorsin the control group, is that previous to theprogram, these services would have beenoffered by the existing (mostly government-run) health posts and centers. With theprogram, demand for such public servicesdropped. As a result, it is likely that wait-ing time diminished for those services, atleast at the outset—increasing demand forthem within the control group. Higherutilization within the control group wouldbe the result. A final possibility is that house-holds in the control group changed their be-havior based on the expectations as discussedin the fourth section of Chapter 3. For thesereasons, double-difference estimates maybe downward biased, as evidenced by thefact that the reflexive first-differences over
46 CHAPTER 4
Table 4.14 RPS average effect on percentage of children agenewborn to 3 years taken to health control and weighed in past6 months, by poverty group
Group Extremely poor Poor Non-poor
Taken to health controlDD 2001–2000 17.5* 20.6** 6.6
(9.0) (8.8) (9.4)DD 2002–2000 15.2* 6.5 –9.1
(8.3) (6.4) (8.6)
WeighedDD 2001–2000 29.9*** 23.5*** 13.0
(9.6) (8.9) (12.1)DD 2002–2000 18.8** 7.3 8.3
(9.5) (9.1) (13.1)
See notes for Table 4.12.
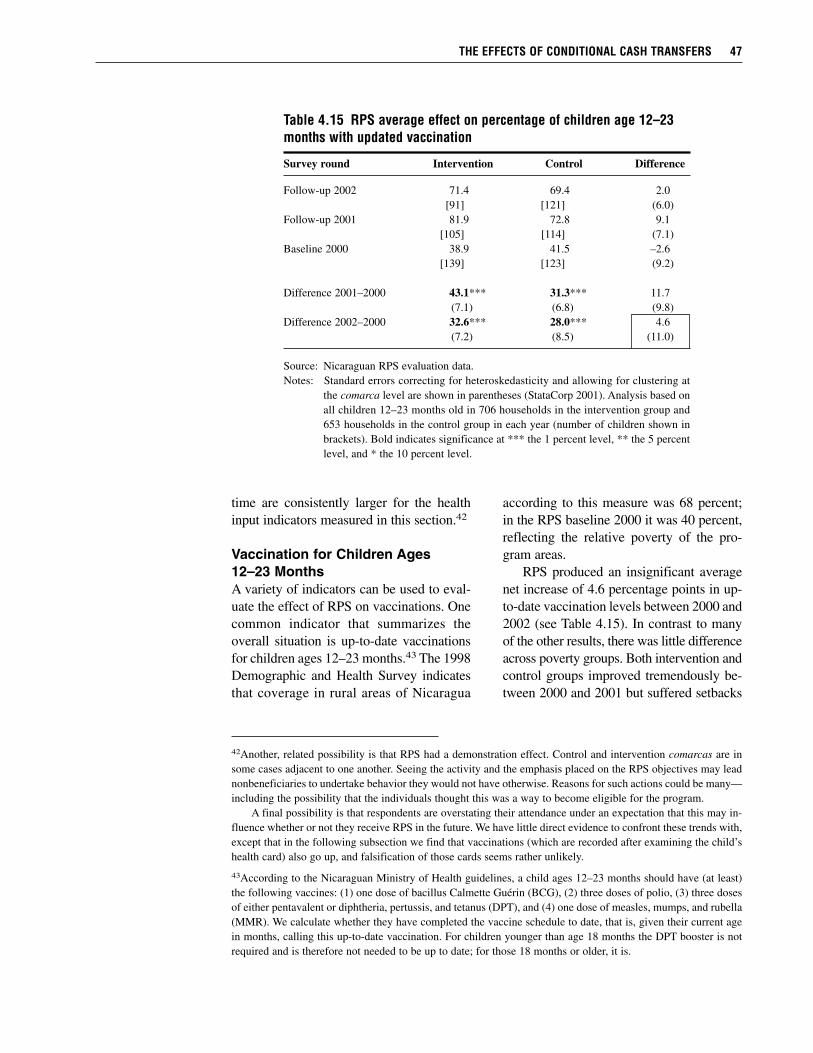
time are consistently larger for the healthinput indicators measured in this section.42
Vaccination for Children Ages12–23 MonthsA variety of indicators can be used to eval-uate the effect of RPS on vaccinations. Onecommon indicator that summarizes theoverall situation is up-to-date vaccinationsfor children ages 12–23 months.43 The 1998Demographic and Health Survey indicatesthat coverage in rural areas of Nicaragua
according to this measure was 68 percent;in the RPS baseline 2000 it was 40 percent,reflecting the relative poverty of the pro-gram areas.
RPS produced an insignificant averagenet increase of 4.6 percentage points in up-to-date vaccination levels between 2000 and2002 (see Table 4.15). In contrast to manyof the other results, there was little differenceacross poverty groups. Both intervention andcontrol groups improved tremendously be-tween 2000 and 2001 but suffered setbacks
THE EFFECTS OF CONDITIONAL CASH TRANSFERS 47
42Another, related possibility is that RPS had a demonstration effect. Control and intervention comarcas are insome cases adjacent to one another. Seeing the activity and the emphasis placed on the RPS objectives may leadnonbeneficiaries to undertake behavior they would not have otherwise. Reasons for such actions could be many—including the possibility that the individuals thought this was a way to become eligible for the program.
A final possibility is that respondents are overstating their attendance under an expectation that this may in-fluence whether or not they receive RPS in the future. We have little direct evidence to confront these trends with,except that in the following subsection we find that vaccinations (which are recorded after examining the child’shealth card) also go up, and falsification of those cards seems rather unlikely.
43According to the Nicaraguan Ministry of Health guidelines, a child ages 12–23 months should have (at least)the following vaccines: (1) one dose of bacillus Calmette Guérin (BCG), (2) three doses of polio, (3) three dosesof either pentavalent or diphtheria, pertussis, and tetanus (DPT), and (4) one dose of measles, mumps, and rubella(MMR). We calculate whether they have completed the vaccine schedule to date, that is, given their current agein months, calling this up-to-date vaccination. For children younger than age 18 months the DPT booster is notrequired and is therefore not needed to be up to date; for those 18 months or older, it is.
Table 4.15 RPS average effect on percentage of children age 12–23months with updated vaccination
Survey round Intervention Control Difference
Follow-up 2002 71.4 69.4 2.0[91] [121] (6.0)
Follow-up 2001 81.9 72.8 9.1[105] [114] (7.1)
Baseline 2000 38.9 41.5 –2.6[139] [123] (9.2)
Difference 2001–2000 43.1*** 31.3*** 11.7(7.1) (6.8) (9.8)
Difference 2002–2000 32.6*** 28.0*** 4.6(7.2) (8.5) (11.0)
Source: Nicaraguan RPS evaluation data. Notes: Standard errors correcting for heteroskedasticity and allowing for clustering at
the comarca level are shown in parentheses (StataCorp 2001). Analysis based onall children 12–23 months old in 706 households in the intervention group and653 households in the control group in each year (number of children shown inbrackets). Bold indicates significance at *** the 1 percent level, ** the 5 percentlevel, and * the 10 percent level.
between 2001 and 2002. Control areas in-creased 28.0 percentage points over theperiod, offsetting nearly all of the 32.6 per-centage point gain in the intervention areasin the calculation of the double-difference.These substantial gains are even more im-pressive when contrasted with nationalfigures that show coverage in rural areasdeclining from 68 percent in 1998 to 60percent in 2001.
An obvious proximate reason for theincreased coverage in the control group istheir increased attendance at health-carecontrols described in the previous section.In addition, discussions with RPS revealedthat increased coordination with the Min-istry of Health in the distribution of vac-cines to RPS health providers in thesemunicipalities may have had an indirecteffect—possibly strengthening the actionsof the Ministry of Health or providing addi-tional vaccines to the health posts servingthe control group. Similar results are foundfor the complete vaccination at 24 monthsindicator (IFPRI 2003).44 Once again, it islikely that the double-difference estimatesare downward biased, and that the first-differences over time may more accuratelyreflect the effect of the program, even withthe variety of measurement problems de-scribed in footnote 44. Given the municipal-ity level trends, it is all but impossible to
avoid the conclusion that RPS had a largeand positive effect on vaccination rates inthe program areas.
Child Nutritional StatusIn a separate interview module implementedin 2000 and 2002 only, the RPS assessed thenutritional status of all children younger thanage 5 in survey households, measuring theirheight, weight, and hemoglobin.45 In thissection, we explore whether the improvedhousehold diet found in the section on ex-penditures, and the improved health-careservices just described (including the growthand monitoring of children), have been ac-companied by improvements in the nutri-tional status of children younger than age 5,as they were in PROGRESA (Behrman andHoddinott 2005). We first define the indi-cators we use to measure child nutritionalstatus and their interpretation (height-for-age, weight-for-height, weight-for-age, andhemoglobin) and then describe the find-ings, placing them in the context of bothNicaragua and Central America, an analysismade possible by the existence of compa-rable data across countries.
In large part because they are growingso quickly, young children have high nutri-tional requirements. Unfortunately, the dietcommonly offered to young children in de-veloping countries to complement breast
48 CHAPTER 4
44When contrasted with RPS administrative data on vaccinations for beneficiary children, which show coverageof nearly 100 percent, the coverage reported in Table 4.15 and calculated for other vaccine measures are sub-stantially lower. There are a number of reasons for the discrepancy: (1) the analyses in this report do not condi-tion on being a beneficiary but only on living in an intervention community; (2) recall may not be complete andaccurate when the health card is unavailable during the interview; (3) even when provided, the health card maybe incorrect; and (4) due to the logistics of visiting communities, there is a small possibility of interviewing achild just after she turns old enough for a certain vaccine but has not had another visit to the health-care provider(it is prohibited to administer vaccines before the minimum age set by the Ministry of Health). When one con-siders vaccine coverage for this group vaccine by vaccine, most are covered at 90 percent or above (IFPRI 2003);only when all are considered together do the coverage rates dip. This could be consistent with minor errors asdescribed above. Finally, in addition to simply having been vaccinated, being vaccinated at the correct time isimportant—late vaccinations can have deleterious consequences for effectiveness and the coverage of the popu-lation as a whole (Bolton et al. 1998). Since we do not consider directly the date of vaccination, ignoring themeasurement concerns just outlined, these estimates tend to overestimate the overall coverage.
45The anthropometric indicators were calculated using EpiInfo v6.4c, eliminating all the observations that Epi-Info indicated had an error in measurement.
milk is of low quality (i.e., monotonous andwith low energy content and nutrient den-sity) and, as a result, multiple nutrient defi-ciencies are common. At the same time,young children are very susceptible to in-fections, because their immature immunesystems are unable to provide adequate pro-tection. In developing countries, foods andliquids are often contaminated and are thuskey sources of frequent infections. Infec-tions reduce appetite, increase nutrient loss,and increase metabolic demands. Finally,in many societies, inadequate traditionalremedies for childhood infections, includ-ing withholding of foods and breast milk,are common. Thus infection and malnutri-tion often reinforce each other. Focusing onthe nutritional status of children is a power-ful way to assess the effects of RPS, in par-ticular because improvements during thisvulnerable period persist throughout one’slife and therefore have long-lasting positivebenefits (Martorell et al. 1995).
Severe protein–energy malnutrition pre-sents itself as kwashiorkor and marasmus,syndromes that are characterized by clinicalsigns, marked metabolic disturbances, andhigh fatality rates in the absence of high-quality care (Waterlow 1992). Severe mal-nutrition is rare, however, even in very poorcountries. Most malnutrition in children isbest described as mild to moderate and ismeasured in terms of growth failure againsta standard reference population. Weightand height are expressed as age-specific z-scores46 and the criterion of a z-score of lessthan –2 for height-for-age, weight-for-height,and weight-for-age is commonly used toidentify stunting, wasting, and underweight,respectively. The percentages of stunted andunderweight children are standard ways ofdescribing the extent of child malnutritionin societies (UN ACC/SCN 2000). The fol-lowing are the standard indicators.
Height-for-age reflects linear growthbefore and after birth. A short stature refersto short height-for-age that can reflect eithernormal variation in growth or a develop-mental deficit. This deficit or retardation ingrowth is the cumulative effect of poor nu-trition or inadequate health for an extendedperiod of time. A child is considered to be indeficit, or stunted, if his or her height-for-age z-score (HAZ) is two or more standarddeviations (SD) below the median of theinternational sex-specific reference popula-tion of the National Center of Health Statis-tics of the United States of America/WorldHealth Organization, referred to as “NCHS/WHO” (WHO Expert Committee 1995).
Weight-for-height measures body weightrelative to stature and, similar to height-for-age, a child is considered to be in deficit,or wasted, if his or her weight-for-heightz-score (WHZ) is more than two standarddeviations below the median of the inter-national reference population NCHS/WHO.In general, this condition is the result of arecent experience such as a severe lack offood or serious illness, which causes sub-stantial weight loss. It is also possible thatthe deficit originates from chronic nutritiondeficiency or chronic illness.
Weight-for-age measures body mass rela-tive to age. It is influenced both by statureand weight of children and, therefore, whenthere is a deficit, it is an indicator of bothretarded growth and of weight loss. For thisreason, it is difficult to interpret. When thereis no deficit in weight-for-height, weight-for-age also indicates the accumulated ef-fects of poor nutrition or health of an in-dividual (or population), similar to theinterpretation for height-for-age. Weight-for-age deficit is defined as weight-for-agez-score (WAZ) more than two standard de-viations below the median of the inter-national reference population NCHS/WHO.
THE EFFECTS OF CONDITIONAL CASH TRANSFERS 49
46z-scores are used to normalize measured heights and weights against those found in well-nourished populations.They are age- and sex-specific; for example, a z-score of height-for-age is defined as measured height minus me-dian height of the reference population, all divided by the standard deviation for that age/sex category.
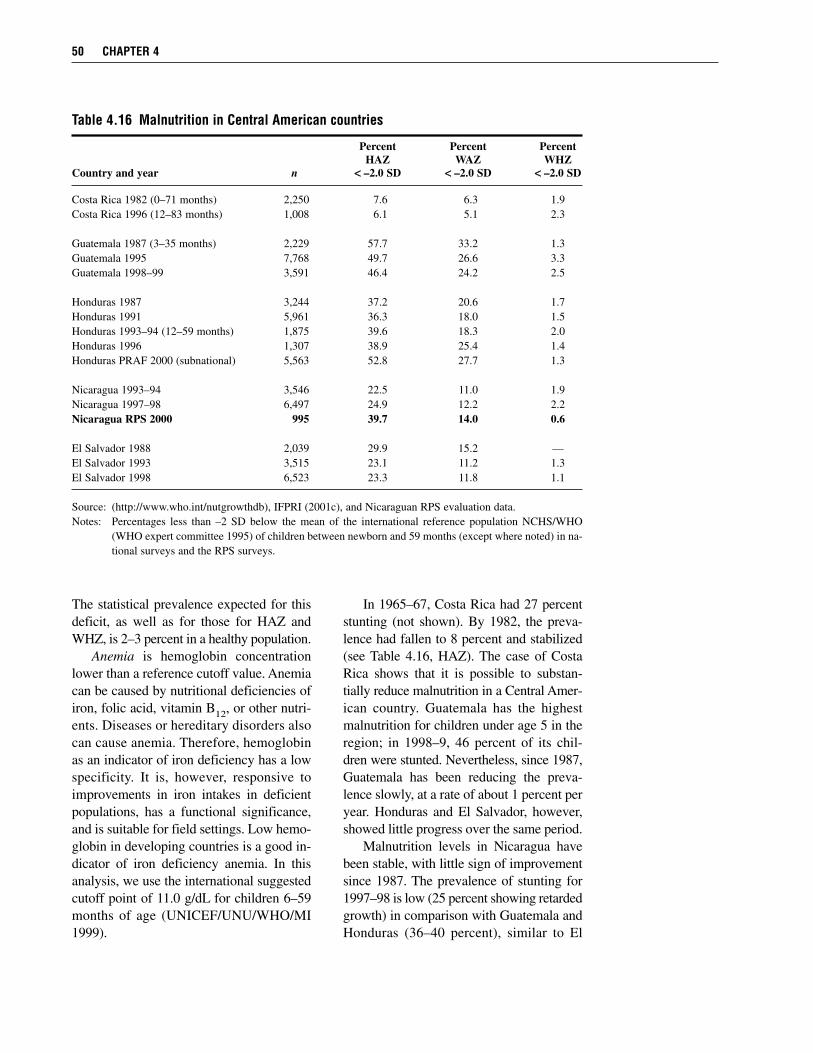
The statistical prevalence expected for thisdeficit, as well as for those for HAZ andWHZ, is 2–3 percent in a healthy population.
Anemia is hemoglobin concentrationlower than a reference cutoff value. Anemiacan be caused by nutritional deficiencies ofiron, folic acid, vitamin B12, or other nutri-ents. Diseases or hereditary disorders alsocan cause anemia. Therefore, hemoglobinas an indicator of iron deficiency has a lowspecificity. It is, however, responsive toimprovements in iron intakes in deficientpopulations, has a functional significance,and is suitable for field settings. Low hemo-globin in developing countries is a good in-dicator of iron deficiency anemia. In thisanalysis, we use the international suggestedcutoff point of 11.0 g/dL for children 6–59months of age (UNICEF/UNU/WHO/MI1999).
In 1965–67, Costa Rica had 27 percentstunting (not shown). By 1982, the preva-lence had fallen to 8 percent and stabilized(see Table 4.16, HAZ). The case of CostaRica shows that it is possible to substan-tially reduce malnutrition in a Central Amer-ican country. Guatemala has the highestmalnutrition for children under age 5 in theregion; in 1998–9, 46 percent of its chil-dren were stunted. Nevertheless, since 1987,Guatemala has been reducing the preva-lence slowly, at a rate of about 1 percent peryear. Honduras and El Salvador, however,showed little progress over the same period.
Malnutrition levels in Nicaragua havebeen stable, with little sign of improvementsince 1987. The prevalence of stunting for1997–98 is low (25 percent showing retardedgrowth) in comparison with Guatemala andHonduras (36–40 percent), similar to El
50 CHAPTER 4
Table 4.16 Malnutrition in Central American countries
Percent Percent PercentHAZ WAZ WHZ
Country and year n << –2.0 SD << –2.0 SD << –2.0 SD
Costa Rica 1982 (0–71 months) 2,250 7.6 6.3 1.9Costa Rica 1996 (12–83 months) 1,008 6.1 5.1 2.3
Guatemala 1987 (3–35 months) 2,229 57.7 33.2 1.3Guatemala 1995 7,768 49.7 26.6 3.3Guatemala 1998–99 3,591 46.4 24.2 2.5
Honduras 1987 3,244 37.2 20.6 1.7Honduras 1991 5,961 36.3 18.0 1.5Honduras 1993–94 (12–59 months) 1,875 39.6 18.3 2.0Honduras 1996 1,307 38.9 25.4 1.4Honduras PRAF 2000 (subnational) 5,563 52.8 27.7 1.3
Nicaragua 1993–94 3,546 22.5 11.0 1.9Nicaragua 1997–98 6,497 24.9 12.2 2.2Nicaragua RPS 2000 995 39.7 14.0 0.6
El Salvador 1988 2,039 29.9 15.2 —El Salvador 1993 3,515 23.1 11.2 1.3El Salvador 1998 6,523 23.3 11.8 1.1
Source: (http://www.who.int/nutgrowthdb), IFPRI (2001c), and Nicaraguan RPS evaluation data.Notes: Percentages less than –2 SD below the mean of the international reference population NCHS/WHO
(WHO expert committee 1995) of children between newborn and 59 months (except where noted) in na-tional surveys and the RPS surveys.
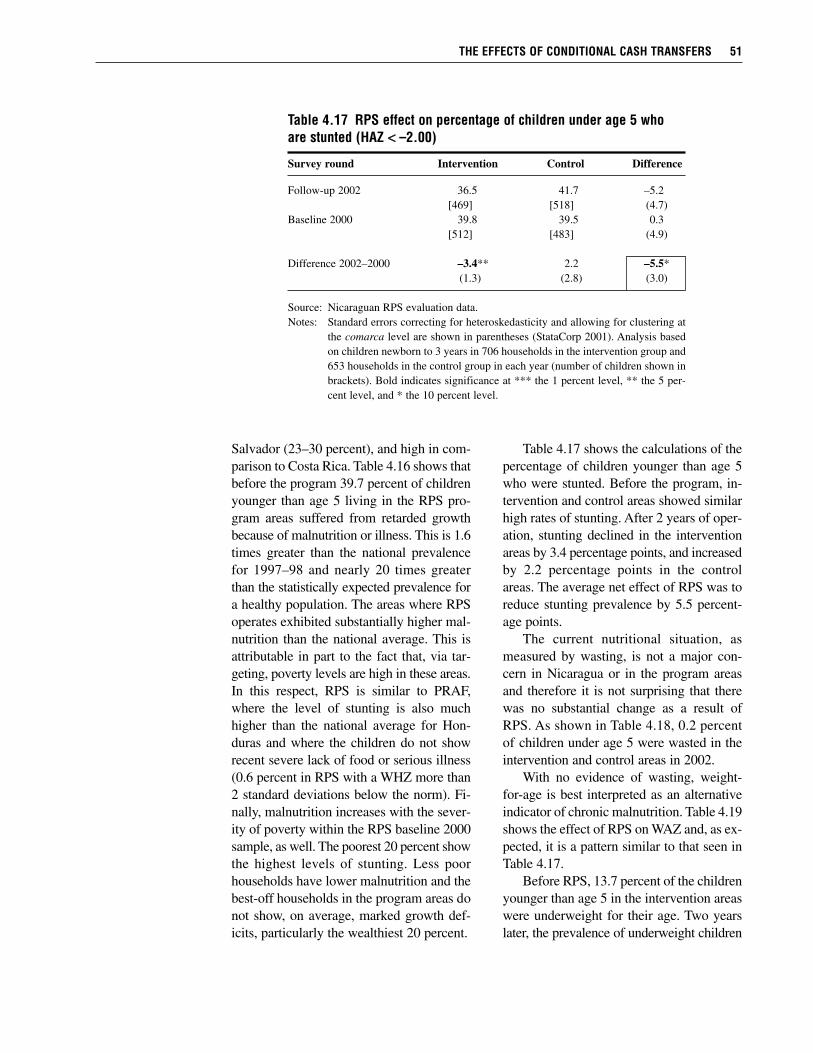
Salvador (23–30 percent), and high in com-parison to Costa Rica. Table 4.16 shows thatbefore the program 39.7 percent of childrenyounger than age 5 living in the RPS pro-gram areas suffered from retarded growthbecause of malnutrition or illness. This is 1.6times greater than the national prevalencefor 1997–98 and nearly 20 times greaterthan the statistically expected prevalence fora healthy population. The areas where RPSoperates exhibited substantially higher mal-nutrition than the national average. This isattributable in part to the fact that, via tar-geting, poverty levels are high in these areas.In this respect, RPS is similar to PRAF,where the level of stunting is also muchhigher than the national average for Hon-duras and where the children do not showrecent severe lack of food or serious illness(0.6 percent in RPS with a WHZ more than2 standard deviations below the norm). Fi-nally, malnutrition increases with the sever-ity of poverty within the RPS baseline 2000sample, as well. The poorest 20 percent showthe highest levels of stunting. Less poorhouseholds have lower malnutrition and thebest-off households in the program areas donot show, on average, marked growth def-icits, particularly the wealthiest 20 percent.
Table 4.17 shows the calculations of thepercentage of children younger than age 5who were stunted. Before the program, in-tervention and control areas showed similarhigh rates of stunting. After 2 years of oper-ation, stunting declined in the interventionareas by 3.4 percentage points, and increasedby 2.2 percentage points in the controlareas. The average net effect of RPS was toreduce stunting prevalence by 5.5 percent-age points.
The current nutritional situation, asmeasured by wasting, is not a major con-cern in Nicaragua or in the program areasand therefore it is not surprising that therewas no substantial change as a result ofRPS. As shown in Table 4.18, 0.2 percentof children under age 5 were wasted in theintervention and control areas in 2002.
With no evidence of wasting, weight-for-age is best interpreted as an alternativeindicator of chronic malnutrition. Table 4.19shows the effect of RPS on WAZ and, as ex-pected, it is a pattern similar to that seen inTable 4.17.
Before RPS, 13.7 percent of the childrenyounger than age 5 in the intervention areaswere underweight for their age. Two yearslater, the prevalence of underweight children
THE EFFECTS OF CONDITIONAL CASH TRANSFERS 51
Table 4.17 RPS effect on percentage of children under age 5 whoare stunted (HAZ << –2.00)
Survey round Intervention Control Difference
Follow-up 2002 36.5 41.7 –5.2[469] [518] (4.7)
Baseline 2000 39.8 39.5 0.3[512] [483] (4.9)
Difference 2002–2000 –3.4** 2.2 –5.5*(1.3) (2.8) (3.0)
Source: Nicaraguan RPS evaluation data. Notes: Standard errors correcting for heteroskedasticity and allowing for clustering at
the comarca level are shown in parentheses (StataCorp 2001). Analysis basedon children newborn to 3 years in 706 households in the intervention group and653 households in the control group in each year (number of children shown inbrackets). Bold indicates significance at *** the 1 percent level, ** the 5 per-cent level, and * the 10 percent level.
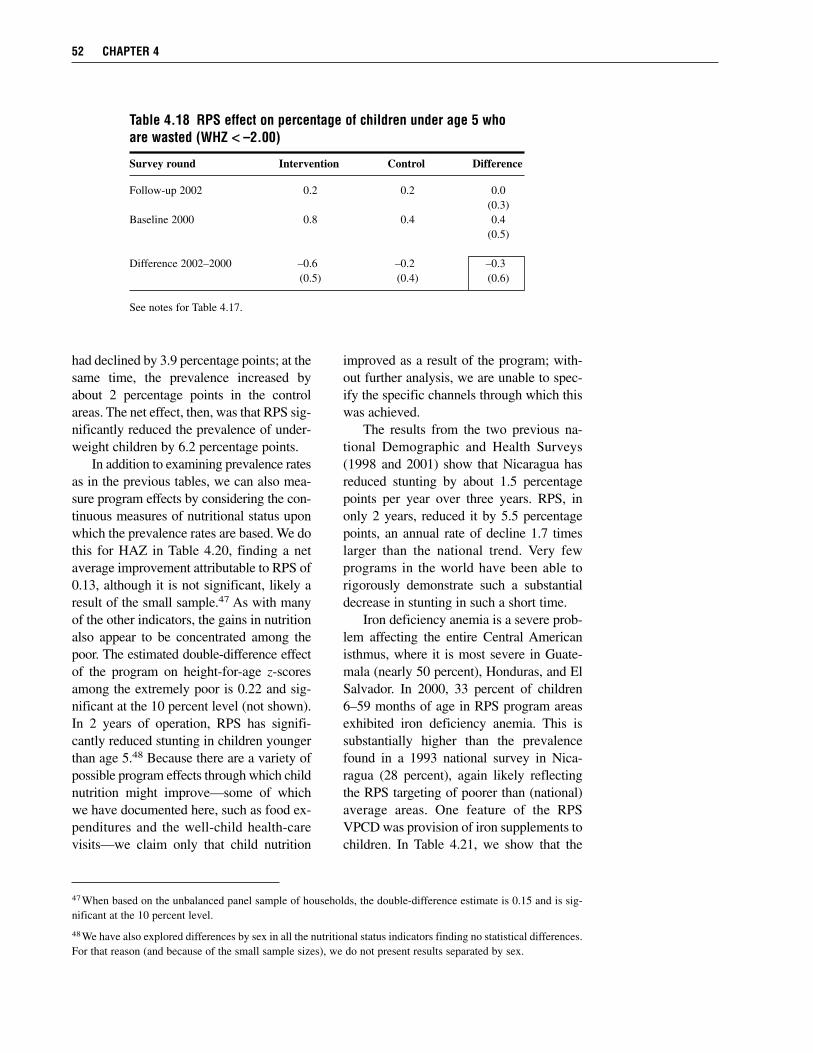
had declined by 3.9 percentage points; at thesame time, the prevalence increased byabout 2 percentage points in the controlareas. The net effect, then, was that RPS sig-nificantly reduced the prevalence of under-weight children by 6.2 percentage points.
In addition to examining prevalence ratesas in the previous tables, we can also mea-sure program effects by considering the con-tinuous measures of nutritional status uponwhich the prevalence rates are based. We dothis for HAZ in Table 4.20, finding a netaverage improvement attributable to RPS of0.13, although it is not significant, likely aresult of the small sample.47 As with manyof the other indicators, the gains in nutritionalso appear to be concentrated among thepoor. The estimated double-difference effectof the program on height-for-age z-scoresamong the extremely poor is 0.22 and sig-nificant at the 10 percent level (not shown).In 2 years of operation, RPS has signifi-cantly reduced stunting in children youngerthan age 5.48 Because there are a variety ofpossible program effects through which childnutrition might improve—some of whichwe have documented here, such as food ex-penditures and the well-child health-carevisits—we claim only that child nutrition
improved as a result of the program; with-out further analysis, we are unable to spec-ify the specific channels through which thiswas achieved.
The results from the two previous na-tional Demographic and Health Surveys(1998 and 2001) show that Nicaragua hasreduced stunting by about 1.5 percentagepoints per year over three years. RPS, inonly 2 years, reduced it by 5.5 percentagepoints, an annual rate of decline 1.7 timeslarger than the national trend. Very fewprograms in the world have been able torigorously demonstrate such a substantialdecrease in stunting in such a short time.
Iron deficiency anemia is a severe prob-lem affecting the entire Central Americanisthmus, where it is most severe in Guate-mala (nearly 50 percent), Honduras, and ElSalvador. In 2000, 33 percent of children6–59 months of age in RPS program areasexhibited iron deficiency anemia. This issubstantially higher than the prevalencefound in a 1993 national survey in Nica-ragua (28 percent), again likely reflectingthe RPS targeting of poorer than (national)average areas. One feature of the RPSVPCD was provision of iron supplements tochildren. In Table 4.21, we show that the
52 CHAPTER 4
47When based on the unbalanced panel sample of households, the double-difference estimate is 0.15 and is sig-nificant at the 10 percent level.
48We have also explored differences by sex in all the nutritional status indicators finding no statistical differences.For that reason (and because of the small sample sizes), we do not present results separated by sex.
Table 4.18 RPS effect on percentage of children under age 5 whoare wasted (WHZ << –2.00)
Survey round Intervention Control Difference
Follow-up 2002 0.2 0.2 0.0(0.3)
Baseline 2000 0.8 0.4 0.4(0.5)
Difference 2002–2000 –0.6 –0.2 –0.3(0.5) (0.4) (0.6)
See notes for Table 4.17.
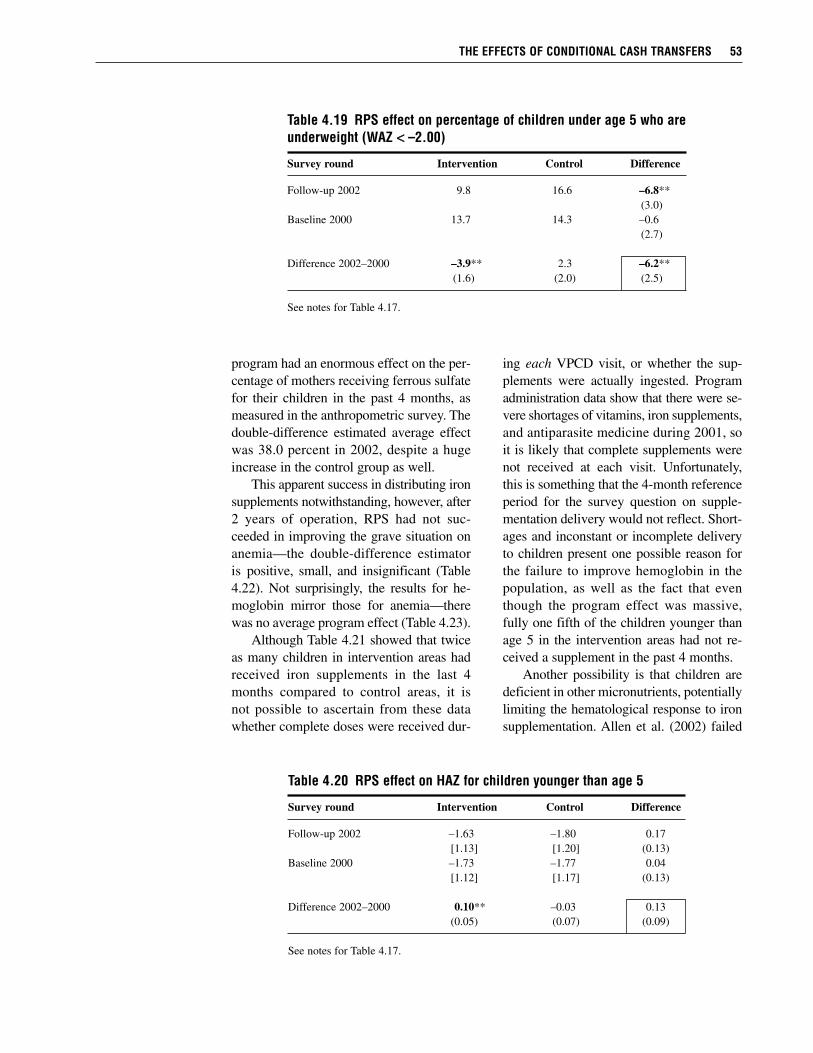
program had an enormous effect on the per-centage of mothers receiving ferrous sulfatefor their children in the past 4 months, asmeasured in the anthropometric survey. Thedouble-difference estimated average effectwas 38.0 percent in 2002, despite a hugeincrease in the control group as well.
This apparent success in distributing ironsupplements notwithstanding, however, after2 years of operation, RPS had not suc-ceeded in improving the grave situation onanemia—the double-difference estimatoris positive, small, and insignificant (Table4.22). Not surprisingly, the results for he-moglobin mirror those for anemia—therewas no average program effect (Table 4.23).
Although Table 4.21 showed that twiceas many children in intervention areas hadreceived iron supplements in the last 4months compared to control areas, it isnot possible to ascertain from these datawhether complete doses were received dur-
ing each VPCD visit, or whether the sup-plements were actually ingested. Programadministration data show that there were se-vere shortages of vitamins, iron supplements,and antiparasite medicine during 2001, soit is likely that complete supplements werenot received at each visit. Unfortunately,this is something that the 4-month referenceperiod for the survey question on supple-mentation delivery would not reflect. Short-ages and inconstant or incomplete deliveryto children present one possible reason forthe failure to improve hemoglobin in thepopulation, as well as the fact that eventhough the program effect was massive,fully one fifth of the children younger thanage 5 in the intervention areas had not re-ceived a supplement in the past 4 months.
Another possibility is that children aredeficient in other micronutrients, potentiallylimiting the hematological response to ironsupplementation. Allen et al. (2002) failed
THE EFFECTS OF CONDITIONAL CASH TRANSFERS 53
Table 4.19 RPS effect on percentage of children under age 5 who areunderweight (WAZ << –2.00)
Survey round Intervention Control Difference
Follow-up 2002 9.8 16.6 –6.8**(3.0)
Baseline 2000 13.7 14.3 –0.6(2.7)
Difference 2002–2000 –3.9** 2.3 –6.2**(1.6) (2.0) (2.5)
See notes for Table 4.17.
Table 4.20 RPS effect on HAZ for children younger than age 5
Survey round Intervention Control Difference
Follow-up 2002 –1.63 –1.80 0.17[1.13] [1.20] (0.13)
Baseline 2000 –1.73 –1.77 0.04[1.12] [1.17] (0.13)
Difference 2002–2000 0.10** –0.03 0.13(0.05) (0.07) (0.09)
See notes for Table 4.17.
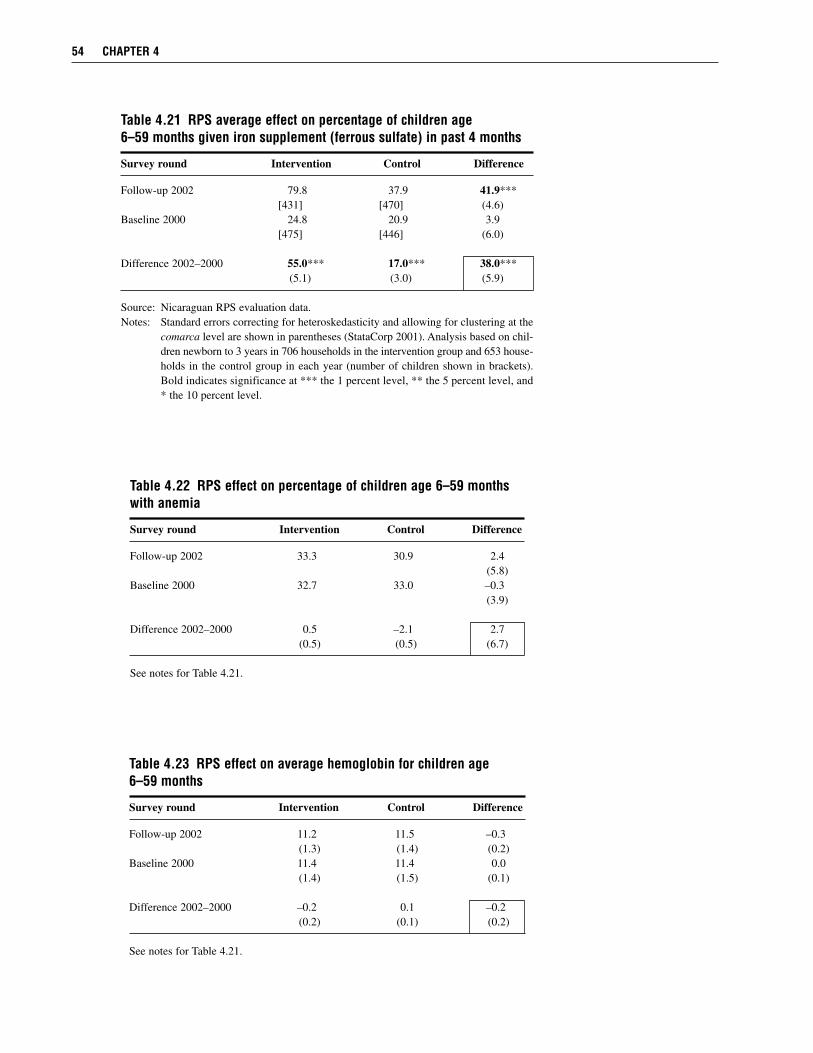
54 CHAPTER 4
Table 4.21 RPS average effect on percentage of children age 6–59 months given iron supplement (ferrous sulfate) in past 4 months
Survey round Intervention Control Difference
Follow-up 2002 79.8 37.9 41.9***[431] [470] (4.6)
Baseline 2000 24.8 20.9 3.9[475] [446] (6.0)
Difference 2002–2000 55.0*** 17.0*** 38.0***(5.1) (3.0) (5.9)
Source: Nicaraguan RPS evaluation data. Notes: Standard errors correcting for heteroskedasticity and allowing for clustering at the
comarca level are shown in parentheses (StataCorp 2001). Analysis based on chil-dren newborn to 3 years in 706 households in the intervention group and 653 house-holds in the control group in each year (number of children shown in brackets).Bold indicates significance at *** the 1 percent level, ** the 5 percent level, and* the 10 percent level.
Table 4.22 RPS effect on percentage of children age 6–59 monthswith anemia
Survey round Intervention Control Difference
Follow-up 2002 33.3 30.9 2.4(5.8)
Baseline 2000 32.7 33.0 –0.3(3.9)
Difference 2002–2000 0.5 –2.1 2.7(0.5) (0.5) (6.7)
See notes for Table 4.21.
Table 4.23 RPS effect on average hemoglobin for children age 6–59 months
Survey round Intervention Control Difference
Follow-up 2002 11.2 11.5 –0.3(1.3) (1.4) (0.2)
Baseline 2000 11.4 11.4 0.0(1.4) (1.5) (0.1)
Difference 2002–2000 –0.2 0.1 –0.2(0.2) (0.1) (0.2)
See notes for Table 4.21.
to find an improvement in hemoglobin inMexican children ages 18–36 months sup-plemented with iron over 12 months in acontrolled experiment. They conclude thatthe failure of the treatment could not beattributed to failure to take the supplement,inadequate length of supplementation, orinadequate absorption of the iron provided.
Probably the most important factor inRPS, however, is whether children were ac-tually ingesting the supplements. This latter
possibility was pursued in the qualitativestudy. It found that mothers knew the sup-plements were important for their children’shealth. Most even said that they administerthem, but in reality this appears not to be thecase (or to be only sporadic). They offered avariety of reasons for not doing so afterprobing, however, including: children didnot like the taste, it caused vomiting or diar-rhea, and it stained their teeth (Adato andRoopnaraine 2004).
THE EFFECTS OF CONDITIONAL CASH TRANSFERS 55
C H A P T E R 5
Conclusions
This report has presented the main findings of a quantitative evaluation of a randomizedcommunity-based intervention, RPS, against its primary objectives. Where possible,we err on the side of assessing what are the short-term effects of the program in con-
servative manners, for example, by presenting intent-to-treat estimates and in the treatment ofpossible contamination and attrition. The estimates presented represent the effect of the pro-gram as a whole, in particular combining supply- and demand-side components. They alsorepresent only the short-term effects of the program (after 1 or 2 years), although some of theoutcomes examined are themselves long-run indicators. In many instances, for example, whenassessing the effects on expenditures during what turned out to be an economic downturn, thecritical importance of having baseline data and a control group for the evaluation was evident—without one it would have been next to impossible to make reliable assessments of the pro-gram effects. Even with one, it was at times difficult to make certain assessments of effects forsome indicators since the evaluation did not exist in a vacuum, and a variety of actors notunder the control of the program continued to operate in the program areas.
Overall, we found that RPS had positive (i.e., favorable) and significant double-differenceestimated average effects on a broad range of indicators and outcomes. Where it did not, it wasoften because of similar, although smaller, improvements in the control group, which werelikely to have been influenced in part by the program itself. Nearly all estimated effects werelarger for the extremely poor, often reflecting their lower starting points (e.g., percentage ofchildren enrolling before the program). Among poorer beneficiaries there was simply morepotential for improvement on many of the indicators. As a result, the program has reducedinequality of these outcomes across expenditure classes.
During Phase I, RPS supplemented per capita annual total household expenditures by 18percent, on average. For beneficiary households, this increase compensated for the large in-come loss experienced by non-beneficiaries during this period, while producing a small over-all increase in expenditures. Most of the increase in expenditures was spent on food; the pro-gram resulted in an average increase of C$640 (US$50) in per capita annual food expendituresand an improvement in the diet of beneficiary households. Expenditures on education alsoincreased significantly, although there was no discernible effect on other types of investmentexpenditures. Labor market participation was apparently little changed with the program overtime, although there was an indication of slightly fewer hours worked by men in the last week,relative to the control group. The economic difficulties experienced by these communitiesenabled RPS to operate somewhat like a traditional social safety net, aiding households dur-ing a downturn. For schooling, RPS produced a large average net increase on enrollment of12.8 percentage points and an even larger effect of 20 percentage points on current attendancefor the target population. Examining the number of children in grades 1–4 who advanced two
56
grades between 2000 and 2002, RPS led toan average increase of 7.3 percentage points,despite the fact that advancement past grade4 was not a formal requirement of the pro-gram. In tandem with the increased school-ing, the percentage of children 7–13 yearsworking declined by 5.6 points.
For child health care, RPS induced an av-erage net increase of 16.3 percentage pointsin the participation of children youngerthan age 3 in VPCD but the effect was only8.4 percentage points (and insignificant) in2002 since participation by control grouphouseholds increased substantially. Thehealth-care services provided by the pro-gram, as measured by process indicators in-cluding whether the child was weighed andwhether his or her health card was updated,improved even more. Participation by chil-dren ages 3–5 also increased substantially.Although it is not possible to statisticallydemonstrate that RPS increased vaccinationcoverage for children ages 12–23 months inthe intervention group (relative to the con-trol group), it was demonstrated that vacci-nation rates climbed 30 percentage points inthe intervention and control areas at a timewhen they were, on average, decreasing inrural areas nationally. One would be hardpressed not to attribute this substantial im-provement in large part to RPS.
Finally, the more varied household dietand increased use of preventive health-careservices for children have been accompaniedby an improvement in the nutritional statusof beneficiary children younger than age 5.The net effect was a 5.5 percentage pointdecline in the number of children who werestunted. This decline was 1.7 times fasterthan the rate of annual improvement seen atthe national level between 1998 and 2001.Very few programs in the world have shownsuch a decrease in stunting in such a shorttime. Despite improvements in the distribu-tion of iron supplements to these same chil-
dren, however, RPS was unable to improvehemoglobin levels or lower rates of anemia.
In related work, Caldés and Maluccio(2005) analyze program and non-programcosts for RPS, including costs for design,planning, and execution of the program inthe evaluation areas and everywhere else itwas operating (see Appendix A). While theywere unable to separate out program costspertaining to the households evaluated inthis report, they present a number of find-ings relevant to this study. In particular, theyfound that administrative costs were a littleless than 20 percent in the pilot phase, aftertaking out fixed costs associated with de-sign, planning, and evaluation. These werehigher than the costs for PROGRESA orPRAF (Caldés, Coady, and Maluccio 2004),although the difference appears to be dueto RPS’s complicated design (with an in-volved supply-side component that the othertwo programs did not have), pilot nature, andits small size, particularly in comparison toPROGRESA. Furthermore, RPS arguablyhad the most impressive effects (Rawlingsand Rubio 2005).
Nearly half of the costs were due to anumber of special program features that arehallmarks of conditional cash transfer pro-grams, in particular targeting, monitoring andconditioning, and coordinating the health-care supply. Removing these costs wouldreduce the administrative costs substantially,but it is not possible to determine by howmuch it would reduce the effectiveness of theprogram—indeed their removal could rep-resent a false savings (Caldés and Maluccio2005).
The findings presented here played animportant role in the decision in late 2002by the Government of Nicaragua and IADBto continue and expand this effective pro-gram as RPS–Mi Familia, Phase II.49 Inthe expansion, the program was altered inthree important ways. First, the health-care
CONCLUSIONS 57
49The program was transferred within the Nicaraguan government from FISE to the Ministry of the Family (MiFamilia) in Phase II.
services were expanded to benefit additionalhousehold members, in particular with pre-natal services for pregnant women, vaccina-tions for 6- to 9-year-olds, and preventivehealth care for adolescents and for all womenage 20 and older. Second, initially designedas a 3-year program with both demand- andsupply-side components lasting for 3 years,the supply-side components of the program(in particular the health-care services andthe teacher transfer) were extended in PhaseII to last for a total of 5 years, such that inthe final 2 years participants would receivesupply-side benefits only. Third, based onevidence of the effectiveness of the programand cost considerations, the transfer size wasreduced by one-third.
RPS has improved a number of the indi-cators included in the Nicaraguan nationalpoverty reduction strategy, during a time inwhich many of them are not on track toachieve the goals set out in the plan to 2015(World Bank 2003). RPS demonstrates thatit is possible in Nicaragua, as it has been inMexico and other places, to combine short-term reduction in rural poverty with im-provements in human capital of children.
The evidence from the evaluation stronglysuggests that if the program were expandedelsewhere in poor rural areas of Nicaragua(as it was in 2003), it would be effective, al-though due to the caveats discussed through-out this report, we stop short of saying itwould necessarily be equally as effective.Nonetheless, it could prove to be an im-portant component of Nicaragua’s overallpoverty reduction policy.
A crucial question that the current eval-uation was unable to answer is whether theeffects documented here will persist afterthe program exits, and whether there arelonger-term effects that have not been cap-tured in what is only a short-term, 2-yearevaluation. In late 2003, RPS delivered thefinal demand-side transfers in the originalintervention areas, although it is scheduledto continue offering health-care services andteacher transfers until the end of 2005. Con-tinued survey work in these areas will pro-vide some of the information necessary toexamine the effects of that transition, andbegin to understand better the sustainabilityof the large changes achieved by RPS.
58 CHAPTER 5
A P P E N D I X A
Descriptive Chronology of RPS ProgramActivities in Phase I
The following is a descriptive timeline of the major activities undertaken during the pilotphase (Phase I) of RPS, constructed in conjunction with RPS staff. We start with theformal beginning of the program, disregarding the substantial planning efforts carried
out before that time by the IADB team and the eventual director to prepare the loan proposaland any consultancies including the targeting strategy presented in Arcia (1999).
RPS was initiated in the final 2 months of 1999 with five full-time employees and thedirector. Even with substantial advance planning, at the outset there was still much to be donebefore RPS could become operational. Nearly all the effort and resources during those 2months were devoted to writing the program’s operational guidelines, preparing the contrac-tual arrangements necessary to hire central and local office staff, and designing the terms ofreference for the program evaluation. Finally, there was an effort to generate social and polit-ical support through advocacy and public advertising campaigns, useful for any new programbut perhaps especially important for a program involving cash transfers, such as RPS.
In 2000, the first full year of operations, there were a number of activities associated withinstitutional strengthening, including selecting and training an experienced professional teamin both the central and regional offices. By the end of the year, RPS had 37 persons on staff inthe central office in Managua and 12 in the regional offices. This team designed informationalmaterials for program beneficiaries, operational manuals for program counterparts (e.g., pro-viders of health and education services), the accounting system, and the information system.The latter comprises a continuously updated, relational database of beneficiaries, health-careproviders, and schools. The MIS was used to (1) select beneficiaries and prepare invitations toprogram incorporation assemblies, (2) calculate transfer amounts, (3) compile requests to theMinistry of Health for vaccines and other materials, and (4) monitor whether both beneficiariesand health-care service providers are meeting their respective responsibilities. Substantial timewas dedicated to designing data forms for the various program participants that feed this sys-tem (including the household registry or census forms, school forms, and health-care providerforms that are all sent to the main office where they were entered into the computer). In con-junction with IFPRI, RPS also estimated and calibrated an econometric model to be used forhousehold targeting in the second stage of Phase I.
Another important activity started in 2000 was the census implemented in the programareas. After designing a two-page questionnaire (to be used in all the comarcas) that wouldserve both as a registry and as an input into the household targeting decisions, RPS contractedthe National Institute of Statistics and Censuses to implement it for all households living in the42 geographically targeted comarcas to identify potential beneficiaries and construct a registry
59
of them. This was first done in March andApril 2000 with follow-up fieldwork inSeptember and October. Citing coordinationproblems and concerns over data qualityand coverage (part of the reason that a secondround of fieldwork was necessary was thathouseholds had been missed), RPS itselfcarried out the census in 17 comarcas inwhich household targeting was to be im-plemented, in January and March 2001, andthereafter internalizing this part of the oper-ation. The next main activity in 2000 wasthe preparation and implementation of thebeneficiary-incorporation assemblies. Oncebeneficiaries had been identified and inte-grated into the database, they were invitedin groups of 30 or fewer to assemblies typi-cally held in the local school to be given theopportunity to participate and to be informedabout the objectives of the program andtheir rights and duties as participants. About6,000 households were incorporated intothe program at the end of 2000; these are thebeneficiaries living in the 21 geographicallytargeted comarcas sampled and studied inthis report. An additional 4,000 beneficiarieswere incorporated in mid-2001 (but are notincluded in the impact evaluation), usinghousehold targeting methods. After eachincorporation, the volunteer representativeshad to be selected and trained.
Another important set of activities in2000 was related to program evaluation. Thesecond tranche of the IADB loan and ex-pansion of the project to Phase II were con-tingent upon various external evaluations,including an impact evaluation, a targetingevaluation, a beneficiary opinion survey,and an institutional evaluation. In conjunc-tion with IFPRI, planning for the first twowas completed in 2000 and the first baselinesurvey, similar in design to an LSMS survey,was carried out in the 42 intervention andcontrol comarcas in August and September2000, before the program started (IFPRI2001a, 2001b). Two follow-up surveys were
carried out in October 2001 and October2002 (IFPRI 2003).
As designed, a normal year of demand-side operations in RPS includes six cashtransfers (every 2 months) to households.In 2000, however, because the program wasjust beginning, only two transfers took placein the latter part of the year. In 2001, whichcan be considered a more operationally nor-mal year, five of the scheduled six cashtransfers were made. Finally, in 2002, owingto budget delays associated with the expan-sion loan, again five of the six transfersoriginally planned were made. Aside fromthe design of the monitoring system, therewere no other activities associated withconditionality in 2000; these began in 2001a few months after the transfers were firstdelivered and continued from then on.
The supply-side intervention of theprogram for the health component consistsof the delivery of health-care services andworkshops by private health-care providers.Payments for the services were supposed tooccur each month, but because of the nec-essary preparation (such as designing theservices and terms of references and con-tracting providers), implementation of thiscomponent was delayed and in 2001 onlytwo transfers were made. Therefore, for sup-ply of health-care services, 2001 cannot beconsidered a normal operational year. In2002, 11 payments were made and only thepayment for December is missing from theaccounting data.
Finally, during both 2001 and 2002, asignificant amount of time was devoted toplanning the expansion phase, redesigningsome program components as well as ne-gotiating with government officials and fi-nancing institutions. Also in late 2002, theprogram was transferred from FISE to theMinistry of the Family (Mi Familia), incharge of social protection of vulnerablegroups in Nicaragua.
60 APPENDIX A
A P P E N D I X B
Household Targeting in GeographicallyTargeted Areas
A fter implementing a registry census in May 2000 (known as the RPS population cen-sus I), RPS excluded a small percentage of households who, even though they wereverified to be living in the geographically targeted rural areas, appeared not to be ex-
tremely poor. This decision was taken, in part, because the intervention areas had 6,000 house-holds, substantially more than 5,000, the planned number of beneficiaries in the program duringthe first stage of Phase I. Households satisfying one or both of the following were excluded:1. Own a vehicle, truck, pickup truck, or jeep2. Own more than 20 manzanas (14.1 hectares) of land
Based on these criteria, a total of 169 households (2.9 percent of the households living inthe intervention areas as reported in the May 2000 RPS census population) were excluded fromthe program. None of these households, however, were drawn in the random sample for the base-line survey. In addition to these households, 219 (3.8 percent) households were excluded afterthe orientation assemblies and program registration for one or more of the following reasons:1. Household comprising a single man or woman who was not disabled2. Household with significant economic resources or a business3. Household that omitted or falsified information during the RPS population census
Thirty-seven households from this category were included in the random sample for the base-line survey.
Finally, 240 (4.2 percent) households did not attend the orientation assembly and/or chosenot to participate. Thus in the first stage of Phase I, the program excluded a total of 628 (10.9percent) of the 5,741 rural households interviewed in the RPS population census of May 2000.An additional 882 households were included as beneficiaries when it was discovered that theMay 2000 RPS population census had missed 949 households in the targeted areas. Thesewere integrated into the registry during the RPS population census II carried out in September2000 and described in IFPRI (2001b). These households were not included in the original sam-ple frame for the evaluation survey and thus are not included in the evaluation. An examina-tion of their characteristics (collected in the RPS population census) shows that on averagethey tended to have fewer resources than the households included in the evaluation survey.Since most of the program effects were larger for the less well off, their exclusion from theevaluation is likely to make the average estimated effects smaller (or more conservatively es-timated), although probably not by very much since they represent only about 15 percent ofhouseholds in the area.
61
A P P E N D I X C
Contractual Indicators for One-Year RPSEvaluation in IADB Loan Contract
Indicator Goal
1. Percentage of children under age 3 who participate An increase of more than 10 percentage points in in the growth and development monitoring the intervention group over the control groupprogram (VPCD)
2. Percentage of children between 12 and 23 months An increase of more than 10 percentage points in of age who have received all necessary vaccinations the intervention group over the control groupaccording to Ministry of Health guidelines
3. Percentage of households that have increased Observe the tendency of the change (changed from spending on food, as a fraction of the total original: An increase of more than 10 percentage household expenditures points in the intervention group over the control
group)4. Percentage of children in the first through fourth An increase of more than 10 percentage points in
grades who continue in school the intervention group over the control group5. Percentage of children in the first through fourth An increase of more than 8 percentage points in
grades who have matriculated in school the intervention group over the control group(changed from the original: 5 percentage points)
6. Percentage of households included in the program More than 70 percentthat are extremely poor
7. Percentage of households included in the program Less than 30 percentthat are not extremely poor
62
References
Adato, M., and T. Roopnaraine. 2004. A Social Analysis of the Red de Protección Social. Report sub-mitted to the Red de Protección Social. International Food Policy Research Institute. Washing-ton, D.C. Photocopy.
Alderman, H., J. R. Behrman, H.-P. Kohler, J. A. Maluccio, and S. Cotts Watkins. 2001. Attrition inlongitudinal household survey data: Some tests for three developing country samples. Demo-graphic Research 5(4): 77–124.
Allen, L. H., J. L. Rosado, J. E. Casterline, P. López, E. Muñoz, O. P. Garcia, and H. Martinez. 2002.Lack of hemoglobin response to iron supplementation in anemic Mexican preschoolers withmultiple micronutrient deficiencies. American Journal of Clinical Nutrition 71: 1485–1494.
Arcia, G. 1999. Proyecto de Red de Protección Social: Focalización de la fase piloto. Report submittedto the Inter-American Development Bank. Washington, D.C. Photocopy.
Baker, J. L. 2000. Evaluating the Impact of Development Projects on Poverty: A Handbook for Practi-tioners. Washington, D.C.: The World Bank.
Behrman, J. R., and J. Hoddinott. 2005. Program evaluation with unobserved heterogeneity and selec-tive implementation: The Mexican PROGRESA impact on child nutrition. Oxford Bulletin ofEconomics and Statistics 67(4): 547–569.
Behrman, J., and P. Todd. 1999. Randomness in the Experimental Samples of PROGRESA (Education,Health, and Nutrition Program). Report to PROGRESA. Washington, D.C.: International FoodPolicy Research Institute.
Bolton, P., A. Hussain, A. Hadpawat, E. Holt, N. Hughart, and B. Guyer. 1998. Deficiencies in currentchildhood immunization indicators. Public Health Reports 113: 527–532.
Burtless, G. 1995. The case for randomized field trials in economic and policy research. Journal ofEconomic Perspectives 9(2): 63–84.
Caldés, N., and J. A. Maluccio. 2005. The cost of conditional cash transfers. Journal of InternationalDevelopment 17(2): 151–168.
Caldés, N., D. Coady, and J. A. Maluccio. 2004. The Cost of Poverty Alleviation Transfer Programs: AComparative Analysis of Three Programs in Latin America. Food Consumption and NutritionDivision Discussion Paper No. 174. Washington, D.C.: International Food Policy ResearchInstitute.
Coady, D., and S. Parker. 2004. Cost-effectiveness of analysis of demand- and supply-side educationinterventions: The case of PROGRESA in Mexico. Review of Development Economics 8(3):440–451.
Deaton, A., and S. Zaidi. 2002. Guidelines for Constructing Consumption Aggregates for Welfare Analy-sis. LSMS Working Paper Number 135. Washington, D.C.: The World Bank.
de Janvry, A., F. Finan, E. Sadoulet, and R. Vakis. 2004. Can conditional cash transfers serve as safetynets to keep children at school and out of the labor market? University of California at Berke-ley. Photocopy.
63
Grosh, M., and P. Glewwe, eds. 2000. Designing Household Survey Questionnaires for DevelopingCountries: Lessons from 15 Years of the Living Standards Measurement Study. Washington, D.C.:The World Bank.
Heckman, J., and J. A. Smith. 1995. Assessing the case for social experiments. Journal of EconomicPerspectives 9(2): 85–110.
Heckman, J., L. Lochner, and C. Taber. 1998. General equilibrium treatment effects: A study of tuitionpolicy. American Economic Review, Papers and Proceedings 88(2): 381–386.
Heckman, J., R. Lalonde, and J. Smith. 1999. The economics and econometrics of active labor marketprograms. In Handbook of Labor Economics, eds. O. Ashenfelter and D. Card. Amsterdam:North-Holland, pp. 1865–2089.
Hoddinott, J., and E. Skoufias. 2005. The impact of PROGRESA on food consumption. Economic De-velopment and Cultural Change 53(1): 37–61.
Hoddinott, J., and Y. Yohannes. 2002. Dietary Diversity as a Food Security Indicator. Food Consump-tion and Nutrition Division Discussion Paper No. 136. Washington, D.C.: International FoodPolicy Research Institute.
IDEA. 2003. A new generation of social programs. In Ideas for Development in the Americas, Volume1. Washington, D.C.: Inter-American Development Bank Research Department, pp. 1–2.
IFPRI. 2001a. Evaluation Design for the Pilot Phase of the Nicaraguan Red de Protección Social. Re-port submitted to the Red de Protección Social. Washington, D.C.: International Food PolicyResearch Institute. Photocopy.
———. 2001b. Evaluation System for the Pilot Phase of Nicaraguan Red de Protección Social: Base-line 2000. Report to the Red de Protección Social. Washington, D.C.: International Food PolicyResearch Institute. Photocopy.
———. 2001c. PRAF/IADB Phase II: Analysis of the Situation before the Beginning of Distribution ofVouchers and Project Implementation. Report 4. Washington, D.C.: International Food PolicyResearch Institute. Photocopy.
———. 2002. Sistema de evaluación de la fase piloto de la Red de Protección Social de Nicaragua:Evaluación de focalización. Report submitted to the Red de Protección Social. Washington,D.C.: International Food Policy Research Institute. Photocopy.
———. 2003. Sistema de evaluación de la fase piloto de la Red de Protección Social de Nicaragua:Evaluación de impacto 2000–02. Report submitted to the Red de Protección Social. Washing-ton, D.C.: International Food Policy Research Institute. Photocopy.
Jensen, R. T. 2003. Do private transfers displace the benefits of public transfers? Evidence from SouthAfrica. Journal of Public Economics 88: 89–112.
King, E. M., B. Ozler, and L. B. Rawlings. 1999. Nicaragua’s School Autonomy Reform: Fact or Fic-tion? Working Paper Series on Impact Evaluation of Educational Reforms, Paper No. 19. Wash-ington, D.C.: The World Bank.
Krueger, A. 1999. Experimental estimates of education production functions. The Quarterly Journal ofEconomics 114(2): 497–532.
Maluccio, J. A. 2005. Household Targeting in Practice: The Nicaraguan Red de Protección Social.Washington, D.C.: International Food Policy Research Institute. Photocopy.
Maluccio, J. A., M. Adato, R. Flores, and T. Roopnaraine. 2005. Breaking the Cycle of Poverty:Nicaraguan Red de Protección Social. International Food Policy Research Institute brief (alsoavailable in Spanish).
Martorell, R., D. Schroeder, J. A. Rivera, and H. J. Kaplowitz. 1995. Patterns of linear growth in ruralGuatemalan adolescents and children. Journal of Nutrition 125(4S): 1060S–1067S.
64 REFERENCES
Michalopoulos, C., H. S. Bloom, and C. J. Hill. 2004. Can propensity-score methods match findingsfrom a random assignment evaluation of mandatory welfare-to-work programs? Review of Eco-nomics and Statistics 86(1): 156–179.
Morley, S., and D. Coady. 2003. From Social Assistance to Social Development: Targeted EducationSubsidies in Developing Countries. Washington, D.C.: Center for Global Development andInternational Food Policy Research Institute.
National Research Council. 2001. Evaluating welfare reform in an era of transition. In Panel on Dataand Methods for Measuring the Effects of Changes in Social Welfare Programs, eds. R. A. Mof-fitt and M. Ver Ploeg. Committee on National Statistics, Division of Behavioral and Social Sci-ences and Education. Washington, D.C.: National Academy Press.
Newman, J., L. Rawlings, and P. Gertler. 1994. Using randomized control designs in evaluating socialsector programs in developing countries. World Bank Research Observer 9(2): 181–201.
Ravallion, M. 2001. The mystery of the vanishing benefits: An introduction to impact evaluation. TheWorld Bank Economic Review 15(1): 115–140.
Rawlings, L. B., and G. M. Rubio. 2005. Evaluating the impact of conditional cash transfer programs.The World Bank Research Observer 20(1): 29–55.
Schultz, T. P. 2004. School subsidies for the poor: Evaluating the Mexican PROGRESA poverty pro-gram. Journal of Development Economics 74: 199–250.
Skoufias, E. 2005. PROGRESA and Its Impacts on the Human Capital and Welfare of Householdsin Rural Mexico: A Synthesis of the Results of an Evaluation by IFPRI. Research Report 139.Washington, D.C.: International Food Policy Research Institute.
Skoufias, E., and S. Parker. 2001. Conditional cash transfers and their impact on child work and schoolenrollment: Evidence from the PROGRESA program in Mexico. Economia 2: 45–96.
StataCorp. 2001. Stata statistical software: Release 7.0. College Station, Tx.: Stata Corporation.
Strauss, J., and D. Thomas. 1995. Empirical modeling of human resources. In The Handbook of Devel-opment Economics, eds. J. Behrman and T. N. Srinivasan. New York: North-Holland.
Thomas, D., E. Frankenberg, and J. P. Smith. 2001. Lost but not forgotten: Attrition and follow-up inthe Indonesia Family Life Survey. Journal of Human Resources 36(3): 556–592.
Thomas, D., E. Frankenberg, J. Friedman, J.-P. Habicht, M. Hakimi, N. Jones, G. Pelto, B. Sikoki,T. Seeman, J. P. Smith, C. Sumantri, W. Suriastini, and S. Wilopo. 2003. Iron deficiency andwellbeing of older adults: Early results from a randomized nutrition intervention. University ofCalifornia at Los Angeles. Photocopy.
UN ACC/SCN (United Nations Administrative Committee on Coordination—Subcommittee onNutrition). 2000. Fourth Report on the World Nutrition Situation: Nutrition Throughout the LifeCycle. Geneva, Switzerland: UN ACC/SCN in collaboration with the International Food PolicyResearch Institute.
UNICEF/UNU/WHO/MI International Nutrition Foundation and the Micronutrient Initiative (MI)Technical Workshop. 1999. Preventing iron deficiency in women and children: Backgroundand consensus on key technical issues and resources for advocacy, planning and implementingnational programs. New York: UNICEF.
USAID (U.S. Agency for International Development). 1992. Policy Determination 19, Definition ofFood Security. Washington, D.C.: U.S. Agency for International Development.
Van Roekel, K., B. Plowman, M. Griffiths, V. Vivas de Alvarado, J. Matute, and M. Calderón. BASICSII Midterm Evaluation of the AIN Program in Honduras, 2000. 2000. Basic Support forInstitutionalizing Child Survival Project (BASICS II) for the United States Agency for Interna-tional Development, Arlington, Va.
REFERENCES 65
Varangis, P., P. Siegel, D. Giovannucci, and B. Lewin. 2003. Dealing with the coffee crisis in CentralAmerica: Impacts and strategies. Policy Research Working Paper No. 2993. Washington, D.C.:The World Bank.
Waterlow, J. C. 1992. Protein Energy Malnutrition. London: Edward Arnold.
WHO Expert Committee. 1995. Physical Status: The Use and Interpretation of Anthropometry. Reportof a WHO Expert Committee. Geneva, Switzerland: World Health Organization.
World Bank. 1997. World Development Report 1997: The State in a Changing World. Washington, D.C.:The World Bank.
———. 2001. Nicaragua Poverty Assessment: Challenges and Opportunities for Poverty Reduction.Report No. 20488-NI. Washington, D.C.: The World Bank.
———. 2003. Nicaragua Poverty Assessment: Raising Welfare and Reducing Vulnerability. ReportNo. 26128-NI. Washington, D.C.: The World Bank.
———. 2004. World Bank Indicators. Washington, D.C.: The World Bank.
World Health Organization. http://www.who.int/nutgrowthd (accessed May 15, 2004).
66 REFERENCES