immofinanz/ca immo - wood & company
TRANSCRIPT
Real Estate, CEE 27 June 2016
Immofinanz/CA Immo Sector report
Deadlocked on the way to wedlock
Price Upside Mkt Cap FFO yield P/BV
Rating target potential (EUR m) YTD Perf 2016E 2017E 2018E 2016E 2017E 2018E
CA Immo HOLD 17.7 14% 1923 -8% 5.7% 6.3% 7.0% 67% 66% 64%
Immofinanz HOLD 2.12 8% 1525 -6% n/m 2.9% 5.7% 59% 61% 59%
It appears that the, at times rather bumpy, road to the merger of the
two largest CEE Real Estate companies has finally been cleared. With
a substantial regional overlap in the office portfolios, we believe that
the combination of CA Immo (CAI) and Immofinanz (IIA) could lead to
a larger, more cost-efficient and significantly less complex entity.
That said, we are struggling to find the best way to play the
combination. Of the two, we like CAI better: with its well-capitalised
balance sheet, broadly conservative valuations and ample lucrative
landbank in key German cities, it offers good value, trading currently
at c.0.7x our 2016E BV and a 5-6% 2016E FFO yield. That said, we fear
that the looming decision on the merger ratio is likely to weigh on
CAI’s share price, capping the potential upside, as we believe that IIA
may have the upper hand in the negotiations. Thus, we initiate with a
HOLD, setting our price target (PT) at EUR 17.7/share. At IIA, we
appreciate the disposal of its logistics portfolio and BWO shares, and
the recent improvement in its office occupancy. Going forward, the
sale or spin-off of the Russian assets, or further improvements in
occupancy may trigger a rerating. However, even though we model a
gradual improvement in office occupancy and margins, we do not see
meaningful FFO generation before 2018E. With little visibility on the
likelihood of the disposal of Russia, we do not see a fundamental
case for a rerating, and we reiterate our HOLD rating, adjusting our
PT to EUR 2.12/share.
CAI looks attractive at its current valuation... Over the past three years,
the cost of debt has declined substantially, the equity ratio has improved to
over 50%, and selective disposals and buyouts of JV partners have
significantly reduced the complexity of the portfolio. CAI generates a
healthy FFO yield (c.5-6%), with an additional boost from the fully-
integrated development arm of the business, which allows CAI to
organically increase its exposure to the well-performing German office
markets.
… however, merger ratio likely to cap upside. IIA’s management has
indicated that the merger ratio will be based on NAV parity. Admittedly, the
decision is still at least a year away, and the NAVs may yet evolve (e.g.,
due to new developments or the disposal of Russia). However, as CAI
trades closer to its NAV than IIA, unless IIA rerates substantially, a merger
ratio based on NAV parity (vs. share price parity) would likely be
disadvantageous for CAI’s shareholders (at current prices, the merger ratio
based on the latest NAVs would correspond to CAI’s share price of c.EUR
13-14/share). That said, as the merger ratio will need to win 75% approval
at both companies’ AGMs, the downside should be limited, in our view.
IIA’s profitability likely to remain weak even after the separation of
Russia. Despite modelling gradual improvements in office occupancy and
margins, we see IIA turning positive on FFO only in 2017E, while starting
to generate a FFO yield (at the current price levels) of around 5-6% (in line
with its peers) only from 2018E-on. While the successful disposal of the
Russian assets would be likely to boost sentiment, we believe that a sale
at the current valuation may prove challenging. Combined with what we
deem to be, on balance, a rather aggressive valuation approach, we would
need to see further evidence before we adopt more a bullish view on the
stock.
Immofinanz
HOLD (maintained)
Price: EUR 1.97/share
Price target: EUR 2.12/share
CA Immo
HOLD (initiation of coverage)
Price: EUR 15.4/share
Price target: EUR 17.7/share
EQUITY
RESEARCH Analyst: Jakub Caithaml Prague: +420 222 096 481
E-mail: [email protected] Website: www.wood.com
Real Estate, CEE 2 WOOD & Company
Contents
The merger and the exchange ratio ................................................................................................................ 3
The potential resulting entity .......................................................................................................................... 7
While cheaper on P/BV, peers continue to offer stronger FFO yields ...................................................... 11
Overview of the individual markets .............................................................................................................. 14
Weak margins hold back profitability ........................................................................................................... 77
Company sections
Immofinanz .............................................................................................................................................. 85
CA Immo ................................................................................................................................................ 107
Important disclosures .................................................................................................................................. 135
Closing Prices as of 24 June 2016
© 2016 by WOOD & Company Financial Services, a.s. All rights reserved. No part of this report may be reproduced or transmitted in any form or by any means electronic or mechanical without written permission from WOOD & Company Financial Services, a.s. This report may not be lent, resold, hired out or otherwise disposed of by way of trade in any form of binding or cover other than that in which it is published without written permission from WOOD & Company Financial Services, a.s. Requests for permission to make copies of any part of this report should be mailed to: WOOD & Company Financial Services a.s. Palladium, Namesti Republiky 1079/1a, 110 00 Prague 1 – Czech Republic tel.: +420 222 096 111 fax: +420 222 096 222 http//:www.wood.cz
Real Estate, CEE 3 WOOD & Company
The merger and the exchange ratio
As its first step towards a full merger, Immofinanz (IIA) announced in mid-April that it had
agreed to purchase a 26% stake in CA Immo (CAI) from O1 Group. If carried out, the merger
would change Immofinanz's profile considerably, creating a CEE Real Estate behemoth, while
shifting the portfolio’s centre of gravity westwards. Even though there is a clear regional
overlap in the office portfolios, and the deal is likely to unlock a number of synergies
(especially stemming from lower overhead costs, in our view), we view the price (EUR
23.5/share, a 34% premium to the market price, or a 3.4% yield on the Bloomberg consensus
2016E FFO for CAI) as rather demanding. In our view, it puts substantial pressure on IIA to
deliver on the merger as, without the synergies, we believe the price would be difficult to
justify.
While the deal may prove value-accretive for IIA eventually, a number of hurdles need to be
overcome first.
We believe the key developments to watch out for on this front in the coming months will be the
disposal or spin-off of the Russian portfolio, along with further information on potential
synergies.
Deal overview
On 18 April, IIA announced that it had purchased 25.7m CAI shares from O1 (a c.26% stake), together
with four registered shares, each of which grants its holder the option to nominate a supervisory board
member.
The price per share is EUR 23.5/share, representing a 34% premium to the closing price the day
before the transaction and a 3.4% discount to CAI’s 2015 EPRA NAV. On the Bloomberg consensus
estimates, the price represents a slight premium to the 2016E BV of EUR 23.0/share and c.3.7%
2016E FFO yield (on the 2016E FFO of EUR 0.88/share).
The O1 Group purchased its stake from UniCredit in 3Q14 for EUR 18.5/share. The current offer
represents 27% upside to the original purchase price.
The total value of the transaction is c.EUR 604m. Initially, Immofinanz planned to fund the purchase via
a combination of additional debt and the issuance of convertible bonds. In the subsequent conference
call, IIA suggested that the company may fund part of the deal also with cash. Following the disposal of
the 18.5m of BWO shares for EUR 19/share, we believe that, instead of the convertible bond, IIA will
use the c.EUR 350m proceeds to fund part of the purchase.
As the next step, IIA is planning a statutory merger of IIA and CAI. In a presentation that explains the
rationale behind the acquisition, IIA cites potential income and cost synergies of EUR 33m annually, of
which synergies of c.EUR 10m per annum are expected to be achieved straight after the stake
acquisition.
Before the statutory merger is completed, IIA plans to dispose of its Russian portfolio.
With respect to timing, the shareholder meetings to approve the statutory merger will not take place
earlier than 2Q17, according to IIA’s presentation.
Russia – liquidity slowly returning to the market?
IIA has highlighted that, before the merger can take place, it would either sell or spin-off its Russian
retail portfolio. While the market environment may still change dramatically (the vote on the merger
should take place in 2Q17, at the earliest), we believe that the disposal of the Russian portfolio at its
current valuation may prove challenging. There has been very little transaction evidence for retail
assets in general in Russia since the start of the crisis, and none of the recent transactions has been
even close to the volume we would be looking at here.
That said, following the recent rebound in oil prices, money may be coming back to the market. This
has been visible already in 1Q16, when USD 1.9m was invested into Russian commercial property,
compared with EUR 3.0m for the whole of 2015, as the deferred demand has gradually started to be
realised, with investors beginning to anticipate a recovery. Although we do not believe there is
substantial upside for the oil price in the short to medium term (as a rising price would likely prompt an
increase in US production, thus putting a cap on further growth), we believe that, unless Saudi Arabia
increases production significantly, strong weakness from the current levels is rather unlikely.
As such, even though Russia is currently barely breakeven at the FFO level, we tend to agree with
IIA’s management that it would likely be over-simplistic just to value Russia by applying a yield to the
current, depressed level of rental income. While we still consider the valuation by IIA to be quite
Real Estate, CEE 4 WOOD & Company
aggressive, we believe that it may be possible to sell the Russian assets at some premium to the
volume of debt on the assets.
That said, should management fail to identify a buyer, we believe that IIA may need to invest further
equity into Russia, repaying part of the loan, in order to reduce the burden of interest costs before it
can consider spinning the assets off. We believe that, after the vote on BREXIT, the risk of this
scenario has increased, as the volatility and risk aversion, induced by the unexpected result of the
referendum, may make the investors more cautious, as they may choose to wait and see how the
negotiations begin to play out. As with Buwog, a spin-off of the Russian assets would need to be voted
through at an AGM. Should there be a spin-off, the entity would be listed in Vienna and Warsaw. It
could also potentially list on other exchanges.
We include a more detailed overview in the chapter on Russia in the market overview section of this
report.
Merger ratio – quarrels ahead
The merger needs to be approved by the shareholder meetings of both companies, with majorities of
75% of the votes cast. As there is still a valuation gap between CAI and IIA’s share prices (IIA trades at
around 55% of its latest reported EPRA NAV; CAI trades at 65%), even after the recent decline in
CAI’s share price, reaching a consensus on the resulting exchange ratio may prove challenging.
While IIA’s management has highlighted that it is too early to announce any details on what the
exchange ratio might be, management has strongly highlighted that the merger ratio will be based on a
fundamental valuation, and, as such, any potential difference in the share prices should not play a role.
The result of the valuation will be a range, within which the two management teams should agree on
the final exchange ratio, which will then be presented to the shareholders for approval.
In order to determine how this has been done in the past, we have looked at the IIA and Immoeast
merger, which took place at the turn of 2009/10. According to a presentation we found, the exchange
ratio then (three shares of Immofinanz for two Immoeast shares, or 1.5x) was based on the NAV of
each company as of the agreed valuation due date, 31 October 2009. Furthermore, the agreed
exchange ratio was verified by the discounted cash flow valuations of the companies.
That said, there clearly had to be some adjustments, as we would arrive at an exchange ratio of 1.3x, if
simply comparing the NAV/share of the two entities (vs. the final exchange ratio of (1.5x)). Looking at
the share prices of the two companies prior to the announcement, it seems that the market was
expecting even higher ratio in favour of Immoeast (around 1.65x), as per the table below.
IIA & Immoeast: illustrative calculation of difference between exchange ratio (ER) based
on share price and NAV
NAV* Share price** ER based on NAV/sh ER based on share price Diff.
EUR/sh EUR/sh
IIA 5.62 2.6 0.77 IIA shrs / 1 IEA share 0.60 IIA shrs / 1 IEA share 27%
IEA 7.31 4.3 1.30 IEA shrs / 1 IIA share 1.65 IEA shrs / 1 IIA share -21%
Source: Immofinanz, Immoeast, WOOD Research; *as of end-October 2010; **as of 16 December 2010; a day prior to the announcement of the exchange ratio
If we were to apply the same methodology to IIA and CAI, the table (priced as of the date of the
transaction) would be as follows:
IIA & CAI: illustrative calculation of the difference between exchange ratio (ER) based on
share price and NAV
NAV* Share price** ER based on NAV/sh ER based on share price Diff.
EUR/sh EUR/sh
CAI 24.32 17.44 6.45 IIA shrs / 1 CAI share 8.76 IIA shrs / 1 CAI share -26%
IIA 3.77 1.99 0.16 CAI shrs / 1 IIA share 0.11 CAI shrs / 1 IIA share 36%
Source: Bloomberg, Immofinanz, CA Immo, WOOD Research; *as of the end of Q415 for CA Immo, as of the end of 3Q15/16 for Immofinanz; **as of 15 April 2016
Essentially, if the exchange ratio were to be based on the share prices, it would imply 8.8 IIA shares for
one CAI share (as of the date of the deal announcement). If based solely on NAV (the latest available
as at the date of the announcement of the transaction), the ratio would stand at 6.45 IIA shares for one
CAI share, implying 26% downside for CA Immo. If we calculate the mid-point as a simple arithmetic
average of the two approaches, we arrive at an exchange ratio of 7.61 IIA shares for one CAI share.
This would imply some 15% upside for IIA and some 15% downside for CAI (prices based on the close
before the deal was announced).
Real Estate, CEE 5 WOOD & Company
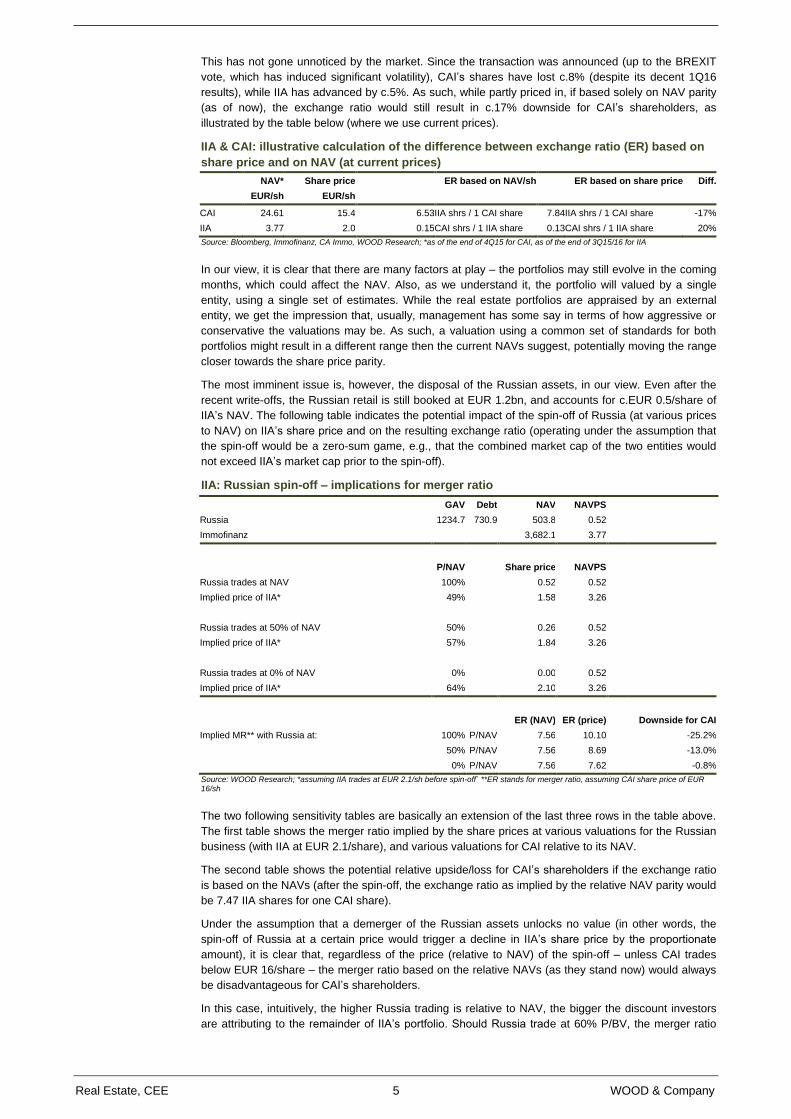
This has not gone unnoticed by the market. Since the transaction was announced (up to the BREXIT
vote, which has induced significant volatility), CAI’s shares have lost c.8% (despite its decent 1Q16
results), while IIA has advanced by c.5%. As such, while partly priced in, if based solely on NAV parity
(as of now), the exchange ratio would still result in c.17% downside for CAI’s shareholders, as
illustrated by the table below (where we use current prices).
IIA & CAI: illustrative calculation of the difference between exchange ratio (ER) based on
share price and on NAV (at current prices)
NAV* Share price ER based on NAV/sh ER based on share price Diff.
EUR/sh EUR/sh
CAI 24.61 15.4 6.53 IIA shrs / 1 CAI share 7.84 IIA shrs / 1 CAI share -17%
IIA 3.77 2.0 0.15 CAI shrs / 1 IIA share 0.13 CAI shrs / 1 IIA share 20%
Source: Bloomberg, Immofinanz, CA Immo, WOOD Research; *as of the end of 4Q15 for CAI, as of the end of 3Q15/16 for IIA
In our view, it is clear that there are many factors at play – the portfolios may still evolve in the coming
months, which could affect the NAV. Also, as we understand it, the portfolio will valued by a single
entity, using a single set of estimates. While the real estate portfolios are appraised by an external
entity, we get the impression that, usually, management has some say in terms of how aggressive or
conservative the valuations may be. As such, a valuation using a common set of standards for both
portfolios might result in a different range then the current NAVs suggest, potentially moving the range
closer towards the share price parity.
The most imminent issue is, however, the disposal of the Russian assets, in our view. Even after the
recent write-offs, the Russian retail is still booked at EUR 1.2bn, and accounts for c.EUR 0.5/share of
IIA’s NAV. The following table indicates the potential impact of the spin-off of Russia (at various prices
to NAV) on IIA’s share price and on the resulting exchange ratio (operating under the assumption that
the spin-off would be a zero-sum game, e.g., that the combined market cap of the two entities would
not exceed IIA’s market cap prior to the spin-off).
IIA: Russian spin-off – implications for merger ratio
GAV Debt NAV NAVPS
Russia 1234.7 730.9 503.8 0.52
Immofinanz
3,682.1 3.77
P/NAV
Share price NAVPS
Russia trades at NAV 100%
0.52 0.52
Implied price of IIA* 49%
1.58 3.26
Russia trades at 50% of NAV 50%
0.26 0.52
Implied price of IIA* 57%
1.84 3.26
Russia trades at 0% of NAV 0%
0.00 0.52
Implied price of IIA* 64%
2.10 3.26
ER (NAV) ER (price)
Downside for CAI
Implied MR** with Russia at: 100% P/NAV 7.56 10.10
-25.2%
50% P/NAV 7.56 8.69
-13.0%
0% P/NAV 7.56 7.62 -0.8%
Source: WOOD Research; *assuming IIA trades at EUR 2.1/sh before spin-off` **ER stands for merger ratio, assuming CAI share price of EUR 16/sh
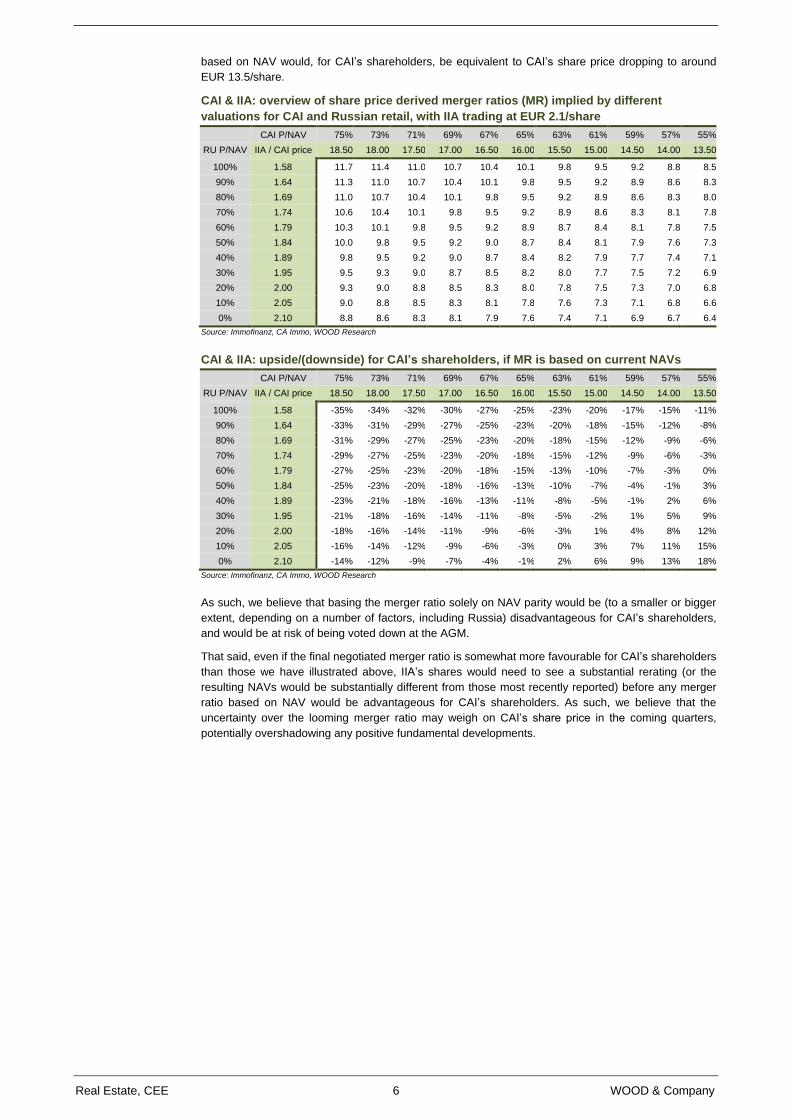
The two following sensitivity tables are basically an extension of the last three rows in the table above.
The first table shows the merger ratio implied by the share prices at various valuations for the Russian
business (with IIA at EUR 2.1/share), and various valuations for CAI relative to its NAV.
The second table shows the potential relative upside/loss for CAI’s shareholders if the exchange ratio
is based on the NAVs (after the spin-off, the exchange ratio as implied by the relative NAV parity would
be 7.47 IIA shares for one CAI share).
Under the assumption that a demerger of the Russian assets unlocks no value (in other words, the
spin-off of Russia at a certain price would trigger a decline in IIA’s share price by the proportionate
amount), it is clear that, regardless of the price (relative to NAV) of the spin-off – unless CAI trades
below EUR 16/share – the merger ratio based on the relative NAVs (as they stand now) would always
be disadvantageous for CAI’s shareholders.
In this case, intuitively, the higher Russia trading is relative to NAV, the bigger the discount investors
are attributing to the remainder of IIA’s portfolio. Should Russia trade at 60% P/BV, the merger ratio
Real Estate, CEE 6 WOOD & Company
based on NAV would, for CAI’s shareholders, be equivalent to CAI’s share price dropping to around
EUR 13.5/share.
CAI & IIA: overview of share price derived merger ratios (MR) implied by different
valuations for CAI and Russian retail, with IIA trading at EUR 2.1/share
CAI P/NAV 75% 73% 71% 69% 67% 65% 63% 61% 59% 57% 55%
RU P/NAV IIA / CAI price 18.50 18.00 17.50 17.00 16.50 16.00 15.50 15.00 14.50 14.00 13.50
100% 1.58 11.7 11.4 11.0 10.7 10.4 10.1 9.8 9.5 9.2 8.8 8.5
90% 1.64 11.3 11.0 10.7 10.4 10.1 9.8 9.5 9.2 8.9 8.6 8.3
80% 1.69 11.0 10.7 10.4 10.1 9.8 9.5 9.2 8.9 8.6 8.3 8.0
70% 1.74 10.6 10.4 10.1 9.8 9.5 9.2 8.9 8.6 8.3 8.1 7.8
60% 1.79 10.3 10.1 9.8 9.5 9.2 8.9 8.7 8.4 8.1 7.8 7.5
50% 1.84 10.0 9.8 9.5 9.2 9.0 8.7 8.4 8.1 7.9 7.6 7.3
40% 1.89 9.8 9.5 9.2 9.0 8.7 8.4 8.2 7.9 7.7 7.4 7.1
30% 1.95 9.5 9.3 9.0 8.7 8.5 8.2 8.0 7.7 7.5 7.2 6.9
20% 2.00 9.3 9.0 8.8 8.5 8.3 8.0 7.8 7.5 7.3 7.0 6.8
10% 2.05 9.0 8.8 8.5 8.3 8.1 7.8 7.6 7.3 7.1 6.8 6.6
0% 2.10 8.8 8.6 8.3 8.1 7.9 7.6 7.4 7.1 6.9 6.7 6.4
Source: Immofinanz, CA Immo, WOOD Research
CAI & IIA: upside/(downside) for CAI’s shareholders, if MR is based on current NAVs
CAI P/NAV 75% 73% 71% 69% 67% 65% 63% 61% 59% 57% 55%
RU P/NAV IIA / CAI price 18.50 18.00 17.50 17.00 16.50 16.00 15.50 15.00 14.50 14.00 13.50
100% 1.58 -35% -34% -32% -30% -27% -25% -23% -20% -17% -15% -11%
90% 1.64 -33% -31% -29% -27% -25% -23% -20% -18% -15% -12% -8%
80% 1.69 -31% -29% -27% -25% -23% -20% -18% -15% -12% -9% -6%
70% 1.74 -29% -27% -25% -23% -20% -18% -15% -12% -9% -6% -3%
60% 1.79 -27% -25% -23% -20% -18% -15% -13% -10% -7% -3% 0%
50% 1.84 -25% -23% -20% -18% -16% -13% -10% -7% -4% -1% 3%
40% 1.89 -23% -21% -18% -16% -13% -11% -8% -5% -1% 2% 6%
30% 1.95 -21% -18% -16% -14% -11% -8% -5% -2% 1% 5% 9%
20% 2.00 -18% -16% -14% -11% -9% -6% -3% 1% 4% 8% 12%
10% 2.05 -16% -14% -12% -9% -6% -3% 0% 3% 7% 11% 15%
0% 2.10 -14% -12% -9% -7% -4% -1% 2% 6% 9% 13% 18%
Source: Immofinanz, CA Immo, WOOD Research
As such, we believe that basing the merger ratio solely on NAV parity would be (to a smaller or bigger
extent, depending on a number of factors, including Russia) disadvantageous for CAI’s shareholders,
and would be at risk of being voted down at the AGM.
That said, even if the final negotiated merger ratio is somewhat more favourable for CAI’s shareholders
than those we have illustrated above, IIA’s shares would need to see a substantial rerating (or the
resulting NAVs would be substantially different from those most recently reported) before any merger
ratio based on NAV would be advantageous for CAI’s shareholders. As such, we believe that the
uncertainty over the looming merger ratio may weigh on CAI’s share price in the coming quarters,
potentially overshadowing any positive fundamental developments.
Real Estate, CEE 7 WOOD & Company
The potential resulting entity
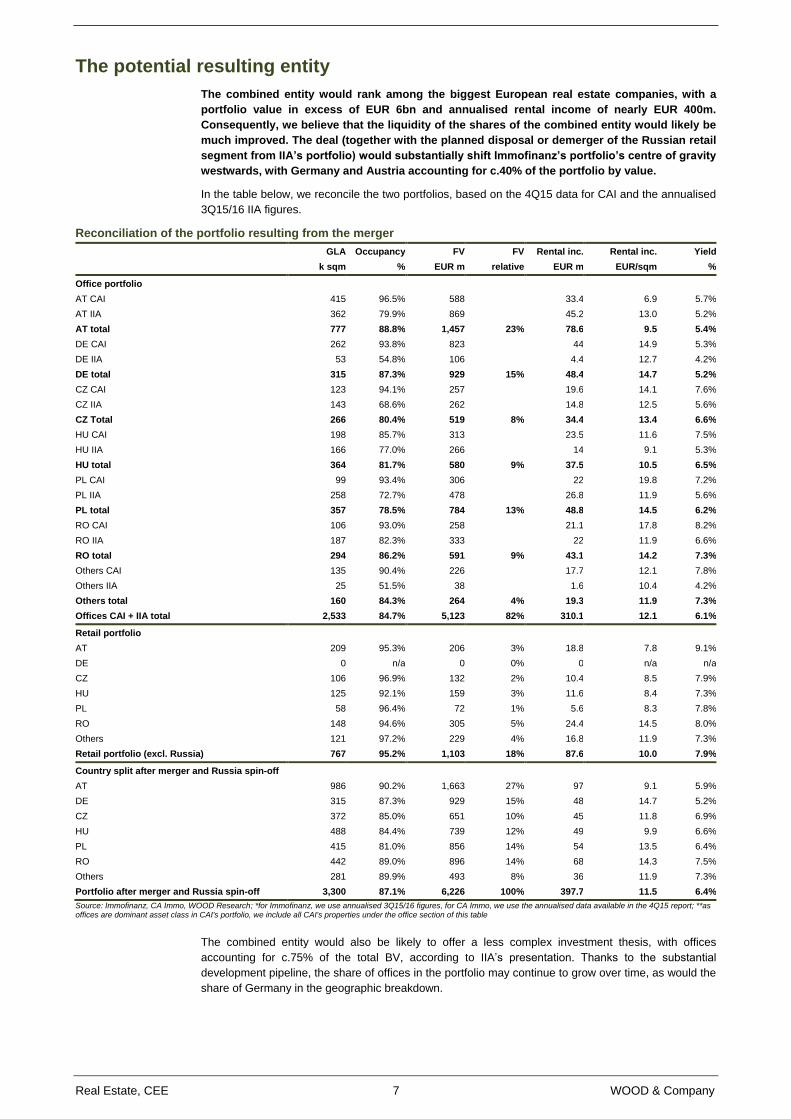
The combined entity would rank among the biggest European real estate companies, with a
portfolio value in excess of EUR 6bn and annualised rental income of nearly EUR 400m.
Consequently, we believe that the liquidity of the shares of the combined entity would likely be
much improved. The deal (together with the planned disposal or demerger of the Russian retail
segment from IIA’s portfolio) would substantially shift Immofinanz’s portfolio’s centre of gravity
westwards, with Germany and Austria accounting for c.40% of the portfolio by value.
In the table below, we reconcile the two portfolios, based on the 4Q15 data for CAI and the annualised
3Q15/16 IIA figures.
Reconciliation of the portfolio resulting from the merger
GLA Occupancy FV FV Rental inc. Rental inc. Yield
k sqm % EUR m relative EUR m EUR/sqm %
Office portfolio
AT CAI 415 96.5% 588
33.4 6.9 5.7%
AT IIA 362 79.9% 869
45.2 13.0 5.2%
AT total 777 88.8% 1,457 23% 78.6 9.5 5.4%
DE CAI 262 93.8% 823
44 14.9 5.3%
DE IIA 53 54.8% 106
4.4 12.7 4.2%
DE total 315 87.3% 929 15% 48.4 14.7 5.2%
CZ CAI 123 94.1% 257
19.6 14.1 7.6%
CZ IIA 143 68.6% 262
14.8 12.5 5.6%
CZ Total 266 80.4% 519 8% 34.4 13.4 6.6%
HU CAI 198 85.7% 313
23.5 11.6 7.5%
HU IIA 166 77.0% 266
14 9.1 5.3%
HU total 364 81.7% 580 9% 37.5 10.5 6.5%
PL CAI 99 93.4% 306
22 19.8 7.2%
PL IIA 258 72.7% 478
26.8 11.9 5.6%
PL total 357 78.5% 784 13% 48.8 14.5 6.2%
RO CAI 106 93.0% 258
21.1 17.8 8.2%
RO IIA 187 82.3% 333
22 11.9 6.6%
RO total 294 86.2% 591 9% 43.1 14.2 7.3%
Others CAI 135 90.4% 226
17.7 12.1 7.8%
Others IIA 25 51.5% 38
1.6 10.4 4.2%
Others total 160 84.3% 264 4% 19.3 11.9 7.3%
Offices CAI + IIA total 2,533 84.7% 5,123 82% 310.1 12.1 6.1%
Retail portfolio
AT 209 95.3% 206 3% 18.8 7.8 9.1%
DE 0 n/a 0 0% 0 n/a n/a
CZ 106 96.9% 132 2% 10.4 8.5 7.9%
HU 125 92.1% 159 3% 11.6 8.4 7.3%
PL 58 96.4% 72 1% 5.6 8.3 7.8%
RO 148 94.6% 305 5% 24.4 14.5 8.0%
Others 121 97.2% 229 4% 16.8 11.9 7.3%
Retail portfolio (excl. Russia) 767 95.2% 1,103 18% 87.6 10.0 7.9%
Country split after merger and Russia spin-off
AT 986 90.2% 1,663 27% 97 9.1 5.9%
DE 315 87.3% 929 15% 48 14.7 5.2%
CZ 372 85.0% 651 10% 45 11.8 6.9%
HU 488 84.4% 739 12% 49 9.9 6.6%
PL 415 81.0% 856 14% 54 13.5 6.4%
RO 442 89.0% 896 14% 68 14.3 7.5%
Others 281 89.9% 493 8% 36 11.9 7.3%
Portfolio after merger and Russia spin-off 3,300 87.1% 6,226 100% 397.7 11.5 6.4%
Source: Immofinanz, CA Immo, WOOD Research; *for Immofinanz, we use annualised 3Q15/16 figures, for CA Immo, we use the annualised data available in the 4Q15 report; **as offices are dominant asset class in CAI's portfolio, we include all CAI's properties under the office section of this table
The combined entity would also be likely to offer a less complex investment thesis, with offices
accounting for c.75% of the total BV, according to IIA’s presentation. Thanks to the substantial
development pipeline, the share of offices in the portfolio may continue to grow over time, as would the
share of Germany in the geographic breakdown.
Real Estate, CEE 8 WOOD & Company
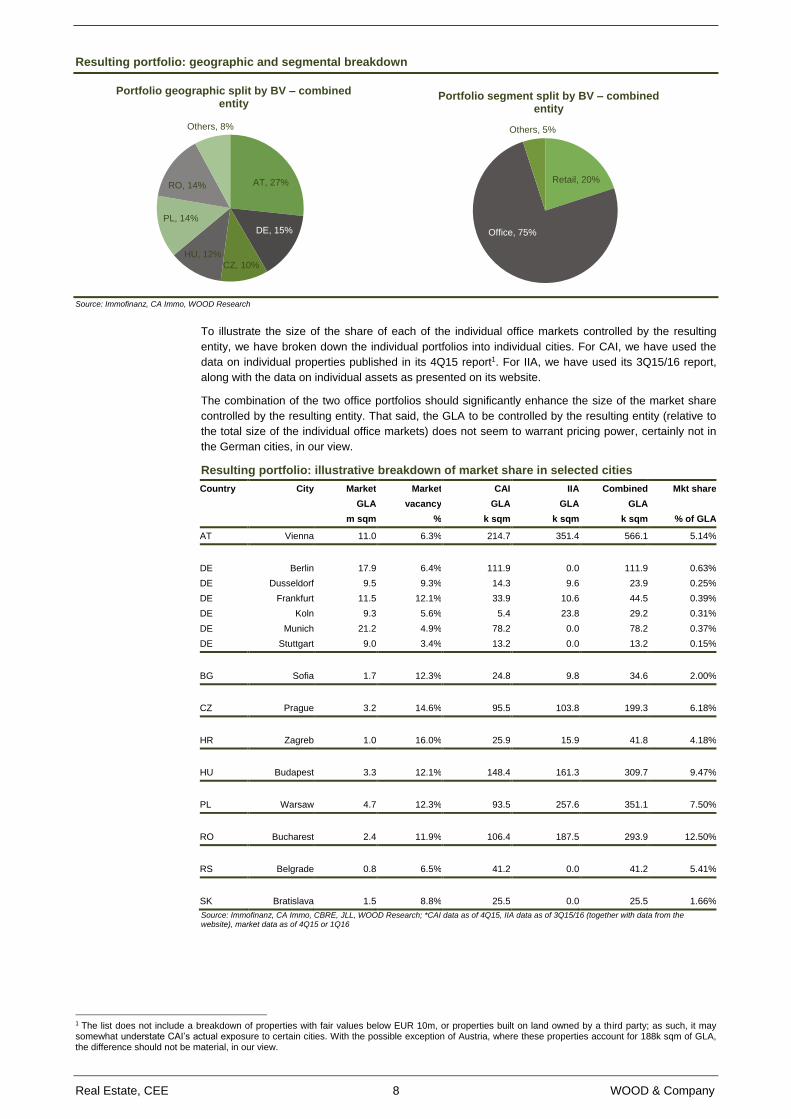
Resulting portfolio: geographic and segmental breakdown
Source: Immofinanz, CA Immo, WOOD Research
To illustrate the size of the share of each of the individual office markets controlled by the resulting
entity, we have broken down the individual portfolios into individual cities. For CAI, we have used the
data on individual properties published in its 4Q15 report1. For IIA, we have used its 3Q15/16 report,
along with the data on individual assets as presented on its website.
The combination of the two office portfolios should significantly enhance the size of the market share
controlled by the resulting entity. That said, the GLA to be controlled by the resulting entity (relative to
the total size of the individual office markets) does not seem to warrant pricing power, certainly not in
the German cities, in our view.
Resulting portfolio: illustrative breakdown of market share in selected cities
Country City Market Market CAI IIA Combined Mkt share
GLA vacancy GLA GLA GLA
m sqm % k sqm k sqm k sqm % of GLA
AT Vienna 11.0 6.3% 214.7 351.4 566.1 5.14%
DE Berlin 17.9 6.4% 111.9 0.0 111.9 0.63%
DE Dusseldorf 9.5 9.3% 14.3 9.6 23.9 0.25%
DE Frankfurt 11.5 12.1% 33.9 10.6 44.5 0.39%
DE Koln 9.3 5.6% 5.4 23.8 29.2 0.31%
DE Munich 21.2 4.9% 78.2 0.0 78.2 0.37%
DE Stuttgart 9.0 3.4% 13.2 0.0 13.2 0.15%
BG Sofia 1.7 12.3% 24.8 9.8 34.6 2.00%
CZ Prague 3.2 14.6% 95.5 103.8 199.3 6.18%
HR Zagreb 1.0 16.0% 25.9 15.9 41.8 4.18%
HU Budapest 3.3 12.1% 148.4 161.3 309.7 9.47%
PL Warsaw 4.7 12.3% 93.5 257.6 351.1 7.50%
RO Bucharest 2.4 11.9% 106.4 187.5 293.9 12.50%
RS Belgrade 0.8 6.5% 41.2 0.0 41.2 5.41%
SK Bratislava 1.5 8.8% 25.5 0.0 25.5 1.66%
Source: Immofinanz, CA Immo, CBRE, JLL, WOOD Research; *CAI data as of 4Q15, IIA data as of 3Q15/16 (together with data from the website), market data as of 4Q15 or 1Q16
1 The list does not include a breakdown of properties with fair values below EUR 10m, or properties built on land owned by a third party; as such, it may somewhat understate CAI’s actual exposure to certain cities. With the possible exception of Austria, where these properties account for 188k sqm of GLA, the difference should not be material, in our view.
AT, 27%
DE, 15%
CZ, 10%
HU, 12%
PL, 14%
RO, 14%
Others, 8%
Portfolio geographic split by BV – combined entity
Retail, 20%
Office, 75%
Others, 5%
Portfolio segment split by BV – combined entity
Real Estate, CEE 9 WOOD & Company
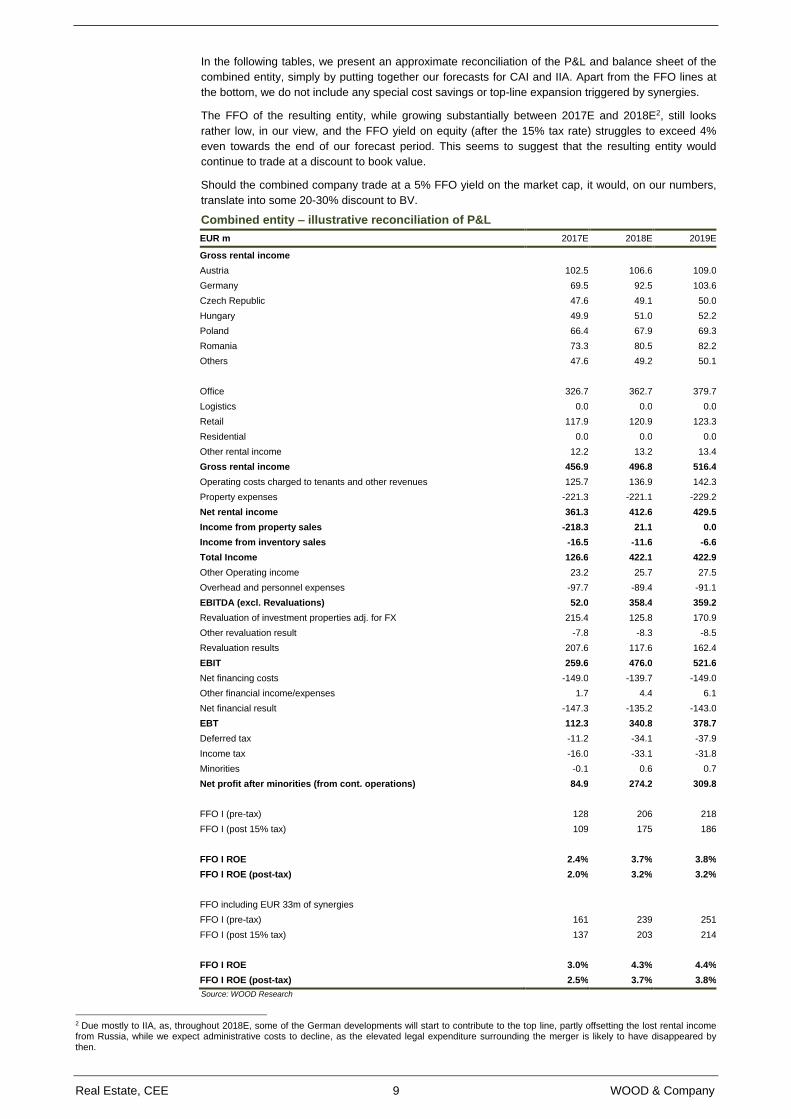
In the following tables, we present an approximate reconciliation of the P&L and balance sheet of the
combined entity, simply by putting together our forecasts for CAI and IIA. Apart from the FFO lines at
the bottom, we do not include any special cost savings or top-line expansion triggered by synergies.
The FFO of the resulting entity, while growing substantially between 2017E and 2018E2, still looks
rather low, in our view, and the FFO yield on equity (after the 15% tax rate) struggles to exceed 4%
even towards the end of our forecast period. This seems to suggest that the resulting entity would
continue to trade at a discount to book value.
Should the combined company trade at a 5% FFO yield on the market cap, it would, on our numbers,
translate into some 20-30% discount to BV.
Combined entity – illustrative reconciliation of P&L
EUR m 2017E 2018E 2019E
Gross rental income
Austria 102.5 106.6 109.0
Germany 69.5 92.5 103.6
Czech Republic 47.6 49.1 50.0
Hungary 49.9 51.0 52.2
Poland 66.4 67.9 69.3
Romania 73.3 80.5 82.2
Others 47.6 49.2 50.1
Office 326.7 362.7 379.7
Logistics 0.0 0.0 0.0
Retail 117.9 120.9 123.3
Residential 0.0 0.0 0.0
Other rental income 12.2 13.2 13.4
Gross rental income 456.9 496.8 516.4
Operating costs charged to tenants and other revenues 125.7 136.9 142.3
Property expenses -221.3 -221.1 -229.2
Net rental income 361.3 412.6 429.5
Income from property sales -218.3 21.1 0.0
Income from inventory sales -16.5 -11.6 -6.6
Total Income 126.6 422.1 422.9
Other Operating income 23.2 25.7 27.5
Overhead and personnel expenses -97.7 -89.4 -91.1
EBITDA (excl. Revaluations) 52.0 358.4 359.2
Revaluation of investment properties adj. for FX 215.4 125.8 170.9
Other revaluation result -7.8 -8.3 -8.5
Revaluation results 207.6 117.6 162.4
EBIT 259.6 476.0 521.6
Net financing costs -149.0 -139.7 -149.0
Other financial income/expenses 1.7 4.4 6.1
Net financial result -147.3 -135.2 -143.0
EBT 112.3 340.8 378.7
Deferred tax -11.2 -34.1 -37.9
Income tax -16.0 -33.1 -31.8
Minorities -0.1 0.6 0.7
Net profit after minorities (from cont. operations) 84.9 274.2 309.8
FFO I (pre-tax) 128 206 218
FFO I (post 15% tax) 109 175 186
FFO I ROE 2.4% 3.7% 3.8%
FFO I ROE (post-tax) 2.0% 3.2% 3.2%
FFO including EUR 33m of synergies
FFO I (pre-tax) 161 239 251
FFO I (post 15% tax) 137 203 214
FFO I ROE 3.0% 4.3% 4.4%
FFO I ROE (post-tax) 2.5% 3.7% 3.8%
Source: WOOD Research
2 Due mostly to IIA, as, throughout 2018E, some of the German developments will start to contribute to the top line, partly offsetting the lost rental income from Russia, while we expect administrative costs to decline, as the elevated legal expenditure surrounding the merger is likely to have disappeared by then.
Real Estate, CEE 10 WOOD & Company
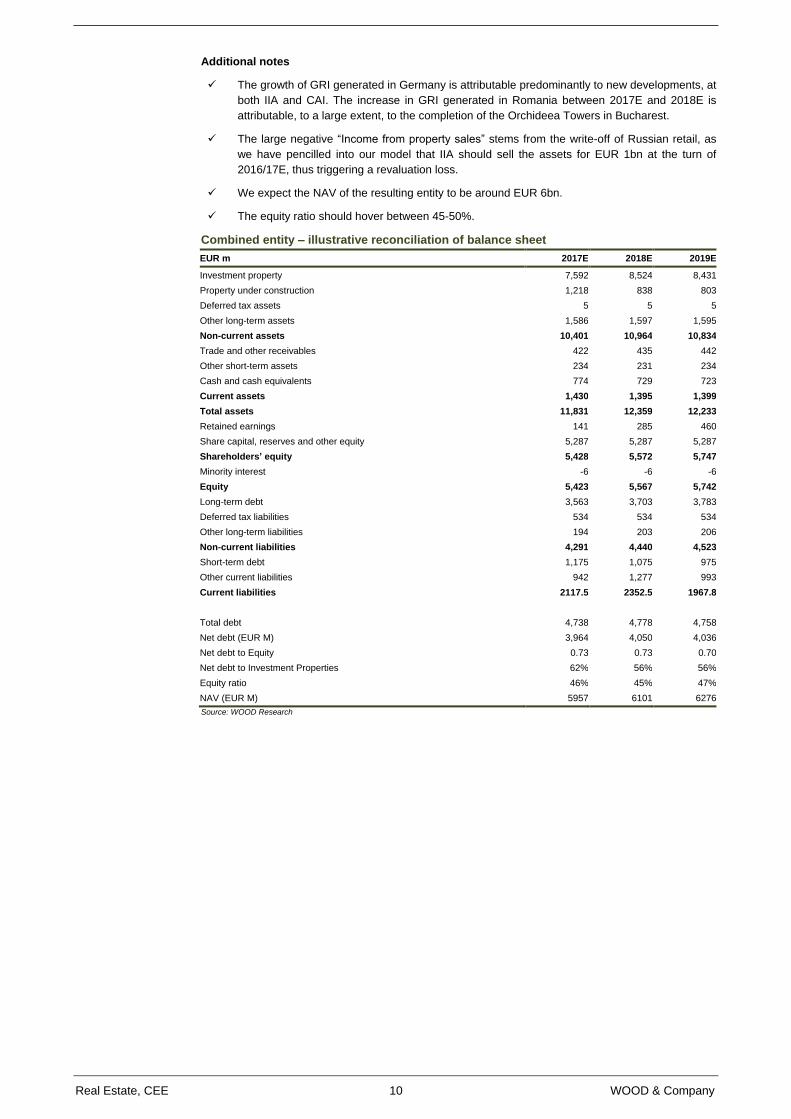
Additional notes
The growth of GRI generated in Germany is attributable predominantly to new developments, at
both IIA and CAI. The increase in GRI generated in Romania between 2017E and 2018E is
attributable, to a large extent, to the completion of the Orchideea Towers in Bucharest.
The large negative “Income from property sales” stems from the write-off of Russian retail, as
we have pencilled into our model that IIA should sell the assets for EUR 1bn at the turn of
2016/17E, thus triggering a revaluation loss.
We expect the NAV of the resulting entity to be around EUR 6bn.
The equity ratio should hover between 45-50%.
Combined entity – illustrative reconciliation of balance sheet
EUR m 2017E 2018E 2019E
Investment property 7,592 8,524 8,431
Property under construction 1,218 838 803
Deferred tax assets 5 5 5
Other long-term assets 1,586 1,597 1,595
Non-current assets 10,401 10,964 10,834
Trade and other receivables 422 435 442
Other short-term assets 234 231 234
Cash and cash equivalents 774 729 723
Current assets 1,430 1,395 1,399
Total assets 11,831 12,359 12,233
Retained earnings 141 285 460
Share capital, reserves and other equity 5,287 5,287 5,287
Shareholders’ equity 5,428 5,572 5,747
Minority interest -6 -6 -6
Equity 5,423 5,567 5,742
Long-term debt 3,563 3,703 3,783
Deferred tax liabilities 534 534 534
Other long-term liabilities 194 203 206
Non-current liabilities 4,291 4,440 4,523
Short-term debt 1,175 1,075 975
Other current liabilities 942 1,277 993
Current liabilities 2117.5 2352.5 1967.8
Total debt 4,738 4,778 4,758
Net debt (EUR M) 3,964 4,050 4,036
Net debt to Equity 0.73 0.73 0.70
Net debt to Investment Properties 62% 56% 56%
Equity ratio 46% 45% 47%
NAV (EUR M) 5957 6101 6276
Source: WOOD Research
Real Estate, CEE 11 WOOD & Company
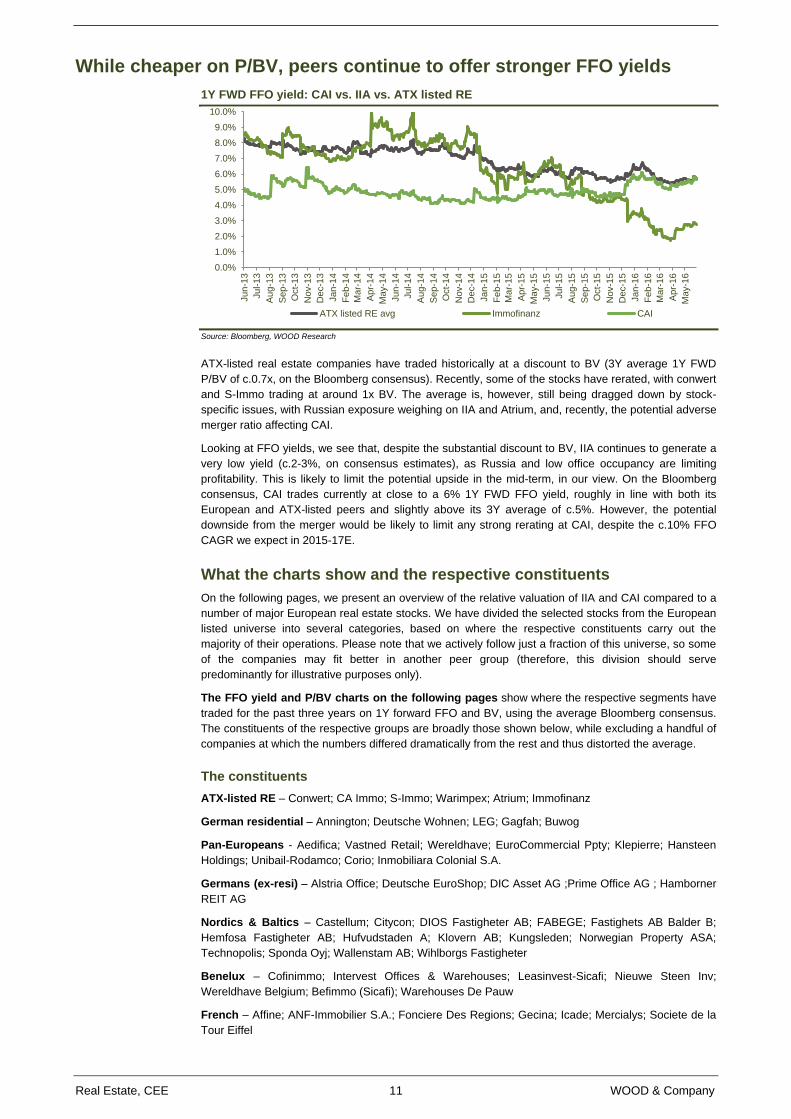
While cheaper on P/BV, peers continue to offer stronger FFO yields
1Y FWD FFO yield: CAI vs. IIA vs. ATX listed RE
Source: Bloomberg, WOOD Research
ATX-listed real estate companies have traded historically at a discount to BV (3Y average 1Y FWD
P/BV of c.0.7x, on the Bloomberg consensus). Recently, some of the stocks have rerated, with conwert
and S-Immo trading at around 1x BV. The average is, however, still being dragged down by stock-
specific issues, with Russian exposure weighing on IIA and Atrium, and, recently, the potential adverse
merger ratio affecting CAI.
Looking at FFO yields, we see that, despite the substantial discount to BV, IIA continues to generate a
very low yield (c.2-3%, on consensus estimates), as Russia and low office occupancy are limiting
profitability. This is likely to limit the potential upside in the mid-term, in our view. On the Bloomberg
consensus, CAI trades currently at close to a 6% 1Y FWD FFO yield, roughly in line with both its
European and ATX-listed peers and slightly above its 3Y average of c.5%. However, the potential
downside from the merger would be likely to limit any strong rerating at CAI, despite the c.10% FFO
CAGR we expect in 2015-17E.
What the charts show and the respective constituents
On the following pages, we present an overview of the relative valuation of IIA and CAI compared to a
number of major European real estate stocks. We have divided the selected stocks from the European
listed universe into several categories, based on where the respective constituents carry out the
majority of their operations. Please note that we actively follow just a fraction of this universe, so some
of the companies may fit better in another peer group (therefore, this division should serve
predominantly for illustrative purposes only).
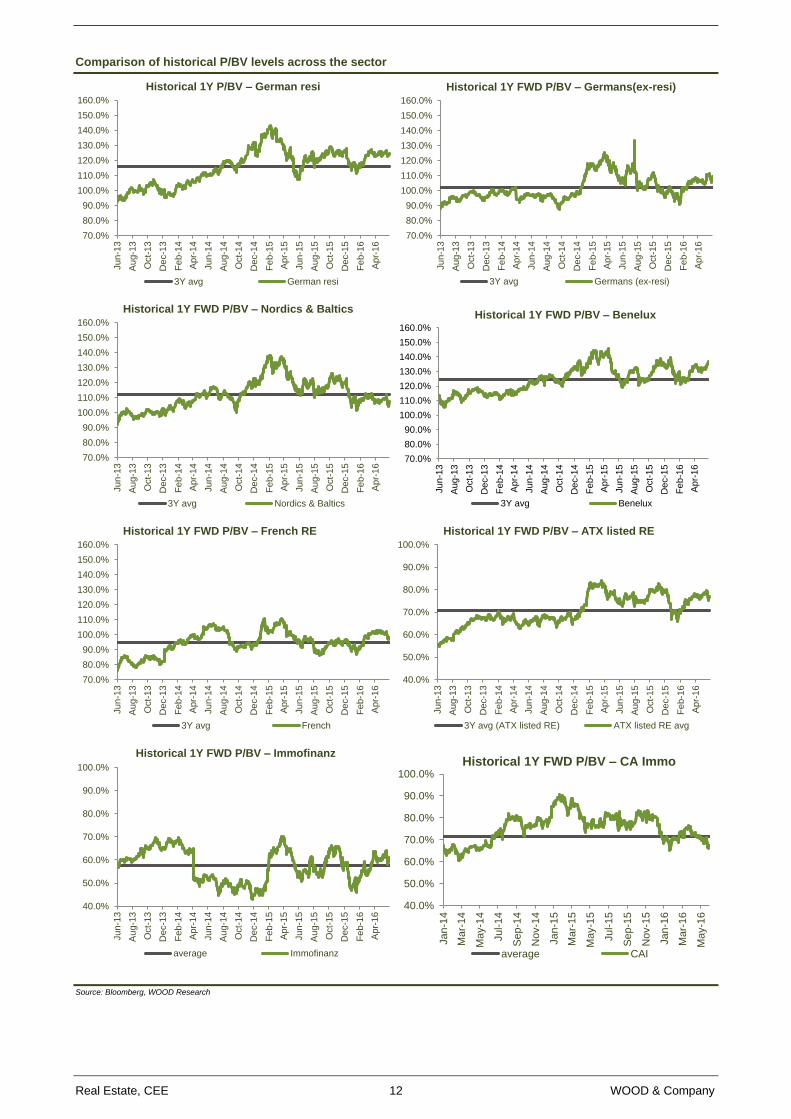
The FFO yield and P/BV charts on the following pages show where the respective segments have
traded for the past three years on 1Y forward FFO and BV, using the average Bloomberg consensus.
The constituents of the respective groups are broadly those shown below, while excluding a handful of
companies at which the numbers differed dramatically from the rest and thus distorted the average.
The constituents
ATX-listed RE – Conwert; CA Immo; S-Immo; Warimpex; Atrium; Immofinanz
German residential – Annington; Deutsche Wohnen; LEG; Gagfah; Buwog
Pan-Europeans - Aedifica; Vastned Retail; Wereldhave; EuroCommercial Ppty; Klepierre; Hansteen
Holdings; Unibail-Rodamco; Corio; Inmobiliara Colonial S.A.
Germans (ex-resi) – Alstria Office; Deutsche EuroShop; DIC Asset AG ;Prime Office AG ; Hamborner
REIT AG
Nordics & Baltics – Castellum; Citycon; DIOS Fastigheter AB; FABEGE; Fastighets AB Balder B;
Hemfosa Fastigheter AB; Hufvudstaden A; Klovern AB; Kungsleden; Norwegian Property ASA;
Technopolis; Sponda Oyj; Wallenstam AB; Wihlborgs Fastigheter
Benelux – Cofinimmo; Intervest Offices & Warehouses; Leasinvest-Sicafi; Nieuwe Steen Inv;
Wereldhave Belgium; Befimmo (Sicafi); Warehouses De Pauw
French – Affine; ANF-Immobilier S.A.; Fonciere Des Regions; Gecina; Icade; Mercialys; Societe de la
Tour Eiffel
0.0%
1.0%
2.0%
3.0%
4.0%
5.0%
6.0%
7.0%
8.0%
9.0%
10.0%
Ju
n-1
3
Ju
l-1
3
Au
g-1
3
Se
p-1
3
Oct-
13
No
v-1
3
De
c-1
3
Ja
n-1
4
Fe
b-1
4
Ma
r-1
4
Ap
r-1
4
Ma
y-1
4
Ju
n-1
4
Ju
l-1
4
Au
g-1
4
Se
p-1
4
Oct-
14
No
v-1
4
De
c-1
4
Ja
n-1
5
Fe
b-1
5
Ma
r-1
5
Ap
r-1
5
Ma
y-1
5
Ju
n-1
5
Ju
l-1
5
Au
g-1
5
Se
p-1
5
Oct-
15
No
v-1
5
De
c-1
5
Ja
n-1
6
Fe
b-1
6
Ma
r-1
6
Ap
r-1
6
Ma
y-1
6
ATX listed RE avg Immofinanz CAI
Real Estate, CEE 12 WOOD & Company
Comparison of historical P/BV levels across the sector
Source: Bloomberg, WOOD Research
70.0%
80.0%
90.0%
100.0%
110.0%
120.0%
130.0%
140.0%
150.0%
160.0%
Ju
n-1
3
Au
g-1
3
Oct-
13
De
c-1
3
Fe
b-1
4
Ap
r-1
4
Ju
n-1
4
Au
g-1
4
Oct-
14
De
c-1
4
Fe
b-1
5
Ap
r-1
5
Ju
n-1
5
Au
g-1
5
Oct-
15
De
c-1
5
Fe
b-1
6
Ap
r-1
6
Historical 1Y P/BV – German resi
3Y avg German resi
70.0%
80.0%
90.0%
100.0%
110.0%
120.0%
130.0%
140.0%
150.0%
160.0%
Ju
n-1
3
Au
g-1
3
Oct-
13
De
c-1
3
Fe
b-1
4
Ap
r-1
4
Ju
n-1
4
Au
g-1
4
Oct-
14
De
c-1
4
Fe
b-1
5
Ap
r-1
5
Ju
n-1
5
Au
g-1
5
Oct-
15
De
c-1
5
Fe
b-1
6
Ap
r-1
6
Historical 1Y FWD P/BV – Germans(ex-resi)
3Y avg Germans (ex-resi)
70.0%
80.0%
90.0%
100.0%
110.0%
120.0%
130.0%
140.0%
150.0%
160.0%
Ju
n-1
3
Au
g-1
3
Oct-
13
De
c-1
3
Fe
b-1
4
Ap
r-1
4
Ju
n-1
4
Au
g-1
4
Oct-
14
De
c-1
4
Fe
b-1
5
Ap
r-1
5
Ju
n-1
5
Au
g-1
5
Oct-
15
De
c-1
5
Fe
b-1
6
Ap
r-1
6
Historical 1Y FWD P/BV – Nordics & Baltics
3Y avg Nordics & Baltics
70.0%
80.0%
90.0%
100.0%
110.0%
120.0%
130.0%
140.0%
150.0%
160.0%
Ju
n-1
3
Au
g-1
3
Oct-
13
De
c-1
3
Fe
b-1
4
Ap
r-1
4
Ju
n-1
4
Au
g-1
4
Oct-
14
De
c-1
4
Fe
b-1
5
Ap
r-1
5
Ju
n-1
5
Au
g-1
5
Oct-
15
De
c-1
5
Fe
b-1
6
Ap
r-1
6
Historical 1Y FWD P/BV – Benelux
3Y avg Benelux
70.0%
80.0%
90.0%
100.0%
110.0%
120.0%
130.0%
140.0%
150.0%
160.0%
Ju
n-1
3
Au
g-1
3
Oct-
13
De
c-1
3
Fe
b-1
4
Ap
r-1
4
Ju
n-1
4
Au
g-1
4
Oct-
14
De
c-1
4
Fe
b-1
5
Ap
r-1
5
Ju
n-1
5
Au
g-1
5
Oct-
15
De
c-1
5
Fe
b-1
6
Ap
r-1
6
Historical 1Y FWD P/BV – French RE
3Y avg French
40.0%
50.0%
60.0%
70.0%
80.0%
90.0%
100.0%
Ju
n-1
3
Au
g-1
3
Oct-
13
De
c-1
3
Fe
b-1
4
Ap
r-1
4
Ju
n-1
4
Au
g-1
4
Oct-
14
De
c-1
4
Fe
b-1
5
Ap
r-1
5
Ju
n-1
5
Au
g-1
5
Oct-
15
De
c-1
5
Fe
b-1
6
Ap
r-1
6
Historical 1Y FWD P/BV – ATX listed RE
3Y avg (ATX listed RE) ATX listed RE avg
40.0%
50.0%
60.0%
70.0%
80.0%
90.0%
100.0%
Ju
n-1
3
Au
g-1
3
Oct-
13
De
c-1
3
Fe
b-1
4
Ap
r-1
4
Ju
n-1
4
Au
g-1
4
Oct-
14
De
c-1
4
Fe
b-1
5
Ap
r-1
5
Ju
n-1
5
Au
g-1
5
Oct-
15
De
c-1
5
Fe
b-1
6
Ap
r-1
6
Historical 1Y FWD P/BV – Immofinanz
average Immofinanz
40.0%
50.0%
60.0%
70.0%
80.0%
90.0%
100.0%
Jan-1
4
Mar-
14
May-1
4
Jul-14
Sep-1
4
Nov-1
4
Jan-1
5
Mar-
15
May-1
5
Jul-15
Sep-1
5
Nov-1
5
Jan-1
6
Mar-
16
May-1
6
Historical 1Y FWD P/BV – CA Immo
average CAI
Real Estate, CEE 13 WOOD & Company
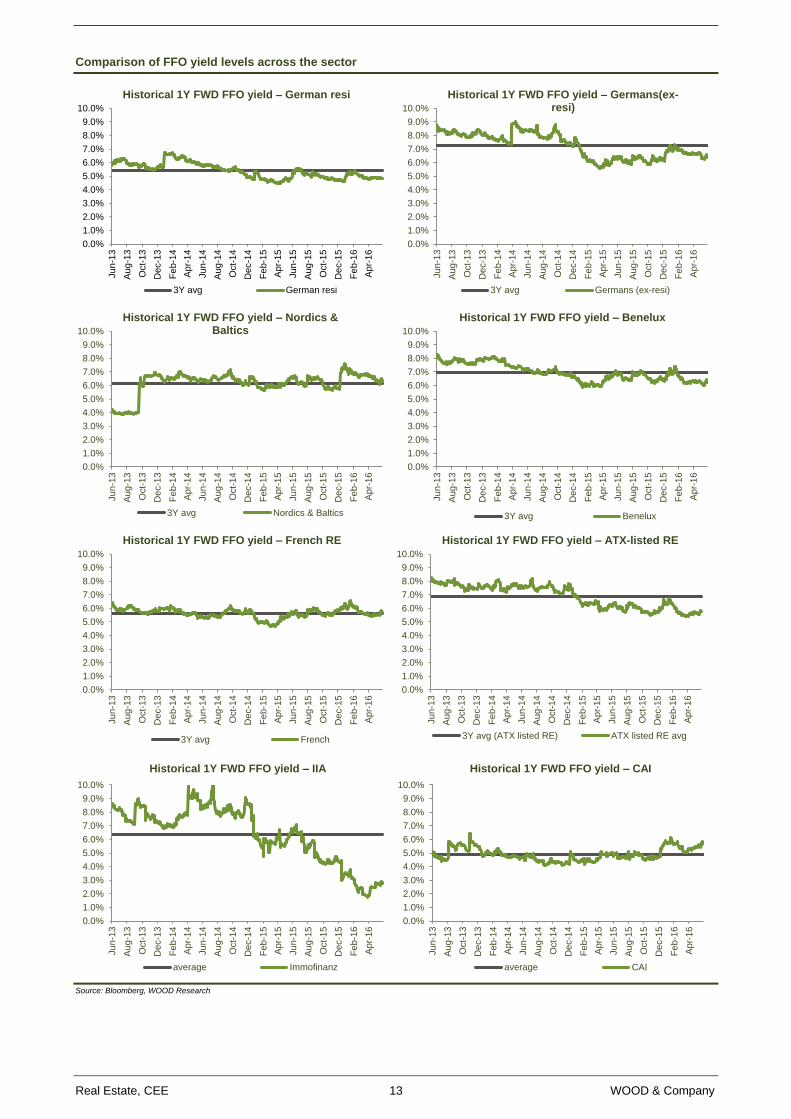
Comparison of FFO yield levels across the sector
Source: Bloomberg, WOOD Research
0.0%
1.0%
2.0%
3.0%
4.0%
5.0%
6.0%
7.0%
8.0%
9.0%
10.0%Ju
n-1
3
Au
g-1
3
Oct-
13
De
c-1
3
Fe
b-1
4
Ap
r-1
4
Ju
n-1
4
Au
g-1
4
Oct-
14
De
c-1
4
Fe
b-1
5
Ap
r-1
5
Ju
n-1
5
Au
g-1
5
Oct-
15
De
c-1
5
Fe
b-1
6
Ap
r-1
6
Historical 1Y FWD FFO yield – German resi
3Y avg German resi
0.0%
1.0%
2.0%
3.0%
4.0%
5.0%
6.0%
7.0%
8.0%
9.0%
10.0%
Ju
n-1
3
Au
g-1
3
Oct-
13
De
c-1
3
Fe
b-1
4
Ap
r-1
4
Ju
n-1
4
Au
g-1
4
Oct-
14
De
c-1
4
Fe
b-1
5
Ap
r-1
5
Ju
n-1
5
Au
g-1
5
Oct-
15
De
c-1
5
Fe
b-1
6
Ap
r-1
6
Historical 1Y FWD FFO yield – Germans(ex-resi)
3Y avg Germans (ex-resi)
0.0%
1.0%
2.0%
3.0%
4.0%
5.0%
6.0%
7.0%
8.0%
9.0%
10.0%
Ju
n-1
3
Au
g-1
3
Oct-
13
De
c-1
3
Fe
b-1
4
Ap
r-1
4
Ju
n-1
4
Au
g-1
4
Oct-
14
De
c-1
4
Fe
b-1
5
Ap
r-1
5
Ju
n-1
5
Au
g-1
5
Oct-
15
De
c-1
5
Fe
b-1
6
Ap
r-1
6
Historical 1Y FWD FFO yield – Nordics & Baltics
3Y avg Nordics & Baltics
0.0%
1.0%
2.0%
3.0%
4.0%
5.0%
6.0%
7.0%
8.0%
9.0%
10.0%
Ju
n-1
3
Au
g-1
3
Oct-
13
De
c-1
3
Fe
b-1
4
Ap
r-1
4
Ju
n-1
4
Au
g-1
4
Oct-
14
De
c-1
4
Fe
b-1
5
Ap
r-1
5
Ju
n-1
5
Au
g-1
5
Oct-
15
De
c-1
5
Fe
b-1
6
Ap
r-1
6
Historical 1Y FWD FFO yield – Benelux
3Y avg Benelux
0.0%
1.0%
2.0%
3.0%
4.0%
5.0%
6.0%
7.0%
8.0%
9.0%
10.0%
Ju
n-1
3
Au
g-1
3
Oct-
13
De
c-1
3
Fe
b-1
4
Ap
r-1
4
Ju
n-1
4
Au
g-1
4
Oct-
14
De
c-1
4
Fe
b-1
5
Ap
r-1
5
Ju
n-1
5
Au
g-1
5
Oct-
15
De
c-1
5
Fe
b-1
6
Ap
r-1
6
Historical 1Y FWD FFO yield – French RE
3Y avg French
0.0%
1.0%
2.0%
3.0%
4.0%
5.0%
6.0%
7.0%
8.0%
9.0%
10.0%
Ju
n-1
3
Au
g-1
3
Oct-
13
De
c-1
3
Fe
b-1
4
Ap
r-1
4
Ju
n-1
4
Au
g-1
4
Oct-
14
De
c-1
4
Fe
b-1
5
Ap
r-1
5
Ju
n-1
5
Au
g-1
5
Oct-
15
De
c-1
5
Fe
b-1
6
Ap
r-1
6
Historical 1Y FWD FFO yield – ATX-listed RE
3Y avg (ATX listed RE) ATX listed RE avg
0.0%
1.0%
2.0%
3.0%
4.0%
5.0%
6.0%
7.0%
8.0%
9.0%
10.0%
Ju
n-1
3
Au
g-1
3
Oct-
13
De
c-1
3
Fe
b-1
4
Ap
r-1
4
Ju
n-1
4
Au
g-1
4
Oct-
14
De
c-1
4
Fe
b-1
5
Ap
r-1
5
Ju
n-1
5
Au
g-1
5
Oct-
15
De
c-1
5
Fe
b-1
6
Ap
r-1
6
Historical 1Y FWD FFO yield – IIA
average Immofinanz
0.0%
1.0%
2.0%
3.0%
4.0%
5.0%
6.0%
7.0%
8.0%
9.0%
10.0%
Ju
n-1
3
Au
g-1
3
Oct-
13
De
c-1
3
Fe
b-1
4
Ap
r-1
4
Ju
n-1
4
Au
g-1
4
Oct-
14
De
c-1
4
Fe
b-1
5
Ap
r-1
5
Ju
n-1
5
Au
g-1
5
Oct-
15
De
c-1
5
Fe
b-1
6
Ap
r-1
6
Historical 1Y FWD FFO yield – CAI
average CAI
Real Estate, CEE 14 WOOD & Company
Overview of the individual markets
On the following pages, we analyse the individual markets in which CAI and IIA operate. We believe
the following are the key takeaways.
IIA’s portfolio seems, on balance, to be booked at more aggressive yields than CAI
In a number of the markets we have reviewed, IIA’s properties had higher vacancy and were
leased at lower average monthly rents compared to its competitors. Ceteris paribus, this seems
to imply that IIA’s properties are lower quality. Despite this, IIA’s properties are often booked at
a lower gross rental yield than its peers’ portfolios, which is the case at its Polish, Czech,
Hungarian and Romanian offices. While the gross rental yield is often depressed by sub-
optimal vacancy, even if we adjust for full occupancy while keeping the average rents intact (an
approach that tends to favour IIA, in our view), the resulting adjusted gross rental yields are, in
most cases, still lower than its competitors in the aforementioned markets.
We see little evidence for organic rental growth
Offices: we expect to see rather stable developments in rents in Vienna, Munich and Frankfurt
over the medium term, as these are generally stable, mature markets. The pace of new
completions seems to have slowed down in Prague and, while it is likely to remain a tenants’
market, it is usually spared strong and abrupt changes in rent levels. We see further downside
potential in Warsaw and Bucharest, where a strong wave of supply is likely to push vacancy up
and put rents under pressure. We believe we may see a positive development in Berlin and
Budapest, where a limited supply of new space is coupled with strong demand.
Moscow retail: the performance of IIA’s shopping malls in the city will depend largely on the
future course of oil prices, which seem unlikely to break above USD 50/barrel in the short- to
mid-term, as this would trigger a ramp-up of US production, which would likely cap further
gains, in our view. That said, with the consensus expecting modest GDP growth from 2017E-
on, we expect a gradual improvement in occupancy, followed by a steady recovery of rents. We
note that the Moscow retail market has been flooded with new projects, and the modern retail
space is set to expand by over a third between 2014-16E. As such, the new rent equilibrium will
likely stand substantially below the levels seen pre-2014/15, even if the economy begins to
grow at a significantly higher-than-forecast pace.
Retail elsewhere: IIA classifies about half of its retail portfolio by BV as Quality Shopping
Center/VIVO!, with the other half being the STOP.SHOPs, or other retail parks. Past
performance seems to suggest that the rents in the segments are generally stable. However,
we believe that the upside for potential rental growth is rather limited, especially in the retail
parks segment.
Across the markets, pricing has reached or surpassed historical highs
Total investment volume for CEE (ex. Russia) stood at EUR 10bn in 2015, up 25% yoy
according to CBRE. In Austria, nearly EUR 4bn was transacted during the year (+38 yoy), while
Germany saw a deal volume of a huge EUR 55bn, (up 39% yoy), according to CBRE figures. In
a number of countries, volumes are moving close to historical highs, surpassed only by
2006/07.
The massive volume of capital is driving the yields down across the markets and
sectors, with the prime yields for offices now standing as low as 4% in a number of German
cities. In CEE, 2015 was dominated by retail investment, which represented nearly 50% of the
turnover. The pricing of prime shopping centres in the CE3 capitals stands at around 5.0%, and
we are seeing retail deals close to the 5% mark even outside the capitals in these countries.
This trend is also visible in the office markets. Having hovered at around 6.0% for a number of
years, the prime office yield for both Prague and Warsaw (as reported by CBRE) has declined
recently to 5.5%. Romania and Hungary, while also registering growing demand, still continue
to offer better pricing, with yields at around 7% for offices and retail, but the liquidity is still
rather limited compared to CEE, and concentrated mainly in the capitals. With respect to
Russia, after a weak 2015, volumes have picked up in 2016 ytd, and we see investor interest
picking up. However, there have been no transactions of a similar size to IIA’s portfolio since
the downturn, so the visibility of pricing in the current environment remains limited.
Real Estate, CEE 15 WOOD & Company
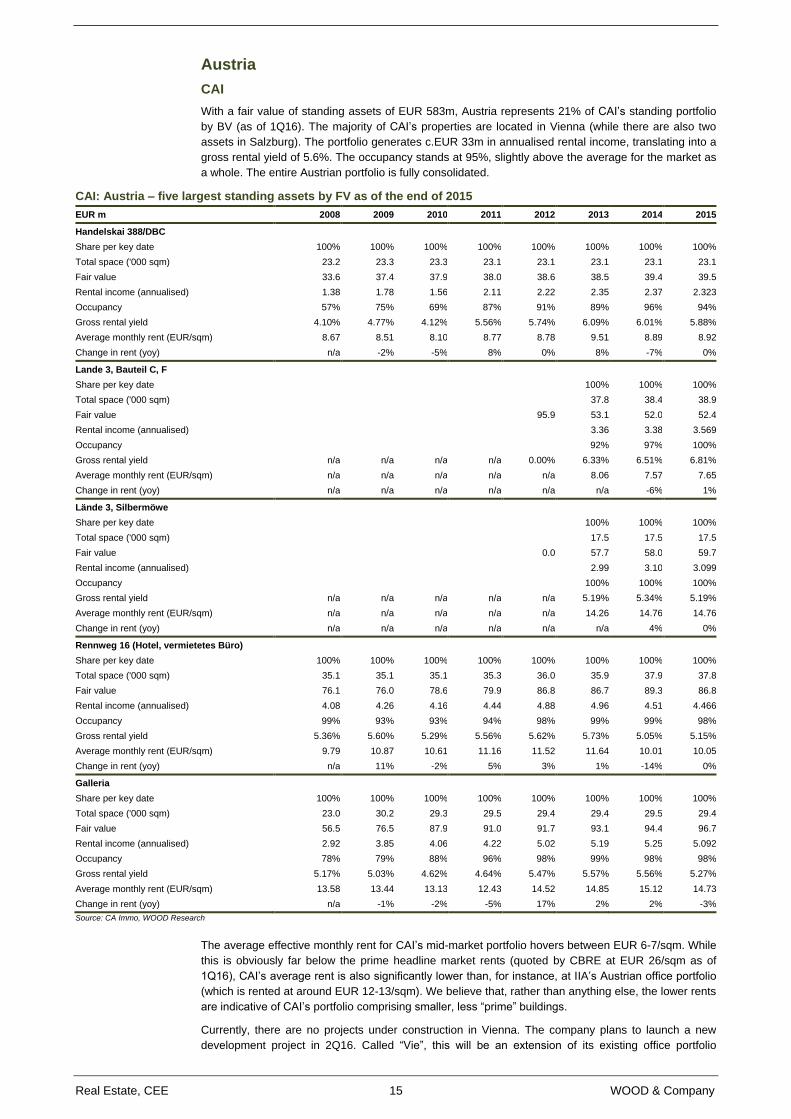
Austria
CAI
With a fair value of standing assets of EUR 583m, Austria represents 21% of CAI’s standing portfolio
by BV (as of 1Q16). The majority of CAI’s properties are located in Vienna (while there are also two
assets in Salzburg). The portfolio generates c.EUR 33m in annualised rental income, translating into a
gross rental yield of 5.6%. The occupancy stands at 95%, slightly above the average for the market as
a whole. The entire Austrian portfolio is fully consolidated.
CAI: Austria – five largest standing assets by FV as of the end of 2015
EUR m 2008 2009 2010 2011 2012 2013 2014 2015
Handelskai 388/DBC
Share per key date 100% 100% 100% 100% 100% 100% 100% 100%
Total space ('000 sqm) 23.2 23.3 23.3 23.1 23.1 23.1 23.1 23.1
Fair value 33.6 37.4 37.9 38.0 38.6 38.5 39.4 39.5
Rental income (annualised) 1.38 1.78 1.56 2.11 2.22 2.35 2.37 2.323
Occupancy 57% 75% 69% 87% 91% 89% 96% 94%
Gross rental yield 4.10% 4.77% 4.12% 5.56% 5.74% 6.09% 6.01% 5.88%
Average monthly rent (EUR/sqm) 8.67 8.51 8.10 8.77 8.78 9.51 8.89 8.92
Change in rent (yoy) n/a -2% -5% 8% 0% 8% -7% 0%
Lande 3, Bauteil C, F
Share per key date
100% 100% 100%
Total space ('000 sqm)
37.8 38.4 38.9
Fair value
95.9 53.1 52.0 52.4
Rental income (annualised)
3.36 3.38 3.569
Occupancy
92% 97% 100%
Gross rental yield n/a n/a n/a n/a 0.00% 6.33% 6.51% 6.81%
Average monthly rent (EUR/sqm) n/a n/a n/a n/a n/a 8.06 7.57 7.65
Change in rent (yoy) n/a n/a n/a n/a n/a n/a -6% 1%
Lände 3, Silbermöwe
Share per key date
100% 100% 100%
Total space ('000 sqm)
17.5 17.5 17.5
Fair value
0.0 57.7 58.0 59.7
Rental income (annualised)
2.99 3.10 3.099
Occupancy
100% 100% 100%
Gross rental yield n/a n/a n/a n/a n/a 5.19% 5.34% 5.19%
Average monthly rent (EUR/sqm) n/a n/a n/a n/a n/a 14.26 14.76 14.76
Change in rent (yoy) n/a n/a n/a n/a n/a n/a 4% 0%
Rennweg 16 (Hotel, vermietetes Büro)
Share per key date 100% 100% 100% 100% 100% 100% 100% 100%
Total space ('000 sqm) 35.1 35.1 35.1 35.3 36.0 35.9 37.9 37.8
Fair value 76.1 76.0 78.6 79.9 86.8 86.7 89.3 86.8
Rental income (annualised) 4.08 4.26 4.16 4.44 4.88 4.96 4.51 4.466
Occupancy 99% 93% 93% 94% 98% 99% 99% 98%
Gross rental yield 5.36% 5.60% 5.29% 5.56% 5.62% 5.73% 5.05% 5.15%
Average monthly rent (EUR/sqm) 9.79 10.87 10.61 11.16 11.52 11.64 10.01 10.05
Change in rent (yoy) n/a 11% -2% 5% 3% 1% -14% 0%
Galleria
Share per key date 100% 100% 100% 100% 100% 100% 100% 100%
Total space ('000 sqm) 23.0 30.2 29.3 29.5 29.4 29.4 29.5 29.4
Fair value 56.5 76.5 87.9 91.0 91.7 93.1 94.4 96.7
Rental income (annualised) 2.92 3.85 4.06 4.22 5.02 5.19 5.25 5.092
Occupancy 78% 79% 88% 96% 98% 99% 98% 98%
Gross rental yield 5.17% 5.03% 4.62% 4.64% 5.47% 5.57% 5.56% 5.27%
Average monthly rent (EUR/sqm) 13.58 13.44 13.13 12.43 14.52 14.85 15.12 14.73
Change in rent (yoy) n/a -1% -2% -5% 17% 2% 2% -3%
Source: CA Immo, WOOD Research
The average effective monthly rent for CAI’s mid-market portfolio hovers between EUR 6-7/sqm. While
this is obviously far below the prime headline market rents (quoted by CBRE at EUR 26/sqm as of
1Q16), CAI’s average rent is also significantly lower than, for instance, at IIA’s Austrian office portfolio
(which is rented at around EUR 12-13/sqm). We believe that, rather than anything else, the lower rents
are indicative of CAI’s portfolio comprising smaller, less “prime” buildings.
Currently, there are no projects under construction in Vienna. The company plans to launch a new
development project in 2Q16. Called “Vie”, this will be an extension of its existing office portfolio
Real Estate, CEE 16 WOOD & Company
Laende 3, in Vienna. However, this building will not increase the size of CAI’s Austrian portfolio, as it is
subject to a forward sale agreement to an Austrian investor.
This is not to say that the composition of the Austrian portfolio will remain intact. We believe the
company may utilise the strong demand and offload some of the smaller properties it holds in Vienna,
thus improving the quality of the portfolio.
The largest building by fair value is the Galleria, a shopping mall with adjacent office space located in
Vienna, on the Landstrasser Hauptstrasse. Generating c.EUR 5m p.a., the building was booked at
EUR 97m, accounting for 16% of the Austrian portfolio and 3% of the total standing portfolio. Jointly,
the five largest buildings, listed in the table above (the mall, three offices and a hotel, Savoyen),
accounted for over half of the Austrian portfolio by BV as of the end of 2015, while c.12% of CAI’s total
standing portfolio.
Booked at gross rental yields between 5.0% and 7.0%, we believe that the valuation of the top-5
buildings in the Austrian portfolio is fairly conservative, considering the steep yield compression across
the city (as of 1Q16, the prime office yield, as reported by CBRE, stood at 4.15%, while high street
retail traded at a yield below 4%, according to the realtor).
IIA
As illustrated in the table presented below, IIA’s Austrian portfolio generates annualised rental income
of c.EUR 70m, or around 20% of the group’s total. IIA owns a large office portfolio, located
predominantly in the capital, along with a number of smaller retail assets scattered across the country.
The margin on asset management hovers at around 60-70%. In our view, the main reason for the
unimpressive figure is the rather low occupancy in the office portfolio, which IIA is currently trying to
address via an extensive refurbishment programme.
The value of the standing assets is at around EUR 1.1bn, with c.EUR 580m of attributable debt, on
which IIA pays 2.7% (including hedging). Together with a handful of pipeline and development assets
(which together amounted to just around EUR 52m as of the end of 3Q15/16), the attributable equity
stands at c.EUR 560m.
On our simplified calculations (we just subtract calculated interest costs from the results from asset
management for the respective quarter), the Austrian portfolio has generated around EUR 28m of FFO
over the past 12 months. This represents c.25% of the total FFO for the period.
Office
As of the end of 3Q15/16, IIA held 33 office assets in Austria, with a BV of EUR 869m. This accounts
for 37% of its standing office portfolio and 18% of its total standing portfolio. With occupancy at around
80%, the 362k sqm GLA office portfolio generates around EUR 11m every quarter, or c.EUR 45m
annually. As of 3Q15/16, the buildings were booked at a 5.25% yield on annualised gross rental
income.
Similar to CAI, the majority of IIA’s properties are located in Vienna. According to the portfolio
breakdown that the company provides on its website, there are two additional buildings in Salzburg,
and one each in Klagenfurt and St. Polten. The largest assets in IIA’s Austrian portfolio include
Business Park Vienna (168k sqm GLA), the Bösendorferstrasse 4 (29k sqm GLA), City Tower Vienna
(27k sqm GLA) and Office 11 (20k sqm GLA).
Although Vienna is its home market, IIA’s office portfolio in the city suffers from persistently high
vacancy, which hovers at around 20%. We expect that IIA is likely to succeed in gradually increasing
the occupancy in its Austrian offices as well, as part of its broader initiative to improve the occupancy
across its office portfolio. In our forecasts, we have pencilled in a gradual improvement in occupancy to
90% by 2018E. That said, we expect the improvement in occupancy to come at a price: a modest
softening in the average rent level. As such, we have pencilled in the rents to stagnate at around EUR
12.5-13.0/sqm until 2018E, while increasing them on par with inflation afterwards.
Real Estate, CEE 17 WOOD & Company
IIA: Austria – approximate FFO reconciliation
EUR m 1Q13/14 2Q13/14 3Q13/14 4Q13/14 1Q14/15 2Q14/15 3Q14/15 4Q14/15 1Q15/16 2Q15/16 3Q15/16
Office 9.6 9.7 9.1 9.3 9.0 8.8 9.2 10.3 8.6 9.0 8.7
Retail 7.3 7.0 6.9 7.0 7.1 7.0 7.1 5.4 6.4 6.4 6.0
Other 4.5 3.9 3.6 3.7 3.5 3.6 3.6 3.2 2.7 2.1 1.6
Rental income 21.4 20.6 19.5 20.1 19.6 19.4 19.9 18.9 17.8 17.5 16.4
As a % of total 17.0% 17.2% 17.1% 17.0% 16.7% 20.3% 19.9% 16.7% 19.4% 25.4% 21.0%
OPEX charged to tenants & others 4.9 3.9 4.5 6.4 3.3 4.8 2.6 5.5 3.3 3.1 3.1
Expenses from inv. property & OPEX -8.3 -8.0 -10.8 -15.9 -7.4 -8.9 -8.5 -14.0 -7.9 -9.1 -10.8
Result from asset management 18.0 16.5 13.2 10.6 15.5 15.3 14.0 10.4 13.2 11.6 8.8
Margin on rental income 84% 80% 68% 53% 79% 79% 70% 55% 74% 66% 53%
Amount of property sales 8.5 62.1 -2.6 18.1 3.4 2.8 1.2 20.9 127.8 56.5 52.9
Revaluation of properties sold 2.0 7.4 -5.6 1.3 0.7 0.2 1.4 26.1 1.4 0.6 2.4
Margin on property sales 32% 14% -189% 8% 25% 7% n/a n/a 1% 1% 5%
Other income/expenses + FX impact -0.3 -0.1 0.0 -0.9 -0.3 -0.3 2.2 -0.4 -1.6 -0.4 -1.6
Results of property sales 10.2 69.5 -8.2 18.5 3.8 2.7 4.9 46.6 127.6 56.7 53.6
Amount of RE inventories sales 0.4 0.0 0.0 0.0 0.0 0.0 0.0 0.0 0.0 2.0 0.0
Revaluation of RE inventories sold 0.0 0.0 0.0 0.0 0.0 0.0 0.0 0.3 0.0 0.8 0.0
Margin on RE inventories sales 35% n/a n/a n/a n/a n/a n/a n/a -100% 185% -100%
Other income/expenses + FX impact -0.1 0.0 -0.7 0.4 0.0 -0.1 -0.1 -0.3 -0.1 -0.1 0.1
Results of property development 0.3 0.0 -0.7 0.4 0.0 -0.1 -0.1 0.1 -0.1 2.7 0.1
Other operating income/expenses -0.4 -2.1 0.3 0.5 -0.5 -0.3 -0.1 1.2 -0.1 -0.2 0.8
EBITDA (ex. revals) 28.1 83.9 4.6 30.0 18.8 17.7 18.7 58.4 140.6 70.8 63.3
Revaluations (adj. for FX) -6.3 0.1 0.8 -4.1 1.7 9.9 62.7 -31.7 -0.1 7.1 3.3
Revaluations (stemming from FX) 0.0 0.0 0.0 0.0 0.0 0.0 0.0 0.0 0.0 0.0 0.0
EBITDA 21.8 84.0 5.4 25.9 20.5 27.6 81.4 26.7 140.5 77.9 66.6
Attributable debt 589.7 549.2 545.4 539.3 509.0 515.7 512.9 546.6 611.3 594.5 579.5
Interest rate (incl. hedging) 3.4% 3.3% 3.3% 3.3% 3.4% 3.3% 3.2% 3.2% 2.6% 2.7% 2.7%
Interest costs (incl. hedging) -20.0 -18.1 -18.0 -17.8 -17.3 -17.0 -16.4 -17.5 -15.9 -16.1 -15.6
Approx. FFO* contribution 13.0 11.9 8.7 6.2 11.2 11.1 9.9 6.1 9.2 7.6 4.8
As a % of total 17.3% 18.0% 16.2% 10.7% 17.5% 26.2% 24.1% 13.6% 29.6% 45.2% 24.4%
Standing assets 1,489 1,429 1,357 1,316 1,276 1,284 1,332 1,308 1,194 1,150 1,086
Development projects 3 4 4 4 1 1 2 2 3 3 24
Pipeline projects 11 10 10 35 36 35 36 36 29 28 28
Approx. equity 913 893 825 816 803 804 857 800 615 586 558
Approx. FFO return on equity* 5.7% 5.3% 4.2% 3.0% 5.6% 5.5% 4.6% 3.0% 6.0% 5.2% 3.5%
Source: Immofinanz, WOOD Research; *excluding taxes
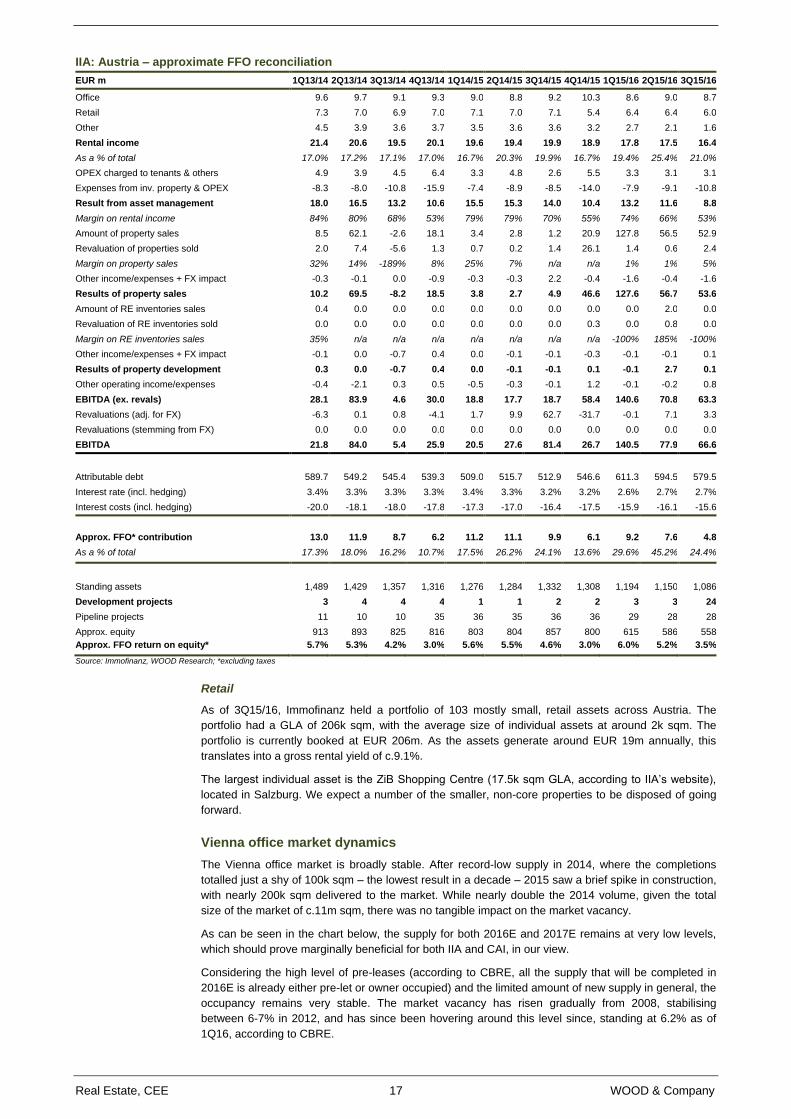
Retail
As of 3Q15/16, Immofinanz held a portfolio of 103 mostly small, retail assets across Austria. The
portfolio had a GLA of 206k sqm, with the average size of individual assets at around 2k sqm. The
portfolio is currently booked at EUR 206m. As the assets generate around EUR 19m annually, this
translates into a gross rental yield of c.9.1%.
The largest individual asset is the ZiB Shopping Centre (17.5k sqm GLA, according to IIA’s website),
located in Salzburg. We expect a number of the smaller, non-core properties to be disposed of going
forward.
Vienna office market dynamics
The Vienna office market is broadly stable. After record-low supply in 2014, where the completions
totalled just a shy of 100k sqm – the lowest result in a decade – 2015 saw a brief spike in construction,
with nearly 200k sqm delivered to the market. While nearly double the 2014 volume, given the total
size of the market of c.11m sqm, there was no tangible impact on the market vacancy.
As can be seen in the chart below, the supply for both 2016E and 2017E remains at very low levels,
which should prove marginally beneficial for both IIA and CAI, in our view.
Considering the high level of pre-leases (according to CBRE, all the supply that will be completed in
2016E is already either pre-let or owner occupied) and the limited amount of new supply in general, the
occupancy remains very stable. The market vacancy has risen gradually from 2008, stabilising
between 6-7% in 2012, and has since been hovering around this level since, standing at 6.2% as of
1Q16, according to CBRE.
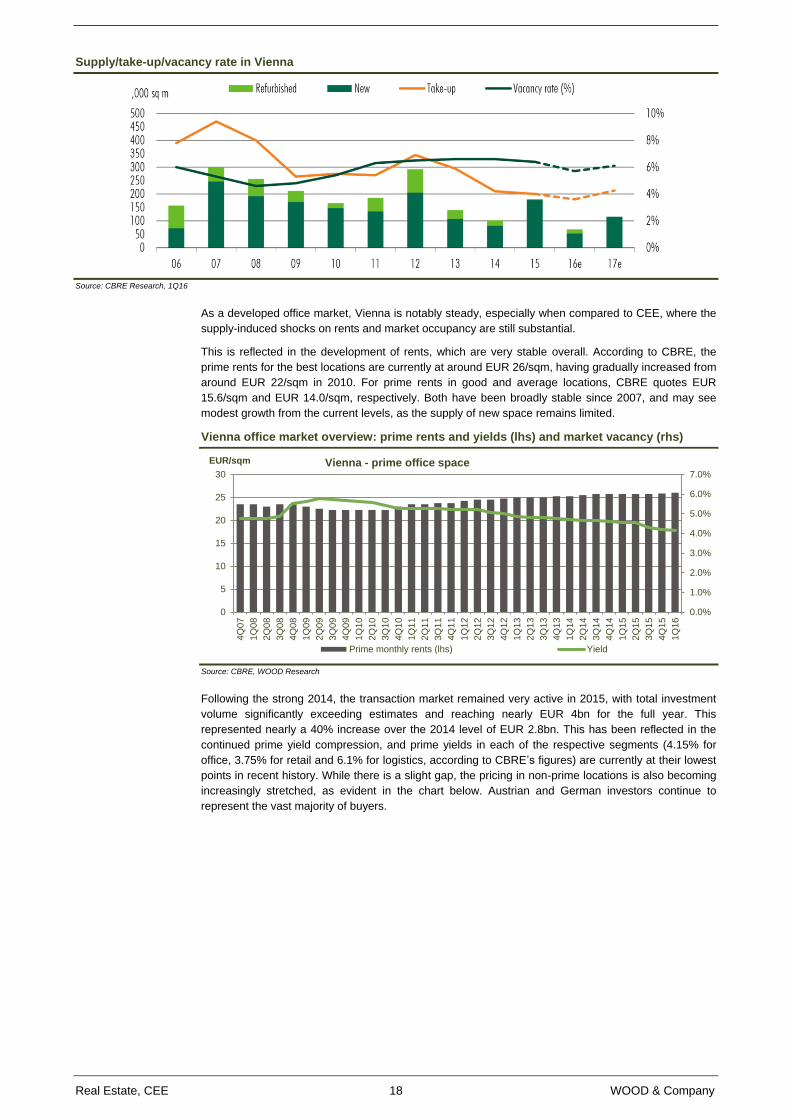
Real Estate, CEE 18 WOOD & Company
Supply/take-up/vacancy rate in Vienna
Source: CBRE Research, 1Q16
As a developed office market, Vienna is notably steady, especially when compared to CEE, where the
supply-induced shocks on rents and market occupancy are still substantial.
This is reflected in the development of rents, which are very stable overall. According to CBRE, the
prime rents for the best locations are currently at around EUR 26/sqm, having gradually increased from
around EUR 22/sqm in 2010. For prime rents in good and average locations, CBRE quotes EUR
15.6/sqm and EUR 14.0/sqm, respectively. Both have been broadly stable since 2007, and may see
modest growth from the current levels, as the supply of new space remains limited.
Vienna office market overview: prime rents and yields (lhs) and market vacancy (rhs)
Source: CBRE, WOOD Research
Following the strong 2014, the transaction market remained very active in 2015, with total investment
volume significantly exceeding estimates and reaching nearly EUR 4bn for the full year. This
represented nearly a 40% increase over the 2014 level of EUR 2.8bn. This has been reflected in the
continued prime yield compression, and prime yields in each of the respective segments (4.15% for
office, 3.75% for retail and 6.1% for logistics, according to CBRE’s figures) are currently at their lowest
points in recent history. While there is a slight gap, the pricing in non-prime locations is also becoming
increasingly stretched, as evident in the chart below. Austrian and German investors continue to
represent the vast majority of buyers.
0.0%
1.0%
2.0%
3.0%
4.0%
5.0%
6.0%
7.0%
0
5
10
15
20
25
30
4Q
07
1Q
08
2Q
08
3Q
08
4Q
08
1Q
09
2Q
09
3Q
09
4Q
09
1Q
10
2Q
10
3Q
10
4Q
10
1Q
11
2Q
11
3Q
11
4Q
11
1Q
12
2Q
12
3Q
12
4Q
12
1Q
13
2Q
13
3Q
13
4Q
13
1Q
14
2Q
14
3Q
14
4Q
14
1Q
15
2Q
15
3Q
15
4Q
15
1Q
16
EUR/sqm Vienna - prime office space
Prime monthly rents (lhs) Yield
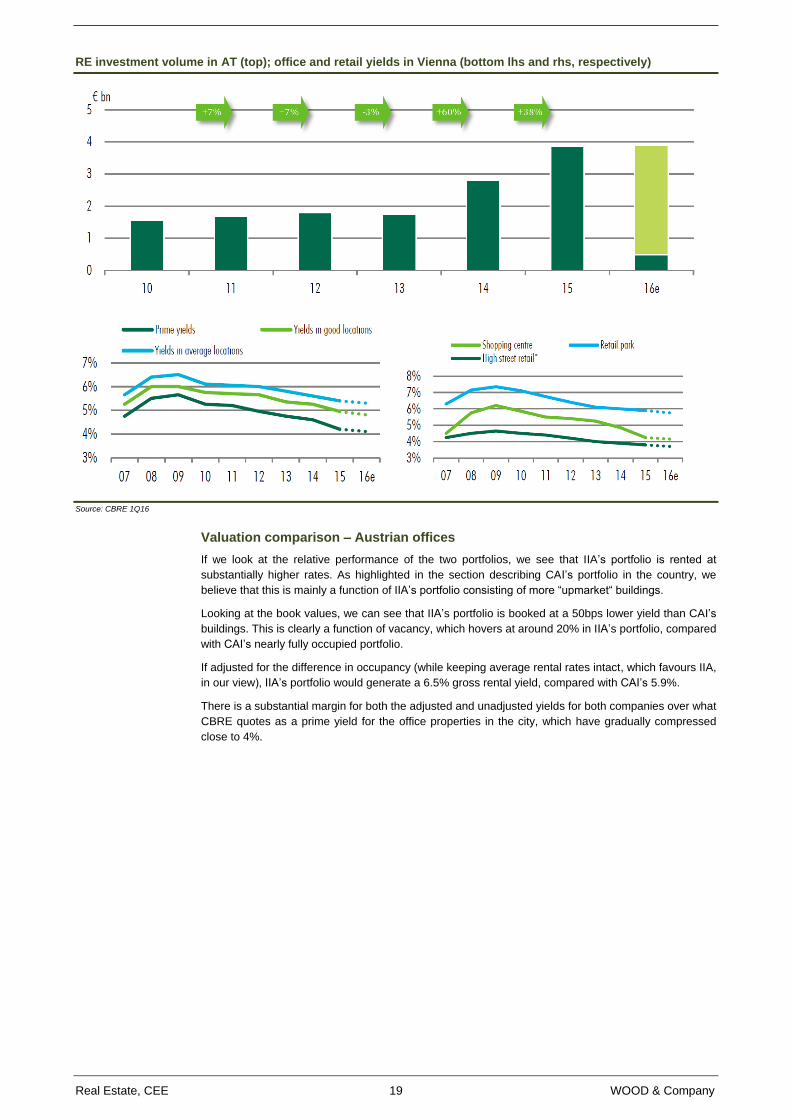
Real Estate, CEE 19 WOOD & Company
RE investment volume in AT (top); office and retail yields in Vienna (bottom lhs and rhs, respectively)
Source: CBRE 1Q16
Valuation comparison – Austrian offices
If we look at the relative performance of the two portfolios, we see that IIA’s portfolio is rented at
substantially higher rates. As highlighted in the section describing CAI’s portfolio in the country, we
believe that this is mainly a function of IIA’s portfolio consisting of more “upmarket“ buildings.
Looking at the book values, we can see that IIA’s portfolio is booked at a 50bps lower yield than CAI’s
buildings. This is clearly a function of vacancy, which hovers at around 20% in IIA’s portfolio, compared
with CAI’s nearly fully occupied portfolio.
If adjusted for the difference in occupancy (while keeping average rental rates intact, which favours IIA,
in our view), IIA’s portfolio would generate a 6.5% gross rental yield, compared with CAI’s 5.9%.
There is a substantial margin for both the adjusted and unadjusted yields for both companies over what
CBRE quotes as a prime yield for the office properties in the city, which have gradually compressed
close to 4%.
Real Estate, CEE 20 WOOD & Company
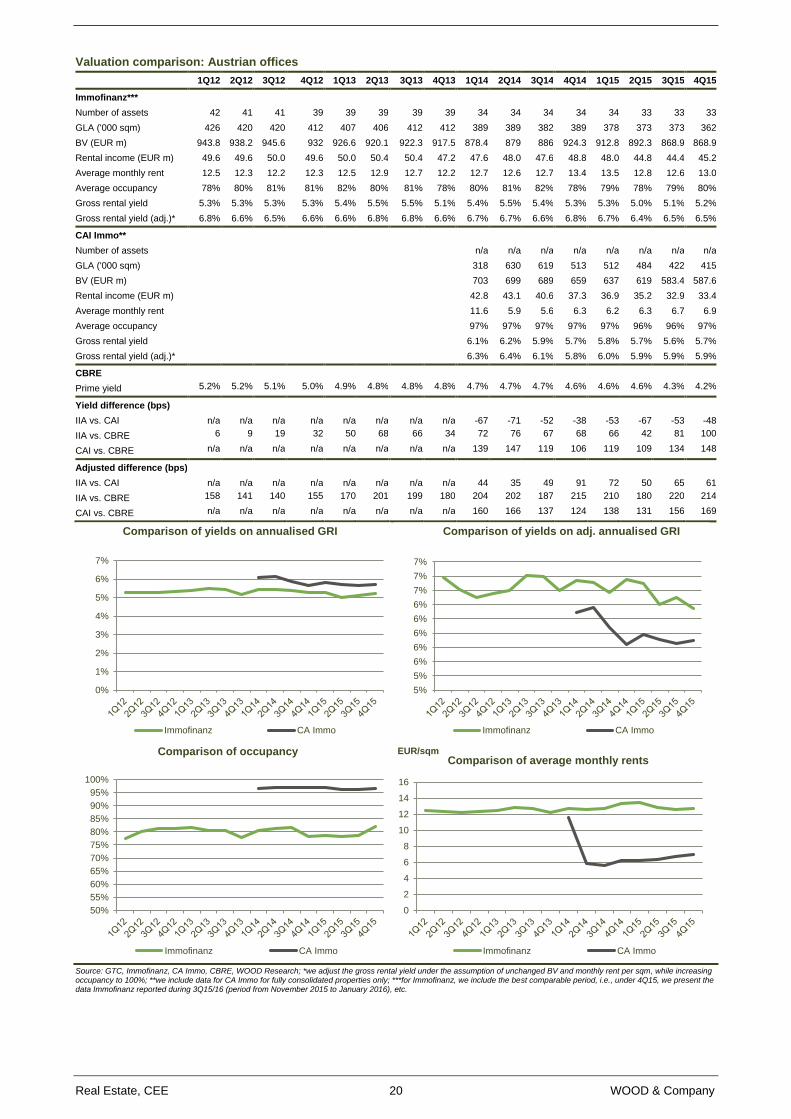
Valuation comparison: Austrian offices
1Q12 2Q12 3Q12 4Q12 1Q13 2Q13 3Q13 4Q13 1Q14 2Q14 3Q14 4Q14 1Q15 2Q15 3Q15 4Q15
Immofinanz***
Number of assets 42 41 41 39 39 39 39 39 34 34 34 34 34 33 33 33
GLA ('000 sqm) 426 420 420 412 407 406 412 412 389 389 382 389 378 373 373 362
BV (EUR m) 943.8 938.2 945.6 932 926.6 920.1 922.3 917.5 878.4 879 886 924.3 912.8 892.3 868.9 868.9
Rental income (EUR m) 49.6 49.6 50.0 49.6 50.0 50.4 50.4 47.2 47.6 48.0 47.6 48.8 48.0 44.8 44.4 45.2
Average monthly rent 12.5 12.3 12.2 12.3 12.5 12.9 12.7 12.2 12.7 12.6 12.7 13.4 13.5 12.8 12.6 13.0
Average occupancy 78% 80% 81% 81% 82% 80% 81% 78% 80% 81% 82% 78% 79% 78% 79% 80%
Gross rental yield 5.3% 5.3% 5.3% 5.3% 5.4% 5.5% 5.5% 5.1% 5.4% 5.5% 5.4% 5.3% 5.3% 5.0% 5.1% 5.2%
Gross rental yield (adj.)* 6.8% 6.6% 6.5% 6.6% 6.6% 6.8% 6.8% 6.6% 6.7% 6.7% 6.6% 6.8% 6.7% 6.4% 6.5% 6.5%
CAI Immo**
Number of assets
n/a n/a n/a n/a n/a n/a n/a n/a
GLA ('000 sqm)
318 630 619 513 512 484 422 415
BV (EUR m)
703 699 689 659 637 619 583.4 587.6
Rental income (EUR m)
42.8 43.1 40.6 37.3 36.9 35.2 32.9 33.4
Average monthly rent
11.6 5.9 5.6 6.3 6.2 6.3 6.7 6.9
Average occupancy
97% 97% 97% 97% 97% 96% 96% 97%
Gross rental yield
6.1% 6.2% 5.9% 5.7% 5.8% 5.7% 5.6% 5.7%
Gross rental yield (adj.)* 6.3% 6.4% 6.1% 5.8% 6.0% 5.9% 5.9% 5.9%
CBRE
Prime yield 5.2% 5.2% 5.1% 5.0% 4.9% 4.8% 4.8% 4.8% 4.7% 4.7% 4.7% 4.6% 4.6% 4.6% 4.3% 4.2%
Yield difference (bps)
IIA vs. CAI n/a n/a n/a n/a n/a n/a n/a n/a -67 -71 -52 -38 -53 -67 -53 -48
IIA vs. CBRE 6 9 19 32 50 68 66 34 72 76 67 68 66 42 81 100
CAI vs. CBRE n/a n/a n/a n/a n/a n/a n/a n/a 139 147 119 106 119 109 134 148
Adjusted difference (bps)
IIA vs. CAI n/a n/a n/a n/a n/a n/a n/a n/a 44 35 49 91 72 50 65 61
IIA vs. CBRE 158 141 140 155 170 201 199 180 204 202 187 215 210 180 220 214
CAI vs. CBRE n/a n/a n/a n/a n/a n/a n/a n/a 160 166 137 124 138 131 156 169
Source: GTC, Immofinanz, CA Immo, CBRE, WOOD Research; *we adjust the gross rental yield under the assumption of unchanged BV and monthly rent per sqm, while increasing occupancy to 100%; **we include data for CA Immo for fully consolidated properties only; ***for Immofinanz, we include the best comparable period, i.e., under 4Q15, we present the data Immofinanz reported during 3Q15/16 (period from November 2015 to January 2016), etc.
0%
1%
2%
3%
4%
5%
6%
7%
Comparison of yields on annualised GRI
Immofinanz CA Immo
5%
5%
6%
6%
6%
6%
6%
7%
7%
7%
Comparison of yields on adj. annualised GRI
Immofinanz CA Immo
50%
55%
60%
65%
70%
75%
80%
85%
90%
95%
100%
Comparison of occupancy
Immofinanz CA Immo
0
2
4
6
8
10
12
14
16
EUR/sqmComparison of average monthly rents
Immofinanz CA Immo
Real Estate, CEE 21 WOOD & Company
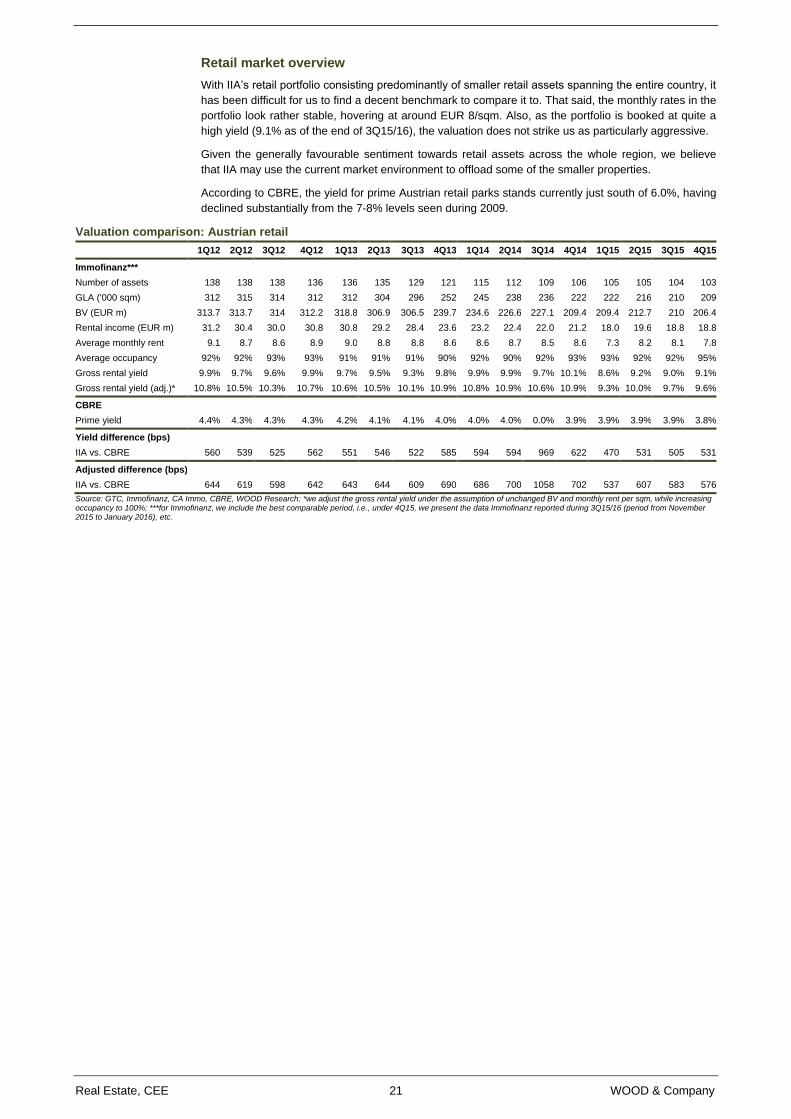
Retail market overview
With IIA’s retail portfolio consisting predominantly of smaller retail assets spanning the entire country, it
has been difficult for us to find a decent benchmark to compare it to. That said, the monthly rates in the
portfolio look rather stable, hovering at around EUR 8/sqm. Also, as the portfolio is booked at quite a
high yield (9.1% as of the end of 3Q15/16), the valuation does not strike us as particularly aggressive.
Given the generally favourable sentiment towards retail assets across the whole region, we believe
that IIA may use the current market environment to offload some of the smaller properties.
According to CBRE, the yield for prime Austrian retail parks stands currently just south of 6.0%, having
declined substantially from the 7-8% levels seen during 2009.
Valuation comparison: Austrian retail
1Q12 2Q12 3Q12 4Q12 1Q13 2Q13 3Q13 4Q13 1Q14 2Q14 3Q14 4Q14 1Q15 2Q15 3Q15 4Q15
Immofinanz***
Number of assets 138 138 138 136 136 135 129 121 115 112 109 106 105 105 104 103
GLA ('000 sqm) 312 315 314 312 312 304 296 252 245 238 236 222 222 216 210 209
BV (EUR m) 313.7 313.7 314 312.2 318.8 306.9 306.5 239.7 234.6 226.6 227.1 209.4 209.4 212.7 210 206.4
Rental income (EUR m) 31.2 30.4 30.0 30.8 30.8 29.2 28.4 23.6 23.2 22.4 22.0 21.2 18.0 19.6 18.8 18.8
Average monthly rent 9.1 8.7 8.6 8.9 9.0 8.8 8.8 8.6 8.6 8.7 8.5 8.6 7.3 8.2 8.1 7.8
Average occupancy 92% 92% 93% 93% 91% 91% 91% 90% 92% 90% 92% 93% 93% 92% 92% 95%
Gross rental yield 9.9% 9.7% 9.6% 9.9% 9.7% 9.5% 9.3% 9.8% 9.9% 9.9% 9.7% 10.1% 8.6% 9.2% 9.0% 9.1%
Gross rental yield (adj.)* 10.8% 10.5% 10.3% 10.7% 10.6% 10.5% 10.1% 10.9% 10.8% 10.9% 10.6% 10.9% 9.3% 10.0% 9.7% 9.6%
CBRE
Prime yield 4.4% 4.3% 4.3% 4.3% 4.2% 4.1% 4.1% 4.0% 4.0% 4.0% 0.0% 3.9% 3.9% 3.9% 3.9% 3.8%
Yield difference (bps)
IIA vs. CBRE 560 539 525 562 551 546 522 585 594 594 969 622 470 531 505 531
Adjusted difference (bps)
IIA vs. CBRE 644 619 598 642 643 644 609 690 686 700 1058 702 537 607 583 576
Source: GTC, Immofinanz, CA Immo, CBRE, WOOD Research; *we adjust the gross rental yield under the assumption of unchanged BV and monthly rent per sqm, while increasing occupancy to 100%; ***for Immofinanz, we include the best comparable period, i.e., under 4Q15, we present the data Immofinanz reported during 3Q15/16 (period from November 2015 to January 2016), etc.
Real Estate, CEE 22 WOOD & Company
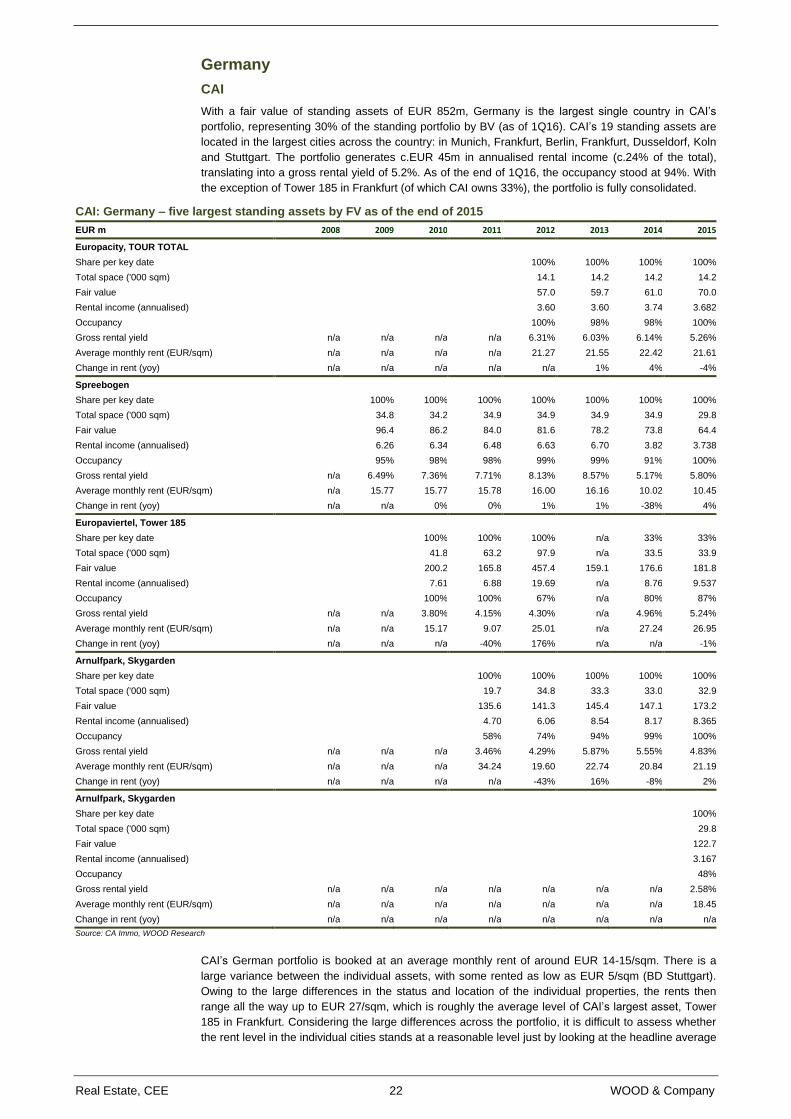
Germany
CAI
With a fair value of standing assets of EUR 852m, Germany is the largest single country in CAI’s
portfolio, representing 30% of the standing portfolio by BV (as of 1Q16). CAI’s 19 standing assets are
located in the largest cities across the country: in Munich, Frankfurt, Berlin, Frankfurt, Dusseldorf, Koln
and Stuttgart. The portfolio generates c.EUR 45m in annualised rental income (c.24% of the total),
translating into a gross rental yield of 5.2%. As of the end of 1Q16, the occupancy stood at 94%. With
the exception of Tower 185 in Frankfurt (of which CAI owns 33%), the portfolio is fully consolidated.
CAI: Germany – five largest standing assets by FV as of the end of 2015
EUR m 2008 2009 2010 2011 2012 2013 2014 2015
Europacity, TOUR TOTAL
Share per key date
100% 100% 100% 100%
Total space ('000 sqm)
14.1 14.2 14.2 14.2
Fair value
57.0 59.7 61.0 70.0
Rental income (annualised)
3.60 3.60 3.74 3.682
Occupancy
100% 98% 98% 100%
Gross rental yield n/a n/a n/a n/a 6.31% 6.03% 6.14% 5.26%
Average monthly rent (EUR/sqm) n/a n/a n/a n/a 21.27 21.55 22.42 21.61
Change in rent (yoy) n/a n/a n/a n/a n/a 1% 4% -4%
Spreebogen
Share per key date
100% 100% 100% 100% 100% 100% 100%
Total space ('000 sqm)
34.8 34.2 34.9 34.9 34.9 34.9 29.8
Fair value
96.4 86.2 84.0 81.6 78.2 73.8 64.4
Rental income (annualised)
6.26 6.34 6.48 6.63 6.70 3.82 3.738
Occupancy
95% 98% 98% 99% 99% 91% 100%
Gross rental yield n/a 6.49% 7.36% 7.71% 8.13% 8.57% 5.17% 5.80%
Average monthly rent (EUR/sqm) n/a 15.77 15.77 15.78 16.00 16.16 10.02 10.45
Change in rent (yoy) n/a n/a 0% 0% 1% 1% -38% 4%
Europaviertel, Tower 185
Share per key date
100% 100% 100% n/a 33% 33%
Total space ('000 sqm)
41.8 63.2 97.9 n/a 33.5 33.9
Fair value
200.2 165.8 457.4 159.1 176.6 181.8
Rental income (annualised)
7.61 6.88 19.69 n/a 8.76 9.537
Occupancy
100% 100% 67% n/a 80% 87%
Gross rental yield n/a n/a 3.80% 4.15% 4.30% n/a 4.96% 5.24%
Average monthly rent (EUR/sqm) n/a n/a 15.17 9.07 25.01 n/a 27.24 26.95
Change in rent (yoy) n/a n/a n/a -40% 176% n/a n/a -1%
Arnulfpark, Skygarden
Share per key date
100% 100% 100% 100% 100%
Total space ('000 sqm)
19.7 34.8 33.3 33.0 32.9
Fair value
135.6 141.3 145.4 147.1 173.2
Rental income (annualised)
4.70 6.06 8.54 8.17 8.365
Occupancy
58% 74% 94% 99% 100%
Gross rental yield n/a n/a n/a 3.46% 4.29% 5.87% 5.55% 4.83%
Average monthly rent (EUR/sqm) n/a n/a n/a 34.24 19.60 22.74 20.84 21.19
Change in rent (yoy) n/a n/a n/a n/a -43% 16% -8% 2%
Arnulfpark, Skygarden
Share per key date
100%
Total space ('000 sqm)
29.8
Fair value
122.7
Rental income (annualised)
3.167
Occupancy
48%
Gross rental yield n/a n/a n/a n/a n/a n/a n/a 2.58%
Average monthly rent (EUR/sqm) n/a n/a n/a n/a n/a n/a n/a 18.45
Change in rent (yoy) n/a n/a n/a n/a n/a n/a n/a n/a
Source: CA Immo, WOOD Research
CAI’s German portfolio is booked at an average monthly rent of around EUR 14-15/sqm. There is a
large variance between the individual assets, with some rented as low as EUR 5/sqm (BD Stuttgart).
Owing to the large differences in the status and location of the individual properties, the rents then
range all the way up to EUR 27/sqm, which is roughly the average level of CAI’s largest asset, Tower
185 in Frankfurt. Considering the large differences across the portfolio, it is difficult to assess whether
the rent level in the individual cities stands at a reasonable level just by looking at the headline average
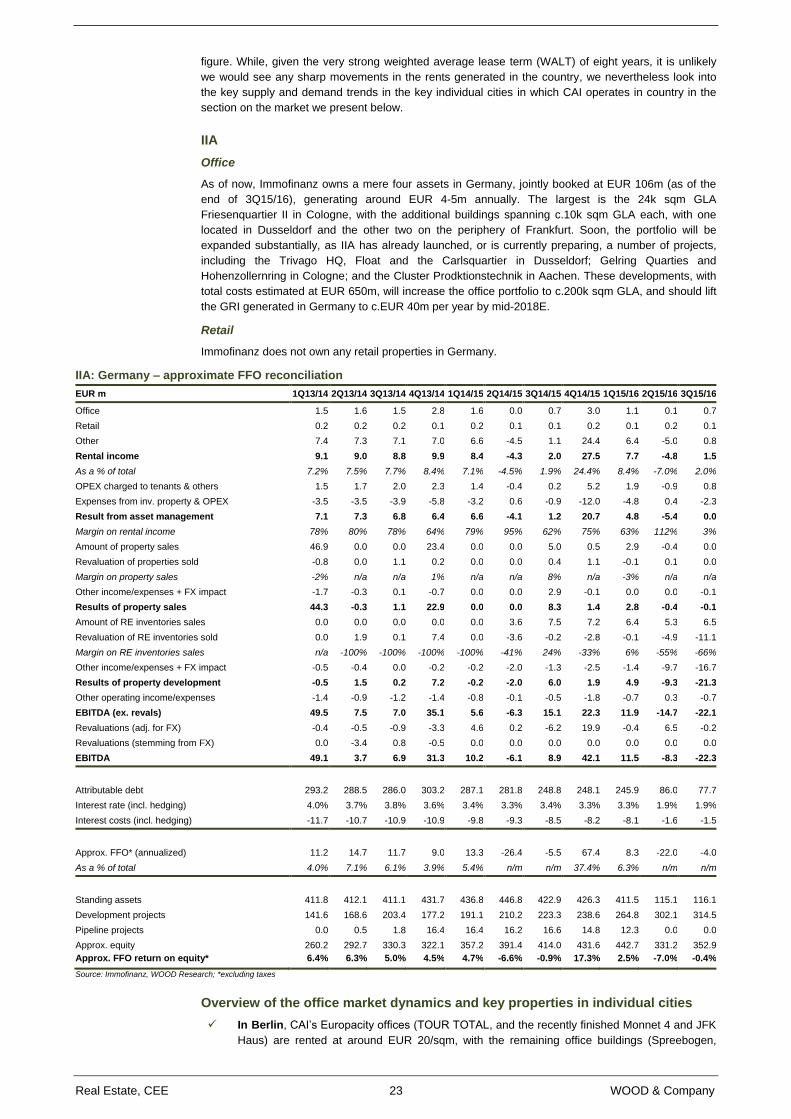
Real Estate, CEE 23 WOOD & Company
figure. While, given the very strong weighted average lease term (WALT) of eight years, it is unlikely
we would see any sharp movements in the rents generated in the country, we nevertheless look into
the key supply and demand trends in the key individual cities in which CAI operates in country in the
section on the market we present below.
IIA
Office
As of now, Immofinanz owns a mere four assets in Germany, jointly booked at EUR 106m (as of the
end of 3Q15/16), generating around EUR 4-5m annually. The largest is the 24k sqm GLA
Friesenquartier II in Cologne, with the additional buildings spanning c.10k sqm GLA each, with one
located in Dusseldorf and the other two on the periphery of Frankfurt. Soon, the portfolio will be
expanded substantially, as IIA has already launched, or is currently preparing, a number of projects,
including the Trivago HQ, Float and the Carlsquartier in Dusseldorf; Gelring Quarties and
Hohenzollernring in Cologne; and the Cluster Prodktionstechnik in Aachen. These developments, with
total costs estimated at EUR 650m, will increase the office portfolio to c.200k sqm GLA, and should lift
the GRI generated in Germany to c.EUR 40m per year by mid-2018E.
Retail
Immofinanz does not own any retail properties in Germany.
IIA: Germany – approximate FFO reconciliation
EUR m 1Q13/14 2Q13/14 3Q13/14 4Q13/14 1Q14/15 2Q14/15 3Q14/15 4Q14/15 1Q15/16 2Q15/16 3Q15/16
Office 1.5 1.6 1.5 2.8 1.6 0.0 0.7 3.0 1.1 0.1 0.7
Retail 0.2 0.2 0.2 0.1 0.2 0.1 0.1 0.2 0.1 0.2 0.1
Other 7.4 7.3 7.1 7.0 6.6 -4.5 1.1 24.4 6.4 -5.0 0.8
Rental income 9.1 9.0 8.8 9.9 8.4 -4.3 2.0 27.5 7.7 -4.8 1.5
As a % of total 7.2% 7.5% 7.7% 8.4% 7.1% -4.5% 1.9% 24.4% 8.4% -7.0% 2.0%
OPEX charged to tenants & others 1.5 1.7 2.0 2.3 1.4 -0.4 0.2 5.2 1.9 -0.9 0.8
Expenses from inv. property & OPEX -3.5 -3.5 -3.9 -5.8 -3.2 0.6 -0.9 -12.0 -4.8 0.4 -2.3
Result from asset management 7.1 7.3 6.8 6.4 6.6 -4.1 1.2 20.7 4.8 -5.4 0.0
Margin on rental income 78% 80% 78% 64% 79% 95% 62% 75% 63% 112% 3%
Amount of property sales 46.9 0.0 0.0 23.4 0.0 0.0 5.0 0.5 2.9 -0.4 0.0
Revaluation of properties sold -0.8 0.0 1.1 0.2 0.0 0.0 0.4 1.1 -0.1 0.1 0.0
Margin on property sales -2% n/a n/a 1% n/a n/a 8% n/a -3% n/a n/a
Other income/expenses + FX impact -1.7 -0.3 0.1 -0.7 0.0 0.0 2.9 -0.1 0.0 0.0 -0.1
Results of property sales 44.3 -0.3 1.1 22.9 0.0 0.0 8.3 1.4 2.8 -0.4 -0.1
Amount of RE inventories sales 0.0 0.0 0.0 0.0 0.0 3.6 7.5 7.2 6.4 5.3 6.5
Revaluation of RE inventories sold 0.0 1.9 0.1 7.4 0.0 -3.6 -0.2 -2.8 -0.1 -4.9 -11.1
Margin on RE inventories sales n/a -100% -100% -100% -100% -41% 24% -33% 6% -55% -66%
Other income/expenses + FX impact -0.5 -0.4 0.0 -0.2 -0.2 -2.0 -1.3 -2.5 -1.4 -9.7 -16.7
Results of property development -0.5 1.5 0.2 7.2 -0.2 -2.0 6.0 1.9 4.9 -9.3 -21.3
Other operating income/expenses -1.4 -0.9 -1.2 -1.4 -0.8 -0.1 -0.5 -1.8 -0.7 0.3 -0.7
EBITDA (ex. revals) 49.5 7.5 7.0 35.1 5.6 -6.3 15.1 22.3 11.9 -14.7 -22.1
Revaluations (adj. for FX) -0.4 -0.5 -0.9 -3.3 4.6 0.2 -6.2 19.9 -0.4 6.5 -0.2
Revaluations (stemming from FX) 0.0 -3.4 0.8 -0.5 0.0 0.0 0.0 0.0 0.0 0.0 0.0
EBITDA 49.1 3.7 6.9 31.3 10.2 -6.1 8.9 42.1 11.5 -8.3 -22.3
Attributable debt 293.2 288.5 286.0 303.2 287.1 281.8 248.8 248.1 245.9 86.0 77.7
Interest rate (incl. hedging) 4.0% 3.7% 3.8% 3.6% 3.4% 3.3% 3.4% 3.3% 3.3% 1.9% 1.9%
Interest costs (incl. hedging) -11.7 -10.7 -10.9 -10.9 -9.8 -9.3 -8.5 -8.2 -8.1 -1.6 -1.5
Approx. FFO* (annualized) 11.2 14.7 11.7 9.0 13.3 -26.4 -5.5 67.4 8.3 -22.0 -4.0
As a % of total 4.0% 7.1% 6.1% 3.9% 5.4% n/m n/m 37.4% 6.3% n/m n/m
Standing assets 411.8 412.1 411.1 431.7 436.8 446.8 422.9 426.3 411.5 115.1 116.1
Development projects 141.6 168.6 203.4 177.2 191.1 210.2 223.3 238.6 264.8 302.1 314.5
Pipeline projects 0.0 0.5 1.8 16.4 16.4 16.2 16.6 14.8 12.3 0.0 0.0
Approx. equity 260.2 292.7 330.3 322.1 357.2 391.4 414.0 431.6 442.7 331.2 352.9
Approx. FFO return on equity* 6.4% 6.3% 5.0% 4.5% 4.7% -6.6% -0.9% 17.3% 2.5% -7.0% -0.4%
Source: Immofinanz, WOOD Research; *excluding taxes
Overview of the office market dynamics and key properties in individual cities
In Berlin, CAI’s Europacity offices (TOUR TOTAL, and the recently finished Monnet 4 and JFK
Haus) are rented at around EUR 20/sqm, with the remaining office buildings (Spreebogen,
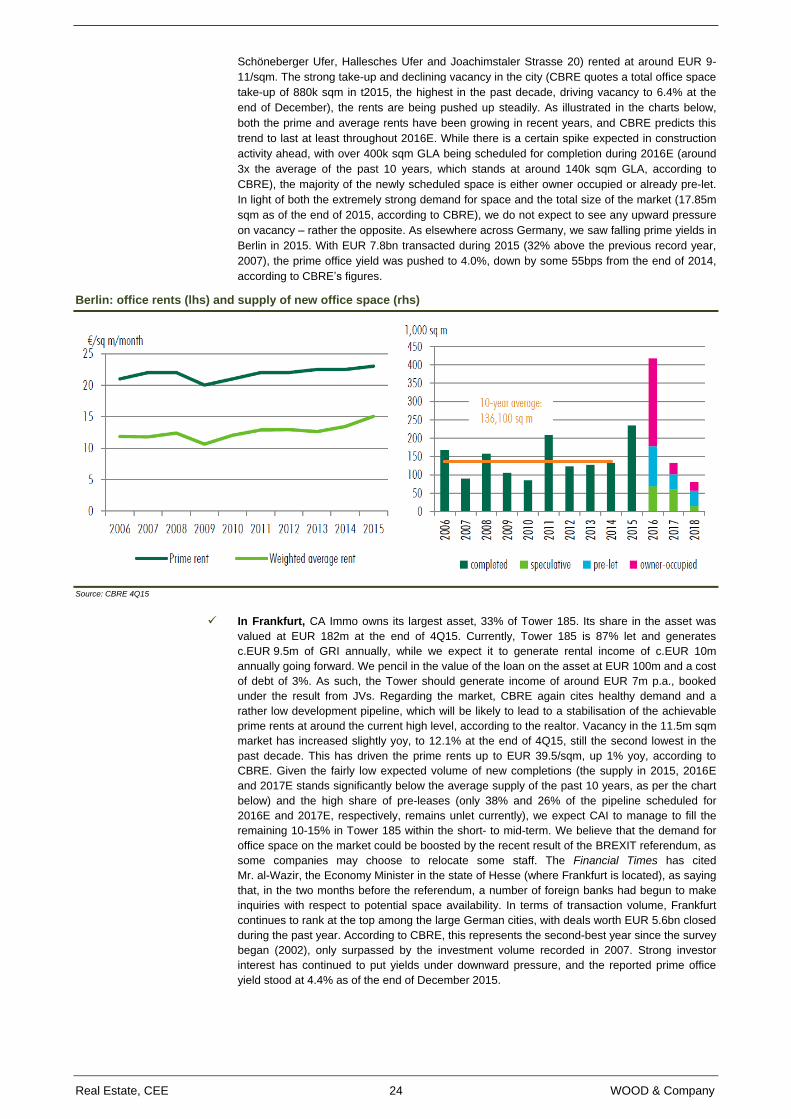
Real Estate, CEE 24 WOOD & Company
Schöneberger Ufer, Hallesches Ufer and Joachimstaler Strasse 20) rented at around EUR 9-
11/sqm. The strong take-up and declining vacancy in the city (CBRE quotes a total office space
take-up of 880k sqm in t2015, the highest in the past decade, driving vacancy to 6.4% at the
end of December), the rents are being pushed up steadily. As illustrated in the charts below,
both the prime and average rents have been growing in recent years, and CBRE predicts this
trend to last at least throughout 2016E. While there is a certain spike expected in construction
activity ahead, with over 400k sqm GLA being scheduled for completion during 2016E (around
3x the average of the past 10 years, which stands at around 140k sqm GLA, according to
CBRE), the majority of the newly scheduled space is either owner occupied or already pre-let.
In light of both the extremely strong demand for space and the total size of the market (17.85m
sqm as of the end of 2015, according to CBRE), we do not expect to see any upward pressure
on vacancy – rather the opposite. As elsewhere across Germany, we saw falling prime yields in
Berlin in 2015. With EUR 7.8bn transacted during 2015 (32% above the previous record year,
2007), the prime office yield was pushed to 4.0%, down by some 55bps from the end of 2014,
according to CBRE’s figures.
Berlin: office rents (lhs) and supply of new office space (rhs)
Source: CBRE 4Q15
In Frankfurt, CA Immo owns its largest asset, 33% of Tower 185. Its share in the asset was
valued at EUR 182m at the end of 4Q15. Currently, Tower 185 is 87% let and generates
c.EUR 9.5m of GRI annually, while we expect it to generate rental income of c.EUR 10m
annually going forward. We pencil in the value of the loan on the asset at EUR 100m and a cost
of debt of 3%. As such, the Tower should generate income of around EUR 7m p.a., booked
under the result from JVs. Regarding the market, CBRE again cites healthy demand and a
rather low development pipeline, which will be likely to lead to a stabilisation of the achievable
prime rents at around the current high level, according to the realtor. Vacancy in the 11.5m sqm
market has increased slightly yoy, to 12.1% at the end of 4Q15, still the second lowest in the
past decade. This has driven the prime rents up to EUR 39.5/sqm, up 1% yoy, according to
CBRE. Given the fairly low expected volume of new completions (the supply in 2015, 2016E
and 2017E stands significantly below the average supply of the past 10 years, as per the chart
below) and the high share of pre-leases (only 38% and 26% of the pipeline scheduled for
2016E and 2017E, respectively, remains unlet currently), we expect CAI to manage to fill the
remaining 10-15% in Tower 185 within the short- to mid-term. We believe that the demand for
office space on the market could be boosted by the recent result of the BREXIT referendum, as
some companies may choose to relocate some staff. The Financial Times has cited
Mr. al-Wazir, the Economy Minister in the state of Hesse (where Frankfurt is located), as saying
that, in the two months before the referendum, a number of foreign banks had begun to make
inquiries with respect to potential space availability. In terms of transaction volume, Frankfurt
continues to rank at the top among the large German cities, with deals worth EUR 5.6bn closed
during the past year. According to CBRE, this represents the second-best year since the survey
began (2002), only surpassed by the investment volume recorded in 2007. Strong investor
interest has continued to put yields under downward pressure, and the reported prime office
yield stood at 4.4% as of the end of December 2015.
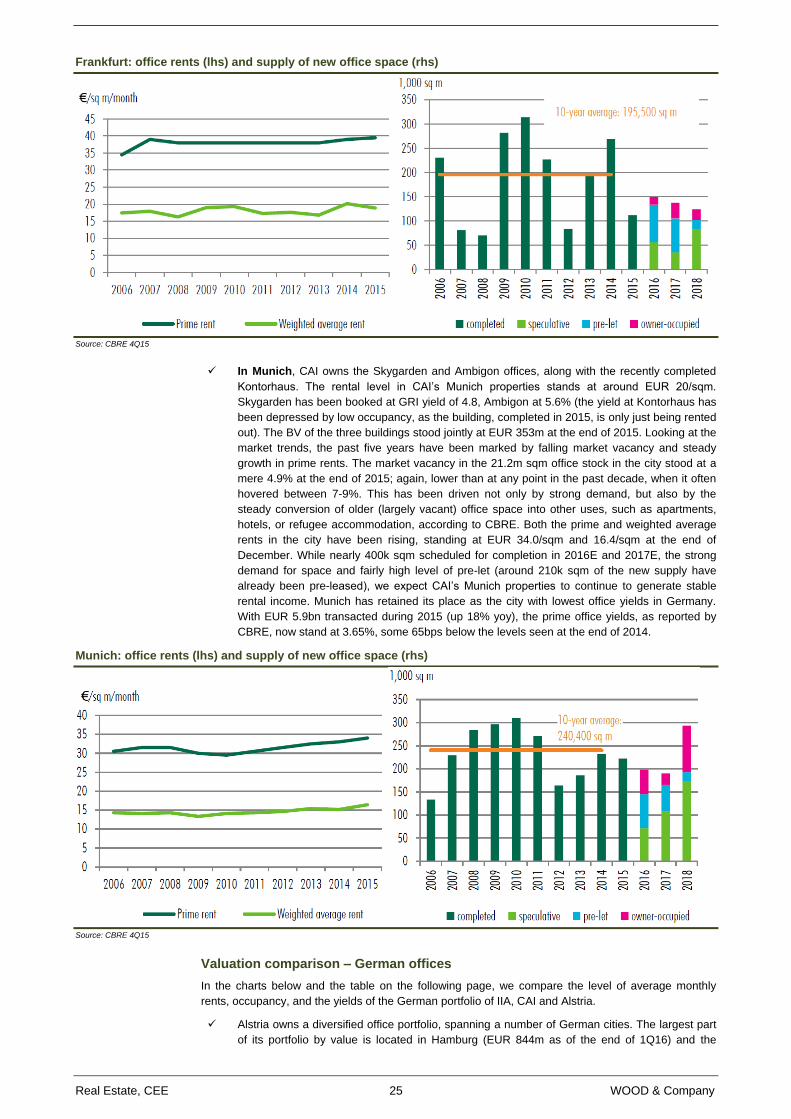
Real Estate, CEE 25 WOOD & Company
Frankfurt: office rents (lhs) and supply of new office space (rhs)
Source: CBRE 4Q15
In Munich, CAI owns the Skygarden and Ambigon offices, along with the recently completed
Kontorhaus. The rental level in CAI’s Munich properties stands at around EUR 20/sqm.
Skygarden has been booked at GRI yield of 4.8, Ambigon at 5.6% (the yield at Kontorhaus has
been depressed by low occupancy, as the building, completed in 2015, is only just being rented
out). The BV of the three buildings stood jointly at EUR 353m at the end of 2015. Looking at the
market trends, the past five years have been marked by falling market vacancy and steady
growth in prime rents. The market vacancy in the 21.2m sqm office stock in the city stood at a
mere 4.9% at the end of 2015; again, lower than at any point in the past decade, when it often
hovered between 7-9%. This has been driven not only by strong demand, but also by the
steady conversion of older (largely vacant) office space into other uses, such as apartments,
hotels, or refugee accommodation, according to CBRE. Both the prime and weighted average
rents in the city have been rising, standing at EUR 34.0/sqm and 16.4/sqm at the end of
December. While nearly 400k sqm scheduled for completion in 2016E and 2017E, the strong
demand for space and fairly high level of pre-let (around 210k sqm of the new supply have
already been pre-leased), we expect CAI’s Munich properties to continue to generate stable
rental income. Munich has retained its place as the city with lowest office yields in Germany.
With EUR 5.9bn transacted during 2015 (up 18% yoy), the prime office yields, as reported by
CBRE, now stand at 3.65%, some 65bps below the levels seen at the end of 2014.
Munich: office rents (lhs) and supply of new office space (rhs)
Source: CBRE 4Q15
Valuation comparison – German offices
In the charts below and the table on the following page, we compare the level of average monthly
rents, occupancy, and the yields of the German portfolio of IIA, CAI and Alstria.
Alstria owns a diversified office portfolio, spanning a number of German cities. The largest part
of its portfolio by value is located in Hamburg (EUR 844m as of the end of 1Q16) and the
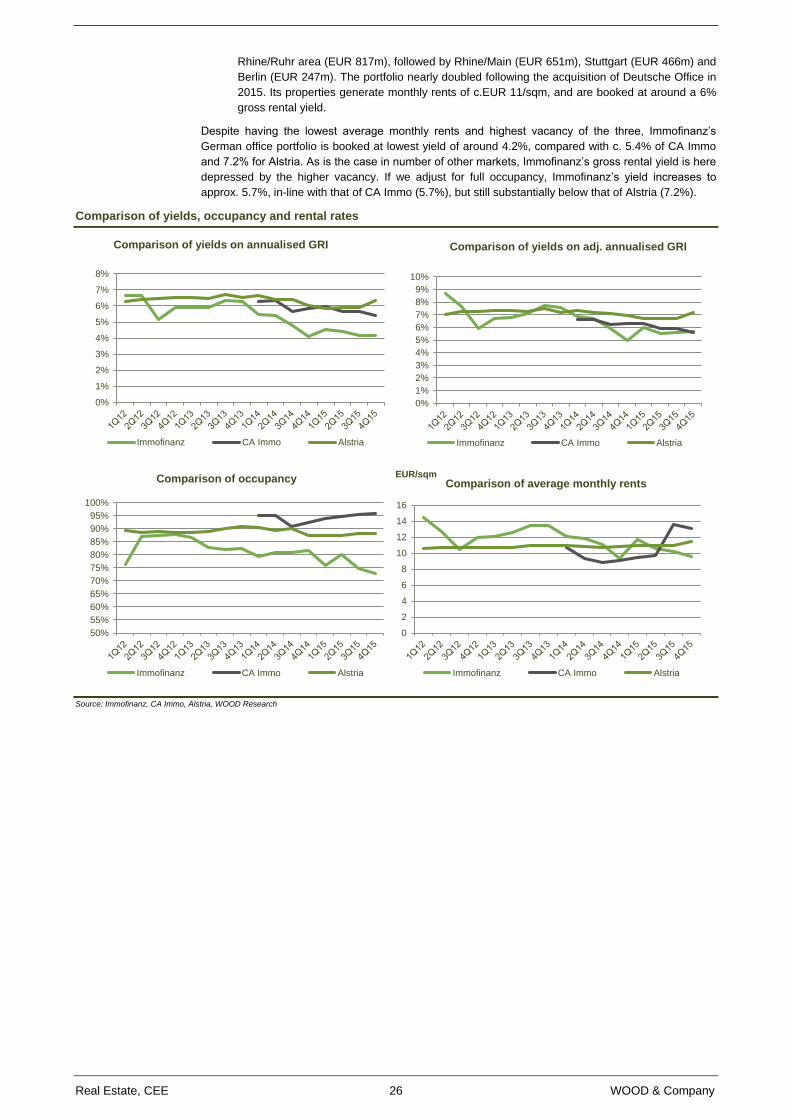
Real Estate, CEE 26 WOOD & Company
Rhine/Ruhr area (EUR 817m), followed by Rhine/Main (EUR 651m), Stuttgart (EUR 466m) and
Berlin (EUR 247m). The portfolio nearly doubled following the acquisition of Deutsche Office in
2015. Its properties generate monthly rents of c.EUR 11/sqm, and are booked at around a 6%
gross rental yield.
Despite having the lowest average monthly rents and highest vacancy of the three, Immofinanz’s
German office portfolio is booked at lowest yield of around 4.2%, compared with c. 5.4% of CA Immo
and 7.2% for Alstria. As is the case in number of other markets, Immofinanz’s gross rental yield is here
depressed by the higher vacancy. If we adjust for full occupancy, Immofinanz’s yield increases to
approx. 5.7%, in-line with that of CA Immo (5.7%), but still substantially below that of Alstria (7.2%).
Comparison of yields, occupancy and rental rates
Source: Immofinanz, CA Immo, Alstria, WOOD Research
0%
1%
2%
3%
4%
5%
6%
7%
8%
Comparison of yields on annualised GRI
Immofinanz CA Immo Alstria
0%
1%
2%
3%
4%
5%
6%
7%
8%
9%
10%
Comparison of yields on adj. annualised GRI
Immofinanz CA Immo Alstria
50%
55%
60%
65%
70%
75%
80%
85%
90%
95%
100%
Comparison of occupancy
Immofinanz CA Immo Alstria
0
2
4
6
8
10
12
14
16
EUR/sqmComparison of average monthly rents
Immofinanz CA Immo Alstria
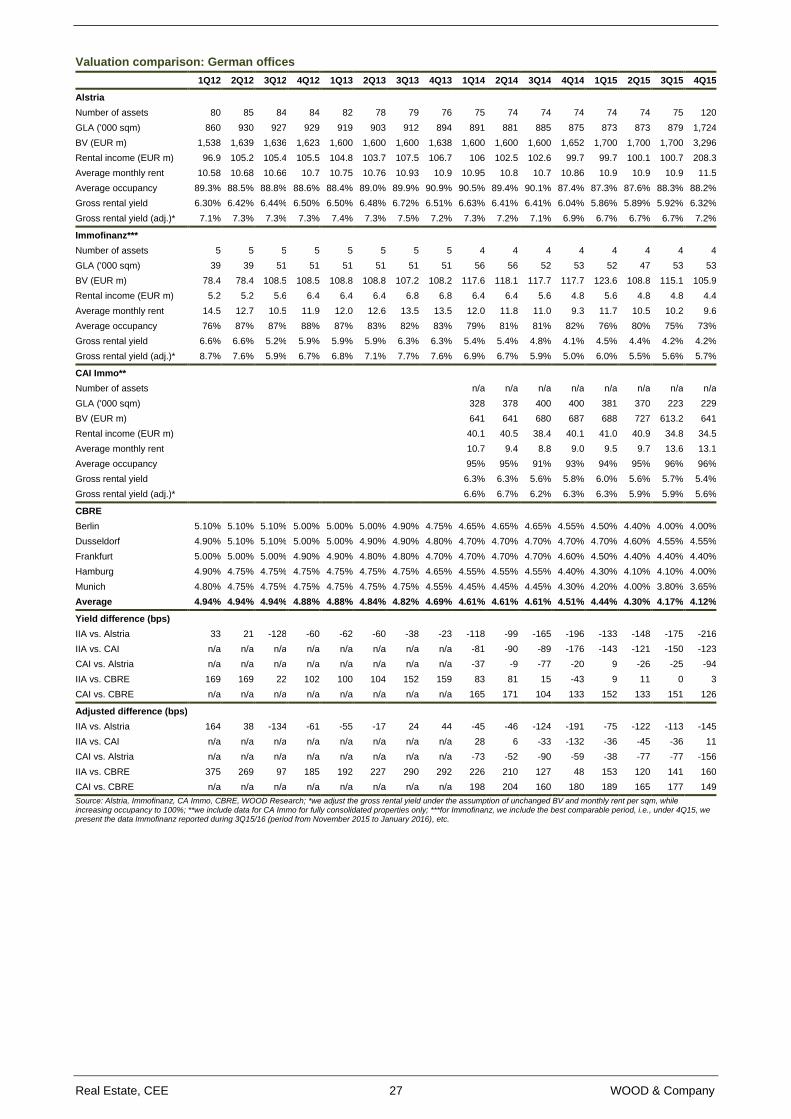
Real Estate, CEE 27 WOOD & Company
Valuation comparison: German offices
1Q12 2Q12 3Q12 4Q12 1Q13 2Q13 3Q13 4Q13 1Q14 2Q14 3Q14 4Q14 1Q15 2Q15 3Q15 4Q15
Alstria
Number of assets 80 85 84 84 82 78 79 76 75 74 74 74 74 74 75 120
GLA ('000 sqm) 860 930 927 929 919 903 912 894 891 881 885 875 873 873 879 1,724
BV (EUR m) 1,538 1,639 1,636 1,623 1,600 1,600 1,600 1,638 1,600 1,600 1,600 1,652 1,700 1,700 1,700 3,296
Rental income (EUR m) 96.9 105.2 105.4 105.5 104.8 103.7 107.5 106.7 106 102.5 102.6 99.7 99.7 100.1 100.7 208.3
Average monthly rent 10.58 10.68 10.66 10.7 10.75 10.76 10.93 10.9 10.95 10.8 10.7 10.86 10.9 10.9 10.9 11.5
Average occupancy 89.3% 88.5% 88.8% 88.6% 88.4% 89.0% 89.9% 90.9% 90.5% 89.4% 90.1% 87.4% 87.3% 87.6% 88.3% 88.2%
Gross rental yield 6.30% 6.42% 6.44% 6.50% 6.50% 6.48% 6.72% 6.51% 6.63% 6.41% 6.41% 6.04% 5.86% 5.89% 5.92% 6.32%
Gross rental yield (adj.)* 7.1% 7.3% 7.3% 7.3% 7.4% 7.3% 7.5% 7.2% 7.3% 7.2% 7.1% 6.9% 6.7% 6.7% 6.7% 7.2%
Immofinanz***
Number of assets 5 5 5 5 5 5 5 5 4 4 4 4 4 4 4 4
GLA ('000 sqm) 39 39 51 51 51 51 51 51 56 56 52 53 52 47 53 53
BV (EUR m) 78.4 78.4 108.5 108.5 108.8 108.8 107.2 108.2 117.6 118.1 117.7 117.7 123.6 108.8 115.1 105.9
Rental income (EUR m) 5.2 5.2 5.6 6.4 6.4 6.4 6.8 6.8 6.4 6.4 5.6 4.8 5.6 4.8 4.8 4.4
Average monthly rent 14.5 12.7 10.5 11.9 12.0 12.6 13.5 13.5 12.0 11.8 11.0 9.3 11.7 10.5 10.2 9.6
Average occupancy 76% 87% 87% 88% 87% 83% 82% 83% 79% 81% 81% 82% 76% 80% 75% 73%
Gross rental yield 6.6% 6.6% 5.2% 5.9% 5.9% 5.9% 6.3% 6.3% 5.4% 5.4% 4.8% 4.1% 4.5% 4.4% 4.2% 4.2%
Gross rental yield (adj.)* 8.7% 7.6% 5.9% 6.7% 6.8% 7.1% 7.7% 7.6% 6.9% 6.7% 5.9% 5.0% 6.0% 5.5% 5.6% 5.7%
CAI Immo**
Number of assets
n/a n/a n/a n/a n/a n/a n/a n/a
GLA ('000 sqm)
328 378 400 400 381 370 223 229
BV (EUR m)
641 641 680 687 688 727 613.2 641
Rental income (EUR m)
40.1 40.5 38.4 40.1 41.0 40.9 34.8 34.5
Average monthly rent
10.7 9.4 8.8 9.0 9.5 9.7 13.6 13.1
Average occupancy
95% 95% 91% 93% 94% 95% 96% 96%
Gross rental yield
6.3% 6.3% 5.6% 5.8% 6.0% 5.6% 5.7% 5.4%
Gross rental yield (adj.)* 6.6% 6.7% 6.2% 6.3% 6.3% 5.9% 5.9% 5.6%
CBRE
Berlin 5.10% 5.10% 5.10% 5.00% 5.00% 5.00% 4.90% 4.75% 4.65% 4.65% 4.65% 4.55% 4.50% 4.40% 4.00% 4.00%
Dusseldorf 4.90% 5.10% 5.10% 5.00% 5.00% 4.90% 4.90% 4.80% 4.70% 4.70% 4.70% 4.70% 4.70% 4.60% 4.55% 4.55%
Frankfurt 5.00% 5.00% 5.00% 4.90% 4.90% 4.80% 4.80% 4.70% 4.70% 4.70% 4.70% 4.60% 4.50% 4.40% 4.40% 4.40%
Hamburg 4.90% 4.75% 4.75% 4.75% 4.75% 4.75% 4.75% 4.65% 4.55% 4.55% 4.55% 4.40% 4.30% 4.10% 4.10% 4.00%
Munich 4.80% 4.75% 4.75% 4.75% 4.75% 4.75% 4.75% 4.55% 4.45% 4.45% 4.45% 4.30% 4.20% 4.00% 3.80% 3.65%
Average 4.94% 4.94% 4.94% 4.88% 4.88% 4.84% 4.82% 4.69% 4.61% 4.61% 4.61% 4.51% 4.44% 4.30% 4.17% 4.12%
Yield difference (bps)
IIA vs. Alstria 33 21 -128 -60 -62 -60 -38 -23 -118 -99 -165 -196 -133 -148 -175 -216
IIA vs. CAI n/a n/a n/a n/a n/a n/a n/a n/a -81 -90 -89 -176 -143 -121 -150 -123
CAI vs. Alstria n/a n/a n/a n/a n/a n/a n/a n/a -37 -9 -77 -20 9 -26 -25 -94
IIA vs. CBRE 169 169 22 102 100 104 152 159 83 81 15 -43 9 11 0 3
CAI vs. CBRE n/a n/a n/a n/a n/a n/a n/a n/a 165 171 104 133 152 133 151 126
Adjusted difference (bps)
IIA vs. Alstria 164 38 -134 -61 -55 -17 24 44 -45 -46 -124 -191 -75 -122 -113 -145
IIA vs. CAI n/a n/a n/a n/a n/a n/a n/a n/a 28 6 -33 -132 -36 -45 -36 11
CAI vs. Alstria n/a n/a n/a n/a n/a n/a n/a n/a -73 -52 -90 -59 -38 -77 -77 -156
IIA vs. CBRE 375 269 97 185 192 227 290 292 226 210 127 48 153 120 141 160
CAI vs. CBRE n/a n/a n/a n/a n/a n/a n/a n/a 198 204 160 180 189 165 177 149
Source: Alstria, Immofinanz, CA Immo, CBRE, WOOD Research; *we adjust the gross rental yield under the assumption of unchanged BV and monthly rent per sqm, while increasing occupancy to 100%; **we include data for CA Immo for fully consolidated properties only; ***for Immofinanz, we include the best comparable period, i.e., under 4Q15, we present the data Immofinanz reported during 3Q15/16 (period from November 2015 to January 2016), etc.
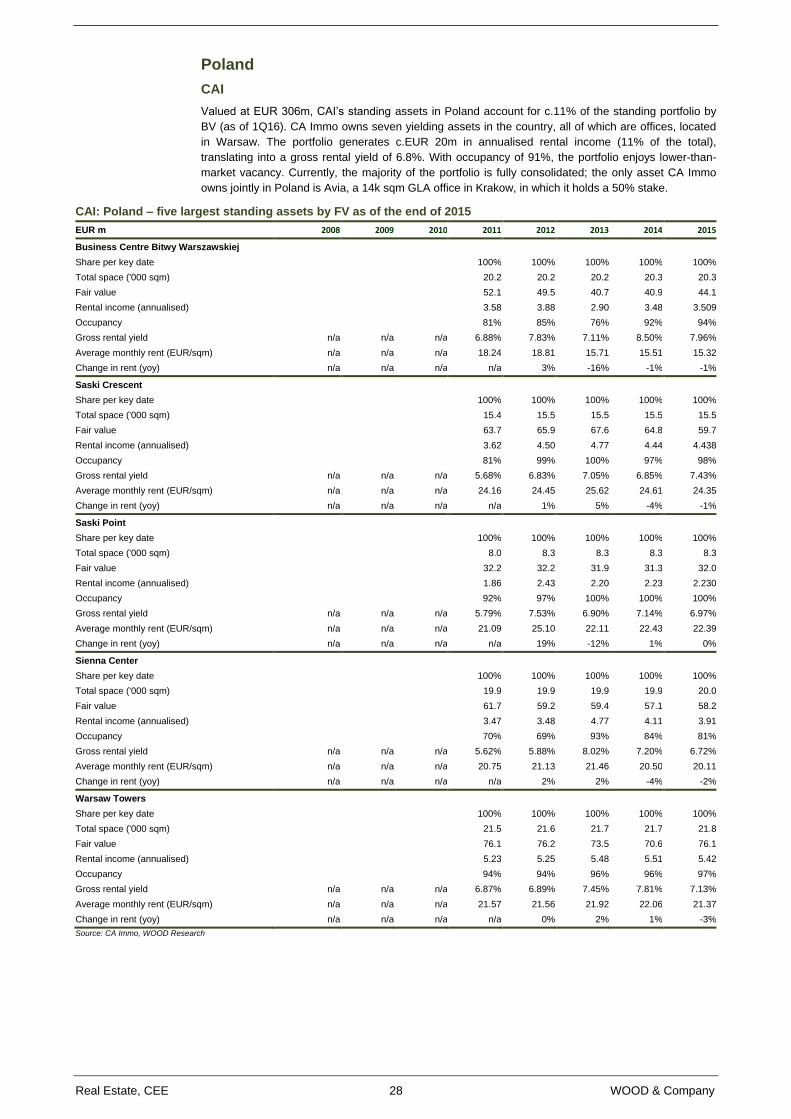
Real Estate, CEE 28 WOOD & Company
Poland
CAI
Valued at EUR 306m, CAI’s standing assets in Poland account for c.11% of the standing portfolio by
BV (as of 1Q16). CA Immo owns seven yielding assets in the country, all of which are offices, located
in Warsaw. The portfolio generates c.EUR 20m in annualised rental income (11% of the total),
translating into a gross rental yield of 6.8%. With occupancy of 91%, the portfolio enjoys lower-than-
market vacancy. Currently, the majority of the portfolio is fully consolidated; the only asset CA Immo
owns jointly in Poland is Avia, a 14k sqm GLA office in Krakow, in which it holds a 50% stake.
CAI: Poland – five largest standing assets by FV as of the end of 2015
EUR m 2008 2009 2010 2011 2012 2013 2014 2015
Business Centre Bitwy Warszawskiej
Share per key date
100% 100% 100% 100% 100%
Total space ('000 sqm)
20.2 20.2 20.2 20.3 20.3
Fair value
52.1 49.5 40.7 40.9 44.1
Rental income (annualised)
3.58 3.88 2.90 3.48 3.509
Occupancy
81% 85% 76% 92% 94%
Gross rental yield n/a n/a n/a 6.88% 7.83% 7.11% 8.50% 7.96%
Average monthly rent (EUR/sqm) n/a n/a n/a 18.24 18.81 15.71 15.51 15.32
Change in rent (yoy) n/a n/a n/a n/a 3% -16% -1% -1%
Saski Crescent
Share per key date
100% 100% 100% 100% 100%
Total space ('000 sqm)
15.4 15.5 15.5 15.5 15.5
Fair value
63.7 65.9 67.6 64.8 59.7
Rental income (annualised)
3.62 4.50 4.77 4.44 4.438
Occupancy
81% 99% 100% 97% 98%
Gross rental yield n/a n/a n/a 5.68% 6.83% 7.05% 6.85% 7.43%
Average monthly rent (EUR/sqm) n/a n/a n/a 24.16 24.45 25.62 24.61 24.35
Change in rent (yoy) n/a n/a n/a n/a 1% 5% -4% -1%
Saski Point
Share per key date
100% 100% 100% 100% 100%
Total space ('000 sqm)
8.0 8.3 8.3 8.3 8.3
Fair value
32.2 32.2 31.9 31.3 32.0
Rental income (annualised)
1.86 2.43 2.20 2.23 2.230
Occupancy
92% 97% 100% 100% 100%
Gross rental yield n/a n/a n/a 5.79% 7.53% 6.90% 7.14% 6.97%
Average monthly rent (EUR/sqm) n/a n/a n/a 21.09 25.10 22.11 22.43 22.39
Change in rent (yoy) n/a n/a n/a n/a 19% -12% 1% 0%
Sienna Center
Share per key date
100% 100% 100% 100% 100%
Total space ('000 sqm)
19.9 19.9 19.9 19.9 20.0
Fair value
61.7 59.2 59.4 57.1 58.2
Rental income (annualised)
3.47 3.48 4.77 4.11 3.91
Occupancy
70% 69% 93% 84% 81%
Gross rental yield n/a n/a n/a 5.62% 5.88% 8.02% 7.20% 6.72%
Average monthly rent (EUR/sqm) n/a n/a n/a 20.75 21.13 21.46 20.50 20.11
Change in rent (yoy) n/a n/a n/a n/a 2% 2% -4% -2%
Warsaw Towers
Share per key date
100% 100% 100% 100% 100%
Total space ('000 sqm)
21.5 21.6 21.7 21.7 21.8
Fair value
76.1 76.2 73.5 70.6 76.1
Rental income (annualised)
5.23 5.25 5.48 5.51 5.42
Occupancy
94% 94% 96% 96% 97%
Gross rental yield n/a n/a n/a 6.87% 6.89% 7.45% 7.81% 7.13%
Average monthly rent (EUR/sqm) n/a n/a n/a 21.57 21.56 21.92 22.06 21.37
Change in rent (yoy) n/a n/a n/a n/a 0% 2% 1% -3%
Source: CA Immo, WOOD Research
Real Estate, CEE 29 WOOD & Company
The average monthly rent in CAI’s Polish portfolio has stood at around EUR 18-20/sqm during the past
two years, which is fairly high, considering the market-wide trend of falling rents. While still some 20%
below the prime headline rent (which stands currently at around EUR 23-24/sqm in Warsaw, according
to CBRE), CAI’s Warsaw properties are rented higher than both the Polish office portfolio of IIA’s
(whose nine properties in Warsaw are rented at EUR 12/sqm/month, on average), and that of GTC
(where the average rents for its Polish portfolio stand at around EUR 14/sqm; however, GTC owns
offices not only in Warsaw, but also in several major Polish cities, where the headline rents are
significantly below those in Warsaw).
The largest standing asset by fair value was the Warsaw Towers as of the end of 2015. Booked at
EUR 76m, the building accounted for 25% and 3% of the Polish and total standing portfolios,
respectively. In total, the five largest buildings, listed in the table above, accounted for nearly 90% of
the Polish portfolio by BV as of the end of 2015.
Understandably, given the strong inflow of space onto the Warsaw office market, CAI is not currently
developing any additional assets in the city.
IIA
Office
IIA owns 18 office properties in Poland, all located in Warsaw. The largest asset is EMPARK Mokotow,
encompassing nine buildings with total GLA of over 115k sqm. In total, IIA’s Polish office portfolio
spans over 250k sqm of GLA, and was valued at nearly EUR 480m as of 3Q15/16.
The persisting problem is the rather low occupancy, which has hovered at around 80% in recent years.
Following the acquisition of the remaining 50% stake in Empark Mokotow from Heitman (in mid-2015),
the occupancy dropped further, standing at a mere 73% as of the end of 3Q15/16. Apart from the
Warsaw office market being currently quite difficult due to a large increase in new office space, we
believe that the reason behind the rather high vacancy may be that a number of the properties are
already quite old – for instance, the Empark Mokotow was built at the turn of the century, with the
number of buildings finished in the late nineties. With a strong inflow of new office space on the market
and increasingly competitive lease terms, we believe that the older office buildings are facing the
biggest threat, and may find it difficult to compete with the newly completed space.
That said, IIA’s current refurbishment initiatives, aimed at increasing the attractiveness of its older
offices, may help to boost the occupancy.
The properties were booked at a 5.6% yield on 3Q15/16 annualised gross rental income. As per the
comparison presented below, we find this quite aggressive, especially when considering the seemingly
lower quality of the properties relative to its peers. While the yield is indeed affected by the rather low
occupancy, even if we adjust it for it, assuming full occupancy at current average monthly rental levels,
the gross rental yield stands at a mere 7.7%, not particularly attractive, considering that it is quite
unlikely that Immofinanz would manage to rent out the remaining space without any rental softening, in
our view.
Retail
Immofinanz owns six retail assets in Poland, according to its 3Q15/16 report. Apart from the Tarasy
Zamkowe, a 38k sqm GLA shopping mall completed in March 2015 in Lublin, the remainder of the
portfolio is comprised of several VIVO! and STOP.SHOP facilities, located in various regional cities.
Also, according to the website, Immofinanz holds one Auchan hypermarket, located in Wroclawek. As
of the end of 3Q15/16, the portfolio was booked at a 7.8% gross rental yield, generating annualised
rental income of c.EUR 5.6m. The occupancy has improved in the past 24 months. Following the
disposal of the landmark Silesia City Center (sold in May 2013 for EUR 412m, we estimate the yield at
around 5.7-5.9%), the occupancy stood at a mere 87%. By 3Q15/16, it improved to 96%, while the
average monthly rents stand at around EUR 7-8/sqm. The portfolio is booked at EUR 72m.
Others
Following the completion of Tarasy Zamkowe and VIVO! Stalowa Wola, the only project that IIA is
currently developing in Poland is a small, 3.6k sqm GLA STOP.SHOP in Swinoujscie. That said, there
are assets worth EUR 245m in Poland that IIA classifies as under development (10 projects), along
with an additional EUR 6.7m worth of pipeline projects.
Of the development projects, five are residential developments, earmarked for disposal. Of the
remaining five, the largest are the following: SC Tarasy Zamkowe (38.3k sqm GLA) and VIVO! in
Stalowa Wola (22.5k sqm GLA), together with the Nimbus Office (21k sqm GLA). Albeit completed, IIA
still accounts for these as under development (so as not to distort the statistics of the standing property
portfolio during the stabilisation phase).
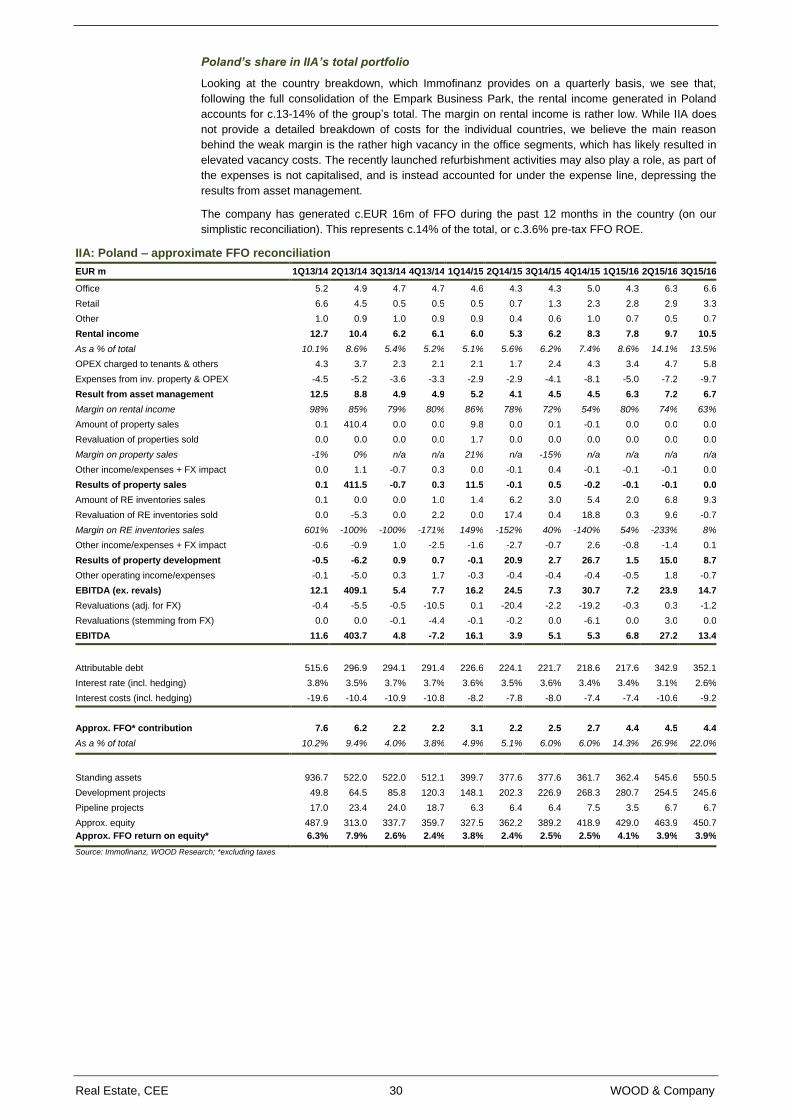
Real Estate, CEE 30 WOOD & Company
Poland’s share in IIA’s total portfolio
Looking at the country breakdown, which Immofinanz provides on a quarterly basis, we see that,
following the full consolidation of the Empark Business Park, the rental income generated in Poland
accounts for c.13-14% of the group’s total. The margin on rental income is rather low. While IIA does
not provide a detailed breakdown of costs for the individual countries, we believe the main reason
behind the weak margin is the rather high vacancy in the office segments, which has likely resulted in
elevated vacancy costs. The recently launched refurbishment activities may also play a role, as part of
the expenses is not capitalised, and is instead accounted for under the expense line, depressing the
results from asset management.
The company has generated c.EUR 16m of FFO during the past 12 months in the country (on our
simplistic reconciliation). This represents c.14% of the total, or c.3.6% pre-tax FFO ROE.
IIA: Poland – approximate FFO reconciliation
EUR m 1Q13/14 2Q13/14 3Q13/14 4Q13/14 1Q14/15 2Q14/15 3Q14/15 4Q14/15 1Q15/16 2Q15/16 3Q15/16
Office 5.2 4.9 4.7 4.7 4.6 4.3 4.3 5.0 4.3 6.3 6.6
Retail 6.6 4.5 0.5 0.5 0.5 0.7 1.3 2.3 2.8 2.9 3.3
Other 1.0 0.9 1.0 0.9 0.9 0.4 0.6 1.0 0.7 0.5 0.7
Rental income 12.7 10.4 6.2 6.1 6.0 5.3 6.2 8.3 7.8 9.7 10.5
As a % of total 10.1% 8.6% 5.4% 5.2% 5.1% 5.6% 6.2% 7.4% 8.6% 14.1% 13.5%
OPEX charged to tenants & others 4.3 3.7 2.3 2.1 2.1 1.7 2.4 4.3 3.4 4.7 5.8
Expenses from inv. property & OPEX -4.5 -5.2 -3.6 -3.3 -2.9 -2.9 -4.1 -8.1 -5.0 -7.2 -9.7
Result from asset management 12.5 8.8 4.9 4.9 5.2 4.1 4.5 4.5 6.3 7.2 6.7
Margin on rental income 98% 85% 79% 80% 86% 78% 72% 54% 80% 74% 63%
Amount of property sales 0.1 410.4 0.0 0.0 9.8 0.0 0.1 -0.1 0.0 0.0 0.0
Revaluation of properties sold 0.0 0.0 0.0 0.0 1.7 0.0 0.0 0.0 0.0 0.0 0.0
Margin on property sales -1% 0% n/a n/a 21% n/a -15% n/a n/a n/a n/a
Other income/expenses + FX impact 0.0 1.1 -0.7 0.3 0.0 -0.1 0.4 -0.1 -0.1 -0.1 0.0
Results of property sales 0.1 411.5 -0.7 0.3 11.5 -0.1 0.5 -0.2 -0.1 -0.1 0.0
Amount of RE inventories sales 0.1 0.0 0.0 1.0 1.4 6.2 3.0 5.4 2.0 6.8 9.3
Revaluation of RE inventories sold 0.0 -5.3 0.0 2.2 0.0 17.4 0.4 18.8 0.3 9.6 -0.7
Margin on RE inventories sales 601% -100% -100% -171% 149% -152% 40% -140% 54% -233% 8%
Other income/expenses + FX impact -0.6 -0.9 1.0 -2.5 -1.6 -2.7 -0.7 2.6 -0.8 -1.4 0.1
Results of property development -0.5 -6.2 0.9 0.7 -0.1 20.9 2.7 26.7 1.5 15.0 8.7
Other operating income/expenses -0.1 -5.0 0.3 1.7 -0.3 -0.4 -0.4 -0.4 -0.5 1.8 -0.7
EBITDA (ex. revals) 12.1 409.1 5.4 7.7 16.2 24.5 7.3 30.7 7.2 23.9 14.7
Revaluations (adj. for FX) -0.4 -5.5 -0.5 -10.5 0.1 -20.4 -2.2 -19.2 -0.3 0.3 -1.2
Revaluations (stemming from FX) 0.0 0.0 -0.1 -4.4 -0.1 -0.2 0.0 -6.1 0.0 3.0 0.0
EBITDA 11.6 403.7 4.8 -7.2 16.1 3.9 5.1 5.3 6.8 27.2 13.4
Attributable debt 515.6 296.9 294.1 291.4 226.6 224.1 221.7 218.6 217.6 342.9 352.1
Interest rate (incl. hedging) 3.8% 3.5% 3.7% 3.7% 3.6% 3.5% 3.6% 3.4% 3.4% 3.1% 2.6%
Interest costs (incl. hedging) -19.6 -10.4 -10.9 -10.8 -8.2 -7.8 -8.0 -7.4 -7.4 -10.6 -9.2
Approx. FFO* contribution 7.6 6.2 2.2 2.2 3.1 2.2 2.5 2.7 4.4 4.5 4.4
As a % of total 10.2% 9.4% 4.0% 3.8% 4.9% 5.1% 6.0% 6.0% 14.3% 26.9% 22.0%
Standing assets 936.7 522.0 522.0 512.1 399.7 377.6 377.6 361.7 362.4 545.6 550.5
Development projects 49.8 64.5 85.8 120.3 148.1 202.3 226.9 268.3 280.7 254.5 245.6
Pipeline projects 17.0 23.4 24.0 18.7 6.3 6.4 6.4 7.5 3.5 6.7 6.7
Approx. equity 487.9 313.0 337.7 359.7 327.5 362.2 389.2 418.9 429.0 463.9 450.7
Approx. FFO return on equity* 6.3% 7.9% 2.6% 2.4% 3.8% 2.4% 2.5% 2.5% 4.1% 3.9% 3.9%
Source: Immofinanz, WOOD Research; *excluding taxes
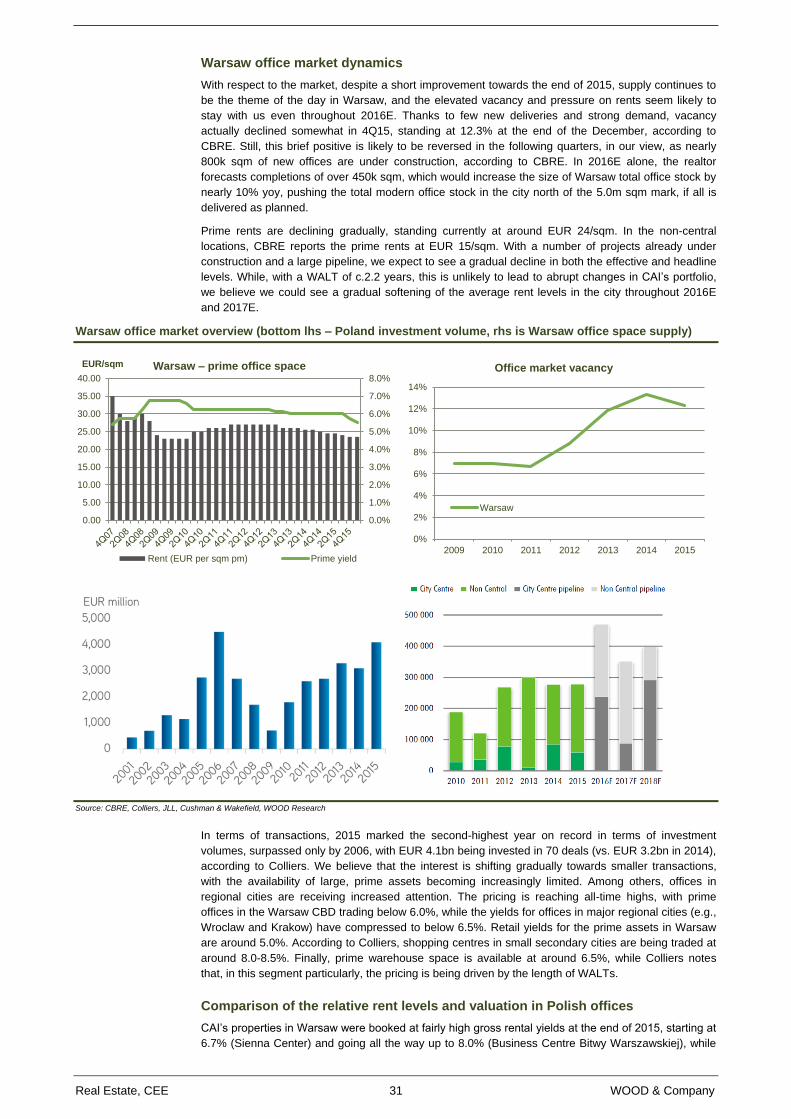
Real Estate, CEE 31 WOOD & Company
Warsaw office market dynamics
With respect to the market, despite a short improvement towards the end of 2015, supply continues to
be the theme of the day in Warsaw, and the elevated vacancy and pressure on rents seem likely to
stay with us even throughout 2016E. Thanks to few new deliveries and strong demand, vacancy
actually declined somewhat in 4Q15, standing at 12.3% at the end of the December, according to
CBRE. Still, this brief positive is likely to be reversed in the following quarters, in our view, as nearly
800k sqm of new offices are under construction, according to CBRE. In 2016E alone, the realtor
forecasts completions of over 450k sqm, which would increase the size of Warsaw total office stock by
nearly 10% yoy, pushing the total modern office stock in the city north of the 5.0m sqm mark, if all is
delivered as planned.
Prime rents are declining gradually, standing currently at around EUR 24/sqm. In the non-central
locations, CBRE reports the prime rents at EUR 15/sqm. With a number of projects already under
construction and a large pipeline, we expect to see a gradual decline in both the effective and headline
levels. While, with a WALT of c.2.2 years, this is unlikely to lead to abrupt changes in CAI’s portfolio,
we believe we could see a gradual softening of the average rent levels in the city throughout 2016E
and 2017E.
Warsaw office market overview (bottom lhs – Poland investment volume, rhs is Warsaw office space supply)
Source: CBRE, Colliers, JLL, Cushman & Wakefield, WOOD Research
In terms of transactions, 2015 marked the second-highest year on record in terms of investment
volumes, surpassed only by 2006, with EUR 4.1bn being invested in 70 deals (vs. EUR 3.2bn in 2014),
according to Colliers. We believe that the interest is shifting gradually towards smaller transactions,
with the availability of large, prime assets becoming increasingly limited. Among others, offices in
regional cities are receiving increased attention. The pricing is reaching all-time highs, with prime
offices in the Warsaw CBD trading below 6.0%, while the yields for offices in major regional cities (e.g.,
Wroclaw and Krakow) have compressed to below 6.5%. Retail yields for the prime assets in Warsaw
are around 5.0%. According to Colliers, shopping centres in small secondary cities are being traded at
around 8.0-8.5%. Finally, prime warehouse space is available at around 6.5%, while Colliers notes
that, in this segment particularly, the pricing is being driven by the length of WALTs.
Comparison of the relative rent levels and valuation in Polish offices
CAI’s properties in Warsaw were booked at fairly high gross rental yields at the end of 2015, starting at
6.7% (Sienna Center) and going all the way up to 8.0% (Business Centre Bitwy Warszawskiej), while
0.0%
1.0%
2.0%
3.0%
4.0%
5.0%
6.0%
7.0%
8.0%
0.00
5.00
10.00
15.00
20.00
25.00
30.00
35.00
40.00
EUR/sqm Warsaw – prime office space
Rent (EUR per sqm pm) Prime yield
0%
2%
4%
6%
8%
10%
12%
14%
2009 2010 2011 2012 2013 2014 2015
Office market vacancy
Warsaw
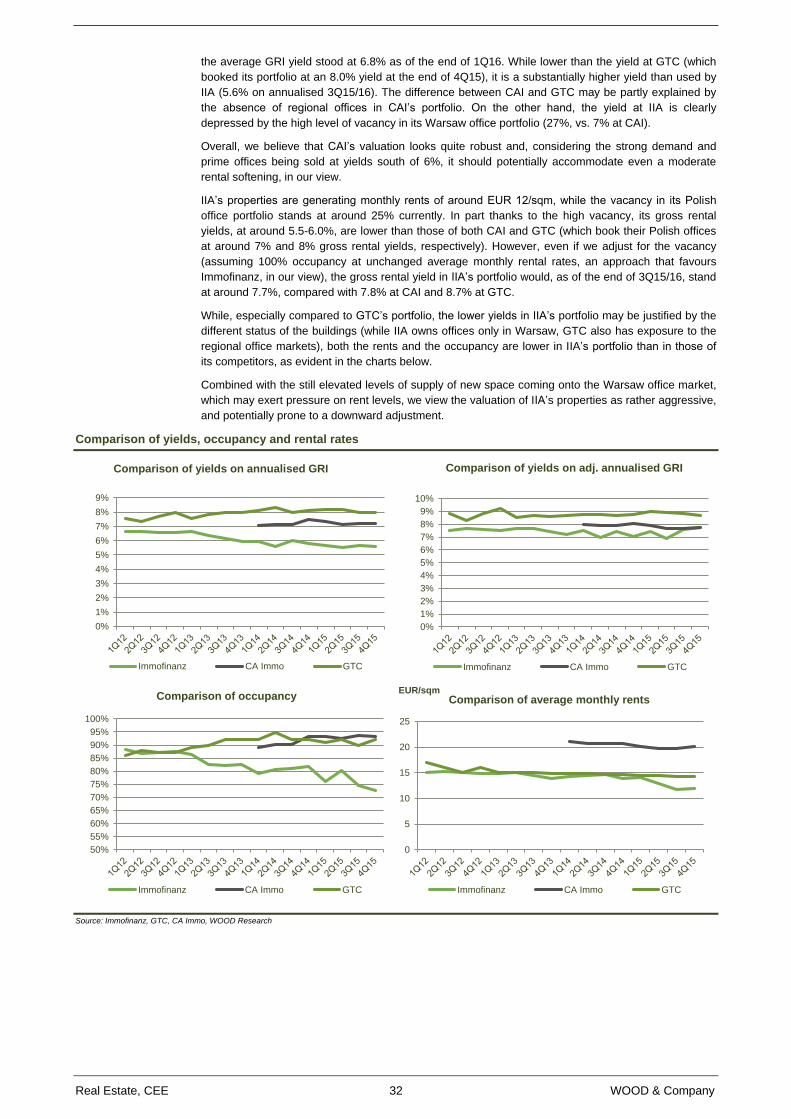
Real Estate, CEE 32 WOOD & Company
the average GRI yield stood at 6.8% as of the end of 1Q16. While lower than the yield at GTC (which
booked its portfolio at an 8.0% yield at the end of 4Q15), it is a substantially higher yield than used by
IIA (5.6% on annualised 3Q15/16). The difference between CAI and GTC may be partly explained by
the absence of regional offices in CAI’s portfolio. On the other hand, the yield at IIA is clearly
depressed by the high level of vacancy in its Warsaw office portfolio (27%, vs. 7% at CAI).
Overall, we believe that CAI’s valuation looks quite robust and, considering the strong demand and
prime offices being sold at yields south of 6%, it should potentially accommodate even a moderate
rental softening, in our view.
IIA’s properties are generating monthly rents of around EUR 12/sqm, while the vacancy in its Polish
office portfolio stands at around 25% currently. In part thanks to the high vacancy, its gross rental
yields, at around 5.5-6.0%, are lower than those of both CAI and GTC (which book their Polish offices
at around 7% and 8% gross rental yields, respectively). However, even if we adjust for the vacancy
(assuming 100% occupancy at unchanged average monthly rental rates, an approach that favours
Immofinanz, in our view), the gross rental yield in IIA’s portfolio would, as of the end of 3Q15/16, stand
at around 7.7%, compared with 7.8% at CAI and 8.7% at GTC.
While, especially compared to GTC’s portfolio, the lower yields in IIA’s portfolio may be justified by the
different status of the buildings (while IIA owns offices only in Warsaw, GTC also has exposure to the
regional office markets), both the rents and the occupancy are lower in IIA’s portfolio than in those of
its competitors, as evident in the charts below.
Combined with the still elevated levels of supply of new space coming onto the Warsaw office market,
which may exert pressure on rent levels, we view the valuation of IIA’s properties as rather aggressive,
and potentially prone to a downward adjustment.
Comparison of yields, occupancy and rental rates
Source: Immofinanz, GTC, CA Immo, WOOD Research
0%
1%
2%
3%
4%
5%
6%
7%
8%
9%
Comparison of yields on annualised GRI
Immofinanz CA Immo GTC
0%
1%
2%
3%
4%
5%
6%
7%
8%
9%
10%
Comparison of yields on adj. annualised GRI
Immofinanz CA Immo GTC
50%
55%
60%
65%
70%
75%
80%
85%
90%
95%
100%
Comparison of occupancy
Immofinanz CA Immo GTC
0
5
10
15
20
25
EUR/sqmComparison of average monthly rents
Immofinanz CA Immo GTC
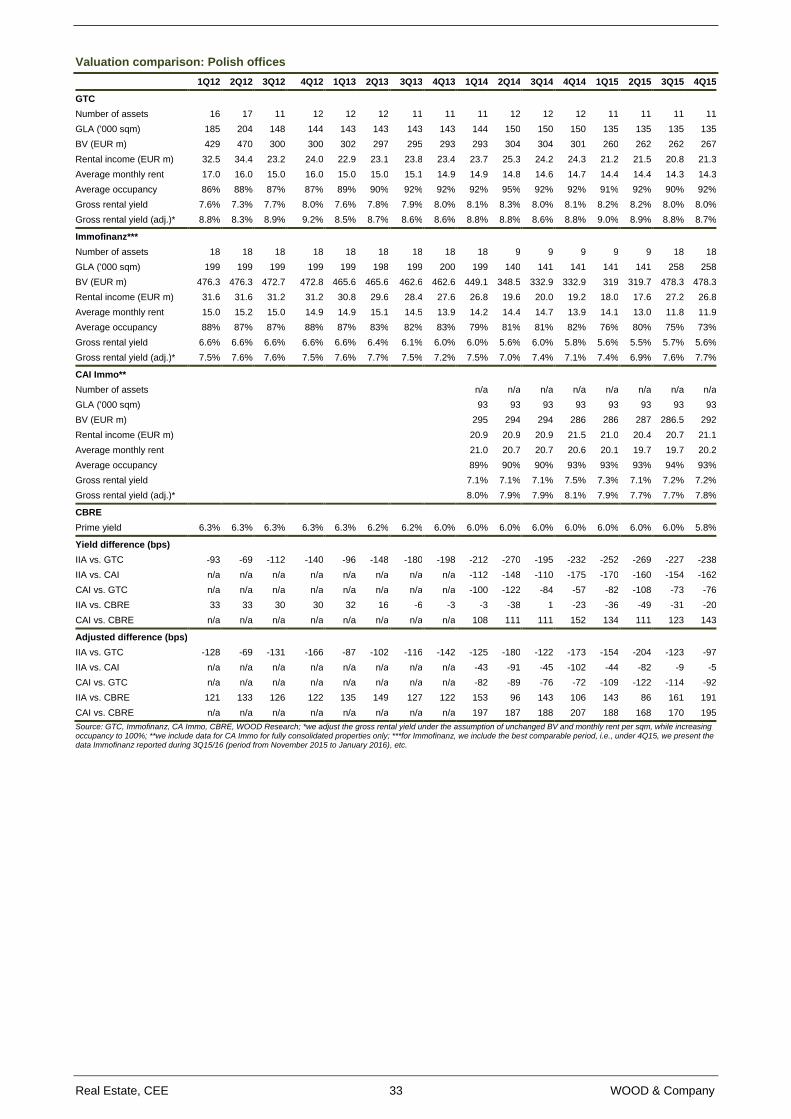
Real Estate, CEE 33 WOOD & Company
Valuation comparison: Polish offices
1Q12 2Q12 3Q12 4Q12 1Q13 2Q13 3Q13 4Q13 1Q14 2Q14 3Q14 4Q14 1Q15 2Q15 3Q15 4Q15
GTC
Number of assets 16 17 11 12 12 12 11 11 11 12 12 12 11 11 11 11
GLA ('000 sqm) 185 204 148 144 143 143 143 143 144 150 150 150 135 135 135 135
BV (EUR m) 429 470 300 300 302 297 295 293 293 304 304 301 260 262 262 267
Rental income (EUR m) 32.5 34.4 23.2 24.0 22.9 23.1 23.8 23.4 23.7 25.3 24.2 24.3 21.2 21.5 20.8 21.3
Average monthly rent 17.0 16.0 15.0 16.0 15.0 15.0 15.1 14.9 14.9 14.8 14.6 14.7 14.4 14.4 14.3 14.3
Average occupancy 86% 88% 87% 87% 89% 90% 92% 92% 92% 95% 92% 92% 91% 92% 90% 92%
Gross rental yield 7.6% 7.3% 7.7% 8.0% 7.6% 7.8% 7.9% 8.0% 8.1% 8.3% 8.0% 8.1% 8.2% 8.2% 8.0% 8.0%
Gross rental yield (adj.)* 8.8% 8.3% 8.9% 9.2% 8.5% 8.7% 8.6% 8.6% 8.8% 8.8% 8.6% 8.8% 9.0% 8.9% 8.8% 8.7%
Immofinanz***
Number of assets 18 18 18 18 18 18 18 18 18 9 9 9 9 9 18 18
GLA ('000 sqm) 199 199 199 199 199 198 199 200 199 140 141 141 141 141 258 258
BV (EUR m) 476.3 476.3 472.7 472.8 465.6 465.6 462.6 462.6 449.1 348.5 332.9 332.9 319 319.7 478.3 478.3
Rental income (EUR m) 31.6 31.6 31.2 31.2 30.8 29.6 28.4 27.6 26.8 19.6 20.0 19.2 18.0 17.6 27.2 26.8
Average monthly rent 15.0 15.2 15.0 14.9 14.9 15.1 14.5 13.9 14.2 14.4 14.7 13.9 14.1 13.0 11.8 11.9
Average occupancy 88% 87% 87% 88% 87% 83% 82% 83% 79% 81% 81% 82% 76% 80% 75% 73%
Gross rental yield 6.6% 6.6% 6.6% 6.6% 6.6% 6.4% 6.1% 6.0% 6.0% 5.6% 6.0% 5.8% 5.6% 5.5% 5.7% 5.6%
Gross rental yield (adj.)* 7.5% 7.6% 7.6% 7.5% 7.6% 7.7% 7.5% 7.2% 7.5% 7.0% 7.4% 7.1% 7.4% 6.9% 7.6% 7.7%
CAI Immo**
Number of assets
n/a n/a n/a n/a n/a n/a n/a n/a
GLA ('000 sqm)
93 93 93 93 93 93 93 93
BV (EUR m)
295 294 294 286 286 287 286.5 292
Rental income (EUR m)
20.9 20.9 20.9 21.5 21.0 20.4 20.7 21.1
Average monthly rent
21.0 20.7 20.7 20.6 20.1 19.7 19.7 20.2
Average occupancy
89% 90% 90% 93% 93% 93% 94% 93%
Gross rental yield
7.1% 7.1% 7.1% 7.5% 7.3% 7.1% 7.2% 7.2%
Gross rental yield (adj.)* 8.0% 7.9% 7.9% 8.1% 7.9% 7.7% 7.7% 7.8%
CBRE
Prime yield 6.3% 6.3% 6.3% 6.3% 6.3% 6.2% 6.2% 6.0% 6.0% 6.0% 6.0% 6.0% 6.0% 6.0% 6.0% 5.8%
Yield difference (bps)
IIA vs. GTC -93 -69 -112 -140 -96 -148 -180 -198 -212 -270 -195 -232 -252 -269 -227 -238
IIA vs. CAI n/a n/a n/a n/a n/a n/a n/a n/a -112 -148 -110 -175 -170 -160 -154 -162
CAI vs. GTC n/a n/a n/a n/a n/a n/a n/a n/a -100 -122 -84 -57 -82 -108 -73 -76
IIA vs. CBRE 33 33 30 30 32 16 -6 -3 -3 -38 1 -23 -36 -49 -31 -20
CAI vs. CBRE n/a n/a n/a n/a n/a n/a n/a n/a 108 111 111 152 134 111 123 143
Adjusted difference (bps)
IIA vs. GTC -128 -69 -131 -166 -87 -102 -116 -142 -125 -180 -122 -173 -154 -204 -123 -97
IIA vs. CAI n/a n/a n/a n/a n/a n/a n/a n/a -43 -91 -45 -102 -44 -82 -9 -5
CAI vs. GTC n/a n/a n/a n/a n/a n/a n/a n/a -82 -89 -76 -72 -109 -122 -114 -92
IIA vs. CBRE 121 133 126 122 135 149 127 122 153 96 143 106 143 86 161 191
CAI vs. CBRE n/a n/a n/a n/a n/a n/a n/a n/a 197 187 188 207 188 168 170 195
Source: GTC, Immofinanz, CA Immo, CBRE, WOOD Research; *we adjust the gross rental yield under the assumption of unchanged BV and monthly rent per sqm, while increasing occupancy to 100%; **we include data for CA Immo for fully consolidated properties only; ***for Immofinanz, we include the best comparable period, i.e., under 4Q15, we present the data Immofinanz reported during 3Q15/16 (period from November 2015 to January 2016), etc.
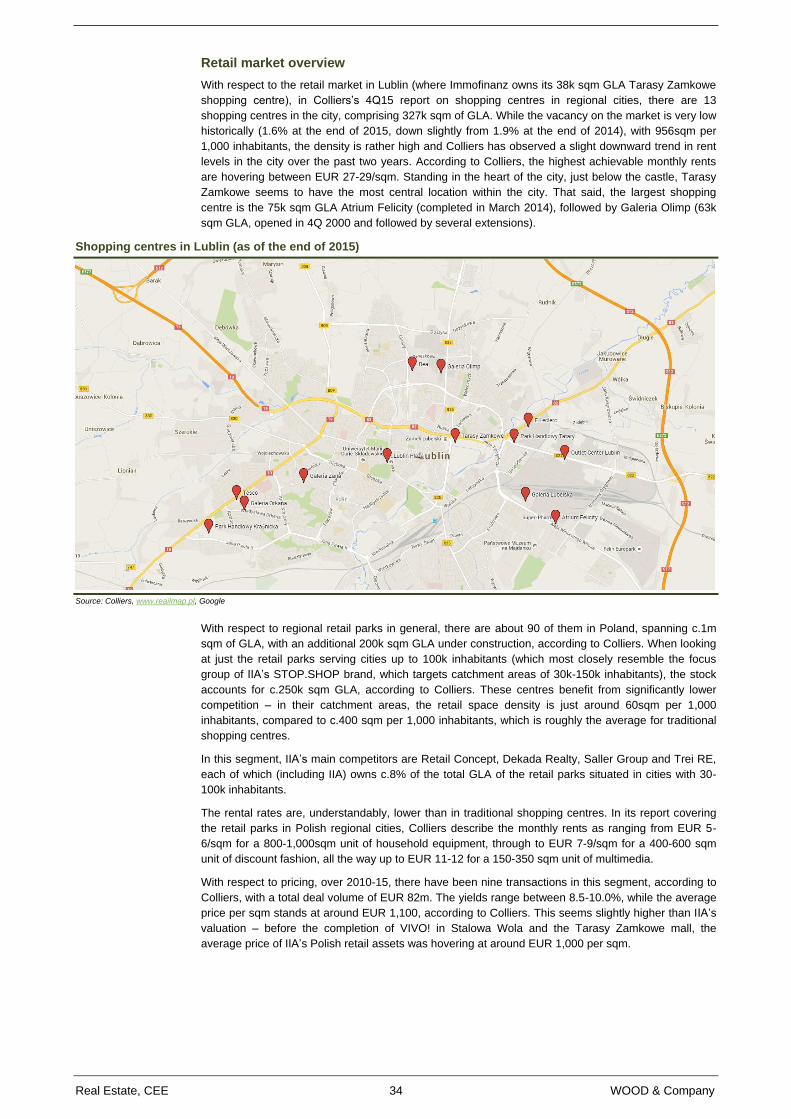
Real Estate, CEE 34 WOOD & Company
Retail market overview
With respect to the retail market in Lublin (where Immofinanz owns its 38k sqm GLA Tarasy Zamkowe
shopping centre), in Colliers’s 4Q15 report on shopping centres in regional cities, there are 13
shopping centres in the city, comprising 327k sqm of GLA. While the vacancy on the market is very low
historically (1.6% at the end of 2015, down slightly from 1.9% at the end of 2014), with 956sqm per
1,000 inhabitants, the density is rather high and Colliers has observed a slight downward trend in rent
levels in the city over the past two years. According to Colliers, the highest achievable monthly rents
are hovering between EUR 27-29/sqm. Standing in the heart of the city, just below the castle, Tarasy
Zamkowe seems to have the most central location within the city. That said, the largest shopping
centre is the 75k sqm GLA Atrium Felicity (completed in March 2014), followed by Galeria Olimp (63k
sqm GLA, opened in 4Q 2000 and followed by several extensions).
Shopping centres in Lublin (as of the end of 2015)
Source: Colliers, www.reailmap.pl, Google
With respect to regional retail parks in general, there are about 90 of them in Poland, spanning c.1m
sqm of GLA, with an additional 200k sqm GLA under construction, according to Colliers. When looking
at just the retail parks serving cities up to 100k inhabitants (which most closely resemble the focus
group of IIA’s STOP.SHOP brand, which targets catchment areas of 30k-150k inhabitants), the stock
accounts for c.250k sqm GLA, according to Colliers. These centres benefit from significantly lower
competition – in their catchment areas, the retail space density is just around 60sqm per 1,000
inhabitants, compared to c.400 sqm per 1,000 inhabitants, which is roughly the average for traditional
shopping centres.
In this segment, IIA’s main competitors are Retail Concept, Dekada Realty, Saller Group and Trei RE,
each of which (including IIA) owns c.8% of the total GLA of the retail parks situated in cities with 30-
100k inhabitants.
The rental rates are, understandably, lower than in traditional shopping centres. In its report covering
the retail parks in Polish regional cities, Colliers describe the monthly rents as ranging from EUR 5-
6/sqm for a 800-1,000sqm unit of household equipment, through to EUR 7-9/sqm for a 400-600 sqm
unit of discount fashion, all the way up to EUR 11-12 for a 150-350 sqm unit of multimedia.
With respect to pricing, over 2010-15, there have been nine transactions in this segment, according to
Colliers, with a total deal volume of EUR 82m. The yields range between 8.5-10.0%, while the average
price per sqm stands at around EUR 1,100, according to Colliers. This seems slightly higher than IIA’s
valuation – before the completion of VIVO! in Stalowa Wola and the Tarasy Zamkowe mall, the
average price of IIA’s Polish retail assets was hovering at around EUR 1,000 per sqm.
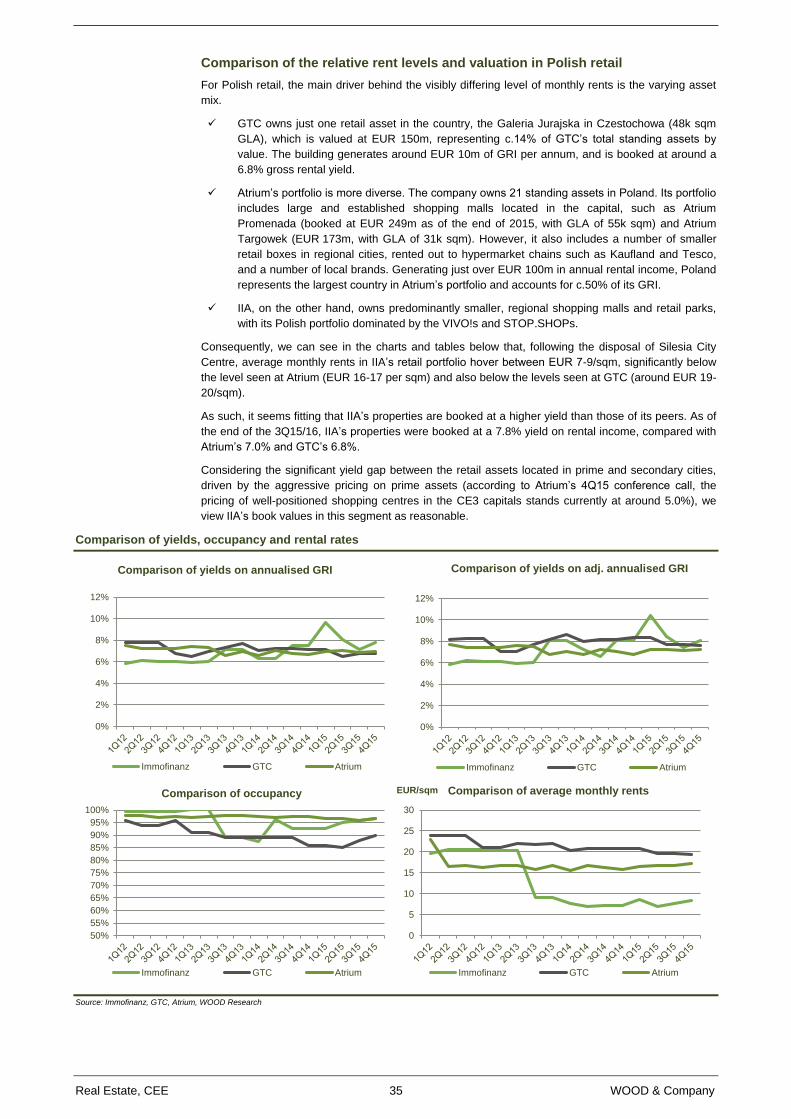
Real Estate, CEE 35 WOOD & Company
Comparison of the relative rent levels and valuation in Polish retail
For Polish retail, the main driver behind the visibly differing level of monthly rents is the varying asset
mix.
GTC owns just one retail asset in the country, the Galeria Jurajska in Czestochowa (48k sqm
GLA), which is valued at EUR 150m, representing c.14% of GTC’s total standing assets by
value. The building generates around EUR 10m of GRI per annum, and is booked at around a
6.8% gross rental yield.
Atrium’s portfolio is more diverse. The company owns 21 standing assets in Poland. Its portfolio
includes large and established shopping malls located in the capital, such as Atrium
Promenada (booked at EUR 249m as of the end of 2015, with GLA of 55k sqm) and Atrium
Targowek (EUR 173m, with GLA of 31k sqm). However, it also includes a number of smaller
retail boxes in regional cities, rented out to hypermarket chains such as Kaufland and Tesco,
and a number of local brands. Generating just over EUR 100m in annual rental income, Poland
represents the largest country in Atrium’s portfolio and accounts for c.50% of its GRI.
IIA, on the other hand, owns predominantly smaller, regional shopping malls and retail parks,
with its Polish portfolio dominated by the VIVO!s and STOP.SHOPs.
Consequently, we can see in the charts and tables below that, following the disposal of Silesia City
Centre, average monthly rents in IIA’s retail portfolio hover between EUR 7-9/sqm, significantly below
the level seen at Atrium (EUR 16-17 per sqm) and also below the levels seen at GTC (around EUR 19-
20/sqm).
As such, it seems fitting that IIA’s properties are booked at a higher yield than those of its peers. As of
the end of the 3Q15/16, IIA’s properties were booked at a 7.8% yield on rental income, compared with
Atrium’s 7.0% and GTC’s 6.8%.
Considering the significant yield gap between the retail assets located in prime and secondary cities,
driven by the aggressive pricing on prime assets (according to Atrium’s 4Q15 conference call, the
pricing of well-positioned shopping centres in the CE3 capitals stands currently at around 5.0%), we
view IIA’s book values in this segment as reasonable.
Comparison of yields, occupancy and rental rates
Source: Immofinanz, GTC, Atrium, WOOD Research
0%
2%
4%
6%
8%
10%
12%
Comparison of yields on annualised GRI
Immofinanz GTC Atrium
0%
2%
4%
6%
8%
10%
12%
Comparison of yields on adj. annualised GRI
Immofinanz GTC Atrium
50%
55%
60%
65%
70%
75%
80%
85%
90%
95%
100%
Comparison of occupancy
Immofinanz GTC Atrium
0
5
10
15
20
25
30
EUR/sqm Comparison of average monthly rents
Immofinanz GTC Atrium
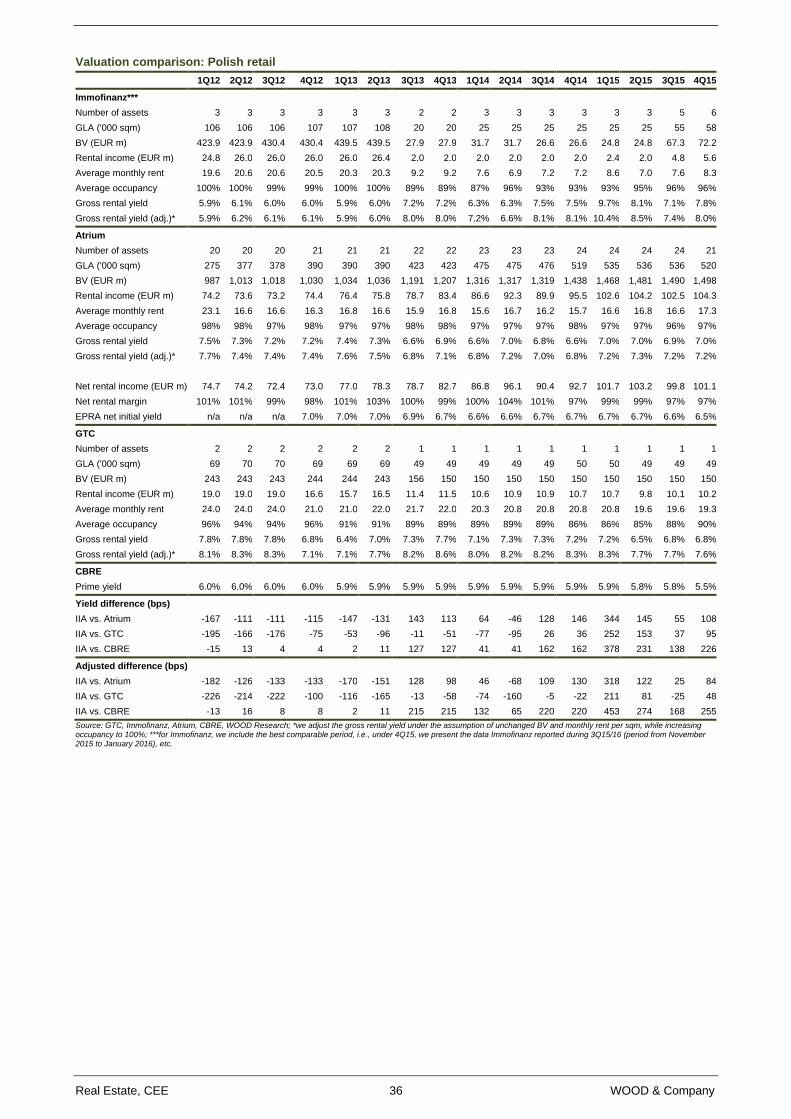
Real Estate, CEE 36 WOOD & Company
Valuation comparison: Polish retail
1Q12 2Q12 3Q12 4Q12 1Q13 2Q13 3Q13 4Q13 1Q14 2Q14 3Q14 4Q14 1Q15 2Q15 3Q15 4Q15
Immofinanz***
Number of assets 3 3 3 3 3 3 2 2 3 3 3 3 3 3 5 6
GLA ('000 sqm) 106 106 106 107 107 108 20 20 25 25 25 25 25 25 55 58
BV (EUR m) 423.9 423.9 430.4 430.4 439.5 439.5 27.9 27.9 31.7 31.7 26.6 26.6 24.8 24.8 67.3 72.2
Rental income (EUR m) 24.8 26.0 26.0 26.0 26.0 26.4 2.0 2.0 2.0 2.0 2.0 2.0 2.4 2.0 4.8 5.6
Average monthly rent 19.6 20.6 20.6 20.5 20.3 20.3 9.2 9.2 7.6 6.9 7.2 7.2 8.6 7.0 7.6 8.3
Average occupancy 100% 100% 99% 99% 100% 100% 89% 89% 87% 96% 93% 93% 93% 95% 96% 96%
Gross rental yield 5.9% 6.1% 6.0% 6.0% 5.9% 6.0% 7.2% 7.2% 6.3% 6.3% 7.5% 7.5% 9.7% 8.1% 7.1% 7.8%
Gross rental yield (adj.)* 5.9% 6.2% 6.1% 6.1% 5.9% 6.0% 8.0% 8.0% 7.2% 6.6% 8.1% 8.1% 10.4% 8.5% 7.4% 8.0%
Atrium
Number of assets 20 20 20 21 21 21 22 22 23 23 23 24 24 24 24 21
GLA ('000 sqm) 275 377 378 390 390 390 423 423 475 475 476 519 535 536 536 520
BV (EUR m) 987 1,013 1,018 1,030 1,034 1,036 1,191 1,207 1,316 1,317 1,319 1,438 1,468 1,481 1,490 1,498
Rental income (EUR m) 74.2 73.6 73.2 74.4 76.4 75.8 78.7 83.4 86.6 92.3 89.9 95.5 102.6 104.2 102.5 104.3
Average monthly rent 23.1 16.6 16.6 16.3 16.8 16.6 15.9 16.8 15.6 16.7 16.2 15.7 16.6 16.8 16.6 17.3
Average occupancy 98% 98% 97% 98% 97% 97% 98% 98% 97% 97% 97% 98% 97% 97% 96% 97%
Gross rental yield 7.5% 7.3% 7.2% 7.2% 7.4% 7.3% 6.6% 6.9% 6.6% 7.0% 6.8% 6.6% 7.0% 7.0% 6.9% 7.0%
Gross rental yield (adj.)* 7.7% 7.4% 7.4% 7.4% 7.6% 7.5% 6.8% 7.1% 6.8% 7.2% 7.0% 6.8% 7.2% 7.3% 7.2% 7.2%
Net rental income (EUR m) 74.7 74.2 72.4 73.0 77.0 78.3 78.7 82.7 86.8 96.1 90.4 92.7 101.7 103.2 99.8 101.1
Net rental margin 101% 101% 99% 98% 101% 103% 100% 99% 100% 104% 101% 97% 99% 99% 97% 97%
EPRA net initial yield n/a n/a n/a 7.0% 7.0% 7.0% 6.9% 6.7% 6.6% 6.6% 6.7% 6.7% 6.7% 6.7% 6.6% 6.5%
GTC
Number of assets 2 2 2 2 2 2 1 1 1 1 1 1 1 1 1 1
GLA ('000 sqm) 69 70 70 69 69 69 49 49 49 49 49 50 50 49 49 49
BV (EUR m) 243 243 243 244 244 243 156 150 150 150 150 150 150 150 150 150
Rental income (EUR m) 19.0 19.0 19.0 16.6 15.7 16.5 11.4 11.5 10.6 10.9 10.9 10.7 10.7 9.8 10.1 10.2
Average monthly rent 24.0 24.0 24.0 21.0 21.0 22.0 21.7 22.0 20.3 20.8 20.8 20.8 20.8 19.6 19.6 19.3
Average occupancy 96% 94% 94% 96% 91% 91% 89% 89% 89% 89% 89% 86% 86% 85% 88% 90%
Gross rental yield 7.8% 7.8% 7.8% 6.8% 6.4% 7.0% 7.3% 7.7% 7.1% 7.3% 7.3% 7.2% 7.2% 6.5% 6.8% 6.8%
Gross rental yield (adj.)* 8.1% 8.3% 8.3% 7.1% 7.1% 7.7% 8.2% 8.6% 8.0% 8.2% 8.2% 8.3% 8.3% 7.7% 7.7% 7.6%
CBRE
Prime yield 6.0% 6.0% 6.0% 6.0% 5.9% 5.9% 5.9% 5.9% 5.9% 5.9% 5.9% 5.9% 5.9% 5.8% 5.8% 5.5%
Yield difference (bps)
IIA vs. Atrium -167 -111 -111 -115 -147 -131 143 113 64 -46 128 146 344 145 55 108
IIA vs. GTC -195 -166 -176 -75 -53 -96 -11 -51 -77 -95 26 36 252 153 37 95
IIA vs. CBRE -15 13 4 4 2 11 127 127 41 41 162 162 378 231 138 226
Adjusted difference (bps)
IIA vs. Atrium -182 -126 -133 -133 -170 -151 128 98 46 -68 109 130 318 122 25 84
IIA vs. GTC -226 -214 -222 -100 -116 -165 -13 -58 -74 -160 -5 -22 211 81 -25 48
IIA vs. CBRE -13 16 8 8 2 11 215 215 132 65 220 220 453 274 168 255
Source: GTC, Immofinanz, Atrium, CBRE, WOOD Research; *we adjust the gross rental yield under the assumption of unchanged BV and monthly rent per sqm, while increasing occupancy to 100%; ***for Immofinanz, we include the best comparable period, i.e., under 4Q15, we present the data Immofinanz reported during 3Q15/16 (period from November 2015 to January 2016), etc.
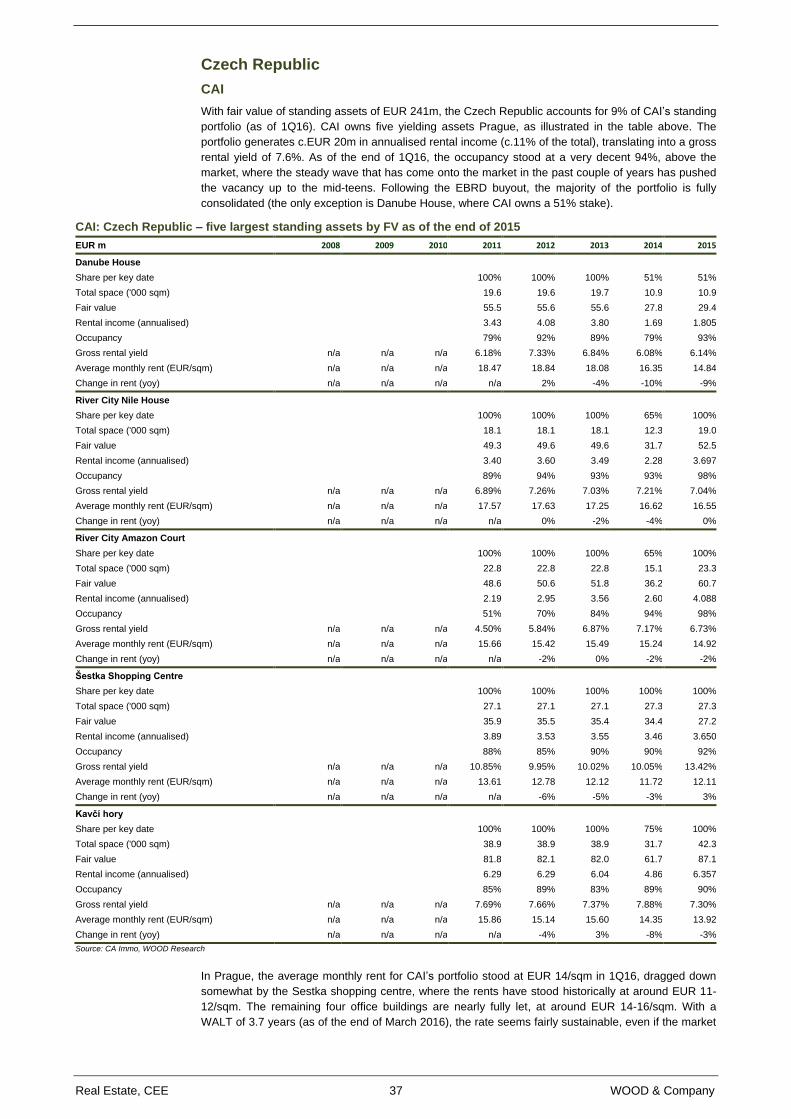
Real Estate, CEE 37 WOOD & Company
Czech Republic
CAI
With fair value of standing assets of EUR 241m, the Czech Republic accounts for 9% of CAI’s standing
portfolio (as of 1Q16). CAI owns five yielding assets Prague, as illustrated in the table above. The
portfolio generates c.EUR 20m in annualised rental income (c.11% of the total), translating into a gross
rental yield of 7.6%. As of the end of 1Q16, the occupancy stood at a very decent 94%, above the
market, where the steady wave that has come onto the market in the past couple of years has pushed
the vacancy up to the mid-teens. Following the EBRD buyout, the majority of the portfolio is fully
consolidated (the only exception is Danube House, where CAI owns a 51% stake).
CAI: Czech Republic – five largest standing assets by FV as of the end of 2015
EUR m 2008 2009 2010 2011 2012 2013 2014 2015
Danube House
Share per key date
100% 100% 100% 51% 51%
Total space ('000 sqm)
19.6 19.6 19.7 10.9 10.9
Fair value
55.5 55.6 55.6 27.8 29.4
Rental income (annualised)
3.43 4.08 3.80 1.69 1.805
Occupancy
79% 92% 89% 79% 93%
Gross rental yield n/a n/a n/a 6.18% 7.33% 6.84% 6.08% 6.14%
Average monthly rent (EUR/sqm) n/a n/a n/a 18.47 18.84 18.08 16.35 14.84
Change in rent (yoy) n/a n/a n/a n/a 2% -4% -10% -9%
River City Nile House
Share per key date
100% 100% 100% 65% 100%
Total space ('000 sqm)
18.1 18.1 18.1 12.3 19.0
Fair value
49.3 49.6 49.6 31.7 52.5
Rental income (annualised)
3.40 3.60 3.49 2.28 3.697
Occupancy
89% 94% 93% 93% 98%
Gross rental yield n/a n/a n/a 6.89% 7.26% 7.03% 7.21% 7.04%
Average monthly rent (EUR/sqm) n/a n/a n/a 17.57 17.63 17.25 16.62 16.55
Change in rent (yoy) n/a n/a n/a n/a 0% -2% -4% 0%
River City Amazon Court
Share per key date
100% 100% 100% 65% 100%
Total space ('000 sqm)
22.8 22.8 22.8 15.1 23.3
Fair value
48.6 50.6 51.8 36.2 60.7
Rental income (annualised)
2.19 2.95 3.56 2.60 4.088
Occupancy
51% 70% 84% 94% 98%
Gross rental yield n/a n/a n/a 4.50% 5.84% 6.87% 7.17% 6.73%
Average monthly rent (EUR/sqm) n/a n/a n/a 15.66 15.42 15.49 15.24 14.92
Change in rent (yoy) n/a n/a n/a n/a -2% 0% -2% -2%
Šestka Shopping Centre
Share per key date
100% 100% 100% 100% 100%
Total space ('000 sqm)
27.1 27.1 27.1 27.3 27.3
Fair value
35.9 35.5 35.4 34.4 27.2
Rental income (annualised)
3.89 3.53 3.55 3.46 3.650
Occupancy
88% 85% 90% 90% 92%
Gross rental yield n/a n/a n/a 10.85% 9.95% 10.02% 10.05% 13.42%
Average monthly rent (EUR/sqm) n/a n/a n/a 13.61 12.78 12.12 11.72 12.11
Change in rent (yoy) n/a n/a n/a n/a -6% -5% -3% 3%
Kavčí hory
Share per key date
100% 100% 100% 75% 100%
Total space ('000 sqm)
38.9 38.9 38.9 31.7 42.3
Fair value
81.8 82.1 82.0 61.7 87.1
Rental income (annualised)
6.29 6.29 6.04 4.86 6.357
Occupancy
85% 89% 83% 89% 90%
Gross rental yield n/a n/a n/a 7.69% 7.66% 7.37% 7.88% 7.30%
Average monthly rent (EUR/sqm) n/a n/a n/a 15.86 15.14 15.60 14.35 13.92
Change in rent (yoy) n/a n/a n/a n/a -4% 3% -8% -3%
Source: CA Immo, WOOD Research
In Prague, the average monthly rent for CAI’s portfolio stood at EUR 14/sqm in 1Q16, dragged down
somewhat by the Sestka shopping centre, where the rents have stood historically at around EUR 11-
12/sqm. The remaining four office buildings are nearly fully let, at around EUR 14-16/sqm. With a
WALT of 3.7 years (as of the end of March 2016), the rate seems fairly sustainable, even if the market
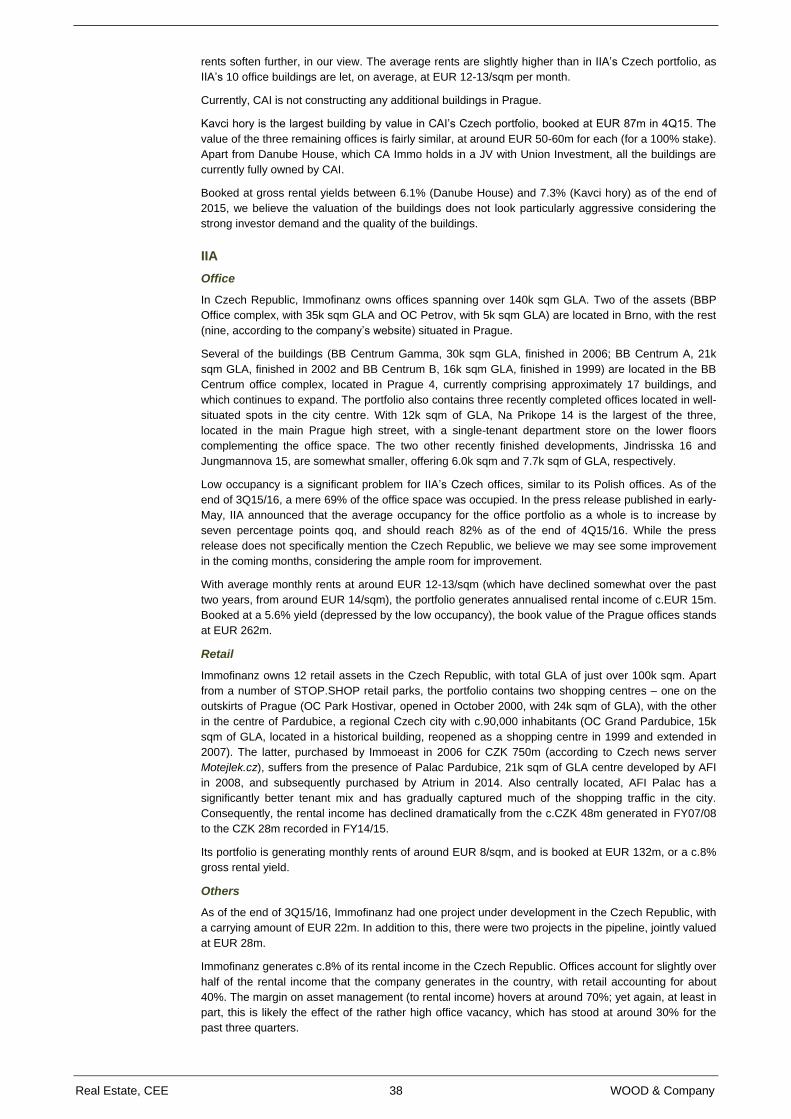
Real Estate, CEE 38 WOOD & Company
rents soften further, in our view. The average rents are slightly higher than in IIA’s Czech portfolio, as
IIA’s 10 office buildings are let, on average, at EUR 12-13/sqm per month.
Currently, CAI is not constructing any additional buildings in Prague.
Kavci hory is the largest building by value in CAI’s Czech portfolio, booked at EUR 87m in 4Q15. The
value of the three remaining offices is fairly similar, at around EUR 50-60m for each (for a 100% stake).
Apart from Danube House, which CA Immo holds in a JV with Union Investment, all the buildings are
currently fully owned by CAI.
Booked at gross rental yields between 6.1% (Danube House) and 7.3% (Kavci hory) as of the end of
2015, we believe the valuation of the buildings does not look particularly aggressive considering the
strong investor demand and the quality of the buildings.
IIA
Office
In Czech Republic, Immofinanz owns offices spanning over 140k sqm GLA. Two of the assets (BBP
Office complex, with 35k sqm GLA and OC Petrov, with 5k sqm GLA) are located in Brno, with the rest
(nine, according to the company’s website) situated in Prague.
Several of the buildings (BB Centrum Gamma, 30k sqm GLA, finished in 2006; BB Centrum A, 21k
sqm GLA, finished in 2002 and BB Centrum B, 16k sqm GLA, finished in 1999) are located in the BB
Centrum office complex, located in Prague 4, currently comprising approximately 17 buildings, and
which continues to expand. The portfolio also contains three recently completed offices located in well-
situated spots in the city centre. With 12k sqm of GLA, Na Prikope 14 is the largest of the three,
located in the main Prague high street, with a single-tenant department store on the lower floors
complementing the office space. The two other recently finished developments, Jindrisska 16 and
Jungmannova 15, are somewhat smaller, offering 6.0k sqm and 7.7k sqm of GLA, respectively.
Low occupancy is a significant problem for IIA’s Czech offices, similar to its Polish offices. As of the
end of 3Q15/16, a mere 69% of the office space was occupied. In the press release published in early-
May, IIA announced that the average occupancy for the office portfolio as a whole is to increase by
seven percentage points qoq, and should reach 82% as of the end of 4Q15/16. While the press
release does not specifically mention the Czech Republic, we believe we may see some improvement
in the coming months, considering the ample room for improvement.
With average monthly rents at around EUR 12-13/sqm (which have declined somewhat over the past
two years, from around EUR 14/sqm), the portfolio generates annualised rental income of c.EUR 15m.
Booked at a 5.6% yield (depressed by the low occupancy), the book value of the Prague offices stands
at EUR 262m.
Retail
Immofinanz owns 12 retail assets in the Czech Republic, with total GLA of just over 100k sqm. Apart
from a number of STOP.SHOP retail parks, the portfolio contains two shopping centres – one on the
outskirts of Prague (OC Park Hostivar, opened in October 2000, with 24k sqm of GLA), with the other
in the centre of Pardubice, a regional Czech city with c.90,000 inhabitants (OC Grand Pardubice, 15k
sqm of GLA, located in a historical building, reopened as a shopping centre in 1999 and extended in
2007). The latter, purchased by Immoeast in 2006 for CZK 750m (according to Czech news server
Motejlek.cz), suffers from the presence of Palac Pardubice, 21k sqm of GLA centre developed by AFI
in 2008, and subsequently purchased by Atrium in 2014. Also centrally located, AFI Palac has a
significantly better tenant mix and has gradually captured much of the shopping traffic in the city.
Consequently, the rental income has declined dramatically from the c.CZK 48m generated in FY07/08
to the CZK 28m recorded in FY14/15.
Its portfolio is generating monthly rents of around EUR 8/sqm, and is booked at EUR 132m, or a c.8%
gross rental yield.
Others
As of the end of 3Q15/16, Immofinanz had one project under development in the Czech Republic, with
a carrying amount of EUR 22m. In addition to this, there were two projects in the pipeline, jointly valued
at EUR 28m.
Immofinanz generates c.8% of its rental income in the Czech Republic. Offices account for slightly over
half of the rental income that the company generates in the country, with retail accounting for about
40%. The margin on asset management (to rental income) hovers at around 70%; yet again, at least in
part, this is likely the effect of the rather high office vacancy, which has stood at around 30% for the
past three quarters.
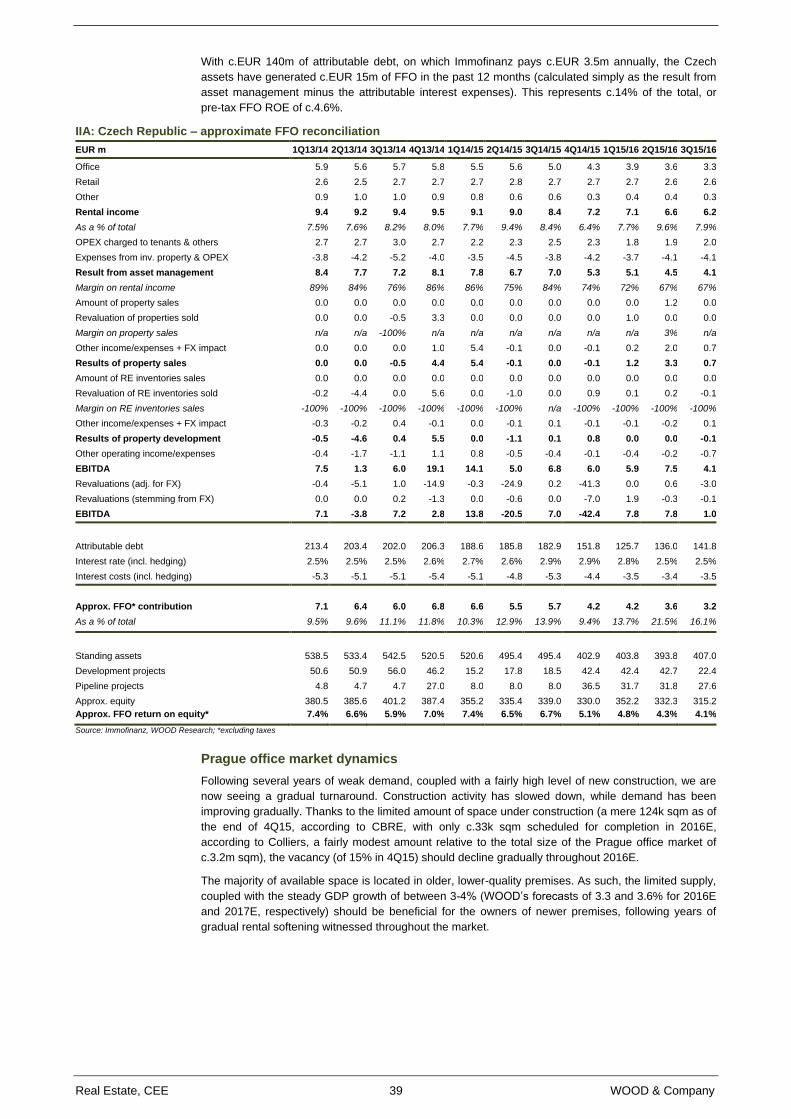
Real Estate, CEE 39 WOOD & Company
With c.EUR 140m of attributable debt, on which Immofinanz pays c.EUR 3.5m annually, the Czech
assets have generated c.EUR 15m of FFO in the past 12 months (calculated simply as the result from
asset management minus the attributable interest expenses). This represents c.14% of the total, or
pre-tax FFO ROE of c.4.6%.
IIA: Czech Republic – approximate FFO reconciliation
EUR m 1Q13/14 2Q13/14 3Q13/14 4Q13/14 1Q14/15 2Q14/15 3Q14/15 4Q14/15 1Q15/16 2Q15/16 3Q15/16
Office 5.9 5.6 5.7 5.8 5.5 5.6 5.0 4.3 3.9 3.6 3.3
Retail 2.6 2.5 2.7 2.7 2.7 2.8 2.7 2.7 2.7 2.6 2.6
Other 0.9 1.0 1.0 0.9 0.8 0.6 0.6 0.3 0.4 0.4 0.3
Rental income 9.4 9.2 9.4 9.5 9.1 9.0 8.4 7.2 7.1 6.6 6.2
As a % of total 7.5% 7.6% 8.2% 8.0% 7.7% 9.4% 8.4% 6.4% 7.7% 9.6% 7.9%
OPEX charged to tenants & others 2.7 2.7 3.0 2.7 2.2 2.3 2.5 2.3 1.8 1.9 2.0
Expenses from inv. property & OPEX -3.8 -4.2 -5.2 -4.0 -3.5 -4.5 -3.8 -4.2 -3.7 -4.1 -4.1
Result from asset management 8.4 7.7 7.2 8.1 7.8 6.7 7.0 5.3 5.1 4.5 4.1
Margin on rental income 89% 84% 76% 86% 86% 75% 84% 74% 72% 67% 67%
Amount of property sales 0.0 0.0 0.0 0.0 0.0 0.0 0.0 0.0 0.0 1.2 0.0
Revaluation of properties sold 0.0 0.0 -0.5 3.3 0.0 0.0 0.0 0.0 1.0 0.0 0.0
Margin on property sales n/a n/a -100% n/a n/a n/a n/a n/a n/a 3% n/a
Other income/expenses + FX impact 0.0 0.0 0.0 1.0 5.4 -0.1 0.0 -0.1 0.2 2.0 0.7
Results of property sales 0.0 0.0 -0.5 4.4 5.4 -0.1 0.0 -0.1 1.2 3.3 0.7
Amount of RE inventories sales 0.0 0.0 0.0 0.0 0.0 0.0 0.0 0.0 0.0 0.0 0.0
Revaluation of RE inventories sold -0.2 -4.4 0.0 5.6 0.0 -1.0 0.0 0.9 0.1 0.2 -0.1
Margin on RE inventories sales -100% -100% -100% -100% -100% -100% n/a -100% -100% -100% -100%
Other income/expenses + FX impact -0.3 -0.2 0.4 -0.1 0.0 -0.1 0.1 -0.1 -0.1 -0.2 0.1
Results of property development -0.5 -4.6 0.4 5.5 0.0 -1.1 0.1 0.8 0.0 0.0 -0.1
Other operating income/expenses -0.4 -1.7 -1.1 1.1 0.8 -0.5 -0.4 -0.1 -0.4 -0.2 -0.7
EBITDA 7.5 1.3 6.0 19.1 14.1 5.0 6.8 6.0 5.9 7.5 4.1
Revaluations (adj. for FX) -0.4 -5.1 1.0 -14.9 -0.3 -24.9 0.2 -41.3 0.0 0.6 -3.0
Revaluations (stemming from FX) 0.0 0.0 0.2 -1.3 0.0 -0.6 0.0 -7.0 1.9 -0.3 -0.1
EBITDA 7.1 -3.8 7.2 2.8 13.8 -20.5 7.0 -42.4 7.8 7.8 1.0
Attributable debt 213.4 203.4 202.0 206.3 188.6 185.8 182.9 151.8 125.7 136.0 141.8
Interest rate (incl. hedging) 2.5% 2.5% 2.5% 2.6% 2.7% 2.6% 2.9% 2.9% 2.8% 2.5% 2.5%
Interest costs (incl. hedging) -5.3 -5.1 -5.1 -5.4 -5.1 -4.8 -5.3 -4.4 -3.5 -3.4 -3.5
Approx. FFO* contribution 7.1 6.4 6.0 6.8 6.6 5.5 5.7 4.2 4.2 3.6 3.2
As a % of total 9.5% 9.6% 11.1% 11.8% 10.3% 12.9% 13.9% 9.4% 13.7% 21.5% 16.1%
Standing assets 538.5 533.4 542.5 520.5 520.6 495.4 495.4 402.9 403.8 393.8 407.0
Development projects 50.6 50.9 56.0 46.2 15.2 17.8 18.5 42.4 42.4 42.7 22.4
Pipeline projects 4.8 4.7 4.7 27.0 8.0 8.0 8.0 36.5 31.7 31.8 27.6
Approx. equity 380.5 385.6 401.2 387.4 355.2 335.4 339.0 330.0 352.2 332.3 315.2
Approx. FFO return on equity* 7.4% 6.6% 5.9% 7.0% 7.4% 6.5% 6.7% 5.1% 4.8% 4.3% 4.1%
Source: Immofinanz, WOOD Research; *excluding taxes
Prague office market dynamics
Following several years of weak demand, coupled with a fairly high level of new construction, we are
now seeing a gradual turnaround. Construction activity has slowed down, while demand has been
improving gradually. Thanks to the limited amount of space under construction (a mere 124k sqm as of
the end of 4Q15, according to CBRE, with only c.33k sqm scheduled for completion in 2016E,
according to Colliers, a fairly modest amount relative to the total size of the Prague office market of
c.3.2m sqm), the vacancy (of 15% in 4Q15) should decline gradually throughout 2016E.
The majority of available space is located in older, lower-quality premises. As such, the limited supply,
coupled with the steady GDP growth of between 3-4% (WOOD’s forecasts of 3.3 and 3.6% for 2016E
and 2017E, respectively) should be beneficial for the owners of newer premises, following years of
gradual rental softening witnessed throughout the market.
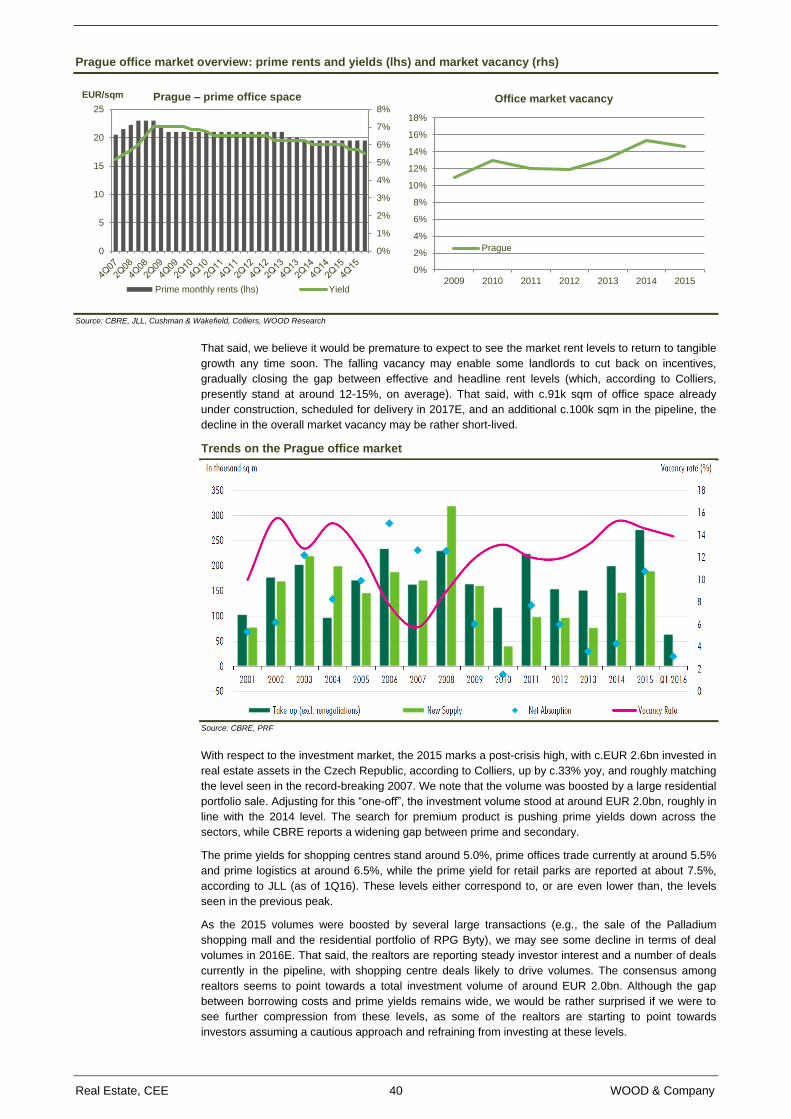
Real Estate, CEE 40 WOOD & Company
Prague office market overview: prime rents and yields (lhs) and market vacancy (rhs)
Source: CBRE, JLL, Cushman & Wakefield, Colliers, WOOD Research
That said, we believe it would be premature to expect to see the market rent levels to return to tangible
growth any time soon. The falling vacancy may enable some landlords to cut back on incentives,
gradually closing the gap between effective and headline rent levels (which, according to Colliers,
presently stand at around 12-15%, on average). That said, with c.91k sqm of office space already
under construction, scheduled for delivery in 2017E, and an additional c.100k sqm in the pipeline, the
decline in the overall market vacancy may be rather short-lived.
Trends on the Prague office market
Source: CBRE, PRF
With respect to the investment market, the 2015 marks a post-crisis high, with c.EUR 2.6bn invested in
real estate assets in the Czech Republic, according to Colliers, up by c.33% yoy, and roughly matching
the level seen in the record-breaking 2007. We note that the volume was boosted by a large residential
portfolio sale. Adjusting for this “one-off”, the investment volume stood at around EUR 2.0bn, roughly in
line with the 2014 level. The search for premium product is pushing prime yields down across the
sectors, while CBRE reports a widening gap between prime and secondary.
The prime yields for shopping centres stand around 5.0%, prime offices trade currently at around 5.5%
and prime logistics at around 6.5%, while the prime yield for retail parks are reported at about 7.5%,
according to JLL (as of 1Q16). These levels either correspond to, or are even lower than, the levels
seen in the previous peak.
As the 2015 volumes were boosted by several large transactions (e.g., the sale of the Palladium
shopping mall and the residential portfolio of RPG Byty), we may see some decline in terms of deal
volumes in 2016E. That said, the realtors are reporting steady investor interest and a number of deals
currently in the pipeline, with shopping centre deals likely to drive volumes. The consensus among
realtors seems to point towards a total investment volume of around EUR 2.0bn. Although the gap
between borrowing costs and prime yields remains wide, we would be rather surprised if we were to
see further compression from these levels, as some of the realtors are starting to point towards
investors assuming a cautious approach and refraining from investing at these levels.
0%
1%
2%
3%
4%
5%
6%
7%
8%
0
5
10
15
20
25
EUR/sqm Prague – prime office space
Prime monthly rents (lhs) Yield
0%
2%
4%
6%
8%
10%
12%
14%
16%
18%
2009 2010 2011 2012 2013 2014 2015
Office market vacancy
Prague
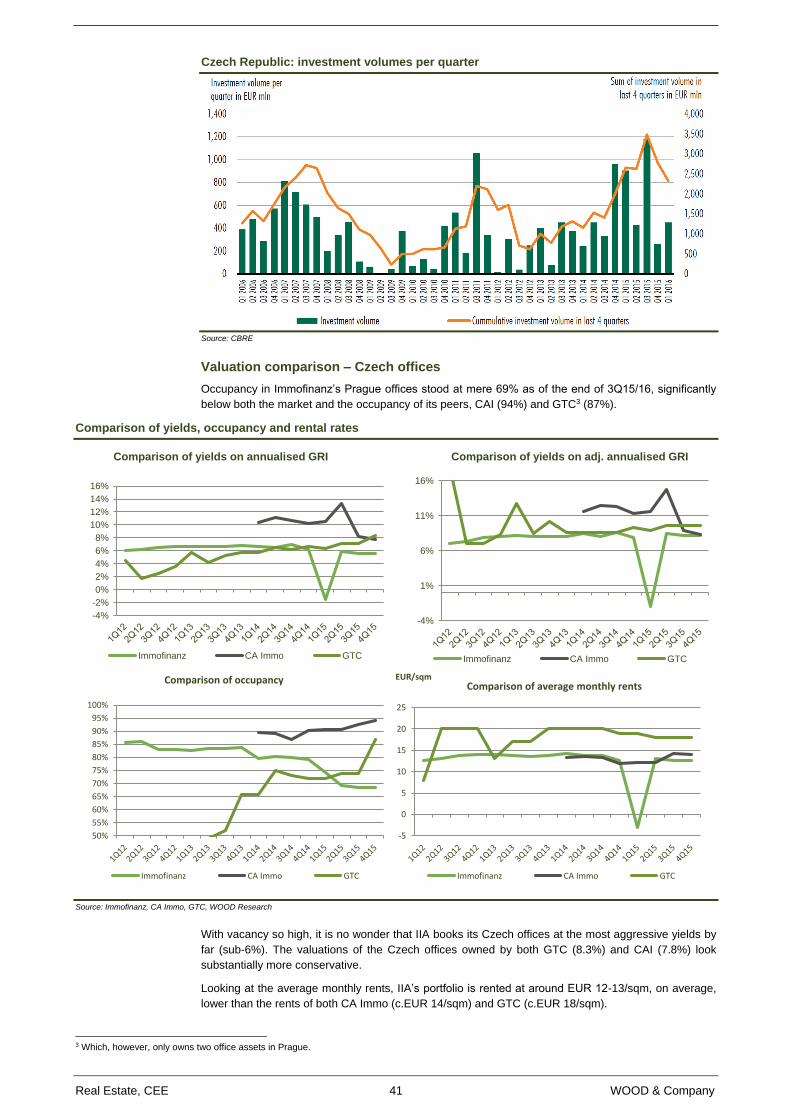
Real Estate, CEE 41 WOOD & Company
Czech Republic: investment volumes per quarter
Source: CBRE
Valuation comparison – Czech offices
Occupancy in Immofinanz’s Prague offices stood at mere 69% as of the end of 3Q15/16, significantly
below both the market and the occupancy of its peers, CAI (94%) and GTC3 (87%).
Comparison of yields, occupancy and rental rates
Source: Immofinanz, CA Immo, GTC, WOOD Research
With vacancy so high, it is no wonder that IIA books its Czech offices at the most aggressive yields by
far (sub-6%). The valuations of the Czech offices owned by both GTC (8.3%) and CAI (7.8%) look
substantially more conservative.
Looking at the average monthly rents, IIA’s portfolio is rented at around EUR 12-13/sqm, on average,
lower than the rents of both CA Immo (c.EUR 14/sqm) and GTC (c.EUR 18/sqm).
3 Which, however, only owns two office assets in Prague.
-4%
-2%
0%
2%
4%
6%
8%
10%
12%
14%
16%
Comparison of yields on annualised GRI
Immofinanz CA Immo GTC
-4%
1%
6%
11%
16%
Comparison of yields on adj. annualised GRI
Immofinanz CA Immo GTC
50%
55%
60%
65%
70%
75%
80%
85%
90%
95%
100%
Comparison of occupancy
Immofinanz CA Immo GTC
-5
0
5
10
15
20
25
EUR/sqmComparison of average monthly rents
Immofinanz CA Immo GTC

Real Estate, CEE 42 WOOD & Company
Valuation comparison: Czech offices
1Q12 2Q12 3Q12 4Q12 1Q13 2Q13 3Q13 4Q13 1Q14 2Q14 3Q14 4Q14 1Q15 2Q15 3Q15 4Q15
GTC
Number of assets 2 2 2 2 2 2 2 2 2 2 2 2 2 2 2 2
GLA ('000 sqm) 11 11 11 11 11 11 11 11 11 11 11 11 11 11 11 11
BV (EUR m) 8 20 20 20 13 17 17 20 20 20 20 19 19 18 18 18
Rental income (EUR m) 0.3 0.6 0.9 1.1 0.8 1.1 1.2 1.7 1.7 2.0 1.9 1.8 1.8 1.7 1.7 2.0
Average monthly rent 8.0 20.0 20.0 20.0 13.0 17.0 17.0 20.0 20.0 20.0 20.0 19.0 19.0 18.0 18.0 18.0
Average occupancy 25% 25% 36% 43% 45% 49% 52% 66% 66% 75% 73% 72% 72% 74% 74% 87%
Gross rental yield 4.5% 1.8% 2.6% 3.6% 5.8% 4.1% 5.3% 5.7% 5.7% 6.5% 6.3% 6.7% 6.4% 7.1% 7.1% 8.3%
Gross rental yield (adj.)* 18.1% 7.1% 7.1% 8.4% 12.8% 8.4% 10.1% 8.7% 8.7% 8.7% 8.6% 9.3% 8.9% 9.6% 9.6% 9.6%
Immofinanz***
Number of assets 16 16 15 13 13 13 13 13 12 12 12 12 10 10 9 9
GLA ('000 sqm) 213 213 214 190 190 190 190 190 191 191 191 190 148 148 143 143
BV (EUR m) 458.9 458.9 453.9 396.4 392.4 392.4 388.5 389 387.1 387.2 364.5 364.5 271.2 272.2 262.3 262.3
Rental income (EUR m) 27.6 28.8 29.6 26.4 26.4 26.4 26.0 26.4 26.0 25.2 25.2 22.8 -4.0 16.0 14.8 14.8
Average monthly rent 12.6 13.1 13.9 13.9 14.0 13.9 13.7 13.9 14.2 13.7 13.8 12.6 -3.0 13.0 12.5 12.5
Average occupancy 86% 86% 83% 83% 83% 84% 84% 84% 80% 80% 80% 79% 74% 69% 69% 69%
Gross rental yield 6.0% 6.3% 6.5% 6.7% 6.7% 6.7% 6.7% 6.8% 6.7% 6.5% 6.9% 6.3% -1.5% 5.9% 5.6% 5.6%
Gross rental yield (adj.)* 7.0% 7.3% 7.9% 8.0% 8.1% 8.1% 8.0% 8.1% 8.4% 8.1% 8.7% 7.9% -2.0% 8.5% 8.2% 8.2%
CAI Immo**
Number of assets
n/a n/a n/a n/a n/a n/a n/a n/a
GLA ('000 sqm)
42 42 42 27 27 27 112 112
BV (EUR m)
58 55 55 34 34 27 213.6 227.5
Rental income (EUR m)
6.0 6.1 5.9 3.5 3.6 3.6 17.6 17.8
Average monthly rent
13.3 13.5 13.4 11.8 12.1 12.1 14.2 14.1
Average occupancy
90% 89% 87% 90% 91% 91% 93% 94%
Gross rental yield
10.3% 11.1% 10.7% 10.3% 10.6% 13.3% 8.2% 7.8%
Gross rental yield (adj.)* 11.5% 12.4% 12.3% 11.4% 11.7% 14.7% 8.9% 8.3%
CBRE
Prime yield 6.3% 6.3% 6.3% 6.3% 6.3% 6.2% 6.2% 6.0% 6.0% 6.0% 6.0% 6.0% 6.0% 6.0% 6.0% 5.8%
Yield difference (bps)
IIA vs. GTC 148 450 396 306 96 259 143 106 99 0 63 -42 -790 -120 -143 -268
IIA vs. CAI n/a n/a n/a n/a n/a n/a n/a n/a -363 -458 -381 -404 -1206 -746 -260 -218
CAI vs. GTC n/a n/a n/a n/a n/a n/a n/a n/a 462 459 444 362 416 626 116 -50
IIA vs. CBRE -24 3 27 41 48 58 54 79 72 51 91 26 -747 -12 -36 -11
CAI vs. CBRE n/a n/a n/a n/a n/a n/a n/a n/a 434 509 473 429 459 733 224 207
Adjusted difference (bps)
IIA vs. GTC -1111 19 75 -37 -470 -38 -211 -56 -23 -57 6 -138 -1091 -107 -134 -134
IIA vs. CAI n/a n/a n/a n/a n/a n/a n/a n/a -311 -431 -368 -351 -1367 -622 -68 -8
CAI vs. GTC n/a n/a n/a n/a n/a n/a n/a n/a 287 375 374 213 276 515 -66 -126
IIA vs. CBRE 77 105 161 175 188 191 186 211 244 210 266 189 -799 249 223 248
CAI vs. CBRE n/a n/a n/a n/a n/a n/a n/a n/a 555 642 634 540 569 872 291 256
Source: GTC, Immofinanz, CA Immo, CBRE, WOOD Research; *we adjust the gross rental yield under the assumption of unchanged BV and monthly rent per sqm, while increasing occupancy to 100%; **we include data for CA Immo for fully consolidated properties only; ***for Immofinanz, we include the best comparable period, i.e., under 4Q15, we present the data Immofinanz reported during 3Q15/16 (period from November 2015 to January 2016), etc.
Retail market overview
With thriving retail sales and strong economic growth, the positive sentiment on the Czech retail market
continues. The investment market is busy with deals, and the pricing has reached historical highs, with
deals priced just north of a 5% yield being closed even outside of Prague.
The 3.75m sqm retail market is rather saturated, with average retail space density of 205 sqm per
1,000 inhabitants, according to JLL. As such, the number of new greenfield developments is limited,
and JLL expects only 50k and 72k sqm of new retail space to be delivered in 2016E and 2017E,
respectively, in the Czech Republic.
CBRE notes that not all the centres are benefiting to the same degree from the supportive
macroeconomic backdrop, with regionally dominant schemes continually improving their positions. This
is underlined by the trends in rents, where the prime centres are seeing rental growth, while the rent
levels in secondary and tertiary spaces are rather stable.
In the charts and tables below, we compare the Czech retail portfolios of Atrium, Immofinanz and GTC.
GTC owns a third of Galerie Harfa, a 41.5k sqm GLA shopping centre located in Prague. The
occupancy has been hovering between 90-95% in recent quarters, while the average rent level
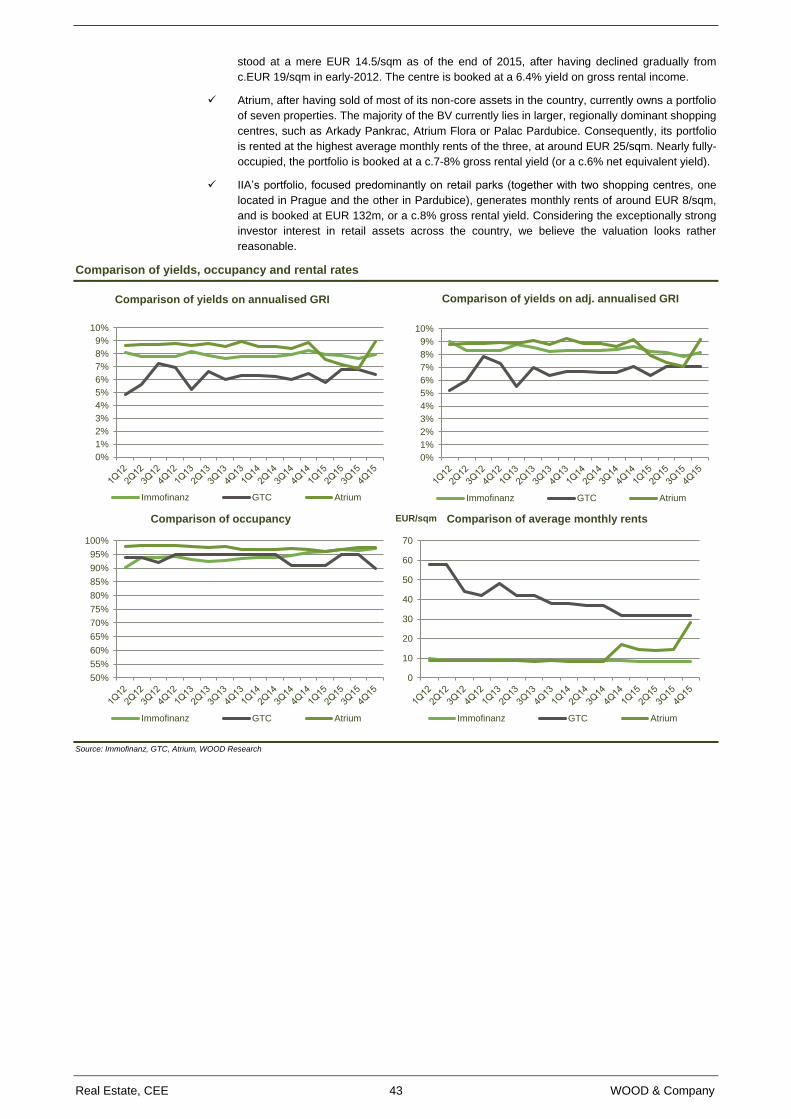
Real Estate, CEE 43 WOOD & Company
stood at a mere EUR 14.5/sqm as of the end of 2015, after having declined gradually from
c.EUR 19/sqm in early-2012. The centre is booked at a 6.4% yield on gross rental income.
Atrium, after having sold of most of its non-core assets in the country, currently owns a portfolio
of seven properties. The majority of the BV currently lies in larger, regionally dominant shopping
centres, such as Arkady Pankrac, Atrium Flora or Palac Pardubice. Consequently, its portfolio
is rented at the highest average monthly rents of the three, at around EUR 25/sqm. Nearly fully-
occupied, the portfolio is booked at a c.7-8% gross rental yield (or a c.6% net equivalent yield).
IIA’s portfolio, focused predominantly on retail parks (together with two shopping centres, one
located in Prague and the other in Pardubice), generates monthly rents of around EUR 8/sqm,
and is booked at EUR 132m, or a c.8% gross rental yield. Considering the exceptionally strong
investor interest in retail assets across the country, we believe the valuation looks rather
reasonable.
Comparison of yields, occupancy and rental rates
Source: Immofinanz, GTC, Atrium, WOOD Research
0%
1%
2%
3%
4%
5%
6%
7%
8%
9%
10%
Comparison of yields on annualised GRI
Immofinanz GTC Atrium
0%
1%
2%
3%
4%
5%
6%
7%
8%
9%
10%
Comparison of yields on adj. annualised GRI
Immofinanz GTC Atrium
50%
55%
60%
65%
70%
75%
80%
85%
90%
95%
100%
Comparison of occupancy
Immofinanz GTC Atrium
0
10
20
30
40
50
60
70
EUR/sqm Comparison of average monthly rents
Immofinanz GTC Atrium
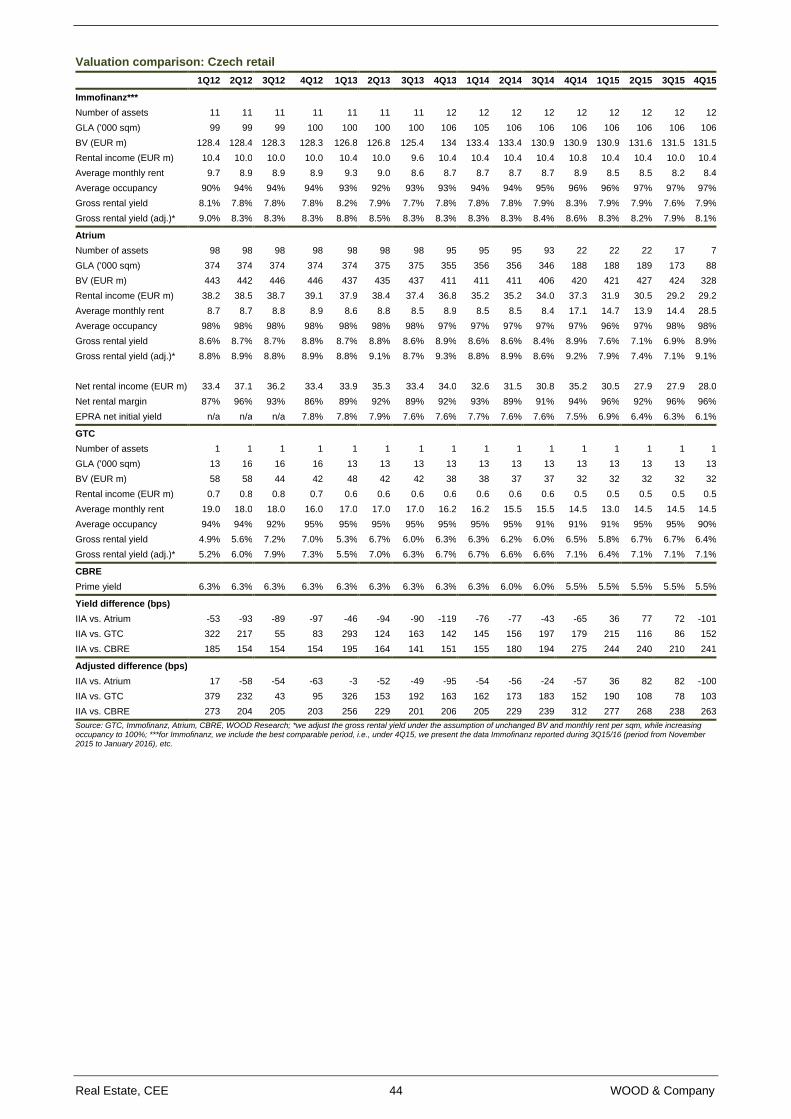
Real Estate, CEE 44 WOOD & Company
Valuation comparison: Czech retail
1Q12 2Q12 3Q12 4Q12 1Q13 2Q13 3Q13 4Q13 1Q14 2Q14 3Q14 4Q14 1Q15 2Q15 3Q15 4Q15
Immofinanz***
Number of assets 11 11 11 11 11 11 11 12 12 12 12 12 12 12 12 12
GLA ('000 sqm) 99 99 99 100 100 100 100 106 105 106 106 106 106 106 106 106
BV (EUR m) 128.4 128.4 128.3 128.3 126.8 126.8 125.4 134 133.4 133.4 130.9 130.9 130.9 131.6 131.5 131.5
Rental income (EUR m) 10.4 10.0 10.0 10.0 10.4 10.0 9.6 10.4 10.4 10.4 10.4 10.8 10.4 10.4 10.0 10.4
Average monthly rent 9.7 8.9 8.9 8.9 9.3 9.0 8.6 8.7 8.7 8.7 8.7 8.9 8.5 8.5 8.2 8.4
Average occupancy 90% 94% 94% 94% 93% 92% 93% 93% 94% 94% 95% 96% 96% 97% 97% 97%
Gross rental yield 8.1% 7.8% 7.8% 7.8% 8.2% 7.9% 7.7% 7.8% 7.8% 7.8% 7.9% 8.3% 7.9% 7.9% 7.6% 7.9%
Gross rental yield (adj.)* 9.0% 8.3% 8.3% 8.3% 8.8% 8.5% 8.3% 8.3% 8.3% 8.3% 8.4% 8.6% 8.3% 8.2% 7.9% 8.1%
Atrium
Number of assets 98 98 98 98 98 98 98 95 95 95 93 22 22 22 17 7
GLA ('000 sqm) 374 374 374 374 374 375 375 355 356 356 346 188 188 189 173 88
BV (EUR m) 443 442 446 446 437 435 437 411 411 411 406 420 421 427 424 328
Rental income (EUR m) 38.2 38.5 38.7 39.1 37.9 38.4 37.4 36.8 35.2 35.2 34.0 37.3 31.9 30.5 29.2 29.2
Average monthly rent 8.7 8.7 8.8 8.9 8.6 8.8 8.5 8.9 8.5 8.5 8.4 17.1 14.7 13.9 14.4 28.5
Average occupancy 98% 98% 98% 98% 98% 98% 98% 97% 97% 97% 97% 97% 96% 97% 98% 98%
Gross rental yield 8.6% 8.7% 8.7% 8.8% 8.7% 8.8% 8.6% 8.9% 8.6% 8.6% 8.4% 8.9% 7.6% 7.1% 6.9% 8.9%
Gross rental yield (adj.)* 8.8% 8.9% 8.8% 8.9% 8.8% 9.1% 8.7% 9.3% 8.8% 8.9% 8.6% 9.2% 7.9% 7.4% 7.1% 9.1%
Net rental income (EUR m) 33.4 37.1 36.2 33.4 33.9 35.3 33.4 34.0 32.6 31.5 30.8 35.2 30.5 27.9 27.9 28.0
Net rental margin 87% 96% 93% 86% 89% 92% 89% 92% 93% 89% 91% 94% 96% 92% 96% 96%
EPRA net initial yield n/a n/a n/a 7.8% 7.8% 7.9% 7.6% 7.6% 7.7% 7.6% 7.6% 7.5% 6.9% 6.4% 6.3% 6.1%
GTC
Number of assets 1 1 1 1 1 1 1 1 1 1 1 1 1 1 1 1
GLA ('000 sqm) 13 16 16 16 13 13 13 13 13 13 13 13 13 13 13 13
BV (EUR m) 58 58 44 42 48 42 42 38 38 37 37 32 32 32 32 32
Rental income (EUR m) 0.7 0.8 0.8 0.7 0.6 0.6 0.6 0.6 0.6 0.6 0.6 0.5 0.5 0.5 0.5 0.5
Average monthly rent 19.0 18.0 18.0 16.0 17.0 17.0 17.0 16.2 16.2 15.5 15.5 14.5 13.0 14.5 14.5 14.5
Average occupancy 94% 94% 92% 95% 95% 95% 95% 95% 95% 95% 91% 91% 91% 95% 95% 90%
Gross rental yield 4.9% 5.6% 7.2% 7.0% 5.3% 6.7% 6.0% 6.3% 6.3% 6.2% 6.0% 6.5% 5.8% 6.7% 6.7% 6.4%
Gross rental yield (adj.)* 5.2% 6.0% 7.9% 7.3% 5.5% 7.0% 6.3% 6.7% 6.7% 6.6% 6.6% 7.1% 6.4% 7.1% 7.1% 7.1%
CBRE
Prime yield 6.3% 6.3% 6.3% 6.3% 6.3% 6.3% 6.3% 6.3% 6.3% 6.0% 6.0% 5.5% 5.5% 5.5% 5.5% 5.5%
Yield difference (bps)
IIA vs. Atrium -53 -93 -89 -97 -46 -94 -90 -119 -76 -77 -43 -65 36 77 72 -101
IIA vs. GTC 322 217 55 83 293 124 163 142 145 156 197 179 215 116 86 152
IIA vs. CBRE 185 154 154 154 195 164 141 151 155 180 194 275 244 240 210 241
Adjusted difference (bps)
IIA vs. Atrium 17 -58 -54 -63 -3 -52 -49 -95 -54 -56 -24 -57 36 82 82 -100
IIA vs. GTC 379 232 43 95 326 153 192 163 162 173 183 152 190 108 78 103
IIA vs. CBRE 273 204 205 203 256 229 201 206 205 229 239 312 277 268 238 263
Source: GTC, Immofinanz, Atrium, CBRE, WOOD Research; *we adjust the gross rental yield under the assumption of unchanged BV and monthly rent per sqm, while increasing occupancy to 100%; ***for Immofinanz, we include the best comparable period, i.e., under 4Q15, we present the data Immofinanz reported during 3Q15/16 (period from November 2015 to January 2016), etc.
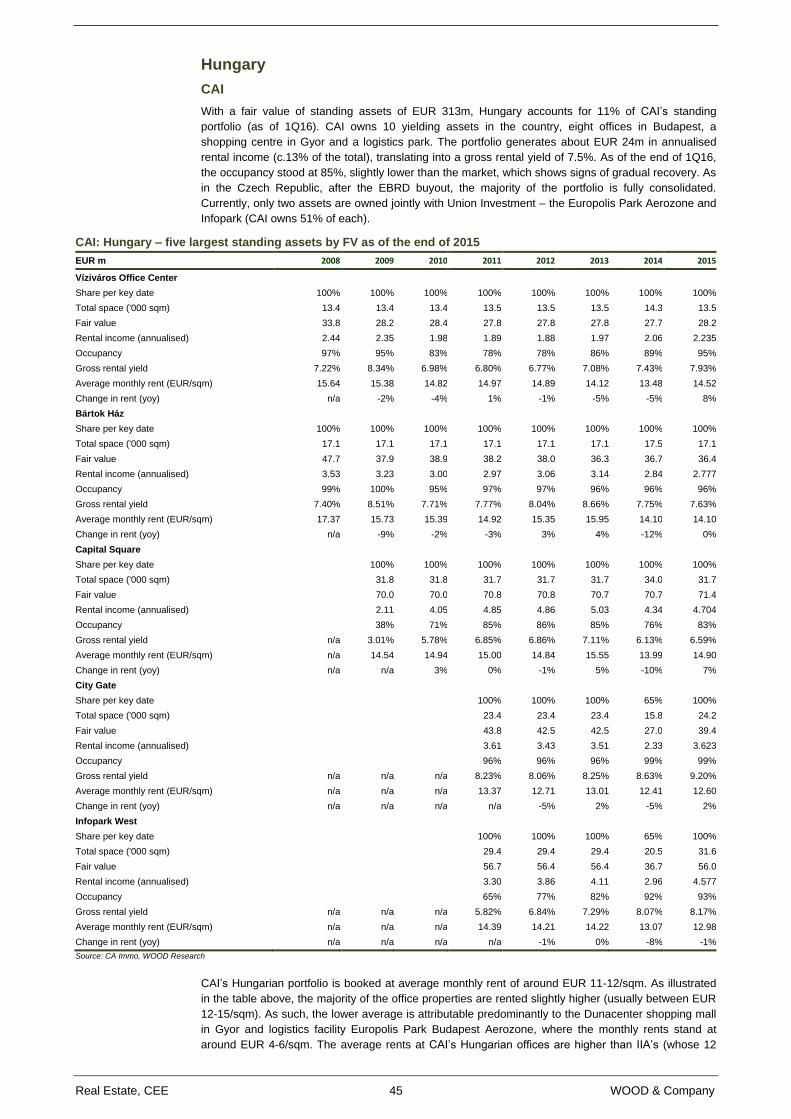
Real Estate, CEE 45 WOOD & Company
Hungary
CAI
With a fair value of standing assets of EUR 313m, Hungary accounts for 11% of CAI’s standing
portfolio (as of 1Q16). CAI owns 10 yielding assets in the country, eight offices in Budapest, a
shopping centre in Gyor and a logistics park. The portfolio generates about EUR 24m in annualised
rental income (c.13% of the total), translating into a gross rental yield of 7.5%. As of the end of 1Q16,
the occupancy stood at 85%, slightly lower than the market, which shows signs of gradual recovery. As
in the Czech Republic, after the EBRD buyout, the majority of the portfolio is fully consolidated.
Currently, only two assets are owned jointly with Union Investment – the Europolis Park Aerozone and
Infopark (CAI owns 51% of each).
CAI: Hungary – five largest standing assets by FV as of the end of 2015
EUR m 2008 2009 2010 2011 2012 2013 2014 2015
Víziváros Office Center
Share per key date 100% 100% 100% 100% 100% 100% 100% 100%
Total space ('000 sqm) 13.4 13.4 13.4 13.5 13.5 13.5 14.3 13.5
Fair value 33.8 28.2 28.4 27.8 27.8 27.8 27.7 28.2
Rental income (annualised) 2.44 2.35 1.98 1.89 1.88 1.97 2.06 2.235
Occupancy 97% 95% 83% 78% 78% 86% 89% 95%
Gross rental yield 7.22% 8.34% 6.98% 6.80% 6.77% 7.08% 7.43% 7.93%
Average monthly rent (EUR/sqm) 15.64 15.38 14.82 14.97 14.89 14.12 13.48 14.52
Change in rent (yoy) n/a -2% -4% 1% -1% -5% -5% 8%
Bártok Ház
Share per key date 100% 100% 100% 100% 100% 100% 100% 100%
Total space ('000 sqm) 17.1 17.1 17.1 17.1 17.1 17.1 17.5 17.1
Fair value 47.7 37.9 38.9 38.2 38.0 36.3 36.7 36.4
Rental income (annualised) 3.53 3.23 3.00 2.97 3.06 3.14 2.84 2.777
Occupancy 99% 100% 95% 97% 97% 96% 96% 96%
Gross rental yield 7.40% 8.51% 7.71% 7.77% 8.04% 8.66% 7.75% 7.63%
Average monthly rent (EUR/sqm) 17.37 15.73 15.39 14.92 15.35 15.95 14.10 14.10
Change in rent (yoy) n/a -9% -2% -3% 3% 4% -12% 0%
Capital Square
Share per key date
100% 100% 100% 100% 100% 100% 100%
Total space ('000 sqm)
31.8 31.8 31.7 31.7 31.7 34.0 31.7
Fair value
70.0 70.0 70.8 70.8 70.7 70.7 71.4
Rental income (annualised)
2.11 4.05 4.85 4.86 5.03 4.34 4.704
Occupancy
38% 71% 85% 86% 85% 76% 83%
Gross rental yield n/a 3.01% 5.78% 6.85% 6.86% 7.11% 6.13% 6.59%
Average monthly rent (EUR/sqm) n/a 14.54 14.94 15.00 14.84 15.55 13.99 14.90
Change in rent (yoy) n/a n/a 3% 0% -1% 5% -10% 7%
City Gate
Share per key date
100% 100% 100% 65% 100%
Total space ('000 sqm)
23.4 23.4 23.4 15.8 24.2
Fair value
43.8 42.5 42.5 27.0 39.4
Rental income (annualised)
3.61 3.43 3.51 2.33 3.623
Occupancy
96% 96% 96% 99% 99%
Gross rental yield n/a n/a n/a 8.23% 8.06% 8.25% 8.63% 9.20%
Average monthly rent (EUR/sqm) n/a n/a n/a 13.37 12.71 13.01 12.41 12.60
Change in rent (yoy) n/a n/a n/a n/a -5% 2% -5% 2%
Infopark West
Share per key date
100% 100% 100% 65% 100%
Total space ('000 sqm)
29.4 29.4 29.4 20.5 31.6
Fair value
56.7 56.4 56.4 36.7 56.0
Rental income (annualised)
3.30 3.86 4.11 2.96 4.577
Occupancy
65% 77% 82% 92% 93%
Gross rental yield n/a n/a n/a 5.82% 6.84% 7.29% 8.07% 8.17%
Average monthly rent (EUR/sqm) n/a n/a n/a 14.39 14.21 14.22 13.07 12.98
Change in rent (yoy) n/a n/a n/a n/a -1% 0% -8% -1%
Source: CA Immo, WOOD Research
CAI’s Hungarian portfolio is booked at average monthly rent of around EUR 11-12/sqm. As illustrated
in the table above, the majority of the office properties are rented slightly higher (usually between EUR
12-15/sqm). As such, the lower average is attributable predominantly to the Dunacenter shopping mall
in Gyor and logistics facility Europolis Park Budapest Aerozone, where the monthly rents stand at
around EUR 4-6/sqm. The average rents at CAI’s Hungarian offices are higher than IIA’s (whose 12
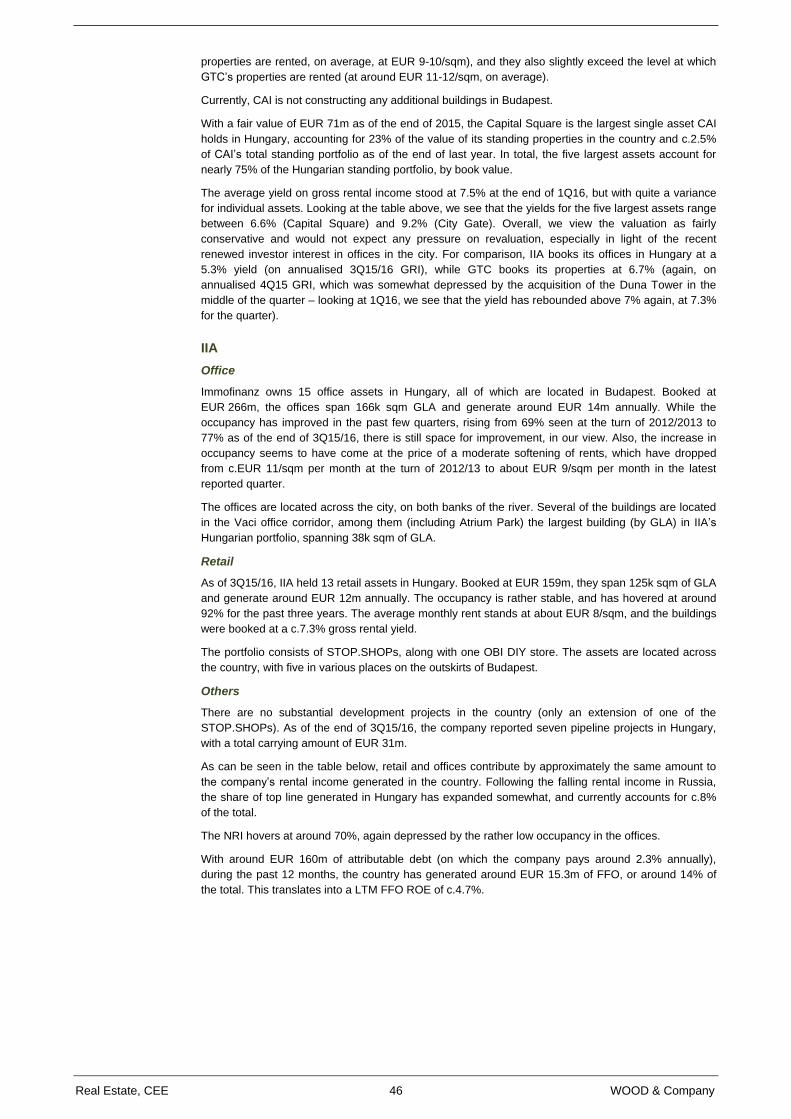
Real Estate, CEE 46 WOOD & Company
properties are rented, on average, at EUR 9-10/sqm), and they also slightly exceed the level at which
GTC’s properties are rented (at around EUR 11-12/sqm, on average).
Currently, CAI is not constructing any additional buildings in Budapest.
With a fair value of EUR 71m as of the end of 2015, the Capital Square is the largest single asset CAI
holds in Hungary, accounting for 23% of the value of its standing properties in the country and c.2.5%
of CAI’s total standing portfolio as of the end of last year. In total, the five largest assets account for
nearly 75% of the Hungarian standing portfolio, by book value.
The average yield on gross rental income stood at 7.5% at the end of 1Q16, but with quite a variance
for individual assets. Looking at the table above, we see that the yields for the five largest assets range
between 6.6% (Capital Square) and 9.2% (City Gate). Overall, we view the valuation as fairly
conservative and would not expect any pressure on revaluation, especially in light of the recent
renewed investor interest in offices in the city. For comparison, IIA books its offices in Hungary at a
5.3% yield (on annualised 3Q15/16 GRI), while GTC books its properties at 6.7% (again, on
annualised 4Q15 GRI, which was somewhat depressed by the acquisition of the Duna Tower in the
middle of the quarter – looking at 1Q16, we see that the yield has rebounded above 7% again, at 7.3%
for the quarter).
IIA
Office
Immofinanz owns 15 office assets in Hungary, all of which are located in Budapest. Booked at
EUR 266m, the offices span 166k sqm GLA and generate around EUR 14m annually. While the
occupancy has improved in the past few quarters, rising from 69% seen at the turn of 2012/2013 to
77% as of the end of 3Q15/16, there is still space for improvement, in our view. Also, the increase in
occupancy seems to have come at the price of a moderate softening of rents, which have dropped
from c.EUR 11/sqm per month at the turn of 2012/13 to about EUR 9/sqm per month in the latest
reported quarter.
The offices are located across the city, on both banks of the river. Several of the buildings are located
in the Vaci office corridor, among them (including Atrium Park) the largest building (by GLA) in IIA’s
Hungarian portfolio, spanning 38k sqm of GLA.
Retail
As of 3Q15/16, IIA held 13 retail assets in Hungary. Booked at EUR 159m, they span 125k sqm of GLA
and generate around EUR 12m annually. The occupancy is rather stable, and has hovered at around
92% for the past three years. The average monthly rent stands at about EUR 8/sqm, and the buildings
were booked at a c.7.3% gross rental yield.
The portfolio consists of STOP.SHOPs, along with one OBI DIY store. The assets are located across
the country, with five in various places on the outskirts of Budapest.
Others
There are no substantial development projects in the country (only an extension of one of the
STOP.SHOPs). As of the end of 3Q15/16, the company reported seven pipeline projects in Hungary,
with a total carrying amount of EUR 31m.
As can be seen in the table below, retail and offices contribute by approximately the same amount to
the company’s rental income generated in the country. Following the falling rental income in Russia,
the share of top line generated in Hungary has expanded somewhat, and currently accounts for c.8%
of the total.
The NRI hovers at around 70%, again depressed by the rather low occupancy in the offices.
With around EUR 160m of attributable debt (on which the company pays around 2.3% annually),
during the past 12 months, the country has generated around EUR 15.3m of FFO, or around 14% of
the total. This translates into a LTM FFO ROE of c.4.7%.
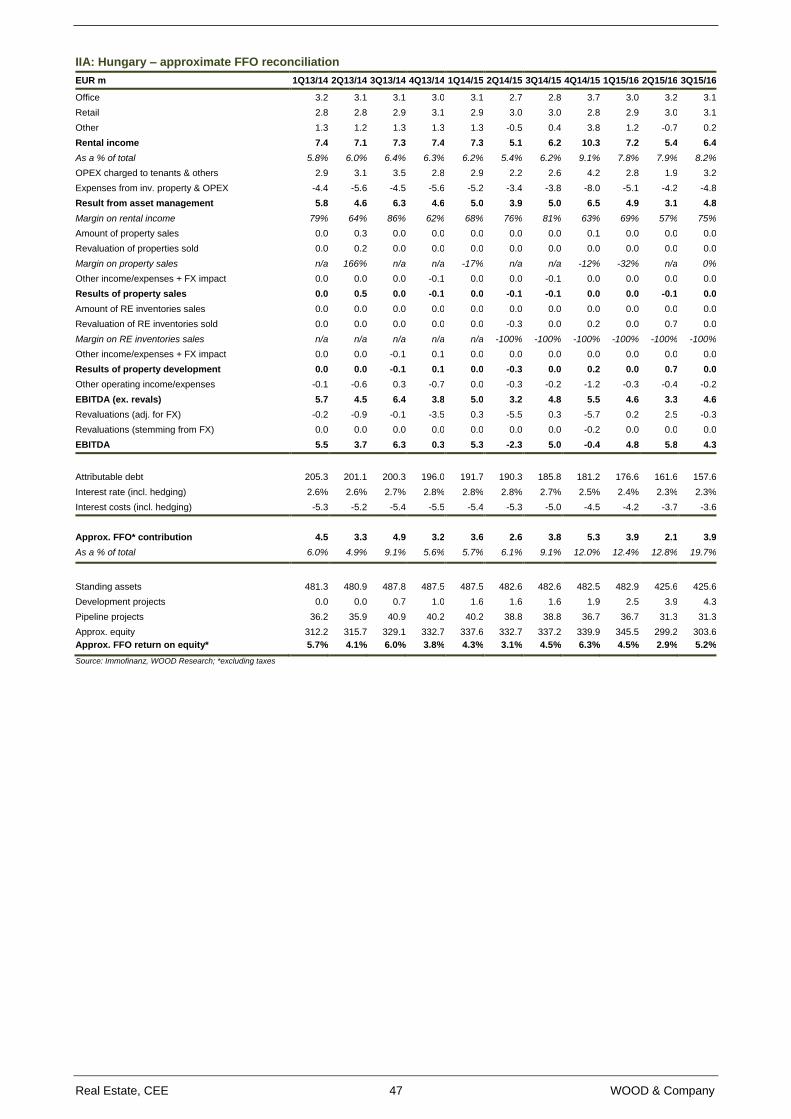
Real Estate, CEE 47 WOOD & Company
IIA: Hungary – approximate FFO reconciliation
EUR m 1Q13/14 2Q13/14 3Q13/14 4Q13/14 1Q14/15 2Q14/15 3Q14/15 4Q14/15 1Q15/16 2Q15/16 3Q15/16
Office 3.2 3.1 3.1 3.0 3.1 2.7 2.8 3.7 3.0 3.2 3.1
Retail 2.8 2.8 2.9 3.1 2.9 3.0 3.0 2.8 2.9 3.0 3.1
Other 1.3 1.2 1.3 1.3 1.3 -0.5 0.4 3.8 1.2 -0.7 0.2
Rental income 7.4 7.1 7.3 7.4 7.3 5.1 6.2 10.3 7.2 5.4 6.4
As a % of total 5.8% 6.0% 6.4% 6.3% 6.2% 5.4% 6.2% 9.1% 7.8% 7.9% 8.2%
OPEX charged to tenants & others 2.9 3.1 3.5 2.8 2.9 2.2 2.6 4.2 2.8 1.9 3.2
Expenses from inv. property & OPEX -4.4 -5.6 -4.5 -5.6 -5.2 -3.4 -3.8 -8.0 -5.1 -4.2 -4.8
Result from asset management 5.8 4.6 6.3 4.6 5.0 3.9 5.0 6.5 4.9 3.1 4.8
Margin on rental income 79% 64% 86% 62% 68% 76% 81% 63% 69% 57% 75%
Amount of property sales 0.0 0.3 0.0 0.0 0.0 0.0 0.0 0.1 0.0 0.0 0.0
Revaluation of properties sold 0.0 0.2 0.0 0.0 0.0 0.0 0.0 0.0 0.0 0.0 0.0
Margin on property sales n/a 166% n/a n/a -17% n/a n/a -12% -32% n/a 0%
Other income/expenses + FX impact 0.0 0.0 0.0 -0.1 0.0 0.0 -0.1 0.0 0.0 0.0 0.0
Results of property sales 0.0 0.5 0.0 -0.1 0.0 -0.1 -0.1 0.0 0.0 -0.1 0.0
Amount of RE inventories sales 0.0 0.0 0.0 0.0 0.0 0.0 0.0 0.0 0.0 0.0 0.0
Revaluation of RE inventories sold 0.0 0.0 0.0 0.0 0.0 -0.3 0.0 0.2 0.0 0.7 0.0
Margin on RE inventories sales n/a n/a n/a n/a n/a -100% -100% -100% -100% -100% -100%
Other income/expenses + FX impact 0.0 0.0 -0.1 0.1 0.0 0.0 0.0 0.0 0.0 0.0 0.0
Results of property development 0.0 0.0 -0.1 0.1 0.0 -0.3 0.0 0.2 0.0 0.7 0.0
Other operating income/expenses -0.1 -0.6 0.3 -0.7 0.0 -0.3 -0.2 -1.2 -0.3 -0.4 -0.2
EBITDA (ex. revals) 5.7 4.5 6.4 3.8 5.0 3.2 4.8 5.5 4.6 3.3 4.6
Revaluations (adj. for FX) -0.2 -0.9 -0.1 -3.5 0.3 -5.5 0.3 -5.7 0.2 2.5 -0.3
Revaluations (stemming from FX) 0.0 0.0 0.0 0.0 0.0 0.0 0.0 -0.2 0.0 0.0 0.0
EBITDA 5.5 3.7 6.3 0.3 5.3 -2.3 5.0 -0.4 4.8 5.8 4.3
Attributable debt 205.3 201.1 200.3 196.0 191.7 190.3 185.8 181.2 176.6 161.6 157.6
Interest rate (incl. hedging) 2.6% 2.6% 2.7% 2.8% 2.8% 2.8% 2.7% 2.5% 2.4% 2.3% 2.3%
Interest costs (incl. hedging) -5.3 -5.2 -5.4 -5.5 -5.4 -5.3 -5.0 -4.5 -4.2 -3.7 -3.6
Approx. FFO* contribution 4.5 3.3 4.9 3.2 3.6 2.6 3.8 5.3 3.9 2.1 3.9
As a % of total 6.0% 4.9% 9.1% 5.6% 5.7% 6.1% 9.1% 12.0% 12.4% 12.8% 19.7%
Standing assets 481.3 480.9 487.8 487.5 487.5 482.6 482.6 482.5 482.9 425.6 425.6
Development projects 0.0 0.0 0.7 1.0 1.6 1.6 1.6 1.9 2.5 3.9 4.3
Pipeline projects 36.2 35.9 40.9 40.2 40.2 38.8 38.8 36.7 36.7 31.3 31.3
Approx. equity 312.2 315.7 329.1 332.7 337.6 332.7 337.2 339.9 345.5 299.2 303.6
Approx. FFO return on equity* 5.7% 4.1% 6.0% 3.8% 4.3% 3.1% 4.5% 6.3% 4.5% 2.9% 5.2%
Source: Immofinanz, WOOD Research; *excluding taxes
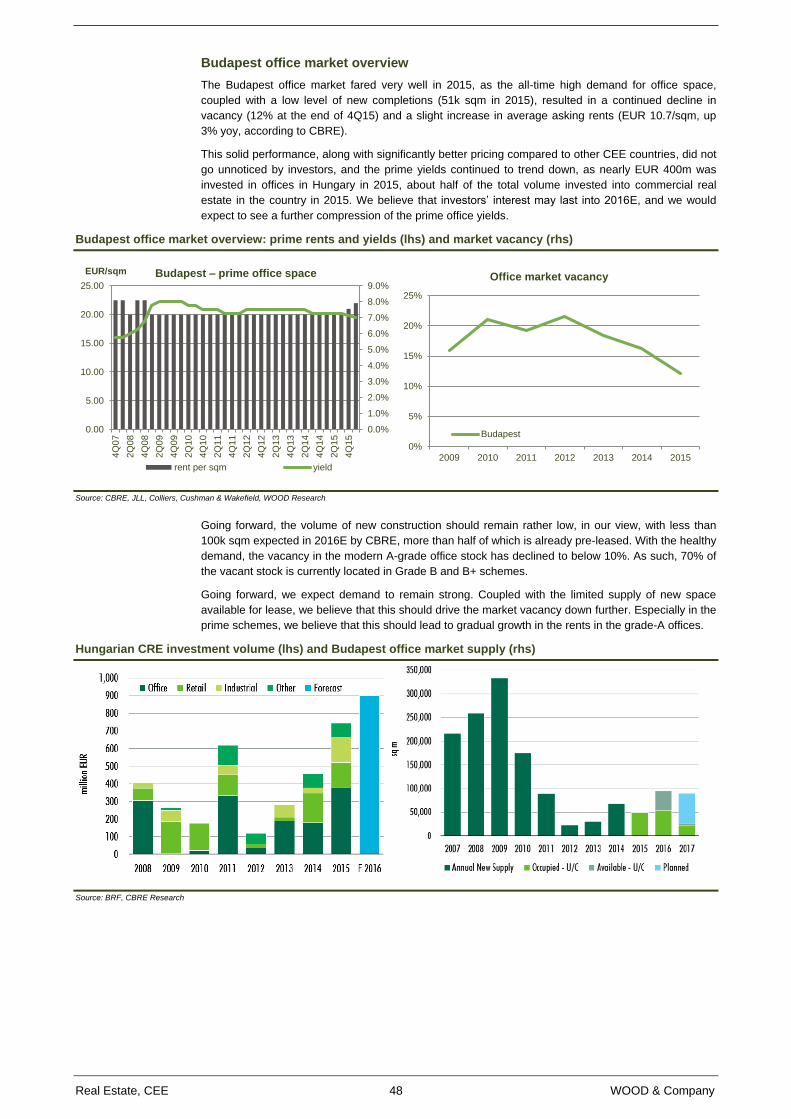
Real Estate, CEE 48 WOOD & Company
Budapest office market overview
The Budapest office market fared very well in 2015, as the all-time high demand for office space,
coupled with a low level of new completions (51k sqm in 2015), resulted in a continued decline in
vacancy (12% at the end of 4Q15) and a slight increase in average asking rents (EUR 10.7/sqm, up
3% yoy, according to CBRE).
This solid performance, along with significantly better pricing compared to other CEE countries, did not
go unnoticed by investors, and the prime yields continued to trend down, as nearly EUR 400m was
invested in offices in Hungary in 2015, about half of the total volume invested into commercial real
estate in the country in 2015. We believe that investors’ interest may last into 2016E, and we would
expect to see a further compression of the prime office yields.
Budapest office market overview: prime rents and yields (lhs) and market vacancy (rhs)
Source: CBRE, JLL, Colliers, Cushman & Wakefield, WOOD Research
Going forward, the volume of new construction should remain rather low, in our view, with less than
100k sqm expected in 2016E by CBRE, more than half of which is already pre-leased. With the healthy
demand, the vacancy in the modern A-grade office stock has declined to below 10%. As such, 70% of
the vacant stock is currently located in Grade B and B+ schemes.
Going forward, we expect demand to remain strong. Coupled with the limited supply of new space
available for lease, we believe that this should drive the market vacancy down further. Especially in the
prime schemes, we believe that this should lead to gradual growth in the rents in the grade-A offices.
Hungarian CRE investment volume (lhs) and Budapest office market supply (rhs)
Source: BRF, CBRE Research
0.0%
1.0%
2.0%
3.0%
4.0%
5.0%
6.0%
7.0%
8.0%
9.0%
0.00
5.00
10.00
15.00
20.00
25.00
4Q
07
2Q
08
4Q
08
2Q
09
4Q
09
2Q
10
4Q
10
2Q
11
4Q
11
2Q
12
4Q
12
2Q
13
4Q
13
2Q
14
4Q
14
2Q
15
4Q
15
EUR/sqm Budapest – prime office space
rent per sqm yield
0%
5%
10%
15%
20%
25%
2009 2010 2011 2012 2013 2014 2015
Office market vacancy
Budapest
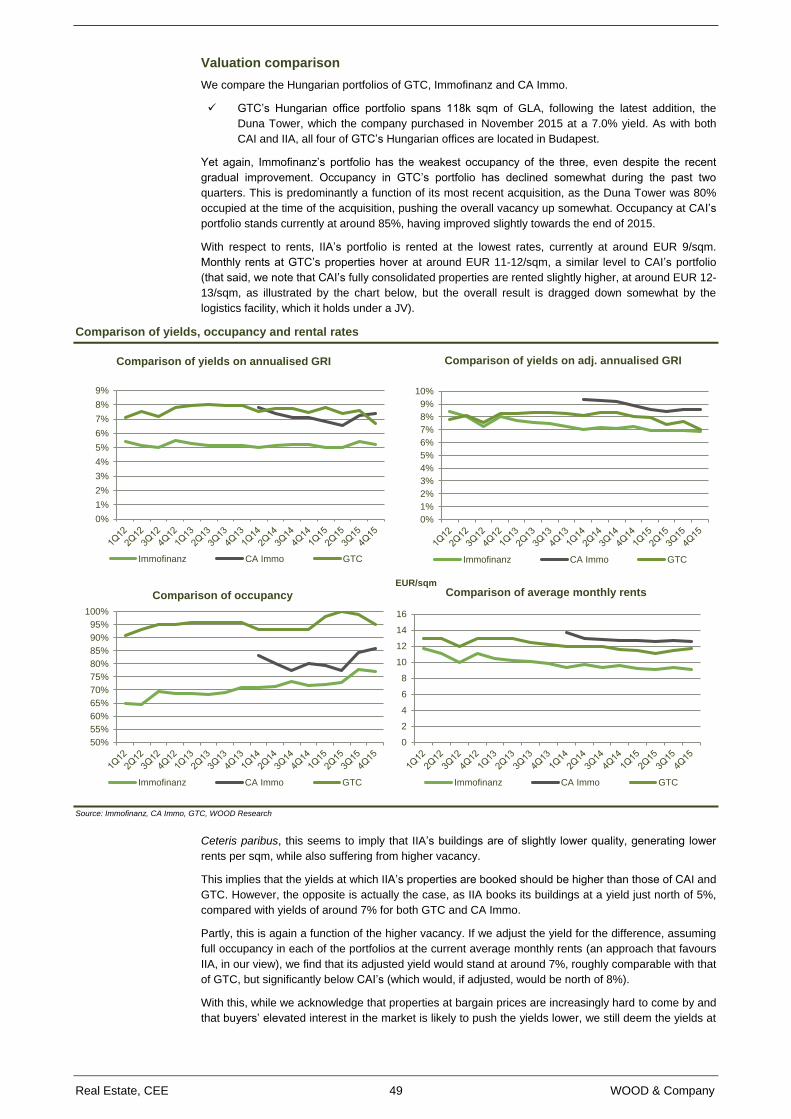
Real Estate, CEE 49 WOOD & Company
Valuation comparison
We compare the Hungarian portfolios of GTC, Immofinanz and CA Immo.
GTC’s Hungarian office portfolio spans 118k sqm of GLA, following the latest addition, the
Duna Tower, which the company purchased in November 2015 at a 7.0% yield. As with both
CAI and IIA, all four of GTC’s Hungarian offices are located in Budapest.
Yet again, Immofinanz’s portfolio has the weakest occupancy of the three, even despite the recent
gradual improvement. Occupancy in GTC’s portfolio has declined somewhat during the past two
quarters. This is predominantly a function of its most recent acquisition, as the Duna Tower was 80%
occupied at the time of the acquisition, pushing the overall vacancy up somewhat. Occupancy at CAI’s
portfolio stands currently at around 85%, having improved slightly towards the end of 2015.
With respect to rents, IIA’s portfolio is rented at the lowest rates, currently at around EUR 9/sqm.
Monthly rents at GTC’s properties hover at around EUR 11-12/sqm, a similar level to CAI’s portfolio
(that said, we note that CAI’s fully consolidated properties are rented slightly higher, at around EUR 12-
13/sqm, as illustrated by the chart below, but the overall result is dragged down somewhat by the
logistics facility, which it holds under a JV).
Comparison of yields, occupancy and rental rates
Source: Immofinanz, CA Immo, GTC, WOOD Research
Ceteris paribus, this seems to imply that IIA’s buildings are of slightly lower quality, generating lower
rents per sqm, while also suffering from higher vacancy.
This implies that the yields at which IIA’s properties are booked should be higher than those of CAI and
GTC. However, the opposite is actually the case, as IIA books its buildings at a yield just north of 5%,
compared with yields of around 7% for both GTC and CA Immo.
Partly, this is again a function of the higher vacancy. If we adjust the yield for the difference, assuming
full occupancy in each of the portfolios at the current average monthly rents (an approach that favours
IIA, in our view), we find that its adjusted yield would stand at around 7%, roughly comparable with that
of GTC, but significantly below CAI’s (which would, if adjusted, would be north of 8%).
With this, while we acknowledge that properties at bargain prices are increasingly hard to come by and
that buyers’ elevated interest in the market is likely to push the yields lower, we still deem the yields at
0%
1%
2%
3%
4%
5%
6%
7%
8%
9%
Comparison of yields on annualised GRI
Immofinanz CA Immo GTC
0%
1%
2%
3%
4%
5%
6%
7%
8%
9%
10%
Comparison of yields on adj. annualised GRI
Immofinanz CA Immo GTC
50%
55%
60%
65%
70%
75%
80%
85%
90%
95%
100%
Comparison of occupancy
Immofinanz CA Immo GTC
0
2
4
6
8
10
12
14
16
EUR/sqmComparison of average monthly rents
Immofinanz CA Immo GTC
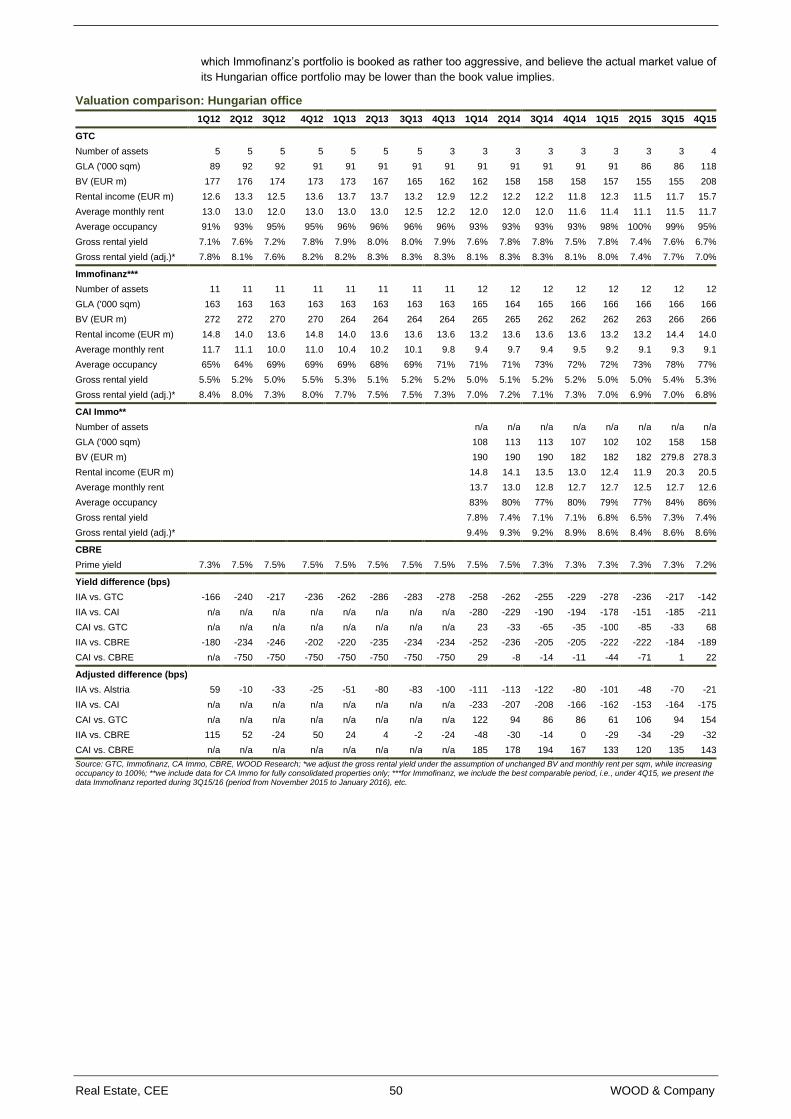
Real Estate, CEE 50 WOOD & Company
which Immofinanz’s portfolio is booked as rather too aggressive, and believe the actual market value of
its Hungarian office portfolio may be lower than the book value implies.
Valuation comparison: Hungarian office
1Q12 2Q12 3Q12 4Q12 1Q13 2Q13 3Q13 4Q13 1Q14 2Q14 3Q14 4Q14 1Q15 2Q15 3Q15 4Q15
GTC
Number of assets 5 5 5 5 5 5 5 3 3 3 3 3 3 3 3 4
GLA ('000 sqm) 89 92 92 91 91 91 91 91 91 91 91 91 91 86 86 118
BV (EUR m) 177 176 174 173 173 167 165 162 162 158 158 158 157 155 155 208
Rental income (EUR m) 12.6 13.3 12.5 13.6 13.7 13.7 13.2 12.9 12.2 12.2 12.2 11.8 12.3 11.5 11.7 15.7
Average monthly rent 13.0 13.0 12.0 13.0 13.0 13.0 12.5 12.2 12.0 12.0 12.0 11.6 11.4 11.1 11.5 11.7
Average occupancy 91% 93% 95% 95% 96% 96% 96% 96% 93% 93% 93% 93% 98% 100% 99% 95%
Gross rental yield 7.1% 7.6% 7.2% 7.8% 7.9% 8.0% 8.0% 7.9% 7.6% 7.8% 7.8% 7.5% 7.8% 7.4% 7.6% 6.7%
Gross rental yield (adj.)* 7.8% 8.1% 7.6% 8.2% 8.2% 8.3% 8.3% 8.3% 8.1% 8.3% 8.3% 8.1% 8.0% 7.4% 7.7% 7.0%
Immofinanz***
Number of assets 11 11 11 11 11 11 11 11 12 12 12 12 12 12 12 12
GLA ('000 sqm) 163 163 163 163 163 163 163 163 165 164 165 166 166 166 166 166
BV (EUR m) 272 272 270 270 264 264 264 264 265 265 262 262 262 263 266 266
Rental income (EUR m) 14.8 14.0 13.6 14.8 14.0 13.6 13.6 13.6 13.2 13.6 13.6 13.6 13.2 13.2 14.4 14.0
Average monthly rent 11.7 11.1 10.0 11.0 10.4 10.2 10.1 9.8 9.4 9.7 9.4 9.5 9.2 9.1 9.3 9.1
Average occupancy 65% 64% 69% 69% 69% 68% 69% 71% 71% 71% 73% 72% 72% 73% 78% 77%
Gross rental yield 5.5% 5.2% 5.0% 5.5% 5.3% 5.1% 5.2% 5.2% 5.0% 5.1% 5.2% 5.2% 5.0% 5.0% 5.4% 5.3%
Gross rental yield (adj.)* 8.4% 8.0% 7.3% 8.0% 7.7% 7.5% 7.5% 7.3% 7.0% 7.2% 7.1% 7.3% 7.0% 6.9% 7.0% 6.8%
CAI Immo**
Number of assets
n/a n/a n/a n/a n/a n/a n/a n/a
GLA ('000 sqm)
108 113 113 107 102 102 158 158
BV (EUR m)
190 190 190 182 182 182 279.8 278.3
Rental income (EUR m)
14.8 14.1 13.5 13.0 12.4 11.9 20.3 20.5
Average monthly rent
13.7 13.0 12.8 12.7 12.7 12.5 12.7 12.6
Average occupancy
83% 80% 77% 80% 79% 77% 84% 86%
Gross rental yield
7.8% 7.4% 7.1% 7.1% 6.8% 6.5% 7.3% 7.4%
Gross rental yield (adj.)* 9.4% 9.3% 9.2% 8.9% 8.6% 8.4% 8.6% 8.6%
CBRE
Prime yield 7.3% 7.5% 7.5% 7.5% 7.5% 7.5% 7.5% 7.5% 7.5% 7.5% 7.3% 7.3% 7.3% 7.3% 7.3% 7.2%
Yield difference (bps)
IIA vs. GTC -166 -240 -217 -236 -262 -286 -283 -278 -258 -262 -255 -229 -278 -236 -217 -142
IIA vs. CAI n/a n/a n/a n/a n/a n/a n/a n/a -280 -229 -190 -194 -178 -151 -185 -211
CAI vs. GTC n/a n/a n/a n/a n/a n/a n/a n/a 23 -33 -65 -35 -100 -85 -33 68
IIA vs. CBRE -180 -234 -246 -202 -220 -235 -234 -234 -252 -236 -205 -205 -222 -222 -184 -189
CAI vs. CBRE n/a -750 -750 -750 -750 -750 -750 -750 29 -8 -14 -11 -44 -71 1 22
Adjusted difference (bps)
IIA vs. Alstria 59 -10 -33 -25 -51 -80 -83 -100 -111 -113 -122 -80 -101 -48 -70 -21
IIA vs. CAI n/a n/a n/a n/a n/a n/a n/a n/a -233 -207 -208 -166 -162 -153 -164 -175
CAI vs. GTC n/a n/a n/a n/a n/a n/a n/a n/a 122 94 86 86 61 106 94 154
IIA vs. CBRE 115 52 -24 50 24 4 -2 -24 -48 -30 -14 0 -29 -34 -29 -32
CAI vs. CBRE n/a n/a n/a n/a n/a n/a n/a n/a 185 178 194 167 133 120 135 143
Source: GTC, Immofinanz, CA Immo, CBRE, WOOD Research; *we adjust the gross rental yield under the assumption of unchanged BV and monthly rent per sqm, while increasing occupancy to 100%; **we include data for CA Immo for fully consolidated properties only; ***for Immofinanz, we include the best comparable period, i.e., under 4Q15, we present the data Immofinanz reported during 3Q15/16 (period from November 2015 to January 2016), etc.
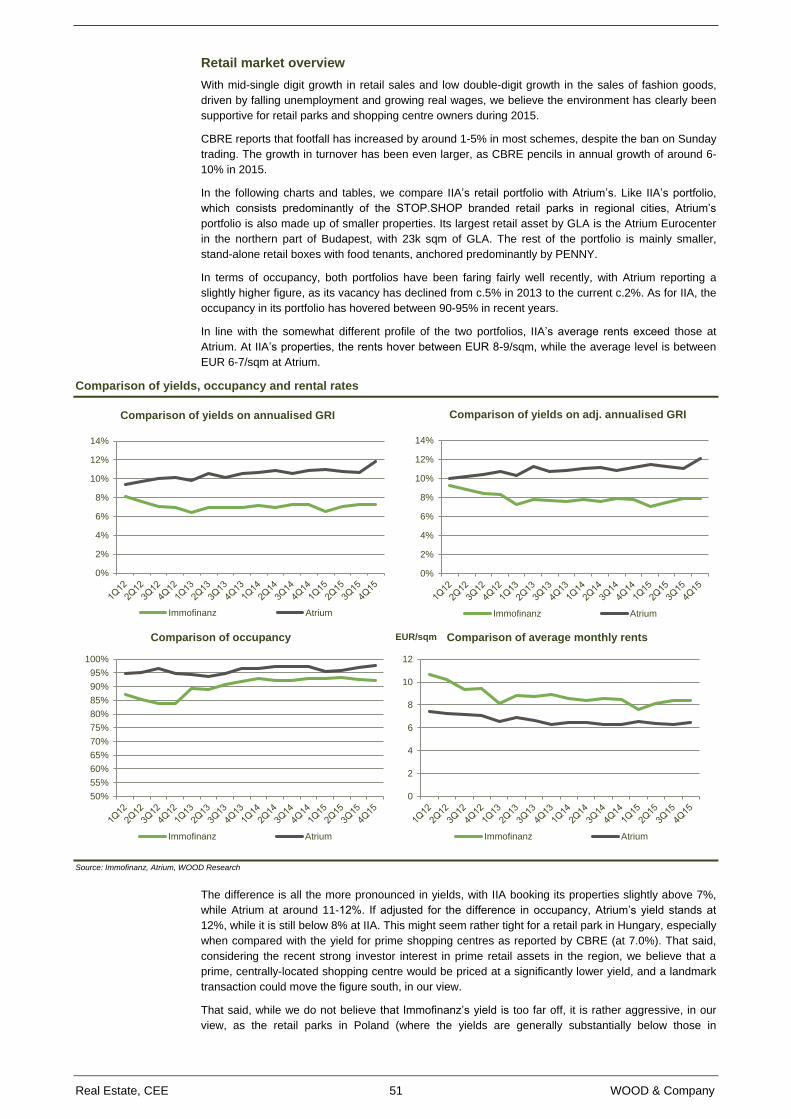
Real Estate, CEE 51 WOOD & Company
Retail market overview
With mid-single digit growth in retail sales and low double-digit growth in the sales of fashion goods,
driven by falling unemployment and growing real wages, we believe the environment has clearly been
supportive for retail parks and shopping centre owners during 2015.
CBRE reports that footfall has increased by around 1-5% in most schemes, despite the ban on Sunday
trading. The growth in turnover has been even larger, as CBRE pencils in annual growth of around 6-
10% in 2015.
In the following charts and tables, we compare IIA’s retail portfolio with Atrium’s. Like IIA’s portfolio,
which consists predominantly of the STOP.SHOP branded retail parks in regional cities, Atrium’s
portfolio is also made up of smaller properties. Its largest retail asset by GLA is the Atrium Eurocenter
in the northern part of Budapest, with 23k sqm of GLA. The rest of the portfolio is mainly smaller,
stand-alone retail boxes with food tenants, anchored predominantly by PENNY.
In terms of occupancy, both portfolios have been faring fairly well recently, with Atrium reporting a
slightly higher figure, as its vacancy has declined from c.5% in 2013 to the current c.2%. As for IIA, the
occupancy in its portfolio has hovered between 90-95% in recent years.
In line with the somewhat different profile of the two portfolios, IIA’s average rents exceed those at
Atrium. At IIA’s properties, the rents hover between EUR 8-9/sqm, while the average level is between
EUR 6-7/sqm at Atrium.
Comparison of yields, occupancy and rental rates
Source: Immofinanz, Atrium, WOOD Research
The difference is all the more pronounced in yields, with IIA booking its properties slightly above 7%,
while Atrium at around 11-12%. If adjusted for the difference in occupancy, Atrium’s yield stands at
12%, while it is still below 8% at IIA. This might seem rather tight for a retail park in Hungary, especially
when compared with the yield for prime shopping centres as reported by CBRE (at 7.0%). That said,
considering the recent strong investor interest in prime retail assets in the region, we believe that a
prime, centrally-located shopping centre would be priced at a significantly lower yield, and a landmark
transaction could move the figure south, in our view.
That said, while we do not believe that Immofinanz’s yield is too far off, it is rather aggressive, in our
view, as the retail parks in Poland (where the yields are generally substantially below those in
0%
2%
4%
6%
8%
10%
12%
14%
Comparison of yields on annualised GRI
Immofinanz Atrium
0%
2%
4%
6%
8%
10%
12%
14%
Comparison of yields on adj. annualised GRI
Immofinanz Atrium
50%
55%
60%
65%
70%
75%
80%
85%
90%
95%
100%
Comparison of occupancy
Immofinanz Atrium
0
2
4
6
8
10
12
EUR/sqm Comparison of average monthly rents
Immofinanz Atrium
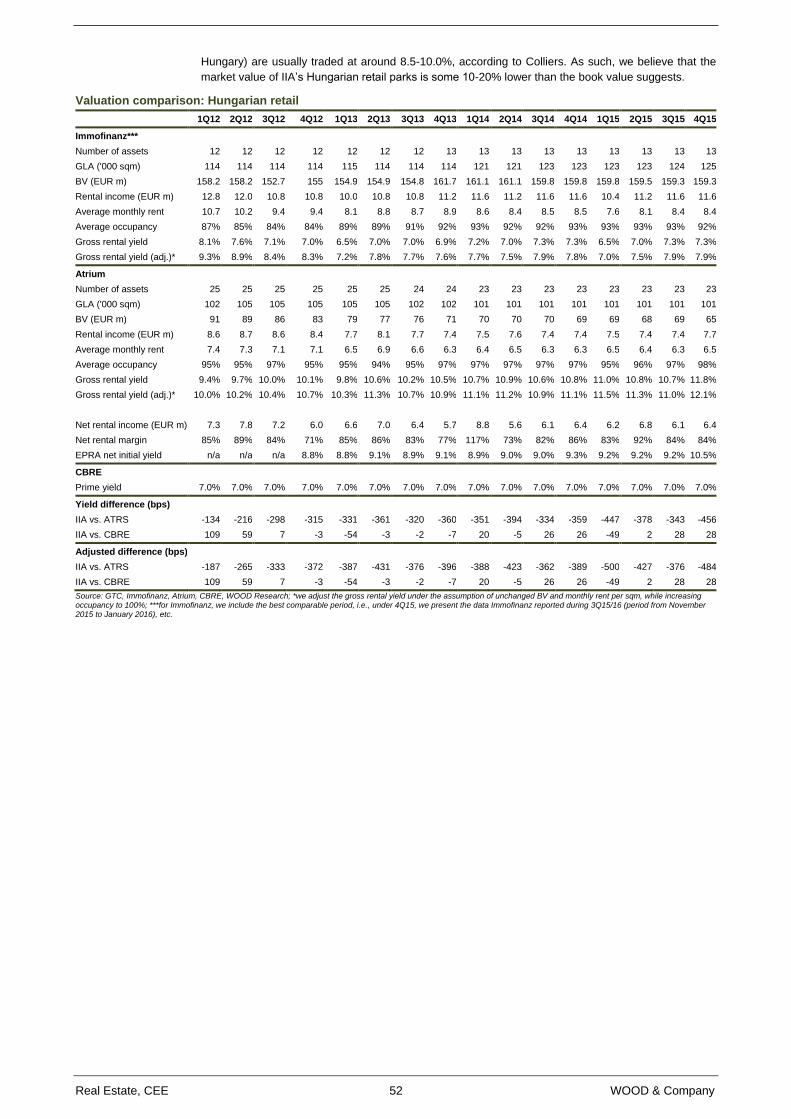
Real Estate, CEE 52 WOOD & Company
Hungary) are usually traded at around 8.5-10.0%, according to Colliers. As such, we believe that the
market value of IIA’s Hungarian retail parks is some 10-20% lower than the book value suggests.
Valuation comparison: Hungarian retail
1Q12 2Q12 3Q12 4Q12 1Q13 2Q13 3Q13 4Q13 1Q14 2Q14 3Q14 4Q14 1Q15 2Q15 3Q15 4Q15
Immofinanz***
Number of assets 12 12 12 12 12 12 12 13 13 13 13 13 13 13 13 13
GLA ('000 sqm) 114 114 114 114 115 114 114 114 121 121 123 123 123 123 124 125
BV (EUR m) 158.2 158.2 152.7 155 154.9 154.9 154.8 161.7 161.1 161.1 159.8 159.8 159.8 159.5 159.3 159.3
Rental income (EUR m) 12.8 12.0 10.8 10.8 10.0 10.8 10.8 11.2 11.6 11.2 11.6 11.6 10.4 11.2 11.6 11.6
Average monthly rent 10.7 10.2 9.4 9.4 8.1 8.8 8.7 8.9 8.6 8.4 8.5 8.5 7.6 8.1 8.4 8.4
Average occupancy 87% 85% 84% 84% 89% 89% 91% 92% 93% 92% 92% 93% 93% 93% 93% 92%
Gross rental yield 8.1% 7.6% 7.1% 7.0% 6.5% 7.0% 7.0% 6.9% 7.2% 7.0% 7.3% 7.3% 6.5% 7.0% 7.3% 7.3%
Gross rental yield (adj.)* 9.3% 8.9% 8.4% 8.3% 7.2% 7.8% 7.7% 7.6% 7.7% 7.5% 7.9% 7.8% 7.0% 7.5% 7.9% 7.9%
Atrium
Number of assets 25 25 25 25 25 25 24 24 23 23 23 23 23 23 23 23
GLA ('000 sqm) 102 105 105 105 105 105 102 102 101 101 101 101 101 101 101 101
BV (EUR m) 91 89 86 83 79 77 76 71 70 70 70 69 69 68 69 65
Rental income (EUR m) 8.6 8.7 8.6 8.4 7.7 8.1 7.7 7.4 7.5 7.6 7.4 7.4 7.5 7.4 7.4 7.7
Average monthly rent 7.4 7.3 7.1 7.1 6.5 6.9 6.6 6.3 6.4 6.5 6.3 6.3 6.5 6.4 6.3 6.5
Average occupancy 95% 95% 97% 95% 95% 94% 95% 97% 97% 97% 97% 97% 95% 96% 97% 98%
Gross rental yield 9.4% 9.7% 10.0% 10.1% 9.8% 10.6% 10.2% 10.5% 10.7% 10.9% 10.6% 10.8% 11.0% 10.8% 10.7% 11.8%
Gross rental yield (adj.)* 10.0% 10.2% 10.4% 10.7% 10.3% 11.3% 10.7% 10.9% 11.1% 11.2% 10.9% 11.1% 11.5% 11.3% 11.0% 12.1%
Net rental income (EUR m) 7.3 7.8 7.2 6.0 6.6 7.0 6.4 5.7 8.8 5.6 6.1 6.4 6.2 6.8 6.1 6.4
Net rental margin 85% 89% 84% 71% 85% 86% 83% 77% 117% 73% 82% 86% 83% 92% 84% 84%
EPRA net initial yield n/a n/a n/a 8.8% 8.8% 9.1% 8.9% 9.1% 8.9% 9.0% 9.0% 9.3% 9.2% 9.2% 9.2% 10.5%
CBRE
Prime yield 7.0% 7.0% 7.0% 7.0% 7.0% 7.0% 7.0% 7.0% 7.0% 7.0% 7.0% 7.0% 7.0% 7.0% 7.0% 7.0%
Yield difference (bps)
IIA vs. ATRS -134 -216 -298 -315 -331 -361 -320 -360 -351 -394 -334 -359 -447 -378 -343 -456
IIA vs. CBRE 109 59 7 -3 -54 -3 -2 -7 20 -5 26 26 -49 2 28 28
Adjusted difference (bps)
IIA vs. ATRS -187 -265 -333 -372 -387 -431 -376 -396 -388 -423 -362 -389 -500 -427 -376 -484
IIA vs. CBRE 109 59 7 -3 -54 -3 -2 -7 20 -5 26 26 -49 2 28 28
Source: GTC, Immofinanz, Atrium, CBRE, WOOD Research; *we adjust the gross rental yield under the assumption of unchanged BV and monthly rent per sqm, while increasing occupancy to 100%; ***for Immofinanz, we include the best comparable period, i.e., under 4Q15, we present the data Immofinanz reported during 3Q15/16 (period from November 2015 to January 2016), etc.
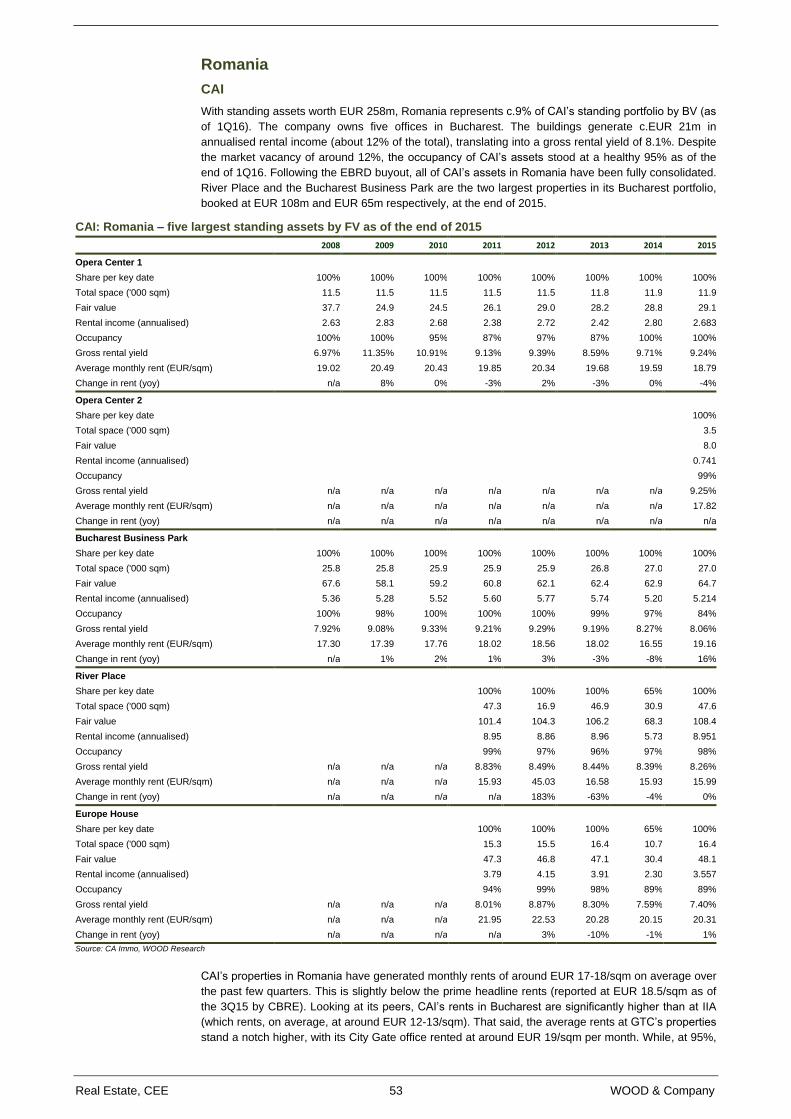
Real Estate, CEE 53 WOOD & Company
Romania
CAI
With standing assets worth EUR 258m, Romania represents c.9% of CAI’s standing portfolio by BV (as
of 1Q16). The company owns five offices in Bucharest. The buildings generate c.EUR 21m in
annualised rental income (about 12% of the total), translating into a gross rental yield of 8.1%. Despite
the market vacancy of around 12%, the occupancy of CAI’s assets stood at a healthy 95% as of the
end of 1Q16. Following the EBRD buyout, all of CAI’s assets in Romania have been fully consolidated.
River Place and the Bucharest Business Park are the two largest properties in its Bucharest portfolio,
booked at EUR 108m and EUR 65m respectively, at the end of 2015.
CAI: Romania – five largest standing assets by FV as of the end of 2015
2008 2009 2010 2011 2012 2013 2014 2015
Opera Center 1
Share per key date 100% 100% 100% 100% 100% 100% 100% 100%
Total space ('000 sqm) 11.5 11.5 11.5 11.5 11.5 11.8 11.9 11.9
Fair value 37.7 24.9 24.5 26.1 29.0 28.2 28.8 29.1
Rental income (annualised) 2.63 2.83 2.68 2.38 2.72 2.42 2.80 2.683
Occupancy 100% 100% 95% 87% 97% 87% 100% 100%
Gross rental yield 6.97% 11.35% 10.91% 9.13% 9.39% 8.59% 9.71% 9.24%
Average monthly rent (EUR/sqm) 19.02 20.49 20.43 19.85 20.34 19.68 19.59 18.79
Change in rent (yoy) n/a 8% 0% -3% 2% -3% 0% -4%
Opera Center 2
Share per key date
100%
Total space ('000 sqm)
3.5
Fair value
8.0
Rental income (annualised)
0.741
Occupancy
99%
Gross rental yield n/a n/a n/a n/a n/a n/a n/a 9.25%
Average monthly rent (EUR/sqm) n/a n/a n/a n/a n/a n/a n/a 17.82
Change in rent (yoy) n/a n/a n/a n/a n/a n/a n/a n/a
Bucharest Business Park
Share per key date 100% 100% 100% 100% 100% 100% 100% 100%
Total space ('000 sqm) 25.8 25.8 25.9 25.9 25.9 26.8 27.0 27.0
Fair value 67.6 58.1 59.2 60.8 62.1 62.4 62.9 64.7
Rental income (annualised) 5.36 5.28 5.52 5.60 5.77 5.74 5.20 5.214
Occupancy 100% 98% 100% 100% 100% 99% 97% 84%
Gross rental yield 7.92% 9.08% 9.33% 9.21% 9.29% 9.19% 8.27% 8.06%
Average monthly rent (EUR/sqm) 17.30 17.39 17.76 18.02 18.56 18.02 16.55 19.16
Change in rent (yoy) n/a 1% 2% 1% 3% -3% -8% 16%
River Place
Share per key date
100% 100% 100% 65% 100%
Total space ('000 sqm)
47.3 16.9 46.9 30.9 47.6
Fair value
101.4 104.3 106.2 68.3 108.4
Rental income (annualised)
8.95 8.86 8.96 5.73 8.951
Occupancy
99% 97% 96% 97% 98%
Gross rental yield n/a n/a n/a 8.83% 8.49% 8.44% 8.39% 8.26%
Average monthly rent (EUR/sqm) n/a n/a n/a 15.93 45.03 16.58 15.93 15.99
Change in rent (yoy) n/a n/a n/a n/a 183% -63% -4% 0%
Europe House
Share per key date
100% 100% 100% 65% 100%
Total space ('000 sqm)
15.3 15.5 16.4 10.7 16.4
Fair value
47.3 46.8 47.1 30.4 48.1
Rental income (annualised)
3.79 4.15 3.91 2.30 3.557
Occupancy
94% 99% 98% 89% 89%
Gross rental yield n/a n/a n/a 8.01% 8.87% 8.30% 7.59% 7.40%
Average monthly rent (EUR/sqm) n/a n/a n/a 21.95 22.53 20.28 20.15 20.31
Change in rent (yoy) n/a n/a n/a n/a 3% -10% -1% 1%
Source: CA Immo, WOOD Research
CAI’s properties in Romania have generated monthly rents of around EUR 17-18/sqm on average over
the past few quarters. This is slightly below the prime headline rents (reported at EUR 18.5/sqm as of
the 3Q15 by CBRE). Looking at its peers, CAI’s rents in Bucharest are significantly higher than at IIA
(which rents, on average, at around EUR 12-13/sqm). That said, the average rents at GTC’s properties
stand a notch higher, with its City Gate office rented at around EUR 19/sqm per month. While, at 95%,
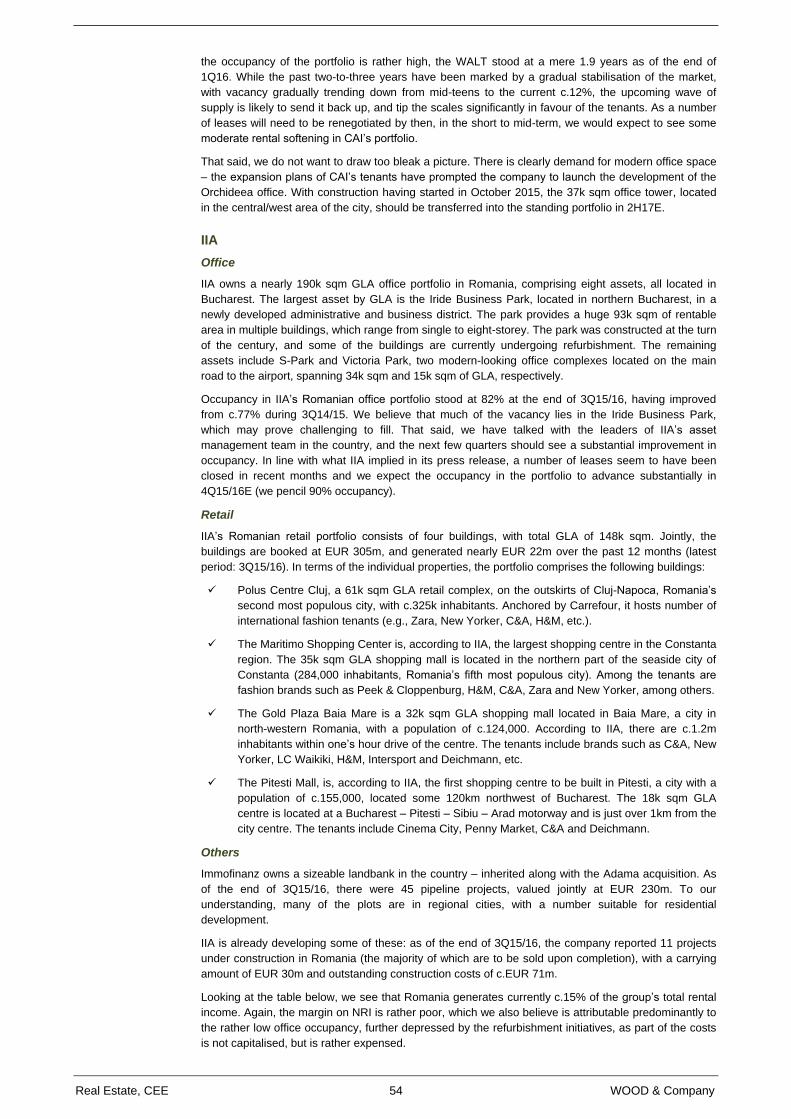
Real Estate, CEE 54 WOOD & Company
the occupancy of the portfolio is rather high, the WALT stood at a mere 1.9 years as of the end of
1Q16. While the past two-to-three years have been marked by a gradual stabilisation of the market,
with vacancy gradually trending down from mid-teens to the current c.12%, the upcoming wave of
supply is likely to send it back up, and tip the scales significantly in favour of the tenants. As a number
of leases will need to be renegotiated by then, in the short to mid-term, we would expect to see some
moderate rental softening in CAI’s portfolio.
That said, we do not want to draw too bleak a picture. There is clearly demand for modern office space
– the expansion plans of CAI’s tenants have prompted the company to launch the development of the
Orchideea office. With construction having started in October 2015, the 37k sqm office tower, located
in the central/west area of the city, should be transferred into the standing portfolio in 2H17E.
IIA
Office
IIA owns a nearly 190k sqm GLA office portfolio in Romania, comprising eight assets, all located in
Bucharest. The largest asset by GLA is the Iride Business Park, located in northern Bucharest, in a
newly developed administrative and business district. The park provides a huge 93k sqm of rentable
area in multiple buildings, which range from single to eight-storey. The park was constructed at the turn
of the century, and some of the buildings are currently undergoing refurbishment. The remaining
assets include S-Park and Victoria Park, two modern-looking office complexes located on the main
road to the airport, spanning 34k sqm and 15k sqm of GLA, respectively.
Occupancy in IIA’s Romanian office portfolio stood at 82% at the end of 3Q15/16, having improved
from c.77% during 3Q14/15. We believe that much of the vacancy lies in the Iride Business Park,
which may prove challenging to fill. That said, we have talked with the leaders of IIA’s asset
management team in the country, and the next few quarters should see a substantial improvement in
occupancy. In line with what IIA implied in its press release, a number of leases seem to have been
closed in recent months and we expect the occupancy in the portfolio to advance substantially in
4Q15/16E (we pencil 90% occupancy).
Retail
IIA’s Romanian retail portfolio consists of four buildings, with total GLA of 148k sqm. Jointly, the
buildings are booked at EUR 305m, and generated nearly EUR 22m over the past 12 months (latest
period: 3Q15/16). In terms of the individual properties, the portfolio comprises the following buildings:
Polus Centre Cluj, a 61k sqm GLA retail complex, on the outskirts of Cluj-Napoca, Romania’s
second most populous city, with c.325k inhabitants. Anchored by Carrefour, it hosts number of
international fashion tenants (e.g., Zara, New Yorker, C&A, H&M, etc.).
The Maritimo Shopping Center is, according to IIA, the largest shopping centre in the Constanta
region. The 35k sqm GLA shopping mall is located in the northern part of the seaside city of
Constanta (284,000 inhabitants, Romania’s fifth most populous city). Among the tenants are
fashion brands such as Peek & Cloppenburg, H&M, C&A, Zara and New Yorker, among others.
The Gold Plaza Baia Mare is a 32k sqm GLA shopping mall located in Baia Mare, a city in
north-western Romania, with a population of c.124,000. According to IIA, there are c.1.2m
inhabitants within one’s hour drive of the centre. The tenants include brands such as C&A, New
Yorker, LC Waikiki, H&M, Intersport and Deichmann, etc.
The Pitesti Mall, is, according to IIA, the first shopping centre to be built in Pitesti, a city with a
population of c.155,000, located some 120km northwest of Bucharest. The 18k sqm GLA
centre is located at a Bucharest – Pitesti – Sibiu – Arad motorway and is just over 1km from the
city centre. The tenants include Cinema City, Penny Market, C&A and Deichmann.
Others
Immofinanz owns a sizeable landbank in the country – inherited along with the Adama acquisition. As
of the end of 3Q15/16, there were 45 pipeline projects, valued jointly at EUR 230m. To our
understanding, many of the plots are in regional cities, with a number suitable for residential
development.
IIA is already developing some of these: as of the end of 3Q15/16, the company reported 11 projects
under construction in Romania (the majority of which are to be sold upon completion), with a carrying
amount of EUR 30m and outstanding construction costs of c.EUR 71m.
Looking at the table below, we see that Romania generates currently c.15% of the group’s total rental
income. Again, the margin on NRI is rather poor, which we also believe is attributable predominantly to
the rather low office occupancy, further depressed by the refurbishment initiatives, as part of the costs
is not capitalised, but is rather expensed.
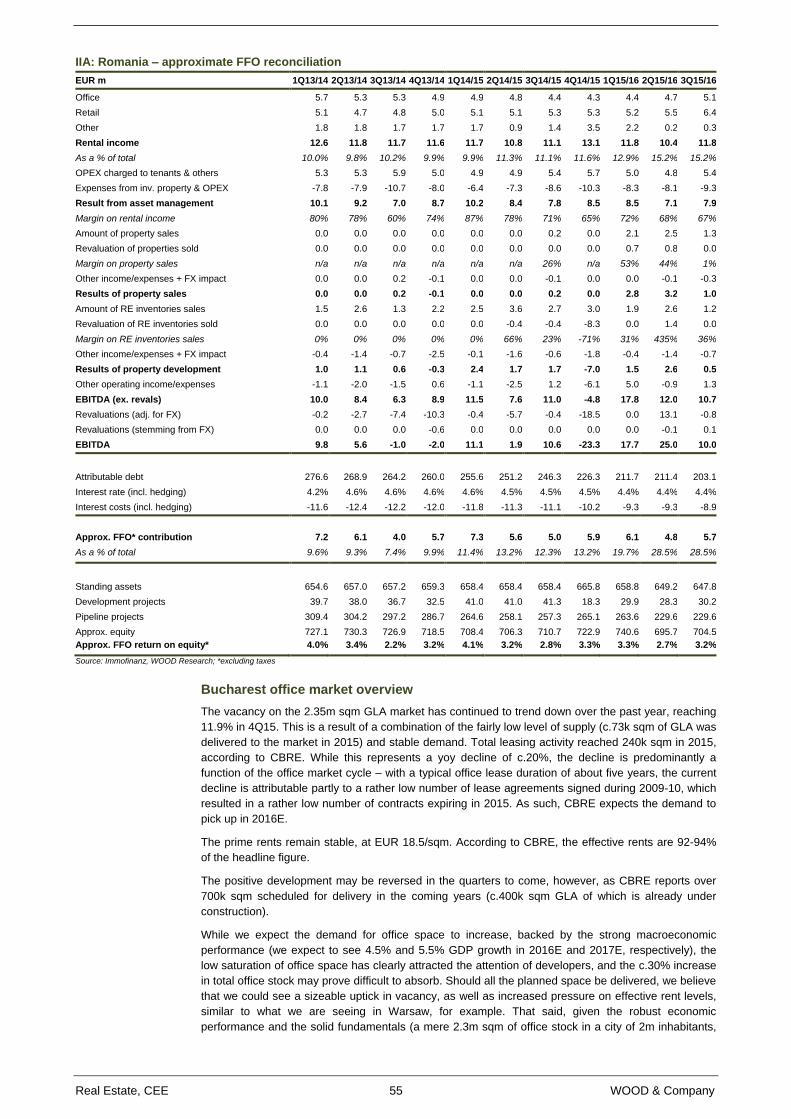
Real Estate, CEE 55 WOOD & Company
IIA: Romania – approximate FFO reconciliation
EUR m 1Q13/14 2Q13/14 3Q13/14 4Q13/14 1Q14/15 2Q14/15 3Q14/15 4Q14/15 1Q15/16 2Q15/16 3Q15/16
Office 5.7 5.3 5.3 4.9 4.9 4.8 4.4 4.3 4.4 4.7 5.1
Retail 5.1 4.7 4.8 5.0 5.1 5.1 5.3 5.3 5.2 5.5 6.4
Other 1.8 1.8 1.7 1.7 1.7 0.9 1.4 3.5 2.2 0.2 0.3
Rental income 12.6 11.8 11.7 11.6 11.7 10.8 11.1 13.1 11.8 10.4 11.8
As a % of total 10.0% 9.8% 10.2% 9.9% 9.9% 11.3% 11.1% 11.6% 12.9% 15.2% 15.2%
OPEX charged to tenants & others 5.3 5.3 5.9 5.0 4.9 4.9 5.4 5.7 5.0 4.8 5.4
Expenses from inv. property & OPEX -7.8 -7.9 -10.7 -8.0 -6.4 -7.3 -8.6 -10.3 -8.3 -8.1 -9.3
Result from asset management 10.1 9.2 7.0 8.7 10.2 8.4 7.8 8.5 8.5 7.1 7.9
Margin on rental income 80% 78% 60% 74% 87% 78% 71% 65% 72% 68% 67%
Amount of property sales 0.0 0.0 0.0 0.0 0.0 0.0 0.2 0.0 2.1 2.5 1.3
Revaluation of properties sold 0.0 0.0 0.0 0.0 0.0 0.0 0.0 0.0 0.7 0.8 0.0
Margin on property sales n/a n/a n/a n/a n/a n/a 26% n/a 53% 44% 1%
Other income/expenses + FX impact 0.0 0.0 0.2 -0.1 0.0 0.0 -0.1 0.0 0.0 -0.1 -0.3
Results of property sales 0.0 0.0 0.2 -0.1 0.0 0.0 0.2 0.0 2.8 3.2 1.0
Amount of RE inventories sales 1.5 2.6 1.3 2.2 2.5 3.6 2.7 3.0 1.9 2.6 1.2
Revaluation of RE inventories sold 0.0 0.0 0.0 0.0 0.0 -0.4 -0.4 -8.3 0.0 1.4 0.0
Margin on RE inventories sales 0% 0% 0% 0% 0% 66% 23% -71% 31% 435% 36%
Other income/expenses + FX impact -0.4 -1.4 -0.7 -2.5 -0.1 -1.6 -0.6 -1.8 -0.4 -1.4 -0.7
Results of property development 1.0 1.1 0.6 -0.3 2.4 1.7 1.7 -7.0 1.5 2.6 0.5
Other operating income/expenses -1.1 -2.0 -1.5 0.6 -1.1 -2.5 1.2 -6.1 5.0 -0.9 1.3
EBITDA (ex. revals) 10.0 8.4 6.3 8.9 11.5 7.6 11.0 -4.8 17.8 12.0 10.7
Revaluations (adj. for FX) -0.2 -2.7 -7.4 -10.3 -0.4 -5.7 -0.4 -18.5 0.0 13.1 -0.8
Revaluations (stemming from FX) 0.0 0.0 0.0 -0.6 0.0 0.0 0.0 0.0 0.0 -0.1 0.1
EBITDA 9.8 5.6 -1.0 -2.0 11.1 1.9 10.6 -23.3 17.7 25.0 10.0
Attributable debt 276.6 268.9 264.2 260.0 255.6 251.2 246.3 226.3 211.7 211.4 203.1
Interest rate (incl. hedging) 4.2% 4.6% 4.6% 4.6% 4.6% 4.5% 4.5% 4.5% 4.4% 4.4% 4.4%
Interest costs (incl. hedging) -11.6 -12.4 -12.2 -12.0 -11.8 -11.3 -11.1 -10.2 -9.3 -9.3 -8.9
Approx. FFO* contribution 7.2 6.1 4.0 5.7 7.3 5.6 5.0 5.9 6.1 4.8 5.7
As a % of total 9.6% 9.3% 7.4% 9.9% 11.4% 13.2% 12.3% 13.2% 19.7% 28.5% 28.5%
Standing assets 654.6 657.0 657.2 659.3 658.4 658.4 658.4 665.8 658.8 649.2 647.8
Development projects 39.7 38.0 36.7 32.5 41.0 41.0 41.3 18.3 29.9 28.3 30.2
Pipeline projects 309.4 304.2 297.2 286.7 264.6 258.1 257.3 265.1 263.6 229.6 229.6
Approx. equity 727.1 730.3 726.9 718.5 708.4 706.3 710.7 722.9 740.6 695.7 704.5
Approx. FFO return on equity* 4.0% 3.4% 2.2% 3.2% 4.1% 3.2% 2.8% 3.3% 3.3% 2.7% 3.2%
Source: Immofinanz, WOOD Research; *excluding taxes
Bucharest office market overview
The vacancy on the 2.35m sqm GLA market has continued to trend down over the past year, reaching
11.9% in 4Q15. This is a result of a combination of the fairly low level of supply (c.73k sqm of GLA was
delivered to the market in 2015) and stable demand. Total leasing activity reached 240k sqm in 2015,
according to CBRE. While this represents a yoy decline of c.20%, the decline is predominantly a
function of the office market cycle – with a typical office lease duration of about five years, the current
decline is attributable partly to a rather low number of lease agreements signed during 2009-10, which
resulted in a rather low number of contracts expiring in 2015. As such, CBRE expects the demand to
pick up in 2016E.
The prime rents remain stable, at EUR 18.5/sqm. According to CBRE, the effective rents are 92-94%
of the headline figure.
The positive development may be reversed in the quarters to come, however, as CBRE reports over
700k sqm scheduled for delivery in the coming years (c.400k sqm GLA of which is already under
construction).
While we expect the demand for office space to increase, backed by the strong macroeconomic
performance (we expect to see 4.5% and 5.5% GDP growth in 2016E and 2017E, respectively), the
low saturation of office space has clearly attracted the attention of developers, and the c.30% increase
in total office stock may prove difficult to absorb. Should all the planned space be delivered, we believe
that we could see a sizeable uptick in vacancy, as well as increased pressure on effective rent levels,
similar to what we are seeing in Warsaw, for example. That said, given the robust economic
performance and the solid fundamentals (a mere 2.3m sqm of office stock in a city of 2m inhabitants,
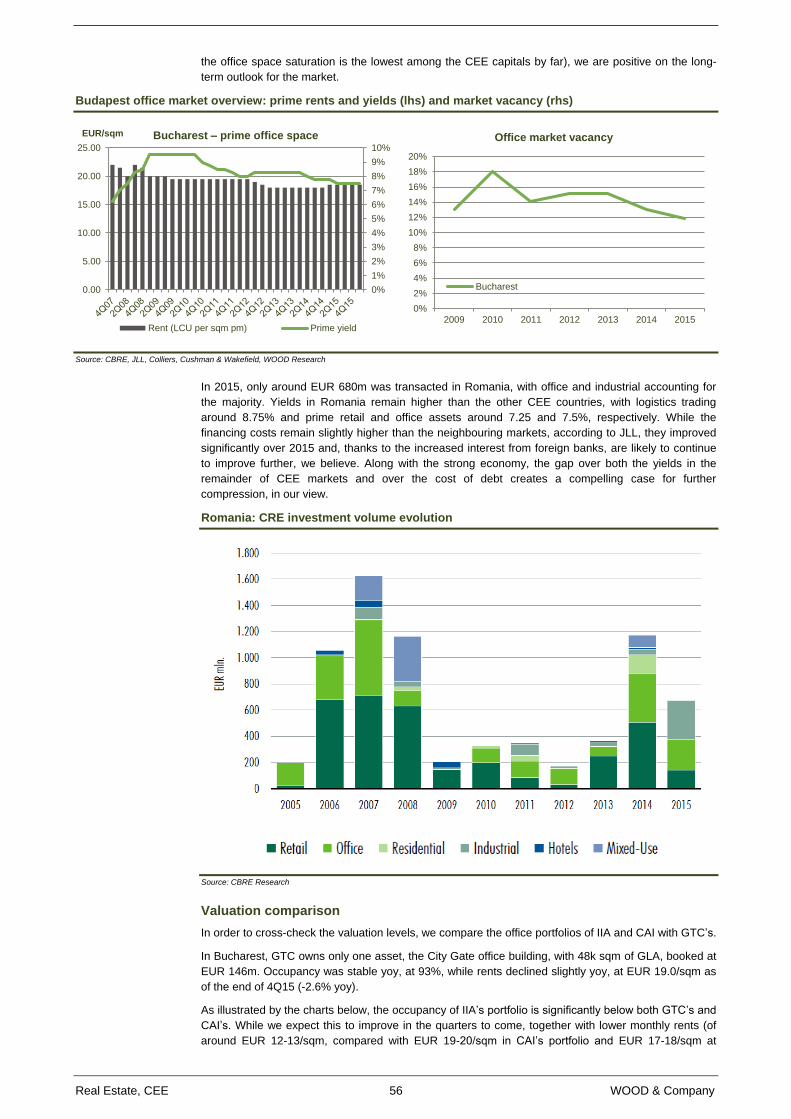
Real Estate, CEE 56 WOOD & Company
the office space saturation is the lowest among the CEE capitals by far), we are positive on the long-
term outlook for the market.
Budapest office market overview: prime rents and yields (lhs) and market vacancy (rhs)
Source: CBRE, JLL, Colliers, Cushman & Wakefield, WOOD Research
In 2015, only around EUR 680m was transacted in Romania, with office and industrial accounting for
the majority. Yields in Romania remain higher than the other CEE countries, with logistics trading
around 8.75% and prime retail and office assets around 7.25 and 7.5%, respectively. While the
financing costs remain slightly higher than the neighbouring markets, according to JLL, they improved
significantly over 2015 and, thanks to the increased interest from foreign banks, are likely to continue
to improve further, we believe. Along with the strong economy, the gap over both the yields in the
remainder of CEE markets and over the cost of debt creates a compelling case for further
compression, in our view.
Romania: CRE investment volume evolution
Source: CBRE Research
Valuation comparison
In order to cross-check the valuation levels, we compare the office portfolios of IIA and CAI with GTC’s.
In Bucharest, GTC owns only one asset, the City Gate office building, with 48k sqm of GLA, booked at
EUR 146m. Occupancy was stable yoy, at 93%, while rents declined slightly yoy, at EUR 19.0/sqm as
of the end of 4Q15 (-2.6% yoy).
As illustrated by the charts below, the occupancy of IIA’s portfolio is significantly below both GTC’s and
CAI’s. While we expect this to improve in the quarters to come, together with lower monthly rents (of
around EUR 12-13/sqm, compared with EUR 19-20/sqm in CAI’s portfolio and EUR 17-18/sqm at
0%
1%
2%
3%
4%
5%
6%
7%
8%
9%
10%
0.00
5.00
10.00
15.00
20.00
25.00
EUR/sqm Bucharest – prime office space
Rent (LCU per sqm pm) Prime yield
0%
2%
4%
6%
8%
10%
12%
14%
16%
18%
20%
2009 2010 2011 2012 2013 2014 2015
Office market vacancy
Bucharest
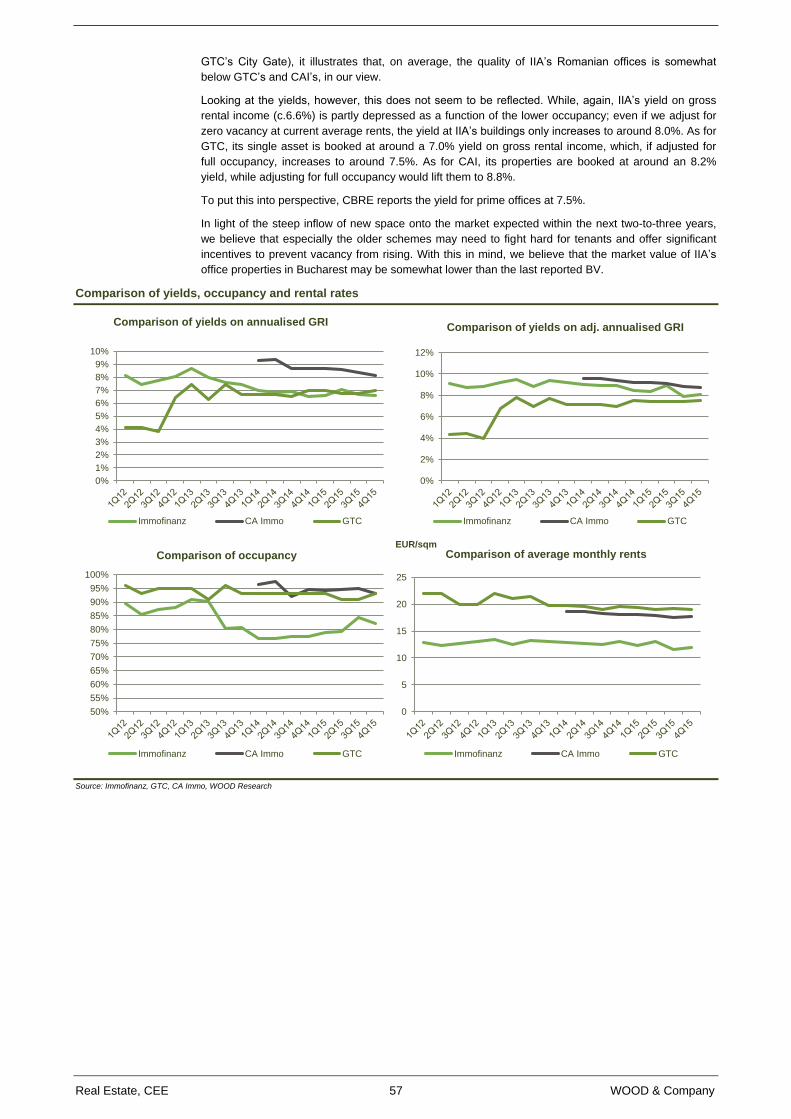
Real Estate, CEE 57 WOOD & Company
GTC’s City Gate), it illustrates that, on average, the quality of IIA’s Romanian offices is somewhat
below GTC’s and CAI’s, in our view.
Looking at the yields, however, this does not seem to be reflected. While, again, IIA’s yield on gross
rental income (c.6.6%) is partly depressed as a function of the lower occupancy; even if we adjust for
zero vacancy at current average rents, the yield at IIA’s buildings only increases to around 8.0%. As for
GTC, its single asset is booked at around a 7.0% yield on gross rental income, which, if adjusted for
full occupancy, increases to around 7.5%. As for CAI, its properties are booked at around an 8.2%
yield, while adjusting for full occupancy would lift them to 8.8%.
To put this into perspective, CBRE reports the yield for prime offices at 7.5%.
In light of the steep inflow of new space onto the market expected within the next two-to-three years,
we believe that especially the older schemes may need to fight hard for tenants and offer significant
incentives to prevent vacancy from rising. With this in mind, we believe that the market value of IIA’s
office properties in Bucharest may be somewhat lower than the last reported BV.
Comparison of yields, occupancy and rental rates
Source: Immofinanz, GTC, CA Immo, WOOD Research
0%
1%
2%
3%
4%
5%
6%
7%
8%
9%
10%
Comparison of yields on annualised GRI
Immofinanz CA Immo GTC
0%
2%
4%
6%
8%
10%
12%
Comparison of yields on adj. annualised GRI
Immofinanz CA Immo GTC
50%
55%
60%
65%
70%
75%
80%
85%
90%
95%
100%
Comparison of occupancy
Immofinanz CA Immo GTC
0
5
10
15
20
25
EUR/sqmComparison of average monthly rents
Immofinanz CA Immo GTC
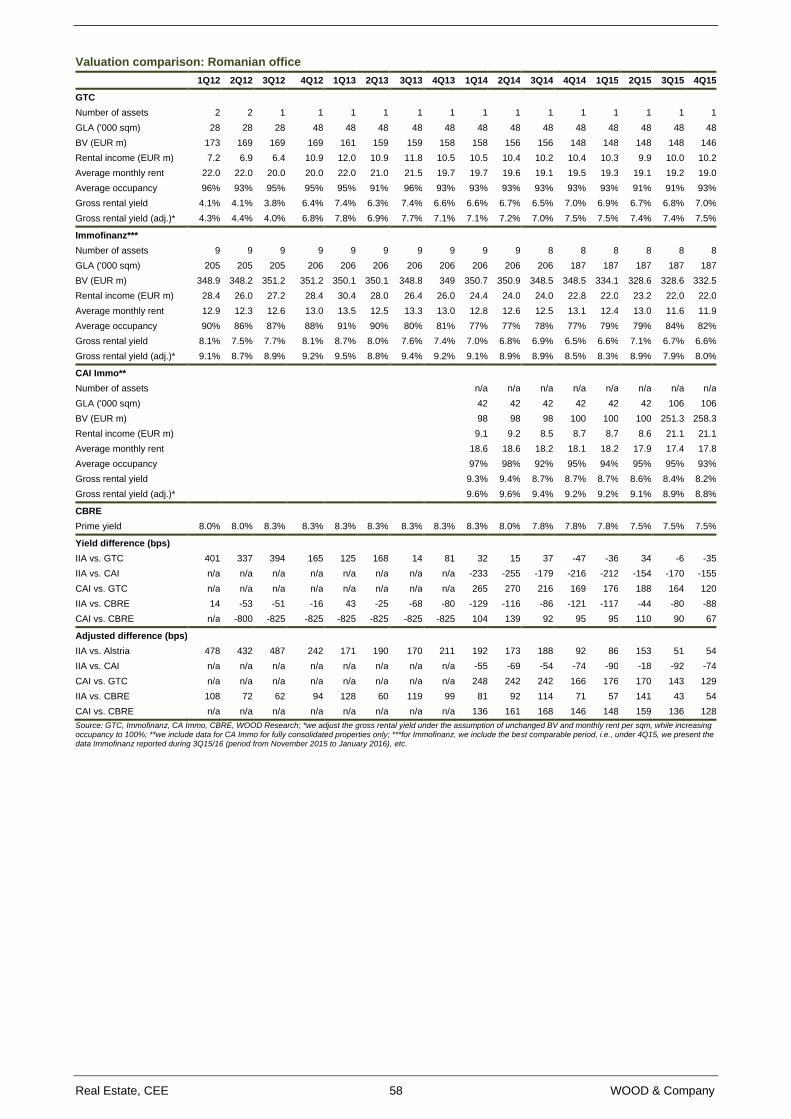
Real Estate, CEE 58 WOOD & Company
Valuation comparison: Romanian office
1Q12 2Q12 3Q12 4Q12 1Q13 2Q13 3Q13 4Q13 1Q14 2Q14 3Q14 4Q14 1Q15 2Q15 3Q15 4Q15
GTC
Number of assets 2 2 1 1 1 1 1 1 1 1 1 1 1 1 1 1
GLA ('000 sqm) 28 28 28 48 48 48 48 48 48 48 48 48 48 48 48 48
BV (EUR m) 173 169 169 169 161 159 159 158 158 156 156 148 148 148 148 146
Rental income (EUR m) 7.2 6.9 6.4 10.9 12.0 10.9 11.8 10.5 10.5 10.4 10.2 10.4 10.3 9.9 10.0 10.2
Average monthly rent 22.0 22.0 20.0 20.0 22.0 21.0 21.5 19.7 19.7 19.6 19.1 19.5 19.3 19.1 19.2 19.0
Average occupancy 96% 93% 95% 95% 95% 91% 96% 93% 93% 93% 93% 93% 93% 91% 91% 93%
Gross rental yield 4.1% 4.1% 3.8% 6.4% 7.4% 6.3% 7.4% 6.6% 6.6% 6.7% 6.5% 7.0% 6.9% 6.7% 6.8% 7.0%
Gross rental yield (adj.)* 4.3% 4.4% 4.0% 6.8% 7.8% 6.9% 7.7% 7.1% 7.1% 7.2% 7.0% 7.5% 7.5% 7.4% 7.4% 7.5%
Immofinanz***
Number of assets 9 9 9 9 9 9 9 9 9 9 8 8 8 8 8 8
GLA ('000 sqm) 205 205 205 206 206 206 206 206 206 206 206 187 187 187 187 187
BV (EUR m) 348.9 348.2 351.2 351.2 350.1 350.1 348.8 349 350.7 350.9 348.5 348.5 334.1 328.6 328.6 332.5
Rental income (EUR m) 28.4 26.0 27.2 28.4 30.4 28.0 26.4 26.0 24.4 24.0 24.0 22.8 22.0 23.2 22.0 22.0
Average monthly rent 12.9 12.3 12.6 13.0 13.5 12.5 13.3 13.0 12.8 12.6 12.5 13.1 12.4 13.0 11.6 11.9
Average occupancy 90% 86% 87% 88% 91% 90% 80% 81% 77% 77% 78% 77% 79% 79% 84% 82%
Gross rental yield 8.1% 7.5% 7.7% 8.1% 8.7% 8.0% 7.6% 7.4% 7.0% 6.8% 6.9% 6.5% 6.6% 7.1% 6.7% 6.6%
Gross rental yield (adj.)* 9.1% 8.7% 8.9% 9.2% 9.5% 8.8% 9.4% 9.2% 9.1% 8.9% 8.9% 8.5% 8.3% 8.9% 7.9% 8.0%
CAI Immo**
Number of assets
n/a n/a n/a n/a n/a n/a n/a n/a
GLA ('000 sqm)
42 42 42 42 42 42 106 106
BV (EUR m)
98 98 98 100 100 100 251.3 258.3
Rental income (EUR m)
9.1 9.2 8.5 8.7 8.7 8.6 21.1 21.1
Average monthly rent
18.6 18.6 18.2 18.1 18.2 17.9 17.4 17.8
Average occupancy
97% 98% 92% 95% 94% 95% 95% 93%
Gross rental yield
9.3% 9.4% 8.7% 8.7% 8.7% 8.6% 8.4% 8.2%
Gross rental yield (adj.)* 9.6% 9.6% 9.4% 9.2% 9.2% 9.1% 8.9% 8.8%
CBRE
Prime yield 8.0% 8.0% 8.3% 8.3% 8.3% 8.3% 8.3% 8.3% 8.3% 8.0% 7.8% 7.8% 7.8% 7.5% 7.5% 7.5%
Yield difference (bps)
IIA vs. GTC 401 337 394 165 125 168 14 81 32 15 37 -47 -36 34 -6 -35
IIA vs. CAI n/a n/a n/a n/a n/a n/a n/a n/a -233 -255 -179 -216 -212 -154 -170 -155
CAI vs. GTC n/a n/a n/a n/a n/a n/a n/a n/a 265 270 216 169 176 188 164 120
IIA vs. CBRE 14 -53 -51 -16 43 -25 -68 -80 -129 -116 -86 -121 -117 -44 -80 -88
CAI vs. CBRE n/a -800 -825 -825 -825 -825 -825 -825 104 139 92 95 95 110 90 67
Adjusted difference (bps)
IIA vs. Alstria 478 432 487 242 171 190 170 211 192 173 188 92 86 153 51 54
IIA vs. CAI n/a n/a n/a n/a n/a n/a n/a n/a -55 -69 -54 -74 -90 -18 -92 -74
CAI vs. GTC n/a n/a n/a n/a n/a n/a n/a n/a 248 242 242 166 176 170 143 129
IIA vs. CBRE 108 72 62 94 128 60 119 99 81 92 114 71 57 141 43 54
CAI vs. CBRE n/a n/a n/a n/a n/a n/a n/a n/a 136 161 168 146 148 159 136 128
Source: GTC, Immofinanz, CA Immo, CBRE, WOOD Research; *we adjust the gross rental yield under the assumption of unchanged BV and monthly rent per sqm, while increasing occupancy to 100%; **we include data for CA Immo for fully consolidated properties only; ***for Immofinanz, we include the best comparable period, i.e., under 4Q15, we present the data Immofinanz reported during 3Q15/16 (period from November 2015 to January 2016), etc.
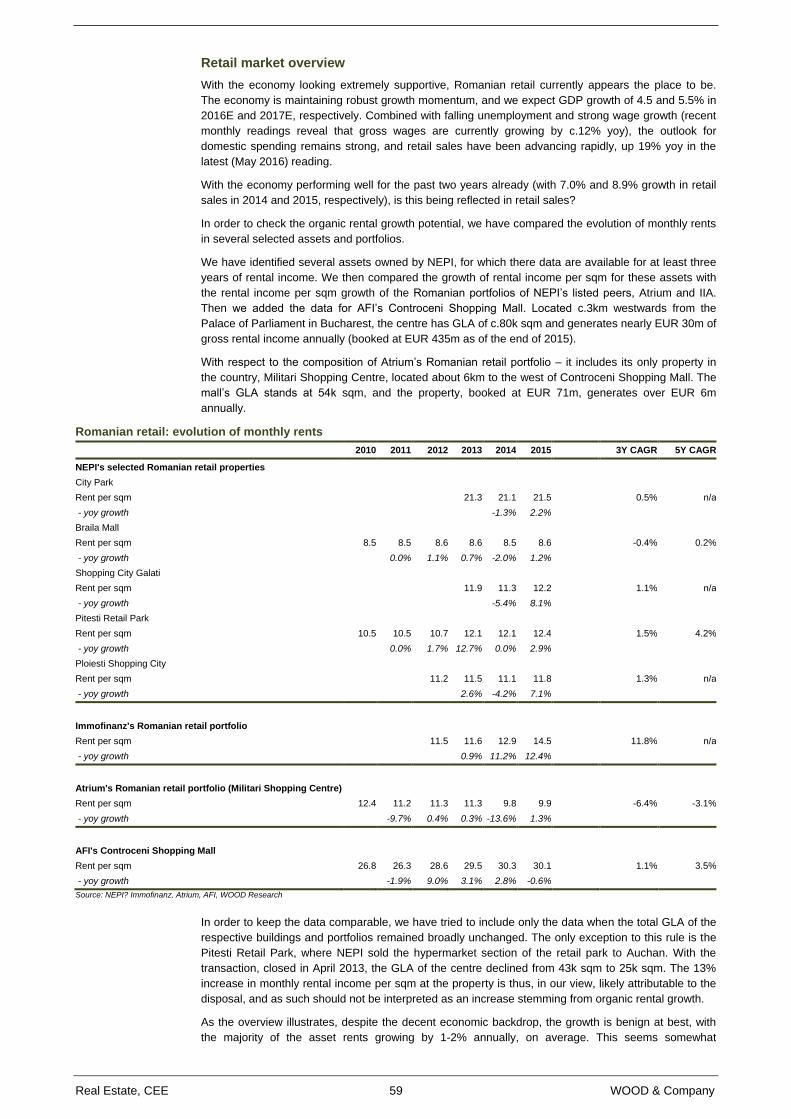
Real Estate, CEE 59 WOOD & Company
Retail market overview
With the economy looking extremely supportive, Romanian retail currently appears the place to be.
The economy is maintaining robust growth momentum, and we expect GDP growth of 4.5 and 5.5% in
2016E and 2017E, respectively. Combined with falling unemployment and strong wage growth (recent
monthly readings reveal that gross wages are currently growing by c.12% yoy), the outlook for
domestic spending remains strong, and retail sales have been advancing rapidly, up 19% yoy in the
latest (May 2016) reading.
With the economy performing well for the past two years already (with 7.0% and 8.9% growth in retail
sales in 2014 and 2015, respectively), is this being reflected in retail sales?
In order to check the organic rental growth potential, we have compared the evolution of monthly rents
in several selected assets and portfolios.
We have identified several assets owned by NEPI, for which there data are available for at least three
years of rental income. We then compared the growth of rental income per sqm for these assets with
the rental income per sqm growth of the Romanian portfolios of NEPI’s listed peers, Atrium and IIA.
Then we added the data for AFI’s Controceni Shopping Mall. Located c.3km westwards from the
Palace of Parliament in Bucharest, the centre has GLA of c.80k sqm and generates nearly EUR 30m of
gross rental income annually (booked at EUR 435m as of the end of 2015).
With respect to the composition of Atrium’s Romanian retail portfolio – it includes its only property in
the country, Militari Shopping Centre, located about 6km to the west of Controceni Shopping Mall. The
mall’s GLA stands at 54k sqm, and the property, booked at EUR 71m, generates over EUR 6m
annually.
Romanian retail: evolution of monthly rents
2010 2011 2012 2013 2014 2015
3Y CAGR 5Y CAGR
NEPI's selected Romanian retail properties
City Park
Rent per sqm
21.3 21.1 21.5
0.5% n/a
- yoy growth
-1.3% 2.2%
Braila Mall
Rent per sqm 8.5 8.5 8.6 8.6 8.5 8.6
-0.4% 0.2%
- yoy growth
0.0% 1.1% 0.7% -2.0% 1.2%
Shopping City Galati
Rent per sqm
11.9 11.3 12.2
1.1% n/a
- yoy growth
-5.4% 8.1%
Pitesti Retail Park
Rent per sqm 10.5 10.5 10.7 12.1 12.1 12.4
1.5% 4.2%
- yoy growth
0.0% 1.7% 12.7% 0.0% 2.9%
Ploiesti Shopping City
Rent per sqm
11.2 11.5 11.1 11.8
1.3% n/a
- yoy growth
2.6% -4.2% 7.1%
Immofinanz's Romanian retail portfolio
Rent per sqm
11.5 11.6 12.9 14.5
11.8% n/a
- yoy growth
0.9% 11.2% 12.4%
Atrium's Romanian retail portfolio (Militari Shopping Centre)
Rent per sqm 12.4 11.2 11.3 11.3 9.8 9.9
-6.4% -3.1%
- yoy growth
-9.7% 0.4% 0.3% -13.6% 1.3%
AFI's Controceni Shopping Mall
Rent per sqm 26.8 26.3 28.6 29.5 30.3 30.1
1.1% 3.5%
- yoy growth
-1.9% 9.0% 3.1% 2.8% -0.6%
Source: NEPI? Immofinanz, Atrium, AFI, WOOD Research
In order to keep the data comparable, we have tried to include only the data when the total GLA of the
respective buildings and portfolios remained broadly unchanged. The only exception to this rule is the
Pitesti Retail Park, where NEPI sold the hypermarket section of the retail park to Auchan. With the
transaction, closed in April 2013, the GLA of the centre declined from 43k sqm to 25k sqm. The 13%
increase in monthly rental income per sqm at the property is thus, in our view, likely attributable to the
disposal, and as such should not be interpreted as an increase stemming from organic rental growth.
As the overview illustrates, despite the decent economic backdrop, the growth is benign at best, with
the majority of the asset rents growing by 1-2% annually, on average. This seems somewhat
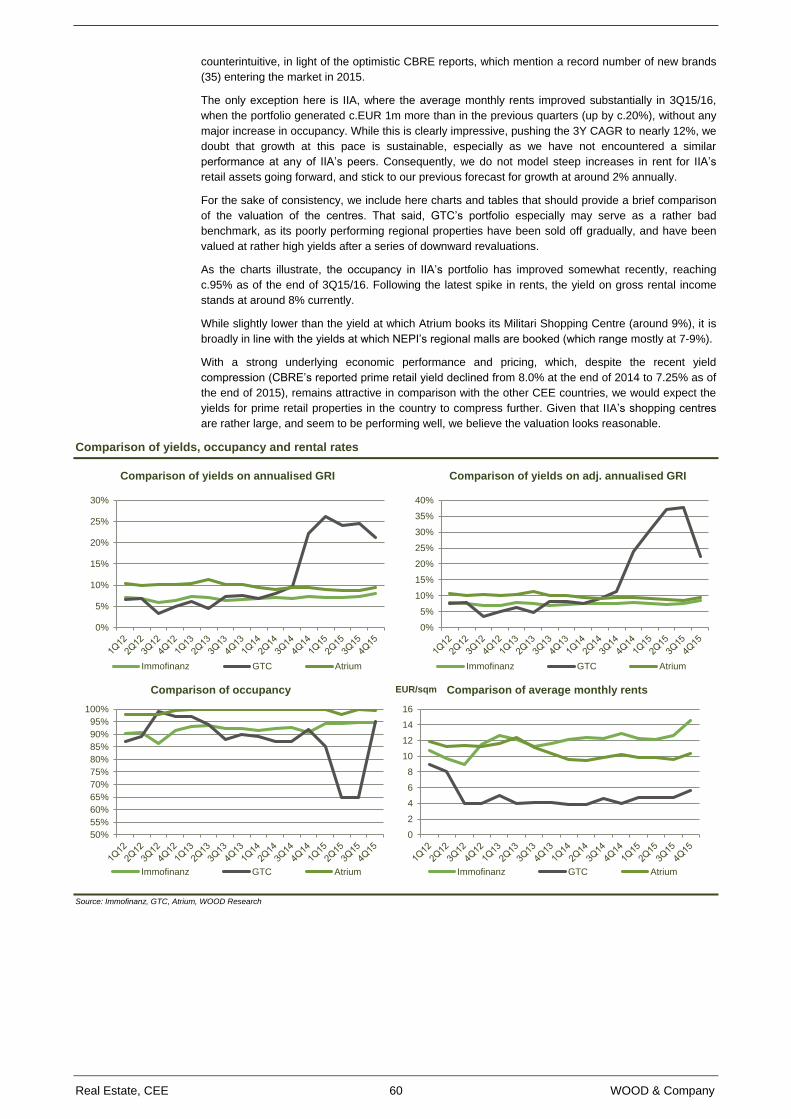
Real Estate, CEE 60 WOOD & Company
counterintuitive, in light of the optimistic CBRE reports, which mention a record number of new brands
(35) entering the market in 2015.
The only exception here is IIA, where the average monthly rents improved substantially in 3Q15/16,
when the portfolio generated c.EUR 1m more than in the previous quarters (up by c.20%), without any
major increase in occupancy. While this is clearly impressive, pushing the 3Y CAGR to nearly 12%, we
doubt that growth at this pace is sustainable, especially as we have not encountered a similar
performance at any of IIA’s peers. Consequently, we do not model steep increases in rent for IIA’s
retail assets going forward, and stick to our previous forecast for growth at around 2% annually.
For the sake of consistency, we include here charts and tables that should provide a brief comparison
of the valuation of the centres. That said, GTC’s portfolio especially may serve as a rather bad
benchmark, as its poorly performing regional properties have been sold off gradually, and have been
valued at rather high yields after a series of downward revaluations.
As the charts illustrate, the occupancy in IIA’s portfolio has improved somewhat recently, reaching
c.95% as of the end of 3Q15/16. Following the latest spike in rents, the yield on gross rental income
stands at around 8% currently.
While slightly lower than the yield at which Atrium books its Militari Shopping Centre (around 9%), it is
broadly in line with the yields at which NEPI’s regional malls are booked (which range mostly at 7-9%).
With a strong underlying economic performance and pricing, which, despite the recent yield
compression (CBRE’s reported prime retail yield declined from 8.0% at the end of 2014 to 7.25% as of
the end of 2015), remains attractive in comparison with the other CEE countries, we would expect the
yields for prime retail properties in the country to compress further. Given that IIA’s shopping centres
are rather large, and seem to be performing well, we believe the valuation looks reasonable.
Comparison of yields, occupancy and rental rates
Source: Immofinanz, GTC, Atrium, WOOD Research
0%
5%
10%
15%
20%
25%
30%
Comparison of yields on annualised GRI
Immofinanz GTC Atrium
0%
5%
10%
15%
20%
25%
30%
35%
40%
Comparison of yields on adj. annualised GRI
Immofinanz GTC Atrium
50%
55%
60%
65%
70%
75%
80%
85%
90%
95%
100%
Comparison of occupancy
Immofinanz GTC Atrium
0
2
4
6
8
10
12
14
16
EUR/sqm Comparison of average monthly rents
Immofinanz GTC Atrium
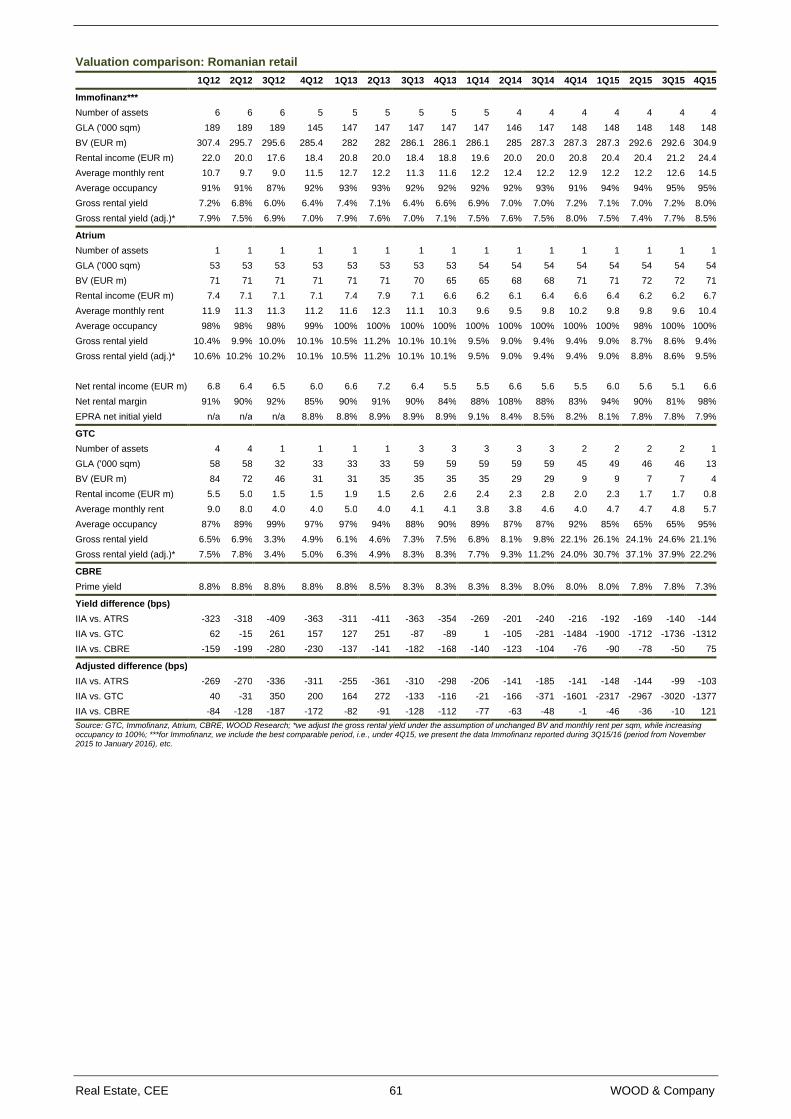
Real Estate, CEE 61 WOOD & Company
Valuation comparison: Romanian retail
1Q12 2Q12 3Q12 4Q12 1Q13 2Q13 3Q13 4Q13 1Q14 2Q14 3Q14 4Q14 1Q15 2Q15 3Q15 4Q15
Immofinanz***
Number of assets 6 6 6 5 5 5 5 5 5 4 4 4 4 4 4 4
GLA ('000 sqm) 189 189 189 145 147 147 147 147 147 146 147 148 148 148 148 148
BV (EUR m) 307.4 295.7 295.6 285.4 282 282 286.1 286.1 286.1 285 287.3 287.3 287.3 292.6 292.6 304.9
Rental income (EUR m) 22.0 20.0 17.6 18.4 20.8 20.0 18.4 18.8 19.6 20.0 20.0 20.8 20.4 20.4 21.2 24.4
Average monthly rent 10.7 9.7 9.0 11.5 12.7 12.2 11.3 11.6 12.2 12.4 12.2 12.9 12.2 12.2 12.6 14.5
Average occupancy 91% 91% 87% 92% 93% 93% 92% 92% 92% 92% 93% 91% 94% 94% 95% 95%
Gross rental yield 7.2% 6.8% 6.0% 6.4% 7.4% 7.1% 6.4% 6.6% 6.9% 7.0% 7.0% 7.2% 7.1% 7.0% 7.2% 8.0%
Gross rental yield (adj.)* 7.9% 7.5% 6.9% 7.0% 7.9% 7.6% 7.0% 7.1% 7.5% 7.6% 7.5% 8.0% 7.5% 7.4% 7.7% 8.5%
Atrium
Number of assets 1 1 1 1 1 1 1 1 1 1 1 1 1 1 1 1
GLA ('000 sqm) 53 53 53 53 53 53 53 53 54 54 54 54 54 54 54 54
BV (EUR m) 71 71 71 71 71 71 70 65 65 68 68 71 71 72 72 71
Rental income (EUR m) 7.4 7.1 7.1 7.1 7.4 7.9 7.1 6.6 6.2 6.1 6.4 6.6 6.4 6.2 6.2 6.7
Average monthly rent 11.9 11.3 11.3 11.2 11.6 12.3 11.1 10.3 9.6 9.5 9.8 10.2 9.8 9.8 9.6 10.4
Average occupancy 98% 98% 98% 99% 100% 100% 100% 100% 100% 100% 100% 100% 100% 98% 100% 100%
Gross rental yield 10.4% 9.9% 10.0% 10.1% 10.5% 11.2% 10.1% 10.1% 9.5% 9.0% 9.4% 9.4% 9.0% 8.7% 8.6% 9.4%
Gross rental yield (adj.)* 10.6% 10.2% 10.2% 10.1% 10.5% 11.2% 10.1% 10.1% 9.5% 9.0% 9.4% 9.4% 9.0% 8.8% 8.6% 9.5%
Net rental income (EUR m) 6.8 6.4 6.5 6.0 6.6 7.2 6.4 5.5 5.5 6.6 5.6 5.5 6.0 5.6 5.1 6.6
Net rental margin 91% 90% 92% 85% 90% 91% 90% 84% 88% 108% 88% 83% 94% 90% 81% 98%
EPRA net initial yield n/a n/a n/a 8.8% 8.8% 8.9% 8.9% 8.9% 9.1% 8.4% 8.5% 8.2% 8.1% 7.8% 7.8% 7.9%
GTC
Number of assets 4 4 1 1 1 1 3 3 3 3 3 2 2 2 2 1
GLA ('000 sqm) 58 58 32 33 33 33 59 59 59 59 59 45 49 46 46 13
BV (EUR m) 84 72 46 31 31 35 35 35 35 29 29 9 9 7 7 4
Rental income (EUR m) 5.5 5.0 1.5 1.5 1.9 1.5 2.6 2.6 2.4 2.3 2.8 2.0 2.3 1.7 1.7 0.8
Average monthly rent 9.0 8.0 4.0 4.0 5.0 4.0 4.1 4.1 3.8 3.8 4.6 4.0 4.7 4.7 4.8 5.7
Average occupancy 87% 89% 99% 97% 97% 94% 88% 90% 89% 87% 87% 92% 85% 65% 65% 95%
Gross rental yield 6.5% 6.9% 3.3% 4.9% 6.1% 4.6% 7.3% 7.5% 6.8% 8.1% 9.8% 22.1% 26.1% 24.1% 24.6% 21.1%
Gross rental yield (adj.)* 7.5% 7.8% 3.4% 5.0% 6.3% 4.9% 8.3% 8.3% 7.7% 9.3% 11.2% 24.0% 30.7% 37.1% 37.9% 22.2%
CBRE
Prime yield 8.8% 8.8% 8.8% 8.8% 8.8% 8.5% 8.3% 8.3% 8.3% 8.3% 8.0% 8.0% 8.0% 7.8% 7.8% 7.3%
Yield difference (bps)
IIA vs. ATRS -323 -318 -409 -363 -311 -411 -363 -354 -269 -201 -240 -216 -192 -169 -140 -144
IIA vs. GTC 62 -15 261 157 127 251 -87 -89 1 -105 -281 -1484 -1900 -1712 -1736 -1312
IIA vs. CBRE -159 -199 -280 -230 -137 -141 -182 -168 -140 -123 -104 -76 -90 -78 -50 75
Adjusted difference (bps)
IIA vs. ATRS -269 -270 -336 -311 -255 -361 -310 -298 -206 -141 -185 -141 -148 -144 -99 -103
IIA vs. GTC 40 -31 350 200 164 272 -133 -116 -21 -166 -371 -1601 -2317 -2967 -3020 -1377
IIA vs. CBRE -84 -128 -187 -172 -82 -91 -128 -112 -77 -63 -48 -1 -46 -36 -10 121
Source: GTC, Immofinanz, Atrium, CBRE, WOOD Research; *we adjust the gross rental yield under the assumption of unchanged BV and monthly rent per sqm, while increasing occupancy to 100%; ***for Immofinanz, we include the best comparable period, i.e., under 4Q15, we present the data Immofinanz reported during 3Q15/16 (period from November 2015 to January 2016), etc.
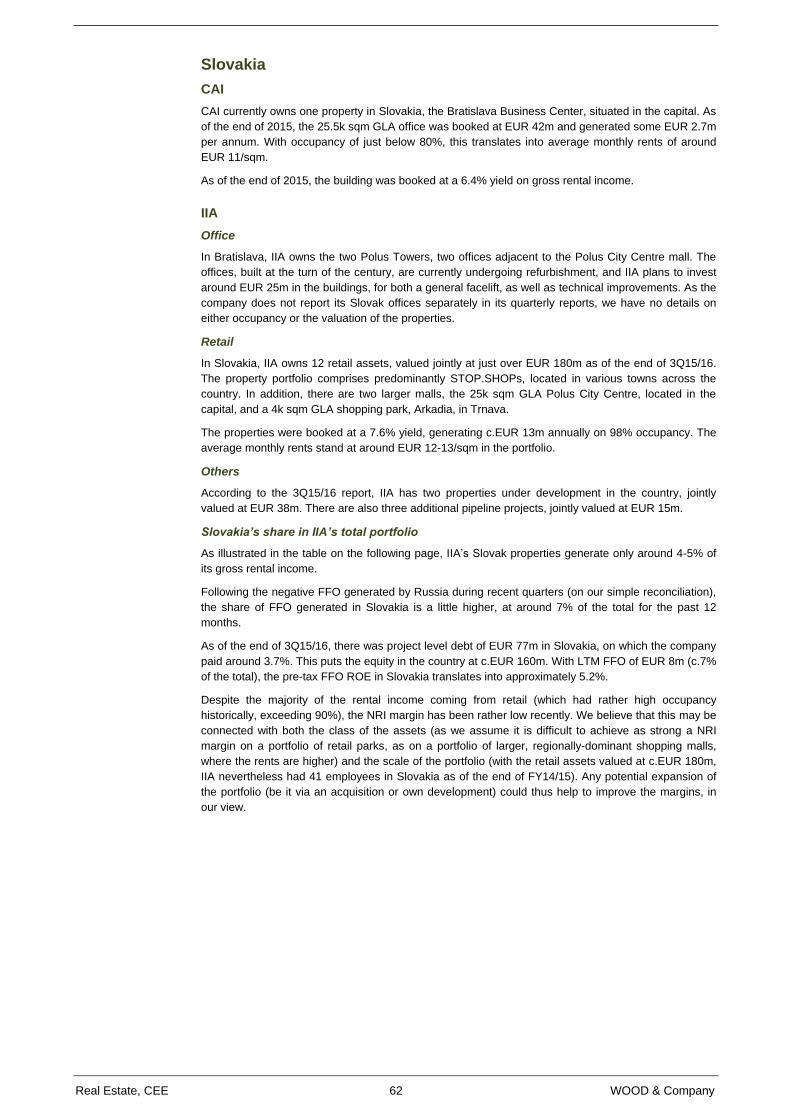
Real Estate, CEE 62 WOOD & Company
Slovakia
CAI
CAI currently owns one property in Slovakia, the Bratislava Business Center, situated in the capital. As
of the end of 2015, the 25.5k sqm GLA office was booked at EUR 42m and generated some EUR 2.7m
per annum. With occupancy of just below 80%, this translates into average monthly rents of around
EUR 11/sqm.
As of the end of 2015, the building was booked at a 6.4% yield on gross rental income.
IIA
Office
In Bratislava, IIA owns the two Polus Towers, two offices adjacent to the Polus City Centre mall. The
offices, built at the turn of the century, are currently undergoing refurbishment, and IIA plans to invest
around EUR 25m in the buildings, for both a general facelift, as well as technical improvements. As the
company does not report its Slovak offices separately in its quarterly reports, we have no details on
either occupancy or the valuation of the properties.
Retail
In Slovakia, IIA owns 12 retail assets, valued jointly at just over EUR 180m as of the end of 3Q15/16.
The property portfolio comprises predominantly STOP.SHOPs, located in various towns across the
country. In addition, there are two larger malls, the 25k sqm GLA Polus City Centre, located in the
capital, and a 4k sqm GLA shopping park, Arkadia, in Trnava.
The properties were booked at a 7.6% yield, generating c.EUR 13m annually on 98% occupancy. The
average monthly rents stand at around EUR 12-13/sqm in the portfolio.
Others
According to the 3Q15/16 report, IIA has two properties under development in the country, jointly
valued at EUR 38m. There are also three additional pipeline projects, jointly valued at EUR 15m.
Slovakia’s share in IIA’s total portfolio
As illustrated in the table on the following page, IIA’s Slovak properties generate only around 4-5% of
its gross rental income.
Following the negative FFO generated by Russia during recent quarters (on our simple reconciliation),
the share of FFO generated in Slovakia is a little higher, at around 7% of the total for the past 12
months.
As of the end of 3Q15/16, there was project level debt of EUR 77m in Slovakia, on which the company
paid around 3.7%. This puts the equity in the country at c.EUR 160m. With LTM FFO of EUR 8m (c.7%
of the total), the pre-tax FFO ROE in Slovakia translates into approximately 5.2%.
Despite the majority of the rental income coming from retail (which had rather high occupancy
historically, exceeding 90%), the NRI margin has been rather low recently. We believe that this may be
connected with both the class of the assets (as we assume it is difficult to achieve as strong a NRI
margin on a portfolio of retail parks, as on a portfolio of larger, regionally-dominant shopping malls,
where the rents are higher) and the scale of the portfolio (with the retail assets valued at c.EUR 180m,
IIA nevertheless had 41 employees in Slovakia as of the end of FY14/15). Any potential expansion of
the portfolio (be it via an acquisition or own development) could thus help to improve the margins, in
our view.
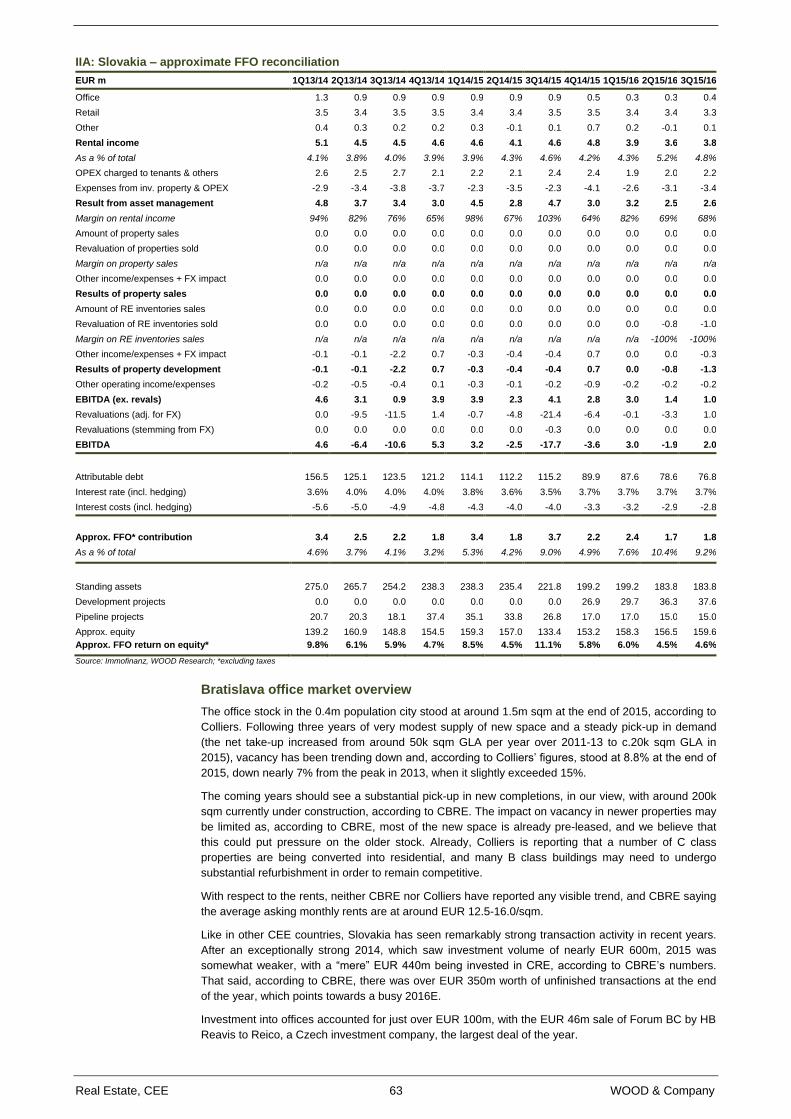
Real Estate, CEE 63 WOOD & Company
IIA: Slovakia – approximate FFO reconciliation
EUR m 1Q13/14 2Q13/14 3Q13/14 4Q13/14 1Q14/15 2Q14/15 3Q14/15 4Q14/15 1Q15/16 2Q15/16 3Q15/16
Office 1.3 0.9 0.9 0.9 0.9 0.9 0.9 0.5 0.3 0.3 0.4
Retail 3.5 3.4 3.5 3.5 3.4 3.4 3.5 3.5 3.4 3.4 3.3
Other 0.4 0.3 0.2 0.2 0.3 -0.1 0.1 0.7 0.2 -0.1 0.1
Rental income 5.1 4.5 4.5 4.6 4.6 4.1 4.6 4.8 3.9 3.6 3.8
As a % of total 4.1% 3.8% 4.0% 3.9% 3.9% 4.3% 4.6% 4.2% 4.3% 5.2% 4.8%
OPEX charged to tenants & others 2.6 2.5 2.7 2.1 2.2 2.1 2.4 2.4 1.9 2.0 2.2
Expenses from inv. property & OPEX -2.9 -3.4 -3.8 -3.7 -2.3 -3.5 -2.3 -4.1 -2.6 -3.1 -3.4
Result from asset management 4.8 3.7 3.4 3.0 4.5 2.8 4.7 3.0 3.2 2.5 2.6
Margin on rental income 94% 82% 76% 65% 98% 67% 103% 64% 82% 69% 68%
Amount of property sales 0.0 0.0 0.0 0.0 0.0 0.0 0.0 0.0 0.0 0.0 0.0
Revaluation of properties sold 0.0 0.0 0.0 0.0 0.0 0.0 0.0 0.0 0.0 0.0 0.0
Margin on property sales n/a n/a n/a n/a n/a n/a n/a n/a n/a n/a n/a
Other income/expenses + FX impact 0.0 0.0 0.0 0.0 0.0 0.0 0.0 0.0 0.0 0.0 0.0
Results of property sales 0.0 0.0 0.0 0.0 0.0 0.0 0.0 0.0 0.0 0.0 0.0
Amount of RE inventories sales 0.0 0.0 0.0 0.0 0.0 0.0 0.0 0.0 0.0 0.0 0.0
Revaluation of RE inventories sold 0.0 0.0 0.0 0.0 0.0 0.0 0.0 0.0 0.0 -0.8 -1.0
Margin on RE inventories sales n/a n/a n/a n/a n/a n/a n/a n/a n/a -100% -100%
Other income/expenses + FX impact -0.1 -0.1 -2.2 0.7 -0.3 -0.4 -0.4 0.7 0.0 0.0 -0.3
Results of property development -0.1 -0.1 -2.2 0.7 -0.3 -0.4 -0.4 0.7 0.0 -0.8 -1.3
Other operating income/expenses -0.2 -0.5 -0.4 0.1 -0.3 -0.1 -0.2 -0.9 -0.2 -0.2 -0.2
EBITDA (ex. revals) 4.6 3.1 0.9 3.9 3.9 2.3 4.1 2.8 3.0 1.4 1.0
Revaluations (adj. for FX) 0.0 -9.5 -11.5 1.4 -0.7 -4.8 -21.4 -6.4 -0.1 -3.3 1.0
Revaluations (stemming from FX) 0.0 0.0 0.0 0.0 0.0 0.0 -0.3 0.0 0.0 0.0 0.0
EBITDA 4.6 -6.4 -10.6 5.3 3.2 -2.5 -17.7 -3.6 3.0 -1.9 2.0
Attributable debt 156.5 125.1 123.5 121.2 114.1 112.2 115.2 89.9 87.6 78.6 76.8
Interest rate (incl. hedging) 3.6% 4.0% 4.0% 4.0% 3.8% 3.6% 3.5% 3.7% 3.7% 3.7% 3.7%
Interest costs (incl. hedging) -5.6 -5.0 -4.9 -4.8 -4.3 -4.0 -4.0 -3.3 -3.2 -2.9 -2.8
Approx. FFO* contribution 3.4 2.5 2.2 1.8 3.4 1.8 3.7 2.2 2.4 1.7 1.8
As a % of total 4.6% 3.7% 4.1% 3.2% 5.3% 4.2% 9.0% 4.9% 7.6% 10.4% 9.2%
Standing assets 275.0 265.7 254.2 238.3 238.3 235.4 221.8 199.2 199.2 183.8 183.8
Development projects 0.0 0.0 0.0 0.0 0.0 0.0 0.0 26.9 29.7 36.3 37.6
Pipeline projects 20.7 20.3 18.1 37.4 35.1 33.8 26.8 17.0 17.0 15.0 15.0
Approx. equity 139.2 160.9 148.8 154.5 159.3 157.0 133.4 153.2 158.3 156.5 159.6
Approx. FFO return on equity* 9.8% 6.1% 5.9% 4.7% 8.5% 4.5% 11.1% 5.8% 6.0% 4.5% 4.6%
Source: Immofinanz, WOOD Research; *excluding taxes
Bratislava office market overview
The office stock in the 0.4m population city stood at around 1.5m sqm at the end of 2015, according to
Colliers. Following three years of very modest supply of new space and a steady pick-up in demand
(the net take-up increased from around 50k sqm GLA per year over 2011-13 to c.20k sqm GLA in
2015), vacancy has been trending down and, according to Colliers’ figures, stood at 8.8% at the end of
2015, down nearly 7% from the peak in 2013, when it slightly exceeded 15%.
The coming years should see a substantial pick-up in new completions, in our view, with around 200k
sqm currently under construction, according to CBRE. The impact on vacancy in newer properties may
be limited as, according to CBRE, most of the new space is already pre-leased, and we believe that
this could put pressure on the older stock. Already, Colliers is reporting that a number of C class
properties are being converted into residential, and many B class buildings may need to undergo
substantial refurbishment in order to remain competitive.
With respect to the rents, neither CBRE nor Colliers have reported any visible trend, and CBRE saying
the average asking monthly rents are at around EUR 12.5-16.0/sqm.
Like in other CEE countries, Slovakia has seen remarkably strong transaction activity in recent years.
After an exceptionally strong 2014, which saw investment volume of nearly EUR 600m, 2015 was
somewhat weaker, with a “mere” EUR 440m being invested in CRE, according to CBRE’s numbers.
That said, according to CBRE, there was over EUR 350m worth of unfinished transactions at the end
of the year, which points towards a busy 2016E.
Investment into offices accounted for just over EUR 100m, with the EUR 46m sale of Forum BC by HB
Reavis to Reico, a Czech investment company, the largest deal of the year.
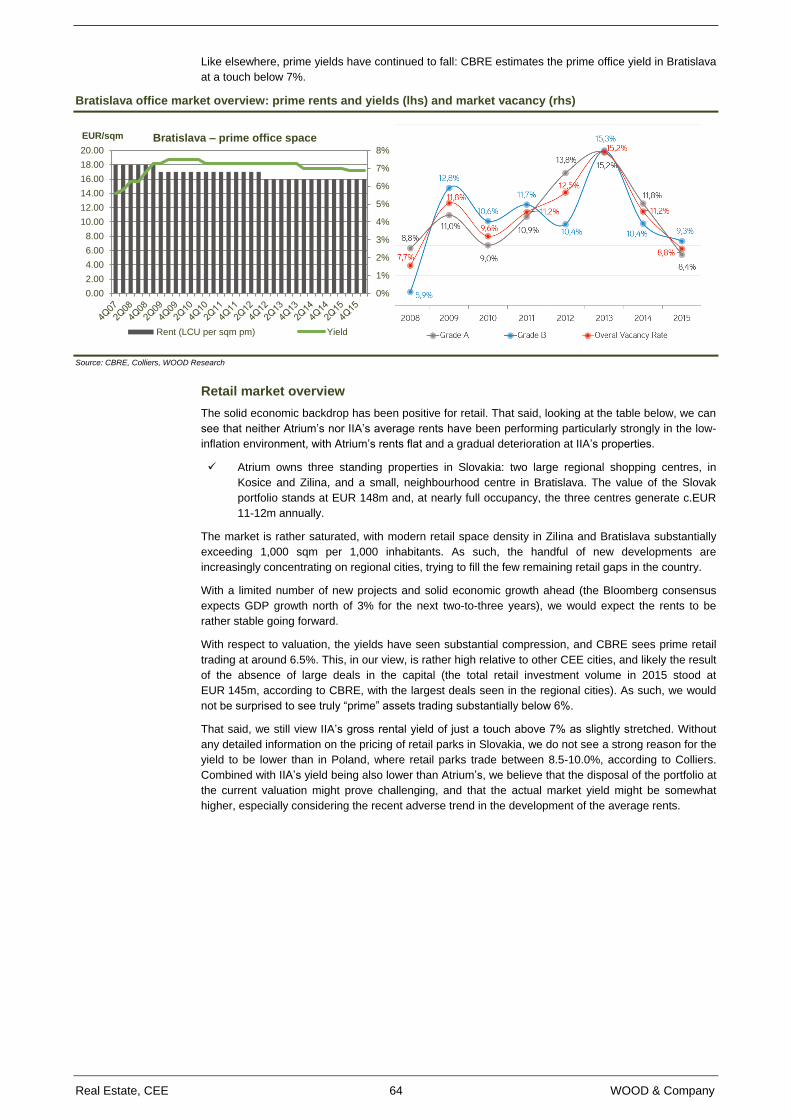
Real Estate, CEE 64 WOOD & Company
Like elsewhere, prime yields have continued to fall: CBRE estimates the prime office yield in Bratislava
at a touch below 7%.
Bratislava office market overview: prime rents and yields (lhs) and market vacancy (rhs)
Source: CBRE, Colliers, WOOD Research
Retail market overview
The solid economic backdrop has been positive for retail. That said, looking at the table below, we can
see that neither Atrium’s nor IIA’s average rents have been performing particularly strongly in the low-
inflation environment, with Atrium’s rents flat and a gradual deterioration at IIA’s properties.
Atrium owns three standing properties in Slovakia: two large regional shopping centres, in
Kosice and Zilina, and a small, neighbourhood centre in Bratislava. The value of the Slovak
portfolio stands at EUR 148m and, at nearly full occupancy, the three centres generate c.EUR
11-12m annually.
The market is rather saturated, with modern retail space density in Zilina and Bratislava substantially
exceeding 1,000 sqm per 1,000 inhabitants. As such, the handful of new developments are
increasingly concentrating on regional cities, trying to fill the few remaining retail gaps in the country.
With a limited number of new projects and solid economic growth ahead (the Bloomberg consensus
expects GDP growth north of 3% for the next two-to-three years), we would expect the rents to be
rather stable going forward.
With respect to valuation, the yields have seen substantial compression, and CBRE sees prime retail
trading at around 6.5%. This, in our view, is rather high relative to other CEE cities, and likely the result
of the absence of large deals in the capital (the total retail investment volume in 2015 stood at
EUR 145m, according to CBRE, with the largest deals seen in the regional cities). As such, we would
not be surprised to see truly “prime” assets trading substantially below 6%.
That said, we still view IIA’s gross rental yield of just a touch above 7% as slightly stretched. Without
any detailed information on the pricing of retail parks in Slovakia, we do not see a strong reason for the
yield to be lower than in Poland, where retail parks trade between 8.5-10.0%, according to Colliers.
Combined with IIA’s yield being also lower than Atrium’s, we believe that the disposal of the portfolio at
the current valuation might prove challenging, and that the actual market yield might be somewhat
higher, especially considering the recent adverse trend in the development of the average rents.
0%
1%
2%
3%
4%
5%
6%
7%
8%
0.00
2.00
4.00
6.00
8.00
10.00
12.00
14.00
16.00
18.00
20.00
EUR/sqm Bratislava – prime office space
Rent (LCU per sqm pm) Yield
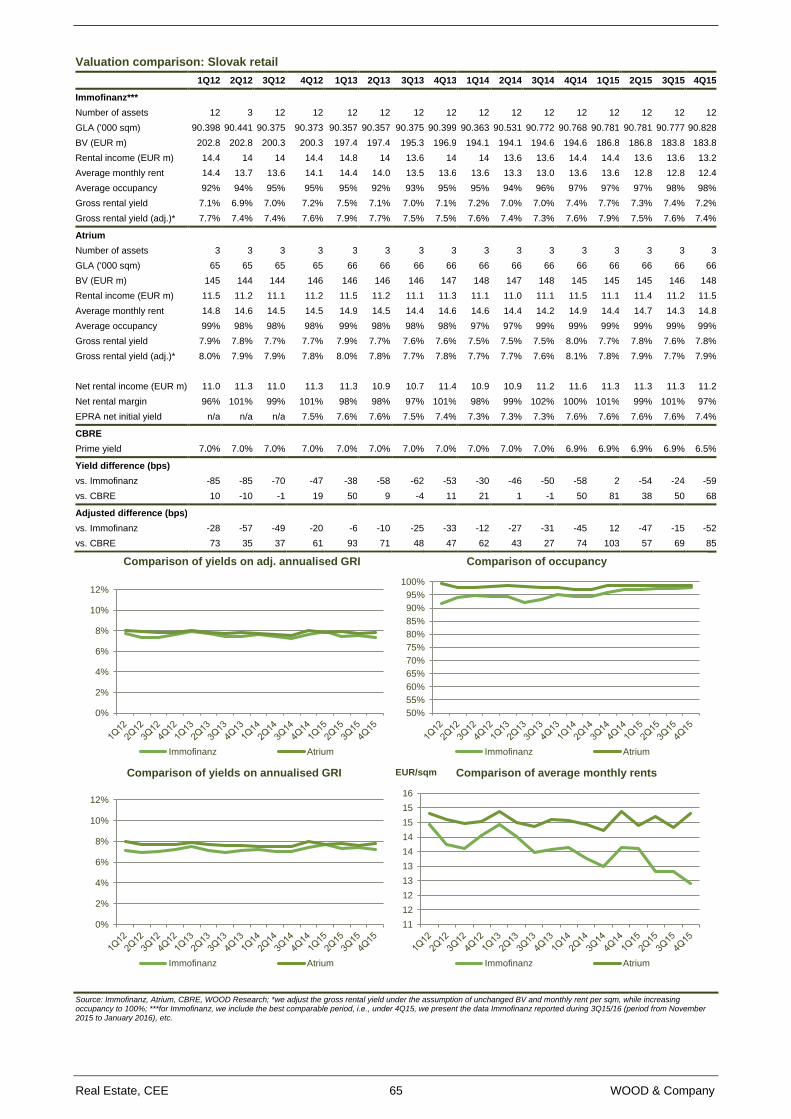
Real Estate, CEE 65 WOOD & Company
Valuation comparison: Slovak retail
1Q12 2Q12 3Q12 4Q12 1Q13 2Q13 3Q13 4Q13 1Q14 2Q14 3Q14 4Q14 1Q15 2Q15 3Q15 4Q15
Immofinanz***
Number of assets 12 3 12 12 12 12 12 12 12 12 12 12 12 12 12 12
GLA ('000 sqm) 90.398 90.441 90.375 90.373 90.357 90.357 90.375 90.399 90.363 90.531 90.772 90.768 90.781 90.781 90.777 90.828
BV (EUR m) 202.8 202.8 200.3 200.3 197.4 197.4 195.3 196.9 194.1 194.1 194.6 194.6 186.8 186.8 183.8 183.8
Rental income (EUR m) 14.4 14 14 14.4 14.8 14 13.6 14 14 13.6 13.6 14.4 14.4 13.6 13.6 13.2
Average monthly rent 14.4 13.7 13.6 14.1 14.4 14.0 13.5 13.6 13.6 13.3 13.0 13.6 13.6 12.8 12.8 12.4
Average occupancy 92% 94% 95% 95% 95% 92% 93% 95% 95% 94% 96% 97% 97% 97% 98% 98%
Gross rental yield 7.1% 6.9% 7.0% 7.2% 7.5% 7.1% 7.0% 7.1% 7.2% 7.0% 7.0% 7.4% 7.7% 7.3% 7.4% 7.2%
Gross rental yield (adj.)* 7.7% 7.4% 7.4% 7.6% 7.9% 7.7% 7.5% 7.5% 7.6% 7.4% 7.3% 7.6% 7.9% 7.5% 7.6% 7.4%
Atrium
Number of assets 3 3 3 3 3 3 3 3 3 3 3 3 3 3 3 3
GLA ('000 sqm) 65 65 65 65 66 66 66 66 66 66 66 66 66 66 66 66
BV (EUR m) 145 144 144 146 146 146 146 147 148 147 148 145 145 145 146 148
Rental income (EUR m) 11.5 11.2 11.1 11.2 11.5 11.2 11.1 11.3 11.1 11.0 11.1 11.5 11.1 11.4 11.2 11.5
Average monthly rent 14.8 14.6 14.5 14.5 14.9 14.5 14.4 14.6 14.6 14.4 14.2 14.9 14.4 14.7 14.3 14.8
Average occupancy 99% 98% 98% 98% 99% 98% 98% 98% 97% 97% 99% 99% 99% 99% 99% 99%
Gross rental yield 7.9% 7.8% 7.7% 7.7% 7.9% 7.7% 7.6% 7.6% 7.5% 7.5% 7.5% 8.0% 7.7% 7.8% 7.6% 7.8%
Gross rental yield (adj.)* 8.0% 7.9% 7.9% 7.8% 8.0% 7.8% 7.7% 7.8% 7.7% 7.7% 7.6% 8.1% 7.8% 7.9% 7.7% 7.9%
Net rental income (EUR m) 11.0 11.3 11.0 11.3 11.3 10.9 10.7 11.4 10.9 10.9 11.2 11.6 11.3 11.3 11.3 11.2
Net rental margin 96% 101% 99% 101% 98% 98% 97% 101% 98% 99% 102% 100% 101% 99% 101% 97%
EPRA net initial yield n/a n/a n/a 7.5% 7.6% 7.6% 7.5% 7.4% 7.3% 7.3% 7.3% 7.6% 7.6% 7.6% 7.6% 7.4%
CBRE
Prime yield 7.0% 7.0% 7.0% 7.0% 7.0% 7.0% 7.0% 7.0% 7.0% 7.0% 7.0% 6.9% 6.9% 6.9% 6.9% 6.5%
Yield difference (bps)
vs. Immofinanz -85 -85 -70 -47 -38 -58 -62 -53 -30 -46 -50 -58 2 -54 -24 -59
vs. CBRE 10 -10 -1 19 50 9 -4 11 21 1 -1 50 81 38 50 68
Adjusted difference (bps)
vs. Immofinanz -28 -57 -49 -20 -6 -10 -25 -33 -12 -27 -31 -45 12 -47 -15 -52
vs. CBRE 73 35 37 61 93 71 48 47 62 43 27 74 103 57 69 85
Source: Immofinanz, Atrium, CBRE, WOOD Research; *we adjust the gross rental yield under the assumption of unchanged BV and monthly rent per sqm, while increasing occupancy to 100%; ***for Immofinanz, we include the best comparable period, i.e., under 4Q15, we present the data Immofinanz reported during 3Q15/16 (period from November 2015 to January 2016), etc.
0%
2%
4%
6%
8%
10%
12%
Comparison of yields on adj. annualised GRI
Immofinanz Atrium
50%
55%
60%
65%
70%
75%
80%
85%
90%
95%
100%
Comparison of occupancy
Immofinanz Atrium
0%
2%
4%
6%
8%
10%
12%
Comparison of yields on annualised GRI
Immofinanz Atrium
11
12
12
13
13
14
14
15
15
16
EUR/sqm Comparison of average monthly rents
Immofinanz Atrium
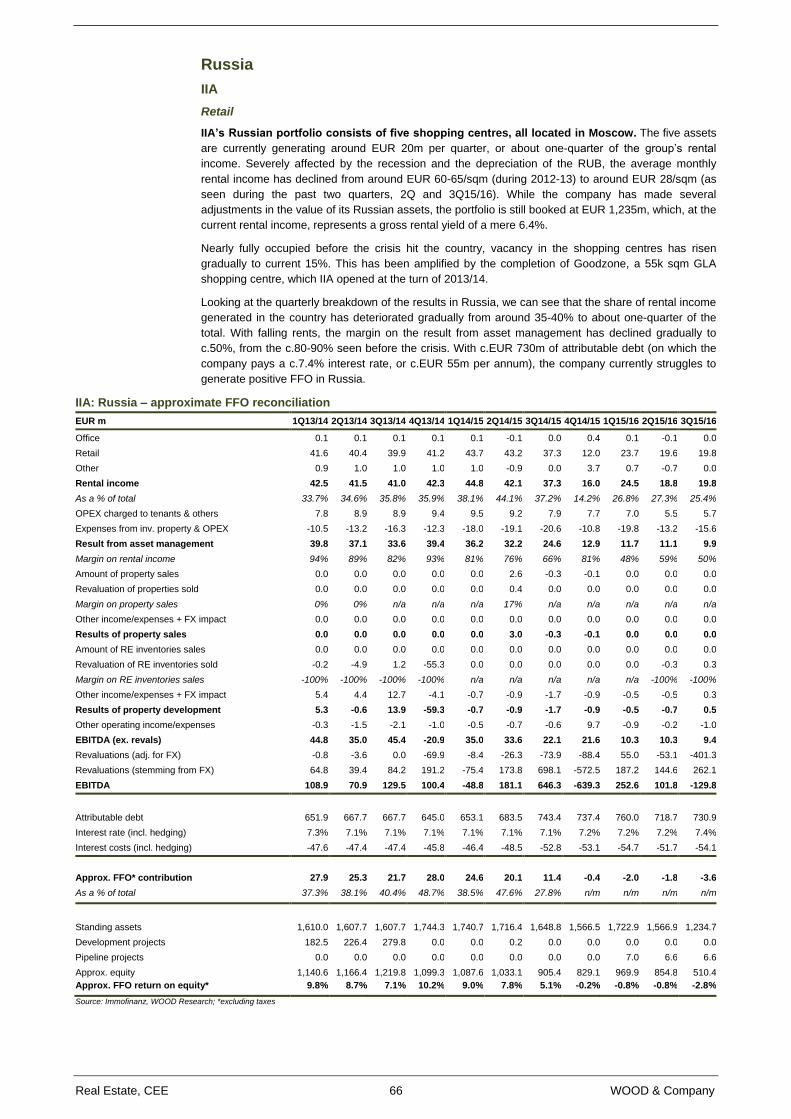
Real Estate, CEE 66 WOOD & Company
Russia
IIA
Retail
IIA’s Russian portfolio consists of five shopping centres, all located in Moscow. The five assets
are currently generating around EUR 20m per quarter, or about one-quarter of the group’s rental
income. Severely affected by the recession and the depreciation of the RUB, the average monthly
rental income has declined from around EUR 60-65/sqm (during 2012-13) to around EUR 28/sqm (as
seen during the past two quarters, 2Q and 3Q15/16). While the company has made several
adjustments in the value of its Russian assets, the portfolio is still booked at EUR 1,235m, which, at the
current rental income, represents a gross rental yield of a mere 6.4%.
Nearly fully occupied before the crisis hit the country, vacancy in the shopping centres has risen
gradually to current 15%. This has been amplified by the completion of Goodzone, a 55k sqm GLA
shopping centre, which IIA opened at the turn of 2013/14.
Looking at the quarterly breakdown of the results in Russia, we can see that the share of rental income
generated in the country has deteriorated gradually from around 35-40% to about one-quarter of the
total. With falling rents, the margin on the result from asset management has declined gradually to
c.50%, from the c.80-90% seen before the crisis. With c.EUR 730m of attributable debt (on which the
company pays a c.7.4% interest rate, or c.EUR 55m per annum), the company currently struggles to
generate positive FFO in Russia.
IIA: Russia – approximate FFO reconciliation
EUR m 1Q13/14 2Q13/14 3Q13/14 4Q13/14 1Q14/15 2Q14/15 3Q14/15 4Q14/15 1Q15/16 2Q15/16 3Q15/16
Office 0.1 0.1 0.1 0.1 0.1 -0.1 0.0 0.4 0.1 -0.1 0.0
Retail 41.6 40.4 39.9 41.2 43.7 43.2 37.3 12.0 23.7 19.6 19.8
Other 0.9 1.0 1.0 1.0 1.0 -0.9 0.0 3.7 0.7 -0.7 0.0
Rental income 42.5 41.5 41.0 42.3 44.8 42.1 37.3 16.0 24.5 18.8 19.8
As a % of total 33.7% 34.6% 35.8% 35.9% 38.1% 44.1% 37.2% 14.2% 26.8% 27.3% 25.4%
OPEX charged to tenants & others 7.8 8.9 8.9 9.4 9.5 9.2 7.9 7.7 7.0 5.5 5.7
Expenses from inv. property & OPEX -10.5 -13.2 -16.3 -12.3 -18.0 -19.1 -20.6 -10.8 -19.8 -13.2 -15.6
Result from asset management 39.8 37.1 33.6 39.4 36.2 32.2 24.6 12.9 11.7 11.1 9.9
Margin on rental income 94% 89% 82% 93% 81% 76% 66% 81% 48% 59% 50%
Amount of property sales 0.0 0.0 0.0 0.0 0.0 2.6 -0.3 -0.1 0.0 0.0 0.0
Revaluation of properties sold 0.0 0.0 0.0 0.0 0.0 0.4 0.0 0.0 0.0 0.0 0.0
Margin on property sales 0% 0% n/a n/a n/a 17% n/a n/a n/a n/a n/a
Other income/expenses + FX impact 0.0 0.0 0.0 0.0 0.0 0.0 0.0 0.0 0.0 0.0 0.0
Results of property sales 0.0 0.0 0.0 0.0 0.0 3.0 -0.3 -0.1 0.0 0.0 0.0
Amount of RE inventories sales 0.0 0.0 0.0 0.0 0.0 0.0 0.0 0.0 0.0 0.0 0.0
Revaluation of RE inventories sold -0.2 -4.9 1.2 -55.3 0.0 0.0 0.0 0.0 0.0 -0.3 0.3
Margin on RE inventories sales -100% -100% -100% -100% n/a n/a n/a n/a n/a -100% -100%
Other income/expenses + FX impact 5.4 4.4 12.7 -4.1 -0.7 -0.9 -1.7 -0.9 -0.5 -0.5 0.3
Results of property development 5.3 -0.6 13.9 -59.3 -0.7 -0.9 -1.7 -0.9 -0.5 -0.7 0.5
Other operating income/expenses -0.3 -1.5 -2.1 -1.0 -0.5 -0.7 -0.6 9.7 -0.9 -0.2 -1.0
EBITDA (ex. revals) 44.8 35.0 45.4 -20.9 35.0 33.6 22.1 21.6 10.3 10.3 9.4
Revaluations (adj. for FX) -0.8 -3.6 0.0 -69.9 -8.4 -26.3 -73.9 -88.4 55.0 -53.1 -401.3
Revaluations (stemming from FX) 64.8 39.4 84.2 191.2 -75.4 173.8 698.1 -572.5 187.2 144.6 262.1
EBITDA 108.9 70.9 129.5 100.4 -48.8 181.1 646.3 -639.3 252.6 101.8 -129.8
Attributable debt 651.9 667.7 667.7 645.0 653.1 683.5 743.4 737.4 760.0 718.7 730.9
Interest rate (incl. hedging) 7.3% 7.1% 7.1% 7.1% 7.1% 7.1% 7.1% 7.2% 7.2% 7.2% 7.4%
Interest costs (incl. hedging) -47.6 -47.4 -47.4 -45.8 -46.4 -48.5 -52.8 -53.1 -54.7 -51.7 -54.1
Approx. FFO* contribution 27.9 25.3 21.7 28.0 24.6 20.1 11.4 -0.4 -2.0 -1.8 -3.6
As a % of total 37.3% 38.1% 40.4% 48.7% 38.5% 47.6% 27.8% n/m n/m n/m n/m
Standing assets 1,610.0 1,607.7 1,607.7 1,744.3 1,740.7 1,716.4 1,648.8 1,566.5 1,722.9 1,566.9 1,234.7
Development projects 182.5 226.4 279.8 0.0 0.0 0.2 0.0 0.0 0.0 0.0 0.0
Pipeline projects 0.0 0.0 0.0 0.0 0.0 0.0 0.0 0.0 7.0 6.6 6.6
Approx. equity 1,140.6 1,166.4 1,219.8 1,099.3 1,087.6 1,033.1 905.4 829.1 969.9 854.8 510.4
Approx. FFO return on equity* 9.8% 8.7% 7.1% 10.2% 9.0% 7.8% 5.1% -0.2% -0.8% -0.8% -2.8%
Source: Immofinanz, WOOD Research; *excluding taxes
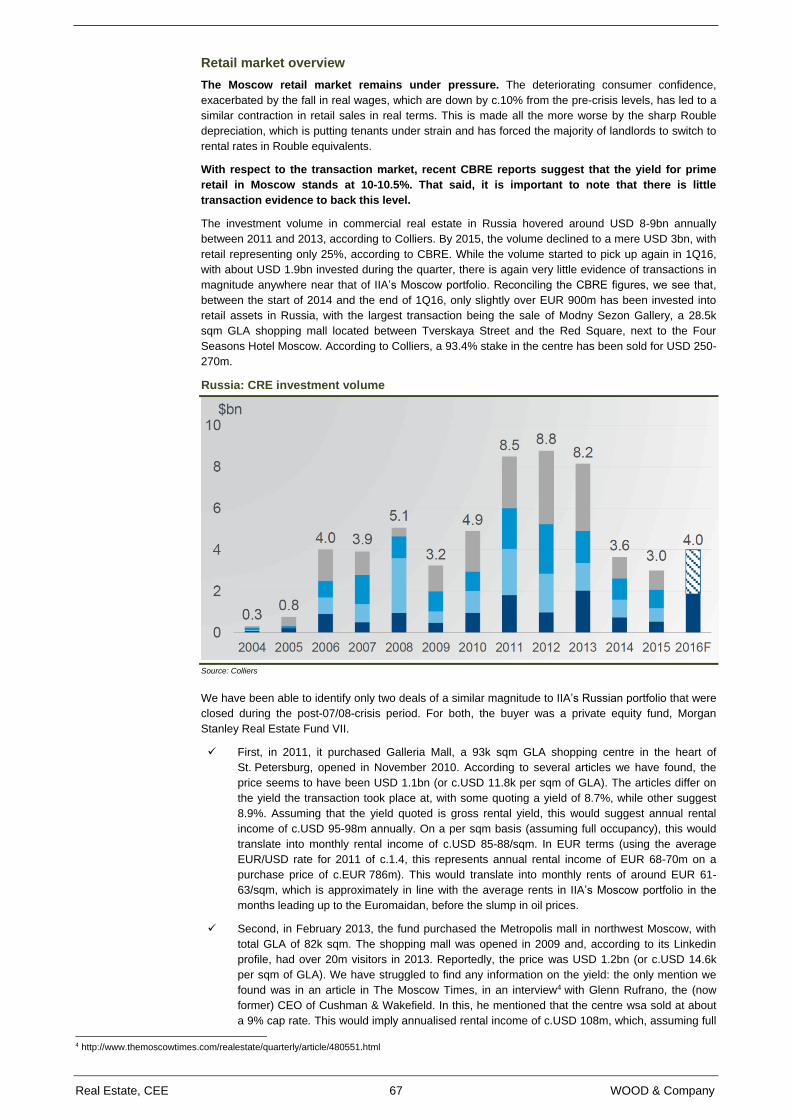
Real Estate, CEE 67 WOOD & Company
Retail market overview
The Moscow retail market remains under pressure. The deteriorating consumer confidence,
exacerbated by the fall in real wages, which are down by c.10% from the pre-crisis levels, has led to a
similar contraction in retail sales in real terms. This is made all the more worse by the sharp Rouble
depreciation, which is putting tenants under strain and has forced the majority of landlords to switch to
rental rates in Rouble equivalents.
With respect to the transaction market, recent CBRE reports suggest that the yield for prime
retail in Moscow stands at 10-10.5%. That said, it is important to note that there is little
transaction evidence to back this level.
The investment volume in commercial real estate in Russia hovered around USD 8-9bn annually
between 2011 and 2013, according to Colliers. By 2015, the volume declined to a mere USD 3bn, with
retail representing only 25%, according to CBRE. While the volume started to pick up again in 1Q16,
with about USD 1.9bn invested during the quarter, there is again very little evidence of transactions in
magnitude anywhere near that of IIA’s Moscow portfolio. Reconciling the CBRE figures, we see that,
between the start of 2014 and the end of 1Q16, only slightly over EUR 900m has been invested into
retail assets in Russia, with the largest transaction being the sale of Modny Sezon Gallery, a 28.5k
sqm GLA shopping mall located between Tverskaya Street and the Red Square, next to the Four
Seasons Hotel Moscow. According to Colliers, a 93.4% stake in the centre has been sold for USD 250-
270m.
Russia: CRE investment volume
Source: Colliers
We have been able to identify only two deals of a similar magnitude to IIA’s Russian portfolio that were
closed during the post-07/08-crisis period. For both, the buyer was a private equity fund, Morgan
Stanley Real Estate Fund VII.
First, in 2011, it purchased Galleria Mall, a 93k sqm GLA shopping centre in the heart of
St. Petersburg, opened in November 2010. According to several articles we have found, the
price seems to have been USD 1.1bn (or c.USD 11.8k per sqm of GLA). The articles differ on
the yield the transaction took place at, with some quoting a yield of 8.7%, while other suggest
8.9%. Assuming that the yield quoted is gross rental yield, this would suggest annual rental
income of c.USD 95-98m annually. On a per sqm basis (assuming full occupancy), this would
translate into monthly rental income of c.USD 85-88/sqm. In EUR terms (using the average
EUR/USD rate for 2011 of c.1.4, this represents annual rental income of EUR 68-70m on a
purchase price of c.EUR 786m). This would translate into monthly rents of around EUR 61-
63/sqm, which is approximately in line with the average rents in IIA’s Moscow portfolio in the
months leading up to the Euromaidan, before the slump in oil prices.
Second, in February 2013, the fund purchased the Metropolis mall in northwest Moscow, with
total GLA of 82k sqm. The shopping mall was opened in 2009 and, according to its Linkedin
profile, had over 20m visitors in 2013. Reportedly, the price was USD 1.2bn (or c.USD 14.6k
per sqm of GLA). We have struggled to find any information on the yield: the only mention we
found was in an article in The Moscow Times, in an interview4 with Glenn Rufrano, the (now
former) CEO of Cushman & Wakefield. In this, he mentioned that the centre wsa sold at about
a 9% cap rate. This would imply annualised rental income of c.USD 108m, which, assuming full
4 http://www.themoscowtimes.com/realestate/quarterly/article/480551.html
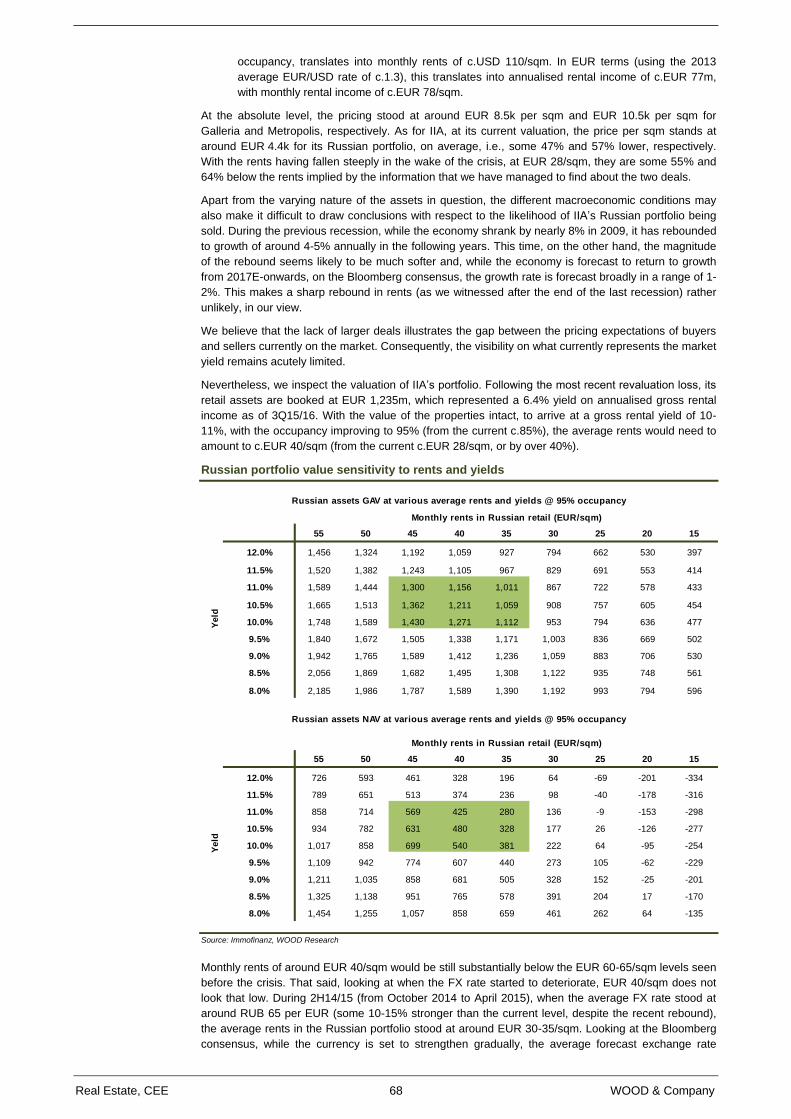
Real Estate, CEE 68 WOOD & Company
occupancy, translates into monthly rents of c.USD 110/sqm. In EUR terms (using the 2013
average EUR/USD rate of c.1.3), this translates into annualised rental income of c.EUR 77m,
with monthly rental income of c.EUR 78/sqm.
At the absolute level, the pricing stood at around EUR 8.5k per sqm and EUR 10.5k per sqm for
Galleria and Metropolis, respectively. As for IIA, at its current valuation, the price per sqm stands at
around EUR 4.4k for its Russian portfolio, on average, i.e., some 47% and 57% lower, respectively.
With the rents having fallen steeply in the wake of the crisis, at EUR 28/sqm, they are some 55% and
64% below the rents implied by the information that we have managed to find about the two deals.
Apart from the varying nature of the assets in question, the different macroeconomic conditions may
also make it difficult to draw conclusions with respect to the likelihood of IIA’s Russian portfolio being
sold. During the previous recession, while the economy shrank by nearly 8% in 2009, it has rebounded
to growth of around 4-5% annually in the following years. This time, on the other hand, the magnitude
of the rebound seems likely to be much softer and, while the economy is forecast to return to growth
from 2017E-onwards, on the Bloomberg consensus, the growth rate is forecast broadly in a range of 1-
2%. This makes a sharp rebound in rents (as we witnessed after the end of the last recession) rather
unlikely, in our view.
We believe that the lack of larger deals illustrates the gap between the pricing expectations of buyers
and sellers currently on the market. Consequently, the visibility on what currently represents the market
yield remains acutely limited.
Nevertheless, we inspect the valuation of IIA’s portfolio. Following the most recent revaluation loss, its
retail assets are booked at EUR 1,235m, which represented a 6.4% yield on annualised gross rental
income as of 3Q15/16. With the value of the properties intact, to arrive at a gross rental yield of 10-
11%, with the occupancy improving to 95% (from the current c.85%), the average rents would need to
amount to c.EUR 40/sqm (from the current c.EUR 28/sqm, or by over 40%).
Russian portfolio value sensitivity to rents and yields
Source: Immofinanz, WOOD Research
Monthly rents of around EUR 40/sqm would be still substantially below the EUR 60-65/sqm levels seen
before the crisis. That said, looking at when the FX rate started to deteriorate, EUR 40/sqm does not
look that low. During 2H14/15 (from October 2014 to April 2015), when the average FX rate stood at
around RUB 65 per EUR (some 10-15% stronger than the current level, despite the recent rebound),
the average rents in the Russian portfolio stood at around EUR 30-35/sqm. Looking at the Bloomberg
consensus, while the currency is set to strengthen gradually, the average forecast exchange rate
55 50 45 40 35 30 25 20 15
12.0% 1,456 1,324 1,192 1,059 927 794 662 530 397
11.5% 1,520 1,382 1,243 1,105 967 829 691 553 414
11.0% 1,589 1,444 1,300 1,156 1,011 867 722 578 433
10.5% 1,665 1,513 1,362 1,211 1,059 908 757 605 454
10.0% 1,748 1,589 1,430 1,271 1,112 953 794 636 477
9.5% 1,840 1,672 1,505 1,338 1,171 1,003 836 669 502
9.0% 1,942 1,765 1,589 1,412 1,236 1,059 883 706 530
8.5% 2,056 1,869 1,682 1,495 1,308 1,122 935 748 561
8.0% 2,185 1,986 1,787 1,589 1,390 1,192 993 794 596
Russian assets GAV at various average rents and yields @ 95% occupancy
Monthly rents in Russian retail (EUR/sqm)
Yeld
55 50 45 40 35 30 25 20 15
12.0% 726 593 461 328 196 64 -69 -201 -334
11.5% 789 651 513 374 236 98 -40 -178 -316
11.0% 858 714 569 425 280 136 -9 -153 -298
10.5% 934 782 631 480 328 177 26 -126 -277
10.0% 1,017 858 699 540 381 222 64 -95 -254
9.5% 1,109 942 774 607 440 273 105 -62 -229
9.0% 1,211 1,035 858 681 505 328 152 -25 -201
8.5% 1,325 1,138 951 765 578 391 204 17 -170
8.0% 1,454 1,255 1,057 858 659 461 262 64 -135
Russian assets NAV at various average rents and yields @ 95% occupancy
Monthly rents in Russian retail (EUR/sqm)
Yeld

Real Estate, CEE 69 WOOD & Company
stands at RUB 68-65 per EUR for 2016-18E. As such, we would be surprised if the average monthly
rents rebounded north of EUR 40/sqm any time soon.
That a substantial amount of new space has been delivered to the Moscow retail market in recent
years also needs to be taken into consideration, in our view. According to CBRE, the modern retail
stock in Moscow amounted to c.4.1m sqm at the end of 2013. Over 2014-15, an additional 1.1m sqm
was delivered to the market. For 2016E, CBRE has identified at least six shopping centres, comprising
c.400k sqm (all currently in very late stages of development; the largest of which has actually already
been opened) that are likely to be delivered to the market throughout 2016E. So, over just three years,
Moscow modern retail space is to expand by over one-third. Exacerbated by the slowdown in spending
and adverse FX development, the market vacancy increased to c.9-10% as of the end of 2015,
according to CBRE.
While, as per the map below, none of the large new centres is being opened in the immediate vicinity
of IIA’s largest assets, the Golden Babylon Rostokino shopping mall, the new centres are currently
being opened with c.40-60% vacancy rates. With a strong incentive to attract tenants and fill the
centres, we would be surprised if the new additions to the Moscow retail market do not substantially
affect the general equilibrium for rents.
To conclude, we highlight that it is important to keep in mind not only the exchange rate and the
general economic environment. Equally important is that the fundamentals of the market have shifted
significantly. As such, we believe that it would be misleading to use the performance of the centres
during the time before the oil price plunge as guidance for the post-recovery future.
Super-regional shopping malls in Moscow
Source: CBRE
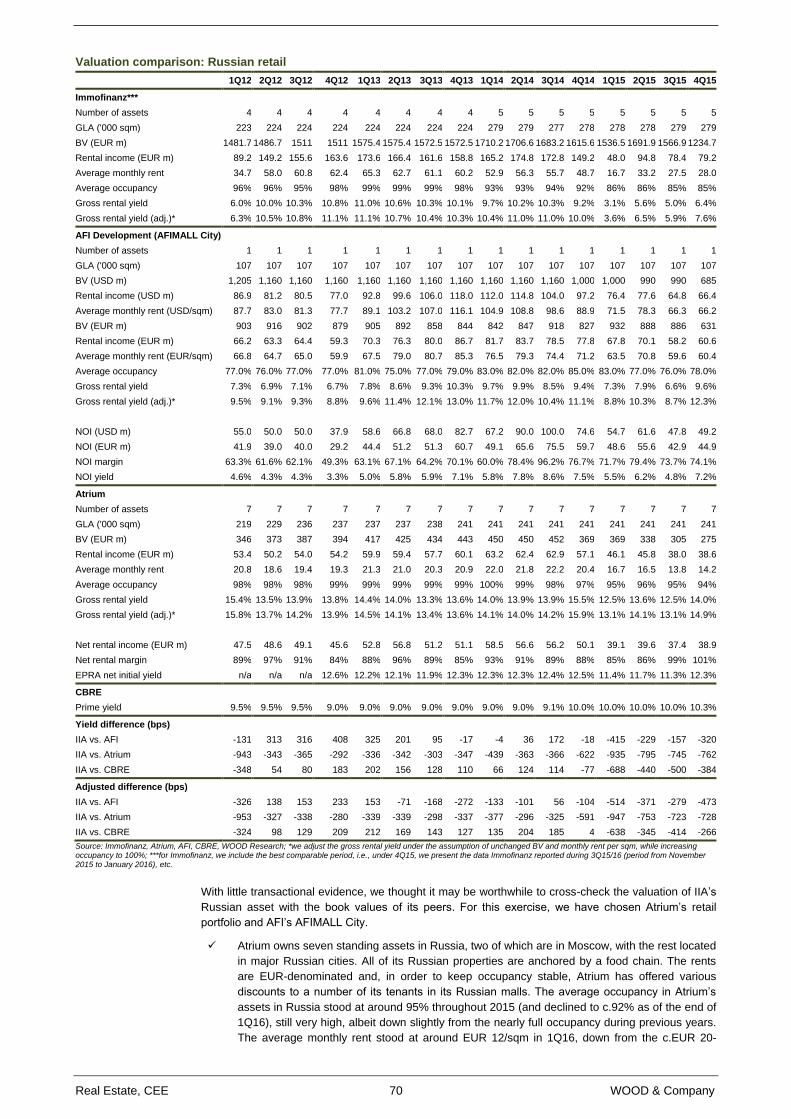
Real Estate, CEE 70 WOOD & Company
Valuation comparison: Russian retail
1Q12 2Q12 3Q12 4Q12 1Q13 2Q13 3Q13 4Q13 1Q14 2Q14 3Q14 4Q14 1Q15 2Q15 3Q15 4Q15
Immofinanz***
Number of assets 4 4 4 4 4 4 4 4 5 5 5 5 5 5 5 5
GLA ('000 sqm) 223 224 224 224 224 224 224 224 279 279 277 278 278 278 279 279
BV (EUR m) 1481.7 1486.7 1511 1511 1575.4 1575.4 1572.5 1572.5 1710.2 1706.6 1683.2 1615.6 1536.5 1691.9 1566.9 1234.7
Rental income (EUR m) 89.2 149.2 155.6 163.6 173.6 166.4 161.6 158.8 165.2 174.8 172.8 149.2 48.0 94.8 78.4 79.2
Average monthly rent 34.7 58.0 60.8 62.4 65.3 62.7 61.1 60.2 52.9 56.3 55.7 48.7 16.7 33.2 27.5 28.0
Average occupancy 96% 96% 95% 98% 99% 99% 99% 98% 93% 93% 94% 92% 86% 86% 85% 85%
Gross rental yield 6.0% 10.0% 10.3% 10.8% 11.0% 10.6% 10.3% 10.1% 9.7% 10.2% 10.3% 9.2% 3.1% 5.6% 5.0% 6.4%
Gross rental yield (adj.)* 6.3% 10.5% 10.8% 11.1% 11.1% 10.7% 10.4% 10.3% 10.4% 11.0% 11.0% 10.0% 3.6% 6.5% 5.9% 7.6%
AFI Development (AFIMALL City)
Number of assets 1 1 1 1 1 1 1 1 1 1 1 1 1 1 1 1
GLA ('000 sqm) 107 107 107 107 107 107 107 107 107 107 107 107 107 107 107 107
BV (USD m) 1,205 1,160 1,160 1,160 1,160 1,160 1,160 1,160 1,160 1,160 1,160 1,000 1,000 990 990 685
Rental income (USD m) 86.9 81.2 80.5 77.0 92.8 99.6 106.0 118.0 112.0 114.8 104.0 97.2 76.4 77.6 64.8 66.4
Average monthly rent (USD/sqm) 87.7 83.0 81.3 77.7 89.1 103.2 107.0 116.1 104.9 108.8 98.6 88.9 71.5 78.3 66.3 66.2
BV (EUR m) 903 916 902 879 905 892 858 844 842 847 918 827 932 888 886 631
Rental income (EUR m) 66.2 63.3 64.4 59.3 70.3 76.3 80.0 86.7 81.7 83.7 78.5 77.8 67.8 70.1 58.2 60.6
Average monthly rent (EUR/sqm) 66.8 64.7 65.0 59.9 67.5 79.0 80.7 85.3 76.5 79.3 74.4 71.2 63.5 70.8 59.6 60.4
Average occupancy 77.0% 76.0% 77.0% 77.0% 81.0% 75.0% 77.0% 79.0% 83.0% 82.0% 82.0% 85.0% 83.0% 77.0% 76.0% 78.0%
Gross rental yield 7.3% 6.9% 7.1% 6.7% 7.8% 8.6% 9.3% 10.3% 9.7% 9.9% 8.5% 9.4% 7.3% 7.9% 6.6% 9.6%
Gross rental yield (adj.)* 9.5% 9.1% 9.3% 8.8% 9.6% 11.4% 12.1% 13.0% 11.7% 12.0% 10.4% 11.1% 8.8% 10.3% 8.7% 12.3%
NOI (USD m) 55.0 50.0 50.0 37.9 58.6 66.8 68.0 82.7 67.2 90.0 100.0 74.6 54.7 61.6 47.8 49.2
NOI (EUR m) 41.9 39.0 40.0 29.2 44.4 51.2 51.3 60.7 49.1 65.6 75.5 59.7 48.6 55.6 42.9 44.9
NOI margin 63.3% 61.6% 62.1% 49.3% 63.1% 67.1% 64.2% 70.1% 60.0% 78.4% 96.2% 76.7% 71.7% 79.4% 73.7% 74.1%
NOI yield 4.6% 4.3% 4.3% 3.3% 5.0% 5.8% 5.9% 7.1% 5.8% 7.8% 8.6% 7.5% 5.5% 6.2% 4.8% 7.2%
Atrium
Number of assets 7 7 7 7 7 7 7 7 7 7 7 7 7 7 7 7
GLA ('000 sqm) 219 229 236 237 237 237 238 241 241 241 241 241 241 241 241 241
BV (EUR m) 346 373 387 394 417 425 434 443 450 450 452 369 369 338 305 275
Rental income (EUR m) 53.4 50.2 54.0 54.2 59.9 59.4 57.7 60.1 63.2 62.4 62.9 57.1 46.1 45.8 38.0 38.6
Average monthly rent 20.8 18.6 19.4 19.3 21.3 21.0 20.3 20.9 22.0 21.8 22.2 20.4 16.7 16.5 13.8 14.2
Average occupancy 98% 98% 98% 99% 99% 99% 99% 99% 100% 99% 98% 97% 95% 96% 95% 94%
Gross rental yield 15.4% 13.5% 13.9% 13.8% 14.4% 14.0% 13.3% 13.6% 14.0% 13.9% 13.9% 15.5% 12.5% 13.6% 12.5% 14.0%
Gross rental yield (adj.)* 15.8% 13.7% 14.2% 13.9% 14.5% 14.1% 13.4% 13.6% 14.1% 14.0% 14.2% 15.9% 13.1% 14.1% 13.1% 14.9%
Net rental income (EUR m) 47.5 48.6 49.1 45.6 52.8 56.8 51.2 51.1 58.5 56.6 56.2 50.1 39.1 39.6 37.4 38.9
Net rental margin 89% 97% 91% 84% 88% 96% 89% 85% 93% 91% 89% 88% 85% 86% 99% 101%
EPRA net initial yield n/a n/a n/a 12.6% 12.2% 12.1% 11.9% 12.3% 12.3% 12.3% 12.4% 12.5% 11.4% 11.7% 11.3% 12.3%
CBRE
Prime yield 9.5% 9.5% 9.5% 9.0% 9.0% 9.0% 9.0% 9.0% 9.0% 9.0% 9.1% 10.0% 10.0% 10.0% 10.0% 10.3%
Yield difference (bps)
IIA vs. AFI -131 313 316 408 325 201 95 -17 -4 36 172 -18 -415 -229 -157 -320
IIA vs. Atrium -943 -343 -365 -292 -336 -342 -303 -347 -439 -363 -366 -622 -935 -795 -745 -762
IIA vs. CBRE -348 54 80 183 202 156 128 110 66 124 114 -77 -688 -440 -500 -384
Adjusted difference (bps)
IIA vs. AFI -326 138 153 233 153 -71 -168 -272 -133 -101 56 -104 -514 -371 -279 -473
IIA vs. Atrium -953 -327 -338 -280 -339 -339 -298 -337 -377 -296 -325 -591 -947 -753 -723 -728
IIA vs. CBRE -324 98 129 209 212 169 143 127 135 204 185 4 -638 -345 -414 -266
Source: Immofinanz, Atrium, AFI, CBRE, WOOD Research; *we adjust the gross rental yield under the assumption of unchanged BV and monthly rent per sqm, while increasing occupancy to 100%; ***for Immofinanz, we include the best comparable period, i.e., under 4Q15, we present the data Immofinanz reported during 3Q15/16 (period from November 2015 to January 2016), etc.
With little transactional evidence, we thought it may be worthwhile to cross-check the valuation of IIA’s
Russian asset with the book values of its peers. For this exercise, we have chosen Atrium’s retail
portfolio and AFI’s AFIMALL City.
Atrium owns seven standing assets in Russia, two of which are in Moscow, with the rest located
in major Russian cities. All of its Russian properties are anchored by a food chain. The rents
are EUR-denominated and, in order to keep occupancy stable, Atrium has offered various
discounts to a number of its tenants in its Russian malls. The average occupancy in Atrium’s
assets in Russia stood at around 95% throughout 2015 (and declined to c.92% as of the end of
1Q16), still very high, albeit down slightly from the nearly full occupancy during previous years.
The average monthly rent stood at around EUR 12/sqm in 1Q16, down from the c.EUR 20-
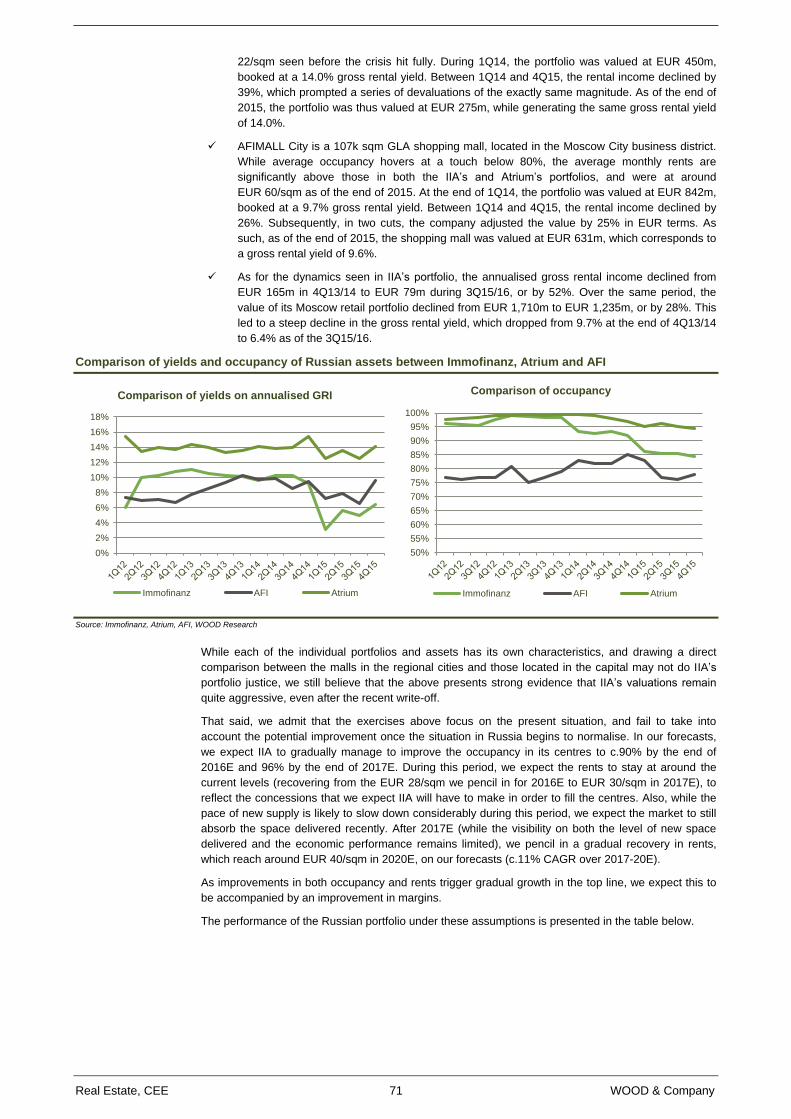
Real Estate, CEE 71 WOOD & Company
22/sqm seen before the crisis hit fully. During 1Q14, the portfolio was valued at EUR 450m,
booked at a 14.0% gross rental yield. Between 1Q14 and 4Q15, the rental income declined by
39%, which prompted a series of devaluations of the exactly same magnitude. As of the end of
2015, the portfolio was thus valued at EUR 275m, while generating the same gross rental yield
of 14.0%.
AFIMALL City is a 107k sqm GLA shopping mall, located in the Moscow City business district.
While average occupancy hovers at a touch below 80%, the average monthly rents are
significantly above those in both the IIA’s and Atrium’s portfolios, and were at around
EUR 60/sqm as of the end of 2015. At the end of 1Q14, the portfolio was valued at EUR 842m,
booked at a 9.7% gross rental yield. Between 1Q14 and 4Q15, the rental income declined by
26%. Subsequently, in two cuts, the company adjusted the value by 25% in EUR terms. As
such, as of the end of 2015, the shopping mall was valued at EUR 631m, which corresponds to
a gross rental yield of 9.6%.
As for the dynamics seen in IIA’s portfolio, the annualised gross rental income declined from
EUR 165m in 4Q13/14 to EUR 79m during 3Q15/16, or by 52%. Over the same period, the
value of its Moscow retail portfolio declined from EUR 1,710m to EUR 1,235m, or by 28%. This
led to a steep decline in the gross rental yield, which dropped from 9.7% at the end of 4Q13/14
to 6.4% as of the 3Q15/16.
Comparison of yields and occupancy of Russian assets between Immofinanz, Atrium and AFI
Source: Immofinanz, Atrium, AFI, WOOD Research
While each of the individual portfolios and assets has its own characteristics, and drawing a direct
comparison between the malls in the regional cities and those located in the capital may not do IIA’s
portfolio justice, we still believe that the above presents strong evidence that IIA’s valuations remain
quite aggressive, even after the recent write-off.
That said, we admit that the exercises above focus on the present situation, and fail to take into
account the potential improvement once the situation in Russia begins to normalise. In our forecasts,
we expect IIA to gradually manage to improve the occupancy in its centres to c.90% by the end of
2016E and 96% by the end of 2017E. During this period, we expect the rents to stay at around the
current levels (recovering from the EUR 28/sqm we pencil in for 2016E to EUR 30/sqm in 2017E), to
reflect the concessions that we expect IIA will have to make in order to fill the centres. Also, while the
pace of new supply is likely to slow down considerably during this period, we expect the market to still
absorb the space delivered recently. After 2017E (while the visibility on both the level of new space
delivered and the economic performance remains limited), we pencil in a gradual recovery in rents,
which reach around EUR 40/sqm in 2020E, on our forecasts (c.11% CAGR over 2017-20E).
As improvements in both occupancy and rents trigger gradual growth in the top line, we expect this to
be accompanied by an improvement in margins.
The performance of the Russian portfolio under these assumptions is presented in the table below.
0%
2%
4%
6%
8%
10%
12%
14%
16%
18%
Comparison of yields on annualised GRI
Immofinanz AFI Atrium
50%
55%
60%
65%
70%
75%
80%
85%
90%
95%
100%
Comparison of occupancy
Immofinanz AFI Atrium
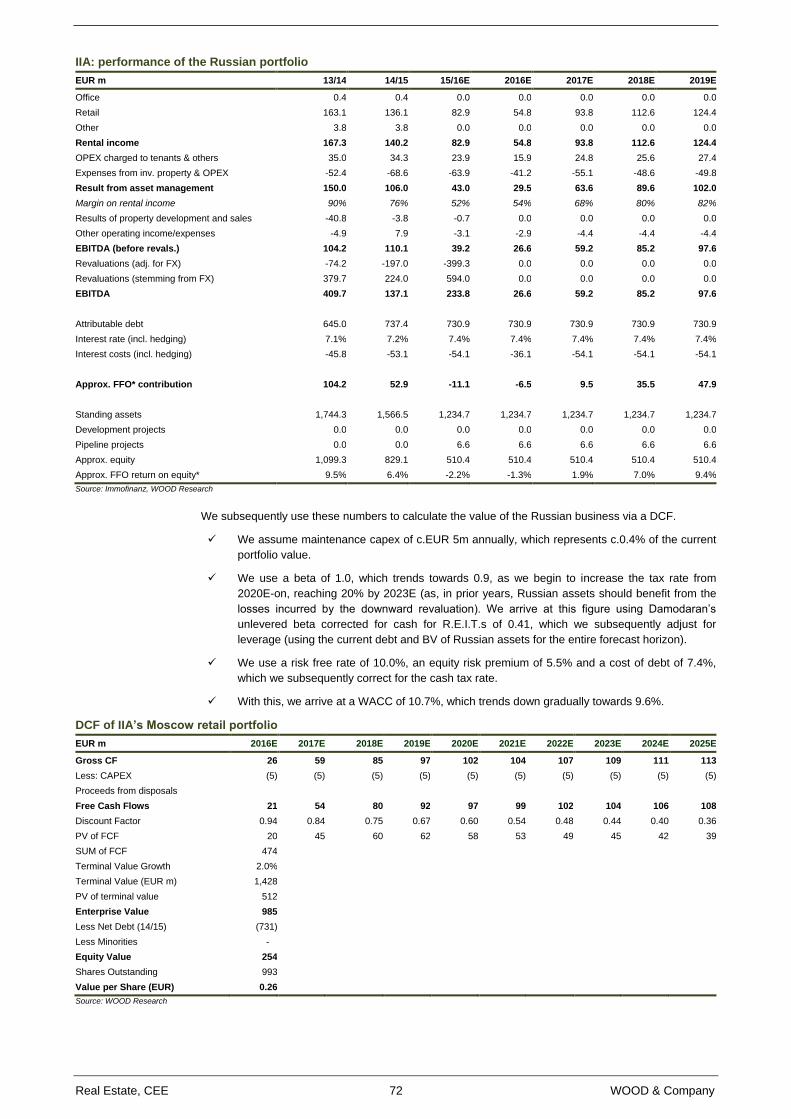
Real Estate, CEE 72 WOOD & Company
IIA: performance of the Russian portfolio
EUR m 13/14 14/15 15/16E 2016E 2017E 2018E 2019E
Office 0.4 0.4 0.0 0.0 0.0 0.0 0.0
Retail 163.1 136.1 82.9 54.8 93.8 112.6 124.4
Other 3.8 3.8 0.0 0.0 0.0 0.0 0.0
Rental income 167.3 140.2 82.9 54.8 93.8 112.6 124.4
OPEX charged to tenants & others 35.0 34.3 23.9 15.9 24.8 25.6 27.4
Expenses from inv. property & OPEX -52.4 -68.6 -63.9 -41.2 -55.1 -48.6 -49.8
Result from asset management 150.0 106.0 43.0 29.5 63.6 89.6 102.0
Margin on rental income 90% 76% 52% 54% 68% 80% 82%
Results of property development and sales -40.8 -3.8 -0.7 0.0 0.0 0.0 0.0
Other operating income/expenses -4.9 7.9 -3.1 -2.9 -4.4 -4.4 -4.4
EBITDA (before revals.) 104.2 110.1 39.2 26.6 59.2 85.2 97.6
Revaluations (adj. for FX) -74.2 -197.0 -399.3 0.0 0.0 0.0 0.0
Revaluations (stemming from FX) 379.7 224.0 594.0 0.0 0.0 0.0 0.0
EBITDA 409.7 137.1 233.8 26.6 59.2 85.2 97.6
Attributable debt 645.0 737.4 730.9 730.9 730.9 730.9 730.9
Interest rate (incl. hedging) 7.1% 7.2% 7.4% 7.4% 7.4% 7.4% 7.4%
Interest costs (incl. hedging) -45.8 -53.1 -54.1 -36.1 -54.1 -54.1 -54.1
Approx. FFO* contribution 104.2 52.9 -11.1 -6.5 9.5 35.5 47.9
Standing assets 1,744.3 1,566.5 1,234.7 1,234.7 1,234.7 1,234.7 1,234.7
Development projects 0.0 0.0 0.0 0.0 0.0 0.0 0.0
Pipeline projects 0.0 0.0 6.6 6.6 6.6 6.6 6.6
Approx. equity 1,099.3 829.1 510.4 510.4 510.4 510.4 510.4
Approx. FFO return on equity* 9.5% 6.4% -2.2% -1.3% 1.9% 7.0% 9.4%
Source: Immofinanz, WOOD Research
We subsequently use these numbers to calculate the value of the Russian business via a DCF.
We assume maintenance capex of c.EUR 5m annually, which represents c.0.4% of the current
portfolio value.
We use a beta of 1.0, which trends towards 0.9, as we begin to increase the tax rate from
2020E-on, reaching 20% by 2023E (as, in prior years, Russian assets should benefit from the
losses incurred by the downward revaluation). We arrive at this figure using Damodaran’s
unlevered beta corrected for cash for R.E.I.T.s of 0.41, which we subsequently adjust for
leverage (using the current debt and BV of Russian assets for the entire forecast horizon).
We use a risk free rate of 10.0%, an equity risk premium of 5.5% and a cost of debt of 7.4%,
which we subsequently correct for the cash tax rate.
With this, we arrive at a WACC of 10.7%, which trends down gradually towards 9.6%.
DCF of IIA’s Moscow retail portfolio
EUR m 2016E 2017E 2018E 2019E 2020E 2021E 2022E 2023E 2024E 2025E
Gross CF 26 59 85 97 102 104 107 109 111 113
Less: CAPEX (5) (5) (5) (5) (5) (5) (5) (5) (5) (5)
Proceeds from disposals
Free Cash Flows 21 54 80 92 97 99 102 104 106 108
Discount Factor 0.94 0.84 0.75 0.67 0.60 0.54 0.48 0.44 0.40 0.36
PV of FCF 20 45 60 62 58 53 49 45 42 39
SUM of FCF 474
Terminal Value Growth 2.0%
Terminal Value (EUR m) 1,428
PV of terminal value 512
Enterprise Value 985
Less Net Debt (14/15) (731)
Less Minorities -
Equity Value 254
Shares Outstanding 993
Value per Share (EUR) 0.26
Source: WOOD Research
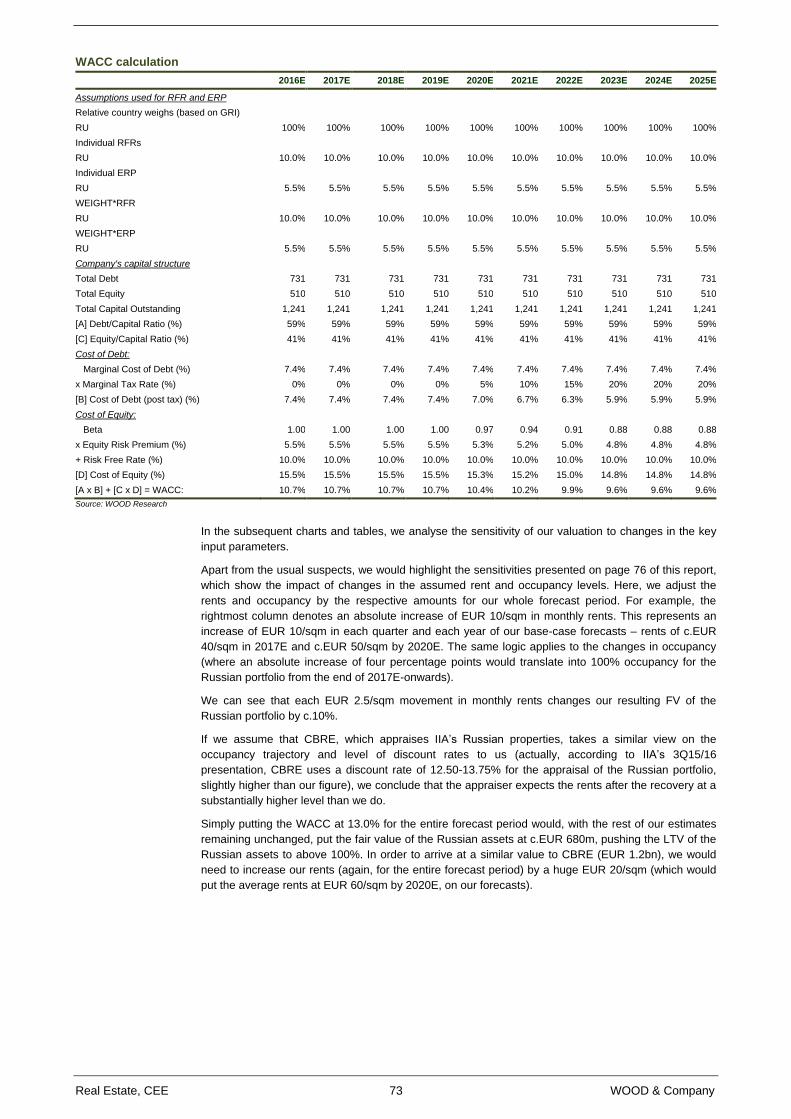
Real Estate, CEE 73 WOOD & Company
WACC calculation
2016E 2017E 2018E 2019E 2020E 2021E 2022E 2023E 2024E 2025E
Assumptions used for RFR and ERP
Relative country weighs (based on GRI)
RU 100% 100% 100% 100% 100% 100% 100% 100% 100% 100%
Individual RFRs
RU 10.0% 10.0% 10.0% 10.0% 10.0% 10.0% 10.0% 10.0% 10.0% 10.0%
Individual ERP
RU 5.5% 5.5% 5.5% 5.5% 5.5% 5.5% 5.5% 5.5% 5.5% 5.5%
WEIGHT*RFR
RU 10.0% 10.0% 10.0% 10.0% 10.0% 10.0% 10.0% 10.0% 10.0% 10.0%
WEIGHT*ERP
RU 5.5% 5.5% 5.5% 5.5% 5.5% 5.5% 5.5% 5.5% 5.5% 5.5%
Company's capital structure
Total Debt 731 731 731 731 731 731 731 731 731 731
Total Equity 510 510 510 510 510 510 510 510 510 510
Total Capital Outstanding 1,241 1,241 1,241 1,241 1,241 1,241 1,241 1,241 1,241 1,241
[A] Debt/Capital Ratio (%) 59% 59% 59% 59% 59% 59% 59% 59% 59% 59%
[C] Equity/Capital Ratio (%) 41% 41% 41% 41% 41% 41% 41% 41% 41% 41%
Cost of Debt:
Marginal Cost of Debt (%) 7.4% 7.4% 7.4% 7.4% 7.4% 7.4% 7.4% 7.4% 7.4% 7.4%
x Marginal Tax Rate (%) 0% 0% 0% 0% 5% 10% 15% 20% 20% 20%
[B] Cost of Debt (post tax) (%) 7.4% 7.4% 7.4% 7.4% 7.0% 6.7% 6.3% 5.9% 5.9% 5.9%
Cost of Equity:
Beta 1.00 1.00 1.00 1.00 0.97 0.94 0.91 0.88 0.88 0.88
x Equity Risk Premium (%) 5.5% 5.5% 5.5% 5.5% 5.3% 5.2% 5.0% 4.8% 4.8% 4.8%
+ Risk Free Rate (%) 10.0% 10.0% 10.0% 10.0% 10.0% 10.0% 10.0% 10.0% 10.0% 10.0%
[D] Cost of Equity (%) 15.5% 15.5% 15.5% 15.5% 15.3% 15.2% 15.0% 14.8% 14.8% 14.8%
[A x B] + [C x D] = WACC: 10.7% 10.7% 10.7% 10.7% 10.4% 10.2% 9.9% 9.6% 9.6% 9.6%
Source: WOOD Research
In the subsequent charts and tables, we analyse the sensitivity of our valuation to changes in the key
input parameters.
Apart from the usual suspects, we would highlight the sensitivities presented on page 76 of this report,
which show the impact of changes in the assumed rent and occupancy levels. Here, we adjust the
rents and occupancy by the respective amounts for our whole forecast period. For example, the
rightmost column denotes an absolute increase of EUR 10/sqm in monthly rents. This represents an
increase of EUR 10/sqm in each quarter and each year of our base-case forecasts – rents of c.EUR
40/sqm in 2017E and c.EUR 50/sqm by 2020E. The same logic applies to the changes in occupancy
(where an absolute increase of four percentage points would translate into 100% occupancy for the
Russian portfolio from the end of 2017E-onwards).
We can see that each EUR 2.5/sqm movement in monthly rents changes our resulting FV of the
Russian portfolio by c.10%.
If we assume that CBRE, which appraises IIA’s Russian properties, takes a similar view on the
occupancy trajectory and level of discount rates to us (actually, according to IIA’s 3Q15/16
presentation, CBRE uses a discount rate of 12.50-13.75% for the appraisal of the Russian portfolio,
slightly higher than our figure), we conclude that the appraiser expects the rents after the recovery at a
substantially higher level than we do.
Simply putting the WACC at 13.0% for the entire forecast period would, with the rest of our estimates
remaining unchanged, put the fair value of the Russian assets at c.EUR 680m, pushing the LTV of the
Russian assets to above 100%. In order to arrive at a similar value to CBRE (EUR 1.2bn), we would
need to increase our rents (again, for the entire forecast period) by a huge EUR 20/sqm (which would
put the average rents at EUR 60/sqm by 2020E, on our forecasts).
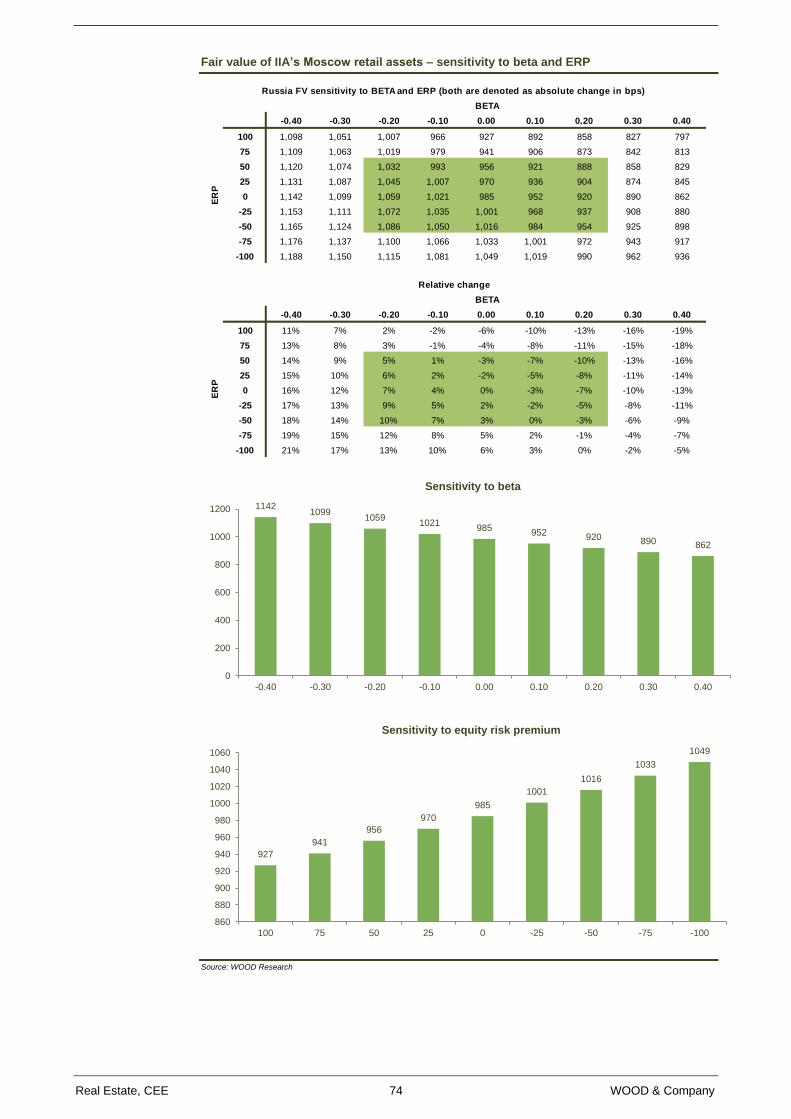
Real Estate, CEE 74 WOOD & Company
Fair value of IIA’s Moscow retail assets – sensitivity to beta and ERP
Source: WOOD Research
985 -0.40 -0.30 -0.20 -0.10 0.00 0.10 0.20 0.30 0.40
100 1,098 1,051 1,007 966 927 892 858 827 797
75 1,109 1,063 1,019 979 941 906 873 842 813
50 1,120 1,074 1,032 993 956 921 888 858 829
25 1,131 1,087 1,045 1,007 970 936 904 874 845
0 1,142 1,099 1,059 1,021 985 952 920 890 862
-25 1,153 1,111 1,072 1,035 1,001 968 937 908 880
-50 1,165 1,124 1,086 1,050 1,016 984 954 925 898
-75 1,176 1,137 1,100 1,066 1,033 1,001 972 943 917
-100 1,188 1,150 1,115 1,081 1,049 1,019 990 962 936
Russia FV sensitivity to BETA and ERP (both are denoted as absolute change in bps)
BETA
ER
P
6 -0.40 -0.30 -0.20 -0.10 0.00 0.10 0.20 0.30 0.40
100 11% 7% 2% -2% -6% -10% -13% -16% -19%
75 13% 8% 3% -1% -4% -8% -11% -15% -18%
50 14% 9% 5% 1% -3% -7% -10% -13% -16%
25 15% 10% 6% 2% -2% -5% -8% -11% -14%
0 16% 12% 7% 4% 0% -3% -7% -10% -13%
-25 17% 13% 9% 5% 2% -2% -5% -8% -11%
-50 18% 14% 10% 7% 3% 0% -3% -6% -9%
-75 19% 15% 12% 8% 5% 2% -1% -4% -7%
-100 21% 17% 13% 10% 6% 3% 0% -2% -5%
Relative change
BETA
ER
P
11421099
10591021
985952
920 890 862
0
200
400
600
800
1000
1200
-0.40 -0.30 -0.20 -0.10 0.00 0.10 0.20 0.30 0.40
Sensitivity to beta
927
941
956
970
985
1001
1016
1033
1049
860
880
900
920
940
960
980
1000
1020
1040
1060
100 75 50 25 0 -25 -50 -75 -100
Sensitivity to equity risk premium
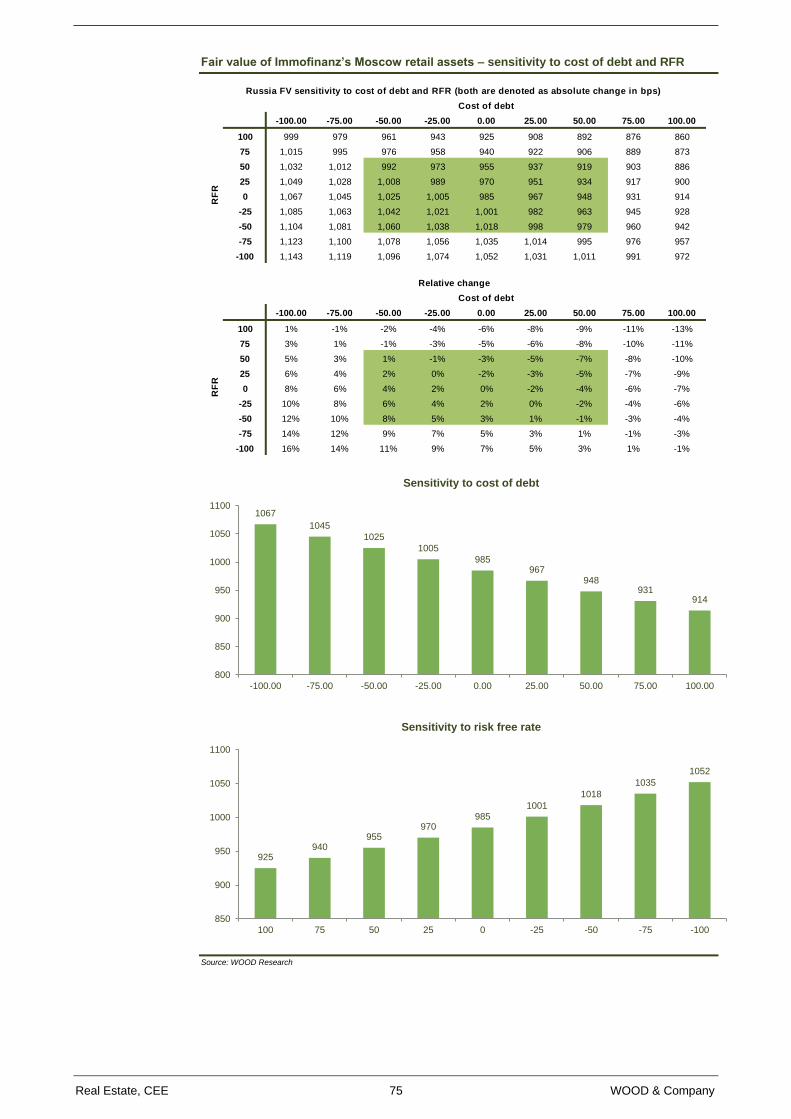
Real Estate, CEE 75 WOOD & Company
Fair value of Immofinanz’s Moscow retail assets – sensitivity to cost of debt and RFR
Source: WOOD Research
985 -100.00 -75.00 -50.00 -25.00 0.00 25.00 50.00 75.00 100.00
100 999 979 961 943 925 908 892 876 860
75 1,015 995 976 958 940 922 906 889 873
50 1,032 1,012 992 973 955 937 919 903 886
25 1,049 1,028 1,008 989 970 951 934 917 900
0 1,067 1,045 1,025 1,005 985 967 948 931 914
-25 1,085 1,063 1,042 1,021 1,001 982 963 945 928
-50 1,104 1,081 1,060 1,038 1,018 998 979 960 942
-75 1,123 1,100 1,078 1,056 1,035 1,014 995 976 957
-100 1,143 1,119 1,096 1,074 1,052 1,031 1,011 991 972
RF
R
Russia FV sensitivity to cost of debt and RFR (both are denoted as absolute change in bps)
Cost of debt
6 -100.00 -75.00 -50.00 -25.00 0.00 25.00 50.00 75.00 100.00
100 1% -1% -2% -4% -6% -8% -9% -11% -13%
75 3% 1% -1% -3% -5% -6% -8% -10% -11%
50 5% 3% 1% -1% -3% -5% -7% -8% -10%
25 6% 4% 2% 0% -2% -3% -5% -7% -9%
0 8% 6% 4% 2% 0% -2% -4% -6% -7%
-25 10% 8% 6% 4% 2% 0% -2% -4% -6%
-50 12% 10% 8% 5% 3% 1% -1% -3% -4%
-75 14% 12% 9% 7% 5% 3% 1% -1% -3%
-100 16% 14% 11% 9% 7% 5% 3% 1% -1%
Cost of debt
RF
R
Relative change
1067
1045
1025
1005
985967
948931
914
800
850
900
950
1000
1050
1100
-100.00 -75.00 -50.00 -25.00 0.00 25.00 50.00 75.00 100.00
Sensitivity to cost of debt
925940
955970
9851001
1018
1035
1052
850
900
950
1000
1050
1100
100 75 50 25 0 -25 -50 -75 -100
Sensitivity to risk free rate
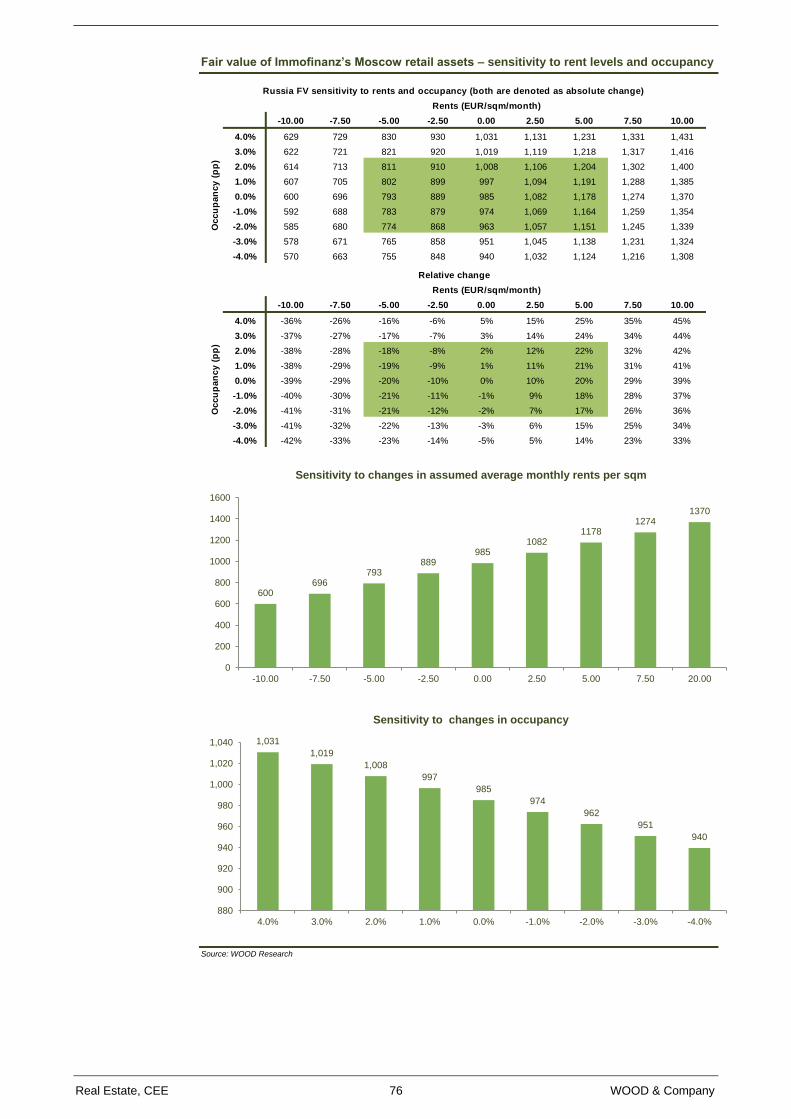
Real Estate, CEE 76 WOOD & Company
Fair value of Immofinanz’s Moscow retail assets – sensitivity to rent levels and occupancy
Source: WOOD Research
985 -10.00 -7.50 -5.00 -2.50 0.00 2.50 5.00 7.50 10.00
4.0% 629 729 830 930 1,031 1,131 1,231 1,331 1,431
3.0% 622 721 821 920 1,019 1,119 1,218 1,317 1,416
2.0% 614 713 811 910 1,008 1,106 1,204 1,302 1,400
1.0% 607 705 802 899 997 1,094 1,191 1,288 1,385
0.0% 600 696 793 889 985 1,082 1,178 1,274 1,370
-1.0% 592 688 783 879 974 1,069 1,164 1,259 1,354
-2.0% 585 680 774 868 963 1,057 1,151 1,245 1,339
-3.0% 578 671 765 858 951 1,045 1,138 1,231 1,324
-4.0% 570 663 755 848 940 1,032 1,124 1,216 1,308
Russia FV sensitivity to rents and occupancy (both are denoted as absolute change)
Rents (EUR/sqm/month)
Oc
cu
pa
nc
y (
pp
)
6 -10.00 -7.50 -5.00 -2.50 0.00 2.50 5.00 7.50 10.00
4.0% -36% -26% -16% -6% 5% 15% 25% 35% 45%
3.0% -37% -27% -17% -7% 3% 14% 24% 34% 44%
2.0% -38% -28% -18% -8% 2% 12% 22% 32% 42%
1.0% -38% -29% -19% -9% 1% 11% 21% 31% 41%
0.0% -39% -29% -20% -10% 0% 10% 20% 29% 39%
-1.0% -40% -30% -21% -11% -1% 9% 18% 28% 37%
-2.0% -41% -31% -21% -12% -2% 7% 17% 26% 36%
-3.0% -41% -32% -22% -13% -3% 6% 15% 25% 34%
-4.0% -42% -33% -23% -14% -5% 5% 14% 23% 33%
Relative change
Rents (EUR/sqm/month)
Oc
cu
pa
nc
y (
pp
)
600696
793889
9851082
11781274
1370
0
200
400
600
800
1000
1200
1400
1600
-10.00 -7.50 -5.00 -2.50 0.00 2.50 5.00 7.50 20.00
Sensitivity to changes in assumed average monthly rents per sqm
1,031
1,019
1,008
997
985
974
962
951
940
880
900
920
940
960
980
1,000
1,020
1,040
4.0% 3.0% 2.0% 1.0% 0.0% -1.0% -2.0% -3.0% -4.0%
Sensitivity to changes in occupancy
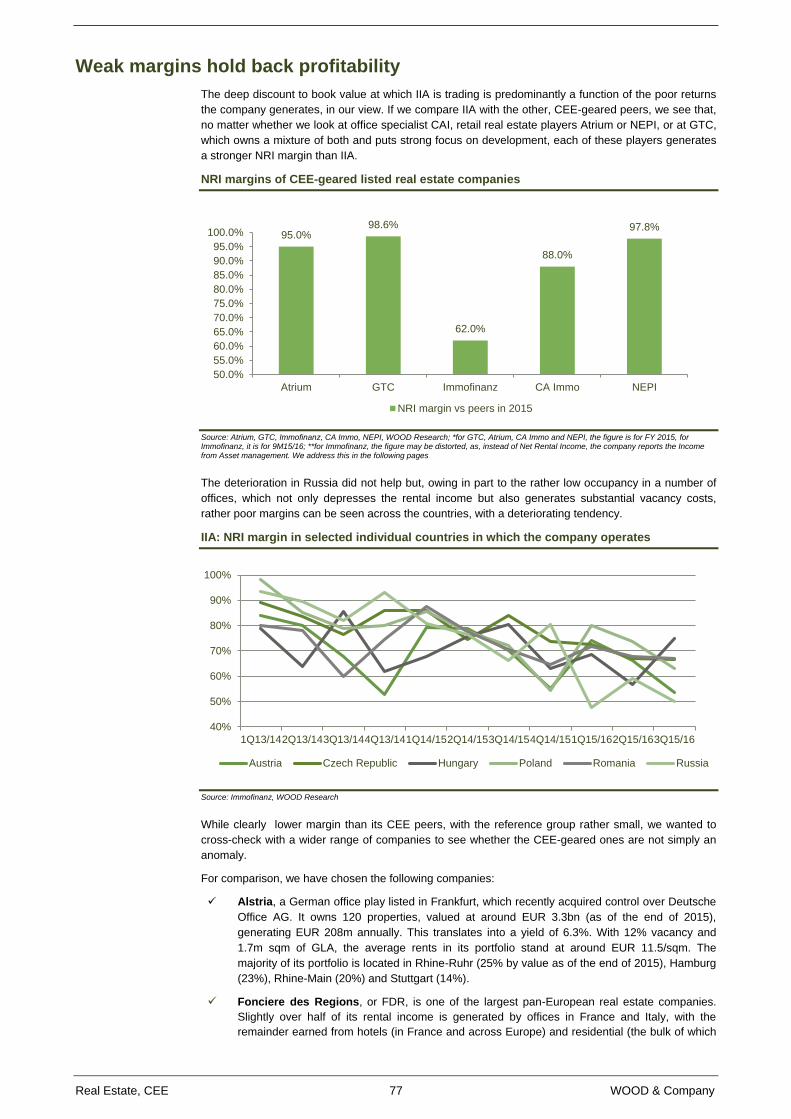
Real Estate, CEE 77 WOOD & Company
Weak margins hold back profitability
The deep discount to book value at which IIA is trading is predominantly a function of the poor returns
the company generates, in our view. If we compare IIA with the other, CEE-geared peers, we see that,
no matter whether we look at office specialist CAI, retail real estate players Atrium or NEPI, or at GTC,
which owns a mixture of both and puts strong focus on development, each of these players generates
a stronger NRI margin than IIA.
NRI margins of CEE-geared listed real estate companies
Source: Atrium, GTC, Immofinanz, CA Immo, NEPI, WOOD Research; *for GTC, Atrium, CA Immo and NEPI, the figure is for FY 2015, for Immofinanz, it is for 9M15/16; **for Immofinanz, the figure may be distorted, as, instead of Net Rental Income, the company reports the Income from Asset management. We address this in the following pages
The deterioration in Russia did not help but, owing in part to the rather low occupancy in a number of
offices, which not only depresses the rental income but also generates substantial vacancy costs,
rather poor margins can be seen across the countries, with a deteriorating tendency.
IIA: NRI margin in selected individual countries in which the company operates
Source: Immofinanz, WOOD Research
While clearly lower margin than its CEE peers, with the reference group rather small, we wanted to
cross-check with a wider range of companies to see whether the CEE-geared ones are not simply an
anomaly.
For comparison, we have chosen the following companies:
Alstria, a German office play listed in Frankfurt, which recently acquired control over Deutsche
Office AG. It owns 120 properties, valued at around EUR 3.3bn (as of the end of 2015),
generating EUR 208m annually. This translates into a yield of 6.3%. With 12% vacancy and
1.7m sqm of GLA, the average rents in its portfolio stand at around EUR 11.5/sqm. The
majority of its portfolio is located in Rhine-Ruhr (25% by value as of the end of 2015), Hamburg
(23%), Rhine-Main (20%) and Stuttgart (14%).
Fonciere des Regions, or FDR, is one of the largest pan-European real estate companies.
Slightly over half of its rental income is generated by offices in France and Italy, with the
remainder earned from hotels (in France and across Europe) and residential (the bulk of which
95.0%98.6%
62.0%
88.0%
97.8%
50.0%
55.0%
60.0%
65.0%
70.0%
75.0%
80.0%
85.0%
90.0%
95.0%
100.0%
Atrium GTC Immofinanz CA Immo NEPI
NRI margin vs peers in 2015
40%
50%
60%
70%
80%
90%
100%
1Q13/142Q13/143Q13/144Q13/141Q14/152Q14/153Q14/154Q14/151Q15/162Q15/163Q15/16
Austria Czech Republic Hungary Poland Romania Russia
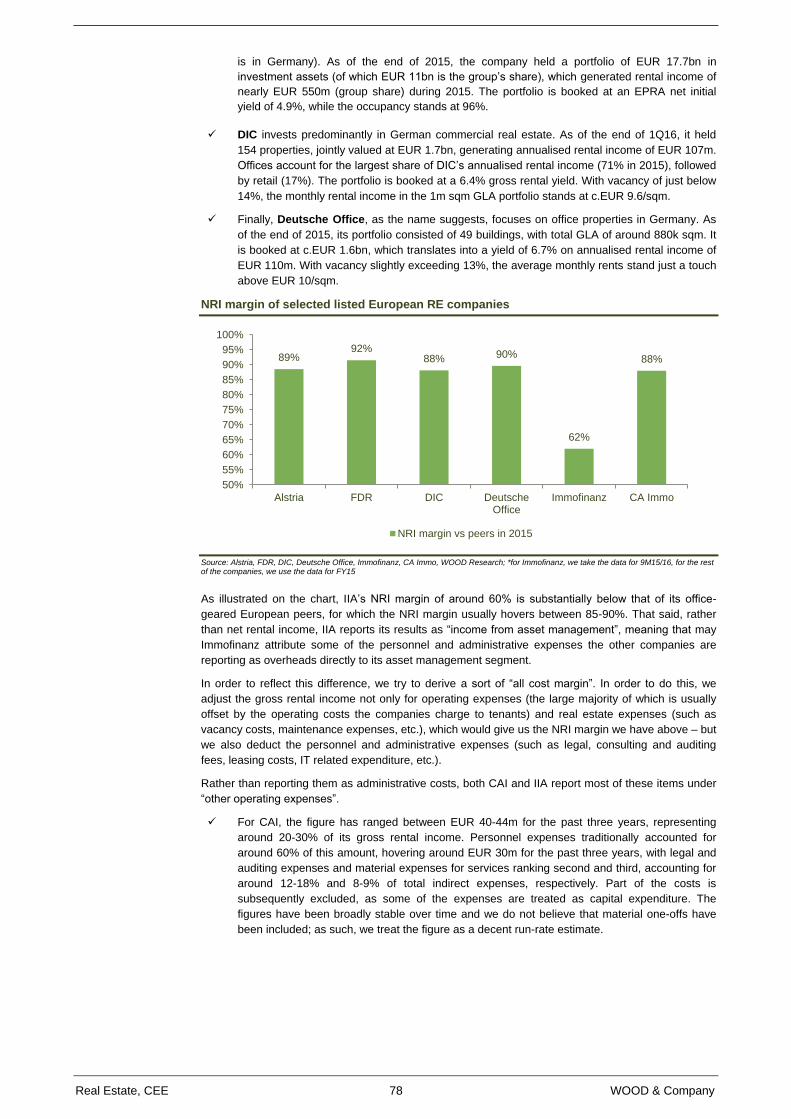
Real Estate, CEE 78 WOOD & Company
is in Germany). As of the end of 2015, the company held a portfolio of EUR 17.7bn in
investment assets (of which EUR 11bn is the group’s share), which generated rental income of
nearly EUR 550m (group share) during 2015. The portfolio is booked at an EPRA net initial
yield of 4.9%, while the occupancy stands at 96%.
DIC invests predominantly in German commercial real estate. As of the end of 1Q16, it held
154 properties, jointly valued at EUR 1.7bn, generating annualised rental income of EUR 107m.
Offices account for the largest share of DIC’s annualised rental income (71% in 2015), followed
by retail (17%). The portfolio is booked at a 6.4% gross rental yield. With vacancy of just below
14%, the monthly rental income in the 1m sqm GLA portfolio stands at c.EUR 9.6/sqm.
Finally, Deutsche Office, as the name suggests, focuses on office properties in Germany. As
of the end of 2015, its portfolio consisted of 49 buildings, with total GLA of around 880k sqm. It
is booked at c.EUR 1.6bn, which translates into a yield of 6.7% on annualised rental income of
EUR 110m. With vacancy slightly exceeding 13%, the average monthly rents stand just a touch
above EUR 10/sqm.
NRI margin of selected listed European RE companies
Source: Alstria, FDR, DIC, Deutsche Office, Immofinanz, CA Immo, WOOD Research; *for Immofinanz, we take the data for 9M15/16, for the rest of the companies, we use the data for FY15
As illustrated on the chart, IIA’s NRI margin of around 60% is substantially below that of its office-
geared European peers, for which the NRI margin usually hovers between 85-90%. That said, rather
than net rental income, IIA reports its results as “income from asset management”, meaning that may
Immofinanz attribute some of the personnel and administrative expenses the other companies are
reporting as overheads directly to its asset management segment.
In order to reflect this difference, we try to derive a sort of “all cost margin”. In order to do this, we
adjust the gross rental income not only for operating expenses (the large majority of which is usually
offset by the operating costs the companies charge to tenants) and real estate expenses (such as
vacancy costs, maintenance expenses, etc.), which would give us the NRI margin we have above – but
we also deduct the personnel and administrative expenses (such as legal, consulting and auditing
fees, leasing costs, IT related expenditure, etc.).
Rather than reporting them as administrative costs, both CAI and IIA report most of these items under
“other operating expenses”.
For CAI, the figure has ranged between EUR 40-44m for the past three years, representing
around 20-30% of its gross rental income. Personnel expenses traditionally accounted for
around 60% of this amount, hovering around EUR 30m for the past three years, with legal and
auditing expenses and material expenses for services ranking second and third, accounting for
around 12-18% and 8-9% of total indirect expenses, respectively. Part of the costs is
subsequently excluded, as some of the expenses are treated as capital expenditure. The
figures have been broadly stable over time and we do not believe that material one-offs have
been included; as such, we treat the figure as a decent run-rate estimate.
89%92%
88% 90%
62%
88%
50%
55%
60%
65%
70%
75%
80%
85%
90%
95%
100%
Alstria FDR DIC DeutscheOffice
Immofinanz CA Immo
NRI margin vs peers in 2015
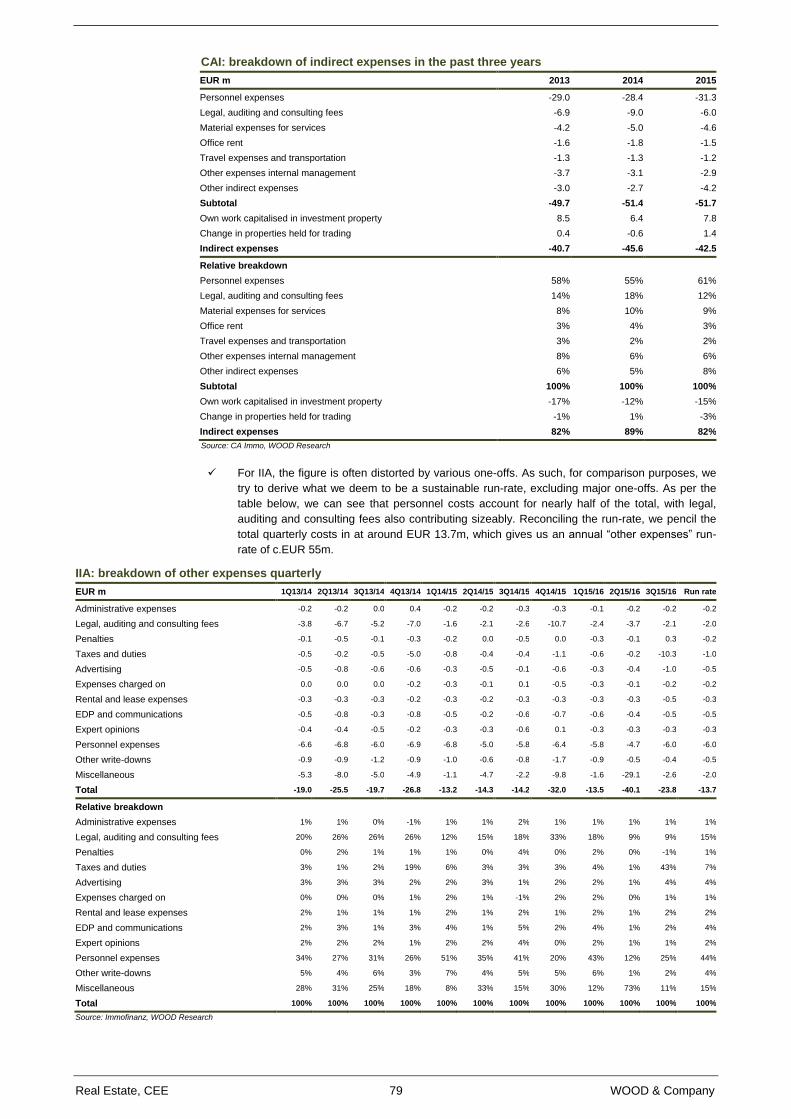
Real Estate, CEE 79 WOOD & Company
CAI: breakdown of indirect expenses in the past three years
EUR m 2013 2014 2015
Personnel expenses -29.0 -28.4 -31.3
Legal, auditing and consulting fees -6.9 -9.0 -6.0
Material expenses for services -4.2 -5.0 -4.6
Office rent -1.6 -1.8 -1.5
Travel expenses and transportation -1.3 -1.3 -1.2
Other expenses internal management -3.7 -3.1 -2.9
Other indirect expenses -3.0 -2.7 -4.2
Subtotal -49.7 -51.4 -51.7
Own work capitalised in investment property 8.5 6.4 7.8
Change in properties held for trading 0.4 -0.6 1.4
Indirect expenses -40.7 -45.6 -42.5
Relative breakdown
Personnel expenses 58% 55% 61%
Legal, auditing and consulting fees 14% 18% 12%
Material expenses for services 8% 10% 9%
Office rent 3% 4% 3%
Travel expenses and transportation 3% 2% 2%
Other expenses internal management 8% 6% 6%
Other indirect expenses 6% 5% 8%
Subtotal 100% 100% 100%
Own work capitalised in investment property -17% -12% -15%
Change in properties held for trading -1% 1% -3%
Indirect expenses 82% 89% 82%
Source: CA Immo, WOOD Research
For IIA, the figure is often distorted by various one-offs. As such, for comparison purposes, we
try to derive what we deem to be a sustainable run-rate, excluding major one-offs. As per the
table below, we can see that personnel costs account for nearly half of the total, with legal,
auditing and consulting fees also contributing sizeably. Reconciling the run-rate, we pencil the
total quarterly costs in at around EUR 13.7m, which gives us an annual “other expenses” run-
rate of c.EUR 55m.
IIA: breakdown of other expenses quarterly
EUR m 1Q13/14 2Q13/14 3Q13/14 4Q13/14 1Q14/15 2Q14/15 3Q14/15 4Q14/15 1Q15/16 2Q15/16 3Q15/16 Run rate
Administrative expenses -0.2 -0.2 0.0 0.4 -0.2 -0.2 -0.3 -0.3 -0.1 -0.2 -0.2 -0.2
Legal, auditing and consulting fees -3.8 -6.7 -5.2 -7.0 -1.6 -2.1 -2.6 -10.7 -2.4 -3.7 -2.1 -2.0
Penalties -0.1 -0.5 -0.1 -0.3 -0.2 0.0 -0.5 0.0 -0.3 -0.1 0.3 -0.2
Taxes and duties -0.5 -0.2 -0.5 -5.0 -0.8 -0.4 -0.4 -1.1 -0.6 -0.2 -10.3 -1.0
Advertising -0.5 -0.8 -0.6 -0.6 -0.3 -0.5 -0.1 -0.6 -0.3 -0.4 -1.0 -0.5
Expenses charged on 0.0 0.0 0.0 -0.2 -0.3 -0.1 0.1 -0.5 -0.3 -0.1 -0.2 -0.2
Rental and lease expenses -0.3 -0.3 -0.3 -0.2 -0.3 -0.2 -0.3 -0.3 -0.3 -0.3 -0.5 -0.3
EDP and communications -0.5 -0.8 -0.3 -0.8 -0.5 -0.2 -0.6 -0.7 -0.6 -0.4 -0.5 -0.5
Expert opinions -0.4 -0.4 -0.5 -0.2 -0.3 -0.3 -0.6 0.1 -0.3 -0.3 -0.3 -0.3
Personnel expenses -6.6 -6.8 -6.0 -6.9 -6.8 -5.0 -5.8 -6.4 -5.8 -4.7 -6.0 -6.0
Other write-downs -0.9 -0.9 -1.2 -0.9 -1.0 -0.6 -0.8 -1.7 -0.9 -0.5 -0.4 -0.5
Miscellaneous -5.3 -8.0 -5.0 -4.9 -1.1 -4.7 -2.2 -9.8 -1.6 -29.1 -2.6 -2.0
Total -19.0 -25.5 -19.7 -26.8 -13.2 -14.3 -14.2 -32.0 -13.5 -40.1 -23.8 -13.7
Relative breakdown
Administrative expenses 1% 1% 0% -1% 1% 1% 2% 1% 1% 1% 1% 1%
Legal, auditing and consulting fees 20% 26% 26% 26% 12% 15% 18% 33% 18% 9% 9% 15%
Penalties 0% 2% 1% 1% 1% 0% 4% 0% 2% 0% -1% 1%
Taxes and duties 3% 1% 2% 19% 6% 3% 3% 3% 4% 1% 43% 7%
Advertising 3% 3% 3% 2% 2% 3% 1% 2% 2% 1% 4% 4%
Expenses charged on 0% 0% 0% 1% 2% 1% -1% 2% 2% 0% 1% 1%
Rental and lease expenses 2% 1% 1% 1% 2% 1% 2% 1% 2% 1% 2% 2%
EDP and communications 2% 3% 1% 3% 4% 1% 5% 2% 4% 1% 2% 4%
Expert opinions 2% 2% 2% 1% 2% 2% 4% 0% 2% 1% 1% 2%
Personnel expenses 34% 27% 31% 26% 51% 35% 41% 20% 43% 12% 25% 44%
Other write-downs 5% 4% 6% 3% 7% 4% 5% 5% 6% 1% 2% 4%
Miscellaneous 28% 31% 25% 18% 8% 33% 15% 30% 12% 73% 11% 15%
Total 100% 100% 100% 100% 100% 100% 100% 100% 100% 100% 100% 100%
Source: Immofinanz, WOOD Research
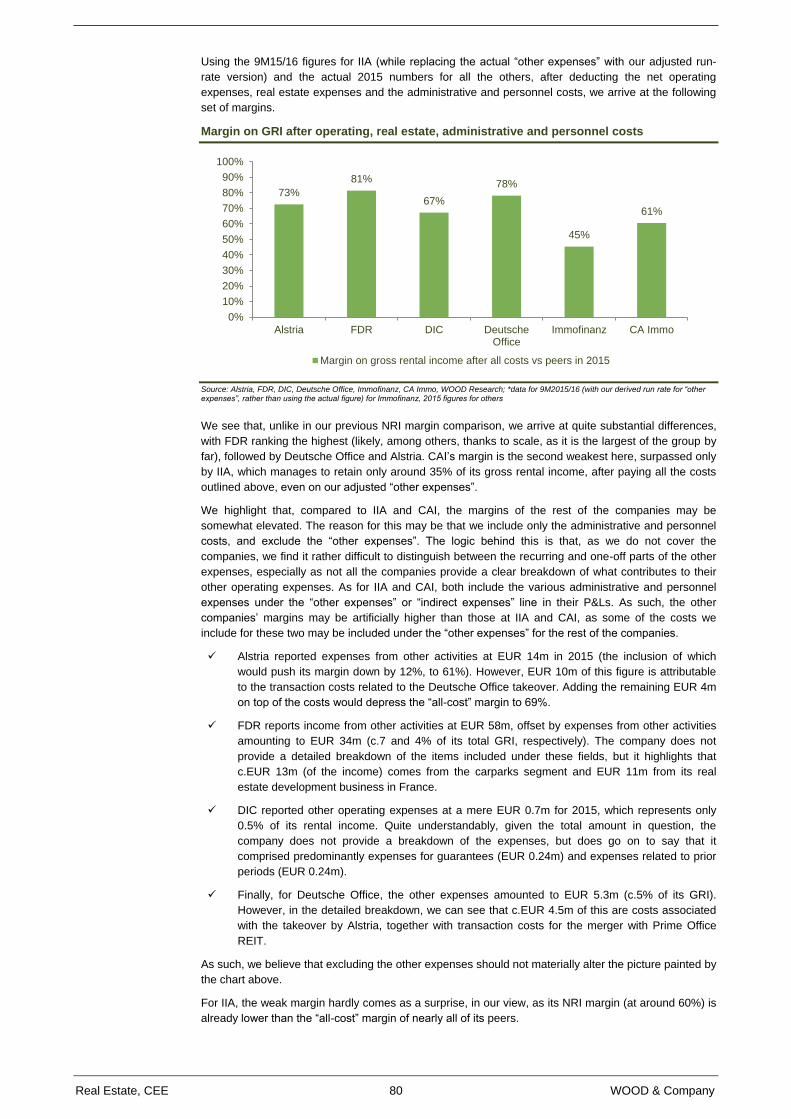
Real Estate, CEE 80 WOOD & Company
Using the 9M15/16 figures for IIA (while replacing the actual “other expenses” with our adjusted run-
rate version) and the actual 2015 numbers for all the others, after deducting the net operating
expenses, real estate expenses and the administrative and personnel costs, we arrive at the following
set of margins.
Margin on GRI after operating, real estate, administrative and personnel costs
Source: Alstria, FDR, DIC, Deutsche Office, Immofinanz, CA Immo, WOOD Research; *data for 9M2015/16 (with our derived run rate for “other expenses”, rather than using the actual figure) for Immofinanz, 2015 figures for others
We see that, unlike in our previous NRI margin comparison, we arrive at quite substantial differences,
with FDR ranking the highest (likely, among others, thanks to scale, as it is the largest of the group by
far), followed by Deutsche Office and Alstria. CAI’s margin is the second weakest here, surpassed only
by IIA, which manages to retain only around 35% of its gross rental income, after paying all the costs
outlined above, even on our adjusted “other expenses”.
We highlight that, compared to IIA and CAI, the margins of the rest of the companies may be
somewhat elevated. The reason for this may be that we include only the administrative and personnel
costs, and exclude the “other expenses”. The logic behind this is that, as we do not cover the
companies, we find it rather difficult to distinguish between the recurring and one-off parts of the other
expenses, especially as not all the companies provide a clear breakdown of what contributes to their
other operating expenses. As for IIA and CAI, both include the various administrative and personnel
expenses under the “other expenses” or “indirect expenses” line in their P&Ls. As such, the other
companies’ margins may be artificially higher than those at IIA and CAI, as some of the costs we
include for these two may be included under the “other expenses” for the rest of the companies.
Alstria reported expenses from other activities at EUR 14m in 2015 (the inclusion of which
would push its margin down by 12%, to 61%). However, EUR 10m of this figure is attributable
to the transaction costs related to the Deutsche Office takeover. Adding the remaining EUR 4m
on top of the costs would depress the “all-cost” margin to 69%.
FDR reports income from other activities at EUR 58m, offset by expenses from other activities
amounting to EUR 34m (c.7 and 4% of its total GRI, respectively). The company does not
provide a detailed breakdown of the items included under these fields, but it highlights that
c.EUR 13m (of the income) comes from the carparks segment and EUR 11m from its real
estate development business in France.
DIC reported other operating expenses at a mere EUR 0.7m for 2015, which represents only
0.5% of its rental income. Quite understandably, given the total amount in question, the
company does not provide a breakdown of the expenses, but does go on to say that it
comprised predominantly expenses for guarantees (EUR 0.24m) and expenses related to prior
periods (EUR 0.24m).
Finally, for Deutsche Office, the other expenses amounted to EUR 5.3m (c.5% of its GRI).
However, in the detailed breakdown, we can see that c.EUR 4.5m of this are costs associated
with the takeover by Alstria, together with transaction costs for the merger with Prime Office
REIT.
As such, we believe that excluding the other expenses should not materially alter the picture painted by
the chart above.
For IIA, the weak margin hardly comes as a surprise, in our view, as its NRI margin (at around 60%) is
already lower than the “all-cost” margin of nearly all of its peers.
73%
81%
67%
78%
45%
61%
0%
10%
20%
30%
40%
50%
60%
70%
80%
90%
100%
Alstria FDR DIC DeutscheOffice
Immofinanz CA Immo
Margin on gross rental income after all costs vs peers in 2015
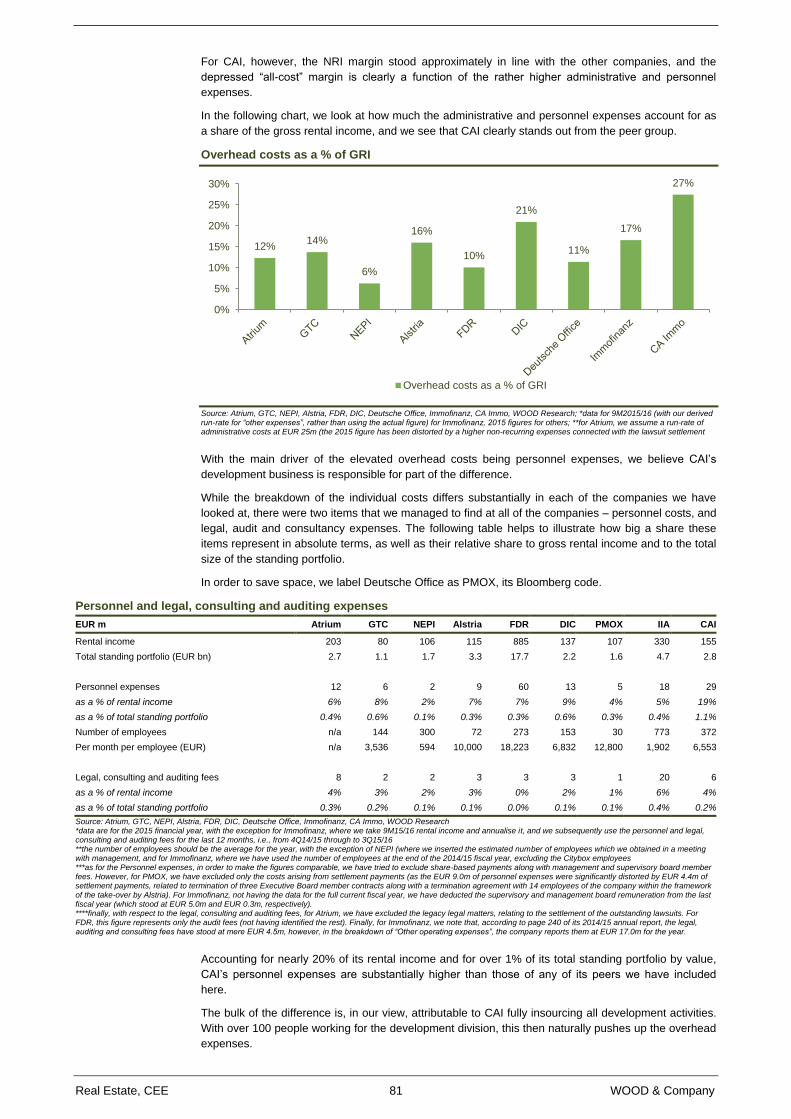
Real Estate, CEE 81 WOOD & Company
For CAI, however, the NRI margin stood approximately in line with the other companies, and the
depressed “all-cost” margin is clearly a function of the rather higher administrative and personnel
expenses.
In the following chart, we look at how much the administrative and personnel expenses account for as
a share of the gross rental income, and we see that CAI clearly stands out from the peer group.
Overhead costs as a % of GRI
Source: Atrium, GTC, NEPI, Alstria, FDR, DIC, Deutsche Office, Immofinanz, CA Immo, WOOD Research; *data for 9M2015/16 (with our derived run-rate for “other expenses”, rather than using the actual figure) for Immofinanz, 2015 figures for others; **for Atrium, we assume a run-rate of administrative costs at EUR 25m (the 2015 figure has been distorted by a higher non-recurring expenses connected with the lawsuit settlement
With the main driver of the elevated overhead costs being personnel expenses, we believe CAI’s
development business is responsible for part of the difference.
While the breakdown of the individual costs differs substantially in each of the companies we have
looked at, there were two items that we managed to find at all of the companies – personnel costs, and
legal, audit and consultancy expenses. The following table helps to illustrate how big a share these
items represent in absolute terms, as well as their relative share to gross rental income and to the total
size of the standing portfolio.
In order to save space, we label Deutsche Office as PMOX, its Bloomberg code.
Personnel and legal, consulting and auditing expenses
EUR m Atrium GTC NEPI Alstria FDR DIC PMOX IIA CAI
Rental income 203 80 106 115 885 137 107 330 155
Total standing portfolio (EUR bn) 2.7 1.1 1.7 3.3 17.7 2.2 1.6 4.7 2.8
Personnel expenses 12 6 2 9 60 13 5 18 29
as a % of rental income 6% 8% 2% 7% 7% 9% 4% 5% 19%
as a % of total standing portfolio 0.4% 0.6% 0.1% 0.3% 0.3% 0.6% 0.3% 0.4% 1.1%
Number of employees n/a 144 300 72 273 153 30 773 372
Per month per employee (EUR) n/a 3,536 594 10,000 18,223 6,832 12,800 1,902 6,553
Legal, consulting and auditing fees 8 2 2 3 3 3 1 20 6
as a % of rental income 4% 3% 2% 3% 0% 2% 1% 6% 4%
as a % of total standing portfolio 0.3% 0.2% 0.1% 0.1% 0.0% 0.1% 0.1% 0.4% 0.2%
Source: Atrium, GTC, NEPI, Alstria, FDR, DIC, Deutsche Office, Immofinanz, CA Immo, WOOD Research *data are for the 2015 financial year, with the exception for Immofinanz, where we take 9M15/16 rental income and annualise it, and we subsequently use the personnel and legal, consulting and auditing fees for the last 12 months, i.e., from 4Q14/15 through to 3Q15/16 **the number of employees should be the average for the year, with the exception of NEPI (where we inserted the estimated number of employees which we obtained in a meeting with management, and for Immofinanz, where we have used the number of employees at the end of the 2014/15 fiscal year, excluding the Citybox employees ***as for the Personnel expenses, in order to make the figures comparable, we have tried to exclude share-based payments along with management and supervisory board member fees. However, for PMOX, we have excluded only the costs arising from settlement payments (as the EUR 9.0m of personnel expenses were significantly distorted by EUR 4.4m of settlement payments, related to termination of three Executive Board member contracts along with a termination agreement with 14 employees of the company within the framework of the take-over by Alstria). For Immofinanz, not having the data for the full current fiscal year, we have deducted the supervisory and management board remuneration from the last fiscal year (which stood at EUR 5.0m and EUR 0.3m, respectively). ****finally, with respect to the legal, consulting and auditing fees, for Atrium, we have excluded the legacy legal matters, relating to the settlement of the outstanding lawsuits. For FDR, this figure represents only the audit fees (not having identified the rest). Finally, for Immofinanz, we note that, according to page 240 of its 2014/15 annual report, the legal, auditing and consulting fees have stood at mere EUR 4.5m, however, in the breakdown of “Other operating expenses”, the company reports them at EUR 17.0m for the year.
Accounting for nearly 20% of its rental income and for over 1% of its total standing portfolio by value,
CAI’s personnel expenses are substantially higher than those of any of its peers we have included
here.
The bulk of the difference is, in our view, attributable to CAI fully insourcing all development activities.
With over 100 people working for the development division, this then naturally pushes up the overhead
expenses.
12%14%
6%
16%
10%
21%
11%
17%
27%
0%
5%
10%
15%
20%
25%
30%
Overhead costs as a % of GRI
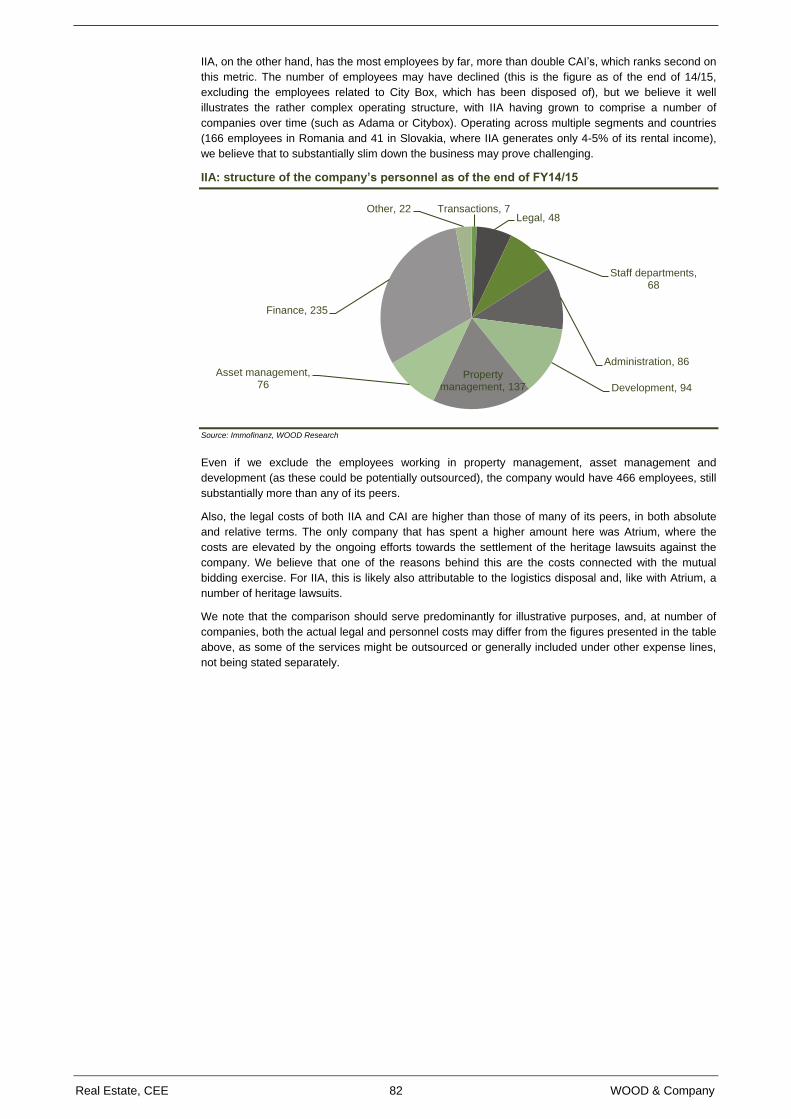
Real Estate, CEE 82 WOOD & Company
IIA, on the other hand, has the most employees by far, more than double CAI’s, which ranks second on
this metric. The number of employees may have declined (this is the figure as of the end of 14/15,
excluding the employees related to City Box, which has been disposed of), but we believe it well
illustrates the rather complex operating structure, with IIA having grown to comprise a number of
companies over time (such as Adama or Citybox). Operating across multiple segments and countries
(166 employees in Romania and 41 in Slovakia, where IIA generates only 4-5% of its rental income),
we believe that to substantially slim down the business may prove challenging.
IIA: structure of the company’s personnel as of the end of FY14/15
Source: Immofinanz, WOOD Research
Even if we exclude the employees working in property management, asset management and
development (as these could be potentially outsourced), the company would have 466 employees, still
substantially more than any of its peers.
Also, the legal costs of both IIA and CAI are higher than those of many of its peers, in both absolute
and relative terms. The only company that has spent a higher amount here was Atrium, where the
costs are elevated by the ongoing efforts towards the settlement of the heritage lawsuits against the
company. We believe that one of the reasons behind this are the costs connected with the mutual
bidding exercise. For IIA, this is likely also attributable to the logistics disposal and, like with Atrium, a
number of heritage lawsuits.
We note that the comparison should serve predominantly for illustrative purposes, and, at number of
companies, both the actual legal and personnel costs may differ from the figures presented in the table
above, as some of the services might be outsourced or generally included under other expense lines,
not being stated separately.
Transactions, 7Legal, 48
Staff departments, 68
Administration, 86
Development, 94
Property management, 137
Asset management, 76
Finance, 235
Other, 22
Real Estate, CEE 83 WOOD & Company
This page is left blank intentionally
Real Estate, CEE 84 WOOD & Company
Company sections
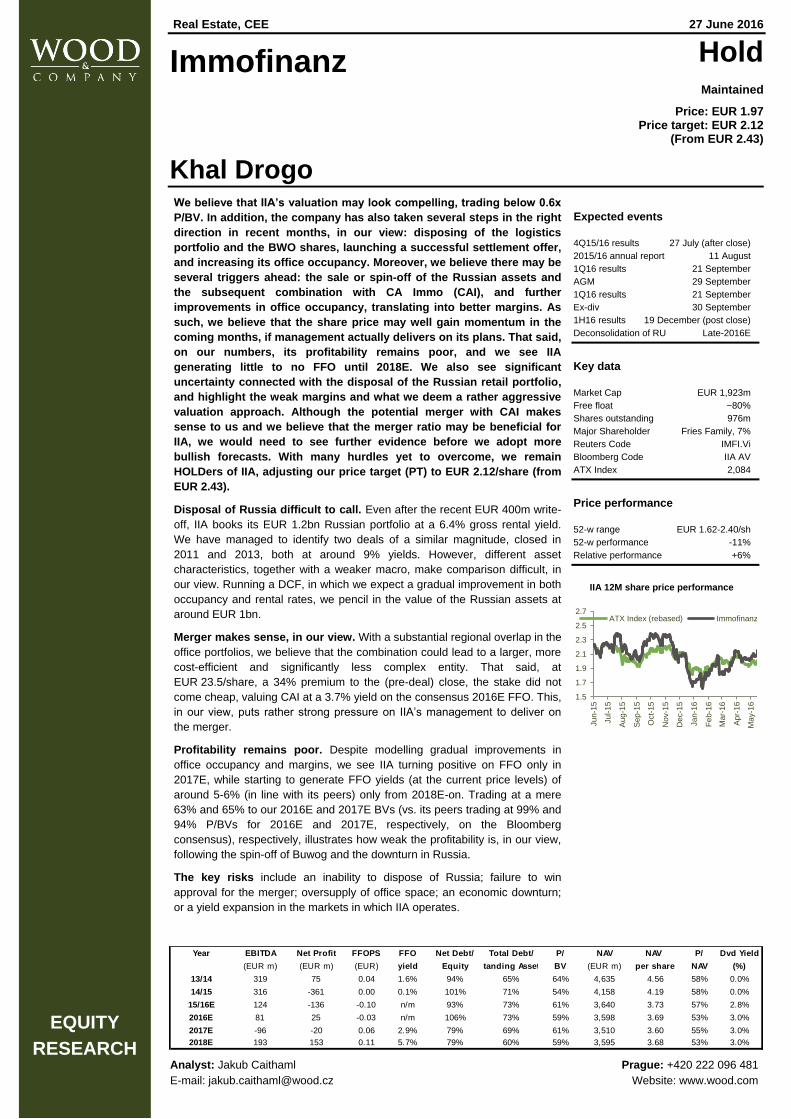
Real Estate, CEE 27 June 2016
Immofinanz Hold
Maintained
Price: EUR 1.97 Price target: EUR 2.12
(From EUR 2.43)
Khal Drogo
We believe that IIA’s valuation may look compelling, trading below 0.6x
P/BV. In addition, the company has also taken several steps in the right
direction in recent months, in our view: disposing of the logistics
portfolio and the BWO shares, launching a successful settlement offer,
and increasing its office occupancy. Moreover, we believe there may be
several triggers ahead: the sale or spin-off of the Russian assets and
the subsequent combination with CA Immo (CAI), and further
improvements in office occupancy, translating into better margins. As
such, we believe that the share price may well gain momentum in the
coming months, if management actually delivers on its plans. That said,
on our numbers, its profitability remains poor, and we see IIA
generating little to no FFO until 2018E. We also see significant
uncertainty connected with the disposal of the Russian retail portfolio,
and highlight the weak margins and what we deem a rather aggressive
valuation approach. Although the potential merger with CAI makes
sense to us and we believe that the merger ratio may be beneficial for
IIA, we would need to see further evidence before we adopt more
bullish forecasts. With many hurdles yet to overcome, we remain
HOLDers of IIA, adjusting our price target (PT) to EUR 2.12/share (from
EUR 2.43).
Disposal of Russia difficult to call. Even after the recent EUR 400m write-
off, IIA books its EUR 1.2bn Russian portfolio at a 6.4% gross rental yield.
We have managed to identify two deals of a similar magnitude, closed in
2011 and 2013, both at around 9% yields. However, different asset
characteristics, together with a weaker macro, make comparison difficult, in
our view. Running a DCF, in which we expect a gradual improvement in both
occupancy and rental rates, we pencil in the value of the Russian assets at
around EUR 1bn.
Merger makes sense, in our view. With a substantial regional overlap in the
office portfolios, we believe that the combination could lead to a larger, more
cost-efficient and significantly less complex entity. That said, at
EUR 23.5/share, a 34% premium to the (pre-deal) close, the stake did not
come cheap, valuing CAI at a 3.7% yield on the consensus 2016E FFO. This,
in our view, puts rather strong pressure on IIA’s management to deliver on
the merger.
Profitability remains poor. Despite modelling gradual improvements in
office occupancy and margins, we see IIA turning positive on FFO only in
2017E, while starting to generate FFO yields (at the current price levels) of
around 5-6% (in line with its peers) only from 2018E-on. Trading at a mere
63% and 65% to our 2016E and 2017E BVs (vs. its peers trading at 99% and
94% P/BVs for 2016E and 2017E, respectively, on the Bloomberg
consensus), respectively, illustrates how weak the profitability is, in our view,
following the spin-off of Buwog and the downturn in Russia.
The key risks include an inability to dispose of Russia; failure to win
approval for the merger; oversupply of office space; an economic downturn;
or a yield expansion in the markets in which IIA operates.
Expected events
4Q15/16 results 27 July (after close)
2015/16 annual report 11 August
1Q16 results 21 September
AGM 29 September
1Q16 results 21 September
Ex-div 30 September
1H16 results 19 December (post close)
Deconsolidation of RU Late-2016E
Key data
Market Cap EUR 1,923m
Free float ~80%
Shares outstanding 976m
Major Shareholder Fries Family, 7%
Reuters Code IMFI.Vi
Bloomberg Code IIA AV
ATX Index 2,084
Price performance
52-w range EUR 1.62-2.40/sh
52-w performance -11%
Relative performance +6%
IIA 12M share price performance
1.5
1.7
1.9
2.1
2.3
2.5
2.7
Ju
n-1
5
Ju
l-1
5
Aug
-15
Sep
-15
Oct-
15
Nov-1
5
Dec-1
5
Ja
n-1
6
Fe
b-1
6
Ma
r-16
Apr-
16
Ma
y-1
6
ATX Index (rebased) Immofinanz
EQUITY
RESEARCH Analyst: Jakub Caithaml Prague: +420 222 096 481
E-mail: [email protected] Website: www.wood.com
Year EBITDA Net Profit FFOPS FFO Net Debt/ Total Debt/ P/ NAV NAV P/ Dvd Yield
(EUR m) (EUR m) (EUR) yield Equity Standing Assets BV (EUR m) per share NAV (%)
13/14 319 75 0.04 1.6% 94% 65% 64% 4,635 4.56 58% 0.0%
14/15 316 -361 0.00 0.1% 101% 71% 54% 4,158 4.19 58% 0.0%
15/16E 124 -136 -0.10 n/m 93% 73% 61% 3,640 3.73 57% 2.8%
2016E 81 25 -0.03 n/m 106% 73% 59% 3,598 3.69 53% 3.0%
2017E -96 -20 0.06 2.9% 79% 69% 61% 3,510 3.60 55% 3.0%
2018E 193 153 0.11 5.7% 79% 60% 59% 3,595 3.68 53% 3.0%
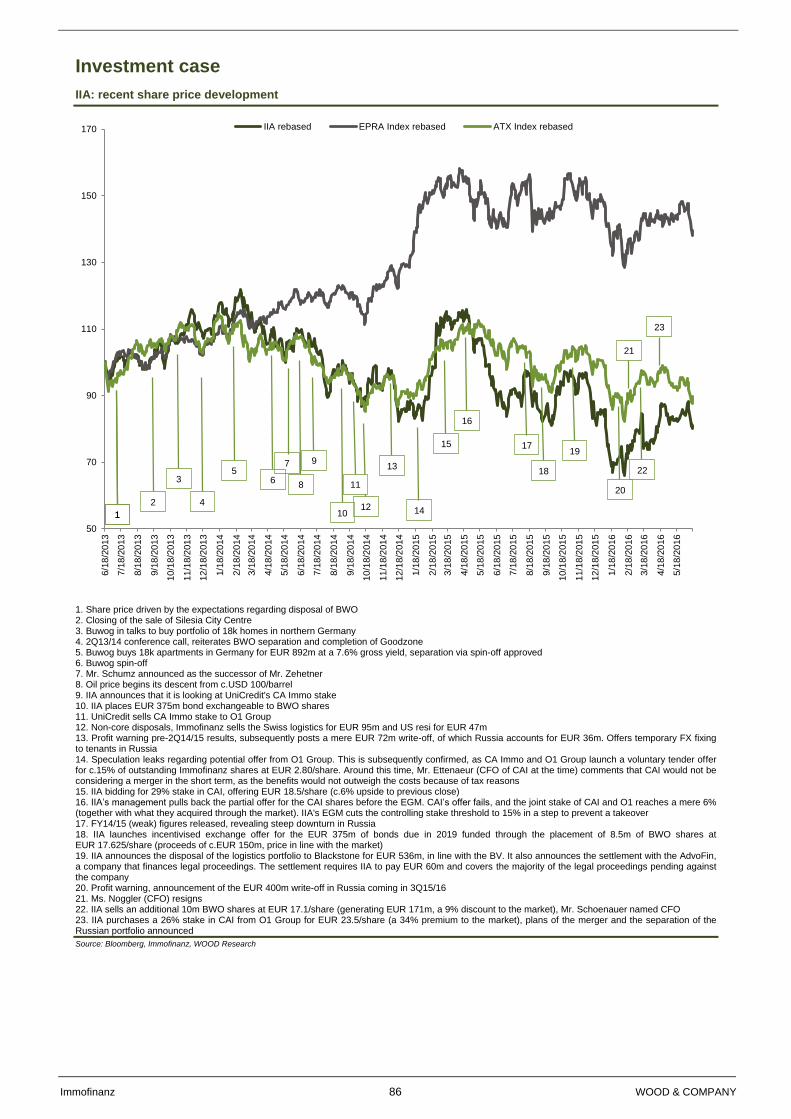
Immofinanz 86 WOOD & COMPANY
Investment case
IIA: recent share price development
1. Share price driven by the expectations regarding disposal of BWO 2. Closing of the sale of Silesia City Centre 3. Buwog in talks to buy portfolio of 18k homes in northern Germany 4. 2Q13/14 conference call, reiterates BWO separation and completion of Goodzone 5. Buwog buys 18k apartments in Germany for EUR 892m at a 7.6% gross yield, separation via spin-off approved 6. Buwog spin-off 7. Mr. Schumz announced as the successor of Mr. Zehetner 8. Oil price begins its descent from c.USD 100/barrel 9. IIA announces that it is looking at UniCredit's CA Immo stake 10. IIA places EUR 375m bond exchangeable to BWO shares 11. UniCredit sells CA Immo stake to O1 Group 12. Non-core disposals, Immofinanz sells the Swiss logistics for EUR 95m and US resi for EUR 47m 13. Profit warning pre-2Q14/15 results, subsequently posts a mere EUR 72m write-off, of which Russia accounts for EUR 36m. Offers temporary FX fixing to tenants in Russia 14. Speculation leaks regarding potential offer from O1 Group. This is subsequently confirmed, as CA Immo and O1 Group launch a voluntary tender offer for c.15% of outstanding Immofinanz shares at EUR 2.80/share. Around this time, Mr. Ettenaeur (CFO of CAI at the time) comments that CAI would not be considering a merger in the short term, as the benefits would not outweigh the costs because of tax reasons 15. IIA bidding for 29% stake in CAI, offering EUR 18.5/share (c.6% upside to previous close) 16. IIA’s management pulls back the partial offer for the CAI shares before the EGM. CAI’s offer fails, and the joint stake of CAI and O1 reaches a mere 6% (together with what they acquired through the market). IIA's EGM cuts the controlling stake threshold to 15% in a step to prevent a takeover 17. FY14/15 (weak) figures released, revealing steep downturn in Russia 18. IIA launches incentivised exchange offer for the EUR 375m of bonds due in 2019 funded through the placement of 8.5m of BWO shares at EUR 17.625/share (proceeds of c.EUR 150m, price in line with the market) 19. IIA announces the disposal of the logistics portfolio to Blackstone for EUR 536m, in line with the BV. It also announces the settlement with the AdvoFin, a company that finances legal proceedings. The settlement requires IIA to pay EUR 60m and covers the majority of the legal proceedings pending against the company 20. Profit warning, announcement of the EUR 400m write-off in Russia coming in 3Q15/16 21. Ms. Noggler (CFO) resigns 22. IIA sells an additional 10m BWO shares at EUR 17.1/share (generating EUR 171m, a 9% discount to the market), Mr. Schoenauer named CFO 23. IIA purchases a 26% stake in CAI from O1 Group for EUR 23.5/share (a 34% premium to the market), plans of the merger and the separation of the Russian portfolio announced
Source: Bloomberg, Immofinanz, WOOD Research
50
70
90
110
130
150
170
6/1
8/2
013
7/1
8/2
013
8/1
8/2
013
9/1
8/2
013
10
/18/2
01
3
11
/18/2
01
3
12
/18/2
01
3
1/1
8/2
014
2/1
8/2
014
3/1
8/2
014
4/1
8/2
014
5/1
8/2
014
6/1
8/2
014
7/1
8/2
014
8/1
8/2
014
9/1
8/2
014
10
/18/2
01
4
11
/18/2
01
4
12
/18/2
01
4
1/1
8/2
015
2/1
8/2
015
3/1
8/2
015
4/1
8/2
015
5/1
8/2
015
6/1
8/2
015
7/1
8/2
015
8/1
8/2
015
9/1
8/2
015
10
/18/2
01
5
11
/18/2
01
5
12
/18/2
01
5
1/1
8/2
016
2/1
8/2
016
3/1
8/2
016
4/1
8/2
016
5/1
8/2
016
IIA rebased EPRA Index rebased ATX Index rebased
11
7
2
3
4
56
8
9
1012
11
13
14
15
16
17
18
19
20
21
22
23
Immofinanz 87 WOOD & COMPANY
IIA may gain momentum, but we lack the conviction to turn bullish
The multiples look undemanding… Or do they?
Trading at around 0.6x P/BV, IIA ranks among the cheapest companies in the European listed RE
universe on this metric. While, at first glance, without any issues in terms of solvency or liquidity, the
valuation may look appealing, we believe that the discount is well-justified. With its profitability impaired
by numerous factors (Russia, high office occupancy and weak margins), the company generates little
to no FFO and, while management is currently trying to target a number of issues, we do not expect IIA
to generate meaningful FFO before 2018E.
There may be a rally ahead, but we would need more evidence to turn bullish
We admit that the share price may gain momentum in the coming months, especially if IIA manages to
find a buyer for its Moscow retail assets, and we see progress in the talks leading towards a merger
with CAI, both of which would, in our view, substantially boost the sentiment on the company.
However, even though we model a gradual improvement in office occupancy and the NRI margin
(following the disposal of the Russian assets, which we pencil in at EUR 1bn), we still do not find the
valuation appealing enough to justify a buy rating.
While the company has already taken the first step in leasing part of its vacant office premises
(announcing that the office occupancy is to increase by seven percentage points, from 75% to 82%,
during 4Q15/16E) and we expect it to grow further, to 86% over the course of the abbreviated 2016E,
after a prolonged period with office vacancy hovering around 20%, we feel we need more evidence
before we can assume a more bullish trajectory of occupancy improvements.
Here, we highlight that it remains to be seen how the improvement in occupancy will affect the average
rent levels. We have not seen any strong or sudden change of sentiment in any of the office markets in
which IIA operates over the past few months. As such, having struggled to improve occupancy for a
number of years, we fail to see how IIA would suddenly manage to achieve such a substantial increase
in occupancy without compromising its rent levels.
Merger with CAI could substantially reshape CEE RE landscape
We believe the combination makes sense…
After a lengthy courtship, it appears that the (at times, rather bumpy) road towards a merger of the two
largest CEE RE companies (IIA and CAI) may finally have been cleared. As its first step towards a full
merger, IIA announced on 18 April that it had agreed to purchase a 26% stake in CAI from O1 Group,
including the four “golden shares”, each of which gives it the power to nominate one supervisory board
member. With a substantial regional overlap in the office portfolios, we believe that the combination
makes sense, and could lead to a larger, more cost-efficient and significantly less complex entity.
…however, the price paid looks quite full…
That said, at EUR 23.5 for one CAI share, a 34% premium to the closing price on the day before the
deal was announced, the price certainly does not strike us as cheap. The deal values CAI at a 3.7%
yield, on the Bloomberg consensus 2016E FFO. If we include the cost synergies that are expected to
kick in pre-merger (which Immofinanz estimates at EUR 10m per annum) on top of the expected
2016E FFO, the yield increases to 4.2%. If we include the expected synergies at the full amount (as
the vote on the merger is likely to be held during 2Q17E, at the earliest, and the full impact is likely to
be visible only in 2018E), the FFO yield would stand at 5.2%.
This, in our view, puts rather strong pressure on IIA’s management to deliver on the merger, as just
holding the stake for the dividend (and any of the potential pre-merger synergies) would hardly be an
optimal use of funds.
…and, although we find some consolation in consolidation…
The good news (for IIA) is that, thanks to the four golden shares, which essentially give IIA effective
control over CAI, the 26% stake is going to be fully consolidated. Should the stake be regarded as a
non-controlling interest, accounted at equity, being purchased at a premium to the market price, the
stake would be NAV dilutive.
As such, we expect that, starting either with 2Q16E or full abbreviated-year 2016E results, CAI’s
performance will be fully consolidated into IIA’s results, substantially increasing the portion of non-
controlling interest.
Immofinanz 88 WOOD & COMPANY
For the sake of clarity (not to overshadow IIA’s performance with the inclusion of the CAI figures), at
this point, we do not combine the P&Ls of the two entities. However, we have increased our estimated
FFO for IIA by the proportionate amount of CAI’s FFO from 2017E-onwards.
… there are still hurdles to be overcome
IIA has highlighted that, before the merger can take place, it will either sell or spin off its Russian retail
portfolio. The recent rerating of the oil price is certainly positive for its assets in Russia, and may help
to attract buyers. However, the recent result of the UK referendum may affect investors’ risk appetite
negatively. That said, even if the BREXIT vote does not affect investment flows in Russia, we believe
that the disposal of the Russian portfolio at around the current valuation (EUR 1.2bn, or a 6.4% yield
on the 3Q15/16 annualised gross rental income) may prove challenging, given the difficult Russian
macro and the low liquidity on the market.
If IIA manages to sell the Russian portfolio, the managements of both companies need to agree on the
exchange ratio, which needs to be approved subsequently by the shareholders. While CAI’s
management seems to be supportive of the deal, there seem to be differences of opinion in how to
reach the exchange ratio.
CAI’s management highlights that a number of factors need to be taken into account and that,
apart from NAV, the share price should play a decisive role in determining the final exchange
ratio.
IIA’s management, on the other hand, insists that the ratio should be determined on the basis of
fundamental valuation, or, essentially, NAV parity.
With CAI historically trading at a lower discount to NAV compared to IIA, an exchange ratio based on
NAV parity would be disadvantageous for CAI’s shareholders. This has already been reflected in the
share price, which has declined by c.10% since the deal was announced.
Overall, we believe that IIA’s management may have the upper hand in the negotiations as it owns a
controlling stake in the company. However, we note that a particularly aggressive merger ratio may fail
to reach the required approval level at the AGM.
In recent months, IIA has taken several steps in the right direction
Disposal of logistics assets improves the portfolio profile…
At the end of October 2015, IIA sold its logistics portfolio to Blackstone for EUR 508m, in line with the
portfolio’s BV. With the sale, which was closed on 1 February 2016 (i.e., on the first day of 4Q15/16),
IIA disposed of all of its remaining logistics properties (24 in Germany, five in Hungary, three in
Romania, two in Poland, one in Slovakia and one in Russia), representing c.1m sqm of rentable space.
The transaction should generate net proceeds of EUR 305m, of which EUR 245m IIA received in
February, with the remaining EUR 60m to be transferred by the end of October 2016, once IIA hands
over the remaining logistics assets, which are currently under development.
Mr. Schumy, IIA’s CEO, has said that the liquid funds will be invested into the further expansion of its
German office portfolio. The sale of the logistics portfolio will reduce the company’s annual rental
income by c.EUR 45m (on an annualised 1Q15/16 basis), or by c.12%.
…as does the disposal of the majority of the BWO shares…
Following two ABBs, in which Immofinanz sold 8.5m and 10.0m Buwog (BWO) shares (in September
2015 and in March 2016, for EUR 17.625/share and EUR 17.1/share, respectively), IIA has finally sold
the remainder of its disposable Buwog stake, selling c.18.5m Buwog shares to SAPINDA Group, at
EUR 19.0/share (generating c.EUR 352m), in June 2016. Following the transaction, IIA still holds
c.10m BWO shares but, according to the press release announcing the disposal, the company needs
to keep these, in order to be able to service the convertible bonds outstanding.
The proceeds from the first two tranches have been used for debt restructuring, while the proceeds
from the most recent disposal of the remaining shares are to be used to finance the purchase of the
CAI stake, the value of which stands at EUR 604m (at EUR 23.5/share, at which IIA purchased the
stake). Initially, IIA outlined its plan to fund the purchase via a combination of a bridge loan and the
issuance of convertible bonds. Following the sale of the BWO shares, instead of issuing the convertible
bond, IIA will fund part of the transaction with the proceeds it is to receive from the disposal of the
BWO shares, in our view.
Immofinanz 89 WOOD & COMPANY
… and the new developments, which shift IIA’s focus gradually westwards
IIA is currently developing a number of offices in large German cities, including Dusseldorf, Cologne
and Aachen. Upon completion, these projects should significantly boost the company’s presence in the
country, increasing the GLA of IIA’s German offices from the current c.50k sqm to c.180k sqm,
increasing the rental income generated in the country to c.EUR 40m by 2018E. Combined with the
disposal of Russia, this should increase the share of rental income generated in Germany from the
current c.4% to c.15% by 2018E, on our estimates.
Successful settlement brings the lengthy legal proceedings to an end
In autumn 2015, IIA announced that it had concluded a settlement with Advofin, a company that
finances legal proceedings. The settlement requires IIA to pay c.EUR 65m for an out-of-court
settlement for more than 3,000 investors represented by Advofin. This settlement covers, among other
things, the majority of the legal proceedings by investors that are currently pending against Immofinanz
AG and Immoeast AG, and Aviso Zeta AG (formerly Constantia Privatbank AG) at the Commercial
Court in Vienna and the District Court in Vienna, which originated in the years prior to 2009.
The offer has been widely accepted and, at the time of the publication of IIA’s 3Q15/16 report (mid-
March), around 95% of the outstanding proceedings against the company were terminated.
Subsequently, IIA booked expenses of EUR 29m in its overhead costs and also increased its trade
payables by EUR 70m (an amount that was included previously under “other provisions”) as of the end
of 3Q15/16.
According to Immofinanz's annual report, the claims were based primarily on: “alleged deficiencies in
the prospectuses of Immofinanz AG or Immoeast AG. Many of the plaintiffs’ claims are also based on
other legal grounds, e.g., the violation of ad-hoc reporting requirements. Among other things, the
plaintiffs contend that the funds raised from the public offering were not used for acquisitions or the
development of new real estate projects, but for the financing of Immofinanz AG and Immoeast AG and
for the purchase of shares in Immofinanz AG and Immoeast AG".
Improvement in office occupancy finally in sight
Management delivers on its promises
In its most recent strategy update, in summer 2015, IIA highlighted an improvement in office
occupancy as one of its key priorities (with the others being the disposal of the logistics portfolio and
the Buwog shares, leading to a focus on two asset classes – retail and office – and growth through
acquisitions and development, which should lead to an improvement of the underlying cash flow,
enabling the adoption of a sustainable dividend policy). During the 2Q15/16 call, IIA’s management
highlighted that the company continues to take steps aimed at improving the occupancy of its office
portfolio (planning to invest c.EUR 40m in 2015/16E and around EUR 30m in 2016/17E in various
refurbishment initiatives across its office portfolio). Mr. Schumy, IIA’s CEO, remarked during the
2Q15/16 call that the company is targeting office occupancy of at least 80% by the end of this financial
year (from the current 75.1%).
Currently, it seems that the company is well on track to achieve the aforementioned target. In a press
release dated 9 May 2016, the company said that it had managed to increase its average office
occupancy by seven percentage points by the end of FY15/16, to 82%.
And we improve our outlook for office occupancy accordingly
Consequently, we are incorporating a significantly better outlook for the office occupancy in our model,
compared to our previous forecasts. We expect the overall office occupancy to reach 86% by the end
of 2016E, to grow to around 89% by the end of 2017E and then to 91% by the end of 2018E.
While we admit that our assumed trajectory of further improvements in occupancy is not particularly
steep, and the company may surprise us to the upside, we would be hesitant to price in a more bullish
scenario at this point.
However, we see little evidence of an abrupt change in any of the office market trends
Austrian offices were IIA’s largest office segment by BV as of the end of 3Q15/16, accounting for 37%
of its office portfolio, followed by Poland (20%), Romania (14%), and the Czech Republic and Hungary
(11% each).
Austria is a mature office market, and we have not identified any abrupt or sudden changes in trends
on the Viennese office market recently. With a small amount of new space scheduled for completion
during 2016/17E, vacancy is likely to continue to hover at around 6% for the next year or two, on our
Immofinanz 90 WOOD & COMPANY
estimates. While gradual growth has been recorded in the prime rents for the best locations (which are
at around EUR 26/sqm currently, having increased gradually from around EUR 22/sqm in 2010), the
prime rents in both good and average locations have been broadly stable since 2007, according to
CBRE.
With the market being broadly stable (with IIA struggling to increase its occupancy in Austrian
offices to substantially above 80% for a number of years), we believe that the increase in
occupancy in this submarket may have come on the back of a moderation in pricing at IIA’s
assets. While we would certainly view this as a good thing, we believe that simply increasing
the average occupancy without making adjustments to the average rent level may lead to an
overly optimistic view, which may have to be readjusted after the publication of the 4Q15/16
figures.
With respect to the other large office markets, we note that both Poland and Romania may
continue (in the case of Poland) or begin (Romania) to suffer from elevated levels in the supply
of new space. With a substantial pipeline scheduled for 2016E and 2017E for both Warsaw and
Bucharest, we believe that increasing office occupancy may prove challenging, and would almost
certainly come at a cost of falling average rent levels.
With respect to Prague, the market is rather stable overall. Following several years of weak
demand, coupled with a fairly high level of new construction, demand now seems to be improving
gradually, while the supply of new space scheduled for delivery in 2016E is rather limited. As such, we
are seeing a gradual decline in vacancy, and the downward pressure on prime rents that we have seen
in recent years has gradually disappeared. This should be marginally positive for IIA’s vacant
premises, in our view. However, we note that the Prague office market has been rather stable
historically and, especially in comparison with other CEE cities, the movements in rent levels (either
way) have usually been rather benign. As such, similar to Vienna, we believe that any substantial
change in IIA’s occupancy may come as a result of a change in pricing policy.
Finally, Budapest, where the strong demand for office space, coupled with the low level of new
completions, has resulted in a decline in vacancy (to 12% as of the end of 4Q15) and a modest
increase in average asking rents. With a limited amount of new construction ahead and healthy
demand, we expect to see further declines in vacancy, which should translate into gradual growth in
the rents in the grade-A offices, in our view. Having struggled to bring its occupancy to above the 80%
mark for a number of years, we believe that the favourable dynamics of the Budapest office market
may allow IIA to improve its occupancy without having to compromise substantially on the rent levels.
Likelihood of the disposal of Russian portfolio remains difficult to call
Despite having written off EUR 400m in 3Q15/16, following the change in appraiser (to CBRE), as
highlighted above, we believe that the disposal of the Russian portfolio at its current valuation may
prove challenging. We elaborate on this topic in more detail in the country section on Russia. The
highlights of our analysis are as follows.
With c.EUR 730m of attributable debt (on which the company pays a c.7.4% interest rate, or
c.EUR 55m per annum), the company is struggling currently to generate positive FFO in the
country.
With respect to the transaction market, the recent CBRE reports suggest that the yield for prime
retail in Moscow stands at 10-10.5%. That said, it is important to note that there is little
transaction evidence to back this level.
Following the most recent revaluation loss, IIA’s Moscow retail assets are booked at
EUR 1,235m, which represented a 6.4% yield on annualised gross rental income as of
3Q15/16. With the value of the properties intact, to arrive at a gross rental yield of 10-11%, with
the occupancy improving to 95% (from the current c.85%), the average rents would need to
amount to c.EUR 40/sqm (from the current c.EUR 28/sqm, or up by over 40%).
Cross-checking IIA’s valuation with its other listed peers, its BV looks more aggressive than
both Atrium and AFI, which booked their Russian asset(s) at 14.0% and 9.6% yields,
respectively, as of the end of 4Q15, compared with IIA’s 6.4%. With respect to the average
monthly rents, at AFI’s AFIMALL City shopping mall, the monthly average EUR-denominated
rents fell by 29% between 4Q15 and 4Q13. At Atrium’s mall in Russia, the average
EUR/denominated rents dropped by c.32% over the same period. In IIA’s portfolio, we have
seen a decline of c.53%, which, however, may have been exacerbated by the addition of
Goodzone to the portfolio in mid-2014.
Immofinanz 91 WOOD & COMPANY
We have been able to identify two deals of a similar magnitude to IIA’s Russian portfolio, which
were closed during the post-07/08-crisis period. In both, the buyer was a private equity fund,
Morgan Stanley Real Estate Fund VII. First, in 2011, it purchased the Galleria Mall, a 93k sqm
GLA shopping centre in the heart of St. Petersburg, opened in November 2010, for around
USD 1.1bn, at a yield of around 8.7-8.9% (according to several articles we have found on the
matter). Secondly, in February 2013, the fund purchased the Metropolis mall in northwest
Moscow, with a total GLA of 82k sqm. Opened in 2009, the price for the mall seems to have
been around USD 1.2bn, with a yield of around 9%.
While better than finding no evidence at all, we believe that the read-across for IIA’s Moscow
retail portfolio may be limited. This is not only because of the varying nature of the assets in
question, but also due to the different macroeconomic conditions. During the previous
recession, the economy shrank by nearly 8% in 2009 and rebounded to growth of around 4-5%
annually in the following years. This time, the magnitude of the rebound seems likely to be
much softer and, while the economy is forecast to return to growth from 2017E-onwards, on the
Bloomberg consensus, the growth rate is forecast broadly in a range of 1-2%. This may make a
sharp rebound in rents, as we witnessed after the end of the last recession, rather unlikely, in
our view.
The exchange rate and the general economic environment have both shifted, as has the
fundamentals of the market (and significantly), which is equally important, in our view.
According to CBRE, the modern retail stock in Moscow amounted to c.4.1m sqm at the end of
2013. During 2014-15, an additional 1.1m sqm has been delivered to the market. For 2016,
CBRE has identified at least six shopping centres, comprising c.400k sqm, which are likely to
be delivered to the market over this year. This translates into an expansion of the modern retail
floor space of over one-third over the course of just three years. Even if the exchange rate and
the economy stabilise, we believe that the visibility on the new equilibrium for rents remains
severely limited currently.
Future performance and valuation of Russian retail
We expect IIIA to gradually manage to improve the occupancy in its centres, to c.90% by the end of
2016E and 96% by the end of 2017E, while still expecting the rents to stay at around the current levels
(recovering from the EUR 28/sqm we pencil in for 2016E to EUR 30/sqm in 2017E), to reflect the
concessions that IIA will have to make in order to fill its centres. Also, while we believe that the pace of
supply of new retail space is likely to slow down considerably during this period, we expect that the
market will still be absorbing the space delivered recently.
After 2017E (while the visibility on both the level of new space delivered and on the economic
performance remains limited), we pencil in a gradual recovery in rents, assuming that the average
rents may reach around EUR 40/sqm by 2020E (c.11% CAGR over 2017-20E).
As the improvement of both occupancy and rents should trigger gradual growth in the top line, we
expect it to be accompanied by an improvement in margins.
Running a DCF on the Russian portfolio under these assumptions (using a WACC of 10.7%, which
gradually trends down towards 9.6%, using a risk free rate of 10.0%, an equity risk premium of 5.5%, a
cost of debt of 7.4% and a beta of 1.0, which trends towards 0.9, as we begin to increase the tax rate
from 2020E-on, reaching 20% by 2023E (as in previous years, the Russian assets should benefit from
the losses incurred by the downward revaluation)), we reach a value of just below EUR 1bn for the
portfolio.
Consequently, in our forecasts, we pencil in that IIA will dispose of its Russian portfolio at EUR 1bn at
the turn of 2016/17E. That said, we highlight the substantial uncertainty connected with the disposal of
an asset of this magnitude, and we note that a spin off remains on the cards. We believe that, in the
event of a spin off, IIA would be likely to need to repay part of the loan on the Russian assets, to make
sure the portfolio generates positive FFO.
Weak FFO caps the upside
We do not believe that we are overly bearish in our forecasts. We model an improvement in occupancy
in a number of the office markets in which IIA operates. We pencil in the disposal of the (currently loss-
making) Russian portfolio at EUR 270m NAV. In 2017E and 2018E, once office occupancy exceeds
90%, on our forecasts, and IIA completes a number of its German development projects, we expect a
gradual return to rental growth, along with margin improvements (with the margin on the income from
asset management (relative to rental income) growing from 62% in 9M15/16E to c.80% from 2018E-
onwards).

Immofinanz 92 WOOD & COMPANY
Even on these estimates, however, we do not see IIA generating substantial FFO before 2018E. We
expect the company to be FFO negative for both 2015/16E and the abbreviated 2016E. Following the
inclusion of 26% of CAI’s FFO in IIA’s figures from 2017E-on, we see IIA generating around EUR 50m
of FFO during 2017E (c.EUR 0.05/share, or a 2.5% FFO yield on a share price of EUR 2/share), about
half of which is attributable to CAI’s contribution.
From 2018E-on, the company starts to generate FFO north of EUR 100m, on our figures (again,
including the proportionate share of CAI’s FFO), translating into a FFO yield of around 5.5-6.5%
between 2018-20E (on a share price of EUR 2.0/share)).
As such, we believe that, unless IIA manages to: 1) generate rental growth at the same time as
ramping up office occupancy; 2) increase office occupancy significantly faster than we expect; 3) sell
the Russian portfolio at a significant premium to our estimated value of c. EUR 1bn; or 4) improve its
margins faster, or to a larger degree, than we expect, the valuation does not make a case for strong
upside from these levels.
At the same time, we believe that turning more bullish on any of these areas would, at this point, be
premature and largely based on speculation, as opposed to hard evidence.
Immofinanz 93 WOOD & COMPANY
Substantial changes in our forecasts
With our last update dating back to August 2015 (“Stuck in the middle with you…”, with a HOLD
recommendation), our figures were in need of a fresh look for quite some time.
Here, we present the overview of the key changes we have made to our forecasts. With the rationale of
many of the changes already reviewed in the chapters above, we keep the list concise, not going in
detail if already discussed above. That said, the following are the major changes in our forecasts.
Time adjustment
In line with IIA’s intentions, we change our model so that the 2017E financial year matches the
respective calendar year, with the 2015/16E financial year followed by the 2016E abbreviated FY,
lasting only eight months.
Disposals
We update our figures to include the disposal of both the logistics portfolio and the Russian retail. In
our previous forecasts, we expected the logistics portfolio to generate around EUR 55-60m annually
between 2016/17E and 2019/20E. As for the Russian portfolio, we were pencilling in a rental income
contribution of around EUR 110-120m annually for these years (assuming 88% occupancy and
average monthly rents growing gradually from EUR 36/sqm in 2016/17E to EUR 42/sqm in 2019/20E).
As mentioned above, the logistics sale should generate net proceeds of over EUR 300m (paid in two
tranches). With respect to the Russian portfolio, we pencil in the disposal at c.EUR 1bn, which should
translate into net proceeds of c.EUR 270m. We expect the Moscow retail assets to cease to contribute
to IIA’s rental income at the end of 2016E.
One of the effects of the disposal of Russian portfolio is the decline in the average cost of debt, which
should drop to around 2.9% from 2017E-onwards (vs. c.3.8% as of the end of 3Q15/16 or vs. c.4.0%,
which was our estimated cost of debt in our last update).
We also include the disposal of all but 10m BWO shares (which IIA cannot dispose of, due to the
outstanding convertible bonds).
Developments
In Germany, we include the following office projects in our forecasts:
Cluster Produktionstechnik in Aachen (29k sqm, completion in 3Q16, total capex of c.EUR
63m).
Carlsquartier in Dusseldorf (3.8k sqm, completion in 1Q17E, total capex of c.EUR 24m).
The second phase of Gerling Quartier in Cologne (we pencil in c.20k sqm of office space,
completion towards the end of 2017E).
Hohenzollernring in Cologne (c.12k sqm, total capex of c.EUR 47m, completion towards the
end of 2017E).
FLOAT in Dusseldorf (31k sqm, completion in 1Q18, total capex of c.EUR 155m).
The Trivago HQ in Dusseldorf (26k sqm GLA, completion in mid-2018E, total capex of
c.EUR 145m).
With these developments, we expect the annual rental income generated by rental offices to increase
from c.EUR 5m currently to c.EUR 40m by around 2018/19E.
With respect to developments outside of Germany, we include only VIVO! in Krosno, Poland (22k sqm
GLA, expected to open in 1Q17E).
Occupancy and rents
In order to reflect the push towards improving occupancy, we assume a sharper trajectory of overall
office occupancy rates. Previously, we expected the average office occupancy to reach around 84% by
the end of 2019/20E; now, we expect occupancy to improve to around 92% by the end of 2019E.
With respect to average office rents, we have moderated our estimates slightly in a number of markets,
as we expect the improvement in occupancy to be offset by a slight decline in the average rent levels.
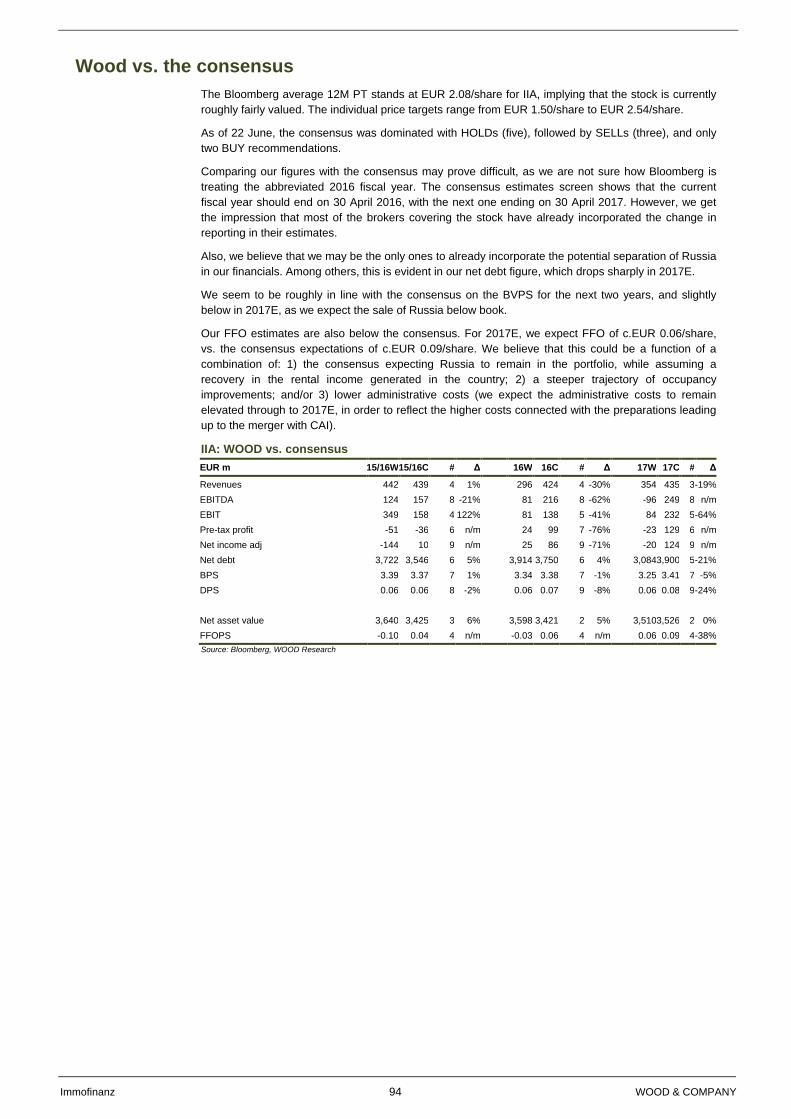
Immofinanz 94 WOOD & COMPANY
Wood vs. the consensus
The Bloomberg average 12M PT stands at EUR 2.08/share for IIA, implying that the stock is currently
roughly fairly valued. The individual price targets range from EUR 1.50/share to EUR 2.54/share.
As of 22 June, the consensus was dominated with HOLDs (five), followed by SELLs (three), and only
two BUY recommendations.
Comparing our figures with the consensus may prove difficult, as we are not sure how Bloomberg is
treating the abbreviated 2016 fiscal year. The consensus estimates screen shows that the current
fiscal year should end on 30 April 2016, with the next one ending on 30 April 2017. However, we get
the impression that most of the brokers covering the stock have already incorporated the change in
reporting in their estimates.
Also, we believe that we may be the only ones to already incorporate the potential separation of Russia
in our financials. Among others, this is evident in our net debt figure, which drops sharply in 2017E.
We seem to be roughly in line with the consensus on the BVPS for the next two years, and slightly
below in 2017E, as we expect the sale of Russia below book.
Our FFO estimates are also below the consensus. For 2017E, we expect FFO of c.EUR 0.06/share,
vs. the consensus expectations of c.EUR 0.09/share. We believe that this could be a function of a
combination of: 1) the consensus expecting Russia to remain in the portfolio, while assuming a
recovery in the rental income generated in the country; 2) a steeper trajectory of occupancy
improvements; and/or 3) lower administrative costs (we expect the administrative costs to remain
elevated through to 2017E, in order to reflect the higher costs connected with the preparations leading
up to the merger with CAI).
IIA: WOOD vs. consensus
EUR m 15/16W 15/16C # Δ
16W 16C # Δ 17W 17C # Δ
Revenues 442 439 4 1%
296 424 4 -30%
354 435 3 -19%
EBITDA 124 157 8 -21%
81 216 8 -62%
-96 249 8 n/m
EBIT 349 158 4 122%
81 138 5 -41%
84 232 5 -64%
Pre-tax profit -51 -36 6 n/m
24 99 7 -76%
-23 129 6 n/m
Net income adj -144 10 9 n/m
25 86 9 -71%
-20 124 9 n/m
Net debt 3,722 3,546 6 5% 3,914 3,750 6 4%
3,084 3,900 5 -21%
BPS 3.39 3.37 7 1%
3.34 3.38 7 -1%
3.25 3.41 7 -5%
DPS 0.06 0.06 8 -2%
0.06 0.07 9 -8%
0.06 0.08 9 -24%
Net asset value 3,640 3,425 3 6%
3,598 3,421 2 5%
3,510 3,526 2 0%
FFOPS -0.10 0.04 4 n/m -0.03 0.06 4 n/m
0.06 0.09 4 -38%
Source: Bloomberg, WOOD Research
Immofinanz 95 WOOD & COMPANY
Risks
Failure to dispose of the Russian retail assets. As our base case, we expect IIA’s
management to succeed in selling its Russian retail assets, pencilling in the price at around
EUR 1bn. That said, we highlight that there is substantial uncertainty connected with the
disposal, with very little transaction evidence for assets of this magnitude. We believe that,
should IIA resort to a spin-off (the likelihood of which has increased in the wake of the UK
referendum result, in our view), the company may need to repay part of the debt on the Russian
assets before the demerger, in order to lessen the burden of the interest costs and make sure
the assets generate positive FFO even under the current, depressed conditions. We doubt that
the market is pricing this in, and we believe that this could trigger a negative market reaction.
Failure to get approval for the exchange ratio, preventing the merger. Although we believe
that, by owning a controlling stake in CA Immo, IIA is likely to have the upper hand in the
negotiations over the exchange ratio, a proposal that is too aggressive may fail to win the
required 75% approval at CAI’s AGM. While this would not, in our view, mean that the merger is
off the table (as it would rather lead to further rounds of talks and additional propositions),
having paid full price for the CAI stake, we would expect to see a negative reaction if the
merger is rejected.
Any further deterioration of the Russian economy could put the share price under strain.
With oil prices having rebounded to USD 50/bbl recently, the Rouble seems to have stabilised
around the RUB 75/EUR level. Should we see yet another round of commodities sell-off, the
rents the company generates in Russia may come under further strain. This would be likely to
make it more difficult for IIA to find a buyer for the assets, and could also mean that, in the
event of a spin-off, IIA would be forced to repay a larger part of the debt on the Russian assets,
in order to turn them FFO positive.
An inability to continue with the occupancy improvements. In our forecasts, we model that
IIA will continue to improve its occupancy gradually across the office portfolio. While the
company announced recently that it managed to increase its overall office occupancy to 82%
by the end of 4Q15/16 (up by approximately seven percentage points yoy), IIA has struggled to
lift the occupancy above 80% in recent years. Should additional occupancy increases fail to
materialise, or come at the price of a significant rental softening, the FFO may come in below
our forecast.
Economic downturn, resulting in lower demand for office space and lower retail
turnover. Rather self-explanatory, we believe that, especially in the mature markets in Austria
and Germany, the office market dynamics are closely linked to the underlying macroeconomic
performance of the respective countries (with the CEE office markets being, in contrast, often
distorted by sudden waves of supply, which may put rents under pressure even if the economy
is improving). As such, any substantial deterioration of the macro backdrop of the countries in
which IIA operates may adversely affect the occupancy and rental income at its offices.
Similarly, an unexpected deterioration would also be likely to affect the retailers, although to a
lesser degree potentially.
A spike in supply in any of the office markets in which Immofinanz operates. As
highlighted in the bullet point above, we believe that especially the CEE office markets are
rather prone to waves of increased supply, which may put rents and vacancy under pressure,
potentially even during times of strong underlying economic performance. Having analysed the
markets in which IIA operates, we have tried to reflect the current outlook for the individual
markets in our forecasts. That said, any unforeseen spike in the supply of new space in any of
IIA’s office markets would be likely to negatively affect its rental income and occupancy.
While the gap between property capitalisation rates and the respective sovereign bond yields
remains high, prime yields in many market segments are either approaching, or have reached,
their all-time lows. Having reviewed the individual markets in which IIA operates, we see that
the company often books its portfolio at lower yields than its peers, despite having lower rents
and higher vacancy. As such, any sizeable uptick in the yields in any of the economies could,
in our view, put the cap rates under pressure (and lead to an increase in borrowing costs),
triggering revaluation losses.
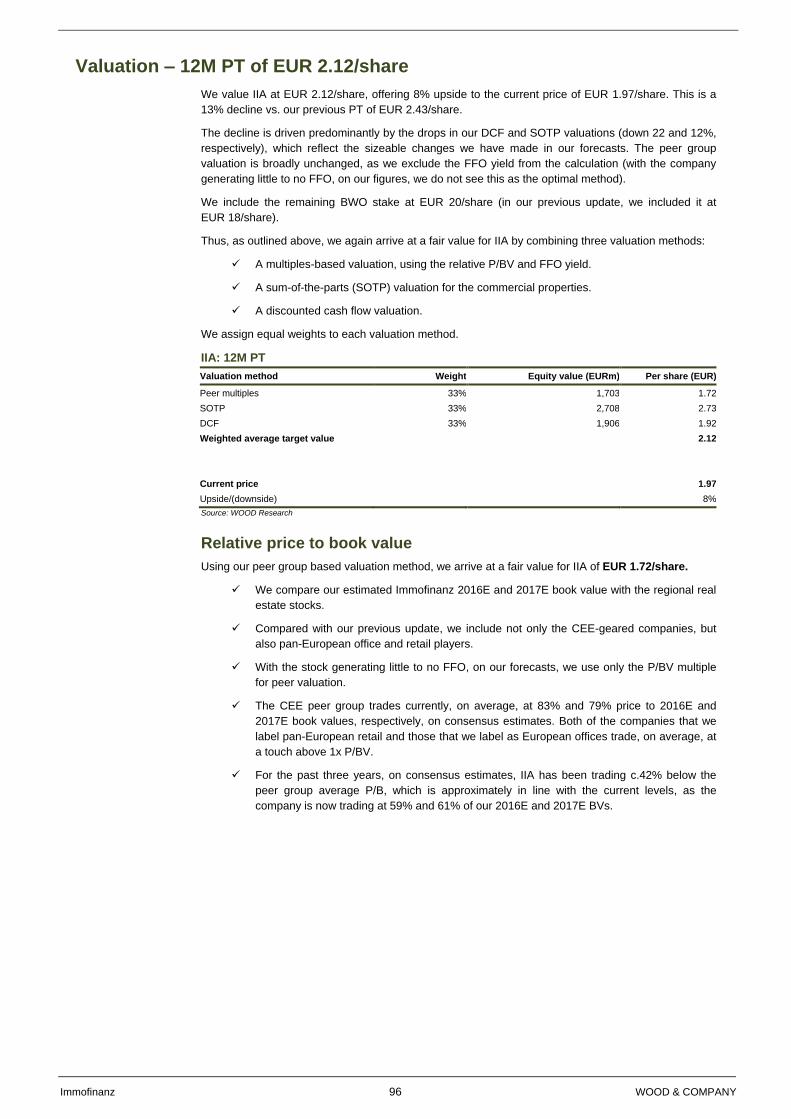
Immofinanz 96 WOOD & COMPANY
Valuation – 12M PT of EUR 2.12/share
We value IIA at EUR 2.12/share, offering 8% upside to the current price of EUR 1.97/share. This is a
13% decline vs. our previous PT of EUR 2.43/share.
The decline is driven predominantly by the drops in our DCF and SOTP valuations (down 22 and 12%,
respectively), which reflect the sizeable changes we have made in our forecasts. The peer group
valuation is broadly unchanged, as we exclude the FFO yield from the calculation (with the company
generating little to no FFO, on our figures, we do not see this as the optimal method).
We include the remaining BWO stake at EUR 20/share (in our previous update, we included it at
EUR 18/share).
Thus, as outlined above, we again arrive at a fair value for IIA by combining three valuation methods:
A multiples-based valuation, using the relative P/BV and FFO yield.
A sum-of-the-parts (SOTP) valuation for the commercial properties.
A discounted cash flow valuation.
We assign equal weights to each valuation method.
IIA: 12M PT
Valuation method Weight Equity value (EURm) Per share (EUR)
Peer multiples 33% 1,703 1.72
SOTP 33% 2,708 2.73
DCF 33% 1,906 1.92
Weighted average target value
2.12
Current price
1.97
Upside/(downside)
8%
Source: WOOD Research
Relative price to book value
Using our peer group based valuation method, we arrive at a fair value for IIA of EUR 1.72/share.
We compare our estimated Immofinanz 2016E and 2017E book value with the regional real
estate stocks.
Compared with our previous update, we include not only the CEE-geared companies, but
also pan-European office and retail players.
With the stock generating little to no FFO, on our forecasts, we use only the P/BV multiple
for peer valuation.
The CEE peer group trades currently, on average, at 83% and 79% price to 2016E and
2017E book values, respectively, on consensus estimates. Both of the companies that we
label pan-European retail and those that we label as European offices trade, on average, at
a touch above 1x P/BV.
For the past three years, on consensus estimates, IIA has been trading c.42% below the
peer group average P/B, which is approximately in line with the current levels, as the
company is now trading at 59% and 61% of our 2016E and 2017E BVs.
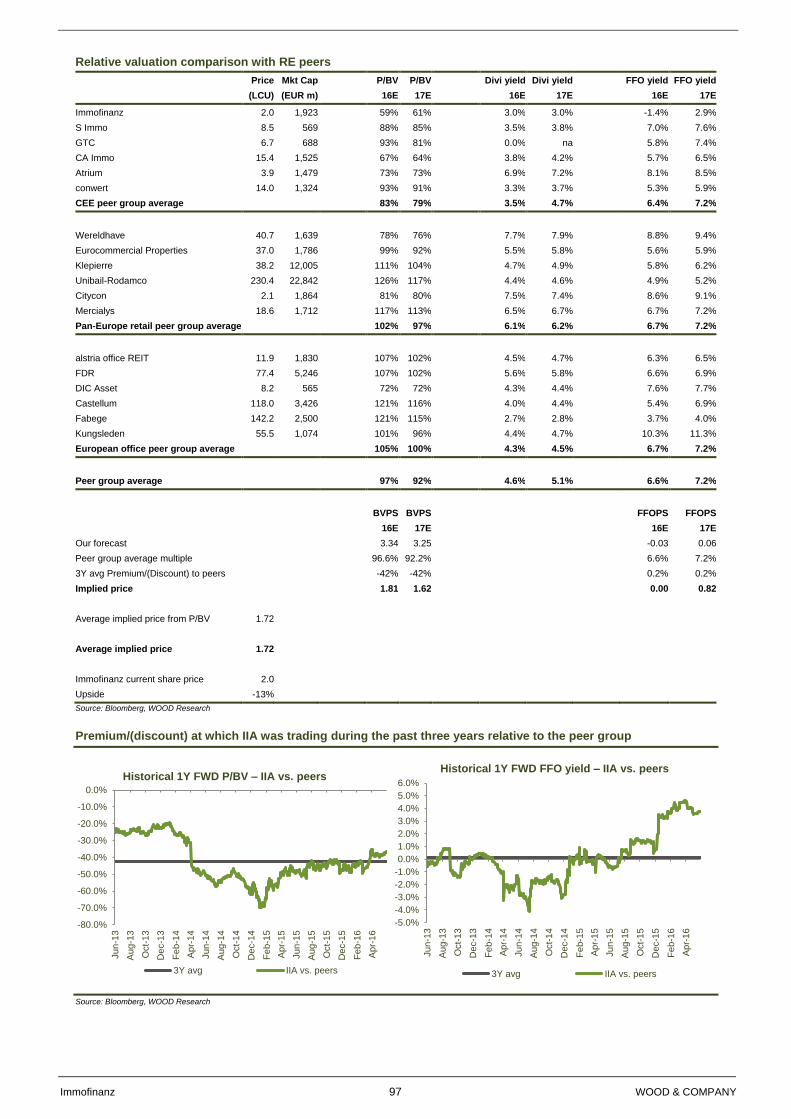
Immofinanz 97 WOOD & COMPANY
Relative valuation comparison with RE peers
Price Mkt Cap
P/BV P/BV
Divi yield Divi yield
FFO yield FFO yield
(LCU) (EUR m)
16E 17E
16E 17E
16E 17E
Immofinanz 2.0 1,923 59% 61% 3.0% 3.0% -1.4% 2.9%
S Immo 8.5 569
88% 85%
3.5% 3.8%
7.0% 7.6%
GTC 6.7 688
93% 81%
0.0% na
5.8% 7.4%
CA Immo 15.4 1,525
67% 64%
3.8% 4.2%
5.7% 6.5%
Atrium 3.9 1,479
73% 73%
6.9% 7.2%
8.1% 8.5%
conwert 14.0 1,324
93% 91%
3.3% 3.7%
5.3% 5.9%
CEE peer group average 83% 79% 3.5% 4.7% 6.4% 7.2%
Wereldhave 40.7 1,639
78% 76%
7.7% 7.9%
8.8% 9.4%
Eurocommercial Properties 37.0 1,786
99% 92%
5.5% 5.8%
5.6% 5.9%
Klepierre 38.2 12,005
111% 104%
4.7% 4.9%
5.8% 6.2%
Unibail-Rodamco 230.4 22,842
126% 117%
4.4% 4.6%
4.9% 5.2%
Citycon 2.1 1,864
81% 80%
7.5% 7.4%
8.6% 9.1%
Mercialys 18.6 1,712
117% 113%
6.5% 6.7%
6.7% 7.2%
Pan-Europe retail peer group average
102% 97% 6.1% 6.2% 6.7% 7.2%
alstria office REIT 11.9 1,830
107% 102%
4.5% 4.7%
6.3% 6.5%
FDR 77.4 5,246
107% 102%
5.6% 5.8%
6.6% 6.9%
DIC Asset 8.2 565
72% 72%
4.3% 4.4%
7.6% 7.7%
Castellum 118.0 3,426
121% 116%
4.0% 4.4%
5.4% 6.9%
Fabege 142.2 2,500
121% 115%
2.7% 2.8%
3.7% 4.0%
Kungsleden 55.5 1,074
101% 96%
4.4% 4.7%
10.3% 11.3%
European office peer group average
105% 100% 4.3% 4.5% 6.7% 7.2%
Peer group average 97% 92% 4.6% 5.1% 6.6% 7.2%
BVPS BVPS
FFOPS FFOPS
16E 17E
16E 17E
Our forecast
3.34 3.25
-0.03 0.06
Peer group average multiple
96.6% 92.2%
6.6% 7.2%
3Y avg Premium/(Discount) to peers
-42% -42%
0.2% 0.2%
Implied price
1.81 1.62
0.00 0.82
Average implied price from P/BV 1.72
Average implied price 1.72
Immofinanz current share price 2.0
Upside -13%
Source: Bloomberg, WOOD Research
Premium/(discount) at which IIA was trading during the past three years relative to the peer group
Source: Bloomberg, WOOD Research
-80.0%
-70.0%
-60.0%
-50.0%
-40.0%
-30.0%
-20.0%
-10.0%
0.0%
Ju
n-1
3
Au
g-1
3
Oct-
13
De
c-1
3
Fe
b-1
4
Ap
r-1
4
Ju
n-1
4
Au
g-1
4
Oct-
14
De
c-1
4
Fe
b-1
5
Ap
r-1
5
Ju
n-1
5
Au
g-1
5
Oct-
15
De
c-1
5
Fe
b-1
6
Ap
r-1
6
Historical 1Y FWD P/BV – IIA vs. peers
3Y avg IIA vs. peers
-5.0%
-4.0%
-3.0%
-2.0%
-1.0%
0.0%
1.0%
2.0%
3.0%
4.0%
5.0%
6.0%
Ju
n-1
3
Au
g-1
3
Oct-
13
De
c-1
3
Fe
b-1
4
Ap
r-1
4
Ju
n-1
4
Au
g-1
4
Oct-
14
De
c-1
4
Fe
b-1
5
Ap
r-1
5
Ju
n-1
5
Au
g-1
5
Oct-
15
De
c-1
5
Fe
b-1
6
Ap
r-1
6
Historical 1Y FWD FFO yield – IIA vs. peers
3Y avg IIA vs. peers
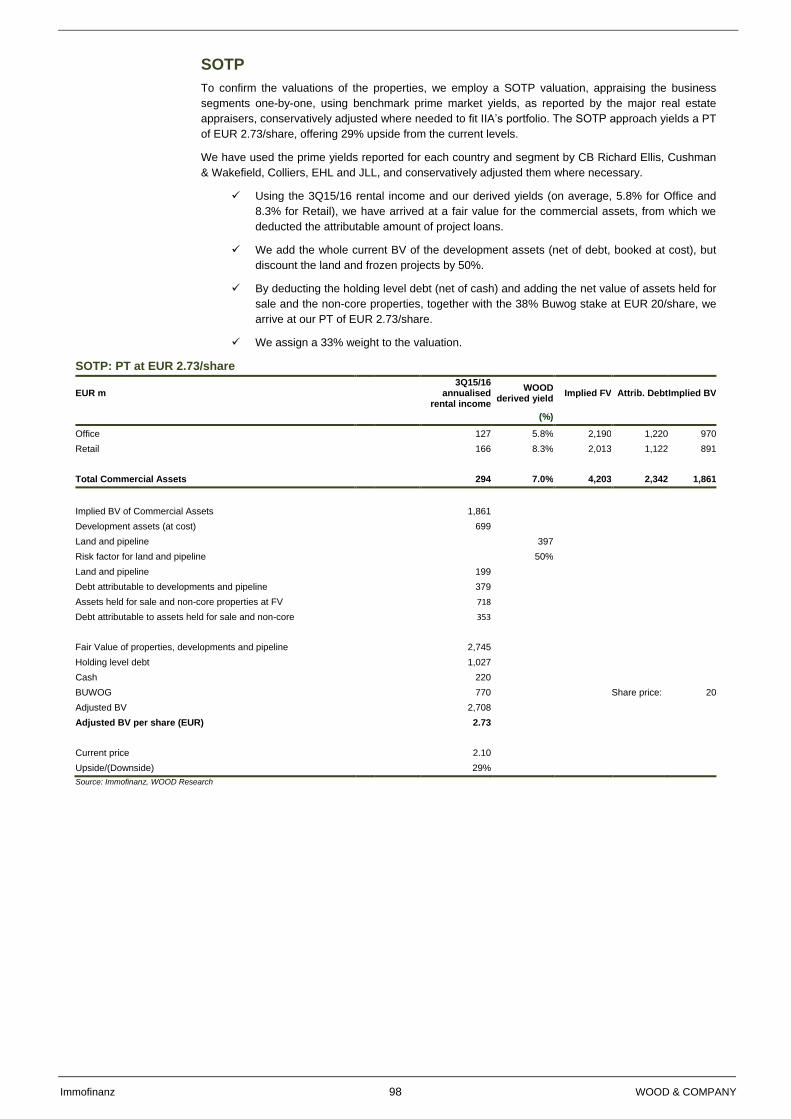
Immofinanz 98 WOOD & COMPANY
SOTP
To confirm the valuations of the properties, we employ a SOTP valuation, appraising the business
segments one-by-one, using benchmark prime market yields, as reported by the major real estate
appraisers, conservatively adjusted where needed to fit IIA’s portfolio. The SOTP approach yields a PT
of EUR 2.73/share, offering 29% upside from the current levels.
We have used the prime yields reported for each country and segment by CB Richard Ellis, Cushman
& Wakefield, Colliers, EHL and JLL, and conservatively adjusted them where necessary.
Using the 3Q15/16 rental income and our derived yields (on average, 5.8% for Office and
8.3% for Retail), we have arrived at a fair value for the commercial assets, from which we
deducted the attributable amount of project loans.
We add the whole current BV of the development assets (net of debt, booked at cost), but
discount the land and frozen projects by 50%.
By deducting the holding level debt (net of cash) and adding the net value of assets held for
sale and the non-core properties, together with the 38% Buwog stake at EUR 20/share, we
arrive at our PT of EUR 2.73/share.
We assign a 33% weight to the valuation.
SOTP: PT at EUR 2.73/share
EUR m
3Q15/16 annualised
rental income
WOOD derived yield
Implied FV Attrib. Debt Implied BV
(%)
Office
127 5.8% 2,190 1,220 970
Retail
166 8.3% 2,013 1,122 891
Total Commercial Assets
294 7.0% 4,203 2,342 1,861
Implied BV of Commercial Assets
1,861
Development assets (at cost)
699
Land and pipeline
397
Risk factor for land and pipeline
50%
Land and pipeline
199
Debt attributable to developments and pipeline
379
Assets held for sale and non-core properties at FV
718
Debt attributable to assets held for sale and non-core
353
Fair Value of properties, developments and pipeline
2,745
Holding level debt
1,027
Cash
220
BUWOG
770
Share price: 20
Adjusted BV
2,708
Adjusted BV per share (EUR)
2.73
Current price
2.10
Upside/(Downside)
29%
Source: Immofinanz, WOOD Research
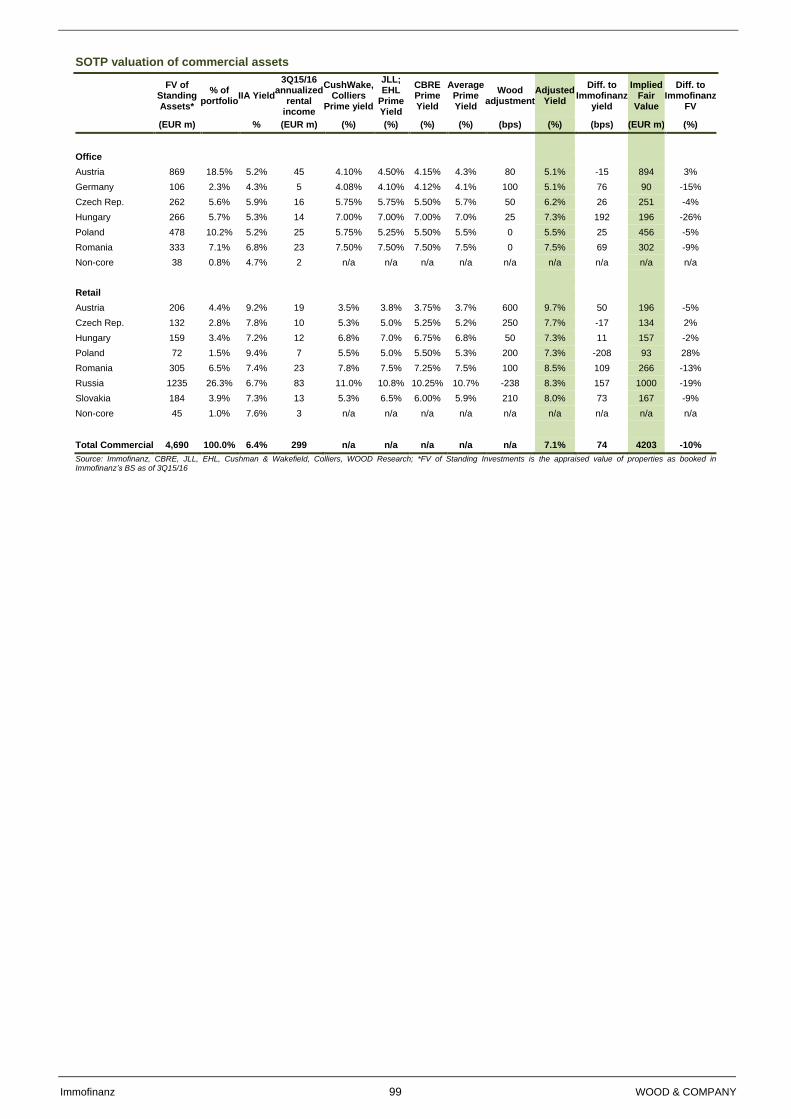
Immofinanz 99 WOOD & COMPANY
SOTP valuation of commercial assets
FV of Standing Assets*
% of portfolio
IIA Yield
3Q15/16 annualized
rental income
CushWake, Colliers
Prime yield
JLL; EHL
Prime Yield
CBRE Prime Yield
Average Prime Yield
Wood adjustment
Adjusted Yield
Diff. to Immofinanz
yield
Implied Fair
Value
Diff. to Immofinanz
FV
(EUR m)
% (EUR m)
(%) (%) (%) (%) (bps) (%)
(bps) (EUR m) (%)
Office
Austria 869 18.5% 5.2% 45
4.10% 4.50% 4.15% 4.3% 80 5.1%
-15 894 3%
Germany 106 2.3% 4.3% 5
4.08% 4.10% 4.12% 4.1% 100 5.1%
76 90 -15%
Czech Rep. 262 5.6% 5.9% 16
5.75% 5.75% 5.50% 5.7% 50 6.2%
26 251 -4%
Hungary 266 5.7% 5.3% 14
7.00% 7.00% 7.00% 7.0% 25 7.3%
192 196 -26%
Poland 478 10.2% 5.2% 25
5.75% 5.25% 5.50% 5.5% 0 5.5%
25 456 -5%
Romania 333 7.1% 6.8% 23
7.50% 7.50% 7.50% 7.5% 0 7.5%
69 302 -9%
Non-core 38 0.8% 4.7% 2
n/a n/a n/a n/a n/a n/a
n/a n/a n/a
Retail
Austria 206 4.4% 9.2% 19
3.5% 3.8% 3.75% 3.7% 600 9.7%
50 196 -5%
Czech Rep. 132 2.8% 7.8% 10
5.3% 5.0% 5.25% 5.2% 250 7.7%
-17 134 2%
Hungary 159 3.4% 7.2% 12
6.8% 7.0% 6.75% 6.8% 50 7.3%
11 157 -2%
Poland 72 1.5% 9.4% 7
5.5% 5.0% 5.50% 5.3% 200 7.3%
-208 93 28%
Romania 305 6.5% 7.4% 23
7.8% 7.5% 7.25% 7.5% 100 8.5%
109 266 -13%
Russia 1235 26.3% 6.7% 83
11.0% 10.8% 10.25% 10.7% -238 8.3%
157 1000 -19%
Slovakia 184 3.9% 7.3% 13
5.3% 6.5% 6.00% 5.9% 210 8.0%
73 167 -9%
Non-core 45 1.0% 7.6% 3
n/a n/a n/a n/a n/a n/a
n/a n/a n/a
Total Commercial 4,690 100.0% 6.4% 299
n/a n/a n/a n/a n/a 7.1%
74 4203 -10%
Source: Immofinanz, CBRE, JLL, EHL, Cushman & Wakefield, Colliers, WOOD Research; *FV of Standing Investments is the appraised value of properties as booked in Immofinanz’s BS as of 3Q15/16
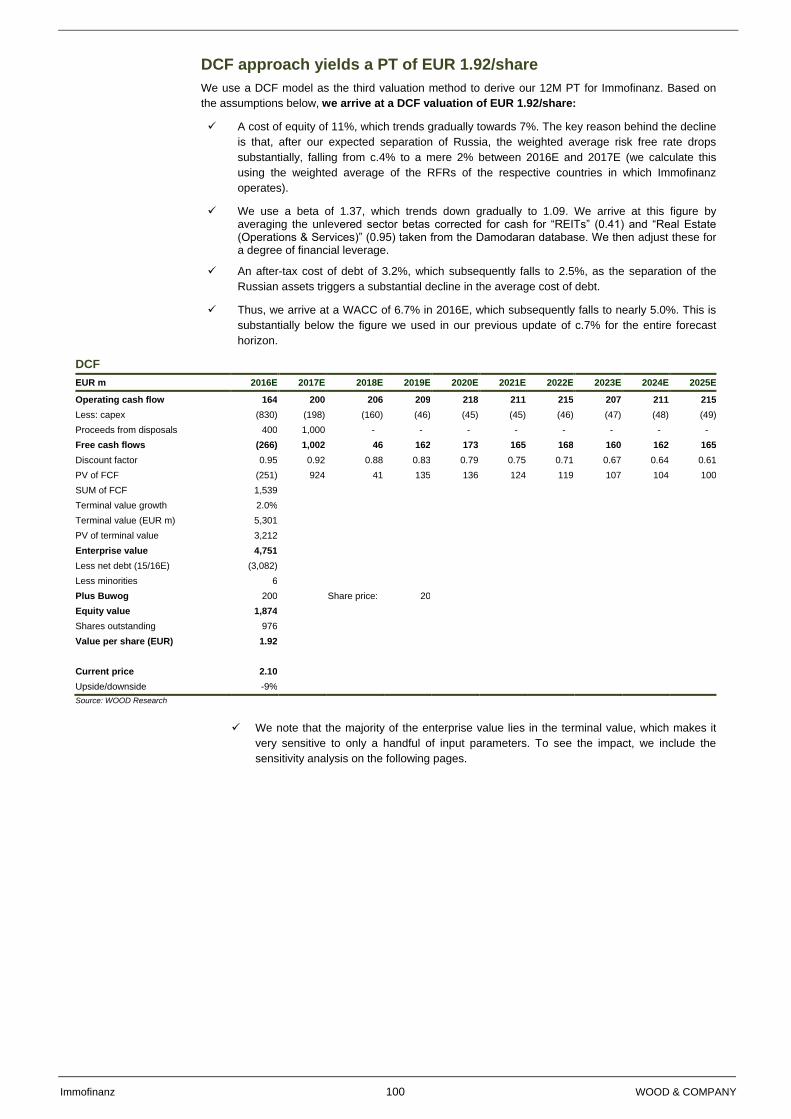
Immofinanz 100 WOOD & COMPANY
DCF approach yields a PT of EUR 1.92/share
We use a DCF model as the third valuation method to derive our 12M PT for Immofinanz. Based on
the assumptions below, we arrive at a DCF valuation of EUR 1.92/share:
A cost of equity of 11%, which trends gradually towards 7%. The key reason behind the decline
is that, after our expected separation of Russia, the weighted average risk free rate drops
substantially, falling from c.4% to a mere 2% between 2016E and 2017E (we calculate this
using the weighted average of the RFRs of the respective countries in which Immofinanz
operates).
We use a beta of 1.37, which trends down gradually to 1.09. We arrive at this figure by averaging the unlevered sector betas corrected for cash for “REITs” (0.41) and “Real Estate (Operations & Services)” (0.95) taken from the Damodaran database. We then adjust these for a degree of financial leverage.
An after-tax cost of debt of 3.2%, which subsequently falls to 2.5%, as the separation of the
Russian assets triggers a substantial decline in the average cost of debt.
Thus, we arrive at a WACC of 6.7% in 2016E, which subsequently falls to nearly 5.0%. This is
substantially below the figure we used in our previous update of c.7% for the entire forecast
horizon.
DCF
EUR m 2016E 2017E 2018E 2019E 2020E 2021E 2022E 2023E 2024E 2025E
Operating cash flow 164 200 206 209 218 211 215 207 211 215
Less: capex (830) (198) (160) (46) (45) (45) (46) (47) (48) (49)
Proceeds from disposals 400 1,000 - - - - - - - -
Free cash flows (266) 1,002 46 162 173 165 168 160 162 165
Discount factor 0.95 0.92 0.88 0.83 0.79 0.75 0.71 0.67 0.64 0.61
PV of FCF (251) 924 41 135 136 124 119 107 104 100
SUM of FCF 1,539
Terminal value growth 2.0%
Terminal value (EUR m) 5,301
PV of terminal value 3,212
Enterprise value 4,751
Less net debt (15/16E) (3,082)
Less minorities 6
Plus Buwog 200
Share price: 20
Equity value 1,874
Shares outstanding 976
Value per share (EUR) 1.92
Current price 2.10
Upside/downside -9%
Source: WOOD Research
We note that the majority of the enterprise value lies in the terminal value, which makes it
very sensitive to only a handful of input parameters. To see the impact, we include the
sensitivity analysis on the following pages.

Immofinanz 101 WOOD & COMPANY
WACC calculation
2016E 2017E 2018E 2019E 2020E 2021E 2022E 2023E 2024E 2025E
Assumptions used for RFR and ERP
Relative country weighs (based on GRI)
AT 20% 26% 25% 24% 24% 24% 24% 24% 24% 24%
DE 4% 10% 15% 16% 16% 16% 16% 16% 16% 16%
CZ 9% 11% 11% 10% 10% 10% 10% 10% 10% 10%
HU 8% 11% 10% 10% 10% 10% 10% 10% 10% 10%
PL 14% 18% 17% 17% 17% 17% 17% 17% 17% 17%
RO 16% 19% 18% 18% 18% 18% 18% 18% 18% 18%
RU 25% 0% 0% 0% 0% 0% 0% 0% 0% 0%
SK 4% 5% 5% 5% 5% 5% 5% 5% 5% 5%
Individual RFRs
AT 0.75% 0.8% 0.8% 0.8% 0.8% 0.8% 0.8% 0.8% 0.8% 0.8%
DE 0.50% 0.5% 0.5% 0.5% 0.5% 0.5% 0.5% 0.5% 0.5% 0.5%
CZ 0.70% 0.7% 0.7% 0.7% 0.7% 0.7% 0.7% 0.7% 0.7% 0.7%
HU 3.40% 3.4% 3.4% 3.4% 3.4% 3.4% 3.4% 3.4% 3.4% 3.4%
PL 3.00% 3.0% 3.0% 3.0% 3.0% 3.0% 3.0% 3.0% 3.0% 3.0%
RO 3.60% 3.6% 3.6% 3.6% 3.6% 3.6% 3.6% 3.6% 3.6% 3.6%
RU 10.00% 10.0% 10.0% 10.0% 10.0% 10.0% 10.0% 10.0% 10.0% 10.0%
SK 0.75% 0.8% 0.8% 0.8% 0.8% 0.8% 0.8% 0.8% 0.8% 0.8%
Individual ERP
AT 4.5% 4.5% 4.5% 4.5% 4.5% 4.5% 4.5% 4.5% 4.5% 4.5%
DE 4.5% 4.5% 4.5% 4.5% 4.5% 4.5% 4.5% 4.5% 4.5% 4.5%
CZ 4.5% 4.5% 4.5% 4.5% 4.5% 4.5% 4.5% 4.5% 4.5% 4.5%
HU 5.0% 5.0% 5.0% 5.0% 5.0% 5.0% 5.0% 5.0% 5.0% 5.0%
PL 5.0% 5.0% 5.0% 5.0% 5.0% 5.0% 5.0% 5.0% 5.0% 5.0%
RO 5.0% 5.0% 5.0% 5.0% 5.0% 5.0% 5.0% 5.0% 5.0% 5.0%
RU 5.5% 5.5% 5.5% 5.5% 5.5% 5.5% 5.5% 5.5% 5.5% 5.5%
SK 4.5% 4.5% 4.5% 4.5% 4.5% 4.5% 4.5% 4.5% 4.5% 4.5%
Company's capital structure
Total Debt 3,914 3,084 3,074 3,054 3,034 3,014 2,994 2,974 2,954 2,954
Total Equity 3,264 3,176 3,261 3,376 3,488 3,605 3,727 3,856 3,990 4,130
Total Capital Outstanding 7,178 6,260 6,336 6,431 6,522 6,619 6,722 6,830 6,944 7,084
[A] Debt/Capital Ratio (%) 55% 49% 49% 47% 47% 46% 45% 44% 43% 42%
[C] Equity/Capital Ratio (%) 45% 51% 51% 53% 53% 54% 55% 56% 57% 58%
Cost of Debt:
Marginal Cost of Debt (%) 3.8% 2.9% 2.9% 2.9% 2.9% 2.9% 2.9% 2.9% 2.9% 2.9%
x Marginal Tax Rate (%) 15% 15% 15% 15% 15% 15% 15% 15% 15% 15%
[B] Cost of Debt (post tax) (%) 3.2% 2.5% 2.5% 2.5% 2.5% 2.5% 2.5% 2.5% 2.5% 2.5%
Cost of Equity:
Beta 1.37 1.24 1.22 1.20 1.18 1.16 1.14 1.13 1.11 1.09
x Equity Risk Premium (%) 6.8% 5.9% 5.8% 5.7% 5.6% 5.5% 5.4% 5.3% 5.2% 5.2%
+ Risk Free Rate (%) 4.1% 2.0% 1.9% 1.8% 1.8% 1.8% 1.8% 1.9% 1.9% 1.9%
[D] Cost of Equity (%) 10.8% 7.8% 7.6% 7.5% 7.4% 7.3% 7.3% 7.2% 7.1% 7.0%
[A x B] + [C x D] = WACC: 6.7% 5.2% 5.1% 5.1% 5.1% 5.1% 5.1% 5.1% 5.1% 5.1%
Source: WOOD Research
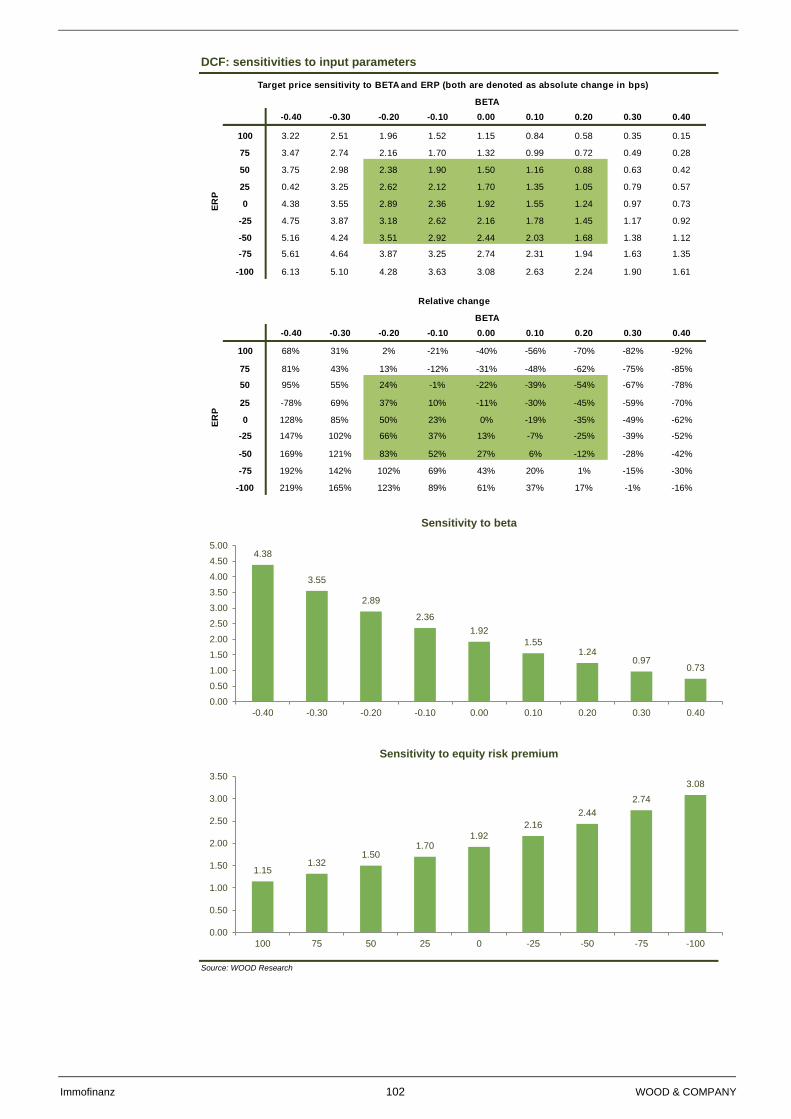
Immofinanz 102 WOOD & COMPANY
DCF: sensitivities to input parameters
Source: WOOD Research
2 -0.40 -0.30 -0.20 -0.10 0.00 0.10 0.20 0.30 0.40
100 3.22 2.51 1.96 1.52 1.15 0.84 0.58 0.35 0.15
75 3.47 2.74 2.16 1.70 1.32 0.99 0.72 0.49 0.28
50 3.75 2.98 2.38 1.90 1.50 1.16 0.88 0.63 0.42
25 0.42 3.25 2.62 2.12 1.70 1.35 1.05 0.79 0.57
0 4.38 3.55 2.89 2.36 1.92 1.55 1.24 0.97 0.73
-25 4.75 3.87 3.18 2.62 2.16 1.78 1.45 1.17 0.92
-50 5.16 4.24 3.51 2.92 2.44 2.03 1.68 1.38 1.12
-75 5.61 4.64 3.87 3.25 2.74 2.31 1.94 1.63 1.35
-100 6.13 5.10 4.28 3.63 3.08 2.63 2.24 1.90 1.61
Target price sensitivity to BETA and ERP (both are denoted as absolute change in bps)
BETA
ER
P
2 -0.40 -0.30 -0.20 -0.10 0.00 0.10 0.20 0.30 0.40
100 68% 31% 2% -21% -40% -56% -70% -82% -92%
75 81% 43% 13% -12% -31% -48% -62% -75% -85%
50 95% 55% 24% -1% -22% -39% -54% -67% -78%
25 -78% 69% 37% 10% -11% -30% -45% -59% -70%
0 128% 85% 50% 23% 0% -19% -35% -49% -62%
-25 147% 102% 66% 37% 13% -7% -25% -39% -52%
-50 169% 121% 83% 52% 27% 6% -12% -28% -42%
-75 192% 142% 102% 69% 43% 20% 1% -15% -30%
-100 219% 165% 123% 89% 61% 37% 17% -1% -16%
Relative change
BETA
ER
P
4.38
3.55
2.89
2.36
1.92
1.551.24
0.970.73
0.00
0.50
1.00
1.50
2.00
2.50
3.00
3.50
4.00
4.50
5.00
-0.40 -0.30 -0.20 -0.10 0.00 0.10 0.20 0.30 0.40
Sensitivity to beta
1.151.32
1.501.70
1.922.16
2.44
2.74
3.08
0.00
0.50
1.00
1.50
2.00
2.50
3.00
3.50
100 75 50 25 0 -25 -50 -75 -100
Sensitivity to equity risk premium
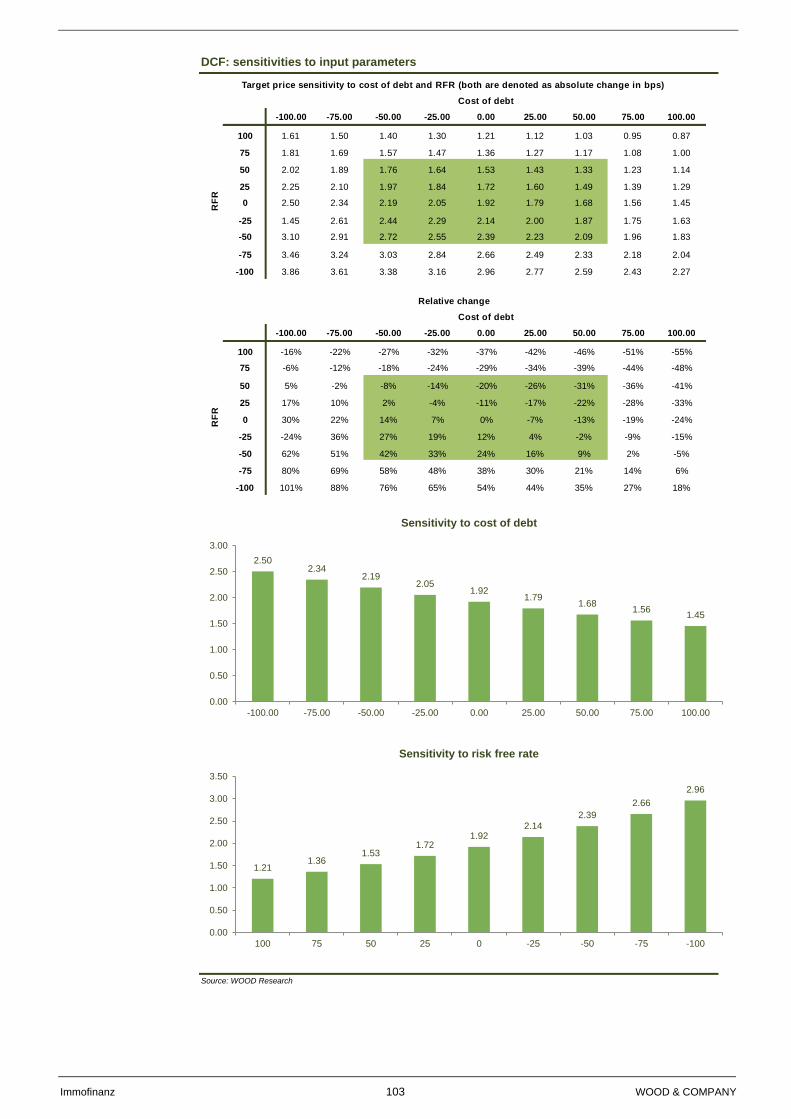
Immofinanz 103 WOOD & COMPANY
DCF: sensitivities to input parameters
Source: WOOD Research
2 -100.00 -75.00 -50.00 -25.00 0.00 25.00 50.00 75.00 100.00
100 1.61 1.50 1.40 1.30 1.21 1.12 1.03 0.95 0.87
75 1.81 1.69 1.57 1.47 1.36 1.27 1.17 1.08 1.00
50 2.02 1.89 1.76 1.64 1.53 1.43 1.33 1.23 1.14
25 2.25 2.10 1.97 1.84 1.72 1.60 1.49 1.39 1.29
0 2.50 2.34 2.19 2.05 1.92 1.79 1.68 1.56 1.45
-25 1.45 2.61 2.44 2.29 2.14 2.00 1.87 1.75 1.63
-50 3.10 2.91 2.72 2.55 2.39 2.23 2.09 1.96 1.83
-75 3.46 3.24 3.03 2.84 2.66 2.49 2.33 2.18 2.04
-100 3.86 3.61 3.38 3.16 2.96 2.77 2.59 2.43 2.27
Target price sensitivity to cost of debt and RFR (both are denoted as absolute change in bps)
Cost of debt
RF
R
2 -100.00 -75.00 -50.00 -25.00 0.00 25.00 50.00 75.00 100.00
100 -16% -22% -27% -32% -37% -42% -46% -51% -55%
75 -6% -12% -18% -24% -29% -34% -39% -44% -48%
50 5% -2% -8% -14% -20% -26% -31% -36% -41%
25 17% 10% 2% -4% -11% -17% -22% -28% -33%
0 30% 22% 14% 7% 0% -7% -13% -19% -24%
-25 -24% 36% 27% 19% 12% 4% -2% -9% -15%
-50 62% 51% 42% 33% 24% 16% 9% 2% -5%
-75 80% 69% 58% 48% 38% 30% 21% 14% 6%
-100 101% 88% 76% 65% 54% 44% 35% 27% 18%
Cost of debt
RF
R
Relative change
2.502.34
2.192.05
1.921.79
1.681.56
1.45
0.00
0.50
1.00
1.50
2.00
2.50
3.00
-100.00 -75.00 -50.00 -25.00 0.00 25.00 50.00 75.00 100.00
Sensitivity to cost of debt
1.211.36
1.531.72
1.922.14
2.39
2.66
2.96
0.00
0.50
1.00
1.50
2.00
2.50
3.00
3.50
100 75 50 25 0 -25 -50 -75 -100
Sensitivity to risk free rate
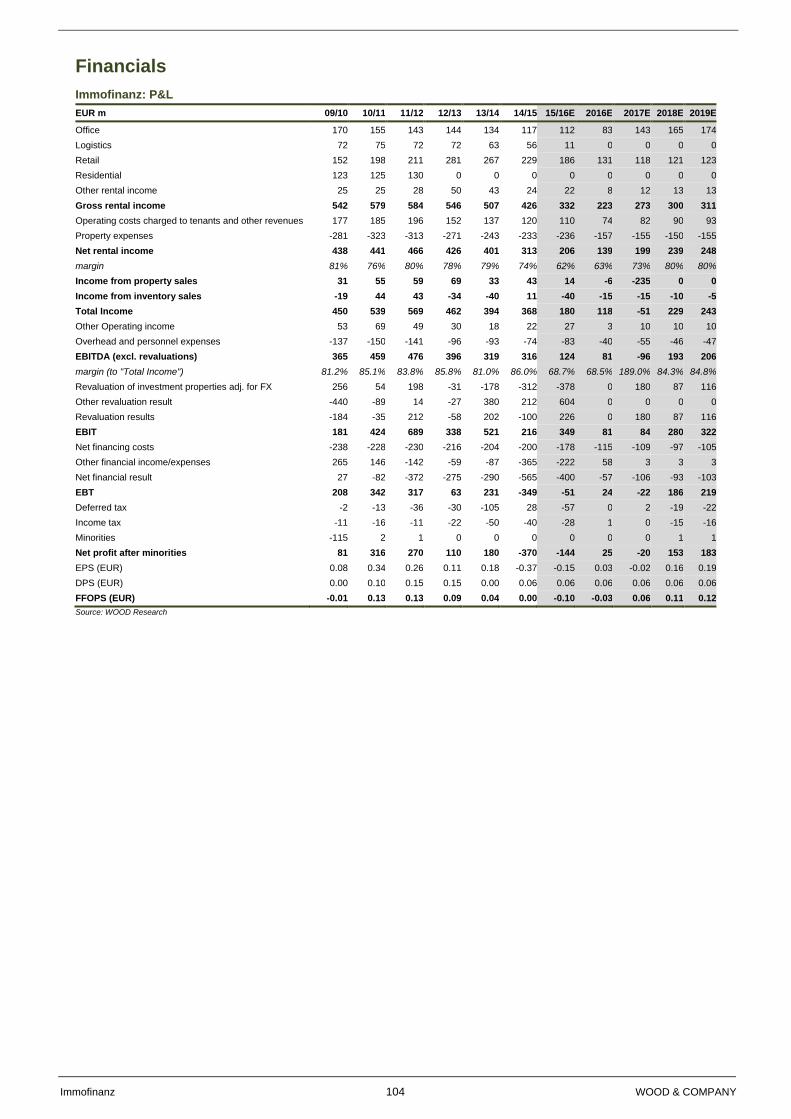
Immofinanz 104 WOOD & COMPANY
Financials
Immofinanz: P&L
EUR m 09/10 10/11 11/12 12/13 13/14 14/15 15/16E 2016E 2017E 2018E 2019E
Office 170 155 143 144 134 117 112 83 143 165 174
Logistics 72 75 72 72 63 56 11 0 0 0 0
Retail 152 198 211 281 267 229 186 131 118 121 123
Residential 123 125 130 0 0 0 0 0 0 0 0
Other rental income 25 25 28 50 43 24 22 8 12 13 13
Gross rental income 542 579 584 546 507 426 332 223 273 300 311
Operating costs charged to tenants and other revenues 177 185 196 152 137 120 110 74 82 90 93
Property expenses -281 -323 -313 -271 -243 -233 -236 -157 -155 -150 -155
Net rental income 438 441 466 426 401 313 206 139 199 239 248
margin 81% 76% 80% 78% 79% 74% 62% 63% 73% 80% 80%
Income from property sales 31 55 59 69 33 43 14 -6 -235 0 0
Income from inventory sales -19 44 43 -34 -40 11 -40 -15 -15 -10 -5
Total Income 450 539 569 462 394 368 180 118 -51 229 243
Other Operating income 53 69 49 30 18 22 27 3 10 10 10
Overhead and personnel expenses -137 -150 -141 -96 -93 -74 -83 -40 -55 -46 -47
EBITDA (excl. revaluations) 365 459 476 396 319 316 124 81 -96 193 206
margin (to "Total Income") 81.2% 85.1% 83.8% 85.8% 81.0% 86.0% 68.7% 68.5% 189.0% 84.3% 84.8%
Revaluation of investment properties adj. for FX 256 54 198 -31 -178 -312 -378 0 180 87 116
Other revaluation result -440 -89 14 -27 380 212 604 0 0 0 0
Revaluation results -184 -35 212 -58 202 -100 226 0 180 87 116
EBIT 181 424 689 338 521 216 349 81 84 280 322
Net financing costs -238 -228 -230 -216 -204 -200 -178 -115 -109 -97 -105
Other financial income/expenses 265 146 -142 -59 -87 -365 -222 58 3 3 3
Net financial result 27 -82 -372 -275 -290 -565 -400 -57 -106 -93 -103
EBT 208 342 317 63 231 -349 -51 24 -22 186 219
Deferred tax -2 -13 -36 -30 -105 28 -57 0 2 -19 -22
Income tax -11 -16 -11 -22 -50 -40 -28 1 0 -15 -16
Minorities -115 2 1 0 0 0 0 0 0 1 1
Net profit after minorities 81 316 270 110 180 -370 -144 25 -20 153 183
EPS (EUR) 0.08 0.34 0.26 0.11 0.18 -0.37 -0.15 0.03 -0.02 0.16 0.19
DPS (EUR) 0.00 0.10 0.15 0.15 0.00 0.06 0.06 0.06 0.06 0.06 0.06
FFOPS (EUR) -0.01 0.13 0.13 0.09 0.04 0.00 -0.10 -0.03 0.06 0.11 0.12
Source: WOOD Research
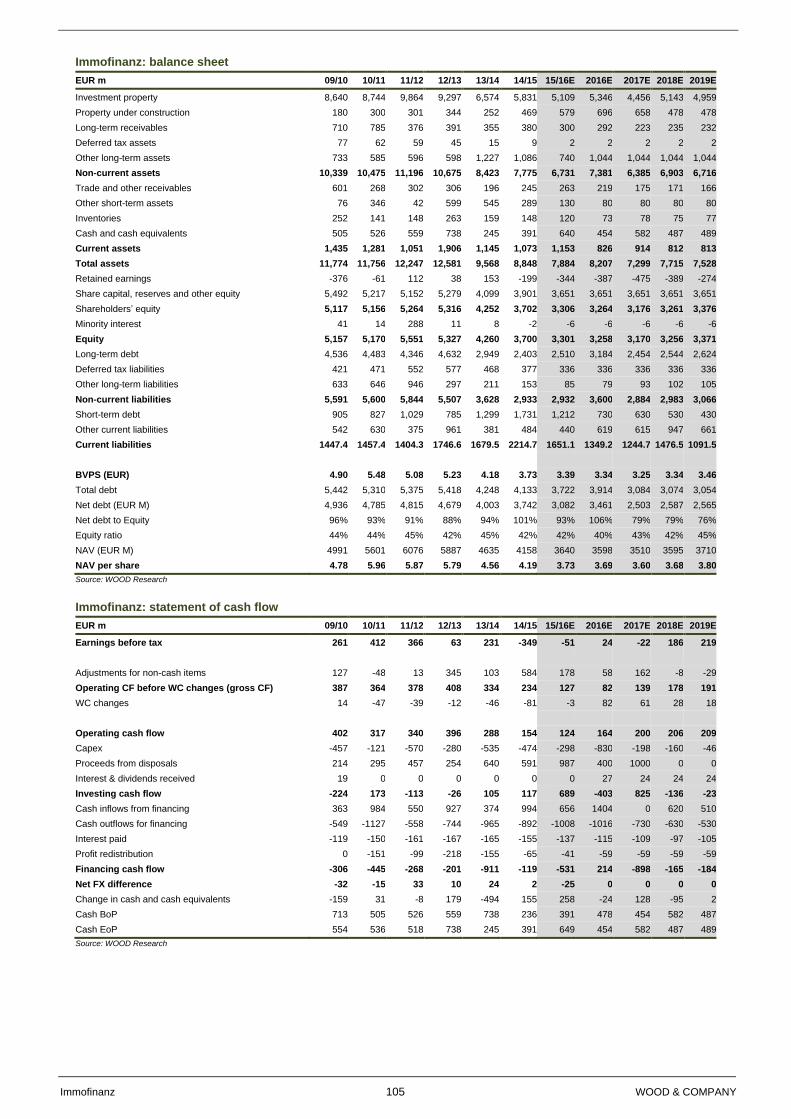
Immofinanz 105 WOOD & COMPANY
Immofinanz: balance sheet
EUR m 09/10 10/11 11/12 12/13 13/14 14/15 15/16E 2016E 2017E 2018E 2019E
Investment property 8,640 8,744 9,864 9,297 6,574 5,831 5,109 5,346 4,456 5,143 4,959
Property under construction 180 300 301 344 252 469 579 696 658 478 478
Long-term receivables 710 785 376 391 355 380 300 292 223 235 232
Deferred tax assets 77 62 59 45 15 9 2 2 2 2 2
Other long-term assets 733 585 596 598 1,227 1,086 740 1,044 1,044 1,044 1,044
Non-current assets 10,339 10,475 11,196 10,675 8,423 7,775 6,731 7,381 6,385 6,903 6,716
Trade and other receivables 601 268 302 306 196 245 263 219 175 171 166
Other short-term assets 76 346 42 599 545 289 130 80 80 80 80
Inventories 252 141 148 263 159 148 120 73 78 75 77
Cash and cash equivalents 505 526 559 738 245 391 640 454 582 487 489
Current assets 1,435 1,281 1,051 1,906 1,145 1,073 1,153 826 914 812 813
Total assets 11,774 11,756 12,247 12,581 9,568 8,848 7,884 8,207 7,299 7,715 7,528
Retained earnings -376 -61 112 38 153 -199 -344 -387 -475 -389 -274
Share capital, reserves and other equity 5,492 5,217 5,152 5,279 4,099 3,901 3,651 3,651 3,651 3,651 3,651
Shareholders’ equity 5,117 5,156 5,264 5,316 4,252 3,702 3,306 3,264 3,176 3,261 3,376
Minority interest 41 14 288 11 8 -2 -6 -6 -6 -6 -6
Equity 5,157 5,170 5,551 5,327 4,260 3,700 3,301 3,258 3,170 3,256 3,371
Long-term debt 4,536 4,483 4,346 4,632 2,949 2,403 2,510 3,184 2,454 2,544 2,624
Deferred tax liabilities 421 471 552 577 468 377 336 336 336 336 336
Other long-term liabilities 633 646 946 297 211 153 85 79 93 102 105
Non-current liabilities 5,591 5,600 5,844 5,507 3,628 2,933 2,932 3,600 2,884 2,983 3,066
Short-term debt 905 827 1,029 785 1,299 1,731 1,212 730 630 530 430
Other current liabilities 542 630 375 961 381 484 440 619 615 947 661
Current liabilities 1447.4 1457.4 1404.3 1746.6 1679.5 2214.7 1651.1 1349.2 1244.7 1476.5 1091.5
BVPS (EUR) 4.90 5.48 5.08 5.23 4.18 3.73 3.39 3.34 3.25 3.34 3.46
Total debt 5,442 5,310 5,375 5,418 4,248 4,133 3,722 3,914 3,084 3,074 3,054
Net debt (EUR M) 4,936 4,785 4,815 4,679 4,003 3,742 3,082 3,461 2,503 2,587 2,565
Net debt to Equity 96% 93% 91% 88% 94% 101% 93% 106% 79% 79% 76%
Equity ratio 44% 44% 45% 42% 45% 42% 42% 40% 43% 42% 45%
NAV (EUR M) 4991 5601 6076 5887 4635 4158 3640 3598 3510 3595 3710
NAV per share 4.78 5.96 5.87 5.79 4.56 4.19 3.73 3.69 3.60 3.68 3.80
Source: WOOD Research
Immofinanz: statement of cash flow
EUR m 09/10 10/11 11/12 12/13 13/14 14/15 15/16E 2016E 2017E 2018E 2019E
Earnings before tax 261 412 366 63 231 -349 -51 24 -22 186 219
Adjustments for non-cash items 127 -48 13 345 103 584 178 58 162 -8 -29
Operating CF before WC changes (gross CF) 387 364 378 408 334 234 127 82 139 178 191
WC changes 14 -47 -39 -12 -46 -81 -3 82 61 28 18
Operating cash flow 402 317 340 396 288 154 124 164 200 206 209
Capex -457 -121 -570 -280 -535 -474 -298 -830 -198 -160 -46
Proceeds from disposals 214 295 457 254 640 591 987 400 1000 0 0
Interest & dividends received 19 0 0 0 0 0 0 27 24 24 24
Investing cash flow -224 173 -113 -26 105 117 689 -403 825 -136 -23
Cash inflows from financing 363 984 550 927 374 994 656 1404 0 620 510
Cash outflows for financing -549 -1127 -558 -744 -965 -892 -1008 -1016 -730 -630 -530
Interest paid -119 -150 -161 -167 -165 -155 -137 -115 -109 -97 -105
Profit redistribution 0 -151 -99 -218 -155 -65 -41 -59 -59 -59 -59
Financing cash flow -306 -445 -268 -201 -911 -119 -531 214 -898 -165 -184
Net FX difference -32 -15 33 10 24 2 -25 0 0 0 0
Change in cash and cash equivalents -159 31 -8 179 -494 155 258 -24 128 -95 2
Cash BoP 713 505 526 559 738 236 391 478 454 582 487
Cash EoP 554 536 518 738 245 391 649 454 582 487 489
Source: WOOD Research

Immofinanz 106 WOOD & COMPANY
This page is left blank intentionally
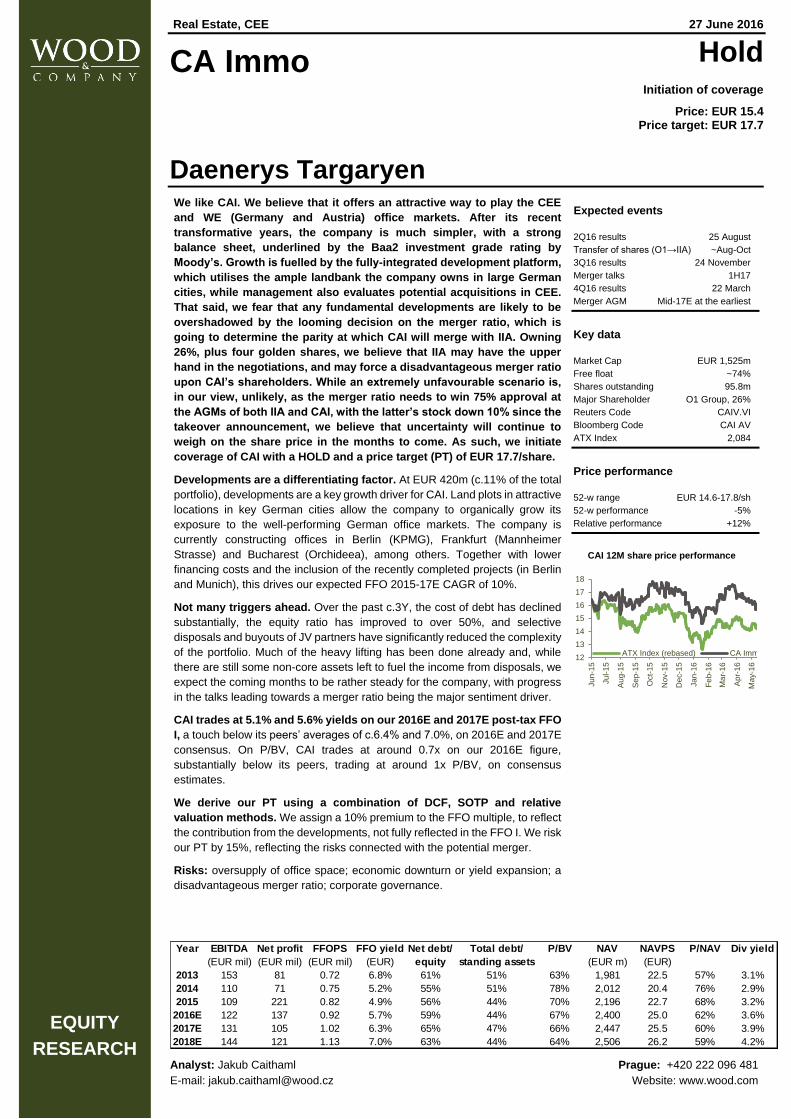
Real Estate, CEE 27 June 2016
CA Immo Hold
Initiation of coverage
Price: EUR 15.4 Price target: EUR 17.7
Daenerys Targaryen
We like CAI. We believe that it offers an attractive way to play the CEE
and WE (Germany and Austria) office markets. After its recent
transformative years, the company is much simpler, with a strong
balance sheet, underlined by the Baa2 investment grade rating by
Moody’s. Growth is fuelled by the fully-integrated development platform,
which utilises the ample landbank the company owns in large German
cities, while management also evaluates potential acquisitions in CEE.
That said, we fear that any fundamental developments are likely to be
overshadowed by the looming decision on the merger ratio, which is
going to determine the parity at which CAI will merge with IIA. Owning
26%, plus four golden shares, we believe that IIA may have the upper
hand in the negotiations, and may force a disadvantageous merger ratio
upon CAI’s shareholders. While an extremely unfavourable scenario is,
in our view, unlikely, as the merger ratio needs to win 75% approval at
the AGMs of both IIA and CAI, with the latter’s stock down 10% since the
takeover announcement, we believe that uncertainty will continue to
weigh on the share price in the months to come. As such, we initiate
coverage of CAI with a HOLD and a price target (PT) of EUR 17.7/share.
Developments are a differentiating factor. At EUR 420m (c.11% of the total
portfolio), developments are a key growth driver for CAI. Land plots in attractive
locations in key German cities allow the company to organically grow its
exposure to the well-performing German office markets. The company is
currently constructing offices in Berlin (KPMG), Frankfurt (Mannheimer
Strasse) and Bucharest (Orchideea), among others. Together with lower
financing costs and the inclusion of the recently completed projects (in Berlin
and Munich), this drives our expected FFO 2015-17E CAGR of 10%.
Not many triggers ahead. Over the past c.3Y, the cost of debt has declined
substantially, the equity ratio has improved to over 50%, and selective
disposals and buyouts of JV partners have significantly reduced the complexity
of the portfolio. Much of the heavy lifting has been done already and, while
there are still some non-core assets left to fuel the income from disposals, we
expect the coming months to be rather steady for the company, with progress
in the talks leading towards a merger ratio being the major sentiment driver.
CAI trades at 5.1% and 5.6% yields on our 2016E and 2017E post-tax FFO
I, a touch below its peers’ averages of c.6.4% and 7.0%, on 2016E and 2017E
consensus. On P/BV, CAI trades at around 0.7x on our 2016E figure,
substantially below its peers, trading at around 1x P/BV, on consensus
estimates.
We derive our PT using a combination of DCF, SOTP and relative
valuation methods. We assign a 10% premium to the FFO multiple, to reflect
the contribution from the developments, not fully reflected in the FFO I. We risk
our PT by 15%, reflecting the risks connected with the potential merger.
Risks: oversupply of office space; economic downturn or yield expansion; a
disadvantageous merger ratio; corporate governance.
Expected events
2Q16 results 25 August
Transfer of shares (O1→IIA) ~Aug-Oct
3Q16 results 24 November
Merger talks 1H17
4Q16 results 22 March
Merger AGM Mid-17E at the earliest
Key data
Market Cap EUR 1,525m
Free float ~74%
Shares outstanding 95.8m
Major Shareholder O1 Group, 26%
Reuters Code CAIV.VI
Bloomberg Code CAI AV
ATX Index 2,084
Price performance
52-w range EUR 14.6-17.8/sh
52-w performance -5%
Relative performance +12%
CAI 12M share price performance
12
13
14
15
16
17
18
Ju
n-1
5
Ju
l-1
5
Aug
-15
Sep
-15
Oct-
15
Nov-1
5
Dec-1
5
Ja
n-1
6
Fe
b-1
6
Ma
r-16
Apr-
16
Ma
y-1
6
ATX Index (rebased) CA Immo
EQUITY
RESEARCH Analyst: Jakub Caithaml Prague: +420 222 096 481
E-mail: [email protected] Website: www.wood.com
Year EBITDA Net profit FFOPS FFO yield Net debt/ Total debt/ P/BV NAV NAVPS P/NAV Div yield
(EUR mil) (EUR mil) (EUR mil) (EUR) equity standing assets (EUR m) (EUR)
2013 153 81 0.72 6.8% 61% 51% 63% 1,981 22.5 57% 3.1%
2014 110 71 0.75 5.2% 55% 51% 78% 2,012 20.4 76% 2.9%
2015 109 221 0.82 4.9% 56% 44% 70% 2,196 22.7 68% 3.2%
2016E 122 137 0.92 5.7% 59% 44% 67% 2,400 25.0 62% 3.6%
2017E 131 105 1.02 6.3% 65% 47% 66% 2,447 25.5 60% 3.9%
2018E 144 121 1.13 7.0% 63% 44% 64% 2,506 26.2 59% 4.2%
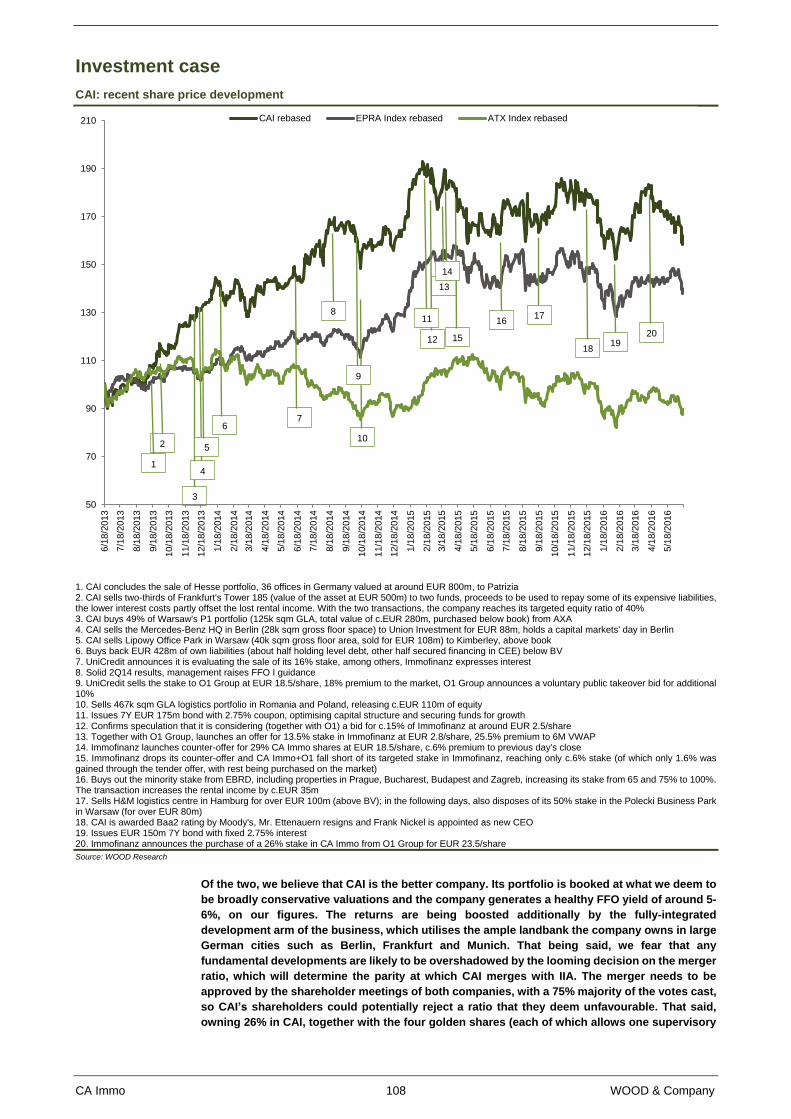
CA Immo 108 WOOD & Company
Investment case
CAI: recent share price development
1. CAI concludes the sale of Hesse portfolio, 36 offices in Germany valued at around EUR 800m, to Patrizia 2. CAI sells two-thirds of Frankfurt's Tower 185 (value of the asset at EUR 500m) to two funds, proceeds to be used to repay some of its expensive liabilities, the lower interest costs partly offset the lost rental income. With the two transactions, the company reaches its targeted equity ratio of 40% 3. CAI buys 49% of Warsaw's P1 portfolio (125k sqm GLA, total value of c.EUR 280m, purchased below book) from AXA 4. CAI sells the Mercedes-Benz HQ in Berlin (28k sqm gross floor space) to Union Investment for EUR 88m, holds a capital markets' day in Berlin 5. CAI sells Lipowy Office Park in Warsaw (40k sqm gross floor area, sold for EUR 108m) to Kimberley, above book 6. Buys back EUR 428m of own liabilities (about half holding level debt, other half secured financing in CEE) below BV 7. UniCredit announces it is evaluating the sale of its 16% stake, among others, Immofinanz expresses interest 8. Solid 2Q14 results, management raises FFO I guidance 9. UniCredit sells the stake to O1 Group at EUR 18.5/share, 18% premium to the market, O1 Group announces a voluntary public takeover bid for additional 10% 10. Sells 467k sqm GLA logistics portfolio in Romania and Poland, releasing c.EUR 110m of equity 11. Issues 7Y EUR 175m bond with 2.75% coupon, optimising capital structure and securing funds for growth 12. Confirms speculation that it is considering (together with O1) a bid for c.15% of Immofinanz at around EUR 2.5/share 13. Together with O1 Group, launches an offer for 13.5% stake in Immofinanz at EUR 2.8/share, 25.5% premium to 6M VWAP 14. Immofinanz launches counter-offer for 29% CA Immo shares at EUR 18.5/share, c.6% premium to previous day's close 15. Immofinanz drops its counter-offer and CA Immo+O1 fall short of its targeted stake in Immofinanz, reaching only c.6% stake (of which only 1.6% was gained through the tender offer, with rest being purchased on the market) 16. Buys out the minority stake from EBRD, including properties in Prague, Bucharest, Budapest and Zagreb, increasing its stake from 65 and 75% to 100%. The transaction increases the rental income by c.EUR 35m 17. Sells H&M logistics centre in Hamburg for over EUR 100m (above BV); in the following days, also disposes of its 50% stake in the Polecki Business Park in Warsaw (for over EUR 80m) 18. CAI is awarded Baa2 rating by Moody's, Mr. Ettenauern resigns and Frank Nickel is appointed as new CEO 19. Issues EUR 150m 7Y bond with fixed 2.75% interest 20. Immofinanz announces the purchase of a 26% stake in CA Immo from O1 Group for EUR 23.5/share
Source: WOOD Research
Of the two, we believe that CAI is the better company. Its portfolio is booked at what we deem to
be broadly conservative valuations and the company generates a healthy FFO yield of around 5-
6%, on our figures. The returns are being boosted additionally by the fully-integrated
development arm of the business, which utilises the ample landbank the company owns in large
German cities such as Berlin, Frankfurt and Munich. That being said, we fear that any
fundamental developments are likely to be overshadowed by the looming decision on the merger
ratio, which will determine the parity at which CAI merges with IIA. The merger needs to be
approved by the shareholder meetings of both companies, with a 75% majority of the votes cast,
so CAI’s shareholders could potentially reject a ratio that they deem unfavourable. That said,
owning 26% in CAI, together with the four golden shares (each of which allows one supervisory
50
70
90
110
130
150
170
190
210
6/1
8/2
01
3
7/1
8/2
01
3
8/1
8/2
01
3
9/1
8/2
01
3
10
/18
/20
13
11
/18
/20
13
12
/18
/20
13
1/1
8/2
01
4
2/1
8/2
01
4
3/1
8/2
01
4
4/1
8/2
01
4
5/1
8/2
01
4
6/1
8/2
01
4
7/1
8/2
01
4
8/1
8/2
01
4
9/1
8/2
01
4
10
/18
/20
14
11
/18
/20
14
12
/18
/20
14
1/1
8/2
01
5
2/1
8/2
01
5
3/1
8/2
01
5
4/1
8/2
01
5
5/1
8/2
01
5
6/1
8/2
01
5
7/1
8/2
01
5
8/1
8/2
01
5
9/1
8/2
01
5
10
/18
/20
15
11
/18
/20
15
12
/18
/20
15
1/1
8/2
01
6
2/1
8/2
01
6
3/1
8/2
01
6
4/1
8/2
01
6
5/1
8/2
01
6
CAI rebased EPRA Index rebased ATX Index rebased
15
2
1
3
5
4
67
8
10
9
12
11
13
14
1617
1819
20
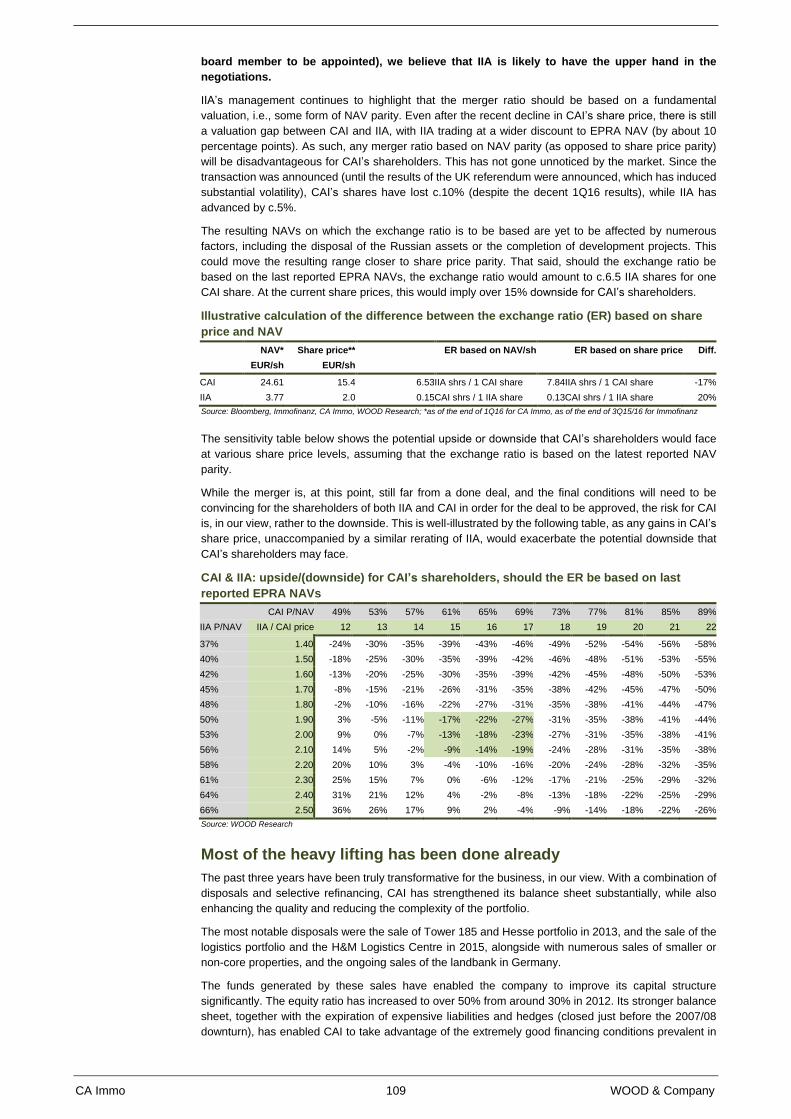
CA Immo 109 WOOD & Company
board member to be appointed), we believe that IIA is likely to have the upper hand in the
negotiations.
IIA’s management continues to highlight that the merger ratio should be based on a fundamental
valuation, i.e., some form of NAV parity. Even after the recent decline in CAI’s share price, there is still
a valuation gap between CAI and IIA, with IIA trading at a wider discount to EPRA NAV (by about 10
percentage points). As such, any merger ratio based on NAV parity (as opposed to share price parity)
will be disadvantageous for CAI’s shareholders. This has not gone unnoticed by the market. Since the
transaction was announced (until the results of the UK referendum were announced, which has induced
substantial volatility), CAI’s shares have lost c.10% (despite the decent 1Q16 results), while IIA has
advanced by c.5%.
The resulting NAVs on which the exchange ratio is to be based are yet to be affected by numerous
factors, including the disposal of the Russian assets or the completion of development projects. This
could move the resulting range closer to share price parity. That said, should the exchange ratio be
based on the last reported EPRA NAVs, the exchange ratio would amount to c.6.5 IIA shares for one
CAI share. At the current share prices, this would imply over 15% downside for CAI’s shareholders.
Illustrative calculation of the difference between the exchange ratio (ER) based on share
price and NAV
NAV* Share price** ER based on NAV/sh ER based on share price Diff.
EUR/sh EUR/sh
CAI 24.61 15.4 6.53 IIA shrs / 1 CAI share 7.84 IIA shrs / 1 CAI share -17%
IIA 3.77 2.0 0.15 CAI shrs / 1 IIA share 0.13 CAI shrs / 1 IIA share 20%
Source: Bloomberg, Immofinanz, CA Immo, WOOD Research; *as of the end of 1Q16 for CA Immo, as of the end of 3Q15/16 for Immofinanz
The sensitivity table below shows the potential upside or downside that CAI’s shareholders would face
at various share price levels, assuming that the exchange ratio is based on the latest reported NAV
parity.
While the merger is, at this point, still far from a done deal, and the final conditions will need to be
convincing for the shareholders of both IIA and CAI in order for the deal to be approved, the risk for CAI
is, in our view, rather to the downside. This is well-illustrated by the following table, as any gains in CAI’s
share price, unaccompanied by a similar rerating of IIA, would exacerbate the potential downside that
CAI’s shareholders may face.
CAI & IIA: upside/(downside) for CAI’s shareholders, should the ER be based on last
reported EPRA NAVs
CAI P/NAV 49% 53% 57% 61% 65% 69% 73% 77% 81% 85% 89%
IIA P/NAV IIA / CAI price 12 13 14 15 16 17 18 19 20 21 22
37% 1.40 -24% -30% -35% -39% -43% -46% -49% -52% -54% -56% -58%
40% 1.50 -18% -25% -30% -35% -39% -42% -46% -48% -51% -53% -55%
42% 1.60 -13% -20% -25% -30% -35% -39% -42% -45% -48% -50% -53%
45% 1.70 -8% -15% -21% -26% -31% -35% -38% -42% -45% -47% -50%
48% 1.80 -2% -10% -16% -22% -27% -31% -35% -38% -41% -44% -47%
50% 1.90 3% -5% -11% -17% -22% -27% -31% -35% -38% -41% -44%
53% 2.00 9% 0% -7% -13% -18% -23% -27% -31% -35% -38% -41%
56% 2.10 14% 5% -2% -9% -14% -19% -24% -28% -31% -35% -38%
58% 2.20 20% 10% 3% -4% -10% -16% -20% -24% -28% -32% -35%
61% 2.30 25% 15% 7% 0% -6% -12% -17% -21% -25% -29% -32%
64% 2.40 31% 21% 12% 4% -2% -8% -13% -18% -22% -25% -29%
66% 2.50 36% 26% 17% 9% 2% -4% -9% -14% -18% -22% -26%
Source: WOOD Research
Most of the heavy lifting has been done already
The past three years have been truly transformative for the business, in our view. With a combination of
disposals and selective refinancing, CAI has strengthened its balance sheet substantially, while also
enhancing the quality and reducing the complexity of the portfolio.
The most notable disposals were the sale of Tower 185 and Hesse portfolio in 2013, and the sale of the
logistics portfolio and the H&M Logistics Centre in 2015, alongside with numerous sales of smaller or
non-core properties, and the ongoing sales of the landbank in Germany.
The funds generated by these sales have enabled the company to improve its capital structure
significantly. The equity ratio has increased to over 50% from around 30% in 2012. Its stronger balance
sheet, together with the expiration of expensive liabilities and hedges (closed just before the 2007/08
downturn), has enabled CAI to take advantage of the extremely good financing conditions prevalent in
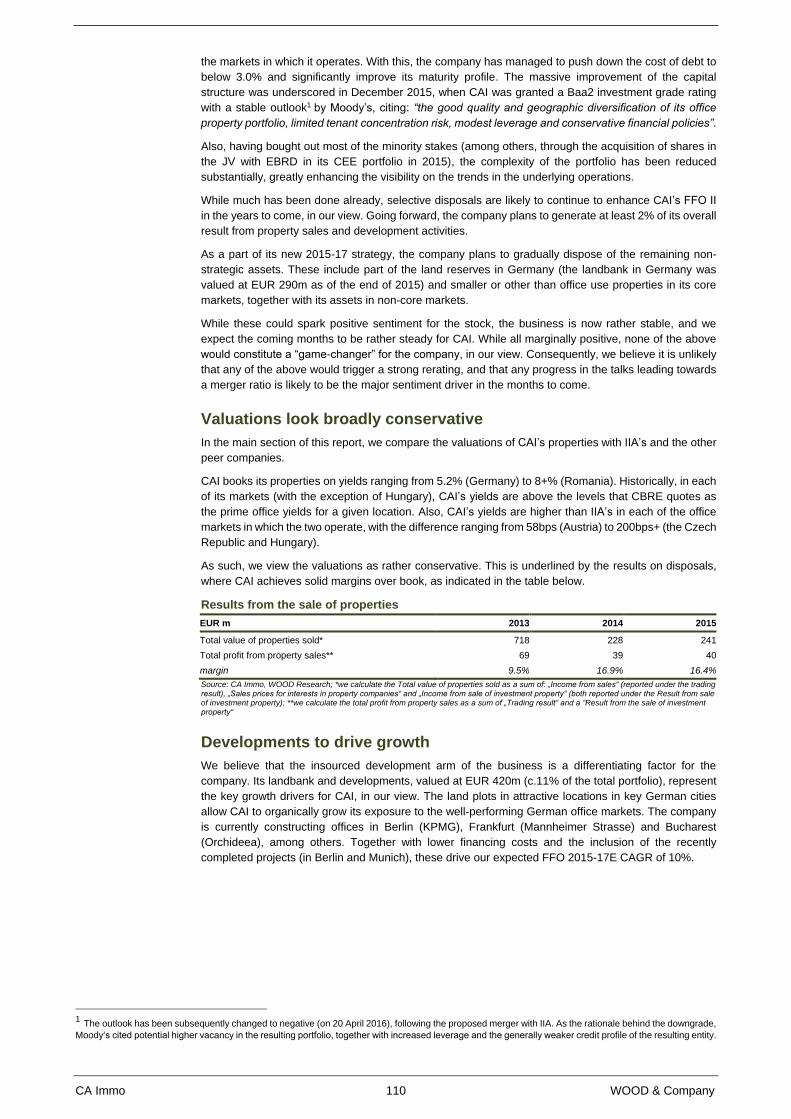
CA Immo 110 WOOD & Company
the markets in which it operates. With this, the company has managed to push down the cost of debt to
below 3.0% and significantly improve its maturity profile. The massive improvement of the capital
structure was underscored in December 2015, when CAI was granted a Baa2 investment grade rating
with a stable outlook1 by Moody’s, citing: “the good quality and geographic diversification of its office
property portfolio, limited tenant concentration risk, modest leverage and conservative financial policies”.
Also, having bought out most of the minority stakes (among others, through the acquisition of shares in
the JV with EBRD in its CEE portfolio in 2015), the complexity of the portfolio has been reduced
substantially, greatly enhancing the visibility on the trends in the underlying operations.
While much has been done already, selective disposals are likely to continue to enhance CAI’s FFO II
in the years to come, in our view. Going forward, the company plans to generate at least 2% of its overall
result from property sales and development activities.
As a part of its new 2015-17 strategy, the company plans to gradually dispose of the remaining non-
strategic assets. These include part of the land reserves in Germany (the landbank in Germany was
valued at EUR 290m as of the end of 2015) and smaller or other than office use properties in its core
markets, together with its assets in non-core markets.
While these could spark positive sentiment for the stock, the business is now rather stable, and we
expect the coming months to be rather steady for CAI. While all marginally positive, none of the above
would constitute a “game-changer” for the company, in our view. Consequently, we believe it is unlikely
that any of the above would trigger a strong rerating, and that any progress in the talks leading towards
a merger ratio is likely to be the major sentiment driver in the months to come.
Valuations look broadly conservative
In the main section of this report, we compare the valuations of CAI’s properties with IIA’s and the other
peer companies.
CAI books its properties on yields ranging from 5.2% (Germany) to 8+% (Romania). Historically, in each
of its markets (with the exception of Hungary), CAI’s yields are above the levels that CBRE quotes as
the prime office yields for a given location. Also, CAI’s yields are higher than IIA’s in each of the office
markets in which the two operate, with the difference ranging from 58bps (Austria) to 200bps+ (the Czech
Republic and Hungary).
As such, we view the valuations as rather conservative. This is underlined by the results on disposals,
where CAI achieves solid margins over book, as indicated in the table below.
Results from the sale of properties
EUR m 2013 2014 2015
Total value of properties sold* 718 228 241
Total profit from property sales** 69 39 40
margin 9.5% 16.9% 16.4%
Source: CA Immo, WOOD Research; *we calculate the Total value of properties sold as a sum of: „Income from sales“ (reported under the trading result), „Sales prices for interests in property companies“ and „Income from sale of investment property“ (both reported under the Result from sale of investment property); **we calculate the total profit from property sales as a sum of „Trading result“ and a “Result from the sale of investment property“
Developments to drive growth
We believe that the insourced development arm of the business is a differentiating factor for the
company. Its landbank and developments, valued at EUR 420m (c.11% of the total portfolio), represent
the key growth drivers for CAI, in our view. The land plots in attractive locations in key German cities
allow CAI to organically grow its exposure to the well-performing German office markets. The company
is currently constructing offices in Berlin (KPMG), Frankfurt (Mannheimer Strasse) and Bucharest
(Orchideea), among others. Together with lower financing costs and the inclusion of the recently
completed projects (in Berlin and Munich), these drive our expected FFO 2015-17E CAGR of 10%.
1 The outlook has been subsequently changed to negative (on 20 April 2016), following the proposed merger with IIA. As the rationale behind the downgrade,
Moody‘s cited potential higher vacancy in the resulting portfolio, together with increased leverage and the generally weaker credit profile of the resulting entity.
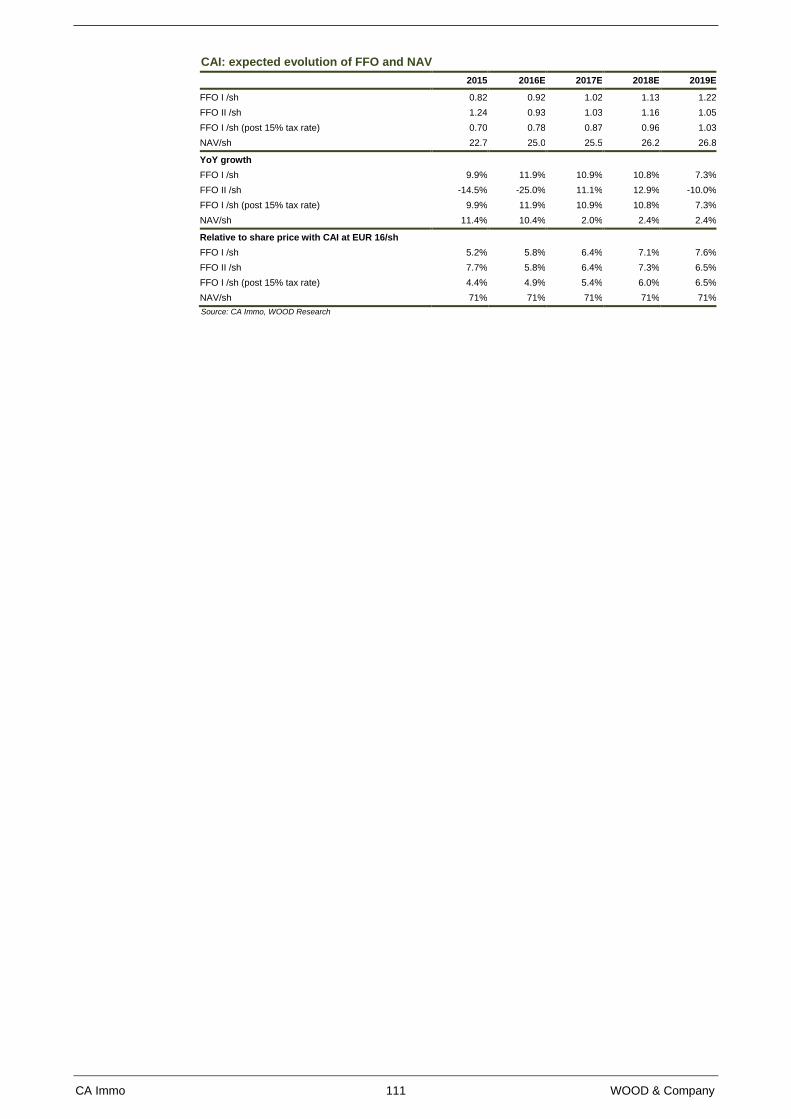
CA Immo 111 WOOD & Company
CAI: expected evolution of FFO and NAV
2015 2016E 2017E 2018E 2019E
FFO I /sh 0.82 0.92 1.02 1.13 1.22
FFO II /sh 1.24 0.93 1.03 1.16 1.05
FFO I /sh (post 15% tax rate) 0.70 0.78 0.87 0.96 1.03
NAV/sh 22.7 25.0 25.5 26.2 26.8
YoY growth
FFO I /sh 9.9% 11.9% 10.9% 10.8% 7.3%
FFO II /sh -14.5% -25.0% 11.1% 12.9% -10.0%
FFO I /sh (post 15% tax rate) 9.9% 11.9% 10.9% 10.8% 7.3%
NAV/sh 11.4% 10.4% 2.0% 2.4% 2.4%
Relative to share price with CAI at EUR 16/sh
FFO I /sh 5.2% 5.8% 6.4% 7.1% 7.6%
FFO II /sh 7.7% 5.8% 6.4% 7.3% 6.5%
FFO I /sh (post 15% tax rate) 4.4% 4.9% 5.4% 6.0% 6.5%
NAV/sh 71% 71% 71% 71% 71%
Source: CA Immo, WOOD Research
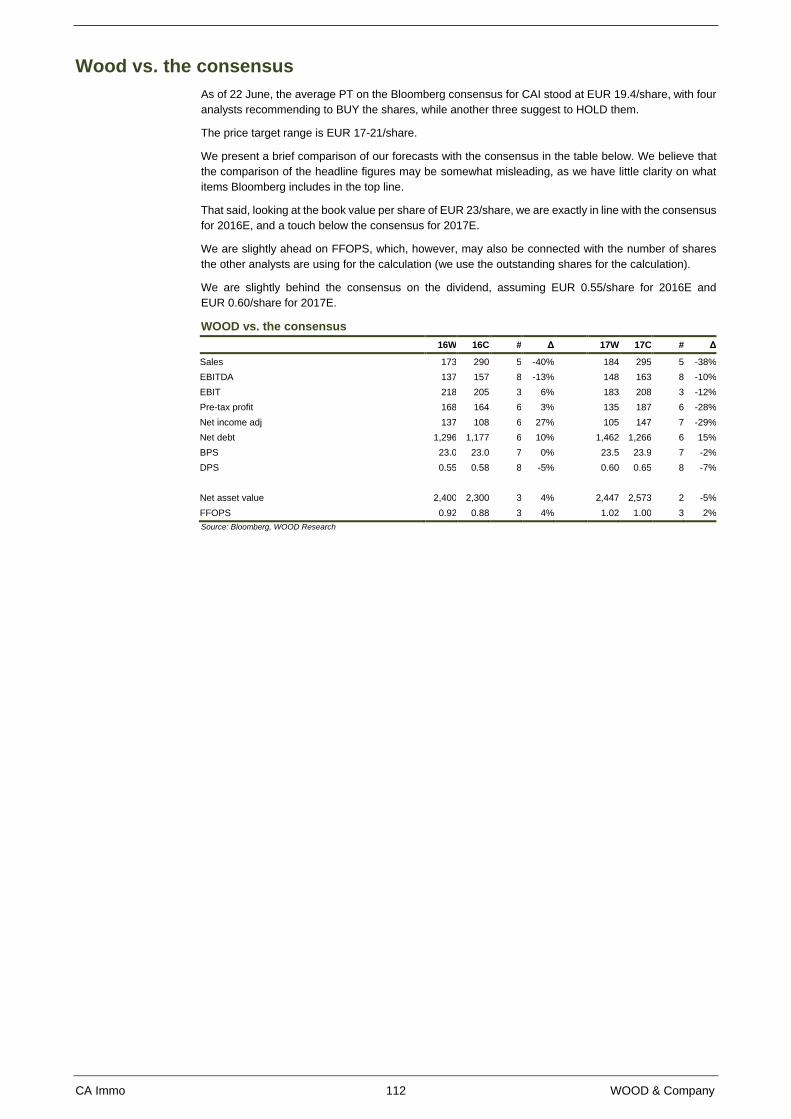
CA Immo 112 WOOD & Company
Wood vs. the consensus
As of 22 June, the average PT on the Bloomberg consensus for CAI stood at EUR 19.4/share, with four
analysts recommending to BUY the shares, while another three suggest to HOLD them.
The price target range is EUR 17-21/share.
We present a brief comparison of our forecasts with the consensus in the table below. We believe that
the comparison of the headline figures may be somewhat misleading, as we have little clarity on what
items Bloomberg includes in the top line.
That said, looking at the book value per share of EUR 23/share, we are exactly in line with the consensus
for 2016E, and a touch below the consensus for 2017E.
We are slightly ahead on FFOPS, which, however, may also be connected with the number of shares
the other analysts are using for the calculation (we use the outstanding shares for the calculation).
We are slightly behind the consensus on the dividend, assuming EUR 0.55/share for 2016E and
EUR 0.60/share for 2017E.
WOOD vs. the consensus
16W 16C # Δ 17W 17C # Δ
Sales 173 290 5 -40% 184 295 5 -38%
EBITDA 137 157 8 -13% 148 163 8 -10%
EBIT 218 205 3 6% 183 208 3 -12%
Pre-tax profit 168 164 6 3% 135 187 6 -28%
Net income adj 137 108 6 27% 105 147 7 -29%
Net debt 1,296 1,177 6 10% 1,462 1,266 6 15%
BPS 23.0 23.0 7 0% 23.5 23.9 7 -2%
DPS 0.55 0.58 8 -5% 0.60 0.65 8 -7%
Net asset value 2,400 2,300 3 4% 2,447 2,573 2 -5%
FFOPS 0.92 0.88 3 4% 1.02 1.00 3 2%
Source: Bloomberg, WOOD Research
CA Immo 113 WOOD & Company
Risks
The exchange ratio. We believe the uncertainty surrounding the exchange ratio is likely to
overshadow many of the fundamental developments at CAI in the coming months and quarters.
While IIA will need to win over 75% approval from CAI’s shareholders for its proposal, we believe
that, by owning a controlling stake in the company, IIA is likely to have the upper hand in the
negotiations. IIA’s management has been highlighting repeatedly that the base for determining
the exchange ratio should be the NAV parity at the time of the merger. Should this be the case,
the higher the gap of P/NAV between CAI and IIA, the higher the potential downside for CAI.
While we acknowledge that there are many factors at play – the portfolios may still evolve in the
coming months, which may affect the NAV; while the appraisal, leading up to the merger, may
affect the NAV of both IIA and CAI – we believe that, ceteris paribus, for CAI, the risk is rather to
the downside. We believe that the market shares our view on this matter, as CAI’s shares have
lost c.10% since the transaction was announced (despite the decent 1Q16 results), while IIA has
advanced by c.5% (before Friday’s BREXIT-induced volatility).
Corporate governance. With IIA (which, until the merger is completed, remains a competitor of
CAI) owning the controlling stake in the company, we would watch out for any action that is not
aligned with the best interests of the other shareholders of CAI.
Economic downturn, resulting in lower demand for office space. Rather self-explanatory,
we believe that, especially in the mature markets in Austria and Germany, the office market
dynamics are closely linked with the underlying macroeconomic performances of the respective
countries (with the CEE office markets being, by contrast, often distorted by sudden waves of
supply, which may put rents under pressure even if the economy is growing). As such, any
substantial deterioration of the macro backdrop of the countries in which CAI operates may
adversely affect its occupancy and rental income.
A spike in supply in any of the office markets in which CAI operates. As highlighted in the
bullet point above, we believe that especially the CEE office markets are rather prone to waves
of increased supply, which may put the rents and vacancy under pressure, potentially even
despite strong underlying economic performances. Having analysed the markets in which CAI
operates, we have tried to reflect the current outlook for the individual markets in our forecasts.
That said, any unforeseen spike in the supply of new space in any of the office markets in which
CAI operates would be likely to negatively affect its rental income and occupancy.
While the gap between property capitalisation rates and the respective sovereign bond yields
remains high, prime yields in many market segments are either approaching, or have reached,
their all-time lows. While we view the valuation of CAI’s standing portfolio as fairly conservative,
any sizeable uptick in yields in any of the economies could, in our view, put the cap rates under
pressure and subsequently increase borrowing costs (and vice versa).
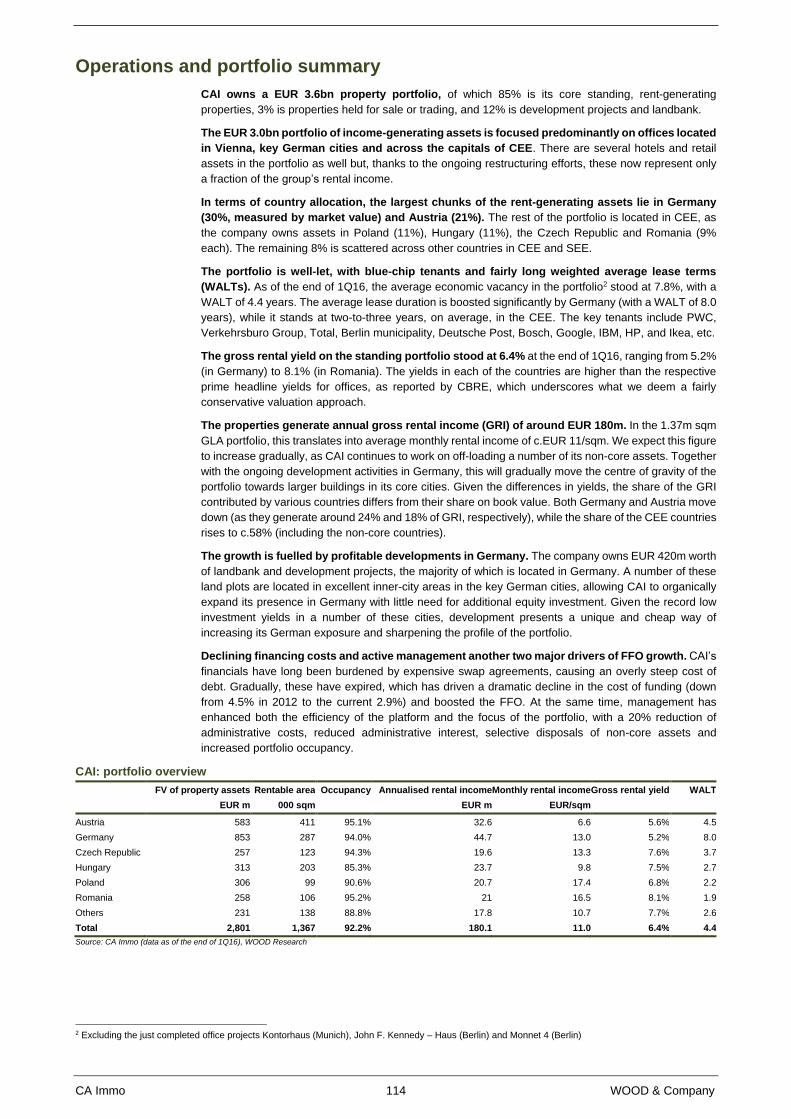
CA Immo 114 WOOD & Company
Operations and portfolio summary
CAI owns a EUR 3.6bn property portfolio, of which 85% is its core standing, rent-generating
properties, 3% is properties held for sale or trading, and 12% is development projects and landbank.
The EUR 3.0bn portfolio of income-generating assets is focused predominantly on offices located
in Vienna, key German cities and across the capitals of CEE. There are several hotels and retail
assets in the portfolio as well but, thanks to the ongoing restructuring efforts, these now represent only
a fraction of the group’s rental income.
In terms of country allocation, the largest chunks of the rent-generating assets lie in Germany
(30%, measured by market value) and Austria (21%). The rest of the portfolio is located in CEE, as
the company owns assets in Poland (11%), Hungary (11%), the Czech Republic and Romania (9%
each). The remaining 8% is scattered across other countries in CEE and SEE.
The portfolio is well-let, with blue-chip tenants and fairly long weighted average lease terms
(WALTs). As of the end of 1Q16, the average economic vacancy in the portfolio2 stood at 7.8%, with a
WALT of 4.4 years. The average lease duration is boosted significantly by Germany (with a WALT of 8.0
years), while it stands at two-to-three years, on average, in the CEE. The key tenants include PWC,
Verkehrsburo Group, Total, Berlin municipality, Deutsche Post, Bosch, Google, IBM, HP, and Ikea, etc.
The gross rental yield on the standing portfolio stood at 6.4% at the end of 1Q16, ranging from 5.2%
(in Germany) to 8.1% (in Romania). The yields in each of the countries are higher than the respective
prime headline yields for offices, as reported by CBRE, which underscores what we deem a fairly
conservative valuation approach.
The properties generate annual gross rental income (GRI) of around EUR 180m. In the 1.37m sqm
GLA portfolio, this translates into average monthly rental income of c.EUR 11/sqm. We expect this figure
to increase gradually, as CAI continues to work on off-loading a number of its non-core assets. Together
with the ongoing development activities in Germany, this will gradually move the centre of gravity of the
portfolio towards larger buildings in its core cities. Given the differences in yields, the share of the GRI
contributed by various countries differs from their share on book value. Both Germany and Austria move
down (as they generate around 24% and 18% of GRI, respectively), while the share of the CEE countries
rises to c.58% (including the non-core countries).
The growth is fuelled by profitable developments in Germany. The company owns EUR 420m worth
of landbank and development projects, the majority of which is located in Germany. A number of these
land plots are located in excellent inner-city areas in the key German cities, allowing CAI to organically
expand its presence in Germany with little need for additional equity investment. Given the record low
investment yields in a number of these cities, development presents a unique and cheap way of
increasing its German exposure and sharpening the profile of the portfolio.
Declining financing costs and active management another two major drivers of FFO growth. CAI’s
financials have long been burdened by expensive swap agreements, causing an overly steep cost of
debt. Gradually, these have expired, which has driven a dramatic decline in the cost of funding (down
from 4.5% in 2012 to the current 2.9%) and boosted the FFO. At the same time, management has
enhanced both the efficiency of the platform and the focus of the portfolio, with a 20% reduction of
administrative costs, reduced administrative interest, selective disposals of non-core assets and
increased portfolio occupancy.
CAI: portfolio overview
FV of property assets Rentable area Occupancy Annualised rental income Monthly rental income Gross rental yield WALT
EUR m 000 sqm EUR m EUR/sqm
Austria 583 411 95.1% 32.6 6.6 5.6% 4.5
Germany 853 287 94.0% 44.7 13.0 5.2% 8.0
Czech Republic 257 123 94.3% 19.6 13.3 7.6% 3.7
Hungary 313 203 85.3% 23.7 9.8 7.5% 2.7
Poland 306 99 90.6% 20.7 17.4 6.8% 2.2
Romania 258 106 95.2% 21 16.5 8.1% 1.9
Others 231 138 88.8% 17.8 10.7 7.7% 2.6
Total 2,801 1,367 92.2% 180.1 11.0 6.4% 4.4
Source: CA Immo (data as of the end of 1Q16), WOOD Research
2 Excluding the just completed office projects Kontorhaus (Munich), John F. Kennedy – Haus (Berlin) and Monnet 4 (Berlin)
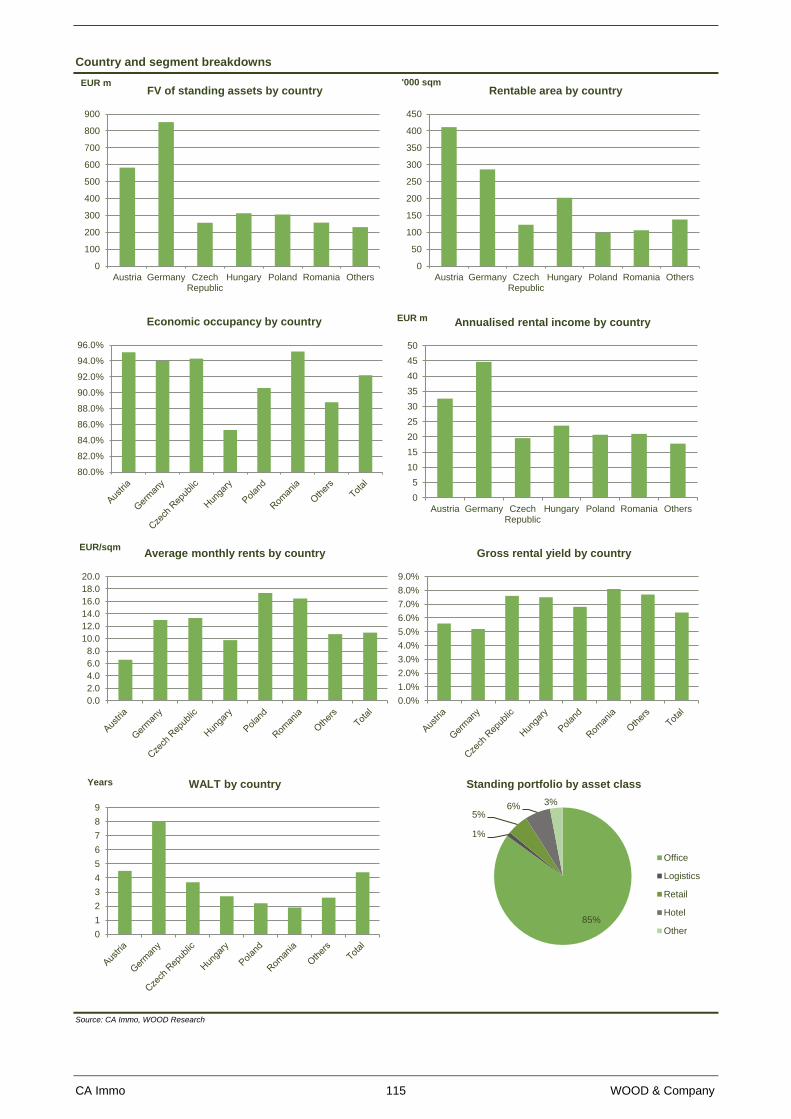
CA Immo 115 WOOD & Company
Country and segment breakdowns
Source: CA Immo, WOOD Research
0
100
200
300
400
500
600
700
800
900
Austria Germany CzechRepublic
Hungary Poland Romania Others
EUR mFV of standing assets by country
0
50
100
150
200
250
300
350
400
450
Austria Germany CzechRepublic
Hungary Poland Romania Others
'000 sqmRentable area by country
80.0%
82.0%
84.0%
86.0%
88.0%
90.0%
92.0%
94.0%
96.0%
Economic occupancy by country
0
5
10
15
20
25
30
35
40
45
50
Austria Germany CzechRepublic
Hungary Poland Romania Others
EUR m Annualised rental income by country
0.0
2.0
4.0
6.0
8.0
10.0
12.0
14.0
16.0
18.0
20.0
EUR/sqmAverage monthly rents by country
0.0%
1.0%
2.0%
3.0%
4.0%
5.0%
6.0%
7.0%
8.0%
9.0%
Gross rental yield by country
0
1
2
3
4
5
6
7
8
9
Years WALT by country
85%
1%
5%6% 3%
Standing portfolio by asset class
Office
Logistics
Retail
Hotel
Other
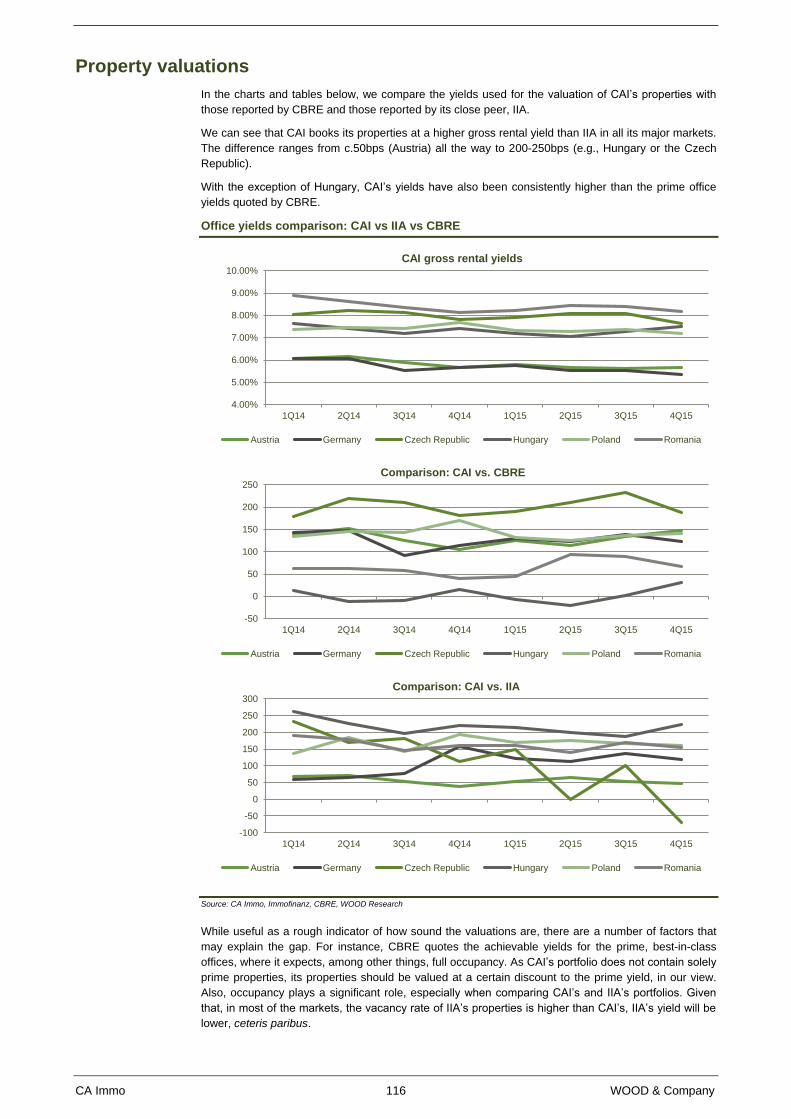
CA Immo 116 WOOD & Company
Property valuations
In the charts and tables below, we compare the yields used for the valuation of CAI’s properties with
those reported by CBRE and those reported by its close peer, IIA.
We can see that CAI books its properties at a higher gross rental yield than IIA in all its major markets.
The difference ranges from c.50bps (Austria) all the way to 200-250bps (e.g., Hungary or the Czech
Republic).
With the exception of Hungary, CAI’s yields have also been consistently higher than the prime office
yields quoted by CBRE.
Office yields comparison: CAI vs IIA vs CBRE
Source: CA Immo, Immofinanz, CBRE, WOOD Research
While useful as a rough indicator of how sound the valuations are, there are a number of factors that
may explain the gap. For instance, CBRE quotes the achievable yields for the prime, best-in-class
offices, where it expects, among other things, full occupancy. As CAI’s portfolio does not contain solely
prime properties, its properties should be valued at a certain discount to the prime yield, in our view.
Also, occupancy plays a significant role, especially when comparing CAI’s and IIA’s portfolios. Given
that, in most of the markets, the vacancy rate of IIA’s properties is higher than CAI’s, IIA’s yield will be
lower, ceteris paribus.
4.00%
5.00%
6.00%
7.00%
8.00%
9.00%
10.00%
1Q14 2Q14 3Q14 4Q14 1Q15 2Q15 3Q15 4Q15
CAI gross rental yields
Austria Germany Czech Republic Hungary Poland Romania
-50
0
50
100
150
200
250
1Q14 2Q14 3Q14 4Q14 1Q15 2Q15 3Q15 4Q15
Comparison: CAI vs. CBRE
Austria Germany Czech Republic Hungary Poland Romania
-100
-50
0
50
100
150
200
250
300
1Q14 2Q14 3Q14 4Q14 1Q15 2Q15 3Q15 4Q15
Comparison: CAI vs. IIA
Austria Germany Czech Republic Hungary Poland Romania
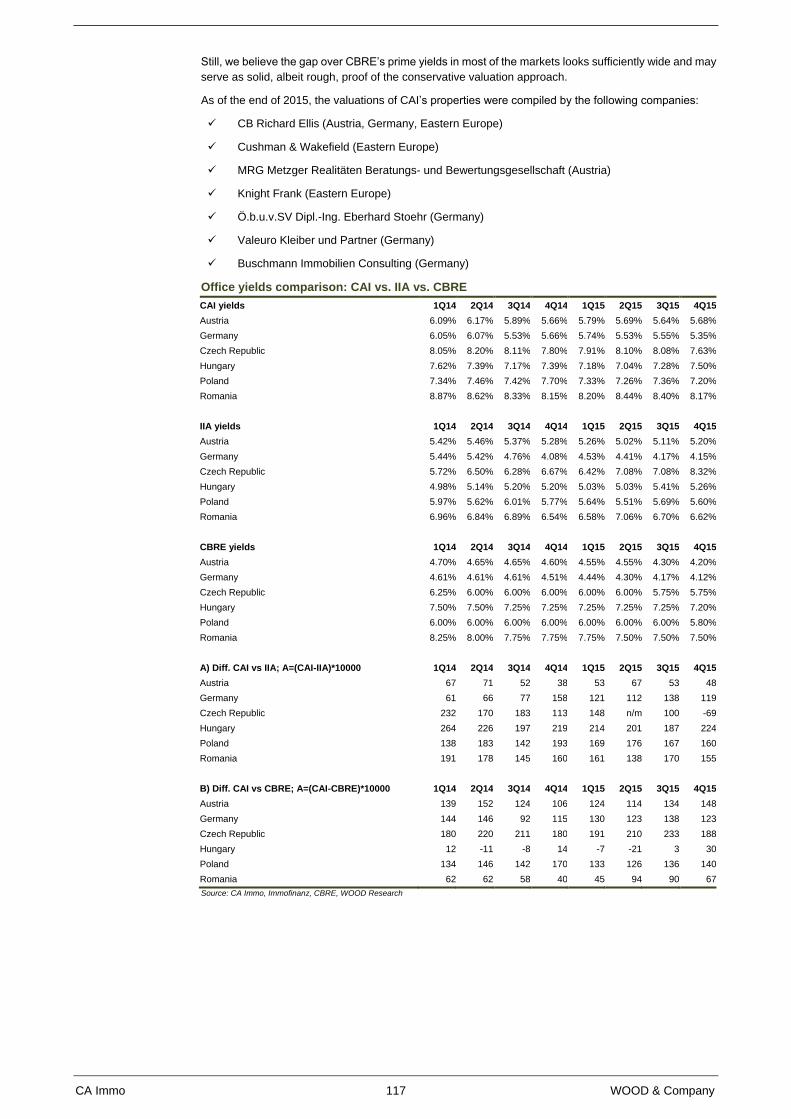
CA Immo 117 WOOD & Company
Still, we believe the gap over CBRE’s prime yields in most of the markets looks sufficiently wide and may
serve as solid, albeit rough, proof of the conservative valuation approach.
As of the end of 2015, the valuations of CAI’s properties were compiled by the following companies:
CB Richard Ellis (Austria, Germany, Eastern Europe)
Cushman & Wakefield (Eastern Europe)
MRG Metzger Realitäten Beratungs- und Bewertungsgesellschaft (Austria)
Knight Frank (Eastern Europe)
Ö.b.u.v.SV Dipl.-Ing. Eberhard Stoehr (Germany)
Valeuro Kleiber und Partner (Germany)
Buschmann Immobilien Consulting (Germany)
Office yields comparison: CAI vs. IIA vs. CBRE
CAI yields 1Q14 2Q14 3Q14 4Q14 1Q15 2Q15 3Q15 4Q15
Austria 6.09% 6.17% 5.89% 5.66% 5.79% 5.69% 5.64% 5.68%
Germany 6.05% 6.07% 5.53% 5.66% 5.74% 5.53% 5.55% 5.35%
Czech Republic 8.05% 8.20% 8.11% 7.80% 7.91% 8.10% 8.08% 7.63%
Hungary 7.62% 7.39% 7.17% 7.39% 7.18% 7.04% 7.28% 7.50%
Poland 7.34% 7.46% 7.42% 7.70% 7.33% 7.26% 7.36% 7.20%
Romania 8.87% 8.62% 8.33% 8.15% 8.20% 8.44% 8.40% 8.17%
IIA yields 1Q14 2Q14 3Q14 4Q14 1Q15 2Q15 3Q15 4Q15
Austria 5.42% 5.46% 5.37% 5.28% 5.26% 5.02% 5.11% 5.20%
Germany 5.44% 5.42% 4.76% 4.08% 4.53% 4.41% 4.17% 4.15%
Czech Republic 5.72% 6.50% 6.28% 6.67% 6.42% 7.08% 7.08% 8.32%
Hungary 4.98% 5.14% 5.20% 5.20% 5.03% 5.03% 5.41% 5.26%
Poland 5.97% 5.62% 6.01% 5.77% 5.64% 5.51% 5.69% 5.60%
Romania 6.96% 6.84% 6.89% 6.54% 6.58% 7.06% 6.70% 6.62%
CBRE yields 1Q14 2Q14 3Q14 4Q14 1Q15 2Q15 3Q15 4Q15
Austria 4.70% 4.65% 4.65% 4.60% 4.55% 4.55% 4.30% 4.20%
Germany 4.61% 4.61% 4.61% 4.51% 4.44% 4.30% 4.17% 4.12%
Czech Republic 6.25% 6.00% 6.00% 6.00% 6.00% 6.00% 5.75% 5.75%
Hungary 7.50% 7.50% 7.25% 7.25% 7.25% 7.25% 7.25% 7.20%
Poland 6.00% 6.00% 6.00% 6.00% 6.00% 6.00% 6.00% 5.80%
Romania 8.25% 8.00% 7.75% 7.75% 7.75% 7.50% 7.50% 7.50%
A) Diff. CAI vs IIA; A=(CAI-IIA)*10000 1Q14 2Q14 3Q14 4Q14 1Q15 2Q15 3Q15 4Q15
Austria 67 71 52 38 53 67 53 48
Germany 61 66 77 158 121 112 138 119
Czech Republic 232 170 183 113 148 n/m 100 -69
Hungary 264 226 197 219 214 201 187 224
Poland 138 183 142 193 169 176 167 160
Romania 191 178 145 160 161 138 170 155
B) Diff. CAI vs CBRE; A=(CAI-CBRE)*10000 1Q14 2Q14 3Q14 4Q14 1Q15 2Q15 3Q15 4Q15
Austria 139 152 124 106 124 114 134 148
Germany 144 146 92 115 130 123 138 123
Czech Republic 180 220 211 180 191 210 233 188
Hungary 12 -11 -8 14 -7 -21 3 30
Poland 134 146 142 170 133 126 136 140
Romania 62 62 58 40 45 94 90 67
Source: CA Immo, Immofinanz, CBRE, WOOD Research
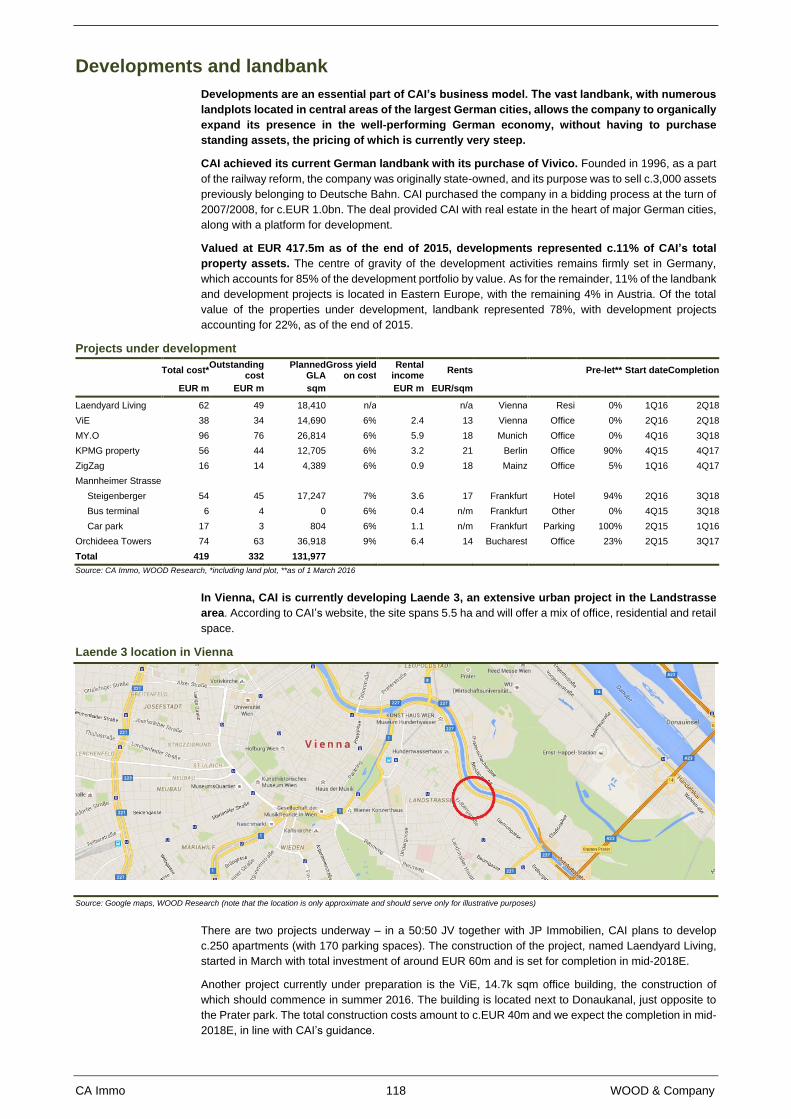
CA Immo 118 WOOD & Company
Developments and landbank
Developments are an essential part of CAI’s business model. The vast landbank, with numerous
landplots located in central areas of the largest German cities, allows the company to organically
expand its presence in the well-performing German economy, without having to purchase
standing assets, the pricing of which is currently very steep.
CAI achieved its current German landbank with its purchase of Vivico. Founded in 1996, as a part
of the railway reform, the company was originally state-owned, and its purpose was to sell c.3,000 assets
previously belonging to Deutsche Bahn. CAI purchased the company in a bidding process at the turn of
2007/2008, for c.EUR 1.0bn. The deal provided CAI with real estate in the heart of major German cities,
along with a platform for development.
Valued at EUR 417.5m as of the end of 2015, developments represented c.11% of CAI’s total
property assets. The centre of gravity of the development activities remains firmly set in Germany,
which accounts for 85% of the development portfolio by value. As for the remainder, 11% of the landbank
and development projects is located in Eastern Europe, with the remaining 4% in Austria. Of the total
value of the properties under development, landbank represented 78%, with development projects
accounting for 22%, as of the end of 2015.
Projects under development
Total cost* Outstanding
cost Planned
GLA Gross yield
on cost Rental
income Rents Pre-let** Start date Completion
EUR m EUR m sqm EUR m EUR/sqm
Laendyard Living 62 49 18,410 n/a n/a Vienna Resi 0% 1Q16 2Q18
ViE 38 34 14,690 6% 2.4 13 Vienna Office 0% 2Q16 2Q18
MY.O 96 76 26,814 6% 5.9 18 Munich Office 0% 4Q16 3Q18
KPMG property 56 44 12,705 6% 3.2 21 Berlin Office 90% 4Q15 4Q17
ZigZag 16 14 4,389 6% 0.9 18 Mainz Office 5% 1Q16 4Q17
Mannheimer Strasse
Steigenberger 54 45 17,247 7% 3.6 17 Frankfurt Hotel 94% 2Q16 3Q18
Bus terminal 6 4 0 6% 0.4 n/m Frankfurt Other 0% 4Q15 3Q18
Car park 17 3 804 6% 1.1 n/m Frankfurt Parking 100% 2Q15 1Q16
Orchideea Towers 74 63 36,918 9% 6.4 14 Bucharest Office 23% 2Q15 3Q17
Total 419 332 131,977
Source: CA Immo, WOOD Research, *including land plot, **as of 1 March 2016
In Vienna, CAI is currently developing Laende 3, an extensive urban project in the Landstrasse
area. According to CAI’s website, the site spans 5.5 ha and will offer a mix of office, residential and retail
space.
Laende 3 location in Vienna
Source: Google maps, WOOD Research (note that the location is only approximate and should serve only for illustrative purposes)
There are two projects underway – in a 50:50 JV together with JP Immobilien, CAI plans to develop
c.250 apartments (with 170 parking spaces). The construction of the project, named Laendyard Living,
started in March with total investment of around EUR 60m and is set for completion in mid-2018E.
Another project currently under preparation is the ViE, 14.7k sqm office building, the construction of
which should commence in summer 2016. The building is located next to Donaukanal, just opposite to
the Prater park. The total construction costs amount to c.EUR 40m and we expect the completion in mid-
2018E, in line with CAI’s guidance.
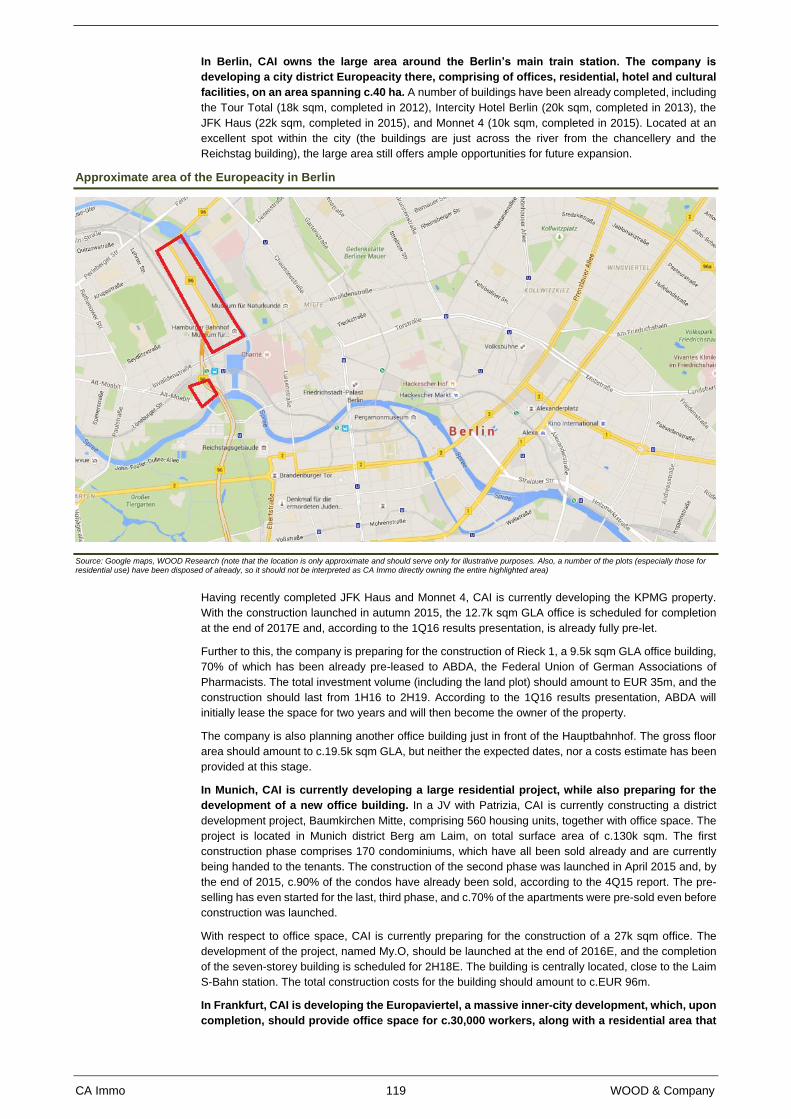
CA Immo 119 WOOD & Company
In Berlin, CAI owns the large area around the Berlin’s main train station. The company is
developing a city district Europeacity there, comprising of offices, residential, hotel and cultural
facilities, on an area spanning c.40 ha. A number of buildings have been already completed, including
the Tour Total (18k sqm, completed in 2012), Intercity Hotel Berlin (20k sqm, completed in 2013), the
JFK Haus (22k sqm, completed in 2015), and Monnet 4 (10k sqm, completed in 2015). Located at an
excellent spot within the city (the buildings are just across the river from the chancellery and the
Reichstag building), the large area still offers ample opportunities for future expansion.
Approximate area of the Europeacity in Berlin
Source: Google maps, WOOD Research (note that the location is only approximate and should serve only for illustrative purposes. Also, a number of the plots (especially those for residential use) have been disposed of already, so it should not be interpreted as CA Immo directly owning the entire highlighted area)
Having recently completed JFK Haus and Monnet 4, CAI is currently developing the KPMG property.
With the construction launched in autumn 2015, the 12.7k sqm GLA office is scheduled for completion
at the end of 2017E and, according to the 1Q16 results presentation, is already fully pre-let.
Further to this, the company is preparing for the construction of Rieck 1, a 9.5k sqm GLA office building,
70% of which has been already pre-leased to ABDA, the Federal Union of German Associations of
Pharmacists. The total investment volume (including the land plot) should amount to EUR 35m, and the
construction should last from 1H16 to 2H19. According to the 1Q16 results presentation, ABDA will
initially lease the space for two years and will then become the owner of the property.
The company is also planning another office building just in front of the Hauptbahnhof. The gross floor
area should amount to c.19.5k sqm GLA, but neither the expected dates, nor a costs estimate has been
provided at this stage.
In Munich, CAI is currently developing a large residential project, while also preparing for the
development of a new office building. In a JV with Patrizia, CAI is currently constructing a district
development project, Baumkirchen Mitte, comprising 560 housing units, together with office space. The
project is located in Munich district Berg am Laim, on total surface area of c.130k sqm. The first
construction phase comprises 170 condominiums, which have all been sold already and are currently
being handed to the tenants. The construction of the second phase was launched in April 2015 and, by
the end of 2015, c.90% of the condos have already been sold, according to the 4Q15 report. The pre-
selling has even started for the last, third phase, and c.70% of the apartments were pre-sold even before
construction was launched.
With respect to office space, CAI is currently preparing for the construction of a 27k sqm office. The
development of the project, named My.O, should be launched at the end of 2016E, and the completion
of the seven-storey building is scheduled for 2H18E. The building is centrally located, close to the Laim
S-Bahn station. The total construction costs for the building should amount to c.EUR 96m.
In Frankfurt, CAI is developing the Europaviertel, a massive inner-city development, which, upon
completion, should provide office space for c.30,000 workers, along with a residential area that
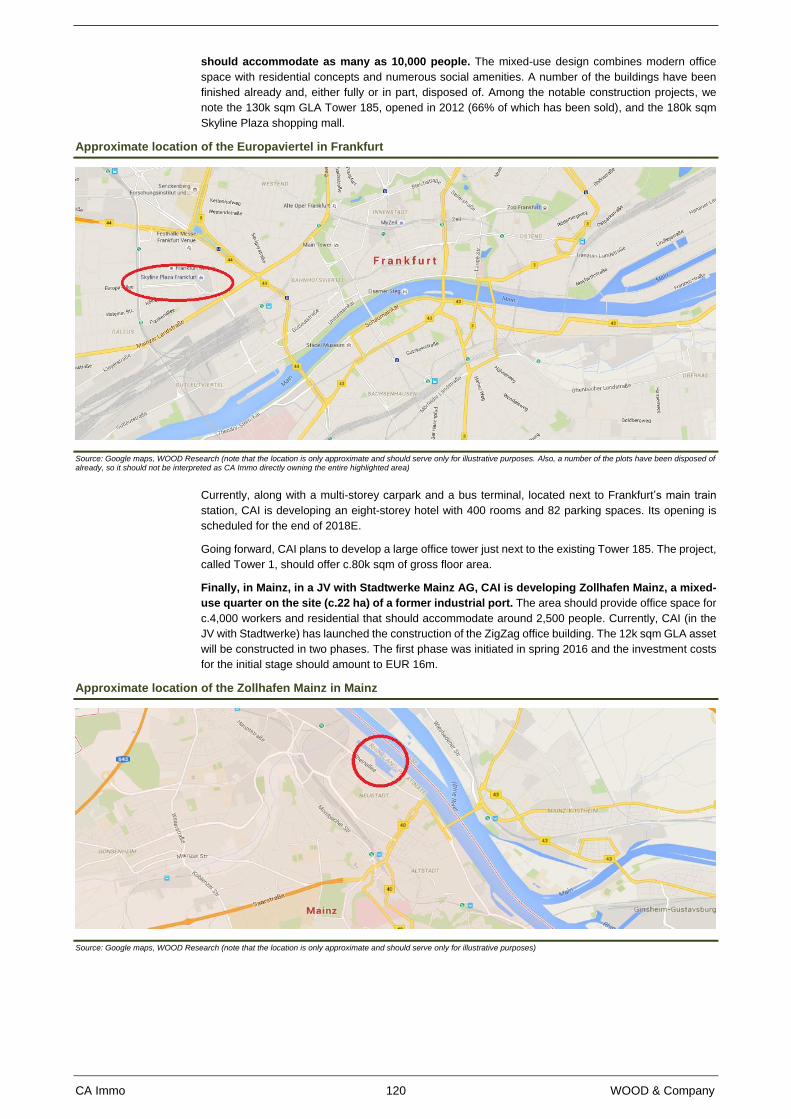
CA Immo 120 WOOD & Company
should accommodate as many as 10,000 people. The mixed-use design combines modern office
space with residential concepts and numerous social amenities. A number of the buildings have been
finished already and, either fully or in part, disposed of. Among the notable construction projects, we
note the 130k sqm GLA Tower 185, opened in 2012 (66% of which has been sold), and the 180k sqm
Skyline Plaza shopping mall.
Approximate location of the Europaviertel in Frankfurt
Source: Google maps, WOOD Research (note that the location is only approximate and should serve only for illustrative purposes. Also, a number of the plots have been disposed of already, so it should not be interpreted as CA Immo directly owning the entire highlighted area)
Currently, along with a multi-storey carpark and a bus terminal, located next to Frankfurt’s main train
station, CAI is developing an eight-storey hotel with 400 rooms and 82 parking spaces. Its opening is
scheduled for the end of 2018E.
Going forward, CAI plans to develop a large office tower just next to the existing Tower 185. The project,
called Tower 1, should offer c.80k sqm of gross floor area.
Finally, in Mainz, in a JV with Stadtwerke Mainz AG, CAI is developing Zollhafen Mainz, a mixed-
use quarter on the site (c.22 ha) of a former industrial port. The area should provide office space for
c.4,000 workers and residential that should accommodate around 2,500 people. Currently, CAI (in the
JV with Stadtwerke) has launched the construction of the ZigZag office building. The 12k sqm GLA asset
will be constructed in two phases. The first phase was initiated in spring 2016 and the investment costs
for the initial stage should amount to EUR 16m.
Approximate location of the Zollhafen Mainz in Mainz
Source: Google maps, WOOD Research (note that the location is only approximate and should serve only for illustrative purposes)
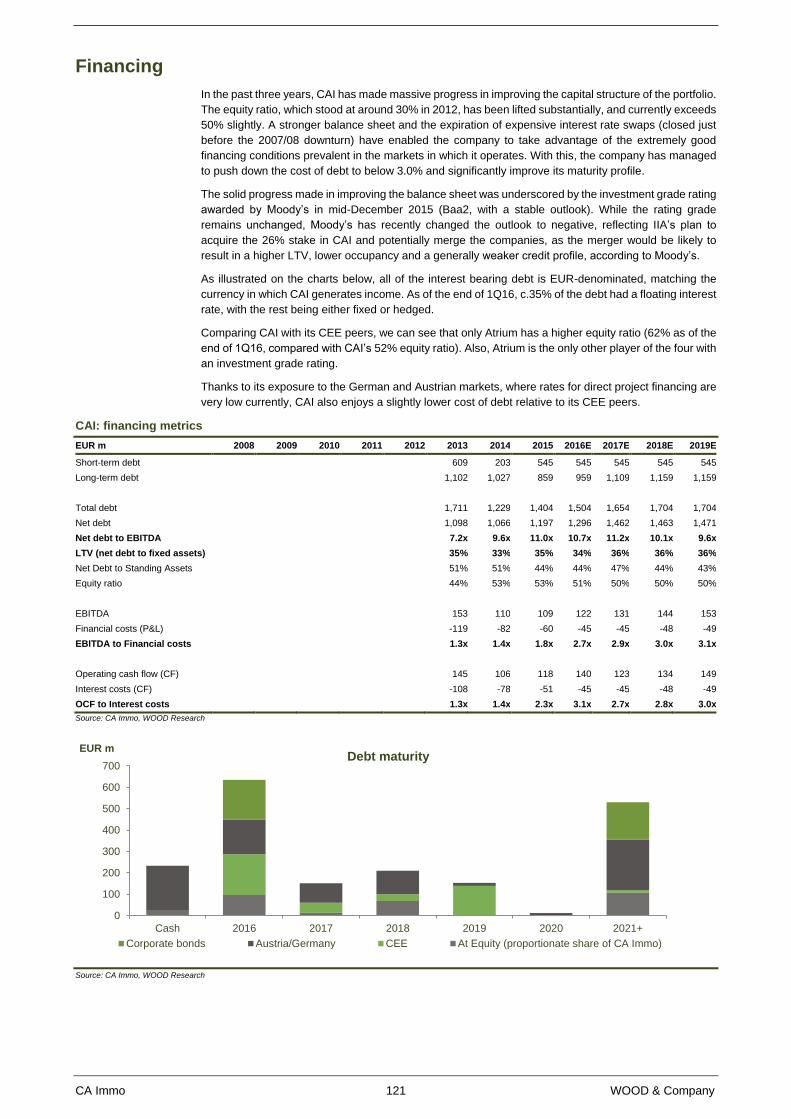
CA Immo 121 WOOD & Company
Financing
In the past three years, CAI has made massive progress in improving the capital structure of the portfolio.
The equity ratio, which stood at around 30% in 2012, has been lifted substantially, and currently exceeds
50% slightly. A stronger balance sheet and the expiration of expensive interest rate swaps (closed just
before the 2007/08 downturn) have enabled the company to take advantage of the extremely good
financing conditions prevalent in the markets in which it operates. With this, the company has managed
to push down the cost of debt to below 3.0% and significantly improve its maturity profile.
The solid progress made in improving the balance sheet was underscored by the investment grade rating
awarded by Moody’s in mid-December 2015 (Baa2, with a stable outlook). While the rating grade
remains unchanged, Moody’s has recently changed the outlook to negative, reflecting IIA’s plan to
acquire the 26% stake in CAI and potentially merge the companies, as the merger would be likely to
result in a higher LTV, lower occupancy and a generally weaker credit profile, according to Moody’s.
As illustrated on the charts below, all of the interest bearing debt is EUR-denominated, matching the
currency in which CAI generates income. As of the end of 1Q16, c.35% of the debt had a floating interest
rate, with the rest being either fixed or hedged.
Comparing CAI with its CEE peers, we can see that only Atrium has a higher equity ratio (62% as of the
end of 1Q16, compared with CAI’s 52% equity ratio). Also, Atrium is the only other player of the four with
an investment grade rating.
Thanks to its exposure to the German and Austrian markets, where rates for direct project financing are
very low currently, CAI also enjoys a slightly lower cost of debt relative to its CEE peers.
CAI: financing metrics
EUR m 2008 2009 2010 2011 2012 2013 2014 2015 2016E 2017E 2018E 2019E
Short-term debt 609 203 545 545 545 545 545
Long-term debt 1,102 1,027 859 959 1,109 1,159 1,159
Total debt 1,711 1,229 1,404 1,504 1,654 1,704 1,704
Net debt 1,098 1,066 1,197 1,296 1,462 1,463 1,471
Net debt to EBITDA 7.2x 9.6x 11.0x 10.7x 11.2x 10.1x 9.6x
LTV (net debt to fixed assets) 35% 33% 35% 34% 36% 36% 36%
Net Debt to Standing Assets 51% 51% 44% 44% 47% 44% 43%
Equity ratio 44% 53% 53% 51% 50% 50% 50%
EBITDA 153 110 109 122 131 144 153
Financial costs (P&L) -119 -82 -60 -45 -45 -48 -49
EBITDA to Financial costs 1.3x 1.4x 1.8x 2.7x 2.9x 3.0x 3.1x
Operating cash flow (CF) 145 106 118 140 123 134 149
Interest costs (CF) -108 -78 -51 -45 -45 -48 -49
OCF to Interest costs 1.3x 1.4x 2.3x 3.1x 2.7x 2.8x 3.0x
Source: CA Immo, WOOD Research
Source: CA Immo, WOOD Research
0
100
200
300
400
500
600
700
Cash 2016 2017 2018 2019 2020 2021+
EUR mDebt maturity
Corporate bonds Austria/Germany CEE At Equity (proportionate share of CA Immo)
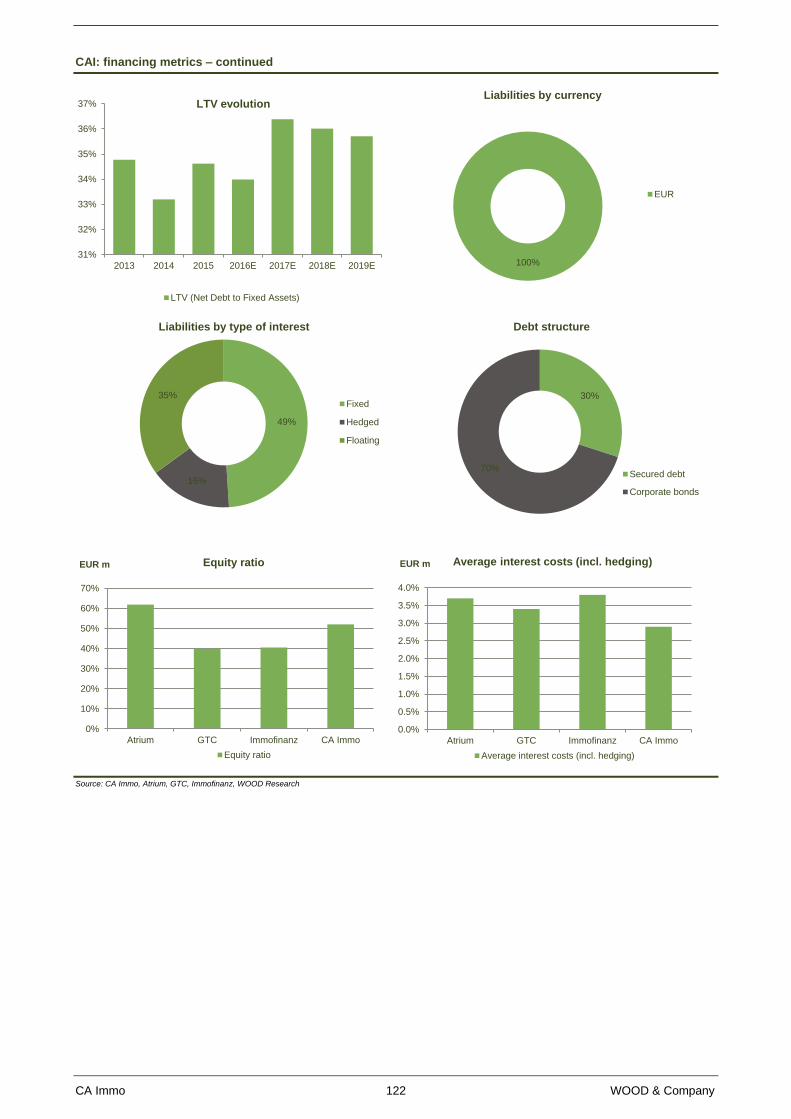
CA Immo 122 WOOD & Company
CAI: financing metrics – continued
Source: CA Immo, Atrium, GTC, Immofinanz, WOOD Research
31%
32%
33%
34%
35%
36%
37%
2013 2014 2015 2016E 2017E 2018E 2019E
LTV evolution
LTV (Net Debt to Fixed Assets)
100%
Liabilities by currency
EUR
49%
16%
35%
Liabilities by type of interest
Fixed
Hedged
Floating
30%
70%
Debt structure
Secured debt
Corporate bonds
0%
10%
20%
30%
40%
50%
60%
70%
Atrium GTC Immofinanz CA Immo
EUR m Equity ratio
Equity ratio
0.0%
0.5%
1.0%
1.5%
2.0%
2.5%
3.0%
3.5%
4.0%
Atrium GTC Immofinanz CA Immo
EUR m Average interest costs (incl. hedging)
Average interest costs (incl. hedging)
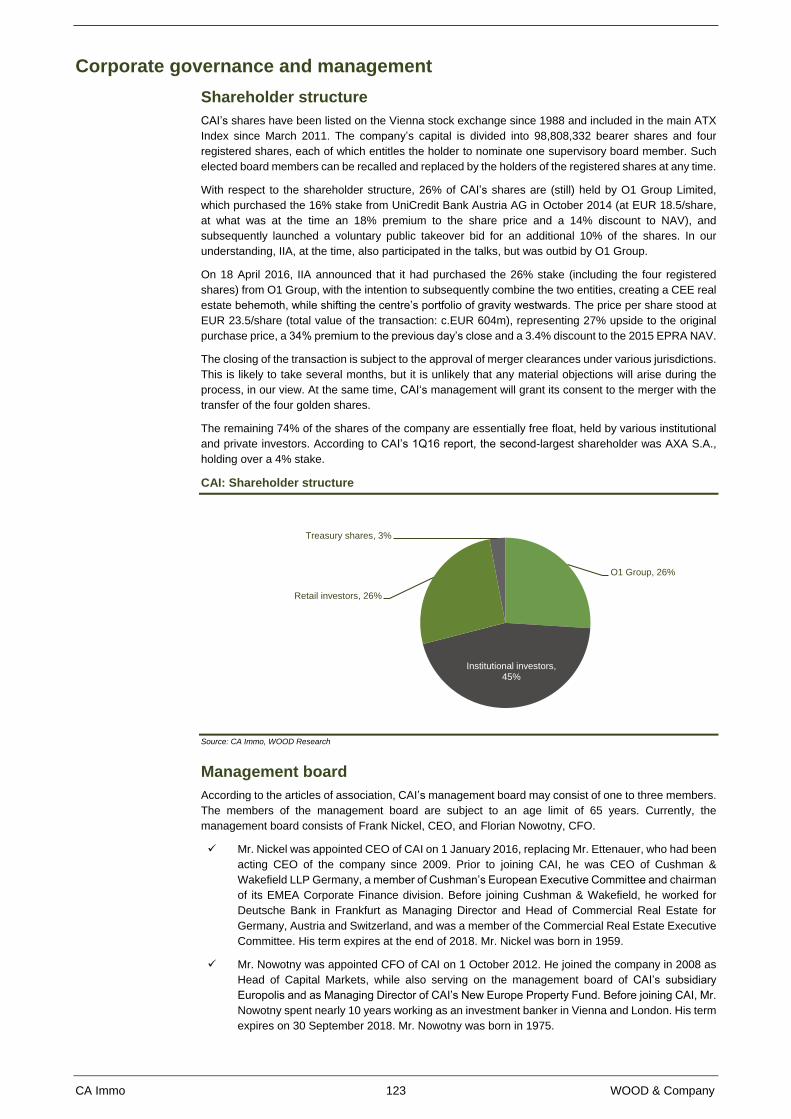
CA Immo 123 WOOD & Company
Corporate governance and management
Shareholder structure
CAI’s shares have been listed on the Vienna stock exchange since 1988 and included in the main ATX
Index since March 2011. The company’s capital is divided into 98,808,332 bearer shares and four
registered shares, each of which entitles the holder to nominate one supervisory board member. Such
elected board members can be recalled and replaced by the holders of the registered shares at any time.
With respect to the shareholder structure, 26% of CAI’s shares are (still) held by O1 Group Limited,
which purchased the 16% stake from UniCredit Bank Austria AG in October 2014 (at EUR 18.5/share,
at what was at the time an 18% premium to the share price and a 14% discount to NAV), and
subsequently launched a voluntary public takeover bid for an additional 10% of the shares. In our
understanding, IIA, at the time, also participated in the talks, but was outbid by O1 Group.
On 18 April 2016, IIA announced that it had purchased the 26% stake (including the four registered
shares) from O1 Group, with the intention to subsequently combine the two entities, creating a CEE real
estate behemoth, while shifting the centre’s portfolio of gravity westwards. The price per share stood at
EUR 23.5/share (total value of the transaction: c.EUR 604m), representing 27% upside to the original
purchase price, a 34% premium to the previous day’s close and a 3.4% discount to the 2015 EPRA NAV.
The closing of the transaction is subject to the approval of merger clearances under various jurisdictions.
This is likely to take several months, but it is unlikely that any material objections will arise during the
process, in our view. At the same time, CAI‘s management will grant its consent to the merger with the
transfer of the four golden shares.
The remaining 74% of the shares of the company are essentially free float, held by various institutional
and private investors. According to CAI’s 1Q16 report, the second-largest shareholder was AXA S.A.,
holding over a 4% stake.
CAI: Shareholder structure
Source: CA Immo, WOOD Research
Management board
According to the articles of association, CAI’s management board may consist of one to three members.
The members of the management board are subject to an age limit of 65 years. Currently, the
management board consists of Frank Nickel, CEO, and Florian Nowotny, CFO.
Mr. Nickel was appointed CEO of CAI on 1 January 2016, replacing Mr. Ettenauer, who had been
acting CEO of the company since 2009. Prior to joining CAI, he was CEO of Cushman &
Wakefield LLP Germany, a member of Cushman’s European Executive Committee and chairman
of its EMEA Corporate Finance division. Before joining Cushman & Wakefield, he worked for
Deutsche Bank in Frankfurt as Managing Director and Head of Commercial Real Estate for
Germany, Austria and Switzerland, and was a member of the Commercial Real Estate Executive
Committee. His term expires at the end of 2018. Mr. Nickel was born in 1959.
Mr. Nowotny was appointed CFO of CAI on 1 October 2012. He joined the company in 2008 as
Head of Capital Markets, while also serving on the management board of CAI’s subsidiary
Europolis and as Managing Director of CAI’s New Europe Property Fund. Before joining CAI, Mr.
Nowotny spent nearly 10 years working as an investment banker in Vienna and London. His term
expires on 30 September 2018. Mr. Nowotny was born in 1975.
O1 Group, 26%
Institutional investors, 45%
Retail investors, 26%
Treasury shares, 3%
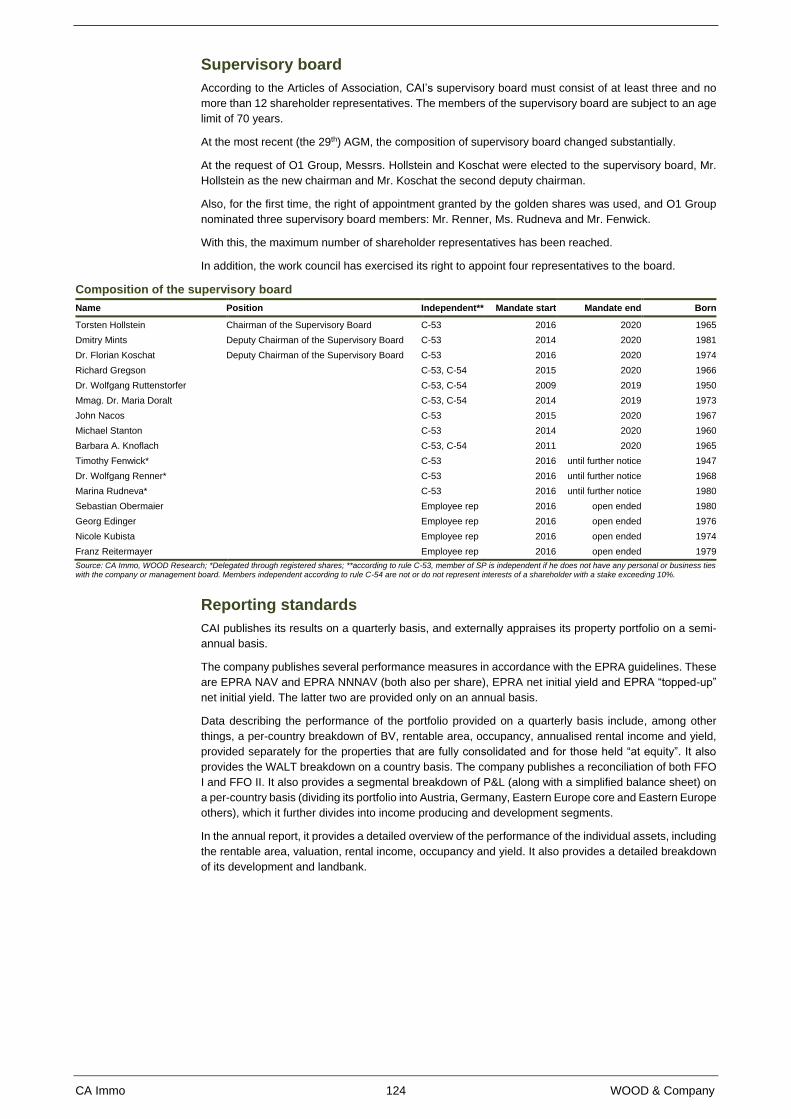
CA Immo 124 WOOD & Company
Supervisory board
According to the Articles of Association, CAI’s supervisory board must consist of at least three and no
more than 12 shareholder representatives. The members of the supervisory board are subject to an age
limit of 70 years.
At the most recent (the 29th) AGM, the composition of supervisory board changed substantially.
At the request of O1 Group, Messrs. Hollstein and Koschat were elected to the supervisory board, Mr.
Hollstein as the new chairman and Mr. Koschat the second deputy chairman.
Also, for the first time, the right of appointment granted by the golden shares was used, and O1 Group
nominated three supervisory board members: Mr. Renner, Ms. Rudneva and Mr. Fenwick.
With this, the maximum number of shareholder representatives has been reached.
In addition, the work council has exercised its right to appoint four representatives to the board.
Composition of the supervisory board
Name Position Independent** Mandate start Mandate end Born
Torsten Hollstein Chairman of the Supervisory Board C-53 2016 2020 1965
Dmitry Mints Deputy Chairman of the Supervisory Board C-53 2014 2020 1981
Dr. Florian Koschat Deputy Chairman of the Supervisory Board C-53 2016 2020 1974
Richard Gregson C-53, C-54 2015 2020 1966
Dr. Wolfgang Ruttenstorfer C-53, C-54 2009 2019 1950
Mmag. Dr. Maria Doralt C-53, C-54 2014 2019 1973
John Nacos C-53 2015 2020 1967
Michael Stanton C-53 2014 2020 1960
Barbara A. Knoflach C-53, C-54 2011 2020 1965
Timothy Fenwick* C-53 2016 until further notice 1947
Dr. Wolfgang Renner* C-53 2016 until further notice 1968
Marina Rudneva* C-53 2016 until further notice 1980
Sebastian Obermaier Employee rep 2016 open ended 1980
Georg Edinger Employee rep 2016 open ended 1976
Nicole Kubista Employee rep 2016 open ended 1974
Franz Reitermayer Employee rep 2016 open ended 1979
Source: CA Immo, WOOD Research; *Delegated through registered shares; **according to rule C-53, member of SP is independent if he does not have any personal or business ties with the company or management board. Members independent according to rule C-54 are not or do not represent interests of a shareholder with a stake exceeding 10%.
Reporting standards
CAI publishes its results on a quarterly basis, and externally appraises its property portfolio on a semi-
annual basis.
The company publishes several performance measures in accordance with the EPRA guidelines. These
are EPRA NAV and EPRA NNNAV (both also per share), EPRA net initial yield and EPRA “topped-up”
net initial yield. The latter two are provided only on an annual basis.
Data describing the performance of the portfolio provided on a quarterly basis include, among other
things, a per-country breakdown of BV, rentable area, occupancy, annualised rental income and yield,
provided separately for the properties that are fully consolidated and for those held “at equity”. It also
provides the WALT breakdown on a country basis. The company publishes a reconciliation of both FFO
I and FFO II. It also provides a segmental breakdown of P&L (along with a simplified balance sheet) on
a per-country basis (dividing its portfolio into Austria, Germany, Eastern Europe core and Eastern Europe
others), which it further divides into income producing and development segments.
In the annual report, it provides a detailed overview of the performance of the individual assets, including
the rentable area, valuation, rental income, occupancy and yield. It also provides a detailed breakdown
of its development and landbank.
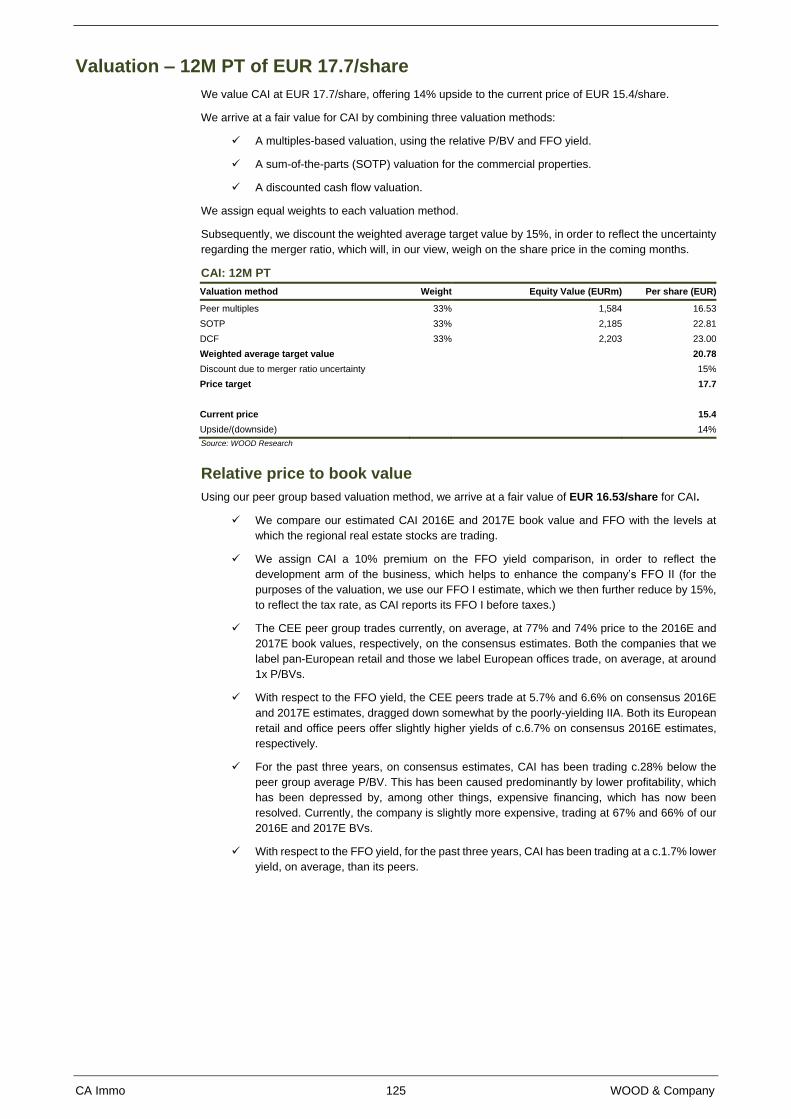
CA Immo 125 WOOD & Company
Valuation – 12M PT of EUR 17.7/share
We value CAI at EUR 17.7/share, offering 14% upside to the current price of EUR 15.4/share.
We arrive at a fair value for CAI by combining three valuation methods:
A multiples-based valuation, using the relative P/BV and FFO yield.
A sum-of-the-parts (SOTP) valuation for the commercial properties.
A discounted cash flow valuation.
We assign equal weights to each valuation method.
Subsequently, we discount the weighted average target value by 15%, in order to reflect the uncertainty
regarding the merger ratio, which will, in our view, weigh on the share price in the coming months.
CAI: 12M PT
Valuation method Weight Equity Value (EURm) Per share (EUR)
Peer multiples 33% 1,584 16.53
SOTP 33% 2,185 22.81
DCF 33% 2,203 23.00
Weighted average target value 20.78
Discount due to merger ratio uncertainty 15%
Price target 17.7
Current price 15.4
Upside/(downside) 14%
Source: WOOD Research
Relative price to book value
Using our peer group based valuation method, we arrive at a fair value of EUR 16.53/share for CAI.
We compare our estimated CAI 2016E and 2017E book value and FFO with the levels at
which the regional real estate stocks are trading.
We assign CAI a 10% premium on the FFO yield comparison, in order to reflect the
development arm of the business, which helps to enhance the company’s FFO II (for the
purposes of the valuation, we use our FFO I estimate, which we then further reduce by 15%,
to reflect the tax rate, as CAI reports its FFO I before taxes.)
The CEE peer group trades currently, on average, at 77% and 74% price to the 2016E and
2017E book values, respectively, on the consensus estimates. Both the companies that we
label pan-European retail and those we label European offices trade, on average, at around
1x P/BVs.
With respect to the FFO yield, the CEE peers trade at 5.7% and 6.6% on consensus 2016E
and 2017E estimates, dragged down somewhat by the poorly-yielding IIA. Both its European
retail and office peers offer slightly higher yields of c.6.7% on consensus 2016E estimates,
respectively.
For the past three years, on consensus estimates, CAI has been trading c.28% below the
peer group average P/BV. This has been caused predominantly by lower profitability, which
has been depressed by, among other things, expensive financing, which has now been
resolved. Currently, the company is slightly more expensive, trading at 67% and 66% of our
2016E and 2017E BVs.
With respect to the FFO yield, for the past three years, CAI has been trading at a c.1.7% lower
yield, on average, than its peers.
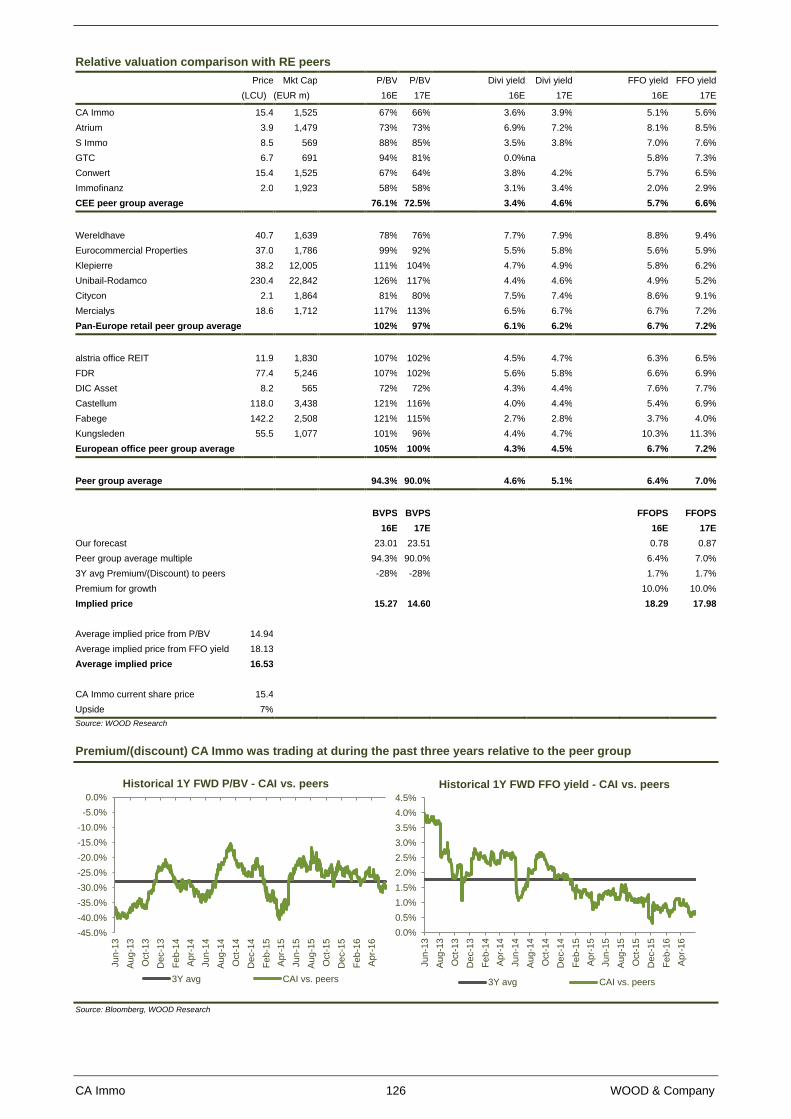
CA Immo 126 WOOD & Company
Relative valuation comparison with RE peers
Price Mkt Cap P/BV P/BV Divi yield Divi yield FFO yield FFO yield
(LCU) (EUR m) 16E 17E 16E 17E 16E 17E
CA Immo 15.4 1,525 67% 66% 3.6% 3.9% 5.1% 5.6%
Atrium 3.9 1,479 73% 73% 6.9% 7.2% 8.1% 8.5%
S Immo 8.5 569 88% 85% 3.5% 3.8% 7.0% 7.6%
GTC 6.7 691 94% 81% 0.0% na 5.8% 7.3%
Conwert 15.4 1,525 67% 64% 3.8% 4.2% 5.7% 6.5%
Immofinanz 2.0 1,923 58% 58% 3.1% 3.4% 2.0% 2.9%
CEE peer group average 76.1% 72.5% 3.4% 4.6% 5.7% 6.6%
Wereldhave 40.7 1,639 78% 76% 7.7% 7.9% 8.8% 9.4%
Eurocommercial Properties 37.0 1,786 99% 92% 5.5% 5.8% 5.6% 5.9%
Klepierre 38.2 12,005 111% 104% 4.7% 4.9% 5.8% 6.2%
Unibail-Rodamco 230.4 22,842 126% 117% 4.4% 4.6% 4.9% 5.2%
Citycon 2.1 1,864 81% 80% 7.5% 7.4% 8.6% 9.1%
Mercialys 18.6 1,712 117% 113% 6.5% 6.7% 6.7% 7.2%
Pan-Europe retail peer group average 102% 97% 6.1% 6.2% 6.7% 7.2%
alstria office REIT 11.9 1,830 107% 102% 4.5% 4.7% 6.3% 6.5%
FDR 77.4 5,246 107% 102% 5.6% 5.8% 6.6% 6.9%
DIC Asset 8.2 565 72% 72% 4.3% 4.4% 7.6% 7.7%
Castellum 118.0 3,438 121% 116% 4.0% 4.4% 5.4% 6.9%
Fabege 142.2 2,508 121% 115% 2.7% 2.8% 3.7% 4.0%
Kungsleden 55.5 1,077 101% 96% 4.4% 4.7% 10.3% 11.3%
European office peer group average 105% 100% 4.3% 4.5% 6.7% 7.2%
Peer group average 94.3% 90.0% 4.6% 5.1% 6.4% 7.0%
BVPS BVPS FFOPS FFOPS
16E 17E 16E 17E
Our forecast 23.01 23.51 0.78 0.87
Peer group average multiple 94.3% 90.0% 6.4% 7.0%
3Y avg Premium/(Discount) to peers -28% -28% 1.7% 1.7%
Premium for growth 10.0% 10.0%
Implied price 15.27 14.60 18.29 17.98
Average implied price from P/BV 14.94
Average implied price from FFO yield 18.13
Average implied price 16.53
CA Immo current share price 15.4
Upside 7%
Source: WOOD Research
Premium/(discount) CA Immo was trading at during the past three years relative to the peer group
Source: Bloomberg, WOOD Research
-45.0%
-40.0%
-35.0%
-30.0%
-25.0%
-20.0%
-15.0%
-10.0%
-5.0%
0.0%
Ju
n-1
3
Au
g-1
3
Oct-
13
De
c-1
3
Fe
b-1
4
Ap
r-1
4
Ju
n-1
4
Au
g-1
4
Oct-
14
De
c-1
4
Fe
b-1
5
Ap
r-1
5
Ju
n-1
5
Au
g-1
5
Oct-
15
De
c-1
5
Fe
b-1
6
Ap
r-1
6
Historical 1Y FWD P/BV - CAI vs. peers
3Y avg CAI vs. peers
0.0%
0.5%
1.0%
1.5%
2.0%
2.5%
3.0%
3.5%
4.0%
4.5%
Ju
n-1
3
Au
g-1
3
Oct-
13
De
c-1
3
Fe
b-1
4
Ap
r-1
4
Ju
n-1
4
Au
g-1
4
Oct-
14
De
c-1
4
Fe
b-1
5
Ap
r-1
5
Ju
n-1
5
Au
g-1
5
Oct-
15
De
c-1
5
Fe
b-1
6
Ap
r-1
6
Historical 1Y FWD FFO yield - CAI vs. peers
3Y avg CAI vs. peers
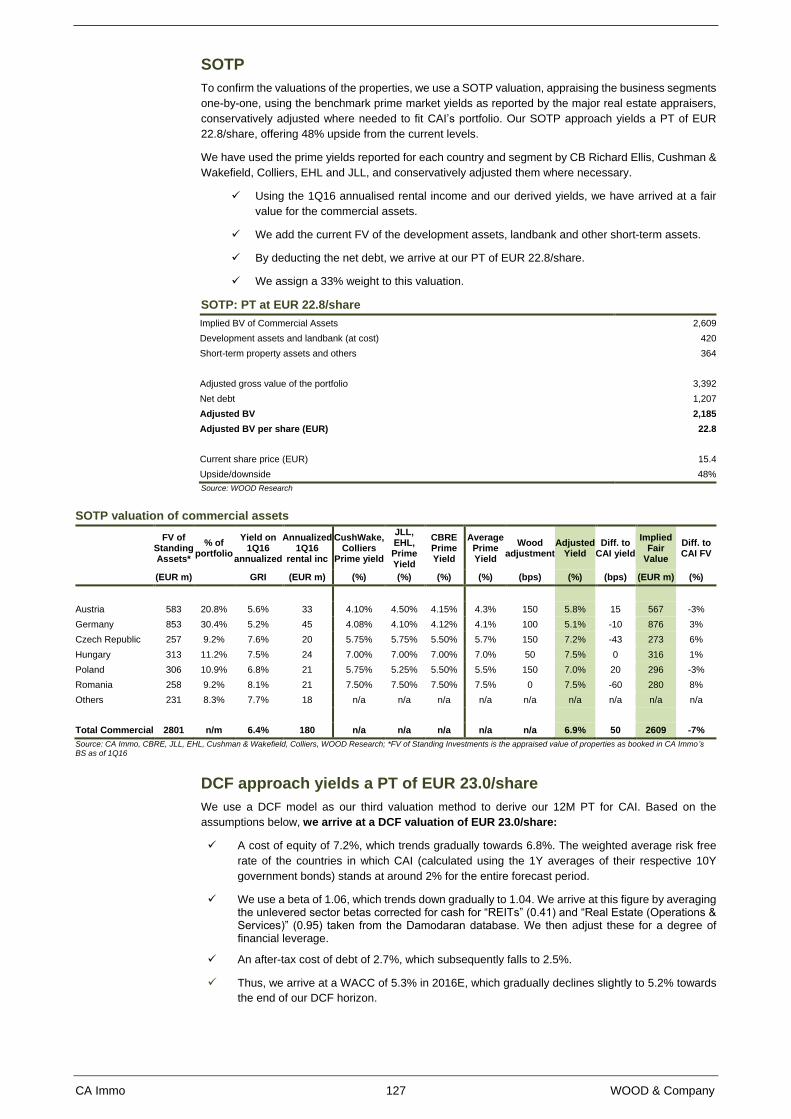
CA Immo 127 WOOD & Company
SOTP
To confirm the valuations of the properties, we use a SOTP valuation, appraising the business segments
one-by-one, using the benchmark prime market yields as reported by the major real estate appraisers,
conservatively adjusted where needed to fit CAI’s portfolio. Our SOTP approach yields a PT of EUR
22.8/share, offering 48% upside from the current levels.
We have used the prime yields reported for each country and segment by CB Richard Ellis, Cushman &
Wakefield, Colliers, EHL and JLL, and conservatively adjusted them where necessary.
Using the 1Q16 annualised rental income and our derived yields, we have arrived at a fair
value for the commercial assets.
We add the current FV of the development assets, landbank and other short-term assets.
By deducting the net debt, we arrive at our PT of EUR 22.8/share.
We assign a 33% weight to this valuation.
SOTP: PT at EUR 22.8/share
Implied BV of Commercial Assets 2,609
Development assets and landbank (at cost) 420
Short-term property assets and others 364
Adjusted gross value of the portfolio 3,392
Net debt 1,207
Adjusted BV 2,185
Adjusted BV per share (EUR) 22.8
Current share price (EUR) 15.4
Upside/downside 48%
Source: WOOD Research
SOTP valuation of commercial assets
FV of
Standing Assets*
% of portfolio
Yield on 1Q16
annualized
Annualized 1Q16
rental inc
CushWake, Colliers
Prime yield
JLL, EHL, Prime Yield
CBRE Prime Yield
Average Prime Yield
Wood adjustment
Adjusted Yield
Diff. to CAI yield
Implied Fair
Value
Diff. to CAI FV
(EUR m) GRI (EUR m) (%) (%) (%) (%) (bps) (%) (bps) (EUR m) (%)
Austria 583 20.8% 5.6% 33 4.10% 4.50% 4.15% 4.3% 150 5.8% 15 567 -3%
Germany 853 30.4% 5.2% 45 4.08% 4.10% 4.12% 4.1% 100 5.1% -10 876 3%
Czech Republic 257 9.2% 7.6% 20 5.75% 5.75% 5.50% 5.7% 150 7.2% -43 273 6%
Hungary 313 11.2% 7.5% 24 7.00% 7.00% 7.00% 7.0% 50 7.5% 0 316 1%
Poland 306 10.9% 6.8% 21 5.75% 5.25% 5.50% 5.5% 150 7.0% 20 296 -3%
Romania 258 9.2% 8.1% 21 7.50% 7.50% 7.50% 7.5% 0 7.5% -60 280 8%
Others 231 8.3% 7.7% 18 n/a n/a n/a n/a n/a n/a n/a n/a n/a
Total Commercial 2801 n/m 6.4% 180 n/a n/a n/a n/a n/a 6.9% 50 2609 -7%
Source: CA Immo, CBRE, JLL, EHL, Cushman & Wakefield, Colliers, WOOD Research; *FV of Standing Investments is the appraised value of properties as booked in CA Immo’s BS as of 1Q16
DCF approach yields a PT of EUR 23.0/share
We use a DCF model as our third valuation method to derive our 12M PT for CAI. Based on the
assumptions below, we arrive at a DCF valuation of EUR 23.0/share:
A cost of equity of 7.2%, which trends gradually towards 6.8%. The weighted average risk free
rate of the countries in which CAI (calculated using the 1Y averages of their respective 10Y
government bonds) stands at around 2% for the entire forecast period.
We use a beta of 1.06, which trends down gradually to 1.04. We arrive at this figure by averaging the unlevered sector betas corrected for cash for “REITs” (0.41) and “Real Estate (Operations & Services)” (0.95) taken from the Damodaran database. We then adjust these for a degree of financial leverage.
An after-tax cost of debt of 2.7%, which subsequently falls to 2.5%.
Thus, we arrive at a WACC of 5.3% in 2016E, which gradually declines slightly to 5.2% towards
the end of our DCF horizon.
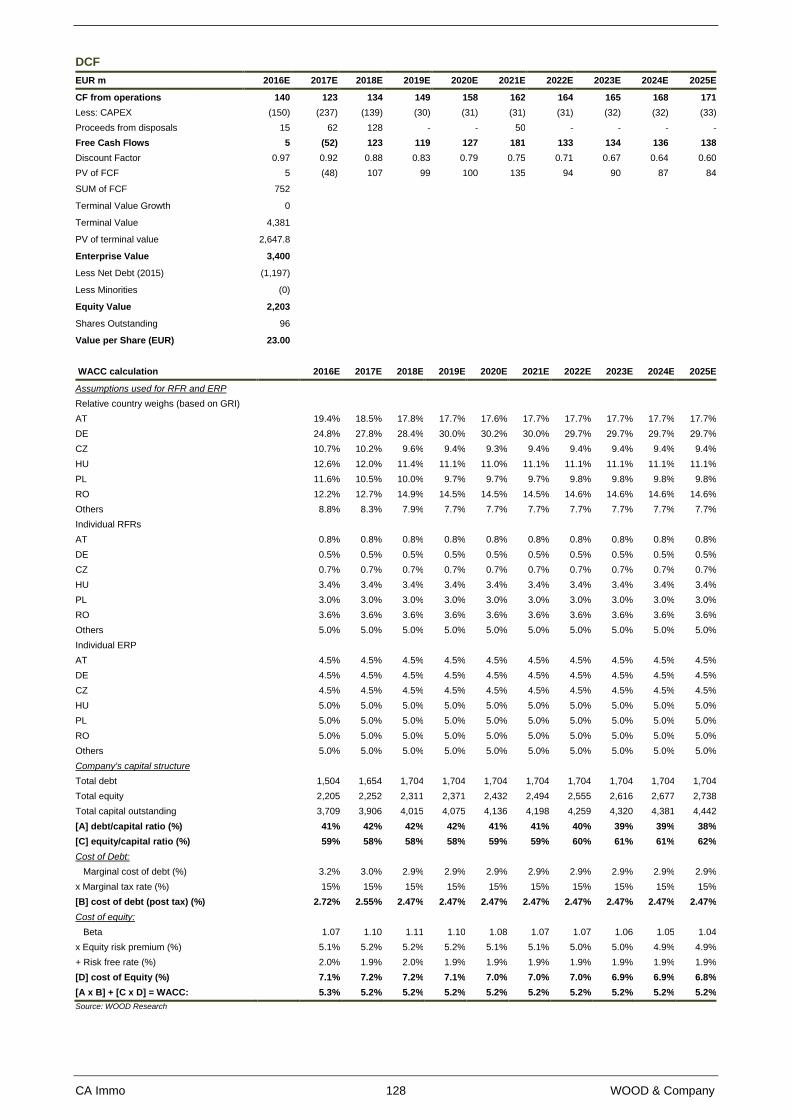
CA Immo 128 WOOD & Company
DCF
EUR m 2016E 2017E 2018E 2019E 2020E 2021E 2022E 2023E 2024E 2025E
CF from operations 140 123 134 149 158 162 164 165 168 171
Less: CAPEX (150) (237) (139) (30) (31) (31) (31) (32) (32) (33)
Proceeds from disposals 15 62 128 - - 50 - - - -
Free Cash Flows 5 (52) 123 119 127 181 133 134 136 138
Discount Factor 0.97 0.92 0.88 0.83 0.79 0.75 0.71 0.67 0.64 0.60
PV of FCF 5 (48) 107 99 100 135 94 90 87 84
SUM of FCF 752 Terminal Value Growth 0 Terminal Value 4,381 PV of terminal value 2,647.8 Enterprise Value 3,400 Less Net Debt (2015) (1,197) Less Minorities (0) Equity Value 2,203 Shares Outstanding 96 Value per Share (EUR) 23.00
WACC calculation 2016E 2017E 2018E 2019E 2020E 2021E 2022E 2023E 2024E 2025E
Assumptions used for RFR and ERP
Relative country weighs (based on GRI)
AT 19.4% 18.5% 17.8% 17.7% 17.6% 17.7% 17.7% 17.7% 17.7% 17.7%
DE 24.8% 27.8% 28.4% 30.0% 30.2% 30.0% 29.7% 29.7% 29.7% 29.7%
CZ 10.7% 10.2% 9.6% 9.4% 9.3% 9.4% 9.4% 9.4% 9.4% 9.4%
HU 12.6% 12.0% 11.4% 11.1% 11.0% 11.1% 11.1% 11.1% 11.1% 11.1%
PL 11.6% 10.5% 10.0% 9.7% 9.7% 9.7% 9.8% 9.8% 9.8% 9.8%
RO 12.2% 12.7% 14.9% 14.5% 14.5% 14.5% 14.6% 14.6% 14.6% 14.6%
Others 8.8% 8.3% 7.9% 7.7% 7.7% 7.7% 7.7% 7.7% 7.7% 7.7%
Individual RFRs
AT 0.8% 0.8% 0.8% 0.8% 0.8% 0.8% 0.8% 0.8% 0.8% 0.8%
DE 0.5% 0.5% 0.5% 0.5% 0.5% 0.5% 0.5% 0.5% 0.5% 0.5%
CZ 0.7% 0.7% 0.7% 0.7% 0.7% 0.7% 0.7% 0.7% 0.7% 0.7%
HU 3.4% 3.4% 3.4% 3.4% 3.4% 3.4% 3.4% 3.4% 3.4% 3.4%
PL 3.0% 3.0% 3.0% 3.0% 3.0% 3.0% 3.0% 3.0% 3.0% 3.0%
RO 3.6% 3.6% 3.6% 3.6% 3.6% 3.6% 3.6% 3.6% 3.6% 3.6%
Others 5.0% 5.0% 5.0% 5.0% 5.0% 5.0% 5.0% 5.0% 5.0% 5.0%
Individual ERP
AT 4.5% 4.5% 4.5% 4.5% 4.5% 4.5% 4.5% 4.5% 4.5% 4.5%
DE 4.5% 4.5% 4.5% 4.5% 4.5% 4.5% 4.5% 4.5% 4.5% 4.5%
CZ 4.5% 4.5% 4.5% 4.5% 4.5% 4.5% 4.5% 4.5% 4.5% 4.5%
HU 5.0% 5.0% 5.0% 5.0% 5.0% 5.0% 5.0% 5.0% 5.0% 5.0%
PL 5.0% 5.0% 5.0% 5.0% 5.0% 5.0% 5.0% 5.0% 5.0% 5.0%
RO 5.0% 5.0% 5.0% 5.0% 5.0% 5.0% 5.0% 5.0% 5.0% 5.0%
Others 5.0% 5.0% 5.0% 5.0% 5.0% 5.0% 5.0% 5.0% 5.0% 5.0%
Company's capital structure
Total debt 1,504 1,654 1,704 1,704 1,704 1,704 1,704 1,704 1,704 1,704
Total equity 2,205 2,252 2,311 2,371 2,432 2,494 2,555 2,616 2,677 2,738
Total capital outstanding 3,709 3,906 4,015 4,075 4,136 4,198 4,259 4,320 4,381 4,442
[A] debt/capital ratio (%) 41% 42% 42% 42% 41% 41% 40% 39% 39% 38%
[C] equity/capital ratio (%) 59% 58% 58% 58% 59% 59% 60% 61% 61% 62%
Cost of Debt:
Marginal cost of debt (%) 3.2% 3.0% 2.9% 2.9% 2.9% 2.9% 2.9% 2.9% 2.9% 2.9%
x Marginal tax rate (%) 15% 15% 15% 15% 15% 15% 15% 15% 15% 15%
[B] cost of debt (post tax) (%) 2.72% 2.55% 2.47% 2.47% 2.47% 2.47% 2.47% 2.47% 2.47% 2.47%
Cost of equity:
Beta 1.07 1.10 1.11 1.10 1.08 1.07 1.07 1.06 1.05 1.04
x Equity risk premium (%) 5.1% 5.2% 5.2% 5.2% 5.1% 5.1% 5.0% 5.0% 4.9% 4.9%
+ Risk free rate (%) 2.0% 1.9% 2.0% 1.9% 1.9% 1.9% 1.9% 1.9% 1.9% 1.9%
[D] cost of Equity (%) 7.1% 7.2% 7.2% 7.1% 7.0% 7.0% 7.0% 6.9% 6.9% 6.8%
[A x B] + [C x D] = WACC: 5.3% 5.2% 5.2% 5.2% 5.2% 5.2% 5.2% 5.2% 5.2% 5.2%
Source: WOOD Research
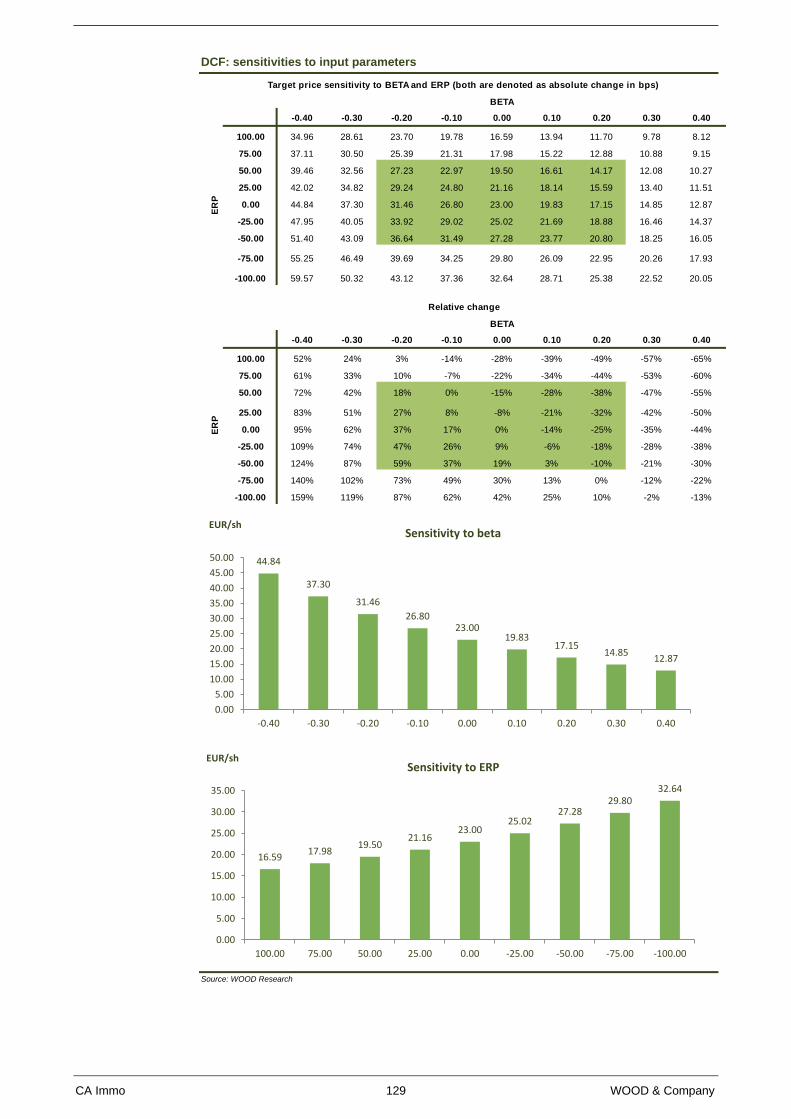
CA Immo 129 WOOD & Company
DCF: sensitivities to input parameters
Source: WOOD Research
23 -0.40 -0.30 -0.20 -0.10 0.00 0.10 0.20 0.30 0.40
100.00 34.96 28.61 23.70 19.78 16.59 13.94 11.70 9.78 8.12
75.00 37.11 30.50 25.39 21.31 17.98 15.22 12.88 10.88 9.15
50.00 39.46 32.56 27.23 22.97 19.50 16.61 14.17 12.08 10.27
25.00 42.02 34.82 29.24 24.80 21.16 18.14 15.59 13.40 11.51
0.00 44.84 37.30 31.46 26.80 23.00 19.83 17.15 14.85 12.87
-25.00 47.95 40.05 33.92 29.02 25.02 21.69 18.88 16.46 14.37
-50.00 51.40 43.09 36.64 31.49 27.28 23.77 20.80 18.25 16.05
-75.00 55.25 46.49 39.69 34.25 29.80 26.09 22.95 20.26 17.93
-100.00 59.57 50.32 43.12 37.36 32.64 28.71 25.38 22.52 20.05
Target price sensitivity to BETA and ERP (both are denoted as absolute change in bps)
BETA
ER
P
23 -0.40 -0.30 -0.20 -0.10 0.00 0.10 0.20 0.30 0.40
100.00 52% 24% 3% -14% -28% -39% -49% -57% -65%
75.00 61% 33% 10% -7% -22% -34% -44% -53% -60%
50.00 72% 42% 18% 0% -15% -28% -38% -47% -55%
25.00 83% 51% 27% 8% -8% -21% -32% -42% -50%
0.00 95% 62% 37% 17% 0% -14% -25% -35% -44%
-25.00 109% 74% 47% 26% 9% -6% -18% -28% -38%
-50.00 124% 87% 59% 37% 19% 3% -10% -21% -30%
-75.00 140% 102% 73% 49% 30% 13% 0% -12% -22%
-100.00 159% 119% 87% 62% 42% 25% 10% -2% -13%
ER
P
BETA
Relative change
44.84
37.30
31.46
26.8023.00
19.8317.15
14.8512.87
0.00
5.00
10.00
15.00
20.00
25.00
30.00
35.00
40.00
45.00
50.00
-0.40 -0.30 -0.20 -0.10 0.00 0.10 0.20 0.30 0.40
EUR/shSensitivity to beta
16.5917.98
19.5021.16
23.0025.02
27.2829.80
32.64
0.00
5.00
10.00
15.00
20.00
25.00
30.00
35.00
100.00 75.00 50.00 25.00 0.00 -25.00 -50.00 -75.00 -100.00
EUR/shSensitivity to ERP
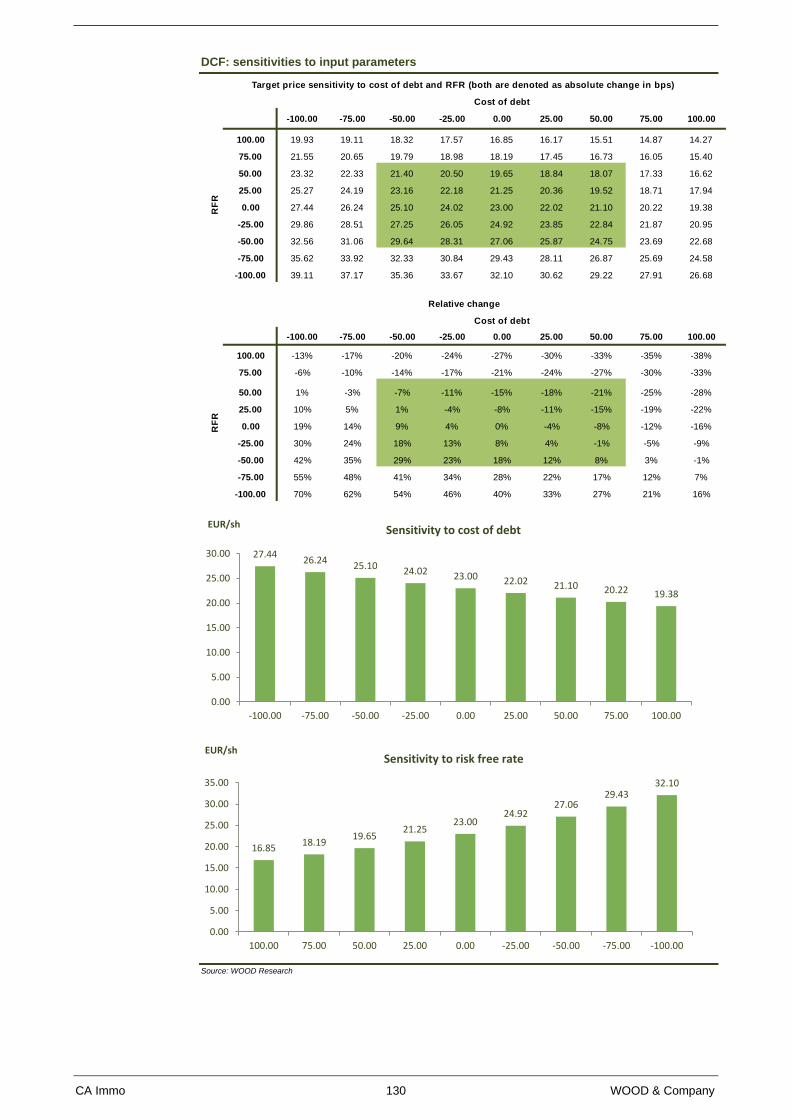
CA Immo 130 WOOD & Company
DCF: sensitivities to input parameters
Source: WOOD Research
23 -100.00 -75.00 -50.00 -25.00 0.00 25.00 50.00 75.00 100.00
100.00 19.93 19.11 18.32 17.57 16.85 16.17 15.51 14.87 14.27
75.00 21.55 20.65 19.79 18.98 18.19 17.45 16.73 16.05 15.40
50.00 23.32 22.33 21.40 20.50 19.65 18.84 18.07 17.33 16.62
25.00 25.27 24.19 23.16 22.18 21.25 20.36 19.52 18.71 17.94
0.00 27.44 26.24 25.10 24.02 23.00 22.02 21.10 20.22 19.38
-25.00 29.86 28.51 27.25 26.05 24.92 23.85 22.84 21.87 20.95
-50.00 32.56 31.06 29.64 28.31 27.06 25.87 24.75 23.69 22.68
-75.00 35.62 33.92 32.33 30.84 29.43 28.11 26.87 25.69 24.58
-100.00 39.11 37.17 35.36 33.67 32.10 30.62 29.22 27.91 26.68
Target price sensitivity to cost of debt and RFR (both are denoted as absolute change in bps)
RF
R
Cost of debt
23 -100.00 -75.00 -50.00 -25.00 0.00 25.00 50.00 75.00 100.00
100.00 -13% -17% -20% -24% -27% -30% -33% -35% -38%
75.00 -6% -10% -14% -17% -21% -24% -27% -30% -33%
50.00 1% -3% -7% -11% -15% -18% -21% -25% -28%
25.00 10% 5% 1% -4% -8% -11% -15% -19% -22%
0.00 19% 14% 9% 4% 0% -4% -8% -12% -16%
-25.00 30% 24% 18% 13% 8% 4% -1% -5% -9%
-50.00 42% 35% 29% 23% 18% 12% 8% 3% -1%
-75.00 55% 48% 41% 34% 28% 22% 17% 12% 7%
-100.00 70% 62% 54% 46% 40% 33% 27% 21% 16%
Relative change
RF
R
Cost of debt
27.4426.24
25.1024.02 23.00 22.02 21.10 20.22 19.38
0.00
5.00
10.00
15.00
20.00
25.00
30.00
-100.00 -75.00 -50.00 -25.00 0.00 25.00 50.00 75.00 100.00
EUR/shSensitivity to cost of debt
16.8518.19
19.6521.25
23.0024.92
27.0629.43
32.10
0.00
5.00
10.00
15.00
20.00
25.00
30.00
35.00
100.00 75.00 50.00 25.00 0.00 -25.00 -50.00 -75.00 -100.00
EUR/shSensitivity to risk free rate
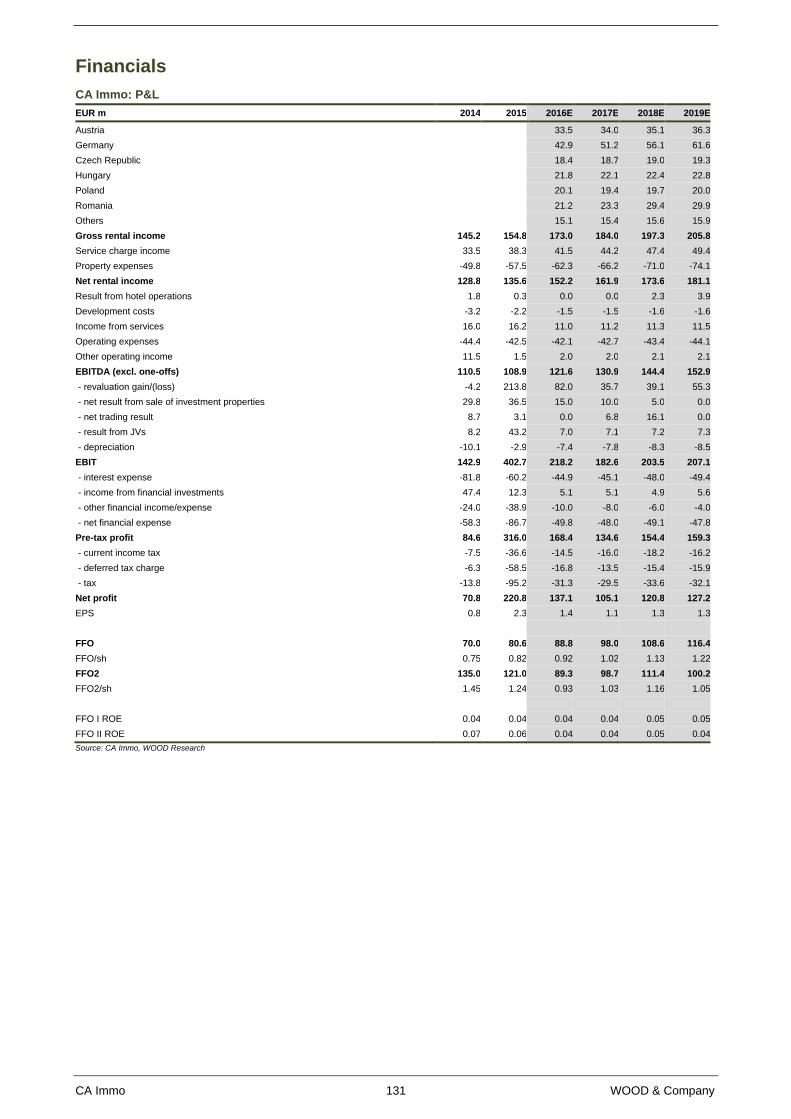
CA Immo 131 WOOD & Company
Financials
CA Immo: P&L
EUR m 2014 2015 2016E 2017E 2018E 2019E
Austria 33.5 34.0 35.1 36.3
Germany 42.9 51.2 56.1 61.6
Czech Republic 18.4 18.7 19.0 19.3
Hungary 21.8 22.1 22.4 22.8
Poland 20.1 19.4 19.7 20.0
Romania 21.2 23.3 29.4 29.9
Others 15.1 15.4 15.6 15.9
Gross rental income 145.2 154.8 173.0 184.0 197.3 205.8
Service charge income 33.5 38.3 41.5 44.2 47.4 49.4
Property expenses -49.8 -57.5 -62.3 -66.2 -71.0 -74.1
Net rental income 128.8 135.6 152.2 161.9 173.6 181.1
Result from hotel operations 1.8 0.3 0.0 0.0 2.3 3.9
Development costs -3.2 -2.2 -1.5 -1.5 -1.6 -1.6
Income from services 16.0 16.2 11.0 11.2 11.3 11.5
Operating expenses -44.4 -42.5 -42.1 -42.7 -43.4 -44.1
Other operating income 11.5 1.5 2.0 2.0 2.1 2.1
EBITDA (excl. one-offs) 110.5 108.9 121.6 130.9 144.4 152.9
- revaluation gain/(loss) -4.2 213.8 82.0 35.7 39.1 55.3
- net result from sale of investment properties 29.8 36.5 15.0 10.0 5.0 0.0
- net trading result 8.7 3.1 0.0 6.8 16.1 0.0
- result from JVs 8.2 43.2 7.0 7.1 7.2 7.3
- depreciation -10.1 -2.9 -7.4 -7.8 -8.3 -8.5
EBIT 142.9 402.7 218.2 182.6 203.5 207.1
- interest expense -81.8 -60.2 -44.9 -45.1 -48.0 -49.4
- income from financial investments 47.4 12.3 5.1 5.1 4.9 5.6
- other financial income/expense -24.0 -38.9 -10.0 -8.0 -6.0 -4.0
- net financial expense -58.3 -86.7 -49.8 -48.0 -49.1 -47.8
Pre-tax profit 84.6 316.0 168.4 134.6 154.4 159.3
- current income tax -7.5 -36.6 -14.5 -16.0 -18.2 -16.2
- deferred tax charge -6.3 -58.5 -16.8 -13.5 -15.4 -15.9
- tax -13.8 -95.2 -31.3 -29.5 -33.6 -32.1
Net profit 70.8 220.8 137.1 105.1 120.8 127.2
EPS 0.8 2.3 1.4 1.1 1.3 1.3
FFO 70.0 80.6 88.8 98.0 108.6 116.4
FFO/sh 0.75 0.82 0.92 1.02 1.13 1.22
FFO2 135.0 121.0 89.3 98.7 111.4 100.2
FFO2/sh 1.45 1.24 0.93 1.03 1.16 1.05
FFO I ROE 0.04 0.04 0.04 0.04 0.05 0.05
FFO II ROE 0.07 0.06 0.04 0.04 0.05 0.04
Source: CA Immo, WOOD Research
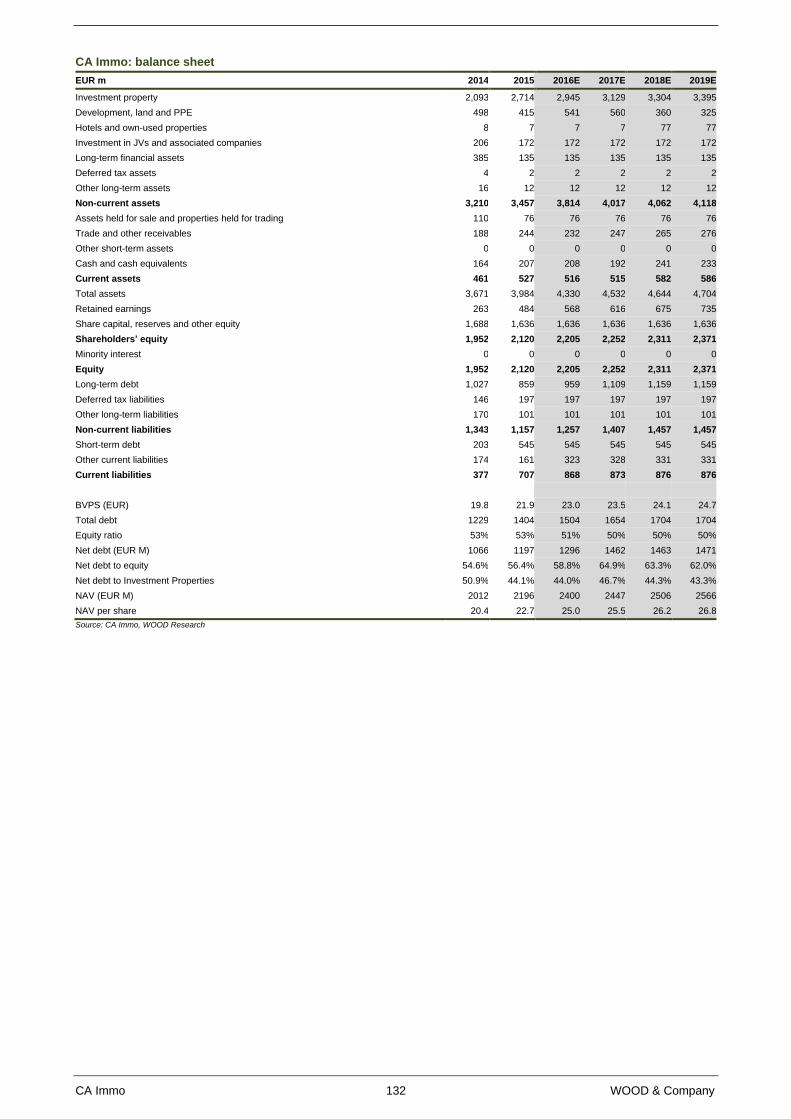
CA Immo 132 WOOD & Company
CA Immo: balance sheet
EUR m 2014 2015 2016E 2017E 2018E 2019E
Investment property 2,093 2,714 2,945 3,129 3,304 3,395
Development, land and PPE 498 415 541 560 360 325
Hotels and own-used properties 8 7 7 7 77 77
Investment in JVs and associated companies 206 172 172 172 172 172
Long-term financial assets 385 135 135 135 135 135
Deferred tax assets 4 2 2 2 2 2
Other long-term assets 16 12 12 12 12 12
Non-current assets 3,210 3,457 3,814 4,017 4,062 4,118
Assets held for sale and properties held for trading 110 76 76 76 76 76
Trade and other receivables 188 244 232 247 265 276
Other short-term assets 0 0 0 0 0 0
Cash and cash equivalents 164 207 208 192 241 233
Current assets 461 527 516 515 582 586
Total assets 3,671 3,984 4,330 4,532 4,644 4,704
Retained earnings 263 484 568 616 675 735
Share capital, reserves and other equity 1,688 1,636 1,636 1,636 1,636 1,636
Shareholders’ equity 1,952 2,120 2,205 2,252 2,311 2,371
Minority interest 0 0 0 0 0 0
Equity 1,952 2,120 2,205 2,252 2,311 2,371
Long-term debt 1,027 859 959 1,109 1,159 1,159
Deferred tax liabilities 146 197 197 197 197 197
Other long-term liabilities 170 101 101 101 101 101
Non-current liabilities 1,343 1,157 1,257 1,407 1,457 1,457
Short-term debt 203 545 545 545 545 545
Other current liabilities 174 161 323 328 331 331
Current liabilities 377 707 868 873 876 876
BVPS (EUR) 19.8 21.9 23.0 23.5 24.1 24.7
Total debt 1229 1404 1504 1654 1704 1704
Equity ratio 53% 53% 51% 50% 50% 50%
Net debt (EUR M) 1066 1197 1296 1462 1463 1471
Net debt to equity 54.6% 56.4% 58.8% 64.9% 63.3% 62.0%
Net debt to Investment Properties 50.9% 44.1% 44.0% 46.7% 44.3% 43.3%
NAV (EUR M) 2012 2196 2400 2447 2506 2566
NAV per share 20.4 22.7 25.0 25.5 26.2 26.8
Source: CA Immo, WOOD Research
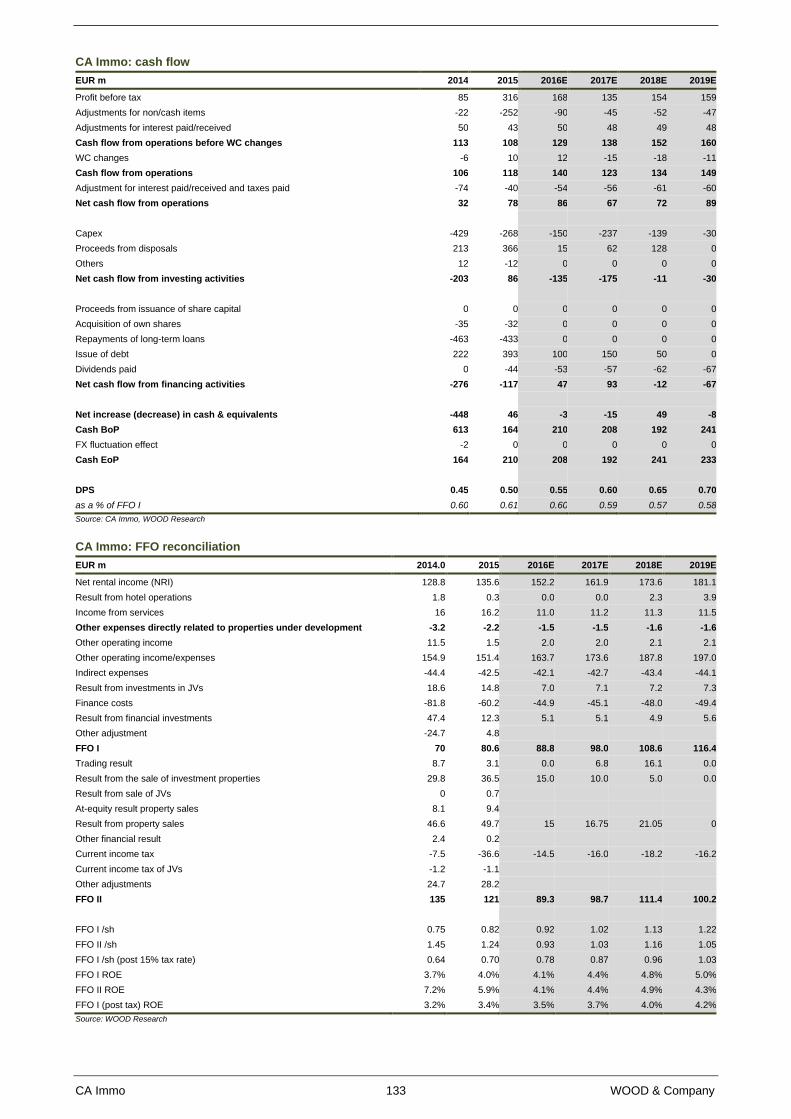
CA Immo 133 WOOD & Company
CA Immo: cash flow
EUR m 2014 2015 2016E 2017E 2018E 2019E
Profit before tax 85 316 168 135 154 159
Adjustments for non/cash items -22 -252 -90 -45 -52 -47
Adjustments for interest paid/received 50 43 50 48 49 48
Cash flow from operations before WC changes 113 108 129 138 152 160
WC changes -6 10 12 -15 -18 -11
Cash flow from operations 106 118 140 123 134 149
Adjustment for interest paid/received and taxes paid -74 -40 -54 -56 -61 -60
Net cash flow from operations 32 78 86 67 72 89
Capex -429 -268 -150 -237 -139 -30
Proceeds from disposals 213 366 15 62 128 0
Others 12 -12 0 0 0 0
Net cash flow from investing activities -203 86 -135 -175 -11 -30
Proceeds from issuance of share capital 0 0 0 0 0 0
Acquisition of own shares -35 -32 0 0 0 0
Repayments of long-term loans -463 -433 0 0 0 0
Issue of debt 222 393 100 150 50 0
Dividends paid 0 -44 -53 -57 -62 -67
Net cash flow from financing activities -276 -117 47 93 -12 -67
Net increase (decrease) in cash & equivalents -448 46 -3 -15 49 -8
Cash BoP 613 164 210 208 192 241
FX fluctuation effect -2 0 0 0 0 0
Cash EoP 164 210 208 192 241 233
DPS 0.45 0.50 0.55 0.60 0.65 0.70
as a % of FFO I 0.60 0.61 0.60 0.59 0.57 0.58
Source: CA Immo, WOOD Research
CA Immo: FFO reconciliation
EUR m 2014.0 2015 2016E 2017E 2018E 2019E
Net rental income (NRI) 128.8 135.6 152.2 161.9 173.6 181.1
Result from hotel operations 1.8 0.3 0.0 0.0 2.3 3.9
Income from services 16 16.2 11.0 11.2 11.3 11.5
Other expenses directly related to properties under development -3.2 -2.2 -1.5 -1.5 -1.6 -1.6
Other operating income 11.5 1.5 2.0 2.0 2.1 2.1
Other operating income/expenses 154.9 151.4 163.7 173.6 187.8 197.0
Indirect expenses -44.4 -42.5 -42.1 -42.7 -43.4 -44.1
Result from investments in JVs 18.6 14.8 7.0 7.1 7.2 7.3
Finance costs -81.8 -60.2 -44.9 -45.1 -48.0 -49.4
Result from financial investments 47.4 12.3 5.1 5.1 4.9 5.6
Other adjustment -24.7 4.8
FFO I 70 80.6 88.8 98.0 108.6 116.4
Trading result 8.7 3.1 0.0 6.8 16.1 0.0
Result from the sale of investment properties 29.8 36.5 15.0 10.0 5.0 0.0
Result from sale of JVs 0 0.7
At-equity result property sales 8.1 9.4
Result from property sales 46.6 49.7 15 16.75 21.05 0
Other financial result 2.4 0.2
Current income tax -7.5 -36.6 -14.5 -16.0 -18.2 -16.2
Current income tax of JVs -1.2 -1.1
Other adjustments 24.7 28.2
FFO II 135 121 89.3 98.7 111.4 100.2
FFO I /sh 0.75 0.82 0.92 1.02 1.13 1.22
FFO II /sh 1.45 1.24 0.93 1.03 1.16 1.05
FFO I /sh (post 15% tax rate) 0.64 0.70 0.78 0.87 0.96 1.03
FFO I ROE 3.7% 4.0% 4.1% 4.4% 4.8% 5.0%
FFO II ROE 7.2% 5.9% 4.1% 4.4% 4.9% 4.3%
FFO I (post tax) ROE 3.2% 3.4% 3.5% 3.7% 4.0% 4.2%
Source: WOOD Research
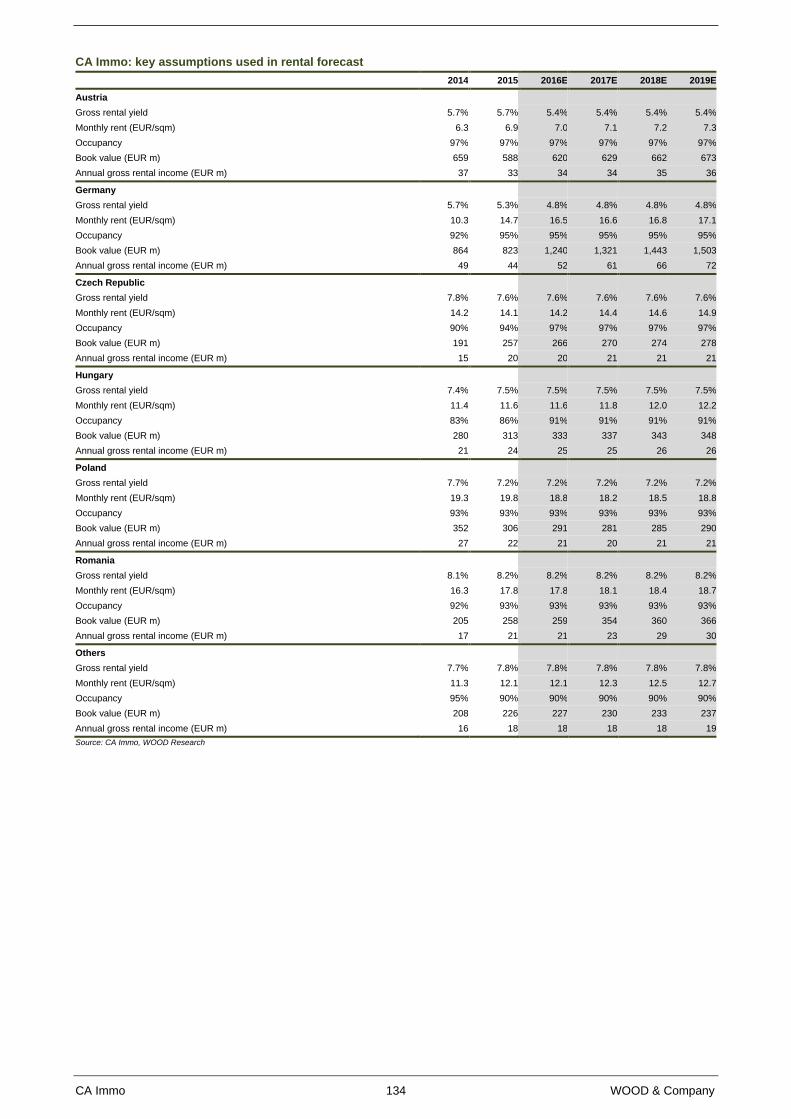
CA Immo 134 WOOD & Company
CA Immo: key assumptions used in rental forecast
2014 2015 2016E 2017E 2018E 2019E
Austria
Gross rental yield 5.7% 5.7% 5.4% 5.4% 5.4% 5.4%
Monthly rent (EUR/sqm) 6.3 6.9 7.0 7.1 7.2 7.3
Occupancy 97% 97% 97% 97% 97% 97%
Book value (EUR m) 659 588 620 629 662 673
Annual gross rental income (EUR m) 37 33 34 34 35 36
Germany
Gross rental yield 5.7% 5.3% 4.8% 4.8% 4.8% 4.8%
Monthly rent (EUR/sqm) 10.3 14.7 16.5 16.6 16.8 17.1
Occupancy 92% 95% 95% 95% 95% 95%
Book value (EUR m) 864 823 1,240 1,321 1,443 1,503
Annual gross rental income (EUR m) 49 44 52 61 66 72
Czech Republic
Gross rental yield 7.8% 7.6% 7.6% 7.6% 7.6% 7.6%
Monthly rent (EUR/sqm) 14.2 14.1 14.2 14.4 14.6 14.9
Occupancy 90% 94% 97% 97% 97% 97%
Book value (EUR m) 191 257 266 270 274 278
Annual gross rental income (EUR m) 15 20 20 21 21 21
Hungary
Gross rental yield 7.4% 7.5% 7.5% 7.5% 7.5% 7.5%
Monthly rent (EUR/sqm) 11.4 11.6 11.6 11.8 12.0 12.2
Occupancy 83% 86% 91% 91% 91% 91%
Book value (EUR m) 280 313 333 337 343 348
Annual gross rental income (EUR m) 21 24 25 25 26 26
Poland
Gross rental yield 7.7% 7.2% 7.2% 7.2% 7.2% 7.2%
Monthly rent (EUR/sqm) 19.3 19.8 18.8 18.2 18.5 18.8
Occupancy 93% 93% 93% 93% 93% 93%
Book value (EUR m) 352 306 291 281 285 290
Annual gross rental income (EUR m) 27 22 21 20 21 21
Romania
Gross rental yield 8.1% 8.2% 8.2% 8.2% 8.2% 8.2%
Monthly rent (EUR/sqm) 16.3 17.8 17.8 18.1 18.4 18.7
Occupancy 92% 93% 93% 93% 93% 93%
Book value (EUR m) 205 258 259 354 360 366
Annual gross rental income (EUR m) 17 21 21 23 29 30
Others
Gross rental yield 7.7% 7.8% 7.8% 7.8% 7.8% 7.8%
Monthly rent (EUR/sqm) 11.3 12.1 12.1 12.3 12.5 12.7
Occupancy 95% 90% 90% 90% 90% 90%
Book value (EUR m) 208 226 227 230 233 237
Annual gross rental income (EUR m) 16 18 18 18 18 19
Source: CA Immo, WOOD Research
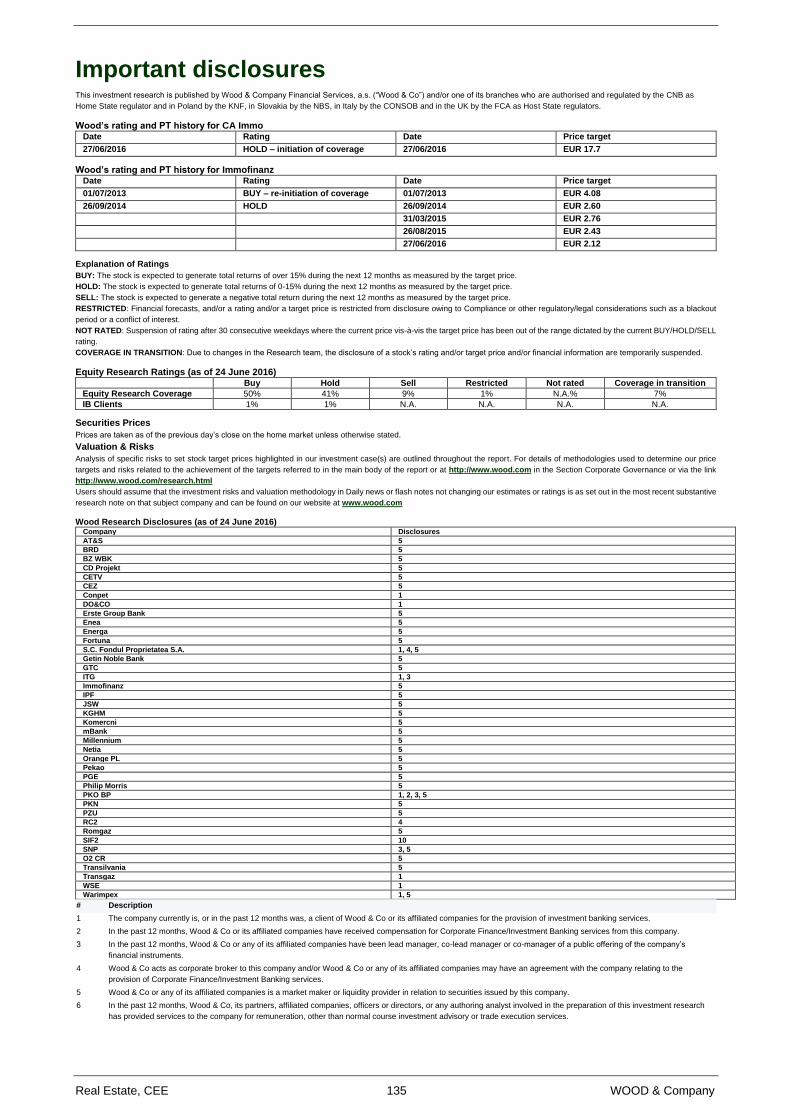
Real Estate, CEE 135 WOOD & Company
Important disclosures This investment research is published by Wood & Company Financial Services, a.s. (“Wood & Co”) and/or one of its branches who are authorised and regulated by the CNB as
Home State regulator and in Poland by the KNF, in Slovakia by the NBS, in Italy by the CONSOB and in the UK by the FCA as Host State regulators.
Wood’s rating and PT history for CA Immo Date Rating Date Price target
27/06/2016 HOLD – initiation of coverage 27/06/2016 EUR 17.7
Wood’s rating and PT history for Immofinanz Date Rating Date Price target
01/07/2013 BUY – re-initiation of coverage 01/07/2013 EUR 4.08
26/09/2014 HOLD 26/09/2014 EUR 2.60
31/03/2015 EUR 2.76
26/08/2015 EUR 2.43
27/06/2016 EUR 2.12
Explanation of Ratings
BUY: The stock is expected to generate total returns of over 15% during the next 12 months as measured by the target price.
HOLD: The stock is expected to generate total returns of 0-15% during the next 12 months as measured by the target price.
SELL: The stock is expected to generate a negative total return during the next 12 months as measured by the target price.
RESTRICTED: Financial forecasts, and/or a rating and/or a target price is restricted from disclosure owing to Compliance or other regulatory/legal considerations such as a blackout
period or a conflict of interest.
NOT RATED: Suspension of rating after 30 consecutive weekdays where the current price vis-à-vis the target price has been out of the range dictated by the current BUY/HOLD/SELL
rating.
COVERAGE IN TRANSITION: Due to changes in the Research team, the disclosure of a stock’s rating and/or target price and/or financial information are temporarily suspended.
Equity Research Ratings (as of 24 June 2016) Buy Hold Sell Restricted Not rated Coverage in transition
Equity Research Coverage 50% 41% 9% 1% N.A.% 7%
IB Clients 1% 1% N.A. N.A. N.A. N.A.
Securities Prices
Prices are taken as of the previous day’s close on the home market unless otherwise stated.
Valuation & Risks
Analysis of specific risks to set stock target prices highlighted in our investment case(s) are outlined throughout the report. For details of methodologies used to determine our price
targets and risks related to the achievement of the targets referred to in the main body of the report or at http://www.wood.com in the Section Corporate Governance or via the link
http://www.wood.com/research.html
Users should assume that the investment risks and valuation methodology in Daily news or flash notes not changing our estimates or ratings is as set out in the most recent substantive
research note on that subject company and can be found on our website at www.wood.com
Wood Research Disclosures (as of 24 June 2016) Company Disclosures
AT&S 5
BRD 5
BZ WBK 5
CD Projekt 5
CETV 5
CEZ 5
Conpet 1
DO&CO 1
Erste Group Bank 5
Enea 5
Energa 5
Fortuna 5
S.C. Fondul Proprietatea S.A. 1, 4, 5
Getin Noble Bank 5
GTC 5
ITG 1, 3
Immofinanz 5
IPF 5
JSW 5
KGHM 5
Komercni 5
mBank 5
Millennium 5
Netia 5
Orange PL 5
Pekao 5
PGE 5
Philip Morris 5
PKO BP 1, 2, 3, 5
PKN 5
PZU 5
RC2 4
Romgaz 5
SIF2 10
SNP 3, 5
O2 CR 5
Transilvania 5
Transgaz 1
WSE 1
Warimpex 1, 5
# Description
1 The company currently is, or in the past 12 months was, a client of Wood & Co or its affiliated companies for the provision of investment banking services.
2 In the past 12 months, Wood & Co or its affiliated companies have received compensation for Corporate Finance/Investment Banking services from this company.
3 In the past 12 months, Wood & Co or any of its affiliated companies have been lead manager, co-lead manager or co-manager of a public offering of the company’s
financial instruments.
4 Wood & Co acts as corporate broker to this company and/or Wood & Co or any of its affiliated companies may have an agreement with the company relating to the
provision of Corporate Finance/Investment Banking services.
5 Wood & Co or any of its affiliated companies is a market maker or liquidity provider in relation to securities issued by this company.
6 In the past 12 months, Wood & Co, its partners, affiliated companies, officers or directors, or any authoring analyst involved in the preparation of this investment research
has provided services to the company for remuneration, other than normal course investment advisory or trade execution services.
Real Estate, CEE 136 WOOD & Company
7 Those persons identified as the author(s) of this investment research, or any individual involved in the preparation of this investment research, have purchased/received
shares in the company prior to a public offering of those shares, and the price at which they were acquired along with the date of acquisition are disclosed above.
8 The authoring analyst, a member of the authoring analyst's household, or any individual directly involved in the preparation of this investment research has a direct
ownership position in securities issued by this company.
9 A partner, director, officer, employee or agent of Wood & Co and its affiliated companies, or a member of his/her household, is an officer, or director, or serves as an
advisor or board member of this company. 10 As of the month end immediately preceding the date of publication of this investment research Wood & Co or its affiliate companies, in the aggregate, beneficially owned
1% or more of any class of the total issued share capital or other common equity securities of the company or held a material non-equity financial interest in this company.
11 As of the month end immediately preceding the date of publication of this investment research the relevant company owned 1% or more of any class of the total issued
share capital in Wood & Co or any of its affiliated companies.
12 Other specific disclosures as described above.
WOOD & Company announces that its affiliated company WOOD & Company Funds SICAV p.l.c (through its mutual funds) increased its stake in Pegas Nonwovens to
22.33%. Some entities of WOOD & Company Group are investors of these mutual funds.
The authoring analysts who are responsible for the preparation of this investment research have received (or will receive) compensation based upon (among other factors)
the Corporate Finance/Investment Banking revenues and general profits of Wood & Co. However, such authoring analysts have not received, and will not receive,
compensation that is directly based upon or linked to one or more specific Corporate Finance/Investment Banking activities, or to recommendations contained in the
investment research.
Wood & Co and its affiliated companies may have a Corporate Finance/Investment Banking or other relationship with the company that is the subject of this investment
research and may trade in any of the designated investments mentioned herein either for their own account or the accounts of their customers, in good faith or in the
normal course of market making. Accordingly, Wood & Co or their affiliated companies, principals or employees (other than the authoring analyst(s) who prepared this
investment research) may at any time have a long or short position in any such designated investments, Related designated investments or in options, futures or other
derivative instruments based thereon.
Wood & Co manages conflicts of interest arising as a result of preparation and publication of research through its use of internal databases, notifications by the relevant
employees and Chinese Walls as monitored by Compliance. For further details see our website at www.wood.com in the Section Corporate Governance or via the link
http://www.wood.com/research.html
The information contained in this investment research has been compiled by Wood & Co from sources believed to be reliable, but (with the exception of the information
about Wood & Co) no representation or warranty, express or implied, is made by Wood & Co, its affiliated companies or any other person as to its fairness, accuracy,
completeness or correctness. Wood & Co has not independently verified the facts, assumptions, and estimates contained herein. All estimates, opinions and other
information contained in this investment research constitute Wood & Co’ judgement as of the date of this investment research, are subject to change without notice and
are provided in good faith but without legal responsibility or liability.
Wood & Co salespeople, traders, and other professionals may provide oral or written market commentary or trading strategies to our clients and our proprietary trading
desk that reflect opinions that are contrary to the opinions expressed in this investment research. Wood & Co’ affiliates, proprietary trading desk, and investing businesses
may make investment decisions that are inconsistent with the recommendations or views expressed in this investment research.
This investment research is provided for information purposes only and does not constitute an offer or solicitation to buy or sell any designated investments discussed
herein in any jurisdiction where such offer or solicitation would be prohibited. As a result, the designated investments discussed in this investment research may not be
eligible for sale in some jurisdictions. This investment research is not, and under no circumstances should be construed as, a solicitation to act as a securities broker or
dealer in any jurisdiction by any person or company that is not legally permitted to carry on the business of a securities broker or dealer in that jurisdiction. This material
is prepared for general circulation to clients and does not have regard to the investment objectives, financial situation or particular needs of any particular person. Investors
should obtain advice based on their own individual circumstances before making an investment decision. To the fullest extent permitted by law, none of Wood & Co, its
affiliated companies or any other person accepts any liability whatsoever for any direct or consequential loss arising from or in connection with the use of this material.
For United Kingdom or European Residents:
This investment research is for persons who are Eligible Counterparties or Professional Clients only and is exempt from the general restrictions in section 21 of the
Financial Services and Markets Act 2000 (or any analogous legislation) on the communication of invitations or inducements to engage in investment activity on the
grounds that it is being distributed in the United Kingdom only to persons of a kind described in Article 19(5) (Investment Professionals) and 49(2) (High Net Worth
companies, unincorporated associations etc) of the Financial Services and Markets Act 2000 (Financial Promotion) Order 2005 (as amended). It is not intended to be
distributed or passed on, directly or indirectly, to any other class of persons. This material is not for distribution in the United Kingdom or Europe to retail clients, as defined
under the rules of the Financial Conduct Authority.
For United States Residents:
This investment research distributed in the United States by Wood & Co, and in certain instances by Enclave Capital LLC (‘Enclave’), a U.S registered broker dealer, only
to “major U.S. institutional investors”, as defined under Rule 15a-6 promulgated under the US Securities Exchange Act of 1934, as amended, and as interpreted by the
staff of the US Securities and Exchange Commission. This investment research is not intended for use by any person or entity that is not a major U.S institutional investor.
If you have received a copy of this research and are not a major U.S institutional investor, you are instructed not to read, rely on or reproduce the contents hereof, and to
destroy this research or return it to Wood & Co or to Enclave. Analyst(s) preparing this report are employees of Wood & Co who are resident outside the United States
and are not associated persons or employees of any US registered broker-dealer. Therefore the analyst(s) are not be subject to Rule 2711 of the Financial Industry
Regulatory Authority (FINRA) or to Regulation AC adopted by the U.S Securities and Exchange Commission (SEC) which among other things, restrict communications
with a subject company, public appearances and personal trading in securities by a research analyst. Any major U.S Institutional investor wishing to effect transactions
in any securities referred to herein or options thereon should do so by contacting a representative of Enclave Capital LLC. Enclave is a broker-dealer registered with the
SEC and a member of FINRA and the Securities Investor Protection Corporation. Its address is 19 West 44th Street, Suite 1410, New York, NY 10036 and its telephone
number is 646-454-8600. Wood & Co is not affiliated with Enclave Capital LLC or any other U.S registered broker-dealer.
CONTACTS
Czech Republic
Namesti Republiky 1079/1a Palladium 110 00 Praha 1 Czech Republic Tel +420 222 096 111 Fax +420 222 096 222
Romania
Metropolis Center 89-97 Grigore Alexandrescu St. 010624 Bucharest 1 Tel.: +40 316 30 11 81
Poland
Skylight Zlote Tarasy Zlota 59 00 120 Warszawa Poland Tel +48 22 222 1530 Fax +48 22 222 1531
UK
City Point, 15th Floor 1 Ropemaker Street London EC2Y 9HT Tel +44 20 3530 0691
Italy
Via Vittor Pisani, 22 20124 Milan Italy Tel + 39 02 67910 963
Kristen Andrasko/ Sadiq Razak Co-Heads of Equities +420 222 096 253/ +44 20 3530 0681 [email protected] [email protected]
Bloomberg page WUCO
www.wood.com
Research Co-Head of Research/ Head of Research Poland
Marta Jezewska-Wasilewska +48 22 222 1548 [email protected]
Co-Head of Research/Head of Greek Research
Alex Boulougouris +30 211 106 9447 [email protected]
Head of Turkey/Industrials
Oytun Altasli +44 203 530 0627 [email protected]
Macroeconomics
Raffaella Tenconi +44 203 530 0685 [email protected]
Consumer/Industrials
Lukasz Wachelko +48 22 222 1560 [email protected]
Energy
Jonathan Lamb +44 203 530 0621 [email protected]
Romania
Lucian Albulescu +420 222 096 273 [email protected]
Utilities/Mining/Pharma
Bram Buring +420 222 096 250 [email protected]
Financials/Turkey
Can Demir +44 203 530 0623 [email protected]
Non-banks financials
Jerzy Kosinski +48 22 222 1564 [email protected]
Metals/Mining
Andy Jones +44 20 3530 0629 [email protected]
Consumer/Industrials
Gabriela Burdach + 48 22 222 1545 [email protected]
Real Estate
Jakub Caithaml +420 222 096 481 jakub.caithaml @wood.com
Czech Republic
Robert Kaplan +420 222 096 483
Consumer/Industrials
Maciej Wardejn +48 22 222 1546
Poland
Pawel Wieprzowski +48 22 222 1549
Jakub Mician + 420 222 096 320
Ondrej Slama + 420 222 096 484 [email protected]
Sales Head of Sales
Kristen Andrasko +420 222 096 253 [email protected]
Sean Callahan +44 203 530 0688 [email protected]
Jan Koch +48 22 222 1616 [email protected]
Piotr Kopec +48 22 222 1615 [email protected]
Ioana Pop +44 20 3530 0693 [email protected]
Vinay Ruparelia +44 203 530 0624 [email protected]
Grzegorz Skowronski +48 22 222 1559 [email protected]
Michal Skowronski +48 22 222 1563 [email protected]
Jan Thomson
+420 222 096 841
Kostas Tsigkourakos +30 694 082 5810 [email protected]
Markus Ulreich +421 2 3240 9046
Tatiana Sarandinaki Enclave Capital in association with WOOD & Company +1 646 454 8657 [email protected]
Sales Trading and Execution Services
Ashley Keep +44 20 3530 0683 [email protected]
Jennifer Ewing +44 20 3530 0692 [email protected]
Jan Jandak +420 222 096 363 [email protected]
Zuzana Mora +420 222 096 283 [email protected]
Ermir Shkurti +420 222 096 847 [email protected]
Marek Siwy +420 222 096 851 [email protected]
Martin Stuchlik +420 222 096 855 [email protected]
Vladimir Vavra +420 222 096 397 [email protected]
RECENTLY PUBLISHED REPORTS
Date Company/Sector Title Analyst
21/06/16 Kernel We still have a crush on the stock Maciej Wardejn
20/06/16 Polish Banks We’re still waiting (for the sagas to end) Marta Jezewska-Wasilewska
20/06/16 Moneta Money Bank Good things come in small packages Marta Jezewska-Wasilewska
16/06/16 CEZ Decision time on dividend policy still to come Bram Buring
03/06/16 The Rear-View Mirror – CEE markets Only the Greek stock exchange rose in May Research Team
03/06/16 GTC Buy the dip! Jakub Caithaml
02/06/16 Russian Steel Producers No longer a steel Andrew Jones
31/05/16 Romanian Banks Banking on the macro story Lucian Albulescu
Although the information contained in this report comes from sources Wood & Company believes to be reliable, we do not guarantee its accuracy, and such information may be incomplete or condensed. All opinions and estimates included in this report constitute our judgment as of this date and are subject to change without notice. This report is for information purposes only and is not intended as an offer or solicitation with respect to the purchase or sale of any security.