image analysis of cracks in the weld metal of a wet welded steel joint by three dimensional (3d)...
TRANSCRIPT

M A T E R I A L S C H A R A C T E R I Z A T I O N 8 3 ( 2 0 1 3 ) 1 3 9 – 1 4 4
Ava i l ab l e on l i ne a t www.sc i enced i r ec t . com
ScienceDirect
www.e l sev i e r . com/ loca te /matcha r
Image analysis of cracks in the weld metal of a wet
welded steel joint by three dimensional(3D) X-ray microtomographyE. Padillaa, N. Chawlaa,⁎, L.F. Silvab, V.R. dos Santosb, S. Paciornikb
aMaterials Science and Engineering, Arizona State University, Tempe, AZ 85287-6106, USAbDepartamento de Engenharia de Materiais, PUC-Rio, Rua Marquês de São Vicente 225, Gávea, Rio de Janeiro, RJ, Brazil
A R T I C L E D A T A
⁎ Corresponding author. Tel.: +1 480 965 2402E-mail address: [email protected] (N. Cha
1044-5803/$ – see front matter © 2013 Elseviehttp://dx.doi.org/10.1016/j.matchar.2013.06.0
A B S T R A C T
Article history:Received 14 September 2012Received in revised form23 May 2013Accepted 25 June 2013
Hydrogen is readily available in underwater wet welds due to the dissociation of water athigh temperatures. Low weld metal toughness and thermal contraction during cooling canlead to the nucleation of cracks, which seriously affect the mechanical properties of theweld. In this paper, X-ray microtomography (μCT) and image analysis (IA) were employed toimage and measure crack length and morphology in the weld metal of a wet welded lowcarbon steel joint. The images were corrected for noise and illumination. The cracks weresegmented and post-processed to correct for artifacts. Size and shape parameters weremeasured and showed a large average value for the Feret diameter (385 μm) compared toaverage crack thickness (18 μm). Three dimensional (3D) renderings of the detected cracksrevealed a spatial distribution in which densely cracked regions are separated by layers ofcrack-free material. The combination of μCT and IA proved to be a powerful tool tocharacterize a complex defect system in 3D, providing information that cannot be obtainedwith traditional 2D microscopy techniques.
© 2013 Elsevier Inc. All rights reserved.
Keywords:X-ray tomographyImage analysisWelding
1. Introduction
Underwater wet welding is a technique for structural repair inoffshore platforms and ships. Its main advantage is theoperational simplicity. Despite efforts to improve the me-chanical properties of wet welds, the welding in direct contactwith the water still presents critical problems. Sound weldswith structural quality similar to that in welds made in the airhave seldom been achieved. High cooling rates due to directcontact with water and the presence of hydrogen derivedfrom water dissociation lead to the formation of defects, suchas pores and cracks in the weld metal (WM) and in heataffected zone (HAZ) which adversely affect mechanicalproperties. The occurrence of hydrogen assisted cold crackingis considered as one of themost important factors responsiblefor the usual low ductility in the WM [1,2].
.wla).
r Inc. All rights reserved.16
During cooling, weld beads contract both in transverse andlongitudinal directions. It is well established that longitudinalcontractions are responsible for higher residual stress afterwelding. As a consequence, in wet welds, the low WMtoughness associated with hydrogen embrittlement can leadto nucleation of cracks with a predominant orientationtransverse to the weld axis. See Fig. 1.
Very few studies about hydrogen assisted cracks in theWM of wet welds have been reported. Visualization of thesecracks has been achieved by optical microscopy (OM) oflongitudinal sections [1,2]. As the cracks are very thin it isoften necessary to use specific polishing and etching pro-cedures for revealing them. Typical aspects are shown inFig. 2. The cracks are short (less than 1 mm) and the density ofcracks (number per unit area) tends to increase with increas-ing weld metal hydrogen content.

WeldingDirection
Fig. 1 – Illustration of a welded joint showing cracks in theweld metal. Hydrogen induced cracks in wet welding aretypically orthogonal to the welding direction. The samplewas extracted from the surface and is about 4 mm thick.
Table 1 – Chemical composition of the weld metal (wt.%).
Mn Si O P S C Ni Mo
0.609 0.370 0.079 0.025 0.008 0.075 0.036 0.440
140 M A T E R I A L S C H A R A C T E R I Z A T I O N 8 3 ( 2 0 1 3 ) 1 3 9 – 1 4 4
The quantification of the size, shape, aspect ratio, etc. ofthese cracks is difficult and relies on large two dimensionalmosaic OM images [3]. The three dimensional (3D) visualiza-tion and quantification of these defects is necessary. X-raytomography is an excellent technique for non-destructive 3Dimaging and quantification [4–11]. It could contribute signifi-cantly to a better characterization and understanding of thecracking phenomena involved as well as for the prediction ofmechanical properties of wet welds. In a previous paper [12]x-ray microtomography (μCT) was used to reveal the 3Dstructure of cracks in wet welds, but no measurements ofsize, shape, or orientation were performed. The presentpaper focuses on statistical and quantitative analysis in 3Dto characterize the crack network in the weld metal of wetwelds.
Fig. 2 – Stepwise cracks in weld metal. Etchant: nital 2%.Longitudinal section in a V grooved multi run wet weld(commercial rutile electrode at 0.5 m water depth).
2. Materials and Experimental Procedures
A water tank with a mechanized welding system wasemployed to simulate wet welding conditions. A Multirunbutt weld was performed on a flat 19 mm thick A36 steel plateat a depth of 0.5 m depth. A V-groove was made with a rootopening of 3 mm and 45° angle. A commercial wet weldingrutile type electrode with 3.25 mm diameter was used. Thiselectrode had a relatively high content of diffusible hydrogen(88.7 ml/100 g). The weld metal chemical composition andrelevant mechanical properties are listed in Tables 1 and 2.
4 × 4 × 10 mm slabs containing just weld metal weremachined from a larger block for examination by μCT.Microtomography was performed with a XRadia MicroXCT200 equipment with the acquisition conditions listed inTable 3.
3. Results and Discussion
The raw tomography data were imported into ImageJ forfiltering and analysis. The steps in the filtering process areshown in Fig. 3. The data were first filtered with ananisotropic diffusion filter to reduce noise while preservingcrack edges [13]. Five iterations using the default settings ofa1 = 0.5 and a2 = 0.9 and dt = 20 were performed. A series ofband pass filters was then applied to remove the darkeningpresent at the outer edges of the sample. The band pass filterin ImageJ was used to filter down the large structures (down to200 voxels), while maintaining the small structures (filter upto 0 voxels). Stripes were suppressed in the directionscorresponding to the long edges of the sample. The filteredimages show good contrast between the cracks and matrix,reduced noise over the original data, and elimination of thedarkening present at the periphery of the sample.
The filtered images were then segmented by thresholding.Tominimize the chance of removing or breaking cracks at thisstep, the threshold level was slightly overestimated initially,which also caused the cracks thicknesses to be overestimated.A simple erosion with a cross structuring element could beused to correct the thicknesses, but again could cause crackbreaking. Thus, the skeleton from the oversegmented imagewas first obtained and combined (logical OR operation) withthe eroded version, in order to reduce crack breaking. Theresult of this procedure is shown in Figs. 3c and d.
Table 2 – All weld metal mechanical properties.
Hardness(HV1)
Yieldstrength(Mpa)
Tensilestrength(Mpa)
Elongation(%)
CharpyV 0 °C (J)
220.6 362 513 6.0 40.9

Table 3 – μCT acquisition conditions.
Resolution 4.3 μmObjective 4×Source settings (kV/W) 15/10Start/end angle −180/180Number of views 2000Time per views (sec) 4Total acquisition time 3.3 h
141M A T E R I A L S C H A R A C T E R I Z A T I O N 8 3 ( 2 0 1 3 ) 1 3 9 – 1 4 4
Any noise remaining in the thresholded images wasremoved using a MATLAB script. In this instance, all particleshaving a volume lower than 450 voxels3 (3.6 × 104 μm3) wereremoved. This value eliminated the great majority of thenoise in the sample, while maintaining the cracks. The fewlarge artifacts still remaining in the data were removedmanually in ImageJ. The filtered data were then quantitative-ly analyzed, and exported to the Mimics software, where itwas reconstructed in 3D (Fig. 4).
200 µm
a b
c d
Fig. 3 – Virtual cross sections showing cracks through sample. a)filtering, c) after segmentation and noise removal, d) with edges
It is important to note that the cracks that can bevisualized with the tomography technique are limited by theresolution of the acquisition. Due to the fact that the greyvalue of a given voxel (3D pixel) represents the average X-rayintensity of that volume, voxels where only a fraction of thevolume is cracked may appear to be fully dense in thereconstructed images. Thus, cracked regions where the crackopening displacement (COD) is less than 1 voxel (4.3 μm) weredifficult to resolve. In addition, since the data are composed ofcubic voxels of finite thickness, any linear measurements willhave a degree of uncertainty due to distances being roundedto the nearest whole voxel (as an example, a 10 μm thick crackmight appear to be 2 voxels (8.6 μm) thick in the segmenteddata, a 14% difference in thickness).
The segmented tomography data were analyzed to char-acterize the geometry of the cracks in 3D. First, the volume ofthe cracks was measured from the crack masks. 193 crackswere identified using the “regionprops” function in Matlab,which looks for regions of connected pixels, and their
before filtering, b) after anisotropic diffusion and band passoutlined to show crack detection accuracy.

1 mm
Fig. 4 – 3D rendering of cracks within the weld metal of a wetwelded steel sample. The arrow shows the weldingdirection.
0.0
10
20
30
40
50
60
0 10 20 30 40 50 60 70
Cou
nts
Equivalent Radius (µm)
0.0
5.0 105
1.0 106
1.5 106
0 5 10 15 20 25 30 35 40
Cou
nts
Thickness (µm)
a
c
Fig. 5 – Histograms showing the distributions of crack measuremThickness, d) Aspect Ratio.
142 M A T E R I A L S C H A R A C T E R I Z A T I O N 8 3 ( 2 0 1 3 ) 1 3 9 – 1 4 4
individual volumes were tallied. The crack volumes, plotted interms of average radius are shown in Fig. 5(a). The corre-sponding statistics are presented in Table 4.
Not accounting for the features below the noise cut-off, themean equivalent radius of the cracks was 20 μm, whichcorresponds to a volume of 3.4 × 104 μm3. The aspect ratio ofindividual cracks was also measured using the followingdefinition:
Aspectratio ¼ Diameter of smallest bounding sphere Feret diameterð ÞDiameter of largest enclosed sphere maximum thicknessð Þ
The Feret diameter for each crack was measured using acustom MATLAB script. The distance between voxels in agiven crack was calculated pair-wise, with the largest distancebeing equal to the Feret diameter. These measurements, alsoequal to themaximum crack length are shown in Fig. 5(b). Thethickness of the cracks was measured using Dougherty's localthickness measurement plug-in for ImageJ [14]. For each voxelin the crack, the local thickness tool measures the largest
0.0
10
20
30
40
50
60
0 500
Cou
nts
Feret Diameter (µm)
0.0
5.0
10
15
20
25
5 10 15 20 25 30 35 40
Cou
nts
Aspect Ratio
b
d
ents. a) Equivalent Radius, b) Feret Diameter, c) Crack
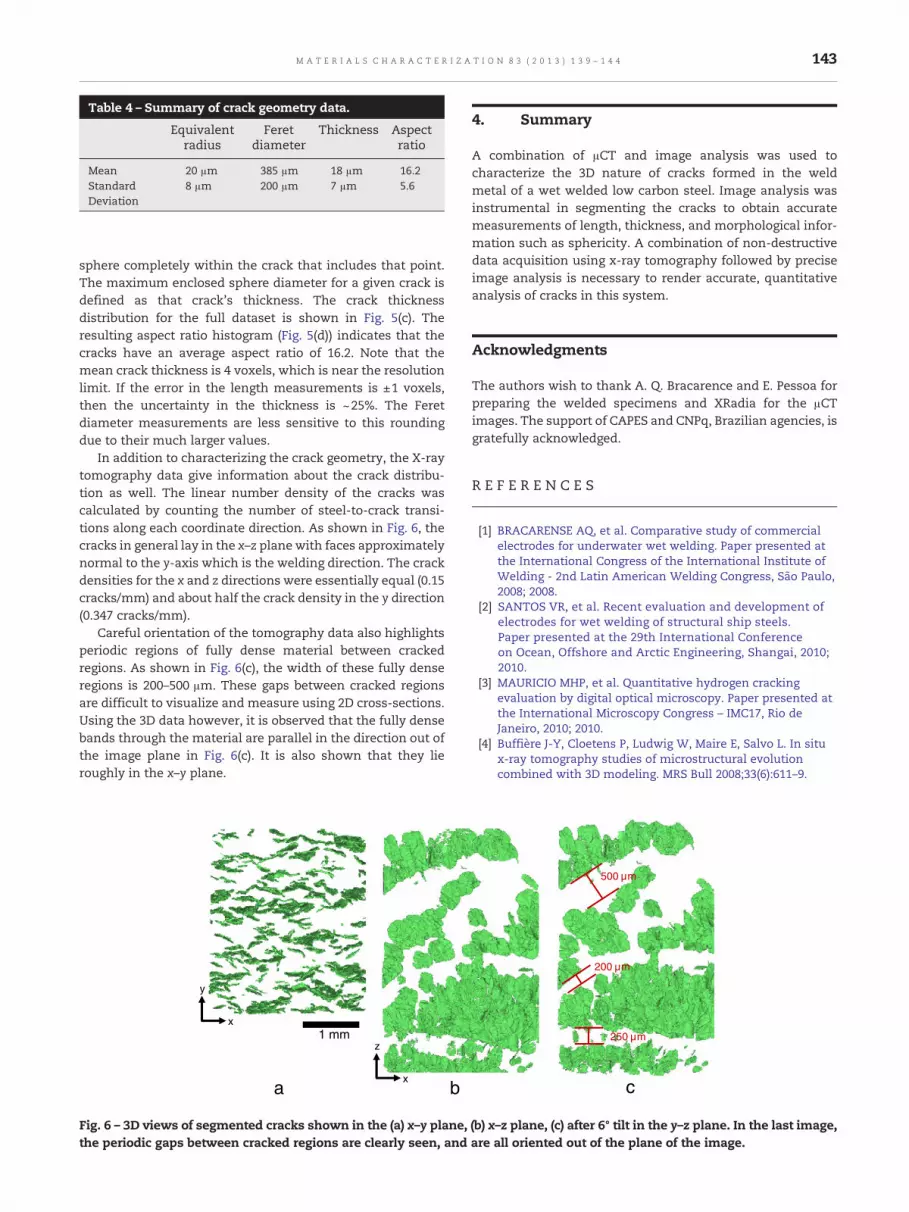
Table 4 – Summary of crack geometry data.
Equivalentradius
Feretdiameter
Thickness Aspectratio
Mean 20 μm 385 μm 18 μm 16.2StandardDeviation
8 μm 200 μm 7 μm 5.6
143M A T E R I A L S C H A R A C T E R I Z A T I O N 8 3 ( 2 0 1 3 ) 1 3 9 – 1 4 4
sphere completely within the crack that includes that point.The maximum enclosed sphere diameter for a given crack isdefined as that crack's thickness. The crack thicknessdistribution for the full dataset is shown in Fig. 5(c). Theresulting aspect ratio histogram (Fig. 5(d)) indicates that thecracks have an average aspect ratio of 16.2. Note that themean crack thickness is 4 voxels, which is near the resolutionlimit. If the error in the length measurements is ±1 voxels,then the uncertainty in the thickness is ~25%. The Feretdiameter measurements are less sensitive to this roundingdue to their much larger values.
In addition to characterizing the crack geometry, the X-raytomography data give information about the crack distribu-tion as well. The linear number density of the cracks wascalculated by counting the number of steel-to-crack transi-tions along each coordinate direction. As shown in Fig. 6, thecracks in general lay in the x–z plane with faces approximatelynormal to the y-axis which is the welding direction. The crackdensities for the x and z directions were essentially equal (0.15cracks/mm) and about half the crack density in the y direction(0.347 cracks/mm).
Careful orientation of the tomography data also highlightsperiodic regions of fully dense material between crackedregions. As shown in Fig. 6(c), the width of these fully denseregions is 200–500 μm. These gaps between cracked regionsare difficult to visualize and measure using 2D cross-sections.Using the 3D data however, it is observed that the fully densebands through the material are parallel in the direction out ofthe image plane in Fig. 6(c). It is also shown that they lieroughly in the x–y plane.
x
y
x
z1 mm
a b
Fig. 6 – 3D views of segmented cracks shown in the (a) x–y plane,the periodic gaps between cracked regions are clearly seen, and
4. Summary
A combination of μCT and image analysis was used tocharacterize the 3D nature of cracks formed in the weldmetal of a wet welded low carbon steel. Image analysis wasinstrumental in segmenting the cracks to obtain accuratemeasurements of length, thickness, and morphological infor-mation such as sphericity. A combination of non-destructivedata acquisition using x-ray tomography followed by preciseimage analysis is necessary to render accurate, quantitativeanalysis of cracks in this system.
Acknowledgments
The authors wish to thank A. Q. Bracarence and E. Pessoa forpreparing the welded specimens and XRadia for the μCTimages. The support of CAPES and CNPq, Brazilian agencies, isgratefully acknowledged.
R E F E R E N C E S
[1] BRACARENSE AQ, et al. Comparative study of commercialelectrodes for underwater wet welding. Paper presented atthe International Congress of the International Institute ofWelding - 2nd Latin American Welding Congress, São Paulo,2008; 2008.
[2] SANTOS VR, et al. Recent evaluation and development ofelectrodes for wet welding of structural ship steels.Paper presented at the 29th International Conferenceon Ocean, Offshore and Arctic Engineering, Shangai, 2010;2010.
[3] MAURICIO MHP, et al. Quantitative hydrogen crackingevaluation by digital optical microscopy. Paper presented atthe International Microscopy Congress – IMC17, Rio deJaneiro, 2010; 2010.
[4] Buffière J-Y, Cloetens P, Ludwig W, Maire E, Salvo L. In situx-ray tomography studies of microstructural evolutioncombined with 3D modeling. MRS Bull 2008;33(6):611–9.
500 µm
200 µm
250 µm
c
(b) x–z plane, (c) after 6° tilt in the y–z plane. In the last image,are all oriented out of the plane of the image.

144 M A T E R I A L S C H A R A C T E R I Z A T I O N 8 3 ( 2 0 1 3 ) 1 3 9 – 1 4 4
[5] Stock SR. Recent advances in X-ray microtomography appliedto materials. Int Mater Rev 2008;53(3):129–81.
[6] Withers Philip J, Preuss Michael. Fatigue and damage instructural materials studied by x-ray tomography. Annu RevMater Res 2012;42:81–103.
[7] Babout L, Janaszewski M, Marrow TJ, Withers PJ. A method forthe 3-D quantification of bridging ligaments during crackpropagation. Scr Mater 2011;65(2):131–4.
[8] Maire E, Bouaziz O, Di Michiel M, Verdu C. Initiation andgrowth of damage in a dual-phase steel observed by X-raymicrotomography. Acta Mater 2008;56(18):4954–64.
[9] Bakavos D, Chen Y-C, Babout L, Prangnell PB. Materialinteractions in a novel pinless tool approach to friction stirspot welding thin aluminum sheet. Metall Mater Trans A2011;42A(5):1266–82.
[10] Schmidt HNB, Dickerson TL, Hattel JH. Material flow in buttfriction stir welds in AA2024-T3. Acta Mater 2006;54(4):1199–209.
[11] Madison J, Aagensen LK. Scr Mater 2012;67:783.[12] PACIORNIK S, et al. Characterization of pores and cracks in
underwater welds by μct and digital optical microscopy. 1stInternational conference on 3D materials science, 2012,Seven Springs. , Proceedings of the 1st internationalconference on 3D materials scienceHoboken: John Wiley &Sons, Inc; 2012. p. 177–82.
[13] Perona P, Malik J. Scale-space and edge detection usinganisotropic diffusion. IEEE Trans Pattern Anal Mach Intell1990;12:629–39.
[14] DOUGHERTY RP, KUNZELMANN KH. Computing local thicknessof 3D Structures with Image J. Microscopy µanalysis 2007meeting August 5–9, 2007, Ft. Lauderdale, Florida; 2007.