İktİsadİ ve - dergipark
TRANSCRIPT
VOLUME • CİLT: 43 • ISSUE • SAYI: 1 JUNE • HAZİRAN 2021 ONLINE ISSN: 2587-2672
MARMARA ÜNİVERSİTESİ
İ KT İ S A D İ V EİDARİ BİLİMLERD E R G İ S İMARMARA UNIVERSITY JOURNAL OFECONOMIC AND ADMINISTRATIVE SCIENCES

Marmara Üniversitesi İktisadi ve İdari Bilimler Dergisi 6 Aylık Hakemli Akademik Dergi / Biannual Peer-Reviewed Academic Journal Volume • Cilt: 43 / Issue • Sayı: 1 / JUNE • HAZİRAN 2021 ONLINE ISSN: 2587-2672
Marmara Üniversitesi Rektörlüğü Adına İmtiyaz Sahibi • Owner: Prof. Dr. Erol ÖZVAR (Rektör • Rector)
Marmara Üniversitesi İktisat, İşletme ve Siyasal Bilgiler Fakülteleri Adına İmtiyaz Sahibi • Owner of the Journal Prof. Dr. Sadullah Çelik
Yayın Kurulu • Editorial Board Prof. Dr. Sadullah Çelik (Marmara Üniversitesi İktisat Fakültesi Dekanı) Prof. Dr. Hakan Yıldırım (Marmara Üniversitesi İşletme Fakültesi Dekanı) Prof. Dr. Nail Yılmaz (Marmara Üniversitesi Siyasal Bilgiler Fakültesi Dekanı)
Yazı İşleri Md. (Editör) • Editor-in-Chief Prof. Dr. Mehmet Şişman (İktisat, İktisat Fakültesi, Marmara Üniversitesi)
Danışma Kurulu • Advisory BoardProf. Dr. Ali Güzel (Kadir Has Üniversitesi), Prof. Dr. Andrea Gatto (University of Greenwich), Prof. Dr. Burak Atamtürk (İstanbul Üniversitesi), Prof. Dr. Burak Saltoğlu (Boğaziçi Üniversitesi), Prof. Dr. Elkhan Richard Sadik-Zada (Ruhr-Universität Bochum, Germany), Prof. Dr. Erhan Aslanoğlu (Piri Reis Üniversitesi), Prof. Dr. Ercan Eren (Yıldız Teknik Üniversitesi), Prof. Dr. Erol Özvar (Marmara Üniversitesi), Prof. Dr. Hakan Yetkiner (İzmir Ekonomi Üniversitesi), Prof. Dr. Mustafa Çelen (Marmara Üniversitesi), Prof. Dr. Şevket Pamuk (Boğaziçi Üniversitesi), Prof. Dr. Zeki Erdut (Dokuz Eylül Üniversitesi)Etik Kurul • Ethics CommitteeProf. Dr. Ebru Çağlayan Akay (Ekonometri, İktisat Fakültesi, Marmara Üniversitesi)Prof. Dr. Murat Dündar Demiröz (İktisat, İktisat Fakültesi, İstanbul Üniversitesi)Dr. Öğr. Üyesi Bumin Doğrusöz (Maliye, İktisat Fakütesi, Marmara Üniversitesi)Alan Editörleri • Field EditorsProf. Dr. Besim Bülent Bali (Siyasal Bilgiler, Siyasal Bilimler Fakültesi, Marmara Üniversitesi) Doç. Dr. İhsan Yiğit (İşletme, İşletme Fakültesi, Marmara Üniversitesi) Dr. Öğr. Üyesi Mustafa Emre Akbaş (İktisat, İktisat Fakültesi, Marmara Üniversitesi) Dr. Öğr. Üyesi Turgut Ün (Ekonometri, İktisat Fakültesi, Marmara Üniversitesi) Dr. Öğr. Üyesi Kemal Cebeci (Maliye, İktisat Fakültesi, Marmara Üniversitesi)Editör Yardımcıları • Editorial AssistantsDr. Öğr. Üyesi Umurcan Polat (İngilizce iktisat, İktisat Fakültesi, Marmara Üniversitesi) Dr. Ekin Karapınar (Almanca İşletme, İşletme Fakültesi, Marmara Üniversitesi) Dr. Hazel Agun (Çalışma Ekonomisi ve Endüstri İlişkileri, İktisat Fakültesi, Marmara Üniversitesi) Arş. Gör. Gizem Acet Dönmez (İktisat, İktisat Fakültesi, Marmara Üniversitesi) Arş. Gör. Hoşeng Bülbül (Ekonometri, İktisat Fakültesi, Marmara Üniversitesi)Yönetim Yeri ve Yazışma Adresi • Address Marmara Üniversitesi İktisat Fakültesi Göztepe Kampüsü 34722 Kadıköy / İSTANBUL Tel: +90 216 338 44 16 Fax: +90 216 346 43 56 E-Posta: [email protected] Üniversitesi Yayınevi • Marmara University Press Adres: Göztepe Kampüsü 34722 Kadıköy, İstanbul Tel/Faks: +90 216 777 14 00 Fax: +90 216 777 14 01 E-posta: [email protected]
M.Ü. İktisadi ve İdari Bilimler Dergisi, Haziran ve Aralık olmak üzere yılda iki kez yayımlanan uluslararası hakemli bir dergidir. Dergi, ECONLIT, EBSCO, ULRICHSWEB Global Serials Directory uluslararası veritabanları ile ULAKBİM ulusal veritabanı tarafından taranmaktadır. Dergide yayımlanan makaleler kaynak gösterilmeden kullanılamaz. Makalelerin yayım hakkı M.Ü. İktisadi ve İdari Bilimler Dergisi’ne aittir.
Marmara University Journal of Economic and Administrative Sciences is an academic journal semi-annually published in June and December. Our journal is internationally indexed in ECONLIT, EBSCO, ULRICHSWEB Global Serials Directory and nationally indexed in ULAKBİM. The Marmara University Journal of Economic and Administrative Sciences holds the publication right of the articles and the articles cannot be used without proper citation.

Hakemler • RefereesProf. Dr. Murat Akbalık (Marmara Üniversitesi) Prof. Dr. A. Taylan Altıntaş (İstanbul Üniversitesi) Prof. Dr. Cengiz Bahçekapılı (Marmara Üniversitesi) Prof. Dr. Tahsin Bakırtaş (Sakarya Üniversitesi) Prof. Dr. Zafer Çalışkan (Hacettepe Üniversitesi) Prof. Dr. Sadullah Çelik (Marmara Üniversitesi) Prof. Dr. Engin Demirel (Trakya Üniversitesi) Prof. Dr. Dündar Murat Demiröz (İstanbul Üniversitesi) Prof. Dr. Nadir Eroğlu (Marmara Üniversitesi) Prof. Dr. Sahavet Gürdal (Marmara Üniversitesi) Prof. Dr. İdil Özlem Koç (Marmara Üniversitesi) Prof. Dr. Tiğinçe Oktar (Marmara Üniversitesi) Prof. Dr. Mehmet Özmen (Çukurova Üniversitesi) Prof. Dr. Ercan Sarıdoğan (İstanbul Üniversitesi) Prof. Dr. Özlem Taşseven (Doğuş Üniversitesi) Prof. Dr. Mahmut Tekçe (Marmara Üniversitesi) Prof. Dr. Fatma Noyan Tekeli (Yıldız Teknik Üniversitesi) Prof. Dr. Veysel Ulusoy (Yeditepe Üniversitesi) Doç. Dr. Burcu Adiloğlu (İstanbul Üniversitesi) Doç. Dr. Dilek Başar Dikmen (Hacettepe Üniversitesi) Doç. Dr. Berna Güler (Marmara Üniversitesi) Doç.Dr. Aycan Hepsağ (İstanbul Üniversitesi) Doç. Dr. Ayşegül İşcanoğlu Çekiç (Trakya Üniversitesi) Doç. Dr. Ayça Can Kırgız (İstanbul Kent Üniversitesi) Doç. Dr. Ayben Koy (İstanbul Ticaret Üniversitesi) Doç. Dr. Aslan Tolga ÖCAL (Marmara Üniversitesi) Doç. Dr. Turgay Sakin (İstanbul Üniversitesi) Doç. Dr. Yaşar Serhat Yaşgül (Marmara Üniversitesi) Dr. Öğr. Üyesi Hande Barlın(Gebze Teknik Üniversitesi) Dr. Öğr. Üyesi Hakkı Kutay Bolkol (İstanbul 29 Mayıs Üniversitesi) Dr. Öğr. Üyesi Pınar Deniz (Marmara Üniversitesi) Dr. Öğr. Üyesi Saim Çağrı Kocakaplan (Marmara Üniversitesi) Dr. Öğr. Üyesi Sevda Köse (Kocaeli Üniversitesi) Dr. Öğr. Üyesi Miris Meryem Kurtulmuş (Marmara Üniversitesi) Dr. Öğr. Üyesi Demet Sezer (Selçuk Üniversitesi( Dr. Öğr. Üyesi Erdem Turgan (Marmara Üniversitesi) Dr. Öğr. Üyesi Tuba Yılmaz Soydan (Marmara Üniversitesi)
TeşekkürMarmara Üniversitesi İktisadi ve İdari Bilimler Dergisinin Haziran 2021 sayısı için değerlendirmeye alınan çalışmalar üzerine değerli zamanlarını ayıran ve değerlendirmelerini sunan hakemlerimize teşekkür ederiz.
We sincerely acknowledge the referees who kindly spent their valuable times and assessed the articles under review process to be published in the Marmara University Journal of Economic and Administrative Sciences for the issue of June, 2021.

V
İçindekiler / Contents
An Analysis of the Impacts of Financial Inclusion on Income Inequality in the Fragile Five Countries
Kırılgan Beşli Ülkelerinde Finansal Kapsayıcılığın Gelir Eşitsizliğine Etkileri Üzerine Bir AnalizEmrah DOĞAN, Cengizhan GÜLER .................................................................................................... 1
TFRS/TMS, BOBİ FRS, KÜMİ FRS ve Faizsiz Finans Muhasebe Standartları Kapsamında Gerçeğe Uygun Değer KavramıFair Value Concept in TFRS / TMS, BOBI FRS, KUMI FRS and Interest-Free Finance Accounting Standards-Free Finance Accounting StandardsSabri Burak ARZOVA, Bertaç Şakir ŞAHİN..................................................................................... 21
The Impact of Exchange Rates on Stock Prices for Turkey: An Asymmetric Non-Linear Cointegration AnalysisTürkiye için Döviz Kurlarının Hisse Senedi Fiyatlarına Etkisi: Asimetrik Doğrusal Olmayan Eşbütünleşme AnaliziEmre ÜRKMEZ, Ömer Faruk BÖLÜKBAŞI ...................................................................................... 42
Genetiği Değiştirilmiş Mısır Üretimi için Ekonomik DeğerlendirmeEconomic Evaluation for Genetically Modified Corn ProductionDuygu ÜNER BAHAR, İsmail Cem AY ............................................................................................. 57
Temel Performans Göstergeleri ile Kritik Başarı Faktörleri İlişkisi: Bir Havayolu İşletmesi UygulamasıThe Relationship of Key Performance Indicators and Critical Success Factors: An Airline Business ApplicationHakan CAVLAK ..................................................................................................................................... 78
OECD Ülkelerinde Kadınların Sosyo-Ekonomik Statüsünün Entropi-Aras Bütünleşik Yöntemiyle İncelenmesiExamining the Social-Economic Status of Women in OECD Countries with The Integrated Method of Entropy-ArasMüge YILMAZ, Mevlüdiye ŞİMŞEK, Gözde KOCA ...................................................................... 100
Industry 4.0 and Sustainable Supply ChainEndüstri 4.0 ve Sürdürülebilir Tedarik ZinciriElif BİLGİN ..........................................................................................................................................................................................123
ARAŞTIRMA MAKALELERİ / RESEARCH ARTICLES
VI
Investors’ Reactions to Environmental Disclosures: Evidence from Borsa IstanbulÇevre ile İlgili Açıklamalara Yatırımcıların Tepkileri: Borsa İstanbul Üzerine Bir AraştırmaV. Evrim ALTUK ÖZTÜRK, Ayşegül İŞCANOĞLU ÇEKİÇ ......................................................... 145
Rezerv Opsiyon Mekanizmasının Finansal İstikrara Etkisi Üzerine Ekonometrik Bir UygulamaAn Econometric Application for the Impact of Reserve Option Mechanism on Financial Stabilityİbrahim Onur KOÇAŞLI, Nadir EROĞLU ...................................................................................... 157
Household Consumption Expenditures in Turkey: A Comparative Quantile Regression AnalysisTürkiye’de Hanehalkı Tüketim Harcamaları Üzerine Karşılaştırmalı Bir Kantil Regresyon AnaliziGizem ACET DÖNMEZ, Hurşit GÜNEŞ ......................................................................................... 179
Aggregate Liquidity Creation of Islamic Banks in TurkeyTürk Katılım Bankalarının Likidite YaratımıOzlem AKIN, S. Mehmet OZSOY ...................................................................................................... 197
Is Trade Against or in Favor of Women? Empirical Evidence from Manufacturing Sector in TurkeyTicaret, Kadınlara Karşı Mı, Onların Lehine Mi Çalışır? Türkiye İmalat Sektöründen Ampirik KanıtlarŞerife GENÇ İLERİ, Mehmet Fatih ULU ......................................................................................... 213
1Makale Gönderim Tarihi:Makale Gönderim Tarihi: 26.01.2021Yayına Kabul Tarihi:Yayına Kabul Tarihi: 13.06.2021
ARAŞTIRMA MAKALESİ / RESEARCH ARTICLE
Marmara Üniversitesi İktisadi ve İdari Bilimler Dergisi • Cilt: 43 • Sayı: 1 • Haziran 2021, ISSN: 2587-2672, ss/pp. 1-20 DOI: 10.14780/muiibd.960047
AN ANALYSIS OF THE IMPACTS OF FINANCIAL INCLUSION ON INCOME INEQUALITY IN THE FRAGILE FIVE COUNTRIES
KIRILGAN BEŞLİ ÜLKELERİNDE FİNANSAL KAPSAYICILIĞIN GELİR EŞİTSİZLİĞİNE ETKİLERİ ÜZERİNE BİR ANALİZ
Emrah DOĞAN1
* Cengizhan GÜLER2
**
AbstractThe equitable distribution of income is a very important problem in the economies of the past and present. In this sense, this study aims to investigate the relationship between financial inclusion and income inequality in the fragile five countries (Colombia, Mexico, South Africa, Turkey, Indonesia). For this purpose, a comprehensive index of financial inclusion was constructed for the Fragile Five Countries. A panel data set from 2005 to 2008 was used for the study. The econometric methods used are Principal Component Analysis (PCA), Parks-Kmenta Estimator and Dumitrescu and Hurlin Panel Granger Causality test. The results show that there is a negative relationship between financial inclusion and income inequality. There is a statistically significant “inverse-U” shaped relationship between GDP per capita and income inequality in the fragile five countries. However, there is a statistically significant and negative relationship between internet usage and income inequality. In this regard, the findings of this study imply that fair growth and financial inclusion together help to reduce income inequality.Keywords: Financial Inclusion, Income Inequality, Panel Data AnalysisJEL Classification: O15, O16, G20
ÖzGelirin adil dağılımı, geçmişten günümüze ekonomilerde oldukça önemli bir sorundur. Bu anlamda bu çalışmada kırılgan beşli ülkelerinde (Kolombiya, Meksika, Güney Afrika, Türkiye, Endonezya) finansal kapsayıcılık ile gelir eşitsizliği arasındaki ilişkinin araştırılması hedeflenmiştir. Çalışmada 2005-2018 yılları arasındaki verileri içeren panel veri seti kullanılmıştır. Ekonometrik yöntem olarak Temel Bileşenler Analizi (PCA) yöntemi, Parks-Kmenta Tahmincisi ve Dumitrescu ve Hurlin tarafından geliştirilen Panel Granger Nedenselik testi kullanılmıştır. Elde edilen bulgulara göre, finansal kapsayıcılık ve gelir eşitsizliği arasında negatif bir ilişki olduğu gözlemlenmiştir. Kırılgan beşli ülkelerinde kişi başına GSYH ile gelir
* Asst. Prof. Dr., Istanbul Gelisim University, Faculty of Economics, Administrative and Social Sciences, International Trade and Finance Department, E-Mail: [email protected], ORCID: 0000-0001-9870-5719
** Res. Asst., Istanbul Gelisim University, Faculty of Economics, Administrative and Social Sciences, International Trade and Finance Department, E-Mail: [email protected], ORCID: 0000-0002-9059-3676
Emrah DOĞAN • Cengizhan GÜLER
2
eşitsizliği arasında istatistiki olarak anlamlı ve “Ters-U” biçimli bir ilişki vardır. Diğer taraftan internet kullanımı ile gelir eşitsizliği arasında ise istatistiksel olarak anlamlı ve negatif bir ilişki vardır. Bu bağlamda, bu çalışmanın bulguları, adil büyüme ve finansal kapsayıcılığın birlikte gelir eşitsizliğini azaltmaya yardımcı olduğunu ima etmektedir.Anahtar Kelimeler: Finansal Kapsayıcılık, Gelir Eşitsizliği, Panel Veri AnaliziJEL Sınıflandırması: O15, O16, G20
1. Introduction
In recent years, the problem of income inequality has become more important in almost all modern economies, regardless of the country. For this reason, policy makers in modern economies are eager to develop policies aimed at a more equal and equitable distribution of income. However, when the policies designed and implemented in the historical process are evaluated, it is found that the policies developed are inadequate One of the main reasons for this situation is that the policies developed as a result of the prevailing economic structures in the time in which we live seem to be against low-income groups, while retaining the benefits of high-income groups. This leads to a high degree of distorted and thus worsening income distribution.
In debates about income inequality, one of the most widely accepted views of how modern economies overcome the problem of income inequality is continuous economic development. However, as Park and Marcado1 noted, the worsening of income equality, despite continued economic expansion, makes the problem even more difficult to solve. Therefore, rapid economic growth is successful when the socio-economic benefits are realized in the low-income groups. When considered in this context; It is an important element to ensure economic growth by creating widespread access to the products and services of financial institutions and channelling savings into productive areas across the board in economic geography. Evaluated in this light, the widespread use of products and services of financial institutions will accelerate economic growth. Income distribution will improve as the rapid increase in economic growth spreads to all strata of society. Therefore, improving the access of low-income groups to financial services is one of the effective tools that help reduce income inequality2. At this point, financial inclusion, which can be expressed by making access to financial services more widespread and easier, especially for people from the low-income group, becomes crucial.
As mentioned earlier, financial inclusion is the process of bringing all individuals in the economy into the financial system and creating the opportunity to benefit from all the system’s opportunities3. However, today more than 70% of the total world population still lacks access to some basic banking services. It is, therefore, necessary to ensure the integration of people belonging to low-income groups into the financial system and to deepen the financial system4. First, the products and services
1 Park, C. Y., Mercado, R., Jr. (2018). Financial Inclusion, Poverty, and Income Inequality, The Singapore Economic Review, 63(01): 185-206.
2 World Bank (2018). Toward Universal Financial Inclusion in China: Models, Challenges, and Global Lessons, World Bank Group, Washington, DC, p. 25-75.
3 Sarma, M. (2008). Index of Financial Inclusion (No. 215). Working Paper: p. 1-26.4 Sehrawat, M., Giri, A. (2016). Panel Data Analysis of Financial Development, Economic Growth and Rural-Urban
Income Inequality, International Journal of Social Economics, 43(10): 998-1015.
Marmara Üniversitesi İktisadi ve İdari Bilimler Dergisi • Cilt: 43 • Sayı: 1 • Haziran 2021, ISSN: 2587-2672, ss/pp. 1-20
3
of financial institutions will become more widely available, and people with low incomes will be able to use their savings to shape their future. Second, they will be able to find suitable financing for entrepreneurial activities. In this sense, financial inclusion is predicted to reduce income inequality in society. However, according to Le et al.5 the distortion of income distribution between low-income and high-income groups does not decrease when some countries become wealthier. This raises the question of whether financial inclusion, which is the subject of this study, helps to reduce income inequality by increasing access to financial resources.
The core of the theoretical approach to financial inclusion and income inequality is the inclusion of low-income households in the financial system. In other words, the prevention of disadvantage by the environments that regulate the financial system according to their own desires forms the basis of the theoretical approach. Accordingly, increasing financial inclusion enables low-income individuals to increase their income by rejoining the financial system6. Low-income households can access financial resources and benefit from employment opportunities created by new investments. Therefore, financial inclusion can be considered as one of the dynamic tools to achieve macroeconomic stability, sustainable and inclusive economic growth, job creation, poverty reduction and equitable income distribution7.
Another view argues that financial inclusion would reduce income inequality by promoting socioeconomic advantages through expanding access to financial services. From this perspective, disadvantaged groups that are mostly excluded from the financial system, such as low-income households, rural residents, and women, should be given the opportunity to benefit from basic financial services, such as deposit and saving accounts, borrowing, payments, and insurance.8. When this possibility is given, the potential savings of this group, excluded due to insufficient income levels and market discrimination, are included in the financial system and the level of investment resources is increased and the loss of wealth accumulation is reduced. Consequently, financial inclusion provides households and firms with greater access to resources to borrow to finance their consumption and investment, thereby increasing the level of economic activity. As a result, income inequality would be attenuated by increasing welfare in the economy in general, especially among groups excluded from the financial system9. At this point, it should be stressed that, as noted by Demirgüç-Kunt et. al10, the desire for financial inclusion to reach the whole of society does not mean giving credit to everyone. For the granting of credit to individuals without any conditions will lead to an inefficient use of savings. On the other hand, allowing anyone who wishes to do so to open a bank account at a low cost that they can reach and afford will not lead to such a negative situation.
5 Le, Q., Ho, H., Mai, N. (2019). The Impact of Financial Inclusion on Income Inequality in Transition Economies, Management Science Letters, 9(5): 661-672.
6 Omar, M. A., Inaba, K. (2020). Does Financial Inclusion Reduce Poverty and Income Inequality in Developing Countries? A Panel Data Analysis, Journal of Economic Structures, 9:1-25.
7 Omar, Inaba, 2020, 1-25.8 World Bank (2014). Global Financial Development Report 2014: Financial Inclusion. World Bank Group, Washington,
DC. https://openknowledge.worldbank.org/handle/10986/16238 (Accessed on: 14 June 2021)9 Omar, Inaba, 2020, 1-25.10 Demirgüç-Kunt, A., Klapper, L. F., Singer, D., Van Oudheusden, P. (2015). The Global Findex Database 2014: Measuring
Financial Inclusion Around The World. World Bank Policy Research Working Paper, (7255): 1-97.
Emrah DOĞAN • Cengizhan GÜLER
4
The purpose of this study is to determine whether financial inclusion, an important topic of discussion in the literature, has an impact on income inequality. It is well known that structural problems such as high current account deficit, high inflation rates and unstable growth rates play an important role in income inequality. The fact that the countries designated as the Fragile Five face intense structural problems makes the issue even more important. In the assessment in this context, these countries were selected as the sample for the study based on the importance of the problem of income inequality in the fragile five countries. To this end, following the report published in 2016 by Morgan Stanley, the relationship between financial inclusion and income inequality in Colombia, Mexico, South Africa, Turkey and Indonesia, the fragile five countries, was investigated. This study has been prepare based on panel dataset, which contains data between 2005 and 2018, and the method Principal Components Analysis (PCA), the Parks-Kmenta Estimator and Dumitrescu and Hurlin Panel Granger Causality test. Given the intense debates about the impact of financial inclusion on income inequality, this study will make an empirical contribution to these debates. The most important feature that distinguishes the study from the other studies is that it provides a comprehensive index of financial inclusion for fragile five countries. If evaluated in this framework, the study is likely to make an important contribution to the literature.
In the study, the literature is first included, in which the results of the previous studies on the topic of the study are presented. Then, after presenting the data set and the method used in the study, the empirical findings obtained in the study are presented. Finally, the findings obtained in the study are evaluated and recommendations are made.
2. Literature Review
Before researching the effect of financial inclusion on income inequality in the literature, the relationship between financial inclusion and economic growth has been a widely studied research subject. According to Honahan11, it was accepted in the established literature that financial sector development had a negative effect on economic growth and subsequent income distribution and poverty. This view has changed with empirical studies accompanied by new data releases. Various studies, such as Li et. al12, Dehejia and Gatti13, Honohan14 have shown that financial development intensive growth reduces poverty. There are many studies in the literature that confirm this relationship. Following the studies that examined poverty and income inequality in the context of financial development, the index of financial inclusion (IFI), formed with different parametric variables, has been the subject of various studies in the economics literature, either alone or together with other phenomena. In short, financial inclusion aims to increase the welfare of individuals who are outside the financial system (mostly low-income groups) by giving them wider access to the
11 Honohan, P. (2004). Financial Development, Growth and Poverty: How Close Are The Links?. In Financial Development and Economic Growth (pp. 1-37). Palgrave Macmillan, London.
12 Li, H., Squire, L., Zou, H. F. (1998). Explaining International and Intertemporal Variations in Income Inequality. The Economic Journal, 108(446): 26-43.
13 Dehejia, R. H., Gatti, R. (2002). Child Labor: The Role of Income Variability and Access to Credit in a Cross-Section of Countries. Working Paper, p. 1-30.
14 Honohan, 2004, 1-37.
Marmara Üniversitesi İktisadi ve İdari Bilimler Dergisi • Cilt: 43 • Sayı: 1 • Haziran 2021, ISSN: 2587-2672, ss/pp. 1-20
5
products and services of financial institutions15. When we consider the context of widespread access, Demirguc-Kut et al.16 found that high financial inclusion was related to factors such as low banking costs, proximity to bank branches, and the need for less paperwork to open a bank account.
Various indices have been constructed in the literature by using different variables in relation to each context to measure financial inclusion. The index created by Sarma17 is widely used. In this index, financial inclusion is discussed in three dimensions. Namely, the share of the population with bank deposit accounts in the total population (penetration), bank branches per 1000 people (accessibility), and the ratio of each country’s loan and deposit volume to GDP (usage). Another index summarises financial inclusion under four headings. The first focuses on the study of formal accounts, the second on the assessment of savings behaviour, the third on the source of borrowing, and the fourth on insurance benefits for health and agriculture18.
Looking at the relationship between financial inclusion, income inequality and poverty, we find that the corresponding topic has been analyzed in the economic literature with different methods and aspects. The main concern in this web of relationships is whether income inequality and poverty in society have decreased with increased economic activity as a result of financial inclusion. Therefore, it is very likely that poverty and income inequality will be reduced if income growth is in favor of low-income groups 19. Studies on this topic consist of a combined analysis of financial inclusion and income inequality, financial inclusion and poverty, or both poverty and income inequality.
Considering the empirical studies that examined financial inclusion, income inequality, and poverty, Bae, Han and Sohn20 used the fixed effects panel regression model for the United States based on 2000-2007 and examined the effect of access to financial resources on income inequality and poverty. The financial inclusion variable created by the researchers was created considering several factors, just like the financial inclusion index. These factors are the number of financial institutions per 10.000 people, the number of financial institutions in an area of 100m2 and the ratio of average deposit account to GDP per capita. The study found that access to financial resources reduces income inequality and poverty. Dhrifi 21 examined the relationship between financial development, economic growth, income inequality and poverty in 89 countries between 1990 and 2011 using simultaneous equations. The results of the study concluded that financial development reduces poverty and income inequality in middle and high income countries. The results of the study concluded that financial development reduces poverty and income inequality in middle and high income countries but increases them in low-income countries.
15 Sarma, M. (2008). Index of Financial Inclusion (No. 215). Working paper: p. 1-26.16 Demirguc-Kunt, A., Klapper, L., Peria, M. S. M. (2012). The Foundations of Financial Inclusion: Understanding
Ownership and Use of Formal Accounts. The World Bank Working paper: p. 1-61.17 Sarma, 2008, 1-26.18 Demirguc-Kunt, Klapper, Peria, 2012, 1-61.19 Jalilian, H., Kirkpatrick, C. (2002). Financial Development and Poverty Reduction in Developing Countries. International
Journal of Finance & Economics, 7(2): 97-108.20 Bae, K., Han, D., Sohn, H. (2012). Importance of Access to Finance in Reducing Income Inequality and Poverty Level.
International Review of Public Administration, 17(1): 55-77.21 Dhrifi, A. (2015). Financial Development and the Growth-Inequality-Poverty Triangle. Journal of the Knowledge
Economy, 6(4): 1163-1176.
Emrah DOĞAN • Cengizhan GÜLER
6
In another study, Seven and Coskun22 used panel regression analysis to analyze income inequality and poverty for the economies of 37 developing countries based on the performance of the banking sector and the stock market. According to the results of the study, it was found that banking sector development reduces inequality and poverty more effectively than the stock market.
In the study by Park and Mercado23, which examined financial inclusion, income inequality and poverty using panel regression analysis for 176 countries, including 37 developing Asian countries, a negative correlation was found between financial inclusion, income inequality and poverty, except for the developing Asian countries. For Asian developing countries, financial inclusion was found to have a positive effect on poverty reduction and no statistically significant causality was found with respect to income inequality. According to the authors, the possible reason for the lack of any causality for income inequality is that when financial inclusion increases, the increase captures every income group; thus, the effect is eliminated when measured by the Gini coefficient. According to the financial inclusion index formed by the researchers, it was observed that per capita income, rule of law, primary school completion and literacy are positively correlated with high financial inclusion.
As a result of the study conducted by Neaime and Gaysset24 using the generalized moments method for MENA countries between 2002 and 2015, it was found that financial inclusion reduced income inequality but had no effect on poverty. Moreover, for MENA countries, the authors pointed out that financial stability, financial inclusion and innovation can work simultaneously. In this context, it was observed that countries such as Tunisia and Morocco, unlike some MENA countries, use financial innovation and financial inclusion as supportive policies to reduce income inequality and poverty.
The relationship between income inequality and financial inclusion was analyzed in the study by Lan and Thuong25 using a two-stage least squares analysis for 22 transition countries between 2005 and 2015 and two different indices of financial inclusion. The result shows that there is a negative correlation between financial inclusion and income inequality.
The impact of financial inclusion on income inequality and poverty through information and communication technologies was investigated by Mushtaq and Bruneau26 , using pooled least squares, fixed effects and random effects panel data analysis methods for 62 countries between 2001-2012. The results of the study showed that poverty decreased in parallel with the spread of microfinance. This result does not change when the Gini coefficient is used instead of the poverty variable.
22 Seven, U., Coskun, Y. (2016). Does Financial Development Reduce Income Inequality and Poverty? Evidence From Emerging Countries. Emerging Markets Review, 26: 34-63.
23 Park, Mercado, 2018, 185-206.24 Neaime, S., Gaysset, I. (2018). Financial Inclusion and Stability in MENA: Evidence From Poverty and Inequality,
Finance Research Letters, 24: 230-237.25 Lan, H. H., Thuong, P. T. H. (2019). Financial Inclusion and Income Inequality: Empirical Evidence From Transition.
Economies, Journal of Economics and Development, 21: 23-34.26 Mushtaq, R., Bruneau, C. (2019). Microfinance, Financial Inclusion and ICT: Implications for Poverty And Inequality.
Technology in Society, 59(101154): 1-19.
Marmara Üniversitesi İktisadi ve İdari Bilimler Dergisi • Cilt: 43 • Sayı: 1 • Haziran 2021, ISSN: 2587-2672, ss/pp. 1-20
7
Another study by Ouechtati27 analyzed the relationship between financial inclusion, income inequality and poverty using various methods dynamic panel data analysis between 2004 and 2017 for 53 developing countries. As a result of the study, it was found that financial inclusion is effective in reducing income inequality and poverty. It was observed that the number of bank branches per 100,000 people and the number of commercial banks per 1,000 people influence income inequality more than other financial inclusion variables at 1% and 5% significance levels. When the study is evaluated on the poverty axis, it was concluded that the variables of commercial banks per 1,000 people and number of commercial banks per 1,000 people are more effective in the financial inclusion index at 1% and 5% significance levels.
In a recent study, Omar and Inaba 28 identified per capita income and internet usage in the positive sense and rate of dependent population, income inequality and inflation in the negative sense as determinants of financial inclusion using dynamic panel regression for 116 developing countries and fixed effects estimation method. According to the findings of the study covering 2004-2016 period, financial inclusion was found to be effective in reducing poverty and income inequality.
In another study, Bettin et al.29 analyzed on a single-country basis the relationship between financial inclusion and poverty using the dynamic random effects probit model for Italy over the period 2002-2016. The results suggest that financial inclusion has a positive effect on poverty reduction. Moreover, women and young people were found to be weaker than men and older people in terms of poverty-reducing financial inclusion. In this context, it was noted that protective measures should be taken for these people.
3. Model, Dataset and Method
3.1. Dataset
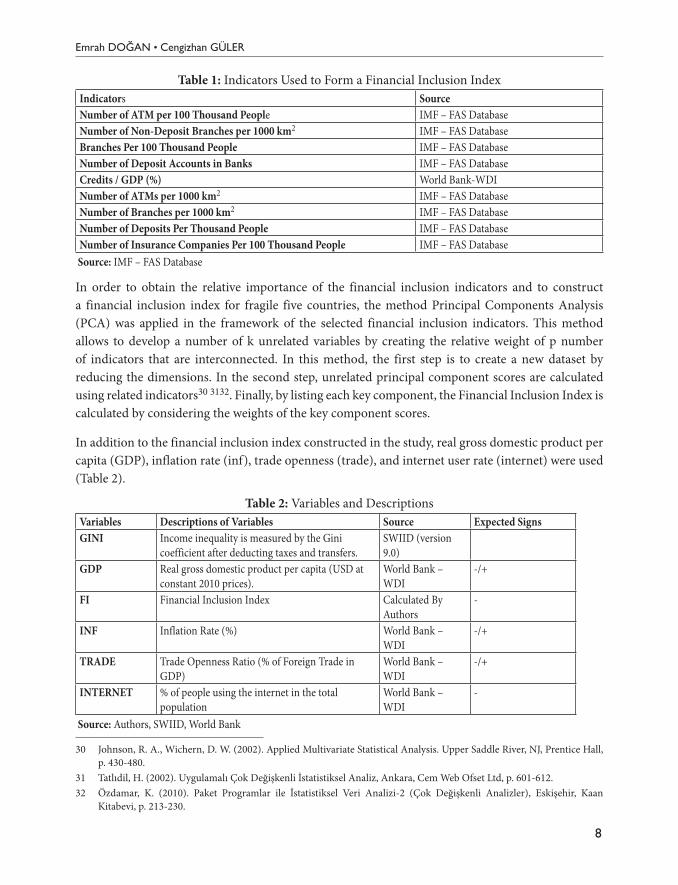
The study empirically examines the effect of financial inclusion in fragile five countries on income inequality. In this regard, the data used in the study were obtained from the IMF database and the World Bank database for the period 2005-2018. The study used the financial inclusion index (FI) to represent financial inclusion while examining the relationship between financial inclusion and income inequality in the fragile five countries. In examining the literature on this index, different financial inclusion indices and related indicators were used by the targets of different studies. Unlike other studies in the literature, this study creates a new financial inclusion index by using most of the indicators accessible from the financial inclusion indicators in the literature. The indicators covered in the study are shown in Table 1.
27 Ouechtati, I. (2020). The Contribution of Financial Inclusion in Reducing Poverty and Income Inequality in Developing Countries. Asian Economic and Financial Review, 10(9): 1051-1061.
28 Omar, Inaba, 2020, 1-25.29 Bettin, G., Pigini, C., Zazzaro, A. (2020). Financial Inclusion and Poverty Transitions: An Empirical Analysis for Italy
(No. 164), Money and Finance Research Group (Mo. Fi. R.) Working Paper, Univ. Politecnica Marche-Dept. Economic and Social Sciences.
Emrah DOĞAN • Cengizhan GÜLER
8
Table 1: Indicators Used to Form a Financial Inclusion IndexIndicators SourceNumber of ATM per 100 Thousand People IMF – FAS DatabaseNumber of Non-Deposit Branches per 1000 km2 IMF – FAS DatabaseBranches Per 100 Thousand People IMF – FAS DatabaseNumber of Deposit Accounts in Banks IMF – FAS DatabaseCredits / GDP (%) World Bank-WDINumber of ATMs per 1000 km2 IMF – FAS DatabaseNumber of Branches per 1000 km2 IMF – FAS DatabaseNumber of Deposits Per Thousand People IMF – FAS DatabaseNumber of Insurance Companies Per 100 Thousand People IMF – FAS Database
Source: IMF – FAS Database
In order to obtain the relative importance of the financial inclusion indicators and to construct a financial inclusion index for fragile five countries, the method Principal Components Analysis (PCA) was applied in the framework of the selected financial inclusion indicators. This method allows to develop a number of k unrelated variables by creating the relative weight of p number of indicators that are interconnected. In this method, the first step is to create a new dataset by reducing the dimensions. In the second step, unrelated principal component scores are calculated using related indicators30 3132. Finally, by listing each key component, the Financial Inclusion Index is calculated by considering the weights of the key component scores.
In addition to the financial inclusion index constructed in the study, real gross domestic product per capita (GDP), inflation rate (inf), trade openness (trade), and internet user rate (internet) were used (Table 2).
Table 2: Variables and DescriptionsVariables Descriptions of Variables Source Expected SignsGINI Income inequality is measured by the Gini
coefficient after deducting taxes and transfers.SWIID (version 9.0)
GDP Real gross domestic product per capita (USD at constant 2010 prices).
World Bank – WDI
-/+
FI Financial Inclusion Index Calculated By Authors
-
INF Inflation Rate (%) World Bank – WDI
-/+
TRADE Trade Openness Ratio (% of Foreign Trade in GDP)
World Bank – WDI
-/+
INTERNET % of people using the internet in the total population
World Bank – WDI
-
Source: Authors, SWIID, World Bank
30 Johnson, R. A., Wichern, D. W. (2002). Applied Multivariate Statistical Analysis. Upper Saddle River, NJ, Prentice Hall, p. 430-480.
31 Tatlıdil, H. (2002). Uygulamalı Çok Değişkenli İstatistiksel Analiz, Ankara, Cem Web Ofset Ltd, p. 601-612.32 Özdamar, K. (2010). Paket Programlar ile İstatistiksel Veri Analizi-2 (Çok Değişkenli Analizler), Eskişehir, Kaan
Kitabevi, p. 213-230.
Marmara Üniversitesi İktisadi ve İdari Bilimler Dergisi • Cilt: 43 • Sayı: 1 • Haziran 2021, ISSN: 2587-2672, ss/pp. 1-20
9
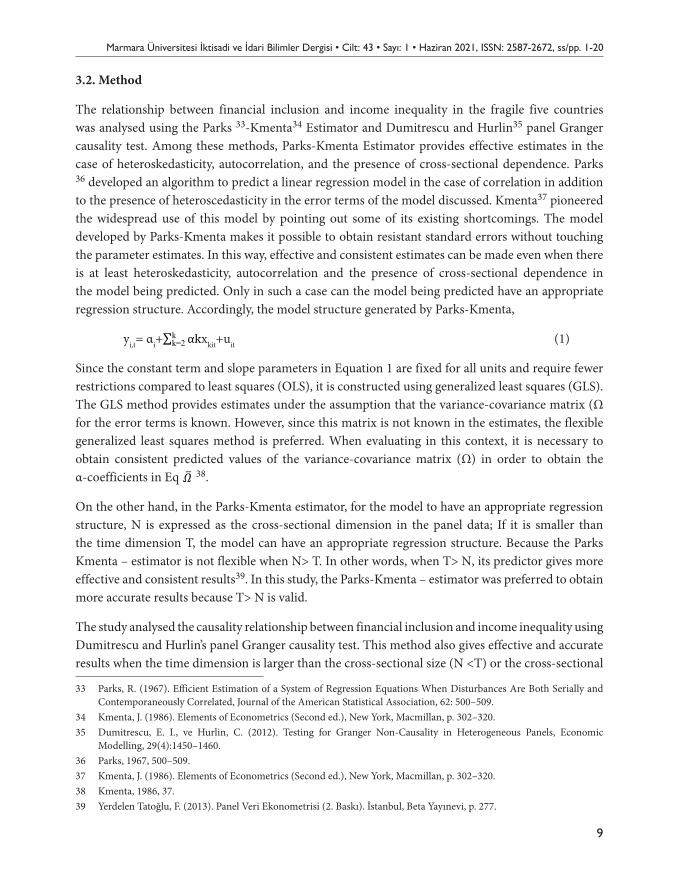
3.2. Method
The relationship between financial inclusion and income inequality in the fragile five countries was analysed using the Parks 33-Kmenta34 Estimator and Dumitrescu and Hurlin35 panel Granger causality test. Among these methods, Parks-Kmenta Estimator provides effective estimates in the case of heteroskedasticity, autocorrelation, and the presence of cross-sectional dependence. Parks 36 developed an algorithm to predict a linear regression model in the case of correlation in addition to the presence of heteroscedasticity in the error terms of the model discussed. Kmenta37 pioneered the widespread use of this model by pointing out some of its existing shortcomings. The model developed by Parks-Kmenta makes it possible to obtain resistant standard errors without touching the parameter estimates. In this way, effective and consistent estimates can be made even when there is at least heteroskedasticity, autocorrelation and the presence of cross-sectional dependence in the model being predicted. Only in such a case can the model being predicted have an appropriate regression structure. Accordingly, the model structure generated by Parks-Kmenta,
yi,t= αi+
INTERNET % of people using the internet in the total population
World Bank- WDI
-
Source: Authors, SWIID, World Bank
3.2. Method
The relationship between financial inclusion and income inequality in the fragile five countries was analysed using the Parks 33-Kmenta34 Estimator and Dumitrescu and Hurlin35 panel Granger causality test. Among these methods, Parks-Kmenta Estimator provides effective estimates in the case of heteroskedasticity, autocorrelation, and the presence of cross-sectional dependence. Parks 36 developed an algorithm to predict a linear regression model in the case of correlation in addition to the presence of heteroscedasticity in the error terms of the model discussed. Kmenta37 pioneered the widespread use of this model by pointing out some of its existing shortcomings. The model developed by Parks-Kmenta makes it possible to obtain resistant standard errors without touching the parameter estimates. In this way, effective and consistent estimates can be made even when there is at least heteroskedasticity, autocorrelation and the presence of cross-sectional dependence in the model being predicted. Only in such a case can the model being predicted have an appropriate regression structure. Accordingly, the model structure generated by Parks-Kmenta,
yi,t= αi+∑ αkkk=2 xkit+uit (1)
Since the constant term and slope parameters in Equation 1 are fixed for all units and require fewer restrictions compared to least squares (OLS), it is constructed using generalized least squares (GLS). The GLS method provides estimates under the assumption that the variance-covariance matrix (Ω for the error terms is known. However, since this matrix is not known in the estimates, the flexible generalized least squares method is preferred. When evaluating in this context, it is necessary to obtain consistent predicted values of the variance-covariance matrix (Ω) in order to obtain the α-coefficients in Eq �̅�𝛺 38.
On the other hand, in the Parks-Kmenta estimator, for the model to have an appropriate regression structure, N is expressed as the cross-sectional dimension in the panel data; If it is smaller than the time dimension T, the model can have an appropriate regression structure. Because the Parks Kmenta -estimator is not flexible when N> T. In other words, when T> N, its
33 Parks, R. (1967). Efficient Estimation of a System of Regression Equations When Disturbances Are Both Serially and Contemporaneously Correlated, Journal of the American Statistical Association, 62: 500–509. 34 Kmenta, J. (1986). Elements of Econometrics (Second ed.), New York, Macmillan, p. 302–320. 35 Dumitrescu, E. I., ve Hurlin, C. (2012). Testing for Granger Non-Causality in Heterogeneous Panels, Economic Modelling, 29(4):1450–1460. 36 Parks, 1967, 500–509. 37 Kmenta, J. (1986). Elements of Econometrics (Second ed.), New York, Macmillan, p. 302–320. 38 Kmenta, 1986, 37.
xkit+uit (1)
Since the constant term and slope parameters in Equation 1 are fixed for all units and require fewer restrictions compared to least squares (OLS), it is constructed using generalized least squares (GLS). The GLS method provides estimates under the assumption that the variance-covariance matrix (Ω for the error terms is known. However, since this matrix is not known in the estimates, the flexible generalized least squares method is preferred. When evaluating in this context, it is necessary to obtain consistent predicted values of the variance-covariance matrix (Ω) in order to obtain the α-coefficients in Eq
INTERNET % of people using the internet in the total population
World Bank- WDI
-
Source: Authors, SWIID, World Bank
3.2. Method
The relationship between financial inclusion and income inequality in the fragile five countries was analysed using the Parks 33-Kmenta34 Estimator and Dumitrescu and Hurlin35 panel Granger causality test. Among these methods, Parks-Kmenta Estimator provides effective estimates in the case of heteroskedasticity, autocorrelation, and the presence of cross-sectional dependence. Parks 36 developed an algorithm to predict a linear regression model in the case of correlation in addition to the presence of heteroscedasticity in the error terms of the model discussed. Kmenta37 pioneered the widespread use of this model by pointing out some of its existing shortcomings. The model developed by Parks-Kmenta makes it possible to obtain resistant standard errors without touching the parameter estimates. In this way, effective and consistent estimates can be made even when there is at least heteroskedasticity, autocorrelation and the presence of cross-sectional dependence in the model being predicted. Only in such a case can the model being predicted have an appropriate regression structure. Accordingly, the model structure generated by Parks-Kmenta,
yi,t= αi+∑ αkkk=2 xkit+uit (1)
Since the constant term and slope parameters in Equation 1 are fixed for all units and require fewer restrictions compared to least squares (OLS), it is constructed using generalized least squares (GLS). The GLS method provides estimates under the assumption that the variance-covariance matrix (Ω for the error terms is known. However, since this matrix is not known in the estimates, the flexible generalized least squares method is preferred. When evaluating in this context, it is necessary to obtain consistent predicted values of the variance-covariance matrix (Ω) in order to obtain the α-coefficients in Eq �̅�𝛺 38.
On the other hand, in the Parks-Kmenta estimator, for the model to have an appropriate regression structure, N is expressed as the cross-sectional dimension in the panel data; If it is smaller than the time dimension T, the model can have an appropriate regression structure. Because the Parks Kmenta -estimator is not flexible when N> T. In other words, when T> N, its
33 Parks, R. (1967). Efficient Estimation of a System of Regression Equations When Disturbances Are Both Serially and Contemporaneously Correlated, Journal of the American Statistical Association, 62: 500–509. 34 Kmenta, J. (1986). Elements of Econometrics (Second ed.), New York, Macmillan, p. 302–320. 35 Dumitrescu, E. I., ve Hurlin, C. (2012). Testing for Granger Non-Causality in Heterogeneous Panels, Economic Modelling, 29(4):1450–1460. 36 Parks, 1967, 500–509. 37 Kmenta, J. (1986). Elements of Econometrics (Second ed.), New York, Macmillan, p. 302–320. 38 Kmenta, 1986, 37.
38.
On the other hand, in the Parks-Kmenta estimator, for the model to have an appropriate regression structure, N is expressed as the cross-sectional dimension in the panel data; If it is smaller than the time dimension T, the model can have an appropriate regression structure. Because the Parks Kmenta – estimator is not flexible when N> T. In other words, when T> N, its predictor gives more effective and consistent results39. In this study, the Parks-Kmenta – estimator was preferred to obtain more accurate results because T> N is valid.
The study analysed the causality relationship between financial inclusion and income inequality using Dumitrescu and Hurlin’s panel Granger causality test. This method also gives effective and accurate results when the time dimension is larger than the cross-sectional size (N <T) or the cross-sectional
33 Parks, R. (1967). Efficient Estimation of a System of Regression Equations When Disturbances Are Both Serially and Contemporaneously Correlated, Journal of the American Statistical Association, 62: 500–509.
34 Kmenta, J. (1986). Elements of Econometrics (Second ed.), New York, Macmillan, p. 302–320.35 Dumitrescu, E. I., ve Hurlin, C. (2012). Testing for Granger Non-Causality in Heterogeneous Panels, Economic
Modelling, 29(4):1450–1460.36 Parks, 1967, 500–509.37 Kmenta, J. (1986). Elements of Econometrics (Second ed.), New York, Macmillan, p. 302–320.38 Kmenta, 1986, 37.39 Yerdelen Tatoğlu, F. (2013). Panel Veri Ekonometrisi (2. Baskı). İstanbul, Beta Yayınevi, p. 277.
Emrah DOĞAN • Cengizhan GÜLER
10
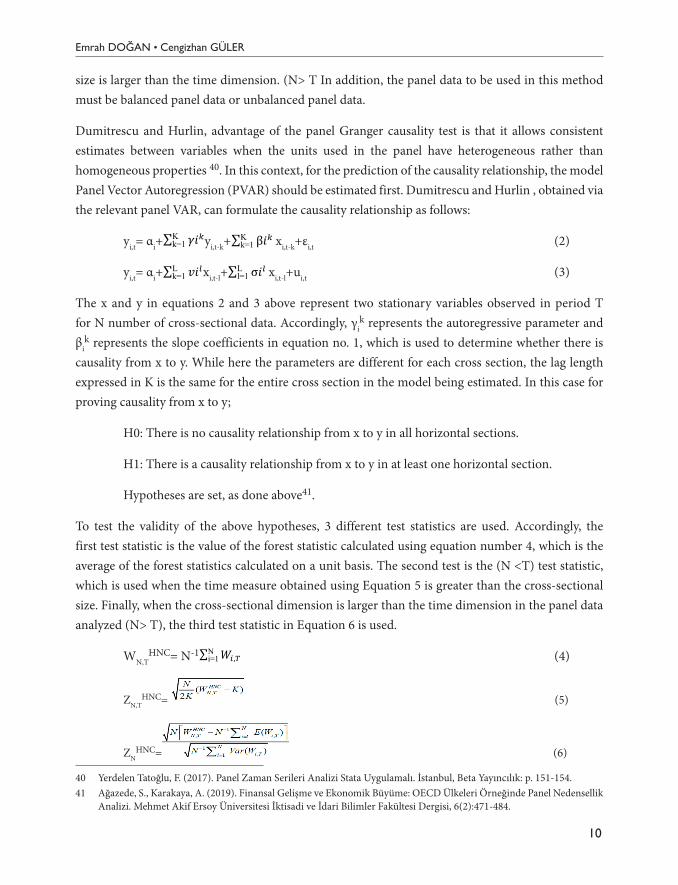
size is larger than the time dimension. (N> T In addition, the panel data to be used in this method must be balanced panel data or unbalanced panel data.
Dumitrescu and Hurlin, advantage of the panel Granger causality test is that it allows consistent estimates between variables when the units used in the panel have heterogeneous rather than homogeneous properties 40. In this context, for the prediction of the causality relationship, the model Panel Vector Autoregression (PVAR) should be estimated first. Dumitrescu and Hurlin , obtained via the relevant panel VAR, can formulate the causality relationship as follows:
yi,t= αi+
Makale Gönderim Tarihi: 26.01.2021 Yayına Kabul Tarihi: 13.06.2021
predictor gives more effective and consistent results39. In this study, the Parks-Kmenta -estimator was preferred to obtain more accurate results because T> N is valid.
The study analysed the causality relationship between financial inclusion and income inequality using Dumitrescu and Hurlin's panel Granger causality test. This method also gives effective and accurate results when the time dimension is larger than the cross-sectional size (N <T) or the cross-sectional size is larger than the time dimension. (N> T In addition, the panel data to be used in this method must be balanced panel data or unbalanced panel data.
Dumitrescu and Hurlin, advantage of the panel Granger causality test is that it allows consistent estimates between variables when the units used in the panel have heterogeneous rather than homogeneous properties 40. In this context, for the prediction of the causality relationship, the model Panel Vector Autoregression (PVAR) should be estimated first. Dumitrescu and Hurlin , obtained via the relevant panel VAR, can formulate the causality relationship as follows:
yi,t= αi+∑ 𝛾𝛾𝛾𝛾𝑘𝑘Kk=1 yi,t-k+∑ β𝛾𝛾𝑘𝑘K
k=1 xi,t-k+εi,t (2)
yi,t= αi+∑ 𝑣𝑣𝛾𝛾𝑙𝑙Lk=1 xi,t-l+∑ σ𝛾𝛾𝑙𝑙L
l=1 xi,t-l+ui,t (3)
The x and y in equations 2 and 3 above represent two stationary variables observed in period T for N number of cross-sectional data. Accordingly, γi
k represents the autoregressive parameter and βi
k represents the slope coefficients in equation no. 1, which is used to determine whether there is causality from x to y. While here the parameters are different for each cross section, the lag length expressed in K is the same for the entire cross section in the model being estimated. In this case for proving causality from x to y;
H0: There is no causality relationship from x to y in all horizontal sections.
H1: There is a causality relationship from x to y in at least one horizontal section.
Hypotheses are set, as done above41.
To test the validity of the above hypotheses, 3 different test statistics are used. Accordingly, the first test statistic is the value of the forest statistic calculated using equation number 4, which is the average of the forest statistics calculated on a unit basis. The second test is the (N <T) test statistic, which is used when the time measure obtained using Equation 5 is greater than the cross-sectional size. Finally, when the cross-sectional dimension is larger than the time dimension in the panel data analyzed (N> T), the third test statistic in Equation 6 is used.
39 Yerdelen Tatoğlu, F. (2013). Panel Veri Ekonometrisi (2. Baskı). İstanbul, Beta Yayınevi, p. 277. 40 Yerdelen Tatoğlu, F. (2017). Panel Zaman Serileri Analizi Stata Uygulamalı. İstanbul, Beta Yayıncılık: p. 151-154. 41 Ağazede, S., Karakaya, A. (2019). Finansal Gelişme ve Ekonomik Büyüme: OECD Ülkeleri Örneğinde Panel Nedensellik Analizi. Mehmet Akif Ersoy Üniversitesi İktisadi ve İdari Bilimler Fakültesi Dergisi, 6(2):471-484.
yi,t-k+
Makale Gönderim Tarihi: 26.01.2021 Yayına Kabul Tarihi: 13.06.2021
predictor gives more effective and consistent results39. In this study, the Parks-Kmenta -estimator was preferred to obtain more accurate results because T> N is valid.
The study analysed the causality relationship between financial inclusion and income inequality using Dumitrescu and Hurlin's panel Granger causality test. This method also gives effective and accurate results when the time dimension is larger than the cross-sectional size (N <T) or the cross-sectional size is larger than the time dimension. (N> T In addition, the panel data to be used in this method must be balanced panel data or unbalanced panel data.
Dumitrescu and Hurlin, advantage of the panel Granger causality test is that it allows consistent estimates between variables when the units used in the panel have heterogeneous rather than homogeneous properties 40. In this context, for the prediction of the causality relationship, the model Panel Vector Autoregression (PVAR) should be estimated first. Dumitrescu and Hurlin , obtained via the relevant panel VAR, can formulate the causality relationship as follows:
yi,t= αi+∑ 𝛾𝛾𝛾𝛾𝑘𝑘Kk=1 yi,t-k+∑ β𝛾𝛾𝑘𝑘K
k=1 xi,t-k+εi,t (2)
yi,t= αi+∑ 𝑣𝑣𝛾𝛾𝑙𝑙Lk=1 xi,t-l+∑ σ𝛾𝛾𝑙𝑙L
l=1 xi,t-l+ui,t (3)
The x and y in equations 2 and 3 above represent two stationary variables observed in period T for N number of cross-sectional data. Accordingly, γi
k represents the autoregressive parameter and βi
k represents the slope coefficients in equation no. 1, which is used to determine whether there is causality from x to y. While here the parameters are different for each cross section, the lag length expressed in K is the same for the entire cross section in the model being estimated. In this case for proving causality from x to y;
H0: There is no causality relationship from x to y in all horizontal sections.
H1: There is a causality relationship from x to y in at least one horizontal section.
Hypotheses are set, as done above41.
To test the validity of the above hypotheses, 3 different test statistics are used. Accordingly, the first test statistic is the value of the forest statistic calculated using equation number 4, which is the average of the forest statistics calculated on a unit basis. The second test is the (N <T) test statistic, which is used when the time measure obtained using Equation 5 is greater than the cross-sectional size. Finally, when the cross-sectional dimension is larger than the time dimension in the panel data analyzed (N> T), the third test statistic in Equation 6 is used.
39 Yerdelen Tatoğlu, F. (2013). Panel Veri Ekonometrisi (2. Baskı). İstanbul, Beta Yayınevi, p. 277. 40 Yerdelen Tatoğlu, F. (2017). Panel Zaman Serileri Analizi Stata Uygulamalı. İstanbul, Beta Yayıncılık: p. 151-154. 41 Ağazede, S., Karakaya, A. (2019). Finansal Gelişme ve Ekonomik Büyüme: OECD Ülkeleri Örneğinde Panel Nedensellik Analizi. Mehmet Akif Ersoy Üniversitesi İktisadi ve İdari Bilimler Fakültesi Dergisi, 6(2):471-484.
xi,t-k+εi,t (2)
yi,t= αi+
Makale Gönderim Tarihi: 26.01.2021 Yayına Kabul Tarihi: 13.06.2021
predictor gives more effective and consistent results39. In this study, the Parks-Kmenta -estimator was preferred to obtain more accurate results because T> N is valid.
The study analysed the causality relationship between financial inclusion and income inequality using Dumitrescu and Hurlin's panel Granger causality test. This method also gives effective and accurate results when the time dimension is larger than the cross-sectional size (N <T) or the cross-sectional size is larger than the time dimension. (N> T In addition, the panel data to be used in this method must be balanced panel data or unbalanced panel data.
Dumitrescu and Hurlin, advantage of the panel Granger causality test is that it allows consistent estimates between variables when the units used in the panel have heterogeneous rather than homogeneous properties 40. In this context, for the prediction of the causality relationship, the model Panel Vector Autoregression (PVAR) should be estimated first. Dumitrescu and Hurlin , obtained via the relevant panel VAR, can formulate the causality relationship as follows:
yi,t= αi+∑ 𝛾𝛾𝛾𝛾𝑘𝑘Kk=1 yi,t-k+∑ β𝛾𝛾𝑘𝑘K
k=1 xi,t-k+εi,t (2)
yi,t= αi+∑ 𝑣𝑣𝛾𝛾𝑙𝑙Lk=1 xi,t-l+∑ σ𝛾𝛾𝑙𝑙L
l=1 xi,t-l+ui,t (3)
The x and y in equations 2 and 3 above represent two stationary variables observed in period T for N number of cross-sectional data. Accordingly, γi
k represents the autoregressive parameter and βi
k represents the slope coefficients in equation no. 1, which is used to determine whether there is causality from x to y. While here the parameters are different for each cross section, the lag length expressed in K is the same for the entire cross section in the model being estimated. In this case for proving causality from x to y;
H0: There is no causality relationship from x to y in all horizontal sections.
H1: There is a causality relationship from x to y in at least one horizontal section.
Hypotheses are set, as done above41.
To test the validity of the above hypotheses, 3 different test statistics are used. Accordingly, the first test statistic is the value of the forest statistic calculated using equation number 4, which is the average of the forest statistics calculated on a unit basis. The second test is the (N <T) test statistic, which is used when the time measure obtained using Equation 5 is greater than the cross-sectional size. Finally, when the cross-sectional dimension is larger than the time dimension in the panel data analyzed (N> T), the third test statistic in Equation 6 is used.
39 Yerdelen Tatoğlu, F. (2013). Panel Veri Ekonometrisi (2. Baskı). İstanbul, Beta Yayınevi, p. 277. 40 Yerdelen Tatoğlu, F. (2017). Panel Zaman Serileri Analizi Stata Uygulamalı. İstanbul, Beta Yayıncılık: p. 151-154. 41 Ağazede, S., Karakaya, A. (2019). Finansal Gelişme ve Ekonomik Büyüme: OECD Ülkeleri Örneğinde Panel Nedensellik Analizi. Mehmet Akif Ersoy Üniversitesi İktisadi ve İdari Bilimler Fakültesi Dergisi, 6(2):471-484.
xi,t-l+
Makale Gönderim Tarihi: 26.01.2021 Yayına Kabul Tarihi: 13.06.2021
predictor gives more effective and consistent results39. In this study, the Parks-Kmenta -estimator was preferred to obtain more accurate results because T> N is valid.
The study analysed the causality relationship between financial inclusion and income inequality using Dumitrescu and Hurlin's panel Granger causality test. This method also gives effective and accurate results when the time dimension is larger than the cross-sectional size (N <T) or the cross-sectional size is larger than the time dimension. (N> T In addition, the panel data to be used in this method must be balanced panel data or unbalanced panel data.
Dumitrescu and Hurlin, advantage of the panel Granger causality test is that it allows consistent estimates between variables when the units used in the panel have heterogeneous rather than homogeneous properties 40. In this context, for the prediction of the causality relationship, the model Panel Vector Autoregression (PVAR) should be estimated first. Dumitrescu and Hurlin , obtained via the relevant panel VAR, can formulate the causality relationship as follows:
yi,t= αi+∑ 𝛾𝛾𝛾𝛾𝑘𝑘Kk=1 yi,t-k+∑ β𝛾𝛾𝑘𝑘K
k=1 xi,t-k+εi,t (2)
yi,t= αi+∑ 𝑣𝑣𝛾𝛾𝑙𝑙Lk=1 xi,t-l+∑ σ𝛾𝛾𝑙𝑙L
l=1 xi,t-l+ui,t (3)
The x and y in equations 2 and 3 above represent two stationary variables observed in period T for N number of cross-sectional data. Accordingly, γi
k represents the autoregressive parameter and βi
k represents the slope coefficients in equation no. 1, which is used to determine whether there is causality from x to y. While here the parameters are different for each cross section, the lag length expressed in K is the same for the entire cross section in the model being estimated. In this case for proving causality from x to y;
H0: There is no causality relationship from x to y in all horizontal sections.
H1: There is a causality relationship from x to y in at least one horizontal section.
Hypotheses are set, as done above41.
To test the validity of the above hypotheses, 3 different test statistics are used. Accordingly, the first test statistic is the value of the forest statistic calculated using equation number 4, which is the average of the forest statistics calculated on a unit basis. The second test is the (N <T) test statistic, which is used when the time measure obtained using Equation 5 is greater than the cross-sectional size. Finally, when the cross-sectional dimension is larger than the time dimension in the panel data analyzed (N> T), the third test statistic in Equation 6 is used.
39 Yerdelen Tatoğlu, F. (2013). Panel Veri Ekonometrisi (2. Baskı). İstanbul, Beta Yayınevi, p. 277. 40 Yerdelen Tatoğlu, F. (2017). Panel Zaman Serileri Analizi Stata Uygulamalı. İstanbul, Beta Yayıncılık: p. 151-154. 41 Ağazede, S., Karakaya, A. (2019). Finansal Gelişme ve Ekonomik Büyüme: OECD Ülkeleri Örneğinde Panel Nedensellik Analizi. Mehmet Akif Ersoy Üniversitesi İktisadi ve İdari Bilimler Fakültesi Dergisi, 6(2):471-484.
xi,t-l+ui,t (3)
The x and y in equations 2 and 3 above represent two stationary variables observed in period T for N number of cross-sectional data. Accordingly, γi
k represents the autoregressive parameter and βi
k represents the slope coefficients in equation no. 1, which is used to determine whether there is causality from x to y. While here the parameters are different for each cross section, the lag length expressed in K is the same for the entire cross section in the model being estimated. In this case for proving causality from x to y;
H0: There is no causality relationship from x to y in all horizontal sections.
H1: There is a causality relationship from x to y in at least one horizontal section.
Hypotheses are set, as done above41.
To test the validity of the above hypotheses, 3 different test statistics are used. Accordingly, the first test statistic is the value of the forest statistic calculated using equation number 4, which is the average of the forest statistics calculated on a unit basis. The second test is the (N <T) test statistic, which is used when the time measure obtained using Equation 5 is greater than the cross-sectional size. Finally, when the cross-sectional dimension is larger than the time dimension in the panel data analyzed (N> T), the third test statistic in Equation 6 is used.
WN,THNC= N-1
WN,THNC= N-1∑ 𝑊𝑊𝑖𝑖,𝑇𝑇
Ni=1 (4)
ZN,THNC= (5)
ZNHNC= (6)
4. Empirical Findings
4.1. Principal Components Analysis Results
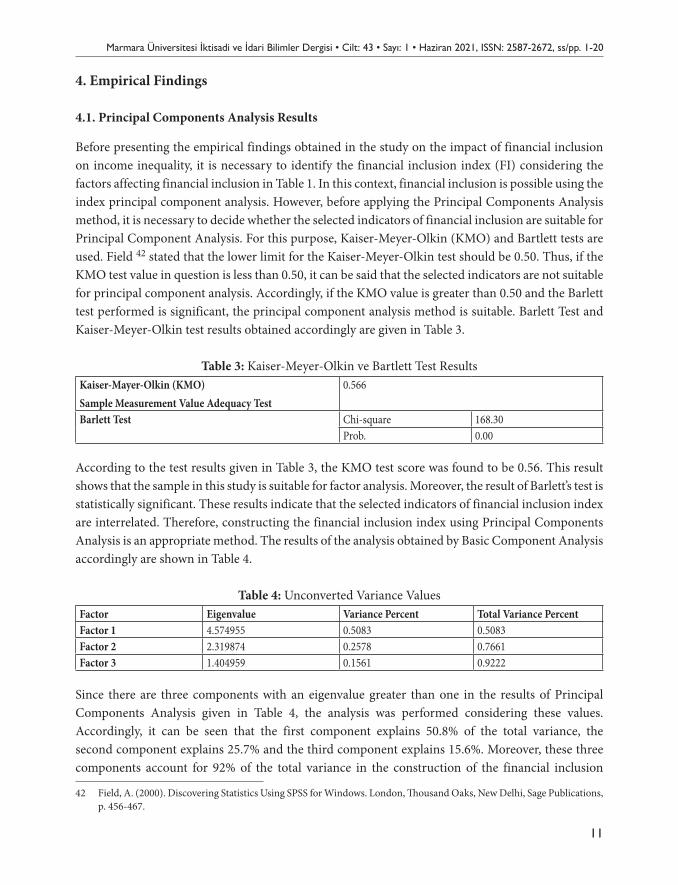
Before presenting the empirical findings obtained in the study on the impact of financial inclusion on income inequality, it is necessary to identify the financial inclusion index (FI) considering the factors affecting financial inclusion in Table 1. In this context, financial inclusion is possible using the index principal component analysis. However, before applying the Principal Components Analysis method, it is necessary to decide whether the selected indicators of financial inclusion are suitable for Principal Component Analysis. For this purpose, Kaiser-Meyer-Olkin (KMO) and Bartlett tests are used. Field 42 stated that the lower limit for the Kaiser-Meyer-Olkin test should be 0.50. Thus, if the KMO test value in question is less than 0.50, it can be said that the selected indicators are not suitable for principal component analysis. Accordingly, if the KMO value is greater than 0.50 and the Barlett test performed is significant, the principal component analysis method is suitable. Barlett Test and Kaiser-Meyer-Olkin test results obtained accordingly are given in Table 3.
Table 3: Kaiser-Meyer-Olkin ve Bartlett Test Results
Kaiser-Mayer-Olkin (KMO)
Sample Measurement Value Adequacy Test
0.566
Barlett Test Chi-square 168.30
Prob. 0.00
According to the test results given in Table 3, the KMO test score was found to be 0.56. This result shows that the sample in this study is suitable for factor analysis. Moreover, the result of Barlett's test is statistically significant. These results indicate that the selected indicators of financial inclusion index are interrelated. Therefore, constructing the financial inclusion index
42 Field, A. (2000). Discovering Statistics Using SPSS for Windows. London, Thousand Oaks, New Delhi, Sage Publications, p. 456-467.
(4)
ZN,THNC=
WN,THNC= N-1∑ 𝑊𝑊𝑖𝑖,𝑇𝑇
Ni=1 (4)
ZN,THNC= (5)
ZNHNC= (6)
4. Empirical Findings
4.1. Principal Components Analysis Results
Before presenting the empirical findings obtained in the study on the impact of financial inclusion on income inequality, it is necessary to identify the financial inclusion index (FI) considering the factors affecting financial inclusion in Table 1. In this context, financial inclusion is possible using the index principal component analysis. However, before applying the Principal Components Analysis method, it is necessary to decide whether the selected indicators of financial inclusion are suitable for Principal Component Analysis. For this purpose, Kaiser-Meyer-Olkin (KMO) and Bartlett tests are used. Field 42 stated that the lower limit for the Kaiser-Meyer-Olkin test should be 0.50. Thus, if the KMO test value in question is less than 0.50, it can be said that the selected indicators are not suitable for principal component analysis. Accordingly, if the KMO value is greater than 0.50 and the Barlett test performed is significant, the principal component analysis method is suitable. Barlett Test and Kaiser-Meyer-Olkin test results obtained accordingly are given in Table 3.
Table 3: Kaiser-Meyer-Olkin ve Bartlett Test Results
Kaiser-Mayer-Olkin (KMO)
Sample Measurement Value Adequacy Test
0.566
Barlett Test Chi-square 168.30
Prob. 0.00
According to the test results given in Table 3, the KMO test score was found to be 0.56. This result shows that the sample in this study is suitable for factor analysis. Moreover, the result of Barlett's test is statistically significant. These results indicate that the selected indicators of financial inclusion index are interrelated. Therefore, constructing the financial inclusion index
42 Field, A. (2000). Discovering Statistics Using SPSS for Windows. London, Thousand Oaks, New Delhi, Sage Publications, p. 456-467.
(5)
ZNHNC=
WN,THNC= N-1∑ 𝑊𝑊𝑖𝑖,𝑇𝑇
Ni=1 (4)
ZN,THNC= (5)
ZNHNC= (6)
4. Empirical Findings
4.1. Principal Components Analysis Results
Before presenting the empirical findings obtained in the study on the impact of financial inclusion on income inequality, it is necessary to identify the financial inclusion index (FI) considering the factors affecting financial inclusion in Table 1. In this context, financial inclusion is possible using the index principal component analysis. However, before applying the Principal Components Analysis method, it is necessary to decide whether the selected indicators of financial inclusion are suitable for Principal Component Analysis. For this purpose, Kaiser-Meyer-Olkin (KMO) and Bartlett tests are used. Field 42 stated that the lower limit for the Kaiser-Meyer-Olkin test should be 0.50. Thus, if the KMO test value in question is less than 0.50, it can be said that the selected indicators are not suitable for principal component analysis. Accordingly, if the KMO value is greater than 0.50 and the Barlett test performed is significant, the principal component analysis method is suitable. Barlett Test and Kaiser-Meyer-Olkin test results obtained accordingly are given in Table 3.
Table 3: Kaiser-Meyer-Olkin ve Bartlett Test Results
Kaiser-Mayer-Olkin (KMO)
Sample Measurement Value Adequacy Test
0.566
Barlett Test Chi-square 168.30
Prob. 0.00
According to the test results given in Table 3, the KMO test score was found to be 0.56. This result shows that the sample in this study is suitable for factor analysis. Moreover, the result of Barlett's test is statistically significant. These results indicate that the selected indicators of financial inclusion index are interrelated. Therefore, constructing the financial inclusion index
42 Field, A. (2000). Discovering Statistics Using SPSS for Windows. London, Thousand Oaks, New Delhi, Sage Publications, p. 456-467.
(6)
40 Yerdelen Tatoğlu, F. (2017). Panel Zaman Serileri Analizi Stata Uygulamalı. İstanbul, Beta Yayıncılık: p. 151-154.41 Ağazede, S., Karakaya, A. (2019). Finansal Gelişme ve Ekonomik Büyüme: OECD Ülkeleri Örneğinde Panel Nedensellik
Analizi. Mehmet Akif Ersoy Üniversitesi İktisadi ve İdari Bilimler Fakültesi Dergisi, 6(2):471-484.
Marmara Üniversitesi İktisadi ve İdari Bilimler Dergisi • Cilt: 43 • Sayı: 1 • Haziran 2021, ISSN: 2587-2672, ss/pp. 1-20
11
4. Empirical Findings
4.1. Principal Components Analysis Results
Before presenting the empirical findings obtained in the study on the impact of financial inclusion on income inequality, it is necessary to identify the financial inclusion index (FI) considering the factors affecting financial inclusion in Table 1. In this context, financial inclusion is possible using the index principal component analysis. However, before applying the Principal Components Analysis method, it is necessary to decide whether the selected indicators of financial inclusion are suitable for Principal Component Analysis. For this purpose, Kaiser-Meyer-Olkin (KMO) and Bartlett tests are used. Field 42 stated that the lower limit for the Kaiser-Meyer-Olkin test should be 0.50. Thus, if the KMO test value in question is less than 0.50, it can be said that the selected indicators are not suitable for principal component analysis. Accordingly, if the KMO value is greater than 0.50 and the Barlett test performed is significant, the principal component analysis method is suitable. Barlett Test and Kaiser-Meyer-Olkin test results obtained accordingly are given in Table 3.
Table 3: Kaiser-Meyer-Olkin ve Bartlett Test ResultsKaiser-Mayer-Olkin (KMO)Sample Measurement Value Adequacy Test
0.566
Barlett Test Chi-square 168.30Prob. 0.00
According to the test results given in Table 3, the KMO test score was found to be 0.56. This result shows that the sample in this study is suitable for factor analysis. Moreover, the result of Barlett’s test is statistically significant. These results indicate that the selected indicators of financial inclusion index are interrelated. Therefore, constructing the financial inclusion index using Principal Components Analysis is an appropriate method. The results of the analysis obtained by Basic Component Analysis accordingly are shown in Table 4.
Table 4: Unconverted Variance ValuesFactor Eigenvalue Variance Percent Total Variance PercentFactor 1 4.574955 0.5083 0.5083Factor 2 2.319874 0.2578 0.7661Factor 3 1.404959 0.1561 0.9222
Since there are three components with an eigenvalue greater than one in the results of Principal Components Analysis given in Table 4, the analysis was performed considering these values. Accordingly, it can be seen that the first component explains 50.8% of the total variance, the second component explains 25.7% and the third component explains 15.6%. Moreover, these three components account for 92% of the total variance in the construction of the financial inclusion
42 Field, A. (2000). Discovering Statistics Using SPSS for Windows. London, Thousand Oaks, New Delhi, Sage Publications, p. 456-467.
Emrah DOĞAN • Cengizhan GÜLER
12
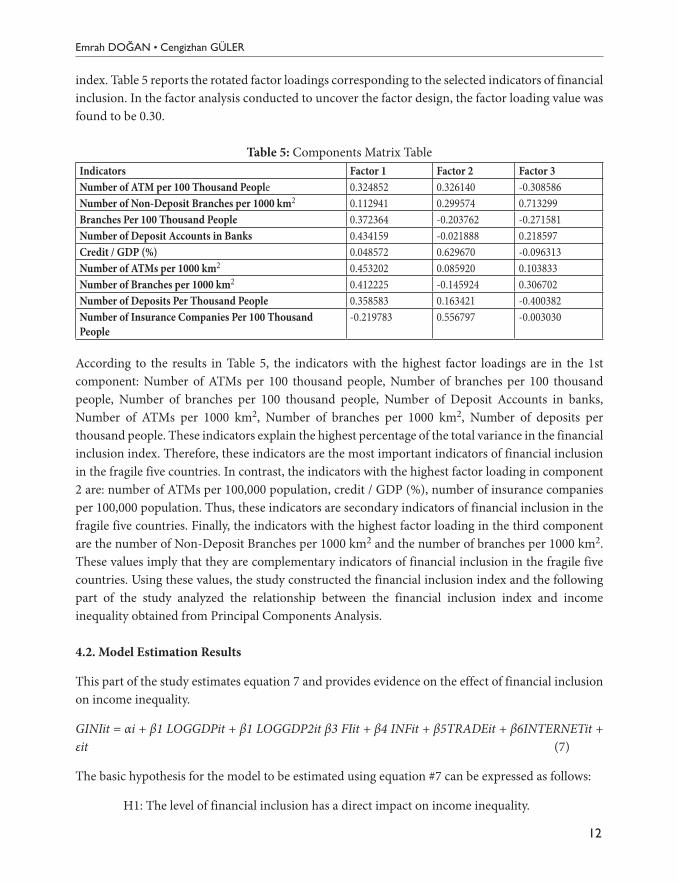
index. Table 5 reports the rotated factor loadings corresponding to the selected indicators of financial inclusion. In the factor analysis conducted to uncover the factor design, the factor loading value was found to be 0.30.
Table 5: Components Matrix TableIndicators Factor 1 Factor 2 Factor 3Number of ATM per 100 Thousand People 0.324852 0.326140 -0.308586Number of Non-Deposit Branches per 1000 km2 0.112941 0.299574 0.713299Branches Per 100 Thousand People 0.372364 -0.203762 -0.271581Number of Deposit Accounts in Banks 0.434159 -0.021888 0.218597Credit / GDP (%) 0.048572 0.629670 -0.096313Number of ATMs per 1000 km2 0.453202 0.085920 0.103833Number of Branches per 1000 km2 0.412225 -0.145924 0.306702Number of Deposits Per Thousand People 0.358583 0.163421 -0.400382Number of Insurance Companies Per 100 Thousand People
-0.219783 0.556797 -0.003030
According to the results in Table 5, the indicators with the highest factor loadings are in the 1st component: Number of ATMs per 100 thousand people, Number of branches per 100 thousand people, Number of branches per 100 thousand people, Number of Deposit Accounts in banks, Number of ATMs per 1000 km2, Number of branches per 1000 km2, Number of deposits per thousand people. These indicators explain the highest percentage of the total variance in the financial inclusion index. Therefore, these indicators are the most important indicators of financial inclusion in the fragile five countries. In contrast, the indicators with the highest factor loading in component 2 are: number of ATMs per 100,000 population, credit / GDP (%), number of insurance companies per 100,000 population. Thus, these indicators are secondary indicators of financial inclusion in the fragile five countries. Finally, the indicators with the highest factor loading in the third component are the number of Non-Deposit Branches per 1000 km2 and the number of branches per 1000 km2. These values imply that they are complementary indicators of financial inclusion in the fragile five countries. Using these values, the study constructed the financial inclusion index and the following part of the study analyzed the relationship between the financial inclusion index and income inequality obtained from Principal Components Analysis.
4.2. Model Estimation Results
This part of the study estimates equation 7 and provides evidence on the effect of financial inclusion on income inequality.
GINIit = αi + β1 LOGGDPit + β1 LOGGDP2it β3 FIit + β4 INFit + β5TRADEit + β6INTERNETit + εit (7)
The basic hypothesis for the model to be estimated using equation #7 can be expressed as follows:
H1: The level of financial inclusion has a direct impact on income inequality.
Marmara Üniversitesi İktisadi ve İdari Bilimler Dergisi • Cilt: 43 • Sayı: 1 • Haziran 2021, ISSN: 2587-2672, ss/pp. 1-20
13
H2: Financial Inclusion and Income Interaction provide the validity of the Kuznets Curve
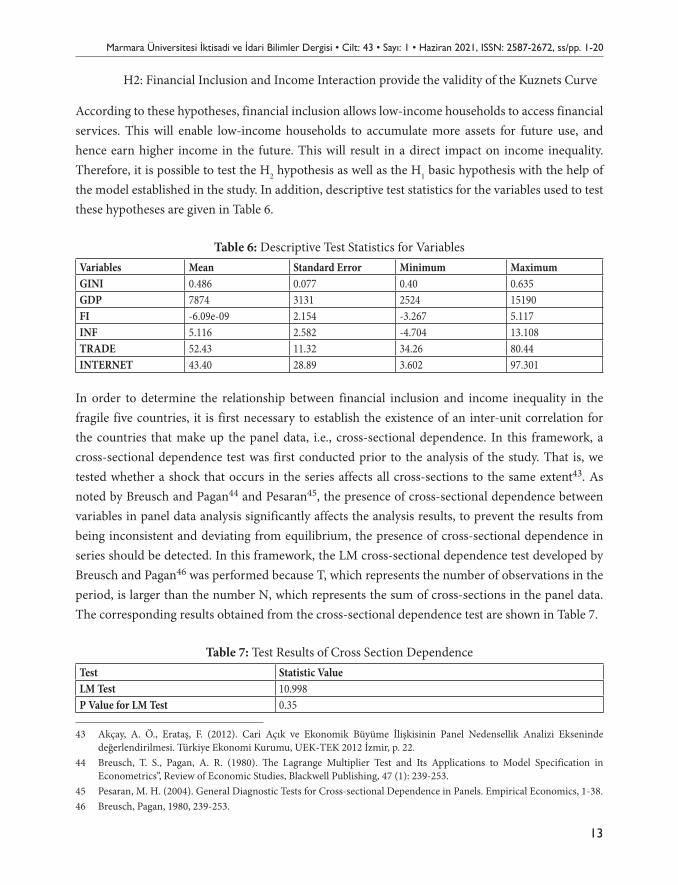
According to these hypotheses, financial inclusion allows low-income households to access financial services. This will enable low-income households to accumulate more assets for future use, and hence earn higher income in the future. This will result in a direct impact on income inequality. Therefore, it is possible to test the H2 hypothesis as well as the H1 basic hypothesis with the help of the model established in the study. In addition, descriptive test statistics for the variables used to test these hypotheses are given in Table 6.
Table 6: Descriptive Test Statistics for VariablesVariables Mean Standard Error Minimum MaximumGINI 0.486 0.077 0.40 0.635GDP 7874 3131 2524 15190FI -6.09e-09 2.154 -3.267 5.117INF 5.116 2.582 -4.704 13.108TRADE 52.43 11.32 34.26 80.44INTERNET 43.40 28.89 3.602 97.301
In order to determine the relationship between financial inclusion and income inequality in the fragile five countries, it is first necessary to establish the existence of an inter-unit correlation for the countries that make up the panel data, i.e., cross-sectional dependence. In this framework, a cross-sectional dependence test was first conducted prior to the analysis of the study. That is, we tested whether a shock that occurs in the series affects all cross-sections to the same extent43. As noted by Breusch and Pagan44 and Pesaran45, the presence of cross-sectional dependence between variables in panel data analysis significantly affects the analysis results, to prevent the results from being inconsistent and deviating from equilibrium, the presence of cross-sectional dependence in series should be detected. In this framework, the LM cross-sectional dependence test developed by Breusch and Pagan46 was performed because T, which represents the number of observations in the period, is larger than the number N, which represents the sum of cross-sections in the panel data. The corresponding results obtained from the cross-sectional dependence test are shown in Table 7.
Table 7: Test Results of Cross Section DependenceTest Statistic ValueLM Test 10.998P Value for LM Test 0.35
43 Akçay, A. Ö., Erataş, F. (2012). Cari Açık ve Ekonomik Büyüme İlişkisinin Panel Nedensellik Analizi Ekseninde değerlendirilmesi. Türkiye Ekonomi Kurumu, UEK-TEK 2012 İzmir, p. 22.
44 Breusch, T. S., Pagan, A. R. (1980). The Lagrange Multiplier Test and Its Applications to Model Specification in Econometrics”, Review of Economic Studies, Blackwell Publishing, 47 (1): 239-253.
45 Pesaran, M. H. (2004). General Diagnostic Tests for Cross-sectional Dependence in Panels. Empirical Economics, 1-38.46 Breusch, Pagan, 1980, 239-253.
Emrah DOĞAN • Cengizhan GÜLER
14
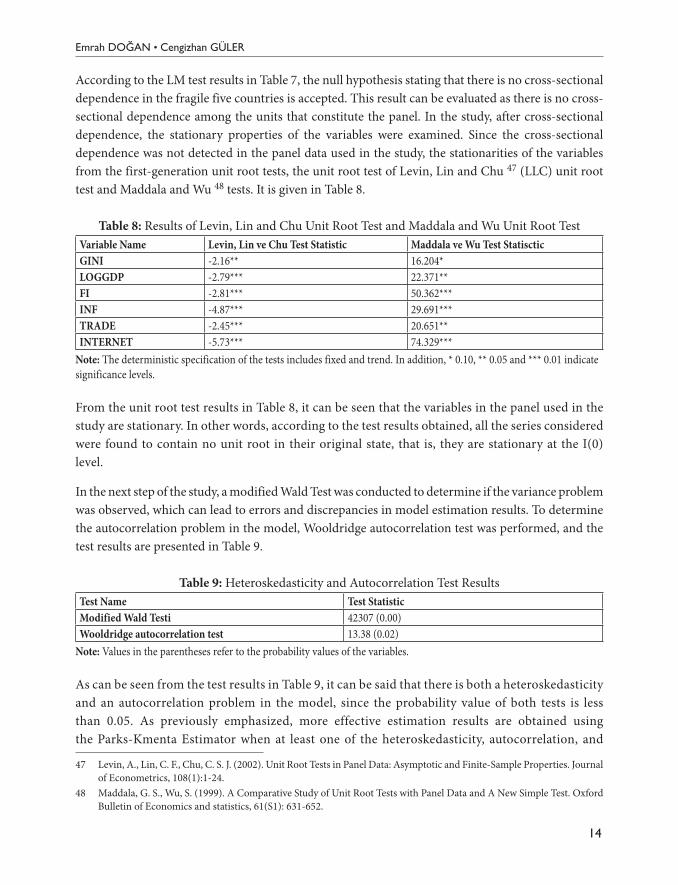
According to the LM test results in Table 7, the null hypothesis stating that there is no cross-sectional dependence in the fragile five countries is accepted. This result can be evaluated as there is no cross-sectional dependence among the units that constitute the panel. In the study, after cross-sectional dependence, the stationary properties of the variables were examined. Since the cross-sectional dependence was not detected in the panel data used in the study, the stationarities of the variables from the first-generation unit root tests, the unit root test of Levin, Lin and Chu 47 (LLC) unit root test and Maddala and Wu 48 tests. It is given in Table 8.
Table 8: Results of Levin, Lin and Chu Unit Root Test and Maddala and Wu Unit Root TestVariable Name Levin, Lin ve Chu Test Statistic Maddala ve Wu Test StatiscticGINI -2.16** 16.204*LOGGDP -2.79*** 22.371**FI -2.81*** 50.362***INF -4.87*** 29.691***TRADE -2.45*** 20.651**INTERNET -5.73*** 74.329***
Note: The deterministic specification of the tests includes fixed and trend. In addition, * 0.10, ** 0.05 and *** 0.01 indicate significance levels.
From the unit root test results in Table 8, it can be seen that the variables in the panel used in the study are stationary. In other words, according to the test results obtained, all the series considered were found to contain no unit root in their original state, that is, they are stationary at the I(0) level.
In the next step of the study, a modified Wald Test was conducted to determine if the variance problem was observed, which can lead to errors and discrepancies in model estimation results. To determine the autocorrelation problem in the model, Wooldridge autocorrelation test was performed, and the test results are presented in Table 9.
Table 9: Heteroskedasticity and Autocorrelation Test ResultsTest Name Test StatisticModified Wald Testi 42307 (0.00)Wooldridge autocorrelation test 13.38 (0.02)
Note: Values in the parentheses refer to the probability values of the variables.
As can be seen from the test results in Table 9, it can be said that there is both a heteroskedasticity and an autocorrelation problem in the model, since the probability value of both tests is less than 0.05. As previously emphasized, more effective estimation results are obtained using the Parks-Kmenta Estimator when at least one of the heteroskedasticity, autocorrelation, and
47 Levin, A., Lin, C. F., Chu, C. S. J. (2002). Unit Root Tests in Panel Data: Asymptotic and Finite-Sample Properties. Journal of Econometrics, 108(1):1-24.
48 Maddala, G. S., Wu, S. (1999). A Comparative Study of Unit Root Tests with Panel Data and A New Simple Test. Oxford Bulletin of Economics and statistics, 61(S1): 631-652.
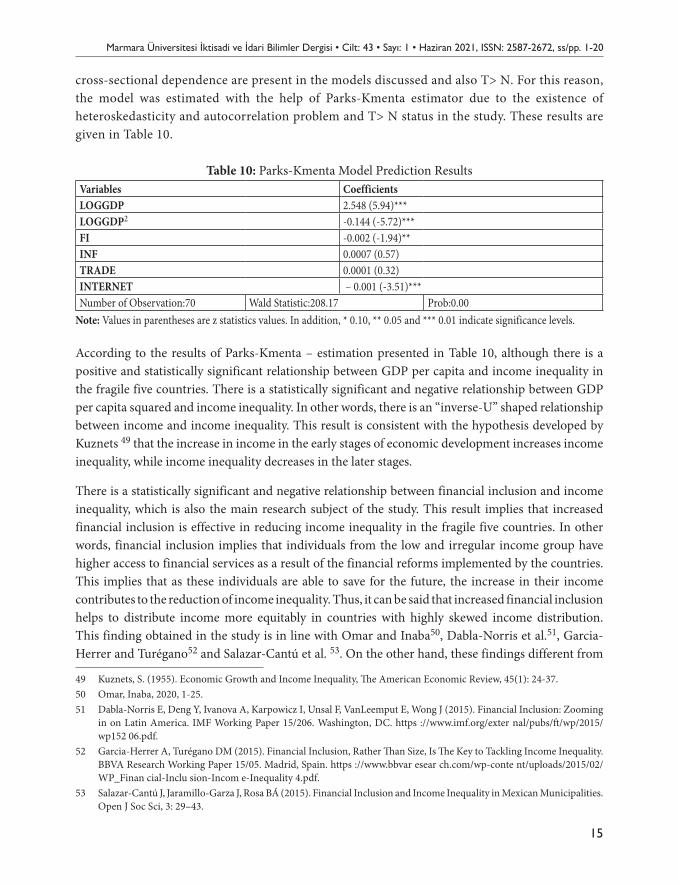
Marmara Üniversitesi İktisadi ve İdari Bilimler Dergisi • Cilt: 43 • Sayı: 1 • Haziran 2021, ISSN: 2587-2672, ss/pp. 1-20
15
cross-sectional dependence are present in the models discussed and also T> N. For this reason, the model was estimated with the help of Parks-Kmenta estimator due to the existence of heteroskedasticity and autocorrelation problem and T> N status in the study. These results are given in Table 10.
Table 10: Parks-Kmenta Model Prediction ResultsVariables CoefficientsLOGGDP 2.548 (5.94)***LOGGDP2 -0.144 (-5.72)***FI -0.002 (-1.94)**INF 0.0007 (0.57)TRADE 0.0001 (0.32)INTERNET – 0.001 (-3.51)***Number of Observation:70 Wald Statistic:208.17 Prob:0.00
Note: Values in parentheses are z statistics values. In addition, * 0.10, ** 0.05 and *** 0.01 indicate significance levels.
According to the results of Parks-Kmenta – estimation presented in Table 10, although there is a positive and statistically significant relationship between GDP per capita and income inequality in the fragile five countries. There is a statistically significant and negative relationship between GDP per capita squared and income inequality. In other words, there is an “inverse-U” shaped relationship between income and income inequality. This result is consistent with the hypothesis developed by Kuznets 49 that the increase in income in the early stages of economic development increases income inequality, while income inequality decreases in the later stages.
There is a statistically significant and negative relationship between financial inclusion and income inequality, which is also the main research subject of the study. This result implies that increased financial inclusion is effective in reducing income inequality in the fragile five countries. In other words, financial inclusion implies that individuals from the low and irregular income group have higher access to financial services as a result of the financial reforms implemented by the countries. This implies that as these individuals are able to save for the future, the increase in their income contributes to the reduction of income inequality. Thus, it can be said that increased financial inclusion helps to distribute income more equitably in countries with highly skewed income distribution. This finding obtained in the study is in line with Omar and Inaba50, Dabla-Norris et al.51, Garcia-Herrer and Turégano52 and Salazar-Cantú et al. 53. On the other hand, these findings different from
49 Kuznets, S. (1955). Economic Growth and Income Inequality, The American Economic Review, 45(1): 24-37.50 Omar, Inaba, 2020, 1-25.51 Dabla-Norris E, Deng Y, Ivanova A, Karpowicz I, Unsal F, VanLeemput E, Wong J (2015). Financial Inclusion: Zooming
in on Latin America. IMF Working Paper 15/206. Washington, DC. https ://www.imf.org/exter nal/pubs/ft/wp/2015/wp152 06.pdf.
52 Garcia-Herrer A, Turégano DM (2015). Financial Inclusion, Rather Than Size, Is The Key to Tackling Income Inequality. BBVA Research Working Paper 15/05. Madrid, Spain. https ://www.bbvar esear ch.com/wp-conte nt/uploads/2015/02/WP_Finan cial-Inclu sion-Incom e-Inequality 4.pdf.
53 Salazar-Cantú J, Jaramillo-Garza J, Rosa BÁ (2015). Financial Inclusion and Income Inequality in Mexican Municipalities.Open J Soc Sci, 3: 29–43.
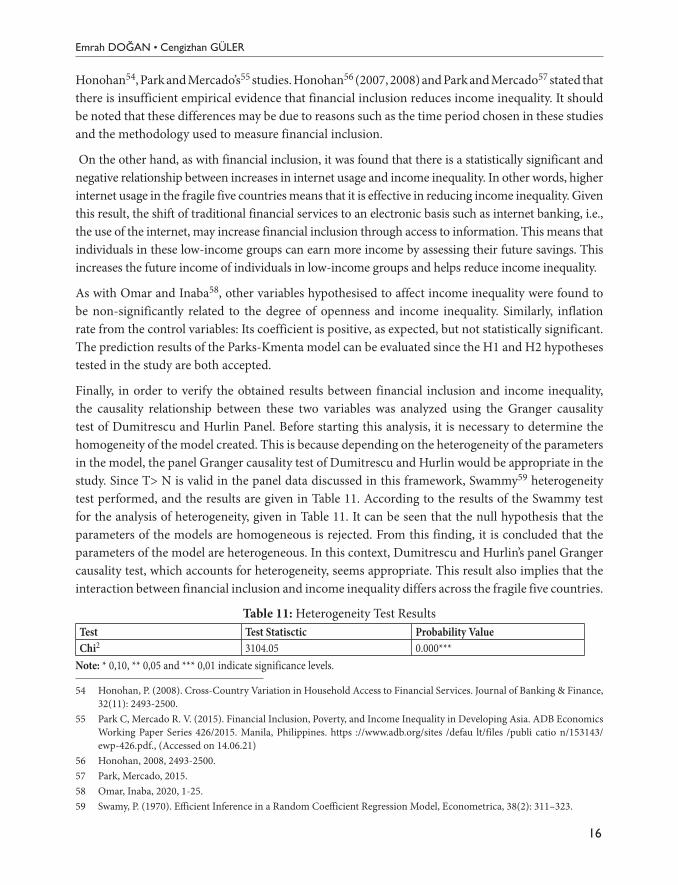
Emrah DOĞAN • Cengizhan GÜLER
16
Honohan54, Park and Mercado’s55 studies. Honohan56 (2007, 2008) and Park and Mercado57 stated that there is insufficient empirical evidence that financial inclusion reduces income inequality. It should be noted that these differences may be due to reasons such as the time period chosen in these studies and the methodology used to measure financial inclusion.
On the other hand, as with financial inclusion, it was found that there is a statistically significant and negative relationship between increases in internet usage and income inequality. In other words, higher internet usage in the fragile five countries means that it is effective in reducing income inequality. Given this result, the shift of traditional financial services to an electronic basis such as internet banking, i.e., the use of the internet, may increase financial inclusion through access to information. This means that individuals in these low-income groups can earn more income by assessing their future savings. This increases the future income of individuals in low-income groups and helps reduce income inequality.
As with Omar and Inaba58, other variables hypothesised to affect income inequality were found to be non-significantly related to the degree of openness and income inequality. Similarly, inflation rate from the control variables: Its coefficient is positive, as expected, but not statistically significant. The prediction results of the Parks-Kmenta model can be evaluated since the H1 and H2 hypotheses tested in the study are both accepted.
Finally, in order to verify the obtained results between financial inclusion and income inequality, the causality relationship between these two variables was analyzed using the Granger causality test of Dumitrescu and Hurlin Panel. Before starting this analysis, it is necessary to determine the homogeneity of the model created. This is because depending on the heterogeneity of the parameters in the model, the panel Granger causality test of Dumitrescu and Hurlin would be appropriate in the study. Since T> N is valid in the panel data discussed in this framework, Swammy59 heterogeneity test performed, and the results are given in Table 11. According to the results of the Swammy test for the analysis of heterogeneity, given in Table 11. It can be seen that the null hypothesis that the parameters of the models are homogeneous is rejected. From this finding, it is concluded that the parameters of the model are heterogeneous. In this context, Dumitrescu and Hurlin’s panel Granger causality test, which accounts for heterogeneity, seems appropriate. This result also implies that the interaction between financial inclusion and income inequality differs across the fragile five countries.
Table 11: Heterogeneity Test ResultsTest Test Statisctic Probability ValueChi2 3104.05 0.000***
Note: * 0,10, ** 0,05 and *** 0,01 indicate significance levels.
54 Honohan, P. (2008). Cross-Country Variation in Household Access to Financial Services. Journal of Banking & Finance, 32(11): 2493-2500.
55 Park C, Mercado R. V. (2015). Financial Inclusion, Poverty, and Income Inequality in Developing Asia. ADB Economics Working Paper Series 426/2015. Manila, Philippines. https ://www.adb.org/sites /defau lt/files /publi catio n/153143/ewp-426.pdf., (Accessed on 14.06.21)
56 Honohan, 2008, 2493-2500.57 Park, Mercado, 2015.58 Omar, Inaba, 2020, 1-25.59 Swamy, P. (1970). Efficient Inference in a Random Coefficient Regression Model, Econometrica, 38(2): 311–323.
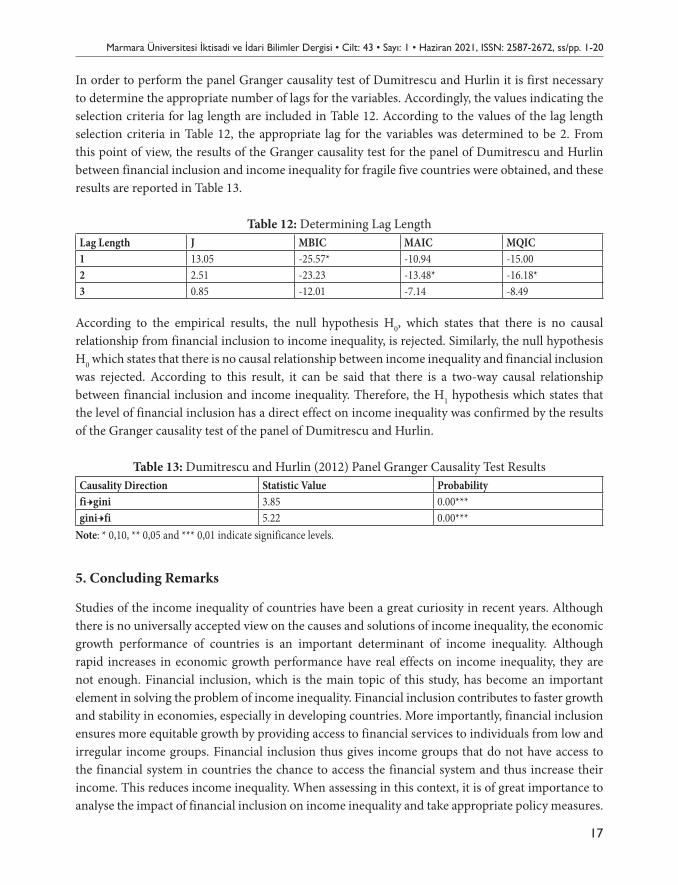
Marmara Üniversitesi İktisadi ve İdari Bilimler Dergisi • Cilt: 43 • Sayı: 1 • Haziran 2021, ISSN: 2587-2672, ss/pp. 1-20
17
In order to perform the panel Granger causality test of Dumitrescu and Hurlin it is first necessary to determine the appropriate number of lags for the variables. Accordingly, the values indicating the selection criteria for lag length are included in Table 12. According to the values of the lag length selection criteria in Table 12, the appropriate lag for the variables was determined to be 2. From this point of view, the results of the Granger causality test for the panel of Dumitrescu and Hurlin between financial inclusion and income inequality for fragile five countries were obtained, and these results are reported in Table 13.
Table 12: Determining Lag LengthLag Length J MBIC MAIC MQIC1 13.05 -25.57* -10.94 -15.002 2.51 -23.23 -13.48* -16.18*3 0.85 -12.01 -7.14 -8.49
According to the empirical results, the null hypothesis H0, which states that there is no causal relationship from financial inclusion to income inequality, is rejected. Similarly, the null hypothesis H0 which states that there is no causal relationship between income inequality and financial inclusion was rejected. According to this result, it can be said that there is a two-way causal relationship between financial inclusion and income inequality. Therefore, the H1 hypothesis which states that the level of financial inclusion has a direct effect on income inequality was confirmed by the results of the Granger causality test of the panel of Dumitrescu and Hurlin.
Table 13: Dumitrescu and Hurlin (2012) Panel Granger Causality Test ResultsCausality Direction Statistic Value Probabilityfi→gini 3.85 0.00***gini→fi 5.22 0.00***
Note: * 0,10, ** 0,05 and *** 0,01 indicate significance levels.
5. Concluding Remarks
Studies of the income inequality of countries have been a great curiosity in recent years. Although there is no universally accepted view on the causes and solutions of income inequality, the economic growth performance of countries is an important determinant of income inequality. Although rapid increases in economic growth performance have real effects on income inequality, they are not enough. Financial inclusion, which is the main topic of this study, has become an important element in solving the problem of income inequality. Financial inclusion contributes to faster growth and stability in economies, especially in developing countries. More importantly, financial inclusion ensures more equitable growth by providing access to financial services to individuals from low and irregular income groups. Financial inclusion thus gives income groups that do not have access to the financial system in countries the chance to access the financial system and thus increase their income. This reduces income inequality. When assessing in this context, it is of great importance to analyse the impact of financial inclusion on income inequality and take appropriate policy measures.
Emrah DOĞAN • Cengizhan GÜLER
18
This study aimed to investigate the relationship between financial inclusion and income inequality in the fragile five countries. This was analysed using the panel data set, which contains the data between 2005 and 2018, and the method Principal Components Analysis (PCA), the Parks-Kmenta Estimator and the Panel Granger Causality test developed by Dumitrescu and Hurlin. The empirical results show that the effect of financial inclusion on income inequality is negative and statistically significant. This result implies that financial inclusion enables low – and middle-income groups, which currently have a low share of financial services, to have a higher share of these products and services, increasing their ability to invest and earn returns, thereby increasing welfare levels. Therefore, increasing financial inclusion has the effect of fixing inequality in income distribution and reducing poverty. While there is a positive and statistically significant relationship between GDP per capita and income inequality in the fragile five countries, there is a statistically significant and negative relationship between GDP per capita squared and income inequality. This can be assessed as an “inverse-U” shaped relationship between financial inclusion and income inequality. It was found that there is a negative and statistically significant relationship between internet usage and income inequality, which is another variable believed to influence on income inequality.
These results show that the interaction between financial inclusion, economic growth, and internet usage has a significant moderating effect on income inequality. However, the interaction between financial inclusion and economic growth performance in the fragile five countries implies that the increase in economic growth initially led to increased income inequality. The main reason for this can be seen in the small marginal effects of financial inclusion. However, the increase in financial inclusion and the subsequent increase in the level of economic development of the fragile five countries increase the marginal effects of financial inclusion. Consequently, economic growth reduces income inequality in the final stage. In other words, increased financial inclusion leads to more equal economic growth and thus reduces income inequality.
On the other hand, the results obtained using the panel Granger Causality test developed by Dumitrescu and Hurlin also show that there is a bidirectional causality relationship between financial inclusion and income inequality. Therefore, this result can be evaluated in the sense that the level of financial inclusion has a direct effect on income inequality.
In the context of the study’s findings, it can be said that financial inclusion helps to reduce income inequality. This is done not only by increasing financial inclusion but also by increasing marginal efficiency due to the interaction with various factors such as fair growth and internet usage. For example, the labor demand created by strong and fair growth leads to higher wages for individuals in the low-income group. This improves living standards and welfare levels. With this improvement, increasing financial inclusion contributes to the development of an efficient and inclusive financial system by providing access to the financial system for poor individuals. At the end of this process, fair growth and financial inclusion together contribute to the reduction of income inequality. Therefore, in economies with highly skewed income distribution, such as the fragile five countries, it is possible to reduce income inequality if reforms are implemented that support the living standards and welfare of lower-income groups and increase the efficiency and inclusiveness of the financial system.
Marmara Üniversitesi İktisadi ve İdari Bilimler Dergisi • Cilt: 43 • Sayı: 1 • Haziran 2021, ISSN: 2587-2672, ss/pp. 1-20
19
ReferencesAĞAZEDE, S., Karakaya, A. (2019). Finansal Gelişme ve Ekonomik Büyüme: OECD Ülkeleri Örneğinde Panel
Nedensellik Analizi, Mehmet Akif Ersoy Üniversitesi İktisadi ve İdari Bilimler Fakültesi Dergisi, 6(2): 471-484.
AKÇAY, A. Ö., Erataş, F. (2012). Cari açık ve Ekonomik Büyüme İlişkisinin Panel Nedensellik Analizi Ekseninde değerlendirilmesi, Türkiye Ekonomi Kurumu, UEK-TEK 2012 İzmir: 1-24.
BAE, K., Han, D., Sohn, H. (2012). Importance of Access to Finance in Reducing Income Inequality and Poverty Level, International Review of Public Administration, 17(1): 55-77.
BETTIN, G., Pigini, C., Zazzaro, A. (2020). Financial Inclusion and Poverty Transitions: An Empirical Analysis for Italy (No. 164), Money and Finance Research Group (Mo. Fi. R.) Working Paper, Univ. Politecnica Marche-Dept. Economic and Social Sciences.
BREUSCH, T. S., Pagan, A. R. (1980). The Lagrange Multiplier Test and Its Applications to Model Specification in Econometrics, Review of Economic Studies, Blackwell Publishing, 47(1): 239-253.
DABLA-NORRIS E, Deng Y., Ivanova A., Karpowicz I., Unsal F., Vanleemput E., Wong J. (2015). Financial Inclusion: Zooming in on Latin America, IMF Working Paper 15/206. Washington, DC.
DEHEJIA, R. H., Gatti, R. (2002). Child Labor: The Role of Income Variability and Access to Credit in A Cross-Section of Countries, Working paper: 1-30.
DHRIFI A. (2015). Financial Development and The Growth-Inequality-Poverty Triangle, Journal of the Knowledge Economy, 6(4): 1163-1176.
DEMIRGUC-KUNT, A., Klapper, L., Peria, M. S. M. (2012). The Foundations of Financial Inclusion: Understanding Ownership and Use of Formal Accounts, The World Bank.
DEMIRGUC-KUNT, A, Klapper, L. F., Singer, D., Van Oudheusden, P. (2015). The Global Findex Database 2014: Measuring Financial Inclusion Around the World, World Bank Policy Research Working Paper, (7255): 1-61.
DUMITRESCU, E. I., Hurlin, C. (2012). Testing for Granger Non-Causality in Heterogeneous Panels, Economic Modelling, 29(4): 1450–1460.
FIELD, A. (2000). Discovering Statistics Using SPSS for Windows, London, Thousand Oaks, New Delhi, Sage Publications.
GARCIA-HERRERG A., Turegano D. M. (2015). Financial Inclusion, rather than Size, is the Key to Tackling Income Inequality, BBVA Research Working Paper 15/05. Madrid, Spain.
HONOHAN, P. (2008). Cross-country Variation in Household Access to Financial Services, Journal of Banking & Finance, 32(11): 2493-2500.
HONOHAN, P. (2004). Financial Development, Growth and Poverty: How Close Are the Links? in Financial Development and Economic Growth, London, Palgrave Macmillan.
JALILIAN, H., Kirkpatrick, C. (2002). Financial Development and Poverty Reduction in Developing Countries, International Journal of Finance & Economics, 7(2): 97-108.
JOHNSON, R. A., Wichern, D. W. 2002. Applied Multivariate Statistical Analysis, Upper Saddle River, NJ, Prentice Hall.
KMENTA, J. (1986). Elements of Econometrics (Second ed.), New York, Macmillan: 302–320.KUZNETS, S. (1955). Economic Growth and Income Inequality, The American Economic Review, 45(1): 24-37.LAN, H. H., Thuong, P. T. H. (2019). Financial Inclusion and Income Inequality: Empirical Evidence from
Transition, Economies, Journal of Economics and Development, 21: 23-34.
Emrah DOĞAN • Cengizhan GÜLER
20
LE, Q., Ho, H, Mai, N. (2019). The Impact of Financial Inclusion on Income Inequality in Transition Economies, Management Science Letters, 9(5): 661-672.
LEVIN, A., Lin, C. F., Chu, C. S. J. (2002). Unit Root Tests in Panel Data: Asymptotic and Finite-Sample Properties, Journal of Econometrics, 108(1): 1-24.
LI, H., Squire, L., Zou, H. F. (1998). Explaining International and Intertemporal Variations in Income Inequality, The Economic Journal, 108(446): 26-43.
MADDALA, G. S., Wu, S. (1999). A Comparative Study of Unit Root Tests with Panel Data and a New Simple Test, Oxford Bulletin of Economics and Statistics, 61(S1): 631-652.
MUSHTAQ, R., Bruneau, C. (2019). Microfinance, Financial Inclusion and ICT: Implications for Poverty and Inequality, Technology in Society, 59(101154): 1-19.
NEAIME, S., Gaysset, I. (2018). Financial Inclusion and Stability in MENA: Evidence from Poverty and Inequality, Finance Research Letters, 24: 230-237.
OMAR, M. A., Inaba, K. (2020). Does Financial Inclusion Reduce Poverty and Income Inequality in Developing Countries? A Panel Data Analysis, Journal of Economic Structures, 9: 1-25.
OUECHTATI, I. (2020). The Contribution of Financial Inclusion in Reducing Poverty and Income Inequality in Developing Countries, Asian Economic and Financial Review, 10(9): 1051-1061.
ÖZDAMAR, K. (2010). Paket Programlar ile İstatistiksel Veri Analizi-2 (Çok Değişkenli Analizler), Eskişehir, Kaan Kitabevi.
PARK, C., Mercado, R. V. (2018). Financial Inclusion, Poverty, and Income Inequality, The Singapore Economic Review, 63(01): 185-206.
PARK, C., Mercado R. V. (2015). Financial Inclusion, Poverty, and Income Inequality in Developing Asia. ADB Economics Working Paper Series 426/2015. Manila, Philippines, https://www.adb.org/sites/default/files/publication/153143/ewp-426.pdf (Accesed on: 14 June 2021)
PARKS, R. (1967). Efficient Estimation of a System of Regression Equations When Disturbances Are Both Serially and Contemporaneously Correlated, Journal of the American Statistical Association, 62: 500–509.
PESARAN, M. H. (2004). General Diagnostic Tests for Cross-sectional Dependence in Panels, Empirical Economics: 1-38.
SALAZAR-CANTUS, J., Jaramillo-Garza, J., Rosa, B.Á. (2015). Financial Inclusion and Income Inequality in Mexican Municipalities, Open Journal of Social Sciences, 3: 29–43.
SARMA, M. (2008). Index of Financial Inclusion (No. 215), Working Paper: 1-26.SEHRAWAT, M., Giri, A. (2016). Panel Data Analysis of Financial Development, Economic Growth and Rural-
Urban Income Inequality, International Journal of Social Economics, 43(10): 998-1015.SEVEN, U., Coşkun, Y. (2016). Does Financial Development Reduce Income Inequality and Poverty? Evidence
from Emerging Countries, Emerging Markets Review, 26: 34-63.SWAMMY, P. (1970). Efficient Inference in a Random Coefficient Regression Model, Econometrica, 38(2): 311–
323.TATLIDİL, H. 2002. Uygulamalı Çok Değişkenli İstatistiksel Analiz, Ankara, Cem Web Ofset Ltd.WORLD BANK (2014). Global Financial Development Report 2014: Financial Inclusion. World Bank Group,
Washington, DC. https://openknowledge.worldbank.org/handle/10986/16238 (Accessed on 14 June 2021).WORLD BANK (2018). Toward Universal Financial Inclusion in China: Models, Challenges, and Global
Lessons, World Bank Group, Washington, DC.YERDELEN TATOĞLU, F. (2013). Panel Veri Ekonometrisi (2. Baskı), İstanbul, Beta Yayınevi.YERDELEN TATOĞLU, F. (2017). Panel Zaman Serileri Analizi Stata Uygulamalı, İstanbul, Beta Yayıncılık.
21Makale Gönderim Tarihi:Makale Gönderim Tarihi: 25.01.2021Yayına Kabul Tarihi:Yayına Kabul Tarihi: 13.06.2021
ARAŞTIRMA MAKALESİ / RESEARCH ARTICLE
Marmara Üniversitesi İktisadi ve İdari Bilimler Dergisi • Cilt: 43 • Sayı: 1 • Haziran 2021, ISSN: 2587-2672, ss/pp. 21-41 DOI: 10.14780/muiibd.960261
TFRS/ TMS, BOBİ FRS, KÜMİ FRS VE FAİZSİZ FİNANS MUHASEBE STANDARTLARI KAPSAMINDA GERÇEĞE UYGUN
DEĞER KAVRAMI
FAIR VALUE CONCEPT IN TFRS / TMS, BOBI FRS, KUMI FRS AND INTEREST-FREE FINANCE ACCOUNTING STANDARDS-FREE
FINANCE ACCOUNTING STANDARDS
Sabri Burak ARZOVA*1
Bertaç Şakir ŞAHİN**2
ÖzFinansal tablolar işletme paydaşlarına bir işletmenin finansal durumu ve faaliyet sonuçlarına ilişkin bilgiler sunar. Finansal tabloların, bu tablolardan yararlananlara doğru, gerçeğe uygun ve faydalı bilgilerin sunması beklenir. Etkin bir finansal raporlama süreci için Uluslararası Finansal Raporlama Standartları yayımlanmaktadır. Bu standartlarda gerçeğe uygun değer yaklaşımı ile uygulamada tarihi değer yaklaşımından uzaklaşılarak varlık ve yükümlülüklerin finansal raporlama tarihindeki değerinin raporlanması amaçlanmıştır. Gerçeğe uygun değer, Türkiye’de farklı ölçek ve türdeki işletmelerin finansal raporlama süreçlerinde kullanılan BOBI FRS, KÜMİ FRS ve Faizsiz Finans Muhasebe Standartları’nda da ölçüm yöntemlerinden biri olarak düzenlenmiştir. Bu çalışmada gerçeğe uygun değer yaklaşımı öncelikle Türkiye’de 2005 yılından beri uygulanan uluslararası raporlama standartları (TFRS/TMS) açısından incelenmiştir. Standartlardaki kavramsal boyutu ve uygulaması ele alındıktan sonra gerçeğe uygun değer yaklaşımı, BOBI FRS, Faizsiz Finans Muhasebe Standartları ve KÜMİ FRS açısından ele alınmış ve düzenlemeler arasındaki farklılıklar ortaya konmuştur.Anahtar Kelimeler: Finansal Raporlama Standartları, Gerçeğe Uygun Değer, DeğerlemeJEL Sınıflandırması: G21, M40, M41
AbstractFinancial statements provide information to business stakeholders about the financial situation operating results of businesses. Beneficial, truthful and clear information are expected from financial statements. International Financial Reporting Standards are published for an effective financial reporting process. In
* Prof. Dr., Marmara Üniversitesi, İşletme Fakültesi, İşletme Bölümü, E-Mail: [email protected], ORCID ID: 0000-0001-9616-4197
** Arş. Gör., Yıldız Teknik Üniversitesi, İktisadi ve İdari Bilimler Fakültesi, İşletme Bölümü, E-Mail: [email protected], ORCID ID: 0000-0003-0414-5402
Sabri Burak ARZOVA • Bertaç Şakir ŞAHİN
22
these standards, with the fair value approach, it is aimed to report assets and liabilities at reporting date value rather than historical value. Fair value method is used in TFRS/ TMS, BOBI FRS, KUMI FRS and Interest Free Finance Accounting Standards. In this study, the fair value approach was examined primarily in terms of international reporting standards (TFRS/TMS) that has been applied in Turkey since 2005. After discussing conceptual dimension and application of the TFRS/ TMS, the fair value approach was examined in terms of BOBI FRS, Interest-Free Finance Accounting and KUMI FRS and Standards and the differences between the regulations were revealed. Keywords: Financial Reporting Standards, Fair Value, ValuationJEL Classification: G21, M40, M41
1. Giriş
Teknolojik gelişmeler ve küreselleşme ile birlikte finansal tablo kullanıcılarının bilgi ihtiyacı artmıştır. Uluslararası Muhasebe Standartları Kurulu, finansal tablo kullanıcılarının talepleri doğrultusunda ortak bir raporlama dili oluşturmak amacıyla finansal raporlama standartlarını yayımlamaktadır1. Standartlar Türkçeye çevrilmiş ve halka açık işletmelerin finansal raporlama süreçlerinde 2005 yılından itibaren uygulanmaya başlanmıştır2. Türkiye’de muhasebe uygulamalarında tekdüzenin sağlanması amacıyla TFRS/TMS’ye ek olarak yeni standart çalışmaları da gerçekleştirilerek tüm işletmeler için, o işletmenin faaliyet türüne ve yapısına uygun muhasebe standartları hazırlanmıştır. Türkiye’de bağımsız denetime tâbi olduğu halde TFRS ve TMS’yi uygulamayan işletmeler için Büyük ve Orta Boy İşletmeler İçin Finansal Raporlama Standardı (BOBİ FRS) hazırlanmıştır3. Bu standartların ardından küçük ve mikro işletmeler için standart çalışmalarına başlanmıştır. Mikro ve küçük işletmelerin, sade ve mümkün olan en düşük maliyet ile finansal raporlama süreçlerinin gerçekleştirebilmesi için Küçük ve Mikro İşletmeler İçin Finansal Raporlama Standardı (KÜMİ FRS) hazırlanmıştır4. Bu standartların dışında faizsiz finans sektöründe yer alan kuruluşların finansal raporlama süreçlerinde kullanılmak üzere Faizsiz Finans Muhasebe Standartları hazırlanmıştır5.
Muhasebe sürecinin etkinliği ve güvenilir bir finansal bilgi akışında değerleme süreci önem taşımaktadır6. Bir işletmenin varlık ve yükümlülüklerin değerlerinin belirlenmesi olarak tanımlanabilecek değerleme uygulamasının ortak bir tanımı olmadığı gibi literatürde ve uygulamada farklı değerleme yöntemleri bulunmaktadır7. TMS ve TFRS’lerde değerleme yöntemleri Cari değer ve tarihi maliyet başlıklarında açıklanmıştır. Cari değer başlığında ise gerçeğe uygun değer, kullanım
1 Cavlak, H., Ataman, B. (2017). Büyük ve Orta Boy İşletmeler İçin Finansal Raporlama Standardı (BOBİ) ile Tam Set Türkiye Muhasebe ve Türkiye Finansal Raporlama Standartlarının (TMS/TFRS) Karşılaştırılması. Finans Ekonomi ve Sosyal Araştırmalar Dergisi (FESA), 2(3): 154.
2 Öztürk, E., Gökçen, G., Güleç, Ö. F. (2019). Kümi FRS Seti Taslağı, BOBİ FRS Seti ve Tam Set TMS/TFR’nin Temel Konular Açısından Karşılaştırılması. Finans Ekonomi ve Sosyal Araştırmalar Dergisi (FESA), 4(3): 414.
3 KGK (2017). Büyük ve Orta Boy İşletmeler İçin Finansal Raporlama Standardı, https://www.kgk.gov.tr, (Erişim Tarihi: 03.10.2020)
4 KGK (2019). Küçük ve Mikro İşletmeler için Finansal Raporlama Standardı Taslak Metni, https://www.kgk.gov.tr, (Erişim Tarihi: 11.10.2020)
5 KGK (2019). Faizsiz Finans Muhasebe Standartları Kurul Kararı, https://www.kgk.gov.tr, (Erişim Tarihi: 11.10.2020)6 Pamukçu, F. (2011). Gerçeğe Uygun Değer Muhasebesi ve Finansal Tablolara Etkisi, Mali Çözüm, 103: 79.7 Gökgöz, A., Şentürk, F. (2015). Borsa İstanbul’da İşlem Gören Şirketlerin Gerçeğe Uygun Değer Ölçümü Hiyerarşisinde
Kullandıkları Seviye Girdilerinin Tespiti Üzerine Bir Araştırma. Journal of Accounting Finance and Auditing Studies, 1(4): 68.
Marmara Üniversitesi İktisadi ve İdari Bilimler Dergisi • Cilt: 43 • Sayı: 1 • Haziran 2021, ISSN: 2587-2672, ss/pp. 21-41
23
değeri/ifa değeri ve cari maliyet yöntemleri düzenlenmiştir8. BOBİ FRS, KÜMİ FRS ve Faizsiz Finans Muhasebe Standartları’nda değerleme ölçüleri, TMS ve TFRS’ye benzer şekilde düzenlense de bahsedilen standartların değerleme süreçlerinde farklı uygulamalar mevcuttur9. Muhasebe uygulamalarında bakış açısının değişmesi sonucunda tarihi maliyet yerine cari ve gelecek dönem maliyetlerine odaklanılmış ve gerçeğe uygun değer yöntemi ağırlık kazanmıştır10. Bu çalışmada gerçeğe uygun değer kavramı TFRS/ TMS, Faizsiz Finans Muhasebe Standartları, BOBİ FRS ve KÜMİ FRS kapsamında incelenmiştir. Bu amaçla standartlarda gerçeğe uygun değer kavramının tanımı, uygulaması ve gerçeğe uygun değer yaklaşımı konusunda standartlar arasındaki farklılıklar ele alınmış ve böylece Türkiye’deki finansal raporlama ekosistemindeki düzenlemeler bütüncül olarak ele alınarak literatüre katkı sunulmuştur. Değerleme kavramı özelde işletmelerin faaliyet sonuçlarını doğru bir şekilde sunmaları genelde ise bu işletmelerin önemli bir parçasını oluşturduğu ekonomilerin etkinliği açısından kritik önemdedir. Dolayısıyla gerçeğe uygun değerin uygulamasının doğru bir şekilde anlaşılması ve uygulamadaki durumun incelenmesi yöntemin etkinliğine katkı sunacaktır. Bu çalışmada Türkiye’de mevcut tüm standartlar gerçeğe uygun değer kavramı açısından ele alınarak literatür açısından daha kapsayıcı bir çalışma gerçekleştirilmiştir.
2. Literatür Özeti
Tablo 1’de gerçeğe uygun değer kavramının literatürdeki durumu ele alınmıştır.
Tablo 1: Yerli Literatürde Gerçekleştirilen ÇalışmalarYazar Kavram Yöntem SonuçPamukçu, (2011)11
Gerçeğe uygun değer kavramının finansal tablolara etkisi
Teorik Çalışmada finansal raporlama süreçlerinde tarihi maliyet yerine gerçeğe uygun değer kavramının öne çıktığı yorumu yapılmıştır.
Çetinkaya, (2017)12
Yatırım amaçlı gayrimenkuller ve gerçeğe uygun değer.
İçerik analizi Gerçeğe uygun değer kullanımının finansal tablolara olan olumlu etkisi sonucunda özellikle 2014 yılından sonra bu yöntemin tercih edildiği yorumu yapılmıştır.
Tuğay, (2013)13 Canlı varlıklar ve gerçeğe uygun değer
Vaka analizi Tekdüzen hesap planının, gerçeğe uygun değer için yetersiz olduğu vurgulanmıştır.
Arı ve Yılmaz, (2015)14
Gerçeğe uygun değer ve tarihi maliyet farkı
Teorik Çalışmada iki yönteme göre hazırlanmış finansal tabloların birlikte sunulması önerilmiştir.
8 KGK (2018). Finansal Raporlamaya İlişkin Kavramsal Çerçeve, https://www.kgk.gov.tr, (Erişim Tarihi: 07.10.2020)9 Gökçen, G., Öztürk, E., Güleç, Ö. F. (2018). BOBİ FRS ve TFRS’nin Finansal Raporlara Etkileri Açısından Karşılaştırılması,
Finans Ekonomi ve Sosyal Araştırmalar Dergisi, 3(2): 442.10 Aktaş, R., Deran, A. (2006). “Fair Value” Karşılığı Olarak Gerçeğe Uygun Değer Kavramı ve Tespit Hiyerarşisi, Gazi
Üniversitesi İktisadi ve İdari Bilimler Fakültesi Dergisi, 8(2): 155.11 Pamukçu, 2011.12 Çetinkaya, N. (2017). Yatırım Amaçlı Gayrimenkullerin Değerlemesinde Gerçeğe Uygun Değer Tespiti ve Türkiye’deki
Uygulamaların Değerlendirilmesi. İktisadi İdari ve Siyasal Araştırmalar Dergisi (İKTİSAD), 2(4): 69-83.13 Tuğay, O. (2013). Türkiye Muhasebe Standardı 41’e Göre Canlı Varlıkların Gerçeğe Uygun Değerinin Tespiti ve
Muhasebeleştirilmesi. Mehmet Akif Ersoy Üniversitesi Sosyal Bilimler Enstitüsü Dergisi, 5(8): 148-165.14 Arı, M., Yılmaz, R. (2015). Avantaj ve Dezavantajları Açısından Gerçeğe Uygun Değer ile Maliyet Değeri
Muhasebesinin Karşılaştırmalı Olarak İncelenmesi, Journal of Accounting & Finance, (65): 147 – 160.
Sabri Burak ARZOVA • Bertaç Şakir ŞAHİN
24
Saçan, (2014)15 Banka raporlaması ve gerçeğe uygun değer
Anket Kredi verenler gerçeğe uygun değerin sübjektif bir yönünü olumsuz bir durum olarak değerlendirmiştir
Erkuş ve Akcan, (2013)16
Gerçeğe uygun değer ve finansal krizler
Anket Anket katılımcıları gerçeğe uygun değeri finansal krizlerin sebebi olarak görmese de bu yöntemin geliştirilmesi gerektiğini savunmuştur.
Şen ve Özbir, (2020).17
KÜMİ FRS uygulamaları Teorik Yazara göre KÜMİ FRS’nin diğer standartlara göre daha yalındır ve kullanıcı açısından daha az süreci içermektedir.
Haswell ve Evans, (2018)18
Enron krizi ve gerçeğe uygun değer
İçerik analizi Düzenlemenin tam olarak anlaşılamaması, sübjektif uygulamalar ve suistimaller nedeniyle yöntemin Enron krizi ve 2008 küresel finansal krizin nedenlerinden olduğu belirtilmiştir.
Percevic, Hladika ve Valenta, (2018)19
Tarihi maliyet ve gerçeğe uygun değer seçimi
İçerik analizi Analize tâbi işletmelerde çoğunlukla tarihi maliyet yöntemi tercih edilmektedir.
Paoloni, Paolucci ve Menicucci, (2017)20
Bankalarda gerçeğe uygun değer muhasebesi ve kazanç kalitesi
Panel veri analizi
Gerçeğe uygun değer yöntemi ile raporlanan gelir/ gider ile kazanç kalitesi arasında anlamlı bir ilişki tespit edilmiştir.
Oyewo, Emebinah and Savage, (2020)21
Gerçeğe uygun değer ölçümünde yaşanan sorunlar
Anket, Anova analizi
Gerçeğe uygun değer ölçümünde bilgi eksikliği, yöntemin suiistimal edilmesi, yeterli farkındalığın oluşmaması.
Chen, Lo, Tsang ve Zhang, (2020)22
Yatırım amaçlı gayrimenkuller ve gerçeğe uygun değer
Lojistik regresyon
Analize dâhil edilen işletmelerde gerçeğe uygun değer yönteminin “yönetimsel fırsat” olarak görüldüğü sonucuna ulaşılmıştır.
Tablo 1’de gerçeğe uygun değerin yerli ve yabancı literatürdeki durumu özetlenmiştir. Yerli literatürde daha çok gerçeğe uygun değerin standartlar ve işletmelerce nasıl ele alındığı teorik çalışmalar ya da içerik analiziyle ele alınmıştır. Yabancı literatürde de işletmelerin gerçeğe uygun değeri nasıl uyguladıkları, yöntemin eksiklikleri ve gerçeğe uygun değer kullanımının işletmelerin finansal
15 Saçan, E. (2014). Türkiye’de Bankacılar Açısından Gerçeğe Uygun Değer Muhasebesinin Yaşanan Finansal Krizlerdeki Rolü. Mali Çözüm Dergisi/Financial Analysis, 24(126): 57-79.
16 Erkuş, H., Akcan, A. (2013). Finansal Kriz Gerçeğe Uygun Değer ve Bir Araştırma. Dicle Üniversitesi Sosyal Bilimler Enstitüsü Dergisi, 5(10): 226 – 241.
17 Kıymetli Şen, İ, Özbirecikli, M. (2020). KÜMİ FRS’NİN İş Dünyasına Sağlayabileceği Yararlar: Bobi Frs, Tms/Tfrs ve Mevcut Muhasebe Sistemi ile Mukayeseli Bir İnceleme. Muhasebe Bilim Dünyası Dergisi, MODAV 16. Uluslararası Muhasebe Konferansı Özel Sayısı, 1-19.
18 Haswell, S., Evans, E. (2018). Enron, Fair Value Accounting, and Financial Crises: a Concise History, Accounting, Auditing & Accountability Journal. 31(1): 25-50.
19 Perčević, H., Hladika, M., Valenta, I. (2020). The Analysis of the Appliance of Fair Value Concept in Croatian Companies from Real Sector. In Eurasian Economic Perspectives (p. 17-29). Springer: Cham.
20 Paoloni, M., Paolucci, G., Menicucci, E. (2017). Fair Value Accounting and Earnings Quality (EQ) in Banking Sector: Evidence from Europe, African Journal of Business Management, 11(20): 597-607.
21 Oyewo, B., Emebinah, E., Savage, R. (2020). Challenges in Auditing Fair Value Measurement and Accounting Estimates, Journal of Financial Reporting and Accounting. 18(1): 51 – 57.
22 Chen, C., Lo, K., Tsang, D., Zhang, J. (2020). Understanding Accounting Discretion in China: An Analysis of Fair Value Reporting for İnvestment Property, Journal of Accounting and Public Policy, 39(4): 1 – 19.
Marmara Üniversitesi İktisadi ve İdari Bilimler Dergisi • Cilt: 43 • Sayı: 1 • Haziran 2021, ISSN: 2587-2672, ss/pp. 21-41
25
sonuçlarına olan etkisi analiz edilmiştir. Yöntemin sübjektif uygulamalara ve dolayısıyla suiistimal ve hatalara açık olması sebebiyle hem yerli literatürde hem de yabancı literatürde gerçeğe uygun değer uygulaması ile finansal krizler arasındaki ilişki ele alınmıştır.
3. TFRS ve TMS’de Gerçeğe Uygun Değer Kullanımı
3.1. Gerçeğe Uygun Değerin Uluslararası Finansal Raporlama Standartlarındaki Geçmişi
İlk kez 1982 yılında Maddi Duran Varlıklar standardında kullanılan gerçeğe uygun değer standartta, piyasa koşullarında istekli ve bilgili bir alıcı ile satıcı arasında bir varlığın el değiştirmesi durumunda ortaya çıkan fiyat olarak tanımlanmıştır. Uluslararası Muhasebe Standartları Kurulu’nun 1988 yılında başlattığı “Finansal Araçlar 1” projesinde gerçeğe uygun değer tanımında değişiklikler yapılmıştır. Yeni tanımda yalnızca varlıklar değil yükümlülükler de kullanılırken, alıcı ve satıcı kavramları yerine taraflar ifadesine yer verilmiştir. Tanım şu şekildedir23: Karşılıklı pazarlık ortamında, bilgili ve istekli gruplar arasında bir varlığın alışverişi ya da yükümlülüğün yerine getirilmesi sonucunda ortaya çıkan fiyattır. İngilizcesi “Fair Value (Adil Değer)” olan gerçeğe uygun değer kavramı Türkiye’de farklı kurumlarca makul değer, cari değer, uygun değer, adil değer olarak Türkçeye tercüme edilmiştir. Ancak gerçekleştirilen düzenlemeler sonucunda TFRS ve TMS’lerin esas alınacağı hükme bağlanmış ve gerçeğe uygun değer ortak kavram olarak kullanılmaya başlanmıştır24.
3.2. TFRS/ TMS’de Gerçeğe Uygun Değer Kullanımını Gerektiren Durumlar
Finansal raporlama standartları; finansal raporlama sürecinde varlıklar, yükümlülükler ve özkaynakların ölçümü, varlıklar, yükümlülükler ve özkaynakların sonraki dönem ölçümü, varlıkların geri kazanılabilir tutarının hesaplanması ve bir işlemin, kendisini oluşturan parçaları arasında, muhasebeleştirildiği ilk tutarın tahsisinde gerçeğe uygun değerin kullanımına izin vermektedir25. Gerçeğe uygun değer ölçümünde, ölçüme konu unsurun piyasa fiyatı kullanılmaktadır. Uygun piyasa fiyatı bulunamadığında ise benzer kalemlerin piyasa fiyatından yararlanılır. Piyasa fiyatının güvenilir olmadığı durumlarda ise sürece uygun olan farklı yöntemler kullanılır (net bugünkü değer, opsiyon fiyatlaması vb.) 26.
3.3. TFRS/ TMS’de Gerçeğe Uygun Değer Uygulaması
3.3.1. Gerçeğe Uygun Değerin İlk Ölçümde Kullanıldığı Standartlar
Tablo 2’de ilk ölçümde gerçeğe uygun değer uygulamasını gerektiren durumlar yer almaktadır.
23 Cairns, D. (2010). The Use of Fair Value in IFRS, Accounting in Europe, 3(1): 8.24 Şenel, A. S., Tuncay, M., Önoğlu, Ö., Karslı, C. (2011). Türkiye Muhasebe Standartlarında Yer Alan Bir
Değerleme Ölçüsü: Gerçeğe Uygun Değer, E-Journal of New World Sciences Academy, 6(1): 6.25 Cairns, 2010, 10.26 Aktaş, Deran, 2006, 160 – 161.
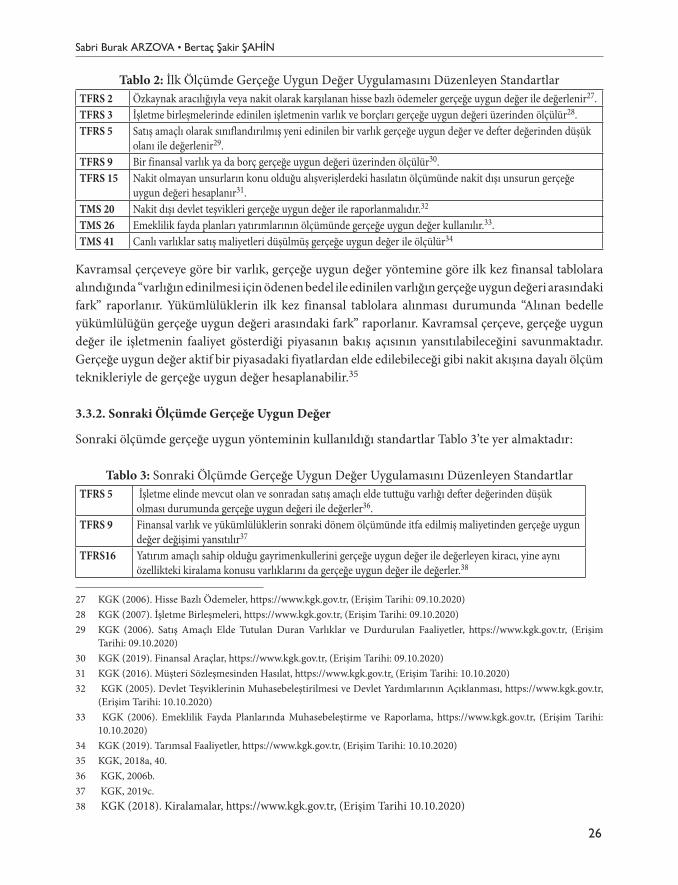
Sabri Burak ARZOVA • Bertaç Şakir ŞAHİN
26
Tablo 2: İlk Ölçümde Gerçeğe Uygun Değer Uygulamasını Düzenleyen StandartlarTFRS 2 Özkaynak aracılığıyla veya nakit olarak karşılanan hisse bazlı ödemeler gerçeğe uygun değer ile değerlenir27.TFRS 3 İşletme birleşmelerinde edinilen işletmenin varlık ve borçları gerçeğe uygun değeri üzerinden ölçülür28.TFRS 5 Satış amaçlı olarak sınıflandırılmış yeni edinilen bir varlık gerçeğe uygun değer ve defter değerinden düşük
olanı ile değerlenir29.TFRS 9 Bir finansal varlık ya da borç gerçeğe uygun değeri üzerinden ölçülür30.TFRS 15 Nakit olmayan unsurların konu olduğu alışverişlerdeki hasılatın ölçümünde nakit dışı unsurun gerçeğe
uygun değeri hesaplanır31.TMS 20 Nakit dışı devlet teşvikleri gerçeğe uygun değer ile raporlanmalıdır.32
TMS 26 Emeklilik fayda planları yatırımlarının ölçümünde gerçeğe uygun değer kullanılır.33.TMS 41 Canlı varlıklar satış maliyetleri düşülmüş gerçeğe uygun değer ile ölçülür34
Kavramsal çerçeveye göre bir varlık, gerçeğe uygun değer yöntemine göre ilk kez finansal tablolara alındığında “varlığın edinilmesi için ödenen bedel ile edinilen varlığın gerçeğe uygun değeri arasındaki fark” raporlanır. Yükümlülüklerin ilk kez finansal tablolara alınması durumunda “Alınan bedelle yükümlülüğün gerçeğe uygun değeri arasındaki fark” raporlanır. Kavramsal çerçeve, gerçeğe uygun değer ile işletmenin faaliyet gösterdiği piyasanın bakış açısının yansıtılabileceğini savunmaktadır. Gerçeğe uygun değer aktif bir piyasadaki fiyatlardan elde edilebileceği gibi nakit akışına dayalı ölçüm teknikleriyle de gerçeğe uygun değer hesaplanabilir.35
3.3.2. Sonraki Ölçümde Gerçeğe Uygun Değer
Sonraki ölçümde gerçeğe uygun yönteminin kullanıldığı standartlar Tablo 3’te yer almaktadır:
Tablo 3: Sonraki Ölçümde Gerçeğe Uygun Değer Uygulamasını Düzenleyen StandartlarTFRS 5 İşletme elinde mevcut olan ve sonradan satış amaçlı elde tuttuğu varlığı defter değerinden düşük
olması durumunda gerçeğe uygun değeri ile değerler36.TFRS 9 Finansal varlık ve yükümlülüklerin sonraki dönem ölçümünde itfa edilmiş maliyetinden gerçeğe uygun
değer değişimi yansıtılır37
TFRS16 Yatırım amaçlı sahip olduğu gayrimenkullerini gerçeğe uygun değer ile değerleyen kiracı, yine aynı özellikteki kiralama konusu varlıklarını da gerçeğe uygun değer ile değerler.38
27 KGK (2006). Hisse Bazlı Ödemeler, https://www.kgk.gov.tr, (Erişim Tarihi: 09.10.2020)28 KGK (2007). İşletme Birleşmeleri, https://www.kgk.gov.tr, (Erişim Tarihi: 09.10.2020)29 KGK (2006). Satış Amaçlı Elde Tutulan Duran Varlıklar ve Durdurulan Faaliyetler, https://www.kgk.gov.tr, (Erişim
Tarihi: 09.10.2020)30 KGK (2019). Finansal Araçlar, https://www.kgk.gov.tr, (Erişim Tarihi: 09.10.2020)31 KGK (2016). Müşteri Sözleşmesinden Hasılat, https://www.kgk.gov.tr, (Erişim Tarihi: 10.10.2020)32 KGK (2005). Devlet Teşviklerinin Muhasebeleştirilmesi ve Devlet Yardımlarının Açıklanması, https://www.kgk.gov.tr,
(Erişim Tarihi: 10.10.2020)33 KGK (2006). Emeklilik Fayda Planlarında Muhasebeleştirme ve Raporlama, https://www.kgk.gov.tr, (Erişim Tarihi:
10.10.2020)34 KGK (2019). Tarımsal Faaliyetler, https://www.kgk.gov.tr, (Erişim Tarihi: 10.10.2020)35 KGK, 2018a, 40.36 KGK, 2006b.37 KGK, 2019c.38 KGK (2018). Kiralamalar, https://www.kgk.gov.tr, (Erişim Tarihi 10.10.2020)
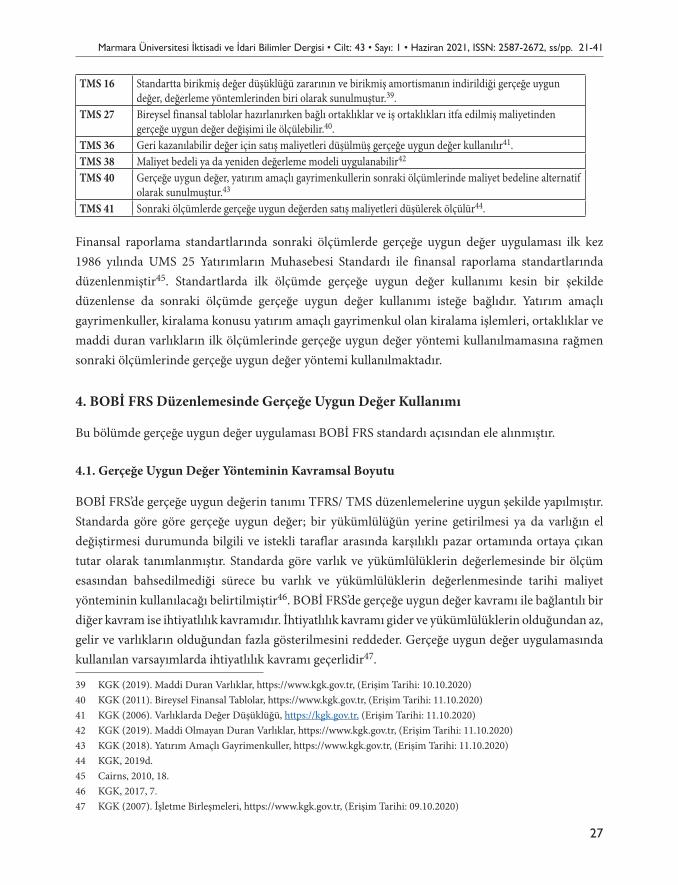
Marmara Üniversitesi İktisadi ve İdari Bilimler Dergisi • Cilt: 43 • Sayı: 1 • Haziran 2021, ISSN: 2587-2672, ss/pp. 21-41
27
TMS 16 Standartta birikmiş değer düşüklüğü zararının ve birikmiş amortismanın indirildiği gerçeğe uygun değer, değerleme yöntemlerinden biri olarak sunulmuştur.39.
TMS 27 Bireysel finansal tablolar hazırlanırken bağlı ortaklıklar ve iş ortaklıkları itfa edilmiş maliyetinden gerçeğe uygun değer değişimi ile ölçülebilir.40.
TMS 36 Geri kazanılabilir değer için satış maliyetleri düşülmüş gerçeğe uygun değer kullanılır41.TMS 38 Maliyet bedeli ya da yeniden değerleme modeli uygulanabilir42
TMS 40 Gerçeğe uygun değer, yatırım amaçlı gayrimenkullerin sonraki ölçümlerinde maliyet bedeline alternatif olarak sunulmuştur.43
TMS 41 Sonraki ölçümlerde gerçeğe uygun değerden satış maliyetleri düşülerek ölçülür44.
Finansal raporlama standartlarında sonraki ölçümlerde gerçeğe uygun değer uygulaması ilk kez 1986 yılında UMS 25 Yatırımların Muhasebesi Standardı ile finansal raporlama standartlarında düzenlenmiştir45. Standartlarda ilk ölçümde gerçeğe uygun değer kullanımı kesin bir şekilde düzenlense da sonraki ölçümde gerçeğe uygun değer kullanımı isteğe bağlıdır. Yatırım amaçlı gayrimenkuller, kiralama konusu yatırım amaçlı gayrimenkul olan kiralama işlemleri, ortaklıklar ve maddi duran varlıkların ilk ölçümlerinde gerçeğe uygun değer yöntemi kullanılmamasına rağmen sonraki ölçümlerinde gerçeğe uygun değer yöntemi kullanılmaktadır.
4. BOBİ FRS Düzenlemesinde Gerçeğe Uygun Değer Kullanımı
Bu bölümde gerçeğe uygun değer uygulaması BOBİ FRS standardı açısından ele alınmıştır.
4.1. Gerçeğe Uygun Değer Yönteminin Kavramsal Boyutu
BOBİ FRS’de gerçeğe uygun değerin tanımı TFRS/ TMS düzenlemelerine uygun şekilde yapılmıştır. Standarda göre göre gerçeğe uygun değer; bir yükümlülüğün yerine getirilmesi ya da varlığın el değiştirmesi durumunda bilgili ve istekli taraflar arasında karşılıklı pazar ortamında ortaya çıkan tutar olarak tanımlanmıştır. Standarda göre varlık ve yükümlülüklerin değerlemesinde bir ölçüm esasından bahsedilmediği sürece bu varlık ve yükümlülüklerin değerlenmesinde tarihi maliyet yönteminin kullanılacağı belirtilmiştir46. BOBİ FRS’de gerçeğe uygun değer kavramı ile bağlantılı bir diğer kavram ise ihtiyatlılık kavramıdır. İhtiyatlılık kavramı gider ve yükümlülüklerin olduğundan az, gelir ve varlıkların olduğundan fazla gösterilmesini reddeder. Gerçeğe uygun değer uygulamasında kullanılan varsayımlarda ihtiyatlılık kavramı geçerlidir47.
39 KGK (2019). Maddi Duran Varlıklar, https://www.kgk.gov.tr, (Erişim Tarihi: 10.10.2020)40 KGK (2011). Bireysel Finansal Tablolar, https://www.kgk.gov.tr, (Erişim Tarihi: 11.10.2020)41 KGK (2006). Varlıklarda Değer Düşüklüğü, https://kgk.gov.tr, (Erişim Tarihi: 11.10.2020)42 KGK (2019). Maddi Olmayan Duran Varlıklar, https://www.kgk.gov.tr, (Erişim Tarihi: 11.10.2020)43 KGK (2018). Yatırım Amaçlı Gayrimenkuller, https://www.kgk.gov.tr, (Erişim Tarihi: 11.10.2020)44 KGK, 2019d.45 Cairns, 2010, 18.46 KGK, 2017, 7.47 KGK (2007). İşletme Birleşmeleri, https://www.kgk.gov.tr, (Erişim Tarihi: 09.10.2020)
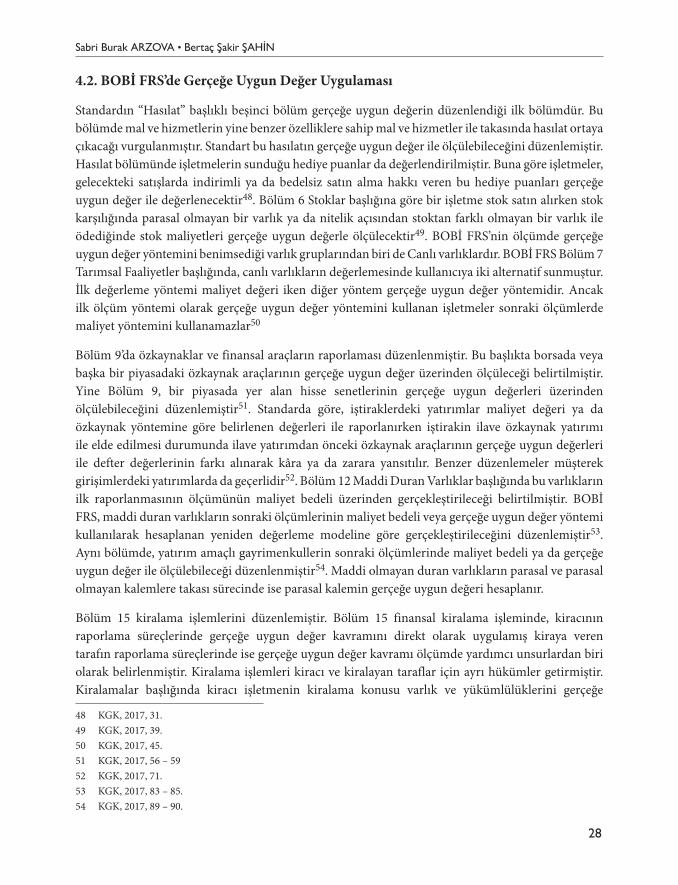
Sabri Burak ARZOVA • Bertaç Şakir ŞAHİN
28
4.2. BOBİ FRS’de Gerçeğe Uygun Değer Uygulaması
Standardın “Hasılat” başlıklı beşinci bölüm gerçeğe uygun değerin düzenlendiği ilk bölümdür. Bu bölümde mal ve hizmetlerin yine benzer özelliklere sahip mal ve hizmetler ile takasında hasılat ortaya çıkacağı vurgulanmıştır. Standart bu hasılatın gerçeğe uygun değer ile ölçülebileceğini düzenlemiştir. Hasılat bölümünde işletmelerin sunduğu hediye puanlar da değerlendirilmiştir. Buna göre işletmeler, gelecekteki satışlarda indirimli ya da bedelsiz satın alma hakkı veren bu hediye puanları gerçeğe uygun değer ile değerlenecektir48. Bölüm 6 Stoklar başlığına göre bir işletme stok satın alırken stok karşılığında parasal olmayan bir varlık ya da nitelik açısından stoktan farklı olmayan bir varlık ile ödediğinde stok maliyetleri gerçeğe uygun değerle ölçülecektir49. BOBİ FRS’nin ölçümde gerçeğe uygun değer yöntemini benimsediği varlık gruplarından biri de Canlı varlıklardır. BOBİ FRS Bölüm 7 Tarımsal Faaliyetler başlığında, canlı varlıkların değerlemesinde kullanıcıya iki alternatif sunmuştur. İlk değerleme yöntemi maliyet değeri iken diğer yöntem gerçeğe uygun değer yöntemidir. Ancak ilk ölçüm yöntemi olarak gerçeğe uygun değer yöntemini kullanan işletmeler sonraki ölçümlerde maliyet yöntemini kullanamazlar50
Bölüm 9’da özkaynaklar ve finansal araçların raporlaması düzenlenmiştir. Bu başlıkta borsada veya başka bir piyasadaki özkaynak araçlarının gerçeğe uygun değer üzerinden ölçüleceği belirtilmiştir. Yine Bölüm 9, bir piyasada yer alan hisse senetlerinin gerçeğe uygun değerleri üzerinden ölçülebileceğini düzenlemiştir51. Standarda göre, iştiraklerdeki yatırımlar maliyet değeri ya da özkaynak yöntemine göre belirlenen değerleri ile raporlanırken iştirakin ilave özkaynak yatırımı ile elde edilmesi durumunda ilave yatırımdan önceki özkaynak araçlarının gerçeğe uygun değerleri ile defter değerlerinin farkı alınarak kâra ya da zarara yansıtılır. Benzer düzenlemeler müşterek girişimlerdeki yatırımlarda da geçerlidir52. Bölüm 12 Maddi Duran Varlıklar başlığında bu varlıkların ilk raporlanmasının ölçümünün maliyet bedeli üzerinden gerçekleştirileceği belirtilmiştir. BOBİ FRS, maddi duran varlıkların sonraki ölçümlerinin maliyet bedeli veya gerçeğe uygun değer yöntemi kullanılarak hesaplanan yeniden değerleme modeline göre gerçekleştirileceğini düzenlemiştir53. Aynı bölümde, yatırım amaçlı gayrimenkullerin sonraki ölçümlerinde maliyet bedeli ya da gerçeğe uygun değer ile ölçülebileceği düzenlenmiştir54. Maddi olmayan duran varlıkların parasal ve parasal olmayan kalemlere takası sürecinde ise parasal kalemin gerçeğe uygun değeri hesaplanır.
Bölüm 15 kiralama işlemlerini düzenlemiştir. Bölüm 15 finansal kiralama işleminde, kiracının raporlama süreçlerinde gerçeğe uygun değer kavramını direkt olarak uygulamış kiraya veren tarafın raporlama süreçlerinde ise gerçeğe uygun değer kavramı ölçümde yardımcı unsurlardan biri olarak belirlenmiştir. Kiralama işlemleri kiracı ve kiralayan taraflar için ayrı hükümler getirmiştir. Kiralamalar başlığında kiracı işletmenin kiralama konusu varlık ve yükümlülüklerini gerçeğe
48 KGK, 2017, 31.49 KGK, 2017, 39.50 KGK, 2017, 45.51 KGK, 2017, 56 – 5952 KGK, 2017, 71.53 KGK, 2017, 83 – 85.54 KGK, 2017, 89 – 90.
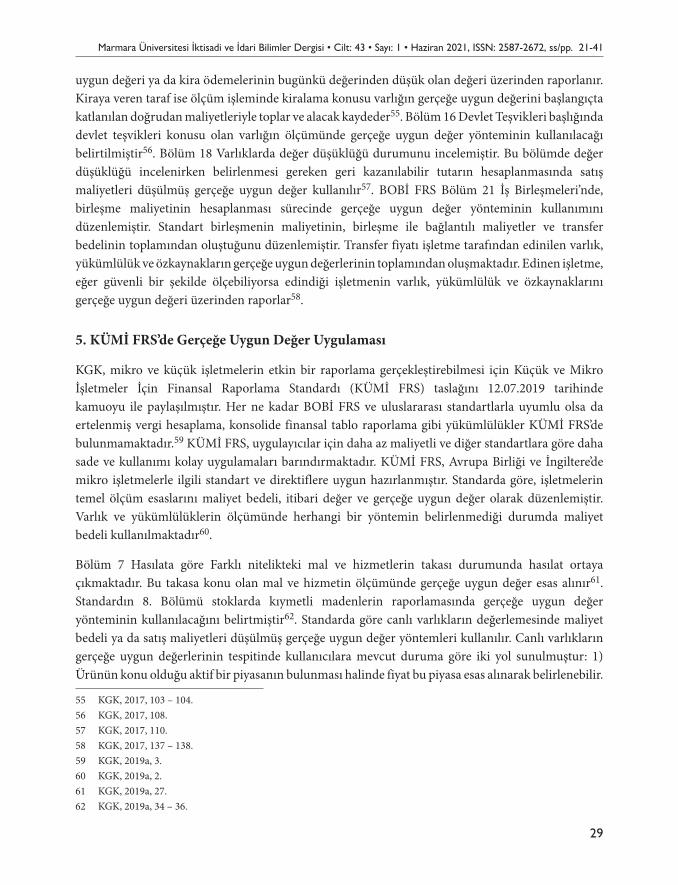
Marmara Üniversitesi İktisadi ve İdari Bilimler Dergisi • Cilt: 43 • Sayı: 1 • Haziran 2021, ISSN: 2587-2672, ss/pp. 21-41
29
uygun değeri ya da kira ödemelerinin bugünkü değerinden düşük olan değeri üzerinden raporlanır. Kiraya veren taraf ise ölçüm işleminde kiralama konusu varlığın gerçeğe uygun değerini başlangıçta katlanılan doğrudan maliyetleriyle toplar ve alacak kaydeder55. Bölüm 16 Devlet Teşvikleri başlığında devlet teşvikleri konusu olan varlığın ölçümünde gerçeğe uygun değer yönteminin kullanılacağı belirtilmiştir56. Bölüm 18 Varlıklarda değer düşüklüğü durumunu incelemiştir. Bu bölümde değer düşüklüğü incelenirken belirlenmesi gereken geri kazanılabilir tutarın hesaplanmasında satış maliyetleri düşülmüş gerçeğe uygun değer kullanılır57. BOBİ FRS Bölüm 21 İş Birleşmeleri’nde, birleşme maliyetinin hesaplanması sürecinde gerçeğe uygun değer yönteminin kullanımını düzenlemiştir. Standart birleşmenin maliyetinin, birleşme ile bağlantılı maliyetler ve transfer bedelinin toplamından oluştuğunu düzenlemiştir. Transfer fiyatı işletme tarafından edinilen varlık, yükümlülük ve özkaynakların gerçeğe uygun değerlerinin toplamından oluşmaktadır. Edinen işletme, eğer güvenli bir şekilde ölçebiliyorsa edindiği işletmenin varlık, yükümlülük ve özkaynaklarını gerçeğe uygun değeri üzerinden raporlar58.
5. KÜMİ FRS’de Gerçeğe Uygun Değer Uygulaması
KGK, mikro ve küçük işletmelerin etkin bir raporlama gerçekleştirebilmesi için Küçük ve Mikro İşletmeler İçin Finansal Raporlama Standardı (KÜMİ FRS) taslağını 12.07.2019 tarihinde kamuoyu ile paylaşılmıştır. Her ne kadar BOBİ FRS ve uluslararası standartlarla uyumlu olsa da ertelenmiş vergi hesaplama, konsolide finansal tablo raporlama gibi yükümlülükler KÜMİ FRS’de bulunmamaktadır.59 KÜMİ FRS, uygulayıcılar için daha az maliyetli ve diğer standartlara göre daha sade ve kullanımı kolay uygulamaları barındırmaktadır. KÜMİ FRS, Avrupa Birliği ve İngiltere’de mikro işletmelerle ilgili standart ve direktiflere uygun hazırlanmıştır. Standarda göre, işletmelerin temel ölçüm esaslarını maliyet bedeli, itibari değer ve gerçeğe uygun değer olarak düzenlemiştir. Varlık ve yükümlülüklerin ölçümünde herhangi bir yöntemin belirlenmediği durumda maliyet bedeli kullanılmaktadır60.
Bölüm 7 Hasılata göre Farklı nitelikteki mal ve hizmetlerin takası durumunda hasılat ortaya çıkmaktadır. Bu takasa konu olan mal ve hizmetin ölçümünde gerçeğe uygun değer esas alınır61. Standardın 8. Bölümü stoklarda kıymetli madenlerin raporlamasında gerçeğe uygun değer yönteminin kullanılacağını belirtmiştir62. Standarda göre canlı varlıkların değerlemesinde maliyet bedeli ya da satış maliyetleri düşülmüş gerçeğe uygun değer yöntemleri kullanılır. Canlı varlıkların gerçeğe uygun değerlerinin tespitinde kullanıcılara mevcut duruma göre iki yol sunulmuştur: 1) Ürünün konu olduğu aktif bir piyasanın bulunması halinde fiyat bu piyasa esas alınarak belirlenebilir.
55 KGK, 2017, 103 – 104.56 KGK, 2017, 108.57 KGK, 2017, 110.58 KGK, 2017, 137 – 138.59 KGK, 2019a, 3.60 KGK, 2019a, 2.61 KGK, 2019a, 27.62 KGK, 2019a, 34 – 36.
Sabri Burak ARZOVA • Bertaç Şakir ŞAHİN
30
2) Aktif bir piyasanın bulunmaması durumunda şu yöntemlerden biri kullanılabilir: a) Yakın tarihte gerçekleşen bir işlem fiyatı b) Benzer varlıkların piyasa fiyatı (farklılıkların düzeltilmesi şartıyla). c) İlgili sektöre ilişkin ölçütler (meyven ağırlığı, bahçe değerinin yüz ölçümü, etin kilosu vb.)63.
Standardın 10. Başlığı Finansal Araçlar ve Özkaynaklar’dır. Bu başlığa göre Ticari ve diğer borç ile alacaklar gerçeğe uygun değer ile değerlenmektedir. Finansal araçların işlem fiyatı bu varlıkların gerçeğe uygun değeridir. Özkaynak araçlarındaki yatırımların değerlenmesinde seçilen yöntem gerçeğe uygun değer yöntemidir. Ayrıca Kâr dağıtımına konu olan nakit dışı varlıklar gerçeğe uygun değerleri ile raporlanır64. KÜMİ FRS’ye göre maddi duran varlıkların değerlemesinde Maliyet bedeli veya yeniden değerleme yöntemi (Gerçeğe uygun değer – birikmiş değer düşüklüğü zararları – birikmiş amortisman) tercih edilebilir65. Bölüm 13 Kiralamalar’da gerçeğe uygun değer kullanımı şu şekildedir: Finansal kiralamaya konu varlık ve kiralamaya ilişkin yükümlülük kiracı tarafça eğer kira ödemelerinin bugünkü değerinden daha düşük bir bedeldeyse gerçeğe uygun değer ile değerlenir. Aksi durumda bugünkü değer kullanılır. Kira konusu varlık, kiraya veren tarafından gerçeğe uygun değer ve başlangıçtaki maliyetler toplamı olarak alacak kaydedilir.66 Bölüm 14 Devlet Teşvikleri’ne göre herhangi bir performans şartı gerektirmeyen devlet teşviklerinin kâr ve zarara yansıtılacağı düzenlenmiştir. Performans şartı gerektiren teşvikler ise ilgili şart gerçekleşene kadar gelir/ gider tahakkuklarında izlenir. Devlet teşvikleri gerçeğe uygun değer ile raporlanır67. KÜMİ FRS’de değer düşüklüğü satış maliyetleri düşülen gerçeğe uygun değeri ile varlığın defter değeri karşılaştırılarak incelenir. Bir varlık için ödenen vergi ve benzeri tutarlar, taşıma, sigorta gibi maliyetler, varlığa ilişkin bir kısıtlamanın kaldırılması gibi maliyetler satış maliyetlerini oluşmaktadır68. Yukarıdaki düzenlemelerin dışında iş birleşmelerinin, gerçeğe uygun değer yönteminin kullanıldığı BOBİ FRS Bölüm 21’e göre raporlanacağı düzenlenmiştir.
6. Faizsiz Finans Muhasebe Standartlarında Gerçeğe Uygun Değer Uygulaması
İnançları gereği finansman süreçlerinde yer almayan kişi ve kurumları finansman sistemine dahil etmek amacıyla özellikle dini kaynakları temel alan bir İslami finansman modeli ortaya çıkmıştır69. İslami finansman modeli özetle faaliyetlerinde faiz unsurunu bulundurmayarak, kâr ve zarara katılım ile ortaklık esasını benimsemektedir. İslami Finans Kuruluşları Muhasebe ve Denetim Kuruluşu, faizsiz finansman süreçlerinin finansal raporlamasında kullanılmak üzere Faizsiz Finans Muhasebe Standartları’nı oluşturmuştur. Bu standartlar genel muhasebe ilkeleri ve uluslararası finansal raporlama standartlarının dışında fıkıh tabanlı ilke ve kurallara da uygunluk taşımaktadır. Türkiye’de faaliyet gösteren faizsiz finans kuruluşlarının finansal raporlama süreçlerinde kullanılmak amacıyla
63 KGK, 2019a, 39 – 40.64 KGK, 2019a, 43 – 51.65 KGK, 2019a, 53.66 KGK, 2019a, 63 – 66.67 KGK, 2019a, 68.68 KGK, 2019a, 70 – 72.69 Özdemir, M. (2019). Katılım Bankaları ve İslami Mikrofinans: Türkiye’deki Mevcut Durum ve Öneriler. Journal of BRSA
Banking and Financial Markets, 13(2): 122.
Marmara Üniversitesi İktisadi ve İdari Bilimler Dergisi • Cilt: 43 • Sayı: 1 • Haziran 2021, ISSN: 2587-2672, ss/pp. 21-41
31
bu standartlar Türkçeye tercüme edilerek 01.01.2020 ve sonraki hesap dönemlerinde ihtiyari olarak kullanılmak üzere yayımlanmıştır. Kavramsal Çerçeve, gerçeğe uygun değeri, değerleme tarihinde istekli bir alıcı ve satıcının bir varlığın elde edilmesi veya bir yükümlülüğün yerine getirilmesi için ödediği/ aldığı nakit ve nakit benzeri varlığın tahmini değeri olarak tanımlamıştır. Gerçeğe uygun değerin hesaplanabilmesi için üretilen bilginin güvenilir, ihtiyaca uygun ve anlaşılabilir olması gerekmektedir. Uygulanabilirlik ve bilgilerin makul seviyede doğrulanabilir olması gerçeğe uygun değer uygulaması için önem taşımaktadır.70
Gerçeğe uygun değer yönteminin benimsendiği ilk standart, Faizsiz Finans Muhasebe Standardı 3 “Mudarebe Finansmanı”dır. Mudarebe, faizsiz finans kuruluşlarınca sunulan ve ortaklığa dayalı bir finansman aracıdır. Emek sermaye ortaklığı olarak da bilinen mudarebe finansmanı sürecinde taraflardan biri ortaklığa sermaye unsurunu koyarken diğer taraf emek ve uzmanlığı ile ortaklığa katılmaktadır. Ortaklık faaliyetleri sonucunda ortaya çıkan kâr taraflar arasında paylaşılırken zarar sermaye koyan tarafça karşılanacaktır71. Faizsiz Finans Muhasebe Standardı 3’e göre mudarebe sermayesine konan parasal olmayan unsurlar gerçeğe uygun değeri ile değerlenmelidir72. Faizsiz Finans Muhasebe Standardı 4 “Müşareke”, müşareke sözleşmelerinin finansal raporlama süreçlerini düzenlemiştir. Ortaklığa dayalı bir diğer finansman yöntemi ise müşarekedir. Mudarebeye benzer bir finansman yöntemi olan müşareke ortaklığı, ortaklığın taraflarından birinin sermaye diğer tarafın ise sermaye ile birlikte emek ve uzmanlığını koyduğu bir finansman yöntemidir73. Standart, mudarebe sözleşmelerine benzer şekilde müşareke sermayesine konan ve parasal olmayan varlıkların gerçeğe uygun değer ile düzenleneceğini vurgulamıştır. Faizsiz finans kuruluşunun müşareke sözleşmesindeki paylarını parça parça devrettiği sözleşme tipi ise azalan müşarekedir. Standart, faizsiz finans kuruluşunun pay satışını gerçeğe uygun değer üzerinden gerçekleştireceğini düzenlemiştir74.
Faizsiz Finans Muhasebe Standardı 7, selem sözleşmelerinin finansal raporlama süreçlerini düzenlenmiştir. Selem, bir malın ileride teslim alınmak üzere peşin ödeme ile satın alındığı bir satış işlemidir. Selem sözleşmeleri farklı mal grupları üzerinde gerçekleşse de genel olarak tarım ürünleri selem sözleşmelerinin konusu olmaktadır. Standart selem sermayesinin nakit dışı unsurlarla sağlanması durumunda sermayenin gerçeğe uygun değer ile değerleneceğini düzenlemiştir. Ayrıca selem konusu malın tesliminde malın piyasa değerinden (piyasa değeri ölçülemiyorsa gerçeğe uygun değer) düşük olması durumunda aradaki fark kâr/ zarara kaydedilir75. Faizsiz Finans Muhasebe Standardı 8 “İcare” sözleşmelerinin finansal raporlama süreçlerini düzenlemektedir. İcare sözleşmeleri, kiralama işlemlerinin fıkhi ilkelerle uyumlaştırılmış halidir. Bu standartta gerçeğe uygun değer yöntemine kiralama konusu varlıkta meydana gelecek değer düşüklüğünün belirlenmesi
70 KGK (2019). Faizsiz Finans Kuruluşlarının Finansal Raporlamasına İlişkin Kavramsal Çerçeve, https://kgk.gov.tr, (Erişim Tarihi: 17.10.2020)
71 Bacha, 0. I. (1995). Conventional versus Mudharabah Financing: An Agency Cost Perspective, Journal of Islamic Economics, 4(1-2): 36.
72 KGK, (2019). Faizsiz Finans Muhasebe Standardı 3 Mudarebe. https://kgk.gov.tr, (Erişim Tarihi: 13.10.2020)73 Shafiai, M. H. M., Moi, M. R. (2015). Fitting Islamic Financial Contracts in Developing Agricultural Land, Global
Journal Al-Thaqafah, 5(1), 43-49.74 KGK (2019). Faizsiz Finans Muhasebe Standardı 4 Müşareke, https://www.kgk.gov.tr, (Erişim Tarihi: 3.10.2020)75 KGK (2019). Faizsiz Finans Muhasebe Standardı 7 Selem ve Alt Selem, https://www.kgk.gov.tr, (Erişim Tarihi: 14.10.2020)
Sabri Burak ARZOVA • Bertaç Şakir ŞAHİN
32
amacıyla kullanılmaktadır. Sözleşme sonunda kiralama konusu varlığın mülkiyetinin kiracı tarafa geçtiği icare sözleşmelerinde, kiralama konusu varlığın yasal mülkiyeti kiracı tarafa geçmeden önce kiracının varlığı satın almak için katlanacağı bedel ile varlığın gerçeğe uygun değeri karşılaştırılır. Eğer kira ödemeleri varlığın gerçeğe uygun değeri aşıyorsa bu fark kiraya veren tarafın yükümlülüğü olarak raporlanır76.
Faizsiz Finans Muhasebe Standardı 24 “İştiraklerdeki Yatırımlar, Faizsiz Finans Kurumunun İştirak Yatırımlarını İlk Raporlamada Maliyet Bedeli ile Sonraki Dönem Raporlamalarında” ise kâr ve zarar düzeltmeleri yapılarak defter değeri ile kaydedilmesi gerektiğini vurgulamıştır. Bireysel finansal tablolarda iştirak yatırımları maliyet bedeli ya da gerçeğe uygun değerden biri ile raporlanır77. Faizsiz Finans Muhasebe Standartları’nda gerçeğe uygun değer yöntemine atıf verilen standartlardan biri de Faizsiz Finans Muhasebe Standardı 26 “Gayrimenkul Yatırımları”dır. Standarda göre gayrimenkul yatırımları ilk ölçümde maliyet bedeli ile değerlenir. Sonraki ölçümde ise kullanım amaçlı elde tutulan gayrimenkuller gerçeğe uygun değer yöntemi ile değerlenir. Etkin bir piyasanın ya da karşılaştırma olanağı olan bir işlemin bulunmaması durumunda işletme maliyet bedeli yöntemini kullanır. Faizsiz finans kuruluşu gayrimenkulü satış amaçlı olarak elde tuttuğunda, gayrimenkul yatırımı “Satış Amaçlı Elde Tutulan Gayrimenkule Yapılan Yatırım” niteliğinde yeniden sınıflandırılır. Sınıflandırma gerçekleştikten sonra amortisman ayırma işlemi sonlandırılır. Sınıflandırılan gayrimenkulün değerlenmesi için defter değeri ile gerçeğe uygun değeri (satış maliyetleri çıkarılmış) karşılaştırılır. Bu iki yöntemden düşük olan kullanılır. Gerçeğe uygun değer ile değerlenen gayrimenkul yatırımları satış amaçlı elde tutulduğunda gerçeğe uygun değer ile takip edilmeye devam edilir78. Faizsiz Finans Muhasebe Standardı 27 “Yatırım Hesapları”, faizsiz finans kuruluşunun yatırım hesabını gerçeğe uygun değeri üzerinden finansal tablolarına alacağını düzenlemiştir79. Faizsiz Finans Muhasebe Standardı 30, bir varlıkta meydana gelen değer düşüklüğünü geri kazanılabilir değerin defter değerinden düşük olması olarak açıklanmaktadır. Geri kazanılabilir değer hesaplanırken satış maliyetleri düşülen gerçeğe uygun değer kullanılır. Bu değer ile kullanım değeri karşılaştırılır ve yüksek olan unsur geri kazanılabilir değer olarak kabul edilir.80
Faizsiz finans kuruluşlarının sukuk ve benzeri araçlara yapılan yatırımların raporlanması süreci Faizsiz Finans Muhasebe Standardı 33 ile düzenlenmiştir. Standart, faizsiz finansman sağlayan kuruluşların yatırımlarının özkaynak araçları, parasal ve parasal olmayan borçlanma araçları ve diğer yatırım araçları olarak sınıflanabileceğini düzenlemiştir. Bu araçlar ilk kez raporlandığında gerçeğe uygun değerleri ile değerlenir. Sonraki ölçümde ise ifta edilmiş maliyet yöntemine göre izlenen yatırımlardaki değişimler kâr/ zarara yansıtılırken diğer yöntemlere göre takip edilen
76 KGK (2019). Faizsiz Finans Muhasebe Standardı 8 İcâre ve İcâre Müntehiye Bittemlîk, https://www.kgk.gov.tr, (Erişim Tarihi: 14.10.2020)
77 KGK (2019). Faizsiz Finans Muhasebe Standardı 24 İştiraklerdeki Yatırımlar, https://www.kgk.gov.tr, (Erişim Tarihi: 15.10.2020)
78 KGK (2019). Faizsiz Finans Muhasebe Standardı 26 Gayrimenkul Yatırımları, https://www.kgk.gov.tr, (Erişim Tarihi: 15.10.2020)
79 KGK (2019). Faizsiz Finans Muhasebe Standardı 27 Yatırım Hesapları, https://www.kgk.gov.tr, (Erişim Tarihi: 16.10.2020)80 KGK (2019). Faizsiz Finans Muhasebe Standardı 30 Değer Düşüklüğü, Kredi Zararları ve Ekonomik Açıdan Dezavantajlı
Taahhütler, https://www.kgk.gov.tr, (Erişim Tarihi: 16.10.2020)
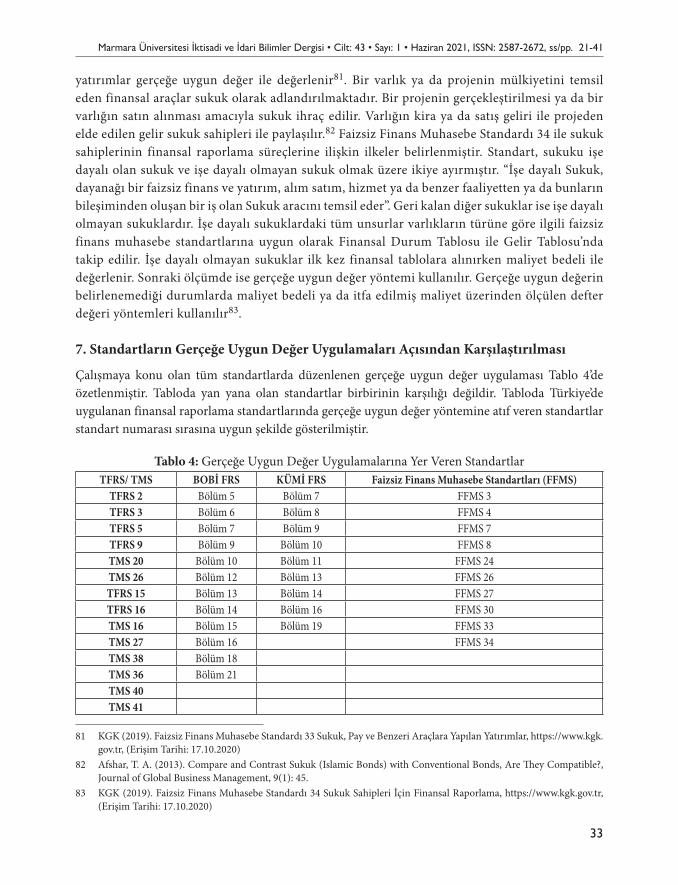
Marmara Üniversitesi İktisadi ve İdari Bilimler Dergisi • Cilt: 43 • Sayı: 1 • Haziran 2021, ISSN: 2587-2672, ss/pp. 21-41
33
yatırımlar gerçeğe uygun değer ile değerlenir81. Bir varlık ya da projenin mülkiyetini temsil eden finansal araçlar sukuk olarak adlandırılmaktadır. Bir projenin gerçekleştirilmesi ya da bir varlığın satın alınması amacıyla sukuk ihraç edilir. Varlığın kira ya da satış geliri ile projeden elde edilen gelir sukuk sahipleri ile paylaşılır.82 Faizsiz Finans Muhasebe Standardı 34 ile sukuk sahiplerinin finansal raporlama süreçlerine ilişkin ilkeler belirlenmiştir. Standart, sukuku işe dayalı olan sukuk ve işe dayalı olmayan sukuk olmak üzere ikiye ayırmıştır. “İşe dayalı Sukuk, dayanağı bir faizsiz finans ve yatırım, alım satım, hizmet ya da benzer faaliyetten ya da bunların bileşiminden oluşan bir iş olan Sukuk aracını temsil eder”. Geri kalan diğer sukuklar ise işe dayalı olmayan sukuklardır. İşe dayalı sukuklardaki tüm unsurlar varlıkların türüne göre ilgili faizsiz finans muhasebe standartlarına uygun olarak Finansal Durum Tablosu ile Gelir Tablosu’nda takip edilir. İşe dayalı olmayan sukuklar ilk kez finansal tablolara alınırken maliyet bedeli ile değerlenir. Sonraki ölçümde ise gerçeğe uygun değer yöntemi kullanılır. Gerçeğe uygun değerin belirlenemediği durumlarda maliyet bedeli ya da itfa edilmiş maliyet üzerinden ölçülen defter değeri yöntemleri kullanılır83.
7. Standartların Gerçeğe Uygun Değer Uygulamaları Açısından Karşılaştırılması
Çalışmaya konu olan tüm standartlarda düzenlenen gerçeğe uygun değer uygulaması Tablo 4’de özetlenmiştir. Tabloda yan yana olan standartlar birbirinin karşılığı değildir. Tabloda Türkiye’de uygulanan finansal raporlama standartlarında gerçeğe uygun değer yöntemine atıf veren standartlar standart numarası sırasına uygun şekilde gösterilmiştir.
Tablo 4: Gerçeğe Uygun Değer Uygulamalarına Yer Veren StandartlarTFRS/ TMS BOBİ FRS KÜMİ FRS Faizsiz Finans Muhasebe Standartları (FFMS)
TFRS 2 Bölüm 5 Bölüm 7 FFMS 3TFRS 3 Bölüm 6 Bölüm 8 FFMS 4TFRS 5 Bölüm 7 Bölüm 9 FFMS 7TFRS 9 Bölüm 9 Bölüm 10 FFMS 8TMS 20 Bölüm 10 Bölüm 11 FFMS 24TMS 26 Bölüm 12 Bölüm 13 FFMS 26TFRS 15 Bölüm 13 Bölüm 14 FFMS 27TFRS 16 Bölüm 14 Bölüm 16 FFMS 30TMS 16 Bölüm 15 Bölüm 19 FFMS 33TMS 27 Bölüm 16 FFMS 34TMS 38 Bölüm 18TMS 36 Bölüm 21TMS 40TMS 41
81 KGK (2019). Faizsiz Finans Muhasebe Standardı 33 Sukuk, Pay ve Benzeri Araçlara Yapılan Yatırımlar, https://www.kgk.gov.tr, (Erişim Tarihi: 17.10.2020)
82 Afshar, T. A. (2013). Compare and Contrast Sukuk (Islamic Bonds) with Conventional Bonds, Are They Compatible?, Journal of Global Business Management, 9(1): 45.
83 KGK (2019). Faizsiz Finans Muhasebe Standardı 34 Sukuk Sahipleri İçin Finansal Raporlama, https://www.kgk.gov.tr, (Erişim Tarihi: 17.10.2020)
Sabri Burak ARZOVA • Bertaç Şakir ŞAHİN
34
Standartlara göre gerçeğe uygun değer uygulaması incelendiğinde KÜMİ FRS, TFRS/TMS, ve BOBİ FRS standartlarında tarımsal faaliyetlerin değerlenmesinde gerçeğe uygun değer yöntemine yer verildiği görülmüştür. TFRS/ TMS’de ilk ölçümde satış maliyetleri düşürülen gerçeğe uygun değer kullanılırken ikinci ölçümde bu yönteme alternatif olarak maliyet bedeli de düzenlenmiştir. BOBİ FRS’de maliyet yöntemi ve satış maliyetleri düşürülen gerçeğe uygun değer alternatifli olarak sunulmuştur. KÜMİ FRS tarımsal varlıkların değerlenmesi sürecinde BOBİ FRS’ye benzer düzenlemelere sahiptir. TFRS/ TMS yatırım amaçlı gayrimenkullerin sonraki ölçümünde gerçeğe uygun değere yer vermiştir. BOBİ FRS ve Faizsiz Finans Muhasebe Standartları da yatırım amaçlı gayrimenkullerin değerlemesinde TFRS/ TMS’ye benzer düzenlemeleri barındırmaktadır. TFRS/ TMS’ye göre nakit dışı devlet teşvikleri gerçeğe uygun değer üzerinden ölçülecektir. BOBİ FRS ve KÜMİ FRS’ye göre devlet teşviğine konu varlıklar gerçeğe uygun değer ile değerlenmektedir. TFRS/ TMS maddi duran varlıkların değerlenmesinde sonraki ölçümde gerçeğe uygun değer alternatif yöntemlerden biri olarak sunulurken BOBİ FRS ve KÜMİ FRS’de maliyet bedeli ya da gerçeğe uygun değer yöntemini alternatifli olarak sunulmuştur. Maddi olmayan duran varlıkların değerlemesi konusunda TFRS/ TMS ve BOBİ FRS düzenlemeler gerçekleştirmiştir. TFRS/ TMS maddi duran varlıkların değerlemesinde önerilen yeniden değerleme modeli sürecinde gerçeğe uygun değer uygulanırken BOBİ FRS’de takas işleminde bu yönteme atıfta bulunulmuştur. Faizsiz Finans Muhasebe Standartları dışındaki tüm standartlarda kiralama işleminde gerçeğe uygun değer raporlama sürecinde bir ölçüm unsuru iken Faizsiz Finans Muhasebe Standartları gerçeğe uygun değeri kiracı ile kiralayan arasında malın devri esnasında değer düşüklüğünün incelenmesi amacıyla kullanmaktadır. KÜMİ FRS, TFRS/TMS, ve BOBİ FRS’ye göre iş birleşmelerindeki edinilen unsurlar gerçeğe uygun değerleri ile değerlenmektedir. Çalışmaya konu tüm standartlar varlıklarda değer düşüklüğü ile finansal araçlar ve özkaynaklarda gerçeğe uygun değer kullanımını benzer şekilde ele almıştır. KÜMİ FRS, TFRS/TMS, ve BOBİ FRS nakit dışı unsurlarla elde edilecek hasılatın gerçeğe uygun değer ile değerleneceğini düzenlemiştir.
BOBİ FRS ve KÜMİ FRS hazırlanırken uluslararası finansal raporlama standartlarından faydalanıldığı için ilk üç standart grubu benzer başlık ve uygulamalara sahiptir. Faizsiz Finans Muhasebe Standartları ise faizsiz finans kuruluşları için fıkıh tabanlı ilkeler de göz önüne alınarak hazırlanmıştır. Bu sebeple Faizsiz Finans Muhasebe Standartları, diğer standartlardan farklı bir yapıya sahiptir. Ancak çalışmaya konu tüm standartların gerçeğe uygun değer uygulamalarında ortak noktalar bulunmaktadır. Tarımsal faaliyetler, duran varlıklar devlet teşvikleri, finansal araçlar ve özkaynaklar, kiralamalar, yatırım amaçlı gayrimenkul ve varlıklarda değer düşüklüğünün raporlama süreçlerinde gerçeğe uygun değer uygulamasına yer verilmiştir. TFRS/ TMS’de gerçeğe uygun değer uygulamasına diğer standartlara göre daha kapsamlı bir şekilde yer verilirken değerleme seçiminde özellikle sonraki raporlamada kullanıcılara esneklik sunulmuştur. BOBİ FRS ve KÜMİ FRS gerçeğe uygun değer uygulaması açısından bire bir aynıdır. Yalnızca KÜMİ FRS’nin daha dar bir kapsama sahip olması sebebiyle gayrimenkul yatırımları ve iştiraklerdeki yatırımlar için ayrı bir standarda yer vermemiştir.
Marmara Üniversitesi İktisadi ve İdari Bilimler Dergisi • Cilt: 43 • Sayı: 1 • Haziran 2021, ISSN: 2587-2672, ss/pp. 21-41
35
8. Gerçeğe Uygun Değer Ölçümü
İncelenen standartlarda gerçeğe uygun değer ölçümüne ilişkin yol gösterici düzenlemeler olsa da bu konuda kapsamlı bir standart yalnızca Türkiye Finansal Raporlama Standartları’nda bulunmaktadır. Bu standart TFRS 13 Gerçeğe Uygun Değer Ölçümü’dür. Bu standart ile gerçeğe uygun değerin ölçümüne ilişkin standart uygulamalar belirlenmiştir84. Standart, gerçeğe uygun değer yöntemi ile bir varlık/ varlık grubu ve borç/ borç grubunun ölçülebileceğini vurgulamıştır. Standarda göre gerçeğe uygun değer ölçümü sürecinde bir varlık ya da borcun el değiştirdiği durumda ortaya çıkacak olan tutar varsayım olarak belirlenir. Burada önemli olan nokta o varlık ve borca ilişkin ölçümün hangi piyasa esas alınarak yapılacağıdır. Standart, varlık ve borçlara ilişkin ölçümün o varlık ve borçların yer aldığı asıl piyasada eğer asıl piyasa mevcut değilse en avantajlı piyasa adı verilen, varlık ve borcun yer aldığı varsayılan alternatif bir piyasada gerçekleştirilebileceğini belirtmiştir. Tüm bu açıklamaları özetlemek gerekirse standart bir gerçeğe uygun değer hesaplaması için piyasa katılımcıları, varlık/ borç ve varlığın/borcun yer aldığı bir piyasa unsurlarının bulunması gerektiğini vurgulamıştır85. Standarda göre, finansal olmayan varlıkların gerçeğe uygun değerleme sürecinde bu varlıkların; fiziksel özellikleri, bu varlıklara ilişkin yasal düzenlemeler ve varlığın ürettiği gelir ile nakit akışı dikkate alınır. İşletme finansal varlıklarını ise eğer mevcutsa kotasyon fiyatıyla, aktif bir kotasyon fiyatı mevcut değilse benzer işlemlerdeki fiyata göre değerler86.
İşletme, gerçeğe uygun değer hesaplamasında değerleme sürecindeki riskleri bertaraf etmek ve değerlemenin etkinliğini sağlayabilmek için çeşitli değerleme yöntemleri kullanabilir. Standart bu yöntemleri maliyet yaklaşımı, piyasa yaklaşımı ve gelir yaklaşımı olarak üçe ayırmıştır. Maliyet yaklaşımında ortaya çıkan fiyat, bir varlığın yenilenmesi amacıyla katlanılan maliyettir. Daha çok maddi duran varlıkların gerçeğe uygun değerlemesinde kullanılan yöntemdeki temel mantık bir piyasa katılımcısının bir varlığa o varlığın yenileme maliyetinden daha yüksek bir fiyat ödemeyeceği varsayımıdır. Piyasa yaklaşımında bir varlık ya da borcun değeri piyasadaki benzer varlık ve borcun değerine göre hesaplanmaktadır. Bu yöntemde karşılaştırılabilir piyasa fiyatlarına ilişkin çarpanlar kullanılabilmektedir. Son yöntem olan gelir yaklaşımında gelecekteki gelir ya da giderler iskonto edilerek değerleme gününe ilişkin tek bir tutara dönüştürülür. Bu yöntemde gelecekteki beklentiler önem taşımaktadır. Piyasa koşulları değiştiğinde, değerleme sürecine yönelik yeni bilgiler elde edildiğinde, yeni piyasa koşulları oluştuğunda ve yeni değerleme yöntemleri ortaya çıktığında gerçeğe uygun değer süreci değiştirilebilir87. Standart, gerçeğe uygun değer ölçümü sürecinin etkinliğini arttırmak adına bu süreçte kullanılan girdileri kendi içinde hiyerarşik bir düzene koymuştur. Bu hiyerarşide kullanılan girdiler kendi içinde üç seviyeye ayrılmaktadır. Seviye 1 varlık ve borçların piyasada bu varlık ve borçlara özdeş olan unsurlara göre belirlenen kotasyon fiyatlarına yönelik bilgilerdir. En güvenilen girdiler seviye 1 girdileridir. Seviye 2 girdiler ilgili varlık ve borca ilişkin benzer piyasa ve koşullardaki gözlemlenebilir bilgilerdir. Seviye 3 bilgileri ise gözlemlenemeyen bilgilerdir88.
84 KGK (2012). Gerçeğe Uygun Değer Ölçümü, https://www.kgk.gov.tr, (13.10.2020)85 KGK, 2012, 3 – 4.86 KGK, 2012, 4 – 6.87 KGK, 2012, 11 – 12.88 KGK, 2012, 14 – 15.
Sabri Burak ARZOVA • Bertaç Şakir ŞAHİN
36
9. Sonuç
Gerçeğe uygun değer ile birlikte değerleme sürecine gerek bakış açısı gerekse zamanlama açısından yenilik getirilmiştir. Gerçeğe uygun değer ile varlık/ yükümlülükler raporlama tarihindeki değerleriyle raporlanarak tarihi maliyet yöntemi yerine daha güncel bir raporlama yaklaşımı getirilmiştir. Ayrıca gerçeğe uygun değer kavramı ile değerleme süreçlerine piyasanın bakış açısının yansıtılması amaçlanmıştır. Gerçeğe uygun değer kavramı literatür ve uygulayıcılar tarafından ele alınmış ve bu yönteme bazı eleştiriler getirilmiştir. Özellikle yöntemin açıkça düzenlenmemesi ve değerlemenin gerçekleştirileceği piyasanın etkinliği konusundaki sorunlar, gerçeğe uygun değer yöntemine getirilen önemli eleştirilerdir. Bu eksiklikler sebebiyle finansal raporlama süreçlerinde hata ve hileler meydana gelebilir ve etkin bir finansal raporlama gerçekleştirilemeyebilir. Bu sebeple gerçeğe uygun değer ile değerleme süreci ve sürecin adımları sınırları net bir şekilde çizilerek açıkça belirlenmelidir.
KGK tarafından Türkçeye tercüme edilen TFRS/TMS standartları ile BOBİ FRS standardında değerleme süreçlerinde gerçeğe uygun değer yöntemine yer verilmiştir. Ardından yayımlanmış olan KÜMİ FRS ve Faizsiz Finans Muhasebe Standartları da gerçeğe uygun değer yöntemini değerleme ölçütlerinden biri olarak düzenlemiştir. Bu çalışmada gerçeğe uygun değer kavramı bahsedilen dört standart grubu açısından incelenmiştir. Gerçeğe uygun değer kavramının tanımı ve genel ilkeler tüm standartlarda benzer şekilde düzenlenmiştir. Tarımsal faaliyetler, duran varlıklar devlet teşvikleri, finansal araçlar ve özkaynaklar, kiralamalar, yatırım amaçlı gayrimenkul ve varlıklarda değer düşüklüğünün raporlama süreçlerinde gerçeğe uygun değer uygulamasına yer verilmiştir. TFRS/ TMS gerçeğe uygun değer kavramına en çok yer veren standart grubu olmuştur. Ayrıca TFRS/ TMS uygulamada esneklik tanıyarak özellikle sonraki ölçüm dönemlerinde gerçeğe uygun değere alternatif yöntemler sunmuştur. BOBİ FRS ve KÜMİ FRS gerçeğe uygun değer uygulamaları açısından neredeyse bire bir aynı uygulamalara sahiptir. Faizsiz Finans Muhasebe Standartları, ortaklığa dayalı finansman yöntemlerinde parasal olmayan sermaye konması durumunda, selem sermayesi ile finansmanda, icare sözleşmelerinde varlığı mülkiyete geçecek olan varlığın değerlemesinde, bireysel finansal tabloların düzenlenmesinde, gayrimenkul yatırımlarının değerlenmesinde, yatırım hesaplarında ve sukuk gibi finansal araçların raporlanmasında gerçeğe uygun değer yöntemini benimsemiştir. Standart grupları arasındaki farklılıklar piyasanın etkinliğini, işletme paydaşlarının işletmelere ilişkin verecekleri kararların kalitesini ve finansal raporlama uygulamalarında bütünlüğün önünde engel teşkil etmektedir. Ayrıca gerçeğe uygun değer uygulaması ve gerçeğe uygun değerin ele alınacağı piyasanın özelliklerinin daha net bir şekilde açıklanması uygulama önündeki sorunların düzeltilmesi açısından önem taşımaktadır. Bazı standartlar gerçeğe uygun değer uygulamasında izlenmesi gereken yöntemi açıklarken bu açıklamaları yer vermeyen standartlar da mevcuttur. Gerçeğe uygun değer uygulamasının kötü niyetli ya da yanlış uygulamalarının önüne geçmek adına uygulamaya yönelik yol gösterici düzenlemelerin yapılması şarttır.
KaynakçaAFSHAR, T. A. (2013). Compare and Contrast Sukuk (Islamic Bonds) with Conventional Bonds, Are They
Compatible?, Journal of Global Business Management, 9(1): 44-52.
Marmara Üniversitesi İktisadi ve İdari Bilimler Dergisi • Cilt: 43 • Sayı: 1 • Haziran 2021, ISSN: 2587-2672, ss/pp. 21-41
37
AKTAŞ, R., Deran, A. (2006). “Fair Value” Karşılığı Olarak Gerçeğe Uygun Değer Kavramı ve Tespit Hiyerarşisi, Gazi Üniversitesi İktisadi ve İdari Bilimler Fakültesi Dergisi, 8(2): 153-166.
ARI, M., Yılmaz, R. (2015). Avantaj ve Dezavantajları Açısından Gerçeğe Uygun Değer ile Maliyet Değeri Muhasebesinin Karşılaştırmalı Olarak İncelenmesi, Journal of Accounting & Finance, (65): 147 – 160.
BACHA, 0. I. (1995). Conventional versus Mudharabah Financing: An Agency Cost Perspective, Journal of Islamic Economics, 4(1-2): 33-50.
CAIRNS, D. (2010). The Use of Fair Value in IFRS, Accounting in Europe, 3(1): 5-22.CAVLAK, H., Ataman, B. (2017). Büyük ve Orta Boy İşletmeler İçin Finansal Raporlama Standardı (BOBİ)
İle Tam Set Türkiye Muhasebe ve Türkiye Finansal Raporlama Standartlarının (TMS/TFRS) Karşılaştırılması, Finans Ekonomi ve Sosyal Araştırmalar Dergisi (FESA), 2(3): 153-168.
CHEN, C., Lo, K., Tsang, D., Zhang, J. (2020). Understanding Accounting Discretion in China: An Analysis of Fair Value Reporting for Investment Property, Journal of Accounting and Public Policy, 39(4): 1 – 19.
ÇETİNKAYA, N. (2017). Yatırım Amaçlı Gayrimenkullerin Değerlemesinde Gerçeğe Uygun Değer Tespiti ve Türkiye’deki Uygulamaların Değerlendirilmesi, İktisadi İdari ve Siyasal Araştırmalar Dergisi (İKTİSAD), 2(4): 69-83.
ERKUŞ, H. ve Akcan, A. (2013). Finansal Kriz Gerçeğe Uygun Değer ve Bir Araştırma, Dicle Üniversitesi Sosyal Bilimler Enstitüsü Dergisi, 5(10): 226 – 241.
GÖKÇEN, G., Öztürk, E., Güleç, Ö. F. (2018). BOBİ FRS Ve TFRS’nin Finansal Raporlara Etkileri Açısından Karşılaştırılması, Finans Ekonomi ve Sosyal Araştırmalar Dergisi, 3(2): 437-457.
GÖKGÖZ, A., Şentürk, F. (2015). Borsa İstanbul’da İşlem Gören Şirketlerin Gerçeğe Uygun Değer Ölçümü Hiyerarşisinde Kullandıkları Seviye Girdilerinin Tespiti Üzerine Bir Araştırma, Journal of Accounting, Finance and Auditing Studies, 1(4): 67-80.
GÜNCE, N. (2018). BOBİ FRS ve TMS/TFRS Arasındaki Farkların Bilanço ve Gelir Tablosu Düzenlenmesi Açısından Karşılaştırılması, Atlas Sosyal Bilimler Dergisi, (4): 23-32.
HASWELL, S., Evans, E. (2018). Enron, Fair Value Accounting, and Financial Crises: A Concise History, Accounting, Auditing & Accountability Journal, 31(1): 25-50.
KGK (2019g). Faizsiz Finans Kuruluşlarının Finansal Raporlamasına İlişkin Kavramsal Çerçeve. https://www.kgk.gov.tr, (Erişim Tarihi: 12.10.2020)
KGK (2005). Devlet Teşviklerinin Muhasebeleştirilmesi ve Devlet Yardımlarının Açıklanması. https://www.kgk.gov.tr, (Erişim Tarihi: 10.10.2020)
KGK (2006a). Hisse Bazlı Ödemeler. https://www.kgk.gov.tr, (Erişim Tarihi: 09.10.2020)KGK (2006b). Satış Amaçlı Elde Tutulan Duran Varlıklar ve Durdurulan Faaliyetler. https://www.kgk.gov.tr,
(Erişim Tarihi: 09.10.2020)KGK (2006c). Emeklilik Fayda Planlarında Muhasebeleştirme ve Raporlama. https://www.kgk.gov.tr, (Erişim
Tarihi: 10.10.2020)KGK (2006d). Varlıklarda Değer Düşüklüğü. https://kgk.gov.tr, TMS_36_2018.pdf, (Erişim Tarihi: 10.10.2020)KGK (2007). İşletme Birleşmeleri. https://www.kgk.gov.tr, (Erişim Tarihi: 09.10.2020)KGK (2011). Bireysel Finansal Tablolar. https://www.kgk.gov.tr, (Erişim Tarihi: 11.10.2020).KGK (2012). Gerçeğe Uygun Değer Ölçümü. https://www.kgk.gov.tr, (Erişim Tarihi: 13.10.2020)KGK (2016). Müşteri Sözleşmesinden Hasılat. https://www.kgk.gov.tr, (Erişim Tarihi: 10.10.2020)KGK (2017). Büyük ve Orta Boy İşletmeler İçin Finansal Raporlama Standardı. https://www.kgk.gov.tr, (Erişim
Tarihi: 03.10.2020)
Sabri Burak ARZOVA • Bertaç Şakir ŞAHİN
38
KGK (2018a). Finansal Raporlamaya İlişkin Kavramsal Çerçeve. https://www.kgk.gov.tr, (Erişim Tarihi: 07.10.2020)
KGK (2018b). Kiralamalar. https://www.kgk.gov.tr, (Erişim Tarihi: 10.10.2020)KGK (2018c). Yatırım Amaçlı Gayrimenkuller. https://www.kgk.gov.tr, (Erişim Tarihi: 11.10.2020)KGK (2019a). Küçük ve Mikro İşletmeler İçin Finansal Raporlama Standardı Taslak Metni. https://www.kgk.
gov.tr, (Erişim Tarihi: 11.10.2020)KGK (2019b). Faizsiz Finans Muhasebe Standartları Kurul Kararı. https://www.kgk.gov.tr, (Erişim Tarihi:
11.10.2020)KGK (2019c). Finansal Araçlar. https://www.kgk.gov.tr, (Erişim Tarihi: 09.10.2020)KGK (2019d). Tarımsal Faaliyetler. https://www.kgk.gov.tr, (Erişim Tarihi: 10.10.2020)KGK (2019e). Maddi Duran Varlıklar. https://www.kgk.gov.tr, (Erişim Tarihi: 10.10.2020)KGK (2019f). Maddi Olmayan Duran Varlıklar. https://www.kgk.gov.tr, (Erişim Tarihi: 11.10.2020)KGK (2019g). Faizsiz Finans Kuruluşlarının Finansal Raporlamasına İlişkin Kavramsal Çerçeve. https://www.
kgk.gov.tr, (Erişim Tarihi: 17.10.2020)KGK (2019h). Faizsiz Finans Muhasebe Standardı 3 Mudarebe. https://www.kgk.gov.tr, (Erişim Tarihi:
13.10.2020)KGK (2019ı). Faizsiz Finans Muhasebe Standardı 4 Müşareke. https://www.kgk.gov.tr, (Erişim Tarihi: 13.10.2020)KGK (2019i). Faizsiz Finans Muhasebe Standardı 7 Selem ve Alt Selem. https://www.kgk.gov.tr, (Erişim Tarihi:
14.10.2020)KGK (2019j). Faizsiz Finans Muhasebe Standardı 8 İcâre ve İcâre Müntehiye Bittemlîk. https://www.kgk.gov.tr,
(Erişim Tarihi: 14.10.2020).KGK (2019k). Faizsiz Finans Muhasebe Standardı 24 İştiraklerdeki Yatırımlar. https://www.kgk.gov.tr, (Erişim
Tarihi: 15.10.2020)KGK (2019l). Faizsiz Finans Muhasebe Standardı 26 Gayrimenkul Yatırımları. https://www.kgk.gov.tr, (Erişim
Tarihi: 15.10.2020)KGK (2019m). Faizsiz Finans Muhasebe Standardı 27 Yatırım Hesapları. https://www.kgk.gov.tr, (Erişim Tarihi:
16.10.2020)KGK (2019n). Faizsiz Finans Muhasebe Standardı 30 Değer Düşüklüğü, Kredi Zararları ve Ekonomik Açıdan
Dezavantajlı Taahhütler. https://www.kgk.gov.tr, (Erişim Tarihi: 16.10.2020)KGK (2019o). Faizsiz Finans Muhasebe Standardı 33 Sukuk, Pay ve Benzeri Araçlara Yapılan Yatırımlar. https://
www.kgk.gov.tr, (Erişim Tarihi: 17.10.2020)KGK (2019ö). Faizsiz Finans Muhasebe Standardı 34 Sukuk Sahipleri İçin Finansal Raporlama.https://www.kgk.
gov.tr, (Erişim Tarihi: 17.10.2020)KIYMETLİ ŞEN, İ., Özbirecikli, M. (2020). KÜMİ FRS’nin İş Dünyasına Sağlayabileceği Yararlar: Bobi Frs,
Tms/Tfrs ve Mevcut Muhasebe Sistemi ile Mukayeseli Bir İnceleme. Muhasebe Bilim Dünyası Dergisi, MODAV 16. Uluslararası Muhasebe Konferansı Özel Sayısı: 1-19.
OYEWO, B., Emebinah, E., Savage, R. (2020). Challenges in Auditing Fair Value Measurement and Accounting Estimates, Journal of Financial Reporting and Accounting, 18(1): 51 – 57.
ÖZDEMİR, M. (2019). Katılım Bankaları ve İslami Mikrofinans: Türkiye’deki Mevcut Durum ve Öneriler, Journal of BRSA Banking & Financial Markets, 13(2): 121 – 160.
ÖZTÜRK, E., Gökçen, G., Güleç, Ö. F. (2019). Kümi FRS Seti Taslağı, BOBİ FRS Seti ve Tam Set TMS/TFR’nin Temel Konular Açısından Karşılaştırılması, Finans Ekonomi ve Sosyal Araştırmalar Dergisi (FESA), 4(3): 413-430.
Marmara Üniversitesi İktisadi ve İdari Bilimler Dergisi • Cilt: 43 • Sayı: 1 • Haziran 2021, ISSN: 2587-2672, ss/pp. 21-41
39
PAMUKÇU, F. (2011). Gerçeğe Uygun Değer Muhasebesi ve Finansal Tablolara Etkisi, Mali Çözüm, (103): 79-95.
PAOLONI, M., Paolucci, G., & Menicucci, E. (2017). Fair Value Accounting and Earnings Quality (Eq) in Banking Sector: Evidence from Europe, African Journal of Business Management, 11(20): 597-607.
PERČEVIĆ, H., Hladika, M., Valenta, I. (2020). The Analysis of the Appliance of Fair Value Concept in Croatian Companies from Real Sector, Eurasian Economic Perspectives. 14(1): 17-29.
SAÇAN, E. (2014). Türkiye’de Bankacılar Açısından Gerçeğe Uygun Değer Muhasebesinin Yaşanan Finansal Krizlerdeki Rolü Mali Çözüm Dergisi/Financial Analysis, 24(126): 57 – 79.
SHAFIAI, M. H. M., Moi, M. R. (2015). Fitting Islamic Financial Contracts in Developing Agricultural Land, Global Journal Al-Thaqafah, 5(1), 43-49.
ŞENEL, A. S., Tuncay, M., Önoğlu, Ö., Karslı, C. (2011). Türkiye Muhasebe Standartlarında Yer Alan Bir Değerleme Ölçüsü: Gerçeğe Uygun Değer, E-Journal of New world Sciences Academy, 6(1): 48-76.
TUĞAY, O. (2013). Türkiye Muhasebe Standardı 41’e Göre Canlı Varlıkların Gerçeğe Uygun Değerinin Tespiti ve Muhasebeleştirilmesi, Mehmet Akif Ersoy Üniversitesi Sosyal Bilimler Enstitüsü Dergisi, 5(8): 148-165.
40
One of the sources of data for stakeholders dealing with business results is the financial statements of businesses. Thanks to financial statements, businesses provide information about operation results, cash flows, and financial situation. Therefore, financial tables must be reliable, clear, and relevant. As a result of innovative improvements and globalization, the data needs of financial statement users have increased. Financial reporting standards were prepared by different institutions because of the standard reporting language and more information requirements. International Accounting Standards Board publishes standards for create a common reporting application. These standards were translated into Turkish and has begun to be implemented in the financial reporting processes of publicly traded companies since 2005. To ensure uniformity in accounting practices, new financial reporting standards were prepared in Turkey. Therefore, Financial Reporting Standards for Large and Medium Enterprises (BOBI FRS) were published. This standard has been utilizing by businesses which are subject to audit and do not utilize TFRS/TMS. KGK published the Financial Reporting Standard for Small and Micro Enterprises, by following the example of the European Union practices. Besides, Interest-Free Finance Accounting Standards, which was prepared by AAOIFI, was translated to Turkish. Interest-free financial institutions use these standards in their financial reporting processes.
One of the imperative issues within the accounting process is the valuation process. The choice of valuation method can affect the overall outlook and reported operating results. Consequently, valuation process is critical for the effectiveness of the accounting process and a reliable financial information flow. The change in accounting practices also changed the perspective on valuation. It is vital to report the occasions that will influence the valuation process of the company not as it were within the past period but moreover within the current and future periods. Therefore, the fair value method was preferred over the historical cost method in financial reporting standards valuation processes. In this consider, the concept of fair value was inspected the scope of TFRS/ TMS, BOBI FRS, KUMI FRS, and Interest-Free Finance Accounting Standards. For this purpose, the definition and employing of the fair value within the measures and contrasts between the guidelines with regard to the fair value approach were talked about. Studies in the domestic literature examined the fair value with financial reporting standards. There are also studies analyzing the opinions of professionals on fair value. In foreign literature, the effect of fair value on financial crises, its effect on financial statements, and deficiencies of the method were analyzed. In this study, the fair value was inspected in all the guidelines, which utilized within the financial reporting in Turkey. Thus, critical commitments were made for researchers and practitioners.
According to TFRS/TMS, fair value is the amount that emerges resulting from paying a debt or transferring an asset between knowledgeable and willing groups in a bargaining environment. The market price of the asset or liability is used to measure the fair value. When a suitable market price cannot be found, the market price can measure with similar item’s price. If the price is not reliable, different methods are used appropriately to the process (net present value, option pricing, etc.). According to TFRS/ TMS, in the first measurement of share-based payment transactions, business
Extended Abstract
Marmara Üniversitesi İktisadi ve İdari Bilimler Dergisi • Cilt: 43 • Sayı: 1 • Haziran 2021, ISSN: 2587-2672, ss/pp. 21-41
41
combinations, fixed assets held for sale, financial instruments, government incentives, retirement benefit plans, and biological assets fair value is applied. Within the consequent estimation, in expansion to these components, fair value is utilized within the valuation of investment properties, leasing transactions, tangible fixed assets, and intangible fixed assets. Fair value is used in common in all standards about the valuation of Agricultural activities, financial instruments and equity, fixed assets tangible fixed assets, leases, government incentives, impairment of assets, and investment real estates. TFRS/TMS is the standard group that most applies fair value. Besides, by allowing flexibility in TFRS/TMS application, offered alternative methods to fair value in subsequent measurement periods. BOBI FRS and KUMI FRS have almost the same applications in terms of fair value applications. Interest-Free Finance Accounting Standards have fair value method in nonmonetary capital adding during the partnership-based financing methods, financing with Selem capital, in Ijare contracts in the valuation of the asset whose asset will become ownership, the individual financial statements regulation, valuation of real estate investments, investment accounts and Sukuk. Differences between standard groups may affect the efficiency of the market, business stakeholders’ decisions, and uniforming of financial reporting processes. Besides, fair value application and the market that fair value is measured should be explained more clearly.
42
Marmara Üniversitesi İktisadi ve İdari Bilimler Dergisi • Cilt: 43 • Sayı: 1 • Haziran 2021, ISSN: 2587-2672, ss/pp. 42-56 DOI: 10.14780/muiibd.960267
Makale Gönderim Tarihi:Makale Gönderim Tarihi: 09.02.2021Yayına Kabul Tarihi:Yayına Kabul Tarihi: 13.06.2021
ARAŞTIRMA MAKALESİ / RESEARCH ARTICLE
THE IMPACT OF EXCHANGE RATES ON STOCK PRICES FOR TURKEY: AN ASYMMETRIC NON-LINEAR COINTEGRATION
ANALYSIS
TÜRKİYE İÇİN DÖVİZ KURLARININ HİSSE SENEDİ FİYATLARINA ETKİSİ: ASİMETRİK DOĞRUSAL OLMAYAN EŞBÜTÜNLEŞME
ANALİZİ
Emre ÜRKMEZ1
* Ömer Faruk BÖLÜKBAŞI2
**
AbstractThis study investigates the impact of exchange rates on stock indices for Turkey and examines whether these impacts are asymmetric. For this purpose, the non-linear autoregressive distributed lag (NARDL) model is used as an asymmetric cointegration method. In the study covering the period 2005-2020, BIST-100, BIST-100 All Shares and four stock sector indices are included in the models as stock indices representing. Thus, the response of the stock indices of the firms in different sectors to the movements in exchange rates is analyzed. The findings indicate that the impacts of exchange rate movements on the BIST-100 All Shares index and the service, industry, and technology sector indices in the short-term are asymmetrical, and the impacts on the technology sector index in the long-term are asymmetrical.Keywords: Sectoral Stock Indices, Exchange Rate, Asymmetry CointegrationJEL Classification: C52, C58, G10
ÖzBu çalışma döviz kurlarının Türkiye için hisse senedi fiyatları üzerindeki etkisini araştırmakta ve bu etkilerin asimetrik olup olmadığını incelemektedir. Bu amaçla doğrusal olmayan otoregresif dağıtılmış gecikme (NARDL) modeli, asimetrik eşbütünleşme yöntemi olarak kullanılmıştır. 2005-2020 dönemini kapsayan çalışmada BIST-100, BIST-100 Tüm Hisse Senetleri ve dört hisse senedi sektör endeksi, hisse senedi fiyatlarını temsil eden modellerde yer almaktadır. Böylelikle farklı sektörlerdeki firmaların hisse senedi fiyatlarının döviz kurlarındaki değişimlere tepkisi analiz edilmiştir. Bulgular, döviz kuru değişimlerinin BIST-100 Tüm Hisse Senetleri endeksi ile kısa vadede hizmet, sanayi ve teknoloji sektörü
* Asst. Prof., Recep Tayyip Erdogan University, Department of Economics, Rize, E-Mail: [email protected], ORCID ID: 0000-0002-2171-5027
** Asst. Prof., Recep Tayyip Erdogan University, Department of Economics, Rize, E-Mail: [email protected], ORCID ID: 0000-0002-0106-0713
Marmara Üniversitesi İktisadi ve İdari Bilimler Dergisi • Cilt: 43 • Sayı: 1 • Haziran 2021, ISSN: 2587-2672, ss/pp. 42-56
43
endeksleri üzerindeki etkilerinin asimetrik olduğunu ve uzun vadede teknoloji sektörü endeksi üzerindeki etkilerinin asimetrik olduğunu göstermektedir.Anahtar Kelimeler: Sektörel Hisse Senedi Endeksleri, Döviz Kuru, Asimetrik EştümleşmeJEL Sınıflandırması: C52, C58, G10
1. Introduction
The stock market indices are one of the important indicators reflecting the economic and financial conditions of countries. It is known that the movements that occur in the economies of the countries affect the stock indices. This causes stock indices and macroeconomic variables to be closely related. Investigating the possible impacts of the exchange rate, which is one of the important financial variables, on stock indices is the center of attention by researchers. The impacts of exchange rate changes on the supply and demand sides and cost and profitability provided the exchange rate one of the important indicators that determine the stock indices of the firms.
Most studies examining the impacts of exchange rate movements on stock indices are based on the assumption that the relationship between exchange rate and stock indices is symmetrical. However, in recent years, there have been studies based on the assumption that the exchange rate possible an asymmetrical impact on stock indices. Thus, the possible impacts of the depreciation and appreciation of the national currency on stock indices can be determined more clearly. The depreciation in the national currency increases the profitability of the companies as a result of the increase in the international competitiveness of the exporting companies and as a result, the stock indices of the companies increase. Depreciation of the national currency may reduce firm profitability as a result of the increase in input costs of firms whose production is predominantly based on imports, and thus stock indices decrease. While the impact of the appreciation of the national currency on the stock indices of export firms may be negative, it may have consequences for firms engaged in import-based production to increase stock indices as a result of the decrease in production costs. In models where the relationship between variables is assumed to be symmetrical, the impacts of the depreciation and appreciation of the national currency on stock indices are also considered the same in magnitude, thus in importance. However, the impacts of the depreciation and appreciation of the national currency on stock indices may not be the same in magnitude. Thus, the estimation results of models that allow an asymmetric relationship between variables give more comprehensive findings than models that are assumed to be symmetrical.
The findings of empirical studies examining the impacts of exchange rate movements on stock indices are compiled in 5 parts below. The studies assumed symmetrical relationship between exchange rate and stock indices in the first paragraph and that are studies conducted for Turkey. Studies carried out in the second paragraph for the Turkish economy have been presented. The third paragraph has been carried out on different country economies studies outside Turkey have been compiled. The studies conducted on different sectors of the country outside of Turkey are summarized in the fourth paragraph and lastly, different groups of countries analyzed in the same study except Turkey summarized.
Emre ÜRKMEZ • Ömer Faruk BÖLÜKBAŞI
44
One of the studies assuming that the relationship between exchange rate and stock indices is symmetrical, Kasman1 has determined that there is a long-term relationship between the exchange rate and BIST-100, finance, industry, and service indices as a result of the Johansen cointegration analysis. As a result of the Granger causality analysis, Kasman2 determined that there is causality from the exchange rate to all of the stock indices. Ayvaz3 showed using the Johansen cointegration analysis that there is a significant relationship between the financial, industry indices and the exchange rate in the long-term. According to the result of the same analysis, it was determined that there is no cointegration between the exchange rate and the service sector index. According to the results of the Granger causality analysis, Ayvaz4 concluded that there is a bidirectional causality relationship between exchange rate and stock indices. According to Toda-Yamamoto causality analysis, Aydemir and Demirhan5 revealed that there is a negative causality relationship towards the stock indices of BIST-100, services, financial, industrial, technology from the exchange rate. Özmen6 determined that there is a significant long-term relationship between the exchange rate and stock indices using the Johansen cointegration test, and Toda Yamamato causality analysis determined that there is bidirectional causality between the variables between the periods 1989-1994 and 1994-1999. Elmas and Esen7,examined the long term relationship between stock prices and exchange rates for 6 countries. According to the Granger causality result, they concluded that there is causality in the exchange rate towards the stock indice and that the variables are cointegrated according to the Johansen cointegration test for Turkey. In another study in which Granger causality analysis was performed, Coşkun et al.8 determined that there is one-way causality from exchange rate to stock indices. Belen and Karamelikli9, as a result of ARDL cointegration analysis, determined that the variables are cointegrated and the exchange rate has a negative effect on the stock indices. Türsoy10 examined the relationship between exchange rate and stock indices for the 2001-2016 period. According to the ARDL cointegration test, it has determined that the variables are cointegrated. Türsoy11 showed that there is bidirectional Granger causality among the variables in the long-term, and the exchange rate is the Granger cause of stock prices in the short-term.
1 Kasman, S. (2003). The Relationship Between Exchange Rates and Stock Prices: A Causality Analysis, Dokuz Eylül Üniversitsi Sosyal Bilimler Dergisi, 5(2): 70-79.
2 Kasman, S, 2003, 70-79.3 Ayvaz, Ö. (2006). Döviz Kuru ve Hisse Senetleri Fiyatları Arasındaki Nedensellik İlişkisi, Gazi Üniversitesi İktisadi ve
İdari Bilimler Fakültesi Dergisi, 8(2): 1-14.4 Ayvaz, Ö, 2006, 1-14.5 Aydemir, O., Demirhan, E. (2009). The Relationship between Stock Prices and Exchange Rates Evidence from Turkey,
International Research Journal of Finance and Economics, 23: 207-215.6 Özmen, M. (2007). Farklı Döviz Kuru Rejimleri Altında Hisse Senetleri Fiyatları íle Döviz Kurları Arasındaki İlişkinin
Ekonometrik Analizi, Ç.Ü. Sosyal Bilimler Enstitüsü Dergisi, 16(1): 519-538.7 Elmas, B., Esen, Ö. (2011). Hisse Senedi Fiyatları ile Döviz Kuru Arasındaki Dinamik İlişkinin Belirlenmesi; Farklı Ülke
Piyasaları İçin Bir Araştırma, Muhasebe ve Finansman Dergisi, 52: 153-170.8 Coşkun, M., Kiracı, K., Muhammed, U. (2016). Seçilmiş Makroekonomik Değişkenlerle Hisse Senedi Fiyatları Arasındaki
İlişki: Türkiye Üzerine Ampirik Bir İnceleme, Finans Politik & Ekonomik Yorumlar, 53(616): 61-74.9 Belen, M., Karamelikli, H. (2016). Türkiye’de Hisse Senedi Getirileri ile Döviz Kuru Arasındaki İlişkinin İncelenmesi:
ARDL Yaklaşımı, Istanbul University Journal of the School of Business, 45(1): 34-42.10 Türsoy, T. (2017). Causality between Stock Prices and Exchange Rates in Turkey: Empirical Evidence from the ARDL
Bounds Test and a Combined Cointegration Approach, International Journal of Finacial Studies, 5(8): 1-10.11 Türsoy, T, 2017, 1-10.
Marmara Üniversitesi İktisadi ve İdari Bilimler Dergisi • Cilt: 43 • Sayı: 1 • Haziran 2021, ISSN: 2587-2672, ss/pp. 42-56
45
One of the studies for the Turkish economy Kaya and Soybilgen12 , using the NARDL cointegration method the exchange rate impacts on stock indices have determined that it is asymmetric both in the short and long-term. According to their findings, the depreciation and appreciation of the Turkish Lira (TRY) in the short-term decreases the stock indices. In the long-term, the depreciation of the national currency decreases the stock indices, while the appreciation of the national currency increases the stock indices. Tiryaki et al.13 found that the impacts of the real exchange rate on stock indices are asymmetrical in the long-term in their study, in which they examined the impacts of exchange rate on stock indices using the NARDL method. The findings of Tiryaki et al.14 indicate that the depreciation of TRY increases the stock returns. In another study on the economics of Turkey Yacouba and Altintas15, the real effective exchange rate of the asymmetric impact on stock indices that have been identified for both in the short and long-term. In their study using the NARDL method, in the long-term study findings indicate that the depreciation of the TRY increased the stock indices, and the appreciation of the TRY decreased the stock indices. From the first studies which examine the exchange rate of the asymmetric impact on sectoral stock prices16 in Turkey Benli et al.17 used the NARDL method. According to their findings, the impacts of exchange rate on stock indices are asymmetrical in all sectors except ISE information service in the short-term. In the long-term, there is an asymmetric cointegration relationship for six sectors18.
Muller and Verschoor19 determine by GARCH analysis that exchange rate fluctuations have asymmetric effects on US stock prices. Bahmani-Oskooee and Saha20, one of the studies examining the effects of exchange rate movements on stock indices using the NARDL cointegration method, found that while there is an asymmetric relationship for the US in the short-term but there is no asymmetric relationship in the long-term. Another important finding is that the appreciation of the dollar increases the stock prices. One of the studies indicating that the asymmetric impacts of exchange rate on stock indices both in the short and long-term. Ajaz et al.21 found that national currency appreciation in India in the long-term increased stock indices. Anjum et al.22 for Germany,
12 Kaya, H., Soybilgen, B. (2019). Evaluating the Asymmetric Effects of Production, Interest Rate and Exchange Rate on the Turkish Stock Prices, Ege Akademik Bakış, 19(2): 293-300.
13 Tiryaki, A., Ceylan, R., Erdoğan, L. (2019). Asymmetric Effects of Industrial Production, Money Supply and Exchange Rate Changes on Stock Returns in Turkey, Applied Economics, 51(20): 2143-2154.
14 Tiryaki, A., Ceylan, R., Erdoğan, L, 2019, 2143-2154.15 Yacouba, K., Altıntaş, H. (2019). The Asymmetric Impact of Macroeconomic Shocks on Stock Returns in Turkey: a
Nonlinear ARDL Approach, Romanian Journal of Economic Forecasting, 22(2): 98-116.16 ISE National 30, ISE National 100, ISE Bank, ISE Information Services, ISE Communucation, ISE Main Metal, ISE Metal
Goods, ISE Insurance, ISE Textile, ISE Transportation, ISE Technology.17 Benli, M., Durmuşkaya, S., Bayramoğlu, G. (2019). Asymmetric Exchange Rate Pass-Through and Sectoral Stock Price
Indices: Evidence From Turkey, International Journal of Business and Management, 7(1): 25-47.18 ISE National 30, ISE National 100, ISE Information Services, ISE Main Metal, ISE Metal Goods, ISE Insurance.19 Muller, A., Verschoor, W. F. C. (2006). Asymmetric Foreign Exchange Risk Exposure: Evidence From U.S. Multinational
Firms, Journal of Empirical Finance, 13(4-5): 495-518.20 Bahmani-Oskooee, M., Saha, S. (2015). On the Relation Between Stock Prices and Exchange Rates: A Review Article,
Journal of Economic Studies, 42(4): 707-732.21 Ajaz, T., Zulquar Nain, Md., Kamaiah, B., Sharma, N. K. (2017). Stock Prices, Exchange Rate and Interest Rate: Evidence
Beyond Symmetry, Journal of Financial Economic Policy, 9(1): 2-19.22 Anjum, N., Ghumro, N. H., Husain, B. (2017). Asymmetric Impact of Exchange Rate Changes on Stock Prices: Empirical
Evidence from Germany, International Journal of Economics and Financial Research, 3(11): 240-245.
Emre ÜRKMEZ • Ömer Faruk BÖLÜKBAŞI
46
Bhutto and Chang23 for China determined that the impacts of exchange rate on stock indices are asymmetric in the long-term. Anjum et al.24 found that the depreciation of the national currency in the long-term decreased the stock indices, while Bhutto and Chang25 found that the depreciation of the national currency increased the stock indices in the long-term. Lee and Ryu26 conclude that the depreciation of the national currency in the long-term reduces stock indices for South Korea. Another study concluding that the depreciation of the national currency in the long-term reduces stock indices is the study conducted for Nigeria by Effiong and Basey27.
Cuestas and Tang28, one of the studies investigating the likely asymmetric impacts of exchange rate on stock indices on an industrial basis, conducted their analysis with the NARDL cointegration method. In line with their findings, Cuestas and Tang29 have concluded that the responses of stock indices to the fluctuations in exchange rates are asymmetrical in some industries in the long-term and some industries in the short-term. Cuestas and Tang30 have concluded that the exchange rates impacts on the stock indices are asymmetrical in the two industries that are the banking, wine, and food industries, both in the long and short-term. Bahmani-Oskooee and Saha31 investigated the impacts of exchange rate on eleven sector stock indices32 for the USA using the NARDL cointegration method. Their findings reveal that the effects of exchange rates on stock indices are asymmetrical in the short-term in ten sectors33 and in the long-term in six sectors34. Bahmani-Oskooee and Saha35 found that the depreciation of the dollar in five36 of these six sectors increased stock indices. Bahmani-Oskooee and Saha37 determined that the appreciation of the dollar in the Dow Jones industrial average sector,
23 Bhutto, N. A., Chang, B. H. (2019). The Effect of the Global Financial Crisis on the Asymmetric Relationship Between Exchange Rate and Stock Prices, High Frequency, 2(3-4): 175-183.
24 Anjum, Ghumro, Husain, 2017, 240-245.25 Bhutto, Chang, 2019, 175-183.26 Lee, G., Ryu, D. (2018). Asymmetry in the Stock Prıce Response to Macroeconomıc Shocks: Evidence From the Korean
Market, Journal of Business Economics and Management, 19(2): 343-359.27 Effiong, E. L., Bassey, G. E. (2019). Stock Prices and Exchange Rate Dynamics in Nigeria: An Asymmetric Perspective,
The Journal of International Trade & Economic Development, 28(3): 299-316.28 Cuestas, J. C., Tang, B. (2015). Asymmetric Exchange Rate Exposure of Stock Returns: Empirical Evidence From Chinese
Industries, Studies in Nonlinear Dynamics & Econometrics, 21(4):1-21.29 Cuestas, Tang, 2015, 1-21.30 Cuestas, Tang, 2015, 1-21.31 Bahmani-Oskooee, M., Saha, S. (2016). Asymmetry Cointegration Between the Value of the Dollar and Sectoral Stock
Indices in the US, International Review of Economics and Finance, 46: 78-86.32 Dow Jones industrial average index, Dow Jones transport average index, Dow Jones utility average index, NASDAQ
bank index, NASDAQ biotech index, NASDAQ computer index, NASDAQ industrial index, NASDAQ insurance index, NASDAQ telecom index, NASDAQ transport index, PHLX semi-conductor index.
33 Dow Jones industrial average index, Dow Jones transport average index, Dow Jones utility average index, NASDAQ biotech index, NASDAQ computer index, NASDAQ industrial index, NASDAQ insurance index, NASDAQ telecom index, NASDAQ transport index, PHLX semi-conductor index.
34 Dow Jones industrial average index, NASDAQ biotech index, NASDAQ computer index, NASDAQ industrial index, NASDAQ insurance index, NASDAQ telecom index.
35 Bahmani-Oskooee, Saha, 2016, 78-86.36 NASDAQ biotech index, NASDAQ computer index, NASDAQ industrial index, NASDAQ insurance index, NASDAQ
telecom index.37 Bahmani-Oskooee, Saha, 2016, 78-86.
Marmara Üniversitesi İktisadi ve İdari Bilimler Dergisi • Cilt: 43 • Sayı: 1 • Haziran 2021, ISSN: 2587-2672, ss/pp. 42-56
47
which is another sector where the impacts of exchange rate on stock indices are asymmetrical in the long-term, increased the stock indices. Adeniyi and Komuka38 analyzed the data of fifty-four Nigeria firms using the NARDL cointegration method and their findings are that the impacts of exchange rates on stock indices are not asymmetrical. Alirezo et al.39 The findings obtained by the NARDL cointegration method for three industries of Iran, namely petrochemical, basic metal and mining, which are export-oriented sectors, indicate the asymmetrical response of stock indices to exchange rate fluctuations both in the short and the long-term.
The studies investigating the possible short and long-term asymmetric impacts of exchange rate on stock indices for different countries, Bahmani-Oskooee and Saha40 and Bahmani and Saha41, employed the NARDL cointegration method. Bahmani-Oskooee and Saha42 determined that the effects of exchange rates on stock indices in Brazil, Canada, and Mexico are asymmetrical in the short-term. Bahmani-Oskooee and Saha43 determined that the relationship between exchange rate and stock prices is asymmetrical in the short-term and the study revealed that the impacts of exchange rate on stock indices are asymmetrical only in Canada and Malaysia in the long-term. Lugman and Kouser44 determined that the relationships between stock indices and exchange rates are asymmetrical in the short and long-term, based on the results of their estimates obtained with the NARDL cointegration method for fourteen countries45. Moussa et al.46 stated that the relationship between exchange rate and stock indices in Canada, Japan, Denmark, Hong-Kong, Singapore, Mexico and Brazil is asymmetrical based on the DCC-FIEGARCH and DCC-FIAPARCH econometric method.
In the literature, there are studies that allow the impacts of exchange rate movements on stock indices to be asymmetrical. It is seen that the econometric method used is predominantly the NARDL, which is the asymmetric cointegration method. Employing the NARDL method, it can be determined whether the exchange rate and stock indices have an asymmetric cointegration relationship and whether the effects of exchange rate movements on stock indices differ in the short and long-term. When the findings are evaluated in general, it is seen that the estimation results made in different periods for different countries’ economies differ. There are a limited number of studies
38 Adeniyi, O., Kumeka, T. (2019). Exchange Rate and Stock Prices in Nigeria: Firm-Level Evidence, Journal of African Business, 21(2): 235-263.
39 Alireza, S., Zahra, H., Samira, Z. (2020). Real Exchange Rate Shocks and Export-Oriented Businesses in Iran: An Empirical Analysis Using NARDL Model, Munich Personal RePEc Archive, 1-24.
40 Bahmani-Oskooee, M., Saha, S. (2016). Do Exchange Rate Changes Have Symmetric or Asymmetric Effects on Stock Prices?, Global Finance Journal, 31: 57-72.
41 Bahmani-Oskooee, M., Saha, S. (2017). On the Relation Between Exchange Rates and Stock Prices: a Non-linear ARDL Approach and Asymmetry Analysis, Journal of Economics and Finance, 42: 112-137.
42 Bahmani-Oskooee, Saha, 2016, 57-72.43 Bahmani-Oskooee, Saha, 2017, 112-137.44 Luqman, R., Kouser, R. (2018). Asymmetrical Linkages Between Foreign Exchange and Stock Markets: Empirical
Evidence through Linear and Non-Linear ARDL, Journal of Risk and Financial Management, 11(3): 1-13.45 Canada, France, Germany, Italy, Japan, UK, USA, Russia, Brazil, China, India, Mexico, South Africa and Pakistan.46 Moussa, W., Bejaoui, A., Mgadmi, N. (2020). Asymmetric Effect and Dynamic Relationships Between Stock Prices and
Exchange Rates Volatility, Annals of Data Science.
Emre ÜRKMEZ • Ömer Faruk BÖLÜKBAŞI
48
examining the effects of exchange rates on sectors’ stock indices. The main objective of this study is to determine whether the impacts of exchange rate movements on stock indices are asymmetrical for Turkey. In line with this purpose, in this study, the error correction model based on the NARDL asymmetric cointegration method is estimated and the short and long-term analyzes are made possible. Representing stock indices, BIST-100 and BIST-100 All Shares indices and service, financial, industrial, technology sector indices are also included in this study. Thus, it is aimed to contribute to the literature by determining the possible asymmetric impacts of exchange rate movements on sector indices. Furthermore, this study estimates the error correction models based on the ARDL models to compare the ARDL and NARDL findings. The second part of the study includes the data set and methodology part, the third part includes findings, and finally, the fourth part includes the conclusion parts of the study.
2. The Data and Methodology
In this study, we use monthly data from December, 2005 to March, 2020. The data that is used in the study obtained from the Electronic Data Delivery System (EDDS) of the Central Bank of the Republic of Turkey (CBRT). Table 1 presents a detailed data description of the variables considered in this study.
Table 1: The Definitions of the VariablesVariables DescriptionXU100 The average closing prices in BIST-100 IndexXUTUM The average closing prices in BIST-100 All Shares IndexXUHIZ The average closing prices in BIST-Services IndexXUMAL The average closing prices in BIST-Financial IndexXUSIN The average closing prices in BIST-Industrials IndexXUTEK The average closing prices in BIST-Technology IndexEX The average closing values of spot USD/TRY foreign exchange rateIPI Industrial Production Index of Turkey, base year = 2015, seasonally adjustedCPI The Consumer Price Index of Turkey, base year = 2003M2 The money supply measured by nominal M2
Note: The Central Bank of the Republic of Turkey, EDDS, Monthly Statistics.
The cointegration methods used to determine the long-term relationship among the variables, it is observed that the ARDL method is mostly involved in empirical studies. The ARDL cointegration method introduced by Pesaran, Shin, and Smith47, one of the major reasons for this situation is that the variables could not be integrated in the same order with the condition that they are not the second-order I(2) integrated. The studies investigating the relationship between exchange rate and stock indices are examined, it is seen that the NARDL cointegration method is mostly used to reveal the possible asymmetric relationship. The ARDL model is expanded to the NARDL model
47 Pesaran, M. H., Shin, Y. Smith, R. J. (2001). Bounds Testing Approaches to the Analysis of Level Relationships, Journal of Applied Econometrics, 16(3): 289-326.
Marmara Üniversitesi İktisadi ve İdari Bilimler Dergisi • Cilt: 43 • Sayı: 1 • Haziran 2021, ISSN: 2587-2672, ss/pp. 42-56
49
by adding the positive and negative partial sums of the relevant variable instead of the variable in which asymmetric impacts are examined. Shin, Yu, Greenwood, Nimmo48 showed that the steps of the ARDL bounds test approach are also valid for the NARDL model. The variables used in the ARDL and NARDL cointegration models, in which the possible impacts of exchange rate on XU100, XUTUM and four sector indices examined, based Bahmani-Oskooee and Saha49, Bahmani-Oskooee and Saha50. SP represents the stock price in the models. The error correction model obtained based on the ARDL cointegration estimation method introduced by Pesaran, Shin and Smith51 as follows:
Makale Gönderim Tarihi: 09.02.2021 Yayına Kabul Tarihi: 13.06.2021 instead of the variable in which asymmetric impacts are examined. Shin, Yu, Greenwood, Nimmo48 showed that the steps of the ARDL bounds test approach are also valid for the NARDL model. The variables used in the ARDL and NARDL cointegration models, in which the possible impacts of exchange rate on XU100, XUTUM and four sector indices examined, based Bahmani-Oskooee and Saha49, Bahmani-Oskooee and Saha50. SP represents the stock price in the models. The error correction model obtained based on the ARDL cointegration estimation method introduced by Pesaran, Shin and Smith51 as follows:
∆𝑙𝑙𝑙𝑙𝑙𝑙𝑙𝑙𝑡𝑡 = 𝛼𝛼 + ∑ 𝛽𝛽𝑘𝑘∆ 𝑙𝑙𝑙𝑙 𝑙𝑙𝑙𝑙 𝑙𝑙𝑙𝑙 𝑡𝑡−𝑘𝑘𝑚𝑚1𝑘𝑘=1 + ∑ 𝛿𝛿𝑘𝑘∆ 𝑙𝑙𝑙𝑙 𝑙𝑙𝑙𝑙 𝐸𝐸𝐸𝐸 𝑡𝑡−𝑘𝑘
𝑚𝑚2𝑘𝑘=0 + ∑ 𝜃𝜃𝑘𝑘∆ 𝑙𝑙𝑙𝑙 𝑙𝑙𝑙𝑙 𝐼𝐼𝑙𝑙𝐼𝐼 𝑡𝑡−𝑘𝑘
𝑚𝑚3𝑘𝑘=0 +
∑ 𝛾𝛾𝑘𝑘∆ 𝑙𝑙𝑙𝑙 𝑙𝑙𝑙𝑙 𝐶𝐶𝑙𝑙𝐼𝐼 𝑡𝑡−𝑘𝑘𝑚𝑚4𝑘𝑘=0 + ∑ 𝜏𝜏𝑘𝑘∆ 𝑙𝑙𝑙𝑙 𝑙𝑙𝑙𝑙 𝑀𝑀2 𝑡𝑡−𝑘𝑘
𝑚𝑚5𝑘𝑘=0 + 𝜆𝜆1𝑙𝑙𝑙𝑙𝑙𝑙𝑙𝑙𝑡𝑡−1 + 𝜆𝜆2𝑙𝑙𝑙𝑙𝐸𝐸𝐸𝐸𝑡𝑡−1 + 𝜆𝜆3𝑙𝑙𝑙𝑙𝐼𝐼𝑙𝑙𝐼𝐼𝑡𝑡−1 +
𝜆𝜆4𝑙𝑙𝑙𝑙𝐶𝐶𝑙𝑙𝐼𝐼𝑡𝑡−1 + 𝜆𝜆5𝑙𝑙𝑙𝑙𝑀𝑀𝑡𝑡−1 + 𝑢𝑢𝑡𝑡 (1)
In equation (1), by using the bounds testing approach, the estimates are made by assuming that the cointegration relationship among the variables is symmetrical. The asymmetric error correction model is obtained by adding the positive and negative partial sums of the exchange rate to the equation (1) instead of the exchange rate variable. The partial sums of positive and negative exchange rate movements, as follows:
𝑙𝑙𝑃𝑃𝑙𝑙𝑡𝑡 = ∑ ∆𝑙𝑙𝑙𝑙𝐸𝐸𝐸𝐸𝑗𝑗+𝑡𝑡
𝑖𝑖=1 = ∑ 𝑚𝑚𝑚𝑚𝑚𝑚 (∆𝑙𝑙𝑙𝑙𝐸𝐸𝐸𝐸𝑗𝑗, 0)𝑡𝑡𝑖𝑖=1 (2)
𝑁𝑁𝐸𝐸𝑁𝑁𝑡𝑡 = ∑ ∆𝑙𝑙𝑙𝑙𝐸𝐸𝐸𝐸𝑗𝑗−𝑡𝑡
𝑖𝑖=1 = ∑ 𝑚𝑚𝑚𝑚𝑙𝑙 (∆𝑙𝑙𝑙𝑙𝐸𝐸𝐸𝐸𝑗𝑗, 0)𝑡𝑡𝑖𝑖=1 (3)
In equation (2) 𝑙𝑙𝑃𝑃𝑙𝑙𝑡𝑡 denotes Turkish lira depreciation, equation (3) 𝑁𝑁𝐸𝐸𝑁𝑁𝑡𝑡 denotes Turkish lira appreciation. The asymmetric error correction model obtained by using the positive and negative partial sums of exchange rate movements instead of the exchange rate variable in the ARDL model is stated as follows:
∆𝑙𝑙𝑙𝑙𝑙𝑙𝑙𝑙𝑡𝑡 = 𝛼𝛼 + ∑ 𝛽𝛽𝑘𝑘∆ 𝑙𝑙𝑙𝑙 𝑙𝑙𝑙𝑙 𝑙𝑙𝑙𝑙 𝑡𝑡−𝑘𝑘𝑚𝑚1𝑘𝑘=1 + ∑ 𝛿𝛿1,𝑘𝑘𝑙𝑙𝑃𝑃𝑙𝑙𝑡𝑡−𝑘𝑘
𝑚𝑚2𝑘𝑘=0 + ∑ 𝛿𝛿2,𝑘𝑘𝑁𝑁𝐸𝐸𝑁𝑁𝑡𝑡−𝑘𝑘
𝑚𝑚3𝑘𝑘=0 +
∑ 𝜃𝜃𝑘𝑘∆𝑙𝑙𝑙𝑙𝐼𝐼𝑙𝑙𝐼𝐼𝑡𝑡−𝑘𝑘𝑚𝑚4𝑘𝑘=0 + ∑ 𝛾𝛾𝑘𝑘∆𝑙𝑙𝑙𝑙𝐶𝐶𝑙𝑙𝐼𝐼𝑡𝑡−𝑘𝑘
𝑚𝑚5𝑘𝑘=0 + ∑ 𝜏𝜏𝑘𝑘∆𝑙𝑙𝑙𝑙𝑀𝑀2𝑡𝑡−𝑘𝑘
𝑚𝑚6𝑘𝑘=0 + 𝜆𝜆1𝑙𝑙𝑙𝑙𝑙𝑙𝑙𝑙𝑡𝑡−1 + 𝜆𝜆2𝑙𝑙𝑃𝑃𝑙𝑙𝑡𝑡−1 +
𝜆𝜆3𝑁𝑁𝐸𝐸𝑁𝑁𝑡𝑡−1 + 𝜆𝜆4𝑙𝑙𝑙𝑙𝐼𝐼𝑙𝑙𝐼𝐼𝑡𝑡−1 + 𝜆𝜆5𝑙𝑙𝑙𝑙𝐶𝐶𝑙𝑙𝐼𝐼𝑡𝑡−1 + 𝜆𝜆6𝑙𝑙𝑙𝑙𝑀𝑀𝑡𝑡−1 + 𝑢𝑢𝑡𝑡 (4)
In equation (4), the hypothesis of 𝜆𝜆1 = 𝜆𝜆2 = 𝜆𝜆3 = 𝜆𝜆4 = 𝜆𝜆5 = 𝜆𝜆6 = 0 is tested with the F test to investigate whether there is a long-term relationship. As in equation (1), this F test statistic obtained in equation (4) is compared with the table critical values of Pesaran, Shin and Smith52.
48 Shin Y., Yu B., Greenwood-Nimmo M. (2014) Modelling Asymmetric Cointegration and Dynamic Multipliers in a Nonlinear ARDL Framework. In: Sickles R., Horrace W. (eds) Festschrift in Honor of Peter Schmidt. Springer, New York, p.281-314. 49 Bahmani-Oskooee, Saha, 2015, 707-732. 50 Bahmani-Oskooee, Saha, 2016, 78-86. 51 Pesaran, Shin, Smith, 2001, 289-326. 52 Pesaran, Shin, Smith, 2001, 289-326.
(1)
In equation (1), by using the bounds testing approach, the estimates are made by assuming that the cointegration relationship among the variables is symmetrical. The asymmetric error correction model is obtained by adding the positive and negative partial sums of the exchange rate to the equation (1) instead of the exchange rate variable. The partial sums of positive and negative exchange rate movements, as follows:
Makale Gönderim Tarihi: 09.02.2021 Yayına Kabul Tarihi: 13.06.2021 instead of the variable in which asymmetric impacts are examined. Shin, Yu, Greenwood, Nimmo48 showed that the steps of the ARDL bounds test approach are also valid for the NARDL model. The variables used in the ARDL and NARDL cointegration models, in which the possible impacts of exchange rate on XU100, XUTUM and four sector indices examined, based Bahmani-Oskooee and Saha49, Bahmani-Oskooee and Saha50. SP represents the stock price in the models. The error correction model obtained based on the ARDL cointegration estimation method introduced by Pesaran, Shin and Smith51 as follows:
∆𝑙𝑙𝑙𝑙𝑙𝑙𝑙𝑙𝑡𝑡 = 𝛼𝛼 + ∑ 𝛽𝛽𝑘𝑘∆ 𝑙𝑙𝑙𝑙 𝑙𝑙𝑙𝑙 𝑙𝑙𝑙𝑙 𝑡𝑡−𝑘𝑘𝑚𝑚1𝑘𝑘=1 + ∑ 𝛿𝛿𝑘𝑘∆ 𝑙𝑙𝑙𝑙 𝑙𝑙𝑙𝑙 𝐸𝐸𝐸𝐸 𝑡𝑡−𝑘𝑘
𝑚𝑚2𝑘𝑘=0 + ∑ 𝜃𝜃𝑘𝑘∆ 𝑙𝑙𝑙𝑙 𝑙𝑙𝑙𝑙 𝐼𝐼𝑙𝑙𝐼𝐼 𝑡𝑡−𝑘𝑘
𝑚𝑚3𝑘𝑘=0 +
∑ 𝛾𝛾𝑘𝑘∆ 𝑙𝑙𝑙𝑙 𝑙𝑙𝑙𝑙 𝐶𝐶𝑙𝑙𝐼𝐼 𝑡𝑡−𝑘𝑘𝑚𝑚4𝑘𝑘=0 + ∑ 𝜏𝜏𝑘𝑘∆ 𝑙𝑙𝑙𝑙 𝑙𝑙𝑙𝑙 𝑀𝑀2 𝑡𝑡−𝑘𝑘
𝑚𝑚5𝑘𝑘=0 + 𝜆𝜆1𝑙𝑙𝑙𝑙𝑙𝑙𝑙𝑙𝑡𝑡−1 + 𝜆𝜆2𝑙𝑙𝑙𝑙𝐸𝐸𝐸𝐸𝑡𝑡−1 + 𝜆𝜆3𝑙𝑙𝑙𝑙𝐼𝐼𝑙𝑙𝐼𝐼𝑡𝑡−1 +
𝜆𝜆4𝑙𝑙𝑙𝑙𝐶𝐶𝑙𝑙𝐼𝐼𝑡𝑡−1 + 𝜆𝜆5𝑙𝑙𝑙𝑙𝑀𝑀𝑡𝑡−1 + 𝑢𝑢𝑡𝑡 (1)
In equation (1), by using the bounds testing approach, the estimates are made by assuming that the cointegration relationship among the variables is symmetrical. The asymmetric error correction model is obtained by adding the positive and negative partial sums of the exchange rate to the equation (1) instead of the exchange rate variable. The partial sums of positive and negative exchange rate movements, as follows:
𝑙𝑙𝑃𝑃𝑙𝑙𝑡𝑡 = ∑ ∆𝑙𝑙𝑙𝑙𝐸𝐸𝐸𝐸𝑗𝑗+𝑡𝑡
𝑖𝑖=1 = ∑ 𝑚𝑚𝑚𝑚𝑚𝑚 (∆𝑙𝑙𝑙𝑙𝐸𝐸𝐸𝐸𝑗𝑗, 0)𝑡𝑡𝑖𝑖=1 (2)
𝑁𝑁𝐸𝐸𝑁𝑁𝑡𝑡 = ∑ ∆𝑙𝑙𝑙𝑙𝐸𝐸𝐸𝐸𝑗𝑗−𝑡𝑡
𝑖𝑖=1 = ∑ 𝑚𝑚𝑚𝑚𝑙𝑙 (∆𝑙𝑙𝑙𝑙𝐸𝐸𝐸𝐸𝑗𝑗, 0)𝑡𝑡𝑖𝑖=1 (3)
In equation (2) 𝑙𝑙𝑃𝑃𝑙𝑙𝑡𝑡 denotes Turkish lira depreciation, equation (3) 𝑁𝑁𝐸𝐸𝑁𝑁𝑡𝑡 denotes Turkish lira appreciation. The asymmetric error correction model obtained by using the positive and negative partial sums of exchange rate movements instead of the exchange rate variable in the ARDL model is stated as follows:
∆𝑙𝑙𝑙𝑙𝑙𝑙𝑙𝑙𝑡𝑡 = 𝛼𝛼 + ∑ 𝛽𝛽𝑘𝑘∆ 𝑙𝑙𝑙𝑙 𝑙𝑙𝑙𝑙 𝑙𝑙𝑙𝑙 𝑡𝑡−𝑘𝑘𝑚𝑚1𝑘𝑘=1 + ∑ 𝛿𝛿1,𝑘𝑘𝑙𝑙𝑃𝑃𝑙𝑙𝑡𝑡−𝑘𝑘
𝑚𝑚2𝑘𝑘=0 + ∑ 𝛿𝛿2,𝑘𝑘𝑁𝑁𝐸𝐸𝑁𝑁𝑡𝑡−𝑘𝑘
𝑚𝑚3𝑘𝑘=0 +
∑ 𝜃𝜃𝑘𝑘∆𝑙𝑙𝑙𝑙𝐼𝐼𝑙𝑙𝐼𝐼𝑡𝑡−𝑘𝑘𝑚𝑚4𝑘𝑘=0 + ∑ 𝛾𝛾𝑘𝑘∆𝑙𝑙𝑙𝑙𝐶𝐶𝑙𝑙𝐼𝐼𝑡𝑡−𝑘𝑘
𝑚𝑚5𝑘𝑘=0 + ∑ 𝜏𝜏𝑘𝑘∆𝑙𝑙𝑙𝑙𝑀𝑀2𝑡𝑡−𝑘𝑘
𝑚𝑚6𝑘𝑘=0 + 𝜆𝜆1𝑙𝑙𝑙𝑙𝑙𝑙𝑙𝑙𝑡𝑡−1 + 𝜆𝜆2𝑙𝑙𝑃𝑃𝑙𝑙𝑡𝑡−1 +
𝜆𝜆3𝑁𝑁𝐸𝐸𝑁𝑁𝑡𝑡−1 + 𝜆𝜆4𝑙𝑙𝑙𝑙𝐼𝐼𝑙𝑙𝐼𝐼𝑡𝑡−1 + 𝜆𝜆5𝑙𝑙𝑙𝑙𝐶𝐶𝑙𝑙𝐼𝐼𝑡𝑡−1 + 𝜆𝜆6𝑙𝑙𝑙𝑙𝑀𝑀𝑡𝑡−1 + 𝑢𝑢𝑡𝑡 (4)
In equation (4), the hypothesis of 𝜆𝜆1 = 𝜆𝜆2 = 𝜆𝜆3 = 𝜆𝜆4 = 𝜆𝜆5 = 𝜆𝜆6 = 0 is tested with the F test to investigate whether there is a long-term relationship. As in equation (1), this F test statistic obtained in equation (4) is compared with the table critical values of Pesaran, Shin and Smith52.
48 Shin Y., Yu B., Greenwood-Nimmo M. (2014) Modelling Asymmetric Cointegration and Dynamic Multipliers in a Nonlinear ARDL Framework. In: Sickles R., Horrace W. (eds) Festschrift in Honor of Peter Schmidt. Springer, New York, p.281-314. 49 Bahmani-Oskooee, Saha, 2015, 707-732. 50 Bahmani-Oskooee, Saha, 2016, 78-86. 51 Pesaran, Shin, Smith, 2001, 289-326. 52 Pesaran, Shin, Smith, 2001, 289-326.
(2)
Makale Gönderim Tarihi: 09.02.2021 Yayına Kabul Tarihi: 13.06.2021 instead of the variable in which asymmetric impacts are examined. Shin, Yu, Greenwood, Nimmo48 showed that the steps of the ARDL bounds test approach are also valid for the NARDL model. The variables used in the ARDL and NARDL cointegration models, in which the possible impacts of exchange rate on XU100, XUTUM and four sector indices examined, based Bahmani-Oskooee and Saha49, Bahmani-Oskooee and Saha50. SP represents the stock price in the models. The error correction model obtained based on the ARDL cointegration estimation method introduced by Pesaran, Shin and Smith51 as follows:
∆𝑙𝑙𝑙𝑙𝑙𝑙𝑙𝑙𝑡𝑡 = 𝛼𝛼 + ∑ 𝛽𝛽𝑘𝑘∆ 𝑙𝑙𝑙𝑙 𝑙𝑙𝑙𝑙 𝑙𝑙𝑙𝑙 𝑡𝑡−𝑘𝑘𝑚𝑚1𝑘𝑘=1 + ∑ 𝛿𝛿𝑘𝑘∆ 𝑙𝑙𝑙𝑙 𝑙𝑙𝑙𝑙 𝐸𝐸𝐸𝐸 𝑡𝑡−𝑘𝑘
𝑚𝑚2𝑘𝑘=0 + ∑ 𝜃𝜃𝑘𝑘∆ 𝑙𝑙𝑙𝑙 𝑙𝑙𝑙𝑙 𝐼𝐼𝑙𝑙𝐼𝐼 𝑡𝑡−𝑘𝑘
𝑚𝑚3𝑘𝑘=0 +
∑ 𝛾𝛾𝑘𝑘∆ 𝑙𝑙𝑙𝑙 𝑙𝑙𝑙𝑙 𝐶𝐶𝑙𝑙𝐼𝐼 𝑡𝑡−𝑘𝑘𝑚𝑚4𝑘𝑘=0 + ∑ 𝜏𝜏𝑘𝑘∆ 𝑙𝑙𝑙𝑙 𝑙𝑙𝑙𝑙 𝑀𝑀2 𝑡𝑡−𝑘𝑘
𝑚𝑚5𝑘𝑘=0 + 𝜆𝜆1𝑙𝑙𝑙𝑙𝑙𝑙𝑙𝑙𝑡𝑡−1 + 𝜆𝜆2𝑙𝑙𝑙𝑙𝐸𝐸𝐸𝐸𝑡𝑡−1 + 𝜆𝜆3𝑙𝑙𝑙𝑙𝐼𝐼𝑙𝑙𝐼𝐼𝑡𝑡−1 +
𝜆𝜆4𝑙𝑙𝑙𝑙𝐶𝐶𝑙𝑙𝐼𝐼𝑡𝑡−1 + 𝜆𝜆5𝑙𝑙𝑙𝑙𝑀𝑀𝑡𝑡−1 + 𝑢𝑢𝑡𝑡 (1)
In equation (1), by using the bounds testing approach, the estimates are made by assuming that the cointegration relationship among the variables is symmetrical. The asymmetric error correction model is obtained by adding the positive and negative partial sums of the exchange rate to the equation (1) instead of the exchange rate variable. The partial sums of positive and negative exchange rate movements, as follows:
𝑙𝑙𝑃𝑃𝑙𝑙𝑡𝑡 = ∑ ∆𝑙𝑙𝑙𝑙𝐸𝐸𝐸𝐸𝑗𝑗+𝑡𝑡
𝑖𝑖=1 = ∑ 𝑚𝑚𝑚𝑚𝑚𝑚 (∆𝑙𝑙𝑙𝑙𝐸𝐸𝐸𝐸𝑗𝑗, 0)𝑡𝑡𝑖𝑖=1 (2)
𝑁𝑁𝐸𝐸𝑁𝑁𝑡𝑡 = ∑ ∆𝑙𝑙𝑙𝑙𝐸𝐸𝐸𝐸𝑗𝑗−𝑡𝑡
𝑖𝑖=1 = ∑ 𝑚𝑚𝑚𝑚𝑙𝑙 (∆𝑙𝑙𝑙𝑙𝐸𝐸𝐸𝐸𝑗𝑗, 0)𝑡𝑡𝑖𝑖=1 (3)
In equation (2) 𝑙𝑙𝑃𝑃𝑙𝑙𝑡𝑡 denotes Turkish lira depreciation, equation (3) 𝑁𝑁𝐸𝐸𝑁𝑁𝑡𝑡 denotes Turkish lira appreciation. The asymmetric error correction model obtained by using the positive and negative partial sums of exchange rate movements instead of the exchange rate variable in the ARDL model is stated as follows:
∆𝑙𝑙𝑙𝑙𝑙𝑙𝑙𝑙𝑡𝑡 = 𝛼𝛼 + ∑ 𝛽𝛽𝑘𝑘∆ 𝑙𝑙𝑙𝑙 𝑙𝑙𝑙𝑙 𝑙𝑙𝑙𝑙 𝑡𝑡−𝑘𝑘𝑚𝑚1𝑘𝑘=1 + ∑ 𝛿𝛿1,𝑘𝑘𝑙𝑙𝑃𝑃𝑙𝑙𝑡𝑡−𝑘𝑘
𝑚𝑚2𝑘𝑘=0 + ∑ 𝛿𝛿2,𝑘𝑘𝑁𝑁𝐸𝐸𝑁𝑁𝑡𝑡−𝑘𝑘
𝑚𝑚3𝑘𝑘=0 +
∑ 𝜃𝜃𝑘𝑘∆𝑙𝑙𝑙𝑙𝐼𝐼𝑙𝑙𝐼𝐼𝑡𝑡−𝑘𝑘𝑚𝑚4𝑘𝑘=0 + ∑ 𝛾𝛾𝑘𝑘∆𝑙𝑙𝑙𝑙𝐶𝐶𝑙𝑙𝐼𝐼𝑡𝑡−𝑘𝑘
𝑚𝑚5𝑘𝑘=0 + ∑ 𝜏𝜏𝑘𝑘∆𝑙𝑙𝑙𝑙𝑀𝑀2𝑡𝑡−𝑘𝑘
𝑚𝑚6𝑘𝑘=0 + 𝜆𝜆1𝑙𝑙𝑙𝑙𝑙𝑙𝑙𝑙𝑡𝑡−1 + 𝜆𝜆2𝑙𝑙𝑃𝑃𝑙𝑙𝑡𝑡−1 +
𝜆𝜆3𝑁𝑁𝐸𝐸𝑁𝑁𝑡𝑡−1 + 𝜆𝜆4𝑙𝑙𝑙𝑙𝐼𝐼𝑙𝑙𝐼𝐼𝑡𝑡−1 + 𝜆𝜆5𝑙𝑙𝑙𝑙𝐶𝐶𝑙𝑙𝐼𝐼𝑡𝑡−1 + 𝜆𝜆6𝑙𝑙𝑙𝑙𝑀𝑀𝑡𝑡−1 + 𝑢𝑢𝑡𝑡 (4)
In equation (4), the hypothesis of 𝜆𝜆1 = 𝜆𝜆2 = 𝜆𝜆3 = 𝜆𝜆4 = 𝜆𝜆5 = 𝜆𝜆6 = 0 is tested with the F test to investigate whether there is a long-term relationship. As in equation (1), this F test statistic obtained in equation (4) is compared with the table critical values of Pesaran, Shin and Smith52.
48 Shin Y., Yu B., Greenwood-Nimmo M. (2014) Modelling Asymmetric Cointegration and Dynamic Multipliers in a Nonlinear ARDL Framework. In: Sickles R., Horrace W. (eds) Festschrift in Honor of Peter Schmidt. Springer, New York, p.281-314. 49 Bahmani-Oskooee, Saha, 2015, 707-732. 50 Bahmani-Oskooee, Saha, 2016, 78-86. 51 Pesaran, Shin, Smith, 2001, 289-326. 52 Pesaran, Shin, Smith, 2001, 289-326.
(3)
In equation (2)
Makale Gönderim Tarihi: 09.02.2021 Yayına Kabul Tarihi: 13.06.2021 instead of the variable in which asymmetric impacts are examined. Shin, Yu, Greenwood, Nimmo48 showed that the steps of the ARDL bounds test approach are also valid for the NARDL model. The variables used in the ARDL and NARDL cointegration models, in which the possible impacts of exchange rate on XU100, XUTUM and four sector indices examined, based Bahmani-Oskooee and Saha49, Bahmani-Oskooee and Saha50. SP represents the stock price in the models. The error correction model obtained based on the ARDL cointegration estimation method introduced by Pesaran, Shin and Smith51 as follows:
∆𝑙𝑙𝑙𝑙𝑙𝑙𝑙𝑙𝑡𝑡 = 𝛼𝛼 + ∑ 𝛽𝛽𝑘𝑘∆ 𝑙𝑙𝑙𝑙 𝑙𝑙𝑙𝑙 𝑙𝑙𝑙𝑙 𝑡𝑡−𝑘𝑘𝑚𝑚1𝑘𝑘=1 + ∑ 𝛿𝛿𝑘𝑘∆ 𝑙𝑙𝑙𝑙 𝑙𝑙𝑙𝑙 𝐸𝐸𝐸𝐸 𝑡𝑡−𝑘𝑘
𝑚𝑚2𝑘𝑘=0 + ∑ 𝜃𝜃𝑘𝑘∆ 𝑙𝑙𝑙𝑙 𝑙𝑙𝑙𝑙 𝐼𝐼𝑙𝑙𝐼𝐼 𝑡𝑡−𝑘𝑘
𝑚𝑚3𝑘𝑘=0 +
∑ 𝛾𝛾𝑘𝑘∆ 𝑙𝑙𝑙𝑙 𝑙𝑙𝑙𝑙 𝐶𝐶𝑙𝑙𝐼𝐼 𝑡𝑡−𝑘𝑘𝑚𝑚4𝑘𝑘=0 + ∑ 𝜏𝜏𝑘𝑘∆ 𝑙𝑙𝑙𝑙 𝑙𝑙𝑙𝑙 𝑀𝑀2 𝑡𝑡−𝑘𝑘
𝑚𝑚5𝑘𝑘=0 + 𝜆𝜆1𝑙𝑙𝑙𝑙𝑙𝑙𝑙𝑙𝑡𝑡−1 + 𝜆𝜆2𝑙𝑙𝑙𝑙𝐸𝐸𝐸𝐸𝑡𝑡−1 + 𝜆𝜆3𝑙𝑙𝑙𝑙𝐼𝐼𝑙𝑙𝐼𝐼𝑡𝑡−1 +
𝜆𝜆4𝑙𝑙𝑙𝑙𝐶𝐶𝑙𝑙𝐼𝐼𝑡𝑡−1 + 𝜆𝜆5𝑙𝑙𝑙𝑙𝑀𝑀𝑡𝑡−1 + 𝑢𝑢𝑡𝑡 (1)
In equation (1), by using the bounds testing approach, the estimates are made by assuming that the cointegration relationship among the variables is symmetrical. The asymmetric error correction model is obtained by adding the positive and negative partial sums of the exchange rate to the equation (1) instead of the exchange rate variable. The partial sums of positive and negative exchange rate movements, as follows:
𝑙𝑙𝑃𝑃𝑙𝑙𝑡𝑡 = ∑ ∆𝑙𝑙𝑙𝑙𝐸𝐸𝐸𝐸𝑗𝑗+𝑡𝑡
𝑖𝑖=1 = ∑ 𝑚𝑚𝑚𝑚𝑚𝑚 (∆𝑙𝑙𝑙𝑙𝐸𝐸𝐸𝐸𝑗𝑗, 0)𝑡𝑡𝑖𝑖=1 (2)
𝑁𝑁𝐸𝐸𝑁𝑁𝑡𝑡 = ∑ ∆𝑙𝑙𝑙𝑙𝐸𝐸𝐸𝐸𝑗𝑗−𝑡𝑡
𝑖𝑖=1 = ∑ 𝑚𝑚𝑚𝑚𝑙𝑙 (∆𝑙𝑙𝑙𝑙𝐸𝐸𝐸𝐸𝑗𝑗, 0)𝑡𝑡𝑖𝑖=1 (3)
In equation (2) 𝑙𝑙𝑃𝑃𝑙𝑙𝑡𝑡 denotes Turkish lira depreciation, equation (3) 𝑁𝑁𝐸𝐸𝑁𝑁𝑡𝑡 denotes Turkish lira appreciation. The asymmetric error correction model obtained by using the positive and negative partial sums of exchange rate movements instead of the exchange rate variable in the ARDL model is stated as follows:
∆𝑙𝑙𝑙𝑙𝑙𝑙𝑙𝑙𝑡𝑡 = 𝛼𝛼 + ∑ 𝛽𝛽𝑘𝑘∆ 𝑙𝑙𝑙𝑙 𝑙𝑙𝑙𝑙 𝑙𝑙𝑙𝑙 𝑡𝑡−𝑘𝑘𝑚𝑚1𝑘𝑘=1 + ∑ 𝛿𝛿1,𝑘𝑘𝑙𝑙𝑃𝑃𝑙𝑙𝑡𝑡−𝑘𝑘
𝑚𝑚2𝑘𝑘=0 + ∑ 𝛿𝛿2,𝑘𝑘𝑁𝑁𝐸𝐸𝑁𝑁𝑡𝑡−𝑘𝑘
𝑚𝑚3𝑘𝑘=0 +
∑ 𝜃𝜃𝑘𝑘∆𝑙𝑙𝑙𝑙𝐼𝐼𝑙𝑙𝐼𝐼𝑡𝑡−𝑘𝑘𝑚𝑚4𝑘𝑘=0 + ∑ 𝛾𝛾𝑘𝑘∆𝑙𝑙𝑙𝑙𝐶𝐶𝑙𝑙𝐼𝐼𝑡𝑡−𝑘𝑘
𝑚𝑚5𝑘𝑘=0 + ∑ 𝜏𝜏𝑘𝑘∆𝑙𝑙𝑙𝑙𝑀𝑀2𝑡𝑡−𝑘𝑘
𝑚𝑚6𝑘𝑘=0 + 𝜆𝜆1𝑙𝑙𝑙𝑙𝑙𝑙𝑙𝑙𝑡𝑡−1 + 𝜆𝜆2𝑙𝑙𝑃𝑃𝑙𝑙𝑡𝑡−1 +
𝜆𝜆3𝑁𝑁𝐸𝐸𝑁𝑁𝑡𝑡−1 + 𝜆𝜆4𝑙𝑙𝑙𝑙𝐼𝐼𝑙𝑙𝐼𝐼𝑡𝑡−1 + 𝜆𝜆5𝑙𝑙𝑙𝑙𝐶𝐶𝑙𝑙𝐼𝐼𝑡𝑡−1 + 𝜆𝜆6𝑙𝑙𝑙𝑙𝑀𝑀𝑡𝑡−1 + 𝑢𝑢𝑡𝑡 (4)
In equation (4), the hypothesis of 𝜆𝜆1 = 𝜆𝜆2 = 𝜆𝜆3 = 𝜆𝜆4 = 𝜆𝜆5 = 𝜆𝜆6 = 0 is tested with the F test to investigate whether there is a long-term relationship. As in equation (1), this F test statistic obtained in equation (4) is compared with the table critical values of Pesaran, Shin and Smith52.
48 Shin Y., Yu B., Greenwood-Nimmo M. (2014) Modelling Asymmetric Cointegration and Dynamic Multipliers in a Nonlinear ARDL Framework. In: Sickles R., Horrace W. (eds) Festschrift in Honor of Peter Schmidt. Springer, New York, p.281-314. 49 Bahmani-Oskooee, Saha, 2015, 707-732. 50 Bahmani-Oskooee, Saha, 2016, 78-86. 51 Pesaran, Shin, Smith, 2001, 289-326. 52 Pesaran, Shin, Smith, 2001, 289-326.
denotes Turkish lira depreciation, equation (3)
Makale Gönderim Tarihi: 09.02.2021 Yayına Kabul Tarihi: 13.06.2021 instead of the variable in which asymmetric impacts are examined. Shin, Yu, Greenwood, Nimmo48 showed that the steps of the ARDL bounds test approach are also valid for the NARDL model. The variables used in the ARDL and NARDL cointegration models, in which the possible impacts of exchange rate on XU100, XUTUM and four sector indices examined, based Bahmani-Oskooee and Saha49, Bahmani-Oskooee and Saha50. SP represents the stock price in the models. The error correction model obtained based on the ARDL cointegration estimation method introduced by Pesaran, Shin and Smith51 as follows:
∆𝑙𝑙𝑙𝑙𝑙𝑙𝑙𝑙𝑡𝑡 = 𝛼𝛼 + ∑ 𝛽𝛽𝑘𝑘∆ 𝑙𝑙𝑙𝑙 𝑙𝑙𝑙𝑙 𝑙𝑙𝑙𝑙 𝑡𝑡−𝑘𝑘𝑚𝑚1𝑘𝑘=1 + ∑ 𝛿𝛿𝑘𝑘∆ 𝑙𝑙𝑙𝑙 𝑙𝑙𝑙𝑙 𝐸𝐸𝐸𝐸 𝑡𝑡−𝑘𝑘
𝑚𝑚2𝑘𝑘=0 + ∑ 𝜃𝜃𝑘𝑘∆ 𝑙𝑙𝑙𝑙 𝑙𝑙𝑙𝑙 𝐼𝐼𝑙𝑙𝐼𝐼 𝑡𝑡−𝑘𝑘
𝑚𝑚3𝑘𝑘=0 +
∑ 𝛾𝛾𝑘𝑘∆ 𝑙𝑙𝑙𝑙 𝑙𝑙𝑙𝑙 𝐶𝐶𝑙𝑙𝐼𝐼 𝑡𝑡−𝑘𝑘𝑚𝑚4𝑘𝑘=0 + ∑ 𝜏𝜏𝑘𝑘∆ 𝑙𝑙𝑙𝑙 𝑙𝑙𝑙𝑙 𝑀𝑀2 𝑡𝑡−𝑘𝑘
𝑚𝑚5𝑘𝑘=0 + 𝜆𝜆1𝑙𝑙𝑙𝑙𝑙𝑙𝑙𝑙𝑡𝑡−1 + 𝜆𝜆2𝑙𝑙𝑙𝑙𝐸𝐸𝐸𝐸𝑡𝑡−1 + 𝜆𝜆3𝑙𝑙𝑙𝑙𝐼𝐼𝑙𝑙𝐼𝐼𝑡𝑡−1 +
𝜆𝜆4𝑙𝑙𝑙𝑙𝐶𝐶𝑙𝑙𝐼𝐼𝑡𝑡−1 + 𝜆𝜆5𝑙𝑙𝑙𝑙𝑀𝑀𝑡𝑡−1 + 𝑢𝑢𝑡𝑡 (1)
In equation (1), by using the bounds testing approach, the estimates are made by assuming that the cointegration relationship among the variables is symmetrical. The asymmetric error correction model is obtained by adding the positive and negative partial sums of the exchange rate to the equation (1) instead of the exchange rate variable. The partial sums of positive and negative exchange rate movements, as follows:
𝑙𝑙𝑃𝑃𝑙𝑙𝑡𝑡 = ∑ ∆𝑙𝑙𝑙𝑙𝐸𝐸𝐸𝐸𝑗𝑗+𝑡𝑡
𝑖𝑖=1 = ∑ 𝑚𝑚𝑚𝑚𝑚𝑚 (∆𝑙𝑙𝑙𝑙𝐸𝐸𝐸𝐸𝑗𝑗, 0)𝑡𝑡𝑖𝑖=1 (2)
𝑁𝑁𝐸𝐸𝑁𝑁𝑡𝑡 = ∑ ∆𝑙𝑙𝑙𝑙𝐸𝐸𝐸𝐸𝑗𝑗−𝑡𝑡
𝑖𝑖=1 = ∑ 𝑚𝑚𝑚𝑚𝑙𝑙 (∆𝑙𝑙𝑙𝑙𝐸𝐸𝐸𝐸𝑗𝑗, 0)𝑡𝑡𝑖𝑖=1 (3)
In equation (2) 𝑙𝑙𝑃𝑃𝑙𝑙𝑡𝑡 denotes Turkish lira depreciation, equation (3) 𝑁𝑁𝐸𝐸𝑁𝑁𝑡𝑡 denotes Turkish lira appreciation. The asymmetric error correction model obtained by using the positive and negative partial sums of exchange rate movements instead of the exchange rate variable in the ARDL model is stated as follows:
∆𝑙𝑙𝑙𝑙𝑙𝑙𝑙𝑙𝑡𝑡 = 𝛼𝛼 + ∑ 𝛽𝛽𝑘𝑘∆ 𝑙𝑙𝑙𝑙 𝑙𝑙𝑙𝑙 𝑙𝑙𝑙𝑙 𝑡𝑡−𝑘𝑘𝑚𝑚1𝑘𝑘=1 + ∑ 𝛿𝛿1,𝑘𝑘𝑙𝑙𝑃𝑃𝑙𝑙𝑡𝑡−𝑘𝑘
𝑚𝑚2𝑘𝑘=0 + ∑ 𝛿𝛿2,𝑘𝑘𝑁𝑁𝐸𝐸𝑁𝑁𝑡𝑡−𝑘𝑘
𝑚𝑚3𝑘𝑘=0 +
∑ 𝜃𝜃𝑘𝑘∆𝑙𝑙𝑙𝑙𝐼𝐼𝑙𝑙𝐼𝐼𝑡𝑡−𝑘𝑘𝑚𝑚4𝑘𝑘=0 + ∑ 𝛾𝛾𝑘𝑘∆𝑙𝑙𝑙𝑙𝐶𝐶𝑙𝑙𝐼𝐼𝑡𝑡−𝑘𝑘
𝑚𝑚5𝑘𝑘=0 + ∑ 𝜏𝜏𝑘𝑘∆𝑙𝑙𝑙𝑙𝑀𝑀2𝑡𝑡−𝑘𝑘
𝑚𝑚6𝑘𝑘=0 + 𝜆𝜆1𝑙𝑙𝑙𝑙𝑙𝑙𝑙𝑙𝑡𝑡−1 + 𝜆𝜆2𝑙𝑙𝑃𝑃𝑙𝑙𝑡𝑡−1 +
𝜆𝜆3𝑁𝑁𝐸𝐸𝑁𝑁𝑡𝑡−1 + 𝜆𝜆4𝑙𝑙𝑙𝑙𝐼𝐼𝑙𝑙𝐼𝐼𝑡𝑡−1 + 𝜆𝜆5𝑙𝑙𝑙𝑙𝐶𝐶𝑙𝑙𝐼𝐼𝑡𝑡−1 + 𝜆𝜆6𝑙𝑙𝑙𝑙𝑀𝑀𝑡𝑡−1 + 𝑢𝑢𝑡𝑡 (4)
In equation (4), the hypothesis of 𝜆𝜆1 = 𝜆𝜆2 = 𝜆𝜆3 = 𝜆𝜆4 = 𝜆𝜆5 = 𝜆𝜆6 = 0 is tested with the F test to investigate whether there is a long-term relationship. As in equation (1), this F test statistic obtained in equation (4) is compared with the table critical values of Pesaran, Shin and Smith52.
48 Shin Y., Yu B., Greenwood-Nimmo M. (2014) Modelling Asymmetric Cointegration and Dynamic Multipliers in a Nonlinear ARDL Framework. In: Sickles R., Horrace W. (eds) Festschrift in Honor of Peter Schmidt. Springer, New York, p.281-314. 49 Bahmani-Oskooee, Saha, 2015, 707-732. 50 Bahmani-Oskooee, Saha, 2016, 78-86. 51 Pesaran, Shin, Smith, 2001, 289-326. 52 Pesaran, Shin, Smith, 2001, 289-326.
denotes Turkish lira appreciation. The asymmetric error correction model obtained by using the positive and negative partial sums of exchange rate movements instead of the exchange rate variable in the ARDL model is stated as follows:
Makale Gönderim Tarihi: 09.02.2021 Yayına Kabul Tarihi: 13.06.2021 instead of the variable in which asymmetric impacts are examined. Shin, Yu, Greenwood, Nimmo48 showed that the steps of the ARDL bounds test approach are also valid for the NARDL model. The variables used in the ARDL and NARDL cointegration models, in which the possible impacts of exchange rate on XU100, XUTUM and four sector indices examined, based Bahmani-Oskooee and Saha49, Bahmani-Oskooee and Saha50. SP represents the stock price in the models. The error correction model obtained based on the ARDL cointegration estimation method introduced by Pesaran, Shin and Smith51 as follows:
∆𝑙𝑙𝑙𝑙𝑙𝑙𝑙𝑙𝑡𝑡 = 𝛼𝛼 + ∑ 𝛽𝛽𝑘𝑘∆ 𝑙𝑙𝑙𝑙 𝑙𝑙𝑙𝑙 𝑙𝑙𝑙𝑙 𝑡𝑡−𝑘𝑘𝑚𝑚1𝑘𝑘=1 + ∑ 𝛿𝛿𝑘𝑘∆ 𝑙𝑙𝑙𝑙 𝑙𝑙𝑙𝑙 𝐸𝐸𝐸𝐸 𝑡𝑡−𝑘𝑘
𝑚𝑚2𝑘𝑘=0 + ∑ 𝜃𝜃𝑘𝑘∆ 𝑙𝑙𝑙𝑙 𝑙𝑙𝑙𝑙 𝐼𝐼𝑙𝑙𝐼𝐼 𝑡𝑡−𝑘𝑘
𝑚𝑚3𝑘𝑘=0 +
∑ 𝛾𝛾𝑘𝑘∆ 𝑙𝑙𝑙𝑙 𝑙𝑙𝑙𝑙 𝐶𝐶𝑙𝑙𝐼𝐼 𝑡𝑡−𝑘𝑘𝑚𝑚4𝑘𝑘=0 + ∑ 𝜏𝜏𝑘𝑘∆ 𝑙𝑙𝑙𝑙 𝑙𝑙𝑙𝑙 𝑀𝑀2 𝑡𝑡−𝑘𝑘
𝑚𝑚5𝑘𝑘=0 + 𝜆𝜆1𝑙𝑙𝑙𝑙𝑙𝑙𝑙𝑙𝑡𝑡−1 + 𝜆𝜆2𝑙𝑙𝑙𝑙𝐸𝐸𝐸𝐸𝑡𝑡−1 + 𝜆𝜆3𝑙𝑙𝑙𝑙𝐼𝐼𝑙𝑙𝐼𝐼𝑡𝑡−1 +
𝜆𝜆4𝑙𝑙𝑙𝑙𝐶𝐶𝑙𝑙𝐼𝐼𝑡𝑡−1 + 𝜆𝜆5𝑙𝑙𝑙𝑙𝑀𝑀𝑡𝑡−1 + 𝑢𝑢𝑡𝑡 (1)
In equation (1), by using the bounds testing approach, the estimates are made by assuming that the cointegration relationship among the variables is symmetrical. The asymmetric error correction model is obtained by adding the positive and negative partial sums of the exchange rate to the equation (1) instead of the exchange rate variable. The partial sums of positive and negative exchange rate movements, as follows:
𝑙𝑙𝑃𝑃𝑙𝑙𝑡𝑡 = ∑ ∆𝑙𝑙𝑙𝑙𝐸𝐸𝐸𝐸𝑗𝑗+𝑡𝑡
𝑖𝑖=1 = ∑ 𝑚𝑚𝑚𝑚𝑚𝑚 (∆𝑙𝑙𝑙𝑙𝐸𝐸𝐸𝐸𝑗𝑗, 0)𝑡𝑡𝑖𝑖=1 (2)
𝑁𝑁𝐸𝐸𝑁𝑁𝑡𝑡 = ∑ ∆𝑙𝑙𝑙𝑙𝐸𝐸𝐸𝐸𝑗𝑗−𝑡𝑡
𝑖𝑖=1 = ∑ 𝑚𝑚𝑚𝑚𝑙𝑙 (∆𝑙𝑙𝑙𝑙𝐸𝐸𝐸𝐸𝑗𝑗, 0)𝑡𝑡𝑖𝑖=1 (3)
In equation (2) 𝑙𝑙𝑃𝑃𝑙𝑙𝑡𝑡 denotes Turkish lira depreciation, equation (3) 𝑁𝑁𝐸𝐸𝑁𝑁𝑡𝑡 denotes Turkish lira appreciation. The asymmetric error correction model obtained by using the positive and negative partial sums of exchange rate movements instead of the exchange rate variable in the ARDL model is stated as follows:
∆𝑙𝑙𝑙𝑙𝑙𝑙𝑙𝑙𝑡𝑡 = 𝛼𝛼 + ∑ 𝛽𝛽𝑘𝑘∆ 𝑙𝑙𝑙𝑙 𝑙𝑙𝑙𝑙 𝑙𝑙𝑙𝑙 𝑡𝑡−𝑘𝑘𝑚𝑚1𝑘𝑘=1 + ∑ 𝛿𝛿1,𝑘𝑘𝑙𝑙𝑃𝑃𝑙𝑙𝑡𝑡−𝑘𝑘
𝑚𝑚2𝑘𝑘=0 + ∑ 𝛿𝛿2,𝑘𝑘𝑁𝑁𝐸𝐸𝑁𝑁𝑡𝑡−𝑘𝑘
𝑚𝑚3𝑘𝑘=0 +
∑ 𝜃𝜃𝑘𝑘∆𝑙𝑙𝑙𝑙𝐼𝐼𝑙𝑙𝐼𝐼𝑡𝑡−𝑘𝑘𝑚𝑚4𝑘𝑘=0 + ∑ 𝛾𝛾𝑘𝑘∆𝑙𝑙𝑙𝑙𝐶𝐶𝑙𝑙𝐼𝐼𝑡𝑡−𝑘𝑘
𝑚𝑚5𝑘𝑘=0 + ∑ 𝜏𝜏𝑘𝑘∆𝑙𝑙𝑙𝑙𝑀𝑀2𝑡𝑡−𝑘𝑘
𝑚𝑚6𝑘𝑘=0 + 𝜆𝜆1𝑙𝑙𝑙𝑙𝑙𝑙𝑙𝑙𝑡𝑡−1 + 𝜆𝜆2𝑙𝑙𝑃𝑃𝑙𝑙𝑡𝑡−1 +
𝜆𝜆3𝑁𝑁𝐸𝐸𝑁𝑁𝑡𝑡−1 + 𝜆𝜆4𝑙𝑙𝑙𝑙𝐼𝐼𝑙𝑙𝐼𝐼𝑡𝑡−1 + 𝜆𝜆5𝑙𝑙𝑙𝑙𝐶𝐶𝑙𝑙𝐼𝐼𝑡𝑡−1 + 𝜆𝜆6𝑙𝑙𝑙𝑙𝑀𝑀𝑡𝑡−1 + 𝑢𝑢𝑡𝑡 (4)
In equation (4), the hypothesis of 𝜆𝜆1 = 𝜆𝜆2 = 𝜆𝜆3 = 𝜆𝜆4 = 𝜆𝜆5 = 𝜆𝜆6 = 0 is tested with the F test to investigate whether there is a long-term relationship. As in equation (1), this F test statistic obtained in equation (4) is compared with the table critical values of Pesaran, Shin and Smith52.
48 Shin Y., Yu B., Greenwood-Nimmo M. (2014) Modelling Asymmetric Cointegration and Dynamic Multipliers in a Nonlinear ARDL Framework. In: Sickles R., Horrace W. (eds) Festschrift in Honor of Peter Schmidt. Springer, New York, p.281-314. 49 Bahmani-Oskooee, Saha, 2015, 707-732. 50 Bahmani-Oskooee, Saha, 2016, 78-86. 51 Pesaran, Shin, Smith, 2001, 289-326. 52 Pesaran, Shin, Smith, 2001, 289-326.
(4)
In equation (4), the hypothesis of
Makale Gönderim Tarihi: 09.02.2021 Yayına Kabul Tarihi: 13.06.2021 instead of the variable in which asymmetric impacts are examined. Shin, Yu, Greenwood, Nimmo48 showed that the steps of the ARDL bounds test approach are also valid for the NARDL model. The variables used in the ARDL and NARDL cointegration models, in which the possible impacts of exchange rate on XU100, XUTUM and four sector indices examined, based Bahmani-Oskooee and Saha49, Bahmani-Oskooee and Saha50. SP represents the stock price in the models. The error correction model obtained based on the ARDL cointegration estimation method introduced by Pesaran, Shin and Smith51 as follows:
∆𝑙𝑙𝑙𝑙𝑙𝑙𝑙𝑙𝑡𝑡 = 𝛼𝛼 + ∑ 𝛽𝛽𝑘𝑘∆ 𝑙𝑙𝑙𝑙 𝑙𝑙𝑙𝑙 𝑙𝑙𝑙𝑙 𝑡𝑡−𝑘𝑘𝑚𝑚1𝑘𝑘=1 + ∑ 𝛿𝛿𝑘𝑘∆ 𝑙𝑙𝑙𝑙 𝑙𝑙𝑙𝑙 𝐸𝐸𝐸𝐸 𝑡𝑡−𝑘𝑘
𝑚𝑚2𝑘𝑘=0 + ∑ 𝜃𝜃𝑘𝑘∆ 𝑙𝑙𝑙𝑙 𝑙𝑙𝑙𝑙 𝐼𝐼𝑙𝑙𝐼𝐼 𝑡𝑡−𝑘𝑘
𝑚𝑚3𝑘𝑘=0 +
∑ 𝛾𝛾𝑘𝑘∆ 𝑙𝑙𝑙𝑙 𝑙𝑙𝑙𝑙 𝐶𝐶𝑙𝑙𝐼𝐼 𝑡𝑡−𝑘𝑘𝑚𝑚4𝑘𝑘=0 + ∑ 𝜏𝜏𝑘𝑘∆ 𝑙𝑙𝑙𝑙 𝑙𝑙𝑙𝑙 𝑀𝑀2 𝑡𝑡−𝑘𝑘
𝑚𝑚5𝑘𝑘=0 + 𝜆𝜆1𝑙𝑙𝑙𝑙𝑙𝑙𝑙𝑙𝑡𝑡−1 + 𝜆𝜆2𝑙𝑙𝑙𝑙𝐸𝐸𝐸𝐸𝑡𝑡−1 + 𝜆𝜆3𝑙𝑙𝑙𝑙𝐼𝐼𝑙𝑙𝐼𝐼𝑡𝑡−1 +
𝜆𝜆4𝑙𝑙𝑙𝑙𝐶𝐶𝑙𝑙𝐼𝐼𝑡𝑡−1 + 𝜆𝜆5𝑙𝑙𝑙𝑙𝑀𝑀𝑡𝑡−1 + 𝑢𝑢𝑡𝑡 (1)
In equation (1), by using the bounds testing approach, the estimates are made by assuming that the cointegration relationship among the variables is symmetrical. The asymmetric error correction model is obtained by adding the positive and negative partial sums of the exchange rate to the equation (1) instead of the exchange rate variable. The partial sums of positive and negative exchange rate movements, as follows:
𝑙𝑙𝑃𝑃𝑙𝑙𝑡𝑡 = ∑ ∆𝑙𝑙𝑙𝑙𝐸𝐸𝐸𝐸𝑗𝑗+𝑡𝑡
𝑖𝑖=1 = ∑ 𝑚𝑚𝑚𝑚𝑚𝑚 (∆𝑙𝑙𝑙𝑙𝐸𝐸𝐸𝐸𝑗𝑗, 0)𝑡𝑡𝑖𝑖=1 (2)
𝑁𝑁𝐸𝐸𝑁𝑁𝑡𝑡 = ∑ ∆𝑙𝑙𝑙𝑙𝐸𝐸𝐸𝐸𝑗𝑗−𝑡𝑡
𝑖𝑖=1 = ∑ 𝑚𝑚𝑚𝑚𝑙𝑙 (∆𝑙𝑙𝑙𝑙𝐸𝐸𝐸𝐸𝑗𝑗, 0)𝑡𝑡𝑖𝑖=1 (3)
In equation (2) 𝑙𝑙𝑃𝑃𝑙𝑙𝑡𝑡 denotes Turkish lira depreciation, equation (3) 𝑁𝑁𝐸𝐸𝑁𝑁𝑡𝑡 denotes Turkish lira appreciation. The asymmetric error correction model obtained by using the positive and negative partial sums of exchange rate movements instead of the exchange rate variable in the ARDL model is stated as follows:
∆𝑙𝑙𝑙𝑙𝑙𝑙𝑙𝑙𝑡𝑡 = 𝛼𝛼 + ∑ 𝛽𝛽𝑘𝑘∆ 𝑙𝑙𝑙𝑙 𝑙𝑙𝑙𝑙 𝑙𝑙𝑙𝑙 𝑡𝑡−𝑘𝑘𝑚𝑚1𝑘𝑘=1 + ∑ 𝛿𝛿1,𝑘𝑘𝑙𝑙𝑃𝑃𝑙𝑙𝑡𝑡−𝑘𝑘
𝑚𝑚2𝑘𝑘=0 + ∑ 𝛿𝛿2,𝑘𝑘𝑁𝑁𝐸𝐸𝑁𝑁𝑡𝑡−𝑘𝑘
𝑚𝑚3𝑘𝑘=0 +
∑ 𝜃𝜃𝑘𝑘∆𝑙𝑙𝑙𝑙𝐼𝐼𝑙𝑙𝐼𝐼𝑡𝑡−𝑘𝑘𝑚𝑚4𝑘𝑘=0 + ∑ 𝛾𝛾𝑘𝑘∆𝑙𝑙𝑙𝑙𝐶𝐶𝑙𝑙𝐼𝐼𝑡𝑡−𝑘𝑘
𝑚𝑚5𝑘𝑘=0 + ∑ 𝜏𝜏𝑘𝑘∆𝑙𝑙𝑙𝑙𝑀𝑀2𝑡𝑡−𝑘𝑘
𝑚𝑚6𝑘𝑘=0 + 𝜆𝜆1𝑙𝑙𝑙𝑙𝑙𝑙𝑙𝑙𝑡𝑡−1 + 𝜆𝜆2𝑙𝑙𝑃𝑃𝑙𝑙𝑡𝑡−1 +
𝜆𝜆3𝑁𝑁𝐸𝐸𝑁𝑁𝑡𝑡−1 + 𝜆𝜆4𝑙𝑙𝑙𝑙𝐼𝐼𝑙𝑙𝐼𝐼𝑡𝑡−1 + 𝜆𝜆5𝑙𝑙𝑙𝑙𝐶𝐶𝑙𝑙𝐼𝐼𝑡𝑡−1 + 𝜆𝜆6𝑙𝑙𝑙𝑙𝑀𝑀𝑡𝑡−1 + 𝑢𝑢𝑡𝑡 (4)
In equation (4), the hypothesis of 𝜆𝜆1 = 𝜆𝜆2 = 𝜆𝜆3 = 𝜆𝜆4 = 𝜆𝜆5 = 𝜆𝜆6 = 0 is tested with the F test to investigate whether there is a long-term relationship. As in equation (1), this F test statistic obtained in equation (4) is compared with the table critical values of Pesaran, Shin and Smith52.
48 Shin Y., Yu B., Greenwood-Nimmo M. (2014) Modelling Asymmetric Cointegration and Dynamic Multipliers in a Nonlinear ARDL Framework. In: Sickles R., Horrace W. (eds) Festschrift in Honor of Peter Schmidt. Springer, New York, p.281-314. 49 Bahmani-Oskooee, Saha, 2015, 707-732. 50 Bahmani-Oskooee, Saha, 2016, 78-86. 51 Pesaran, Shin, Smith, 2001, 289-326. 52 Pesaran, Shin, Smith, 2001, 289-326.
is tested with the F test to investigate whether there is a long-term relationship. As in equation (1), this F test statistic obtained in equation (4) is compared with the table critical values of Pesaran, Shin and Smith52. The rejection of the The rejection of the 𝜆𝜆2−𝜆𝜆1
= 𝜆𝜆3−𝜆𝜆1
hypothesis indicates that the impacts of exchange rates on stock indices in the long-term are asymmetrical. The hypothesis of ∑ 𝛿𝛿1,𝑘𝑘𝑚𝑚2
𝑘𝑘=0 = ∑ 𝛿𝛿2,𝑘𝑘𝑚𝑚3𝑘𝑘=0 is being
tested to examine whether the impacts of exchange rate on stock indices are asymmetric in the short-term. The rejection of this hypothesis reveals that the impacts of exchange rates on stock indices are asymmetrical in the short-term. Normalized 𝜆𝜆2, 𝜆𝜆3 are parameters expressing long-term positive and negative exchange rate movements, respectively.
3.Empirical Findings
We study the natural logarithm of all the variables for the analysis. Firstly, the correlation among the variables we report the correlation matrix in Table 2. The correlation between the LEX and the sectoral indices is positive. As the LEX gains, the exports of the national firms traded in the stock market increase and thus their profitability increases. This situation implies that the stock indices of national firms have increased.
Table 2: The Correlation Coefficients Among the Variables
XU100 XUTUM XUHIZ XUMAL XUSIN XUTEK EX IPI CPI M2 XU100 1.00
XUTUM 0.95 1.00 XUHIZ 0.96 0.95 1.00 XUMAL 0.95 0.84 0.85 1.00 XUSIN 0.97 0.98 0.97 0.86 1.00 XUTEK 0.93 0.96 0.93 0.80 0.97 1.00
EX 0.74 0.85 0.83 0.52 0.85 0.88 1.00 IPI 0.89 0.93 0.92 0.76 0.94 0.94 0.85 1.00 CPI 0.83 0.91 0.90 0.63 0.92 0.92 0.98 0.90 1.00 M2 0.84 0.93 0.91 0.66 0.93 0.93 0.97 0.93 0.99 1.00
Note: We use the natural logarithm of all the variables
The most important advantage of the ARDL cointegration method is that the time series analyzed are I(0) or I(1), but not I(2). For this reason, we apply the ADF and PP unit root tests. The results are presented in Table 3 for all the variables in levels and in the first differences. According to the unit root test results, LXUTUM, LXUHIZ and LIPI variables are stationary at level, the rest are first difference stationary. Since the variables used in this study are not I(2) integrated series, we can estimate the ARDL and NARDL models.
Table 3: Unit Root Test Results
Variables ADF test PP test Level First Difference Level First Difference
LXU100 -2.8361 [0] -12.8755 [0]* -3.0245 [3] -12.8748 [1]* LXUTUM -4.2178 [0]* -9.4080 [0]* -4.2594 [4]* -9.3116 [7]* LXUHIZ -3.4403 [0]* -14.9710 [0]* -3.5482 [5]** -14.9781 [3]*
LXUMAL -2.8817 [0] -12.9113 [0]* -3.0132 [2] -12.9118 [2]* LXUSIN -2.5445 [0] -11.1906 [0]* -2.8227 [2] -11.2182 [2]*
hypothesis indicates that the impacts of exchange rates on stock indices in the long-term are asymmetrical. The hypothesis of
The rejection of the 𝜆𝜆2−𝜆𝜆1= 𝜆𝜆3
−𝜆𝜆1 hypothesis indicates that the impacts of exchange rates on stock
indices in the long-term are asymmetrical. The hypothesis of ∑ 𝛿𝛿1,𝑘𝑘𝑚𝑚2𝑘𝑘=0 = ∑ 𝛿𝛿2,𝑘𝑘𝑚𝑚3
𝑘𝑘=0 is being tested to examine whether the impacts of exchange rate on stock indices are asymmetric in the short-term. The rejection of this hypothesis reveals that the impacts of exchange rates on stock indices are asymmetrical in the short-term. Normalized 𝜆𝜆2, 𝜆𝜆3 are parameters expressing long-term positive and negative exchange rate movements, respectively.
3.Empirical Findings
We study the natural logarithm of all the variables for the analysis. Firstly, the correlation among the variables we report the correlation matrix in Table 2. The correlation between the LEX and the sectoral indices is positive. As the LEX gains, the exports of the national firms traded in the stock market increase and thus their profitability increases. This situation implies that the stock indices of national firms have increased.
Table 2: The Correlation Coefficients Among the Variables
XU100 XUTUM XUHIZ XUMAL XUSIN XUTEK EX IPI CPI M2 XU100 1.00
XUTUM 0.95 1.00 XUHIZ 0.96 0.95 1.00 XUMAL 0.95 0.84 0.85 1.00 XUSIN 0.97 0.98 0.97 0.86 1.00 XUTEK 0.93 0.96 0.93 0.80 0.97 1.00
EX 0.74 0.85 0.83 0.52 0.85 0.88 1.00 IPI 0.89 0.93 0.92 0.76 0.94 0.94 0.85 1.00 CPI 0.83 0.91 0.90 0.63 0.92 0.92 0.98 0.90 1.00 M2 0.84 0.93 0.91 0.66 0.93 0.93 0.97 0.93 0.99 1.00
Note: We use the natural logarithm of all the variables
The most important advantage of the ARDL cointegration method is that the time series analyzed are I(0) or I(1), but not I(2). For this reason, we apply the ADF and PP unit root tests. The results are presented in Table 3 for all the variables in levels and in the first differences. According to the unit root test results, LXUTUM, LXUHIZ and LIPI variables are stationary at level, the rest are first difference stationary. Since the variables used in this study are not I(2) integrated series, we can estimate the ARDL and NARDL models.
Table 3: Unit Root Test Results
Variables ADF test PP test Level First Difference Level First Difference
LXU100 -2.8361 [0] -12.8755 [0]* -3.0245 [3] -12.8748 [1]* LXUTUM -4.2178 [0]* -9.4080 [0]* -4.2594 [4]* -9.3116 [7]* LXUHIZ -3.4403 [0]* -14.9710 [0]* -3.5482 [5]** -14.9781 [3]*
LXUMAL -2.8817 [0] -12.9113 [0]* -3.0132 [2] -12.9118 [2]* LXUSIN -2.5445 [0] -11.1906 [0]* -2.8227 [2] -11.2182 [2]*
is being tested to examine whether
48 Shin Y., Yu B., Greenwood-Nimmo M. (2014) Modelling Asymmetric Cointegration and Dynamic Multipliers in a Nonlinear ARDL Framework. In: Sickles R., Horrace W. (eds) Festschrift in Honor of Peter Schmidt. Springer, New York, p.281-314.
49 Bahmani-Oskooee, Saha, 2015, 707-732.50 Bahmani-Oskooee, Saha, 2016, 78-86.51 Pesaran, Shin, Smith, 2001, 289-326.52 Pesaran, Shin, Smith, 2001, 289-326.
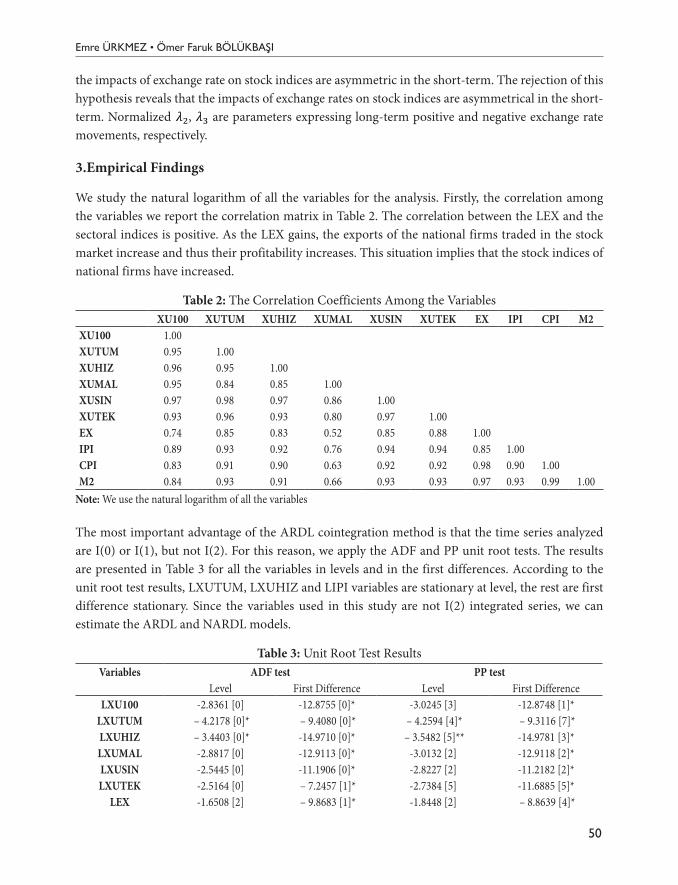
Emre ÜRKMEZ • Ömer Faruk BÖLÜKBAŞI
50
the impacts of exchange rate on stock indices are asymmetric in the short-term. The rejection of this hypothesis reveals that the impacts of exchange rates on stock indices are asymmetrical in the short-term. Normalized
The rejection of the 𝜆𝜆2−𝜆𝜆1= 𝜆𝜆3
−𝜆𝜆1 hypothesis indicates that the impacts of exchange rates on stock
indices in the long-term are asymmetrical. The hypothesis of ∑ 𝛿𝛿1,𝑘𝑘𝑚𝑚2𝑘𝑘=0 = ∑ 𝛿𝛿2,𝑘𝑘𝑚𝑚3
𝑘𝑘=0 is being tested to examine whether the impacts of exchange rate on stock indices are asymmetric in the short-term. The rejection of this hypothesis reveals that the impacts of exchange rates on stock indices are asymmetrical in the short-term. Normalized 𝜆𝜆2, 𝜆𝜆3 are parameters expressing long-term positive and negative exchange rate movements, respectively.
3.Empirical Findings
We study the natural logarithm of all the variables for the analysis. Firstly, the correlation among the variables we report the correlation matrix in Table 2. The correlation between the LEX and the sectoral indices is positive. As the LEX gains, the exports of the national firms traded in the stock market increase and thus their profitability increases. This situation implies that the stock indices of national firms have increased.
Table 2: The Correlation Coefficients Among the Variables
XU100 XUTUM XUHIZ XUMAL XUSIN XUTEK EX IPI CPI M2 XU100 1.00
XUTUM 0.95 1.00 XUHIZ 0.96 0.95 1.00 XUMAL 0.95 0.84 0.85 1.00 XUSIN 0.97 0.98 0.97 0.86 1.00 XUTEK 0.93 0.96 0.93 0.80 0.97 1.00
EX 0.74 0.85 0.83 0.52 0.85 0.88 1.00 IPI 0.89 0.93 0.92 0.76 0.94 0.94 0.85 1.00 CPI 0.83 0.91 0.90 0.63 0.92 0.92 0.98 0.90 1.00 M2 0.84 0.93 0.91 0.66 0.93 0.93 0.97 0.93 0.99 1.00
Note: We use the natural logarithm of all the variables
The most important advantage of the ARDL cointegration method is that the time series analyzed are I(0) or I(1), but not I(2). For this reason, we apply the ADF and PP unit root tests. The results are presented in Table 3 for all the variables in levels and in the first differences. According to the unit root test results, LXUTUM, LXUHIZ and LIPI variables are stationary at level, the rest are first difference stationary. Since the variables used in this study are not I(2) integrated series, we can estimate the ARDL and NARDL models.
Table 3: Unit Root Test Results
Variables ADF test PP test Level First Difference Level First Difference
LXU100 -2.8361 [0] -12.8755 [0]* -3.0245 [3] -12.8748 [1]* LXUTUM -4.2178 [0]* -9.4080 [0]* -4.2594 [4]* -9.3116 [7]* LXUHIZ -3.4403 [0]* -14.9710 [0]* -3.5482 [5]** -14.9781 [3]*
LXUMAL -2.8817 [0] -12.9113 [0]* -3.0132 [2] -12.9118 [2]* LXUSIN -2.5445 [0] -11.1906 [0]* -2.8227 [2] -11.2182 [2]*
,
The rejection of the 𝜆𝜆2−𝜆𝜆1= 𝜆𝜆3
−𝜆𝜆1 hypothesis indicates that the impacts of exchange rates on stock
indices in the long-term are asymmetrical. The hypothesis of ∑ 𝛿𝛿1,𝑘𝑘𝑚𝑚2𝑘𝑘=0 = ∑ 𝛿𝛿2,𝑘𝑘𝑚𝑚3
𝑘𝑘=0 is being tested to examine whether the impacts of exchange rate on stock indices are asymmetric in the short-term. The rejection of this hypothesis reveals that the impacts of exchange rates on stock indices are asymmetrical in the short-term. Normalized 𝜆𝜆2, 𝜆𝜆3 are parameters expressing long-term positive and negative exchange rate movements, respectively.
3.Empirical Findings
We study the natural logarithm of all the variables for the analysis. Firstly, the correlation among the variables we report the correlation matrix in Table 2. The correlation between the LEX and the sectoral indices is positive. As the LEX gains, the exports of the national firms traded in the stock market increase and thus their profitability increases. This situation implies that the stock indices of national firms have increased.
Table 2: The Correlation Coefficients Among the Variables
XU100 XUTUM XUHIZ XUMAL XUSIN XUTEK EX IPI CPI M2 XU100 1.00
XUTUM 0.95 1.00 XUHIZ 0.96 0.95 1.00 XUMAL 0.95 0.84 0.85 1.00 XUSIN 0.97 0.98 0.97 0.86 1.00 XUTEK 0.93 0.96 0.93 0.80 0.97 1.00
EX 0.74 0.85 0.83 0.52 0.85 0.88 1.00 IPI 0.89 0.93 0.92 0.76 0.94 0.94 0.85 1.00 CPI 0.83 0.91 0.90 0.63 0.92 0.92 0.98 0.90 1.00 M2 0.84 0.93 0.91 0.66 0.93 0.93 0.97 0.93 0.99 1.00
Note: We use the natural logarithm of all the variables
The most important advantage of the ARDL cointegration method is that the time series analyzed are I(0) or I(1), but not I(2). For this reason, we apply the ADF and PP unit root tests. The results are presented in Table 3 for all the variables in levels and in the first differences. According to the unit root test results, LXUTUM, LXUHIZ and LIPI variables are stationary at level, the rest are first difference stationary. Since the variables used in this study are not I(2) integrated series, we can estimate the ARDL and NARDL models.
Table 3: Unit Root Test Results
Variables ADF test PP test Level First Difference Level First Difference
LXU100 -2.8361 [0] -12.8755 [0]* -3.0245 [3] -12.8748 [1]* LXUTUM -4.2178 [0]* -9.4080 [0]* -4.2594 [4]* -9.3116 [7]* LXUHIZ -3.4403 [0]* -14.9710 [0]* -3.5482 [5]** -14.9781 [3]*
LXUMAL -2.8817 [0] -12.9113 [0]* -3.0132 [2] -12.9118 [2]* LXUSIN -2.5445 [0] -11.1906 [0]* -2.8227 [2] -11.2182 [2]*
are parameters expressing long-term positive and negative exchange rate movements, respectively.
3.Empirical Findings
We study the natural logarithm of all the variables for the analysis. Firstly, the correlation among the variables we report the correlation matrix in Table 2. The correlation between the LEX and the sectoral indices is positive. As the LEX gains, the exports of the national firms traded in the stock market increase and thus their profitability increases. This situation implies that the stock indices of national firms have increased.
Table 2: The Correlation Coefficients Among the VariablesXU100 XUTUM XUHIZ XUMAL XUSIN XUTEK EX IPI CPI M2
XU100 1.00XUTUM 0.95 1.00XUHIZ 0.96 0.95 1.00XUMAL 0.95 0.84 0.85 1.00XUSIN 0.97 0.98 0.97 0.86 1.00XUTEK 0.93 0.96 0.93 0.80 0.97 1.00EX 0.74 0.85 0.83 0.52 0.85 0.88 1.00IPI 0.89 0.93 0.92 0.76 0.94 0.94 0.85 1.00CPI 0.83 0.91 0.90 0.63 0.92 0.92 0.98 0.90 1.00M2 0.84 0.93 0.91 0.66 0.93 0.93 0.97 0.93 0.99 1.00
Note: We use the natural logarithm of all the variables
The most important advantage of the ARDL cointegration method is that the time series analyzed are I(0) or I(1), but not I(2). For this reason, we apply the ADF and PP unit root tests. The results are presented in Table 3 for all the variables in levels and in the first differences. According to the unit root test results, LXUTUM, LXUHIZ and LIPI variables are stationary at level, the rest are first difference stationary. Since the variables used in this study are not I(2) integrated series, we can estimate the ARDL and NARDL models.
Table 3: Unit Root Test ResultsVariables ADF test PP test
Level First Difference Level First DifferenceLXU100 -2.8361 [0] -12.8755 [0]* -3.0245 [3] -12.8748 [1]*
LXUTUM – 4.2178 [0]* – 9.4080 [0]* – 4.2594 [4]* – 9.3116 [7]*LXUHIZ – 3.4403 [0]* -14.9710 [0]* – 3.5482 [5]** -14.9781 [3]*LXUMAL -2.8817 [0] -12.9113 [0]* -3.0132 [2] -12.9118 [2]*LXUSIN -2.5445 [0] -11.1906 [0]* -2.8227 [2] -11.2182 [2]*LXUTEK -2.5164 [0] – 7.2457 [1]* -2.7384 [5] -11.6885 [5]*
LEX -1.6508 [2] – 9.8683 [1]* -1.8448 [2] – 8.8639 [4]*
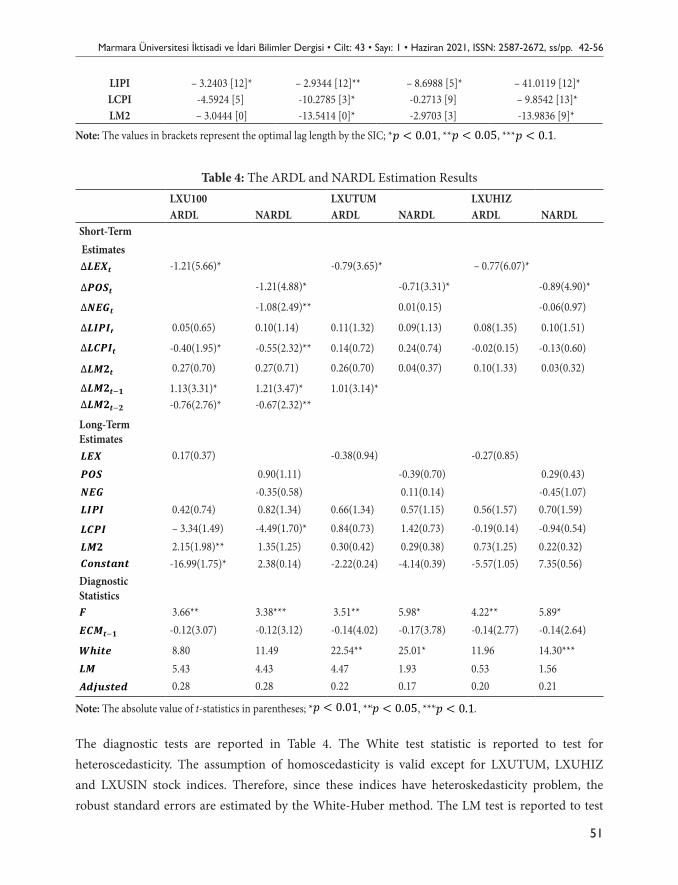
Marmara Üniversitesi İktisadi ve İdari Bilimler Dergisi • Cilt: 43 • Sayı: 1 • Haziran 2021, ISSN: 2587-2672, ss/pp. 42-56
51
LIPI – 3.2403 [12]* – 2.9344 [12]** – 8.6988 [5]* – 41.0119 [12]*LCPI -4.5924 [5] -10.2785 [3]* -0.2713 [9] – 9.8542 [13]*LM2 – 3.0444 [0] -13.5414 [0]* -2.9703 [3] -13.9836 [9]*
Note: The values in brackets represent the optimal lag length by the SIC; *
Makale Gönderim Tarihi: 09.02.2021 Yayına Kabul Tarihi: 13.06.2021
LXUTEK -2.5164 [0] -7.2457 [1]* -2.7384 [5] -11.6885 [5]* LEX -1.6508 [2] -9.8683 [1]* -1.8448 [2] -8.8639 [4]* LIPI -3.2403 [12]* -2.9344 [12]** -8.6988 [5]* -41.0119 [12]* LCPI -4.5924 [5] -10.2785 [3]* -0.2713 [9] -9.8542 [13]* LM2 -3.0444 [0] -13.5414 [0]* -2.9703 [3] -13.9836 [9]*
Note: The values in brackets represent the optimal lag length by the SIC; *𝑝𝑝 < 0.01, **𝑝𝑝 <0.05, ***𝑝𝑝 < 0.1.
Table 4: The ARDL and NARDL Estimation Results
LXU100 LXUTUM LXUHIZ ARDL NARDL ARDL NARDL ARDL NARDL
Short-Term Estimates
∆𝑳𝑳𝑳𝑳𝑳𝑳𝒕𝒕 -1.21(5.66)* -0.79(3.65)* -0.77(6.07)*
∆𝑷𝑷𝑷𝑷𝑷𝑷𝒕𝒕 -1.21(4.88)* -0.71(3.31)* -0.89(4.90)*
∆𝑵𝑵𝑳𝑳𝑵𝑵𝒕𝒕 -1.08(2.49)**
0.01(0.15) -0.06(0.97)
∆𝑳𝑳𝑳𝑳𝑷𝑷𝑳𝑳𝒕𝒕 0.05(0.65) 0.10(1.14) 0.11(1.32) 0.09(1.13) 0.08(1.35) 0.10(1.51) ∆𝑳𝑳𝑳𝑳𝑷𝑷𝑳𝑳𝒕𝒕 -0.40(1.95)* -
0.55(2.32)** 0.14(0.72) 0.24(0.74) -0.02(0.15) -0.13(0.60)
∆𝑳𝑳𝑳𝑳𝑳𝑳𝒕𝒕 0.27(0.70) 0.27(0.71) 0.26(0.70) 0.04(0.37) 0.10(1.33) 0.03(0.32) ∆𝑳𝑳𝑳𝑳𝑳𝑳𝒕𝒕−𝟏𝟏 1.13(3.31)* 1.21(3.47)* 1.01(3.14)* ∆𝑳𝑳𝑳𝑳𝑳𝑳𝒕𝒕−𝑳𝑳 -0.76(2.76)* -
0.67(2.32)**
Long-Term Estimates
𝑳𝑳𝑳𝑳𝑳𝑳 0.17(0.37) -0.38(0.94) -0.27(0.85) 𝑷𝑷𝑷𝑷𝑷𝑷 0.90(1.11) -0.39(0.70) 0.29(0.43) 𝑵𝑵𝑳𝑳𝑵𝑵 -0.35(0.58) 0.11(0.14) -0.45(1.07) 𝑳𝑳𝑳𝑳𝑷𝑷𝑳𝑳 0.42(0.74) 0.82(1.34) 0.66(1.34) 0.57(1.15) 0.56(1.57) 0.70(1.59) 𝑳𝑳𝑳𝑳𝑷𝑷𝑳𝑳 -3.34(1.49) -4.49(1.70)* 0.84(0.73) 1.42(0.73) -0.19(0.14) -0.94(0.54) 𝑳𝑳𝑳𝑳𝑳𝑳 2.15(1.98)** 1.35(1.25) 0.30(0.42) 0.29(0.38) 0.73(1.25) 0.22(0.32) 𝑳𝑳𝑪𝑪𝑪𝑪𝑪𝑪𝒕𝒕𝑪𝑪𝑪𝑪𝒕𝒕 -16.99(1.75)* 2.38(0.14) -2.22(0.24) -4.14(0.39) -5.57(1.05) 7.35(0.56) Diagnostic Statistics
𝑭𝑭 3.66** 3.38*** 3.51** 5.98* 4.22** 5.89*
𝑳𝑳𝑳𝑳𝑳𝑳𝒕𝒕−𝟏𝟏 -0.12(3.07) -0.12(3.12) -0.14(4.02) -0.17(3.78) -0.14(2.77) -0.14(2.64)
𝑾𝑾𝑾𝑾𝑾𝑾𝒕𝒕𝑾𝑾 8.80 11.49 22.54** 25.01* 11.96 14.30*** 𝑳𝑳𝑳𝑳 5.43 4.43 4.47 1.93 0.53 1.56 𝑨𝑨𝑨𝑨𝑨𝑨𝑨𝑨𝑪𝑪𝒕𝒕𝑾𝑾𝑨𝑨 𝑹𝑹𝑳𝑳 0.28 0.28 0.22 0.17 0.20 0.21
Note: The absolute value of t-statistics in parentheses; *𝑝𝑝 < 0.01, **𝑝𝑝 < 0.05, ***𝑝𝑝 < 0.1.
The diagnostic tests are reported in Table 4. The White test statistic is reported to test for heteroscedasticity. The assumption of homoscedasticity is valid except for LXUTUM, LXUHIZ and LXUSIN stock indices. Therefore, since these indices have heteroskedasticity problem, the
, **
Makale Gönderim Tarihi: 09.02.2021 Yayına Kabul Tarihi: 13.06.2021
LXUTEK -2.5164 [0] -7.2457 [1]* -2.7384 [5] -11.6885 [5]* LEX -1.6508 [2] -9.8683 [1]* -1.8448 [2] -8.8639 [4]* LIPI -3.2403 [12]* -2.9344 [12]** -8.6988 [5]* -41.0119 [12]* LCPI -4.5924 [5] -10.2785 [3]* -0.2713 [9] -9.8542 [13]* LM2 -3.0444 [0] -13.5414 [0]* -2.9703 [3] -13.9836 [9]*
Note: The values in brackets represent the optimal lag length by the SIC; *𝑝𝑝 < 0.01, **𝑝𝑝 <0.05, ***𝑝𝑝 < 0.1.
Table 4: The ARDL and NARDL Estimation Results
LXU100 LXUTUM LXUHIZ ARDL NARDL ARDL NARDL ARDL NARDL
Short-Term Estimates
∆𝑳𝑳𝑳𝑳𝑳𝑳𝒕𝒕 -1.21(5.66)* -0.79(3.65)* -0.77(6.07)*
∆𝑷𝑷𝑷𝑷𝑷𝑷𝒕𝒕 -1.21(4.88)* -0.71(3.31)* -0.89(4.90)*
∆𝑵𝑵𝑳𝑳𝑵𝑵𝒕𝒕 -1.08(2.49)**
0.01(0.15) -0.06(0.97)
∆𝑳𝑳𝑳𝑳𝑷𝑷𝑳𝑳𝒕𝒕 0.05(0.65) 0.10(1.14) 0.11(1.32) 0.09(1.13) 0.08(1.35) 0.10(1.51) ∆𝑳𝑳𝑳𝑳𝑷𝑷𝑳𝑳𝒕𝒕 -0.40(1.95)* -
0.55(2.32)** 0.14(0.72) 0.24(0.74) -0.02(0.15) -0.13(0.60)
∆𝑳𝑳𝑳𝑳𝑳𝑳𝒕𝒕 0.27(0.70) 0.27(0.71) 0.26(0.70) 0.04(0.37) 0.10(1.33) 0.03(0.32) ∆𝑳𝑳𝑳𝑳𝑳𝑳𝒕𝒕−𝟏𝟏 1.13(3.31)* 1.21(3.47)* 1.01(3.14)* ∆𝑳𝑳𝑳𝑳𝑳𝑳𝒕𝒕−𝑳𝑳 -0.76(2.76)* -
0.67(2.32)**
Long-Term Estimates
𝑳𝑳𝑳𝑳𝑳𝑳 0.17(0.37) -0.38(0.94) -0.27(0.85) 𝑷𝑷𝑷𝑷𝑷𝑷 0.90(1.11) -0.39(0.70) 0.29(0.43) 𝑵𝑵𝑳𝑳𝑵𝑵 -0.35(0.58) 0.11(0.14) -0.45(1.07) 𝑳𝑳𝑳𝑳𝑷𝑷𝑳𝑳 0.42(0.74) 0.82(1.34) 0.66(1.34) 0.57(1.15) 0.56(1.57) 0.70(1.59) 𝑳𝑳𝑳𝑳𝑷𝑷𝑳𝑳 -3.34(1.49) -4.49(1.70)* 0.84(0.73) 1.42(0.73) -0.19(0.14) -0.94(0.54) 𝑳𝑳𝑳𝑳𝑳𝑳 2.15(1.98)** 1.35(1.25) 0.30(0.42) 0.29(0.38) 0.73(1.25) 0.22(0.32) 𝑳𝑳𝑪𝑪𝑪𝑪𝑪𝑪𝒕𝒕𝑪𝑪𝑪𝑪𝒕𝒕 -16.99(1.75)* 2.38(0.14) -2.22(0.24) -4.14(0.39) -5.57(1.05) 7.35(0.56) Diagnostic Statistics
𝑭𝑭 3.66** 3.38*** 3.51** 5.98* 4.22** 5.89*
𝑳𝑳𝑳𝑳𝑳𝑳𝒕𝒕−𝟏𝟏 -0.12(3.07) -0.12(3.12) -0.14(4.02) -0.17(3.78) -0.14(2.77) -0.14(2.64)
𝑾𝑾𝑾𝑾𝑾𝑾𝒕𝒕𝑾𝑾 8.80 11.49 22.54** 25.01* 11.96 14.30*** 𝑳𝑳𝑳𝑳 5.43 4.43 4.47 1.93 0.53 1.56 𝑨𝑨𝑨𝑨𝑨𝑨𝑨𝑨𝑪𝑪𝒕𝒕𝑾𝑾𝑨𝑨 𝑹𝑹𝑳𝑳 0.28 0.28 0.22 0.17 0.20 0.21
Note: The absolute value of t-statistics in parentheses; *𝑝𝑝 < 0.01, **𝑝𝑝 < 0.05, ***𝑝𝑝 < 0.1.
The diagnostic tests are reported in Table 4. The White test statistic is reported to test for heteroscedasticity. The assumption of homoscedasticity is valid except for LXUTUM, LXUHIZ and LXUSIN stock indices. Therefore, since these indices have heteroskedasticity problem, the
, ***
Makale Gönderim Tarihi: 09.02.2021 Yayına Kabul Tarihi: 13.06.2021
LXUTEK -2.5164 [0] -7.2457 [1]* -2.7384 [5] -11.6885 [5]* LEX -1.6508 [2] -9.8683 [1]* -1.8448 [2] -8.8639 [4]* LIPI -3.2403 [12]* -2.9344 [12]** -8.6988 [5]* -41.0119 [12]* LCPI -4.5924 [5] -10.2785 [3]* -0.2713 [9] -9.8542 [13]* LM2 -3.0444 [0] -13.5414 [0]* -2.9703 [3] -13.9836 [9]*
Note: The values in brackets represent the optimal lag length by the SIC; *𝑝𝑝 < 0.01, **𝑝𝑝 <0.05, ***𝑝𝑝 < 0.1.
Table 4: The ARDL and NARDL Estimation Results
LXU100 LXUTUM LXUHIZ ARDL NARDL ARDL NARDL ARDL NARDL
Short-Term Estimates
∆𝑳𝑳𝑳𝑳𝑳𝑳𝒕𝒕 -1.21(5.66)* -0.79(3.65)* -0.77(6.07)*
∆𝑷𝑷𝑷𝑷𝑷𝑷𝒕𝒕 -1.21(4.88)* -0.71(3.31)* -0.89(4.90)*
∆𝑵𝑵𝑳𝑳𝑵𝑵𝒕𝒕 -1.08(2.49)**
0.01(0.15) -0.06(0.97)
∆𝑳𝑳𝑳𝑳𝑷𝑷𝑳𝑳𝒕𝒕 0.05(0.65) 0.10(1.14) 0.11(1.32) 0.09(1.13) 0.08(1.35) 0.10(1.51) ∆𝑳𝑳𝑳𝑳𝑷𝑷𝑳𝑳𝒕𝒕 -0.40(1.95)* -
0.55(2.32)** 0.14(0.72) 0.24(0.74) -0.02(0.15) -0.13(0.60)
∆𝑳𝑳𝑳𝑳𝑳𝑳𝒕𝒕 0.27(0.70) 0.27(0.71) 0.26(0.70) 0.04(0.37) 0.10(1.33) 0.03(0.32) ∆𝑳𝑳𝑳𝑳𝑳𝑳𝒕𝒕−𝟏𝟏 1.13(3.31)* 1.21(3.47)* 1.01(3.14)* ∆𝑳𝑳𝑳𝑳𝑳𝑳𝒕𝒕−𝑳𝑳 -0.76(2.76)* -
0.67(2.32)**
Long-Term Estimates
𝑳𝑳𝑳𝑳𝑳𝑳 0.17(0.37) -0.38(0.94) -0.27(0.85) 𝑷𝑷𝑷𝑷𝑷𝑷 0.90(1.11) -0.39(0.70) 0.29(0.43) 𝑵𝑵𝑳𝑳𝑵𝑵 -0.35(0.58) 0.11(0.14) -0.45(1.07) 𝑳𝑳𝑳𝑳𝑷𝑷𝑳𝑳 0.42(0.74) 0.82(1.34) 0.66(1.34) 0.57(1.15) 0.56(1.57) 0.70(1.59) 𝑳𝑳𝑳𝑳𝑷𝑷𝑳𝑳 -3.34(1.49) -4.49(1.70)* 0.84(0.73) 1.42(0.73) -0.19(0.14) -0.94(0.54) 𝑳𝑳𝑳𝑳𝑳𝑳 2.15(1.98)** 1.35(1.25) 0.30(0.42) 0.29(0.38) 0.73(1.25) 0.22(0.32) 𝑳𝑳𝑪𝑪𝑪𝑪𝑪𝑪𝒕𝒕𝑪𝑪𝑪𝑪𝒕𝒕 -16.99(1.75)* 2.38(0.14) -2.22(0.24) -4.14(0.39) -5.57(1.05) 7.35(0.56) Diagnostic Statistics
𝑭𝑭 3.66** 3.38*** 3.51** 5.98* 4.22** 5.89*
𝑳𝑳𝑳𝑳𝑳𝑳𝒕𝒕−𝟏𝟏 -0.12(3.07) -0.12(3.12) -0.14(4.02) -0.17(3.78) -0.14(2.77) -0.14(2.64)
𝑾𝑾𝑾𝑾𝑾𝑾𝒕𝒕𝑾𝑾 8.80 11.49 22.54** 25.01* 11.96 14.30*** 𝑳𝑳𝑳𝑳 5.43 4.43 4.47 1.93 0.53 1.56 𝑨𝑨𝑨𝑨𝑨𝑨𝑨𝑨𝑪𝑪𝒕𝒕𝑾𝑾𝑨𝑨 𝑹𝑹𝑳𝑳 0.28 0.28 0.22 0.17 0.20 0.21
Note: The absolute value of t-statistics in parentheses; *𝑝𝑝 < 0.01, **𝑝𝑝 < 0.05, ***𝑝𝑝 < 0.1.
The diagnostic tests are reported in Table 4. The White test statistic is reported to test for heteroscedasticity. The assumption of homoscedasticity is valid except for LXUTUM, LXUHIZ and LXUSIN stock indices. Therefore, since these indices have heteroskedasticity problem, the
.
Table 4: The ARDL and NARDL Estimation ResultsLXU100 LXUTUM LXUHIZARDL NARDL ARDL NARDL ARDL NARDL
Short-Term Estimates
Makale Gönderim Tarihi: 09.02.2021 Yayına Kabul Tarihi: 13.06.2021
LXUTEK -2.5164 [0] -7.2457 [1]* -2.7384 [5] -11.6885 [5]* LEX -1.6508 [2] -9.8683 [1]* -1.8448 [2] -8.8639 [4]* LIPI -3.2403 [12]* -2.9344 [12]** -8.6988 [5]* -41.0119 [12]* LCPI -4.5924 [5] -10.2785 [3]* -0.2713 [9] -9.8542 [13]* LM2 -3.0444 [0] -13.5414 [0]* -2.9703 [3] -13.9836 [9]*
Note: The values in brackets represent the optimal lag length by the SIC; *𝑝𝑝 < 0.01, **𝑝𝑝 <0.05, ***𝑝𝑝 < 0.1.
Table 4: The ARDL and NARDL Estimation Results
LXU100 LXUTUM LXUHIZ ARDL NARDL ARDL NARDL ARDL NARDL
Short-Term Estimates
∆𝑳𝑳𝑳𝑳𝑳𝑳𝒕𝒕 -1.21(5.66)* -0.79(3.65)* -0.77(6.07)*
∆𝑷𝑷𝑷𝑷𝑷𝑷𝒕𝒕 -1.21(4.88)* -0.71(3.31)* -0.89(4.90)*
∆𝑵𝑵𝑳𝑳𝑵𝑵𝒕𝒕 -1.08(2.49)**
0.01(0.15) -0.06(0.97)
∆𝑳𝑳𝑳𝑳𝑷𝑷𝑳𝑳𝒕𝒕 0.05(0.65) 0.10(1.14) 0.11(1.32) 0.09(1.13) 0.08(1.35) 0.10(1.51) ∆𝑳𝑳𝑳𝑳𝑷𝑷𝑳𝑳𝒕𝒕 -0.40(1.95)* -
0.55(2.32)** 0.14(0.72) 0.24(0.74) -0.02(0.15) -0.13(0.60)
∆𝑳𝑳𝑳𝑳𝑳𝑳𝒕𝒕 0.27(0.70) 0.27(0.71) 0.26(0.70) 0.04(0.37) 0.10(1.33) 0.03(0.32) ∆𝑳𝑳𝑳𝑳𝑳𝑳𝒕𝒕−𝟏𝟏 1.13(3.31)* 1.21(3.47)* 1.01(3.14)* ∆𝑳𝑳𝑳𝑳𝑳𝑳𝒕𝒕−𝑳𝑳 -0.76(2.76)* -
0.67(2.32)**
Long-Term Estimates
𝑳𝑳𝑳𝑳𝑳𝑳 0.17(0.37) -0.38(0.94) -0.27(0.85) 𝑷𝑷𝑷𝑷𝑷𝑷 0.90(1.11) -0.39(0.70) 0.29(0.43) 𝑵𝑵𝑳𝑳𝑵𝑵 -0.35(0.58) 0.11(0.14) -0.45(1.07) 𝑳𝑳𝑳𝑳𝑷𝑷𝑳𝑳 0.42(0.74) 0.82(1.34) 0.66(1.34) 0.57(1.15) 0.56(1.57) 0.70(1.59) 𝑳𝑳𝑳𝑳𝑷𝑷𝑳𝑳 -3.34(1.49) -4.49(1.70)* 0.84(0.73) 1.42(0.73) -0.19(0.14) -0.94(0.54) 𝑳𝑳𝑳𝑳𝑳𝑳 2.15(1.98)** 1.35(1.25) 0.30(0.42) 0.29(0.38) 0.73(1.25) 0.22(0.32) 𝑳𝑳𝑪𝑪𝑪𝑪𝑪𝑪𝒕𝒕𝑪𝑪𝑪𝑪𝒕𝒕 -16.99(1.75)* 2.38(0.14) -2.22(0.24) -4.14(0.39) -5.57(1.05) 7.35(0.56) Diagnostic Statistics
𝑭𝑭 3.66** 3.38*** 3.51** 5.98* 4.22** 5.89*
𝑳𝑳𝑳𝑳𝑳𝑳𝒕𝒕−𝟏𝟏 -0.12(3.07) -0.12(3.12) -0.14(4.02) -0.17(3.78) -0.14(2.77) -0.14(2.64)
𝑾𝑾𝑾𝑾𝑾𝑾𝒕𝒕𝑾𝑾 8.80 11.49 22.54** 25.01* 11.96 14.30*** 𝑳𝑳𝑳𝑳 5.43 4.43 4.47 1.93 0.53 1.56 𝑨𝑨𝑨𝑨𝑨𝑨𝑨𝑨𝑪𝑪𝒕𝒕𝑾𝑾𝑨𝑨 𝑹𝑹𝑳𝑳 0.28 0.28 0.22 0.17 0.20 0.21
Note: The absolute value of t-statistics in parentheses; *𝑝𝑝 < 0.01, **𝑝𝑝 < 0.05, ***𝑝𝑝 < 0.1.
The diagnostic tests are reported in Table 4. The White test statistic is reported to test for heteroscedasticity. The assumption of homoscedasticity is valid except for LXUTUM, LXUHIZ and LXUSIN stock indices. Therefore, since these indices have heteroskedasticity problem, the
-1.21(5.66)* -0.79(3.65)* – 0.77(6.07)*
Makale Gönderim Tarihi: 09.02.2021 Yayına Kabul Tarihi: 13.06.2021
LXUTEK -2.5164 [0] -7.2457 [1]* -2.7384 [5] -11.6885 [5]* LEX -1.6508 [2] -9.8683 [1]* -1.8448 [2] -8.8639 [4]* LIPI -3.2403 [12]* -2.9344 [12]** -8.6988 [5]* -41.0119 [12]* LCPI -4.5924 [5] -10.2785 [3]* -0.2713 [9] -9.8542 [13]* LM2 -3.0444 [0] -13.5414 [0]* -2.9703 [3] -13.9836 [9]*
Note: The values in brackets represent the optimal lag length by the SIC; *𝑝𝑝 < 0.01, **𝑝𝑝 <0.05, ***𝑝𝑝 < 0.1.
Table 4: The ARDL and NARDL Estimation Results
LXU100 LXUTUM LXUHIZ ARDL NARDL ARDL NARDL ARDL NARDL
Short-Term Estimates
∆𝑳𝑳𝑳𝑳𝑳𝑳𝒕𝒕 -1.21(5.66)* -0.79(3.65)* -0.77(6.07)*
∆𝑷𝑷𝑷𝑷𝑷𝑷𝒕𝒕 -1.21(4.88)* -0.71(3.31)* -0.89(4.90)*
∆𝑵𝑵𝑳𝑳𝑵𝑵𝒕𝒕 -1.08(2.49)**
0.01(0.15) -0.06(0.97)
∆𝑳𝑳𝑳𝑳𝑷𝑷𝑳𝑳𝒕𝒕 0.05(0.65) 0.10(1.14) 0.11(1.32) 0.09(1.13) 0.08(1.35) 0.10(1.51) ∆𝑳𝑳𝑳𝑳𝑷𝑷𝑳𝑳𝒕𝒕 -0.40(1.95)* -
0.55(2.32)** 0.14(0.72) 0.24(0.74) -0.02(0.15) -0.13(0.60)
∆𝑳𝑳𝑳𝑳𝑳𝑳𝒕𝒕 0.27(0.70) 0.27(0.71) 0.26(0.70) 0.04(0.37) 0.10(1.33) 0.03(0.32) ∆𝑳𝑳𝑳𝑳𝑳𝑳𝒕𝒕−𝟏𝟏 1.13(3.31)* 1.21(3.47)* 1.01(3.14)* ∆𝑳𝑳𝑳𝑳𝑳𝑳𝒕𝒕−𝑳𝑳 -0.76(2.76)* -
0.67(2.32)**
Long-Term Estimates
𝑳𝑳𝑳𝑳𝑳𝑳 0.17(0.37) -0.38(0.94) -0.27(0.85) 𝑷𝑷𝑷𝑷𝑷𝑷 0.90(1.11) -0.39(0.70) 0.29(0.43) 𝑵𝑵𝑳𝑳𝑵𝑵 -0.35(0.58) 0.11(0.14) -0.45(1.07) 𝑳𝑳𝑳𝑳𝑷𝑷𝑳𝑳 0.42(0.74) 0.82(1.34) 0.66(1.34) 0.57(1.15) 0.56(1.57) 0.70(1.59) 𝑳𝑳𝑳𝑳𝑷𝑷𝑳𝑳 -3.34(1.49) -4.49(1.70)* 0.84(0.73) 1.42(0.73) -0.19(0.14) -0.94(0.54) 𝑳𝑳𝑳𝑳𝑳𝑳 2.15(1.98)** 1.35(1.25) 0.30(0.42) 0.29(0.38) 0.73(1.25) 0.22(0.32) 𝑳𝑳𝑪𝑪𝑪𝑪𝑪𝑪𝒕𝒕𝑪𝑪𝑪𝑪𝒕𝒕 -16.99(1.75)* 2.38(0.14) -2.22(0.24) -4.14(0.39) -5.57(1.05) 7.35(0.56) Diagnostic Statistics
𝑭𝑭 3.66** 3.38*** 3.51** 5.98* 4.22** 5.89*
𝑳𝑳𝑳𝑳𝑳𝑳𝒕𝒕−𝟏𝟏 -0.12(3.07) -0.12(3.12) -0.14(4.02) -0.17(3.78) -0.14(2.77) -0.14(2.64)
𝑾𝑾𝑾𝑾𝑾𝑾𝒕𝒕𝑾𝑾 8.80 11.49 22.54** 25.01* 11.96 14.30*** 𝑳𝑳𝑳𝑳 5.43 4.43 4.47 1.93 0.53 1.56 𝑨𝑨𝑨𝑨𝑨𝑨𝑨𝑨𝑪𝑪𝒕𝒕𝑾𝑾𝑨𝑨 𝑹𝑹𝑳𝑳 0.28 0.28 0.22 0.17 0.20 0.21
Note: The absolute value of t-statistics in parentheses; *𝑝𝑝 < 0.01, **𝑝𝑝 < 0.05, ***𝑝𝑝 < 0.1.
The diagnostic tests are reported in Table 4. The White test statistic is reported to test for heteroscedasticity. The assumption of homoscedasticity is valid except for LXUTUM, LXUHIZ and LXUSIN stock indices. Therefore, since these indices have heteroskedasticity problem, the
-1.21(4.88)* -0.71(3.31)* -0.89(4.90)*
Makale Gönderim Tarihi: 09.02.2021 Yayına Kabul Tarihi: 13.06.2021
LXUTEK -2.5164 [0] -7.2457 [1]* -2.7384 [5] -11.6885 [5]* LEX -1.6508 [2] -9.8683 [1]* -1.8448 [2] -8.8639 [4]* LIPI -3.2403 [12]* -2.9344 [12]** -8.6988 [5]* -41.0119 [12]* LCPI -4.5924 [5] -10.2785 [3]* -0.2713 [9] -9.8542 [13]* LM2 -3.0444 [0] -13.5414 [0]* -2.9703 [3] -13.9836 [9]*
Note: The values in brackets represent the optimal lag length by the SIC; *𝑝𝑝 < 0.01, **𝑝𝑝 <0.05, ***𝑝𝑝 < 0.1.
Table 4: The ARDL and NARDL Estimation Results
LXU100 LXUTUM LXUHIZ ARDL NARDL ARDL NARDL ARDL NARDL
Short-Term Estimates
∆𝑳𝑳𝑳𝑳𝑳𝑳𝒕𝒕 -1.21(5.66)* -0.79(3.65)* -0.77(6.07)*
∆𝑷𝑷𝑷𝑷𝑷𝑷𝒕𝒕 -1.21(4.88)* -0.71(3.31)* -0.89(4.90)*
∆𝑵𝑵𝑳𝑳𝑵𝑵𝒕𝒕 -1.08(2.49)**
0.01(0.15) -0.06(0.97)
∆𝑳𝑳𝑳𝑳𝑷𝑷𝑳𝑳𝒕𝒕 0.05(0.65) 0.10(1.14) 0.11(1.32) 0.09(1.13) 0.08(1.35) 0.10(1.51) ∆𝑳𝑳𝑳𝑳𝑷𝑷𝑳𝑳𝒕𝒕 -0.40(1.95)* -
0.55(2.32)** 0.14(0.72) 0.24(0.74) -0.02(0.15) -0.13(0.60)
∆𝑳𝑳𝑳𝑳𝑳𝑳𝒕𝒕 0.27(0.70) 0.27(0.71) 0.26(0.70) 0.04(0.37) 0.10(1.33) 0.03(0.32) ∆𝑳𝑳𝑳𝑳𝑳𝑳𝒕𝒕−𝟏𝟏 1.13(3.31)* 1.21(3.47)* 1.01(3.14)* ∆𝑳𝑳𝑳𝑳𝑳𝑳𝒕𝒕−𝑳𝑳 -0.76(2.76)* -
0.67(2.32)**
Long-Term Estimates
𝑳𝑳𝑳𝑳𝑳𝑳 0.17(0.37) -0.38(0.94) -0.27(0.85) 𝑷𝑷𝑷𝑷𝑷𝑷 0.90(1.11) -0.39(0.70) 0.29(0.43) 𝑵𝑵𝑳𝑳𝑵𝑵 -0.35(0.58) 0.11(0.14) -0.45(1.07) 𝑳𝑳𝑳𝑳𝑷𝑷𝑳𝑳 0.42(0.74) 0.82(1.34) 0.66(1.34) 0.57(1.15) 0.56(1.57) 0.70(1.59) 𝑳𝑳𝑳𝑳𝑷𝑷𝑳𝑳 -3.34(1.49) -4.49(1.70)* 0.84(0.73) 1.42(0.73) -0.19(0.14) -0.94(0.54) 𝑳𝑳𝑳𝑳𝑳𝑳 2.15(1.98)** 1.35(1.25) 0.30(0.42) 0.29(0.38) 0.73(1.25) 0.22(0.32) 𝑳𝑳𝑪𝑪𝑪𝑪𝑪𝑪𝒕𝒕𝑪𝑪𝑪𝑪𝒕𝒕 -16.99(1.75)* 2.38(0.14) -2.22(0.24) -4.14(0.39) -5.57(1.05) 7.35(0.56) Diagnostic Statistics
𝑭𝑭 3.66** 3.38*** 3.51** 5.98* 4.22** 5.89*
𝑳𝑳𝑳𝑳𝑳𝑳𝒕𝒕−𝟏𝟏 -0.12(3.07) -0.12(3.12) -0.14(4.02) -0.17(3.78) -0.14(2.77) -0.14(2.64)
𝑾𝑾𝑾𝑾𝑾𝑾𝒕𝒕𝑾𝑾 8.80 11.49 22.54** 25.01* 11.96 14.30*** 𝑳𝑳𝑳𝑳 5.43 4.43 4.47 1.93 0.53 1.56 𝑨𝑨𝑨𝑨𝑨𝑨𝑨𝑨𝑪𝑪𝒕𝒕𝑾𝑾𝑨𝑨 𝑹𝑹𝑳𝑳 0.28 0.28 0.22 0.17 0.20 0.21
Note: The absolute value of t-statistics in parentheses; *𝑝𝑝 < 0.01, **𝑝𝑝 < 0.05, ***𝑝𝑝 < 0.1.
The diagnostic tests are reported in Table 4. The White test statistic is reported to test for heteroscedasticity. The assumption of homoscedasticity is valid except for LXUTUM, LXUHIZ and LXUSIN stock indices. Therefore, since these indices have heteroskedasticity problem, the
-1.08(2.49)** 0.01(0.15) -0.06(0.97)
Makale Gönderim Tarihi: 09.02.2021 Yayına Kabul Tarihi: 13.06.2021
LXUTEK -2.5164 [0] -7.2457 [1]* -2.7384 [5] -11.6885 [5]* LEX -1.6508 [2] -9.8683 [1]* -1.8448 [2] -8.8639 [4]* LIPI -3.2403 [12]* -2.9344 [12]** -8.6988 [5]* -41.0119 [12]* LCPI -4.5924 [5] -10.2785 [3]* -0.2713 [9] -9.8542 [13]* LM2 -3.0444 [0] -13.5414 [0]* -2.9703 [3] -13.9836 [9]*
Note: The values in brackets represent the optimal lag length by the SIC; *𝑝𝑝 < 0.01, **𝑝𝑝 <0.05, ***𝑝𝑝 < 0.1.
Table 4: The ARDL and NARDL Estimation Results
LXU100 LXUTUM LXUHIZ ARDL NARDL ARDL NARDL ARDL NARDL
Short-Term Estimates
∆𝑳𝑳𝑳𝑳𝑳𝑳𝒕𝒕 -1.21(5.66)* -0.79(3.65)* -0.77(6.07)*
∆𝑷𝑷𝑷𝑷𝑷𝑷𝒕𝒕 -1.21(4.88)* -0.71(3.31)* -0.89(4.90)*
∆𝑵𝑵𝑳𝑳𝑵𝑵𝒕𝒕 -1.08(2.49)**
0.01(0.15) -0.06(0.97)
∆𝑳𝑳𝑳𝑳𝑷𝑷𝑳𝑳𝒕𝒕 0.05(0.65) 0.10(1.14) 0.11(1.32) 0.09(1.13) 0.08(1.35) 0.10(1.51) ∆𝑳𝑳𝑳𝑳𝑷𝑷𝑳𝑳𝒕𝒕 -0.40(1.95)* -
0.55(2.32)** 0.14(0.72) 0.24(0.74) -0.02(0.15) -0.13(0.60)
∆𝑳𝑳𝑳𝑳𝑳𝑳𝒕𝒕 0.27(0.70) 0.27(0.71) 0.26(0.70) 0.04(0.37) 0.10(1.33) 0.03(0.32) ∆𝑳𝑳𝑳𝑳𝑳𝑳𝒕𝒕−𝟏𝟏 1.13(3.31)* 1.21(3.47)* 1.01(3.14)* ∆𝑳𝑳𝑳𝑳𝑳𝑳𝒕𝒕−𝑳𝑳 -0.76(2.76)* -
0.67(2.32)**
Long-Term Estimates
𝑳𝑳𝑳𝑳𝑳𝑳 0.17(0.37) -0.38(0.94) -0.27(0.85) 𝑷𝑷𝑷𝑷𝑷𝑷 0.90(1.11) -0.39(0.70) 0.29(0.43) 𝑵𝑵𝑳𝑳𝑵𝑵 -0.35(0.58) 0.11(0.14) -0.45(1.07) 𝑳𝑳𝑳𝑳𝑷𝑷𝑳𝑳 0.42(0.74) 0.82(1.34) 0.66(1.34) 0.57(1.15) 0.56(1.57) 0.70(1.59) 𝑳𝑳𝑳𝑳𝑷𝑷𝑳𝑳 -3.34(1.49) -4.49(1.70)* 0.84(0.73) 1.42(0.73) -0.19(0.14) -0.94(0.54) 𝑳𝑳𝑳𝑳𝑳𝑳 2.15(1.98)** 1.35(1.25) 0.30(0.42) 0.29(0.38) 0.73(1.25) 0.22(0.32) 𝑳𝑳𝑪𝑪𝑪𝑪𝑪𝑪𝒕𝒕𝑪𝑪𝑪𝑪𝒕𝒕 -16.99(1.75)* 2.38(0.14) -2.22(0.24) -4.14(0.39) -5.57(1.05) 7.35(0.56) Diagnostic Statistics
𝑭𝑭 3.66** 3.38*** 3.51** 5.98* 4.22** 5.89*
𝑳𝑳𝑳𝑳𝑳𝑳𝒕𝒕−𝟏𝟏 -0.12(3.07) -0.12(3.12) -0.14(4.02) -0.17(3.78) -0.14(2.77) -0.14(2.64)
𝑾𝑾𝑾𝑾𝑾𝑾𝒕𝒕𝑾𝑾 8.80 11.49 22.54** 25.01* 11.96 14.30*** 𝑳𝑳𝑳𝑳 5.43 4.43 4.47 1.93 0.53 1.56 𝑨𝑨𝑨𝑨𝑨𝑨𝑨𝑨𝑪𝑪𝒕𝒕𝑾𝑾𝑨𝑨 𝑹𝑹𝑳𝑳 0.28 0.28 0.22 0.17 0.20 0.21
Note: The absolute value of t-statistics in parentheses; *𝑝𝑝 < 0.01, **𝑝𝑝 < 0.05, ***𝑝𝑝 < 0.1.
The diagnostic tests are reported in Table 4. The White test statistic is reported to test for heteroscedasticity. The assumption of homoscedasticity is valid except for LXUTUM, LXUHIZ and LXUSIN stock indices. Therefore, since these indices have heteroskedasticity problem, the
0.05(0.65) 0.10(1.14) 0.11(1.32) 0.09(1.13) 0.08(1.35) 0.10(1.51)
Makale Gönderim Tarihi: 09.02.2021 Yayına Kabul Tarihi: 13.06.2021
LXUTEK -2.5164 [0] -7.2457 [1]* -2.7384 [5] -11.6885 [5]* LEX -1.6508 [2] -9.8683 [1]* -1.8448 [2] -8.8639 [4]* LIPI -3.2403 [12]* -2.9344 [12]** -8.6988 [5]* -41.0119 [12]* LCPI -4.5924 [5] -10.2785 [3]* -0.2713 [9] -9.8542 [13]* LM2 -3.0444 [0] -13.5414 [0]* -2.9703 [3] -13.9836 [9]*
Note: The values in brackets represent the optimal lag length by the SIC; *𝑝𝑝 < 0.01, **𝑝𝑝 <0.05, ***𝑝𝑝 < 0.1.
Table 4: The ARDL and NARDL Estimation Results
LXU100 LXUTUM LXUHIZ ARDL NARDL ARDL NARDL ARDL NARDL
Short-Term Estimates
∆𝑳𝑳𝑳𝑳𝑳𝑳𝒕𝒕 -1.21(5.66)* -0.79(3.65)* -0.77(6.07)*
∆𝑷𝑷𝑷𝑷𝑷𝑷𝒕𝒕 -1.21(4.88)* -0.71(3.31)* -0.89(4.90)*
∆𝑵𝑵𝑳𝑳𝑵𝑵𝒕𝒕 -1.08(2.49)**
0.01(0.15) -0.06(0.97)
∆𝑳𝑳𝑳𝑳𝑷𝑷𝑳𝑳𝒕𝒕 0.05(0.65) 0.10(1.14) 0.11(1.32) 0.09(1.13) 0.08(1.35) 0.10(1.51) ∆𝑳𝑳𝑳𝑳𝑷𝑷𝑳𝑳𝒕𝒕 -0.40(1.95)* -
0.55(2.32)** 0.14(0.72) 0.24(0.74) -0.02(0.15) -0.13(0.60)
∆𝑳𝑳𝑳𝑳𝑳𝑳𝒕𝒕 0.27(0.70) 0.27(0.71) 0.26(0.70) 0.04(0.37) 0.10(1.33) 0.03(0.32) ∆𝑳𝑳𝑳𝑳𝑳𝑳𝒕𝒕−𝟏𝟏 1.13(3.31)* 1.21(3.47)* 1.01(3.14)* ∆𝑳𝑳𝑳𝑳𝑳𝑳𝒕𝒕−𝑳𝑳 -0.76(2.76)* -
0.67(2.32)**
Long-Term Estimates
𝑳𝑳𝑳𝑳𝑳𝑳 0.17(0.37) -0.38(0.94) -0.27(0.85) 𝑷𝑷𝑷𝑷𝑷𝑷 0.90(1.11) -0.39(0.70) 0.29(0.43) 𝑵𝑵𝑳𝑳𝑵𝑵 -0.35(0.58) 0.11(0.14) -0.45(1.07) 𝑳𝑳𝑳𝑳𝑷𝑷𝑳𝑳 0.42(0.74) 0.82(1.34) 0.66(1.34) 0.57(1.15) 0.56(1.57) 0.70(1.59) 𝑳𝑳𝑳𝑳𝑷𝑷𝑳𝑳 -3.34(1.49) -4.49(1.70)* 0.84(0.73) 1.42(0.73) -0.19(0.14) -0.94(0.54) 𝑳𝑳𝑳𝑳𝑳𝑳 2.15(1.98)** 1.35(1.25) 0.30(0.42) 0.29(0.38) 0.73(1.25) 0.22(0.32) 𝑳𝑳𝑪𝑪𝑪𝑪𝑪𝑪𝒕𝒕𝑪𝑪𝑪𝑪𝒕𝒕 -16.99(1.75)* 2.38(0.14) -2.22(0.24) -4.14(0.39) -5.57(1.05) 7.35(0.56) Diagnostic Statistics
𝑭𝑭 3.66** 3.38*** 3.51** 5.98* 4.22** 5.89*
𝑳𝑳𝑳𝑳𝑳𝑳𝒕𝒕−𝟏𝟏 -0.12(3.07) -0.12(3.12) -0.14(4.02) -0.17(3.78) -0.14(2.77) -0.14(2.64)
𝑾𝑾𝑾𝑾𝑾𝑾𝒕𝒕𝑾𝑾 8.80 11.49 22.54** 25.01* 11.96 14.30*** 𝑳𝑳𝑳𝑳 5.43 4.43 4.47 1.93 0.53 1.56 𝑨𝑨𝑨𝑨𝑨𝑨𝑨𝑨𝑪𝑪𝒕𝒕𝑾𝑾𝑨𝑨 𝑹𝑹𝑳𝑳 0.28 0.28 0.22 0.17 0.20 0.21
Note: The absolute value of t-statistics in parentheses; *𝑝𝑝 < 0.01, **𝑝𝑝 < 0.05, ***𝑝𝑝 < 0.1.
The diagnostic tests are reported in Table 4. The White test statistic is reported to test for heteroscedasticity. The assumption of homoscedasticity is valid except for LXUTUM, LXUHIZ and LXUSIN stock indices. Therefore, since these indices have heteroskedasticity problem, the
-0.40(1.95)* -0.55(2.32)** 0.14(0.72) 0.24(0.74) -0.02(0.15) -0.13(0.60)
Makale Gönderim Tarihi: 09.02.2021 Yayına Kabul Tarihi: 13.06.2021
LXUTEK -2.5164 [0] -7.2457 [1]* -2.7384 [5] -11.6885 [5]* LEX -1.6508 [2] -9.8683 [1]* -1.8448 [2] -8.8639 [4]* LIPI -3.2403 [12]* -2.9344 [12]** -8.6988 [5]* -41.0119 [12]* LCPI -4.5924 [5] -10.2785 [3]* -0.2713 [9] -9.8542 [13]* LM2 -3.0444 [0] -13.5414 [0]* -2.9703 [3] -13.9836 [9]*
Note: The values in brackets represent the optimal lag length by the SIC; *𝑝𝑝 < 0.01, **𝑝𝑝 <0.05, ***𝑝𝑝 < 0.1.
Table 4: The ARDL and NARDL Estimation Results
LXU100 LXUTUM LXUHIZ ARDL NARDL ARDL NARDL ARDL NARDL
Short-Term Estimates
∆𝑳𝑳𝑳𝑳𝑳𝑳𝒕𝒕 -1.21(5.66)* -0.79(3.65)* -0.77(6.07)*
∆𝑷𝑷𝑷𝑷𝑷𝑷𝒕𝒕 -1.21(4.88)* -0.71(3.31)* -0.89(4.90)*
∆𝑵𝑵𝑳𝑳𝑵𝑵𝒕𝒕 -1.08(2.49)**
0.01(0.15) -0.06(0.97)
∆𝑳𝑳𝑳𝑳𝑷𝑷𝑳𝑳𝒕𝒕 0.05(0.65) 0.10(1.14) 0.11(1.32) 0.09(1.13) 0.08(1.35) 0.10(1.51) ∆𝑳𝑳𝑳𝑳𝑷𝑷𝑳𝑳𝒕𝒕 -0.40(1.95)* -
0.55(2.32)** 0.14(0.72) 0.24(0.74) -0.02(0.15) -0.13(0.60)
∆𝑳𝑳𝑳𝑳𝑳𝑳𝒕𝒕 0.27(0.70) 0.27(0.71) 0.26(0.70) 0.04(0.37) 0.10(1.33) 0.03(0.32) ∆𝑳𝑳𝑳𝑳𝑳𝑳𝒕𝒕−𝟏𝟏 1.13(3.31)* 1.21(3.47)* 1.01(3.14)* ∆𝑳𝑳𝑳𝑳𝑳𝑳𝒕𝒕−𝑳𝑳 -0.76(2.76)* -
0.67(2.32)**
Long-Term Estimates
𝑳𝑳𝑳𝑳𝑳𝑳 0.17(0.37) -0.38(0.94) -0.27(0.85) 𝑷𝑷𝑷𝑷𝑷𝑷 0.90(1.11) -0.39(0.70) 0.29(0.43) 𝑵𝑵𝑳𝑳𝑵𝑵 -0.35(0.58) 0.11(0.14) -0.45(1.07) 𝑳𝑳𝑳𝑳𝑷𝑷𝑳𝑳 0.42(0.74) 0.82(1.34) 0.66(1.34) 0.57(1.15) 0.56(1.57) 0.70(1.59) 𝑳𝑳𝑳𝑳𝑷𝑷𝑳𝑳 -3.34(1.49) -4.49(1.70)* 0.84(0.73) 1.42(0.73) -0.19(0.14) -0.94(0.54) 𝑳𝑳𝑳𝑳𝑳𝑳 2.15(1.98)** 1.35(1.25) 0.30(0.42) 0.29(0.38) 0.73(1.25) 0.22(0.32) 𝑳𝑳𝑪𝑪𝑪𝑪𝑪𝑪𝒕𝒕𝑪𝑪𝑪𝑪𝒕𝒕 -16.99(1.75)* 2.38(0.14) -2.22(0.24) -4.14(0.39) -5.57(1.05) 7.35(0.56) Diagnostic Statistics
𝑭𝑭 3.66** 3.38*** 3.51** 5.98* 4.22** 5.89*
𝑳𝑳𝑳𝑳𝑳𝑳𝒕𝒕−𝟏𝟏 -0.12(3.07) -0.12(3.12) -0.14(4.02) -0.17(3.78) -0.14(2.77) -0.14(2.64)
𝑾𝑾𝑾𝑾𝑾𝑾𝒕𝒕𝑾𝑾 8.80 11.49 22.54** 25.01* 11.96 14.30*** 𝑳𝑳𝑳𝑳 5.43 4.43 4.47 1.93 0.53 1.56 𝑨𝑨𝑨𝑨𝑨𝑨𝑨𝑨𝑪𝑪𝒕𝒕𝑾𝑾𝑨𝑨 𝑹𝑹𝑳𝑳 0.28 0.28 0.22 0.17 0.20 0.21
Note: The absolute value of t-statistics in parentheses; *𝑝𝑝 < 0.01, **𝑝𝑝 < 0.05, ***𝑝𝑝 < 0.1.
The diagnostic tests are reported in Table 4. The White test statistic is reported to test for heteroscedasticity. The assumption of homoscedasticity is valid except for LXUTUM, LXUHIZ and LXUSIN stock indices. Therefore, since these indices have heteroskedasticity problem, the
0.27(0.70) 0.27(0.71) 0.26(0.70) 0.04(0.37) 0.10(1.33) 0.03(0.32)
Makale Gönderim Tarihi: 09.02.2021 Yayına Kabul Tarihi: 13.06.2021
LXUTEK -2.5164 [0] -7.2457 [1]* -2.7384 [5] -11.6885 [5]* LEX -1.6508 [2] -9.8683 [1]* -1.8448 [2] -8.8639 [4]* LIPI -3.2403 [12]* -2.9344 [12]** -8.6988 [5]* -41.0119 [12]* LCPI -4.5924 [5] -10.2785 [3]* -0.2713 [9] -9.8542 [13]* LM2 -3.0444 [0] -13.5414 [0]* -2.9703 [3] -13.9836 [9]*
Note: The values in brackets represent the optimal lag length by the SIC; *𝑝𝑝 < 0.01, **𝑝𝑝 <0.05, ***𝑝𝑝 < 0.1.
Table 4: The ARDL and NARDL Estimation Results
LXU100 LXUTUM LXUHIZ ARDL NARDL ARDL NARDL ARDL NARDL
Short-Term Estimates
∆𝑳𝑳𝑳𝑳𝑳𝑳𝒕𝒕 -1.21(5.66)* -0.79(3.65)* -0.77(6.07)*
∆𝑷𝑷𝑷𝑷𝑷𝑷𝒕𝒕 -1.21(4.88)* -0.71(3.31)* -0.89(4.90)*
∆𝑵𝑵𝑳𝑳𝑵𝑵𝒕𝒕 -1.08(2.49)**
0.01(0.15) -0.06(0.97)
∆𝑳𝑳𝑳𝑳𝑷𝑷𝑳𝑳𝒕𝒕 0.05(0.65) 0.10(1.14) 0.11(1.32) 0.09(1.13) 0.08(1.35) 0.10(1.51) ∆𝑳𝑳𝑳𝑳𝑷𝑷𝑳𝑳𝒕𝒕 -0.40(1.95)* -
0.55(2.32)** 0.14(0.72) 0.24(0.74) -0.02(0.15) -0.13(0.60)
∆𝑳𝑳𝑳𝑳𝑳𝑳𝒕𝒕 0.27(0.70) 0.27(0.71) 0.26(0.70) 0.04(0.37) 0.10(1.33) 0.03(0.32) ∆𝑳𝑳𝑳𝑳𝑳𝑳𝒕𝒕−𝟏𝟏 1.13(3.31)* 1.21(3.47)* 1.01(3.14)* ∆𝑳𝑳𝑳𝑳𝑳𝑳𝒕𝒕−𝑳𝑳 -0.76(2.76)* -
0.67(2.32)**
Long-Term Estimates
𝑳𝑳𝑳𝑳𝑳𝑳 0.17(0.37) -0.38(0.94) -0.27(0.85) 𝑷𝑷𝑷𝑷𝑷𝑷 0.90(1.11) -0.39(0.70) 0.29(0.43) 𝑵𝑵𝑳𝑳𝑵𝑵 -0.35(0.58) 0.11(0.14) -0.45(1.07) 𝑳𝑳𝑳𝑳𝑷𝑷𝑳𝑳 0.42(0.74) 0.82(1.34) 0.66(1.34) 0.57(1.15) 0.56(1.57) 0.70(1.59) 𝑳𝑳𝑳𝑳𝑷𝑷𝑳𝑳 -3.34(1.49) -4.49(1.70)* 0.84(0.73) 1.42(0.73) -0.19(0.14) -0.94(0.54) 𝑳𝑳𝑳𝑳𝑳𝑳 2.15(1.98)** 1.35(1.25) 0.30(0.42) 0.29(0.38) 0.73(1.25) 0.22(0.32) 𝑳𝑳𝑪𝑪𝑪𝑪𝑪𝑪𝒕𝒕𝑪𝑪𝑪𝑪𝒕𝒕 -16.99(1.75)* 2.38(0.14) -2.22(0.24) -4.14(0.39) -5.57(1.05) 7.35(0.56) Diagnostic Statistics
𝑭𝑭 3.66** 3.38*** 3.51** 5.98* 4.22** 5.89*
𝑳𝑳𝑳𝑳𝑳𝑳𝒕𝒕−𝟏𝟏 -0.12(3.07) -0.12(3.12) -0.14(4.02) -0.17(3.78) -0.14(2.77) -0.14(2.64)
𝑾𝑾𝑾𝑾𝑾𝑾𝒕𝒕𝑾𝑾 8.80 11.49 22.54** 25.01* 11.96 14.30*** 𝑳𝑳𝑳𝑳 5.43 4.43 4.47 1.93 0.53 1.56 𝑨𝑨𝑨𝑨𝑨𝑨𝑨𝑨𝑪𝑪𝒕𝒕𝑾𝑾𝑨𝑨 𝑹𝑹𝑳𝑳 0.28 0.28 0.22 0.17 0.20 0.21
Note: The absolute value of t-statistics in parentheses; *𝑝𝑝 < 0.01, **𝑝𝑝 < 0.05, ***𝑝𝑝 < 0.1.
The diagnostic tests are reported in Table 4. The White test statistic is reported to test for heteroscedasticity. The assumption of homoscedasticity is valid except for LXUTUM, LXUHIZ and LXUSIN stock indices. Therefore, since these indices have heteroskedasticity problem, the
1.13(3.31)* 1.21(3.47)* 1.01(3.14)*
Makale Gönderim Tarihi: 09.02.2021 Yayına Kabul Tarihi: 13.06.2021
LXUTEK -2.5164 [0] -7.2457 [1]* -2.7384 [5] -11.6885 [5]* LEX -1.6508 [2] -9.8683 [1]* -1.8448 [2] -8.8639 [4]* LIPI -3.2403 [12]* -2.9344 [12]** -8.6988 [5]* -41.0119 [12]* LCPI -4.5924 [5] -10.2785 [3]* -0.2713 [9] -9.8542 [13]* LM2 -3.0444 [0] -13.5414 [0]* -2.9703 [3] -13.9836 [9]*
Note: The values in brackets represent the optimal lag length by the SIC; *𝑝𝑝 < 0.01, **𝑝𝑝 <0.05, ***𝑝𝑝 < 0.1.
Table 4: The ARDL and NARDL Estimation Results
LXU100 LXUTUM LXUHIZ ARDL NARDL ARDL NARDL ARDL NARDL
Short-Term Estimates
∆𝑳𝑳𝑳𝑳𝑳𝑳𝒕𝒕 -1.21(5.66)* -0.79(3.65)* -0.77(6.07)*
∆𝑷𝑷𝑷𝑷𝑷𝑷𝒕𝒕 -1.21(4.88)* -0.71(3.31)* -0.89(4.90)*
∆𝑵𝑵𝑳𝑳𝑵𝑵𝒕𝒕 -1.08(2.49)**
0.01(0.15) -0.06(0.97)
∆𝑳𝑳𝑳𝑳𝑷𝑷𝑳𝑳𝒕𝒕 0.05(0.65) 0.10(1.14) 0.11(1.32) 0.09(1.13) 0.08(1.35) 0.10(1.51) ∆𝑳𝑳𝑳𝑳𝑷𝑷𝑳𝑳𝒕𝒕 -0.40(1.95)* -
0.55(2.32)** 0.14(0.72) 0.24(0.74) -0.02(0.15) -0.13(0.60)
∆𝑳𝑳𝑳𝑳𝑳𝑳𝒕𝒕 0.27(0.70) 0.27(0.71) 0.26(0.70) 0.04(0.37) 0.10(1.33) 0.03(0.32) ∆𝑳𝑳𝑳𝑳𝑳𝑳𝒕𝒕−𝟏𝟏 1.13(3.31)* 1.21(3.47)* 1.01(3.14)* ∆𝑳𝑳𝑳𝑳𝑳𝑳𝒕𝒕−𝑳𝑳 -0.76(2.76)* -
0.67(2.32)**
Long-Term Estimates
𝑳𝑳𝑳𝑳𝑳𝑳 0.17(0.37) -0.38(0.94) -0.27(0.85) 𝑷𝑷𝑷𝑷𝑷𝑷 0.90(1.11) -0.39(0.70) 0.29(0.43) 𝑵𝑵𝑳𝑳𝑵𝑵 -0.35(0.58) 0.11(0.14) -0.45(1.07) 𝑳𝑳𝑳𝑳𝑷𝑷𝑳𝑳 0.42(0.74) 0.82(1.34) 0.66(1.34) 0.57(1.15) 0.56(1.57) 0.70(1.59) 𝑳𝑳𝑳𝑳𝑷𝑷𝑳𝑳 -3.34(1.49) -4.49(1.70)* 0.84(0.73) 1.42(0.73) -0.19(0.14) -0.94(0.54) 𝑳𝑳𝑳𝑳𝑳𝑳 2.15(1.98)** 1.35(1.25) 0.30(0.42) 0.29(0.38) 0.73(1.25) 0.22(0.32) 𝑳𝑳𝑪𝑪𝑪𝑪𝑪𝑪𝒕𝒕𝑪𝑪𝑪𝑪𝒕𝒕 -16.99(1.75)* 2.38(0.14) -2.22(0.24) -4.14(0.39) -5.57(1.05) 7.35(0.56) Diagnostic Statistics
𝑭𝑭 3.66** 3.38*** 3.51** 5.98* 4.22** 5.89*
𝑳𝑳𝑳𝑳𝑳𝑳𝒕𝒕−𝟏𝟏 -0.12(3.07) -0.12(3.12) -0.14(4.02) -0.17(3.78) -0.14(2.77) -0.14(2.64)
𝑾𝑾𝑾𝑾𝑾𝑾𝒕𝒕𝑾𝑾 8.80 11.49 22.54** 25.01* 11.96 14.30*** 𝑳𝑳𝑳𝑳 5.43 4.43 4.47 1.93 0.53 1.56 𝑨𝑨𝑨𝑨𝑨𝑨𝑨𝑨𝑪𝑪𝒕𝒕𝑾𝑾𝑨𝑨 𝑹𝑹𝑳𝑳 0.28 0.28 0.22 0.17 0.20 0.21
Note: The absolute value of t-statistics in parentheses; *𝑝𝑝 < 0.01, **𝑝𝑝 < 0.05, ***𝑝𝑝 < 0.1.
The diagnostic tests are reported in Table 4. The White test statistic is reported to test for heteroscedasticity. The assumption of homoscedasticity is valid except for LXUTUM, LXUHIZ and LXUSIN stock indices. Therefore, since these indices have heteroskedasticity problem, the
-0.76(2.76)* -0.67(2.32)**
Long-Term Estimates
Makale Gönderim Tarihi: 09.02.2021 Yayına Kabul Tarihi: 13.06.2021
LXUTEK -2.5164 [0] -7.2457 [1]* -2.7384 [5] -11.6885 [5]* LEX -1.6508 [2] -9.8683 [1]* -1.8448 [2] -8.8639 [4]* LIPI -3.2403 [12]* -2.9344 [12]** -8.6988 [5]* -41.0119 [12]* LCPI -4.5924 [5] -10.2785 [3]* -0.2713 [9] -9.8542 [13]* LM2 -3.0444 [0] -13.5414 [0]* -2.9703 [3] -13.9836 [9]*
Note: The values in brackets represent the optimal lag length by the SIC; *𝑝𝑝 < 0.01, **𝑝𝑝 <0.05, ***𝑝𝑝 < 0.1.
Table 4: The ARDL and NARDL Estimation Results
LXU100 LXUTUM LXUHIZ ARDL NARDL ARDL NARDL ARDL NARDL
Short-Term Estimates
∆𝑳𝑳𝑳𝑳𝑳𝑳𝒕𝒕 -1.21(5.66)* -0.79(3.65)* -0.77(6.07)*
∆𝑷𝑷𝑷𝑷𝑷𝑷𝒕𝒕 -1.21(4.88)* -0.71(3.31)* -0.89(4.90)*
∆𝑵𝑵𝑳𝑳𝑵𝑵𝒕𝒕 -1.08(2.49)**
0.01(0.15) -0.06(0.97)
∆𝑳𝑳𝑳𝑳𝑷𝑷𝑳𝑳𝒕𝒕 0.05(0.65) 0.10(1.14) 0.11(1.32) 0.09(1.13) 0.08(1.35) 0.10(1.51) ∆𝑳𝑳𝑳𝑳𝑷𝑷𝑳𝑳𝒕𝒕 -0.40(1.95)* -
0.55(2.32)** 0.14(0.72) 0.24(0.74) -0.02(0.15) -0.13(0.60)
∆𝑳𝑳𝑳𝑳𝑳𝑳𝒕𝒕 0.27(0.70) 0.27(0.71) 0.26(0.70) 0.04(0.37) 0.10(1.33) 0.03(0.32) ∆𝑳𝑳𝑳𝑳𝑳𝑳𝒕𝒕−𝟏𝟏 1.13(3.31)* 1.21(3.47)* 1.01(3.14)* ∆𝑳𝑳𝑳𝑳𝑳𝑳𝒕𝒕−𝑳𝑳 -0.76(2.76)* -
0.67(2.32)**
Long-Term Estimates
𝑳𝑳𝑳𝑳𝑳𝑳 0.17(0.37) -0.38(0.94) -0.27(0.85) 𝑷𝑷𝑷𝑷𝑷𝑷 0.90(1.11) -0.39(0.70) 0.29(0.43) 𝑵𝑵𝑳𝑳𝑵𝑵 -0.35(0.58) 0.11(0.14) -0.45(1.07) 𝑳𝑳𝑳𝑳𝑷𝑷𝑳𝑳 0.42(0.74) 0.82(1.34) 0.66(1.34) 0.57(1.15) 0.56(1.57) 0.70(1.59) 𝑳𝑳𝑳𝑳𝑷𝑷𝑳𝑳 -3.34(1.49) -4.49(1.70)* 0.84(0.73) 1.42(0.73) -0.19(0.14) -0.94(0.54) 𝑳𝑳𝑳𝑳𝑳𝑳 2.15(1.98)** 1.35(1.25) 0.30(0.42) 0.29(0.38) 0.73(1.25) 0.22(0.32) 𝑳𝑳𝑪𝑪𝑪𝑪𝑪𝑪𝒕𝒕𝑪𝑪𝑪𝑪𝒕𝒕 -16.99(1.75)* 2.38(0.14) -2.22(0.24) -4.14(0.39) -5.57(1.05) 7.35(0.56) Diagnostic Statistics
𝑭𝑭 3.66** 3.38*** 3.51** 5.98* 4.22** 5.89*
𝑳𝑳𝑳𝑳𝑳𝑳𝒕𝒕−𝟏𝟏 -0.12(3.07) -0.12(3.12) -0.14(4.02) -0.17(3.78) -0.14(2.77) -0.14(2.64)
𝑾𝑾𝑾𝑾𝑾𝑾𝒕𝒕𝑾𝑾 8.80 11.49 22.54** 25.01* 11.96 14.30*** 𝑳𝑳𝑳𝑳 5.43 4.43 4.47 1.93 0.53 1.56 𝑨𝑨𝑨𝑨𝑨𝑨𝑨𝑨𝑪𝑪𝒕𝒕𝑾𝑾𝑨𝑨 𝑹𝑹𝑳𝑳 0.28 0.28 0.22 0.17 0.20 0.21
Note: The absolute value of t-statistics in parentheses; *𝑝𝑝 < 0.01, **𝑝𝑝 < 0.05, ***𝑝𝑝 < 0.1.
The diagnostic tests are reported in Table 4. The White test statistic is reported to test for heteroscedasticity. The assumption of homoscedasticity is valid except for LXUTUM, LXUHIZ and LXUSIN stock indices. Therefore, since these indices have heteroskedasticity problem, the
0.17(0.37) -0.38(0.94) -0.27(0.85)
Makale Gönderim Tarihi: 09.02.2021 Yayına Kabul Tarihi: 13.06.2021
LXUTEK -2.5164 [0] -7.2457 [1]* -2.7384 [5] -11.6885 [5]* LEX -1.6508 [2] -9.8683 [1]* -1.8448 [2] -8.8639 [4]* LIPI -3.2403 [12]* -2.9344 [12]** -8.6988 [5]* -41.0119 [12]* LCPI -4.5924 [5] -10.2785 [3]* -0.2713 [9] -9.8542 [13]* LM2 -3.0444 [0] -13.5414 [0]* -2.9703 [3] -13.9836 [9]*
Note: The values in brackets represent the optimal lag length by the SIC; *𝑝𝑝 < 0.01, **𝑝𝑝 <0.05, ***𝑝𝑝 < 0.1.
Table 4: The ARDL and NARDL Estimation Results
LXU100 LXUTUM LXUHIZ ARDL NARDL ARDL NARDL ARDL NARDL
Short-Term Estimates
∆𝑳𝑳𝑳𝑳𝑳𝑳𝒕𝒕 -1.21(5.66)* -0.79(3.65)* -0.77(6.07)*
∆𝑷𝑷𝑷𝑷𝑷𝑷𝒕𝒕 -1.21(4.88)* -0.71(3.31)* -0.89(4.90)*
∆𝑵𝑵𝑳𝑳𝑵𝑵𝒕𝒕 -1.08(2.49)**
0.01(0.15) -0.06(0.97)
∆𝑳𝑳𝑳𝑳𝑷𝑷𝑳𝑳𝒕𝒕 0.05(0.65) 0.10(1.14) 0.11(1.32) 0.09(1.13) 0.08(1.35) 0.10(1.51) ∆𝑳𝑳𝑳𝑳𝑷𝑷𝑳𝑳𝒕𝒕 -0.40(1.95)* -
0.55(2.32)** 0.14(0.72) 0.24(0.74) -0.02(0.15) -0.13(0.60)
∆𝑳𝑳𝑳𝑳𝑳𝑳𝒕𝒕 0.27(0.70) 0.27(0.71) 0.26(0.70) 0.04(0.37) 0.10(1.33) 0.03(0.32) ∆𝑳𝑳𝑳𝑳𝑳𝑳𝒕𝒕−𝟏𝟏 1.13(3.31)* 1.21(3.47)* 1.01(3.14)* ∆𝑳𝑳𝑳𝑳𝑳𝑳𝒕𝒕−𝑳𝑳 -0.76(2.76)* -
0.67(2.32)**
Long-Term Estimates
𝑳𝑳𝑳𝑳𝑳𝑳 0.17(0.37) -0.38(0.94) -0.27(0.85) 𝑷𝑷𝑷𝑷𝑷𝑷 0.90(1.11) -0.39(0.70) 0.29(0.43) 𝑵𝑵𝑳𝑳𝑵𝑵 -0.35(0.58) 0.11(0.14) -0.45(1.07) 𝑳𝑳𝑳𝑳𝑷𝑷𝑳𝑳 0.42(0.74) 0.82(1.34) 0.66(1.34) 0.57(1.15) 0.56(1.57) 0.70(1.59) 𝑳𝑳𝑳𝑳𝑷𝑷𝑳𝑳 -3.34(1.49) -4.49(1.70)* 0.84(0.73) 1.42(0.73) -0.19(0.14) -0.94(0.54) 𝑳𝑳𝑳𝑳𝑳𝑳 2.15(1.98)** 1.35(1.25) 0.30(0.42) 0.29(0.38) 0.73(1.25) 0.22(0.32) 𝑳𝑳𝑪𝑪𝑪𝑪𝑪𝑪𝒕𝒕𝑪𝑪𝑪𝑪𝒕𝒕 -16.99(1.75)* 2.38(0.14) -2.22(0.24) -4.14(0.39) -5.57(1.05) 7.35(0.56) Diagnostic Statistics
𝑭𝑭 3.66** 3.38*** 3.51** 5.98* 4.22** 5.89*
𝑳𝑳𝑳𝑳𝑳𝑳𝒕𝒕−𝟏𝟏 -0.12(3.07) -0.12(3.12) -0.14(4.02) -0.17(3.78) -0.14(2.77) -0.14(2.64)
𝑾𝑾𝑾𝑾𝑾𝑾𝒕𝒕𝑾𝑾 8.80 11.49 22.54** 25.01* 11.96 14.30*** 𝑳𝑳𝑳𝑳 5.43 4.43 4.47 1.93 0.53 1.56 𝑨𝑨𝑨𝑨𝑨𝑨𝑨𝑨𝑪𝑪𝒕𝒕𝑾𝑾𝑨𝑨 𝑹𝑹𝑳𝑳 0.28 0.28 0.22 0.17 0.20 0.21
Note: The absolute value of t-statistics in parentheses; *𝑝𝑝 < 0.01, **𝑝𝑝 < 0.05, ***𝑝𝑝 < 0.1.
The diagnostic tests are reported in Table 4. The White test statistic is reported to test for heteroscedasticity. The assumption of homoscedasticity is valid except for LXUTUM, LXUHIZ and LXUSIN stock indices. Therefore, since these indices have heteroskedasticity problem, the
0.90(1.11) -0.39(0.70) 0.29(0.43)
Makale Gönderim Tarihi: 09.02.2021 Yayına Kabul Tarihi: 13.06.2021
LXUTEK -2.5164 [0] -7.2457 [1]* -2.7384 [5] -11.6885 [5]* LEX -1.6508 [2] -9.8683 [1]* -1.8448 [2] -8.8639 [4]* LIPI -3.2403 [12]* -2.9344 [12]** -8.6988 [5]* -41.0119 [12]* LCPI -4.5924 [5] -10.2785 [3]* -0.2713 [9] -9.8542 [13]* LM2 -3.0444 [0] -13.5414 [0]* -2.9703 [3] -13.9836 [9]*
Note: The values in brackets represent the optimal lag length by the SIC; *𝑝𝑝 < 0.01, **𝑝𝑝 <0.05, ***𝑝𝑝 < 0.1.
Table 4: The ARDL and NARDL Estimation Results
LXU100 LXUTUM LXUHIZ ARDL NARDL ARDL NARDL ARDL NARDL
Short-Term Estimates
∆𝑳𝑳𝑳𝑳𝑳𝑳𝒕𝒕 -1.21(5.66)* -0.79(3.65)* -0.77(6.07)*
∆𝑷𝑷𝑷𝑷𝑷𝑷𝒕𝒕 -1.21(4.88)* -0.71(3.31)* -0.89(4.90)*
∆𝑵𝑵𝑳𝑳𝑵𝑵𝒕𝒕 -1.08(2.49)**
0.01(0.15) -0.06(0.97)
∆𝑳𝑳𝑳𝑳𝑷𝑷𝑳𝑳𝒕𝒕 0.05(0.65) 0.10(1.14) 0.11(1.32) 0.09(1.13) 0.08(1.35) 0.10(1.51) ∆𝑳𝑳𝑳𝑳𝑷𝑷𝑳𝑳𝒕𝒕 -0.40(1.95)* -
0.55(2.32)** 0.14(0.72) 0.24(0.74) -0.02(0.15) -0.13(0.60)
∆𝑳𝑳𝑳𝑳𝑳𝑳𝒕𝒕 0.27(0.70) 0.27(0.71) 0.26(0.70) 0.04(0.37) 0.10(1.33) 0.03(0.32) ∆𝑳𝑳𝑳𝑳𝑳𝑳𝒕𝒕−𝟏𝟏 1.13(3.31)* 1.21(3.47)* 1.01(3.14)* ∆𝑳𝑳𝑳𝑳𝑳𝑳𝒕𝒕−𝑳𝑳 -0.76(2.76)* -
0.67(2.32)**
Long-Term Estimates
𝑳𝑳𝑳𝑳𝑳𝑳 0.17(0.37) -0.38(0.94) -0.27(0.85) 𝑷𝑷𝑷𝑷𝑷𝑷 0.90(1.11) -0.39(0.70) 0.29(0.43) 𝑵𝑵𝑳𝑳𝑵𝑵 -0.35(0.58) 0.11(0.14) -0.45(1.07) 𝑳𝑳𝑳𝑳𝑷𝑷𝑳𝑳 0.42(0.74) 0.82(1.34) 0.66(1.34) 0.57(1.15) 0.56(1.57) 0.70(1.59) 𝑳𝑳𝑳𝑳𝑷𝑷𝑳𝑳 -3.34(1.49) -4.49(1.70)* 0.84(0.73) 1.42(0.73) -0.19(0.14) -0.94(0.54) 𝑳𝑳𝑳𝑳𝑳𝑳 2.15(1.98)** 1.35(1.25) 0.30(0.42) 0.29(0.38) 0.73(1.25) 0.22(0.32) 𝑳𝑳𝑪𝑪𝑪𝑪𝑪𝑪𝒕𝒕𝑪𝑪𝑪𝑪𝒕𝒕 -16.99(1.75)* 2.38(0.14) -2.22(0.24) -4.14(0.39) -5.57(1.05) 7.35(0.56) Diagnostic Statistics
𝑭𝑭 3.66** 3.38*** 3.51** 5.98* 4.22** 5.89*
𝑳𝑳𝑳𝑳𝑳𝑳𝒕𝒕−𝟏𝟏 -0.12(3.07) -0.12(3.12) -0.14(4.02) -0.17(3.78) -0.14(2.77) -0.14(2.64)
𝑾𝑾𝑾𝑾𝑾𝑾𝒕𝒕𝑾𝑾 8.80 11.49 22.54** 25.01* 11.96 14.30*** 𝑳𝑳𝑳𝑳 5.43 4.43 4.47 1.93 0.53 1.56 𝑨𝑨𝑨𝑨𝑨𝑨𝑨𝑨𝑪𝑪𝒕𝒕𝑾𝑾𝑨𝑨 𝑹𝑹𝑳𝑳 0.28 0.28 0.22 0.17 0.20 0.21
Note: The absolute value of t-statistics in parentheses; *𝑝𝑝 < 0.01, **𝑝𝑝 < 0.05, ***𝑝𝑝 < 0.1.
The diagnostic tests are reported in Table 4. The White test statistic is reported to test for heteroscedasticity. The assumption of homoscedasticity is valid except for LXUTUM, LXUHIZ and LXUSIN stock indices. Therefore, since these indices have heteroskedasticity problem, the
-0.35(0.58) 0.11(0.14) -0.45(1.07)
Makale Gönderim Tarihi: 09.02.2021 Yayına Kabul Tarihi: 13.06.2021
LXUTEK -2.5164 [0] -7.2457 [1]* -2.7384 [5] -11.6885 [5]* LEX -1.6508 [2] -9.8683 [1]* -1.8448 [2] -8.8639 [4]* LIPI -3.2403 [12]* -2.9344 [12]** -8.6988 [5]* -41.0119 [12]* LCPI -4.5924 [5] -10.2785 [3]* -0.2713 [9] -9.8542 [13]* LM2 -3.0444 [0] -13.5414 [0]* -2.9703 [3] -13.9836 [9]*
Note: The values in brackets represent the optimal lag length by the SIC; *𝑝𝑝 < 0.01, **𝑝𝑝 <0.05, ***𝑝𝑝 < 0.1.
Table 4: The ARDL and NARDL Estimation Results
LXU100 LXUTUM LXUHIZ ARDL NARDL ARDL NARDL ARDL NARDL
Short-Term Estimates
∆𝑳𝑳𝑳𝑳𝑳𝑳𝒕𝒕 -1.21(5.66)* -0.79(3.65)* -0.77(6.07)*
∆𝑷𝑷𝑷𝑷𝑷𝑷𝒕𝒕 -1.21(4.88)* -0.71(3.31)* -0.89(4.90)*
∆𝑵𝑵𝑳𝑳𝑵𝑵𝒕𝒕 -1.08(2.49)**
0.01(0.15) -0.06(0.97)
∆𝑳𝑳𝑳𝑳𝑷𝑷𝑳𝑳𝒕𝒕 0.05(0.65) 0.10(1.14) 0.11(1.32) 0.09(1.13) 0.08(1.35) 0.10(1.51) ∆𝑳𝑳𝑳𝑳𝑷𝑷𝑳𝑳𝒕𝒕 -0.40(1.95)* -
0.55(2.32)** 0.14(0.72) 0.24(0.74) -0.02(0.15) -0.13(0.60)
∆𝑳𝑳𝑳𝑳𝑳𝑳𝒕𝒕 0.27(0.70) 0.27(0.71) 0.26(0.70) 0.04(0.37) 0.10(1.33) 0.03(0.32) ∆𝑳𝑳𝑳𝑳𝑳𝑳𝒕𝒕−𝟏𝟏 1.13(3.31)* 1.21(3.47)* 1.01(3.14)* ∆𝑳𝑳𝑳𝑳𝑳𝑳𝒕𝒕−𝑳𝑳 -0.76(2.76)* -
0.67(2.32)**
Long-Term Estimates
𝑳𝑳𝑳𝑳𝑳𝑳 0.17(0.37) -0.38(0.94) -0.27(0.85) 𝑷𝑷𝑷𝑷𝑷𝑷 0.90(1.11) -0.39(0.70) 0.29(0.43) 𝑵𝑵𝑳𝑳𝑵𝑵 -0.35(0.58) 0.11(0.14) -0.45(1.07) 𝑳𝑳𝑳𝑳𝑷𝑷𝑳𝑳 0.42(0.74) 0.82(1.34) 0.66(1.34) 0.57(1.15) 0.56(1.57) 0.70(1.59) 𝑳𝑳𝑳𝑳𝑷𝑷𝑳𝑳 -3.34(1.49) -4.49(1.70)* 0.84(0.73) 1.42(0.73) -0.19(0.14) -0.94(0.54) 𝑳𝑳𝑳𝑳𝑳𝑳 2.15(1.98)** 1.35(1.25) 0.30(0.42) 0.29(0.38) 0.73(1.25) 0.22(0.32) 𝑳𝑳𝑪𝑪𝑪𝑪𝑪𝑪𝒕𝒕𝑪𝑪𝑪𝑪𝒕𝒕 -16.99(1.75)* 2.38(0.14) -2.22(0.24) -4.14(0.39) -5.57(1.05) 7.35(0.56) Diagnostic Statistics
𝑭𝑭 3.66** 3.38*** 3.51** 5.98* 4.22** 5.89*
𝑳𝑳𝑳𝑳𝑳𝑳𝒕𝒕−𝟏𝟏 -0.12(3.07) -0.12(3.12) -0.14(4.02) -0.17(3.78) -0.14(2.77) -0.14(2.64)
𝑾𝑾𝑾𝑾𝑾𝑾𝒕𝒕𝑾𝑾 8.80 11.49 22.54** 25.01* 11.96 14.30*** 𝑳𝑳𝑳𝑳 5.43 4.43 4.47 1.93 0.53 1.56 𝑨𝑨𝑨𝑨𝑨𝑨𝑨𝑨𝑪𝑪𝒕𝒕𝑾𝑾𝑨𝑨 𝑹𝑹𝑳𝑳 0.28 0.28 0.22 0.17 0.20 0.21
Note: The absolute value of t-statistics in parentheses; *𝑝𝑝 < 0.01, **𝑝𝑝 < 0.05, ***𝑝𝑝 < 0.1.
The diagnostic tests are reported in Table 4. The White test statistic is reported to test for heteroscedasticity. The assumption of homoscedasticity is valid except for LXUTUM, LXUHIZ and LXUSIN stock indices. Therefore, since these indices have heteroskedasticity problem, the
0.42(0.74) 0.82(1.34) 0.66(1.34) 0.57(1.15) 0.56(1.57) 0.70(1.59)
Makale Gönderim Tarihi: 09.02.2021 Yayına Kabul Tarihi: 13.06.2021
LXUTEK -2.5164 [0] -7.2457 [1]* -2.7384 [5] -11.6885 [5]* LEX -1.6508 [2] -9.8683 [1]* -1.8448 [2] -8.8639 [4]* LIPI -3.2403 [12]* -2.9344 [12]** -8.6988 [5]* -41.0119 [12]* LCPI -4.5924 [5] -10.2785 [3]* -0.2713 [9] -9.8542 [13]* LM2 -3.0444 [0] -13.5414 [0]* -2.9703 [3] -13.9836 [9]*
Note: The values in brackets represent the optimal lag length by the SIC; *𝑝𝑝 < 0.01, **𝑝𝑝 <0.05, ***𝑝𝑝 < 0.1.
Table 4: The ARDL and NARDL Estimation Results
LXU100 LXUTUM LXUHIZ ARDL NARDL ARDL NARDL ARDL NARDL
Short-Term Estimates
∆𝑳𝑳𝑳𝑳𝑳𝑳𝒕𝒕 -1.21(5.66)* -0.79(3.65)* -0.77(6.07)*
∆𝑷𝑷𝑷𝑷𝑷𝑷𝒕𝒕 -1.21(4.88)* -0.71(3.31)* -0.89(4.90)*
∆𝑵𝑵𝑳𝑳𝑵𝑵𝒕𝒕 -1.08(2.49)**
0.01(0.15) -0.06(0.97)
∆𝑳𝑳𝑳𝑳𝑷𝑷𝑳𝑳𝒕𝒕 0.05(0.65) 0.10(1.14) 0.11(1.32) 0.09(1.13) 0.08(1.35) 0.10(1.51) ∆𝑳𝑳𝑳𝑳𝑷𝑷𝑳𝑳𝒕𝒕 -0.40(1.95)* -
0.55(2.32)** 0.14(0.72) 0.24(0.74) -0.02(0.15) -0.13(0.60)
∆𝑳𝑳𝑳𝑳𝑳𝑳𝒕𝒕 0.27(0.70) 0.27(0.71) 0.26(0.70) 0.04(0.37) 0.10(1.33) 0.03(0.32) ∆𝑳𝑳𝑳𝑳𝑳𝑳𝒕𝒕−𝟏𝟏 1.13(3.31)* 1.21(3.47)* 1.01(3.14)* ∆𝑳𝑳𝑳𝑳𝑳𝑳𝒕𝒕−𝑳𝑳 -0.76(2.76)* -
0.67(2.32)**
Long-Term Estimates
𝑳𝑳𝑳𝑳𝑳𝑳 0.17(0.37) -0.38(0.94) -0.27(0.85) 𝑷𝑷𝑷𝑷𝑷𝑷 0.90(1.11) -0.39(0.70) 0.29(0.43) 𝑵𝑵𝑳𝑳𝑵𝑵 -0.35(0.58) 0.11(0.14) -0.45(1.07) 𝑳𝑳𝑳𝑳𝑷𝑷𝑳𝑳 0.42(0.74) 0.82(1.34) 0.66(1.34) 0.57(1.15) 0.56(1.57) 0.70(1.59) 𝑳𝑳𝑳𝑳𝑷𝑷𝑳𝑳 -3.34(1.49) -4.49(1.70)* 0.84(0.73) 1.42(0.73) -0.19(0.14) -0.94(0.54) 𝑳𝑳𝑳𝑳𝑳𝑳 2.15(1.98)** 1.35(1.25) 0.30(0.42) 0.29(0.38) 0.73(1.25) 0.22(0.32) 𝑳𝑳𝑪𝑪𝑪𝑪𝑪𝑪𝒕𝒕𝑪𝑪𝑪𝑪𝒕𝒕 -16.99(1.75)* 2.38(0.14) -2.22(0.24) -4.14(0.39) -5.57(1.05) 7.35(0.56) Diagnostic Statistics
𝑭𝑭 3.66** 3.38*** 3.51** 5.98* 4.22** 5.89*
𝑳𝑳𝑳𝑳𝑳𝑳𝒕𝒕−𝟏𝟏 -0.12(3.07) -0.12(3.12) -0.14(4.02) -0.17(3.78) -0.14(2.77) -0.14(2.64)
𝑾𝑾𝑾𝑾𝑾𝑾𝒕𝒕𝑾𝑾 8.80 11.49 22.54** 25.01* 11.96 14.30*** 𝑳𝑳𝑳𝑳 5.43 4.43 4.47 1.93 0.53 1.56 𝑨𝑨𝑨𝑨𝑨𝑨𝑨𝑨𝑪𝑪𝒕𝒕𝑾𝑾𝑨𝑨 𝑹𝑹𝑳𝑳 0.28 0.28 0.22 0.17 0.20 0.21
Note: The absolute value of t-statistics in parentheses; *𝑝𝑝 < 0.01, **𝑝𝑝 < 0.05, ***𝑝𝑝 < 0.1.
The diagnostic tests are reported in Table 4. The White test statistic is reported to test for heteroscedasticity. The assumption of homoscedasticity is valid except for LXUTUM, LXUHIZ and LXUSIN stock indices. Therefore, since these indices have heteroskedasticity problem, the
– 3.34(1.49) -4.49(1.70)* 0.84(0.73) 1.42(0.73) -0.19(0.14) -0.94(0.54)
Makale Gönderim Tarihi: 09.02.2021 Yayına Kabul Tarihi: 13.06.2021
LXUTEK -2.5164 [0] -7.2457 [1]* -2.7384 [5] -11.6885 [5]* LEX -1.6508 [2] -9.8683 [1]* -1.8448 [2] -8.8639 [4]* LIPI -3.2403 [12]* -2.9344 [12]** -8.6988 [5]* -41.0119 [12]* LCPI -4.5924 [5] -10.2785 [3]* -0.2713 [9] -9.8542 [13]* LM2 -3.0444 [0] -13.5414 [0]* -2.9703 [3] -13.9836 [9]*
Note: The values in brackets represent the optimal lag length by the SIC; *𝑝𝑝 < 0.01, **𝑝𝑝 <0.05, ***𝑝𝑝 < 0.1.
Table 4: The ARDL and NARDL Estimation Results
LXU100 LXUTUM LXUHIZ ARDL NARDL ARDL NARDL ARDL NARDL
Short-Term Estimates
∆𝑳𝑳𝑳𝑳𝑳𝑳𝒕𝒕 -1.21(5.66)* -0.79(3.65)* -0.77(6.07)*
∆𝑷𝑷𝑷𝑷𝑷𝑷𝒕𝒕 -1.21(4.88)* -0.71(3.31)* -0.89(4.90)*
∆𝑵𝑵𝑳𝑳𝑵𝑵𝒕𝒕 -1.08(2.49)**
0.01(0.15) -0.06(0.97)
∆𝑳𝑳𝑳𝑳𝑷𝑷𝑳𝑳𝒕𝒕 0.05(0.65) 0.10(1.14) 0.11(1.32) 0.09(1.13) 0.08(1.35) 0.10(1.51) ∆𝑳𝑳𝑳𝑳𝑷𝑷𝑳𝑳𝒕𝒕 -0.40(1.95)* -
0.55(2.32)** 0.14(0.72) 0.24(0.74) -0.02(0.15) -0.13(0.60)
∆𝑳𝑳𝑳𝑳𝑳𝑳𝒕𝒕 0.27(0.70) 0.27(0.71) 0.26(0.70) 0.04(0.37) 0.10(1.33) 0.03(0.32) ∆𝑳𝑳𝑳𝑳𝑳𝑳𝒕𝒕−𝟏𝟏 1.13(3.31)* 1.21(3.47)* 1.01(3.14)* ∆𝑳𝑳𝑳𝑳𝑳𝑳𝒕𝒕−𝑳𝑳 -0.76(2.76)* -
0.67(2.32)**
Long-Term Estimates
𝑳𝑳𝑳𝑳𝑳𝑳 0.17(0.37) -0.38(0.94) -0.27(0.85) 𝑷𝑷𝑷𝑷𝑷𝑷 0.90(1.11) -0.39(0.70) 0.29(0.43) 𝑵𝑵𝑳𝑳𝑵𝑵 -0.35(0.58) 0.11(0.14) -0.45(1.07) 𝑳𝑳𝑳𝑳𝑷𝑷𝑳𝑳 0.42(0.74) 0.82(1.34) 0.66(1.34) 0.57(1.15) 0.56(1.57) 0.70(1.59) 𝑳𝑳𝑳𝑳𝑷𝑷𝑳𝑳 -3.34(1.49) -4.49(1.70)* 0.84(0.73) 1.42(0.73) -0.19(0.14) -0.94(0.54) 𝑳𝑳𝑳𝑳𝑳𝑳 2.15(1.98)** 1.35(1.25) 0.30(0.42) 0.29(0.38) 0.73(1.25) 0.22(0.32) 𝑳𝑳𝑪𝑪𝑪𝑪𝑪𝑪𝒕𝒕𝑪𝑪𝑪𝑪𝒕𝒕 -16.99(1.75)* 2.38(0.14) -2.22(0.24) -4.14(0.39) -5.57(1.05) 7.35(0.56) Diagnostic Statistics
𝑭𝑭 3.66** 3.38*** 3.51** 5.98* 4.22** 5.89*
𝑳𝑳𝑳𝑳𝑳𝑳𝒕𝒕−𝟏𝟏 -0.12(3.07) -0.12(3.12) -0.14(4.02) -0.17(3.78) -0.14(2.77) -0.14(2.64)
𝑾𝑾𝑾𝑾𝑾𝑾𝒕𝒕𝑾𝑾 8.80 11.49 22.54** 25.01* 11.96 14.30*** 𝑳𝑳𝑳𝑳 5.43 4.43 4.47 1.93 0.53 1.56 𝑨𝑨𝑨𝑨𝑨𝑨𝑨𝑨𝑪𝑪𝒕𝒕𝑾𝑾𝑨𝑨 𝑹𝑹𝑳𝑳 0.28 0.28 0.22 0.17 0.20 0.21
Note: The absolute value of t-statistics in parentheses; *𝑝𝑝 < 0.01, **𝑝𝑝 < 0.05, ***𝑝𝑝 < 0.1.
The diagnostic tests are reported in Table 4. The White test statistic is reported to test for heteroscedasticity. The assumption of homoscedasticity is valid except for LXUTUM, LXUHIZ and LXUSIN stock indices. Therefore, since these indices have heteroskedasticity problem, the
2.15(1.98)** 1.35(1.25) 0.30(0.42) 0.29(0.38) 0.73(1.25) 0.22(0.32)
Makale Gönderim Tarihi: 09.02.2021 Yayına Kabul Tarihi: 13.06.2021
LXUTEK -2.5164 [0] -7.2457 [1]* -2.7384 [5] -11.6885 [5]* LEX -1.6508 [2] -9.8683 [1]* -1.8448 [2] -8.8639 [4]* LIPI -3.2403 [12]* -2.9344 [12]** -8.6988 [5]* -41.0119 [12]* LCPI -4.5924 [5] -10.2785 [3]* -0.2713 [9] -9.8542 [13]* LM2 -3.0444 [0] -13.5414 [0]* -2.9703 [3] -13.9836 [9]*
Note: The values in brackets represent the optimal lag length by the SIC; *𝑝𝑝 < 0.01, **𝑝𝑝 <0.05, ***𝑝𝑝 < 0.1.
Table 4: The ARDL and NARDL Estimation Results
LXU100 LXUTUM LXUHIZ ARDL NARDL ARDL NARDL ARDL NARDL
Short-Term Estimates
∆𝑳𝑳𝑳𝑳𝑳𝑳𝒕𝒕 -1.21(5.66)* -0.79(3.65)* -0.77(6.07)*
∆𝑷𝑷𝑷𝑷𝑷𝑷𝒕𝒕 -1.21(4.88)* -0.71(3.31)* -0.89(4.90)*
∆𝑵𝑵𝑳𝑳𝑵𝑵𝒕𝒕 -1.08(2.49)**
0.01(0.15) -0.06(0.97)
∆𝑳𝑳𝑳𝑳𝑷𝑷𝑳𝑳𝒕𝒕 0.05(0.65) 0.10(1.14) 0.11(1.32) 0.09(1.13) 0.08(1.35) 0.10(1.51) ∆𝑳𝑳𝑳𝑳𝑷𝑷𝑳𝑳𝒕𝒕 -0.40(1.95)* -
0.55(2.32)** 0.14(0.72) 0.24(0.74) -0.02(0.15) -0.13(0.60)
∆𝑳𝑳𝑳𝑳𝑳𝑳𝒕𝒕 0.27(0.70) 0.27(0.71) 0.26(0.70) 0.04(0.37) 0.10(1.33) 0.03(0.32) ∆𝑳𝑳𝑳𝑳𝑳𝑳𝒕𝒕−𝟏𝟏 1.13(3.31)* 1.21(3.47)* 1.01(3.14)* ∆𝑳𝑳𝑳𝑳𝑳𝑳𝒕𝒕−𝑳𝑳 -0.76(2.76)* -
0.67(2.32)**
Long-Term Estimates
𝑳𝑳𝑳𝑳𝑳𝑳 0.17(0.37) -0.38(0.94) -0.27(0.85) 𝑷𝑷𝑷𝑷𝑷𝑷 0.90(1.11) -0.39(0.70) 0.29(0.43) 𝑵𝑵𝑳𝑳𝑵𝑵 -0.35(0.58) 0.11(0.14) -0.45(1.07) 𝑳𝑳𝑳𝑳𝑷𝑷𝑳𝑳 0.42(0.74) 0.82(1.34) 0.66(1.34) 0.57(1.15) 0.56(1.57) 0.70(1.59) 𝑳𝑳𝑳𝑳𝑷𝑷𝑳𝑳 -3.34(1.49) -4.49(1.70)* 0.84(0.73) 1.42(0.73) -0.19(0.14) -0.94(0.54) 𝑳𝑳𝑳𝑳𝑳𝑳 2.15(1.98)** 1.35(1.25) 0.30(0.42) 0.29(0.38) 0.73(1.25) 0.22(0.32) 𝑳𝑳𝑪𝑪𝑪𝑪𝑪𝑪𝒕𝒕𝑪𝑪𝑪𝑪𝒕𝒕 -16.99(1.75)* 2.38(0.14) -2.22(0.24) -4.14(0.39) -5.57(1.05) 7.35(0.56) Diagnostic Statistics
𝑭𝑭 3.66** 3.38*** 3.51** 5.98* 4.22** 5.89*
𝑳𝑳𝑳𝑳𝑳𝑳𝒕𝒕−𝟏𝟏 -0.12(3.07) -0.12(3.12) -0.14(4.02) -0.17(3.78) -0.14(2.77) -0.14(2.64)
𝑾𝑾𝑾𝑾𝑾𝑾𝒕𝒕𝑾𝑾 8.80 11.49 22.54** 25.01* 11.96 14.30*** 𝑳𝑳𝑳𝑳 5.43 4.43 4.47 1.93 0.53 1.56 𝑨𝑨𝑨𝑨𝑨𝑨𝑨𝑨𝑪𝑪𝒕𝒕𝑾𝑾𝑨𝑨 𝑹𝑹𝑳𝑳 0.28 0.28 0.22 0.17 0.20 0.21
Note: The absolute value of t-statistics in parentheses; *𝑝𝑝 < 0.01, **𝑝𝑝 < 0.05, ***𝑝𝑝 < 0.1.
The diagnostic tests are reported in Table 4. The White test statistic is reported to test for heteroscedasticity. The assumption of homoscedasticity is valid except for LXUTUM, LXUHIZ and LXUSIN stock indices. Therefore, since these indices have heteroskedasticity problem, the
-16.99(1.75)* 2.38(0.14) -2.22(0.24) -4.14(0.39) -5.57(1.05) 7.35(0.56)Diagnostic Statistics
Makale Gönderim Tarihi: 09.02.2021 Yayına Kabul Tarihi: 13.06.2021
LXUTEK -2.5164 [0] -7.2457 [1]* -2.7384 [5] -11.6885 [5]* LEX -1.6508 [2] -9.8683 [1]* -1.8448 [2] -8.8639 [4]* LIPI -3.2403 [12]* -2.9344 [12]** -8.6988 [5]* -41.0119 [12]* LCPI -4.5924 [5] -10.2785 [3]* -0.2713 [9] -9.8542 [13]* LM2 -3.0444 [0] -13.5414 [0]* -2.9703 [3] -13.9836 [9]*
Note: The values in brackets represent the optimal lag length by the SIC; *𝑝𝑝 < 0.01, **𝑝𝑝 <0.05, ***𝑝𝑝 < 0.1.
Table 4: The ARDL and NARDL Estimation Results
LXU100 LXUTUM LXUHIZ ARDL NARDL ARDL NARDL ARDL NARDL
Short-Term Estimates
∆𝑳𝑳𝑳𝑳𝑳𝑳𝒕𝒕 -1.21(5.66)* -0.79(3.65)* -0.77(6.07)*
∆𝑷𝑷𝑷𝑷𝑷𝑷𝒕𝒕 -1.21(4.88)* -0.71(3.31)* -0.89(4.90)*
∆𝑵𝑵𝑳𝑳𝑵𝑵𝒕𝒕 -1.08(2.49)**
0.01(0.15) -0.06(0.97)
∆𝑳𝑳𝑳𝑳𝑷𝑷𝑳𝑳𝒕𝒕 0.05(0.65) 0.10(1.14) 0.11(1.32) 0.09(1.13) 0.08(1.35) 0.10(1.51) ∆𝑳𝑳𝑳𝑳𝑷𝑷𝑳𝑳𝒕𝒕 -0.40(1.95)* -
0.55(2.32)** 0.14(0.72) 0.24(0.74) -0.02(0.15) -0.13(0.60)
∆𝑳𝑳𝑳𝑳𝑳𝑳𝒕𝒕 0.27(0.70) 0.27(0.71) 0.26(0.70) 0.04(0.37) 0.10(1.33) 0.03(0.32) ∆𝑳𝑳𝑳𝑳𝑳𝑳𝒕𝒕−𝟏𝟏 1.13(3.31)* 1.21(3.47)* 1.01(3.14)* ∆𝑳𝑳𝑳𝑳𝑳𝑳𝒕𝒕−𝑳𝑳 -0.76(2.76)* -
0.67(2.32)**
Long-Term Estimates
𝑳𝑳𝑳𝑳𝑳𝑳 0.17(0.37) -0.38(0.94) -0.27(0.85) 𝑷𝑷𝑷𝑷𝑷𝑷 0.90(1.11) -0.39(0.70) 0.29(0.43) 𝑵𝑵𝑳𝑳𝑵𝑵 -0.35(0.58) 0.11(0.14) -0.45(1.07) 𝑳𝑳𝑳𝑳𝑷𝑷𝑳𝑳 0.42(0.74) 0.82(1.34) 0.66(1.34) 0.57(1.15) 0.56(1.57) 0.70(1.59) 𝑳𝑳𝑳𝑳𝑷𝑷𝑳𝑳 -3.34(1.49) -4.49(1.70)* 0.84(0.73) 1.42(0.73) -0.19(0.14) -0.94(0.54) 𝑳𝑳𝑳𝑳𝑳𝑳 2.15(1.98)** 1.35(1.25) 0.30(0.42) 0.29(0.38) 0.73(1.25) 0.22(0.32) 𝑳𝑳𝑪𝑪𝑪𝑪𝑪𝑪𝒕𝒕𝑪𝑪𝑪𝑪𝒕𝒕 -16.99(1.75)* 2.38(0.14) -2.22(0.24) -4.14(0.39) -5.57(1.05) 7.35(0.56) Diagnostic Statistics
𝑭𝑭 3.66** 3.38*** 3.51** 5.98* 4.22** 5.89*
𝑳𝑳𝑳𝑳𝑳𝑳𝒕𝒕−𝟏𝟏 -0.12(3.07) -0.12(3.12) -0.14(4.02) -0.17(3.78) -0.14(2.77) -0.14(2.64)
𝑾𝑾𝑾𝑾𝑾𝑾𝒕𝒕𝑾𝑾 8.80 11.49 22.54** 25.01* 11.96 14.30*** 𝑳𝑳𝑳𝑳 5.43 4.43 4.47 1.93 0.53 1.56 𝑨𝑨𝑨𝑨𝑨𝑨𝑨𝑨𝑪𝑪𝒕𝒕𝑾𝑾𝑨𝑨 𝑹𝑹𝑳𝑳 0.28 0.28 0.22 0.17 0.20 0.21
Note: The absolute value of t-statistics in parentheses; *𝑝𝑝 < 0.01, **𝑝𝑝 < 0.05, ***𝑝𝑝 < 0.1.
The diagnostic tests are reported in Table 4. The White test statistic is reported to test for heteroscedasticity. The assumption of homoscedasticity is valid except for LXUTUM, LXUHIZ and LXUSIN stock indices. Therefore, since these indices have heteroskedasticity problem, the
3.66** 3.38*** 3.51** 5.98* 4.22** 5.89*
Makale Gönderim Tarihi: 09.02.2021 Yayına Kabul Tarihi: 13.06.2021
LXUTEK -2.5164 [0] -7.2457 [1]* -2.7384 [5] -11.6885 [5]* LEX -1.6508 [2] -9.8683 [1]* -1.8448 [2] -8.8639 [4]* LIPI -3.2403 [12]* -2.9344 [12]** -8.6988 [5]* -41.0119 [12]* LCPI -4.5924 [5] -10.2785 [3]* -0.2713 [9] -9.8542 [13]* LM2 -3.0444 [0] -13.5414 [0]* -2.9703 [3] -13.9836 [9]*
Note: The values in brackets represent the optimal lag length by the SIC; *𝑝𝑝 < 0.01, **𝑝𝑝 <0.05, ***𝑝𝑝 < 0.1.
Table 4: The ARDL and NARDL Estimation Results
LXU100 LXUTUM LXUHIZ ARDL NARDL ARDL NARDL ARDL NARDL
Short-Term Estimates
∆𝑳𝑳𝑳𝑳𝑳𝑳𝒕𝒕 -1.21(5.66)* -0.79(3.65)* -0.77(6.07)*
∆𝑷𝑷𝑷𝑷𝑷𝑷𝒕𝒕 -1.21(4.88)* -0.71(3.31)* -0.89(4.90)*
∆𝑵𝑵𝑳𝑳𝑵𝑵𝒕𝒕 -1.08(2.49)**
0.01(0.15) -0.06(0.97)
∆𝑳𝑳𝑳𝑳𝑷𝑷𝑳𝑳𝒕𝒕 0.05(0.65) 0.10(1.14) 0.11(1.32) 0.09(1.13) 0.08(1.35) 0.10(1.51) ∆𝑳𝑳𝑳𝑳𝑷𝑷𝑳𝑳𝒕𝒕 -0.40(1.95)* -
0.55(2.32)** 0.14(0.72) 0.24(0.74) -0.02(0.15) -0.13(0.60)
∆𝑳𝑳𝑳𝑳𝑳𝑳𝒕𝒕 0.27(0.70) 0.27(0.71) 0.26(0.70) 0.04(0.37) 0.10(1.33) 0.03(0.32) ∆𝑳𝑳𝑳𝑳𝑳𝑳𝒕𝒕−𝟏𝟏 1.13(3.31)* 1.21(3.47)* 1.01(3.14)* ∆𝑳𝑳𝑳𝑳𝑳𝑳𝒕𝒕−𝑳𝑳 -0.76(2.76)* -
0.67(2.32)**
Long-Term Estimates
𝑳𝑳𝑳𝑳𝑳𝑳 0.17(0.37) -0.38(0.94) -0.27(0.85) 𝑷𝑷𝑷𝑷𝑷𝑷 0.90(1.11) -0.39(0.70) 0.29(0.43) 𝑵𝑵𝑳𝑳𝑵𝑵 -0.35(0.58) 0.11(0.14) -0.45(1.07) 𝑳𝑳𝑳𝑳𝑷𝑷𝑳𝑳 0.42(0.74) 0.82(1.34) 0.66(1.34) 0.57(1.15) 0.56(1.57) 0.70(1.59) 𝑳𝑳𝑳𝑳𝑷𝑷𝑳𝑳 -3.34(1.49) -4.49(1.70)* 0.84(0.73) 1.42(0.73) -0.19(0.14) -0.94(0.54) 𝑳𝑳𝑳𝑳𝑳𝑳 2.15(1.98)** 1.35(1.25) 0.30(0.42) 0.29(0.38) 0.73(1.25) 0.22(0.32) 𝑳𝑳𝑪𝑪𝑪𝑪𝑪𝑪𝒕𝒕𝑪𝑪𝑪𝑪𝒕𝒕 -16.99(1.75)* 2.38(0.14) -2.22(0.24) -4.14(0.39) -5.57(1.05) 7.35(0.56) Diagnostic Statistics
𝑭𝑭 3.66** 3.38*** 3.51** 5.98* 4.22** 5.89*
𝑳𝑳𝑳𝑳𝑳𝑳𝒕𝒕−𝟏𝟏 -0.12(3.07) -0.12(3.12) -0.14(4.02) -0.17(3.78) -0.14(2.77) -0.14(2.64)
𝑾𝑾𝑾𝑾𝑾𝑾𝒕𝒕𝑾𝑾 8.80 11.49 22.54** 25.01* 11.96 14.30*** 𝑳𝑳𝑳𝑳 5.43 4.43 4.47 1.93 0.53 1.56 𝑨𝑨𝑨𝑨𝑨𝑨𝑨𝑨𝑪𝑪𝒕𝒕𝑾𝑾𝑨𝑨 𝑹𝑹𝑳𝑳 0.28 0.28 0.22 0.17 0.20 0.21
Note: The absolute value of t-statistics in parentheses; *𝑝𝑝 < 0.01, **𝑝𝑝 < 0.05, ***𝑝𝑝 < 0.1.
The diagnostic tests are reported in Table 4. The White test statistic is reported to test for heteroscedasticity. The assumption of homoscedasticity is valid except for LXUTUM, LXUHIZ and LXUSIN stock indices. Therefore, since these indices have heteroskedasticity problem, the
-0.12(3.07) -0.12(3.12) -0.14(4.02) -0.17(3.78) -0.14(2.77) -0.14(2.64)
Makale Gönderim Tarihi: 09.02.2021 Yayına Kabul Tarihi: 13.06.2021
LXUTEK -2.5164 [0] -7.2457 [1]* -2.7384 [5] -11.6885 [5]* LEX -1.6508 [2] -9.8683 [1]* -1.8448 [2] -8.8639 [4]* LIPI -3.2403 [12]* -2.9344 [12]** -8.6988 [5]* -41.0119 [12]* LCPI -4.5924 [5] -10.2785 [3]* -0.2713 [9] -9.8542 [13]* LM2 -3.0444 [0] -13.5414 [0]* -2.9703 [3] -13.9836 [9]*
Note: The values in brackets represent the optimal lag length by the SIC; *𝑝𝑝 < 0.01, **𝑝𝑝 <0.05, ***𝑝𝑝 < 0.1.
Table 4: The ARDL and NARDL Estimation Results
LXU100 LXUTUM LXUHIZ ARDL NARDL ARDL NARDL ARDL NARDL
Short-Term Estimates
∆𝑳𝑳𝑳𝑳𝑳𝑳𝒕𝒕 -1.21(5.66)* -0.79(3.65)* -0.77(6.07)*
∆𝑷𝑷𝑷𝑷𝑷𝑷𝒕𝒕 -1.21(4.88)* -0.71(3.31)* -0.89(4.90)*
∆𝑵𝑵𝑳𝑳𝑵𝑵𝒕𝒕 -1.08(2.49)**
0.01(0.15) -0.06(0.97)
∆𝑳𝑳𝑳𝑳𝑷𝑷𝑳𝑳𝒕𝒕 0.05(0.65) 0.10(1.14) 0.11(1.32) 0.09(1.13) 0.08(1.35) 0.10(1.51) ∆𝑳𝑳𝑳𝑳𝑷𝑷𝑳𝑳𝒕𝒕 -0.40(1.95)* -
0.55(2.32)** 0.14(0.72) 0.24(0.74) -0.02(0.15) -0.13(0.60)
∆𝑳𝑳𝑳𝑳𝑳𝑳𝒕𝒕 0.27(0.70) 0.27(0.71) 0.26(0.70) 0.04(0.37) 0.10(1.33) 0.03(0.32) ∆𝑳𝑳𝑳𝑳𝑳𝑳𝒕𝒕−𝟏𝟏 1.13(3.31)* 1.21(3.47)* 1.01(3.14)* ∆𝑳𝑳𝑳𝑳𝑳𝑳𝒕𝒕−𝑳𝑳 -0.76(2.76)* -
0.67(2.32)**
Long-Term Estimates
𝑳𝑳𝑳𝑳𝑳𝑳 0.17(0.37) -0.38(0.94) -0.27(0.85) 𝑷𝑷𝑷𝑷𝑷𝑷 0.90(1.11) -0.39(0.70) 0.29(0.43) 𝑵𝑵𝑳𝑳𝑵𝑵 -0.35(0.58) 0.11(0.14) -0.45(1.07) 𝑳𝑳𝑳𝑳𝑷𝑷𝑳𝑳 0.42(0.74) 0.82(1.34) 0.66(1.34) 0.57(1.15) 0.56(1.57) 0.70(1.59) 𝑳𝑳𝑳𝑳𝑷𝑷𝑳𝑳 -3.34(1.49) -4.49(1.70)* 0.84(0.73) 1.42(0.73) -0.19(0.14) -0.94(0.54) 𝑳𝑳𝑳𝑳𝑳𝑳 2.15(1.98)** 1.35(1.25) 0.30(0.42) 0.29(0.38) 0.73(1.25) 0.22(0.32) 𝑳𝑳𝑪𝑪𝑪𝑪𝑪𝑪𝒕𝒕𝑪𝑪𝑪𝑪𝒕𝒕 -16.99(1.75)* 2.38(0.14) -2.22(0.24) -4.14(0.39) -5.57(1.05) 7.35(0.56) Diagnostic Statistics
𝑭𝑭 3.66** 3.38*** 3.51** 5.98* 4.22** 5.89*
𝑳𝑳𝑳𝑳𝑳𝑳𝒕𝒕−𝟏𝟏 -0.12(3.07) -0.12(3.12) -0.14(4.02) -0.17(3.78) -0.14(2.77) -0.14(2.64)
𝑾𝑾𝑾𝑾𝑾𝑾𝒕𝒕𝑾𝑾 8.80 11.49 22.54** 25.01* 11.96 14.30*** 𝑳𝑳𝑳𝑳 5.43 4.43 4.47 1.93 0.53 1.56 𝑨𝑨𝑨𝑨𝑨𝑨𝑨𝑨𝑪𝑪𝒕𝒕𝑾𝑾𝑨𝑨 𝑹𝑹𝑳𝑳 0.28 0.28 0.22 0.17 0.20 0.21
Note: The absolute value of t-statistics in parentheses; *𝑝𝑝 < 0.01, **𝑝𝑝 < 0.05, ***𝑝𝑝 < 0.1.
The diagnostic tests are reported in Table 4. The White test statistic is reported to test for heteroscedasticity. The assumption of homoscedasticity is valid except for LXUTUM, LXUHIZ and LXUSIN stock indices. Therefore, since these indices have heteroskedasticity problem, the
8.80 11.49 22.54** 25.01* 11.96 14.30***
Makale Gönderim Tarihi: 09.02.2021 Yayına Kabul Tarihi: 13.06.2021
LXUTEK -2.5164 [0] -7.2457 [1]* -2.7384 [5] -11.6885 [5]* LEX -1.6508 [2] -9.8683 [1]* -1.8448 [2] -8.8639 [4]* LIPI -3.2403 [12]* -2.9344 [12]** -8.6988 [5]* -41.0119 [12]* LCPI -4.5924 [5] -10.2785 [3]* -0.2713 [9] -9.8542 [13]* LM2 -3.0444 [0] -13.5414 [0]* -2.9703 [3] -13.9836 [9]*
Note: The values in brackets represent the optimal lag length by the SIC; *𝑝𝑝 < 0.01, **𝑝𝑝 <0.05, ***𝑝𝑝 < 0.1.
Table 4: The ARDL and NARDL Estimation Results
LXU100 LXUTUM LXUHIZ ARDL NARDL ARDL NARDL ARDL NARDL
Short-Term Estimates
∆𝑳𝑳𝑳𝑳𝑳𝑳𝒕𝒕 -1.21(5.66)* -0.79(3.65)* -0.77(6.07)*
∆𝑷𝑷𝑷𝑷𝑷𝑷𝒕𝒕 -1.21(4.88)* -0.71(3.31)* -0.89(4.90)*
∆𝑵𝑵𝑳𝑳𝑵𝑵𝒕𝒕 -1.08(2.49)**
0.01(0.15) -0.06(0.97)
∆𝑳𝑳𝑳𝑳𝑷𝑷𝑳𝑳𝒕𝒕 0.05(0.65) 0.10(1.14) 0.11(1.32) 0.09(1.13) 0.08(1.35) 0.10(1.51) ∆𝑳𝑳𝑳𝑳𝑷𝑷𝑳𝑳𝒕𝒕 -0.40(1.95)* -
0.55(2.32)** 0.14(0.72) 0.24(0.74) -0.02(0.15) -0.13(0.60)
∆𝑳𝑳𝑳𝑳𝑳𝑳𝒕𝒕 0.27(0.70) 0.27(0.71) 0.26(0.70) 0.04(0.37) 0.10(1.33) 0.03(0.32) ∆𝑳𝑳𝑳𝑳𝑳𝑳𝒕𝒕−𝟏𝟏 1.13(3.31)* 1.21(3.47)* 1.01(3.14)* ∆𝑳𝑳𝑳𝑳𝑳𝑳𝒕𝒕−𝑳𝑳 -0.76(2.76)* -
0.67(2.32)**
Long-Term Estimates
𝑳𝑳𝑳𝑳𝑳𝑳 0.17(0.37) -0.38(0.94) -0.27(0.85) 𝑷𝑷𝑷𝑷𝑷𝑷 0.90(1.11) -0.39(0.70) 0.29(0.43) 𝑵𝑵𝑳𝑳𝑵𝑵 -0.35(0.58) 0.11(0.14) -0.45(1.07) 𝑳𝑳𝑳𝑳𝑷𝑷𝑳𝑳 0.42(0.74) 0.82(1.34) 0.66(1.34) 0.57(1.15) 0.56(1.57) 0.70(1.59) 𝑳𝑳𝑳𝑳𝑷𝑷𝑳𝑳 -3.34(1.49) -4.49(1.70)* 0.84(0.73) 1.42(0.73) -0.19(0.14) -0.94(0.54) 𝑳𝑳𝑳𝑳𝑳𝑳 2.15(1.98)** 1.35(1.25) 0.30(0.42) 0.29(0.38) 0.73(1.25) 0.22(0.32) 𝑳𝑳𝑪𝑪𝑪𝑪𝑪𝑪𝒕𝒕𝑪𝑪𝑪𝑪𝒕𝒕 -16.99(1.75)* 2.38(0.14) -2.22(0.24) -4.14(0.39) -5.57(1.05) 7.35(0.56) Diagnostic Statistics
𝑭𝑭 3.66** 3.38*** 3.51** 5.98* 4.22** 5.89*
𝑳𝑳𝑳𝑳𝑳𝑳𝒕𝒕−𝟏𝟏 -0.12(3.07) -0.12(3.12) -0.14(4.02) -0.17(3.78) -0.14(2.77) -0.14(2.64)
𝑾𝑾𝑾𝑾𝑾𝑾𝒕𝒕𝑾𝑾 8.80 11.49 22.54** 25.01* 11.96 14.30*** 𝑳𝑳𝑳𝑳 5.43 4.43 4.47 1.93 0.53 1.56 𝑨𝑨𝑨𝑨𝑨𝑨𝑨𝑨𝑪𝑪𝒕𝒕𝑾𝑾𝑨𝑨 𝑹𝑹𝑳𝑳 0.28 0.28 0.22 0.17 0.20 0.21
Note: The absolute value of t-statistics in parentheses; *𝑝𝑝 < 0.01, **𝑝𝑝 < 0.05, ***𝑝𝑝 < 0.1.
The diagnostic tests are reported in Table 4. The White test statistic is reported to test for heteroscedasticity. The assumption of homoscedasticity is valid except for LXUTUM, LXUHIZ and LXUSIN stock indices. Therefore, since these indices have heteroskedasticity problem, the
5.43 4.43 4.47 1.93 0.53 1.56
Makale Gönderim Tarihi: 09.02.2021 Yayına Kabul Tarihi: 13.06.2021
LXUTEK -2.5164 [0] -7.2457 [1]* -2.7384 [5] -11.6885 [5]* LEX -1.6508 [2] -9.8683 [1]* -1.8448 [2] -8.8639 [4]* LIPI -3.2403 [12]* -2.9344 [12]** -8.6988 [5]* -41.0119 [12]* LCPI -4.5924 [5] -10.2785 [3]* -0.2713 [9] -9.8542 [13]* LM2 -3.0444 [0] -13.5414 [0]* -2.9703 [3] -13.9836 [9]*
Note: The values in brackets represent the optimal lag length by the SIC; *𝑝𝑝 < 0.01, **𝑝𝑝 <0.05, ***𝑝𝑝 < 0.1.
Table 4: The ARDL and NARDL Estimation Results
LXU100 LXUTUM LXUHIZ ARDL NARDL ARDL NARDL ARDL NARDL
Short-Term Estimates
∆𝑳𝑳𝑳𝑳𝑳𝑳𝒕𝒕 -1.21(5.66)* -0.79(3.65)* -0.77(6.07)*
∆𝑷𝑷𝑷𝑷𝑷𝑷𝒕𝒕 -1.21(4.88)* -0.71(3.31)* -0.89(4.90)*
∆𝑵𝑵𝑳𝑳𝑵𝑵𝒕𝒕 -1.08(2.49)**
0.01(0.15) -0.06(0.97)
∆𝑳𝑳𝑳𝑳𝑷𝑷𝑳𝑳𝒕𝒕 0.05(0.65) 0.10(1.14) 0.11(1.32) 0.09(1.13) 0.08(1.35) 0.10(1.51) ∆𝑳𝑳𝑳𝑳𝑷𝑷𝑳𝑳𝒕𝒕 -0.40(1.95)* -
0.55(2.32)** 0.14(0.72) 0.24(0.74) -0.02(0.15) -0.13(0.60)
∆𝑳𝑳𝑳𝑳𝑳𝑳𝒕𝒕 0.27(0.70) 0.27(0.71) 0.26(0.70) 0.04(0.37) 0.10(1.33) 0.03(0.32) ∆𝑳𝑳𝑳𝑳𝑳𝑳𝒕𝒕−𝟏𝟏 1.13(3.31)* 1.21(3.47)* 1.01(3.14)* ∆𝑳𝑳𝑳𝑳𝑳𝑳𝒕𝒕−𝑳𝑳 -0.76(2.76)* -
0.67(2.32)**
Long-Term Estimates
𝑳𝑳𝑳𝑳𝑳𝑳 0.17(0.37) -0.38(0.94) -0.27(0.85) 𝑷𝑷𝑷𝑷𝑷𝑷 0.90(1.11) -0.39(0.70) 0.29(0.43) 𝑵𝑵𝑳𝑳𝑵𝑵 -0.35(0.58) 0.11(0.14) -0.45(1.07) 𝑳𝑳𝑳𝑳𝑷𝑷𝑳𝑳 0.42(0.74) 0.82(1.34) 0.66(1.34) 0.57(1.15) 0.56(1.57) 0.70(1.59) 𝑳𝑳𝑳𝑳𝑷𝑷𝑳𝑳 -3.34(1.49) -4.49(1.70)* 0.84(0.73) 1.42(0.73) -0.19(0.14) -0.94(0.54) 𝑳𝑳𝑳𝑳𝑳𝑳 2.15(1.98)** 1.35(1.25) 0.30(0.42) 0.29(0.38) 0.73(1.25) 0.22(0.32) 𝑳𝑳𝑪𝑪𝑪𝑪𝑪𝑪𝒕𝒕𝑪𝑪𝑪𝑪𝒕𝒕 -16.99(1.75)* 2.38(0.14) -2.22(0.24) -4.14(0.39) -5.57(1.05) 7.35(0.56) Diagnostic Statistics
𝑭𝑭 3.66** 3.38*** 3.51** 5.98* 4.22** 5.89*
𝑳𝑳𝑳𝑳𝑳𝑳𝒕𝒕−𝟏𝟏 -0.12(3.07) -0.12(3.12) -0.14(4.02) -0.17(3.78) -0.14(2.77) -0.14(2.64)
𝑾𝑾𝑾𝑾𝑾𝑾𝒕𝒕𝑾𝑾 8.80 11.49 22.54** 25.01* 11.96 14.30*** 𝑳𝑳𝑳𝑳 5.43 4.43 4.47 1.93 0.53 1.56 𝑨𝑨𝑨𝑨𝑨𝑨𝑨𝑨𝑪𝑪𝒕𝒕𝑾𝑾𝑨𝑨 𝑹𝑹𝑳𝑳 0.28 0.28 0.22 0.17 0.20 0.21
Note: The absolute value of t-statistics in parentheses; *𝑝𝑝 < 0.01, **𝑝𝑝 < 0.05, ***𝑝𝑝 < 0.1.
The diagnostic tests are reported in Table 4. The White test statistic is reported to test for heteroscedasticity. The assumption of homoscedasticity is valid except for LXUTUM, LXUHIZ and LXUSIN stock indices. Therefore, since these indices have heteroskedasticity problem, the
0.28 0.28 0.22 0.17 0.20 0.21
Note: The absolute value of t-statistics in parentheses; *
Makale Gönderim Tarihi: 09.02.2021 Yayına Kabul Tarihi: 13.06.2021
LXUTEK -2.5164 [0] -7.2457 [1]* -2.7384 [5] -11.6885 [5]* LEX -1.6508 [2] -9.8683 [1]* -1.8448 [2] -8.8639 [4]* LIPI -3.2403 [12]* -2.9344 [12]** -8.6988 [5]* -41.0119 [12]* LCPI -4.5924 [5] -10.2785 [3]* -0.2713 [9] -9.8542 [13]* LM2 -3.0444 [0] -13.5414 [0]* -2.9703 [3] -13.9836 [9]*
Note: The values in brackets represent the optimal lag length by the SIC; *𝑝𝑝 < 0.01, **𝑝𝑝 <0.05, ***𝑝𝑝 < 0.1.
Table 4: The ARDL and NARDL Estimation Results
LXU100 LXUTUM LXUHIZ ARDL NARDL ARDL NARDL ARDL NARDL
Short-Term Estimates
∆𝑳𝑳𝑳𝑳𝑳𝑳𝒕𝒕 -1.21(5.66)* -0.79(3.65)* -0.77(6.07)*
∆𝑷𝑷𝑷𝑷𝑷𝑷𝒕𝒕 -1.21(4.88)* -0.71(3.31)* -0.89(4.90)*
∆𝑵𝑵𝑳𝑳𝑵𝑵𝒕𝒕 -1.08(2.49)**
0.01(0.15) -0.06(0.97)
∆𝑳𝑳𝑳𝑳𝑷𝑷𝑳𝑳𝒕𝒕 0.05(0.65) 0.10(1.14) 0.11(1.32) 0.09(1.13) 0.08(1.35) 0.10(1.51) ∆𝑳𝑳𝑳𝑳𝑷𝑷𝑳𝑳𝒕𝒕 -0.40(1.95)* -
0.55(2.32)** 0.14(0.72) 0.24(0.74) -0.02(0.15) -0.13(0.60)
∆𝑳𝑳𝑳𝑳𝑳𝑳𝒕𝒕 0.27(0.70) 0.27(0.71) 0.26(0.70) 0.04(0.37) 0.10(1.33) 0.03(0.32) ∆𝑳𝑳𝑳𝑳𝑳𝑳𝒕𝒕−𝟏𝟏 1.13(3.31)* 1.21(3.47)* 1.01(3.14)* ∆𝑳𝑳𝑳𝑳𝑳𝑳𝒕𝒕−𝑳𝑳 -0.76(2.76)* -
0.67(2.32)**
Long-Term Estimates
𝑳𝑳𝑳𝑳𝑳𝑳 0.17(0.37) -0.38(0.94) -0.27(0.85) 𝑷𝑷𝑷𝑷𝑷𝑷 0.90(1.11) -0.39(0.70) 0.29(0.43) 𝑵𝑵𝑳𝑳𝑵𝑵 -0.35(0.58) 0.11(0.14) -0.45(1.07) 𝑳𝑳𝑳𝑳𝑷𝑷𝑳𝑳 0.42(0.74) 0.82(1.34) 0.66(1.34) 0.57(1.15) 0.56(1.57) 0.70(1.59) 𝑳𝑳𝑳𝑳𝑷𝑷𝑳𝑳 -3.34(1.49) -4.49(1.70)* 0.84(0.73) 1.42(0.73) -0.19(0.14) -0.94(0.54) 𝑳𝑳𝑳𝑳𝑳𝑳 2.15(1.98)** 1.35(1.25) 0.30(0.42) 0.29(0.38) 0.73(1.25) 0.22(0.32) 𝑳𝑳𝑪𝑪𝑪𝑪𝑪𝑪𝒕𝒕𝑪𝑪𝑪𝑪𝒕𝒕 -16.99(1.75)* 2.38(0.14) -2.22(0.24) -4.14(0.39) -5.57(1.05) 7.35(0.56) Diagnostic Statistics
𝑭𝑭 3.66** 3.38*** 3.51** 5.98* 4.22** 5.89*
𝑳𝑳𝑳𝑳𝑳𝑳𝒕𝒕−𝟏𝟏 -0.12(3.07) -0.12(3.12) -0.14(4.02) -0.17(3.78) -0.14(2.77) -0.14(2.64)
𝑾𝑾𝑾𝑾𝑾𝑾𝒕𝒕𝑾𝑾 8.80 11.49 22.54** 25.01* 11.96 14.30*** 𝑳𝑳𝑳𝑳 5.43 4.43 4.47 1.93 0.53 1.56 𝑨𝑨𝑨𝑨𝑨𝑨𝑨𝑨𝑪𝑪𝒕𝒕𝑾𝑾𝑨𝑨 𝑹𝑹𝑳𝑳 0.28 0.28 0.22 0.17 0.20 0.21
Note: The absolute value of t-statistics in parentheses; *𝑝𝑝 < 0.01, **𝑝𝑝 < 0.05, ***𝑝𝑝 < 0.1.
The diagnostic tests are reported in Table 4. The White test statistic is reported to test for heteroscedasticity. The assumption of homoscedasticity is valid except for LXUTUM, LXUHIZ and LXUSIN stock indices. Therefore, since these indices have heteroskedasticity problem, the
, **
Makale Gönderim Tarihi: 09.02.2021 Yayına Kabul Tarihi: 13.06.2021
LXUTEK -2.5164 [0] -7.2457 [1]* -2.7384 [5] -11.6885 [5]* LEX -1.6508 [2] -9.8683 [1]* -1.8448 [2] -8.8639 [4]* LIPI -3.2403 [12]* -2.9344 [12]** -8.6988 [5]* -41.0119 [12]* LCPI -4.5924 [5] -10.2785 [3]* -0.2713 [9] -9.8542 [13]* LM2 -3.0444 [0] -13.5414 [0]* -2.9703 [3] -13.9836 [9]*
Note: The values in brackets represent the optimal lag length by the SIC; *𝑝𝑝 < 0.01, **𝑝𝑝 <0.05, ***𝑝𝑝 < 0.1.
Table 4: The ARDL and NARDL Estimation Results
LXU100 LXUTUM LXUHIZ ARDL NARDL ARDL NARDL ARDL NARDL
Short-Term Estimates
∆𝑳𝑳𝑳𝑳𝑳𝑳𝒕𝒕 -1.21(5.66)* -0.79(3.65)* -0.77(6.07)*
∆𝑷𝑷𝑷𝑷𝑷𝑷𝒕𝒕 -1.21(4.88)* -0.71(3.31)* -0.89(4.90)*
∆𝑵𝑵𝑳𝑳𝑵𝑵𝒕𝒕 -1.08(2.49)**
0.01(0.15) -0.06(0.97)
∆𝑳𝑳𝑳𝑳𝑷𝑷𝑳𝑳𝒕𝒕 0.05(0.65) 0.10(1.14) 0.11(1.32) 0.09(1.13) 0.08(1.35) 0.10(1.51) ∆𝑳𝑳𝑳𝑳𝑷𝑷𝑳𝑳𝒕𝒕 -0.40(1.95)* -
0.55(2.32)** 0.14(0.72) 0.24(0.74) -0.02(0.15) -0.13(0.60)
∆𝑳𝑳𝑳𝑳𝑳𝑳𝒕𝒕 0.27(0.70) 0.27(0.71) 0.26(0.70) 0.04(0.37) 0.10(1.33) 0.03(0.32) ∆𝑳𝑳𝑳𝑳𝑳𝑳𝒕𝒕−𝟏𝟏 1.13(3.31)* 1.21(3.47)* 1.01(3.14)* ∆𝑳𝑳𝑳𝑳𝑳𝑳𝒕𝒕−𝑳𝑳 -0.76(2.76)* -
0.67(2.32)**
Long-Term Estimates
𝑳𝑳𝑳𝑳𝑳𝑳 0.17(0.37) -0.38(0.94) -0.27(0.85) 𝑷𝑷𝑷𝑷𝑷𝑷 0.90(1.11) -0.39(0.70) 0.29(0.43) 𝑵𝑵𝑳𝑳𝑵𝑵 -0.35(0.58) 0.11(0.14) -0.45(1.07) 𝑳𝑳𝑳𝑳𝑷𝑷𝑳𝑳 0.42(0.74) 0.82(1.34) 0.66(1.34) 0.57(1.15) 0.56(1.57) 0.70(1.59) 𝑳𝑳𝑳𝑳𝑷𝑷𝑳𝑳 -3.34(1.49) -4.49(1.70)* 0.84(0.73) 1.42(0.73) -0.19(0.14) -0.94(0.54) 𝑳𝑳𝑳𝑳𝑳𝑳 2.15(1.98)** 1.35(1.25) 0.30(0.42) 0.29(0.38) 0.73(1.25) 0.22(0.32) 𝑳𝑳𝑪𝑪𝑪𝑪𝑪𝑪𝒕𝒕𝑪𝑪𝑪𝑪𝒕𝒕 -16.99(1.75)* 2.38(0.14) -2.22(0.24) -4.14(0.39) -5.57(1.05) 7.35(0.56) Diagnostic Statistics
𝑭𝑭 3.66** 3.38*** 3.51** 5.98* 4.22** 5.89*
𝑳𝑳𝑳𝑳𝑳𝑳𝒕𝒕−𝟏𝟏 -0.12(3.07) -0.12(3.12) -0.14(4.02) -0.17(3.78) -0.14(2.77) -0.14(2.64)
𝑾𝑾𝑾𝑾𝑾𝑾𝒕𝒕𝑾𝑾 8.80 11.49 22.54** 25.01* 11.96 14.30*** 𝑳𝑳𝑳𝑳 5.43 4.43 4.47 1.93 0.53 1.56 𝑨𝑨𝑨𝑨𝑨𝑨𝑨𝑨𝑪𝑪𝒕𝒕𝑾𝑾𝑨𝑨 𝑹𝑹𝑳𝑳 0.28 0.28 0.22 0.17 0.20 0.21
Note: The absolute value of t-statistics in parentheses; *𝑝𝑝 < 0.01, **𝑝𝑝 < 0.05, ***𝑝𝑝 < 0.1.
The diagnostic tests are reported in Table 4. The White test statistic is reported to test for heteroscedasticity. The assumption of homoscedasticity is valid except for LXUTUM, LXUHIZ and LXUSIN stock indices. Therefore, since these indices have heteroskedasticity problem, the
, ***
Makale Gönderim Tarihi: 09.02.2021 Yayına Kabul Tarihi: 13.06.2021
LXUTEK -2.5164 [0] -7.2457 [1]* -2.7384 [5] -11.6885 [5]* LEX -1.6508 [2] -9.8683 [1]* -1.8448 [2] -8.8639 [4]* LIPI -3.2403 [12]* -2.9344 [12]** -8.6988 [5]* -41.0119 [12]* LCPI -4.5924 [5] -10.2785 [3]* -0.2713 [9] -9.8542 [13]* LM2 -3.0444 [0] -13.5414 [0]* -2.9703 [3] -13.9836 [9]*
Note: The values in brackets represent the optimal lag length by the SIC; *𝑝𝑝 < 0.01, **𝑝𝑝 <0.05, ***𝑝𝑝 < 0.1.
Table 4: The ARDL and NARDL Estimation Results
LXU100 LXUTUM LXUHIZ ARDL NARDL ARDL NARDL ARDL NARDL
Short-Term Estimates
∆𝑳𝑳𝑳𝑳𝑳𝑳𝒕𝒕 -1.21(5.66)* -0.79(3.65)* -0.77(6.07)*
∆𝑷𝑷𝑷𝑷𝑷𝑷𝒕𝒕 -1.21(4.88)* -0.71(3.31)* -0.89(4.90)*
∆𝑵𝑵𝑳𝑳𝑵𝑵𝒕𝒕 -1.08(2.49)**
0.01(0.15) -0.06(0.97)
∆𝑳𝑳𝑳𝑳𝑷𝑷𝑳𝑳𝒕𝒕 0.05(0.65) 0.10(1.14) 0.11(1.32) 0.09(1.13) 0.08(1.35) 0.10(1.51) ∆𝑳𝑳𝑳𝑳𝑷𝑷𝑳𝑳𝒕𝒕 -0.40(1.95)* -
0.55(2.32)** 0.14(0.72) 0.24(0.74) -0.02(0.15) -0.13(0.60)
∆𝑳𝑳𝑳𝑳𝑳𝑳𝒕𝒕 0.27(0.70) 0.27(0.71) 0.26(0.70) 0.04(0.37) 0.10(1.33) 0.03(0.32) ∆𝑳𝑳𝑳𝑳𝑳𝑳𝒕𝒕−𝟏𝟏 1.13(3.31)* 1.21(3.47)* 1.01(3.14)* ∆𝑳𝑳𝑳𝑳𝑳𝑳𝒕𝒕−𝑳𝑳 -0.76(2.76)* -
0.67(2.32)**
Long-Term Estimates
𝑳𝑳𝑳𝑳𝑳𝑳 0.17(0.37) -0.38(0.94) -0.27(0.85) 𝑷𝑷𝑷𝑷𝑷𝑷 0.90(1.11) -0.39(0.70) 0.29(0.43) 𝑵𝑵𝑳𝑳𝑵𝑵 -0.35(0.58) 0.11(0.14) -0.45(1.07) 𝑳𝑳𝑳𝑳𝑷𝑷𝑳𝑳 0.42(0.74) 0.82(1.34) 0.66(1.34) 0.57(1.15) 0.56(1.57) 0.70(1.59) 𝑳𝑳𝑳𝑳𝑷𝑷𝑳𝑳 -3.34(1.49) -4.49(1.70)* 0.84(0.73) 1.42(0.73) -0.19(0.14) -0.94(0.54) 𝑳𝑳𝑳𝑳𝑳𝑳 2.15(1.98)** 1.35(1.25) 0.30(0.42) 0.29(0.38) 0.73(1.25) 0.22(0.32) 𝑳𝑳𝑪𝑪𝑪𝑪𝑪𝑪𝒕𝒕𝑪𝑪𝑪𝑪𝒕𝒕 -16.99(1.75)* 2.38(0.14) -2.22(0.24) -4.14(0.39) -5.57(1.05) 7.35(0.56) Diagnostic Statistics
𝑭𝑭 3.66** 3.38*** 3.51** 5.98* 4.22** 5.89*
𝑳𝑳𝑳𝑳𝑳𝑳𝒕𝒕−𝟏𝟏 -0.12(3.07) -0.12(3.12) -0.14(4.02) -0.17(3.78) -0.14(2.77) -0.14(2.64)
𝑾𝑾𝑾𝑾𝑾𝑾𝒕𝒕𝑾𝑾 8.80 11.49 22.54** 25.01* 11.96 14.30*** 𝑳𝑳𝑳𝑳 5.43 4.43 4.47 1.93 0.53 1.56 𝑨𝑨𝑨𝑨𝑨𝑨𝑨𝑨𝑪𝑪𝒕𝒕𝑾𝑾𝑨𝑨 𝑹𝑹𝑳𝑳 0.28 0.28 0.22 0.17 0.20 0.21
Note: The absolute value of t-statistics in parentheses; *𝑝𝑝 < 0.01, **𝑝𝑝 < 0.05, ***𝑝𝑝 < 0.1.
The diagnostic tests are reported in Table 4. The White test statistic is reported to test for heteroscedasticity. The assumption of homoscedasticity is valid except for LXUTUM, LXUHIZ and LXUSIN stock indices. Therefore, since these indices have heteroskedasticity problem, the
.
The diagnostic tests are reported in Table 4. The White test statistic is reported to test for heteroscedasticity. The assumption of homoscedasticity is valid except for LXUTUM, LXUHIZ and LXUSIN stock indices. Therefore, since these indices have heteroskedasticity problem, the robust standard errors are estimated by the White-Huber method. The LM test is reported to test
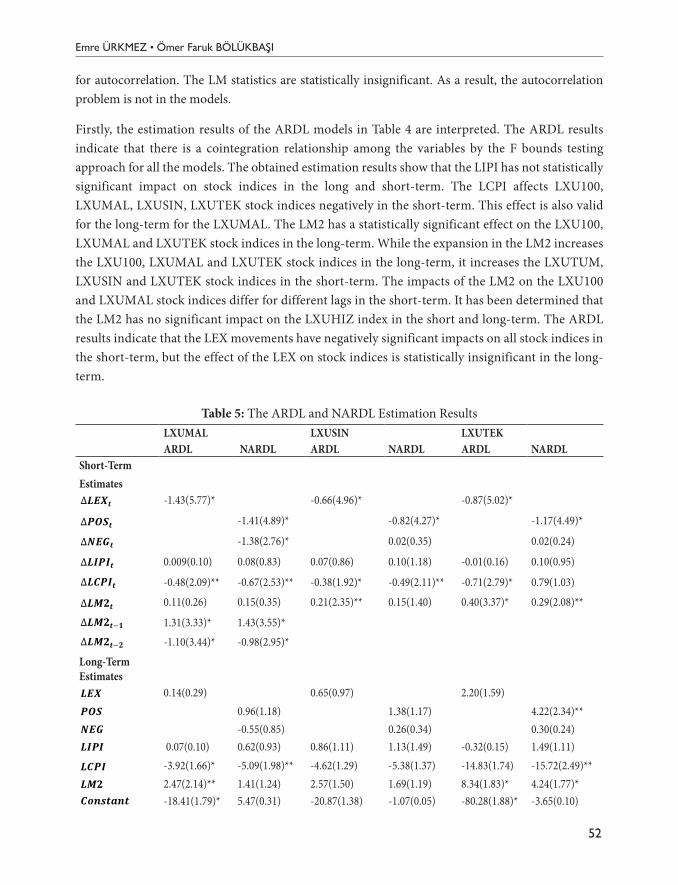
Emre ÜRKMEZ • Ömer Faruk BÖLÜKBAŞI
52
for autocorrelation. The LM statistics are statistically insignificant. As a result, the autocorrelation problem is not in the models.
Firstly, the estimation results of the ARDL models in Table 4 are interpreted. The ARDL results indicate that there is a cointegration relationship among the variables by the F bounds testing approach for all the models. The obtained estimation results show that the LIPI has not statistically significant impact on stock indices in the long and short-term. The LCPI affects LXU100, LXUMAL, LXUSIN, LXUTEK stock indices negatively in the short-term. This effect is also valid for the long-term for the LXUMAL. The LM2 has a statistically significant effect on the LXU100, LXUMAL and LXUTEK stock indices in the long-term. While the expansion in the LM2 increases the LXU100, LXUMAL and LXUTEK stock indices in the long-term, it increases the LXUTUM, LXUSIN and LXUTEK stock indices in the short-term. The impacts of the LM2 on the LXU100 and LXUMAL stock indices differ for different lags in the short-term. It has been determined that the LM2 has no significant impact on the LXUHIZ index in the short and long-term. The ARDL results indicate that the LEX movements have negatively significant impacts on all stock indices in the short-term, but the effect of the LEX on stock indices is statistically insignificant in the long-term.
Table 5: The ARDL and NARDL Estimation ResultsLXUMAL LXUSIN LXUTEKARDL NARDL ARDL NARDL ARDL NARDL
Short-TermEstimates
Makale Gönderim Tarihi: 09.02.2021 Yayına Kabul Tarihi: 13.06.2021
LXUTEK -2.5164 [0] -7.2457 [1]* -2.7384 [5] -11.6885 [5]* LEX -1.6508 [2] -9.8683 [1]* -1.8448 [2] -8.8639 [4]* LIPI -3.2403 [12]* -2.9344 [12]** -8.6988 [5]* -41.0119 [12]* LCPI -4.5924 [5] -10.2785 [3]* -0.2713 [9] -9.8542 [13]* LM2 -3.0444 [0] -13.5414 [0]* -2.9703 [3] -13.9836 [9]*
Note: The values in brackets represent the optimal lag length by the SIC; *𝑝𝑝 < 0.01, **𝑝𝑝 <0.05, ***𝑝𝑝 < 0.1.
Table 4: The ARDL and NARDL Estimation Results
LXU100 LXUTUM LXUHIZ ARDL NARDL ARDL NARDL ARDL NARDL
Short-Term Estimates
∆𝑳𝑳𝑳𝑳𝑳𝑳𝒕𝒕 -1.21(5.66)* -0.79(3.65)* -0.77(6.07)*
∆𝑷𝑷𝑷𝑷𝑷𝑷𝒕𝒕 -1.21(4.88)* -0.71(3.31)* -0.89(4.90)*
∆𝑵𝑵𝑳𝑳𝑵𝑵𝒕𝒕 -1.08(2.49)**
0.01(0.15) -0.06(0.97)
∆𝑳𝑳𝑳𝑳𝑷𝑷𝑳𝑳𝒕𝒕 0.05(0.65) 0.10(1.14) 0.11(1.32) 0.09(1.13) 0.08(1.35) 0.10(1.51) ∆𝑳𝑳𝑳𝑳𝑷𝑷𝑳𝑳𝒕𝒕 -0.40(1.95)* -
0.55(2.32)** 0.14(0.72) 0.24(0.74) -0.02(0.15) -0.13(0.60)
∆𝑳𝑳𝑳𝑳𝑳𝑳𝒕𝒕 0.27(0.70) 0.27(0.71) 0.26(0.70) 0.04(0.37) 0.10(1.33) 0.03(0.32) ∆𝑳𝑳𝑳𝑳𝑳𝑳𝒕𝒕−𝟏𝟏 1.13(3.31)* 1.21(3.47)* 1.01(3.14)* ∆𝑳𝑳𝑳𝑳𝑳𝑳𝒕𝒕−𝑳𝑳 -0.76(2.76)* -
0.67(2.32)**
Long-Term Estimates
𝑳𝑳𝑳𝑳𝑳𝑳 0.17(0.37) -0.38(0.94) -0.27(0.85) 𝑷𝑷𝑷𝑷𝑷𝑷 0.90(1.11) -0.39(0.70) 0.29(0.43) 𝑵𝑵𝑳𝑳𝑵𝑵 -0.35(0.58) 0.11(0.14) -0.45(1.07) 𝑳𝑳𝑳𝑳𝑷𝑷𝑳𝑳 0.42(0.74) 0.82(1.34) 0.66(1.34) 0.57(1.15) 0.56(1.57) 0.70(1.59) 𝑳𝑳𝑳𝑳𝑷𝑷𝑳𝑳 -3.34(1.49) -4.49(1.70)* 0.84(0.73) 1.42(0.73) -0.19(0.14) -0.94(0.54) 𝑳𝑳𝑳𝑳𝑳𝑳 2.15(1.98)** 1.35(1.25) 0.30(0.42) 0.29(0.38) 0.73(1.25) 0.22(0.32) 𝑳𝑳𝑪𝑪𝑪𝑪𝑪𝑪𝒕𝒕𝑪𝑪𝑪𝑪𝒕𝒕 -16.99(1.75)* 2.38(0.14) -2.22(0.24) -4.14(0.39) -5.57(1.05) 7.35(0.56) Diagnostic Statistics
𝑭𝑭 3.66** 3.38*** 3.51** 5.98* 4.22** 5.89*
𝑳𝑳𝑳𝑳𝑳𝑳𝒕𝒕−𝟏𝟏 -0.12(3.07) -0.12(3.12) -0.14(4.02) -0.17(3.78) -0.14(2.77) -0.14(2.64)
𝑾𝑾𝑾𝑾𝑾𝑾𝒕𝒕𝑾𝑾 8.80 11.49 22.54** 25.01* 11.96 14.30*** 𝑳𝑳𝑳𝑳 5.43 4.43 4.47 1.93 0.53 1.56 𝑨𝑨𝑨𝑨𝑨𝑨𝑨𝑨𝑪𝑪𝒕𝒕𝑾𝑾𝑨𝑨 𝑹𝑹𝑳𝑳 0.28 0.28 0.22 0.17 0.20 0.21
Note: The absolute value of t-statistics in parentheses; *𝑝𝑝 < 0.01, **𝑝𝑝 < 0.05, ***𝑝𝑝 < 0.1.
The diagnostic tests are reported in Table 4. The White test statistic is reported to test for heteroscedasticity. The assumption of homoscedasticity is valid except for LXUTUM, LXUHIZ and LXUSIN stock indices. Therefore, since these indices have heteroskedasticity problem, the
-1.43(5.77)* -0.66(4.96)* -0.87(5.02)*
Makale Gönderim Tarihi: 09.02.2021 Yayına Kabul Tarihi: 13.06.2021
LXUTEK -2.5164 [0] -7.2457 [1]* -2.7384 [5] -11.6885 [5]* LEX -1.6508 [2] -9.8683 [1]* -1.8448 [2] -8.8639 [4]* LIPI -3.2403 [12]* -2.9344 [12]** -8.6988 [5]* -41.0119 [12]* LCPI -4.5924 [5] -10.2785 [3]* -0.2713 [9] -9.8542 [13]* LM2 -3.0444 [0] -13.5414 [0]* -2.9703 [3] -13.9836 [9]*
Note: The values in brackets represent the optimal lag length by the SIC; *𝑝𝑝 < 0.01, **𝑝𝑝 <0.05, ***𝑝𝑝 < 0.1.
Table 4: The ARDL and NARDL Estimation Results
LXU100 LXUTUM LXUHIZ ARDL NARDL ARDL NARDL ARDL NARDL
Short-Term Estimates
∆𝑳𝑳𝑳𝑳𝑳𝑳𝒕𝒕 -1.21(5.66)* -0.79(3.65)* -0.77(6.07)*
∆𝑷𝑷𝑷𝑷𝑷𝑷𝒕𝒕 -1.21(4.88)* -0.71(3.31)* -0.89(4.90)*
∆𝑵𝑵𝑳𝑳𝑵𝑵𝒕𝒕 -1.08(2.49)**
0.01(0.15) -0.06(0.97)
∆𝑳𝑳𝑳𝑳𝑷𝑷𝑳𝑳𝒕𝒕 0.05(0.65) 0.10(1.14) 0.11(1.32) 0.09(1.13) 0.08(1.35) 0.10(1.51) ∆𝑳𝑳𝑳𝑳𝑷𝑷𝑳𝑳𝒕𝒕 -0.40(1.95)* -
0.55(2.32)** 0.14(0.72) 0.24(0.74) -0.02(0.15) -0.13(0.60)
∆𝑳𝑳𝑳𝑳𝑳𝑳𝒕𝒕 0.27(0.70) 0.27(0.71) 0.26(0.70) 0.04(0.37) 0.10(1.33) 0.03(0.32) ∆𝑳𝑳𝑳𝑳𝑳𝑳𝒕𝒕−𝟏𝟏 1.13(3.31)* 1.21(3.47)* 1.01(3.14)* ∆𝑳𝑳𝑳𝑳𝑳𝑳𝒕𝒕−𝑳𝑳 -0.76(2.76)* -
0.67(2.32)**
Long-Term Estimates
𝑳𝑳𝑳𝑳𝑳𝑳 0.17(0.37) -0.38(0.94) -0.27(0.85) 𝑷𝑷𝑷𝑷𝑷𝑷 0.90(1.11) -0.39(0.70) 0.29(0.43) 𝑵𝑵𝑳𝑳𝑵𝑵 -0.35(0.58) 0.11(0.14) -0.45(1.07) 𝑳𝑳𝑳𝑳𝑷𝑷𝑳𝑳 0.42(0.74) 0.82(1.34) 0.66(1.34) 0.57(1.15) 0.56(1.57) 0.70(1.59) 𝑳𝑳𝑳𝑳𝑷𝑷𝑳𝑳 -3.34(1.49) -4.49(1.70)* 0.84(0.73) 1.42(0.73) -0.19(0.14) -0.94(0.54) 𝑳𝑳𝑳𝑳𝑳𝑳 2.15(1.98)** 1.35(1.25) 0.30(0.42) 0.29(0.38) 0.73(1.25) 0.22(0.32) 𝑳𝑳𝑪𝑪𝑪𝑪𝑪𝑪𝒕𝒕𝑪𝑪𝑪𝑪𝒕𝒕 -16.99(1.75)* 2.38(0.14) -2.22(0.24) -4.14(0.39) -5.57(1.05) 7.35(0.56) Diagnostic Statistics
𝑭𝑭 3.66** 3.38*** 3.51** 5.98* 4.22** 5.89*
𝑳𝑳𝑳𝑳𝑳𝑳𝒕𝒕−𝟏𝟏 -0.12(3.07) -0.12(3.12) -0.14(4.02) -0.17(3.78) -0.14(2.77) -0.14(2.64)
𝑾𝑾𝑾𝑾𝑾𝑾𝒕𝒕𝑾𝑾 8.80 11.49 22.54** 25.01* 11.96 14.30*** 𝑳𝑳𝑳𝑳 5.43 4.43 4.47 1.93 0.53 1.56 𝑨𝑨𝑨𝑨𝑨𝑨𝑨𝑨𝑪𝑪𝒕𝒕𝑾𝑾𝑨𝑨 𝑹𝑹𝑳𝑳 0.28 0.28 0.22 0.17 0.20 0.21
Note: The absolute value of t-statistics in parentheses; *𝑝𝑝 < 0.01, **𝑝𝑝 < 0.05, ***𝑝𝑝 < 0.1.
The diagnostic tests are reported in Table 4. The White test statistic is reported to test for heteroscedasticity. The assumption of homoscedasticity is valid except for LXUTUM, LXUHIZ and LXUSIN stock indices. Therefore, since these indices have heteroskedasticity problem, the
-1.41(4.89)* -0.82(4.27)* -1.17(4.49)*
Makale Gönderim Tarihi: 09.02.2021 Yayına Kabul Tarihi: 13.06.2021
LXUTEK -2.5164 [0] -7.2457 [1]* -2.7384 [5] -11.6885 [5]* LEX -1.6508 [2] -9.8683 [1]* -1.8448 [2] -8.8639 [4]* LIPI -3.2403 [12]* -2.9344 [12]** -8.6988 [5]* -41.0119 [12]* LCPI -4.5924 [5] -10.2785 [3]* -0.2713 [9] -9.8542 [13]* LM2 -3.0444 [0] -13.5414 [0]* -2.9703 [3] -13.9836 [9]*
Note: The values in brackets represent the optimal lag length by the SIC; *𝑝𝑝 < 0.01, **𝑝𝑝 <0.05, ***𝑝𝑝 < 0.1.
Table 4: The ARDL and NARDL Estimation Results
LXU100 LXUTUM LXUHIZ ARDL NARDL ARDL NARDL ARDL NARDL
Short-Term Estimates
∆𝑳𝑳𝑳𝑳𝑳𝑳𝒕𝒕 -1.21(5.66)* -0.79(3.65)* -0.77(6.07)*
∆𝑷𝑷𝑷𝑷𝑷𝑷𝒕𝒕 -1.21(4.88)* -0.71(3.31)* -0.89(4.90)*
∆𝑵𝑵𝑳𝑳𝑵𝑵𝒕𝒕 -1.08(2.49)**
0.01(0.15) -0.06(0.97)
∆𝑳𝑳𝑳𝑳𝑷𝑷𝑳𝑳𝒕𝒕 0.05(0.65) 0.10(1.14) 0.11(1.32) 0.09(1.13) 0.08(1.35) 0.10(1.51) ∆𝑳𝑳𝑳𝑳𝑷𝑷𝑳𝑳𝒕𝒕 -0.40(1.95)* -
0.55(2.32)** 0.14(0.72) 0.24(0.74) -0.02(0.15) -0.13(0.60)
∆𝑳𝑳𝑳𝑳𝑳𝑳𝒕𝒕 0.27(0.70) 0.27(0.71) 0.26(0.70) 0.04(0.37) 0.10(1.33) 0.03(0.32) ∆𝑳𝑳𝑳𝑳𝑳𝑳𝒕𝒕−𝟏𝟏 1.13(3.31)* 1.21(3.47)* 1.01(3.14)* ∆𝑳𝑳𝑳𝑳𝑳𝑳𝒕𝒕−𝑳𝑳 -0.76(2.76)* -
0.67(2.32)**
Long-Term Estimates
𝑳𝑳𝑳𝑳𝑳𝑳 0.17(0.37) -0.38(0.94) -0.27(0.85) 𝑷𝑷𝑷𝑷𝑷𝑷 0.90(1.11) -0.39(0.70) 0.29(0.43) 𝑵𝑵𝑳𝑳𝑵𝑵 -0.35(0.58) 0.11(0.14) -0.45(1.07) 𝑳𝑳𝑳𝑳𝑷𝑷𝑳𝑳 0.42(0.74) 0.82(1.34) 0.66(1.34) 0.57(1.15) 0.56(1.57) 0.70(1.59) 𝑳𝑳𝑳𝑳𝑷𝑷𝑳𝑳 -3.34(1.49) -4.49(1.70)* 0.84(0.73) 1.42(0.73) -0.19(0.14) -0.94(0.54) 𝑳𝑳𝑳𝑳𝑳𝑳 2.15(1.98)** 1.35(1.25) 0.30(0.42) 0.29(0.38) 0.73(1.25) 0.22(0.32) 𝑳𝑳𝑪𝑪𝑪𝑪𝑪𝑪𝒕𝒕𝑪𝑪𝑪𝑪𝒕𝒕 -16.99(1.75)* 2.38(0.14) -2.22(0.24) -4.14(0.39) -5.57(1.05) 7.35(0.56) Diagnostic Statistics
𝑭𝑭 3.66** 3.38*** 3.51** 5.98* 4.22** 5.89*
𝑳𝑳𝑳𝑳𝑳𝑳𝒕𝒕−𝟏𝟏 -0.12(3.07) -0.12(3.12) -0.14(4.02) -0.17(3.78) -0.14(2.77) -0.14(2.64)
𝑾𝑾𝑾𝑾𝑾𝑾𝒕𝒕𝑾𝑾 8.80 11.49 22.54** 25.01* 11.96 14.30*** 𝑳𝑳𝑳𝑳 5.43 4.43 4.47 1.93 0.53 1.56 𝑨𝑨𝑨𝑨𝑨𝑨𝑨𝑨𝑪𝑪𝒕𝒕𝑾𝑾𝑨𝑨 𝑹𝑹𝑳𝑳 0.28 0.28 0.22 0.17 0.20 0.21
Note: The absolute value of t-statistics in parentheses; *𝑝𝑝 < 0.01, **𝑝𝑝 < 0.05, ***𝑝𝑝 < 0.1.
The diagnostic tests are reported in Table 4. The White test statistic is reported to test for heteroscedasticity. The assumption of homoscedasticity is valid except for LXUTUM, LXUHIZ and LXUSIN stock indices. Therefore, since these indices have heteroskedasticity problem, the
-1.38(2.76)* 0.02(0.35) 0.02(0.24)
Makale Gönderim Tarihi: 09.02.2021 Yayına Kabul Tarihi: 13.06.2021
LXUTEK -2.5164 [0] -7.2457 [1]* -2.7384 [5] -11.6885 [5]* LEX -1.6508 [2] -9.8683 [1]* -1.8448 [2] -8.8639 [4]* LIPI -3.2403 [12]* -2.9344 [12]** -8.6988 [5]* -41.0119 [12]* LCPI -4.5924 [5] -10.2785 [3]* -0.2713 [9] -9.8542 [13]* LM2 -3.0444 [0] -13.5414 [0]* -2.9703 [3] -13.9836 [9]*
Note: The values in brackets represent the optimal lag length by the SIC; *𝑝𝑝 < 0.01, **𝑝𝑝 <0.05, ***𝑝𝑝 < 0.1.
Table 4: The ARDL and NARDL Estimation Results
LXU100 LXUTUM LXUHIZ ARDL NARDL ARDL NARDL ARDL NARDL
Short-Term Estimates
∆𝑳𝑳𝑳𝑳𝑳𝑳𝒕𝒕 -1.21(5.66)* -0.79(3.65)* -0.77(6.07)*
∆𝑷𝑷𝑷𝑷𝑷𝑷𝒕𝒕 -1.21(4.88)* -0.71(3.31)* -0.89(4.90)*
∆𝑵𝑵𝑳𝑳𝑵𝑵𝒕𝒕 -1.08(2.49)**
0.01(0.15) -0.06(0.97)
∆𝑳𝑳𝑳𝑳𝑷𝑷𝑳𝑳𝒕𝒕 0.05(0.65) 0.10(1.14) 0.11(1.32) 0.09(1.13) 0.08(1.35) 0.10(1.51) ∆𝑳𝑳𝑳𝑳𝑷𝑷𝑳𝑳𝒕𝒕 -0.40(1.95)* -
0.55(2.32)** 0.14(0.72) 0.24(0.74) -0.02(0.15) -0.13(0.60)
∆𝑳𝑳𝑳𝑳𝑳𝑳𝒕𝒕 0.27(0.70) 0.27(0.71) 0.26(0.70) 0.04(0.37) 0.10(1.33) 0.03(0.32) ∆𝑳𝑳𝑳𝑳𝑳𝑳𝒕𝒕−𝟏𝟏 1.13(3.31)* 1.21(3.47)* 1.01(3.14)* ∆𝑳𝑳𝑳𝑳𝑳𝑳𝒕𝒕−𝑳𝑳 -0.76(2.76)* -
0.67(2.32)**
Long-Term Estimates
𝑳𝑳𝑳𝑳𝑳𝑳 0.17(0.37) -0.38(0.94) -0.27(0.85) 𝑷𝑷𝑷𝑷𝑷𝑷 0.90(1.11) -0.39(0.70) 0.29(0.43) 𝑵𝑵𝑳𝑳𝑵𝑵 -0.35(0.58) 0.11(0.14) -0.45(1.07) 𝑳𝑳𝑳𝑳𝑷𝑷𝑳𝑳 0.42(0.74) 0.82(1.34) 0.66(1.34) 0.57(1.15) 0.56(1.57) 0.70(1.59) 𝑳𝑳𝑳𝑳𝑷𝑷𝑳𝑳 -3.34(1.49) -4.49(1.70)* 0.84(0.73) 1.42(0.73) -0.19(0.14) -0.94(0.54) 𝑳𝑳𝑳𝑳𝑳𝑳 2.15(1.98)** 1.35(1.25) 0.30(0.42) 0.29(0.38) 0.73(1.25) 0.22(0.32) 𝑳𝑳𝑪𝑪𝑪𝑪𝑪𝑪𝒕𝒕𝑪𝑪𝑪𝑪𝒕𝒕 -16.99(1.75)* 2.38(0.14) -2.22(0.24) -4.14(0.39) -5.57(1.05) 7.35(0.56) Diagnostic Statistics
𝑭𝑭 3.66** 3.38*** 3.51** 5.98* 4.22** 5.89*
𝑳𝑳𝑳𝑳𝑳𝑳𝒕𝒕−𝟏𝟏 -0.12(3.07) -0.12(3.12) -0.14(4.02) -0.17(3.78) -0.14(2.77) -0.14(2.64)
𝑾𝑾𝑾𝑾𝑾𝑾𝒕𝒕𝑾𝑾 8.80 11.49 22.54** 25.01* 11.96 14.30*** 𝑳𝑳𝑳𝑳 5.43 4.43 4.47 1.93 0.53 1.56 𝑨𝑨𝑨𝑨𝑨𝑨𝑨𝑨𝑪𝑪𝒕𝒕𝑾𝑾𝑨𝑨 𝑹𝑹𝑳𝑳 0.28 0.28 0.22 0.17 0.20 0.21
Note: The absolute value of t-statistics in parentheses; *𝑝𝑝 < 0.01, **𝑝𝑝 < 0.05, ***𝑝𝑝 < 0.1.
The diagnostic tests are reported in Table 4. The White test statistic is reported to test for heteroscedasticity. The assumption of homoscedasticity is valid except for LXUTUM, LXUHIZ and LXUSIN stock indices. Therefore, since these indices have heteroskedasticity problem, the
0.009(0.10) 0.08(0.83) 0.07(0.86) 0.10(1.18) -0.01(0.16) 0.10(0.95)
Makale Gönderim Tarihi: 09.02.2021 Yayına Kabul Tarihi: 13.06.2021
LXUTEK -2.5164 [0] -7.2457 [1]* -2.7384 [5] -11.6885 [5]* LEX -1.6508 [2] -9.8683 [1]* -1.8448 [2] -8.8639 [4]* LIPI -3.2403 [12]* -2.9344 [12]** -8.6988 [5]* -41.0119 [12]* LCPI -4.5924 [5] -10.2785 [3]* -0.2713 [9] -9.8542 [13]* LM2 -3.0444 [0] -13.5414 [0]* -2.9703 [3] -13.9836 [9]*
Note: The values in brackets represent the optimal lag length by the SIC; *𝑝𝑝 < 0.01, **𝑝𝑝 <0.05, ***𝑝𝑝 < 0.1.
Table 4: The ARDL and NARDL Estimation Results
LXU100 LXUTUM LXUHIZ ARDL NARDL ARDL NARDL ARDL NARDL
Short-Term Estimates
∆𝑳𝑳𝑳𝑳𝑳𝑳𝒕𝒕 -1.21(5.66)* -0.79(3.65)* -0.77(6.07)*
∆𝑷𝑷𝑷𝑷𝑷𝑷𝒕𝒕 -1.21(4.88)* -0.71(3.31)* -0.89(4.90)*
∆𝑵𝑵𝑳𝑳𝑵𝑵𝒕𝒕 -1.08(2.49)**
0.01(0.15) -0.06(0.97)
∆𝑳𝑳𝑳𝑳𝑷𝑷𝑳𝑳𝒕𝒕 0.05(0.65) 0.10(1.14) 0.11(1.32) 0.09(1.13) 0.08(1.35) 0.10(1.51) ∆𝑳𝑳𝑳𝑳𝑷𝑷𝑳𝑳𝒕𝒕 -0.40(1.95)* -
0.55(2.32)** 0.14(0.72) 0.24(0.74) -0.02(0.15) -0.13(0.60)
∆𝑳𝑳𝑳𝑳𝑳𝑳𝒕𝒕 0.27(0.70) 0.27(0.71) 0.26(0.70) 0.04(0.37) 0.10(1.33) 0.03(0.32) ∆𝑳𝑳𝑳𝑳𝑳𝑳𝒕𝒕−𝟏𝟏 1.13(3.31)* 1.21(3.47)* 1.01(3.14)* ∆𝑳𝑳𝑳𝑳𝑳𝑳𝒕𝒕−𝑳𝑳 -0.76(2.76)* -
0.67(2.32)**
Long-Term Estimates
𝑳𝑳𝑳𝑳𝑳𝑳 0.17(0.37) -0.38(0.94) -0.27(0.85) 𝑷𝑷𝑷𝑷𝑷𝑷 0.90(1.11) -0.39(0.70) 0.29(0.43) 𝑵𝑵𝑳𝑳𝑵𝑵 -0.35(0.58) 0.11(0.14) -0.45(1.07) 𝑳𝑳𝑳𝑳𝑷𝑷𝑳𝑳 0.42(0.74) 0.82(1.34) 0.66(1.34) 0.57(1.15) 0.56(1.57) 0.70(1.59) 𝑳𝑳𝑳𝑳𝑷𝑷𝑳𝑳 -3.34(1.49) -4.49(1.70)* 0.84(0.73) 1.42(0.73) -0.19(0.14) -0.94(0.54) 𝑳𝑳𝑳𝑳𝑳𝑳 2.15(1.98)** 1.35(1.25) 0.30(0.42) 0.29(0.38) 0.73(1.25) 0.22(0.32) 𝑳𝑳𝑪𝑪𝑪𝑪𝑪𝑪𝒕𝒕𝑪𝑪𝑪𝑪𝒕𝒕 -16.99(1.75)* 2.38(0.14) -2.22(0.24) -4.14(0.39) -5.57(1.05) 7.35(0.56) Diagnostic Statistics
𝑭𝑭 3.66** 3.38*** 3.51** 5.98* 4.22** 5.89*
𝑳𝑳𝑳𝑳𝑳𝑳𝒕𝒕−𝟏𝟏 -0.12(3.07) -0.12(3.12) -0.14(4.02) -0.17(3.78) -0.14(2.77) -0.14(2.64)
𝑾𝑾𝑾𝑾𝑾𝑾𝒕𝒕𝑾𝑾 8.80 11.49 22.54** 25.01* 11.96 14.30*** 𝑳𝑳𝑳𝑳 5.43 4.43 4.47 1.93 0.53 1.56 𝑨𝑨𝑨𝑨𝑨𝑨𝑨𝑨𝑪𝑪𝒕𝒕𝑾𝑾𝑨𝑨 𝑹𝑹𝑳𝑳 0.28 0.28 0.22 0.17 0.20 0.21
Note: The absolute value of t-statistics in parentheses; *𝑝𝑝 < 0.01, **𝑝𝑝 < 0.05, ***𝑝𝑝 < 0.1.
The diagnostic tests are reported in Table 4. The White test statistic is reported to test for heteroscedasticity. The assumption of homoscedasticity is valid except for LXUTUM, LXUHIZ and LXUSIN stock indices. Therefore, since these indices have heteroskedasticity problem, the
-0.48(2.09)** -0.67(2.53)** -0.38(1.92)* -0.49(2.11)** -0.71(2.79)* 0.79(1.03)
Makale Gönderim Tarihi: 09.02.2021 Yayına Kabul Tarihi: 13.06.2021
LXUTEK -2.5164 [0] -7.2457 [1]* -2.7384 [5] -11.6885 [5]* LEX -1.6508 [2] -9.8683 [1]* -1.8448 [2] -8.8639 [4]* LIPI -3.2403 [12]* -2.9344 [12]** -8.6988 [5]* -41.0119 [12]* LCPI -4.5924 [5] -10.2785 [3]* -0.2713 [9] -9.8542 [13]* LM2 -3.0444 [0] -13.5414 [0]* -2.9703 [3] -13.9836 [9]*
Note: The values in brackets represent the optimal lag length by the SIC; *𝑝𝑝 < 0.01, **𝑝𝑝 <0.05, ***𝑝𝑝 < 0.1.
Table 4: The ARDL and NARDL Estimation Results
LXU100 LXUTUM LXUHIZ ARDL NARDL ARDL NARDL ARDL NARDL
Short-Term Estimates
∆𝑳𝑳𝑳𝑳𝑳𝑳𝒕𝒕 -1.21(5.66)* -0.79(3.65)* -0.77(6.07)*
∆𝑷𝑷𝑷𝑷𝑷𝑷𝒕𝒕 -1.21(4.88)* -0.71(3.31)* -0.89(4.90)*
∆𝑵𝑵𝑳𝑳𝑵𝑵𝒕𝒕 -1.08(2.49)**
0.01(0.15) -0.06(0.97)
∆𝑳𝑳𝑳𝑳𝑷𝑷𝑳𝑳𝒕𝒕 0.05(0.65) 0.10(1.14) 0.11(1.32) 0.09(1.13) 0.08(1.35) 0.10(1.51) ∆𝑳𝑳𝑳𝑳𝑷𝑷𝑳𝑳𝒕𝒕 -0.40(1.95)* -
0.55(2.32)** 0.14(0.72) 0.24(0.74) -0.02(0.15) -0.13(0.60)
∆𝑳𝑳𝑳𝑳𝑳𝑳𝒕𝒕 0.27(0.70) 0.27(0.71) 0.26(0.70) 0.04(0.37) 0.10(1.33) 0.03(0.32) ∆𝑳𝑳𝑳𝑳𝑳𝑳𝒕𝒕−𝟏𝟏 1.13(3.31)* 1.21(3.47)* 1.01(3.14)* ∆𝑳𝑳𝑳𝑳𝑳𝑳𝒕𝒕−𝑳𝑳 -0.76(2.76)* -
0.67(2.32)**
Long-Term Estimates
𝑳𝑳𝑳𝑳𝑳𝑳 0.17(0.37) -0.38(0.94) -0.27(0.85) 𝑷𝑷𝑷𝑷𝑷𝑷 0.90(1.11) -0.39(0.70) 0.29(0.43) 𝑵𝑵𝑳𝑳𝑵𝑵 -0.35(0.58) 0.11(0.14) -0.45(1.07) 𝑳𝑳𝑳𝑳𝑷𝑷𝑳𝑳 0.42(0.74) 0.82(1.34) 0.66(1.34) 0.57(1.15) 0.56(1.57) 0.70(1.59) 𝑳𝑳𝑳𝑳𝑷𝑷𝑳𝑳 -3.34(1.49) -4.49(1.70)* 0.84(0.73) 1.42(0.73) -0.19(0.14) -0.94(0.54) 𝑳𝑳𝑳𝑳𝑳𝑳 2.15(1.98)** 1.35(1.25) 0.30(0.42) 0.29(0.38) 0.73(1.25) 0.22(0.32) 𝑳𝑳𝑪𝑪𝑪𝑪𝑪𝑪𝒕𝒕𝑪𝑪𝑪𝑪𝒕𝒕 -16.99(1.75)* 2.38(0.14) -2.22(0.24) -4.14(0.39) -5.57(1.05) 7.35(0.56) Diagnostic Statistics
𝑭𝑭 3.66** 3.38*** 3.51** 5.98* 4.22** 5.89*
𝑳𝑳𝑳𝑳𝑳𝑳𝒕𝒕−𝟏𝟏 -0.12(3.07) -0.12(3.12) -0.14(4.02) -0.17(3.78) -0.14(2.77) -0.14(2.64)
𝑾𝑾𝑾𝑾𝑾𝑾𝒕𝒕𝑾𝑾 8.80 11.49 22.54** 25.01* 11.96 14.30*** 𝑳𝑳𝑳𝑳 5.43 4.43 4.47 1.93 0.53 1.56 𝑨𝑨𝑨𝑨𝑨𝑨𝑨𝑨𝑪𝑪𝒕𝒕𝑾𝑾𝑨𝑨 𝑹𝑹𝑳𝑳 0.28 0.28 0.22 0.17 0.20 0.21
Note: The absolute value of t-statistics in parentheses; *𝑝𝑝 < 0.01, **𝑝𝑝 < 0.05, ***𝑝𝑝 < 0.1.
The diagnostic tests are reported in Table 4. The White test statistic is reported to test for heteroscedasticity. The assumption of homoscedasticity is valid except for LXUTUM, LXUHIZ and LXUSIN stock indices. Therefore, since these indices have heteroskedasticity problem, the
0.11(0.26) 0.15(0.35) 0.21(2.35)** 0.15(1.40) 0.40(3.37)* 0.29(2.08)**
Makale Gönderim Tarihi: 09.02.2021 Yayına Kabul Tarihi: 13.06.2021
LXUTEK -2.5164 [0] -7.2457 [1]* -2.7384 [5] -11.6885 [5]* LEX -1.6508 [2] -9.8683 [1]* -1.8448 [2] -8.8639 [4]* LIPI -3.2403 [12]* -2.9344 [12]** -8.6988 [5]* -41.0119 [12]* LCPI -4.5924 [5] -10.2785 [3]* -0.2713 [9] -9.8542 [13]* LM2 -3.0444 [0] -13.5414 [0]* -2.9703 [3] -13.9836 [9]*
Note: The values in brackets represent the optimal lag length by the SIC; *𝑝𝑝 < 0.01, **𝑝𝑝 <0.05, ***𝑝𝑝 < 0.1.
Table 4: The ARDL and NARDL Estimation Results
LXU100 LXUTUM LXUHIZ ARDL NARDL ARDL NARDL ARDL NARDL
Short-Term Estimates
∆𝑳𝑳𝑳𝑳𝑳𝑳𝒕𝒕 -1.21(5.66)* -0.79(3.65)* -0.77(6.07)*
∆𝑷𝑷𝑷𝑷𝑷𝑷𝒕𝒕 -1.21(4.88)* -0.71(3.31)* -0.89(4.90)*
∆𝑵𝑵𝑳𝑳𝑵𝑵𝒕𝒕 -1.08(2.49)**
0.01(0.15) -0.06(0.97)
∆𝑳𝑳𝑳𝑳𝑷𝑷𝑳𝑳𝒕𝒕 0.05(0.65) 0.10(1.14) 0.11(1.32) 0.09(1.13) 0.08(1.35) 0.10(1.51) ∆𝑳𝑳𝑳𝑳𝑷𝑷𝑳𝑳𝒕𝒕 -0.40(1.95)* -
0.55(2.32)** 0.14(0.72) 0.24(0.74) -0.02(0.15) -0.13(0.60)
∆𝑳𝑳𝑳𝑳𝑳𝑳𝒕𝒕 0.27(0.70) 0.27(0.71) 0.26(0.70) 0.04(0.37) 0.10(1.33) 0.03(0.32) ∆𝑳𝑳𝑳𝑳𝑳𝑳𝒕𝒕−𝟏𝟏 1.13(3.31)* 1.21(3.47)* 1.01(3.14)* ∆𝑳𝑳𝑳𝑳𝑳𝑳𝒕𝒕−𝑳𝑳 -0.76(2.76)* -
0.67(2.32)**
Long-Term Estimates
𝑳𝑳𝑳𝑳𝑳𝑳 0.17(0.37) -0.38(0.94) -0.27(0.85) 𝑷𝑷𝑷𝑷𝑷𝑷 0.90(1.11) -0.39(0.70) 0.29(0.43) 𝑵𝑵𝑳𝑳𝑵𝑵 -0.35(0.58) 0.11(0.14) -0.45(1.07) 𝑳𝑳𝑳𝑳𝑷𝑷𝑳𝑳 0.42(0.74) 0.82(1.34) 0.66(1.34) 0.57(1.15) 0.56(1.57) 0.70(1.59) 𝑳𝑳𝑳𝑳𝑷𝑷𝑳𝑳 -3.34(1.49) -4.49(1.70)* 0.84(0.73) 1.42(0.73) -0.19(0.14) -0.94(0.54) 𝑳𝑳𝑳𝑳𝑳𝑳 2.15(1.98)** 1.35(1.25) 0.30(0.42) 0.29(0.38) 0.73(1.25) 0.22(0.32) 𝑳𝑳𝑪𝑪𝑪𝑪𝑪𝑪𝒕𝒕𝑪𝑪𝑪𝑪𝒕𝒕 -16.99(1.75)* 2.38(0.14) -2.22(0.24) -4.14(0.39) -5.57(1.05) 7.35(0.56) Diagnostic Statistics
𝑭𝑭 3.66** 3.38*** 3.51** 5.98* 4.22** 5.89*
𝑳𝑳𝑳𝑳𝑳𝑳𝒕𝒕−𝟏𝟏 -0.12(3.07) -0.12(3.12) -0.14(4.02) -0.17(3.78) -0.14(2.77) -0.14(2.64)
𝑾𝑾𝑾𝑾𝑾𝑾𝒕𝒕𝑾𝑾 8.80 11.49 22.54** 25.01* 11.96 14.30*** 𝑳𝑳𝑳𝑳 5.43 4.43 4.47 1.93 0.53 1.56 𝑨𝑨𝑨𝑨𝑨𝑨𝑨𝑨𝑪𝑪𝒕𝒕𝑾𝑾𝑨𝑨 𝑹𝑹𝑳𝑳 0.28 0.28 0.22 0.17 0.20 0.21
Note: The absolute value of t-statistics in parentheses; *𝑝𝑝 < 0.01, **𝑝𝑝 < 0.05, ***𝑝𝑝 < 0.1.
The diagnostic tests are reported in Table 4. The White test statistic is reported to test for heteroscedasticity. The assumption of homoscedasticity is valid except for LXUTUM, LXUHIZ and LXUSIN stock indices. Therefore, since these indices have heteroskedasticity problem, the
1.31(3.33)* 1.43(3.55)*
Makale Gönderim Tarihi: 09.02.2021 Yayına Kabul Tarihi: 13.06.2021
LXUTEK -2.5164 [0] -7.2457 [1]* -2.7384 [5] -11.6885 [5]* LEX -1.6508 [2] -9.8683 [1]* -1.8448 [2] -8.8639 [4]* LIPI -3.2403 [12]* -2.9344 [12]** -8.6988 [5]* -41.0119 [12]* LCPI -4.5924 [5] -10.2785 [3]* -0.2713 [9] -9.8542 [13]* LM2 -3.0444 [0] -13.5414 [0]* -2.9703 [3] -13.9836 [9]*
Note: The values in brackets represent the optimal lag length by the SIC; *𝑝𝑝 < 0.01, **𝑝𝑝 <0.05, ***𝑝𝑝 < 0.1.
Table 4: The ARDL and NARDL Estimation Results
LXU100 LXUTUM LXUHIZ ARDL NARDL ARDL NARDL ARDL NARDL
Short-Term Estimates
∆𝑳𝑳𝑳𝑳𝑳𝑳𝒕𝒕 -1.21(5.66)* -0.79(3.65)* -0.77(6.07)*
∆𝑷𝑷𝑷𝑷𝑷𝑷𝒕𝒕 -1.21(4.88)* -0.71(3.31)* -0.89(4.90)*
∆𝑵𝑵𝑳𝑳𝑵𝑵𝒕𝒕 -1.08(2.49)**
0.01(0.15) -0.06(0.97)
∆𝑳𝑳𝑳𝑳𝑷𝑷𝑳𝑳𝒕𝒕 0.05(0.65) 0.10(1.14) 0.11(1.32) 0.09(1.13) 0.08(1.35) 0.10(1.51) ∆𝑳𝑳𝑳𝑳𝑷𝑷𝑳𝑳𝒕𝒕 -0.40(1.95)* -
0.55(2.32)** 0.14(0.72) 0.24(0.74) -0.02(0.15) -0.13(0.60)
∆𝑳𝑳𝑳𝑳𝑳𝑳𝒕𝒕 0.27(0.70) 0.27(0.71) 0.26(0.70) 0.04(0.37) 0.10(1.33) 0.03(0.32) ∆𝑳𝑳𝑳𝑳𝑳𝑳𝒕𝒕−𝟏𝟏 1.13(3.31)* 1.21(3.47)* 1.01(3.14)* ∆𝑳𝑳𝑳𝑳𝑳𝑳𝒕𝒕−𝑳𝑳 -0.76(2.76)* -
0.67(2.32)**
Long-Term Estimates
𝑳𝑳𝑳𝑳𝑳𝑳 0.17(0.37) -0.38(0.94) -0.27(0.85) 𝑷𝑷𝑷𝑷𝑷𝑷 0.90(1.11) -0.39(0.70) 0.29(0.43) 𝑵𝑵𝑳𝑳𝑵𝑵 -0.35(0.58) 0.11(0.14) -0.45(1.07) 𝑳𝑳𝑳𝑳𝑷𝑷𝑳𝑳 0.42(0.74) 0.82(1.34) 0.66(1.34) 0.57(1.15) 0.56(1.57) 0.70(1.59) 𝑳𝑳𝑳𝑳𝑷𝑷𝑳𝑳 -3.34(1.49) -4.49(1.70)* 0.84(0.73) 1.42(0.73) -0.19(0.14) -0.94(0.54) 𝑳𝑳𝑳𝑳𝑳𝑳 2.15(1.98)** 1.35(1.25) 0.30(0.42) 0.29(0.38) 0.73(1.25) 0.22(0.32) 𝑳𝑳𝑪𝑪𝑪𝑪𝑪𝑪𝒕𝒕𝑪𝑪𝑪𝑪𝒕𝒕 -16.99(1.75)* 2.38(0.14) -2.22(0.24) -4.14(0.39) -5.57(1.05) 7.35(0.56) Diagnostic Statistics
𝑭𝑭 3.66** 3.38*** 3.51** 5.98* 4.22** 5.89*
𝑳𝑳𝑳𝑳𝑳𝑳𝒕𝒕−𝟏𝟏 -0.12(3.07) -0.12(3.12) -0.14(4.02) -0.17(3.78) -0.14(2.77) -0.14(2.64)
𝑾𝑾𝑾𝑾𝑾𝑾𝒕𝒕𝑾𝑾 8.80 11.49 22.54** 25.01* 11.96 14.30*** 𝑳𝑳𝑳𝑳 5.43 4.43 4.47 1.93 0.53 1.56 𝑨𝑨𝑨𝑨𝑨𝑨𝑨𝑨𝑪𝑪𝒕𝒕𝑾𝑾𝑨𝑨 𝑹𝑹𝑳𝑳 0.28 0.28 0.22 0.17 0.20 0.21
Note: The absolute value of t-statistics in parentheses; *𝑝𝑝 < 0.01, **𝑝𝑝 < 0.05, ***𝑝𝑝 < 0.1.
The diagnostic tests are reported in Table 4. The White test statistic is reported to test for heteroscedasticity. The assumption of homoscedasticity is valid except for LXUTUM, LXUHIZ and LXUSIN stock indices. Therefore, since these indices have heteroskedasticity problem, the
-1.10(3.44)* -0.98(2.95)*
Long-Term Estimates
Makale Gönderim Tarihi: 09.02.2021 Yayına Kabul Tarihi: 13.06.2021
LXUTEK -2.5164 [0] -7.2457 [1]* -2.7384 [5] -11.6885 [5]* LEX -1.6508 [2] -9.8683 [1]* -1.8448 [2] -8.8639 [4]* LIPI -3.2403 [12]* -2.9344 [12]** -8.6988 [5]* -41.0119 [12]* LCPI -4.5924 [5] -10.2785 [3]* -0.2713 [9] -9.8542 [13]* LM2 -3.0444 [0] -13.5414 [0]* -2.9703 [3] -13.9836 [9]*
Note: The values in brackets represent the optimal lag length by the SIC; *𝑝𝑝 < 0.01, **𝑝𝑝 <0.05, ***𝑝𝑝 < 0.1.
Table 4: The ARDL and NARDL Estimation Results
LXU100 LXUTUM LXUHIZ ARDL NARDL ARDL NARDL ARDL NARDL
Short-Term Estimates
∆𝑳𝑳𝑳𝑳𝑳𝑳𝒕𝒕 -1.21(5.66)* -0.79(3.65)* -0.77(6.07)*
∆𝑷𝑷𝑷𝑷𝑷𝑷𝒕𝒕 -1.21(4.88)* -0.71(3.31)* -0.89(4.90)*
∆𝑵𝑵𝑳𝑳𝑵𝑵𝒕𝒕 -1.08(2.49)**
0.01(0.15) -0.06(0.97)
∆𝑳𝑳𝑳𝑳𝑷𝑷𝑳𝑳𝒕𝒕 0.05(0.65) 0.10(1.14) 0.11(1.32) 0.09(1.13) 0.08(1.35) 0.10(1.51) ∆𝑳𝑳𝑳𝑳𝑷𝑷𝑳𝑳𝒕𝒕 -0.40(1.95)* -
0.55(2.32)** 0.14(0.72) 0.24(0.74) -0.02(0.15) -0.13(0.60)
∆𝑳𝑳𝑳𝑳𝑳𝑳𝒕𝒕 0.27(0.70) 0.27(0.71) 0.26(0.70) 0.04(0.37) 0.10(1.33) 0.03(0.32) ∆𝑳𝑳𝑳𝑳𝑳𝑳𝒕𝒕−𝟏𝟏 1.13(3.31)* 1.21(3.47)* 1.01(3.14)* ∆𝑳𝑳𝑳𝑳𝑳𝑳𝒕𝒕−𝑳𝑳 -0.76(2.76)* -
0.67(2.32)**
Long-Term Estimates
𝑳𝑳𝑳𝑳𝑳𝑳 0.17(0.37) -0.38(0.94) -0.27(0.85) 𝑷𝑷𝑷𝑷𝑷𝑷 0.90(1.11) -0.39(0.70) 0.29(0.43) 𝑵𝑵𝑳𝑳𝑵𝑵 -0.35(0.58) 0.11(0.14) -0.45(1.07) 𝑳𝑳𝑳𝑳𝑷𝑷𝑳𝑳 0.42(0.74) 0.82(1.34) 0.66(1.34) 0.57(1.15) 0.56(1.57) 0.70(1.59) 𝑳𝑳𝑳𝑳𝑷𝑷𝑳𝑳 -3.34(1.49) -4.49(1.70)* 0.84(0.73) 1.42(0.73) -0.19(0.14) -0.94(0.54) 𝑳𝑳𝑳𝑳𝑳𝑳 2.15(1.98)** 1.35(1.25) 0.30(0.42) 0.29(0.38) 0.73(1.25) 0.22(0.32) 𝑳𝑳𝑪𝑪𝑪𝑪𝑪𝑪𝒕𝒕𝑪𝑪𝑪𝑪𝒕𝒕 -16.99(1.75)* 2.38(0.14) -2.22(0.24) -4.14(0.39) -5.57(1.05) 7.35(0.56) Diagnostic Statistics
𝑭𝑭 3.66** 3.38*** 3.51** 5.98* 4.22** 5.89*
𝑳𝑳𝑳𝑳𝑳𝑳𝒕𝒕−𝟏𝟏 -0.12(3.07) -0.12(3.12) -0.14(4.02) -0.17(3.78) -0.14(2.77) -0.14(2.64)
𝑾𝑾𝑾𝑾𝑾𝑾𝒕𝒕𝑾𝑾 8.80 11.49 22.54** 25.01* 11.96 14.30*** 𝑳𝑳𝑳𝑳 5.43 4.43 4.47 1.93 0.53 1.56 𝑨𝑨𝑨𝑨𝑨𝑨𝑨𝑨𝑪𝑪𝒕𝒕𝑾𝑾𝑨𝑨 𝑹𝑹𝑳𝑳 0.28 0.28 0.22 0.17 0.20 0.21
Note: The absolute value of t-statistics in parentheses; *𝑝𝑝 < 0.01, **𝑝𝑝 < 0.05, ***𝑝𝑝 < 0.1.
The diagnostic tests are reported in Table 4. The White test statistic is reported to test for heteroscedasticity. The assumption of homoscedasticity is valid except for LXUTUM, LXUHIZ and LXUSIN stock indices. Therefore, since these indices have heteroskedasticity problem, the
0.14(0.29) 0.65(0.97) 2.20(1.59)
Makale Gönderim Tarihi: 09.02.2021 Yayına Kabul Tarihi: 13.06.2021
LXUTEK -2.5164 [0] -7.2457 [1]* -2.7384 [5] -11.6885 [5]* LEX -1.6508 [2] -9.8683 [1]* -1.8448 [2] -8.8639 [4]* LIPI -3.2403 [12]* -2.9344 [12]** -8.6988 [5]* -41.0119 [12]* LCPI -4.5924 [5] -10.2785 [3]* -0.2713 [9] -9.8542 [13]* LM2 -3.0444 [0] -13.5414 [0]* -2.9703 [3] -13.9836 [9]*
Note: The values in brackets represent the optimal lag length by the SIC; *𝑝𝑝 < 0.01, **𝑝𝑝 <0.05, ***𝑝𝑝 < 0.1.
Table 4: The ARDL and NARDL Estimation Results
LXU100 LXUTUM LXUHIZ ARDL NARDL ARDL NARDL ARDL NARDL
Short-Term Estimates
∆𝑳𝑳𝑳𝑳𝑳𝑳𝒕𝒕 -1.21(5.66)* -0.79(3.65)* -0.77(6.07)*
∆𝑷𝑷𝑷𝑷𝑷𝑷𝒕𝒕 -1.21(4.88)* -0.71(3.31)* -0.89(4.90)*
∆𝑵𝑵𝑳𝑳𝑵𝑵𝒕𝒕 -1.08(2.49)**
0.01(0.15) -0.06(0.97)
∆𝑳𝑳𝑳𝑳𝑷𝑷𝑳𝑳𝒕𝒕 0.05(0.65) 0.10(1.14) 0.11(1.32) 0.09(1.13) 0.08(1.35) 0.10(1.51) ∆𝑳𝑳𝑳𝑳𝑷𝑷𝑳𝑳𝒕𝒕 -0.40(1.95)* -
0.55(2.32)** 0.14(0.72) 0.24(0.74) -0.02(0.15) -0.13(0.60)
∆𝑳𝑳𝑳𝑳𝑳𝑳𝒕𝒕 0.27(0.70) 0.27(0.71) 0.26(0.70) 0.04(0.37) 0.10(1.33) 0.03(0.32) ∆𝑳𝑳𝑳𝑳𝑳𝑳𝒕𝒕−𝟏𝟏 1.13(3.31)* 1.21(3.47)* 1.01(3.14)* ∆𝑳𝑳𝑳𝑳𝑳𝑳𝒕𝒕−𝑳𝑳 -0.76(2.76)* -
0.67(2.32)**
Long-Term Estimates
𝑳𝑳𝑳𝑳𝑳𝑳 0.17(0.37) -0.38(0.94) -0.27(0.85) 𝑷𝑷𝑷𝑷𝑷𝑷 0.90(1.11) -0.39(0.70) 0.29(0.43) 𝑵𝑵𝑳𝑳𝑵𝑵 -0.35(0.58) 0.11(0.14) -0.45(1.07) 𝑳𝑳𝑳𝑳𝑷𝑷𝑳𝑳 0.42(0.74) 0.82(1.34) 0.66(1.34) 0.57(1.15) 0.56(1.57) 0.70(1.59) 𝑳𝑳𝑳𝑳𝑷𝑷𝑳𝑳 -3.34(1.49) -4.49(1.70)* 0.84(0.73) 1.42(0.73) -0.19(0.14) -0.94(0.54) 𝑳𝑳𝑳𝑳𝑳𝑳 2.15(1.98)** 1.35(1.25) 0.30(0.42) 0.29(0.38) 0.73(1.25) 0.22(0.32) 𝑳𝑳𝑪𝑪𝑪𝑪𝑪𝑪𝒕𝒕𝑪𝑪𝑪𝑪𝒕𝒕 -16.99(1.75)* 2.38(0.14) -2.22(0.24) -4.14(0.39) -5.57(1.05) 7.35(0.56) Diagnostic Statistics
𝑭𝑭 3.66** 3.38*** 3.51** 5.98* 4.22** 5.89*
𝑳𝑳𝑳𝑳𝑳𝑳𝒕𝒕−𝟏𝟏 -0.12(3.07) -0.12(3.12) -0.14(4.02) -0.17(3.78) -0.14(2.77) -0.14(2.64)
𝑾𝑾𝑾𝑾𝑾𝑾𝒕𝒕𝑾𝑾 8.80 11.49 22.54** 25.01* 11.96 14.30*** 𝑳𝑳𝑳𝑳 5.43 4.43 4.47 1.93 0.53 1.56 𝑨𝑨𝑨𝑨𝑨𝑨𝑨𝑨𝑪𝑪𝒕𝒕𝑾𝑾𝑨𝑨 𝑹𝑹𝑳𝑳 0.28 0.28 0.22 0.17 0.20 0.21
Note: The absolute value of t-statistics in parentheses; *𝑝𝑝 < 0.01, **𝑝𝑝 < 0.05, ***𝑝𝑝 < 0.1.
The diagnostic tests are reported in Table 4. The White test statistic is reported to test for heteroscedasticity. The assumption of homoscedasticity is valid except for LXUTUM, LXUHIZ and LXUSIN stock indices. Therefore, since these indices have heteroskedasticity problem, the
0.96(1.18) 1.38(1.17) 4.22(2.34)**
Makale Gönderim Tarihi: 09.02.2021 Yayına Kabul Tarihi: 13.06.2021
LXUTEK -2.5164 [0] -7.2457 [1]* -2.7384 [5] -11.6885 [5]* LEX -1.6508 [2] -9.8683 [1]* -1.8448 [2] -8.8639 [4]* LIPI -3.2403 [12]* -2.9344 [12]** -8.6988 [5]* -41.0119 [12]* LCPI -4.5924 [5] -10.2785 [3]* -0.2713 [9] -9.8542 [13]* LM2 -3.0444 [0] -13.5414 [0]* -2.9703 [3] -13.9836 [9]*
Note: The values in brackets represent the optimal lag length by the SIC; *𝑝𝑝 < 0.01, **𝑝𝑝 <0.05, ***𝑝𝑝 < 0.1.
Table 4: The ARDL and NARDL Estimation Results
LXU100 LXUTUM LXUHIZ ARDL NARDL ARDL NARDL ARDL NARDL
Short-Term Estimates
∆𝑳𝑳𝑳𝑳𝑳𝑳𝒕𝒕 -1.21(5.66)* -0.79(3.65)* -0.77(6.07)*
∆𝑷𝑷𝑷𝑷𝑷𝑷𝒕𝒕 -1.21(4.88)* -0.71(3.31)* -0.89(4.90)*
∆𝑵𝑵𝑳𝑳𝑵𝑵𝒕𝒕 -1.08(2.49)**
0.01(0.15) -0.06(0.97)
∆𝑳𝑳𝑳𝑳𝑷𝑷𝑳𝑳𝒕𝒕 0.05(0.65) 0.10(1.14) 0.11(1.32) 0.09(1.13) 0.08(1.35) 0.10(1.51) ∆𝑳𝑳𝑳𝑳𝑷𝑷𝑳𝑳𝒕𝒕 -0.40(1.95)* -
0.55(2.32)** 0.14(0.72) 0.24(0.74) -0.02(0.15) -0.13(0.60)
∆𝑳𝑳𝑳𝑳𝑳𝑳𝒕𝒕 0.27(0.70) 0.27(0.71) 0.26(0.70) 0.04(0.37) 0.10(1.33) 0.03(0.32) ∆𝑳𝑳𝑳𝑳𝑳𝑳𝒕𝒕−𝟏𝟏 1.13(3.31)* 1.21(3.47)* 1.01(3.14)* ∆𝑳𝑳𝑳𝑳𝑳𝑳𝒕𝒕−𝑳𝑳 -0.76(2.76)* -
0.67(2.32)**
Long-Term Estimates
𝑳𝑳𝑳𝑳𝑳𝑳 0.17(0.37) -0.38(0.94) -0.27(0.85) 𝑷𝑷𝑷𝑷𝑷𝑷 0.90(1.11) -0.39(0.70) 0.29(0.43) 𝑵𝑵𝑳𝑳𝑵𝑵 -0.35(0.58) 0.11(0.14) -0.45(1.07) 𝑳𝑳𝑳𝑳𝑷𝑷𝑳𝑳 0.42(0.74) 0.82(1.34) 0.66(1.34) 0.57(1.15) 0.56(1.57) 0.70(1.59) 𝑳𝑳𝑳𝑳𝑷𝑷𝑳𝑳 -3.34(1.49) -4.49(1.70)* 0.84(0.73) 1.42(0.73) -0.19(0.14) -0.94(0.54) 𝑳𝑳𝑳𝑳𝑳𝑳 2.15(1.98)** 1.35(1.25) 0.30(0.42) 0.29(0.38) 0.73(1.25) 0.22(0.32) 𝑳𝑳𝑪𝑪𝑪𝑪𝑪𝑪𝒕𝒕𝑪𝑪𝑪𝑪𝒕𝒕 -16.99(1.75)* 2.38(0.14) -2.22(0.24) -4.14(0.39) -5.57(1.05) 7.35(0.56) Diagnostic Statistics
𝑭𝑭 3.66** 3.38*** 3.51** 5.98* 4.22** 5.89*
𝑳𝑳𝑳𝑳𝑳𝑳𝒕𝒕−𝟏𝟏 -0.12(3.07) -0.12(3.12) -0.14(4.02) -0.17(3.78) -0.14(2.77) -0.14(2.64)
𝑾𝑾𝑾𝑾𝑾𝑾𝒕𝒕𝑾𝑾 8.80 11.49 22.54** 25.01* 11.96 14.30*** 𝑳𝑳𝑳𝑳 5.43 4.43 4.47 1.93 0.53 1.56 𝑨𝑨𝑨𝑨𝑨𝑨𝑨𝑨𝑪𝑪𝒕𝒕𝑾𝑾𝑨𝑨 𝑹𝑹𝑳𝑳 0.28 0.28 0.22 0.17 0.20 0.21
Note: The absolute value of t-statistics in parentheses; *𝑝𝑝 < 0.01, **𝑝𝑝 < 0.05, ***𝑝𝑝 < 0.1.
The diagnostic tests are reported in Table 4. The White test statistic is reported to test for heteroscedasticity. The assumption of homoscedasticity is valid except for LXUTUM, LXUHIZ and LXUSIN stock indices. Therefore, since these indices have heteroskedasticity problem, the
-0.55(0.85) 0.26(0.34) 0.30(0.24)
Makale Gönderim Tarihi: 09.02.2021 Yayına Kabul Tarihi: 13.06.2021
LXUTEK -2.5164 [0] -7.2457 [1]* -2.7384 [5] -11.6885 [5]* LEX -1.6508 [2] -9.8683 [1]* -1.8448 [2] -8.8639 [4]* LIPI -3.2403 [12]* -2.9344 [12]** -8.6988 [5]* -41.0119 [12]* LCPI -4.5924 [5] -10.2785 [3]* -0.2713 [9] -9.8542 [13]* LM2 -3.0444 [0] -13.5414 [0]* -2.9703 [3] -13.9836 [9]*
Note: The values in brackets represent the optimal lag length by the SIC; *𝑝𝑝 < 0.01, **𝑝𝑝 <0.05, ***𝑝𝑝 < 0.1.
Table 4: The ARDL and NARDL Estimation Results
LXU100 LXUTUM LXUHIZ ARDL NARDL ARDL NARDL ARDL NARDL
Short-Term Estimates
∆𝑳𝑳𝑳𝑳𝑳𝑳𝒕𝒕 -1.21(5.66)* -0.79(3.65)* -0.77(6.07)*
∆𝑷𝑷𝑷𝑷𝑷𝑷𝒕𝒕 -1.21(4.88)* -0.71(3.31)* -0.89(4.90)*
∆𝑵𝑵𝑳𝑳𝑵𝑵𝒕𝒕 -1.08(2.49)**
0.01(0.15) -0.06(0.97)
∆𝑳𝑳𝑳𝑳𝑷𝑷𝑳𝑳𝒕𝒕 0.05(0.65) 0.10(1.14) 0.11(1.32) 0.09(1.13) 0.08(1.35) 0.10(1.51) ∆𝑳𝑳𝑳𝑳𝑷𝑷𝑳𝑳𝒕𝒕 -0.40(1.95)* -
0.55(2.32)** 0.14(0.72) 0.24(0.74) -0.02(0.15) -0.13(0.60)
∆𝑳𝑳𝑳𝑳𝑳𝑳𝒕𝒕 0.27(0.70) 0.27(0.71) 0.26(0.70) 0.04(0.37) 0.10(1.33) 0.03(0.32) ∆𝑳𝑳𝑳𝑳𝑳𝑳𝒕𝒕−𝟏𝟏 1.13(3.31)* 1.21(3.47)* 1.01(3.14)* ∆𝑳𝑳𝑳𝑳𝑳𝑳𝒕𝒕−𝑳𝑳 -0.76(2.76)* -
0.67(2.32)**
Long-Term Estimates
𝑳𝑳𝑳𝑳𝑳𝑳 0.17(0.37) -0.38(0.94) -0.27(0.85) 𝑷𝑷𝑷𝑷𝑷𝑷 0.90(1.11) -0.39(0.70) 0.29(0.43) 𝑵𝑵𝑳𝑳𝑵𝑵 -0.35(0.58) 0.11(0.14) -0.45(1.07) 𝑳𝑳𝑳𝑳𝑷𝑷𝑳𝑳 0.42(0.74) 0.82(1.34) 0.66(1.34) 0.57(1.15) 0.56(1.57) 0.70(1.59) 𝑳𝑳𝑳𝑳𝑷𝑷𝑳𝑳 -3.34(1.49) -4.49(1.70)* 0.84(0.73) 1.42(0.73) -0.19(0.14) -0.94(0.54) 𝑳𝑳𝑳𝑳𝑳𝑳 2.15(1.98)** 1.35(1.25) 0.30(0.42) 0.29(0.38) 0.73(1.25) 0.22(0.32) 𝑳𝑳𝑪𝑪𝑪𝑪𝑪𝑪𝒕𝒕𝑪𝑪𝑪𝑪𝒕𝒕 -16.99(1.75)* 2.38(0.14) -2.22(0.24) -4.14(0.39) -5.57(1.05) 7.35(0.56) Diagnostic Statistics
𝑭𝑭 3.66** 3.38*** 3.51** 5.98* 4.22** 5.89*
𝑳𝑳𝑳𝑳𝑳𝑳𝒕𝒕−𝟏𝟏 -0.12(3.07) -0.12(3.12) -0.14(4.02) -0.17(3.78) -0.14(2.77) -0.14(2.64)
𝑾𝑾𝑾𝑾𝑾𝑾𝒕𝒕𝑾𝑾 8.80 11.49 22.54** 25.01* 11.96 14.30*** 𝑳𝑳𝑳𝑳 5.43 4.43 4.47 1.93 0.53 1.56 𝑨𝑨𝑨𝑨𝑨𝑨𝑨𝑨𝑪𝑪𝒕𝒕𝑾𝑾𝑨𝑨 𝑹𝑹𝑳𝑳 0.28 0.28 0.22 0.17 0.20 0.21
Note: The absolute value of t-statistics in parentheses; *𝑝𝑝 < 0.01, **𝑝𝑝 < 0.05, ***𝑝𝑝 < 0.1.
The diagnostic tests are reported in Table 4. The White test statistic is reported to test for heteroscedasticity. The assumption of homoscedasticity is valid except for LXUTUM, LXUHIZ and LXUSIN stock indices. Therefore, since these indices have heteroskedasticity problem, the
0.07(0.10) 0.62(0.93) 0.86(1.11) 1.13(1.49) -0.32(0.15) 1.49(1.11)
Makale Gönderim Tarihi: 09.02.2021 Yayına Kabul Tarihi: 13.06.2021
LXUTEK -2.5164 [0] -7.2457 [1]* -2.7384 [5] -11.6885 [5]* LEX -1.6508 [2] -9.8683 [1]* -1.8448 [2] -8.8639 [4]* LIPI -3.2403 [12]* -2.9344 [12]** -8.6988 [5]* -41.0119 [12]* LCPI -4.5924 [5] -10.2785 [3]* -0.2713 [9] -9.8542 [13]* LM2 -3.0444 [0] -13.5414 [0]* -2.9703 [3] -13.9836 [9]*
Note: The values in brackets represent the optimal lag length by the SIC; *𝑝𝑝 < 0.01, **𝑝𝑝 <0.05, ***𝑝𝑝 < 0.1.
Table 4: The ARDL and NARDL Estimation Results
LXU100 LXUTUM LXUHIZ ARDL NARDL ARDL NARDL ARDL NARDL
Short-Term Estimates
∆𝑳𝑳𝑳𝑳𝑳𝑳𝒕𝒕 -1.21(5.66)* -0.79(3.65)* -0.77(6.07)*
∆𝑷𝑷𝑷𝑷𝑷𝑷𝒕𝒕 -1.21(4.88)* -0.71(3.31)* -0.89(4.90)*
∆𝑵𝑵𝑳𝑳𝑵𝑵𝒕𝒕 -1.08(2.49)**
0.01(0.15) -0.06(0.97)
∆𝑳𝑳𝑳𝑳𝑷𝑷𝑳𝑳𝒕𝒕 0.05(0.65) 0.10(1.14) 0.11(1.32) 0.09(1.13) 0.08(1.35) 0.10(1.51) ∆𝑳𝑳𝑳𝑳𝑷𝑷𝑳𝑳𝒕𝒕 -0.40(1.95)* -
0.55(2.32)** 0.14(0.72) 0.24(0.74) -0.02(0.15) -0.13(0.60)
∆𝑳𝑳𝑳𝑳𝑳𝑳𝒕𝒕 0.27(0.70) 0.27(0.71) 0.26(0.70) 0.04(0.37) 0.10(1.33) 0.03(0.32) ∆𝑳𝑳𝑳𝑳𝑳𝑳𝒕𝒕−𝟏𝟏 1.13(3.31)* 1.21(3.47)* 1.01(3.14)* ∆𝑳𝑳𝑳𝑳𝑳𝑳𝒕𝒕−𝑳𝑳 -0.76(2.76)* -
0.67(2.32)**
Long-Term Estimates
𝑳𝑳𝑳𝑳𝑳𝑳 0.17(0.37) -0.38(0.94) -0.27(0.85) 𝑷𝑷𝑷𝑷𝑷𝑷 0.90(1.11) -0.39(0.70) 0.29(0.43) 𝑵𝑵𝑳𝑳𝑵𝑵 -0.35(0.58) 0.11(0.14) -0.45(1.07) 𝑳𝑳𝑳𝑳𝑷𝑷𝑳𝑳 0.42(0.74) 0.82(1.34) 0.66(1.34) 0.57(1.15) 0.56(1.57) 0.70(1.59) 𝑳𝑳𝑳𝑳𝑷𝑷𝑳𝑳 -3.34(1.49) -4.49(1.70)* 0.84(0.73) 1.42(0.73) -0.19(0.14) -0.94(0.54) 𝑳𝑳𝑳𝑳𝑳𝑳 2.15(1.98)** 1.35(1.25) 0.30(0.42) 0.29(0.38) 0.73(1.25) 0.22(0.32) 𝑳𝑳𝑪𝑪𝑪𝑪𝑪𝑪𝒕𝒕𝑪𝑪𝑪𝑪𝒕𝒕 -16.99(1.75)* 2.38(0.14) -2.22(0.24) -4.14(0.39) -5.57(1.05) 7.35(0.56) Diagnostic Statistics
𝑭𝑭 3.66** 3.38*** 3.51** 5.98* 4.22** 5.89*
𝑳𝑳𝑳𝑳𝑳𝑳𝒕𝒕−𝟏𝟏 -0.12(3.07) -0.12(3.12) -0.14(4.02) -0.17(3.78) -0.14(2.77) -0.14(2.64)
𝑾𝑾𝑾𝑾𝑾𝑾𝒕𝒕𝑾𝑾 8.80 11.49 22.54** 25.01* 11.96 14.30*** 𝑳𝑳𝑳𝑳 5.43 4.43 4.47 1.93 0.53 1.56 𝑨𝑨𝑨𝑨𝑨𝑨𝑨𝑨𝑪𝑪𝒕𝒕𝑾𝑾𝑨𝑨 𝑹𝑹𝑳𝑳 0.28 0.28 0.22 0.17 0.20 0.21
Note: The absolute value of t-statistics in parentheses; *𝑝𝑝 < 0.01, **𝑝𝑝 < 0.05, ***𝑝𝑝 < 0.1.
The diagnostic tests are reported in Table 4. The White test statistic is reported to test for heteroscedasticity. The assumption of homoscedasticity is valid except for LXUTUM, LXUHIZ and LXUSIN stock indices. Therefore, since these indices have heteroskedasticity problem, the
-3.92(1.66)* -5.09(1.98)** -4.62(1.29) -5.38(1.37) -14.83(1.74) -15.72(2.49)**
Makale Gönderim Tarihi: 09.02.2021 Yayına Kabul Tarihi: 13.06.2021
LXUTEK -2.5164 [0] -7.2457 [1]* -2.7384 [5] -11.6885 [5]* LEX -1.6508 [2] -9.8683 [1]* -1.8448 [2] -8.8639 [4]* LIPI -3.2403 [12]* -2.9344 [12]** -8.6988 [5]* -41.0119 [12]* LCPI -4.5924 [5] -10.2785 [3]* -0.2713 [9] -9.8542 [13]* LM2 -3.0444 [0] -13.5414 [0]* -2.9703 [3] -13.9836 [9]*
Note: The values in brackets represent the optimal lag length by the SIC; *𝑝𝑝 < 0.01, **𝑝𝑝 <0.05, ***𝑝𝑝 < 0.1.
Table 4: The ARDL and NARDL Estimation Results
LXU100 LXUTUM LXUHIZ ARDL NARDL ARDL NARDL ARDL NARDL
Short-Term Estimates
∆𝑳𝑳𝑳𝑳𝑳𝑳𝒕𝒕 -1.21(5.66)* -0.79(3.65)* -0.77(6.07)*
∆𝑷𝑷𝑷𝑷𝑷𝑷𝒕𝒕 -1.21(4.88)* -0.71(3.31)* -0.89(4.90)*
∆𝑵𝑵𝑳𝑳𝑵𝑵𝒕𝒕 -1.08(2.49)**
0.01(0.15) -0.06(0.97)
∆𝑳𝑳𝑳𝑳𝑷𝑷𝑳𝑳𝒕𝒕 0.05(0.65) 0.10(1.14) 0.11(1.32) 0.09(1.13) 0.08(1.35) 0.10(1.51) ∆𝑳𝑳𝑳𝑳𝑷𝑷𝑳𝑳𝒕𝒕 -0.40(1.95)* -
0.55(2.32)** 0.14(0.72) 0.24(0.74) -0.02(0.15) -0.13(0.60)
∆𝑳𝑳𝑳𝑳𝑳𝑳𝒕𝒕 0.27(0.70) 0.27(0.71) 0.26(0.70) 0.04(0.37) 0.10(1.33) 0.03(0.32) ∆𝑳𝑳𝑳𝑳𝑳𝑳𝒕𝒕−𝟏𝟏 1.13(3.31)* 1.21(3.47)* 1.01(3.14)* ∆𝑳𝑳𝑳𝑳𝑳𝑳𝒕𝒕−𝑳𝑳 -0.76(2.76)* -
0.67(2.32)**
Long-Term Estimates
𝑳𝑳𝑳𝑳𝑳𝑳 0.17(0.37) -0.38(0.94) -0.27(0.85) 𝑷𝑷𝑷𝑷𝑷𝑷 0.90(1.11) -0.39(0.70) 0.29(0.43) 𝑵𝑵𝑳𝑳𝑵𝑵 -0.35(0.58) 0.11(0.14) -0.45(1.07) 𝑳𝑳𝑳𝑳𝑷𝑷𝑳𝑳 0.42(0.74) 0.82(1.34) 0.66(1.34) 0.57(1.15) 0.56(1.57) 0.70(1.59) 𝑳𝑳𝑳𝑳𝑷𝑷𝑳𝑳 -3.34(1.49) -4.49(1.70)* 0.84(0.73) 1.42(0.73) -0.19(0.14) -0.94(0.54) 𝑳𝑳𝑳𝑳𝑳𝑳 2.15(1.98)** 1.35(1.25) 0.30(0.42) 0.29(0.38) 0.73(1.25) 0.22(0.32) 𝑳𝑳𝑪𝑪𝑪𝑪𝑪𝑪𝒕𝒕𝑪𝑪𝑪𝑪𝒕𝒕 -16.99(1.75)* 2.38(0.14) -2.22(0.24) -4.14(0.39) -5.57(1.05) 7.35(0.56) Diagnostic Statistics
𝑭𝑭 3.66** 3.38*** 3.51** 5.98* 4.22** 5.89*
𝑳𝑳𝑳𝑳𝑳𝑳𝒕𝒕−𝟏𝟏 -0.12(3.07) -0.12(3.12) -0.14(4.02) -0.17(3.78) -0.14(2.77) -0.14(2.64)
𝑾𝑾𝑾𝑾𝑾𝑾𝒕𝒕𝑾𝑾 8.80 11.49 22.54** 25.01* 11.96 14.30*** 𝑳𝑳𝑳𝑳 5.43 4.43 4.47 1.93 0.53 1.56 𝑨𝑨𝑨𝑨𝑨𝑨𝑨𝑨𝑪𝑪𝒕𝒕𝑾𝑾𝑨𝑨 𝑹𝑹𝑳𝑳 0.28 0.28 0.22 0.17 0.20 0.21
Note: The absolute value of t-statistics in parentheses; *𝑝𝑝 < 0.01, **𝑝𝑝 < 0.05, ***𝑝𝑝 < 0.1.
The diagnostic tests are reported in Table 4. The White test statistic is reported to test for heteroscedasticity. The assumption of homoscedasticity is valid except for LXUTUM, LXUHIZ and LXUSIN stock indices. Therefore, since these indices have heteroskedasticity problem, the
2.47(2.14)** 1.41(1.24) 2.57(1.50) 1.69(1.19) 8.34(1.83)* 4.24(1.77)*
Makale Gönderim Tarihi: 09.02.2021 Yayına Kabul Tarihi: 13.06.2021
LXUTEK -2.5164 [0] -7.2457 [1]* -2.7384 [5] -11.6885 [5]* LEX -1.6508 [2] -9.8683 [1]* -1.8448 [2] -8.8639 [4]* LIPI -3.2403 [12]* -2.9344 [12]** -8.6988 [5]* -41.0119 [12]* LCPI -4.5924 [5] -10.2785 [3]* -0.2713 [9] -9.8542 [13]* LM2 -3.0444 [0] -13.5414 [0]* -2.9703 [3] -13.9836 [9]*
Note: The values in brackets represent the optimal lag length by the SIC; *𝑝𝑝 < 0.01, **𝑝𝑝 <0.05, ***𝑝𝑝 < 0.1.
Table 4: The ARDL and NARDL Estimation Results
LXU100 LXUTUM LXUHIZ ARDL NARDL ARDL NARDL ARDL NARDL
Short-Term Estimates
∆𝑳𝑳𝑳𝑳𝑳𝑳𝒕𝒕 -1.21(5.66)* -0.79(3.65)* -0.77(6.07)*
∆𝑷𝑷𝑷𝑷𝑷𝑷𝒕𝒕 -1.21(4.88)* -0.71(3.31)* -0.89(4.90)*
∆𝑵𝑵𝑳𝑳𝑵𝑵𝒕𝒕 -1.08(2.49)**
0.01(0.15) -0.06(0.97)
∆𝑳𝑳𝑳𝑳𝑷𝑷𝑳𝑳𝒕𝒕 0.05(0.65) 0.10(1.14) 0.11(1.32) 0.09(1.13) 0.08(1.35) 0.10(1.51) ∆𝑳𝑳𝑳𝑳𝑷𝑷𝑳𝑳𝒕𝒕 -0.40(1.95)* -
0.55(2.32)** 0.14(0.72) 0.24(0.74) -0.02(0.15) -0.13(0.60)
∆𝑳𝑳𝑳𝑳𝑳𝑳𝒕𝒕 0.27(0.70) 0.27(0.71) 0.26(0.70) 0.04(0.37) 0.10(1.33) 0.03(0.32) ∆𝑳𝑳𝑳𝑳𝑳𝑳𝒕𝒕−𝟏𝟏 1.13(3.31)* 1.21(3.47)* 1.01(3.14)* ∆𝑳𝑳𝑳𝑳𝑳𝑳𝒕𝒕−𝑳𝑳 -0.76(2.76)* -
0.67(2.32)**
Long-Term Estimates
𝑳𝑳𝑳𝑳𝑳𝑳 0.17(0.37) -0.38(0.94) -0.27(0.85) 𝑷𝑷𝑷𝑷𝑷𝑷 0.90(1.11) -0.39(0.70) 0.29(0.43) 𝑵𝑵𝑳𝑳𝑵𝑵 -0.35(0.58) 0.11(0.14) -0.45(1.07) 𝑳𝑳𝑳𝑳𝑷𝑷𝑳𝑳 0.42(0.74) 0.82(1.34) 0.66(1.34) 0.57(1.15) 0.56(1.57) 0.70(1.59) 𝑳𝑳𝑳𝑳𝑷𝑷𝑳𝑳 -3.34(1.49) -4.49(1.70)* 0.84(0.73) 1.42(0.73) -0.19(0.14) -0.94(0.54) 𝑳𝑳𝑳𝑳𝑳𝑳 2.15(1.98)** 1.35(1.25) 0.30(0.42) 0.29(0.38) 0.73(1.25) 0.22(0.32) 𝑳𝑳𝑪𝑪𝑪𝑪𝑪𝑪𝒕𝒕𝑪𝑪𝑪𝑪𝒕𝒕 -16.99(1.75)* 2.38(0.14) -2.22(0.24) -4.14(0.39) -5.57(1.05) 7.35(0.56) Diagnostic Statistics
𝑭𝑭 3.66** 3.38*** 3.51** 5.98* 4.22** 5.89*
𝑳𝑳𝑳𝑳𝑳𝑳𝒕𝒕−𝟏𝟏 -0.12(3.07) -0.12(3.12) -0.14(4.02) -0.17(3.78) -0.14(2.77) -0.14(2.64)
𝑾𝑾𝑾𝑾𝑾𝑾𝒕𝒕𝑾𝑾 8.80 11.49 22.54** 25.01* 11.96 14.30*** 𝑳𝑳𝑳𝑳 5.43 4.43 4.47 1.93 0.53 1.56 𝑨𝑨𝑨𝑨𝑨𝑨𝑨𝑨𝑪𝑪𝒕𝒕𝑾𝑾𝑨𝑨 𝑹𝑹𝑳𝑳 0.28 0.28 0.22 0.17 0.20 0.21
Note: The absolute value of t-statistics in parentheses; *𝑝𝑝 < 0.01, **𝑝𝑝 < 0.05, ***𝑝𝑝 < 0.1.
The diagnostic tests are reported in Table 4. The White test statistic is reported to test for heteroscedasticity. The assumption of homoscedasticity is valid except for LXUTUM, LXUHIZ and LXUSIN stock indices. Therefore, since these indices have heteroskedasticity problem, the
-18.41(1.79)* 5.47(0.31) -20.87(1.38) -1.07(0.05) -80.28(1.88)* -3.65(0.10)
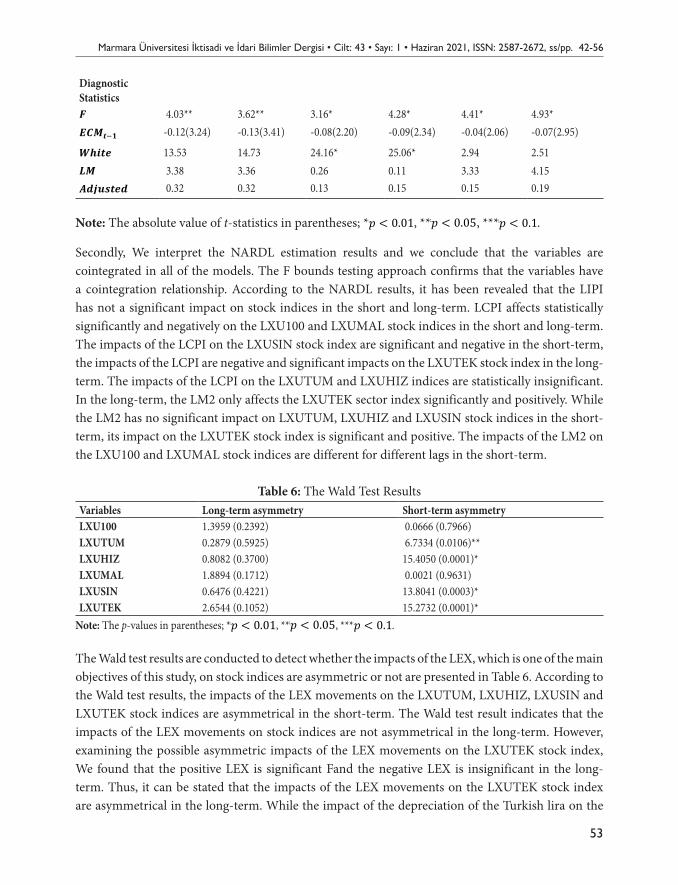
Marmara Üniversitesi İktisadi ve İdari Bilimler Dergisi • Cilt: 43 • Sayı: 1 • Haziran 2021, ISSN: 2587-2672, ss/pp. 42-56
53
Diagnostic Statistics
Makale Gönderim Tarihi: 09.02.2021 Yayına Kabul Tarihi: 13.06.2021
LXUTEK -2.5164 [0] -7.2457 [1]* -2.7384 [5] -11.6885 [5]* LEX -1.6508 [2] -9.8683 [1]* -1.8448 [2] -8.8639 [4]* LIPI -3.2403 [12]* -2.9344 [12]** -8.6988 [5]* -41.0119 [12]* LCPI -4.5924 [5] -10.2785 [3]* -0.2713 [9] -9.8542 [13]* LM2 -3.0444 [0] -13.5414 [0]* -2.9703 [3] -13.9836 [9]*
Note: The values in brackets represent the optimal lag length by the SIC; *𝑝𝑝 < 0.01, **𝑝𝑝 <0.05, ***𝑝𝑝 < 0.1.
Table 4: The ARDL and NARDL Estimation Results
LXU100 LXUTUM LXUHIZ ARDL NARDL ARDL NARDL ARDL NARDL
Short-Term Estimates
∆𝑳𝑳𝑳𝑳𝑳𝑳𝒕𝒕 -1.21(5.66)* -0.79(3.65)* -0.77(6.07)*
∆𝑷𝑷𝑷𝑷𝑷𝑷𝒕𝒕 -1.21(4.88)* -0.71(3.31)* -0.89(4.90)*
∆𝑵𝑵𝑳𝑳𝑵𝑵𝒕𝒕 -1.08(2.49)**
0.01(0.15) -0.06(0.97)
∆𝑳𝑳𝑳𝑳𝑷𝑷𝑳𝑳𝒕𝒕 0.05(0.65) 0.10(1.14) 0.11(1.32) 0.09(1.13) 0.08(1.35) 0.10(1.51) ∆𝑳𝑳𝑳𝑳𝑷𝑷𝑳𝑳𝒕𝒕 -0.40(1.95)* -
0.55(2.32)** 0.14(0.72) 0.24(0.74) -0.02(0.15) -0.13(0.60)
∆𝑳𝑳𝑳𝑳𝑳𝑳𝒕𝒕 0.27(0.70) 0.27(0.71) 0.26(0.70) 0.04(0.37) 0.10(1.33) 0.03(0.32) ∆𝑳𝑳𝑳𝑳𝑳𝑳𝒕𝒕−𝟏𝟏 1.13(3.31)* 1.21(3.47)* 1.01(3.14)* ∆𝑳𝑳𝑳𝑳𝑳𝑳𝒕𝒕−𝑳𝑳 -0.76(2.76)* -
0.67(2.32)**
Long-Term Estimates
𝑳𝑳𝑳𝑳𝑳𝑳 0.17(0.37) -0.38(0.94) -0.27(0.85) 𝑷𝑷𝑷𝑷𝑷𝑷 0.90(1.11) -0.39(0.70) 0.29(0.43) 𝑵𝑵𝑳𝑳𝑵𝑵 -0.35(0.58) 0.11(0.14) -0.45(1.07) 𝑳𝑳𝑳𝑳𝑷𝑷𝑳𝑳 0.42(0.74) 0.82(1.34) 0.66(1.34) 0.57(1.15) 0.56(1.57) 0.70(1.59) 𝑳𝑳𝑳𝑳𝑷𝑷𝑳𝑳 -3.34(1.49) -4.49(1.70)* 0.84(0.73) 1.42(0.73) -0.19(0.14) -0.94(0.54) 𝑳𝑳𝑳𝑳𝑳𝑳 2.15(1.98)** 1.35(1.25) 0.30(0.42) 0.29(0.38) 0.73(1.25) 0.22(0.32) 𝑳𝑳𝑪𝑪𝑪𝑪𝑪𝑪𝒕𝒕𝑪𝑪𝑪𝑪𝒕𝒕 -16.99(1.75)* 2.38(0.14) -2.22(0.24) -4.14(0.39) -5.57(1.05) 7.35(0.56) Diagnostic Statistics
𝑭𝑭 3.66** 3.38*** 3.51** 5.98* 4.22** 5.89*
𝑳𝑳𝑳𝑳𝑳𝑳𝒕𝒕−𝟏𝟏 -0.12(3.07) -0.12(3.12) -0.14(4.02) -0.17(3.78) -0.14(2.77) -0.14(2.64)
𝑾𝑾𝑾𝑾𝑾𝑾𝒕𝒕𝑾𝑾 8.80 11.49 22.54** 25.01* 11.96 14.30*** 𝑳𝑳𝑳𝑳 5.43 4.43 4.47 1.93 0.53 1.56 𝑨𝑨𝑨𝑨𝑨𝑨𝑨𝑨𝑪𝑪𝒕𝒕𝑾𝑾𝑨𝑨 𝑹𝑹𝑳𝑳 0.28 0.28 0.22 0.17 0.20 0.21
Note: The absolute value of t-statistics in parentheses; *𝑝𝑝 < 0.01, **𝑝𝑝 < 0.05, ***𝑝𝑝 < 0.1.
The diagnostic tests are reported in Table 4. The White test statistic is reported to test for heteroscedasticity. The assumption of homoscedasticity is valid except for LXUTUM, LXUHIZ and LXUSIN stock indices. Therefore, since these indices have heteroskedasticity problem, the
4.03** 3.62** 3.16* 4.28* 4.41* 4.93*
Makale Gönderim Tarihi: 09.02.2021 Yayına Kabul Tarihi: 13.06.2021
LXUTEK -2.5164 [0] -7.2457 [1]* -2.7384 [5] -11.6885 [5]* LEX -1.6508 [2] -9.8683 [1]* -1.8448 [2] -8.8639 [4]* LIPI -3.2403 [12]* -2.9344 [12]** -8.6988 [5]* -41.0119 [12]* LCPI -4.5924 [5] -10.2785 [3]* -0.2713 [9] -9.8542 [13]* LM2 -3.0444 [0] -13.5414 [0]* -2.9703 [3] -13.9836 [9]*
Note: The values in brackets represent the optimal lag length by the SIC; *𝑝𝑝 < 0.01, **𝑝𝑝 <0.05, ***𝑝𝑝 < 0.1.
Table 4: The ARDL and NARDL Estimation Results
LXU100 LXUTUM LXUHIZ ARDL NARDL ARDL NARDL ARDL NARDL
Short-Term Estimates
∆𝑳𝑳𝑳𝑳𝑳𝑳𝒕𝒕 -1.21(5.66)* -0.79(3.65)* -0.77(6.07)*
∆𝑷𝑷𝑷𝑷𝑷𝑷𝒕𝒕 -1.21(4.88)* -0.71(3.31)* -0.89(4.90)*
∆𝑵𝑵𝑳𝑳𝑵𝑵𝒕𝒕 -1.08(2.49)**
0.01(0.15) -0.06(0.97)
∆𝑳𝑳𝑳𝑳𝑷𝑷𝑳𝑳𝒕𝒕 0.05(0.65) 0.10(1.14) 0.11(1.32) 0.09(1.13) 0.08(1.35) 0.10(1.51) ∆𝑳𝑳𝑳𝑳𝑷𝑷𝑳𝑳𝒕𝒕 -0.40(1.95)* -
0.55(2.32)** 0.14(0.72) 0.24(0.74) -0.02(0.15) -0.13(0.60)
∆𝑳𝑳𝑳𝑳𝑳𝑳𝒕𝒕 0.27(0.70) 0.27(0.71) 0.26(0.70) 0.04(0.37) 0.10(1.33) 0.03(0.32) ∆𝑳𝑳𝑳𝑳𝑳𝑳𝒕𝒕−𝟏𝟏 1.13(3.31)* 1.21(3.47)* 1.01(3.14)* ∆𝑳𝑳𝑳𝑳𝑳𝑳𝒕𝒕−𝑳𝑳 -0.76(2.76)* -
0.67(2.32)**
Long-Term Estimates
𝑳𝑳𝑳𝑳𝑳𝑳 0.17(0.37) -0.38(0.94) -0.27(0.85) 𝑷𝑷𝑷𝑷𝑷𝑷 0.90(1.11) -0.39(0.70) 0.29(0.43) 𝑵𝑵𝑳𝑳𝑵𝑵 -0.35(0.58) 0.11(0.14) -0.45(1.07) 𝑳𝑳𝑳𝑳𝑷𝑷𝑳𝑳 0.42(0.74) 0.82(1.34) 0.66(1.34) 0.57(1.15) 0.56(1.57) 0.70(1.59) 𝑳𝑳𝑳𝑳𝑷𝑷𝑳𝑳 -3.34(1.49) -4.49(1.70)* 0.84(0.73) 1.42(0.73) -0.19(0.14) -0.94(0.54) 𝑳𝑳𝑳𝑳𝑳𝑳 2.15(1.98)** 1.35(1.25) 0.30(0.42) 0.29(0.38) 0.73(1.25) 0.22(0.32) 𝑳𝑳𝑪𝑪𝑪𝑪𝑪𝑪𝒕𝒕𝑪𝑪𝑪𝑪𝒕𝒕 -16.99(1.75)* 2.38(0.14) -2.22(0.24) -4.14(0.39) -5.57(1.05) 7.35(0.56) Diagnostic Statistics
𝑭𝑭 3.66** 3.38*** 3.51** 5.98* 4.22** 5.89*
𝑳𝑳𝑳𝑳𝑳𝑳𝒕𝒕−𝟏𝟏 -0.12(3.07) -0.12(3.12) -0.14(4.02) -0.17(3.78) -0.14(2.77) -0.14(2.64)
𝑾𝑾𝑾𝑾𝑾𝑾𝒕𝒕𝑾𝑾 8.80 11.49 22.54** 25.01* 11.96 14.30*** 𝑳𝑳𝑳𝑳 5.43 4.43 4.47 1.93 0.53 1.56 𝑨𝑨𝑨𝑨𝑨𝑨𝑨𝑨𝑪𝑪𝒕𝒕𝑾𝑾𝑨𝑨 𝑹𝑹𝑳𝑳 0.28 0.28 0.22 0.17 0.20 0.21
Note: The absolute value of t-statistics in parentheses; *𝑝𝑝 < 0.01, **𝑝𝑝 < 0.05, ***𝑝𝑝 < 0.1.
The diagnostic tests are reported in Table 4. The White test statistic is reported to test for heteroscedasticity. The assumption of homoscedasticity is valid except for LXUTUM, LXUHIZ and LXUSIN stock indices. Therefore, since these indices have heteroskedasticity problem, the
-0.12(3.24) -0.13(3.41) -0.08(2.20) -0.09(2.34) -0.04(2.06) -0.07(2.95)
Makale Gönderim Tarihi: 09.02.2021 Yayına Kabul Tarihi: 13.06.2021
LXUTEK -2.5164 [0] -7.2457 [1]* -2.7384 [5] -11.6885 [5]* LEX -1.6508 [2] -9.8683 [1]* -1.8448 [2] -8.8639 [4]* LIPI -3.2403 [12]* -2.9344 [12]** -8.6988 [5]* -41.0119 [12]* LCPI -4.5924 [5] -10.2785 [3]* -0.2713 [9] -9.8542 [13]* LM2 -3.0444 [0] -13.5414 [0]* -2.9703 [3] -13.9836 [9]*
Note: The values in brackets represent the optimal lag length by the SIC; *𝑝𝑝 < 0.01, **𝑝𝑝 <0.05, ***𝑝𝑝 < 0.1.
Table 4: The ARDL and NARDL Estimation Results
LXU100 LXUTUM LXUHIZ ARDL NARDL ARDL NARDL ARDL NARDL
Short-Term Estimates
∆𝑳𝑳𝑳𝑳𝑳𝑳𝒕𝒕 -1.21(5.66)* -0.79(3.65)* -0.77(6.07)*
∆𝑷𝑷𝑷𝑷𝑷𝑷𝒕𝒕 -1.21(4.88)* -0.71(3.31)* -0.89(4.90)*
∆𝑵𝑵𝑳𝑳𝑵𝑵𝒕𝒕 -1.08(2.49)**
0.01(0.15) -0.06(0.97)
∆𝑳𝑳𝑳𝑳𝑷𝑷𝑳𝑳𝒕𝒕 0.05(0.65) 0.10(1.14) 0.11(1.32) 0.09(1.13) 0.08(1.35) 0.10(1.51) ∆𝑳𝑳𝑳𝑳𝑷𝑷𝑳𝑳𝒕𝒕 -0.40(1.95)* -
0.55(2.32)** 0.14(0.72) 0.24(0.74) -0.02(0.15) -0.13(0.60)
∆𝑳𝑳𝑳𝑳𝑳𝑳𝒕𝒕 0.27(0.70) 0.27(0.71) 0.26(0.70) 0.04(0.37) 0.10(1.33) 0.03(0.32) ∆𝑳𝑳𝑳𝑳𝑳𝑳𝒕𝒕−𝟏𝟏 1.13(3.31)* 1.21(3.47)* 1.01(3.14)* ∆𝑳𝑳𝑳𝑳𝑳𝑳𝒕𝒕−𝑳𝑳 -0.76(2.76)* -
0.67(2.32)**
Long-Term Estimates
𝑳𝑳𝑳𝑳𝑳𝑳 0.17(0.37) -0.38(0.94) -0.27(0.85) 𝑷𝑷𝑷𝑷𝑷𝑷 0.90(1.11) -0.39(0.70) 0.29(0.43) 𝑵𝑵𝑳𝑳𝑵𝑵 -0.35(0.58) 0.11(0.14) -0.45(1.07) 𝑳𝑳𝑳𝑳𝑷𝑷𝑳𝑳 0.42(0.74) 0.82(1.34) 0.66(1.34) 0.57(1.15) 0.56(1.57) 0.70(1.59) 𝑳𝑳𝑳𝑳𝑷𝑷𝑳𝑳 -3.34(1.49) -4.49(1.70)* 0.84(0.73) 1.42(0.73) -0.19(0.14) -0.94(0.54) 𝑳𝑳𝑳𝑳𝑳𝑳 2.15(1.98)** 1.35(1.25) 0.30(0.42) 0.29(0.38) 0.73(1.25) 0.22(0.32) 𝑳𝑳𝑪𝑪𝑪𝑪𝑪𝑪𝒕𝒕𝑪𝑪𝑪𝑪𝒕𝒕 -16.99(1.75)* 2.38(0.14) -2.22(0.24) -4.14(0.39) -5.57(1.05) 7.35(0.56) Diagnostic Statistics
𝑭𝑭 3.66** 3.38*** 3.51** 5.98* 4.22** 5.89*
𝑳𝑳𝑳𝑳𝑳𝑳𝒕𝒕−𝟏𝟏 -0.12(3.07) -0.12(3.12) -0.14(4.02) -0.17(3.78) -0.14(2.77) -0.14(2.64)
𝑾𝑾𝑾𝑾𝑾𝑾𝒕𝒕𝑾𝑾 8.80 11.49 22.54** 25.01* 11.96 14.30*** 𝑳𝑳𝑳𝑳 5.43 4.43 4.47 1.93 0.53 1.56 𝑨𝑨𝑨𝑨𝑨𝑨𝑨𝑨𝑪𝑪𝒕𝒕𝑾𝑾𝑨𝑨 𝑹𝑹𝑳𝑳 0.28 0.28 0.22 0.17 0.20 0.21
Note: The absolute value of t-statistics in parentheses; *𝑝𝑝 < 0.01, **𝑝𝑝 < 0.05, ***𝑝𝑝 < 0.1.
The diagnostic tests are reported in Table 4. The White test statistic is reported to test for heteroscedasticity. The assumption of homoscedasticity is valid except for LXUTUM, LXUHIZ and LXUSIN stock indices. Therefore, since these indices have heteroskedasticity problem, the
13.53 14.73 24.16* 25.06* 2.94 2.51
Makale Gönderim Tarihi: 09.02.2021 Yayına Kabul Tarihi: 13.06.2021
LXUTEK -2.5164 [0] -7.2457 [1]* -2.7384 [5] -11.6885 [5]* LEX -1.6508 [2] -9.8683 [1]* -1.8448 [2] -8.8639 [4]* LIPI -3.2403 [12]* -2.9344 [12]** -8.6988 [5]* -41.0119 [12]* LCPI -4.5924 [5] -10.2785 [3]* -0.2713 [9] -9.8542 [13]* LM2 -3.0444 [0] -13.5414 [0]* -2.9703 [3] -13.9836 [9]*
Note: The values in brackets represent the optimal lag length by the SIC; *𝑝𝑝 < 0.01, **𝑝𝑝 <0.05, ***𝑝𝑝 < 0.1.
Table 4: The ARDL and NARDL Estimation Results
LXU100 LXUTUM LXUHIZ ARDL NARDL ARDL NARDL ARDL NARDL
Short-Term Estimates
∆𝑳𝑳𝑳𝑳𝑳𝑳𝒕𝒕 -1.21(5.66)* -0.79(3.65)* -0.77(6.07)*
∆𝑷𝑷𝑷𝑷𝑷𝑷𝒕𝒕 -1.21(4.88)* -0.71(3.31)* -0.89(4.90)*
∆𝑵𝑵𝑳𝑳𝑵𝑵𝒕𝒕 -1.08(2.49)**
0.01(0.15) -0.06(0.97)
∆𝑳𝑳𝑳𝑳𝑷𝑷𝑳𝑳𝒕𝒕 0.05(0.65) 0.10(1.14) 0.11(1.32) 0.09(1.13) 0.08(1.35) 0.10(1.51) ∆𝑳𝑳𝑳𝑳𝑷𝑷𝑳𝑳𝒕𝒕 -0.40(1.95)* -
0.55(2.32)** 0.14(0.72) 0.24(0.74) -0.02(0.15) -0.13(0.60)
∆𝑳𝑳𝑳𝑳𝑳𝑳𝒕𝒕 0.27(0.70) 0.27(0.71) 0.26(0.70) 0.04(0.37) 0.10(1.33) 0.03(0.32) ∆𝑳𝑳𝑳𝑳𝑳𝑳𝒕𝒕−𝟏𝟏 1.13(3.31)* 1.21(3.47)* 1.01(3.14)* ∆𝑳𝑳𝑳𝑳𝑳𝑳𝒕𝒕−𝑳𝑳 -0.76(2.76)* -
0.67(2.32)**
Long-Term Estimates
𝑳𝑳𝑳𝑳𝑳𝑳 0.17(0.37) -0.38(0.94) -0.27(0.85) 𝑷𝑷𝑷𝑷𝑷𝑷 0.90(1.11) -0.39(0.70) 0.29(0.43) 𝑵𝑵𝑳𝑳𝑵𝑵 -0.35(0.58) 0.11(0.14) -0.45(1.07) 𝑳𝑳𝑳𝑳𝑷𝑷𝑳𝑳 0.42(0.74) 0.82(1.34) 0.66(1.34) 0.57(1.15) 0.56(1.57) 0.70(1.59) 𝑳𝑳𝑳𝑳𝑷𝑷𝑳𝑳 -3.34(1.49) -4.49(1.70)* 0.84(0.73) 1.42(0.73) -0.19(0.14) -0.94(0.54) 𝑳𝑳𝑳𝑳𝑳𝑳 2.15(1.98)** 1.35(1.25) 0.30(0.42) 0.29(0.38) 0.73(1.25) 0.22(0.32) 𝑳𝑳𝑪𝑪𝑪𝑪𝑪𝑪𝒕𝒕𝑪𝑪𝑪𝑪𝒕𝒕 -16.99(1.75)* 2.38(0.14) -2.22(0.24) -4.14(0.39) -5.57(1.05) 7.35(0.56) Diagnostic Statistics
𝑭𝑭 3.66** 3.38*** 3.51** 5.98* 4.22** 5.89*
𝑳𝑳𝑳𝑳𝑳𝑳𝒕𝒕−𝟏𝟏 -0.12(3.07) -0.12(3.12) -0.14(4.02) -0.17(3.78) -0.14(2.77) -0.14(2.64)
𝑾𝑾𝑾𝑾𝑾𝑾𝒕𝒕𝑾𝑾 8.80 11.49 22.54** 25.01* 11.96 14.30*** 𝑳𝑳𝑳𝑳 5.43 4.43 4.47 1.93 0.53 1.56 𝑨𝑨𝑨𝑨𝑨𝑨𝑨𝑨𝑪𝑪𝒕𝒕𝑾𝑾𝑨𝑨 𝑹𝑹𝑳𝑳 0.28 0.28 0.22 0.17 0.20 0.21
Note: The absolute value of t-statistics in parentheses; *𝑝𝑝 < 0.01, **𝑝𝑝 < 0.05, ***𝑝𝑝 < 0.1.
The diagnostic tests are reported in Table 4. The White test statistic is reported to test for heteroscedasticity. The assumption of homoscedasticity is valid except for LXUTUM, LXUHIZ and LXUSIN stock indices. Therefore, since these indices have heteroskedasticity problem, the
3.38 3.36 0.26 0.11 3.33 4.15
Makale Gönderim Tarihi: 09.02.2021 Yayına Kabul Tarihi: 13.06.2021
LXUTEK -2.5164 [0] -7.2457 [1]* -2.7384 [5] -11.6885 [5]* LEX -1.6508 [2] -9.8683 [1]* -1.8448 [2] -8.8639 [4]* LIPI -3.2403 [12]* -2.9344 [12]** -8.6988 [5]* -41.0119 [12]* LCPI -4.5924 [5] -10.2785 [3]* -0.2713 [9] -9.8542 [13]* LM2 -3.0444 [0] -13.5414 [0]* -2.9703 [3] -13.9836 [9]*
Note: The values in brackets represent the optimal lag length by the SIC; *𝑝𝑝 < 0.01, **𝑝𝑝 <0.05, ***𝑝𝑝 < 0.1.
Table 4: The ARDL and NARDL Estimation Results
LXU100 LXUTUM LXUHIZ ARDL NARDL ARDL NARDL ARDL NARDL
Short-Term Estimates
∆𝑳𝑳𝑳𝑳𝑳𝑳𝒕𝒕 -1.21(5.66)* -0.79(3.65)* -0.77(6.07)*
∆𝑷𝑷𝑷𝑷𝑷𝑷𝒕𝒕 -1.21(4.88)* -0.71(3.31)* -0.89(4.90)*
∆𝑵𝑵𝑳𝑳𝑵𝑵𝒕𝒕 -1.08(2.49)**
0.01(0.15) -0.06(0.97)
∆𝑳𝑳𝑳𝑳𝑷𝑷𝑳𝑳𝒕𝒕 0.05(0.65) 0.10(1.14) 0.11(1.32) 0.09(1.13) 0.08(1.35) 0.10(1.51) ∆𝑳𝑳𝑳𝑳𝑷𝑷𝑳𝑳𝒕𝒕 -0.40(1.95)* -
0.55(2.32)** 0.14(0.72) 0.24(0.74) -0.02(0.15) -0.13(0.60)
∆𝑳𝑳𝑳𝑳𝑳𝑳𝒕𝒕 0.27(0.70) 0.27(0.71) 0.26(0.70) 0.04(0.37) 0.10(1.33) 0.03(0.32) ∆𝑳𝑳𝑳𝑳𝑳𝑳𝒕𝒕−𝟏𝟏 1.13(3.31)* 1.21(3.47)* 1.01(3.14)* ∆𝑳𝑳𝑳𝑳𝑳𝑳𝒕𝒕−𝑳𝑳 -0.76(2.76)* -
0.67(2.32)**
Long-Term Estimates
𝑳𝑳𝑳𝑳𝑳𝑳 0.17(0.37) -0.38(0.94) -0.27(0.85) 𝑷𝑷𝑷𝑷𝑷𝑷 0.90(1.11) -0.39(0.70) 0.29(0.43) 𝑵𝑵𝑳𝑳𝑵𝑵 -0.35(0.58) 0.11(0.14) -0.45(1.07) 𝑳𝑳𝑳𝑳𝑷𝑷𝑳𝑳 0.42(0.74) 0.82(1.34) 0.66(1.34) 0.57(1.15) 0.56(1.57) 0.70(1.59) 𝑳𝑳𝑳𝑳𝑷𝑷𝑳𝑳 -3.34(1.49) -4.49(1.70)* 0.84(0.73) 1.42(0.73) -0.19(0.14) -0.94(0.54) 𝑳𝑳𝑳𝑳𝑳𝑳 2.15(1.98)** 1.35(1.25) 0.30(0.42) 0.29(0.38) 0.73(1.25) 0.22(0.32) 𝑳𝑳𝑪𝑪𝑪𝑪𝑪𝑪𝒕𝒕𝑪𝑪𝑪𝑪𝒕𝒕 -16.99(1.75)* 2.38(0.14) -2.22(0.24) -4.14(0.39) -5.57(1.05) 7.35(0.56) Diagnostic Statistics
𝑭𝑭 3.66** 3.38*** 3.51** 5.98* 4.22** 5.89*
𝑳𝑳𝑳𝑳𝑳𝑳𝒕𝒕−𝟏𝟏 -0.12(3.07) -0.12(3.12) -0.14(4.02) -0.17(3.78) -0.14(2.77) -0.14(2.64)
𝑾𝑾𝑾𝑾𝑾𝑾𝒕𝒕𝑾𝑾 8.80 11.49 22.54** 25.01* 11.96 14.30*** 𝑳𝑳𝑳𝑳 5.43 4.43 4.47 1.93 0.53 1.56 𝑨𝑨𝑨𝑨𝑨𝑨𝑨𝑨𝑪𝑪𝒕𝒕𝑾𝑾𝑨𝑨 𝑹𝑹𝑳𝑳 0.28 0.28 0.22 0.17 0.20 0.21
Note: The absolute value of t-statistics in parentheses; *𝑝𝑝 < 0.01, **𝑝𝑝 < 0.05, ***𝑝𝑝 < 0.1.
The diagnostic tests are reported in Table 4. The White test statistic is reported to test for heteroscedasticity. The assumption of homoscedasticity is valid except for LXUTUM, LXUHIZ and LXUSIN stock indices. Therefore, since these indices have heteroskedasticity problem, the
0.32 0.32 0.13 0.15 0.15 0.19
Note: The absolute value of t-statistics in parentheses; *
Makale Gönderim Tarihi: 09.02.2021 Yayına Kabul Tarihi: 13.06.2021
LXUTEK -2.5164 [0] -7.2457 [1]* -2.7384 [5] -11.6885 [5]* LEX -1.6508 [2] -9.8683 [1]* -1.8448 [2] -8.8639 [4]* LIPI -3.2403 [12]* -2.9344 [12]** -8.6988 [5]* -41.0119 [12]* LCPI -4.5924 [5] -10.2785 [3]* -0.2713 [9] -9.8542 [13]* LM2 -3.0444 [0] -13.5414 [0]* -2.9703 [3] -13.9836 [9]*
Note: The values in brackets represent the optimal lag length by the SIC; *𝑝𝑝 < 0.01, **𝑝𝑝 <0.05, ***𝑝𝑝 < 0.1.
Table 4: The ARDL and NARDL Estimation Results
LXU100 LXUTUM LXUHIZ ARDL NARDL ARDL NARDL ARDL NARDL
Short-Term Estimates
∆𝑳𝑳𝑳𝑳𝑳𝑳𝒕𝒕 -1.21(5.66)* -0.79(3.65)* -0.77(6.07)*
∆𝑷𝑷𝑷𝑷𝑷𝑷𝒕𝒕 -1.21(4.88)* -0.71(3.31)* -0.89(4.90)*
∆𝑵𝑵𝑳𝑳𝑵𝑵𝒕𝒕 -1.08(2.49)**
0.01(0.15) -0.06(0.97)
∆𝑳𝑳𝑳𝑳𝑷𝑷𝑳𝑳𝒕𝒕 0.05(0.65) 0.10(1.14) 0.11(1.32) 0.09(1.13) 0.08(1.35) 0.10(1.51) ∆𝑳𝑳𝑳𝑳𝑷𝑷𝑳𝑳𝒕𝒕 -0.40(1.95)* -
0.55(2.32)** 0.14(0.72) 0.24(0.74) -0.02(0.15) -0.13(0.60)
∆𝑳𝑳𝑳𝑳𝑳𝑳𝒕𝒕 0.27(0.70) 0.27(0.71) 0.26(0.70) 0.04(0.37) 0.10(1.33) 0.03(0.32) ∆𝑳𝑳𝑳𝑳𝑳𝑳𝒕𝒕−𝟏𝟏 1.13(3.31)* 1.21(3.47)* 1.01(3.14)* ∆𝑳𝑳𝑳𝑳𝑳𝑳𝒕𝒕−𝑳𝑳 -0.76(2.76)* -
0.67(2.32)**
Long-Term Estimates
𝑳𝑳𝑳𝑳𝑳𝑳 0.17(0.37) -0.38(0.94) -0.27(0.85) 𝑷𝑷𝑷𝑷𝑷𝑷 0.90(1.11) -0.39(0.70) 0.29(0.43) 𝑵𝑵𝑳𝑳𝑵𝑵 -0.35(0.58) 0.11(0.14) -0.45(1.07) 𝑳𝑳𝑳𝑳𝑷𝑷𝑳𝑳 0.42(0.74) 0.82(1.34) 0.66(1.34) 0.57(1.15) 0.56(1.57) 0.70(1.59) 𝑳𝑳𝑳𝑳𝑷𝑷𝑳𝑳 -3.34(1.49) -4.49(1.70)* 0.84(0.73) 1.42(0.73) -0.19(0.14) -0.94(0.54) 𝑳𝑳𝑳𝑳𝑳𝑳 2.15(1.98)** 1.35(1.25) 0.30(0.42) 0.29(0.38) 0.73(1.25) 0.22(0.32) 𝑳𝑳𝑪𝑪𝑪𝑪𝑪𝑪𝒕𝒕𝑪𝑪𝑪𝑪𝒕𝒕 -16.99(1.75)* 2.38(0.14) -2.22(0.24) -4.14(0.39) -5.57(1.05) 7.35(0.56) Diagnostic Statistics
𝑭𝑭 3.66** 3.38*** 3.51** 5.98* 4.22** 5.89*
𝑳𝑳𝑳𝑳𝑳𝑳𝒕𝒕−𝟏𝟏 -0.12(3.07) -0.12(3.12) -0.14(4.02) -0.17(3.78) -0.14(2.77) -0.14(2.64)
𝑾𝑾𝑾𝑾𝑾𝑾𝒕𝒕𝑾𝑾 8.80 11.49 22.54** 25.01* 11.96 14.30*** 𝑳𝑳𝑳𝑳 5.43 4.43 4.47 1.93 0.53 1.56 𝑨𝑨𝑨𝑨𝑨𝑨𝑨𝑨𝑪𝑪𝒕𝒕𝑾𝑾𝑨𝑨 𝑹𝑹𝑳𝑳 0.28 0.28 0.22 0.17 0.20 0.21
Note: The absolute value of t-statistics in parentheses; *𝑝𝑝 < 0.01, **𝑝𝑝 < 0.05, ***𝑝𝑝 < 0.1.
The diagnostic tests are reported in Table 4. The White test statistic is reported to test for heteroscedasticity. The assumption of homoscedasticity is valid except for LXUTUM, LXUHIZ and LXUSIN stock indices. Therefore, since these indices have heteroskedasticity problem, the
, **
Makale Gönderim Tarihi: 09.02.2021 Yayına Kabul Tarihi: 13.06.2021
LXUTEK -2.5164 [0] -7.2457 [1]* -2.7384 [5] -11.6885 [5]* LEX -1.6508 [2] -9.8683 [1]* -1.8448 [2] -8.8639 [4]* LIPI -3.2403 [12]* -2.9344 [12]** -8.6988 [5]* -41.0119 [12]* LCPI -4.5924 [5] -10.2785 [3]* -0.2713 [9] -9.8542 [13]* LM2 -3.0444 [0] -13.5414 [0]* -2.9703 [3] -13.9836 [9]*
Note: The values in brackets represent the optimal lag length by the SIC; *𝑝𝑝 < 0.01, **𝑝𝑝 <0.05, ***𝑝𝑝 < 0.1.
Table 4: The ARDL and NARDL Estimation Results
LXU100 LXUTUM LXUHIZ ARDL NARDL ARDL NARDL ARDL NARDL
Short-Term Estimates
∆𝑳𝑳𝑳𝑳𝑳𝑳𝒕𝒕 -1.21(5.66)* -0.79(3.65)* -0.77(6.07)*
∆𝑷𝑷𝑷𝑷𝑷𝑷𝒕𝒕 -1.21(4.88)* -0.71(3.31)* -0.89(4.90)*
∆𝑵𝑵𝑳𝑳𝑵𝑵𝒕𝒕 -1.08(2.49)**
0.01(0.15) -0.06(0.97)
∆𝑳𝑳𝑳𝑳𝑷𝑷𝑳𝑳𝒕𝒕 0.05(0.65) 0.10(1.14) 0.11(1.32) 0.09(1.13) 0.08(1.35) 0.10(1.51) ∆𝑳𝑳𝑳𝑳𝑷𝑷𝑳𝑳𝒕𝒕 -0.40(1.95)* -
0.55(2.32)** 0.14(0.72) 0.24(0.74) -0.02(0.15) -0.13(0.60)
∆𝑳𝑳𝑳𝑳𝑳𝑳𝒕𝒕 0.27(0.70) 0.27(0.71) 0.26(0.70) 0.04(0.37) 0.10(1.33) 0.03(0.32) ∆𝑳𝑳𝑳𝑳𝑳𝑳𝒕𝒕−𝟏𝟏 1.13(3.31)* 1.21(3.47)* 1.01(3.14)* ∆𝑳𝑳𝑳𝑳𝑳𝑳𝒕𝒕−𝑳𝑳 -0.76(2.76)* -
0.67(2.32)**
Long-Term Estimates
𝑳𝑳𝑳𝑳𝑳𝑳 0.17(0.37) -0.38(0.94) -0.27(0.85) 𝑷𝑷𝑷𝑷𝑷𝑷 0.90(1.11) -0.39(0.70) 0.29(0.43) 𝑵𝑵𝑳𝑳𝑵𝑵 -0.35(0.58) 0.11(0.14) -0.45(1.07) 𝑳𝑳𝑳𝑳𝑷𝑷𝑳𝑳 0.42(0.74) 0.82(1.34) 0.66(1.34) 0.57(1.15) 0.56(1.57) 0.70(1.59) 𝑳𝑳𝑳𝑳𝑷𝑷𝑳𝑳 -3.34(1.49) -4.49(1.70)* 0.84(0.73) 1.42(0.73) -0.19(0.14) -0.94(0.54) 𝑳𝑳𝑳𝑳𝑳𝑳 2.15(1.98)** 1.35(1.25) 0.30(0.42) 0.29(0.38) 0.73(1.25) 0.22(0.32) 𝑳𝑳𝑪𝑪𝑪𝑪𝑪𝑪𝒕𝒕𝑪𝑪𝑪𝑪𝒕𝒕 -16.99(1.75)* 2.38(0.14) -2.22(0.24) -4.14(0.39) -5.57(1.05) 7.35(0.56) Diagnostic Statistics
𝑭𝑭 3.66** 3.38*** 3.51** 5.98* 4.22** 5.89*
𝑳𝑳𝑳𝑳𝑳𝑳𝒕𝒕−𝟏𝟏 -0.12(3.07) -0.12(3.12) -0.14(4.02) -0.17(3.78) -0.14(2.77) -0.14(2.64)
𝑾𝑾𝑾𝑾𝑾𝑾𝒕𝒕𝑾𝑾 8.80 11.49 22.54** 25.01* 11.96 14.30*** 𝑳𝑳𝑳𝑳 5.43 4.43 4.47 1.93 0.53 1.56 𝑨𝑨𝑨𝑨𝑨𝑨𝑨𝑨𝑪𝑪𝒕𝒕𝑾𝑾𝑨𝑨 𝑹𝑹𝑳𝑳 0.28 0.28 0.22 0.17 0.20 0.21
Note: The absolute value of t-statistics in parentheses; *𝑝𝑝 < 0.01, **𝑝𝑝 < 0.05, ***𝑝𝑝 < 0.1.
The diagnostic tests are reported in Table 4. The White test statistic is reported to test for heteroscedasticity. The assumption of homoscedasticity is valid except for LXUTUM, LXUHIZ and LXUSIN stock indices. Therefore, since these indices have heteroskedasticity problem, the
, ***
Makale Gönderim Tarihi: 09.02.2021 Yayına Kabul Tarihi: 13.06.2021
LXUTEK -2.5164 [0] -7.2457 [1]* -2.7384 [5] -11.6885 [5]* LEX -1.6508 [2] -9.8683 [1]* -1.8448 [2] -8.8639 [4]* LIPI -3.2403 [12]* -2.9344 [12]** -8.6988 [5]* -41.0119 [12]* LCPI -4.5924 [5] -10.2785 [3]* -0.2713 [9] -9.8542 [13]* LM2 -3.0444 [0] -13.5414 [0]* -2.9703 [3] -13.9836 [9]*
Note: The values in brackets represent the optimal lag length by the SIC; *𝑝𝑝 < 0.01, **𝑝𝑝 <0.05, ***𝑝𝑝 < 0.1.
Table 4: The ARDL and NARDL Estimation Results
LXU100 LXUTUM LXUHIZ ARDL NARDL ARDL NARDL ARDL NARDL
Short-Term Estimates
∆𝑳𝑳𝑳𝑳𝑳𝑳𝒕𝒕 -1.21(5.66)* -0.79(3.65)* -0.77(6.07)*
∆𝑷𝑷𝑷𝑷𝑷𝑷𝒕𝒕 -1.21(4.88)* -0.71(3.31)* -0.89(4.90)*
∆𝑵𝑵𝑳𝑳𝑵𝑵𝒕𝒕 -1.08(2.49)**
0.01(0.15) -0.06(0.97)
∆𝑳𝑳𝑳𝑳𝑷𝑷𝑳𝑳𝒕𝒕 0.05(0.65) 0.10(1.14) 0.11(1.32) 0.09(1.13) 0.08(1.35) 0.10(1.51) ∆𝑳𝑳𝑳𝑳𝑷𝑷𝑳𝑳𝒕𝒕 -0.40(1.95)* -
0.55(2.32)** 0.14(0.72) 0.24(0.74) -0.02(0.15) -0.13(0.60)
∆𝑳𝑳𝑳𝑳𝑳𝑳𝒕𝒕 0.27(0.70) 0.27(0.71) 0.26(0.70) 0.04(0.37) 0.10(1.33) 0.03(0.32) ∆𝑳𝑳𝑳𝑳𝑳𝑳𝒕𝒕−𝟏𝟏 1.13(3.31)* 1.21(3.47)* 1.01(3.14)* ∆𝑳𝑳𝑳𝑳𝑳𝑳𝒕𝒕−𝑳𝑳 -0.76(2.76)* -
0.67(2.32)**
Long-Term Estimates
𝑳𝑳𝑳𝑳𝑳𝑳 0.17(0.37) -0.38(0.94) -0.27(0.85) 𝑷𝑷𝑷𝑷𝑷𝑷 0.90(1.11) -0.39(0.70) 0.29(0.43) 𝑵𝑵𝑳𝑳𝑵𝑵 -0.35(0.58) 0.11(0.14) -0.45(1.07) 𝑳𝑳𝑳𝑳𝑷𝑷𝑳𝑳 0.42(0.74) 0.82(1.34) 0.66(1.34) 0.57(1.15) 0.56(1.57) 0.70(1.59) 𝑳𝑳𝑳𝑳𝑷𝑷𝑳𝑳 -3.34(1.49) -4.49(1.70)* 0.84(0.73) 1.42(0.73) -0.19(0.14) -0.94(0.54) 𝑳𝑳𝑳𝑳𝑳𝑳 2.15(1.98)** 1.35(1.25) 0.30(0.42) 0.29(0.38) 0.73(1.25) 0.22(0.32) 𝑳𝑳𝑪𝑪𝑪𝑪𝑪𝑪𝒕𝒕𝑪𝑪𝑪𝑪𝒕𝒕 -16.99(1.75)* 2.38(0.14) -2.22(0.24) -4.14(0.39) -5.57(1.05) 7.35(0.56) Diagnostic Statistics
𝑭𝑭 3.66** 3.38*** 3.51** 5.98* 4.22** 5.89*
𝑳𝑳𝑳𝑳𝑳𝑳𝒕𝒕−𝟏𝟏 -0.12(3.07) -0.12(3.12) -0.14(4.02) -0.17(3.78) -0.14(2.77) -0.14(2.64)
𝑾𝑾𝑾𝑾𝑾𝑾𝒕𝒕𝑾𝑾 8.80 11.49 22.54** 25.01* 11.96 14.30*** 𝑳𝑳𝑳𝑳 5.43 4.43 4.47 1.93 0.53 1.56 𝑨𝑨𝑨𝑨𝑨𝑨𝑨𝑨𝑪𝑪𝒕𝒕𝑾𝑾𝑨𝑨 𝑹𝑹𝑳𝑳 0.28 0.28 0.22 0.17 0.20 0.21
Note: The absolute value of t-statistics in parentheses; *𝑝𝑝 < 0.01, **𝑝𝑝 < 0.05, ***𝑝𝑝 < 0.1.
The diagnostic tests are reported in Table 4. The White test statistic is reported to test for heteroscedasticity. The assumption of homoscedasticity is valid except for LXUTUM, LXUHIZ and LXUSIN stock indices. Therefore, since these indices have heteroskedasticity problem, the
.
Secondly, We interpret the NARDL estimation results and we conclude that the variables are cointegrated in all of the models. The F bounds testing approach confirms that the variables have a cointegration relationship. According to the NARDL results, it has been revealed that the LIPI has not a significant impact on stock indices in the short and long-term. LCPI affects statistically significantly and negatively on the LXU100 and LXUMAL stock indices in the short and long-term. The impacts of the LCPI on the LXUSIN stock index are significant and negative in the short-term, the impacts of the LCPI are negative and significant impacts on the LXUTEK stock index in the long-term. The impacts of the LCPI on the LXUTUM and LXUHIZ indices are statistically insignificant. In the long-term, the LM2 only affects the LXUTEK sector index significantly and positively. While the LM2 has no significant impact on LXUTUM, LXUHIZ and LXUSIN stock indices in the short-term, its impact on the LXUTEK stock index is significant and positive. The impacts of the LM2 on the LXU100 and LXUMAL stock indices are different for different lags in the short-term.
Table 6: The Wald Test ResultsVariables Long-term asymmetry Short-term asymmetryLXU100 1.3959 (0.2392) 0.0666 (0.7966)LXUTUM 0.2879 (0.5925) 6.7334 (0.0106)**LXUHIZ 0.8082 (0.3700) 15.4050 (0.0001)*LXUMAL 1.8894 (0.1712) 0.0021 (0.9631)LXUSIN 0.6476 (0.4221) 13.8041 (0.0003)*LXUTEK 2.6544 (0.1052) 15.2732 (0.0001)*
Note: The p-values in parentheses; *
Makale Gönderim Tarihi: 09.02.2021 Yayına Kabul Tarihi: 13.06.2021
LXUTEK -2.5164 [0] -7.2457 [1]* -2.7384 [5] -11.6885 [5]* LEX -1.6508 [2] -9.8683 [1]* -1.8448 [2] -8.8639 [4]* LIPI -3.2403 [12]* -2.9344 [12]** -8.6988 [5]* -41.0119 [12]* LCPI -4.5924 [5] -10.2785 [3]* -0.2713 [9] -9.8542 [13]* LM2 -3.0444 [0] -13.5414 [0]* -2.9703 [3] -13.9836 [9]*
Note: The values in brackets represent the optimal lag length by the SIC; *𝑝𝑝 < 0.01, **𝑝𝑝 <0.05, ***𝑝𝑝 < 0.1.
Table 4: The ARDL and NARDL Estimation Results
LXU100 LXUTUM LXUHIZ ARDL NARDL ARDL NARDL ARDL NARDL
Short-Term Estimates
∆𝑳𝑳𝑳𝑳𝑳𝑳𝒕𝒕 -1.21(5.66)* -0.79(3.65)* -0.77(6.07)*
∆𝑷𝑷𝑷𝑷𝑷𝑷𝒕𝒕 -1.21(4.88)* -0.71(3.31)* -0.89(4.90)*
∆𝑵𝑵𝑳𝑳𝑵𝑵𝒕𝒕 -1.08(2.49)**
0.01(0.15) -0.06(0.97)
∆𝑳𝑳𝑳𝑳𝑷𝑷𝑳𝑳𝒕𝒕 0.05(0.65) 0.10(1.14) 0.11(1.32) 0.09(1.13) 0.08(1.35) 0.10(1.51) ∆𝑳𝑳𝑳𝑳𝑷𝑷𝑳𝑳𝒕𝒕 -0.40(1.95)* -
0.55(2.32)** 0.14(0.72) 0.24(0.74) -0.02(0.15) -0.13(0.60)
∆𝑳𝑳𝑳𝑳𝑳𝑳𝒕𝒕 0.27(0.70) 0.27(0.71) 0.26(0.70) 0.04(0.37) 0.10(1.33) 0.03(0.32) ∆𝑳𝑳𝑳𝑳𝑳𝑳𝒕𝒕−𝟏𝟏 1.13(3.31)* 1.21(3.47)* 1.01(3.14)* ∆𝑳𝑳𝑳𝑳𝑳𝑳𝒕𝒕−𝑳𝑳 -0.76(2.76)* -
0.67(2.32)**
Long-Term Estimates
𝑳𝑳𝑳𝑳𝑳𝑳 0.17(0.37) -0.38(0.94) -0.27(0.85) 𝑷𝑷𝑷𝑷𝑷𝑷 0.90(1.11) -0.39(0.70) 0.29(0.43) 𝑵𝑵𝑳𝑳𝑵𝑵 -0.35(0.58) 0.11(0.14) -0.45(1.07) 𝑳𝑳𝑳𝑳𝑷𝑷𝑳𝑳 0.42(0.74) 0.82(1.34) 0.66(1.34) 0.57(1.15) 0.56(1.57) 0.70(1.59) 𝑳𝑳𝑳𝑳𝑷𝑷𝑳𝑳 -3.34(1.49) -4.49(1.70)* 0.84(0.73) 1.42(0.73) -0.19(0.14) -0.94(0.54) 𝑳𝑳𝑳𝑳𝑳𝑳 2.15(1.98)** 1.35(1.25) 0.30(0.42) 0.29(0.38) 0.73(1.25) 0.22(0.32) 𝑳𝑳𝑪𝑪𝑪𝑪𝑪𝑪𝒕𝒕𝑪𝑪𝑪𝑪𝒕𝒕 -16.99(1.75)* 2.38(0.14) -2.22(0.24) -4.14(0.39) -5.57(1.05) 7.35(0.56) Diagnostic Statistics
𝑭𝑭 3.66** 3.38*** 3.51** 5.98* 4.22** 5.89*
𝑳𝑳𝑳𝑳𝑳𝑳𝒕𝒕−𝟏𝟏 -0.12(3.07) -0.12(3.12) -0.14(4.02) -0.17(3.78) -0.14(2.77) -0.14(2.64)
𝑾𝑾𝑾𝑾𝑾𝑾𝒕𝒕𝑾𝑾 8.80 11.49 22.54** 25.01* 11.96 14.30*** 𝑳𝑳𝑳𝑳 5.43 4.43 4.47 1.93 0.53 1.56 𝑨𝑨𝑨𝑨𝑨𝑨𝑨𝑨𝑪𝑪𝒕𝒕𝑾𝑾𝑨𝑨 𝑹𝑹𝑳𝑳 0.28 0.28 0.22 0.17 0.20 0.21
Note: The absolute value of t-statistics in parentheses; *𝑝𝑝 < 0.01, **𝑝𝑝 < 0.05, ***𝑝𝑝 < 0.1.
The diagnostic tests are reported in Table 4. The White test statistic is reported to test for heteroscedasticity. The assumption of homoscedasticity is valid except for LXUTUM, LXUHIZ and LXUSIN stock indices. Therefore, since these indices have heteroskedasticity problem, the
, **
Makale Gönderim Tarihi: 09.02.2021 Yayına Kabul Tarihi: 13.06.2021
LXUTEK -2.5164 [0] -7.2457 [1]* -2.7384 [5] -11.6885 [5]* LEX -1.6508 [2] -9.8683 [1]* -1.8448 [2] -8.8639 [4]* LIPI -3.2403 [12]* -2.9344 [12]** -8.6988 [5]* -41.0119 [12]* LCPI -4.5924 [5] -10.2785 [3]* -0.2713 [9] -9.8542 [13]* LM2 -3.0444 [0] -13.5414 [0]* -2.9703 [3] -13.9836 [9]*
Note: The values in brackets represent the optimal lag length by the SIC; *𝑝𝑝 < 0.01, **𝑝𝑝 <0.05, ***𝑝𝑝 < 0.1.
Table 4: The ARDL and NARDL Estimation Results
LXU100 LXUTUM LXUHIZ ARDL NARDL ARDL NARDL ARDL NARDL
Short-Term Estimates
∆𝑳𝑳𝑳𝑳𝑳𝑳𝒕𝒕 -1.21(5.66)* -0.79(3.65)* -0.77(6.07)*
∆𝑷𝑷𝑷𝑷𝑷𝑷𝒕𝒕 -1.21(4.88)* -0.71(3.31)* -0.89(4.90)*
∆𝑵𝑵𝑳𝑳𝑵𝑵𝒕𝒕 -1.08(2.49)**
0.01(0.15) -0.06(0.97)
∆𝑳𝑳𝑳𝑳𝑷𝑷𝑳𝑳𝒕𝒕 0.05(0.65) 0.10(1.14) 0.11(1.32) 0.09(1.13) 0.08(1.35) 0.10(1.51) ∆𝑳𝑳𝑳𝑳𝑷𝑷𝑳𝑳𝒕𝒕 -0.40(1.95)* -
0.55(2.32)** 0.14(0.72) 0.24(0.74) -0.02(0.15) -0.13(0.60)
∆𝑳𝑳𝑳𝑳𝑳𝑳𝒕𝒕 0.27(0.70) 0.27(0.71) 0.26(0.70) 0.04(0.37) 0.10(1.33) 0.03(0.32) ∆𝑳𝑳𝑳𝑳𝑳𝑳𝒕𝒕−𝟏𝟏 1.13(3.31)* 1.21(3.47)* 1.01(3.14)* ∆𝑳𝑳𝑳𝑳𝑳𝑳𝒕𝒕−𝑳𝑳 -0.76(2.76)* -
0.67(2.32)**
Long-Term Estimates
𝑳𝑳𝑳𝑳𝑳𝑳 0.17(0.37) -0.38(0.94) -0.27(0.85) 𝑷𝑷𝑷𝑷𝑷𝑷 0.90(1.11) -0.39(0.70) 0.29(0.43) 𝑵𝑵𝑳𝑳𝑵𝑵 -0.35(0.58) 0.11(0.14) -0.45(1.07) 𝑳𝑳𝑳𝑳𝑷𝑷𝑳𝑳 0.42(0.74) 0.82(1.34) 0.66(1.34) 0.57(1.15) 0.56(1.57) 0.70(1.59) 𝑳𝑳𝑳𝑳𝑷𝑷𝑳𝑳 -3.34(1.49) -4.49(1.70)* 0.84(0.73) 1.42(0.73) -0.19(0.14) -0.94(0.54) 𝑳𝑳𝑳𝑳𝑳𝑳 2.15(1.98)** 1.35(1.25) 0.30(0.42) 0.29(0.38) 0.73(1.25) 0.22(0.32) 𝑳𝑳𝑪𝑪𝑪𝑪𝑪𝑪𝒕𝒕𝑪𝑪𝑪𝑪𝒕𝒕 -16.99(1.75)* 2.38(0.14) -2.22(0.24) -4.14(0.39) -5.57(1.05) 7.35(0.56) Diagnostic Statistics
𝑭𝑭 3.66** 3.38*** 3.51** 5.98* 4.22** 5.89*
𝑳𝑳𝑳𝑳𝑳𝑳𝒕𝒕−𝟏𝟏 -0.12(3.07) -0.12(3.12) -0.14(4.02) -0.17(3.78) -0.14(2.77) -0.14(2.64)
𝑾𝑾𝑾𝑾𝑾𝑾𝒕𝒕𝑾𝑾 8.80 11.49 22.54** 25.01* 11.96 14.30*** 𝑳𝑳𝑳𝑳 5.43 4.43 4.47 1.93 0.53 1.56 𝑨𝑨𝑨𝑨𝑨𝑨𝑨𝑨𝑪𝑪𝒕𝒕𝑾𝑾𝑨𝑨 𝑹𝑹𝑳𝑳 0.28 0.28 0.22 0.17 0.20 0.21
Note: The absolute value of t-statistics in parentheses; *𝑝𝑝 < 0.01, **𝑝𝑝 < 0.05, ***𝑝𝑝 < 0.1.
The diagnostic tests are reported in Table 4. The White test statistic is reported to test for heteroscedasticity. The assumption of homoscedasticity is valid except for LXUTUM, LXUHIZ and LXUSIN stock indices. Therefore, since these indices have heteroskedasticity problem, the
, ***
Makale Gönderim Tarihi: 09.02.2021 Yayına Kabul Tarihi: 13.06.2021
LXUTEK -2.5164 [0] -7.2457 [1]* -2.7384 [5] -11.6885 [5]* LEX -1.6508 [2] -9.8683 [1]* -1.8448 [2] -8.8639 [4]* LIPI -3.2403 [12]* -2.9344 [12]** -8.6988 [5]* -41.0119 [12]* LCPI -4.5924 [5] -10.2785 [3]* -0.2713 [9] -9.8542 [13]* LM2 -3.0444 [0] -13.5414 [0]* -2.9703 [3] -13.9836 [9]*
Note: The values in brackets represent the optimal lag length by the SIC; *𝑝𝑝 < 0.01, **𝑝𝑝 <0.05, ***𝑝𝑝 < 0.1.
Table 4: The ARDL and NARDL Estimation Results
LXU100 LXUTUM LXUHIZ ARDL NARDL ARDL NARDL ARDL NARDL
Short-Term Estimates
∆𝑳𝑳𝑳𝑳𝑳𝑳𝒕𝒕 -1.21(5.66)* -0.79(3.65)* -0.77(6.07)*
∆𝑷𝑷𝑷𝑷𝑷𝑷𝒕𝒕 -1.21(4.88)* -0.71(3.31)* -0.89(4.90)*
∆𝑵𝑵𝑳𝑳𝑵𝑵𝒕𝒕 -1.08(2.49)**
0.01(0.15) -0.06(0.97)
∆𝑳𝑳𝑳𝑳𝑷𝑷𝑳𝑳𝒕𝒕 0.05(0.65) 0.10(1.14) 0.11(1.32) 0.09(1.13) 0.08(1.35) 0.10(1.51) ∆𝑳𝑳𝑳𝑳𝑷𝑷𝑳𝑳𝒕𝒕 -0.40(1.95)* -
0.55(2.32)** 0.14(0.72) 0.24(0.74) -0.02(0.15) -0.13(0.60)
∆𝑳𝑳𝑳𝑳𝑳𝑳𝒕𝒕 0.27(0.70) 0.27(0.71) 0.26(0.70) 0.04(0.37) 0.10(1.33) 0.03(0.32) ∆𝑳𝑳𝑳𝑳𝑳𝑳𝒕𝒕−𝟏𝟏 1.13(3.31)* 1.21(3.47)* 1.01(3.14)* ∆𝑳𝑳𝑳𝑳𝑳𝑳𝒕𝒕−𝑳𝑳 -0.76(2.76)* -
0.67(2.32)**
Long-Term Estimates
𝑳𝑳𝑳𝑳𝑳𝑳 0.17(0.37) -0.38(0.94) -0.27(0.85) 𝑷𝑷𝑷𝑷𝑷𝑷 0.90(1.11) -0.39(0.70) 0.29(0.43) 𝑵𝑵𝑳𝑳𝑵𝑵 -0.35(0.58) 0.11(0.14) -0.45(1.07) 𝑳𝑳𝑳𝑳𝑷𝑷𝑳𝑳 0.42(0.74) 0.82(1.34) 0.66(1.34) 0.57(1.15) 0.56(1.57) 0.70(1.59) 𝑳𝑳𝑳𝑳𝑷𝑷𝑳𝑳 -3.34(1.49) -4.49(1.70)* 0.84(0.73) 1.42(0.73) -0.19(0.14) -0.94(0.54) 𝑳𝑳𝑳𝑳𝑳𝑳 2.15(1.98)** 1.35(1.25) 0.30(0.42) 0.29(0.38) 0.73(1.25) 0.22(0.32) 𝑳𝑳𝑪𝑪𝑪𝑪𝑪𝑪𝒕𝒕𝑪𝑪𝑪𝑪𝒕𝒕 -16.99(1.75)* 2.38(0.14) -2.22(0.24) -4.14(0.39) -5.57(1.05) 7.35(0.56) Diagnostic Statistics
𝑭𝑭 3.66** 3.38*** 3.51** 5.98* 4.22** 5.89*
𝑳𝑳𝑳𝑳𝑳𝑳𝒕𝒕−𝟏𝟏 -0.12(3.07) -0.12(3.12) -0.14(4.02) -0.17(3.78) -0.14(2.77) -0.14(2.64)
𝑾𝑾𝑾𝑾𝑾𝑾𝒕𝒕𝑾𝑾 8.80 11.49 22.54** 25.01* 11.96 14.30*** 𝑳𝑳𝑳𝑳 5.43 4.43 4.47 1.93 0.53 1.56 𝑨𝑨𝑨𝑨𝑨𝑨𝑨𝑨𝑪𝑪𝒕𝒕𝑾𝑾𝑨𝑨 𝑹𝑹𝑳𝑳 0.28 0.28 0.22 0.17 0.20 0.21
Note: The absolute value of t-statistics in parentheses; *𝑝𝑝 < 0.01, **𝑝𝑝 < 0.05, ***𝑝𝑝 < 0.1.
The diagnostic tests are reported in Table 4. The White test statistic is reported to test for heteroscedasticity. The assumption of homoscedasticity is valid except for LXUTUM, LXUHIZ and LXUSIN stock indices. Therefore, since these indices have heteroskedasticity problem, the
.
The Wald test results are conducted to detect whether the impacts of the LEX, which is one of the main objectives of this study, on stock indices are asymmetric or not are presented in Table 6. According to the Wald test results, the impacts of the LEX movements on the LXUTUM, LXUHIZ, LXUSIN and LXUTEK stock indices are asymmetrical in the short-term. The Wald test result indicates that the impacts of the LEX movements on stock indices are not asymmetrical in the long-term. However, examining the possible asymmetric impacts of the LEX movements on the LXUTEK stock index, We found that the positive LEX is significant Fand the negative LEX is insignificant in the long-term. Thus, it can be stated that the impacts of the LEX movements on the LXUTEK stock index are asymmetrical in the long-term. While the impact of the depreciation of the Turkish lira on the
Emre ÜRKMEZ • Ömer Faruk BÖLÜKBAŞI
54
LXUTEK stock index is positive, a significant impact of the appreciation of the Turkish lira could not be found. According to these findings, 1% depreciation in the Turkish lira increases the LXUTEK stock index by 4.22%. Contrary to the long-term findings in the LXUTEK sector index, which is determined to have asymmetric impacts on stock indices in the short-term, the depreciation of the Turkish lira has a negative impact on the stock indices in the short-term. The negative coefficient does not have a significant impact on the LXUTEK stock index in the short-term. The NARDL model findings indicate that the positive LEX coefficient affects LXUTUM, LXUHIZ and LXUSIN stock indices negatively and significantly in the short-term. It has been determined that the negative coefficient has a statistically significant impact on LXUTUM, LXUHIZ and LXUSIN stock indices in the short-term. It has been revealed that the depreciation of the Turkish lira has negative impacts on LXUTUM, LXUHIZ and LXUSIN stock indices in the short-term.
4. Conclusion
This study analyses exchange rates asymmetric impact on stock indices for Turkey over the period 2005 to 2020. For this purpose, the linear and non-linear ARDL models are used to the LEX, LIPI, LCPI and LM2 variables included as explanatory variables. LXU100 and LXUTUM indices and four sector indices LXUHIZ, LXUMAL, LXUSIN and LXUTEK indices are used to represent the stock indices. The ARDL, which is assumed to be symmetrical in the impacts of LEX movements on stock indices, and the NARDL cointegration method, which allows these impacts on stock indices can be asymmetrical, are employed. We estimate six models under the cointegration methods, thus enabling us to compare findings.
The estimation results obtained for all the models indicate that the variables are cointegrated according to the ARDL and NARDL methods. It has been determined that the impacts of the LEX movements on stock indices are asymmetrical only on the LXUTEK stock index in the long-term. In the LXUTEK model, the ARDL findings indicate that the LEX has not a significant impact on stock indices in the long-term, while the NARDL findings reveal that the depreciation of the Turkish lira increases the LXUTEK stock index. Thus, it has been determined that the NARDL, which is an asymmetric cointegration method in the LXUTEK model, is a more successful model for determining the impacts of LEX movements on stock indices. This finding indicates that as a result of the depreciation of the Turkish lira of export-origin firms included in the LXUTEK stock index, the competitiveness in international markets increases with the relative price impact, and firm profitability increases. Thus, the stock indices of firms with higher profitability also increase. In this study, according to the findings of NARDL, it is concluded that the impacts of the LEX on stock indices are asymmetric in the short-term and not asymmetric in the long-term. From the studies conducted for Turkey, Kaya and Soybilgen53, Yacouba and Altıntaş54, Benli et al.55 have determined that the impact of the exchange rate on the BIST-100 index is asymmetric both in short and long-term. Also, Tiryaki et al.56 showed that this impact is asymmetrical in the long-term.
53 Kaya, Soybilgen, 2019, 293-300.54 Yacouba, Altıntaş, 2019, 98-116.55 Benli, Durmuşkaya, Bayramoğlu, 2019, 25-47.56 Tiryaki, Ceylan, Erdoğan, 2019, 2143-2154.
Marmara Üniversitesi İktisadi ve İdari Bilimler Dergisi • Cilt: 43 • Sayı: 1 • Haziran 2021, ISSN: 2587-2672, ss/pp. 42-56
55
As stated by the NARDL estimation results, it has been determined that the impacts of the LEX movements on the LXUTUM stock index and the LXUHIZ, LXUSIN and LXUTEK stock indices are asymmetrical in the short-term. Thus, it has been determined that the response of the stock indices of the firms in the LXUTUM, LXUHIZ, LXUSIN and LXUTEK indices is different in the short-term against the depreciation and appreciation of the Turkish lira. It has been revealed that the depreciation of the Turkish lira decreases the relevant stock indices in the short-term. It has been determined that the appreciation of the Turkish lira has no significant effect on the same stock indices. The depreciation of the Turkish lira increases the production costs of the firms included in the relevant stock indices and causes a decrease in their profitability. Thus, it has been determined that the depreciation of the Turkish lira caused a decrease in stock indices. It can be argued that this finding may be due to the fact that the production of the firms included in the LXUTUM, LXUHIZ, LXUSIN and LXUTEK stock indices is based on imports. However, since the long-term positive coefficients are not statistically significant in the LXUTUM, LXUHIZ, LXUSIN stock indices and positive and significant in the LXUTEK stock index, this impact is not valid in the long-term. Moreover, the money supply expansion increases stock indices, while inflation decreases stock indices. It has been determined that the LIPI, which is included in the models representing economic activity, does not have a significant effect on stock indices. It can be inferred that economic activity does not affect stock indices for Turkey.
ReferencesADENIYI, O., Kumeka, T. (2019). Exchange Rate and Stock Prices in Nigeria: Firm-Level Evidence, Journal of
African Business, 21(2): 235-263.AJAZ, T., Zulquar Nain, Md., Kamaiah, B., Sharma, N. K. (2017). Stock prices, Exchange Rate and Interest Rate:
Evidence Beyond Symmetry, Journal of Financial Economic Policy, 9(1): 2-19.ALIREZA, S., Zahra, H., Samira, Z. (2020). Real Exchange Rate Shocks and Export-Oriented Businesses in Iran:
An Empirical Analysis Using NARDL Model, Munich Personal RePEc Archive, 101554.ANJUM, N., Ghumro, N. H., Husain, B. (2017). Asymmetric Impact of Exchange Rate Changes on Stock Prices:
Empirical Evidence from Germany, International Journal of Economics and Financial Research, 3(11): 240-245.
AYDEMİR, O., Demirhan, E. (2009). The Relationship between Stock Prices and Exchange Rates Evidence from Turkey, International Research Journal of Finance and Economics, 23: 207-215.
AYVAZ, Ö. (2006). Döviz Kuru ve Hisse Senetleri Fiyatları Arasındaki Nedensellik İlişkisi, Gazi Üniversitesi İktisadi ve İdari Bilimler Fakültesi Dergisi, 8(2): 1-14.
BAHMANI-OSKOOEE, M., Saha, S. (2015). On the Relation Between Stock Prices and Exchange Rates: a Review Article, Journal of Economic Studies, 42(4): 707-732.
BAHMANI-OSKOOEE, M., Saha, S. (2016). Asymmetry Cointegration Between the Value of the Dollar and Sectoral Stock Indices in the US, International Review of Economics and Finance, 46: 78-86.
BAHMANI-OSKOOEE, M., Saha, S. (2016). Do Exchange Rate Changes Have Symmetric or Asymmetric Effects on Stock Prices?, Global Finance Journal, 31: 57-72.
BAHMANI-OSKOOEE, M., Saha, S. (2017). On the Relation Between Exchange Rates and Stock Prices: A Non-linear ARDL Approach and Asymmetry Analysis, Journal of Economics and Finance, 42: 112-137.
Emre ÜRKMEZ • Ömer Faruk BÖLÜKBAŞI
56
BELEN, M., Karamelikli, H. (2016). Türkiye’de Hisse Senedi Getirileri ile Döviz Kuru Arasındaki İlişkinin İncelenmesi: ARDL Yaklaşımı, Istanbul University Journal of the School of Business, 45(1): 34-42.
BENLİ, M., Durmuşkaya, S., Bayramoğlu, G. (2019). Asymmetric Exchange Rate Pass-Through and Sectoral Stock Price Indices: Evidence from Turkey, International Journal of Business and Management, 7(1): 25-47.
BHUTTO, N. A., Chang, B. H. (2019). The Effect of the Global Financial Crisis on the Asymmetric Relationship Between Exchange Rate and Stock Prices, High Frequency, 2(3-4): 175-183.
COŞKUN, M., Kiracı, K., Muhammed, U. (2016). Seçilmiş Makroekonomik Değişkenlerle Hisse Senedi Fiyatları Arasındaki İlişki: Türkiye Üzerine Ampirik Bir İnceleme, Finans Politik & Ekonomik Yorumlar, 53(616): 61-74.
CUESTAS, J. C., Tang, B. (2015). Asymmetric Exchange Rate Exposure of Stock Returns: Empirical Evidence from Chinese Industries, Studies in Nonlinear Dynamics & Econometrics, 21(4): 1-21.
EFFIONG, E. L., Bassey, G. E. (2019). Stock Prices and Exchange Rate Dynamics in Nigeria: An Asymmetric Perspective, The Journal of International Trade & Economic Development, 28(3): 299-316.
ELMAS, B., Esen, Ö. (2011). Hisse Senedi Fiyatları İle Döviz Kuru Arasındaki Dinamik İlişkinin Belirlenmesi; Farklı Ülke Piyasaları İçin Bir Araştırma, Muhasebe ve Finansman Dergisi, 52: 153-170.
KASMAN, S. (2003). The Relationship between Exchange Rates and Stock Prices: A Causality Analysis, Dokuz Eylül Üniversitsi Sosyal Bilimler Dergisi, 5(2): 70-79.
KAYA, H., Soybilgen, B. (2019). Evaluating the Asymmetric Effects of Production, Interest Rate and Exchange Rate on the Turkish Stock Prices, Ege Akademik Bakış, 19(2): 293-300.
LEE, G., Ryu, D. (2018). Asymmetry in the Stock Prıce Response to Macroeconomıc Shocks: Evidence from the Korean Market, Journal of Business Economics and Management, 19(2): 343-359.
LUQMAN, R., Kouser, R. (2018). Asymmetrical Linkages between Foreign Exchange and Stock Markets: Empirical Evidence through Linear and Non-Linear ARDL, Journal of Risk and Financial Management, 11(3): 1-13.
MOUSSA, W., Bejaoui, A., Mgadmi, N. (2020). Asymmetric Effect and Dynamic Relationships between Stock Prices and Exchange Rates Volatility, Annals of Data Science, 2020.
MULLER, A., Verschoor, W. F. C. (2006). Asymmetric Foreign Exchange Risk Exposure: Evidence from U.S. Multinational Firms, Journal of Empirical Finance, 13(4-5): 495-518.
ÖZMEN, M. (2007). Farklı Döviz Kuru Rejimleri Altında Hisse Senetleri Fiyatları İle Döviz Kurları Arasındaki İlişkinin Ekonometrik Analizi, Ç.Ü. Sosyal Bilimler Enstitüsü Dergisi, 16(1): 519-538.
PESARAN, M. H., Shin, Y. Smith, R. J. (2001). Bounds Testing Approaches to the Analysis of Level Relationships, Journal of Applied Econometrics, 16(3): 289-326.
SHIN Y., Yu B., Greenwood-Nimmo M. (2014) Modelling Asymmetric Cointegration and Dynamic Multipliers in a Nonlinear ARDL Framework. In: Sickles R., Horrace W. (eds) Festschrift in Honor of Peter Schmidt. Springer, New York, 281-314.
TİRYAKİ, A., Ceylan, R., Erdoğan, L. (2019). Asymmetric Effects of Industrial Production, Money Supply and Exchange Rate Changes on Stock Returns in Turkey, Applied Economics, 51(20): 2143-2154.
TÜRSOY, T. (2017). Causality Between Stock Prices and Exchange Rates in Turkey: Empirical Evidence from the ARDL Bounds Test and a Combined Cointegration Approach, International Journal of Finacial Studies, 5(8): 1-10.
YACOUBA, K., Altıntaş, H. (2019). The Asymmetric Impact of Macroeconomic Shocks on Stock Returns in Turkey: a Nonlinear ARDL Approach, Romanian Journal of Economic Forecasting, 22(2): 98-116.
57Makale Gönderim Tarihi:Makale Gönderim Tarihi: 24.04.2020Yayına Kabul Tarihi:Yayına Kabul Tarihi: 13.06.2021
ARAŞTIRMA MAKALESİ / RESEARCH ARTICLE
Marmara Üniversitesi İktisadi ve İdari Bilimler Dergisi • Cilt: 43 • Sayı: 1 • Haziran 2021, ISSN: 2587-2672, ss/pp. 57-77 DOI: 10.14780/muiibd.960273
GENETİĞİ DEĞİŞTİRİLMİŞ MISIR ÜRETİMİ İÇİN EKONOMİK DEĞERLENDİRME
ECONOMIC EVALUATION FOR GENETICALLY MODIFIED CORN PRODUCTION
Duygu ÜNER BAHAR1
* İsmail Cem AY2
**
ÖzGünümüzde en çok ticarileştirilen genetiği değiştirilmiş tarım ürünleri mısır, domates, pamuk, kanola ve soya fasulyesidir. Bu çalışma, genetiği değiştirilmiş mısır hasadındaki verim ve üretim maliyetlerinin değerlendirmesini konu almaktadır. Ekonomik değerlendirme yapılırken kârlılık faktörleri olarak girdi, mahsul kalitesi ve hasılat dikkate alınmıştır. Tarım ürünleri arasında talep ayrımı olmadığı varsayılmıştır. Genetiği değiştirilmiş tohumların olası ekonomik etkileri konusu mümkün olduğunca hem pozitif hem de negatif bakış açısını kapsayacak şekilde hazırlanmıştır. Çalışmanın giriş bölümünde genetik değişim hakkında temel teorik bilgiler verilerek tohumun genetiğinin nasıl değiştirildiği, maliyeti, verim artışı sağlayıp sağlamadığı konusu araştırılmıştır. Birinci bölümde Genetiği Değiştirilmiş (GD) tohum piyasası hakkında genel bilgiler verilmiştir. İkinci bölümde ekonomik değerlendirme, genetiği değiştirilmiş mısır bazında yapılmıştır. Bu bölümde Gerald C. Nelson’nın GD tohum piyasası işleyişi için tasarladığı iktisadi teorik model incelenmiştir. Üçüncü bölümde genetiği değiştirilmiş mısırın kârlılık değerlendirmesine yer verilmiştir. Dördüncü bölümde ise konunun ticari boyutu ve riskleri ele alınarak sonuç paylaşılmıştır.Anahtar Kelimeler: GDO, GD Mısır, Biyoekonomi, Tarım Biyoteknolojisi, Tarım Ekonomisi, Sürdürülebilir TarımJEL Sınıflandırması: Q01, Q17, Q18, Q57
AbstractNowadays, most commercialized genetically modified agricultural products are corn, tomatoes, cotton, canola and soybeans. This study focuses on the theoretical evaluation of yield and production costs in genetically modified corn harvest. While making an economic evaluation, input, crop quality and revenue were taken into account as profitability factors. It is assumed that there is no demand difference between agricultural products. The topic of possible economic impacts of genetically modified seeds has been
* Dr.Öğr.Üyesi, İstanbul Gelişim Üniversitesi, Sağlık Hizmetleri Meslek Yüksek Okulu, Biyomedikal Cihaz Teknolojisi Programı, İstanbul, E-Mail: [email protected], ORCID ID: 0000-0003-3726-829X
** Dr.Öğr.Üyesi, İstanbul Gelişim Üniversitesi, İktisadi İdari ve Sosyal Bilimler Fakültesi, Ekonomi ve Finans Bölümü, İstanbul, İSBF, İstanbul, E-Mail: [email protected], ORCID ID: 0000-0002-8915-8183
Duygu ÜNER BAHAR • İsmail Cem AY
58
prepared in a way that encompasses both positive and negative perspectives. In the introduction part of the study, basic theoretical information about the genetic change is given and how the genetics of the seed is changed, its cost and whether it provides an increase in productivity has been investigated. In the first part, general information about Genetically Modified seed market is given. In the second part, economic evaluation is made based on genetically modified maize. In this section, the economic theoretical model designed by Gerald C. Nelson for the operation of the GM seed market is examined. In the third chapter, the profitability evaluation of genetically modified corn is given. In the fourth part, the commercial aspect of the issue is handled and the result is shared.Keywords: GMO, GM Corn, Bioeconomy, Agricultural Biotechnology, Agricultural Economics, Sustainable AgricultureJEL Classification: Q01, Q17, Q18, Q57
1. Giriş
20.yy boyunca insanoğlu ulaştığı birçok bilimsel gelişme ve teknolojik ilerleme sayesinde yaşam kalitesini arttırmaya çalışmış ve/veya başarmıştır. Bu ilerlemenin belki de en önemlisi “İnsan Genom Projesi”nin (İGP) tamamlanması olmuştur. Bu buluşun insan sağlığı açısından bir devrim niteliğinde olduğu düşünülmektedir. Çünkü bu proje sayesinde insanlık ilk kez kendi biyolojisini tam olarak inceleme fırsatını yakalayabilmiş ve diğer canlıların genetiğini değiştirerek kendisi için daha kullanışlı şekle dönüştürmeyi başarabilmiştir.
Bir türe başka bir canlı türünden gen aktarılması ve mevcut genetik yapısına müdahale edilmesi yoluyla yeni genetik özellikler kazandırılmasını sağlayan modern biyoteknolojik tekniklere gen teknolojisi denir. Özellikle çiftçiler ve ülkeler tarımsal maliyetleri düşürmek için teknolojideki bu gelişmeye kayıtsız kalmamışlar tarımsal üretimde GD (genetiği değiştirilmiş) tohum kullanmaya başlamışlardır. GD tohum kullanılmasında esas fayda parazitlere karşı koruma sağlamasından ileri gelmektedir. Böylece mahsulü korumak için kullanılan kimyasal ilaçların azaltılması ya da birim alandan alınan ürün miktarının arttırılması sağlanmaya çalışılır. Bu amaca ulaşabilmek için tohuma; herbisit toleransı, insektisit ve virüs direnci, tohumun genetiği değiştirilerek kazandırılmaya çalışılır.
Böcek direnci (insektisit) tohumlara, Bacillus thuringiensis (Bt) geni eklenerek bitkilerin kendi insektisitlerini kendilerinin üretmeleri avantajı sağlamıştır. Böylece böcek öldürücü kimyasalın tarımda kullanılmasına gerek olmayacağı düşünülmüş ve virüse karşı dirençli gen başta tütün, domates ve patatese ürünlerinde uygulanmaya başlanmıştır.1 GD tohum teknolojisindeki hızlı gelişmeler sayesinde tarımsal üretimdeki maliyet yapılarının azaltılması ve bu teknolojinin rekabette yaratacağı avantajlar ya da dezavantajlar bu çalışmanın ana inceleme konusunu oluşturmaktadır. Bu kapsamda çok kısıtlı olan hem ulusal hem de uluslararası literatür titizlikle taranmış, bu tarama neticesinde “genetiği değiştirilmiş mısır tohumlarının olası ekonomik etkileri” konusunun hem olumlu hem de olumsuz bakış açılarını kapsayacak şekilde bir çalışmayla ortaya konmasına karar verilmiştir. Bu çalışma için sosyal bilimlerde kullanılan geçerlilik kavramı araştırma yönteminden hareket edilmiştir.
1 Commission of the European Communities (2000). “Economic Impacts of Genetically Modified Crops on The Agri-Food Sector”, Working Document, s.4-39, http://aei.pitt.edu/34717/1/A17.pdf, (Erişim Tarihi: 10.03.2020)
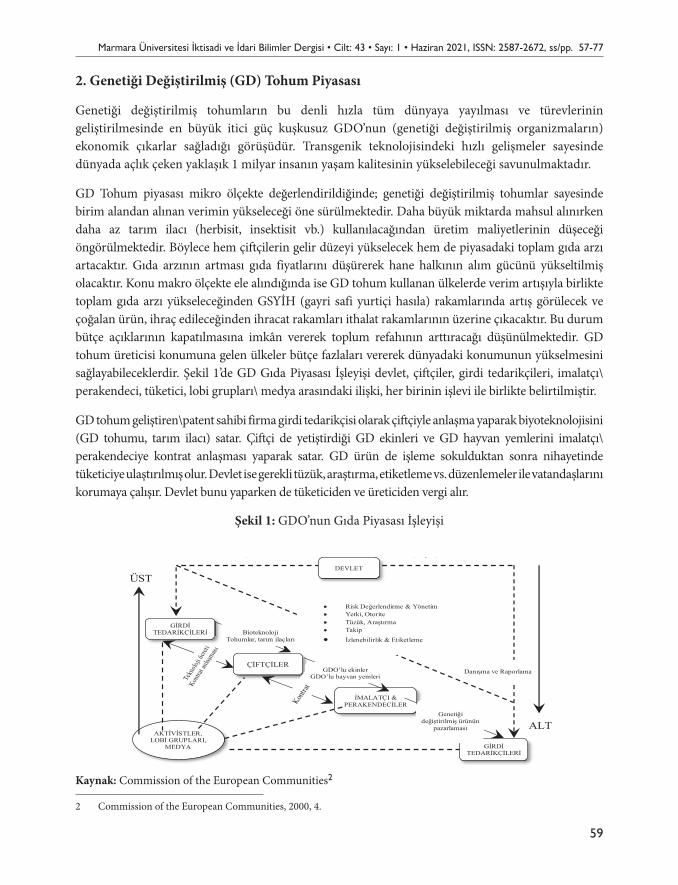
Marmara Üniversitesi İktisadi ve İdari Bilimler Dergisi • Cilt: 43 • Sayı: 1 • Haziran 2021, ISSN: 2587-2672, ss/pp. 57-77
59
2. Genetiği Değiştirilmiş (GD) Tohum Piyasası
Genetiği değiştirilmiş tohumların bu denli hızla tüm dünyaya yayılması ve türevlerinin geliştirilmesinde en büyük itici güç kuşkusuz GDO’nun (genetiği değiştirilmiş organizmaların) ekonomik çıkarlar sağladığı görüşüdür. Transgenik teknolojisindeki hızlı gelişmeler sayesinde dünyada açlık çeken yaklaşık 1 milyar insanın yaşam kalitesinin yükselebileceği savunulmaktadır.
GD Tohum piyasası mikro ölçekte değerlendirildiğinde; genetiği değiştirilmiş tohumlar sayesinde birim alandan alınan verimin yükseleceği öne sürülmektedir. Daha büyük miktarda mahsul alınırken daha az tarım ilacı (herbisit, insektisit vb.) kullanılacağından üretim maliyetlerinin düşeceği öngörülmektedir. Böylece hem çiftçilerin gelir düzeyi yükselecek hem de piyasadaki toplam gıda arzı artacaktır. Gıda arzının artması gıda fiyatlarını düşürerek hane halkının alım gücünü yükseltilmiş olacaktır. Konu makro ölçekte ele alındığında ise GD tohum kullanan ülkelerde verim artışıyla birlikte toplam gıda arzı yükseleceğinden GSYİH (gayri safi yurtiçi hasıla) rakamlarında artış görülecek ve çoğalan ürün, ihraç edileceğinden ihracat rakamları ithalat rakamlarının üzerine çıkacaktır. Bu durum bütçe açıklarının kapatılmasına imkân vererek toplum refahının arttıracağı düşünülmektedir. GD tohum üreticisi konumuna gelen ülkeler bütçe fazlaları vererek dünyadaki konumunun yükselmesini sağlayabileceklerdir. Şekil 1’de GD Gıda Piyasası İşleyişi devlet, çiftçiler, girdi tedarikçileri, imalatçı\perakendeci, tüketici, lobi grupları\ medya arasındaki ilişki, her birinin işlevi ile birlikte belirtilmiştir.
GD tohum geliştiren\patent sahibi firma girdi tedarikçisi olarak çiftçiyle anlaşma yaparak biyoteknolojisini (GD tohumu, tarım ilacı) satar. Çiftçi de yetiştirdiği GD ekinleri ve GD hayvan yemlerini imalatçı\perakendeciye kontrat anlaşması yaparak satar. GD ürün de işleme sokulduktan sonra nihayetinde tüketiciye ulaştırılmış olur. Devlet ise gerekli tüzük, araştırma, etiketleme vs. düzenlemeler ile vatandaşlarını korumaya çalışır. Devlet bunu yaparken de tüketiciden ve üreticiden vergi alır.
Şekil 1: GDO’nun Gıda Piyasası İşleyişi
Şekil 1: GDO’nun Gıda Piyasası İşleyişi
Kaynak: Commission of the European Communities2
Şekil 2’de ise GD Tohum teknolojisinin en önemli gelişmeleri zaman çizelgesi üzerinde gösterilmiştir. Şekil 2’de gösterildiği üzere 1983 yılında ilk GD bitki geliştirilmiş ve 1994 yılında ilk insan tüketimine yönelik GD tohum Amerikan gıda ve ilaç dairesi (FDA) onayı alabilmiştir.
2 Commission of the European Communities, 2000, 4.
AKTİVİSTLER, LOBİ GRUPLARI,
MEDYA GİRDİ TEDARİKÇİLERİ
İMALATÇI & PERAKENDECİLER
DEVLET
Danışma ve Raporlama
Bioteknoloji Tohumlar, tarım ilaçları
ÇİFTÇİLER
Genetiği değiştirilmiş ürünün
pazarlaması
ÜST
ALT
GİRDİ TEDARİKÇİLERİ
GDO’lu ekinler GDO’lu hayvan yemleri
•• Risk Değerlendirme & Yönetim •• Yetki, Otorite •• Tüzük, Araştırma •• Takip •• İzlenebilirlik & Etiketleme
Kaynak: Commission of the European Communities2
2 Commission of the European Communities, 2000, 4.
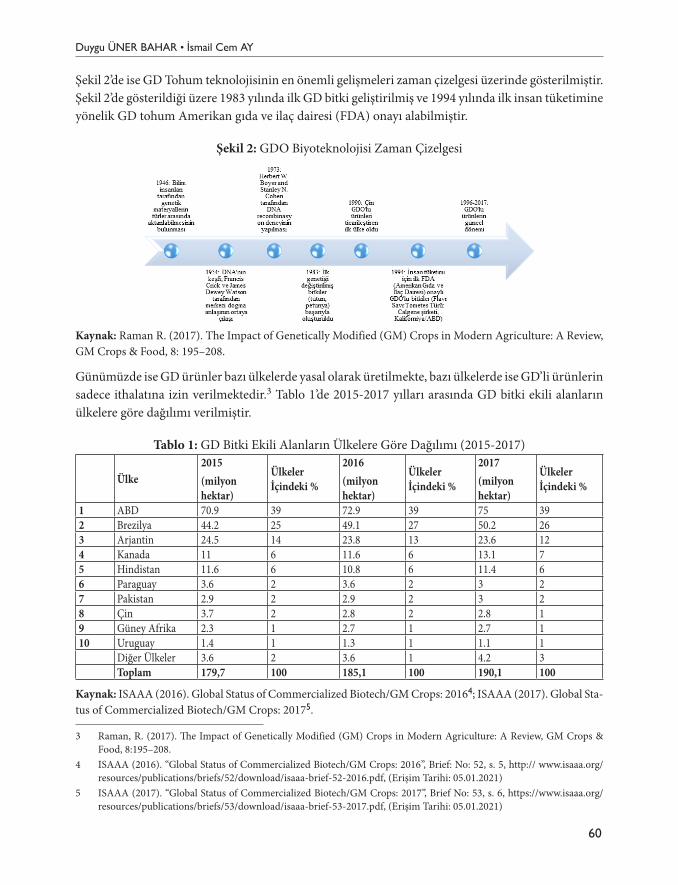
Duygu ÜNER BAHAR • İsmail Cem AY
60
Şekil 2’de ise GD Tohum teknolojisinin en önemli gelişmeleri zaman çizelgesi üzerinde gösterilmiştir. Şekil 2’de gösterildiği üzere 1983 yılında ilk GD bitki geliştirilmiş ve 1994 yılında ilk insan tüketimine yönelik GD tohum Amerikan gıda ve ilaç dairesi (FDA) onayı alabilmiştir.
Şekil 2: GDO Biyoteknolojisi Zaman Çizelgesi
Kaynak: Raman R. (2017). The Impact of Genetically Modified (GM) Crops in Modern Agriculture: A Review, GM Crops & Food, 8: 195–208.
Günümüzde ise GD ürünler bazı ülkelerde yasal olarak üretilmekte, bazı ülkelerde ise GD’li ürünlerin sadece ithalatına izin verilmektedir.3 Tablo 1’de 2015-2017 yılları arasında GD bitki ekili alanların ülkelere göre dağılımı verilmiştir.
Tablo 1: GD Bitki Ekili Alanların Ülkelere Göre Dağılımı (2015-2017)
Ülke2015(milyon hektar)
Ülkeler İçindeki %
2016(milyon hektar)
Ülkeler İçindeki %
2017(milyon hektar)
Ülkeler İçindeki %
1 ABD 70.9 39 72.9 39 75 392 Brezilya 44.2 25 49.1 27 50.2 263 Arjantin 24.5 14 23.8 13 23.6 124 Kanada 11 6 11.6 6 13.1 75 Hindistan 11.6 6 10.8 6 11.4 66 Paraguay 3.6 2 3.6 2 3 27 Pakistan 2.9 2 2.9 2 3 28 Çin 3.7 2 2.8 2 2.8 19 Güney Afrika 2.3 1 2.7 1 2.7 110 Uruguay 1.4 1 1.3 1 1.1 1
Diğer Ülkeler 3.6 2 3.6 1 4.2 3Toplam 179,7 100 185,1 100 190,1 100
Kaynak: ISAAA (2016). Global Status of Commercialized Biotech/GM Crops: 20164; ISAAA (2017). Global Sta-tus of Commercialized Biotech/GM Crops: 20175.
3 Raman, R. (2017). The Impact of Genetically Modified (GM) Crops in Modern Agriculture: A Review, GM Crops & Food, 8:195–208.
4 ISAAA (2016). “Global Status of Commercialized Biotech/GM Crops: 2016”, Brief: No: 52, s. 5, http:// www.isaaa.org/resources/publications/briefs/52/download/isaaa-brief-52-2016.pdf, (Erişim Tarihi: 05.01.2021)
5 ISAAA (2017). “Global Status of Commercialized Biotech/GM Crops: 2017”, Brief No: 53, s. 6, https://www.isaaa.org/resources/publications/briefs/53/download/isaaa-brief-53-2017.pdf, (Erişim Tarihi: 05.01.2021)
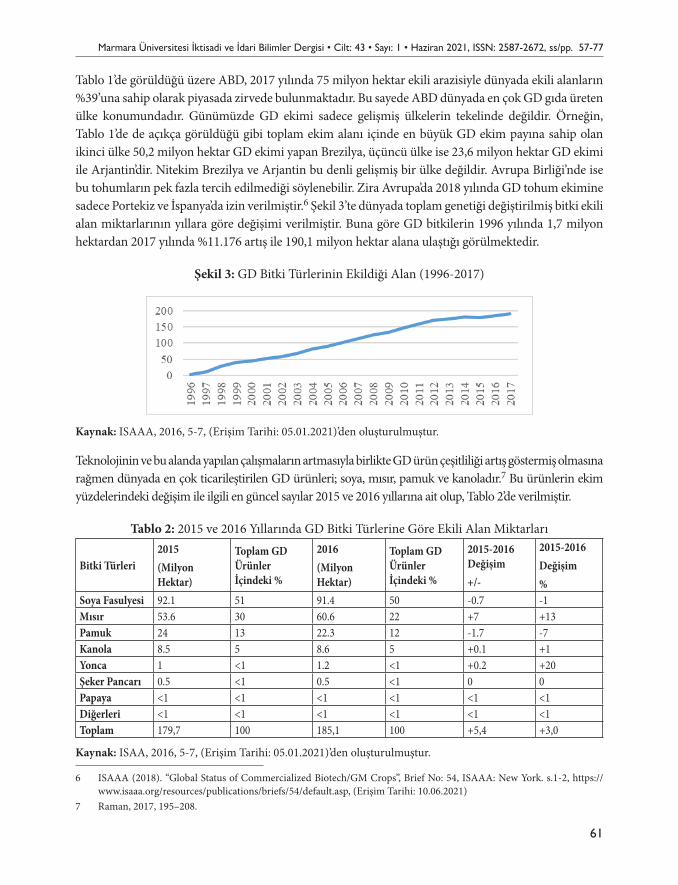
Marmara Üniversitesi İktisadi ve İdari Bilimler Dergisi • Cilt: 43 • Sayı: 1 • Haziran 2021, ISSN: 2587-2672, ss/pp. 57-77
61
Tablo 1’de görüldüğü üzere ABD, 2017 yılında 75 milyon hektar ekili arazisiyle dünyada ekili alanların %39’una sahip olarak piyasada zirvede bulunmaktadır. Bu sayede ABD dünyada en çok GD gıda üreten ülke konumundadır. Günümüzde GD ekimi sadece gelişmiş ülkelerin tekelinde değildir. Örneğin, Tablo 1’de de açıkça görüldüğü gibi toplam ekim alanı içinde en büyük GD ekim payına sahip olan ikinci ülke 50,2 milyon hektar GD ekimi yapan Brezilya, üçüncü ülke ise 23,6 milyon hektar GD ekimi ile Arjantin’dir. Nitekim Brezilya ve Arjantin bu denli gelişmiş bir ülke değildir. Avrupa Birliği’nde ise bu tohumların pek fazla tercih edilmediği söylenebilir. Zira Avrupa’da 2018 yılında GD tohum ekimine sadece Portekiz ve İspanya’da izin verilmiştir.6 Şekil 3’te dünyada toplam genetiği değiştirilmiş bitki ekili alan miktarlarının yıllara göre değişimi verilmiştir. Buna göre GD bitkilerin 1996 yılında 1,7 milyon hektardan 2017 yılında %11.176 artış ile 190,1 milyon hektar alana ulaştığı görülmektedir.
Şekil 3: GD Bitki Türlerinin Ekildiği Alan (1996-2017)
Kaynak: ISAAA, 2016, 5-7, (Erişim Tarihi: 05.01.2021)’den oluşturulmuştur.
Teknolojinin ve bu alanda yapılan çalışmaların artmasıyla birlikte GD ürün çeşitliliği artış göstermiş olmasına rağmen dünyada en çok ticarileştirilen GD ürünleri; soya, mısır, pamuk ve kanoladır.7 Bu ürünlerin ekim yüzdelerindeki değişim ile ilgili en güncel sayılar 2015 ve 2016 yıllarına ait olup, Tablo 2’de verilmiştir.
Tablo 2: 2015 ve 2016 Yıllarında GD Bitki Türlerine Göre Ekili Alan Miktarları
Bitki Türleri2015(Milyon Hektar)
Toplam GD Ürünler İçindeki %
2016(Milyon Hektar)
Toplam GD Ürünler İçindeki %
2015-2016 Değişim+/-
2015-2016Değişim%
Soya Fasulyesi 92.1 51 91.4 50 -0.7 -1Mısır 53.6 30 60.6 22 +7 +13Pamuk 24 13 22.3 12 -1.7 -7Kanola 8.5 5 8.6 5 +0.1 +1Yonca 1 <1 1.2 <1 +0.2 +20Şeker Pancarı 0.5 <1 0.5 <1 0 0Papaya <1 <1 <1 <1 <1 <1Diğerleri <1 <1 <1 <1 <1 <1Toplam 179,7 100 185,1 100 +5,4 +3,0
Kaynak: ISAA, 2016, 5-7, (Erişim Tarihi: 05.01.2021)’den oluşturulmuştur.
6 ISAAA (2018). “Global Status of Commercialized Biotech/GM Crops”, Brief No: 54, ISAAA: New York. s.1-2, https://www.isaaa.org/resources/publications/briefs/54/default.asp, (Erişim Tarihi: 10.06.2021)
7 Raman, 2017, 195–208.
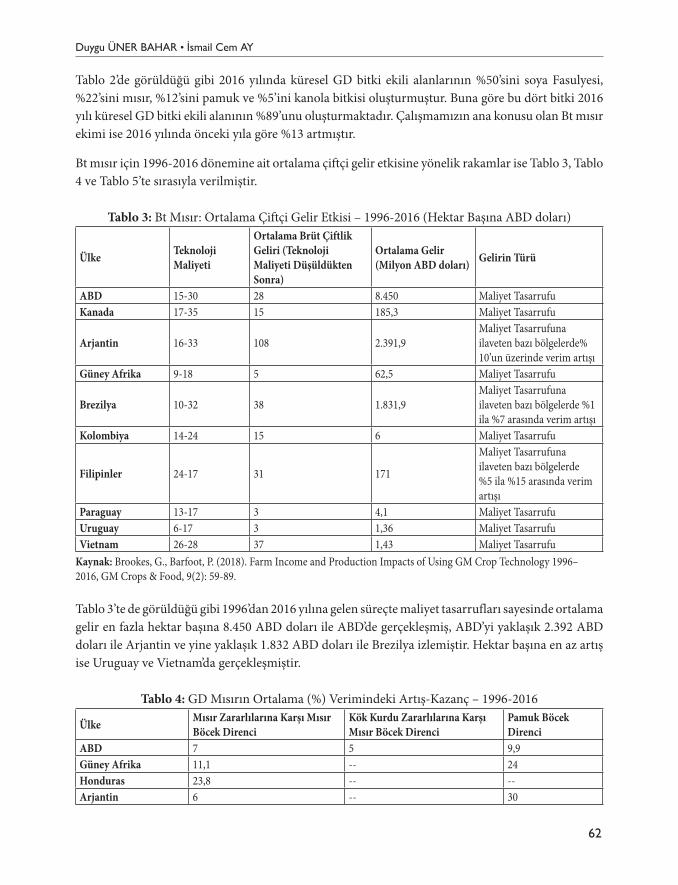
Duygu ÜNER BAHAR • İsmail Cem AY
62
Tablo 2’de görüldüğü gibi 2016 yılında küresel GD bitki ekili alanlarının %50’sini soya Fasulyesi, %22’sini mısır, %12’sini pamuk ve %5’ini kanola bitkisi oluşturmuştur. Buna göre bu dört bitki 2016 yılı küresel GD bitki ekili alanının %89’unu oluşturmaktadır. Çalışmamızın ana konusu olan Bt mısır ekimi ise 2016 yılında önceki yıla göre %13 artmıştır.
Bt mısır için 1996-2016 dönemine ait ortalama çiftçi gelir etkisine yönelik rakamlar ise Tablo 3, Tablo 4 ve Tablo 5’te sırasıyla verilmiştir.
Tablo 3: Bt Mısır: Ortalama Çiftçi Gelir Etkisi – 1996-2016 (Hektar Başına ABD doları)
Ülke Teknoloji Maliyeti
Ortalama Brüt Çiftlik Geliri (Teknoloji Maliyeti Düşüldükten Sonra)
Ortalama Gelir (Milyon ABD doları) Gelirin Türü
ABD 15-30 28 8.450 Maliyet TasarrufuKanada 17-35 15 185,3 Maliyet Tasarrufu
Arjantin 16-33 108 2.391,9Maliyet Tasarrufuna ilaveten bazı bölgelerde% 10’un üzerinde verim artışı
Güney Afrika 9-18 5 62,5 Maliyet Tasarrufu
Brezilya 10-32 38 1.831,9Maliyet Tasarrufuna ilaveten bazı bölgelerde %1 ila %7 arasında verim artışı
Kolombiya 14-24 15 6 Maliyet Tasarrufu
Filipinler 24-17 31 171
Maliyet Tasarrufuna ilaveten bazı bölgelerde %5 ila %15 arasında verim artışı
Paraguay 13-17 3 4,1 Maliyet TasarrufuUruguay 6-17 3 1,36 Maliyet TasarrufuVietnam 26-28 37 1,43 Maliyet Tasarrufu
Kaynak: Brookes, G., Barfoot, P. (2018). Farm Income and Production Impacts of Using GM Crop Technology 1996–2016, GM Crops & Food, 9(2): 59-89.
Tablo 3’te de görüldüğü gibi 1996’dan 2016 yılına gelen süreçte maliyet tasarrufları sayesinde ortalama gelir en fazla hektar başına 8.450 ABD doları ile ABD’de gerçekleşmiş, ABD’yi yaklaşık 2.392 ABD doları ile Arjantin ve yine yaklaşık 1.832 ABD doları ile Brezilya izlemiştir. Hektar başına en az artış ise Uruguay ve Vietnam’da gerçekleşmiştir.
Tablo 4: GD Mısırın Ortalama (%) Verimindeki Artış-Kazanç – 1996-2016
Ülke Mısır Zararlılarına Karşı Mısır Böcek Direnci
Kök Kurdu Zararlılarına Karşı Mısır Böcek Direnci
Pamuk Böcek Direnci
ABD 7 5 9,9Güney Afrika 11,1 -- 24Honduras 23,8 -- --Arjantin 6 -- 30
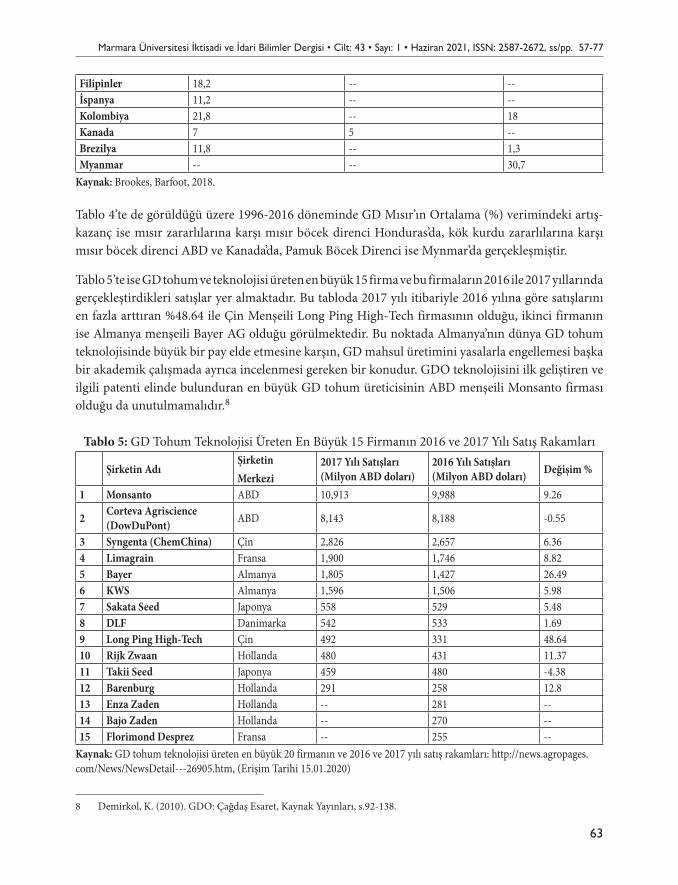
Marmara Üniversitesi İktisadi ve İdari Bilimler Dergisi • Cilt: 43 • Sayı: 1 • Haziran 2021, ISSN: 2587-2672, ss/pp. 57-77
63
Filipinler 18,2 -- --İspanya 11,2 -- --Kolombiya 21,8 -- 18Kanada 7 5 --Brezilya 11,8 -- 1,3Myanmar -- -- 30,7
Kaynak: Brookes, Barfoot, 2018.
Tablo 4’te de görüldüğü üzere 1996-2016 döneminde GD Mısır’ın Ortalama (%) verimindeki artış-kazanç ise mısır zararlılarına karşı mısır böcek direnci Honduras’da, kök kurdu zararlılarına karşı mısır böcek direnci ABD ve Kanada’da, Pamuk Böcek Direnci ise Mynmar’da gerçekleşmiştir.
Tablo 5’te ise GD tohum ve teknolojisi üreten en büyük 15 firma ve bu firmaların 2016 ile 2017 yıllarında gerçekleştirdikleri satışlar yer almaktadır. Bu tabloda 2017 yılı itibariyle 2016 yılına göre satışlarını en fazla arttıran %48.64 ile Çin Menşeili Long Ping High-Tech firmasının olduğu, ikinci firmanın ise Almanya menşeili Bayer AG olduğu görülmektedir. Bu noktada Almanya’nın dünya GD tohum teknolojisinde büyük bir pay elde etmesine karşın, GD mahsul üretimini yasalarla engellemesi başka bir akademik çalışmada ayrıca incelenmesi gereken bir konudur. GDO teknolojisini ilk geliştiren ve ilgili patenti elinde bulunduran en büyük GD tohum üreticisinin ABD menşeili Monsanto firması olduğu da unutulmamalıdır.8
Tablo 5: GD Tohum Teknolojisi Üreten En Büyük 15 Firmanın 2016 ve 2017 Yılı Satış Rakamları
Şirketin AdıŞirketinMerkezi
2017 Yılı Satışları (Milyon ABD doları)
2016 Yılı Satışları (Milyon ABD doları) Değişim %
1 Monsanto ABD 10,913 9,988 9.26
2 Corteva Agriscience (DowDuPont) ABD 8,143 8,188 -0.55
3 Syngenta (ChemChina) Çin 2,826 2,657 6.364 Limagrain Fransa 1,900 1,746 8.825 Bayer Almanya 1,805 1,427 26.496 KWS Almanya 1,596 1,506 5.987 Sakata Seed Japonya 558 529 5.488 DLF Danimarka 542 533 1.699 Long Ping High-Tech Çin 492 331 48.6410 Rijk Zwaan Hollanda 480 431 11.3711 Takii Seed Japonya 459 480 -4.3812 Barenburg Hollanda 291 258 12.813 Enza Zaden Hollanda -- 281 --14 Bajo Zaden Hollanda -- 270 --15 Florimond Desprez Fransa -- 255 --
Kaynak: GD tohum teknolojisi üreten en büyük 20 firmanın ve 2016 ve 2017 yılı satış rakamları: http://news.agropages.com/News/NewsDetail---26905.htm, (Erişim Tarihi 15.01.2020)
8 Demirkol, K. (2010). GDO: Çağdaş Esaret, Kaynak Yayınları, s.92-138.
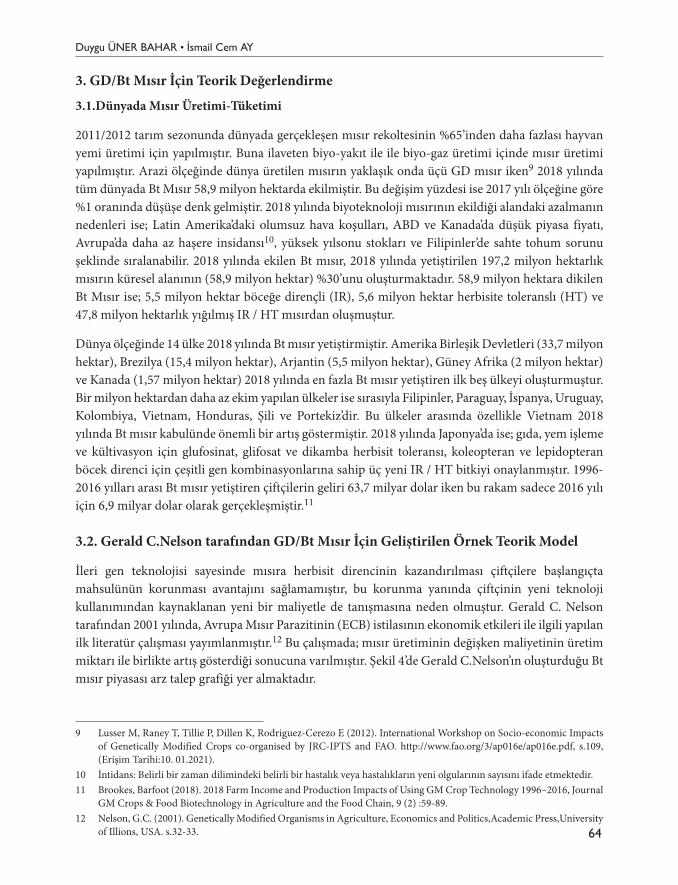
Duygu ÜNER BAHAR • İsmail Cem AY
64
3. GD/Bt Mısır İçin Teorik Değerlendirme
3.1.Dünyada Mısır Üretimi-Tüketimi
2011/2012 tarım sezonunda dünyada gerçekleşen mısır rekoltesinin %65’inden daha fazlası hayvan yemi üretimi için yapılmıştır. Buna ilaveten biyo-yakıt ile ile biyo-gaz üretimi içinde mısır üretimi yapılmıştır. Arazi ölçeğinde dünya üretilen mısırın yaklaşık onda üçü GD mısır iken9 2018 yılında tüm dünyada Bt Mısır 58,9 milyon hektarda ekilmiştir. Bu değişim yüzdesi ise 2017 yılı ölçeğine göre %1 oranında düşüşe denk gelmiştir. 2018 yılında biyoteknoloji mısırının ekildiği alandaki azalmanın nedenleri ise; Latin Amerika’daki olumsuz hava koşulları, ABD ve Kanada’da düşük piyasa fiyatı, Avrupa’da daha az haşere insidansı10, yüksek yılsonu stokları ve Filipinler’de sahte tohum sorunu şeklinde sıralanabilir. 2018 yılında ekilen Bt mısır, 2018 yılında yetiştirilen 197,2 milyon hektarlık mısırın küresel alanının (58,9 milyon hektar) %30’unu oluşturmaktadır. 58,9 milyon hektara dikilen Bt Mısır ise; 5,5 milyon hektar böceğe dirençli (IR), 5,6 milyon hektar herbisite toleranslı (HT) ve 47,8 milyon hektarlık yığılmış IR / HT mısırdan oluşmuştur.
Dünya ölçeğinde 14 ülke 2018 yılında Bt mısır yetiştirmiştir. Amerika Birleşik Devletleri (33,7 milyon hektar), Brezilya (15,4 milyon hektar), Arjantin (5,5 milyon hektar), Güney Afrika (2 milyon hektar) ve Kanada (1,57 milyon hektar) 2018 yılında en fazla Bt mısır yetiştiren ilk beş ülkeyi oluşturmuştur. Bir milyon hektardan daha az ekim yapılan ülkeler ise sırasıyla Filipinler, Paraguay, İspanya, Uruguay, Kolombiya, Vietnam, Honduras, Şili ve Portekiz’dir. Bu ülkeler arasında özellikle Vietnam 2018 yılında Bt mısır kabulünde önemli bir artış göstermiştir. 2018 yılında Japonya’da ise; gıda, yem işleme ve kültivasyon için glufosinat, glifosat ve dikamba herbisit toleransı, koleopteran ve lepidopteran böcek direnci için çeşitli gen kombinasyonlarına sahip üç yeni IR / HT bitkiyi onaylanmıştır. 1996-2016 yılları arası Bt mısır yetiştiren çiftçilerin geliri 63,7 milyar dolar iken bu rakam sadece 2016 yılı için 6,9 milyar dolar olarak gerçekleşmiştir.11
3.2. Gerald C.Nelson tarafından GD/Bt Mısır İçin Geliştirilen Örnek Teorik Model
İleri gen teknolojisi sayesinde mısıra herbisit direncinin kazandırılması çiftçilere başlangıçta mahsulünün korunması avantajını sağlamamıştır, bu korunma yanında çiftçinin yeni teknoloji kullanımından kaynaklanan yeni bir maliyetle de tanışmasına neden olmuştur. Gerald C. Nelson tarafından 2001 yılında, Avrupa Mısır Parazitinin (ECB) istilasının ekonomik etkileri ile ilgili yapılan ilk literatür çalışması yayımlanmıştır.12 Bu çalışmada; mısır üretiminin değişken maliyetinin üretim miktarı ile birlikte artış gösterdiği sonucuna varılmıştır. Şekil 4’de Gerald C.Nelson’ın oluşturduğu Bt mısır piyasası arz talep grafiği yer almaktadır.
9 Lusser M, Raney T, Tillie P, Dillen K, Rodriguez-Cerezo E (2012). International Workshop on Socio-economic Impacts of Genetically Modified Crops co-organised by JRC-IPTS and FAO. http://www.fao.org/3/ap016e/ap016e.pdf, s.109, (Erişim Tarihi:10. 01.2021).
10 İntidans: Belirli bir zaman dilimindeki belirli bir hastalık veya hastalıkların yeni olgularının sayısını ifade etmektedir.11 Brookes, Barfoot (2018). 2018 Farm Income and Production Impacts of Using GM Crop Technology 1996–2016, Journal
GM Crops & Food Biotechnology in Agriculture and the Food Chain, 9 (2) :59-89.12 Nelson, G.C. (2001). Genetically Modified Organisms in Agriculture, Economics and Politics,Academic Press,University
of Illions, USA. s.32-33.
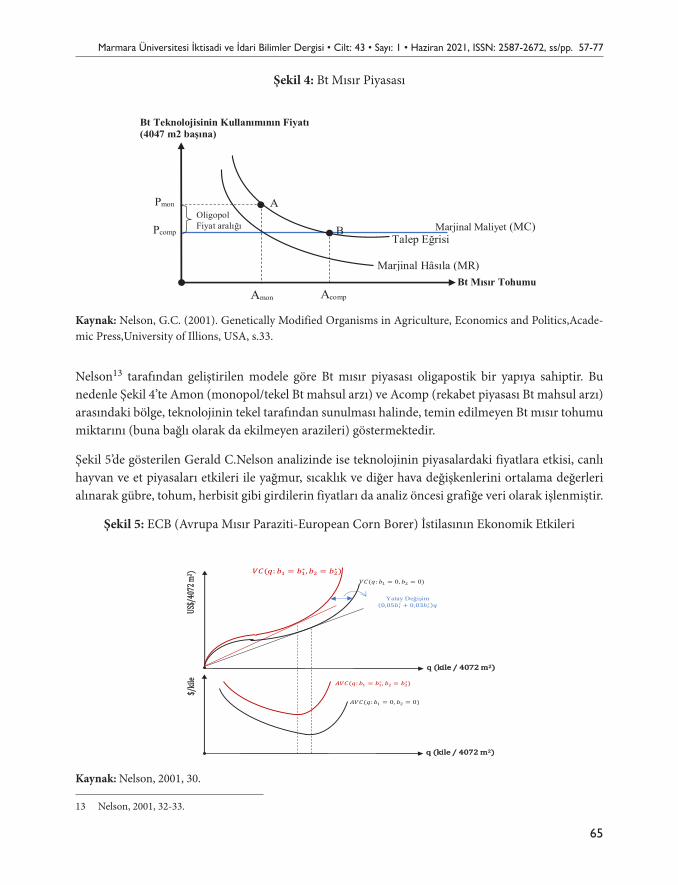
Marmara Üniversitesi İktisadi ve İdari Bilimler Dergisi • Cilt: 43 • Sayı: 1 • Haziran 2021, ISSN: 2587-2672, ss/pp. 57-77
65
Şekil 4: Bt Mısır PiyasasıMakale Gönderim Tarihi: 27.04.2020 Yayına Kabul Tarihi: 13.06.2021
Şekil 4: Bt Mısır Piyasası
Kaynak: Nelson, G.C. (2001). Genetically Modified Organisms in Agriculture, Economics and Politics,Academic Press,University of Illions, USA, s.33.
Nelson13 tarafından geliştirilen modele göre Bt mısır piyasası oligapostik bir yapıya sahiptir. Bu nedenle Şekil 4’te Amon (monopol/tekel Bt mahsul arzı) ve Acomp (rekabet piyasası Bt mahsul arzı) arasındaki bölge, teknolojinin tekel tarafından sunulması halinde, temin edilmeyen Bt mısır tohumu miktarını (buna bağlı olarak da ekilmeyen arazileri) göstermektedir.
Şekil 5’de gösterilen Gerald C.Nelson analizinde ise teknolojinin piyasalardaki fiyatlara etkisi, canlı hayvan ve et piyasaları etkileri ile yağmur, sıcaklık ve diğer hava değişkenlerini ortalama değerleri alınarak gübre, tohum, herbisit gibi girdilerin fiyatları da analiz öncesi grafiğe veri olarak işlenmiştir.
13 Nelson, 2001, 32-33.
Bt Teknolojisinin Kullanımının Fiyatı (4047 m2 başına)
A
B
Amon
Talep Eğrisi
Bt Mısır Tohumu
Pmon
Marjinal Hâsıla (MR)
Marjinal Maliyet (MC)
Acomp
Pcomp Oligopol Fiyat aralığı
Kaynak: Nelson, G.C. (2001). Genetically Modified Organisms in Agriculture, Economics and Politics,Acade-mic Press,University of Illions, USA, s.33.
Nelson13 tarafından geliştirilen modele göre Bt mısır piyasası oligapostik bir yapıya sahiptir. Bu nedenle Şekil 4’te Amon (monopol/tekel Bt mahsul arzı) ve Acomp (rekabet piyasası Bt mahsul arzı) arasındaki bölge, teknolojinin tekel tarafından sunulması halinde, temin edilmeyen Bt mısır tohumu miktarını (buna bağlı olarak da ekilmeyen arazileri) göstermektedir.
Şekil 5’de gösterilen Gerald C.Nelson analizinde ise teknolojinin piyasalardaki fiyatlara etkisi, canlı hayvan ve et piyasaları etkileri ile yağmur, sıcaklık ve diğer hava değişkenlerini ortalama değerleri alınarak gübre, tohum, herbisit gibi girdilerin fiyatları da analiz öncesi grafiğe veri olarak işlenmiştir.
Şekil 5: ECB (Avrupa Mısır Paraziti-European Corn Borer) İstilasının Ekonomik Etkileri
Şekil 5: ECB (Avrupa Mısır Paraziti-European Corn Borer) İstilasının Ekonomik Etkileri
Kaynak: Nelson, 2001, 30.
Avrupa Mısır Parazitinin (ECB) farklı türleri vardır ve her bölgede faklı bir alttürü etkili olabilmektedir. Örneğin ABD’de, ECB’nin 4 çeşit alttürü mısırın büyüme dönemlerinde oluşmaktadır. ECB nedeniyle meydana gelen mahsul kaybı her nesildeki parazit hastalığının derecesine göre değişmektedir. Oluşan mısır parazitlerin büyüyerek etkili olması da hava durumu ve iklim koşullarına bağlıdır.
Örneğin birinci nesil parazit; mısırın ilk filizlendiği dönemde etkili iken bu parazitin tek bir mısırda verdiği zarar %5-6 seviyesindedir. İkinci nesil parazit ise mısırın kulak gelişimi aşamasında etkili olmakta, bu parazit yüzünden de %2-4 arası mahsul kaybı yaşanmaktadır.14
14Ayrıntı için bkz. Bessin, R. (1996). Bt-Corn: What it is and How it Works, https://entomology.ca.uky.edu/ef130, (Erişim Tarihi: 14.06.2021); Bode, W., Blode, W.M, and Calvin, D.D. (1990). Yield-Loss Relationships and Economic Injury Levels for European Corn Borer Populations (Lepidoptera: Pyralidae) Infesting Pennsylvania Field Corn, Journal of Economic Entomology, 83: 1595–1603.; Mason, C., Rice, M., DiFonzo C. ve Porter R.P. (1996). “European Corn Borer: Ecology and Management and Association with Other Corn Pests.”, NCR-327, North Central Regional Extension
𝑉𝑉𝑉𝑉(𝑞𝑞: 𝑏𝑏1 = 0, 𝑏𝑏2 = 0)
Yatay Değişim (0,05𝑏𝑏1∗ + 0,03𝑏𝑏2∗)𝑞𝑞
𝑉𝑉𝑉𝑉(𝑞𝑞: 𝑏𝑏1 = 𝑏𝑏1∗, 𝑏𝑏2 = 𝑏𝑏2∗)
𝐴𝐴𝑉𝑉𝑉𝑉(𝑞𝑞: 𝑏𝑏1 = 0, 𝑏𝑏2 = 0)
𝐴𝐴𝑉𝑉𝑉𝑉(𝑞𝑞: 𝑏𝑏1 = 𝑏𝑏1∗, 𝑏𝑏2 = 𝑏𝑏2∗)
Kaynak: Nelson, 2001, 30.
13 Nelson, 2001, 32-33.
Duygu ÜNER BAHAR • İsmail Cem AY
66
Avrupa Mısır Parazitinin (ECB) farklı türleri vardır ve her bölgede faklı bir alttürü etkili olabilmektedir. Örneğin ABD’de, ECB’nin 4 çeşit alttürü mısırın büyüme dönemlerinde oluşmaktadır. ECB nedeniyle meydana gelen mahsul kaybı her nesildeki parazit hastalığının derecesine göre değişmektedir. Oluşan mısır parazitlerin büyüyerek etkili olması da hava durumu ve iklim koşullarına bağlıdır.
Örneğin birinci nesil parazit; mısırın ilk filizlendiği dönemde etkili iken bu parazitin tek bir mısırda verdiği zarar %5-6 seviyesindedir. İkinci nesil parazit ise mısırın kulak gelişimi aşamasında etkili olmakta, bu parazit yüzünden de %2-4 arası mahsul kaybı yaşanmaktadır.14
Şekil 5’te yer alan b1: 1.nesil ve b2: 2.nesil parazitleri temsil etmektedir. Kalın çizilmiş VC eğrisi (q; b1 = 0, b2 = 0) mısır parazitlerinden arındırılmış değişken maliyetleri göstermektedir. İnce çizilmiş VC eğrisi (q; b1 = b1*, b2 = b2*) her bir bitkide parazitlerin neden oldukları her kile15 başına değişken maliyeti ifade etmektedir. Nelson yaptığı analizde 0,404 dönüm (4047 m2) başına mahsulün [0.05b1* + 0.03b2*]q miktarı kadar azaldığını hesaplamıştır. Bu azalış da değişken maliyet (VC) eğrisinin daha yatay (yatık) bir konuma geçmesine neden olmaktadır. Bu durum da alt ortalama değişken maliyet (AVC) eğrisinin büyümesine neden olmaktadır. Nelson, çiftçilerin gelecek sezonda ne kadar parazitin ortaya çıkacağını bilemeyeceklerini belirterek Şekil 5’te yer alan b1 ve b2 değerlerinin kesin olarak ifade edilemeyeceğini belirtir. Bu durum ise Şekil 6 yardımı ile açıklanmıştır.
E{b1}’in her bir bitki başına beklenen 1. Nesil parazit sayısını, E{b2} de her bir bitki başına beklenen 2. Nesil parazitlerin olası sayısını göstermektedir. Şekil 6’da değişken maliyet eğrisinde beklenen yatay değişim [0.05E{b1} + 0.03E{b2}]q olarak, geleneksel mısır için beklenen değişken maliyet eğrisi ise EVC(q) eğrisi ile gösterilmiştir.
Nelson’ın yaptığı analiz, genetiği değiştirilmiş mısırla ECB parazitinin mahsul üzerindeki etkisinin en aza indiği sonucuna varmıştır. VCBt(q) eğrisi, VC(q: b1 = 0, b2 = 0) eğrisinden 8$ ‘lık farkla sola kaymış, geleneksel yöntemle mısır ekildiğinde ise beklenen değişken maliyet eğrisinin ise EAVC(q) olduğu sonucuna varmıştır. Şekil 7’den hareketle mısırın fiyatını yorumlarsak; mısırın beklenen fiyatı AVCBt(q) ile EAVC(q) kesişimindeki fiyattan daha düşük olursa, çiftçi geleneksel ekimiyle kârını maksimize etmiş olacaktır. Eğer fiyat daha yüksek ise, transgenik teknoloji üretimi en yüksek kârı vermiş olacaktır.
Nelson’un teorik yaklaşımı bağlamında Tablo 3’teki 1996-2016 yılları arasında Bt Mısırın ortalama çiftçi gelir etkisi verileri incelendiğinde; analize konu olan ülkelerin tamamında, ABD, Kanada,
14 Ayrıntı için bkz. Bessin, R. (1996). Bt-Corn: What it is and How it Works, https://entomology.ca.uky.edu/ef130, (Erişim Tarihi: 14.06.2021); Bode, W., Blode, W.M, and Calvin, D.D. (1990). Yield-Loss Relationships and Economic Injury Levels for European Corn Borer Populations (Lepidoptera: Pyralidae) Infesting Pennsylvania Field Corn, Journal of Economic Entomology, 83: 1595–1603.; Mason, C., Rice, M., DiFonzo C. ve Porter R.P. (1996). “European Corn Borer: Ecology and Management and Association with Other Corn Pests.”, NCR-327, North Central Regional Extension Publication, Iowa State University, July.; Monsanto Company (1998). “YieldGard Insect-Protected Corn: The Whole Plant. The Whole Season”.; Ostlie, K.R., Hutchison, W.D., Hellmich, R.L. (1998). Bt Corn and European Corn Borer: Long-Term Success Through Resistance Management, http://www.extension.umn.edu/Documents/D/C/DC7055.html. (Erişim Tarihi: 05.01.2020) October 1998 supplement available at https//ent.agri.umn.edu/ecb/nc205doc.htm., (Erişim Tarihi:.12.02.2020)
15 Kile; ziraatte kuru ürünlerde kullanılan bir hacim ölçüsüdür.
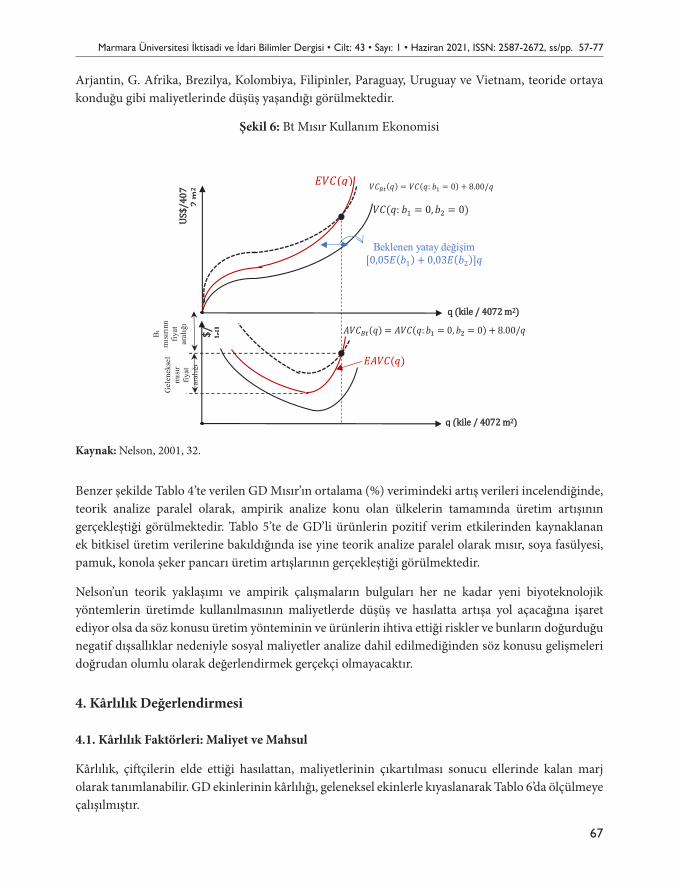
Marmara Üniversitesi İktisadi ve İdari Bilimler Dergisi • Cilt: 43 • Sayı: 1 • Haziran 2021, ISSN: 2587-2672, ss/pp. 57-77
67
Arjantin, G. Afrika, Brezilya, Kolombiya, Filipinler, Paraguay, Uruguay ve Vietnam, teoride ortaya konduğu gibi maliyetlerinde düşüş yaşandığı görülmektedir.
Şekil 6: Bt Mısır Kullanım Ekonomisi
Şekil 6: Bt Mısır Kullanım Ekonomisi
Kaynak: Nelson, 2001, 32.
Benzer şekilde Tablo 4’te verilen GD Mısır’ın ortalama (%) verimindeki artış verileri incelendiğinde, teorik analize paralel olarak, ampirik analize konu olan ülkelerin tamamında üretim artışının gerçekleştiği görülmektedir. Tablo 5’te de GD’li ürünlerin pozitif verim etkilerinden kaynaklanan ek bitkisel üretim verilerine bakıldığında ise yine teorik analize paralel olarak mısır, soya fasülyesi, pamuk, konola şeker pancarı üretim artışlarının gerçekleştiği görülmektedir.
Nelson’un teorik yaklaşımı ve ampirik çalışmaların bulguları her ne kadar yeni biyoteknolojik yöntemlerin üretimde kullanılmasının maliyetlerde düşüş ve hasılatta artışa yol açacağına işaret ediyor olsa da söz konusu üretim yönteminin ve ürünlerin ihtiva ettiği riskler ve bunların doğurduğu negatif dışsallıklar nedeniyle sosyal maliyetler analize dahil edilmediğinden söz konusu gelişmeleri doğrudan olumlu olarak değerlendirmek gerçekçi olmayacaktır.
4. Kârlılık Değerlendirmesi
4.1. Kârlılık Faktörleri: Maliyet ve Mahsul
Beklenen yatay değişim [0,05𝐸𝐸(𝑏𝑏1) + 0,03𝐸𝐸(𝑏𝑏2)]𝑞𝑞
𝐸𝐸𝐸𝐸𝐸𝐸𝐸𝐸(𝑞𝑞)
𝐸𝐸𝐸𝐸𝐸𝐸𝐵𝐵𝐵𝐵(𝑞𝑞) = 𝐸𝐸𝐸𝐸𝐸𝐸(𝑞𝑞: 𝑏𝑏1 = 0, 𝑏𝑏2 = 0) + 8.00/𝑞𝑞
Gel
enek
sel
mıs
ır
fiyat
ar
alığ
ı
Bt
mıs
ırınn
fiy
at
aral
ığı
𝐸𝐸𝐸𝐸𝐵𝐵𝐵𝐵(𝑞𝑞) = 𝐸𝐸𝐸𝐸(𝑞𝑞: 𝑏𝑏1 = 0) + 8.00/𝑞𝑞
𝐸𝐸𝐸𝐸(𝑞𝑞: 𝑏𝑏1 = 0, 𝑏𝑏2 = 0)
𝐸𝐸𝐸𝐸𝐸𝐸(𝑞𝑞)
Kaynak: Nelson, 2001, 32.
Benzer şekilde Tablo 4’te verilen GD Mısır’ın ortalama (%) verimindeki artış verileri incelendiğinde, teorik analize paralel olarak, ampirik analize konu olan ülkelerin tamamında üretim artışının gerçekleştiği görülmektedir. Tablo 5’te de GD’li ürünlerin pozitif verim etkilerinden kaynaklanan ek bitkisel üretim verilerine bakıldığında ise yine teorik analize paralel olarak mısır, soya fasülyesi, pamuk, konola şeker pancarı üretim artışlarının gerçekleştiği görülmektedir.
Nelson’un teorik yaklaşımı ve ampirik çalışmaların bulguları her ne kadar yeni biyoteknolojik yöntemlerin üretimde kullanılmasının maliyetlerde düşüş ve hasılatta artışa yol açacağına işaret ediyor olsa da söz konusu üretim yönteminin ve ürünlerin ihtiva ettiği riskler ve bunların doğurduğu negatif dışsallıklar nedeniyle sosyal maliyetler analize dahil edilmediğinden söz konusu gelişmeleri doğrudan olumlu olarak değerlendirmek gerçekçi olmayacaktır.
4. Kârlılık Değerlendirmesi
4.1. Kârlılık Faktörleri: Maliyet ve Mahsul
Kârlılık, çiftçilerin elde ettiği hasılattan, maliyetlerinin çıkartılması sonucu ellerinde kalan marj olarak tanımlanabilir. GD ekinlerinin kârlılığı, geleneksel ekinlerle kıyaslanarak Tablo 6’da ölçülmeye çalışılmıştır.
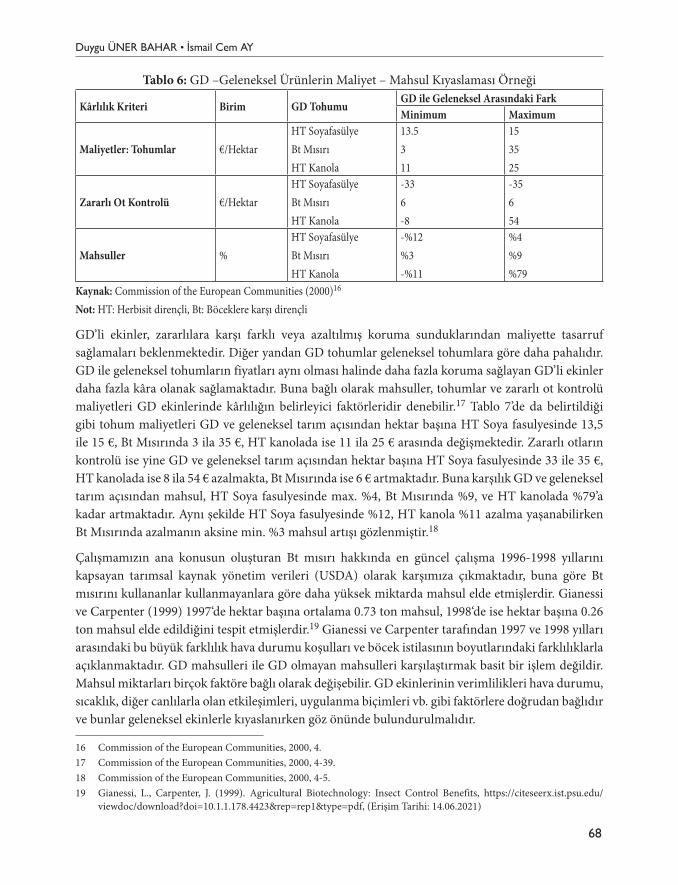
Duygu ÜNER BAHAR • İsmail Cem AY
68
Tablo 6: GD –Geleneksel Ürünlerin Maliyet – Mahsul Kıyaslaması Örneği
Kârlılık Kriteri Birim GD TohumuGD ile Geleneksel Arasındaki FarkMinimum Maximum
Maliyetler: Tohumlar €/HektarHT SoyafasülyeBt MısırıHT Kanola
13.5311
153525
Zararlı Ot Kontrolü €/HektarHT SoyafasülyeBt MısırıHT Kanola
-336-8
-35654
Mahsuller %HT SoyafasülyeBt MısırıHT Kanola
-%12%3-%11
%4%9%79
Kaynak: Commission of the European Communities (2000)16
Not: HT: Herbisit dirençli, Bt: Böceklere karşı dirençli
GD’li ekinler, zararlılara karşı farklı veya azaltılmış koruma sunduklarından maliyette tasarruf sağlamaları beklenmektedir. Diğer yandan GD tohumlar geleneksel tohumlara göre daha pahalıdır. GD ile geleneksel tohumların fiyatları aynı olması halinde daha fazla koruma sağlayan GD’li ekinler daha fazla kâra olanak sağlamaktadır. Buna bağlı olarak mahsuller, tohumlar ve zararlı ot kontrolü maliyetleri GD ekinlerinde kârlılığın belirleyici faktörleridir denebilir.17 Tablo 7’de da belirtildiği gibi tohum maliyetleri GD ve geleneksel tarım açısından hektar başına HT Soya fasulyesinde 13,5 ile 15 €, Bt Mısırında 3 ila 35 €, HT kanolada ise 11 ila 25 € arasında değişmektedir. Zararlı otların kontrolü ise yine GD ve geleneksel tarım açısından hektar başına HT Soya fasulyesinde 33 ile 35 €, HT kanolada ise 8 ila 54 € azalmakta, Bt Mısırında ise 6 € artmaktadır. Buna karşılık GD ve geleneksel tarım açısından mahsul, HT Soya fasulyesinde max. %4, Bt Mısırında %9, ve HT kanolada %79’a kadar artmaktadır. Aynı şekilde HT Soya fasulyesinde %12, HT kanola %11 azalma yaşanabilirken Bt Mısırında azalmanın aksine min. %3 mahsul artışı gözlenmiştir.18
Çalışmamızın ana konusun oluşturan Bt mısırı hakkında en güncel çalışma 1996-1998 yıllarını kapsayan tarımsal kaynak yönetim verileri (USDA) olarak karşımıza çıkmaktadır, buna göre Bt mısırını kullananlar kullanmayanlara göre daha yüksek miktarda mahsul elde etmişlerdir. Gianessi ve Carpenter (1999) 1997‘de hektar başına ortalama 0.73 ton mahsul, 1998‘de ise hektar başına 0.26 ton mahsul elde edildiğini tespit etmişlerdir.19 Gianessi ve Carpenter tarafından 1997 ve 1998 yılları arasındaki bu büyük farklılık hava durumu koşulları ve böcek istilasının boyutlarındaki farklılıklarla açıklanmaktadır. GD mahsulleri ile GD olmayan mahsulleri karşılaştırmak basit bir işlem değildir. Mahsul miktarları birçok faktöre bağlı olarak değişebilir. GD ekinlerinin verimlilikleri hava durumu, sıcaklık, diğer canlılarla olan etkileşimleri, uygulanma biçimleri vb. gibi faktörlere doğrudan bağlıdır ve bunlar geleneksel ekinlerle kıyaslanırken göz önünde bulundurulmalıdır.
16 Commission of the European Communities, 2000, 4.17 Commission of the European Communities, 2000, 4-39.18 Commission of the European Communities, 2000, 4-5.19 Gianessi, L., Carpenter, J. (1999). Agricultural Biotechnology: Insect Control Benefits, https://citeseerx.ist.psu.edu/
viewdoc/download?doi=10.1.1.178.4423&rep=rep1&type=pdf, (Erişim Tarihi: 14.06.2021)
Marmara Üniversitesi İktisadi ve İdari Bilimler Dergisi • Cilt: 43 • Sayı: 1 • Haziran 2021, ISSN: 2587-2672, ss/pp. 57-77
69
4.2. Efektif Kârlılık
Eldeki çalışmalar ve veriler GD ürünlerinin kârlılığı hakkında kesin sonuç vermek için yeterli görünmemektedir. ABD’de GD tarım faaliyetlerinin yeni başladığı dönemde yapılan ilk çalışmalarda, HT bitkilerin tarımsal üretim maliyetlerine olan olumlu etkisinin, tohumların üretimi için katlanılan ilave maliyetlere eşit hatta maliyetlerin lehine daha yüksek olduğu sonucuna varılmıştır. Maliyetinin daha yüksek olmasına rağmen çiftçilerin GD tarımı yabancı ot kontrolünde daha hızlı sonuç verdiğinden dolayı tercih ettikleri aynı çalışmalarda tespit edilmiştir.
Bt mısırının maliyet etkinliği mısırın büyüme koşullarına bağlıdır. Mısır parazitlerinin istilalarının yoğunluğu önemli ölçüde etkili olmaktadır. Kârlılığı konusundaki veriler ise kesin ve belirgin değildir. Bu çelişkili ve kesin olmayan sonuçlar, kısa dönemde GD ürünlerin tercihinde tek itici gücün kârlılık olmadığını göstermektedir. Uygulamada genetiği değiştirilmiş ürünlerin en önemli tercih edilme nedeni herbisitlere karşı dirençli oluşlarıdır. Bu ekinler, çeşitli büyüme koşullarına uyumluluk gösterebilmektedirler, bu da işgücü ihtiyacını azaltmak için kullanılabilir ya da esnek çalışabilen işgücü ihtiyacını ortaya çıkarmaktadır. Bu uyumluluk etkisi, işgücü maliyetlerinde tasarruf ve işgücü verimliliğinde artış anlamına gelir. Ancak bu etki kârlılık olarak değerlendirilmez. İş gücü daha az maliyetli olsaydı daha az işgücü üzerinden daha fazla getiri, kârlılığın artması anlamına gelebilirdi, dolayısıyla Bt mısırın pratikte emeğin değeriyle birlikte değerlendirilmesi gerekmektedir.20
Graham Brookes’un yaptığı çalışmaya göre eğer GD teknolojisi var olmasaydı mısır, soya fasulyesi ve kanolanın fiyatlarının sırasıyla %5.8, %9.6, %3.8 daha yüksek olacağı sonucuna varılmıştır. Yine aynı çalışmaya göre soya fasulyesi ve yağı fiyatında da %5-9 artış yaşanması muhtemel bir sonuç olarak belirtilmiştir.21
Bt mısırının ekimi ile ilgili kararı vermek çok karmaşık bir olgudur. Beklenen istilanın boyutlarına göre ve ekim yerinin özelliğine göre düzenlemeler yapmak gereklidir. Bu tarz farklılıklar, mahsuller ve getiriler kıyaslanırken, biyoteknolojiyi kullananlar ile kullanmayanlar arasındaki farkı ele alarak değerlendirilme yapılmalıdır. Daha yüksek eğitim düzeyi de o kişinin değişiklik durumlarında ihtiyaç duyulan yönetim becerilerini daha etkin kullanmasını sağlayabilir ve elde edeceği kârı etkileyebilir. Ayrıca GD mahsul kârlılığının tohum fiyatlarına ve tarım ürünlerinin verimini artıran kimyasallara ve hava koşullarına karşı oldukça duyarlı olduğu da unutulmamalıdır.
Kârlılığı daha doğru değerlendirebilmek için gıda sektöründeki arz ve talep değişimleri birlikte ele alınmalıdır. Bu nedenle hem GD mahsul tarlalarının hem geleneksel mahsul tarlalarının yıllarca düzenli takip edilmesi ve tüketici taleplerindeki değişimlerin de belirlenmesi gerekmektedir.
HT ürünlerinin etkinliğinin artması durumunda bu avantaj işçilerin verimliliklerinde de bir artışa dönüşmelidir. Bt mısır mahsulündeki artış daha gelişmiş toprak verimliliği anlamına
20 Ching, L., Matthews, J. (2001). GM Crops Failed, The Institute of Science in Society, GM Crops Failed, iatp.org, (Erişim Tarihi: 15.06.2021)
21 Brookes G. (2010). The Production and Price Impact of Biyotech Corn, Canola and Soybean Crops, AgBioForum, 13(1): 25-52. Web: http://www.agbioforum.org/v13n1/v13n1a03-brookes.pdf, (Erişim Tarihi: 13.03.2020).
Duygu ÜNER BAHAR • İsmail Cem AY
70
gelir. Etkilerin her iki türü de, çiftçilerdeki üretim faaliyetleri için bir basamak anlamına gelir. Piyasadaki fiyatlarla, arttırılmış tarla verimliliği arzda bir artışa yol açar. Eğer talebin fonksiyonu değişiklik göstermiyorsa fiyatlar düşecektir. Giderek daha çok üretici, bioteknolojik ekinleri benimseyip, üretmeye başlamakta ve bu da arz tarafında artışa neden olmaktadır. Talep tarafında ise genetiği değiştirilmiş ürünlerle ilgili kaygılar ortaya çıkmaktadır. Sonuç olarak, maliyetlerdeki ve fiyatlardaki farklılığı ifade eden, genetiği değiştirilmiş ve genetiği değiştirilmemiş ürünler arasındaki ayrım giderek büyümektedir denilebilir. Sadece kalite arttırmaya yönelik yenilikler, talep fonksiyonunda yapısal bir değişikliğe ve fiyat artışına neden olacaktır.22 Buna rağmen, pazarda kalite özelliğini artırmaya yol açan çok fazla genetiği değiştirilmiş ürün bulunmamaktadır ve beklentiler hala orta dönemle sınırlıdır. Hızlı benimsenmeleri sebepleri ve genetiği değiştirilmiş ürünlerin kârlılığı dikkate alındığında tarımsal politikaların ölçümlerinin etkileri de hesaba katılmalıdır.
5. Dünyada Genetiği Değiştirilmiş Organizma Ticareti
Biyoteknolojideki yeni gelişmeler mısır, soya fasulyesi ve pamuğun üretiminde gelişmelere yol açmıştır. Tüketicinin bu yeni teknolojiye tepkisi ise karmaşıktır. Artan verimlilikle veya azalan girdi kullanımı ile birlikte, arzdaki artış şoku ve GD’li gıdalara karşı davranışlarıyla şekillenen talep şoku, GD mahsul üretimini, ticaretini ve GD gıda fiyatlarını etkilemektedir. Sonuçlar birçok faktöre bağlıdır. Bunlardan bazıları; işçilik ve piyasa ayrışmaları, GD ürünlerinin üreticilerde neden olduğu üretim şoku ve tüketicilerin GD ürünlerine olan karşıtlığının boyutlarıdır. Sonuçlar global ticaret modellerine bağlı olmakla birlikte eğer işçilik maliyeti ve piyasa ayrışması fazla değilse, global düzeyde GD ve geleneksel ürünler arasında büyük fiyat farklılıkları yaratmayacağı veya dünya üretim ve ticaretinde büyük değişimler meydana gelmeyeceği sonucu çıkarılabilir. Gelişmekte olan ülkeler bu yeni teknolojileri benimserlerse budan kazanç elde edebilirler.
Gıda ve Tarım Örgütü’nün (FAO) 2014 yılında yapmış olduğu uluslararası bir çalışmaya göre; Arjantin’in Brezilya’dan ithal ettiği pamuğun tamamı, Avustralya’nın ABD’den ithal ettiği pamuk tohumunun tamamı, Kanada’nın ABD’den ithal ettiği mısır, soya ve kolza’nın tamamı veya tamamına yakını (%95-100), Bolivya’nın Arjantin ve Brezilya’dan ithal ettiği mısır ve soya’nın %99’u GD ürünlerdir.23 FAO araştırmasında ülkelere ihraç ettikleri ürünlerin içindeki GD ürün oranları da sorulmuştur. Ülkelerin beyanlarına göre; Avustralya’nın ihraç ettiği pamuğun tamamı, Arjantin’in ihraç ettiği mısırın %90’ı, soyanın %99’u, pamuğun ise %95’i, Kanada’nın ihraç ettiği mısırın %85’i, soyanın %50’si, kolzanın ise %95’i GD ürünlerdir. Araştırmaya katılan ülkelerin ihraç ettikleri ürünlerin içindeki GD ürün oranları ve ana ticaret ortağı olan ülkeler Tablo 7’de gösterilmektedir.
22 Bullock, D., Nitsi, E.I. (1999). GMO adoption and Private Profitability. The Economics and Politics of Genetically Modified Organisms in Agriculture. Bülten 809, University of Illinois, s.21-38.
23 FAO (2014). Low Levels of Genetically Modified Crops in International Food and Feed Trade: FAO International Survey and Economic Analysis, FAO web sitesi: http://www.fao.org/docrep/019/i3734e/i3734e.pdf, Erişim Tarihi (6. 01. 2021), s.19.
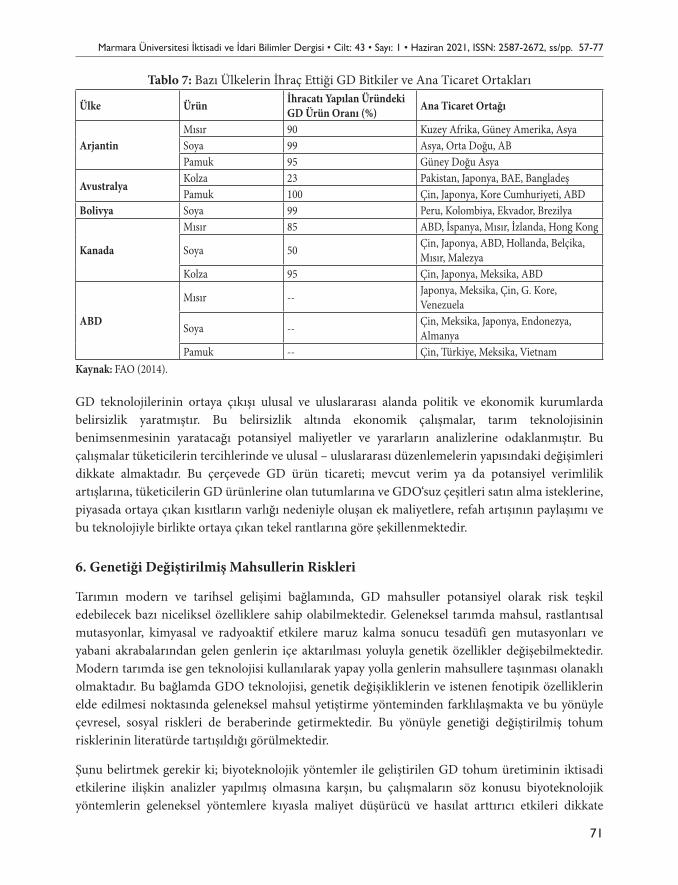
Marmara Üniversitesi İktisadi ve İdari Bilimler Dergisi • Cilt: 43 • Sayı: 1 • Haziran 2021, ISSN: 2587-2672, ss/pp. 57-77
71
Tablo 7: Bazı Ülkelerin İhraç Ettiği GD Bitkiler ve Ana Ticaret Ortakları
Ülke Ürün İhracatı Yapılan Üründeki GD Ürün Oranı (%) Ana Ticaret Ortağı
ArjantinMısır 90 Kuzey Afrika, Güney Amerika, AsyaSoya 99 Asya, Orta Doğu, ABPamuk 95 Güney Doğu Asya
AvustralyaKolza 23 Pakistan, Japonya, BAE, BangladeşPamuk 100 Çin, Japonya, Kore Cumhuriyeti, ABD
Bolivya Soya 99 Peru, Kolombiya, Ekvador, Brezilya
Kanada
Mısır 85 ABD, İspanya, Mısır, İzlanda, Hong Kong
Soya 50 Çin, Japonya, ABD, Hollanda, Belçika, Mısır, Malezya
Kolza 95 Çin, Japonya, Meksika, ABD
ABD
Mısır -- Japonya, Meksika, Çin, G. Kore, Venezuela
Soya -- Çin, Meksika, Japonya, Endonezya, Almanya
Pamuk -- Çin, Türkiye, Meksika, VietnamKaynak: FAO (2014).
GD teknolojilerinin ortaya çıkışı ulusal ve uluslararası alanda politik ve ekonomik kurumlarda belirsizlik yaratmıştır. Bu belirsizlik altında ekonomik çalışmalar, tarım teknolojisinin benimsenmesinin yaratacağı potansiyel maliyetler ve yararların analizlerine odaklanmıştır. Bu çalışmalar tüketicilerin tercihlerinde ve ulusal – uluslararası düzenlemelerin yapısındaki değişimleri dikkate almaktadır. Bu çerçevede GD ürün ticareti; mevcut verim ya da potansiyel verimlilik artışlarına, tüketicilerin GD ürünlerine olan tutumlarına ve GDO‘suz çeşitleri satın alma isteklerine, piyasada ortaya çıkan kısıtların varlığı nedeniyle oluşan ek maliyetlere, refah artışının paylaşımı ve bu teknolojiyle birlikte ortaya çıkan tekel rantlarına göre şekillenmektedir.
6. Genetiği Değiştirilmiş Mahsullerin Riskleri
Tarımın modern ve tarihsel gelişimi bağlamında, GD mahsuller potansiyel olarak risk teşkil edebilecek bazı niceliksel özelliklere sahip olabilmektedir. Geleneksel tarımda mahsul, rastlantısal mutasyonlar, kimyasal ve radyoaktif etkilere maruz kalma sonucu tesadüfi gen mutasyonları ve yabani akrabalarından gelen genlerin içe aktarılması yoluyla genetik özellikler değişebilmektedir. Modern tarımda ise gen teknolojisi kullanılarak yapay yolla genlerin mahsullere taşınması olanaklı olmaktadır. Bu bağlamda GDO teknolojisi, genetik değişikliklerin ve istenen fenotipik özelliklerin elde edilmesi noktasında geleneksel mahsul yetiştirme yönteminden farklılaşmakta ve bu yönüyle çevresel, sosyal riskleri de beraberinde getirmektedir. Bu yönüyle genetiği değiştirilmiş tohum risklerinin literatürde tartışıldığı görülmektedir.
Şunu belirtmek gerekir ki; biyoteknolojik yöntemler ile geliştirilen GD tohum üretiminin iktisadi etkilerine ilişkin analizler yapılmış olmasına karşın, bu çalışmaların söz konusu biyoteknolojik yöntemlerin geleneksel yöntemlere kıyasla maliyet düşürücü ve hasılat arttırıcı etkileri dikkate
Duygu ÜNER BAHAR • İsmail Cem AY
72
alınarak analiz edildiği; çevre, insan ve hayvan sağlığı üzerindeki kısa ve uzun dönemde zararları gibi negatif dışsallıklarının dikkate alınmadığı görülmektedir. GDO’lu mahsüllerin gerçekleşen ve potansiyel zararlarına ilişkin tartışmalar iktisadi analizlere yoğun bir şekilde yansımadığı söylenebilir. İktisadi analizlere olumsuz dışsallıklar olarak dahil edilmesi gereken ekolojik alanda oraya konan olumsuzlukları şöyle özetleyebiliriz.
GDO’larla ilgili önemli bir riski de Yatay Gen Transferi (YGT) riskidir. YGT, çeşitli çevresel koşullarda organizmalar tarafından yabancı genlerin edinilmesidir. GDO’dan başka organizmalara yatay gen transferi ile insanların veya çevrenin sağlığına potansiyel bir zarar kaynağı olabilecek yeni bir özellik ortaya çıkabilmektedir. Örneğin, antibiyotik direnç genlerinin bir patojene aktarılması, insan veya hayvan tedavisini tehlikeye atma potansiyeline sahiptir.24 Bu tür bir yatay transferi, birçok farklı bakteri için, birçok gen için ve birçok farklı ortamda gözlemlendiğinden, önlem alınmadıkça rekombinant genlerin diğer bakterilere yayılmayacağını varsaymak yanlış olur.25 YGT’nin bir diğer önemli olası etkisi, eklenen genleri bir GDO’dan potansiyel zararlılara veya patojenlere aktarabilmesidir. Bu durum, beklenmedik/istenmeyen değişikliklere neden olabilir. GD ürünler ile geleneksel ürünler dış görünümleri itibariyle benzerlik gösterdiğinden, tüketici açısından bu ürünleri birbirinden ayırmak imkansız olmaktadır ki bu durum da tüketici hakları açısından ayrıca değerlendirilmesi gereken bir konudur. Tüm bu olumsuz dışsallıklar, kısa dönem-mikro düzeyde maliyet düşüşü ve üretim artışına neden olurlarken, uzun dönem – sosyal maliyetlerde ciddi artışlara da neden olabileceği dikkate alınması gereken bir noktadır. Tarımsal – tıbbi-endüstriyel alanda biyoteknolojik ilerlemeler ve meydana getirdiği olumlu ve olumsuz sonuçları, değişen dinamikleri içinde çevre – insan sağlığı açısından sürekli denetlenmeli ve düzenlenmelidir.
İktisadi açıdan yeni biyoteknolojik yöntemlerin üretim ve maliyet üzerindeki etkisi dışında, yukarıda bahsi geçen negatif dışsallıkların neden olduğu sosyal maliyetler de dikkate alınarak biyoloji-genetik bilim gibi yaşam bilimleri ile multidisipliner çalışmaların yapılması gerektiği kanaatindeyiz.
7. Sonuç
Bu çalışma “Genetiği değiştirilmiş mısır tohumların olası ekonomik etkileri” konusunu hem pozitif hem de negatif bakış açısını kapsayacak şekilde hazırlanmıştır. Çalışmanın giriş bölümünde genetik değişim konusunda teorik bilgilere yer verilmiştir. İkinci bölümde GD piyasası hakkında genel bilgiler verilmiştir. Üçüncü bölümde teorik bir model genetiği değiştirilmiş mısır bazında incelenmiştir, dördüncü bölümde kârlılık analizine yer verilmiştir. Son bölümde ise konunun ticari boyutu ve riskleri ele alınmaya çalışılmıştır.
Son 20-25 yıldır dünya gündeminde genetiği değiştirilmiş gıdalar yer almaktadır. Ancak tarım biyoteknolojisinin ilk ticarileştirilen ürünü olan domatesin dünya piyasasına sürüldüğü döneme bakarsak 1990’ların başından beri (hatta daha da önce) farkında olalım ya da olmayalım GD
24 Bennett P. Livesey C. T., Nathwani D. D., Reeves S., Saunders J. R., Wise R., (2004). An Assessment of the Risks Associated with the Use ofAntibiotic Resistance Genes in Genetically Modified Plants: Report of the Working Party of the British Society for Antimicrobial Chemotherapy, Journal of Antimicrobial Chemotherapy, 53(3): 418–431.
25 Çelik V., Turgut Balık, D. (2007). Genetiği Değiştirilmiş Organizmalar (GDO), Erciyes Üniversitesi Fen Bilimleri Enstitüsü Dergisi, 23(1-2): 3–23.
Marmara Üniversitesi İktisadi ve İdari Bilimler Dergisi • Cilt: 43 • Sayı: 1 • Haziran 2021, ISSN: 2587-2672, ss/pp. 57-77
73
ürün tüketiyoruz. Buna rağmen ABD’nin patentini elinde bulundurduğu bu genetiği değiştirilmiş tohumların ne sağlık, çevre, biyoçeşitlilik vs. açısından, ne de ekonomik açıdan avantajları ve dezavantajları konusunda görüş birliğine varılabilen net bir çalışmaya literatürde rastlanamamıştır. Birçok yaklaşım, model, analiz öne sürülmesine rağmen gerçekte etkisinin ne olduğu ya da olacağı şimdilik bilinememektedir. Bu durumun en büyük gerekçesi olarak GDO’nun etkisinin gözlemlenebilmesine olanak sağlayacak olan yeterli sürenin dolmadığı yönündedir. Diğer bir gerekçe olarak ABD’nin ekonomik çıkarlarını zedelememek için elde ettiği deneysel sonuçları (özellikle GDO’nun sağlığa zararları konusunda) kamuoyundan gizlediği ya da üzerini “test için yetersiz süre” yaklaşımıyla örttüğü yönündedir. Dolayısıyla bazı bilim insanları; konuya ılımlı (pozitif) yaklaşırken bazıları da olası negatif sonuçlarını vurgulamaktadırlar.
Pozitif bakış açısına göre oluşması muhtemel GDO piyasasının işleyiş mekanizması özetle şu şekilde oluşmaktadır: GD tohum sayesinde artan üretim verimliliğiyle birlikte, ürünlerin fiyatlarında düşüş meydana gelecektir. Maliyetlerdeki düşüşler fiyatların düşmesine neden olarak tüketimi arttıracak ve refahı arttırıcı yönde etki edecektir. Tarım biyoteknolojisini benimseyenler benimsemeyenlere göre piyasalarındaki güçlerine oranla daha yüksek getiri elde edeceklerdir. Benimsemeyenlerin bir kısmı, dünyadaki değişen fiyatlara bağlı olarak az miktarda getiri elde edeceklerdir. Gelişmekte olan ülkeler bu yeni teknolojiyi benimserlerse getirileri de uzun vadede daha yüksek olacaktır. Etiketleme zorunluluğu olmadığı ve talep piyasasındaki ayrışmanın olmadığı varsayıldığında, dünya piyasaları bu yeni teknolojinin ortaya çıkışına kolaylıkla uyum sağlayabilecektir. Diğer yandan GD mahsul piyasası gelişmiş-az gelişmiş ülkeler (merkez-çevre) bazında değerlendirilirse gelişmekte olan ülkelerde hane halklarının refahı tarıma daha çok bağlı olduğundan tarım biyoteknolojisindeki gelişmelere daha duyarlı olacakları düşünülmektedir. Çin ve Hindistan gibi büyük nüfusa sahip ülkelerin iç piyasaları daha büyük olduğundan ticaret rejimi değişimden fazla etkilenmeyebilirler. Fakat Afrika’nın özellikle Sahara altı bölgelerindeki ülkelerde bu durum iç piyasa darlığı nedeniyle farklılık gösterir. Bu ülkeler AB kısıtlayıcı kuralları yüzünden GD ürünlerin ihracatını çok fazla yapamamaktadırlar.
Negatif bakış açısına sahip ekonomik modeller ise özetle şu şekilde şekillenmektedir: GD tohumlar hibrit tohumlar gibi kısırlaştırılmış tohum olduklarından bir tarladan ikinci ürünü alabilmek için çiftçilerin tohum satan şirkete bağımlı hale gelecekleri ve bu nedenle tarım maliyetlerinin artıp bu durumun gıda fiyatlarına yansıyacağı öngörülmektedir. Bu nedenle de yerel ekonomide hanehalkının alım gücünün düşeceği ve enflasyonist etkiler oluşacağı öngörülmektedir. GD mahsul piyasası makro ölçekte değerlendirildiğinde, ülke tarım ekonomisinin GD tohum patentini elinde bulunduran ülkeye bağımlı hale dönüşeceği de belirtilmektedir. Ayrıca sağlık açısından zararlarının da çeşitli hayvan deneyleri ile kanıtlanmış olduğu ancak basında yer alamadığı da öne sürülmektedir. Diğer yandan ekonomik fayda yaratacağını vurgulayanların savunduğu gibi bir verim artışının gerçeği yansıtmadığı öne sürülmektedir. Ayrıca konu ile ilgili çok farklı modeller de oluşturulmuştur: Bazı modeller GD ürün ve geleneksel ürün tespiti konularında uzmanlaşmalar meydana geleceğini öne sürerken, bazı çalışmalarda ülkelerin bunların her ikisini de üretebileceği fakat arz zincirinde ayrımını yapacağını belirtmiştir. Nitekim 2018 yılında GD mahsul üreten 15 ülke vardır; Amerika Birleşik Devletleri (33,7 milyon hektar), Brezilya (15,4 milyon hektar), Arjantin (5,5 milyon hektar), Güney Afrika (2
Duygu ÜNER BAHAR • İsmail Cem AY
74
milyon hektar) ve Kanada (1,57 milyon) hektar), bir milyon hektardan daha az dikim yapılan ülkeler Filipinler, Paraguay, İspanya, Uruguay, Kolombiya, Vietnam, Honduras, Şili, Vietnam ve Portekizdir. Ayrıca GD tohum ekimine izin vermeyip GD ürün ithalatına izin veren ülkeler de mevcuttur. Türkiye de bu ülkelerden biridir.26 İlgili modellerde tüketicilerin GD ürünlere karşı tutumlarına göre farklı sonuçlar elde edilmektedir. Modellerde üretim artışlarında da farklılıklar oluşmaktadır.
Son olarak konu ile ilgili pek çok doğruluğundan emin olunamayan bilginin mevcut olduğunu belirtmek gereklidir. Ayrıca hem ekonomik hem de sağlık açısından yapılan değerlendirmelerin ve modellerin gerçeği ne kadar yansıttığı, öngörülen sonuçların gerçekleşip gerçekleşmeyeceği de önümüzdeki yıllarda ancak sahada kontrollü ekim yapılarak, üretim süreçleri düzenli takip edilerek ve düzenli tüketici talep anketleri yapılarak oluşturulan modellerle ortaya çıkarılabilir.
KaynakçaAGRICULTURAL BIOTECHNOLOGY: Insect Control Benefits. Washington, DC: National Center for Food
and Agricultural Policy, http://www.ncfap.org/reports/biotech/insectcontrolbenefits.pdf., (Erişim Tarihi: 09.03.2020).
BENNETT P. M., Livesey C. T., Nathwani D., Reeves D. S., Saunders J. R., and Wise R. (2004). An Assessment of The Risks Associated with the Use of Antibiotic Resistance Genes in Genetically Modified Plants: Report of The Working Party of The British Society for Antimicrobial Chemotherapy, Journal of Antimicrobial Chemotherapy, 53(3): 418–431.
BESSIN, R. (1996). Bt-Corn: What It is and How It Works, https://entomology.ca.uky.edu/ef130, (Erişim Tarihi: 14.06.2021)
BODE, W., Blode W. M., CALVIN, D. D. (1990). Yield-Loss Relationships and Economic Injury Levels for European Corn Borer Populations (Lepidoptera: Pyralidae) Infesting Pennsylvania Field Corn, Journal of Economic Entomology, 83: 1595–1603.
BROOKES, G. (2010). The Production and Price Impact of Biyotech Corn, Canola and Soybean Crops, AgBioForum, 13(1): 25-52.
BROOKES, G., Barfoot, P. (2018). Farm Income and Production Impacts of Using GM Crop Technology 1996–2016, GM Crops & Food, 9(2): 59-89.
BULLOCK, D. and Nitsi, E. I. (1999). GMO Adoption and Private Profitability. The Economics and Politics of Genetically Modified Organisms in Agriculture, Bulten 809, University of Illinois: 21-38.
COMMISSION OF THE EUROPEAN COMMUNITIES (2000). Economic Impacts of Genetically Modified Crops on The Agri-Food Sector, Working Document: 4-39, http://aei.pitt.edu/34717/1/A17.pdf, (Erişim Tarihi: 10.03.2020)
CHING, L. and Matthews, J. (2001). GM Crops Failed, The Institute of Science in Society, GM Crops Failed (iatp.org), (Erişim Tarihi: 15.06.2021).
ÇELİK V, Turgut Balık, D. (2007). Genetiği Değiştirilmiş Organizmalar (GDO), Erciyes Üniversitesi Fen Bilimleri Enstitüsü Dergisi 23(1-2): 13–23.
DEMİRKOL, K. (2010). GDO: Çağdaş Esaret, Kaynak Yayınları.FAO (2014). Low Levels of Genetically Modified Crops in International Food and Feed Trade: FAO International
Survey and Economic Analysis, FAO web sitesi: http://www.fao.org/docrep/019/i3734e/i3734e.pdf, (Erişim Tarihi: 06.01.2021).
26 ISAAA (2018). Where are Biotech Crops Grown in the World?, s.1-2, https://www.isaaa.org/resources/publications/pocketk/16/, (Erişim Tarihi: 10.03.2020)
Marmara Üniversitesi İktisadi ve İdari Bilimler Dergisi • Cilt: 43 • Sayı: 1 • Haziran 2021, ISSN: 2587-2672, ss/pp. 57-77
75
GIANESSI, L. and Carpenter, J. (1999). Agricultural Biotechnology: Insect Control Benefits, https://citeseerx.ist.psu.edu/viewdoc/download?doi=10.1.1.178.4423&rep=rep1&type=pdf, (Erişim Tarihi: 14.06.2021).
ISAAA (2016). Global Status of Commercialized Biotech/GM Crops, Brief 52, http:// www.isaaa.org/resources/publications/briefs/52/ download/isaaa-brief-52-2016.pdf, (Erişim Tarihi: 05.01.2021).
ISAAA (2017). Global Status of Commercialized Biotech/GM Crops, Brief 53, https://www.isaaa.org/resources/publications/briefs/53/download/isaaa-brief-53-2017.pdf (Erişim Tarihi: 05.01.2021).
ISAAA (2018). Where Are Biotech Crops Grown in The World?, https://www.isaaa.org/resources/publications/pocketk/16/, (Erişim Tarihi: 10.03.2020).
ISAAA (2018). Global Status of Commercialized Biotech/GM Crops, Brief No: 54, ISAAA: New York: 1-2, https://www.isaaa.org/resources/publications/briefs/54/default.asp, (Erişim Tarihi: 10.06.2021)
LUSSER M., Raney T., Tillie P., Dillen K., Rodriguez-Cerezo E. (2012). International Workshop on Socio-economic Impacts of Genetically Modified Crops co-organised by JRC-IPTS and FAO. http://www.fao.org/3/ap016e/ap016e.pdf, (Erişim Tarihi:10 Ocak 2021).
MASON, C., Rice, M., Difonzo C., Porter R. P. (1996). European Corn Borer: Ecology and Management, NCR-327, North Central Regional Extension Publication, Iowa State University, July.
MONSANTO COMPANY (1998). YieldGard Insect-Protected Corn: The Whole Plant, The Whole Season.NELSON, G. C. (2001). Genetically Modified Organisms in Agriculture, Economics and Politics,Academic
Press, University of Illions, USA.OSTLIE, K. R., Hutchison, W. D., Hellmich, R. L. (1998). Bt Corn And European Corn Borer: Long-Term
Success Through Resistance Management, http://www.extension.umn.edu/Documents/D/C/DC7055.html. (Erişim Tarihi: 05.01.2020) October 1998 Supplement Available at https//ent.agri.umn.edu/ecb/nc205doc.htm., (Erişim Tarihi:12.02.2020).
RAMAN, R. (2017). The Impact of Genetically Modified (GM) Crops in Modern Agriculture: A review, GM Crops & Food, 8: 195–208.
TOP 20 GLOBAL SEED COMPANIES in 2017, (2017), http://news.agropages.com/News/NewsDetail---26905.htm, (Erişim Tarihi 15.01.2020).
76
Genetically modified organisms (GMO) are the living organisms whose gene sequences have been modified with the help of gene technology, to gain new characteristics that cannot be obtained throughout their natural processes. Nowadays, the most commercialized genetically modified agricultural products are corn, tomato, cotton, canola and soybeans. This study focuses on the theoretical analysis of yield and production costs in genetically modified corn harvest. While conducting economic analysis, input, crop quality and revenue were taken into account as profitability factors. It is assumed that there is no demand distinction among agricultural products. The probable economic effects of genetically modified seeds have been analyzed from both positive and negative perspectives. In the first part of the study, the basic theoretical background of genetic modification has been presented and the subject of changes in the genetics of the seed, and whether the modification has increased the yield have been investigated. The second part covers the framework of the market for genetically modified (GM) seeds. In the third part, economic models and theoretical analyses are examined based on genetically modified corn. In this section, the economic theoretical model designed by Gerald C. Nelson for GM seed market functioning has been evaluated. While the fourth section includes profitability analysis of genetically modified corn, in the fifth chapter, the commercial dimension of the subject has been discussed.
Thanks to genetically modified seeds (herbicide, insecticide tolerance, drought resistance), it is anticipated that production costs will decrease as fewer pesticides will be used while harvesting a larger amount per unit area. Thus, the aggregate food supply in the market and the income level of the farmers will increase. Increment in food supply will lower food prices and raise the purchasing power of households. In the countries using genetically modified seeds, as the aggregate food supply increases based on an increment of yield, the gross domestic product (GDP) figures will raise. The export figures will exceed the import figures due to the exportation of the proliferated crops. This situation is thought to help to eliminate budget deficits and increase public welfare. Countries that become GM seed producers will be able to get a better position in the world economy with the help of their budget surpluses. However, to evaluate the genetically modified crop market more accurately, some responses need to be clarified; What are the real and potential gains in production efficiency and food quality, and who benefits? What are the potential effects of genetically modified crops on world agricultural trade? What are the effects of restrictions on GM seed production, agriculture and trade? What are the changes in consumers’ preferences? What are the effects of genetically modified and unmodified product decomposition? What are the differences of effects of the usage of genetically modified seeds in developed and developing countries? These questions create uncertainty in political and economic institutions in the national and international arena. Under this uncertainty, economic studies have focused on the analysis of potential costs and benefits from the adoption of agricultural biotechnology. Besides, the extent to which the evaluations and models in economic and health-wise reflect the reality, and whether the predicted results will be realized, can only be demonstrated in the coming years with the light of models created based on controlled planting in the field, following the production processes regularly and conducting regular consumer demand surveys.
Extended Abstract
Marmara Üniversitesi İktisadi ve İdari Bilimler Dergisi • Cilt: 43 • Sayı: 1 • Haziran 2021, ISSN: 2587-2672, ss/pp. 57-77
77
The emergence of gene technologies has created uncertainty in political and economic institutions in the national and international arena. Under this uncertainty, economic studies have focused on the analysis of potential costs and benefits from the adoption of agricultural technology. These studies consider the changes in consumers’ preferences and the structure of national-international regulations. In this framework, GM crops trade is shaped by the enhancing in current or the potential yield, consumers’ attitudes towards GM or non-GM crops varieties, additional costs due to the presence of constraints in the market, sharing of increases in welfare, and monopoly rent arising with this technology.
78
Marmara Üniversitesi İktisadi ve İdari Bilimler Dergisi • Cilt: 43 • Sayı: 1 • Haziran 2021, ISSN: 2587-2672, ss/pp. 78-99 DOI: 10.14780/muiibd.960283
Makale Gönderim Tarihi:Makale Gönderim Tarihi: 08.01.2021Yayına Kabul Tarihi:Yayına Kabul Tarihi: 13.06.2021
ARAŞTIRMA MAKALESİ / RESEARCH ARTICLE
TEMEL PERFORMANS GÖSTERGELERİ İLE KRİTİK BAŞARI FAKTÖRLERİ İLİŞKİSİ: BİR HAVAYOLU İŞLETMESİ
UYGULAMASI
THE RELATIONSHIP OF KEY PERFORMANCE INDICATORS AND CRITICAL SUCCESS FACTORS: AN AIRLINE BUSINESS
APPLICATION
Hakan CAVLAK1
*
ÖzMisyon ve vizyon, işletmelerin kendilerini nasıl tanımladıklarını, konumlandırdıklarını ve geleceğe ilişkin hedeflerini en net şekilde ortaya koyan ifadelerdir. Bu ifadeler, işletme stratejilerinin ve hedeflerinin oluşturulmasındaki temel unsurlardır. Belirtilen tüm bu unsurların gerçekleştirilmesi için bunların belirli birtakım araçlar doğrultusunda takip edilmesi, izlenmesi ve değerlendirilmesi gerekmektedir. Bu noktada kullanabilecek araçlar ise kritik başarı faktörleri (CSF’ler) ve temel performans göstergeleridir (KPI’lar). CSF ve KPI, bu çalışmanın ana konusunu oluşturmaktadır. CSF, işletmelerin misyonu, vizyonu ve stratejileri çerçevesinde oluşturduğu ve bu unsurların gerçekleşmesi için gerekli olan kilit faaliyet alanlarını temsil etmektedir. Söz konusu bu kilit faktörler belirlendikten sonra ise CSF’lere bağlı KPI’ların oluşturulması gerekmektedir. KPI’lar ise CSF’lerin, stratejilerin, vizyonun ve misyonun başarılmasına katkı sunan faaliyetlerin gerçekleştirilmesinde temel uyarıcı göstergelerdir. Bu göstergeler, işletmelere hangi unsurların düzeltilmesi ya da iyileştirilmesi gerektiği hususunda rehberlik sağlamaktadır. Çalışmada, KPI ve CSF başta olmak üzere ilgili tüm unsurların özellikleri ve ilişkileri açıklanmakta ve açıklamalar bir hava yolu işletmesi uygulaması üzerinden somutlaştırılmaktadır.Anahtar Kelimeler: Temel Performans Göstergesi, Kritik Başarı Faktörleri, KPI, CSF.JEL Sınıflandırması: L21, L29, M10.
AbstractMission and vision show how businesses define and position themselves. These statements also clearly explain the future targets of the company. Also, these are the central elements in establishing business strategies and goals. To realize all these elements, they must be followed, monitored, and evaluated in line with certain tools. The tools that can be used at this point are critical success factors (CSFs) and key performance indicators (KPIs). CSF and KPI are the main subject of this study. CSF represents the key
* Arş. Gör. Dr., Ardahan Üniversitesi, İktisadi ve İdari Bilimler Fakültesi, İşletme Bölümü, Ardahan, E-Mail: [email protected], ORCID ID: 0000-0002-5891-7722
Marmara Üniversitesi İktisadi ve İdari Bilimler Dergisi • Cilt: 43 • Sayı: 1 • Haziran 2021, ISSN: 2587-2672, ss/pp. 78-99
79
areas of activity required for the realization of the mission, vision, and strategies of the businesses. After these key areas are determined, KPIs linked to CSFs should be created. KPIs are leading indicators that contribute to the achievement of CSFs, strategies, vision, and mission. These indicators guide businesses on what activities need to be corrected or improved. In the study, first of all, the properties of KPI, CSF, and all other related elements and their relationship with each other are explained. Finally, the explanations given are concretized through an airline business application.Keywords: Key Performance Indicator, Critical Success Factor, KPI, CSF.JEL Classification: L21, L29, M10.
1. Giriş
İşletmeler, günümüzde yoğun bir rekabetin, daralan bütçelerin ve ağır fiyat baskılarının olduğu dinamik bir ticari ortamda faaliyet göstermektedir. Bu ortamda yapılan geri bildirimler, her sistemin veya organizasyonun sürekli öğrenmesi, kontrolü ve adaptasyonu için büyük önem arz etmektedir. İşletmeler zamanında ve doğru geri bildirim almadıklarında durum tespiti yapamamakta, fırsatları ya da hataları tanımada başarısız olmaktadır. Önemli geri bildirim araçlarından biri performans ölçümü sonucunda elde edilen bilgilerdir. Performans ölçümü, ilgililere önemli bilgiler sağlamakta ve işletme faaliyetlerine ilişkin işletme içindeki tüm unsurların sorumluluk alanları üzerinde kontrolün sağlanmasına olanak tanımaktadır1,2.
Peter Drucker’a atfedilen “Ölçemediğiniz şeyi yönetmezsiniz.” cümlesi, işletmelerdeki performans ölçümünün önemini gösteren ifadelerden biridir. İşletmelerin kurumsal stratejilerini uygulamaları için işletme performansını doğru ve gerçekçi bir şekilde ölçmeleri ve bu süreci iyi yönetmeleri gerekmektedir3. Performans yönetimi, işletmenin doğru yönde gidip gitmediğini teyit etmek için kullanılmaktadır. Bu yönetimin sağlanabilmesi için performansın ölçülmesi, karşılaştırılması ve performans göstergeleri hakkında bilgi sahibi olunması gerekmektedir4,5.
İş dünyası kafa karıştırıcı olabilecek kelimeler, terimler ve kısaltmalarla doludur. Özellikle, performans ölçümünde kullanılan birçok terim birbiri yerine kullanılabilmekte ya da birbiri ile karıştırılabilmektedir. Kuruluşların, organizasyonların ya da işletmelerin performanslarının ölçülmesinde kullanılan araçlar, literatürde ölçüt, gösterge, metrik gibi muhtelif terimler şeklinde isimlendirilmektedir. Performans ölçütü, göstergesi, metriği, anahtar performans göstergesi, temel performans göstergesi, kritik başarı göstergesi, kritik başarı faktörü terimleri de bunlardan bazılarıdır. Bu karışıklık ise işletmelerin, paydaşların ve konu ile ilgililerin iletişiminde kopukluklara ve muhtelif kayıplara yol açabilmektedir.
1 Chae, B. (2009). Developing Key Performance Indicators for Supply Chain: An Industry Perspective, Supply Chain Management: An International Journal, 14(6): 422.
2 Kaydos, W. (1999). Operational Performance Measurement: Increasing Total Productivity, Florida, CRC Press, s.2.3 Human Resources Development Working Group, Labour and Social Protection Network, and Asia-Pacific Economic
Cooperation. (2007). “Developing Key Performance Indicators and Productivity/Performance Benchmarks for Performance Based Remuneration Systems Report”, Malaysia, s.3.
4 Ghalayini, A. M. ve diğerleri. (1997). An Integrated Dynamic Performance Measurement System for Improving Manufacturing Competitiveness, International Journal of Production Economics, 48: 207.
5 Ishaq Bhatti, M. ve diğerleri. (2014). The Key Performance Indicators (KPIs) and Their Impact on Overall Organizational Performance, Quality & Quantity 48(6): 3128.
Hakan CAVLAK
80
Çalışmada; öncelikle temel performans göstergesi-KPI ile kritik başarı faktörü-CSF temel anlamda özetlenmiştir. Daha sonra ise KPI ile CSF arasındaki ilişki işletmenin misyonu, vizyonu ve stratejisi doğrultusundaki zincirleme çerçevede detaylandırılmıştır. Son bölümde, teorik olarak ele alınan tüm unsurlar bir hava yolu işletmesi uygulaması ile somutlaştırılmıştır. Çalışmanın konu hakkında çalışma yapacaklara ve ilgililere kavramsal bir çerçeve sunması, karmaşıklığa yol açan ilgili kavramların basit bir uygulama ile netleştirilmesi ve işletmelere konu hakkında bir rehber sunması amaçlanan temel beklentilerdir.
2. Temel Performans Göstergeleri (KPI)
İşletme yönetiminin önemli fonksiyonlarından biri olan kontrol, gerçek ve planlanan performans arasında sapmaya neden olan koşulları düzeltmek için yönetsel eylemleri içermektedir6. İşletme kontrolü ise işletme performansının ölçümü vasıtası ile sağlanabilmektedir7.
Heinz Company’nin başkanı Anthony J. F. O’Reilly ile 1977 yılında yapılan bir röpartajda “Bilgi sistemleri ile ilgili beni etkileyen ilk şey, birinin çok fazla bilgi almasıdır. Bilgi patlaması, yöneticilerin anlaşılamayan ve çoğu alakasız büyük miktarda veri ile uğraşmasına neden olmaktadır.”8 tespitinde bulunmuştur. Günümüzde bilginin sınırsızca üretildiği dijital çağda ise mevcut veri hacmi katlanarak artmaktadır. Bu yapı içinde temel performans göstergeleri (KPI’lar), işletmelerin ve işletme yönetimlerinin ayrılmaz bir parçası olarak görülmektedir9,10.
“Key performance indicator”, Türkçeye anahtar/temel/kilit/stratejik performans göstergesi olarak çevrilmekte ancak ağırlıklı kullanım temel performans göstergesi şeklindedir. Diğer taraftan KPI yerine literatürde “key success indicator” (KSI) (temel başarı göstergesi) terimi de kullanılabilmektedir11,12.
Temel performans göstergeleri, bazı akademik çalışmalarda temel performans göstergeleri-ölçütleri-metrikleri olarak da ifade edilmektedir. Ancak, bu araçların performans yönetim sistemi içindeki işlevi ve aşağıdaki ölçüt-gösterge ayrımı göz önünde bulundurulduğunda temel performans göstergesi kavramının kullanımı daha uygun görünmektedir13.
6 Khan, M. Y., Jain, P. K. (2013). Management Accounting – Text, Problems and Cases, New Delhi, McGraw Hill Education (India) Private Limited, s.42.
7 Franceschini, F. ve diğerleri. (2007). Management by Measurement – Designing Key Indicators and Performance Measurement Systems, Heidelberg, Springer-Verlag Berlin Heidelberg, s.7.
8 Rockart, J. F. (1979). Chief Executives Define Their Own Data Needs, Harvard Business Review, 57(2): 82.9 KPMG. (2018). “Trust Your Decisions. Have Confidence in Your Data and Analytics”, Reporting & Analytics – KPI’s
and Dashboarding, 2018, https://home.kpmg/be/en/home/insights/2018/04/reporting-analytics-kpi-and-dashboarding.html, (Erişim Tarihi: 11.11.2020)
10 Köylüoğlu, B. (2017). “KPI ve Performans Göstergeleri Gerçeği”, Stratejik Yönetim ve Kurumsal Finans Üzerine Düşünceler, https://www.stratejivefinans.com/kpi-ve-performans-gostergeleri-gercegi, (Erişim Tarihi: 08.11.2020)
11 Shackleton, C. (2007). Developing Key Perfomance Indicators for Corporate Communication in the Information Technology Industry, University of Pretoria, s.38.
12 Lind, P. (2015). Monitoring Business Performance, New York, Routledge, s.136.13 Alexander, J. (2018). Financial Planning & Analysis and Performance Management, New Jersey, John Wiley & Sons Inc.,
s.175.
Marmara Üniversitesi İktisadi ve İdari Bilimler Dergisi • Cilt: 43 • Sayı: 1 • Haziran 2021, ISSN: 2587-2672, ss/pp. 78-99
81
• Ölçüt; daha çok uzun vadeli ve belirli bir dönemin sonuçlarından hareketle elde edilen veriyi ifade etmektedir.
• Gösterge; daha çok kısa vadeli sonuçlardan hareketle elde edilen, uzun dönemli performansı etkileyen ve uyarıcı bir görev yapan veriyi ifade etmektedir.
KPI’lar, performansı temsil ettiğinden dolayı çoğu kişinin algısında finansal bir unsur olarak yer almaktadır. Ancak KPI’lar performansın tüm yönlerini içermektedir. Uzun vadeli başarı olasılıklarını değerlendirmeye yardımcı olmak için genellikle önemli bir oranda finansal olmayan göstergeler de içermektedir14,15. Ancak finansal olmayan göstergelerin tasarlanması ve kullanımı sonuç ölçütleri olarak da nitelendirilen ve uzun bir geçmişe sahip olan finansal göstergelerden daha zordur16.
İşletmelerin sürdürülebilirliklerini sağlamaları için faaliyetlerinin sonucunu bir başka ifade ile performanslarını ölçmeleri ve bu süreci etkin bir şekilde yönetmeleri gerekmektedir. Bu amaç ile kullanılabilecek önemli araçlardan biri temel performans göstergeleridir17. KPI’lar, şirketlerin performansı ölçmek ve geleceği planlamak için kullandıkları üst düzey göstergelerdendir. Diğer bir taraftan KPI’lar, kuruluşun nasıl performans gösterdiğine ve performansın ortaya konulan hedefler ile uyumlu olup olmadığına dair üst düzey yöneticilere gösterge sağlamaktadır18. Üst düzey (tepe yönetim tarafından belirlenen) KPI’lar, işletmenin genel performansına odaklanırken düşük düzeyli (orta ve alt kademe yönetim, departman ya da ekipler tarafından belirlenen) KPI’lar kendi ilgili alanları içindeki süreçlere ait performansa odaklanmaktadır19.
İşletmeler için önemli bir performans izleme aracı olan KPI’lar, birçok işletme tarafından yanlış olarak tanımlanmaktadır. Bunun nedeni; araştırmacıların, muhasebecilerin ya da danışmanların KPI’ların gerçekte ne olduğunu tam olarak belirtmemelerinden ve diğer gösterge araçlarını açıklamamalarından kaynaklanmaktadır. KPI ile yakın bir ilişki içinde olan söz konusu diğer performans unsurları Şekil 1’de verilmektedir20.
Şekildeki görünüm dört gösterge arasındaki ilişkiyi bir soğanın yapısına benzeterek açıklamaktadır. Dış kabuk, önemli bir sonuç göstergesi olarak soğanın genel durumunu gösterirken iç katmanlar,
14 Atkinson, A. A. ve diğerleri. (2012). Management Accounting: Information for Decision-Making and Strategy Execution, London, Pearson Education, Inc., s.363.
15 Atrill, P., McLaney, E. (2009). Management Accounting for Decision Makers, Harlow, Pearson Education Ltd., s.24.16 Bourne, M. (2008). Performance Measurement: Learning from the Past and Projecting the Future, Measuring Business
Excellence, 12(4): 67.17 Kleindienst, B. (2017). Performance Measurement Und Management, Wiesbaden, Springer Fachmedien Wiesbaden,
s.39.18 Pacific Crest Group. (2012). “Applying Key Performance Indicators to Build Your Business”, s.3.19 Klipfolio. (2020). “What Is a KPI?”, www.klipfolio.com/resources/articles/what-is-a-key-performance-indicator, (Erişim
Tarihi: 15.11.2020).20 Parmenter, D. (2011a). The Leading-Edge Manager’s Guide to Success: Strategies and Better Practices, New Jersey, John
Wiley & Sons Inc., s.170.
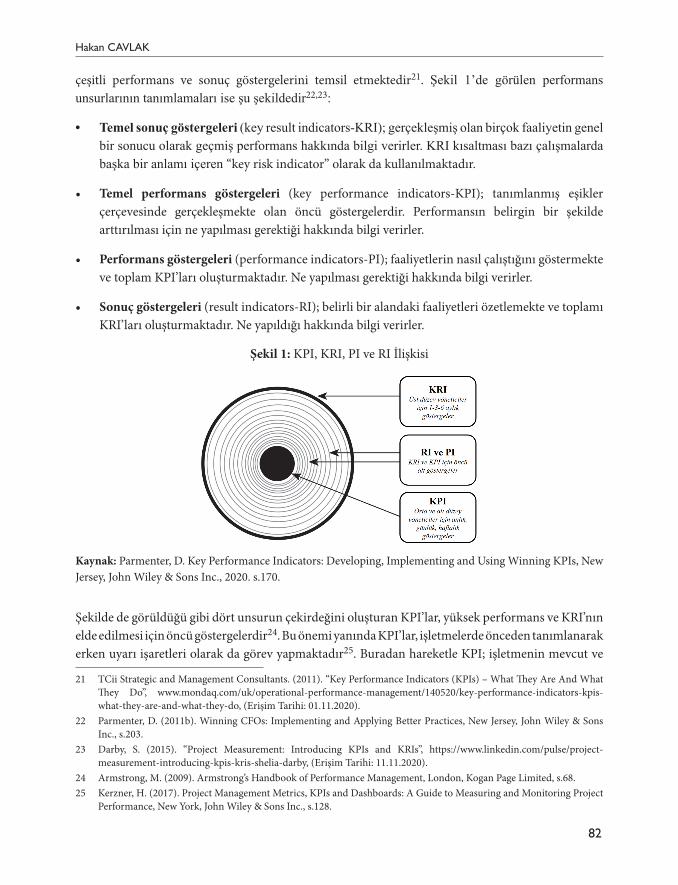
Hakan CAVLAK
82
çeşitli performans ve sonuç göstergelerini temsil etmektedir21. Şekil 1’de görülen performans unsurlarının tanımlamaları ise şu şekildedir22,23:
• Temel sonuç göstergeleri (key result indicators-KRI); gerçekleşmiş olan birçok faaliyetin genel bir sonucu olarak geçmiş performans hakkında bilgi verirler. KRI kısaltması bazı çalışmalarda başka bir anlamı içeren “key risk indicator” olarak da kullanılmaktadır.
• Temel performans göstergeleri (key performance indicators-KPI); tanımlanmış eşikler çerçevesinde gerçekleşmekte olan öncü göstergelerdir. Performansın belirgin bir şekilde arttırılması için ne yapılması gerektiği hakkında bilgi verirler.
• Performans göstergeleri (performance indicators-PI); faaliyetlerin nasıl çalıştığını göstermekte ve toplam KPI’ları oluşturmaktadır. Ne yapılması gerektiği hakkında bilgi verirler.
• Sonuç göstergeleri (result indicators-RI); belirli bir alandaki faaliyetleri özetlemekte ve toplamı KRI’ları oluşturmaktadır. Ne yapıldığı hakkında bilgi verirler.
Şekil 1: KPI, KRI, PI ve RI İlişkisi
Kaynak: Parmenter, D. Key Performance Indicators: Developing, Implementing and Using Winning KPIs, New Jersey, John Wiley & Sons Inc., 2020. s.170.
Şekilde de görüldüğü gibi dört unsurun çekirdeğini oluşturan KPI’lar, yüksek performans ve KRI’nın elde edilmesi için öncü göstergelerdir24. Bu önemi yanında KPI’lar, işletmelerde önceden tanımlanarak erken uyarı işaretleri olarak da görev yapmaktadır25. Buradan hareketle KPI; işletmenin mevcut ve
21 TCii Strategic and Management Consultants. (2011). “Key Performance Indicators (KPIs) – What They Are And What They Do”, www.mondaq.com/uk/operational-performance-management/140520/key-performance-indicators-kpis-what-they-are-and-what-they-do, (Erişim Tarihi: 01.11.2020).
22 Parmenter, D. (2011b). Winning CFOs: Implementing and Applying Better Practices, New Jersey, John Wiley & Sons Inc., s.203.
23 Darby, S. (2015). “Project Measurement: Introducing KPIs and KRIs”, https://www.linkedin.com/pulse/project-measurement-introducing-kpis-kris-shelia-darby, (Erişim Tarihi: 11.11.2020).
24 Armstrong, M. (2009). Armstrong’s Handbook of Performance Management, London, Kogan Page Limited, s.68.25 Kerzner, H. (2017). Project Management Metrics, KPIs and Dashboards: A Guide to Measuring and Monitoring Project
Performance, New York, John Wiley & Sons Inc., s.128.
Marmara Üniversitesi İktisadi ve İdari Bilimler Dergisi • Cilt: 43 • Sayı: 1 • Haziran 2021, ISSN: 2587-2672, ss/pp. 78-99
83
gelecekteki başarısı için kritik olan operasyonel, taktiksel veya stratejik bir faaliyet hakkında ne kadar iyi performans gösterdiğini ölçen bir araç olarak tanımlanabilir26.
3. Kritik Başarı Faktörleri (CSF)
Kritik başarı faktörü ilk olarak D. Ronald Daniel tarafından 1961 yılında Harvard Business Review makalesinde tanıtılmış ancak detaylı tanımlama Rockart tarafından 1979 yılında yapılmıştır27. CSF, basit bir şekilde işletmenin gelişmesi için “işlerin doğru gitmesi gereken” birkaç kilit alan olarak tanımlanmaktadır. Bu faaliyet alanları kritik olduğundan, yöneticinin, olayların her alanda yeterince iyi ilerleyip ilerlemediğini belirlemesine izin verecek uygun bilgilere sahip olması gerekir. Bu nedenle kritik başarı faktörleri, yönetimin sürekli ve dikkatli bir şekilde dikkat etmesi gereken faaliyet alanlarıdır. Her bir alandaki mevcut performans durumu sürekli olarak ölçülmeli ve bu bilgiler erişilebilir hale getirilmelidir28,29.
İşletmelerin rekabet edebilmesi ve müşteri değerini artırabilmesi için çoğunlukla kritik başarı faktörleri olarak yenilikçi ve yüksek kaliteli ürünler ya da hizmetler ile düşük maliyetler seçilmektedir30. CSF’leri işletmelerin en önemli paydaşı olan müşterileri tarafından tanımlamak gerekirse Johnson, Scholes ve Whittington tarafından yapılan; “CSF’ler müşteri tarafından değer verilen ve kuruluşun rekabette daha iyi performans göstermesi gereken alanlardır.” ifadesi en iyi tanımlama olarak gösterilebilir31.
CSF, literatürde ağırlıklı olarak “critical success factor” şeklinde ifade edilmekle birlikte bazı çalışmalarda “key success factors” ya da “key result areas” olarak da kullanılabilmektedir32. Kritik başarı faktörleri, işletme stratejisinin başarılı olması için hayati önem taşıyan bireysel, bölümsel ve kurumsal unsurlardır33. CSF’lerin kullanımı, ilgili işletme, sektör ve işletme yöneticilerine göre değişmektedir34.
Her işletmenin kritik başarı faktörleri, nihai olarak stratejisine, bir başka ifade ile işletme yönetiminin rekabet etmeye karar verme şekline göre belirlenir35. Bu açından bakıldığında CSF’ler işletmenin
26 Eckerson, W. W. (2006). Performance Dashboards: Measuring, Monitoring and Managing Your Business, New Jersey, John Wiley & Sons Inc., s.294.
27 Rockart, 1979, 82.28 Bullen, C. V., Rockart, J. F. (1981). A Primer on Critical Success Factors, Cambridge, Center for Information Systems
Research Sloan School of Management Massachusetts Institute of Technology, s.3.29 Rockart, 1979, 85.30 McWatters, C. S. ve Zimmerman, J. L. (2016). Management Accounting in a Dynamic Environment, New York,
Routledge, s.170.31 Garrett, K. (2020). “Performance Indicators”, www.accaglobal.com/us/en/student/exam-support-resources/professional-
exams-study-resources/strategic-business-leader/technical-articles/performance-indicators.html, (Erişim Tarihi: 08.11.2020).
32 Sousa, J. M. E. (2004). “Definition and Analysis of Critical Success Factors for ERP Implementation Projects”, Universitat Politècnica de Catalunya, s.46.
33 Morrison, M. (2016). “Critical Success Factors (CSF’s) Made Easy: A Step by Step Guide,” RapidBI, https://rapidbi.com/criticalsuccessfactors, (Erişim Tarihi: 11.11.2020).
34 Parmenter, 2011a, 196.35 Hill, M. (2020). “Critical Success Factors for Your Business”, BDO Insights – Advisory, www.bdo.nz/en-nz/advisory/
critical-success-factors-for-your-business, (Erişim Tarihi: 10.11.2020).
Hakan CAVLAK
84
veya bir projenin başarısının başlangıcında yapılan en önemli tespitlerdir. Ayrıca CSF’ler, işletmenin başarısında hayati bir rol oynayan tüm değişkenlerdir. İşletmenlerin stratejileri şirketin misyonunu ve hedeflerini (neyi başarmak istediklerini) belirlerken, CSF’ler bunların nasıl başarılacağını belirlemektedir36.
CSF yaklaşımının amacı, yöneticinin başarısı için kritik olarak gördüğü bir dizi faktörün belirlenmesidir37. Dolayısıyla CSF’ler yöneticilerin kendi sorumluluk alanlarındaki süreçleri yönetmeleri, kontrol etmeleri için önemli bir araçtır38 ve üst yöneticilerin yönetimsel bilgi ihtiyaçlarını belirleme ve yardımcı olma amacı ile geliştirilmiştir39. Bu amaç çerçevesinde CSF, yöneticilerin hedeflerine ulaşabilmeleri ve işletmeyi sıfıra yakın hata ile yönetebilmeleri adına odaklanılması ve doğru olması gereken birkaç anahtar alanı temsil etmektedir40.
CSF’ler, firmanın genel performansı üzerinde en büyük etkiye sahip olacak faaliyetleri ve süreçleri vurgulamalıdır41. CSF’ler bir kurumun en üst yönetimden en alt kademesine kadar tüm seviyelerinde kullanılabilir42. Bununla birlikte CSF, bir kuruluşun misyonunu gerçekleştirmesinde gerekli olan iş bileşenleri için kullanılan bir terimdir ve tipik olarak yönetici düzeyinde tanımlanır. Ancak CSF’ler, her ne kadar işletmenin stratejisi ile bağlantılı olarak en üst kademede kullanıldığı düşünülse de işletmenin her kademesinde kullanılabilmektedir43. Bu durum, endüstri CSF’si, işletme CSF’si, işletme yönetimine ait CSF’ler, alt organizasyon CSF’leri, kişisel CSF’ler şeklinde CSF hiyerarşisi içinde tanımlanabilmektedir44.
Kritik başarı faktörleri, işletmelerde oluşturulan bilgi kalitesinin geliştirilebilmesi adına önem arz etmektedir. CSF, faydalı bilgilerin tanımlanarak gereksiz bilgilerden ayrıştırılmasına yardımcı olur ve ilgili birimler arasındaki iletişimi kolaylaştırır45.
4. KPI ve CSF Arasındaki İlişki
İşletmelerin önemli strateji değerlendirme faaliyetinden biri kurumsal performansı ölçmektir. Bu faaliyet, beklenen sonuçları gerçek sonuçlarla karşılaştırmayı, planlardan sapmaları araştırmayı, bireysel performansı değerlendirmeyi ve belirtilen hedeflere ulaşmak için kaydedilen ilerlemeyi
36 Marr, B. (2020). “What Is the Difference between Key Performance Indicators (KPIs) and Critical Success Factors (CSFs)?”, https://bernardmarr.com/default.asp?contentID=1406, (Erişim Tarihi: 08.11.2020).
37 Dadashzadeh, M. (1989). Teaching MIS Concepts to MBA Students: A Critical Success Factor Approach, Journal of Information Systems Education, 1(4): 11.
38 Galliers, R. D. ve diğerleri. (2020). Strategic Information Management – Theory and Practice, New York, Routledge, s.34.39 Rockart, 1979, 82.40 Bullen ve Rockart, 1981, 7.41 McNair, C. J., Merchant, K. (2020). Management Accounting: An Integrative Approach, New Jersey, John Wiley & Sons
Ltd., s.45.42 Howell, M. T. (2010). Critical Success Factors Simplified – Implementing the Powerful Drivers of Dramatic Business
Improvement, New York, CRC Press, s.1.43 Hawkins, B. ve Pavone, R. (2006). “Network Management Architecture Supporting Today’s IT Service Delivery”, CISCO
TECNMS Report, s.58.44 Bullen ve Rockart, 1981, 8.45 Acar, D., Özçelik, H. (2011). Muhasebe Bilgi Kalitesini Etkileyen Kritik Başarı Faktörleri”, Muhasebe ve Finansman
Dergisi, (49): 11.
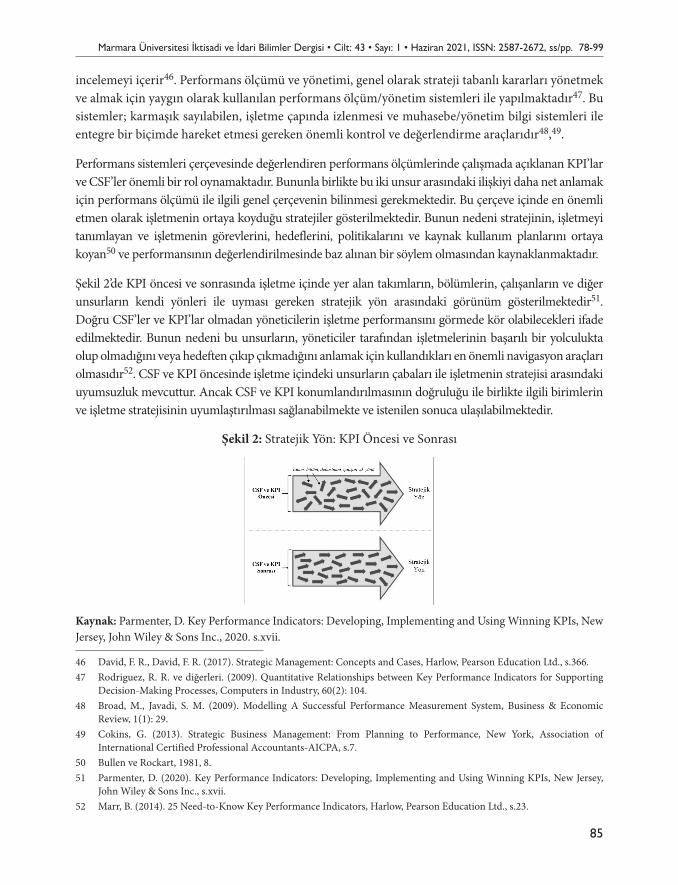
Marmara Üniversitesi İktisadi ve İdari Bilimler Dergisi • Cilt: 43 • Sayı: 1 • Haziran 2021, ISSN: 2587-2672, ss/pp. 78-99
85
incelemeyi içerir46. Performans ölçümü ve yönetimi, genel olarak strateji tabanlı kararları yönetmek ve almak için yaygın olarak kullanılan performans ölçüm/yönetim sistemleri ile yapılmaktadır47. Bu sistemler; karmaşık sayılabilen, işletme çapında izlenmesi ve muhasebe/yönetim bilgi sistemleri ile entegre bir biçimde hareket etmesi gereken önemli kontrol ve değerlendirme araçlarıdır48,49.
Performans sistemleri çerçevesinde değerlendiren performans ölçümlerinde çalışmada açıklanan KPI’lar ve CSF’ler önemli bir rol oynamaktadır. Bununla birlikte bu iki unsur arasındaki ilişkiyi daha net anlamak için performans ölçümü ile ilgili genel çerçevenin bilinmesi gerekmektedir. Bu çerçeve içinde en önemli etmen olarak işletmenin ortaya koyduğu stratejiler gösterilmektedir. Bunun nedeni stratejinin, işletmeyi tanımlayan ve işletmenin görevlerini, hedeflerini, politikalarını ve kaynak kullanım planlarını ortaya koyan50 ve performansının değerlendirilmesinde baz alınan bir söylem olmasından kaynaklanmaktadır.
Şekil 2’de KPI öncesi ve sonrasında işletme içinde yer alan takımların, bölümlerin, çalışanların ve diğer unsurların kendi yönleri ile uyması gereken stratejik yön arasındaki görünüm gösterilmektedir51. Doğru CSF’ler ve KPI’lar olmadan yöneticilerin işletme performansını görmede kör olabilecekleri ifade edilmektedir. Bunun nedeni bu unsurların, yöneticiler tarafından işletmelerinin başarılı bir yolculukta olup olmadığını veya hedeften çıkıp çıkmadığını anlamak için kullandıkları en önemli navigasyon araçları olmasıdır52. CSF ve KPI öncesinde işletme içindeki unsurların çabaları ile işletmenin stratejisi arasındaki uyumsuzluk mevcuttur. Ancak CSF ve KPI konumlandırılmasının doğruluğu ile birlikte ilgili birimlerin ve işletme stratejisinin uyumlaştırılması sağlanabilmekte ve istenilen sonuca ulaşılabilmektedir.
Şekil 2: Stratejik Yön: KPI Öncesi ve Sonrası
Kaynak: Parmenter, D. Key Performance Indicators: Developing, Implementing and Using Winning KPIs, New Jersey, John Wiley & Sons Inc., 2020. s.xvii.
46 David, F. R., David, F. R. (2017). Strategic Management: Concepts and Cases, Harlow, Pearson Education Ltd., s.366.47 Rodriguez, R. R. ve diğerleri. (2009). Quantitative Relationships between Key Performance Indicators for Supporting
Decision-Making Processes, Computers in Industry, 60(2): 104.48 Broad, M., Javadi, S. M. (2009). Modelling A Successful Performance Measurement System, Business & Economic
Review, 1(1): 29.49 Cokins, G. (2013). Strategic Business Management: From Planning to Performance, New York, Association of
International Certified Professional Accountants-AICPA, s.7.50 Bullen ve Rockart, 1981, 8.51 Parmenter, D. (2020). Key Performance Indicators: Developing, Implementing and Using Winning KPIs, New Jersey,
John Wiley & Sons Inc., s.xvii.52 Marr, B. (2014). 25 Need-to-Know Key Performance Indicators, Harlow, Pearson Education Ltd., s.23.
Hakan CAVLAK
86
İşletmenin karşı karşıya olduğu muhtelif risklerin azaltılması ya da yok edilmesi adına işletmelerin kritik başarı faktörlerini ve buna bağlı olarak temel performans göstergelerini iyi tanımlaması gerekmektedir53. Pek çok şirket, CSF ve KPI gibi önemli performans ölçümü faktörlerinin farkında olsa da işletmelerin çoğunluğu bu unsurlar arasındaki bağlantıyı net bir şekilde ortaya koyamamakta ve başarısız bir performans ölçüm sürecine neden olmaktadır54.
CSF’ler genellikle KPI’’lar ile karıştırılmaktadır ve birbirlerinin yerine kullanılmaktadır, ancak ikisi aynı şey değildir. CSF’ler uzun vadeli ve doğrudan işletme stratejisine bağlı iken KPI’lar kısa vadeli ve dolaylı olarak strateji ile ilişkilidir55. KPI’lar ve CSF’ler arasındaki fark, neden sonuç ilişkisi gibidir. CSF’ler başarının sebebidir ve başarılı olmak için ne yapılması gerektiğini belirlerler. KPI’lar eylemlerin etkileridir ve başarılı olup olunmadığını ölçerler. İki terim farklı olsalar da ikisi özünde birbirine bağlıdır ve bağımlıdır56,57. Çoğunluk tarafından işletme performansını yansıtan tüm ölçütler ya da göstergeler KPI olarak adlandırılabilmektedir. Ancak performansı yansıtan bir ölçütün KPI olabilmesi için onun CSF ile ilişkilendirilmesi gerekmektedir. CSF ile ilişkilendirilmeyen ölçütler ya da göstergeler normal performans ölçütüdür58. KPI’lar CSF’lerin ne kadar iyi başarıldığını ölçer; CSF ile bağlantısı kurulmamış diğer performans göstergeleri ise performansın diğer yönlerinin ne kadar iyi başarıldığını ölçer59.
4.1. KPI ve CSF Kullanımı ve Örnekleri
KPI’ların ve CSF’lerin önceliklendirilmesi, işletme yönetiminin sahip olduğu kaynakları verimli olarak kullanmasına dolaylı olarak olanak tanır60. Bu nedenle de işletmeler tarafından çeşitli kullanıma sahiptirler. Son yıllarda KPI’lar ya da CSF’ler işletmelerin yıllık faaliyet raporları, basın bültenleri ya da yatırımcı sunumlarında yer almaktadır. CSF ve KPI’ların uygulama alanları; finansal yönetimden hasta kayıtları yönetimine, personel yönetiminden ekonomik analize, tesis ve ekipman kullanımından organizasyonel davranışa kadar birçok alanda kullanılabilmektedir61. KPI ve CSF’nin kullanıldığı araçlardan biri de ERP-Kurumsal Kaynak Planlamasıdır. ERP, bir işletmenin iş süreçlerine ilişkin işlem bazındaki kayıtlarını tutmakta ve farklı fonksiyonlar arasındaki bütünleşmeyi ortak bir platformda sağlamaktadır. ERP sistemi uygulamasının başarıya ulaşmasında CSF’ler ve KPI’lar
53 Fritzenschaft, T. (2014). Critical Success Factors of Change Management, Wiesbaden, Springer Fachmedien Wiesbaden, s.5.
54 Mazlum, A. R. (2017). Determining of Key Performance Indicators in Business, İstanbul Ticaret Üniversitesi Dış Ticaret Enstitüsü (Tartışma Metinleri), s.10.
55 Witcher, B. J. (2020). Absolute Essentials of Strategic Management, Oxon, Routledge, s.40.56 Marr, 2020.57 Parker, J. E. (2014). “KPIs for Agile Project Managers and Business Analysts”, Enfocus Solutions Inc..58 Parmenter, D. (2015). The New Thinking on KPIs, New York, IBM Corporation Software Group, s.2.59 Garrett, 2020.60 Vachnadze, R. (2016). Prioritization of Performance Measures Using Analytic Hierarchy Process, International Journal
of the Analytic Hierarchy Process 8(3): 498.61 Bergeron, B. P. (2018). Performance Management in Healthcare – From Key Performance Indicators to Balanced
Scorecard, New York, CRC Press, s.39.
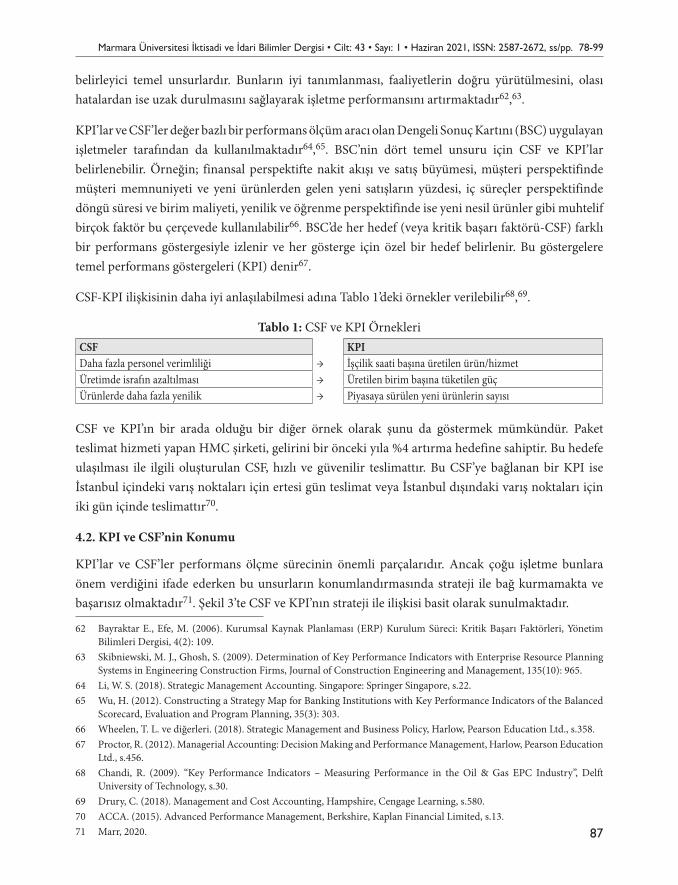
Marmara Üniversitesi İktisadi ve İdari Bilimler Dergisi • Cilt: 43 • Sayı: 1 • Haziran 2021, ISSN: 2587-2672, ss/pp. 78-99
87
belirleyici temel unsurlardır. Bunların iyi tanımlanması, faaliyetlerin doğru yürütülmesini, olası hatalardan ise uzak durulmasını sağlayarak işletme performansını artırmaktadır62,63.
KPI’lar ve CSF’ler değer bazlı bir performans ölçüm aracı olan Dengeli Sonuç Kartını (BSC) uygulayan işletmeler tarafından da kullanılmaktadır64,65. BSC’nin dört temel unsuru için CSF ve KPI’lar belirlenebilir. Örneğin; finansal perspektifte nakit akışı ve satış büyümesi, müşteri perspektifinde müşteri memnuniyeti ve yeni ürünlerden gelen yeni satışların yüzdesi, iç süreçler perspektifinde döngü süresi ve birim maliyeti, yenilik ve öğrenme perspektifinde ise yeni nesil ürünler gibi muhtelif birçok faktör bu çerçevede kullanılabilir66. BSC’de her hedef (veya kritik başarı faktörü-CSF) farklı bir performans göstergesiyle izlenir ve her gösterge için özel bir hedef belirlenir. Bu göstergelere temel performans göstergeleri (KPI) denir67.
CSF-KPI ilişkisinin daha iyi anlaşılabilmesi adına Tablo 1’deki örnekler verilebilir68,69.
Tablo 1: CSF ve KPI ÖrnekleriCSF KPIDaha fazla personel verimliliği → İşçilik saati başına üretilen ürün/hizmetÜretimde israfın azaltılması → Üretilen birim başına tüketilen güçÜrünlerde daha fazla yenilik → Piyasaya sürülen yeni ürünlerin sayısı
CSF ve KPI’ın bir arada olduğu bir diğer örnek olarak şunu da göstermek mümkündür. Paket teslimat hizmeti yapan HMC şirketi, gelirini bir önceki yıla %4 artırma hedefine sahiptir. Bu hedefe ulaşılması ile ilgili oluşturulan CSF, hızlı ve güvenilir teslimattır. Bu CSF’ye bağlanan bir KPI ise İstanbul içindeki varış noktaları için ertesi gün teslimat veya İstanbul dışındaki varış noktaları için iki gün içinde teslimattır70.
4.2. KPI ve CSF’nin Konumu
KPI’lar ve CSF’ler performans ölçme sürecinin önemli parçalarıdır. Ancak çoğu işletme bunlara önem verdiğini ifade ederken bu unsurların konumlandırmasında strateji ile bağ kurmamakta ve başarısız olmaktadır71. Şekil 3’te CSF ve KPI’nın strateji ile ilişkisi basit olarak sunulmaktadır.
62 Bayraktar E., Efe, M. (2006). Kurumsal Kaynak Planlaması (ERP) Kurulum Süreci: Kritik Başarı Faktörleri, Yönetim Bilimleri Dergisi, 4(2): 109.
63 Skibniewski, M. J., Ghosh, S. (2009). Determination of Key Performance Indicators with Enterprise Resource Planning Systems in Engineering Construction Firms, Journal of Construction Engineering and Management, 135(10): 965.
64 Li, W. S. (2018). Strategic Management Accounting. Singapore: Springer Singapore, s.22.65 Wu, H. (2012). Constructing a Strategy Map for Banking Institutions with Key Performance Indicators of the Balanced
Scorecard, Evaluation and Program Planning, 35(3): 303.66 Wheelen, T. L. ve diğerleri. (2018). Strategic Management and Business Policy, Harlow, Pearson Education Ltd., s.358.67 Proctor, R. (2012). Managerial Accounting: Decision Making and Performance Management, Harlow, Pearson Education
Ltd., s.456.68 Chandi, R. (2009). “Key Performance Indicators – Measuring Performance in the Oil & Gas EPC Industry”, Delft
University of Technology, s.30.69 Drury, C. (2018). Management and Cost Accounting, Hampshire, Cengage Learning, s.580.70 ACCA. (2015). Advanced Performance Management, Berkshire, Kaplan Financial Limited, s.13.71 Marr, 2020.
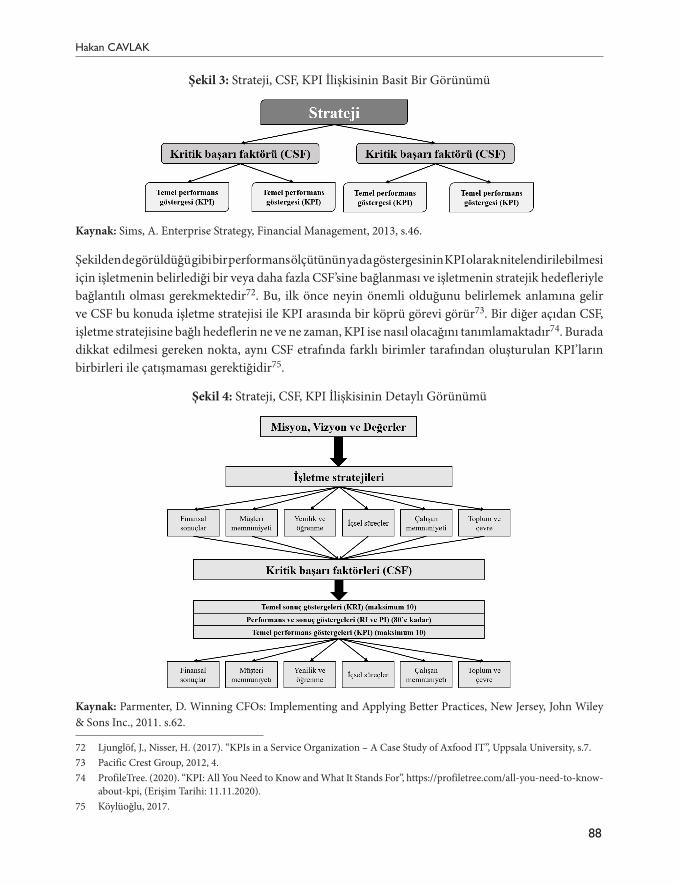
Hakan CAVLAK
88
Şekil 3: Strateji, CSF, KPI İlişkisinin Basit Bir Görünümü
Kaynak: Sims, A. Enterprise Strategy, Financial Management, 2013, s.46.
Şekilden de görüldüğü gibi bir performans ölçütünün ya da göstergesinin KPI olarak nitelendirilebilmesi için işletmenin belirlediği bir veya daha fazla CSF’sine bağlanması ve işletmenin stratejik hedefleriyle bağlantılı olması gerekmektedir72. Bu, ilk önce neyin önemli olduğunu belirlemek anlamına gelir ve CSF bu konuda işletme stratejisi ile KPI arasında bir köprü görevi görür73. Bir diğer açıdan CSF, işletme stratejisine bağlı hedeflerin ne ve ne zaman, KPI ise nasıl olacağını tanımlamaktadır74. Burada dikkat edilmesi gereken nokta, aynı CSF etrafında farklı birimler tarafından oluşturulan KPI’ların birbirleri ile çatışmaması gerektiğidir75.
Şekil 4: Strateji, CSF, KPI İlişkisinin Detaylı Görünümü
Kaynak: Parmenter, D. Winning CFOs: Implementing and Applying Better Practices, New Jersey, John Wiley & Sons Inc., 2011. s.62.
72 Ljunglöf, J., Nisser, H. (2017). “KPIs in a Service Organization – A Case Study of Axfood IT”, Uppsala University, s.7.73 Pacific Crest Group, 2012, 4.74 ProfileTree. (2020). “KPI: All You Need to Know and What It Stands For”, https://profiletree.com/all-you-need-to-know-
about-kpi, (Erişim Tarihi: 11.11.2020).75 Köylüoğlu, 2017.
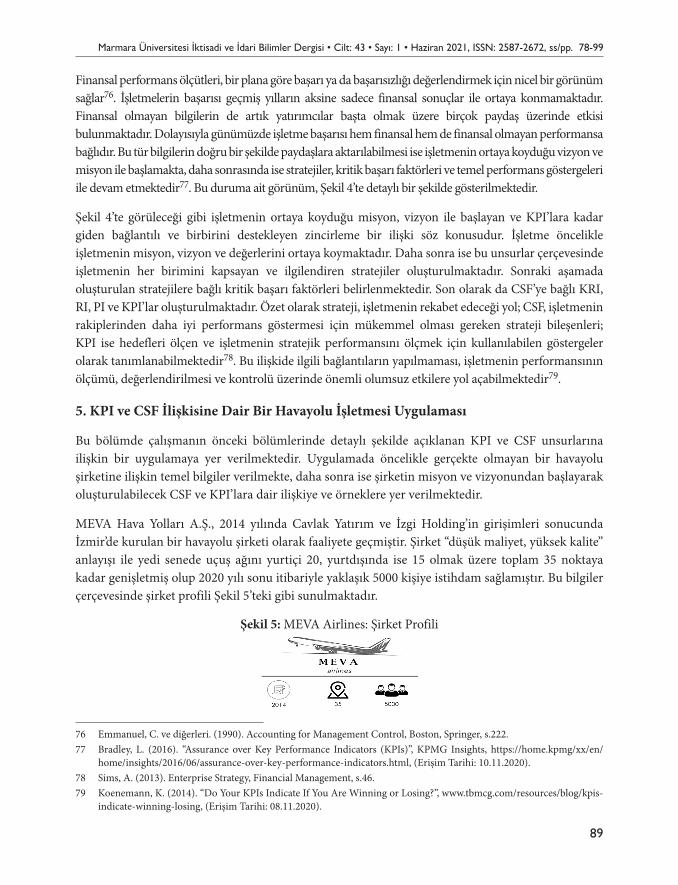
Marmara Üniversitesi İktisadi ve İdari Bilimler Dergisi • Cilt: 43 • Sayı: 1 • Haziran 2021, ISSN: 2587-2672, ss/pp. 78-99
89
Finansal performans ölçütleri, bir plana göre başarı ya da başarısızlığı değerlendirmek için nicel bir görünüm sağlar76. İşletmelerin başarısı geçmiş yılların aksine sadece finansal sonuçlar ile ortaya konmamaktadır. Finansal olmayan bilgilerin de artık yatırımcılar başta olmak üzere birçok paydaş üzerinde etkisi bulunmaktadır. Dolayısıyla günümüzde işletme başarısı hem finansal hem de finansal olmayan performansa bağlıdır. Bu tür bilgilerin doğru bir şekilde paydaşlara aktarılabilmesi ise işletmenin ortaya koyduğu vizyon ve misyon ile başlamakta, daha sonrasında ise stratejiler, kritik başarı faktörleri ve temel performans göstergeleri ile devam etmektedir77. Bu duruma ait görünüm, Şekil 4’te detaylı bir şekilde gösterilmektedir.
Şekil 4’te görüleceği gibi işletmenin ortaya koyduğu misyon, vizyon ile başlayan ve KPI’lara kadar giden bağlantılı ve birbirini destekleyen zincirleme bir ilişki söz konusudur. İşletme öncelikle işletmenin misyon, vizyon ve değerlerini ortaya koymaktadır. Daha sonra ise bu unsurlar çerçevesinde işletmenin her birimini kapsayan ve ilgilendiren stratejiler oluşturulmaktadır. Sonraki aşamada oluşturulan stratejilere bağlı kritik başarı faktörleri belirlenmektedir. Son olarak da CSF’ye bağlı KRI, RI, PI ve KPI’lar oluşturulmaktadır. Özet olarak strateji, işletmenin rekabet edeceği yol; CSF, işletmenin rakiplerinden daha iyi performans göstermesi için mükemmel olması gereken strateji bileşenleri; KPI ise hedefleri ölçen ve işletmenin stratejik performansını ölçmek için kullanılabilen göstergeler olarak tanımlanabilmektedir78. Bu ilişkide ilgili bağlantıların yapılmaması, işletmenin performansının ölçümü, değerlendirilmesi ve kontrolü üzerinde önemli olumsuz etkilere yol açabilmektedir79.
5. KPI ve CSF İlişkisine Dair Bir Havayolu İşletmesi Uygulaması
Bu bölümde çalışmanın önceki bölümlerinde detaylı şekilde açıklanan KPI ve CSF unsurlarına ilişkin bir uygulamaya yer verilmektedir. Uygulamada öncelikle gerçekte olmayan bir havayolu şirketine ilişkin temel bilgiler verilmekte, daha sonra ise şirketin misyon ve vizyonundan başlayarak oluşturulabilecek CSF ve KPI’lara dair ilişkiye ve örneklere yer verilmektedir.
MEVA Hava Yolları A.Ş., 2014 yılında Cavlak Yatırım ve İzgi Holding’in girişimleri sonucunda İzmir’de kurulan bir havayolu şirketi olarak faaliyete geçmiştir. Şirket “düşük maliyet, yüksek kalite” anlayışı ile yedi senede uçuş ağını yurtiçi 20, yurtdışında ise 15 olmak üzere toplam 35 noktaya kadar genişletmiş olup 2020 yılı sonu itibariyle yaklaşık 5000 kişiye istihdam sağlamıştır. Bu bilgiler çerçevesinde şirket profili Şekil 5’teki gibi sunulmaktadır.
Şekil 5: MEVA Airlines: Şirket Profili
76 Emmanuel, C. ve diğerleri. (1990). Accounting for Management Control, Boston, Springer, s.222.77 Bradley, L. (2016). “Assurance over Key Performance Indicators (KPIs)”, KPMG Insights, https://home.kpmg/xx/en/
home/insights/2016/06/assurance-over-key-performance-indicators.html, (Erişim Tarihi: 10.11.2020).78 Sims, A. (2013). Enterprise Strategy, Financial Management, s.46.79 Koenemann, K. (2014). “Do Your KPIs Indicate If You Are Winning or Losing?”, www.tbmcg.com/resources/blog/kpis-
indicate-winning-losing, (Erişim Tarihi: 08.11.2020).
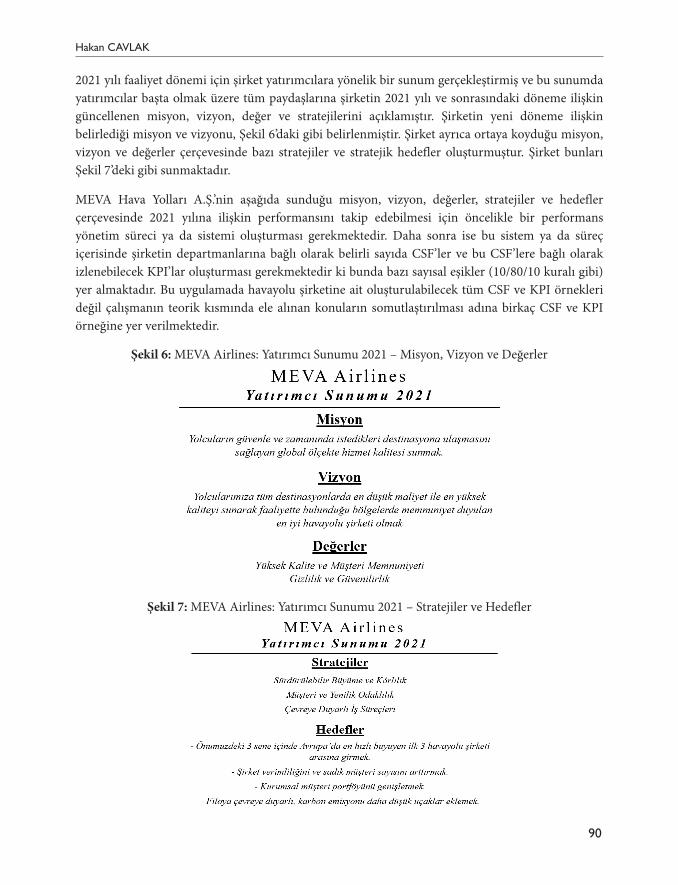
Hakan CAVLAK
90
2021 yılı faaliyet dönemi için şirket yatırımcılara yönelik bir sunum gerçekleştirmiş ve bu sunumda yatırımcılar başta olmak üzere tüm paydaşlarına şirketin 2021 yılı ve sonrasındaki döneme ilişkin güncellenen misyon, vizyon, değer ve stratejilerini açıklamıştır. Şirketin yeni döneme ilişkin belirlediği misyon ve vizyonu, Şekil 6’daki gibi belirlenmiştir. Şirket ayrıca ortaya koyduğu misyon, vizyon ve değerler çerçevesinde bazı stratejiler ve stratejik hedefler oluşturmuştur. Şirket bunları Şekil 7’deki gibi sunmaktadır.
MEVA Hava Yolları A.Ş.’nin aşağıda sunduğu misyon, vizyon, değerler, stratejiler ve hedefler çerçevesinde 2021 yılına ilişkin performansını takip edebilmesi için öncelikle bir performans yönetim süreci ya da sistemi oluşturması gerekmektedir. Daha sonra ise bu sistem ya da süreç içerisinde şirketin departmanlarına bağlı olarak belirli sayıda CSF’ler ve bu CSF’lere bağlı olarak izlenebilecek KPI’lar oluşturması gerekmektedir ki bunda bazı sayısal eşikler (10/80/10 kuralı gibi) yer almaktadır. Bu uygulamada havayolu şirketine ait oluşturulabilecek tüm CSF ve KPI örnekleri değil çalışmanın teorik kısmında ele alınan konuların somutlaştırılması adına birkaç CSF ve KPI örneğine yer verilmektedir.
Şekil 6: MEVA Airlines: Yatırımcı Sunumu 2021 – Misyon, Vizyon ve Değerler
Şekil 7: MEVA Airlines: Yatırımcı Sunumu 2021 – Stratejiler ve Hedefler
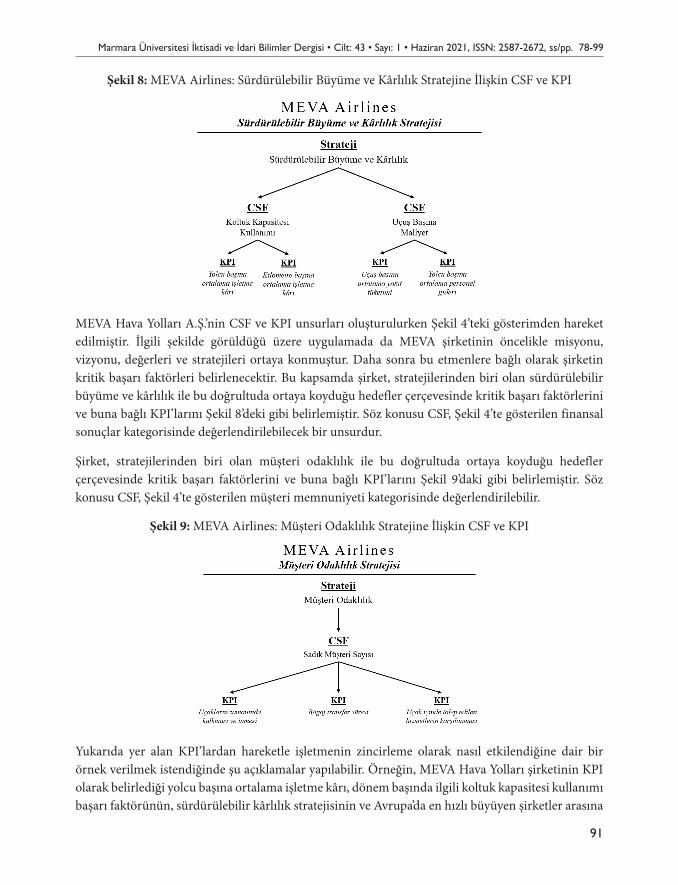
Marmara Üniversitesi İktisadi ve İdari Bilimler Dergisi • Cilt: 43 • Sayı: 1 • Haziran 2021, ISSN: 2587-2672, ss/pp. 78-99
91
Şekil 8: MEVA Airlines: Sürdürülebilir Büyüme ve Kârlılık Stratejine İlişkin CSF ve KPI
MEVA Hava Yolları A.Ş.’nin CSF ve KPI unsurları oluşturulurken Şekil 4’teki gösterimden hareket edilmiştir. İlgili şekilde görüldüğü üzere uygulamada da MEVA şirketinin öncelikle misyonu, vizyonu, değerleri ve stratejileri ortaya konmuştur. Daha sonra bu etmenlere bağlı olarak şirketin kritik başarı faktörleri belirlenecektir. Bu kapsamda şirket, stratejilerinden biri olan sürdürülebilir büyüme ve kârlılık ile bu doğrultuda ortaya koyduğu hedefler çerçevesinde kritik başarı faktörlerini ve buna bağlı KPI’larını Şekil 8’deki gibi belirlemiştir. Söz konusu CSF, Şekil 4’te gösterilen finansal sonuçlar kategorisinde değerlendirilebilecek bir unsurdur.
Şirket, stratejilerinden biri olan müşteri odaklılık ile bu doğrultuda ortaya koyduğu hedefler çerçevesinde kritik başarı faktörlerini ve buna bağlı KPI’larını Şekil 9’daki gibi belirlemiştir. Söz konusu CSF, Şekil 4’te gösterilen müşteri memnuniyeti kategorisinde değerlendirilebilir.
Şekil 9: MEVA Airlines: Müşteri Odaklılık Stratejine İlişkin CSF ve KPI
Yukarıda yer alan KPI’lardan hareketle işletmenin zincirleme olarak nasıl etkilendiğine dair bir örnek verilmek istendiğinde şu açıklamalar yapılabilir. Örneğin, MEVA Hava Yolları şirketinin KPI olarak belirlediği yolcu başına ortalama işletme kârı, dönem başında ilgili koltuk kapasitesi kullanımı başarı faktörünün, sürdürülebilir kârlılık stratejisinin ve Avrupa’da en hızlı büyüyen şirketler arasına
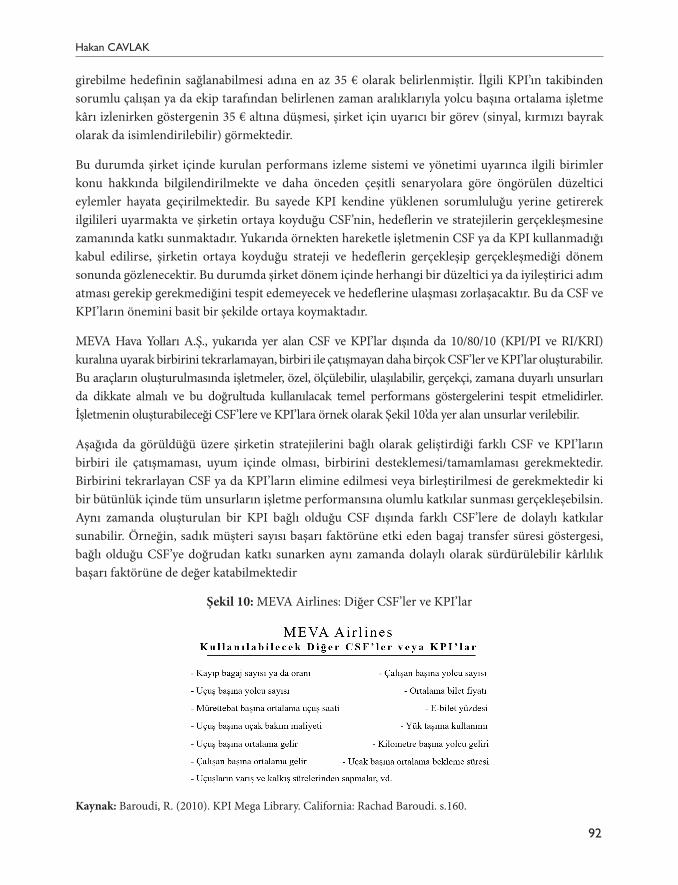
Hakan CAVLAK
92
girebilme hedefinin sağlanabilmesi adına en az 35 € olarak belirlenmiştir. İlgili KPI’ın takibinden sorumlu çalışan ya da ekip tarafından belirlenen zaman aralıklarıyla yolcu başına ortalama işletme kârı izlenirken göstergenin 35 € altına düşmesi, şirket için uyarıcı bir görev (sinyal, kırmızı bayrak olarak da isimlendirilebilir) görmektedir.
Bu durumda şirket içinde kurulan performans izleme sistemi ve yönetimi uyarınca ilgili birimler konu hakkında bilgilendirilmekte ve daha önceden çeşitli senaryolara göre öngörülen düzeltici eylemler hayata geçirilmektedir. Bu sayede KPI kendine yüklenen sorumluluğu yerine getirerek ilgilileri uyarmakta ve şirketin ortaya koyduğu CSF’nin, hedeflerin ve stratejilerin gerçekleşmesine zamanında katkı sunmaktadır. Yukarıda örnekten hareketle işletmenin CSF ya da KPI kullanmadığı kabul edilirse, şirketin ortaya koyduğu strateji ve hedeflerin gerçekleşip gerçekleşmediği dönem sonunda gözlenecektir. Bu durumda şirket dönem içinde herhangi bir düzeltici ya da iyileştirici adım atması gerekip gerekmediğini tespit edemeyecek ve hedeflerine ulaşması zorlaşacaktır. Bu da CSF ve KPI’ların önemini basit bir şekilde ortaya koymaktadır.
MEVA Hava Yolları A.Ş., yukarıda yer alan CSF ve KPI’lar dışında da 10/80/10 (KPI/PI ve RI/KRI) kuralına uyarak birbirini tekrarlamayan, birbiri ile çatışmayan daha birçok CSF’ler ve KPI’lar oluşturabilir. Bu araçların oluşturulmasında işletmeler, özel, ölçülebilir, ulaşılabilir, gerçekçi, zamana duyarlı unsurları da dikkate almalı ve bu doğrultuda kullanılacak temel performans göstergelerini tespit etmelidirler. İşletmenin oluşturabileceği CSF’lere ve KPI’lara örnek olarak Şekil 10’da yer alan unsurlar verilebilir.
Aşağıda da görüldüğü üzere şirketin stratejilerini bağlı olarak geliştirdiği farklı CSF ve KPI’ların birbiri ile çatışmaması, uyum içinde olması, birbirini desteklemesi/tamamlaması gerekmektedir. Birbirini tekrarlayan CSF ya da KPI’ların elimine edilmesi veya birleştirilmesi de gerekmektedir ki bir bütünlük içinde tüm unsurların işletme performansına olumlu katkılar sunması gerçekleşebilsin. Aynı zamanda oluşturulan bir KPI bağlı olduğu CSF dışında farklı CSF’lere de dolaylı katkılar sunabilir. Örneğin, sadık müşteri sayısı başarı faktörüne etki eden bagaj transfer süresi göstergesi, bağlı olduğu CSF’ye doğrudan katkı sunarken aynı zamanda dolaylı olarak sürdürülebilir kârlılık başarı faktörüne de değer katabilmektedir
Şekil 10: MEVA Airlines: Diğer CSF’ler ve KPI’lar
Kaynak: Baroudi, R. (2010). KPI Mega Library. California: Rachad Baroudi. s.160.
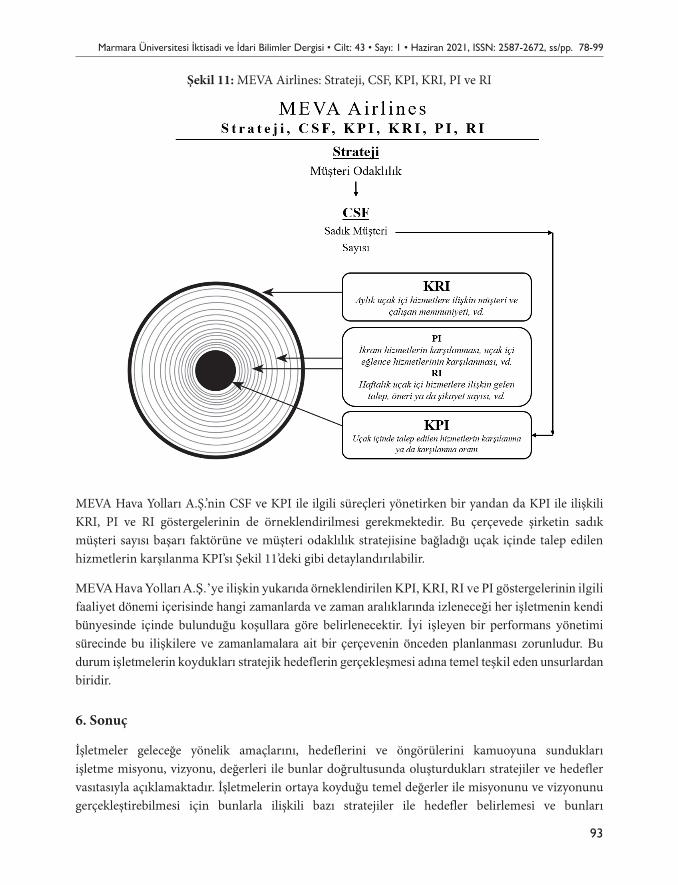
Marmara Üniversitesi İktisadi ve İdari Bilimler Dergisi • Cilt: 43 • Sayı: 1 • Haziran 2021, ISSN: 2587-2672, ss/pp. 78-99
93
Şekil 11: MEVA Airlines: Strateji, CSF, KPI, KRI, PI ve RI
MEVA Hava Yolları A.Ş.’nin CSF ve KPI ile ilgili süreçleri yönetirken bir yandan da KPI ile ilişkili KRI, PI ve RI göstergelerinin de örneklendirilmesi gerekmektedir. Bu çerçevede şirketin sadık müşteri sayısı başarı faktörüne ve müşteri odaklılık stratejisine bağladığı uçak içinde talep edilen hizmetlerin karşılanma KPI’sı Şekil 11’deki gibi detaylandırılabilir.
MEVA Hava Yolları A.Ş.’ye ilişkin yukarıda örneklendirilen KPI, KRI, RI ve PI göstergelerinin ilgili faaliyet dönemi içerisinde hangi zamanlarda ve zaman aralıklarında izleneceği her işletmenin kendi bünyesinde içinde bulunduğu koşullara göre belirlenecektir. İyi işleyen bir performans yönetimi sürecinde bu ilişkilere ve zamanlamalara ait bir çerçevenin önceden planlanması zorunludur. Bu durum işletmelerin koydukları stratejik hedeflerin gerçekleşmesi adına temel teşkil eden unsurlardan biridir.
6. Sonuç
İşletmeler geleceğe yönelik amaçlarını, hedeflerini ve öngörülerini kamuoyuna sundukları işletme misyonu, vizyonu, değerleri ile bunlar doğrultusunda oluşturdukları stratejiler ve hedefler vasıtasıyla açıklamaktadır. İşletmelerin ortaya koyduğu temel değerler ile misyonunu ve vizyonunu gerçekleştirebilmesi için bunlarla ilişkili bazı stratejiler ile hedefler belirlemesi ve bunları
Hakan CAVLAK
94
belirli bir çerçevede izlemesi, takip etmesi ve değerlendirmesi gerekmektedir. Bu gereklilik ise işletmelerde genellikle kritik başarı faktörleri-CSF’ler ve temel performans göstergeleri-KPI’lar ile sağlanabilmektedir.
Bu çalışmanın da ana konusunu teşkil eden KPI ve CSF bir bütün içindeki en temel araçlardır. Bütünün görünümü ise şu şekildedir: İşletmenin öncelikle içinde bulunduğu sektör başta olmak üzere muhtelif unsurlar doğrultusunda şekillendirdiği misyon, vizyon ve değerleri belirlenmektedir. Daha sonraki aşamada ise bunların gerçekleştirilmesi adına gerekli olan stratejiler ve hedefler ortaya konmaktadır. Bir sonraki aşamada, stratejilere ya da hedeflere ulaşılmasında kritik bir önem arz eden başarı faktörleri (CSF’ler) oluşturulmakta ve bu faktörlere bağlı temel performans göstergeleri (KPI’lar) belirlenmektedir. KPI’lar ile birlikte ayrıca KRI, PI ve RI göstergeleri de ortaya konulmaktadır. Tüm bu bütünlüğün gerçekçi, ölçülebilir, belirli kişilere ve zamanlamalara tabi olarak oluşturulması, işletmenin başlangıçta sunduğu misyonun ve vizyonun gerçekleştirilmesi açısından çok önemlidir.
Bu çalışmada yukarıda ifade edilen görünüm, ağırlıklı olarak temel performans göstergeleri ve kritik başarı faktörleri çerçevesinde açıklanmakta ve bir hava yolu işletmesi örneğinde uygulanabilirliği basit bir şekilde gösterilmektedir. Hem teorik açıklamaların hem de uygulamanın bir sonucu olarak KPI’ların ve CSF’lerin işletmelerin kendilerini tanımladıkları misyonun ve vizyonun gerçekleştirilmesi adına ne kadar önemli oldukları açıkça görülmektedir. Bu önem ise KPI’ların ve CSF’lerin işletmede yukarıdan aşağıya doğru başarı veya başarısızlığı gerçekçi bir şekilde zamanında göstermesinden kaynaklanmaktadır. Ancak unutulmamalıdır ki bu araçların etkin ve verimli kullanılabilmesi için bu süreçte yer alan tüm çalışanların, ekiplerin ya da bölümlerin işletme yönetimi ile bütüncül bir yapıda çalışması, ilişki ağının net olarak oluşturulması, ortaya çıkacak verilerin iyi bir şekilde yorumlanması, Covid-19 gibi belirsizlik dönemlerinde gerekli esneklik ile dönüşümün sağlanabilmesi ve bu çerçevede gerekli eylemlerin hayata geçirilmesi büyük önem arz etmektedir.
KaynakçaACAR, D., Özçelik, H. (2011). Muhasebe Bilgi Kalitesini Etkileyen Kritik Başarı Faktörleri, Muhasebe ve
Finansman Dergisi, (49): 10–23.ACCA. (2015). Advanced Performance Management, Berkshire, Kaplan Financial Limited.ALEXANDER, J. (2018). Financial Planning & Analysis and Performance Management, New Jersey, John Wiley
& Sons Inc.ARMSTRONG, M. (2009). Armstrong’s Handbook of Performance Management, London, Kogan Page Limited.ATKINSON, Anthony A., Kaplan, Robert S., Matsumura, E. M. ve Young, S. M. (2012). Management Accounting:
Information for Decision-Making and Strategy Execution, London, Pearson Education, Inc.ATRILL, P., McLaney, E. (2009). Management Accounting for Decision Makers, Harlow, Pearson Education Ltd.BAROUDI, R. (2010). KPI Mega Library, California, Rachad Baroudi.BAYRAKTAR, E., Efe, M. (2006). Kurumsal Kaynak Planlaması (ERP) Kurulum Süreci: Kritik Başarı Faktörleri,
Yönetim Bilimleri Dergisi, 4(2): 91–109.BERGERON, B. P. (2018). Performance Management in Healthcare – From Key Performance Indicators to
Balanced Scorecard, New York, CRC Press.
Marmara Üniversitesi İktisadi ve İdari Bilimler Dergisi • Cilt: 43 • Sayı: 1 • Haziran 2021, ISSN: 2587-2672, ss/pp. 78-99
95
BOURNE, M. (2008). Performance Measurement: Learning from the Past and Projecting the Future, Measuring Business Excellence, 12(4): 67-72.
BRADLEY, L. (2016). “Assurance over Key Performance Indicators (KPIs)”, KPMG Insights, https://home.kpmg/xx/en/home/insights/2016/06/assurance-over-key-performance-indicators.html, (Erişim Tarihi: 10.11.2020).
BROAD, M., Javadi, S. M. (2009). Modelling A Successful Performance Measurement System. Business & Economic Review, 1(1): 29–39.
BULLEN, C. V., Rockart, J. F. (1981). A Primer on Critical Success Factors, Cambridge, Center for Information Systems Research Sloan School of Management Massachusetts Institute of Technology.
CHAE, B. (Kevin). (2009). Developing Key Performance İndicators for Supply Chain: An İndustry Perspective, Supply Chain Management: An International Journal, 14(6): 422–428.
CHANDI, R. (2009). Key Performance Indicators – Measuring Performance in the Oil & Gas EPC Industry, Delft University of Technology.
COKINS, G. (2013). Strategic Business Management: From Planning to Performance, New York, Association of International Certified Professional Accountants-AICPA.
DADASHZADEH, M. (1989). Teaching MIS Concepts to MBA students: A Critical Success Factor Approach, Journal of Information Systems Education, 1(4): 11-16.
DARBY, S. (2015). “Project Measurement: Introducing KPIs and KRIs”, https://www.linkedin.com/pulse/project-measurement-introducing-kpis-kris-shelia-darby, (Erişim Tarihi: 11.11.2020).
DAVID, F. R., David, F. R. (2017). Strategic Management: Concepts and Cases, Harlow, Pearson Education Ltd.DRURY, C. (2018). Management and Cost Accounting, Hampshire, Cengage Learning.ECKERSON, W. W. (2006). Performance Dashboards: Measuring, Monitoring and Managing Your Business,
New Jersey, John Wiley & Sons Inc.EMMANUEL, C., Otley, D. ve Merchant, K. (1990). Accounting for Management Control, Boston, MA, Springer
US, https://doi.org/10.1007/978-1-4899-6952-1FRANCESCHINI, F., Galetto, M. ve Maisano, D. (2007). Management by Measurement – Designing Key
Indicators and Performance Measurement Systems, Heidelberg, Springer-Verlag Berlin Heidelberg.FRITZENSCHAFT, T. (2014). Critical Success Factors of Change Management, Wiesbaden, Springer
Fachmedien Wiesbaden, https://doi.org/10.1007/978-3-658-04549-4GALLIERS, R. D., Leidner, D. E. ve Simeonova, B. (2020). Strategic Information Management – Theory and
Practice, New York, Routledge.GARRETT, K. (2020). “Performance Indicators”, www.accaglobal.com/us/en/student/exam-support-resources/
professional-exams-study-resources/strategic-business-leader/technical-articles/performance-indicators.html, (Erişim Tarihi: 08.11.2020).
GHALAYINI, A. M., Noble, J. S. ve Crowe, T. J. (1997). An Integrated Dynamic Performance Measurement System for Improving Manufacturing Competitiveness, International Journal of Production Economics, (48): 207–225.
HAWKINS, B., Pavone, R. (2006). Network Management Architecture Supporting Today’s IT Service Delivery, CISCO TECNMS Report.
HILL, M. (2020). “Critical Success Factors for Your Business”, BDO Insights – Advisory, www.bdo.nz/en-nz/advisory/critical-success-factors-for-your-business, (Erişim Tarihi: 10.11.2020).
HOWELL, M. T. (2010). Critical Success Factors Simplified – Implementing the Powerful Drivers of Dramatic Business Improvement, New York, CRC Press.
Hakan CAVLAK
96
HUMAN RESOURCES DEVELOPMENT WORKING GROUP, LABOUR AND SOCIAL PROTECTION NETWORK, & ASIA-PACIFIC ECONOMIC COOPERATION. (2007). Developing Key Performance Indicators and Productivity/Performance Benchmarks for Performance Based Remuneration Systems Report, Malaysia.
ISHAQ BHATTI, M., Awan, H. M. ve Razaq, Z. (2014). The key performance indicators (KPIs) and their impact on overall organizational performance, Quality & Quantity, 48(6): 3127–3143.
JITURI, S. (2018). A Methodology to Satisfy Key Performance Indicators for Successful ERP Implementation in Small and Medium Enterprises, International Journal of Innovation, Management and Technology, 9(2): 79–84.
KAYDOS, W. (1999). Operational Performance Measurement: Increasing Total Productivity, Florida, CRC Press.
KERZNER, H. (2017). Project Management Metrics, KPIs and Dashboards: A Guide to Measuring and Monitoring Project Performance, New York, John Wiley & Sons Inc.
KHAN, M. Y. ve Jain, P. K. (2013). Management Accounting – Text, Problems and Cases, New Delhi, McGraw Hill Education (India) Private Limited.
KLEINDIENST, B. (2017). Performance Measurement und Management, Wiesbaden, Springer Fachmedien Wiesbaden.
KLIPFOLIO. (2020). “What Is a KPI?”, www.klipfolio.com/resources/articles/what-is-a-key-performance-indicator, (Erişim Tarihi: 15.11.2020).
KOENEMANN, K. (2014). “Do Your KPIs Indicate If You Are Winning or Losing?”, www.tbmcg.com/resources/blog/kpis-indicate-winning-losing, (Erişim Tarihi: 08.11.2020).
KÖYLÜOĞLU, B. (2017). “KPI ve Performans Göstergeleri Gerçeği”, Stratejik Yönetim ve Kurumsal Finans Üzerine Düşünceler, https://www.stratejivefinans.com/kpi-ve-performans-gostergeleri-gercegi, (Erişim Tarihi: 08.11.2020)
KPMG (2018). “Trust Your Decisions. Have Confidence in Your Data and Analytics”, Reporting & Analytics – KPI’s and Dashboarding, 2018, https://home.kpmg/be/en/home/insights/2018/04/reporting-analytics-kpi-and-dashboarding.html, (Erişim Tarihi: 11.11.2020)
LI, W. S. (2018). Strategic Management Accounting, Singapore, Springer Singapore.LIND, P. (2015). Monitoring Business Performance, New York, Routledge.LJUNGLOF, J., Nisser, H. (2017). KPIs in a service organization – A case study of Axfood IT, Uppsala University.MARR, B. (2014). 25 need-to-know key performance indicators, Harlow, Pearson Education Ltd.MARR, B. (2020). “What Is the Difference between Key Performance Indicators (KPIs) and Critical Success
Factors (CSFs)?”, https://bernardmarr.com/default.asp?contentID=1406, (Erişim Tarihi: 08.11.2020).MAZLUM, A. R. (2017). Determining of Key Performance Indicators in Business, İstanbul Ticaret Üniversitesi
Dış Ticaret Enstitüsü (Tartışma Metinleri), 1–18.McNAIR, C. J., Merchant, K. (2020). Management Accounting: An Integrative Approach, New Jersey, John
Wiley & Sons Ltd.McWATTERS, C. S. ve Zimmerman, J. L. (2016). Management Accounting in a Dynamic Environment, New
York, Routledge.MORRISON, M. (2016). “Critical Success Factors (CSF’s) Made Easy: A Step by Step Guide”, RapidBI, https://
rapidbi.com/criticalsuccessfactors, (Erişim Tarihi: 11.11.2020).PACIFIC CREST GROUP. (2012). Applying Key Performance Indicators to Build Your Business, Larkspur,
Pacific Crest Group.PARKER, J. E. (2014). KPIs for Agile Project Managers and Business Analysts, Enfocus Solutions Inc..
Marmara Üniversitesi İktisadi ve İdari Bilimler Dergisi • Cilt: 43 • Sayı: 1 • Haziran 2021, ISSN: 2587-2672, ss/pp. 78-99
97
PARMENTER, D. (2011a). The Leading-Edge Manager’s Guide to Success: Strategies and Better Practices, New Jersey, John Wiley & Sons Inc.
PARMENTER, D. (2011b). Winning CFOs: Implementing and Applying Better Practices, New Jersey, John Wiley & Sons Inc.
PARMENTER, D. (2015). The New Thinking on KPIs, New York, IBM Corporation Software Group.PARMENTER, D. (2020). Key Performance Indicators: Developing, Implementing and Using Winning KPIs,
New Jersey, John Wiley & Sons Inc.PROCTOR, R. (2012). Managerial Accounting: Decision Making and Performance Management, Harlow,
Pearson Education Ltd.PROFILETREE. (2020). “KPI: All You Need to Know and What It Stands For”, https://profiletree.com/all-you-
need-to-know-about-kpi, (Erişim Tarihi: 11.11.2020).ROCKART, J. F. (1979). Chief Executives Define Their Own Data Needs, Harvard Business Review, 57(2): 81-
93.RODRIGUEZ, R. R., Saiz, J. J. A. ve Bas, A. O. (2009). Quantitative relationships between key performance
indicators for supporting decision-making processes, Computers in Industry, 60(2): 104–113.SHACKLETON, C. (2007). Developing Key Perfomance Indicators for Corporate Communication in the
Information Technology Industry, University of Pretoria.SIMS, A. (2013). Enterprise Strategy, Financial Management, 45–48.SKIBNIEWSKI, M. J. ve Ghosh, S. (2009). Determination of Key Performance Indicators with Enterprise
Resource Planning Systems in Engineering Construction Firms, Journal of Construction Engineering and Management, 135(10): 965–978.
SOUSA, J. M. E. (2004). “Definition and Analysis of Critical Success Factors for ERP Implementation Projects”, Universitat Politècnica de Catalunya.
TCii STRATEGIC AND MANAGEMENT CONSULTANTS. (2011). “Key Performance Indicators (KPIs) – What They Are And What They Do”, www.mondaq.com/uk/operational-performance-management/140520/key-performance-indicators-kpis-what-they-are-and-what-they-do, (Erişim Tarihi: 01.11.2020).
VACHNADZE, R. (2016). Prioritization of Performance Measures Using Analytic Hierarchy Process, International Journal of the Analytic Hierarchy Process, 8(3): 490–501,
WHEELEN, T. L., Hunger, J. D., Hoffman, A. N. ve Bamford, C. E. (2018). Strategic Management and Business Policy, Harlow, Pearson Education Ltd.
WITCHER, B. J. (2020). Absolute Essentials of Strategic Management, Oxon, Routledge.WU, H.-Y. (2012). Constructing a strategy map for banking institutions with key performance indicators of the
balanced scorecard, Evaluation and Program Planning, 35(3): 303–320.
98
The business world is full of confusing words, terms, and abbreviations. Many terms used in performance measurement can be used interchangeably or mixed. The tools used in measuring the performance of organizations or businesses are named as various terms such as measure, indicator, metric. Some of these terms are performance measure-indicator-metric, key performance indicator, key performance metric, critical success factor. This confusion can lead to various losses for businesses, stakeholders, or other parties. One of the important evaluation activities in organizations is to measure corporate performance. This activity includes comparing expected results with actual results, investigating deviations from plans, evaluating individual performance, and reviewing progress. Performance measurement is generally made by performance measurement/management systems used to manage strategy-based decisions. These systems are important control tools that can be considered complex and must act in integration with accounting information systems.
KPI and CSF play an important role in performance measurements that evaluate within the framework of performance systems. In order to understand the relationship between KPI and CSF more clearly, it is necessary to know the general framework of performance measurement. The most important part of this framework is shown as business strategies. This is because business strategies are a discourse that reveals the business’s tasks, goals, and policies. Businesses explain their future goals, targets, and predictions to the public through the vision, values and strategies they have created. In order for businesses to realize their mission and vision, they must first determine the strategies related to them. Then, it needs to monitor, follow, and evaluate the strategies within a certain framework. This requirement can usually be met with CSFs and KPIs.
Mission and vision show how businesses define and position themselves. These statements also clearly explain the future targets of the company. Also, these are the central elements in establishing business strategies and goals. To realize all these elements, they must be followed, monitored, and evaluated in line with certain tools. The tools that can be used at this point are critical success factors (CSFs) and key performance indicators (KPIs). CSF and KPI are the main subject of this study. CSF represents the key areas of activity required for the realization of the mission, vision, and strategies of the businesses. After these key areas are determined, KPIs linked to CSFs should be created. KPIs are leading indicators that contribute to the achievement of CSFs, strategies, vision, and mission. These indicators guide businesses on what activities need to be corrected or improved.
CSFs are often confused with KPIs and used interchangeably, but the two are not the same thing. While CSFs are long-term and directly linked to business strategy, KPIs are short-term and indirectly related to strategy. The difference between KPIs and CSFs is like a cause-effect relationship. CSFs are the reason for success and determine what needs to be done to be successful. KPIs are the effects of actions and measure whether they are successful or not. Although the two terms are different, the two are intrinsically linked and dependent.
KPI and CSF, which is the main subject of this study, are the most basic tools in a whole. The view of the whole is as follows: First of all, the mission, vision and values of the business are determined in
Extended Abstract
Marmara Üniversitesi İktisadi ve İdari Bilimler Dergisi • Cilt: 43 • Sayı: 1 • Haziran 2021, ISSN: 2587-2672, ss/pp. 78-99
99
line with various factors. In the next stage, the necessary strategies and targets are established for the realization of the mission and vision. Then, critical success factors (CSFs), which have an important place in the realization of business strategies, and key performance indicators (KPIs) related to these factors are formed. KRI, PI and RI are also created with KPIs. In terms of realizing the business mission and vision, it is very important that the above-mentioned process is realistic, measurable, dependent on specific people and timings.
In this study, the above process is mainly explained within the framework of basic performance indicators and critical success factors. In addition, it is aimed to understand the subject better with an example of an airline business. As a result of both theoretical explanations and example, it is clearly seen how important KPIs and CSFs are for the realization of the mission and vision that businesses define themselves. This importance is due to the fact that KPIs and CSFs show the success or failure in the business from top to bottom in a realistic way. However, it should not be forgotten that in order to use these tools effectively and efficiently, all employees, teams or departments involved in this process should work in a holistic structure with the business management, a clear relationship network should be established, and the resulting data should be interpreted well. In addition, in times of uncertainty such as Covid-19, it is of great importance to provide the necessary flexibility and transformation, and to implement the required actions.
100
Marmara Üniversitesi İktisadi ve İdari Bilimler Dergisi • Cilt: 43 • Sayı: 1 • Haziran 2021, ISSN: 2587-2672, ss/pp. 100-122 DOI: 10.14780/muiibd.960297
Makale Gönderim Tarihi:Makale Gönderim Tarihi: 28.10.2020Yayına Kabul Tarihi:Yayına Kabul Tarihi: 13.06.2021
ARAŞTIRMA MAKALESİ / RESEARCH ARTICLE
OECD ÜLKELERİNDE KADINLARIN SOSYO-EKONOMİK STATÜSÜNÜN ENTROPİ-ARAS BÜTÜNLEŞİK YÖNTEMİYLE
İNCELENMESİ1
*
EXAMINING THE SOCIAL-ECONOMIC STATUS OF WOMEN IN OECD COUNTRIES WITH THE INTEGRATED METHOD OF
ENTROPY-ARAS
Müge YILMAZ2
** Mevlüdiye ŞİMŞEK3
*** Gözde KOCA4
****
Öz
Bu çalışmadaki amaç, OECD ülkelerinde kadınların sosyo-ekonomik statüsünün Çok Kriterli Karar Verme (ÇKKV) yöntemleriyle analiz edilmesidir. Sosyo-ekonomik statüyü etkileyen 9 faktör belirlenmiştir. Bu faktörler, kadınlarda kişi başına düşen gelir (GDP), kadınlarda istihdam oranı, kadınlarda işgücüne katılım oranı, kadın ilköğretim okullaşma oranı, kadın ortaöğretim okullaşma oranı, kadın yükseköğretim okullaşma oranı, kadınlarda ortalama yaşam beklentisi, kadınlarda politik katılım oranı ve cinsiyete dayalı insani kalkınma endeksi (HDI) şeklindedir. Analizde ÇKKV metotlarından Entropi ve ARAS yöntemleri kullanılmıştır. OECD ülkelerin 2010-2017 arası döneme ait verileri kullanılmıştır. Yapılan analiz sonucuna göre, kadınların sosyo-ekonomik statüsü açısından en iyi durumda olan ilk üç ülke sırasıyla Norveç, İzlanda ve İsveç olurken, kadın statüsü açısından Japonya ve Macaristan son iki sırada yer almıştır.Anahtar Kelimeler: Kadın, Sosyo-Ekonomik Statü, Çok Kriterli Karar Verme, Entropi, ARAS.JEL Sınıflandırması: C44, C60, Z13
* Bu çalışma, Bilecik Şeyh Edebali Üniversitesi, Sosyal Bilimler Enstitüsü, İktisat Anabilim Dalı’nda Prof. Dr. Mevlüdiye Şimşek danışmanlığında Müge Yılmaz tarafından hazırlanan “OECD Ülkelerinde Kadınların Sosyo-Ekonomik Statüsünün Entropi-ARAS Bütünleşik Yöntemiyle İncelenmesi” adlı yüksek lisans tezinden türetilmiştir.
** Yüksek Lisans Mezunu, Bilecik Şeyh Edebali Üniversitesi, Sosyal Bilimler Enstitüsü, Bilecik, E-Mail: [email protected], ORCID ID: 0000-0001-5703-0284
*** Prof. Dr., Bilecik Şeyh Edebali Üniversitesi, İktisadi ve İdari Bilimler Fakültesi, İktisat Bölümü, Bilecik, E-Mail: [email protected], ORCID ID: 0000-0002-4586-6575
**** Dr. Öğr. Üyesi, Bilecik Şeyh Edebali Üniversitesi, İktisadi ve İdari Bilimler Fakültesi, İşletme Bölümü, Bilecik, E-Mail: gö[email protected], ORCID ID: 0000-0001-6847-6812
Marmara Üniversitesi İktisadi ve İdari Bilimler Dergisi • Cilt: 43 • Sayı: 1 • Haziran 2021, ISSN: 2587-2672, ss/pp. 100-122
101
AbstractThe purpose of this study is to analyze the socio-economic status of women in OECD countries by Multi Criteria Decision Making (MCDM) methods. Nine factors that affect socio-economic status have been identified. These factors are per capita income (GDP) for women, employment rate for women, labor force participation rate for women, female primary education schooling rate, female secondary education schooling rate, female higher education schooling rate, average life expectancy among women, the political participation rate and gender-based human development index (HDI) for women. Entropy and ARAS methods are used in the analysis. The data of OECD member countries for the period 2010-2017 are used. The results reveal that the top three countries that are in the best condition in terms of women’s socio-economic status are Norway, Iceland, and Sweden, respectively while Japan and Hungary are in the last two places in terms of women’s status.Keywords: Women, Socio-Economic Status, Multi Criteria Decision Making, Entropy, ARAS.JEL Classification: C44, C60, Z13
1. Giriş
Kalkınma biliminde insan en önemli faktörlerden birisidir. Bu bağlamda, dünya nüfusunun yaklaşık yarısını oluşturan kadınların görmezden gelinmesi ekonomik kalkınma bakımından önemli bir konu olup; beklenen düzeyde kalkınmak ve toplumsal ilerleme için kadınların sosyo-ekonomik statüsünün güçlendirilmesi bir zorunluluktur. Kadının toplum içindeki sosyal ve ekonomik konumu gerek bir üretim faktörü olarak gerekse gelecek nesillerin yetişmesinde oldukça önem arz eden bir konudur. Aslında; kadının toplum içindeki konumunun güçlenmesi toplumların ekonomik ve sosyal anlamda kalkınmasının temel şartlarından birisidir. Ülke ekonomilerinin kalkınması sadece ekonomik göstergelerdeki iyileşmelerle kalmayıp, kadının statüsündeki iyileşmeleri de içine alan çok geniş kapsamlı bir olgudur. Dolayısıyla, ekonomik anlamda kalkınma hedefini kadının sosyal ve ekonomik statüsünün güçlendirilmesi de destekleyecek ve/veya zenginleştirecektir. Bu çalışmanın amacı; kadınların sosyo-ekonomik statüsünün belirlenen faktörler ışığında çok kriterli karar verme (ÇKKV) yöntemleriyle OECD üyesi ülkeler özelinde analiz edilmesidir. Son yıllarda kadınlarla ilgili çalışma sayısı artmakla birlikte, bunların çoğunun kadınların ekonomik konumuyla ilgili olduğu gözlenmektedir. Benzer şekilde; çalışmamızda kullanılan çok kriterli karar verme yöntemlerinin uygulama alanı artmakla birlikte, kadın konusu üzerine yapılmış çalışmalar oldukça kısıtlıdır. Bu çalışmada kadınların sosyo-ekonomik statüsünü etkileyen dokuz faktör ele alınarak bu faktörlerin OECD ülkeleri özelinde analiz edilmesi amaçlanmıştır. Analiz sonucunda elde edilen sıralama; analize dâhil edilen ülkelerdeki kadınların statüsünün belirlenmesi için önem taşımaktadır.
2. Teorik Çerçeve
Geçmişten bugüne iktisat tarihi ve iktisadi düşünce yapıları incelendiğinde, kadının ve onların ilgi alanlarının büyük ölçüde yok sayıldığını görmek mümkündür. İlk uygarlıklardan sanayi devrimine kadar olan süreçte kadının yaşamı daha çok gelenekler, inanç, kültürel yapı, çevre vb. birçok unsur tarafından şekillendirilmiştir. Özel mülkiyetin gelişmesiyle birlikte, kadınlar toplumda tamamen ötekileştirilmiş ve ekonomik yaşam erkeğe göre şekillenmeye başlamıştır.1 Kadınlar yüzyıllar boyunca
1 Kapanoğlu, S. (2006). Çin’de Kadın İmgesi, Yüksek Lisans Tezi, Ankara Üniversitesi Sosyal Bilimler Enstitüsü, Doğu Dilleri ve Edebiyatları Anabilim Dalı, Ankara, s.11.
Müge YILMAZ • Mevlüdiye ŞİMŞEK • Gözde KOCA
102
üretimin her aşamasına katkıda bulunmuşlar; fakat modern anlamda kadının ücretli işçi statüsünü alması ve çalışma hayatına girmesi Sanayi Devrimi ile gerçekleşmiştir.2 Kapitalist ekonomik sistem içerisinde önemli bir yer tutan emek arzı, iktisatçılar tarafından, teorik yaklaşımların geliştirildiği ve tartışmaya oldukça açık bir konudur. Ancak iktisadi yaklaşımların geneline bakıldığında; gerek klasik ve Neoklasik iktisatçılarda gerekse Kurumsal ve Marksist iktisatçılarda işgücü piyasalarına ait teorilerin büyük oranda erkek emeği göz önüne alınarak oluşturulduğu görülmektedir. Kadın emeği üzerinde fazla durulmamış ve dolayısıyla kadın konusu ikinci planda kalmıştır.3
Kadının kalkınmadaki öneminin uzunca bir süre göz ardı edilmesinden sonra, kalkınma iktisadında kadının rolü ilk defa Danimarkalı araştırmacı Esther Boserup’un “Ekonomik Kalkınmada Kadının Rolü4” isimli çalışmasında ele alınmıştır. Boserup; ‘modernleşme ile birlikte tarımda ve diğer alanlarda verimlilik artışları yaşandığını; teknoloji ve makine kullanımının bu süreçte erkeklerin kontrolüne geçmesiyle kadının ikincil konuma itildiği geleneksel iş bölümünün oluştuğunu’ ileri sürmektedir.5 Bu eserle literatürde ‘Kalkınmada Kadın’ kavramı ön plana çıkmıştır. 1970’li yıllarda ‘bütün kalkınma çabalarına kadınların tam entegrasyonu’ en çok tekrarlanan cümle haline gelmiştir. Kalkınmada kadın kavramının benimsenmesiyle fırsat eşitliğine, kadınların üretken sektördeki dezavantajlarının azaltılmasına ve ayrımcılığa son verecek kalkınma stratejilerine vurgu yapılmıştır.6 Ancak Boserup, kadınların kalkınmaya dâhil edilmesini savunurken, sürece dâhil olunacak kadar radikal bir değişiklik talep etmemektedir.7
Kalkınma, ekonomik anlamda refah artışı yanında, sosyal ve beşeri anlamda da refah artışını içermektedir. Ekonomik kalkınma için üretim faktörlerinin en yüksek düzeyde ve verimlilikte kullanılması, sosyal refahın artırılması, cinsiyet eşitliğinin sağlanması, sağlık, eğitim gibi şartlardan toplumdaki her bireyin eşit faydalanması öncelikli amaç olmalıdır. Kalkınma bilimiyle uğraşanlara göre; büyüme hızı kadar büyümenin kalitesi de önem taşımaktadır. Başka bir ifadeyle, ekonomik kalkınma nicel olmaktan ziyade nitel bir olgu olup; ekonomik büyümenin yanında çok sayıda konuyu kapsamaktadır. Söz konusu konular; büyümeden kimin yararlandığı, kadın ve erkeklerin büyümenin faydalarından nasıl yararlandığı, büyümenin tüm gelir gruplarına eşit dağılmış olup olmadığı, büyümeden belli sektörlerin mi yoksa tüm toplumun mu fayda sağladığı ve ekonomik büyümenin, bir ülkenin insanları arasında refah eşitliği sonucunu yaratıp yaratmadığı gibi konulardır.8
Sürdürülebilir büyüme ve kalkınma, toplumların ayakta kalması ve istikrarı için oldukça önemlidir. Ülkelerin kalkınmışlık seviyelerinin belirlenmesinde birçok faktör bulunmakla birlikte ekonomik
2 Durmaz, Ş. (2016). İşgücü Piyasasında Kadınlar ve Karşılaştıkları Engeller, Ahi Evran Üniversitesi Sosyal Bilimler Enstitüsü Dergisi, 2(3): 38.
3 Kaplan, A. (2019). Bölgesel Kalkınmada Kadın İstihdamının Etkisi: GAP Bölgesi’nde Kadının Güçlendirilmesinde Yenilikler Projesi, Yüksek Lisans Tezi, Mersin Üniversitesi Sosyal Bilimler Enstitüsü, İktisat Anabilim Dalı, Mersin, s.4.
4 Boserup, E. (1970). Women’s Role in Economic Development, St. Martin’s Press, Newyork.5 Boserup, 1970.6 Toksöz, G. (2011). Kalkınmada Kadın Emeği, Varlık Yayınları, 2. Baskı, İstanbul, s.52.7 Visvanathan, N. (1997). Theories of Women, Gender and Development, N. Visvanathan, L. Duggan, N. Wiegersma, L.
Nisonoff (Ed.), The Women, Gender and Development Reader, Zed Books, Londra, s.23.8 Şimşek, M. (2008). Küreselleşen Dünyada Kadının Ekonomik Konumu, Ekin Yayınevi, Bursa, s.11.
Marmara Üniversitesi İktisadi ve İdari Bilimler Dergisi • Cilt: 43 • Sayı: 1 • Haziran 2021, ISSN: 2587-2672, ss/pp. 100-122
103
anlamda kalkınmanın yönünü ve hızını belirleyen en önemli faktör insan gücüdür. Söz konusu gücün yaklaşık yarısı ise kadınlardan oluşmaktadır. Kadınların ekonomik statüsünün belirlenmesinde işsizlik oranları, milli gelirden aldıkları pay, istihdam ve işgücüne katılım oranları gibi faktörler oldukça önemlidir. Ancak geçmişte kalkınma dendiğinde sadece ekonomik verilerin ortaya konulduğu bir yaklaşım benimsenirken; artık günümüz dünyasında ekonomik verilerin yanı sıra insan odaklı, eğitim düzeylerini ve niteliklerinin artırılmasını, yoksulluk ve gelir dağılımı gibi konuları da içine alan bir kalkınma anlayışı öne çıkmaya başlamıştır.9 Başarılı bir kalkınmadan bahsedebilmek için kadın erkek ayırmaksızın toplumun tüm bireylerinin ekonomik faaliyetlere katılımının sağlanması, eğitim ve sağlık imkânlarından eşit şekilde faydalanılması öncelikli amaç olmalıdır. Ancak, toplumsal cinsiyet eşitsizliği, ekonomik alanda olduğu gibi sosyal alanda da kendini göstermektedir. Kadının statüsü genelde kadının gelir düzeyi, ekonomik bağımsızlığı, eğitimi, sağlığı, aile ve toplum içindeki rolü gibi faktörlerle tanımlanmaktadır. Ancak toplumun kadına bakışı, kadın rollerini algılayış biçimi ve bu rollere verdiği değerden de etkilenmektedir.10 Geçmişten bugüne, kadının ekonomik ve sosyal statüsünde gelişmeler görülse de, hala büyük oranda eşitsizlikler mevcuttur. Bu eşitsizliğin yaşandığı bir alan da siyasi ortamdır. Kadınlar, yıllarca kendilerine yönelik bakış açısı sebebiyle siyaset alanından uzak kalmış ve bunun doğal sonucu olarak günümüzde erkeklere oranla siyaset alanının farklı kademelerinde daha az yer almışlardır.11 Kadınların haklarını elde edebilmeleri ve toplumsal cinsiyet eşitliğinin daha fazla sağlanabilmesi için kadınların siyasette daha fazla yer almaları büyük önem taşımaktadır. Bütüne bakıldığında aslında kadınların sosyal, ekonomik ve politik statüsünü etkileyen tüm faktörler aynı zamanda birbirleriyle etkileşim içindedir. Kadınlar; işgücüne katılım, eğitim ve sağlık imkânlarından yararlanma, siyasi hayata katılma gibi konularda gerek ekonomik gerekse ekonomik olmayan birçok nedenle karşılaşmaktadırlar. Kadınların ekonomik sisteme katılımı, gelişmenin hem girdisi hem de çıktısıdır. Şöyle ki; daha fazla kadın işgücü olarak piyasada yer aldığında ekonomik büyüme hızlanacak ve ülkeler gelişecektir. Ülkelerin gelişmesiyle birlikte kadınların yetenekleri de gelişecek, üzerlerindeki sosyal baskı ve kısıtlamalar zayıflayacak ve kadınların ev dışına çıkmalarına imkân tanınmış olacaktır.
3. Literatür İncelemesi
Son yıllarda çok kriterli karar verme yöntemlerinin uygulama alanı artmış bulunmakla birlikte, kadın konusu üzerine yapılmış çalışmalar oldukça kısıtlıdır. Yapılan literatür incelemesi sonucunda uluslararası literatürde, ÇKKV yöntemlerinin kadın konusuna uygulanması ile ilgili sınırlı sayıda çalışma ile karşılaşılmıştır. Fakat ulusal literatürde kadın konusu ile ilgili oldukça fazla çalışma bulunmakla birlikte, ÇKKV yöntemlerinin kullanıldığı herhangi bir çalışmaya rastlanılmamıştır. Bu nedenle literatür taramasında kadın konusunu ve ÇKKV yöntemlerini içeren çalışmalara yer verilmiştir. Uluslararası literatürde kadın konusunu ve ÇKKV yöntemlerinin uygulanmasını içeren çalışmalar şu şekildedir:
9 Açık, Y. (2018). İş Dünyasında Kadın Raporu Cilt III’e Önsöz, (Erişim Tarihi: 5.11.2019, http://www.turkonfed.org/tr/icerikler/arastirma-raporlari/), s.5.
10 Mıhçıokur, S., Akın, A. (2003). Kadının Statüsü ve Anne Ölümleri, Hacettepe Üniversitesi Kadın Sorunları Uygulama ve Araştırma Merkezi (HÜKSAM). Hacettepe Üniversitesi Yayınları, Ankara, s. 127.
11 Kurt Topuz, S. (2014). Sosyo-Ekonomik, Siyasal ve Kültürel Faktörler Ekseninde Kadın Milletvekili Temsil Oranına İlişkin Bir Analiz: OECD Ülkeleri Örneği, H.Ü. İktisadi ve İdari Bilimler Fakültesi Dergisi, 32(1): 213.
Müge YILMAZ • Mevlüdiye ŞİMŞEK • Gözde KOCA
104
Mirghafouri12 çalışmasında; kadınların ilerlemesinin önündeki engelleri incelemiştir. Uzman görüşü ve Delphi tekniği kullanılarak bu engeller dört boyut ve yirmi yedi faktör olarak sınıflandırılmıştır. İstatistiksel yöntemler ve MCDM teknikleri (Topsis ve AHP) kullanılarak bu engeller sıralanmıştır. Bu sıralamanın bulgularına göre kültürel ve sosyal faktörlerin kadının ilerlemesinin önündeki en önemli engeller olduğunu belirtmiştir.
Chou, Yen ve Sun13 çalışmalarında; 21. yüzyılda kadınların bilim ve teknoloji (WIST) alanındaki rolünün önemi üzerinde durmuşlardır. Çalışmalarında entropi ve Vikor yöntemini kullanmışlardır. Yapılan analiz sonucunda kadınların bilim ve teknoloji (WIST) alanındaki rolünde en iyi performansa sahip ülke Güney Kore olurken, Hollanda ve Japonya onu takip etmektedir.
Ramezani, Montazeri ve Montazeri14 çalışmalarında; ARAS yöntemini kullanarak, tipik kadın girişimciliği özelliklerinin ölçülmesine yönelik kriterlere öncelik vermek için 11 girişimci kadın seçmişlerdir Yapılan analiz sonucu iş ve aile arasındaki ölçütler arasındaki denge en yüksek ağırlık olarak görülürken, aynı anda farklı işleri yapmak kriteri en düşük ağırlık olarak görülmektedir. Bununla birlikte, tipik girişimci kadınları üretkenlik, endüstriyel, ticari, sosyal, kültürel ve hatta bunlardan daha yüksek alanlarda kullanmanın her ülkenin ilerleme ve büyümesinin ana eksenlerinden olduğu vurgulanmıştır.
İpekçi Çetin ve Çetin15 çalışmalarında; Avrupa Birliği ve Aday ülkelerinde özellikle kadınlarla ilgili bazı yeterlilik düzeyleri ve istihdam göstergelerini değerlendirmiş ve sıralamışlardır. Bu çalışmada ÇKKV yöntemlerinden VIKOR yöntemi kullanılmıştır. Kullanılan değişkenler; mesleki eğitim alanına göre kadınlara verilen yükseköğretim yeterliliklerinin oranı, yaş grubuna göre istihdam edilenlerin oranı (25-39; 40-64), 25-64 yaş grubundaki kadınların eğitim durumuna göre işsizlik oranları ve meslek kategorisine göre kadın istihdamında yükseköğretim mezunları şeklindedir. Çalışmada 28 ülke değerlendirilmiştir. Değerlendirme sonucuna göre İsveç, yeterlilik düzeyleri ve istihdam açısından yirmi sekiz ülke arasında en iyi ülkedir. İkinci ve üçüncü ülkeler sırasıyla Portekiz ve Finlandiya’dır. Türkiye ise listenin sonunda yer almaktadır.
Meshram, Boiroju ve Kodali16 çalışmasında kadın ve çocukların beslenme ve sağlık göstergeleri ile ilgili verileri kullanarak incelenen bölgedeki eyalet ve ilçeleri sıralamak için TOPSIS adı verilen çok kriterli bir karar verme yöntemi kullanılmıştır. Bulgular, Krishna bölgesinin birinci sırada olduğunu ve Vizianagaram’ın son sırada olduğunu göstermektedir. Kişi başına düşen gelir, kentleşme, temiz yakıt kullanımı ve anne eğitimi gibi göstergeler yüksek gözlenirken, iyi performans gösteren bölgelerde bebek
12 Mirghafouri, S.H.A. (2006). Ranking The Barriers of Women’s Promotion to Managerial Positions: A Case Study of Yazd Province’s Public Sector, Womens Studies, 4(1): 101-122.
13 Chou, Y. ve diğerleri (2014). An İntegrate Method for Performance of Women in Science and Technology Based on Entropy Measure for Objective Weighting, Qual Quant, 48: 157–172.
14 Ramezani, E., ve diğerleri (2014). A Study on Prioritizing Typical Women’s Entrepreneur Characteristics, Management Science Letters, 4: 1271-1278.
15 İpekçi Çetin, E., Çetin H.H. (2016). Using VIKOR Method for Analyzing of Qualification Levels and Transition to Employment of European Union and Candidate Countries, The Online Journal of Science and Technology, 6: 99-102.
16 Meshram, I.I., ve diğerleri (2017). Ranking of Districts in Andhra Pradesh Using Women and Children Nutrition and Health Indicators by Topsis Method, Indian J Community Health, 29(4): 350-6.
Marmara Üniversitesi İktisadi ve İdari Bilimler Dergisi • Cilt: 43 • Sayı: 1 • Haziran 2021, ISSN: 2587-2672, ss/pp. 100-122
105
ve anne ölümlerinin düşük olduğu gözlenmiştir. Beslenme ve sağlık göstergelerinin yetersiz olduğu ilçelerin en son, göstergeleri yüksek olanların ise birinci sırada olduğu sonucuna varılmıştır.
Jalil ve Sharif17 Shannon’ın entropi yöntemini kullanarak bir doğurganlık endeksi geliştirmeyi amaçlamışlar. Çalışma, Malezya’da doğurganlık oranının düşmesi nedeniyle yapılmış olup; sonuçlarına göre; Selangor, Johor ve Sarawak’ım en yüksek doğurganlık endeksine sahip olduğu gözlenmiştir. Diğer yandan, Terengganu, W.P. Labuan ve Perlis ise doğurganlık endeksine göre son sırada yer almaktadır. Bu nedenle, azalan doğurganlık hızı nedeniyle, stratejik ve etkili önlemlerin planlanması ve uygulanması gerektiği vurgulanmıştır.
Martin ve Pandiamal18 çalışmalarında; kadın girişimcilerin problemlerini araştırmak amacıyla Vikor sıralama yöntemini Linguistik Sekizgen Nötrosofik Yumuşak matris (LONSM) ile birlikte kullanmaktadır. Yapılan analiz sonucunda; incelenen 10 kriter içinde sosyal ayrımcılık, cinsiyet önyargıları ve risklerle başa çıkma becerilerinin eksikliği kadın girişimcilerin karşılaştığı üç ana problem olarak ortaya çıkmaktadır.
Stefanović vd.19 çalışmalarındaki amaç, işyerlerini çok kriterli karar verme yöntemini kullanarak kadınların istihdam edildiği üretim süreçlerinde risk değerlendirmesi açısından sıralamaktır. Sıralama sonuçları, çalışan başına düşen riski en yüksek iş yeri olarak kaba dikişli giysilerdeki işyerine işaret eder. İşyerinde sağlık ve güvenlik riski en düşük olan işyeri otomobil endüstrisinin üretim sürecindedir. Sonuçlar, çalışma koşullarını iyileştirmek, kadın çalışanların sağlığını korumak, memnuniyetlerini artırmak ve kurumsal hedeflere daha iyi ulaşmak için önemlidir.
4. Veri ve Metot
Bu çalışmada Çok Kriterli Karar Verme (ÇKKV) yöntemlerinden Entropi yöntemi ve ARAS yöntemi kullanılarak, OECD ülkelerinde kadınların sosyo-ekonomik statüsünün saptanması amaçlanmaktadır. Kadınların sosyal ve ekonomik statüsünü etkileyen birçok faktör bulunmakla birlikte ülkelerin verileri; kadınlarda kişi başına düşen gelir (GDP), kadın istihdam oranı, kadın işgücüne katılım oranı, kadınlarda okullaşma oranı (ilk-orta-yükseköğretim), ortalama yaşam beklentisi, politik katılım oranı ve cinsiyete dayalı insani kalkınma endeksi (HDI) kriterleri çerçevesinde değerlendirilmiştir. Kadınlarda okullaşma oranına ait bazı ülkelerin sağlıklı verilerine ulaşılamadığı için, bu kriterin yıllar itibariyle değerleri; ilköğretim, ortaöğretim ve yükseköğretimde olan kadın nüfusunun toplam kadın nüfusuna oranlanmasıyla tarafımızdan elde edilmiştir. Bu hesaplamada kullanılan veriler UNESCO (http://data.uis.unesco.org) sitesinden alınmıştır. Ayrıca OECD üyesi 36 ülke bulunmakla birlikte İsrail ve Lüksemburg’un eğitimle ilgili sağlıklı verilerine ulaşılamadığı için analize 34 ülke dahil edilmiştir. Değerlendirmede kullanılan kriterler, ülkelerin 2010-2017 dönemini kapsamaktadır.
17 Jalil, W.A.F.W.A. ve Sharif, S. (2017). Development of Malaysian Women Fertility Index: Evidence from Shannon’s Entropy, AIP Conference Proceedings, 1905.
18 Martin, N., Pandiammal, P. (2018). Ranking the Problems of Women Entrepreneurs in India Using Vikor Method with Lonsm, International Journal of Mathematics Trends and Technology (IJMTT) – Special Issue, s. 68-72.
19 Stefanović, V., ve diğerleri (2019). Multi-Criteria Ranking of Workplaces from the Aspect of Risk Assessment in the Production Processes in Which Women are Employed, Safety Science, 116: 116-126.
Müge YILMAZ • Mevlüdiye ŞİMŞEK • Gözde KOCA
106
4.1. Çok Kriterli Karar Verme Yöntemleri
ÇKKV, ekonomi, enformatik psikoloji, matematik ve sosyal bilimler gibi birçok disiplinin bir araya gelip, karar vericiye problemini farklı boyutlarda değerlendirme ve karar alma imkânı sağlayan yöntemlerin bir araya getirildiği bir yapıdır. ÇKKV problemlerini, birden fazla kriterin optimize edildiği mümkün olan çözüm setleri içerisinde en iyi alternatifin seçildiği problemler olarak da tanımlamak mümkündür.20 Kişisel seçim problemlerinden, endüstriyel, finansal, eğitim ve politik karar problemlerine kadar birçok alanda kullanılan ÇKKV yöntemleri, 1960’lı yılların başından itibaren karar verme sürecine yardımcı olacak çözüm yöntemlerine ihtiyaç duyulmasıyla geliştirilmeye başlanmıştır. ÇKKV yöntemlerini kullanmadaki amaç, alternatif ve kriter sayılarının çok olduğu durumda karar verme mekanizmasını kontrol altında tutabilmek ve karar sonucunu mümkün olduğunca kolay ve çabuk elde etmektir.21
4.2. Entropi Yöntemi
Entropi kavramı ilk olarak 1965 yılında Rudolph Clausius tarafından bir sistemde meydana gelen düzensizliğin ve belirsizliğin bir ölçüsü olarak ifade edilmiştir22. Entropi yöntemi karar probleminin hiyerarşik bir yapı oluşturmadan kriterlerin önem düzeylerinin ortaya çıkardığı ve AHP (Analitik Hiyerarşi Prosesi), Delphi teknikleri gibi karar vericilerin sübjektif yargılarına gerek kalmadan verileri dikkate alarak kriter ağırlıklarını hesapladığı için objektif bir değerlendirme yöntemidir.23 Entropi, sosyal bilimler, fizik ve bilgi teorisinde kullanımı tercih edilen önemli kavramlardan olmakla birlikte ÇKKV problemlerinde her bir kriterin uygun ağırlıklarını bulmak için uygun bir yöntemdir. Entropi yönteminin adımları aşağıdaki gibidir24:
Adım 1: Karar matrisinde birbirinden farklı indeks boyutlarının eşölçülemezlik üzerindeki etkilerini yok etmek amacıyla indeksler çeşitli yöntemlerle standartlaştırılabilmektedir. Fayda ve maliyet indekslerine göre kriterler Eşitlik (1) ve (2) yardımıyla normalize edilmektedir.
olarak da tanımlamak mümkündür. 20 Kişisel seçim problemlerinden, endüstriyel, finansal, eğitim ve politik karar problemlerine kadar birçok alanda kullanılan ÇKKV yöntemleri, 1960’lı yılların başından itibaren karar verme sürecine yardımcı olacak çözüm yöntemlerine ihtiyaç duyulmasıyla geliştirilmeye başlanmıştır. ÇKKV yöntemlerini kullanmadaki amaç, alternatif ve kriter sayılarının çok olduğu durumda karar verme mekanizmasını kontrol altında tutabilmek ve karar sonucunu mümkün olduğunca kolay ve çabuk elde etmektir.21
4.2. Entropi Yöntemi
Entropi kavramı ilk olarak 1965 yılında Rudolph Clausius tarafından bir sistemde meydana gelen düzensizliğin ve belirsizliğin bir ölçüsü olarak ifade edilmiştir 22 . Entropi yöntemi karar probleminin hiyerarşik bir yapı oluşturmadan kriterlerin önem düzeylerinin ortaya çıkardığı ve AHP (Analitik Hiyerarşi Prosesi), Delphi teknikleri gibi karar vericilerin sübjektif yargılarına gerek kalmadan verileri dikkate alarak kriter ağırlıklarını hesapladığı için objektif bir değerlendirme yöntemidir.23 Entropi, sosyal bilimler, fizik ve bilgi teorisinde kullanımı tercih edilen önemli kavramlardan olmakla birlikte ÇKKV problemlerinde her bir kriterin uygun ağırlıklarını bulmak için uygun bir yöntemdir. Entropi yönteminin adımları aşağıdaki gibidir24:
Adım 1: Karar matrisinde birbirinden farklı indeks boyutlarının eşölçülemezlik üzerindeki etkilerini yok etmek amacıyla indeksler çeşitli yöntemlerle standartlaştırılabilmektedir. Fayda ve maliyet indekslerine göre kriterler Eşitlik (1) ve (2) yardımıyla normalize edilmektedir.
rij = xij/maxij (i = 1, … , m j = 1, … , n) (1)
rij = minij/xij (i = 1, … , m j = 1, … , n) (2)
Adım 2: Farklı ölçü birimlerindeki aykırılıkları ortadan kaldırmak için normalizasyon işlemi yapılarak 𝑃𝑃𝑖𝑖𝑖𝑖 değeri hesaplanır.
20 Kılıç, O. (2016). Uzlaşık Çok Ölçütlü Karar Verme Yöntemleri Kullanılarak TCDD Yatırım Projelerinin Sıralanması, Yüksek Lisans Tezi, Gazi Üniversitesi, Fen Bilimler Enstitüsü, Endüstri Mühendisliği Anabilim Dalı, Ankara, s.19. 21 Taşabat, S.E., ve diğerleri (2015). Farklı Ağırlıklandırma Tekniklerinin Denendiği Çok Kriterli Karar Verme Yöntemleri ile Türkiye’deki Mevduat Bankalarının Mali Performanslarının Değerlendirilmesi, Social Sciences Research Journal, 4 (2): 96. 22 Zhang, H., ve diğerleri (2011). The Evaluation of Tourism Destination Competitiveness by TOPSIS & Information Entropy–A case in the Yangtze River Delta of China. Tourism Management, 32(2): 444. 23 Çakır, S., Perçin, S. (2013). AB Ülkeleri’nde Bütünleşik Entropi Ağırlık-Topsis Yöntemiyle Ar-Ge Performansının Ölçülmesi, Uludağ Üniversitesi, İktisadi ve İdari Bilimler Fakültesi Dergisi, 3(1): 79. 24 Karami, A., Johansson, R. (2014). Utilization of Multi Attribute Decision Making Techniques to Integrate Automatic and Manual Ranking of Options, Journal of Information Science and Engineering, 30: 523-524.
(1)
olarak da tanımlamak mümkündür. 20 Kişisel seçim problemlerinden, endüstriyel, finansal, eğitim ve politik karar problemlerine kadar birçok alanda kullanılan ÇKKV yöntemleri, 1960’lı yılların başından itibaren karar verme sürecine yardımcı olacak çözüm yöntemlerine ihtiyaç duyulmasıyla geliştirilmeye başlanmıştır. ÇKKV yöntemlerini kullanmadaki amaç, alternatif ve kriter sayılarının çok olduğu durumda karar verme mekanizmasını kontrol altında tutabilmek ve karar sonucunu mümkün olduğunca kolay ve çabuk elde etmektir.21
4.2. Entropi Yöntemi
Entropi kavramı ilk olarak 1965 yılında Rudolph Clausius tarafından bir sistemde meydana gelen düzensizliğin ve belirsizliğin bir ölçüsü olarak ifade edilmiştir 22 . Entropi yöntemi karar probleminin hiyerarşik bir yapı oluşturmadan kriterlerin önem düzeylerinin ortaya çıkardığı ve AHP (Analitik Hiyerarşi Prosesi), Delphi teknikleri gibi karar vericilerin sübjektif yargılarına gerek kalmadan verileri dikkate alarak kriter ağırlıklarını hesapladığı için objektif bir değerlendirme yöntemidir.23 Entropi, sosyal bilimler, fizik ve bilgi teorisinde kullanımı tercih edilen önemli kavramlardan olmakla birlikte ÇKKV problemlerinde her bir kriterin uygun ağırlıklarını bulmak için uygun bir yöntemdir. Entropi yönteminin adımları aşağıdaki gibidir24:
Adım 1: Karar matrisinde birbirinden farklı indeks boyutlarının eşölçülemezlik üzerindeki etkilerini yok etmek amacıyla indeksler çeşitli yöntemlerle standartlaştırılabilmektedir. Fayda ve maliyet indekslerine göre kriterler Eşitlik (1) ve (2) yardımıyla normalize edilmektedir.
rij = xij/maxij (i = 1, … , m j = 1, … , n) (1)
rij = minij/xij (i = 1, … , m j = 1, … , n) (2)
Adım 2: Farklı ölçü birimlerindeki aykırılıkları ortadan kaldırmak için normalizasyon işlemi yapılarak 𝑃𝑃𝑖𝑖𝑖𝑖 değeri hesaplanır.
20 Kılıç, O. (2016). Uzlaşık Çok Ölçütlü Karar Verme Yöntemleri Kullanılarak TCDD Yatırım Projelerinin Sıralanması, Yüksek Lisans Tezi, Gazi Üniversitesi, Fen Bilimler Enstitüsü, Endüstri Mühendisliği Anabilim Dalı, Ankara, s.19. 21 Taşabat, S.E., ve diğerleri (2015). Farklı Ağırlıklandırma Tekniklerinin Denendiği Çok Kriterli Karar Verme Yöntemleri ile Türkiye’deki Mevduat Bankalarının Mali Performanslarının Değerlendirilmesi, Social Sciences Research Journal, 4 (2): 96. 22 Zhang, H., ve diğerleri (2011). The Evaluation of Tourism Destination Competitiveness by TOPSIS & Information Entropy–A case in the Yangtze River Delta of China. Tourism Management, 32(2): 444. 23 Çakır, S., Perçin, S. (2013). AB Ülkeleri’nde Bütünleşik Entropi Ağırlık-Topsis Yöntemiyle Ar-Ge Performansının Ölçülmesi, Uludağ Üniversitesi, İktisadi ve İdari Bilimler Fakültesi Dergisi, 3(1): 79. 24 Karami, A., Johansson, R. (2014). Utilization of Multi Attribute Decision Making Techniques to Integrate Automatic and Manual Ranking of Options, Journal of Information Science and Engineering, 30: 523-524.
(2)
Adım 2: Farklı ölçü birimlerindeki aykırılıkları ortadan kaldırmak için normalizasyon işlemi yapılarak
olarak da tanımlamak mümkündür. 20 Kişisel seçim problemlerinden, endüstriyel, finansal, eğitim ve politik karar problemlerine kadar birçok alanda kullanılan ÇKKV yöntemleri, 1960’lı yılların başından itibaren karar verme sürecine yardımcı olacak çözüm yöntemlerine ihtiyaç duyulmasıyla geliştirilmeye başlanmıştır. ÇKKV yöntemlerini kullanmadaki amaç, alternatif ve kriter sayılarının çok olduğu durumda karar verme mekanizmasını kontrol altında tutabilmek ve karar sonucunu mümkün olduğunca kolay ve çabuk elde etmektir.21
4.2. Entropi Yöntemi
Entropi kavramı ilk olarak 1965 yılında Rudolph Clausius tarafından bir sistemde meydana gelen düzensizliğin ve belirsizliğin bir ölçüsü olarak ifade edilmiştir 22 . Entropi yöntemi karar probleminin hiyerarşik bir yapı oluşturmadan kriterlerin önem düzeylerinin ortaya çıkardığı ve AHP (Analitik Hiyerarşi Prosesi), Delphi teknikleri gibi karar vericilerin sübjektif yargılarına gerek kalmadan verileri dikkate alarak kriter ağırlıklarını hesapladığı için objektif bir değerlendirme yöntemidir.23 Entropi, sosyal bilimler, fizik ve bilgi teorisinde kullanımı tercih edilen önemli kavramlardan olmakla birlikte ÇKKV problemlerinde her bir kriterin uygun ağırlıklarını bulmak için uygun bir yöntemdir. Entropi yönteminin adımları aşağıdaki gibidir24:
Adım 1: Karar matrisinde birbirinden farklı indeks boyutlarının eşölçülemezlik üzerindeki etkilerini yok etmek amacıyla indeksler çeşitli yöntemlerle standartlaştırılabilmektedir. Fayda ve maliyet indekslerine göre kriterler Eşitlik (1) ve (2) yardımıyla normalize edilmektedir.
rij = xij/maxij (i = 1, … , m j = 1, … , n) (1)
rij = minij/xij (i = 1, … , m j = 1, … , n) (2)
Adım 2: Farklı ölçü birimlerindeki aykırılıkları ortadan kaldırmak için normalizasyon işlemi yapılarak 𝑃𝑃𝑖𝑖𝑖𝑖 değeri hesaplanır.
20 Kılıç, O. (2016). Uzlaşık Çok Ölçütlü Karar Verme Yöntemleri Kullanılarak TCDD Yatırım Projelerinin Sıralanması, Yüksek Lisans Tezi, Gazi Üniversitesi, Fen Bilimler Enstitüsü, Endüstri Mühendisliği Anabilim Dalı, Ankara, s.19. 21 Taşabat, S.E., ve diğerleri (2015). Farklı Ağırlıklandırma Tekniklerinin Denendiği Çok Kriterli Karar Verme Yöntemleri ile Türkiye’deki Mevduat Bankalarının Mali Performanslarının Değerlendirilmesi, Social Sciences Research Journal, 4 (2): 96. 22 Zhang, H., ve diğerleri (2011). The Evaluation of Tourism Destination Competitiveness by TOPSIS & Information Entropy–A case in the Yangtze River Delta of China. Tourism Management, 32(2): 444. 23 Çakır, S., Perçin, S. (2013). AB Ülkeleri’nde Bütünleşik Entropi Ağırlık-Topsis Yöntemiyle Ar-Ge Performansının Ölçülmesi, Uludağ Üniversitesi, İktisadi ve İdari Bilimler Fakültesi Dergisi, 3(1): 79. 24 Karami, A., Johansson, R. (2014). Utilization of Multi Attribute Decision Making Techniques to Integrate Automatic and Manual Ranking of Options, Journal of Information Science and Engineering, 30: 523-524.
değeri hesaplanır.
20 Kılıç, O. (2016). Uzlaşık Çok Ölçütlü Karar Verme Yöntemleri Kullanılarak TCDD Yatırım Projelerinin Sıralanması, Yüksek Lisans Tezi, Gazi Üniversitesi, Fen Bilimler Enstitüsü, Endüstri Mühendisliği Anabilim Dalı, Ankara, s.19.
21 Taşabat, S.E., ve diğerleri (2015). Farklı Ağırlıklandırma Tekniklerinin Denendiği Çok Kriterli Karar Verme Yöntemleri ile Türkiye’deki Mevduat Bankalarının Mali Performanslarının Değerlendirilmesi, Social Sciences Research Journal, 4 (2): 96.
22 Zhang, H., ve diğerleri (2011). The Evaluation of Tourism Destination Competitiveness by TOPSIS & Information Entropy–A case in the Yangtze River Delta of China. Tourism Management, 32(2): 444.
23 Çakır, S., Perçin, S. (2013). AB Ülkeleri’nde Bütünleşik Entropi Ağırlık-Topsis Yöntemiyle Ar-Ge Performansının Ölçülmesi, Uludağ Üniversitesi, İktisadi ve İdari Bilimler Fakültesi Dergisi, 3(1): 79.
24 Karami, A., Johansson, R. (2014). Utilization of Multi Attribute Decision Making Techniques to Integrate Automatic and Manual Ranking of Options, Journal of Information Science and Engineering, 30: 523-524.
Marmara Üniversitesi İktisadi ve İdari Bilimler Dergisi • Cilt: 43 • Sayı: 1 • Haziran 2021, ISSN: 2587-2672, ss/pp. 100-122
107
𝑃𝑃𝑖𝑖𝑖𝑖 = 𝑎𝑎𝑖𝑖𝑖𝑖∑ 𝑎𝑎𝑖𝑖𝑖𝑖𝑚𝑚
𝑖𝑖=1 (3)
i: alternatifler
j: kriterler
𝑃𝑃𝑖𝑖𝑖𝑖: normalize edilmiş değerler
𝑎𝑎𝑖𝑖𝑖𝑖 : verilen fayda değerleri
Adım 3: Bu adımda 𝐸𝐸𝑖𝑖entropi değeri Eşitlik (4) yardımıyla hesaplanır.
𝐸𝐸𝑖𝑖 = ( −1ln (𝑚𝑚)) ∑ [𝑃𝑃𝑖𝑖𝑖𝑖𝑥𝑥 𝑙𝑙𝑙𝑙𝑃𝑃𝑖𝑖𝑖𝑖]𝑚𝑚
𝑖𝑖=1 ; ∀𝑖𝑖 ( −1ln (𝑚𝑚)) = 𝑘𝑘 (4)
k: Entropi katsayısı
Adım 4: Çeşitliliğin derecesi olarak 𝑑𝑑𝑖𝑖 belirsizliği hesaplanır.
𝑑𝑑𝑖𝑖 = 1 − 𝐸𝐸𝑖𝑖 ; ∀𝑖𝑖 (5)
Adım 5: j kriterinin önem derecesi olarak 𝑤𝑤𝑖𝑖 ağırlıkları hesaplanır. Elde edilen ağırlıklar 0 ve 1 aralığında olmalı ve ağırlıkların toplamı 1 değerini vermelidir.
𝑤𝑤𝑖𝑖 = 𝑑𝑑𝑖𝑖∑ 𝑑𝑑𝑖𝑖𝑛𝑛
𝑖𝑖=1; ∀𝑖𝑖 (6)
4.3. ARAS Yöntemi
Zavadskas ve Turksis25 tarafından geliştirilen ARAS yöntemi, alternatiflerin fayda fonksiyonu değerlerini, karar problemine araştırmacı tarafından eklenen optimal alternatife ait fayda fonksiyonu değerleri ile karşılaştırmaktadır26. Bu yöntem, her bir alternatifin ideal alternatife göre oransal benzerliğini ortaya çıkarmaktadır. Böylece ARAS diğer ÇKKV yöntemleri arasında oransal derecelendirme hedefine en yakın yöntem olarak görünmektedir.27 ARAS yönteminin adımları şu şekildedir28:
25 Zavadskas, E.K., Turskis, Z. (2010). A New Additive Ratio Assessment (ARAS) Method in Multicriteria Decision-Making, Technological and Economic Development of Economy, 16(2): 159-172. 26 Sliogeriene, J., ve diğerleri (2013). Analysis and Choice of Energy Generation Technologies: The Multiple Criteria Assessment on the Case Study of Lithuania, Energy Procedia, (32): 13. 27 Ecer, F. (2016). Aras Yöntemi Kullanılarak Kurumsal Kaynak Planlaması Yazılımı Seçimi, Uluslararası Alanya İşletme Fakültesi Dergisi, 8(1): 91. 28 Zavadskas, 2010, 163-165.
(3)
i: alternatifler
j: kriterler
olarak da tanımlamak mümkündür. 20 Kişisel seçim problemlerinden, endüstriyel, finansal, eğitim ve politik karar problemlerine kadar birçok alanda kullanılan ÇKKV yöntemleri, 1960’lı yılların başından itibaren karar verme sürecine yardımcı olacak çözüm yöntemlerine ihtiyaç duyulmasıyla geliştirilmeye başlanmıştır. ÇKKV yöntemlerini kullanmadaki amaç, alternatif ve kriter sayılarının çok olduğu durumda karar verme mekanizmasını kontrol altında tutabilmek ve karar sonucunu mümkün olduğunca kolay ve çabuk elde etmektir.21
4.2. Entropi Yöntemi
Entropi kavramı ilk olarak 1965 yılında Rudolph Clausius tarafından bir sistemde meydana gelen düzensizliğin ve belirsizliğin bir ölçüsü olarak ifade edilmiştir 22 . Entropi yöntemi karar probleminin hiyerarşik bir yapı oluşturmadan kriterlerin önem düzeylerinin ortaya çıkardığı ve AHP (Analitik Hiyerarşi Prosesi), Delphi teknikleri gibi karar vericilerin sübjektif yargılarına gerek kalmadan verileri dikkate alarak kriter ağırlıklarını hesapladığı için objektif bir değerlendirme yöntemidir.23 Entropi, sosyal bilimler, fizik ve bilgi teorisinde kullanımı tercih edilen önemli kavramlardan olmakla birlikte ÇKKV problemlerinde her bir kriterin uygun ağırlıklarını bulmak için uygun bir yöntemdir. Entropi yönteminin adımları aşağıdaki gibidir24:
Adım 1: Karar matrisinde birbirinden farklı indeks boyutlarının eşölçülemezlik üzerindeki etkilerini yok etmek amacıyla indeksler çeşitli yöntemlerle standartlaştırılabilmektedir. Fayda ve maliyet indekslerine göre kriterler Eşitlik (1) ve (2) yardımıyla normalize edilmektedir.
rij = xij/maxij (i = 1, … , m j = 1, … , n) (1)
rij = minij/xij (i = 1, … , m j = 1, … , n) (2)
Adım 2: Farklı ölçü birimlerindeki aykırılıkları ortadan kaldırmak için normalizasyon işlemi yapılarak 𝑃𝑃𝑖𝑖𝑖𝑖 değeri hesaplanır.
20 Kılıç, O. (2016). Uzlaşık Çok Ölçütlü Karar Verme Yöntemleri Kullanılarak TCDD Yatırım Projelerinin Sıralanması, Yüksek Lisans Tezi, Gazi Üniversitesi, Fen Bilimler Enstitüsü, Endüstri Mühendisliği Anabilim Dalı, Ankara, s.19. 21 Taşabat, S.E., ve diğerleri (2015). Farklı Ağırlıklandırma Tekniklerinin Denendiği Çok Kriterli Karar Verme Yöntemleri ile Türkiye’deki Mevduat Bankalarının Mali Performanslarının Değerlendirilmesi, Social Sciences Research Journal, 4 (2): 96. 22 Zhang, H., ve diğerleri (2011). The Evaluation of Tourism Destination Competitiveness by TOPSIS & Information Entropy–A case in the Yangtze River Delta of China. Tourism Management, 32(2): 444. 23 Çakır, S., Perçin, S. (2013). AB Ülkeleri’nde Bütünleşik Entropi Ağırlık-Topsis Yöntemiyle Ar-Ge Performansının Ölçülmesi, Uludağ Üniversitesi, İktisadi ve İdari Bilimler Fakültesi Dergisi, 3(1): 79. 24 Karami, A., Johansson, R. (2014). Utilization of Multi Attribute Decision Making Techniques to Integrate Automatic and Manual Ranking of Options, Journal of Information Science and Engineering, 30: 523-524.
: normalize edilmiş değerler
𝑃𝑃𝑖𝑖𝑖𝑖 = 𝑎𝑎𝑖𝑖𝑖𝑖∑ 𝑎𝑎𝑖𝑖𝑖𝑖𝑚𝑚
𝑖𝑖=1 (3)
i: alternatifler
j: kriterler
𝑃𝑃𝑖𝑖𝑖𝑖: normalize edilmiş değerler
𝑎𝑎𝑖𝑖𝑖𝑖 : verilen fayda değerleri
Adım 3: Bu adımda 𝐸𝐸𝑖𝑖entropi değeri Eşitlik (4) yardımıyla hesaplanır.
𝐸𝐸𝑖𝑖 = ( −1ln (𝑚𝑚)) ∑ [𝑃𝑃𝑖𝑖𝑖𝑖𝑥𝑥 𝑙𝑙𝑙𝑙𝑃𝑃𝑖𝑖𝑖𝑖]𝑚𝑚
𝑖𝑖=1 ; ∀𝑖𝑖 ( −1ln (𝑚𝑚)) = 𝑘𝑘 (4)
k: Entropi katsayısı
Adım 4: Çeşitliliğin derecesi olarak 𝑑𝑑𝑖𝑖 belirsizliği hesaplanır.
𝑑𝑑𝑖𝑖 = 1 − 𝐸𝐸𝑖𝑖 ; ∀𝑖𝑖 (5)
Adım 5: j kriterinin önem derecesi olarak 𝑤𝑤𝑖𝑖 ağırlıkları hesaplanır. Elde edilen ağırlıklar 0 ve 1 aralığında olmalı ve ağırlıkların toplamı 1 değerini vermelidir.
𝑤𝑤𝑖𝑖 = 𝑑𝑑𝑖𝑖∑ 𝑑𝑑𝑖𝑖𝑛𝑛
𝑖𝑖=1; ∀𝑖𝑖 (6)
4.3. ARAS Yöntemi
Zavadskas ve Turksis25 tarafından geliştirilen ARAS yöntemi, alternatiflerin fayda fonksiyonu değerlerini, karar problemine araştırmacı tarafından eklenen optimal alternatife ait fayda fonksiyonu değerleri ile karşılaştırmaktadır26. Bu yöntem, her bir alternatifin ideal alternatife göre oransal benzerliğini ortaya çıkarmaktadır. Böylece ARAS diğer ÇKKV yöntemleri arasında oransal derecelendirme hedefine en yakın yöntem olarak görünmektedir.27 ARAS yönteminin adımları şu şekildedir28:
25 Zavadskas, E.K., Turskis, Z. (2010). A New Additive Ratio Assessment (ARAS) Method in Multicriteria Decision-Making, Technological and Economic Development of Economy, 16(2): 159-172. 26 Sliogeriene, J., ve diğerleri (2013). Analysis and Choice of Energy Generation Technologies: The Multiple Criteria Assessment on the Case Study of Lithuania, Energy Procedia, (32): 13. 27 Ecer, F. (2016). Aras Yöntemi Kullanılarak Kurumsal Kaynak Planlaması Yazılımı Seçimi, Uluslararası Alanya İşletme Fakültesi Dergisi, 8(1): 91. 28 Zavadskas, 2010, 163-165.
: verilen fayda değerleri
Adım 3: Bu adımda
𝑃𝑃𝑖𝑖𝑖𝑖 = 𝑎𝑎𝑖𝑖𝑖𝑖∑ 𝑎𝑎𝑖𝑖𝑖𝑖𝑚𝑚
𝑖𝑖=1 (3)
i: alternatifler
j: kriterler
𝑃𝑃𝑖𝑖𝑖𝑖: normalize edilmiş değerler
𝑎𝑎𝑖𝑖𝑖𝑖 : verilen fayda değerleri
Adım 3: Bu adımda 𝐸𝐸𝑖𝑖entropi değeri Eşitlik (4) yardımıyla hesaplanır.
𝐸𝐸𝑖𝑖 = ( −1ln (𝑚𝑚)) ∑ [𝑃𝑃𝑖𝑖𝑖𝑖𝑥𝑥 𝑙𝑙𝑙𝑙𝑃𝑃𝑖𝑖𝑖𝑖]𝑚𝑚
𝑖𝑖=1 ; ∀𝑖𝑖 ( −1ln (𝑚𝑚)) = 𝑘𝑘 (4)
k: Entropi katsayısı
Adım 4: Çeşitliliğin derecesi olarak 𝑑𝑑𝑖𝑖 belirsizliği hesaplanır.
𝑑𝑑𝑖𝑖 = 1 − 𝐸𝐸𝑖𝑖 ; ∀𝑖𝑖 (5)
Adım 5: j kriterinin önem derecesi olarak 𝑤𝑤𝑖𝑖 ağırlıkları hesaplanır. Elde edilen ağırlıklar 0 ve 1 aralığında olmalı ve ağırlıkların toplamı 1 değerini vermelidir.
𝑤𝑤𝑖𝑖 = 𝑑𝑑𝑖𝑖∑ 𝑑𝑑𝑖𝑖𝑛𝑛
𝑖𝑖=1; ∀𝑖𝑖 (6)
4.3. ARAS Yöntemi
Zavadskas ve Turksis25 tarafından geliştirilen ARAS yöntemi, alternatiflerin fayda fonksiyonu değerlerini, karar problemine araştırmacı tarafından eklenen optimal alternatife ait fayda fonksiyonu değerleri ile karşılaştırmaktadır26. Bu yöntem, her bir alternatifin ideal alternatife göre oransal benzerliğini ortaya çıkarmaktadır. Böylece ARAS diğer ÇKKV yöntemleri arasında oransal derecelendirme hedefine en yakın yöntem olarak görünmektedir.27 ARAS yönteminin adımları şu şekildedir28:
25 Zavadskas, E.K., Turskis, Z. (2010). A New Additive Ratio Assessment (ARAS) Method in Multicriteria Decision-Making, Technological and Economic Development of Economy, 16(2): 159-172. 26 Sliogeriene, J., ve diğerleri (2013). Analysis and Choice of Energy Generation Technologies: The Multiple Criteria Assessment on the Case Study of Lithuania, Energy Procedia, (32): 13. 27 Ecer, F. (2016). Aras Yöntemi Kullanılarak Kurumsal Kaynak Planlaması Yazılımı Seçimi, Uluslararası Alanya İşletme Fakültesi Dergisi, 8(1): 91. 28 Zavadskas, 2010, 163-165.
entropi değeri Eşitlik (4) yardımıyla hesaplanır.
𝑃𝑃𝑖𝑖𝑖𝑖 = 𝑎𝑎𝑖𝑖𝑖𝑖∑ 𝑎𝑎𝑖𝑖𝑖𝑖𝑚𝑚
𝑖𝑖=1 (3)
i: alternatifler
j: kriterler
𝑃𝑃𝑖𝑖𝑖𝑖: normalize edilmiş değerler
𝑎𝑎𝑖𝑖𝑖𝑖 : verilen fayda değerleri
Adım 3: Bu adımda 𝐸𝐸𝑖𝑖entropi değeri Eşitlik (4) yardımıyla hesaplanır.
𝐸𝐸𝑖𝑖 = ( −1ln (𝑚𝑚)) ∑ [𝑃𝑃𝑖𝑖𝑖𝑖𝑥𝑥 𝑙𝑙𝑙𝑙𝑃𝑃𝑖𝑖𝑖𝑖]𝑚𝑚
𝑖𝑖=1 ; ∀𝑖𝑖 ( −1ln (𝑚𝑚)) = 𝑘𝑘 (4)
k: Entropi katsayısı
Adım 4: Çeşitliliğin derecesi olarak 𝑑𝑑𝑖𝑖 belirsizliği hesaplanır.
𝑑𝑑𝑖𝑖 = 1 − 𝐸𝐸𝑖𝑖 ; ∀𝑖𝑖 (5)
Adım 5: j kriterinin önem derecesi olarak 𝑤𝑤𝑖𝑖 ağırlıkları hesaplanır. Elde edilen ağırlıklar 0 ve 1 aralığında olmalı ve ağırlıkların toplamı 1 değerini vermelidir.
𝑤𝑤𝑖𝑖 = 𝑑𝑑𝑖𝑖∑ 𝑑𝑑𝑖𝑖𝑛𝑛
𝑖𝑖=1; ∀𝑖𝑖 (6)
4.3. ARAS Yöntemi
Zavadskas ve Turksis25 tarafından geliştirilen ARAS yöntemi, alternatiflerin fayda fonksiyonu değerlerini, karar problemine araştırmacı tarafından eklenen optimal alternatife ait fayda fonksiyonu değerleri ile karşılaştırmaktadır26. Bu yöntem, her bir alternatifin ideal alternatife göre oransal benzerliğini ortaya çıkarmaktadır. Böylece ARAS diğer ÇKKV yöntemleri arasında oransal derecelendirme hedefine en yakın yöntem olarak görünmektedir.27 ARAS yönteminin adımları şu şekildedir28:
25 Zavadskas, E.K., Turskis, Z. (2010). A New Additive Ratio Assessment (ARAS) Method in Multicriteria Decision-Making, Technological and Economic Development of Economy, 16(2): 159-172. 26 Sliogeriene, J., ve diğerleri (2013). Analysis and Choice of Energy Generation Technologies: The Multiple Criteria Assessment on the Case Study of Lithuania, Energy Procedia, (32): 13. 27 Ecer, F. (2016). Aras Yöntemi Kullanılarak Kurumsal Kaynak Planlaması Yazılımı Seçimi, Uluslararası Alanya İşletme Fakültesi Dergisi, 8(1): 91. 28 Zavadskas, 2010, 163-165.
(4)
k: Entropi katsayısı
Adım 4: Çeşitliliğin derecesi olarak
𝑃𝑃𝑖𝑖𝑖𝑖 = 𝑎𝑎𝑖𝑖𝑖𝑖∑ 𝑎𝑎𝑖𝑖𝑖𝑖𝑚𝑚
𝑖𝑖=1 (3)
i: alternatifler
j: kriterler
𝑃𝑃𝑖𝑖𝑖𝑖: normalize edilmiş değerler
𝑎𝑎𝑖𝑖𝑖𝑖 : verilen fayda değerleri
Adım 3: Bu adımda 𝐸𝐸𝑖𝑖entropi değeri Eşitlik (4) yardımıyla hesaplanır.
𝐸𝐸𝑖𝑖 = ( −1ln (𝑚𝑚)) ∑ [𝑃𝑃𝑖𝑖𝑖𝑖𝑥𝑥 𝑙𝑙𝑙𝑙𝑃𝑃𝑖𝑖𝑖𝑖]𝑚𝑚
𝑖𝑖=1 ; ∀𝑖𝑖 ( −1ln (𝑚𝑚)) = 𝑘𝑘 (4)
k: Entropi katsayısı
Adım 4: Çeşitliliğin derecesi olarak 𝑑𝑑𝑖𝑖 belirsizliği hesaplanır.
𝑑𝑑𝑖𝑖 = 1 − 𝐸𝐸𝑖𝑖 ; ∀𝑖𝑖 (5)
Adım 5: j kriterinin önem derecesi olarak 𝑤𝑤𝑖𝑖 ağırlıkları hesaplanır. Elde edilen ağırlıklar 0 ve 1 aralığında olmalı ve ağırlıkların toplamı 1 değerini vermelidir.
𝑤𝑤𝑖𝑖 = 𝑑𝑑𝑖𝑖∑ 𝑑𝑑𝑖𝑖𝑛𝑛
𝑖𝑖=1; ∀𝑖𝑖 (6)
4.3. ARAS Yöntemi
Zavadskas ve Turksis25 tarafından geliştirilen ARAS yöntemi, alternatiflerin fayda fonksiyonu değerlerini, karar problemine araştırmacı tarafından eklenen optimal alternatife ait fayda fonksiyonu değerleri ile karşılaştırmaktadır26. Bu yöntem, her bir alternatifin ideal alternatife göre oransal benzerliğini ortaya çıkarmaktadır. Böylece ARAS diğer ÇKKV yöntemleri arasında oransal derecelendirme hedefine en yakın yöntem olarak görünmektedir.27 ARAS yönteminin adımları şu şekildedir28:
25 Zavadskas, E.K., Turskis, Z. (2010). A New Additive Ratio Assessment (ARAS) Method in Multicriteria Decision-Making, Technological and Economic Development of Economy, 16(2): 159-172. 26 Sliogeriene, J., ve diğerleri (2013). Analysis and Choice of Energy Generation Technologies: The Multiple Criteria Assessment on the Case Study of Lithuania, Energy Procedia, (32): 13. 27 Ecer, F. (2016). Aras Yöntemi Kullanılarak Kurumsal Kaynak Planlaması Yazılımı Seçimi, Uluslararası Alanya İşletme Fakültesi Dergisi, 8(1): 91. 28 Zavadskas, 2010, 163-165.
belirsizliği hesaplanır.
𝑃𝑃𝑖𝑖𝑖𝑖 = 𝑎𝑎𝑖𝑖𝑖𝑖∑ 𝑎𝑎𝑖𝑖𝑖𝑖𝑚𝑚
𝑖𝑖=1 (3)
i: alternatifler
j: kriterler
𝑃𝑃𝑖𝑖𝑖𝑖: normalize edilmiş değerler
𝑎𝑎𝑖𝑖𝑖𝑖 : verilen fayda değerleri
Adım 3: Bu adımda 𝐸𝐸𝑖𝑖entropi değeri Eşitlik (4) yardımıyla hesaplanır.
𝐸𝐸𝑖𝑖 = ( −1ln (𝑚𝑚)) ∑ [𝑃𝑃𝑖𝑖𝑖𝑖𝑥𝑥 𝑙𝑙𝑙𝑙𝑃𝑃𝑖𝑖𝑖𝑖]𝑚𝑚
𝑖𝑖=1 ; ∀𝑖𝑖 ( −1ln (𝑚𝑚)) = 𝑘𝑘 (4)
k: Entropi katsayısı
Adım 4: Çeşitliliğin derecesi olarak 𝑑𝑑𝑖𝑖 belirsizliği hesaplanır.
𝑑𝑑𝑖𝑖 = 1 − 𝐸𝐸𝑖𝑖 ; ∀𝑖𝑖 (5)
Adım 5: j kriterinin önem derecesi olarak 𝑤𝑤𝑖𝑖 ağırlıkları hesaplanır. Elde edilen ağırlıklar 0 ve 1 aralığında olmalı ve ağırlıkların toplamı 1 değerini vermelidir.
𝑤𝑤𝑖𝑖 = 𝑑𝑑𝑖𝑖∑ 𝑑𝑑𝑖𝑖𝑛𝑛
𝑖𝑖=1; ∀𝑖𝑖 (6)
4.3. ARAS Yöntemi
Zavadskas ve Turksis25 tarafından geliştirilen ARAS yöntemi, alternatiflerin fayda fonksiyonu değerlerini, karar problemine araştırmacı tarafından eklenen optimal alternatife ait fayda fonksiyonu değerleri ile karşılaştırmaktadır26. Bu yöntem, her bir alternatifin ideal alternatife göre oransal benzerliğini ortaya çıkarmaktadır. Böylece ARAS diğer ÇKKV yöntemleri arasında oransal derecelendirme hedefine en yakın yöntem olarak görünmektedir.27 ARAS yönteminin adımları şu şekildedir28:
25 Zavadskas, E.K., Turskis, Z. (2010). A New Additive Ratio Assessment (ARAS) Method in Multicriteria Decision-Making, Technological and Economic Development of Economy, 16(2): 159-172. 26 Sliogeriene, J., ve diğerleri (2013). Analysis and Choice of Energy Generation Technologies: The Multiple Criteria Assessment on the Case Study of Lithuania, Energy Procedia, (32): 13. 27 Ecer, F. (2016). Aras Yöntemi Kullanılarak Kurumsal Kaynak Planlaması Yazılımı Seçimi, Uluslararası Alanya İşletme Fakültesi Dergisi, 8(1): 91. 28 Zavadskas, 2010, 163-165.
(5)
Adım 5: j kriterinin önem derecesi olarak
𝑃𝑃𝑖𝑖𝑖𝑖 = 𝑎𝑎𝑖𝑖𝑖𝑖∑ 𝑎𝑎𝑖𝑖𝑖𝑖𝑚𝑚
𝑖𝑖=1 (3)
i: alternatifler
j: kriterler
𝑃𝑃𝑖𝑖𝑖𝑖: normalize edilmiş değerler
𝑎𝑎𝑖𝑖𝑖𝑖 : verilen fayda değerleri
Adım 3: Bu adımda 𝐸𝐸𝑖𝑖entropi değeri Eşitlik (4) yardımıyla hesaplanır.
𝐸𝐸𝑖𝑖 = ( −1ln (𝑚𝑚)) ∑ [𝑃𝑃𝑖𝑖𝑖𝑖𝑥𝑥 𝑙𝑙𝑙𝑙𝑃𝑃𝑖𝑖𝑖𝑖]𝑚𝑚
𝑖𝑖=1 ; ∀𝑖𝑖 ( −1ln (𝑚𝑚)) = 𝑘𝑘 (4)
k: Entropi katsayısı
Adım 4: Çeşitliliğin derecesi olarak 𝑑𝑑𝑖𝑖 belirsizliği hesaplanır.
𝑑𝑑𝑖𝑖 = 1 − 𝐸𝐸𝑖𝑖 ; ∀𝑖𝑖 (5)
Adım 5: j kriterinin önem derecesi olarak 𝑤𝑤𝑖𝑖 ağırlıkları hesaplanır. Elde edilen ağırlıklar 0 ve 1 aralığında olmalı ve ağırlıkların toplamı 1 değerini vermelidir.
𝑤𝑤𝑖𝑖 = 𝑑𝑑𝑖𝑖∑ 𝑑𝑑𝑖𝑖𝑛𝑛
𝑖𝑖=1; ∀𝑖𝑖 (6)
4.3. ARAS Yöntemi
Zavadskas ve Turksis25 tarafından geliştirilen ARAS yöntemi, alternatiflerin fayda fonksiyonu değerlerini, karar problemine araştırmacı tarafından eklenen optimal alternatife ait fayda fonksiyonu değerleri ile karşılaştırmaktadır26. Bu yöntem, her bir alternatifin ideal alternatife göre oransal benzerliğini ortaya çıkarmaktadır. Böylece ARAS diğer ÇKKV yöntemleri arasında oransal derecelendirme hedefine en yakın yöntem olarak görünmektedir.27 ARAS yönteminin adımları şu şekildedir28:
25 Zavadskas, E.K., Turskis, Z. (2010). A New Additive Ratio Assessment (ARAS) Method in Multicriteria Decision-Making, Technological and Economic Development of Economy, 16(2): 159-172. 26 Sliogeriene, J., ve diğerleri (2013). Analysis and Choice of Energy Generation Technologies: The Multiple Criteria Assessment on the Case Study of Lithuania, Energy Procedia, (32): 13. 27 Ecer, F. (2016). Aras Yöntemi Kullanılarak Kurumsal Kaynak Planlaması Yazılımı Seçimi, Uluslararası Alanya İşletme Fakültesi Dergisi, 8(1): 91. 28 Zavadskas, 2010, 163-165.
ağırlıkları hesaplanır. Elde edilen ağırlıklar 0 ve 1 aralığında olmalı ve ağırlıkların toplamı 1 değerini vermelidir.
𝑃𝑃𝑖𝑖𝑖𝑖 = 𝑎𝑎𝑖𝑖𝑖𝑖∑ 𝑎𝑎𝑖𝑖𝑖𝑖𝑚𝑚
𝑖𝑖=1 (3)
i: alternatifler
j: kriterler
𝑃𝑃𝑖𝑖𝑖𝑖: normalize edilmiş değerler
𝑎𝑎𝑖𝑖𝑖𝑖 : verilen fayda değerleri
Adım 3: Bu adımda 𝐸𝐸𝑖𝑖entropi değeri Eşitlik (4) yardımıyla hesaplanır.
𝐸𝐸𝑖𝑖 = ( −1ln (𝑚𝑚)) ∑ [𝑃𝑃𝑖𝑖𝑖𝑖𝑥𝑥 𝑙𝑙𝑙𝑙𝑃𝑃𝑖𝑖𝑖𝑖]𝑚𝑚
𝑖𝑖=1 ; ∀𝑖𝑖 ( −1ln (𝑚𝑚)) = 𝑘𝑘 (4)
k: Entropi katsayısı
Adım 4: Çeşitliliğin derecesi olarak 𝑑𝑑𝑖𝑖 belirsizliği hesaplanır.
𝑑𝑑𝑖𝑖 = 1 − 𝐸𝐸𝑖𝑖 ; ∀𝑖𝑖 (5)
Adım 5: j kriterinin önem derecesi olarak 𝑤𝑤𝑖𝑖 ağırlıkları hesaplanır. Elde edilen ağırlıklar 0 ve 1 aralığında olmalı ve ağırlıkların toplamı 1 değerini vermelidir.
𝑤𝑤𝑖𝑖 = 𝑑𝑑𝑖𝑖∑ 𝑑𝑑𝑖𝑖𝑛𝑛
𝑖𝑖=1; ∀𝑖𝑖 (6)
4.3. ARAS Yöntemi
Zavadskas ve Turksis25 tarafından geliştirilen ARAS yöntemi, alternatiflerin fayda fonksiyonu değerlerini, karar problemine araştırmacı tarafından eklenen optimal alternatife ait fayda fonksiyonu değerleri ile karşılaştırmaktadır26. Bu yöntem, her bir alternatifin ideal alternatife göre oransal benzerliğini ortaya çıkarmaktadır. Böylece ARAS diğer ÇKKV yöntemleri arasında oransal derecelendirme hedefine en yakın yöntem olarak görünmektedir.27 ARAS yönteminin adımları şu şekildedir28:
25 Zavadskas, E.K., Turskis, Z. (2010). A New Additive Ratio Assessment (ARAS) Method in Multicriteria Decision-Making, Technological and Economic Development of Economy, 16(2): 159-172. 26 Sliogeriene, J., ve diğerleri (2013). Analysis and Choice of Energy Generation Technologies: The Multiple Criteria Assessment on the Case Study of Lithuania, Energy Procedia, (32): 13. 27 Ecer, F. (2016). Aras Yöntemi Kullanılarak Kurumsal Kaynak Planlaması Yazılımı Seçimi, Uluslararası Alanya İşletme Fakültesi Dergisi, 8(1): 91. 28 Zavadskas, 2010, 163-165.
(6)
4.3. ARAS Yöntemi
Zavadskas ve Turksis25 tarafından geliştirilen ARAS yöntemi, alternatiflerin fayda fonksiyonu değerlerini, karar problemine araştırmacı tarafından eklenen optimal alternatife ait fayda fonksiyonu değerleri ile karşılaştırmaktadır26. Bu yöntem, her bir alternatifin ideal alternatife göre oransal benzerliğini ortaya çıkarmaktadır. Böylece ARAS diğer ÇKKV yöntemleri arasında oransal derecelendirme hedefine en yakın yöntem olarak görünmektedir.27 ARAS yönteminin adımları şu şekildedir28:
Adım 1: Öncelikle ilk satırında her bir kritere ait optimal değerin yer aldığı karar matrisi oluşturulur.
25 Zavadskas, E.K., Turskis, Z. (2010). A New Additive Ratio Assessment (ARAS) Method in Multicriteria Decision-Making, Technological and Economic Development of Economy, 16(2): 159-172.
26 Sliogeriene, J., ve diğerleri (2013). Analysis and Choice of Energy Generation Technologies: The Multiple Criteria Assessment on the Case Study of Lithuania, Energy Procedia, (32): 13.
27 Ecer, F. (2016). Aras Yöntemi Kullanılarak Kurumsal Kaynak Planlaması Yazılımı Seçimi, Uluslararası Alanya İşletme Fakültesi Dergisi, 8(1): 91.
28 Zavadskas, 2010, 163-165.
Müge YILMAZ • Mevlüdiye ŞİMŞEK • Gözde KOCA
108
Adım 1: Öncelikle ilk satırında her bir kritere ait optimal değerin yer aldığı karar matrisi oluşturulur.
=
mnmjm
iniji
nj
XXX
XXX
XXX
X
1
1
0001
; i=0,1,…,m j=0,1,…,n (7)
Adım 2: ARAS yönteminde �̅�𝑋 normalize karar matrisi �̅�𝑥𝑖𝑖𝑖𝑖 değerlerinden oluşmaktadır. �̅�𝑥𝑖𝑖𝑖𝑖 değerleri kriterin fayda ya da maliyet özelliği göstermesine göre iki şekilde hesaplanmaktadır. Kriter performans değerlerinin maksimum olması daha iyi kabul ediliyorsa, normalize değerler Eşitlik (8) kullanılarak hesaplanmaktadır.
=
= m
iij
ijij
x
xx
0
(8)
Kriter performans değerlerinin minimum olması daha iyi kabul ediliyorsa, normalizasyon işlemi iki adımda (Eşitlik (9) ve Eşitlik (10)) gerçekleştirilir. Öncelikle performans değerleri kullanılarak fayda durumuna dönüştürülür, daha sonra ise normalize değerler hesaplanır.
ijij x
x 1* = (9)
=
= m
iij
ijij
x
xx
0
*
*
(10)
Adım 3: Normalize karar matrisi elde edildikten sonra belirlenen 𝑤𝑤𝑖𝑖 ağırlıkları kullanılarak 𝑋𝑋ağırlıklandırılmış normalize karar matrisi oluşturulur. Kriterlere ait ağırlıklar toplamı Eşitlik (11)’ de gösterildiği gibidir:
11
==
n
jjw (11)
(7)
Adım 2: ARAS yönteminde
Adım 1: Öncelikle ilk satırında her bir kritere ait optimal değerin yer aldığı karar matrisi oluşturulur.
=
mnmjm
iniji
nj
XXX
XXX
XXX
X
1
1
0001
; i=0,1,…,m j=0,1,…,n (7)
Adım 2: ARAS yönteminde �̅�𝑋 normalize karar matrisi �̅�𝑥𝑖𝑖𝑖𝑖 değerlerinden oluşmaktadır. �̅�𝑥𝑖𝑖𝑖𝑖 değerleri kriterin fayda ya da maliyet özelliği göstermesine göre iki şekilde hesaplanmaktadır. Kriter performans değerlerinin maksimum olması daha iyi kabul ediliyorsa, normalize değerler Eşitlik (8) kullanılarak hesaplanmaktadır.
=
= m
iij
ijij
x
xx
0
(8)
Kriter performans değerlerinin minimum olması daha iyi kabul ediliyorsa, normalizasyon işlemi iki adımda (Eşitlik (9) ve Eşitlik (10)) gerçekleştirilir. Öncelikle performans değerleri kullanılarak fayda durumuna dönüştürülür, daha sonra ise normalize değerler hesaplanır.
ijij x
x 1* = (9)
=
= m
iij
ijij
x
xx
0
*
*
(10)
Adım 3: Normalize karar matrisi elde edildikten sonra belirlenen 𝑤𝑤𝑖𝑖 ağırlıkları kullanılarak 𝑋𝑋ağırlıklandırılmış normalize karar matrisi oluşturulur. Kriterlere ait ağırlıklar toplamı Eşitlik (11)’ de gösterildiği gibidir:
11
==
n
jjw (11)
normalize karar matrisi
Adım 1: Öncelikle ilk satırında her bir kritere ait optimal değerin yer aldığı karar matrisi oluşturulur.
=
mnmjm
iniji
nj
XXX
XXX
XXX
X
1
1
0001
; i=0,1,…,m j=0,1,…,n (7)
Adım 2: ARAS yönteminde �̅�𝑋 normalize karar matrisi �̅�𝑥𝑖𝑖𝑖𝑖 değerlerinden oluşmaktadır. �̅�𝑥𝑖𝑖𝑖𝑖 değerleri kriterin fayda ya da maliyet özelliği göstermesine göre iki şekilde hesaplanmaktadır. Kriter performans değerlerinin maksimum olması daha iyi kabul ediliyorsa, normalize değerler Eşitlik (8) kullanılarak hesaplanmaktadır.
=
= m
iij
ijij
x
xx
0
(8)
Kriter performans değerlerinin minimum olması daha iyi kabul ediliyorsa, normalizasyon işlemi iki adımda (Eşitlik (9) ve Eşitlik (10)) gerçekleştirilir. Öncelikle performans değerleri kullanılarak fayda durumuna dönüştürülür, daha sonra ise normalize değerler hesaplanır.
ijij x
x 1* = (9)
=
= m
iij
ijij
x
xx
0
*
*
(10)
Adım 3: Normalize karar matrisi elde edildikten sonra belirlenen 𝑤𝑤𝑖𝑖 ağırlıkları kullanılarak 𝑋𝑋ağırlıklandırılmış normalize karar matrisi oluşturulur. Kriterlere ait ağırlıklar toplamı Eşitlik (11)’ de gösterildiği gibidir:
11
==
n
jjw (11)
değerlerinden oluşmaktadır.
Adım 1: Öncelikle ilk satırında her bir kritere ait optimal değerin yer aldığı karar matrisi oluşturulur.
=
mnmjm
iniji
nj
XXX
XXX
XXX
X
1
1
0001
; i=0,1,…,m j=0,1,…,n (7)
Adım 2: ARAS yönteminde �̅�𝑋 normalize karar matrisi �̅�𝑥𝑖𝑖𝑖𝑖 değerlerinden oluşmaktadır. �̅�𝑥𝑖𝑖𝑖𝑖 değerleri kriterin fayda ya da maliyet özelliği göstermesine göre iki şekilde hesaplanmaktadır. Kriter performans değerlerinin maksimum olması daha iyi kabul ediliyorsa, normalize değerler Eşitlik (8) kullanılarak hesaplanmaktadır.
=
= m
iij
ijij
x
xx
0
(8)
Kriter performans değerlerinin minimum olması daha iyi kabul ediliyorsa, normalizasyon işlemi iki adımda (Eşitlik (9) ve Eşitlik (10)) gerçekleştirilir. Öncelikle performans değerleri kullanılarak fayda durumuna dönüştürülür, daha sonra ise normalize değerler hesaplanır.
ijij x
x 1* = (9)
=
= m
iij
ijij
x
xx
0
*
*
(10)
Adım 3: Normalize karar matrisi elde edildikten sonra belirlenen 𝑤𝑤𝑖𝑖 ağırlıkları kullanılarak 𝑋𝑋ağırlıklandırılmış normalize karar matrisi oluşturulur. Kriterlere ait ağırlıklar toplamı Eşitlik (11)’ de gösterildiği gibidir:
11
==
n
jjw (11)
değerleri kriterin fayda ya da maliyet özelliği göstermesine göre iki şekilde hesaplanmaktadır. Kriter performans değerlerinin maksimum olması daha iyi kabul ediliyorsa, normalize değerler Eşitlik (8) kullanılarak hesaplanmaktadır.
Adım 1: Öncelikle ilk satırında her bir kritere ait optimal değerin yer aldığı karar matrisi oluşturulur.
=
mnmjm
iniji
nj
XXX
XXX
XXX
X
1
1
0001
; i=0,1,…,m j=0,1,…,n (7)
Adım 2: ARAS yönteminde �̅�𝑋 normalize karar matrisi �̅�𝑥𝑖𝑖𝑖𝑖 değerlerinden oluşmaktadır. �̅�𝑥𝑖𝑖𝑖𝑖 değerleri kriterin fayda ya da maliyet özelliği göstermesine göre iki şekilde hesaplanmaktadır. Kriter performans değerlerinin maksimum olması daha iyi kabul ediliyorsa, normalize değerler Eşitlik (8) kullanılarak hesaplanmaktadır.
=
= m
iij
ijij
x
xx
0
(8)
Kriter performans değerlerinin minimum olması daha iyi kabul ediliyorsa, normalizasyon işlemi iki adımda (Eşitlik (9) ve Eşitlik (10)) gerçekleştirilir. Öncelikle performans değerleri kullanılarak fayda durumuna dönüştürülür, daha sonra ise normalize değerler hesaplanır.
ijij x
x 1* = (9)
=
= m
iij
ijij
x
xx
0
*
*
(10)
Adım 3: Normalize karar matrisi elde edildikten sonra belirlenen 𝑤𝑤𝑖𝑖 ağırlıkları kullanılarak 𝑋𝑋ağırlıklandırılmış normalize karar matrisi oluşturulur. Kriterlere ait ağırlıklar toplamı Eşitlik (11)’ de gösterildiği gibidir:
11
==
n
jjw (11)
(8)
Kriter performans değerlerinin minimum olması daha iyi kabul ediliyorsa, normalizasyon işlemi iki adımda (Eşitlik (9) ve Eşitlik (10)) gerçekleştirilir. Öncelikle performans değerleri kullanılarak fayda durumuna dönüştürülür, daha sonra ise normalize değerler hesaplanır.
Adım 1: Öncelikle ilk satırında her bir kritere ait optimal değerin yer aldığı karar matrisi oluşturulur.
=
mnmjm
iniji
nj
XXX
XXX
XXX
X
1
1
0001
; i=0,1,…,m j=0,1,…,n (7)
Adım 2: ARAS yönteminde �̅�𝑋 normalize karar matrisi �̅�𝑥𝑖𝑖𝑖𝑖 değerlerinden oluşmaktadır. �̅�𝑥𝑖𝑖𝑖𝑖 değerleri kriterin fayda ya da maliyet özelliği göstermesine göre iki şekilde hesaplanmaktadır. Kriter performans değerlerinin maksimum olması daha iyi kabul ediliyorsa, normalize değerler Eşitlik (8) kullanılarak hesaplanmaktadır.
=
= m
iij
ijij
x
xx
0
(8)
Kriter performans değerlerinin minimum olması daha iyi kabul ediliyorsa, normalizasyon işlemi iki adımda (Eşitlik (9) ve Eşitlik (10)) gerçekleştirilir. Öncelikle performans değerleri kullanılarak fayda durumuna dönüştürülür, daha sonra ise normalize değerler hesaplanır.
ijij x
x 1* = (9)
=
= m
iij
ijij
x
xx
0
*
*
(10)
Adım 3: Normalize karar matrisi elde edildikten sonra belirlenen 𝑤𝑤𝑖𝑖 ağırlıkları kullanılarak 𝑋𝑋ağırlıklandırılmış normalize karar matrisi oluşturulur. Kriterlere ait ağırlıklar toplamı Eşitlik (11)’ de gösterildiği gibidir:
11
==
n
jjw (11)
(9)
Adım 1: Öncelikle ilk satırında her bir kritere ait optimal değerin yer aldığı karar matrisi oluşturulur.
=
mnmjm
iniji
nj
XXX
XXX
XXX
X
1
1
0001
; i=0,1,…,m j=0,1,…,n (7)
Adım 2: ARAS yönteminde �̅�𝑋 normalize karar matrisi �̅�𝑥𝑖𝑖𝑖𝑖 değerlerinden oluşmaktadır. �̅�𝑥𝑖𝑖𝑖𝑖 değerleri kriterin fayda ya da maliyet özelliği göstermesine göre iki şekilde hesaplanmaktadır. Kriter performans değerlerinin maksimum olması daha iyi kabul ediliyorsa, normalize değerler Eşitlik (8) kullanılarak hesaplanmaktadır.
=
= m
iij
ijij
x
xx
0
(8)
Kriter performans değerlerinin minimum olması daha iyi kabul ediliyorsa, normalizasyon işlemi iki adımda (Eşitlik (9) ve Eşitlik (10)) gerçekleştirilir. Öncelikle performans değerleri kullanılarak fayda durumuna dönüştürülür, daha sonra ise normalize değerler hesaplanır.
ijij x
x 1* = (9)
=
= m
iij
ijij
x
xx
0
*
*
(10)
Adım 3: Normalize karar matrisi elde edildikten sonra belirlenen 𝑤𝑤𝑖𝑖 ağırlıkları kullanılarak 𝑋𝑋ağırlıklandırılmış normalize karar matrisi oluşturulur. Kriterlere ait ağırlıklar toplamı Eşitlik (11)’ de gösterildiği gibidir:
11
==
n
jjw (11)
(10)
Adım 3: Normalize karar matrisi elde edildikten sonra belirlenen
𝑃𝑃𝑖𝑖𝑖𝑖 = 𝑎𝑎𝑖𝑖𝑖𝑖∑ 𝑎𝑎𝑖𝑖𝑖𝑖𝑚𝑚
𝑖𝑖=1 (3)
i: alternatifler
j: kriterler
𝑃𝑃𝑖𝑖𝑖𝑖: normalize edilmiş değerler
𝑎𝑎𝑖𝑖𝑖𝑖 : verilen fayda değerleri
Adım 3: Bu adımda 𝐸𝐸𝑖𝑖entropi değeri Eşitlik (4) yardımıyla hesaplanır.
𝐸𝐸𝑖𝑖 = ( −1ln (𝑚𝑚)) ∑ [𝑃𝑃𝑖𝑖𝑖𝑖𝑥𝑥 𝑙𝑙𝑙𝑙𝑃𝑃𝑖𝑖𝑖𝑖]𝑚𝑚
𝑖𝑖=1 ; ∀𝑖𝑖 ( −1ln (𝑚𝑚)) = 𝑘𝑘 (4)
k: Entropi katsayısı
Adım 4: Çeşitliliğin derecesi olarak 𝑑𝑑𝑖𝑖 belirsizliği hesaplanır.
𝑑𝑑𝑖𝑖 = 1 − 𝐸𝐸𝑖𝑖 ; ∀𝑖𝑖 (5)
Adım 5: j kriterinin önem derecesi olarak 𝑤𝑤𝑖𝑖 ağırlıkları hesaplanır. Elde edilen ağırlıklar 0 ve 1 aralığında olmalı ve ağırlıkların toplamı 1 değerini vermelidir.
𝑤𝑤𝑖𝑖 = 𝑑𝑑𝑖𝑖∑ 𝑑𝑑𝑖𝑖𝑛𝑛
𝑖𝑖=1; ∀𝑖𝑖 (6)
4.3. ARAS Yöntemi
Zavadskas ve Turksis25 tarafından geliştirilen ARAS yöntemi, alternatiflerin fayda fonksiyonu değerlerini, karar problemine araştırmacı tarafından eklenen optimal alternatife ait fayda fonksiyonu değerleri ile karşılaştırmaktadır26. Bu yöntem, her bir alternatifin ideal alternatife göre oransal benzerliğini ortaya çıkarmaktadır. Böylece ARAS diğer ÇKKV yöntemleri arasında oransal derecelendirme hedefine en yakın yöntem olarak görünmektedir.27 ARAS yönteminin adımları şu şekildedir28:
25 Zavadskas, E.K., Turskis, Z. (2010). A New Additive Ratio Assessment (ARAS) Method in Multicriteria Decision-Making, Technological and Economic Development of Economy, 16(2): 159-172. 26 Sliogeriene, J., ve diğerleri (2013). Analysis and Choice of Energy Generation Technologies: The Multiple Criteria Assessment on the Case Study of Lithuania, Energy Procedia, (32): 13. 27 Ecer, F. (2016). Aras Yöntemi Kullanılarak Kurumsal Kaynak Planlaması Yazılımı Seçimi, Uluslararası Alanya İşletme Fakültesi Dergisi, 8(1): 91. 28 Zavadskas, 2010, 163-165.
ağırlıkları kullanılarak 𝑋 ağırlıklandırılmış normalize karar matrisi oluşturulur. Kriterlere ait ağırlıklar toplamı Eşitlik (11)’ de gösterildiği gibidir:
11
=∑=
n
jjw
(11)
Eşitlik (12) ile de normalize değerler kullanılarak
Eşitlik (12) ile de normalize değerler kullanılarak 𝑥𝑥𝑖𝑖𝑖𝑖 ağırlıklandırılmış normalize değerleri elde edilmektedir.
𝑥𝑥𝑖𝑖𝑖𝑖 = �̅�𝑥𝑖𝑖𝑖𝑖 . 𝑤𝑤𝑖𝑖𝑖𝑖 (12)
Adım 4: Son adımda her bir alternatif için optimal değerler hesaplanır. Alternatiflere ait değerler Eşitlik (13) yardımıyla elde edilir.
mixSn
jiji ,...,1,0;ˆ
1==
=
(13)
Alternatiflere ait 𝑆𝑆𝑖𝑖 değerleri, 𝑆𝑆0optimal değerine oranlanarak 𝐾𝐾𝑖𝑖 fayda dereceleri Eşitlik (14) yardımıyla hesaplanır.
Ki = SiS0
, i = 0,1, … , m (14)
[0,1] aralığında değer alan 𝐾𝐾𝑖𝑖 oranları kullanılarak alternatiflerin fayda fonksiyonu değerleri hesaplanabilmektedir. Değerler, büyükten küçüğe doğru sıralanarak alternatifler değerlendirilir.
5. Araştırma Bulguları
Çalışmanın bu bölümünde ÇKKV yöntemlerinden Entropi yöntemi ve ARAS yöntemi kullanılarak, OECD ülkelerinde kadınların sosyo-ekonomik statüsünün 2010- 2017 arası döneme ait veriler kullanılarak analiz edilmesi sonucu elde edilen bulgular yer almaktadır. Akışı etkilememesi nedeniyle bu bölümde diğerlerine göre daha güncel verileri içeren 2017 yılına ait bulgulara yer verilecektir. Diğer yıllar içinde aynı şekilde hesaplamalar yapılmıştır.
5.1. 2017 Yılı için Entropi Yöntemiyle Kriter Ağırlıklarının Hesaplanması
2017 yılına ait kriterlerin yer aldığı karar matrisi Tablo 1’de ve 2017 yılı için Ej, dj ve Wj değerlerinin hesaplanması Tablo 2’de gösterilmiştir.
Tablo 1: 2017 Yılı Karar Matrisi
ÜLKELER GDP* İstihdam Oranı**
İşgücüne Katılım Oranı**
Okullaşma ilköğretim
***
Okullaşma ortaöğretim
***
Okullaşma yükseköğretim
***
Ortalama yaşam
beklentisi*
Politik Katılım Oranı**
HDI *
ABD 43899 53.332 66.191 7.3422 7.4535 6.3915 81.4 19.4 0.919 ALMANYA 37689 53.202 73.759 3.2558 8.2191 5.0530 83.5 37 0.919 AVUSTRALYA 35323 55.855 71.784 8.6612 6.9626 6.2104 85.1 28.7 0.926 AVUSTURYA 35626 52.186 71.776 3.4879 7.4199 5.4788 83.7 30.6 0.893 BELÇİKA 33260 44.434 63.154 6.6474 6.3416 5.6194 83.6 38 0.901 BİRLEŞİK KRALLIK 28043 54.423 72.222 6.9478 7.4170 5.9410 82.9 32 0.903 ÇEKYA 23224 50.099 68.186 5.1704 6.7488 4.9951 81.7 20 0.881
ağırlıklandırılmış normalize değerleri elde edilmektedir.
Eşitlik (12) ile de normalize değerler kullanılarak 𝑥𝑥𝑖𝑖𝑖𝑖 ağırlıklandırılmış normalize değerleri elde edilmektedir.
𝑥𝑥𝑖𝑖𝑖𝑖 = �̅�𝑥𝑖𝑖𝑖𝑖 . 𝑤𝑤𝑖𝑖𝑖𝑖 (12)
Adım 4: Son adımda her bir alternatif için optimal değerler hesaplanır. Alternatiflere ait değerler Eşitlik (13) yardımıyla elde edilir.
mixSn
jiji ,...,1,0;ˆ
1==
=
(13)
Alternatiflere ait 𝑆𝑆𝑖𝑖 değerleri, 𝑆𝑆0optimal değerine oranlanarak 𝐾𝐾𝑖𝑖 fayda dereceleri Eşitlik (14) yardımıyla hesaplanır.
Ki = SiS0
, i = 0,1, … , m (14)
[0,1] aralığında değer alan 𝐾𝐾𝑖𝑖 oranları kullanılarak alternatiflerin fayda fonksiyonu değerleri hesaplanabilmektedir. Değerler, büyükten küçüğe doğru sıralanarak alternatifler değerlendirilir.
5. Araştırma Bulguları
Çalışmanın bu bölümünde ÇKKV yöntemlerinden Entropi yöntemi ve ARAS yöntemi kullanılarak, OECD ülkelerinde kadınların sosyo-ekonomik statüsünün 2010- 2017 arası döneme ait veriler kullanılarak analiz edilmesi sonucu elde edilen bulgular yer almaktadır. Akışı etkilememesi nedeniyle bu bölümde diğerlerine göre daha güncel verileri içeren 2017 yılına ait bulgulara yer verilecektir. Diğer yıllar içinde aynı şekilde hesaplamalar yapılmıştır.
5.1. 2017 Yılı için Entropi Yöntemiyle Kriter Ağırlıklarının Hesaplanması
2017 yılına ait kriterlerin yer aldığı karar matrisi Tablo 1’de ve 2017 yılı için Ej, dj ve Wj değerlerinin hesaplanması Tablo 2’de gösterilmiştir.
Tablo 1: 2017 Yılı Karar Matrisi
ÜLKELER GDP* İstihdam Oranı**
İşgücüne Katılım Oranı**
Okullaşma ilköğretim
***
Okullaşma ortaöğretim
***
Okullaşma yükseköğretim
***
Ortalama yaşam
beklentisi*
Politik Katılım Oranı**
HDI *
ABD 43899 53.332 66.191 7.3422 7.4535 6.3915 81.4 19.4 0.919 ALMANYA 37689 53.202 73.759 3.2558 8.2191 5.0530 83.5 37 0.919 AVUSTRALYA 35323 55.855 71.784 8.6612 6.9626 6.2104 85.1 28.7 0.926 AVUSTURYA 35626 52.186 71.776 3.4879 7.4199 5.4788 83.7 30.6 0.893 BELÇİKA 33260 44.434 63.154 6.6474 6.3416 5.6194 83.6 38 0.901 BİRLEŞİK KRALLIK 28043 54.423 72.222 6.9478 7.4170 5.9410 82.9 32 0.903 ÇEKYA 23224 50.099 68.186 5.1704 6.7488 4.9951 81.7 20 0.881
(12)
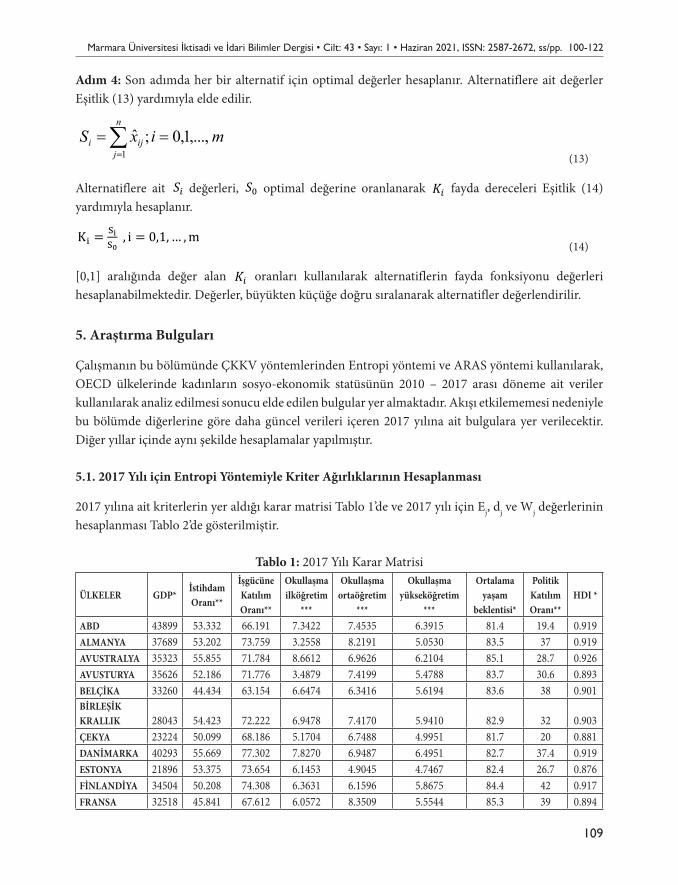
Marmara Üniversitesi İktisadi ve İdari Bilimler Dergisi • Cilt: 43 • Sayı: 1 • Haziran 2021, ISSN: 2587-2672, ss/pp. 100-122
109
Adım 4: Son adımda her bir alternatif için optimal değerler hesaplanır. Alternatiflere ait değerler Eşitlik (13) yardımıyla elde edilir.
Eşitlik (12) ile de normalize değerler kullanılarak 𝑥𝑥𝑖𝑖𝑖𝑖 ağırlıklandırılmış normalize değerleri elde edilmektedir.
𝑥𝑥𝑖𝑖𝑖𝑖 = �̅�𝑥𝑖𝑖𝑖𝑖 . 𝑤𝑤𝑖𝑖𝑖𝑖 (12)
Adım 4: Son adımda her bir alternatif için optimal değerler hesaplanır. Alternatiflere ait değerler Eşitlik (13) yardımıyla elde edilir.
mixSn
jiji ,...,1,0;ˆ
1==
=
(13)
Alternatiflere ait 𝑆𝑆𝑖𝑖 değerleri, 𝑆𝑆0optimal değerine oranlanarak 𝐾𝐾𝑖𝑖 fayda dereceleri Eşitlik (14) yardımıyla hesaplanır.
Ki = SiS0
, i = 0,1, … , m (14)
[0,1] aralığında değer alan 𝐾𝐾𝑖𝑖 oranları kullanılarak alternatiflerin fayda fonksiyonu değerleri hesaplanabilmektedir. Değerler, büyükten küçüğe doğru sıralanarak alternatifler değerlendirilir.
5. Araştırma Bulguları
Çalışmanın bu bölümünde ÇKKV yöntemlerinden Entropi yöntemi ve ARAS yöntemi kullanılarak, OECD ülkelerinde kadınların sosyo-ekonomik statüsünün 2010- 2017 arası döneme ait veriler kullanılarak analiz edilmesi sonucu elde edilen bulgular yer almaktadır. Akışı etkilememesi nedeniyle bu bölümde diğerlerine göre daha güncel verileri içeren 2017 yılına ait bulgulara yer verilecektir. Diğer yıllar içinde aynı şekilde hesaplamalar yapılmıştır.
5.1. 2017 Yılı için Entropi Yöntemiyle Kriter Ağırlıklarının Hesaplanması
2017 yılına ait kriterlerin yer aldığı karar matrisi Tablo 1’de ve 2017 yılı için Ej, dj ve Wj değerlerinin hesaplanması Tablo 2’de gösterilmiştir.
Tablo 1: 2017 Yılı Karar Matrisi
ÜLKELER GDP* İstihdam Oranı**
İşgücüne Katılım Oranı**
Okullaşma ilköğretim
***
Okullaşma ortaöğretim
***
Okullaşma yükseköğretim
***
Ortalama yaşam
beklentisi*
Politik Katılım Oranı**
HDI *
ABD 43899 53.332 66.191 7.3422 7.4535 6.3915 81.4 19.4 0.919 ALMANYA 37689 53.202 73.759 3.2558 8.2191 5.0530 83.5 37 0.919 AVUSTRALYA 35323 55.855 71.784 8.6612 6.9626 6.2104 85.1 28.7 0.926 AVUSTURYA 35626 52.186 71.776 3.4879 7.4199 5.4788 83.7 30.6 0.893 BELÇİKA 33260 44.434 63.154 6.6474 6.3416 5.6194 83.6 38 0.901 BİRLEŞİK KRALLIK 28043 54.423 72.222 6.9478 7.4170 5.9410 82.9 32 0.903 ÇEKYA 23224 50.099 68.186 5.1704 6.7488 4.9951 81.7 20 0.881
(13)
Alternatiflere ait
Eşitlik (12) ile de normalize değerler kullanılarak 𝑥𝑥𝑖𝑖𝑖𝑖 ağırlıklandırılmış normalize değerleri elde edilmektedir.
𝑥𝑥𝑖𝑖𝑖𝑖 = �̅�𝑥𝑖𝑖𝑖𝑖 . 𝑤𝑤𝑖𝑖𝑖𝑖 (12)
Adım 4: Son adımda her bir alternatif için optimal değerler hesaplanır. Alternatiflere ait değerler Eşitlik (13) yardımıyla elde edilir.
mixSn
jiji ,...,1,0;ˆ
1==
=
(13)
Alternatiflere ait 𝑆𝑆𝑖𝑖 değerleri, 𝑆𝑆0optimal değerine oranlanarak 𝐾𝐾𝑖𝑖 fayda dereceleri Eşitlik (14) yardımıyla hesaplanır.
Ki = SiS0
, i = 0,1, … , m (14)
[0,1] aralığında değer alan 𝐾𝐾𝑖𝑖 oranları kullanılarak alternatiflerin fayda fonksiyonu değerleri hesaplanabilmektedir. Değerler, büyükten küçüğe doğru sıralanarak alternatifler değerlendirilir.
5. Araştırma Bulguları
Çalışmanın bu bölümünde ÇKKV yöntemlerinden Entropi yöntemi ve ARAS yöntemi kullanılarak, OECD ülkelerinde kadınların sosyo-ekonomik statüsünün 2010- 2017 arası döneme ait veriler kullanılarak analiz edilmesi sonucu elde edilen bulgular yer almaktadır. Akışı etkilememesi nedeniyle bu bölümde diğerlerine göre daha güncel verileri içeren 2017 yılına ait bulgulara yer verilecektir. Diğer yıllar içinde aynı şekilde hesaplamalar yapılmıştır.
5.1. 2017 Yılı için Entropi Yöntemiyle Kriter Ağırlıklarının Hesaplanması
2017 yılına ait kriterlerin yer aldığı karar matrisi Tablo 1’de ve 2017 yılı için Ej, dj ve Wj değerlerinin hesaplanması Tablo 2’de gösterilmiştir.
Tablo 1: 2017 Yılı Karar Matrisi
ÜLKELER GDP* İstihdam Oranı**
İşgücüne Katılım Oranı**
Okullaşma ilköğretim
***
Okullaşma ortaöğretim
***
Okullaşma yükseköğretim
***
Ortalama yaşam
beklentisi*
Politik Katılım Oranı**
HDI *
ABD 43899 53.332 66.191 7.3422 7.4535 6.3915 81.4 19.4 0.919 ALMANYA 37689 53.202 73.759 3.2558 8.2191 5.0530 83.5 37 0.919 AVUSTRALYA 35323 55.855 71.784 8.6612 6.9626 6.2104 85.1 28.7 0.926 AVUSTURYA 35626 52.186 71.776 3.4879 7.4199 5.4788 83.7 30.6 0.893 BELÇİKA 33260 44.434 63.154 6.6474 6.3416 5.6194 83.6 38 0.901 BİRLEŞİK KRALLIK 28043 54.423 72.222 6.9478 7.4170 5.9410 82.9 32 0.903 ÇEKYA 23224 50.099 68.186 5.1704 6.7488 4.9951 81.7 20 0.881
değerleri,
Eşitlik (12) ile de normalize değerler kullanılarak 𝑥𝑥𝑖𝑖𝑖𝑖 ağırlıklandırılmış normalize değerleri elde edilmektedir.
𝑥𝑥𝑖𝑖𝑖𝑖 = �̅�𝑥𝑖𝑖𝑖𝑖 . 𝑤𝑤𝑖𝑖𝑖𝑖 (12)
Adım 4: Son adımda her bir alternatif için optimal değerler hesaplanır. Alternatiflere ait değerler Eşitlik (13) yardımıyla elde edilir.
mixSn
jiji ,...,1,0;ˆ
1==
=
(13)
Alternatiflere ait 𝑆𝑆𝑖𝑖 değerleri, 𝑆𝑆0optimal değerine oranlanarak 𝐾𝐾𝑖𝑖 fayda dereceleri Eşitlik (14) yardımıyla hesaplanır.
Ki = SiS0
, i = 0,1, … , m (14)
[0,1] aralığında değer alan 𝐾𝐾𝑖𝑖 oranları kullanılarak alternatiflerin fayda fonksiyonu değerleri hesaplanabilmektedir. Değerler, büyükten küçüğe doğru sıralanarak alternatifler değerlendirilir.
5. Araştırma Bulguları
Çalışmanın bu bölümünde ÇKKV yöntemlerinden Entropi yöntemi ve ARAS yöntemi kullanılarak, OECD ülkelerinde kadınların sosyo-ekonomik statüsünün 2010- 2017 arası döneme ait veriler kullanılarak analiz edilmesi sonucu elde edilen bulgular yer almaktadır. Akışı etkilememesi nedeniyle bu bölümde diğerlerine göre daha güncel verileri içeren 2017 yılına ait bulgulara yer verilecektir. Diğer yıllar içinde aynı şekilde hesaplamalar yapılmıştır.
5.1. 2017 Yılı için Entropi Yöntemiyle Kriter Ağırlıklarının Hesaplanması
2017 yılına ait kriterlerin yer aldığı karar matrisi Tablo 1’de ve 2017 yılı için Ej, dj ve Wj değerlerinin hesaplanması Tablo 2’de gösterilmiştir.
Tablo 1: 2017 Yılı Karar Matrisi
ÜLKELER GDP* İstihdam Oranı**
İşgücüne Katılım Oranı**
Okullaşma ilköğretim
***
Okullaşma ortaöğretim
***
Okullaşma yükseköğretim
***
Ortalama yaşam
beklentisi*
Politik Katılım Oranı**
HDI *
ABD 43899 53.332 66.191 7.3422 7.4535 6.3915 81.4 19.4 0.919 ALMANYA 37689 53.202 73.759 3.2558 8.2191 5.0530 83.5 37 0.919 AVUSTRALYA 35323 55.855 71.784 8.6612 6.9626 6.2104 85.1 28.7 0.926 AVUSTURYA 35626 52.186 71.776 3.4879 7.4199 5.4788 83.7 30.6 0.893 BELÇİKA 33260 44.434 63.154 6.6474 6.3416 5.6194 83.6 38 0.901 BİRLEŞİK KRALLIK 28043 54.423 72.222 6.9478 7.4170 5.9410 82.9 32 0.903 ÇEKYA 23224 50.099 68.186 5.1704 6.7488 4.9951 81.7 20 0.881
optimal değerine oranlanarak
Eşitlik (12) ile de normalize değerler kullanılarak 𝑥𝑥𝑖𝑖𝑖𝑖 ağırlıklandırılmış normalize değerleri elde edilmektedir.
𝑥𝑥𝑖𝑖𝑖𝑖 = �̅�𝑥𝑖𝑖𝑖𝑖 . 𝑤𝑤𝑖𝑖𝑖𝑖 (12)
Adım 4: Son adımda her bir alternatif için optimal değerler hesaplanır. Alternatiflere ait değerler Eşitlik (13) yardımıyla elde edilir.
mixSn
jiji ,...,1,0;ˆ
1==
=
(13)
Alternatiflere ait 𝑆𝑆𝑖𝑖 değerleri, 𝑆𝑆0optimal değerine oranlanarak 𝐾𝐾𝑖𝑖 fayda dereceleri Eşitlik (14) yardımıyla hesaplanır.
Ki = SiS0
, i = 0,1, … , m (14)
[0,1] aralığında değer alan 𝐾𝐾𝑖𝑖 oranları kullanılarak alternatiflerin fayda fonksiyonu değerleri hesaplanabilmektedir. Değerler, büyükten küçüğe doğru sıralanarak alternatifler değerlendirilir.
5. Araştırma Bulguları
Çalışmanın bu bölümünde ÇKKV yöntemlerinden Entropi yöntemi ve ARAS yöntemi kullanılarak, OECD ülkelerinde kadınların sosyo-ekonomik statüsünün 2010- 2017 arası döneme ait veriler kullanılarak analiz edilmesi sonucu elde edilen bulgular yer almaktadır. Akışı etkilememesi nedeniyle bu bölümde diğerlerine göre daha güncel verileri içeren 2017 yılına ait bulgulara yer verilecektir. Diğer yıllar içinde aynı şekilde hesaplamalar yapılmıştır.
5.1. 2017 Yılı için Entropi Yöntemiyle Kriter Ağırlıklarının Hesaplanması
2017 yılına ait kriterlerin yer aldığı karar matrisi Tablo 1’de ve 2017 yılı için Ej, dj ve Wj değerlerinin hesaplanması Tablo 2’de gösterilmiştir.
Tablo 1: 2017 Yılı Karar Matrisi
ÜLKELER GDP* İstihdam Oranı**
İşgücüne Katılım Oranı**
Okullaşma ilköğretim
***
Okullaşma ortaöğretim
***
Okullaşma yükseköğretim
***
Ortalama yaşam
beklentisi*
Politik Katılım Oranı**
HDI *
ABD 43899 53.332 66.191 7.3422 7.4535 6.3915 81.4 19.4 0.919 ALMANYA 37689 53.202 73.759 3.2558 8.2191 5.0530 83.5 37 0.919 AVUSTRALYA 35323 55.855 71.784 8.6612 6.9626 6.2104 85.1 28.7 0.926 AVUSTURYA 35626 52.186 71.776 3.4879 7.4199 5.4788 83.7 30.6 0.893 BELÇİKA 33260 44.434 63.154 6.6474 6.3416 5.6194 83.6 38 0.901 BİRLEŞİK KRALLIK 28043 54.423 72.222 6.9478 7.4170 5.9410 82.9 32 0.903 ÇEKYA 23224 50.099 68.186 5.1704 6.7488 4.9951 81.7 20 0.881
fayda dereceleri Eşitlik (14) yardımıyla hesaplanır.
Eşitlik (12) ile de normalize değerler kullanılarak 𝑥𝑥𝑖𝑖𝑖𝑖 ağırlıklandırılmış normalize değerleri elde edilmektedir.
𝑥𝑥𝑖𝑖𝑖𝑖 = �̅�𝑥𝑖𝑖𝑖𝑖 . 𝑤𝑤𝑖𝑖𝑖𝑖 (12)
Adım 4: Son adımda her bir alternatif için optimal değerler hesaplanır. Alternatiflere ait değerler Eşitlik (13) yardımıyla elde edilir.
mixSn
jiji ,...,1,0;ˆ
1==
=
(13)
Alternatiflere ait 𝑆𝑆𝑖𝑖 değerleri, 𝑆𝑆0optimal değerine oranlanarak 𝐾𝐾𝑖𝑖 fayda dereceleri Eşitlik (14) yardımıyla hesaplanır.
Ki = SiS0
, i = 0,1, … , m (14)
[0,1] aralığında değer alan 𝐾𝐾𝑖𝑖 oranları kullanılarak alternatiflerin fayda fonksiyonu değerleri hesaplanabilmektedir. Değerler, büyükten küçüğe doğru sıralanarak alternatifler değerlendirilir.
5. Araştırma Bulguları
Çalışmanın bu bölümünde ÇKKV yöntemlerinden Entropi yöntemi ve ARAS yöntemi kullanılarak, OECD ülkelerinde kadınların sosyo-ekonomik statüsünün 2010- 2017 arası döneme ait veriler kullanılarak analiz edilmesi sonucu elde edilen bulgular yer almaktadır. Akışı etkilememesi nedeniyle bu bölümde diğerlerine göre daha güncel verileri içeren 2017 yılına ait bulgulara yer verilecektir. Diğer yıllar içinde aynı şekilde hesaplamalar yapılmıştır.
5.1. 2017 Yılı için Entropi Yöntemiyle Kriter Ağırlıklarının Hesaplanması
2017 yılına ait kriterlerin yer aldığı karar matrisi Tablo 1’de ve 2017 yılı için Ej, dj ve Wj değerlerinin hesaplanması Tablo 2’de gösterilmiştir.
Tablo 1: 2017 Yılı Karar Matrisi
ÜLKELER GDP* İstihdam Oranı**
İşgücüne Katılım Oranı**
Okullaşma ilköğretim
***
Okullaşma ortaöğretim
***
Okullaşma yükseköğretim
***
Ortalama yaşam
beklentisi*
Politik Katılım Oranı**
HDI *
ABD 43899 53.332 66.191 7.3422 7.4535 6.3915 81.4 19.4 0.919 ALMANYA 37689 53.202 73.759 3.2558 8.2191 5.0530 83.5 37 0.919 AVUSTRALYA 35323 55.855 71.784 8.6612 6.9626 6.2104 85.1 28.7 0.926 AVUSTURYA 35626 52.186 71.776 3.4879 7.4199 5.4788 83.7 30.6 0.893 BELÇİKA 33260 44.434 63.154 6.6474 6.3416 5.6194 83.6 38 0.901 BİRLEŞİK KRALLIK 28043 54.423 72.222 6.9478 7.4170 5.9410 82.9 32 0.903 ÇEKYA 23224 50.099 68.186 5.1704 6.7488 4.9951 81.7 20 0.881
(14)
[0,1] aralığında değer alan
Eşitlik (12) ile de normalize değerler kullanılarak 𝑥𝑥𝑖𝑖𝑖𝑖 ağırlıklandırılmış normalize değerleri elde edilmektedir.
𝑥𝑥𝑖𝑖𝑖𝑖 = �̅�𝑥𝑖𝑖𝑖𝑖 . 𝑤𝑤𝑖𝑖𝑖𝑖 (12)
Adım 4: Son adımda her bir alternatif için optimal değerler hesaplanır. Alternatiflere ait değerler Eşitlik (13) yardımıyla elde edilir.
mixSn
jiji ,...,1,0;ˆ
1==
=
(13)
Alternatiflere ait 𝑆𝑆𝑖𝑖 değerleri, 𝑆𝑆0optimal değerine oranlanarak 𝐾𝐾𝑖𝑖 fayda dereceleri Eşitlik (14) yardımıyla hesaplanır.
Ki = SiS0
, i = 0,1, … , m (14)
[0,1] aralığında değer alan 𝐾𝐾𝑖𝑖 oranları kullanılarak alternatiflerin fayda fonksiyonu değerleri hesaplanabilmektedir. Değerler, büyükten küçüğe doğru sıralanarak alternatifler değerlendirilir.
5. Araştırma Bulguları
Çalışmanın bu bölümünde ÇKKV yöntemlerinden Entropi yöntemi ve ARAS yöntemi kullanılarak, OECD ülkelerinde kadınların sosyo-ekonomik statüsünün 2010- 2017 arası döneme ait veriler kullanılarak analiz edilmesi sonucu elde edilen bulgular yer almaktadır. Akışı etkilememesi nedeniyle bu bölümde diğerlerine göre daha güncel verileri içeren 2017 yılına ait bulgulara yer verilecektir. Diğer yıllar içinde aynı şekilde hesaplamalar yapılmıştır.
5.1. 2017 Yılı için Entropi Yöntemiyle Kriter Ağırlıklarının Hesaplanması
2017 yılına ait kriterlerin yer aldığı karar matrisi Tablo 1’de ve 2017 yılı için Ej, dj ve Wj değerlerinin hesaplanması Tablo 2’de gösterilmiştir.
Tablo 1: 2017 Yılı Karar Matrisi
ÜLKELER GDP* İstihdam Oranı**
İşgücüne Katılım Oranı**
Okullaşma ilköğretim
***
Okullaşma ortaöğretim
***
Okullaşma yükseköğretim
***
Ortalama yaşam
beklentisi*
Politik Katılım Oranı**
HDI *
ABD 43899 53.332 66.191 7.3422 7.4535 6.3915 81.4 19.4 0.919 ALMANYA 37689 53.202 73.759 3.2558 8.2191 5.0530 83.5 37 0.919 AVUSTRALYA 35323 55.855 71.784 8.6612 6.9626 6.2104 85.1 28.7 0.926 AVUSTURYA 35626 52.186 71.776 3.4879 7.4199 5.4788 83.7 30.6 0.893 BELÇİKA 33260 44.434 63.154 6.6474 6.3416 5.6194 83.6 38 0.901 BİRLEŞİK KRALLIK 28043 54.423 72.222 6.9478 7.4170 5.9410 82.9 32 0.903 ÇEKYA 23224 50.099 68.186 5.1704 6.7488 4.9951 81.7 20 0.881
oranları kullanılarak alternatiflerin fayda fonksiyonu değerleri hesaplanabilmektedir. Değerler, büyükten küçüğe doğru sıralanarak alternatifler değerlendirilir.
5. Araştırma Bulguları
Çalışmanın bu bölümünde ÇKKV yöntemlerinden Entropi yöntemi ve ARAS yöntemi kullanılarak, OECD ülkelerinde kadınların sosyo-ekonomik statüsünün 2010 – 2017 arası döneme ait veriler kullanılarak analiz edilmesi sonucu elde edilen bulgular yer almaktadır. Akışı etkilememesi nedeniyle bu bölümde diğerlerine göre daha güncel verileri içeren 2017 yılına ait bulgulara yer verilecektir. Diğer yıllar içinde aynı şekilde hesaplamalar yapılmıştır.
5.1. 2017 Yılı için Entropi Yöntemiyle Kriter Ağırlıklarının Hesaplanması
2017 yılına ait kriterlerin yer aldığı karar matrisi Tablo 1’de ve 2017 yılı için Ej, dj ve Wj değerlerinin hesaplanması Tablo 2’de gösterilmiştir.
Tablo 1: 2017 Yılı Karar Matrisi
ÜLKELER GDP*İstihdam Oranı**
İşgücüne Katılım Oranı**
Okullaşma ilköğretim
***
Okullaşma ortaöğretim
***
Okullaşma yükseköğretim
***
Ortalama yaşam
beklentisi*
Politik Katılım Oranı**
HDI *
ABD 43899 53.332 66.191 7.3422 7.4535 6.3915 81.4 19.4 0.919ALMANYA 37689 53.202 73.759 3.2558 8.2191 5.0530 83.5 37 0.919AVUSTRALYA 35323 55.855 71.784 8.6612 6.9626 6.2104 85.1 28.7 0.926AVUSTURYA 35626 52.186 71.776 3.4879 7.4199 5.4788 83.7 30.6 0.893BELÇİKA 33260 44.434 63.154 6.6474 6.3416 5.6194 83.6 38 0.901BİRLEŞİK KRALLIK 28043 54.423 72.222 6.9478 7.4170 5.9410 82.9 32 0.903ÇEKYA 23224 50.099 68.186 5.1704 6.7488 4.9951 81.7 20 0.881DANİMARKA 40293 55.669 77.302 7.8270 6.9487 6.4951 82.7 37.4 0.919ESTONYA 21896 53.375 73.654 6.1453 4.9045 4.7467 82.4 26.7 0.876FİNLANDİYA 34504 50.208 74.308 6.3631 6.1596 5.8675 84.4 42 0.917FRANSA 32518 45.841 67.612 6.0572 8.3509 5.5544 85.3 39 0.894
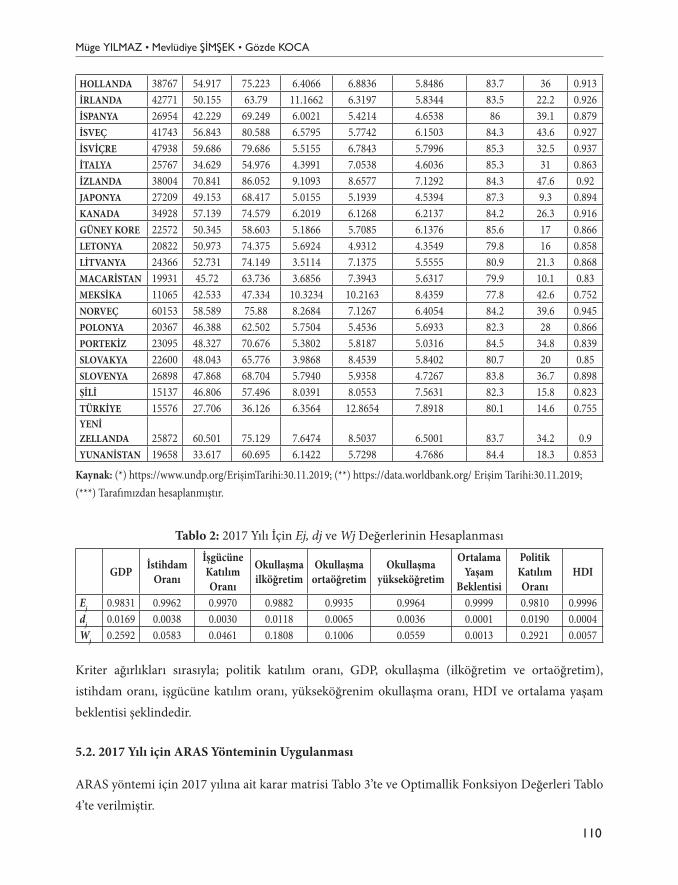
Müge YILMAZ • Mevlüdiye ŞİMŞEK • Gözde KOCA
110
HOLLANDA 38767 54.917 75.223 6.4066 6.8836 5.8486 83.7 36 0.913İRLANDA 42771 50.155 63.79 11.1662 6.3197 5.8344 83.5 22.2 0.926İSPANYA 26954 42.229 69.249 6.0021 5.4214 4.6538 86 39.1 0.879İSVEÇ 41743 56.843 80.588 6.5795 5.7742 6.1503 84.3 43.6 0.927İSVİÇRE 47938 59.686 79.686 5.5155 6.7843 5.7996 85.3 32.5 0.937İTALYA 25767 34.629 54.976 4.3991 7.0538 4.6036 85.3 31 0.863İZLANDA 38004 70.841 86.052 9.1093 8.6577 7.1292 84.3 47.6 0.92JAPONYA 27209 49.153 68.417 5.0155 5.1939 4.5394 87.3 9.3 0.894KANADA 34928 57.139 74.579 6.2019 6.1268 6.2137 84.2 26.3 0.916GÜNEY KORE 22572 50.345 58.603 5.1866 5.7085 6.1376 85.6 17 0.866LETONYA 20822 50.973 74.375 5.6924 4.9312 4.3549 79.8 16 0.858LİTVANYA 24366 52.731 74.149 3.5114 7.1375 5.5555 80.9 21.3 0.868MACARİSTAN 19931 45.72 63.736 3.6856 7.3943 5.6317 79.9 10.1 0.83MEKSİKA 11065 42.533 47.334 10.3234 10.2163 8.4359 77.8 42.6 0.752NORVEÇ 60153 58.589 75.88 8.2684 7.1267 6.4054 84.2 39.6 0.945POLONYA 20367 46.388 62.502 5.7504 5.4536 5.6933 82.3 28 0.866PORTEKİZ 23095 48.327 70.676 5.3802 5.8187 5.0316 84.5 34.8 0.839SLOVAKYA 22600 48.043 65.776 3.9868 8.4539 5.8402 80.7 20 0.85SLOVENYA 26898 47.868 68.704 5.7940 5.9358 4.7267 83.8 36.7 0.898ŞİLİ 15137 46.806 57.496 8.0391 8.0553 7.5631 82.3 15.8 0.823TÜRKİYE 15576 27.706 36.126 6.3564 12.8654 7.8918 80.1 14.6 0.755YENİ ZELLANDA 25872 60.501 75.129 7.6474 8.5037 6.5001 83.7 34.2 0.9YUNANİSTAN 19658 33.617 60.695 6.1422 5.7298 4.7686 84.4 18.3 0.853
Kaynak: (*) https://www.undp.org/ErişimTarihi:30.11.2019; (**) https://data.worldbank.org/ Erişim Tarihi:30.11.2019; (***) Tarafımızdan hesaplanmıştır.
Tablo 2: 2017 Yılı İçin Ej, dj ve Wj Değerlerinin Hesaplanması
GDP İstihdam Oranı
İşgücüne Katılım Oranı
Okullaşma ilköğretim
Okullaşma ortaöğretim
Okullaşma yükseköğretim
Ortalama Yaşam
Beklentisi
Politik Katılım Oranı
HDI
Ej 0.9831 0.9962 0.9970 0.9882 0.9935 0.9964 0.9999 0.9810 0.9996dj 0.0169 0.0038 0.0030 0.0118 0.0065 0.0036 0.0001 0.0190 0.0004Wj 0.2592 0.0583 0.0461 0.1808 0.1006 0.0559 0.0013 0.2921 0.0057
Kriter ağırlıkları sırasıyla; politik katılım oranı, GDP, okullaşma (ilköğretim ve ortaöğretim), istihdam oranı, işgücüne katılım oranı, yükseköğrenim okullaşma oranı, HDI ve ortalama yaşam beklentisi şeklindedir.
5.2. 2017 Yılı için ARAS Yönteminin Uygulanması
ARAS yöntemi için 2017 yılına ait karar matrisi Tablo 3’te ve Optimallik Fonksiyon Değerleri Tablo 4’te verilmiştir.
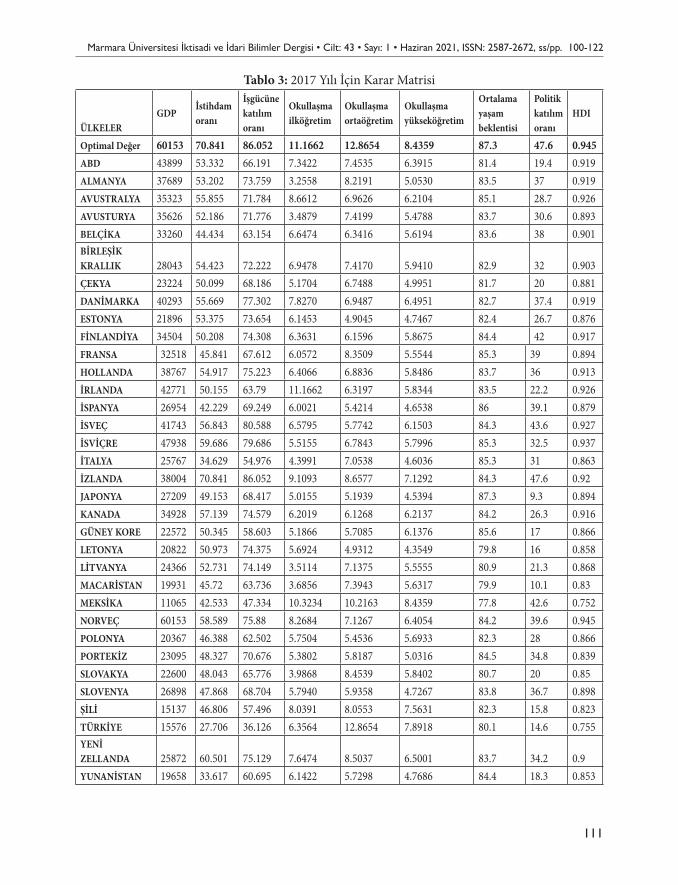
Marmara Üniversitesi İktisadi ve İdari Bilimler Dergisi • Cilt: 43 • Sayı: 1 • Haziran 2021, ISSN: 2587-2672, ss/pp. 100-122
111
Tablo 3: 2017 Yılı İçin Karar Matrisi
ÜLKELERGDP
İstihdam oranı
İşgücüne katılım oranı
Okullaşma ilköğretim
Okullaşma ortaöğretim
Okullaşma yükseköğretim
Ortalama yaşam beklentisi
Politik katılım oranı
HDI
Optimal Değer 60153 70.841 86.052 11.1662 12.8654 8.4359 87.3 47.6 0.945ABD 43899 53.332 66.191 7.3422 7.4535 6.3915 81.4 19.4 0.919ALMANYA 37689 53.202 73.759 3.2558 8.2191 5.0530 83.5 37 0.919AVUSTRALYA 35323 55.855 71.784 8.6612 6.9626 6.2104 85.1 28.7 0.926AVUSTURYA 35626 52.186 71.776 3.4879 7.4199 5.4788 83.7 30.6 0.893BELÇİKA 33260 44.434 63.154 6.6474 6.3416 5.6194 83.6 38 0.901BİRLEŞİK KRALLIK 28043 54.423 72.222 6.9478 7.4170 5.9410 82.9 32 0.903ÇEKYA 23224 50.099 68.186 5.1704 6.7488 4.9951 81.7 20 0.881DANİMARKA 40293 55.669 77.302 7.8270 6.9487 6.4951 82.7 37.4 0.919ESTONYA 21896 53.375 73.654 6.1453 4.9045 4.7467 82.4 26.7 0.876FİNLANDİYA 34504 50.208 74.308 6.3631 6.1596 5.8675 84.4 42 0.917FRANSA 32518 45.841 67.612 6.0572 8.3509 5.5544 85.3 39 0.894HOLLANDA 38767 54.917 75.223 6.4066 6.8836 5.8486 83.7 36 0.913İRLANDA 42771 50.155 63.79 11.1662 6.3197 5.8344 83.5 22.2 0.926İSPANYA 26954 42.229 69.249 6.0021 5.4214 4.6538 86 39.1 0.879İSVEÇ 41743 56.843 80.588 6.5795 5.7742 6.1503 84.3 43.6 0.927İSVİÇRE 47938 59.686 79.686 5.5155 6.7843 5.7996 85.3 32.5 0.937İTALYA 25767 34.629 54.976 4.3991 7.0538 4.6036 85.3 31 0.863İZLANDA 38004 70.841 86.052 9.1093 8.6577 7.1292 84.3 47.6 0.92JAPONYA 27209 49.153 68.417 5.0155 5.1939 4.5394 87.3 9.3 0.894KANADA 34928 57.139 74.579 6.2019 6.1268 6.2137 84.2 26.3 0.916GÜNEY KORE 22572 50.345 58.603 5.1866 5.7085 6.1376 85.6 17 0.866LETONYA 20822 50.973 74.375 5.6924 4.9312 4.3549 79.8 16 0.858LİTVANYA 24366 52.731 74.149 3.5114 7.1375 5.5555 80.9 21.3 0.868MACARİSTAN 19931 45.72 63.736 3.6856 7.3943 5.6317 79.9 10.1 0.83MEKSİKA 11065 42.533 47.334 10.3234 10.2163 8.4359 77.8 42.6 0.752NORVEÇ 60153 58.589 75.88 8.2684 7.1267 6.4054 84.2 39.6 0.945POLONYA 20367 46.388 62.502 5.7504 5.4536 5.6933 82.3 28 0.866PORTEKİZ 23095 48.327 70.676 5.3802 5.8187 5.0316 84.5 34.8 0.839SLOVAKYA 22600 48.043 65.776 3.9868 8.4539 5.8402 80.7 20 0.85SLOVENYA 26898 47.868 68.704 5.7940 5.9358 4.7267 83.8 36.7 0.898ŞİLİ 15137 46.806 57.496 8.0391 8.0553 7.5631 82.3 15.8 0.823TÜRKİYE 15576 27.706 36.126 6.3564 12.8654 7.8918 80.1 14.6 0.755YENİ ZELLANDA 25872 60.501 75.129 7.6474 8.5037 6.5001 83.7 34.2 0.9YUNANİSTAN 19658 33.617 60.695 6.1422 5.7298 4.7686 84.4 18.3 0.853
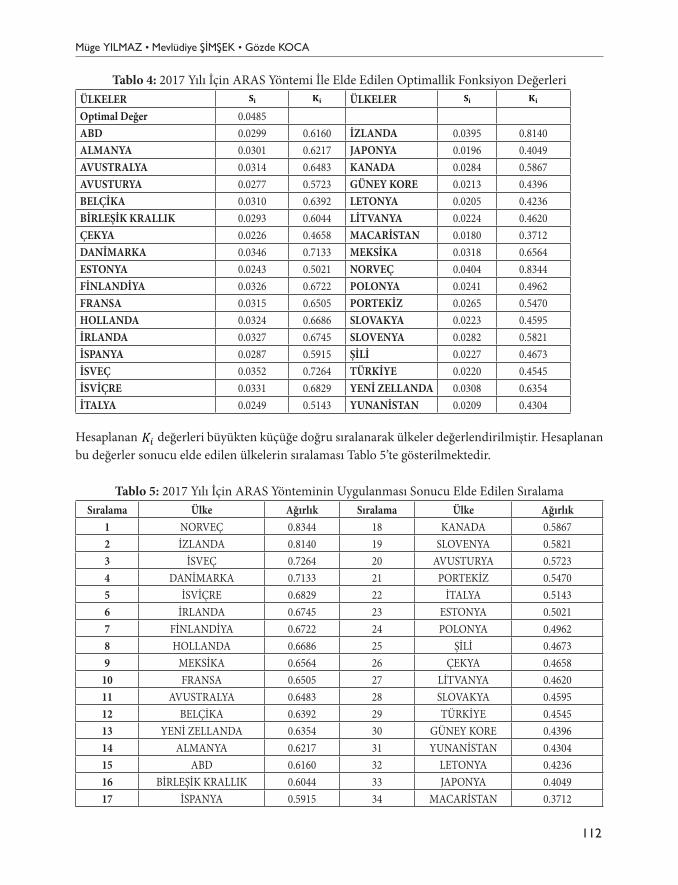
Müge YILMAZ • Mevlüdiye ŞİMŞEK • Gözde KOCA
112
Tablo 4: 2017 Yılı İçin ARAS Yöntemi İle Elde Edilen Optimallik Fonksiyon DeğerleriÜLKELER
Tablo 3: 2017 Yılı İçin Karar Matrisi
ÜLKELER
GDP İstihdam oranı
İşgücüne katılım oranı
Okullaşma ilköğretim
Okullaşma ortaöğretim
Okullaşma yükseköğretim
Ortalama yaşam
beklentisi
Politik katılım oranı
HDI
Optimal Değer 60153 70.841 86.052 11.1662 12.8654 8.4359 87.3 47.6 0.945 ABD 43899 53.332 66.191 7.3422 7.4535 6.3915 81.4 19.4 0.919 ALMANYA 37689 53.202 73.759 3.2558 8.2191 5.0530 83.5 37 0.919 AVUSTRALYA 35323 55.855 71.784 8.6612 6.9626 6.2104 85.1 28.7 0.926 AVUSTURYA 35626 52.186 71.776 3.4879 7.4199 5.4788 83.7 30.6 0.893 BELÇİKA 33260 44.434 63.154 6.6474 6.3416 5.6194 83.6 38 0.901 BİRLEŞİK KRALLIK 28043 54.423 72.222 6.9478 7.4170 5.9410 82.9 32 0.903 ÇEKYA 23224 50.099 68.186 5.1704 6.7488 4.9951 81.7 20 0.881 DANİMARKA 40293 55.669 77.302 7.8270 6.9487 6.4951 82.7 37.4 0.919 ESTONYA 21896 53.375 73.654 6.1453 4.9045 4.7467 82.4 26.7 0.876 FİNLANDİYA 34504 50.208 74.308 6.3631 6.1596 5.8675 84.4 42 0.917 FRANSA 32518 45.841 67.612 6.0572 8.3509 5.5544 85.3 39 0.894 HOLLANDA 38767 54.917 75.223 6.4066 6.8836 5.8486 83.7 36 0.913 İRLANDA 42771 50.155 63.79 11.1662 6.3197 5.8344 83.5 22.2 0.926 İSPANYA 26954 42.229 69.249 6.0021 5.4214 4.6538 86 39.1 0.879 İSVEÇ 41743 56.843 80.588 6.5795 5.7742 6.1503 84.3 43.6 0.927 İSVİÇRE 47938 59.686 79.686 5.5155 6.7843 5.7996 85.3 32.5 0.937 İTALYA 25767 34.629 54.976 4.3991 7.0538 4.6036 85.3 31 0.863 İZLANDA 38004 70.841 86.052 9.1093 8.6577 7.1292 84.3 47.6 0.92 JAPONYA 27209 49.153 68.417 5.0155 5.1939 4.5394 87.3 9.3 0.894 KANADA 34928 57.139 74.579 6.2019 6.1268 6.2137 84.2 26.3 0.916 GÜNEY KORE 22572 50.345 58.603 5.1866 5.7085 6.1376 85.6 17 0.866 LETONYA 20822 50.973 74.375 5.6924 4.9312 4.3549 79.8 16 0.858 LİTVANYA 24366 52.731 74.149 3.5114 7.1375 5.5555 80.9 21.3 0.868 MACARİSTAN 19931 45.72 63.736 3.6856 7.3943 5.6317 79.9 10.1 0.83 MEKSİKA 11065 42.533 47.334 10.3234 10.2163 8.4359 77.8 42.6 0.752 NORVEÇ 60153 58.589 75.88 8.2684 7.1267 6.4054 84.2 39.6 0.945 POLONYA 20367 46.388 62.502 5.7504 5.4536 5.6933 82.3 28 0.866 PORTEKİZ 23095 48.327 70.676 5.3802 5.8187 5.0316 84.5 34.8 0.839 SLOVAKYA 22600 48.043 65.776 3.9868 8.4539 5.8402 80.7 20 0.85 SLOVENYA 26898 47.868 68.704 5.7940 5.9358 4.7267 83.8 36.7 0.898 ŞİLİ 15137 46.806 57.496 8.0391 8.0553 7.5631 82.3 15.8 0.823 TÜRKİYE 15576 27.706 36.126 6.3564 12.8654 7.8918 80.1 14.6 0.755 YENİ ZELLANDA 25872 60.501 75.129 7.6474 8.5037 6.5001 83.7 34.2 0.9 YUNANİSTAN 19658 33.617 60.695 6.1422 5.7298 4.7686 84.4 18.3 0.853
Tablo 4: 2017 Yılı İçin ARAS Yöntemi İle Elde Edilen Optimallik Fonksiyon Değerleri
ÜLKELER 𝐒𝐒𝐢𝐢 𝐊𝐊𝐢𝐢 ÜLKELER 𝐒𝐒𝐢𝐢 𝐊𝐊𝐢𝐢 Optimal Değer 0.0485 ABD 0.0299 0.6160 İZLANDA 0.0395 0.8140 ALMANYA 0.0301 0.6217 JAPONYA 0.0196 0.4049 AVUSTRALYA 0.0314 0.6483 KANADA 0.0284 0.5867 AVUSTURYA 0.0277 0.5723 GÜNEY KORE 0.0213 0.4396 BELÇİKA 0.0310 0.6392 LETONYA 0.0205 0.4236 BİRLEŞİK KRALLIK 0.0293 0.6044 LİTVANYA 0.0224 0.4620
ÜLKELER
Tablo 3: 2017 Yılı İçin Karar Matrisi
ÜLKELER
GDP İstihdam oranı
İşgücüne katılım oranı
Okullaşma ilköğretim
Okullaşma ortaöğretim
Okullaşma yükseköğretim
Ortalama yaşam
beklentisi
Politik katılım oranı
HDI
Optimal Değer 60153 70.841 86.052 11.1662 12.8654 8.4359 87.3 47.6 0.945 ABD 43899 53.332 66.191 7.3422 7.4535 6.3915 81.4 19.4 0.919 ALMANYA 37689 53.202 73.759 3.2558 8.2191 5.0530 83.5 37 0.919 AVUSTRALYA 35323 55.855 71.784 8.6612 6.9626 6.2104 85.1 28.7 0.926 AVUSTURYA 35626 52.186 71.776 3.4879 7.4199 5.4788 83.7 30.6 0.893 BELÇİKA 33260 44.434 63.154 6.6474 6.3416 5.6194 83.6 38 0.901 BİRLEŞİK KRALLIK 28043 54.423 72.222 6.9478 7.4170 5.9410 82.9 32 0.903 ÇEKYA 23224 50.099 68.186 5.1704 6.7488 4.9951 81.7 20 0.881 DANİMARKA 40293 55.669 77.302 7.8270 6.9487 6.4951 82.7 37.4 0.919 ESTONYA 21896 53.375 73.654 6.1453 4.9045 4.7467 82.4 26.7 0.876 FİNLANDİYA 34504 50.208 74.308 6.3631 6.1596 5.8675 84.4 42 0.917 FRANSA 32518 45.841 67.612 6.0572 8.3509 5.5544 85.3 39 0.894 HOLLANDA 38767 54.917 75.223 6.4066 6.8836 5.8486 83.7 36 0.913 İRLANDA 42771 50.155 63.79 11.1662 6.3197 5.8344 83.5 22.2 0.926 İSPANYA 26954 42.229 69.249 6.0021 5.4214 4.6538 86 39.1 0.879 İSVEÇ 41743 56.843 80.588 6.5795 5.7742 6.1503 84.3 43.6 0.927 İSVİÇRE 47938 59.686 79.686 5.5155 6.7843 5.7996 85.3 32.5 0.937 İTALYA 25767 34.629 54.976 4.3991 7.0538 4.6036 85.3 31 0.863 İZLANDA 38004 70.841 86.052 9.1093 8.6577 7.1292 84.3 47.6 0.92 JAPONYA 27209 49.153 68.417 5.0155 5.1939 4.5394 87.3 9.3 0.894 KANADA 34928 57.139 74.579 6.2019 6.1268 6.2137 84.2 26.3 0.916 GÜNEY KORE 22572 50.345 58.603 5.1866 5.7085 6.1376 85.6 17 0.866 LETONYA 20822 50.973 74.375 5.6924 4.9312 4.3549 79.8 16 0.858 LİTVANYA 24366 52.731 74.149 3.5114 7.1375 5.5555 80.9 21.3 0.868 MACARİSTAN 19931 45.72 63.736 3.6856 7.3943 5.6317 79.9 10.1 0.83 MEKSİKA 11065 42.533 47.334 10.3234 10.2163 8.4359 77.8 42.6 0.752 NORVEÇ 60153 58.589 75.88 8.2684 7.1267 6.4054 84.2 39.6 0.945 POLONYA 20367 46.388 62.502 5.7504 5.4536 5.6933 82.3 28 0.866 PORTEKİZ 23095 48.327 70.676 5.3802 5.8187 5.0316 84.5 34.8 0.839 SLOVAKYA 22600 48.043 65.776 3.9868 8.4539 5.8402 80.7 20 0.85 SLOVENYA 26898 47.868 68.704 5.7940 5.9358 4.7267 83.8 36.7 0.898 ŞİLİ 15137 46.806 57.496 8.0391 8.0553 7.5631 82.3 15.8 0.823 TÜRKİYE 15576 27.706 36.126 6.3564 12.8654 7.8918 80.1 14.6 0.755 YENİ ZELLANDA 25872 60.501 75.129 7.6474 8.5037 6.5001 83.7 34.2 0.9 YUNANİSTAN 19658 33.617 60.695 6.1422 5.7298 4.7686 84.4 18.3 0.853
Tablo 4: 2017 Yılı İçin ARAS Yöntemi İle Elde Edilen Optimallik Fonksiyon Değerleri
ÜLKELER 𝐒𝐒𝐢𝐢 𝐊𝐊𝐢𝐢 ÜLKELER 𝐒𝐒𝐢𝐢 𝐊𝐊𝐢𝐢 Optimal Değer 0.0485 ABD 0.0299 0.6160 İZLANDA 0.0395 0.8140 ALMANYA 0.0301 0.6217 JAPONYA 0.0196 0.4049 AVUSTRALYA 0.0314 0.6483 KANADA 0.0284 0.5867 AVUSTURYA 0.0277 0.5723 GÜNEY KORE 0.0213 0.4396 BELÇİKA 0.0310 0.6392 LETONYA 0.0205 0.4236 BİRLEŞİK KRALLIK 0.0293 0.6044 LİTVANYA 0.0224 0.4620
Optimal Değer 0.0485ABD 0.0299 0.6160 İZLANDA 0.0395 0.8140ALMANYA 0.0301 0.6217 JAPONYA 0.0196 0.4049AVUSTRALYA 0.0314 0.6483 KANADA 0.0284 0.5867AVUSTURYA 0.0277 0.5723 GÜNEY KORE 0.0213 0.4396BELÇİKA 0.0310 0.6392 LETONYA 0.0205 0.4236BİRLEŞİK KRALLIK 0.0293 0.6044 LİTVANYA 0.0224 0.4620ÇEKYA 0.0226 0.4658 MACARİSTAN 0.0180 0.3712DANİMARKA 0.0346 0.7133 MEKSİKA 0.0318 0.6564ESTONYA 0.0243 0.5021 NORVEÇ 0.0404 0.8344FİNLANDİYA 0.0326 0.6722 POLONYA 0.0241 0.4962FRANSA 0.0315 0.6505 PORTEKİZ 0.0265 0.5470HOLLANDA 0.0324 0.6686 SLOVAKYA 0.0223 0.4595İRLANDA 0.0327 0.6745 SLOVENYA 0.0282 0.5821İSPANYA 0.0287 0.5915 ŞİLİ 0.0227 0.4673İSVEÇ 0.0352 0.7264 TÜRKİYE 0.0220 0.4545İSVİÇRE 0.0331 0.6829 YENİ ZELLANDA 0.0308 0.6354İTALYA 0.0249 0.5143 YUNANİSTAN 0.0209 0.4304
Hesaplanan
Eşitlik (12) ile de normalize değerler kullanılarak 𝑥𝑥𝑖𝑖𝑖𝑖 ağırlıklandırılmış normalize değerleri elde edilmektedir.
𝑥𝑥𝑖𝑖𝑖𝑖 = �̅�𝑥𝑖𝑖𝑖𝑖 . 𝑤𝑤𝑖𝑖𝑖𝑖 (12)
Adım 4: Son adımda her bir alternatif için optimal değerler hesaplanır. Alternatiflere ait değerler Eşitlik (13) yardımıyla elde edilir.
mixSn
jiji ,...,1,0;ˆ
1==
=
(13)
Alternatiflere ait 𝑆𝑆𝑖𝑖 değerleri, 𝑆𝑆0optimal değerine oranlanarak 𝐾𝐾𝑖𝑖 fayda dereceleri Eşitlik (14) yardımıyla hesaplanır.
Ki = SiS0
, i = 0,1, … , m (14)
[0,1] aralığında değer alan 𝐾𝐾𝑖𝑖 oranları kullanılarak alternatiflerin fayda fonksiyonu değerleri hesaplanabilmektedir. Değerler, büyükten küçüğe doğru sıralanarak alternatifler değerlendirilir.
5. Araştırma Bulguları
Çalışmanın bu bölümünde ÇKKV yöntemlerinden Entropi yöntemi ve ARAS yöntemi kullanılarak, OECD ülkelerinde kadınların sosyo-ekonomik statüsünün 2010- 2017 arası döneme ait veriler kullanılarak analiz edilmesi sonucu elde edilen bulgular yer almaktadır. Akışı etkilememesi nedeniyle bu bölümde diğerlerine göre daha güncel verileri içeren 2017 yılına ait bulgulara yer verilecektir. Diğer yıllar içinde aynı şekilde hesaplamalar yapılmıştır.
5.1. 2017 Yılı için Entropi Yöntemiyle Kriter Ağırlıklarının Hesaplanması
2017 yılına ait kriterlerin yer aldığı karar matrisi Tablo 1’de ve 2017 yılı için Ej, dj ve Wj değerlerinin hesaplanması Tablo 2’de gösterilmiştir.
Tablo 1: 2017 Yılı Karar Matrisi
ÜLKELER GDP* İstihdam Oranı**
İşgücüne Katılım Oranı**
Okullaşma ilköğretim
***
Okullaşma ortaöğretim
***
Okullaşma yükseköğretim
***
Ortalama yaşam
beklentisi*
Politik Katılım Oranı**
HDI *
ABD 43899 53.332 66.191 7.3422 7.4535 6.3915 81.4 19.4 0.919 ALMANYA 37689 53.202 73.759 3.2558 8.2191 5.0530 83.5 37 0.919 AVUSTRALYA 35323 55.855 71.784 8.6612 6.9626 6.2104 85.1 28.7 0.926 AVUSTURYA 35626 52.186 71.776 3.4879 7.4199 5.4788 83.7 30.6 0.893 BELÇİKA 33260 44.434 63.154 6.6474 6.3416 5.6194 83.6 38 0.901 BİRLEŞİK KRALLIK 28043 54.423 72.222 6.9478 7.4170 5.9410 82.9 32 0.903 ÇEKYA 23224 50.099 68.186 5.1704 6.7488 4.9951 81.7 20 0.881
değerleri büyükten küçüğe doğru sıralanarak ülkeler değerlendirilmiştir. Hesaplanan bu değerler sonucu elde edilen ülkelerin sıralaması Tablo 5’te gösterilmektedir.
Tablo 5: 2017 Yılı İçin ARAS Yönteminin Uygulanması Sonucu Elde Edilen SıralamaSıralama Ülke Ağırlık Sıralama Ülke Ağırlık
1 NORVEÇ 0.8344 18 KANADA 0.58672 İZLANDA 0.8140 19 SLOVENYA 0.58213 İSVEÇ 0.7264 20 AVUSTURYA 0.57234 DANİMARKA 0.7133 21 PORTEKİZ 0.54705 İSVİÇRE 0.6829 22 İTALYA 0.51436 İRLANDA 0.6745 23 ESTONYA 0.50217 FİNLANDİYA 0.6722 24 POLONYA 0.49628 HOLLANDA 0.6686 25 ŞİLİ 0.46739 MEKSİKA 0.6564 26 ÇEKYA 0.4658
10 FRANSA 0.6505 27 LİTVANYA 0.462011 AVUSTRALYA 0.6483 28 SLOVAKYA 0.459512 BELÇİKA 0.6392 29 TÜRKİYE 0.454513 YENİ ZELLANDA 0.6354 30 GÜNEY KORE 0.439614 ALMANYA 0.6217 31 YUNANİSTAN 0.430415 ABD 0.6160 32 LETONYA 0.423616 BİRLEŞİK KRALLIK 0.6044 33 JAPONYA 0.404917 İSPANYA 0.5915 34 MACARİSTAN 0.3712
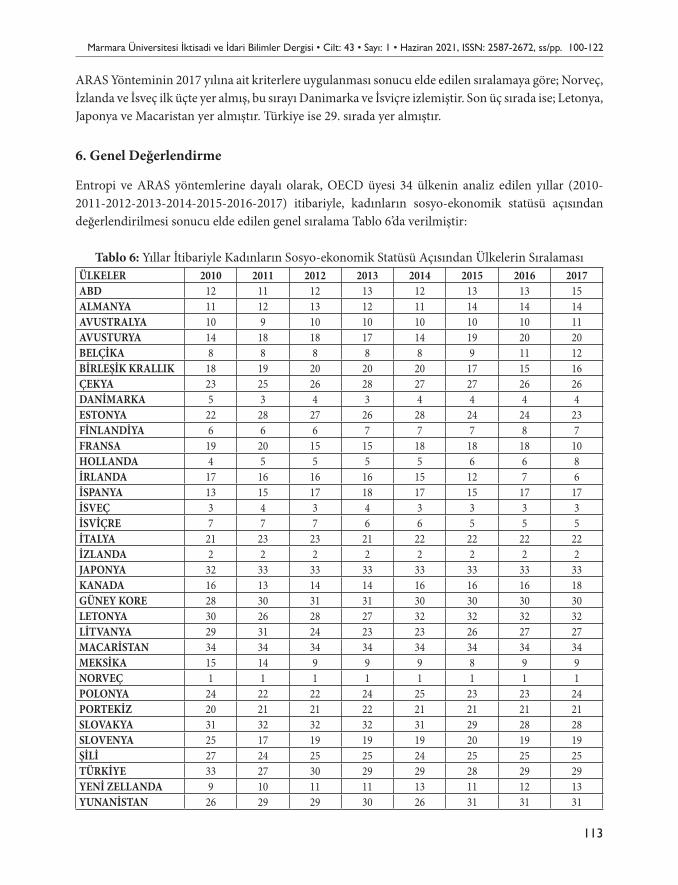
Marmara Üniversitesi İktisadi ve İdari Bilimler Dergisi • Cilt: 43 • Sayı: 1 • Haziran 2021, ISSN: 2587-2672, ss/pp. 100-122
113
ARAS Yönteminin 2017 yılına ait kriterlere uygulanması sonucu elde edilen sıralamaya göre; Norveç, İzlanda ve İsveç ilk üçte yer almış, bu sırayı Danimarka ve İsviçre izlemiştir. Son üç sırada ise; Letonya, Japonya ve Macaristan yer almıştır. Türkiye ise 29. sırada yer almıştır.
6. Genel Değerlendirme
Entropi ve ARAS yöntemlerine dayalı olarak, OECD üyesi 34 ülkenin analiz edilen yıllar (2010-2011-2012-2013-2014-2015-2016-2017) itibariyle, kadınların sosyo-ekonomik statüsü açısından değerlendirilmesi sonucu elde edilen genel sıralama Tablo 6’da verilmiştir:
Tablo 6: Yıllar İtibariyle Kadınların Sosyo-ekonomik Statüsü Açısından Ülkelerin SıralamasıÜLKELER 2010 2011 2012 2013 2014 2015 2016 2017ABD 12 11 12 13 12 13 13 15ALMANYA 11 12 13 12 11 14 14 14AVUSTRALYA 10 9 10 10 10 10 10 11AVUSTURYA 14 18 18 17 14 19 20 20BELÇİKA 8 8 8 8 8 9 11 12BİRLEŞİK KRALLIK 18 19 20 20 20 17 15 16ÇEKYA 23 25 26 28 27 27 26 26DANİMARKA 5 3 4 3 4 4 4 4ESTONYA 22 28 27 26 28 24 24 23FİNLANDİYA 6 6 6 7 7 7 8 7FRANSA 19 20 15 15 18 18 18 10HOLLANDA 4 5 5 5 5 6 6 8İRLANDA 17 16 16 16 15 12 7 6İSPANYA 13 15 17 18 17 15 17 17İSVEÇ 3 4 3 4 3 3 3 3İSVİÇRE 7 7 7 6 6 5 5 5İTALYA 21 23 23 21 22 22 22 22İZLANDA 2 2 2 2 2 2 2 2JAPONYA 32 33 33 33 33 33 33 33KANADA 16 13 14 14 16 16 16 18GÜNEY KORE 28 30 31 31 30 30 30 30LETONYA 30 26 28 27 32 32 32 32LİTVANYA 29 31 24 23 23 26 27 27MACARİSTAN 34 34 34 34 34 34 34 34MEKSİKA 15 14 9 9 9 8 9 9NORVEÇ 1 1 1 1 1 1 1 1POLONYA 24 22 22 24 25 23 23 24PORTEKİZ 20 21 21 22 21 21 21 21SLOVAKYA 31 32 32 32 31 29 28 28SLOVENYA 25 17 19 19 19 20 19 19ŞİLİ 27 24 25 25 24 25 25 25TÜRKİYE 33 27 30 29 29 28 29 29YENİ ZELLANDA 9 10 11 11 13 11 12 13YUNANİSTAN 26 29 29 30 26 31 31 31
Müge YILMAZ • Mevlüdiye ŞİMŞEK • Gözde KOCA
114
Analiz edilen yıllar itibariyle hazırlanan Tablo 6 incelendiğinde; uygulama sonucunda elde edilen sıralamalara göre tüm yıllarda, Norveç ve İzlanda ilk iki sırada yer almaktadır. Bu ülkeleri ise, sıralamadaki yerlerinde küçük değişiklikler olmakla birlikte İsveç, Danimarka ve Hollanda izlemektedir. Kadınların sosyo-ekonomik statüsünü etki eden belirli kriterler dikkate alınarak yapılan analiz sonucuna göre OECD ülkelerinin sıralamasına bakıldığında; kadın statüsü itibariyle İskandinav ülkelerinin en iyi konumda olduğu gözlenmiştir. Yapılan analize göre İskandinav ülkelerinin bu uygulamada ilk sıralarda olmasında kadınların politik katılım oranlarının yüksek olmasının etkili olduğu gözlenmiştir. Yine yapılan analize göre bu ülkeler toplumsal cinsiyet eşitliği indeksinin en yüksek düzeyde olduğu ülkelerdir. Bu da kadınların tamamen olmasa bile çoğu alanda erkeklerle eşit imkânlara sahip olduklarını göstermektedir. İskandinav ülkelerinde öncelikle kadınların ücretli istihdam, emeklilik, yaşlılık, çocuk yetiştirme vb. konulardaki sorunları çözülerek kadınların geleneksel konumlarından kurtulmaları sağlanmıştır. 1960’lardan bu yana cinsiyet eşitliği politikalarının sistemli bir şekilde uygulanması kadınların yaşamlarını kolaylaştıran ve özgürleştiren bir etki yaratmıştır.29 İsveç’te uygulanan, erkeklere de doğum/ebeveyn izni verilmesi, kadınlara doğum iznindeyken doğum izni sigortası yapılması, çalışan annelere çocuk sayısıyla orantılı olarak ödenen çocuk-bakım yardımının artırılması gibi uygulamaları cinsiyet eşitliği politikalarına örnek olarak göstermek mümkündür. Bu olumlu gelişmeler, kadının sadece iş hayatına değil, başta eğitim olmak üzere sosyal yaşama da aktif olarak katılımını amaçlamaktadır.30
Kadın statüsü bakımından OECD ülkelerine genel olarak bakıldığında; sıralamadaki yerleri itibariyle olumlu anlamda en fazla değişim Fransa, İrlanda, Meksika ve Slovenya’da görülmektedir. Özellikle, Fransa’da 2017 yılında yapılan seçimler sonucu parlamentoda kadın sayısında büyük artış gözlenmiştir.31 Slovenya ise cinsiyet kotası uygulamasını zorunlu kılan yasanın kabulüyle siyasette kadın temsilinde oldukça önemli bir yol kat etmiştir.32 Özellikle 2011 yılından sonra siyasette kadın temsili yüzde 30’u aşmıştır. Bu da kadınların politik alanda daha etkin rol oynayacağını göstermektedir. Meksika da aynı şekilde kadınların siyasi alanda etkin rol oynadığı ülkelerden biridir. Aynı zamanda analiz edilen yıllar bakımından Meksika’da okullaşma oranları da OECD ortalamasının üzerindedir. İrlanda ise kadınların eğitime katılımı açısından oldukça gelişmiş bir ülkedir. İrlanda’da İlköğretim, ortaöğretim ve yükseköğretimde kadınların okullaşma oranı erkeklerin okullaşma oranından yüksektir. Özellikle ilköğretim ve ortaöğretim okullaşma oranında İrlanda, OECD ortalamasının üzerindedir.
Süper güç olarak nitelendirilen ABD’de ise, cinsiyet eşitliği indeksinde üst sıralarda olmasına ve okullaşma oranlarında kadın ve erkeklerin hemen hemen eşit durumda olmasına rağmen, politik katılım konusunda kadın erkek eşitsizliği oldukça ön plandadır. OECD ülkelerinde kadınların politik katılım oranı ortalaması yüzde 31 iken ABD yüzde 24 ile ortalamanın altında yer almaktadır33.
29 Demiray, E. (2009). Kadın ve Siyaset, Gürsel Yaktıl Oğuz (Ed.); Toplumsal Yaşamda Kadın, T.C Anadolu Üniversitesi Yayını No:1700, s.128.
30 Akarçay, P. (2019). İsveç’te Cinsiyet Eşitliği Politikaları, International Journal of Social Inquiry, 12(1): 4.31 Ünal Erzen, M. (2019). Siyasette Cinsiyet Eşitsizliği, Akademik Sosyal Araştırmalar, 8: 24.32 Sancar, S. (2018). Siyasal Kararlara Katılımda Toplumsal Cinsiyet Eşitliği Haritalama ve İzleme Çalışması, CEİD
Yayınları, 1. Baskı, Ankara, s.55.33 Worldbank, https://data.worldbank.org/, (Erişim Tarihi:30.11.2019).
Marmara Üniversitesi İktisadi ve İdari Bilimler Dergisi • Cilt: 43 • Sayı: 1 • Haziran 2021, ISSN: 2587-2672, ss/pp. 100-122
115
Diğer yandan, ABD’de 2010 yılından itibaren kadının sosyo-ekonomik statüsü bakımından yapılan uygulama sonucuna göre, bir kötüleşme olduğu görülmektedir. 2010 yılında OECD ülkeleri arasında 12. sırada olan ABD, 2017 yılında 15. sıraya gerilemiştir. Dünyanın süper gücü olarak değerlendirilen ABD’nin bu anlamda ekonomik büyüklüğünü Amerika’da yaşayan kadınların sosyo-ekonomik ve politik statüsüne yansıtma konusunda yeterince başarılı olmadığını belirtmek mümkündür.
Yıllar itibariyle yapılan analiz sonucunda oluşturulan sıralamada, son sıralardaki ülkelere bakıldığında, Japonya ve Macaristan’ın son sıralarda yer aldığı görülmektedir. Burada Japon kadınının sosyo-ekonomik statüsü oldukça dikkat çekicidir. Dünyanın üçüncü büyük ekonomisi olan Japonya’da kadın statüsünün OECD ülkeleri içinde oldukça geri olması Japonya’da ekonomik büyüklüğün kalitesini tartışılır kılmaktadır. Bu noktada; “ekonomik büyüme kadar O’nun kalitesinin önemi” ön plana çıkmaktadır. Ülkelerin ekonomik büyükleri önemli olmakla birlikte, söz konusu büyüklüğü insan ve/veya kadın yaşamına yeterince yansıtabilmesi gerçek bir başarı olacaktır. Oysa Japonya’nın bu anlamdaki performansının oldukça düşük olduğu gözlenmektedir. Japonya ekonomik anlamda her ne kadar gelişmiş görünse de, kadının varlığının arka planda olduğu gözlenmektedir. Örneğin, Japonya’da, kadınların okullaşma oranları OECD ortalamasının altında bir seyir izlemektedir. Kadınlar eğitim imkânlarından yararlanmakta; fakat aldıkları eğitim sonucunda çalışma hayatının her alanında kendilerine yer bulamamaktadırlar. Çalışan kadınlar ile erkekler arasında ise büyük bir ücret farkı bulunmaktadır.
Macaristan’da ise, kültürel yapı itibariyle ataerkil bir aile yapısı hâkimdir. Kadının daha çok ev içinde zaman geçirdiği ve en önemli sorumluluklarının çocuklarına ve kocasına hizmet etmek ve ev işlerini yapmak olduğu görülmektedir. Geçmişten bugüne tarihe bakıldığında balkan toprakları birçok farklı ülkenin hâkimiyetinde kalmıştır. Bunun sonucunda da farklı kültürel özelliklerden etkilenmiştir. Oluşan bu heterojen yapı ise kadının sosyal ve ekonomik konumunda oldukça etkilidir. Bu bağlamda OECD ülkeleri içinde 2010-2017 döneminde kadın statüsünün en zayıf olduğu ülke Macaristan olarak gözlenmektedir. Macaristan’ın nüfus verilerine (2010-2018) bakıldığında hem kadın hem erkek nüfusunda azalma görülmektedir. Ancak kadın nüfusundaki azalmanın oranı (%3) erkek nüfusundaki azalmadan (%2) fazladır (World Bank, 2020). Ülkedeki kadın nüfusunun azalmasında; ülkede doğum oranının düşmesi, küresel kriz sonrası ülke ekonomisinin bozulması ve AB üyeliği ile üye ülkeler arasındaki göç hareketliliği başlıca nedenlerdir.
Çalışmaya dâhil edilen OECD üyesi 34 ülke içerisinde Türkiye’nin sıralamada nispi olarak sonlarda yer aldığı görülmektedir. Bununla birlikte, 2010-2017 döneminde Türkiye’deki kadınlarının sosyo-ekonomik statüsünde bir iyileşme görülmekle birlikte, söz konusu iyileşmenin OECD ülkeleri genelinde yapılan sıralamaya göre fazla belirgin olmadığı gözlenmektedir. 2010 yılında 34 ülke içerisinde 33. sırada olan Türkiye, kadınlarda politik katılım oranı ve HDI’daki artışla birlikte 2017 yılında 29. sıraya yükselmiştir. Fakat Türkiye, özellikle kadınların işgücüne katılımı, kadınlarda istihdam oranı, politik katılım oranı ve cinsiyet eşitliği gibi kriterlerde OECD ortalamasının nispi olarak gerisindedir. Türkiye’de eğitim verileri incelendiğinde kadınlarda okullaşma oranında artış olmakla birlikte bu oran nispi olarak diğer OECD üyesi ülkelere göre düşüktür. Türkiye’de işsizlerin büyük bir kısmını kadınların oluşturduğu görülmektedir. Bu problemin ortaya çıkmasında öncelikli
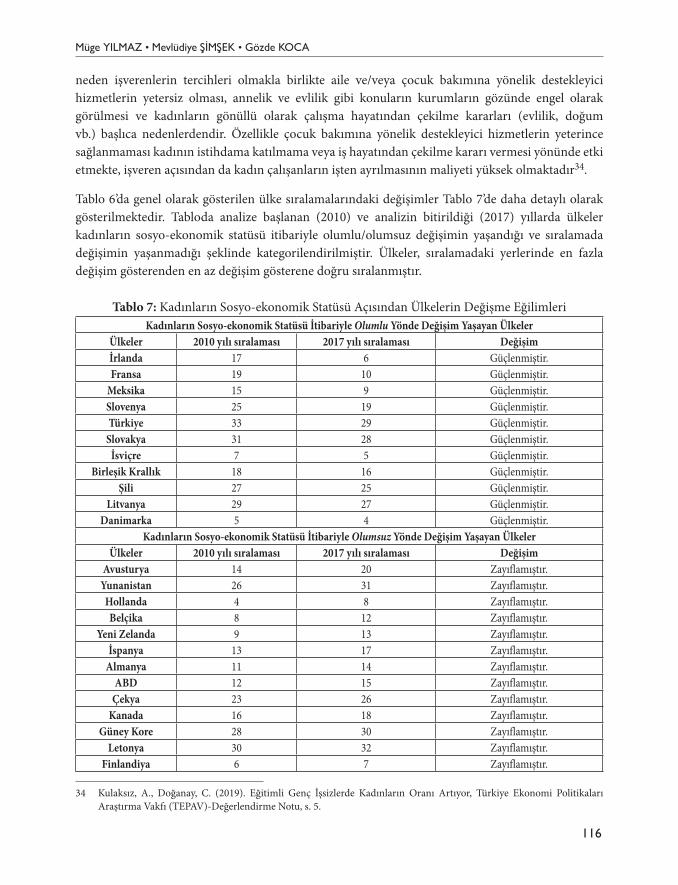
Müge YILMAZ • Mevlüdiye ŞİMŞEK • Gözde KOCA
116
neden işverenlerin tercihleri olmakla birlikte aile ve/veya çocuk bakımına yönelik destekleyici hizmetlerin yetersiz olması, annelik ve evlilik gibi konuların kurumların gözünde engel olarak görülmesi ve kadınların gönüllü olarak çalışma hayatından çekilme kararları (evlilik, doğum vb.) başlıca nedenlerdendir. Özellikle çocuk bakımına yönelik destekleyici hizmetlerin yeterince sağlanmaması kadının istihdama katılmama veya iş hayatından çekilme kararı vermesi yönünde etki etmekte, işveren açısından da kadın çalışanların işten ayrılmasının maliyeti yüksek olmaktadır34.
Tablo 6’da genel olarak gösterilen ülke sıralamalarındaki değişimler Tablo 7’de daha detaylı olarak gösterilmektedir. Tabloda analize başlanan (2010) ve analizin bitirildiği (2017) yıllarda ülkeler kadınların sosyo-ekonomik statüsü itibariyle olumlu/olumsuz değişimin yaşandığı ve sıralamada değişimin yaşanmadığı şeklinde kategorilendirilmiştir. Ülkeler, sıralamadaki yerlerinde en fazla değişim gösterenden en az değişim gösterene doğru sıralanmıştır.
Tablo 7: Kadınların Sosyo-ekonomik Statüsü Açısından Ülkelerin Değişme EğilimleriKadınların Sosyo-ekonomik Statüsü İtibariyle Olumlu Yönde Değişim Yaşayan Ülkeler
Ülkeler 2010 yılı sıralaması 2017 yılı sıralaması Değişimİrlanda 17 6 Güçlenmiştir.Fransa 19 10 Güçlenmiştir.
Meksika 15 9 Güçlenmiştir.Slovenya 25 19 Güçlenmiştir.Türkiye 33 29 Güçlenmiştir.
Slovakya 31 28 Güçlenmiştir.İsviçre 7 5 Güçlenmiştir.
Birleşik Krallık 18 16 Güçlenmiştir.Şili 27 25 Güçlenmiştir.
Litvanya 29 27 Güçlenmiştir.Danimarka 5 4 Güçlenmiştir.
Kadınların Sosyo-ekonomik Statüsü İtibariyle Olumsuz Yönde Değişim Yaşayan ÜlkelerÜlkeler 2010 yılı sıralaması 2017 yılı sıralaması Değişim
Avusturya 14 20 Zayıflamıştır.Yunanistan 26 31 Zayıflamıştır.Hollanda 4 8 Zayıflamıştır.Belçika 8 12 Zayıflamıştır.
Yeni Zelanda 9 13 Zayıflamıştır.İspanya 13 17 Zayıflamıştır.
Almanya 11 14 Zayıflamıştır.ABD 12 15 Zayıflamıştır.
Çekya 23 26 Zayıflamıştır.Kanada 16 18 Zayıflamıştır.
Güney Kore 28 30 Zayıflamıştır.Letonya 30 32 Zayıflamıştır.
Finlandiya 6 7 Zayıflamıştır.
34 Kulaksız, A., Doğanay, C. (2019). Eğitimli Genç İşsizlerde Kadınların Oranı Artıyor, Türkiye Ekonomi Politikaları Araştırma Vakfı (TEPAV)-Değerlendirme Notu, s. 5.
Marmara Üniversitesi İktisadi ve İdari Bilimler Dergisi • Cilt: 43 • Sayı: 1 • Haziran 2021, ISSN: 2587-2672, ss/pp. 100-122
117
Avustralya 10 11 Zayıflamıştır.Portekiz 20 21 Zayıflamıştır.
İtalya 21 22 Zayıflamıştır.Estonya 22 23 Zayıflamıştır.Japonya 32 33 Zayıflamıştır.
Kadınların Sosyo-ekonomik Statüsü İtibariyle Değişimin Yaşanmadığı ÜlkelerÜlkeler 2010 yılı sıralaması 2017 yılı sıralaması DeğişimNorveç 1 1 Değişmemiştir.İzlanda 2 2 Değişmemiştir.
İsveç 3 3 Değişmemiştir.Polonya 24 24 Değişmemiştir.
Macaristan 34 34 Değişmemiştir.
İskandinav ülkelerinin, toplumsal cinsiyet eşitliğine verdikleri önem nedeniyle kadının statüsü açısından ilk sıralarda yer aldığı görülmektedir. Türkiye’de kadının sosyo-ekonomik statüsü açısından politik katılım, eğitim, HDI’da yaşanan ilerlemelerle birlikte olumlu anlamda değişim görülen ülkeler içerisinde yer almakta fakat genele bakıldığında eğitim, politik katılım gibi kriterler açısından OECD ortalamasının altında yer aldığı görülmektedir.
Tablo 7’de kadının statüsü itibariyle olumsuz yönde değişimin yaşandığı 18 ülke bulunmaktadır. Fakat yapılan incelemede söz konusu 18 ülkeden 11’inin aynı zamanda AB üyesi ülkeler olması dikkat çekmektedir. AB üyesi ülkelerin ağırlıklı olmasında tek neden olmamakla birlikte başlıca nedenin; ABD’de 2007 yılının ikinci yarısında başlayan finansal krizin 2009 yılı itibariyle AB ülkelerindeki büyük bir borç krizini tetiklemesinin etkisinin olduğu düşünülmektedir. Yaşanan bu kriz Yunanistan, İrlanda, Portekiz, İspanya ve İtalya başta olmak üzere birçok AB üyesi ülkeyi büyük ölçüde etkilemiştir35. En çok etkilenen ülkelerden biri olan İrlanda bu kriz ortamının etkisinden ilk kurtulan ülkelerden biri olmuş ve ekonomisini hızlı şekilde toparlamıştır. Uyguladığı cinsiyet eşitliğine dayalı politikalar sürecin hızlı atlatılmasında etkili olmuştur. Ancak Yunanistan, İtalya ve İspanya gibi ülkelerde krizin etkisi uzun sürmüş ve bu kriz ortamı da kadınların sosyo-ekonomik statüsünün olumsuz etkilenmesine neden olmuştur. Yapılan analizde incelenen yıllar itibariyle bu krizin olumsuz etkisinin görülebileceği öncelikli kriter kadın istihdam oranı verileridir.
7. Sonuç
Kadının toplum içindeki statüsü gerek ülke ekonomisi gerekse gelecek nesillerin yetiştirilmesi açısından oldukça önemlidir. Ülkelerin başarılı bir kalkınma sağlamasında toplumdaki tüm bireylerin ekonomik ve sosyal hayata eşit katılımı büyük önem taşımaktadır. Dünya nüfusunun yaklaşık yarısını oluşturan kadınların hem ekonomik hem sosyal alanda desteklenmesini sağlayan ülkelerdeki büyüme ve kalkınma süreci daha sağlıklı olacaktır.
35 Erarslan, C., Timurtaş, M.E. (2015). Avrupa Borç Krizinin Seçilmiş Ülke Örnekleri Üzerindeki Etkileri, Gazi İktisat ve İşletme Dergisi, 1(2): 17.
Müge YILMAZ • Mevlüdiye ŞİMŞEK • Gözde KOCA
118
Çalışmada uygulanan Entropi yöntemi sonucu analize dahil edilen tüm yıllar itibariyle elde edilen kriter ağırlıkları sırasıyla; politik katılım oranı, GDP, okullaşma (ilköğretim ve ortaöğretim), istihdam oranı, işgücüne katılım oranı, yükseköğrenim okullaşma oranı, HDI ve ortalama yaşam beklentisi şeklindedir. Bu kriter ağırlıklarının kullanılmasıyla birlikte ARAS yönteminin uygulanmasıyla 34 OECD ülkesi arasında bir sıralama elde edilmiştir. Analiz edilen yıllar itibariyle kriter ağırlıklarının sıralaması aynı olmakla birlikte ülkelerin sıralamasında değişiklikler olduğu görülmüştür. Ancak tüm yıllarda Norveç ve İzlanda ilk iki sırada yer alırken, Japonya ve Macaristan ise son iki sırada yer almıştır. Türkiye’nin ise analiz edilen yıllar itibariyle sıralamadaki yerinde olumlu anlamda değişiklik olmasına rağmen 34 ülke içinde nispeten sonlarda yer aldığı görülmektedir.
Yapılan uygulama sonucu elde edilen bulgulara göre ele alınan kriterler çerçevesinde OECD ülkelerindeki kadınların sosyo-ekonomik statüsünün belirlenmesinde politik katılım ve eğitim faktörlerin ön planda olduğu sonucuna varılmıştır. Yapılan analiz sonucunda ekonomik büyümenin hızla arttığı ülkelerde kadının statüsünün aynı hızla artmadığı görülmektedir. Sürdürülebilir bir kalkınma için ekonomik gelişmenin yanı sıra güçlü bir sosyal yapı ile birlikte toplumun tüm bireylerinin refahının artırılması ülkelerin öncelikli amaçlarından olmalıdır. Kadınların toplum içindeki statüsünün artırılması o ülkenin hem ekonomik hem sosyal hayatına olumlu katkı yaparak büyüme ve kalkınma yolunda daha sağlam ilerlemesine destek olacaktır. Çünkü kadın ekonomik hayatta bir üretim faktörü olması ve sosyal hayatta ise bir ailenin temel ögesi ve gelecek nesillerin yetiştirilmesindeki önemi açısından oldukça önemlidir. Norveç, İzlanda gibi ülkelerin cinsiyet eşitliğine dayalı politikalarla kadını gerek ekonomik gerekse sosyal ve politik alanda desteklemesi OECD ülkeleri içerisinde ön planda olmalarının başlıca nedenleridir. Bu bağlamda Türkiye ve diğer ülkelerde kadının statüsünün artırılması için öncelikle kadınların eğitiminin desteklenmesi ülkeler için bir zorunluluktur. Ayrıca kadın işsizliğini azaltacak yatırımlar ve özellikle kadınlarda kayıt dışı istihdamın önlenmesi ile ilgili düzenlemelerle birlikte kadınlar üzerindeki ekonomik hayatını zayıflatan etkenler hakkında gerekli önlemlerin alınması sağlanmalıdır. İşgücü piyasasına katılımının desteklenmesiyle kadınlar ekonomik özgürlüğünü kazanacak ve bu sayede sosyal hayatta daha aktif rol almaya başlayacaklardır. Kadının eğitim alanında desteklenmesi ve tüm kadınların sağlık imkânlarından eşit şartlarda yararlanmasının sağlanması hem ülkelerin ekonomisinde olumlu etki yapacak hem de gelecek nesillerin daha bilinçli şekilde yetiştirilmesine katkı sağlayacaktır. Ayrıca kadınlarla ilgili sorunlara kadın gözüyle bakmak büyük önem taşımaktadır. İskandinav ülkeleri siyasette kota uygulamasıyla birlikte bu sorunu önemli ölçüde çözmeyi başararak kadınların politik hayata katılımını büyük ölçüde sağlamışlardır. Ülkemiz gibi birçok gelişmekte olan ülkede var olan ataerkil toplumsal yapı ve siyasetteki erkek egemen yapı ülkelerde kadın sorunlarının geri planda kalmasındaki önemli etkenlerdendir. Kadının ekonomik ve sosyal hayatta olduğu gibi politik hayatta da desteklenmesiyle beraber kadın sorunları daha fazla gündeme gelecek ve kadın katılımının artırılmasıyla kadın bakış açısıyla bu konularda çözümler daha hızlı olacaktır.
Kadın konusunda literatürde oldukça fazla çalışma olmasına karşın bu çalışmaların sadece kadının ekonomik statüsü veya sadece sosyal statüsü gibi çoğunlukla tek yönlü inceleme ve analizlerden oluştuğu görülmektedir. Bu çalışmanın kadının hem ekonomik hem de sosyal ve politik statüsünü birlikte ele alması diğer çalışmalardan farklı olmasını sağlamaktadır.
Marmara Üniversitesi İktisadi ve İdari Bilimler Dergisi • Cilt: 43 • Sayı: 1 • Haziran 2021, ISSN: 2587-2672, ss/pp. 100-122
119
KaynakçaAÇIK, Y. (2018). İş Dünyasında Kadın Raporu Cilt III’e Önsöz, (Erişim: 5 Kasım 2019, http://www.turkonfed.
org/tr/icerikler/arastirma-raporlari/).AKARÇAY, P. (2019). İsveç’te Cinsiyet Eşitliği Politikaları, International Journal of Social Inquiry, 12(1):1-27.BOSERUP, E. (1970). Women’s Role in Economic Development, St. Martin’s Press, Newyork.CHOU, Y., Yen,H., Sun, C. (2014). An Integrate Method for Performance of Women in Science and Technology
Based on Entropy Measure for Objective Weighting, Qual Quant, 48: 157–172.ÇAKIR, S., Perçin, S. (2013). AB Ülkeleri’nde Bütünleşik Entropi Ağırlık-Topsis Yöntemiyle Ar-Ge
Performansının Ölçülmesi, Uludağ Üniversitesi, İktisadi ve İdari Bilimler Fakültesi Dergisi, 32(1): 77-95.
DEMİRAY, E. (2009). Kadın ve Siyaset, Gürsel Yaktıl Oğuz (Ed.); Toplumsal Yaşamda Kadın, T.C Anadolu Üniversitesi Yayını No:1700.
DURMAZ, Ş. (2016). İşgücü Piyasasında Kadınlar ve Karşılaştıkları Engeller, Ahi Evran Üniversitesi Sosyal Bilimler Enstitüsü Dergisi, 2(3): 37-60.
ECER, F. (2016). Aras Yöntemi Kullanılarak Kurumsal Kaynak Planlaması Yazılımı Seçimi, Uluslararası Alanya İşletme Fakültesi Dergisi, 8(1): 89-98.
ERARSLAN, C., Timurtaş, M.E. (2015). Avrupa Borç Krizinin Seçilmiş Ülke Örnekleri Üzerindeki Etkileri, Gazi İktisat ve İşletme Dergisi, 1(2): 17-54.
İPEKÇİ Çetin, E., Çetin H.H. (2016). Using VIKOR Method for Analyzing of Qualification Levels and Transition to Employment of European Union and Candidate Countries, The Online Journal of Science and Technology, 6: 99-102.
JALIL, W.A.F.W.A., Sharif, S. (2017). Development of Malaysian Women Fertility Index: Evidence From Shannon’s Entropy, AIP Conference Proceedings, 1905.
KAPANOĞLU, S. (2006). Çin’de Kadın İmgesi, Yüksek Lisans Tezi, Ankara Üniversitesi Sosyal Bilimler Enstitüsü, Doğu Dilleri ve Edebiyatları Anabilim Dalı, Ankara.
KAPLAN, A. (2019). Bölgesel Kalkınmada Kadın İstihdamının Etkisi: GAP Bölgesi’nde Kadının Güçlendirilmesinde Yenilikler Projesi, Yüksek Lisans Tezi, Mersin Üniversitesi Sosyal Bilimler Enstitüsü, İktisat Anabilim Dalı, Mersin.
KARAMİ, A., Johansson, R. (2014). Utilization of Multi Attribute Decision Making Techniques to Integrate Automatic and Manual Ranking of Options, Journal of Information Science and Engineering, 30: 519-534.
KILIÇ, O. (2016). Uzlaşık Çok Ölçütlü Karar Verme Yöntemleri Kullanılarak TCDD Yatırım Projelerinin Sıralanması, Yüksek Lisans Tezi, Gazi Üniversitesi, Fen Bilimler Enstitüsü, Endüstri Mühendisliği Anabilim Dalı, Ankara.
KULAKSIZ, A., Doğanay, C. (2019). Eğitimli Genç İşsizlerde Kadınların Oranı Artıyor, Türkiye Ekonomi Politikaları Araştırma Vakfı (TEPAV) – Değerlendirme Notu.
KURT TOPUZ, S. (2014). Sosyo-Ekonomik, Siyasal ve Kültürel Faktörler Ekseninde Kadın Milletvekili Temsil Oranına İlişkin Bir Analiz: OECD Ülkeleri Örneği, H.Ü. İktisadi ve İdari Bilimler Fakültesi Dergisi, 32(1): 211-228.
MARTIN, N., Pandiammal, P. (2018). Ranking the Problems of Women Entrepreneurs in India Using Vikor Method with Lonsm, International Journal of Mathematics Trends and Technology (IJMTT) – Special Issue: 68-72.
MESHRAM, I.I., Boiroju, NK., Kodali, V. (2017). Ranking of Districts in Andhra Prades Husin Women and Children Nutrition and Health Indicators by Topsis Method, Indian J Community Health, 29(4): 350-6.
Müge YILMAZ • Mevlüdiye ŞİMŞEK • Gözde KOCA
120
MIRGHAFOURI, S.H.A. (2006). Ranking The Barriers of Women’s Promotion to Managerial Positions: A Case Study of Yazd Province’s Public Sector, Womens Studies, 4(1): 101-122.
MIHÇIOKUR, S., Akın, A. (2003). Kadının Statüsü ve Anne Ölümleri, Hacettepe Üniversitesi Kadın Sorunları Uygulama ve Araştırma Merkezi (HÜKSAM). Hacettepe Üniversitesi Yayınları, Ankara: 127-141.
RAMEZANI, E., Montazeri, M., Montazeri, Z. (2014). A Study on Prioritizing Typical Women’s Entrepreneur Characteristics, Management Science Letters, 4: 1271-1278.
SANCAR, S. (2018). Siyasal Kararlara Katılımda Toplumsal Cinsiyet Eşitliği Haritalama ve İzleme Çalışması, CEİD Yayınları, 1. Baskı, Ankara.
SLIOGERIENE, J., Turskis, Z., Streimikiene, D. (2013). Analysis and Choice of Energy Generation Technologies: The Multiple Criteria Assessment on The Case Study of Lithuania, Energy Procedia, 32: 11-20.
STEFANOVIC, V., Urošević, S., Ranisavljević , I., Stojilković, P. (2019). Multi-Criteria Ranking of Work Places from the Aspect of Risk Assessment in the Production Processes in Which Women are Employed, Safety Science, 116: 116-126.
ŞİMŞEK, M. (2008). Küreselleşen Dünyada Kadının Ekonomik Konumu, Ekin Yayınevi, Bursa.TAŞABAT, S.E., Cinemre, N., Şen, S. (2015). Farklı Ağırlıklandırma Tekniklerinin Denendiği Çok Kriterli Karar
Verme Yöntemleri ile Türkiye’deki Mevduat Bankalarının Mali Performanslarının Değerlendirilmesi, Social Sciences Research Journal, 4(2): 96-110.
TOKSÖZ, G. (2018). Kalkınmada Kadın Emeği, Varlık Yayınları, 2. Baskı, İstanbul.ÜNAL ERZEN, M. (2019). Siyasette Cinsiyet Eşitsizliği, Akademik Sosyal Araştırmalar, 8: 21-32.VISVANATHAN, N. (1997). Theories of Women, Gender and Development, N. Visvanathan, L. Duggan, N.
Wiegersma, L. Nisonoff (Ed.), The Women, Gender and Development Reader, Zed Books, Londra.ZAVADSKAS, E. K., Turskis, Z. (2010). A New Additive Ratio Assessment (ARAS) Method in Multicriteria
Decision-Making, Technological and Economic Development of Economy, 16 (2): 159-172.ZHANG, H., Gu, C., Gu, L., Zhang, Y. (2011). The Evaluation of Tourism Destination Competitiveness by
TOPSIS & Information Entropy–A case in the Yangtze River Delta of China, Tourism Management, 32(2): 443-451.
UNDP, https://www.undp.org/, (ErişimTarihi:30.11.2019)WORLDBANK, https://data.worldbank.org/, (Erişim Tarihi:30.11.2019)
121
The social and economic position of women in society is an important issue both as a production factor and in the upbringing of future generations. Actually; strengthening the position of women in society is one of the basic conditions for the economic and social development of societies. The fact that women reach the desired level in social, economic, and political terms is of great importance for the development of countries. It is very important to ensure equal participation of all individuals in the social and economic life rather than just providing economic growth in the development process. Women’s location is one of the important factors that affect this process. Especially in recent years, studies on women in the literature have increased, but it has been observed that these studies generally consist only of studies involving the social or economic status of women. For this reason, in this study, it was aimed to examine the socio-economic status of women by using MCDM (Multi-Criteria Decision Making) methods. The difference of this study from other studies is that many factors affecting women’s economic, social, and political status are included in the analysis at the same time. To include all factors together and simultaneously in the analysis, MCDM methods were preferred as the method in the study.
In this study, the socio-economic status of women in OECD countries was analyzed by the Entropy-ARAS integrated method, which is one of the MCDM methods. The reason for the preferred choice of MCDM methods in the study is that multiple factors can be included in the analysis at the same time. The Entropy method is an objective evaluation method used to find the appropriate weights of each criterion in MCDM problems. ARAS method, on the other hand, reveals the proportional similarity of each alternative to the ideal alternative. For this reason, the ARAS method seems to be the closest method to the proportional grading target among other MCDM methods. In the study, the data of the countries between 2010 and 2017 were used. In order to determine the socio-economic and political status of women, 9 factors were included in the analysis. These factors are per capita income (GDP) for women, employment rate for women, labor force participation rate for women, the school enrollment rate for women (primary, secondary education, higher education), average life expectancy for women, political participation rate and gender-based human development index (HDI). Since the healthy data of some countries related to schooling rate in women are not available, the values of this criterion over the years are; It is obtained by us by proportioning the female population in primary, secondary, and higher education to the total female population. The data used in this calculation are taken from UNESCO (http://data.uis.unesco.org). In addition, although there are 36 OECD member countries, 34 countries have been included in the analysis since the healthy data of Israel and Luxembourg are not available.
Entropy and ARAS methods, which are among the MCDM methods, were used in the study. Firstly, the data of the countries were analyzed by the Entropy method and a ranking was obtained among the 9 factors included in the application in terms of criterion weights. This ranking is as follows: political participation rate, GDP, schooling (primary and secondary education), female employment rate, female labor force participation rate, higher education enrollment rate, HDI, and average life expectancy in women. Then, the ARAS method was applied by using criterion weights created with
Extended Abstract
Müge YILMAZ • Mevlüdiye ŞİMŞEK • Gözde KOCA
122
the Entropy method. With this method, a ranking has been achieved among OECD countries in terms of the socio-economic and political status of women. Although there are changes in country rankings in the years included in the analysis, Norway, Iceland, and Sweden were the top three countries that are in the best condition in terms of women’s socioeconomic status, while Japan and Hungary took the last two places in terms of women’s status. According to the findings obtained as a result of the application made, it was concluded that political participation and education factors were at the forefront in determining the socio-economic status of women in OECD countries. As a result of the analysis, it is seen that the status of women does not increase at the same rate in countries where economic growth is increasing rapidly. Increasing the welfare of all members of the society together with a strong social structure should be among the primary goals of the countries for sustainable development. Increasing the status of women in society will contribute to the country’s economic and social life positively and support its progress in the direction of growth and development. Because, women are very important in terms of being a production factor in economic life, and in social life, the basic element of a family and its importance in raising future generations. The main reasons for the fact that countries like Norway and Iceland support women in economic, social, and political fields with gender equality policies are among the OECD countries.
Supporting the education of women is imperative for countries to increase the status of women. Also, necessary measures should be taken for the investments that will reduce female unemployment and especially the regulations regarding the prevention of unregistered employment in women and the factors that weaken the economic life of women. With the support of participation in the labor market, women will gain economic freedom and thus will start to take a more active role in social life. Supporting women in the field of education and ensuring that all women benefit from healthcare facilities on an equal basis will both have a positive impact on the economy of the countries and contribute to a more conscious raising of future generations. Also, it is very important to look at women’s problems through the eyes of women. Scandinavian countries succeeded in solving this problem considerably with the application of quotas in politics and ensured the participation of women in political life to a great extent. Patriarchal social structure and male-dominant structure in politics, which exist in many developing countries like our country, are important factors in keeping women’s problems in the background. With the support of women in political life as well as in economic and social life, women’s problems will come to the agenda more and solutions will be faster with a women’s perspective by increasing women’s participation.
123Makale Gönderim Tarihi:Makale Gönderim Tarihi: 12.02.2021Yayına Kabul Tarihi:Yayına Kabul Tarihi: 13.06.2021
ARAŞTIRMA MAKALESİ / RESEARCH ARTICLE
Marmara Üniversitesi İktisadi ve İdari Bilimler Dergisi • Cilt: 43 • Sayı: 1 • Haziran 2021, ISSN: 2587-2672, ss/pp. 123-144 DOI: 10.14780/muiibd.960306
INDUSTRY 4.0 AND SUSTAINABLE SUPPLY CHAIN
ENDÜSTRİ 4.0 VE SÜRDÜRÜLEBİLİR TEDARİK ZİNCİRİ
Elif BİLGİN*1
AbstractThe integration of information technologies with industry has marked the beginning of the Fourth Industrial Revolution, which is called Industry 4.0 for short. The technologies of this era have been transforming not only the industry itself but also reshaping individuals and society. One cannot deny the very positive outcomes of Industry 4.0; however, it has also given rise to some environmental problems, including changes in climatic conditions, the running out of resources due to increasing amounts of production, industrial wastes, all of which pose irreversible threats to nature. These negative outcomes have mobilized individuals, non-governmental organizations and states requiring companies to reform the operation of supply chains in line with the sustainability principle of “meeting today’s needs without compromising the ability of future generations to meet their own needs”. The purpose of the current study is to present how Industry 4.0 might influence the functioning of the sustainable supply chain and the benefits it might bring. First, industrial revolutions, the concept of Industry 4.0 were introduced briefly. Then, the trends in supply chain management and with reference to sustainability and the possible contributions of Industry 4.0 to sustainability were discussed.Keywords: Industry 4.0, Sustainable Supply Chain, Closed-loop Product Lifecycle, 6RJEL Classification: L1, L2, M1, O33, Q31, Q56, Q57
ÖzBilişim teknolojilerinin sanayi ile bütünleşmesi sonucu günümüzde 4. Sanayi Devriminin içinde olduğumuz kabul edilmektedir. Endüstri 4.0 olarak adlandırılan bu dönemde hayata geçirilen teknolojik faktörlerin sadece endüstriyi değil; bireyleri ve toplumu da önemli ölçüde etkilemektedir. Endüstrideki olumlu teknolojik gelişmelerin yanında çevresel etkiler de değişmekte fakat bu etki ne yazık ki olumsuz yönde olmaktadır. Değişen iklim koşulları, artan üretim ve buna bağlı artan kaynak tüketimi, endüstriyel atıklar vb. birçok faktör doğayı geri dönülemez ölçüde tehdit eder hale gelmiştir. Bu olumsuz gelişmeler bireyleri, sivil toplum örgütlerini ve devletleri harekete geçirmiştir. İşletmeler de dâhil oldukları tedarik zincirlerinin işleyişini ‘günümüz ihtiyaçlarının, gelecek nesillerin kendi ihtiyaçlarını karşılama kabiliyetinden ödün vermeksizin karşılanması’ şeklinde tanımlanan sürdürülebilirlik ilkesi doğrultusunda yeniden biçimlendirmektedirler. Bu çalışmanın amacı Endüstri 4.0’ın sürdürülebilir tedarik zincirinin işleyişinde nasıl bir etkisi olacağının ve getireceği faydaların sunulmasıdır. Çalışmada öncelikle sanayinin
* PhD., Marmara University, Faculty of Business Administritation, Istanbul, E-Mail: [email protected], ORCID ID: 0000-0002-5823-3822
Elif BİLGİN
124
devrimleri, Endüstri 4.0 kavramı ve getirdiği yeniliklerden bahsedilmiştir. Ardından tedarik zincirinin yönetiminin gelişimi, sürdürülebilir tedarik zincirinin özelliklerine değinilmiştir. Son olarak Endüstri 4.0’ın sürdürülebilir tedarik zincirine nasıl katkı sunmasının beklendiği açıklanmıştır.Anahtar Kelimeler: Endüstri 4.0, Sürdürülebilir Tedarik Zinciri, Kapalı Çevrim Ürün Yaşam Döngüsü, 6RJEL Sınıflandırması: L1, L2, M1, O33, Q31, Q56, Q57
1. Introduction
The primary goal of companies since the beginning of the industrial revolution has always been to increase their profits. During the early years of industrialization, just increasing the amount of production was sufficient to increase the profitability thanks to the high demand and low competition. However, a lot has changed in the following years. First, companies that wanted to increase their profitability sought ways to reduce their costs due to increasing competition and the growing number of suppliers for the demand. Flexible production strategies were developed when cost reduction alone was insufficient to get ahead of competitors and reducing costs while increasing production flexibility and quality required new management approaches. Since then, companies on supply chains have tended to work cooperatively and have implemented technological and strategic plans for economic growth.
However, industrial development has brought about many threats to nature, such as climate change. Increasing consumption of natural resources and the resulting industrial waste has mobilized individuals, non-governmental organizations and governments as well as companies. The management of supply chain processes with only economic targets has lost its rationality because processes to meet unlimited consumption over the years. Meeting the needs of the modern world without compromising the ability of future generations to meet their own needs, the value of renewable resources and the issue of production using less harmful methods to nature have gained importance as the world cannot be a place to live without the sustainability of natural resources and the cooperation of all individuals, states and companies. Therefore, sustainability and its environmental dimension have become an important concept for companies.
The aim of Sustainable Supply Chain Management is to provide materials, information and capital flow to reach economic, environmental and social goals while meeting the expectations of all stakeholders in the supply chain network, from suppliers to customers. Supply chain involves processes from product design, raw material purchasing, logistics, production, sales, distribution, usage, end-of-life processes to waste management. In sustainable supply chains, new regulations are made compatible with the issues of using environmentally friendly materials, carbon emissions and ecological footprint to minimize pollution with waste management activities and promote recycling.
Industry 4.0 is a concept that basically aims the integration of production with Information Technologies. Beyond the automation of the value chains only within the enterprises, it is an industrial integration strategy in which all value chain steps are in real-time and continuous communication with each other, and thus, it is a smart and self-adapting strategy. Due to the technological factors summarized with the concept of Industry 4.0, it will be possible to practice sustainable management strategies in the entire supply chain.
Marmara Üniversitesi İktisadi ve İdari Bilimler Dergisi • Cilt: 43 • Sayı: 1 • Haziran 2021, ISSN: 2587-2672, ss/pp. 123-144
125
2. Historical Evolution of Industry and Industry 4.0
There have been three major industrial changes in the past that fundamentally changed the factors of production and their relationships. The first and the most impressive influence of these was the transition from craft production to factory production in the late 18th century with the invention of mechanical looms that enabled more efficient use of water and steam power. The main development that led to this First Industrial Revolution was James Watt’s invention of the steam-powered machine in Scotland in 1763 followed by Edmund Cartwright who invented the mechanical loom in 1784, which mechanized the weaving process and became the pioneer of the mechanization era. This revolution, which first appeared in the UK, spread to Western Europe, North America, Japan and then all around the world. While machines replaced manpower with the First Industrial Revolution, the use of minerals and metals increased, and transportation was greatly improved. Machines used in this period comprised of simple mechanical tools operating with the help of gears, pistons, belts and pulleys.1 This great change in the industry and the great increase in the amount of production transformed economic relations and social structure as well.
The second major change in industrial production occurred with the assembly line technology developed in the US in the early 20th century and Taylor’s management strategy. With the production facilities operating with electrical energy and the division of labor in manufacturing the mass production methods, such as the inexpensive steel production method developed by British inventor Henry Bessemer in 1860 and the first “assembly line” in a slaughterhouse in Cincinnati in 1870 began to spread all around the world. In the expansion of the Second Industrial Revolution, the developments in electricity and chemical science and the development of the transportation network, especially the railways, played a major role. The ease of transportation facilitated the supply of raw materials while the products manufactured could reach new and distant markets. The reforms in industry again spread to social and economic platforms. The US and Germany became world leaders thanks to their developed economies. Electrical machines were manufactured in the USA and Germany and they were exported to other countries. Productivity in manufacturing has significantly increased by means of the “mass production line” method that Henry Ford started to use in his automobile factory in 1913, which was then adopted by other sectors as well. This method enables mass production based on standardized goods. The motto of this industrial period, known as Fordism, has been called “mass production for the masses”. When Fordism, which prevailed as the main manufacturing method until the end of the 1960s, was not able to respond to the increasing competition and the diversification in consumer demands anymore, new production strategies were developed in which flexibility and diversity came into prominence to reduce costs.
The third major change in the industry was the result of the combination of technological developments with increasing competition and the necessity to respond to diversity in consumer demands. In 1968, the development of PLC (programmable logic controller), a microprocessor-based device that processes the information received from the sensors according to the existing program and transfers it to other
1 Çeliktaş, M.S. et al. (2015). Endüstriyel Devrimin Son Sürümünde Mühendisliğin Yol Haritası, Mühendis ve Makine, 56(662): 25.
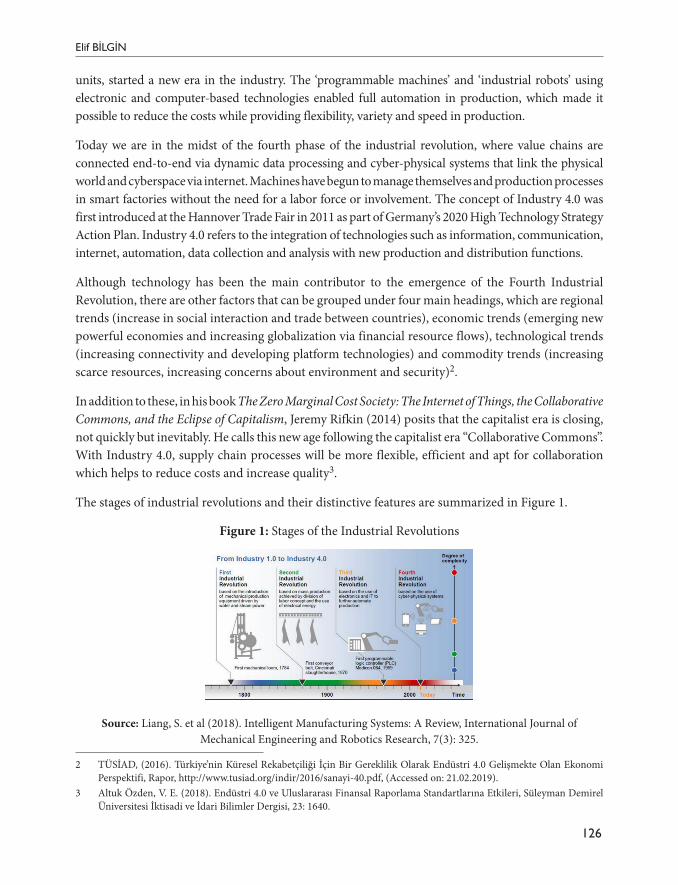
Elif BİLGİN
126
units, started a new era in the industry. The ‘programmable machines’ and ‘industrial robots’ using electronic and computer-based technologies enabled full automation in production, which made it possible to reduce the costs while providing flexibility, variety and speed in production.
Today we are in the midst of the fourth phase of the industrial revolution, where value chains are connected end-to-end via dynamic data processing and cyber-physical systems that link the physical world and cyberspace via internet. Machines have begun to manage themselves and production processes in smart factories without the need for a labor force or involvement. The concept of Industry 4.0 was first introduced at the Hannover Trade Fair in 2011 as part of Germany’s 2020 High Technology Strategy Action Plan. Industry 4.0 refers to the integration of technologies such as information, communication, internet, automation, data collection and analysis with new production and distribution functions.
Although technology has been the main contributor to the emergence of the Fourth Industrial Revolution, there are other factors that can be grouped under four main headings, which are regional trends (increase in social interaction and trade between countries), economic trends (emerging new powerful economies and increasing globalization via financial resource flows), technological trends (increasing connectivity and developing platform technologies) and commodity trends (increasing scarce resources, increasing concerns about environment and security)2.
In addition to these, in his book The Zero Marginal Cost Society: The Internet of Things, the Collaborative Commons, and the Eclipse of Capitalism, Jeremy Rifkin (2014) posits that the capitalist era is closing, not quickly but inevitably. He calls this new age following the capitalist era “Collaborative Commons”. With Industry 4.0, supply chain processes will be more flexible, efficient and apt for collaboration which helps to reduce costs and increase quality3.
The stages of industrial revolutions and their distinctive features are summarized in Figure 1.
Figure 1: Stages of the Industrial Revolutions
Source: Liang, S. et al (2018). Intelligent Manufacturing Systems: A Review, International Journal of Mechanical Engineering and Robotics Research, 7(3): 325.
2 TÜSİAD, (2016). Türkiye’nin Küresel Rekabetçiliği İçin Bir Gereklilik Olarak Endüstri 4.0 Gelişmekte Olan Ekonomi Perspektifi, Rapor, http://www.tusiad.org/indir/2016/sanayi-40.pdf, (Accessed on: 21.02.2019).
3 Altuk Özden, V. E. (2018). Endüstri 4.0 ve Uluslararası Finansal Raporlama Standartlarına Etkileri, Süleyman Demirel Üniversitesi İktisadi ve İdari Bilimler Dergisi, 23: 1640.
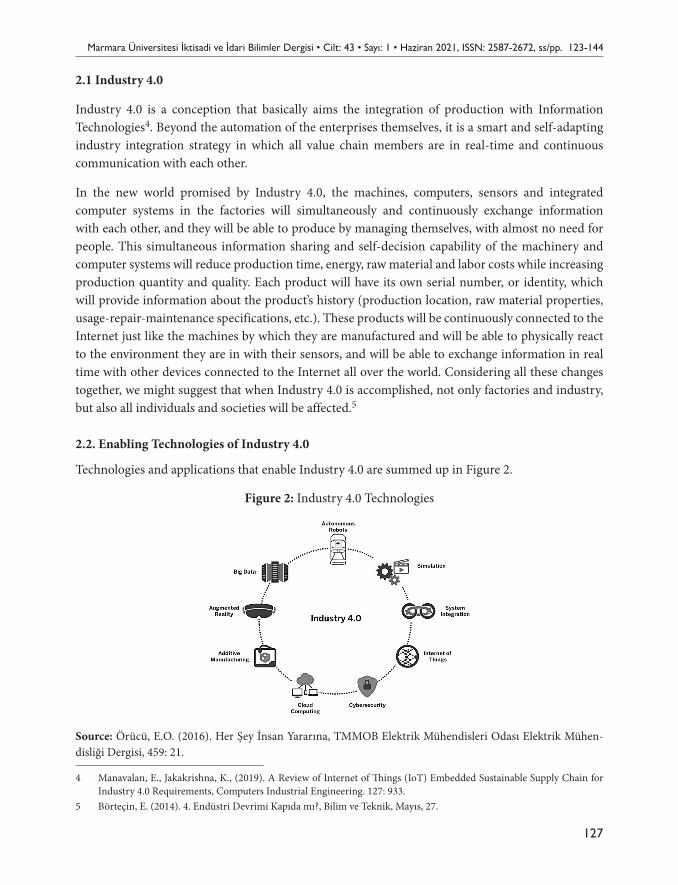
Marmara Üniversitesi İktisadi ve İdari Bilimler Dergisi • Cilt: 43 • Sayı: 1 • Haziran 2021, ISSN: 2587-2672, ss/pp. 123-144
127
2.1 Industry 4.0
Industry 4.0 is a conception that basically aims the integration of production with Information Technologies4. Beyond the automation of the enterprises themselves, it is a smart and self-adapting industry integration strategy in which all value chain members are in real-time and continuous communication with each other.
In the new world promised by Industry 4.0, the machines, computers, sensors and integrated computer systems in the factories will simultaneously and continuously exchange information with each other, and they will be able to produce by managing themselves, with almost no need for people. This simultaneous information sharing and self-decision capability of the machinery and computer systems will reduce production time, energy, raw material and labor costs while increasing production quantity and quality. Each product will have its own serial number, or identity, which will provide information about the product’s history (production location, raw material properties, usage-repair-maintenance specifications, etc.). These products will be continuously connected to the Internet just like the machines by which they are manufactured and will be able to physically react to the environment they are in with their sensors, and will be able to exchange information in real time with other devices connected to the Internet all over the world. Considering all these changes together, we might suggest that when Industry 4.0 is accomplished, not only factories and industry, but also all individuals and societies will be affected.5
2.2. Enabling Technologies of Industry 4.0
Technologies and applications that enable Industry 4.0 are summed up in Figure 2.
Figure 2: Industry 4.0 Technologies
Source: Örücü, E.O. (2016). Her Şey İnsan Yararına, TMMOB Elektrik Mühendisleri Odası Elektrik Mühen-disliği Dergisi, 459: 21.
4 Manavalan, E., Jakakrishna, K., (2019). A Review of Internet of Things (IoT) Embedded Sustainable Supply Chain for Industry 4.0 Requirements, Computers Industrial Engineering. 127: 933.
5 Börteçin, E. (2014). 4. Endüstri Devrimi Kapıda mı?, Bilim ve Teknik, Mayıs, 27.
Elif BİLGİN
128
Internet of Things (IoT): ‘Things’ for Industry 4.0 refers to any physical substance, such as a system, device, product. For example, refrigerators, bus stops, vehicles, ventilation systems, production machines, etc. can make conclusions by use of “artificial intelligence” operated by the information hardware and software embedded and act accordingly. Since the communication medium in the Internet of Things is the Internet, the need to confine the objects to a certain limited area is eliminated. Through the Internet of Things, machines and cyber-physical systems can access databases of globally dispersed suppliers, manufacturers and distributors, thereby all processes on the supply chain can communicate with each other. For instance, thanks to the Internet of Things, it is possible to place an order with suppliers in different countries for the reduced raw material stock of a product produced in a country, without the need for human intervention, and it can be ensured that the desired amount of raw materials are included in production just in time and efficiently.6 In addition to the concept of Internet of Things-IoT, the concept of Internet of Services-IoS has also begun to be used. Internet of Systems-IoS, is a concept that encompasses IoT and CPS (Cyber Physical Systems) together. It refers to the integration of web and service-based information technologies with the value chain that produces not only goods but also services.7
Big Data and Analytics: The term big data refers to data sets that are too large or too complex to be analyzed by traditional methods. Traditionally, companies tend to make business decisions based on the data obtained from various sources, such as production records, financial records and market research reports. However, the data used in decision making is now obtained from many different and new sources, such as the sensors of smart products (especially thanks to the Internet of Things), websites, search engines and social media sites (e.g., Google, Facebook, Twitter). Data collected and stored systematically from these new sources is called big data.8 Distinguishing properties of big data are defined by 4V, Volume, Variety, Velocity and Veracity. Developments in information technologies and decrease in data storage costs have popularized the use and analysis of big data. With the analysis of big data, the trends in customer demands can be predicted, and strategic plans and evaluations can be made based on these predictions.
Smart Robotics: Robots are programmable, multi-purpose, stationary or mobile machines that can provide autonomous control. Robots can solve the problems they encounter within their own programs installed by humans. Smart robots, on the other hand, update their programs with their past experiences and develop different attitudes and solutions to new situations and problems without the need for human intervention.
Vertical and Horizontal Integration: In Industry 4.0, vertical integration is a digital system integration where entire in-house processes (starting from product design, procurement, production, marketing, distribution, etc.), machines, workstations, computers and all means of production are
6 Kaygın, E. et al. (2019). Endüstri 4.0’a Akademik Bakış, Atatürk Üniversitesi İktisadi ve İdari Bilimler Dergisi, 33(4): 1070.7 Reis, J. Z., Gonçalves, R.F. (2018). The Role of Internet of Services (IoS) on Industry 4.0 through the Service Oriented
Architecture (SOA). IFIP WG 5.7 International Conference, APMS 2018, Seoul, Korea, August 26-30, 2018, Proceedings, Part II. p.3.
8 Yıldırım, Y. (2019). Endüstri 4.0’a Kapsamlı Bir Bakış: 2011’den Bugüne, Bilgi Dünyası, 20(2): 232
Marmara Üniversitesi İktisadi ve İdari Bilimler Dergisi • Cilt: 43 • Sayı: 1 • Haziran 2021, ISSN: 2587-2672, ss/pp. 123-144
129
connected and communicated through the Internet of Things.9 Horizontal integration, on the other hand, is a digital system integration of each production and planning process of the enterprise with the equivalent production and planning processes of other members on the value chain in order to ensure the eliminate waste and maximize flow. For instance, product design, manufacturing and shipment processes of the companies on the supply chain can be integrated with each other through their digital systems. End-to-end engineering refers to the integration of the entire product life cycle from beginning to end. It is the integration of the same interfaces of systems and processes within the factory with the end-to-end digital engineering systems and the systems of all value chain members including customers. It can also be expressed as the incorporation of vertical and horizontal integration.
Cloud Computing: Cloud computing technologies ensure that all data owned by companies are stored on a virtual server, that is, in the cloud, and that the data is accessible when needed through internet-connected devices.10
Cyber Security: Every device using an Internet system is vulnerable to cyber-attacks. With cyber security technologies, only permitted computer systems can connect to the existing network and transactions are encrypted to prevent cyber-attacks. These cyber security risks that can be encountered in both horizontal and vertical integration processes can be in the form of theft or alteration of personal or corporate data and information as well as possible cyber interventions in production lines and machines, which may lead to life-threatening conditions, disruption or full stop of production.11
Additive Manufacturing (3D Printing): It is the construction of a physical ‘three-dimensional’ object by printing layer by layer from a digital three-dimensional model.
Augmented Reality (AR): Augmented reality is defined as the transformation of objects in the physical world into sound, video, graphic and GPS data with computer-based sensors.
Simulation: Simulation, which can be described in its simplest form, imitation of real life combining many of the Industry 4.0 technologies. For example, the data regarding demands and expectations of customers, which are collected and processed via big data and analytics, can be modeled by simulations to evaluate how it might change in the future or how different attitudes of companies might affect customers. Smart factories can pre-adapt their production to changing conditions thanks to simulation models. Along with augmented reality, simulation applications are particularly beneficial for repair-maintenance and training services.
9 Duarte, S., Cruz-Machado, V. (2017). An Investigation of Lean and Green Supply Chain in the Industry 4.0, Proceedings of the 2017 International Conference on Industrial Engineering and Operations Management (IEOM). Bristol, UK. p.259.
10 Annaç Göv, S., Erdoğan, D. (2020). Dördüncü Endüstri Devriminin (Endüstri 4.0) Neresindeyiz?, İstanbul Gelişim Üniversitesi Sosyal Bilimler Dergisi, 7(2): 302.
11 Yoşumaz, İ., Özkara, B., (2019). Endüstri 4.0 Sürecinin Hazır Giyim İşletmeleri Üzerindeki Etkileri: Hugo Boss Türkiye Örneği, İşletme Araştırmaları Dergisi, 11(4): 2591.
Elif BİLGİN
130
Cyber-Physical-Systems (CPS): The systems that connect the physical world and the cyber space via the Internet are called cyber-physical systems. Virtual elements can be transferred to outputs that easy to understand and ideas can be transferred to machines to be implemented. It is possible for both elements to act together in a coordinated manner.12
Smart Factories: The application of Cyber-Physical Systems (CPS) in production systems is called Cyber-Physical Production Systems (CPPS) or Smart Factories.13 Smart factories are flexible systems that can adapt their operations to new conditions in real or near-real time, learn from their experiences, and fulfill entire production processes autonomously.14 The new generation smart factories where product-related data are stored and shared, production and planning are carried out by smart robots without the need for human intervention. Similarly, the reverse process from the customer to the raw material supply as well as from raw material to product phase and even to the recycling processes after the use of the product is planned using big data. In this way, labor costs might be reduced to almost zero, most of the human-induced errors might be prevented while speed and flexibility in production might be increased, and much more efficient output might be obtained with unmanned production in safety – or health-threatening sectors.
3. The Evolution of Supply Chain Management and Sustainable Supply Chain
The history of supply chain dates back to the 1960s. The pioneering discourse about the “physical distribution stage”, which is considered the first stage of supply chain management, belongs to Donald J. Bowersox, who is the author of the book “Supply Chain Logistics Management”. In his book published in 1969, Bowersox argued that fulfilling the distribution function outside the company with intra-channel integration would provide a competitive advantage, which emphasizes the logistics function of the management of supply chain.
In the 1970s, the effect of high inventory levels on total production costs as well as product quality and delivery time gained attention, and it was apparent that in coordination with suppliers and distributors negatively affected customer satisfaction and costs.15 During this period, Material Requirements Planning (MRP) method, which combined production planning and purchasing, was developed. Companies established a central physical distribution department that carried out marketing, production and financing-related distribution activities within themselves and have adopted a management approach that combined the logistics management of the entire system instead of optimizing the logistics of each activity separately. As the supplier and materials management functions were integrated with physical distribution, a new paradigm called Supply
12 Alçın, S. (2016). Üretim İçin Yeni Bir İzlek: Sanayi 4.0, Journal of Life Economics, 3(8): 23.13 Rudtsch, V., Gausemeier, J., Gesing, J., Mittag, T., Peter, S. (2014). Pattern-based Business Model Development for Cyber-
Physical Production Systems, Procedia CIRP, 25: 314.14 Coşkun Arslan, M., Demirkan, S. (2019). Endüstri 4.0 ve Muhasebe Sistemine Etkisi Üzerine Kuramsal Bir İnceleme,
Enderun Dergisi, 3(1): 45.15 Güleş, H.K., Paksoy, T., Bülbül, H., Özceylan, E. (2009). Tedarik Zinciri Yönetimi, Stratejik Planlama, Modelleme ve
Optimizasyon, Gazi Kitabevi, p.2.
Marmara Üniversitesi İktisadi ve İdari Bilimler Dergisi • Cilt: 43 • Sayı: 1 • Haziran 2021, ISSN: 2587-2672, ss/pp. 123-144
131
Chain Management (SCM) emerged.16 In his book “International Supply Chain Management”, J.B. Houlihan brought a new holistic perspective to the supply chain by combining the firm’s strategic decisions with the physical distribution focus.17
The increasing global competition in the 1980s forced companies to reduce costs and increase product quality and diversity. At that time, the storage and transportations processes took %70 of the total production time starting from raw materials to the phase when the product is available to customers.18 In his book ‘Competing Through Supply Chain Management’ published in 1998, David Frederick Ross describes this phase as the integration of logistics, which combines distribution, transportation and material management to shorten lead time and reduce costs.
The 1990s was a period when the agile supply chain concept was expressed by combining agile production systems with supply chain management. Quick response production and supply chain management, which emerged in response to rapidly changing customer expectations and needs under increasingly competitive conditions, enabled companies to adapt to changes with sufficient flexibility and reduced cycle time and costs by taking advantage of new strategies and new technologies.19 Rapid innovations in technology and the density of competitive conditions triggered companies to change their understanding of supply chain management. The 1990s is the period when lean production and lean management philosophy became widespread following agile production. Lean manufacturing originated from the Toyota Production System (TPS) established by Taiichi Ohno and Shigeo Shingo. The lean supply chain was the evolution of the lean production philosophy pioneered by Toyota Motor Company, which highlighted the uninterrupted transfer of value throughout the value chain, starting from raw materials, and quickly arriving to end users.20
By the 2000s, some threats to nature, such as changes in climatic conditions, industrial wastes, and increasing energy consumption have been motivating individuals, non-governmental organizations and governments as well as companies. The increasing amount of production have led to the running out of scarce natural resources. Consequently, the value of renewable resources and the issue of production using less harmful methods have gained importance and green supply chain has inevitably come to the agenda of companies. Green supply chain aims to increase the profitability and market share by increasing the ecological efficiency of enterprises and all stakeholders on the chain, and prioritizing the reduction of environmental impacts and risks.21
16 Çetin, O., Knouch, M. (2018). Sustainable Competitive Advantage in Green Supply Chain Management, in Çalıyurt, K.T., Said, R. (Eds.). Sustainability and Social Responsibility of Accountability Reporting Systems. Accounting, Finance, Sustainability, Governance & Fraud: Theory and Application. Springer Nature Singapore Pte Ltd. p.356.
17 Özdemir, A.İ. (2004). Tedarik Zinciri Yönetiminin Gelişimi, Süreçleri ve Yararları, Erciyes Üniversitesi İktisadi ve İdari Bilimler Fakültesi Dergisi, 23: 90.
18 Güleş, H.K., Paksoy, T., Bülbül, H., Özceylan, E., 2009, .3.19 Uçal Sarı İ., Çayır Ervural, B., Bozat, S. (2017). Sürdürülebilir Tedarik Zinciri Yönetiminde DEMATEL Yöntemiyle
Tedarikçi Değerlendirme Kriterlerinin İncelenmesi ve Sağlık Sektöründe bir Uygulama, Pamukkale Üniversitesi Mühendislik Bilimleri Dergisi, 23(4): 479.
20 Akben, İ. Güngör, A. (2018). Tedarik Zinciri ve Yalın Tedarik Zinciri, Avrasya Sosyal ve Ekonomi Araştırmaları Dergisi (ASEAD), 5(7): 3.
21 Duarte, S., Cruz-Machado, V. (2018). Exploring Linkages Between Lean and Green Supply Chain and the Industry 4.0, Proceedings of the Eleventh International Conference on Management Science and Engineering Management, Lecture Notes on Multidisciplinary Industrial Engineering, p.1246.
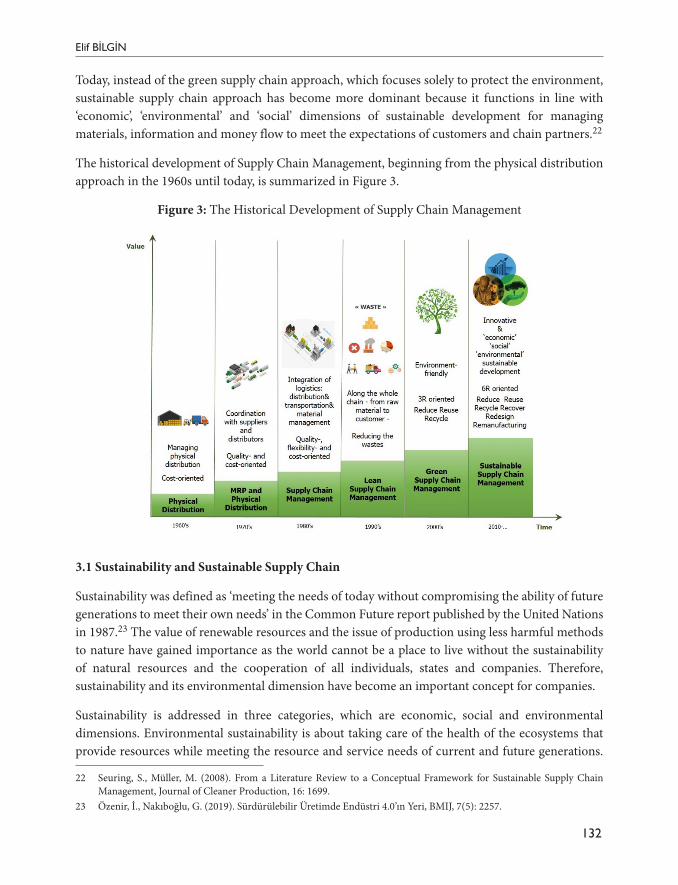
Elif BİLGİN
132
Today, instead of the green supply chain approach, which focuses solely to protect the environment, sustainable supply chain approach has become more dominant because it functions in line with ‘economic’, ‘environmental’ and ‘social’ dimensions of sustainable development for managing materials, information and money flow to meet the expectations of customers and chain partners.22
The historical development of Supply Chain Management, beginning from the physical distribution approach in the 1960s until today, is summarized in Figure 3.
Figure 3: The Historical Development of Supply Chain Management
3.1 Sustainability and Sustainable Supply Chain
Sustainability was defined as ‘meeting the needs of today without compromising the ability of future generations to meet their own needs’ in the Common Future report published by the United Nations in 1987.23 The value of renewable resources and the issue of production using less harmful methods to nature have gained importance as the world cannot be a place to live without the sustainability of natural resources and the cooperation of all individuals, states and companies. Therefore, sustainability and its environmental dimension have become an important concept for companies.
Sustainability is addressed in three categories, which are economic, social and environmental dimensions. Environmental sustainability is about taking care of the health of the ecosystems that provide resources while meeting the resource and service needs of current and future generations.
22 Seuring, S., Müller, M. (2008). From a Literature Review to a Conceptual Framework for Sustainable Supply Chain Management, Journal of Cleaner Production, 16: 1699.
23 Özenir, İ., Nakıboğlu, G. (2019). Sürdürülebilir Üretimde Endüstri 4.0’ın Yeri, BMIJ, 7(5): 2257.
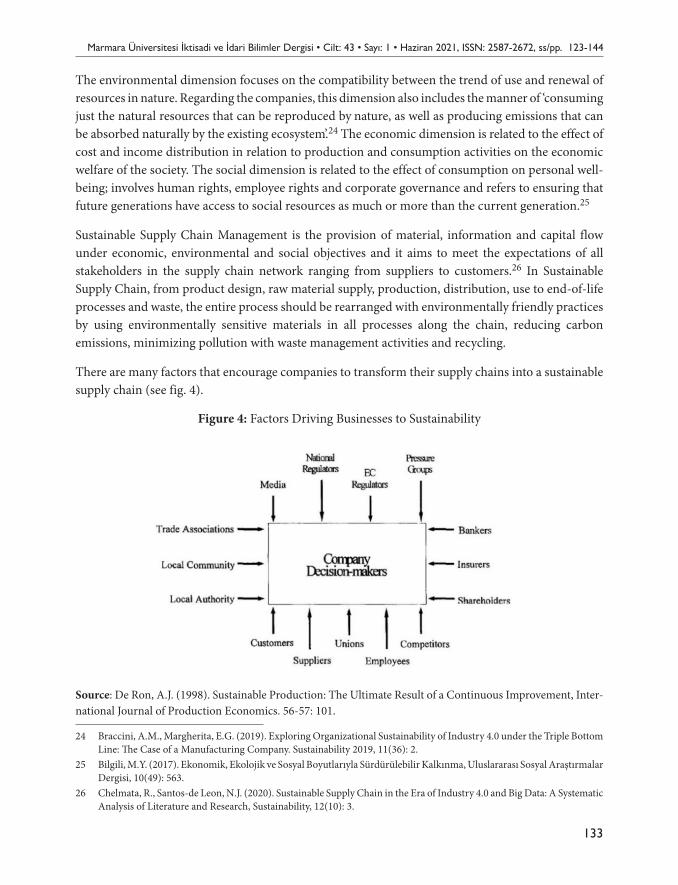
Marmara Üniversitesi İktisadi ve İdari Bilimler Dergisi • Cilt: 43 • Sayı: 1 • Haziran 2021, ISSN: 2587-2672, ss/pp. 123-144
133
The environmental dimension focuses on the compatibility between the trend of use and renewal of resources in nature. Regarding the companies, this dimension also includes the manner of ‘consuming just the natural resources that can be reproduced by nature, as well as producing emissions that can be absorbed naturally by the existing ecosystem’.24 The economic dimension is related to the effect of cost and income distribution in relation to production and consumption activities on the economic welfare of the society. The social dimension is related to the effect of consumption on personal well-being; involves human rights, employee rights and corporate governance and refers to ensuring that future generations have access to social resources as much or more than the current generation.25
Sustainable Supply Chain Management is the provision of material, information and capital flow under economic, environmental and social objectives and it aims to meet the expectations of all stakeholders in the supply chain network ranging from suppliers to customers.26 In Sustainable Supply Chain, from product design, raw material supply, production, distribution, use to end-of-life processes and waste, the entire process should be rearranged with environmentally friendly practices by using environmentally sensitive materials in all processes along the chain, reducing carbon emissions, minimizing pollution with waste management activities and recycling.
There are many factors that encourage companies to transform their supply chains into a sustainable supply chain (see fig. 4).
Figure 4: Factors Driving Businesses to Sustainability
Source: De Ron, A.J. (1998). Sustainable Production: The Ultimate Result of a Continuous Improvement, Inter-national Journal of Production Economics. 56-57: 101.
24 Braccini, A.M., Margherita, E.G. (2019). Exploring Organizational Sustainability of Industry 4.0 under the Triple Bottom Line: The Case of a Manufacturing Company. Sustainability 2019, 11(36): 2.
25 Bilgili, M.Y. (2017). Ekonomik, Ekolojik ve Sosyal Boyutlarıyla Sürdürülebilir Kalkınma, Uluslararası Sosyal Araştırmalar Dergisi, 10(49): 563.
26 Chelmata, R., Santos-de Leon, N.J. (2020). Sustainable Supply Chain in the Era of Industry 4.0 and Big Data: A Systematic Analysis of Literature and Research, Sustainability, 12(10): 3.
Elif BİLGİN
134
The main purpose of companies is to reduce costs and increase the flexibility and efficiency of production to gain a long-term competitive advantage. With the development of an environmentally friendly management approach, energy and resource efficiency, increasing productivity, shortening innovation and marketing cycle times, horizontal and vertical integration and end-to-end digital integration of engineering on the entire value chain have also been included in business objectives. Industry 4.0 has the potential to create positive sustainability impacts across the entire value chain by providing solutions to economic problems by increasing efficiency and customizing products for customers with a transparent and traceable supply chain. Due to these developments, it might be suggested that the Industry 4.0 paradigm is a step towards creating more sustainable industrial values.27
3.2 Closed Loop Product Life-cycle and 6R
The product life-cycle refers to all the processes that a product goes through, from the idea phase, material supply, production, sales, after-sales services to after use. Product life-cycle management, on the other hand, is the system that allows all companies on the chain to register and track information of all of these phases with a common software.
The implementation of a closed loop product life-cycle system in environmentally friendly supply chains is an important tool to ensure sustainability.28 With the closed-loop product life cycle, the aim is to improve environmental and social impacts as well as the economic benefits in the traditional form in all processes in the chain, starting from the design of the product, purchasing, production, storage, distribution and after-sales services.29 Traditional supply chains can be classified under two categories based on the stages of the product lifecycle, which are forward and reverse supply chains. Forward supply chains generally include a series of processes related to obtaining the final product from raw materials and activities related to the delivery of these products to customers. Reverse supply chains, on the other hand, include the collection of products from the end user and transporting them to the separation facilities, testing the product in order to determine the condition of the product and the most economically effective reuse option, classification and separation processes, economically the most suitable recovery (repair, re-production, reuse, recycling) or selection and practice of disposal methods, and remarketing and distribution activities for recovered products.30 The closed loop product life cycle system, which enables sustainability in the supply chain, incorporates forward and reverse supply chain processes.
27 Toker, K. (2018). Endüstri 4.0. ve Sürdürülebilirliğe Etkileri, İstanbul Management Journal, 29(84): 56.28 Yadav G., et al. (2020). A Framework to Overcome Sustainable Supply Chain Challenges through Solution Measures of
Industry 4.0 and Circular Economy: An Automotive Case, Journal of Cleaner Production, p.4.29 Badurdeen, F. (2015). Planning, Design and Management of Supply Chains for Sustainability, Proceedings of the
Measurement Science for Sustainable Construction and Manufacturing Workshop Volume I, Position Papers and Findings, p.8.
30 Kaya, A., Alumur Alev, S. (2014). Kapalı Döngü Tedarik Zinciri Ağı Tasarımı. 14. Üretim Araştırmaları Sempozyumu (ÜAS 2014) İstanbul. Bildiri Kitabı. p.270.
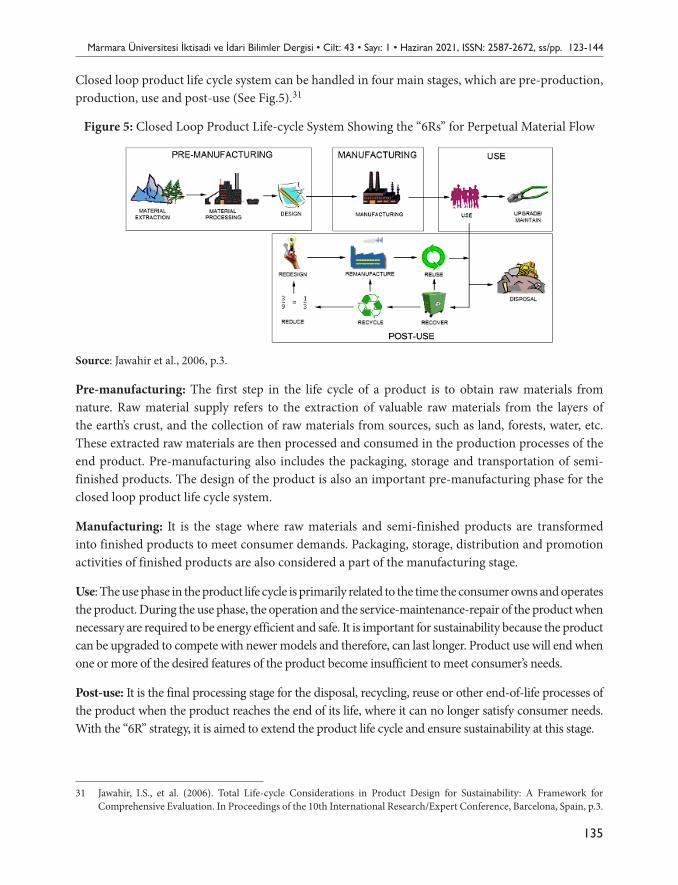
Marmara Üniversitesi İktisadi ve İdari Bilimler Dergisi • Cilt: 43 • Sayı: 1 • Haziran 2021, ISSN: 2587-2672, ss/pp. 123-144
135
Closed loop product life cycle system can be handled in four main stages, which are pre-production, production, use and post-use (See Fig.5).31
Figure 5: Closed Loop Product Life-cycle System Showing the “6Rs” for Perpetual Material Flow
Source: Jawahir et al., 2006, p.3.
Pre-manufacturing: The first step in the life cycle of a product is to obtain raw materials from nature. Raw material supply refers to the extraction of valuable raw materials from the layers of the earth’s crust, and the collection of raw materials from sources, such as land, forests, water, etc. These extracted raw materials are then processed and consumed in the production processes of the end product. Pre-manufacturing also includes the packaging, storage and transportation of semi-finished products. The design of the product is also an important pre-manufacturing phase for the closed loop product life cycle system.
Manufacturing: It is the stage where raw materials and semi-finished products are transformed into finished products to meet consumer demands. Packaging, storage, distribution and promotion activities of finished products are also considered a part of the manufacturing stage.
Use: The use phase in the product life cycle is primarily related to the time the consumer owns and operates the product. During the use phase, the operation and the service-maintenance-repair of the product when necessary are required to be energy efficient and safe. It is important for sustainability because the product can be upgraded to compete with newer models and therefore, can last longer. Product use will end when one or more of the desired features of the product become insufficient to meet consumer’s needs.
Post-use: It is the final processing stage for the disposal, recycling, reuse or other end-of-life processes of the product when the product reaches the end of its life, where it can no longer satisfy consumer needs. With the “6R” strategy, it is aimed to extend the product life cycle and ensure sustainability at this stage.
31 Jawahir, I.S., et al. (2006). Total Life-cycle Considerations in Product Design for Sustainability: A Framework for Comprehensive Evaluation. In Proceedings of the 10th International Research/Expert Conference, Barcelona, Spain, p.3.
Elif BİLGİN
136
In previous years, closed system product lifecycle management in green supply chains was traditionally defined with 3R ‘reduce, reuse and recycle’, while in sustainable supply chains ‘recover, redesign, remanufacturing’ strategies were added to these practices and the definition has been expanded to 6R strategy.
Reduce signifies designs that will reduce the need for resources during the design phase, techniques to reduce material and energy consumption and waste during the production phase, and practices for reducing waste for use and post-use phases.32 With the reduce strategy, benefits such as cost reduction, gaining costumer’s reputation and fulfillment of environmental regulations will also be achieved.
Reuse refers to the reuse of the parts of the product or the whole product itself, with little or no change.33
Recycle is the conversion of used and waste material into a new raw material or product.34
Recover is the process of collecting the product at the post-use phase and disassembling, classifying and cleaning the product for re-use in later life cycle stages.35
Redesign is improving next generate product through innovative techniques to facilitate recovery, reuse or reduce of products and materials.36
Remanufacturing involves the re-processing of used products or components without loss of functionality. It involves disassembling a used and returned product in its life cycle, repairing and reusing some parts after check, replacing some parts with new ones and producing a product that is “as good as new” in terms of quality, features and performance after reassembly.37 The difference between manufacturing and remanufacturing is that the materials used in manufacturing are used for the first time whereas the sub-components of the product in remanufacturing consist of previously used raw materials and parts.
The practice of 6R in sustainable supply chain processes can make great contributions to the constant re-integration of products into the life cycle and thus minimize the ecological footprint.
4. Industry 4.0 and Sustainable Supply Chain
In order to be able to use closed-loop product life cycle management systems in sustainable supply chains and to implement 6R, which will minimize the damage caused by chain activities to the
32 Kuik, S.S., Nagalingam, S.V., Amer, Y. (2011). Sustainable Supply Chain for Collaborative Manufacturing, Journal of Manufacturing Technology Management, 22(8): 993.
33 Rosenthal, C., Fatimah, Y.A., Biswas, W.K. (2016). Application of 6R Principles in Sustainable Supply Chain Design of Western Australian White Goods, Procedia CIRP, 40:318.
34 Jawahir, I. S., Bradley, R. (2016). Technological Elements of Circular Economy and the Principles of 6R-Based Closed-loop Material Flow in Sustainable Manufacturing, Procedia CIRP, 40:104.
35 Jawahir, I.S., et al (2006). Op cit. p.4.36 Jawahir, I. S., Bradley, R. (2016). Technological Elements of Circular Economy and the Principles of 6R-Based Closed-
loop Material Flow in Sustainable Manufacturing, Procedia CIRP, 40: 104.37 Reimann, M., Xiong, Y., Zhou, Y. (2019). Managing a Closed-loop Supply Chain with Process Innovation for
Remanufacturing, European Journal of Operational Research, 276(2): 512.
Marmara Üniversitesi İktisadi ve İdari Bilimler Dergisi • Cilt: 43 • Sayı: 1 • Haziran 2021, ISSN: 2587-2672, ss/pp. 123-144
137
environment, companies should pay attention to the issues covered by the three dimensions of sustainable development as well as having sufficient technological capability. The use of Industry 4.0 technologies in companies will enable sustainable supply chains to optimize their environmental, economic and social performance targets.
Industry 4.0 makes work processes more flexible, economical and environmentally friendly by transforming supply chain elements into a smart system based on cyber-physical interactions. Industry 4.0 contributes to the development of a global network of cyber-physical machines, equipment, sensors and facilities to improve data sharing, analysis and control of industrial systems. In addition, with the utilization of Industry 4.0 technologies, it is possible to monitor and control important production parameters such as production status, energy consumption, material flow, customer orders and supplier data in real time.38
The differences between sustainable supply chain functions and traditional supply chain functions and the contributions of Industry 4.0 technologies to these functions can be summarized as follows:
Product Design: In sustainable supply chains, the product design stage should be held with care so that the product components would not contain harmful contents to human health and nature. The durable design that will allow the product to be used for a long time will reduce the amount of waste after use. It is also important that these raw materials and supplies are compatible with 6R practices, especially with reuse and re-manufacturing. The reduction of materials used in product and packaging content is as important as the use of environmentally friendly materials in terms of sustainability. Contrary to a production manner that consumes nature by using new resources, redesign practices allow the reuse of resources for product designs.
Using the Internet of Things as an Industry 4.0 technology, it becomes possible to track the product throughout its life cycle will facilitate 6R practices.39 In the design phase, attention should be paid to the design of smart products that will enable the Internet of Things. With the help of simulation, the compatibility of the materials to be used in the product with 6R practices and their impact on human health and on the environment can be tested. Thanks to the horizontal and vertical integration, 6R-compatible product design information can be shared with internal processes. In addition, the information of the design processes of other stakeholders in the supply chain can be shared and the efficiency of sustainability factors that can be achieved with the closed-cycle product life cycle, such as reduction and reuse might be ensured on the entire chain. Cloud technology, big data and analytics are important prerequisite technologies for data sharing in horizontal and vertical integration just as the cyber security is very important for the safety of the shared data throughout the supply chain.
Sourcing/Procurement and Purchasing: It is important to choose suppliers that use environmentally friendly production technologies and materials in the sourcing and purchasing stages in the sustainable supply chain. Environment-friendly materials should be selected in raw material and
38 Yıldız A. (2018). Endüstri 4.0 ile Bütünleştirilmiş Dijital Tedarik Zinciri. BMIJ, 6(4): 1217.39 Ghobakloo, M. (2020). Industry 4.0, Digitization, and Opportunities for Sustainability, Journal of Cleaner Production,
252: 3.
Elif BİLGİN
138
supplies purchasing and environment-friendly technologies should be preferred in purchasing the production technologies as well. Priority should be given to machines and systems that will reduce carbon emissions, energy consumption and waste. 6R practices should also be prioritized in purchasing decisions. For example, by choosing recovered, recycled or reused raw materials and supplies in material purchases, the product life cycle will be extended and the use of resources and waste will be reduced throughout the supply chain. In terms of social sustainability, companies that meet the sustainability criteria for labor conditions should be selected and labor working conditions should be clearly defined in procurement contracts. It may also be preferable to work with suppliers from underdeveloped countries or regions to ensure economic sustainability since inequality of income distribution between countries or regions might be reduced to some extent.
Horizontal and vertical integration of Industry 4.0 technologies plays a major role in the performance of sustainability in the purchasing process. In addition to tracking whether the raw materials used and the products produced are harmless to the environment, regularly monitoring of the labor working conditions might force suppliers to improve their working conditions. Additive manufacturing technologies might make it possible to work with suppliers in much more distant regions and help backward regions with economic sustainability. Thanks to big data and analytics, it will be possible to compare many alternative suppliers and materials, which will increase economic sustainability efficiency by choosing lower cost alternatives. The Internet of Things, real-time tracking of raw material and supplies usage in production processes will be possible, which means that the time and amount of the material needed could be shared simultaneously with horizontally integrated suppliers, and that suppliers could work with less inventory and shorten delivery times.40
Production: With the design of production processes and technologies that will reduce waste generation, energy and raw material use, the efficiency of the environmental dimension of sustainability of the supply chain will be achieved. It will also contribute to economic sustainability as the costs will be reduced as a result of reducing the use of energy, raw materials and supplies. In traditional supply chains, production management focuses only on the increase of production or cost minimization where labor working conditions might go unnoticed. The social dimension of sustainability focuses on issues such as improving social opportunities including working conditions, wages, and health rights of the workforce utilized in production processes. Social sustainability requires fair employment of diverse groups within society with respect to gender, age, etc. Providing equal employment opportunities to diverse groups of society, being fair in remuneration and additional social rights while planning workforce in production processes is an issue that companies should pay attention to. Production in different regions and the fair allocation of employment to the regions is important for economic sustainability.
Thanks to the fast and transparent data sharing with horizontal and vertical integration of Industry 4.0 practices in production processes, wastes from defective production, overproduction, etc. might be greatly reduced. With the use of smart robotics and smart factories, production processes that
40 Luthra, S., Mangla, S. K (2018). Evaluating Challenges to Industry 4.0 Initiatives for Supply Chain Sustainability in Emerging Economies, Process Safety and Environmental Protection, 117: 170
Marmara Üniversitesi İktisadi ve İdari Bilimler Dergisi • Cilt: 43 • Sayı: 1 • Haziran 2021, ISSN: 2587-2672, ss/pp. 123-144
139
pose a threat to human health or life can be practiced without human need. The Internet of Things and cyber-physical systems may simplify the monitoring of all stages of the product in real time and malfunction or unnecessary waiting could be immediately intervened. With the incorporation of technologies such as the Internet of Things, cyber-physical systems, big data and analytics, simulation, etc., it will be possible to track the increasing or decreasing trends in demands and production levels might be updated accordingly.41 Thus, the damage to the environment will be minimized by reducing unnecessary resource consumption. It will be possible to significantly reduce inventory levels thanks to the real-time adaptation of production and predicted demand changes, which can be monitored in real time with smart factory applications. Since additive manufacturing technologies will eliminate the necessity of making all stages of production in the same place, part of the production can be shifted to underdeveloped regions or countries.42
Distribution: The distribution function in the supply chain includes distribution from the supplier to the production unit and from the production site to the distributor, retailer, customer and consumers. In sustainable supply chains, the distribution function is particularly effective in environmental sustainability. While cost minimization is the main target in traditional supply chains by deciding transportation type to be used in distribution; alternatives that will cause the least damage to the environment are preferred in sustainable supply chains. Especially in road transport, the type of fuel used in vehicles is important in terms of environmental sustainability. Since the number of trips in distribution will directly affect the fuel consumption of vehicles, mathematical models are used for careful planning to minimize the number of trips jointly by different stakeholders on the supply chain.
The Internet of Things enables simultaneous tracking of materials and products that will participate in distribution at all stages throughout the supply chain. Thanks to horizontal integration and cloud computing, the data is made accessible to all chain partners so that distribution vehicles could be used by different companies in product distribution. Since these technologies make the sharing of demand and production information at different stages of the chain simultaneously available to the whole chain, the future needs could be recognized in advance and added to the distribution planning. Equipping distribution vehicles with cyber-physical systems, such as navigation applications, will also reduce travel time.
Costumer-Use: The customer, who demanded that the product and the processes that the product goes through throughout the life cycle should comply with the sustainability dimensions, has been particularly effective in transforming the supply chain from traditional manner to sustainability. By preferring products that do not contain raw materials and materials that are harmless for human health and environment, by choosing brands that comply with the social sustainability conditions such as proper working conditions, by not buying products from brands that use harmful manufacturing technologies; customers could also act as an auditor of sustainability practices in the supply chain.
41 Bag, S., Telukdarie, A., Pretorius, J.H.C., Gupta, S (2018). Industry 4.0 and Supply Chain Sustainability: Framework and Future Research Directions, Benchmarking: An International Journal, p.11.
42 Moktadir, Md. A., Mithun Ali. S., Kusi-Sarpong, S., Ali Shaikh, M.A. (2018). Assessing Challenges for Implementing Industry 4.0: Implications for Process Safety and Environmental Protection, Process Safety and Environmental Protection, 11: 732.
Elif BİLGİN
140
Big data and analytics play a major role in Industry 4.0 and are seen as key ‘game changers’ especially for the sustainable supply chain management.43 With big data and analytics applications, customers can access great amount of data about supply chains. With the Internet of Things, it is possible to get access to information in which country the product to be purchased is manufactured, which country the materials used are from, and what the content of the product is. In addition, thanks to the augmented reality technology, customers who get the opportunity to experience the product before the actual purchase will be able to predict its benefits during use and will be able to choose the most suitable product for themselves. It will be possible to guide customers on issues such as next product preferences, re-purchases by processing the data related to the customer’s current usage experiences through simulation and big data and analysis. In this case, cyber security is a very important prerequisite technology.
Post-use – Reverse Logistics: The most prominent point where the sustainable supply chain differs from traditional manner is the 6R strategies. With the closed-loop product life cycle, supply chain management does not end when the product reaches the customer, it is re-included in the value chain post-use with practices such as recycling, recovery, re-manufacturing, and reuse. In this way, first of all, the harm that will occur as a result of disposing the product or its components as garbage will be reduced. In addition, with the re-incorporation of this product or its components into the value chain as raw materials, the inputs required for producing these materials once again will be reduced. Maintenance and repair activities of the product also determine the environmental, economic and social dimensions in the sustainable supply chain in the post-use phase. Promoting consumption and re-purchasing in line with the growth target of economies causes consumption of natural resources at an irreversible level. Companies will support economic, social and environmental sustainability from a different perspective by offering maintenance and repair services to their customers that will ensure long-term use of their products and also increasing employment in these services. At this stage, just like the forward logistics operations in the distribution stage, the environmental harm of the distribution operations should be minimized in the reverse logistics stage. The fuel that will cause the least damage to the environment is preferred in the vehicles to be used, and the number of trips should be reduced as it directly affects the fuel consumption.
It will be possible to increase the quality of these services with the use of augmented reality technology in maintenance and repair services in the post-use phase. Increasing the quality of services such as repair and maintenance will prolong the life of the product and prevent waste generation.44 Thanks to additive manufacturing, it will be possible to produce the materials required for these services at the place of use, so fuel consumption for transport will be reduced. In reverse logistics phase, with the horizontal integration and Internet of Things, it will be possible to gather products from their locations after use and send them to value chain levels where they can be re-utilized with 6R applications.45 As in all other stages where Industry 4.0 technologies are utilized, in the reverse
43 Hahn, G.J. (2020). Industry 4.0: A Supply Chain Innovation Perspective, International Journal of Production Research, 58(5):1426.
44 De Man, J.C., Strandhagen, J.O. (2017). An Industry 4.0 Research Agenda for Sustainable Business Models, Procedia CIRP, 63:722.
45 Stock, T., Seiger, G. (2016). Opportunities of Sustainable Manufacturing in Industry 4.0, 13th Global Conference on Sustainable Manufacturing. Procedia CIRP, 40:5.
Marmara Üniversitesi İktisadi ve İdari Bilimler Dergisi • Cilt: 43 • Sayı: 1 • Haziran 2021, ISSN: 2587-2672, ss/pp. 123-144
141
logistics stage, cyber-security technology is of utmost importance to the successful implementation of Industry 4.0 principles.
5. Conclusion
The developments in information technologies and their integration with industry have marked the beginning of the Fourth Industrial Revolution. It is apparent that the technological changes experienced in this period, which is also called Industry 4.0, will significantly affect not just industry but also individuals and society as a whole. However, technological and industrial developments bring about some harmful effects while making human life easier. The growing populations of countries and their changing consumption habits trigger an increase in production. The increase in production leads to an increase in industrial waste generation and consumption of natural resources. Changes in climatic conditions and industrial effects pose serious threats to future generations. The attempts of individuals who try to raise awareness have encouraged governments and enterprises to show some respect to nature. Companies have been reforming their supply chains in line with the ‘sustainability’ principle defined as ‘meeting the needs of today without compromising the ability of future generations to meet their own needs’ in the Common Future report published by the United Nations in 1987.
In the sustainable supply chain, in order for the world to continue to be a livable place, starting from product design, all processes along the chain such as raw material supply, production, distribution, use, end-of-life processes and waste must be rearranged in line with economic, social and environmental sustainability principles.
With the principle of environmental sustainability, environmental-friendly practices such as the use of environmental-friendly materials, reducing resource consumption and carbon emissions, minimizing pollution with waste management activities, and the potential of recycling come to the fore in the chain. The closed-loop product life cycle system is one of the most effective tools in ensuring environmental sustainability with reduce, reuse, recycle, recover, redesign and re-manufacturing practices expressed as 6R. Economical dimension of sustainability aims at fair share of costs and income related to production and consumption activities in society and the continuation of prosperity in the future. As a matter of social sustainability principle, the aim of supply chain activities is to comply with human rights, care about improving working conditions and fair distribution among social classes such as employment age, gender, etc., and that the consumption opportunities are equally shared among all individuals with diverse backgrounds.
Industry 4.0, whose technological components are summarized as the Internet of Things, big data and analytics, vertical-horizontal integration, cloud computing, additive manufacturing, augmented reality, simulation, cyber physical systems, smart robots, smart factories and cyber security, will enable supply chain functions to work in line with sustainable principles. Thanks to Industry 4.0 technologies, the Internet of Objects and horizontal integration especially, it will be possible to track the product along the entire life cycle beginning from production process as raw material to final
Elif BİLGİN
142
product and until after use phase. In this way, systems that contribute to environmental sustainability such as using materials harmless for nature, reducing of resource and energy consumption, recycling, reuse, recovery, re-manufacturing can be utilized. Horizontal and vertical integration in supply chain, cloud computing, big data and analytics technologies are Industry 4.0 applications that support economic and social sustainability as well as environmental sustainability. Thanks to smart robots, smart factories and cyber-physical systems, decisions related to demand and production can be made simultaneously throughout the supply chain, thus reducing overproduction, the resulting resource consumption and waste generation.
Sustainable supply chain management has become a necessity for the world to continue to be a livable place with its environmental, social and economic dimensions. Industry 4.0 technologies are expected to provide convenience and opportunity for the transformation of supply chain functions into sustainable applications. However, there are also claims that it may have some negative outcomes, especially in social and economic dimensions. As the use of industry 4.0 technologies in supply chains becomes widespread, its effects might be evaluated closely by making comparative analyses in future studies.
ReferencesAKBEN, İ. Güngör, A. (2018). Tedarik Zinciri ve Yalın Tedarik Zinciri, Avrasya Sosyal ve Ekonomi Araştırmaları
Dergisi (ASEAD), 5(7): 1-12.ALÇIN, S. (2016). Üretim İçin Yeni Bir İzlek: Sanayi 4.0, Journal of Life Economics, 3(8): 19-30.ALTUK ÖZDEN, V.E. (2018). Endüstri 4.0 ve Uluslararası Finansal Raporlama Standartlarına Etkileri, Süleyman
Demirel Üniversitesi İktisadi ve İdari Bilimler Dergisi, 23: 1639-1650.ANNAÇ GÖV, S., Erdoğan, D. (2020). Dördüncü Endüstri Devriminin (Endüstri 4.0) Neresindeyiz?, İstanbul
Gelişim Üniversitesi Sosyal Bilimler Dergisi, 7(2): 299-318.BADURDEEN, F. (2015). Planning, Design and Management of Supply Chains for Sustainability. Proceedings
of the Measurement Science for Sustainable Construction and Manufacturing Workshop Volume I. Position Papers and Findings, 7-11.
BAG, S., Telukdarie, A., Pretorius, J.H.C., Gupta, S. (2018). Industry 4.0 and Supply Chain Sustainability: Framework and Future Research Directions, Benchmarking: An International Journal.
BILGILI, M.Y. (2017). Ekonomik, Ekolojik ve Sosyal Boyutlarıyla Sürdürülebilir Kalkınma. Uluslararası Sosyal Araştırmalar Dergisi, 10(49): 559-569.
BÖRTEÇIN, E. (2014). 4. Endüstri Devrimi Kapıda mı? Bilim ve Teknik, Mayıs: 26-29.BRACCINI, A.M., Margherita, E.G. (2019). Exploring Organizational Sustainability of Industry 4.0 under the
Triple Bottom Line: The Case of a Manufacturing Company, Sustainability, 11(36): 1-17.CHELMATA, R., Santos-de Leon, N.J. (2020). Sustainable Supply Chain in the Era of Industry 4.0 and Big Data:
A Systematic Analysis of Literature and Research, Sustainability, 12(10): 1-24.COŞKUN ARSLAN, M., Demirkan, S. (2019). Endüstri 4.0 ve Muhasebe Sistemine Etkisi Üzerine Kuramsal Bir
İnceleme, Enderun Dergisi, 3(1): 40-56.ÇELIKTAŞ, M.S., Sonlu, G., Özgel, S., Atalay, Y. (2015). Endüstriyel Devrimin Son Sürümünde Mühendisliğin
Yol Haritası, Mühendis ve Makine, 6(662): 24-34.
Marmara Üniversitesi İktisadi ve İdari Bilimler Dergisi • Cilt: 43 • Sayı: 1 • Haziran 2021, ISSN: 2587-2672, ss/pp. 123-144
143
ÇETIN, O., Knouch, M. (2018). Sustainable Competitive Advantage in Green Supply Chain Management, in Çalıyurt, K.T., & Said, R. (Eds.). Sustainability and Social Responsibility of Accountability Reporting Systems, Accounting, Finance, Sustainability, Governance & Fraud: Theory and Application, Springer Nature Singapore Pte Ltd, 347-367.
DE MAN, J.C., Strandhagen, J.O. (2017). An Industry 4.0 Research Agenda for Sustainable Business Models, Procedia CIRP, 63:721-726.
DE RON, A.J. (1998). Sustainable Production: The Ultimate Result of a Continuous Improvement, International Journal of Production Economics, 56-57: 99-110.
DUARTE, S., Cruz-Machado, V. (2017). An Investigation of Lean and Green Supply Chain in the Industry 4.0. Proceedings of the 2017 International Conference on Industrial Engineering and Operations Management (IEOM). Bristol, UK, p. 256-265.
DUARTE, S., Cruz-Machado, V. (2018). Exploring Linkages Between Lean and Green Supply Chain and the Industry 4.0. Proceedings of the Eleventh International Conference on Management Science and Engineering Management, Lecture Notes on Multidisciplinary Industrial Engineering.
GÜLEŞ, H.K., Paksoy, T., Bülbül, H., Özceylan, E. (2009). Tedarik Zinciri Yönetimi, Stratejik Planlama, Modelleme ve Optimizasyon, Gazi Kitabevi.
GHOBAKLOO, M. (2020). Industry 4.0, Digitization, and Opportunities for Sustainability, Journal of Cleaner Production, 252.
HAHN, G.J. (2020). Industry 4.0: A Supply Chain Innovation Perspective, International Journal of Production Research, 58(5): 1425-1441.
JAWAHIR, I. S., Bradley, R. (2016). Technological Elements of Circular Economy and the Principles of 6R-Based Closed-loop Material Flow in Sustainable Manufacturing, Procedia CIRP, 40: 103–108.
JAWAHIR, I.S., Dillon, O.W., Rouch, K.E., Joshi, K.J., Venkatachalam, A., Jaafar, I.H. (2006). Total life-cycle Considerations in Product Design for Sustainability: A framework for Comprehensive Evaluation, In Proceedings of the 10th International Research/Expert Conference, Barcelona, Spain, 1-10.
KAYA, A., Alumur Alev, S. (2014). Kapalı Döngü Tedarik Zinciri Ağı Tasarımı, 14. Üretim Araştırmaları Sempozyumu (ÜAS 2014), İstanbul, Bildiri Kitabı, 267-278.
KAYGIN, E., Zengin, Y., Topçuoğlu, E. (2019). Endüstri 4.0’a Akademik Bakış, Atatürk Üniversitesi İktisadi ve İdari Bilimler Dergisi, 33(4): 1065-1081.
KUIK, S.S., Nagalingam, S.V., Amer, Y. (2011). Sustainable Supply Chain for Collaborative Manufacturing, Journal of Manufacturing Technology Management, 22(8): 984-1001.
LIANG, S. et al (2018). Intelligent Manufacturing Systems: A Review, International Journal of Mechanical Engineering and Robotics Research, 7(3): 324-330.
LUTHRA, S., Mangla, S. K. (2018). Evaluating Challenges to Industry 4.0 Initiatives for Supply Chain Sustainability in Emerging Economies, Process Safety and Environmental Protection, 117: 168-179.
MANAVALAN, E., Jakakrishna, K. (2019). A Review of Internet of Things (IoT) Embedded Sustainable Supply Chain for Industry 4.0 Requirements, Computers Industrial Engineering, 127: 925-953.
MOKTADIR, Md. A., Mithun Ali. S., Kusi-Sarpong, S., Ali Shaikh, M.A. (2018). Assessing Challenges for Implementing Industry 4.0: Implications for Process Safety and Environmental Protection, Process Safety and Environmental Protection, 117: 730-741.
ÖRÜCÜ, E.O. (2016). Her Şey İnsan Yararına, TMMOB Elektrik Mühendisleri Odası Elektrik Mühendisliği Dergisi, 459: 20-22.
ÖZDEMIR, A.İ. (2004). Tedarik Zinciri Yönetiminin Gelişimi, Süreçleri ve Yararları, Erciyes Üniversitesi İktisadi ve İdari Bilimler Fakültesi Dergisi, 23: 87-96.
Elif BİLGİN
144
ÖZENIR, İ., Nakıboğlu, G. (2019). Sürdürülebilir Üretimde Endüstri 4.0’ın Yeri, BMIJ, 7(5): 2248-2281.REIMANN, M., Xiong, Y., Zhou, Y. (2019). Managing a Closed-loop Supply Chain with Process Innovation for
Remanufacturing, European Journal of Operational Research, 276(2): 510-518.REIS, J.Z., Gonçalves, R.F. (2018). The Role of Internet of Services (IoS) on Industry 4.0 Through the Service
Oriented Architecture (SOA). IFIP WG 5.7 International Conference, APMS 2018, Seoul, Korea, August 26-30, 2018, Proceedings, Part II.
ROSENTHAL, C., Fatimah, Y.A., Biswas, W.K. (2016). Application of 6R Principles in Sustainable Supply Chain Design of Western Australian White Goods, Procedia CIRP, 40: 318-323.
RUDTSCH, V., Gausemeier, J., Gesing, J., Mittag, T., Peter, S. (2014). Pattern-based Business Model Development for Cyber-Physical Production Systems, Procedia CIRP, 25: 313-319.
STOCK, T., Seiger, G. (2016). Opportunities of Sustainable Manufacturing in Industry 4.0. 13th Global Conference on Sustainable Manufacturing, Procedia CIRP. 40: 536-541.
SEURING, S., Müller, M. (2008). From a Literature Review to a Conceptual Framework for Sustainable Supply Chain Management, Journal of Cleaner Production, 16: 1699–1710.
TOKER, K. (2018). Endüstri 4.0. ve Sürdürülebilirliğe Etkileri, İstanbul Management Journal, 29(84): 51-64.TÜSİAD. (2016). Türkiye’nin Küresel Rekabetçiliği İçin Bir Gereklilik Olarak Endüstri 4.0 Gelişmekte Olan
Ekonomi Perspektifi, Rapor, http://www.tusiad.org/indir/2016/sanayi-40.pdf, (Accessed on: 21.02.2019)UÇAL SARI, İ., Çayır Ervural, B., Bozat, S. (2017). Sürdürülebilir Tedarik Zinciri Yönetiminde DEMATEL
Yöntemiyle Tedarikçi Değerlendirme Kriterlerinin İncelenmesi ve Sağlık Sektöründe bir Uygulama, Pamukkale Üniversitesi Mühendislik Bilimleri Dergisi, 23(4): 477-485.
YADAV, G., Luthra, S., Jakhar, S. K., Mangla, S.K., Rai, D. P. (2020). A Framework to Overcome Sustainable Supply Chain Challenges Through Solution Measures of Industry 4.0 and Circular Economy: An Automotive Case, Journal of Cleaner Production: 2-15.
YILDIRIM, Y. (2019). Endüstri 4.0’a Kapsamlı Bir Bakış: 2011’den Bugüne, Bilgi Dünyası, 20(2): 217-249.YILDIZ, A. (2018). Endüstri 4.0 ile Bütünleştirilmiş Dijital Tedarik Zinciri. BMIJ, 6(4): 1215-1230.YOŞUMAZ, İ., Özkara, B., (2019). Endüstri 4.0 Sürecinin Hazır Giyim İşletmeleri Üzerindeki Etkileri: Hugo
Boss Türkiye Örneği, İşletme Araştırmaları Dergisi, 11(4): 2587-2600.
145Makale Gönderim Tarihi:Makale Gönderim Tarihi: 12.02.2021Yayına Kabul Tarihi:Yayına Kabul Tarihi: 13.06.2021
ARAŞTIRMA MAKALESİ / RESEARCH ARTICLE
Marmara Üniversitesi İktisadi ve İdari Bilimler Dergisi • Cilt: 43 • Sayı: 1 • Haziran 2021, ISSN: 2587-2672, ss/pp. 145-156 DOI: 10.14780/muiibd.960318
INVESTORS’ REACTIONS TO ENVIRONMENTAL DISCLOSURES: EVIDENCE FROM BORSA ISTANBUL
ÇEVRE İLE İLGİLİ AÇIKLAMALARA YATIRIMCILARIN TEPKİLERİ: BORSA ISTANBUL ÜZERİNE BİR ARAŞTIRMA
V. Evrim ALTUK ÖZTÜRK*1
Ayşegül İŞCANOĞLU ÇEKİÇ2
**
AbstractThe goal of this study is to analyze the impacts of the environmental corporate social responsibility on stock performances. In other words, this study aims to measure investors’ reactions to environmental awareness. In this regard, we consider listing in the BIST Sustainability Index as an environmental awareness and we implement an event study around the announcement of the companies included in the BIST Sustainability Index. This study covers the daily stock prices of 59 companies indexed in the BIST Sustainability Index between 2014-2019. The eight different event windows are considered. According to the findings of the study, no significant performance change is observed in the companies included or delisting from the sustainability index in short time.Keywords: Event Study, BIST Sustainability Index, Environmental Awareness, Stock PerformanceJEL Classification: G14, M41, Q56
ÖzBu çalışmanın amacı, şirketlerin çevreye ilişkin sosyal sorumluluklarının hisse senedi performansına etkisini analiz etmektir. Bir başka ifadeyle çevre duyarlılığına yatırımcı tepkilerinin ölçmeyi hedeflemektedir. Bu bağlamda, BIST Sürdürülebilirlik Endeksi’nde yer alan şirketler, çevresel duyarlılığı olan şirketler olarak ele alındı ve BIST Sürdürülebilirlik Endeksi’ndeki şirketlerin duyuruları çerçevesinde bir olay çalışması uygulandı. Bu çalışma, 2014-2019 yılları arasında BIST Sürdürülebilirlik Endeksi’nde yer alan 59 şirketin günlük hisse senedi fiyatlarını kapsamaktadır. Çalışmada, sekiz farklı olay penceresi dikkate alınmıştır. Araştırmanın bulgularına göre, sürdürülebilirlik endeksine dâhil edilen veya çıkarılan şirketlerde, kısa dönemde, önemli bir performans değişikliği gözlemlenmemiştir.Anahtar Kelimeler: Olay Çalışması, BIST Sürdürülebilirlik Endeksi, Çevresel Duyarlılık, Hisse Senedi PerformansıJEL Sınıflandırması: G14, M41 Q56
* Asst. Prof. Dr., Trakya University, Department of Accounting and Finance Management, E-Mail: [email protected], ORCID ID: 0000-0003-2139-8081
** Assoc. Prof. Dr., Trakya University, Department of Econometrics, Edirne, E-Mail: [email protected], ORCID ID: 0000-0003-0692-7870
V. Evrim ALTUK ÖZTÜRK • Ayşegül İŞCANOĞLU ÇEKİÇ
146
1. Introduction
The resources of our world are running out due to human activities. Therefore, the renewal of resources is extremely important for humans. At this point, sustainability becomes a necessity to make the world a better place to live.
Today, the importance of sustainability has been understood in many areas and an increasing environmental awareness has been created. While most consumers prefer environmentally friendly products, some investors consider sustainability as well as profitability. Changes in consumer and investor perspectives encourage companies to produce recyclable products and become more environmentally friendly. This is actually so called stakeholder theory which states that companies should care about all parties related to the company, such as the state, the public, investors, opponents, customers, employees1.
This study is about the reactions of the investors to the environmental disclosures of the companies. In other words, our hypothesis is that investors react to companies’ environmental awareness and precautions and as a result, if the company takes necessary environmental precautions then it’s earnings will increase.
In this context, our hypothesis adopts the following views. Companies that prefer to be socially responsible undertake Corporate Social Responsibility (CSR) activities2 and this behavior is a great opportunity to create permanent value for many stakeholders3. Sustainability will increase reputation, increase in reputation will increase sales and thus companies will create financial value with increased earnings and reduced costs.
For this reason, we have three research questions; how to measure environmental awareness of the companies, how to measure financial performance of the companies and how to measure the reaction of the investors.
Here the answer to our first question is sustainability reporting. The concept of sustainability reporting has emerged in the late 1980s4. This report allows investors to learn more about the risks and opportunities associated with social, economic and environmental factors, as well as to have accounting data that will affect stock prices5.
1 Ziegler, A. et al. (2011). Disclosed Corporate Responses to Climate Change and Stock Performances: An International Empirical Analysis, Energy Economics, 33(6): 1283-1294.
2 Shakil, M.H. et al. (2019). Do Environmental, Social and Governance Performance Affect the Financial Performance of Banks? A Cross-Country Study of Emerging Market Banks, Management of Environmental Quality, 30(6): 1331-1344.
3 Epstein, M. J. (2018). Making Sustainability Work: Best Practices in Managing and Measuring Corporate Social, Environmental and Economic Impacts, Routledge
Eccles, R. G., Serafeim, G. (2013). A Tale of Two Stories: Sustainability and the Quarterly Earnings Call, Journal of Applied Corporate Finance, 25(3): 8-19.
4 Sustainability Reporting, https://en.wikipedia.org/wiki/Sustainability_reporting, (Accessed on: February 6, 2021)5 Carnevale, C., Mazzuca, M. (2014). Sustainability Report and Bank Valuation: Evidence from European Stock
Markets, Business Ethics: A European Review, 23(1): 69-90.
Marmara Üniversitesi İktisadi ve İdari Bilimler Dergisi • Cilt: 43 • Sayı: 1 • Haziran 2021, ISSN: 2587-2672, ss/pp. 145-156
147
Nowadays, since reliable and comparable Environmental, Social and Governance (ESG) reports help investors in order to make their decisions, investors have an increasing demand on ESG Reports. Therefore, more companies have started to publish ESG Reports to meet this need6. While sustainability reports mediate the sharing of environmental activities with shareholders, improvement in processes and reductions in fines imposed by regulatory agencies help reduce costs7. Extending the explanations in the reports will reduce the information asymmetry and investors will be able to decide whether a company is good at managing carbon emissions and equipped to deal with such risks 8.
Our second research has not only one answer. Actually, there are two ways to assess financial performance which are accounting-based and market-based performance. Accounting-based performance indicators mainly include return on equity, return on asset, rate on sales which are based on the information obtained from corporate financial statements while market-based performance includes share price and mutual funds9. On the other hand, market-based performance is measured by stock returns and volatility.
Combining financial performance with investor’s reactions event study is our methodology, the event study overlaps with our problem in that it is a method used to demonstrate the reactions of investors and the market to corporate announcements published directly by companies. On this perspective we consider ESG report publishing date as an announcement date (or event) and we try to measure changes in market-based performance with event study. For this purpose, we consider 59 companies which issue sustainability reports in 2014-2019.
This study contributes the literature in several ways. In the study, we analyze investors reactions by considering 59 companies with eight different event windows. Accordingly, this study measures the effects of inclusion or delisting from sustainability index on stock performances. Moreover, this study provides evidence of the link between stock prices and environmental disclosures.
The paper is structured as follows. In the next section a brief literature review is presented. Section 2 reviews the methodology. Section 3 summarizes the findings. The final section concludes the paper and discusses the results.
2. Literature Review
There are numerous studies investigating investors’ reactions to the statements of companies related to environmental issues. Some of them analyze investors’ reactions to environment-friendly companies and environmentally hazardous companies while the others focus on investors’ reactions to companies which release sustainability reports.
6 Wong, KTK. (2017). A Literature Review on Environmental, Social and Governance Reporting and Its Impact on Financial Performance, Austin Journal of Business Administration and Management, 1(4): 1016.
7 Epstein, 2018.8 Liu, Y. et al. (2017). Corporate Carbon Emissions and Financial Performance: Does Carbon Disclosure Mediate the
Relationship in the UK?, Available at SSRN 2941123.9 Liu et al., 2017; Peloza, J. (2009). The Challenge of Measuring Financial Impacts from Investments in Corporate Social
Performance. Journal of Management, 35(6), 1518-1541.
V. Evrim ALTUK ÖZTÜRK • Ayşegül İŞCANOĞLU ÇEKİÇ
148
Chan and Milne10 used an experimental design to examine whether investors react badly or well to performing companies. Their findings revealed that investors tended to react strongly and negatively to the companies performing poorly while they did not have significantly better reactions to environmental performers.
Ziegler et al.11 investigated European and US stock markets to determine whether there is a relationship between disclosed corporate responses to climate change and stock performances from 2001 to 2006. Their results showed that investors buy stocks of companies with higher levels of responses to climate change in Europe. They also found a positive relationship between disclosed responses to climate change and stock performances for energy firms in the USA.
Murgia and Lence12 used event study to analyze whether the release of Newsweek’s “Global 100 Green Rankings” is relevant to the market. They investigated investors’ reactions to the “Global 100 Ranking” by considering the changes in the relative price of the stocks.
Liu et al.13 found out that market responses react to excessive carbon emission.
Murray et al. 14 investigated the link between market returns and the tendency to undertake social and environmental disclosure in UK companies. They did not find a direct relationship between share returns and disclosure. However, they found a positive relationship between returns and the predilection for disclosure.
Berthelot et al.15 investigated whether investors value the publication of sustainability reports of the Canadian companies listed on Toronto Stock Exchange. The findings suggest that investors react positively to these reports.
Carnevale and Mazzuca16 studied the direct effects of sustainability reports of European Banks on stock prices. Their results indicated that the reports had a positive effect on stock prices and that the statements in the reports are noted by the investors. The statements in the sustainability reports seem to prevent information asymmetry, thus helping investors with their decision-making.
10 Chan, C. C., Milne, M. J. (1999). Investor Reactions to Corporate Environmental Saints and Sinners: An Experimental Analysis, Accounting and Business Research, 29(4): 265-279.
11 Ziegler, A., Busch, T., Hoffmann, V. H. (2011). Disclosed Corporate Responses to Climate Change and Stock Performances: An International Empirical Analysis, Energy Economics, 33(6): 1283-1294.
12 Murguia, J. M., Lence, S. H. (2015). Investors’ Reaction to Environmental Performance: A Global Perspective of the Newsweek’s “Green Rankings”, Environmental and Resource Economics, 60(4): 583-605.
13 Liu et al., 2017.14 Murray, A., Sinclair, D., Power, D., Gray, R. (2006). Do Financial Markets Care About Social and
Environmental Disclosure?, Accounting, Auditing & Accountability Journal, 19(2): 228-255.15 Berthelot, S., Coulmont, M., Serret, V. (2012). Do Investors Value Sustainability Reports? A Canadian study, Corporate
Social Responsibility and Environmental Management, 19(6): 355-363.16 Carnevale, Mazzuca, 2014.
Marmara Üniversitesi İktisadi ve İdari Bilimler Dergisi • Cilt: 43 • Sayı: 1 • Haziran 2021, ISSN: 2587-2672, ss/pp. 145-156
149
Çıtak and Ersoy17 reviewed the difference between the companies in the BIST-30 Index and the companies that are not included in the BIST Sustainability Index with respect to their financial performance in January-March 2014. They employed event study as the research method to investigate the investor reactions to their announcement that they would be included in the sustainability index. Although investors’ short-term decisions did not seem to be affected, positive reactions were given for the whole three days following the date of announcement.
Du et al.18 investigated investors’ reactions to sustainability reports using event study method. Their results revealed that investors tend to give significant reactions to sustainability reports in the short run.
Çıtak et al.19 compared the investor reactions to BIST Sustainability Index and non-BIST Sustainability Index companies. They did not find a significant difference between in the mean and median. However, cumulative abnormal returns were positive for the data windows for 4, 5, 7, 8, 9 and 10 days, which suggests that investors have increasingly begun to react.
Aureli et al.20 reviewed the companies in Dow Jones Sustainability World Index between 2009 and 2016 and underlined that the release of ESG (Environmental, Social and Governance) Reports had a significant contribution to their market cap.
Wasara and Ganda21 investigated the mining companies listed on Johannesburg Stock Exchange from 2010 to 2014 to test whether there is a relationship between return on investment and environmental and social disclosures in the sustainability reports. They found a positive link between corporate social disclosure and return on investment while there was a negative link between environmental disclosure and return on investment.
Çimen22 used event study analysis to find out whether there is a relationship between companies listed in Sustainability Index and their stock returns in Borsa Istanbul. The results show that the announcement of Borsa Istanbul and the inclusion of the index have positive impact on the companies’ financial performance and the companies also experience abnormal returns.
17 Çıtak, L., Ersoy, E. (2016). Firmaların BIST Sürdürülebilirlik Endeksine Alınmasına Yatırımcı Tepkisi: Olay Çalışması ve Ortalama Testleri ile Bir Analiz (Investors’ Reactions to the Inclusion of Firms in the BIST Sustainability Index: An Analysis by Event Study and Mean-Median Tests), International Journal of Alanya Faculty of Business, 8(1): 43-57.
18 Du, S., Yu, K., Bhattacharya, C. B., Sen, S. (2017). The Business Case for Sustainability Reporting: Evidence from Stock Market Reactions, Journal of Public Policy & Marketing, 36(2): 313-330.
19 Çıtak, L., Akel, V., Ersoy, E. (2020). Investors’ Reactions to the Announcement of New Constituents of BIST Sustainability Index: An Analysis by Event Study and Mean-Median Tests.” Value Sharing for Sustainable and Inclusive Development, IGI Global, 2018: 270-289.
20 Aureli, S., Gigli, S., Medei, R., Supino, E. (2019). The Value Relevance of Environmental, Social, and Governance Disclosure: Evidence from Dow Jones Sustainability World Index Listed Companies, Corporate Social Responsibility and Environmental Management, 27(1): 43-52.
21 Wasara, T. M., Ganda, F. (2019). The Relationship Between Corporate Sustainability Disclosure and Firm Financial Performance in Johannesburg Stock Exchange (JSE) Listed Mining Companies, Sustainability, 11(16): 4496.
22 Çimen, A. (2019). The Impact of Sustainability Index on Firm Performance: An Event Study. International Journal of Contemporary Economics and Administrative Sciences, 9(1): 170-183.
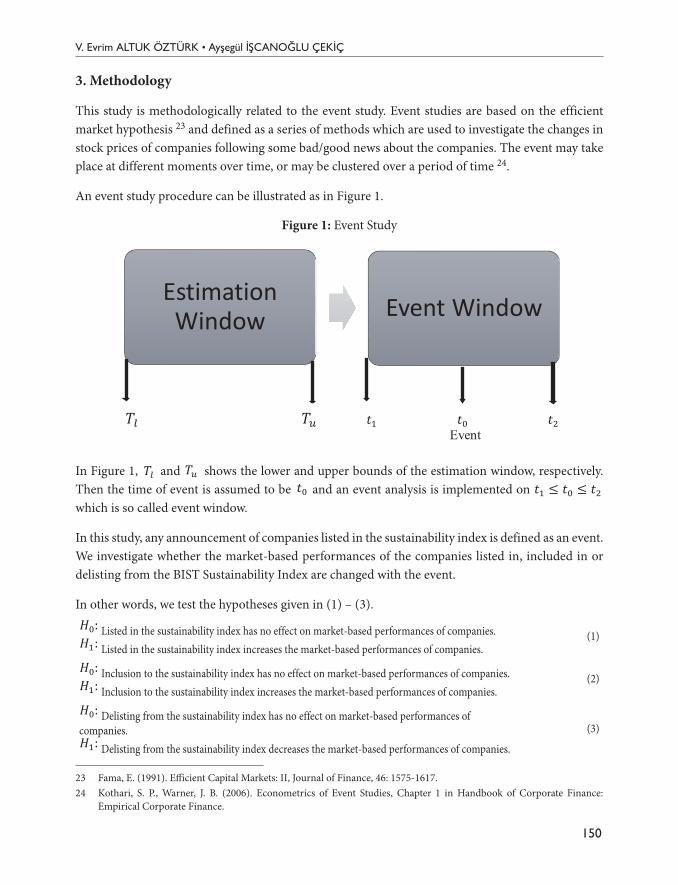
V. Evrim ALTUK ÖZTÜRK • Ayşegül İŞCANOĞLU ÇEKİÇ
150
3. Methodology
This study is methodologically related to the event study. Event studies are based on the efficient market hypothesis 23 and defined as a series of methods which are used to investigate the changes in stock prices of companies following some bad/good news about the companies. The event may take place at different moments over time, or may be clustered over a period of time 24.
An event study procedure can be illustrated as in Figure 1.
Figure 1: Event Study
Makale Gönderim Tarihi: 12.02.2021 Yayına Kabul Tarihi: 13.06.2021
Figure 1: Event Study
In Figure 1, 𝑇𝑇𝑙𝑙 and 𝑇𝑇𝑢𝑢 shows the lower and upper bounds of the estimation window, respectively. Then the time of event is assumed to be 𝑡𝑡0 and an event analysis is implemented on 𝑡𝑡1 ≤ 𝑡𝑡0 ≤ 𝑡𝑡2 which is so called event window.
In this study, any announcement of companies listed in the sustainability index is defined as an event. We investigate whether the market-based performances of the companies listed in, included in or delisting from the BIST Sustainability Index are changed with the event.
In other words, we test the hypotheses given in (1)- (3).
𝐻𝐻0: Listed in the sustainability index has no effect on market-based performances of companies.
𝐻𝐻1: Listed in the sustainability index increases the market-based performances of companies.
(1)
𝐻𝐻0: Inclusion to the sustainability index has no effect on market-based performances of companies.
𝐻𝐻1: Inclusion to the sustainability index increases the market-based performances of companies.
(2)
𝐻𝐻0: Delisting from the sustainability index has no effect on market-based performances of companies.
𝐻𝐻1: Delisting from the sustainability index decreases the market-based performances of companies.
(3)
In an event study whether the distribution of returns during an event window is abnormal than expected is investigated. For this reason, firstly the returns are calculated. Then, by using
Estimation Window Event Window
𝑡𝑡1 𝑡𝑡0 𝑡𝑡2 Event
𝑇𝑇𝑙𝑙 𝑇𝑇𝑢𝑢
In Figure 1,
Makale Gönderim Tarihi: 12.02.2021 Yayına Kabul Tarihi: 13.06.2021
Figure 1: Event Study
In Figure 1, 𝑇𝑇𝑙𝑙 and 𝑇𝑇𝑢𝑢 shows the lower and upper bounds of the estimation window, respectively. Then the time of event is assumed to be 𝑡𝑡0 and an event analysis is implemented on 𝑡𝑡1 ≤ 𝑡𝑡0 ≤ 𝑡𝑡2 which is so called event window.
In this study, any announcement of companies listed in the sustainability index is defined as an event. We investigate whether the market-based performances of the companies listed in, included in or delisting from the BIST Sustainability Index are changed with the event.
In other words, we test the hypotheses given in (1)- (3).
𝐻𝐻0: Listed in the sustainability index has no effect on market-based performances of companies.
𝐻𝐻1: Listed in the sustainability index increases the market-based performances of companies.
(1)
𝐻𝐻0: Inclusion to the sustainability index has no effect on market-based performances of companies.
𝐻𝐻1: Inclusion to the sustainability index increases the market-based performances of companies.
(2)
𝐻𝐻0: Delisting from the sustainability index has no effect on market-based performances of companies.
𝐻𝐻1: Delisting from the sustainability index decreases the market-based performances of companies.
(3)
In an event study whether the distribution of returns during an event window is abnormal than expected is investigated. For this reason, firstly the returns are calculated. Then, by using
Estimation Window Event Window
𝑡𝑡1 𝑡𝑡0 𝑡𝑡2 Event
𝑇𝑇𝑙𝑙 𝑇𝑇𝑢𝑢
and
Makale Gönderim Tarihi: 12.02.2021 Yayına Kabul Tarihi: 13.06.2021
Figure 1: Event Study
In Figure 1, 𝑇𝑇𝑙𝑙 and 𝑇𝑇𝑢𝑢 shows the lower and upper bounds of the estimation window, respectively. Then the time of event is assumed to be 𝑡𝑡0 and an event analysis is implemented on 𝑡𝑡1 ≤ 𝑡𝑡0 ≤ 𝑡𝑡2 which is so called event window.
In this study, any announcement of companies listed in the sustainability index is defined as an event. We investigate whether the market-based performances of the companies listed in, included in or delisting from the BIST Sustainability Index are changed with the event.
In other words, we test the hypotheses given in (1)- (3).
𝐻𝐻0: Listed in the sustainability index has no effect on market-based performances of companies.
𝐻𝐻1: Listed in the sustainability index increases the market-based performances of companies.
(1)
𝐻𝐻0: Inclusion to the sustainability index has no effect on market-based performances of companies.
𝐻𝐻1: Inclusion to the sustainability index increases the market-based performances of companies.
(2)
𝐻𝐻0: Delisting from the sustainability index has no effect on market-based performances of companies.
𝐻𝐻1: Delisting from the sustainability index decreases the market-based performances of companies.
(3)
In an event study whether the distribution of returns during an event window is abnormal than expected is investigated. For this reason, firstly the returns are calculated. Then, by using
Estimation Window Event Window
𝑡𝑡1 𝑡𝑡0 𝑡𝑡2 Event
𝑇𝑇𝑙𝑙 𝑇𝑇𝑢𝑢
shows the lower and upper bounds of the estimation window, respectively. Then the time of event is assumed to be
Makale Gönderim Tarihi: 12.02.2021 Yayına Kabul Tarihi: 13.06.2021
Figure 1: Event Study
In Figure 1, 𝑇𝑇𝑙𝑙 and 𝑇𝑇𝑢𝑢 shows the lower and upper bounds of the estimation window, respectively. Then the time of event is assumed to be 𝑡𝑡0 and an event analysis is implemented on 𝑡𝑡1 ≤ 𝑡𝑡0 ≤ 𝑡𝑡2 which is so called event window.
In this study, any announcement of companies listed in the sustainability index is defined as an event. We investigate whether the market-based performances of the companies listed in, included in or delisting from the BIST Sustainability Index are changed with the event.
In other words, we test the hypotheses given in (1)- (3).
𝐻𝐻0: Listed in the sustainability index has no effect on market-based performances of companies.
𝐻𝐻1: Listed in the sustainability index increases the market-based performances of companies.
(1)
𝐻𝐻0: Inclusion to the sustainability index has no effect on market-based performances of companies.
𝐻𝐻1: Inclusion to the sustainability index increases the market-based performances of companies.
(2)
𝐻𝐻0: Delisting from the sustainability index has no effect on market-based performances of companies.
𝐻𝐻1: Delisting from the sustainability index decreases the market-based performances of companies.
(3)
In an event study whether the distribution of returns during an event window is abnormal than expected is investigated. For this reason, firstly the returns are calculated. Then, by using
Estimation Window Event Window
𝑡𝑡1 𝑡𝑡0 𝑡𝑡2 Event
𝑇𝑇𝑙𝑙 𝑇𝑇𝑢𝑢
and an event analysis is implemented on
Makale Gönderim Tarihi: 12.02.2021 Yayına Kabul Tarihi: 13.06.2021
Figure 1: Event Study
In Figure 1, 𝑇𝑇𝑙𝑙 and 𝑇𝑇𝑢𝑢 shows the lower and upper bounds of the estimation window, respectively. Then the time of event is assumed to be 𝑡𝑡0 and an event analysis is implemented on 𝑡𝑡1 ≤ 𝑡𝑡0 ≤ 𝑡𝑡2 which is so called event window.
In this study, any announcement of companies listed in the sustainability index is defined as an event. We investigate whether the market-based performances of the companies listed in, included in or delisting from the BIST Sustainability Index are changed with the event.
In other words, we test the hypotheses given in (1)- (3).
𝐻𝐻0: Listed in the sustainability index has no effect on market-based performances of companies.
𝐻𝐻1: Listed in the sustainability index increases the market-based performances of companies.
(1)
𝐻𝐻0: Inclusion to the sustainability index has no effect on market-based performances of companies.
𝐻𝐻1: Inclusion to the sustainability index increases the market-based performances of companies.
(2)
𝐻𝐻0: Delisting from the sustainability index has no effect on market-based performances of companies.
𝐻𝐻1: Delisting from the sustainability index decreases the market-based performances of companies.
(3)
In an event study whether the distribution of returns during an event window is abnormal than expected is investigated. For this reason, firstly the returns are calculated. Then, by using
Estimation Window Event Window
𝑡𝑡1 𝑡𝑡0 𝑡𝑡2 Event
𝑇𝑇𝑙𝑙 𝑇𝑇𝑢𝑢
which is so called event window.
In this study, any announcement of companies listed in the sustainability index is defined as an event. We investigate whether the market-based performances of the companies listed in, included in or delisting from the BIST Sustainability Index are changed with the event.
In other words, we test the hypotheses given in (1) – (3).
Makale Gönderim Tarihi: 12.02.2021 Yayına Kabul Tarihi: 13.06.2021
Figure 1: Event Study
In Figure 1, 𝑇𝑇𝑙𝑙 and 𝑇𝑇𝑢𝑢 shows the lower and upper bounds of the estimation window, respectively. Then the time of event is assumed to be 𝑡𝑡0 and an event analysis is implemented on 𝑡𝑡1 ≤ 𝑡𝑡0 ≤ 𝑡𝑡2 which is so called event window.
In this study, any announcement of companies listed in the sustainability index is defined as an event. We investigate whether the market-based performances of the companies listed in, included in or delisting from the BIST Sustainability Index are changed with the event.
In other words, we test the hypotheses given in (1)- (3).
𝐻𝐻0: Listed in the sustainability index has no effect on market-based performances of companies.
𝐻𝐻1: Listed in the sustainability index increases the market-based performances of companies.
(1)
𝐻𝐻0: Inclusion to the sustainability index has no effect on market-based performances of companies.
𝐻𝐻1: Inclusion to the sustainability index increases the market-based performances of companies.
(2)
𝐻𝐻0: Delisting from the sustainability index has no effect on market-based performances of companies.
𝐻𝐻1: Delisting from the sustainability index decreases the market-based performances of companies.
(3)
In an event study whether the distribution of returns during an event window is abnormal than expected is investigated. For this reason, firstly the returns are calculated. Then, by using
Estimation Window Event Window
𝑡𝑡1 𝑡𝑡0 𝑡𝑡2 Event
𝑇𝑇𝑙𝑙 𝑇𝑇𝑢𝑢
Listed in the sustainability index has no effect on market-based performances of companies.
Makale Gönderim Tarihi: 12.02.2021 Yayına Kabul Tarihi: 13.06.2021
Figure 1: Event Study
In Figure 1, 𝑇𝑇𝑙𝑙 and 𝑇𝑇𝑢𝑢 shows the lower and upper bounds of the estimation window, respectively. Then the time of event is assumed to be 𝑡𝑡0 and an event analysis is implemented on 𝑡𝑡1 ≤ 𝑡𝑡0 ≤ 𝑡𝑡2 which is so called event window.
In this study, any announcement of companies listed in the sustainability index is defined as an event. We investigate whether the market-based performances of the companies listed in, included in or delisting from the BIST Sustainability Index are changed with the event.
In other words, we test the hypotheses given in (1)- (3).
𝐻𝐻0: Listed in the sustainability index has no effect on market-based performances of companies.
𝐻𝐻1: Listed in the sustainability index increases the market-based performances of companies.
(1)
𝐻𝐻0: Inclusion to the sustainability index has no effect on market-based performances of companies.
𝐻𝐻1: Inclusion to the sustainability index increases the market-based performances of companies.
(2)
𝐻𝐻0: Delisting from the sustainability index has no effect on market-based performances of companies.
𝐻𝐻1: Delisting from the sustainability index decreases the market-based performances of companies.
(3)
In an event study whether the distribution of returns during an event window is abnormal than expected is investigated. For this reason, firstly the returns are calculated. Then, by using
Estimation Window Event Window
𝑡𝑡1 𝑡𝑡0 𝑡𝑡2 Event
𝑇𝑇𝑙𝑙 𝑇𝑇𝑢𝑢
Listed in the sustainability index increases the market-based performances of companies.(1)
Makale Gönderim Tarihi: 12.02.2021 Yayına Kabul Tarihi: 13.06.2021
Figure 1: Event Study
In Figure 1, 𝑇𝑇𝑙𝑙 and 𝑇𝑇𝑢𝑢 shows the lower and upper bounds of the estimation window, respectively. Then the time of event is assumed to be 𝑡𝑡0 and an event analysis is implemented on 𝑡𝑡1 ≤ 𝑡𝑡0 ≤ 𝑡𝑡2 which is so called event window.
In this study, any announcement of companies listed in the sustainability index is defined as an event. We investigate whether the market-based performances of the companies listed in, included in or delisting from the BIST Sustainability Index are changed with the event.
In other words, we test the hypotheses given in (1)- (3).
𝐻𝐻0: Listed in the sustainability index has no effect on market-based performances of companies.
𝐻𝐻1: Listed in the sustainability index increases the market-based performances of companies.
(1)
𝐻𝐻0: Inclusion to the sustainability index has no effect on market-based performances of companies.
𝐻𝐻1: Inclusion to the sustainability index increases the market-based performances of companies.
(2)
𝐻𝐻0: Delisting from the sustainability index has no effect on market-based performances of companies.
𝐻𝐻1: Delisting from the sustainability index decreases the market-based performances of companies.
(3)
In an event study whether the distribution of returns during an event window is abnormal than expected is investigated. For this reason, firstly the returns are calculated. Then, by using
Estimation Window Event Window
𝑡𝑡1 𝑡𝑡0 𝑡𝑡2 Event
𝑇𝑇𝑙𝑙 𝑇𝑇𝑢𝑢
Inclusion to the sustainability index has no effect on market-based performances of companies.
Makale Gönderim Tarihi: 12.02.2021 Yayına Kabul Tarihi: 13.06.2021
Figure 1: Event Study
In Figure 1, 𝑇𝑇𝑙𝑙 and 𝑇𝑇𝑢𝑢 shows the lower and upper bounds of the estimation window, respectively. Then the time of event is assumed to be 𝑡𝑡0 and an event analysis is implemented on 𝑡𝑡1 ≤ 𝑡𝑡0 ≤ 𝑡𝑡2 which is so called event window.
In this study, any announcement of companies listed in the sustainability index is defined as an event. We investigate whether the market-based performances of the companies listed in, included in or delisting from the BIST Sustainability Index are changed with the event.
In other words, we test the hypotheses given in (1)- (3).
𝐻𝐻0: Listed in the sustainability index has no effect on market-based performances of companies.
𝐻𝐻1: Listed in the sustainability index increases the market-based performances of companies.
(1)
𝐻𝐻0: Inclusion to the sustainability index has no effect on market-based performances of companies.
𝐻𝐻1: Inclusion to the sustainability index increases the market-based performances of companies.
(2)
𝐻𝐻0: Delisting from the sustainability index has no effect on market-based performances of companies.
𝐻𝐻1: Delisting from the sustainability index decreases the market-based performances of companies.
(3)
In an event study whether the distribution of returns during an event window is abnormal than expected is investigated. For this reason, firstly the returns are calculated. Then, by using
Estimation Window Event Window
𝑡𝑡1 𝑡𝑡0 𝑡𝑡2 Event
𝑇𝑇𝑙𝑙 𝑇𝑇𝑢𝑢
Inclusion to the sustainability index increases the market-based performances of companies.(2)
Makale Gönderim Tarihi: 12.02.2021 Yayına Kabul Tarihi: 13.06.2021
Figure 1: Event Study
In Figure 1, 𝑇𝑇𝑙𝑙 and 𝑇𝑇𝑢𝑢 shows the lower and upper bounds of the estimation window, respectively. Then the time of event is assumed to be 𝑡𝑡0 and an event analysis is implemented on 𝑡𝑡1 ≤ 𝑡𝑡0 ≤ 𝑡𝑡2 which is so called event window.
In this study, any announcement of companies listed in the sustainability index is defined as an event. We investigate whether the market-based performances of the companies listed in, included in or delisting from the BIST Sustainability Index are changed with the event.
In other words, we test the hypotheses given in (1)- (3).
𝐻𝐻0: Listed in the sustainability index has no effect on market-based performances of companies.
𝐻𝐻1: Listed in the sustainability index increases the market-based performances of companies.
(1)
𝐻𝐻0: Inclusion to the sustainability index has no effect on market-based performances of companies.
𝐻𝐻1: Inclusion to the sustainability index increases the market-based performances of companies.
(2)
𝐻𝐻0: Delisting from the sustainability index has no effect on market-based performances of companies.
𝐻𝐻1: Delisting from the sustainability index decreases the market-based performances of companies.
(3)
In an event study whether the distribution of returns during an event window is abnormal than expected is investigated. For this reason, firstly the returns are calculated. Then, by using
Estimation Window Event Window
𝑡𝑡1 𝑡𝑡0 𝑡𝑡2 Event
𝑇𝑇𝑙𝑙 𝑇𝑇𝑢𝑢
Delisting from the sustainability index has no effect on market-based performances of companies.
Makale Gönderim Tarihi: 12.02.2021 Yayına Kabul Tarihi: 13.06.2021
Figure 1: Event Study
In Figure 1, 𝑇𝑇𝑙𝑙 and 𝑇𝑇𝑢𝑢 shows the lower and upper bounds of the estimation window, respectively. Then the time of event is assumed to be 𝑡𝑡0 and an event analysis is implemented on 𝑡𝑡1 ≤ 𝑡𝑡0 ≤ 𝑡𝑡2 which is so called event window.
In this study, any announcement of companies listed in the sustainability index is defined as an event. We investigate whether the market-based performances of the companies listed in, included in or delisting from the BIST Sustainability Index are changed with the event.
In other words, we test the hypotheses given in (1)- (3).
𝐻𝐻0: Listed in the sustainability index has no effect on market-based performances of companies.
𝐻𝐻1: Listed in the sustainability index increases the market-based performances of companies.
(1)
𝐻𝐻0: Inclusion to the sustainability index has no effect on market-based performances of companies.
𝐻𝐻1: Inclusion to the sustainability index increases the market-based performances of companies.
(2)
𝐻𝐻0: Delisting from the sustainability index has no effect on market-based performances of companies.
𝐻𝐻1: Delisting from the sustainability index decreases the market-based performances of companies.
(3)
In an event study whether the distribution of returns during an event window is abnormal than expected is investigated. For this reason, firstly the returns are calculated. Then, by using
Estimation Window Event Window
𝑡𝑡1 𝑡𝑡0 𝑡𝑡2 Event
𝑇𝑇𝑙𝑙 𝑇𝑇𝑢𝑢
Delisting from the sustainability index decreases the market-based performances of companies.
(3)
23 Fama, E. (1991). Efficient Capital Markets: II, Journal of Finance, 46: 1575-1617.24 Kothari, S. P., Warner, J. B. (2006). Econometrics of Event Studies, Chapter 1 in Handbook of Corporate Finance:
Empirical Corporate Finance.
Marmara Üniversitesi İktisadi ve İdari Bilimler Dergisi • Cilt: 43 • Sayı: 1 • Haziran 2021, ISSN: 2587-2672, ss/pp. 145-156
151
In an event study whether the distribution of returns during an event window is abnormal than expected is investigated. For this reason, firstly the returns are calculated. Then, by using estimation window data, abnormal returns are obtained with the help of expected return model (e.g., market model, capital asset pricing model, factor models etc.)25.
Kothari and Warner (2006) state that in the event studies the use of daily (and sometimes intraday) returns is more common than that of monthly returns. Because using daily returns allows for more precise measurement of abnormal returns and for better detection of announcement effects. Moreover, they also state that event studies can be implemented by using two different time horizons; short-horizon and long-horizon. Event studies that focus on the announcement effects of the short-horizon related to an event provide relevant evidence to understand corporate policy decisions. On the other hand, event studies that focus on the announcement effects of the long-horizon related to an event provide relevant evidence of market efficiency.
Following Kothari and Warner (2006) we construct our methodology, which includes as follows:
Step 1
The daily logarithmic returns given in (4) of each company are calculated.
Makale Gönderim Tarihi: 12.02.2021 Yayına Kabul Tarihi: 13.06.2021
estimation window data, abnormal returns are obtained with the help of expected return model (e.g., market model, capital asset pricing model, factor models etc.)25.
Kothari and Warner (2006) state that in the event studies the use of daily (and sometimes intraday) returns is more common than that of monthly returns. Because using daily returns allows for more precise measurement of abnormal returns and for better detection of announcement effects. Moreover, they also state that event studies can be implemented by using two different time horizons; short-horizon and long-horizon. Event studies that focus on the announcement effects of the short-horizon related to an event provide relevant evidence to understand corporate policy decisions. On the other hand, event studies that focus on the announcement effects of the long-horizon related to an event provide relevant evidence of market efficiency.
Following Kothari and Warner (2006) we construct our methodology, which includes as follows:
Step 1
The daily logarithmic returns given in (4) of each company are calculated.
𝑅𝑅𝑖𝑖𝑖𝑖 = ln(𝑃𝑃𝑖𝑖,𝑖𝑖) − ln(𝑃𝑃𝑖𝑖,𝑖𝑖−1). (4)
where 𝑃𝑃𝑖𝑖,𝑖𝑖 is the stock price of the company 𝑖𝑖 at time 𝑡𝑡. Step 2
The market model which is defined in (5) is applied.
𝑅𝑅𝑖𝑖𝑖𝑖 = 𝛽𝛽0𝑖𝑖 + 𝛽𝛽1𝑖𝑖𝑅𝑅𝑚𝑚𝑖𝑖 + 𝜀𝜀𝑖𝑖𝑖𝑖 (5)
where 𝑅𝑅𝑖𝑖𝑖𝑖 is the return of the company 𝑖𝑖 at time 𝑡𝑡, 𝑅𝑅𝑚𝑚𝑖𝑖 is the market return, 𝛽𝛽1𝑖𝑖 is the sensitivity of the company 𝑖𝑖 to the market and 𝜀𝜀𝑖𝑖𝑖𝑖 is the unexpected return at the time 𝑡𝑡 which is called “Abnormal Return”.
In other words, if we denote abnormal return of the company 𝑖𝑖 at time 𝑡𝑡 as 𝐴𝐴𝑅𝑅𝑖𝑖𝑖𝑖. Then, 𝐴𝐴𝑅𝑅𝑖𝑖𝑖𝑖 is written as follows:
𝐴𝐴𝑅𝑅𝑖𝑖𝑖𝑖 = 𝑅𝑅𝑖𝑖𝑖𝑖 − 𝛽𝛽0𝑖𝑖 − 𝛽𝛽1𝑖𝑖𝑅𝑅𝑚𝑚𝑖𝑖. (6)
At this step we use 1-year estimation window which is started 1-day after the announcement and ended 1-month before the event date. Moreover, we use BIST100 as the market index.
Step 3
25 Kothari, Warner, 2006.
(4)
where
Makale Gönderim Tarihi: 12.02.2021 Yayına Kabul Tarihi: 13.06.2021
estimation window data, abnormal returns are obtained with the help of expected return model (e.g., market model, capital asset pricing model, factor models etc.)25.
Kothari and Warner (2006) state that in the event studies the use of daily (and sometimes intraday) returns is more common than that of monthly returns. Because using daily returns allows for more precise measurement of abnormal returns and for better detection of announcement effects. Moreover, they also state that event studies can be implemented by using two different time horizons; short-horizon and long-horizon. Event studies that focus on the announcement effects of the short-horizon related to an event provide relevant evidence to understand corporate policy decisions. On the other hand, event studies that focus on the announcement effects of the long-horizon related to an event provide relevant evidence of market efficiency.
Following Kothari and Warner (2006) we construct our methodology, which includes as follows:
Step 1
The daily logarithmic returns given in (4) of each company are calculated.
𝑅𝑅𝑖𝑖𝑖𝑖 = ln(𝑃𝑃𝑖𝑖,𝑖𝑖) − ln(𝑃𝑃𝑖𝑖,𝑖𝑖−1). (4)
where 𝑃𝑃𝑖𝑖,𝑖𝑖 is the stock price of the company 𝑖𝑖 at time 𝑡𝑡. Step 2
The market model which is defined in (5) is applied.
𝑅𝑅𝑖𝑖𝑖𝑖 = 𝛽𝛽0𝑖𝑖 + 𝛽𝛽1𝑖𝑖𝑅𝑅𝑚𝑚𝑖𝑖 + 𝜀𝜀𝑖𝑖𝑖𝑖 (5)
where 𝑅𝑅𝑖𝑖𝑖𝑖 is the return of the company 𝑖𝑖 at time 𝑡𝑡, 𝑅𝑅𝑚𝑚𝑖𝑖 is the market return, 𝛽𝛽1𝑖𝑖 is the sensitivity of the company 𝑖𝑖 to the market and 𝜀𝜀𝑖𝑖𝑖𝑖 is the unexpected return at the time 𝑡𝑡 which is called “Abnormal Return”.
In other words, if we denote abnormal return of the company 𝑖𝑖 at time 𝑡𝑡 as 𝐴𝐴𝑅𝑅𝑖𝑖𝑖𝑖. Then, 𝐴𝐴𝑅𝑅𝑖𝑖𝑖𝑖 is written as follows:
𝐴𝐴𝑅𝑅𝑖𝑖𝑖𝑖 = 𝑅𝑅𝑖𝑖𝑖𝑖 − 𝛽𝛽0𝑖𝑖 − 𝛽𝛽1𝑖𝑖𝑅𝑅𝑚𝑚𝑖𝑖. (6)
At this step we use 1-year estimation window which is started 1-day after the announcement and ended 1-month before the event date. Moreover, we use BIST100 as the market index.
Step 3
25 Kothari, Warner, 2006.
is the stock price of the company
Makale Gönderim Tarihi: 12.02.2021 Yayına Kabul Tarihi: 13.06.2021
estimation window data, abnormal returns are obtained with the help of expected return model (e.g., market model, capital asset pricing model, factor models etc.)25.
Kothari and Warner (2006) state that in the event studies the use of daily (and sometimes intraday) returns is more common than that of monthly returns. Because using daily returns allows for more precise measurement of abnormal returns and for better detection of announcement effects. Moreover, they also state that event studies can be implemented by using two different time horizons; short-horizon and long-horizon. Event studies that focus on the announcement effects of the short-horizon related to an event provide relevant evidence to understand corporate policy decisions. On the other hand, event studies that focus on the announcement effects of the long-horizon related to an event provide relevant evidence of market efficiency.
Following Kothari and Warner (2006) we construct our methodology, which includes as follows:
Step 1
The daily logarithmic returns given in (4) of each company are calculated.
𝑅𝑅𝑖𝑖𝑖𝑖 = ln(𝑃𝑃𝑖𝑖,𝑖𝑖) − ln(𝑃𝑃𝑖𝑖,𝑖𝑖−1). (4)
where 𝑃𝑃𝑖𝑖,𝑖𝑖 is the stock price of the company 𝑖𝑖 at time 𝑡𝑡. Step 2
The market model which is defined in (5) is applied.
𝑅𝑅𝑖𝑖𝑖𝑖 = 𝛽𝛽0𝑖𝑖 + 𝛽𝛽1𝑖𝑖𝑅𝑅𝑚𝑚𝑖𝑖 + 𝜀𝜀𝑖𝑖𝑖𝑖 (5)
where 𝑅𝑅𝑖𝑖𝑖𝑖 is the return of the company 𝑖𝑖 at time 𝑡𝑡, 𝑅𝑅𝑚𝑚𝑖𝑖 is the market return, 𝛽𝛽1𝑖𝑖 is the sensitivity of the company 𝑖𝑖 to the market and 𝜀𝜀𝑖𝑖𝑖𝑖 is the unexpected return at the time 𝑡𝑡 which is called “Abnormal Return”.
In other words, if we denote abnormal return of the company 𝑖𝑖 at time 𝑡𝑡 as 𝐴𝐴𝑅𝑅𝑖𝑖𝑖𝑖. Then, 𝐴𝐴𝑅𝑅𝑖𝑖𝑖𝑖 is written as follows:
𝐴𝐴𝑅𝑅𝑖𝑖𝑖𝑖 = 𝑅𝑅𝑖𝑖𝑖𝑖 − 𝛽𝛽0𝑖𝑖 − 𝛽𝛽1𝑖𝑖𝑅𝑅𝑚𝑚𝑖𝑖. (6)
At this step we use 1-year estimation window which is started 1-day after the announcement and ended 1-month before the event date. Moreover, we use BIST100 as the market index.
Step 3
25 Kothari, Warner, 2006.
at time
Makale Gönderim Tarihi: 12.02.2021 Yayına Kabul Tarihi: 13.06.2021
estimation window data, abnormal returns are obtained with the help of expected return model (e.g., market model, capital asset pricing model, factor models etc.)25.
Kothari and Warner (2006) state that in the event studies the use of daily (and sometimes intraday) returns is more common than that of monthly returns. Because using daily returns allows for more precise measurement of abnormal returns and for better detection of announcement effects. Moreover, they also state that event studies can be implemented by using two different time horizons; short-horizon and long-horizon. Event studies that focus on the announcement effects of the short-horizon related to an event provide relevant evidence to understand corporate policy decisions. On the other hand, event studies that focus on the announcement effects of the long-horizon related to an event provide relevant evidence of market efficiency.
Following Kothari and Warner (2006) we construct our methodology, which includes as follows:
Step 1
The daily logarithmic returns given in (4) of each company are calculated.
𝑅𝑅𝑖𝑖𝑖𝑖 = ln(𝑃𝑃𝑖𝑖,𝑖𝑖) − ln(𝑃𝑃𝑖𝑖,𝑖𝑖−1). (4)
where 𝑃𝑃𝑖𝑖,𝑖𝑖 is the stock price of the company 𝑖𝑖 at time 𝑡𝑡. Step 2
The market model which is defined in (5) is applied.
𝑅𝑅𝑖𝑖𝑖𝑖 = 𝛽𝛽0𝑖𝑖 + 𝛽𝛽1𝑖𝑖𝑅𝑅𝑚𝑚𝑖𝑖 + 𝜀𝜀𝑖𝑖𝑖𝑖 (5)
where 𝑅𝑅𝑖𝑖𝑖𝑖 is the return of the company 𝑖𝑖 at time 𝑡𝑡, 𝑅𝑅𝑚𝑚𝑖𝑖 is the market return, 𝛽𝛽1𝑖𝑖 is the sensitivity of the company 𝑖𝑖 to the market and 𝜀𝜀𝑖𝑖𝑖𝑖 is the unexpected return at the time 𝑡𝑡 which is called “Abnormal Return”.
In other words, if we denote abnormal return of the company 𝑖𝑖 at time 𝑡𝑡 as 𝐴𝐴𝑅𝑅𝑖𝑖𝑖𝑖. Then, 𝐴𝐴𝑅𝑅𝑖𝑖𝑖𝑖 is written as follows:
𝐴𝐴𝑅𝑅𝑖𝑖𝑖𝑖 = 𝑅𝑅𝑖𝑖𝑖𝑖 − 𝛽𝛽0𝑖𝑖 − 𝛽𝛽1𝑖𝑖𝑅𝑅𝑚𝑚𝑖𝑖. (6)
At this step we use 1-year estimation window which is started 1-day after the announcement and ended 1-month before the event date. Moreover, we use BIST100 as the market index.
Step 3
25 Kothari, Warner, 2006.
.
Step 2
The market model which is defined in (5) is applied.
Makale Gönderim Tarihi: 12.02.2021 Yayına Kabul Tarihi: 13.06.2021
estimation window data, abnormal returns are obtained with the help of expected return model (e.g., market model, capital asset pricing model, factor models etc.)25.
Kothari and Warner (2006) state that in the event studies the use of daily (and sometimes intraday) returns is more common than that of monthly returns. Because using daily returns allows for more precise measurement of abnormal returns and for better detection of announcement effects. Moreover, they also state that event studies can be implemented by using two different time horizons; short-horizon and long-horizon. Event studies that focus on the announcement effects of the short-horizon related to an event provide relevant evidence to understand corporate policy decisions. On the other hand, event studies that focus on the announcement effects of the long-horizon related to an event provide relevant evidence of market efficiency.
Following Kothari and Warner (2006) we construct our methodology, which includes as follows:
Step 1
The daily logarithmic returns given in (4) of each company are calculated.
𝑅𝑅𝑖𝑖𝑖𝑖 = ln(𝑃𝑃𝑖𝑖,𝑖𝑖) − ln(𝑃𝑃𝑖𝑖,𝑖𝑖−1). (4)
where 𝑃𝑃𝑖𝑖,𝑖𝑖 is the stock price of the company 𝑖𝑖 at time 𝑡𝑡. Step 2
The market model which is defined in (5) is applied.
𝑅𝑅𝑖𝑖𝑖𝑖 = 𝛽𝛽0𝑖𝑖 + 𝛽𝛽1𝑖𝑖𝑅𝑅𝑚𝑚𝑖𝑖 + 𝜀𝜀𝑖𝑖𝑖𝑖 (5)
where 𝑅𝑅𝑖𝑖𝑖𝑖 is the return of the company 𝑖𝑖 at time 𝑡𝑡, 𝑅𝑅𝑚𝑚𝑖𝑖 is the market return, 𝛽𝛽1𝑖𝑖 is the sensitivity of the company 𝑖𝑖 to the market and 𝜀𝜀𝑖𝑖𝑖𝑖 is the unexpected return at the time 𝑡𝑡 which is called “Abnormal Return”.
In other words, if we denote abnormal return of the company 𝑖𝑖 at time 𝑡𝑡 as 𝐴𝐴𝑅𝑅𝑖𝑖𝑖𝑖. Then, 𝐴𝐴𝑅𝑅𝑖𝑖𝑖𝑖 is written as follows:
𝐴𝐴𝑅𝑅𝑖𝑖𝑖𝑖 = 𝑅𝑅𝑖𝑖𝑖𝑖 − 𝛽𝛽0𝑖𝑖 − 𝛽𝛽1𝑖𝑖𝑅𝑅𝑚𝑚𝑖𝑖. (6)
At this step we use 1-year estimation window which is started 1-day after the announcement and ended 1-month before the event date. Moreover, we use BIST100 as the market index.
Step 3
25 Kothari, Warner, 2006.
(5)
where
Makale Gönderim Tarihi: 12.02.2021 Yayına Kabul Tarihi: 13.06.2021
estimation window data, abnormal returns are obtained with the help of expected return model (e.g., market model, capital asset pricing model, factor models etc.)25.
Kothari and Warner (2006) state that in the event studies the use of daily (and sometimes intraday) returns is more common than that of monthly returns. Because using daily returns allows for more precise measurement of abnormal returns and for better detection of announcement effects. Moreover, they also state that event studies can be implemented by using two different time horizons; short-horizon and long-horizon. Event studies that focus on the announcement effects of the short-horizon related to an event provide relevant evidence to understand corporate policy decisions. On the other hand, event studies that focus on the announcement effects of the long-horizon related to an event provide relevant evidence of market efficiency.
Following Kothari and Warner (2006) we construct our methodology, which includes as follows:
Step 1
The daily logarithmic returns given in (4) of each company are calculated.
𝑅𝑅𝑖𝑖𝑖𝑖 = ln(𝑃𝑃𝑖𝑖,𝑖𝑖) − ln(𝑃𝑃𝑖𝑖,𝑖𝑖−1). (4)
where 𝑃𝑃𝑖𝑖,𝑖𝑖 is the stock price of the company 𝑖𝑖 at time 𝑡𝑡. Step 2
The market model which is defined in (5) is applied.
𝑅𝑅𝑖𝑖𝑖𝑖 = 𝛽𝛽0𝑖𝑖 + 𝛽𝛽1𝑖𝑖𝑅𝑅𝑚𝑚𝑖𝑖 + 𝜀𝜀𝑖𝑖𝑖𝑖 (5)
where 𝑅𝑅𝑖𝑖𝑖𝑖 is the return of the company 𝑖𝑖 at time 𝑡𝑡, 𝑅𝑅𝑚𝑚𝑖𝑖 is the market return, 𝛽𝛽1𝑖𝑖 is the sensitivity of the company 𝑖𝑖 to the market and 𝜀𝜀𝑖𝑖𝑖𝑖 is the unexpected return at the time 𝑡𝑡 which is called “Abnormal Return”.
In other words, if we denote abnormal return of the company 𝑖𝑖 at time 𝑡𝑡 as 𝐴𝐴𝑅𝑅𝑖𝑖𝑖𝑖. Then, 𝐴𝐴𝑅𝑅𝑖𝑖𝑖𝑖 is written as follows:
𝐴𝐴𝑅𝑅𝑖𝑖𝑖𝑖 = 𝑅𝑅𝑖𝑖𝑖𝑖 − 𝛽𝛽0𝑖𝑖 − 𝛽𝛽1𝑖𝑖𝑅𝑅𝑚𝑚𝑖𝑖. (6)
At this step we use 1-year estimation window which is started 1-day after the announcement and ended 1-month before the event date. Moreover, we use BIST100 as the market index.
Step 3
25 Kothari, Warner, 2006.
is the return of the company
Makale Gönderim Tarihi: 12.02.2021 Yayına Kabul Tarihi: 13.06.2021
estimation window data, abnormal returns are obtained with the help of expected return model (e.g., market model, capital asset pricing model, factor models etc.)25.
Kothari and Warner (2006) state that in the event studies the use of daily (and sometimes intraday) returns is more common than that of monthly returns. Because using daily returns allows for more precise measurement of abnormal returns and for better detection of announcement effects. Moreover, they also state that event studies can be implemented by using two different time horizons; short-horizon and long-horizon. Event studies that focus on the announcement effects of the short-horizon related to an event provide relevant evidence to understand corporate policy decisions. On the other hand, event studies that focus on the announcement effects of the long-horizon related to an event provide relevant evidence of market efficiency.
Following Kothari and Warner (2006) we construct our methodology, which includes as follows:
Step 1
The daily logarithmic returns given in (4) of each company are calculated.
𝑅𝑅𝑖𝑖𝑖𝑖 = ln(𝑃𝑃𝑖𝑖,𝑖𝑖) − ln(𝑃𝑃𝑖𝑖,𝑖𝑖−1). (4)
where 𝑃𝑃𝑖𝑖,𝑖𝑖 is the stock price of the company 𝑖𝑖 at time 𝑡𝑡. Step 2
The market model which is defined in (5) is applied.
𝑅𝑅𝑖𝑖𝑖𝑖 = 𝛽𝛽0𝑖𝑖 + 𝛽𝛽1𝑖𝑖𝑅𝑅𝑚𝑚𝑖𝑖 + 𝜀𝜀𝑖𝑖𝑖𝑖 (5)
where 𝑅𝑅𝑖𝑖𝑖𝑖 is the return of the company 𝑖𝑖 at time 𝑡𝑡, 𝑅𝑅𝑚𝑚𝑖𝑖 is the market return, 𝛽𝛽1𝑖𝑖 is the sensitivity of the company 𝑖𝑖 to the market and 𝜀𝜀𝑖𝑖𝑖𝑖 is the unexpected return at the time 𝑡𝑡 which is called “Abnormal Return”.
In other words, if we denote abnormal return of the company 𝑖𝑖 at time 𝑡𝑡 as 𝐴𝐴𝑅𝑅𝑖𝑖𝑖𝑖. Then, 𝐴𝐴𝑅𝑅𝑖𝑖𝑖𝑖 is written as follows:
𝐴𝐴𝑅𝑅𝑖𝑖𝑖𝑖 = 𝑅𝑅𝑖𝑖𝑖𝑖 − 𝛽𝛽0𝑖𝑖 − 𝛽𝛽1𝑖𝑖𝑅𝑅𝑚𝑚𝑖𝑖. (6)
At this step we use 1-year estimation window which is started 1-day after the announcement and ended 1-month before the event date. Moreover, we use BIST100 as the market index.
Step 3
25 Kothari, Warner, 2006.
at time
Makale Gönderim Tarihi: 12.02.2021 Yayına Kabul Tarihi: 13.06.2021
estimation window data, abnormal returns are obtained with the help of expected return model (e.g., market model, capital asset pricing model, factor models etc.)25.
Kothari and Warner (2006) state that in the event studies the use of daily (and sometimes intraday) returns is more common than that of monthly returns. Because using daily returns allows for more precise measurement of abnormal returns and for better detection of announcement effects. Moreover, they also state that event studies can be implemented by using two different time horizons; short-horizon and long-horizon. Event studies that focus on the announcement effects of the short-horizon related to an event provide relevant evidence to understand corporate policy decisions. On the other hand, event studies that focus on the announcement effects of the long-horizon related to an event provide relevant evidence of market efficiency.
Following Kothari and Warner (2006) we construct our methodology, which includes as follows:
Step 1
The daily logarithmic returns given in (4) of each company are calculated.
𝑅𝑅𝑖𝑖𝑖𝑖 = ln(𝑃𝑃𝑖𝑖,𝑖𝑖) − ln(𝑃𝑃𝑖𝑖,𝑖𝑖−1). (4)
where 𝑃𝑃𝑖𝑖,𝑖𝑖 is the stock price of the company 𝑖𝑖 at time 𝑡𝑡. Step 2
The market model which is defined in (5) is applied.
𝑅𝑅𝑖𝑖𝑖𝑖 = 𝛽𝛽0𝑖𝑖 + 𝛽𝛽1𝑖𝑖𝑅𝑅𝑚𝑚𝑖𝑖 + 𝜀𝜀𝑖𝑖𝑖𝑖 (5)
where 𝑅𝑅𝑖𝑖𝑖𝑖 is the return of the company 𝑖𝑖 at time 𝑡𝑡, 𝑅𝑅𝑚𝑚𝑖𝑖 is the market return, 𝛽𝛽1𝑖𝑖 is the sensitivity of the company 𝑖𝑖 to the market and 𝜀𝜀𝑖𝑖𝑖𝑖 is the unexpected return at the time 𝑡𝑡 which is called “Abnormal Return”.
In other words, if we denote abnormal return of the company 𝑖𝑖 at time 𝑡𝑡 as 𝐴𝐴𝑅𝑅𝑖𝑖𝑖𝑖. Then, 𝐴𝐴𝑅𝑅𝑖𝑖𝑖𝑖 is written as follows:
𝐴𝐴𝑅𝑅𝑖𝑖𝑖𝑖 = 𝑅𝑅𝑖𝑖𝑖𝑖 − 𝛽𝛽0𝑖𝑖 − 𝛽𝛽1𝑖𝑖𝑅𝑅𝑚𝑚𝑖𝑖. (6)
At this step we use 1-year estimation window which is started 1-day after the announcement and ended 1-month before the event date. Moreover, we use BIST100 as the market index.
Step 3
25 Kothari, Warner, 2006.
,
Makale Gönderim Tarihi: 12.02.2021 Yayına Kabul Tarihi: 13.06.2021
estimation window data, abnormal returns are obtained with the help of expected return model (e.g., market model, capital asset pricing model, factor models etc.)25.
Kothari and Warner (2006) state that in the event studies the use of daily (and sometimes intraday) returns is more common than that of monthly returns. Because using daily returns allows for more precise measurement of abnormal returns and for better detection of announcement effects. Moreover, they also state that event studies can be implemented by using two different time horizons; short-horizon and long-horizon. Event studies that focus on the announcement effects of the short-horizon related to an event provide relevant evidence to understand corporate policy decisions. On the other hand, event studies that focus on the announcement effects of the long-horizon related to an event provide relevant evidence of market efficiency.
Following Kothari and Warner (2006) we construct our methodology, which includes as follows:
Step 1
The daily logarithmic returns given in (4) of each company are calculated.
𝑅𝑅𝑖𝑖𝑖𝑖 = ln(𝑃𝑃𝑖𝑖,𝑖𝑖) − ln(𝑃𝑃𝑖𝑖,𝑖𝑖−1). (4)
where 𝑃𝑃𝑖𝑖,𝑖𝑖 is the stock price of the company 𝑖𝑖 at time 𝑡𝑡. Step 2
The market model which is defined in (5) is applied.
𝑅𝑅𝑖𝑖𝑖𝑖 = 𝛽𝛽0𝑖𝑖 + 𝛽𝛽1𝑖𝑖𝑅𝑅𝑚𝑚𝑖𝑖 + 𝜀𝜀𝑖𝑖𝑖𝑖 (5)
where 𝑅𝑅𝑖𝑖𝑖𝑖 is the return of the company 𝑖𝑖 at time 𝑡𝑡, 𝑅𝑅𝑚𝑚𝑖𝑖 is the market return, 𝛽𝛽1𝑖𝑖 is the sensitivity of the company 𝑖𝑖 to the market and 𝜀𝜀𝑖𝑖𝑖𝑖 is the unexpected return at the time 𝑡𝑡 which is called “Abnormal Return”.
In other words, if we denote abnormal return of the company 𝑖𝑖 at time 𝑡𝑡 as 𝐴𝐴𝑅𝑅𝑖𝑖𝑖𝑖. Then, 𝐴𝐴𝑅𝑅𝑖𝑖𝑖𝑖 is written as follows:
𝐴𝐴𝑅𝑅𝑖𝑖𝑖𝑖 = 𝑅𝑅𝑖𝑖𝑖𝑖 − 𝛽𝛽0𝑖𝑖 − 𝛽𝛽1𝑖𝑖𝑅𝑅𝑚𝑚𝑖𝑖. (6)
At this step we use 1-year estimation window which is started 1-day after the announcement and ended 1-month before the event date. Moreover, we use BIST100 as the market index.
Step 3
25 Kothari, Warner, 2006.
is the market return,
Makale Gönderim Tarihi: 12.02.2021 Yayına Kabul Tarihi: 13.06.2021
estimation window data, abnormal returns are obtained with the help of expected return model (e.g., market model, capital asset pricing model, factor models etc.)25.
Kothari and Warner (2006) state that in the event studies the use of daily (and sometimes intraday) returns is more common than that of monthly returns. Because using daily returns allows for more precise measurement of abnormal returns and for better detection of announcement effects. Moreover, they also state that event studies can be implemented by using two different time horizons; short-horizon and long-horizon. Event studies that focus on the announcement effects of the short-horizon related to an event provide relevant evidence to understand corporate policy decisions. On the other hand, event studies that focus on the announcement effects of the long-horizon related to an event provide relevant evidence of market efficiency.
Following Kothari and Warner (2006) we construct our methodology, which includes as follows:
Step 1
The daily logarithmic returns given in (4) of each company are calculated.
𝑅𝑅𝑖𝑖𝑖𝑖 = ln(𝑃𝑃𝑖𝑖,𝑖𝑖) − ln(𝑃𝑃𝑖𝑖,𝑖𝑖−1). (4)
where 𝑃𝑃𝑖𝑖,𝑖𝑖 is the stock price of the company 𝑖𝑖 at time 𝑡𝑡. Step 2
The market model which is defined in (5) is applied.
𝑅𝑅𝑖𝑖𝑖𝑖 = 𝛽𝛽0𝑖𝑖 + 𝛽𝛽1𝑖𝑖𝑅𝑅𝑚𝑚𝑖𝑖 + 𝜀𝜀𝑖𝑖𝑖𝑖 (5)
where 𝑅𝑅𝑖𝑖𝑖𝑖 is the return of the company 𝑖𝑖 at time 𝑡𝑡, 𝑅𝑅𝑚𝑚𝑖𝑖 is the market return, 𝛽𝛽1𝑖𝑖 is the sensitivity of the company 𝑖𝑖 to the market and 𝜀𝜀𝑖𝑖𝑖𝑖 is the unexpected return at the time 𝑡𝑡 which is called “Abnormal Return”.
In other words, if we denote abnormal return of the company 𝑖𝑖 at time 𝑡𝑡 as 𝐴𝐴𝑅𝑅𝑖𝑖𝑖𝑖. Then, 𝐴𝐴𝑅𝑅𝑖𝑖𝑖𝑖 is written as follows:
𝐴𝐴𝑅𝑅𝑖𝑖𝑖𝑖 = 𝑅𝑅𝑖𝑖𝑖𝑖 − 𝛽𝛽0𝑖𝑖 − 𝛽𝛽1𝑖𝑖𝑅𝑅𝑚𝑚𝑖𝑖. (6)
At this step we use 1-year estimation window which is started 1-day after the announcement and ended 1-month before the event date. Moreover, we use BIST100 as the market index.
Step 3
25 Kothari, Warner, 2006.
is the sensitivity of the company
Makale Gönderim Tarihi: 12.02.2021 Yayına Kabul Tarihi: 13.06.2021
estimation window data, abnormal returns are obtained with the help of expected return model (e.g., market model, capital asset pricing model, factor models etc.)25.
Kothari and Warner (2006) state that in the event studies the use of daily (and sometimes intraday) returns is more common than that of monthly returns. Because using daily returns allows for more precise measurement of abnormal returns and for better detection of announcement effects. Moreover, they also state that event studies can be implemented by using two different time horizons; short-horizon and long-horizon. Event studies that focus on the announcement effects of the short-horizon related to an event provide relevant evidence to understand corporate policy decisions. On the other hand, event studies that focus on the announcement effects of the long-horizon related to an event provide relevant evidence of market efficiency.
Following Kothari and Warner (2006) we construct our methodology, which includes as follows:
Step 1
The daily logarithmic returns given in (4) of each company are calculated.
𝑅𝑅𝑖𝑖𝑖𝑖 = ln(𝑃𝑃𝑖𝑖,𝑖𝑖) − ln(𝑃𝑃𝑖𝑖,𝑖𝑖−1). (4)
where 𝑃𝑃𝑖𝑖,𝑖𝑖 is the stock price of the company 𝑖𝑖 at time 𝑡𝑡. Step 2
The market model which is defined in (5) is applied.
𝑅𝑅𝑖𝑖𝑖𝑖 = 𝛽𝛽0𝑖𝑖 + 𝛽𝛽1𝑖𝑖𝑅𝑅𝑚𝑚𝑖𝑖 + 𝜀𝜀𝑖𝑖𝑖𝑖 (5)
where 𝑅𝑅𝑖𝑖𝑖𝑖 is the return of the company 𝑖𝑖 at time 𝑡𝑡, 𝑅𝑅𝑚𝑚𝑖𝑖 is the market return, 𝛽𝛽1𝑖𝑖 is the sensitivity of the company 𝑖𝑖 to the market and 𝜀𝜀𝑖𝑖𝑖𝑖 is the unexpected return at the time 𝑡𝑡 which is called “Abnormal Return”.
In other words, if we denote abnormal return of the company 𝑖𝑖 at time 𝑡𝑡 as 𝐴𝐴𝑅𝑅𝑖𝑖𝑖𝑖. Then, 𝐴𝐴𝑅𝑅𝑖𝑖𝑖𝑖 is written as follows:
𝐴𝐴𝑅𝑅𝑖𝑖𝑖𝑖 = 𝑅𝑅𝑖𝑖𝑖𝑖 − 𝛽𝛽0𝑖𝑖 − 𝛽𝛽1𝑖𝑖𝑅𝑅𝑚𝑚𝑖𝑖. (6)
At this step we use 1-year estimation window which is started 1-day after the announcement and ended 1-month before the event date. Moreover, we use BIST100 as the market index.
Step 3
25 Kothari, Warner, 2006.
to the market and
Makale Gönderim Tarihi: 12.02.2021 Yayına Kabul Tarihi: 13.06.2021
estimation window data, abnormal returns are obtained with the help of expected return model (e.g., market model, capital asset pricing model, factor models etc.)25.
Kothari and Warner (2006) state that in the event studies the use of daily (and sometimes intraday) returns is more common than that of monthly returns. Because using daily returns allows for more precise measurement of abnormal returns and for better detection of announcement effects. Moreover, they also state that event studies can be implemented by using two different time horizons; short-horizon and long-horizon. Event studies that focus on the announcement effects of the short-horizon related to an event provide relevant evidence to understand corporate policy decisions. On the other hand, event studies that focus on the announcement effects of the long-horizon related to an event provide relevant evidence of market efficiency.
Following Kothari and Warner (2006) we construct our methodology, which includes as follows:
Step 1
The daily logarithmic returns given in (4) of each company are calculated.
𝑅𝑅𝑖𝑖𝑖𝑖 = ln(𝑃𝑃𝑖𝑖,𝑖𝑖) − ln(𝑃𝑃𝑖𝑖,𝑖𝑖−1). (4)
where 𝑃𝑃𝑖𝑖,𝑖𝑖 is the stock price of the company 𝑖𝑖 at time 𝑡𝑡. Step 2
The market model which is defined in (5) is applied.
𝑅𝑅𝑖𝑖𝑖𝑖 = 𝛽𝛽0𝑖𝑖 + 𝛽𝛽1𝑖𝑖𝑅𝑅𝑚𝑚𝑖𝑖 + 𝜀𝜀𝑖𝑖𝑖𝑖 (5)
where 𝑅𝑅𝑖𝑖𝑖𝑖 is the return of the company 𝑖𝑖 at time 𝑡𝑡, 𝑅𝑅𝑚𝑚𝑖𝑖 is the market return, 𝛽𝛽1𝑖𝑖 is the sensitivity of the company 𝑖𝑖 to the market and 𝜀𝜀𝑖𝑖𝑖𝑖 is the unexpected return at the time 𝑡𝑡 which is called “Abnormal Return”.
In other words, if we denote abnormal return of the company 𝑖𝑖 at time 𝑡𝑡 as 𝐴𝐴𝑅𝑅𝑖𝑖𝑖𝑖. Then, 𝐴𝐴𝑅𝑅𝑖𝑖𝑖𝑖 is written as follows:
𝐴𝐴𝑅𝑅𝑖𝑖𝑖𝑖 = 𝑅𝑅𝑖𝑖𝑖𝑖 − 𝛽𝛽0𝑖𝑖 − 𝛽𝛽1𝑖𝑖𝑅𝑅𝑚𝑚𝑖𝑖. (6)
At this step we use 1-year estimation window which is started 1-day after the announcement and ended 1-month before the event date. Moreover, we use BIST100 as the market index.
Step 3
25 Kothari, Warner, 2006.
is the unexpected return at the time
Makale Gönderim Tarihi: 12.02.2021 Yayına Kabul Tarihi: 13.06.2021
estimation window data, abnormal returns are obtained with the help of expected return model (e.g., market model, capital asset pricing model, factor models etc.)25.
Kothari and Warner (2006) state that in the event studies the use of daily (and sometimes intraday) returns is more common than that of monthly returns. Because using daily returns allows for more precise measurement of abnormal returns and for better detection of announcement effects. Moreover, they also state that event studies can be implemented by using two different time horizons; short-horizon and long-horizon. Event studies that focus on the announcement effects of the short-horizon related to an event provide relevant evidence to understand corporate policy decisions. On the other hand, event studies that focus on the announcement effects of the long-horizon related to an event provide relevant evidence of market efficiency.
Following Kothari and Warner (2006) we construct our methodology, which includes as follows:
Step 1
The daily logarithmic returns given in (4) of each company are calculated.
𝑅𝑅𝑖𝑖𝑖𝑖 = ln(𝑃𝑃𝑖𝑖,𝑖𝑖) − ln(𝑃𝑃𝑖𝑖,𝑖𝑖−1). (4)
where 𝑃𝑃𝑖𝑖,𝑖𝑖 is the stock price of the company 𝑖𝑖 at time 𝑡𝑡. Step 2
The market model which is defined in (5) is applied.
𝑅𝑅𝑖𝑖𝑖𝑖 = 𝛽𝛽0𝑖𝑖 + 𝛽𝛽1𝑖𝑖𝑅𝑅𝑚𝑚𝑖𝑖 + 𝜀𝜀𝑖𝑖𝑖𝑖 (5)
where 𝑅𝑅𝑖𝑖𝑖𝑖 is the return of the company 𝑖𝑖 at time 𝑡𝑡, 𝑅𝑅𝑚𝑚𝑖𝑖 is the market return, 𝛽𝛽1𝑖𝑖 is the sensitivity of the company 𝑖𝑖 to the market and 𝜀𝜀𝑖𝑖𝑖𝑖 is the unexpected return at the time 𝑡𝑡 which is called “Abnormal Return”.
In other words, if we denote abnormal return of the company 𝑖𝑖 at time 𝑡𝑡 as 𝐴𝐴𝑅𝑅𝑖𝑖𝑖𝑖. Then, 𝐴𝐴𝑅𝑅𝑖𝑖𝑖𝑖 is written as follows:
𝐴𝐴𝑅𝑅𝑖𝑖𝑖𝑖 = 𝑅𝑅𝑖𝑖𝑖𝑖 − 𝛽𝛽0𝑖𝑖 − 𝛽𝛽1𝑖𝑖𝑅𝑅𝑚𝑚𝑖𝑖. (6)
At this step we use 1-year estimation window which is started 1-day after the announcement and ended 1-month before the event date. Moreover, we use BIST100 as the market index.
Step 3
25 Kothari, Warner, 2006.
which is called “Abnormal Return”.
In other words, if we denote abnormal return of the company
Makale Gönderim Tarihi: 12.02.2021 Yayına Kabul Tarihi: 13.06.2021
estimation window data, abnormal returns are obtained with the help of expected return model (e.g., market model, capital asset pricing model, factor models etc.)25.
Kothari and Warner (2006) state that in the event studies the use of daily (and sometimes intraday) returns is more common than that of monthly returns. Because using daily returns allows for more precise measurement of abnormal returns and for better detection of announcement effects. Moreover, they also state that event studies can be implemented by using two different time horizons; short-horizon and long-horizon. Event studies that focus on the announcement effects of the short-horizon related to an event provide relevant evidence to understand corporate policy decisions. On the other hand, event studies that focus on the announcement effects of the long-horizon related to an event provide relevant evidence of market efficiency.
Following Kothari and Warner (2006) we construct our methodology, which includes as follows:
Step 1
The daily logarithmic returns given in (4) of each company are calculated.
𝑅𝑅𝑖𝑖𝑖𝑖 = ln(𝑃𝑃𝑖𝑖,𝑖𝑖) − ln(𝑃𝑃𝑖𝑖,𝑖𝑖−1). (4)
where 𝑃𝑃𝑖𝑖,𝑖𝑖 is the stock price of the company 𝑖𝑖 at time 𝑡𝑡. Step 2
The market model which is defined in (5) is applied.
𝑅𝑅𝑖𝑖𝑖𝑖 = 𝛽𝛽0𝑖𝑖 + 𝛽𝛽1𝑖𝑖𝑅𝑅𝑚𝑚𝑖𝑖 + 𝜀𝜀𝑖𝑖𝑖𝑖 (5)
where 𝑅𝑅𝑖𝑖𝑖𝑖 is the return of the company 𝑖𝑖 at time 𝑡𝑡, 𝑅𝑅𝑚𝑚𝑖𝑖 is the market return, 𝛽𝛽1𝑖𝑖 is the sensitivity of the company 𝑖𝑖 to the market and 𝜀𝜀𝑖𝑖𝑖𝑖 is the unexpected return at the time 𝑡𝑡 which is called “Abnormal Return”.
In other words, if we denote abnormal return of the company 𝑖𝑖 at time 𝑡𝑡 as 𝐴𝐴𝑅𝑅𝑖𝑖𝑖𝑖. Then, 𝐴𝐴𝑅𝑅𝑖𝑖𝑖𝑖 is written as follows:
𝐴𝐴𝑅𝑅𝑖𝑖𝑖𝑖 = 𝑅𝑅𝑖𝑖𝑖𝑖 − 𝛽𝛽0𝑖𝑖 − 𝛽𝛽1𝑖𝑖𝑅𝑅𝑚𝑚𝑖𝑖. (6)
At this step we use 1-year estimation window which is started 1-day after the announcement and ended 1-month before the event date. Moreover, we use BIST100 as the market index.
Step 3
25 Kothari, Warner, 2006.
at time
Makale Gönderim Tarihi: 12.02.2021 Yayına Kabul Tarihi: 13.06.2021
estimation window data, abnormal returns are obtained with the help of expected return model (e.g., market model, capital asset pricing model, factor models etc.)25.
Kothari and Warner (2006) state that in the event studies the use of daily (and sometimes intraday) returns is more common than that of monthly returns. Because using daily returns allows for more precise measurement of abnormal returns and for better detection of announcement effects. Moreover, they also state that event studies can be implemented by using two different time horizons; short-horizon and long-horizon. Event studies that focus on the announcement effects of the short-horizon related to an event provide relevant evidence to understand corporate policy decisions. On the other hand, event studies that focus on the announcement effects of the long-horizon related to an event provide relevant evidence of market efficiency.
Following Kothari and Warner (2006) we construct our methodology, which includes as follows:
Step 1
The daily logarithmic returns given in (4) of each company are calculated.
𝑅𝑅𝑖𝑖𝑖𝑖 = ln(𝑃𝑃𝑖𝑖,𝑖𝑖) − ln(𝑃𝑃𝑖𝑖,𝑖𝑖−1). (4)
where 𝑃𝑃𝑖𝑖,𝑖𝑖 is the stock price of the company 𝑖𝑖 at time 𝑡𝑡. Step 2
The market model which is defined in (5) is applied.
𝑅𝑅𝑖𝑖𝑖𝑖 = 𝛽𝛽0𝑖𝑖 + 𝛽𝛽1𝑖𝑖𝑅𝑅𝑚𝑚𝑖𝑖 + 𝜀𝜀𝑖𝑖𝑖𝑖 (5)
where 𝑅𝑅𝑖𝑖𝑖𝑖 is the return of the company 𝑖𝑖 at time 𝑡𝑡, 𝑅𝑅𝑚𝑚𝑖𝑖 is the market return, 𝛽𝛽1𝑖𝑖 is the sensitivity of the company 𝑖𝑖 to the market and 𝜀𝜀𝑖𝑖𝑖𝑖 is the unexpected return at the time 𝑡𝑡 which is called “Abnormal Return”.
In other words, if we denote abnormal return of the company 𝑖𝑖 at time 𝑡𝑡 as 𝐴𝐴𝑅𝑅𝑖𝑖𝑖𝑖. Then, 𝐴𝐴𝑅𝑅𝑖𝑖𝑖𝑖 is written as follows:
𝐴𝐴𝑅𝑅𝑖𝑖𝑖𝑖 = 𝑅𝑅𝑖𝑖𝑖𝑖 − 𝛽𝛽0𝑖𝑖 − 𝛽𝛽1𝑖𝑖𝑅𝑅𝑚𝑚𝑖𝑖. (6)
At this step we use 1-year estimation window which is started 1-day after the announcement and ended 1-month before the event date. Moreover, we use BIST100 as the market index.
Step 3
25 Kothari, Warner, 2006.
as
Makale Gönderim Tarihi: 12.02.2021 Yayına Kabul Tarihi: 13.06.2021
estimation window data, abnormal returns are obtained with the help of expected return model (e.g., market model, capital asset pricing model, factor models etc.)25.
Kothari and Warner (2006) state that in the event studies the use of daily (and sometimes intraday) returns is more common than that of monthly returns. Because using daily returns allows for more precise measurement of abnormal returns and for better detection of announcement effects. Moreover, they also state that event studies can be implemented by using two different time horizons; short-horizon and long-horizon. Event studies that focus on the announcement effects of the short-horizon related to an event provide relevant evidence to understand corporate policy decisions. On the other hand, event studies that focus on the announcement effects of the long-horizon related to an event provide relevant evidence of market efficiency.
Following Kothari and Warner (2006) we construct our methodology, which includes as follows:
Step 1
The daily logarithmic returns given in (4) of each company are calculated.
𝑅𝑅𝑖𝑖𝑖𝑖 = ln(𝑃𝑃𝑖𝑖,𝑖𝑖) − ln(𝑃𝑃𝑖𝑖,𝑖𝑖−1). (4)
where 𝑃𝑃𝑖𝑖,𝑖𝑖 is the stock price of the company 𝑖𝑖 at time 𝑡𝑡. Step 2
The market model which is defined in (5) is applied.
𝑅𝑅𝑖𝑖𝑖𝑖 = 𝛽𝛽0𝑖𝑖 + 𝛽𝛽1𝑖𝑖𝑅𝑅𝑚𝑚𝑖𝑖 + 𝜀𝜀𝑖𝑖𝑖𝑖 (5)
where 𝑅𝑅𝑖𝑖𝑖𝑖 is the return of the company 𝑖𝑖 at time 𝑡𝑡, 𝑅𝑅𝑚𝑚𝑖𝑖 is the market return, 𝛽𝛽1𝑖𝑖 is the sensitivity of the company 𝑖𝑖 to the market and 𝜀𝜀𝑖𝑖𝑖𝑖 is the unexpected return at the time 𝑡𝑡 which is called “Abnormal Return”.
In other words, if we denote abnormal return of the company 𝑖𝑖 at time 𝑡𝑡 as 𝐴𝐴𝑅𝑅𝑖𝑖𝑖𝑖. Then, 𝐴𝐴𝑅𝑅𝑖𝑖𝑖𝑖 is written as follows:
𝐴𝐴𝑅𝑅𝑖𝑖𝑖𝑖 = 𝑅𝑅𝑖𝑖𝑖𝑖 − 𝛽𝛽0𝑖𝑖 − 𝛽𝛽1𝑖𝑖𝑅𝑅𝑚𝑚𝑖𝑖. (6)
At this step we use 1-year estimation window which is started 1-day after the announcement and ended 1-month before the event date. Moreover, we use BIST100 as the market index.
Step 3
25 Kothari, Warner, 2006.
. Then,
Makale Gönderim Tarihi: 12.02.2021 Yayına Kabul Tarihi: 13.06.2021
estimation window data, abnormal returns are obtained with the help of expected return model (e.g., market model, capital asset pricing model, factor models etc.)25.
Kothari and Warner (2006) state that in the event studies the use of daily (and sometimes intraday) returns is more common than that of monthly returns. Because using daily returns allows for more precise measurement of abnormal returns and for better detection of announcement effects. Moreover, they also state that event studies can be implemented by using two different time horizons; short-horizon and long-horizon. Event studies that focus on the announcement effects of the short-horizon related to an event provide relevant evidence to understand corporate policy decisions. On the other hand, event studies that focus on the announcement effects of the long-horizon related to an event provide relevant evidence of market efficiency.
Following Kothari and Warner (2006) we construct our methodology, which includes as follows:
Step 1
The daily logarithmic returns given in (4) of each company are calculated.
𝑅𝑅𝑖𝑖𝑖𝑖 = ln(𝑃𝑃𝑖𝑖,𝑖𝑖) − ln(𝑃𝑃𝑖𝑖,𝑖𝑖−1). (4)
where 𝑃𝑃𝑖𝑖,𝑖𝑖 is the stock price of the company 𝑖𝑖 at time 𝑡𝑡. Step 2
The market model which is defined in (5) is applied.
𝑅𝑅𝑖𝑖𝑖𝑖 = 𝛽𝛽0𝑖𝑖 + 𝛽𝛽1𝑖𝑖𝑅𝑅𝑚𝑚𝑖𝑖 + 𝜀𝜀𝑖𝑖𝑖𝑖 (5)
where 𝑅𝑅𝑖𝑖𝑖𝑖 is the return of the company 𝑖𝑖 at time 𝑡𝑡, 𝑅𝑅𝑚𝑚𝑖𝑖 is the market return, 𝛽𝛽1𝑖𝑖 is the sensitivity of the company 𝑖𝑖 to the market and 𝜀𝜀𝑖𝑖𝑖𝑖 is the unexpected return at the time 𝑡𝑡 which is called “Abnormal Return”.
In other words, if we denote abnormal return of the company 𝑖𝑖 at time 𝑡𝑡 as 𝐴𝐴𝑅𝑅𝑖𝑖𝑖𝑖. Then, 𝐴𝐴𝑅𝑅𝑖𝑖𝑖𝑖 is written as follows:
𝐴𝐴𝑅𝑅𝑖𝑖𝑖𝑖 = 𝑅𝑅𝑖𝑖𝑖𝑖 − 𝛽𝛽0𝑖𝑖 − 𝛽𝛽1𝑖𝑖𝑅𝑅𝑚𝑚𝑖𝑖. (6)
At this step we use 1-year estimation window which is started 1-day after the announcement and ended 1-month before the event date. Moreover, we use BIST100 as the market index.
Step 3
25 Kothari, Warner, 2006.
is written as follows:
Makale Gönderim Tarihi: 12.02.2021 Yayına Kabul Tarihi: 13.06.2021
estimation window data, abnormal returns are obtained with the help of expected return model (e.g., market model, capital asset pricing model, factor models etc.)25.
Kothari and Warner (2006) state that in the event studies the use of daily (and sometimes intraday) returns is more common than that of monthly returns. Because using daily returns allows for more precise measurement of abnormal returns and for better detection of announcement effects. Moreover, they also state that event studies can be implemented by using two different time horizons; short-horizon and long-horizon. Event studies that focus on the announcement effects of the short-horizon related to an event provide relevant evidence to understand corporate policy decisions. On the other hand, event studies that focus on the announcement effects of the long-horizon related to an event provide relevant evidence of market efficiency.
Following Kothari and Warner (2006) we construct our methodology, which includes as follows:
Step 1
The daily logarithmic returns given in (4) of each company are calculated.
𝑅𝑅𝑖𝑖𝑖𝑖 = ln(𝑃𝑃𝑖𝑖,𝑖𝑖) − ln(𝑃𝑃𝑖𝑖,𝑖𝑖−1). (4)
where 𝑃𝑃𝑖𝑖,𝑖𝑖 is the stock price of the company 𝑖𝑖 at time 𝑡𝑡. Step 2
The market model which is defined in (5) is applied.
𝑅𝑅𝑖𝑖𝑖𝑖 = 𝛽𝛽0𝑖𝑖 + 𝛽𝛽1𝑖𝑖𝑅𝑅𝑚𝑚𝑖𝑖 + 𝜀𝜀𝑖𝑖𝑖𝑖 (5)
where 𝑅𝑅𝑖𝑖𝑖𝑖 is the return of the company 𝑖𝑖 at time 𝑡𝑡, 𝑅𝑅𝑚𝑚𝑖𝑖 is the market return, 𝛽𝛽1𝑖𝑖 is the sensitivity of the company 𝑖𝑖 to the market and 𝜀𝜀𝑖𝑖𝑖𝑖 is the unexpected return at the time 𝑡𝑡 which is called “Abnormal Return”.
In other words, if we denote abnormal return of the company 𝑖𝑖 at time 𝑡𝑡 as 𝐴𝐴𝑅𝑅𝑖𝑖𝑖𝑖. Then, 𝐴𝐴𝑅𝑅𝑖𝑖𝑖𝑖 is written as follows:
𝐴𝐴𝑅𝑅𝑖𝑖𝑖𝑖 = 𝑅𝑅𝑖𝑖𝑖𝑖 − 𝛽𝛽0𝑖𝑖 − 𝛽𝛽1𝑖𝑖𝑅𝑅𝑚𝑚𝑖𝑖. (6)
At this step we use 1-year estimation window which is started 1-day after the announcement and ended 1-month before the event date. Moreover, we use BIST100 as the market index.
Step 3
25 Kothari, Warner, 2006.
(6)
At this step we use 1-year estimation window which is started 1-day after the announcement and ended 1-month before the event date. Moreover, we use BIST100 as the market index.
Step 3
Since abnormal return is only 1-day unexpected return, one day is not enough to understand the impact of an event 26. Therefore, we consider the Cumulative Abnormal Returns (CAR) which is defined in (7) for the event window.
25 Kothari, Warner, 2006.26 Tellis, G. J., Johnson, J. (2007), The Value of Quality, Marketing Science, 26(6): 758-773.
V. Evrim ALTUK ÖZTÜRK • Ayşegül İŞCANOĞLU ÇEKİÇ
152
Makale Gönderim Tarihi: 12.02.2021 Yayına Kabul Tarihi: 13.06.2021
Since abnormal return is only 1-day unexpected return, one day is not enough to understand the impact of an event 26. Therefore, we consider the Cumulative Abnormal Returns (CAR) which is defined in (7) for the event window.
𝐶𝐶𝐶𝐶𝐶𝐶1 = ∑ 𝐶𝐶𝐶𝐶𝑖𝑖𝑖𝑖
𝑖𝑖2
𝑖𝑖=𝑖𝑖1
(7)
In the analysis, we consider eight different event windows which are listed as follows:
Event Window 1: 𝑡𝑡1 = 0 to 𝑡𝑡2 = 3 (4-days) Event Window 2: 𝑡𝑡1 = 0 to 𝑡𝑡2 = 5 (6-days) Event Window 3: 𝑡𝑡1 = 0 to 𝑡𝑡2 = 10 (11-days) Event Window 4: 𝑡𝑡1 = 0 to 𝑡𝑡2 = 20 (21-days) Event Window 5: 𝑡𝑡1 = −3 to 𝑡𝑡2 = 3 (7-days) Event Window 6: 𝑡𝑡1 = −5 to 𝑡𝑡2 = 5 (11-days) Event Window 7: 𝑡𝑡1 = −10 to 𝑡𝑡2 = 10 (21-days) Event Window 8: 𝑡𝑡1 = −20 to 𝑡𝑡2 = 20 (41-days)
Step 4
Finally, nonparametric CAR test is implemented27. In these tests, under the null hypothesis event does not have effect, in other words, there is no abnormal returns.
4. Empirical Results
In this study, our data cover 59 companies which publish sustainability reports and are listed in the BIST sustainability index in the period from 2014 to 2019. In the analysis, we use daily logarithmic returns. All the applications are implemented on R28 and CAR values are calculated by using R package called “estudy2”29.
Accordingly, we consider daily stock prices of 60 companies listed in the Borsa Istanbul Sustainability Index for the period from 2014 to 2019. However, in 2017 SAF REIT merges with
26 Tellis, G. J., Johnson, J. (2007), The Value of Quality, Marketing Science, 26(6): 758-773. 27 Corrado C. J. (1989). A Nonparametric Test for Abnormal Security-Price Performance in Event Studies, Journal of Financial Economics, 23: 385-395; Cowan A. R. (1992). Nonparametric Event Study Tests. Review of Quantitative Finance and Accounting, 2: 343-358. 28 R Core Team (2020). R: A language and Environment for Statistical Computing, R Foundation for Statistical Computing, Vienna, Austria. URL https://www.R-project.org/ 29 Rudnytskyi, I. (2019). Estudy2: An Implementation of Parametric and Nonparametric Event Study, R package version 0.9.1.
(7)
In the analysis, we consider eight different event windows which are listed as follows:
Event Window 1:
Makale Gönderim Tarihi: 12.02.2021 Yayına Kabul Tarihi: 13.06.2021
Since abnormal return is only 1-day unexpected return, one day is not enough to understand the impact of an event 26. Therefore, we consider the Cumulative Abnormal Returns (CAR) which is defined in (7) for the event window.
𝐶𝐶𝐶𝐶𝐶𝐶1 = ∑ 𝐶𝐶𝐶𝐶𝑖𝑖𝑖𝑖
𝑖𝑖2
𝑖𝑖=𝑖𝑖1
(7)
In the analysis, we consider eight different event windows which are listed as follows:
Event Window 1: 𝑡𝑡1 = 0 to 𝑡𝑡2 = 3 (4-days) Event Window 2: 𝑡𝑡1 = 0 to 𝑡𝑡2 = 5 (6-days) Event Window 3: 𝑡𝑡1 = 0 to 𝑡𝑡2 = 10 (11-days) Event Window 4: 𝑡𝑡1 = 0 to 𝑡𝑡2 = 20 (21-days) Event Window 5: 𝑡𝑡1 = −3 to 𝑡𝑡2 = 3 (7-days) Event Window 6: 𝑡𝑡1 = −5 to 𝑡𝑡2 = 5 (11-days) Event Window 7: 𝑡𝑡1 = −10 to 𝑡𝑡2 = 10 (21-days) Event Window 8: 𝑡𝑡1 = −20 to 𝑡𝑡2 = 20 (41-days)
Step 4
Finally, nonparametric CAR test is implemented27. In these tests, under the null hypothesis event does not have effect, in other words, there is no abnormal returns.
4. Empirical Results
In this study, our data cover 59 companies which publish sustainability reports and are listed in the BIST sustainability index in the period from 2014 to 2019. In the analysis, we use daily logarithmic returns. All the applications are implemented on R28 and CAR values are calculated by using R package called “estudy2”29.
Accordingly, we consider daily stock prices of 60 companies listed in the Borsa Istanbul Sustainability Index for the period from 2014 to 2019. However, in 2017 SAF REIT merges with
26 Tellis, G. J., Johnson, J. (2007), The Value of Quality, Marketing Science, 26(6): 758-773. 27 Corrado C. J. (1989). A Nonparametric Test for Abnormal Security-Price Performance in Event Studies, Journal of Financial Economics, 23: 385-395; Cowan A. R. (1992). Nonparametric Event Study Tests. Review of Quantitative Finance and Accounting, 2: 343-358. 28 R Core Team (2020). R: A language and Environment for Statistical Computing, R Foundation for Statistical Computing, Vienna, Austria. URL https://www.R-project.org/ 29 Rudnytskyi, I. (2019). Estudy2: An Implementation of Parametric and Nonparametric Event Study, R package version 0.9.1.
to
Makale Gönderim Tarihi: 12.02.2021 Yayına Kabul Tarihi: 13.06.2021
Since abnormal return is only 1-day unexpected return, one day is not enough to understand the impact of an event 26. Therefore, we consider the Cumulative Abnormal Returns (CAR) which is defined in (7) for the event window.
𝐶𝐶𝐶𝐶𝐶𝐶1 = ∑ 𝐶𝐶𝐶𝐶𝑖𝑖𝑖𝑖
𝑖𝑖2
𝑖𝑖=𝑖𝑖1
(7)
In the analysis, we consider eight different event windows which are listed as follows:
Event Window 1: 𝑡𝑡1 = 0 to 𝑡𝑡2 = 3 (4-days) Event Window 2: 𝑡𝑡1 = 0 to 𝑡𝑡2 = 5 (6-days) Event Window 3: 𝑡𝑡1 = 0 to 𝑡𝑡2 = 10 (11-days) Event Window 4: 𝑡𝑡1 = 0 to 𝑡𝑡2 = 20 (21-days) Event Window 5: 𝑡𝑡1 = −3 to 𝑡𝑡2 = 3 (7-days) Event Window 6: 𝑡𝑡1 = −5 to 𝑡𝑡2 = 5 (11-days) Event Window 7: 𝑡𝑡1 = −10 to 𝑡𝑡2 = 10 (21-days) Event Window 8: 𝑡𝑡1 = −20 to 𝑡𝑡2 = 20 (41-days)
Step 4
Finally, nonparametric CAR test is implemented27. In these tests, under the null hypothesis event does not have effect, in other words, there is no abnormal returns.
4. Empirical Results
In this study, our data cover 59 companies which publish sustainability reports and are listed in the BIST sustainability index in the period from 2014 to 2019. In the analysis, we use daily logarithmic returns. All the applications are implemented on R28 and CAR values are calculated by using R package called “estudy2”29.
Accordingly, we consider daily stock prices of 60 companies listed in the Borsa Istanbul Sustainability Index for the period from 2014 to 2019. However, in 2017 SAF REIT merges with
26 Tellis, G. J., Johnson, J. (2007), The Value of Quality, Marketing Science, 26(6): 758-773. 27 Corrado C. J. (1989). A Nonparametric Test for Abnormal Security-Price Performance in Event Studies, Journal of Financial Economics, 23: 385-395; Cowan A. R. (1992). Nonparametric Event Study Tests. Review of Quantitative Finance and Accounting, 2: 343-358. 28 R Core Team (2020). R: A language and Environment for Statistical Computing, R Foundation for Statistical Computing, Vienna, Austria. URL https://www.R-project.org/ 29 Rudnytskyi, I. (2019). Estudy2: An Implementation of Parametric and Nonparametric Event Study, R package version 0.9.1.
(4-days)
Event Window 2:
Makale Gönderim Tarihi: 12.02.2021 Yayına Kabul Tarihi: 13.06.2021
Since abnormal return is only 1-day unexpected return, one day is not enough to understand the impact of an event 26. Therefore, we consider the Cumulative Abnormal Returns (CAR) which is defined in (7) for the event window.
𝐶𝐶𝐶𝐶𝐶𝐶1 = ∑ 𝐶𝐶𝐶𝐶𝑖𝑖𝑖𝑖
𝑖𝑖2
𝑖𝑖=𝑖𝑖1
(7)
In the analysis, we consider eight different event windows which are listed as follows:
Event Window 1: 𝑡𝑡1 = 0 to 𝑡𝑡2 = 3 (4-days) Event Window 2: 𝑡𝑡1 = 0 to 𝑡𝑡2 = 5 (6-days) Event Window 3: 𝑡𝑡1 = 0 to 𝑡𝑡2 = 10 (11-days) Event Window 4: 𝑡𝑡1 = 0 to 𝑡𝑡2 = 20 (21-days) Event Window 5: 𝑡𝑡1 = −3 to 𝑡𝑡2 = 3 (7-days) Event Window 6: 𝑡𝑡1 = −5 to 𝑡𝑡2 = 5 (11-days) Event Window 7: 𝑡𝑡1 = −10 to 𝑡𝑡2 = 10 (21-days) Event Window 8: 𝑡𝑡1 = −20 to 𝑡𝑡2 = 20 (41-days)
Step 4
Finally, nonparametric CAR test is implemented27. In these tests, under the null hypothesis event does not have effect, in other words, there is no abnormal returns.
4. Empirical Results
In this study, our data cover 59 companies which publish sustainability reports and are listed in the BIST sustainability index in the period from 2014 to 2019. In the analysis, we use daily logarithmic returns. All the applications are implemented on R28 and CAR values are calculated by using R package called “estudy2”29.
Accordingly, we consider daily stock prices of 60 companies listed in the Borsa Istanbul Sustainability Index for the period from 2014 to 2019. However, in 2017 SAF REIT merges with
26 Tellis, G. J., Johnson, J. (2007), The Value of Quality, Marketing Science, 26(6): 758-773. 27 Corrado C. J. (1989). A Nonparametric Test for Abnormal Security-Price Performance in Event Studies, Journal of Financial Economics, 23: 385-395; Cowan A. R. (1992). Nonparametric Event Study Tests. Review of Quantitative Finance and Accounting, 2: 343-358. 28 R Core Team (2020). R: A language and Environment for Statistical Computing, R Foundation for Statistical Computing, Vienna, Austria. URL https://www.R-project.org/ 29 Rudnytskyi, I. (2019). Estudy2: An Implementation of Parametric and Nonparametric Event Study, R package version 0.9.1.
to
Makale Gönderim Tarihi: 12.02.2021 Yayına Kabul Tarihi: 13.06.2021
Since abnormal return is only 1-day unexpected return, one day is not enough to understand the impact of an event 26. Therefore, we consider the Cumulative Abnormal Returns (CAR) which is defined in (7) for the event window.
𝐶𝐶𝐶𝐶𝐶𝐶1 = ∑ 𝐶𝐶𝐶𝐶𝑖𝑖𝑖𝑖
𝑖𝑖2
𝑖𝑖=𝑖𝑖1
(7)
In the analysis, we consider eight different event windows which are listed as follows:
Event Window 1: 𝑡𝑡1 = 0 to 𝑡𝑡2 = 3 (4-days) Event Window 2: 𝑡𝑡1 = 0 to 𝑡𝑡2 = 5 (6-days) Event Window 3: 𝑡𝑡1 = 0 to 𝑡𝑡2 = 10 (11-days) Event Window 4: 𝑡𝑡1 = 0 to 𝑡𝑡2 = 20 (21-days) Event Window 5: 𝑡𝑡1 = −3 to 𝑡𝑡2 = 3 (7-days) Event Window 6: 𝑡𝑡1 = −5 to 𝑡𝑡2 = 5 (11-days) Event Window 7: 𝑡𝑡1 = −10 to 𝑡𝑡2 = 10 (21-days) Event Window 8: 𝑡𝑡1 = −20 to 𝑡𝑡2 = 20 (41-days)
Step 4
Finally, nonparametric CAR test is implemented27. In these tests, under the null hypothesis event does not have effect, in other words, there is no abnormal returns.
4. Empirical Results
In this study, our data cover 59 companies which publish sustainability reports and are listed in the BIST sustainability index in the period from 2014 to 2019. In the analysis, we use daily logarithmic returns. All the applications are implemented on R28 and CAR values are calculated by using R package called “estudy2”29.
Accordingly, we consider daily stock prices of 60 companies listed in the Borsa Istanbul Sustainability Index for the period from 2014 to 2019. However, in 2017 SAF REIT merges with
26 Tellis, G. J., Johnson, J. (2007), The Value of Quality, Marketing Science, 26(6): 758-773. 27 Corrado C. J. (1989). A Nonparametric Test for Abnormal Security-Price Performance in Event Studies, Journal of Financial Economics, 23: 385-395; Cowan A. R. (1992). Nonparametric Event Study Tests. Review of Quantitative Finance and Accounting, 2: 343-358. 28 R Core Team (2020). R: A language and Environment for Statistical Computing, R Foundation for Statistical Computing, Vienna, Austria. URL https://www.R-project.org/ 29 Rudnytskyi, I. (2019). Estudy2: An Implementation of Parametric and Nonparametric Event Study, R package version 0.9.1.
(6-days)
Event Window 3:
Makale Gönderim Tarihi: 12.02.2021 Yayına Kabul Tarihi: 13.06.2021
Since abnormal return is only 1-day unexpected return, one day is not enough to understand the impact of an event 26. Therefore, we consider the Cumulative Abnormal Returns (CAR) which is defined in (7) for the event window.
𝐶𝐶𝐶𝐶𝐶𝐶1 = ∑ 𝐶𝐶𝐶𝐶𝑖𝑖𝑖𝑖
𝑖𝑖2
𝑖𝑖=𝑖𝑖1
(7)
In the analysis, we consider eight different event windows which are listed as follows:
Event Window 1: 𝑡𝑡1 = 0 to 𝑡𝑡2 = 3 (4-days) Event Window 2: 𝑡𝑡1 = 0 to 𝑡𝑡2 = 5 (6-days) Event Window 3: 𝑡𝑡1 = 0 to 𝑡𝑡2 = 10 (11-days) Event Window 4: 𝑡𝑡1 = 0 to 𝑡𝑡2 = 20 (21-days) Event Window 5: 𝑡𝑡1 = −3 to 𝑡𝑡2 = 3 (7-days) Event Window 6: 𝑡𝑡1 = −5 to 𝑡𝑡2 = 5 (11-days) Event Window 7: 𝑡𝑡1 = −10 to 𝑡𝑡2 = 10 (21-days) Event Window 8: 𝑡𝑡1 = −20 to 𝑡𝑡2 = 20 (41-days)
Step 4
Finally, nonparametric CAR test is implemented27. In these tests, under the null hypothesis event does not have effect, in other words, there is no abnormal returns.
4. Empirical Results
In this study, our data cover 59 companies which publish sustainability reports and are listed in the BIST sustainability index in the period from 2014 to 2019. In the analysis, we use daily logarithmic returns. All the applications are implemented on R28 and CAR values are calculated by using R package called “estudy2”29.
Accordingly, we consider daily stock prices of 60 companies listed in the Borsa Istanbul Sustainability Index for the period from 2014 to 2019. However, in 2017 SAF REIT merges with
26 Tellis, G. J., Johnson, J. (2007), The Value of Quality, Marketing Science, 26(6): 758-773. 27 Corrado C. J. (1989). A Nonparametric Test for Abnormal Security-Price Performance in Event Studies, Journal of Financial Economics, 23: 385-395; Cowan A. R. (1992). Nonparametric Event Study Tests. Review of Quantitative Finance and Accounting, 2: 343-358. 28 R Core Team (2020). R: A language and Environment for Statistical Computing, R Foundation for Statistical Computing, Vienna, Austria. URL https://www.R-project.org/ 29 Rudnytskyi, I. (2019). Estudy2: An Implementation of Parametric and Nonparametric Event Study, R package version 0.9.1.
to
Makale Gönderim Tarihi: 12.02.2021 Yayına Kabul Tarihi: 13.06.2021
Since abnormal return is only 1-day unexpected return, one day is not enough to understand the impact of an event 26. Therefore, we consider the Cumulative Abnormal Returns (CAR) which is defined in (7) for the event window.
𝐶𝐶𝐶𝐶𝐶𝐶1 = ∑ 𝐶𝐶𝐶𝐶𝑖𝑖𝑖𝑖
𝑖𝑖2
𝑖𝑖=𝑖𝑖1
(7)
In the analysis, we consider eight different event windows which are listed as follows:
Event Window 1: 𝑡𝑡1 = 0 to 𝑡𝑡2 = 3 (4-days) Event Window 2: 𝑡𝑡1 = 0 to 𝑡𝑡2 = 5 (6-days) Event Window 3: 𝑡𝑡1 = 0 to 𝑡𝑡2 = 10 (11-days) Event Window 4: 𝑡𝑡1 = 0 to 𝑡𝑡2 = 20 (21-days) Event Window 5: 𝑡𝑡1 = −3 to 𝑡𝑡2 = 3 (7-days) Event Window 6: 𝑡𝑡1 = −5 to 𝑡𝑡2 = 5 (11-days) Event Window 7: 𝑡𝑡1 = −10 to 𝑡𝑡2 = 10 (21-days) Event Window 8: 𝑡𝑡1 = −20 to 𝑡𝑡2 = 20 (41-days)
Step 4
Finally, nonparametric CAR test is implemented27. In these tests, under the null hypothesis event does not have effect, in other words, there is no abnormal returns.
4. Empirical Results
In this study, our data cover 59 companies which publish sustainability reports and are listed in the BIST sustainability index in the period from 2014 to 2019. In the analysis, we use daily logarithmic returns. All the applications are implemented on R28 and CAR values are calculated by using R package called “estudy2”29.
Accordingly, we consider daily stock prices of 60 companies listed in the Borsa Istanbul Sustainability Index for the period from 2014 to 2019. However, in 2017 SAF REIT merges with
26 Tellis, G. J., Johnson, J. (2007), The Value of Quality, Marketing Science, 26(6): 758-773. 27 Corrado C. J. (1989). A Nonparametric Test for Abnormal Security-Price Performance in Event Studies, Journal of Financial Economics, 23: 385-395; Cowan A. R. (1992). Nonparametric Event Study Tests. Review of Quantitative Finance and Accounting, 2: 343-358. 28 R Core Team (2020). R: A language and Environment for Statistical Computing, R Foundation for Statistical Computing, Vienna, Austria. URL https://www.R-project.org/ 29 Rudnytskyi, I. (2019). Estudy2: An Implementation of Parametric and Nonparametric Event Study, R package version 0.9.1.
(11-days)
Event Window 4:
Makale Gönderim Tarihi: 12.02.2021 Yayına Kabul Tarihi: 13.06.2021
Since abnormal return is only 1-day unexpected return, one day is not enough to understand the impact of an event 26. Therefore, we consider the Cumulative Abnormal Returns (CAR) which is defined in (7) for the event window.
𝐶𝐶𝐶𝐶𝐶𝐶1 = ∑ 𝐶𝐶𝐶𝐶𝑖𝑖𝑖𝑖
𝑖𝑖2
𝑖𝑖=𝑖𝑖1
(7)
In the analysis, we consider eight different event windows which are listed as follows:
Event Window 1: 𝑡𝑡1 = 0 to 𝑡𝑡2 = 3 (4-days) Event Window 2: 𝑡𝑡1 = 0 to 𝑡𝑡2 = 5 (6-days) Event Window 3: 𝑡𝑡1 = 0 to 𝑡𝑡2 = 10 (11-days) Event Window 4: 𝑡𝑡1 = 0 to 𝑡𝑡2 = 20 (21-days) Event Window 5: 𝑡𝑡1 = −3 to 𝑡𝑡2 = 3 (7-days) Event Window 6: 𝑡𝑡1 = −5 to 𝑡𝑡2 = 5 (11-days) Event Window 7: 𝑡𝑡1 = −10 to 𝑡𝑡2 = 10 (21-days) Event Window 8: 𝑡𝑡1 = −20 to 𝑡𝑡2 = 20 (41-days)
Step 4
Finally, nonparametric CAR test is implemented27. In these tests, under the null hypothesis event does not have effect, in other words, there is no abnormal returns.
4. Empirical Results
In this study, our data cover 59 companies which publish sustainability reports and are listed in the BIST sustainability index in the period from 2014 to 2019. In the analysis, we use daily logarithmic returns. All the applications are implemented on R28 and CAR values are calculated by using R package called “estudy2”29.
Accordingly, we consider daily stock prices of 60 companies listed in the Borsa Istanbul Sustainability Index for the period from 2014 to 2019. However, in 2017 SAF REIT merges with
26 Tellis, G. J., Johnson, J. (2007), The Value of Quality, Marketing Science, 26(6): 758-773. 27 Corrado C. J. (1989). A Nonparametric Test for Abnormal Security-Price Performance in Event Studies, Journal of Financial Economics, 23: 385-395; Cowan A. R. (1992). Nonparametric Event Study Tests. Review of Quantitative Finance and Accounting, 2: 343-358. 28 R Core Team (2020). R: A language and Environment for Statistical Computing, R Foundation for Statistical Computing, Vienna, Austria. URL https://www.R-project.org/ 29 Rudnytskyi, I. (2019). Estudy2: An Implementation of Parametric and Nonparametric Event Study, R package version 0.9.1.
to
Makale Gönderim Tarihi: 12.02.2021 Yayına Kabul Tarihi: 13.06.2021
Since abnormal return is only 1-day unexpected return, one day is not enough to understand the impact of an event 26. Therefore, we consider the Cumulative Abnormal Returns (CAR) which is defined in (7) for the event window.
𝐶𝐶𝐶𝐶𝐶𝐶1 = ∑ 𝐶𝐶𝐶𝐶𝑖𝑖𝑖𝑖
𝑖𝑖2
𝑖𝑖=𝑖𝑖1
(7)
In the analysis, we consider eight different event windows which are listed as follows:
Event Window 1: 𝑡𝑡1 = 0 to 𝑡𝑡2 = 3 (4-days) Event Window 2: 𝑡𝑡1 = 0 to 𝑡𝑡2 = 5 (6-days) Event Window 3: 𝑡𝑡1 = 0 to 𝑡𝑡2 = 10 (11-days) Event Window 4: 𝑡𝑡1 = 0 to 𝑡𝑡2 = 20 (21-days) Event Window 5: 𝑡𝑡1 = −3 to 𝑡𝑡2 = 3 (7-days) Event Window 6: 𝑡𝑡1 = −5 to 𝑡𝑡2 = 5 (11-days) Event Window 7: 𝑡𝑡1 = −10 to 𝑡𝑡2 = 10 (21-days) Event Window 8: 𝑡𝑡1 = −20 to 𝑡𝑡2 = 20 (41-days)
Step 4
Finally, nonparametric CAR test is implemented27. In these tests, under the null hypothesis event does not have effect, in other words, there is no abnormal returns.
4. Empirical Results
In this study, our data cover 59 companies which publish sustainability reports and are listed in the BIST sustainability index in the period from 2014 to 2019. In the analysis, we use daily logarithmic returns. All the applications are implemented on R28 and CAR values are calculated by using R package called “estudy2”29.
Accordingly, we consider daily stock prices of 60 companies listed in the Borsa Istanbul Sustainability Index for the period from 2014 to 2019. However, in 2017 SAF REIT merges with
26 Tellis, G. J., Johnson, J. (2007), The Value of Quality, Marketing Science, 26(6): 758-773. 27 Corrado C. J. (1989). A Nonparametric Test for Abnormal Security-Price Performance in Event Studies, Journal of Financial Economics, 23: 385-395; Cowan A. R. (1992). Nonparametric Event Study Tests. Review of Quantitative Finance and Accounting, 2: 343-358. 28 R Core Team (2020). R: A language and Environment for Statistical Computing, R Foundation for Statistical Computing, Vienna, Austria. URL https://www.R-project.org/ 29 Rudnytskyi, I. (2019). Estudy2: An Implementation of Parametric and Nonparametric Event Study, R package version 0.9.1.
(21-days)
Event Window 5:
Makale Gönderim Tarihi: 12.02.2021 Yayına Kabul Tarihi: 13.06.2021
Since abnormal return is only 1-day unexpected return, one day is not enough to understand the impact of an event 26. Therefore, we consider the Cumulative Abnormal Returns (CAR) which is defined in (7) for the event window.
𝐶𝐶𝐶𝐶𝐶𝐶1 = ∑ 𝐶𝐶𝐶𝐶𝑖𝑖𝑖𝑖
𝑖𝑖2
𝑖𝑖=𝑖𝑖1
(7)
In the analysis, we consider eight different event windows which are listed as follows:
Event Window 1: 𝑡𝑡1 = 0 to 𝑡𝑡2 = 3 (4-days) Event Window 2: 𝑡𝑡1 = 0 to 𝑡𝑡2 = 5 (6-days) Event Window 3: 𝑡𝑡1 = 0 to 𝑡𝑡2 = 10 (11-days) Event Window 4: 𝑡𝑡1 = 0 to 𝑡𝑡2 = 20 (21-days) Event Window 5: 𝑡𝑡1 = −3 to 𝑡𝑡2 = 3 (7-days) Event Window 6: 𝑡𝑡1 = −5 to 𝑡𝑡2 = 5 (11-days) Event Window 7: 𝑡𝑡1 = −10 to 𝑡𝑡2 = 10 (21-days) Event Window 8: 𝑡𝑡1 = −20 to 𝑡𝑡2 = 20 (41-days)
Step 4
Finally, nonparametric CAR test is implemented27. In these tests, under the null hypothesis event does not have effect, in other words, there is no abnormal returns.
4. Empirical Results
In this study, our data cover 59 companies which publish sustainability reports and are listed in the BIST sustainability index in the period from 2014 to 2019. In the analysis, we use daily logarithmic returns. All the applications are implemented on R28 and CAR values are calculated by using R package called “estudy2”29.
Accordingly, we consider daily stock prices of 60 companies listed in the Borsa Istanbul Sustainability Index for the period from 2014 to 2019. However, in 2017 SAF REIT merges with
26 Tellis, G. J., Johnson, J. (2007), The Value of Quality, Marketing Science, 26(6): 758-773. 27 Corrado C. J. (1989). A Nonparametric Test for Abnormal Security-Price Performance in Event Studies, Journal of Financial Economics, 23: 385-395; Cowan A. R. (1992). Nonparametric Event Study Tests. Review of Quantitative Finance and Accounting, 2: 343-358. 28 R Core Team (2020). R: A language and Environment for Statistical Computing, R Foundation for Statistical Computing, Vienna, Austria. URL https://www.R-project.org/ 29 Rudnytskyi, I. (2019). Estudy2: An Implementation of Parametric and Nonparametric Event Study, R package version 0.9.1.
to
Makale Gönderim Tarihi: 12.02.2021 Yayına Kabul Tarihi: 13.06.2021
Since abnormal return is only 1-day unexpected return, one day is not enough to understand the impact of an event 26. Therefore, we consider the Cumulative Abnormal Returns (CAR) which is defined in (7) for the event window.
𝐶𝐶𝐶𝐶𝐶𝐶1 = ∑ 𝐶𝐶𝐶𝐶𝑖𝑖𝑖𝑖
𝑖𝑖2
𝑖𝑖=𝑖𝑖1
(7)
In the analysis, we consider eight different event windows which are listed as follows:
Event Window 1: 𝑡𝑡1 = 0 to 𝑡𝑡2 = 3 (4-days) Event Window 2: 𝑡𝑡1 = 0 to 𝑡𝑡2 = 5 (6-days) Event Window 3: 𝑡𝑡1 = 0 to 𝑡𝑡2 = 10 (11-days) Event Window 4: 𝑡𝑡1 = 0 to 𝑡𝑡2 = 20 (21-days) Event Window 5: 𝑡𝑡1 = −3 to 𝑡𝑡2 = 3 (7-days) Event Window 6: 𝑡𝑡1 = −5 to 𝑡𝑡2 = 5 (11-days) Event Window 7: 𝑡𝑡1 = −10 to 𝑡𝑡2 = 10 (21-days) Event Window 8: 𝑡𝑡1 = −20 to 𝑡𝑡2 = 20 (41-days)
Step 4
Finally, nonparametric CAR test is implemented27. In these tests, under the null hypothesis event does not have effect, in other words, there is no abnormal returns.
4. Empirical Results
In this study, our data cover 59 companies which publish sustainability reports and are listed in the BIST sustainability index in the period from 2014 to 2019. In the analysis, we use daily logarithmic returns. All the applications are implemented on R28 and CAR values are calculated by using R package called “estudy2”29.
Accordingly, we consider daily stock prices of 60 companies listed in the Borsa Istanbul Sustainability Index for the period from 2014 to 2019. However, in 2017 SAF REIT merges with
26 Tellis, G. J., Johnson, J. (2007), The Value of Quality, Marketing Science, 26(6): 758-773. 27 Corrado C. J. (1989). A Nonparametric Test for Abnormal Security-Price Performance in Event Studies, Journal of Financial Economics, 23: 385-395; Cowan A. R. (1992). Nonparametric Event Study Tests. Review of Quantitative Finance and Accounting, 2: 343-358. 28 R Core Team (2020). R: A language and Environment for Statistical Computing, R Foundation for Statistical Computing, Vienna, Austria. URL https://www.R-project.org/ 29 Rudnytskyi, I. (2019). Estudy2: An Implementation of Parametric and Nonparametric Event Study, R package version 0.9.1.
(7-days)
Event Window 6:
Makale Gönderim Tarihi: 12.02.2021 Yayına Kabul Tarihi: 13.06.2021
Since abnormal return is only 1-day unexpected return, one day is not enough to understand the impact of an event 26. Therefore, we consider the Cumulative Abnormal Returns (CAR) which is defined in (7) for the event window.
𝐶𝐶𝐶𝐶𝐶𝐶1 = ∑ 𝐶𝐶𝐶𝐶𝑖𝑖𝑖𝑖
𝑖𝑖2
𝑖𝑖=𝑖𝑖1
(7)
In the analysis, we consider eight different event windows which are listed as follows:
Event Window 1: 𝑡𝑡1 = 0 to 𝑡𝑡2 = 3 (4-days) Event Window 2: 𝑡𝑡1 = 0 to 𝑡𝑡2 = 5 (6-days) Event Window 3: 𝑡𝑡1 = 0 to 𝑡𝑡2 = 10 (11-days) Event Window 4: 𝑡𝑡1 = 0 to 𝑡𝑡2 = 20 (21-days) Event Window 5: 𝑡𝑡1 = −3 to 𝑡𝑡2 = 3 (7-days) Event Window 6: 𝑡𝑡1 = −5 to 𝑡𝑡2 = 5 (11-days) Event Window 7: 𝑡𝑡1 = −10 to 𝑡𝑡2 = 10 (21-days) Event Window 8: 𝑡𝑡1 = −20 to 𝑡𝑡2 = 20 (41-days)
Step 4
Finally, nonparametric CAR test is implemented27. In these tests, under the null hypothesis event does not have effect, in other words, there is no abnormal returns.
4. Empirical Results
In this study, our data cover 59 companies which publish sustainability reports and are listed in the BIST sustainability index in the period from 2014 to 2019. In the analysis, we use daily logarithmic returns. All the applications are implemented on R28 and CAR values are calculated by using R package called “estudy2”29.
Accordingly, we consider daily stock prices of 60 companies listed in the Borsa Istanbul Sustainability Index for the period from 2014 to 2019. However, in 2017 SAF REIT merges with
26 Tellis, G. J., Johnson, J. (2007), The Value of Quality, Marketing Science, 26(6): 758-773. 27 Corrado C. J. (1989). A Nonparametric Test for Abnormal Security-Price Performance in Event Studies, Journal of Financial Economics, 23: 385-395; Cowan A. R. (1992). Nonparametric Event Study Tests. Review of Quantitative Finance and Accounting, 2: 343-358. 28 R Core Team (2020). R: A language and Environment for Statistical Computing, R Foundation for Statistical Computing, Vienna, Austria. URL https://www.R-project.org/ 29 Rudnytskyi, I. (2019). Estudy2: An Implementation of Parametric and Nonparametric Event Study, R package version 0.9.1.
to
Makale Gönderim Tarihi: 12.02.2021 Yayına Kabul Tarihi: 13.06.2021
Since abnormal return is only 1-day unexpected return, one day is not enough to understand the impact of an event 26. Therefore, we consider the Cumulative Abnormal Returns (CAR) which is defined in (7) for the event window.
𝐶𝐶𝐶𝐶𝐶𝐶1 = ∑ 𝐶𝐶𝐶𝐶𝑖𝑖𝑖𝑖
𝑖𝑖2
𝑖𝑖=𝑖𝑖1
(7)
In the analysis, we consider eight different event windows which are listed as follows:
Event Window 1: 𝑡𝑡1 = 0 to 𝑡𝑡2 = 3 (4-days) Event Window 2: 𝑡𝑡1 = 0 to 𝑡𝑡2 = 5 (6-days) Event Window 3: 𝑡𝑡1 = 0 to 𝑡𝑡2 = 10 (11-days) Event Window 4: 𝑡𝑡1 = 0 to 𝑡𝑡2 = 20 (21-days) Event Window 5: 𝑡𝑡1 = −3 to 𝑡𝑡2 = 3 (7-days) Event Window 6: 𝑡𝑡1 = −5 to 𝑡𝑡2 = 5 (11-days) Event Window 7: 𝑡𝑡1 = −10 to 𝑡𝑡2 = 10 (21-days) Event Window 8: 𝑡𝑡1 = −20 to 𝑡𝑡2 = 20 (41-days)
Step 4
Finally, nonparametric CAR test is implemented27. In these tests, under the null hypothesis event does not have effect, in other words, there is no abnormal returns.
4. Empirical Results
In this study, our data cover 59 companies which publish sustainability reports and are listed in the BIST sustainability index in the period from 2014 to 2019. In the analysis, we use daily logarithmic returns. All the applications are implemented on R28 and CAR values are calculated by using R package called “estudy2”29.
Accordingly, we consider daily stock prices of 60 companies listed in the Borsa Istanbul Sustainability Index for the period from 2014 to 2019. However, in 2017 SAF REIT merges with
26 Tellis, G. J., Johnson, J. (2007), The Value of Quality, Marketing Science, 26(6): 758-773. 27 Corrado C. J. (1989). A Nonparametric Test for Abnormal Security-Price Performance in Event Studies, Journal of Financial Economics, 23: 385-395; Cowan A. R. (1992). Nonparametric Event Study Tests. Review of Quantitative Finance and Accounting, 2: 343-358. 28 R Core Team (2020). R: A language and Environment for Statistical Computing, R Foundation for Statistical Computing, Vienna, Austria. URL https://www.R-project.org/ 29 Rudnytskyi, I. (2019). Estudy2: An Implementation of Parametric and Nonparametric Event Study, R package version 0.9.1.
(11-days)
Event Window 7:
Makale Gönderim Tarihi: 12.02.2021 Yayına Kabul Tarihi: 13.06.2021
Since abnormal return is only 1-day unexpected return, one day is not enough to understand the impact of an event 26. Therefore, we consider the Cumulative Abnormal Returns (CAR) which is defined in (7) for the event window.
𝐶𝐶𝐶𝐶𝐶𝐶1 = ∑ 𝐶𝐶𝐶𝐶𝑖𝑖𝑖𝑖
𝑖𝑖2
𝑖𝑖=𝑖𝑖1
(7)
In the analysis, we consider eight different event windows which are listed as follows:
Event Window 1: 𝑡𝑡1 = 0 to 𝑡𝑡2 = 3 (4-days) Event Window 2: 𝑡𝑡1 = 0 to 𝑡𝑡2 = 5 (6-days) Event Window 3: 𝑡𝑡1 = 0 to 𝑡𝑡2 = 10 (11-days) Event Window 4: 𝑡𝑡1 = 0 to 𝑡𝑡2 = 20 (21-days) Event Window 5: 𝑡𝑡1 = −3 to 𝑡𝑡2 = 3 (7-days) Event Window 6: 𝑡𝑡1 = −5 to 𝑡𝑡2 = 5 (11-days) Event Window 7: 𝑡𝑡1 = −10 to 𝑡𝑡2 = 10 (21-days) Event Window 8: 𝑡𝑡1 = −20 to 𝑡𝑡2 = 20 (41-days)
Step 4
Finally, nonparametric CAR test is implemented27. In these tests, under the null hypothesis event does not have effect, in other words, there is no abnormal returns.
4. Empirical Results
In this study, our data cover 59 companies which publish sustainability reports and are listed in the BIST sustainability index in the period from 2014 to 2019. In the analysis, we use daily logarithmic returns. All the applications are implemented on R28 and CAR values are calculated by using R package called “estudy2”29.
Accordingly, we consider daily stock prices of 60 companies listed in the Borsa Istanbul Sustainability Index for the period from 2014 to 2019. However, in 2017 SAF REIT merges with
26 Tellis, G. J., Johnson, J. (2007), The Value of Quality, Marketing Science, 26(6): 758-773. 27 Corrado C. J. (1989). A Nonparametric Test for Abnormal Security-Price Performance in Event Studies, Journal of Financial Economics, 23: 385-395; Cowan A. R. (1992). Nonparametric Event Study Tests. Review of Quantitative Finance and Accounting, 2: 343-358. 28 R Core Team (2020). R: A language and Environment for Statistical Computing, R Foundation for Statistical Computing, Vienna, Austria. URL https://www.R-project.org/ 29 Rudnytskyi, I. (2019). Estudy2: An Implementation of Parametric and Nonparametric Event Study, R package version 0.9.1.
to
Makale Gönderim Tarihi: 12.02.2021 Yayına Kabul Tarihi: 13.06.2021
Since abnormal return is only 1-day unexpected return, one day is not enough to understand the impact of an event 26. Therefore, we consider the Cumulative Abnormal Returns (CAR) which is defined in (7) for the event window.
𝐶𝐶𝐶𝐶𝐶𝐶1 = ∑ 𝐶𝐶𝐶𝐶𝑖𝑖𝑖𝑖
𝑖𝑖2
𝑖𝑖=𝑖𝑖1
(7)
In the analysis, we consider eight different event windows which are listed as follows:
Event Window 1: 𝑡𝑡1 = 0 to 𝑡𝑡2 = 3 (4-days) Event Window 2: 𝑡𝑡1 = 0 to 𝑡𝑡2 = 5 (6-days) Event Window 3: 𝑡𝑡1 = 0 to 𝑡𝑡2 = 10 (11-days) Event Window 4: 𝑡𝑡1 = 0 to 𝑡𝑡2 = 20 (21-days) Event Window 5: 𝑡𝑡1 = −3 to 𝑡𝑡2 = 3 (7-days) Event Window 6: 𝑡𝑡1 = −5 to 𝑡𝑡2 = 5 (11-days) Event Window 7: 𝑡𝑡1 = −10 to 𝑡𝑡2 = 10 (21-days) Event Window 8: 𝑡𝑡1 = −20 to 𝑡𝑡2 = 20 (41-days)
Step 4
Finally, nonparametric CAR test is implemented27. In these tests, under the null hypothesis event does not have effect, in other words, there is no abnormal returns.
4. Empirical Results
In this study, our data cover 59 companies which publish sustainability reports and are listed in the BIST sustainability index in the period from 2014 to 2019. In the analysis, we use daily logarithmic returns. All the applications are implemented on R28 and CAR values are calculated by using R package called “estudy2”29.
Accordingly, we consider daily stock prices of 60 companies listed in the Borsa Istanbul Sustainability Index for the period from 2014 to 2019. However, in 2017 SAF REIT merges with
26 Tellis, G. J., Johnson, J. (2007), The Value of Quality, Marketing Science, 26(6): 758-773. 27 Corrado C. J. (1989). A Nonparametric Test for Abnormal Security-Price Performance in Event Studies, Journal of Financial Economics, 23: 385-395; Cowan A. R. (1992). Nonparametric Event Study Tests. Review of Quantitative Finance and Accounting, 2: 343-358. 28 R Core Team (2020). R: A language and Environment for Statistical Computing, R Foundation for Statistical Computing, Vienna, Austria. URL https://www.R-project.org/ 29 Rudnytskyi, I. (2019). Estudy2: An Implementation of Parametric and Nonparametric Event Study, R package version 0.9.1.
(21-days)
Event Window 8:
Makale Gönderim Tarihi: 12.02.2021 Yayına Kabul Tarihi: 13.06.2021
Since abnormal return is only 1-day unexpected return, one day is not enough to understand the impact of an event 26. Therefore, we consider the Cumulative Abnormal Returns (CAR) which is defined in (7) for the event window.
𝐶𝐶𝐶𝐶𝐶𝐶1 = ∑ 𝐶𝐶𝐶𝐶𝑖𝑖𝑖𝑖
𝑖𝑖2
𝑖𝑖=𝑖𝑖1
(7)
In the analysis, we consider eight different event windows which are listed as follows:
Event Window 1: 𝑡𝑡1 = 0 to 𝑡𝑡2 = 3 (4-days) Event Window 2: 𝑡𝑡1 = 0 to 𝑡𝑡2 = 5 (6-days) Event Window 3: 𝑡𝑡1 = 0 to 𝑡𝑡2 = 10 (11-days) Event Window 4: 𝑡𝑡1 = 0 to 𝑡𝑡2 = 20 (21-days) Event Window 5: 𝑡𝑡1 = −3 to 𝑡𝑡2 = 3 (7-days) Event Window 6: 𝑡𝑡1 = −5 to 𝑡𝑡2 = 5 (11-days) Event Window 7: 𝑡𝑡1 = −10 to 𝑡𝑡2 = 10 (21-days) Event Window 8: 𝑡𝑡1 = −20 to 𝑡𝑡2 = 20 (41-days)
Step 4
Finally, nonparametric CAR test is implemented27. In these tests, under the null hypothesis event does not have effect, in other words, there is no abnormal returns.
4. Empirical Results
In this study, our data cover 59 companies which publish sustainability reports and are listed in the BIST sustainability index in the period from 2014 to 2019. In the analysis, we use daily logarithmic returns. All the applications are implemented on R28 and CAR values are calculated by using R package called “estudy2”29.
Accordingly, we consider daily stock prices of 60 companies listed in the Borsa Istanbul Sustainability Index for the period from 2014 to 2019. However, in 2017 SAF REIT merges with
26 Tellis, G. J., Johnson, J. (2007), The Value of Quality, Marketing Science, 26(6): 758-773. 27 Corrado C. J. (1989). A Nonparametric Test for Abnormal Security-Price Performance in Event Studies, Journal of Financial Economics, 23: 385-395; Cowan A. R. (1992). Nonparametric Event Study Tests. Review of Quantitative Finance and Accounting, 2: 343-358. 28 R Core Team (2020). R: A language and Environment for Statistical Computing, R Foundation for Statistical Computing, Vienna, Austria. URL https://www.R-project.org/ 29 Rudnytskyi, I. (2019). Estudy2: An Implementation of Parametric and Nonparametric Event Study, R package version 0.9.1.
to
Makale Gönderim Tarihi: 12.02.2021 Yayına Kabul Tarihi: 13.06.2021
Since abnormal return is only 1-day unexpected return, one day is not enough to understand the impact of an event 26. Therefore, we consider the Cumulative Abnormal Returns (CAR) which is defined in (7) for the event window.
𝐶𝐶𝐶𝐶𝐶𝐶1 = ∑ 𝐶𝐶𝐶𝐶𝑖𝑖𝑖𝑖
𝑖𝑖2
𝑖𝑖=𝑖𝑖1
(7)
In the analysis, we consider eight different event windows which are listed as follows:
Event Window 1: 𝑡𝑡1 = 0 to 𝑡𝑡2 = 3 (4-days) Event Window 2: 𝑡𝑡1 = 0 to 𝑡𝑡2 = 5 (6-days) Event Window 3: 𝑡𝑡1 = 0 to 𝑡𝑡2 = 10 (11-days) Event Window 4: 𝑡𝑡1 = 0 to 𝑡𝑡2 = 20 (21-days) Event Window 5: 𝑡𝑡1 = −3 to 𝑡𝑡2 = 3 (7-days) Event Window 6: 𝑡𝑡1 = −5 to 𝑡𝑡2 = 5 (11-days) Event Window 7: 𝑡𝑡1 = −10 to 𝑡𝑡2 = 10 (21-days) Event Window 8: 𝑡𝑡1 = −20 to 𝑡𝑡2 = 20 (41-days)
Step 4
Finally, nonparametric CAR test is implemented27. In these tests, under the null hypothesis event does not have effect, in other words, there is no abnormal returns.
4. Empirical Results
In this study, our data cover 59 companies which publish sustainability reports and are listed in the BIST sustainability index in the period from 2014 to 2019. In the analysis, we use daily logarithmic returns. All the applications are implemented on R28 and CAR values are calculated by using R package called “estudy2”29.
Accordingly, we consider daily stock prices of 60 companies listed in the Borsa Istanbul Sustainability Index for the period from 2014 to 2019. However, in 2017 SAF REIT merges with
26 Tellis, G. J., Johnson, J. (2007), The Value of Quality, Marketing Science, 26(6): 758-773. 27 Corrado C. J. (1989). A Nonparametric Test for Abnormal Security-Price Performance in Event Studies, Journal of Financial Economics, 23: 385-395; Cowan A. R. (1992). Nonparametric Event Study Tests. Review of Quantitative Finance and Accounting, 2: 343-358. 28 R Core Team (2020). R: A language and Environment for Statistical Computing, R Foundation for Statistical Computing, Vienna, Austria. URL https://www.R-project.org/ 29 Rudnytskyi, I. (2019). Estudy2: An Implementation of Parametric and Nonparametric Event Study, R package version 0.9.1.
(41-days)
Step 4
Finally, nonparametric CAR test is implemented27. In these tests, under the null hypothesis event does not have effect, in other words, there is no abnormal returns.
4. Empirical Results
In this study, our data cover 59 companies which publish sustainability reports and are listed in the BIST sustainability index in the period from 2014 to 2019. In the analysis, we use daily logarithmic returns. All the applications are implemented on R28 and CAR values are calculated by using R package called “estudy2”29.
Accordingly, we consider daily stock prices of 60 companies listed in the Borsa Istanbul Sustainability Index for the period from 2014 to 2019. However, in 2017 SAF REIT merges with Akis REIT and therefore, SAF REIT’s shares have not been traded anymore. Therefore, we exclude SAFGY from our sample. We continue with 59 companies.
We collect daily closing prices data from “finance.yahoo.com” database for the period from November 4, 2013 to January 3, 2020.
27 Corrado C. J. (1989). A Nonparametric Test for Abnormal Security-Price Performance in Event Studies, Journal of Financial Economics, 23: 385-395; Cowan A. R. (1992). Nonparametric Event Study Tests. Review of Quantitative Finance and Accounting, 2: 343-358.
28 R Core Team (2020). R: A language and Environment for Statistical Computing, R Foundation for Statistical Computing, Vienna, Austria. URL https://www.R-project.org/
29 Rudnytskyi, I. (2019). Estudy2: An Implementation of Parametric and Nonparametric Event Study, R package version 0.9.1.
Marmara Üniversitesi İktisadi ve İdari Bilimler Dergisi • Cilt: 43 • Sayı: 1 • Haziran 2021, ISSN: 2587-2672, ss/pp. 145-156
153
We firstly apply Augmented Dickey Fuller test30 for stationarity and Jarque Bera test31 for normality of return series. According to results all return series are stationary and do not follow normal distribution.
Our event dates are listed in Table 1 which are actually announcement dates of the companies included in the BIST Sustainability index. Table 1 also includes the number of companies in index.
Table 1: Announcement Dates, Index Calculation Period and Number of Companies in Sustainability Index
Year Period of Index Announcement Date Number of Companies
2014-2015 November 2014-October 2015 November 4, 2014 152015-2016 November 2015-October 2016 November 3, 2015 292016-2017 November 2016-October 2017 October 25, 2016 432017-2018 November 2017-October 2018 October 27, 2017 442018-2019 November 2018-October 2019 October 27, 2018 502019-2020 November 2019-October 2020 October 25, 2019 56
Estimation window and stock names included and delisting from the index are listed in Table 2.
Table 2: Estimation Window, Shares Included and Delisting
YearEstimation Window(Start Date;End Date)
Shares included to the Sustainability Index
Shares Delisting from the Sustainability Index
2014-2015 2013-11-04; 2014-10-03
AKBNK, ARCLK, ASELS, GARAN, KCHOL, MGROS, PETKM, SAHOL, TAVHL, TCELL, TOASO, TUPRS, TTKOM, VAKBN, YKBNK
-
2015-2016 2014-11-05; 2015-10-02
AEFES, AKSEN, BRISA, CCOLA, DOAS, EREGL, FROTO, ISCTR, OTKAR, SAFG THYAO, TSKB, ULKER, VESTL
-
2016-2017 2015-11-04; 2016-09-24
ADEL, DOHOL, GLYHO, HALKB, ISGYO, KORDS, NETAS, PGSUS, SISE, TATGD, TKFEN, TTRAK, VESBE, ZOREN
-
2017-2018 2016-10-26; 2017-09-26 AKENR, CIMSA, LOGO, POLHO, SODA ADEL, GLYHO, ISGYO
2018-2019 2017-10-28; 2018-09-26 AKSA, ANACM, ANELE, AYGAZ, GLYHO, SKBNK -
2019-2020 2018-10-28; 2019-09-24 ALBRK, ENJSA, ENKAI, ISDMR, KERVT, SOKM, TRKCM PGSUS
30 Dickey, D. A., Fuller, W. A. (1979). Distribution of the Estimators for Autoregressive Time Series with A Unit Root, Journal of the American Statistical Association, 74(366): 427-431.
31 Jarque, C., Bera, A. (1987). A Test for Normality of Observations and Regression Residuals, International Statistical Review, 55: 163–172.
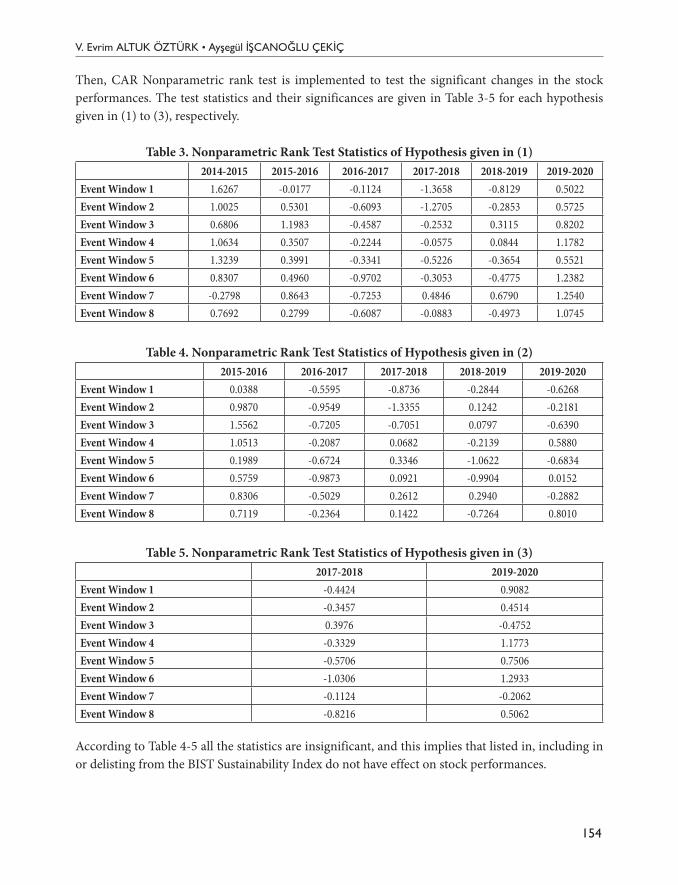
V. Evrim ALTUK ÖZTÜRK • Ayşegül İŞCANOĞLU ÇEKİÇ
154
Then, CAR Nonparametric rank test is implemented to test the significant changes in the stock performances. The test statistics and their significances are given in Table 3-5 for each hypothesis given in (1) to (3), respectively.
Table 3. Nonparametric Rank Test Statistics of Hypothesis given in (1)2014-2015 2015-2016 2016-2017 2017-2018 2018-2019 2019-2020
Event Window 1 1.6267 -0.0177 -0.1124 -1.3658 -0.8129 0.5022Event Window 2 1.0025 0.5301 -0.6093 -1.2705 -0.2853 0.5725Event Window 3 0.6806 1.1983 -0.4587 -0.2532 0.3115 0.8202Event Window 4 1.0634 0.3507 -0.2244 -0.0575 0.0844 1.1782Event Window 5 1.3239 0.3991 -0.3341 -0.5226 -0.3654 0.5521Event Window 6 0.8307 0.4960 -0.9702 -0.3053 -0.4775 1.2382Event Window 7 -0.2798 0.8643 -0.7253 0.4846 0.6790 1.2540Event Window 8 0.7692 0.2799 -0.6087 -0.0883 -0.4973 1.0745
Table 4. Nonparametric Rank Test Statistics of Hypothesis given in (2)2015-2016 2016-2017 2017-2018 2018-2019 2019-2020
Event Window 1 0.0388 -0.5595 -0.8736 -0.2844 -0.6268Event Window 2 0.9870 -0.9549 -1.3355 0.1242 -0.2181Event Window 3 1.5562 -0.7205 -0.7051 0.0797 -0.6390Event Window 4 1.0513 -0.2087 0.0682 -0.2139 0.5880Event Window 5 0.1989 -0.6724 0.3346 -1.0622 -0.6834Event Window 6 0.5759 -0.9873 0.0921 -0.9904 0.0152Event Window 7 0.8306 -0.5029 0.2612 0.2940 -0.2882Event Window 8 0.7119 -0.2364 0.1422 -0.7264 0.8010
Table 5. Nonparametric Rank Test Statistics of Hypothesis given in (3)2017-2018 2019-2020
Event Window 1 -0.4424 0.9082Event Window 2 -0.3457 0.4514Event Window 3 0.3976 -0.4752Event Window 4 -0.3329 1.1773Event Window 5 -0.5706 0.7506Event Window 6 -1.0306 1.2933Event Window 7 -0.1124 -0.2062Event Window 8 -0.8216 0.5062
According to Table 4-5 all the statistics are insignificant, and this implies that listed in, including in or delisting from the BIST Sustainability Index do not have effect on stock performances.
Marmara Üniversitesi İktisadi ve İdari Bilimler Dergisi • Cilt: 43 • Sayı: 1 • Haziran 2021, ISSN: 2587-2672, ss/pp. 145-156
155
5. Conclusion
This study empirically analyzes the impact of Turkish companies’ environmental corporate social responsibility on stock performances. By doing that this study also investigates the investors’ reactions on sustainability. In this respect, listed in, including in or delisting from the BIST Sustainability Index assumed to be an indicator of environmental responsibility.
The analysis is based on an event study. The disclosure of the BIST Sustainability Index is defined as an event. Empirically, three different hypotheses are considered. These hypotheses focus on measuring the effect of being listed in the BIST sustainability index on stock performances, the effect of inclusion in the BIST Sustainability Index on stock performances and the effect of delisting from the BIST Sustainability Index on stock performances. In order to obtain consistent results, we implement a short-term event study with market model, where BIST100 is considered as market index. For this purpose, we calculate the cumulative abnormal returns (CAR) for 8 different event windows. Finally, a nonparametric CAR test is applied.
The findings show that being on, being included or being delisting from the sustainability index have no significant effect on stock performances. Therefore, assuming that listed in the sustainability index is an indicator of the company’s environmental awareness, our results suggest that higher environmental or social performance is not financially rewarded. This result supports the view that investors in Turkish financial markets do not react sustainability and therefore environmental disclosure.
ReferencesAURELI, S., Gigli, S., Medei, R., Supino, E. (2019). The Value Relevance of Environmental, Social, and Governance
Disclosure: Evidence from Dow Jones Sustainability World Index Listed Companies, Corporate Social Responsibility and Environmental Management, 27(1): 43-52.
BERTHELOT, S., Coulmont, M., Serret, V. (2012). Do Investors Value Sustainability Reports? A Canadian Study, Corporate Social Responsibility and Environmental Management, 19(6): 355-363.
CARNEVALE, C., Mazzuca, M. (2014). Sustainability Report and Bank Valuation: Evidence from European Stock Markets, Business Ethics: A European Review, 23(1): 69-90.
CHAN, C. C., Milne, M. J. (1999). Investor Reactions to Corporate Environmental Saints and Sinners: An Experimental Analysis. Accounting and Business Research, 29(4): 265-279.
ÇİMEN, A. (2019). The Impact of Sustainability Index on Firm Performance: An Event Study, International Journal of Contemporary Economics and Administrative Sciences, 9(1): 170-183.
ÇITAK, L., Ersoy, E. (2016). Firmaların BIST Sürdürülebilirlik Endeksine Alınmasına Yatırımcı Tepkisi: Olay Çalışması ve Ortalama Testleri ile Bir Analiz (Investors’ Reactions to the Inclusion of Firms in the BIST Sustainability Index: An Analysis by Event Study and Mean-Median Tests), International Journal of Alanya Faculty of Business, 8(1): 43-57.
ÇITAK, L., Akel, V., Ersoy, E. (2020). Investors’ Reactions to the Announcement of New Constituents of BIST Sustainability Index: An Analysis by Event Study and Mean-Median Tests. Value Sharing for Sustainable and Inclusive Development. IGI Global, 2018: 270-289.
V. Evrim ALTUK ÖZTÜRK • Ayşegül İŞCANOĞLU ÇEKİÇ
156
CORRADO C. J. (1989). A Nonparametric Test for Abnormal Security-Price Performance in Event Studies, Journal of Financial Economics, 23: 385-395.
COWAN A. R. (1992). Nonparametric Event Study Tests, Review of Quantitative Finance and Accounting, 2: 343-358.
DICKEY, D. A., Fuller, W. A. (1979). Distribution of The Estimators for Autoregressive Time Series with A Unit Root, Journal of the American Statistical Association, 74(366): 427-431.
DU, S., Yu, K., Bhattacharya, C. B., Sen, S. (2017). The Business Case for Sustainability Reporting: Evidence from Stock Market Reactions, Journal of Public Policy & Marketing, 36(2): 313-330.
ECCLES, R. G., Serafeim, G. (2013). A Tale of Two Stories: Sustainability and the Quarterly Earnings Call, Journal of Applied Corporate Finance, 25(3): 8-19.
EPSTEIN, M. J. (2018). Making Sustainability Work: Best Practices in Managing and Measuring Corporate Social, Environmental and Economic Impacts. Routledge.
FAMA, E. (1998). Market Efficiency, Long-Term Returns, and Behavioral Finance, Journal of Financial Economics, 49(3): 283-306.
JARQUE, C., Bera, A. (1987). A Test for Normality of Observations and Regression Residuals, International Statistical Review, 55: 163–172.
KOTHARI, S. P., Warner, J. B. (2006). Econometrics of Event Studies, Chapter 1 in Handbook of Corporate Finance: Empirical Corporate Finance.
LIU, Y., Zhou, X., Yang, J., Hoepner, A. G. (2017). Corporate Carbon Emissions and Financial Performance: Does Carbon Disclosure Mediate the Relationship in the UK?, SSRN 2941123.
MURGUIA, J. M., Lence, S. H. (2015). Investors’ Reaction to Environmental Performance: A Global Perspective of the Newsweek’s “Green Rankings”, Environmental and Resource Economics, 60(4): 583-605.
MURRAY, A., Sinclair, D., Power, D., Gray, R. (2006). Do Financial Markets Care About Social and Environmental Disclosure?, Accounting, Auditing & Accountability Journal, 19(2): 228-255.
PELOZA, J. (2009). The Challenge of Measuring Financial Impacts from Investments in Corporate Social Performance, Journal of Management, 35(6): 1518-1541.
R CORE TEAM (2020). R: A language and Environment for Statistical Computing. R Foundation for Statistical Computing, Vienna, Austria. URL https://www.R-project.org/
RUDNYTSKYI, I. (2019). Estudy2: An Implementation of Parametric and Nonparametric Event Study. R package version 0.9.1.
SHAKIL, M.H., Mahmood, N., Tasnia, M., Munim, Z.H. (2019), Do environmental, Social and Governance Performance Affect the Financial Performance of Banks? A Cross-Country Study of Emerging Market Banks, Management of Environmental Quality, 30(6): 1331-1344.
SUSTAINABILITY REPORTING, https://en.wikipedia.org/wiki/Sustainability_reporting (Accessed on: February 6, 2021).
TELLIS, G.J., Johnson, J. (2007). The Value of Quality, Marketing Science, 26(6): 758-773.WASARA, T. M., Ganda, F. (2019). The Relationship Between Corporate Sustainability Disclosure
and Firm Financial Performance in Johannesburg Stock Exchange (Jse) Listed Mining Companies, Sustainability, 11(16): 4496.
WONG, KTK. (2017). A Literature Review on Environmental, Social and Governance Reporting and Its Impact on Financial Performance, Austin Journal of Business Administration and Management, 1(4): 1016.
ZIEGLER, A., Busch, T., Hoffmann, V. H. (2011). Disclosed Corporate Responses to Climate Change and Stock Performances: An International Empirical Analysis, Energy Economics, 33(6): 1283-1294.
157Makale Gönderim Tarihi:Makale Gönderim Tarihi: 14.02.2021Yayına Kabul Tarihi:Yayına Kabul Tarihi: 13.06.2021
ARAŞTIRMA MAKALESİ / RESEARCH ARTICLE
Marmara Üniversitesi İktisadi ve İdari Bilimler Dergisi • Cilt: 43 • Sayı: 1 • Haziran 2021, ISSN: 2587-2672, ss/pp. 157-178 DOI: 10.14780/muiibd.960323
REZERV OPSİYON MEKANİZMASININ FİNANSAL İSTİKRARA ETKİSİ ÜZERİNE EKONOMETRİK BİR UYGULAMA1
*
AN ECONOMETRIC APPLICATION FOR THE IMPACT OF RESERVE OPTION MECHANISM ON FINANCIAL STABILITY
İbrahim Onur KOÇAŞLI2
** Nadir EROĞLU3
***
ÖzÇalışmada, TCMB’nin 2011 yılı sonunda uygulamaya koyduğu Rezerv Opsiyon Mekanizmasının finansal istikrara etkisini analiz etmek amaçlanmıştır. Analizde, 2011:Q4-2018:Q4 dönemini kapsayan verilerden oluşan bir veri seti ile Aracı Değişken Regresyon Analizi kullanılarak, rezerv opsiyon mekanizması ile finansal sağlamlık, finansal gelişmişlik ve finansal kırılganlık göstergelerinden oluşturulan finansal istikrar endeksi arasındaki, ayrıca göstergelerin her birinin arasındaki ilişkiler araştırılmıştır. Genişletilmiş Dickey-Fuller ve Phillips Perron birim kök testleri yardımı ile serilerin bireysel zaman serisi özellikleri, regresyon analizi ile de serilerin birbirlerine etkileri araştırılmıştır. Uygulama sonuçlarına göre, ele alınan dönemde, rezerv opsiyon mekanizmasının finansal istikrarı temsilen oluşturulan finansal istikrar endeksini olumlu etkilediği tespit edilmiştir.Anahtar Kelimeler: Rezerv Opsiyon Mekanizması, Finansal İstikrar, Finansal İstikrar EndeksiJEL Sınıflandırması: E44, E58
AbstractIn this study, it is aimed to analyze the impact of Reserve Option Mechanism, that CBRT put into the practice in late 2011, on financial stability. In the analysis, the relationships between the reserve option mechanism and the financial stability index formed from financial soundness, financial development and financial fragility indicators and also between each of the indicators were investigated by using data set covering the period 2011:Q4-2018:Q4 and Intermediary Variable Regression Analysis. Individual time series properties
* Bu çalışma Marmara Üniversitesi Sosyal Bilimler Enstitüsü İktisat Anabilim Dalı’nda Prof. Dr. Nadir Eroğlu danışmanlığında İbrahim Onur Koçaşlı tarafından “Finansal İstikrara Yönelik Merkez Bankalarının Kullandığı Araçlar: Rezerv Opsiyon Mekanizmasının Etkinliği Üzerine Bir Analiz” başlığı ile tamamlanarak 24.02.2020 tarihinde savunulan Doktora tezinden türetilmiştir.
** Araş. Gör. Dr., Kırklareli Üniversitesi, İktisadi ve İdari Bilimler Fakültesi, Kırklareli, E-Mail: [email protected], ORCID ID: 0000-0001-9381-8765
*** Prof. Dr., Marmara Üniversitesi, İktisat Fakültesi, İstanbul, E-Mail: [email protected], ORCID ID: 0000-0001-8403-1725
İbrahim Onur KOÇAŞLI • Nadir EROĞLU
158
of the series were investigated with the help of Augmented Dickey-Fuller and Phillips Perron unit root tests, the effects of the series on each other were investigated by regression analysis. According to application results, it was determined that Reserve Option Mechanism had a positive effect on the Financial Stability Index that was created to represent financial stability.Keywords: Reserve Option Mechanism, Financial Stability, Financial Stability IndexJEL Classification: E44, E58
1. Giriş
Ekonominin geneline ilişkin üretim, istihdam, bütçe, dış ticaret ve enflasyon gibi makroekonomik göstergelerin dalgalı seyir izlemesi; başka bir ifadeyle istikrardan uzaklaşması; gelir dağılımdaki adaletsizliği arttırmakta ve toplumun refah seviyesini olumsuz etkilemektedir. Finansal istikrar, makroekonomik açıdan istikrarlı bir süreç için, aktarım mekanizmasının düzgün işlemesinde ve şokların azaltılmasında doğrudan etkilidir. Bu yüzden süreç içinde etkin işleyen ve sağlam bir finansal sistem; yani finansal istikrar; makroekonomik istikrar için olmazsa olmazlardandır. 2008 yılında finansal istikrarsızlık kaynaklı küresel kriz, dünya çapında makroekonomik politika setlerinin gözden geçirilmesine sebep olmuş ve politika yürütücülerin makro finansal risklerle mücadelede kullandığı makro ihtiyari politika araçlarının çoğaltmasına yol açmıştır.1
Bu kapsamda Türkiye’de finansal istikrarın sağlanması ve korunmasında önemli bir rol üstlenen TCMB’nin 2011 yılında uygulamaya koyduğu rezerv opsiyon mekanizmasının finansal istikrarı nasıl ve ne kadar etkilediği de araştırmaya değer bir konudur. Bu kapsamda çalışmada, 2011:Q4-2018:Q4 arası çeyrek dönem verilerinden hareketle rezerv opsiyon mekanizması kullanımının finansal istikrara etkisinin varlığı veya yokluğu ve varsa büyüklüğü, aracı değişken regresyon analizi yöntemi kullanılarak araştırılması amaçlanmıştır.
Bu kapsamda çalışmada öncelikle rezerv opsiyon mekanizmasının tarihsel gelişimi, temelleri ve çalışma prensibi hakkında bilgi verilmiştir. Sonrasında literatürde rezerv opsiyon mekanizması hakkında temelleri ortaya koyan ve mekanizmanın etkinliğini araştıran teorik ve ampirik çalışmalar özetlenmiştir. Bir sonraki bölümde ekonometrik analiz için oluşturulan model, kullanılan veri seti ve metodoloji ortaya konmuştur. Nihayetinde analizle elde edilen bulgulara dayanarak sonuca ve politika önerilerine ulaşılmıştır.
2. Rezerv Opsiyon Mekanizması
TCMB küresel finansal krizden çıkış stratejisi kapsamında sermaye hareketliliğindeki aşırı oynaklığın finansal istikrar ve makroekonomik düzeydeki negatif etkilerini azaltmak amacıyla Rezerv Opsiyon Mekanizması (ROM)’nı geliştirmiştir.2 ROM, bankaların TCMB nezdinde tutmakla mükellef oldukları Türk lirası zorunlu karşılıkların bir kısmını döviz (dolar ya/ya da Euro) ve standart ve hurda altın cinsinden tesis edebilmelerine olanak veren bir uygulamadır. Bankalar bu sayede Türk Lirası likidite ihtiyaçlarını karşılayabilmek için döviz ve altın varlıklarının bir kısmını kullanma
1 Kara, H. (2016). Turkey’s Experience With Macroprudential Policy, BIS Papers, No:86, s.123.2 Kara, H. (2012). Küresel Kriz Sonrası Para Politikası, TCMB Çalışma Tebliği, No:12/17, s.7.
Marmara Üniversitesi İktisadi ve İdari Bilimler Dergisi • Cilt: 43 • Sayı: 1 • Haziran 2021, ISSN: 2587-2672, ss/pp. 157-178
159
imkânlarına sahip olmuşlardır. Bankalar böylece TL zorunlu karşılıkların ayrımında esneklik kazanmışlar ve kendi isteklerince TCMB nezdindeki döviz ve altın varlıklarını arttırmaktadırlar.3
Rezerv opsiyon mekanizmasının uygulanmasından elde edilecek faydaları aşağıdaki gibi sıralamak mümkündür:
• Kısa vadeli sermaye akımlarının ortaya çıkarabileceği volatiliteyi düşürmek
• TCMB brüt döviz rezervlerini arttırmak
• Bankalara likidite hareketlerinde çeşit sunmak
• Kredilerin sermaye hareketlerine hassasiyetini düşürmek
• Her bankaya kendi likidite optimizasyonu sağlama fırsatı sunmak
• Diğer politika araçlarına olan ihtiyaçları düşürmektir.4
ROM tedrici bir biçimde lanse edilerek uygulama evresine geçişi zamana yayılmıştır. İlk olarak bankaların TL zorunlu karşılıklarının bir kısmını o dönemdeki döviz kuru değeri hesaba katılarak bütünüyle döviz ve altın karşılığı tutmasına olanak verilmiştir.5 Türk lirası zorunlu karşılıkların belirli bir kısmını döviz olarak tesis edilebilme imkânı 2011 Eylül’de, yine belirli bir kısmını da altın olarak tesis edilebilme imkânı ise 2011 Ekim’de verilmiştir. Döviz olarak başlangıçta sadece ABD Doları (USD) tesis imkânı sağlanmış, Temmuz 2018’de Euro (EUR) da tesis imkânına dâhil edilmiştir. Standart altın imkânının yanı sıra, hurda altın tesis edebilme imkânı da Kasım 2016’da verilmiştir. İlk aşamada yüzde 10 olarak sınırlandırılan döviz tesis imkânı, piyasa koşullarına paralel olarak dereceli olarak yükseltilmiş, 2012 Ağustos’ta döviz imkânı için yüzde 60, altın imkânı için yüzde 30; hurda altın imkânı için ise 2019 Mart’ta yüzde 10 düzeyine kadar yükseltilmiştir. Sonraki süreçte piyasa koşullarına bağlı olarak, TCMB’nin politikaları doğrultusunda döviz için tesis imkânı yüzde 30’a kadar kademeli şekilde düşürülmüştür.
Haziran 2012’de rezerv opsiyon dilimleri (ROD) ve dilimlere göre farklılaştırılmış rezerv opsiyon katsayıları (ROK) uygulamaya konmuş ve sonrasında piyasa şartlarına ve ROM kullanım oranına göre devamlı olarak değiştirilmektedir. Rezerv opsiyon katsayısı, bankaların TCMB nezdinde tesis etmesi gereken 1 birim TL zorunlu karşılık için kaç birim yabancı para tutması gerektiğini gösteren katsayıya denmektedir. TCMB piyasa şartlarına göre optimal rezerv opsiyon katsayısını belirlemektedir.6 Rezerv opsiyon dilimi (ROD) ise TL zorunlu karşılıklar karşılığında döviz getirebilme üst sınırının 0-10, 10-20, 20-30, 30-35, 35-40, 40-45, 45-50, 50-55, 55-60 şeklinde yüzde
3 Ermişoğlu, E., Oduncu, A., Akçelik, Y. (2013). Rezerv Opsiyon Mekanizması ve Kur Oynaklığı, TCMB Ekonomi Notları, Sayı: 2013 /04, s.3.
4 TCMB (2012). Bülten, Sayı 28, Aralık, s.2.5 Aysan, A.F. ve diğerleri (2014). Managing Short-Term Capital Flows in New Central Banking: Unconventional Monetary
Policy Framework in Turkey, TCMB Working Papers, No:14/03, s.14.6 Küçüksaraç, D., Özgür Ö. (2012). Rezerv Opsiyon Mekanizması ve Optimal Rezerv Opsiyonu Katsayısının Hesaplanması,
TCMB Çalışma Tebliği, No:12/32, s.7.
İbrahim Onur KOÇAŞLI • Nadir EROĞLU
160
5 ve yüzde 10’luk dilimlere bölünmesi ile oluşan bölümleri ifade etmektedir. Bu her bir dilimde uygulanan farklı ROK’lar aracılığıyla, ROM’u daha fazla kullanmak isteyen bankalar yeni bir dilime geçtikçe, artan ROK’lar karşılığında yabancı para getirmek durumunda kalmaktadır. ROM aracılığıyla bankalar, TCMB nezdinde tutmaları gereken TL zorunlu karşılıkların bir kısmını döviz olarak tutma imkânına ek olarak altın olarak da tutma imkânına sahip olmuşlardır.
Rezerv opsiyon mekanizmasının tasarlanma süreci, sermaye girişlerinin arttığı ve yabancı para kaynaklara ulaşmanın görece kolay ve maliyetlerinin daha düşük olduğu dönemlerde, bankaların TL zorunlu karşılıklar yerine daha fazla yabancı para tesis etmeye yöneleceği, bu sayede de TL’nin aşırı değerlenmesinin önüne geçilebileceği prensibine dayanmaktadır.7 Tersi durumda da; yani sermaye girişlerinin yavaşladığı dönemlerde, TL karşılıklar yerine tesis ettikleri yabancı parayı kendi bünyesinde kullanmaya eğilimli olacakları, bu sayede de TL deki değer kaybını azaltıcı bir etki yapacağı prensibini etkili kılmaktadır.8 Böylece rezerv opsiyon mekanizması, uygun ROK’lar ve ROD’lar sayesinde otomatik dengeleyici bir rol üstlenerek finansal piyasalardaki volatiliteyi azaltmada etkili bir rol üstlenmiştir.9
Rezerv opsiyon mekanizması sayesinde TCMB döviz rezervlerinin güçlendirilmesi ve sermaye akımlarının oynaklığının arttığı dönemde bankaların TCMB nezdinde tesis ettikleri döviz ve altının ilk müdahale aracı olarak işlev görmesi beklenmektedir.10
3. Literatür
Literatürde rezerv opsiyon mekanizmasını uygulama başlangıcından bugüne kadar genel hatlarıyla tanıtan, teorik temellerini ortaya koyan, finansal istikrara beklenen etkilerini teorik olarak ifade eden birçok çalışma bulunmaktadır. Rezerv opsiyon mekanizması merkez bankacılığında dünyadaki ilk ve tek örnek olması dolayısıyla literatürü ulusal düzeyle sınırlıdır. Teorik, gözlem ve öngörüye dayalı bu çalışmaların öne çıkanları, Yücel ve Serbest11, Alper ve diğerleri12, Demirhan13, Aysan ve diğerleri14, Serel ve Özkurt15, Çetin16, Ergin ve Aydın17 çalışmalarıdır. Buna rağmen rezerv opsiyon
7 Alper, K. ve diğerleri (2013). Alternative Tools to Manage Capital Flow Volatility, TCMB Working Paper, No:13/31, s.10.8 Ergin, A., Aydın H. İ. (2017). Finansal İstikrarı Sağlamaya Yönelik Bir Araç: Rezerv Opsiyon Mekanizması, Batman
Üniversitesi Yaşam Bilimleri Dergisi. 7 (1):71.9 Aslaner O. ve diğerleri (2014). Reserve Option Mechanism: Does It Work as an Automatic Stabilizer?, TCMB Working
Paper, No:14/38, s.14.10 Böcüoğlu, M.E. (2015). Rezerv Opsiyon Mekanizmasının Banka Davranışlarına Etkisi, TCMB Uzmanlık Yeterlilik Tezi,
s.22.11 Yücel T., Serbest E. (2012). Yeni Dönem Para Politikası Araçları, Dayanışma Dergisi, 116 (2) :8-17.12 Alper, K. ve diğerleri (2013), Reserve Options Mechanism, Central Bank Review. 13: 1-14.13 Demirhan, B. (2013). Türkiye’de Yeni Yaklaşım Çerçevesinde Para Politikalarının Finansal İstikrarı Sağlama Yönünde
Uygulanması, Afyon Kocatepe Üniversitesi İİBF Dergisi. 15 (2): 567-589.14 Aysan, A. F ve diğerleri, 2014, 14.15 Serel A., Özkurt İ. C. (2014). Geleneksel Olmayan Para Politikası Araçları ve Türkiye Cumhuriyet Merkez Bankası,
Yönetim ve Ekonomi Araştırmaları Dergisi, 22: 56-71.16 Çetin M. Ö. (2016). Türkiye Cumhuriyet Merkez Bankası (TCMB) Para Politikası Uygulamalarının Gelişimi, Finansal
Araştırmalar ve Çalışmalar Dergisi, 8(14): 67-101.17 Ergin, Aydın, 2017, 63-75.
Marmara Üniversitesi İktisadi ve İdari Bilimler Dergisi • Cilt: 43 • Sayı: 1 • Haziran 2021, ISSN: 2587-2672, ss/pp. 157-178
161
mekanizmasının finansal istikrara etkilerini; finansal istikrarı bir bütün halde tanımlamanın ve formülleştirmenin zorluğundan dolayı; bir bütün olarak ele alan ampirik bir çalışmaya literatürde rastlanmamıştır. Ancak rezerv opsiyon mekanizmasının kullanımını etkileyen faktörleri ve sadece bazı değişkenler üzerindeki etkilerini inceleyen ampirik çalışmalara rastlamak mümkündür.
Küçüksaraç ve Özel18’in çalışmalarında, henüz yeni uygulamaya konan rezerv opsiyon mekanizmasında uygulama aşamasında belirlenecek optimal rezerv opsiyon katsayısını etkileyen faktörleri tespit etmeyi amaçlanmaktadır. Çalışmada bankaların TL zorunlu karşılık tesis etmede kullandığı fon kaynaklarının maliyetleri karşılaştırılmıştır. Çalışma sonucunda rezerv opsiyon katsayısının etkilendiği faktörlerin TL ve YP fonlama maliyetleri, LIBOR faiz oranı, TL swap faiz oranı ve YP zorunlu karşılık oranlarının olduğu; özellikle de YP borçlanma maliyetlerine karşı çok daha hassas olduğu kanaatine varılmıştır.
Değerli ve Fendoğlu19’nun çalışmalarında, rezerv opsiyon mekanizmasının döviz kuru oynaklığı üzerinden döviz kuru beklentilerine etkisi araştırılmaktadır. Çalışmada rezerv opsiyon mekanizmasının kullanılmadığı Ekim-2010/Eylül 2011 dönemi ile kullanıldığı Eylül-2011/Kasım-2012 dönemi karşılaştırılmıştır. 11 gelişmekte olan ülkelerdeki vadeli döviz opsiyon sözleşmeleri aracılığıyla karşılaştırma yapılan analizde, rezerv opsiyon mekanizmasının hassaslığının döviz kuru beklentilerinde volatiliteyi azalttığı, Türkiye’de döviz kuru beklentilerinin diğer ülkelere paralel seyrettiği ve rezerv opsiyon mekanizmasının döviz kuru ani değişimlerinde otomatik bir stabilizatör görevini üstlendiği sonuçlarına ulaşılmıştır.
Ermişoğlu, Oduncu ve Akçelik20’in çalışmalarında, rezerv opsiyon mekanizmasının döviz kuru oynaklığı üzerindeki etkileri araştırılmıştır. Araştırmada kullanılan GARCH modelinde bağımlı değişken olarak dolar ve eurodan oluşturulan kur seti, açıklayıcı değişken olarak da ROM kapsamında TL zorunlu karşılık için tutulan döviz miktarı seçilmiştir. Modele VIX endeks değişimi, TCMB’nin piyasaya verdiği döviz miktarı değişkenlerine ek olarak TCMB’nin şok müdahalelerini temsil eden bir kukla değişken de dâhil edilmiştir. Çalışmada, rezerv opsiyon mekanizmasının döviz kuru oynaklığını azaltıcı bir politika aracı olduğu kanaatine ulaşılmıştır. Bu çalışmaya yöntem, amaç ve ulaşılan sonuçlar açısından benzer başka çalışmalar da bulunmaktadır.
Böcüoğlu21’nun çalışmasında, rezerv opsiyon mekanizmasının finansal istikrarda önemli birer aktör olan bankaların davranışlarına ve parasal aktarıma etkilerini araştırmaktadır. Tüketici ve ticari kredilerin parasal aktarımlarından yola çıkılarak ortaya konan iki model ve panel VAR yöntemi ile yapılan çalışma sonucunda, rezerv opsiyon mekanizması kullanımının bankalara maliyet avantajı sağladığı ancak, TL tüketici kredilerini azalttığı bulgularına ulaşılmıştır. Bu çalışmada varılan sonuçlarına benzer olarak rezerv opsiyon mekanizmasının bankalara maliyet avantajını ortaya koyan başka çalışmalara da rastlamak mümkündür.
18 Küçüksaraç, Özgür, 2012, 7.19 Değerli, A., Fendoğlu, S. (2013). Reserve Option Mechanism as a Stabilizing Policy Tool: Evidence from Exchange Rate
Expectations. TCMB Working Paper. No:13/28.20 Ermişoğlu E. ve diğerleri, 2013, 3.21 Böcüoğlu, 2015, 22.
İbrahim Onur KOÇAŞLI • Nadir EROĞLU
162
Aslaner ve diğerleri22’nin çalışmalarında, rezerv opsiyon mekanizmasının finansal istikrara önemli katkı sağlayan dengeleyici özelliğinin belirleyicilerini davranışsal bir yaklaşımla araştırmaktadırlar. 2012 Haziran ve 2014 Haziran döneminde 17 banka verileri ile yapılan çalışmada, katlanılan alternatif fonlama maliyetlerin göre beklenen ROM kullanım oranları hesaplanmış ve gerçekleşen ROM kullanımları ile karşılaştırılmıştır. Çalışma sonucunda, ROM kullanımı belirleyicilerinde TCMB ortalama fonlama faiz oranı ve gecelik para piyasası faiz oranının yüksek derecede önemli olduğu kanaatine varılmıştır. Bu çalışmaya benzer olarak Kılcı23 çalışmasında da TCMB fonlama faiz oranının bankacılık sektörü kredi hacmi ve döviz kurları üzerinde, politika faiz oranından daha kuvvetli bir ilişkinin olduğu düşüncesine varılmıştır.
Eroğlu ve diğerleri24’nin çalışmalarında, zorunlu karşılıkların tüketici kredilerine etkilerini araştırmaktadırlar. Rezerv opsiyon mekanizmasının yeni zorunlu karşılıklar sisteminde önemli değişikliğe neden olduğunu vurgulayan çalışmada regresyon yöntemi ile etkiler araştırılmaktadır. Çalışmada sonucunda, zorunlu karşılıkların tüketici kredileri ile ters orantılı çalışan mekanizma olduğu tespit edilmiştir. Ayrıca zorunlu karşılıklarda rezerv opsiyon mekanizması uygulamasının zorunlu karşılıkların etkinliğini arttırdığı kanaatine varılmıştır.
Eroğlu ve Kara25’nın çalışmalarında, makro ihtiyati politika araçlarının makroekonomik değişkenlere etkilerini araştırmaktadırlar. VAR analizi kullanılan çalışmada TÜFE, toplam kredi hacimleri ve sermaye hareketlerinin para politikası araçları ile arasındaki ilişki tespit edilmeye çalışılmaktadır. Çalışma sonucunda, diğer sonuçların yanı sıra rezerv opsiyon mekanizmasının sermaye akımlarının etkilerini azalttığı yorumuna ulaşılmıştır.
Kurum ve Oktar26 çalışmalarında rezerv opsiyon mekanizmasının döviz kuru üzerindeki etkisini araştırmaktadır. 2011 Eylül ve 2018 Aralık döneminde rezerv opsiyon mekanizması kullanım oranı ve dolar alış kuru arasındaki ilişki Engle-Granger eş bütünleşme ve Toda-Yamamato nedensellik analizleri ile tespit edilmeye çalışılmıştır. Çalışma sonucunda rezerv opsiyon mekanizması kullanımının döviz kuru üzerinden finansal istikrarı arttırıcı etkisi olduğu yargısına ulaşılmıştır.
Literatürde çalışmaların geneline bakıldığında, rezerv opsiyon mekanizmasının ya kullanımına etki eden faktörler ya da kullanımı sonucu döviz kuru volatilitesi, krediler gibi değişkenler üzerindeki etkilerinin incelendiği gözlemlenmektedir. Bu çalışma ise rezerv opsiyon mekanizmasının finansal istikrara bir bütün olarak, daha makro perspektiften nasıl etki ettiğini araştırmaya yöneliktir. Bu özelliği ile bu çalışmanın literatürden farklı bir yaklaşım içererek literatüre katkı sağlayacağı düşünülmektedir.
22 Aslaner O. ve diğerleri., 2014, 14.23 Kılcı, E. N. (2019). New Trends in Cenrtal Banking in Turkey; A Study on the Reserve Option Mechanism and the
Asymetric Interest Rate Corridor, Muhasebe ve Finansman Dergisi, Ağustos Özel sayı, s.194-212.24 Eroğlu, N. ve diğerleri (2016). Türkiye’de Zorunlu Karşılıklar ve Tüketici Kredileri: Ekonometrik Bir Model Denemesi,
Marmara Üniversitesi İktisadi ve İdari Bilimler Dergisi, 38 (2): 63-86.25 Eroğlu, N., Kara F. (2017). Türkiye’de Makro İhtiyati Para Politikası Araçlarının Makroekonomik Değişkenlere Etkisinin
VAR Analizi ile İncelenmesi, İstanbul İktisat Dergisi, Sayı:76, 2017/2, s.59-88.26 Kurum M.S., Oktar S. (2019). Rezerv Opsiyon Mekanizmasının Döviz Kuru Üzerindeki Etkisi, Marmara Üniversitesi
İktisadi ve İdari Bilimler Dergisi, 41(1): .223-246.
Marmara Üniversitesi İktisadi ve İdari Bilimler Dergisi • Cilt: 43 • Sayı: 1 • Haziran 2021, ISSN: 2587-2672, ss/pp. 157-178
163
4. Model ve Veri Seti
Rezerv opsiyon mekanizmasının finansal istikrar etkisinin araştırılacağı analizde bağımsız 1 değişken, bağımlı 16 aracı değişken ve bu 16 değişkenden oluşturulan endeks de temel bağımlı değişken olmak üzere toplamda 17 bağımlı değişken seçilmiştir. Bağımsız değişken olarak rezerv opsiyon mekanizmasının kullanımı gösteren Toplam ROM Kullanımı/TCMB Brüt Döviz Rezervleri + Altın Rezervleri kullanılmıştır. ROM kullanımında opsiyonlar arasında olan Dolar, Euro, standart ve hurda altın olmak üzere tüm opsiyon kullanımları toplamının TCMB bünyesindeki döviz ve altın rezervleri içindeki payı TCMB Zorunlu Karşılıklar Veri Seti’nden elde edilen verilerle hesaplanarak bağımsız değişken olarak seçilmiştir. Bu değişkenin ROM kullanımını en geniş anlamda temsil ettiği düşünülmektedir.
Bağımlı değişken olarak; literatürde sık olarak kullanılan ve Türkiye’de de karşılığı net olarak bulunabilen; finansal sağlamlık göstergelerinden 8 adet, finansal kırılganlık göstergelerinden 5 adet ve finansal gelişmişlik göstergelerinden 3 adet gösterge seçilmiştir. Ayrıca bu göstergelerden çalışma bünyesinde oluşturulan kompozit (endeks) bir gösterge seçilmiştir.
IMF27’nin piyasaları takip ettiği, ayrıca TCMB’nin de yurtiçi bankacılık sektörünü izlemek için uyarladığı finansal sağlamlık göstergelerinden 3 Aya Kadar Vadede Faize Duyarlı Aktifler / 3 Aya Kadar Vadede Faize Duyarlı Pasifler, Bilanço İçi Yabancı Para Pozisyonu / Yasal Öz kaynak, Yabancı Para Net Genel Pozisyonu / Yasal Öz kaynak, Dönem Net Karı / Ortalama Toplam Aktifler, Dönem Net Karı / Ortalama Öz kaynaklar, Likidite Yeterlilik Oranı, Sermaye Yeterlilik Standart Oranı ve Brüt Takipteki Alacaklar / Toplam Nakdi Krediler seçilmiştir. Finansal kırılganlık göstergelerinden Kısa Vade Borç Stoku / TCMB Brüt Döviz Rezervler, Genel Bütçe Dengesi / GSYH, Cari İşlem Hesabı / GSYH, Toplam Nakdi Krediler / Toplam Mevduat ve Enflasyon Oranı seçilmiştir. Finansal gelişmişlik göstergelerinden ise Toplam Krediler / GSYH, Toplam Piyasa Değeri / GSYH ve M2 / GSYH seçilmiştir.
Finansal sağlamlık göstergelerinden 3 Aya Kadar Vadede Faize Duyarlı Aktifler / 3 Aya Kadar Vadede Faize Duyarlı Pasifler göstergesi faiz riskini, Bilanço İçi Yabancı Para Pozisyonu / Yasal Öz kaynak, Yabancı Para Net Genel Pozisyonu / Yasal Öz kaynak göstergeleri kur riskini, Dönem Net Karı / Ortalama Toplam Aktifler, Dönem Net Karı / Ortalama Öz kaynaklar göstergeleri aktif ve öz kaynak karlılığını, Likidite Yeterlilik Oranı aktifler içinde likit aktif düzeyini (Likit Aktifler = Nakit Değerler + TCMB, piyasalar, bankalar ve ters repodan doğan alacaklar), Sermaye Yeterlilik Standart Oranı sermaye durumunu ve Brüt Takipteki Alacaklar / Toplam Nakdi Krediler ise aktif kalitesini göstermektedir. Seçilen finansal sağlamlık göstergelerine ait veriler BDDK İnteraktif E-Bülten’den elde edilmiştir.
Finansal kırılganlık göstergelerinden Kısa Vade Borç Stoku / TCMB Brüt Döviz Rezervler göstergesi borç yükünün karşılanma kapasitesini, Genel Bütçe Dengesi / GSYH göstergesi kamu gelir ve harcama dengesini, Cari İşlem Hesabı / GSYH göstergesi dış alemle ticari ilişkiler durumunu, Toplam Nakdi
27 IMF (2004). “Financial Soundness Indicators: Compilation Guide”, https://www.imf.org/external/np/sta/ fsi/eng/2004/guide/index.htm, s.1 (Erişim Tarihi: 10.11.2020).
İbrahim Onur KOÇAŞLI • Nadir EROĞLU
164
Krediler / Toplam Mevduat göstergesi kredi genişlemesini ve Enflasyon Oranı göstergesi de fiyatlar genel düzeyinin gelişimini yansıtmaktadır. Seçilen finansal kırılganlık göstergelerine ait veriler TCMB EVDS ve TUİK Resmi İstatistik Portalı’ndan elde edilmiştir.
Finansal gelişmişlik göstergelerinden Toplam Krediler / GSYH göstergesi ekonomide kredi genişlemesini, Toplam Piyasa Değeri / GSYH göstergesi BIST’de işlem gören şirket hisselerinin toplam değerinin GSYH’e oranının gelişimini ve M2 / GSYH göstergesi ise vadeli ve vadesiz mevduatlar gibi parasal büyüklüklerin GSYH’e oranını ifade etmektedir. Finansal gelişmişlik göstergelerinden seçilen bu 3 gösterge, literatürde en sık başvurulan ve Dünya Bankası’nın çerçevesini çizdiği finansal gelişmişlik göstergelerindendir.28 Seçilen finansal gelişmişlik göstergeleri verileri BDDK, TCMB EVDS ve BIST’den elde edilmiştir.
Finansal istikrarı tek bir çerçevede tanımlamak ve ölçmek kolay değildir. Bu yüzden özellikle de finansal istikrarın ölçülmesi konusu gün geçtikçe önemini arttırmakta ve tartışılmaktadır. Finansal istikrarın ölçülmesinde finansal sağlamlık göstergeleri, erken uyarı sistemleri, stres testleri ve kompozit göstergeler kullanılmaktadır. Bu çalışmada finansal istikrarı bir bütün olarak ele almak için toplama yöntemiyle oluşturulan kompozit gösterge yöntemi (endeks yaklaşımı) kullanılmıştır. Kompozit gösterge oluşturulurken izlenen yol önce ölçülmek istenen ana tema belirleme ile başlamaktadır. Bu ana temanın ilgili olduğu alt göstergeler seçilir ve bu göstergelere ait veriler düzenlenir. Alt göstergelerin arasındaki ilişki tespit edilir. Daha sonra göstergeler çeşitli yöntemlerle normalize edilir ve istenen ölçüde ağırlıklandırılır. Bu kapsamda finansal istikrara etki araştırılırken finansal istikrara yönelik başlıca göstergelerin standardize edilerek toplandığı ve eşit ağırlıklandırıldığı bir endeks oluşturulmuştur. Endeks oluşturulmada toplama ile kompozit gösterge oluşturma yöntemlerinden bir tanesi olan ve formülü;
1
1
.,
nt
t ti ict ti ic EUic icn t
EUii
i
w yx xCI y
w σ=
=
−= =∑
∑ (1)
ticx , (t zamanında c ülkesinin i gösterge değerini; iw , i göstergesinin kompozit endeks içindeki
ağırlığı göstermektedir.) olan standardize edilmiş değerler yöntemi kullanılmıştır.29 Yeni oluşturulan bu göstergenin adı finansal istikrar endeksidir (FIENDK). Finansal istikrar endeksi oluşturmak için, önceki paragraflarda detayları verilen finansal sağlamlık, finansal kırılganlık ve finansal gelişmişlik göstergeleri kullanılmıştır. Seçilen göstergelerle, çalışmanın birinci bölümü, finansal istikrarın ölçülmesi başlığında açıklanan standardize edilmiş değerler toplamı yöntemiyle bir endeks oluşturulmuştur.
28 The World Bank (2014). “World Development Indicators 2014”, openknowledge.worldbank.org, s.68 (Erişim Tarihi: 11.10.2020).
29 Saisana M., Tarantola S. (2002). State of the Art Report on Current Methodologies and Practices for Composite Indicator Development, European Commission JRC, s.10.
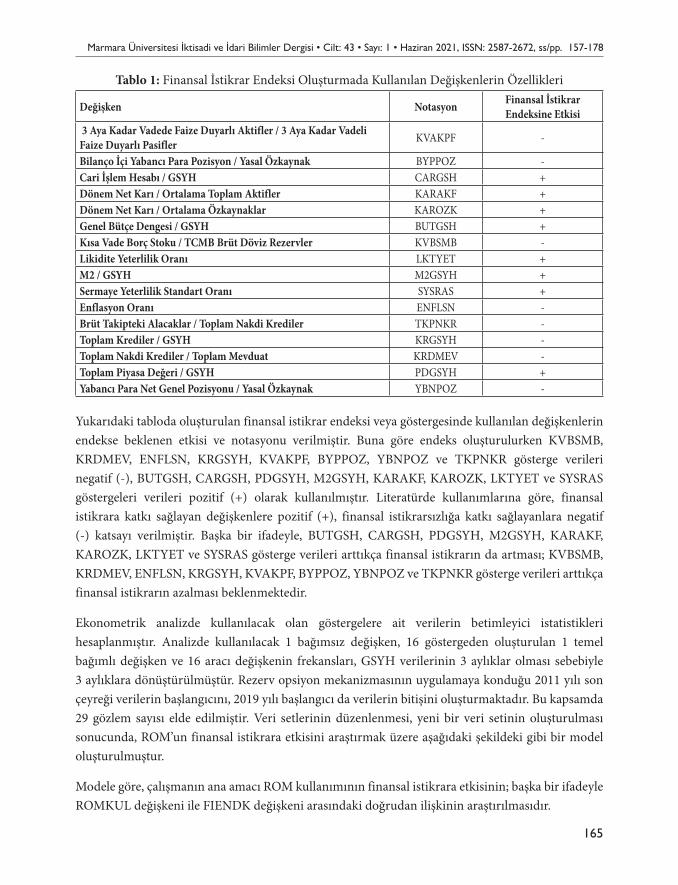
Marmara Üniversitesi İktisadi ve İdari Bilimler Dergisi • Cilt: 43 • Sayı: 1 • Haziran 2021, ISSN: 2587-2672, ss/pp. 157-178
165
Tablo 1: Finansal İstikrar Endeksi Oluşturmada Kullanılan Değişkenlerin Özellikleri
Değişken Notasyon Finansal İstikrar Endeksine Etkisi
3 Aya Kadar Vadede Faize Duyarlı Aktifler / 3 Aya Kadar Vadeli Faize Duyarlı Pasifler KVAKPF -
Bilanço İçi Yabancı Para Pozisyon / Yasal Özkaynak BYPPOZ -Cari İşlem Hesabı / GSYH CARGSH +Dönem Net Karı / Ortalama Toplam Aktifler KARAKF +Dönem Net Karı / Ortalama Özkaynaklar KAROZK +Genel Bütçe Dengesi / GSYH BUTGSH +Kısa Vade Borç Stoku / TCMB Brüt Döviz Rezervler KVBSMB -Likidite Yeterlilik Oranı LKTYET +M2 / GSYH M2GSYH +Sermaye Yeterlilik Standart Oranı SYSRAS +Enflasyon Oranı ENFLSN -Brüt Takipteki Alacaklar / Toplam Nakdi Krediler TKPNKR -Toplam Krediler / GSYH KRGSYH -Toplam Nakdi Krediler / Toplam Mevduat KRDMEV -Toplam Piyasa Değeri / GSYH PDGSYH +Yabancı Para Net Genel Pozisyonu / Yasal Özkaynak YBNPOZ -
Yukarıdaki tabloda oluşturulan finansal istikrar endeksi veya göstergesinde kullanılan değişkenlerin endekse beklenen etkisi ve notasyonu verilmiştir. Buna göre endeks oluşturulurken KVBSMB, KRDMEV, ENFLSN, KRGSYH, KVAKPF, BYPPOZ, YBNPOZ ve TKPNKR gösterge verileri negatif (-), BUTGSH, CARGSH, PDGSYH, M2GSYH, KARAKF, KAROZK, LKTYET ve SYSRAS göstergeleri verileri pozitif (+) olarak kullanılmıştır. Literatürde kullanımlarına göre, finansal istikrara katkı sağlayan değişkenlere pozitif (+), finansal istikrarsızlığa katkı sağlayanlara negatif (-) katsayı verilmiştir. Başka bir ifadeyle, BUTGSH, CARGSH, PDGSYH, M2GSYH, KARAKF, KAROZK, LKTYET ve SYSRAS gösterge verileri arttıkça finansal istikrarın da artması; KVBSMB, KRDMEV, ENFLSN, KRGSYH, KVAKPF, BYPPOZ, YBNPOZ ve TKPNKR gösterge verileri arttıkça finansal istikrarın azalması beklenmektedir.
Ekonometrik analizde kullanılacak olan göstergelere ait verilerin betimleyici istatistikleri hesaplanmıştır. Analizde kullanılacak 1 bağımsız değişken, 16 göstergeden oluşturulan 1 temel bağımlı değişken ve 16 aracı değişkenin frekansları, GSYH verilerinin 3 aylıklar olması sebebiyle 3 aylıklara dönüştürülmüştür. Rezerv opsiyon mekanizmasının uygulamaya konduğu 2011 yılı son çeyreği verilerin başlangıcını, 2019 yılı başlangıcı da verilerin bitişini oluşturmaktadır. Bu kapsamda 29 gözlem sayısı elde edilmiştir. Veri setlerinin düzenlenmesi, yeni bir veri setinin oluşturulması sonucunda, ROM’un finansal istikrara etkisini araştırmak üzere aşağıdaki şekildeki gibi bir model oluşturulmuştur.
Modele göre, çalışmanın ana amacı ROM kullanımının finansal istikrara etkisinin; başka bir ifadeyle ROMKUL değişkeni ile FIENDK değişkeni arasındaki doğrudan ilişkinin araştırılmasıdır.
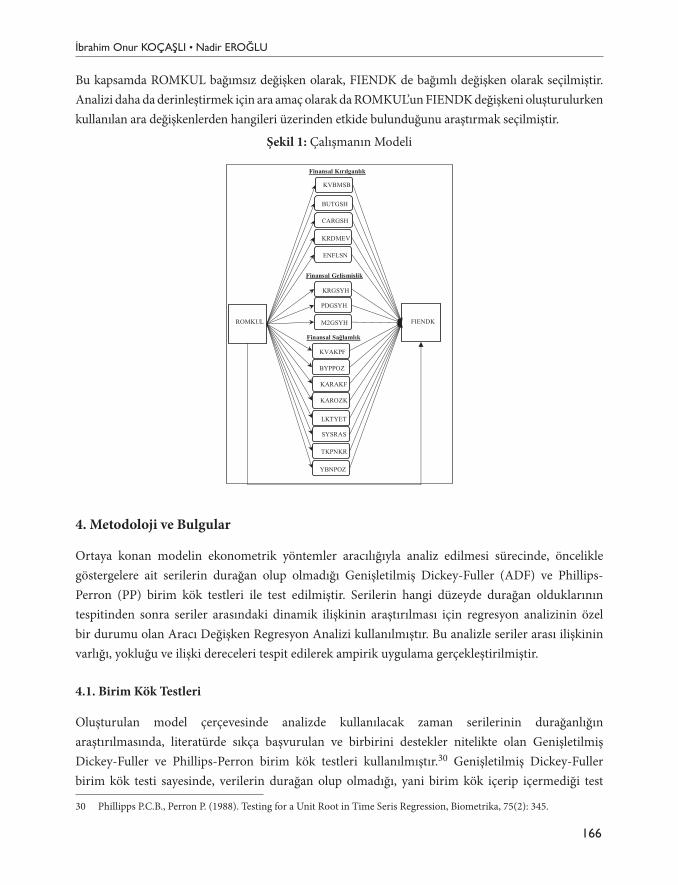
İbrahim Onur KOÇAŞLI • Nadir EROĞLU
166
Bu kapsamda ROMKUL bağımsız değişken olarak, FIENDK de bağımlı değişken olarak seçilmiştir. Analizi daha da derinleştirmek için ara amaç olarak da ROMKUL’un FIENDK değişkeni oluşturulurken kullanılan ara değişkenlerden hangileri üzerinden etkide bulunduğunu araştırmak seçilmiştir.
Şekil 1: Çalışmanın Modeli Makale Gönderim Tarihi: 14.02.2021 Yayına Kabul Tarihi: 13.06.2021
Şekil 1: Çalışmanın Modeli
4. Metodoloji ve Bulgular
Ortaya konan modelin ekonometrik yöntemler aracılığıyla analiz edilmesi sürecinde, öncelikle göstergelere ait serilerin durağan olup olmadığı Genişletilmiş Dickey-Fuller (ADF) ve Phillips-Perron (PP) birim kök testleri ile test edilmiştir. Serilerin hangi düzeyde durağan olduklarının tespitinden sonra seriler arasındaki dinamik ilişkinin araştırılması için regresyon analizinin özel bir durumu olan Aracı Değişken Regresyon Analizi kullanılmıştır. Bu analizle seriler arası
KVBMSB
Finansal Sağlamlık
Finansal Gelişmişlik
Finansal Kırılganlık
KRGSYH
PDGSYH
M2GSYH
KVAKPF
BYPPOZ
KARAKF
KAROZK
LKTYET
SYSRAS
BUTGSH
CARGSH
KRDMEV
ENFLSN
TKPNKR
YBNPOZ
ROMKUL FIENDK
4. Metodoloji ve Bulgular
Ortaya konan modelin ekonometrik yöntemler aracılığıyla analiz edilmesi sürecinde, öncelikle göstergelere ait serilerin durağan olup olmadığı Genişletilmiş Dickey-Fuller (ADF) ve Phillips-Perron (PP) birim kök testleri ile test edilmiştir. Serilerin hangi düzeyde durağan olduklarının tespitinden sonra seriler arasındaki dinamik ilişkinin araştırılması için regresyon analizinin özel bir durumu olan Aracı Değişken Regresyon Analizi kullanılmıştır. Bu analizle seriler arası ilişkinin varlığı, yokluğu ve ilişki dereceleri tespit edilerek ampirik uygulama gerçekleştirilmiştir.
4.1. Birim Kök Testleri
Oluşturulan model çerçevesinde analizde kullanılacak zaman serilerinin durağanlığın araştırılmasında, literatürde sıkça başvurulan ve birbirini destekler nitelikte olan Genişletilmiş Dickey-Fuller ve Phillips-Perron birim kök testleri kullanılmıştır.30 Genişletilmiş Dickey-Fuller birim kök testi sayesinde, verilerin durağan olup olmadığı, yani birim kök içerip içermediği test
30 Phillipps P.C.B., Perron P. (1988). Testing for a Unit Root in Time Seris Regression, Biometrika, 75(2): 345.
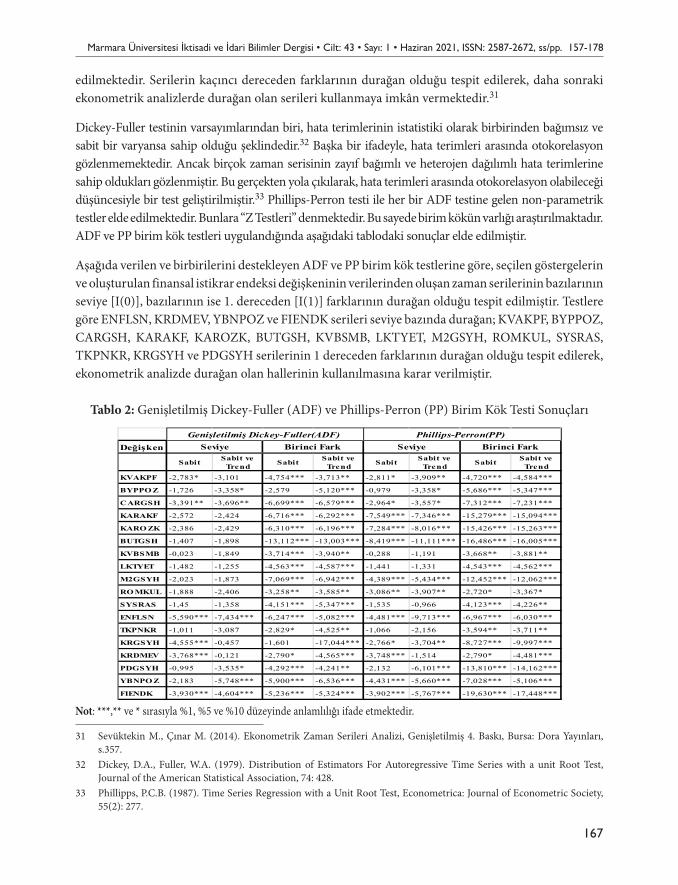
Marmara Üniversitesi İktisadi ve İdari Bilimler Dergisi • Cilt: 43 • Sayı: 1 • Haziran 2021, ISSN: 2587-2672, ss/pp. 157-178
167
edilmektedir. Serilerin kaçıncı dereceden farklarının durağan olduğu tespit edilerek, daha sonraki ekonometrik analizlerde durağan olan serileri kullanmaya imkân vermektedir.31
Dickey-Fuller testinin varsayımlarından biri, hata terimlerinin istatistiki olarak birbirinden bağımsız ve sabit bir varyansa sahip olduğu şeklindedir.32 Başka bir ifadeyle, hata terimleri arasında otokorelasyon gözlenmemektedir. Ancak birçok zaman serisinin zayıf bağımlı ve heterojen dağılımlı hata terimlerine sahip oldukları gözlenmiştir. Bu gerçekten yola çıkılarak, hata terimleri arasında otokorelasyon olabileceği düşüncesiyle bir test geliştirilmiştir.33 Phillips-Perron testi ile her bir ADF testine gelen non-parametrik testler elde edilmektedir. Bunlara “Z Testleri” denmektedir. Bu sayede birim kökün varlığı araştırılmaktadır. ADF ve PP birim kök testleri uygulandığında aşağıdaki tablodaki sonuçlar elde edilmiştir.
Aşağıda verilen ve birbirilerini destekleyen ADF ve PP birim kök testlerine göre, seçilen göstergelerin ve oluşturulan finansal istikrar endeksi değişkeninin verilerinden oluşan zaman serilerinin bazılarının seviye [I(0)], bazılarının ise 1. dereceden [I(1)] farklarının durağan olduğu tespit edilmiştir. Testlere göre ENFLSN, KRDMEV, YBNPOZ ve FIENDK serileri seviye bazında durağan; KVAKPF, BYPPOZ, CARGSH, KARAKF, KAROZK, BUTGSH, KVBSMB, LKTYET, M2GSYH, ROMKUL, SYSRAS, TKPNKR, KRGSYH ve PDGSYH serilerinin 1 dereceden farklarının durağan olduğu tespit edilerek, ekonometrik analizde durağan olan hallerinin kullanılmasına karar verilmiştir.
Tablo 2: Genişletilmiş Dickey-Fuller (ADF) ve Phillips-Perron (PP) Birim Kök Testi Sonuçları
Değişken
Sabit Sabit ve Trend Sabit Sabit ve
Trend Sabit Sabit ve Trend Sabit Sabit ve
TrendKVAKPF -2,783* -3,101 -4,754*** -3,713** -2,811* -3,909** -4,720*** -4,584***
BYPPO Z -1,726 -3,358* -2,579 -5,120*** -0,979 -3,358* -5,686*** -5,347***
CARGSH -3,391** -3,696** -6,699*** -6,579*** -2,964* -3,557* -7,312*** -7,231***
KARAKF -2,572 -2,424 -6,716*** -6,292*** -7,549*** -7,346*** -15,279*** -15,094***
KARO ZK -2,386 -2,429 -6,310*** -6,196*** -7,284*** -8,016*** -15,426*** -15,263***
BUTGSH -1,407 -1,898 -13,112*** -13,003*** -8,419*** -11,111*** -16,486*** -16,005***
KVBSMB -0,023 -1,849 -3,714*** -3,940** -0,288 -1,191 -3,668** -3,881**
LKTYET -1,482 -1,255 -4,563*** -4,587*** -1,441 -1,331 -4,543*** -4,562***
M2GSYH -2,023 -1,873 -7,069*** -6,942*** -4,389*** -5,434*** -12,452*** -12,062***
RO MKUL -1,888 -2,406 -3,258** -3,585** -3,086** -3,907** -2,720* -3,367*
SYSRAS -1,45 -1,358 -4,151*** -5,347*** -1,535 -0,966 -4,123*** -4,226**
ENFLSN -5,590*** -7,434*** -6,247*** -5,082*** -4,481*** -9,713*** -6,967*** -6,030***
TKPNKR -1,011 -3,087 -2,829* -4,525** -1,066 -2,156 -3,594** -3,711**
KRGSYH -4,555*** -0,457 -1,601 -17,044*** -2,766* -3,704** -8,727*** -9,997***
KRDMEV -3,768*** -0,121 -2,790* -4,565*** -3,748*** -1,514 -2,790* -4,481***
PDGSYH -0,995 -3,535* -4,292*** -4,241** -2,132 -6,101*** -13,810*** -14,162***
YBNPO Z -2,183 -5,748*** -5,900*** -6,536*** -4,431*** -5,660*** -7,028*** -5,106***
FIENDK -3,930*** -4,604*** -5,236*** -5,324*** -3,902*** -5,767*** -19,630*** -17,448***
Seviye Birinci FarkSeviye Birinci FarkGenişletilmiş Dickey-Fuller(ADF) Phillips-Perron(PP)
Not: ***,** ve * sırasıyla %1, %5 ve %10 düzeyinde anlamlılığı ifade etmektedir.
31 Sevüktekin M., Çınar M. (2014). Ekonometrik Zaman Serileri Analizi, Genişletilmiş 4. Baskı, Bursa: Dora Yayınları, s.357.
32 Dickey, D.A., Fuller, W.A. (1979). Distribution of Estimators For Autoregressive Time Series with a unit Root Test, Journal of the American Statistical Association, 74: 428.
33 Phillipps, P.C.B. (1987). Time Series Regression with a Unit Root Test, Econometrica: Journal of Econometric Society, 55(2): 277.
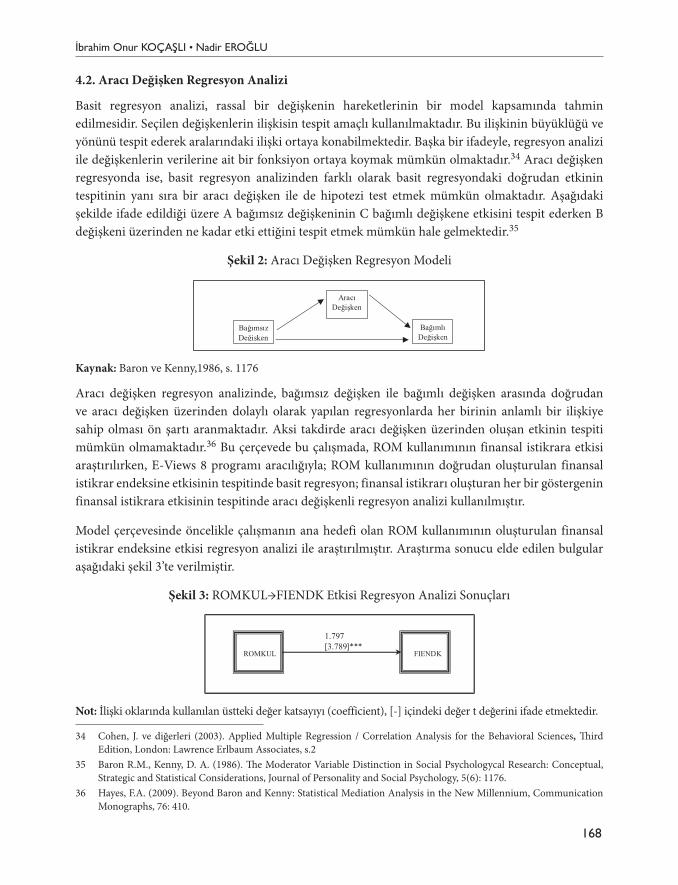
İbrahim Onur KOÇAŞLI • Nadir EROĞLU
168
4.2. Aracı Değişken Regresyon Analizi
Basit regresyon analizi, rassal bir değişkenin hareketlerinin bir model kapsamında tahmin edilmesidir. Seçilen değişkenlerin ilişkisin tespit amaçlı kullanılmaktadır. Bu ilişkinin büyüklüğü ve yönünü tespit ederek aralarındaki ilişki ortaya konabilmektedir. Başka bir ifadeyle, regresyon analizi ile değişkenlerin verilerine ait bir fonksiyon ortaya koymak mümkün olmaktadır.34 Aracı değişken regresyonda ise, basit regresyon analizinden farklı olarak basit regresyondaki doğrudan etkinin tespitinin yanı sıra bir aracı değişken ile de hipotezi test etmek mümkün olmaktadır. Aşağıdaki şekilde ifade edildiği üzere A bağımsız değişkeninin C bağımlı değişkene etkisini tespit ederken B değişkeni üzerinden ne kadar etki ettiğini tespit etmek mümkün hale gelmektedir.35
Şekil 2: Aracı Değişken Regresyon Modeli
mümkün olmaktadır. Aşağıdaki şekilde ifade edildiği üzere A bağımsız değişkeninin C bağımlı değişkene etkisini tespit ederken B değişkeni üzerinden ne kadar etki ettiğini tespit etmek mümkün hale gelmektedir.35
Şekil 2: Aracı Değişken Regresyon Modeli
Kaynak: Baron ve Kenny,1986, s. 1176
Aracı değişken regresyon analizinde, bağımsız değişken ile bağımlı değişken arasında doğrudan ve aracı değişken üzerinden dolaylı olarak yapılan regresyonlarda her birinin anlamlı bir ilişkiye sahip olması ön şartı aranmaktadır. Aksi takdirde aracı değişken üzerinden oluşan etkinin tespiti mümkün olmamaktadır.36 Bu çerçevede bu çalışmada, ROM kullanımının finansal istikrara etkisi araştırılırken, E-Views 8 programı aracılığıyla; ROM kullanımının doğrudan oluşturulan finansal istikrar endeksine etkisinin tespitinde basit regresyon; finansal istikrarı oluşturan her bir göstergenin finansal istikrara etkisinin tespitinde aracı değişkenli regresyon analizi kullanılmıştır.
Model çerçevesinde öncelikle çalışmanın ana hedefi olan ROM kullanımının oluşturulan finansal istikrar endeksine etkisi regresyon analizi ile araştırılmıştır. Araştırma sonucu elde edilen bulgular aşağıdaki şekil 3’te verilmiştir.
Şekil 3: ROMKUL→FIENDK Etkisi Regresyon Analizi Sonuçları
Not: İlişki oklarında kullanılan üstteki değer katsayıyı (coefficient), [-] içindeki değer t değerini ifade etmektedir.
35 Baron R.M., Kenny, D. A. (1986). The Moderator Variable Distinction in Social Psychologycal Research: Conceptual, Strategic and Statistical Considerations, Journal of Personality and Social Psychology, 5(6): 1176. 36 Hayes, F.A. (2009). Beyond Baron and Kenny: Statistical Mediation Analysis in the New Millennium, Communication Monographs, 76: 410.
Bağımsız Değişken
Bağımlı Değişken
Aracı Değişken
ROMKUL
FIENDK
1.797 [3.789]***
Kaynak: Baron ve Kenny,1986, s. 1176
Aracı değişken regresyon analizinde, bağımsız değişken ile bağımlı değişken arasında doğrudan ve aracı değişken üzerinden dolaylı olarak yapılan regresyonlarda her birinin anlamlı bir ilişkiye sahip olması ön şartı aranmaktadır. Aksi takdirde aracı değişken üzerinden oluşan etkinin tespiti mümkün olmamaktadır.36 Bu çerçevede bu çalışmada, ROM kullanımının finansal istikrara etkisi araştırılırken, E-Views 8 programı aracılığıyla; ROM kullanımının doğrudan oluşturulan finansal istikrar endeksine etkisinin tespitinde basit regresyon; finansal istikrarı oluşturan her bir göstergenin finansal istikrara etkisinin tespitinde aracı değişkenli regresyon analizi kullanılmıştır.
Model çerçevesinde öncelikle çalışmanın ana hedefi olan ROM kullanımının oluşturulan finansal istikrar endeksine etkisi regresyon analizi ile araştırılmıştır. Araştırma sonucu elde edilen bulgular aşağıdaki şekil 3’te verilmiştir.
Şekil 3: ROMKUL→FIENDK Etkisi Regresyon Analizi Sonuçları
mümkün olmaktadır. Aşağıdaki şekilde ifade edildiği üzere A bağımsız değişkeninin C bağımlı değişkene etkisini tespit ederken B değişkeni üzerinden ne kadar etki ettiğini tespit etmek mümkün hale gelmektedir.35
Şekil 2: Aracı Değişken Regresyon Modeli
Kaynak: Baron ve Kenny,1986, s. 1176
Aracı değişken regresyon analizinde, bağımsız değişken ile bağımlı değişken arasında doğrudan ve aracı değişken üzerinden dolaylı olarak yapılan regresyonlarda her birinin anlamlı bir ilişkiye sahip olması ön şartı aranmaktadır. Aksi takdirde aracı değişken üzerinden oluşan etkinin tespiti mümkün olmamaktadır.36 Bu çerçevede bu çalışmada, ROM kullanımının finansal istikrara etkisi araştırılırken, E-Views 8 programı aracılığıyla; ROM kullanımının doğrudan oluşturulan finansal istikrar endeksine etkisinin tespitinde basit regresyon; finansal istikrarı oluşturan her bir göstergenin finansal istikrara etkisinin tespitinde aracı değişkenli regresyon analizi kullanılmıştır.
Model çerçevesinde öncelikle çalışmanın ana hedefi olan ROM kullanımının oluşturulan finansal istikrar endeksine etkisi regresyon analizi ile araştırılmıştır. Araştırma sonucu elde edilen bulgular aşağıdaki şekil 3’te verilmiştir.
Şekil 3: ROMKUL→FIENDK Etkisi Regresyon Analizi Sonuçları
Not: İlişki oklarında kullanılan üstteki değer katsayıyı (coefficient), [-] içindeki değer t değerini ifade etmektedir.
35 Baron R.M., Kenny, D. A. (1986). The Moderator Variable Distinction in Social Psychologycal Research: Conceptual, Strategic and Statistical Considerations, Journal of Personality and Social Psychology, 5(6): 1176. 36 Hayes, F.A. (2009). Beyond Baron and Kenny: Statistical Mediation Analysis in the New Millennium, Communication Monographs, 76: 410.
Bağımsız Değişken
Bağımlı Değişken
Aracı Değişken
ROMKUL
FIENDK
1.797 [3.789]***
Not: İlişki oklarında kullanılan üstteki değer katsayıyı (coefficient), [-] içindeki değer t değerini ifade etmektedir.
34 Cohen, J. ve diğerleri (2003). Applied Multiple Regression / Correlation Analysis for the Behavioral Sciences, Third Edition, London: Lawrence Erlbaum Associates, s.2
35 Baron R.M., Kenny, D. A. (1986). The Moderator Variable Distinction in Social Psychologycal Research: Conceptual, Strategic and Statistical Considerations, Journal of Personality and Social Psychology, 5(6): 1176.
36 Hayes, F.A. (2009). Beyond Baron and Kenny: Statistical Mediation Analysis in the New Millennium, Communication Monographs, 76: 410.
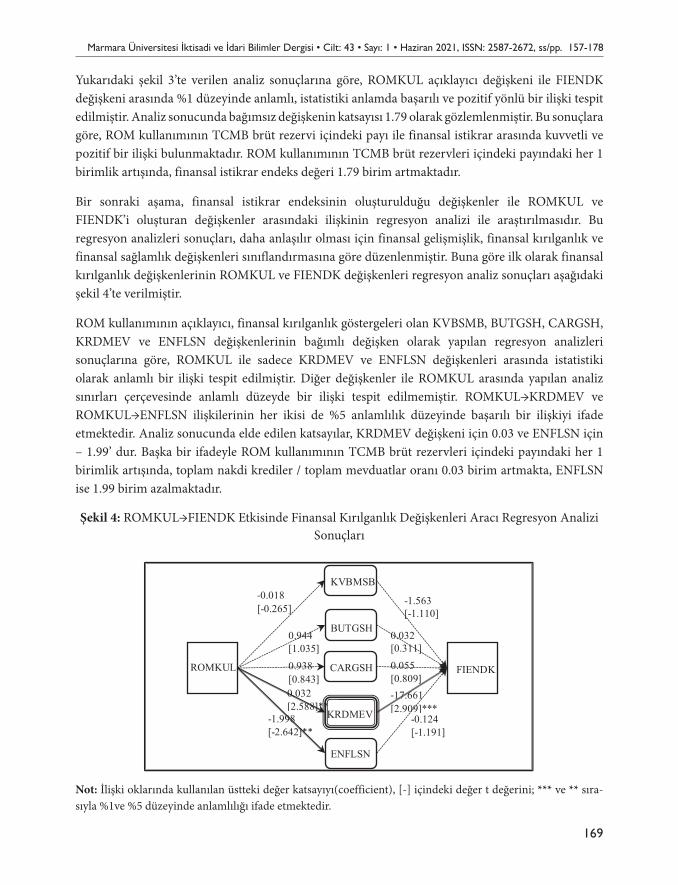
Marmara Üniversitesi İktisadi ve İdari Bilimler Dergisi • Cilt: 43 • Sayı: 1 • Haziran 2021, ISSN: 2587-2672, ss/pp. 157-178
169
Yukarıdaki şekil 3’te verilen analiz sonuçlarına göre, ROMKUL açıklayıcı değişkeni ile FIENDK değişkeni arasında %1 düzeyinde anlamlı, istatistiki anlamda başarılı ve pozitif yönlü bir ilişki tespit edilmiştir. Analiz sonucunda bağımsız değişkenin katsayısı 1.79 olarak gözlemlenmiştir. Bu sonuçlara göre, ROM kullanımının TCMB brüt rezervi içindeki payı ile finansal istikrar arasında kuvvetli ve pozitif bir ilişki bulunmaktadır. ROM kullanımının TCMB brüt rezervleri içindeki payındaki her 1 birimlik artışında, finansal istikrar endeks değeri 1.79 birim artmaktadır.
Bir sonraki aşama, finansal istikrar endeksinin oluşturulduğu değişkenler ile ROMKUL ve FIENDK’i oluşturan değişkenler arasındaki ilişkinin regresyon analizi ile araştırılmasıdır. Bu regresyon analizleri sonuçları, daha anlaşılır olması için finansal gelişmişlik, finansal kırılganlık ve finansal sağlamlık değişkenleri sınıflandırmasına göre düzenlenmiştir. Buna göre ilk olarak finansal kırılganlık değişkenlerinin ROMKUL ve FIENDK değişkenleri regresyon analiz sonuçları aşağıdaki şekil 4’te verilmiştir.
ROM kullanımının açıklayıcı, finansal kırılganlık göstergeleri olan KVBSMB, BUTGSH, CARGSH, KRDMEV ve ENFLSN değişkenlerinin bağımlı değişken olarak yapılan regresyon analizleri sonuçlarına göre, ROMKUL ile sadece KRDMEV ve ENFLSN değişkenleri arasında istatistiki olarak anlamlı bir ilişki tespit edilmiştir. Diğer değişkenler ile ROMKUL arasında yapılan analiz sınırları çerçevesinde anlamlı düzeyde bir ilişki tespit edilmemiştir. ROMKUL→KRDMEV ve ROMKUL→ENFLSN ilişkilerinin her ikisi de %5 anlamlılık düzeyinde başarılı bir ilişkiyi ifade etmektedir. Analiz sonucunda elde edilen katsayılar, KRDMEV değişkeni için 0.03 ve ENFLSN için – 1.99’ dur. Başka bir ifadeyle ROM kullanımının TCMB brüt rezervleri içindeki payındaki her 1 birimlik artışında, toplam nakdi krediler / toplam mevduatlar oranı 0.03 birim artmakta, ENFLSN ise 1.99 birim azalmaktadır.
Şekil 4: ROMKUL→FIENDK Etkisinde Finansal Kırılganlık Değişkenleri Aracı Regresyon Analizi Sonuçları
Makale Gönderim Tarihi: 14.02.2021 Yayına Kabul Tarihi: 13.06.2021
Yukarıdaki şekil 3’te verilen analiz sonuçlarına göre, ROMKUL açıklayıcı değişkeni ile FIENDK değişkeni arasında %1 düzeyinde anlamlı, istatistiki anlamda başarılı ve pozitif yönlü bir ilişki tespit edilmiştir. Analiz sonucunda bağımsız değişkenin katsayısı 1.79 olarak gözlemlenmiştir. Bu sonuçlara göre, ROM kullanımının TCMB brüt rezervi içindeki payı ile finansal istikrar arasında kuvvetli ve pozitif bir ilişki bulunmaktadır. ROM kullanımının TCMB brüt rezervleri içindeki payındaki her 1 birimlik artışında, finansal istikrar endeks değeri 1.79 birim artmaktadır.
Bir sonraki aşama, finansal istikrar endeksinin oluşturulduğu değişkenler ile ROMKUL ve FIENDK’i oluşturan değişkenler arasındaki ilişkinin regresyon analizi ile araştırılmasıdır. Bu regresyon analizleri sonuçları, daha anlaşılır olması için finansal gelişmişlik, finansal kırılganlık ve finansal sağlamlık değişkenleri sınıflandırmasına göre düzenlenmiştir. Buna göre ilk olarak finansal kırılganlık değişkenlerinin ROMKUL ve FIENDK değişkenleri regresyon analiz sonuçları aşağıdaki şekil 4’te verilmiştir.
ROM kullanımının açıklayıcı, finansal kırılganlık göstergeleri olan KVBSMB, BUTGSH, CARGSH, KRDMEV ve ENFLSN değişkenlerinin bağımlı değişken olarak yapılan regresyon analizleri sonuçlarına göre, ROMKUL ile sadece KRDMEV ve ENFLSN değişkenleri arasında istatistiki olarak anlamlı bir ilişki tespit edilmiştir. Diğer değişkenler ile ROMKUL arasında yapılan analiz sınırları çerçevesinde anlamlı düzeyde bir ilişki tespit edilmemiştir. ROMKUL→KRDMEV ve ROMKUL→ENFLSN ilişkilerinin her ikisi de %5 anlamlılık düzeyinde başarılı bir ilişkiyi ifade etmektedir. Analiz sonucunda elde edilen katsayılar, KRDMEV değişkeni için 0.03 ve ENFLSN için -1.99’ dur. Başka bir ifadeyle ROM kullanımının TCMB brüt rezervleri içindeki payındaki her 1 birimlik artışında, toplam nakdi krediler / toplam mevduatlar oranı 0.03 birim artmakta, ENFLSN ise 1.99 birim azalmaktadır.
Şekil 4: ROMKUL→FIENDK Etkisinde Finansal Kırılganlık Değişkenleri Aracı Regresyon
Analizi Sonuçları
Not: İlişki oklarında kullanılan üstteki değer katsayıyı(coefficient), [-] içindeki değer t değerini; *** ve ** sırasıyla %1ve %5 düzeyinde anlamlılığı ifade etmektedir.
KVBMSB
BUTGSH
CARGSH
KRDMEV
ENFLSN
ROMKUL FIENDK
-0.018 [-0.265]
0.944 [1.035] 0.938 [0.843] 0.032 [2.588]**
-1.998 [-2.642]**
-1.563 [-1.110]
0.032 [0.311] 0.055 [0.809] -17.661 [2.909]***
-0.124 [-1.191]
Not: İlişki oklarında kullanılan üstteki değer katsayıyı(coefficient), [-] içindeki değer t değerini; *** ve ** sıra-sıyla %1ve %5 düzeyinde anlamlılığı ifade etmektedir.
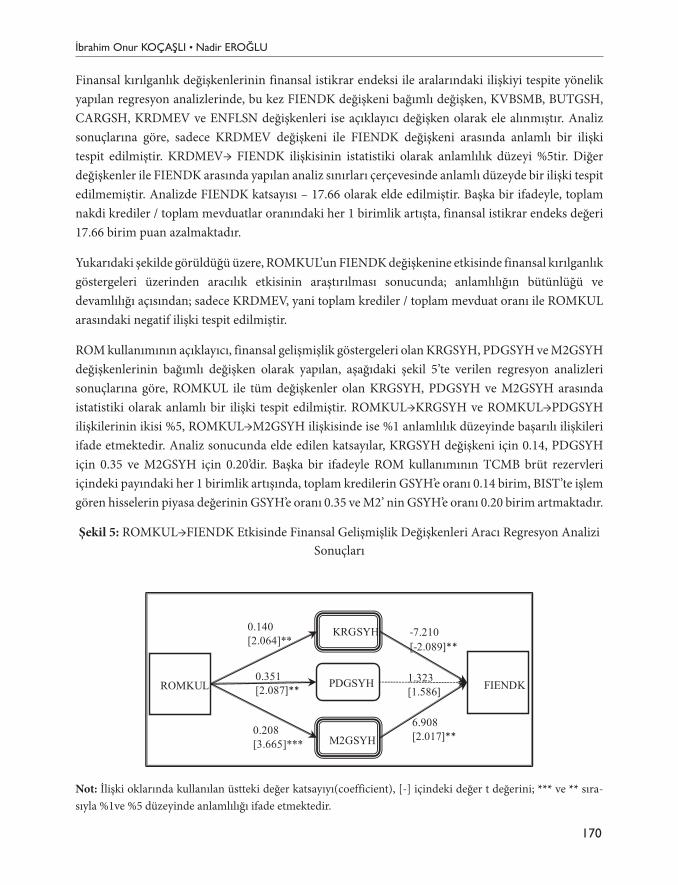
İbrahim Onur KOÇAŞLI • Nadir EROĞLU
170
Finansal kırılganlık değişkenlerinin finansal istikrar endeksi ile aralarındaki ilişkiyi tespite yönelik yapılan regresyon analizlerinde, bu kez FIENDK değişkeni bağımlı değişken, KVBSMB, BUTGSH, CARGSH, KRDMEV ve ENFLSN değişkenleri ise açıklayıcı değişken olarak ele alınmıştır. Analiz sonuçlarına göre, sadece KRDMEV değişkeni ile FIENDK değişkeni arasında anlamlı bir ilişki tespit edilmiştir. KRDMEV→ FIENDK ilişkisinin istatistiki olarak anlamlılık düzeyi %5tir. Diğer değişkenler ile FIENDK arasında yapılan analiz sınırları çerçevesinde anlamlı düzeyde bir ilişki tespit edilmemiştir. Analizde FIENDK katsayısı – 17.66 olarak elde edilmiştir. Başka bir ifadeyle, toplam nakdi krediler / toplam mevduatlar oranındaki her 1 birimlik artışta, finansal istikrar endeks değeri 17.66 birim puan azalmaktadır.
Yukarıdaki şekilde görüldüğü üzere, ROMKUL’un FIENDK değişkenine etkisinde finansal kırılganlık göstergeleri üzerinden aracılık etkisinin araştırılması sonucunda; anlamlılığın bütünlüğü ve devamlılığı açısından; sadece KRDMEV, yani toplam krediler / toplam mevduat oranı ile ROMKUL arasındaki negatif ilişki tespit edilmiştir.
ROM kullanımının açıklayıcı, finansal gelişmişlik göstergeleri olan KRGSYH, PDGSYH ve M2GSYH değişkenlerinin bağımlı değişken olarak yapılan, aşağıdaki şekil 5’te verilen regresyon analizleri sonuçlarına göre, ROMKUL ile tüm değişkenler olan KRGSYH, PDGSYH ve M2GSYH arasında istatistiki olarak anlamlı bir ilişki tespit edilmiştir. ROMKUL→KRGSYH ve ROMKUL→PDGSYH ilişkilerinin ikisi %5, ROMKUL→M2GSYH ilişkisinde ise %1 anlamlılık düzeyinde başarılı ilişkileri ifade etmektedir. Analiz sonucunda elde edilen katsayılar, KRGSYH değişkeni için 0.14, PDGSYH için 0.35 ve M2GSYH için 0.20’dir. Başka bir ifadeyle ROM kullanımının TCMB brüt rezervleri içindeki payındaki her 1 birimlik artışında, toplam kredilerin GSYH’e oranı 0.14 birim, BIST’te işlem gören hisselerin piyasa değerinin GSYH’e oranı 0.35 ve M2’ nin GSYH’e oranı 0.20 birim artmaktadır.
Şekil 5: ROMKUL→FIENDK Etkisinde Finansal Gelişmişlik Değişkenleri Aracı Regresyon Analizi Sonuçları
Finansal kırılganlık değişkenlerinin finansal istikrar endeksi ile aralarındaki ilişkiyi tespite yönelik yapılan regresyon analizlerinde, bu kez FIENDK değişkeni bağımlı değişken, KVBSMB, BUTGSH, CARGSH, KRDMEV ve ENFLSN değişkenleri ise açıklayıcı değişken olarak ele alınmıştır. Analiz sonuçlarına göre, sadece KRDMEV değişkeni ile FIENDK değişkeni arasında anlamlı bir ilişki tespit edilmiştir. KRDMEV→ FIENDK ilişkisinin istatistiki olarak anlamlılık düzeyi %5tir. Diğer değişkenler ile FIENDK arasında yapılan analiz sınırları çerçevesinde anlamlı düzeyde bir ilişki tespit edilmemiştir. Analizde FIENDK katsayısı -17.66 olarak elde edilmiştir. Başka bir ifadeyle, toplam nakdi krediler / toplam mevduatlar oranındaki her 1 birimlik artışta, finansal istikrar endeks değeri 17.66 birim puan azalmaktadır.
Yukarıdaki şekilde görüldüğü üzere, ROMKUL’un FIENDK değişkenine etkisinde finansal kırılganlık göstergeleri üzerinden aracılık etkisinin araştırılması sonucunda; anlamlılığın bütünlüğü ve devamlılığı açısından; sadece KRDMEV, yani toplam krediler / toplam mevduat oranı ile ROMKUL arasındaki negatif ilişki tespit edilmiştir.
ROM kullanımının açıklayıcı, finansal gelişmişlik göstergeleri olan KRGSYH, PDGSYH ve M2GSYH değişkenlerinin bağımlı değişken olarak yapılan, aşağıdaki şekil 5’te verilen regresyon analizleri sonuçlarına göre, ROMKUL ile tüm değişkenler olan KRGSYH, PDGSYH ve M2GSYH arasında istatistiki olarak anlamlı bir ilişki tespit edilmiştir. ROMKUL→KRGSYH ve ROMKUL→PDGSYH ilişkilerinin ikisi %5, ROMKUL→M2GSYH ilişkisinde ise %1 anlamlılık düzeyinde başarılı ilişkileri ifade etmektedir. Analiz sonucunda elde edilen katsayılar, KRGSYH değişkeni için 0.14, PDGSYH için 0.35 ve M2GSYH için 0.20’dir. Başka bir ifadeyle ROM kullanımının TCMB brüt rezervleri içindeki payındaki her 1 birimlik artışında, toplam kredilerin GSYH’e oranı 0.14 birim, BIST’te işlem gören hisselerin piyasa değerinin GSYH’e oranı 0.35 ve M2’ nin GSYH’e oranı 0.20 birim artmaktadır.
Şekil 5: ROMKUL→FIENDK Etkisinde Finansal Gelişmişlik Değişkenleri Aracı Regresyon
Analizi Sonuçları
Not: İlişki oklarında kullanılan üstteki değer katsayıyı(coefficient), [-] içindeki değer t değerini; *** ve ** sırasıyla %1ve %5 düzeyinde anlamlılığı ifade etmektedir.
KRGSYH
PDGSYH
M2GSYH
ROMKUL FIENDK
0.140 [2.064]**
0.351 [2.087]**
0.208 [3.665]***
-7.210 [-2.089]**
1.323 [1.586]
6.908 [2.017]**
Not: İlişki oklarında kullanılan üstteki değer katsayıyı(coefficient), [-] içindeki değer t değerini; *** ve ** sıra-sıyla %1ve %5 düzeyinde anlamlılığı ifade etmektedir.
Marmara Üniversitesi İktisadi ve İdari Bilimler Dergisi • Cilt: 43 • Sayı: 1 • Haziran 2021, ISSN: 2587-2672, ss/pp. 157-178
171
Finansal gelişmişlik değişkenlerinin finansal istikrar endeksi ile aralarındaki ilişkiyi tespite yönelik yapılan ve yukarıdaki şekilde sonuçları verilen regresyon analizlerinde, bu kez FIENDK değişkeni bağımlı değişken, KRGSYH, PDGSYH ve M2GSYH değişkenleri ise açıklayıcı değişken olarak ele alınmıştır.
Analiz sonuçlarına göre, sadece KRGSYH ve M2GSYH değişkenleri ile FIENDK değişkeni arasında anlamlı bir ilişki tespit edilmiştir. KRGSYH ile negatif, M2GSYH ile pozitif bir ilişki tespit edilmiştir. KRGSYH→FIENDK ve M2GSYH→FIENDK ilişkilerinin her ikisi için de istatistiki olarak anlamlılık düzeyi %5’tir. Diğer değişken PDGSYH ile FIENDK arasında yapılan analiz sınırları çerçevesinde anlamlı düzeyde bir ilişki tespit edilmemiştir. Analizde FIENDK katsayısı KRGSYH için – 7.20, M2GSYH için ise 6.90 olarak elde edilmiştir. Başka bir ifadeyle, toplam kredilerin ve M2’nin GSYH’e oranlarındaki her biri için 1 birimlik artışta, finansal istikrar endeks değeri KRGSYH için 7.20 birim puan azalmakta, M2GSYH için ise 6.90 birim puan artmaktadır.
Yukarıdaki şekilde görüldüğü üzere, ROMKUL’un FIENDK değişkenine etkisinde finansal gelişmişlik göstergeleri üzerinden aracılık etkisinin araştırılması sonucunda; anlamlılığın bütünlüğü ve devamlılığı açısından; KRGSYH ve M2GSYH, yani toplam kredilerin ve M2’nin GSYH’e oranları ile ROMKUL arasındaki sırasıyla negatif ve pozitif ilişkiler tespit edilmiştir.
ROM kullanımının açıklayıcı, finansal sağlamlık göstergeleri olan KVAKPF, BYPPOZ, KARAKF, KAROZK, LKTYET, SYSRAS, TKPNKR ve YBNPOZ değişkenlerinin bağımlı değişken olarak yapılan ve aşağıdaki şekil 6’da verilen regresyon analizleri sonuçlarına göre, ROMKUL ile sadece BYPPOZ ve YBNPOZ değişkenleri arasında istatistiki olarak anlamlı bir ilişki tespit edilmiştir. ROMKUL→BYPPOZ ve ROMKUL→YBNPOZ ilişkilerinin her ikisi de %5 anlamlılık düzeyinde başarılı ilişkileri ifade etmektedir. Analiz sonucunda elde edilen katsayılar, BYPPOZ değişkeni için 0.16, YBNPOZ için 0.54’tür. Başka bir ifadeyle ROM kullanımının TCMB brüt rezervleri içindeki payındaki her 1 birimlik artışında, bilanço içi yabancı para pozisyonunun yasal öz kaynaklara oranı 0.16 birim, yabancı para net genel pozisyonunun yasal öz kaynaklara oranı 0.54 birim artmaktadır.
Finansal sağlamlık değişkenlerinin finansal istikrar endeksi ile aralarındaki ilişkiyi tespite yönelik yapılan ve aşağıdaki şekilde sonuçları verilen regresyon analizlerinde, bu kez FIENDK değişkeni bağımlı değişken, KVAKPF, BYPPOZ, KARAKF, KAROZK, LKTYET, SYSRAS, TKPNKR ve YBNPOZ değişkenleri ise açıklayıcı değişken olarak ele alınmıştır. Analiz sonuçlarına göre, sadece BYPPOZ ve YBNPOZ değişkenleri ile FIENDK değişkeni arasında anlamlı bir ilişki tespit edilmiştir. Her iki değişken için de negatif bir ilişki tespit edilmiştir. BYPPOZ→FIENDK ilişkisi için istatistiki olarak anlamlılık düzeyi %5, YBNPOZ→FIENDK ilişkisinin istatistiki olarak anlamlılık düzeyi ise %1dir. Diğer değişkenler ile FIENDK arasında yapılan analiz sınırları çerçevesinde anlamlı düzeyde bir ilişki tespit edilmemiştir. Analizde FIENDK katsayısı BYPPOZ için – 5.30, YBNPOZ için ise – 1.84 olarak elde edilmiştir. Başka bir ifadeyle, bilanço içi yabancı para pozisyonunun ve yabancı para net genel pozisyonunun yasal öz kaynaklara oranlarındaki her biri için 1 birimlik artışta, finansal istikrar endeks değeri BYPPOZ için 5.30 birim, YBNPOZ için ise 1.84 birim azalmaktadır.
İbrahim Onur KOÇAŞLI • Nadir EROĞLU
172
Şekil 6: ROMKUL→FIENDK Etkisinde Finansal Sağlamlık Değişkenleri Aracı Regresyon Analizi SonuçlarıŞekil 6: ROMKUL→FIENDK Etkisinde Finansal Sağlamlık Değişkenleri Aracı Regresyon
Analizi Sonuçları
Not: İlişki oklarında kullanılan üstteki değer katsayıyı (coefficient), [-] içindeki değer t değerini; *** ve ** sırasıyla %1ve %5 düzeyinde anlamlılığı ifade etmektedir.
Yukarıdaki şekilde görüldüğü üzere, ROMKUL’un FIENDK değişkenine etkisinde finansal sağlamlık göstergeleri üzerinden aracılık etkisinin araştırılması sonucunda; anlamlılığın bütünlüğü ve devamlılığı açısından; BYPPOZ ve YBNPOZ, yani bilanço içi yabancı para pozisyonunun ve yabancı para net genel pozisyonunun yasal öz kaynaklara oranları üzerinden FIENDK ile ROMKUL arasındaki negatif ilişki tespit edilmiştir.
5. Sonuç Finansal sistemde yaşanan krizlerin etkileri küresel anlamda yayılmış ve makroekonomik göstergelerin olumsuz etkilenmesine sebep olmuştur. Sonrasında, merkez bankaları için fiyat istikrarı hedefinin tek başına makroekonomik istikrarı sağlayamadığının farkına varılmış ve finansal sistemin istikrarına yönelik politika uygulamaları da önem kazanmıştır. Bu kapsamda yeni amaçları benimseyen merkez bankalarının finansal istikrara yönelik araçlarını devreye sokmasıyla araç ve amaç sayıları da artmıştır. Kullanılan araçların etkinliğini anlamak, finansal istikrarın ölçülmesinin kolay olmaması nedeniyle daha zor bir hale gelmiştir.
BYPPOZ
KARAKF
KAROZK
LKTYET
SYSRAS
ROMKUL FIENDK
0.027 [0.881]
0.169 [2.100]**
-1.082 [-0.799]
-1.167 [-0.841]
-1.054 [-0.294]
-5.309 [-2,945]***
3.237 [1.546]
0.334 [0.075]
3.165 [1.580]
KVAKPF
TKPNKR
YBNPOZ 0.542 [2.516]**
-0.054 [-0.956]
0.005 [0.113]
0.003 [0.090]
4.839 [1.588]
-0.882 [-0.533]
-1.849 [-2.362]**
Not: İlişki oklarında kullanılan üstteki değer katsayıyı (coefficient), [-] içindeki değer t değerini; *** ve ** sıra-sıyla %1ve %5 düzeyinde anlamlılığı ifade etmektedir.
Yukarıdaki şekilde görüldüğü üzere, ROMKUL’un FIENDK değişkenine etkisinde finansal sağlamlık göstergeleri üzerinden aracılık etkisinin araştırılması sonucunda; anlamlılığın bütünlüğü ve devamlılığı açısından; BYPPOZ ve YBNPOZ, yani bilanço içi yabancı para pozisyonunun ve yabancı para net genel pozisyonunun yasal öz kaynaklara oranları üzerinden FIENDK ile ROMKUL arasındaki negatif ilişki tespit edilmiştir.
5. Sonuç
Finansal sistemde yaşanan krizlerin etkileri küresel anlamda yayılmış ve makroekonomik göstergelerin olumsuz etkilenmesine sebep olmuştur. Sonrasında, merkez bankaları için fiyat istikrarı hedefinin tek başına makroekonomik istikrarı sağlayamadığının farkına varılmış ve finansal sistemin istikrarına yönelik politika uygulamaları da önem kazanmıştır. Bu kapsamda yeni amaçları benimseyen merkez bankalarının finansal istikrara yönelik araçlarını devreye sokmasıyla araç ve amaç sayıları da artmıştır. Kullanılan araçların etkinliğini anlamak, finansal istikrarın ölçülmesinin kolay olmaması nedeniyle daha zor bir hale gelmiştir.
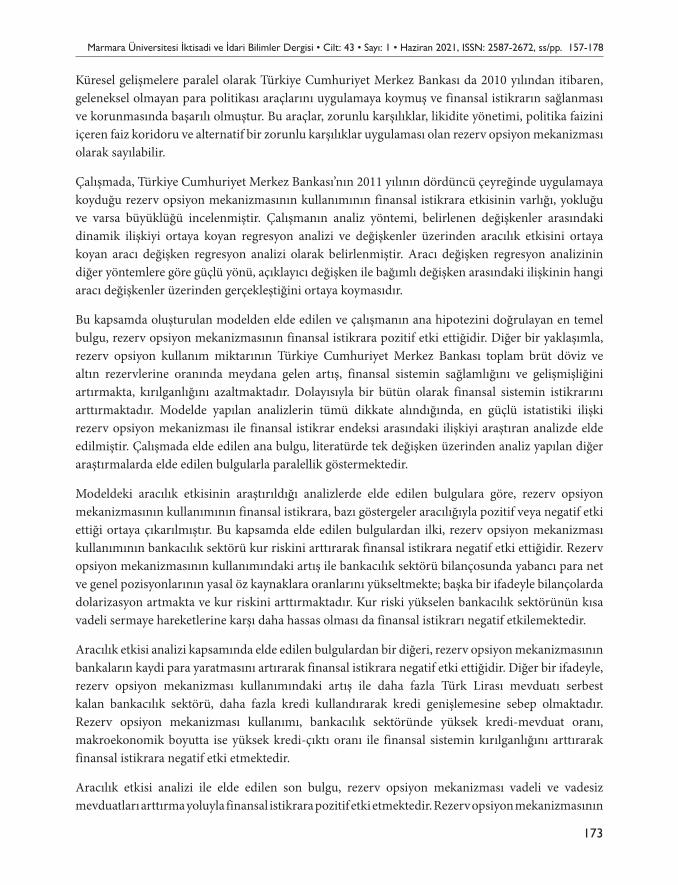
Marmara Üniversitesi İktisadi ve İdari Bilimler Dergisi • Cilt: 43 • Sayı: 1 • Haziran 2021, ISSN: 2587-2672, ss/pp. 157-178
173
Küresel gelişmelere paralel olarak Türkiye Cumhuriyet Merkez Bankası da 2010 yılından itibaren, geleneksel olmayan para politikası araçlarını uygulamaya koymuş ve finansal istikrarın sağlanması ve korunmasında başarılı olmuştur. Bu araçlar, zorunlu karşılıklar, likidite yönetimi, politika faizini içeren faiz koridoru ve alternatif bir zorunlu karşılıklar uygulaması olan rezerv opsiyon mekanizması olarak sayılabilir.
Çalışmada, Türkiye Cumhuriyet Merkez Bankası’nın 2011 yılının dördüncü çeyreğinde uygulamaya koyduğu rezerv opsiyon mekanizmasının kullanımının finansal istikrara etkisinin varlığı, yokluğu ve varsa büyüklüğü incelenmiştir. Çalışmanın analiz yöntemi, belirlenen değişkenler arasındaki dinamik ilişkiyi ortaya koyan regresyon analizi ve değişkenler üzerinden aracılık etkisini ortaya koyan aracı değişken regresyon analizi olarak belirlenmiştir. Aracı değişken regresyon analizinin diğer yöntemlere göre güçlü yönü, açıklayıcı değişken ile bağımlı değişken arasındaki ilişkinin hangi aracı değişkenler üzerinden gerçekleştiğini ortaya koymasıdır.
Bu kapsamda oluşturulan modelden elde edilen ve çalışmanın ana hipotezini doğrulayan en temel bulgu, rezerv opsiyon mekanizmasının finansal istikrara pozitif etki ettiğidir. Diğer bir yaklaşımla, rezerv opsiyon kullanım miktarının Türkiye Cumhuriyet Merkez Bankası toplam brüt döviz ve altın rezervlerine oranında meydana gelen artış, finansal sistemin sağlamlığını ve gelişmişliğini artırmakta, kırılganlığını azaltmaktadır. Dolayısıyla bir bütün olarak finansal sistemin istikrarını arttırmaktadır. Modelde yapılan analizlerin tümü dikkate alındığında, en güçlü istatistiki ilişki rezerv opsiyon mekanizması ile finansal istikrar endeksi arasındaki ilişkiyi araştıran analizde elde edilmiştir. Çalışmada elde edilen ana bulgu, literatürde tek değişken üzerinden analiz yapılan diğer araştırmalarda elde edilen bulgularla paralellik göstermektedir.
Modeldeki aracılık etkisinin araştırıldığı analizlerde elde edilen bulgulara göre, rezerv opsiyon mekanizmasının kullanımının finansal istikrara, bazı göstergeler aracılığıyla pozitif veya negatif etki ettiği ortaya çıkarılmıştır. Bu kapsamda elde edilen bulgulardan ilki, rezerv opsiyon mekanizması kullanımının bankacılık sektörü kur riskini arttırarak finansal istikrara negatif etki ettiğidir. Rezerv opsiyon mekanizmasının kullanımındaki artış ile bankacılık sektörü bilançosunda yabancı para net ve genel pozisyonlarının yasal öz kaynaklara oranlarını yükseltmekte; başka bir ifadeyle bilançolarda dolarizasyon artmakta ve kur riskini arttırmaktadır. Kur riski yükselen bankacılık sektörünün kısa vadeli sermaye hareketlerine karşı daha hassas olması da finansal istikrarı negatif etkilemektedir.
Aracılık etkisi analizi kapsamında elde edilen bulgulardan bir diğeri, rezerv opsiyon mekanizmasının bankaların kaydi para yaratmasını artırarak finansal istikrara negatif etki ettiğidir. Diğer bir ifadeyle, rezerv opsiyon mekanizması kullanımındaki artış ile daha fazla Türk Lirası mevduatı serbest kalan bankacılık sektörü, daha fazla kredi kullandırarak kredi genişlemesine sebep olmaktadır. Rezerv opsiyon mekanizması kullanımı, bankacılık sektöründe yüksek kredi-mevduat oranı, makroekonomik boyutta ise yüksek kredi-çıktı oranı ile finansal sistemin kırılganlığını arttırarak finansal istikrara negatif etki etmektedir.
Aracılık etkisi analizi ile elde edilen son bulgu, rezerv opsiyon mekanizması vadeli ve vadesiz mevduatları arttırma yoluyla finansal istikrara pozitif etki etmektedir. Rezerv opsiyon mekanizmasının
İbrahim Onur KOÇAŞLI • Nadir EROĞLU
174
kullanımındaki artış ile bankalar kaydi para yaratma imkanlarını genişletmektedir. Bu sayede Türkiye Cumhuriyet Merkez Bankası’nın tanımladığı parasal büyüklükler de artarak finansal piyasaların genişlemesine, dolayısıyla da finansal istikrarın artmasına pozitif etki etmektedir.
Çalışmada elde edilen bir başka bulgu da rezerv opsiyon mekanizmasının Türkiye Cumhuriyet Merkez Bankası brüt döviz rezervlerini arttırarak finansal istikrara pozitif etki ettiğidir. Rezerv opsiyon mekanizmasının kullanımı ile bankalar tarafından Türkiye Cumhuriyet Merkez Bankası bünyesinde tutulan döviz ve altın miktarı artmaktadır. Türkiye Cumhuriyet Merkez Bankası brüt rezervlerindeki bu artış, Türkiye Cumhuriyet Merkez Bankası aracılığıyla finansal sistemi de içeren tüm ekonomiyi gerek yurtiçi gerekse yurtdışı kaynaklı oluşabilecek ani değişimlere karşı daha güçlü hale getirmektedir. Ayrıca rezervlerin güçlü olması ile özellikle Türkiye gibi gelişmekte olan ülkeler, kısa vadeli dış borç servislerini düzenli olarak sağlayabilmekte ve uluslararası finans çevreleri ile piyasalarda kendisine duyulan güveni artırmaktadırlar.
Çalışmada elde edilen bulgular değerlendirildiğinde, Türkiye Cumhuriyet Merkez Bankası’nın finansal istikrara yönelik uyguladığı politika ve kullandığı araçlar ile ilgili öneriler çıkarmak mümkündür. İlk olarak, finansal istikrarın sağlanması ve korunmasına yönelik uyguladığı rezerv opsiyon mekanizmasının kullanılmasına devam edilmelidir. Rezerv opsiyon mekanizmasının negatif etkilediği finansal istikrar göstergelerine yönelik; özellikle enflasyon hedeflemesi politikasını zayıflatmasını engelleyecek kredi genişleme kontrol araçları üzerine ek politika tedbiri almalıdır. Ayrıca bankacılık sektörü bilanço dalgalanmalarından dolayı reel sektör fonlama maliyetleri değişkenlik gösterebilir, bu da TCMB büyüme hedefine yönelik faiz politikasında zayıflık oluşturabilir.
Rezerv opsiyon mekanizması finansal sisteme pozitif etki yaptıkça Türkiye Cumhuriyet Merkez Bankası enflasyon hedeflemesinde başarılı olacaktır. Bu başarı ile sağlanan fiyat istikrarı ile de reel sektör ve büyüme arasındaki ilişki uzun vadede korunacaktır. Diğer taraftan sağlanan ve korunan finansal istikrara duyulan güven ile yurt dışı sermaye hareketlerinin brüt döviz rezervlerine olan düzenli katkısı devam edecek ve yaşanabilecek muhtemel döviz krizlerine mahal vermeyecektir.
TCMB rezerv opsiyon mekanizması ve diğer araçların koordineli kullanımından oluşan politika setini, rezerv opsiyon mekanizması kullanımında ortaya çıkan negatif etkileri dikkate alarak dizayn etmelidir. Ayrıca bu politika setinin dizaynında kullanılacak her bir araç ve bu araçların optimal kullanım düzeyleri, hem kurumsal olarak TCMB için, hem de yapılacak yeni çalışmalar adına önemli bir araştırma sorusu olacaktır.
KaynakçaALPER, K., Kara, H., Yörükoğlu, M. (2013). Alternative Tools to Manage Capital Flow Volatility, TCMB Working
Paper, No:13/31.ALPER, K., Kara H., Yörükoğlu, M. (2013). Reserve Options Mechanism, Central Bank Review, 13: 1-14.ASLANER, O., Çıplak, U., Kara, H., Küçüksaraç, D. (2014). Reserve Option Mechanism: Does It Work As An
Automatic Stabilizer?, TCMB Working Paper, No:14/38.AYSAN, A.F, Fendoğlu, S., Kılınç, M. (2014). Managing Short-Term Capital Flows in New Central Banking:
Unconventional Monetary Policy Framework in Turkey, TCMB Working Papers, No:14/03.
Marmara Üniversitesi İktisadi ve İdari Bilimler Dergisi • Cilt: 43 • Sayı: 1 • Haziran 2021, ISSN: 2587-2672, ss/pp. 157-178
175
BARON, R.M., Kenny, D.A. (1986). The Moderator Variable Distinction in Social Psychologycal Research: Conceptual, Strategic and Statistical Considerations, Journal of Personality and Social Psychology, 51(6): 1173-1182.
BÖCÜOĞLU, M.E. (2015). Rezerv Opsiyon Mekanizmasının Banka Davranışlarına Etkisi, TCMB Uzmanlık Yeterlilik Tezi.
COHEN, J., Cohen P., West, S., Aiken, L. (2003). Applied Multiple Regression / Correlation Analysis for the Behavioral Sciences, Third Edition, London: Lawrence Erlbaum Associates.
ÇETİN, M.Ö. (2016). Türkiye Cumhuriyet Merkez Bankası (TCMB) Para Politikası Uygulamalarının Gelişimi, Finansal Araştırmalar ve Çalışmalar Dergisi, 8(14): 67-101.
DEĞERLİ, A., Fendoğlu, S. (2013). Reserve Option Mechanism as a Stabilizing Policy Tool: Evidence from Exchange Rate Expectations, TCMB Working Paper, No:13/28.
DEMİRHAN, B. (2013). Türkiye’de Yeni Yaklaşım Çerçevesinde Para Politikalarının Finansal İstikrarı Sağlama Yönünde Uygulanması, Afyon Kocatepe Üniversitesi İİBF Dergisi, 15(2): 567-589.
DİCKEY, D.A., Fuller W.A. (1979). Distribution of the Estimators for Autoregressive Time Series with a Unit Root, Journal of the American Statistical Association, 74: 427-432.
ERGİN, A., Aydın, H.A. (2017). Finansal İstikrarı Sağlamaya Yönelik Bir Araç: Rezerv Opsiyon Mekanizması, Batman Üniversitesi Yaşam Bilimleri Dergisi, 7(1): 63-75.
ERMİŞOĞLU, E., Oduncu, A., Akçelik, Y. (2013). Rezerv Opsiyon Mekanizması ve Kur Oynaklığı, TCMB Ekonomi Notları, Sayı: 2013/04.
EROĞLU, N., Söylemez, A.O., Alıç, C. (2016). Türkiye’de Zorunlu Karşılıklar ve Tüketici Kredileri: Ekonometrik Bir Model Denemesi. Marmara Üniversitesi İktisadi ve İdari Bilimler Dergisi, 38(2): 63-86.
EROĞLU, N., Kara F. (2017). Türkiye’de Makro İhtiyati Para Politikası Araçlarının Makroekonomik Değişkenlere Etkisinin VAR Analizi ile İncelenmesi, İstanbul İktisat Dergisi, 76(2): 59-88.
HAYES, F.A. (2009). Beyond Baron and Kenny: Statistical Mediation Analysis in the New Millennium, Communication Monographs, 76: 408-420.
IMF (2004). “Financial Soundness Indicators: Compilation Guide”, imf.org/external/np/sta/fsi/ eng/2004/guide/index.htm, (Erişim Tarihi: 10.11.2020).
KANTAR, L. (2017). Rezerv Opsiyon Mekanizması ve Döviz Kuru Volatilitesi: Türkiye Üzerine Bir Uygulama, 21. Finans Sempozyumu Bildiri Kitabı, Balıkesir Üniversitesi, 1: 623-634.
KARA, A.H. (2012). Küresel Kriz Sonrası Para Politikası, TCMB Çalışma Tebliği, No:12/17.KARA, A. H. (2016). Turkey’s Experience With Macroprudential Policy, BIS Papers, No:86.KILCI, E.N. (2019). New Trends in Cenrtal Banking in Turkey; A Study on the Reserve Option Mechanism and
the Asymetric Interest Rate Corridor, Muhasebe ve Finansman Dergisi, Ağustos 2019 Özel sayı: 185-200.
KURUM, M.S., Oktar S. (2019). Rezerv Opsiyon Mekanizmasının Döviz Kuru Üzerindeki Etkisi, Marmara Üniversitesi İktisadi ve İdari Bilimler Dergisi, 41(1): 223-246.
KÜÇÜKSARAÇ, D., Özgür Ö. (2012). Rezerv Opsiyon Mekanizması ve Optimal Rezerv Opsiyonu Katsayısının Hesaplanması, TCMB Çalışma Tebliği. No:12/32.
PHILLIPS, P.C.B., Perron P. (1988). Testing for a Unit Root in Time Seris Regression, Biometrika, 75(2): 335-346.
PHILLIPS, P. C. B. (1987). Time Series Regression with a Unit Root Test, Econometrica: Journal of Econometric Society, 55(2): 277-301.
SAİSANA, M., Tarantola S. (2002). State of the Art Report on Current Öethodologies and Practices for Composite Indicator Development, European Commission JRC.
İbrahim Onur KOÇAŞLI • Nadir EROĞLU
176
SEREL, A., Özkurt İ.C. (2014). Geleneksel Olmayan Para Politikası Araçları ve Türkiye Cumhuriyet Merkez Bankası, Yönetim ve Ekonomi Araştırmaları Dergisi, 22: 56-71.
SEVÜKTEKİN, M., Çınar M. (2014). Ekonometrik Zaman Serileri Analizi, Genişletilmiş 4. Baskı, Bursa: Dora Yayınları.
TCMB. EVDS-Elektronik Veri Dağıtım Sistemi, https://evds2.tcmb.gov.tr/, (Erişim Tarihi: 10/2019-12/2020).TCMB. “Zorunlu Karşılıklar Veri Seti”, https://www.tcmb.gov.tr/wps/wcm/connect /TR/TCMB+TR/ Main+
Menu/Istatistikler/Bankacilik+Verileri/Zorunlu+Karsiliklar/, Erişim Tarihi: (10/2019-12/2020).TCMB (2012). Bülten, Sayı 28, Aralık 2012.THE WORLD BANK (2014). “World Development Indicators 2014”, openknowledge.worldbank.org, (Erişim
Tarihi: 11.10.2019).TÜİK. İstatistik Veri Portalı, https://data.tuik.gov.tr/Kategori/GetKategori?p=Enflasyon-ve-Fiyat-106, (Erişim
Tarihi: 10/2019-12/2020).YÜCEL, T., Serbest E. (2012). Yeni Dönem Para Politikası Araçları, Dayanışma Dergisi, 116(2): 8-17.
177
The effects of the crises experienced in the financial system spread globally and caused negative effects on the macroeconomic indicators. Later, it was realized that the price stability target for central banks could not provide macroeconomic stability alone and policy practices for the stability of the financial system increased in importance. In this context, the number of instruments and objectives increased with using financial stability instruments by central banks, which adopted new objectives. Understanding the effectiveness of the tools used has become more difficult because financial stability is not easy to measure.
In parallel with global developments, the Central Bank of the Republic of Turkey has implemented unconventional monetary policy tools to achieve and maintain financial stability since 2010 and has been successful. These tools can be listed as required reserves, liquidity management, interest rate corridor including policy interest and reserve option mechanism that is an alternative required reserves application.
In this study, the presence and the importance of the impact on financial stability of the reserve option mechanism usage implemented in the fourth quarter of 2011 by The Central Bank of the Republic of Turkey. The analysis method of the study was determined as regression analysis, which reveals the dynamic relationship between the determined variables, and the intermediary variable regression analysis, which reveals the mediation effect on the variables. The strength of the intermediary variable regression analysis compared to other methods is that it can explain the source of relationship between the explanatory variable and the dependent variable.
The most basic finding obtained from the model created in this context and confirming the main hypothesis of the study is that the reserve option mechanism has a positive effect on financial stability. In other approach, increasing of the amount of reserve option mechanism usage in the proportion of the total gross foreign exchange and gold reserve of the Central Bank of the Republic of Turkey reserves, increases the stability of the financial system and reduces the vulnerability. Therefore, it increases the stability of the financial system as a whole. Considering all the analyzes performed in the model, the strongest statistical relationship was obtained in the analysis is the relationship between the reserve option mechanism and the financial stability index. The main finding obtained in the study is in parallel with the findings obtained in other studies in the literature that have been analyzed by a single variable.
According to the findings obtained in the mediation effect analyzes of the model, it was revealed that the use of the reserve option mechanism has positive or negative effects on financial stability through some indicators. The first of the findings obtained in this context is that the use of the reserve option mechanism has a negative effect on financial stability by increasing the banking sector’s currency risk. With the increase in the use of the reserve option mechanism, the ratio of foreign currency net and general positions to legal equity in its balance sheet in the banking sector increases. In other words, dollarization increases in balance sheets. So, exchange rate risk increases for the banking
Extended Abstract
İbrahim Onur KOÇAŞLI • Nadir EROĞLU
178
sector. The fact that the banking sector, whose currency risk is increasing, becomes more sensitive to short-term capital movements and also affects financial stability negatively.
Another finding obtained in the mediation effect analysis is that the reserve option mechanism has a negative impact on financial stability by increasing banks’ money creation. In other words, the banking sector, which has released more Turkish Lira deposits with the increase in the use of the reserve option mechanism, causes credit expansion by extending more loans. The use of the reserve option mechanism has a negative effect on financial stability by increasing the fragility of the financial system with a high loan-to-deposit ratio in the banking sector and a high loan-output ratio in the macroeconomic dimension.
The latest finding obtained in the mediation effect analysis is that the reserve option mechanism has a positive effect on financial stability by increasing bank deposits. With the increase in the use of the reserve option mechanism, banks are expanding their ability to create bank money. This causes an increase in the monetary aggregates defined by the Central Bank of the Republic of Turkey. And the increase of monetary aggregates supports expansion of financial markets and have positive impact on the financial stability.
Another finding obtained in this study is that the reserve option mechanism has a positive effect on financial stability by increasing gross foreign exchange reserves of Central Bank of the Republic of Turkey reserves. With the use of reserve option mechanism by banks, the amount of gold and foreign exchange reserves held at the Central Bank of the Republic of Turkey is increasing. This increase in gross reserves of the Central Bank of the Republic of Turkey makes the entire economy and also financial system stronger. Additionally, the increase of the amount reserves of the Central Bank of the Republic of Turkey, makes the economy more resistant to sudden changes that may occur origin domestic and abroad. Also, strong reserves, especially for developing countries such as Turkey, can provide the short-term external debt service regularly and are increasing the international financial community’s confidence in the market.
When evaluating the findings obtained in this study, it is possible to make recommendations about instruments that are used for financial stability by the Central Bank of the Republic of Turkey. First of all, the use of the reserve option mechanism, which is implemented for the establishment and protection of financial stability, should be continued. Regarding financial stability indicators negatively affected by the reserve option mechanism; Central Bank of the Republic of Turkey should take additional policy measures on credit expansion control tools that will prevent it from weakening inflation targeting policy. In addition, real sector funding costs may vary due to the banking sector balance sheet fluctuations, which may create a weakness in the interest rate policy towards the CBRT growth target. The CBRT should design the policy set, which consists of the use of the reserve option mechanism and coordinated use of other instruments, taking into account the negative effects that occur in the use of the reserve option mechanism.
179Makale Gönderim Tarihi:Makale Gönderim Tarihi: 14.02.2021Yayına Kabul Tarihi:Yayına Kabul Tarihi: 13.06.2021
ARAŞTIRMA MAKALESİ / RESEARCH ARTICLE
Marmara Üniversitesi İktisadi ve İdari Bilimler Dergisi • Cilt: 43 • Sayı: 1 • Haziran 2021, ISSN: 2587-2672, ss/pp. 179-196 DOI: 10.14780/muiibd.960326
HOUSEHOLD CONSUMPTION EXPENDITURES IN TURKEY: A COMPARATIVE QUANTILE REGRESSION ANALYSIS
TÜRKİYE’DE HANEHALKI TÜKETİM HARCAMALARI ÜZERİNE KARŞILAŞTIRMALI BİR KANTİL REGRESYON ANALİZİ
Gizem ACET DÖNMEZ1
* Hurşit GÜNEŞ2
**
AbstractConsumption is one of the key concepts in economics due to its animate connections with GDP, savings, and utility. The current study aims to analyse the relationship between household consumption expenditures and some household characteristics in Turkey through Household Budget Surveys of TurkStat for the years 2002 and 2018. With the implementation of quantile regression estimations, it is shown that disposable income emerges as a very important determinant of consumption expenditures as suggested by the conventional theories of consumption. Most of the households, who intensify their savings, especially to purchase real estate, reduce their consumption levels. It is also observed that the household-heads who are single or enjoy a higher level of education spend more. Although the age of the household head is positively associated with the level of consumption in 2002, this relationship seems to be reversed in 2018. Regarding economic growth trends in the Turkish economy, such an observation might support the life-cycle theory. The households who use credit cards and online shopping are associated with a higher level of consumption expenditure compared to those who do not use these opportunities.Keywords: Consumer Economics: Empirical Analysis, Quantile Regressions, Household ConsumptionJEL Classification: D12, C31
ÖzTüketim özellikle GSYH, tasarruflar ve fayda teorisi ile ilişkileri nedeniyle iktisat alanında çok önemli bir yere sahiptir. Bu çalışmanın amacı hanehalkı tüketim harcamaları ile bazı hanehalkı özellikleri arasındaki ilişkiyi analiz etmektir. Bu amaçla, TÜİK’in 2002 ve 2018 yıllarındaki Hanehalkı Bütçe Anketleri kullanılmıştır. Kantil regresyon tahminleri, kullanılabilir gelirin geleneksel tüketim teorilerinin de belirttiği gibi tüketim harcamalarını açıklayan çok önemli bir faktör olduğunu göstermiştir. Genel olarak, daha fazla tasarruf yaparak gayrimenkul satın alan hanelerin daha az tüketim yaptığı gözlenmiştir. Eğitim seviyesi daha yüksek
* Res. Asst., Marmara University, Department of Economics, Istanbul, E-Mail: [email protected], ORCID ID: 0000-0002-3936-7147
** Prof. Dr., Marmara University, Department of Economics, Istanbul, E-Mail: [email protected], ORCID ID: 0000-0003-2441-4171
Gizem ACET DÖNMEZ • Hurşit GÜNEŞ
180
ve bekar hanehalkı reislerinin olduğu hanelerde daha fazla tüketim yapıldığı ortaya çıkmıştır. 2002 yılında hanehalkı reisinin yaşı tüketim harcamaları ile pozitif yönlü bir ilişkiye sahip iken, 2018 yılında bu ilişki tersine dönmüştür. Türkiye ekonomisindeki büyüme trendleri göz önünde bulundurulduğunda bu bulgu yaşam boyu gelir teorisini destekler niteliktedir. Kredi kartı kullanan ve online alışveriş yapan hanelerin bu olanakları kullanmayan hanelere göre daha fazla tüketim harcaması yaptığı sonucuna ulaşılmıştır. Kredi kartları ile e-ticaretin yaygınlaşmasının önemli bir kolaylık sağlaması dolayısıyla bireylerin tüketimini arttırdığı açıktır.Anahtar Kelimeler: Tüketici Ekonomisi: Ampirik Analiz, Kantil Regresyon, Hanehalkı TüketimiJEL Sınıflandırması: D12, C31
1. Introduction
The role of consumption expenditure in economics can be comprehended by its share within Gross Domestic Product (GDP); 55.8 per cent of GDP in Turkey was composed of household consumption expenditures in 2018.1 While GDP provides tracking of the performance of the whole economy, trends in living standards can be better captured through measures of household-level consumption expenditure or income.2
According to the utility theory, a higher level of consumption is preferred by consumers because of the assumption of “more is better”. A person who consumes more is regarded as having a higher level of economic well-being, as long as a commodity has a positive utility. Therefore, consumption is mostly used as a welfare indicator. Although household income is another widely used welfare indicator, many studies prefer the concept of consumption to the concept of income. For example, an analysis conducted by the UK Office for National Statistics found that household consumption expenditure has a stronger relationship with individual well-being (i.e., life satisfaction, the feeling of worthiness, and happiness) than household income.3 Because of the strong connection between consumption expenditures and human well-being, the information on the structure of consumption and how it changes over time will be a major contribution to the understanding of the formation of the standard of living of the society.4
On the other hand, criticism towards excessive consumption or consumerism, also known as minimalism, supports the idea of “less is more” with the suggestion that by owning less, more can be achieved through the non-material aspects of life. According to Veblen’s concept of conspicuous consumption, individuals desire to consume goods and services beyond their needs to gain a higher status in society.5 Veblen had attributed two main characteristics to consumption goods; serviceability
1 Turkish Statistical Institute (2020). Annual GDP 2019, Press Bulletin, https://data.tuik.gov.tr/Bulten/Index?p=Annual-Gross-Domestic-Product-2019-33671, (Accessed on: 07.06.2021)
2 Stiglitz, J. E., Sen, A., Fitoussi, J. P. (2009). Report by the Commission on the Measurement of Economic Performance and Social Progress (CMEPSP), p. 12-18, https://ec.europa.eu/eurostat/documents/8131721/8131772/Stiglitz-Sen-Fitoussi-Commission-report.pdf, (Accessed on 10.06.2021)
3 Lewis, J. (2014). Income, Expenditure and Personal Wellbeing, 2011/12, UK Office for National Statistics.4 OECD (2013). OECD Framework for Statistics on the Distribution of Household Income, Consumption and Wealth,
OECD Publishing, https://read.oecd-ilibrary.org/economics/framework-for-statistics-on-the-distribution-of-household-income-consumption-and-wealth_978.926.4194830-en#page1, (Accessed on: 15.12.2020)
5 Veblen, T. (1899). The Theory of the Leisure Class, Reprint, Delhi: Aakar Books, 2005, p. 17-26.
Marmara Üniversitesi İktisadi ve İdari Bilimler Dergisi • Cilt: 43 • Sayı: 1 • Haziran 2021, ISSN: 2587-2672, ss/pp. 179-196
181
and honorific aspects. People may consume luxury goods and services (e. g. luxury cars, expensive vacations, clothes) as a show-off to others. Scott states that conspicuous consumption has surged in our time, more than any other time in history.6 He links the recent rise in conspicuous consumption with the prevalence of credit cards. He argues that credit cards enable individuals to purchase luxury items. The rising trend of luxury consumption has also influenced Turkish consumers.7 Consumption expenditures in Turkey have increased sharply with the facility of foreign borrowing (negative savings) and the development of the financial system. In recent years, striking expansion in credit card usage has been seen in Turkey. Credit cards provide consumers with some opportunities such as short-term cash credit, the possibility of not carrying cash, instalment payments and late payment advantage. These opportunities enable individuals to consume beyond their permanent income. Another expansion has been seen in online shopping among Turkish consumers. The proliferation of online shopping probably improves consumer welfare because it offers consumers a wider variety of products and lower search costs. Since it also intensifies the competition among firms, it can increase efficiency and social welfare by reducing prices. Nevertheless, the opportunities that credit cards and online shopping offer may result in excessive consumption by triggering individuals to buy more than what they need. It is well known that excessive consumption patterns that exacerbate debt accumulation raises the risk of financial fragility and may end up in financial crises8.
In this respect, it is important to understand how households or individuals make their consumption decisions, the characteristics of consumption and how such relations have changed over time. For this purpose, this paper traces the factors affecting household consumption expenditures in Turkey for the years 2002 and 2018. It examines the linkages between household consumption expenditure and some household characteristics including income, wealth, savings, credit card usage, online shopping habits, tobacco usage, alcohol usage, and some demographic features (e. g. education level, age, gender, and marital status of household heads) by using Household Budget Surveys (HBS) conducted by the Turkish Statistical Institute (TurkStat). Comparing the relationship between consumption expenditures and household characteristics in 2002 with that in 2018 would allow us to observe how these connections have changed over time.
Table 1 provides an overview of household consumption in Turkey from 2002 to 2018. It indicates that the number of households in Turkey has considerably increased throughout this period. Similarly, average expenditure per household has sharply increased as well. When the shares of different goods and services in the total consumption expenditure are examined, it is seen that food and non-alcoholic beverages have the largest share in 2002 (26.7 %), but it has declined to 20.3 per cent in 2018. This fall can be attributed to the improvement in the living standards of the Turkish people as a decline in the share of food and non-alcoholic beverages, which are necessary goods, means an
6 Scott, R. H. (2007). Credit Card Use and Abuse: A Veblenian Analysis, Journal of Economic Issues, 41(2): 567-574.7 Demirezen, Ö. (2015). The Effect of Loans to Private Consumption Expenditures in Turkey, Planning Expertise Thesis,
p. 80. (in Turkish)8 For example, Koh, W. C., Köse, M. A., Nagle, P. S., Ohnsorge, F. L., Sugawara, N. (2020). Debt and Financial Crises, World
Bank Policy Research Working Paper, 9116.
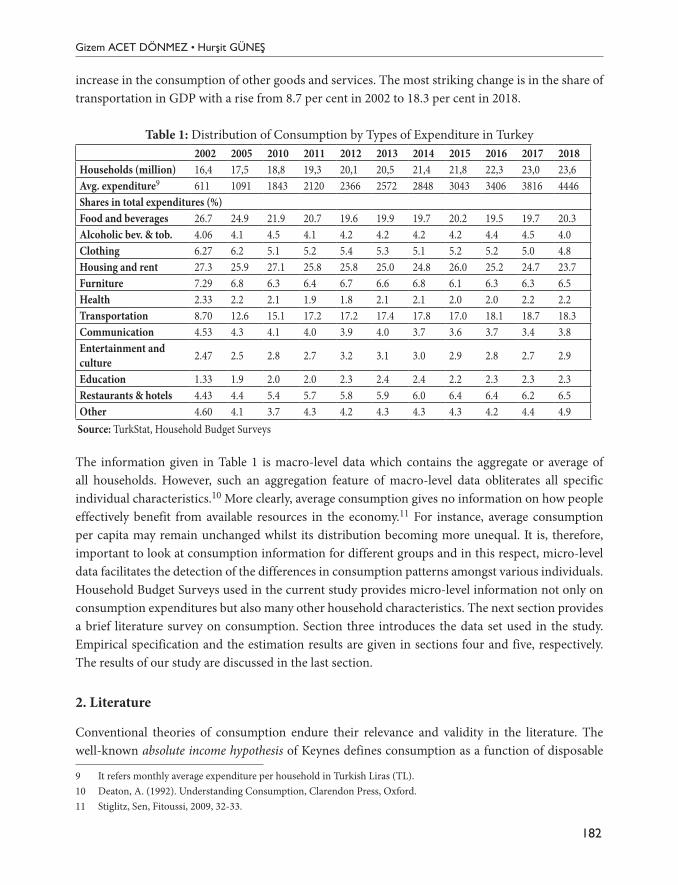
Gizem ACET DÖNMEZ • Hurşit GÜNEŞ
182
increase in the consumption of other goods and services. The most striking change is in the share of transportation in GDP with a rise from 8.7 per cent in 2002 to 18.3 per cent in 2018.
Table 1: Distribution of Consumption by Types of Expenditure in Turkey2002 2005 2010 2011 2012 2013 2014 2015 2016 2017 2018
Households (million) 16,4 17,5 18,8 19,3 20,1 20,5 21,4 21,8 22,3 23,0 23,6Avg. expenditure9 611 1091 1843 2120 2366 2572 2848 3043 3406 3816 4446Shares in total expenditures (%)Food and beverages 26.7 24.9 21.9 20.7 19.6 19.9 19.7 20.2 19.5 19.7 20.3Alcoholic bev. & tob. 4.06 4.1 4.5 4.1 4.2 4.2 4.2 4.2 4.4 4.5 4.0Clothing 6.27 6.2 5.1 5.2 5.4 5.3 5.1 5.2 5.2 5.0 4.8Housing and rent 27.3 25.9 27.1 25.8 25.8 25.0 24.8 26.0 25.2 24.7 23.7Furniture 7.29 6.8 6.3 6.4 6.7 6.6 6.8 6.1 6.3 6.3 6.5Health 2.33 2.2 2.1 1.9 1.8 2.1 2.1 2.0 2.0 2.2 2.2Transportation 8.70 12.6 15.1 17.2 17.2 17.4 17.8 17.0 18.1 18.7 18.3Communication 4.53 4.3 4.1 4.0 3.9 4.0 3.7 3.6 3.7 3.4 3.8Entertainment and culture 2.47 2.5 2.8 2.7 3.2 3.1 3.0 2.9 2.8 2.7 2.9
Education 1.33 1.9 2.0 2.0 2.3 2.4 2.4 2.2 2.3 2.3 2.3Restaurants & hotels 4.43 4.4 5.4 5.7 5.8 5.9 6.0 6.4 6.4 6.2 6.5Other 4.60 4.1 3.7 4.3 4.2 4.3 4.3 4.3 4.2 4.4 4.9
Source: TurkStat, Household Budget Surveys
The information given in Table 1 is macro-level data which contains the aggregate or average of all households. However, such an aggregation feature of macro-level data obliterates all specific individual characteristics.10 More clearly, average consumption gives no information on how people effectively benefit from available resources in the economy.11 For instance, average consumption per capita may remain unchanged whilst its distribution becoming more unequal. It is, therefore, important to look at consumption information for different groups and in this respect, micro-level data facilitates the detection of the differences in consumption patterns amongst various individuals. Household Budget Surveys used in the current study provides micro-level information not only on consumption expenditures but also many other household characteristics. The next section provides a brief literature survey on consumption. Section three introduces the data set used in the study. Empirical specification and the estimation results are given in sections four and five, respectively. The results of our study are discussed in the last section.
2. Literature
Conventional theories of consumption endure their relevance and validity in the literature. The well-known absolute income hypothesis of Keynes defines consumption as a function of disposable
9 It refers monthly average expenditure per household in Turkish Liras (TL).10 Deaton, A. (1992). Understanding Consumption, Clarendon Press, Oxford.11 Stiglitz, Sen, Fitoussi, 2009, 32-33.
Marmara Üniversitesi İktisadi ve İdari Bilimler Dergisi • Cilt: 43 • Sayı: 1 • Haziran 2021, ISSN: 2587-2672, ss/pp. 179-196
183
income12. On the other hand, according to the life cycle hypothesis individuals do not make their consumption decisions by the sole consideration of their present income level.13 Wealth and expected annual income based on lifetime earnings also determine the consumption expenditure patterns. According to the life cycle hypothesis, lifetime resources – thereby consumption – of young individuals are higher in rapidly growing economies, since consumption does not depend on the current level of income but the entire lifetime earnings. Another approach to consumption is the permanent income hypothesis which separates income into permanent and temporary components and argues that consumption is a function of permanent income.14
Amongst the fundamental approaches to consumption, there is also the relative income hypothesis which infers that the utility of an individual depends on the relative magnitude of his/her consumption level in the society rather than its absolute level.15 According to this hypothesis, the percentage of income consumed by an individual depends on his/her percentile position within the income distribution. The relative income hypothesis also asserts that individuals tend to increase their consumption expenditures immediately by a rise in income, whilst they resist reducing their consumption when their income level falls. There is also the random walk model of consumption – also called rational expectations permanent income hypothesis – which incorporates the idea of rational expectations into the consumption models and sets up the model in such a way that consumers maximize their utility.16 This hypothesis puts forward that if consumers comply with the permanent income hypothesis and have rational expectations, then consumption may only change concerning unexpected policy changes. Therefore, consumption is regarded as a random walk because it is a function of only its previous level and the unexpected shock.
There are, of course, some empirical studies on consumption as well. For example, Tapsin and Hepsag investigated household consumption expenditures in EA-18 countries17 at the macro level throughout 2000-2012.18 The results of their panel data analysis demonstrated that household consumption expenditures were strongly and positively connected with GDP. A similar study held for the Czech Republic for 1993-2012 found that net disposable income, inflation rate and household saving rate had significant connections with household spending.19 Another study using microdata of the United Kingdom concluded that uncertainties in the income level had a negative effect on
12 Keynes, J. M. (1936). The General Theory of Employment, Interest and Money. London: Macmillan.13 Modigliani, F. and Brumberg, R. (1954). Utility Analysis and the Consumption Function: An Interpretation of Cross-
section Data, In the Collective Papers of Franco Modigliani, Volume 6. Cambridge, MA and London: MIT Press.14 Friedman, M. (1957). A Theory of the Consumption Function. Princeton, NJ: Princeton University Press.15 Duesenberry, J. S. (1949). Income, Saving and the Theory of Consumer Behaviour. Cambridge: Harvard University Press.16 Hall, R. (1978). Stochastic Implications of the Life Cycle-Permanent Income Hypothesis: Theory and Evidence, Journal
of Political Economy, 86 (6): 971–987.17 Euro area countries; Austria, Belgium, Cyprus, Estonia, France, Finland, Germany, Italy, Latvia, Luxemburg, Malta,
Netherlands, Slovakia, Slovenia, Ireland, Greece, Portugal, and Spain.18 Tapsin, G., Hepsag, A. (2014). An Analysis of Household Consumption Expenditures in EA-18, European Scientific
Journal, 10(16): 1-12.19 Verter, N., Osakwe, C. (2014). A Time Series Analysis of Macroeconomic Determinants of Household Spending in the
Era of Cross-cultural Dynamics: Czech Republic as a Case Study, Procedia Economics and Finance, 12(2014): 733-742.
Gizem ACET DÖNMEZ • Hurşit GÜNEŞ
184
consumption expenditures, while household size had a positive effect.20 A study – conducted through OLS and quantile regression – on the determinants of household consumption expenditures in yam-growing areas of Ghana and Nigeria found that factors such as education, age, household size, farm size, and main occupation appear to be significant determinants of consumption expenditures.21 Luo, Wang, and Zhang investigated the impact of e-commerce on consumption growth at the household level in China.22 They utilized online sales data from Alibaba Group, and household consumption data from China Family Panel Studies (CFPS) survey and found that e-commerce development was associated with higher consumption growth. Another study on household consumption in China examined the effect of tobacco spending on household expenditures.23 Their results showed that tobacco expenditures crowded out other expenditures such as spending on education, medical care, insurance, and investment in farming.
Regarding the studies on consumption in Turkey, for instance, Akbay and Boz found that not only price and income, but also socio-economic and demographic factors (i.e. household size, education, age and gender of household head) account for food consumption expenditures of the Turkish households in 2003.24 Çağlayan and Astar investigated the determinants of household consumption expenditures in Turkey for urban and rural areas separately by using HBS 2009 through quantile regression.25 They concluded that household consumption was increasing with income and household size. Households with higher education levels and married household heads were consuming more. By using HBS and Annual Survey of Income and Living Conditions (SILC), Albayrak found that relative income, inequality, and household indebtedness affected household consumption in Turkey.26 The same study detected a negative connection between relative income and consumption, even after controlling for absolute income level, and thereby concluded that people were consuming to gain or to keep a social status because of the “keeping up with the Joneses effect”.27
20 Miles, D. (1997). A Household Level Study of the Determinants of Incomes and Consumption, The Economic Journal, 107: 1-25.
21 Mignouna, D. B., Abdoulaye, T., Alena, A., Manyong, V. M., Dontsop, P. N., Ainembabazi, J, H., Asiedu, R. (2015). A Microeconometric Analysis of Household Consumption Expenditure Determinants in Yam-growing Areas of Nigeria and Ghana, Tropicultura, 33(3): 226-237.
22 Luo, X., Wang, Y., Zhang, X. (2019). E-Commerce Development and Household Consumption Growth in China, World Bank Policy Research Working Paper, No 8810.
23 Wang, H., Sindelar, J., Bush, S. (2006) The Impact of Tobacco Expenditure on Household Consumption Patterns in Rural China, Social Science and Medicine, 62(6): 1414–1426.
24 Akbay, C., Boz, İ. (2007). Household Food Consumption in Turkey, European Review of Agricultural Economics, 34 (2): 209–231.
25 Çağlayan, E., Astar, M. (2012). A Microeconometric Analysis of Household Consumption Expenditure Determinants for Both Rural and Urban Areas in Turkey, American International Journal of Contemporary Research, 2(2): 27-34.
26 Albayrak, Ö. (2020). Household Consumption, Household Indebtedness, and Inequality in Turkey: A Microeconometric Analysis, Levy Economics Institute Working Paper, No: 954.
27 Keeping up with the Joneses is an idiom which refers the individuals’ comparison of themselves with their neighbours as a benchmark for social class. The idea is the same with the concept of conspicuous consumption of Veblen.
Marmara Üniversitesi İktisadi ve İdari Bilimler Dergisi • Cilt: 43 • Sayı: 1 • Haziran 2021, ISSN: 2587-2672, ss/pp. 179-196
185
Ceritoğlu found a positive relationship between the growth rate of consumption and expected real income changes.28 Therefore, the results of that study rejected the strict version of the rational expectations permanent income hypothesis but supported the precautionary saving hypothesis for the case of the Turkish economy. Another finding of that study was that the real expansion of the consumer credits had a more significant effect on the growth of consumption than the real interest rates. In another study, Demirezen concluded that bank loans had significant effects on consumption expenditures in Turkey, and consumer credits were more important than commercial credits in stimulating growth through induced private consumption.29 In a study on the effect of credit card usage on household expenditures in Turkey, a long-term relationship between consumption and credit card use was observed by using macro-level quarterly data throughout 2002-2015.30
Overall, there are numerous studies in the literature which focus on explaining the factors associated with consumption. This paper attempts to contribute by examining some unprecedented factors at micro levels such as the use of tobacco, alcohol, and especially online shopping and credit cards alongside the familiar connections (e.g., household income, wealth, and savings) for the Turkish economy. Another attempt is the comparison of the factors affecting consumption in 2002 with that in 2018 to see the changes in the consumption behaviour of the households in Turkey over time if any.
3. Data
This study utilizes the HBS31 of 2002 and 2018 conducted by TurkStat. Surveys include repeated cross-sectional data where a random sample is taken from the population at different points in time. In other words, the survey does not cover the same households in each survey year, so that the data set is not a genuine panel.32 This study, therefore, adopts cross-sectional analyses for the beginning (2002) and the end (2018) of the survey years separately, instead of a panel data analysis.33 These surveys include information on both household consumption expenditures and many other household characteristic traits as mentioned above. Consumption expenditures in these surveys are classified based on the purpose of individual consumption (COICOP). Detailed information about
28 Ceritoğlu, E. (2013). Household Expectations and Household Consumption Expenditures: The Case of Turkey, Central Bank of the Republic of Turkey Working Paper, No: 13/10.
29 Demirezen, 2015, 132-139.30 Önder, K. (2018). The Effect of Credit Card Usage on Consumer Behaviour, International Journal of Eurasia Social
Sciences, 9(32): 1099-1120.31 Household Budget Statistics micro data set is not an open access data set. The author got permission from the TurkStat
to access this data set. For more information about these surveys, you can see: https://www.tuik.gov.tr/media/microdata/pdf/hanehalki-butce_YeiTwew.pdf, (Accessed on 10.06.2021)
32 A pseudo panel approach could have been followed, but this study does not adopt that approach because pseudo panels have certain limitations such as information loss and sensitivity of estimations to group design.
33 In fact, first HBS of TurkStat was conducted in 1994. TurkStat has reinstated these surveys in 2002. Nonetheless, due to the methodological differences, the current study did not include the survey of 1994. The 2002 survey is accepted as the beginning, and the most recent survey, which was published in 2018, is accepted as the comparison period of the consumption behaviour.
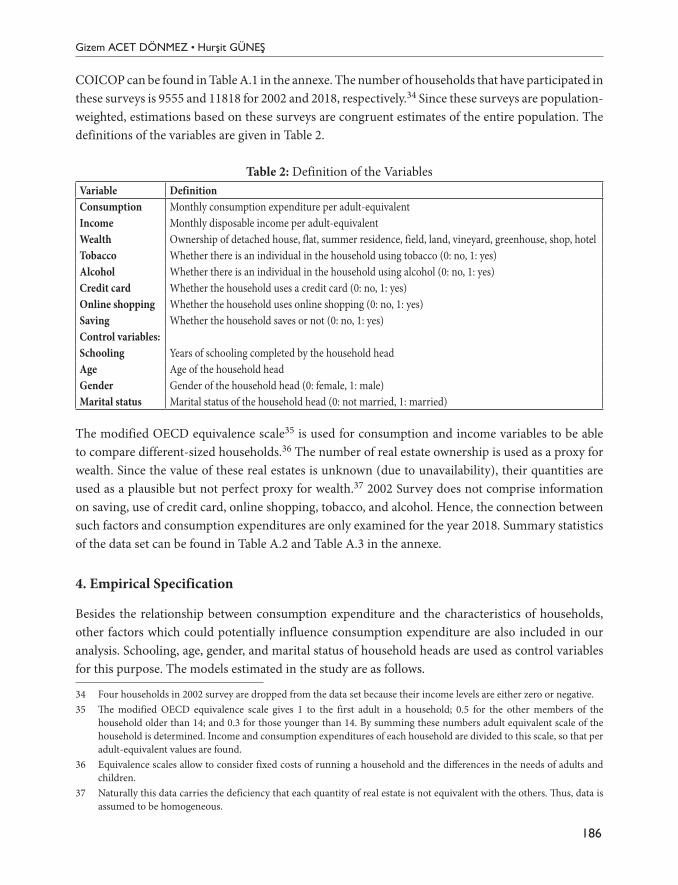
Gizem ACET DÖNMEZ • Hurşit GÜNEŞ
186
COICOP can be found in Table A.1 in the annexe. The number of households that have participated in these surveys is 9555 and 11818 for 2002 and 2018, respectively.34 Since these surveys are population-weighted, estimations based on these surveys are congruent estimates of the entire population. The definitions of the variables are given in Table 2.
Table 2: Definition of the VariablesVariable DefinitionConsumption Monthly consumption expenditure per adult-equivalentIncome Monthly disposable income per adult-equivalentWealth Ownership of detached house, flat, summer residence, field, land, vineyard, greenhouse, shop, hotelTobacco Whether there is an individual in the household using tobacco (0: no, 1: yes)Alcohol Whether there is an individual in the household using alcohol (0: no, 1: yes)Credit card Whether the household uses a credit card (0: no, 1: yes)Online shopping Whether the household uses online shopping (0: no, 1: yes)Saving Whether the household saves or not (0: no, 1: yes)Control variables:Schooling Years of schooling completed by the household headAge Age of the household headGender Gender of the household head (0: female, 1: male)Marital status Marital status of the household head (0: not married, 1: married)
The modified OECD equivalence scale35 is used for consumption and income variables to be able to compare different-sized households.36 The number of real estate ownership is used as a proxy for wealth. Since the value of these real estates is unknown (due to unavailability), their quantities are used as a plausible but not perfect proxy for wealth.37 2002 Survey does not comprise information on saving, use of credit card, online shopping, tobacco, and alcohol. Hence, the connection between such factors and consumption expenditures are only examined for the year 2018. Summary statistics of the data set can be found in Table A.2 and Table A.3 in the annexe.
4. Empirical Specification
Besides the relationship between consumption expenditure and the characteristics of households, other factors which could potentially influence consumption expenditure are also included in our analysis. Schooling, age, gender, and marital status of household heads are used as control variables for this purpose. The models estimated in the study are as follows.
34 Four households in 2002 survey are dropped from the data set because their income levels are either zero or negative.35 The modified OECD equivalence scale gives 1 to the first adult in a household; 0.5 for the other members of the
household older than 14; and 0.3 for those younger than 14. By summing these numbers adult equivalent scale of the household is determined. Income and consumption expenditures of each household are divided to this scale, so that per adult-equivalent values are found.
36 Equivalence scales allow to consider fixed costs of running a household and the differences in the needs of adults and children.
37 Naturally this data carries the deficiency that each quantity of real estate is not equivalent with the others. Thus, data is assumed to be homogeneous.
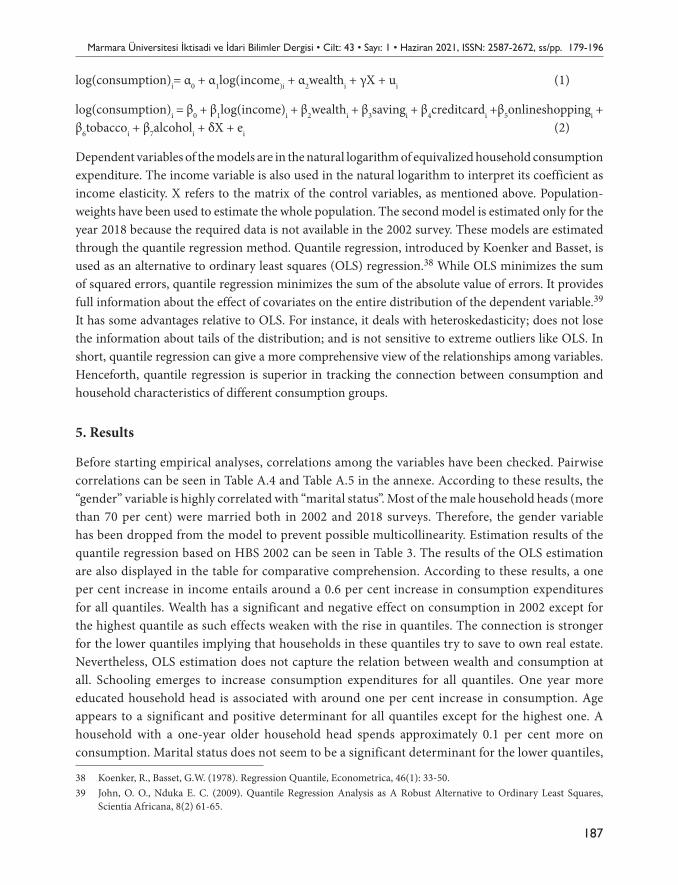
Marmara Üniversitesi İktisadi ve İdari Bilimler Dergisi • Cilt: 43 • Sayı: 1 • Haziran 2021, ISSN: 2587-2672, ss/pp. 179-196
187
log(consumption)i= α0 + α1log(income)i + α2wealthi + γX + ui (1)
log(consumption)i = β0 + β1log(income)i + β2wealthi + β3savingi + β4creditcardi +β5onlineshoppingi + β6tobaccoi + β7alcoholi + δX + ei (2)
Dependent variables of the models are in the natural logarithm of equivalized household consumption expenditure. The income variable is also used in the natural logarithm to interpret its coefficient as income elasticity. X refers to the matrix of the control variables, as mentioned above. Population-weights have been used to estimate the whole population. The second model is estimated only for the year 2018 because the required data is not available in the 2002 survey. These models are estimated through the quantile regression method. Quantile regression, introduced by Koenker and Basset, is used as an alternative to ordinary least squares (OLS) regression.38 While OLS minimizes the sum of squared errors, quantile regression minimizes the sum of the absolute value of errors. It provides full information about the effect of covariates on the entire distribution of the dependent variable.39 It has some advantages relative to OLS. For instance, it deals with heteroskedasticity; does not lose the information about tails of the distribution; and is not sensitive to extreme outliers like OLS. In short, quantile regression can give a more comprehensive view of the relationships among variables. Henceforth, quantile regression is superior in tracking the connection between consumption and household characteristics of different consumption groups.
5. Results
Before starting empirical analyses, correlations among the variables have been checked. Pairwise correlations can be seen in Table A.4 and Table A.5 in the annexe. According to these results, the “gender” variable is highly correlated with “marital status”. Most of the male household heads (more than 70 per cent) were married both in 2002 and 2018 surveys. Therefore, the gender variable has been dropped from the model to prevent possible multicollinearity. Estimation results of the quantile regression based on HBS 2002 can be seen in Table 3. The results of the OLS estimation are also displayed in the table for comparative comprehension. According to these results, a one per cent increase in income entails around a 0.6 per cent increase in consumption expenditures for all quantiles. Wealth has a significant and negative effect on consumption in 2002 except for the highest quantile as such effects weaken with the rise in quantiles. The connection is stronger for the lower quantiles implying that households in these quantiles try to save to own real estate. Nevertheless, OLS estimation does not capture the relation between wealth and consumption at all. Schooling emerges to increase consumption expenditures for all quantiles. One year more educated household head is associated with around one per cent increase in consumption. Age appears to a significant and positive determinant for all quantiles except for the highest one. A household with a one-year older household head spends approximately 0.1 per cent more on consumption. Marital status does not seem to be a significant determinant for the lower quantiles,
38 Koenker, R., Basset, G.W. (1978). Regression Quantile, Econometrica, 46(1): 33-50.39 John, O. O., Nduka E. C. (2009). Quantile Regression Analysis as A Robust Alternative to Ordinary Least Squares,
Scientia Africana, 8(2) 61-65.
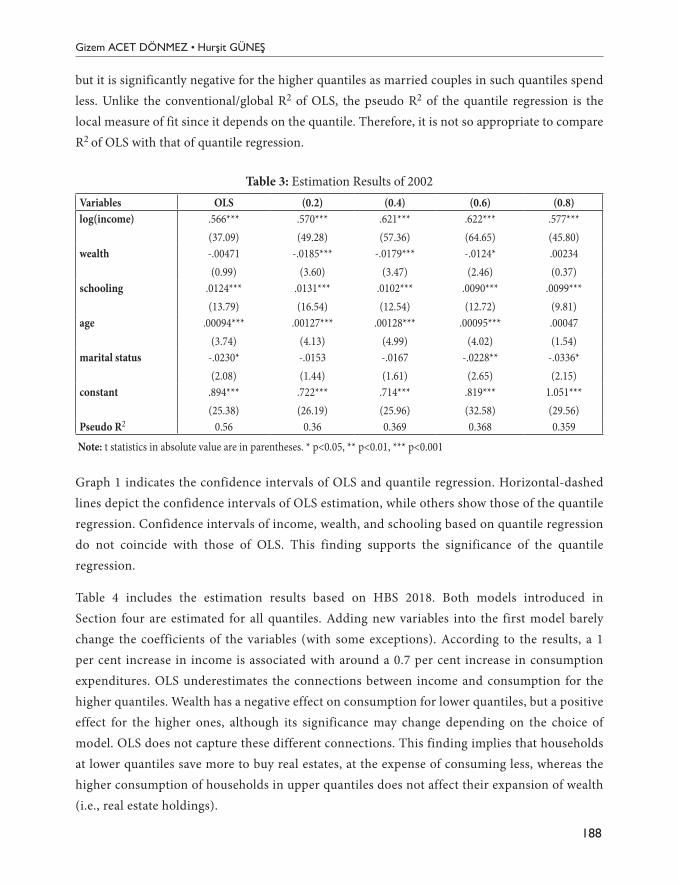
Gizem ACET DÖNMEZ • Hurşit GÜNEŞ
188
but it is significantly negative for the higher quantiles as married couples in such quantiles spend less. Unlike the conventional/global R2 of OLS, the pseudo R2 of the quantile regression is the local measure of fit since it depends on the quantile. Therefore, it is not so appropriate to compare R2 of OLS with that of quantile regression.
Table 3: Estimation Results of 2002Variables OLS (0.2) (0.4) (0.6) (0.8)log(income) .566***
(37.09).570***(49.28)
.621***(57.36)
.622***(64.65)
.577***(45.80)
wealth -.00471(0.99)
-.0185***(3.60)
-.0179***(3.47)
-.0124*(2.46)
.00234(0.37)
schooling .0124***(13.79)
.0131***(16.54)
.0102***(12.54)
.0090***(12.72)
.0099***(9.81)
age .00094***(3.74)
.00127***(4.13)
.00128***(4.99)
.00095***(4.02)
.00047(1.54)
marital status -.0230*(2.08)
-.0153(1.44)
-.0167(1.61)
-.0228**(2.65)
-.0336*(2.15)
constant .894***(25.38)
.722***(26.19)
.714***(25.96)
.819***(32.58)
1.051***(29.56)
Pseudo R2 0.56 0.36 0.369 0.368 0.359
Note: t statistics in absolute value are in parentheses. * p<0.05, ** p<0.01, *** p<0.001
Graph 1 indicates the confidence intervals of OLS and quantile regression. Horizontal-dashed lines depict the confidence intervals of OLS estimation, while others show those of the quantile regression. Confidence intervals of income, wealth, and schooling based on quantile regression do not coincide with those of OLS. This finding supports the significance of the quantile regression.
Table 4 includes the estimation results based on HBS 2018. Both models introduced in Section four are estimated for all quantiles. Adding new variables into the first model barely change the coefficients of the variables (with some exceptions). According to the results, a 1 per cent increase in income is associated with around a 0.7 per cent increase in consumption expenditures. OLS underestimates the connections between income and consumption for the higher quantiles. Wealth has a negative effect on consumption for lower quantiles, but a positive effect for the higher ones, although its significance may change depending on the choice of model. OLS does not capture these different connections. This finding implies that households at lower quantiles save more to buy real estates, at the expense of consuming less, whereas the higher consumption of households in upper quantiles does not affect their expansion of wealth (i.e., real estate holdings).
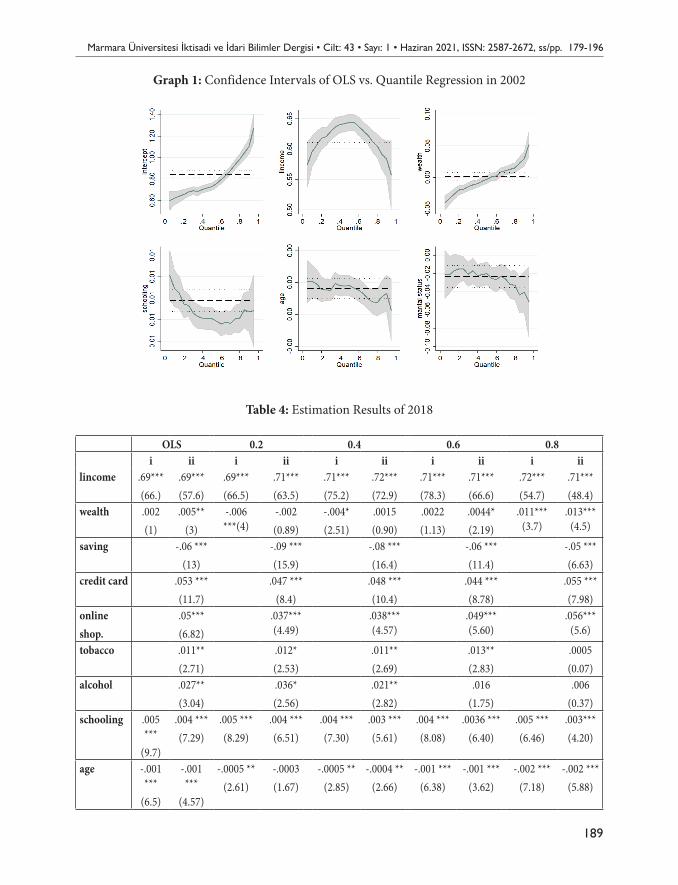
Marmara Üniversitesi İktisadi ve İdari Bilimler Dergisi • Cilt: 43 • Sayı: 1 • Haziran 2021, ISSN: 2587-2672, ss/pp. 179-196
189
Graph 1: Confidence Intervals of OLS vs. Quantile Regression in 2002
Table 4: Estimation Results of 2018
OLS 0.2 0.4 0.6 0.8i ii i ii i ii i ii i ii
lincome .69***(66.)
.69***(57.6)
.69***(66.5)
.71***(63.5)
.71***(75.2)
.72***(72.9)
.71***(78.3)
.71***(66.6)
.72***(54.7)
.71***(48.4)
wealth .002(1)
.005**(3)
-.006 ***(4)
-.002(0.89)
-.004*(2.51)
.0015(0.90)
.0022(1.13)
.0044*(2.19)
.011*** (3.7)
.013*** (4.5)
saving -.06 ***(13)
-.09 ***(15.9)
-.08 ***(16.4)
-.06 ***(11.4)
-.05 ***(6.63)
credit card .053 ***(11.7)
.047 ***(8.4)
.048 ***(10.4)
.044 ***(8.78)
.055 ***(7.98)
onlineshop.
.05***(6.82)
.037*** (4.49)
.038*** (4.57)
.049*** (5.60)
.056*** (5.6)
tobacco .011**(2.71)
.012*(2.53)
.011**(2.69)
.013**(2.83)
.0005(0.07)
alcohol .027**(3.04)
.036*(2.56)
.021**(2.82)
.016(1.75)
.006(0.37)
schooling .005 ***
(9.7)
.004 ***(7.29)
.005 ***(8.29)
.004 ***(6.51)
.004 ***(7.30)
.003 ***(5.61)
.004 ***(8.08)
.0036 ***(6.40)
.005 ***(6.46)
.003***(4.20)
age -.001 ***
(6.5)
-.001 ***
(4.57)
-.0005 **(2.61)
-.0003(1.67)
-.0005 **(2.85)
-.0004 **(2.66)
-.001 ***(6.38)
-.001 ***(3.62)
-.002 ***(7.18)
-.002 ***(5.88)
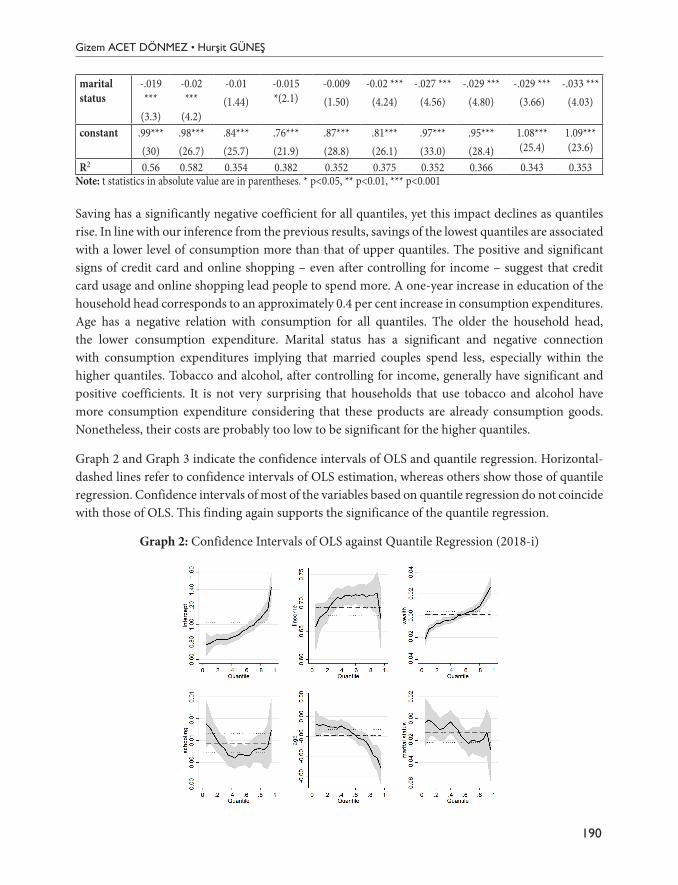
Gizem ACET DÖNMEZ • Hurşit GÜNEŞ
190
marital status
-.019 ***
(3.3)
-0.02 ***
(4.2)
-0.01(1.44)
-0.015 *(2.1)
-0.009(1.50)
-0.02 ***(4.24)
-.027 ***(4.56)
-.029 ***(4.80)
-.029 ***(3.66)
-.033 ***(4.03)
constant .99***(30)
.98***(26.7)
.84***(25.7)
.76***(21.9)
.87***(28.8)
.81***(26.1)
.97***(33.0)
.95***(28.4)
1.08*** (25.4)
1.09*** (23.6)
R2 0.56 0.582 0.354 0.382 0.352 0.375 0.352 0.366 0.343 0.353Note: t statistics in absolute value are in parentheses. * p<0.05, ** p<0.01, *** p<0.001
Saving has a significantly negative coefficient for all quantiles, yet this impact declines as quantiles rise. In line with our inference from the previous results, savings of the lowest quantiles are associated with a lower level of consumption more than that of upper quantiles. The positive and significant signs of credit card and online shopping – even after controlling for income – suggest that credit card usage and online shopping lead people to spend more. A one-year increase in education of the household head corresponds to an approximately 0.4 per cent increase in consumption expenditures. Age has a negative relation with consumption for all quantiles. The older the household head, the lower consumption expenditure. Marital status has a significant and negative connection with consumption expenditures implying that married couples spend less, especially within the higher quantiles. Tobacco and alcohol, after controlling for income, generally have significant and positive coefficients. It is not very surprising that households that use tobacco and alcohol have more consumption expenditure considering that these products are already consumption goods. Nonetheless, their costs are probably too low to be significant for the higher quantiles.
Graph 2 and Graph 3 indicate the confidence intervals of OLS and quantile regression. Horizontal-dashed lines refer to confidence intervals of OLS estimation, whereas others show those of quantile regression. Confidence intervals of most of the variables based on quantile regression do not coincide with those of OLS. This finding again supports the significance of the quantile regression.
Graph 2: Confidence Intervals of OLS against Quantile Regression (2018-i)
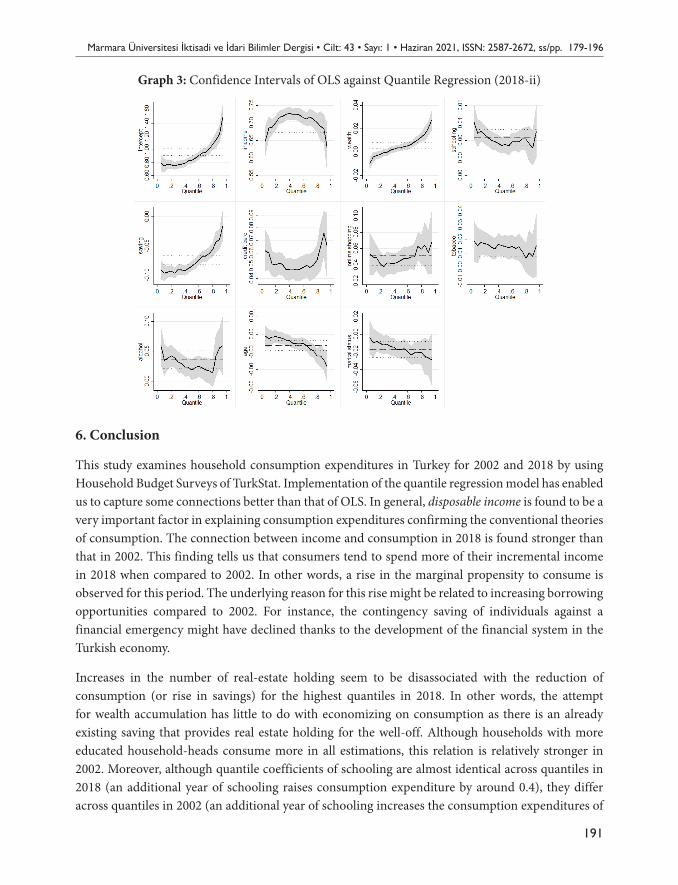
Marmara Üniversitesi İktisadi ve İdari Bilimler Dergisi • Cilt: 43 • Sayı: 1 • Haziran 2021, ISSN: 2587-2672, ss/pp. 179-196
191
Graph 3: Confidence Intervals of OLS against Quantile Regression (2018-ii)
6. Conclusion
This study examines household consumption expenditures in Turkey for 2002 and 2018 by using Household Budget Surveys of TurkStat. Implementation of the quantile regression model has enabled us to capture some connections better than that of OLS. In general, disposable income is found to be a very important factor in explaining consumption expenditures confirming the conventional theories of consumption. The connection between income and consumption in 2018 is found stronger than that in 2002. This finding tells us that consumers tend to spend more of their incremental income in 2018 when compared to 2002. In other words, a rise in the marginal propensity to consume is observed for this period. The underlying reason for this rise might be related to increasing borrowing opportunities compared to 2002. For instance, the contingency saving of individuals against a financial emergency might have declined thanks to the development of the financial system in the Turkish economy.
Increases in the number of real-estate holding seem to be disassociated with the reduction of consumption (or rise in savings) for the highest quantiles in 2018. In other words, the attempt for wealth accumulation has little to do with economizing on consumption as there is an already existing saving that provides real estate holding for the well-off. Although households with more educated household-heads consume more in all estimations, this relation is relatively stronger in 2002. Moreover, although quantile coefficients of schooling are almost identical across quantiles in 2018 (an additional year of schooling raises consumption expenditure by around 0.4), they differ across quantiles in 2002 (an additional year of schooling increases the consumption expenditures of
Gizem ACET DÖNMEZ • Hurşit GÜNEŞ
192
the lowest quantile by 1.3 per cent, and that of the highest quantile by 0.9 per cent). Households with married household heads have a lower level of consumption expenditure probably due to fixed costs of running a household. Though age is positively associated with consumption in 2002, its coefficient appears to be negative for 2018 showing an adverse relationship for the latter period. In other words, households with younger household heads seem to spend relatively higher in 2018. Considering the economic growth trends in the Turkish economy, this finding rather supports the life cycle theory which suggests that in a rapidly growing economy, lifetime resources of the younger generation are greater compared to that of the old in a slower-growing economy. In other words, households with younger heads spent more than those with older heads in 2018 during the times of high economic growth, contrary to the relationship for 2002 when The Turkish economy was staggering with the severe conditions of the crisis in the previous year.
This paper contributes to the literature by providing a comparison between household consumption expenditures in 2002 and those in 2018. Most studies on consumption are based on a household survey of a specific year and thus they fail to accomplish a dynamic analysis. Another contribution of this present study is to explore the links between consumption expenditures and some recently developed factors (i.e., credit card usage and online shopping) at the micro-level. From a utilitarian perspective (more is better), credit cards and online shopping are found as useful tools since they augment utility by consumption. On the contrary, from a minimalistic perspective, credit cards and online shopping might be interpreted as unfavourable factors that elicit excessive consumption higher than needs.
To sum up, assuming that utility is an increasing function of consumption (monotonic preferences), a higher level of household income, having a more educated household head, usage of credit-card and e-commerce are associated with a higher level of utility of households. On the other hand, although consumption increases utility and stimulates economic activity, excessive consumption may cause a saving gap which might threaten macroeconomic stability and cause serious fragilities in the long run. The recent decrease in the number of credit card instalments in hire-purchases can be regarded as an appropriate measure for curbing the excessive consumption pattern in Turkey. It is known that individuals consume exceeding their earnings, offered by the borrowing opportunities, causing negative savings. In the long run, these negative savings or accumulated debt may lead consumption to decrease, thereby affect the economy adversely. Transferring resources from excessive consumption back to savings would provide the financial means of productive investments and thus the facilitation of economic growth. Besides, there is a need for income redistribution by restructuring tax policies and thence the well-being of the less privileged may be raised. This would also provide the rise of social utility.
ReferencesAKBAY, C., Boz, İ. (2007). Household Food Consumption in Turkey, European Review of Agricultural
Economics, 34(2): 209–231.ALBAYRAK, Ö. (2020). Household Consumption, Household Indebtedness, and Inequality in Turkey: A
Microeconometric Analysis, Levy Economics Institute Working Paper, No: 954.CERİTOĞLU, E. (2013). Household Expectations and Household Consumption Expenditures: The Case of
Turkey, Central Bank of the Republic of Turkey Working Paper, No: 13/10.
Marmara Üniversitesi İktisadi ve İdari Bilimler Dergisi • Cilt: 43 • Sayı: 1 • Haziran 2021, ISSN: 2587-2672, ss/pp. 179-196
193
ÇAĞLAYAN, E., Astar, M. (2012). A Microeconometric Analysis of Household Consumption Expenditure Determinants for Both Rural and Urban Areas in Turkey, American International Journal of Contemporary Research, 2(2): 27-34.
DEATON, A. (1992). Understanding Consumption, Clarendon Press, Oxford.DEMİREZEN, Ö. (2015). Türkiye’de Kredilerin Özel Tüketim Harcamalarına Etkisi, T. C. Kalkınma Bakanlığı
Uzmanlık Tezi.DUESENBERRY, J. S. (1949). Income, Saving and the Theory of Consumer Behaviour, Cambridge: Harvard
University Press.FRIEDMAN, M. (1957). A Theory of the Consumption Function, Princeton, NJ: Princeton University Press.HALL, R. (1978). Stochastic Implications of the Life Cycle-Permanent Income Hypothesis: Theory and
Evidence, Journal of Political Economy, 86(6): 971–987.JOHN, O. O., Nduka E. C. (2009). Quantile Regression Analysis as a Robust Alternative to Ordinary Least
Squares, Scientia Africana, 8(2): 61-65.KEYNES, J. M. (1936). The General Theory of Employment, Interest and Money, London: Macmillan.KOENKER, R., Basset, G.W. (1978). Regression Quantile, Econometrica, 46(1): 33-50.KOH, W. C., Köse, M. A., Nagle, P. S., Ohnsorge, F. L., Sugawara, N. (2020). Debt and Financial Crises, World
Bank Policy Research Working Paper, 9116.LEWIS, J. (2014). Income, Expenditure and Personal Wellbeing, 2011/12, UK Office for National Statistics.LUO, X., Wang, Y., Zhang, X. (2019). E-Commerce Development and Household Consumption Growth in
China, World Bank Policy Research Working Paper, No 8810.MIGNOUNA, D. B., Abdoulaye, T., Alena, A., Manyong, V. M., Dontsop, P. N., Ainembabazi, J, H., Asiedu, R.
(2015). A Microeconometric Analysis of Household Consumption Expenditure Determinants in Yam-growing Areas of Nigeria and Ghana, Tropicultura, 33(3): 226-237.
MILES, D. (1997). A Household Level Study of the Determinants of Incomes and Consumption, The Economic Journal, 107: 1-25.
MODIGLIANI, F., Brumberg, R. (1954). Utility Analysis and The Consumption Function: An Interpretation of Cross-Section Data, In the Collective Papers of Franco Modigliani, Volume, Cambridge, MA and London: MIT Press.
OECD (2013). OECD Framework for Statistics on the Distribution of Household Income, Consumption and Wealth, OECD Publishing, https://read.oecd-ilibrary.org/economics/framework-for-statistics-on-the-distribution-of-household-income-consumption-and-wealth_978.926.4194830-en#page1, (Accessed on 15.12.2020)
ÖNDER, K. (2018). The Effect of Credit Card Usage on Consumer Behavior, International Journal of Eurasia Social Sciences, 9(32): 1099-1120.
SCOTT, R. H. (2007). Credit Card Use and Abuse: A Veblenian Analysis, Journal of Economic Issues, 41(2): 567-574.
STIGLITZ, J., Sen, A., Fitoussi, J. P. (2009). Report of the Commission on the Measurement of Economic Performance and Social Progress, https://ec.europa.eu/eurostat/documents/8131721/8131772/Stiglitz-Sen-Fitoussi-Commission-report.pdf, (Accessed on 10.06.2021)
TAPSIN, G., Hepsag, A. (2014). An Analysis of Household Consumption Expenditures in EA-18, European Scientific Journal, 10(16): 1-12.
TURKISH STATISTICAL INSTITUTE (2018). Household Budget Statistics Micro Data Set, https://www.tuik.gov.tr/media/microdata/pdf/hanehalki-butce_YeiTwew.pdf, (Accessed on 10.06.2021)
Gizem ACET DÖNMEZ • Hurşit GÜNEŞ
194
TURKISH STATISTICAL INSTITUTE (2020). Annual GDP 2019, Press Bulletin, https://data.tuik.gov.tr/Bulten/Index?p=Annual-Gross-Domestic-Product-2019-33671, (Accessed on 07.06.2021)
TURKSTAT (2002). Household Budget Statistics Micro Data Set 2002.TURKSTAT (2018). Household Budget Statistics Micro Data Set 2018.VEBLEN, T. (1899). The Theory of the Leisure Class, Reprint, Delhi: Aakar Books, 2005.VERTER, N., Osakwe, C. (2014). A Time Series Analysis of Macroeconomic Determinants of Household
Spending in the Era of Cross-cultural Dynamics: Czech Republic as a Case Study, Procedia Economics and Finance, 12(2014): 733-742.
WANG, H., Sindelar, J., Bush, S. (2006). The Impact of Tobacco Expenditure on Household Consumption Patterns in Rural China, Social Science & Medicine, 62(6): 1414–1426.
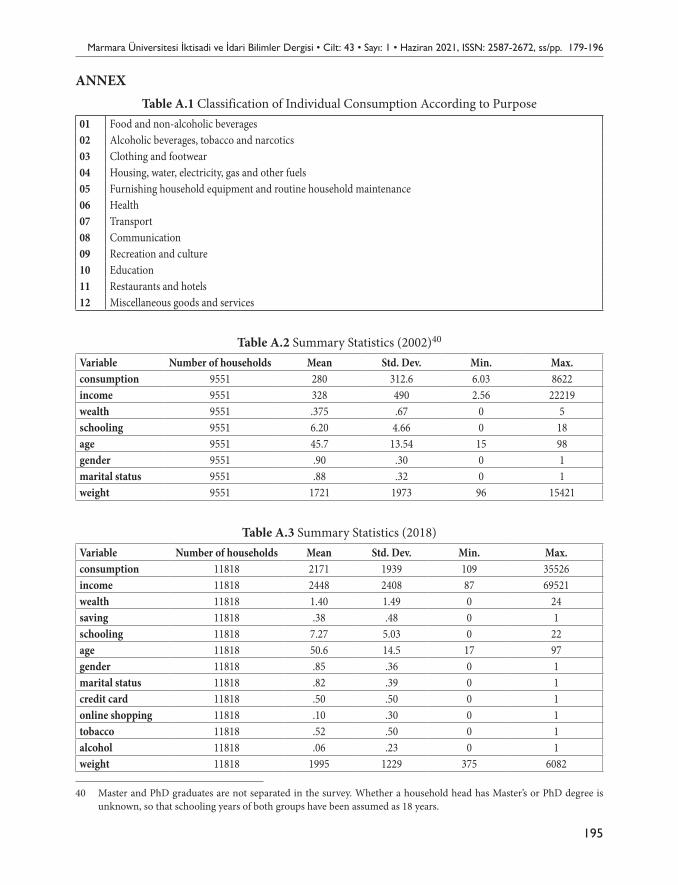
Marmara Üniversitesi İktisadi ve İdari Bilimler Dergisi • Cilt: 43 • Sayı: 1 • Haziran 2021, ISSN: 2587-2672, ss/pp. 179-196
195
ANNEXTable A.1 Classification of Individual Consumption According to Purpose
01 Food and non-alcoholic beverages02 Alcoholic beverages, tobacco and narcotics03 Clothing and footwear04 Housing, water, electricity, gas and other fuels05 Furnishing household equipment and routine household maintenance06 Health07 Transport08 Communication09 Recreation and culture10 Education11 Restaurants and hotels12 Miscellaneous goods and services
Table A.2 Summary Statistics (2002)40
Variable Number of households Mean Std. Dev. Min. Max.consumption 9551 280 312.6 6.03 8622income 9551 328 490 2.56 22219wealth 9551 .375 .67 0 5schooling 9551 6.20 4.66 0 18age 9551 45.7 13.54 15 98gender 9551 .90 .30 0 1marital status 9551 .88 .32 0 1weight 9551 1721 1973 96 15421
Table A.3 Summary Statistics (2018)Variable Number of households Mean Std. Dev. Min. Max.consumption 11818 2171 1939 109 35526income 11818 2448 2408 87 69521wealth 11818 1.40 1.49 0 24saving 11818 .38 .48 0 1schooling 11818 7.27 5.03 0 22age 11818 50.6 14.5 17 97gender 11818 .85 .36 0 1marital status 11818 .82 .39 0 1credit card 11818 .50 .50 0 1online shopping 11818 .10 .30 0 1tobacco 11818 .52 .50 0 1alcohol 11818 .06 .23 0 1weight 11818 1995 1229 375 6082
40 Master and PhD graduates are not separated in the survey. Whether a household head has Master’s or PhD degree is unknown, so that schooling years of both groups have been assumed as 18 years.
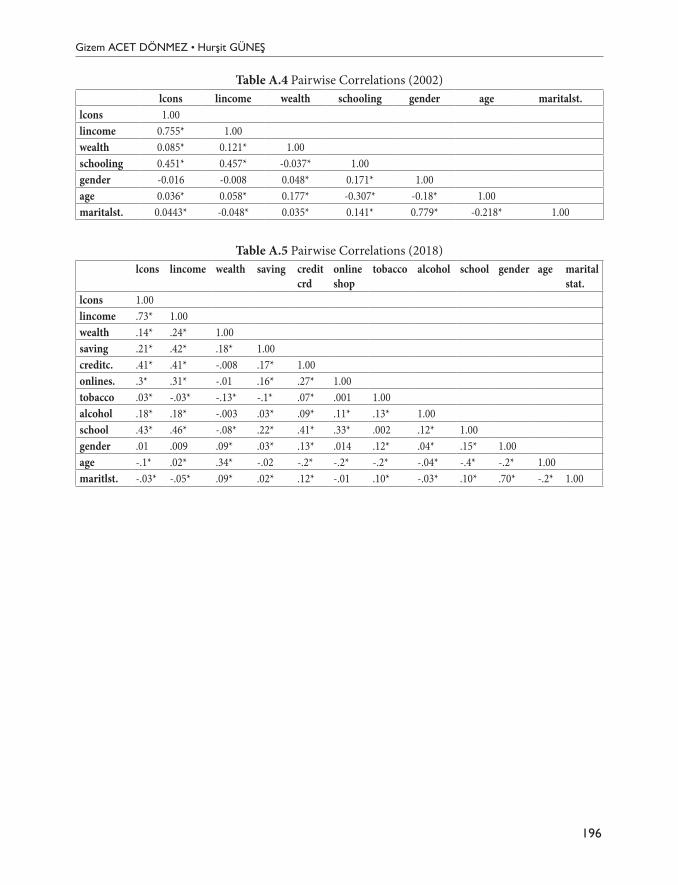
Gizem ACET DÖNMEZ • Hurşit GÜNEŞ
196
Table A.4 Pairwise Correlations (2002)lcons lincome wealth schooling gender age maritalst.
lcons 1.00lincome 0.755* 1.00wealth 0.085* 0.121* 1.00schooling 0.451* 0.457* -0.037* 1.00gender -0.016 -0.008 0.048* 0.171* 1.00age 0.036* 0.058* 0.177* -0.307* -0.18* 1.00maritalst. 0.0443* -0.048* 0.035* 0.141* 0.779* -0.218* 1.00
Table A.5 Pairwise Correlations (2018)lcons lincome wealth saving credit
crdonline shop
tobacco alcohol school gender age marital stat.
lcons 1.00lincome .73* 1.00wealth .14* .24* 1.00saving .21* .42* .18* 1.00creditc. .41* .41* -.008 .17* 1.00onlines. .3* .31* -.01 .16* .27* 1.00tobacco .03* -.03* -.13* -.1* .07* .001 1.00alcohol .18* .18* -.003 .03* .09* .11* .13* 1.00school .43* .46* -.08* .22* .41* .33* .002 .12* 1.00gender .01 .009 .09* .03* .13* .014 .12* .04* .15* 1.00age -.1* .02* .34* -.02 -.2* -.2* -.2* -.04* -.4* -.2* 1.00maritlst. -.03* -.05* .09* .02* .12* -.01 .10* -.03* .10* .70* -.2* 1.00
197Makale Gönderim Tarihi:Makale Gönderim Tarihi: 15.02.2021Yayına Kabul Tarihi:Yayına Kabul Tarihi: 13.06.2021
ARAŞTIRMA MAKALESİ / RESEARCH ARTICLE
Marmara Üniversitesi İktisadi ve İdari Bilimler Dergisi • Cilt: 43 • Sayı: 1 • Haziran 2021, ISSN: 2587-2672, ss/pp. 197-212 DOI: 10.14780/muiibd.960332
AGGREGATE LIQUIDITY CREATION OF ISLAMIC BANKS IN TURKEY
TÜRK KATILIM BANKALARININ LİKİDİTE YARATIMI
Ozlem AKIN2
* S. Mehmet OZSOY**
3
AbstractThis paper provides a detailed analysis of aggregate liquidity created by Islamic (participation) banks in Turkey. Using quarterly regulatory dataset for the period of 2010–2017 and applying Berger and Bouwman4
1 framework to measure liquidity creation, we document that the liquidity created by Turkish Islamic (participation) banks has tripled (in inflation adjusted terms) in our sample period. Furthermore, we find that Islamic banks have created liquidity both on and off their balance sheets. Finally, we observe that Turkish Islamic banks have been creating more liquidity with their liabilities than their assets. Despite the continuous upward trend in aggregate liquidity created by Turkish Islamic banks, their loan-to-asset and deposit-to-asset ratios have been declining in our sample period, which suggests that the observed trend has been driven by extensive margin (i.e., bank sizes growing in real terms) rather than the intensive margin (banks creating liquidity more effectively).Keywords: Islamic Banks, Liquidity Creation, TurkeyJEL Classification: G21, G28
ÖzBu makale Türkiye’deki İslami (Katılım) bankalarının yarattığı toplam likiditenin ayrıntılı bir analizini sunmaktadır. 2010-2017 dönemine ait üçer aylık Bankacılık Düzenleme ve Denetleme Kurulu (BDDK) verileri kullanılarak ve Berger ve Bouwman (2009) likidite yaratımı ölçüm yöntemi uygulanarak Türk İslami (Kalkınma) Bankalarının yarattığı likiditenin incelenen dönemde üçe katlandığı (enflasyondan arındırılmış olarak) sonucuna ulaşılmıştır. Bunun yanında, Türk İslami bankaların hem bilanço hem de nazım hesaplar ile likidite yarattığı görülmektedir. Son olarak, Türk İslami bankalarının yükümlülükleri ile varlıklarından daha fazla likidite yarattığı gözlemlenmiştir. Toplam likiditede gözüken yukarı yönlü eğilime rağmen incelenen dönemde kredi/varlık ve mevduat/varlık oranlarının düşüş eğiliminde olması
* Asst. Prof. Dr., Ozyegin University, Faculty of Business, Istanbul, E-Mail: [email protected], ORCID ID: 0000-0003-2115-8416
** Asst. Prof. Dr., Ozyegin University, Faculty of Business, Istanbul, E-Mail [email protected], ORCID ID: 0000-0002-9391-7859
1 Berger, A. N., Bouwman, C. H. (2009). Bank liquidity creation, Review of Financial Studies, 22(9): 3779-3837.
Ozlem AKIN • S. Mehmet OZSOY
198
gözlemlenen yükseliş eğiliminin bankaların daha etkin likidite yaratması sebebi ile değil de banka büyüklüklerinin reel olarak artmasından kaynaklandığına işaret etmektedir.Anahtar Kelimeler: İslami (Katılım) Bankalar, Likidite Yaratımı, TürkiyeJEL Sınıflandırması: G21, G28
1. Introduction
After the 2007-2008 financial crisis, interest in Islamic banking have expanded beyond the Muslim majority countries. The acceptability of Islamic finance has penetrated not only the Middle East and Asian countries, but also the rest of the world2. Given the increasing interest in Islamic banking, recent empirical literature discusses their role in the economy and their performance in several aspects. Recent studies on the role and relative importance of Islamic banks show that development of Islamic banking leads to a higher banking sector development3, increases macroeconomic efficiency4 and improve economic welfare5. We contribute to this recently growing literature by focusing on Islamic (participation) banks’ performance in terms of liquidity creation6. Following Berger and Bouwman7 liquidity created on – and off-balance sheet are computed for Islamic banks operating in Turkey. Furthermore, Berger and Bouwman8 methodology allows us to disentangle contribution to the liquidity creation from the asset and liability sides. Comparing these liquidity creation measures, we document the aggregate liquidity created by Islamic banks and further we elaborate how it changed over time.
We study the liquidity creation performance of Islamic banks in Turkey. Our sample contains 5 Islamic (participation) banks operating during the period of 2010 – 2017. We obtained quarterly detailed regulatory dataset from The Banks Association of Turkey which provides free access to financial statements of banks. Our main variable of interest is the aggregate liquidity created by Turkish Islamic banks. To this end, first we calculate liquidity creation for individual banks a-la Berger and Bouwman9 on a quarterly basis, following the methodology described in Akin and Ozsoy10 and then aggregate them for each quarter.
First aim of the paper is to document the aggregate liquidity created by Turkish Islamic banks. We find that during our sample period the liquidity created by Turkish Islamic (participation) banks has
2 Hassan, M. K., Aliyu, S. (2018). A Contemporary Survey of Islamic Banking Literature, Journal of Financial Stability, 34: 12-43.
3 Gheeraert, L. (2014). Does Islamic Finance Spur Banking Sector Development?, Journal of Economic Behavior and Organization, 103: 4-S20.
4 Gheeraert, L., Weill, L. (2015). Does Islamic Banking Development Favor Macroeconomic Efficiency? Evidence on the Islamic Finance-Growth Nexus, Economic Modelling, 47: 32-39.
5 Abedifar, P., Hasan, I., Tarazi, A. (2016). Finance-Growth Nexus and Dual-Banking Systems: Relative Importance of Islamic Banks, Journal of Economic Behavior and Organization, 132: 198-215.
6 In this study, we use the terms Islamic and Participation interchangeably. In 2005, Turkey renamed interest-free banks as participation banks which are named as Islamic banks in global banking system.
7 Berger, Bouwman, 2009.8 Berger, Bouwman, 2009.9 Berger, Bouwman, 2009.10 Akin, O., Ozsoy, M. (2020). Political Liquidity Creation: Electoral Cycles and State-owned Banks, Working Paper.
Marmara Üniversitesi İktisadi ve İdari Bilimler Dergisi • Cilt: 43 • Sayı: 1 • Haziran 2021, ISSN: 2587-2672, ss/pp. 197-212
199
tripled, in inflation-adjusted terms. We further show that Islamic banks have created liquidity both on and off their balance sheets. The liquidity created off-balance sheets varies more over time and equals, on average, to 75 percent of liquidity creation on balance sheets. Finally, we disentangle the source of liquidity creation by computing liquidity created from asset and from liabilities side separately. Banks can create liquidity for their customers with their assets, such as illiquid loans and with their liabilities, such as by offering demandable deposits. When we compare the liquidity created on the asset and liability sides, we observe that Turkish Islamic Banks have been creating more liquidity with their liabilities than their assets. In some quarters the amount of liquidity created via liabilities is double of liquidity created via assets. Despite the upward trend in aggregate liquidity created by Turkish Islamic banks, their loan-to-asset and deposit-to-asset ratios have been declining in our sample period, which suggests that the observed upward trend has been driven by extensive margin (i.e. bank sizes growing in real terms) rather than the intensive margin (banks creating liquidity more effectively).
We contribute to the literature in several ways. First, the literature on Islamic banking has mostly been theoretical and the empirical results are limited. Recently growing empirical literature investigates the several aspects of Islamic banking including their profitability, efficiency, survival rate and stock market liquidity. By analysing the most recent data from Turkey, we extend the earlier work on Islamic banks (e.g., Field, et al11; Abdelsalam et al12; Elnahass et al13) in general. More specifically, we contribute to this recently growing empirical literature by analysing their performance in terms of liquidity creation. As Berger et al14. argues that despite the growth of Islamic banks little is known about their liquidity creation performance which is one of the fundamental roles of financial intermediaries. Berger et al.15 address this issue at bank level in a multi-country setting using data from 24 countries including Turkey over 2000 – 2014. Akin and Ozsoy16 study the liquidity creation performance of Islamic banks in a single-country context using data from Turkey in post-crisis period (2010 – 2017). It is crucial to provide evidence from a single country setting as the literature documents that performance of Islamic banks across Muslim countries varies significantly due to differences in institutional environments (see e.g., Bitar et al17). Unlike Akin and Ozsoy18, this paper analyse it at the aggregate level. We also extend the limited literature on the performance of Turkish Islamic banks. Aysan et al19 provides an overview of the developments in the Turkish
11 Field, L., Lowry, M., Mkrtchyan, A. (2013). Are Busy Boards Detrimental?, Journal of Financial Economics, 109(1): 63-82.12 Abdelsalam, O., El-Komi, M. (2016). Islamic Finance: Introduction and Implications for Future Research and Practice,
Journal of Economic Behavior and Organization., 132: 1-3.13 Elnahass, M., Izzeldin, M., Steele, G. (2018). Capital and Earnings Management: Evidence from Alternative Banking
Business Models, The International Journal of Accounting, 53(1): 20-32.14 Berger, A. N., Boubakri, N., Guedhami, O., Li, X. (2019). Liquidity Creation Performance and Financial Stability
Consequences of Islamic Banking: Evidence from A Multinational Study, Journal of Financial Stability, 44: 100692.15 Berger et. al. 2019.16 Akin, O., Ozsoy, M. (2021). Bank Liquidity Creation in Turkey: Conventional vs. Islamic Banks, Working Paper.17 Bitar, M., Hassan, M. K., Walker, T. (2017). Political Systems and The Financial Soundness of Islamic banks. Journal of
Financial Stability, 31: 18-44.18 Akin, Ozsoy, 2021.19 Aysan, A. F., Dolgun, M. H., Turhan, M. I. (2013). Assessment of the Participation Banks and Their Role in Financial
Inclusion in Turkey, Emerging Markets Finance and Trade, 49: 99-111.
Ozlem AKIN • S. Mehmet OZSOY
200
Islamic banking sector. Earlier studies on Islamic banking in Turkey focused on their performance mostly in terms of profitability measured by various financial ratios. Previous studies that conduct comparative analysis of the performance of Islamic bank and conventional bank operating in Turkey produce mixed results. Karakaya and Er20 analyse 6 years of data between 2005 – 2010 and document that equity capital profitability of participation banks is higher than that of commercial banks. Erol et al21 compare the performance of Islamic banks in Turkey with that of commercial banks using CAMEL approach for the period of 2001 – 2009. Their results show that Islamic banks have better performance in earnings. On the other hand, Akala22 analyses the period of 2005-2015 and shows that conventional banks in Turkey are performing better than Islamic banks by comparing several financial ratios over time. We contribute to Turkish Islamic banking literature by analysing their performance in terms of liquidity creation.
Second, we contribute to growing empirical liquidity creation literature using Berger and Bouwman23 framework. Deep and Schaefer24, the first study that has investigated bank liquidity creation, use only liquid items from assets and liabilities side to measure liquidity creation. In a follow up study, Berger and Bouwman25 emphasize the importance of a comprehensive liquidity creation measure and propose measure that considers items from both asset and liabilities sides and on – and off-balance sheet items. This comprehensive liquidity creation measure is often used in subsequent studies that are analyzing liquidity creation in developed countries as well as emerging countries (See e.g., Pana et al26; Horváth et al27; DeYoung and Huang28; Berger and Bouwman29; Fungácová et al30; Beck et al31).
We further specifically contribute to the literature analysing liquidity aspects of Turkish banks. The number of papers studying the liquidity in the context of Turkish banks is limited and none of
20 Karakaya, A., Er, B. (2013). Noninterest (Nonprofit) Income and Financial Performance at Turkish Commercial and Participation Banks, International Business Research, 6(1): 106.
21 Erol, C., Baklaci, H. F., Aydoğan, B., Tunç, G. (2014). Performance Comparison of Islamic (participation) Banks and Commercial Banks in Turkish Banking Sector, EuroMed Journal of Business, 9(2): 114-128.
22 Akala, İ. (2018). Comparing Financial Performances of Conventional and Participation Banks: Case of Turkey (2005–2015), International Journal of Inspiration and Resilience Economy, 2(1): 11-17.
23 Berger, Bouwman, 2009.24 Deep, A., Schaefer, G. K. (2004). Are Banks Liquidity Transformers?, Working Paper, Harvard University.25 Berger, Bouwman, 2009.26 Pana, E., Park, J., Query, T. (2010). The Impact of Bank Mergers on Liquidity Creation, Journal of Risk Management in
Financial Institutions, 4(1): 74-96.27 Horvath, R., Seidler, J., Weill, L. (2014). Bank Capital and Liquidity Creation: Granger-Causality Evidence, Journal of
Financial Services Research, 45(3): 341-361.28 Deyoung, R., Huang, M. (2016). The External Effects of Bank Executive Pay: Liquidity Creation and Systemic Risk,
Working Paper.29 Berger, A. N., Bouwman, C. H. (2017). Bank Liquidity Creation, Monetary Policy, and Financial Crises, Journal of
Financial Stability, 30: 139-155.30 Fungacova, Z., Weill, L., Zhou, M. (2017). Bank Capital, Liquidity Creation and Deposit Insurance, Journal of Financial
Services Research, 51(1): 97-123.31 Beck, T., Dottling R., Lambert T., Van Dijk, M. (2020). Liquidity Creation, Investment, and Growth. CEPR Discussion
Papers no 14956, Centre for Economic Policy Research.
Marmara Üniversitesi İktisadi ve İdari Bilimler Dergisi • Cilt: 43 • Sayı: 1 • Haziran 2021, ISSN: 2587-2672, ss/pp. 197-212
201
these studies use the comprehensive liquidity creation measure. Alper et al.32 define liquidity as the difference between liquid assets and liquid liabilities. Similar to Deep and Schaefer33, they take into account items from both assets and liabilities side. But different from Berger and Bouwman34 they do not include loans and any semi-liquid items (both from asset and liability sides) in their analysis. Other studies that analyze liquidity aspects of Turkish banks measure liquidity as the share of liquid assets in total assets and have not used any items from liabilities side (See e.g., Akıncı et al35; Ozsuca and Akbostanci36).
Finally, we also contribute to the debate on the role of off-balance sheet items. It is critical to include off-balance sheet activities in liquidity creation computation because they include items such as loan commitments which can provide significant liquidity to firms, especially when obtaining new credit lines are difficult. The growing pattern of off-balance sheet (OBS) activities has attracted attention of both regulators and academicians. Globally, there is a growing pattern in off-balance sheet activities. Acharya and Richardson37 reports growing pattern of the securitization-generated income in many OECD countries especially after 2003. Altunbas et. al38 provide evidence on the increasing securitization in European banks. In line with global trends, the share of off-balance sheet items increased significantly after the crisis of 1994 in Turkish banking system as well. However, an early study by Altan and Parlakkaya39 documents that these transactions did not positively affect the performance of the banks due to their ineffective use. Anbar and Alper40 analyze the banks that are listed on Istanbul Stock Exchange for the 1999-2010 and find that the banks with higher return on equity and higher net interest margin and smaller banks use derivatives more intensely. Using data in a more recent period (2002-2017), Akin and Ozsoy41 documents that loan commitments of Turkish banks take a dramatic deep dive in 2013, while at the same time the use of derivatives begins a trend of a steady increase. The importance of OBS has risen even more after the recent crisis as OBS activities of banking sector are blamed as one of the main reasons of crisis. It has been argued that the standard capital adequacy and liquidity ratios that did not consider the riskiness of
32 Alper, K., Hulagu, T., Keles, G. (2012). An Empirical Study on Liquidity and Bank Lending, Central Bank of the Republic of Turkey Working Paper, 4.
33 Deep, Schaefer, 2004.34 Berger, Bouwman, 2009.35 Akıncı, D. A., Matousek, R., Radić, N., Stewart, C. (2013). Monetary policy and The Banking Sector in Turkey, Journal of
International Financial Markets, Institutions and Money, 27: 269-285.36 Ozsuca, E. A., Akbostanci, E. (2012). An Empirical Analysis of the Bank Lending Channel in Turkey, Middle East
Technical University ERC Working Papers in Economics, 12(05): 1-33.37 Acharya, V. V., Richardson, M. (2009). Causes of The Financial Crisis., Critical Review, 21(2-3): 195-210.38 Altunbas, Y., Gambacorta, L., Marques-Ibanez, D. (2009). Securitisation and the Bank Lending Channel, European
Economic Review, 53(8): 996-1009.39 Altan, M., Parlakkaya, R. (2004). Bilanço Dışı İşlemlerin Banka Performansına Etkisi: Türk Bankacılık Sektörü
Örneği, Iktisat Isletme ve Finans, 19(219): 107-122.40 Anbar, A., Alper, D. (2011). Bankaların Türev Ürün Kullanım Yoğunluğunu Etkileyen Faktörlerin Belirlenmesi,
Muhasebe ve Finansman Dergisi, 50: 77-94.41 Akin, O., Ozsoy, M. (2019). Global Trends in Liquidity Creation: The Role of the Off – Balance Sheet, New Trends in
Banking and Finance, Peter Lang, Berlin, p. 77-94.
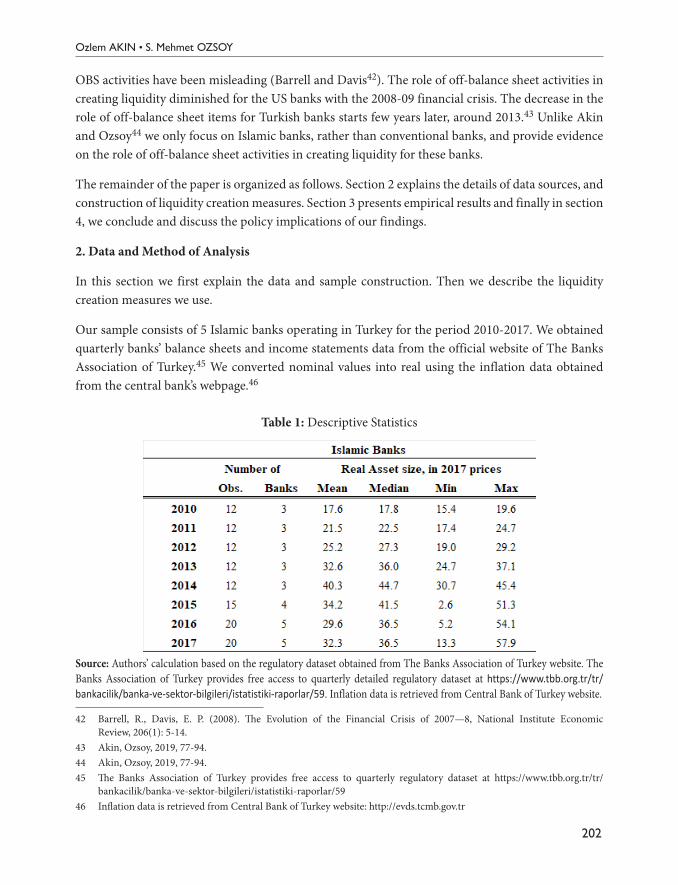
Ozlem AKIN • S. Mehmet OZSOY
202
OBS activities have been misleading (Barrell and Davis42). The role of off-balance sheet activities in creating liquidity diminished for the US banks with the 2008-09 financial crisis. The decrease in the role of off-balance sheet items for Turkish banks starts few years later, around 2013.43 Unlike Akin and Ozsoy44 we only focus on Islamic banks, rather than conventional banks, and provide evidence on the role of off-balance sheet activities in creating liquidity for these banks.
The remainder of the paper is organized as follows. Section 2 explains the details of data sources, and construction of liquidity creation measures. Section 3 presents empirical results and finally in section 4, we conclude and discuss the policy implications of our findings.
2. Data and Method of Analysis
In this section we first explain the data and sample construction. Then we describe the liquidity creation measures we use.
Our sample consists of 5 Islamic banks operating in Turkey for the period 2010-2017. We obtained quarterly banks’ balance sheets and income statements data from the official website of The Banks Association of Turkey.45 We converted nominal values into real using the inflation data obtained from the central bank’s webpage.46
Table 1: Descriptive Statistics
Makale Gönderim Tarihi: 15.02.2021 Yayına Kabul Tarihi: 13.06.2021
Ozsoy44 we only focus on Islamic banks, rather than conventional banks, and provide evidence on the role of off-balance sheet activities in creating liquidity for these banks.
The remainder of the paper is organized as follows. Section 2 explains the details of data sources, and construction of liquidity creation measures. Section 3 presents empirical results and finally in section 4, we conclude and discuss the policy implications of our findings.
2. Data and Method of Analysis
In this section we first explain the data and sample construction. Then we describe the liquidity creation measures we use.
Our sample consists of 5 Islamic banks operating in Turkey for the period 2010-2017. We obtained quarterly banks’ balance sheets and income statements data from the official website of The Banks Association of Turkey.45 We converted nominal values into real using the inflation data obtained from the central bank’s webpage.46
Table 1: Descriptive Statistics
Source: Authors’ calculation based on the regulatory dataset obtained from The Banks Association of Turkey website. The Banks Association of Turkey provides free access to quarterly detailed regulatory dataset at https://www.tbb.org.tr/tr/bankacilik/banka-ve-sektor-bilgileri/istatistiki-raporlar/59. Inflation data is retrieved from Central Bank of Turkey website.
44 Akin, Ozsoy, 2019, 77-94. 45 The Banks Association of Turkey provides free access to quarterly regulatory dataset at https://www.tbb.org.tr/tr/bankacilik/banka-ve-sektor-bilgileri/istatistiki-raporlar/59 46 Inflation data is retrieved from Central Bank of Turkey website: http://evds.tcmb.gov.tr
Source: Authors’ calculation based on the regulatory dataset obtained from The Banks Association of Turkey website. The Banks Association of Turkey provides free access to quarterly detailed regulatory dataset at https://www.tbb.org.tr/tr/bankacilik/banka-ve-sektor-bilgileri/istatistiki-raporlar/59. Inflation data is retrieved from Central Bank of Turkey website.
42 Barrell, R., Davis, E. P. (2008). The Evolution of the Financial Crisis of 2007—8, National Institute Economic Review, 206(1): 5-14.
43 Akin, Ozsoy, 2019, 77-94.44 Akin, Ozsoy, 2019, 77-94.45 The Banks Association of Turkey provides free access to quarterly regulatory dataset at https://www.tbb.org.tr/tr/
bankacilik/banka-ve-sektor-bilgileri/istatistiki-raporlar/5946 Inflation data is retrieved from Central Bank of Turkey website: http://evds.tcmb.gov.tr
Marmara Üniversitesi İktisadi ve İdari Bilimler Dergisi • Cilt: 43 • Sayı: 1 • Haziran 2021, ISSN: 2587-2672, ss/pp. 197-212
203
Table 1 compares the numbers and asset sizes of Islamic (participation) banks over the period 2010 – 2017. The first column presents the number of observations in each year. The second column presents the number of distinct Islamic (participation) banks included in our analysis in each year. The following columns (from three to six) provide descriptive statistics on asset sizes of Islamic (participation) banks over years. Asset size is denoted in 2017 prices (i.e. adjusted for inflation) and in million Turkish Liras.
Our main variable of interest is the aggregate liquidity created by Turkish Islamic banks. We follow Berger and Bouwman47 to compute bank level liquidity created on a quarterly basis. Then we aggregate the bank level liquidity at quarter level to compute our aggregate liquidity creation measure. We follow three-step procedure to compute liquidity created from on – and off – balance sheet: (1) Each item in on – and off-balance sheet will be classified as “liquid”, “semi-liquid” and “illiquid” (2) The value of each item will be multiplied by the weight that Berger and Bouwman (2009) assigned and (3) finally the items classified will be summed under the categories defined in previous steps.
Now, we explain the steps of computing liquidity creation measure in detail.
1. Classifying items: At first step, Berger and Bouwman classifies each item on and off-balance sheet as “liquid”, “semi-liquid” or “illiquid”. We go through all the items on the balance sheet. In asset side cash and similar items are classified as liquid assets and premises and investments are classified as illiquid assets. Berger and Bouwman48 classify loans based on two characteristics: (1) category (such as business loans vs. mortgages) and (2) maturity (less than 1-year vs. longer maturity loans). We classify the loans based on their type since we do not have access to maturity information. For instance, consumer loans, credit cards and loans to depository institutions are considered as semi-liquid and the rest of the loans are classified as illiquid. On the liabilities side, we classify deposits as liquid and total equity as illiquid. Then off-balance sheet items of loan commitments and letter of credits are classified as “illiquid” whereas derivatives will be classified as “liquid” due to their easy sell and buy.
2. Assigning weights: At second step, we assign the weights of Berger and Bouwman to each item based on its category. We multiply all items that are classified as liquid by ½, semi-liquid items will be multiplied by 0 and finally the items classified as illiquid will be multiplied by – 1/2.
3. Constructing liquidity creation measures: At third step, we sum the value of items multiplied by corresponding weights at bank-quarter level. Finally, we aggregate bank level liquidity at quarter level to obtain our aggregate level liquidity measures.
Following the steps defined above, we obtain five aggregate liquidity creation measures for Islamic banks. First, we have liquidity created from on-balance sheet (nonfat) and second liquidity created from on and off-balance sheet together (fat). Then we further disentangle the aggregate liquidity creation into liquidity created on the asset – and liability-side, as well as aggregate liquidity created off-balance sheet.
47 Berger, Bouwman, 2009.48 Berger, Bouwman, 2009.
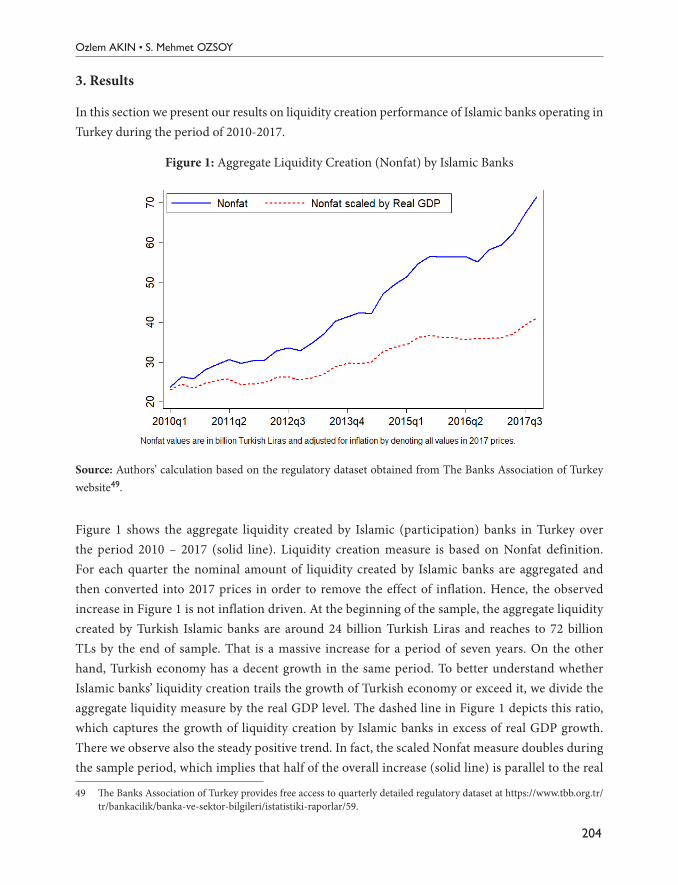
Ozlem AKIN • S. Mehmet OZSOY
204
3. Results
In this section we present our results on liquidity creation performance of Islamic banks operating in Turkey during the period of 2010-2017.
Figure 1: Aggregate Liquidity Creation (Nonfat) by Islamic Banks
Source: Authors’ calculation based on the regulatory dataset obtained from The Banks Association of Turkey website49.
Figure 1 shows the aggregate liquidity created by Islamic (participation) banks in Turkey over the period 2010 – 2017 (solid line). Liquidity creation measure is based on Nonfat definition. For each quarter the nominal amount of liquidity created by Islamic banks are aggregated and then converted into 2017 prices in order to remove the effect of inflation. Hence, the observed increase in Figure 1 is not inflation driven. At the beginning of the sample, the aggregate liquidity created by Turkish Islamic banks are around 24 billion Turkish Liras and reaches to 72 billion TLs by the end of sample. That is a massive increase for a period of seven years. On the other hand, Turkish economy has a decent growth in the same period. To better understand whether Islamic banks’ liquidity creation trails the growth of Turkish economy or exceed it, we divide the aggregate liquidity measure by the real GDP level. The dashed line in Figure 1 depicts this ratio, which captures the growth of liquidity creation by Islamic banks in excess of real GDP growth. There we observe also the steady positive trend. In fact, the scaled Nonfat measure doubles during the sample period, which implies that half of the overall increase (solid line) is parallel to the real
49 The Banks Association of Turkey provides free access to quarterly detailed regulatory dataset at https://www.tbb.org.tr/tr/bankacilik/banka-ve-sektor-bilgileri/istatistiki-raporlar/59.
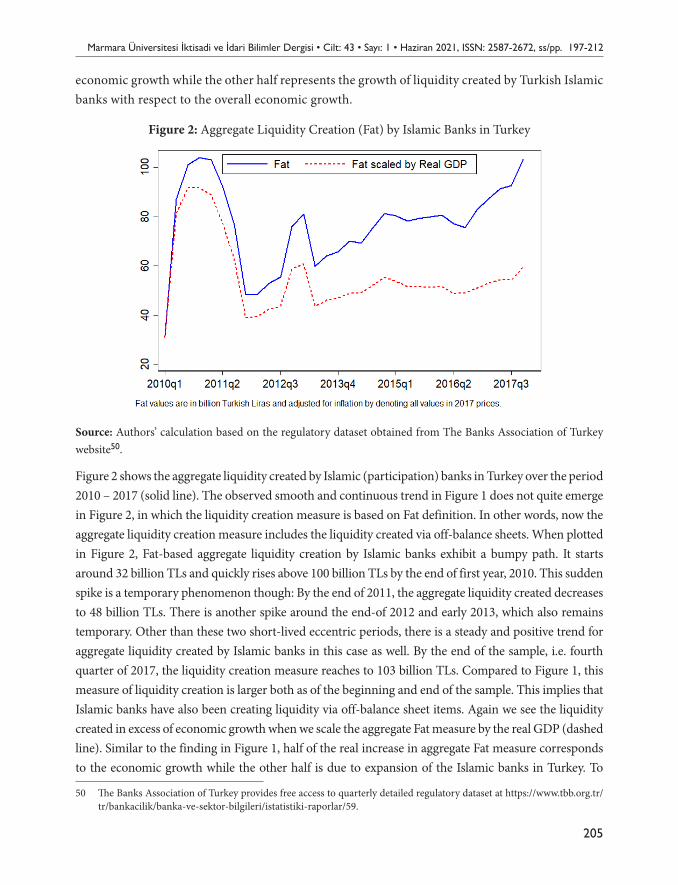
Marmara Üniversitesi İktisadi ve İdari Bilimler Dergisi • Cilt: 43 • Sayı: 1 • Haziran 2021, ISSN: 2587-2672, ss/pp. 197-212
205
economic growth while the other half represents the growth of liquidity created by Turkish Islamic banks with respect to the overall economic growth.
Figure 2: Aggregate Liquidity Creation (Fat) by Islamic Banks in Turkey
Source: Authors’ calculation based on the regulatory dataset obtained from The Banks Association of Turkey website50.
Figure 2 shows the aggregate liquidity created by Islamic (participation) banks in Turkey over the period 2010 – 2017 (solid line). The observed smooth and continuous trend in Figure 1 does not quite emerge in Figure 2, in which the liquidity creation measure is based on Fat definition. In other words, now the aggregate liquidity creation measure includes the liquidity created via off-balance sheets. When plotted in Figure 2, Fat-based aggregate liquidity creation by Islamic banks exhibit a bumpy path. It starts around 32 billion TLs and quickly rises above 100 billion TLs by the end of first year, 2010. This sudden spike is a temporary phenomenon though: By the end of 2011, the aggregate liquidity created decreases to 48 billion TLs. There is another spike around the end-of 2012 and early 2013, which also remains temporary. Other than these two short-lived eccentric periods, there is a steady and positive trend for aggregate liquidity created by Islamic banks in this case as well. By the end of the sample, i.e. fourth quarter of 2017, the liquidity creation measure reaches to 103 billion TLs. Compared to Figure 1, this measure of liquidity creation is larger both as of the beginning and end of the sample. This implies that Islamic banks have also been creating liquidity via off-balance sheet items. Again we see the liquidity created in excess of economic growth when we scale the aggregate Fat measure by the real GDP (dashed line). Similar to the finding in Figure 1, half of the real increase in aggregate Fat measure corresponds to the economic growth while the other half is due to expansion of the Islamic banks in Turkey. To
50 The Banks Association of Turkey provides free access to quarterly detailed regulatory dataset at https://www.tbb.org.tr/tr/bankacilik/banka-ve-sektor-bilgileri/istatistiki-raporlar/59.
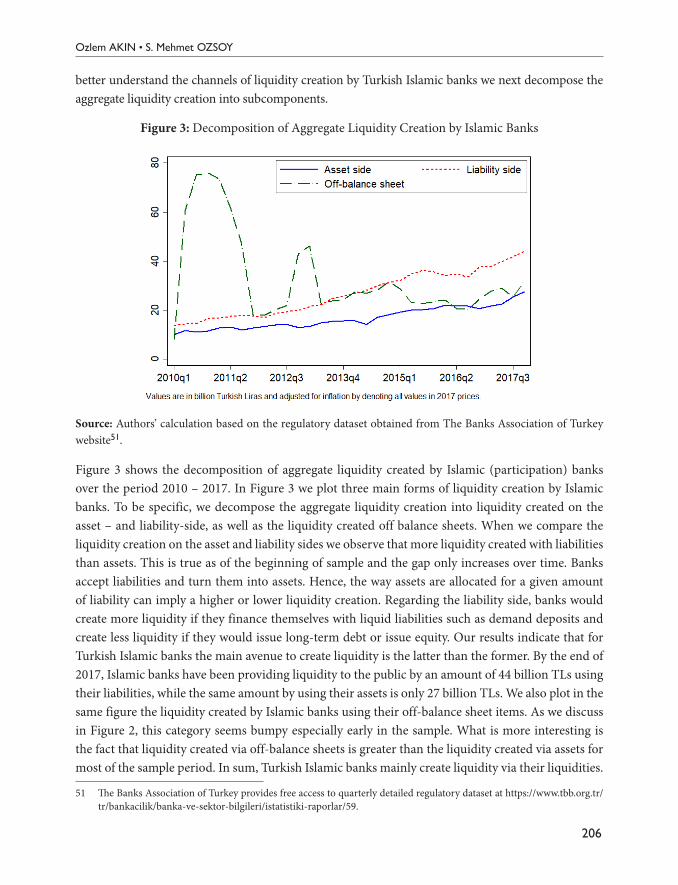
Ozlem AKIN • S. Mehmet OZSOY
206
better understand the channels of liquidity creation by Turkish Islamic banks we next decompose the aggregate liquidity creation into subcomponents.
Figure 3: Decomposition of Aggregate Liquidity Creation by Islamic Banks
Source: Authors’ calculation based on the regulatory dataset obtained from The Banks Association of Turkey website51.
Figure 3 shows the decomposition of aggregate liquidity created by Islamic (participation) banks over the period 2010 – 2017. In Figure 3 we plot three main forms of liquidity creation by Islamic banks. To be specific, we decompose the aggregate liquidity creation into liquidity created on the asset – and liability-side, as well as the liquidity created off balance sheets. When we compare the liquidity creation on the asset and liability sides we observe that more liquidity created with liabilities than assets. This is true as of the beginning of sample and the gap only increases over time. Banks accept liabilities and turn them into assets. Hence, the way assets are allocated for a given amount of liability can imply a higher or lower liquidity creation. Regarding the liability side, banks would create more liquidity if they finance themselves with liquid liabilities such as demand deposits and create less liquidity if they would issue long-term debt or issue equity. Our results indicate that for Turkish Islamic banks the main avenue to create liquidity is the latter than the former. By the end of 2017, Islamic banks have been providing liquidity to the public by an amount of 44 billion TLs using their liabilities, while the same amount by using their assets is only 27 billion TLs. We also plot in the same figure the liquidity created by Islamic banks using their off-balance sheet items. As we discuss in Figure 2, this category seems bumpy especially early in the sample. What is more interesting is the fact that liquidity created via off-balance sheets is greater than the liquidity created via assets for most of the sample period. In sum, Turkish Islamic banks mainly create liquidity via their liquidities.
51 The Banks Association of Turkey provides free access to quarterly detailed regulatory dataset at https://www.tbb.org.tr/tr/bankacilik/banka-ve-sektor-bilgileri/istatistiki-raporlar/59.
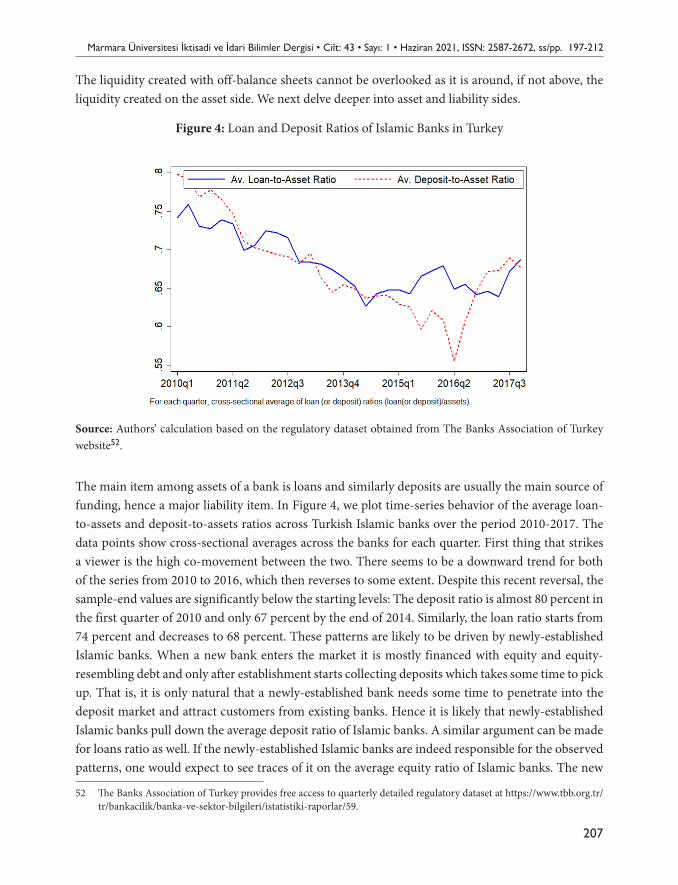
Marmara Üniversitesi İktisadi ve İdari Bilimler Dergisi • Cilt: 43 • Sayı: 1 • Haziran 2021, ISSN: 2587-2672, ss/pp. 197-212
207
The liquidity created with off-balance sheets cannot be overlooked as it is around, if not above, the liquidity created on the asset side. We next delve deeper into asset and liability sides.
Figure 4: Loan and Deposit Ratios of Islamic Banks in Turkey
Source: Authors’ calculation based on the regulatory dataset obtained from The Banks Association of Turkey website52.
The main item among assets of a bank is loans and similarly deposits are usually the main source of funding, hence a major liability item. In Figure 4, we plot time-series behavior of the average loan-to-assets and deposit-to-assets ratios across Turkish Islamic banks over the period 2010-2017. The data points show cross-sectional averages across the banks for each quarter. First thing that strikes a viewer is the high co-movement between the two. There seems to be a downward trend for both of the series from 2010 to 2016, which then reverses to some extent. Despite this recent reversal, the sample-end values are significantly below the starting levels: The deposit ratio is almost 80 percent in the first quarter of 2010 and only 67 percent by the end of 2014. Similarly, the loan ratio starts from 74 percent and decreases to 68 percent. These patterns are likely to be driven by newly-established Islamic banks. When a new bank enters the market it is mostly financed with equity and equity-resembling debt and only after establishment starts collecting deposits which takes some time to pick up. That is, it is only natural that a newly-established bank needs some time to penetrate into the deposit market and attract customers from existing banks. Hence it is likely that newly-established Islamic banks pull down the average deposit ratio of Islamic banks. A similar argument can be made for loans ratio as well. If the newly-established Islamic banks are indeed responsible for the observed patterns, one would expect to see traces of it on the average equity ratio of Islamic banks. The new
52 The Banks Association of Turkey provides free access to quarterly detailed regulatory dataset at https://www.tbb.org.tr/tr/bankacilik/banka-ve-sektor-bilgileri/istatistiki-raporlar/59.
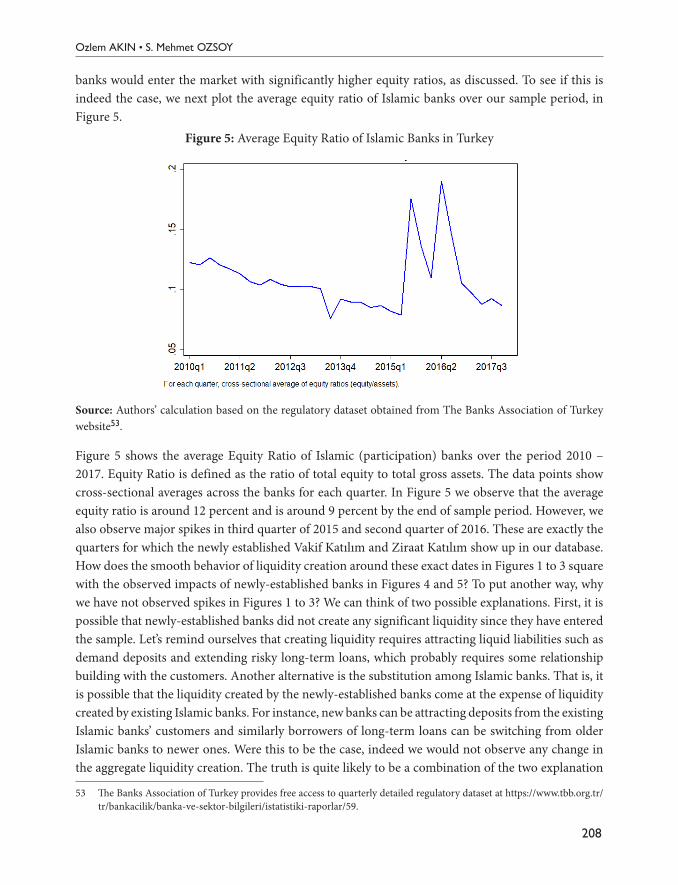
Ozlem AKIN • S. Mehmet OZSOY
208
banks would enter the market with significantly higher equity ratios, as discussed. To see if this is indeed the case, we next plot the average equity ratio of Islamic banks over our sample period, in Figure 5.
Figure 5: Average Equity Ratio of Islamic Banks in Turkey
Source: Authors’ calculation based on the regulatory dataset obtained from The Banks Association of Turkey website53.
Figure 5 shows the average Equity Ratio of Islamic (participation) banks over the period 2010 – 2017. Equity Ratio is defined as the ratio of total equity to total gross assets. The data points show cross-sectional averages across the banks for each quarter. In Figure 5 we observe that the average equity ratio is around 12 percent and is around 9 percent by the end of sample period. However, we also observe major spikes in third quarter of 2015 and second quarter of 2016. These are exactly the quarters for which the newly established Vakif Katılım and Ziraat Katılım show up in our database. How does the smooth behavior of liquidity creation around these exact dates in Figures 1 to 3 square with the observed impacts of newly-established banks in Figures 4 and 5? To put another way, why we have not observed spikes in Figures 1 to 3? We can think of two possible explanations. First, it is possible that newly-established banks did not create any significant liquidity since they have entered the sample. Let’s remind ourselves that creating liquidity requires attracting liquid liabilities such as demand deposits and extending risky long-term loans, which probably requires some relationship building with the customers. Another alternative is the substitution among Islamic banks. That is, it is possible that the liquidity created by the newly-established banks come at the expense of liquidity created by existing Islamic banks. For instance, new banks can be attracting deposits from the existing Islamic banks’ customers and similarly borrowers of long-term loans can be switching from older Islamic banks to newer ones. Were this to be the case, indeed we would not observe any change in the aggregate liquidity creation. The truth is quite likely to be a combination of the two explanation
53 The Banks Association of Turkey provides free access to quarterly detailed regulatory dataset at https://www.tbb.org.tr/tr/bankacilik/banka-ve-sektor-bilgileri/istatistiki-raporlar/59.
Marmara Üniversitesi İktisadi ve İdari Bilimler Dergisi • Cilt: 43 • Sayı: 1 • Haziran 2021, ISSN: 2587-2672, ss/pp. 197-212
209
we laid out. Nevertheless, the two explanations have different implications for the future of Islamic banking in Turkey. The first explanation does not imply anything positive or negative about the future of Turkish Islamic banks. The second explanation, on the other hand, implies that Islamic banks compete with each other rather than being alternatives to conventional commercial banks and other formal and informal financial institutions. This explanation implies that there exists a certain clientele for Islamic banks of Turkey and Islamic banks compete within this given pool of customers and do not attract new customers into the Islamic banking system. That would also imply that, going forward, the (insufficient) demand for Islamic banking is the main impediment for the growth of Islamic banking in Turkey rather than the supply of Islamic banking instruments. Simply, it can be a demand issue rather than a supply one. The newly established Islamic banks being state-owned rather than being private sector ventures also speak volumes about the unattractive or unpromising demand for the Islamic banking in Turkey. Having said this, pinning down the exact answer is not straightforward and beyond the scope of current paper and so we leave it for future research.
4. Conclusion
This paper analyzes the aggregate liquidity created by Turkish Islamic banks. Following Berger and Bouwman54 liquidity created on – and off-balance sheet are computed for Islamic banks operating in Turkey. Furthermore, their methodology allows us to disentangle contribution to the liquidity creation from the asset and liability sides. Comparing these liquidity creation measures, we document the aggregate liquidity created by Islamic banks and further we elaborate how it changed over time.
We find that during our sample period the liquidity created by Turkish Islamic (participation) banks has tripled, in inflation-adjusted terms. We further show that Islamic banks have created liquidity both on and off their balance sheets. Finally, we disentangle the source of liquidity creation by computing liquidity created from asset and from liabilities side separately. Banks can create liquidity for their customers with their assets, such as illiquid loans and with their liabilities, such as by offering demandable deposits. When we compare the liquidity created on the asset and liability sides, we observe that Turkish Islamic Banks have been creating more liquidity with their liabilities than their assets. In some quarters the amount of liquidity created via liabilities is double of liquidity created via assets. Despite the secular upward trend in aggregate liquidity created by Turkish Islamic banks, their loan-to-asset and deposit-to-asset ratios have been declining in our sample period, which suggests that the observed continuous upward trend has been driven by extensive margin (i.e. bank sizes growing in real terms) rather than the intensive margin (banks creating liquidity more effectively).
Our results would be of interest for policymakers in Turkey. First, Aysan et al.55 show that a significant portion of financing for small and medium-sized enterprises in Turkey is supported by Islamic rather than conventional banks. This result indicates that it is important to explore the stability of Islamic banks which can be endangered by excessive liquidity creation. Secondly, in line with Turkish
54 Berger, Bouwman, 2009.55 Aysan, A. F., Disli, M., Ng, A., Ozturk, H. (2016). Is Small the New Big? Islamic Banking for SMEs in Turkey, Economic
Modelling, 54: 187-194.
Ozlem AKIN • S. Mehmet OZSOY
210
government’s economic target of transforming Istanbul into a prominent financial center, Islamic banking has been argued as one of the important avenues to become a financial hub at region level. However, the existing studies discuss the insufficient demand and stagnation in Islamic banking in Turkey (See e.g. Savasan et al.56; Egresi and Belge57; Yanikkaya and Pabuçcu58; İkiz59). Our analysis also provides some insights on the demand problem in the sector. We show that the newly established state-owned banks (Ziraat Katılım and Vakif Katılım) did not increase the aggregate liquidity created which may hint problems in the demand side and will have important implications for the development of Islamic banking in Turkey in the future.
ReferencesABDELSALAM, O., El-Komi, M. (2016). Islamic Finance: Introduction and Implications for Future Research
and Practice, Journal of Economic Behavior and Organization, 132: 1-3.ABEDIFAR, P., Hasan, I., Tarazi, A. (2016). Finance-Growth Nexus and Dual-Banking Systems: Relative
Importance of Islamic Banks, Journal of Economic Behavior and Organization, 132: 198-215.ACHARYA, V. V., Richardson, M. (2009). Causes of The Financial Crisis, Critical Review, 21(2-3): 195-210.AKALA, İ. (2018). Comparing Financial Performances of Conventional and Participation Banks: Case of Turkey
(2005–2015), International Journal of Inspiration and Resilience Economy, 2(1): 11-17.AKIN, O., Ozsoy, M. (2019). Global Trends in Liquidity Creation: The Role of the Off – Balance Sheet, New
Trends in Banking and Finance: 77-94, Peter Lang, Berlin.AKIN, O., Ozsoy, M. (2020). Political Liquidity Creation: Electoral Cycles and State-Owned Banks, Working
Paper.AKIN, O., Ozsoy, M. (2021). Bank Liquidity Creation in Turkey: Conventional vs. Islamic Banks, Working
Paper.AKINCI, D. A., Matousek, R., Radić, N., Stewart, C. (2013). Monetary policy and The Banking Sector in
Turkey, Journal of International Financial Markets, Institutions and Money, 27: 269-285.ALPER, K., Hulagu, T., Keles, G. (2012). An Empirical Study on Liquidity and Bank Lending, Central Bank of
the Republic of Turkey Working Paper, 4.ALTAN, M., Parlakkaya, R. (2004). Bilanço Dışı İşlemlerin Banka Performansına Etkisi: Türk Bankacılık Sektörü
Örneği, İktisat İşletme ve Finans, 19(219): 107-122.ALTUNBAS, Y., Gambacorta, L., Marques-Ibanez, D. (2009). Securitisation and the Bank Lending Channel,
European Economic Review, 53(8): 996-1009.ANBAR, A., Alper, D. (2011). Bankaların Türev Ürün Kullanım Yoğunluğunu Etkileyen Faktörlerin Belirlenmesi,
Muhasebe ve Finansman Dergisi, 50: 77-94.AYSAN, A. F., Disli, M., Ng, A., Ozturk, H. (2016). Is Small the New Big? Islamic Banking for SMEs in Turkey,
Economic Modelling, 54: 187-194.
56 Savaşan, F., Saraç, M., Gürdal, T. (2013). Exploring The Demand Side Issues in Participation Banking in Turkey: Questionnaire Survey on Current Issues and Proposed Solutions, Afro Eurasian Studies, 2(1-2): 111-125.
57 Egresi, I., Belge, R. (2017). Islamic Banking in Turkey: Population Perception and Development Challenges, Romanian Review on Political Geography/Revista Româna Geografie Politica, 19(1).
58 Yanıkkaya, H., Pabuçcu, Y. U. (2017). Causes and Solutions for The Stagnation of Islamic Banking in Turkey, ISRA International Journal of Islamic Finance, 9(1): 43-61.
59 İkiz, A. (2020). Islamic Banking in Turkey Facts, Figures and Prospects, Uluslararası Ekonomi ve Siyaset Bilimleri Akademik Araştırmalar Dergisi, 4(10): 74-81.
Marmara Üniversitesi İktisadi ve İdari Bilimler Dergisi • Cilt: 43 • Sayı: 1 • Haziran 2021, ISSN: 2587-2672, ss/pp. 197-212
211
AYSAN, A. F., Dolgun, M. H., Turhan, M. I. (2013). Assessment of the Participation Banks and Their Role in Financial Inclusion in Turkey, Emerging Markets Finance and Trade, 49(sup5): 99-111.
BARRELL, R., Davis, E. P. (2008). The Evolution of the Financial Crisis of 2007—8, National Institute Economic Review, 206(1): 5-14.
BECK, T., R. Dottling, T. Lambert, and M. van Dijk (2020). Liquidity Creation, Investment, and Growth, CEPR Discussion Papers no 14956, Centre for Economic Policy Research.
BERGER, A. N., Bouwman, C. H. (2009). Bank Liquidity Creation, Review of Financial Studies, 22(9): 3779-3837.
BERGER, A. N., Bouwman, C. H. (2017). Bank Liquidity Creation, Monetary Policy, and Financial Crises, Journal of Financial Stability, 30, 139-155.
BERGER, A. N., Boubakri, N., Guedhami, O., and Li, X. (2019). Liquidity Creation Performance and Financial Stability Consequences of Islamic Banking: Evidence from A Multinational Study, Journal of Financial Stability, 44: 100692.
BITAR, M., Hassan, M. K., Walker, T. (2017). Political Systems and The Financial Soundness of Islamic banks, Journal of Financial Stability, 31: 18-44.
DEEP, A., Schaefer, G. K. (2004). Are Banks Liquidity Transformers?, Working Paper, Harvard University.DEYOUNG, R., Huang, M. (2016). The External Effects of Bank Executive Pay: Liquidity Creation and Systemic
Risk, Working Paper.ELNAHASS, M., Izzeldin, M., Steele, G. (2018). Capital and Earnings Management: Evidence from Alternative
Banking Business Models, The International Journal of Accounting, 53(1): 20-32.EGRESI, I., Belge, R. (2017). Islamic Banking in Turkey: Population Perception and Development Challenges,
Romanian Review on Political Geography/Revista Româna Geografie Politica, 19(1).EROL, C., Baklaci, H. F., Aydoğan, B., Tunç, G. (2014). Performance Comparison of Islamic (participation)
Banks and Commercial Banks in Turkish Banking Sector, EuroMed Journal of Business, 9(2): 114-128.FIELD, L., Lowry, M., Mkrtchyan, A. (2013). Are Busy Boards Detrimental?, Journal of Financial
Economics, 109(1): 63-82.FUNGACOVA, Z., Weill, L., Zhou, M. (2017). Bank Capital, Liquidity Creation and Deposit Insurance, Journal
of Financial Services Research, 51(1): 97-123.GHEERAERT, L. (2014). Does Islamic Finance Spur Banking Sector Development?, Journal of Economic
Behavior and Organization, 103: S4-S20.GHEERAERT, L., Weill, L. (2015). Does Islamic Banking Development Favor Macroeconomic Efficiency?
Evidence on the Islamic Finance-Growth Nexus, Economic Modelling, 47: 32-39.HASSAN, M. K., Aliyu, S. (2018). A Contemporary Survey of Islamic Banking Literature, Journal of Financial
Stability, 34: 12-43.HORVATH, R., Seidler, J., Weill, L. (2014). Bank Capital and Liquidity Creation: Granger-Causality Evidence,
Journal of Financial Services Research, 45(3): 341-361.İKİZ, A. (2020). Islamic Banking in Turkey Facts, Figures and Prospects, Uluslararası Ekonomi ve Siyaset
Bilimleri Akademik Araştırmalar Dergisi, 4(10): 74-81.KARAKAYA, A., Er, B. (2013). Noninterest (Nonprofit) Income and Financial Performance at Turkish
Commercial and Participation Banks, International Business Research, 6(1): 106.OZSUCA, E. A., Akbostanci, E. (2012). An Empirical Analysis of the Bank Lending Channel in Turkey, Middle
East Technical University ERC Working Papers in Economics, 12(05): 1-33.PANA, E., Park, J., Query, T. (2010). The Impact of Bank Mergers on Liquidity Creation, Journal of Risk
Management in Financial Institutions, 4(1): 74-96.

Ozlem AKIN • S. Mehmet OZSOY
212
SAVASAN, F., Saraç, M., Gürdal, T. (2013). Exploring The Demand Side Issues in Participation Banking in Turkey: Questionnaire Survey on Current Issues and Proposed Solutions, Afro Eurasian Studies, 2(1-2): 111-125.
YANIKKAYA, H., Pabuçcu, Y. U. (2017). Causes and Solutions for The Stagnation of Islamic Banking in Turkey, ISRA International Journal of Islamic Finance, 9(1): 43-61.
213Makale Gönderim Tarihi:Makale Gönderim Tarihi: 15.02.2021Yayına Kabul Tarihi:Yayına Kabul Tarihi: 13.06.2021
ARAŞTIRMA MAKALESİ / RESEARCH ARTICLE
Marmara Üniversitesi İktisadi ve İdari Bilimler Dergisi • Cilt: 43 • Sayı: 1 • Haziran 2021, ISSN: 2587-2672, ss/pp. 213-230 DOI: 10.14780/muiibd.960340
IS TRADE AGAINST OR IN FAVOR OF WOMEN? EMPIRICAL EVIDENCE FROM MANUFACTURING SECTOR IN TURKEY
TİCARET, KADINLARA KARŞI MI, ONLARIN LEHİNE Mİ ÇALIŞIR? TÜRKİYE İMALAT SEKTÖRÜNDEN AMPİRİK KANITLAR
Şerife GENÇ İLERİ*1***
Mehmet Fatih ULU2
**
AbstractThis paper studies the effect of trade openness on relative wage earnings of female workers in Turkey’s manufacturing sector. We compute the export intensity of a sector by dividing the export value to production value as our measure of trade openness. Using Structure of Earnings Survey data for 2010 and 2014, we estimate the impact of export intensity on the gender wage gap. Our results indicate that a one-percentage point increase in the export intensity of a sector leads to a 0.17 percent higher gender wage gap. We further investigate the trade-gender wage gap link by grouping the sectors into four quartiles according to their export intensities. Our estimations for each quartile reinforce our finding of a negative impact of trade on the male-female wage inequality. Lastly, we analyze how the wage gap between men and women change according to skill levels. In line with the previous findings in the literature, we estimate a higher wage discrimination against high-skill women.Keywords: Wage Inequality, Female wages, Gender wage gap, Trade, Export IntensityJEL Classification: J16, J24, J31, J71
ÖzBu çalışma, ticaretin Türkiye imalat sektöründeki kadın işçilerin göreli ücret kazançları üzerindeki etkisini incelemektedir. Çalışmada kullanılan ticarete açıklık değeri, sektörlerin ihracat değerini üretim değerine bölerek hesapladığımız sektör ihracat yoğunluğudur. 2010 ve 2014 için Kazanç Yapısı Araştırması verilerini kullanarak, ihracat yoğunluğunun cinsiyetler arası ücret farkı üzerindeki etkisini ölçmekteyiz. Sonuçlarımız, bir sektörün ihracat yoğunluğundaki bir yüzde puanlık artışın kadın ve erkekler arasındaki ücret farkını yüzde 0,17 oranında arttırdığına işaret etmektedir. Sektörleri ihracat yoğunluklarına göre dörtte birlik gruplara ayırarak yaptığımız analiz de benzer sonuçlar vermektedir. Erkekler ve kadınlar arasındaki ücret farkının eğitim seviyelerine göre nasıl değiştiğine baktığımızda ise, literatürdeki önceki bulgulara paralel olarak, yüksek eğitimli kadınların daha fazla ücret ayrımcılığına maruz kaldığı sonucuna ulaşmaktayız.
1 Asst. Prof., Ibn Haldun University, Department of Economics, Istanbul, E-Mail: [email protected], ORCID ID: 0000-0002-5214-2583
2 Asst. Prof., Koc University, Department of Finance, Istanbul. E-Mail: [email protected], ORCID ID: 0000-0001-8691-7503
Şerife GENÇ İLERİ • Mehmet Fatih ULU
214
Anahtar Kelimeler: Ücret Eşitsizliği, Kadın Ücretleri, Kadın-Erkek Ücret Farkı, Ticaret, İhracat YoğunluğuJEL Sınıflandırması: J16, J24, J31, J71
1. Introduction
It is a well-known fact that female workers are in a disadvantaged position against their male peers in terms of both earnings and employment status. The gap between median wages of men and women in OECD countries is 13.5% and there is recently very little progress towards closing the gender pay gap.1The discrimination against women in labor markets is a globally important issue in terms of its social, economic impacts, and policy implications. Empirical evidence shows that promoting the income of females in a household improves health and educational outcomes of children and hence is very important in terms of long-run growth prospects of especially the developing countries.2,3 In that respect, it is essential to understand the factors that affect the relative well-being of women in labor markets.
Segregation of women in low-paid jobs and positions4,5, institutional factors related to work-family relations such as parental leave and child-care policies, the design of pay-bargaining institutions, and unionization in labor markets are mentioned in the literature as possible factors that affect the relative wage earnings of women. The hierarchical structure of labor markets has also been discussed as a factor generating a higher gender wage gap. Differing promotion and appointment procedures in labor markets where the appointment of a worker may depend on his/her negotiation skills, and bargaining power has the potential to affect the relative earnings of women in the labor market.6,7,8
Besides the above-mentioned factors, the degree of trade exposure of a country is also studied as an important force in shaping the wage inequality between male and female workers. Our objective in this paper is to explore the link between the gender wage gap and trade in Turkey, which is a developing country with a particularly low female labor force participation rate* and an overall
1 World Economic Forum (2019). Global Gender Report 2020, p.17.2 Thomas, D. (1990). Intra-Household Resource Allocation: An Inferential Approach, Journal of Human Resources, 25(4):
635–664.3 Duflo, E. (2003). Grandmothers And Granddaughters: Old Age Pension and Intra-Household Allocation in South
Africa, World Bank Economic Review, 17(1): 1–25.4 Bayard, K., Hellerstein, J., Neumark, D., Troske, K. (2003). New Evidence on Sex Segregation and Sex Differences in
Wages from Matched Employee-Employer Data, Journal of Labor Economics, 21(4): 887-922.5 Amuedo-Dorantes, C., de la Rica, S. (2005). The Impact of Gender Segregation on Male-Female Wage Differentials:
Evidence from Matched Employer-Employee Data for Spain, IZA Discussion Papers 1742.6 Arulampalam,W., Booth, A. Bryan, M. (2007). Is There a Glass Ceiling over Europe?, Exploring the Gender Pay Gap
across the Wage Distribution, ILR Review, 60(2): 163-186.7 Albrecht, J., Björklund, A., Vroman, S. (2003). Is There a Glass Ceiling in Sweden?, Journal of Labor Economics, 21(1):
145-177.8 Antonczyk, D., Fitzenberger, B., Sommerfeld, K. (2010). Rising Wage Inequality: The Decline of Collective Bargaining,
and the Gender Wage Gap, Labour Economics, 17: 835–847.* As of September 2020, the female labor force participation rate is 33% and it is the lowest among OECD countries
followed by Mexico where around 45% of the women participate in the labor markets. Source: International Labour Organization, ILOSTAT Database. (Accessed on: 20.09.2020).
Marmara Üniversitesi İktisadi ve İdari Bilimler Dergisi • Cilt: 43 • Sayı: 1 • Haziran 2021, ISSN: 2587-2672, ss/pp. 213-230
215
gender wage gap of 15.6%9. We combine individual and firm-level data provided in 2010 and 2014 waves of the Structure of Earnings Survey with industry-level information on export and production values of the manufacturing sector. We construct an export intensity measure for each subsector under manufacturing and estimate the impact of export intensity on the wage gap between males and females. We also explore this link on an additional dimension by analyzing the trade and gender gap relation for different skill categories. In Turkey, 2018 figures show that gender wage is highest among workers with elementary level or less education and it is the lowest among college and above education group10. The variation in the overall gender wage among different education groups makes the skill dimension worth exploring.
The results of our analysis show that more trade exposure, which we measure as the export intensity, generates a higher gender wage gap in Turkey’s manufacturing sector. According to our estimations, a 1 percentage point rise in export intensity stimulates a 0.17 percent higher male wages relative to female wages. Moreover, our analysis of the trade-gender wage gap relation for two different skill groups shows that in sectors with the highest export intensity, the gender wage gap is higher among skilled workers compared to the unskilled. This result is in line with other findings in the literature that trade liberalization hurts skilled women more than unskilled ones.11,12
Our results provide support to the non-neoclassical view that the gender wage gap rises with increased trade relations in Turkey. Previous work that find a similar result, attribute this outcome to the degree of market competition of exporting firms. The same reasoning may explain the results we found for Turkey, as well. The increased profits due to trade may be increasing the discriminatory power of firms in concentrated industries hence generating a higher gender wage gap in the country. 13,14
The rest of the paper is organized as follows. In section 2, we elaborate on the theoretical discussions about the link between trade and gender wage gap. In section 3, we present a brief review of the literature. In section 4, we explain the data and methodology. Section 5 discusses the results and section 6 concludes the paper.
2. Trade and Gender Wage Gap
On the theoretical ground, there are conflicting arguments regarding the relationship between trade and the gender pay gap. Neoclassical theories suggest that trade liberalization closes the pay gap between men and women. Hecksher-Ohlin and Stolper-Samuelson theorems together demonstrate that with the increased competition due to trade liberalization, each country will produce the goods
9 ILO and TurkStat (2020). Measuring the Gender Wage Gap: Turkey Case, p.10.10 ILO and TurkStat, 2020, 12.11 Yahmed, S. B. (2012). Gender Wage Gaps Across Skills and Trade Openness, AMSE Working Papers, 1232, 1-33.12 Juhn, C., Ujhelyi, G., Villegas-Sanchez, C. (2014). Men, Women, and Machines: How Trade Impacts Gender Inequality,
Journal of Development Economics, 106: 179-193.13 Berik, G., Rodgers, Y., R., Zveglich, J. E. (2004). International Trade and Wage Discrimination: Evidence From East Asia,
Review of Development Economics, 8(2): 237-254.14 Yahmed, S. B. (2017). Gender Wage Discrimination and Trade Openness, Prejudiced Employers in an Open Industry,
Zew Discussion Papers, 17-047: 1-53.
Şerife GENÇ İLERİ • Mehmet Fatih ULU
216
for which it has more abundant production factors. Hence, the relative price of the abundant factor will rise in these countries. For developing countries, the relatively abundant factor is unskilled labor whereas developed countries have more of skilled labor. Since women on average have lower levels of schooling, trade is expected to create a more equitable wage distribution between men and women in developing countries.15
The non-neoclassical approach, on the other hand, argues that more intense trade engagement may increase the gender gap. According to this approach, if trade increases competition in sectors that are competing through cost reduction and female workers are employed more in these sectors, the bargaining power of female workers will be reduced hence gender gap may rise.16
Another line of argument supporting the view that trade diminishes the gender wage gap can be found in Becker’s theory of discrimination. Some employers have a “taste for discrimination”, which may raise their cost. In non-competitive markets where firms are able to make excess profits, employers can afford to pay for the discrimination they exert. However, when markets are competitive, firms do not have the opportunity to make extra payments for their discriminatory behavior, otherwise they will make negative profits. Hence, increased trade exposure reduces discrimination and the gender wage gap by increasing competition and driving down excess profits.17 Becker’s theory of discrimination holds in competitive markets. However, there is the “market-size” effect of trade on a firm’s discriminatory power. If the market structure is concentrated, and firms operating in these concentrated sectors that already discriminate engage in trade, this will provide them the chance to earn extra profits hence they may discriminate more and the gender wage gap may rise.18
Another theory that discusses the link between relative wage earning of women and trade highlights the effect of complementarity between capital and female workers. In a capital – abundant economy where female workers are more complementary with capital, trade induces an increase in the demand and the price of goods produced in sectors that demand relatively more female labor. The price increase leads to higher production and hence an inflow of male workers to these sectors. As a result, there will be dilution in the capital intensity, which results in a decline in the productivity hence the wages of female workers.19 The next section presents the empirical evidence for all the different theories discussed.
3. Literature Review
Our paper sheds additional light on the controversial link between trade openness and the wage discrimination practiced against women in Turkey’s manufacturing sector. In that regard, we provide
15 Almasifard, M. (2018). Gender Wage Gap in Selected Developing Upper-Middle Income Countries, International Journal of Development Issues, 17(2) : 144.
16 Oostendorp, R. H. (2004). Globalization and The Gender Wage Gap, World Bank Policy Research Working Paper, 3256: 2-3.17 Becker, G.S. (1971). The Economics of Discrimination, Chicago, The University of Chicago Press: 39-45.18 Yahmed, 2017, 2-5.19 Sauré, P., Zoabi, H. (2014). International Trade, the Gender Wage Gap and Female Labor Force Participation, Journal of
Development Economics, 111: 17-33.
Marmara Üniversitesi İktisadi ve İdari Bilimler Dergisi • Cilt: 43 • Sayı: 1 • Haziran 2021, ISSN: 2587-2672, ss/pp. 213-230
217
a prominent contribution to the literature that examines whether or not increased trade exposure improves or worsens the relative earnings of women in the labor market. We also contribute to the literature that study the factors affecting the gender wage gap. Our particular focus on Turkey makes our paper part of the literature that examine the wage differential between men and women in Turkey.
Extensive research has been conducted to investigate the factors underlying the gender wage gap in many countries. Empirical evidence shows for developed countries like the US and Spain that segregation of women into jobs with low pay, account for a sizable fraction of the relative earnings of women.20,21 Institutional factors have also been analyzed as a potential candidate for generating the gender wage gap. In particular how parental leave, child-care policies and pay-bargaining institutions affect the gender wage gap is studied in numerous works. This line of research examines the “glass ceiling”, defined as a widening wage difference between men and women at the top of the wage distribution. The results of this research suggest that in countries with more generous work-family policies, the wage gap at the bottom of the distribution is lower whereas the gap at the top is higher. Collective bargaining is discussed as another institutional factor affecting the women’s wages indirectly through creating a more compressed wage distribution. Differing promotion and appointment procedures in labor markets where the appointment of a worker may depend on his/her negotiation skills, and bargaining power affects the relative earnings of women in the labor market.22,23 High wages at the bottom of the wage distribution may also make it difficult for high-career women to afford the household and child-care help they need. Thus, women may have to opt for easier jobs, which may result in women performing better at the bottom and the middle of the wage distribution and worse at the top.24
In addition to all these factors, there is an extensive literature that study how the trade exposure of countries affect the relative wage earnings of female workers. Similar to the theoretical arguments about the link between trade openness and wage discrimination, the empirical findings in the literature provide mixed results. Numerous studies on advanced and emerging markets support the neoclassical theory and Becker’s theory of discrimination.25,26 The degree of competitiveness is also found as an important determinant of the trade-gender wage gap link. Evidence from U.S. reveals that trade exposure narrows down the gender wage gap in concentrated industries whereas it has an opposite effect in unconcentrated industries.27
20 Bayard et al., 2003, 887-922.21 Amuedo-Dorantes, de la Rica, 2005.22 Arulampalam et al., 2007, 163-186.23 Antonczyk et al., 2010, 835–847.24 Albrecht et al., 2003, 145-177.25 Artecona, R., Cunningham, W. (2002). Effects of Trade Liberalization on the Gender Wage Gap in Mexico, The World
Bank Development Research Group/ Poverty Reduction and Economic Management Network, No. 34144.26 Greaney, T., Tanaka, A. (2020). Foreign Ownership, Exporting and Gender Wage Gaps: Evidence from Japanese Linked
Employer-Employee Data, Munich Personal Repec Archive, Mpra Paper No. 101339.27 Black, S. E., Brainerd, E. (2004). Importing Equality: The Impact of Globalization on Gender Discrimination, Sage
Publications, Inc., 57(4): 540-559.
Şerife GENÇ İLERİ • Mehmet Fatih ULU
218
Trade openness may have impacts on the technology choice of firms, which in turn, may affect the gender wage gap. If exporting firms adopt a new technology, which favors blue-collar female workers, trade will diminish the pay gap between men and women. This theory is verified by empirical evidence from Mexico where firms became exporters after NAFTA, updated their machinery and equipment. The labor market outcomes of females in these new exporter firms improved which implies that trade openness works in favor of women in the labor market.28 Trade may have differential effects on female workers depending on the skill content of the job. Women working in low skill occupations is found as benefiting from trade in both rich and poor countries. In rich countries, trade narrows down gender wage gap in high-skill occupations as well.29 .
Meanwhile, a significant number of papers show empirical evidence that trade has either no or worsening effect on the gender wage gap for both developed and developing countries.30,31,32 .In markets with a high degree of concentration, competition from foreign trade results in higher wage discrimination between men and women.33,34
Besides the market structure channel, another view suggests that exporting firms exhibit a greater gender wage gap than non-exporters because the increased competition exporters face necessitate more committed and flexible workers. Women are usually perceived as having less of these two characteristics compared to men thus generating a higher gender wage gap in exporting firms. 35,36 The literature also discusses that the impact of trade on male-female wage differentials may vary among different demographic groups. It is shown that higher trade openness generates a lower gender wage gap among unskilled workers but it leads to a higher gender wage gap among high-skill workers.37,38
The impact of the degree of trade exposure on women’s relative earnings is also studied in the literature. Results of these studies show that gender wage gap is higher, the higher is the share of output exported, the number of markets served, and the number of export varieties. Similar to exports, the import intensity of an industry is also predicted to worsen the wage gap between men and women.39
28 Juhn et al., 2014, 179-193.29 Oostendorp, 2004, 18-21.30 Sauré, Zoabi, 2014, 17-33.31 Musazay, S. (2019). Gender Wage Gap and International Trade: Evidence from Turkey’s Manufacturing Sector, Ibn
Haldun University, Unpublished Master’s Thesis.32 Wei, H., Yang, S., Liu, S., Wu, J., Xiang, S. (2013). International Trade and Gender Wage Gap in China, European
Scientific Journal, 9(22): 21-52.33 Pérez, R.E.R., Lugo, D.C. (2017). Trade Liberalization and Gender Wage Gap in Mexico, Modern Economy, 8: 1167-1185.34 Menon, N., Rodgers, Y. (2009). International Trade and The Gender Wage Gap: New Evidence from India’s Manufacturing
Sector, World Development, 37(5): 965-981.35 Boler, E. A., Javorcik, B., Ulltveit-Moe, K. H. (2015). Globalization: A Woman’s Best Friend? Exporters and The Gender
Wage Gap, Center For Economic Studies and Info Institute, Working Paper No. 5296.36 Boler, E. A., Javorcik, B., Ulltveit-Moe, K. H. (2018). Working Across Time Zones: Exporters And The Gender Wage Gap,
Journal of International Economics, 111: 122-133.37 Yahmed, 2012, 1-33.38 Juhn et al., 2014, 179-193.39 Deb, K., Hauk, W. R. (2020). The Impact of Chinese Imports on Indian Wage Inequality, The Indian Journal of Labour
Economics, 63: 267–290.
Marmara Üniversitesi İktisadi ve İdari Bilimler Dergisi • Cilt: 43 • Sayı: 1 • Haziran 2021, ISSN: 2587-2672, ss/pp. 213-230
219
The link between trade openness and the gender wage discrimination is analyzed previously for Turkey using 2006 Household Labor Force Survey data and trade statistics. The results of this paper reveal that there is a larger gender wage gap in tradable sectors in than non-tradable sectors. 40 Our paper differs from this existing work in various dimensions. First of all, in our analysis, we use 2010 and 2014 Structure of Earnings Survey data. This data provides additional information on firm characteristics such as firm size and union coverage which we include as controls in our wage regressions. Besides this, we concentrate on the manufacturing sector rather than all sectors in the economy. Moreover, instead of measuring the impact of trade on the gender wage gap along the binary scale of tradable vs. non-tradable, we quantify this effect along the intensive margin by using the export intensity of a sector as a proxy for trade openness. We also analyze the relationship between trade openness and the gender wage gap for different skill groups which is absent in existing studies done for Turkey.
Our paper is also part of the literature that examines the gender wage gap in Turkey. Previous studies use various data sources to tackle this question, which include the Household Income and Expenditure Survey and Wage Structure Survey of various years. They estimate an overall gender wage gap that range between 4 to 35%.41,42,43 The wage inequality between men and women in Turkey has also been examined for different categories of workers, such as the wage workers and self-employed, public and private, those working in covered and uncovered sectors. 44,45,46. These studies all reach the same conclusion that there is significant discrimination against women in all segments of the economy. More recent studies use the Structure of Earnings Survey and Household Labor Force Surveys. The range of overall gender wage gap estimates vary between 3 and 13 %.47,48
Estimates of the gender wage gap for different education categories using 2004 and 2011 Labor Force Surveys in Turkey settle on a wide range. Low-educated women earn 24% less than their male counterparts whereas the male-female wage differential falls to 9% for tertiary-educated group in 2011. Looking at public and private sectors separately, unexplained part of the gender wage gap is predicted to be larger for women with high education in public sector. These differences reveal
40 Aydıner-Avsar, N. (2010). International Trade and Gender Wage Gap: A Distributional Analysis for Turkey, University of Utah, Working Paper: 1-33.
41 Dayıoğlu, M., Kasnakoğlu, Z. (1997). Kentsel Kesimde Kadın ve Erkeklerin İşgücüne Katılımları ve Kazanç Farklılıkları, Metu Studies In Development, 24(3): 329–361.
42 Ilkkaracan, İ., Selim, R. (2007). The Gender Wage Gap in The Turkish Labor Market, Review of Labour Economics And Industrial Relations, 21(2): 563–59.
43 Kara, O. (2006 ). Occupational Gender Wage Discrimination in Turkey, Journal of Economic Studies, 33(2): 130-143.44 Tansel, A. (2001). Wage Earners, Self-Employed And Gender in The Informal Sector in Turkey, Economic Research
Forum Working Paper, No. 0102.45 Özcan, K. M., Özcan, Y. Z., Üçdoğruk, S. (2003). Wage Differences By Gender, Wage and Self Employment in Urban
Turkey, Journal of Economic Cooperation, 24(1): 1-24.46 Tansel, A. (2004). Public‐Private Employment Choice, Wage Differentials and Gender in Turkey, Iza Discussion Papers,
53(2): 1-43.47 Aktas, A., Uysal, G. (2016). The Gender Wage Gap in Turkey, Marmara Üniversitesi İktisadi ve İdari Bilimler Dergisi,
38(2): 1–19.48 Tekgüç, H., Eryar, D., Cindoğlu, D. (2017) Women’s Tertiary Education Masks the Gender Wage Gap in Turkey, Journal
of Labor Research, 38: 360–386.
Şerife GENÇ İLERİ • Mehmet Fatih ULU
220
the importance of their disaggregated analysis and show that analyses done with aggregated data might conceal important heterogeneous outcomes.49 We contribute to this literature by analyzing the gender wage gap in Turkey using more recent data. Moreover, our analysis extends the previous literature by examining the link between trade exposure on female wages and how this link varies for different skill categories.
4. Data and Methodology
4.1. Data
The first data source is the 2010 and 2014 waves of the Structure of Earnings Survey (SES) conducted with wage and salary workers in Turkey by the Turkish Statistical Institute (TURKSTAT).* This survey provides individual-level data on worker characteristics, such as age, gender, education level. Besides these, work-related data of individuals which include tenure in the current job, occupation, administrative duty status, their union coverage, part-time/full-time position, type of the job, hours worked in the reference week, days worked in reference month, gross monthly salary payments, annual gross wage and salary payments and number of paid days in a year. The dataset provides information on important firm characteristics such as firm size, the 2-digit code of the sector in Nace Rev.2 classification as well.
By combining individual-level and firm-level information, the dataset provides a valuable opportunity to examine how sector and firm-related variables affect the labor market outcomes of a different group of workers. The sample we select from SES consists of full-time workers employed in the manufacturing sector, aged between 15 and 65 who earn at least the minimum wage. Minimum wage in 2010, 2014 are taken as 761 TL and 1071 TL, respectively. This leaves us with 80,095 observations in our sample of which around 80% are men and 20% are women.
In this paper, we study the link between the export intensity and gender wage gap to understand whether or not increased trade openness affects the wage inequality between men and women. We combine the individual, sector, and firm-level data provided in SES with sector-level exports and industrial production data provided by TURKSTAT. Sectoral export data are retrieved from Foreign Trade Statistics Database and sector-level production data are extracted from Annual Industry and Services Survey.50 We construct the export intensity of each subsector by dividing the total value of their annual exports by their production value. Based on these export intensities, we divide the sectors to 4 quartiles, i.e. 0-25%, 25-50%, 50-75%, 75-100%.
49 Tekgüç et al,. 2017, 360–386.* Currently, three waves of the survey for the years 2006, 2010, 2014 are available. We use 2010 and 2014 waves since the 2006
survey provides sector information using Nace Rev.1 classification. For 2010 and 2014, sector information is available at two digits in Nace Rev.2 classification. Harmonization of the sector information provided in these 3 years results in aggregation of the sector-level data. To avoid the loss of cross-sector variation, we use 2010 and 2014 waves of the SES.
50 Trade data is retrieved from https://data.tuik.gov.tr/Kategori/GetKategori?p=Foreign-Trade-104, and Industry production data is retrieved from https://data.tuik.gov.tr/Kategori/GetKategori?p=Industry-114 (Accessed on: 5.11.2020)
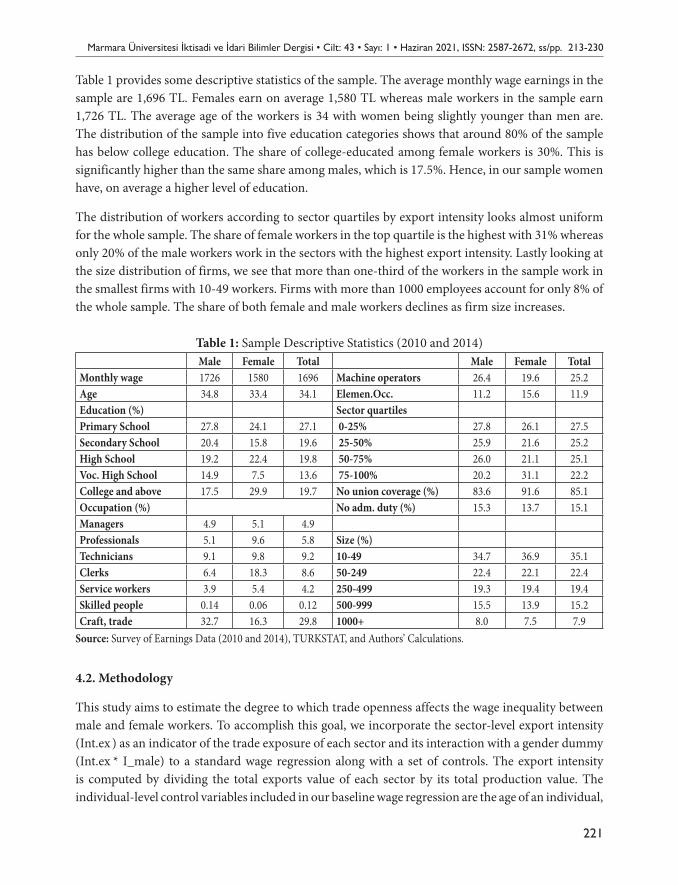
Marmara Üniversitesi İktisadi ve İdari Bilimler Dergisi • Cilt: 43 • Sayı: 1 • Haziran 2021, ISSN: 2587-2672, ss/pp. 213-230
221
Table 1 provides some descriptive statistics of the sample. The average monthly wage earnings in the sample are 1,696 TL. Females earn on average 1,580 TL whereas male workers in the sample earn 1,726 TL. The average age of the workers is 34 with women being slightly younger than men are. The distribution of the sample into five education categories shows that around 80% of the sample has below college education. The share of college-educated among female workers is 30%. This is significantly higher than the same share among males, which is 17.5%. Hence, in our sample women have, on average a higher level of education.
The distribution of workers according to sector quartiles by export intensity looks almost uniform for the whole sample. The share of female workers in the top quartile is the highest with 31% whereas only 20% of the male workers work in the sectors with the highest export intensity. Lastly looking at the size distribution of firms, we see that more than one-third of the workers in the sample work in the smallest firms with 10-49 workers. Firms with more than 1000 employees account for only 8% of the whole sample. The share of both female and male workers declines as firm size increases.
Table 1: Sample Descriptive Statistics (2010 and 2014)Male Female Total Male Female Total
Monthly wage 1726 1580 1696 Machine operators 26.4 19.6 25.2Age 34.8 33.4 34.1 Elemen.Occ. 11.2 15.6 11.9Education (%) Sector quartilesPrimary School 27.8 24.1 27.1 0-25% 27.8 26.1 27.5Secondary School 20.4 15.8 19.6 25-50% 25.9 21.6 25.2High School 19.2 22.4 19.8 50-75% 26.0 21.1 25.1Voc. High School 14.9 7.5 13.6 75-100% 20.2 31.1 22.2College and above 17.5 29.9 19.7 No union coverage (%) 83.6 91.6 85.1Occupation (%) No adm. duty (%) 15.3 13.7 15.1Managers 4.9 5.1 4.9Professionals 5.1 9.6 5.8 Size (%)Technicians 9.1 9.8 9.2 10-49 34.7 36.9 35.1Clerks 6.4 18.3 8.6 50-249 22.4 22.1 22.4Service workers 3.9 5.4 4.2 250-499 19.3 19.4 19.4Skilled people 0.14 0.06 0.12 500-999 15.5 13.9 15.2Craft, trade 32.7 16.3 29.8 1000+ 8.0 7.5 7.9
Source: Survey of Earnings Data (2010 and 2014), TURKSTAT, and Authors’ Calculations.
4.2. Methodology
This study aims to estimate the degree to which trade openness affects the wage inequality between male and female workers. To accomplish this goal, we incorporate the sector-level export intensity (Int.ex ) as an indicator of the trade exposure of each sector and its interaction with a gender dummy (Int.ex * I_male) to a standard wage regression along with a set of controls. The export intensity is computed by dividing the total exports value of each sector by its total production value. The individual-level control variables included in our baseline wage regression are the age of an individual,
Şerife GENÇ İLERİ • Mehmet Fatih ULU
222
his/her tenure at the current firm, gender dummy (female is the baseline category), dummy variables for education level (primary school is the baseline category), dummy variables for each occupation category (managers are the baseline category), a dummy variable indicating whether or not the individual has an administrative duty. Firm and sector level controls included can be listed as dummy variables for different firm size (firms with less than 50 employees is the baseline), whether or not the firm is under a collective wage agreement (I_union), the export intensity of each sector (Int.ex), the logged value of sectoral production (Qkt). We also control for year fixed effects denoted by
Makale Gönderim Tarihi: 15.02.2021 Yayına Kabul Tarihi: 13.06.2021
Craft, trade 32.7 16.3 29.8 1000+ 8.0 7.5 7.9
Source: Survey of Earnings Data (2010 and 2014), TURKSTAT, and Authors’ Calculations.
4.2 Methodology
This study aims to estimate the degree to which trade openness affects the wage inequality between male and female workers. To accomplish this goal, we incorporate the sector-level export intensity (Int.ex ) as an indicator of the trade exposure of each sector and its interaction with a gender dummy (Int.ex * I_male) to a standard wage regression along with a set of controls. The export intensity is computed by dividing the total exports value of each sector by its total production value. The individual-level control variables included in our baseline wage regression are the age of an individual, his/her tenure at the current firm, gender dummy (female is the baseline category), dummy variables for education level (primary school is the baseline category), dummy variables for each occupation category (managers are the baseline category), a dummy variable indicating whether or not the individual has an administrative duty. Firm and sector level controls included can be listed as dummy variables for different firm size (firms with less than 50 employees is the baseline), whether or not the firm is under a collective wage agreement (I_union), the export intensity of each sector (Int.ex), the logged value of sectoral production (Qkt). We also control for year fixed effects denoted by 𝛾𝛾𝑡𝑡 . The baseline wage regression is presented in Equation (1) below.
𝑙𝑙𝑙𝑙𝑊𝑊𝑖𝑖𝑖𝑖𝑖𝑖𝑡𝑡 = 𝛼𝛼 + 𝛽𝛽1𝑋𝑋𝑖𝑖 + 𝛽𝛽2𝑆𝑆𝑆𝑆𝑆𝑆𝑆𝑆𝑖𝑖 + 𝛽𝛽3𝐼𝐼_𝑢𝑢𝑙𝑙𝑆𝑆𝑢𝑢𝑙𝑙𝑖𝑖 + 𝛽𝛽4𝐼𝐼𝑙𝑙𝐼𝐼. 𝑆𝑆𝑒𝑒𝑖𝑖𝑡𝑡 + 𝛽𝛽5(𝐼𝐼𝑙𝑙𝐼𝐼. 𝑆𝑆𝑒𝑒𝑖𝑖𝑡𝑡 𝑒𝑒 𝐼𝐼𝑚𝑚𝑚𝑚𝑚𝑚𝑚𝑚 𝑖𝑖) + 𝛽𝛽6 𝑙𝑙𝑙𝑙𝑙𝑙𝑖𝑖,𝑡𝑡 + 𝛾𝛾𝑡𝑡 + 𝜀𝜀𝑖𝑖𝑖𝑖𝑖𝑖𝑡𝑡 (1)
Here i, j, k represents individual, firm and sector, respectively and t denotes the year. Our dependent variable is the logged value of hourly wages (𝑙𝑙𝑙𝑙𝑊𝑊𝑖𝑖𝑖𝑖𝑖𝑖𝑡𝑡). We compute the hourly wages using data on the weekly hours worked and monthly wages available in the SES data. As a further exploration of the link between export intensity and the gender wage gap, we divide sectors into four quartiles according to their export intensities. Then we estimate the following equation separately for the four quartiles.
𝑙𝑙𝑙𝑙𝑊𝑊𝑖𝑖𝑖𝑖𝑖𝑖𝑡𝑡 = 𝛼𝛼 + 𝛽𝛽1𝑋𝑋𝑖𝑖 + 𝛽𝛽2𝑆𝑆𝑆𝑆𝑆𝑆𝑆𝑆𝑖𝑖 + 𝛽𝛽3𝐼𝐼_𝑢𝑢𝑙𝑙𝑆𝑆𝑢𝑢𝑙𝑙𝑖𝑖 + 𝛽𝛽4 𝐼𝐼_𝑚𝑚𝑚𝑚𝑙𝑙𝑆𝑆𝑖𝑖 + 𝛽𝛽5 𝑙𝑙𝑙𝑙𝑙𝑙𝑖𝑖,𝑡𝑡 + 𝛾𝛾𝑡𝑡 + 𝜀𝜀𝑖𝑖𝑖𝑖𝑖𝑖𝑡𝑡 (2)
Similar to Equation (1), our individual-level control variables are included in 𝑋𝑋𝑖𝑖. This time we focus on the coefficient of the gender dummy (𝐼𝐼_𝑚𝑚𝑚𝑚𝑙𝑙𝑆𝑆𝑖𝑖) for which the baseline category is the female workers. A comparison of this coefficient (𝛽𝛽4) across all sector quartiles shows how the wage earnings of two gender groups differ from each other.
Lastly, we are interested in learning whether or not a sector’s degree of trade exposure has a differential impact on the gender wage gap across different education categories. We study this question by estimating the following equation for the four sector quartiles, separately.
. The baseline wage regression is presented in Equation (1) below.IIBD 43-1 (12. GENÇ İLERİ-ULU) çalışmasında sayfa 10daki ilgili bölümün aşağıdaki şekilde düzeltilmesi gerekmektedir:
𝑙𝑙𝑙𝑙𝑊𝑊𝑖𝑖𝑖𝑖𝑖𝑖𝑖𝑖 = 𝛼𝛼 + 𝛽𝛽1𝑋𝑋𝑖𝑖 + 𝛽𝛽2𝑆𝑆𝑆𝑆𝑆𝑆𝑆𝑆𝑖𝑖 + 𝛽𝛽3𝐼𝐼_𝑢𝑢𝑙𝑙𝑆𝑆𝑢𝑢𝑙𝑙𝑖𝑖 + 𝛽𝛽4𝐼𝐼𝑙𝑙𝐼𝐼. 𝑆𝑆𝑒𝑒𝑖𝑖𝑖𝑖 + 𝛽𝛽5(𝐼𝐼𝑙𝑙𝐼𝐼. 𝑆𝑆𝑒𝑒𝑖𝑖𝑖𝑖 𝑒𝑒 𝐼𝐼𝑚𝑚𝑚𝑚𝑚𝑚𝑚𝑚 𝑖𝑖) + 𝛽𝛽6 𝑙𝑙𝑙𝑙𝑙𝑙𝑖𝑖,𝑖𝑖 + 𝛾𝛾𝑖𝑖 + 𝜀𝜀𝑖𝑖𝑖𝑖𝑖𝑖𝑖𝑖 (1)
Here i, j, k represents individual, firm and sector, respectively and t denotes the year. Our dependent variable is the logged value of hourly wages (𝑙𝑙𝑙𝑙𝑊𝑊𝑖𝑖𝑖𝑖𝑖𝑖𝑖𝑖). We compute the hourly wages using data on the weekly hours worked and monthly wages available in the SES data. As a further exploration of the link between export intensity and the gender wage gap, we divide sectors into four quartiles according to their export intensities. Then we estimate the following equation separately for the four quartiles.
𝑙𝑙𝑙𝑙𝑊𝑊𝑖𝑖𝑖𝑖𝑖𝑖𝑖𝑖 = 𝛼𝛼 + 𝛽𝛽1𝑋𝑋𝑖𝑖 + 𝛽𝛽2𝑆𝑆𝑆𝑆𝑆𝑆𝑆𝑆𝑖𝑖 + 𝛽𝛽3𝐼𝐼_𝑢𝑢𝑙𝑙𝑆𝑆𝑢𝑢𝑙𝑙𝑖𝑖 + 𝛽𝛽4 𝐼𝐼_𝑚𝑚𝑚𝑚𝑙𝑙𝑆𝑆𝑖𝑖 + 𝛽𝛽5 𝑙𝑙𝑙𝑙𝑙𝑙𝑖𝑖,𝑖𝑖 + 𝛾𝛾𝑖𝑖 + 𝜀𝜀𝑖𝑖𝑖𝑖𝑖𝑖𝑖𝑖 (2)
Similar to Equation (1), our individual-level control variables are included in 𝑋𝑋𝑖𝑖. This time we focus on the coefficient of the gender dummy (𝐼𝐼_𝑚𝑚𝑚𝑚𝑙𝑙𝑆𝑆𝑖𝑖) for which the baseline category is the female workers. A comparison of this coefficient (𝛽𝛽4) across all sector quartiles shows how the wage earnings of two gender groups differ from each other.
Lastly, we are interested in learning whether or not a sector’s degree of trade exposure has a differential impact on the gender wage gap across different education categories. We study this question by estimating the following equation for the four sector quartiles, separately.
𝑙𝑙𝑙𝑙𝑊𝑊𝑖𝑖𝑖𝑖𝑖𝑖𝑖𝑖 = 𝛼𝛼 + 𝛽𝛽1𝑋𝑋𝑖𝑖 + 𝛽𝛽2𝑆𝑆𝑆𝑆𝑆𝑆𝑆𝑆𝑖𝑖 + 𝛽𝛽3𝐼𝐼_𝑢𝑢𝑙𝑙𝑆𝑆𝑢𝑢𝑙𝑙𝑖𝑖 + 𝛽𝛽4 (𝐼𝐼_𝑚𝑚𝑚𝑚𝑙𝑙𝑆𝑆𝑖𝑖 𝑒𝑒 𝐼𝐼_𝑠𝑠𝑠𝑠𝑆𝑆𝑙𝑙𝑙𝑙𝑖𝑖 ) + 𝛽𝛽5 𝑙𝑙𝑙𝑙𝑙𝑙𝑖𝑖,𝑖𝑖 + 𝛾𝛾𝑖𝑖 + 𝜀𝜀𝑖𝑖𝑖𝑖𝑖𝑖𝑖𝑖 (3)
The coefficient of the interaction between gender dummy and skill dummy provides the answer to this question. We construct the skill categories based on the education categories information provided in the survey. We group workers with college and above education as skilled and other education groups as unskilled. The baseline category against which we compare our coefficients of all the interaction categories is the unskilled females (i.e. 𝐼𝐼_𝑚𝑚𝑚𝑚𝑙𝑙𝑆𝑆 = 0 𝐼𝐼_𝑠𝑠𝑠𝑠𝑆𝑆𝑙𝑙𝑙𝑙 =0). In all of the estimations, we cluster standard errors at the sector level. This controls for a possible correlation in the residuals for individuals within each sector category. Our estimation results and their discussion are provided in the next section.
(1)
Here i, j, k represents individual, firm and sector, respectively and t denotes the year. Our dependent variable is the logged value of hourly wages (
Makale Gönderim Tarihi: 15.02.2021 Yayına Kabul Tarihi: 13.06.2021
Craft, trade 32.7 16.3 29.8 1000+ 8.0 7.5 7.9
Source: Survey of Earnings Data (2010 and 2014), TURKSTAT, and Authors’ Calculations.
4.2 Methodology
This study aims to estimate the degree to which trade openness affects the wage inequality between male and female workers. To accomplish this goal, we incorporate the sector-level export intensity (Int.ex ) as an indicator of the trade exposure of each sector and its interaction with a gender dummy (Int.ex * I_male) to a standard wage regression along with a set of controls. The export intensity is computed by dividing the total exports value of each sector by its total production value. The individual-level control variables included in our baseline wage regression are the age of an individual, his/her tenure at the current firm, gender dummy (female is the baseline category), dummy variables for education level (primary school is the baseline category), dummy variables for each occupation category (managers are the baseline category), a dummy variable indicating whether or not the individual has an administrative duty. Firm and sector level controls included can be listed as dummy variables for different firm size (firms with less than 50 employees is the baseline), whether or not the firm is under a collective wage agreement (I_union), the export intensity of each sector (Int.ex), the logged value of sectoral production (Qkt). We also control for year fixed effects denoted by 𝛾𝛾𝑡𝑡 . The baseline wage regression is presented in Equation (1) below.
𝑙𝑙𝑙𝑙𝑊𝑊𝑖𝑖𝑖𝑖𝑖𝑖𝑡𝑡 = 𝛼𝛼 + 𝛽𝛽1𝑋𝑋𝑖𝑖 + 𝛽𝛽2𝑆𝑆𝑆𝑆𝑆𝑆𝑆𝑆𝑖𝑖 + 𝛽𝛽3𝐼𝐼_𝑢𝑢𝑙𝑙𝑆𝑆𝑢𝑢𝑙𝑙𝑖𝑖 + 𝛽𝛽4𝐼𝐼𝑙𝑙𝐼𝐼. 𝑆𝑆𝑒𝑒𝑖𝑖𝑡𝑡 + 𝛽𝛽5(𝐼𝐼𝑙𝑙𝐼𝐼. 𝑆𝑆𝑒𝑒𝑖𝑖𝑡𝑡 𝑒𝑒 𝐼𝐼𝑚𝑚𝑚𝑚𝑚𝑚𝑚𝑚 𝑖𝑖) + 𝛽𝛽6 𝑙𝑙𝑙𝑙𝑙𝑙𝑖𝑖,𝑡𝑡 + 𝛾𝛾𝑡𝑡 + 𝜀𝜀𝑖𝑖𝑖𝑖𝑖𝑖𝑡𝑡 (1)
Here i, j, k represents individual, firm and sector, respectively and t denotes the year. Our dependent variable is the logged value of hourly wages (𝑙𝑙𝑙𝑙𝑊𝑊𝑖𝑖𝑖𝑖𝑖𝑖𝑡𝑡). We compute the hourly wages using data on the weekly hours worked and monthly wages available in the SES data. As a further exploration of the link between export intensity and the gender wage gap, we divide sectors into four quartiles according to their export intensities. Then we estimate the following equation separately for the four quartiles.
𝑙𝑙𝑙𝑙𝑊𝑊𝑖𝑖𝑖𝑖𝑖𝑖𝑡𝑡 = 𝛼𝛼 + 𝛽𝛽1𝑋𝑋𝑖𝑖 + 𝛽𝛽2𝑆𝑆𝑆𝑆𝑆𝑆𝑆𝑆𝑖𝑖 + 𝛽𝛽3𝐼𝐼_𝑢𝑢𝑙𝑙𝑆𝑆𝑢𝑢𝑙𝑙𝑖𝑖 + 𝛽𝛽4 𝐼𝐼_𝑚𝑚𝑚𝑚𝑙𝑙𝑆𝑆𝑖𝑖 + 𝛽𝛽5 𝑙𝑙𝑙𝑙𝑙𝑙𝑖𝑖,𝑡𝑡 + 𝛾𝛾𝑡𝑡 + 𝜀𝜀𝑖𝑖𝑖𝑖𝑖𝑖𝑡𝑡 (2)
Similar to Equation (1), our individual-level control variables are included in 𝑋𝑋𝑖𝑖. This time we focus on the coefficient of the gender dummy (𝐼𝐼_𝑚𝑚𝑚𝑚𝑙𝑙𝑆𝑆𝑖𝑖) for which the baseline category is the female workers. A comparison of this coefficient (𝛽𝛽4) across all sector quartiles shows how the wage earnings of two gender groups differ from each other.
Lastly, we are interested in learning whether or not a sector’s degree of trade exposure has a differential impact on the gender wage gap across different education categories. We study this question by estimating the following equation for the four sector quartiles, separately.
). We compute the hourly wages using data on the weekly hours worked and monthly wages available in the SES data. As a further exploration of the link between export intensity and the gender wage gap, we divide sectors into four quartiles according to their export intensities. Then we estimate the following equation separately for the four quartiles.
Makale Gönderim Tarihi: 15.02.2021 Yayına Kabul Tarihi: 13.06.2021
Craft, trade 32.7 16.3 29.8 1000+ 8.0 7.5 7.9
Source: Survey of Earnings Data (2010 and 2014), TURKSTAT, and Authors’ Calculations.
4.2 Methodology
This study aims to estimate the degree to which trade openness affects the wage inequality between male and female workers. To accomplish this goal, we incorporate the sector-level export intensity (Int.ex ) as an indicator of the trade exposure of each sector and its interaction with a gender dummy (Int.ex * I_male) to a standard wage regression along with a set of controls. The export intensity is computed by dividing the total exports value of each sector by its total production value. The individual-level control variables included in our baseline wage regression are the age of an individual, his/her tenure at the current firm, gender dummy (female is the baseline category), dummy variables for education level (primary school is the baseline category), dummy variables for each occupation category (managers are the baseline category), a dummy variable indicating whether or not the individual has an administrative duty. Firm and sector level controls included can be listed as dummy variables for different firm size (firms with less than 50 employees is the baseline), whether or not the firm is under a collective wage agreement (I_union), the export intensity of each sector (Int.ex), the logged value of sectoral production (Qkt). We also control for year fixed effects denoted by 𝛾𝛾𝑡𝑡 . The baseline wage regression is presented in Equation (1) below.
𝑙𝑙𝑙𝑙𝑊𝑊𝑖𝑖𝑖𝑖𝑖𝑖𝑡𝑡 = 𝛼𝛼 + 𝛽𝛽1𝑋𝑋𝑖𝑖 + 𝛽𝛽2𝑆𝑆𝑆𝑆𝑆𝑆𝑆𝑆𝑖𝑖 + 𝛽𝛽3𝐼𝐼_𝑢𝑢𝑙𝑙𝑆𝑆𝑢𝑢𝑙𝑙𝑖𝑖 + 𝛽𝛽4𝐼𝐼𝑙𝑙𝐼𝐼. 𝑆𝑆𝑒𝑒𝑖𝑖𝑡𝑡 + 𝛽𝛽5(𝐼𝐼𝑙𝑙𝐼𝐼. 𝑆𝑆𝑒𝑒𝑖𝑖𝑡𝑡 𝑒𝑒 𝐼𝐼𝑚𝑚𝑚𝑚𝑚𝑚𝑚𝑚 𝑖𝑖) + 𝛽𝛽6 𝑙𝑙𝑙𝑙𝑙𝑙𝑖𝑖,𝑡𝑡 + 𝛾𝛾𝑡𝑡 + 𝜀𝜀𝑖𝑖𝑖𝑖𝑖𝑖𝑡𝑡 (1)
Here i, j, k represents individual, firm and sector, respectively and t denotes the year. Our dependent variable is the logged value of hourly wages (𝑙𝑙𝑙𝑙𝑊𝑊𝑖𝑖𝑖𝑖𝑖𝑖𝑡𝑡). We compute the hourly wages using data on the weekly hours worked and monthly wages available in the SES data. As a further exploration of the link between export intensity and the gender wage gap, we divide sectors into four quartiles according to their export intensities. Then we estimate the following equation separately for the four quartiles.
𝑙𝑙𝑙𝑙𝑊𝑊𝑖𝑖𝑖𝑖𝑖𝑖𝑡𝑡 = 𝛼𝛼 + 𝛽𝛽1𝑋𝑋𝑖𝑖 + 𝛽𝛽2𝑆𝑆𝑆𝑆𝑆𝑆𝑆𝑆𝑖𝑖 + 𝛽𝛽3𝐼𝐼_𝑢𝑢𝑙𝑙𝑆𝑆𝑢𝑢𝑙𝑙𝑖𝑖 + 𝛽𝛽4 𝐼𝐼_𝑚𝑚𝑚𝑚𝑙𝑙𝑆𝑆𝑖𝑖 + 𝛽𝛽5 𝑙𝑙𝑙𝑙𝑙𝑙𝑖𝑖,𝑡𝑡 + 𝛾𝛾𝑡𝑡 + 𝜀𝜀𝑖𝑖𝑖𝑖𝑖𝑖𝑡𝑡 (2)
Similar to Equation (1), our individual-level control variables are included in 𝑋𝑋𝑖𝑖. This time we focus on the coefficient of the gender dummy (𝐼𝐼_𝑚𝑚𝑚𝑚𝑙𝑙𝑆𝑆𝑖𝑖) for which the baseline category is the female workers. A comparison of this coefficient (𝛽𝛽4) across all sector quartiles shows how the wage earnings of two gender groups differ from each other.
Lastly, we are interested in learning whether or not a sector’s degree of trade exposure has a differential impact on the gender wage gap across different education categories. We study this question by estimating the following equation for the four sector quartiles, separately.
(2)
Similar to Equation (1), our individual-level control variables are included in
Makale Gönderim Tarihi: 15.02.2021 Yayına Kabul Tarihi: 13.06.2021
Craft, trade 32.7 16.3 29.8 1000+ 8.0 7.5 7.9
Source: Survey of Earnings Data (2010 and 2014), TURKSTAT, and Authors’ Calculations.
4.2 Methodology
This study aims to estimate the degree to which trade openness affects the wage inequality between male and female workers. To accomplish this goal, we incorporate the sector-level export intensity (Int.ex ) as an indicator of the trade exposure of each sector and its interaction with a gender dummy (Int.ex * I_male) to a standard wage regression along with a set of controls. The export intensity is computed by dividing the total exports value of each sector by its total production value. The individual-level control variables included in our baseline wage regression are the age of an individual, his/her tenure at the current firm, gender dummy (female is the baseline category), dummy variables for education level (primary school is the baseline category), dummy variables for each occupation category (managers are the baseline category), a dummy variable indicating whether or not the individual has an administrative duty. Firm and sector level controls included can be listed as dummy variables for different firm size (firms with less than 50 employees is the baseline), whether or not the firm is under a collective wage agreement (I_union), the export intensity of each sector (Int.ex), the logged value of sectoral production (Qkt). We also control for year fixed effects denoted by 𝛾𝛾𝑡𝑡 . The baseline wage regression is presented in Equation (1) below.
𝑙𝑙𝑙𝑙𝑊𝑊𝑖𝑖𝑖𝑖𝑖𝑖𝑡𝑡 = 𝛼𝛼 + 𝛽𝛽1𝑋𝑋𝑖𝑖 + 𝛽𝛽2𝑆𝑆𝑆𝑆𝑆𝑆𝑆𝑆𝑖𝑖 + 𝛽𝛽3𝐼𝐼_𝑢𝑢𝑙𝑙𝑆𝑆𝑢𝑢𝑙𝑙𝑖𝑖 + 𝛽𝛽4𝐼𝐼𝑙𝑙𝐼𝐼. 𝑆𝑆𝑒𝑒𝑖𝑖𝑡𝑡 + 𝛽𝛽5(𝐼𝐼𝑙𝑙𝐼𝐼. 𝑆𝑆𝑒𝑒𝑖𝑖𝑡𝑡 𝑒𝑒 𝐼𝐼𝑚𝑚𝑚𝑚𝑚𝑚𝑚𝑚 𝑖𝑖) + 𝛽𝛽6 𝑙𝑙𝑙𝑙𝑙𝑙𝑖𝑖,𝑡𝑡 + 𝛾𝛾𝑡𝑡 + 𝜀𝜀𝑖𝑖𝑖𝑖𝑖𝑖𝑡𝑡 (1)
Here i, j, k represents individual, firm and sector, respectively and t denotes the year. Our dependent variable is the logged value of hourly wages (𝑙𝑙𝑙𝑙𝑊𝑊𝑖𝑖𝑖𝑖𝑖𝑖𝑡𝑡). We compute the hourly wages using data on the weekly hours worked and monthly wages available in the SES data. As a further exploration of the link between export intensity and the gender wage gap, we divide sectors into four quartiles according to their export intensities. Then we estimate the following equation separately for the four quartiles.
𝑙𝑙𝑙𝑙𝑊𝑊𝑖𝑖𝑖𝑖𝑖𝑖𝑡𝑡 = 𝛼𝛼 + 𝛽𝛽1𝑋𝑋𝑖𝑖 + 𝛽𝛽2𝑆𝑆𝑆𝑆𝑆𝑆𝑆𝑆𝑖𝑖 + 𝛽𝛽3𝐼𝐼_𝑢𝑢𝑙𝑙𝑆𝑆𝑢𝑢𝑙𝑙𝑖𝑖 + 𝛽𝛽4 𝐼𝐼_𝑚𝑚𝑚𝑚𝑙𝑙𝑆𝑆𝑖𝑖 + 𝛽𝛽5 𝑙𝑙𝑙𝑙𝑙𝑙𝑖𝑖,𝑡𝑡 + 𝛾𝛾𝑡𝑡 + 𝜀𝜀𝑖𝑖𝑖𝑖𝑖𝑖𝑡𝑡 (2)
Similar to Equation (1), our individual-level control variables are included in 𝑋𝑋𝑖𝑖. This time we focus on the coefficient of the gender dummy (𝐼𝐼_𝑚𝑚𝑚𝑚𝑙𝑙𝑆𝑆𝑖𝑖) for which the baseline category is the female workers. A comparison of this coefficient (𝛽𝛽4) across all sector quartiles shows how the wage earnings of two gender groups differ from each other.
Lastly, we are interested in learning whether or not a sector’s degree of trade exposure has a differential impact on the gender wage gap across different education categories. We study this question by estimating the following equation for the four sector quartiles, separately.
. This time we focus on the coefficient of the gender dummy (
Makale Gönderim Tarihi: 15.02.2021 Yayına Kabul Tarihi: 13.06.2021
Craft, trade 32.7 16.3 29.8 1000+ 8.0 7.5 7.9
Source: Survey of Earnings Data (2010 and 2014), TURKSTAT, and Authors’ Calculations.
4.2 Methodology
This study aims to estimate the degree to which trade openness affects the wage inequality between male and female workers. To accomplish this goal, we incorporate the sector-level export intensity (Int.ex ) as an indicator of the trade exposure of each sector and its interaction with a gender dummy (Int.ex * I_male) to a standard wage regression along with a set of controls. The export intensity is computed by dividing the total exports value of each sector by its total production value. The individual-level control variables included in our baseline wage regression are the age of an individual, his/her tenure at the current firm, gender dummy (female is the baseline category), dummy variables for education level (primary school is the baseline category), dummy variables for each occupation category (managers are the baseline category), a dummy variable indicating whether or not the individual has an administrative duty. Firm and sector level controls included can be listed as dummy variables for different firm size (firms with less than 50 employees is the baseline), whether or not the firm is under a collective wage agreement (I_union), the export intensity of each sector (Int.ex), the logged value of sectoral production (Qkt). We also control for year fixed effects denoted by 𝛾𝛾𝑡𝑡 . The baseline wage regression is presented in Equation (1) below.
𝑙𝑙𝑙𝑙𝑊𝑊𝑖𝑖𝑖𝑖𝑖𝑖𝑡𝑡 = 𝛼𝛼 + 𝛽𝛽1𝑋𝑋𝑖𝑖 + 𝛽𝛽2𝑆𝑆𝑆𝑆𝑆𝑆𝑆𝑆𝑖𝑖 + 𝛽𝛽3𝐼𝐼_𝑢𝑢𝑙𝑙𝑆𝑆𝑢𝑢𝑙𝑙𝑖𝑖 + 𝛽𝛽4𝐼𝐼𝑙𝑙𝐼𝐼. 𝑆𝑆𝑒𝑒𝑖𝑖𝑡𝑡 + 𝛽𝛽5(𝐼𝐼𝑙𝑙𝐼𝐼. 𝑆𝑆𝑒𝑒𝑖𝑖𝑡𝑡 𝑒𝑒 𝐼𝐼𝑚𝑚𝑚𝑚𝑚𝑚𝑚𝑚 𝑖𝑖) + 𝛽𝛽6 𝑙𝑙𝑙𝑙𝑙𝑙𝑖𝑖,𝑡𝑡 + 𝛾𝛾𝑡𝑡 + 𝜀𝜀𝑖𝑖𝑖𝑖𝑖𝑖𝑡𝑡 (1)
Here i, j, k represents individual, firm and sector, respectively and t denotes the year. Our dependent variable is the logged value of hourly wages (𝑙𝑙𝑙𝑙𝑊𝑊𝑖𝑖𝑖𝑖𝑖𝑖𝑡𝑡). We compute the hourly wages using data on the weekly hours worked and monthly wages available in the SES data. As a further exploration of the link between export intensity and the gender wage gap, we divide sectors into four quartiles according to their export intensities. Then we estimate the following equation separately for the four quartiles.
𝑙𝑙𝑙𝑙𝑊𝑊𝑖𝑖𝑖𝑖𝑖𝑖𝑡𝑡 = 𝛼𝛼 + 𝛽𝛽1𝑋𝑋𝑖𝑖 + 𝛽𝛽2𝑆𝑆𝑆𝑆𝑆𝑆𝑆𝑆𝑖𝑖 + 𝛽𝛽3𝐼𝐼_𝑢𝑢𝑙𝑙𝑆𝑆𝑢𝑢𝑙𝑙𝑖𝑖 + 𝛽𝛽4 𝐼𝐼_𝑚𝑚𝑚𝑚𝑙𝑙𝑆𝑆𝑖𝑖 + 𝛽𝛽5 𝑙𝑙𝑙𝑙𝑙𝑙𝑖𝑖,𝑡𝑡 + 𝛾𝛾𝑡𝑡 + 𝜀𝜀𝑖𝑖𝑖𝑖𝑖𝑖𝑡𝑡 (2)
Similar to Equation (1), our individual-level control variables are included in 𝑋𝑋𝑖𝑖. This time we focus on the coefficient of the gender dummy (𝐼𝐼_𝑚𝑚𝑚𝑚𝑙𝑙𝑆𝑆𝑖𝑖) for which the baseline category is the female workers. A comparison of this coefficient (𝛽𝛽4) across all sector quartiles shows how the wage earnings of two gender groups differ from each other.
Lastly, we are interested in learning whether or not a sector’s degree of trade exposure has a differential impact on the gender wage gap across different education categories. We study this question by estimating the following equation for the four sector quartiles, separately.
) for which the baseline category is the female workers. A comparison of this coefficient (
Makale Gönderim Tarihi: 15.02.2021 Yayına Kabul Tarihi: 13.06.2021
Craft, trade 32.7 16.3 29.8 1000+ 8.0 7.5 7.9
Source: Survey of Earnings Data (2010 and 2014), TURKSTAT, and Authors’ Calculations.
4.2 Methodology
This study aims to estimate the degree to which trade openness affects the wage inequality between male and female workers. To accomplish this goal, we incorporate the sector-level export intensity (Int.ex ) as an indicator of the trade exposure of each sector and its interaction with a gender dummy (Int.ex * I_male) to a standard wage regression along with a set of controls. The export intensity is computed by dividing the total exports value of each sector by its total production value. The individual-level control variables included in our baseline wage regression are the age of an individual, his/her tenure at the current firm, gender dummy (female is the baseline category), dummy variables for education level (primary school is the baseline category), dummy variables for each occupation category (managers are the baseline category), a dummy variable indicating whether or not the individual has an administrative duty. Firm and sector level controls included can be listed as dummy variables for different firm size (firms with less than 50 employees is the baseline), whether or not the firm is under a collective wage agreement (I_union), the export intensity of each sector (Int.ex), the logged value of sectoral production (Qkt). We also control for year fixed effects denoted by 𝛾𝛾𝑡𝑡 . The baseline wage regression is presented in Equation (1) below.
𝑙𝑙𝑙𝑙𝑊𝑊𝑖𝑖𝑖𝑖𝑖𝑖𝑡𝑡 = 𝛼𝛼 + 𝛽𝛽1𝑋𝑋𝑖𝑖 + 𝛽𝛽2𝑆𝑆𝑆𝑆𝑆𝑆𝑆𝑆𝑖𝑖 + 𝛽𝛽3𝐼𝐼_𝑢𝑢𝑙𝑙𝑆𝑆𝑢𝑢𝑙𝑙𝑖𝑖 + 𝛽𝛽4𝐼𝐼𝑙𝑙𝐼𝐼. 𝑆𝑆𝑒𝑒𝑖𝑖𝑡𝑡 + 𝛽𝛽5(𝐼𝐼𝑙𝑙𝐼𝐼. 𝑆𝑆𝑒𝑒𝑖𝑖𝑡𝑡 𝑒𝑒 𝐼𝐼𝑚𝑚𝑚𝑚𝑚𝑚𝑚𝑚 𝑖𝑖) + 𝛽𝛽6 𝑙𝑙𝑙𝑙𝑙𝑙𝑖𝑖,𝑡𝑡 + 𝛾𝛾𝑡𝑡 + 𝜀𝜀𝑖𝑖𝑖𝑖𝑖𝑖𝑡𝑡 (1)
Here i, j, k represents individual, firm and sector, respectively and t denotes the year. Our dependent variable is the logged value of hourly wages (𝑙𝑙𝑙𝑙𝑊𝑊𝑖𝑖𝑖𝑖𝑖𝑖𝑡𝑡). We compute the hourly wages using data on the weekly hours worked and monthly wages available in the SES data. As a further exploration of the link between export intensity and the gender wage gap, we divide sectors into four quartiles according to their export intensities. Then we estimate the following equation separately for the four quartiles.
𝑙𝑙𝑙𝑙𝑊𝑊𝑖𝑖𝑖𝑖𝑖𝑖𝑡𝑡 = 𝛼𝛼 + 𝛽𝛽1𝑋𝑋𝑖𝑖 + 𝛽𝛽2𝑆𝑆𝑆𝑆𝑆𝑆𝑆𝑆𝑖𝑖 + 𝛽𝛽3𝐼𝐼_𝑢𝑢𝑙𝑙𝑆𝑆𝑢𝑢𝑙𝑙𝑖𝑖 + 𝛽𝛽4 𝐼𝐼_𝑚𝑚𝑚𝑚𝑙𝑙𝑆𝑆𝑖𝑖 + 𝛽𝛽5 𝑙𝑙𝑙𝑙𝑙𝑙𝑖𝑖,𝑡𝑡 + 𝛾𝛾𝑡𝑡 + 𝜀𝜀𝑖𝑖𝑖𝑖𝑖𝑖𝑡𝑡 (2)
Similar to Equation (1), our individual-level control variables are included in 𝑋𝑋𝑖𝑖. This time we focus on the coefficient of the gender dummy (𝐼𝐼_𝑚𝑚𝑚𝑚𝑙𝑙𝑆𝑆𝑖𝑖) for which the baseline category is the female workers. A comparison of this coefficient (𝛽𝛽4) across all sector quartiles shows how the wage earnings of two gender groups differ from each other.
Lastly, we are interested in learning whether or not a sector’s degree of trade exposure has a differential impact on the gender wage gap across different education categories. We study this question by estimating the following equation for the four sector quartiles, separately.
) across all sector quartiles shows how the wage earnings of two gender groups differ from each other.
Lastly, we are interested in learning whether or not a sector’s degree of trade exposure has a differential impact on the gender wage gap across different education categories. We study this question by estimating the following equation for the four sector quartiles, separately.
𝑙𝑙𝑙𝑙𝑊𝑊𝑖𝑖𝑖𝑖𝑖𝑖𝑖𝑖 = 𝛼𝛼 + 𝛽𝛽1𝑋𝑋𝑖𝑖 + 𝛽𝛽2𝑆𝑆𝑆𝑆𝑆𝑆𝑆𝑆𝑖𝑖 + 𝛽𝛽3𝐼𝐼_𝑢𝑢𝑙𝑙𝑆𝑆𝑢𝑢𝑙𝑙𝑖𝑖 + 𝛽𝛽4 (𝐼𝐼_𝑚𝑚𝑚𝑚𝑙𝑙𝑆𝑆𝑖𝑖 𝑥𝑥 𝐼𝐼_𝑠𝑠𝑠𝑠𝑆𝑆𝑙𝑙𝑙𝑙𝑖𝑖 ) + 𝛽𝛽5 𝑙𝑙𝑙𝑙𝑙𝑙𝑖𝑖,𝑖𝑖 + 𝛾𝛾𝑖𝑖 + 𝜀𝜀𝑖𝑖𝑖𝑖𝑖𝑖𝑖𝑖 (3)
The coefficient of the interaction between gender dummy and skill dummy provides the answer to this question. We construct the skill categories based on the education categories information provided in the survey. We group workers with college and above education as skilled and other education groups as unskilled. The baseline category against which we compare our coefficients of all the interaction categories is the unskilled females (i.e. 𝐼𝐼_𝑚𝑚𝑚𝑚𝑙𝑙𝑆𝑆 = 0 𝐼𝐼_𝑠𝑠𝑠𝑠𝑆𝑆𝑙𝑙𝑙𝑙 = 0). In all of the estimations, we cluster standard errors at the sector level. This controls for a possible correlation in the residuals for individuals within each sector category. Our estimation results and their discussion are provided in the next section.
5. Results
The estimation results for the baseline wage regression in Equation (1) are reported in Table 2. The coefficient estimates of the control variables included in the regression have expected signs. According to these results, age and tenure have positive and significant impacts on wage earnings. The coefficient estimates of the dummy variables for education levels show that as the education level of an individual improves, the wage earnings also increase. The coefficients of the occupation categories report how the wage earnings of these groups differ from the baseline category, which is managers. All the occupation categories have negative and significant coefficient estimates implying that they earn less compared to the baseline group.
The estimate of the no administrative duty coefficient, which is -0.18, implies that workers having an administrative position earns almost 20% higher compared to other workers. Not being covered by a union seems to have no significant effect on average wages. On the other hand, firm size affects average wage earnings positively and significantly. The estimates for these coefficients imply the higher is the size of the firm, the higher is the average wage earnings of the workers are with respect to the baseline category of firms with less than 50 employees. Lastly, the coefficient of the logged value of industrial production has a negative and significant effect on wage earnings. An interpretation of this together with the firm-size coefficient estimates is that small firms that produce high values of output pay on average the smallest wages to their workers.
The main objective of this research is to analyze the link between the degree to which a firm is involved with trade, which is measured by export intensity, and the wage gap between male and female workers. Hence, the coefficient of interest belongs to the interaction term Male x Export Intensity. This coefficient measures how much the wage of a male worker differs from that of a female worker with increasing export intensity. The regression results point to an estimate of 0.17 which is significant at a 10% level. This result implies that a 1-percentage point increase in the export intensity of the manufacturing firms produces a 0.17% higher male wages compared to female wages. Based on this estimate, we can infer that in a firm whose exports are on average 70% of its total production value pays the gender wage gap is 8.5% more than the firm with an export intensity of 20% is.
(3)
The coefficient of the interaction between gender dummy and skill dummy provides the answer to this question. We construct the skill categories based on the education categories information provided in the survey. We group workers with college and above education as skilled and other education groups as unskilled. The baseline category against which we compare our coefficients of all the interaction categories is the unskilled females (
𝑙𝑙𝑙𝑙𝑊𝑊𝑖𝑖𝑖𝑖𝑖𝑖𝑖𝑖 = 𝛼𝛼 + 𝛽𝛽1𝑋𝑋𝑖𝑖 + 𝛽𝛽2𝑆𝑆𝑆𝑆𝑆𝑆𝑆𝑆𝑖𝑖 + 𝛽𝛽3𝐼𝐼_𝑢𝑢𝑙𝑙𝑆𝑆𝑢𝑢𝑙𝑙𝑖𝑖 + 𝛽𝛽4 (𝐼𝐼_𝑚𝑚𝑚𝑚𝑙𝑙𝑆𝑆𝑖𝑖 𝑥𝑥 𝐼𝐼_𝑠𝑠𝑠𝑠𝑆𝑆𝑙𝑙𝑙𝑙𝑖𝑖 ) + 𝛽𝛽5 𝑙𝑙𝑙𝑙𝑙𝑙𝑖𝑖,𝑖𝑖 + 𝛾𝛾𝑖𝑖 + 𝜀𝜀𝑖𝑖𝑖𝑖𝑖𝑖𝑖𝑖 (3)
The coefficient of the interaction between gender dummy and skill dummy provides the answer to this question. We construct the skill categories based on the education categories information provided in the survey. We group workers with college and above education as skilled and other education groups as unskilled. The baseline category against which we compare our coefficients of all the interaction categories is the unskilled females (i.e. 𝐼𝐼_𝑚𝑚𝑚𝑚𝑙𝑙𝑆𝑆 = 0 𝐼𝐼_𝑠𝑠𝑠𝑠𝑆𝑆𝑙𝑙𝑙𝑙 = 0). In all of the estimations, we cluster standard errors at the sector level. This controls for a possible correlation in the residuals for individuals within each sector category. Our estimation results and their discussion are provided in the next section.
5. Results
The estimation results for the baseline wage regression in Equation (1) are reported in Table 2. The coefficient estimates of the control variables included in the regression have expected signs. According to these results, age and tenure have positive and significant impacts on wage earnings. The coefficient estimates of the dummy variables for education levels show that as the education level of an individual improves, the wage earnings also increase. The coefficients of the occupation categories report how the wage earnings of these groups differ from the baseline category, which is managers. All the occupation categories have negative and significant coefficient estimates implying that they earn less compared to the baseline group.
The estimate of the no administrative duty coefficient, which is -0.18, implies that workers having an administrative position earns almost 20% higher compared to other workers. Not being covered by a union seems to have no significant effect on average wages. On the other hand, firm size affects average wage earnings positively and significantly. The estimates for these coefficients imply the higher is the size of the firm, the higher is the average wage earnings of the workers are with respect to the baseline category of firms with less than 50 employees. Lastly, the coefficient of the logged value of industrial production has a negative and significant effect on wage earnings. An interpretation of this together with the firm-size coefficient estimates is that small firms that produce high values of output pay on average the smallest wages to their workers.
The main objective of this research is to analyze the link between the degree to which a firm is involved with trade, which is measured by export intensity, and the wage gap between male and female workers. Hence, the coefficient of interest belongs to the interaction term Male x Export Intensity. This coefficient measures how much the wage of a male worker differs from that of a female worker with increasing export intensity. The regression results point to an estimate of 0.17 which is significant at a 10% level. This result implies that a 1-percentage point increase in the export intensity of the manufacturing firms produces a 0.17% higher male wages compared to female wages. Based on this estimate, we can infer that in a firm whose exports are on average 70% of its total production value pays the gender wage gap is 8.5% more than the firm with an export intensity of 20% is.
). In all of the estimations, we cluster standard errors at the sector level. This controls for a possible correlation in the residuals for individuals within each sector category. Our estimation results and their discussion are provided in the next section.
5. Results
The estimation results for the baseline wage regression in Equation (1) are reported in Table 2. The coefficient estimates of the control variables included in the regression have expected signs. According to these results, age and tenure have positive and significant impacts on wage earnings.
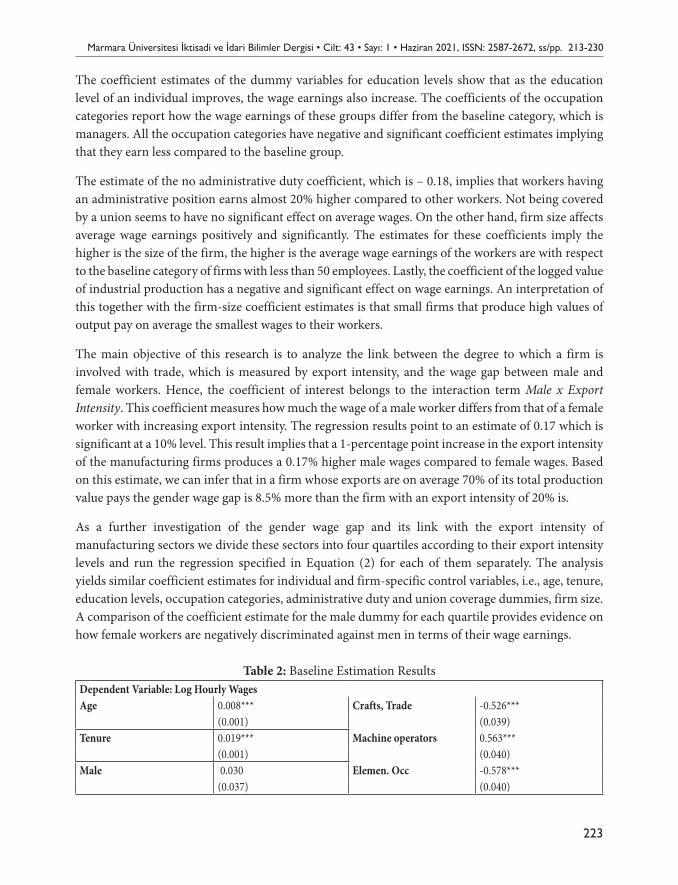
Marmara Üniversitesi İktisadi ve İdari Bilimler Dergisi • Cilt: 43 • Sayı: 1 • Haziran 2021, ISSN: 2587-2672, ss/pp. 213-230
223
The coefficient estimates of the dummy variables for education levels show that as the education level of an individual improves, the wage earnings also increase. The coefficients of the occupation categories report how the wage earnings of these groups differ from the baseline category, which is managers. All the occupation categories have negative and significant coefficient estimates implying that they earn less compared to the baseline group.
The estimate of the no administrative duty coefficient, which is – 0.18, implies that workers having an administrative position earns almost 20% higher compared to other workers. Not being covered by a union seems to have no significant effect on average wages. On the other hand, firm size affects average wage earnings positively and significantly. The estimates for these coefficients imply the higher is the size of the firm, the higher is the average wage earnings of the workers are with respect to the baseline category of firms with less than 50 employees. Lastly, the coefficient of the logged value of industrial production has a negative and significant effect on wage earnings. An interpretation of this together with the firm-size coefficient estimates is that small firms that produce high values of output pay on average the smallest wages to their workers.
The main objective of this research is to analyze the link between the degree to which a firm is involved with trade, which is measured by export intensity, and the wage gap between male and female workers. Hence, the coefficient of interest belongs to the interaction term Male x Export Intensity. This coefficient measures how much the wage of a male worker differs from that of a female worker with increasing export intensity. The regression results point to an estimate of 0.17 which is significant at a 10% level. This result implies that a 1-percentage point increase in the export intensity of the manufacturing firms produces a 0.17% higher male wages compared to female wages. Based on this estimate, we can infer that in a firm whose exports are on average 70% of its total production value pays the gender wage gap is 8.5% more than the firm with an export intensity of 20% is.
As a further investigation of the gender wage gap and its link with the export intensity of manufacturing sectors we divide these sectors into four quartiles according to their export intensity levels and run the regression specified in Equation (2) for each of them separately. The analysis yields similar coefficient estimates for individual and firm-specific control variables, i.e., age, tenure, education levels, occupation categories, administrative duty and union coverage dummies, firm size. A comparison of the coefficient estimate for the male dummy for each quartile provides evidence on how female workers are negatively discriminated against men in terms of their wage earnings.
Table 2: Baseline Estimation ResultsDependent Variable: Log Hourly WagesAge 0.008*** Crafts, Trade -0.526***
(0.001) (0.039)Tenure 0.019*** Machine operators 0.563***
(0.001) (0.040)Male 0.030 Elemen. Occ -0.578***
(0.037) (0.040)
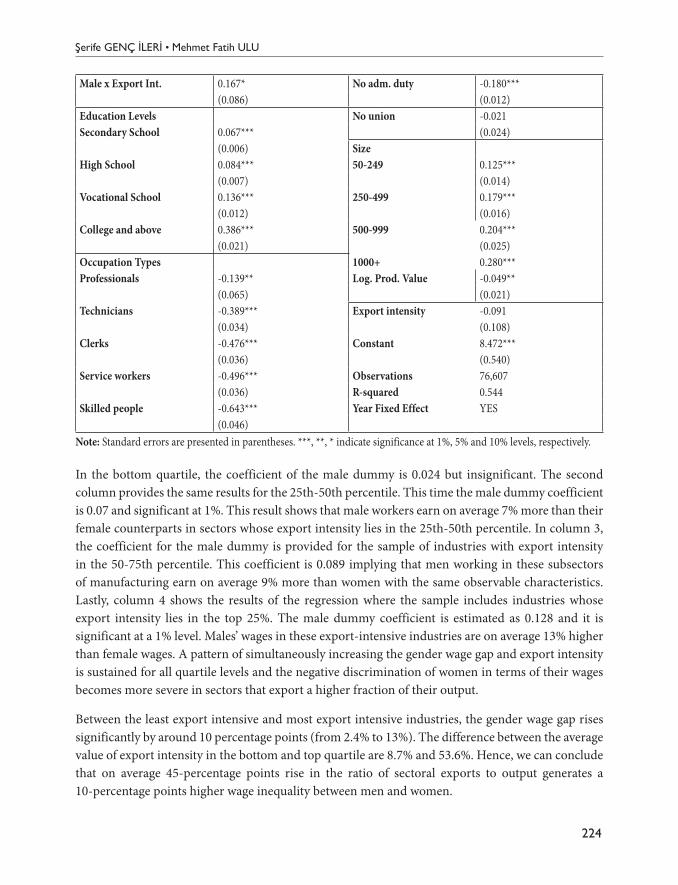
Şerife GENÇ İLERİ • Mehmet Fatih ULU
224
Male x Export Int. 0.167* No adm. duty -0.180***(0.086) (0.012)
Education Levels No union -0.021Secondary School 0.067*** (0.024)
(0.006) SizeHigh School 0.084*** 50-249 0.125***
(0.007) (0.014)Vocational School 0.136*** 250-499 0.179***
(0.012) (0.016)College and above 0.386*** 500-999 0.204***
(0.021) (0.025)Occupation Types 1000+ 0.280***Professionals -0.139** Log. Prod. Value -0.049**
(0.065) (0.021)Technicians -0.389*** Export intensity -0.091
(0.034) (0.108)Clerks -0.476*** Constant 8.472***
(0.036) (0.540)Service workers -0.496*** Observations 76,607
(0.036) R-squared 0.544Skilled people -0.643*** Year Fixed Effect YES
(0.046)Note: Standard errors are presented in parentheses. ***, **, * indicate significance at 1%, 5% and 10% levels, respectively.
In the bottom quartile, the coefficient of the male dummy is 0.024 but insignificant. The second column provides the same results for the 25th-50th percentile. This time the male dummy coefficient is 0.07 and significant at 1%. This result shows that male workers earn on average 7% more than their female counterparts in sectors whose export intensity lies in the 25th-50th percentile. In column 3, the coefficient for the male dummy is provided for the sample of industries with export intensity in the 50-75th percentile. This coefficient is 0.089 implying that men working in these subsectors of manufacturing earn on average 9% more than women with the same observable characteristics. Lastly, column 4 shows the results of the regression where the sample includes industries whose export intensity lies in the top 25%. The male dummy coefficient is estimated as 0.128 and it is significant at a 1% level. Males’ wages in these export-intensive industries are on average 13% higher than female wages. A pattern of simultaneously increasing the gender wage gap and export intensity is sustained for all quartile levels and the negative discrimination of women in terms of their wages becomes more severe in sectors that export a higher fraction of their output.
Between the least export intensive and most export intensive industries, the gender wage gap rises significantly by around 10 percentage points (from 2.4% to 13%). The difference between the average value of export intensity in the bottom and top quartile are 8.7% and 53.6%. Hence, we can conclude that on average 45-percentage points rise in the ratio of sectoral exports to output generates a 10-percentage points higher wage inequality between men and women.
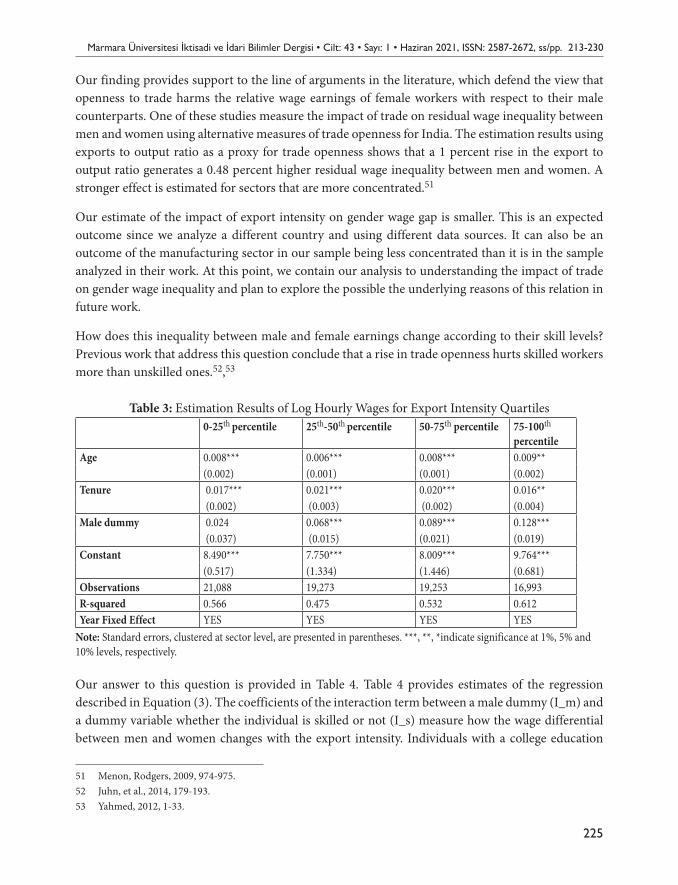
Marmara Üniversitesi İktisadi ve İdari Bilimler Dergisi • Cilt: 43 • Sayı: 1 • Haziran 2021, ISSN: 2587-2672, ss/pp. 213-230
225
Our finding provides support to the line of arguments in the literature, which defend the view that openness to trade harms the relative wage earnings of female workers with respect to their male counterparts. One of these studies measure the impact of trade on residual wage inequality between men and women using alternative measures of trade openness for India. The estimation results using exports to output ratio as a proxy for trade openness shows that a 1 percent rise in the export to output ratio generates a 0.48 percent higher residual wage inequality between men and women. A stronger effect is estimated for sectors that are more concentrated.51
Our estimate of the impact of export intensity on gender wage gap is smaller. This is an expected outcome since we analyze a different country and using different data sources. It can also be an outcome of the manufacturing sector in our sample being less concentrated than it is in the sample analyzed in their work. At this point, we contain our analysis to understanding the impact of trade on gender wage inequality and plan to explore the possible the underlying reasons of this relation in future work.
How does this inequality between male and female earnings change according to their skill levels? Previous work that address this question conclude that a rise in trade openness hurts skilled workers more than unskilled ones.52,53
Table 3: Estimation Results of Log Hourly Wages for Export Intensity Quartiles0-25th percentile 25th-50th percentile 50-75th percentile 75-100th
percentileAge 0.008*** 0.006*** 0.008*** 0.009**
(0.002) (0.001) (0.001) (0.002)Tenure 0.017*** 0.021*** 0.020*** 0.016**
(0.002) (0.003) (0.002) (0.004)Male dummy 0.024 0.068*** 0.089*** 0.128***
(0.037) (0.015) (0.021) (0.019)Constant 8.490*** 7.750*** 8.009*** 9.764***
(0.517) (1.334) (1.446) (0.681)Observations 21,088 19,273 19,253 16,993R-squared 0.566 0.475 0.532 0.612Year Fixed Effect YES YES YES YES
Note: Standard errors, clustered at sector level, are presented in parentheses. ***, **, *indicate significance at 1%, 5% and 10% levels, respectively.
Our answer to this question is provided in Table 4. Table 4 provides estimates of the regression described in Equation (3). The coefficients of the interaction term between a male dummy (I_m) and a dummy variable whether the individual is skilled or not (I_s) measure how the wage differential between men and women changes with the export intensity. Individuals with a college education
51 Menon, Rodgers, 2009, 974-975.52 Juhn, et al., 2014, 179-193.53 Yahmed, 2012, 1-33.
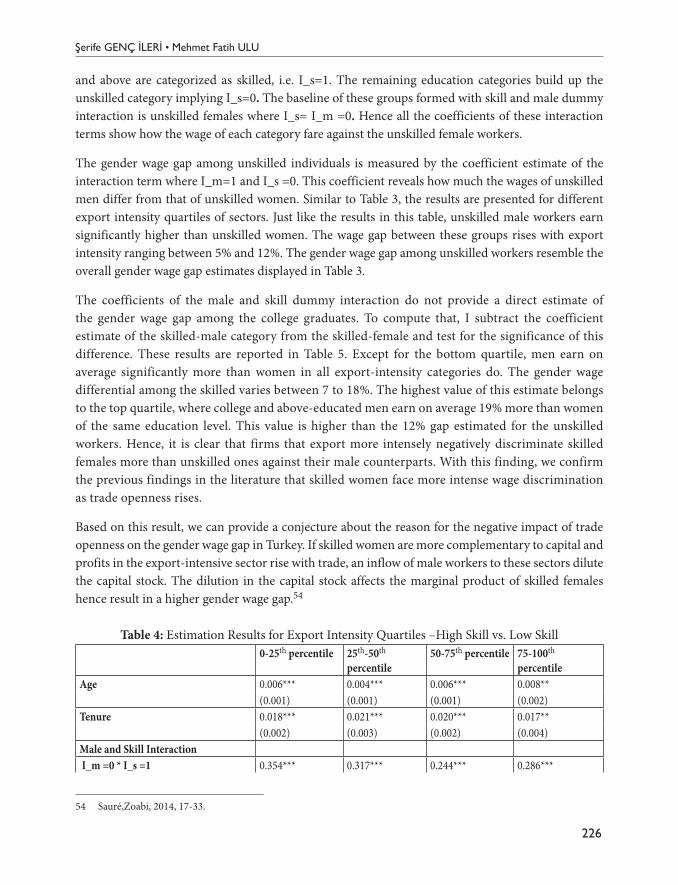
Şerife GENÇ İLERİ • Mehmet Fatih ULU
226
and above are categorized as skilled, i.e. I_s=1. The remaining education categories build up the unskilled category implying I_s=0. The baseline of these groups formed with skill and male dummy interaction is unskilled females where I_s= I_m =0. Hence all the coefficients of these interaction terms show how the wage of each category fare against the unskilled female workers.
The gender wage gap among unskilled individuals is measured by the coefficient estimate of the interaction term where I_m=1 and I_s =0. This coefficient reveals how much the wages of unskilled men differ from that of unskilled women. Similar to Table 3, the results are presented for different export intensity quartiles of sectors. Just like the results in this table, unskilled male workers earn significantly higher than unskilled women. The wage gap between these groups rises with export intensity ranging between 5% and 12%. The gender wage gap among unskilled workers resemble the overall gender wage gap estimates displayed in Table 3.
The coefficients of the male and skill dummy interaction do not provide a direct estimate of the gender wage gap among the college graduates. To compute that, I subtract the coefficient estimate of the skilled-male category from the skilled-female and test for the significance of this difference. These results are reported in Table 5. Except for the bottom quartile, men earn on average significantly more than women in all export-intensity categories do. The gender wage differential among the skilled varies between 7 to 18%. The highest value of this estimate belongs to the top quartile, where college and above-educated men earn on average 19% more than women of the same education level. This value is higher than the 12% gap estimated for the unskilled workers. Hence, it is clear that firms that export more intensely negatively discriminate skilled females more than unskilled ones against their male counterparts. With this finding, we confirm the previous findings in the literature that skilled women face more intense wage discrimination as trade openness rises.
Based on this result, we can provide a conjecture about the reason for the negative impact of trade openness on the gender wage gap in Turkey. If skilled women are more complementary to capital and profits in the export-intensive sector rise with trade, an inflow of male workers to these sectors dilute the capital stock. The dilution in the capital stock affects the marginal product of skilled females hence result in a higher gender wage gap.54
Table 4: Estimation Results for Export Intensity Quartiles –High Skill vs. Low Skill0-25th percentile 25th-50th
percentile50-75th percentile 75-100th
percentileAge 0.006*** 0.004*** 0.006*** 0.008**
(0.001) (0.001) (0.001) (0.002)Tenure 0.018*** 0.021*** 0.020*** 0.017**
(0.002) (0.003) (0.002) (0.004)Male and Skill Interaction I_m =0 * I_s =1 0.354*** 0.317*** 0.244*** 0.286***
54 Sauré,Zoabi, 2014, 17-33.
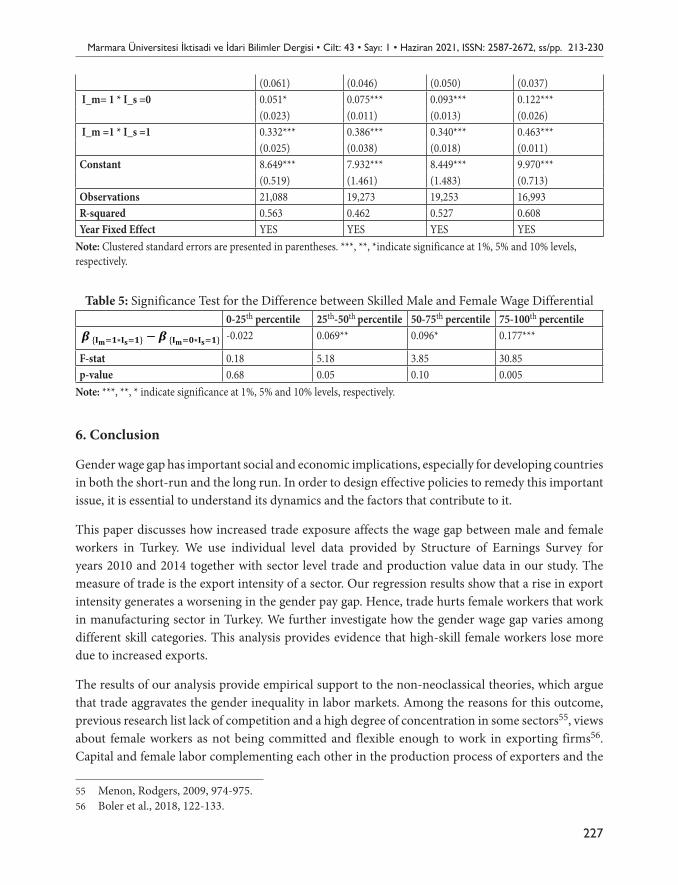
Marmara Üniversitesi İktisadi ve İdari Bilimler Dergisi • Cilt: 43 • Sayı: 1 • Haziran 2021, ISSN: 2587-2672, ss/pp. 213-230
227
(0.061) (0.046) (0.050) (0.037) I_m= 1 * I_s =0 0.051* 0.075*** 0.093*** 0.122***
(0.023) (0.011) (0.013) (0.026) I_m =1 * I_s =1 0.332*** 0.386*** 0.340*** 0.463***
(0.025) (0.038) (0.018) (0.011)Constant 8.649*** 7.932*** 8.449*** 9.970***
(0.519) (1.461) (1.483) (0.713)Observations 21,088 19,273 19,253 16,993R-squared 0.563 0.462 0.527 0.608Year Fixed Effect YES YES YES YES
Note: Clustered standard errors are presented in parentheses. ***, **, *indicate significance at 1%, 5% and 10% levels, respectively.
Table 5: Significance Test for the Difference between Skilled Male and Female Wage Differential0-25th percentile 25th-50th percentile 50-75th percentile 75-100th percentile
Makale Gönderim Tarihi: 15.02.2021 Yayına Kabul Tarihi: 13.06.2021
Table 5: Significance Test for the Difference between Skilled Male and Female Wage
Differential
0-25th percentile
25th-50th
percentile 50-75th percentile
75-100th percentile
𝜷𝜷 {𝐈𝐈𝐦𝐦=𝟏𝟏∗𝐈𝐈𝐬𝐬=𝟏𝟏} − 𝜷𝜷 {𝐈𝐈𝐦𝐦=𝟎𝟎∗𝐈𝐈𝐬𝐬=𝟏𝟏} -0.022 0.069** 0.096* 0.177***
F-stat 0.18 5.18 3.85 30.85 p-value 0.68 0.05 0.10 0.005
Note: ***, **, * indicate significance at 1%, 5% and 10% levels, respectively.
6. Conclusion
Gender wage gap has important social and economic implications, especially for developing countries in both the short-run and the long run. In order to design effective policies to remedy this important issue, it is essential to understand its dynamics and the factors that contribute to it.
This paper discusses how increased trade exposure affects the wage gap between male and female workers in Turkey. We use individual level data provided by Structure of Earnings Survey for years 2010 and 2014 together with sector level trade and production value data in our study. The measure of trade is the export intensity of a sector. Our regression results show that a rise in export intensity generates a worsening in the gender pay gap. Hence, trade hurts female workers that work in manufacturing sector in Turkey. We further investigate how the gender wage gap varies among different skill categories. This analysis provides evidence that high-skill female workers lose more due to increased exports.
The results of our analysis provide empirical support to the non-neoclassical theories, which argue that trade aggravates the gender inequality in labor markets. Among the reasons for this outcome, previous research list lack of competition and a high degree of concentration in some sectors55, views about female workers as not being committed and flexible enough to work in exporting firms56. Capital and female labor complementing each other in the production process of exporters and the dilution of capital with an increase in male worker abundance due to increased profits in these firms has also been proposed as a mechanism through which trade deteriorates the relative wages of female workers.57
55Menon, Rodgers, 2009, 974-975. 56Boler et al., 2018, 122-133. 57Sauré, Zoabi, 2014, 17-33.
-0.022 0.069** 0.096* 0.177***
F-stat 0.18 5.18 3.85 30.85p-value 0.68 0.05 0.10 0.005
Note: ***, **, * indicate significance at 1%, 5% and 10% levels, respectively.
6. Conclusion
Gender wage gap has important social and economic implications, especially for developing countries in both the short-run and the long run. In order to design effective policies to remedy this important issue, it is essential to understand its dynamics and the factors that contribute to it.
This paper discusses how increased trade exposure affects the wage gap between male and female workers in Turkey. We use individual level data provided by Structure of Earnings Survey for years 2010 and 2014 together with sector level trade and production value data in our study. The measure of trade is the export intensity of a sector. Our regression results show that a rise in export intensity generates a worsening in the gender pay gap. Hence, trade hurts female workers that work in manufacturing sector in Turkey. We further investigate how the gender wage gap varies among different skill categories. This analysis provides evidence that high-skill female workers lose more due to increased exports.
The results of our analysis provide empirical support to the non-neoclassical theories, which argue that trade aggravates the gender inequality in labor markets. Among the reasons for this outcome, previous research list lack of competition and a high degree of concentration in some sectors55, views about female workers as not being committed and flexible enough to work in exporting firms56. Capital and female labor complementing each other in the production process of exporters and the
55 Menon, Rodgers, 2009, 974-975.56 Boler et al., 2018, 122-133.
Şerife GENÇ İLERİ • Mehmet Fatih ULU
228
dilution of capital with an increase in male worker abundance due to increased profits in these firms has also been proposed as a mechanism through which trade deteriorates the relative wages of female workers.57
For Turkey, the negative impact of trade on the gender wage gap may be resulting from all or a combination of these factors. The bigger gender wage gap observed in skilled-female category makes the theory based on complementarity of capital and female labor a more likely potential candidate. Though the reason why trade impairs the labor market outcomes of women is essential to understand, we leave that important issue for future research.
ReferencesAKTAS, A., Uysal, G. (2016). The Gender Wage Gap in Turkey, Marmara Üniversitesi İktisadi ve İdari Bilimler
Dergisi, 38(2): 1–19.ALBRECHT, J., Björklund, A., Vroman, S. (2003). Is there a Glass Ceiling in Sweden?, Journal of Labor
Economics, 21(1): 145-177.ALMASIFARD, M. (2018). Gender Wage Gap in Selected Developing Upper-Middle Income Countries,
International Journal of Development Issues, 17(2): 142-156.AMUEDO-DORANTES, C., De La Rica, S. (2005). The Impact of Gender Segregation on Male-Female Wage
Differentials: Evidence from Matched Employer-Employee Data for Spain, IZA Discussion Papers 1742.ANTONCZYK, D., Fitzenberger, B., Sommerfeld, K. (2010). Rising Wage Inequality: The Decline of Collective
Bargaining, and The Gender Wage Gap, Labour Economics, 17: 835–847.ARTECONA, R., Cunningham, W. (2002). Effects of Trade Liberalization on The Gender Wage Gap in Mexico,
The World Bank Development Research Group/ Poverty Reduction and Economic Management Network, No. 34144.
ARULAMPALAM, W., Booth, A., Bryan, M. (2007). Is There a Glass Ceiling over Europe? Exploring the Gender Pay Gap across the Wage Distribution, ILR Review, 60 (2): 163-186.
AYDINER-AVSAR, N. (2010) International Trade and Gender Wage Gap: A Distributional Analysis for Turkey. University of Utah, Working Paper.
BAYARD, K., Hellerstein, J., Neumark, D., Troske, K. (2003). New Evidence on Sex Segregation and Sex Differences in Wages from Matched Employee-Employer Data, Journal of Labor Economics, 21(4): 887-922.
BECKER, G. S. (1971). The Economics of Discrimination, Chicago, The University of Chicago Press.BERIK, G., Rodgers, Y., R., Zveglich, J. E. (2004). International Trade and Wage Discrimination: Evidence from
East Asia, Review of Development Economics, 8(2): 237-254.BLACK, S. E., Brainerd, E. (2004). Importing Equality: The Impact of Globalization on Gender Discrimination,
Industrial & Labor Relations Review, 57(4): 540-559.BOLER, E. A., Javorcik, B., Ulltveit-Moe, K. H. (2015). Globalization: A Woman’s Best Friend? Exporters and
The Gender Wage Gap, Center for Economic Studies and Info Institute, Working Paper No. 5296.BOLER, E. A., Javorcik, B., Ulltveit-Moe, K. H. (2018). Working Across Time Zones: Exporters and The Gender
Wage Gap, Journal of International Economics, 111: 122-133.CHINHUI, J., Dae Il, K. (1999). The Effects of Rising Female Labor Supply on Male Wages, Journal of Labor
Economics, 17(1): 23-48.
57 Sauré, Zoabi, 2014, 17-33.
Marmara Üniversitesi İktisadi ve İdari Bilimler Dergisi • Cilt: 43 • Sayı: 1 • Haziran 2021, ISSN: 2587-2672, ss/pp. 213-230
229
DAYIOGLU, M., Kasnakoglu, Z. (1997). Kentsel Kesimde Kadın ve Erkeklerin İşgücüne Katılımları ve Kazanç Farklılıkları, Metu Studies in Development, 24(3): 329–361.
DEB, K., Hauk, W. R. (2020). The Impact of Chinese Imports on Indian Wage Inequality, The Indian Journal of Labour Economics, 63: 267–290.
DUFLO, E. (2003). Grandmothers and Granddaughters: Old Age Pension and Intra-Household Allocation in South Africa, World Bank Economic Review, 17(1): 1–25.
FIELDS, J., Wolff, E. N. (1995). Interindustry Wage Differentials and The Gender Wage Gap, Industrial and Labor Relations Review, 49(1): 105-120.
GALOR, O., Weil, D. N. (1996). The Gender Gap, Fertility, and Growth, The American Economic Review, 86(3): 374-387.
GANNON, B., Plasman, R., Rycx, F., Tojerow, I. (2007). Inter-Industry Wage Differentials and The Gender Wage Gap: Evidence from European Countries, The Economic and Social Review, 38(1): 135–155.
GREANEY, T., Tanaka, A. (2020). Foreign Ownership, Exporting and Gender Wage Gaps: Evidence from Japanese Linked Employer-Employee Data, Munich Personal Repec Archive, MPRA Paper No. 101339.
HEIWAI, T., Yifan, Z. (2017). Do Multinationals Transfer Culture? Evidence on Female Employment in China, Center for Economic Studies and Info Institute, Cesifo Working Paper No. 6295.
HOLLWEG, C. H., Ong Lopez, A. (2020). Exporting and Female Labor Market Outcomes in Georgia, World Bank Policy Research Working Paper No. 9432.
ILKKARACAN, İ., Selim, R. (2007) The Gender Wage Gap in the Turkish Labor Market, Review of Labour Economics and Industrial Relations, 21(2): 563–59.
ILO (2012). International Standard Classification of Occupations Structure, Group Definitions and Correspondence Tables.
ILO AND TURKSTAT (2020). Measuring the Gender Wage Gap: Turkey Case: 1-21.JUHN, C., Ujhelyi, G., Villegas-Sanchez, C. (2014). Men, Women, and Machines: How Trade Impacts Gender
Inequality, Journal of Development Economics, 106: 179-193.KARA, O. (2006). Occupational Gender Wage Discrimination in Turkey, Journal of Economic Studies, 33(2):
130-143.LUGO, D. C., Pérez, R. E. R. (2017). Trade Liberalization and Gender Wage Gap in Mexico, Modern Economy,
8: 1167-1185.MENON, N., Rodgers, Y. M. (2009). International Trade and the Gender Wage Gap: New Evidence from India’s
Manufacturing Sector, World Development, 37(5): 965-981.MUSAZAY, S. (2019). Gender Wage Gap and İnternational Trade: Evidence from Turkey’s Manufacturing
Sector. (Unpublished master’s thesis). Ibn Haldun University, School of Graduate Studies, İstanbul.OOSTENDORP, R. H. (2004). Globalization and The Gender Wage Gap, World Bank Policy Research Working
Paper 3256.ÖZCAN, K. M., Özcan, Y. Z., Üçdoğruk, S. (2003). Wage Differences by Gender, Wage and Self Employment in
Urban Turkey, Journal of Economic Cooperation, 24(1): 1-24.ÖZTÜRK, S., Başar, D. (2018). Türkiye’de Kadınların İşgücü Piyasasına Yönelik Tercihleri: Kayıt Dışı Sektör
Özelinde Bir Analiz, Journal of Social Security, 8(2): 41-58.PÉREZ, R. E. R., Lugo, D.C. (2017) Trade Liberalization and Gender Wage Gap in Mexico, Modern Economy,
8: 1167-1185.SAURÉ, P., Zoabi, H. (2014). International Trade, The Gender Wage Gap and Female Labor Force Participation,
Journal of Development Economics, 111: 17-33.
Şerife GENÇ İLERİ • Mehmet Fatih ULU
230
SEGUINO, S. (1997). Gender Wage Inequality and Export‐Led Growth in South Korea, The Journal of Development Studies, 34(2): 102-132.
TANSEL, A. (2001). Wage Earners, Self-Employed and Gender in The Informal Sector in Turkey, Economic Research Forum Working Paper, No. 0102.
TANSEL, A. (2004). Public‐Private Employment Choice, Wage Differentials and Gender in Turkey, IZA Discussion Papers, 53(2): 1-43.
TEKGÜÇ, H., Eryar, D., Cindoğlu, D. (2017). Women’s Tertiary Education Masks the Gender Wage Gap in Turkey, Journal of Labor Research, 38: 360–386.
THOMAS, D. (1990). Intra-Household Resource Allocation: An Inferential Approach, Journal of Human Resources, 25(4): 635–664.
WEI, H., Yang, S., Liu, S., Wu, J., Xiang, S. (2013). International Trade and Gender Wage Gap In China, European Scientific Journal, 9(22): 21-52.
WORLD ECONOMIC FORUM (2019). Global Gender Report 2020. https://www.weforum.org/reports/gender-gap-2020-report-100-years-pay-equality (Accessed on: 05.02.2021)
YAHMED, S. B. (2012). Gender Wage Gaps Across Skills and Trade Openness, AMSE Working Papers, 1232: 1-33.
YAHMED, S. B. (2017). Gender Wage Discrimination and Trade Openness, Prejudiced Employers in an Open Industry, ZEW Discussion Papers No. 17-047: 1-53.