ife metropolis using geographic informa - journal of scientific
TRANSCRIPT
_____________________________________________________________________________________________________ *Corresponding author: Email: [email protected];
Journal of Scientific Research & Reports 10(1): 1-15, 2016; Article no.JSRR.22339
ISSN: 2320-0227
SCIENCEDOMAIN international www.sciencedomain.org
Spatial Analysis of the Distribution Pattern of Primary Healthcare Facilities in Ile – Ife Metropolis
Using Geographic Information System
A. Hafeez Sedenu1*, K. H. Muibi1, A. T. Alaga1, O. O. Ajileye1, John Ogbole1,
A. A. Kappo1, O. S. Popoola1 and Oloko-Oba O. Mustapha1
1Cooperative Information Network, National Space Research and Development Agency, Obafemi Awolowo University, Ile-Ife, Nigeria.
Authors’ contributions
This work was carried out in collaboration between all authors. Author AHS designed the study, wrote
the protocol and wrote the first draft of the manuscript. Authors KHM, JO, ATA, OOA, OSP, AAK and OOOM managed the literature searches and analyses of the study. All authors read and approved the
final draft of the manuscript.
Article Information
DOI: 10.9734/JSRR/2016/22339 Editor(s):
(1) Viroj Wiwanitkit, Department of Laboratory Medicine, Faculty of Medicine, Chulalongkorn University, Bangkok, Thailand.
Reviewers: (1) Anonymous, Kocaeli University, Turkey.
(2) Kadiri Umar Afegbua, Centre for Geodesy and Geodynamics, Nigeria. (3) G. Y. Sheu, Chang-Jung Christian University, Taiwan.
Complete Peer review History: http://sciencedomain.org/review-history/12817
Received 29th September 2015 Accepted 20
th November 2015
Published 28th December 2015
ABSTRACT
The importance of health to the overall wellbeing of every nation cannot be overemphasized. Therefore, there is a need for effective planning and management of the healthcare facilities in order to achieve optimum result in the country for equitable distribution of health facilities as a factor for sustaining the population in the cities. This research explores potential use of Goespatial Techniques for analysing public healthcare facilities accessibility and distribution pattern in Ile- Ife metropolis. Primary and secondary data were acquired. Primary data include questionnaire administration and Global Positioning System (GPS) receiver’s coordinate points of the health facilities while secondary data include administrative map of Ile-Ife metropolis and geo-eye satellite image 2011. These set of data were integrated into Arcgis environment and the following spatial analyses were carried out; overlay
Original Research Article
Sedenu et al.; JSRR, 10(1): 1-15, 2016; Article no.JSRR.22339
2
operation, statistical analysis and network analysis. The results obtained are: study area map, digital road network, most centrally located facilities, mean center, standard distance, directional distribution, kernel density and nearest neighbourhood ratio (NNR=1.068821). The Nearest Neighbour Ratio shows a random distribution pattern for health care facility. The service area maps were also produced to show the total travel time from the points of resident to the nearest healthcare facilities within a given time of 2, 3, 5 and 7 minutes. The total area served by the healthcare facilities in km² was determined. From the results it shows that the study area is fairly provided with health care facilities. However, they are concentrated around the center of the town while other areas are inadequately served. Primary healthcare facilities should be provided to serve the areas that are underserved in the study area. The centrally located primary health center should be well equipped by the government so as to serve the population better. Improvement should be made on healthcare provision by having a standardized regulation for establishing primary healthcare facilities.
Keywords: Geospatial techniques; healthcare facilities; spatial analysis; Ile- ife metropolis.
1. INTRODUCTION
Primary Health care has been long considered a major contributor to the health of a population [1]. Physical accessibility of health services is determined by the geographical location of homes in relation to available facilities, by physical and topographical barriers by the modes of transport that are available to reach these destinations. Health facilities in Nigeria have evolved through a series of historical development including a succession of policies and plans which had been introduced by various administrations. However, the health facilities are inadequate in meeting the needs and demands of the public. Man through technology has continued to expand his land holding capacity and to improve his well-being. This is because he believes that economic survival or self-sufficiency is synonymous with high standard of living. Also, various religious bodies and private agencies established hospitals, dispensaries and maternities in different parts of the country without considering the convenience of residents at patronizing them. Primary Healthcare (PHC) service delivery in Nigeria has been faced with a lot of problems some of which are inadequate manpower, obsolete equipment and unavailable drugs etc. Depending on which perspective of observation, some have applauded the efforts of the government in providing grassroots healthcare services whereas in some quarters such services are not adequately provided. This is evidenced in the number of ailing hospitals across the country. Besides, most of the government-owned hospitals are not optimally located which implies
that community-based accessibility to these medical facilities has been compromised. By implication, the distribution of primary healthcare services in Nigeria has been characterized by significant disparity. Such disparity is shown in the ways some of these medical facilities are concentrated in one geopolitical region at the expense of others. This often resulted in spatial inequality that characterizes Nigeria’s socio-political landscape. Also, this inequality places pressure on the facilities which are already inadequate. There is need to ascertain how this spatial inequality can be reduced to favour patients patronizing these healthcare facilities. Even though the government has shown serious commitment towards addressing these inequalities, more is still expected in the areas of technical knowhow. However, attempt to address such disparity from technical perspective may require the use of a cut edge information management tool such as the geographic information systems (GIS) and remote sensing technology (RS). As a result, this research work investigated the nature of distribution pattern of primary healthcare facilities in Ile – Ife metropolis Osun state with the view to addressing disparity where available.
1.1 Aim and Objectives of the Study
The aim of this study is to analyse primary healthcare facilities distribution pattern in Ile – Ife Osun Nigeria Metropolis using Geospatial Techniques. This can be accomplished using the following objectives: Production of digital road network of the
study area.
Sedenu et al.; JSRR, 10(1): 1-15, 2016; Article no.JSRR.22339
3
Carry out an inventory and map out the health facilities in the study area.
Determine the spatial distribution pattern of the health facilities.
Evaluate the accessibility level of the health facilities.
1.2 Scope of the Study This research work will basically be centered on healthcare facilities in Ife Central Local Government Areas and it is only based on orthodox healthcare facilities not traditional health centers.
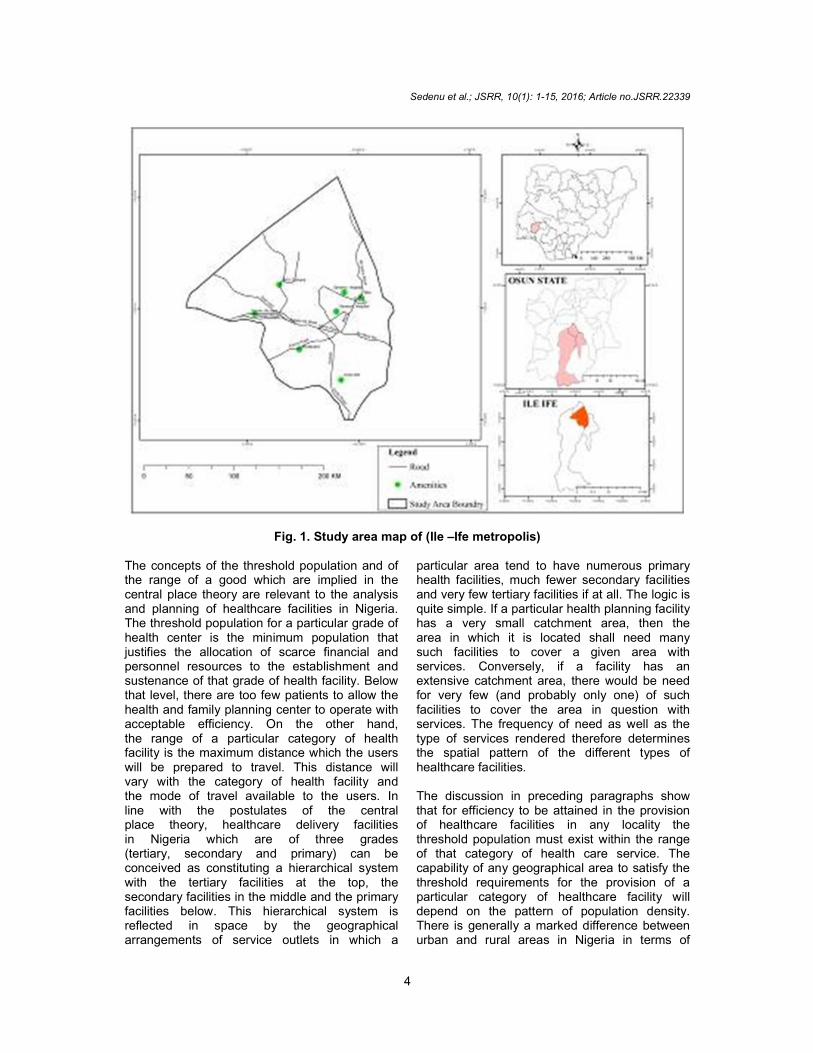
1.3 Study Area Ife Central Local Government Area of Osun State, Nigeria covers an area of approximately 111 square kilometers with coordinates 7° 28’N -7° 35’N and 4° 29’E- 4°35’E. It is located in the southern part of Osun State which lies in the South Western part of Nigeria. It is bounded by Ife North, Ife South, Ayedaade, Atakumosa West and Ife-West Local Government Areas. Ife Central Local Government Area has a population of about 167,254 people comprising of about 84,653 males and 82,601 females [2] and total land mark of 111 km². The population is made up of people of different cultural and socioeconomic background. 2. LITRATURE REVIEW AND
CONCEPTUAL FRAMEWORK Although healthcare facilities have considerable impact on the population of any given area because of the almost universal demand for the services they provide, there is as yet no definite theory for the location and distribution of health facilities as in the case with other public facilities. Existing location theories are primarily concerned with agricultural, industrial, commercial and residential activities. There is therefore no clear theoretical basis for planning and evaluating the spatial efficiency of public facilities. The literature is however replete with a wide range of concepts and principles which can provide the framework for the analysis and planning of health facilities in a developing country such as theory which was articulated by Walter Christaller [3] to show the relationship between the presence of a service and the population needed to support it, the size of the hinterland within which such a population was contained and the size and the central place
itself. In an elegant and rigorous statement, Christaller [3] demonstrated how, under specified conditions nested hierarchy of central places would result and these would be distributed in a hexagonal pattern of service areas. The main thesis of central place theory is that the spatial pattern of central places displays remarkable regularities. In the ideal case, if there is:
A uniform plane of constant population
density and purchasing power;
A linear variation of transport cost with distance; and
An equal movement ease in all directions, then central places will spring up at evenly spaced points to serve tributary market areas with goods and services.
The spatial expression of this arrangement is one of regularly spaced settlements or central places with hexagonal market areas. When central places are considered in terms of their mutual relationship, their organization follows a hierarchical pattern. At one extreme are the lowest order central places which provide low range goods and services for very small catchment areas. At the other extreme are the highest order central places, (towns and cities) which supply goods and services of their respective orders, as well as those supplied at lower-order centers. High-order central places have extensive catchment areas. Within a theoretically ideal landscape, a hierarchy of tiered size-orders of centers will therefore emerge and their trade areas in a regular way. That is to say that the trade areas of smaller centers lie within those of large centers. The area for which a central place is center is variously described as the complementary region, catchment area, market area or sphere of influence. Distance is important in determining complementary regions, especially economic distance measured in terms of travel time or transport cost. Economic distance determines the range of goods and services. In central place theory the range of a good or service is the maximum distance over which a seller will offer a good or service or from which a purchaser will travel for it. The former interpretation relates to the provision of ambulatory services while the latter relates to the utilization of point-located services. There is a functional relationship between the size of a central place, the order of the goods or services it offers and the size of its complementary region.
Sedenu et al.; JSRR, 10(1): 1-15, 2016; Article no.JSRR.22339
4
Fig. 1. Study area map of (Ile –Ife metropolis) The concepts of the threshold population and of the range of a good which are implied in the central place theory are relevant to the analysis and planning of healthcare facilities in Nigeria. The threshold population for a particular grade of health center is the minimum population that justifies the allocation of scarce financial and personnel resources to the establishment and sustenance of that grade of health facility. Below that level, there are too few patients to allow the health and family planning center to operate with acceptable efficiency. On the other hand, the range of a particular category of health facility is the maximum distance which the users will be prepared to travel. This distance will vary with the category of health facility and the mode of travel available to the users. In line with the postulates of the central place theory, healthcare delivery facilities in Nigeria which are of three grades (tertiary, secondary and primary) can be conceived as constituting a hierarchical system with the tertiary facilities at the top, the secondary facilities in the middle and the primary facilities below. This hierarchical system is reflected in space by the geographical arrangements of service outlets in which a
particular area tend to have numerous primary health facilities, much fewer secondary facilities and very few tertiary facilities if at all. The logic is quite simple. If a particular health planning facility has a very small catchment area, then the area in which it is located shall need many such facilities to cover a given area with services. Conversely, if a facility has an extensive catchment area, there would be need for very few (and probably only one) of such facilities to cover the area in question with services. The frequency of need as well as the type of services rendered therefore determines the spatial pattern of the different types of healthcare facilities. The discussion in preceding paragraphs show that for efficiency to be attained in the provision of healthcare facilities in any locality the threshold population must exist within the range of that category of health care service. The capability of any geographical area to satisfy the threshold requirements for the provision of a particular category of healthcare facility will depend on the pattern of population density. There is generally a marked difference between urban and rural areas in Nigeria in terms of
Sedenu et al.; JSRR, 10(1): 1-15, 2016; Article no.JSRR.22339
5
satisfying the threshold population requirements. Urban centers are known areas of high population concentration. Consequently it is easier for the threshold population’s requirements for the three tiers of healthcare facilities to be attained in most urban centers. The problem, however, is in the rural areas where settlements are quite small in terms of population size and transport facilities are poorly developed or non-existent. In most rural areas in Nigeria it is difficult and in most cases impossible to attain the minimum threshold population to provide secondary healthcare facilities. In such areas it is basically unrealistic to plan the provision of a tertiary healthcare facility which will achieve the required efficiency in terms of the utilization of scarce resources. The market on the day when it is their turn to hold the market. In this case the traders and sellers move from one market place to another so that they can sustain their continued stay in business by attracting customers periodically. If every settlement attempts to hold its market daily, the threshold population which will ensure a daily availability of customers to sustain the tracers to make sales will not be attained and so the markets will die a natural death of nonsurvival [4]. The periodic market system as enunciated above can provide the basis for the establishment of mobile clinics in sparsely populated rural areas of Nigeria and indeed other parts of Africa. It is obvious that unless efforts are made to make healthcare services available to people in sparsely populated areas through a well organized and coordinated mobile clinics the hope of their being accessible to modern healthcare facilities will take a long time to realize. If the people are aware of the specific days and points where mobile clinics will be stationed, there is no doubt that they will organize themselves to visit such clinics. Apart from taking care of people in sparsely populated rural areas, mobile clinics can also serve mobile farmers and herdsmen in many localities in the country. Obviously such mobile clinics will be linked to specific primary health centers and thereby also linked to secondary and tertiary health centers through the referral system. It is only within such a framework that the much desired spatial equity in the provision of healthcare facilities can be assured in a less developed country such as Nigeria. It is within the framework provided by the central place theory and the concept of periodic markets that this study will examine the situation
in Ife Central Local Government Area, Osun State.
2.1 Concept of Health Although healthcare facilities have considerable impact on the population of any given area because of the almost universal demand for the services they provide, there is as yet no definite theory for the location and distribution of healthcare facilities as in the case with other public facilities. Existing location theories are primarily concerned with agricultural, industrial, commercial and residential activities [4]. The World Health Organization regards health rather as a state of complete physical, mental and social wellbeing and not merely the absence of disease or infirmity. The importance of health to individuals, communities and the nation in general cannot be over emphasized. Health is considered a crucial component of wellbeing and economic development. Therefore with the development planning in the Third World Countries, efforts have been made consistently to improve people’s health since the Second World War. It was further stressed that the wealth of any nation is in its people [5]. Health is a dynamic process with ever changing stimuli and responses; it is generally regarded as a social welfare requirement in urban or rural setting in order to acquire a disease free society. It may also be seen as a series of complex interactions between an individual and his environment. The outstanding feature of health is that it is a quality and therefore cannot be weighed and measured. Health is not a single entity or condition, it is a state of mind, a projection of our belief about the nature and perfect ability of humans and our value judgment about what constitute a good person in a good society. Health is a state of feeling well in the body, mind and spirit together with a sense of reserve power based upon normal functioning of tissues, a practical understanding of the principles of healthy living. It was also observed that strong association exists between healthcare facilities and nearby settlements [6]. The study concluded that distance was a paramount factor in the accessibility of healthcare facilities to the people [4]. It was also found out that distance influences the pattern of patronage of the healthcare centers in Offa area of Kwara State. He found out that 40% of the patients surveyed who were on admission at Offa General Hospital came within 10 kilometers
Sedenu et al.; JSRR, 10(1): 1-15, 2016; Article no.JSRR.22339
6
radius. Rural people also waste a lot of time getting to the nearest health care centre, in which they have to trek long distance on many occasion [7]. Rural people easily fall victims of quacks and semi- qualified medical staffs leading at times to preventable death [8]. The scenario painted above depicted the situation in many states of the federation. Despite the slogan of health for all by years 2000 and even the proclaimed free health policy by some states government, the accessibility to health care facilities are still far from been adequate. 2.2 Provision of Health Facilities The subject of health is complex, sensitive, highly scientific and a technical issue with very serious and complicated ethical undertones. It is for this reason that the provision of healthcare services is not allowed to be determined neither by the whims and caprices of market forces alone with its inherent market failures nor by government monopoly that may fraught with inefficiency from over- centralization, instability, lack of continuity, misplacement of priorities, lack of political will and commitment [9]. The importance of health is reflected in the fact that in free-market societies, the provision of healthcare services is a function of the state and the private sector (organized and non-organized). For instance, the Nigerian constitution of 1997 and 1999 alike, place health in the concurrent list of responsibility with the exception of the external health relations, quarantine and the control of drugs and poisons which are exclusively the responsibility of the Federal Government [10]. The implication is that all the three tiers of Government (Federal, State and Local) and even individuals and non-governmental organizations can participate in the planning, provision and management of healthcare facilities. Without any exaggeration, the provision of different health institutions which are adequately staffed and guarantee of individual access of the utilization of the healthcare facilities is a pre-requisite to the realization of the laudable intention of Nigerian health policy, and the compliance with the WHO directives [11].
2.3 Location of Healthcare Facilities In most developing countries, some health-related studies [4] have established that there
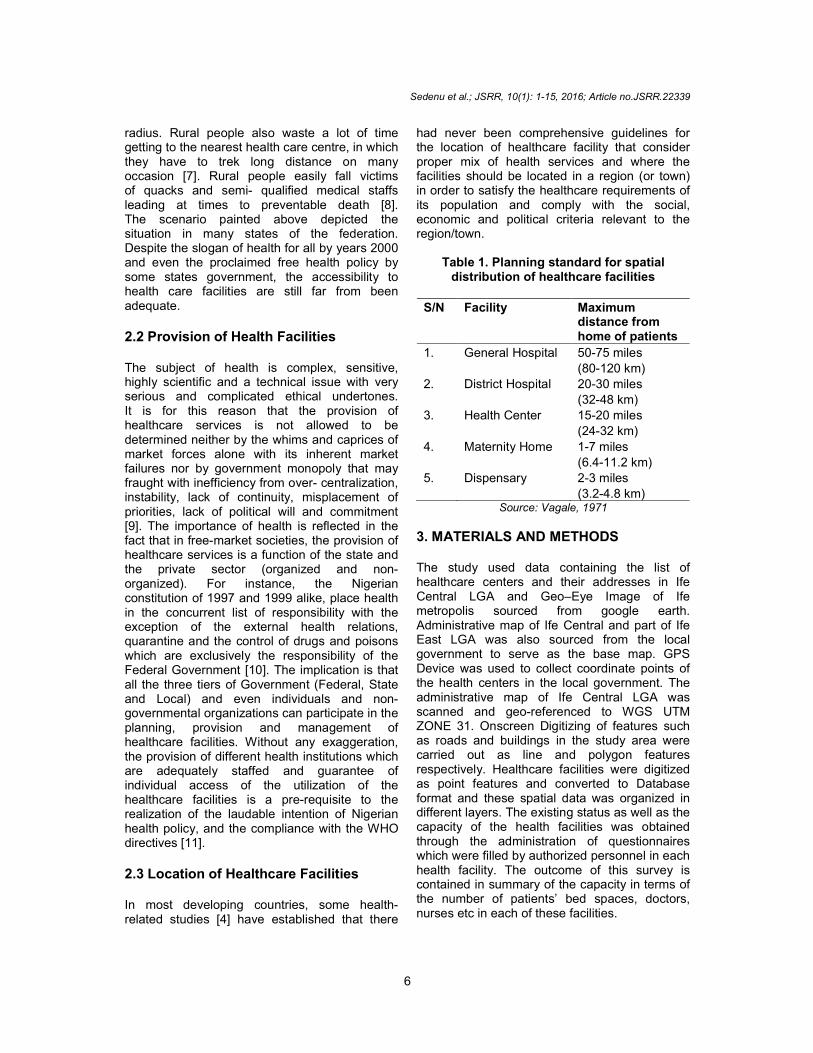
had never been comprehensive guidelines for the location of healthcare facility that consider proper mix of health services and where the facilities should be located in a region (or town) in order to satisfy the healthcare requirements of its population and comply with the social, economic and political criteria relevant to the region/town.
Table 1. Planning standard for spatial distribution of healthcare facilities
S/N Facility Maximum distance from home of patients
1. General Hospital 50-75 miles
(80-120 km)
2. District Hospital 20-30 miles
(32-48 km)
3. Health Center 15-20 miles
(24-32 km)
4. Maternity Home 1-7 miles
(6.4-11.2 km)
5. Dispensary 2-3 miles
(3.2-4.8 km) Source: Vagale, 1971
3. MATERIALS AND METHODS The study used data containing the list of healthcare centers and their addresses in Ife Central LGA and Geo–Eye Image of Ife metropolis sourced from google earth. Administrative map of Ife Central and part of Ife East LGA was also sourced from the local government to serve as the base map. GPS Device was used to collect coordinate points of the health centers in the local government. The administrative map of Ife Central LGA was scanned and geo-referenced to WGS UTM ZONE 31. Onscreen Digitizing of features such as roads and buildings in the study area were carried out as line and polygon features respectively. Healthcare facilities were digitized as point features and converted to Database format and these spatial data was organized in different layers. The existing status as well as the capacity of the health facilities was obtained through the administration of questionnaires which were filled by authorized personnel in each health facility. The outcome of this survey is contained in summary of the capacity in terms of the number of patients’ bed spaces, doctors, nurses etc in each of these facilities.
Sedenu et al.; JSRR, 10(1): 1-15, 2016; Article no.JSRR.22339
7
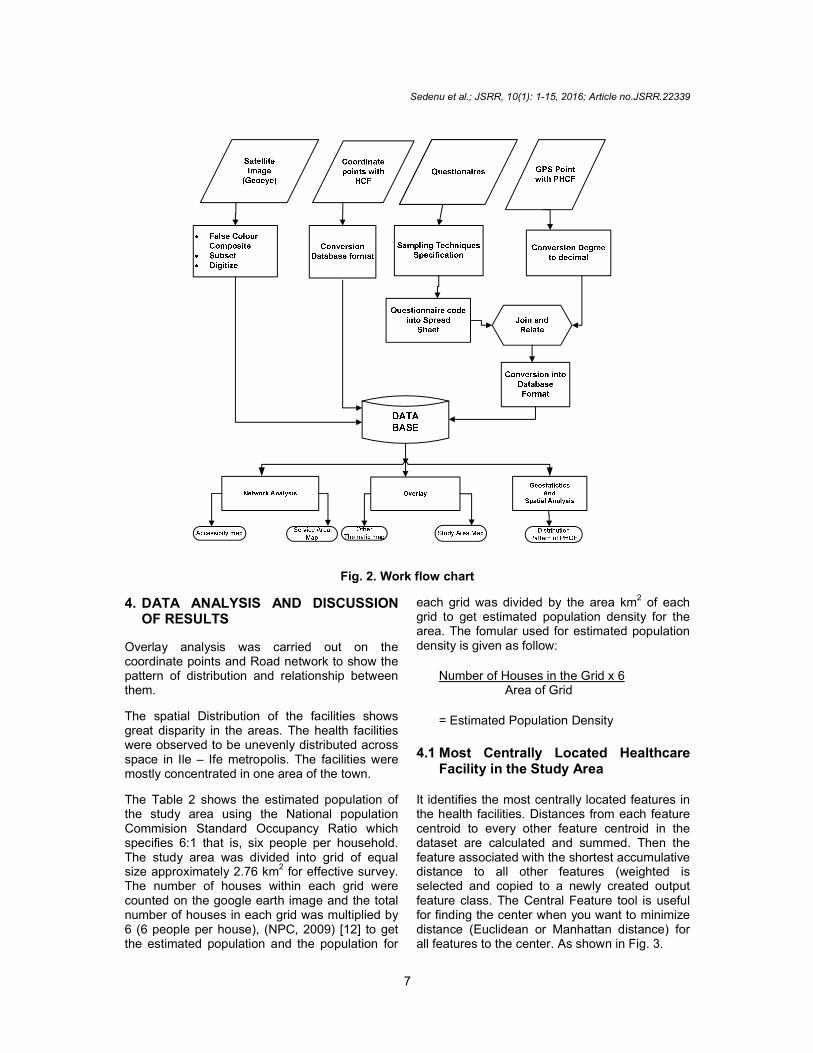
Fig. 2. Work flow chart
4. DATA ANALYSIS AND DISCUSSION OF RESULTS
Overlay analysis was carried out on the coordinate points and Road network to show the pattern of distribution and relationship between them.
The spatial Distribution of the facilities shows great disparity in the areas. The health facilities were observed to be unevenly distributed across space in Ile – Ife metropolis. The facilities were mostly concentrated in one area of the town.
The Table 2 shows the estimated population of the study area using the National population Commision Standard Occupancy Ratio which specifies 6:1 that is, six people per household. The study area was divided into grid of equal size approximately 2.76 km
2 for effective survey.
The number of houses within each grid were counted on the google earth image and the total number of houses in each grid was multiplied by 6 (6 people per house), (NPC, 2009) [12] to get the estimated population and the population for
each grid was divided by the area km2 of each grid to get estimated population density for the area. The fomular used for estimated population density is given as follow:
Number of Houses in the Grid x 6 Area of Grid
= Estimated Population Density
4.1 Most Centrally Located Healthcare
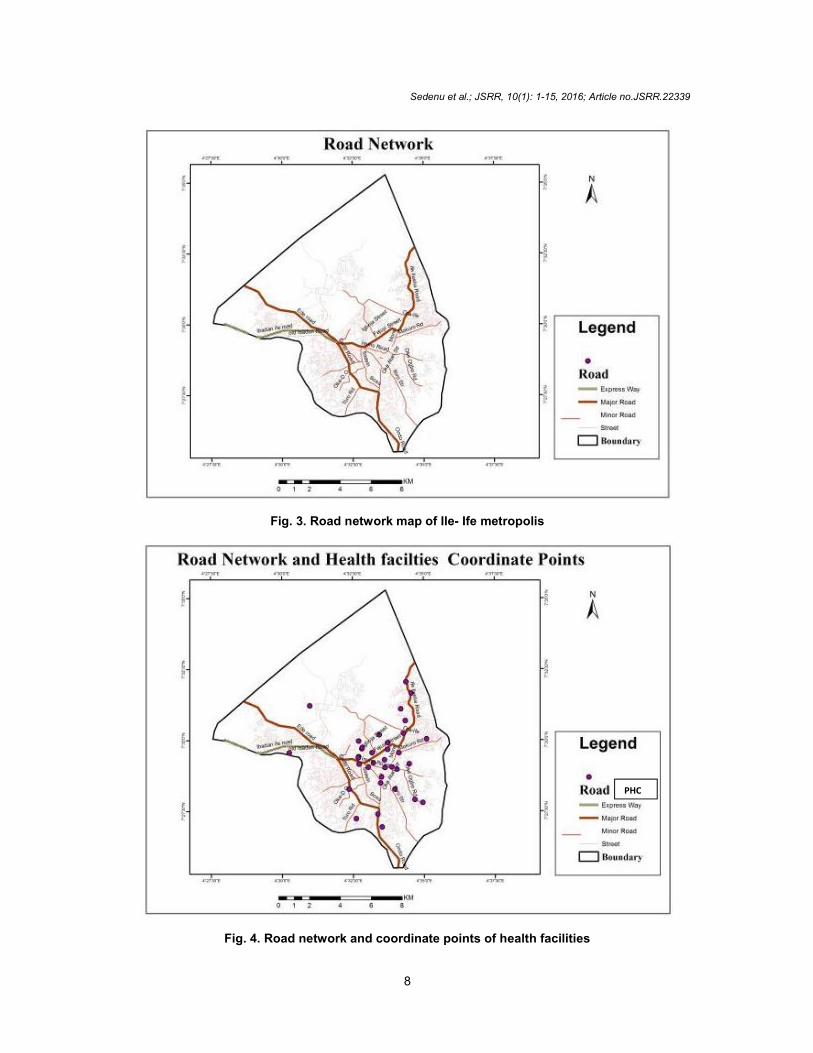
Facility in the Study Area It identifies the most centrally located features in the health facilities. Distances from each feature centroid to every other feature centroid in the dataset are calculated and summed. Then the feature associated with the shortest accumulative distance to all other features (weighted is selected and copied to a newly created output feature class. The Central Feature tool is useful for finding the center when you want to minimize distance (Euclidean or Manhattan distance) for all features to the center. As shown in Fig. 3.
Sedenu et al.; JSRR, 10(1): 1-15, 2016; Article no.JSRR.22339
8
Fig. 3. Road network map of Ile- Ife metropolis
Fig. 4. Road network and coordinate points of health facilities
PHC
Sedenu et al.; JSRR, 10(1): 1-15, 2016; Article no.JSRR.22339
9
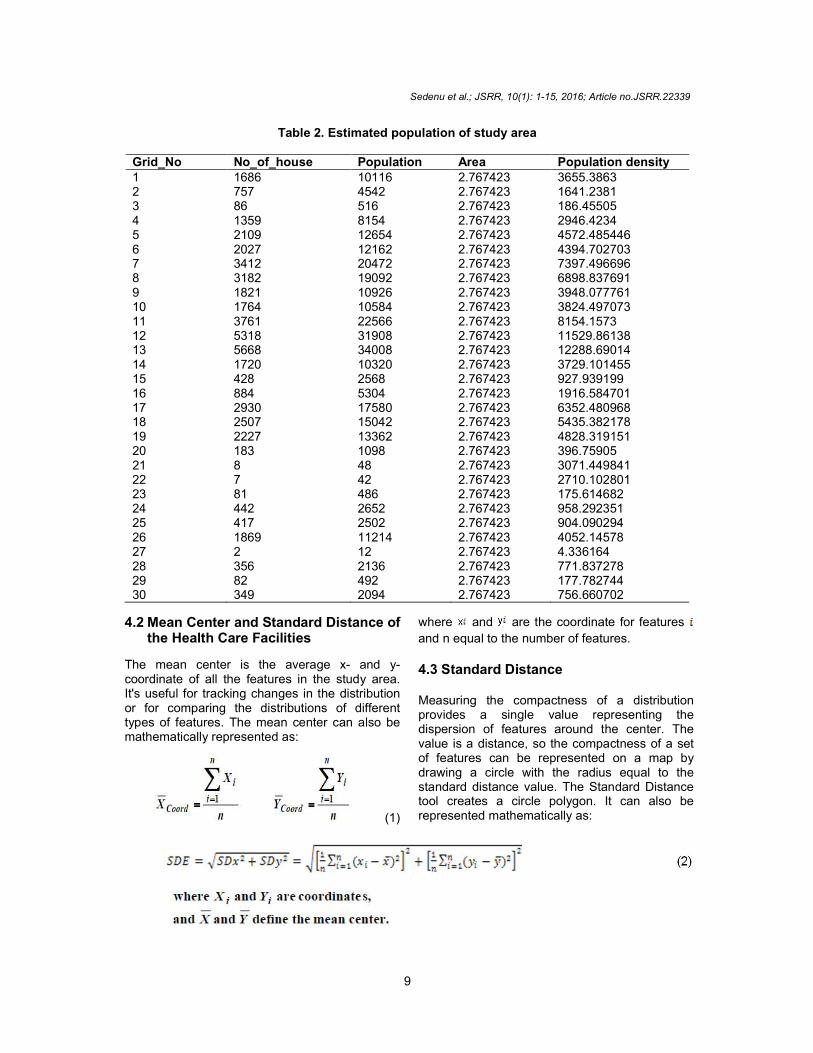
Table 2. Estimated population of study area
Grid_No No_of_house Population Area Population density 1 1686 10116 2.767423 3655.3863 2 757 4542 2.767423 1641.2381 3 86 516 2.767423 186.45505 4 1359 8154 2.767423 2946.4234 5 2109 12654 2.767423 4572.485446 6 2027 12162 2.767423 4394.702703 7 3412 20472 2.767423 7397.496696 8 3182 19092 2.767423 6898.837691 9 1821 10926 2.767423 3948.077761 10 1764 10584 2.767423 3824.497073 11 3761 22566 2.767423 8154.1573 12 5318 31908 2.767423 11529.86138 13 5668 34008 2.767423 12288.69014 14 1720 10320 2.767423 3729.101455 15 428 2568 2.767423 927.939199 16 884 5304 2.767423 1916.584701 17 2930 17580 2.767423 6352.480968 18 2507 15042 2.767423 5435.382178 19 2227 13362 2.767423 4828.319151 20 183 1098 2.767423 396.75905 21 8 48 2.767423 3071.449841 22 7 42 2.767423 2710.102801 23 81 486 2.767423 175.614682 24 442 2652 2.767423 958.292351 25 417 2502 2.767423 904.090294 26 1869 11214 2.767423 4052.14578 27 2 12 2.767423 4.336164 28 356 2136 2.767423 771.837278 29 82 492 2.767423 177.782744 30 349 2094 2.767423 756.660702
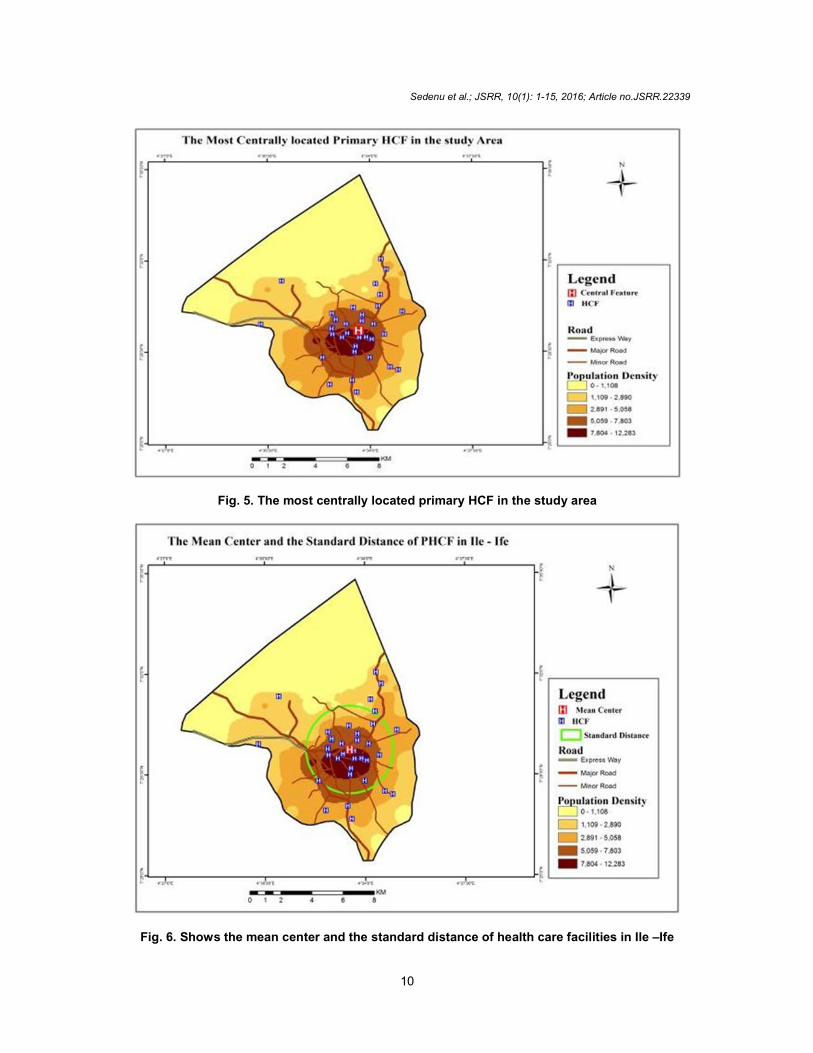
4.2 Mean Center and Standard Distance of the Health Care Facilities
The mean center is the average x- and y-coordinate of all the features in the study area. It's useful for tracking changes in the distribution or for comparing the distributions of different types of features. The mean center can also be mathematically represented as:
(1)
where and are the coordinate for features
and n equal to the number of features. 4.3 Standard Distance Measuring the compactness of a distribution provides a single value representing the dispersion of features around the center. The value is a distance, so the compactness of a set of features can be represented on a map by drawing a circle with the radius equal to the standard distance value. The Standard Distance tool creates a circle polygon. It can also be represented mathematically as:
Sedenu et al.; JSRR, 10(1): 1-15, 2016; Article no.JSRR.22339
10
Fig. 5. The most centrally located primary HCF in the study area
Fig. 6. Shows the mean center and the standard distance of health care facilities in Ile –Ife
Sedenu et al.; JSRR, 10(1): 1-15, 2016; Article no.JSRR.22339
11
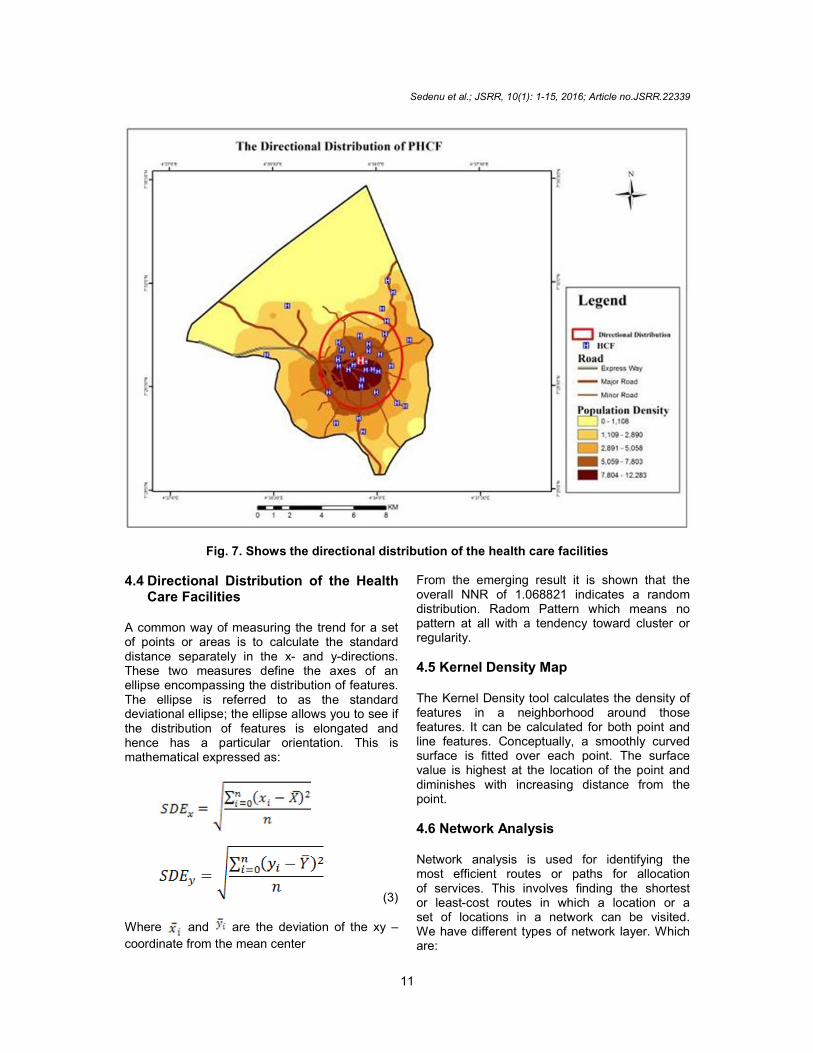
Fig. 7. Shows the directional distribution of the health care facilities
4.4 Directional Distribution of the Health Care Facilities
A common way of measuring the trend for a set of points or areas is to calculate the standard distance separately in the x- and y-directions. These two measures define the axes of an ellipse encompassing the distribution of features. The ellipse is referred to as the standard deviational ellipse; the ellipse allows you to see if the distribution of features is elongated and hence has a particular orientation. This is mathematical expressed as:
(3)
Where and are the deviation of the xy –
coordinate from the mean center
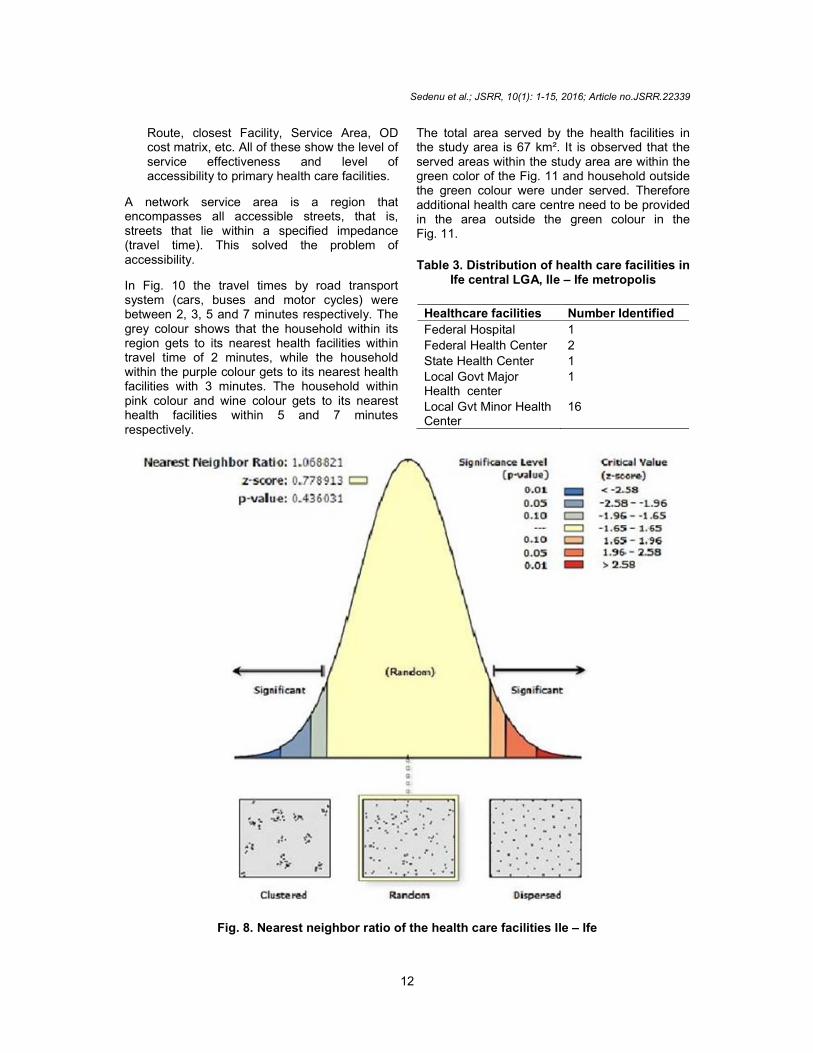
From the emerging result it is shown that the overall NNR of 1.068821 indicates a random distribution. Radom Pattern which means no pattern at all with a tendency toward cluster or regularity.
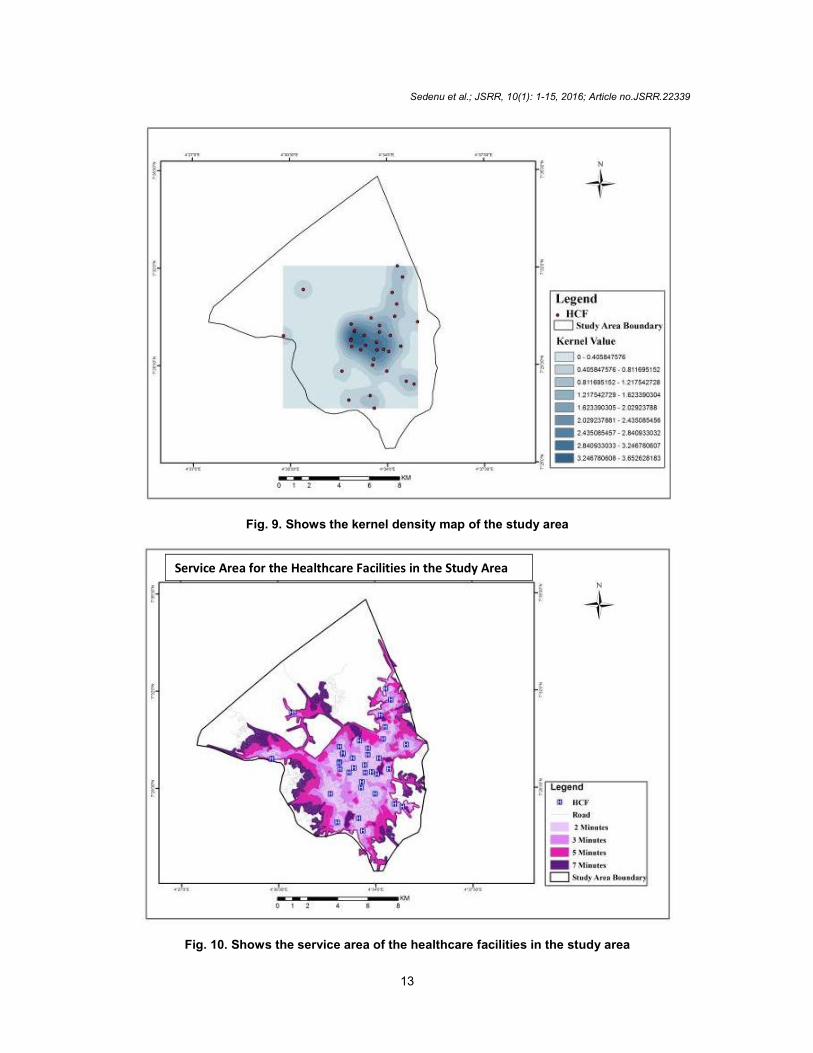
4.5 Kernel Density Map The Kernel Density tool calculates the density of features in a neighborhood around those features. It can be calculated for both point and line features. Conceptually, a smoothly curved surface is fitted over each point. The surface value is highest at the location of the point and diminishes with increasing distance from the point. 4.6 Network Analysis Network analysis is used for identifying the most efficient routes or paths for allocation of services. This involves finding the shortest or least-cost routes in which a location or a set of locations in a network can be visited. We have different types of network layer. Which are:
Sedenu et al.; JSRR, 10(1): 1-15, 2016; Article no.JSRR.22339
12
Route, closest Facility, Service Area, OD cost matrix, etc. All of these show the level of service effectiveness and level of accessibility to primary health care facilities.
A network service area is a region that encompasses all accessible streets, that is, streets that lie within a specified impedance (travel time). This solved the problem of accessibility.
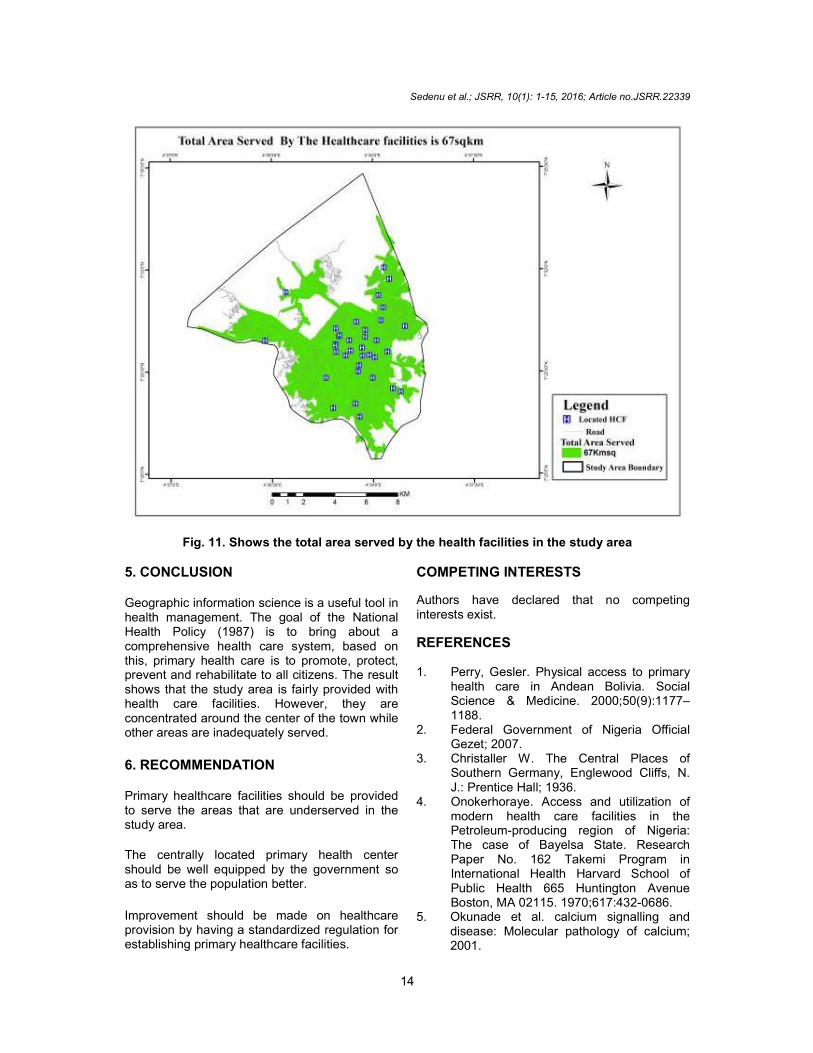
In Fig. 10 the travel times by road transport system (cars, buses and motor cycles) were between 2, 3, 5 and 7 minutes respectively. The grey colour shows that the household within its region gets to its nearest health facilities within travel time of 2 minutes, while the household within the purple colour gets to its nearest health facilities with 3 minutes. The household within pink colour and wine colour gets to its nearest health facilities within 5 and 7 minutes respectively.
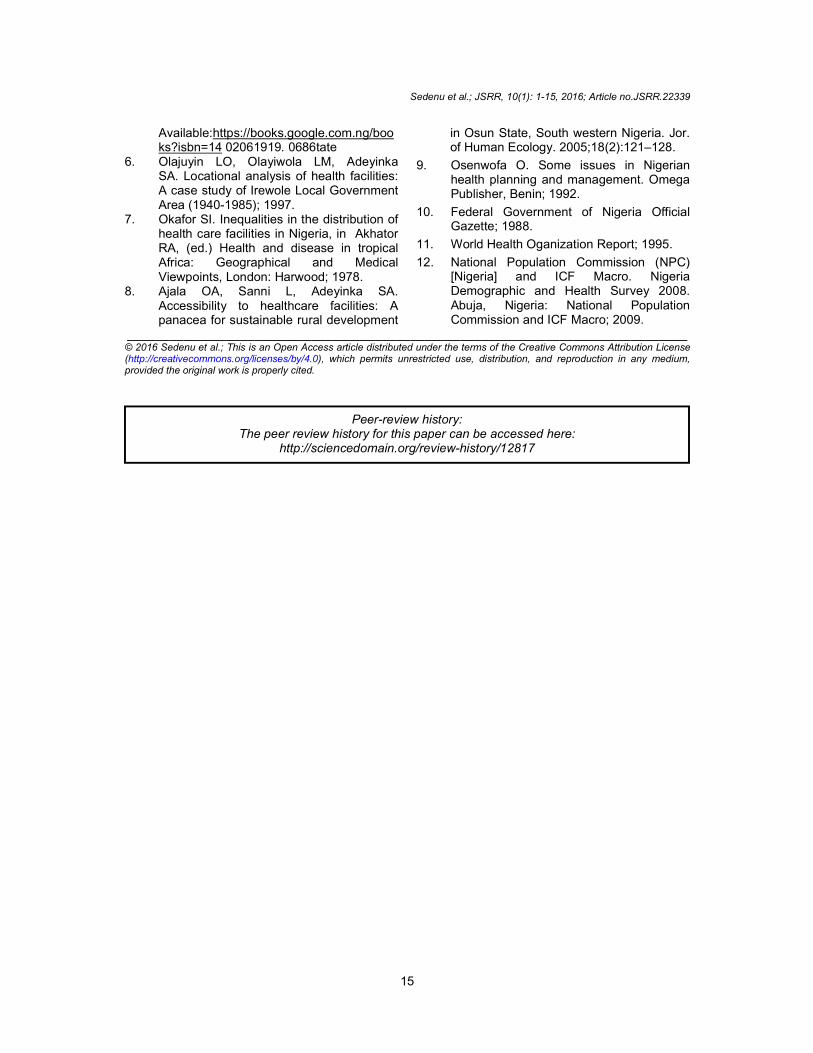
The total area served by the health facilities in the study area is 67 km². It is observed that the served areas within the study area are within the green color of the Fig. 11 and household outside the green colour were under served. Therefore additional health care centre need to be provided in the area outside the green colour in the Fig. 11.
Table 3. Distribution of health care facilities in
Ife central LGA, Ile – Ife metropolis
Healthcare facilities Number Identified
Federal Hospital 1
Federal Health Center 2
State Health Center 1
Local Govt Major Health center
1
Local Gvt Minor Health Center
16
Fig. 8. Nearest neighbor ratio of the health care facilities Ile – Ife
Sedenu et al.; JSRR, 10(1): 1-15, 2016; Article no.JSRR.22339
13
Fig. 9. Shows the kernel density map of the study area
Fig. 10. Shows the service area of the healthcare facilities in the study area
Service Area for the Healthcare Facilities in the Study Area
Sedenu et al.; JSRR, 10(1): 1-15, 2016; Article no.JSRR.22339
14
Fig. 11. Shows the total area served by the health facilities in the study area
5. CONCLUSION Geographic information science is a useful tool in health management. The goal of the National Health Policy (1987) is to bring about a comprehensive health care system, based on this, primary health care is to promote, protect, prevent and rehabilitate to all citizens. The result shows that the study area is fairly provided with health care facilities. However, they are concentrated around the center of the town while other areas are inadequately served.
6. RECOMMENDATION Primary healthcare facilities should be provided to serve the areas that are underserved in the study area.
The centrally located primary health center should be well equipped by the government so as to serve the population better.
Improvement should be made on healthcare provision by having a standardized regulation for establishing primary healthcare facilities.
COMPETING INTERESTS Authors have declared that no competing interests exist.
REFERENCES 1. Perry, Gesler. Physical access to primary
health care in Andean Bolivia. Social Science & Medicine. 2000;50(9):1177–1188.
2. Federal Government of Nigeria Official Gezet; 2007.
3. Christaller W. The Central Places of Southern Germany, Englewood Cliffs, N. J.: Prentice Hall; 1936.
4. Onokerhoraye. Access and utilization of modern health care facilities in the Petroleum-producing region of Nigeria: The case of Bayelsa State. Research Paper No. 162 Takemi Program in International Health Harvard School of Public Health 665 Huntington Avenue Boston, MA 02115. 1970;617:432-0686.
5. Okunade et al. calcium signalling and disease: Molecular pathology of calcium; 2001.
Sedenu et al.; JSRR, 10(1): 1-15, 2016; Article no.JSRR.22339
15
Available:https://books.google.com.ng/books?isbn=14 02061919. 0686tate
6. Olajuyin LO, Olayiwola LM, Adeyinka SA. Locational analysis of health facilities: A case study of Irewole Local Government Area (1940-1985); 1997.
7. Okafor SI. Inequalities in the distribution of health care facilities in Nigeria, in Akhator RA, (ed.) Health and disease in tropical Africa: Geographical and Medical Viewpoints, London: Harwood; 1978.
8. Ajala OA, Sanni L, Adeyinka SA. Accessibility to healthcare facilities: A panacea for sustainable rural development
in Osun State, South western Nigeria. Jor. of Human Ecology. 2005;18(2):121–128.
9. Osenwofa O. Some issues in Nigerian health planning and management. Omega Publisher, Benin; 1992.
10. Federal Government of Nigeria Official Gazette; 1988.
11. World Health Oganization Report; 1995.
12. National Population Commission (NPC) [Nigeria] and ICF Macro. Nigeria Demographic and Health Survey 2008. Abuja, Nigeria: National Population Commission and ICF Macro; 2009.
_______________________________________________________________________________ © 2016 Sedenu et al.; This is an Open Access article distributed under the terms of the Creative Commons Attribution License (http://creativecommons.org/licenses/by/4.0), which permits unrestricted use, distribution, and reproduction in any medium, provided the original work is properly cited.
Peer-review history: The peer review history for this paper can be accessed here:
http://sciencedomain.org/review-history/12817