identification of diagnostic markers for tuberculosis by proteomic fingerprinting of serum
TRANSCRIPT
Articles
1012 www.thelancet.com Vol 368 September 16, 2006
Identifi cation of diagnostic markers for tuberculosis by proteomic fi ngerprinting of serumDan Agranoff , Delmiro Fernandez-Reyes, Marios C Papadopoulos, Sergio A Rojas, Mark Herbster, Alison Loosemore, Edward Tarelli, Jo Sheldon, Achim Schwenk, Richard Pollok, Charlotte F J Rayner, Sanjeev Krishna
SummaryBackground We investigated the potential of proteomic fi ngerprinting with mass spectrometric serum profi ling, coupled with pattern recognition methods, to identify biomarkers that could improve diagnosis of tuberculosis.
Methods We obtained serum proteomic profi les from patients with active tuberculosis and controls by surface-enhanced laser desorption ionisation time of fl ight mass spectrometry. A supervised machine-learning approach based on the support vector machine (SVM) was used to obtain a classifi er that distinguished between the groups in two independent test sets. We used k-fold cross validation and random sampling of the SVM classifi er to assess the classifi er further. Relevant mass peaks were selected by correlational analysis and assessed with SVM. We tested the diagnostic potential of candidate biomarkers, identifi ed by peptide mass fi ngerprinting, by conventional immunoassays and SVM classifi ers trained on these data.
Findings Our SVM classifi er discriminated the proteomic profi le of patients with active tuberculosis from that of controls with overlapping clinical features. Diagnostic accuracy was 94% (sensitivity 93·5%, specifi city 94·9%) for patients with tuberculosis and was unaff ected by HIV status. A classifi er trained on the 20 most informative peaks achieved diagnostic accuracy of 90%. From these peaks, two peptides (serum amyloid A protein and transthyretin) were identifi ed and quantitated by immunoassay. Because these peptides refl ect infl ammatory states, we also quantitated neopterin and C reactive protein. Application of an SVM classifi er using combinations of these values gave diagnostic accuracies of up to 84% for tuberculosis. Validation on a second, prospectively collected testing set gave similar accuracies using the whole proteomic signature and the 20 selected peaks. Using combinations of the four biomarkers, we achieved diagnostic accuracies of up to 78%.
Interpretation The potential biomarkers for tuberculosis that we identifi ed through proteomic fi ngerprinting and pattern recognition have a plausible biological connection with the disease and could be used to develop new diagnostic tests.
IntroductionLatent tuberculosis is present in a third of the world’s population, with the prevalence of active tuberculosis in many areas exceeding 700 cases per 100 000 of the population.1 This global epidemic is fuelled by synergy with HIV, which is found in 40–70% of African patients with active tuberculosis.1 Most deaths from tuberculosis are preventable by early diagnosis and treatment.2 In areas of high prevalence, sputum smear microscopy is often the only available and aff ordable test, but at best achieves a sensitivity of 50–70%. Culture of Mycobacterium tuberculosis, the diagnostic gold standard, is sensitive and specifi c in cases of smear-positive tuberculosis, but takes 2–6 weeks to yield a result and is not routinely used in countries with high prevalences of tuberculosis. In these areas, tuberculin skin tests are often insuffi ciently accurate to aid diagnosis,3 and do not readily distinguish between contained infection and disease. Serological tests for tuberculosis have focused on detection of mycobacterial antigens and, like skin tests, can be confounded by crossreactivity with non-pathogenic mycobacteria or previous immunisation with BCG.4 Recently developed tests based on DNA amplifi cation or interferon γ release are expensive and need particular
expertise. 5 A cheap, accurate, and rapid diagnostic test for tuberculosis will have immense impact on the control of this disease. For example, a test yielding results within a few hours but with a sensitivity similar to that of existing tests such as sputum microscopy (which requires two or more clinic visits) would be a great advance because it would enable initiation of treatment at a single clinic visit.
Proteomic fi ngerprinting is a diagnostic concept based on the idea that disease states are sometimes associated with distinctive confi gurations of circulating proteins. Because the biological complexity of most diseases means that individual biomarkers have limited diagnostic sensitivities and specifi cities, analysis of combinations of several biomarkers off ers the possibility of enhanced diagnostic accuracy. High throughput proteomic profi ling of serum has been revolutionised by recent advances in mass spectrometry, such as surface-enhanced laser desorption ionisation time of fl ight (SELDI-ToF) mass spectrometry.6 The application of approaches based on machine learning to the problem of pattern recognition7 makes it possible to identify diagnostic combinations of proteins (diagnostic signatures) embedded within such profi les.8 Analysis of serum proteomic fi ngerprints has
Lancet 2006; 368: 1012–21
See Comment page 971
Published Online September 14, 2006DOI:10.1016/S0140-
6736(06)69342-2
Division of Cellular and Molecular Medicine, Centre for
Infection (D Agranoff MRCP, M C Papadopoulos FRCS,
A Loosemore BSc, J Sheldon PhD, Prof S Krishna FMedSci) and
Biomics Centre (E Tarelli), St George’s, University of
London, London SW17 ORE, UK; Division of Parasitology
and Division of Mathematical Biology, National Institute for Medical Research, London, UK
(D Fernandez-Reyes DPhil, S A Rojas MSc); Department of Computer Science, University
College London, UK (D Fernandez-Reyes, S A Rojas,
M Herbster PhD); North Middlesex University Hospital
NHS Trust, London, UK (A Schwenk MD); and
St George’s Healthcare Trust, London, UK (R Pollok,
C F J Rayner)
Correspondence to:Prof Sanjeev Krishna
Articles
www.thelancet.com Vol 368 September 16, 2006 1013
improved diagnostic accuracy for some cancers6,9,10 and infections such as human African trypanosomiasis.11 This approach has also been used in the search for novel biomarkers for severe acute respiratory syndrome12 and intra-amniotic infections.13 We assessed the potential of proteomic fi ngerprinting as a basis for diagnosis of pulmonary tuberculosis.
MethodsPatients and controlsFor the fi rst phase of the study, 179 serum samples were obtained from patients with retrospectively confi rmed culture-positive tuberculosis. Banked serum samples collected in Uganda and The Gambia were obtained from the WHO TB specimen bank.14 These samples had been taken at the time of fi rst presentation to designated outpatient clinics, before initiation of chemotherapy for tuberculosis. Other samples were obtained prospectively from patients presenting with tuberculosis to the inpatient and outpatient facilities at St George’s Hospital, London, UK. We restricted ourselves mainly to patients with tuberculosis who presented with typical manifestations of pulmonary disease,15 because this is the commonest presentation of tuberculosis in adults in all geographical areas.
170 serum samples from controls were collected at four separate sites: St George’s Hospital, UK; Angola; The Gambia; and Uganda. Those from The Gambia and Uganda were taken from the WHO specimen bank. We recruited controls with a range of infl ammatory conditions (confi rmed by standard diagnostic criteria) with clinical features that can overlap with those of tuberculosis. For example, we included patients with sarcoidosis, which is frequently included in the diff erential diagnosis of pulmonary tuberculosis, and other severe respiratory infections representing patients who have non-tuberculous destructive pulmonary pathology. To allow for systemic infl ammatory processes that can mimic tuberculosis, we recruited patients with other systemic infections, and patients with infl ammatory bowel and autoimmune diseases. 21 healthy volunteers were also included among the controls. The distribution of cases and controls was not intended to refl ect a particular population or epidemiological setting, but to encompass a broad range of symptomatically overlapping clinical presentations.
Because this fi rst dataset relied heavily on archived samples, we subsequently collected a second dataset entirely from the UK to validate further our classifi ers. These samples, from patients with tuberculosis and controls, were obtained prospectively from consecutive patients with predominantly respiratory symptoms attending the Hammersmith Hospital and St George’s Hospital, London. Serum was collected within 2 days of fi rst presentation and before initiation of treatment for tuberculosis. Most patients presented through the accident and emergency department, as is typical for cases of tuberculosis in these hospitals. Controls were
symptomatic and underwent full diagnostic assessment to exclude tuberculosis.
For both datasets, fully informed consent was obtained from every patient, in accordance with local research ethics committee policy. Clinical information was archived in a linked, anonymised database.
Procedures Serum was separated from 5 mL blood by centrifugation, and samples were allowed to clot for 30 min at room temperature in sterile glass tubes. 100-μL aliquots were frozen at –80oC within 1 h of collection, and underwent no more than two freeze-thaw cycles before mass spectrum analysis.
Samples were applied to CM10 protein chip arrays (Ciphergen, Fremont, CA, USA) as described previously,11 and a saturated solution of sinapinic acid in 50% acetonitrile, 0·5% trifl uoroacetic acid was applied twice to each spot on the array, with air drying between each application. To minimise bias, serum samples from patients with tuberculosis and controls were assayed on the same chips.
Time-of-fl ight spectra were generated using a PBS-II mass spectrometer (Ciphergen, Freemont, CA, USA) at laser intensities of 200, 220, and 240, high mass 100 kDa, detector sensitivity 8, and focus mass 10 kDa. Each spot on the array was analysed from position 20 to 80, delta 4, with seven shots per position, preceded by two warming shots at laser intensities of 205, 225, or 245. Every protein chip array included a universal control sample (aliquoted from a single sample from one individual and stored at –80oC). Both groups of spectra (tuberculosis and controls) comprised samples run on diff erent occasions over a 6-month period. The instrument was calibrated weekly using the Ciphergen all-in-one protein and peptide calibrants.
To identify peaks, spectra were normalised to the total ion current in the m/z range over 2000–100 000 after baseline subtraction. For each patient a single spectrum generated at a laser intensity of 200, 220, or 240 was selected to minimise deviation of the total ion current to within 2 SD from the mean of all patients, as described previously.11 Biomarker Wizard version 3.1 was used to identify corresponding peaks in each spectrum (peak clusters) within 0·6% of the molecular mass. Signal-to-noise ratio was set at 10 for the fi rst pass and 2 for the second pass.
To identify proteins, 20 µL serum was incubated on ice for 20 min with 30 µL denaturation buff er, diluted in 50 µL binding buff er (denaturation buff er diluted 1:9 in 50 mM Tris-HCl pH 9) followed by a further 30 min incubation on ice. Samples were applied to Q Ceramic HyperD spin columns (Ciphergen, 20 minutes), pre-equilibrated fi rst in Tris (50 mM, pH 9), followed by binding buff er. The 11·5 kDa and 13·7 kDa biomarkers were eluted from the spin column in elution buff er (50 mM sodium citrate, 0·1% octyl glucopyranoside,
Articles
1014 www.thelancet.com Vol 368 September 16, 2006
pH 3) and selective enrichment was confi rmed by SELDI-ToF MS. The biomarkers were resolved by one-dimensional SDS-PAGE (NuPAGE, 4–12% Bis-Tris, Invitrogen, Carlsbad, CA, USA), stained with Coomassie blue, and excised from the gel. Gel pieces were washed three times in a mixture of ammonium bicarbonate (50 mM) and acetonitrile (50%), dehydrated in acetonitrile (100%) and dried. Proteins were subjected to in-gel tryptic digestion (15 min, room temperature) by the addition of trypsin (20 ng/µL) in acetonitrile (10%) and ammonium
bicarbonate (25 mM), followed by incubation in ammonium bicarbonate (25 mM) for 4 h. Peptide mass fi ngerprints16 of the digests were analysed by matrix-assisted laser desorption/ionisation time-of-fl ight (MALDI-ToF) mass spectrometry using 20% α-cyano-4-hydroxy-cinnamic acid as matrix. The results of the in-gel tryptic digest were corroborated by tryptic digestion after passive elution of the protein from the gel. The peptide mass fi ngerprints were used to interrogate public databases with the MASCOT search engine.17
The four selected biomarkers were measured in a regional protein reference laboratory at St George’s Hospital with commercially available kits validated for clinical use. Neopterin was measured by competitive ELISA with a kit (ELItest Neopterin, BRAHMS Aktiengesellschaft, Hennigsdorf, Germany) in a Triturus analyser (Diagnostics Grifols SA, Barcelona, Spain). Rate nephelemetry was used for measurement of C-reactive protein, transthyretin (Beckmann Immage 800 analyser, Beckman Coulter, Fullerton, CA, USA) and serum amyloid A (N latex SAA, BN II analyser, Dade-Behring, Marburg, Germany). In each case, kits were used according to the manufacturers’ instructions. The antibody used in the serum amyloid A assay detects total serum amyloid A.
In supervised machine learning, a supervised learning algorithm is tasked to fi nd a decision function capable of assigning the correct label for a set of input/output pairs of examples, called the training data. The ability of the decision function to predict correct labels for unseen samples (test data) is known as its generalisation. Current machine learning methods, such as support vector machines (SVM), aim to optimise this property (webappendix).18 The generalisation of a classifi er is dependent on a set of parameters (model) that must be chosen to optimise performance. For this purpose we adopted a grid search strategy in which a range of parameter values were used and tested using cross-validation.
We used two cross-validation schemes. In k-fold cross-validation the training set is randomly split in k groups of equally distributed positive and negative cases. A classifi er is trained on k–1 of the groups and its generalisation performance is validated on the remaining group. This process is repeated k times, each time holding out a diff erent validation subset and the average represents the overall generalisation. In the second scheme, k-fold cross-validation with test, the data are fi rst randomly split into training and testing sets. A k-fold cross-validation is performed on the training set and the generalisation is obtained on the unseen testing set.
The generalisation performance of the classifi ers was assessed by considering the number of correctly classifi ed (true positives, TP, and true negatives, TN) and incorrectly classifi ed (false positives, FP, and false negatives, FN) cases in the testing set. Sensitivity (se) was defi ned as the conditional probability of a true
Train Test Total
Tuberculosis
Total number of patients 102 77 179
Symptomatic 100 (98%) 74 (96%) 174 (97%)
Persistent cough 98 (96%) 74 (96%) 171 (96%)
Haemoptysis 5 (5%) 1 (1%) 6 (3%)
Night sweats/fever 68 (67%) 53 (67%) 121 (68%)
Weight loss ≥5% 86 (84%) 60 (78%) 146 (82%)
Weight loss <5% 11 (11%) 15 (19%) 26 (15%)
Mean (range)symptom duration before recruitment in days
122·6 (13–449) 129·5 (12–754) 126 (12–754)
Smear positive 89 (87%) 66 (86%) 155 (87%)
Pulmonary disease 77 (75%) 64 (83%) 141 (79%)
Extrapulmonary disease 2 (2%) 2 (3%) 4 (2%)
Pulmonary and extrapulmonary 22 (22%) 11 (14%) 33 (18%)
Abnormal chest radiograph 95 (93%) 67 (87%) 162 (91%)
Cavitary disease Previous BCG vaccination*Skin test positive†
66 (65%)36 (35%)56 (55%)
49 (64%)26 (34%)36 (47%)
115 (64%)62 (35%)92 (51%)
Controls‡
Total number of patients 91 79 170
Infl ammatory bowel disease 10 (11%) 6 (8%) 16 (9%)
Sarcoidosis 6 (7%) 7 (9%) 13 (8%)
Respiratory infections§ 27 (30%) 24 (30%) 51 (30%)
Other Infections
Malaria (Plasmodium falciparum) 4 (4%) 3 (4%) 7 (4%)
HAT (Trypanosoma brucei gambiense)¶
10 (11%) 9 (11%) 19 (11%)
Others || 1 (1%) 2 (3%) 3 (2%)
Neurological disease** 13 (14%) 13 (16%) 26 (15%)
Autoimmune disease†† 6 (7%) 3 (4%) 9 (5%)
Myeloma/monoclonal gammopathy
2 (2%) 3 (4%) 5 (3%)
Healthy volunteers 12 (13%) 9 (11%) 21 (12%)
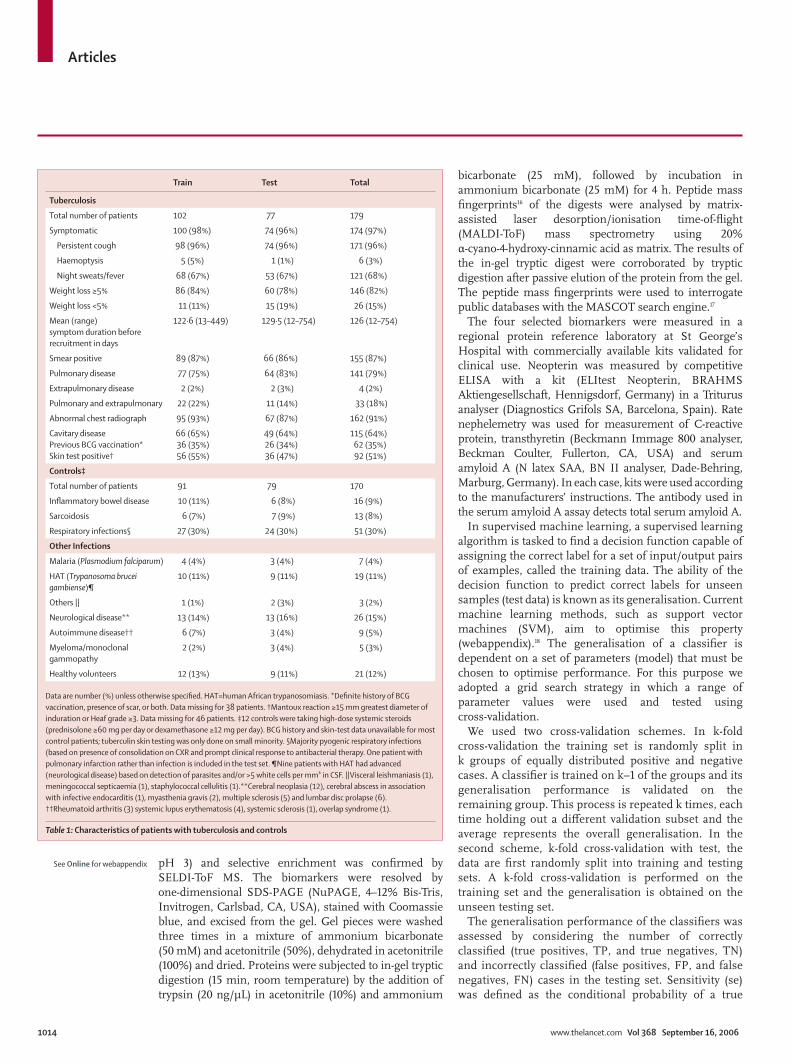
Data are number (%) unless otherwise specifi ed. HAT=human African trypanosomiasis. *Defi nite history of BCG vaccination, presence of scar, or both. Data missing for 38 patients. †Mantoux reaction ≥15 mm greatest diameter of induration or Heaf grade ≥3. Data missing for 46 patients. ‡12 controls were taking high-dose systemic steroids (prednisolone ≥60 mg per day or dexamethasone ≥12 mg per day). BCG history and skin-test data unavailable for most control patients; tuberculin skin testing was only done on small minority. §Majority pyogenic respiratory infections (based on presence of consolidation on CXR and prompt clinical response to antibacterial therapy. One patient with pulmonary infarction rather than infection is included in the test set. ¶Nine patients with HAT had advanced (neurological disease) based on detection of parasites and/or >5 white cells per mm³ in CSF. ||Visceral leishmaniasis (1), meningococcal septicaemia (1), staphylococcal cellulitis (1).**Cerebral neoplasia (12), cerebral abscess in association with infective endocarditis (1), myasthenia gravis (2), multiple sclerosis (5) and lumbar disc prolapse (6). ††Rheumatoid arthritis (3) systemic lupus erythematosis (4), systemic sclerosis (1), overlap syndrome (1).
Table 1: Characteristics of patients with tuberculosis and controls
See Online for webappendix
Articles
www.thelancet.com Vol 368 September 16, 2006 1015
positive, se=TP/(TP+FN); specifi city (sp) as the conditional probability of a true negative, sp=TN/(TN+FP); and accuracy (ac) as the proportion of correct classifi cations, ac=(TP+TN)/(TP+FP+TN+FN). The per-formance (positive diagnostic likelihood ratio) of a classifi er expressed by its true positive rate (se) and false positive rate (1–sp) was plotted in a receiver operator curve (ROC) space.
We created independent training and testing sets, with similar numbers of patients with tuberculosis and controls and similar representation of age and sex in each set. Using these sets we evaluated the generalisation performance of several supervised machine learning methods, such as single layer perceptron (SLP),19 multi-layered perceptron (MLP),20 tree classifi ers,21–23 and SVMs.
To provide robust estimates of the generalisation capability of the classifi er we did ten-fold cross-validation with test. First, we generated 100 80:20 train:test sets by random sampling without replacement in the entire dataset. For each 80:20 train:test set a ten-fold cross-validation is done on the training set and the parameter with the best performance is chosen. The SVM is retrained with the best parameter over all ten subsets and the fi nal performance is assessed on the testing set. In these experiments each ROC curve is smoothed, sampled, and averaged to show the mean curve with SD.
For further validation in the second independent testing set, the classifi er was refi ned by training in the entire fi rst dataset and then applied to the second set.
We used the Pearson correlation coeffi cient to rank peaks for their discriminatory power (webappendix). It can be used as a test statistic to assess the signifi cance of a variable and it is linked to the t test. We estimated the Pearson correlation coeffi cient between values of each mass cluster and corresponding class labels across the training set. We then used this estimate to rank positively and negatively correlated mass clusters. We selected ten mass clusters with the highest positive, and ten with the highest negative, correlation coeffi cients.
We used a chunking and decomposition implementation of the support vector machine, SVMlight.24 We used Waikato Environment for Knowledge Analysis25 for decision tree algorithms, boosting, and MLP. The experimentation framework was coded in Matlab and Java. A custom and reusable object-oriented database was created using ObjectDB and interfaced with the experimentation framework. The Matlab interface to SVMlight was obtained online.26 The SPIDER Matlab object-oriented machine learning library was obtained online27 and was modifi ed to use SVMlight version 6.
Role of the funding sourceThe sponsor of the study had no direct role in study design, data collection, data analysis, data interpretation, or writing of the report. A proportion of the serum samples from patients with tuberculosis were made available through the WHO TB databank. The corresponding author had full access to all the data in the study and had fi nal responsibility for the decision to submit for publication.
Tuberculosis* Controls Total
Train Test Total Train Test Total
Total number of patients 102 77 179 91 79 170 349
Mean (range) age in years 31 (16–86) 33 (19–84) 32 (16–86) 44 (16–88) 46 (14–84) 45 (16–84) 38 (14–88)
Sex (male:female) 65:37 47:30 112:67 52:39 42:37 94:76 206:143
Ethnic origin
Sub-Saharan African 81 (79%) 60 (78%) 141 (79%) 29 (32%) 29 (37%) 58 (34%) 199
African, not specifi ed 3 (3%) 1 (1%) 4 (2%) 5 (6%) 4 (5%) 9 (5%) 13
Asian 13 (13%) 9 (12%) 22 (12%) 6 (7%) 3 (4%) 9 (5%) 31
White 5 (5%) 7 (9%) 12 (7%) 49(54%) 39 (49%) 88 (51%) 100
Not recorded .. .. .. 2 (2%) 4 (5%) 6 (4%) 6
Collection site
Sub-Saharan Africa 81 (79%) 60 (78%) 141 (79%) 21 (23%) 19 (24%) 40 (24%) 181
UK 21 (21%) 17 (22%) 38 (21%) 70 (77%) 60 (76%) 130 (76%) 168
HIV serology
HIV positive† 35 (34%) 24 (31%) 59 (33%) 2 (2%) 3 (4%) 5 (3%) 64
CD4 count ≥200x106 per mL 19 13 32 .. .. .. ..
CD4 count <200x106 per mL 15 11 26 .. .. .. ..
HIV negative 60 (59%) 45 (58%) 105 (59%) 12 (13%) 8 (10%) 20 (12%) 125
Not determined 7 (7%) 8 (10%) 15 (8%) 77 (85%) 68 (86%) 145 (85%) 160
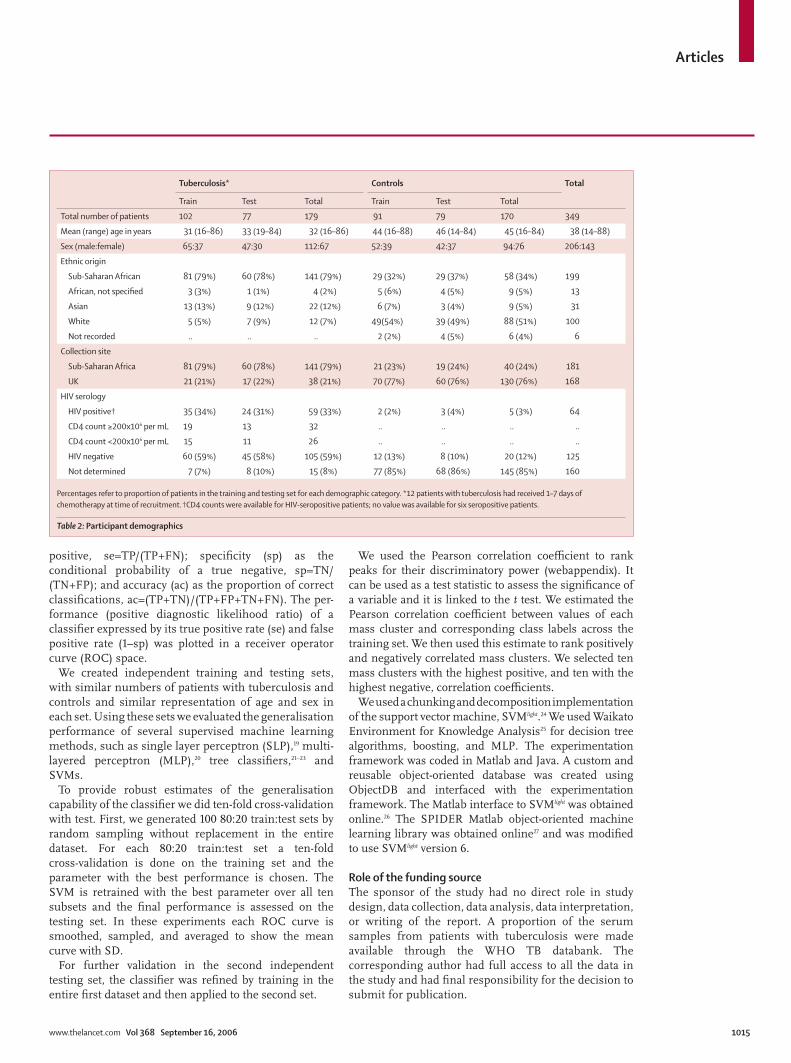
Percentages refer to proportion of patients in the training and testing set for each demographic category. *12 patients with tuberculosis had received 1–7 days of chemotherapy at time of recruitment. †CD4 counts were available for HIV-seropositive patients; no value was available for six seropositive patients.
Table 2: Participant demographics
Articles
1016 www.thelancet.com Vol 368 September 16, 2006
Results Details of patients and controls from the fi rst phase of the study are given in tables 1 and 2. Most patients had advanced pulmonary disease, presenting with cough, fever, and weight loss, and the majority had smear positive cavitary disease.
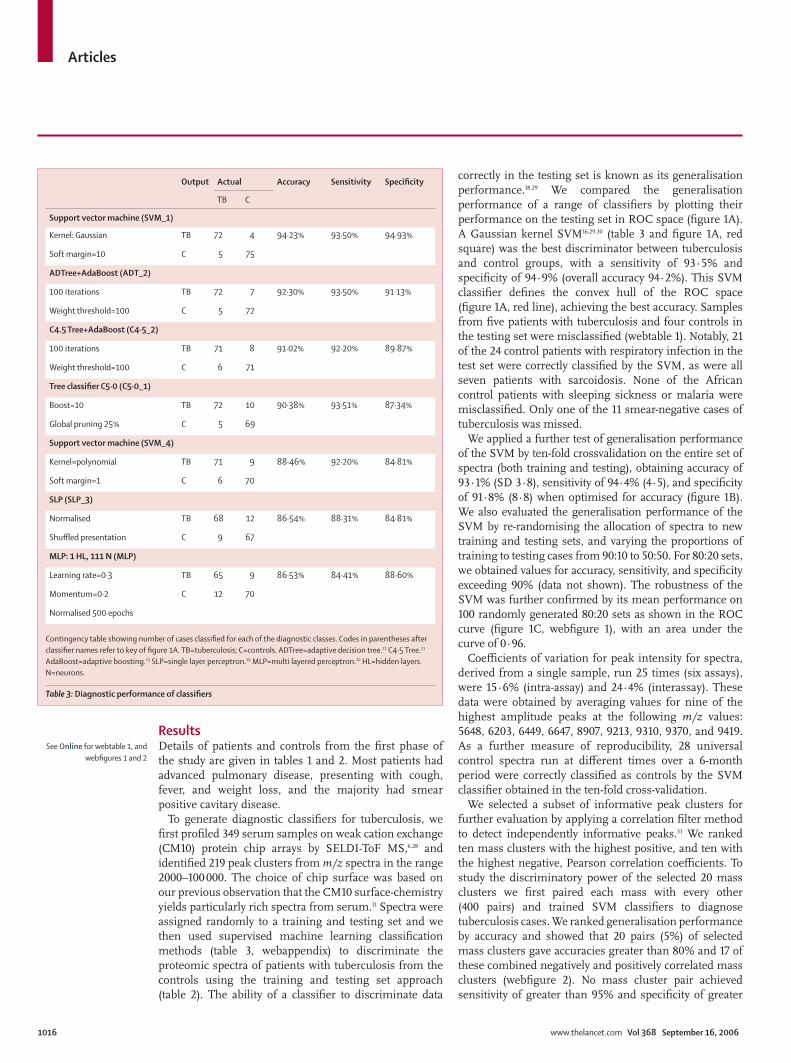
To generate diagnostic classifi ers for tuberculosis, we fi rst profi led 349 serum samples on weak cation exchange (CM10) protein chip arrays by SELDI-ToF MS,6,28 and identifi ed 219 peak clusters from m/z spectra in the range 2000–100 000. The choice of chip surface was based on our previous observation that the CM10 surface-chemistry yields particularly rich spectra from serum.11 Spectra were assigned randomly to a training and testing set and we then used supervised machine learning classifi cation methods (table 3, webappendix) to discriminate the proteomic spectra of patients with tuberculosis from the controls using the training and testing set approach (table 2). The ability of a classifi er to discriminate data
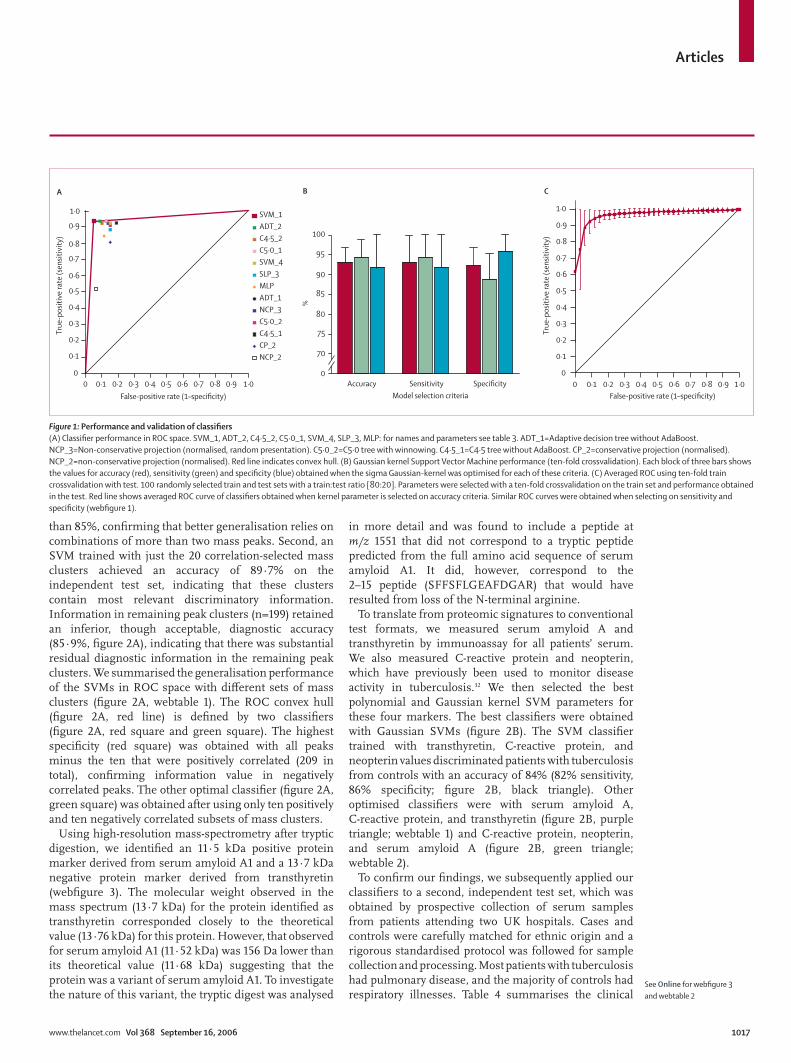
correctly in the testing set is known as its generalisation performance.18,29 We compared the generalisation performance of a range of classifi ers by plotting their performance on the testing set in ROC space (fi gure 1A). A Gaussian kernel SVM16,29,30 (table 3 and fi gure 1A, red square) was the best discriminator between tuberculosis and control groups, with a sensitivity of 93·5% and specifi city of 94·9% (overall accuracy 94·2%). This SVM classifi er defi nes the convex hull of the ROC space (fi gure 1A, red line), achieving the best accuracy. Samples from fi ve patients with tuberculosis and four controls in the testing set were misclassifi ed (webtable 1). Notably, 21 of the 24 control patients with respiratory infection in the test set were correctly classifi ed by the SVM, as were all seven patients with sarcoidosis. None of the African control patients with sleeping sickness or malaria were misclassifi ed. Only one of the 11 smear-negative cases of tuberculosis was missed.
We applied a further test of generalisation performance of the SVM by ten-fold crossvalidation on the entire set of spectra (both training and testing), obtaining accuracy of 93·1% (SD 3·8), sensitivity of 94·4% (4·5), and specifi city of 91·8% (8·8) when optimised for accuracy (fi gure 1B). We also evaluated the generalisation performance of the SVM by re-randomising the allocation of spectra to new training and testing sets, and varying the proportions of training to testing cases from 90:10 to 50:50. For 80:20 sets, we obtained values for accuracy, sensitivity, and specifi city exceeding 90% (data not shown). The robustness of the SVM was further confi rmed by its mean performance on 100 randomly generated 80:20 sets as shown in the ROC curve (fi gure 1C, webfi gure 1), with an area under the curve of 0·96.
Coeffi cients of variation for peak intensity for spectra, derived from a single sample, run 25 times (six assays), were 15·6% (intra-assay) and 24·4% (interassay). These data were obtained by averaging values for nine of the highest amplitude peaks at the following m/z values: 5648, 6203, 6449, 6647, 8907, 9213, 9310, 9370, and 9419. As a further measure of reproducibility, 28 universal control spectra run at diff erent times over a 6-month period were correctly classifi ed as controls by the SVM classifi er obtained in the ten-fold cross-validation.
We selected a subset of informative peak clusters for further evaluation by applying a correlation fi lter method to detect independently informative peaks.31 We ranked ten mass clusters with the highest positive, and ten with the highest negative, Pearson correlation coeffi cients. To study the discriminatory power of the selected 20 mass clusters we fi rst paired each mass with every other (400 pairs) and trained SVM classifi ers to diagnose tuberculosis cases. We ranked generalisation performance by accuracy and showed that 20 pairs (5%) of selected mass clusters gave accuracies greater than 80% and 17 of these combined negatively and positively correlated mass clusters (webfi gure 2). No mass cluster pair achieved sensitivity of greater than 95% and specifi city of greater
Output Actual Accuracy Sensitivity Specifi city
TB C
Support vector machine (SVM_1)
Kernel: Gaussian TB 72 4 94·23% 93·50% 94·93%
Soft margin=10 C 5 75
ADTree+AdaBoost (ADT_2)
100 iterations TB 72 7 92·30% 93·50% 91·13%
Weight threshold=100 C 5 72
C4.5 Tree+AdaBoost (C4·5_2)
100 iterations TB 71 8 91·02% 92·20% 89·87%
Weight threshold=100 C 6 71
Tree classifi er C5·0 (C5·0_1)
Boost=10 TB 72 10 90·38% 93·51% 87·34%
Global pruning 25% C 5 69
Support vector machine (SVM_4)
Kernel=polynomial TB 71 9 88·46% 92·20% 84·81%
Soft margin=1 C 6 70
SLP (SLP_3)
Normalised TB 68 12 86·54% 88·31% 84·81%
Shuffl ed presentation C 9 67
MLP: 1 HL, 111 N (MLP)
Learning rate=0·3 TB 65 9 86·53% 84·41% 88·60%
Momentum=0·2 C 12 70
Normalised 500 epochs
Contingency table showing number of cases classifi ed for each of the diagnostic classes. Codes in parentheses after classifi er names refer to key of fi gure 1A. TB=tuberculosis; C=controls. ADTree=adaptive decision tree.22 C4·5 Tree.21 AdaBoost=adaptive boosting.23 SLP=single layer perceptron.19 MLP=multi layered perceptron.20 HL=hidden layers. N=neurons.
Table 3: Diagnostic performance of classifi ers
See Online for webtable 1, and webfi gures 1 and 2
Articles
www.thelancet.com Vol 368 September 16, 2006 1017
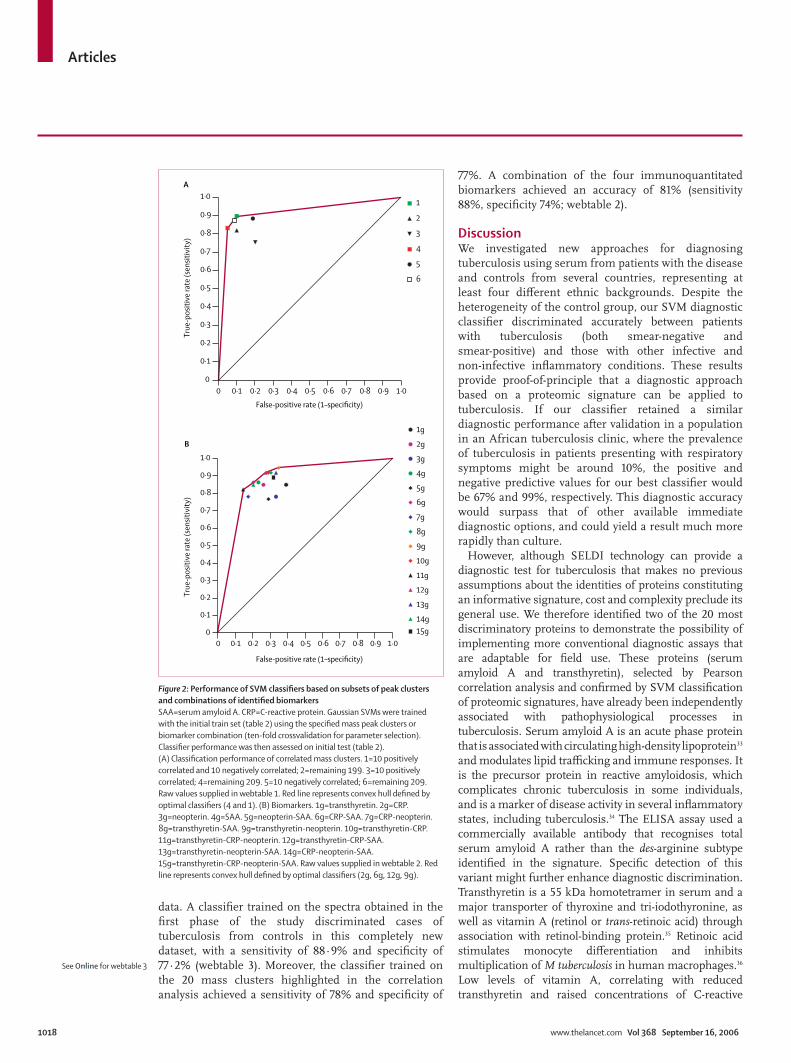
than 85%, confi rming that better generalisation relies on combinations of more than two mass peaks. Second, an SVM trained with just the 20 correlation-selected mass clusters achieved an accuracy of 89·7% on the independent test set, indicating that these clusters contain most relevant discriminatory information. Information in remaining peak clusters (n=199) retained an inferior, though acceptable, diagnostic accuracy (85·9%, fi gure 2A), indicating that there was substantial residual diagnostic information in the remaining peak clusters. We summarised the generalisation performance of the SVMs in ROC space with diff erent sets of mass clusters (fi gure 2A, webtable 1). The ROC convex hull (fi gure 2A, red line) is defi ned by two classifi ers (fi gure 2A, red square and green square). The highest specifi city (red square) was obtained with all peaks minus the ten that were positively correlated (209 in total), confi rming information value in negatively correlated peaks. The other optimal classifi er (fi gure 2A, green square) was obtained after using only ten positively and ten negatively correlated subsets of mass clusters.
Using high-resolution mass-spectrometry after tryptic digestion, we identifi ed an 11·5 kDa positive protein marker derived from serum amyloid A1 and a 13·7 kDa negative protein marker derived from transthyretin (webfi gure 3). The molecular weight observed in the mass spectrum (13·7 kDa) for the protein identifi ed as transthyretin corresponded closely to the theoretical value (13·76 kDa) for this protein. However, that observed for serum amyloid A1 (11·52 kDa) was 156 Da lower than its theoretical value (11·68 kDa) suggesting that the protein was a variant of serum amyloid A1. To investigate the nature of this variant, the tryptic digest was analysed
in more detail and was found to include a peptide at m/z 1551 that did not correspond to a tryptic peptide predicted from the full amino acid sequence of serum amyloid A1. It did, however, correspond to the 2–15 peptide (SFFSFLGEAFDGAR) that would have resulted from loss of the N-terminal arginine.
To translate from proteomic signatures to conventional test formats, we measured serum amyloid A and transthyretin by immunoassay for all patients’ serum. We also measured C-reactive protein and neopterin, which have previously been used to monitor disease activity in tuberculosis.32 We then selected the best polynomial and Gaussian kernel SVM parameters for these four markers. The best classifi ers were obtained with Gaussian SVMs (fi gure 2B). The SVM classifi er trained with transthyretin, C-reactive protein, and neopterin values discriminated patients with tuberculosis from controls with an accuracy of 84% (82% sensitivity, 86% specifi city; fi gure 2B, black triangle). Other optimised classifi ers were with serum amyloid A, C-reactive protein, and transthyretin (fi gure 2B, purple triangle; webtable 1) and C-reactive protein, neopterin, and serum amyloid A (fi gure 2B, green triangle; webtable 2).
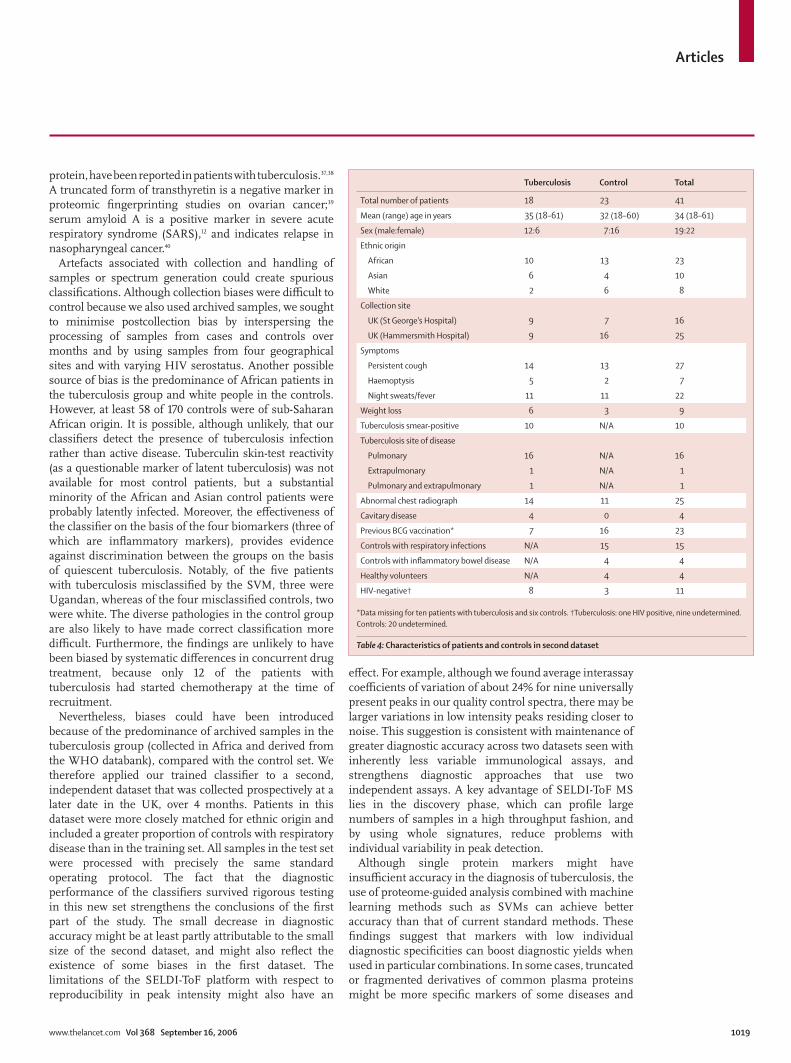
To confi rm our fi ndings, we subsequently applied our classifi ers to a second, independent test set, which was obtained by prospective collection of serum samples from patients attending two UK hospitals. Cases and controls were carefully matched for ethnic origin and a rigorous standardised protocol was followed for sample collection and processing. Most patients with tuberculosis had pulmonary disease, and the majority of controls had respiratory illnesses. Table 4 summarises the clinical
Accuracy
70
0
75
80
85
90
95
100
Model selection criteria
%
0 0·1 0·2 0·3 0·4 0·5 0·6 0·7 0·8 0·9 1·00
0·1
0·2
0·3
0·4
0·5
0·6
0·7
0·8
0·9
1·0 SVM_1ADT_2C4·5_2C5·0_1SVM_4SLP_3MLPADT_1NCP_3C5·0_2C4·5_1CP_2NCP_2
0 0·1 0·2 0·3 0·4 0·5 0·6 0·7 0·8 0·9 1·00
0·1
0·2
0·3
0·4
0·5
0·6
0·7
0·8
0·9
1·0
False-positive rate (1–specificity)False-positive rate (1–specificity)
True
-pos
itive
rate
(sen
sitiv
ity)
True
-pos
itive
rate
(sen
sitiv
ity)
A B C
SpecificitySensitivity
Figure 1: Performance and validation of classifi ers(A) Classifi er performance in ROC space. SVM_1, ADT_2, C4·5_2, C5·0_1, SVM_4, SLP_3, MLP: for names and parameters see table 3. ADT_1=Adaptive decision tree without AdaBoost. NCP_3=Non-conservative projection (normalised, random presentation). C5·0_2=C5·0 tree with winnowing. C4·5_1=C4·5 tree without AdaBoost. CP_2=conservative projection (normalised). NCP_2=non-conservative projection (normalised). Red line indicates convex hull. (B) Gaussian kernel Support Vector Machine performance (ten-fold crossvalidation). Each block of three bars shows the values for accuracy (red), sensitivity (green) and specifi city (blue) obtained when the sigma Gaussian-kernel was optimised for each of these criteria. (C) Averaged ROC using ten-fold train crossvalidation with test. 100 randomly selected train and test sets with a train:test ratio [80:20]. Parameters were selected with a ten-fold crossvalidation on the train set and performance obtained in the test. Red line shows averaged ROC curve of classifi ers obtained when kernel parameter is selected on accuracy criteria. Similar ROC curves were obtained when selecting on sensitivity and specifi city (webfi gure 1).
See Online for webfi gure 3 and webtable 2
Articles
1018 www.thelancet.com Vol 368 September 16, 2006
data. A classifi er trained on the spectra obtained in the fi rst phase of the study discriminated cases of tuberculosis from controls in this completely new dataset, with a sensitivity of 88·9% and specifi city of 77·2% (webtable 3). Moreover, the classifi er trained on the 20 mass clusters highlighted in the correlation analysis achieved a sensitivity of 78% and specifi city of
77%. A combination of the four immunoquantitated biomarkers achieved an accuracy of 81% (sensitivity 88%, specifi city 74%; web table 2).
DiscussionWe investigated new approaches for diagnosing tuberculosis using serum from patients with the disease and controls from several countries, representing at least four diff erent ethnic backgrounds. Despite the heterogeneity of the control group, our SVM diagnostic classifi er discriminated accurately between patients with tuberculosis (both smear-negative and smear-positive) and those with other infective and non-infective infl ammatory conditions. These results provide proof-of-principle that a diagnostic approach based on a proteomic signature can be applied to tuberculosis. If our classifi er retained a similar diagnostic performance after validation in a population in an African tuberculosis clinic, where the prevalence of tuberculosis in patients presenting with respiratory symptoms might be around 10%, the positive and negative predictive values for our best classifi er would be 67% and 99%, respectively. This diagnostic accuracy would surpass that of other available immediate diagnostic options, and could yield a result much more rapidly than culture.
However, although SELDI technology can provide a diagnostic test for tuberculosis that makes no previous assumptions about the identities of proteins constituting an informative signature, cost and complexity preclude its general use. We therefore identifi ed two of the 20 most discriminatory proteins to demonstrate the possibility of implementing more conventional diagnostic assays that are adaptable for fi eld use. These proteins (serum amyloid A and transthyretin), selected by Pearson correlation analysis and confi rmed by SVM classifi cation of proteomic signatures, have already been independently associated with pathophysiological processes in tuberculosis. Serum amyloid A is an acute phase protein that is associated with circulating high-density lipoprotein33 and modulates lipid traffi cking and immune responses. It is the precursor protein in reactive amyloidosis, which complicates chronic tuberculosis in some individuals, and is a marker of disease activity in several infl ammatory states, including tuberculosis.34 The ELISA assay used a commercially available antibody that recognises total serum amyloid A rather than the des-arginine subtype identifi ed in the signature. Specifi c detection of this variant might further enhance diagnostic discrimination. Transthyretin is a 55 kDa homotetramer in serum and a major transporter of thyroxine and tri-iodothyronine, as well as vitamin A (retinol or trans-retinoic acid) through association with retinol-binding protein.35 Retinoic acid stimulates monocyte diff erentiation and inhibits multiplication of M tuberculosis in human macrophages.36 Low levels of vitamin A, correlating with reduced transthyretin and raised concentrations of C-reactive
0 0·1 0·2 0·3 0·4 0·5 0·6 0·7 0·8 0·9 1·00
0·1
0·2
0·3
0·4
0·5
0·6
0·7
0·8
0·9
1·01
2
3
4
5
6
False-positive rate (1–specificity)
True
-pos
itive
rate
(sen
sitiv
ity)
True
-pos
itive
rate
(sen
sitiv
ity)
False-positive rate (1–specificity)
A
B
0 0·1 0·2 0·3 0·4 0·5 0·6 0·7 0·8 0·9 1·00
0·1
0·2
0·3
0·4
0·5
0·6
0·7
0·8
0·9
1·0
1g
2g
3g
4g
5g
6g
7g
8g
9g
10g
11g
12g
13g
14g15g
Figure 2: Performance of SVM classifi ers based on subsets of peak clusters and combinations of identifi ed biomarkersSAA=serum amyloid A. CRP=C-reactive protein. Gaussian SVMs were trained with the initial train set (table 2) using the specifi ed mass peak clusters or biomarker combination (ten-fold crossvalidation for parameter selection). Classifi er performance was then assessed on initial test (table 2). (A) Classifi cation performance of correlated mass clusters. 1=10 positively correlated and 10 negatively correlated; 2=remaining 199. 3=10 positively correlated; 4=remaining 209. 5=10 negatively correlated; 6=remaining 209. Raw values supplied in webtable 1. Red line represents convex hull defi ned by optimal classifi ers (4 and 1). (B) Biomarkers. 1g=transthyretin. 2g=CRP. 3g=neopterin. 4g=SAA. 5g=neopterin-SAA. 6g=CRP-SAA. 7g=CRP-neopterin. 8g=transthyretin-SAA. 9g=transthyretin-neopterin. 10g=transthyretin-CRP. 11g=transthyretin-CRP-neopterin. 12g=transthyretin-CRP-SAA. 13g=transthyretin-neopterin-SAA. 14g=CRP-neopterin-SAA. 15g=transthyretin-CRP-neopterin-SAA. Raw values supplied in webtable 2. Red line represents convex hull defi ned by optimal classifi ers (2g, 6g, 12g, 9g).
See Online for webtable 3
Articles
www.thelancet.com Vol 368 September 16, 2006 1019
protein, have been reported in patients with tuberculosis.37,38
A truncated form of transthyretin is a negative marker in proteomic fi ngerprinting studies on ovarian cancer;39
serum amyloid A is a positive marker in severe acute respiratory syndrome (SARS),12 and indicates relapse in nasopharyngeal cancer.40
Artefacts associated with collection and handling of samples or spectrum generation could create spurious classifi cations. Although collection biases were diffi cult to control because we also used archived samples, we sought to minimise postcollection bias by interspersing the processing of samples from cases and controls over months and by using samples from four geographical sites and with varying HIV serostatus. Another possible source of bias is the predominance of African patients in the tuberculosis group and white people in the controls. However, at least 58 of 170 controls were of sub-Saharan African origin. It is possible, although unlikely, that our classifi ers detect the presence of tuberculosis infection rather than active disease. Tuberculin skin-test reactivity (as a questionable marker of latent tuberculosis) was not available for most control patients, but a substantial minority of the African and Asian control patients were probably latently infected. Moreover, the eff ectiveness of the classifi er on the basis of the four biomarkers (three of which are infl ammatory markers), provides evidence against discrimination between the groups on the basis of quiescent tuberculosis. Notably, of the fi ve patients with tuberculosis misclassifi ed by the SVM, three were Ugandan, whereas of the four misclassifi ed controls, two were white. The diverse pathologies in the control group are also likely to have made correct classifi cation more diffi cult. Furthermore, the fi ndings are unlikely to have been biased by systematic diff erences in concurrent drug treatment, because only 12 of the patients with tuberculosis had started chemotherapy at the time of recruitment.
Nevertheless, biases could have been introduced because of the predominance of archived samples in the tuberculosis group (collected in Africa and derived from the WHO databank), compared with the control set. We therefore applied our trained classifi er to a second, independent dataset that was collected prospectively at a later date in the UK, over 4 months. Patients in this dataset were more closely matched for ethnic origin and included a greater proportion of controls with respiratory disease than in the training set. All samples in the test set were processed with precisely the same standard operating protocol. The fact that the diagnostic performance of the classifi ers survived rigorous testing in this new set strengthens the conclusions of the fi rst part of the study. The small decrease in diagnostic accuracy might be at least partly attributable to the small size of the second dataset, and might also refl ect the existence of some biases in the fi rst dataset. The limitations of the SELDI-ToF platform with respect to reproducibility in peak intensity might also have an
eff ect. For example, although we found average interassay coeffi cients of variation of about 24% for nine universally present peaks in our quality control spectra, there may be larger variations in low intensity peaks residing closer to noise. This suggestion is consistent with maintenance of greater diagnostic accuracy across two datasets seen with inherently less variable immunological assays, and strengthens diagnostic approaches that use two independent assays. A key advantage of SELDI-ToF MS lies in the discovery phase, which can profi le large numbers of samples in a high throughput fashion, and by using whole signatures, reduce problems with individual variability in peak detection.
Although single protein markers might have insuffi cient accuracy in the diagnosis of tuberculosis, the use of proteome-guided analysis combined with machine learning methods such as SVMs can achieve better accuracy than that of current standard methods. These fi ndings suggest that markers with low individual diagnostic specifi cities can boost diagnostic yields when used in particular combinations. In some cases, truncated or fragmented derivatives of common plasma proteins might be more specifi c markers of some diseases and
Tuberculosis Control Total
Total number of patients 18 23 41
Mean (range) age in years 35 (18–61) 32 (18–60) 34 (18–61)
Sex (male:female) 12:6 7:16 19:22
Ethnic origin
African 10 13 23
Asian 6 4 10
White 2 6 8
Collection site
UK (St George’s Hospital) 9 7 16
UK (Hammersmith Hospital) 9 16 25
Symptoms
Persistent cough 14 13 27
Haemoptysis 5 2 7
Night sweats/fever 11 11 22
Weight loss 6 3 9
Tuberculosis smear-positive 10 N/A 10
Tuberculosis site of disease
Pulmonary 16 N/A 16
Extrapulmonary 1 N/A 1
Pulmonary and extrapulmonary 1 N/A 1
Abnormal chest radiograph 14 11 25
Cavitary disease 4 0 4
Previous BCG vaccination* 7 16 23
Controls with respiratory infections N/A 15 15
Controls with infl ammatory bowel disease N/A 4 4
Healthy volunteers N/A 4 4
HIV-negative† 8 3 11
*Data missing for ten patients with tuberculosis and six controls. †Tuberculosis: one HIV positive, nine undetermined. Controls: 20 undetermined.
Table 4: Characteristics of patients and controls in second dataset
Articles
1020 www.thelancet.com Vol 368 September 16, 2006
arise by proteolytic enzyme induction characteristic of defi ned disease states.41 For example, the des-arginine variant of serum amyloid A we identifi ed might be more specifi c than other variants for tuberculosis. Similarly, truncated forms of another apparently non-specifi c acute-phase protein, α1-antitrypsin, have been reported as relatively specifi c markers in SARS.12 Thus, a possible explanation for the apparent paradox that seemingly non-specifi c acute-phase proteins could provide diagnostic specifi city for particular infections, is the possibility of disease-specifi c modifi cation of common proteins, as has been proposed for several cancers.8
Preservation of high diagnostic accuracy when translating from proteomic signatures to immunoassays, and the plausible disease-association of the identifi ed biomarkers, establishes the value of SVM classifi ers for diagnosis of tuberculosis and provides strong evidence to support the use of serological testing. Although we have shown reasonable diagnostic accuracies based on a subset of four biomarkers as an illustration of the principle, better classifi ers might ultimately require use of a larger number of biomarkers. To adapt the test for fi eld use, antibodies to panels of defi ned biomarkers could be incorporated into dipstick-type formats, and patterns analysed with trained SVM classifi ers on personal computers. These tests can then be applied to longitudinal studies of tuberculosis and other diffi cult diagnostic categories, such as sputum-negative tuberculosis, extrapulmonary cases, and paediatric infections.ContributorsThe study was designed by D Agranoff , D Fernandez-Reyes, and S Krishna. D Fernandez-Reyes and M Herbster developed the machine-learning and feature selection analyses. D Fernandez-Reyes and S Rojas did classifi cation experiments and produced the diagnostic SVM classifi ers. A Loosemore, R Pollock, and C Rayner recruited patients and obtained serum samples in the UK. A Schwenk provided some of the UK tuberculosis serum samples. D Agranoff , M Papadopoulos, D Fernandez-Reyes, and E Tarelli generated the mass spectra. Protein identifi cation was undertaken by D Agranoff with help from E Tarelli. J Sheldon coordinated and advised on immunoassays. Writing was by D Agranoff , D Fernandez-Reyes, and S Krishna, with contributions from all authors. D Agranoff and D Fernandez-Reyes contributed equally to this work.
Confl ict of interest statementSt George’s, University of London has applied for a patent to diagnose tuberculosis.
AcknowledgmentsDA and MP were Wellcome Trust Clinical Fellows sponsored by SK. DF-R is a Medical Research Council Fellow in Bioinformatics. AS was a Wellcome International Fellow. This investigation received fi nancial support from the UNDP/World Bank/WHO Special programme for Research and Training in Tropical Diseases (TDR) (Project ID A20536). We thank Mark Perkins, the WHO TB databank, and Derek Macallan for serum samples, Angotrip for collaboration, Diane Irving for immunoassays, Gurjinder Sandhu for help in sample processing and Nathan Harris (Ciphergen, UK) for assistance in identifi cation of proteins.
References1 WHO. Global tuberculosis control-surveillance, planning,
fi nancing. Annex 1: Profi les of high burden countries. http://www.who.int/tb/publications/global_report/2006/annex_1_download/en/index.html (accessed April 7, 2005).
2 Mwinga A, Fourie PB. Prospects for new tuberculosis treatment in Africa. Trop Med Int Health 2004; 9: 827–32.
3 Perkins M, Kritski AL. Diagnostic testing in the control of tuberculosis. Bull WHO 2002; 80: 512–13.
4 Perkins MD, Conde MB, Martins M, Kritski AL. Serologic diagnosis of tuberculosis using a simple commercial multiantigen assay. Chest 2003; 123: 107–12.
5 Drobniewski FA, Caws M, Gibson A, You ng D. Modern laboratory diagnosis of tuberculosis. Lancet Infect Dis 2003; 3: 141–47.
6 Issaq HJ, Veenstra TD, Conrads TP, Felschow D. The SELDI-TOF MS approach to proteomics: protein profi ling and biomarker identifi cation. Biochem Biophys Res Comm 2002; 292: 587–92.
7 Duda RO, Hart PE, Stork DG. Pattern classifi cation. 2nd edn. New York: John Wiley and Sons, 2001.
8 Petricoin EF, Liotta LA. SELDI-TOF-based proteomic pattern diagnostics for early detection of cancer. Curr Opin Biotechnol 2004; 15: 24–30.
9 Adam BL, Qu Y, Davis JW, et al. Serum protein fi ngerprinting coupled with a pattern-matching algorithm distinguishes prostate cancer from benign prostatic hyperplasia and healthy men. Cancer Res 2002; 62: 3609–14.
10 Petricoin EF, Ardekani AM, Hitt BA, et al. Use of proteomic patterns in serum to identify ovarian cancer. Lancet 2002; 359: 572–77.
11 Papadopoulos MC, Abel PM, Agranoff D, et al. A novel and accurate test for human African trypanosomiasis. Lancet 2004; 363: 1358–63.
12 Ren Y, He QY, Fan J, et al. The use of proteomics in the discovery of serum biomarkers from patients with severe acute respiratory syndrome. Proteomics 2004; 4: 3477–84.
13 Buhimschi IA, Christner R, Buhimschi CS. Proteomic biomarker analysis of amniotic fl uid for identifi cation of intra-amniotic infl ammation. Bjog 2005; 112: 173–81.
14 Special Programme for Research and Training in Tropical Diseases. WHO/TDR TB specimen bank. http://www.who.int/tdr/diseases/tb/specimen.htm (accessed April 5, 2003).
15 Rathman G, Sillah J, Hill PC, et al. Clinical and radiological presentation of 340 adults with smear-positive tuberculosis in The Gambia. Int J Tuberc Lung Dis 2003; 7: 942–47.
16 Thiede B, Hohenwarter W, Krah A, et al. Peptide mass fi ngerprinting. Methods 2005; 35: 237–47.
17 Perkins DN, Pappin DJ, Creasy DM, Cottrell JS. Probability-based protein identifi cation by searching sequence databases using mass spectrometry data. Electrophoresis 1999; 20: 3551–67.
18 Cristianini N, Shawe-Taylor J. An introduction to support vector machines and other kernel-based learning methods. Cambridge: Cambridge University Press, 2000.
19 Rosenblatt F. Principles of neurodynamics. New York: Spartan Books, 1962.
20 McClelland JL, Rumelhart DE. Parallel and Distributed Processing: MIT Bradford Press, 1986.
21 Quinlan JR. C4.5: Programs for Machine Learning. San Francisco: Morgan Kaufmann, 1993.
22 Freund Y, Mason L. The alternating decision tree learning algorithm. In: Proceedings of the sixteenth international conference on machine learning. San Francisco: Morgan Kaufmann, 1999: 124–33.
23 Freund Y, Schapire RE. Experiments with a new boosting algorithm. Bari: Thirteenth International Conference on Machine Learning, 1996: 148–56.
24 Joachims T. Making large-scale SVM learning practical. Advances in kernel methods—support vector learning. Cambridge: MIT Press, 1999.
25 Witten IH, Frank E. Data mining: practical machine learning tools with Java implementations. San Francisco: Morgan Kaufmann, 2000.
26 Schweighofer A. Matlab interface to SVM light, Intelligent Data Analysis (IDA), Berlin, Germany. http://www.igi.tugraz.at/aschwaig/software.html (accessed January 2005).
27 Weston J, Elisseeff A, BakIr G, et al. The spider. Department: Empirical Inference for Machine Learning and Perception, Max Planck Institute for Biological Cybernetics, Tübingen, Germany. http://www.kyb.tuebingen.mpg.de/bs/people/spider (accessed January, 2004)
Articles
www.thelancet.com Vol 368 September 16, 2006 1021
28 von Eggeling F, Junker K, Fiedle W, et al. Mass spectrometry meets chip technology: a new proteomic tool in cancer research? Electrophoresis 2001; 22: 2898–902.
29 Vapnik V. Statistical learning theory. New York: John Wiley and Sons, 1998.
30 Boser BE, Guyon IM, Vapnik VN. A training algorithm for optimal margin classifi ers. Pittsburgh: Proceedings of the fi fth annual workshop on computational learning theory, 1992: 144–52.
31 Guyon I, Eliseeff A. An introduction to variable and feature selection. J Machine Learn Res 2003; 3: 1157–82.
32 Hosp M, Elliott AM, Raynes JG, et al. Neopterin, beta 2-microglobulin and acute phase proteins in HIV-1-seropositive and -seronegative Zambian patients with tuberculosis. Lung 1997; 175: 265–75.
33 Kiernan UA, Tubbs KA, Nedelkov D, Niederkofl er EE, Nelson RW. Detection of novel truncated forms of human serum amyloid A protein in human plasma. FEBS Letts 2003; 537: 166–70.
34 Salazar A, Pinto X, Mana J. Serum amyloid A and high-density lipoprotein cholesterol: serum markers of infl ammation in sarcoidosis and other systemic disorders. Eur J Clin Invest 2001; 31: 1070–77.
35 Peterson PA. Characteristics of a vitamin A-transporting protein complex occuring in human serum. J Biol Chem 1971; 246: 34–43.
36 Crowle AJ, Ross EJ. Inhibition by retinoic acid of multiplication of virulent tubercle bacilli in cultured macrophages. Infect Immun 1989; 57: 840–44.
37 Hanekom WA, Potgieter S, Hughes EJ, Malan H, Kessow G, Hussey GD. Vitamin A status and therapy in childhood pulmonary tuberculosis. J Pediatr 1997; 131: 925–27.
38 Koyanagi A, Kuff o D, Gresely L, Shenkin A, Cuevas LE. Relationships between serum concentrations of C-reactive protein and micronutrients in patients with tuberculosis. Ann Trop Med Parasitol 2004; 98: 391–99.
39 Zhang Z, Bast RCJ, Yinhua Y, et al. Three biomarkers identifi ed from serum proteomic analysis for the detection of early stage ovarian cancer. Cancer Res 2004; 64: 5882–90.
40 Cho WCS, Yip TTC, Yip C, et al. Identifi cation of serum Amyloid A protein as a potentially useful biomarker to monitor relapse of nasopharyngeal cancer by serum proteomic profi ling. Clin Canc Res 2004; 10: 43–52.
41 Tolson J, Bogumil R, Brunst E, et al. Serum protein profi ling by SELDI mass spectrometry: detection of multiple variants of serum amyloid alpha in renal cancer patients. Lab Invest 2004; 84: 845–56.