identification and imaging of lipids in tissues using tof-sims
TRANSCRIPT
Doctoral Thesis for the Degree of Doctor of Philosophy, Faculty of Medicine
Identification and imaging of lipids in tissues using TOF-SIMS
Ylva Magnusson
Wallenberg Laboratory
Department of Molecular and Clinical Medicine, Institution of Medicine,
Sahlgrenska Academy, at Göteborg University
Göteborg, Sweden
2008
1
Doctoral Thesis for the Degree of Doctor of Philosophy, Faculty of Medicine
Identification and imaging of lipids in tissues using TOF-SIMS
Ylva Magnusson
© Ylva Magnusson, Göteborg. 2008-04-11
ISBN 978-91-628-7470-4
Doktorsavhandling
Department of Molecular and Clinical Medicine,
Institution of Medicine,
Sahlgrenska Academy, at Göteborg University
Göteborg, Sweden 2008
Printed by Chalmers Reproservice
Göteborg, 2008
2
Identification and imaging of lipids in tissues using TOF-SIMS
Ylva Magnusson
Department of Molecular and Clinical Medicine, Institution of Medicine,
Sahlgrenska Academy, at Göteborg University
Göteborg, Sweden. Thesis defended 11 april, 2008
Abstract
Introduction: Normal lipid metabolism in the adipose tissue, skeletal muscle and aortic wall is important for the physiological function of these tissues. Dyslipidemia that is often associated with intake of high energy diet and sedentary lifestyles can lead to the development of insulin resistance and cardiovascular diseases. Existing methods for imaging the heterogeneous distribution of lipids in the skeletal muscle and adipose tissue is limited. Our aim is to, without probing and chemical fixation, identify and image the spatial distribution of lipids in the skeletal muscle, adipose tissue and aorta, and to reveal an altered lipid pattern in the skeletal muscle associated with obesity and in the aorta associated with high glucose intake. To achieve this, we used time-of-flight secondary-ion mass spectrometry (TOF-SIMS) equipped with a bismuth (Bi)-cluster gun which is a new technique for molecular imaging of biological samples. Principal component analysis (PCA) was used for studying changes between experimental and control groups. Methods: Human adipose and skeletal muscle tissue were obtained from obese youths and aortas were taken from Wistar Rats with or without glucose drinking. The samples were prepared by high pressure freezing, freeze-fracturing. Gastrocnemius skeletal muscle was taken from obese ob/ob mice and lean wild-type mice. The tissue was cryofixed and cryosectionized. All samples were dehydrated by a freeze drying process in ultra high vaacum. The tissue was analyzed by TOF-SIMS. Semi-quantitative measurements in the rat aorta and in the mice skeletal muscle were based on principal component analysis. Results: In the negative spectra, we identified fatty acids and triacylglycerol. In the positive spectra, we identified the phosphocholine, cholesterol and diacylglycerol. Heterogeneous distribution of these molecules was observed in the skeletal muscle and adipose tissue. By using PCA, we identified a reduced signal of cholesterol in rats with high glucose intake compared to control rats. The obese ob/ob mice showed an increased level of fatty acids and diacylglycerol. The ratio between fatty acid peaks showed changed fatty acid composition in the rat aorta associated with high glucose intake and in the mice skeletal muscle associated with obesity. Conclusions: With the help of imaging TOF-SIMS, it is possible to depict the heterogeneous localization of fatty acids, phosphocholine, cholesterol, diacylglycerol and triacylglycerol in the adipose tissue, skeletal muscle and aortic wall. Moreover, imaging TOF-SIMS together with PCA analysis of TOF-SIMS spectra is a promising tool for studying lipid alterations in tissues.

3
LIST OF PAPERS
This thesis is based on the following papers, which will be referred to in the text by their
roman numerals:
I: Per Malmberg, Håkan Nygren, Katrin Richter, Yun Chen, Frida Dangardt, Peter Friberg and Ylva Magnusson. Imaging of Lipids in Human Adipose Tissue by Cluster Ion TOF-SIMS. Microscopic research and technique, 2007 Volume 70, Issue 9 828-835 II: Ylva Magnusson, Peter Friberg, Peter Sjövall, Frida Dangardt, Per Malmberg and Yun Chen. Lipid imaging of human skeletal muscle using TOF-SIMS with Bismuth cluster ion as a primary ion source. Clinical Pysiology and functional imaging (In press) III: Ylva Magnusson, Peter Friberg, Per Malmberg, Håkan Nygren and Yun Chen. Application of multivariate analysis of TOF-SIMS spectra for styding the effect of high glucose intake on aortic lipid profile Submitted IV: Ylva Magnusson, Peter Friberg, Peter Sjövall, Jakob Malm and Yun Chen. TOF-SIMS analysis of lipid accumulation in the skeletal muscle of ob/ob mice Submitted
4
LIST OF CONTENTS
ABBREVIATIONS 6
INTRODUCTION 7 Dyslipidemia and Insulin resistance 8 Lipids 9
Phospholipids 9 DAG 10 Cholesterol 10
Chain elongation and desaturation of fatty acids 11 The Adipose tissue 13
The characteristics 13 The lipid metabolism 14
The skeletal muscle 15 The structure 15 Lipid metabolism 15
The aortic wall 16 The structure 16 The lipid metabolism 16 Cholesterol 17
Need of new methodology 18 Time of Flight Secondary Ion Spectrometry 19 Historic 19
Imaging and detection of lipids with TOF-SIMS 20 Principal of TOF-SIMS in biological samples 21 Primary ion source 22 Quantitative SIMS 24 Tissue preservation method 25 Principal Component Analysis (PCA) 26 Data pre-processing 26
Auto scaling 26 Mean centering 26 Normalization 27
AIM OF THE STUDY 28
METHODS AND MATERIALS 29 Sample preparation 29
Human adipose tissue and skeletal muscle (paper I and II) 29 Rat aortic wall (paper III) 29
High-pressure freezing and freeze-fracturing 29 Mouse skeletal muscle (paper IV) 30 Cryo-sectioning 30
TOF-SIMS analysis 30 Pulse Mode 30
The bunched mode 30 The burst alignment mode 31
Charge compensation 31 Region of Interest analysis 31 Morphology 31 Statistics 32
5
SUMMERY OF RESULTS 33 Paper I 33 Paper II 33 Paper III 33 Paper IV 34
RESULTS AND DISCUSSION 35 Tissue preserving method 35 Cryo-fix and cryo-sectioning 35 TOF-SIMS imaging of fat and muscle tissue 37 Semi-quantitative comparation of TOF-SIMS spectra 39
High-carbohydrate diet and lipid accumulation in the aortic wall 42
CONCLUSIONS 45
ACKNOWLEDGEMENT 46
REFERENCES 47
APPENDIX (PAPERS I-IV). 52
6
ABBREVIATIONS
ADRP Adipose differentiation- related protein
DAG Diacylglycerols
DGLA Dihomo-gamma linolenic acids
EM PACT High-pressure freezing machine
ER Endoplasmic reticulum
FAS Fatty acid synthetase
FFA Free fatty acids
HPF High-pressure frozen
IMCL Intramyocellular lipids
LMIG Liquid metal ion gun
LN2 Liquid nitrogen
MALDI-MS Matrix-assisted laser desorption/ionization mass spectrometry
MRS Magnetic Resonance Spectroscopy
MUFA Monounsaturated fatty acids
m/z Mass to charge ratio
PC phosphatidylcholine
PCh Phosphocholine
PC1 Principal Component 1
PCA Principal Component Analysis
PUFA Polyunsaturated fatty acids
SEM Scanning electron microscopy
SIMS Secondary Ion Mass Spectrometry
TAG Triacylglycerol
TLC Thin Layer Chromatography
TOF-SIMS Time-of-flight secondary ion mass spectrometry

7
“Ad extremum”
8
INTRODUCTION
Obesity induced by sedentary lifestyle and energy-rich diet is an increasing problem around
the world. Millions of people are suffering from overweight, a problem which is hazardous to
their health and leading to premature death. Obese animals and humans accumulate lipids not
only in the adipose tissue, but also in other tissues such as the liver, skeletal muscle and the
aortic wall. This so-called non-ectopic lipid accumulation is a strong contributor to the
development of insulin resistance, type-2 diabetes and cardiovascular disease [1-4]. On the
basis thereof, it is necessary to further investigate the lipid distribution pattern in those tissues.
Time-of-flight secondary ion mass spectrometry (TOF-SIMS) with the use of Bismuth
clustering ions is an imaging mass spectrometry method with high lateral resolution, which
permits identification and localization of lipids without probing and chemical fixation. This
method provides information about the chemistry of tissue samples, and represents a new
approach for identifying and imaging lipids in biological tissues.
Dyslipidemia and Insulin resistance
Insulin, a protein hormone produced by pancreatic β-cells is needed for the control of both
carbohydrate and lipid metabolism [5]. Consequently, failure in insulin signalling has
widespread and devastating effects on many organs. When the amount of insulin is
insufficient to produce a physiologically adequate insulin response from fat, muscle and liver
cells, insulin resistance develops [6,7]. As a result, the possibility to store lipids within the
adipose tissue fails. The free fatty acid (FFA) uptake by the adipose tissue is decreased and
the stored triacylglycerol (TAG) is hydrolyzed. This causes an augmented FFA release by the
adipocytes, resulting in elevated plasma FFA [8,9]. When excess FFA is transported to the
skeletal muscle, this will lead to lipid overloading in muscle cells which will prevent glucose
uptake and utilization [10,11]. More specifically, accumulation of intermediates of lipid
metabolism, such as diacylglycerol (DAG) and Acyl-CoA has been shown to interfere with
insulin signalling [12]. In the liver, high FFA level decreases its ability to store carbohydrates,
which consequently leads to elevated blood glucose. High plasma insulin levels of and
glucose due to insulin resistance often lead to metabolic syndrome with an increased risk of
both atherosclerosis and type-2 diabetes[13-15] .
9
Lipids
The primary function of lipids in biological systems is to store energy, predominately in the
form of TAG. Lipids are also the important integral components in the cell membrane, and
they can act as secondary messengers in signal transduction or produce prostaglandins.
Further, other purposes of lipids are to function as vitamins and hormones. Choline is an
amine originated in the lipids. Choline is vital for the build up signalling functions of cell
membranes, and in the formation of phosphocholine as reviewed by Vance et Vance [16].
Abnormal lipid metabolism is strong contributors to insulin resistance, type-2 diabetes and
cardiovascular diseases. For example, in obesity many studies show that both saturated fatty
acid (SFA), and monounsaturated fatty acids (MUFA) are upregulated, and that
polyunsaturated fatty acid (PUFA) are decreased [17].
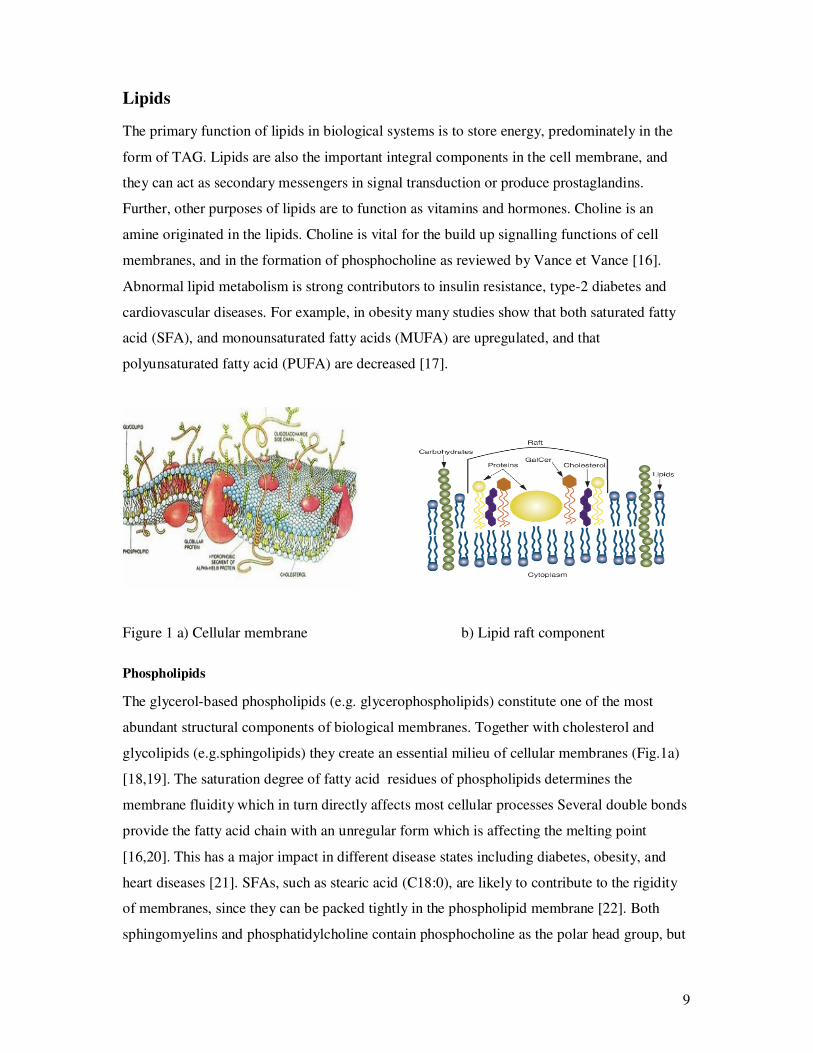
Figure 1 a) Cellular membrane b) Lipid raft component
Phospholipids
The glycerol-based phospholipids (e.g. glycerophospholipids) constitute one of the most
abundant structural components of biological membranes. Together with cholesterol and
glycolipids (e.g.sphingolipids) they create an essential milieu of cellular membranes (Fig.1a)
[18,19]. The saturation degree of fatty acid residues of phospholipids determines the
membrane fluidity which in turn directly affects most cellular processes Several double bonds
provide the fatty acid chain with an unregular form which is affecting the melting point
[16,20]. This has a major impact in different disease states including diabetes, obesity, and
heart diseases [21]. SFAs, such as stearic acid (C18:0), are likely to contribute to the rigidity
of membranes, since they can be packed tightly in the phospholipid membrane [22]. Both
sphingomyelins and phosphatidylcholine contain phosphocholine as the polar head group, but
10
their hydrophobic backbone is different. Sphingomyelin synthesis involves the transfer of
phosphocholine from phosphatidylcholine onto ceramide, producing DAG as a by-product
[23].
DAG
DAG is a glyceride with two fatty acids esterfied with a glycerol molecule produced from
glycerol-3-phosphate pathway [24,25] or synthesised from acylation of monoacylglycerol
[26]. DAG can be further converted to phosphatidylcholine and phosphatidyletanolamine or
TAG [16]. DAG is not a major component of biological membranes, but plays a significant
role in both intermediate metabolism and in signal transduction as a second messenger and
has been shown to accumulate in the insulin-resistant muscle of high-fat fed rats [27,28].
Increased levels of DAG may be due to chronic hyperinsulinemia or by hydrolysis of
phosphatidylcholine.
Cholesterol
Cholesterol is another lipid that plays a major role in the membrane structure. However,
excessive cholesterol is involved in the formation of atherosclerotic lesions [16]. Cholesterol
is transported in the plasma predominantly as cholesteryl esters associated with lipoproteins
[29]. Acetyl-CoA derived from fatty acids or pyruvate in mitochondria β-oxidation is utilized
in cholesterol biosynthesis. A dynamic clustering of sphingolipids and cholesterol forms rafts
in the lipid bilayer (see figure 1b) [30]. Lipid raft appears to be a mechanism to group various
processes on the cell surface by bringing together various receptor mediated signal
transduction processes [31].
11
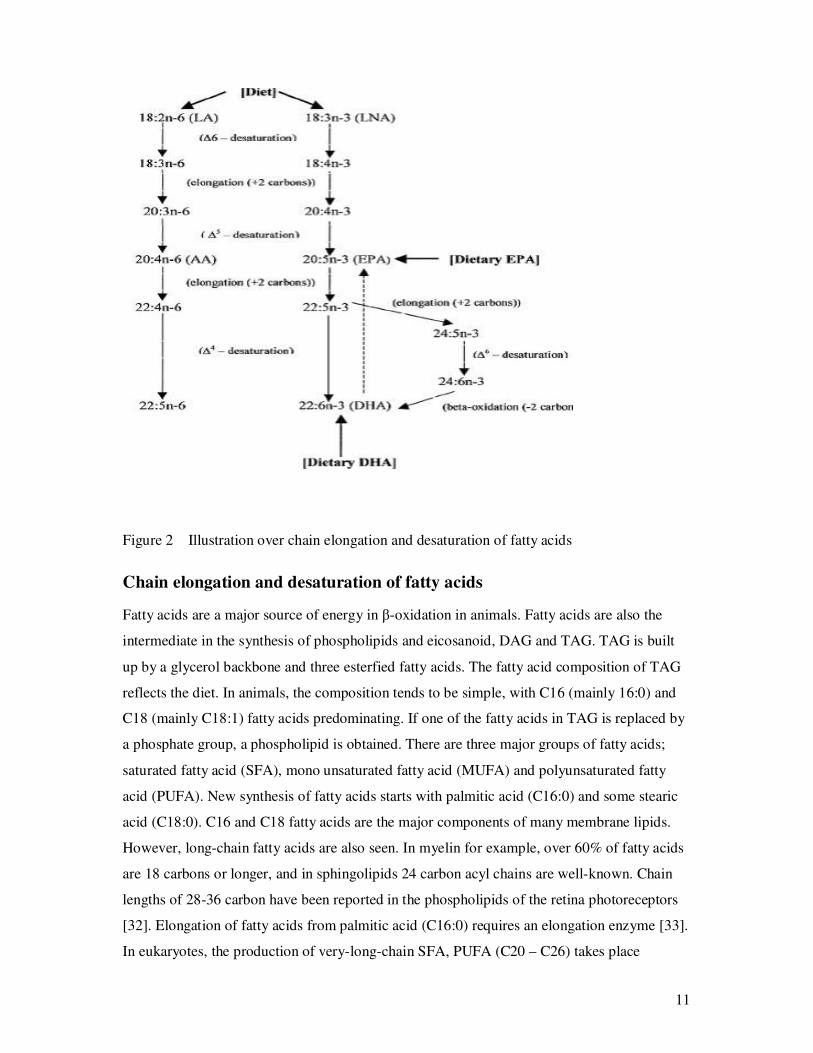
Figure 2 Illustration over chain elongation and desaturation of fatty acids
Chain elongation and desaturation of fatty acids
Fatty acids are a major source of energy in β-oxidation in animals. Fatty acids are also the
intermediate in the synthesis of phospholipids and eicosanoid, DAG and TAG. TAG is built
up by a glycerol backbone and three esterfied fatty acids. The fatty acid composition of TAG
reflects the diet. In animals, the composition tends to be simple, with C16 (mainly 16:0) and
C18 (mainly C18:1) fatty acids predominating. If one of the fatty acids in TAG is replaced by
a phosphate group, a phospholipid is obtained. There are three major groups of fatty acids;
saturated fatty acid (SFA), mono unsaturated fatty acid (MUFA) and polyunsaturated fatty
acid (PUFA). New synthesis of fatty acids starts with palmitic acid (C16:0) and some stearic
acid (C18:0). C16 and C18 fatty acids are the major components of many membrane lipids.
However, long-chain fatty acids are also seen. In myelin for example, over 60% of fatty acids
are 18 carbons or longer, and in sphingolipids 24 carbon acyl chains are well-known. Chain
lengths of 28-36 carbon have been reported in the phospholipids of the retina photoreceptors
[32]. Elongation of fatty acids from palmitic acid (C16:0) requires an elongation enzyme [33].
In eukaryotes, the production of very-long-chain SFA, PUFA (C20 – C26) takes place
12
independently of fatty acid synthetase (FAS) by membrane-bound elongases on the cytosolic
face of the endoplasmic reticulum (ER) membrane [34]. Fatty acid desaturase introduces
double bound specific locations in the acyl-chain. By successive actions of elongase and
desaturase enzymes the fatty acid chains decide the physiological properties of the membrane
function. There are three different desaturase occurring in mammals: delta 9 desaturase, delta
6 desaturase and delta 5 desaturase. The delta 9 desaturase, is also known as stearoyl-CoA
desaturase -1 (SCD-1) and is used to synthesize palmitoleic (C16:1) and oleic acid (C18:1) by
insertion of a cis-double bond in the delta 9 position of the fatty acid chain. The delta 6 and
delta 5 desaturase are required for the synthesis of PUFA such as arachidonic acid,
eicosapentanoic acid (EPA) and docosahexaenoic acid (DHA), where alpha-linolenic acid
(ALA; 18:3n–3) are the precursor for EPA and DHA. While, arachidonic acid is synthesized
from linoleic acid (LA; 18:2 n-6) and is the precursor for prostaglandins [35-37]. All the
essential fatty acids, such as linolenic and -linolenic acid, must come from the diet, since
mammals are incapable of producing these fatty acids by themselves.
13
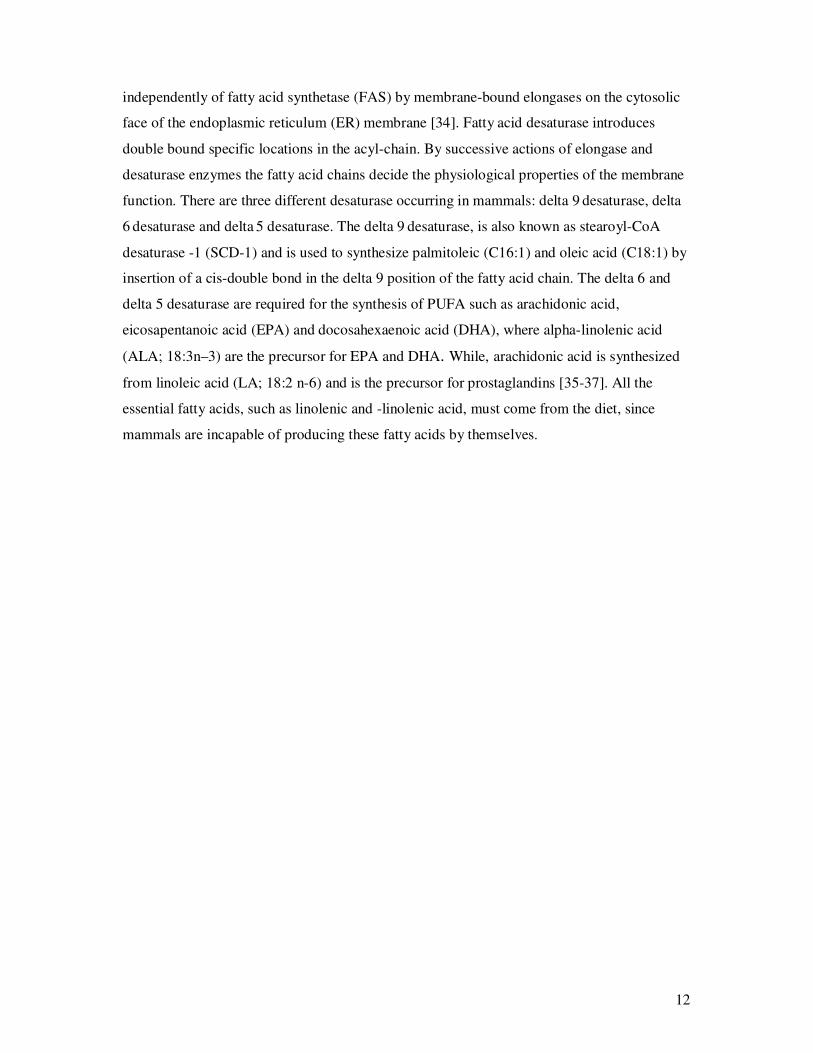
Figure 3 Illustration of the adipose tissue
The Adipose tissue
The characteristics
Adipose tissue is a loose connective tissue composed of adipocytes in an abundant capillary
bed; this was known as early as 1850 in work by Fleming [38]. In the middle of 1900 Mirski
and co-workers found the adipose tissue to be an active organ with a specific carbohydrate
metabolism [39], and at the same time Reynolds and Marble found the lipolytic activity of the
adipose tissue in rat and man [40]. Histochemical techniques and chemical analysis showed
that insulin increased glycogen synthesis in this tissue [41]. Del Vecchio et al showed the
distribution and concentrations of cholesterol in skeletal muscle and adipose tissue [42].
Adipose tissue involvement in insulin resistance and obesity was recognized by Rabinowitz in
1960 [43]. However, since the introduction of the gas-liquid chromatography technique the
same decade, more detailed information has been obtained. Hirsch, Hegsted and co-workers
showed the fatty acid composition of the adipose tissue in different region of the body [44].
Siiteri et al identified the adipose tissue as a major site for metabolism of sex steroids (i.e.
estrogens and cortisone/cortisol) [45]. In the middle of the 1990’s, the hormone leptin was
identified to be produced by the adipocytes. Hence, the adipose tissue was considered as an
endocrine organ [46]. Today, the adipose tissue is established as a complex and highly active
metabolic and endocrine organ, which is releasing a number of hormones such as tumor
necrosis factor-alpha (TNF-α), Interleukin-6 (IL-6) and adiponectin [47-49] .
14
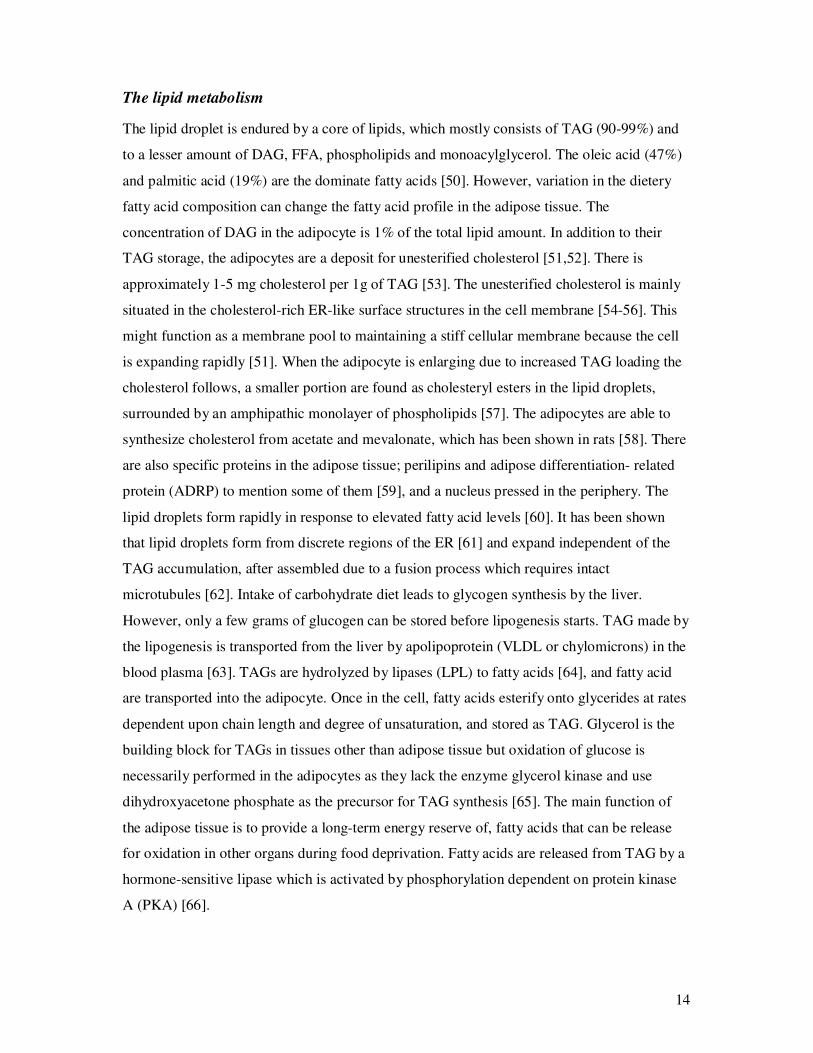
The lipid metabolism
The lipid droplet is endured by a core of lipids, which mostly consists of TAG (90-99%) and
to a lesser amount of DAG, FFA, phospholipids and monoacylglycerol. The oleic acid (47%)
and palmitic acid (19%) are the dominate fatty acids [50]. However, variation in the dietery
fatty acid composition can change the fatty acid profile in the adipose tissue. The
concentration of DAG in the adipocyte is 1% of the total lipid amount. In addition to their
TAG storage, the adipocytes are a deposit for unesterified cholesterol [51,52]. There is
approximately 1-5 mg cholesterol per 1g of TAG [53]. The unesterified cholesterol is mainly
situated in the cholesterol-rich ER-like surface structures in the cell membrane [54-56]. This
might function as a membrane pool to maintaining a stiff cellular membrane because the cell
is expanding rapidly [51]. When the adipocyte is enlarging due to increased TAG loading the
cholesterol follows, a smaller portion are found as cholesteryl esters in the lipid droplets,
surrounded by an amphipathic monolayer of phospholipids [57]. The adipocytes are able to
synthesize cholesterol from acetate and mevalonate, which has been shown in rats [58]. There
are also specific proteins in the adipose tissue; perilipins and adipose differentiation- related
protein (ADRP) to mention some of them [59], and a nucleus pressed in the periphery. The
lipid droplets form rapidly in response to elevated fatty acid levels [60]. It has been shown
that lipid droplets form from discrete regions of the ER [61] and expand independent of the
TAG accumulation, after assembled due to a fusion process which requires intact
microtubules [62]. Intake of carbohydrate diet leads to glycogen synthesis by the liver.
However, only a few grams of glucogen can be stored before lipogenesis starts. TAG made by
the lipogenesis is transported from the liver by apolipoprotein (VLDL or chylomicrons) in the
blood plasma [63]. TAGs are hydrolyzed by lipases (LPL) to fatty acids [64], and fatty acid
are transported into the adipocyte. Once in the cell, fatty acids esterify onto glycerides at rates
dependent upon chain length and degree of unsaturation, and stored as TAG. Glycerol is the
building block for TAGs in tissues other than adipose tissue but oxidation of glucose is
necessarily performed in the adipocytes as they lack the enzyme glycerol kinase and use
dihydroxyacetone phosphate as the precursor for TAG synthesis [65]. The main function of
the adipose tissue is to provide a long-term energy reserve of, fatty acids that can be release
for oxidation in other organs during food deprivation. Fatty acids are released from TAG by a
hormone-sensitive lipase which is activated by phosphorylation dependent on protein kinase
A (PKA) [66].
15
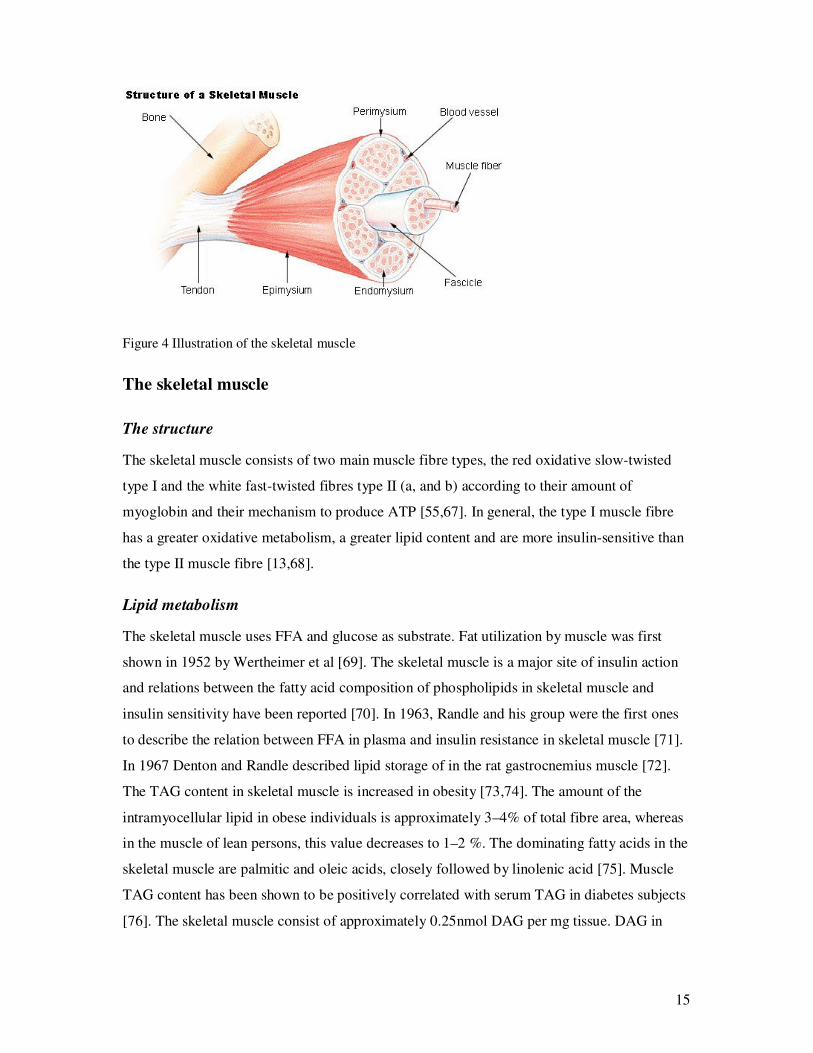
Figure 4 Illustration of the skeletal muscle
The skeletal muscle
The structure
The skeletal muscle consists of two main muscle fibre types, the red oxidative slow-twisted
type I and the white fast-twisted fibres type II (a, and b) according to their amount of
myoglobin and their mechanism to produce ATP [55,67]. In general, the type I muscle fibre
has a greater oxidative metabolism, a greater lipid content and are more insulin-sensitive than
the type II muscle fibre [13,68].
Lipid metabolism
The skeletal muscle uses FFA and glucose as substrate. Fat utilization by muscle was first
shown in 1952 by Wertheimer et al [69]. The skeletal muscle is a major site of insulin action
and relations between the fatty acid composition of phospholipids in skeletal muscle and
insulin sensitivity have been reported [70]. In 1963, Randle and his group were the first ones
to describe the relation between FFA in plasma and insulin resistance in skeletal muscle [71].
In 1967 Denton and Randle described lipid storage of in the rat gastrocnemius muscle [72].
The TAG content in skeletal muscle is increased in obesity [73,74]. The amount of the
intramyocellular lipid in obese individuals is approximately 3–4% of total fibre area, whereas
in the muscle of lean persons, this value decreases to 1–2 %. The dominating fatty acids in the
skeletal muscle are palmitic and oleic acids, closely followed by linolenic acid [75]. Muscle
TAG content has been shown to be positively correlated with serum TAG in diabetes subjects
[76]. The skeletal muscle consist of approximately 0.25nmol DAG per mg tissue. DAG in
16
skeletal muscle has been shown to be upregulated in insulin resistance and type 2 –diabetes
[12]. There is also a minor amount of cholesterol in the skeletal muscle [42].
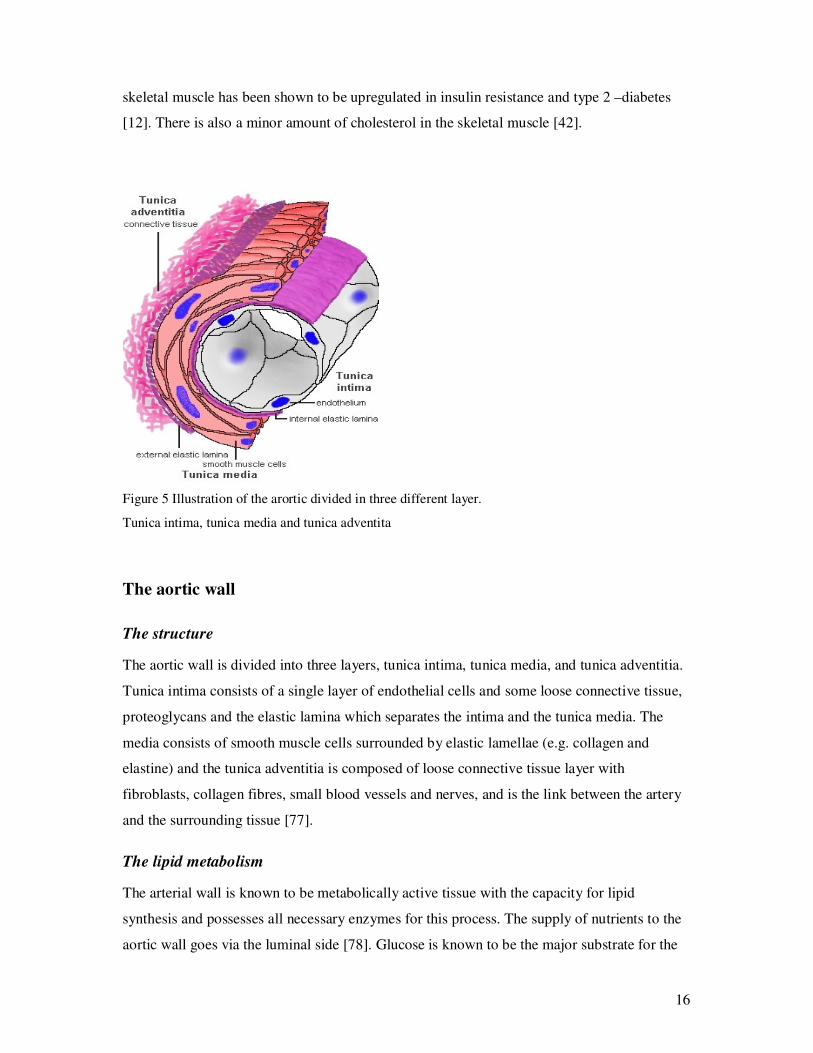
Figure 5 Illustration of the arortic divided in three different layer.
Tunica intima, tunica media and tunica adventita
The aortic wall
The structure
The aortic wall is divided into three layers, tunica intima, tunica media, and tunica adventitia.
Tunica intima consists of a single layer of endothelial cells and some loose connective tissue,
proteoglycans and the elastic lamina which separates the intima and the tunica media. The
media consists of smooth muscle cells surrounded by elastic lamellae (e.g. collagen and
elastine) and the tunica adventitia is composed of loose connective tissue layer with
fibroblasts, collagen fibres, small blood vessels and nerves, and is the link between the artery
and the surrounding tissue [77].
The lipid metabolism
The arterial wall is known to be metabolically active tissue with the capacity for lipid
synthesis and possesses all necessary enzymes for this process. The supply of nutrients to the
aortic wall goes via the luminal side [78]. Glucose is known to be the major substrate for the
17
arterial wall and endothelial cells have been shown to utilize exogenous glucose at
physiological concentrations for their energy production [79]. Aortic endothelial cells do
express insulin receptors with characteristics similar to those in other tissues, and GLUT1 is
the major glucose-transporting protein in endothelial cells [80]. Further, the vascular smooth
muscle cell utilizes primarily medium-chain fatty acids as substrate for energy [78]. TAG is
synthesised from fatty acids and glucose is active in the arterial wall in response to insulin.
They also express lipases that hydrolyse TAG in response to low insulin levels [81]. Elastic
tissue has been shown to be important for the lipid accumulation in the aortic wall where it
forms stable complex together with lipids [82]. Atherosclerosis is a cardiovascular disease
related to intake of high fat diet and accumulation of lipids in the intima and media of the
aortic wall.
Cholesterol
Different species response differently to cholesterol feeding, rat for example has been shown
to have only a minor elevation of serum cholesterol levels, whereas in humans the plasma
cholesterol level is increased moderate when fed with cholesterol-rich diet [83]. Plasma
cholesterol is an important source of cholesterol in the aortic wall where it is transported with
lipoprotein VLDL and LDL particles. The subendothelial retention of lipoproteins in the aortic
wall is a key initiating process in atherogenesis [84]. The synthesies of cholesterol in the
aortic wall has been demonstrated in several animals and humans [16,85]. Cholesterol
homeostasis in the body is dependent on several factors, such as absorption, synthesis,
storage, and excretion. The cholesterol concentration in humans and animals is at a constant
level [86]. Cholesterol can be hydrolysed and excreted from the arterial wall [87] and is
transported back to the liver by HDL-cholesterol proteins. The efflux of cholesterol from
tissues goes via liver X receptors (LXR) situated in both macrophages, endothelial cells and
smooth muscle cells [88,89]. LXRs operate as cholesterol sensors which protect from
cholesterol overload [90].
18
Need of new methodology
Interests in studying lipid and metabolic disorders are expanding quickly. To cope with all
these advances in disease research an imaging technique is. This has motivated to explore
TOF-SIMS imaging techniques for further studies in lipid research, to discover lipids within
biological tissues. Different methods have been used in the past. Electromicroscopy provides
information about lipids in relation to organelles [91]. Histochemical staining with Oil Red O
or Sudan dye is used to nonspecifically localize neutral lipids, while lipid-specific
fluorescence probes are only available for cholesterol [92,93]. Chromatography methods
previously used for lipid identification include gas chromatography, thin layer
chromatography and high-performance liquid chromatography (HPLC). The separation of
gangliosides for example was done by the use thin-layer chromatography and mass
spectrometry [94,95]. HPLC separates TAG, DAG, acetates and even intact phospholipids by
degree of unsaturation [96]. However, these techniques require extraction steps and lipid
derivatization from tissues, which are both time-consuming and requires relatively large
amounts of tissues and may result in lipid mobilization. Moreover, these techniques cannot
reveal the heterogeneous distribution of lipids in the biological tissues. Different mass
spectrometry (MS) techniques have been used in lipid research. For example, multiple
precursor ions scanning hybrid quadrupole time of flight has been used very successfully in
quantitative profiling of phospholipids [97]. Matrix enhanced SIMS (ME-SIMS) has been
used for imaging phosphatidylcholine and sphingomyelin at cellular level [98] and Matrix-
assisted laser desorption/ionization mass spectrometry (MALDI-MS) has been used for mass
determination and distribution of phosphatidylcholine and cerebroside in rat brain [99].
MALDI-MS coupled with a time-of-flight technique leads to the acquisition of images with
high mass resolution but relatively low spatial resolution, and the signal visibility is low,
because of mass interference with matrix ion peaks [100]. Raman mapping and Fourier
transform infrared (FTIR) imaging spectroscopy have been used for identifying
polymorphism of ceramide [101]. However, these methods are lacking from chemical
specificity.
19
Time of Flight Secondary Ion Spectrometry
TOF-SIMS ion microscope affords molecule-specific information without the incorporation
of dye, isotopes or labels. Static TOF-SIMS is a surface-sensitive method where the primary
ion dose is low, and thus provides molecular information of the sample surface with minor
damage.The use of TOF-SIMS permits ion imaging in areas as large as 500 µm2. Allow
visualization of the morphology, topology, and chemical composition of significant peaks in
the spectrum from the biologic samples with molecular weight of some thousand daltons. A
recent modification is to use bismuth (Bi3+) cluster ion as the primary ion source, which
increased spatial (100 nm) and mass (m/∆m 5000-10000) resolution [102] makes it possible,
without any chemical pretreatment of the tissue, to measure directly the intensity of, and map,
biomolecules within the tissues [103,104]. TOF-SIMS has several advantages. It has the
possibility to direct compare signal intensity of different molecules in biological tissue and the
ability to analyze sequential layers to form a three-dimensional analysis. Moreover, its
detection of atomic concentrations can be as low as 10 ppm.
Historic
Secondary ion mass spectrometry (SIMS) is a relatively new technique for investigation in
biological research. The first prototype to SIMS was developed by Castaing and Slodzian in
the early 1960 in parallel to the Americans Liebel and Herzog [105]. There are two different
operational regimes in SIMS, the dynamic and the static, which provides fundamentally
different information. Dynamic SIMS, with a single non-pulsed primary beam is a rather
destructive technique. The high numbers of bombarding ions allows depth profiling, reaching
several microns with elemental sensitivity. The maximum mass range is typically ~ 250 m/z.
The static SIMS appeared when Benninghoven (1970) reduced the primary ion current density
on the sample [106]. It was first used to analyze inorganic compounds as oxids layers on
metals, or mapping organic contaminats on semiconductors devices [107,108]. Static SIMS is
surface mass spectrometric techniques which gives information about the chemical
composition of the upper most monolayer of the bombarded surface with a high mass
resolution. The technique creates some destruction of tissues and therefore it is necessary to
use a very low dose of primary ions. Less than 1% of the top surface layer of atoms or
molecules receives an ion impact [109]. Vickerman and his team saw the possibilities of static
SIMS to be developed into a surface mass spectrometry in the middle of the 1970 [110], and
from this technique, the TOF-SIMS instrument was developed. The first results were reported
20
by Chait and Standing in 1981 [111] by the implementation of TOF analyzers which
achieved a significant improvement in mass resolution and transmission efficiency imaging
[112-115]. Many interesting works have been done since the beginning of the 1980. For
example 1981, Burns detected ions in the cat choroidea and in 1982, Na+ and In+ were
detected in the kidney and cardiac tissue from rat [116]. The most famous one is the mapping
of stable and radioactive isotopes in the thyroid gland by Berry et al in 1986 [117]. TOF-
SIMS has also been used for drug detection in cells (anti-tumor drugs in histological sections)
[118] to better evaluate successful early cancer treatments. Drug detection is accomplished
indirectly by detecting a tag isotope naturally present or introduced by labeling, mainly with
halogens,15N and 14C [118-120].
Imaging and detection of lipids with TOF-SIMS
Detection of lipids with TOF-SIMS was introduced by McMahon in 1995 by the imaging and
detection of phosphatidylcholine and sphingomyeline in porcine brain and dog adrenal gland
[121]. The same year Seedorf manages to detect cholesterol in blood from patients suffering
from Smith-Lemli-Opitz syndrome [122], which is another example of early TOF-SIMS
studies in the biomedical field. The technique is still developing mainly due to the
development of new primary clustering sources as buckminister fulleren (C60+), gold (Au+)
and bismuth (Bi+). Its use in biological research is expanding. McQuaw et al have identified
sphingomyelin in cholesterol domains in the process of raft formation in cellular membranes
[123]. They have detected lateral heterogeneity of dipalmitoyl phosphatidylethanolamine-
cholesterol in Langmuir-Blodgett film [124]. Using Au3+ cluster ions Sjövall et al
demonstrated cholesterol, sulfatides, phosphatidylinositols, and phosphatidylcholine [125].
Later on the Bi3+ cluster ions have been used in the localization of cholesterol,
phosphocholine and galactosylceramide in rat cerebellar cortex [126,127].
21
High energy
Ion extraction
Pulsed
Primary beam
High energy
Ion extraction
High energy
Ion extraction
Pulsed
Primary beam
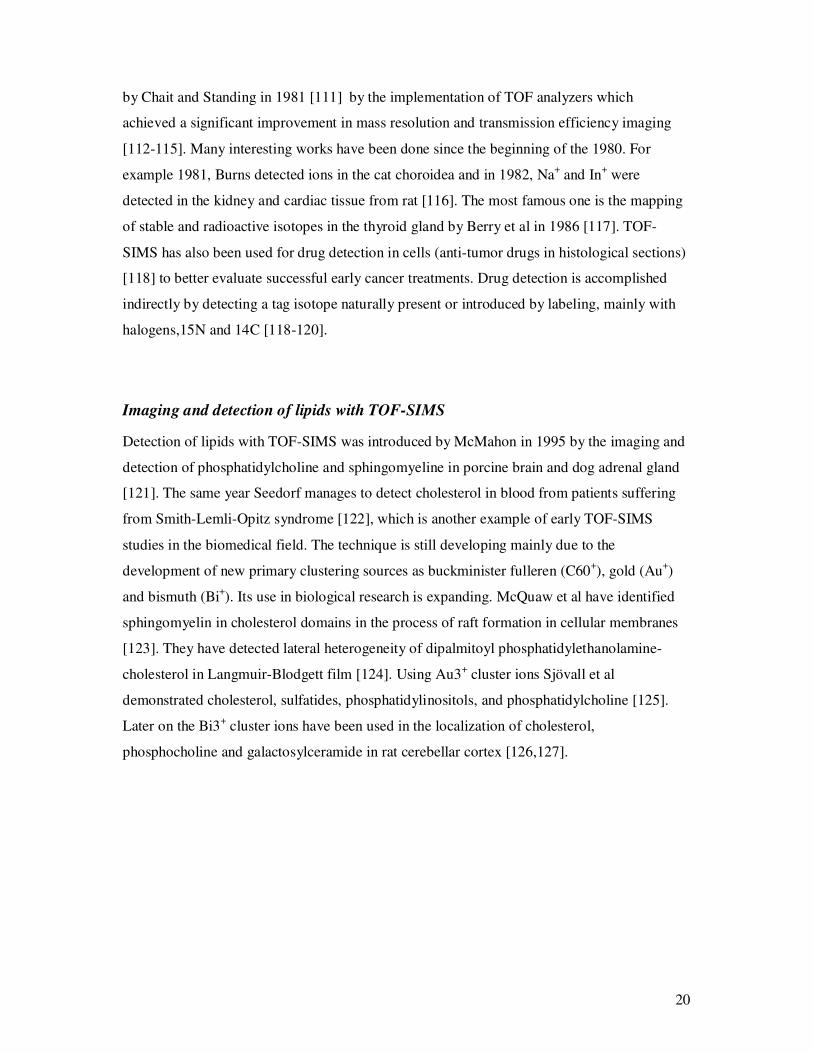
Figure 7 Schematic drawing of TOF-SIMS instrument
Principal of TOF-SIMS in biological samples
The “Time-of-Flight” of an ion is proportional to the square root of its mass, so that all
different masses are separated during the flight and can be detected individually [128]. The
sample is sputtered by a primary ion beam with energy between 5 and 25 keV. The beam can
be pulsed with a puls lengt from ns up to µs. This generates a sort of collision cascade of
atoms and molecules of the <3 upper most layer of the sample surface [129]. A cloud of atoms
and molecules arises; most of them are neutrals only, some (approx. 1%) are ionized as
secondary ions, positively or negatively charged [130]. The emitted ionized particles with
different masses leave the surface at the same time via the deflection of the electron
trajectories due to the Lorentz force which is transmitted into kinetic energy. Ions are
separated charged by the TOF extraction optics. Ions are accelerated to a given energy with an
electric potential and transferred into a field-free flight path of vacuum of approximately 2m.
With a certain amount of kinetic and internal energy “they” are travelling in free and are
separated by their mass in the end of the flight path the ionized particle hits a “detector”
where the ions are detected and counted. The flight times of all the ions to the detector are
electronically measured and related to the ion mass (m/z) [113,131]. Moreover, some of the
identical secondary ions will leave the sample surface with different kinetic energy, which
results in a decreased resolution due to a band broadening. To compensate for this, the
instrument is equipped with a type of “mirror” called the reflectron in the end of the flight
path. Ions with same mass-to-charge ratio but higher kinetic energy penetrate deeper into the
reflector, delaying their time of arrival to the detector than the slower low-energy ions. This
22
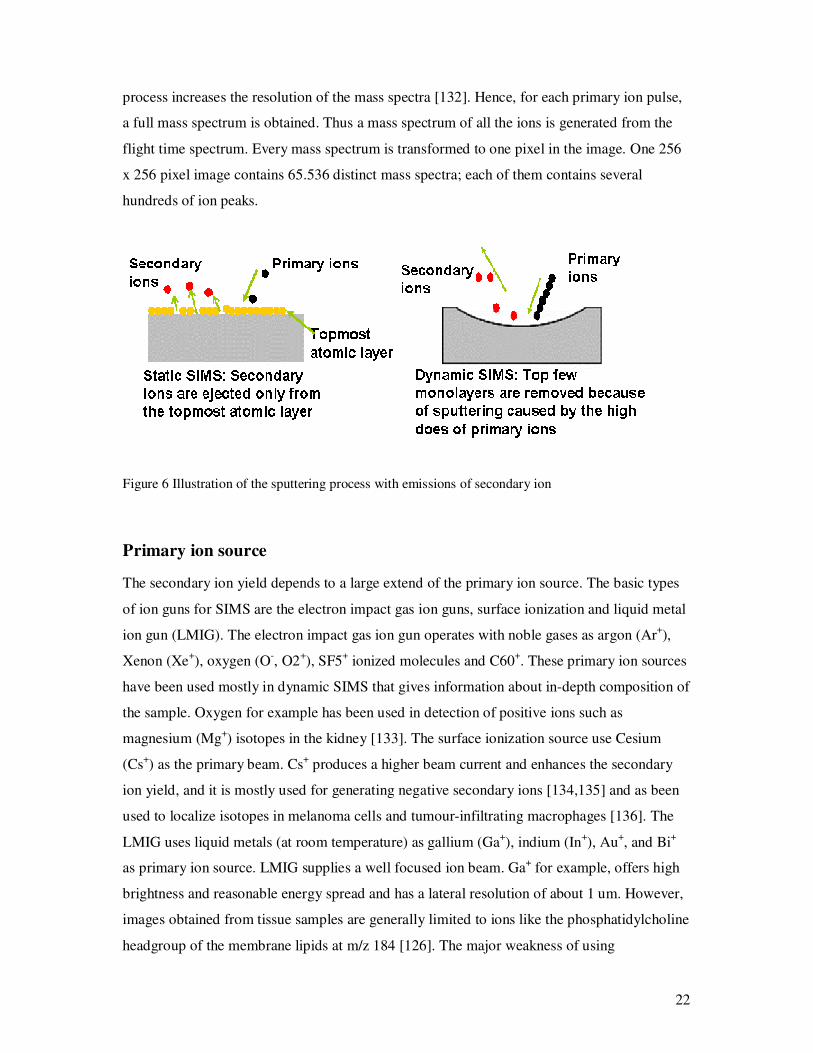
process increases the resolution of the mass spectra [132]. Hence, for each primary ion pulse,
a full mass spectrum is obtained. Thus a mass spectrum of all the ions is generated from the
flight time spectrum. Every mass spectrum is transformed to one pixel in the image. One 256
x 256 pixel image contains 65.536 distinct mass spectra; each of them contains several
hundreds of ion peaks.
Figure 6 Illustration of the sputtering process with emissions of secondary ion
Primary ion source
The secondary ion yield depends to a large extend of the primary ion source. The basic types
of ion guns for SIMS are the electron impact gas ion guns, surface ionization and liquid metal
ion gun (LMIG). The electron impact gas ion gun operates with noble gases as argon (Ar+),
Xenon (Xe+), oxygen (O-, O2+), SF5+ ionized molecules and C60+. These primary ion sources
have been used mostly in dynamic SIMS that gives information about in-depth composition of
the sample. Oxygen for example has been used in detection of positive ions such as
magnesium (Mg+) isotopes in the kidney [133]. The surface ionization source use Cesium
(Cs+) as the primary beam. Cs+ produces a higher beam current and enhances the secondary
ion yield, and it is mostly used for generating negative secondary ions [134,135] and as been
used to localize isotopes in melanoma cells and tumour-infiltrating macrophages [136]. The
LMIG uses liquid metals (at room temperature) as gallium (Ga+), indium (In+), Au+, and Bi+
as primary ion source. LMIG supplies a well focused ion beam. Ga+ for example, offers high
brightness and reasonable energy spread and has a lateral resolution of about 1 um. However,
images obtained from tissue samples are generally limited to ions like the phosphatidylcholine
headgroup of the membrane lipids at m/z 184 [126]. The major weakness of using
23
monoatomic primary ion sources, such as Ga+, has been the low ion intensities and the high
fragmentation of the high mass secondary ions.
A breakthrough with SIMS analysis resulted from the development of polyatomic cluster
primary ion beam systems. Polyatomic ions involve the simultaneously collision of a number
of atoms within a space of a few tenths of a nanometer. Because a cluster ion dissociates upon
collision with a surface, the penetration depth of the elements of the cluster is reduced as
compared to monoatomic primary ion bombardment [137,138]. This significantly increases
the secondary ion yield and molecular specificity in the MS, even though the formation of
oxide fragments arises with polyatomic ions [139]. The Au3+ cluster ion beams for example
have the potential to increase the secondary ion yield to 3 orders of magnitude compared to
the conventional monoatomic Ga+ [114]. By using Au3+ Touboul detected cholesterol at m/z
385 in mouse brain [140] and later on different fatty acids and TAG in mouse leg [141]. The
Bi3+ cluster ions give better intensities and efficiencies of ions and produces less
fragmentation of the parent ions and allow a better lateral and mass
resolution[102,137,140,141]. The C60+ is another used cluster ion source [142]. The C60+
projectiles produce about a tenfold increase in the measured signal compared with Ga+.
However, this thin primary ion source is primarily used for depth-profiling generating 3-
dimentional images [143].
Sputtering process for organic ion is not fully understood. The ion impact on the target is of
major importance. During high energetic bombardment when the sample is receiving a high
amount of energy, a crater can form. This often occurs when heavy ion such as Cu+ or Au+
cluster are used. When crater is formed only half of the sputtered atoms leave the surface, the
other half is stocked in form of a crater rim [134]. Moreover, ionization of secondary ions can
be formed either as ionization of the entire molecule M, through an ejection of an electron as
radicals (M+, M-), by protonation [M+H] +, de-proteonation [M-H]-, or cationisation by Na+,
K+ or Ag+. The protonation (and de-protonation) or cationisation strongly depends on the
matrix and this is referred as the matrix effect [144]. In principal the emission of secondary
ions could be non-ionized in the absence of cations. On the contrary, adding Na+ or K+ salts to
the sample the ionization of the analytes will occur. This was also shown in the presence of
hydrogen-rich substrate [145]. To enhance the secondary ion yield other techniques can be
used. For example, covering the sample by a nm-thick layer of gold or silver, has been shown
to provide increased intensities for large analytes in biological tissue, so-called sample
metallization (Meta-SIMS) [146].
24
Quantitative SIMS
Static SIMS produces qualitative information, but quantitative information is more
complicated to obtain. However, even though TOF-SIMS is not being regarded as a
quantitative technique, different quantitative approaches have been tried out with both static
and dynamic TOF-SIMS. There are several factors that can influence the ion intensity in the
sample, such as the chemical composition of the sample matrix, topography, matrix-and
primary ion interactions, instrumental transmission, and detector response [114].
One approache to acheiving quantitative SIMS data was the implantation of an ion (e.g.
isotope) of known concentration into the sample of interest [147,148]. By this approach the
difficulty to control chemical environment can be compensated by simultaneously depositing
an internal standard with the similar properties. The sample is then sputtered and depth
profiled and the reference material signals are integrated over the sputtered time. The
integrated ion intensity of the reference material can then be directly related to its known
concentration, and a relative concentration of other elements can be calculated. This has been
used in work by Harris et al [149] for quantifying the calcium distribution in biological
samples. Moreover, this was also used for quantitative analysis of the immunosuppressive
drug cyclosporine A (CsA), in whole blood of organ transplant patients. In this study,
cyclosporine D, an analog of CsA which does not exhibit immunosuppressive activity, was
used as an internal standard. Good correlation was obtained between HPLC, which is the
specific method for the CSA analysis, and TOF-SIMS and MALDI results [150]. Another
used approached is to add deuterium labeled molecules as internal standard. For example,
direct quantification of cocaine in urine has been achieved by use of deuterated cocaine as an
internal standard [151]. Analysis of L-DOPA is another example were a linear calibration
curves were constructed by integrating the protonated molecular ion to silver ion peak area
ratios over a known ion dosage and plotting versus the original sample concentration [152]. In
addition, semi-quantitative information may be obtained by ToF-SIMS by normalizing the
intensity of a signal of interest to a ubiquitous ion that produces a reasonably stable signal
across samples of interest. This ion serves as an internal standard to account for variations in
ionization efficiency across a sample caused by, for example, topographical and matrix effects
[153]. This was applied in the work by Ostrowski where they relatively quantified cholesterol
in membranes of individual cells from differt subjects [154]. These authors used a fatty acid
fragment C5H9+ as an internal standard to normalize the signal of interest. Relative
quantitative approach is possible for tissue by using carbon (12C) as an internal reference. This
25
approach was used for the quantification of halogens and calcium [155]. Standard preparation
was determined based on molecular incorporation (halogens) or mixing (calcium) in
methacrylate resin. Standard measurements were performed by depth analysis. Results
obtained show that the relationship between the signal intensity measured and the elemental
concentration is linear in the range of biological concentrations [155]. SIMS quantification
has also been used to measure the concentration of 14C –labeled molecules and their
variabilities in different cells of human fibroblast. This procedure was assessed through local
isotope 14C/12C ratio measurement. This relates the signal intensity of the labeled 14C to that of
the corresponding natural isotope (12C) of known tissue concentration. Thus, differences in the
concentration of arginine between different fibroblasts [156] could be obtained successfully.
Tissue preservation method
When preparing samples for TOF-SIMS analysis, several issues have to be taken into
consideration. Preparation and fixation technique is very important to preserve the chemical
and structural integrity of the tissue cells. Molecular species such as K+, Ca+, Na+ as well as
some proteins can diffuse, thus leading to incorrect results [113]. It is also necessary to avoid
contaminations as they could hide native molecules in the sample surface. Most cells and
tissue contain more than 70 % water. Given that samples are analyzed in ultra high vacuum, if
they are placed in vacuum directly, artifacts will be created. Consequently, water must be
removed from the sample. Before samples are analyzed by TOF-SIMS the ice must be
eliminated by freeze-drying. In the freeze-drying process the pressure is lowered and vacuum
created, adding heat to this low pressure environment allows the ice to sublimate into vapor.
The removal of ice during the freeze-drying process can cause biomolecules to undergo
significant structure changes. However, time, pressure and temperature in the freeze-drying
process are factors that can be adjusted to avoid unnecessary mobilization of ions.
Cryo-sectioning can be immediately performed from liquid nitrogen (LN2) snap-frozen
samples. The cryo-sectioned sample can than be mounted directly on electrically conducted
substrates and freeze-dried prior to SIMS analysis. The rapidity of the cooling process is
another important issue. High speed freezing is vital to limit the ice-crystal size and related
damage of the cells [119]. Another way is to use liquid propane for rapid freezing, which
protects samples from ice-crystals without any prefixation or cryoprotectants, however this is
very hazardous [157]. The newest method in freezing without cryo-protectants is the high-
26
pressure-freezing. High-pressure-freezing will immobilize all cells and/or tissue components
immediately. This method is vitrifying the tissue fluids, i.e., absence of ice crystals, a so-
called amorphos-ice. This technique reduces osmotic effects [158] and shifting and loss of
ions in the sample [159] that occur with chemical fixation. High-pressure-freezing is at
present the only way to vitrify or freeze well biological samples thicker than 50 µm [160].
Other methods have been tried out, for example the gluteraldyd fixation in protein film [161].
This has been shown to be successful in protein analysis.
Principal Component Analysis (PCA)
PCA is a common statistical technique for finding patterns in data of high dimension and
expressing the data in such a way as to highlight their similarities and differences by
transforming a number of (possibly) correlated variables into a (smaller) number of
uncorrelated variables called principal components (PC). So, the first principal component
accounts for as much of the variability in the data as possible, and each succeed component
expresses for as much of the remaining variability as possible [162-164].
Data pre-processing
The pre-processing of the data before PCA analysis is important so it transforms the data into
a format that will be more easily and effectively processed for the purpose of the user. There
are a number of different tools and methods used for preprocessing; the most common ways
are auto-scaling, mean-centering and normalization.
Auto scaling
Auto-scaling of the spectra are used to get a fair comparison between variables with an
unequal spread. By auto scaling all variables, i.e. by dividing each peak values with the
standard deviation of that peak are scaled so unit variance achieves. Auto-scaling allows all
variables to influence equally.
Mean centering
If the variables have the same units, mean-centering may be the suitable option because that
variables (peaks) with significantly variation are in fact more important, i.e. include more
information regarding the spectra in the study, compared to those peaks with small variation.
Mean centering consists of subtracting each peak with respectively peaks mean to achieve
clarity in the model. The mean of the peaks will be equal to zero [165]. If you do not mean

27
center your data the first component does not really describe the largest direction of variation
in the data, but rather it tends to describe the mean of the data, or at least some combination of
the mean and the direction of largest variation.
Normalization
Normalization consists of dividing the spectra at each pixel by the total ion counts at that
pixel. Normalization is typically done to reduce topographic or matrix effects.
28
Aim of the study
1) To test new technique “high-pressure frozen” for preserving tissues for TOF-SIMS
analysis
2) To use imaging TOF-SIMS to localize different lipids in human adipose tissue and
skeletal muscle.
3) To test whether multivariate analysis of TOF-SIMS spectra can be used for studying lipid
changes:
a) In the skeletal muscle, associated with obesity
b) In the aorta, associated with high glucose intake
29
Methods and materials
Sample preparation
Human adipose tissue and skeletal muscle (paper I and II)
Healthy volunteers with a high body-mass index (age 14-16 yr, BMI>30, n=3) were used as
subjects. A subcutaneous adipose tissue was obtained using the percutaneous needle biopsy
technique with suction. A small piece of skeletal muscle was obtained after administration of
local anaesthesia, by a Bergström needle (6 mm) from the middle part of lateral vastus muscle
in the right leg. The biopsies were directly placed in ice-cold phosphate buffered saline (PBS;
pH 7.4) until used for high-pressure freezing.
Rat aortic wall (paper III)
Aortas were taken from male Wistar rats with or without glucose drinking from birth to 6
months of age, directly placed into ice-cold phosphate buffered saline (PBS; pH 7.4) until
used for high-pressure freezing, same procedures as described above.
High-pressure freezing and freeze-fracturing
An equal procedure was utilized using high-pressure freezing and freeze-fracturing in
experiments of paper I, II and III. High-pressure-freezing was preformed at 2000 bar and -
196◦C using the EMPACT high pressure freezer (Leica, Vienna) as described in details by
others [160]. Briefly, the sample is placed into a specimen holder composed of a gold carrier
and a copper ring sealed on the top. The carrier is inserted into a pressure chamber through
which the pressurized liquid nitrogen is jetted and the sample is quickly frozen. This
procedure immobilizes cell components immediately. Samples were quickly transferred onto
a pre-cooled copper block in a liquid nitrogen bath. With help of a pair of forceps, the copper
ring was removed from the gold carrier to lay open a fractured surface. The sample on the
carrier was transferred to a vacuum chamber and freeze-dried over night at 10-3 mbar. The
freeze-dried tissues were kept in a desiccator under vacuum until TOF-SIMS measurements.
The copper-rings were placed in a box filled with absolute ethanol and kept in -20◦C until
used.
30
Mouse skeletal muscle (paper IV)
Mice were anaesthetized with isofluran, and gastrocnemius skeletal muscle was extirpated and
frozen immediately.
Cryo-sectioning
In paper IV cryo-sectioning was performed at -20 ºC with a Leica cryostat.
The frozen-tissue blocks were attached were taken from the -80 degree freezer and thawed in
the cryostat machine for 45 min before the sample were sectioned. The sample was fastening
with a sucrose solution on the tissue holder. Slices of 16 µm were cut, placed on an object
slide and kept in the freezer at -20 ºC. Before measurement, the samples were freeze-dried in
a vacuum chamber over night and directly analysed in vacuum by TOF-SIMS.
TOF-SIMS analysis
Measurements were performed using both an ION TOF TOF-SIMS IV and an ION TOF
TOF-SIMS V instruments. Spectra of positive and negative ions were recorded using 25 keV
Bi3+ primary ions and low-energy electron flooding for charge compensation as described
previously [120]. To identify ion species present at respective surfaces the bunched mode was
used. Spectra were recorded with the instrument optimized for maximum mass resolution
(m/∆m = 3000–6000, beam diameter 5 µm, pulse width 10 ns, repetition rate 5 kHz) .The
average primary ion current was 0.1 to 0.15 pA. Subsequently, high resolution secondary ion
images (m/∆m 500, beam diameter 300 nm) were acquired in the burst alignment mode with
a target current of 0.04 pA to 0.1 pA. Data were collected from several image fields on each
section. The primary ion doses were kept well below the so-called static limit of 1013
ions/cm2.
Pulse Mode
Two different modes have been used in imaging lipids in this thesis.
The bunched mode
The bunched mode means that ion pulses that LMIG bombard the surface with are bunched
and in a short pulse (10-30 ns pulse). This mode provides a high mass-resolution (∆/∆m
3000-6000) and a mass spectrum with thin peaks, but low lateral resolution (around 5 µm).
31
The burst alignment mode
The burst alignment mode means that the ion squirt is well-focused without the ability to
compress the ion-pulses in time, thus primary ion bombardment occurs in a long pulse period.
This mode provides high-lateral images (around 100 nm) however; the mass resolution is low
(m/∆m < 500) and peaks are broader [115].
Charge compensation
TOF analysis depends on the sample being at its ground potential, otherwise the primary ion
beam can be deflected by the sample charging and the secondary ions energies will be
different [140] and their yield is reduced [112]. By irradiation of the surface with low energy
electrons this is avoided. To handle this problem TOF-SIMS instrument is provided by an
electron flood gun [113]. This function is activated during TOF-SIMS measurements.
Region of Interest analysis
Region of interest, abbreviated ROI, is imaging software tool. This is used to select specific
regions within the image for particular purposes. ROI was used in paper I and IV. For defined
regions (any shape and size) whitin the analysed area, it is possible to sum the mass spectra
with the help of ROI at the entire pixel points within each defined region.
Morphology
The fractured copper rings that kept in ice-cooled ethanol 99% were transferred to propylene
oxide and embedded in epoxy resin. Semi thin sections (about 0.8 µm thick) were cut with a
Leica Ultracut R ultramicrotome, equipped with an FC 4E cryounit, collected on super frost
glass and air-dried at room temperature. Tissue sections were stained with toluidine blue/azan.
For visualization of slow twisted skeletal muscle fibres sections were incubated with
monoclonal anti-skeletal myosin (slow) (1:100 dilution Sigma-Aldrich, St Louis, Missouri). A
controlled corrosion of the section surface was obtained by etching the section for at least 15
min in sodium ethoxide diluted to 50 % with absolute ethanol and subsequently rehydrating in
descending concentrations of ethanol. For histological analysis of lipids, 5 µm thick fresh
frozen OCT imbedded skeletal muscle tissue sections were used and stained with oil-red. All
histological stainings were analysed with microscopy automated software (KS400, Zeiss). To
obtain information about tissue surface, the sample on the carrier that was used for TOF-
32
SIMS analysis was coated with palladium using an Edwards Xenosput 200 sputter. Scanning
electron microscopy was performed using a Zeiss 982 Gemini.
Statistics
Variance patterns within the TOF-SIMS peak intensities were analysed by principal
component analysis (PCA), described in detail elsewhere (10), using PLS_Toolbox 4.0
(Eigenvector Research, Wenatchee,WA) for MATLAB Version 7.1.0.246 R14 (The
MathWorks Inc., Natick, MA). Spectral variations between samples are visualized in score
plots, in which each dot represents an individual sample. The loadings plots show the
contribution of each original variable (ion peak) to the new variables, principal components
(PCs). All significant peaks with intensities above 50 count in the m/z region of 200-900 in
the negative ion spectra and of 300-900 in the positive ion spectra were selected for analysis.
Peak intensities were normalized to total ion intensities, and the data was auto-scaled before
analysis. To further elucidate differences between two groups, the data were analyzed with
Student’s unpaired t test. Values are presented as means ± SD. A p-value less than 0.05 were
considered statistically significant.
33
Summery of Results
Paper I
The most significant lipids found in human adipose tissue are palmitic acid (C16:0) at m/z
255, palmitoleic acid (16:1) at m/z 253, oleic (C18:1) at m/z 281 and stearic acid (18:0) at m/z
283. The phosphocholine head group at m/z 184, cholesterol at m/z 385, diacylglycerols in the
m/z of (550 - 640) and triacylglycerols in the m/z (830 - 880) were also identified. The
distribution of lipids in human adipose tissue was heterogeneous, with cholesterol localized in
intracellular organelles and in the lipid droplets and FA/TAG localized in the lipid droplets.
Thus, TOF-SIMS equipped with Bi3+ LMIG provides us an extra possibility to detect and
localize different lipids in human adipose tissue at their original localization.
Paper II
This paper shows heterogeneous distribution of lipids in the human skeletal muscle. The most
significant lipids found in human skeletal muscle are palmitic acid (C16:0) at m/z 255,
palmitoleic acid (16:1) at m/z 253, oleic (C18:1) at m/z 281 and stearic acid (18:0) at m/z 283.
The phosphocholine headgroup at m/z 184 representing phosphatidylcholine and
sphingomyelin, cholesterol at m/z 385, diacylglycerols in the m/z (550 - 640) and
triacylglycerol in the m/z (830 - 880) were also identified. The PC was mostly localized to the
edge of the fibre, representing the sarcoplasma or endomysium. Cholesterol was weak, and
more scattered in the edge of the muscle fibre. The fatty acids were scattered all over the
fibre, more intensed in some area which could be related to the Type-1 skeletal muscle fibres.
High DAG signal and low TAG signal were detected within the muscle fibre.
Paper III
In this paper multivariate analysis of TOF-SIMS spectra was used as a semi-quantitative tool
for measuring lipids in the aortic wall. Rats were divided into two groups, with or without
glucose in their drinking water from birth to 6 months of age. The results showed a
statistically significant reduction in cholesterol ion intensity the aortic wall. The present study
also showed that ratio of palmitoleic over palmitic acid (C16:1/C16:0) was increased and the
ratio of linolenic over oleic acid (C18:2/C18:1) was decreased. The same pattern was shown
for the ratios of DAGs with different fatty acid residues.
34
Paper IV
The results of Paper IV showed that there was an increased signal intensity of fatty acids and
DAGs in skeletal muscle of the obese ob/ob mice. ROI showed that fatty acid signal
intensities within the muscle cell were significantly increased in the ob/ob mice. These
changes were revealed through, PCA analysis of TOF-SIMS spectra. TOF-SIMS images
showed also increased fatty acids and DAGs in the skeletal muscle of the obese ob/ob mice
when compared with the lean wild-type mice. Moreover, analysis of the ratio between
different fatty acid peaks revealed changes in MUFA and PUFA that have been reported early
in obesity. These changes in fatty acid composition were also reflected in the ratio between
different DAGs and phosphatidylcholine that contain different fatty acid residues.
35
Results and Discussion
Tissue preserving method
The samples in papers I, II and III were preserved by high-pressure freezing, freeze-fracturing
and freeze-drying. When samples are prepared by high-pressure freezing, all analytes in an
intact cell are preserved at their original location [160]. TOF-SIMS is a surface-sensitive
method, it is very important to avoid surface contamination which can hide native molecules
in a tissue sample. In the freeze-fracturing process the sample is cracked into two parts
generating two new fresh surfaces without contacting the preparation environment. One
surface was used for TOF-SIMS imaging and another complementary surface was used for
histological stainings. According to earlier studies, the fractured plane of a biological sample
is irregular and extends along the inner hydrophobic area of the lipid bilayer in the plasma
membrane or surfaces of organelles [166]. The irregular surface can lead to topographic
effects that can present apparent enrichments or depletions of molecules, which have to be
taken under consideration in the interpretation of images [167]. Although TOF-SIMS usually
requires flat sample surfaces, rough surfaces can also be investigated [168]. However, care
has to be taken when interpretating the data. Accordingly, both the human adipose tissue and
skeletal muscle samples were freeze-fractured and were affected by topographic effects.
Topographic effects will give significant effects on the yield of the secondary ions, e.g. band
broadering and loss of signal intensities [134]. To compensate for topographic and/or matrix
effects in rough samples, it is possible to divide the spectra at each pixel by the total ion
counts at that pixel, so-called normalization. Another approach is to use principal component
analysis where images are normalized against the first principal component [165]. However,
normalization seems to result in loss of contrast and vividness in the image, so neither of these
two normalization methods was applied for the images shown in this thesis.
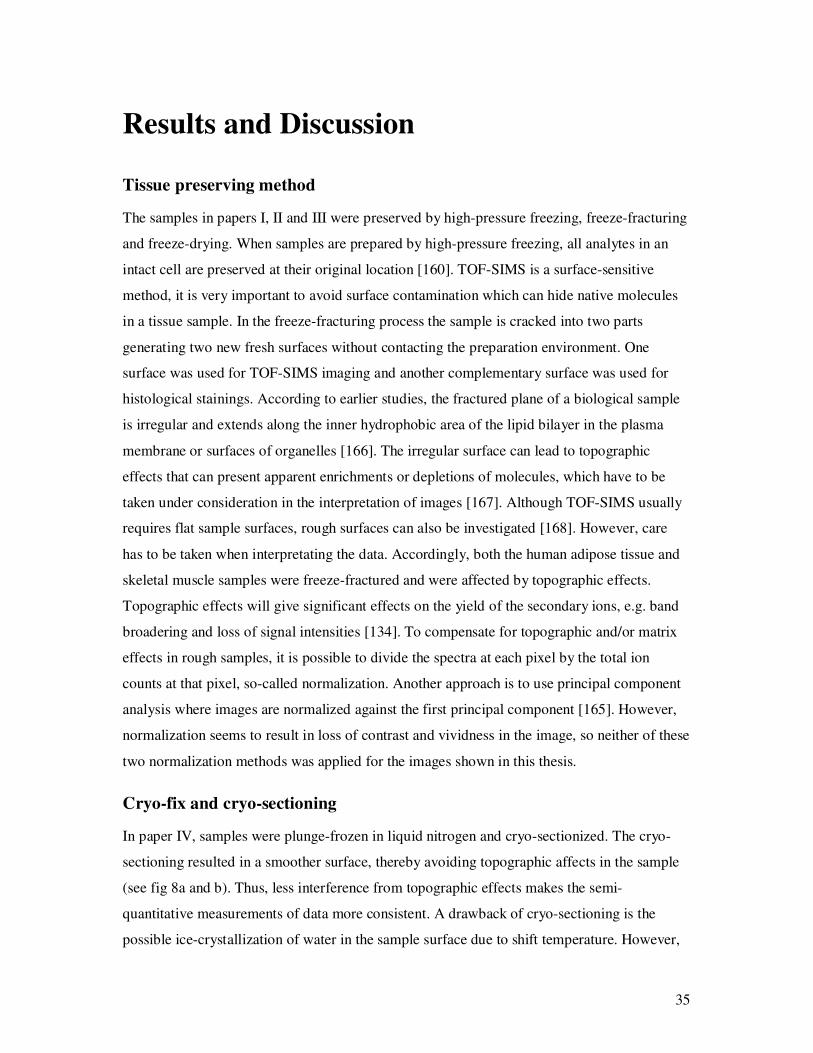
Cryo-fix and cryo-sectioning
In paper IV, samples were plunge-frozen in liquid nitrogen and cryo-sectionized. The cryo-
sectioning resulted in a smoother surface, thereby avoiding topographic affects in the sample
(see fig 8a and b). Thus, less interference from topographic effects makes the semi-
quantitative measurements of data more consistent. A drawback of cryo-sectioning is the
possible ice-crystallization of water in the sample surface due to shift temperature. However,
36
a b
ice-crystallization can be minimized if the tissue is cryofixed directly with a cryogen. We did
not observe any influence of ice-cryztal formation, despite the fact that samples were
untreated. To avoid water interfering in the mass spectra, a freeze-drying step in ultra-high
vaacum before analysis is necessary [169]. This can cause ion motility and shrinkage of the
sample. However, this step was used in both methods and for all of the samples. In addition,
another disadvantage with the cryo-sectioning method is the possible ion redistribution when
slicing the tissue [169].
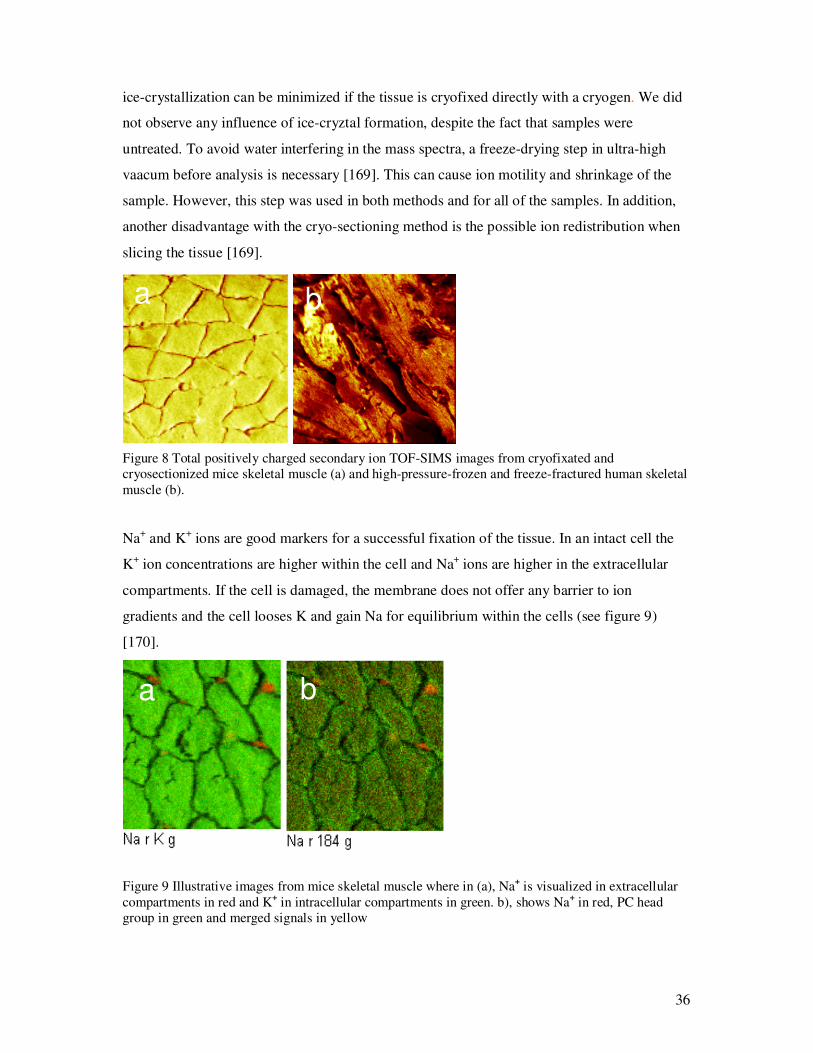
Figure 8 Total positively charged secondary ion TOF-SIMS images from cryofixated and cryosectionized mice skeletal muscle (a) and high-pressure-frozen and freeze-fractured human skeletal muscle (b). Na+ and K+ ions are good markers for a successful fixation of the tissue. In an intact cell the
K+ ion concentrations are higher within the cell and Na+ ions are higher in the extracellular
compartments. If the cell is damaged, the membrane does not offer any barrier to ion
gradients and the cell looses K and gain Na for equilibrium within the cells (see figure 9)
[170].
a ba b
Figure 9 Illustrative images from mice skeletal muscle where in (a), Na+ is visualized in extracellular compartments in red and K+ in intracellular compartments in green. b), shows Na+ in red, PC head group in green and merged signals in yellow
a b a ba b
37
TOF-SIMS imaging of fat and muscle tissue
In papers I and II the TOF-SIMS technique was used to study lipid distribution in the human
adipose tissue and skeletal muscle from obese youth. In paper I, high cholesterol signals were
detected in the membrane of the adipocytes, a finding that is in agreement with previous
results [56]. Other studies have shown that approximately 6% of the total cholesterol is
located in the lipid droplets, in the form of cholesteryl esters [53]. Moreover, our data showed
that clear-cut signals of DAG, fatty acids and low levels of TAG were located to the central
part of the adipocyte. High CN signals derived from proteins and nucleic acids were found in
structures related to loose connective tissue. The result of low TAG was unexpected,
considering that lipids in the adipocyte contain 90-99 % of TAG. The reason for the low TAG
signal is not clear. It might be that their high masses reduce their ability to reach high ion
intensity. Another possible explanation is fragmentation of TAG. Indeed, in addition to TAG
peak, we observed DAG peak in the TAG reference spectra. Fragmentation makes the lipid
identification complex. However, fragmentation is also necessary to ensure the accuracy of
lipid identities. The characteristic peak intensity ratio and “fingerprint patterns” are used to
distinguish different compounds. The localization of fragments from one molecule may give
us information of its possible relations to other fragments and their parent ions. For example,
areas which exclusively express fatty acids or DAG without TAG indicates that fatty acids or
DAG are naturally occurring molecules. Thirdly, low signal intensities of specific ions can
also be caused by topographic features. Topographic effects could occur in the freeze-
fractured sample surface as irregularities in the sample surface may affect the sputtering
process of secondary ions. However, matrix effects caused by the high contribution of the
secondary ions of K+ and Na+ localized to some areas in the sample are probably to some
extent contributing to the shift in ion signals. These ions can either reduce the levels of other
ion signals, the so-called quenching effect, or contribute to enhanced emission of some
molecules. In cultured adipocytes, about 20-50 % of DAG is newly synthesized, however, less
than 1% of DAG is accumulated in the adipocyte in vivo [171,172]. It has been shown that
TAG synthesis, and/or lipolysis, may influence the accumulation of DAG in the adipose tissue
[173]. In line with this, high DAG signals were observed in the adipose tissue, which probably
arises from fragmented TAG as shown by reference spectra. Moreover, some of the DAG
signals observed in the adipose tissue are probably unique localizations in the sample that are
not related to TAG. High signals of fatty acids were also depicted in the adipose tissue. As the
amount of non esterified fatty acids is low in the adipose tissue, it is probable that some of the
38
fatty acids emanated from fragmented TAG, DAG or PC. We observed that the most abundant
fatty acids in adipose tissue, skeletal muscle and aortic wall were palmitic acid (C16:0) at m/z
255, and oleic acid (C18:1) at m/z 281. These are also the most frequent fatty acids in the
circulation [174]. High levels of palmitic acid can lead to insulin resistance due to changes in
the level of phosphorylation of the insulin receptor and insulin receptor substrate-1. Moreover,
we identified linolenic acid (18:2) at m/z 279 a fatty acid that is used in the synthesis of
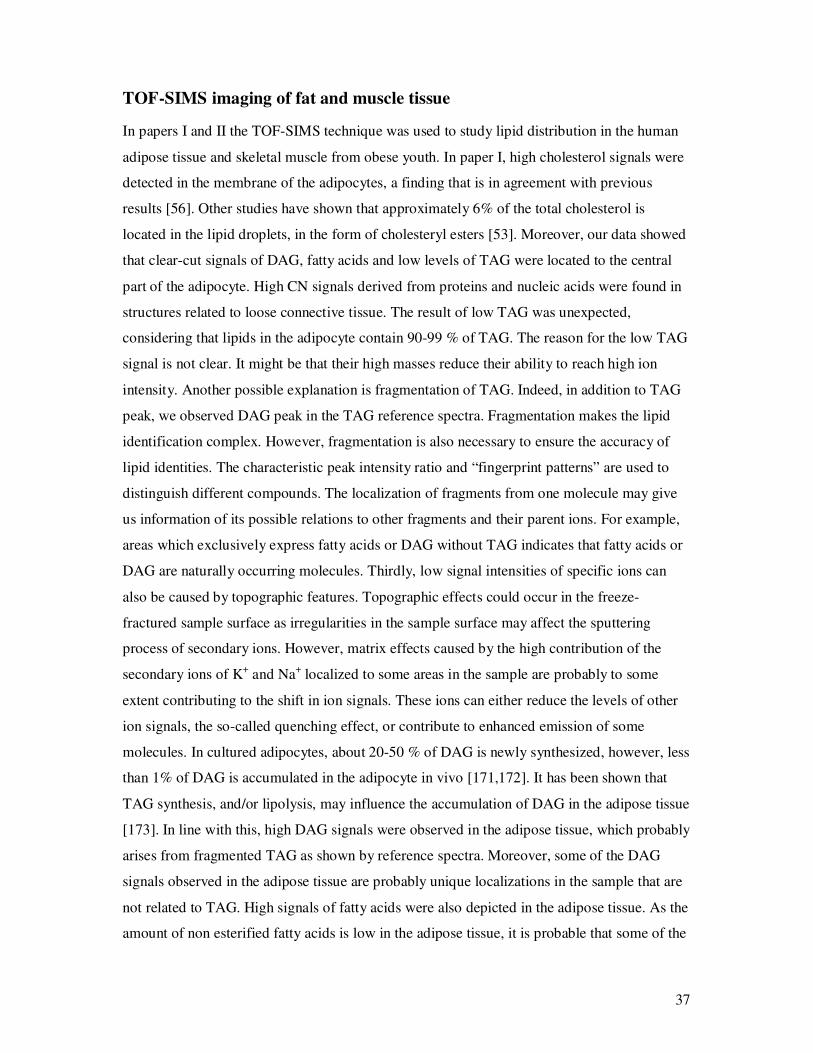
prostaglandin. Low peaks at m/z 283 representing stearic acid (18:0) were identified from
mass spectra of all tissues investigated in this thesis. Stearic acids are not so abundant in
human tissues compared to palmitic acid (16:0) the incorporation into TAG and cholesterol is
30-40% lower while its incorporation into PC is 40% [27]. Accordingly, in mass spectra from
human adipose tissue there were almost no TAG peaks found in the region of m/z 886-890
which are the peaks for TAG with stearic fatty acids incorporated in the fatty acid tails (see
figure 11). The same pattern could be seen in the skeletal muscle, figure not shown.
Figure 10 shows a spectrum from human adipose tissue in the range of m/z (800-1000)
Intake of an energy-rich diet will lead to obesity and lipid overloading in non-adipose tissues,
so called ectopic tissues, in particular the insulin-sensitive skeletal muscle. In paper II TOF-
SIMS was applied to image lipids in the skeletal muscle. Since ion microscopy is not a
morphological tool, complementary techniques are generally needed for identification of
microstructures in the SIMS image. In this study we have used scanning electron microscopy
to identify morphology in areas where TOF-SIMS images were studied. Low TAG signals
were detected in the skeletal muscle, probable due to the fact that the amount of lipid is
generally much lower in the skeletal muscle than in adipose tissue. Moreover, TAG is likely
to be fragmented in the same way in the skeletal muscle as in adipose tissue. Storage of
39
intramyocellular TAG in the skeletal muscle is associated with insulin resistance [175].
However, the primary cause of insulin resistance is not TAG, rather other intermediates of
TAG like DAG, fatty acyl-CoAs or ceramide. DAG is known to activate protein kinase C
(PKC). Site of PKC phosphorylates of serine/threonine residue on insulin receptor substrates,
which inhibits insulin signalling [34]. Interestingly, high DAG signals in the m/z range 550-
640 were detected in the skeletal muscle. The phosphocholine signals, on the other hand, were
much more intense in the skeletal muscle than in the adipose tissue. This is probably due to
the abundant sarcolemma and endomysium, which covers the skeletal muscle fibre. In
addition, the skeletal muscle had low ion intensities of cholesterol. Accordingly, the
cholesterol content in the skeletal muscle is only half that of the TAG content [154,155].
Endogenous cholesterol synthesis is low in the skeletal muscle and most cholesterol is
transported from lipoproteins in the circulation [176].
We found that in the skeletal muscle, a highly complementary localization of fatty acids,
DAGs and TAGs can be seen in the intracellular part of muscle cells, whereas PC and
cholesterol are mostly located in the edge of the cells, probably in the plasma membrane e.g.
sarcolemma. Low levels of cholesterol were scattered intracellularly in the fibre, possibly in
the intracellular organelles such as the sarcoplasmic reticulum and the mitochondria. Earlier
studies have shown that cholesterol is abundant in the lipid-laden caveolae of the sarcolemma
[177]. Cholesterol is also found in the T-tubule and to a lesser amount in the sarcoplasmatic
reticulum and mitochondria membrane [178]. The sarcolemma fluidity depends on the
cholesterol content. Phosphatidylcholine is a major phospholipid found in the membrane of
the sarcolemma, T-tubule and the sarcoplasmatic reticulum of the skeletal muscle cell [179].
We observed that the cholesterol-to-phospholipid ratio detected in the adipose tissue were 16
times higher than in the skeletal muscle.
Semi-quantitative comparation of TOF-SIMS spectra
In papers III and IV, static TOF-SIMS was used as a tool for semi-quantitative measurements
of lipid alteration in tissues. To achieve this, we used principal component analysis (PCA) to
reduce the data-set and to extract the most important information embedded in the data [115].
The 3-dimension score plot of the negative spectra in paper III showed that glucose-drinking
rats could be distinguished from control rats on the PC2 and PC3 axes. The corresponding 3-
dimension loading plot showed that linoleic acid (C18:2) was the main contributor to
differences between the two groups. Further, the 3-dimension score plot of the positive
spectra showed that the glucose-drinking rats could be distinguished from control rats
40
presumably on the PC2 and PC3 axes. The corresponding 3-d loading plot showed that the
main contributor to this deployment was DAG and cholesterol. In addition, the ratios of
different fatty acid peaks were calculated. Hereby, we found that the ratio of palmitoleic acid
(C16:1) over palmitic acid (C16:0) was increased; while the ratio of linolenic acid (C18:2)
over oleic acid (C18:1) was decreased. The same approached was used for DAG signals in
positive spectra. We found the ratio of DAG with MUFA residues over DAG with SFA
residues was upregulated. While, the ratio of DAG with PUFA residues over DAG with
MUFA residues was significantly reduced in the glucose-drinking rats when compared with
the control rats. This is in line with another study in sucrose-fed rats, where the proportion of
MUFA were increased and PUFA was decreased [180].
In paper IV the same principal was used to explore lipid differences in skeletal muscles
between the obese and lean mice. We observed increased signals in fatty acid and DAGs in
the skeletal muscle from obese mice. Accordingly, increased fatty acid deposits in tissues of
the ob/ob mice have been reported earlier [181-184]. The 3-dimensional score-plot from
negative spectra of the skeletal muscle showed that the ob/ob mice could be distinguished
from the lean wild-type mice mainly on the PC2 and PC3 axes. The corresponding loading-
plot identified palmitoleic, oleic and linoleic acids as the main contributors to the cluster of
the ob/ob mice. Furthermore, the 3-dimensional score-plot of the positive spectra from the
skeletal muscle distinguished ob/ob mice from the wild-type mice, mainly on the PC2 and
PC3 axis. The corresponding loading-plot showed that the main contributors were DAGs and
cholesterol. The ratio between different fatty acids showed that the proportion of palmitoleic
acids and oleic acids was upregulated while the proportion of linoleic acid was decreased in
the ob/ob mice as compared to the lean mice. This is in line with changes in MUFAs and
PUFAs that have been reported earlier in obesity [181,183]. These changes in fatty acid
composition were also reflected in the ratio between different DAGs and phosphatidylcholine
that contain different fatty acid residues as shown in our study. Moreover, it has been shown
that increased MUFA concentrations in muscle phospholipids are positively correlated with
fasting insulin concentrations and insulin resistance [185,186]. One of the reasons for the
accumulation of MUFA is the activation of the enzyme stearoyl-CoA desaturase (SCD-1)
associated with obesity. SCD-1 is rate limiting enzyme catalysing the synthesis of MUFA,
mainly oleic and palmitoleic acids, which are major component in tissue lipids [187].
41
Further, we observed that arachidonic acid (C20:4) over dihomo-gamma-linolenic acids
(DGLA, C20:3) were upregulated, while DGLA over linoleic acids decreased in the obese
ob/ob mice. The increased C20:4/C20:3 ratios and its relation to obesity and insulin resistance
are controversial since both increment and decrement have been reported in obese subjects
[17,188].
Moreover, region-of-interest analysis showed that fatty acid signal intensities within the
muscle cell were statistically significantly increased in ob/ob mice compared with the lean
wild-type mice. The increased DAG may contribute to insulin resistance through the
activation of protein kinase C family [12]. Moreover, insulin resistance is characterized by a
specific fatty acid pattern in the serum lipid esters, as well as in lipid storage and in cell
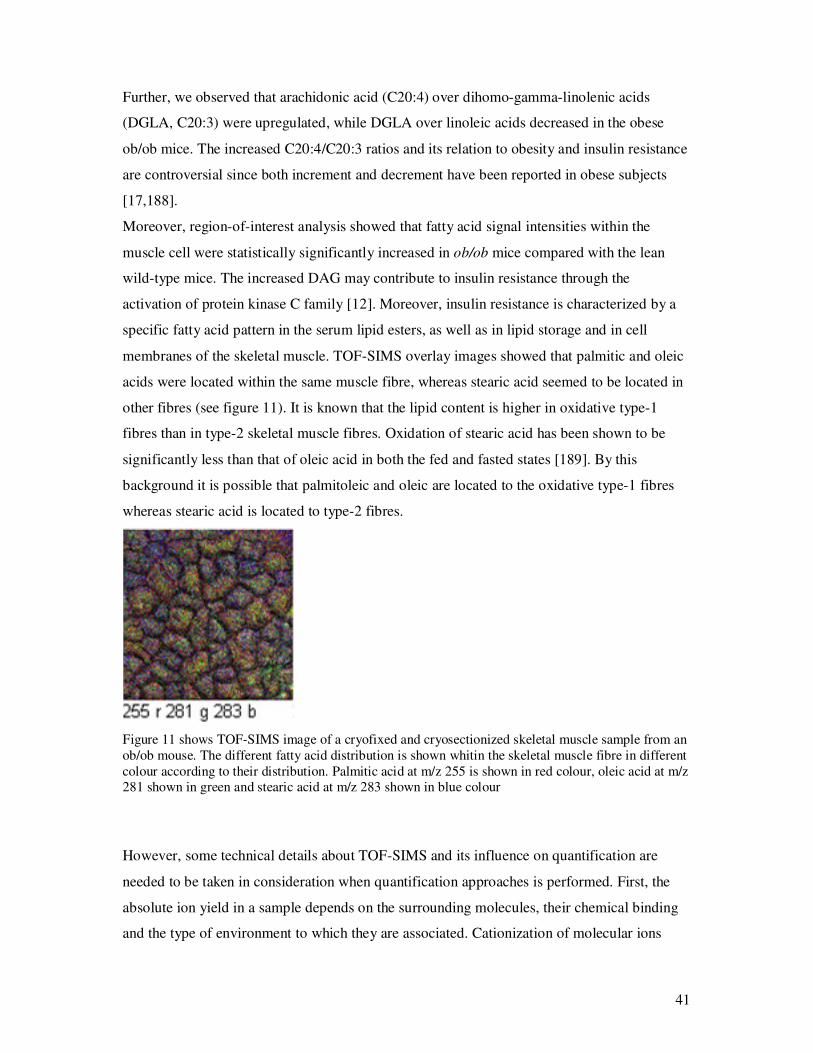
membranes of the skeletal muscle. TOF-SIMS overlay images showed that palmitic and oleic
acids were located within the same muscle fibre, whereas stearic acid seemed to be located in
other fibres (see figure 11). It is known that the lipid content is higher in oxidative type-1
fibres than in type-2 skeletal muscle fibres. Oxidation of stearic acid has been shown to be
significantly less than that of oleic acid in both the fed and fasted states [189]. By this
background it is possible that palmitoleic and oleic are located to the oxidative type-1 fibres
whereas stearic acid is located to type-2 fibres.
Figure 11 shows TOF-SIMS image of a cryofixed and cryosectionized skeletal muscle sample from an ob/ob mouse. The different fatty acid distribution is shown whitin the skeletal muscle fibre in different colour according to their distribution. Palmitic acid at m/z 255 is shown in red colour, oleic acid at m/z 281 shown in green and stearic acid at m/z 283 shown in blue colour
However, some technical details about TOF-SIMS and its influence on quantification are
needed to be taken in consideration when quantification approaches is performed. First, the
absolute ion yield in a sample depends on the surrounding molecules, their chemical binding
and the type of environment to which they are associated. Cationization of molecular ions
42
with Na+ and K+ may for example influence the ion yield of a specific ion. Na+ is known for
cationisation with ceramides, and the presence of water in the sample surface will increase ion
intensity of phosphocholine [190]. This so-called matrix effect is a known phenomenon in
TOF-SIMS methodology [191]. Thus, when quantifying with TOF-SIMS data, the matrix
effect has to be taken into consideration. TOF-SIMS has been shown to be useful in
quantifying cyclosporine A in blood samples [192] and cocaine has been successfully
measured by TOF-SIMS in urine [151]. In these studies, known concentration of internal
standards was added to the sample, and by calibration curves, it was possible to determine the
concentration of the analytes of interest in the sample. However, this approach is very difficult
to apply on tissue as it is difficult to add internal standard to the tissue as it would hide native
molecules. Moreover, the concentration of analyte molecules at the very surface must be
known and typically we only know the bulk concentration of a reference sample. Instead,
using appropriate control group offers the possibility for comparing analytes from the same
type of tissue in different groups. When quantitatively comparing samples from similar areas
in the same type of tissue (matrix), the matrix effect should be similar from one sample to the
other, and the secondary ion yields are likely to be similar. Variations in other parameters,
such as the surface inclination, acquisition time, primary ion source and current, the angle of
the beam and charge state of the matrix, should also be the same [135,193]. Thus, it is also
possible to calculate the ratio of different peaks within the same sample and to compare the
ratios between different groups. With this approach we identified differences in the fatty acid
composition as a result of obesity and high glucose intake.
High-carbohydrate diet and lipid accumulation in the aortic wall
It has been shown that a high-carbohydrate diet contributes to obesity with raised TAG and
reduced HDL content in blood plasma [194]. Accordingly, we found that rats with a high-
glucose intake had both an increased plasma TAG and a reduced HDL-cholesterol level.
Lowering of the HDL-cholesterol level plays an important role in endothelial activation and
accumulation of cholesteryl esters in the aortic wall [195,196]. However, our study showed
decreased cholesterol signals in the aortic wall. Despite the reduced HDL-cholesterol in the
glucose-drinking rats, the level of LDL-cholesterol and total cholesterol remained unchanged.
It has shown that high-carbohydrate diet reduce blood levels of both HDL- and LDL-
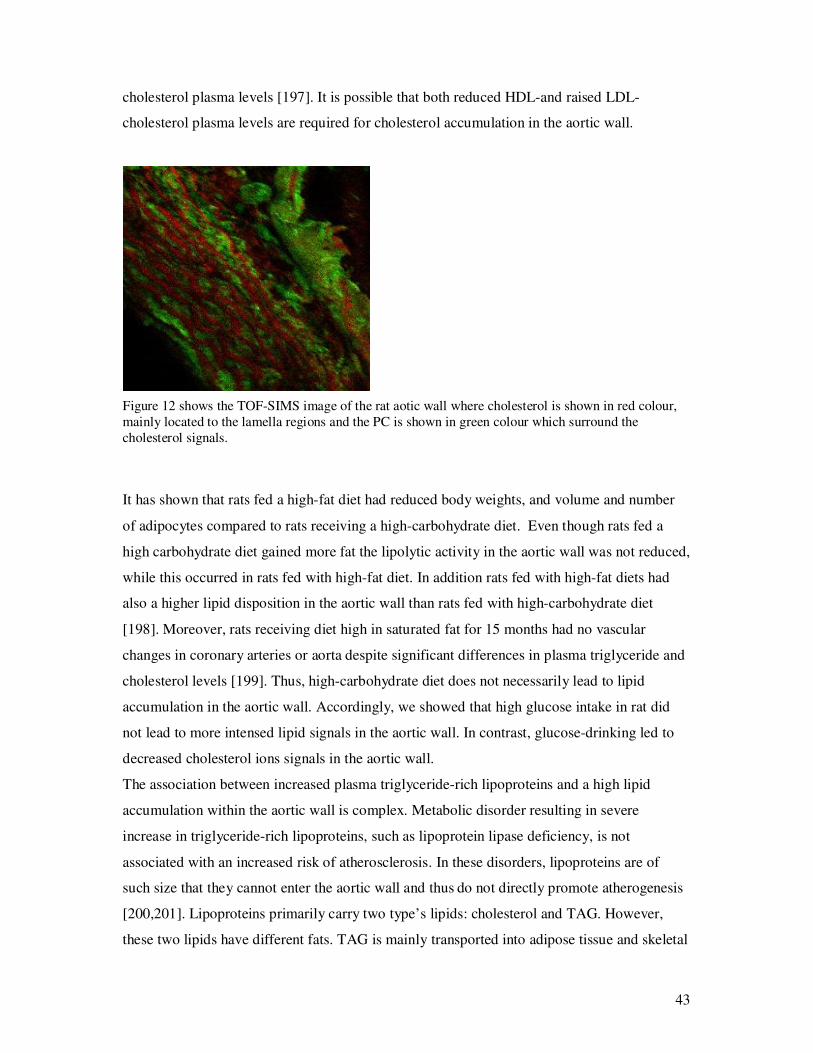
43
cholesterol plasma levels [197]. It is possible that both reduced HDL-and raised LDL-
cholesterol plasma levels are required for cholesterol accumulation in the aortic wall.
Figure 12 shows the TOF-SIMS image of the rat aotic wall where cholesterol is shown in red colour, mainly located to the lamella regions and the PC is shown in green colour which surround the cholesterol signals.
It has shown that rats fed a high-fat diet had reduced body weights, and volume and number
of adipocytes compared to rats receiving a high-carbohydrate diet. Even though rats fed a
high carbohydrate diet gained more fat the lipolytic activity in the aortic wall was not reduced,
while this occurred in rats fed with high-fat diet. In addition rats fed with high-fat diets had
also a higher lipid disposition in the aortic wall than rats fed with high-carbohydrate diet
[198]. Moreover, rats receiving diet high in saturated fat for 15 months had no vascular
changes in coronary arteries or aorta despite significant differences in plasma triglyceride and
cholesterol levels [199]. Thus, high-carbohydrate diet does not necessarily lead to lipid
accumulation in the aortic wall. Accordingly, we showed that high glucose intake in rat did
not lead to more intensed lipid signals in the aortic wall. In contrast, glucose-drinking led to
decreased cholesterol ions signals in the aortic wall.
The association between increased plasma triglyceride-rich lipoproteins and a high lipid
accumulation within the aortic wall is complex. Metabolic disorder resulting in severe
increase in triglyceride-rich lipoproteins, such as lipoprotein lipase deficiency, is not
associated with an increased risk of atherosclerosis. In these disorders, lipoproteins are of
such size that they cannot enter the aortic wall and thus do not directly promote atherogenesis
[200,201]. Lipoproteins primarily carry two type’s lipids: cholesterol and TAG. However,
these two lipids have different fats. TAG is mainly transported into adipose tissue and skeletal
44
muscle where the fatty acids are stored or oxidized for energy production. Cholesterol is
continuously transported between the liver, intestines and other extrahepatic tissues.
Cholesterol serves as a structural component of the cellular membrane and as a precursor to
the synthesis of steroid hormones and bile acids [86].
The liver X receptors (LXRs) are involved in lipid metabolism and reverse cholesterol
transport, glucose has been shown to be an LXR agonist and upregulated in the expression of
the LXR gene [90]. LXRs are expressed in endothelial cells [88] and in human coronary
artery vascular smooth muscle cells [89]. LXR stimulates cholesterol efflux to lipid-poor
apolipoproteins [202]. It is possible that high-glucose intake can activate LXRs in the aortic
wall and this pathway may explain the decreased cholesterol in the rat aorta.
Moreover, we observed that rats receiving high glucose intake had a major reduction of
pellets consumption, probably due to the high energy intake of glucose reducing their hunger,
which has been seen in other studies [203]. This means that their protein intake was lowered
during six months of life. Interestingly, a low-protein diet during neonatal and postnatal life
has been shown to reduce arterial wall thickness and elastic tissue [204]. The reduction in
protein intake during neonatal and postnatal life probably contributed to the reduction of
cholesterol in the aortic wall. It has been shown that elastic tissue is important for the
accumulation of lipids in the aortic wall, as elastine forms stable complex together with
cholesterol [82]. TOF-SIMS images of rat aorta showed that cholesterol and oxysterols are
located to the elastic lamellae in the aortic wall [205] (see figure 12). Furthermore, correlation
between collagen synthesis and cholesterol has been shown [206]. Moreover, high-pressure
freezing has been shown to retain relationships between cells, collagen and elasin in the aortic
media [207]. Thereby, this would be adequate method of preserve samples for semi-
quantitative measurement of lipids in the aortic. Thus, it is possible that the decreased
cholesterol signals in the aortic wall are caused by protein deficiency during neo- and
postnatal life due to high glucose consumption. Reduced HDL-cholesterol levels in the blood
lead to augmented cholesterol concentration primarily in the adipose tissue, which is our
body’s largest cholesterol storage compartment [51]. Moreover, it has been shown that
cholesterol depletion in the endothelial cell increases the stiffness of the membrane by altering
the properties of the submembrane F-actin and/or its attachment to the membrane [208].
45
Conclusions
This thesis showed the possibility of using TOF-SIMS in tissue research. Peaks from fatty
acid, DAG, TAG cholesterol and phosphatidylcholin were identified in the TOF-SIMS
spectrum, from the skeletal muscle, adipose tissue and aortic wall, tissues which are
connected to insulin resistance and metabolic syndrome. This thesis is also revealing a semi-
quantitative way of using TOF-SIMS for comparation of lipids in the aortic wall and in the
samples of mouse skeletal muscle. By principal component analysis we were able to reveal
changes of lipids in the samples between experimental and control groups. This revealed
interesting data with the use of unfixed samples. TOF-SIMS is an interesting technique of
mapping lipids in biological tissues and future experiment with this technique should improve
the knowledge of lipids interaction in metabolic diseases and cellular processes.

46
Acknowledgement
Jag vill uttrycka min tacksamhet till alla Er som medverkat till att denna avhandling blivit klar
Jag vill tacka
Min handledare Professor Peter Friberg, för vägledning och stöd i arbetet
Min bihandledare Docent Yun Chen för att du tålmodigt och glatt väglett mig i detta arbete och att du
alltid, alltid tar Dig tid till att förklara oförståeliga saker och på ett lättbegriplig sätt och för Du så
generöst delar med Dig av din kunskap.
Peter Sjövall and Jakob Malm, SP i Borås, för all hjälp med TOF-SIMS
Övriga medlemmar i Peter Friberg grupp: Marika för din hjälpsamhet med administrativa frågor, Gun
och Frida
Ulla Gustavsson-Weicer för all hjälp i den tidigare gruppen
Heimir, för all hjälp med alla tänkbara data tekniska problem
Merja Meuronen Österholm, Christina, Mutjaba Siddiqui och Magnus Gustavsson för att Ni
skapade/skapar en trevlig atmosfär på Wlab.
Christina Ericsson medicinska institutionen för stöd
Rosie Perkins för hjälp med korrekturläsning av manus
Anna H för hjälp med bildbehandling o Birgitta O för gott sammarbete när vi delade lab.
Till alla i ”skrivarrummet” för att ni alltid är trevliga och bussiga när man frågar om hjälp:
Sara Sjöberg, tack för alltid uppmuntrande ord och trevliga pratstunder
Liliana för trevligt sällskap i skrivarrummet
Levent Akurek för ditt engagemang med torsdagseminarierna samt tidigare ”journalclub”
Alla Ni andra forskare på Wlab som bidrar till en trevlig atmosfär att forska i.
Fei Tian, vi som följt åt nu i många år, tack för gott sammarbete under denna tid, stöd samt trevliga
pratstunder. Det kommer att kännas tomt nu.
Kristina Nilsson för fin vänskap.
Mina kära vänner: Karin, Sara Annette, Sanna och Katta, tack för alla roliga stunder och minnen
tillsammans.
Moster Ronny för att Du alltid kommer ihåg oss.
Mina syskon Filip, Dag och Sofia med familjer … Vad vore livet utan syskon… Roligt att vi hamnat i
Göteborg igen allihop.
Till mamma i minne för all trygghet och uppbackning
Bernard, för att du fick mig att tro att det var möjligt och allt som förgyller vardagen
Ylva
47
References
[1] Bansilal, S., Farkouh, M.E. and Fuster, V. (2007) Am J Cardiol 99, 6B-14B. [2] Keller, K.B. and Lemberg, L. (2003) Am J Crit Care 12, 167-70. [3] Goran, M.I., Ball, G.D. and Cruz, M.L. (2003) J Clin Endocrinol Metab 88, 1417-27. [4] Steinberger, J. and Daniels, S.R. (2003) Circulation 107, 1448-53. [5] De Meyts, P. (2004) Bioessays 26, 1351-62. [6] Krentz, A.J. (1996) Bmj 313, 1385-9. [7] Greenfield, J.R. and Campbell, L.V. (2004) Clin Dermatol 22, 289-95. [8] Abate, N., Garg, A., Peshock, R.M., Stray-Gundersen, J. and Grundy, S.M. (1995) J
Clin Invest 96, 88-98. [9] Garg, A. (2006) Clin Cornerstone 8 Suppl 4, S7-S13. [10] Delarue, J. and Magnan, C. (2007) Curr Opin Clin Nutr Metab Care 10, 142-8. [11] Hegarty, B.D., Furler, S.M., Ye, J., Cooney, G.J. and Kraegen, E.W. (2003) Acta
Physiol Scand 178, 373-83. [12] Schmitz-Peiffer, C. (2002) Ann N Y Acad Sci 967, 146-57. [13] Kelley, D.E. and Mandarino, L.J. (2000) Diabetes 49, 677-83. [14] Goodpaster, B.H., He, J., Watkins, S. and Kelley, D.E. (2001) J Clin Endocrinol
Metab 86, 5755-61. [15] Goodpaster, B.H. and Kelley, D.E. (2002) Curr Diab Rep 2, 216-22. [16] Vance, V.a. (2002), Vol. 35. [17] Decsi, T., Csabi, G., Torok, K., Erhardt, E., Minda, H., Burus, I., Molnar, S. and
Molnar, D. (2000) Lipids 35, 1179-84. [18] Quastel, J.H. (1967) Science 158, 146-61. [19] Yeagle, P.l. [20] Garg, M.L. and Sabine, J.R. (1988) Biochem J 251, 11-6. [21] Hulbert, A.J., Turner, N., Storlien, L.H. and Else, P.L. (2005) Biol Rev Camb Philos
Soc 80, 155-69. [22] Emken, E.A. (1994) Am J Clin Nutr 60, 1023S-1028S. [23] Huitema, K., van den Dikkenberg, J., Brouwers, J.F. and Holthuis, J.C. (2004) Embo J
23, 33-44. [24] Lands, W.E. and Hart, P. (1965) J Biol Chem 240, 1905-11. [25] Lee, D.P., Deonarine, A.S., Kienetz, M., Zhu, Q., Skrzypczak, M., Chan, M. and
Choy, P.C. (2001) J Lipid Res 42, 1979-86. [26] Coleman, R.A. and Haynes, E.B. (1985) Biochim Biophys Acta 834, 180-7. [27] Besterman, J.M., Duronio, V. and Cuatrecasas, P. (1986) Proc Natl Acad Sci U S A
83, 6785-9. [28] Schmitz-Peiffer, C., Browne, C.L., Oakes, N.D., Watkinson, A., Chisholm, D.J.,
Kraegen, E.W. and Biden, T.J. (1997) Diabetes 46, 169-78. [29] Bruce, C. and Tall, A.R. (1995) Curr Opin Lipidol 6, 306-11. [30] Simons, K. and Ikonen, E. (1997) Nature 387, 569-72. [31] Pike, L.J. (2004) Biochem J 378, 281-92. [32] Xi, Z.P. and Wang, J.Y. (2003) J Nutr Sci Vitaminol (Tokyo) 49, 210-3. [33] Jakobsson, A., Westerberg, R. and Jacobsson, A. (2006) Prog Lipid Res 45, 237-49. [34] Seubert, W. and Podack, E.R. (1973) Mol Cell Biochem 1, 29-40. [35] Nakamura, M.T. and Nara, T.Y. (2004) Annu Rev Nutr 24, 345-76. [36] Parker-Barnes, J.M., Das, T., Bobik, E., Leonard, A.E., Thurmond, J.M., Chaung,
L.T., Huang, Y.S. and Mukerji, P. (2000) Proc Natl Acad Sci U S A 97, 8284-9.
48
[37] Vessby, B., Gustafsson, I.B., Tengblad, S., Boberg, M. and Andersson, A. (2002) Ann N Y Acad Sci 967, 183-95.
[38] Shaw, H.B. (1901) J Anat Physiol 36, 1-13. [39] Mirski, A. (1942) Biochem J 36, 232-41. [40] Renold, A.E. and Marble, A. (1950) J Biol Chem 185, 367-75. [41] Haugaard, N. and Marsh, J.B. (1952) J Biol Chem 194, 33-40. [42] Del Vecchio, A., Keys, A. and Anderson, J.T. (1955) Proc Soc Exp Biol Med 90, 449-
51. [43] Rabinowitz, D. and Zierler, K.L. (1962) J Clin Invest 41, 2173-81. [44] Imaichi, K., Fukuda, J.I., Oyama, K. and Mukawa, A. (1965) J Biochem (Tokyo) 58,
463-9. [45] Siiteri, P.K. (1987) Am J Clin Nutr 45, 277-82. [46] Zhang, Y., Proenca, R., Maffei, M., Barone, M., Leopold, L. and Friedman, J.M.
(1994) Nature 372, 425-32. [47] Kershaw, E.E. and Flier, J.S. (2004) J Clin Endocrinol Metab 89, 2548-56. [48] Murphy, D.J. (2001) Prog Lipid Res 40, 325-438. [49] Martin, S. and Parton, R.G. (2006) Nat Rev Mol Cell Biol 7, 373-8. [50] Galton, D.J. and Wilson, J.P. (1970) Clin Sci 38, 649-60. [51] Krause, B.R. and Hartman, A.D. (1984) J Lipid Res 25, 97-110. [52] Prattes, S., Horl, G., Hammer, A., Blaschitz, A., Graier, W.F., Sattler, W., Zechner, R.
and Steyrer, E. (2000) J Cell Sci 113 ( Pt 17), 2977-89. [53] Schreibman, P.H. and Dell, R.B. (1975) J Clin Invest 55, 986-93. [54] Schiaffino, S. and Reggiani, C. (1996) Physiol Rev 76, 371-423. [55] Hess, A. (1970) Physiol Rev 50, 40-62. [56] Le Lay, S., Ferre, P. and Dugail, I. (2004) Biochem Soc Trans 32, 103-6. [57] Tauchi-Sato, K., Ozeki, S., Houjou, T., Taguchi, R. and Fujimoto, T. (2002) J Biol
Chem 277, 44507-12. [58] Kovanen, P.T., Nikkila, E.A. and Miettinen, T.A. (1975) J Lipid Res 16, 211-23. [59] Zweytick, D., Athenstaedt, K. and Daum, G. (2000) Biochim Biophys Acta 1469, 101-
20. [60] Pol, A., Martin, S., Fernandez, M.A., Ferguson, C., Carozzi, A., Luetterforst, R.,
Enrich, C. and Parton, R.G. (2004) Mol Biol Cell 15, 99-110. [61] Blanchette-Mackie, E.J. et al. (1995) J Lipid Res 36, 1211-26. [62] Bostrom, P., Rutberg, M., Ericsson, J., Holmdahl, P., Andersson, L., Frohman, M.A.,
Boren, J. and Olofsson, S.O. (2005) Arterioscler Thromb Vasc Biol 25, 1945-51. [63] Spector, A.A. (1984) Clin Physiol Biochem 2, 123-34. [64] Merkel, M., Eckel, R.H. and Goldberg, I.J. (2002) J Lipid Res 43, 1997-2006. [65] Swierczynski, J., Zabrocka, L., Goyke, E., Raczynska, S., Adamonis, W. and
Sledzinski, Z. (2003) Mol Cell Biochem 254, 55-9. [66] Holm, C. (2003) Biochem Soc Trans 31, 1120-4. [67] Brooke, M.H. and Kaiser, K.K. (1970) Arch Neurol 23, 369-79. [68] Schrauwen-Hinderling, V.B., Hesselink, M.K., Schrauwen, P. and Kooi, M.E. (2006)
Obesity (Silver Spring) 14, 357-67. [69] Wertheimer, E. and Ben-Tor, V. (1952) Biochem J 50, 573-6. [70] Andersson, A., Sjodin, A., Hedman, A., Olsson, R. and Vessby, B. (2000) Am J
Physiol Endocrinol Metab 279, E744-51. [71] Arslanian, S.A. and Kalhan, S.C. (1994) Diabetes 43, 908-14. [72] Denton, R.M. and Randle, P.J. (1967) Biochem J 104, 416-22. [73] Pagliassotti, M.J., Pan, D., Prach, P., Koppenhafer, T., Storlien, L. and Hill, J.O.
(1995) Obes Res 3, 459-64.
49
[74] Pan, D.A., Lillioja, S., Kriketos, A.D., Milner, M.R., Baur, L.A., Bogardus, C., Jenkins, A.B. and Storlien, L.H. (1997) Diabetes 46, 983-8.
[75] Thomas, T.R., Londeree, B.R., Gerhardt, K.O. and Gehrke, C.W. (1978) Mech Ageing Dev 8, 429-34.
[76] Standl, E., Lotz, N., Dexel, T., Janka, H.U. and Kolb, H.J. (1980) Diabetologia 18, 463-9.
[77] Stout, R.W. (1976) Acta Diabetol Lat 13, 87-92. [78] Odessey, R. and Chace, K.V. (1982) Am J Physiol 243, H128-32. [79] Krutzfeldt, A., Spahr, R., Mertens, S., Siegmund, B. and Piper, H.M. (1990) J Mol
Cell Cardiol 22, 1393-404. [80] Bar, R.S., Boes, M., Dake, B.L., Booth, B.A., Henley, S.A. and Sandra, A. (1988) Am
J Med 85, 59-70. [81] Stein, Y., Stein, O. and Shapiro, B. (1963) Biochim Biophys Acta 70, 33-42. [82] Jacotot, B., Beaumont, J.L., Monnier, G., Szigeti, M., Robert, B. and Robert, L. (1973)
Nutr Metab 15, 46-58. [83] Lin, D.S. and Connor, W.E. (1980) J Lipid Res 21, 1042-52. [84] Tabas, I., Williams, K.J. and Boren, J. (2007) Circulation 116, 1832-44. [85] Dayton, S. (1959) Circ Res 7, 468-75. [86] Bhattacharyya, A.K. (1989) Artery 16, 84-9. [87] Eriksson, M., Carlson, L.A., Miettinen, T.A. and Angelin, B. (1999) Circulation 100,
594-8. [88] Norata, G.D., Ongari, M., Uboldi, P., Pellegatta, F. and Catapano, A.L. (2005) Int J
Mol Med 16, 717-22. [89] Blaschke, F. et al. (2004) Circ Res 95, e110-23. [90] Mitro, N., Mak, P.A., Vargas, L., Godio, C., Hampton, E., Molteni, V., Kreusch, A.
and Saez, E. (2007) Nature 445, 219-23. [91] Hoppeler, H. (1986) Int J Sports Med 7, 187-204. [92] Molotkovsky, J.G., Manevich, Y.M., Gerasimova, E.N., Molotkovskaya, I.M.,
Polessky, V.A. and Bergelson, L.D. (1982) Eur J Biochem 122, 573-9. [93] Bergelson, L.D., Molotkovsky, J.G. and Manevich, Y.M. (1985) Chem Phys Lipids
37, 165-95. [94] Svennerholm, L., Bruce, A., Mansson, J.E., Rynmark, B.M. and Vanier, M.T. (1972)
Biochim Biophys Acta 280, 626-36. [95] Holm, M., Mansson, J.E., Vanier, M.T. and Svennerholm, L. (1972) Biochim Biophys
Acta 280, 356-64. [96] Markello, T.C., Guo, J. and Gahl, W.A. (1991) Anal Biochem 198, 368-74. [97] Ekroos, K., Chernushevich, I.V., Simons, K. and Shevchenko, A. (2002) Anal Chem
74, 941-9. [98] Altelaar, A.F., Klinkert, I., Jalink, K., de Lange, R.P., Adan, R.A., Heeren, R.M. and
Piersma, S.R. (2006) Anal Chem 78, 734-42. [99] Jackson, S.N., Ugarov, M., Egan, T., Post, J.D., Langlais, D., Albert Schultz, J. and
Woods, A.S. (2007) J Mass Spectrom 42, 1093-8. [100] Schwartz, S.A., Reyzer, M.L. and Caprioli, R.M. (2003) J Mass Spectrom 38, 699-
708. [101] Raudenkolb, S., Wartewig, S. and Neubert, R.H. (2003) Chem Phys Lipids 124, 89-
101. [102] Touboul, D., Kollmer, F., Niehuis, E., Brunelle, A. and Laprevote, O. (2005) J Am
Soc Mass Spectrom 16, 1608-18. [103] Tahallah, N., Brunelle, A., De La Porte, S. and Laprevote, O. (2008) J Lipid Res 49,
438-54.
50
[104] Malmberg, P., Nygren, H., Richter, K., Chen, Y., Dangardt, F., Friberg, P. and Magnusson, Y. (2007) Microsc Res Tech 70, 828-35.
[105] R Castaing, G.S. (1962) J.microscope 1, 395-410. [106] Benninghoven (1970) Z Physik 230, 417-30. [107] Benninghoven, A. (1971) Surface Science 28, 541-562. [108] Benninghoven, A. (1973) Surface science 35, 427-457. [109] Benninghoven, A. (1994) Surface science 299-300, 246-260. [110] John C Vickerman, A.B.a.N.M.R. (1989) in: Secondary Ion Mass Specrtrometry
Principles and Applications, pp. 1-8. [111] Chait BT, S.K. (1981) International Journal of Mass Spectrometry and Ion Physics
40, 185-193. [112] Belu, A.M., Graham, D.J. and Castner, D.G. (2003) Biomaterials 24, 3635-53. [113] Vickerman, J.C. (2001) in: TOF-SIMS surface analysis by mass spectrometry, pp. 1-
40. [114] Pacholski, M.L. and Winograd, N. (1999) Chem Rev 99, 2977-3006. [115] Sodhi, R.N. (2004) Analyst 129, 483-7. [116] Burns, M. (1981) Anal Chem 53, 2149-2152. [117] Berry, J.P., Escaig, F., Lange, F. and Galle, P. (1986) Lab Invest 55, 109-19. [118] Fragu, P. and Kahn, E. (1997) Microsc Res Tech 36, 296-300. [119] Clerc, J., Fourre, C. and Fragu, P. (1997) Cell Biol Int 21, 619-33. [120] Guerquin-Kern, J.L., Coppey, M., Carrez, D., Brunet, A.C., Nguyen, C.H., Rivalle, C.,
Slodzian, G. and Croisy, A. (1997) Microsc Res Tech 36, 287-95. [121] McMahon JM, S.R., McCandlish CA, Brenna JT and Todd PJ (1996) RApid
Commun Mass Spectrometry 10, 335-340. [122] U Seedorf, M.F., R Voss, K Meyer, F Kannenberg, D Meschede, K Ullrich, J Horst, A
Benninghoven and G Assmann (1995) Clinical Chemistry 41, 548-552. [123] McQuaw, C.M., Sostarecz, A.G., Zheng, L., Ewing, A.G. and Winograd, N. (2006)
Appl Surf Sci 252, 6716-6718. [124] McQuaw, C.M., Sostarecz, A.G., Zheng, L., Ewing, A.G. and Winograd, N. (2005)
Langmuir 21, 807-13. [125] Sjovall, P., Lausmaa, J., Nygren, H., Carlsson, L. and Malmberg, P. (2003) Anal
Chem 75, 3429-34. [126] Pacholski, M.L., Cannon, D.M., Jr., Ewing, A.G. and Winograd, N. (1998) Rapid
Commun Mass Spectrom 12, 1232-5. [127] Nygren, H., Borner, K., Hagenhoff, B., Malmberg, P. and Mansson, J.E. (2005)
Biochim Biophys Acta 1737, 102-10. [128] W.Schueler, B. (2001) in: TOF-SIMS:Surface Analysis by Maa Spectrometry, pp. 75-
94 (Briggs, J.C.V.D., Ed.). [129] Urbassek, H.M. (2001) in: ToF-SIMS: Surface Analysis by Mass Spectrometry, pp.
139-159, Kaiserslautern. [130] Benninghoven A, H., and Niehuis E (1993) Analytical Chemistry 65, 630-639. [131] Vickerman, B.D.a.N.R. (1989). [132] Schueler, B.W. (2001) in: TOF-SIMS:Surface Analysis by Mass Spectrometry, pp. 75-
94 (Briggs, J.C.V.a.D., Ed.). [133] Chandra, S., Morrison, G.H. and Beyenbach, K.W. (1997) Am J Physiol 273, F939-
48. [134] Gilmore (2001) in: TOF-SIMS:Surface Analysis by Mass Spectrometry, pp. 261-283. [135] Roddy, T.P., Cannon, D.M., Jr., Ostrowski, S.G., Winograd, N. and Ewing, A.G.
(2002) Anal Chem 74, 4020-6. [136] Chehade, F. et al. (2005) J Nucl Med 46, 1701-6.
51
[137] Kollmer, F. (2004) Applied Surface Science 231-232, 153-158. [138] Benguerba, A.B., S. Della-Negra, J. Depauw, H. Joret, Y. Le Beyec, M.G. Blain, E.A.
Schweikert, G. Ben Assayag and P. Sudraud (1991) Nucl. Instrum. Methods Phys. Res.
[139] Van Hama Rita, V.V.L., Adamsa Freddy and Adriaens Annemie (2005) J. Anal. At. Spectrom 20, 1088-1094.
[140] Touboul, D., Halgand, F., Brunelle, A., Kersting, R., Tallarek, E., Hagenhoff, B. and Laprevote, O. (2004) Anal Chem 76, 1550-9.
[141] Touboul, D., Brunelle, A., Halgand, F., De La Porte, S. and Laprevote, O. (2005) J Lipid Res 46, 1388-95.
[142] Weibel, D., Wong, S., Lockyer, N., Blenkinsopp, P., Hill, R. and Vickerman, J.C. (2003) Anal Chem 75, 1754-64.
[143] Fletcher, J.S., Lockyer, N.P., Vaidyanathan, S. and Vickerman, J.C. (2007) Anal Chem 79, 2199-206.
[144] Delcorte (2001) in: TOF-SIMS: Surface Analysis by Mass Spectrometry, pp. 161-194. [145] Gusev, C.a.H. (1998) JOURNAL OF MASS SPECTROMETRY 33, 480-485. [146] Nygren, H. and Malmberg, P. (2004) J Microsc 215, 156-61. [147] Morrison, D.P.L.G.H. (1980) 52, 277-280. [148] Morrison, P.K.C.G.H. (1982) 54, 2111. [149] Harris, W.C., Jr., Chandra, S. and Morrison, G.H. (1983) Anal Chem 55, 1959-63. [150] Muddiman, D.C., Gusev, A.I., Proctor, A., Hercules, D.M., Venkataramanan, R. and
Diven, W. (1994) Anal Chem 66, 2362-8. [151] Muddiman David C, G.I., Martin Lee B, Hercules David M. (1996) Fresenius' Journal
of Analytical Chemistry 354. [152] Clark, M.B., Jr. and Gardella, J.A., Jr. (1990) Anal Chem 62, 870-5. [153] Ostrowski, S.G., Van Bell, C.T., Winograd, N. and Ewing, A.G. (2004) Science 305,
71-3. [154] Ostrowski, S.G., Kurczy, M.E., Roddy, T.P., Winograd, N. and Ewing, A.G. (2007)
Anal Chem 79, 3554-60. [155] Jeusset, J., Stelly, N., Briancon, C., Halpern, S., Roshani, M. and Fragu, P. (1995) J
Microsc 179, 314-20. [156] Hindie, E., Coulomb, B. and Galle, P. (1992) Biol Cell 74, 89-92. [157] Grignon, N. (1997) J Microsc 186, 51-66. [158] Studer, D., Hennecke, H., Müller, M (1992) Planta 188, 155–163. [159] Somlyo, A.P., Bond, M. and Somlyo, A.V. (1985) Nature 314, 622-5. [160] Studer, D., Graber, W., Al-Amoudi, A. and Eggli, P. (2001) J Microsc 203, 285-94. [161] Xia, N. and Castner, D.G. (2003) J Biomed Mater Res A 67, 179-90. [162] Wold, E.a.G. (1987) Chemometrics and Intellegent Laboratory Sysmtems 2, 37-52. [163] Bernard W. Agranoff, J.A.B., and Amiya K. Hajra (1999) in: Basic Neurochemistry Molecular, Cellular and Medical Aspects Sixth Edition (Uhler,
G.J.S.B.W.A.S.K.F.R.W.A.M.D., Ed.). [164] X. Vanden Eynde *, P.B. (1998) Surface and Interface Analysis 25, 878 - 888. [165] Tyler, B.J., Rayal, G. and Castner, D.G. (2007) Biomaterials 28, 2412-23. [166] Lodisch, B., Zipursky, Matsudaira, Baltimore, Darnell (1999) in: MOLECULAR
CELL BIOLOGY. [167] McDonnell, L.A., Piersma, S.R., MaartenAltelaar, A.F., Mize, T.H., Luxembourg,
S.L., Verhaert, P.D., van Minnen, J. and Heeren, R.M. (2005) J Mass Spectrom 40, 160-8.
[168] Rost D., S.T., Wies C., and Jessberger E. K (1999) Meteorit. Planet. Sci. 34, 637–646. [169] Warley, A. and Skepper, J.N. (2000) J Microsc 198, 116-23.
52
[170] Chandra, S. and Morrison, G.H. (1992) Biol Cell 74, 31-42. [171] Arner, P. (2002) Diabetes Metab Res Rev 18 Suppl 2, S5-9. [172] Scow, R.O., Stricker, F.A., Pick, T.Y. and Clary, T.R. (1965) Ann N Y Acad Sci 131,
288-301. [173] Edens, N.K., Leibel, R.L. and Hirsch, J. (1990) J Lipid Res 31, 1351-9. [174] Aas, V., Rokling-Andersen, M., Wensaas, A.J., Thoresen, G.H., Kase, E.T. and
Rustan, A.C. (2005) Acta Physiol Scand 183, 31-41. [175] Forouhi, N.G., Jenkinson, G., Thomas, E.L., Mullick, S., Mierisova, S., Bhonsle, U.,
McKeigue, P.M. and Bell, J.D. (1999) Diabetologia 42, 932-5. [176] Connellan, J.M. and Masters, C.J. (1965) Biochem J 94, 81-4. [177] Clarke, M.S., Vanderburg, C.R., Bamman, M.M., Caldwell, R.W. and Feeback, D.L.
(2000) J Appl Physiol 89, 731-41. [178] Fiehn, W., Peter, J.B., Mead, J.F. and Gan-Elepano, M. (1971) J Biol Chem 246,
5617-20. [179] Masoro, E.J., Rowell, L.B., McDonald, R.M. and Steiert, B. (1966) J Biol Chem 241,
2626-34. [180] El Hafidi, M., Valdez, R. and Banos, G. (2000) Clin Exp Hypertens 22, 99-108. [181] Bulfield, G. (1972) Genet Res 20, 51-64. [182] Winand, J., Furnelle, J. and Christophe, J. (1968) Biochim Biophys Acta 152, 280-92. [183] Haessler, H.A. and Crawford, J.D. (1965) Ann N Y Acad Sci 131, 476-84. [184] Enser, M. (1975) Biochem J 148, 551-5. [185] Storlien, L.H., Baur, L.A., Kriketos, A.D., Pan, D.A., Cooney, G.J., Jenkins, A.B.,
Calvert, G.D. and Campbell, L.V. (1996) Diabetologia 39, 621-31. [186] Storlien, L.H., Pan, D.A., Kriketos, A.D., O'Connor, J., Caterson, I.D., Cooney, G.J.,
Jenkins, A.B. and Baur, L.A. (1996) Lipids 31 Suppl, S261-5. [187] Dobrzyn, A. and Ntambi, J.M. (2004) Trends Cardiovasc Med 14, 77-81. [188] Phinney, S.D., Davis, P.G., Johnson, S.B. and Holman, R.T. (1991) Am J Clin Nutr
53, 831-8. [189] Bessesen, D.H., Vensor, S.H. and Jackman, M.R. (2000) Am J Physiol Endocrinol
Metab 278, E1124-32. [190] Roddy, T.P., Cannon, D.M., Jr., Ostrowski, S.G., Ewing, A.G. and Winograd, N.
(2003) Anal Chem 75, 4087-94. [191] Milillo Tammy M, G.J.A. [192] David C Muddiman, A.I.G., Andrew Proctor, and David M Hercules (1994) Anal
Chem 66, 2366-2368. [193] Hansong Cheng, P.A.C.C., and Scott D. Hanton (2000) J. Phys. Chem. A, 18195-
1501. [194] Parks, E.J., Krauss, R.M., Christiansen, M.P., Neese, R.A. and Hellerstein, M.K.
(1999) J Clin Invest 104, 1087-96. [195] Rhoads, G.G., Gulbrandsen, C.L. and Kagan, A. (1976) N Engl J Med 294, 293-8. [196] Barter, P. (2005) European heart journal Supplements 7, F4-F8. [197] Willett, W.C. (2000) Proc Soc Exp Biol Med 225, 187-90. [198] Nasledova, I.D., Fashchevskaia, I.A., Khmel'nitskaia, T.O. and Shaposhnikova, E.S.
(1976) Biull Eksp Biol Med 82, 1297-8. [199] Turner, J., McLennan, P.L., Abeywardena, M.Y. and Charnock, J.S. (1990)
Atherosclerosis 82, 105-12. [200] Zilversmit, D.B. and Shea, T.M. (1989) J Lipid Res 30, 1639-46. [201] Zilversmit, D.B. (1995) Clin Chem 41, 153-8. [202] Tall, A.R. (2008) J Intern Med 263, 256-73. [203] Baird, J.P., Grill, H.J. and Kaplan, J.M. (1997) Am J Physiol 272, R1454-60.

53
[204] Skilton, M.R., Gosby, A.K., Wu, B.J., Ho, L.M., Stocker, R., Caterson, I.D. and Celermajer, D.S. (2006) Clin Sci (Lond) 111, 281-7.
[205] Malmberg, P., Borner, K., Chen, Y., Friberg, P., Hagenhoff, B., Mansson, J.E. and Nygren, H. (2007) Biochim Biophys Acta 1771, 185-95.
[206] Modrak, J.B. and Langner, R.O. (1980) Atherosclerosis 37, 211-8. [207] Tufa, K. (2005). [208] Byfield, F.J., Aranda-Espinoza, H., Romanenko, V.G., Rothblat, G.H. and Levitan, I.
(2004) Biophys J 87, 3336-43.