ica mixtures applied to ultrasonic nondestructive classification of archaeological ceramics
TRANSCRIPT
Hindawi Publishing CorporationEURASIP Journal on Advances in Signal ProcessingVolume 2010, Article ID 125201, 11 pagesdoi:10.1155/2010/125201
Research Article
ICA Mixtures Applied to Ultrasonic Nondestructive Classificationof Archaeological Ceramics
Addisson Salazar and Luis Vergara
Grupo de Tratamiento de Senal, Instituto de Telecomunicaciones y Aplicaciones Multimedia, iTEAM,Universidad Politecnica de Valencia, Camino de Vera s/n, 46022 Valencia, Spain
Correspondence should be addressed to Luis Vergara, [email protected]
Received 23 December 2009; Revised 7 May 2010; Accepted 7 June 2010
Academic Editor: Joao Manuel R. S. Tavares
Copyright © 2010 A. Salazar and L. Vergara. This is an open access article distributed under the Creative Commons AttributionLicense, which permits unrestricted use, distribution, and reproduction in any medium, provided the original work is properlycited.
We consider a classifier based on Independent Component Analysis Mixture Modelling (ICAMM) to model the feature joint-probability density. This classifier is applied to a challenging novel application: classification of archaeological ceramics. ICAMMgathers relevant characteristics that have general interest for material classification. It can deal with arbitrary forms of theunderlying probability densities in the feature vector space as nonparametric methods can do. Mutual dependences among thefeatures are modelled in a parametric form so that ICAMM can achieve good performance even with a training set of relativelysmall size, which is characteristic of parametric methods. Moreover, in the training stage, ICAMM can incorporate probabilisticsemisupervision (PSS): labelling by an expert of a portion of the whole available training set of samples. These properties ofICAMM are well-suited for the problem considered: classification of ceramic pieces coming from four different periods, namely,Bronze Age, Iberian, Roman, and Middle Ages. A feature set is obtained from the processing of the ultrasonic signal that isrecorded in through-transmission mode using an ad hoc device. A physical explanation of the results is obtained with comparisonwith classical methods used in archaeology. The results obtained demonstrate the promising potential of ICAMM for materialclassification.
1. Introduction
Determining the historical period of archaeological ceramicshards is important for many archaeological applications,particularly to reconstruct human activities of the past. Infact, the standardization of an efficient and nondestruc-tive testing (NDT) method for ceramic characterizationcould become an important contribution for archaeologists.Chemical, thermoluminescence, and other analyses haveshown to measure the age of ceramics accurately, but they areexpensive, time-consuming and involve some destruction ofthe analyzed pieces [1]. Relative dating by comparison withceramic collections is nondestructive but very inaccurate[1].
Ultrasound has been used in archaeological applicationssuch as ocean exploration to detect wrecks, imaging ofarchaeological sites, and cleaning archaeological objects [2–4]. In this paper, we consider a method to sort archaeological
ceramic shards based on ultrasonic nondestructive eval-uation. This method aims to be economic, fast, precise,and innocuous for the ceramic pieces. It consists of threesteps: measuring by the through-transmission technique,extracting features from the measured ultrasonic signals, andclassifying the feature set in classes corresponding to historicor protohistoric periods.
The estimation of the chronological period of an archae-ological fragment is not a straightforward work, especiallyif we consider that the fragment might be moved fromits context of origin due to migrations, wars, or tradeexchange, and so forth. In addition, some external featuresused for classification of archaeological objects, such asparticular shapes and decorations, might be not evident inthe fragments, and thus these aspects would not provideinformation for a correct classification of the fragments.
Through-transmission was selected because the ceramicproduces large attenuation to the propagation of ultrasound,

2 EURASIP Journal on Advances in Signal Processing
so the pulse-echo technique cannot be implemented atthe required operating frequency. Time, frequency, andstatistical features (to be described later) were extracted usingstandard signal processing techniques. The characteristicsof the classification problem offer a good case study fortesting advanced classifiers, like those based on modellingthe underlying statistical densities of the feature space asmixtures of independent component analyzers.
In consequence, we dedicate Section 2 to presenting theultrasound through-transmission model from a linear sys-tem perspective and to defining the selected features. Then,in Section 3 we present the rationale for these classifiers anddescribe them based on mixtures of independent compo-nent analyzers. Section 4 presents the experiments and theresults obtained in the sorting of ceramic pieces from fourdifferent periods: Bronze Age, Iberian, Roman, and MiddleAges. Section 5 presents the conclusions and future line ofwork.
We reported some preliminary results related to thisarchaeological application which was presented in confer-ence [5]. The following significant new contributions arepresented in this paper: rationale and selection of newultrasonic features; use of a classifier that is based onprobabilistic semisupervision of independent componentanalyzers (ICA) mixture models that are suitable for han-dling expert uncertainty; implementation of an ad hocdevice designed to avoid the uncontrolled conditions of atotally manual measurement procedure; and demonstrationof physical interpretation of the results obtained by theproposed method in comparison with classical methodsused in archaeology. Therefore, this work provides thefoundations to implement a practical method to com-plement or even replace some of the destructive andtime-consuming techniques that are currently employed inarchaeology.
2. Through-Transmission Model andFeatures Definition
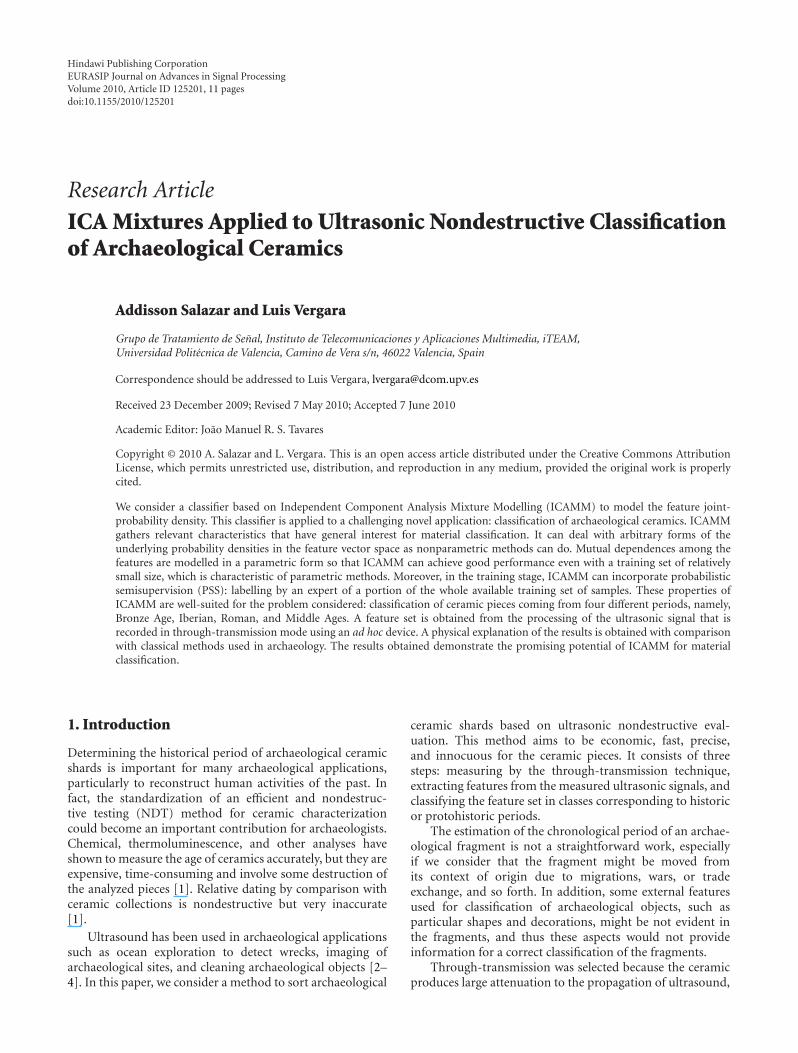
A simplified model of ultrasonic through-transmission anal-ysis is to consider that the recorded signal is the convolutionof the material reflectivity with a linear time-varying system(LTV) (see Figure 1). The variant impulse response of theLTV is the injected ultrasonic pulse travelling throughthe material, which bears the effects of attenuation anddispersion that affect both its amplitude and frequencycontent. Actually, some nonlinearity may be incorporatedinto this simple model in some specific cases; however, ingeneral, the linear assumption is adequate for a large numberof situations, or is at least enough to be able to obtainpractical solutions yielding reasonable performance. Thus,the received signal x(t) looks similar to the one shown inFigure 1.
If we consider that x(t) is a realization of a nonstationarystochastic process {x(t)} having instantaneous power spec-tral density Px( f , t), different “ultrasonic signatures” us(t)can be computed like those included in the following
Centroid frequency(
fc)
:
us(t) = fc(t) =∫ f2f1f · Px
(
f , t)
df∫ f2f1Px(
f , t)
df.
Maximum frequency(
fmax)
:
us(t) = fmax(t) = max︸ ︷︷ ︸
f
Px(
f , t)
.
Bandwidth (BW):
us(t) = BW(t) =∫ f2f1
(
f − fc(t))2 · Px
(
f , t)
df∫ f2f1Px(
f , t)
df.
Maximum frequency amplitude(
A fmax)
:
us(t) = maxPx(
f , t)
.
(1)
These signatures are measures of the spectral contentvariations that are affected by the ultrasonic pulse travellinginside the material. They can be estimated by means of well-known smoothing techniques of time-frequency spectralanalysis [6].
From us(t), we can obtain features in different forms. Forexample, the time average value (1/(t1− t0))
∫ t1t0 us(t)dt or the
instantaneous value at one particular time instant us(t0) canbe elements of the feature vector in the observation space.
Other time-domain features, such as the parameters Aand β corresponding to an exponential model of the signalattenuation x(t) = Ae−βt or the total signal power receivedP = ∫ T
0 |x(t)|2dt/T , are also possible to complement thefrequency-domain features.
More features can be defined considering special con-ditions of the through-transmission model. For example,higher-order statistics can be used to detect the possibledegree of non-Gaussianity of the reflectivity by measuringhigher-order moments of the received signal like HOM =E[x(nTs) ·x((n−1)Ts) ·x((n−2)Ts)] [7], where E[·] meansstatistical expectation and 1/Ts is the sampling frequency.Departures from the linear model of Figure 1 can be testedin different forms, for example, using the so-called time-reversibility [8], which is defined by TR = E[(dx(t)/dt)3].
3. Independent Component AnalysisMixture Model
Let us consider a probabilistic classification context wheresome selected features are organized as elements of vectorsbelonging to an observation space to be divided into Kclasses {Ck} k = 1 · · ·K . Given an observed feature vectorx, we want to determine the most probable class. Moreformally, we want to determine the class Ck that maximizesthe conditional probability p(Ck/x). Since classes are notdirectly observed, Bayes theorem is used to express p(Ck/x)in terms of the class-conditioned observation probabilitydensity p(x/Ck) in the form p(Ck/x) = p(x/Ck)p(Ck)/p(x).Note that p(x) is a scaling factor that is irrelevant to themaximization of p(Ck/x), and that a priori probability p(Ck)
EURASIP Journal on Advances in Signal Processing 3
Material reflectivity:Gaussian or non-Gaussian white noise Ultrasound pulse:
Attenuation and dispersioneffectsLinear time variant system
Recorded signal:
Grain noise (Gaussian ornon-Gaussian coloured noise)Observation white Gaussiannoise
H(t, τ)
LTV
x(t)
Figure 1: The through-transmission linear time variant model.
is assumed to be known (or equal to 1/K for all classes).Hence, the key problem focuses on estimation of p(x/Ck).A nonparametric classifier tries to estimate p(x/Ck) froma training set of observation vectors, but this becomesprogressively intractable as the dimension of the observationspace (number of features) increases, because the requiredsize of the training set becomes prohibitive. On the otherhand, a parametric classifier assumes a given form forp(Ck/x) and, thus, tries to estimate the required parametersfrom the training observation set [9]. Most of the classifiersfrom parametric approaches consider Gaussian densities tosimplify the problem in the absence of other informationthat could lead to better choices. Moreover, both parametricand nonparametric classifiers are very much complicated insemisupervised scenarios, that is, when part of the observedvectors belonging to the training set have unknown classes[10].
Therefore, procedures that would be of interest in thegeneral area of classification should combine the followingcharacteristics: the versatility of the nonparametric approach(from the point of view of the assumed form of p(x/Ck));the simplicity of the parametric methods (in the sense thatmost effort will concentrate on the estimation of a finiteset of parameters); and operate in semisupervised scenarios.This is especially remarkable in the area of nondestructiveclassification of materials. On one hand, the prediction of thejoint density of some selected features is almost impossible(Gaussianity is an assumption that is too restrictive in manycases). On the other hand, there are some applications wherethe available set of specimens used to obtain the training setcan hardly be classified. This happens, for example, when thespecimen cannot be destroyed to find the true inner state orwhen the definition of the K classes is not clearly known apriori.
The classification application considered in this paperhas the conditions necessary for verifying the usefulnessof a versatile classifier that is capable of working withsemisupervised training. Ceramic composition is assumed tobe different in different historic and protohistoric periods,so there should be opportunities to classify the pieces fromfeatures derived from ultrasonic analysis. Nevertheless, exactmodelling of the propagation of ultrasound in ceramic andstatistical characterization of the features is a complex matter.
Hence, it is advisable not to assume particular parametricdistributions (like normal density) in the design of theclassifier. On the other hand, very often, the archaeologistdoes not know the period of all the available specimensthat could be used to form the training set of observation:semisupervised training is a requirement in this application.Even more interesting is that the expert archaeologist canassign some probabilities of classes (ranging from 0 to 1)to part of the pieces of the training set, scenario that wewill call probabilistic semisupervision (PSS). Most of thesemisupervised classifiers are not capable of dealing withPSS, only if the assigned probabilities to the labelled featurevectors are 0 or 1.
In this paper, we consider the application of a classifica-tion method based on the independent component analysismixture model (ICAMM) [11–15]. ICAMM has the tworequired conditions: versatile modelling and the possibilityof PSS training. In ICAMM, it is assumed that every classsatisfies an independent component analysis (ICA) model[16, 17]: vectors xk corresponding to a given class Ck k =1 · · ·K are the result of applying a linear transformationAk to a (source) vector sk, whose elements are independentrandom variables, plus a bias or centroid vector bk, that is,xk = Aksk + bk k = 1 · · ·K . This implies that the overalldensity of the observation vectors may be expressed as themixture p(x) = ∑K
k=1 p(x/Ck)p(Ck) which gives the nameto the model. Moreover, it also implies that p(x/Ck) =|det A−1
k |p(sk) where sk = A−1k (x − bk). Thus, estimation
of p(x/Ck) means estimation of A−1k = Wk, and bk (like
in a parametric method) plus estimation of p(sk). However,this problem is simpler than the original one since thejoint density of the elements of sk can be expressed as theproduct of the marginals p(sk) = p(sk1)p(sk2) · · · p(skN ).Therefore, a very complex N-dimensional problem (whereN is the number of features) is broken down into N one-dimensional problems that are more tractable. Actually,many different types of densities can be assumed for themarginals, thus relaxing the Gaussianity constraint, andallowing a nonparametric estimation. In this sense, ICAMMcan be considered a hybrid method that compiles theadvantages of nonparametric and parametric models. Thereare a few references of the application of this method in NDT[18].
4 EURASIP Journal on Advances in Signal Processing
In summary, given one measured feature vector x, theassigned class is given by
C(x) = max︸ ︷︷ ︸
Ck
p(Ck/x),
= max︸ ︷︷ ︸
Ck
|det Wk|p(sk)p(Ck), k = 1 · · ·K ,(2)
where sk = Wk(x − bk), and Wk,bk and p(sk) are estimatedby means of a PSS training. This is achieved using an iterativealgorithm that we briefly describe below (a more detaileddescription can be found in [15]). A relevant conceptin ICAMM learning is the embedded ICA algorithm. AsICAMM is a set of multiple ICA models, learning of theICAMM parameters is essentially equivalent to simultaneouslearning of a set of ICA parameters. Thus, any ICA algorithmcould be used as part of the global ICAMM learningalgorithm as we describe below.
Let us consider that the set of training feature vectorsis formed by xm m = 1 · · ·M. We divide the set intotwo subsets. The first subset is formed by xm m =1 · · ·M1 M1 ≤ M vectors such that the expert archaeologistis capable of assigning some p(0)(Ck/xm)ranging between 0and 1 for k = 1 · · ·K . The second subset is formed byM2 = M − M1 vectors where no knowledge exists aboutthe possible class they belong to. The learning algorithmsproceed in the following manner.
Initialization. For k = 1 · · ·K , compute
b(0)k = ∑M1
m=1 xmp(0)(Ck/xm) (If M1 = 0, then selectthe initial centroids randomly);
W(0)k (randomly);
p(0)(sk) (in a form depending on the selected embed-
ded ICA algorithm) using s(0)km = W(0)
k (xm − b(0)k ).
Updating. For i = 1 · · · I and for k = 1 · · ·K , compute
for the probabilistically labelled vectors
p(i)(
Ckxm
)
= p(0)(
Ckxm
)
m = 1 · · ·M1. (3)
For the unlabelled vectors
p(i)(Ck/xm) = p(i)(Ck/xm)p(Ck)p(xm)
,
=∣
∣
∣det W(i−1)k
∣
∣
∣p(i−1)(
s(i−1)km
)
p(Ck)∑K
k′=1
∣
∣
∣det W(i−1)k′
∣
∣
∣p(i−1)(
s(i−1)k′m
)
p(Ck′),
m =M1 + 1 · · ·M,
b(i)k =
M∑
m=1
xmp(i)(
Ckxm
)
,
W(i)k = W(i−1)
k + ΔW(i−1)k ,
ΔW(i−1)k =
M∑
m=1
ΔW(i−1)km(ICA)p
(i−1)(
Ckxm
)
,
(4)
(ΔW(i−1)km(ICA) is the updating due to training sample xm
in the selected embedded ICA algorithm).
p(i)(sk) (in a form depending on the selected embed-
ded ICA algorithm) using s(i)km = W(i)
k (xm − b(i)k ).
4. Experiments and Results
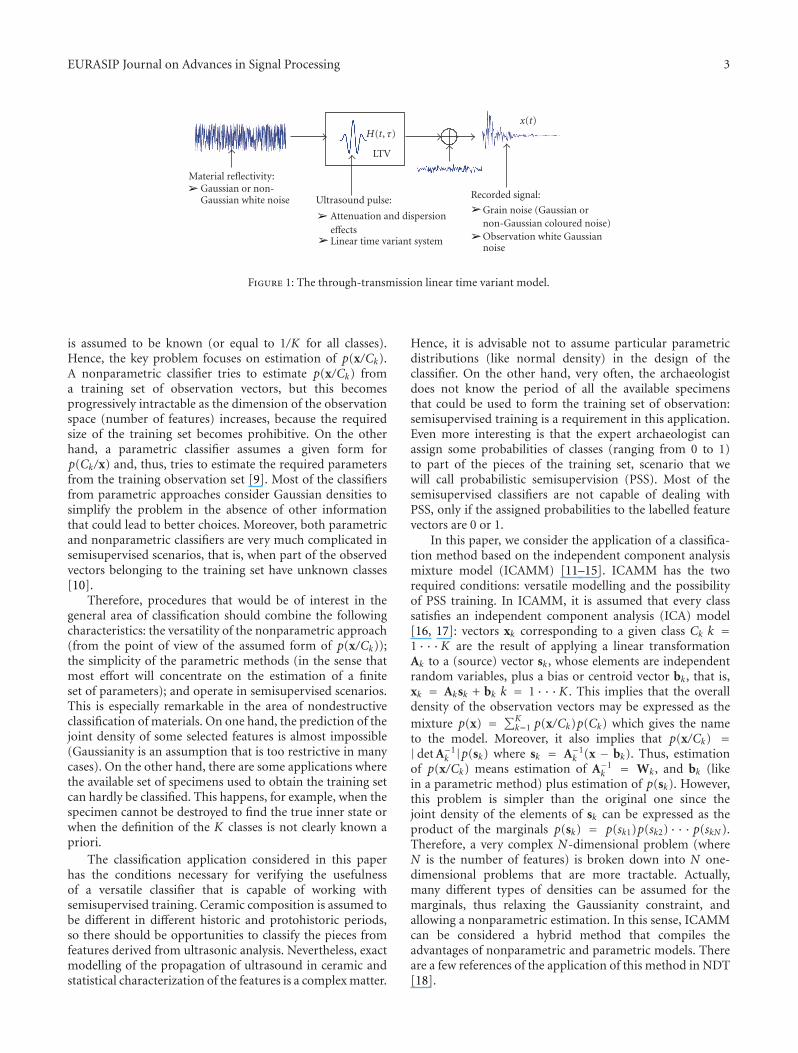
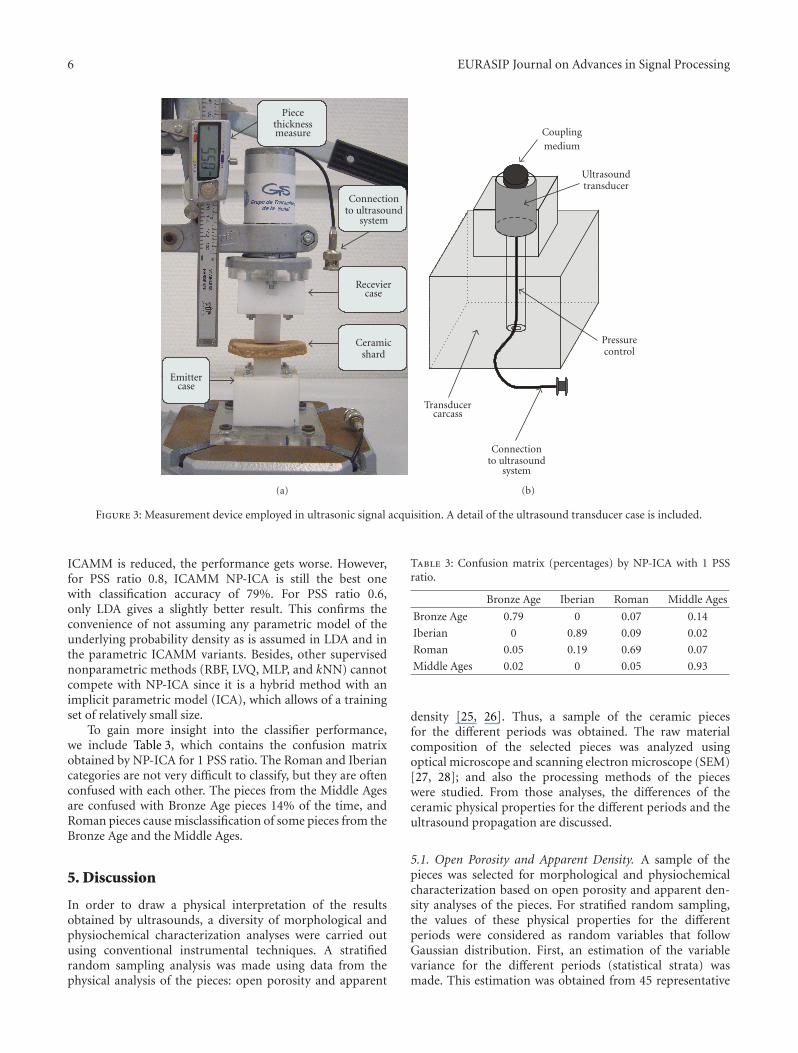
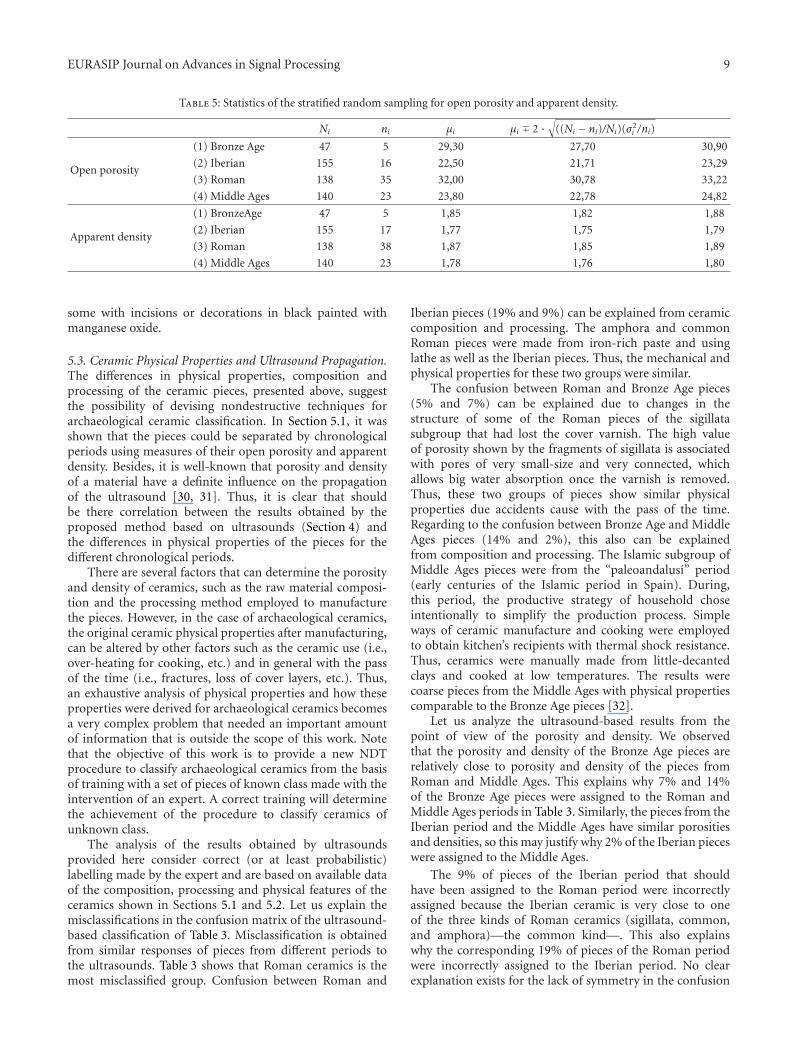
Two identical transducers (one in emitter mode and theother one in receiver mode) with a nominal operatingfrequency of 1.05 MHz were used to obtain the through-transmission signals. This operating frequency was selectedafter performing different tests, as the most appropriate toachieve small ultrasound attenuation with resolution enoughto separate different kinds of ceramics. Sampling frequencywas 100 MHz and the observation time was 0.1 ms (10000samples) for every acquisition. To reduce observation noise16 acquisitions were averaged. The size of the transducerswas also important since the ceramic pieces were small (afew centimetres in height and length, and less than onecentimetre in width, see Figure 2).
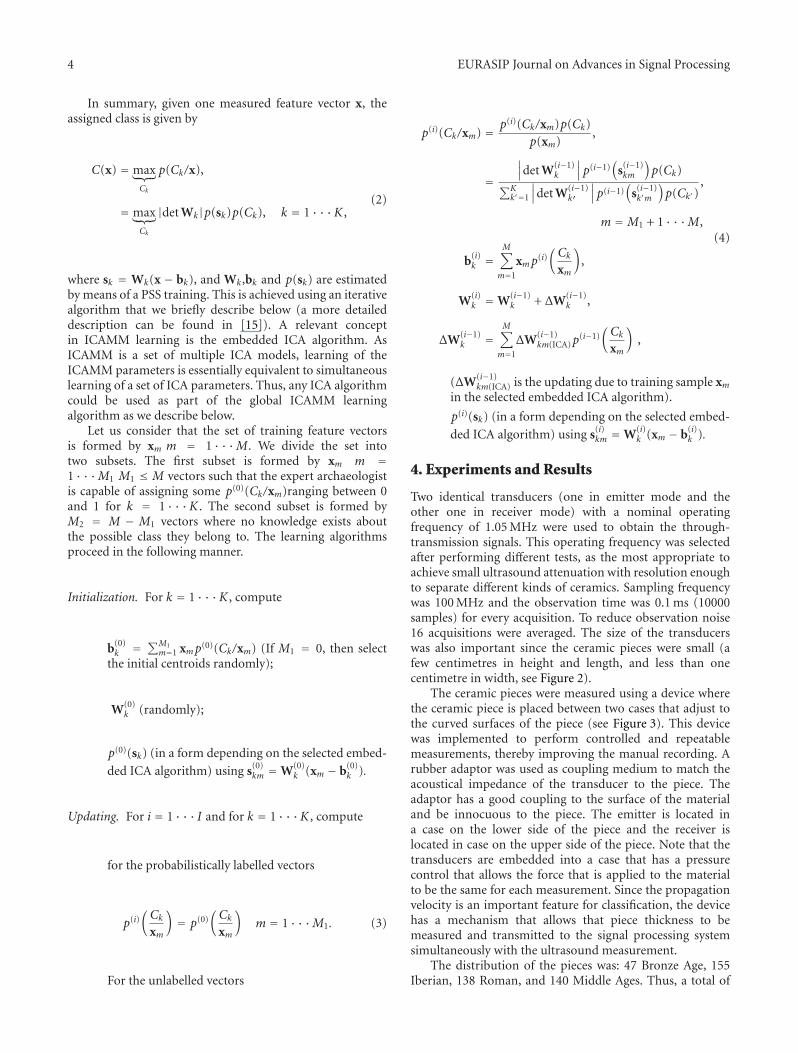
The ceramic pieces were measured using a device wherethe ceramic piece is placed between two cases that adjust tothe curved surfaces of the piece (see Figure 3). This devicewas implemented to perform controlled and repeatablemeasurements, thereby improving the manual recording. Arubber adaptor was used as coupling medium to match theacoustical impedance of the transducer to the piece. Theadaptor has a good coupling to the surface of the materialand be innocuous to the piece. The emitter is located ina case on the lower side of the piece and the receiver islocated in case on the upper side of the piece. Note that thetransducers are embedded into a case that has a pressurecontrol that allows the force that is applied to the materialto be the same for each measurement. Since the propagationvelocity is an important feature for classification, the devicehas a mechanism that allows that piece thickness to bemeasured and transmitted to the signal processing systemsimultaneously with the ultrasound measurement.
The distribution of the pieces was: 47 Bronze Age, 155Iberian, 138 Roman, and 140 Middle Ages. Thus, a total of
EURASIP Journal on Advances in Signal Processing 5
Bronze Age Iberian Roman Middle Ages
Figure 2: Images of typical ceramic pieces.
480 pieces were used in the experiments from deposits at theValencian Community in Spain. The features were selectedfrom the features defined in Section 2. A total of 11 featureswere considered. The first 4 were the time averages overthe whole acquisition interval of the 4 ultrasonic signaturesdefined in (1). The squared magnitude of the Short TermFourier Transform was used to estimate Px( f , t).
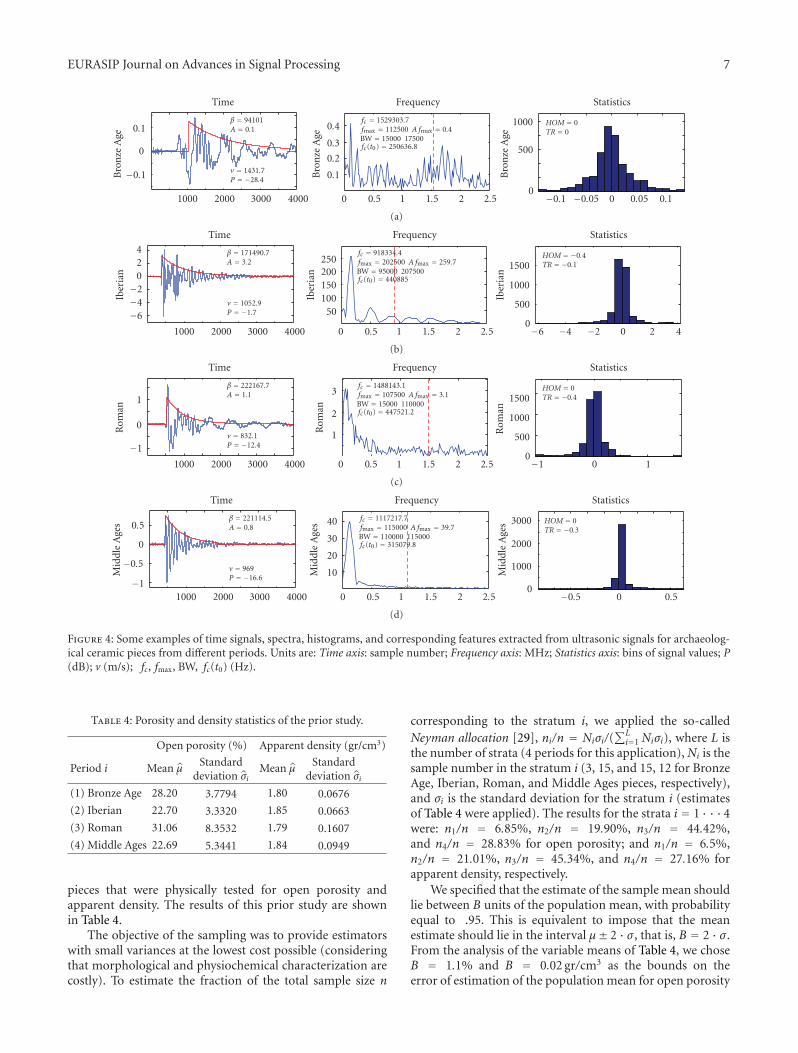
Feature number 5 was fc(t0), the instantaneous valueof the centroid frequency at a specific time instant. Theparameters A, β, P, HOM, and TR that are defined inSection 2, were also included in the feature vector. Finally,the velocity of propagation v of the ultrasound, whichwas measured by dividing the piece thickness by the pulsearrival delay, was also considered, since it is a standardvariable in the ultrasonic characterization of materials.Figure 4 shows examples of the time record, spectrum, andhistogram for each period. It also shows the eleven featuresobtained for each example. Note the significant differences(in general) among the feature values corresponding todifferent periods, which provide the opportunity for goodclassification performance.
First, the signal features were preprocessed with PrincipalComponent Analysis (PCA) [19] to reduce the dimension ofthe problem as much as possible and to detect redundanciesamong the selected features. This resulted in only 6 signifi-cant features (components), which were linear combinationsof the original ones. These 6 components explained a total of90% of the data variance.
We had a total of 480∗0.75 = 360 original samples fortraining. By adding spherical Gaussian noise to the originalsamples, three replicates were estimated to obtain a total of1440 samples for training. We performed 100 runs varyingthe sets of 360 samples used for training and 120 used fortesting. The percentage of success in determining the correctclass was then evaluated for a total of 120 × 100 testingsamples.
Different alternative ICAMM classifiers were imple-mented together with other classical classifiers. We consid-ered four embedded ICA algorithms: nonparametric ICA
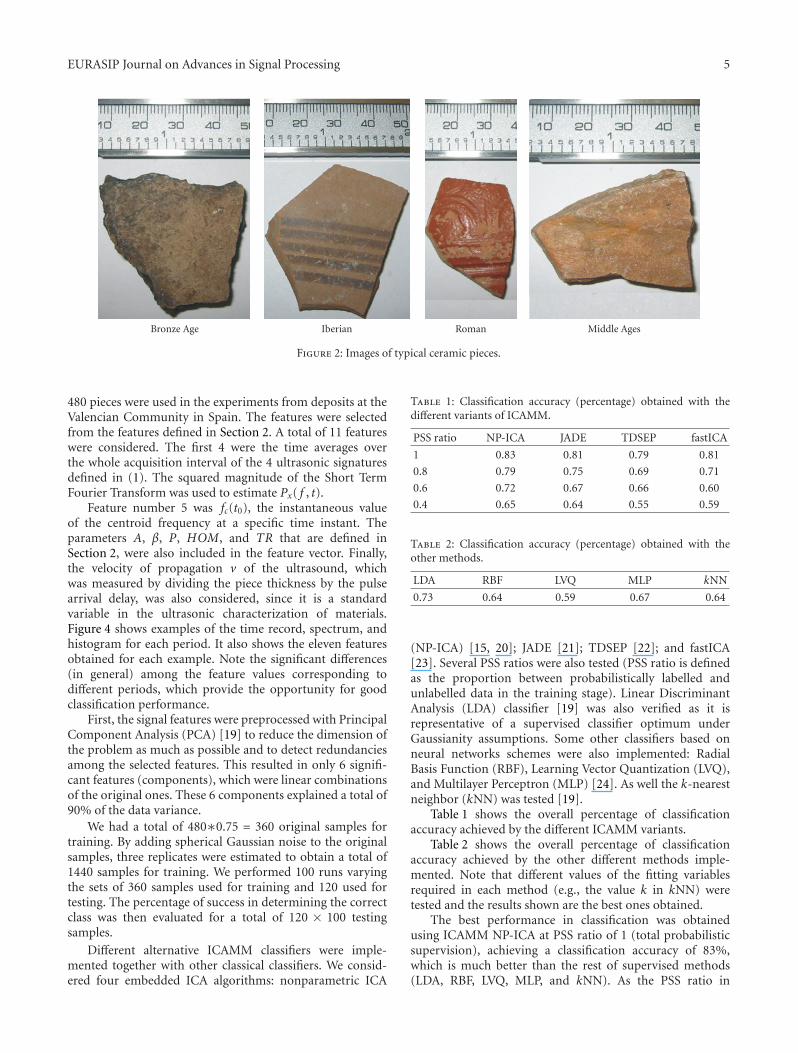
Table 1: Classification accuracy (percentage) obtained with thedifferent variants of ICAMM.
PSS ratio NP-ICA JADE TDSEP fastICA
1 0.83 0.81 0.79 0.81
0.8 0.79 0.75 0.69 0.71
0.6 0.72 0.67 0.66 0.60
0.4 0.65 0.64 0.55 0.59
Table 2: Classification accuracy (percentage) obtained with theother methods.
LDA RBF LVQ MLP kNN
0.73 0.64 0.59 0.67 0.64
(NP-ICA) [15, 20]; JADE [21]; TDSEP [22]; and fastICA[23]. Several PSS ratios were also tested (PSS ratio is definedas the proportion between probabilistically labelled andunlabelled data in the training stage). Linear DiscriminantAnalysis (LDA) classifier [19] was also verified as it isrepresentative of a supervised classifier optimum underGaussianity assumptions. Some other classifiers based onneural networks schemes were also implemented: RadialBasis Function (RBF), Learning Vector Quantization (LVQ),and Multilayer Perceptron (MLP) [24]. As well the k-nearestneighbor (kNN) was tested [19].
Table 1 shows the overall percentage of classificationaccuracy achieved by the different ICAMM variants.
Table 2 shows the overall percentage of classificationaccuracy achieved by the other different methods imple-mented. Note that different values of the fitting variablesrequired in each method (e.g., the value k in kNN) weretested and the results shown are the best ones obtained.
The best performance in classification was obtainedusing ICAMM NP-ICA at PSS ratio of 1 (total probabilisticsupervision), achieving a classification accuracy of 83%,which is much better than the rest of supervised methods(LDA, RBF, LVQ, MLP, and kNN). As the PSS ratio in
6 EURASIP Journal on Advances in Signal Processing
Piecethicknessmeasure
Connectionto ultrasound
system
Receviercase
Ceramicshard
Emittercase
(a)
Couplingmedium
Ultrasoundtransducer
Connectionto ultrasound
system
Pressurecontrol
Transducercarcass
(b)
Figure 3: Measurement device employed in ultrasonic signal acquisition. A detail of the ultrasound transducer case is included.
ICAMM is reduced, the performance gets worse. However,for PSS ratio 0.8, ICAMM NP-ICA is still the best onewith classification accuracy of 79%. For PSS ratio 0.6,only LDA gives a slightly better result. This confirms theconvenience of not assuming any parametric model of theunderlying probability density as is assumed in LDA and inthe parametric ICAMM variants. Besides, other supervisednonparametric methods (RBF, LVQ, MLP, and kNN) cannotcompete with NP-ICA since it is a hybrid method with animplicit parametric model (ICA), which allows of a trainingset of relatively small size.
To gain more insight into the classifier performance,we include Table 3, which contains the confusion matrixobtained by NP-ICA for 1 PSS ratio. The Roman and Iberiancategories are not very difficult to classify, but they are oftenconfused with each other. The pieces from the Middle Agesare confused with Bronze Age pieces 14% of the time, andRoman pieces cause misclassification of some pieces from theBronze Age and the Middle Ages.
5. Discussion
In order to draw a physical interpretation of the resultsobtained by ultrasounds, a diversity of morphological andphysiochemical characterization analyses were carried outusing conventional instrumental techniques. A stratifiedrandom sampling analysis was made using data from thephysical analysis of the pieces: open porosity and apparent
Table 3: Confusion matrix (percentages) by NP-ICA with 1 PSSratio.
Bronze Age Iberian Roman Middle Ages
Bronze Age 0.79 0 0.07 0.14
Iberian 0 0.89 0.09 0.02
Roman 0.05 0.19 0.69 0.07
Middle Ages 0.02 0 0.05 0.93
density [25, 26]. Thus, a sample of the ceramic piecesfor the different periods was obtained. The raw materialcomposition of the selected pieces was analyzed usingoptical microscope and scanning electron microscope (SEM)[27, 28]; and also the processing methods of the pieceswere studied. From those analyses, the differences of theceramic physical properties for the different periods and theultrasound propagation are discussed.
5.1. Open Porosity and Apparent Density. A sample of thepieces was selected for morphological and physiochemicalcharacterization based on open porosity and apparent den-sity analyses of the pieces. For stratified random sampling,the values of these physical properties for the differentperiods were considered as random variables that followGaussian distribution. First, an estimation of the variablevariance for the different periods (statistical strata) wasmade. This estimation was obtained from 45 representative
EURASIP Journal on Advances in Signal Processing 7
fc = 1529303.7fmax = 112500 A fmax = 0.4BW = 15000 17500fc(t0) = 250636.8
β = 94101A = 0.1
v = 1431.7P = −28.4
HOM = 0TR = 0
0.1
0.2
0.3
0.4
Bro
nze
Age
1000
500
0
Bro
nze
Age
0.1
0
−0.1Bro
nze
Age
1000 2000 3000 4000 0 0.5 1 1.5 2 2.5 −0.1 −0.05 0 0.05 0.1
Time Frequency Statistics
(a)
fc = 918334.4fmax = 202500 A fmax = 259.7BW = 95000 207500fc(t0) = 440885
β = 171490.7A = 3.2
v = 1052.9P = −1.7
HOM = −0.4TR = −0.1
50100150200250
Iber
ian
1500
1000
500
0
Iber
ian
−6−4−2
024
Iber
ian
1000 2000 3000 4000 0 0.5 1 1.5 2 2.5 −6 −4 −2 0 2 4
Time Frequency Statistics
(b)
fc = 1488143.1fmax = 107500 A fmax = 3.1BW = 15000 110000fc(t0) = 447521.2
β = 222167.7A = 1.1
v = 832.1P = −12.4
HOM = 0TR = −0.4
1
2
3
Rom
an
1500
1000
500
0
Rom
an
−1
0
1
Rom
an
1000 2000 3000 4000 0 0.5 1 1.5 2 2.5 −1 0 1
Time Frequency Statistics
(c)
fc = 1117217.7fmax = 115000 A fmax = 39.7BW = 110000 115000fc(t0) = 315079.8
β = 221114.5A = 0.8
v = 969P = −16.6
HOM = 0TR = −0.3
10
20
30
40
Mid
dle
Age
s 3000
2000
1000
0
Mid
dle
Age
s
−1
−0.5
0
0.5
Mid
dle
Age
s
1000 2000 3000 4000 0 0.5 1 1.5 2 2.5 −0.5 0 0.5
Time Frequency Statistics
(d)
Figure 4: Some examples of time signals, spectra, histograms, and corresponding features extracted from ultrasonic signals for archaeolog-ical ceramic pieces from different periods. Units are: Time axis: sample number; Frequency axis: MHz; Statistics axis: bins of signal values; P(dB); v (m/s); fc, fmax, BW, fc(t0) (Hz).
Table 4: Porosity and density statistics of the prior study.
Open porosity (%) Apparent density (gr/cm3)
Period i Mean μ Standarddeviation σi
Mean μ Standarddeviation σi
(1) Bronze Age 28.20 3.7794 1.80 0.0676
(2) Iberian 22.70 3.3320 1.85 0.0663
(3) Roman 31.06 8.3532 1.79 0.1607
(4) Middle Ages 22.69 5.3441 1.84 0.0949
pieces that were physically tested for open porosity andapparent density. The results of this prior study are shownin Table 4.
The objective of the sampling was to provide estimatorswith small variances at the lowest cost possible (consideringthat morphological and physiochemical characterization arecostly). To estimate the fraction of the total sample size n
corresponding to the stratum i, we applied the so-calledNeyman allocation [29], ni/n = Niσi/(
∑Li=1 Niσi), where L is
the number of strata (4 periods for this application),Ni is thesample number in the stratum i (3, 15, and 15, 12 for BronzeAge, Iberian, Roman, and Middle Ages pieces, respectively),and σi is the standard deviation for the stratum i (estimatesof Table 4 were applied). The results for the strata i = 1 · · · 4were: n1/n = 6.85%, n2/n = 19.90%, n3/n = 44.42%,and n4/n = 28.83% for open porosity; and n1/n = 6.5%,n2/n = 21.01%, n3/n = 45.34%, and n4/n = 27.16% forapparent density, respectively.
We specified that the estimate of the sample mean shouldlie between B units of the population mean, with probabilityequal to .95. This is equivalent to impose that the meanestimate should lie in the interval μ± 2 · σ , that is, B = 2 · σ .From the analysis of the variable means of Table 4, we choseB = 1.1% and B = 0.02 gr/cm3 as the bounds on theerror of estimation of the population mean for open porosity
8 EURASIP Journal on Advances in Signal Processing
Figure 5: Bits taken from the ceramic fragments included in the testprobes prepared for the Scanning Electron Microscope.
and apparent density, respectively. These bounds allowed thestratum mean of the sampling to be separated adequately.
The total number of samples was estimated using [29],
n = (∑L
i=1 Niσi)2/(N2 · D +
∑Li=1 Niσ
2i ), where D = B2/4.
Thus, we obtained the total number of samples n = 79 andn = 83 for open porosity and apparent density, respectively.These were the number of pieces that the morphologicaland physiochemical characterization analyses were appliedto. Using the estimated fractions ni/n for the strata andthe total number of samples n, we obtained the samplingpopulation for each stratum. The final results of the stratifiedrandom sampling for an error margin of .05 are in Table 5.The estimate of the population mean for open porosityand apparent density for each stratum are shown with anapproximate 2 standard deviation bound on the error ofestimation.
Table 5 shows that the samples of the different strata(chronological periods) can be clearly separated by openporosity, since the bounds of the distributions define themost part of the densities to be disjoint. The separation ofthe samples by apparent density is more difficult becausethere is a degree of overlapping between densities of Romanand Bronze Age pieces, and a higher overlapping betweendensities of Iberian and Middle Ages pieces. However thejoint densities of these two collections of pieces are well-separated between them. In conclusion, physical propertiesof the ceramics shows that it is possible a separation ofthe pieces in the different chronological periods of thisstudy. Different porosities and densities of the pieces aredetermined by the material composition and processingmethods employed in the ceramic manufacturing. Theseissues are studied in the next section.
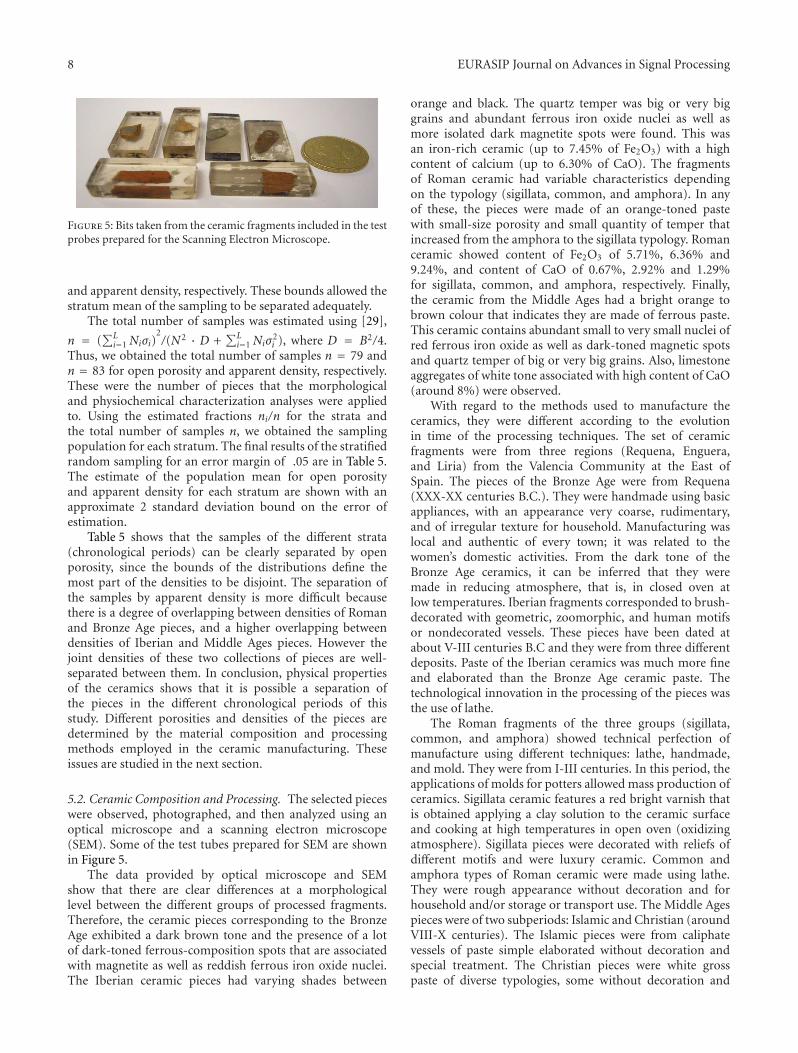
5.2. Ceramic Composition and Processing. The selected pieceswere observed, photographed, and then analyzed using anoptical microscope and a scanning electron microscope(SEM). Some of the test tubes prepared for SEM are shownin Figure 5.
The data provided by optical microscope and SEMshow that there are clear differences at a morphologicallevel between the different groups of processed fragments.Therefore, the ceramic pieces corresponding to the BronzeAge exhibited a dark brown tone and the presence of a lotof dark-toned ferrous-composition spots that are associatedwith magnetite as well as reddish ferrous iron oxide nuclei.The Iberian ceramic pieces had varying shades between
orange and black. The quartz temper was big or very biggrains and abundant ferrous iron oxide nuclei as well asmore isolated dark magnetite spots were found. This wasan iron-rich ceramic (up to 7.45% of Fe2O3) with a highcontent of calcium (up to 6.30% of CaO). The fragmentsof Roman ceramic had variable characteristics dependingon the typology (sigillata, common, and amphora). In anyof these, the pieces were made of an orange-toned pastewith small-size porosity and small quantity of temper thatincreased from the amphora to the sigillata typology. Romanceramic showed content of Fe2O3 of 5.71%, 6.36% and9.24%, and content of CaO of 0.67%, 2.92% and 1.29%for sigillata, common, and amphora, respectively. Finally,the ceramic from the Middle Ages had a bright orange tobrown colour that indicates they are made of ferrous paste.This ceramic contains abundant small to very small nuclei ofred ferrous iron oxide as well as dark-toned magnetic spotsand quartz temper of big or very big grains. Also, limestoneaggregates of white tone associated with high content of CaO(around 8%) were observed.
With regard to the methods used to manufacture theceramics, they were different according to the evolutionin time of the processing techniques. The set of ceramicfragments were from three regions (Requena, Enguera,and Liria) from the Valencia Community at the East ofSpain. The pieces of the Bronze Age were from Requena(XXX-XX centuries B.C.). They were handmade using basicappliances, with an appearance very coarse, rudimentary,and of irregular texture for household. Manufacturing waslocal and authentic of every town; it was related to thewomen’s domestic activities. From the dark tone of theBronze Age ceramics, it can be inferred that they weremade in reducing atmosphere, that is, in closed oven atlow temperatures. Iberian fragments corresponded to brush-decorated with geometric, zoomorphic, and human motifsor nondecorated vessels. These pieces have been dated atabout V-III centuries B.C and they were from three differentdeposits. Paste of the Iberian ceramics was much more fineand elaborated than the Bronze Age ceramic paste. Thetechnological innovation in the processing of the pieces wasthe use of lathe.
The Roman fragments of the three groups (sigillata,common, and amphora) showed technical perfection ofmanufacture using different techniques: lathe, handmade,and mold. They were from I-III centuries. In this period, theapplications of molds for potters allowed mass production ofceramics. Sigillata ceramic features a red bright varnish thatis obtained applying a clay solution to the ceramic surfaceand cooking at high temperatures in open oven (oxidizingatmosphere). Sigillata pieces were decorated with reliefs ofdifferent motifs and were luxury ceramic. Common andamphora types of Roman ceramic were made using lathe.They were rough appearance without decoration and forhousehold and/or storage or transport use. The Middle Agespieces were of two subperiods: Islamic and Christian (aroundVIII-X centuries). The Islamic pieces were from caliphatevessels of paste simple elaborated without decoration andspecial treatment. The Christian pieces were white grosspaste of diverse typologies, some without decoration and
EURASIP Journal on Advances in Signal Processing 9
Table 5: Statistics of the stratified random sampling for open porosity and apparent density.
Ni ni μi μi ∓ 2 ·√
((Ni − ni)/Ni)(σ2i /ni)
Open porosity
(1) Bronze Age 47 5 29,30 27,70 30,90
(2) Iberian 155 16 22,50 21,71 23,29
(3) Roman 138 35 32,00 30,78 33,22
(4) Middle Ages 140 23 23,80 22,78 24,82
Apparent density
(1) BronzeAge 47 5 1,85 1,82 1,88
(2) Iberian 155 17 1,77 1,75 1,79
(3) Roman 138 38 1,87 1,85 1,89
(4) Middle Ages 140 23 1,78 1,76 1,80
some with incisions or decorations in black painted withmanganese oxide.
5.3. Ceramic Physical Properties and Ultrasound Propagation.The differences in physical properties, composition andprocessing of the ceramic pieces, presented above, suggestthe possibility of devising nondestructive techniques forarchaeological ceramic classification. In Section 5.1, it wasshown that the pieces could be separated by chronologicalperiods using measures of their open porosity and apparentdensity. Besides, it is well-known that porosity and densityof a material have a definite influence on the propagationof the ultrasound [30, 31]. Thus, it is clear that shouldbe there correlation between the results obtained by theproposed method based on ultrasounds (Section 4) andthe differences in physical properties of the pieces for thedifferent chronological periods.
There are several factors that can determine the porosityand density of ceramics, such as the raw material composi-tion and the processing method employed to manufacturethe pieces. However, in the case of archaeological ceramics,the original ceramic physical properties after manufacturing,can be altered by other factors such as the ceramic use (i.e.,over-heating for cooking, etc.) and in general with the passof the time (i.e., fractures, loss of cover layers, etc.). Thus,an exhaustive analysis of physical properties and how theseproperties were derived for archaeological ceramics becomesa very complex problem that needed an important amountof information that is outside the scope of this work. Notethat the objective of this work is to provide a new NDTprocedure to classify archaeological ceramics from the basisof training with a set of pieces of known class made with theintervention of an expert. A correct training will determinethe achievement of the procedure to classify ceramics ofunknown class.
The analysis of the results obtained by ultrasoundsprovided here consider correct (or at least probabilistic)labelling made by the expert and are based on available dataof the composition, processing and physical features of theceramics shown in Sections 5.1 and 5.2. Let us explain themisclassifications in the confusion matrix of the ultrasound-based classification of Table 3. Misclassification is obtainedfrom similar responses of pieces from different periods tothe ultrasounds. Table 3 shows that Roman ceramics is themost misclassified group. Confusion between Roman and
Iberian pieces (19% and 9%) can be explained from ceramiccomposition and processing. The amphora and commonRoman pieces were made from iron-rich paste and usinglathe as well as the Iberian pieces. Thus, the mechanical andphysical properties for these two groups were similar.
The confusion between Roman and Bronze Age pieces(5% and 7%) can be explained due to changes in thestructure of some of the Roman pieces of the sigillatasubgroup that had lost the cover varnish. The high valueof porosity shown by the fragments of sigillata is associatedwith pores of very small-size and very connected, whichallows big water absorption once the varnish is removed.Thus, these two groups of pieces show similar physicalproperties due accidents cause with the pass of the time.Regarding to the confusion between Bronze Age and MiddleAges pieces (14% and 2%), this also can be explainedfrom composition and processing. The Islamic subgroup ofMiddle Ages pieces were from the “paleoandalusı” period(early centuries of the Islamic period in Spain). During,this period, the productive strategy of household choseintentionally to simplify the production process. Simpleways of ceramic manufacture and cooking were employedto obtain kitchen’s recipients with thermal shock resistance.Thus, ceramics were manually made from little-decantedclays and cooked at low temperatures. The results werecoarse pieces from the Middle Ages with physical propertiescomparable to the Bronze Age pieces [32].
Let us analyze the ultrasound-based results from thepoint of view of the porosity and density. We observedthat the porosity and density of the Bronze Age pieces arerelatively close to porosity and density of the pieces fromRoman and Middle Ages. This explains why 7% and 14%of the Bronze Age pieces were assigned to the Roman andMiddle Ages periods in Table 3. Similarly, the pieces from theIberian period and the Middle Ages have similar porositiesand densities, so this may justify why 2% of the Iberian pieceswere assigned to the Middle Ages.
The 9% of pieces of the Iberian period that shouldhave been assigned to the Roman period were incorrectlyassigned because the Iberian ceramic is very close to oneof the three kinds of Roman ceramics (sigillata, common,and amphora)—the common kind—. This also explainswhy the corresponding 19% of pieces of the Roman periodwere incorrectly assigned to the Iberian period. No clearexplanation exists for the lack of symmetry in the confusion
10 EURASIP Journal on Advances in Signal Processing
matrix of Table 3; however, it must be taken into account thatthe training process introduced some degree of arbitrarinessbecause of the probabilistic labelling of the expert. Thus, itseems that the expert was able to clearly identify the piecesfrom Iberian and Middle Ages, but had more difficultieswith the Bronze Age and Roman ones. This uncertainty mayhave been transmitted to the classifier during the trainingstage.
The experiments with classical methods of ceramiccharacterization used in archaeology not only show thatcorrelations between the extracted parameters from theultrasound signals and the physical properties of the materi-als were found. Moreover, they also have demonstrated someadvantages of the proposed ultrasound method. The equip-ment required for nondestructive evaluation by ultrasoundis, in general, less costly, and the experiments are easier toperform. The pieces are not damaged in any way duringtesting, nor is it necessary to alter or destroy any of thematerial that is analyzed. Very significant differences for thetime required to analyze the pieces were demonstrated: theultrasound analysis (measuring, processing, and automaticclassification) for 480 pieces took only 6 hours; the SEManalysis (tube preparation and electron microscope analysis)for 80 pieces took 274 hours; the porosity and densityanalyses (immersion and weighing of the pieces) for 80 piecestook 288 hours.
There are limitations to the application of this proceduredue to the fact that the training of the classifier must beperformed from a specific set of data. Thus, the classifiermust be adapted to a specific data model and its efficiencyis restricted by the fact that the new data to be classified mustfollow the same data model. Nevertheless, the training ofthe classifier could progressively be improved by increasingthe number of pieces for each known chronological period.With proper training, the classifier would be able to providea prediction of the chronological period for pieces thatdo not have clear chronological markers. In addition, thesemisupervised training mode could be used to model theuncertainty that expert archaeologists may have about thechronological period to which the pieces belong.
6. Conclusions
We have presented the results of applying ICAMM to achallenging application in the area of nondestructive testingof materials: the classification of archaeological ceramicpieces into different historic periods. We have demonstratedthe interest of using methods that are able to consider non-Gaussian models of the underlying probability densities inthe feature vector space. Thus, an ICAMM classifier wastested using different variants depending on the embeddedICA algorithm. ICAMM has the additional merit of allowingPSS labelling, which is of practical interest in the consideredapplication. Note that in any ICAMM variant, the mutualdependence among features is modelled in a parametricform; also note that in nonparametric ICAMM, the esti-mated marginals are nonparametric. This confirms thatnonparametric ICAMM shares the good general modellingcapability of nonparametric classifiers and also can work
with a training set of relatively small size, which is a relevantproperty of parametric techniques. This explains the fact thatnonparametric ICAMM has shown the best results and isable to produce acceptable performance for even low ratiosof PSS.
The experiments show promising results in defininga standardised method that could complement or replacedestructive, costly, and time-consuming techniques, whichare currently being used by archaeologists in the area ofceramic characterization. Extensions of the procedures pre-sented in this work to other emergent material applicationsare planned for future work.
Acknowledgments
This paper has been supported by the Spanish Admin-istration and the FEDER Programme of the EuropeanCommunity under Grant TEC 2008-02975; the GeneralitatValenciana under Grant GV-ACOMP/2009/340, and GrantPROMETEO/2010/040.
References
[1] R. E. Taylor and M. J. Aitken, Chronometric Dating inArchaeology, vol. 2 of Advances in Archaeological and MuseumScience Series, Springer, New York, NY, USA, 1997.
[2] R. Cribbs and F. Saleh, “An ultrasonic based system used fornon-destructive imaging of archaeological sites,” in Proceed-ings of Informatica ed Egittologia all’Inizio Degli Anni ’90, pp.97–108, Rome, Italy, 1996.
[3] A. Murray, M. F. Mecklenburg, C. M. Fortenko, and R. E.Green, “Detection of delaminations in art objects using air-coupled ultrasound,” in Proceedings of Materials Issues in Artand Archaeology III Symposium, pp. 371–378, San Francisco,Calif, USA, 1992.
[4] W. I. Sellers and A. T. Chamberlain, “Ultrasonic cave map-ping,” Journal of Archaeological Science, vol. 25, no. 9, pp. 867–873, 1998.
[5] A. Salazar, R. Miralles, A. Parra, L. Vergara, and J. Gosal-bez, “Ultrasonic signal processing for archaeological ceramicrestoration,” in Proceedings of the IEEE International Confer-ence on Acoustics, Speech and Signal Processing (ICASSP ’06),pp. III1160–III1163, Toulouse, France, May 2006.
[6] L. Cohen and P. Loughlin, Recent Developments in Time-Frequency Analysis, Springer, New York, NY, USA, 1998.
[7] R. Miralles, L. Vergara, and J. Gosalbez, “Material grain noiseanalysis by using higher-order statistics,” Signal Processing, vol.84, no. 1, pp. 197–205, 2004.
[8] R. Miralles, L. Vergara, A. Salazar, and J. Igual, “Blind detec-tion of nonlinearities in multiple-echo ultrasonic signals,”IEEE Transactions on Ultrasonics, Ferroelectrics, and FrequencyControl, vol. 55, no. 3, pp. 637–647, 2008.
[9] A. K. Jain, R. P. W. Duin, and J. Mao, “Statistical patternrecognition: a review,” IEEE Transactions on Pattern Analysisand Machine Intelligence, vol. 22, no. 1, pp. 4–37, 2000.
[10] O. Chapelle, B. Scholkopf, and A. Zien, Semi-SupervisedLearning, MIT Press, Cambridge, Mass, USA, 2006.
[11] T.-W. Lee, M. S. Lewicki, and T. J. Sejnowski, “ICA mixturemodels for unsupervised classification of non-Gaussian classesand automatic context switching in blind signal separation,”
EURASIP Journal on Advances in Signal Processing 11
IEEE Transactions on Pattern Analysis and Machine Intelligence,vol. 22, no. 10, pp. 1078–1089, 2000.
[12] R. A. Choudrey and S. J. Roberts, “Variational mixture ofBayesian independent component analyzers,” Neural Compu-tation, vol. 15, no. 1, pp. 213–252, 2003.
[13] C.-T. Lin, W.-C. Cheng, and S.-F. Liang, “An on-lineICA-mixture-model-based self-constructing fuzzy neural net-work,” IEEE Transactions on Circuits and Systems I, vol. 52, no.1, pp. 207–221, 2005.
[14] C. A. Shah, P. K. Varshney, and M. K. Arora, “ICA mixturemodel algorithm for unsupervised classification of remotesensing imagery,” International Journal of Remote Sensing, vol.28, no. 8, pp. 1711–1731, 2007.
[15] A. Salazar, L. Vergara, A. Serrano, and J. Igual, “A generalprocedure for learning mixtures of independent componentanalyzers,” Pattern Recognition, vol. 43, no. 1, pp. 69–85, 2010.
[16] A. Hyvarinen, J. Karhunen, and E. Oja, Independent Compo-nent Analysis, John Wiley & Sons, New York, NY, USA, 2001.
[17] P. Comon, “Independent component analysis—a new con-cept?” Signal Processing, vol. 36, no. 3, pp. 287–314, 1994.
[18] A. Salazar, L. Vergara, and R. Llinares, “Learning materialdefect patterns by separating mixtures of independent com-ponent analyzers from NDT sonic signals,” Mechanical Systemsand Signal Processing, vol. 24, no. 6, pp. 1870–1886, 2010.
[19] R. O. Duda, P. E. Hart, and D. G. Stork, Pattern Classification,Wiley-Interscience, New York,NY, USA, 2nd edition, 2000.
[20] R. Boscolo, H. Pan, and V. P. Roychowdhury, “Independentcomponent analysis based on nonparametric density estima-tion,” IEEE Transactions on Neural Networks, vol. 15, no. 1, pp.55–65, 2004.
[21] J. F. Cardoso and A. Souloumiac, “Blind beamforming fornon-Gaussian signals,” IEE Proceedings, Part F, vol. 140, no.6, pp. 362–370, 1993.
[22] A. Ziehe and K. R. Muller, “TDSEP- an efficient algorithm forblind separation using time structure,” in Proceedings of the 8thInternational Conference on Artificial Neural Networks (ICANN’98), pp. 675–680, Skovde, Sweden, September 1998.
[23] A. Hyvarinen, “Fast and robust fixed-point algorithms forindependent component analysis,” IEEE Transactions on Neu-ral Networks, vol. 10, no. 3, pp. 626–634, 1999.
[24] C. M. Bishop, Neural Networks for Pattern Recognition, OxfordUniversity Press, Oxford, UK, 2004.
[25] P. M. Rice, Pottery Analysis: A Sourcebook, The University ofChicago Press, Chicago, Ill, USA, 1989.
[26] K. G. Harry and A. Johnson, “A non-destructive technique formeasuring ceramic porosity using liquid nitrogen,” Journal ofArchaeological Science, vol. 31, no. 11, pp. 1567–1575, 2004.
[27] A. M. Pollard and C. Heron, Archaeological Chemistry, TheRoyal Society of Chemistry, Cambridge, UK, 2008.
[28] S. L. Olsen, Scanning Electron Microscopy in Archaeology,British Archaeological Reports, Institute of Physics, Oxford,UK, 1998.
[29] S. K. Thompson, Sampling, Wiley-Interscience, New York, NY,USA, 2nd edition, 2002.
[30] J. D. Cheeke, Fundamentals and Applications of UltrasonicWaves, CRC Press, LLC, Boca Raton, Fla, USA, 2002.
[31] J. Krautkramer, Ultrasonic Testing of Materials, Springer,Berlin, Germany, 4th edition, 1990.
[32] M. Alba-Calzado and S. Gutierrez-Lloret, “Las produccionesde transicion al Mundo Islamico: el problema de la ceramicapaleoandalusı (siglos VIII y IX),” in Ceramicas Hispanorro-manas: Un Estado de la Cuestion, B. Casasola and A. Riberai Lacomba, Eds., pp. 585–613, Universidad de Cadiz, Cadiz,Spain, 2008.
Photograph © Turisme de Barcelona / J. Trullàs
Preliminary call for papers
The 2011 European Signal Processing Conference (EUSIPCO 2011) is thenineteenth in a series of conferences promoted by the European Association forSignal Processing (EURASIP, www.eurasip.org). This year edition will take placein Barcelona, capital city of Catalonia (Spain), and will be jointly organized by theCentre Tecnològic de Telecomunicacions de Catalunya (CTTC) and theUniversitat Politècnica de Catalunya (UPC).EUSIPCO 2011 will focus on key aspects of signal processing theory and
li ti li t d b l A t f b i i ill b b d lit
Organizing Committee
Honorary ChairMiguel A. Lagunas (CTTC)
General ChairAna I. Pérez Neira (UPC)
General Vice ChairCarles Antón Haro (CTTC)
Technical Program ChairXavier Mestre (CTTC)
Technical Program Co Chairsapplications as listed below. Acceptance of submissions will be based on quality,relevance and originality. Accepted papers will be published in the EUSIPCOproceedings and presented during the conference. Paper submissions, proposalsfor tutorials and proposals for special sessions are invited in, but not limited to,the following areas of interest.
Areas of Interest
• Audio and electro acoustics.• Design, implementation, and applications of signal processing systems.
l d l d d
Technical Program Co ChairsJavier Hernando (UPC)Montserrat Pardàs (UPC)
Plenary TalksFerran Marqués (UPC)Yonina Eldar (Technion)
Special SessionsIgnacio Santamaría (Unversidadde Cantabria)Mats Bengtsson (KTH)
FinancesMontserrat Nájar (UPC)• Multimedia signal processing and coding.
• Image and multidimensional signal processing.• Signal detection and estimation.• Sensor array and multi channel signal processing.• Sensor fusion in networked systems.• Signal processing for communications.• Medical imaging and image analysis.• Non stationary, non linear and non Gaussian signal processing.
Submissions
Montserrat Nájar (UPC)
TutorialsDaniel P. Palomar(Hong Kong UST)Beatrice Pesquet Popescu (ENST)
PublicityStephan Pfletschinger (CTTC)Mònica Navarro (CTTC)
PublicationsAntonio Pascual (UPC)Carles Fernández (CTTC)
I d i l Li i & E hibiSubmissions
Procedures to submit a paper and proposals for special sessions and tutorials willbe detailed at www.eusipco2011.org. Submitted papers must be camera ready, nomore than 5 pages long, and conforming to the standard specified on theEUSIPCO 2011 web site. First authors who are registered students can participatein the best student paper competition.
Important Deadlines:
P l f i l i 15 D 2010
Industrial Liaison & ExhibitsAngeliki Alexiou(University of Piraeus)Albert Sitjà (CTTC)
International LiaisonJu Liu (Shandong University China)Jinhong Yuan (UNSW Australia)Tamas Sziranyi (SZTAKI Hungary)Rich Stern (CMU USA)Ricardo L. de Queiroz (UNB Brazil)
Webpage: www.eusipco2011.org
Proposals for special sessions 15 Dec 2010Proposals for tutorials 18 Feb 2011Electronic submission of full papers 21 Feb 2011Notification of acceptance 23 May 2011Submission of camera ready papers 6 Jun 2011