hydrothermal alteration of magnetic fabrics of rocks in the xiaoban gold-bearing shear belt, fujian...
TRANSCRIPT
Geofísica InternacionalUniversidad Nacional Autónoma de Mé[email protected] ISSN (Versión impresa): 0016-7169MÉXICO
2003 Shunshan Xu / Ganguo Wu / Jianshe Wu / Bailin Chen
HYDROTHERMAL ALTERATION OF MAGNETIC FABRICS OF ROCKS IN THE XIAOBAN GOLD-BEARING SHEAR BELT, FUJIAN PROVINCE, CHINA
Geofísica Internacional, january-march, año/vol. 42, número 001 Universidad Nacional Autónoma de México
Distrito Federal, México pp. 83-94
Red de Revistas Científicas de América Latina y el Caribe, España y Portugal
Universidad Autónoma del Estado de México

Hydrothermal alteration of magnetic fabrics of rocks in theXiaoban gold-bearing shear belt, Fujian Province, China
Shunshan Xu1 , 2, Ganguo Wu3, Jianshe Wu4 and Bailin Chen2
1 Universidad Nacional Autónoma de México, Centro de Geociencias, Querétaro, Qro., México2 Institute of Geomechanics, CAGS, Beijing, China3 China University of Geosciences, Haidian District, Beijing, China4 Minxi Geological Team, Sanming, Fujian Province, China
Received: September 13, 2000; accepted: August 26, 2002.
RESUMENLa zona de deformación de Xiaoban experimentó alteración hidrotermal a temperaturas moderadas en el Mesozoico
(180 Ma). Las muestras estudiadas corresponden a unidades alteradas e inalteradas provenientes de tres niveles en la mina.Después de un estudio sistemático de las fábricas de rocas magnéticas encontramos que: 1) La susceptibilidad se debe principal-mente a la presencia de minerales paramagnéticos como la biotita y la pirita. La reducción de la susceptibilidad promedio se debea la disminución de hierro y al cambio del tamaño del mineral magnético, así como al incremento de minerales diamagnéticos. 2)Decrecimiento de la anisotropía (P) después de la alteración hidrotermal. La tendencia al cambio es la misma que la de la suscep-tibilidad promedio. 3) El elipsoide de AMS no cambia sustancialmente su forma después de la alteración hidrotermal, y se mantie-ne una esfera oblada. El eje menor de susceptibilidad axial principal (K3) cae cerca del plano perpendicular al plano de equistosidadde todas las muestras. Sin embargo, el eje mayor de susceptibilidad axial principal está sujeto a grandes cambios. Los resultadosindican que los nuevos minerales magnéticos están distribuidos en el plano existente de equistosidad, pero no tienen una orienta-ción preferencial.
PALABRAS CLAVE: Fábrica magnética, susceptibilidad, anisotropía, alteración hidrotermal, China.
ABSTRACTMagnetic fabrics indicate that the Xiaoban shear zone underwent low-grade hydrothermal alteration in the Mesozoic (~
180Ma). Samples studied come from altered and unaltered units from three mine levels. (1) Susceptibility is mainly due toparamagnetic minerals such as biotite and pyrite. The reduction of mean susceptibility is due to decrease in Fe content and changeof magnetic mineral size, as well as increase of diamagnetic minerals. (2) Anisotropy (P) decreases after hydrothermal alteration.Its tendency to change is the same as that of the mean susceptibility. (3) The AMS ellipsoid does not substantially change its shapeafter hydrothermal alteration. An oblate sphere is maintained. The minimum principal susceptibility axis (K
3) falls close to the
plane which is perpendicular to the schistosity for all samples. However, the maximum principal susceptibility axis is subject tolarge changes. The results indicate that new magnetic minerals are distributed on the existing schistosity plane, without a preferredorientation.
KEY WORDS: Magnetic fabric, susceptibility, anisotropy, hydrothermal alteration, China.
1. INTRODUCTION
Anisotropy of magnetic susceptibility (AMS) measuredin weak magnetic fields can be used to express magneticfabrics. The AMS second-order tensor is geometricallyrepresented by an ellipsoid described by its eigenvalues K
1
(maximum susceptibility), K2 (intermediate susceptibility),
K3(minimum susceptibility), and eigenvectors respectively
presenting spatial attitude of K1, K
2, K
3.
Factors producing AMS in rocks may be due tosedimentation, orientation of magnetic minerals accordingto magmatic flow, orientation recrystallization or orientationof magnetic minerals during ductile or plastic deformation.Thus measurement of AMS is useful in studying strain
patterns, effect of hydrothermal alteration, etc. For example,magnetic anisotropy has been utilized in many fabric studiesof shear zones (Rathore et al., 1983; Goldstein and Brown,1986; Ruf et al., 1988).
Deformation re-orients an originally random distributionof magnetic grains (Hrouda, 1982). The maximum suscepti-bility axis is parallel to the petrographic lineation and theminimum susceptibility axis is perpendicular to foliation(Goldstein and Brown, 1986; Rathore, 1985; Kligfield et al.,1983; Rathore et al., 1983). The relationship between strainand magnetic anisotropy has been established in rock typesfrom different deformed regions (Rathore, 1980; Urrutia-Fucugauchi, 1980 a, b; Kligfield et al., 1983; Hrouda, 1982;Lowrie and Hirt, 1986; Housen et al., 1995, Xu et al., 1998).
Geofísica Internacional (2003), Vol. 42, Num. 1, pp. 83-94
83
84
S-S. Xu et al.
Heating can also affect the magnetic fabric of rocks(Xu and Chen, 1998). This has been shown by manyexperiments and field observations (e.g. Urrutia-Fucugauchi,1981; Kelso and Banerjee, 1991; Hirt and Gehring, 1991;Walderhaug, 1993; Fujimoto and Kikawa, 1989). Two effectshave been reported when rocks (minerals) are heated. First,heated rock samples increase their bulk magneticsusceptibility, commonly due to the growth of iron oxides(Thompson and Oldfield, 1986). This makes it easy todiscriminate between sedimentary, magmatic or tectonic flowpatterns (Borradaile and Henry, 1997; Rochette et al., 1992;Hrouda, 1982). Second, heated rock samples decrease theirbulk magnetic susceptibility. Walderhaug (1993) observedthat heat treatment (600°C) led to a general reduction ofanisotropy in three dykes from Sunnhordland, westernNorway and suggested that the reduction of magnetic grainsize on heating offered a possible reason. Borradaile andLagroix (2000) experimented on tectonites from the high-grade granulite facies in the Kapuskasing Structural Zone ofnorthern Ontario and showed that heating enhanced theAARM (anisotropy of anhysteretic remanence) fabric andrefined the AMS orientation-distribution, preserving itsdirections. Fujimoto and Kikawa (1989) showed thatmagnetic susceptibility and intensity of magnetization ofpyroxene andesite lavas in the Noya geothermal area, Japan,generally had lower values of AMS in more intensely alteredrocks. This was due to the decomposition of magnetite inintensely altered rocks. Jelenska and Kadzialko-Hofmokl(1990) observed that the P values and bulk susceptibility forheated felsic porphyry decreased but that those for heatedlimestones and sandstones increased. Those same propertieschanged only slightly for gabbro that was heated.
These previous studies indicate that change of AMS isdependent on type of rock, deformation of rocks,hydrothermal fluid, and so on. This paper studies the changein magnetic fabrics of tectonites, which undergo hydrothermalalteration during gold mineralization in the Xiaoban gold-bearing shear zone, Fujian province, China. This area wasselected because non-weathering specimens could beobtained within the mine and multi-level sampling waspossible.
2. GEOLOGICAL BACKGROUND
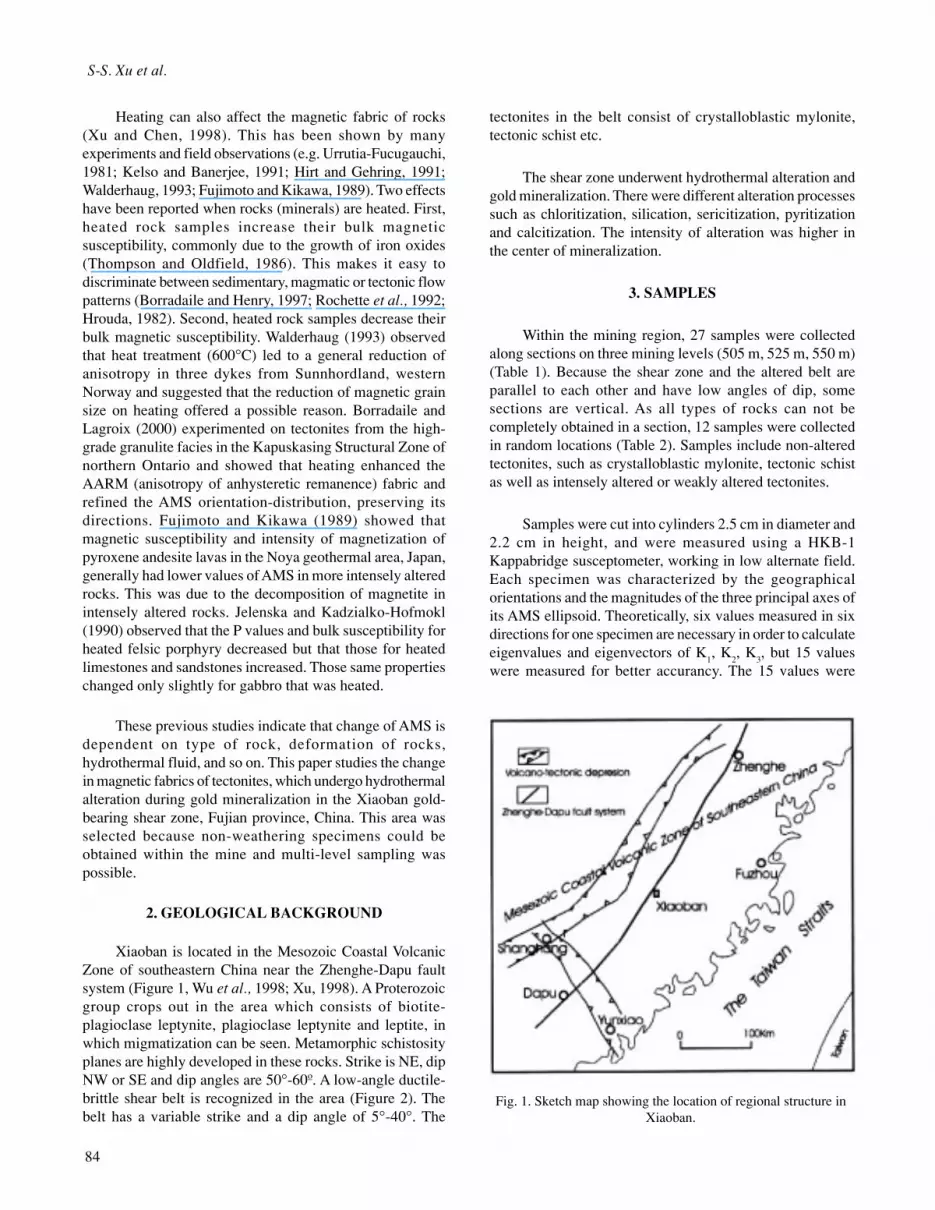
Xiaoban is located in the Mesozoic Coastal VolcanicZone of southeastern China near the Zhenghe-Dapu faultsystem (Figure 1, Wu et al., 1998; Xu, 1998). A Proterozoicgroup crops out in the area which consists of biotite-plagioclase leptynite, plagioclase leptynite and leptite, inwhich migmatization can be seen. Metamorphic schistosityplanes are highly developed in these rocks. Strike is NE, dipNW or SE and dip angles are 50°-60º. A low-angle ductile-brittle shear belt is recognized in the area (Figure 2). Thebelt has a variable strike and a dip angle of 5°-40°. The
tectonites in the belt consist of crystalloblastic mylonite,tectonic schist etc.
The shear zone underwent hydrothermal alteration andgold mineralization. There were different alteration processessuch as chloritization, silication, sericitization, pyritizationand calcitization. The intensity of alteration was higher inthe center of mineralization.
3. SAMPLES
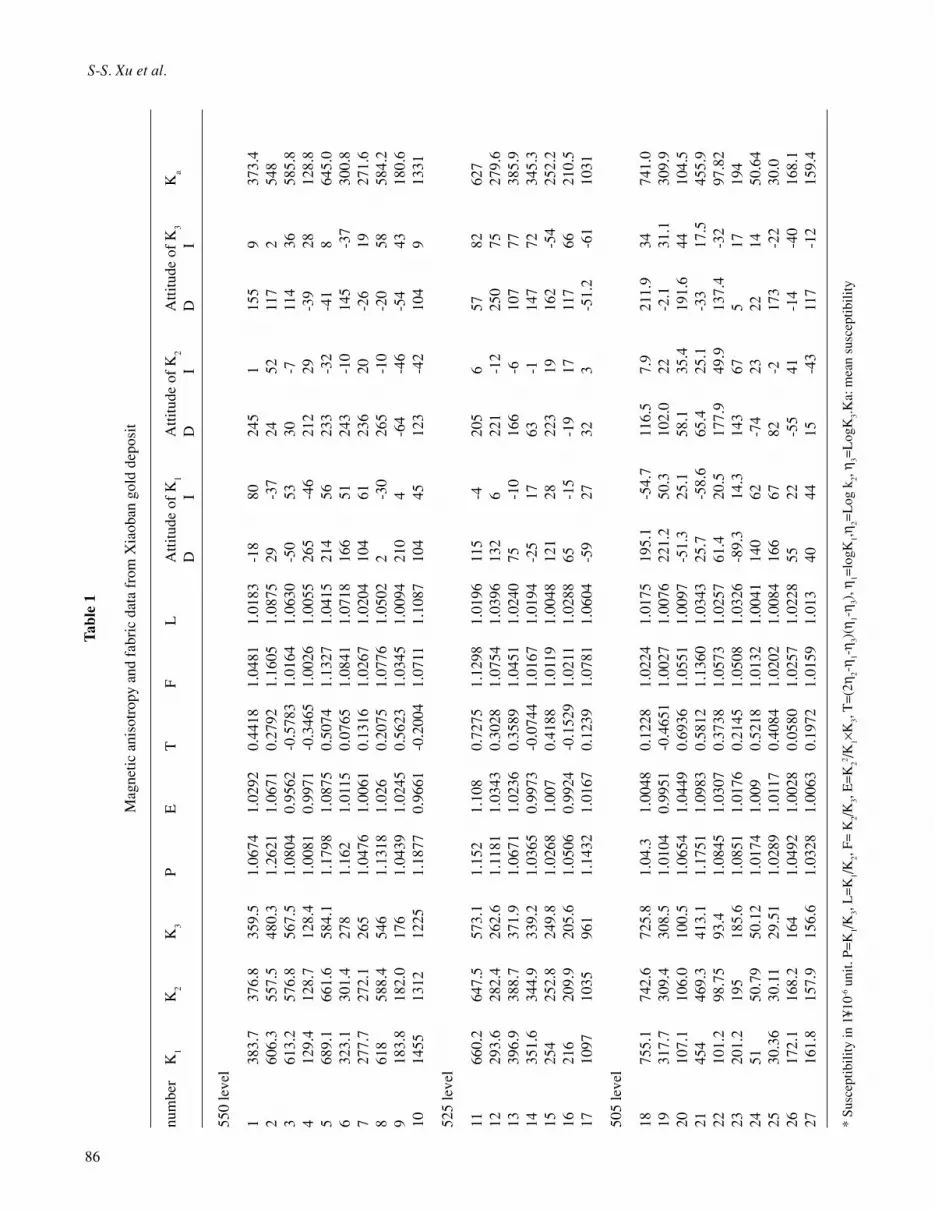
Within the mining region, 27 samples were collectedalong sections on three mining levels (505 m, 525 m, 550 m)(Table 1). Because the shear zone and the altered belt areparallel to each other and have low angles of dip, somesections are vertical. As all types of rocks can not becompletely obtained in a section, 12 samples were collectedin random locations (Table 2). Samples include non-alteredtectonites, such as crystalloblastic mylonite, tectonic schistas well as intensely altered or weakly altered tectonites.
Samples were cut into cylinders 2.5 cm in diameter and2.2 cm in height, and were measured using a HKB-1Kappabridge susceptometer, working in low alternate field.Each specimen was characterized by the geographicalorientations and the magnitudes of the three principal axes ofits AMS ellipsoid. Theoretically, six values measured in sixdirections for one specimen are necessary in order to calculateeigenvalues and eigenvectors of K
1, K
2, K
3, but 15 values
were measured for better accurancy. The 15 values were
Fig. 1. Sketch map showing the location of regional structure inXiaoban.

85
Magnetic fabrics of rocks in Xiaoban, China
processed by the method of least squares and six mean valueswere obtained. Subsequently, eigenvalues and eigenvectorswere calculated.
4. RESULTS
Mean susceptibility (Ka)
The mean susceptibility data is given in Tables 1 and 2,Figures 3 and 4. Mean susceptibility K
a goes from 30 to 1300
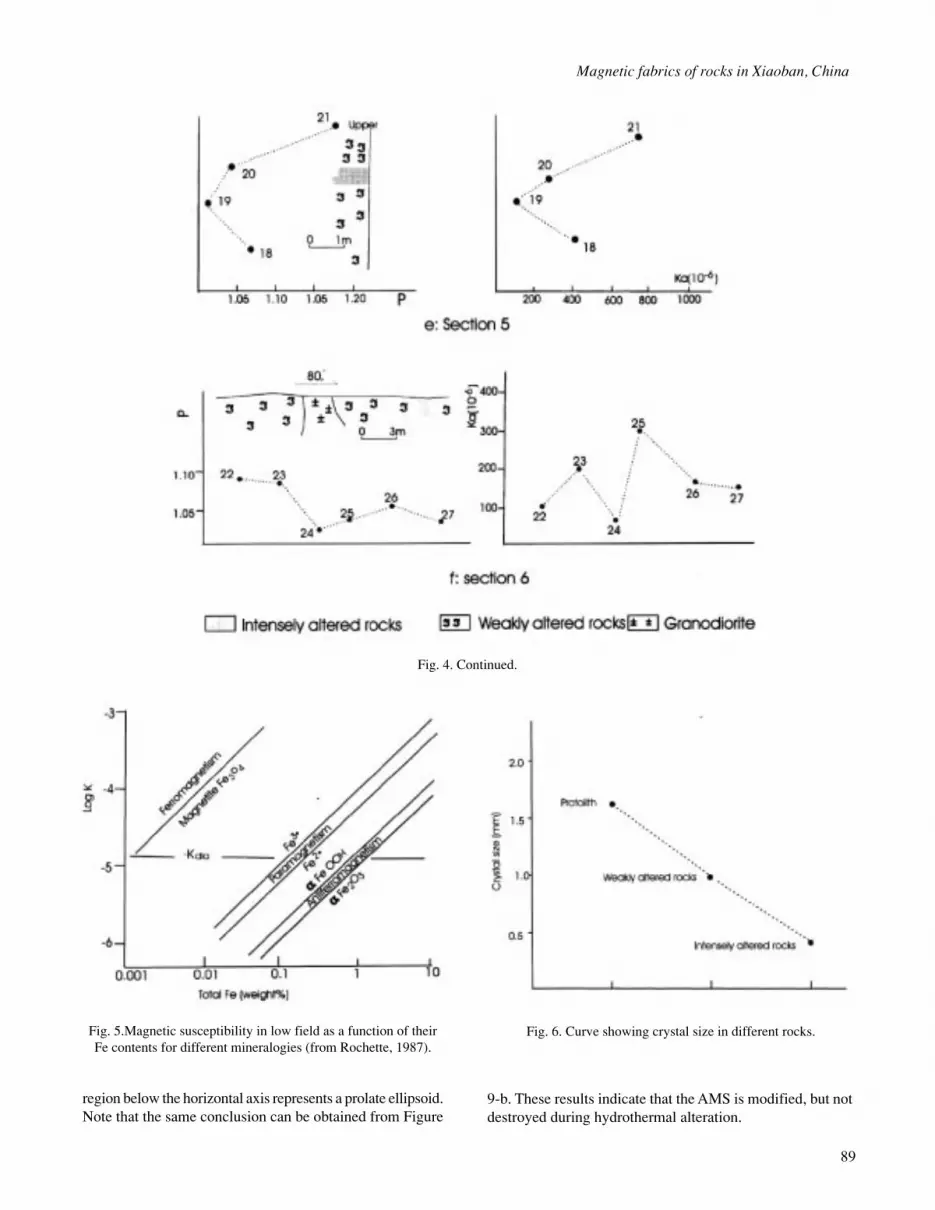
µSI (Tables 1, 2), but is mainly in the range of 100- 500 µSI(Figure 3). Its peak value is 100-200 µSI . This indicates thatthe susceptibility of rocks in the studied area is due toparamagnetic minerals (Rochette, 1987; Gleizes et al., 1993)(Figure 5). Therefore the magnetic minerals may be biotiteand pyrite which exist in both non-altered protolith and alteredrocks in the studied region. K
a in rocks of higher intensity of
alteration is lower (Figure 4). This effect is also presented byFujimoto and Kikawa (1989). The reduction of the value ofK
a could be due to following factors: (1)The content of
TFe2O
3 in non-altered protolith reaches 10% but that in altered
rocks is < 3% (Wu et al., 1998). Reduction of total Fe content
in intensely altered rocks can be deduced by change of Ka
from Figure 5. (2)It is known that susceptibility is a functionof grain size and concentration of magnetic minerals, andthus the observed relation between K
a and alteration intensity
could be due to one or both of these factors which can beaffected by hydrothermal alteration. The smaller size of pyritein the intensely altered rocks can be seen in thin section whenobserved under a microscope (Figure 6). (3) In the intensivelyaltered rocks, altered minerals such as quartz and calcite withnegative susceptibilities increase relatively at intensivelyaltered locations. For example, the content of quartz in non-altered protolith is 25%-45%, but in altered rocks it is morethan 80%.
Anisotropy degree (P)
Different authors use different parameters for studyingdegrees of anisotropy. The parameter P = K
1/K
3 is used in
this paper.
For mineral grains, anisotropy degree is determined bythe magnetic anisotropy of the mineral shape and the magnetic
Fig. 2. Geological map of Xiaoban district. 1. proterozoic rocks; 2. monzodiorite; 3. granodiorite; 4. granite-porphyry; 5. fault; 6. shearzone; 7: gold mineralization.
86
S-S. Xu et al.Ta
ble
1
Mag
netic
ani
sotr
opy
and
fabr
ic d
ata
from
Xia
oban
gol
d de
posi
t
num
ber
K1
K2
K3
PE
TF
LA
ttitu
de o
f K
1A
ttitu
de o
f K
2A
ttitu
de o
f K
3K
a
DI
DI
DI
550
leve
l
138
3.7
376.
835
9.5
1.06
741.
0292
0.44
181.
0481
1.01
83-1
880
245
115
59
373.
42
606.
355
7.5
480.
31.
2621
1.06
710.
2792
1.16
051.
0875
29-3
724
5211
72
548
361
3.2
576.
856
7.5
1.08
040.
9562
-0.5
783
1.01
641.
0630
-50
5330
-711
436
585.
84
129.
412
8.7
128.
41.
0081
0.99
71-0
.346
51.
0026
1.00
5526
5-4
621
229
-39
2812
8.8
568
9.1
661.
658
4.1
1.17
981.
0875
0.50
741.
1327
1.04
1521
456
233
-32
-41
864
5.0
632
3.1
301.
427
81.
162
1.01
150.
0765
1.08
411.
0718
166
5124
3-1
014
5-3
730
0.8
727
7.7
272.
126
51.
0476
1.00
610.
1316
1.02
671.
0204
104
6123
620
-26
1927
1.6
861
858
8.4
546
1.13
181.
026
0.20
751.
0776
1.05
022
-30
265
-10
-20
5858
4.2
918
3.8
182.
017
61.
0439
1.02
450.
5623
1.03
451.
0094
210
4-6
4-4
6-5
443
180.
610
1455
1312
1225
1.18
770.
9661
-0.2
004
1.07
111.
1087
104
4512
3-4
210
49
1331
525
leve
l
1166
0.2
647.
557
3.1
1.15
21.
108
0.72
751.
1298
1.01
9611
5-4
205
657
8262
712
293.
628
2.4
262.
61.
1181
1.03
430.
3028
1.07
541.
0396
132
622
1-1
225
075
279.
613
396.
938
8.7
371.
91.
0671
1.02
360.
3589
1.04
511.
0240
75-1
016
6-6
107
7738
5.9
1435
1.6
344.
933
9.2
1.03
650.
9973
-0.0
744
1.01
671.
0194
-25
1763
-114
772
345.
315
254
252.
824
9.8
1.02
681.
007
0.41
881.
0119
1.00
4812
128
223
1916
2-5
425
2.2
1621
620
9.9
205.
61.
0506
0.99
24-0
.152
91.
0211
1.02
8865
-15
-19
1711
766
210.
517
1097
1035
961
1.14
321.
0167
0.12
391.
0781
1.06
04-5
927
323
-51.
2-6
110
31
505
leve
l
1875
5.1
742.
672
5.8
1.04
.31.
0048
0.12
281.
0224
1.01
7519
5.1
-54.
711
6.5
7.9
211.
934
741.
019
317.
730
9.4
308.
51.
0104
0.99
51-0
.465
11.
0027
1.00
7622
1.2
50.3
102.
022
-2.1
31.1
309.
920
107.
110
6.0
100.
51.
0654
1.04
490.
6936
1.05
511.
0097
-51.
325
.158
.135
.419
1.6
4410
4.5
2145
446
9.3
413.
11.
1751
1.09
830.
5812
1.13
601.
0343
25.7
-58.
665
.425
.1-3
317
.545
5.9
2210
1.2
98.7
593
.41.
0845
1.03
070.
3738
1.05
731.
0257
61.4
20.5
177.
949
.913
7.4
-32
97.8
223
201.
219
518
5.6
1.08
511.
0176
0.21
451.
0508
1.03
26-8
9.3
14.3
143
675
1719
424
5150
.79
50.1
21.
0174
1.00
90.
5218
1.01
321.
0041
140
62-7
423
2214
50.6
425
30.3
630
.11
29.5
11.
0289
1.01
170.
4084
1.02
021.
0084
166
6782
-217
3-2
230
.026
172.
116
8.2
164
1.04
921.
0028
0.05
801.
0257
1.02
2855
22-5
541
-14
-40
168.
127
161.
815
7.9
156.
61.
0328
1.00
630.
1972
1.01
591.
013
4044
15-4
311
7-1
215
9.4
* Su
scep
tibili
ty in
1¥1
0-6 u
nit.
P=K
1/K3,
L=
K1/
K2,
F= K
2/K
3, E
=K
22 /K
1×K
3, T
=(2
η 2-η 1-
η 3)(η
1-η 3)
, η1=
logK
1,η2=
Log
k2,
η 3=L
ogK
3.Ka:
mea
n su
scep
tibili
ty
87
Magnetic fabrics of rocks in Xiaoban, China
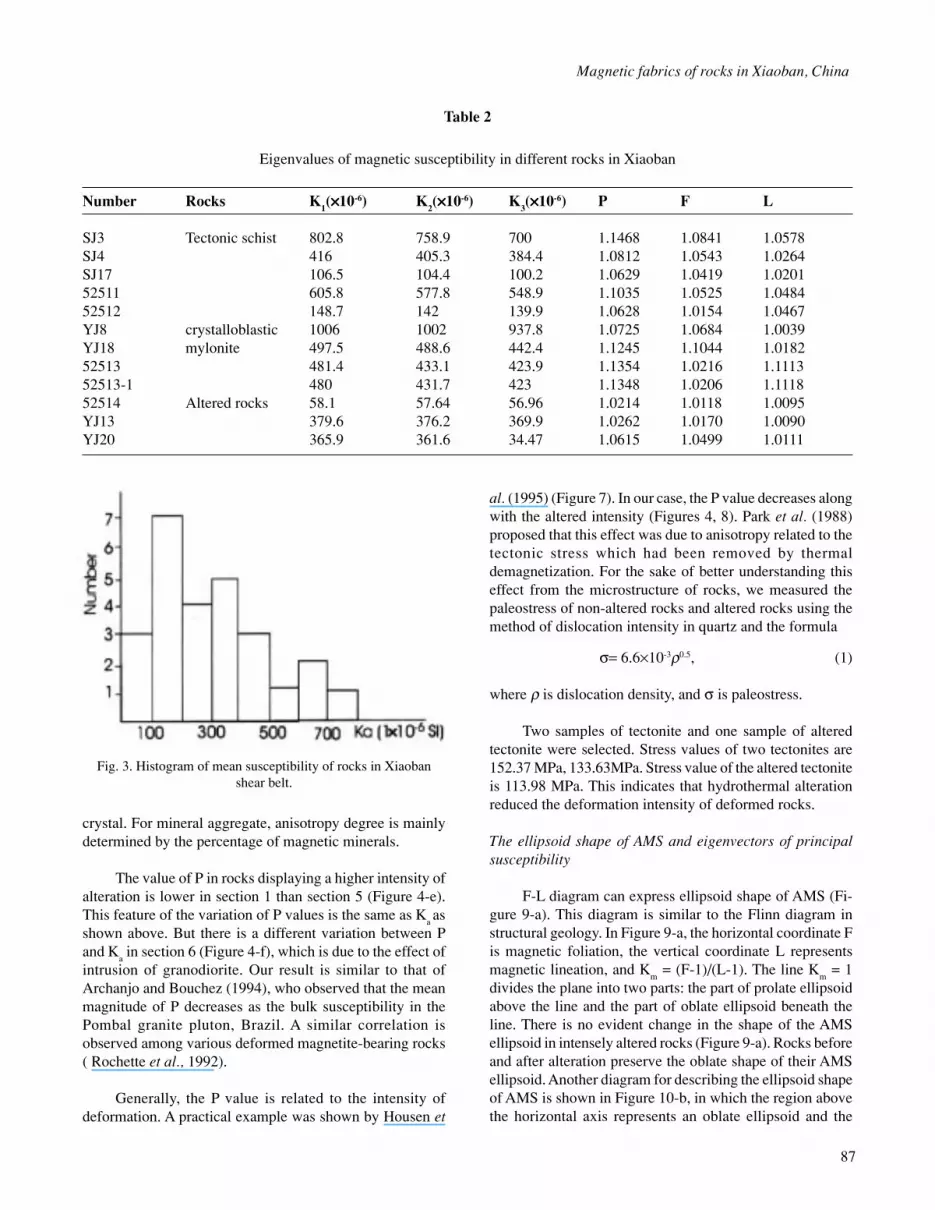
crystal. For mineral aggregate, anisotropy degree is mainlydetermined by the percentage of magnetic minerals.
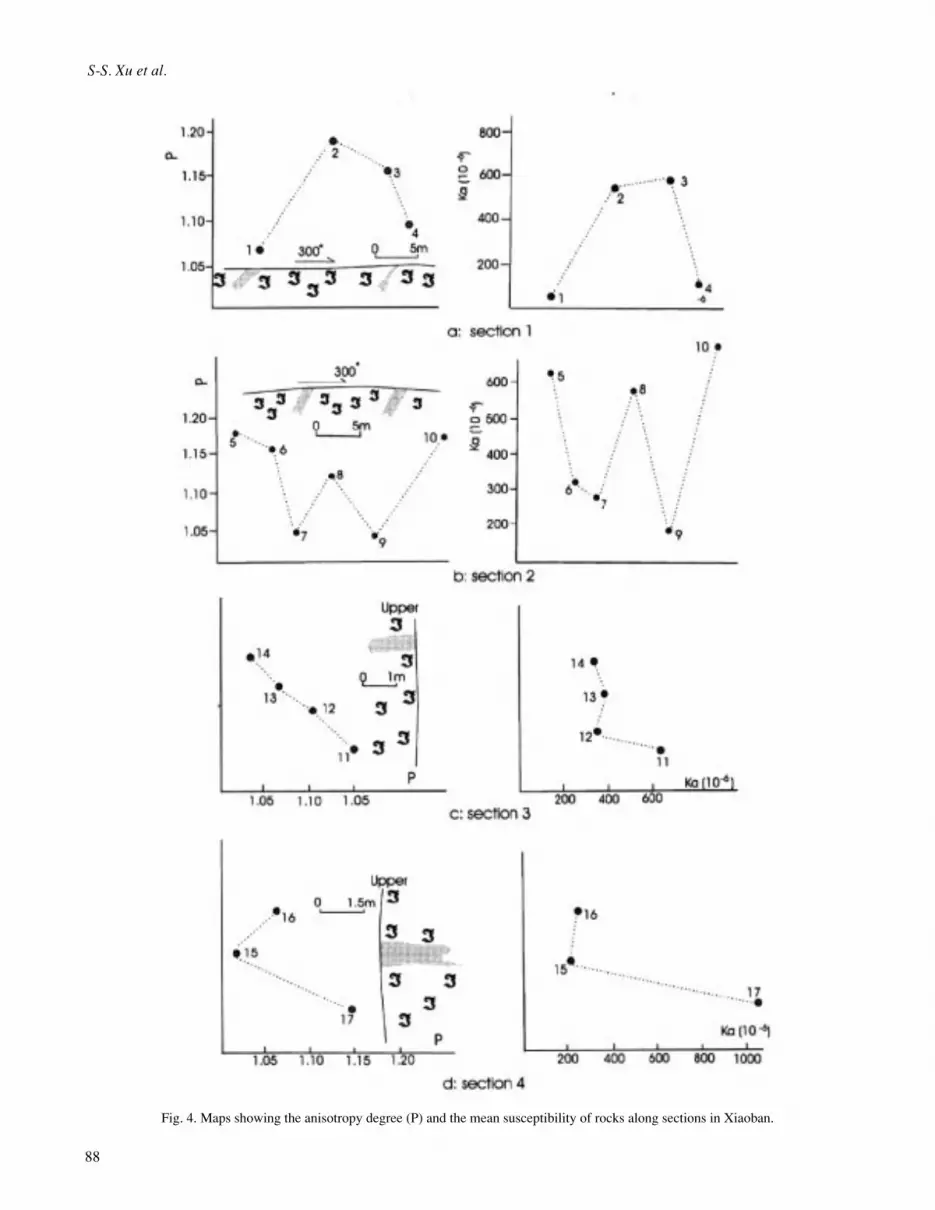
The value of P in rocks displaying a higher intensity ofalteration is lower in section 1 than section 5 (Figure 4-e).This feature of the variation of P values is the same as K
a as
shown above. But there is a different variation between Pand K
a in section 6 (Figure 4-f), which is due to the effect of
intrusion of granodiorite. Our result is similar to that ofArchanjo and Bouchez (1994), who observed that the meanmagnitude of P decreases as the bulk susceptibility in thePombal granite pluton, Brazil. A similar correlation isobserved among various deformed magnetite-bearing rocks( Rochette et al., 1992).
Generally, the P value is related to the intensity ofdeformation. A practical example was shown by Housen et
al. (1995) (Figure 7). In our case, the P value decreases alongwith the altered intensity (Figures 4, 8). Park et al. (1988)proposed that this effect was due to anisotropy related to thetectonic stress which had been removed by thermaldemagnetization. For the sake of better understanding thiseffect from the microstructure of rocks, we measured thepaleostress of non-altered rocks and altered rocks using themethod of dislocation intensity in quartz and the formula
σ= 6.6×10⁻³ρ0.5, (1)
where ρ is dislocation density, and σ is paleostress.
Two samples of tectonite and one sample of alteredtectonite were selected. Stress values of two tectonites are152.37 MPa, 133.63MPa. Stress value of the altered tectoniteis 113.98 MPa. This indicates that hydrothermal alterationreduced the deformation intensity of deformed rocks.
The ellipsoid shape of AMS and eigenvectors of principalsusceptibility
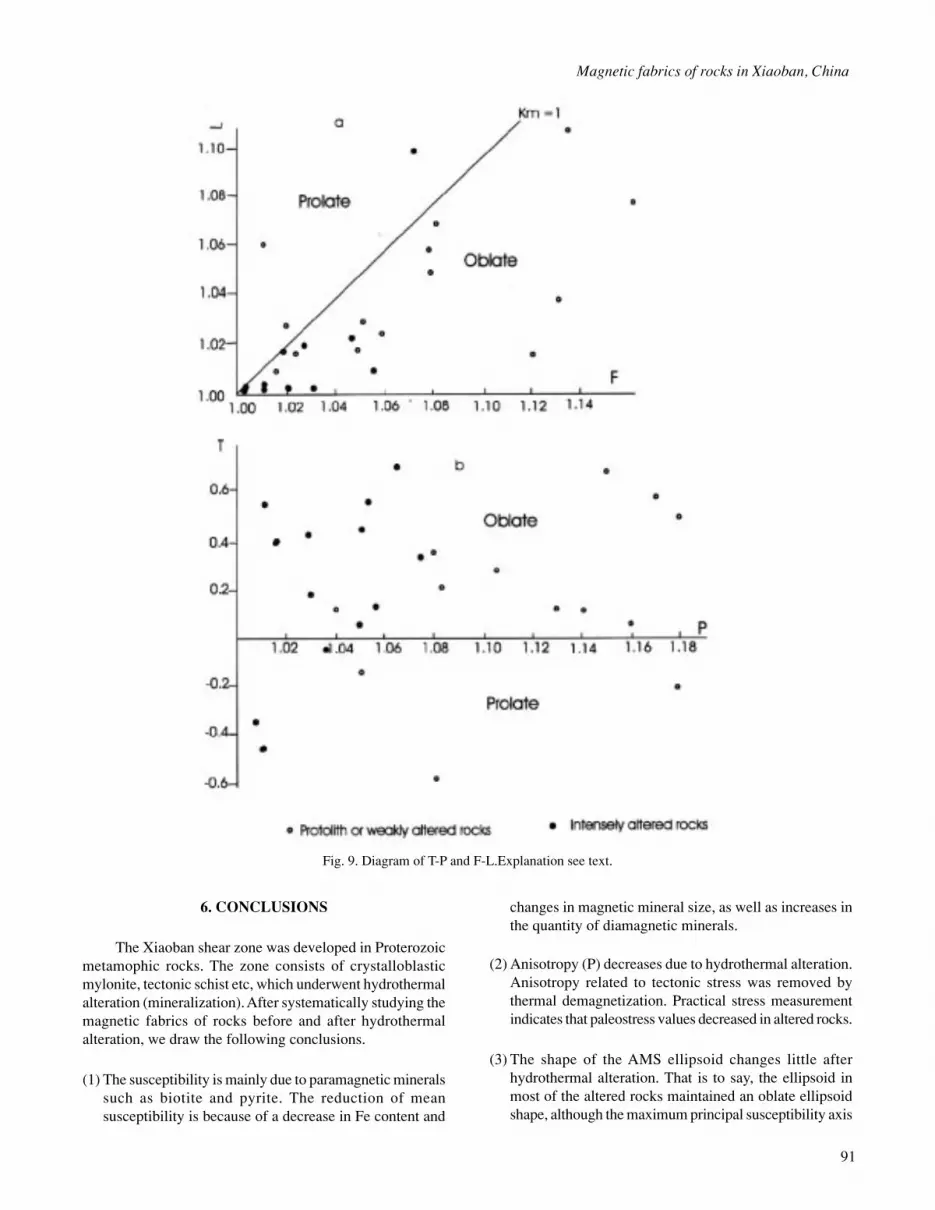
F-L diagram can express ellipsoid shape of AMS (Fi-gure 9-a). This diagram is similar to the Flinn diagram instructural geology. In Figure 9-a, the horizontal coordinate Fis magnetic foliation, the vertical coordinate L representsmagnetic lineation, and K
m = (F-1)/(L-1). The line K
m = 1
divides the plane into two parts: the part of prolate ellipsoidabove the line and the part of oblate ellipsoid beneath theline. There is no evident change in the shape of the AMSellipsoid in intensely altered rocks (Figure 9-a). Rocks beforeand after alteration preserve the oblate shape of their AMSellipsoid. Another diagram for describing the ellipsoid shapeof AMS is shown in Figure 10-b, in which the region abovethe horizontal axis represents an oblate ellipsoid and the
Table 2
Eigenvalues of magnetic susceptibility in different rocks in Xiaoban
Number Rocks K1(×××××10-6) K
2(×××××10-6) K
3(×××××10-6) P F L
SJ3 Tectonic schist 802.8 758.9 700 1.1468 1.0841 1.0578SJ4 416 405.3 384.4 1.0812 1.0543 1.0264SJ17 106.5 104.4 100.2 1.0629 1.0419 1.020152511 605.8 577.8 548.9 1.1035 1.0525 1.048452512 148.7 142 139.9 1.0628 1.0154 1.0467YJ8 crystalloblastic 1006 1002 937.8 1.0725 1.0684 1.0039YJ18 mylonite 497.5 488.6 442.4 1.1245 1.1044 1.018252513 481.4 433.1 423.9 1.1354 1.0216 1.111352513-1 480 431.7 423 1.1348 1.0206 1.111852514 Altered rocks 58.1 57.64 56.96 1.0214 1.0118 1.0095YJ13 379.6 376.2 369.9 1.0262 1.0170 1.0090YJ20 365.9 361.6 34.47 1.0615 1.0499 1.0111
Fig. 3. Histogram of mean susceptibility of rocks in Xiaobanshear belt.
88
S-S. Xu et al.
Fig. 4. Maps showing the anisotropy degree (P) and the mean susceptibility of rocks along sections in Xiaoban.
89
Magnetic fabrics of rocks in Xiaoban, China
9-b. These results indicate that the AMS is modified, but notdestroyed during hydrothermal alteration.
Fig. 4. Continued.
Fig. 5.Magnetic susceptibility in low field as a function of theirFe contents for different mineralogies (from Rochette, 1987).
region below the horizontal axis represents a prolate ellipsoid.Note that the same conclusion can be obtained from Figure
Fig. 6. Curve showing crystal size in different rocks.

90
S-S. Xu et al.
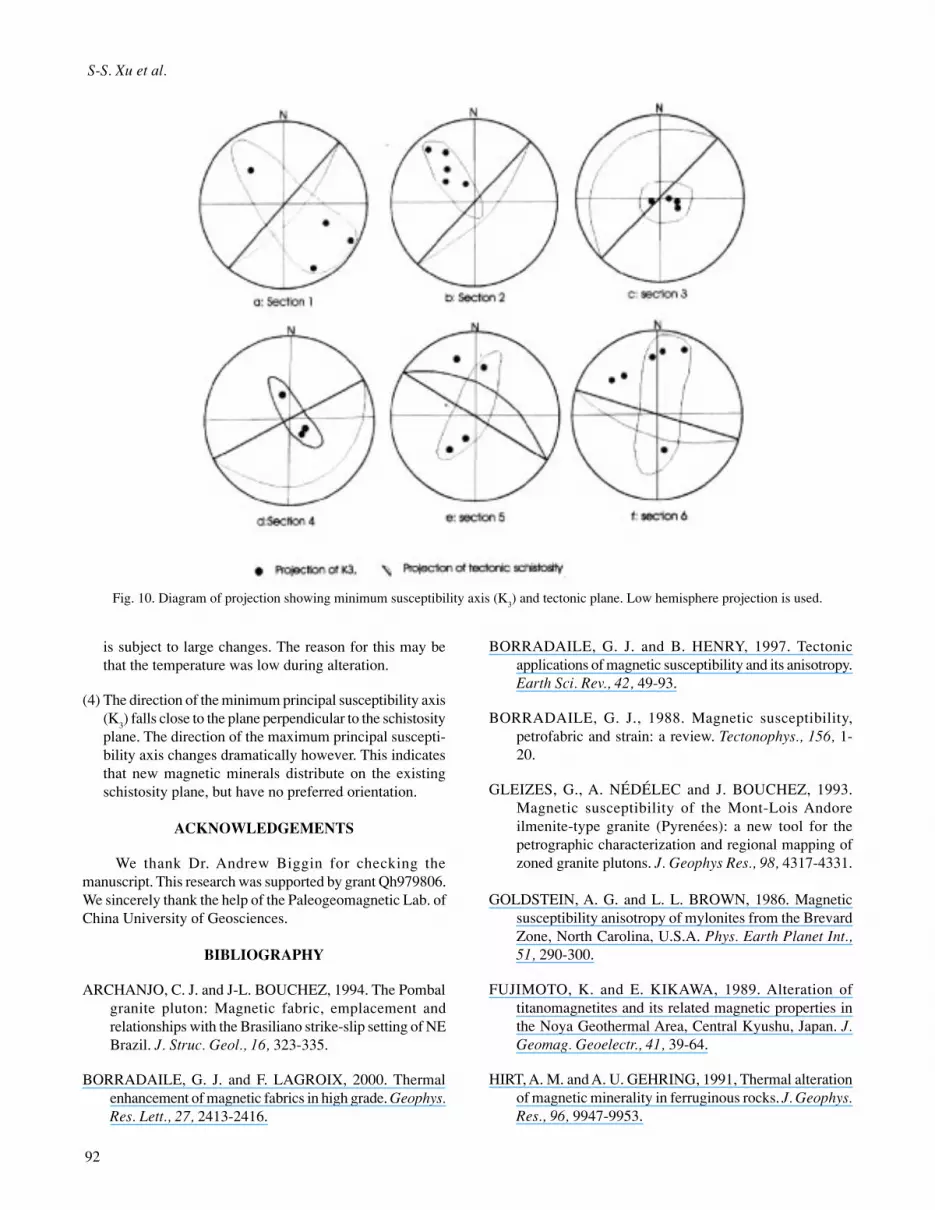
The minimum principal susceptibility axis (K3) falls
close to the plane perpendicular to schistosity plane (Figure10), i.e. altered rocks maintain the main feature of tectonicrocks (Goldstein and Brow, 1986; Rathore, 1985; Kligfieldet al., 1983; Rathore et al., 1983). However, the maximumprincipal susceptibility axis is subject to large changes (Tables1, 2). This indicates that the new magnetic minerals distributeon the previous schistosity plane, but have no preferredorientation. The same phenomenon was observed in thePinaleno mountains, Arizona by Ruf et al. (1988) and in flumeexperiment for sands and silts by Rees and Woodall (1975).Our result may indicate that fluid during alteration is under alower stress state and flows along previous structural planes,which is somewhat similar to flume experiment of Rees andWoodall (1975). Chemical remnant magnetization directionof new minerals should be along the original thermoremnentmagnetization direction (Marshall and Cox, 1972).
5. DISCUSSION
(1) According to experiments by previous authors (e.g.Urrutia-Fucugauchi, 1981; Perarnau and Tarling, 1985;Jelenska and Kodzialko-Hofmokl, 1990), magneticsusceptibility Ka generally increases after heating andhence the anisotropy of magnetic susceptibility may alsobe increased. But our results lead to an oppositeconclusion. The probable reasons are: (a) Laboratoryheating is performed under dry conditions withoutfluidization whereas large quantities of fluids are presentduring hydrothermal alteration; (b) The physicochemicalconditions during laboratory heating and hydrothermalalteration are different. LogfO
2 during hydrothermal
alteration in the Xiaoban gold deposit is –40, whichindicates a reducing environment. However, laboratoryheating is performed in an oxidising environment; (c) Thetemperature in the laboratory is usually above 600°C (e.g.
Urrutia-Fucugauchi, 1981; Perarnau and Tarling, 1985),which is much higher than that of hydrothermal alterationin Xiaoban gold deposit.
(2) Walderhaug (1994) reported that the heated specimensclose to dyke margins retain their original axis directions.He explained that when heating to a temperature below400°C, this may be due to the removal of secondaryanisotropy related to tectonic stress. Above 400°C,alteration of magnetic minerals and formulation of newmagnetic phases in low-stress environment furthercontributes to a lowering of anisotropy. Urrutia-Fucu-gauchi (1981) showed that the direction of eigenvectorsof AMS slightly changes up to 300°C, but largely changesstronger at 400°C and 500°C. Similar results wereobtained by Jelensk and Kadzialko-Hofmokl (1990).Urrutia-Fucugauchi (1981) observed that, although theheated fabric contained a greater component of the“sedimentary” fabric than the unheated fabrics, both theinitial and heated fabric shapes had similar axis directions.Fujimoto and Kikawa (1989) considered that alteredtitanomagnetites at low temperature (<150°C) have nearlythe same characteristics as low temperature oxidizedtitanomagnetite.
In the Xiaoban ore deposit, the temperature of alterationis not high and peaks at 210°C- 230°C. Considering thegeothermal gradient, ambient temperature is about 45°C -55°C at a depth of 1.48-1.81km. The temperature duringalteration is therefore increased by 150°C-190°C. The lowtemperatures at which this alteration occurred may explainwhy the shape of the AMS ellipsoid changed little.
In brief, AMS is dependent on many factors such astemperature, deformation, chemistry of rocks etc. Alterationis a chemical and mineralogical response of rocks tohydrothermal fluid and a complex process controlled by manyfactors such as temperature, chemistry of fluid, hydrodynamiccondition, properities of original rocks, the fluid/rock ratioand so on.
Fig. 7. Curve of P value in different rocks which have differentdeformation intensity (data from Housen et al., 1995).
Fig. 8. The change of P values of rocks in Xiaoban shear zone.
91
Magnetic fabrics of rocks in Xiaoban, China
6. CONCLUSIONS
The Xiaoban shear zone was developed in Proterozoicmetamophic rocks. The zone consists of crystalloblasticmylonite, tectonic schist etc, which underwent hydrothermalalteration (mineralization). After systematically studying themagnetic fabrics of rocks before and after hydrothermalalteration, we draw the following conclusions.
(1) The susceptibility is mainly due to paramagnetic mineralssuch as biotite and pyrite. The reduction of meansusceptibility is because of a decrease in Fe content and
changes in magnetic mineral size, as well as increases inthe quantity of diamagnetic minerals.
(2) Anisotropy (P) decreases due to hydrothermal alteration.Anisotropy related to tectonic stress was removed bythermal demagnetization. Practical stress measurementindicates that paleostress values decreased in altered rocks.
(3) The shape of the AMS ellipsoid changes little afterhydrothermal alteration. That is to say, the ellipsoid inmost of the altered rocks maintained an oblate ellipsoidshape, although the maximum principal susceptibility axis
Fig. 9. Diagram of T-P and F-L.Explanation see text.
92
S-S. Xu et al.
is subject to large changes. The reason for this may bethat the temperature was low during alteration.
(4) The direction of the minimum principal susceptibility axis(K
3) falls close to the plane perpendicular to the schistosity
plane. The direction of the maximum principal suscepti-bility axis changes dramatically however. This indicatesthat new magnetic minerals distribute on the existingschistosity plane, but have no preferred orientation.
ACKNOWLEDGEMENTS
We thank Dr. Andrew Biggin for checking themanuscript. This research was supported by grant Qh979806.We sincerely thank the help of the Paleogeomagnetic Lab. ofChina University of Geosciences.
BIBLIOGRAPHY
ARCHANJO, C. J. and J-L. BOUCHEZ, 1994. The Pombalgranite pluton: Magnetic fabric, emplacement andrelationships with the Brasiliano strike-slip setting of NEBrazil. J. Struc. Geol., 16, 323-335.
BORRADAILE, G. J. and F. LAGROIX, 2000. Thermalenhancement of magnetic fabrics in high grade. Geophys.Res. Lett., 27, 2413-2416.
BORRADAILE, G. J. and B. HENRY, 1997. Tectonicapplications of magnetic susceptibility and its anisotropy.Earth Sci. Rev., 42, 49-93.
BORRADAILE, G. J., 1988. Magnetic susceptibility,petrofabric and strain: a review. Tectonophys., 156, 1-20.
GLEIZES, G., A. NÉDÉLEC and J. BOUCHEZ, 1993.Magnetic susceptibility of the Mont-Lois Andoreilmenite-type granite (Pyrenées): a new tool for thepetrographic characterization and regional mapping ofzoned granite plutons. J. Geophys Res., 98, 4317-4331.
GOLDSTEIN, A. G. and L. L. BROWN, 1986. Magneticsusceptibility anisotropy of mylonites from the BrevardZone, North Carolina, U.S.A. Phys. Earth Planet Int.,51, 290-300.
FUJIMOTO, K. and E. KIKAWA, 1989. Alteration oftitanomagnetites and its related magnetic properties inthe Noya Geothermal Area, Central Kyushu, Japan. J.Geomag. Geoelectr., 41, 39-64.
HIRT, A. M. and A. U. GEHRING, 1991, Thermal alterationof magnetic minerality in ferruginous rocks. J. Geophys.Res., 96, 9947-9953.
Fig. 10. Diagram of projection showing minimum susceptibility axis (K3) and tectonic plane. Low hemisphere projection is used.
93
Magnetic fabrics of rocks in Xiaoban, China
HOUSEN, B. A., B. A. VAN DE PLUIJM and E. J.ESSENE, 1995. Plastic behavior of magnetite and highstrains obtained from magnetic fabrics in the Parrysound shear zone, Notario Grenvill province. J. Struc.Geol., 17, 265-278.
HROUDA, F., 1982. Magnetic anisotropy of rocks and itsapplication in geology and geophysics. Geophys. Surv.,5, 37-82.
JELENSKA, M. and M. KADZIALKO-HOFMOKL. 1990.Dependence of anisotropy of magnetic susceptibilityof rocks on temperature. Phys Earth Planet Int., 62,19-31.
KELSO, P. R. and S. K. BANERJEE, 1991. The effect oflow-temperature hydrothermal alteration on theremnant magnetization of synthetic titanomagnetites:A case for acquisition of chemical remnantmagnetization. J. Geophys. Res., 96, 19545-19553.
KLIGFIELD, R., W. LOWRIE, A. M. HIRT and A. W. B.SIDDANS, 1983. Effect of progrssive deformation onremanent magnetization of Permian redbeds from theAlps Maritimes (France). Tectonophys., 97, 58-85.
LOWIE, W. and A. M. HIRT, 1986. Effects of tectonicdeformation on the remnant magnetization of rocks.Tectonics, 5, 713-722.
MARSHALL, M. and A. COX, 1978. The magnetic changesin pillow basalts from the North Pacific and inferencesfor Pacific Plate tectonics. J. Geophys. Res., 83, 289-308.
PARK, J. K., E. I. TANCZYK and A. DESBARATES, 1988.Magnetic fabric and its significance in the 1400 MaMealy Diabase Dykes of Labrador, Canada. J. Geophys.Res., 93, 13689-13704.
PEARNAU, A. and D. H. TARLING, 1985. Thermalenhancement of magnetic fabric in Cretaceoussandstones. J. Geol. Soc. London, 142, 1029-1034.
RATHORE, J. S., G. COURRIOUX and P.CHOUKROUNE, 1983. Study of magnetic fabricmethods. Tectonophys., 98, 87-109.
RATHORE, J. S., 1985. Some magnetic fabriccharacteristics of sheared zone. Geodynamics, 2, 291-310.
REES, A. I. and W. WOODALL, 1975. The magnetic fabricof some laboratory-deposited sedments. Earth Planet.Sci. Lett., 25, 121-130.
ROCHETTE, P., M. JACKSON and C. AUBOURG, 1992.Rock magnetism and the interpretation of magneticsusceptibility. Rev. Geophys., 30, 209-226.
ROCHETTE, P., 1987. Magnetic susceptibility of the rockmatrix related to magnetic fabric studies. J. Struc.Geol.,9, 1015-1020.
RUF, A.S., S.J. NARUK, R.F. BUTLER and G. J.CALDERONE, 1988. Strain and magnetic fabrics inthe Santa Catalina and Pinaleno Mountainsmetamorphic core complex mylonite zones, Arizona.Tectonics, 7, 235-248.
THOMPSON, R. and F. OLDFIELD, 1986. EnvironmentalMagnetism, 227pp., Allen and Unwin, Boston.
URRUTIA-FUCUGAUCHI, J., 1980a.On the relationshipbetween magnetic and strain fabric in slates andpossible effects on consistent instrumentaldiscrepancies. Tectonophys., 69, T15-T23.
URRUTIA-FUCUGAUCHI, J., 1980b. On the magneticsusceptibility anisotropy and its measurement. Ann.Inst. Geog., 26, 75-110.
URRUTIA-FUCUGAUCHI, J., 1981. Preliminary resultson the effects of heating on the magnetic susceptibilityanisotropy of rocks. J. Geomag. Geoelectr. 33, 411-419.
WALDERHAUG, H., 1993. Rock magnetic and magneticfabric variations across three thin alkaline dykes fromSunnhordland, western Norway; Influence of intialmineralogy and secondary chemical alterations.Geophys. J. Int., 124, 97-108.
WU GANGUO, CHEN BAILIN, WU JIANSHE et al.,1998. Metallogenic condition in west-southernWuyishan and its adjacent area. (unpublished).
XU, SHUNSHAN, 1998. Dynamics of Mesozoicmagmation and metallogeny of gold deposit inShanghang- Youxi region, Fujian. Doctoral thesis.
XU, SHUNSHAN and CHEN BAILIN, 1998. Studying ondynamic deformation by magnetic fabric. ACTAGeoscientia Sinica 1, 19-24.
94
S-S. Xu et al.
XU, SHUNSHAN, CHEN BAILIN and DONG FAXIAN,1998. Study on magnetic fabric of Congshuban Pb-Znore deposit. J. CUST 2, 156-161.
_____________
Shunshan Xu1,2,*, Ganguo Wu3, JiansheWu4 andBailin Chen2
1 Universidad Nacional Autónoma de México, Centro deGeociencias, Apartado Postal 1-742, Querétaro, Qro.,76001, México.2 Institute of Geomechanics, CAGS, Beijing 100081,China.3 China University of Geosciences, Xueyuanlu 29,Haidian District, Beijing 100083, China4 Minxi Geological Team, Sanming, Fujian Province,China* Corresponding author: Current address,Instituto Mexicano del Petroleo, Programa YNF,Eje Central Lázaro Cárdenas No.152, Col. San BartoloAtepehuácan, C. P. 07730, México, D.F.Email: [email protected] or [email protected]