hydrogen sulfide-evoked intracellular ca2+ signals in ... - mdpi
TRANSCRIPT
cancers
Article
Hydrogen Sulfide-Evoked Intracellular Ca2+ Signalsin Primary Cultures of Metastatic ColorectalCancer Cells
Pawan Faris 1,2 , Federica Ferulli 3, Mauro Vismara 4, Matteo Tanzi 3, Sharon Negri 1,Agnese Rumolo 3, Kostantinos Lefkimmiatis 5,6, Marcello Maestri 7, Mudhir Shekha 8 ,Paolo Pedrazzoli 9 , Gianni Francesco Guidetti 4 , Daniela Montagna 3,10,*,† andFrancesco Moccia 1,*,†
1 Laboratory of General Physiology, Department of Biology and Biotechnology “L. Spallanzani”, University ofPavia, 27100 Pavia, Italy; [email protected] (P.F.); [email protected] (S.N.)
2 Department of Biology, Cihan University-Erbil, 44001 Erbil, Iraq3 Laboratory of Immunology Transplantation, Foundation IRCCS Policlinico San Matteo, 27100 Pavia, Italy;
[email protected] (F.F.); [email protected] (M.T.);[email protected] (A.R.)
4 Laboratory of Biochemistry, Department of Biology and Biotechnology “L. Spallanzani”, University of Pavia,27100 Pavia, Italy; [email protected] (M.V.); [email protected] (G.F.G.)
5 Department of Molecular Medicine, University of Pavia, 27100 Pavia, Italy;[email protected]
6 Veneto Institute of Molecular Medicine, Foundation for Advanced Biomedical Research, 35131 Padua, Italy7 Medical Surgery, Foundation IRCCS Policlinico San Matteo, 27100 Pavia, Italy; [email protected] Faculty of Science, Department of Medical Analysis, Tishk International University-Erbil, 44001 Erbil, Iraq;
[email protected] Medical Oncology, Foundation IRCCS Policlinico San Matteo, 27100 Pavia, Italy; [email protected] Diagnostic and Pediatric, Department of Sciences Clinic-Surgical, University of Pavia, 27100 Pavia, Italy* Correspondence: [email protected] (D.M.); [email protected] (F.M.);
Tel.: +39-382-987-619 (F.M.)† These authors contributed equally to this work.
Received: 10 September 2020; Accepted: 6 November 2020; Published: 11 November 2020 �����������������
Simple Summary: Colorectal cancer (CRC) is the most common type of gastrointestinal cancerand the third most predominant cancer in the world. CRC is potentially curable with surgicalresection of the primary tumor. The clinical problem of colorectal cancer, however, is the spread andoutgrowth of metastases, which are difficult to eradicate and lead to a patient’s death. The failure ofconventional treatment to significantly improved outcomes in mCRC has prompted the search foralternative molecular targets with the goal of ameliorating the prognosis of these patients. The presentinvestigation revealed that exogenous delivery of hydrogen sulfide (H2S) suppresses proliferationin metastatic colorectal cancer cells by inducing an increase in intracellular Ca2+ concentration.H2S was effective on metastatic, but not normal, cells. Therefore, we propose that exogenousadministration of H2S to patients affected by metastatic colorectal carcinoma could represent apromising therapeutic alternative.
Abstract: Exogenous administration of hydrogen sulfide (H2S) is emerging as an alternative anticancertreatment. H2S-releasing compounds have been shown to exert a strong anticancer effect bysuppressing proliferation and/or inducing apoptosis in several cancer cell types, including colorectalcarcinoma (CRC). The mechanism whereby exogenous H2S affects CRC cell proliferation is yet tobe clearly elucidated, but it could involve an increase in intracellular Ca2+ concentration ([Ca2+]i).Herein, we sought to assess for the first time whether (and how) sodium hydrosulfide (NaHS), one ofthe most widely employed H2S donors, induced intracellular Ca2+ signals in primary cultures of
Cancers 2020, 12, 3338; doi:10.3390/cancers12113338 www.mdpi.com/journal/cancers
Cancers 2020, 12, 3338 2 of 28
human metastatic CRC (mCRC) cells. We provided the evidence that NaHS induced extracellularCa2+ entry in mCRC cells by activating the Ca2+-permeable channel Transient Receptor PotentialVanilloid 1 (TRPV1) followed by the Na+-dependent recruitment of the reverse-mode of the Na+/Ca2+
(NCX) exchanger. In agreement with these observations, TRPV1 protein was expressed and capsaicin,a selective TRPV1 agonist, induced Ca2+ influx by engaging both TRPV1 and NCX in mCRCcells. Finally, NaHS reduced mCRC cell proliferation, but did not promote apoptosis or aberrantmitochondrial depolarization. These data support the notion that exogenous administration of H2Smay prevent mCRC cell proliferation through an increase in [Ca2+]i, which is triggered by TRPV1.
Keywords: H2S; TRPV1; NCX; cancer; metastatic colorectal carcinoma; proliferation
1. Introduction
Colorectal cancer (CRC) is the most common type of gastrointestinal cancer and the third mostpredominant cancer in the world. In 2018, around 1.8 million cases were reported by the WorldHealth Organization (WHO) and 862,000 deaths were registered (WHO, 2018). These numbers areexpected to increase by 80% in year 2035, reaching approximately 2.4 million cases and contributing to1.3 million deaths worldwide [1]. CRC is potentially curable with surgical resection of the primarytumor [2]. The clinical problem of colorectal cancer, however, is the spread and outgrowth of metastases.Over the last decade, the development of new combinations of chemotherapeutic agents along with theintroduction of targeted therapies improved survival of a cohort of metastatic CRC (mCRC) patients.Moreover, treatment of advanced disease is still associated with a poor prognosis and significantmorbidity. The failure of conventional treatment to significantly improved outcomes in mCRC hasprompted the search for alternative molecular targets with the goal of ameliorating the prognosis ofthese patients [2]. This makes of pivotal importance the search for alternative molecular targets withthe goal of ameliorating the prognosis of these patients.
Exogenous administration of hydrogen sulfide (H2S) is emerging as an alternative anticancertreatment. H2S is the latest addition to the family of gasotransmitters, also including nitric oxideand carbon monoxide. H2S is endogenously generated from the precursor L-cysteine by pyridoxal-5’phosphate-dependent (PLP) enzymes, including cystathionine β-synthase (CBS) and cystathionineγ-lyase (CSE), and 3-mercaptopyruvate sulfurtransferase (3MST) [3,4]. H2S is produced in response toappropriate cell stimulation and regulates a myriad of physiological processes, including vasculartone and blood flow regulation [5,6], angiogenesis [7], synaptic transmission [8], cellular stress,inflammation, apoptosis, and energy metabolism [4,9]. Not surprisingly, disruption of physiologicalH2S synthesis has been implicated in multiple disorders, including hypertension, Alzheimer’s disease,diabetes mellitus, ulcerative colitis, and end-stage renal disease [9,10], while high cellular or tissuelevels of H2S are highly toxic and result in severe cytotoxic effects [11]. The double-edged roleplayed by H2S has recently been highlighted in cancer. Endogenous production of H2S enhancestumor growth and metastasis by stimulating mitochondrial bioenergetics, by eliciting proliferation,migration and invasion, and by promoting angiogenesis [12–14]. Nevertheless, exogenous H2Sadministration through H2S-releasing compounds exerts a strong anticancer effect by suppressingcancer cell proliferation and/or inducing cancer cell apoptosis [12,14,15]. A recent series of studiesrevealed that exogenously delivered H2S suppressed proliferation in a panel of CRC cell lines, includingHT-29, Caco-2, SW1116, HCT116, and DLD1 [16–19]. The mechanism whereby exogenous H2S affectsCRC cell proliferation is yet to be clearly elucidated, although it could involve the expression ofthe cyclin-dependent kinase inhibitor p21Cip [17] and an increase in intracellular Ca2+ concentration([Ca2+]i) [20]. It has long been known that H2S is able to elevate [Ca2+]i by inducing either Ca2+ releasefrom the endoplasmic reticulum (ER) [7] or by promoting extracellular Ca2+ entry through multipleCa2+ entry pathways [21,22], including Transient Receptor Potential Vanilloid 1 (TRPV1) [21,23–25],
Cancers 2020, 12, 3338 3 of 28
TRPV3, and TRPV6 [26], TRP Ankyrin 1 (TRPA1) [27,28], L- and T-type voltage-gated Ca2+ channels(VGCCs) [21,29,30]. Intracellular Ca2+ signaling plays a crucial role in CRC cell proliferation andmigration [31–35]; however, it has been demonstrated that Ca2+-entry pathways which exert a mitogeniceffect in commercial CRC cell lines fail to do so in primary cultures derived from CRC patients [36].It would be, therefore, therapeutically relevant to assess the effect of exogenous H2S on patients-derivedCRC cells.
TRPV1 is a polymodal non-selective cation channel, which is gated by multiple stimuli,including the dietary agonist capsaicin [37], noxious heat (>41 ◦C) [37], extracellular acidification [38],reactive oxygen species [39], and several vanillotoxins [40]. Furthermore, TRPV1 is regarded amongthe main mediators of H2S-induced extracellular Ca2+ entry in healthy cells [21,23–25]. Notably,exogenously delivered H2S may suppress cell proliferation by promoting TRPV1-mediated extracellularCa2+ entry in multiple cancer cell lines [41], including leukemia, breast cancer, cervical carcinoma,whereas capsaicin-induced TRPV1 activation exerts an anticancer effect in CRC [42], breast cancer [43]and bladder cancer [44] cell lines. Therefore, the present investigation aimed at assessing for thefirst time whether and how exogenously added H2S exerts an anticancer effect in primary culturesof metastatic CRC (mCRC) cells. We focused on mCRC cells, such as mCRC, it is often not treatableand tends to develop resistance mechanisms towards conventional pharmacological therapies [2,45].It is, therefore, mandatory to identify alternative strategies, which could be effectively be translated inthe clinical practice, to eradicate mCRC cells. To do so, we exploited a multidisciplinary approach,including intracellular Ca2+ imaging, western blotting, immunocytochemistry, flow cytometer andpharmacological manipulation. Our findings demonstrated that H2S was able to trigger extracellularCa2+ entry in mCRC cells by activating TRPV1 and the reverse (i.e., Ca2+ entry) mode of the Na+/Ca2+
exchanger (NCX). H2S-induced Ca2+ entry was in turn able to suppress mCRC proliferation by arrestingthe cell cycle in the S-phase, thereby confirming that exogenous delivery of H2S may represent areliable strategy to treat metastatic CRC patients.
2. Results
2.1. H2S Evokes a Dose-Dependent Increase [Ca2+]i in Primary Cultures of mCRC Cells
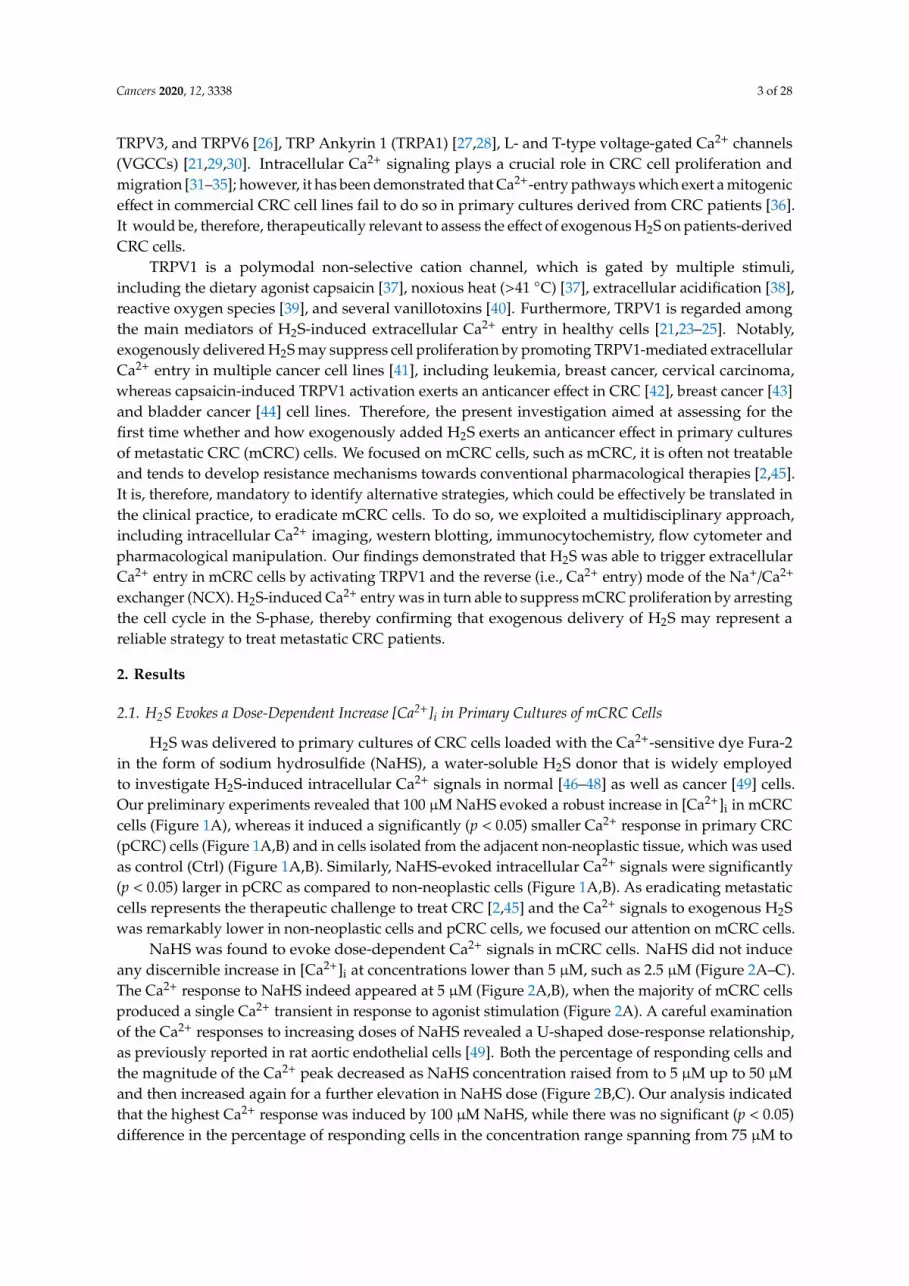
H2S was delivered to primary cultures of CRC cells loaded with the Ca2+-sensitive dye Fura-2in the form of sodium hydrosulfide (NaHS), a water-soluble H2S donor that is widely employedto investigate H2S-induced intracellular Ca2+ signals in normal [46–48] as well as cancer [49] cells.Our preliminary experiments revealed that 100 µM NaHS evoked a robust increase in [Ca2+]i in mCRCcells (Figure 1A), whereas it induced a significantly (p < 0.05) smaller Ca2+ response in primary CRC(pCRC) cells (Figure 1A,B) and in cells isolated from the adjacent non-neoplastic tissue, which was usedas control (Ctrl) (Figure 1A,B). Similarly, NaHS-evoked intracellular Ca2+ signals were significantly(p < 0.05) larger in pCRC as compared to non-neoplastic cells (Figure 1A,B). As eradicating metastaticcells represents the therapeutic challenge to treat CRC [2,45] and the Ca2+ signals to exogenous H2Swas remarkably lower in non-neoplastic cells and pCRC cells, we focused our attention on mCRC cells.
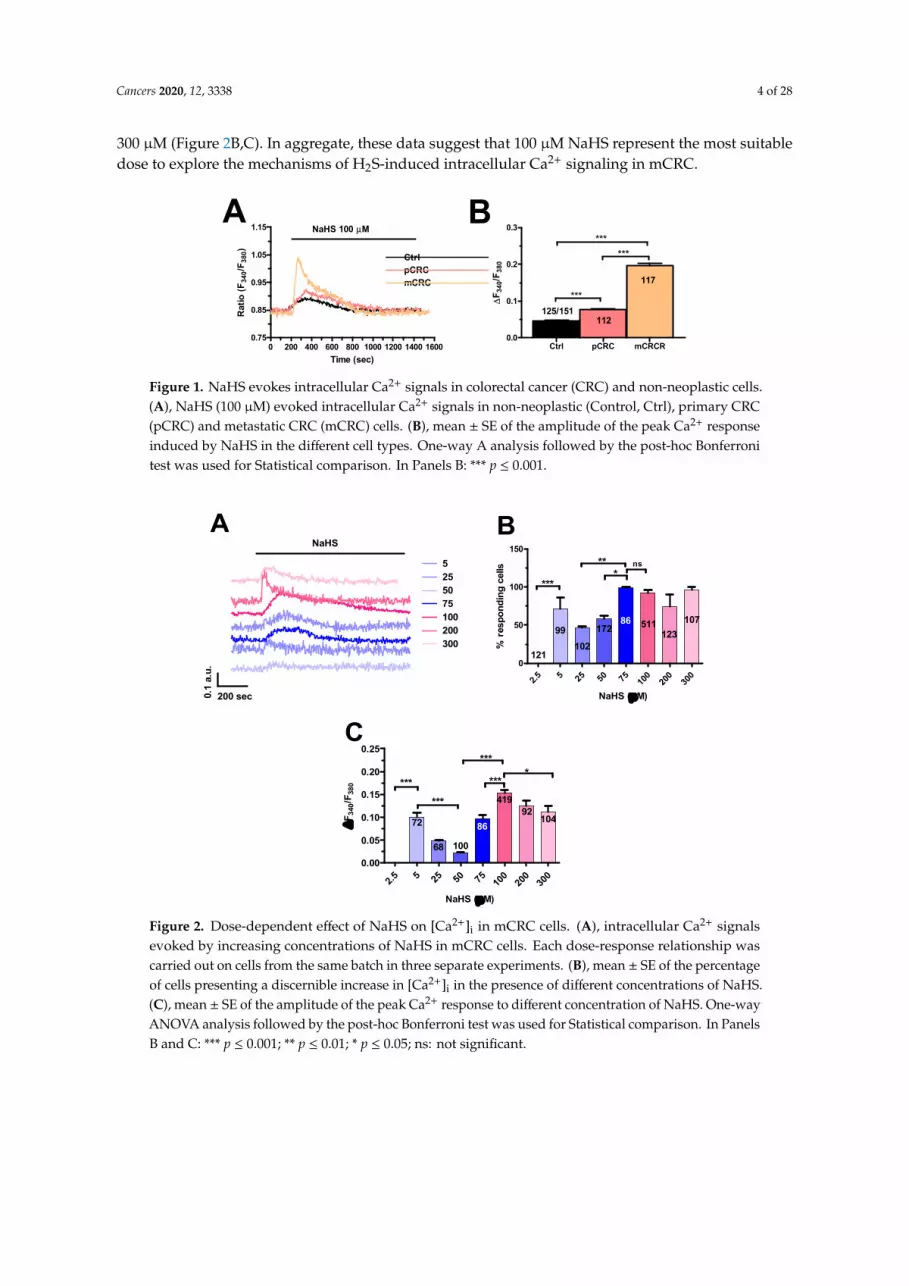
NaHS was found to evoke dose-dependent Ca2+ signals in mCRC cells. NaHS did not induceany discernible increase in [Ca2+]i at concentrations lower than 5 µM, such as 2.5 µM (Figure 2A–C).The Ca2+ response to NaHS indeed appeared at 5 µM (Figure 2A,B), when the majority of mCRC cellsproduced a single Ca2+ transient in response to agonist stimulation (Figure 2A). A careful examinationof the Ca2+ responses to increasing doses of NaHS revealed a U-shaped dose-response relationship,as previously reported in rat aortic endothelial cells [49]. Both the percentage of responding cells andthe magnitude of the Ca2+ peak decreased as NaHS concentration raised from to 5 µM up to 50 µMand then increased again for a further elevation in NaHS dose (Figure 2B,C). Our analysis indicatedthat the highest Ca2+ response was induced by 100 µM NaHS, while there was no significant (p < 0.05)difference in the percentage of responding cells in the concentration range spanning from 75 µM to
Cancers 2020, 12, 3338 4 of 28
300 µM (Figure 2B,C). In aggregate, these data suggest that 100 µM NaHS represent the most suitabledose to explore the mechanisms of H2S-induced intracellular Ca2+ signaling in mCRC.
Cancers 2020, 12, x 4 of 28
0 200 400 600 800 1000 1200 1400 16000.75
0.85
0.95
1.05
1.15
CtrlpCRCmCRC
NaHS 100 μM
Time (sec)
Rat
io (F
340/
F 380
)
Ctrl pCRC mCRCR0.0
0.1
0.2
0.3
***
******
112
117
125/151
ΔF 3
40/F
380
A B
Figure 1. NaHS evokes intracellular Ca2+ signals in colorectal cancer (CRC) and non-neoplastic cells. A, NaHS (100 µM) evoked intracellular Ca2+ signals in non-neoplastic (Control, Ctrl), primary CRC (pCRC) and metastatic CRC (mCRC) cells. B, mean ± SE of the amplitude of the peak Ca2+ response induced by NaHS in the different cell types. One-way A analysis followed by the post-hoc Bonferroni test was used for Statistical comparison. In Panels B: *** p ≤ 0.001.
75
5
50
100
25
200
NaHS
300
200 sec0.1
a.u.
2.5 5 25 50 75 100
200
300
0
50
100
150
102121
99 17286 511
123107
***
NaHS (μM)
% r
espo
ndin
g ce
lls
***
ns
2.5 5 25 50 75 100
200
300
0.00
0.05
0.10
0.15
0.20
0.25
NaHS (μM)
72
68 100
86
41992
104***
****
***
ΔF 3
40/F
380 ***
A B
C
Figure 2. Dose-dependent effect of NaHS on [Ca2+]i in mCRC cells. A, intracellular Ca2+ signals evoked by increasing concentrations of NaHS in mCRC cells. Each dose-response relationship was carried out on cells from the same batch in three separate experiments. B, mean ± SE of the percentage of cells presenting a discernible increase in [Ca2+]i in the presence of different concentrations of NaHS. C, mean ± SE of the amplitude of the peak Ca2+ response to different concentration of NaHS. One-way ANOVA analysis followed by the post-hoc Bonferroni test was used for Statistical comparison. In Panels B and C: *** p ≤ 0.001; ** p ≤ 0.01; * p ≤ 0.05, ns: not significant.
The kinetics of the Ca2+ response to 100 µM NaHS showed two main patterns even in cells from the same microscopic field. The most frequent pattern observed consisted in a rapid increase in [Ca2+]i which rapidly decayed to the baseline on agonist removal (blue trace in Figure 3A). This transient increase in [Ca2+]i was detected in ≈75% of the cells (Figure 3B). In the remaining 25% (Figure 3B), the
Commented [M1]: Please revise the “NaSH”
Figure 1. NaHS evokes intracellular Ca2+ signals in colorectal cancer (CRC) and non-neoplastic cells.(A), NaHS (100 µM) evoked intracellular Ca2+ signals in non-neoplastic (Control, Ctrl), primary CRC(pCRC) and metastatic CRC (mCRC) cells. (B), mean ± SE of the amplitude of the peak Ca2+ responseinduced by NaHS in the different cell types. One-way A analysis followed by the post-hoc Bonferronitest was used for Statistical comparison. In Panels B: *** p ≤ 0.001.
Cancers 2020, 12, x 4 of 28
0 200 400 600 800 1000 1200 1400 16000.75
0.85
0.95
1.05
1.15
CtrlpCRCmCRC
NaSH 100 M
Time (sec)
Rat
io (
F3
40/F
38
0)
Ctrl pCRC mCRCR0.0
0.1
0.2
0.3
***
***
***
112
117
125
F
34
0/F
38
0
A B
Figure 1. NaHS evokes intracellular Ca2+ signals in colorectal cancer (CRC) and non-neoplastic cells. A, NaHS (100 µM) evoked intracellular Ca2+ signals in non-neoplastic (Control, Ctrl), primary CRC (pCRC) and metastatic CRC (mCRC) cells. B, mean ± SE of the amplitude of the peak Ca2+ response induced by NaHS in the different cell types. One-way A analysis followed by the post-hoc Bonferroni test was used for Statistical comparison. In Panels B: *** p 0.001.
75
5
50
100
25
200
NaHS
300
200 sec0.1
a.u
.
2.5 5 25 50 75 10
020
030
0
0
50
100
150
102121
99 17286 511
123
107
***
NaHS (M)
% r
esp
on
din
g c
ells
***
ns
2.5 5 25 50 75 10
020
030
0
0.00
0.05
0.10
0.15
0.20
0.25
NaHS (M)
72
68 100
86
41992
104
***
****
***
F
340
/F38
0 ***
A B
C
Figure 2. Dose-dependent effect of NaHS on [Ca2+]i in mCRC cells. A, intracellular Ca2+ signals evoked by increasing concentrations of NaHS in mCRC cells. Each dose-response relationship was carried out on cells from the same batch in three separate experiments. B, mean ± SE of the percentage of cells presenting a discernible increase in [Ca2+]i in the presence of different concentrations of NaHS. C, mean ± SE of the amplitude of the peak Ca2+ response to different concentration of NaHS. One-way ANOVA analysis followed by the post-hoc Bonferroni test was used for Statistical comparison. In Panels B and C: *** p 0.001; ** p 0.01; * p 0.05.
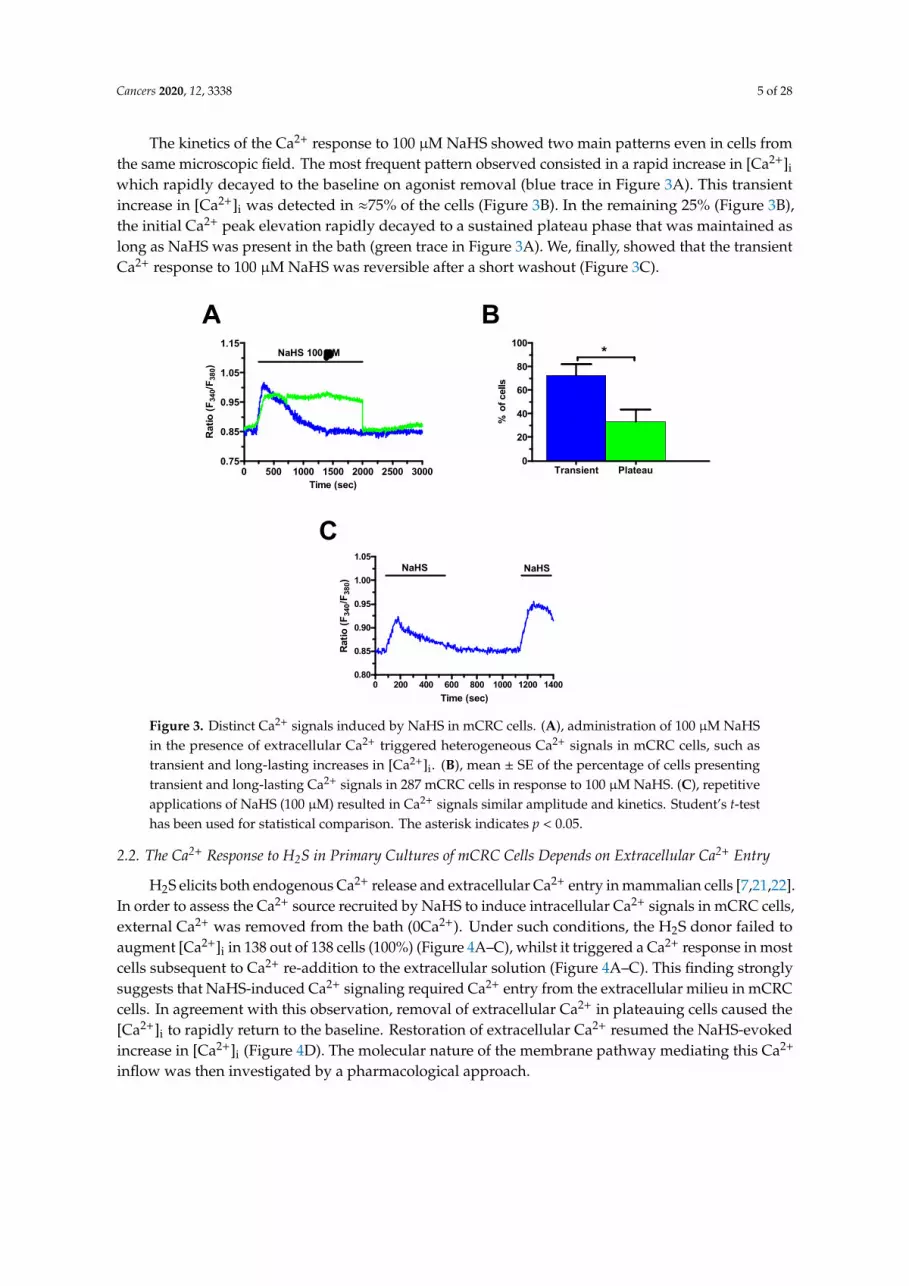
The kinetics of the Ca2+ response to 100 µM NaHS showed two main patterns even in cells from the same microscopic field. The most frequent pattern observed consisted in a rapid increase in [Ca2+]i which rapidly decayed to the baseline on agonist removal (blue trace in Figure 3A). This transient increase in [Ca2+]i was detected in ≈75% of the cells (Figure 3B). In the remaining 25% (Figure 3B), the initial Ca2+ peak elevation rapidly decayed to a sustained plateau phase that was maintained as long as NaHS was present in the bath (green trace in Figure 3A). We, finally, showed that the transient Ca2+ response to 100 µM NaHS was reversible after a short washout (Figure 3C).
Figure 2. Dose-dependent effect of NaHS on [Ca2+]i in mCRC cells. (A), intracellular Ca2+ signalsevoked by increasing concentrations of NaHS in mCRC cells. Each dose-response relationship wascarried out on cells from the same batch in three separate experiments. (B), mean ± SE of the percentageof cells presenting a discernible increase in [Ca2+]i in the presence of different concentrations of NaHS.(C), mean ± SE of the amplitude of the peak Ca2+ response to different concentration of NaHS. One-wayANOVA analysis followed by the post-hoc Bonferroni test was used for Statistical comparison. In PanelsB and C: *** p ≤ 0.001; ** p ≤ 0.01; * p ≤ 0.05; ns: not significant.
Cancers 2020, 12, 3338 5 of 28
The kinetics of the Ca2+ response to 100 µM NaHS showed two main patterns even in cells fromthe same microscopic field. The most frequent pattern observed consisted in a rapid increase in [Ca2+]i
which rapidly decayed to the baseline on agonist removal (blue trace in Figure 3A). This transientincrease in [Ca2+]i was detected in ≈75% of the cells (Figure 3B). In the remaining 25% (Figure 3B),the initial Ca2+ peak elevation rapidly decayed to a sustained plateau phase that was maintained aslong as NaHS was present in the bath (green trace in Figure 3A). We, finally, showed that the transientCa2+ response to 100 µM NaHS was reversible after a short washout (Figure 3C).Cancers 2020, 12, x 5 of 28
0 500 1000 1500 2000 2500 30000.75
0.85
0.95
1.05
1.15NaHS 100 M
Time (sec)
Rat
io (
F34
0/F
380)
Transient Plateau0
20
40
60
80
100*
% o
f ce
lls
0 200 400 600 800 1000 1200 14000.80
0.85
0.90
0.95
1.00
1.05NaHS NaHS
Time (sec)
Rat
io (
F34
0/F
380)
A B
C
Figure 3. Distinct Ca2+ signals induced by NaHS in mCRC cells. A, administration of 100 µM NaHS in the presence of extracellular Ca2+ triggered heterogeneous Ca2+ signals in mCRC cells, such as transient and long-lasting increases in [Ca2+]i. B, mean ± SE of the percentage of cells presenting transient and long-lasting Ca2+ signals in 287 mCRC cells in response to 100 µM NaHS. C, repetitive applications of NaHS (100 µM) resulted in Ca2+ signals similar amplitude and kinetics. Student’s t-test has been used for statistical comparison. The asterisk indicates p < 0.05.
2.2. The Ca2+ Response to H2S in Primary Cultures of mCRC Cells Depends on Extracellular Ca2+ Entry
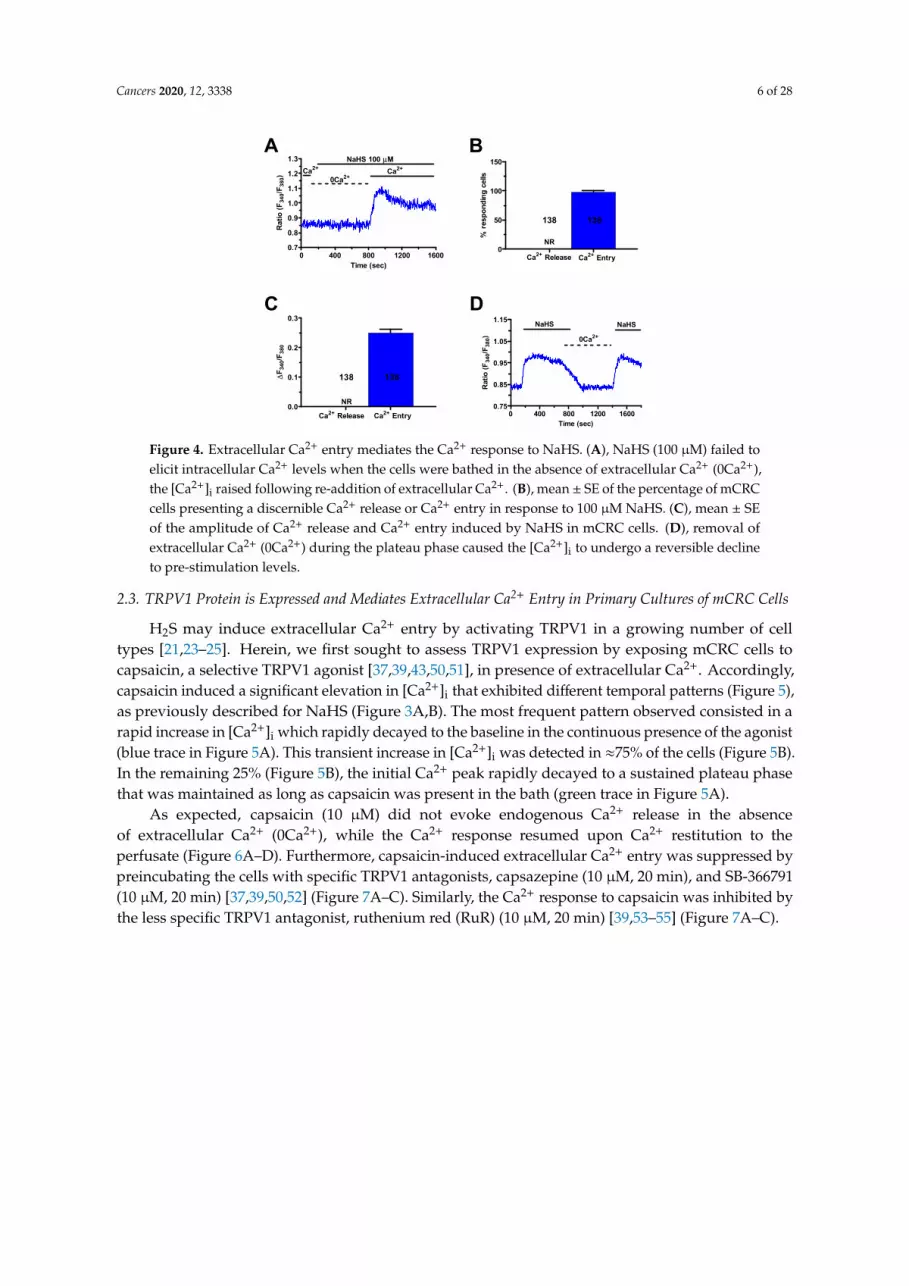
H2S elicits both endogenous Ca2+ release and extracellular Ca2+ entry in mammalian cells [7,21,22]. In order to assess the Ca2+ source recruited by NaHS to induce intracellular Ca2+ signals in mCRC cells, external Ca2+ was removed from the bath (0Ca2+). Under such conditions, the H2S donor failed to augment [Ca2+]i in 138 out of 138 cells (100%) (Figure 4A–C), whilst it triggered a Ca2+
response in most cells subsequent to Ca2+ re-addition to the extracellular solution (Figure 4A–C). This finding strongly suggests that NaHS-induced Ca2+ signaling required Ca2+ entry from the extracellular milieu in mCRC cells. In agreement with this observation, removal of extracellular Ca2+ in plateauing cells caused the [Ca2+]i to rapidly return to the baseline. Restoration of extracellular Ca2+ resumed the NaHS-evoked increase in [Ca2+]i (Figure 4D). The molecular nature of the membrane pathway mediating this Ca2+ inflow was then investigated by a pharmacological approach.
Figure 3. Distinct Ca2+ signals induced by NaHS in mCRC cells. (A), administration of 100 µM NaHSin the presence of extracellular Ca2+ triggered heterogeneous Ca2+ signals in mCRC cells, such astransient and long-lasting increases in [Ca2+]i. (B), mean ± SE of the percentage of cells presentingtransient and long-lasting Ca2+ signals in 287 mCRC cells in response to 100 µM NaHS. (C), repetitiveapplications of NaHS (100 µM) resulted in Ca2+ signals similar amplitude and kinetics. Student’s t-testhas been used for statistical comparison. The asterisk indicates p < 0.05.
2.2. The Ca2+ Response to H2S in Primary Cultures of mCRC Cells Depends on Extracellular Ca2+ Entry
H2S elicits both endogenous Ca2+ release and extracellular Ca2+ entry in mammalian cells [7,21,22].In order to assess the Ca2+ source recruited by NaHS to induce intracellular Ca2+ signals in mCRC cells,external Ca2+ was removed from the bath (0Ca2+). Under such conditions, the H2S donor failed toaugment [Ca2+]i in 138 out of 138 cells (100%) (Figure 4A–C), whilst it triggered a Ca2+ response in mostcells subsequent to Ca2+ re-addition to the extracellular solution (Figure 4A–C). This finding stronglysuggests that NaHS-induced Ca2+ signaling required Ca2+ entry from the extracellular milieu in mCRCcells. In agreement with this observation, removal of extracellular Ca2+ in plateauing cells caused the[Ca2+]i to rapidly return to the baseline. Restoration of extracellular Ca2+ resumed the NaHS-evokedincrease in [Ca2+]i (Figure 4D). The molecular nature of the membrane pathway mediating this Ca2+
inflow was then investigated by a pharmacological approach.
Cancers 2020, 12, 3338 6 of 28Cancers 2020, 12, x 6 of 28
0 400 800 1200 16000.7
0.8
0.9
1.0
1.1
1.2
1.3 NaHS 100 μM
0Ca2+Ca2+ Ca2+
Time (sec)Ra
tio (F
340/
F 380
)
0
50
100
150
Ca2+ Release Ca2+ Entry
NR
138 138
% re
spon
ding
cel
ls
0.0
0.1
0.2
0.3
Ca2+ Release Ca2+ Entry
NR
138 138ΔF 3
40/F
380
A B
C
0 400 800 1200 16000.75
0.85
0.95
1.05
1.15
0Ca2+
NaHS NaHS
Time (sec)
Ratio
(F34
0/F 3
80)
D
Figure 4. Extracellular Ca2+ entry mediates the Ca2+ response to NaHS. A, NaHS (100 µM) failed to elicit intracellular Ca2+ levels when the cells were bathed in the absence of extracellular Ca2+ (0Ca2+), the [Ca2+]i raised following re-addition of extracellular Ca2+. B, mean ± SE of the percentage of mCRC cells presenting a discernible Ca2+ release or Ca2+ entry in response to 100 µM NaHS. C, mean ± SE of the amplitude of Ca2+ release and Ca2+ entry induced by NaHS in mCRC cells. D, removal of extracellular Ca2+ (0Ca2+) during the plateau phase caused the [Ca2+]i to undergo a reversible decline to pre-stimulation levels.
2.3. TRPV1 Protein is Expressed and Mediates Extracellular Ca2+ Entry in Primary Cultures of mCRC Cells
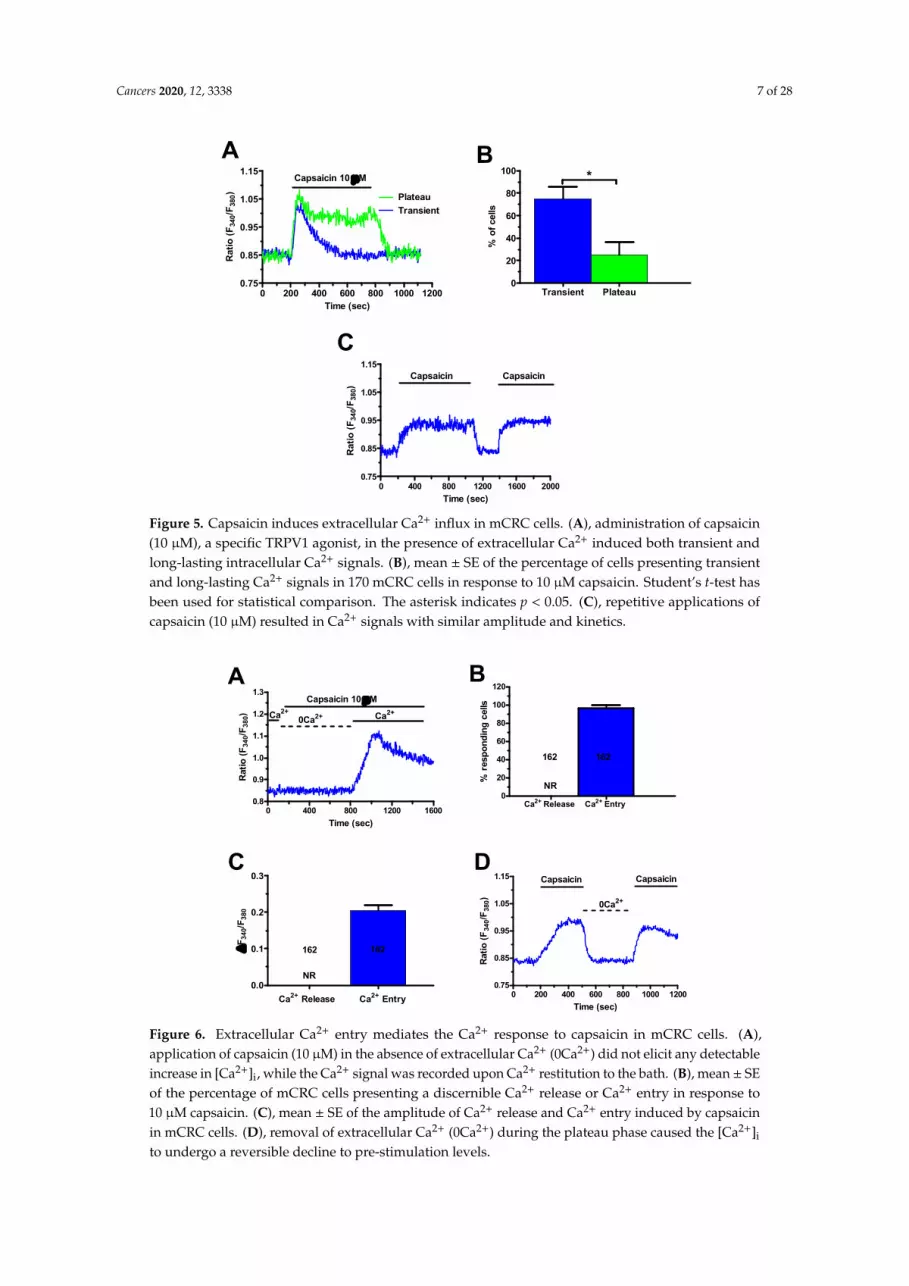
H2S may induce extracellular Ca2+ entry by activating TRPV1 in a growing number of cell types [21,23–25]. Herein, we first sought to assess TRPV1 expression by exposing mCRC cells to capsaicin, a selective TRPV1 agonist [37,39,43,51,52], in presence of extracellular Ca2+. Accordingly, capsaicin induced a significant elevation in [Ca2+]i that exhibited different temporal patterns (Figure 5), as previously described for NaHS (Figure 3A,B). The most frequent pattern observed consisted in a rapid increase in [Ca2+]i which rapidly decayed to the baseline in the continuous presence of the agonist (blue trace in Figure 5A). This transient increase in [Ca2+]i was detected in ≈75% of the cells (Figure 5B). In the remaining 25% (Figure 5B), the initial Ca2+ peak rapidly decayed to a sustained plateau phase that was maintained as long as capsaicin was present in the bath (green trace in Figure 5A).
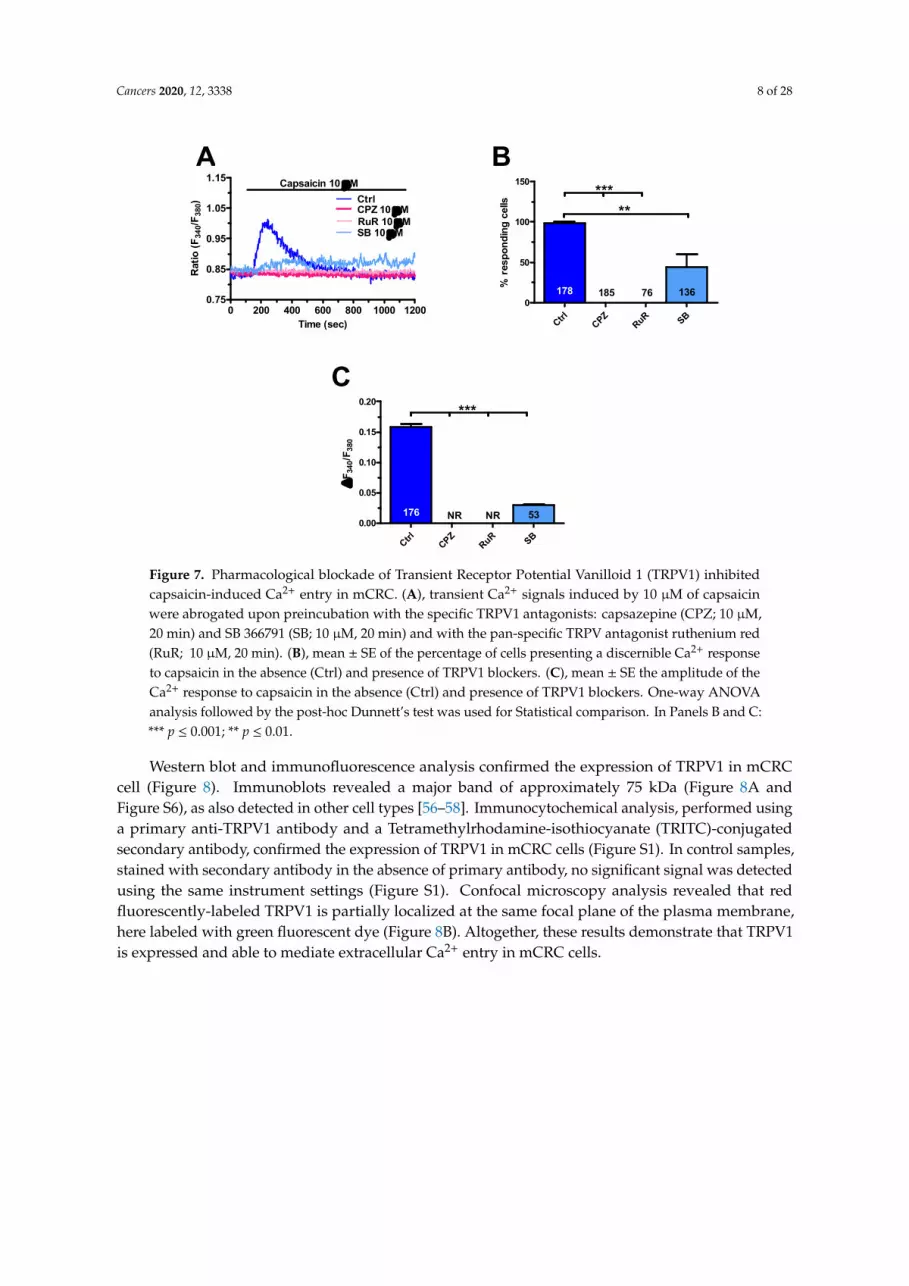
As expected, capsaicin (10 µM) did not evoke endogenous Ca2+ release in the absence of extracellular Ca2+ (0Ca2+), while the Ca2+ response resumed upon Ca2+ restitution to the perfusate (Figure 6A–D). Furthermore, capsaicin-induced extracellular Ca2+ entry was suppressed by preincubating the cells with specific TRPV1 antagonists, capsazepine (10 µM, 20 min), and SB-366791 (10 µM, 20 min) [37,39,51,53] (Figure 7A–C). Similarly, the Ca2+ response to capsaicin was inhibited by the less specific TRPV1 antagonist, ruthenium red (RuR) (10 µM, 20 min) [39,54–56] (Figure 7A–C).
Commented [M2]: Please revise the “NaSH”
Figure 4. Extracellular Ca2+ entry mediates the Ca2+ response to NaHS. (A), NaHS (100 µM) failed toelicit intracellular Ca2+ levels when the cells were bathed in the absence of extracellular Ca2+ (0Ca2+),the [Ca2+]i raised following re-addition of extracellular Ca2+. (B), mean ± SE of the percentage of mCRCcells presenting a discernible Ca2+ release or Ca2+ entry in response to 100 µM NaHS. (C), mean ± SEof the amplitude of Ca2+ release and Ca2+ entry induced by NaHS in mCRC cells. (D), removal ofextracellular Ca2+ (0Ca2+) during the plateau phase caused the [Ca2+]i to undergo a reversible declineto pre-stimulation levels.
2.3. TRPV1 Protein is Expressed and Mediates Extracellular Ca2+ Entry in Primary Cultures of mCRC Cells
H2S may induce extracellular Ca2+ entry by activating TRPV1 in a growing number of celltypes [21,23–25]. Herein, we first sought to assess TRPV1 expression by exposing mCRC cells tocapsaicin, a selective TRPV1 agonist [37,39,43,50,51], in presence of extracellular Ca2+. Accordingly,capsaicin induced a significant elevation in [Ca2+]i that exhibited different temporal patterns (Figure 5),as previously described for NaHS (Figure 3A,B). The most frequent pattern observed consisted in arapid increase in [Ca2+]i which rapidly decayed to the baseline in the continuous presence of the agonist(blue trace in Figure 5A). This transient increase in [Ca2+]i was detected in ≈75% of the cells (Figure 5B).In the remaining 25% (Figure 5B), the initial Ca2+ peak rapidly decayed to a sustained plateau phasethat was maintained as long as capsaicin was present in the bath (green trace in Figure 5A).
As expected, capsaicin (10 µM) did not evoke endogenous Ca2+ release in the absenceof extracellular Ca2+ (0Ca2+), while the Ca2+ response resumed upon Ca2+ restitution to theperfusate (Figure 6A–D). Furthermore, capsaicin-induced extracellular Ca2+ entry was suppressed bypreincubating the cells with specific TRPV1 antagonists, capsazepine (10 µM, 20 min), and SB-366791(10 µM, 20 min) [37,39,50,52] (Figure 7A–C). Similarly, the Ca2+ response to capsaicin was inhibited bythe less specific TRPV1 antagonist, ruthenium red (RuR) (10 µM, 20 min) [39,53–55] (Figure 7A–C).
Cancers 2020, 12, 3338 7 of 28
Cancers 2020, 12, x 7 of 28
0 400 800 1200 1600 20000.75
0.85
0.95
1.05
1.15Capsaicin Capsaicin
Time (sec)
Rat
io (
F34
0/F
380)
Transient Plateau0
20
40
60
80
100 *
% o
f ce
lls
0 200 400 600 800 1000 12000.75
0.85
0.95
1.05
1.15
Transient
Plateau
Capsaicin 10 M
Time (sec)
Rat
io (
F34
0/F
380)
A B
C
Figure 5. Capsaicin induces extracellular Ca2+ influx in mCRC cells. A, administration of capsaicin (10 µM), a specific TRPV1 agonist, in the presence of extracellular Ca2+ induced both transient and long-lasting intracellular Ca2+ signals. B, mean ± SE of the percentage of cells presenting transient and long-lasting Ca2+ signals in 170 mCRC cells in response to 10 µM capsaicin. Student’s t-test has been used for statistical comparison. The asterisk indicates p < 0.05. C, repetitive applications of capsaicin (10 µM) resulted in Ca2+ signals with similar amplitude and kinetics.
0 400 800 1200 16000.8
0.9
1.0
1.1
1.2
1.3
0Ca2+Ca2+Ca2+
Capsaicin 10 M
Time (sec)
Rat
io (
F3
40/F
38
0)
Ca2+ Release Ca2+ Entry0
20
40
60
80
100
120
NR
162 162
% r
esp
on
din
g c
ells
0.0
0.1
0.2
0.3
NR
Ca2+ Release Ca2+ Entry
162 162F
34
0/F
380
A B
C
0 200 400 600 800 1000 12000.75
0.85
0.95
1.05
1.15
0Ca2+
Capsaicin Capsaicin
Time (sec)
Rat
io (
F34
0/F
380)
D
Figure 6. Extracellular Ca2+ entry mediates the Ca2+ response to capsaicin in mCRC cells. A, application of capsaicin (10 µM) in the absence of extracellular Ca2+ (0Ca2+) did not elicit any detectable increase in [Ca2+]i, while the Ca2+ signal was recorded upon Ca2+ restitution to the bath. B, mean ± SE of the percentage of mCRC cells presenting a discernible Ca2+ release or Ca2+ entry in response to 10 µM capsaicin. C, mean ± SE of the amplitude of Ca2+ release and Ca2+ entry induced by capsaicin in mCRC cells. D, removal of extracellular Ca2+ (0Ca2+) during the plateau phase caused the [Ca2+]i to undergo a reversible decline to pre-stimulation levels.
Figure 5. Capsaicin induces extracellular Ca2+ influx in mCRC cells. (A), administration of capsaicin(10 µM), a specific TRPV1 agonist, in the presence of extracellular Ca2+ induced both transient andlong-lasting intracellular Ca2+ signals. (B), mean ± SE of the percentage of cells presenting transientand long-lasting Ca2+ signals in 170 mCRC cells in response to 10 µM capsaicin. Student’s t-test hasbeen used for statistical comparison. The asterisk indicates p < 0.05. (C), repetitive applications ofcapsaicin (10 µM) resulted in Ca2+ signals with similar amplitude and kinetics.
Cancers 2020, 12, x 7 of 28
0 400 800 1200 1600 20000.75
0.85
0.95
1.05
1.15Capsaicin Capsaicin
Time (sec)
Rat
io (
F34
0/F
380)
Transient Plateau0
20
40
60
80
100 *
% o
f ce
lls
0 200 400 600 800 1000 12000.75
0.85
0.95
1.05
1.15
Transient
Plateau
Capsaicin 10 M
Time (sec)
Rat
io (
F34
0/F
380)
A B
C
Figure 5. Capsaicin induces extracellular Ca2+ influx in mCRC cells. A, administration of capsaicin (10 µM), a specific TRPV1 agonist, in the presence of extracellular Ca2+ induced both transient and long-lasting intracellular Ca2+ signals. B, mean ± SE of the percentage of cells presenting transient and long-lasting Ca2+ signals in 170 mCRC cells in response to 10 µM capsaicin. Student’s t-test has been used for statistical comparison. The asterisk indicates p < 0.05. C, repetitive applications of capsaicin (10 µM) resulted in Ca2+ signals with similar amplitude and kinetics.
0 400 800 1200 16000.8
0.9
1.0
1.1
1.2
1.3
0Ca2+Ca2+Ca2+
Capsaicin 10 M
Time (sec)
Rat
io (
F3
40/F
38
0)
Ca2+ Release Ca2+ Entry0
20
40
60
80
100
120
NR
162 162
% r
esp
on
din
g c
ells
0.0
0.1
0.2
0.3
NR
Ca2+ Release Ca2+ Entry
162 162F
34
0/F
380
A B
C
0 200 400 600 800 1000 12000.75
0.85
0.95
1.05
1.15
0Ca2+
Capsaicin Capsaicin
Time (sec)
Rat
io (
F34
0/F
380)
D
Figure 6. Extracellular Ca2+ entry mediates the Ca2+ response to capsaicin in mCRC cells. A, application of capsaicin (10 µM) in the absence of extracellular Ca2+ (0Ca2+) did not elicit any detectable increase in [Ca2+]i, while the Ca2+ signal was recorded upon Ca2+ restitution to the bath. B, mean ± SE of the percentage of mCRC cells presenting a discernible Ca2+ release or Ca2+ entry in response to 10 µM capsaicin. C, mean ± SE of the amplitude of Ca2+ release and Ca2+ entry induced by capsaicin in mCRC cells. D, removal of extracellular Ca2+ (0Ca2+) during the plateau phase caused the [Ca2+]i to undergo a reversible decline to pre-stimulation levels.
Figure 6. Extracellular Ca2+ entry mediates the Ca2+ response to capsaicin in mCRC cells. (A),application of capsaicin (10 µM) in the absence of extracellular Ca2+ (0Ca2+) did not elicit any detectableincrease in [Ca2+]i, while the Ca2+ signal was recorded upon Ca2+ restitution to the bath. (B), mean± SEof the percentage of mCRC cells presenting a discernible Ca2+ release or Ca2+ entry in response to10 µM capsaicin. (C), mean ± SE of the amplitude of Ca2+ release and Ca2+ entry induced by capsaicinin mCRC cells. (D), removal of extracellular Ca2+ (0Ca2+) during the plateau phase caused the [Ca2+]i
to undergo a reversible decline to pre-stimulation levels.
Cancers 2020, 12, 3338 8 of 28Cancers 2020, 12, x 8 of 28
0 200 400 600 800 1000 12000.75
0.85
0.95
1.05
1.15 Capsaicin 10 M
CtrlCPZ 10 MRuR 10 MSB 10 M
Time (sec)
Rat
io (
F34
0/F
380)
CtrlCPZ
RuR SB
0.00
0.05
0.10
0.15
0.20
176 53NR NR
***
F
340/F
380
CtrlCPZ
RuR SB
0
50
100
150
178 13676185
*****
% r
esp
on
din
g c
ells
A B
C
Figure 7. Pharmacological blockade of Transient Receptor Potential Vanilloid 1 (TRPV1) inhibited capsaicin-induced Ca2+ entry in mCRC. A, transient Ca2+ signals induced by 10 µM of capsaicin were abrogated upon preincubation with the specific TRPV1 antagonists: capsazepine (CPZ; 10 µM, 20 min) and SB 366791 (SB; 10 µM, 20 min) and with the pan-specific TRPV antagonist ruthenium red (RuR; 10 µM, 20 min). B, mean ± SE of the percentage of cells presenting a discernible Ca2+ response to capsaicin in the absence (Ctrl) and presence of TRPV1 blockers. C, mean ± SE the amplitude of the Ca2+ response to capsaicin in the absence (Ctrl) and presence of TRPV1 blockers. One-way ANOVA analysis followed by the post-hoc Dunnett’s test was used for Statistical comparison. In Panels B and C: *** p 0.001; ** p 0.01.
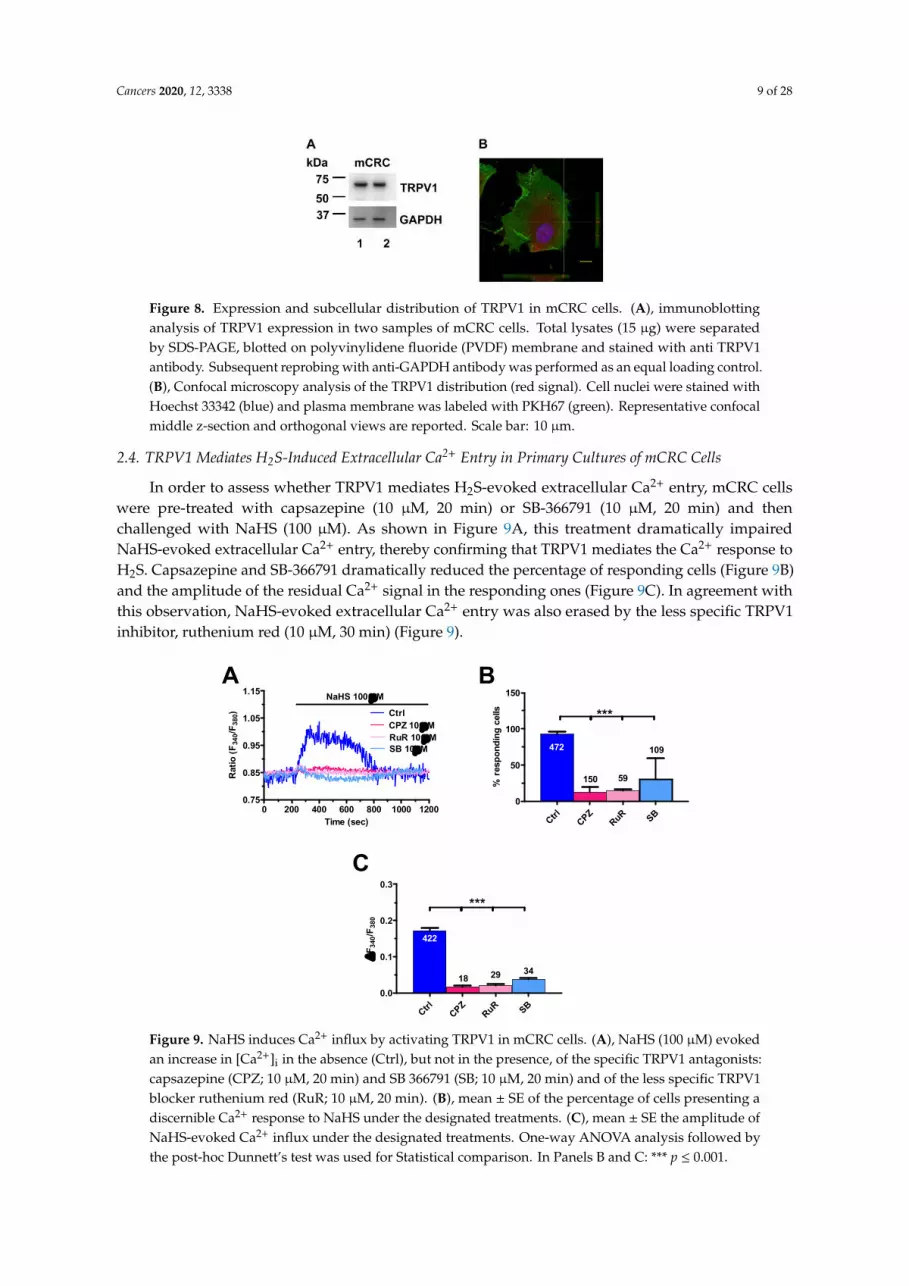
Western blot and immunofluorescence analysis confirmed the expression of TRPV1 in mCRC cell (Figure 8). Immunoblots revealed a major band of approximately 75 kDa (Figure 8A and Figure S6), as also detected in other cell types [56–58]. Immunocytochemical analysis, performed using a primary anti-TRPV1 antibody and a Tetramethylrhodamine-isothiocyanate (TRITC)-conjugated secondary antibody, confirmed the expression of TRPV1 in mCRC cells (Figure S1). In control samples, stained with secondary antibody in the absence of primary antibody, no significant signal was detected using the same instrument settings (Figure S1). Confocal microscopy analysis revealed that red fluorescently-labeled TRPV1 is partially localized at the same focal plane of the plasma membrane, here labeled with green fluorescent dye (Figure 8B). Altogether, these results demonstrate that TRPV1 is expressed and able to mediate extracellular Ca2+ entry in mCRC cells.
Figure 8. Expression and subcellular distribution of TRPV1 in mCRC cells. A, immunoblotting analysis of TRPV1 expression in two samples of mCRC cells. Total lysates (15 µg) were separated by
Figure 7. Pharmacological blockade of Transient Receptor Potential Vanilloid 1 (TRPV1) inhibitedcapsaicin-induced Ca2+ entry in mCRC. (A), transient Ca2+ signals induced by 10 µM of capsaicinwere abrogated upon preincubation with the specific TRPV1 antagonists: capsazepine (CPZ; 10 µM,20 min) and SB 366791 (SB; 10 µM, 20 min) and with the pan-specific TRPV antagonist ruthenium red(RuR; 10 µM, 20 min). (B), mean ± SE of the percentage of cells presenting a discernible Ca2+ responseto capsaicin in the absence (Ctrl) and presence of TRPV1 blockers. (C), mean ± SE the amplitude of theCa2+ response to capsaicin in the absence (Ctrl) and presence of TRPV1 blockers. One-way ANOVAanalysis followed by the post-hoc Dunnett’s test was used for Statistical comparison. In Panels B and C:*** p ≤ 0.001; ** p ≤ 0.01.
Western blot and immunofluorescence analysis confirmed the expression of TRPV1 in mCRCcell (Figure 8). Immunoblots revealed a major band of approximately 75 kDa (Figure 8A andFigure S6), as also detected in other cell types [56–58]. Immunocytochemical analysis, performed usinga primary anti-TRPV1 antibody and a Tetramethylrhodamine-isothiocyanate (TRITC)-conjugatedsecondary antibody, confirmed the expression of TRPV1 in mCRC cells (Figure S1). In control samples,stained with secondary antibody in the absence of primary antibody, no significant signal was detectedusing the same instrument settings (Figure S1). Confocal microscopy analysis revealed that redfluorescently-labeled TRPV1 is partially localized at the same focal plane of the plasma membrane,here labeled with green fluorescent dye (Figure 8B). Altogether, these results demonstrate that TRPV1is expressed and able to mediate extracellular Ca2+ entry in mCRC cells.
Cancers 2020, 12, 3338 9 of 28
Cancers 2020, 12, x 8 of 28
0 200 400 600 800 1000 12000.75
0.85
0.95
1.05
1.15 Capsaicin 10 M
CtrlCPZ 10 MRuR 10 MSB 10 M
Time (sec)
Rat
io (
F34
0/F
380)
CtrlCPZ
RuR SB
0.00
0.05
0.10
0.15
0.20
176 53NR NR
***
F
340/F
380
CtrlCPZ
RuR SB
0
50
100
150
178 13676185
*****
% r
esp
on
din
g c
ells
A B
C
Figure 7. Pharmacological blockade of Transient Receptor Potential Vanilloid 1 (TRPV1) inhibited capsaicin-induced Ca2+ entry in mCRC. A, transient Ca2+ signals induced by 10 µM of capsaicin were abrogated upon preincubation with the specific TRPV1 antagonists: capsazepine (CPZ; 10 µM, 20 min) and SB 366791 (SB; 10 µM, 20 min) and with the pan-specific TRPV antagonist ruthenium red (RuR; 10 µM, 20 min). B, mean ± SE of the percentage of cells presenting a discernible Ca2+ response to capsaicin in the absence (Ctrl) and presence of TRPV1 blockers. C, mean ± SE the amplitude of the Ca2+ response to capsaicin in the absence (Ctrl) and presence of TRPV1 blockers. One-way ANOVA analysis followed by the post-hoc Dunnett’s test was used for Statistical comparison. In Panels B and C: *** p 0.001; ** p 0.01.
Western blot and immunofluorescence analysis confirmed the expression of TRPV1 in mCRC cell (Figure 8). Immunoblots revealed a major band of approximately 75 kDa (Figure 8A and Figure S6), as also detected in other cell types [56–58]. Immunocytochemical analysis, performed using a primary anti-TRPV1 antibody and a Tetramethylrhodamine-isothiocyanate (TRITC)-conjugated secondary antibody, confirmed the expression of TRPV1 in mCRC cells (Figure S1). In control samples, stained with secondary antibody in the absence of primary antibody, no significant signal was detected using the same instrument settings (Figure S1). Confocal microscopy analysis revealed that red fluorescently-labeled TRPV1 is partially localized at the same focal plane of the plasma membrane, here labeled with green fluorescent dye (Figure 8B). Altogether, these results demonstrate that TRPV1 is expressed and able to mediate extracellular Ca2+ entry in mCRC cells.
Figure 8. Expression and subcellular distribution of TRPV1 in mCRC cells. A, immunoblotting analysis of TRPV1 expression in two samples of mCRC cells. Total lysates (15 µg) were separated by
Figure 8. Expression and subcellular distribution of TRPV1 in mCRC cells. (A), immunoblottinganalysis of TRPV1 expression in two samples of mCRC cells. Total lysates (15 µg) were separatedby SDS-PAGE, blotted on polyvinylidene fluoride (PVDF) membrane and stained with anti TRPV1antibody. Subsequent reprobing with anti-GAPDH antibody was performed as an equal loading control.(B), Confocal microscopy analysis of the TRPV1 distribution (red signal). Cell nuclei were stained withHoechst 33342 (blue) and plasma membrane was labeled with PKH67 (green). Representative confocalmiddle z-section and orthogonal views are reported. Scale bar: 10 µm.
2.4. TRPV1 Mediates H2S-Induced Extracellular Ca2+ Entry in Primary Cultures of mCRC Cells
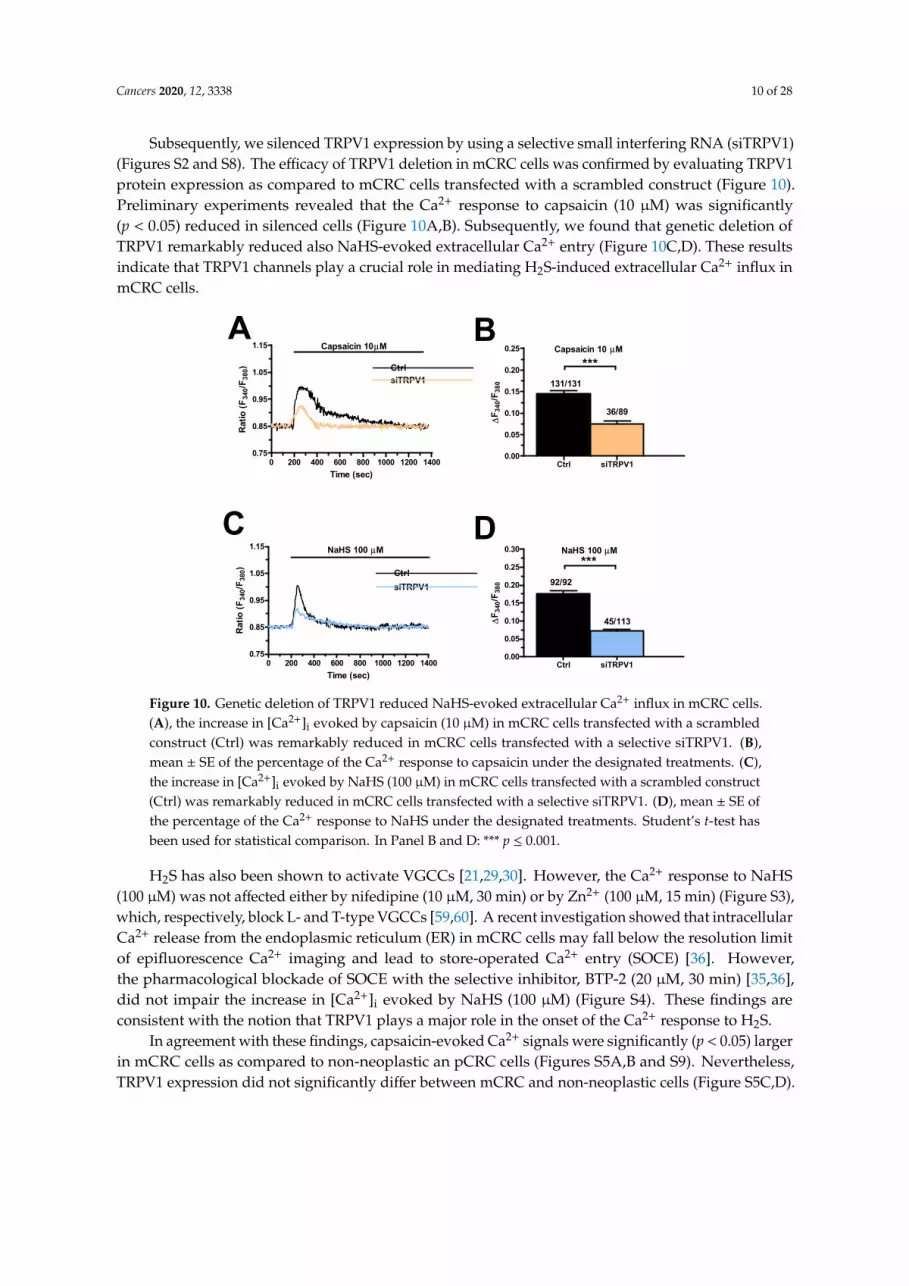
In order to assess whether TRPV1 mediates H2S-evoked extracellular Ca2+ entry, mCRC cellswere pre-treated with capsazepine (10 µM, 20 min) or SB-366791 (10 µM, 20 min) and thenchallenged with NaHS (100 µM). As shown in Figure 9A, this treatment dramatically impairedNaHS-evoked extracellular Ca2+ entry, thereby confirming that TRPV1 mediates the Ca2+ response toH2S. Capsazepine and SB-366791 dramatically reduced the percentage of responding cells (Figure 9B)and the amplitude of the residual Ca2+ signal in the responding ones (Figure 9C). In agreement withthis observation, NaHS-evoked extracellular Ca2+ entry was also erased by the less specific TRPV1inhibitor, ruthenium red (10 µM, 30 min) (Figure 9).
Cancers 2020, 12, x 9 of 28
SDS-PAGE, blotted on polyvinylidene fluoride (PVDF) membrane and stained with anti TRPV1 antibody. Subsequent reprobing with anti-GAPDH antibody was performed as an equal loading control. B, Confocal microscopy analysis of the TRPV1 distribution (red signal). Cell nuclei were stained with Hoechst 33342 (blue) and plasma membrane was labeled with PKH67 (green). Representative confocal middle z-section and orthogonal views are reported. Scale bar: 10 µm.
2.4. TRPV1 Mediates H2S-Induced Extracellular Ca2+ Entry in Primary Cultures of mCRC Cells
In order to assess whether TRPV1 mediates H2S-evoked extracellular Ca2+ entry, mCRC cells were pre-treated with capsazepine (10 µM, 20 min) or SB-366791 (10 µM, 20 min) and then challenged with NaHS (100 µM). As shown in Figure 9A, this treatment dramatically impaired NaHS-evoked extracellular Ca2+ entry, thereby confirming that TRPV1 mediates the Ca2+ response to H2S. Capsazepine and SB-366791 dramatically reduced the percentage of responding cells (Figure 9B) and the amplitude of the residual Ca2+ signal in the responding ones (Figure 9C). In agreement with this observation, NaHS-evoked extracellular Ca2+ entry was also erased by the less specific TRPV1 inhibitor, ruthenium red (10 µM, 30 min) (Figure 9).
0 200 400 600 800 1000 12000.75
0.85
0.95
1.05
1.15
Ctrl
NaHS 100 M
CPZ 10 MRuR 10 MSB 10M
Time (sec)
Rat
io (
F34
0/F
380
)
CtrlCPZ
RuR SB
0
50
100
150
472
150 59
109
***
% r
esp
on
din
g c
ells
CtrlCPZ
RuR SB
0.0
0.1
0.2
0.3
18
422
29 34
***
F
340
/F3
80
A B
C
Figure 9. NaHS induces Ca2+ influx by activating TRPV1 in mCRC cells. A, NaHS (100 µM) evoked an increase in [Ca2+]i in the absence (Ctrl), but not in the presence, of the specific TRPV1 antagonists: capsazepine (CPZ; 10 µM, 20 min) and SB 366791 (SB; 10 µM, 20 min) and of the less specific TRPV1 blocker ruthenium red (RuR; 10 µM, 20 min). B, mean ± SE of the percentage of cells presenting a discernible Ca2+ response to NaHS under the designated treatments. C, mean ± SE the amplitude of NaHS-evoked Ca2+ influx under the designated treatments. One-way ANOVA analysis followed by the post-hoc Dunnett’s test was used for Statistical comparison. In Panels B and C: *** p 0.001.
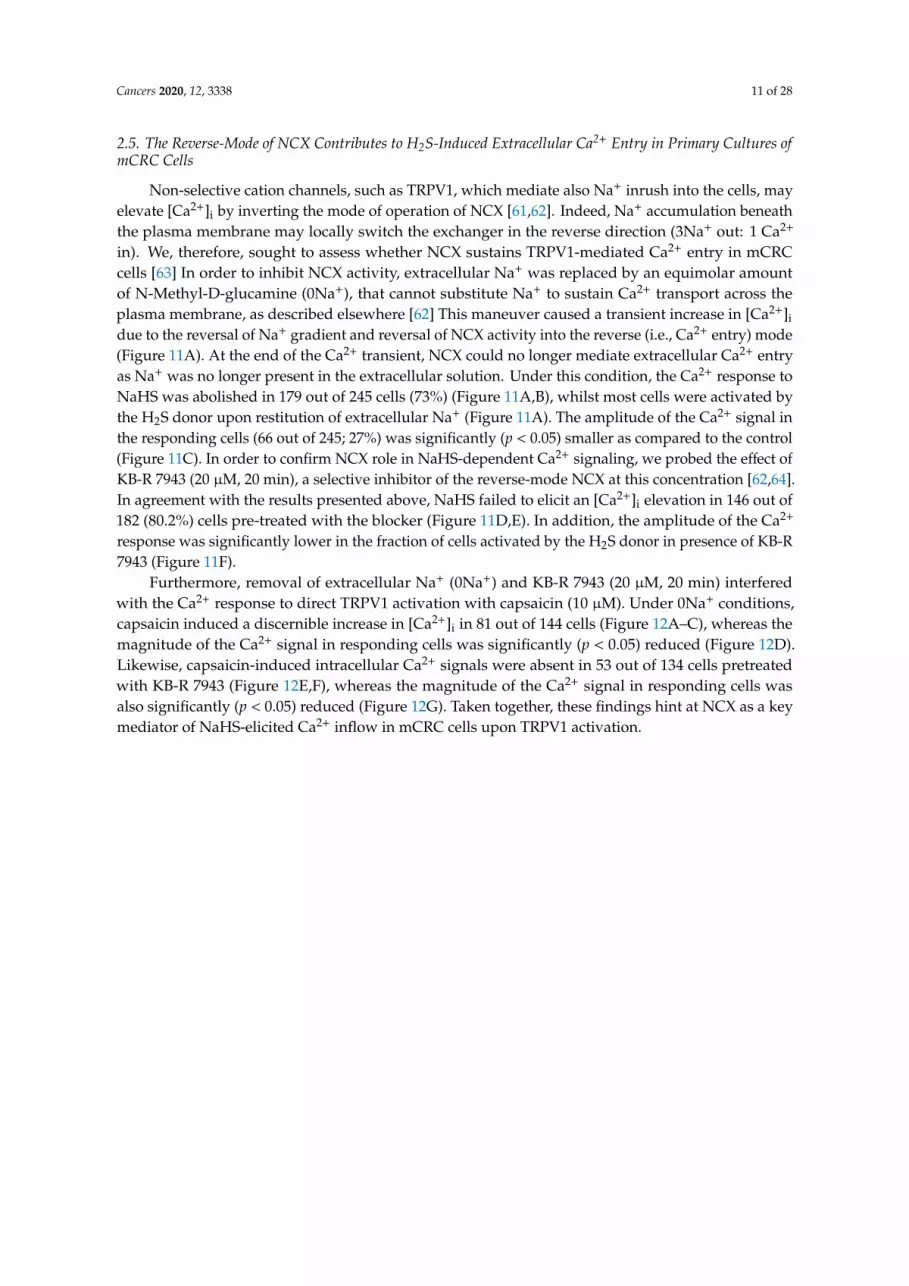
Subsequently, we silenced TRPV1 expression by using a selective small interfering RNA (siTRPV1) (Figures S2 and S8). The efficacy of TRPV1 deletion in mCRC cells was confirmed by evaluating TRPV1 protein expression as compared to mCRC cells transfected with a scrambled construct (Figure 10). Preliminary experiments revealed that the Ca2+ response to capsaicin (10 µM) was significantly (p < 0.05) reduced in silenced cells (Figure 10A,B). Subsequently, we found that genetic deletion of TRPV1 remarkably reduced also NaHS-evoked extracellular Ca2+ entry (Figure 10C,D). These results indicate that TRPV1 channels play a crucial role in mediating H2S-induced extracellular Ca2+ influx in mCRC cells.
Figure 9. NaHS induces Ca2+ influx by activating TRPV1 in mCRC cells. (A), NaHS (100 µM) evokedan increase in [Ca2+]i in the absence (Ctrl), but not in the presence, of the specific TRPV1 antagonists:capsazepine (CPZ; 10 µM, 20 min) and SB 366791 (SB; 10 µM, 20 min) and of the less specific TRPV1blocker ruthenium red (RuR; 10 µM, 20 min). (B), mean ± SE of the percentage of cells presenting adiscernible Ca2+ response to NaHS under the designated treatments. (C), mean ± SE the amplitude ofNaHS-evoked Ca2+ influx under the designated treatments. One-way ANOVA analysis followed bythe post-hoc Dunnett’s test was used for Statistical comparison. In Panels B and C: *** p ≤ 0.001.
Cancers 2020, 12, 3338 10 of 28
Subsequently, we silenced TRPV1 expression by using a selective small interfering RNA (siTRPV1)(Figures S2 and S8). The efficacy of TRPV1 deletion in mCRC cells was confirmed by evaluating TRPV1protein expression as compared to mCRC cells transfected with a scrambled construct (Figure 10).Preliminary experiments revealed that the Ca2+ response to capsaicin (10 µM) was significantly(p < 0.05) reduced in silenced cells (Figure 10A,B). Subsequently, we found that genetic deletion ofTRPV1 remarkably reduced also NaHS-evoked extracellular Ca2+ entry (Figure 10C,D). These resultsindicate that TRPV1 channels play a crucial role in mediating H2S-induced extracellular Ca2+ influx inmCRC cells. Cancers 2020, 12, x 10 of 28
0 200 400 600 800 1000 1200 14000.75
0.85
0.95
1.05
1.15
CtrlsiTRPV1
Capsaicin 10μM
Time (sec)
Rat
io (F
340/
F 380
)
Ctrl siTRPV10.00
0.05
0.10
0.15
0.20
0.25 Capsaicin 10 μM
***131/131
36/89
ΔF 3
40/F
380
0 200 400 600 800 1000 1200 14000.75
0.85
0.95
1.05
1.15
CtrlsiTRPV1
NaHS 100 μM
Time (sec)
Ratio
(F34
0/F 3
80)
Ctrl siTRPV10.00
0.05
0.10
0.15
0.20
0.25
0.30 NaHS 100 μM***
92/92
45/113ΔF 3
40/F
380
A B
C D
Figure 10. Genetic deletion of TRPV1 reduced NaHS-evoked extracellular Ca2+ influx in mCRC cells. A, the increase in [Ca2+]i evoked by capsaicin (10 µM) in mCRC cells transfected with a scrambled construct (Ctrl) was remarkably reduced in mCRC cells transfected with a selective siTRPV1. B, mean ± SE of the percentage of the Ca2+ response to capsaicin under the designated treatments. C, the increase in [Ca2+]i evoked by NaHS (100 µM) in mCRC cells transfected with a scrambled construct (Ctrl) was remarkably reduced in mCRC cells transfected with a selective siTRPV1. D, mean ± SE of the percentage of the Ca2+ response to NaHS under the designated treatments. Student’s t-test has been used for statistical comparison. In Panel B and D: *** p ≤ 0.001.
H2S has also been shown to activate VGCCs [21,29,30]. However, the Ca2+ response to NaHS (100 µM) was not affected either by nifedipine (10 µM, 30 min) or by Zn2+ (100 µM, 15 min) (Figure S3), which, respectively, block L- and T-type VGCCs [60,61]. A recent investigation showed that intracellular Ca2+ release from the endoplasmic reticulum (ER) in mCRC cells may fall below the resolution limit of epifluorescence Ca2+ imaging and lead to store-operated Ca2+ entry (SOCE) [36]. However, the pharmacological blockade of SOCE with the selective inhibitor, BTP-2 (20 µM, 30 min) [35,36], did not impair the increase in [Ca2+]i evoked by NaHS (100 µM) (Figure S4). These findings are consistent with the notion that TRPV1 plays a major role in the onset of the Ca2+ response to H2S.
In agreement with these findings, capsaicin-evoked Ca2+ signals were significantly (p < 0.05) larger in mCRC cells as compared to non-neoplastic an pCRC cells (Figure S5A,B and Figure S9). Nevertheless, TRPV1 expression did not significantly differ between mCRC and non-neoplastic cells (Figure S5C,D).
2.5. The Reverse-Mode of NCX Contributes to H2S-Induced Extracellular Ca2+ Entry in Primary Cultures of mCRC Cells
Non-selective cation channels, such as TRPV1, which mediate also Na+ inrush into the cells, may elevate [Ca2+]i by inverting the mode of operation of NCX [62,63]. Indeed, Na+ accumulation beneath
Commented [M3]: Please revise the “NaSH”
Figure 10. Genetic deletion of TRPV1 reduced NaHS-evoked extracellular Ca2+ influx in mCRC cells.(A), the increase in [Ca2+]i evoked by capsaicin (10 µM) in mCRC cells transfected with a scrambledconstruct (Ctrl) was remarkably reduced in mCRC cells transfected with a selective siTRPV1. (B),mean ± SE of the percentage of the Ca2+ response to capsaicin under the designated treatments. (C),the increase in [Ca2+]i evoked by NaHS (100 µM) in mCRC cells transfected with a scrambled construct(Ctrl) was remarkably reduced in mCRC cells transfected with a selective siTRPV1. (D), mean ± SE ofthe percentage of the Ca2+ response to NaHS under the designated treatments. Student’s t-test hasbeen used for statistical comparison. In Panel B and D: *** p ≤ 0.001.
H2S has also been shown to activate VGCCs [21,29,30]. However, the Ca2+ response to NaHS(100 µM) was not affected either by nifedipine (10 µM, 30 min) or by Zn2+ (100 µM, 15 min) (Figure S3),which, respectively, block L- and T-type VGCCs [59,60]. A recent investigation showed that intracellularCa2+ release from the endoplasmic reticulum (ER) in mCRC cells may fall below the resolution limitof epifluorescence Ca2+ imaging and lead to store-operated Ca2+ entry (SOCE) [36]. However,the pharmacological blockade of SOCE with the selective inhibitor, BTP-2 (20 µM, 30 min) [35,36],did not impair the increase in [Ca2+]i evoked by NaHS (100 µM) (Figure S4). These findings areconsistent with the notion that TRPV1 plays a major role in the onset of the Ca2+ response to H2S.
In agreement with these findings, capsaicin-evoked Ca2+ signals were significantly (p < 0.05) largerin mCRC cells as compared to non-neoplastic an pCRC cells (Figures S5A,B and S9). Nevertheless,TRPV1 expression did not significantly differ between mCRC and non-neoplastic cells (Figure S5C,D).
Cancers 2020, 12, 3338 11 of 28
2.5. The Reverse-Mode of NCX Contributes to H2S-Induced Extracellular Ca2+ Entry in Primary Cultures ofmCRC Cells
Non-selective cation channels, such as TRPV1, which mediate also Na+ inrush into the cells, mayelevate [Ca2+]i by inverting the mode of operation of NCX [61,62]. Indeed, Na+ accumulation beneaththe plasma membrane may locally switch the exchanger in the reverse direction (3Na+ out: 1 Ca2+
in). We, therefore, sought to assess whether NCX sustains TRPV1-mediated Ca2+ entry in mCRCcells [63] In order to inhibit NCX activity, extracellular Na+ was replaced by an equimolar amountof N-Methyl-D-glucamine (0Na+), that cannot substitute Na+ to sustain Ca2+ transport across theplasma membrane, as described elsewhere [62] This maneuver caused a transient increase in [Ca2+]i
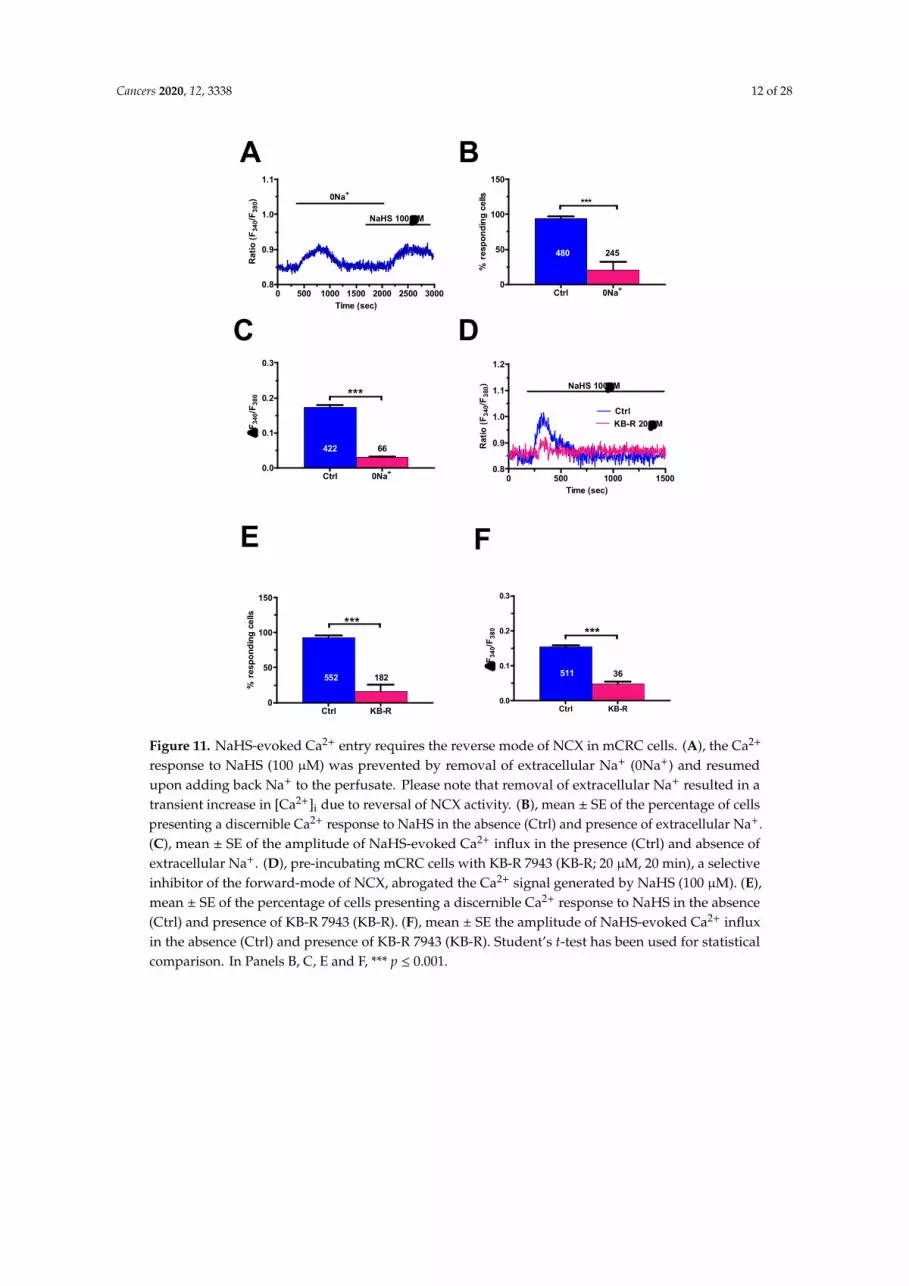
due to the reversal of Na+ gradient and reversal of NCX activity into the reverse (i.e., Ca2+ entry) mode(Figure 11A). At the end of the Ca2+ transient, NCX could no longer mediate extracellular Ca2+ entryas Na+ was no longer present in the extracellular solution. Under this condition, the Ca2+ response toNaHS was abolished in 179 out of 245 cells (73%) (Figure 11A,B), whilst most cells were activated bythe H2S donor upon restitution of extracellular Na+ (Figure 11A). The amplitude of the Ca2+ signal inthe responding cells (66 out of 245; 27%) was significantly (p < 0.05) smaller as compared to the control(Figure 11C). In order to confirm NCX role in NaHS-dependent Ca2+ signaling, we probed the effect ofKB-R 7943 (20 µM, 20 min), a selective inhibitor of the reverse-mode NCX at this concentration [62,64].In agreement with the results presented above, NaHS failed to elicit an [Ca2+]i elevation in 146 out of182 (80.2%) cells pre-treated with the blocker (Figure 11D,E). In addition, the amplitude of the Ca2+
response was significantly lower in the fraction of cells activated by the H2S donor in presence of KB-R7943 (Figure 11F).
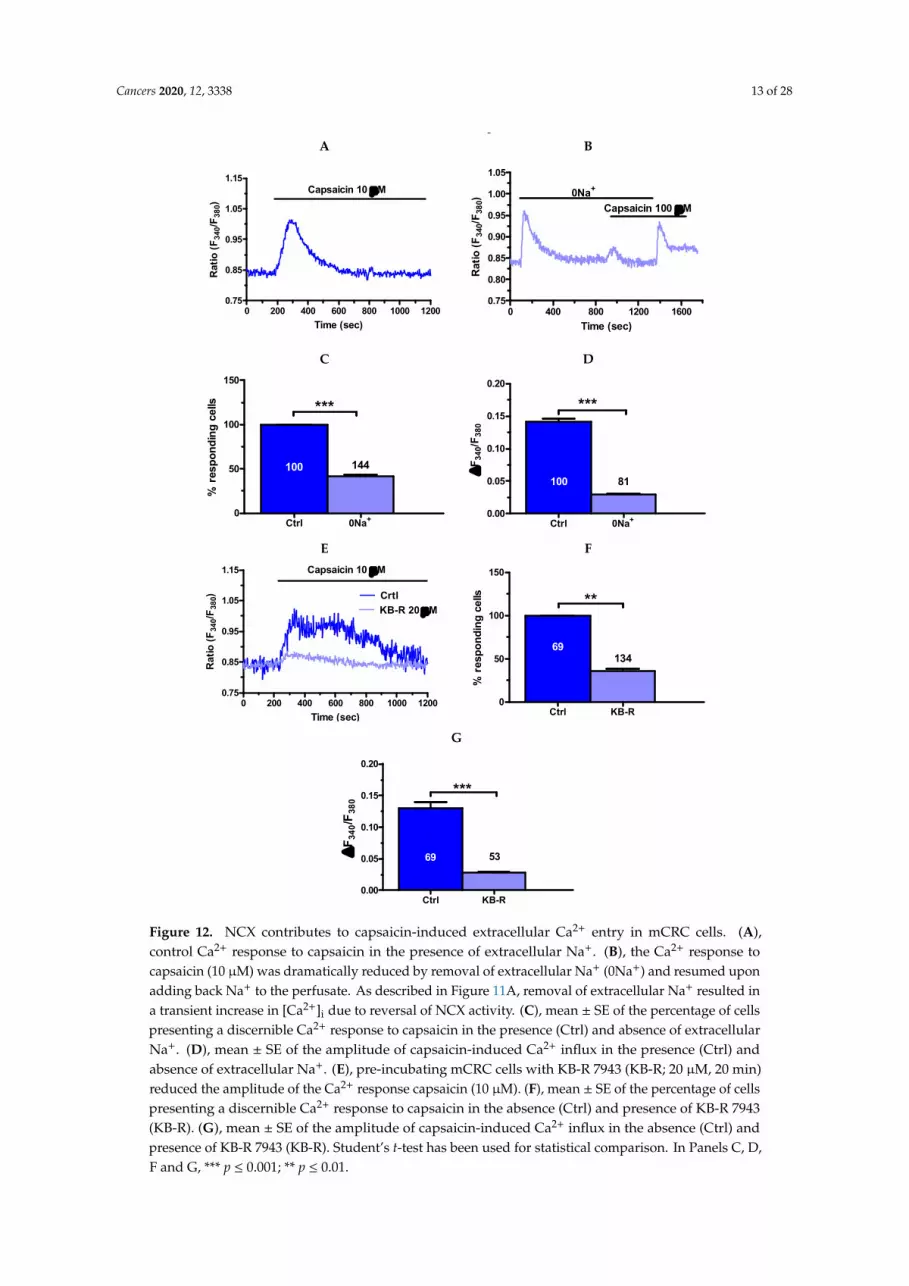
Furthermore, removal of extracellular Na+ (0Na+) and KB-R 7943 (20 µM, 20 min) interferedwith the Ca2+ response to direct TRPV1 activation with capsaicin (10 µM). Under 0Na+ conditions,capsaicin induced a discernible increase in [Ca2+]i in 81 out of 144 cells (Figure 12A–C), whereas themagnitude of the Ca2+ signal in responding cells was significantly (p < 0.05) reduced (Figure 12D).Likewise, capsaicin-induced intracellular Ca2+ signals were absent in 53 out of 134 cells pretreatedwith KB-R 7943 (Figure 12E,F), whereas the magnitude of the Ca2+ signal in responding cells wasalso significantly (p < 0.05) reduced (Figure 12G). Taken together, these findings hint at NCX as a keymediator of NaHS-elicited Ca2+ inflow in mCRC cells upon TRPV1 activation.
Cancers 2020, 12, 3338 12 of 28
Cancers 2020, 12, x 11 of 28
In order to inhibit NCX activity, extracellular Na+ was replaced by an equimolar amount of N-Methyl-D-glucamine (0Na+), that cannot substitute Na+ to sustain Ca2+ transport across the plasma membrane, as described elsewhere [62] This maneuver caused a transient increase in [Ca2+]i due to the reversal of Na+ gradient and reversal of NCX activity into the reverse (i.e., Ca2+ entry) mode (Figure 11A). At the end of the Ca2+ transient, NCX could no longer mediate extracellular Ca2+ entry as Na+ was no longer present in the extracellular solution. Under this condition, the Ca2+ response to NaHS was abolished in 179 out of 245 cells (73%) (Figure 11A,B), whilst most cells were activated by the H2S donor upon restitution of extracellular Na+ (Figure 11A). The amplitude of the Ca2+ signal in the responding cells (66 out of 245; 27%) was significantly (p < 0.05) smaller as compared to the control (Figure 11C). In order to confirm NCX role in NaHS-dependent Ca2+ signaling, we probed the effect of KB-R 7943 (20 µM, 20 min), a selective inhibitor of the reverse-mode NCX at this concentration [62,64]. In agreement with the results presented above, NaHS failed to elicit an [Ca2+]i elevation in 146 out of 182 (80.2%) cells pre-treated with the blocker (Figure 11D,E). In addition, the amplitude of the Ca2+ response was significantly lower in the fraction of cells activated by the H2S donor in presence of KB-R 7943 (Figure 11F).
0 500 1000 1500 2000 2500 30000.8
0.9
1.0
1.1
NaHS 100 M
0Na+
Time (sec)
Rat
io (
F34
0/F
38
0)
Ctrl 0Na+0
50
100
150
245480
***
% r
esp
on
din
g c
ells
Ctrl 0Na+0.0
0.1
0.2
0.3
422 66
***
F
34
0/F
38
0
0 500 1000 15000.8
0.9
1.0
1.1
1.2
Ctrl
KB-R 20 M
NaHS 100M
Time (sec)R
atio
(F
34
0/F
380
)
Ctrl KB-R0
50
100
150
***
552 182
% r
esp
on
din
g c
ells
Ctrl KB-R0.0
0.1
0.2
0.3
***
511 36
F
34
0/F
38
0
A B
C D
E F
Figure 11. NaHS-evoked Ca2+ entry requires the reverse mode of NCX in mCRC cells. A, the Ca2+ response to NaHS (100 µM) was prevented by removal of extracellular Na+ (0Na+) and resumed upon adding back Na+ to the perfusate. Please note that removal of extracellular Na+ resulted in a transient increase in [Ca2+]i due to reversal of NCX activity. B, mean ± SE of the percentage of cells presenting a discernible Ca2+ response to NaHS in the absence (Ctrl) and presence of extracellular Na+. C, mean ± SE of the amplitude of NaHS-evoked Ca2+ influx in the presence (Ctrl) and absence of extracellular Na+. D, pre-incubating mCRC cells with KB-R 7943 (KB-R; 20 µM, 20 min), a selective inhibitor of the forward-mode of NCX, abrogated the Ca2+ signal generated by NaHS (100 µM). E, mean ± SE of the
Figure 11. NaHS-evoked Ca2+ entry requires the reverse mode of NCX in mCRC cells. (A), the Ca2+
response to NaHS (100 µM) was prevented by removal of extracellular Na+ (0Na+) and resumedupon adding back Na+ to the perfusate. Please note that removal of extracellular Na+ resulted in atransient increase in [Ca2+]i due to reversal of NCX activity. (B), mean ± SE of the percentage of cellspresenting a discernible Ca2+ response to NaHS in the absence (Ctrl) and presence of extracellular Na+.(C), mean ± SE of the amplitude of NaHS-evoked Ca2+ influx in the presence (Ctrl) and absence ofextracellular Na+. (D), pre-incubating mCRC cells with KB-R 7943 (KB-R; 20 µM, 20 min), a selectiveinhibitor of the forward-mode of NCX, abrogated the Ca2+ signal generated by NaHS (100 µM). (E),mean ± SE of the percentage of cells presenting a discernible Ca2+ response to NaHS in the absence(Ctrl) and presence of KB-R 7943 (KB-R). (F), mean ± SE the amplitude of NaHS-evoked Ca2+ influxin the absence (Ctrl) and presence of KB-R 7943 (KB-R). Student’s t-test has been used for statisticalcomparison. In Panels B, C, E and F, *** p ≤ 0.001.
Cancers 2020, 12, 3338 13 of 28
Cancers 2020, 12, x 12 of 28
percentage of cells presenting a discernible Ca2+ response to NaHS in the absence (Ctrl) and presence of KB-R 7943 (KB-R). F, mean ± SE the amplitude of NaHS-evoked Ca2+ influx in the absence (Ctrl) and presence of KB-R 7943 (KB-R). Student’s t-test has been used for statistical comparison. In Panels B, C, E and F, *** p 0.001.
Furthermore, removal of extracellular Na+ (0Na+) and KB-R 7943 (20 µM, 20 min) interfered with the Ca2+ response to direct TRPV1 activation with capsaicin (10 µM). Under 0Na+ conditions, capsaicin induced a discernible increase in [Ca2+]i in 81 out of 144 cells (Figure 12A–C), whereas the magnitude of the Ca2+ signal in responding cells was significantly (p < 0.05) reduced (Figure 12D). Likewise, capsaicin-induced intracellular Ca2+ signals were absent in 53 out of 134 cells pretreated with KB-R 7943 (Figure 12E,F), whereas the magnitude of the Ca2+ signal in responding cells was also significantly (p < 0.05) reduced (Figure 12G). Taken together, these findings hint at NCX as a key mediator of NaHS-elicited Ca2+ inflow in mCRC cells upon TRPV1 activation.
A
B
C
D
E
F
G
0 200 400 600 800 1000 12000.75
0.85
0.95
1.05
1.15Capsaicin 10 M
Time (sec)
Rat
io (
F3
40/F
380)
0 400 800 1200 16000.75
0.80
0.85
0.90
0.95
1.00
1.05
Capsaicin 100 M
0Na+
Time (sec)
Rat
io (
F3
40/F
380)
Ctrl 0Na+0
50
100
150
100 144
% r
esp
on
din
g c
ells ***
C
Ctrl 0Na+0.00
0.05
0.10
0.15
0.20
100 81
***
F
34
0/F
38
0
D
0 200 400 600 800 1000 12000.75
0.85
0.95
1.05
1.15
Crtl
KB-R 20 M
Capsaicin 10 M
Time (sec)
Rat
io (
F34
0/F
380)
Ctrl KB-R0
50
100
150
13469
% r
esp
on
din
g c
ells **
Ctrl KB-R0.00
0.05
0.10
0.15
0.20
69 53
***
F
34
0/F
38
0
Figure 12. NCX contributes to capsaicin-induced extracellular Ca2+ entry in mCRC cells. (A),control Ca2+ response to capsaicin in the presence of extracellular Na+. (B), the Ca2+ response tocapsaicin (10 µM) was dramatically reduced by removal of extracellular Na+ (0Na+) and resumed uponadding back Na+ to the perfusate. As described in Figure 11A, removal of extracellular Na+ resulted ina transient increase in [Ca2+]i due to reversal of NCX activity. (C), mean ± SE of the percentage of cellspresenting a discernible Ca2+ response to capsaicin in the presence (Ctrl) and absence of extracellularNa+. (D), mean ± SE of the amplitude of capsaicin-induced Ca2+ influx in the presence (Ctrl) andabsence of extracellular Na+. (E), pre-incubating mCRC cells with KB-R 7943 (KB-R; 20 µM, 20 min)reduced the amplitude of the Ca2+ response capsaicin (10 µM). (F), mean ± SE of the percentage of cellspresenting a discernible Ca2+ response to capsaicin in the absence (Ctrl) and presence of KB-R 7943(KB-R). (G), mean ± SE of the amplitude of capsaicin-induced Ca2+ influx in the absence (Ctrl) andpresence of KB-R 7943 (KB-R). Student’s t-test has been used for statistical comparison. In Panels C, D,F and G, *** p ≤ 0.001; ** p ≤ 0.01.
Cancers 2020, 12, 3338 14 of 28
2.6. Exogenous H2S Suppresses Proliferation, but Does Not Induce Apoptosis, in mCRC Cells throughTRPV1 Activation
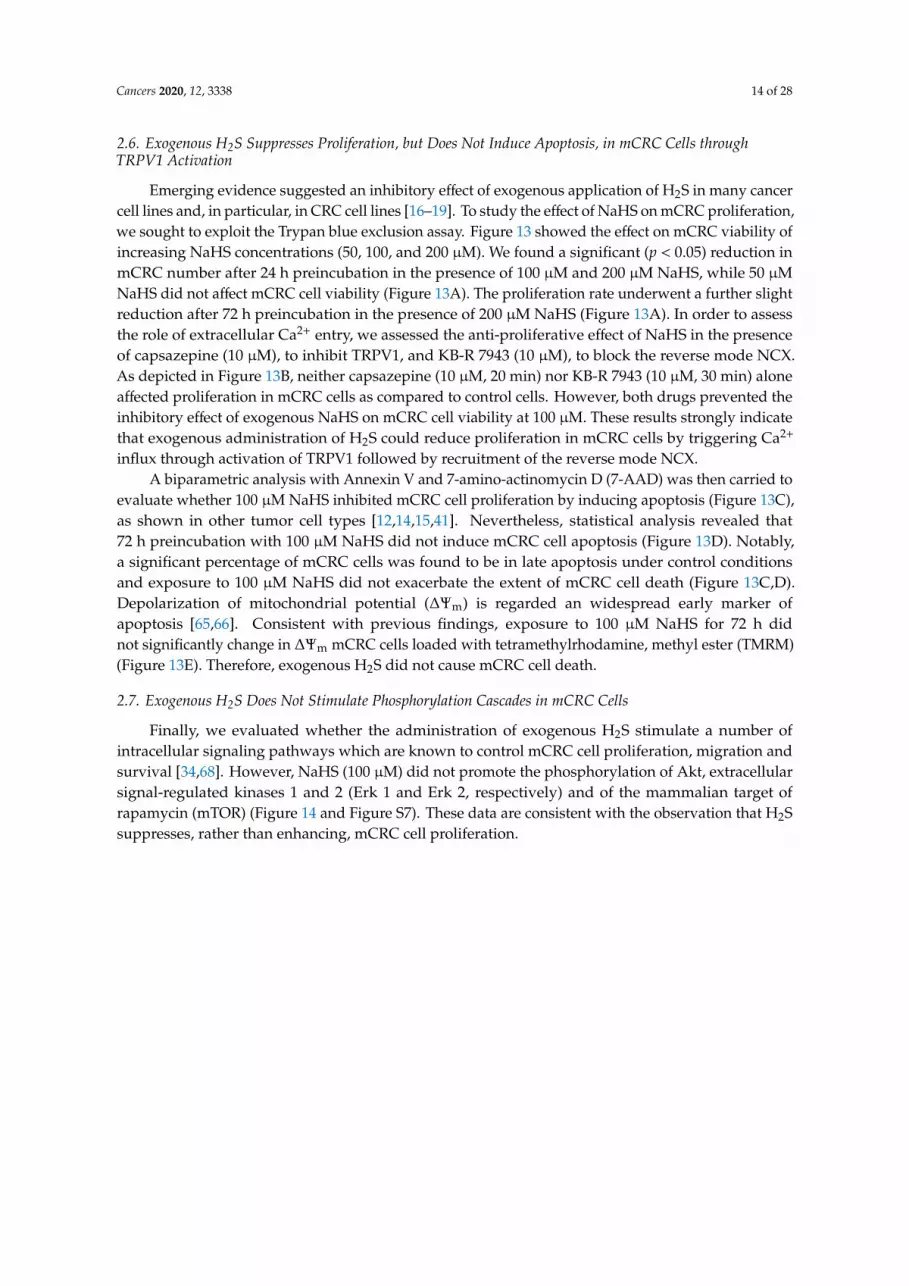
Emerging evidence suggested an inhibitory effect of exogenous application of H2S in many cancercell lines and, in particular, in CRC cell lines [16–19]. To study the effect of NaHS on mCRC proliferation,we sought to exploit the Trypan blue exclusion assay. Figure 13 showed the effect on mCRC viability ofincreasing NaHS concentrations (50, 100, and 200 µM). We found a significant (p < 0.05) reduction inmCRC number after 24 h preincubation in the presence of 100 µM and 200 µM NaHS, while 50 µMNaHS did not affect mCRC cell viability (Figure 13A). The proliferation rate underwent a further slightreduction after 72 h preincubation in the presence of 200 µM NaHS (Figure 13A). In order to assessthe role of extracellular Ca2+ entry, we assessed the anti-proliferative effect of NaHS in the presenceof capsazepine (10 µM), to inhibit TRPV1, and KB-R 7943 (10 µM), to block the reverse mode NCX.As depicted in Figure 13B, neither capsazepine (10 µM, 20 min) nor KB-R 7943 (10 µM, 30 min) aloneaffected proliferation in mCRC cells as compared to control cells. However, both drugs prevented theinhibitory effect of exogenous NaHS on mCRC cell viability at 100 µM. These results strongly indicatethat exogenous administration of H2S could reduce proliferation in mCRC cells by triggering Ca2+
influx through activation of TRPV1 followed by recruitment of the reverse mode NCX.A biparametric analysis with Annexin V and 7-amino-actinomycin D (7-AAD) was then carried to
evaluate whether 100 µM NaHS inhibited mCRC cell proliferation by inducing apoptosis (Figure 13C),as shown in other tumor cell types [12,14,15,41]. Nevertheless, statistical analysis revealed that72 h preincubation with 100 µM NaHS did not induce mCRC cell apoptosis (Figure 13D). Notably,a significant percentage of mCRC cells was found to be in late apoptosis under control conditionsand exposure to 100 µM NaHS did not exacerbate the extent of mCRC cell death (Figure 13C,D).Depolarization of mitochondrial potential (∆Ψm) is regarded an widespread early marker ofapoptosis [65,66]. Consistent with previous findings, exposure to 100 µM NaHS for 72 h didnot significantly change in ∆Ψm mCRC cells loaded with tetramethylrhodamine, methyl ester (TMRM)(Figure 13E). Therefore, exogenous H2S did not cause mCRC cell death.
2.7. Exogenous H2S Does Not Stimulate Phosphorylation Cascades in mCRC Cells
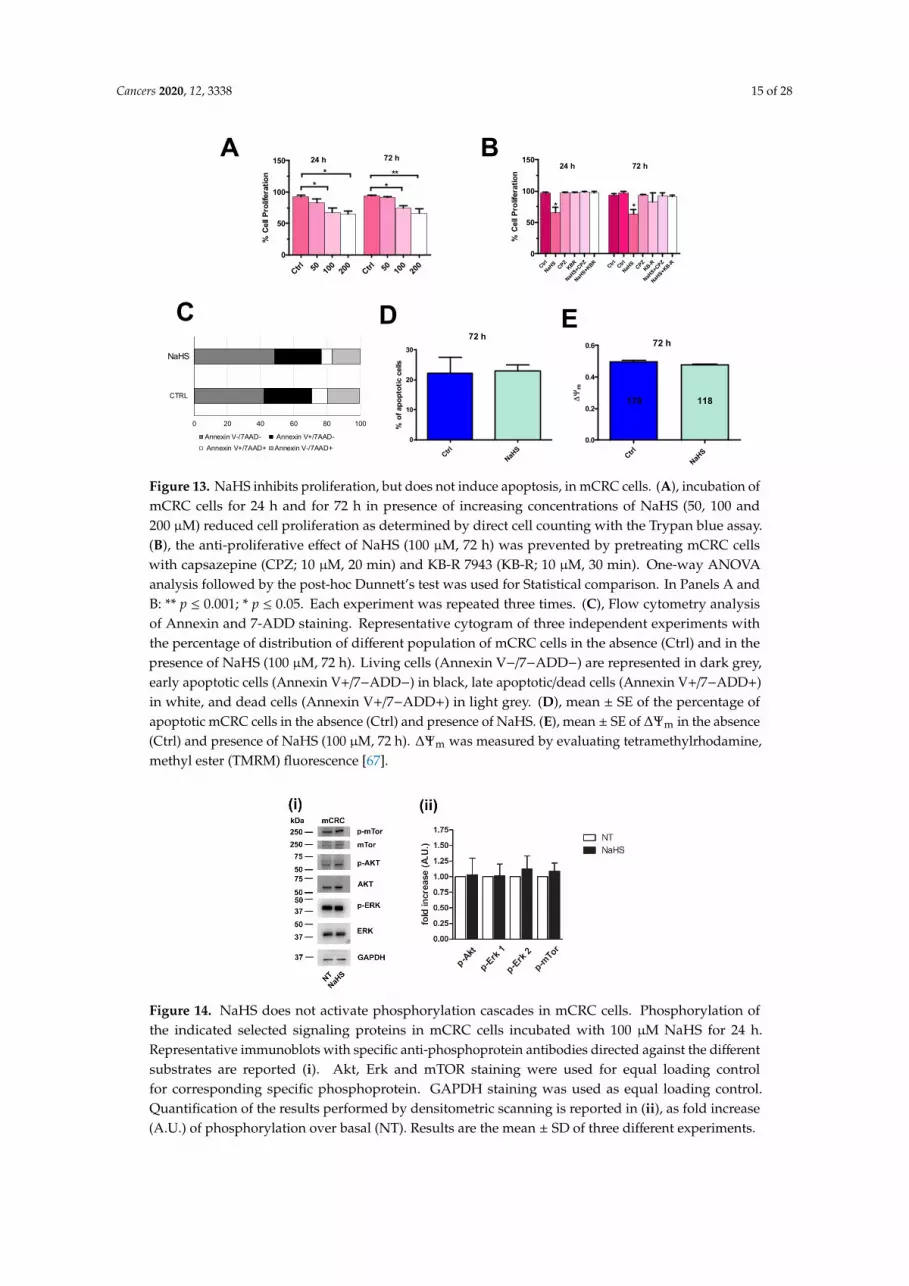
Finally, we evaluated whether the administration of exogenous H2S stimulate a number ofintracellular signaling pathways which are known to control mCRC cell proliferation, migration andsurvival [34,68]. However, NaHS (100 µM) did not promote the phosphorylation of Akt, extracellularsignal-regulated kinases 1 and 2 (Erk 1 and Erk 2, respectively) and of the mammalian target ofrapamycin (mTOR) (Figure 14 and Figure S7). These data are consistent with the observation that H2Ssuppresses, rather than enhancing, mCRC cell proliferation.
Cancers 2020, 12, 3338 15 of 28Cancers 2020, 12, x 14 of 28
72 h
CtrlNaH
S0
10
20
30
% o
f apo
ptot
ic c
ells
72 h
Ctrl
NaHS
0.0
0.2
0.4
0.6
178 118ΔΨ
m
Ctrl 50 100
200
Ctrl 50 100
200
0
50
100
150 72 h
***
**
24 h
% C
ell P
rolif
erat
ion
Ctrl
NaHS
CPZKBR
NaHS+C
PZ
NaHS+K
BR Ctrl Ctrl
NaHS
CPZKB-R
NaHS+C
PZ
NaHS+K
B-R0
50
100
15024 h 72 h
* *
% C
ell P
rolif
erat
ion
0 20 40 60 80 100
CTRL
NaSH
Annexin V-/7AAD- Annexin V+/7AAD- Annexin V+/7AAD+ Annexin V-/7AAD+
A B
C D ENaHS
Figure 13. NaHS inhibits proliferation, but does not induce apoptosis, in mCRC cells. A, incubation of mCRC cells for 24 h and for 72 h in presence of increasing concentrations of NaHS (50, 100 and 200 µM) reduced cell proliferation as determined by direct cell counting with the Trypan blue assay. B, the anti-proliferative effect of NaHS (100 µM, 72 h) was prevented by pretreating mCRC cells with capsazepine (CPZ; 10 µM, 20 min) and KB-R 7943 (KB-R; 10 µM, 30 min). One-way ANOVA analysis followed by the post-hoc Dunnett’s test was used for Statistical comparison. In Panels A and B: ** p ≤ 0.001; * p ≤ 0.05. Each experiment was repeated three times. C, Flow cytometry analysis of Annexin and 7-ADD staining. Representative cytogram of three independent experiments with the percentage of distribution of different population of mCRC cells in the absence (Ctrl) and in the presence of NaHS (100 µM, 72 h). Living cells (Annexin V−/7−ADD−) are represented in dark grey, early apoptotic cells (Annexin V+/7−ADD−) in black, late apoptotic/dead cells (Annexin V+/7−ADD+) in white, and dead cells (Annexin V+/7−ADD+) in light grey. D, mean ± SE of the percentage of apoptotic mCRC cells in the absence (Ctrl) and presence of NaHS. E, mean ± SE of ΔΨm in the absence (Ctrl) and presence of NaHS (100 µM, 72 h). ΔΨm was measured by evaluating tetramethylrhodamine, methyl ester (TMRM) fluorescence [69].
2.7. Exogenous H2S Does Not Stimulate Phosphorylation Cascades in mCRC Cells
Finally, we evaluated whether the administration of exogenous H2S stimulate a number of intracellular signaling pathways which are known to control mCRC cell proliferation, migration and survival [34,70]. However, NaHS (100 µM) did not promote the phosphorylation of Akt, extracellular signal-regulated kinases 1 and 2 (Erk 1 and Erk 2, respectively) and of the mammalian target of rapamycin (mTOR) (Figure 14 and Figure S7). These data are consistent with the observation that H2S suppresses, rather than enhancing, mCRC cell proliferation.
Figure 13. NaHS inhibits proliferation, but does not induce apoptosis, in mCRC cells. (A), incubation ofmCRC cells for 24 h and for 72 h in presence of increasing concentrations of NaHS (50, 100 and200 µM) reduced cell proliferation as determined by direct cell counting with the Trypan blue assay.(B), the anti-proliferative effect of NaHS (100 µM, 72 h) was prevented by pretreating mCRC cellswith capsazepine (CPZ; 10 µM, 20 min) and KB-R 7943 (KB-R; 10 µM, 30 min). One-way ANOVAanalysis followed by the post-hoc Dunnett’s test was used for Statistical comparison. In Panels A andB: ** p ≤ 0.001; * p ≤ 0.05. Each experiment was repeated three times. (C), Flow cytometry analysisof Annexin and 7-ADD staining. Representative cytogram of three independent experiments withthe percentage of distribution of different population of mCRC cells in the absence (Ctrl) and in thepresence of NaHS (100 µM, 72 h). Living cells (Annexin V−/7−ADD−) are represented in dark grey,early apoptotic cells (Annexin V+/7−ADD−) in black, late apoptotic/dead cells (Annexin V+/7−ADD+)in white, and dead cells (Annexin V+/7−ADD+) in light grey. (D), mean ± SE of the percentage ofapoptotic mCRC cells in the absence (Ctrl) and presence of NaHS. (E), mean ± SE of ∆Ψm in the absence(Ctrl) and presence of NaHS (100 µM, 72 h). ∆Ψm was measured by evaluating tetramethylrhodamine,methyl ester (TMRM) fluorescence [67].Cancers 2020, 12, x 15 of 28
Figure 14. NaHS does not activate phosphorylation cascades in mCRC cells. Phosphorylation of the indicated selected signaling proteins in mCRC cells incubated with 100 µM NaHS for 24 h. Representative immunoblots with specific anti-phosphoprotein antibodies directed against the different substrates are reported (i). Akt, Erk and mTOR staining were used for equal loading control for corresponding specific phosphoprotein. GAPDH staining was used as equal loading control. Quantification of the results performed by densitometric scanning is reported in (ii), as fold increase (A.U.) of phosphorylation over basal (NT). Results are the mean ± SD of three different experiments.
3. Discussion
Exogenous delivery of H2S is emerging as an alternative strategy to treat multiple types of malignancies [12,14,15], including CRC [71]. The mechanism whereby exogenous H2S inhibits CRC proliferation is still unclear, although it could involve an increase in [Ca2+]i [20]. Furthermore, the anticancer effect of H2S remains to be confirmed in patients-derived CRC cells, as recent studies revealed that intracellular Ca2+ signals may drive cell fate in multiple commercially available cancer cell lines, but not in primary cultures established from tumors as different as glioblastoma [72], renal cellular carcinoma [73], and CRC [36]. In addition, only a few studies described H2S-induced intracellular Ca2+ signals in cancer cells [20,49], but they failed to identify the main mediator(s) of the Ca2+ response. The present investigation provided the first evidence that H2S inhibits proliferation in primary cultures of mCRC cells by inducing extracellular Ca2+ entry through TRPV1. TRPV1-mediated Ca2+ entry is, in turn, sustained by the reverse mode NCX. This finding endorses the view that exogenous delivery of H2S represents a promising strategy to treat CRC.
Commented [M5]: Please revise “NaSH” in the figure.
Figure 14. NaHS does not activate phosphorylation cascades in mCRC cells. Phosphorylation ofthe indicated selected signaling proteins in mCRC cells incubated with 100 µM NaHS for 24 h.Representative immunoblots with specific anti-phosphoprotein antibodies directed against the differentsubstrates are reported (i). Akt, Erk and mTOR staining were used for equal loading controlfor corresponding specific phosphoprotein. GAPDH staining was used as equal loading control.Quantification of the results performed by densitometric scanning is reported in (ii), as fold increase(A.U.) of phosphorylation over basal (NT). Results are the mean ± SD of three different experiments.
Cancers 2020, 12, 3338 16 of 28
3. Discussion
Exogenous delivery of H2S is emerging as an alternative strategy to treat multiple types ofmalignancies [12,14,15], including CRC [69]. The mechanism whereby exogenous H2S inhibits CRCproliferation is still unclear, although it could involve an increase in [Ca2+]i [20]. Furthermore,the anticancer effect of H2S remains to be confirmed in patients-derived CRC cells, as recent studiesrevealed that intracellular Ca2+ signals may drive cell fate in multiple commercially available cancer celllines, but not in primary cultures established from tumors as different as glioblastoma [70], renal cellularcarcinoma [71], and CRC [36]. In addition, only a few studies described H2S-induced intracellular Ca2+
signals in cancer cells [20,49], but they failed to identify the main mediator(s) of the Ca2+ response.The present investigation provided the first evidence that H2S inhibits proliferation in primary culturesof mCRC cells by inducing extracellular Ca2+ entry through TRPV1. TRPV1-mediated Ca2+ entry is,in turn, sustained by the reverse mode NCX. This finding endorses the view that exogenous deliveryof H2S represents a promising strategy to treat CRC.
3.1. H2S-Evoked Intracellular Ca2+ Signals in Primary Cultures of mCRC Cells
Exogenous administration of H2S in the form of the widely employed H2S-donor, NaHS,reliably increased the [Ca2+]i in primary cultures of mCRC cells. Conversely, the Ca2+ responses toNaHS were remarkably smaller in non-neoplastic and pCRC cells. This preliminary investigationrevealed that mCRC cells displayed a higher sensitivity of exogenous delivery of H2S. An increase in[Ca2+]i was also induced by H2S release from another donor, GYY4137, in the CRC cell line, DLD1 [20].While this investigation did not investigate the dose-response relationship and the kinetics of the Ca2+
response to H2S release [20], herein we first found that, while the Ca2+ signal arose at low NaHSconcentration ([NaHS]) (i.e., 5 µM), the percentage of responding cells and the magnitude of the initialCa2+ peak decreased by further reducing the [NaHS] to 25–50 µM. Nevertheless, the Ca2+ response wasfully restored by increasing the [NaHS] to 75-300 µM. A similar U-shaped dose-response relationshiphas been described for NaHS-evoked intracellular Ca2+ signals in the native endothelium of rataorta [62] and EA.hy926 cells, while a bell-shaped pattern has been reported in breast tumor-derivedendothelial cells (B-TECs) [7]. The peculiar U-shaped pattern of the dose-response relationship thatH2S exhibits in several cellular models has been attributed to the wide array of signaling pathwaysrecruited by this gasotransmitter [72,73]. It should also be noticed that H2S may differently affectthe Ca2+ handling machinery even within the same cell type [21,22]. For instance, NaHS stimulatedinositol-1,4,5-trisphosphate (InsP3) receptors (InsP3Rs) in Ea.hy926 cells [7] and saphenous vein-derivedendothelial cells [74], while it inhibited InsP3-dependent Ca2+ release in rat aortic endothelium [7] andwas ineffective in human endothelial colony forming cells [7]. Furthermore, NaHS was found to bothinhibit [75] and activate [76] voltage-gated Ca2+ entry in rat cardiac myocytes. Likewise, NaHS wasable to facilitate [77] or block [78] CaV3.2 ectopically expressed in HEK-293 cells. Such a variable effectexerted by H2S could be due to the different cysteine residues that can be sulfhydrated within thesame protein channel, thereby exerting distinct effects on its activity [22]. We, therefore, focused on100 µM NaHS, as mCRC cells displayed the highest Ca2+ sensitivity to this [NaHS] and preliminaryexperiments showed that NaHS did not affect mCRC cell viability at lower doses.
One hundred µM NaHS evoked two main intracellular Ca2+ signatures in mCRC cells: a transientincrease in [Ca2+]i, which occurred in ≈75% of the cells, and a biphasic Ca2+ signal, which arose inthe remaining lower fraction of cells. Different patterns of intracellular Ca2+ signals were also elicitedby NaHS in rat aortic endothelium [62] and endothelial cells harvested from human saphenous vein(SVECs) [74]. Unlike non-cancer cells [62,74], the Ca2+ response to NaHS was reversible and did notdesensitize after the first stimulation, which suggests that the molecular trigger of the Ca2+ signal isdifferent and/or that the recovery from H2S-induced modifications (most likely, sulfhydration) is fasterin mCRC cells. As discussed in more detail in the next paragraph, our evidence hints at TRPV1 as themain responsible for the onset of the Ca2+ response to NaHS in mCRC cells.
Cancers 2020, 12, 3338 17 of 28
3.2. Evidence that TRPV1 and Reverse Mode NCX Mediate H2S-Evoked Intracellular Ca2+ Signals in PrimaryCultures of mCRC Cells
It has been demonstrated that H2S may increase the [Ca2+]i by both mobilizing ER stored Ca2+
through InsP3Rs and ryanodine receptors (RyRs) and activating extracellular Ca2+ entry [7,21,22,74].However, NaHS evoked failed to induce any discernible Ca2+ signal upon removal of extracellular Ca2+,while the Ca2+ response immediately resumed upon Ca2+ restitution to the bathing solution. While thisfinding does not rule out the possibility that a local Ca2+ signal is induced by NaHS, and is missed byour epifluorescence detection system, it does demonstrate that the bulk increase in [Ca2+]i is triggeredby extracellular Ca2+ entry. The same observation has been reported in another cancer-derived cellline, i.e., B-TECs [49], although the underlying signaling pathway has not been uncovered.
3.2.1. TRPV1 Triggers the Ca2+ Response to NaHS in Primary Cultures of mCRC Cells
The following pieces of evidence indicate that NaHS-evoked extracellular Ca2+ entry in primarycultures of mCRC cells is triggered by TRPV1. First, the Ca2+ response to NaHS was erased by blockingTRPV1 with the selective antagonists, capsazepine and SB-366791 [37,39,50,52], and the less selectiveblocker ruthenium red [39,40]. Moreover, NaHS-evoked extracellular Ca2+ entry was significantlyreduced by the genetic deletion of TRPV1 by a selective siTRPV1. Second, TRPV1 protein wasabundantly expressed in mCRC cells, as demonstrated by immunoblotting and confocal microscopyanalysis of TRPV1 expression. Likewise, TRPV1 transcript has been reported in the CRC cell line [79],HT29, and TRPV1 protein has been detected in CRC tissue [42]. The theoretical molecular weight(MW) of TRPV1 protein is 90 kDa [37]. Our TRPV1 antibody revealed a protein species of 75 kDa,as previously reported in rodent urothelium [58], retinal ganglion cells [57] and astrocytes [56],normal human bronchial epithelial cells [80], mouse and chicken chondrogenic cells [81]. As discussedin [81], multiple TRPV1 splice variants were detected [82–86]. Furthermore, TRPV1 proteins presentsseveral sites for post-translational modifications, which induce alterations in the MW of the channelprotein [86–89]. Third, the dietary agonist capsaicin, which is widely exploited to monitor TRPV1activation [37,39,43,50,51], induced an increase in [Ca2+]i that was also sensitive to capsazepine,SB-366791 and ruthenium red, and to genetic deletion of TRPV1. Notably, capsaicin evoked two distinctpatterns of intracellular Ca2+ signals that strongly resembled those induced by NaHS: a transientCa2+ elevation in ≈75% cells and a biphasic Ca2+ response in the remaining ≈25% cells. One toten µM capsaicin was shown to elicit both transient [52,90] and long-lasting [51,91–94] intracellularCa2+ signals upon TRPV1 activation. The variable kinetics of the Ca2+ response to capsaicin (andNaHS) is likely to depend on the different extent of TRPV1 inactivation. As widely discussed in [40],extracellular Ca2+ entry could inactivate the channel by inducing TRPV1 dephosphorylation [95],depleting phosphatidylinositol 4,5-bisphosphate levels [96], or calmodulin binding [97]. It is,therefore, conceivable that the Ca2+-dependent mechanisms of TRPV1 inactivation are uncoupledfrom extracellular Ca2+ entry in the majority of mCRC cells. In addition, it has been suggested thatincreasing the strength of capsaicin stimulation results in TRPV1 pore dilation, thereby increasingsingle channel conductance and prolonging the duration of the ensuing increase in [Ca2+]i [93,98].However, this mechanism is unlikely to explain the heterogeneity in the Ca2+ response to capsaicinreported in the present investigation as this was observed by presenting mCRC cells with the sameagonist concentration. Ten µM capsaicin was found to stimulate TRPV1 and induce long-lastingelevations in in MCF-7 breast cancer cells [43], while the effect of TRPV1 stimulation on prostate canceris more controversial. Indeed, 50 µM capsaicin induced intracellular Ca2+ oscillations in some prostatecancer cell lines (DU 145 and PC-3) in one study [50], while it failed to increase the [Ca2+]I in anotherone [51]. Capsaicin increased resting also in CRC HCT116 cells [42], but this study did not evaluate thekinetics and underlying mechanisms of the Ca2+ signal.
Cancers 2020, 12, 3338 18 of 28
3.2.2. The Reverse Mode NCX Sustains the Ca2+ Response to NaHS in Primary Cultures ofmCRC Cells
The following pieces of evidence indicate that the reverse (i.e., Ca2+ entry) mode NCX sustainsNaHS- and capsaicin-induced extracellular Ca2+ entry. First, replacement of extracellular Na+ withan equimolar amount of choline induced a transient increase in [Ca2+]i, which reflects the directionalswitch of NCX from the forward (i.e., Ca2+ exit) to the reverse (i.e., Ca2+ entry) mode upon reversalof Na+ gradient across the plasma membrane [62,99]. Second, only a modest fraction (≈25%) ofmCRC cells displayed a Ca2+ signal in response to NaHS and capsaicin under 0Na+ conditions.The amplitude of the Ca2+ elevation was, however, significantly lower whereas its duration wasdramatically curtailed. Third, the selective blockade of the reverse mode NCX with KB-R mimickedthe effect of Na+ withdrawal on NaHS- and capsaicin-induced intracellular Ca2+ signals [62,64],thereby confirming that the reverse mode NCX is recruited by TRPV1-mediated extracellular Na+
entry to sustain the ensuing increase in [Ca2+]i. These data are consistent with those reported innative endothelium of rat aorta [62] and confirm a recent report on in the CRC cell line, DLD1 [20].In these cells, exogenous delivery of H2S through GYY4137 induced an increase in resting [Ca2+]i
that was associated to the switch of NCX activity into the reverse mode. Furthermore, earlier workdemonstrated that H2S release was able to increase the expression levels of NCX1 [100], the mainNCX isoform expressed in CRC cells [20]. It is, therefore, possible to conclude that TRPV1 and NCXmay by physically coupled in primary mCRC cells, as also described for TRP Melastatin 4 [101] andTRP Canonical 6 [102]. This feature might contribute to explaining why capsaicin- and NaHS-evokedextracellular Ca2+ entry is larger in mCRC cells although TRPV1 protein expression was similar inmCRC and non-neoplastic cells. We speculate that TRPV1 channels may be uncoupled from NCX(possibly due to lower NCX expression) in non-neoplastic and pCRC cells, thereby attenuating theamplitude of the Ca2+ response to TRPV1 activation. Experiments in our laboratories are under way toassess this important issue.
3.3. H2S Inhibits Proliferation in Primary Cultures of mCRC Cells
Exogenous delivery of H2S has been shown to suppress proliferation in several types ofcancer cell lines, including hepatocellular carcinoma (Hep G2), human cervical carcinoma (HeLa),breast adenocarcinoma (MCF-7), osteosarcoma (U2OS), human thyroid carcinoma (Nthy-ori3-1),and erythroleukemia (K562) [19,41,103]. In addition, exogenously added H2S impaired cell viability in awide number of CRC cell lines, including HT-29, Caco-2, HCT-116, SW1116, HCT116, and DLD1 [16–19].Herein, we confirmed that exogenous H2S significantly reduced proliferation in primary cultures ofmCRC cells exposed to 100–200 µM NaHS for 24 h. Of note, there was not further decrease in mCRCcell survival when the exposure to NaHS was prolonged to 72 h, which suggests the activation ofprotective signaling pathways. For instance, 24–48 h treatment with 400–1000 µM NaHS inducedprotective autophagy by inhibiting the mammalian target of rapamycin, thereby hampering theconcurrent anti-mitogenic effect on CRC cell lines [17]. The anti-proliferative effect of NaHS wasrescued by preventing TRPV1-induced extracellular Ca2+ entry wither with capsazepine or KB-R7943, as recently reported in leukemia, breast cancer, cervical carcinoma cell lines [41]. TRPV1 hasbeen shown to inhibit cancer cell proliferation by promoting apoptosis [42]. However, 72 h treatmentwith NaHS did not increase the basal rate of mCRC cell apoptosis, neither promoted mitochondrialdepolarization, which represents an established marker of apoptosis. Conversely, TRPV1-mediatedCa2+ entry recruited calcineurin to activate p53 and induce apoptosis in the CRC HCT116 cell line [42].As discussed elsewhere [35,104], the discrepancy between this report and our findings is consistentwith the emerging notion that the same components of the Ca2+ toolkit could induce distinct outcomesin primary cultures of mCRC cells [36] and commercially available CRC cell lines [31,105]. Furthermore,the Ca2+ response evoked by exogenous administration of H2S displayed transient kinetics in themajority of mCRC cells. Conversely, pro-apoptotic Ca2+ signals usually consist in prolonged elevations
Cancers 2020, 12, 3338 19 of 28
in [Ca2+]i, which persist as long as the stimulus is presented to the cells [66,106–109], as we haverecently shown in cisplatin-treated glioblastoma cells [65].
Nevertheless, data obtained from both primary cultures and immortalized cell lines support theanticancer effect of exogenous H2S delivery in CRC. Interestingly, a recent report showed that, in bladdercancer cell lines, TRPV1-mediated extracellular Ca2+ entry prevented the nuclear translocation ofproliferating cell nuclear antigen (PCNA), a 29 kDa protein which serves as auxiliary protein foraccessory protein for DNA polymerase δ (Polδ) and DNA polymerase ε (Polε) [110,111]. Future workwill have to assess whether this signaling pathway is recruited by exogenous H2S to inhibit proliferationalso in mCRC cells. Currently, we provided the evidence that the administration of exogenous H2S didnot activate the Akt, Erk 1/2, and mTOR signaling pathways.
4. Materials and Methods
4.1. Expansion of Tumor Cells
Patients (>18 years) suffering from mCRC who had undergone surgery intervention to dissectprimary tumor and/or liver metastases were enrolled. All the patients signed an informed consent.Tumor specimens were processed as previously described [36,112]. The present investigationhas been approved by the Ethical Committee of the IRCCS Foundation Policlinico San Matteo(protocol number: 20190069408). Briefly, tumor samples were treated with Tumor dissociation Kit(Miltenyi BIOTEC, Bergisch Gladbach, Germany) and then disaggregated with the gentleMACSDissociator (Miltenyi BIOTEC, Bergisch Gladbach, Germany) according to the manufacturers’instructions. Tumor cells recovered from filtration for removing were resuspended at a concentrationof 0.5–1 × 10⁶ cells/mL of CellGro SCGM (CellGenix, Freiburg, Germany), supplemented with 20% FBS,2 mM L-glutamine (complete medium) (Life Technologies, Inc. Monza, Italy) and cultured in 25 cm2
tissue flasks (Corning, Stone, England) at 37 ◦C and 5% CO2. The culture medium was changed twicea week and cellular homogeneity evaluated microscopically every 24–48 h, when cultures reachingabout 75–100% confluence were subjected to trypsinization with 0.25% trypsin and 0.02% EDTA(Life Technologies, Inc.) in a calcium/magnesium-free balanced solution. The culture medium waschanged twice a week and cellular homogeneity was confirmed by using a light microscope every24–48 h. In particular, we cryopreserved several vials at passage T0 (after disaggregation) and atpassage T1. These vials were then further thawed for further experiments. Using this approach,the experiments were carried out with tumor cells that underwent no more than 3–4 in vitro passages,to avoid problems related to long-term culture of cancer cells. Cells were cryopreserved in 90% FBS and10% dimethyl sulfoxide and stored in liquid nitrogen for further experiments. To confirm the neoplasticorigin of cultured cells passaged 3–5 times, we carried out morphological and immunocytochemicalanalysis, as described in [112,113]. Non-neoplastic cells were derived from tissue a sample of healthycolon tissue near the tumor. Cells were expanded and their non-neoplastic nature was assessed bymorphological and immunocytochemical analysis.
4.2. Solutions for Intracellular Ca2+ Recordings
The composition of the physiological salt solution (PSS) was the following (in mM): 150 NaCl,6 KCl, 1.5 CaCl2, 1 MgCl2, 10 Glucose, 10 HEPES. In Ca2+-free solution (0Ca2+), Ca2+ was replacedwith 2 mM NaCl, and 0.5 mM EGTA was added. Solutions were titrated to pH 7.4 with NaOH.The osmolality of PSS was measured with an osmometer (WESCOR 5500, Logan, UT, USA) and wasequal to 338 mmol/kg.
4.3. [Ca2+]i Measurements
Ca2+ imaging in mCRC cells was carried out as described elsewhere [34,36]. Briefly, mCRC cellswere loaded with 4 µM fura-2 acetoxymethyl ester (Fura-2/AM; 1 mM stock in dimethyl sulfoxide) inPSS for 30 min at 37 ◦C and 5% CO2. The cells were maintained in the presence of Fura-2 for 30 min at
Cancers 2020, 12, 3338 20 of 28
37 ◦C and 5% CO2 saturated humidity. After de-esterification in PSS for 15 min, the coverslip (8 mm)was mounted on the bottom of a Petri dish and the cells observed by an upright epifluorescenceAxiolab microscope (Carl Zeiss, Oberkochen, Germany) equipped with a Zeiss ×40 Achroplan objective(water-immersion, 2.0 mm working distance, 0.9 numerical aperture). The cells were alternately excitedat 340 nM and 380 nm by using a filter wheel (Lambda 10, Sutter Instrument, Novato, CA, USA).The emitted fluorescence was detected at 510 nm by using an Extended-ISIS CCD camera (PhotonicScience, Millham, UK). Custom software, working in the LINUX environment, was used to drivethe camera and the filter wheel, and to measure and plot on-line the fluorescence from 10 up to40 rectangular “regions of interest” (ROI), each corresponding to a well-defined single cell. The [Ca2+]i
was monitored by measuring, for each ROI, the ratio of the mean fluorescence emitted at 510 nm whenexciting alternatively at 340 and 380 nm (Ratio (F340/F380)). An increase in [Ca2+]i causes an increase inthe ratio [36]. Ratio measurements were performed and plotted on-line every 3 s. The experimentswere performed at room temperature (22 ◦C).
4.4. SDS-PAGE and Immunoblotting
Cells were lysed in ice-cold RIPA buffer (50 mM TRIS/HCl, pH 7.4, 150 mM NaCl, 1% Nonidet P40,1 mM EDTA, 0.25% sodium deoxycholate, 0.1% SDS) added of protease and phosphatase inhibitors.Upon protein quantification, the samples were dissociated by addition of half volume of SDS-samplebuffer 3× (37.5 mM TRIS, pH 8.3, 288 mM glycine, 6% SDS, 1.5% DTT, 30% glycerol, and 0.03%bromophenol blue), separated by SDS-PAGE on a 10% or 6% polyacrylamide gel, and blotted on aPVDF membrane. Membrane probing was performed using the different antibodies diluted 1:1000in TBS (20 mM Tris, 500 mM NaCl, pH 7.5) containing 5% BSA and 0.1% Tween-20 in combinationwith the appropriate horseradish peroxidase (HRP)-conjugated secondary antibodies (1:2000 inPhosphate Buffered Saline (PBS) plus 0.1% Tween-20). The following antibodies were used: anti-TRPV1(ab3487) from ABCAM (Cambridge, UK), HRP-conjugated anti-GAPDH (sc365062), anti-Akt 1/2/3(sc8312), anti-Erk 2 (sc-154) and anti-mTOR (sc1549) from Santa Cruz Biotechnology (Dallas, TX, USA);the specific phospho-antibodies: phospho-Akt (Ser473) (#9271), phospho-Erk 1/2 (Thr 202/Tyr 204)(#9101) and phosphor-mTOR (Ser 2481) (#2974) from Cell Signaling Technology (Danvers, MA, USA).The chemiluminescence reaction was performed using Immobilon Western (Millipore, Burlington, MA,USA) and images were acquired by ChemiDoc XRS (Bio-Rad, Hercules, CA, USA). Membrane wasthen re-probed with an HRP-conjugated anti-GAPDH antibody as equal loading control.
4.5. Confocal Microscopy and Immunofluorescence
Cells were grown for 24 h on 15 mm glass coverslips in a 12-well plate. Samples were thenfixed with 3% PFA in PBS, permeabilized with 0.25% ice-cold TRITON X100 in PBS and blockedwith 1% BSA in PBS. The coverslips were stained with a rabbit anti-human TRPV1 antibody (1:250,ab3487-ABCAM; Cambridge, UK) for 1 h at room temperature and then incubated with TRITC-antirabbit secondary antibody (1:500, ab6718-ABCAM; Cambride, UK) in the dark for 1 h at roomtemperature. Negative controls were prepared by omitting the primary antibody. Nuclei werestained with 1 µg/mL Hoechst 33342 (#4082-Cell Signaling Technologies; Danvers, MA, USA) andcell membrane with 2 µM PKH67 (MINI67–Sigma-Aldrich; Milan, Italy). Finally, the coverslips weremounted on glass slides using ProLong Gold antifade reagent (Invitrogen, Carlsbad, CA, USA) asmounting medium. Immunofluorescence images were acquired using an Olympus BX51 microscope,whereas the confocal microscopy images were captured using a Leica TCS SP8 Microscope and analyzedwith LAS X software (Leica Microsystems GmbH, Wetzlar, Germany).
4.6. Gene Silencing
The siRNA targeting TRPV1 was purchased from Sigma-Aldrich Inc. MISSION esiRNA(human TRPV1) (EHU073721). Scrambled siRNA was used as negative control. In brief, once theseeded mCRC cells had reached 50% confluency, the medium was replaced with Opti-MEM, the serum
Cancers 2020, 12, 3338 21 of 28
in the medium reduced without antibiotics (Life Technologies, Milan, Italy). siRNAs (100 nM finalconcentration) were diluted with Opti-MEM I reduced serum medium and mixed with Lipofectamine™RNAiMAX transfection reagent (Life Technologies, Milan, Italy) pre-diluted in Opti-MEM), according tothe manufacturer’s instructions. After 20 min incubation at room temperature, the mixtures were addedto the cells and incubated at 37 ◦C for 5 h. Transfection mixes were then completely removed and freshculture media was added again and silenced cells were used 48 h after transfection. The effectivenessof silencing was determined by immunoblotting (see Figure S2).
4.7. Identification of Apoptotic Cells
Metastatic CRC cells at confluence were detached by trypsinization and incubated withFITC-conjugated Annexin V (5 µL/5 × 105 cells) (Annexin V apoptosis Detection Kit, Invitrogen,Carlsbad, California, USA) and with 7-ADD (5 µL/5 × 105 cells) (BD Pharmingen, San Diego, CA,USA). Metastatic CRC cells maintained in the absence and presence of NaHS (100 µM, 72 h) wereincubated for 15 min at resting temperature and then analyzed by Beckman Coulter Navios accordingto manufactures’ instructions.
4.8. Measurement of Mitochondrial Membrane Potential (∆Ψm)
∆Ψm was evaluated with TMRM at a loading concentration sufficient to cause dye aggregationwithin the mitochondrial matrix and by using the same fluorescence detection system used to measurechanges in Fura-2 fluorescence. The mCRC cells were loaded with 25 nM TMRM and 200 nM ofcyclosporine H, in PSS for 30 min at 37 ◦C and 5% CO2. After washing in PSS, the coverslip was fixedto the bottom of a Petri dish and the cells were excited 480 nm, while the emitted light was detected at510 nm. TRITC filter for live imaging has been utilized to examine the TMRM red-orange fluorescence,and round diaphragm was employed to augment the contrast. Measurements were carried out andplotted on-line every 10 s. All the recordings were carried out at 22 ◦C.
4.9. Statistics
All the data have been obtained from mCRC cells plated on at least three coverslips and derivingfrom three distinct donors. Each trace shown is representative of multiple cells displaying a similarCa2+ activity and deriving from at least three distinct donors. The peak amplitude of NaHs- andcapsaicin-evoked Ca2+ signals was measured by evaluating the difference between the F340/F380 ratioat the peak of the Ca2+ response, and the mean F340/F380 ratio of 1 min baseline recording beforeagonist addition. Pooled data are presented as mean ± SE, and statistical significance (p < 0.05) wasevaluated by the Student’s t-test for unpaired observations or one-way ANOVA analysis followedby the post-hoc Dunnett’s or Bonferroni tests, as required. The number of cells measured for eachexperimental condition is indicated in, or above, the corresponding bar histogram.
5. Conclusions
This study demonstrates for the first time that the H2S-releasing compounds NaHS elicitintracellular Ca2+ signals in primary cultures of mCRC, but not of non-neoplastic and pCRC cells,by stimulating TRPV1 to mediate extracellular Ca2+ entry and induce NCX to switch into the reverse(Ca2+ entry) mode. NaHS-induced TRPV1 activation, in turn, inhibited mCRC cell proliferation.The anti-proliferative effect of NaHS was not due to mCRC cell apoptosis. These data lend furthersupport to the exogenous delivery of H2S as a novel therapeutic strategy to treat mCRC.
Cancers 2020, 12, 3338 22 of 28
Supplementary Materials: The following are available online at http://www.mdpi.com/2072-6694/12/11/3338/s1,Figure S1: Representative immunofluorescence analysis of TRPV1 expression in mCRC cells, Figure S2: Geneticsilencing of TRPV1 in silenced mCRC cells, Figure S3: The pharmacological blockade of voltage-gated Ca2+channels does not affect NaHS-evokes intracellular Ca2+ signals in CRC and non-neoplastic cells, Figure S4:The pharmacological blockade of SOCE does not affect NaHS-evokes intracellular Ca2+ signals in CRC andnon-neoplastic cells, Figure S5: TRPV1-mediated extracellular Ca2+ entry is larger in mCRC cells, Figure S6:Uncropped blots corresponding to Western blot in the Figure 8A in the main text, Figure S7: Uncropped blotscorresponding to Western blot in the Figure 14 in the main text, Figure S8: Uncropped blots corresponding toWestern blot in the Figure S2 shown above, Figure S9: Uncropped blots corresponding to Western blot in theFigure S5 shown above.
Author Contributions: Conceptualization, F.M.; methodology, P.F., F.F., M.V., M.T., S.N., A.R.; formal analysis,P.F., F.F., M.V., M.T. and S.N.; resources, K.L., M.M., M.S., P.P., G.F.G., D.M., and F.M.; writing—original draftpreparation, F.M.; writing—review and editing, G.F.G., D.M., F.M.; writing—final approval, G.F.G., D.M.,and F.M.; funding acquisition, P.P., D.M., and F.M. All authors have read and agreed to the published version ofthe manuscript.
Funding: This research was funded by: Italian Ministry of Education, University and Research (MIUR):Dipartimenti di Eccellenza Program (2018–2022)-Dept. of Biology and Biotechnology "L. Spallanzani", University ofPavia (F.M.), Fondo Ricerca Giovani from the University of Pavia (F.M.), Italian Ministry of Health GrantsRF-2010-2316319 (D.M.), and by program “Ricerca Corrente” of the IRCCS Policlinico San Matteo: RC/08059815B(D.M.) and RF-2011-02352315 (P.P.).
Acknowledgments: The authors thank Maria Grazia Bottone and Valentina Astesana, Department of Biologyand Biotechnology “L. Spallanzani”, Laboratory of Cell Biology, for the use of the fluorescence microscope forLysotracker Red experiments.
Conflicts of Interest: The authors declare no conflict of interest.
References
1. Douaiher, J.; Ravipati, A.; Grams, B.; Chowdhury, S.; Alatise, O.; Are, C. Colorectal cancer-global burden,trends, and geographical variations. J. Surg. Oncol. 2017, 115, 619–630. [CrossRef] [PubMed]
2. Carrato, A. Adjuvant treatment of colorectal cancer. Gastrointest. Cancer Res. 2008, 2, S42–S46. [PubMed]3. Paul, B.D.; Snyder, S.H. H2S signalling through protein sulfhydration and beyond. Nat. Rev. Mol. Cell Biol.
2012, 13, 499–507. [CrossRef] [PubMed]4. Li, L.; Rose, P.; Moore, P.K. Hydrogen sulfide and cell signaling. Annu. Rev. Pharmacol. Toxicol. 2011, 51,
169–187. [CrossRef]5. Yang, G.; Wu, L.; Jiang, B.; Yang, W.; Qi, J.; Cao, K.; Meng, Q.; Mustafa, A.K.; Mu, W.; Zhang, S.; et al. H2S as
a physiologic vasorelaxant: Hypertension in mice with deletion of cystathionine gamma-lyase. Science 2008,322, 587–590. [CrossRef] [PubMed]
6. Altaany, Z.; Moccia, F.; Munaron, L.; Mancardi, D.; Wang, R. Hydrogen sulfide and endothelial dysfunction:Relationship with nitric oxide. Curr. Med. Chem. 2014, 21, 3646–3661. [CrossRef]
7. Potenza, D.M.; Guerra, G.; Avanzato, D.; Poletto, V.; Pareek, S.; Guido, D.; Gallanti, A.; Rosti, V.; Munaron, L.;Tanzi, F.; et al. Hydrogen sulphide triggers VEGF-induced intracellular Ca2+ signals in human endothelialcells but not in their immature progenitors. Cell Calcium 2014, 56, 225–234. [CrossRef]
8. Austgen, J.R.; Hermann, G.E.; Dantzler, H.A.; Rogers, R.C.; Kline, D.D. Hydrogen sulfide augments synapticneurotransmission in the nucleus of the solitary tract. J. Neurophysiol. 2011, 106, 1822–1832. [CrossRef]
9. Wang, R. Physiological implications of hydrogen sulfide: A whiff exploration that blossomed. Physiol. Rev.2012, 92, 791–896. [CrossRef]
10. Whiteman, M.; Le Trionnaire, S.; Chopra, M.; Fox, B.; Whatmore, J. Emerging role of hydrogen sulfide inhealth and disease: Critical appraisal of biomarkers and pharmacological tools. Clin. Sci. 2011, 121, 459–488.[CrossRef]
11. Jiang, J.; Chan, A.; Ali, S.; Saha, A.; Haushalter, K.J.; Lam, W.L.; Glasheen, M.; Parker, J.; Brenner, M.;Mahon, S.B.; et al. Hydrogen Sulfide—Mechanisms of Toxicity and Development of an Antidote. Sci. Rep.2016, 6, 20831. [CrossRef] [PubMed]
12. Hellmich, M.R.; Szabo, C. Hydrogen Sulfide and Cancer. Handb. Exp. Pharmacol. 2015, 230, 233–241.[CrossRef] [PubMed]
13. Katsouda, A.; Bibli, S.I.; Pyriochou, A.; Szabo, C.; Papapetropoulos, A. Regulation and role of endogenouslyproduced hydrogen sulfide in angiogenesis. Pharmacol. Res. 2016, 113, 175–185. [CrossRef] [PubMed]
Cancers 2020, 12, 3338 23 of 28
14. Szabo, C. Gasotransmitters in cancer: From pathophysiology to experimental therapy. Nat. Rev. Drug Discov.2016, 15, 185–203. [CrossRef] [PubMed]
15. Cao, X.; Ding, L.; Xie, Z.Z.; Yang, Y.; Whiteman, M.; Moore, P.K.; Bian, J.S. A Review of Hydrogen SulfideSynthesis, Metabolism, and Measurement: Is Modulation of Hydrogen Sulfide a Novel Therapeutic forCancer? Antioxid. Redox Signal. 2019, 31, 1–38. [CrossRef]
16. Olah, G.; Modis, K.; Toro, G.; Hellmich, M.R.; Szczesny, B.; Szabo, C. Role of endogenous and exogenous nitricoxide, carbon monoxide and hydrogen sulfide in HCT116 colon cancer cell proliferation. Biochem. Pharmacol.2018, 149, 186–204. [CrossRef] [PubMed]
17. Wu, Y.C.; Wang, X.J.; Yu, L.; Chan, F.K.; Cheng, A.S.; Yu, J.; Sung, J.J.; Wu, W.K.; Cho, C.H. Hydrogen sulfidelowers proliferation and induces protective autophagy in colon epithelial cells. PLoS ONE 2012, 7, e37572.[CrossRef]
18. Sakuma, S.; Minamino, S.; Takase, M.; Ishiyama, Y.; Hosokura, H.; Kohda, T.; Ikeda, Y.; Fujimoto, Y.Hydrogen sulfide donor GYY4137 suppresses proliferation of human colorectal cancer Caco-2 cells byinducing both cell cycle arrest and cell death. Heliyon 2019, 5, e02244. [CrossRef]
19. Lee, Z.W.; Zhou, J.; Chen, C.S.; Zhao, Y.; Tan, C.H.; Li, L.; Moore, P.K.; Deng, L.W. The slow-releasinghydrogen sulfide donor, GYY4137, exhibits novel anti-cancer effects in vitro and in vivo. PLoS ONE 2011, 6,e21077. [CrossRef]
20. Szadvari, I.; Hudecova, S.; Chovancova, B.; Matuskova, M.; Cholujova, D.; Lencesova, L.; Valerian, D.;Ondrias, K.; Babula, P.; Krizanova, O. Sodium/calcium exchanger is involved in apoptosis induced by H2S intumor cells through decreased levels of intracellular pH. Nitric Oxide 2019, 87, 1–9. [CrossRef]
21. Munaron, L.; Avanzato, D.; Moccia, F.; Mancardi, D. Hydrogen sulfide as a regulator of calcium channels.Cell Calcium 2013, 53, 77–84. [CrossRef] [PubMed]
22. Zhang, W.; Xu, C.; Yang, G.; Wu, L.; Wang, R. Interaction of H2S with Calcium Permeable Channels andTransporters. Oxid. Med. Cell. Longev. 2015, 2015, 323269. [CrossRef] [PubMed]
23. Yang, R.; Liu, Y.; Yu, T.; Liu, D.; Shi, S.; Zhou, Y.; Zhou, Y. Hydrogen sulfide maintains dental pulp stem cellfunction via TRPV1-mediated calcium influx. Cell Death Discov. 2018, 4, 1. [CrossRef] [PubMed]
24. Patacchini, R.; Santicioli, P.; Giuliani, S.; Maggi, C.A. Hydrogen sulfide (H2S) stimulates capsaicin-sensitiveprimary afferent neurons in the rat urinary bladder. Br. J. Pharmacol. 2004, 142, 31–34. [CrossRef] [PubMed]
25. Bhatia, M.; Zhi, L.; Zhang, H.; Ng, S.W.; Moore, P.K. Role of substance P in hydrogen sulfide-inducedpulmonary inflammation in mice. Am. J. Physiol. Lung Cell Mol. Physiol. 2006, 291, L896–L904. [CrossRef]
26. Liu, Y.; Yang, R.; Liu, X.; Zhou, Y.; Qu, C.; Kikuiri, T.; Wang, S.; Zandi, E.; Du, J.; Ambudkar, I.S.; et al.Hydrogen sulfide maintains mesenchymal stem cell function and bone homeostasis via regulation of Ca2+
channel sulfhydration. Cell Stem Cell 2014, 15, 66–78. [CrossRef]27. Hajna, Z.; Saghy, E.; Payrits, M.; Aubdool, A.A.; Szoke, E.; Pozsgai, G.; Batai, I.Z.; Nagy, L.; Filotas, D.;
Helyes, Z.; et al. Capsaicin-Sensitive Sensory Nerves Mediate the Cellular and Microvascular Effects of H2Svia TRPA1 Receptor Activation and Neuropeptide Release. J. Mol. Neurosci. 2016, 60, 157–170. [CrossRef]
28. Pozsgai, G.; Hajna, Z.; Bagoly, T.; Boros, M.; Kemeny, A.; Materazzi, S.; Nassini, R.; Helyes, Z.;Szolcsanyi, J.; Pinter, E. The role of transient receptor potential ankyrin 1 (TRPA1) receptor activationin hydrogen-sulphide-induced CGRP-release and vasodilation. Eur. J. Pharmacol. 2012, 689, 56–64.[CrossRef]
29. Tang, G.; Wu, L.; Wang, R. Interaction of hydrogen sulfide with ion channels. Clin. Exp. Pharmacol. Physiol.2010, 37, 753–763. [CrossRef]
30. Elies, J.; Scragg, J.L.; Boyle, J.P.; Gamper, N.; Peers, C. Regulation of the T-type Ca2+ channel Cav3.2 byhydrogen sulfide: Emerging controversies concerning the role of H2 S in nociception. J. Physiol. 2016, 594,4119–4129. [CrossRef]
31. Nunez, L.; Valero, R.A.; Senovilla, L.; Sanz-Blasco, S.; Garcia-Sancho, J.; Villalobos, C. Cell proliferationdepends on mitochondrial Ca2+ uptake: Inhibition by salicylate. J. Physiol. 2006, 571, 57–73. [CrossRef][PubMed]
32. Weiss, H.; Amberger, A.; Widschwendter, M.; Margreiter, R.; Ofner, D.; Dietl, P. Inhibition of store-operatedcalcium entry contributes to the anti-proliferative effect of non-steroidal anti-inflammatory drugs in humancolon cancer cells. Int. J. Cancer 2001, 92, 877–882. [CrossRef] [PubMed]
33. Valero, R.A.; Senovilla, L.; Nunez, L.; Villalobos, C. The role of mitochondrial potential in control of calciumsignals involved in cell proliferation. Cell Calcium 2008, 44, 259–269. [CrossRef] [PubMed]
Cancers 2020, 12, 3338 24 of 28
34. Faris, P.; Pellavio, G.; Ferulli, F.; Di Nezza, F.; Shekha, M.; Lim, D.; Maestri, M.; Guerra, G.; Ambrosone, L.;Pedrazzoli, P.; et al. Nicotinic Acid Adenine Dinucleotide Phosphate (NAADP) Induces Intracellular Ca2+
Release through the Two-Pore Channel TPC1 in Metastatic Colorectal Cancer Cells. Cancers 2019, 11, 542.[CrossRef] [PubMed]
35. Moccia, F.; Zuccolo, E.; Poletto, V.; Turin, I.; Guerra, G.; Pedrazzoli, P.; Rosti, V.; Porta, C.; Montagna, D.Targeting Stim and Orai Proteins as an Alternative Approach in Anticancer Therapy. Curr. Med. Chem. 2016,23, 3450–3480. [CrossRef]
36. Zuccolo, E.; Laforenza, U.; Ferulli, F.; Pellavio, G.; Scarpellino, G.; Tanzi, M.; Turin, I.; Faris, P.; Lucariello, A.;Maestri, M.; et al. Stim and Orai mediate constitutive Ca2+ entry and control endoplasmic reticulum Ca2+
refilling in primary cultures of colorectal carcinoma cells. Oncotarget 2018, 9, 31098–31119. [CrossRef]37. Caterina, M.J.; Schumacher, M.A.; Tominaga, M.; Rosen, T.A.; Levine, J.D.; Julius, D. The capsaicin receptor:
A heat-activated ion channel in the pain pathway. Nature 1997, 389, 816–824. [CrossRef]38. Caterina, M.J.; Leffler, A.; Malmberg, A.B.; Martin, W.J.; Trafton, J.; Petersen-Zeitz, K.R.; Koltzenburg, M.;
Basbaum, A.I.; Julius, D. Impaired nociception and pain sensation in mice lacking the capsaicin receptor.Science 2000, 288, 306–313. [CrossRef]
39. Lodola, F.; Rosti, V.; Tullii, G.; Desii, A.; Tapella, L.; Catarsi, P.; Lim, D.; Moccia, F.; Antognazza, M.R.Conjugated polymers optically regulate the fate of endothelial colony-forming cells. Sci. Adv. 2019, 5,eaav4620. [CrossRef]
40. Bevan, S.; Quallo, T.; Andersson, D.A. Trpv1. Handb. Exp. Pharmacol. 2014, 222, 207–245. [CrossRef]41. Gao, M.; Li, J.; Nie, C.; Song, B.; Yan, L.; Qian, H. Design, synthesis and biological evaluation of novel
hydrogen sulfide releasing capsaicin derivatives. Bioorg. Med. Chem. 2018, 26, 2632–2639. [CrossRef][PubMed]
42. Hou, N.; He, X.; Yang, Y.; Fu, J.; Zhang, W.; Guo, Z.; Hu, Y.; Liang, L.; Xie, W.; Xiong, H.; et al.TRPV1 Induced Apoptosis of Colorectal Cancer Cells by Activating Calcineurin-NFAT2-p53 SignalingPathway. BioMed Res. Int. 2019, 2019, 6712536. [CrossRef] [PubMed]
43. Wu, T.T.; Peters, A.A.; Tan, P.T.; Roberts-Thomson, S.J.; Monteith, G.R. Consequences of activating thecalcium-permeable ion channel TRPV1 in breast cancer cells with regulated TRPV1 expression. Cell Calcium2014, 56, 59–67. [CrossRef] [PubMed]
44. Zheng, L.; Chen, J.; Ma, Z.; Liu, W.; Yang, F.; Yang, Z.; Wang, K.; Wang, X.; He, D.; Li, L.; et al.Capsaicin enhances anti-proliferation efficacy of pirarubicin via activating TRPV1 and inhibiting PCNAnuclear translocation in 5637 cells. Mol. Med. Rep. 2016, 13, 881–887. [CrossRef]
45. Gonzalez-Villarreal, C.A.; Quiroz-Reyes, A.G.; Islas, J.F.; Garza-Trevino, E.N. Colorectal Cancer Stem Cells inthe Progression to Liver Metastasis. Front. Oncol. 2020, 10, 1511. [CrossRef]
46. Hennig, B.; Diener, M. Actions of hydrogen sulphide on ion transport across rat distal colon. Br. J. Pharmacol.2009, 158, 1263–1275. [CrossRef]
47. Zhang, Y.; Wang, Y.; Read, E.; Fu, M.; Pei, Y.; Wu, L.; Wang, R.; Yang, G. Golgi stress response, H2S metabolism,and intracellular calcium homeostasis. Antioxid. Redox Signal. 2019, 32, 583–601. [CrossRef]
48. De Pascual, R.; Baraibar, A.M.; Mendez-Lopez, I.; Perez-Ciria, M.; Polo-Vaquero, I.; Gandia, L.; Ohia, S.E.;Garcia, A.G.; de Diego, A.M.G. Hydrogen sulphide facilitates exocytosis by regulating the handling ofintracellular calcium by chromaffin cells. Pflugers Arch. 2018, 470, 1255–1270. [CrossRef]
49. Pupo, E.; Pla, A.F.; Avanzato, D.; Moccia, F.; Cruz, J.E.; Tanzi, F.; Merlino, A.; Mancardi, D.; Munaron, L.Hydrogen sulfide promotes calcium signals and migration in tumor-derived endothelial cells. Free Radic.Biol. Med. 2011, 51, 1765–1773. [CrossRef]
50. Pecze, L.; Blum, W.; Henzi, T.; Schwaller, B. Endogenous TRPV1 stimulation leads to the activation of theinositol phospholipid pathway necessary for sustained Ca2+ oscillations. Biochim. Biophys. Acta 2016, 1863,2905–2915. [CrossRef]
51. Pecze, L.; Josvay, K.; Blum, W.; Petrovics, G.; Vizler, C.; Olah, Z.; Schwaller, B. Activation of endogenousTRPV1 fails to induce overstimulation-based cytotoxicity in breast and prostate cancer cells but not inpain-sensing neurons. Biochim. Biophys. Acta 2016, 1863, 2054–2064. [CrossRef] [PubMed]
52. Ramirez-Barrantes, R.; Cordova, C.; Gatica, S.; Rodriguez, B.; Lozano, C.; Marchant, I.; Echeverria, C.;Simon, F.; Olivero, P. Transient Receptor Potential Vanilloid 1 Expression Mediates Capsaicin-Induced CellDeath. Front Physiol 2018, 9, 682. [CrossRef] [PubMed]
Cancers 2020, 12, 3338 25 of 28
53. Dragoni, S.; Guerra, G.; Fiorio Pla, A.; Bertoni, G.; Rappa, A.; Poletto, V.; Bottino, C.; Aronica, A.; Lodola, F.;Cinelli, M.P.; et al. A functional Transient Receptor Potential Vanilloid 4 (TRPV4) channel is expressed inhuman endothelial progenitor cells. J. Cell. Physiol. 2015, 230, 95–104. [CrossRef] [PubMed]
54. Parpaite, T.; Cardouat, G.; Mauroux, M.; Gillibert-Duplantier, J.; Robillard, P.; Quignard, J.F.; Marthan, R.;Savineau, J.P.; Ducret, T. Effect of hypoxia on TRPV1 and TRPV4 channels in rat pulmonary arterial smoothmuscle cells. Pflugers Arch. 2016, 468, 111–130. [CrossRef] [PubMed]
55. Pan, L.; Song, K.; Hu, F.; Sun, W.; Lee, I. Nitric oxide induces apoptosis associated with TRPV1channel-mediated Ca2+ entry via S-nitrosylation in osteoblasts. Eur. J. Pharmacol. 2013, 715, 280–285.[CrossRef]
56. Ho, K.W.; Lambert, W.S.; Calkins, D.J. Activation of the TRPV1 cation channel contributes to stress-inducedastrocyte migration. Glia 2014, 62, 1435–1451. [CrossRef]
57. Sappington, R.M.; Sidorova, T.; Ward, N.J.; Chakravarthy, R.; Ho, K.W.; Calkins, D.J. Activation oftransient receptor potential vanilloid-1 (TRPV1) influences how retinal ganglion cell neurons respondto pressure-related stress. Channels 2015, 9, 102–113. [CrossRef]
58. Yu, W.; Hill, W.G.; Apodaca, G.; Zeidel, M.L. Expression and distribution of transient receptor potential(TRP) channels in bladder epithelium. Am. J. Physiol. Renal Physiol. 2011, 300, F49–F59. [CrossRef]
59. Rebuzzini, P.; Zuccolo, E.; Civello, C.; Fassina, L.; Arechaga, J.; Izquierdo, A.; Faris, P.; Zuccotti, M.; Moccia, F.;Garagna, S. Polychlorinated biphenyls reduce the kinematics contractile properties of embryonic stemcells-derived cardiomyocytes by disrupting their intracellular Ca2+ dynamics. Sci. Rep. 2018, 8, 17909.[CrossRef]
60. Hazzaz Abouamal, T.; Choukairi, Z.; Taoufiq, F. Functional Exploration Of T-Type Calcium Channels(Cav3.2 and Cav3.3) And Their Sensitivity to Zinc. Open Microbiol. J. 2018, 12, 280–287. [CrossRef]
61. Batista-Silva, H.; Dambros, B.F.; Rodrigues, K.; Cesconetto, P.A.; Zamoner, A.; Sousa de Moura, K.R.;Gomes Castro, A.J.; Van Der Kraak, G.; Mena Barreto Silva, F.R. Acute exposure to bis(2-ethylhexyl)phthalatedisrupts calcium homeostasis, energy metabolism and induces oxidative stress in the testis of Danio rerio.Biochimie 2020, 175, 23–33. [CrossRef] [PubMed]
62. Moccia, F.; Bertoni, G.; Pla, A.F.; Dragoni, S.; Pupo, E.; Merlino, A.; Mancardi, D.; Munaron, L.; Tanzi, F.Hydrogen sulfide regulates intracellular Ca2+ concentration in endothelial cells from excised rat aorta.Curr. Pharm. Biotechnol. 2011, 12, 1416–1426. [CrossRef] [PubMed]
63. Tsumura, M.; Sobhan, U.; Muramatsu, T.; Sato, M.; Ichikawa, H.; Sahara, Y.; Tazaki, M.; Shibukawa, Y.TRPV1-mediated calcium signal couples with cannabinoid receptors and sodium-calcium exchangers in ratodontoblasts. Cell Calcium 2012, 52, 124–136. [CrossRef] [PubMed]
64. Di Giuro, C.M.L.; Shrestha, N.; Malli, R.; Groschner, K.; van Breemen, C.; Fameli, N. Na+/Ca2+ exchangersand Orai channels jointly refill endoplasmic reticulum (ER) Ca2+ via ER nanojunctions in vascular endothelialcells. Pflugers Arch. 2017, 469, 1287–1299. [CrossRef]
65. Astesana, V.; Faris, P.; Ferrari, B.; Siciliani, S.; Lim, D.; Biggiogera, M.; De Pascali, S.A.; Fanizzi, F.P.; Roda, E.;Moccia, F.; et al. [Pt(O,O’-acac)(gamma-acac)(DMS)]: Alternative Strategies to Overcome Cisplatin-InducedSide Effects and Resistance in T98G Glioma Cells. Cell. Mol. Neurobiol. 2020. [CrossRef]
66. Giorgi, C.; Romagnoli, A.; Pinton, P.; Rizzuto, R. Ca2+ signaling, mitochondria and cell death. Curr. Mol. Med.2008, 8, 119–130.
67. De, P.; Carlson, J.H.; Leyland-Jones, B.; Williams, C.; Dey, N. Triple Fluorescence staining to EvaluateMechanism-based Apoptosis following Chemotherapeutic and Targeted Anti-cancer Drugs in Live TumorCells. Sci. Rep. 2018, 8, 13192. [CrossRef]
68. Li, C.; Zhan, Y.; Ma, X.; Fang, H.; Gai, X. B7-H4 facilitates proliferation and metastasis of colorectal carcinomacell through PI3K/Akt/mTOR signaling pathway. Clin. Exp. Med. 2020, 20, 79–86. [CrossRef]
69. Guo, F.F.; Yu, T.C.; Hong, J.; Fang, J.Y. Emerging Roles of Hydrogen Sulfide in Inflammatory and NeoplasticColonic Diseases. Front. Physiol. 2016, 7, 156. [CrossRef]
70. Motiani, R.K.; Hyzinski-Garcia, M.C.; Zhang, X.; Henkel, M.M.; Abdullaev, I.F.; Kuo, Y.H.; Matrougui, K.;Mongin, A.A.; Trebak, M. STIM1 and Orai1 mediate CRAC channel activity and are essential for humanglioblastoma invasion. Pflugers Arch. 2013, 465, 1249–1260. [CrossRef]
71. Dragoni, S.; Turin, I.; Laforenza, U.; Potenza, D.M.; Bottino, C.; Glasnov, T.N.; Prestia, M.; Ferulli, F.; Saitta, A.;Mosca, A.; et al. Store-operated Ca2+ entry does not control proliferation in primary cultures of humanmetastatic renal cellular carcinoma. BioMed Res. Int. 2014, 2014, 739494. [CrossRef] [PubMed]
Cancers 2020, 12, 3338 26 of 28
72. Coavoy-Sanchez, S.A.; Costa, S.K.P.; Muscara, M.N. Hydrogen sulfide and dermatological diseases.Br. J. Pharmacol. 2019. [CrossRef] [PubMed]
73. Hellmich, M.R.; Coletta, C.; Chao, C.; Szabo, C. The therapeutic potential of cystathioninebeta-synthetase/hydrogen sulfide inhibition in cancer. Antioxid. Redox Signal. 2015, 22, 424–448. [CrossRef][PubMed]
74. Bauer, C.C.; Boyle, J.P.; Porter, K.E.; Peers, C. Modulation of Ca2+ signalling in human vascular endothelialcells by hydrogen sulfide. Atherosclerosis 2010, 209, 374–380. [CrossRef] [PubMed]
75. Zhang, R.; Sun, Y.; Tsai, H.; Tang, C.; Jin, H.; Du, J. Hydrogen sulfide inhibits L-type calcium currentsdepending upon the protein sulfhydryl state in rat cardiomyocytes. PLoS ONE 2012, 7, e37073. [CrossRef]
76. Avanzato, D.; Merlino, A.; Porrera, S.; Wang, R.; Munaron, L.; Mancardi, D. Role of calcium channels inthe protective effect of hydrogen sulfide in rat cardiomyoblasts. Cell. Physiol. Biochem. 2014, 33, 1205–1214.[CrossRef]
77. Sekiguchi, F.; Miyamoto, Y.; Kanaoka, D.; Ide, H.; Yoshida, S.; Ohkubo, T.; Kawabata, A. Endogenous andexogenous hydrogen sulfide facilitates T-type calcium channel currents in Cav3.2-expressing HEK293 cells.Biochem. Biophys. Res. Commun. 2014, 445, 225–229. [CrossRef]
78. Elies, J.; Scragg, J.L.; Huang, S.; Dallas, M.L.; Huang, D.; MacDougall, D.; Boyle, J.P.; Gamper, N.; Peers, C.Hydrogen sulfide inhibits Cav3.2 T-type Ca2+ channels. FASEB J. 2014, 28, 5376–5387. [CrossRef]
79. Perez-Riesgo, E.; Gutierrez, L.G.; Ubierna, D.; Acedo, A.; Moyer, M.P.; Nunez, L.; Villalobos, C. TranscriptomicAnalysis of Calcium Remodeling in Colorectal Cancer. Int. J. Mol. Sci. 2017, 18, 922. [CrossRef]
80. Deering-Rice, C.E.; Stockmann, C.; Romero, E.G.; Lu, Z.; Shapiro, D.; Stone, B.L.; Fassl, B.; Nkoy, F.;Uchida, D.A.; Ward, R.M.; et al. Characterization of Transient Receptor Potential Vanilloid-1 (TRPV1) VariantActivation by Coal Fly Ash Particles and Associations with Altered Transient Receptor Potential Ankyrin-1(TRPA1) Expression and Asthma. J. Biol. Chem. 2016, 291, 24866–24879. [CrossRef]
81. Somogyi, C.S.; Matta, C.; Foldvari, Z.; Juhasz, T.; Katona, E.; Takacs, A.R.; Hajdu, T.; Dobrosi, N.; Gergely, P.;Zakany, R. Polymodal Transient Receptor Potential Vanilloid (TRPV) Ion Channels in Chondrogenic Cells.Int. J. Mol. Sci. 2015, 16, 18412–18438. [CrossRef] [PubMed]
82. Wang, C.; Hu, H.Z.; Colton, C.K.; Wood, J.D.; Zhu, M.X. An alternative splicing product of the murine trpv1gene dominant negatively modulates the activity of TRPV1 channels. J. Biol. Chem. 2004, 279, 37423–37430.[CrossRef] [PubMed]
83. Tian, W.; Fu, Y.; Wang, D.H.; Cohen, D.M. Regulation of TRPV1 by a novel renally expressed rat TRPV1splice variant. Am. J. Physiol. Renal Physiol. 2006, 290, F117–F126. [CrossRef] [PubMed]
84. Eilers, H.; Lee, S.Y.; Hau, C.W.; Logvinova, A.; Schumacher, M.A. The rat vanilloid receptor splice variantVR.5’sv blocks TRPV1 activation. Neuroreport 2007, 18, 969–973. [CrossRef]
85. Schumacher, M.A.; Eilers, H. TRPV1 splice variants: Structure and function. Front. Biosci. 2010, 15, 872–882.[CrossRef]
86. Mistry, S.; Paule, C.C.; Varga, A.; Photiou, A.; Jenes, A.; Avelino, A.; Buluwela, L.; Nagy, I. Prolonged exposureto bradykinin and prostaglandin E2 increases TRPV1 mRNA but does not alter TRPV1 and TRPV1b proteinexpression in cultured rat primary sensory neurons. Neurosci. Lett. 2014, 564, 89–93. [CrossRef]
87. Kedei, N.; Szabo, T.; Lile, J.D.; Treanor, J.J.; Olah, Z.; Iadarola, M.J.; Blumberg, P.M. Analysis of the nativequaternary structure of vanilloid receptor 1. J. Biol. Chem. 2001, 276, 28613–28619. [CrossRef]
88. Veldhuis, N.A.; Lew, M.J.; Abogadie, F.C.; Poole, D.P.; Jennings, E.A.; Ivanusic, J.J.; Eilers, H.; Bunnett, N.W.;McIntyre, P. N-glycosylation determines ionic permeability and desensitization of the TRPV1 capsaicinreceptor. J. Biol. Chem. 2012, 287, 21765–21772. [CrossRef]
89. Winter, Z.; Buhala, A.; Otvos, F.; Josvay, K.; Vizler, C.; Dombi, G.; Szakonyi, G.; Olah, Z. Functionally importantamino acid residues in the transient receptor potential vanilloid 1 (TRPV1) ion channel—An overview of thecurrent mutational data. Mol. Pain 2013, 9, 30. [CrossRef]
90. Song, S.; Ayon, R.J.; Yamamura, A.; Yamamura, H.; Dash, S.; Babicheva, A.; Tang, H.; Sun, X.; Cordery, A.G.;Khalpey, Z.; et al. Capsaicin-induced Ca2+ signaling is enhanced via upregulated TRPV1 channels inpulmonary artery smooth muscle cells from patients with idiopathic PAH. Am. J. Physiol. Lung CellMol. Physiol. 2017, 312, L309–L325. [CrossRef]
91. Medvedeva, Y.V.; Kim, M.S.; Usachev, Y.M. Mechanisms of prolonged presynaptic Ca2+ signaling andglutamate release induced by TRPV1 activation in rat sensory neurons. J. Neurosci. 2008, 28, 5295–5311.[CrossRef] [PubMed]
Cancers 2020, 12, 3338 27 of 28
92. Fenwick, A.J.; Fowler, D.K.; Wu, S.W.; Shaffer, F.J.; Lindberg, J.E.M.; Kinch, D.C.; Peters, J.H. DirectAnandamide Activation of TRPV1 Produces Divergent Calcium and Current Responses. Front. Mol. Neurosci.2017, 10, 200. [CrossRef] [PubMed]
93. Tian, Q.; Hu, J.; Xie, C.; Mei, K.; Pham, C.; Mo, X.; Hepp, R.; Soares, S.; Nothias, F.; Wang, Y.; et al. Recoveryfrom tachyphylaxis of TRPV1 coincides with recycling to the surface membrane. Proc. Natl. Acad. Sci. USA2019, 116, 5170–5175. [CrossRef] [PubMed]
94. Stueber, T.; Eberhardt, M.J.; Caspi, Y.; Lev, S.; Binshtok, A.; Leffler, A. Differential cytotoxicity andintracellular calcium-signalling following activation of the calcium-permeable ion channels TRPV1 andTRPA1. Cell Calcium 2017, 68, 34–44. [CrossRef] [PubMed]
95. Mohapatra, D.P.; Nau, C. Regulation of Ca2+-dependent desensitization in the vanilloid receptor TRPV1 bycalcineurin and cAMP-dependent protein kinase. J. Biol. Chem. 2005, 280, 13424–13432. [CrossRef]
96. Yao, J.; Qin, F. Interaction with phosphoinositides confers adaptation onto the TRPV1 pain receptor. PLoS Biol.2009, 7, e46. [CrossRef]
97. Grycova, L.; Lansky, Z.; Friedlova, E.; Obsilova, V.; Janouskova, H.; Obsil, T.; Teisinger, J. Ionic interactionsare essential for TRPV1 C-terminus binding to calmodulin. Biochem. Biophys. Res. Commun. 2008, 375,680–683. [CrossRef]
98. Chung, M.K.; Guler, A.D.; Caterina, M.J. TRPV1 shows dynamic ionic selectivity during agonist stimulation.Nat. Neurosci. 2008, 11, 555–564. [CrossRef]
99. Berra-Romani, R.; Guzman-Silva, A.; Vargaz-Guadarrama, A.; Flores-Alonso, J.C.; Alonso-Romero, J.;Trevino, S.; Sanchez-Gomez, J.; Coyotl-Santiago, N.; Garcia-Carrasco, M.; Moccia, F. Type 2 Diabetes AltersIntracellular Ca2+ Handling in Native Endothelium of Excised Rat Aorta. Int. J. Mol. Sci. 2019, 21, 250.[CrossRef]
100. Markova, J.; Hudecova, S.; Soltysova, A.; Sirova, M.; Csaderova, L.; Lencesova, L.; Ondrias, K.; Krizanova, O.Sodium/calcium exchanger is upregulated by sulfide signaling, forms complex with the beta1 and beta3 butnot beta2 adrenergic receptors, and induces apoptosis. Pflugers Arch. 2014, 466, 1329–1342. [CrossRef]
101. Cantero-Recasens, G.; Butnaru, C.M.; Brouwers, N.; Mitrovic, S.; Valverde, M.A.; Malhotra, V. Sodiumchannel TRPM4 and sodium/calcium exchangers (NCX) cooperate in the control of Ca2+-induced mucinsecretion from goblet cells. J. Biol. Chem. 2019, 294, 816–826. [CrossRef] [PubMed]
102. Poburko, D.; Fameli, N.; Kuo, K.H.; van Breemen, C. Ca2+ signaling in smooth muscle: TRPC6, NCX andLNats in nanodomains. Channels 2008, 2, 10–12. [CrossRef] [PubMed]
103. Wu, D.; Li, J.; Zhang, Q.; Tian, W.; Zhong, P.; Liu, Z.; Wang, H.; Wang, H.; Ji, A.; Li, Y. Exogenous HydrogenSulfide Regulates the Growth of Human Thyroid Carcinoma Cells. Oxid. Med. Cell. Longev. 2019, 2019,6927298. [CrossRef]
104. Tanwar, J.; Arora, S.; Motiani, R.K. Orai3: Oncochannel with therapeutic potential. Cell Calcium 2020, 90,102247. [CrossRef] [PubMed]
105. Villalobos, C.; Sobradillo, D.; Hernandez-Morales, M.; Nunez, L. Calcium remodeling in colorectal cancer.Biochim. Biophys. Acta 2017, 1864, 843–849. [CrossRef]
106. Marchi, S.; Rimessi, A.; Giorgi, C.; Baldini, C.; Ferroni, L.; Rizzuto, R.; Pinton, P. Akt kinase reducingendoplasmic reticulum Ca2+ release protects cells from Ca2+-dependent apoptotic stimuli. Biochem. Biophys.Res. Commun. 2008, 375, 501–505. [CrossRef]
107. Giorgi, C.; Ito, K.; Lin, H.K.; Santangelo, C.; Wieckowski, M.R.; Lebiedzinska, M.; Bononi, A.; Bonora, M.;Duszynski, J.; Bernardi, R.; et al. PML regulates apoptosis at endoplasmic reticulum by modulating calciumrelease. Science 2010, 330, 1247–1251. [CrossRef]
108. Al-Taweel, N.; Varghese, E.; Florea, A.M.; Busselberg, D. Cisplatin (CDDP) triggers cell death of MCF-7cells following disruption of intracellular calcium ([Ca2+]i) homeostasis. J. Toxicol. Sci. 2014, 39, 765–774.[CrossRef]
109. Busselberg, D.; Florea, A.M. Targeting Intracellular Calcium Signaling ([Ca2+]i) to Overcome AcquiredMultidrug Resistance of Cancer Cells: A Mini-Overview. Cancers 2017, 9, 48. [CrossRef]
110. Kelman, Z. PCNA: Structure, functions and interactions. Oncogene 1997, 14, 629–640. [CrossRef]111. Bravo, R.; Frank, R.; Blundell, P.A.; Macdonald-Bravo, H. Cyclin/PCNA is the auxiliary protein of DNA
polymerase-delta. Nature 1987, 326, 515–517. [CrossRef] [PubMed]
Cancers 2020, 12, 3338 28 of 28
112. Turin, I.; Schiavo, R.; Maestri, M.; Luinetti, O.; Dal Bello, B.; Paulli, M.; Dionigi, P.; Roccio, M.; Spinillo, A.;Ferulli, F.; et al. In Vitro Efficient Expansion of Tumor Cells Deriving from Different Types of Human TumorSamples. Med. Sci. 2014, 2, 70–81. [CrossRef]
113. Turin, I.; Delfanti, S.; Ferulli, F.; Brugnatelli, S.; Tanzi, M.; Maestri, M.; Cobianchi, L.; Lisini, D.; Luinetti, O.;Paulli, M.; et al. In Vitro Killing of Colorectal Carcinoma Cells by Autologous Activated NK Cells isBoosted by Anti-Epidermal Growth Factor Receptor-induced ADCC Regardless of RAS Mutation Status.J. Immunother. 2018, 41, 190–200. [CrossRef] [PubMed]
Publisher’s Note: MDPI stays neutral with regard to jurisdictional claims in published maps and institutionalaffiliations.
© 2020 by the authors. Licensee MDPI, Basel, Switzerland. This article is an open accessarticle distributed under the terms and conditions of the Creative Commons Attribution(CC BY) license (http://creativecommons.org/licenses/by/4.0/).