hydrodynamic load on the building caused by overtopping waves
TRANSCRIPT
HYDRODYNAMIC LOAD ON THE BUILDING C A U SE D BY O V E R T O P P IN G W AV ES
Xuexue Chen1, Wael Hassan23, Wim Uijttewaal1, Toon Verwaest2, Henk Jan Verhagen1, Tomohiro Suzuki12 3, SebastiaanN. Jonkman1
W ide crested dike can reduce the kinetic energy o f the overtopping wave and make the overtopping wave to flow back to the seaside. If a coastal town were built on or near a dike, the overtopping wave running on the dike crest generates the force which can affect the buildings located in its path. However, quantifying the hydrodynamic load on the building caused by overtopping waves is not straightforward because little empirical formulas are given in literature for this kind o f configuration. Therefore, physical scale model research was carried out. The purpose o f this research is to come up with a relationship describing the force on a vertical wall exerted by the overtopping wave as a function o f wave parameters and geometrical characteristics.
Keym ords: Overtopping wave; hydrodynamic load; vertical wall; wide crested dike
INTRODUCTION
Natural disasters such as earthquakes, tsunamis, and floods have occurred frequently in the past decades. For example, the flooding in Japan caused by a tsunami on 11 March 2011, swept away boats, houses and cars along the north-eastern Japanese coast. In late August 2005, flooding due to hurricane Katrina also left more titan 204,000 homes in Louisiana uninhabitable, damaged, or destroyed (FEMA, 2006). And in 2004, the tsunami wave caused by an earthquake in Indonesia, one of the biggest natural disasters in recent human history, killed at least 290,000 people and affected the livelihood of millions of people in more than ten countries.
Existing building codes, design practices and disaster planning methods pay little attention to flood load, related to earthquakes and wind impact on buildings. This is mainly because the buildings are always built far from the coastal line or the flood defense structure (Wilson et al, 2009), but tsunami and storm surge may bring the waves inland. If the structures are built on top of the crest o f the sea dike, the overtopping wave caused by tsunami, storm surge or other forms of waves occurring in coastal areas might result in hydrodynamic loads on them. By far, little research lias been done involving the overtopping waves impacting upon the buildings.
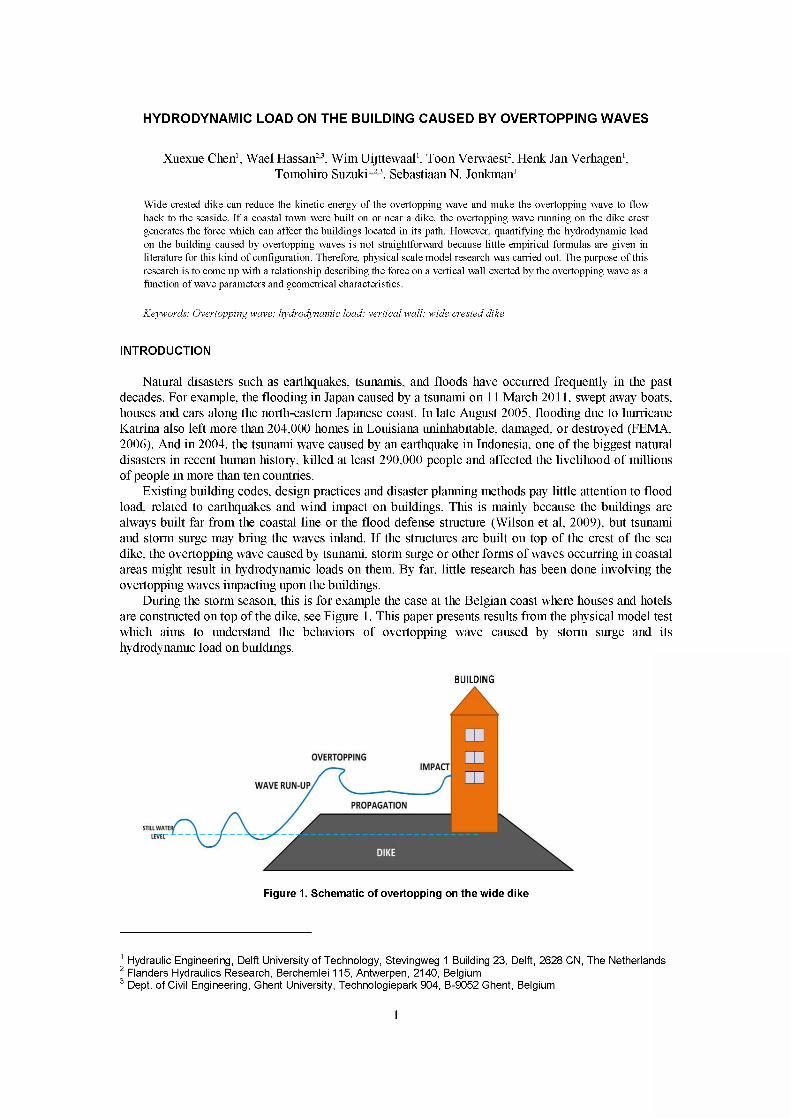
During the storm season, this is for example the case at the Belgian coast where houses and hotels are constructed on top of the dike, see Figure 1. This paper presents results from the physical model test which aims to understand the behaviors of overtopping wave caused by storm surge and its hydrodynamic load on buildings.
BUILDING
OVERTOPPINGIMPACT
WAVE RUN-UP,
PROPAGATION
Figure 1. Schematic of overtopping on the wide dike
1 Hydraulic Engineering, Delft University o f Technology, Stevingweg 1 Building 23, Delft, 2628 CN, The Netherlands2 Flanders Hydraulics Research, Berchemlei 115, Antwerpen, 2140, Belgium3 Dept, o f Civil Engineering, Ghent University, Technologiepark 904, B-9052 Ghent, Belgium
1
2 COASTAL ENGINEERING 2012
EXPERIM ENTAL TEST
Physical model set-upThe physical model tests were executed on a schematized model scaled 1/30 (Chen, 2011). The
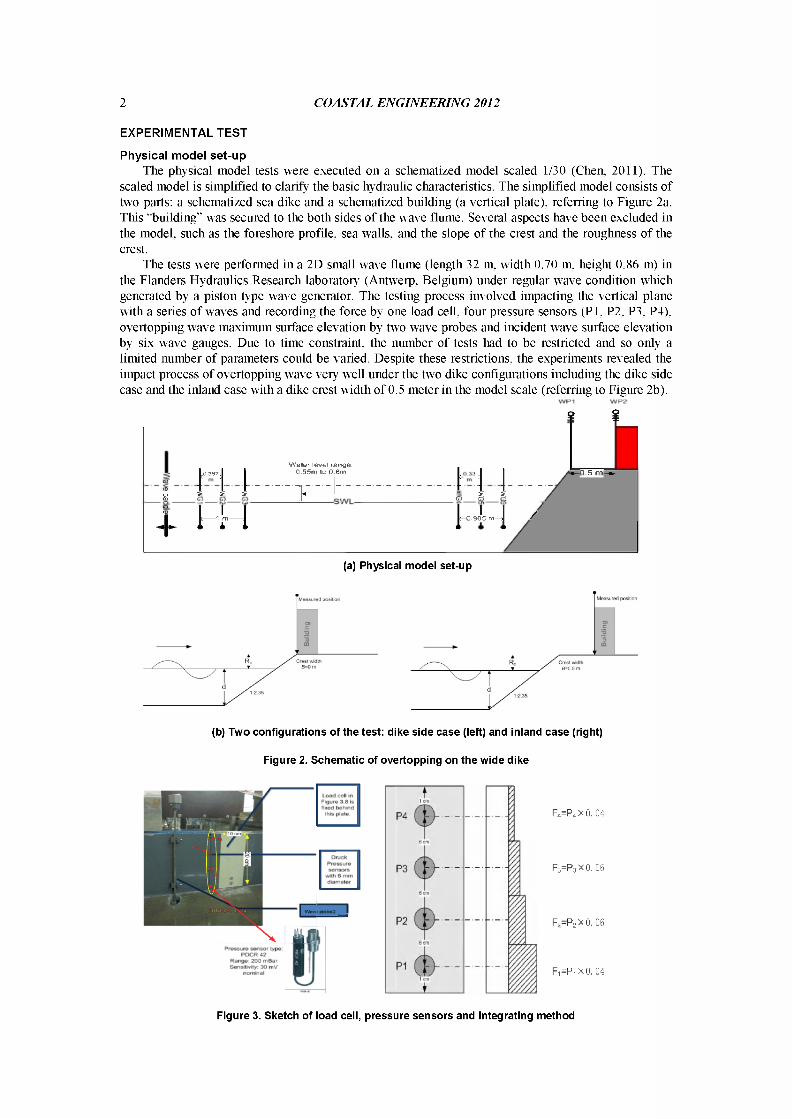
scaled model is simplified to clarify the basic hydraulic characteristics. The simplified model consists of two parts: a schematized sea dike and a schematized building (a vertical plate), referring to Figure 2a. This “building” was secured to the both sides of the wave flume. Several aspects have been excluded in the model, such as the foreshore profile, sea walls, and the slope of the crest and the rouglmess of the crest.
The tests were performed in a 2D small wave flume (length 32 m, width 0.70 m, height 0.86 m) in the Flanders Hydraulics Research laboratory (Antwerp, Belgium) under regular wave condition which generated by a piston type wave generator. The testing process involved impacting the vertical plane with a series o f waves and recording the force by one load cell, four pressure sensors (PI, P2, P3, P4), overtopping wave maximum surface elevation by two wave probes and incident wave surface elevation by six wave gauges. Due to time constraint, the nmnber of tests had to be restricted and so only a limited number of parameters could be varied. Despite these restrictions, the experiments revealed the impact process of overtopping wave very well under the two dike configurations including the dike side case and the inland case with a dike crest width of 0.5 meter in the model scale (referring to Figure 2b).
Water level range:
1 1 !O O o
ÇutuÍDTZJCU
L0 387J I 0.55nri to 0.6nri
1 1 1 y i
•—0 .5 m —►
o_(D
+K - l
I 1 J /J h-0.905 m—̂
(a) Physical model set-up
(b) Two configurations of the test: dike side case (left) and inland case (right)
Figure 2. Schematic of overtopping on the wide dike
F4= P i XQ. 04
F3= P 3X 0 . 06
F j-P ^ X 0. 06
F ,= P , XO. 04
Figure 3. Sketch of load cell, pressure sensors and integrating method
COASTAL ENGINEERING 2012 3
Data AcquisitionThe data were collected by a 13 channel-real time data acquisition system. In the present study, the
water surface elevation was measured by six wave gauges and two wave probes with a sampling rate of 20 Hz. Note that the water surface elevation is not the key research target, so the highest sample rates for wave gauges didn’t explore in this study.
In order to determine the sampling rate of load cell and pressure sensors, three series tests were done by the same regular wave conditions for the dike side case, with water level 0.6 m, wave height 0.06 m and wave periods 1.8s. The sampling rates of load cell and pressure sensors were varied among 100 Hz, 200 Hz and 500 Hz. Both of the signals of the load cell and pressure sensors reveal that the higher sampling rates can capture larger peak values; however, the difference among the peaks of the three sample rates was not obvious. Due to limitations in time and capacity of data acquisition system, the sampling rate was kept at 200 Hz to allow for acquisition of load data during the trials. The sampling duration was nominally 120 seconds.
RESULTS
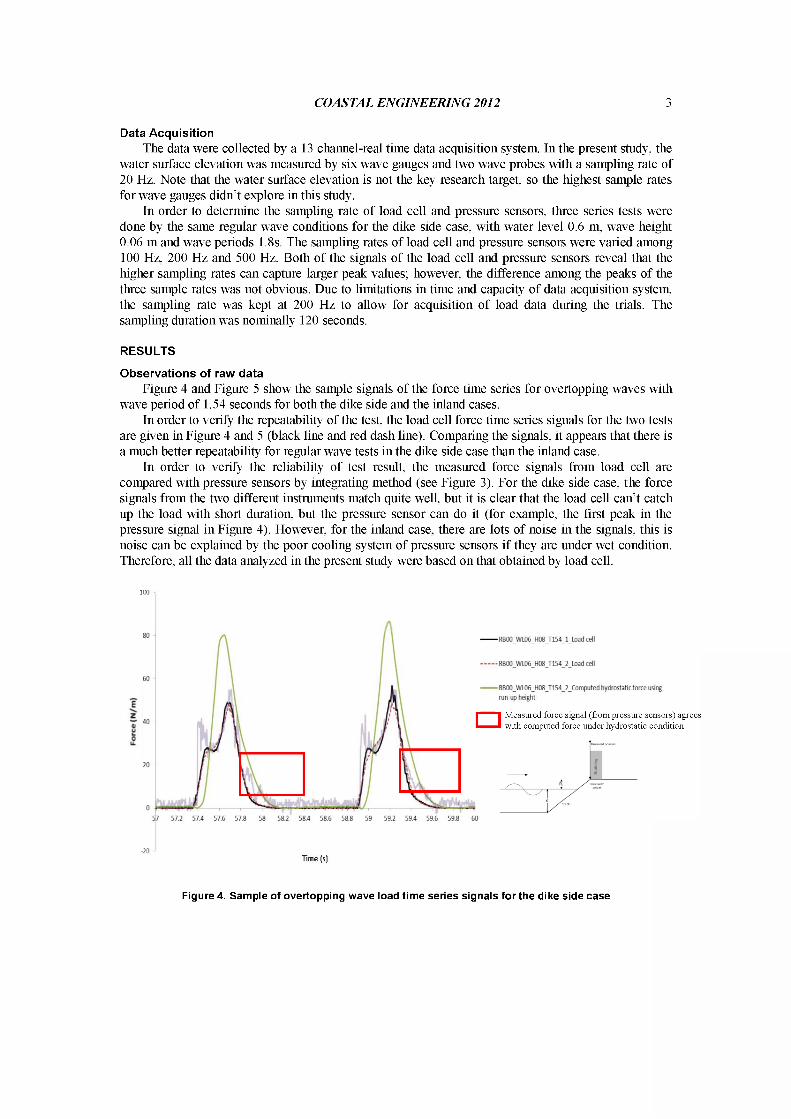
O bservations o f raw dataFigure 4 and Figure 5 show the sample signals of the force time series for overtopping waves with
wave period of 1.54 seconds for both the dike side and the inland cases.In order to verify the repeatability of the test, the load cell force time series signals for the two tests
are given in Figure 4 and 5 (black line and red dash line). Comparing the signals, it appears that there is a much better repeatability for regular wave tests in the dike side case than the inland case.
In order to verify the reliability of test result, the measured force signals from load cell are compared with pressure sensors by integrating method (see Figure 3). For the dike side case, the force signals from the two different instruments match quite well, but it is clear that the load cell can’t catch up the load with short duration, but the pressure sensor can do it (for example, the first peak in the pressure signal in Figure 4). However, for the inland case, there are lots of noise in the signals, this is noise can be explained by the poor cooling system of pressure sensors if they are under wet condition. Therefore, all the data analyzed in the present study were based on that obtained by load cell.
100 -
R B 00W L 06H 08T 154_l_Load cell
RB00_WL06_H08_T 154_2_Load cell
60— RB00_WL06_H08_T154_2_Computed hydrostatic force using
run-up height
Measured force signal (from pressure sensors) agrees with computed force under hydrostatic condition□40
20
057 57.2 57.4 57.6 57.8 58 58.2 58.4 58.6 58.8 59 59.2 59.4 59.6 59.8 60
-20 -Time (s)
Figure 4. Sample of overtopping wave load time series signals for the dike side case
4 COASTAL ENGINEERING 2012
'Z io
57.9 58.1 58.3 58*P
RB50_W L06_H08_T154_l_Load cell
RB50 WL06 H08 T 154_2_Load cell
RB50 WL06 H08 T 154_2_C om puted hydrostaticforce using run-up heightl
RB50_W L06_H08_T154_l_lntegral resu lts o f p ressu re sensors
RB50_W L06_H08_T154_2_lntegral resu lts of p ressure sensors
□ Measured force signal (from pressure sensors) agrees with computed force under hydrostatic condition
Time (s)
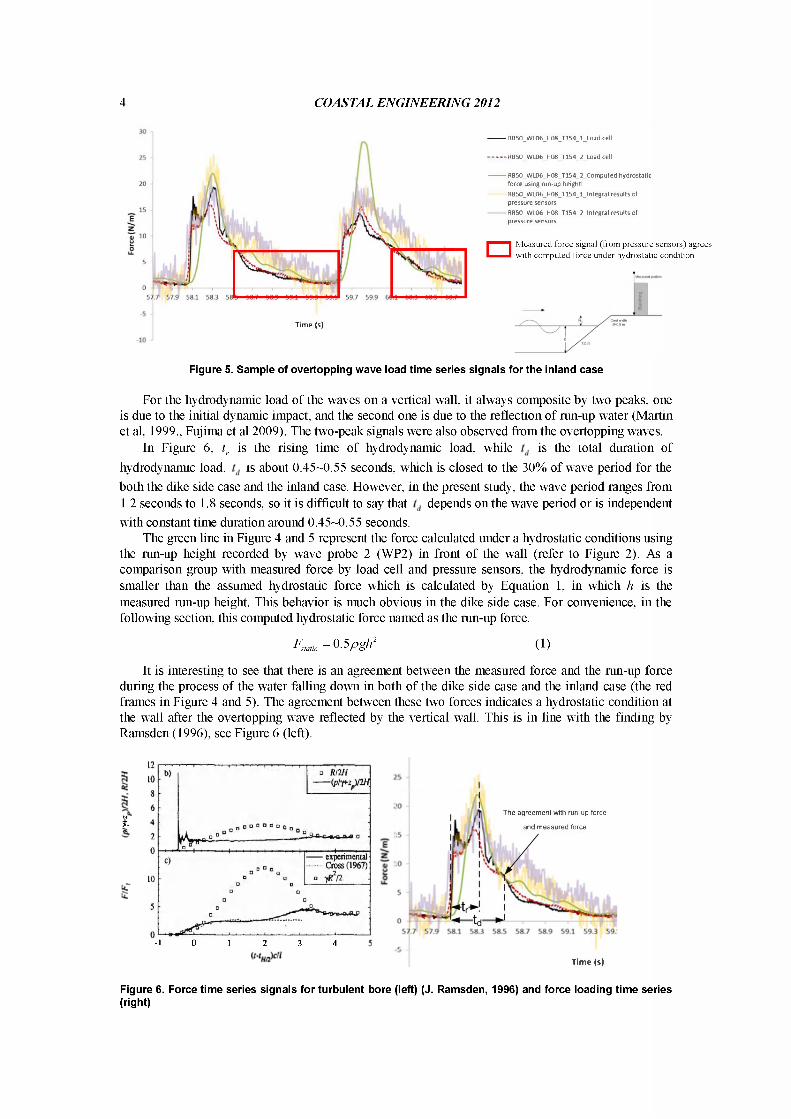
Figure 5. Sample of overtopping wave load time series signals for the inland case
For the hydrodynamic load of the waves on a vertical wall, it always composite by two peaks, one is due to the initial dynamic impact, and the second one is due to the reflection of run-up water (Martin et al, 1999., Fujima et al 2009). The two-peak signals were also observed from the overtopping waves.
In Figure 6, tr is the rising time of hydrodynamic load, while is the total duration of hydrodynamic load. is about 0.45-0.55 seconds, which is closed to the 30% of wave period for the both the dike side case and the inland case. However, in the present study, the wave period ranges from 1.2 seconds to 1.8 seconds, so it is difficult to say that depends on the wave period or is independent with constant time duration around 0.45-0.55 seconds.
The green line in Figure 4 and 5 represent the force calculated under a hydrostatic conditions using the run-up height recorded by wave probe 2 (WP2) in front of the wall (refer to Figure 2). As a comparison group with measured force by load cell and pressure sensors, the hydrodynamic force is smaller than the assumed hydrostatic force which is calculated by Equation 1, in which h is the measured run-up height. This behavior is much obvious in the dike side case. For convenience, in the following section, this computed hydrostatic force named as the run-up force.
Fsmtc = °-5 p g h 2 ( 1)
It is interesting to see that there is an agreement between the measured force and the run-up force during the process o f the water falling down in both o f the dike side case and the inland case (the red frames in Figure 4 and 5). The agreement between these two forces indicates a hydrostatic condition at the wall after the overtopping wave reflected by the vertical wall. This is in line with the finding by Ramsden (1996), see Figure 6 (left).
I
12108
6
42
0
10
5
0-1 0 1 2 3 4
Time (s)
T h e a g re e m e n t w ith ru n -u p fo rce
a n d m e a s u re d fo rce
Figure 6. Force time series signals for turbulent bore (left) (J. Ramsden, 1996) and force loading time series (right)
COASTAL ENGINEERING 2012 5
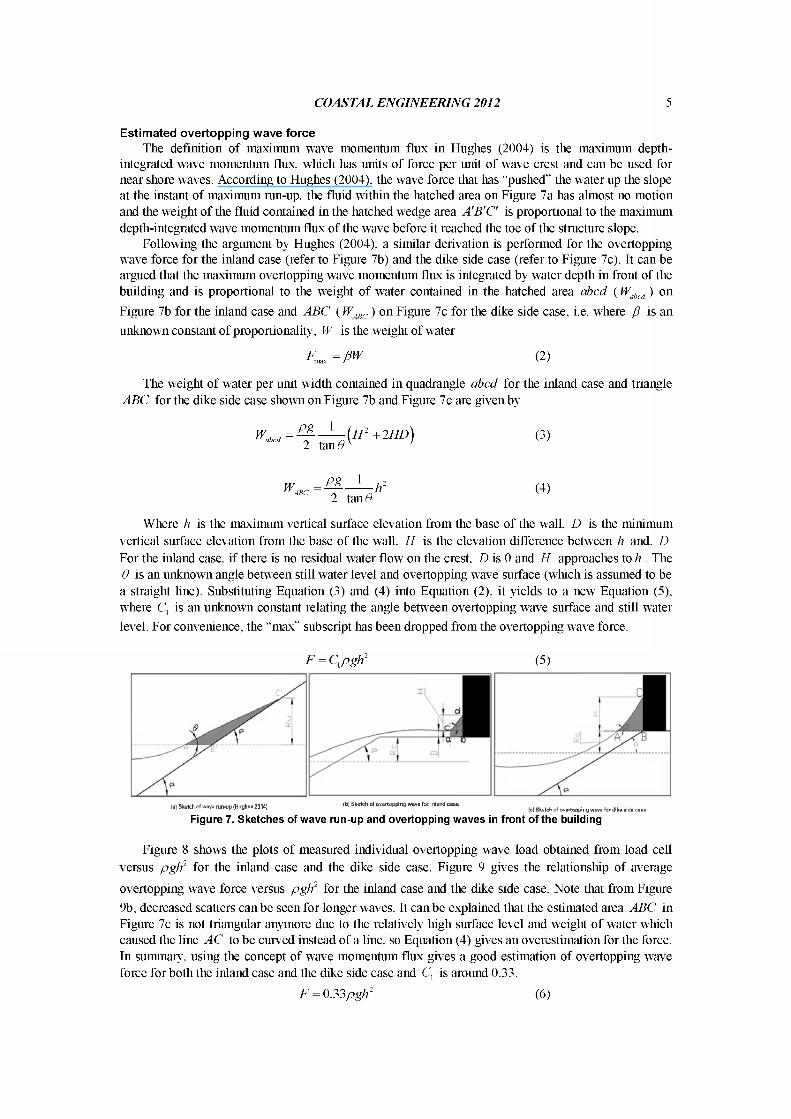
Estim ated overtopping w ave forceThe definition of maximum wave momentum flux in Hughes (2004) is the maximum depth-
integrated wave momentum flux, which has units o f force per unit o f wave crest and can be used for near shore waves. According to Hughes (2004), the wave force that lias “pushed” the water up the slope at the instant o f maximum run-up, the fluid within the hatched area on Figure 7a lias almost no motion and the weight o f the fluid contained in the hatched wedge area A'B 'C ' is proportional to the maximum depth-integrated wave momentum flux of the wave before it reached the toe of the structure slope.
Following the argument by Hughes (2004), a similar derivation is performed for the overtopping wave force for the inland case (refer to Figure 7b) and the dike side case (refer to Figure 7c). It can be argued that the maximum overtopping wave momentum flux is integrated by water depth in front of the building and is proportional to the weight of water contained in the hatched area abed ( Wabct1 ) on Figure 7b for the inland case and A B C ( IV, nr ) on Figure 7c for the dike side case, i.e. where ß is an unknown constant of proportionality, W is the weight o f water
F ^ = ß W (2)
The weight of water per unit width contained in quadrangle abed for the inland case and triangle A B C for the dike side case shown on Figure 7b and Figure 7c are given by
K ^ = ^ - ^ { h 2 +2HD) (3)2 tan 0 v ’
W4BC= ^ - ^ — h2 (4)ÆC 2 tan#
Where h is the maximum vertical surface elevation from the base of the wall, D is the minimum vertical surface elevation from the base of the wall, H is the elevation difference between h and. I) For the inland case, if there is no residual water flow on the crest, D is 0 and H approaches to h . The 0 is an unknown angle between still water level and overtopping wave surface (which is assmned to be a straight line). Substituting Equation (3) and (4) into Equation (2), it yields to a new Equation (5), where ( \ is an unknown constant relating the angle between overtopping wave surface and still water level. For convenience, the “max” subscript lias been dropped from the overtopping wave force.
F = ClPgh2 (5)
la) Sketch of wave run-uo iHuohos 20045 *b) Sketch of overtopping wave for inland c ase(a) snoten oi wave run-up (Hugnes,¿oiw) (c) Sfcatch of overtopping wavö for dike slde case
Figure 7. Sketches of wave run-up and overtopping waves in front of the building
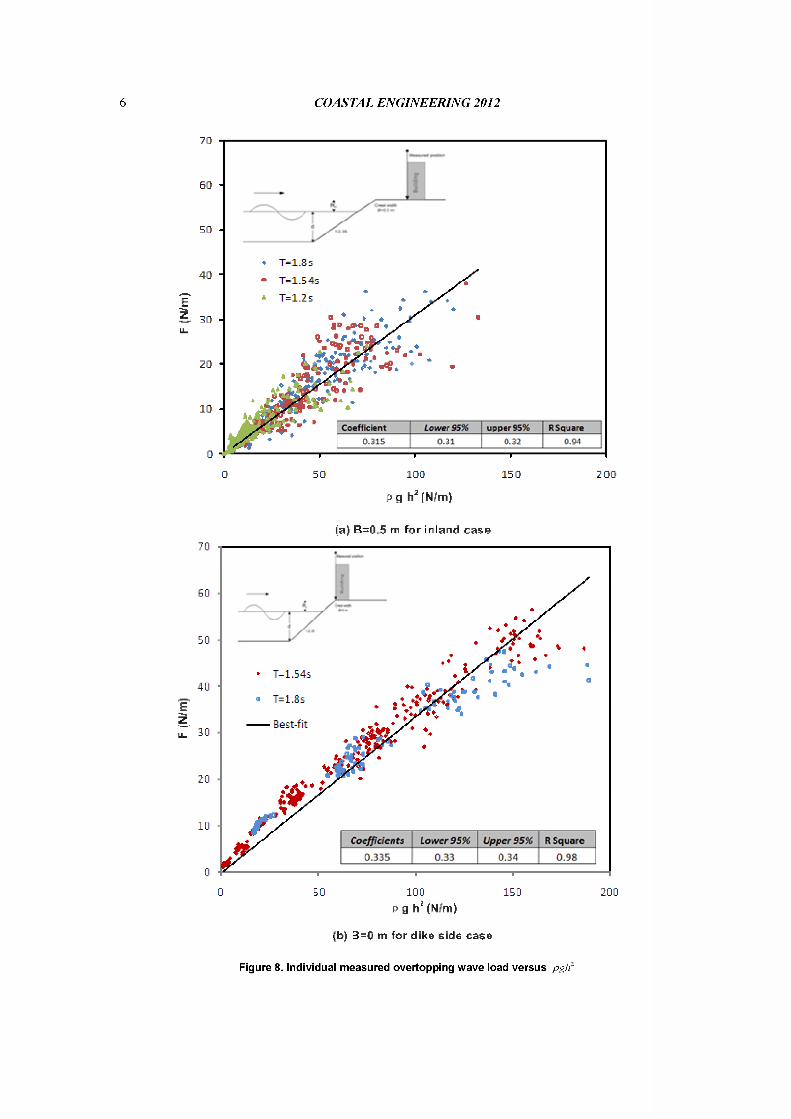
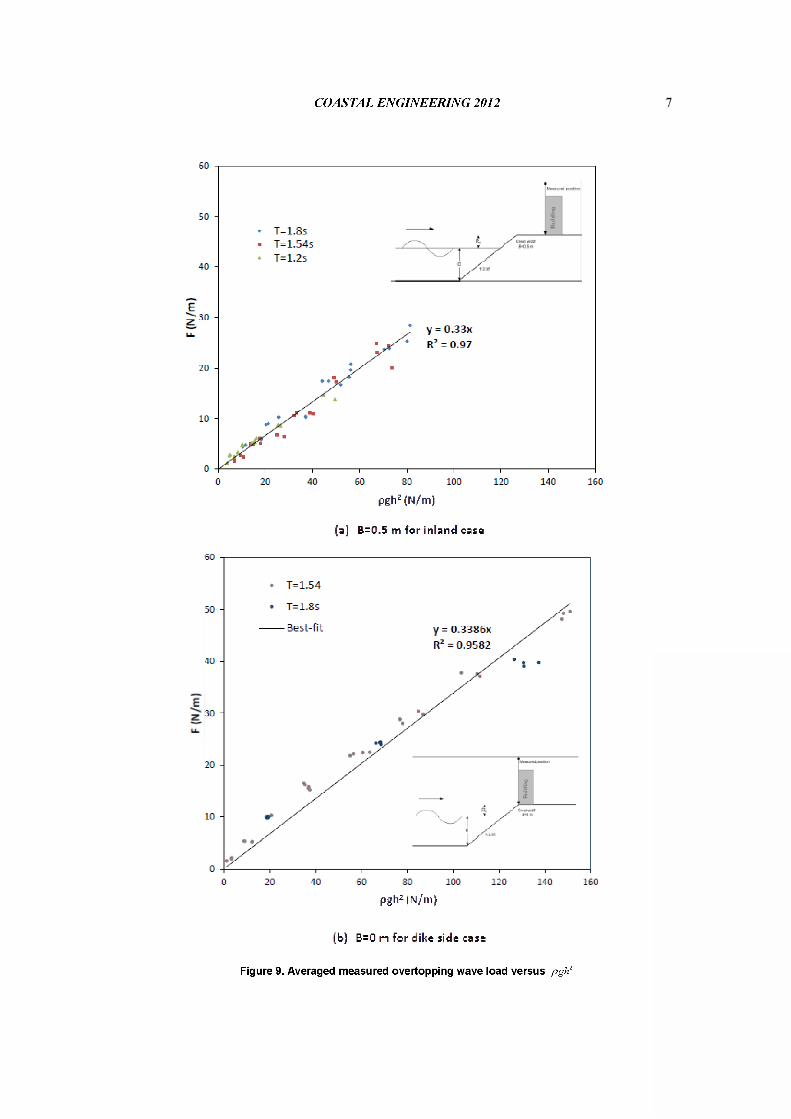
Figure 8 shows the plots o f measured individual overtopping wave load obtained from load cell versus p g h 2 for the inland case and the dike side case. Figure 9 gives the relationship of average
overtopping wave force versus p g h 2 for the inland case and the dike side case. Note that from Figure 9b, decreased scatters can be seen for longer waves. It can be explained that the estimated area A B C in Figure 7c is not triangular anymore due to the relatively high surface level and weight o f water which caused the line A C to be curved instead of a line, so Equation (4) gives an overestimation for the force. In summary, using the concept of wave momentum flux gives a good estimation of overtopping wave force for both the inland case and the dike side case and ( \ is around 0.33.
F = 0.33pgh2 (6)
F (M
m)
F (N
/m)
6 COASTAL ENGINEERING 2012
7 0
6 0
5 0
4 0
3 0
20
10
00 5 0 1 0 0 1 5 0 2 0 0
P g h 3 (N /m )
(a) B=0 5 m for inland case70
GO
50
40 ■
30
20
10
00 50 100 150 200
p g h" (N /m )
(b) B=0 m for dike side case
Figure 8. Individual measured overtopping wave load versus p g lr
Coefficients Lower 95% U pper 95% R Square
C o e f f i c i e n t L ow tf 95% upper 95%
COASTAL ENGINEERING 2012
60
SO -
T=LBs T= 1.54s T=1.2s
E
20 -
10 -
0 20 40 60 ao 100 120 140 160
pghJ (N/m)
(a) B=0.5 m for inland case
60
SOB e s t - f i t
30
20
10
00 20 40 60 SO 100 120 140 160
pgh2 (N/m)
(b) B=0 m for dike side case
Figure 9. Averaged measured overtopping wave load versus pgh2
8 COASTAL ENGINEERING 2012
Based on Equation (6) which does not depend on the incident wave characters, the concept of overtopping wave tongue (Martin et al, 1999) was introduced to explore the relation between incident wave and overtopping loadings, referring to Equation (7), where S0 is the overtopping wave tongue
thickness at the beginning of the dike crest, IIm is the average value of incident wave height near the toe of the dike, Rc is the crest freeboard and Ru is the maximum wave-run-up height for regular wave on a smooth impermeable plane slope, recommended by Schüttrumpf (2001). Note that there are many formulas which can estimate the maximum regular wave run-up on an infinite slope, so in this study, all the formulas related to the regular wave Ru are applied into the Equation from Schüttrumpf (2001).
(7)Ku
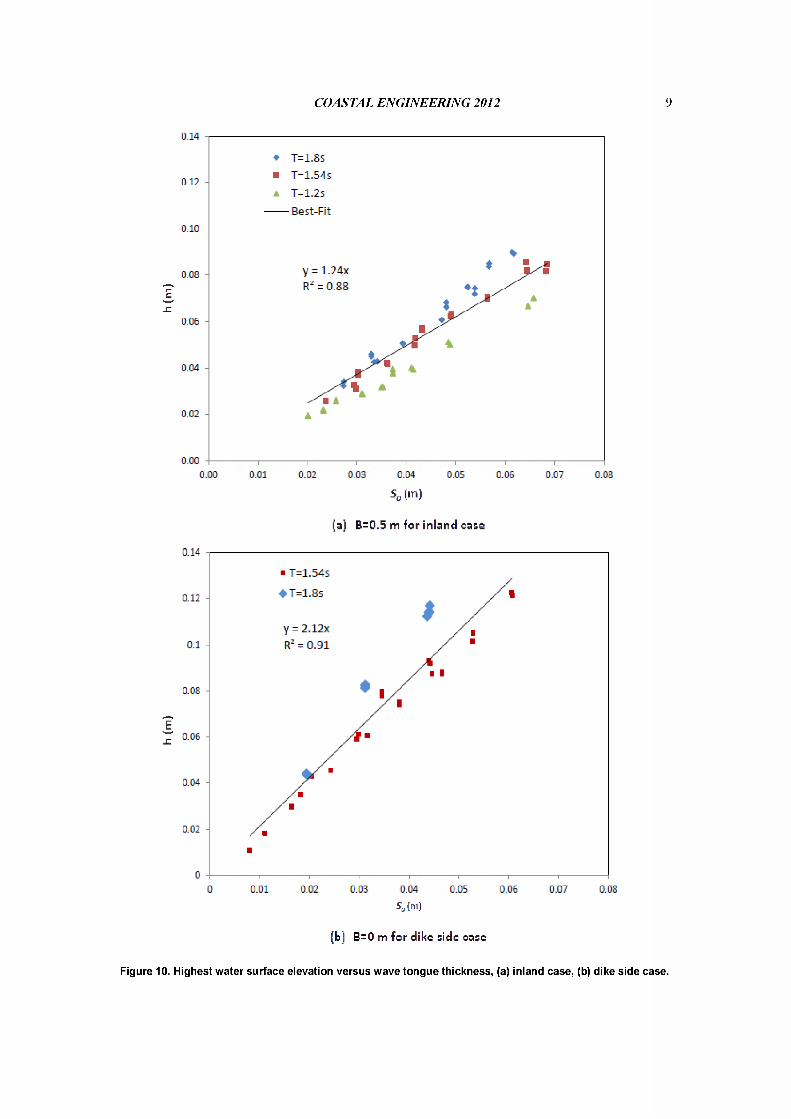
Figure 10 plots the relation between the average ran up height h in front of the building and the wave tongue thickness S0 for the two cases with the straight best-fit line representing Equation (8) in Figure 10a, and Equation (9) in Figure 10b. Therefore, the overtopping wave force can be represented by substituting the relationship between the wave tongue thickness parameter ( S 0) and the run-up height ( h ), i.e. Equation (8) and (9) directly into the Equation (6) and get two new Equation (10) and ( 11).
h = l.24S0 (8)h = 2A 2S0 (9)
F = 0 .51pg(N J2( l - ^ ) 2 (10)K u
F = l A 8 p g ( H J 2( l - ^ ) 2 (11)Ku
F = C2p g (H mf ( \ - ^ - f (12)K u
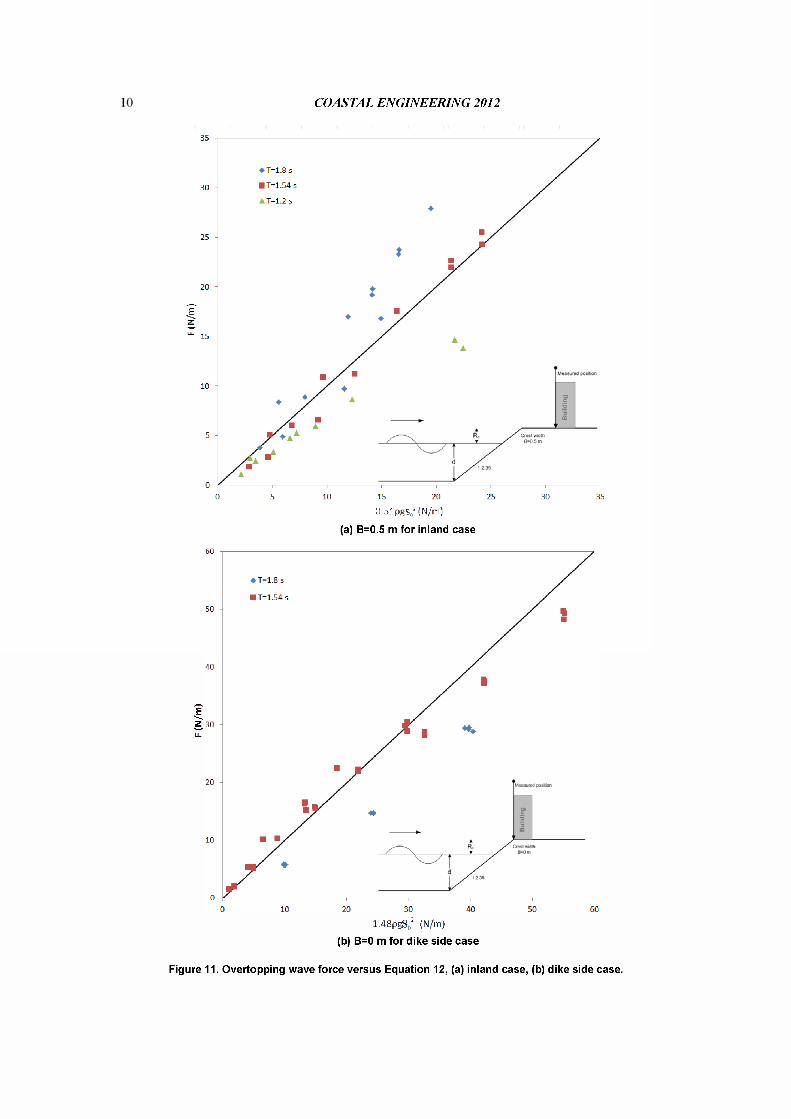
Therefore, a uniform equation of the overtopping force can be rewritten as Equation (12), where C2 is the coefficient related to the dike crest width, for the inland case, C2 is 0.51 while for the dike side case, C2 is 1.48. The reduction effect for crest width of 0.5 meter is about 65% in the model scale. For regular waves, Equation (12) can give a good estimation for the average measured overtopping wave force, especially for the waves with T = 1.545 (See Figure 11).
For the inland case (Figure lia ) , Equation (10) gives an overestimation for the waves with short periods ( T = 1.2s ) and underestimation for the waves with long periods ( T = 1.85 ). For the dike side case (Figure l ib ) , the data from T = 1.85 series are tested under one water level condition, so Equation(11) can’t give a good estimation for the waves with long periods.
This relative lower level o f correlation between the predictions and observation for the waves with different periods could be explained as that the incoming waves are interrupted by the return flow from the previous incoming waves on the crest. This merge of the two direction flows could weak the relationship between the overtopping wave tongue thickness ( .S'0 ) and ran up height ( h ) which will influence the overtopping wave load on the vertical wall. In the future study, the merge effect will be discovered.
h (m
) h
(m)
COASTAL ENGINEERING 2012 9
0.14
0.12 -
Best-Fit0.10 -
y = 1.24X Rz = O.SS
o.os -
0.04 -
■ A0.02 -
0.000.00 0.01 0.02 0.00 0.04 O.OS 0.07
S0 (m)
(a) B=0.5 m for inland case
0.14
0.12 -
0.06 -
0 0.01 0.03 0.04 0.07 O.OS
s, (")
(b) B=0 m for dike side case
Figure 10. Highest water surface elevation versus wave tongue thickness, (a) inland case, (b) dike side case.
F (N
/m)
COASTAL ENGINEERING 2012
m T=1.54 s30
20
E
10
0 5 10 15 20 25 30 35
0.51pgS02 (N/m)
(a) B=0.5 m for inland case
60
50
40
30
20
10
0 10 20 30 40 50 60
1.48pgS02 (N/m)
(b) B=0 m for dike side case
Figure 11. Overtopping wave force versus Equation 12, (a) inland case, (b) dike side case.
COASTAL ENGINEERING 2012 11
CO NCLUSIO N AND RECOM M ENDATIONIn this study, physical model tests were executed on a schematized model scaled 1/30. The aim was
to come up with a relationship describing the force on a vertical plane exerted by the overtopping wave as a function of wave parameters and geometrical characteristics. Due to time constraints, only two configurations: the inland case and the dike case were explored and the number of tests had to be restricted. So only a limited number of parameters could be varied. Despite these restrictions, the experiments revealed the impact process of overtopping wave.
The overtopping wave force could directly be related to the overtopping wave momentum flux, resulting in a simple formulation for the prediction of it. From a theoretical point of view, it is important to increase the test range to investigate the parameters and further research the physical meaning of the dimensionless parameters.,
The reduction effect for crest width with 0.5 m is about 65%. Due to the fact that only two widths crest were tested in the present study, the relationship between the width and overtopping wave force could not be presented. Therefore, in the future study, for the same scale model, variation of the width of crest should be increased and the effect o f the crest width could be found out.
Recommendation could include testing instruments for more than 8 pressure sensors to be distributed on the surface of the vertical plane with small spaces between two sensors. The load cell and pressure sensors should be sampled with a high sample frequency (~1 kHz), to be able to catch the peak values during a very short time.
In order to investigate the overtopping wave crest elevation propagation on the crest, at least two more wave probes should be equipped, or other, more accurate instruments such as laser could be used. This is crucial to expand the findings of the present study in the future. The record for the water surface on the wall should be measured more accurately and its time series should be measured with the same sample frequency of pressure and force.
For other recommendations, the findings in the present study can be compared with other datasets, and using the results to analyses forces on buildings and actual damage to buildings.
REFERENCES
Chen, X. 2011. Hydrodynamic loads on buildings caused by overtopping waves, M aster thesis fo r Delft University o f Technology, Delft, Netherlands; Project number: 770 59 fo r Flanders Hydraulics Research, Antwerp, Belgium.
FEMA. 2006. Hurricane Katrina in the Gulf Coast (FEMA 549), Washington DC: Federal Emergency Management Agency.
Fujima, K., Achmad, F., Shigihara, Y.„ and Mizutani, N. 2009. Estimation of Tsunami Force Acting on Rectangular Structures, Journal o f Disaster Research., 4(6), 404-409.
Hughes, S. A. 2004. Estimation of wave run-up on smooth, impermeable slopes using the wave momentum flux parameter, Coastal Engineering, 51, 1085-1104.
Martin, F. L., Losada, M. A., and Medina, R. 1999. Wave loads on rubble mound breakwater crown walls. Coastal Engineering ,37, 149-174.
Ramsden, J.D. 1993. Tsunamis-Forces on a vertical wall caused by long waves, bores and surges on a dry bed. Report No. KH-R-54, W.M. Keck Lab o f Hydraulic and Water Resource., Calif. Inst. O f Technol., Pasadena, Calif.
Ramsden, J.D. 1996. Forces on a vertical wall due to long waves, bores, and dry-bed surges, Journal o f Waterway, Port, Coastal, Ocean Eng.,122(3), 134-141.
Schüttrumpf, H. F. 2001. Wellenüberlaufströmung bei Seedeichen-Experimentelle und Theoretische Untersuchungen. PhD thesis, http://www.biblio.tu-bs.de/ediss/data/20010703a/20010703a.html.
Wilson, J., Gupta, R., van de Lindt, J., Clauson, M., and Garcia, R. 2009. Behavior of a one-sixth scale wood-framed residential structure under wave loading, Journal o f Performance o f Constructed Facilities, 23, 336-345.