hydrodynamic cavitation in microsystems. i. experiments with
TRANSCRIPT
HAL Id: hal-00700345https://hal.archives-ouvertes.fr/hal-00700345
Submitted on 12 May 2020
HAL is a multi-disciplinary open accessarchive for the deposit and dissemination of sci-entific research documents, whether they are pub-lished or not. The documents may come fromteaching and research institutions in France orabroad, or from public or private research centers.
L’archive ouverte pluridisciplinaire HAL, estdestinée au dépôt et à la diffusion de documentsscientifiques de niveau recherche, publiés ou non,émanant des établissements d’enseignement et derecherche français ou étrangers, des laboratoirespublics ou privés.
Distributed under a Creative Commons Attribution| 4.0 International License
Hydrodynamic cavitation in microsystems. I.Experiments with deionized water and nanofluids
M. Medrano, P.J. Zermatten, Christian Pellone, Jean-Pierre Franc, FrédéricAyela
To cite this version:M. Medrano, P.J. Zermatten, Christian Pellone, Jean-Pierre Franc, Frédéric Ayela. Hydrodynamiccavitation in microsystems. I. Experiments with deionized water and nanofluids. Physics of Fluids,American Institute of Physics, 2011, 23 (12), pp.127103. �10.1063/1.3671682�. �hal-00700345�
Hydrodynamic cavitation in microsystems. I. Experiments with deionizedwater and nanofluids
M. Medrano, P. J. Zermatten, C. Pellone, J. P. Franc, and F. Ayelaa)
Laboratoire des Ecoulements Geophysiques et Industriels, UJF Grenoble 1 – CNRS, BP 53,38041 Grenoble Cedex 9, France
An experimental study of hydrodynamic cavitation downstream microdiaphragms and microventuris is presented. Deionized
water and nanofluids have been characterized within silicon–Pyrex micromachined devices with hydraulic diameters ranging
from 51 lm t o 1 0 4 lm. The input pressure could reach up to 10 bars, and the flow rate was below 1 liter per hour. The output pressure of the devices was fixed at values ranging from 0.3 bar to 2 bars, so that it was possible to study the evolution
of the cavitation number as a function of the Reynolds number in the orifice of the diaphragms or in the throat of the venturis.
A delay on the onset of cavitation has been recorded for all the devices when they are fed with deionized water, because of the
metastability of the liquid and because of the lack of roughness of the walls. For the first time, hydrodynamic cavitation of
nanofluids (nanoparticles dispersed into the liquid) has been considered. The presence of nano-aggregates in the liquid does
not exhibit any noticeable effect on the cavitation threshold through the venturis. However, such a presence has a strong
influence on the cavitation onset in microdiaphragms: above a critical volume solid concentration of �10�5, the metastability is broken and the nanofluids behave as tap water filled up with large nuclei. These microdevices, where a low amount of fluid
is required to reach cavitating flows, appear to be useful tools in order to study cavitating phenomena in localized area with
specific fluids.
I. INTRODUCTION
Hydrodynamic cavitation is generally defined as the phe-
nomenon of nucleation, growth, and collapse of vapor bubble,
in a region where the static pressure of a liquid falls below its
vapour pressure. Simple geometries, such as orifices or ven-
turi, may generate large pressure drops within a moving liq-
uid. As indicated by Bernoulli equation, the low pressure
regions are generated by the flowing liquid via velocity
changes. A low pressure is expected in the regions of high ve-
locity as the throat of a venturi or through an orifice. Cavita-
tion can also develop in a turbulent shear layer due to the
formation of local cores of fluid vortices in submerged jets.1
During the growth phase of the bubble, liquid from the sur-
rounding medium evaporates into the cavity. When the bubble
is subjected to a higher pressure (because it has moved
towards a higher pressure zone), it is collapsing down via a
rather violent mechanism.
Hydrodynamic cavitation has been largely studied, due
to the negative consequences caused by the collapse of the
vapor bubbles once the flow recovers a static pressure above
the vapor pressure. More recently, possible favorable conse-
quences of hydrodynamic cavitation have been investigated.
Chemistry induced by hydrodynamic cavitation has been
compared to that induced by acoustic cavitation.2–5 Radicals
produced from hydrodynamic cavitation are expected to
enhance the treatment of wastewaters and other pollutants.6
The synthesis of nanomaterials by high shear hydrodynamic
cavitation has also been investigated.7,8 The high expected
temperatures inside collapsing bubbles and the efficiency of
the mixing of chemical species are assumed to enhance the
synthesis of solid materials. Each cavitation bubble appears
as a micro-reactor, whose efficiency depends on the maxi-
mum temperature reached in its core.
Heterogeneous bubble nucleation is enhanced when a
solid phase is dispersed in the liquid. The influence of solid
microparticles in water on the tensile strength of water has
already been studied9,10 but without taking into account the
influence of the solid volume concentration. Microparticles
are likely to enhance cavitation inception because of trapped
gas on their corrugated surfaces. Nanoparticles should be of
no effect on the onset of cavitation, because of enhanced ten-
sion effects related to their very small radius of curvature.
The effect of nanoparticles on the liquid-gas surface tension
of nanofluids11 and on the dynamics of gas bubbles12 has
been recently reported. An anomalous gas hold up in a bub-
ble column with nanofluids has also been noticed.13 To our
knowledge, no hydrodynamic cavitation experiments with
nanofluids have been reported up to now.
Some authors use the term of cavitation to describe any
bubble nucleation and collapse phenomenon, caused either by
a heat pulse14 or by a laser pulse.15–17 They are mainly moti-
vated by the study of bubble dynamics and use microfluidic
systems for their experimental or analytical investigations.
Hydrodynamic cavitation through microchannels has been
studied only very recently.18–20 At the time, these papers were
written, there were still some discrepancies in the literature
about the validity of the laws of hydrodynamics at micro-
scales. So, there was a need to investigate similarities and
a)Author to whom correspondence should be addressed. Electronic mail:
1
differences between cavitation at microscale and conventional
cavitation. Today, the controversy about unusual physical
effects in microflows is over.21,22 Microchannels should now
be considered as “labs on chip” allowing experiments with a
relative low amount of fluid. On the one hand, that could be
efficient tools for any studies about the physico-chemical
applications of hydrodynamic cavitation cited above. On the
other hand, microchannels with diaphragms or venturi may
act as facilities devoted to test microgeometries as encoun-
tered in diesel engines nozzles. Otherwise, from a more funda-
mental point of view, mastering hydrodynamic cavitation in a
microchannel should make possible fine observations of the
bubble dynamics, as already performed but from laser induced
bubbles16,17 or from acoustically driven waves.23
Even if the classical laws of hydrodynamics are valid at
microscale, micromachined devices exhibit some special
peculiarities not attainable in larger ducts. It is well-known
that the onset of cavitation is related to the tensile strength of
the liquid, rather than the vapor pressure. The tensile strength
of the liquid depends on free stream nuclei, and on surface
nuclei present in the surfaces bounding the flow. With micro-
fluidic devices, surface effects become predominant. More-
over, microfabrication gives way to very smooth surfaces.
And as the residence time of any nuclei in a low pressure
area is reduced because of the smallest sizes of the restricted
area, a delay in the inception of cavitation is expected with
micro-diaphragms and micro venturi.
The present investigation is an experimental study of
hydrodynamic cavitation performed on various microfluidic
geometries. Micro-orifices with different hydraulic diameters
dH as well as micro venturi with different throats and different
diffusers angles have been tested. Venturi tubes at macroscale
are used as cavitation susceptibility meters24 and the exten-
sion of this process at microscale should be considered. The
working fluids were de-ionized water and nanofluids. The
influence of the solid volume concentration of nanoparticles
inseminated into the water has been studied. That was in order
to scrutinize the role of homogeneous and heterogeneous
nucleation. Other parameters such as the Reynolds number in
the orifices and the exit pressure of the flow have been consid-
ered. Our analytical approach and our results confirm some of
previous results obtained with similar geometries,18–20 but
also give a finest appreciation on the transition towards cavita-
tion at the microscale. High-speed camera recordings of the
flow have been performed and will be presented and analyzed
in a companion paper.
Section II recalls the analytical expressions related to
hydrodynamic cavitation in diaphragms and venturis and
underlines the specific trends involved by a reduction of size.
Section III describes the micromachining of the devices and
the experimental set up. Results and discussion are provided
in Sec. IV, and Sec. V presents the conclusions.
II. FORMULATION
A. Micro diaphragms
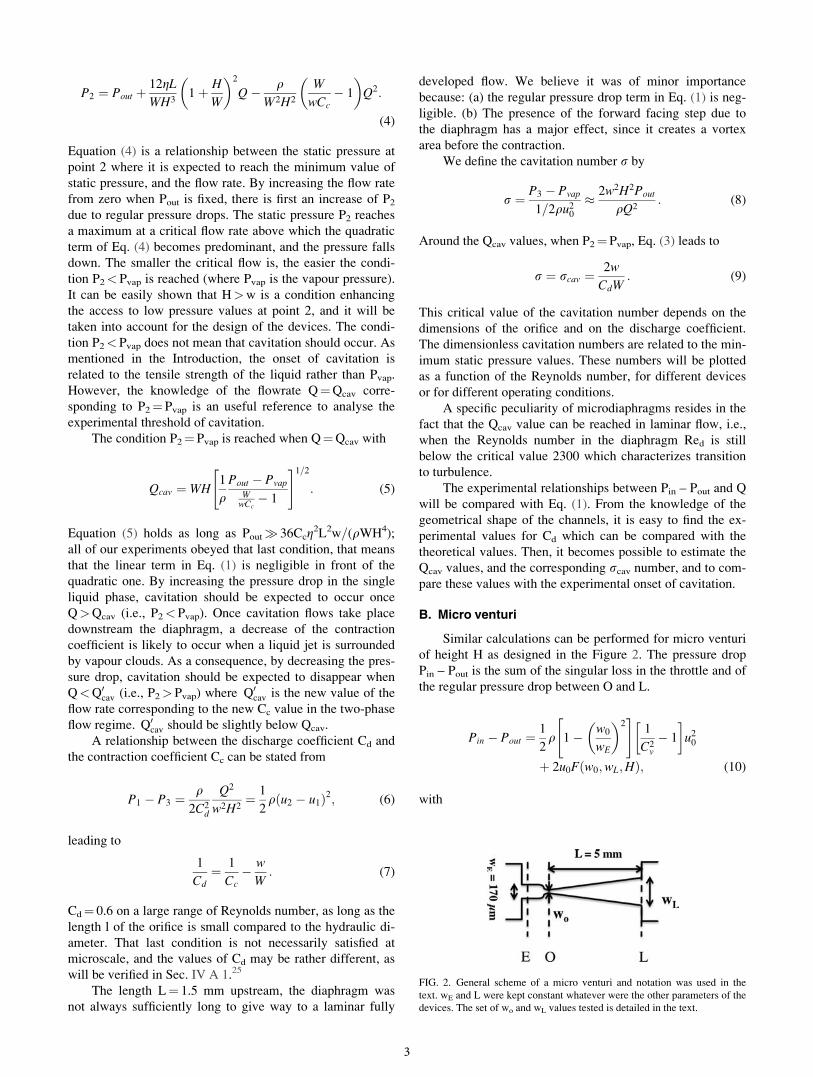
The design of the microdiaphragms is shown in Fig. 1.
Large tanks, where the velocity of the fluid is negligible, are
located at the ends of the channels, with static pressures noted
Pin and Pout, respectively. The fluid flows through a rectangu-
lar microchannel of width W¼ 510 lm, length L¼ 1500 lm,
and height H and is submitted to a regular pressure drop
between 10 and 1, as between 3 and 30. The presence of a dia-
phragm of width w�W, length l¼ 100 lm and same height
as the channel, increases the velocity of the fluid, that reaches
a maximum at the vena contracta (point 2).
The area of the cross section of the flow, noted A2, is
smaller than the area of the diaphragm (A0), and the contrac-
tion coefficient Cc is defined by Cc¼A2=A0. From point 3 to
30, the fluid flows through a channel of same shape as
between 10 and 1. The calculation of the regular pressure
drop along the channel and of the singular pressure drop
through the orifice leads to
Pin � Pout ¼24gL
WH31þ H
W
� �2
Qþ q
2C2d
1
w2H2Q2; (1)
where Q is the flow rate, g is the viscosity of the fluid, q is
its density, respectively, and Cd is the discharge coefficient
of the orifice. By noting ui the average velocity of the fluid at
point i, and by applying Bernoulli equation, one finds
P1 þ1
2qu2
1 ¼ P2 þ1
2qu2
2; (2)
P3 þ1
2qu2
1 ¼ P2 þ1
2qu2
2 � DP1! 3; (3)
where DP1!3¼ 1=2q(u2-u1)2 with u1¼Q=(WH) and
u2¼Q=(CcwH).
There is not much loss between 1 and 2. Losses occur in
the flow expansion from 2 to 3 and are due to the abrupt
enlargement. They are given by the Borda–Carnot approach.
We get
FIG. 1. (a) General scheme of a rectangular chan-
nel with a micro-orifice inside. (b) zoom on the
micro-orifice of width w and (dashed) lines of the
flow. At the vena contracta (2), the effective cross
section of the jet is characterized by the contraction
coefficient Cc. All the micro-diaphragms under test
obeyed W¼ 510 lm, L¼ 1.5 mm, and l¼ 100 lm.
Different heights H and width w were tested; their
values are provided in Table I.
2
P2 ¼ Pout þ12gL
WH31þ H
W
� �2
Q� qW2H2
W
wCc� 1
� �Q2:
(4)
Equation (4) is a relationship between the static pressure at
point 2 where it is expected to reach the minimum value of
static pressure, and the flow rate. By increasing the flow rate
from zero when Pout is fixed, there is first an increase of P2
due to regular pressure drops. The static pressure P2 reaches
a maximum at a critical flow rate above which the quadratic
term of Eq. (4) becomes predominant, and the pressure falls
down. The smaller the critical flow is, the easier the condi-
tion P2< Pvap is reached (where Pvap is the vapour pressure).
It can be easily shown that H>w is a condition enhancing
the access to low pressure values at point 2, and it will be
taken into account for the design of the devices. The condi-
tion P2< Pvap does not mean that cavitation should occur. As
mentioned in the Introduction, the onset of cavitation is
related to the tensile strength of the liquid rather than Pvap.
However, the knowledge of the flowrate Q¼Qcav corre-
sponding to P2¼Pvap is an useful reference to analyse the
experimental threshold of cavitation.
The condition P2¼Pvap is reached when Q¼Qcav with
Qcav ¼ WH1
qPout � Pvap
WwCc� 1
" #1=2
: (5)
Equation (5) holds as long as Pout� 36Ccg2L2w=(qWH4);
all of our experiments obeyed that last condition, that means
that the linear term in Eq. (1) is negligible in front of the
quadratic one. By increasing the pressure drop in the single
liquid phase, cavitation should be expected to occur once
Q>Qcav (i.e., P2<Pvap). Once cavitation flows take place
downstream the diaphragm, a decrease of the contraction
coefficient is likely to occur when a liquid jet is surrounded
by vapour clouds. As a consequence, by decreasing the pres-
sure drop, cavitation should be expected to disappear when
Q<Q0cav (i.e., P2>Pvap) where Q0cav is the new value of the
flow rate corresponding to the new Cc value in the two-phase
flow regime. Q0cav should be slightly below Qcav.
A relationship between the discharge coefficient Cd and
the contraction coefficient Cc can be stated from
P1 � P3 ¼q
2C2d
Q2
w2H2¼ 1
2qðu2 � u1Þ2; (6)
leading to
1
Cd¼ 1
Cc� w
W: (7)
Cd¼ 0.6 on a large range of Reynolds number, as long as the
length l of the orifice is small compared to the hydraulic di-
ameter. That last condition is not necessarily satisfied at
microscale, and the values of Cd may be rather different, as
will be verified in Sec. IV A 1.25
The length L¼ 1.5 mm upstream, the diaphragm was
not always sufficiently long to give way to a laminar fully
developed flow. We believe it was of minor importance
because: (a) the regular pressure drop term in Eq. (1) is neg-
ligible. (b) The presence of the forward facing step due to
the diaphragm has a major effect, since it creates a vortex
area before the contraction.
We define the cavitation number r by
r ¼ P3 � Pvap
1=2qu20
� 2w2H2Pout
qQ2: (8)
Around the Qcav values, when P2¼Pvap, Eq. (3) leads to
r ¼ rcav ¼2w
CdW: (9)
This critical value of the cavitation number depends on the
dimensions of the orifice and on the discharge coefficient.
The dimensionless cavitation numbers are related to the min-
imum static pressure values. These numbers will be plotted
as a function of the Reynolds number, for different devices
or for different operating conditions.
A specific peculiarity of microdiaphragms resides in the
fact that the Qcav value can be reached in laminar flow, i.e.,
when the Reynolds number in the diaphragm Red is still
below the critical value 2300 which characterizes transition
to turbulence.
The experimental relationships between Pin – Pout and Q
will be compared with Eq. (1). From the knowledge of the
geometrical shape of the channels, it is easy to find the ex-
perimental values for Cd which can be compared with the
theoretical values. Then, it becomes possible to estimate the
Qcav values, and the corresponding rcav number, and to com-
pare these values with the experimental onset of cavitation.
B. Micro venturi
Similar calculations can be performed for micro venturi
of height H as designed in the Figure 2. The pressure drop
Pin – Pout is the sum of the singular loss in the throttle and of
the regular pressure drop between O and L.
Pin � Pout ¼1
2q 1� w0
wE
� �2" #
1
C2v
� 1
� �u2
0
þ 2u0Fðw0;wL;HÞ; (10)
with
FIG. 2. General scheme of a micro venturi and notation was used in the
text. wE and L were kept constant whatever were the other parameters of the
devices. The set of wo and wL values tested is detailed in the text.
3
Fðw0;wL;HÞ ¼ 3gLwL þ w0
w0w2L
þ 4
HwLþ 2w0
H2ðwL � w0Þ‘n
wL
w0
� �:
(11)
The F(wo, wL, and H) function is related to the regular losses
through the diffuser and has been calculated by assuming that
there is no laminar separation between O and L.
Equation (10) results from
PE � PO ¼1
2C2v
q 1� wO
wE
� �2" #
u20; (12)
Pin ¼ PE þ1
2q
wO
wE
� �2
u2O; (13)
and
Pout ¼ PL þ1
2qu2
L ¼ PO þ1
2qu2
0 � 2u0Fðw0;wL;HÞ; (14)
which allows us to write
PO ¼ Pout þ 2u0Fðw0;wL;HÞ �1
2qu2
O
¼ Pin �1
2qu2
0
1
C2v
� 1
C2v
� 1
� �wO
wE
� �2" #
: (15)
Pout is assumed to be a fixed pressure value. The venturi
coefficient is noted Cv. It is Reynolds dependent and typical
values Cv � 0.6 have been published at Re � 1000, for micro
venturis devices.20
From Eq. (15), it becomes possible to find the critical
velocity of the fluid in the throttle, above which the pressure
Po falls below Pvap, and the corresponding pressure gradient.
Once again, we are considering Pout as a fixed pressure value.
One finds
Qcav¼2w0H
q
� Fðw0;wL;HÞþffiffiffiffiffiffiffiffiffiffiffiffiffiffiffiffiffiffiffiffiffiffiffiffiffiffiffiffiffiffiffiffiffiffiffiffiffiffiffiffiffiffiffiffiffiffiffiffiffiffiffiffiffiffiffiffiffiffiF2ðw0;wL;HÞþ
q2ðPout�PvapÞ
r� �:
(16)
In a same way as for the micro diaphragms, it can be shown
that the Qcav value is easily reached when H>w0.
The cavitation number is now defined by
r ¼ PL � Pvap
1=2qu20
� 2ðPout � PvapÞq
H2w2O
Q2; (17)
and when PO¼ Pvap
1
rcav¼1þ 4Fðw0;wL;HÞ
qðPout�PvapÞ
� Fðw0;wL;HÞþffiffiffiffiffiffiffiffiffiffiffiffiffiffiffiffiffiffiffiffiffiffiffiffiffiffiffiffiffiffiffiffiffiffiffiffiffiffiffiffiffiffiffiffiffiffiffiffiffiffiffiffiffiffiffiffiffiffiffiF2ðw0;wL;HÞþ
q2ðPout�PvapÞ
r� �:
(18)
The critical cavitation number rcav is now dependent on the
exit pressure.
The relative contribution of F(wo, wL, and H) in Eq.
(10) is not negligible in front of the quadratic evolution of
the pressure drop. So, the experimental evolution DP¼ Pin –
Pout plotted as a function of the flow rate Q contains two ex-
perimental parameters: Cv and Fexp. Parameter Cv accounts
for the quadratic term, whereas parameter F accounts for the
linear term. These parameters will be determined from
experiments by plotting the experimental values DP=Q2 as a
function of 1=Q for the single liquid phase data. A linear
evolution is then expected, from which a semi-empirical
Q�cav value, calculated from Eq. (16) but with Fexp, will be
compared to the experimental cavitating flow rate. A semi-
empirical r�cav value will be determined in a similar way
from Fexp.
C. Role of solid micro- and nanoparticles
Small inhomogeneities in the liquid may influence the
cavitation inception. As said in the Introduction, gaseous
voids attached to the irregularities of a solid particle may
grow up when the pressure inside is sufficiently low. The
pressure Pb inside a gaseous cavity of mean radius of curva-
ture R obeys
Pb ¼ Pþ 2cR; (19)
where P is the pressure of the surrounding liquid water, and
c¼ 70 mN=m is the surface tension of water. The experi-
ments presented here have been performed with filtered
(filter porosity¼ 1 lm) DI water. The condition Pb< Pvap
with R � 1 lm corresponds to P � �1.4 bars. So, when
increasing the flow rate from a single liquid phase, a delay
in the inception of cavitation is likely to occur with DI
water, and the onset of cavitation is expected at Q>Qcav.
Adding nanoparticles in the liquid should be of no effect,
because the condition Pb<Pvap with R � 20 nm corre-
sponds to P � �70 bars. So, it is obvious that the role of
residual microparticles should be predominant since cavita-
tion should have occurred before reaching these highly neg-
ative values of static pressure.
III. EXPERIMENTAL SET UP
A. Device fabrication
Our experiments were performed with hybrid silicon-
Pyrex micromachined devices. The steps leading to the
microfabrication of the devices (micro-diaphragm or micro-
venturi) fall into three main phases. We start from double-
side polished 350 lm thick h100i silicon wafers. The first
step is the transfer onto the silicon of the whole structure of
the channel. The second one is the deep reactive ion etching
of the channel. The third one is the anodic bonding between
the etched silicon substrate and a 300 lm thick Pyrex sub-
strate with two drilled holes located in front of the inlet and
outlet tanks machined into the silicon substrate.
The first step was processed by a classical ultraviolet li-
thography process. It is sufficient to spread a positive photo-
resist onto the bare silicon side to perform channels with
4
smooth surface silicon at the bottom. The deep reactive ion
etching of the samples is based on a Bosch process (alterna-
tion of etching and passivation of the walls by SF6 – C4F8
plasma) with an etch rate of a few lm per minute. That gives
way to scalloping on the walls with a spatial period of a few
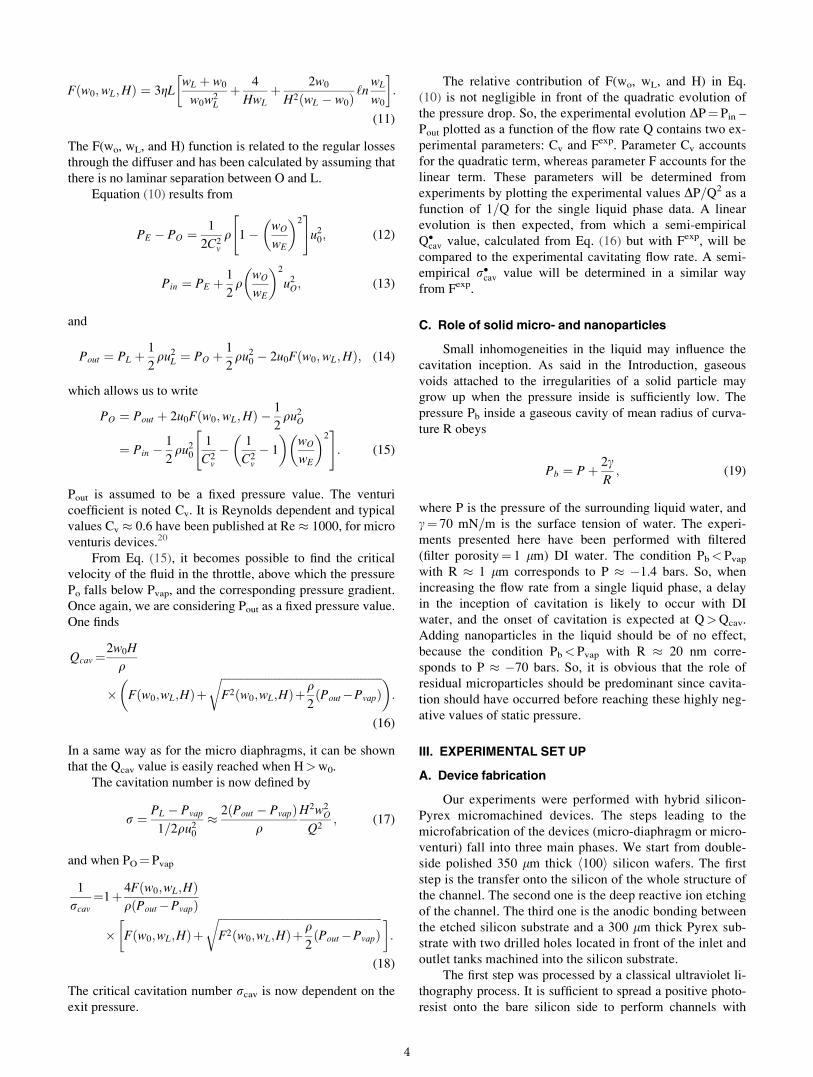
nanometers. Fig. 3(a) is a SEM micrograph of a microdiaph-
ragm. Fig. 3(b) is a SEM micrograph of the input of a micro
venturi. As the parameters w, W, and H are of primary im-
portance, a SEM observation was performed for each device
in order to accurately measure these parameters. As the ani-
sotropic etching is never perfect, a slight deviation from ver-
tical walls was observed. It was taken into account, by
determining the effective average values of W and of w. At
last, the anodic bonding of a Pyrex cap is performed by
applying a negative voltage (�500 V) to the Pyrex at around
300 �C. Hydraulic connections are made following a well-
suited method developed previously for microfluidic experi-
ments and published elsewhere.26
Most of the devices have the shape displayed in Fig. 1.
With these geometries, it is not possible to reach experimen-
tal static pressures except Pin and Pout. To verify the order of
magnitude of P1 and P3, we have designed devices with per-
pendicular grooves included on both sides of the diaphragms.
The grooves were connected to pressure transducers and
gave local data close to Pin and Pout and in a good agreement
with expected values. That is consistent with the validity of
the law of hydrodynamics at microscale.21,22
Other variants in the design and fabrication of the devi-
ces were related to optical observations. The hybrid Si–-
Pyrex devices are not optically transparent, and that may be
troublesome for high speed camera imaging. For such appli-
cations, which will be presented in a forthcoming paper, we
have performed double anodic bonded Pyrex–silicon–Pyrex
devices. In these particular devices, a thinned silicon foil is
first bonded onto a Pyrex cap, then the channel is etched
through the whole thickness of the silicon, and then another
Pyrex cap is bonded onto the free silicon side to assure the
tightness.
No change in the onset of cavitation was observed when
working either with Si–Pyrex or Pyrex–Si–Pyrex devices,
since the smoothness of the bottom of etched silicon grooves
has the same order of magnitude as that of Pyrex.
B. Experimental apparatus
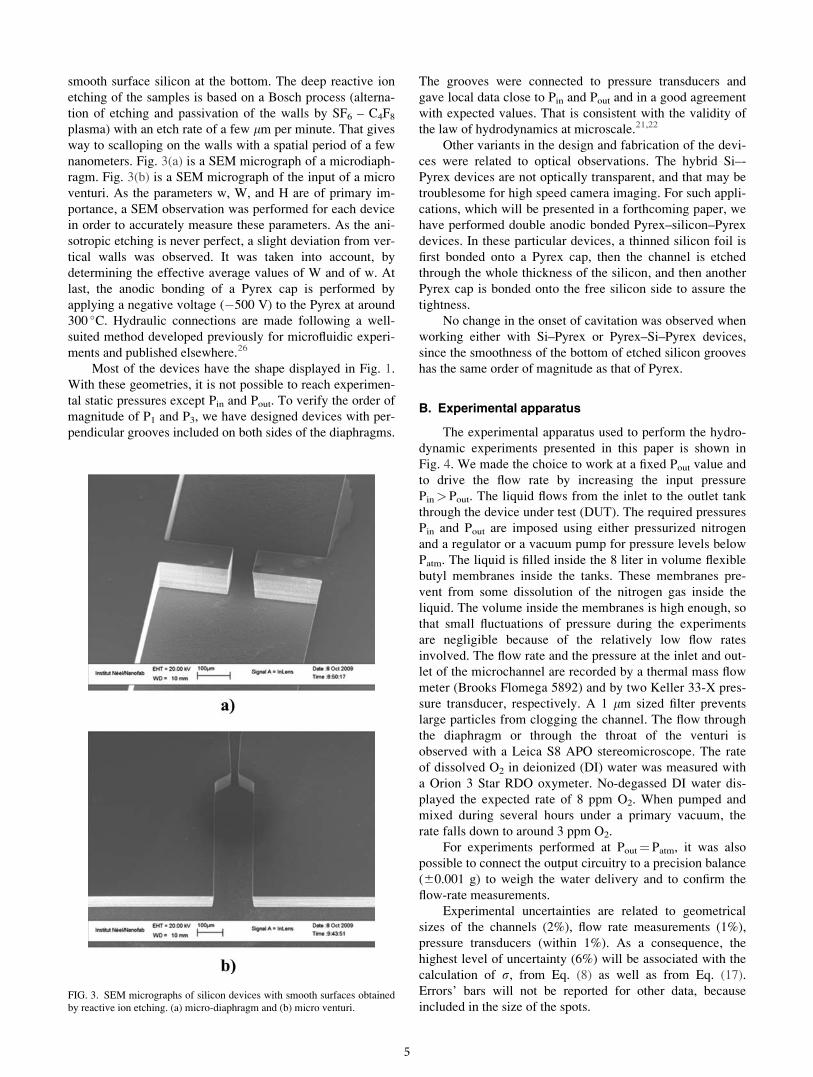
The experimental apparatus used to perform the hydro-
dynamic experiments presented in this paper is shown in
Fig. 4. We made the choice to work at a fixed Pout value and
to drive the flow rate by increasing the input pressure
Pin> Pout. The liquid flows from the inlet to the outlet tank
through the device under test (DUT). The required pressures
Pin and Pout are imposed using either pressurized nitrogen
and a regulator or a vacuum pump for pressure levels below
Patm. The liquid is filled inside the 8 liter in volume flexible
butyl membranes inside the tanks. These membranes pre-
vent from some dissolution of the nitrogen gas inside the
liquid. The volume inside the membranes is high enough, so
that small fluctuations of pressure during the experiments
are negligible because of the relatively low flow rates
involved. The flow rate and the pressure at the inlet and out-
let of the microchannel are recorded by a thermal mass flow
meter (Brooks Flomega 5892) and by two Keller 33-X pres-
sure transducer, respectively. A 1 lm sized filter prevents
large particles from clogging the channel. The flow through
the diaphragm or through the throat of the venturi is
observed with a Leica S8 APO stereomicroscope. The rate
of dissolved O2 in deionized (DI) water was measured with
a Orion 3 Star RDO oxymeter. No-degassed DI water dis-
played the expected rate of 8 ppm O2. When pumped and
mixed during several hours under a primary vacuum, the
rate falls down to around 3 ppm O2.
For experiments performed at Pout¼ Patm, it was also
possible to connect the output circuitry to a precision balance
(60.001 g) to weigh the water delivery and to confirm the
flow-rate measurements.
Experimental uncertainties are related to geometrical
sizes of the channels (2%), flow rate measurements (1%),
pressure transducers (within 1%). As a consequence, the
highest level of uncertainty (6%) will be associated with the
calculation of r, from Eq. (8) as well as from Eq. (17).
Errors’ bars will not be reported for other data, because
included in the size of the spots.FIG. 3. SEM micrographs of silicon devices with smooth surfaces obtained
by reactive ion etching. (a) micro-diaphragm and (b) micro venturi.
5
IV. RESULTS AND DISCUSSION
A. Micro-diaphragms
1. De ionized water and output at atmosphericalpressure
Six different microdiaphragms with smooth surfaces
have been tested, and all the devices displayed the same gen-
eral behaviour detailed below.
By increasing the inlet pressure, the experimental rela-
tionship DP(Q) in the single liquid phase obeys a quadratic
evolution. Using Eq. (1), one may find for each sample the
experimental values of both the discharge coefficient Cexpd
and the contraction coefficient Cc. The single liquid phase in
the diaphragm withstands flow rates higher than the thresh-
old value Qtheocav calculated from Eq. (5), which corresponds to
a minimum pressure equal to the vapor pressure. That con-
firms that de-ionized water is able to sustain a metastable liq-
uid phase at P<Pvap. Still when increasing the inlet
pressure, cavitation occurs suddenly and due to the vapor
phase, the flow rate falls down. Such a transition is noticea-
ble, because it is very noisy, and vapor pockets downstream
the diaphragm are clearly observable. By increasing the inlet
pressure in the cavitating regime, there is still an increase of
the flow rate, but with a reduced slope due to a smaller value
of the contraction coefficient Cc.
The critical flow rates at which the cavitation occurred
for a given channel, although being always above Qcav, could
randomly change from an experimental run to another. Cavi-
tation occurs either suddenly or following any external per-
turbation (as a mechanical vibration on the set up, for
example). As we never could observe any individual bubbles
before each transition, we cannot define an incipient cavita-
tion number.
Desinent cavitation was scrutinized by decreasing the
inlet pressure. The experimental desinent cavitation number
was defined at the crossing between the cavitating curve and
the single liquid phase DP(Q) curve, respectively. Desinence
is well stated when the vapor pockets and the noise are no
more noticeable, and when the flow rate recovers the value it
had in the single liquid phase flow. The vanishing of the
two-phase flow was in fact characterized by the vanishing of
the noise and of the vapor clouds. That occurs at flow rates
below Qcav that means at rexpdes> rcav. Sometimes, although
cavitation has disappeared, the flow rate does not recover its
noncavitating value and is slightly smaller than the expected
ones, for a given value of the pressure drop DP. This comes
from unsteady thin twin pockets which are attached to the
exit of the diaphragm. These pockets are not vapor cavities
but are actually due to the accumulation of non-condensable
gas trapped in the two separated regions downstream the dia-
phragm. They are easily removed by turning off and on the
valve located upstream the channel (Fig. 4).
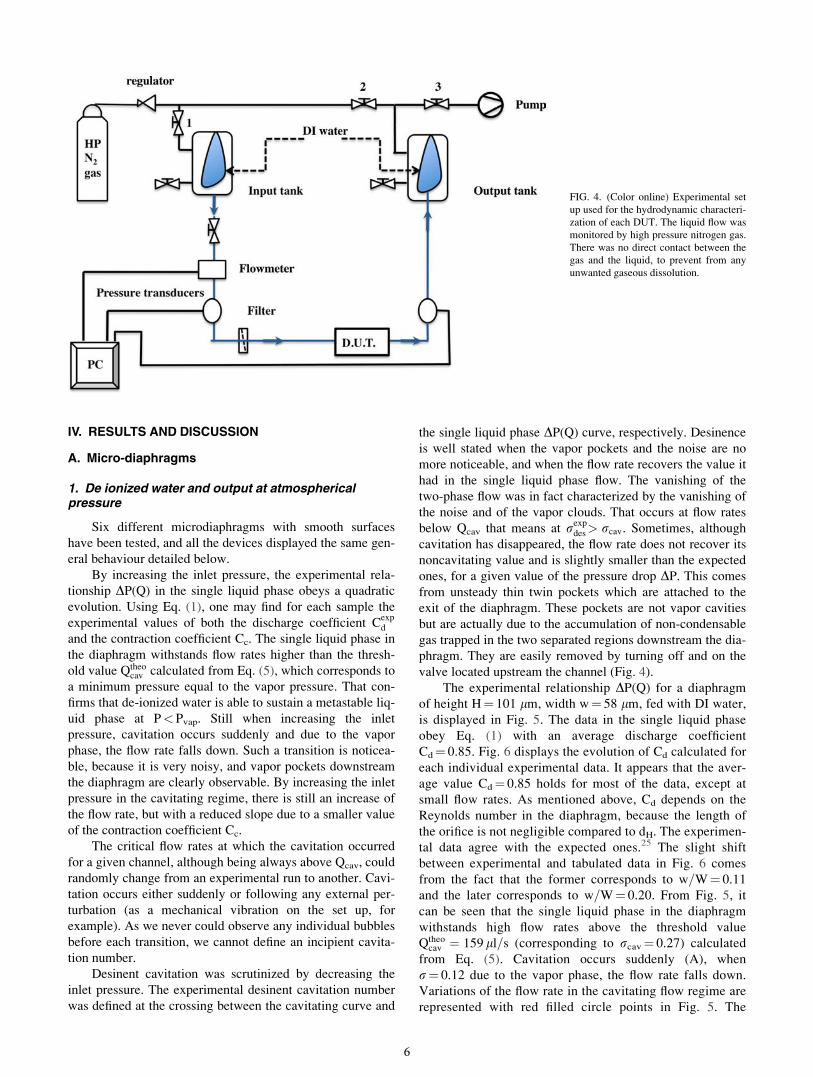
The experimental relationship DP(Q) for a diaphragm
of height H¼ 101 lm, width w¼ 58 lm, fed with DI water,
is displayed in Fig. 5. The data in the single liquid phase
obey Eq. (1) with an average discharge coefficient
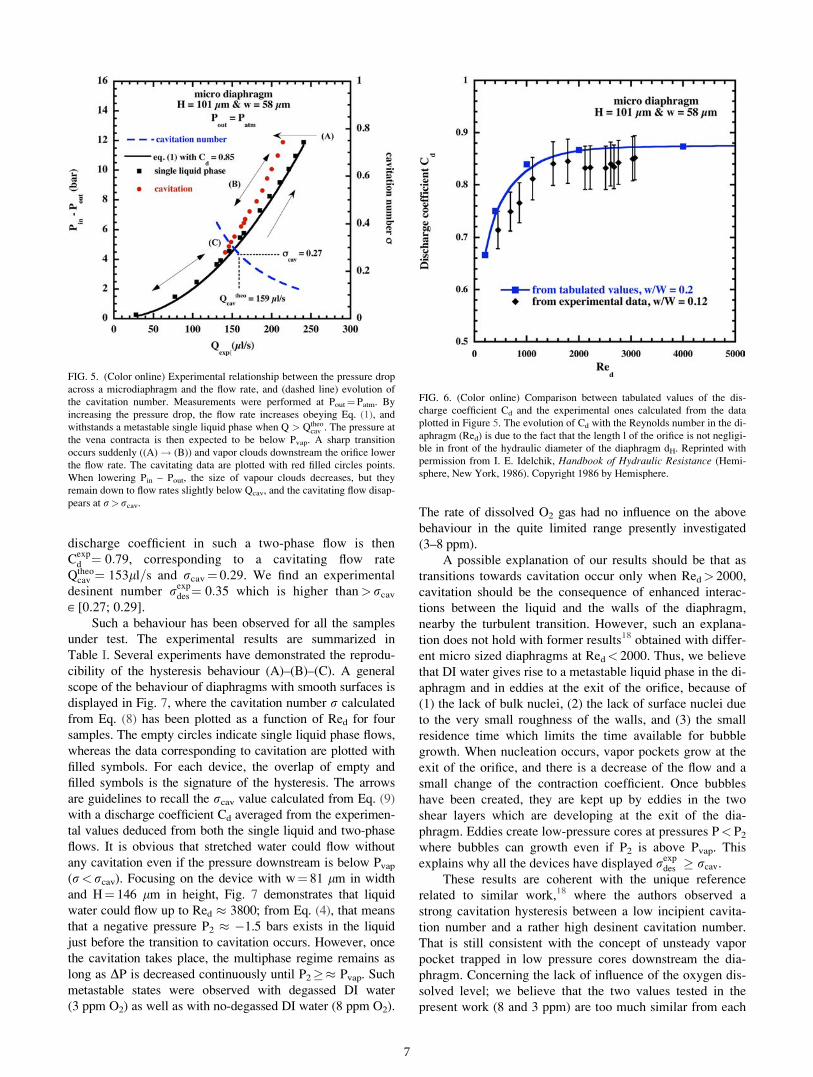
Cd¼ 0.85. Fig. 6 displays the evolution of Cd calculated for
each individual experimental data. It appears that the aver-
age value Cd¼ 0.85 holds for most of the data, except at
small flow rates. As mentioned above, Cd depends on the
Reynolds number in the diaphragm, because the length of
the orifice is not negligible compared to dH. The experimen-
tal data agree with the expected ones.25 The slight shift
between experimental and tabulated data in Fig. 6 comes
from the fact that the former corresponds to w=W¼ 0.11
and the later corresponds to w=W¼ 0.20. From Fig. 5, it
can be seen that the single liquid phase in the diaphragm
withstands high flow rates above the threshold value
Qtheocav ¼ 159 ll=s (corresponding to rcav¼ 0.27) calculated
from Eq. (5). Cavitation occurs suddenly (A), when
r¼ 0.12 due to the vapor phase, the flow rate falls down.
Variations of the flow rate in the cavitating flow regime are
represented with red filled circle points in Fig. 5. The
FIG. 4. (Color online) Experimental set
up used for the hydrodynamic characteri-
zation of each DUT. The liquid flow was
monitored by high pressure nitrogen gas.
There was no direct contact between the
gas and the liquid, to prevent from any
unwanted gaseous dissolution.
6
discharge coefficient in such a two-phase flow is then
Cexpd ¼ 0:79, corresponding to a cavitating flow rate
Qtheocav ¼ 153ll=s and rcav¼ 0.29. We find an experimental
desinent number rexpdes¼ 0:35 which is higher than>rcav
[ [0.27; 0.29].
Such a behaviour has been observed for all the samples
under test. The experimental results are summarized in
Table I. Several experiments have demonstrated the reprodu-
cibility of the hysteresis behaviour (A)–(B)–(C). A general
scope of the behaviour of diaphragms with smooth surfaces is
displayed in Fig. 7, where the cavitation number r calculated
from Eq. (8) has been plotted as a function of Red for four
samples. The empty circles indicate single liquid phase flows,
whereas the data corresponding to cavitation are plotted with
filled symbols. For each device, the overlap of empty and
filled symbols is the signature of the hysteresis. The arrows
are guidelines to recall the rcav value calculated from Eq. (9)
with a discharge coefficient Cd averaged from the experimen-
tal values deduced from both the single liquid and two-phase
flows. It is obvious that stretched water could flow without
any cavitation even if the pressure downstream is below Pvap
(r<rcav). Focusing on the device with w¼ 81 lm in width
and H¼ 146 lm in height, Fig. 7 demonstrates that liquid
water could flow up to Red � 3800; from Eq. (4), that means
that a negative pressure P2 � �1.5 bars exists in the liquid
just before the transition to cavitation occurs. However, once
the cavitation takes place, the multiphase regime remains as
long as DP is decreased continuously until P2� Pvap. Such
metastable states were observed with degassed DI water
(3 ppm O2) as well as with no-degassed DI water (8 ppm O2).
The rate of dissolved O2 gas had no influence on the above
behaviour in the quite limited range presently investigated
(3–8 ppm).
A possible explanation of our results should be that as
transitions towards cavitation occur only when Red> 2000,
cavitation should be the consequence of enhanced interac-
tions between the liquid and the walls of the diaphragm,
nearby the turbulent transition. However, such an explana-
tion does not hold with former results18 obtained with differ-
ent micro sized diaphragms at Red< 2000. Thus, we believe
that DI water gives rise to a metastable liquid phase in the di-
aphragm and in eddies at the exit of the orifice, because of
(1) the lack of bulk nuclei, (2) the lack of surface nuclei due
to the very small roughness of the walls, and (3) the small
residence time which limits the time available for bubble
growth. When nucleation occurs, vapor pockets grow at the
exit of the orifice, and there is a decrease of the flow and a
small change of the contraction coefficient. Once bubbles
have been created, they are kept up by eddies in the two
shear layers which are developing at the exit of the dia-
phragm. Eddies create low-pressure cores at pressures P< P2
where bubbles can growth even if P2 is above Pvap. This
explains why all the devices have displayed rexpdes rcav.
These results are coherent with the unique reference
related to similar work,18 where the authors observed a
strong cavitation hysteresis between a low incipient cavita-
tion number and a rather high desinent cavitation number.
That is still consistent with the concept of unsteady vapor
pocket trapped in low pressure cores downstream the dia-
phragm. Concerning the lack of influence of the oxygen dis-
solved level; we believe that the two values tested in the
present work (8 and 3 ppm) are too much similar from each
FIG. 5. (Color online) Experimental relationship between the pressure drop
across a microdiaphragm and the flow rate, and (dashed line) evolution of
the cavitation number. Measurements were performed at Pout¼Patm. By
increasing the pressure drop, the flow rate increases obeying Eq. (1), and
withstands a metastable single liquid phase when Q > Qtheocav . The pressure at
the vena contracta is then expected to be below Pvap. A sharp transition
occurs suddenly ((A)! (B)) and vapor clouds downstream the orifice lower
the flow rate. The cavitating data are plotted with red filled circles points.
When lowering Pin – Pout, the size of vapour clouds decreases, but they
remain down to flow rates slightly below Qcav, and the cavitating flow disap-
pears at r>rcav.
FIG. 6. (Color online) Comparison between tabulated values of the dis-
charge coefficient Cd and the experimental ones calculated from the data
plotted in Figure 5. The evolution of Cd with the Reynolds number in the di-
aphragm (Red) is due to the fact that the length l of the orifice is not negligi-
ble in front of the hydraulic diameter of the diaphragm dH. Reprinted with
permission from I. E. Idelchik, Handbook of Hydraulic Resistance (Hemi-
sphere, New York, 1986). Copyright 1986 by Hemisphere.
7
other to draw any conclusion. With values in the same order
of magnitude, Mishra and Peles18 noticed only a slightly
expected delay in the inception of cavitation when the O2
concentration was lowered, and they did not notice any
effect on other parameters.
2. Variable output pressures
Complementary experiments were conducted at different
fixed output pressures Pout, with the devices A¼ [H¼ 101
lm, w¼ 80 lm] and B¼ [H¼ 126 lm, w¼ 60 lm]. The sin-
gle liquid flow obeys Eq. (1) with Cd¼ 0.8 for sample A and
Cd¼ 0.93 for sample B, whatever the output pressure is. A
strong hysteresis behaviour still occurs, and when the cavitat-
ing flow is established, the DP(Q) relationship does not
depend on Pout. The flow rates at which the desinence of cavi-
tation occurs depend on Pout; however, they do not obey
Eq. (5). These flow rates are below the expected ones. That
is, summarized in Fig. 8 for the device A, where the cavita-
tion number is plotted as a function of Red for the different
output pressures. An increase of rexpdes when Pout increases is
clearly noticeable.
The conclusions we may draw from the results plotted
in Fig. 8 are as follows. The transition from a single liquid
phase flow to a cavitating flow regime may be strongly and
randomly delayed, once a negative pressure exerts on DI
water flowing through the smooth micro diaphragms. It is
definitely in agreement with the presence of a liquid metasta-
ble state. When the cavitating flow regime is established, the
desinence of cavitation depends strongly on the Reynolds
number, and does not display any random character. Con-
densation of vapour clouds downstream the diaphragm is
anomalously delayed when increasing the static pressure at
the vena contracta.
These results may be the consequence of the use of DI
water flowing through devices of reduced size with smooth
walls. A typical order of magnitude of the average velocity
of the fluid through the diaphragm when Q¼Qcav is �20 m
s�1, so that the shear rate of the flow downstream is around
105 s�1. To get a better understanding of the tensile strength
of water in such conditions, we have performed the same
experiments but with water loaded with nanoparticles acting
as solid nuclei in the liquid.
3. Cavitation of nanofluids
Similar experiments have been performed with the
smooth diaphragm of height H¼ 126 lm and width w¼ 60
lm (sample B) fed with dilute nanofluids. Gadolinium nano-
particles functionalized with a SiO2 hydrophilic shell were
dilute in DI water as the base fluid. TEM photographs of that
sort of nanoparticles are available in Ref. 27. The size of the
nanoparticles is 2–3 nm in diameter, and the solid volume
concentration / of the nanofluids tested was /¼ 10�5,
/¼ 7� 10�5, and /¼ 10�4. However, it is established that
nanoparticles form aggregates that give way to an apparent
solid volume concentration /a higher than the calculated
one.28,29 From the conclusions of former works on the rheol-
ogy of nanofluids flowing through microchannels,30 we can
estimate for the present experiments an average diameter of a
single aggregate around 25 nm, and an apparent solid volume
concentration 10�4</a <10�3. Such a range of /a is low
enough, so that it is of negligible influence on the density and
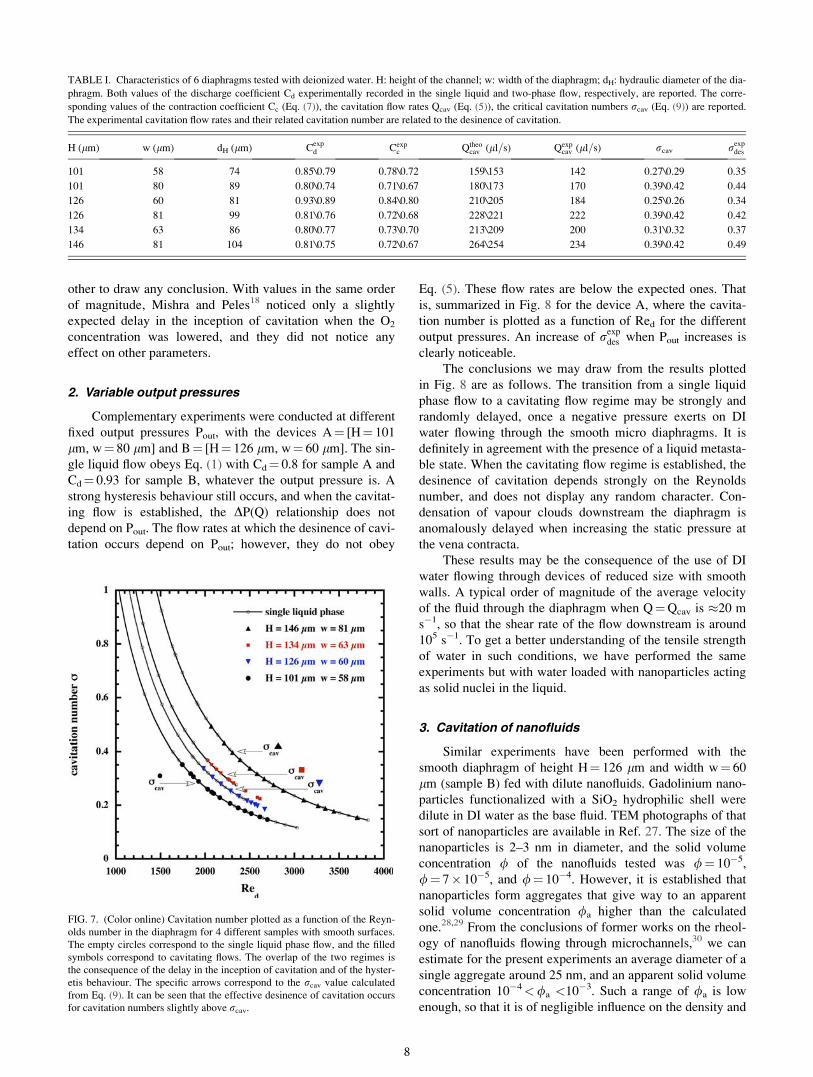
TABLE I. Characteristics of 6 diaphragms tested with deionized water. H: height of the channel; w: width of the diaphragm; dH: hydraulic diameter of the dia-
phragm. Both values of the discharge coefficient Cd experimentally recorded in the single liquid and two-phase flow, respectively, are reported. The corre-
sponding values of the contraction coefficient Cc (Eq. (7)), the cavitation flow rates Qcav (Eq. (5)), the critical cavitation numbers rcav (Eq. (9)) are reported.
The experimental cavitation flow rates and their related cavitation number are related to the desinence of cavitation.
H (lm) w (lm) dH (lm) Cexpd Cexp
c Qtheocav (ll=s) Qexp
cav (ll=s) rcav rexpdes
101 58 74 0.85\0.79 0.78\0.72 159\153 142 0.27\0.29 0.35
101 80 89 0.80\0.74 0.71\0.67 180\173 170 0.39\0.42 0.44
126 60 81 0.93\0.89 0.84\0.80 210\205 184 0.25\0.26 0.34
126 81 99 0.81\0.76 0.72\0.68 228\221 222 0.39\0.42 0.42
134 63 86 0.80\0.77 0.73\0.70 213\209 200 0.31\0.32 0.37
146 81 104 0.81\0.75 0.72\0.67 264\254 234 0.39\0.42 0.49
FIG. 7. (Color online) Cavitation number plotted as a function of the Reyn-
olds number in the diaphragm for 4 different samples with smooth surfaces.
The empty circles correspond to the single liquid phase flow, and the filled
symbols correspond to cavitating flows. The overlap of the two regimes is
the consequence of the delay in the inception of cavitation and of the hyster-
etis behaviour. The specific arrows correspond to the rcav value calculated
from Eq. (9). It can be seen that the effective desinence of cavitation occurs
for cavitation numbers slightly above rcav.
8
on the viscosity of the fluid. Compared to pure DI water, cav-
itation with nanofluids arises in a softened way: the shift of
the flowrate and the intensity of the noise are weaker. With
the very dilute nanofluid, (/¼ 10�5), it is still possible to
withstand negative pressures when Q>Qcav¼ 210 ll=s, and
cavitation occurs at Q � 240 ll=s. However, the nanofluid
with a concentration ten times higher does not exhibit any
hysteretic behaviour. The relationship between the pressure
drop and the flow rate is reported in Fig. 9 for /¼ 10�4,and
is compared to results obtained with pure deionize water.
Experiments were conducted at Pout¼Patm. Cavitation with
/¼ 10�4 occurs just before that the pressure falls below Pvap
at the vena contracta. No hysteretis behaviour is noticeable
when /¼ 10�4. Whatever the solid concentrations are
(/¼ 0, 10�5, 10�4), the desinence of cavitation takes place
around Q � 180 ll=s, that is, a cavitation number (from Eq.
(9)) r � 0.35. The expected cavitation number (calculated
from Eq. (10)) is rcav¼ 0.25.
Experiments were then conducted at /¼ 7� 10�5 by
varying the output pressure, and the results are compiled in
Fig. 10 via a r(Red) graph. Errors’ bars associated with r val-
ues are reported only for Pout¼ 0.60 bar and Pout¼ 1.52 bar
for a better reading of the data. The hysteretic behaviour is
weak and becomes unnoticeable when the fixed value of Pout
is increased. The desinence of the cavitation obeys the same
empirical relationship rexpdes � 0:12þ 5:10�3:Re
1=2d as with
pure DI water.
4. Discussion
As a matter of fact, cavitation observed here is a shear
type cavitation. Because of the sudden enlargement, a jet is
formed at the throat exit. Its border is a region of high shear,
where vortices develop. Because of centrifugal forces, the
pressure in the core of these vortices is somewhat smaller
than the ambient pressure. The pressure drop inside vortices
should be added to the conventional pressure drop due to the
change of device area, in order to estimate the desinent
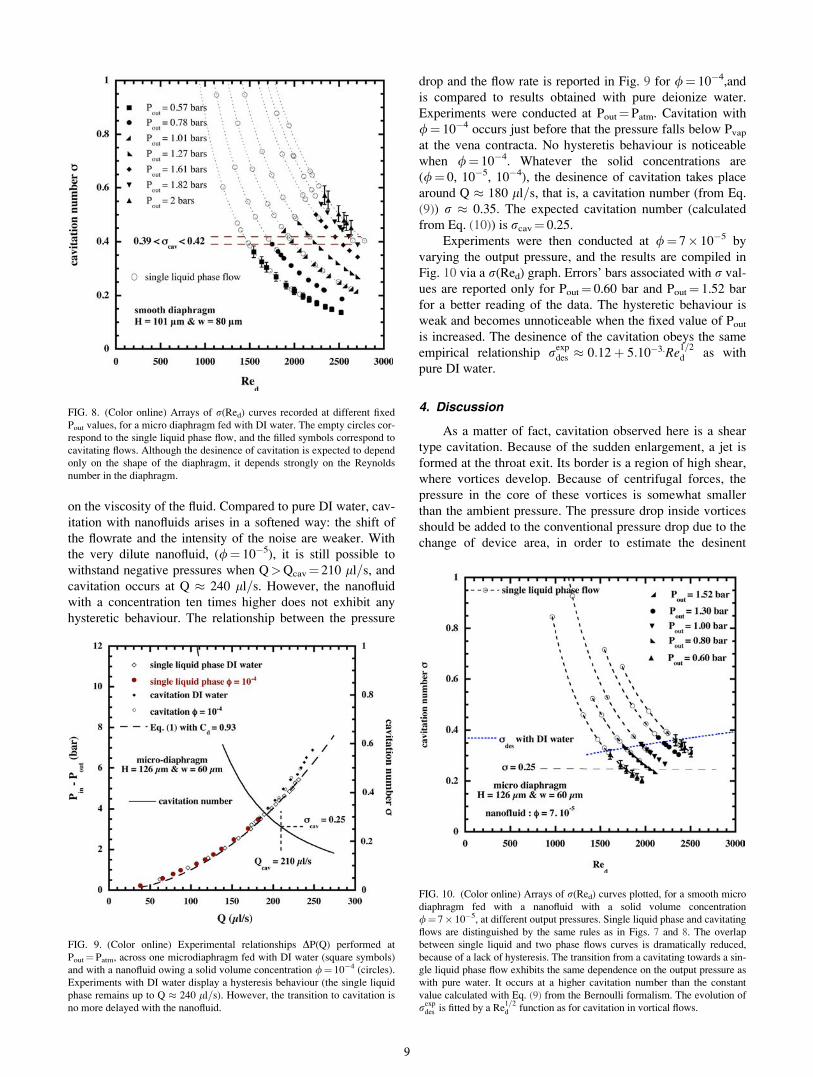
FIG. 8. (Color online) Arrays of r(Red) curves recorded at different fixed
Pout values, for a micro diaphragm fed with DI water. The empty circles cor-
respond to the single liquid phase flow, and the filled symbols correspond to
cavitating flows. Although the desinence of cavitation is expected to depend
only on the shape of the diaphragm, it depends strongly on the Reynolds
number in the diaphragm.
FIG. 9. (Color online) Experimental relationships DP(Q) performed at
Pout¼Patm, across one microdiaphragm fed with DI water (square symbols)
and with a nanofluid owing a solid volume concentration /¼ 10�4 (circles).
Experiments with DI water display a hysteresis behaviour (the single liquid
phase remains up to Q � 240 ll=s). However, the transition to cavitation is
no more delayed with the nanofluid.
FIG. 10. (Color online) Arrays of r(Red) curves plotted, for a smooth micro
diaphragm fed with a nanofluid with a solid volume concentration
/¼ 7� 10�5, at different output pressures. Single liquid phase and cavitating
flows are distinguished by the same rules as in Figs. 7 and 8. The overlap
between single liquid and two phase flows curves is dramatically reduced,
because of a lack of hysteresis. The transition from a cavitating towards a sin-
gle liquid phase flow exhibits the same dependence on the output pressure as
with pure water. It occurs at a higher cavitation number than the constant
value calculated with Eq. (9) from the Bernoulli formalism. The evolution of
rexpdes is fitted by a Re
1=2d function as for cavitation in vortical flows.
9
cavitation number. As a result, that number should be larger
than that given by Eq. (9) which is derived from Bernoulli
equation and which takes into account the only change in
area. Equation (9) shows that rcav can be considered as inde-
pendent of Red. However, Arndt31 has shown that, by consid-
ering the vortical structures, the incipient cavitation number
becomes Reynolds dependent. For laminar flow, Arndt’s
theory predicts a variation of the critical cavitation number
as Re1=2. Following Arndt’s conclusions, it may be conjec-
tured that the Reynolds dependency observed in Fig. 10 is
actually due to the coherent vortical structures which de-
velop in the two shear layers at the limit of the jet. The
results of our experiments agree with such a model but based
on the vanishing of cavitation, when the pressure in eddies
raises above Pvap. Vortical structures are related to the influ-
ence of the Reynolds number in the vanishing of cavitation.
It must be noticed that the vanishing of cavitating flows with
pure DI water does not display any random character, con-
trary to what is observed in the onset of cavitation.
However, the experimental evolution of rexpdes as a func-
tion of Red (Fig. 8) is rather linear for the device with
H¼ 101 lm and w¼ 80 lm, when experiments are per-
formed with pure DI water. Unfortunately that device has
broken before collecting a set of data with nanofluids and a
comparison is actually not possible. It should be noticed, for
that device, that the deviation from a Re1=2 evolution of rdes
is mainly the consequence of the data recorded at Re> 2300.
Cavitating flows are perhaps kept up for Re> 2300 and as
long as the flow does not recover a fully laminar regime.
It is generally stated, that submicron particles have no
measurable influence on the onset of cavitation.10 Gaseous
voids attached to their irregularities cannot grow up, unless
exposed to very high tensile strengths. Concerning pure DI
water, the application of Eq. (4), using the flow rates corre-
sponding to the onsets of cavitation, gives negative local
pressure values, which are in a good agreement with the
assumption of micrometer size nuclei. The anomalous effect
is that the presence of nano aggregates above a critical solid
concentration has lowered the nucleation threshold via
another mechanism that the classical growth of attached gas
bubbles around lonely particles. With these devices, the
onset of cavitation is almost the same as for water “filled to
the brim” with the large nuclei. The explanation we suggest
is that clusters of nanoparticles (a) are trapped in the core of
vortices; (b) interact with each other and; (c) grow up to
form aggregates of several micrometers in size, so that the
onset of cavitation is no more delayed.
Complementary experiments with micro venturis, which
are depicted below, were performed in order to confirm or
infirm that explanation, since the sheet cavitation usually
observed inside the venturi is free from high shear vortical
structures.
B. Micro venturi
1. De ionized water and output at atmosphericalpressure
Three micro venturis have been tested with DI water at
Pout¼Patm. Their hydraulic characteristics are summarized
in Table II. In these devices, the regular pressure losses
expected from the F(wo, wL, H) function are no more negli-
gible. As noticed above, plotting (Pin – Pout)=Q2 as a function
of 1=Q with the data recorded in the single liquid phase must
lead to a straight line, whose slope is related to F and whose
intersection with the vertical axis, when 1=Q! 0, is related
to Cv. For each device, in the single liquid phase, two flow
regimes are noticeable: below flow rates around 50–70 ll=s,
the slope is in a good agreement with the numerical data cal-
culated from Eq. (11); above flow rates around 50–70 ll=s,
there is a sharp increase of the slope, that is, a consequence
of a laminar separation of the liquid from the wall of the
channel downstream the throat. These deductions have been
confirmed by optical observations and will be discussed in a
forthcoming paper.
The previous equations related to venturis assume that
no separation occurs in the diffuser. Even though the flow is
separated, we assume that the decomposition of the pressure
losses as the sum of a linear and a quadratic terms is still
valid. The experimental values of parameter Fexp which is
found from the tuning procedure explained above is signifi-
cantly larger than that derived from Eq. (11) (see Table II)
and takes into account, to some extent, the separated nature
of the flow in the diffuser.
The data recorded for each venturi in the single liquid
phase, once laminar separation has occurred, are displayed in
Fig. 11, and the corresponding Cv and Fexp values are
reported in Table II. We get 0.74<Cv< 0.79 for the three
samples, with a constant Cv value that does not depend on
the Reynolds number Rev in the range of the flow rates under
consideration. As Fexp is greater than F nearby the transition
towards a cavitating flow regime, the Qcav value calculated
from Eq. (16) must be reconsidered. In Table II, we give the
semi-empirical Q�cav and r�cav values calculated from the Fexp
data obtained from the graphs in Fig. 11.
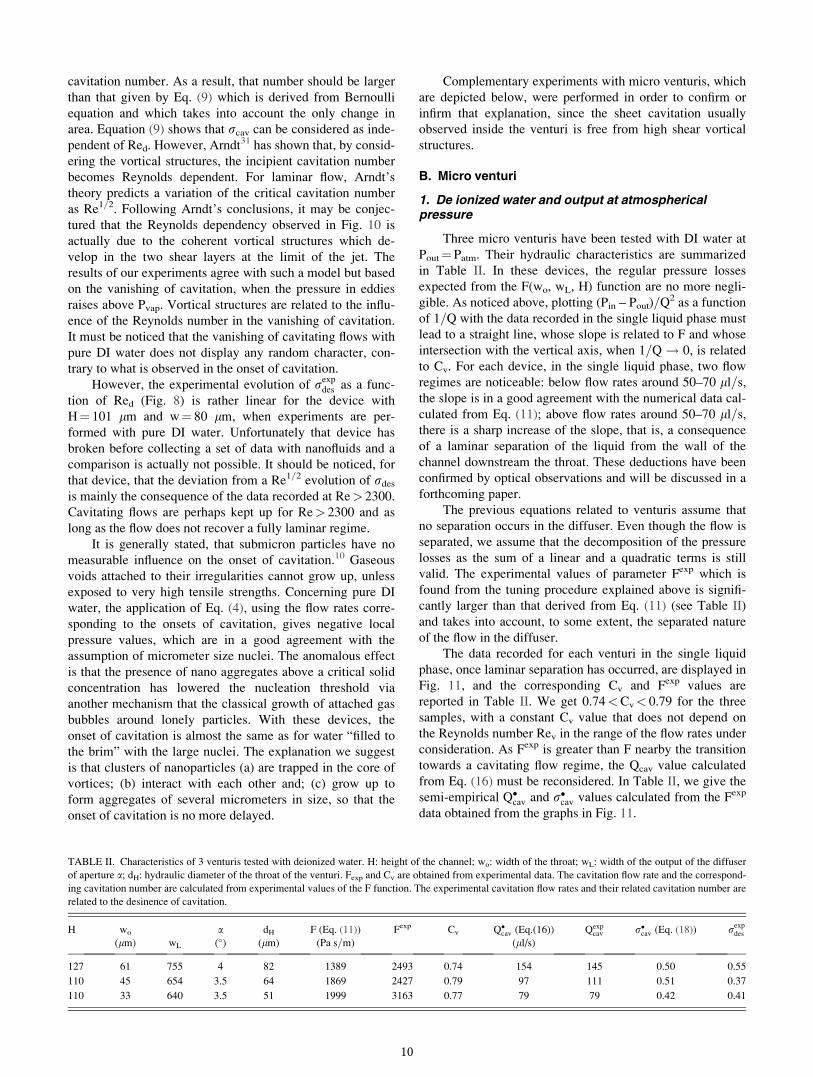
TABLE II. Characteristics of 3 venturis tested with deionized water. H: height of the channel; wo: width of the throat; wL: width of the output of the diffuser
of aperture a; dH: hydraulic diameter of the throat of the venturi. Fexp and Cv are obtained from experimental data. The cavitation flow rate and the correspond-
ing cavitation number are calculated from experimental values of the F function. The experimental cavitation flow rates and their related cavitation number are
related to the desinence of cavitation.
H wo a dH F (Eq. (11)) Fexp Cv Q�cav (Eq.(16)) Qexpcav r�cav (Eq. (18)) rexp
des
(lm) wL (�) (lm) (Pa s=m) (ll/s)
127 61 755 4 82 1389 2493 0.74 154 145 0.50 0.55
110 45 654 3.5 64 1869 2427 0.79 97 111 0.51 0.37
110 33 640 3.5 51 1999 3163 0.77 79 79 0.42 0.41
10
For all the devices under test, the liquid withstands high
flow rates without cavitating at Q > Q�cav which corresponds
to negative absolute pressures Po estimated from Eq. (15)
(with Fexp) to be ranging from �0.8 bar to �1.5 bar. The
transition to cavitating flow arises in a laminar regime, at
cavitation numbers around r¼ 0.25, well below the calcu-
lated rcav values. The sudden transition gives way to a drop
of the flow rate, more important for the device with the larger
throat and the larger diffuser aperture. Whatever the sizes of
the devices, a vapor attached cavity develops downstream
the throat of the venturi. Laminar separation is the conse-
quence of large negative pressure gradients present in the
diffuser. In such a case, cavitation nuclei from the main flow
are trapped in the recirculation region where they grow and
develop into an attached cavity. High frequency imaging
(that will be displayed in a forthcoming paper) has demon-
strated that the vapor sheet is unsteady, with a periodic shape
pulsation. When decreasing the inlet pressure, the size of the
vapor cavity is progressively reduced until it disappears,
unless an unsteady bubble filled with non-condensable gas
remains attached to the wall of the channel. The experimen-
tal desinence of cavitation is in a rather good agreement with
the Eqs. (16) and (18), when using Fexp.
The relationship DP(Q) is reported in Fig. 12 for the de-
vice with a¼ 4�. A hysteresis behaviour, similar to what was
observed with diaphragms, is present.
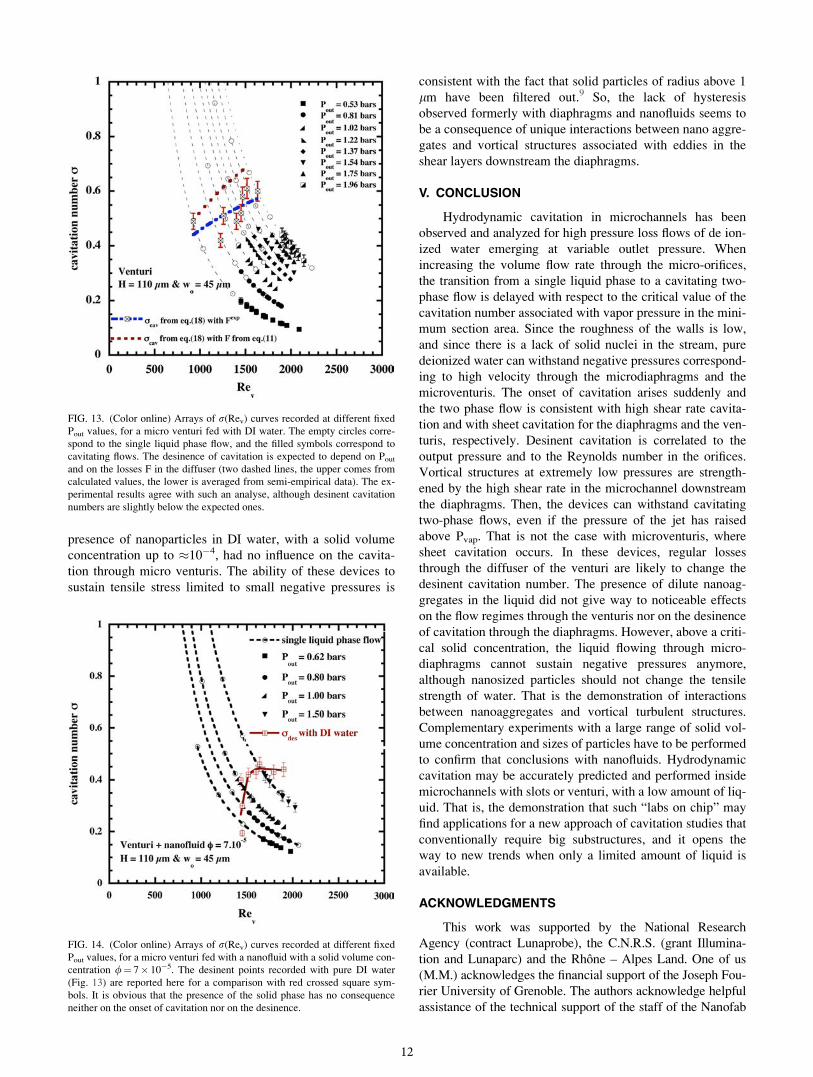
2. Variable output pressures
A set of data recorded at different output pressures with
the venturi wo¼ 45 lm and H¼ 110 lm, fed with deionized
water is displayed in Fig. 13, where the cavitation number
calculated from Eq. (17) is plotted as a function of the Reyn-
olds number in the throat of the venturi. The limits, expected
from Eq. (11), are represented by bold dashed curves calcu-
lated as well with the theoretical F value as with the experi-
mental one. As mentioned above, rcav is expected to depend
on Pout. Such a dependence is obvious, especially when
Pout<Patm. When decreasing the pressure drop and the flow
rate, cavitation stops at r values below the expected ones. It
must be noticed that it is rather difficult to state the vanishing
of cavitation at low output pressures, because of the large
size of the vapor cavity which may spread downstream the
diffuser.
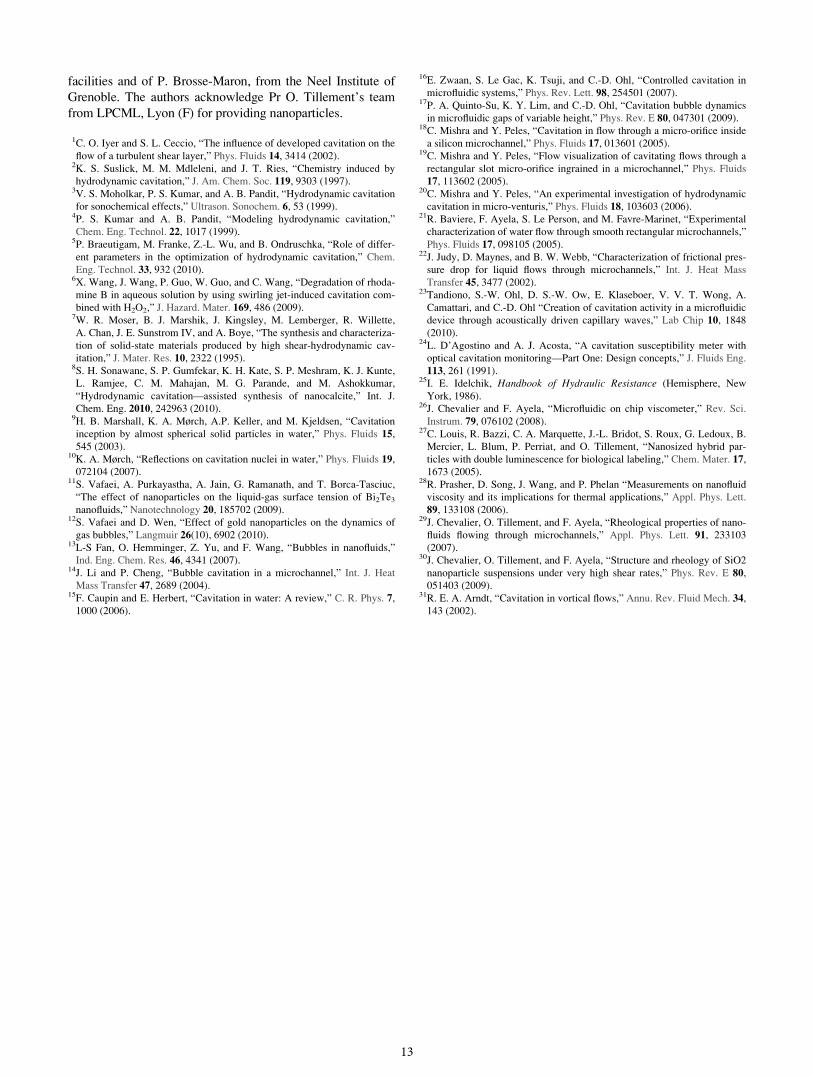
3. Cavitation of nanofluids
The same types of nanofluids as presented above have
been tested with the venturi H¼ 110 lm and wo¼ 45 lm.
The results are summarized in Fig. 14, and the similarity
with the results of Fig. 13, obtained with the same device but
with DI water, must be underlined. The presence of nanopar-
ticles in the liquid did not break the hysteresis phenomena
and did not change the transition from cavitating to single
liquid phase flow. The solid phase is of no influence, neither
in the threshold of the cavitation flow nor in the condensation
of vapor pockets.
4. Discussion
Downstream the throttle of the micro venturis, a cavita-
tion sheet grows from an attached cavity issue from laminar
separation of the flow from the walls. High speed camera
visualisations, which will be presented in a forthcoming pa-
per, will furnish more informations, about the bubbles shape
and its evolution. We confirm that supercavitation develops
when the pressure downstream the throat is reduced.20 The
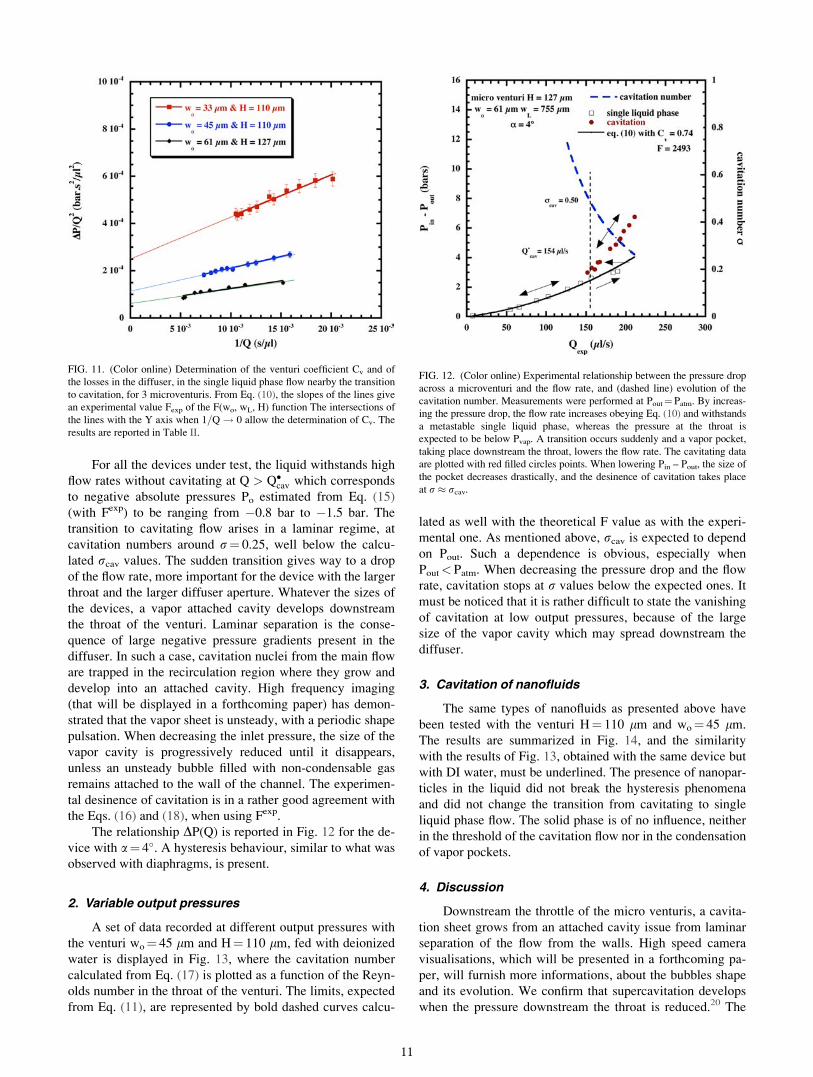
FIG. 11. (Color online) Determination of the venturi coefficient Cv and of
the losses in the diffuser, in the single liquid phase flow nearby the transition
to cavitation, for 3 microventuris. From Eq. (10), the slopes of the lines give
an experimental value Fexp of the F(wo, wL, H) function The intersections of
the lines with the Y axis when 1=Q! 0 allow the determination of Cv. The
results are reported in Table II.
FIG. 12. (Color online) Experimental relationship between the pressure drop
across a microventuri and the flow rate, and (dashed line) evolution of the
cavitation number. Measurements were performed at Pout¼Patm. By increas-
ing the pressure drop, the flow rate increases obeying Eq. (10) and withstands
a metastable single liquid phase, whereas the pressure at the throat is
expected to be below Pvap. A transition occurs suddenly and a vapor pocket,
taking place downstream the throat, lowers the flow rate. The cavitating data
are plotted with red filled circles points. When lowering Pin – Pout, the size of
the pocket decreases drastically, and the desinence of cavitation takes place
at r � rcav.
11
presence of nanoparticles in DI water, with a solid volume
concentration up to �10�4, had no influence on the cavita-
tion through micro venturis. The ability of these devices to
sustain tensile stress limited to small negative pressures is
consistent with the fact that solid particles of radius above 1
lm have been filtered out.9 So, the lack of hysteresis
observed formerly with diaphragms and nanofluids seems to
be a consequence of unique interactions between nano aggre-
gates and vortical structures associated with eddies in the
shear layers downstream the diaphragms.
V. CONCLUSION
Hydrodynamic cavitation in microchannels has been
observed and analyzed for high pressure loss flows of de ion-
ized water emerging at variable outlet pressure. When
increasing the volume flow rate through the micro-orifices,
the transition from a single liquid phase to a cavitating two-
phase flow is delayed with respect to the critical value of the
cavitation number associated with vapor pressure in the mini-
mum section area. Since the roughness of the walls is low,
and since there is a lack of solid nuclei in the stream, pure
deionized water can withstand negative pressures correspond-
ing to high velocity through the microdiaphragms and the
microventuris. The onset of cavitation arises suddenly and
the two phase flow is consistent with high shear rate cavita-
tion and with sheet cavitation for the diaphragms and the ven-
turis, respectively. Desinent cavitation is correlated to the
output pressure and to the Reynolds number in the orifices.
Vortical structures at extremely low pressures are strength-
ened by the high shear rate in the microchannel downstream
the diaphragms. Then, the devices can withstand cavitating
two-phase flows, even if the pressure of the jet has raised
above Pvap. That is not the case with microventuris, where
sheet cavitation occurs. In these devices, regular losses
through the diffuser of the venturi are likely to change the
desinent cavitation number. The presence of dilute nanoag-
gregates in the liquid did not give way to noticeable effects
on the flow regimes through the venturis nor on the desinence
of cavitation through the diaphragms. However, above a criti-
cal solid concentration, the liquid flowing through micro-
diaphragms cannot sustain negative pressures anymore,
although nanosized particles should not change the tensile
strength of water. That is the demonstration of interactions
between nanoaggregates and vortical turbulent structures.
Complementary experiments with a large range of solid vol-
ume concentration and sizes of particles have to be performed
to confirm that conclusions with nanofluids. Hydrodynamic
cavitation may be accurately predicted and performed inside
microchannels with slots or venturi, with a low amount of liq-
uid. That is, the demonstration that such “labs on chip” may
find applications for a new approach of cavitation studies that
conventionally require big substructures, and it opens the
way to new trends when only a limited amount of liquid is
available.
ACKNOWLEDGMENTS
This work was supported by the National Research
Agency (contract Lunaprobe), the C.N.R.S. (grant Illumina-
tion and Lunaparc) and the Rhone – Alpes Land. One of us
(M.M.) acknowledges the financial support of the Joseph Fou-
rier University of Grenoble. The authors acknowledge helpful
assistance of the technical support of the staff of the Nanofab
FIG. 13. (Color online) Arrays of r(Rev) curves recorded at different fixed
Pout values, for a micro venturi fed with DI water. The empty circles corre-
spond to the single liquid phase flow, and the filled symbols correspond to
cavitating flows. The desinence of cavitation is expected to depend on Pout
and on the losses F in the diffuser (two dashed lines, the upper comes from
calculated values, the lower is averaged from semi-empirical data). The ex-
perimental results agree with such an analyse, although desinent cavitation
numbers are slightly below the expected ones.
FIG. 14. (Color online) Arrays of r(Rev) curves recorded at different fixed
Pout values, for a micro venturi fed with a nanofluid with a solid volume con-
centration /¼ 7� 10�5. The desinent points recorded with pure DI water
(Fig. 13) are reported here for a comparison with red crossed square sym-
bols. It is obvious that the presence of the solid phase has no consequence
neither on the onset of cavitation nor on the desinence.
12
facilities and of P. Brosse-Maron, from the Neel Institute of
Grenoble. The authors acknowledge Pr O. Tillement’s team
from LPCML, Lyon (F) for providing nanoparticles.
1C. O. Iyer and S. L. Ceccio, “The influence of developed cavitation on the
flow of a turbulent shear layer,” Phys. Fluids 14, 3414 (2002).2K. S. Suslick, M. M. Mdleleni, and J. T. Ries, “Chemistry induced by
hydrodynamic cavitation,” J. Am. Chem. Soc. 119, 9303 (1997).3V. S. Moholkar, P. S. Kumar, and A. B. Pandit, “Hydrodynamic cavitation
for sonochemical effects,” Ultrason. Sonochem. 6, 53 (1999).4P. S. Kumar and A. B. Pandit, “Modeling hydrodynamic cavitation,”
Chem. Eng. Technol. 22, 1017 (1999).5P. Braeutigam, M. Franke, Z.-L. Wu, and B. Ondruschka, “Role of differ-
ent parameters in the optimization of hydrodynamic cavitation,” Chem.
Eng. Technol. 33, 932 (2010).6X. Wang, J. Wang, P. Guo, W. Guo, and C. Wang, “Degradation of rhoda-
mine B in aqueous solution by using swirling jet-induced cavitation com-
bined with H2O2,” J. Hazard. Mater. 169, 486 (2009).7W. R. Moser, B. J. Marshik, J. Kingsley, M. Lemberger, R. Willette,
A. Chan, J. E. Sunstrom IV, and A. Boye, “The synthesis and characteriza-
tion of solid-state materials produced by high shear-hydrodynamic cav-
itation,” J. Mater. Res. 10, 2322 (1995).8S. H. Sonawane, S. P. Gumfekar, K. H. Kate, S. P. Meshram, K. J. Kunte,
L. Ramjee, C. M. Mahajan, M. G. Parande, and M. Ashokkumar,
“Hydrodynamic cavitation—assisted synthesis of nanocalcite,” Int. J.
Chem. Eng. 2010, 242963 (2010).9H. B. Marshall, K. A. Mørch, A.P. Keller, and M. Kjeldsen, “Cavitation
inception by almost spherical solid particles in water,” Phys. Fluids 15,
545 (2003).10K. A. Mørch, “Reflections on cavitation nuclei in water,” Phys. Fluids 19,
072104 (2007).11S. Vafaei, A. Purkayastha, A. Jain, G. Ramanath, and T. Borca-Tasciuc,
“The effect of nanoparticles on the liquid-gas surface tension of Bi2Te3
nanofluids,” Nanotechnology 20, 185702 (2009).12S. Vafaei and D. Wen, “Effect of gold nanoparticles on the dynamics of
gas bubbles,” Langmuir 26(10), 6902 (2010).13L-S Fan, O. Hemminger, Z. Yu, and F. Wang, “Bubbles in nanofluids,”
Ind. Eng. Chem. Res. 46, 4341 (2007).14J. Li and P. Cheng, “Bubble cavitation in a microchannel,” Int. J. Heat
Mass Transfer 47, 2689 (2004).15F. Caupin and E. Herbert, “Cavitation in water: A review,” C. R. Phys. 7,
1000 (2006).
16E. Zwaan, S. Le Gac, K. Tsuji, and C.-D. Ohl, “Controlled cavitation in
microfluidic systems,” Phys. Rev. Lett. 98, 254501 (2007).17P. A. Quinto-Su, K. Y. Lim, and C.-D. Ohl, “Cavitation bubble dynamics
in microfluidic gaps of variable height,” Phys. Rev. E 80, 047301 (2009).18C. Mishra and Y. Peles, “Cavitation in flow through a micro-orifice inside
a silicon microchannel,” Phys. Fluids 17, 013601 (2005).19C. Mishra and Y. Peles, “Flow visualization of cavitating flows through a
rectangular slot micro-orifice ingrained in a microchannel,” Phys. Fluids
17, 113602 (2005).20C. Mishra and Y. Peles, “An experimental investigation of hydrodynamic
cavitation in micro-venturis,” Phys. Fluids 18, 103603 (2006).21R. Baviere, F. Ayela, S. Le Person, and M. Favre-Marinet, “Experimental
characterization of water flow through smooth rectangular microchannels,”
Phys. Fluids 17, 098105 (2005).22J. Judy, D. Maynes, and B. W. Webb, “Characterization of frictional pres-
sure drop for liquid flows through microchannels,” Int. J. Heat Mass
Transfer 45, 3477 (2002).23Tandiono, S.-W. Ohl, D. S.-W. Ow, E. Klaseboer, V. V. T. Wong, A.
Camattari, and C.-D. Ohl “Creation of cavitation activity in a microfluidic
device through acoustically driven capillary waves,” Lab Chip 10, 1848
(2010).24L. D’Agostino and A. J. Acosta, “A cavitation susceptibility meter with
optical cavitation monitoring—Part One: Design concepts,” J. Fluids Eng.
113, 261 (1991).25I. E. Idelchik, Handbook of Hydraulic Resistance (Hemisphere, New
York, 1986).26J. Chevalier and F. Ayela, “Microfluidic on chip viscometer,” Rev. Sci.
Instrum. 79, 076102 (2008).27C. Louis, R. Bazzi, C. A. Marquette, J.-L. Bridot, S. Roux, G. Ledoux, B.
Mercier, L. Blum, P. Perriat, and O. Tillement, “Nanosized hybrid par-
ticles with double luminescence for biological labeling,” Chem. Mater. 17,
1673 (2005).28R. Prasher, D. Song, J. Wang, and P. Phelan “Measurements on nanofluid
viscosity and its implications for thermal applications,” Appl. Phys. Lett.
89, 133108 (2006).29J. Chevalier, O. Tillement, and F. Ayela, “Rheological properties of nano-
fluids flowing through microchannels,” Appl. Phys. Lett. 91, 233103
(2007).30J. Chevalier, O. Tillement, and F. Ayela, “Structure and rheology of SiO2
nanoparticle suspensions under very high shear rates,” Phys. Rev. E 80,
051403 (2009).31R. E. A. Arndt, “Cavitation in vortical flows,” Annu. Rev. Fluid Mech. 34,
143 (2002).
13