wave overtopping and rubble mound stability under combined loading of waves and current
TRANSCRIPT

Wave Overtopping and Rubble Mound Stability under Combined Loading of Waves and Current
Marcel R.A. van Gent*, Ivo van der Werf and Sepehr Eslami Arab
Deltares | Delft Hydraulics, The Netherlands
Abstract: Coastal structures such as breakwaters are usually studied under wave loading only. However, at several locations also a current is present. For instance, breakwaters along intake and outfall channels of power plants and desalination plants, or structures in regions with important tidal currents, experience wave loading that can be affected by currents. Nevertheless, wave overtopping and rubble mound stability are usually studied under wave loading only; the effects of waves on wave overtopping and rock slope stability have been summarised in many empirical design formulae. None of the existing empirical relations account for the effects of currents on the wave loading and consequently on wave overtopping and rock slope stability. The effects of wave-current interaction on wave overtopping and rubble mound stability has not been quantified, other than that for mild currents these processes are dominated by waves. Therefore, the present study is focussed on wave loading in combination with a strong current. This study is based on physical model tests in a wave-current basin. The results show to what extent wave overtopping and rubble mound stability are affected by wave loading in combination with a current. Wave overtopping and the damage to rock slopes generally reduce due to the presence of a current compared to the situation without a current.
Key words: Physical Model Tests; Rock Slopes; Breakwaters, Intake and Outfall Structures; Overtopping; Stability; Waves, Current * Corresponding author. Email: [email protected]
1. Introduction Wave overtopping and rubble mound stability are
usually studied under wave loading only. The effects of waves on wave overtopping and rock slope stability have been summarised in many empirical design formulae (e.g. CEM-2002, Rock Manual-2007, Eurotop Manual-2008, Van der Meer, 1988, Van Gent et al. 2002, 2003, 2004). None of the existing empirical relations account for the effects of currents on the wave loading and consequently on wave overtopping and rock slope stability. The effects of wave-current interaction on wave overtopping and rubble mound stability has not been quantified, other than that for mild currents these processes are dominated by waves. Therefore, the present study is focussed on more significant currents that are in the range of 1m/s to 2m/s in prototype. This study is based on physical model tests in a wave-current basin of Deltares in Delft, in which a current is generated along structures. First, wave overtopping is studied for an impermeable structure. Secondly, a rubble mound structure is studied for wave overtopping and stability.
2. Physical Model Tests Within the 50mx50m wave basin of Deltares | Delft
Hydraulics, a structure with a length of 26.4m was constructed. A current was generated along the structure
over the entire length of 26.4m and width of 7m. See Fig.1 for a schematised overview of one of the test set-ups.
Wave board
Structure
Testsection
OutflowInflow
Wave guiding walls
Wave directions
26.4 m
7 m
5 m
Figure 1. Overview of test set-up.
Each wave condition has been tested with a mean flow of 0m/s, 0.175m/s and 0.35m/s (model scale). Each mean flow is combined with three wave directions: perpendicular, 30° in the upstream direction (opposing current) and 30° in the downstream direction (following current). For each wave direction wave guiding walls were placed over the first 5 m, before the section with the mean flow (see Fig.1). The location of the test sections depended on the wave direction. The wave height has been varied while the undisturbed wave steepness has been kept constant.

Figure 2. Overview of the test set-up with current only; Upper left: Downstream side; Mid left and lower left: Inflow; Right: Details of inflow. Fig.2 shows pictures of the test facility with an overview and details of the system of inflow and outflow. The inflow structure (see Fig.3) consists of two major systems: a pumping system and a weir system. Five pumps pump water into a stilling basin, then, water flows underneath a wall, streams over a system of weirs, and eventually through a number of barrier boxes into the wave basin. This system damps turbulence and entrains air packets. Each of the eight adjustable weirs is regulated such that the flow is distributed evenly over the entire 7m. At the outflow boundary, a system of four weirs is placed. The outflow system is calibrated for the correct water level (0.4m in all tests) in combination with a flow that is evenly distributed over the 7m width without generating large-eddies.
Figure 3. Overview of the inflow system.
Figure 4. Overview of the outflow system.

Two structure geometries were tested: a smooth impermeable 1:4 slope and a rough permeable 1:4 rock slope. For the impermeable slope only wave overtopping was measured. The freeboard was 0.105m. The crest width was 0.1m. For the permeable rock slope both wave overtopping and rock slope stability were studied. The structure consisted of an armour layer with Dn50 = 0.018m with a layer thickness of 0.048m, a filter layer with Dn50 = 0.008m with a layer thickness of 0.024m and an impermeable core. The crest had a width of 0m. Two freeboards were used: 0.18m (i.e. mostly non-overtopped) and 0.04m (overtopping measurements).
Waves were measured with resistance type wave gauges and directional wave gauges (a combination of a wave gauge and an EMF, Electro-Magnetic Flow meter) close the wave board in the region without a current (between wave guiding walls), close to the toe of the structure, and at several other locations within the wave basin (e.g. upstream and downstream). Velocities were measured with EMFs in two transects to check flow distribution over the basin; one upstream and one in the middle of the basin. Calibration of the current was performed such that differences of less than 10% between individual positions at the same vertical position were considered acceptable. These differences in velocities are expected to cause measurement errors in overtopping discharges and damage to rock slopes of one order of magnitude lower, thus less than 1%.
Overtopping was measured by collecting the overtopped water in bins. The overtopping bins were equipped with water level gauges. The overtopping volume divided by the duration of the test provides the mean overtopping discharge.
Stability was measured at four positions, of which two were used per wave angle. One of these two test sections was for overtopping measurements at a relatively low crest while the second test section was for stability measurements with a higher crest. The tests sections had a width of 1m. Damage was measured by measuring six profiles before and after each test. The mean profiles were used to obtain the area that is eroded (AE) to determined the values for S, characterising the damage: S = AE / Dn50
2. Fig.5 (fourth panel) shows a picture in front of a test section for stability measurements and in the background a test section for wave overtopping measurements.
The test programme for the wave overtopping tests consisted of three wave directions (-30°, 0°, 30°), three currents (0, 0.175m/s and 0.35m/s) and a maximum of eight wave heights (Hs = 0.04m to 0.011m). The wave heights for which clearly no or extreme wave overtopping discharges were expected were not performed. In all tests, the wave steepness at the wave board was sp = 0.030 (sm-1,0 = 0.036), the water depth was 0.4m, a JONSWAP wave spectrum was used, and each test consisted of 1000 waves.
The test programme for the rubble mound stability tests consisted of three wave directions (-30°, 0°, 30°), two currents (0 and 0.35m/s) and a maximum of ten wave heights (Hs = 0.04m to 0.014m). In the tests the wave steepness at the wave board was sp = 0.03 (sm-1,0 = 0.036), the water depth was 0.4m, a JONSWAP wave spectrum was used, and each test consisted of 1000 waves.
Figure 5. Rock slope tests (first panel: topview with opposing current; second panel: inflow with opposing current; third panel: outflow with following current; fourth panel: detail of test sections.

The current affects the wave direction at the structure. For the tested conditions the current of 0.35m/s changes the wave angle from 30° at the wave board to approximately 25° at the toe for the opposing current, and to approximately 35° at the toe for the following current. For the tested conditions the current of 0.175m/s changes the wave angle from 30° at the wave board to about 27.5° at the toe for the opposing current and to about 32.5° at the toe for the following current.
3. Wave Overtopping on Smooth Slopes First, the wave overtopping discharges are presented for the impermeable 1:4 slope. Figs. 6, 7 and 8 show graphs for each of the wave directions. In these graphs, the wave heights refer to those that are measured in the section that is not affected by the current. Similar graphs can be made with the wave height at the toe of the structure; those values are slightly different but the same trends can be observed (which means that the conclusions do not depend on which wave height location is used).
Fig.6 shows the results for perpendicular wave attack (wave angle at the structure is not affected by the current, although the energy transport angle is affected). This figure shows that the measured overtopping discharges for the tests including a current are slightly smaller than for the tests without a current. This factor is about 0.75 for the tests with u=0.175m/s and about 0.7 for the tests with u=0.35m/s.
Fig.7 shows the results for oblique wave attack (30° to the normal) with following current. This figure shows that the measured overtopping discharges for the tests including a current are somewhat lower (for higher wave heights) compared to the tests without a current. This factor is about 0.9 for the tests with u=0.175m/s and about 0.75 for the tests with u=0.35m/s. For the strongest current (u=0.35m/s) the wave angle at the toe of the structure is increased from 30° to 35°. Using the empirical relation by De Waal and Van der Meer (1992) for the influence of angular wave attack (γβ = 1-0.0033·β with β ≤80°), for the present test conditions a reduction in overtopping is expected with a factor of about 0.9 due to the change in wave direction from 30° to 35°. Due to the following current the wavelength increases compared to the wavelength without a current. For the present test conditions the wave steepness s reduces with a factor of about 0.8 for the current with u=0.35m/s. Using the reduced wave steepness in the wave overtopping formula by TAW (2002), the increase in overtopping discharge due to an increased wavelength is about 1.2. This means that based on empirical formulae, the influence of an increased wavelength is larger than the influence of an increased angle of wave direction; altogether, leading to an increased amount of wave overtopping (factor 1.1). However, the test results show for the higher wave heights a reduced amount of overtopping (about 0.75 for u=0.35m/s). This indicates that besides the influence of a current on the wave angle and wavelength,
there is an additional influence of the current on wave overtopping. This could be due to effects of the current on the wave motion on the slope.
0 0.01 0.02 0.03 0.04 0.05 0.06 0.07 0.08 0.09 0.1 0.11 0.120
0.1
0.2
0.3
0.4
0.5
0.6
0.7
0.8
Hm0
(m)
q (l/
s/m
)
U=0 m/sU=0.175 m/sU=0.35 m/s
Figure 6. Overtopping for perpendicular wave attack (smooth impermeable slope).
0 0.01 0.02 0.03 0.04 0.05 0.06 0.07 0.08 0.09 0.1 0.11 0.120
0.1
0.2
0.3
0.4
0.5
0.6
0.7
0.8
Hm0
(m)
q (l/
s/m
)
U=0 m/sU=0.175 m/sU=0.35 m/s
Figure 7. Overtopping for a wave direction of 30° and a following current (smooth impermeable slope).
0 0.01 0.02 0.03 0.04 0.05 0.06 0.07 0.08 0.09 0.1 0.11 0.120
0.1
0.2
0.3
0.4
0.5
0.6
0.7
0.8
Hm0
(m)
q (l/
s/m
)
U=0 m/sU=0.175 m/sU=0.35 m/s
Figure 8. Overtopping for a wave direction of 30° and an opposing current (smooth impermeable slope). Fig.8 shows the results for oblique wave attack (30° compared to perpendicular wave attack) with opposing
current. This figure shows that the measured overtopping discharges for the tests including a current are somewhat lower (for higher wave heights) compared to the tests without a current. This factor is about 0.75 for the tests with u=0.175m/s and about 0.65 for the tests with u=0.35m/s. For the strongest current (u=0.35m/s) the wave angle at the toe of the structure is decreased from 30° to 25°. For the present test conditions, an increase in overtopping is expected with a factor of about 1.05 due to the change in wave direction from 30° to 25°. Due to the opposing current, the wavelength decreases compared to the wavelength without a current. For the present test conditions the wave steepness s increases with a factor of about 1.25 for the current with u=0.35m/s. Using the reduced wave steepness in the wave overtopping formula by TAW (2002), the decrease in overtopping discharge due to a reduced wavelength is about 0.9. This means that based on empirical formulae the influence of a reduced wavelength is larger than the influence of a reduced angle of wave attack, altogether leading to a reduced amount of wave overtopping (about a factor 0.95). The test results show for the higher wave heights a reduced amount of overtopping with a factor of about 0.65 for u=0.35m/s. This again indicates that besides the influence of a current on the wave angle and on the wavelength, there is an additional influence of the current.
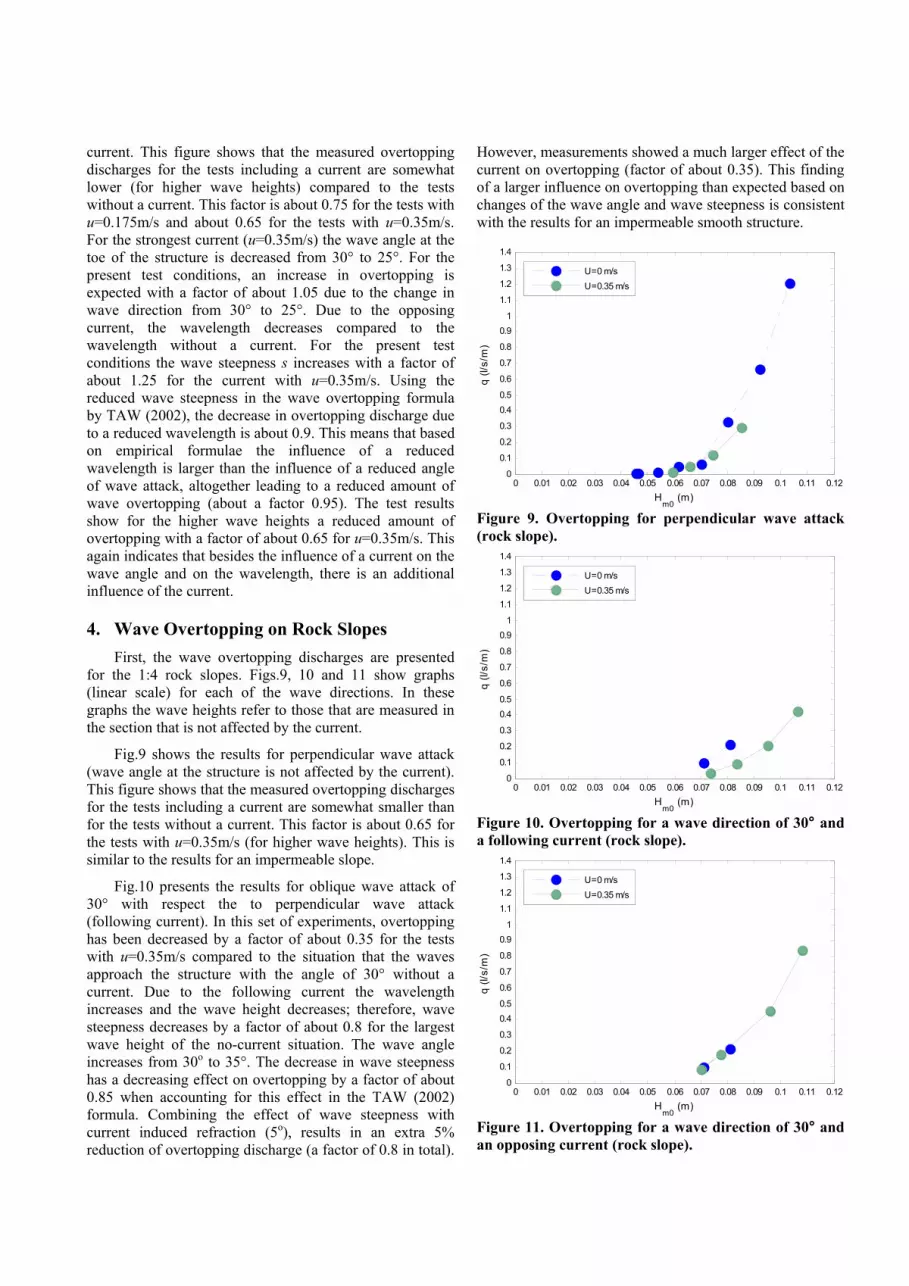
4. Wave Overtopping on Rock Slopes First, the wave overtopping discharges are presented for the 1:4 rock slopes. Figs.9, 10 and 11 show graphs (linear scale) for each of the wave directions. In these graphs the wave heights refer to those that are measured in the section that is not affected by the current.
Fig.9 shows the results for perpendicular wave attack (wave angle at the structure is not affected by the current). This figure shows that the measured overtopping discharges for the tests including a current are somewhat smaller than for the tests without a current. This factor is about 0.65 for the tests with u=0.35m/s (for higher wave heights). This is similar to the results for an impermeable slope.
Fig.10 presents the results for oblique wave attack of 30° with respect the to perpendicular wave attack (following current). In this set of experiments, overtopping has been decreased by a factor of about 0.35 for the tests with u=0.35m/s compared to the situation that the waves approach the structure with the angle of 30° without a current. Due to the following current the wavelength increases and the wave height decreases; therefore, wave steepness decreases by a factor of about 0.8 for the largest wave height of the no-current situation. The wave angle increases from 30o to 35°. The decrease in wave steepness has a decreasing effect on overtopping by a factor of about 0.85 when accounting for this effect in the TAW (2002) formula. Combining the effect of wave steepness with current induced refraction (5o), results in an extra 5% reduction of overtopping discharge (a factor of 0.8 in total).
However, measurements showed a much larger effect of the current on overtopping (factor of about 0.35). This finding of a larger influence on overtopping than expected based on changes of the wave angle and wave steepness is consistent with the results for an impermeable smooth structure.
0 0.01 0.02 0.03 0.04 0.05 0.06 0.07 0.08 0.09 0.1 0.11 0.120
0.1
0.2
0.3
0.40.5
0.6
0.7
0.8
0.91
1.1
1.2
1.3
1.4
Hm0
(m)q
(l/s/
m)
U=0 m/sU=0.35 m/s
Figure 9. Overtopping for perpendicular wave attack (rock slope).
0 0.01 0.02 0.03 0.04 0.05 0.06 0.07 0.08 0.09 0.1 0.11 0.120
0.1
0.2
0.3
0.40.5
0.6
0.7
0.8
0.91
1.1
1.2
1.3
1.4
Hm0
(m)
q (l/
s/m
)
U=0 m/sU=0.35 m/s
Figure 10. Overtopping for a wave direction of 30° and a following current (rock slope).
0 0.01 0.02 0.03 0.04 0.05 0.06 0.07 0.08 0.09 0.1 0.11 0.120
0.1
0.2
0.3
0.40.5
0.6
0.7
0.8
0.91
1.1
1.2
1.3
1.4
Hm0
(m)
q (l/
s/m
)
U=0 m/sU=0.35 m/s
Figure 11. Overtopping for a wave direction of 30° and an opposing current (rock slope).

Fig.11 presents the results for oblique wave attack of 30o with the opposing current. The measurements showed almost no change in overtopping discharge in the presence of the opposing current. In the present experiment, the wave angle changes about 5° and increase the wave steepness by a factor of about 1.25. According to the TAW (2002) formulation, the increased wave steepness results in an increase on wave overtopping by a factor of 1.15, and the change in wave angle (from 30° to 25°) increases wave overtopping, altogether leading to a factor of 1.2. However, the measurements indicate no change in overtopping for the tests with a strong opposing current, although this is based on only a two test results.
An additional test series was performed with a higher wave steepness (sp=0.045 compared to sp=0.03). Fig.12 shows the results for the tests with and without opposing current (u=0.35m/s). The tests showed a relatively large reduction of wave overtopping discharge (a factor of about 0.7) in presence of a current (for the higher wave height). The increase in the wave steepness due to the opposing current, according to the TAW (2002) formula, results in a decrease of overtopping by a factor of 0.9. This value underestimates the value shown in the tests. Although the test series with a lower wave steepness showed no change of overtopping in presence of an opposing current, increasing the wave steepness results in a comparatively larger reduction of the overtopping discharge in the presence of an opposing current.
0 0.01 0.02 0.03 0.04 0.05 0.06 0.07 0.08 0.09 0.1 0.11 0.120
0.1
0.2
0.3
0.40.5
0.6
0.7
0.8
0.91
1.1
1.2
1.3
1.4
Hm0
(m)
q (l/
s/m
)
U=0 m/sU=0.35 m/s
Figure 12. Overtopping for a wave direction of 30°, an opposing current and a higher wave steepness (rock slope).
5. Stability of Rock Slopes The effect of combined loading of waves and current on stability of rock slopes is considered next. Fig.13 shows an example of a rock slope test section before a test. Figs. 14, 15 and 16 show damage level S = AE / Dn50
2 for three different wave directions (perpendicular wave to the structure, 30° and -30° relative to the structure normal), against measured wave height.
Figure 13. Example of a test section (1:4 slope). Fig.14 shows the damage level when waves approach the structure perpendicular in the presence of a current (u=0.35m/s) and without a current. The results show a reduction of damage in the presence of a current by a factor of 0.65 (for the higher wave heights).
Fig.15 shows the results of the tests with oblique wave attack to the structure (30°) without a current and a following current with u=0.35m/s. The experiments show a reduction of the damage level by a factor of about 0.7 for the largest wave height. For lower wave heights, some of the test results show more erosion for the tests including a current. The following current causes the waves to have a smaller wave steepness (larger wavelength and a smaller wave height). For the largest wave height, the wave steepness is reduced by a factor of 0.8, which would result in a decrease of damage level by a factor of 0.95 (according to the stability formula by Van der Meer, 1988, or the modified version by Van Gent et al. 2003, 2004). A change in the wave angle due to wave-current interaction results in a reduction of damage level by a factor of 0.73 (using the influence of the wave angle as described by Wolters and Van Gent, 2010). In total, a factor of 0.7 in the damage level is expected based on existing formulations for the wave loading, which agrees with the measured reduction of 0.7 in the presence of a current. This indicates that by taking into account the effects of a current on the wave characteristic it would have been possible to predict the damage level. The following current has a stabilizing effect on the maximum damage level. For the lower wave heights, the current leads to more damage, while based on the modified wave loading a reduction of damage by a factor of 0.55 would be expected.
Fig.16 shows the results of tests with oblique waves approaching the structure (-30°) without a current and with an opposing current (u=0.35m/s). In these tests, a reduction of damage by a factor of 0.9 for the largest wave was observed. For lower wave heights, some of the test results show more erosion for the tests including a current. The opposing current changes the wave steepness (wavelength and wave height). Based on the existing formulations, a increase in the level of damage by a factor of 1.08 would be expected based on changes of wave steepness. The wave

0.04 0.05 0.06 0.07 0.08 0.09 0.1 0.11 0.120123456789
10111213141516
Hm0
(m)
S
U=0 m/sU=0.35 m/s
Figure 14. Damage level for perpendicular wave attack (rock slope).
0.04 0.05 0.06 0.07 0.08 0.09 0.1 0.11 0.120123456789
10111213141516
Hm0
(m)
S
U=0 m/sU=0.35 m/s
Figure 15. Damage level for a wave direction of 30° and a following current (rock slope).
0.04 0.05 0.06 0.07 0.08 0.09 0.1 0.11 0.120123456789
10111213141516
Hm0
(m)
S
U=0 m/sU=0.35 m/s
Figure 16. Damage level for a wave direction of 30° and an opposing current (rock slope).
angle decreases due to opposing current which results in an increase of damage level by a factor of 1.23 (using the formulation by Wolters and Van Gent, 2010) which, in addition to the effect of wave steepness, indicates an increase of the damage level by a factor of 1.3. However, for the largest wave height the experiments show 10% more damage for the tests without a current. This means that in
this case, the opposing current has an additional effect on stability of the rock armour layer, in addition to its effect on wave characteristics (wave angle and wavelength). This extra effect is a stabilizing factor (for the largest waves) due to the current.
Thus, similar to the results for perpendicular wave attack and for the following current, also for the opposing current, the current reduces the damage levels (for the higher wave heights) compared to the tests without a current. In the tests with a following current, the stabilizing effect of a current can be expected through wave characteristic changes. In the other two cases, the observed differences are due to apparent additional effects of the current.
Fig.17 shows the results of an additional set of experiments with a larger wave steepness (sp=0.045 and an opposing current). The opposing current causes an extra increase in the wave steepness by a factor of 1.25. The change in wave steepness and wave height results in an increase of damage based on stability formulations by a factor of 1.08. The 5o reduction in the wave angle due to an opposing current, results in an increase of damage level by a factor of 1.2 (using the formulation by Wolters and Van Gent, 2010). In total, an increase by a factor of 1.3 is expected. However, the tests show a decrease of the damage level by a factor of about 0.7 for the tests with u=0.35m/s. This result is consistent with the previous test series with a lower steepness (sp=0.03) and an opposing current. This shows that for a larger wave steepness the damage decreases if an opposing current is present, even for the smaller wave heights.
0.04 0.05 0.06 0.07 0.08 0.09 0.1 0.11 0.12 0.13 0.14 0.150123456789
10111213141516
Hm0
(m)
S
U=0 m/sU=0.35 m/s
Figure 17. Damage level for a wave direction of 30°, opposing current and higher wave steepness (rock slope).
Analysis of the damage profiles shows that the location of the damage is not significantly different in the tests including a current; the locations of accretion and erosion within a cross-section are more or less similar. However, long-shore transport of material was observed for the tests including a current.

In the above figures and analysis, the wave height values used are the measured wave heights at a position where no current exists (in front of the wave paddle). Applying the wave height at the toe of the structure (where the waves are affected by current), shows more or less the same trend in the damage levels except for the following current for the condition shown in Fig.15. For the following current, also for the highest wave height, the damage level increased in the presence of current comparing to the no current situation.
6. Discussion Tests were performed to investigate the effect of waves in combination with a current, on wave overtopping and rock slope stability. All the tests showed that an ambient current affects wave overtopping and rock slope stability. An overall view of the wave overtopping results is given in Table 1, based on the tests with largest wave heights: Table 1. Wave overtopping results of tests with largest current and largest waves (Hm0) compared to values expected based on changes in wave characteristics only.
Factor of
overtopping change
Test Wave- angle
(degr.)
Current (m/s)
Expected Experiment1 0 0.35 1 0.7 2 30 0.35 1.1 0.75 Smooth
Structure 3 -30 0.35 0.95 0.65 4 0 0.35 1 0.65 5 30 0.35 0.8 0.35 6 -30 0.35 1.2 1
Rock Slope
7* -30 0.35 0.9 0.7 * increased wave steepness In all overtopping cases, both impermeable and permeable (rock) slopes, the ambient current resulted in a reduced amount of wave overtopping, except one case where no influence was observed. Table 1 shows:
• Perpendicular wave attack in combination with a current shows a decrease in overtopping due to the current (no effects on wave characteristics).
• A following current shows an additional influence (compared to perpendicular wave attack) on wave overtopping that can largely be explained by changes in wave characteristics due to current (test results show an increase or decrease if the change in wave characteristics indicate an increase or decrease compared to perpendicular wave attack).
• For an opposing current, the additional influence (compared to perpendicular wave attack) on wave overtopping can largely be explained by changes in the wave characteristics due to prevailing current (test
results show an increase or decrease if modification of wave characteristics indicate an increase or decrease compared to perpendicular wave attack).
• The influence of a current, apart from the effects on changing wave characteristics, is mainly in the order of magnitude of 30% to 35%, although some results show rather larger or smaller influence (45% and 20% respectively).
• The effect of a current, apart from the influence on wave characteristics (mainly through the wave steepness and the wave angle), is a reduction compared to the situation without a current.
A comparison (see Figs.18 and 19) is made between the measured and calculated wave overtopping discharges for an opposing and a following current in combination with an impermeable slope. Two methods, neglecting the influence of a current and applying the wave characteristics measured where no current exists (between the wave guiding walls), have been used:
a) The Neural Network method by Van Gent et al. (2007); hereafter: NN.
b) The empirical formulation of TAW (2002); hereafter: TAW.
0 0.01 0.02 0.03 0.04 0.05 0.06 0.07 0.08 0.09 0.1 0.11 0.120
0.1
0.2
0.3
0.4
0.5
0.6
Hm0
(m)
q (l/
s/m
)
MeasuredNNTAW
Figure 18. Comparison of overtopping discharges for oblique wave attack in presence of a following current.
0 0.01 0.02 0.03 0.04 0.05 0.06 0.07 0.08 0.09 0.1 0.11 0.120
0.1
0.2
0.3
0.4
0.5
0.6
Hm0
(m)
q (l/
s/m
)
MeasuredNNTAW
Figure 19. Comparison of overtopping discharges for oblique wave attack in presence of an opposing current.

Figs.18 and 19 show that both methods provide rather accurate predictions; the TAW formula slightly overestimates the value of overtopping while the Neural Network slightly underestimates the discharges for the largest wave height.
It is also possible to include some of the effects of wave-current interaction by using the relative wave period instead of the absolute wave period. However, this does not significantly improve the overtopping predictions, neither in the case of a following nor in the case of an opposing current.
Studying stability of rubble mound slopes in situations where both waves and currents exist (not in the cases of a wave-induced flow field) affect rock slope stability. An overall view of the results is given in Table 2, based on the tests with largest wave heights. Table 2. Rock slope stability results of tests with largest current and largest waves (Hm0) compared to values expected based on changes in wave characteristics only.
Factor of change in damage level S
Test Wave- angle
(degr.)
Current (m/s)
Expected Experiment1 0 0.35 1 0.65 2 30 0.35 0.7 0.7 3 -30 0.35 1.3 0.9
Rock Slope
4* -30 0.35 1.3 0.7 * increased wave steepness
All test series showed, for the highest waves, a reduction in the amount of damage due to the presence of a current compared to the corresponding test series without a current. For the smaller waves within these test series this was not always the case. It should be noted that the relative influence of the current on the wave propagation is larger for the lower wave heights. Table 2 shows:
• For perpendicular wave attack in combination with a current, thus without effects on wave characteristics, damage is reduced due to the current; this is similar to the results observed for wave overtopping.
• The tests with oblique wave attack in combination with a following current or with an opposing current show smaller damage levels than the tests with a current and perpendicular wave attack.
• The reduction in damage due to the presence of a current is larger than, or equal to, expected based on changes in the wave characteristics; changes in the wave characteristics do not sufficiently explain the additional differences.
• The influence of a current is in the order of magnitude of 10% to 35% (on the value of S) for the highest waves in each test series. This is without taking the
effects of a current on wave characteristics into account. Taking these effects of changing wave characteristics into account, the maximum observed reduction due to the presence of a current can be higher or lower than these values. In the presented tests the mean velocity of the current
reached a value up to u=0.35m/s. This was in combination with significant wave height of about Hs=0.1m. The presented results can be scaled to prototype conditions: For wave heights that are in reality Hs=1.0m, the maximum mean velocity of the current for which the results can be used is u=1.1m/s (i.e. 0.35m/s ⋅√10), while for Hs=3.3m in reality, the maximum mean velocity for which the findings can be used is u=2m/s.
7. Conclusions Wave overtopping and rubble mound stability of structures are studied under combined loading of waves and a current. The influence of a current on wave parameters such as wave steepness and wave angle are known. However, the effects of wave loading in the presence of a current on wave overtopping and rock slope stability have not been comprehensively studied before. The present study was performed to obtain more insight into these specific aspects. The series of physical model tests showed changes of wave overtopping and rock slope stability in the presence of a current. The flow field represents tidal currents or other currents, but not wave-induced currents. The magnitude of the currents studied here were significantly larger than wave-induced currents. They correspond to mean velocities of about u=1m/s to 2m/s in prototype (depending on wave heights in reality). The main findings of the present study are:
• Wave overtopping in the presence of a current is generally reduced compared to the situation without a current. This is observed for smooth impermeable slopes and for permeable rock slopes. This is observed for situations with a current with perpendicular wave attack and for oblique wave attack, both for an opposing current and for a following current.
• The current affects wave characteristics such as wave steepness and wave angle. The influence of a current on the wave overtopping rate is, however, larger than can be explained based on changes of the wave characteristics; this additional effect of a current is generally a reducing factor. This could be due to the influence of the current on the wave motion on the slope.
• For wave overtopping the influence of a current, apart from effects of changing wave characteristics, is mainly in the order of magnitude of 30% to 35%, although some results showed either a somewhat larger or smaller influence (45% and 20% respectively).

• Damage levels of rock slopes under wave loading in the presence of a current are generally reduced compared to the situation without a current; for either perpendicular or oblique wave attack, both for an opposing and a following current (as is the case for wave overtopping).
• The influence of currents on rock slope stability is often larger than can be explained based on changes of wave characteristics (although in the case of a following current, damage level reduction could be predicted through wave characteristic changes). This additional effect of currents is generally a reducing effect (as is the case for the wave overtopping).
• The influence of a current on reduction of damage levels to rock slope is in the order of magnitude of 10% to 35% (on the value of S) for the highest waves in each test series. This is without accounting for the effects of a current on wave characteristics. Taking these effects of changing wave characteristics into account, the maximum observed reduction due to presence of a current can be higher or lower.
The test results generally show that for both wave overtopping and rock slope stability, currents have reducing effects. This means that if the effects of currents on the required crest level and required rock size are not taken into account, often a conservative design is obtained (i.e. too high crest level or too large rock material).
These findings are based on an extensive test programme. However, the test programme is still limited with respect to the variation of relevant parameters (e.g. slope angle, angle of wave attack, rock size, crest height, wave period, wave steepness, etc). Therefore, these findings are not general findings and should be applied with caution.
References CEM 2002. “Coastal Engineering Manual”, U.S. Army
Corps of Engineers, Engineer Manual 1110-2-1100, Washington D.C.
De Waal, J.P. and Van der Meer, J.W. 1992, “Wave run-up and overtopping on coastal structures”, Proc. ICCE 1992, ASCE, Vol.2, pp.1758-1771, Venice.
Eurotop Manual 2008. “Eurotop: Wave overtopping of sea defences and related structures”, www.overtopping-manual.com.
Rock Manual 2007, “The Rock Manual; the use of rock in hydraulic engineering”, CIRIA-CUR, Publication C683, ISBN 978-0-86017-683-1 and 5.
TAW 2002, “Wave run-up and wave overtopping at dikes”, Technical report, Technical Advisory Committee on Flood Defences (TAW), Delft.
Van der Meer, J.W. 1988, “Rock slopes and gravel beaches under wave attack”, Ph.D. thesis, Delft University of Technology, Delft.
Van Gent, M.R.A. 2002, “Wave overtopping at dikes”, World Scientific, Proc. ICCE 2002, Vol.2 pp.2203-2215, Cardiff.
Van Gent, M.R.A., Smale, A.J. and Kuiper, C. 2003, “Stability of rock slopes with shallow foreshores”, ASCE, Proc. Coastal Structures 2003, Portland.
Van Gent, M.R.A. 2004, “On the stability of rock slopes”, Balkema, Keynote, Proc. NATO-Workshop on Environmental friendly coastal protection structures, Varna, Bulgaria.
Van Gent, M.R.A., Van den Boogaard, H.F.P., Pozueta, B., and Medina, J.R. 2007, “Neural network modelling of wave overtopping at coastal structures”, Elsevier, Coastal Engineering, Vol.54, pp. 586-593.
Wolters G. and Van Gent M.R.A. 2010, “Oblique wave attack on cube and rock armoured rubble mound Breakwaters”, accepted for publication in Proc. ICCE 2010, Shanghai.