hydraulically coupled microejection technique for precise local solution delivery in tissues
TRANSCRIPT
A
ilatortrbtHc©
K
1
itsetdtirosl
0d
Journal of Neuroscience Methods 155 (2006) 231–240
Hydraulically coupled microejection technique for preciselocal solution delivery in tissues
Andrei G. Pakhomov ∗, Iurii Semenov, Robert Brenner, Glenn M. ToneyDepartment of Physiology, University of Texas Health Science Center at San Antonio, 7703 Floyd Curl Drive, San Antonio, TX 78229-3900, United States
Received 30 November 2005; received in revised form 12 January 2006; accepted 12 January 2006
bstract
Hydraulically coupled volume microejection (HCVM) was employed to overcome known drawbacks of conventional pressure ejection of drugsn isolated brain slices and other tissues. For HCVM, a solution-filled glass micropipette is connected to a motor-driven, liquid-filled syringe byow-compliance, liquid-filled tubing, and the system is sealed leaving no gaps or air bubbles. The volume ejected from the micropipette is the sames the volume displaced by movement of the syringe plunger (it is not much influenced by the diameter of the micropipette tip or its clogging byissue debris), so the ejection rate and duration can be precisely controlled. The HCVM performance was characterized by fluorescent imagingf ejected dyes, its combination with infrared/differential interference contrast (IR/DIC) imaging in brain slices, and by concurrent patch-clampecording of ejected drug effects in individual neurons. Ejection of varied volumes into a brain slice (1.6–400 nl) formed a globular shape thatransiently displaced the tissue adjacent to the micropipette tip. The radial penetration of the ejected dye correlated well with the electrophysiologicalesponses to a concurrently ejected drug, at least for brief (100–200 ms) intervals after the ejection. The penetration distance could be increasedy increasing either the ejection volume, or the ejection rate, or both. However, at higher ejection volumes (100–400 nl), a notable fraction of
he ejectate was “pushed” out of the slice by tissue resiliency, and escaped to the outside by a back-flow along the ejection pipette. The use ofCVM enabled us to achieve a concentration rise time (10–90%) on the order of 20–40 ms. These and other measurements demonstrated principalapabilities and limitations of HCVM and provided guidance for its practical use, including some potentially unique applications.2006 Elsevier B.V. All rights reserved.
lue(c(12
ana
eywords: Pressure ejection; Drug delivery; Brain slices; Patch-clamp
. Introduction
A wide variety of physiological and pharmacological exper-ments depend critically on the delivery of solutions containingest agents (drugs, salts, antibodies, etc.) to target cells and tis-ues. Solution changes are a vital part of virtually every cellularlectrophysiological experiment, including those in cell cul-ures, tissue slices, and isolated organs. If the solution changeoes not have to be rapid or spatially restricted, a simple switcho a different perfusion solution may be adequate. However,n many neurobiological experiments it is necessary to makeapid step changes in the concentration of test compounds in
rder to outpace receptor desensitization and/or to mimic fastynaptic responses (Tang, 1998). Many experiments also requireocal application of the test compound to a single cell or a∗ Corresponding author. Tel.: +1 210 204 90 12; fax: +1 210 567 4410.E-mail address: [email protected] (A.G. Pakhomov).
s(cn
mf
165-0270/$ – see front matter © 2006 Elsevier B.V. All rights reserved.oi:10.1016/j.jneumeth.2006.01.007
imited group of cells, while the rest of the preparation is leftntreated. Depending on the needs of a particular study, thexperimenter can choose between a parallel-flow pipe systemJohnson and Ascher, 1987; Vyklicky et al., 1990), U-tube appli-ation (Krishtal and Pidoplichko, 1980), pressure microejectionAlkondon et al., 1996; McCaman et al., 1977; Sakai et al.,979), flash photolysis (Callaway and Katz, 1993; Park et al.,002), and other methods (see Tang, 1998 for review).
Available choices, however, become rather limited whengents must be locally delivered into tissue, e.g., to a particulareuron within an isolated brain slice preparation. Devices likeU-tube are simply too bulky to penetrate the tissue, although
ome success with miniature U-tube delivery has been reportedPidoplichko and Dani, 2005). Many other devices, by design,an only work in a liquid medium (e.g., parallel-flow pipes do
ot create parallel flow within tissue).Pressure ejection of drugs via single- and multibarrel glassicropipettes is an effective and frequently employed method
or applying small volumes of solution in close proximity of the
2 urosc
tebfipp
cmpmUgibgrat
p(sptidttwp
galttprtsca
thcdotpmruet
mvicnt
bsdotas
fbcabr
(
2
2
b2tl(opim1caKw
aspt
e(
2
32 A.G. Pakhomov et al. / Journal of Ne
arget cell (Alkondon et al., 1996; McCaman et al., 1977; Sakait al., 1979). The method is technically straightforward and cane used equally well with most soluble drugs. Another attractiveeature of this method is that the ejected volume, when injectingnto a solution and using tips larger than 0.6 �m, is linearlyroportional to the applied pressure and the time duration of theressure pulse (Sakai et al., 1979).
Glass micropipettes with tips of a few microns in diameteran effectively cut through many tissues, so pressure ejectionay be a method of choice to deliver test solutions locally into
reparations such as brain slices. However, the performance oficropipettes inside tissue can be notoriously unpredictable.sually, the principal problem is tip contamination and clog-ing by tissue debris. Not only is debris mechanically forcednto the tip during tissue penetration, it is also actively pulled iny capillary forces. When no positive pressure is applied, debrisradually accumulates within the pipette—a process that can beeadily observed under a microscope. A pressure pulse appliedfterwards results in debris compacting in the narrow area nexto the tip and clogging of the pipette, often irreversibly.
An “opposite” problem of continual solution leakage from theuffer pipette was recently addressed by Pidoplichko and Dani2005). Apparently, the puffer pipette was filled with enougholution to overcome the capillary suction with the hydrostaticressure of the fluid column, and the capillary force was rela-ively small because of wider than usual diameter of the cap-llaries (1.6 mm i.d.). It is also possible that the “Picospritzer”evice employed in this study allowed a small positive pressureo remain in the system between puffs, which would contributeo leakage. The leakage problem had to be solved by mechanicalithdrawal of the puffer pipette between the puffs, despite theossibility of artifacts from tissue displacement.
A method employed by other investigators to alleviate clog-ing was increasing the tip diameter to 5–15 �m per barrel (Catond Toney, 2005; Marchand and Pearlstein, 1995). However,arger tips do not cut as well through the tissue and cause moreissue compression and damage. Larger tips do not prevent suc-ioning of debris, but are less likely to clog when the debris isushed out by a pressure pulse. The drug within a large tip isapidly diluted by the bath solution, and the only practical wayo maintain the drug concentration is by applying repetitive pres-ure pulses at short and constant intervals, although the targetell may not have enough time to fully recover between drugpplications.
To overcome the drawbacks of conventional pressure ejec-ion for in-tissue applications, we propose to replace it withydraulically coupled volume microejection (HCVM). The prin-ipal difference of hydraulic coupling is that volume of the liquidoes not change under pressure; hence, in a liquid-filled systemf a micropipette and a syringe connected with low-complianceubing, a volume displacement by movement of the syringelunger ejects precisely the same volume of the drug from theicropipette tip. In conventional pressure ejection, a two-fold
eduction of the pipette tip diameter can reduce the ejected vol-me as much as 250-fold (Sakai et al., 1979). In HCVM, thejected volume within a wide range should not depend on theip diameter or clogging, because it is determined by the plunger
ot
ience Methods 155 (2006) 231–240
ovement, and the hydraulic pressure would overwhelm anyariations in the tip flow resistance. As an added benefit, theres no air–liquid interface in HCVM system, hence there is noapillary suction into the tip, and clogging should be reduced sig-ificantly. Similarly, no leakage from the tip is expected becausehe entire HCVM system is sealed.
The above features make it feasible to expect that HCVM cane used for consistent local drug delivery within tissues usingmall-tip micropipettes, will help to minimize tissue damage, tipilution of the drug, and tip clogging. Furthermore, with the usef proper step motor control devices to move the plunger, bothhe ejected volume and ejection rate can be precisely controlled,feature that cannot be reliably achieved by conventional pres-
ure ejection.The goal of the present study was to evaluate HCVM per-
ormance and applicability for precise local drug delivery intorain slices. Along with neuroactive drugs, we used fluores-ent dyes to evaluate the spatial distribution, time dynamics,nd pathways of clearance of ejected substances. HCVM capa-ilities have also been tested in experiments with patch-clampecording from individual neurons in brain slices.
This work was presented earlier in abstract formatPakhomov et al., 2005).
. Methods
.1. Solutions and chemicals
Isolated brain slices were superfused with artificial cere-rospinal fluid (ACSF) containing (in mM) 124 NaCl, 2 KCl,MgSO4, 1.25 NaH2PO4, 26 NaHCO3, 2 CaCl2, and 10 dex-
rose; pH 7.2–7.4, osmolality ∼290 mOsm. Micropipettes wereoaded with neuroactive drugs and/or Lucifer Yellow CH dye2 mg/ml) dissolved in the ACSF. This dye was chosen becausef its intense emission fluorescence at 490 nm and negligiblehotobleaching. The composition of intracellular solution var-ed depending on the experiment, but typically it consisted of (in
M) 130 K gluconate, 10 HEPES, 5 EGTA, 1 MgCl2, 1 NaCl,CaCl2, 2 K2-ATP, and 0.5 Na-GTP. For experiments in which
hloride currents were recorded in the whole-cell configurationnd for cell-attached recordings, K gluconate was replaced withCl or CsCl. The pH and osmolality of patch pipette solutionsere adjusted to 7.2 and 290–300 mOsm, respectively.For measurement of the rise time of HCVM-ejected dye with
phototube (see Section 2.4 below), both bath and micropipetteolutions contained (in mM) 100 KCl, 10 HEPES, and 1 EGTA;H 7.2. To monitor the ejections, 400 mM of Fura-2 was addedo the pipette solution.
All chemicals were purchased from Sigma (St. Louis, MO),xcept Fura-2, which was received from Molecular ProbesEugene, Oregon).
.2. HCVM pipettes
HCVM pipettes were pulled from a single-barreled 1.5-mm.d. borosilicate glass (type 1B150F-4, WPI, Sarasota, FL) tohe tip size from 1 to 6 �m (hereinafter, the tip size refers to the
urosc
pttfeW
Pos(l3pmabwwmtthiscaT
2
obp(itaswwIwmcwm1
iPwsweu
vC4nici
2
mida(t(cDtfodm
impoCwfenwarSifl
3
bseHietv
A.G. Pakhomov et al. / Journal of Ne
ipette o.d. at the opening). We used a Flaming/Brown horizon-al puller (Sutter Instrument Co., Novato, CA) programmed forhree- or four-step pulling process, similar to a routine employedor manufacturing of patch-clamp recording pipettes. In somexperiments, we used three-barreled pipettes (type 3B120F-4,
PI) pulled in the same manner.The pipettes were filled with the test solution to the top.
ipette-to-syringe coupling was made by a liquid-filled lengthf low-compliance tubing (i.e., a tubing that does not expandignificantly under pressure). We used 28-gauge Microfil tubingWPI) or PE10 (Becton Dickinson, Franklin Lakes, NJ). Theength of the tubing connection was usually from 10 to about0 cm (while excessive tubing length and coiling may impair theerformance, it should be at least long enough to allow pipetteovement to and from the preparation). The pipette, tubing, andpre-filled syringe were assembled together leaving no visibleubbles or air gaps, and the connection of the tubing to the pipetteas sealed with a fast-curing epoxy (see Section 4 for alternativeays and caveats on assembling the HCVM system). We nor-ally filled the tubing and the syringe with the same solution as
he pipette, although oil and pure water could also be used (dilu-ion of a drug in the pipette tip by water from the syringe takesours and usually poses little problem). Depending on the exper-ment, we used 1–100-�l syringes (Hamilton, Reno, NV). Theyringes were driven by step motors of a three-channel UltraMi-roPumpII system (WPI), to control both the ejection volumend ejection rate. The onset of each ejection was marked by aTL pulse sent to the data recording system.
.3. Brain slice preparation and electrophysiology
All patch-clamp measurements were performed in neuronsf the hypothalamic paraventricular nucleus (PVN), but otherrain regions could be used as well. The slice preparationrocedure was similar to that described by Tasker and Dudek1991). Male Sprague-Dawley rats (150–300 g) were decap-tated under halothane anesthesia; a tissue block containinghe hypothalamus was quickly removed and placed in ice-coldrtificial cerebrospinal fluid (ACSF). For initial handling andlicing of the brain tissue, NaCl in the ACSF was substitutedith equiosmolar sucrose. Coronal sections (200 �m thick)ere cut on a vibratome (Series 1000, Technical Products,
nc., St. Louis, MO) and transferred into a holding chamberith ACSF continually gassed with 95% O2 and 5% CO2ixture. The slices were allowed to equilibrate in the holding
hamber for at least 1 h prior to use in experiments. Recordingsere performed in a glass-bottomed chamber (Warner Instru-ents, Hamden, CT). Recording electrodes were pulled from
B150F-4 glass (WPI) to a tip resistance of 2–5 M�.A patch electrode and an HCVM pipette were positioned
n the PVN with two independent micropositioners (Burleigh,CS-5000, Fishers, NY and NMN-21, Narishige, Japan). Theyere advanced to a chosen cell under visual control using a fixed-
tage, upright microscope (E600FN, Nikon, Japan) equippedith infrared differential interference contrast (IR/DIC) and
pifluorescence optics. Patch-clamp recordings were acquiredsing an Axopatch 200B amplifier, Digidata 1322A A-D con-
dvas
ience Methods 155 (2006) 231–240 233
erter, and pCLAMP 8.1 software (Axon Instruments, Fosterity, CA). Typical values of the seal and access resistance were–8 G� and 12–20 M�, respectively. The series resistance wasot compensated. The access resistance was repeatedly mon-tored during the experiment, and data were discarded if ithanged by more than 20%. Additional details for specific exper-ments are provided in Section 3 and in figure captions.
.4. Visualization and measurements of ejections
The size and shape of Lucifer Yellow dye ejections wereonitored with the E600FN microscope using a 40× water
mmersion objective and an appropriate filter cube. Repeatedigital images of the ejections (as revealed by fluorescencet 490 nm) were taken with a CoolSnap ES fast CCD cameraRoper Scientific, Tucson, AZ) at the fastest rate supported byhe hardware (∼43 Hz) and analyzed with MetaMorph softwareMolecular Devices Corp., Chicago, IL). The exposure time toapture one frame was from 1 to 3 ms in different experiments.uring the course of each individual experiment, the exposure
ime was kept constant, and any automatic image optimizationeatures of the software were turned off. For precise localizationf neurons in the slice, and also to evaluate tissue displacementuring ejections, the same images were captured in the IR/DICode and laid over the fluorescent ones off-line.Since the CCD camera was only able to capture discrete
mages at more than 20-ms intervals, more precise measure-ents of the rise time of HCVM-ejected dye concentration were
erformed using a phototube system. Dye ejections into a flowf solution were monitored with a phototube PMT400 (IonOptixorp., Milton, MA) via Nikon TE2000-S inverted microscopeith 40× oil immersion Plan Fluor objective (Nikon, Japan)
or Fura-2 fluorescence measurements. The fluorescence wasxcited at 340 nm, and continually measured at 510 nm; the sig-al was integrated over a 30-�m diameter window (the pipette tipas positioned immediately outside the window) and detected
s 5-ms “running average”. The signal was digitized at 4 kHz,ecorded, and analyzed using MP100/BIOPAC Data Acquisitionystem (WPI). Signals from 5 to 15 ejections were averaged to
mprove the signal-to-noise ratio and filter any “spontaneous”uctuations.
. Results
Unlike conventional pressure ejection, HCVM made it possi-le to use smaller tip pipettes (1.5–6 �m) for ejections into brainlices. Because tip clogging and drug dilution were minimized,jected drugs evoked highly reproducible effects (Figs. 1 and 2).ydraulically coupled pipettes did not require frequent cleans-
ng at constant time intervals; hence, the interval between thejections could be increased to 1–2 min or more, to allow ampleime for cell recovery. Repeated ejections of precisely knownolumes, with up to a 100-fold variation in the amount of ejected
rug, made it possible to generate dose–response curves for indi-idual cells (Figs. 1 and 2); this result would be problematic tochieve with conventional pressure ejection, even in culturedingle-layer cells.
234 A.G. Pakhomov et al. / Journal of Neuroscience Methods 155 (2006) 231–240
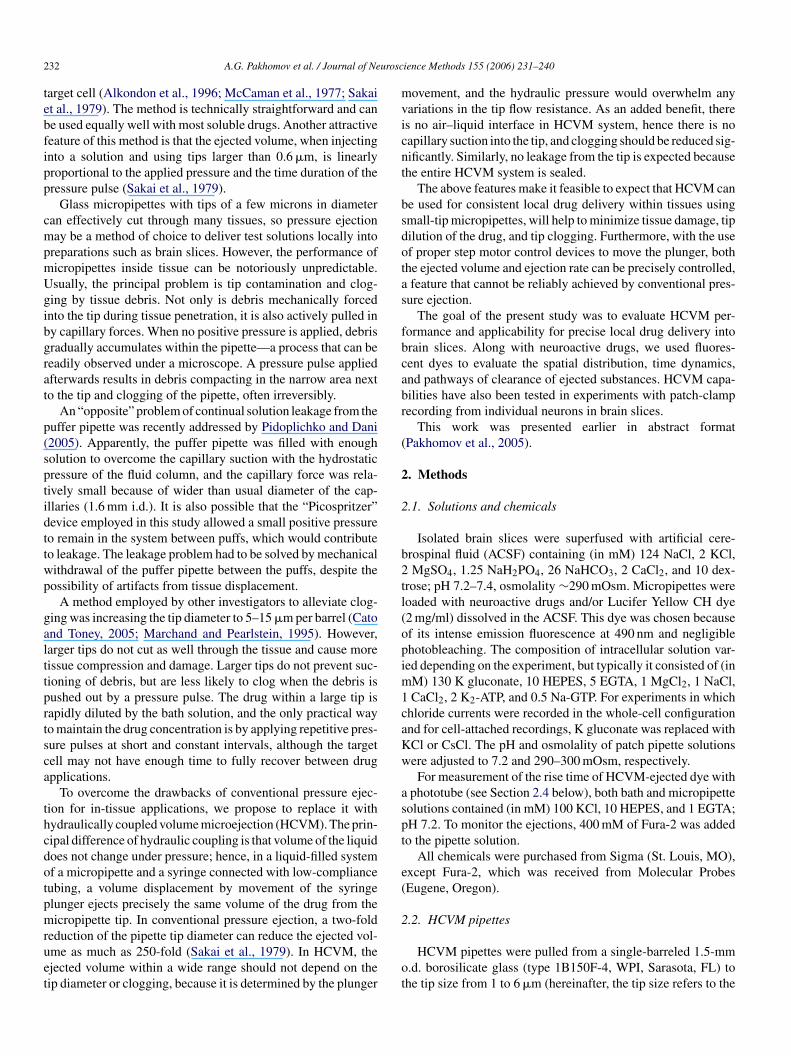
Fig. 1. Whole-cell currents induced by HCVM delivery of 100-�M GABA solution at a rate of 100 nl/s. The ejection pipette was inserted into a brain slice so thatits tip (3-�m diameter) was at 10 �m from the patched cell. The membrane potential was held at −80 mV; the internal solution contained 130 mM KCl to maximizeGABA-induced Cl− current. (A) Repeated ejections of GABA induce responses that are highly reproducible and proportional to the amount of ejected drug. Notethat the response does not appear to be affected by possible tip dilution of the drug or tip contamination by tissue debris during the intervals between the ejections.(B) Overlapped responses to sequential ejections of 6 pmol of GABA at expanded time scale. (C) Overlapped responses to different doses of GABA, namely 1, 2, 4,6 rizonc on is 0
atfatob
aeat
Fe5s4(s
, 10, 14, 20, and 30 pmol, which were administered in a random sequence. Hourve based on data presented in (C). The correlation coefficient for Hill equati
For proper application of the HCVM method in brain slicesnd correct interpretation of drug effects, it is critically importanto understand how the drug is distributed in tissue and clearedrom it, and how these processes depend on the ejection ratend volume. One can expect that because of tissue resiliency,
he “behavior” of the ejected volume is different from what isbserved with pressure ejection into liquid (Sakai et al., 1979),ut no studies have specifically explored this issue.aae
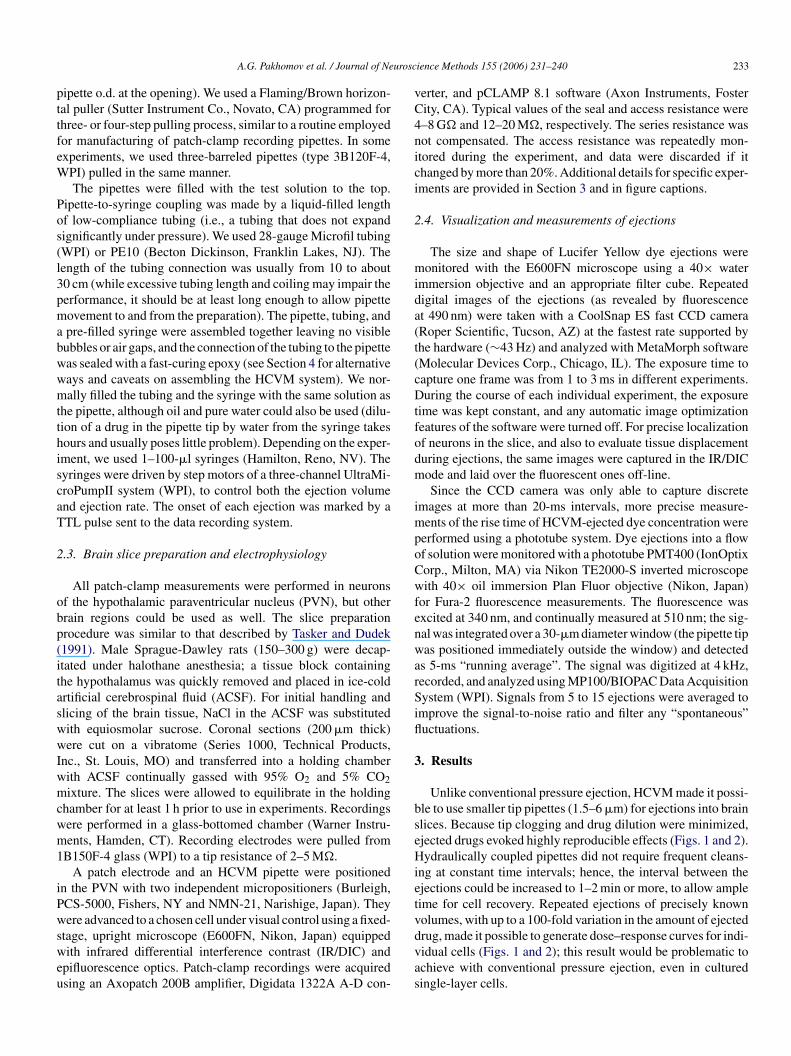
ig. 2. Effect of HCVM-delivered glutamate (20 �m) on the firing rate of a spontanextracellularly in a cell-attached configuration. The ejection pipette tip (5-�m diams; different doses of the drug were delivered by varying the ejection rate. The firing
ample burst response to ejection of glutamate at 40 nl/s; the time of ejection is sho0 nl/s (first five ejections, indicated by horizontal bars under the graph) and at 60 nC) A representative dose–response curve; the ordinate is the number of action potenequential trials with the same cell. Ejections at a rate exceeding 60 nl/s could destroy
tal bars show the actual time duration of these ejections. (D) A dose response.98; EC50 of GABA for studied conditions is 7.3 ± 0.53 pmol.
We used a fluorescent dye (ejected alone or in a cocktail withdrug) to analyze the time dynamics and distribution of the
jectate within tissue. It is understood that due to different sizend mobility of drug and dye molecules, their diffusion intoissue may differ somewhat. However, at short time intervals
fter the ejection, the diffusion plays relatively little role,s both the drug and the dye are initially contained in thejected volume of liquid and travel with this volume. Localously active neuron in a hypothalamic brain slice. The firing rate was recordedeter) was in the slice at 25 �m from the patched cell. All ejections lasted forrate (spikes/s) was measured every second during continual recording. (A) A
wn by the horizontal bar. (B) Responses to repeated ejections of glutamate atl/s (last ejection). The arrow identifies the response depicted in fragment (A).tials in the glutamate-evoked burst. Shown are the mean values ± S.E. for fivethe cell-attached configuration (see Fig. 6) and were not tested.
A.G. Pakhomov et al. / Journal of Neuroscience Methods 155 (2006) 231–240 235
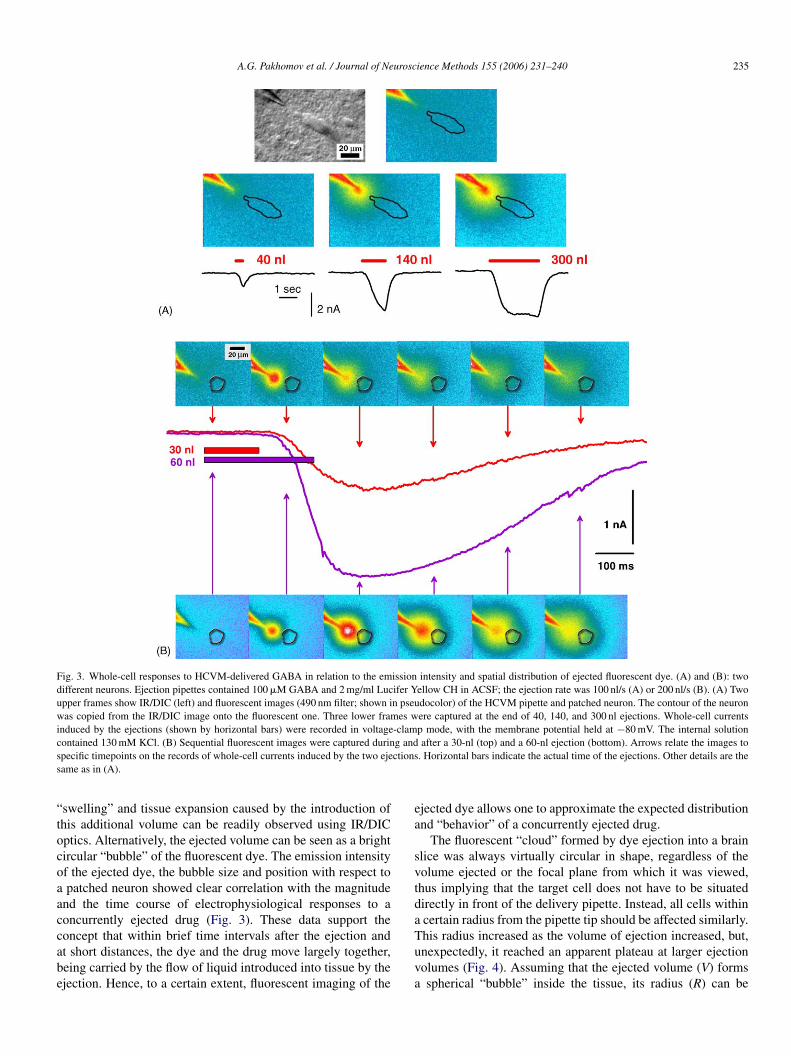
Fig. 3. Whole-cell responses to HCVM-delivered GABA in relation to the emission intensity and spatial distribution of ejected fluorescent dye. (A) and (B): twodifferent neurons. Ejection pipettes contained 100 �M GABA and 2 mg/ml Lucifer Yellow CH in ACSF; the ejection rate was 100 nl/s (A) or 200 nl/s (B). (A) Twoupper frames show IR/DIC (left) and fluorescent images (490 nm filter; shown in pseudocolor) of the HCVM pipette and patched neuron. The contour of the neuronwas copied from the IR/DIC image onto the fluorescent one. Three lower frames were captured at the end of 40, 140, and 300 nl ejections. Whole-cell currentsinduced by the ejections (shown by horizontal bars) were recorded in voltage-clamp mode, with the membrane potential held at −80 mV. The internal solutionc g ands ctionss
“tocoaaccabe
ea
svtda
ontained 130 mM KCl. (B) Sequential fluorescent images were captured durinpecific timepoints on the records of whole-cell currents induced by the two ejeame as in (A).
swelling” and tissue expansion caused by the introduction ofhis additional volume can be readily observed using IR/DICptics. Alternatively, the ejected volume can be seen as a brightircular “bubble” of the fluorescent dye. The emission intensityf the ejected dye, the bubble size and position with respect topatched neuron showed clear correlation with the magnitude
nd the time course of electrophysiological responses to aoncurrently ejected drug (Fig. 3). These data support the
oncept that within brief time intervals after the ejection andt short distances, the dye and the drug move largely together,eing carried by the flow of liquid introduced into tissue by thejection. Hence, to a certain extent, fluorescent imaging of theTuva
after a 30-nl (top) and a 60-nl ejection (bottom). Arrows relate the images to. Horizontal bars indicate the actual time of the ejections. Other details are the
jected dye allows one to approximate the expected distributionnd “behavior” of a concurrently ejected drug.
The fluorescent “cloud” formed by dye ejection into a brainlice was always virtually circular in shape, regardless of theolume ejected or the focal plane from which it was viewed,hus implying that the target cell does not have to be situatedirectly in front of the delivery pipette. Instead, all cells withincertain radius from the pipette tip should be affected similarly.
his radius increased as the volume of ejection increased, but,nexpectedly, it reached an apparent plateau at larger ejectionolumes (Fig. 4). Assuming that the ejected volume (V) formsspherical “bubble” inside the tissue, its radius (R) can be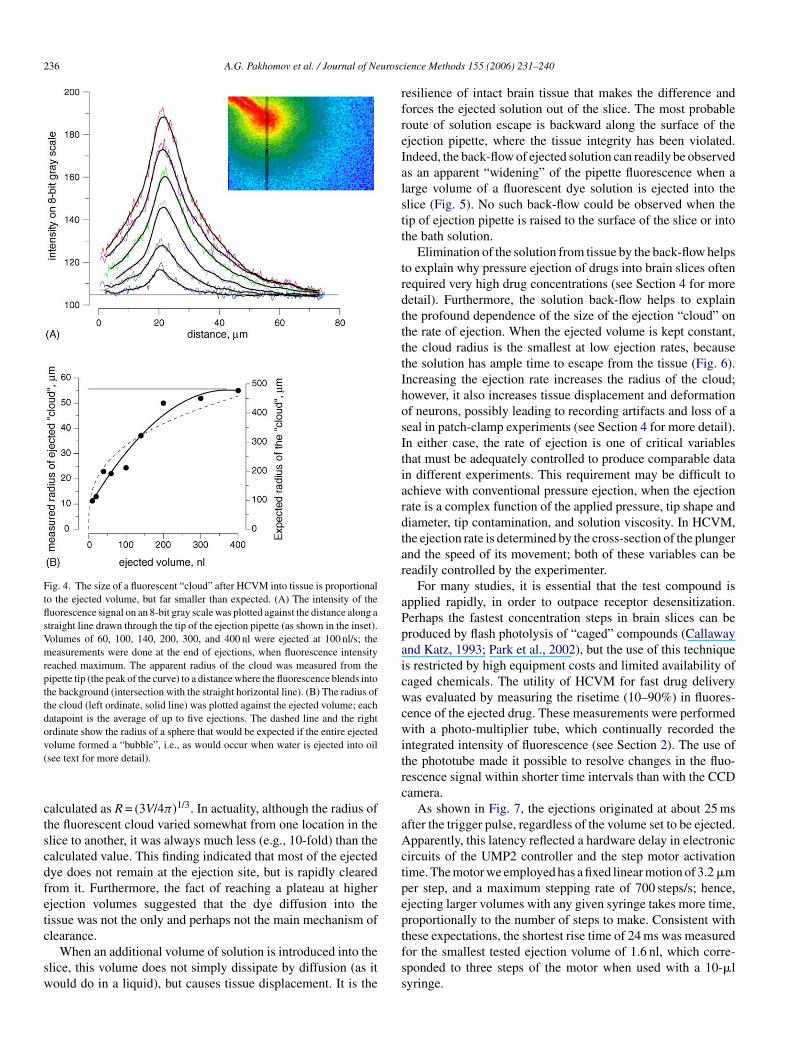
236 A.G. Pakhomov et al. / Journal of Neurosc
Fig. 4. The size of a fluorescent “cloud” after HCVM into tissue is proportionalto the ejected volume, but far smaller than expected. (A) The intensity of thefluorescence signal on an 8-bit gray scale was plotted against the distance along astraight line drawn through the tip of the ejection pipette (as shown in the inset).Volumes of 60, 100, 140, 200, 300, and 400 nl were ejected at 100 nl/s; themeasurements were done at the end of ejections, when fluorescence intensityreached maximum. The apparent radius of the cloud was measured from thepipette tip (the peak of the curve) to a distance where the fluorescence blends intothe background (intersection with the straight horizontal line). (B) The radius ofthe cloud (left ordinate, solid line) was plotted against the ejected volume; eachdatapoint is the average of up to five ejections. The dashed line and the rightordinate show the radius of a sphere that would be expected if the entire ejectedv(
ctscdfetc
sw
rfreIalstt
trdttttIhosItiardtar
aPpaicwcwitrc
aActpepthese expectations, the shortest rise time of 24 ms was measured
olume formed a “bubble”, i.e., as would occur when water is ejected into oilsee text for more detail).
alculated as R = (3V/4π)1/3. In actuality, although the radius ofhe fluorescent cloud varied somewhat from one location in thelice to another, it was always much less (e.g., 10-fold) than thealculated value. This finding indicated that most of the ejectedye does not remain at the ejection site, but is rapidly clearedrom it. Furthermore, the fact of reaching a plateau at higherjection volumes suggested that the dye diffusion into theissue was not the only and perhaps not the main mechanism oflearance.
When an additional volume of solution is introduced into thelice, this volume does not simply dissipate by diffusion (as itould do in a liquid), but causes tissue displacement. It is the
fss
ience Methods 155 (2006) 231–240
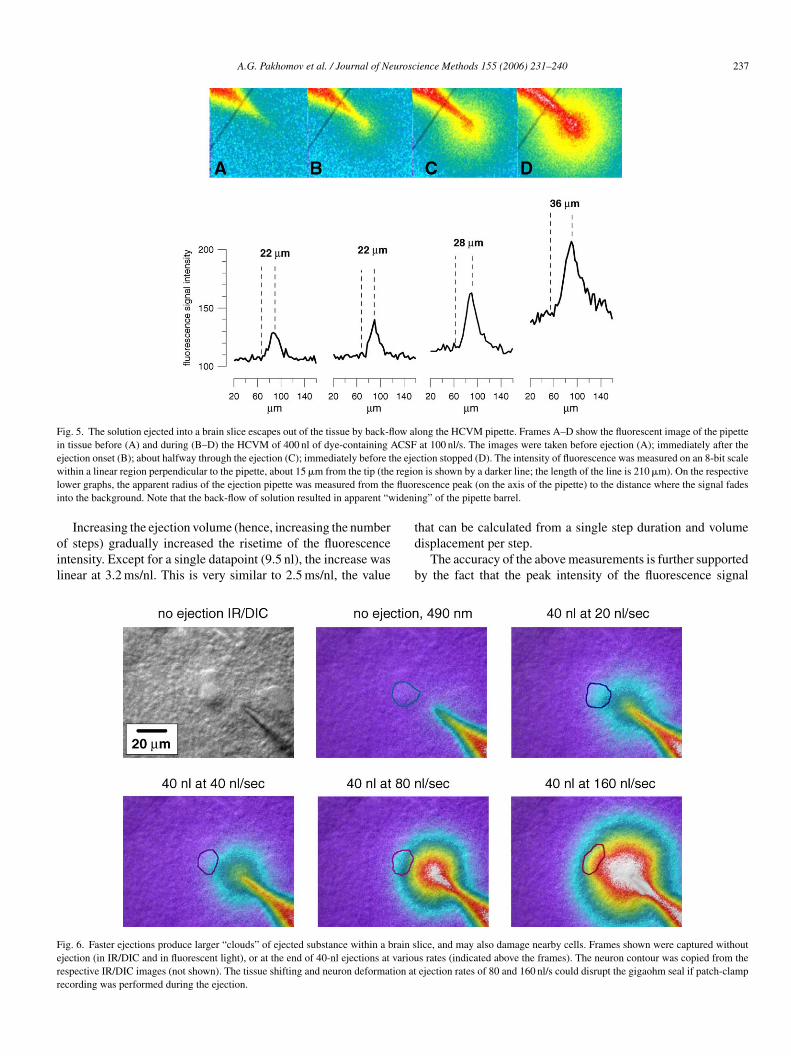
esilience of intact brain tissue that makes the difference andorces the ejected solution out of the slice. The most probableoute of solution escape is backward along the surface of thejection pipette, where the tissue integrity has been violated.ndeed, the back-flow of ejected solution can readily be observeds an apparent “widening” of the pipette fluorescence when aarge volume of a fluorescent dye solution is ejected into thelice (Fig. 5). No such back-flow could be observed when theip of ejection pipette is raised to the surface of the slice or intohe bath solution.
Elimination of the solution from tissue by the back-flow helpso explain why pressure ejection of drugs into brain slices oftenequired very high drug concentrations (see Section 4 for moreetail). Furthermore, the solution back-flow helps to explainhe profound dependence of the size of the ejection “cloud” onhe rate of ejection. When the ejected volume is kept constant,he cloud radius is the smallest at low ejection rates, becausehe solution has ample time to escape from the tissue (Fig. 6).ncreasing the ejection rate increases the radius of the cloud;owever, it also increases tissue displacement and deformationf neurons, possibly leading to recording artifacts and loss of aeal in patch-clamp experiments (see Section 4 for more detail).n either case, the rate of ejection is one of critical variableshat must be adequately controlled to produce comparable datan different experiments. This requirement may be difficult tochieve with conventional pressure ejection, when the ejectionate is a complex function of the applied pressure, tip shape andiameter, tip contamination, and solution viscosity. In HCVM,he ejection rate is determined by the cross-section of the plungernd the speed of its movement; both of these variables can beeadily controlled by the experimenter.
For many studies, it is essential that the test compound ispplied rapidly, in order to outpace receptor desensitization.erhaps the fastest concentration steps in brain slices can beroduced by flash photolysis of “caged” compounds (Callawaynd Katz, 1993; Park et al., 2002), but the use of this techniques restricted by high equipment costs and limited availability ofaged chemicals. The utility of HCVM for fast drug deliveryas evaluated by measuring the risetime (10–90%) in fluores-
ence of the ejected drug. These measurements were performedith a photo-multiplier tube, which continually recorded the
ntegrated intensity of fluorescence (see Section 2). The use ofhe phototube made it possible to resolve changes in the fluo-escence signal within shorter time intervals than with the CCDamera.
As shown in Fig. 7, the ejections originated at about 25 msfter the trigger pulse, regardless of the volume set to be ejected.pparently, this latency reflected a hardware delay in electronic
ircuits of the UMP2 controller and the step motor activationime. The motor we employed has a fixed linear motion of 3.2 �mer step, and a maximum stepping rate of 700 steps/s; hence,jecting larger volumes with any given syringe takes more time,roportionally to the number of steps to make. Consistent with
or the smallest tested ejection volume of 1.6 nl, which corre-ponded to three steps of the motor when used with a 10-�lyringe.
A.G. Pakhomov et al. / Journal of Neuroscience Methods 155 (2006) 231–240 237
Fig. 5. The solution ejected into a brain slice escapes out of the tissue by back-flow along the HCVM pipette. Frames A–D show the fluorescent image of the pipettein tissue before (A) and during (B–D) the HCVM of 400 nl of dye-containing ACSF at 100 nl/s. The images were taken before ejection (A); immediately after theejection onset (B); about halfway through the ejection (C); immediately before the ejection stopped (D). The intensity of fluorescence was measured on an 8-bit scalew regiol fluori ideni
oil
Ferr
ithin a linear region perpendicular to the pipette, about 15 �m from the tip (theower graphs, the apparent radius of the ejection pipette was measured from thento the background. Note that the back-flow of solution resulted in apparent “w
Increasing the ejection volume (hence, increasing the numberf steps) gradually increased the risetime of the fluorescencentensity. Except for a single datapoint (9.5 nl), the increase wasinear at 3.2 ms/nl. This is very similar to 2.5 ms/nl, the value
td
b
ig. 6. Faster ejections produce larger “clouds” of ejected substance within a brain sjection (in IR/DIC and in fluorescent light), or at the end of 40-nl ejections at variouespective IR/DIC images (not shown). The tissue shifting and neuron deformation atecording was performed during the ejection.
n is shown by a darker line; the length of the line is 210 �m). On the respectiveescence peak (on the axis of the pipette) to the distance where the signal fadesng” of the pipette barrel.
hat can be calculated from a single step duration and volumeisplacement per step.
The accuracy of the above measurements is further supportedy the fact that the peak intensity of the fluorescence signal
lice, and may also damage nearby cells. Frames shown were captured withouts rates (indicated above the frames). The neuron contour was copied from theejection rates of 80 and 160 nl/s could disrupt the gigaohm seal if patch-clamp
238 A.G. Pakhomov et al. / Journal of Neurosc
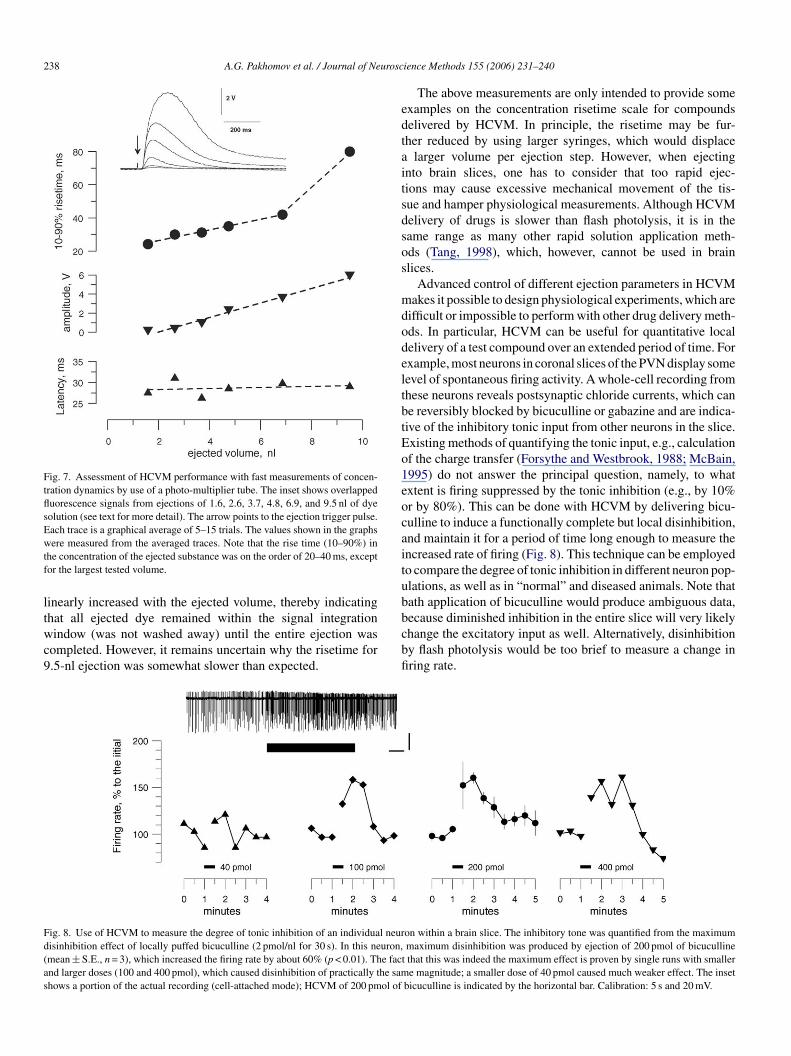
Fig. 7. Assessment of HCVM performance with fast measurements of concen-tration dynamics by use of a photo-multiplier tube. The inset shows overlappedfluorescence signals from ejections of 1.6, 2.6, 3.7, 4.8, 6.9, and 9.5 nl of dyesolution (see text for more detail). The arrow points to the ejection trigger pulse.Each trace is a graphical average of 5–15 trials. The values shown in the graphswtf
ltwc9
edtaitsdsos
mdodeltbtEo1eocaitub
Fd(as
ere measured from the averaged traces. Note that the rise time (10–90%) inhe concentration of the ejected substance was on the order of 20–40 ms, exceptor the largest tested volume.
inearly increased with the ejected volume, thereby indicating
hat all ejected dye remained within the signal integrationindow (was not washed away) until the entire ejection wasompleted. However, it remains uncertain why the risetime for.5-nl ejection was somewhat slower than expected.
bcbfi
ig. 8. Use of HCVM to measure the degree of tonic inhibition of an individual neurisinhibition effect of locally puffed bicuculline (2 pmol/nl for 30 s). In this neuron,mean ± S.E., n = 3), which increased the firing rate by about 60% (p < 0.01). The facnd larger doses (100 and 400 pmol), which caused disinhibition of practically the samhows a portion of the actual recording (cell-attached mode); HCVM of 200 pmol of
ience Methods 155 (2006) 231–240
The above measurements are only intended to provide somexamples on the concentration risetime scale for compoundselivered by HCVM. In principle, the risetime may be fur-her reduced by using larger syringes, which would displace
larger volume per ejection step. However, when ejectingnto brain slices, one has to consider that too rapid ejec-ions may cause excessive mechanical movement of the tis-ue and hamper physiological measurements. Although HCVMelivery of drugs is slower than flash photolysis, it is in theame range as many other rapid solution application meth-ds (Tang, 1998), which, however, cannot be used in brainlices.
Advanced control of different ejection parameters in HCVMakes it possible to design physiological experiments, which are
ifficult or impossible to perform with other drug delivery meth-ds. In particular, HCVM can be useful for quantitative localelivery of a test compound over an extended period of time. Forxample, most neurons in coronal slices of the PVN display someevel of spontaneous firing activity. A whole-cell recording fromhese neurons reveals postsynaptic chloride currents, which cane reversibly blocked by bicuculline or gabazine and are indica-ive of the inhibitory tonic input from other neurons in the slice.xisting methods of quantifying the tonic input, e.g., calculationf the charge transfer (Forsythe and Westbrook, 1988; McBain,995) do not answer the principal question, namely, to whatxtent is firing suppressed by the tonic inhibition (e.g., by 10%r by 80%). This can be done with HCVM by delivering bicu-ulline to induce a functionally complete but local disinhibition,nd maintain it for a period of time long enough to measure thencreased rate of firing (Fig. 8). This technique can be employedo compare the degree of tonic inhibition in different neuron pop-lations, as well as in “normal” and diseased animals. Note thatath application of bicuculline would produce ambiguous data,
ecause diminished inhibition in the entire slice will very likelyhange the excitatory input as well. Alternatively, disinhibitiony flash photolysis would be too brief to measure a change inring rate.on within a brain slice. The inhibitory tone was quantified from the maximummaximum disinhibition was produced by ejection of 200 pmol of bicuculline
t that this was indeed the maximum effect is proven by single runs with smallere magnitude; a smaller dose of 40 pmol caused much weaker effect. The inset
bicuculline is indicated by the horizontal bar. Calibration: 5 s and 20 mV.
urosc
4
ccssflitwinicS(c1ulf(ocdmtdlreipe
tTs
1
2
3
4
5
6
edbhpwgwiwrtodwcfis
bpds
A.G. Pakhomov et al. / Journal of Ne
. Discussion
At present, the time dynamics, the distribution pattern, andlearance of drugs microejected into tissue have not been fullyharacterized or well understood. Even studies that focusedpecifically on advanced techniques of drug delivery into brainlices (Pidoplichko and Dani, 2005) and on the in-tissue dif-usion of ejected substances (e.g., Thorne et al., 2004) giveittle consideration to such tissue properties as, for example,ts resiliency to introduction of an additional volume of solu-ion. Overall, one may expect that the volume ejected into tissueill behave differently compared with the same volume ejected
nto a liquid. For example, it has been found empirically butot explained yet, why drug concentrations for pressure puff-ng into brain slices should be hundreds of times higher thanoncentrations already effective in bath applications. Li andmith (1997) pressure ejected dl-2-amino-5-phosphonovalerateAPV) at pipette concentrations of 0.5 or 2.0 mM, whereas bathoncentration required for maximum effect of APV is about0–25 �M (Ma et al., 2002). In another study, angiotensin II wassed at concentrations of 0.5–7.5 mM for wide-barrel pipetteow-pressure puffing onto a patched neuron, but only at 2 �Mor bath superfusion (Cato and Toney, 2005). Hallworth et al.2002) used 20-mM glutamate for pressure puffing, whereasther authors observed profound effects at 100-�M bath con-entration of this drug (Kahlert et al., 2005). Here, we haveemonstrated that a significant amount of the ejected solutionay escape from tissue by the back-flow (Fig. 5). More solu-
ion is likely to escape when more damage is done to the tissueuring pipette penetration, e.g., when using wide-tip pipettes forow-pressure conventional microejection. That is why the bar-el concentrations of drugs needed to be so high: most of thejected drug did not reach the target cell, but was pushed backnto superfusing solution flow. The use of HCVM and smalleripettes helps to reduce the solution escape, although does notliminate it.
Although the concept of HCVM is straightforward (see Sec-ion 1), its technical implementation is not quite as simple.o achieve maximum performance of HCVM, an experimenterhould regard several critical details:
. The entire system (syringe, tubing, and pipette) should befilled with liquid and assembled so that no voids or air bubblesremain. Degassing of liquids under vacuum or by pre-heating,though not used in this study, may further improve deliveryspeed and volume control.
. Proper selection of a low-compliance tubing is vitally impor-tant. Popular tubing materials like silicon or Tygon are tooflexible and cannot be used. A good choice is a wide-gaugeMicrofil (WPI), however, PE10 tubing (Beckton Dickson)performed fairly well in most experiments.
. The connection of tubing to the pipette must be tight, rigid,
and able to withstand high hydraulic pressure. This may bea tricky task, especially with multibarrel pipettes, and whenboth the pipette and tubing are filled with liquid. If PE10 tub-ing is used, one may glue it to a dry pipette with an epoxy;tduc
ience Methods 155 (2006) 231–240 239
afterwards, both the tubing and the pipette can be filled withliquid by means of a Microfil fiber long enough to reach intothe pipette via the PE10 tubing already glued on. Alterna-tively, the pipette can be held tight in a liquid-filled pipetteholder with a pressure port (such as MEH6RFW, WPI) andthe hydraulic connection is established between the pressureport and the syringe.
. A syringe to be used for HCVM should first be checked forthe ability to eject against a high pressure. Unexpectedly, theliquid may seep between the plunger and the syringe wall,and appear behind the plunger. This problem is more commonin small-volume syringes (1–10 �l), which are most usefulfor HCVM. Potentially, the use of hydraulic fluids other thanwater may alleviate this problem.
. A properly assembled hydraulic ejection system is sensitiveto temperature, and a step motor that drives the syringe maywarm up considerably even when kept idle. Thermal expan-sion of the fluid may lead to a continual low-rate leakagefrom the pipette tip, which may be unacceptable in someexperiments.
. When osmolality of the fluid in the HCVM pipette is sub-stantially different (higher) than that of the bath fluid, onemay expect that water would enter the pipette to displaceother compounds and push them out of the tip. In this case, acontinual “plume” of these compounds may come from thepipette tip even when no ejections are made. (Note: a “plume”of fluorescence from the pipette tip may also be created justby diffusion of die molecules into the bath.)
Another issue of high importance is the design of controlxperiments. Even when regular ACSF is used as a vehicle forrug delivery with HCVM, it may cause bioeffects or artifactsy mechanical displacement and shifting the cells. Having doneundreds of ejections by HCVM during gap-free, whole-cellatch-clamp recordings, the only mechanical effect we observedas a fast and irreversible loss of the gigaseal (although theigaseal is mechanically quite stable and withstands pressureaves that appear damaging when viewed with IR/DIC optics
n real time). We have not observed any effects of the pressureave that would mimic the effects of tested drugs (e.g., brief and
eversible changes in the firing rate or in the holding current), buthis does not necessarily hold true for other types of neurons orther drugs. Hence, vehicle ejection controls must accompanyrug ejection experiments, and this can be done in two differentays: (1) by using a multibarrel pipette, which has the vehi-
le in one of the barrels and (2) by using single-barrel pipetteslled with either vehicle or a drug solution, and alternating theseolutions from one experiment to another.
The first approach appears more productive, however, a multi-arrel pipette system is more problematic to fill and assembleroperly. Also, the larger tip of a multibarrel pipette causes moreamage during tissue penetration, allowing more of the ejectedolution to escape from tissue via back-flow along the pipette
rack, and making the ejection results less predictable and repro-ucible. On the other hand, single-barrel pipettes are typicallysed one at a time, filled either with a drug or with the vehi-le for each studied neuron. Therefore, drug and vehicle effects
2 eurosc
wusafo
utIgetreowcti(aa
HtdstiCoc
tetcattavd
msmdp
A
Ha
ai
R
A
C
C
F
H
J
K
K
L
M
M
M
M
P
P
P
S
S
T
T
T
40 A.G. Pakhomov et al. / Journal of N
ill be tested in different individual cells, thus introducing somencertainty and requiring larger sample sizes and more robusttatistics to identify true effects of the drug. Having tested bothpproaches, we suggest that single-barrel pipettes should be pre-erred, unless the experimental protocol requires testing of twor more different drugs on the same cell.
It is important to note that precise control of drug deliverysing HCVM made it possible to produce dose–response rela-ionships by ejections of just a single concentration of a drug.nstead of the usual approach of varying the drug concentration,raded responses were elicited by varying the amount of thejected drug. This amount was effectively controlled by eitherhe duration of ejection (Fig. 1) or by its rate (Fig. 2). Thisesult fits well with a recent report by Sabeti et al. (2002), whoxplored dose responses in vivo by delivering different amountsf a drug at a fixed concentration. The drug (200 �M dopamine)as delivered into the brain with a help of a microprocessor-
ontrolled syringe pump; this procedure was essentially similaro HCVM, except for using a larger diameter tubing (40 �m i.d.)nstead of a micropipette, and delivering larger solution volumesup to 20,000 nl). In our study, the use of HCVM extended thepplication of this approach to the level of isolated brain slicesnd single-cell responses.
Depending on the needs of a particular experiments, theCVM technique can find new and potentially unique applica-
ions, such as protection of a small local area from a bath-appliedrug. For example, continual HCVM delivery of ACSF to apontaneously active neuron may protect it from bath-appliedetrodotoxin, thereby making it possible to continue recordingts action potentials when firing in the rest of the slice is blocked.omparing the firing rates before and during the block allowsne to quantify the activity-dependent input to that particularell.
Adding a fluorescent dye like Lucifer Yellow to drug solu-ions in the delivery pipette provides additional control over thejection process. Observing in real time the “cloud” ejected fromhe pipette helps to adjust the ejection parameters to meet spe-ific needs of each experiment. Using this approach, the areaffected by the ejected drug can be restricted to a certain por-ion of cell soma or to a dendrite (however, possible effects ofhe diffused drug at remote locations should also be taken intoccount). Alternatively, by increasing the ejection speed and/orolume one can make sure that the entire soma and proximalendrites are “bathed” in the ejected solution.
Overall, HCVM appears to be a powerful and versatileethod of local drug delivery into tissues such as brain
lices. HCVM has clear advantages over conventional pressureicroejection and supplements the capabilities of other local
rug delivery methods, such as flash photolysis and microionto-horesis.
cknowledgements
This study was supported in part by National Institutes ofealth grants HL07446 (AGP), HL71645 and HL76312 (GMT),
nd by Sandler Program For Asthma Research (RB, IS). We
V
ience Methods 155 (2006) 231–240
re thankful to Dr. G. Tolstykh for valuable discussions andndependent testing of the HCVM technique.
eferences
lkondon M, Pereira EF, Albuquerque EX. Mapping the location of func-tional nicotinic and gamma-aminobutyric acidA receptors on hippocampalneurons. J Pharmacol Exp Ther 1996;279:1491–506.
allaway EM, Katz LC. Photostimulation using caged glutamate revealsfunctional circuitry in living brain slices. Proc Natl Acad Sci USA1993;90:7661–5.
ato MJ, Toney GM. Angiotensin II excites paraventricular nucleus neuronsthat innervate the rostral ventrolateral medulla: an in vitro patch-clampstudy in brain slices. J Neurophysiol 2005;93:403–13.
orsythe ID, Westbrook GL. Slow excitatory postsynaptic currents mediatedby N-methyl-d-aspartate receptors on cultured mouse central neurones. JPhysiol 1988;396:515–33.
allworth R, Cato M, Colbert C, Rea MA. Presynaptic adenosine A1receptors regulate retinohypothalamic neurotransmission in the hamstersuprachiasmatic nucleus. J Neurobiol 2002;52:230–40.
ohnson JW, Ascher P. Glycine potentiates the NMDA response in culturedmouse brain neurons. Nature 1987;325:529–31.
ahlert S, Zundorf G, Reiser G. Glutamate-mediated influx of extracellularCa2+ is coupled with reactive oxygen species generation in cultured hip-pocampal neurons but not in astrocytes. J Neurosci Res 2005;79:262–71.
rishtal OA, Pidoplichko VI. A receptor for protons in the nerve cell mem-brane. Neuroscience 1980;5:2325–7.
i CS, Smith DV. Glutamate receptor antagonists block gustatory afferentinput to the nucleus of the solitary tract. J Neurophysiol 1997;77:1514–25.
a CL, Kelly JB, Wu SH. Presynaptic modulation of GABAergic inhibi-tion by GABA(B) receptors in the rat’s inferior colliculus. Neuroscience2002;114:207–15.
archand AR, Pearlstein E. A simple dual pressure-ejection system andcalibration method for brief local applications of drugs and modifiedsalines. J Neurosci Meth 1995;60:99–105.
cBain CJ. Hippocampal inhibitory neuron activity in the elevated potassiummodel of epilepsy. J Neurophysiol 1995;73:2853–63.
cCaman RE, McKenna DG, Ono JK. A pressure system for intracellular andextracellular ejections of picoliter volumes. Brain Res 1977;136:141–7.
akhomov AG, Semenov Y, Toney GM. Precise local drug delivery in brainslices using hydraulically coupled volume microejection (HCVM) pro-gram no. 921.4. 2005 abstract viewer/itinerary planner. Washington, DC:Society for Neuroscience; 2005 [online].
ark MK, Tepikin AV, Petersen OH. What can we learn about cell signallingby combining optical imaging and patch clamp techniques? Pflugers Arch2002;444:305–16.
idoplichko VI, Dani JA. Applying small quantities of multiple com-pounds to defined locations of in vitro brain slices. J Neurosci Meth2005;142:55–66.
abeti J, Adams CE, Burmeister J, Gerhardt GA, Zahniser NR. Kinetic anal-ysis of striatal clearance of exogenous dopamine recorded by chronoam-perometry in freely moving rats. J Neurosci Meth 2002;121:41–52.
akai M, Swartz BE, Woody CD. Controlled micro release of pharmacolog-ical agents: measurements of volume ejected in vitro through fine tippedglass microelectrodes by pressure. Neuropharmacology 1979;18:209–13.
ang Ch-M. Rapid solution application methods. Curr Protoc Neurosci1998:6.9.1–17.
asker JG, Dudek FE. Electrophysiological properties of neurones in theregion of the paraventricular nucleus in slices of rat hypothalamus. JPhysiol 1991;434:271–93.
horne RG, Hrabetova S, Nicholson C. Diffusion of epidermal growth factor
in rat brain extracellular space measured by integrative optical imaging.J Neurophysiol 2004;92(6):3471–81.yklicky Jr L, Benveniste M, Mayer ML. Modulation of N-methyl-d-asparticacid receptor desensitization by glycine in mouse cultured hippocampalneurones. J Physiol 1990;428:313–31.