human chemosensory perception of methyl isothiocyanate: chemesthesis and odor
TRANSCRIPT

1
Human Chemosensory Perception of Methyl Isothiocyanate: Odor and Chemesthesis
William S. Caina, Michael L. Doursonb, Melissa J. Kohrman-Vincentb, and Bruce C. Allenc
a University of California, San Diego
b Toxicology Excellence for Risk Assessment c Bruce Allen Consulting
Address for Correspondence
William S. Cain, Ph.D.
Chemosensory Perception Laboratory
Dept. of Surgery (Otolaryngology)
University of California, San Diego
La Jolla, CA 92093-0957
Tel: 858-361-5831
Fax: 858-458-9417
Email: [email protected]
Keywords
Methyl Isothiocyanate, Odor, Sensory Irritation, Chemesthesis, Human, Benchmark Concentration.

2
Abstract
An unpublished laboratory study by M. Russell and T. Rush (1996) showed that human
subjects sense the presence of methyl isothiocyanate (MITC) via the eyes at
concentrations as low as hundreds of ppb in air, with dependence upon duration of
exposure. The longer the stimulation, the lower the concentration sensed. Application of
benchmark concentration (BMC10) modeling indicated a best estimate of 330 ppb at 4
hours. With a confidence limit (BMCL) applied, the level dropped to 220 ppb, when
employing a probit model. New findings indicate that chemesthesis, the capacity to feel
chemicals, derives principally and perhaps exclusively from activity in ion channels
known as the TRP superfamily. TRPA1 channels in the trigeminal nerve have particular
sensitivity to isothiocyanates, many of which occur naturally in plants (e.g., capers and
mustard greens). Sensitivity to these electrophiles seems to derive from a mechanism of
reversible covalent bonding, protective insofar as it provides warning of potential
damage. Russell and Rush assumed that the eyes would sense MITC, a lachrymator,
before the upper airways, so gathered no data via that route. Field results from spills and
results of acute exposures to animals covered in Dourson et al. (2010) add pertinent
information on the matter.

3
1. Introduction
The material methyl isothiocyanate (MITC), sometimes called methyl mustard,
occurs in nature, as do related isothiocyanates, where they fend off animal predation of
certain plants, e.g., capers and other mustard-related plants (El-Ghorab et al., 2007). The
materials, alkylating agents of one level of reactivity or another, perform their role by
evoking stinging (Peterlin et al., 2007).
MITC serves various commercial purposes, notably fumigation of soil. Applied
commonly to fields via a liquid-precursor metam-sodium, the evolved vapor essentially
sterilizes fields for planting of high-value crops (Luzo, 2006). Both in this and in certain
other roles, MITC may enter the atmosphere at ground level and affect human beings,
with the first sign typically stinging, not surprisingly. Depending upon concentration and
duration of acute exposure, the stinging may not progress beyond this symptom or may
progress to more serious symptoms, including acutely incapacitating reactions of the
airways.
The human database for MITC consists of one unpublished investigation
performed more than a decade ago by M. J. Russell and T. I. Rush (1996), who examined
the odor and sensory irritating properties of MITC. The study of odor focused upon
concentrations necessary to detect vapor in just a sniff, pertinent to when the nose would
evince its best sensitivity. The study of sensory irritation focused upon concentrations
that might just evoke responses to exposures out to eight hours. The investigators sought
to measure sensitivity just to perceive the vapor, not more serious consequences, and in
this regard they examined the site of contact historically considered most sensitive, the
eye.

4
1.1. “Chemesthesis”
Research in receptor biology has recently uncovered novel mechanisms for the
sensory reception of the feel of chemicals (Story, 2006). Previously, it had seemed likely
that low thresholds to detect some materials came about from either damage to cells or
from penetration into cell membranes that may or may not have qualified as damage
(e.g., Moncrieff, 1944; Nomura & Kurihara, 1987; Nielsen, 1991). The idea that
receptors underlay the process began to take hold about 25 years ago (Nielsen et al.
1984). About that time, the term chemesthesis also began to appear. This term refers to
the capacity to sense the presence of chemicals by means other than olfaction or taste
(Green & Lawless, 1991; Shusterman, 2002). Many decades earlier, the term common
chemical sense had occupied that ground, but then the term sensory irritation gradually
took over (Moncrieff, 1944).
Three problems accompany the use of the term sensory irritation: 1) Many people,
including physicians, have assumed that sensory irritation refers to the same phenomenon
as “classical” irritation, a state normally accompanied by erythema and inflammation. It
does not. 2) Use of the term irritation seems incompatible with some of the enjoyable
chemesthetic sensations associated with eating and drinking. Essentially all alcoholic
beverages, even table wines, have some bite that imbibers would disclaim as irritating.
Alcohol aside, much food and many condiments have a pungent character that eaters
would similarly abjure as irritating. These range from mustard, capers, onions,
horseradish, chili peppers, and paprika to soda pop and mineral water, where the bubbles
of carbon dioxide stimulate chemesthesis. 3) Even materials outside the diet, certain
soluble dusts, for example, and many vapors will trigger some feel at a level few would

5
spontaneously call irritating (Cain et al., 2004). A person may sense the presence of
solvent vapors, such as those of rubbing alcohol or acetone (e.g., as a nail-polish
remover), through feel at a level below those called irritating. Hence, the term
chemesthesis for the potential to sense the materials and chemesthetic sensation for the
experience itself have provided neutrality of characterization. This does not mean,
however, that chemesthetic magnitude does not enter the picture and make the term
irritation justified. What one person finds pleasantly hot, another might call irritating
indeed, but both have experienced chemesthetic sensations. For the record, cold
sensations caused by chemicals, such as menthol, also qualify as chemesthetic (Bandell,
et al., 2007).
1.2. Aims
This report: a) will include enough methodological detail to reveal how Russell
and Rush measured the chemosensory properties of MITC, b) will propose an analysis to
derive a safe level for acute exposure from the data of Russell and Rush, and c) will place
the outcome into the context of modern findings on the understanding of chemesthesis.
An early order of business for Russell and Rush concerned measurement of odor
detection. If humans could smell MITC at much lower concentration than they could feel
it, then the design of the investigation might have had to differ. Since humans could not,
in fact, smell MITC until its concentration lay into the zone that they could feel in the eye
within a few minutes of exposure, odor became unimportant.
The methodology to measure the odor threshold appears as an appendix here so as
not to distract from details of the chemesthetic measurements. However, the olfactory
portion of the investigation established the credibility of the unique vapor delivery system

6
the investigators had chosen. Besides the finding of an odor threshold above the
chemesthetic point of detection for MITC, methodological points justify some treatment
of the olfactory investigation.
2. Methods
2.1. Subjects
Russell and Rush (1996) recruited volunteers from the Sacramento area.
Exclusion criteria, established by questionnaire, consisted of 1) abnormal eye irritability,
2) wearing contact lenses, 3) frequent headaches, 4) recent asthma attacks, and 5)
pregnancy. The sample contained 70 subjects (32 female) of an average age 32 years
(range 18-67). Subjects could serve multiple times. The investigators reserved the right
to exclude anyone who arrived for testing with “observably” irritated eyes. The subjects
gave informed consent, with the protocol approved by an Institutional Review Board at
University of California, Davis.
2.2. Materials
Methyl isothiocyanate (MITC, CAS number 556-61-6), 99.6% by GC as reported
in the manufacturer’s certificate of analysis (MCA); acetic acid (CAS number 64-19-7),
100% per MCA; particle- and vapor-filtered room air from the HVAC system of the
building; and compressed nitrogen (Liquid Carbonic).
2.3. Apparatus
Control of concentration came from a vapor delivery device (olfactometer)
designed for the study by Vapor Science, Inc, and used in the olfactory portion,
conducted first (see appendix for additional details of vapor generation and dilution). For

7
chemesthetic testing, vapors of stimulus material diluted with nitrogen and air flowed at 1
L/min through glass-paned masks that covered the eyes, but not the nose. A manifold on
the upper inside surface of a mask distributed the vapor across the expanse of the eyes
without direct flow toward the ocular surface. A test-session could employ up to three
masks, i.e., three subjects, simultaneously. A total hydrocarbon analyzer served to
monitor relative concentration of vapor.
Other apparatus of note included an analytical balance (Mettler AE100) as a tool
to measure concentration indirectly via loss of mass into a flowing stream of air, an
electroencephalograph (Grass 8-10E) to measure eye blinking via electromyography, and
a 35-mm camera (Canon EOS Elan, with ring flash, and 100-mm macro lens) to take
close-up photos of the eyes.
2.4. Analytical Confirmation
Analytical confirmation of delivery of MITC entailed gas chromatography, as
described under Method in the Appendix. Of note here, the confirmation included
samples taken from inside the masks at the end of the study.
Whereas recovery of MITC proved adequate, recovery of acetic acid assessed via
Draeger-tube sampling at the end of the study implied that concentration delivered in the
mask had declined during individual exposures. The investigators suggested that the
vapor might have reacted with plastic in the mask. Hence, they discarded the results
obtained with that vapor in the chemesthetic part of the study.
8
2.5. Procedure
Russell and Rush exposed subjects via the masks to levels of MTIC that ranged
from 0.22 to 3.3 ppm in air. Exposures consisted of periods of 14 min, 4 hr, and 8 hr.
All testing at 8 hr preceded that at 4 hr, and both preceded that at 14 min. The regimen
gave the investigators the opportunity to choose combinations of level and duration
strategically, so as to minimize eventual discomfort to the subjects. Longer exposures
involved use of only lower concentrations.
The investigators measured five types of responses: perceived irritation (rated on
a visual analogue scale), rate of blinking, tearing, visual acuity, and structural alterations
(hyperemia, edema) possibly evident in photos of the eye. These assays would inevitably
differ in sensitivity, as appropriate to gauge severity of effects. Hence, detection of feel
of MITC in the eye would precede the objective effects, but served nevertheless as an
indicator of a biological effect.
The investigators took measurements at intervals throughout the exposures. Each
period of exposure (e.g., a 14-min trial, a 4-hr trial) and concentration included mainly
different subjects, with some used for more than one combination. The majority of
subjects served once or twice, and none more than four times.
2.6. Data Analysis
Initial processing of the data took two forms: 1) normalization against blank
conditions and 2) qualification of responses as positive and negative, with positive
defined as an adverse event. (These analyses took advantage of the listing of individual
responses in the report of Russell and Rush, who performed no normalization.)
9
1) The mean and standard deviation of responses in the control exposures
permitted expression of responses during experimental exposures as normal deviates, i.e.,
z-scores. Hence, if a subject’s response reached two standard deviations above the mean
for the control exposure at the corresponding duration, then the response received a value
of 2.0. If the response lay one and a half standard deviations above that mean, it received
a value of 1.5, and so on. The procedure standardized the unit of measurement both
within a variable, such as perceived magnitude, and across variables, such as perceived
magnitude and blinking. Assuming an underlying normal distribution, a z ≥ 2 would
occur in less than 2.5% of cases in the control exposure.
2) For irritation and blinking, a response was identified as adverse if at least one
of the following conditions held:
• A subject had a value of z ≥ 2 for the pertinent variable (e.g., rating) on two
successive occasions; or
• A subject had a value of z ≥ 2 for the pertinent variable at the end of exposure
when previous responses displayed a trend toward such a value.
The approach of requiring a response at more than one time point served to
minimize false positives from random fluctuations in time.
For tearing, a single value of z ≥ 2 defined a response as adverse. Measurement
of tearing occurred only occasionally during an exposure since it required accumulation
of fluid over time.
10
The analysis counted a subject as a responder on a given trial when he or she
yielded at least two adverse responses; this criterion assured at least one objective
measure of response. These response frequencies became the input for modeling.
2.7. Modeling of Benchmark Concentration (BMC)
Concentration-time-response methods employed both exposure-level and duration
to predict probability of responses for eye irritation (Zwart et al., 1990, 1992). The
analysis conformed to the following general model to represent relationships among
concentration (c), duration of exposure (t) and response (P(c,t)):
P(c,t) = g(b0 + b1*f1(c) + b2*f2(t)).
The function g() transforms the linear relationship to a probability between 0 and
1 via a suitable function, in this case, logistic and probit:
Logistic: g(z) = exp(z) / (1 + exp(z))
Probit: g(z) = (z-5),
where z equals the standard deviate score and () the function for the cumulative
standard normal distribution. The effort to model also considered linear and logarithmic
transformations for the functions f():
fi(u) = u (identity transformation)
fi(u) = ln(u) (logarithmic transformation).
All four combinations of g() and f() were considered for predictive value.
An algorithm developed by ten Berge (2007) estimated the parameters (b0, b1, b2)
to describe the relative contributions of concentration and duration, and to calculate

11
benchmark concentrations (BMC). The program calculated confidence limits around
BMC by the Wald method (Fieller, 1944). That method has certain weaknesses (Crump
and Howe, 1985).1 An alternative method that computed well-behaved limits for BMCs
computed for specific durations, circumvented the problem. EPA software BMDS
version 1.4.1, met the purpose, with BMCL estimates (benchmark concentration lower
bounds) defined as the 95% lower bounds on a BMC, corresponding to 10% extra risk.
3. Results
3.1. Rated Magnitude and Blinking
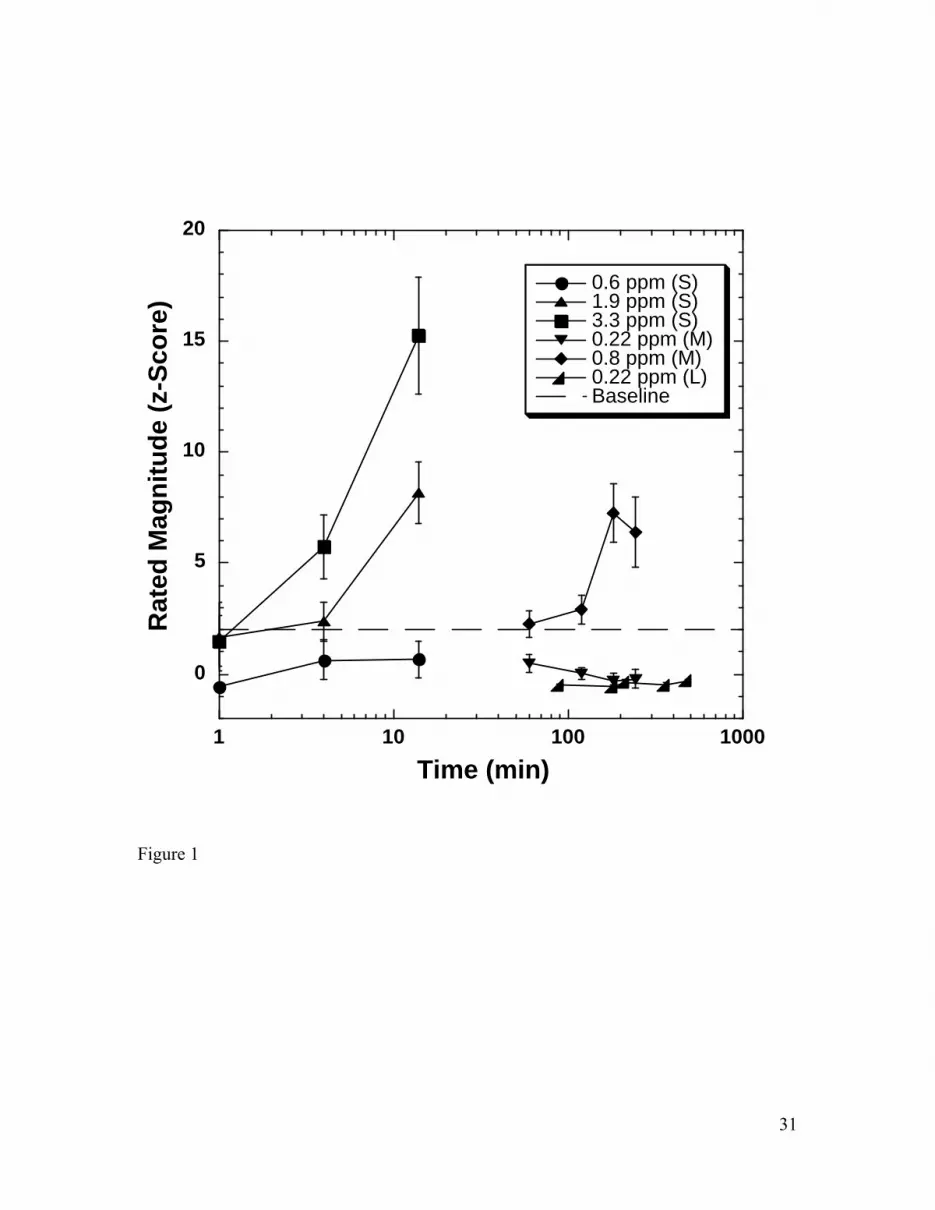
Figure 1 depicts how normalized rated magnitude (±SEM), expressed in units of
z, varied with duration and concentration. Values at or near z = 0 correspond to parity
between responses for experimental and control exposures. For the three concentrations
explored in short exposures (S = 14 min), 0.6 ppm, 1.9 ppm, and 3.3 ppm, perceived
magnitude after a minute had changed little from zero. Hence, MITC required time to
exert its sensory effects. By 4 min, concentration dependence had emerged and
continued expansively out to the duration of 14 min. The marked interaction of duration
and concentration, not seen commonly in responses to VOCs, suggested a particular
characteristic in the way MITC stimulates chemesthesis.
For the two concentrations explored in medium-length exposures (M = 4 hr), the
interaction of duration and concentration appeared again. In this case, the data for 0.8
ppm (M) implied that the temporal integration seen in the shorter exposures could follow
a less brisk course, consistent with its low relative concentration. Perceived magnitude
1 For example, some BMC bound calculations in this analysis, computed using the method in the ten Berge software, gave negative concentrations.

12
from exposure to 0.8 ppm (M) had reached significance in the first judgments, at one
hour, and then increased further over the next two hours. Because the investigators had
asked for no ratings during that first hour, the course of the climb does not exist. The
slope of the function for 0.6 ppm (S) provides just a hint that this concentration too might
evoke a slow upward course of sensation over hours.
The experimenters included two exposures to 0.22 ppm, one in the medium
category [0.22 pm (M = 4 hr)] and one in the long category [0.22 ppm (L = 8 hr)]. Both
yielded the same information, namely, that subjects experienced no chemesthetic effect.
If all five test-concentrations had covered the span out from 1 min, the pattern in
Fig. 1 might have generally resembled a fan well into the exposures. Such a pattern
could reflect either Haber’s Law per se, or some variant of it. Figure 2 shows the trade-
off between concentration and time, out to three hours, for a criterion effect, in this case,
the point of no observable effect, as calculated by Russell and Rush.
The power function fitted to the data fails to account for the data point at 1.9 ppm,
though perhaps just because of the large step between the test concentrations of 0.6 and
1.9 ppm. In any case, trading between time and concentration does reveal itself and the
function implies a square root relationship (concentration = k x time-1/2) rather than a one-
to-one relationship (concentration = k x time-1). Had the point at 0.6 ppm at 4 min lay in
the range 1 to 1.4 ppm, for instance, the correlation would have risen, but the square-root
relationship would have remained (see emendation below). Concentrations into the low
ppm’s start off equal in the first minute or so and only thereafter differentiate themselves.
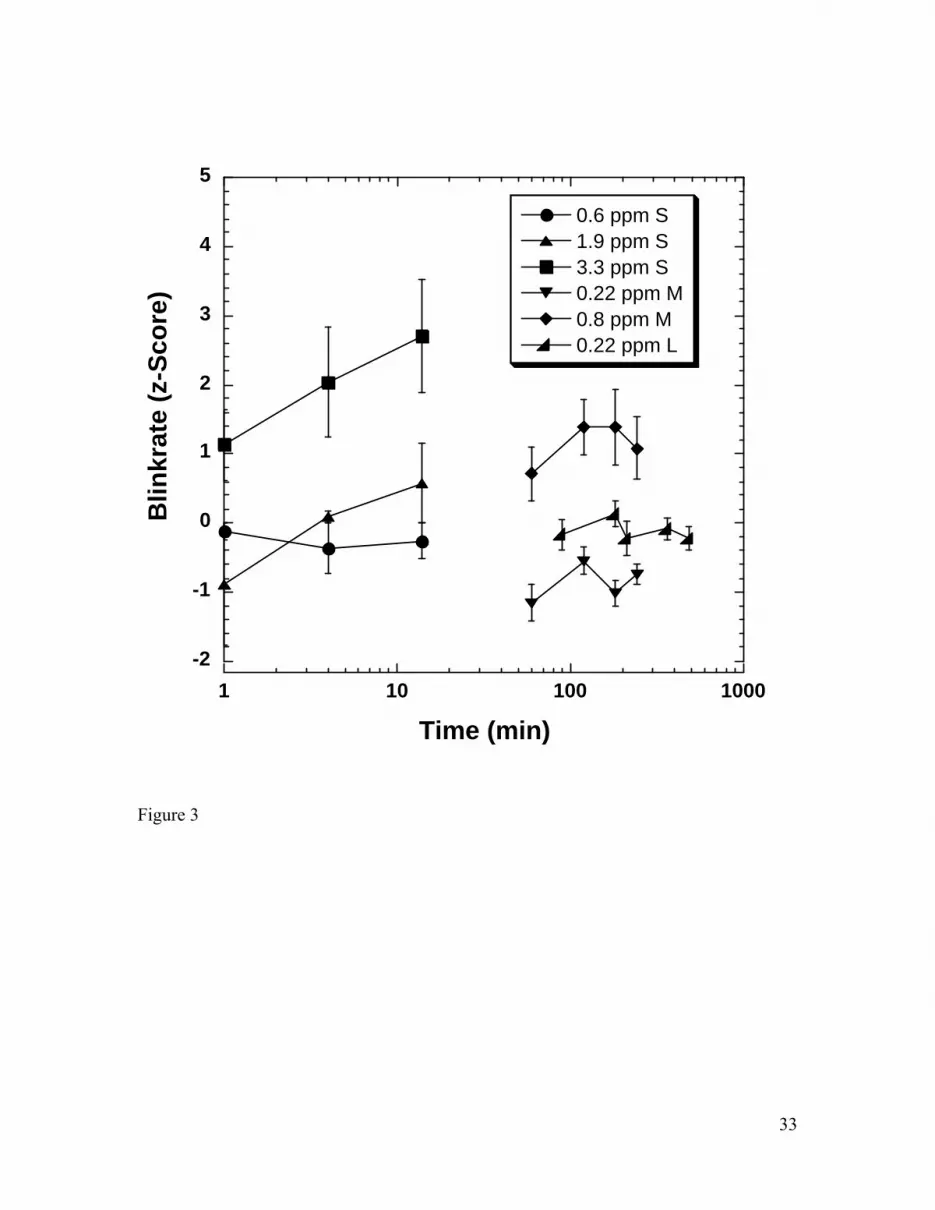
In the hierarchy of responses to a chemesthetic stimulus for the eye, blinking
would seem to have sensitivity either poorer-than or at parity with perceived magnitude.
13
That is, a person might blink more than normal upon feelings of irritation, but would
seem unlikely to blink more without some accompanying feel. This expectation accords
with the outcome of the investigation (Figure 3). For the short exposures, only 3.3 ppm
(S) differentiated itself in magnitude from the other two levels, 0.6 ppm (S) and 1.9 ppm
(S), though the function for 1.9 ppm (S) displayed a time-dependence like that of 3.3 ppm
(S). Accordingly, the underlying relationship seemed to remain, though the variability in
the response reduced its magnitude in z units.
Blink rate from exposure to 0.8 ppm (M) showed enough similarity to the
outcome of perceived magnitude to confirm that temporal integration continues beyond
an hour. The non-monotonic nature of the functions for the two endpoints suggests that
some form of adaptation, i.e., a reduction in effect, may occur long into an exposure. An
on-going process of adaptation from the beginning of an exposure, not always evident
until a downturn in a function, may well account for departures from the strict form of
Haber’s Law. As in the case for perceived magnitude, exposure to 0.22 ppm (M and L)
revealed no effect.
The variables of tearing, visual acuity, and visible changes of the ocular surface
presumably would apparently have required more intense exposures to reveal
relationships such as those of rated magnitude and blinking. Tearing, however, did hold
some useful information in the qualification of responders.
Modeling for Benchmark Concentration
Modeling dealt with the relationship between concentration, duration, and the
number of adverse responses, as defined above. Logistic and probit modeling, applied to
the number of responders per group of exposed subjects (Table 1), yielded acceptable fits

14
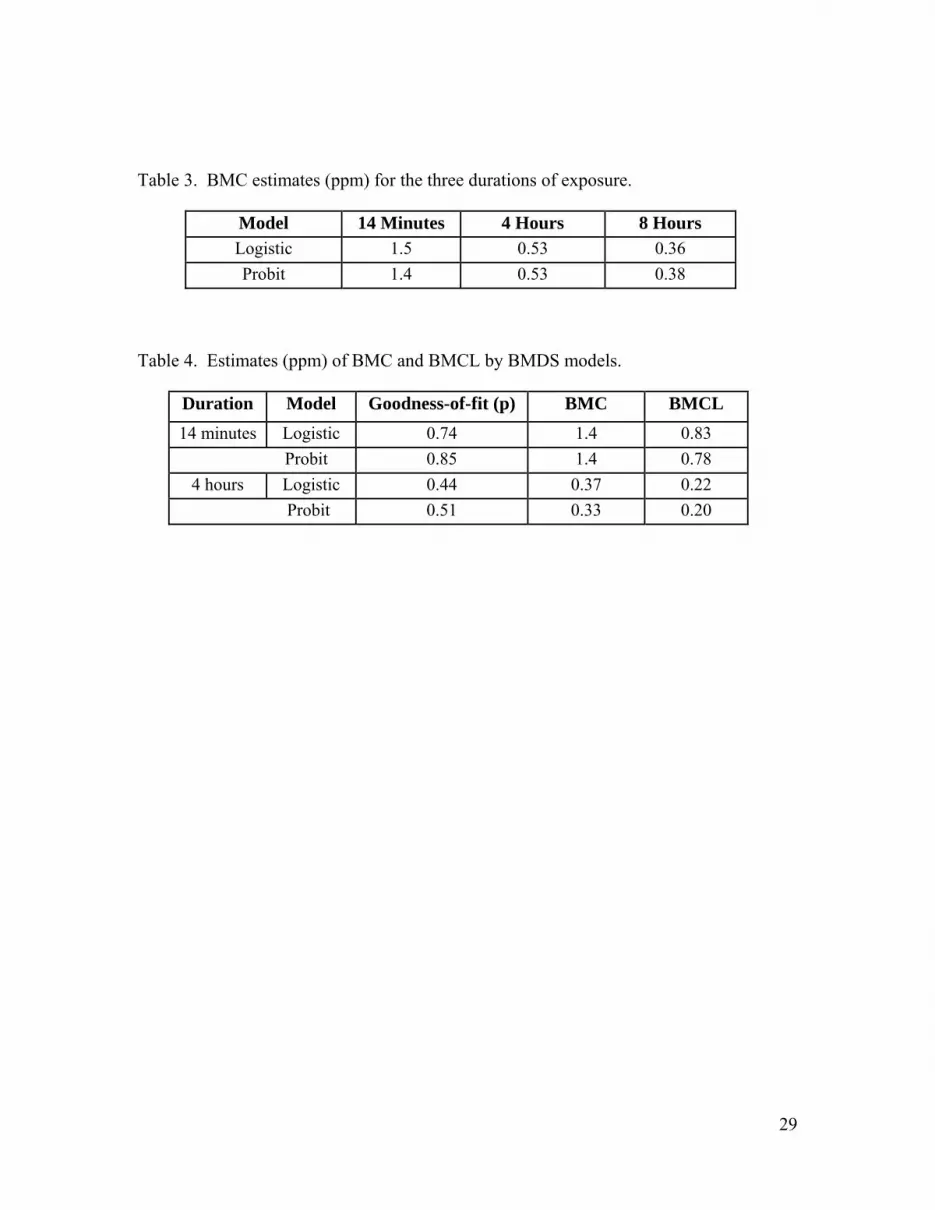
(p> 0.1) for the functions c and ln t (Table 2). Each gave almost identical estimates for a
time-integrated benchmark concentration, BMC10 (Table 3).
The logistic and probit models from the BMDS software were fit separately to the
14-min and 4-hr exposures (Table 4).2 Both models yielded almost identical values per
duration, though a bit lower than that yielded with the time-integrated modeling (Table
3). The width of the bounds on BMC10s depends upon number of observations, with
generally wider calculated bounds for fewer observations. The separate analyses for 14-
min and 4-hr exposures entailed fewer observations per analysis than the preferred time-
integrated analysis. This suggests conservatism for the BMCL10s in Table 4, i.e., makes
them more likely to be health protective if used to establish a safe concentration. The
results in Table 4 accord well with those in Figures 1 through 3.
4. Discussion
The investigation of Russell and Rush indicated that feelings in the eye provided
the most sensitive index for the presence of airborne MITC among those explored. At
0.22 ppm, subjects registered no detection over an exposure as long as long as eight
hours. Subjects seemed unable to detect a concentration of 0.6 ppm, though an exposure
of just 14 minutes left some uncertainty about whether detection might develop over
time. Subjects could detect concentrations of 0.8 ppm and above, where the exposure
over hours allowed development of a response. Signs of such temporal integration could
become part of a definition of a positive vs. a negative level of stimulation in
chemesthetic studies.
2 Separate modeling was omitted for the eight-hour exposures since there existed only two groups, including control; neither of which contained a responder.

15
At the very beginning of exposure, MITC had little or no effect, even at a
concentration as high as 3.3 ppm that within minutes could become quite noxious. For
0.8 ppm, the feeling in the eye increased over three hours, a possibly unprecedented
outcome in studies of exposure to volatile organic compounds (VOCs). Some
investigators had observed, however, that the VOCs formaldehyde and environmental
tobacco smoke (stripped of particles), exhibited slow integration of sensory magnitude at
low levels of stimulation and faster integration at higher levels (e.g., Cain et al., 1986;
Cain et al., 1987). Russell and Rush added new information by their use of long
exposures. The eventual decline of perceived magnitude and blinking in the exposure to
0.8 ppm suggested some adaptation to MITC. For the VOC formaldehyde, Cain et al.
(1986) concluded that the process of adaptation occurred simultaneously with integration
throughout exposure, but with a longer time constant. This kind of process could explain
incomplete trading of duration and concentration, i.e., a square-root function, obtained in
Fig. 2, as opposed to the more complete trading of Haber’s Law. Recent findings of
time-intensity trading at detection over the first seconds of chemesthetic stimulation,
leave room for the physicochemical nature of the stimulus to play a role in integration
(Wise et al., 2009). These factors merit attention in the design of future studies.
4.1. TRP Channels
Materials that trigger chemesthesis sort themselves into that stimulate in the
condensed form, e.g., chili pepper in a soup, and those that can stimulate in both vapor
and condensed form, e.g., onions. The former, most notably capsaicin, the active
ingredient in chili pepper and other hot dishes, received attention first in the modern
study of chemesthetic receptors (Story, 2006). Agonists related to capsaicin stimulate

16
through channels known as TRPV1. Both heat and chemicals can modulate activity in
them, evident when cold water quells the burn of chili pepper. The channels also respond
to acidic pH. The bubbles of carbonated beverages cause their tingle because of the pH
of carbonic acid.
A related set of channels, TRPA1, mediate other chemesthetic agonists, most
often vapors of both unreactive and reactive materials, including endogenous materials
(Bautista et al., 2006). The great breadth of sensitivity of these channels exists because
they allow stimulation via various loci separated spatially from others on the protein
molecule. A mechanism of note for present purposes includes reversible covalent
bonding (Hinman, et al., 2006). Chemosensory stimulation via such bonding had no
known precedent (Peterlin et al., 2007), but its discovery resolves issues regarding
whether receptors mediate the chemesthetic effects of reactive materials, or whether they
“stimulated” strictly through damage. The TRPA1 channels provide organisms with a
high-sensitivity mechanism to warn of potentially damaging materials.
MITC stimulates chemesthesis through the TRPA1 system, though it has
somewhat less activity than other notable isothiocyanates, such as allyl isothiocyanate
(Jordt, et al., 2004). These have an electrophilic carbon atom that makes them reactive to
nucleophilic materials in tissue, including cysteine residues of the TRPA1 channels. The
isothiocyantes almost certainly activate the channels via this path. Formaldehyde and
many unsaturated aldehydes apparently stimulate through the same path. Do organisms
have such channels to avoid all contact with electrophiles? Presumably not. In the diet,
isothiocyantes have evoked interest because of their possible anti-carcinogenic and anti-
inflammatory properties (Conaway et al., 2002; Liu et al., 2008). The dietary sources in

17
that case consist of cruciferous vegetables, cabbage, kale, and others that contain or
provide precursors for isothiocyanates created in the course of eating (Chang et al.,
2007).
The threshold for sensory detection and that for evident damage from
electrophiles may differ by orders of magnitude. Before conditions reach damaging
levels, endogenous nucleophiles, such as glutathione, may neutralize the electrophilic
center of the molecule (Ganea & Harding, 2006). This action may play a role in the level
dependent temporal integration of the effects of electrophiles. At low concentrations, the
neutralizing effects may forestall growth, but at higher concentrations capacity may
diminish. The temporal property can confer advantages to a person educated to
disengage from contact with the electrophile at the first sign of any chemesthetic effect.
The modeling of the chemesthetic results of Russell and Rush led to BMCs of
about 0.33 ppm irrespective of model. With estimates of confidence (BMCLs) also
calculated, the estimate a health protective concentration for the most sensitive
individuals comes out to 0.20-0.22 ppm for exposures as long as eight hours, and
presumably longer.
4.2. Eyes versus Airways
MITC has a long-standing reputation as a lachrymator. This hardly means that it
stimulates only the eyes, but it seems to stimulate them preferentially. Unfortunately, no
human clinical data, such as those obtained by Russell and Rush, afford an estimate of
sensitivity in the airway, upper or lower. The distinction between sites in the airway can
have major importance. In general, the upper airway should serve as a filter for the lower

18
airways, though it does so selectively (Morris, 2001). The more water-soluble a vapor,
the more it will deposit itself in the upper airway, where chemesthesis can alert the
organism of its presence. A water-soluble material such as formaldehyde will register its
presence in the eyes and nose long before it leads to any discomfort in the chest (Overton
et al., 2001; Yokley et al., 2008). An insoluble material such as ozone will do the
opposite. MITC has some water solubility (7.6 g/L), suggestive of some protection. The
nose itself has enough mucous to accommodate concentrations well into the range of
part-per-million, but the Henry’s Law constant of MITC suggests some likely penetration
beyond the nose (Worthington & Wade, 2006). The exact attenuation of concentration
would require dosimetric measurements and modeling. Dourson et al. (2009) address the
issue with available data on accidental field exposures to humans and controlled
exposures in rats.

19
A. Appendix
1. Olfactory Measurements of the Russell and Rush Study
Russell and Rush set out to discover the odor threshold for MITC and to place it
amongst the thresholds for some commonly studied odorants. The vapor control device
(olfactometer) had the unusual property that it could deliver threshold level
concentrations without use of a liquid solvent. This entailed dilution of saturated vapor
concentration over many orders of magnitude. Use of a solvent could have altered the
reactivity of MITC in particular. Because of the high sensitivity of the nose vs. analytical
instruments, direct assessment of concentration at threshold levels poses serious
challenges. The investigators could not just take grab samples of peri-threshold
concentrations. They needed to rely upon an integrated measure, in their case loss of
weight from the liquid sources. The outcome of the testing itself also needed also to play
a role in the credibility of the vapor control device. If the thresholds for the commonly
studied odorants fell in line with expectations, then they would add credibility to the
outcome for MITC, the material of principal interest. Because compiled odor thresholds
exhibit very high variation from study to study, the testing needed to show no more than
moderate variability among subjects (reliability) and threshold near the low end of the
compiled values (validity) (Cain & Schmidt, 2009). The latter requirement derives from
the expectation that a low threshold implies better measurement than a high threshold.
Stated otherwise, poor measurement generally yields high thresholds.

20
2. Methods
2.1. Subjects
Thirty-three persons (17 females) between 18 and 34 years participated in odor
measurements after screening for olfactory normality, current infection, pregnancy, and
ability to follow a training protocol. The subjects came from the larger pool recruited for
the entire investigation.
2.2 Materials
The materials included: MITC (CAS No. 556-61-6), with an onion, horseradish
odor; pyridine (CAS No. 110-86-1), with fishy, scallop odor; iso-amyl acetate (CAS No.
123-92-2), with a fruity odor; acetic acid (CAS No. 64-19-7), with a vinegar odor; and n-
butyl alcohol (CAS No. 71-36-3), with a malty odor. All had better than 99% purity by
manufacturers’ certificates of analysis (MCA).
2.3 Vapor Delivery
The investigators employed an apparently one-of-a-kind device, a Vapor Science
Olfactometer (Vapor Science, Inc., El Cerrito, CA), to generate test concentrations of
interest. The device could control the concentration of up to five materials at nine levels
and present these for three-alternative forced-choice testing.
The device controlled concentration via 1) a combination of temperature (30-
70°C) of the pure source (3-5 ml of liquid) in a 28-ml jar, 2) size of the aperture through
which evaporated material would enter a flowing stream of nitrogen, and 3) subsequent
dilution with nitrogen and with air. Dilution took place in stages in order to
accommodate the very wide range needed to attenuate the material from saturated vapor

21
to threshold levels. Verification of delivered concentration relied principally upon loss of
weight from neat samples per unit flow of diluting gases. The procedure also included
quantitative chromatographic measurement before the series of experiments began and
after they ended, a six-week span. These generally lay within 30% of expected values for
MITC. [Russell and Rush left some ambiguity about the use of chromatography in the
study. They referred to a method developed by Stauffer Chemical Co. in 1982 for
measurement of the concentration of MITC in workplaces and presumably similar to that
used by Collina & Maini (1979). Personnel at the Western Research Center of Zenaca
Ag Products (Richmond, CA), a successor to Stauffer, performed the analysis of samples
trapped from the vapor phase on activated carbon (SKC-West, no. 226-01) and desorbed
with carbon disulfide. Sampling and chromatographic analysis dealt with MITC and iso-
amyl acetate only, with the results for iso-amyl acetate deemed inadequate to verify
delivery.]
2.4. Procedure
At any given dilution, subject needed on a trial to choose the active station, a
nose-cone in odor testing, from among three, where two delivered just blanks. Flow rate
from the cones equaled 10 L/min. Testing followed double-blind protocol where neither
the subject nor the operator knew the combination of material by concentration in testing.
A routine psychophysical procedure, called a staircase/up-down method,
bracketed the detectable concentrations and allowed the investigators to calculate a
threshold for each subject. Other procedural variables of testing accorded with standard
psychophysical protocol.
3. Results

22
Figure A1 shows the cumulative percent of subjects whose thresholds equaled
various criterion concentrations for four of the five materials studied. The points of 50%
detection across the group of subjects equaled 0.06 ppm for acetic acid, 0.10 ppm for
pyridine, 0.16 ppm for butyl alcohol, and 1.7 ppm for MITC. The variation in threshold
generally equaled one and a half orders of magnitude. For the fifth material iso-amyl
acetate, the threshold fell so low that it challenged the range of the device and an effort to
extend the range produced unreliable measured concentrations.
4. Discussion
For the materials acetic acid, pyridine, and butyl alcohol, the investigators found
lower thresholds than expected (1:6 compared with the average of a common data base)
and smaller variability among subjects than commonly found, about 30:1 (Devos et al.,
1990; Cain, Schmidt, & Wolkoff, 2007). These outcomes implied that both the
procedures used and the vapor delivery device performed effectively. The inability of the
vapor device to provide suitable control for iso-amyl acetate came principally from a pre-
experiment underestimation of the potency that the investigators would uncover.
The only prior study of MITC had produced an odor threshold of 0.1 ppm, which
suggested that people could smell MITC before it produced any chemesthetic effects
(Nesterova, 1969). Investigators, such as Nesterova, in laboratories in the former Soviet
Union would not uncommonly claim extraordinarily low thresholds for biological effects
of chemicals, but offer too little detail for critical assessment of their values. In view of
the high sensitivity that Russell and Rush found for acetic acid, pyridine, and butyl
alcohol, their finding of 1.7 ppm for MITC has higher credibility than the value of
Nesterova.

23
Acknowledgement
The authors acknowledge financial and technical support from Amvac Chemical
Corporation and Taminco and Tessenderlo-Kerley. The opinions expressed in are those
of the authors for the purposes of protecting public health. The authors’ opinions do not
necessarily represent the views of the sponsors.
References
Bandell, M., Macpherson, L.J., Patapoutian, A., 2007. From chills to chilis: mechanisms
for thermosensotion and chemesthesis via thermoTRPs. Current Opinion in
Neurobiology, 17, 490-497.
Bautista, D.M., Jordt, S.-E., Nikai, T., Tsuruda, P.R., Read, A.J., Poblete, J., Yamoah,
E.N., Basbaum, A.I., Julius, D., 2006. TRPA1 mediates the inflammatory actions
of environmental irritants and proalgesic agents. Cell, 124, 1269-1282.
Cain, W.S., Schmidt, R., 2009. Can we trust odor databases? Example of t- and n-butyl
acetate. Atmospheric Environment, 43, 2591-2601.
Cain, W.S., Schmidt, R., Wolkoff, P., 2007. Olfactory detection of ozone and d-
limonene: reactants in indoor spaces. Indoor Air, 17, 337-347.
Cain, W.S., See, L.-C., Tosun T., 1986. Irritation and odor from formaldehyde: Chamber
studies. In IAQ '86: Managing Indoor Air for Health and Energy Conservation
(pp. 126-137). Atlanta: American Society of Heating, Refrigerating and Air-
Conditioning Engineers.
Cain, W.S., Tosun, T., See, L.-C., Leaderer, B.P., 1987. Environmental tobacco smoke:
Sensory reactions of occupants. Atmospheric Environment, 21, 347-353.

24
Cain, W.S., Jalowayski, A.A., Kleinman, M., Lee, N.-S., Lee, B.-R., Ahn, B.-H.,
Magruder, K., Schmidt, R., Hillen, B.K., Warren, C.B., Culver, B.D., 2004.
Sensory and associated reactions to mineral dusts: Sodium borate, calcium oxide,
and calcium sulfate. Journal of Occupational and Environmental Hygiene, 1, 222-
236.
Chang, E.T., Lee, V.S., Canchola, A.J., et al., 2007. Diet and risk of ovarian cancer in the
California Teacher Study Cohort. American Journal of Epidemiology, 165, 802-
813.
Collina, A., Maini, P., 1979. Analysis of methylisothiocyanate derived from the soil
fumigant metham-sodium in workroom air. Bulletin of Environmental
Contamination and Toxicology, 22, 400-4004.
Conaway, C.C., Yang, Y.M., Chung, F.L., 2002. Isothiocyanates as cancer
chemopreventive agents: their biological activities and metabolism in rodents and
humans. Current Drug Metabolism, 3, 233-255.
Crump, K., Howe, R., 1985. A review of methods for calculating statistical confidence
limits in low dose extrapolation. In: D. Clayton, D. Krewski and I. Munro (eds.).
Toxicological Risk Assessment, Vol. 1, pp. 187-203. CRC Press, Boca Raton, FL.
Devos, M., Patte, F., Rouault, J., Laffort, P., van Gemert, L.J., 1990. Standardized
Human Olfactory Thresholds. Oxford: IRL Press at Oxford University Press.
Dourson, M.L., Kohrman-Vincent, M.J., Allen, B.C., Cain, W.S., 2010. Dose response
assessment from effects of acute exposure to methyl isothiocyanate (MITC).
Submitted for publication.

25
El-Ghorab, A., Shibamoto, T., Ozcan, M., 2007. Chemical composition and anitoxidant
activities of buds and leaves of capers (Capparis ovata Desf. Var. canescens)
cultivated in Turkey. Journal of Essential Oil Research, January/February.
Fieller, E., 1944. Fundamental formula in the statistics of biological assay and some
applications. Quarterly Journal of Pharmacology, 17, 117-123.
Green, B.G., Lawless, H.T., 1991. The psychophysics of somatosensory chemoreception
in the nose and mouth. In: T.V. Getchell, R. L. Doty, L. M. Bartoshuk, J.B. Snow,
Jr., eds. Smell and Taste in Health and Disease. New York: Raven Press, pp. 235–
253.
Hinman, A., Chuang, H., Bautista, D.M., Julius, D., 2006. TRP channel activation by
reversible covalent modification. Proceedings of the National Academy of
Sciences, 103, 19564-19568.
Jordt, S.-E., Bautista, D.M., Chuang, H., McKenny, D.D., Zygmunt, P.M., Höhestatt,
E.D., Meng, I.D., Julius, D., 2004. Mustard oils and cannabinoids excite sensory
nerve fibres through the TRP channel ANKTM1. Nature, 427, 260-265.
Liu, H., Dinkova-Kostova, Talalay, P., 2008. Coordinate regulation of enzyme markers
for inflammation and for protection against oxidants and electrophiles.
Proceedings of the National Academy of Sciences, 105, 15926-15931.
Moncrieff, R.W., 1944. The Chemical Senses. London: Leonard Hill.
Morris, J. B., 2001. Overview of upper respiratory tract vapor uptake studies. Inhalation
Toxicology, 13, 335-345.
26
Nesterova, M.F., 1969. The establishment of norms for carbathion content in the air of a
work area. Gigiena I Sanitarija, 34, 191-196.
Nielsen, G.D., 1991. Mechanisms of activation of the sensory irritant receptor by
airborne chemicals. CRC Critical Reviews in Toxicology, 21, 183-208.
Nielsen, G.D., Bakb, J.C., Holst, E., 1984. Sensory irritation and pulmonary irritation by
airborne allyl acetate, allyl alcohol, and allyl ether compared to acrolein. Acta
Pharmacologica et Toxicologica, 54, 292-298.
Peterlin, Z., Chesler, A., Firestein, S., 2007. A painful Trp can be a bonding experience.
Neuron, 53, 635-638.
Russell, M. J., Rush, T. I., 1996. Methyl Isothiocyanate: Determination of Human
Olfactory Detection Threshold and Human No Observable Effect Level for Eye
Irritation. Study Numbers MITC-UCD-1A-1993 & MITC-UCD-1B- 1994,
Sensory Testing Laboratory, School of Medicine, University of California, Davis.
Report Number RR 96-049B.
Ruzo, L.O., 2006. Physical, chemical and environmental properties of selected chemical
alternatives for the pre-plant use of methyl bromide as soil fumigant. Pest
Management Science, 62, 99-113.
Shusterman, D., 2002. Individual factors in nasal chemesthesis. Chemical Senses, 27,
551-564.
Story, G.M., 2006. The emerging role of TRP channels in mechanisms of temperature
and pain sensation. Current Neuropharmacology, 4, 183-196.
27
Wise, P.M., Zhao, K., Wysocki, C.J., 2009. Dynamics of nasal chemesthesis. Annals of
the New York Academy of Sciences, 1170, 206-214.
Worthington, E.K., Wade, E.A., 2007. Henry's Law coefficients of chloropicrin and
methyl isothiocyanate. Atmospheric Environment, 41, 5510-5515.
Yokley, K.A., Tran, H., Schlosser, P.M., 2008. Sensory irritation in rats: Modeling,
analysis and validation. Bulletin of Mathematical Biology, 70, 555-588.

28
Table 1. Number of positive responders over the three variables, ratings, blinking, and tearing.
Duration Level (ppm) Number of Responders Total in Group
14-Minutes
0 0 10
0.6 0 9
1.9 3 9
3.3 8 9
4-Hours
0 0 12
0.22 1 12
0.8 5 9
8-Hours
0 0 12
0.22 0 16
Table 2. C x T modeling on the n number of responders (Table 1). Only the logistic and probit models with the explanatory variable of concentration fitted the data adequately.
aSmaller p-values indicate poorer fit. EPA typically recommends a p-value of 0.1 or greater
as an indication of adequate fit.
Model f1(c) = f
2(t) = Goodness-of-fit (p)a
Logistic C t 0.006
C ln(t) 0.12
ln(c) t < .0001
ln(c) ln(t) < .0001
Probit C t 0.01
C ln(t) 0.15
ln(c) t < .0001
ln(c) ln(t) < .0001
29
Table 3. BMC estimates (ppm) for the three durations of exposure.
Model 14 Minutes 4 Hours 8 Hours Logistic 1.5 0.53 0.36
Probit 1.4 0.53 0.38
Table 4. Estimates (ppm) of BMC and BMCL by BMDS models.
Duration Model Goodness-of-fit (p) BMC BMCL
14 minutes Logistic 0.74 1.4 0.83
Probit 0.85 1.4 0.78
4 hours Logistic 0.44 0.37 0.22
Probit 0.51 0.33 0.20

30
Figure Captions (Main Text)
Figure 1. Magnitude of rated feel (visual analogue scale) in the eye normalized to
conditions before stimulation and blank exposures.
Figure 2. Trading relationship between concentration at the level of no observed
chemesthetic effect and duration of exposure.
Figure 3. Blink rate normalized to conditions before stimulation and blank exposures.
Figure Caption (Appendix)
Figure A1. Cumulative percent of subjects at threshold over a range of concentrations.
Mean thresholds for the materials equaled: 1.7 ppm for MITC, 0.10 for pyridine, 0.06
ppm for acetic acid, and 0.16 ppm for n-butyl alcohol.
31
Figure 1
0
5
10
15
20
1 10 100 1000
0.6 ppm (S)1.9 ppm (S)3.3 ppm (S)0.22 ppm (M)0.8 ppm (M)0.22 ppm (L)Baseline
Rat
ed M
agn
itu
de
(z-S
core
)
Time (min)

32
0
0.5
1
1.5
2
2.5
3
0 20 40 60 80 100 120
y = 2.22 * x-0.53
R= 0.95
MIT
C (
pp
m)
Time (min)
Figure 2
33
Figure 3
-2
-1
0
1
2
3
4
5
1 10 100 1000
0.6 ppm S1.9 ppm S3.3 ppm S0.22 ppm M0.8 ppm M0.22 ppm L
Blin
krat
e (z
-Sco
re)
Time (min)

34
Figure A1
0
20
40
60
80
100
-2 -1.5 -1 -0.5 0 0.5 1
Cu
mu
lati
ve P
erce
nt
Concentration (log ppm)
Acetic Acid
Pyridine
n-Butyl Alcohol MITC