development of odor wheel as primary assessment tool for odor
TRANSCRIPT
DEVELOPMENT OF ODOR WHEEL AS PRIMARY ASSESSMENT TOOL
FOR ODOR
Nastaein Qamaruz Zamana, Ros Nadiah Rosli and Ahmad Shukri Yahya
School of Civil Engineering, Universiti Sains Malaysia, 14300, Nibong Tebal, Penang, Malaysia
a Corresponding email : [email protected]
ABSTRACT
The aim of this paper was to develop an effective odor wheel to
evaluate or rank an odor. Emission of odor can be measured using
various types of techniques around the world. Odor wheel was used as
indicator for primary observation to detect odor characteristic and
intensity. Five sources of odor within coverage of 2 km radius from
this Universiti Sains Malaysia (Engineering campus) were sampled and
brought to lab for analysis. With two colors presented on the wheel,
blue and red, darker color tone respectively represents increase in
odor pleasantness and characteristic. In this study, pictures were
also added to be represented the smell and combined together with
color tone to let the assessor easily detect the odor. The odor wheel
was designed to be rotatable, as assessor can scale odor based on
their experience of smell. However, the assessor needs to pass the
screening test so that the test will be valid. Details of panel such
as gender, level of education and age are also recorded. Results are
presented by combination of pleasantness and characteristic of sample.
Mean of pleasantness for each odor sample are gathered statistically.
This study introduces an easy tool to the community to detect odor
nearby their place.
Keyword: odor wheel development, hedonic tone, odor characteristic

INTRODUCTION
There is no specific unit for odor. Odor concentration is usually
reported in terms of dilution per threshold or odor unit per meter
cube (OU/m3). The odor concentration value is obtained from number of
dilution of a sample to an individual detection (threshold) level.
There are various techniques of measuring odor concentration either
manual or automatic. Most developed countries had developed their odor
measurement tool and regulation standard for example, the Japanese
introduced Triangular Odor Bag more than thirty years ago and it was
applicable until now (Iwasaki, 2003). The Canadian recently develop a
highly technology and practical odor measurement tool for field and
in-lab assessment named as Scentroid SM100 (Benzo et al., 2012).
Nevertheless, the whole world agreed that the Olfactometer, standard
that used by the European as the standard to measure odor and it was
stated on EN13725 Air Quality – Determination of Odour Concentration
by Dynamic Olfactometry. In Malaysia, the Malaysian Standard MS 1963:
2007 similar to the EN13725 is used as the guideline for in-lab odor
assessment. The Olfctometer can only analyze odor concentration of
odor; nevertheless, the ICH (Intensity, Characteristic, and Hedonic
tone) measurement is still under development.
There are many types of odor wheel, for example odor wheel for odors
drinking water, wastewater, compost and urban environment (Suffet and
Rosenfeld, 2007). Also, McGinley et al. (2002) described that there
are eight classes for odor that are floral, fruity, vegetable, earthy,
offensive, fishy, chemical and medicine. But, until now, there is no
specific odor wheel that contained all human descriptor for odor.
Meanwhile, study conducted by Castro et al. (2013), determined ten
cluster of human odor descriptor by statistical methods. However, all
the cluster group are in the form of wording that is quite difficult
and take longer time to think before the assessors give the answer.
Sakai et al. (2005) and Saito et al. (2006) suggested that picture and
color evoke common mental image for objects and this mental image lead
to form expectation to the odor.
By using odor wheel, it is introduce to measure odor based on their
characteristic and hedonic tone (pleasantness) instead of odor
concentration value. An odor wheel is expressed in terms of
“descriptors” that describe a characteristic of an odor. Hedonic tone
is one of odor parameter that define pleasantness or unpleasantness of
an odor (Stuetz et al., 2001). It usually is presented in form of
scales, either increasing or decreasing number to represent the
pleasantness. However, the normal scales is nine level scales, -4
(extremely unpleasant odor) to +4 (extremely pleasant odor) (Guideline
VDI 3882 Part 2, 1994). Importantly, hedonic tone address odor
complaint especially if the unpleasantness smells keeps continuing at
long time. In order to evaluate acceptability of odor, simply
referring to hedonic tone is not sufficient (Nimmermark, 2011).
Since odor is very subjective, sometimes it is very difficult to
characterize the odor. For this case, the people might face difficult
situation on complaining if the odor source is not recognized.
However, there is still an optional solution where the odor can be
characterize based on chemical component inside the odor or based on
the similarity of odor. Therefore, the purpose of odor wheel is to
check the odor character as well as the pleasantness of an odor.
The problem statement is what would be the best odor representation;
is it sufficient only to measure odor concentration or needed some
additional tool to help people identify the odor. Thus, the aim of
this study is to investigate the effectiveness of using odor wheel to
describe odor. Combination of hedonic tone and odor characteristics
are attached together in the odor wheel, since none of previous
researches combined that parameter.
METHODOLOGY
Odor Threshold Test
All samples were measured using Odor Threshold Test, developed method
from Japanese Triangular Odor Bag. The test involved three bags filled
with odorless air. Only one bag was selected to be diluted with
odorous compound. Panels need to choose which bag contained odorous
compound. More details of Odor Threshold Test can be referred to
Higuchi (2003).
Odor Wheel Test
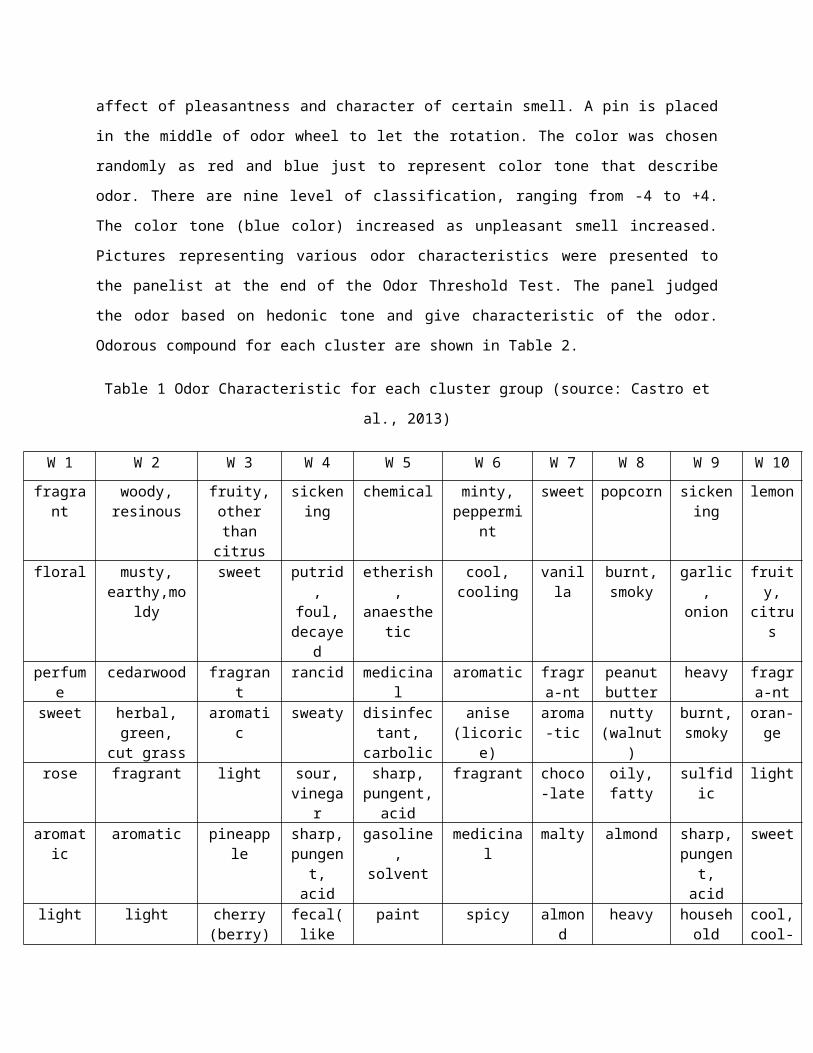
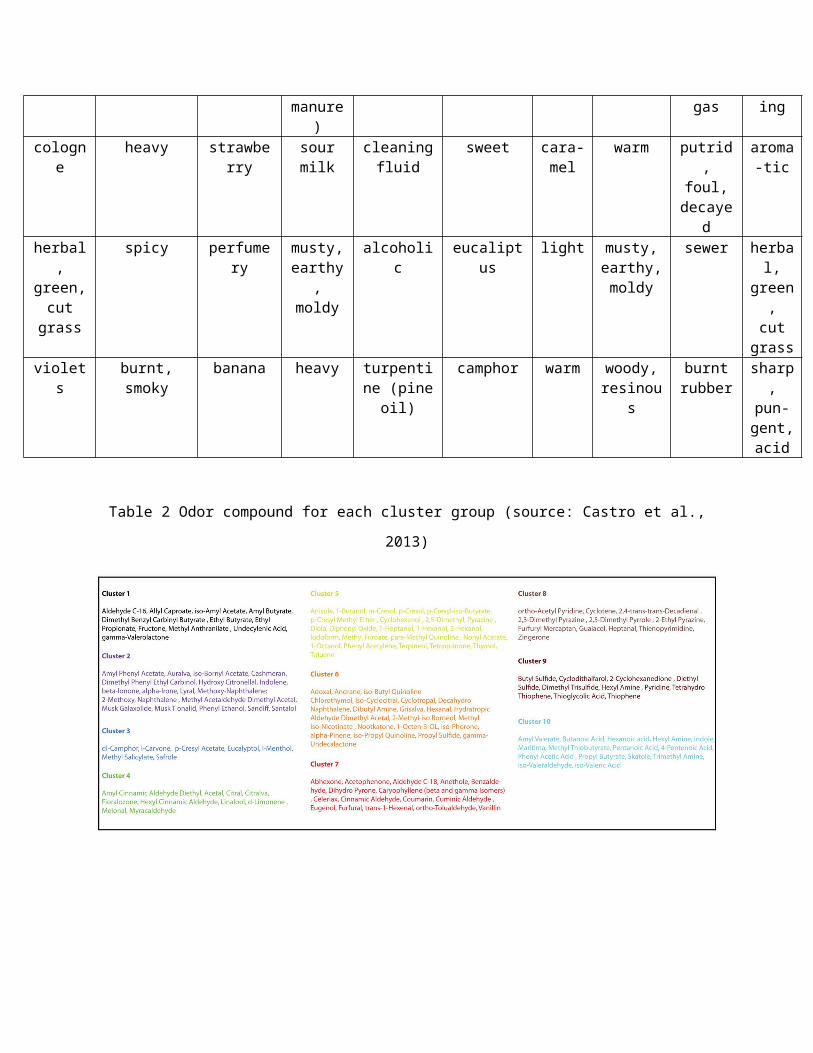
Table 1 shows ten clusters suggested by Castro et al. (2013). Cluster
1 (W1), Cluster 3 (W3) and Cluster 7 (W7) are group of pleasant odor,
while Cluster 4 (W4), Cluster 5 (W5) and Cluster 9 (W9) are the group
of very unpleasant smell. The remaining cluster, Cluster 2 (W2),
Cluster 6 (W6), Cluster 8 (W8) and Cluster 10 (W10) having a neutral
odor. From the table, few odor characters of each cluster are taken in
the form of picture into odor wheel shown in Figure 1. The selected
picture was based on character in the cluster group. Each of the
cluster group is divided into three colors which are pink (good
smell), red (neutral) and dark red (bad smell). The hedonic tone, also
called as pleasantness scales (Naddeo et al., 2013) in blue color is
attached together with the wheel and able to rotate to let combination
affect of pleasantness and character of certain smell. A pin is placed
in the middle of odor wheel to let the rotation. The color was chosen
randomly as red and blue just to represent color tone that describe
odor. There are nine level of classification, ranging from -4 to +4.
The color tone (blue color) increased as unpleasant smell increased.
Pictures representing various odor characteristics were presented to
the panelist at the end of the Odor Threshold Test. The panel judged
the odor based on hedonic tone and give characteristic of the odor.
Odorous compound for each cluster are shown in Table 2.
Table 1 Odor Characteristic for each cluster group (source: Castro et
al., 2013)
W 1 W 2 W 3 W 4 W 5 W 6 W 7 W 8 W 9 W 10fragra
ntwoody,resinous
fruity,otherthancitrus
sickening
chemical minty,peppermi
nt
sweet popcorn sickening
lemon
floral musty,earthy,mo
ldy
sweet putrid,
foul,decaye
d
etherish,
anaesthetic
cool,cooling
vanilla
burnt,smoky
garlic,
onion
fruity,
citrus
perfume
cedarwood fragrant
rancid medicinal
aromatic fragra-nt
peanutbutter
heavy fragra-nt
sweet herbal,green,
cut grass
aromatic
sweaty disinfectant,
carbolic
anise(licoric
e)
aroma-tic
nutty(walnut
)
burnt,smoky
oran-ge
rose fragrant light sour,vinega
r
sharp,pungent,
acid
fragrant choco-late
oily,fatty
sulfidic
light
aromatic
aromatic pineapple
sharp,pungent,
acid
gasoline,
solvent
medicinal
malty almond sharp,pungen
t,acid
sweet
light light cherry(berry)
fecal(like
paint spicy almond
heavy household
cool,cool-
manure)
gas ing
cologne
heavy strawberry
sourmilk
cleaningfluid
sweet cara-mel
warm putrid,
foul,decaye
d
aroma-tic
herbal,
green,cutgrass
spicy perfumery
musty,earthy
,moldy
alcoholic
eucaliptus
light musty,earthy,moldy
sewer herbal,
green,cut
grassviolet
sburnt,smoky
banana heavy turpentine (pine
oil)
camphor warm woody,resinou
s
burntrubber
sharp,
pun-gent,acid
Table 2 Odor compound for each cluster group (source: Castro et al.,
2013)
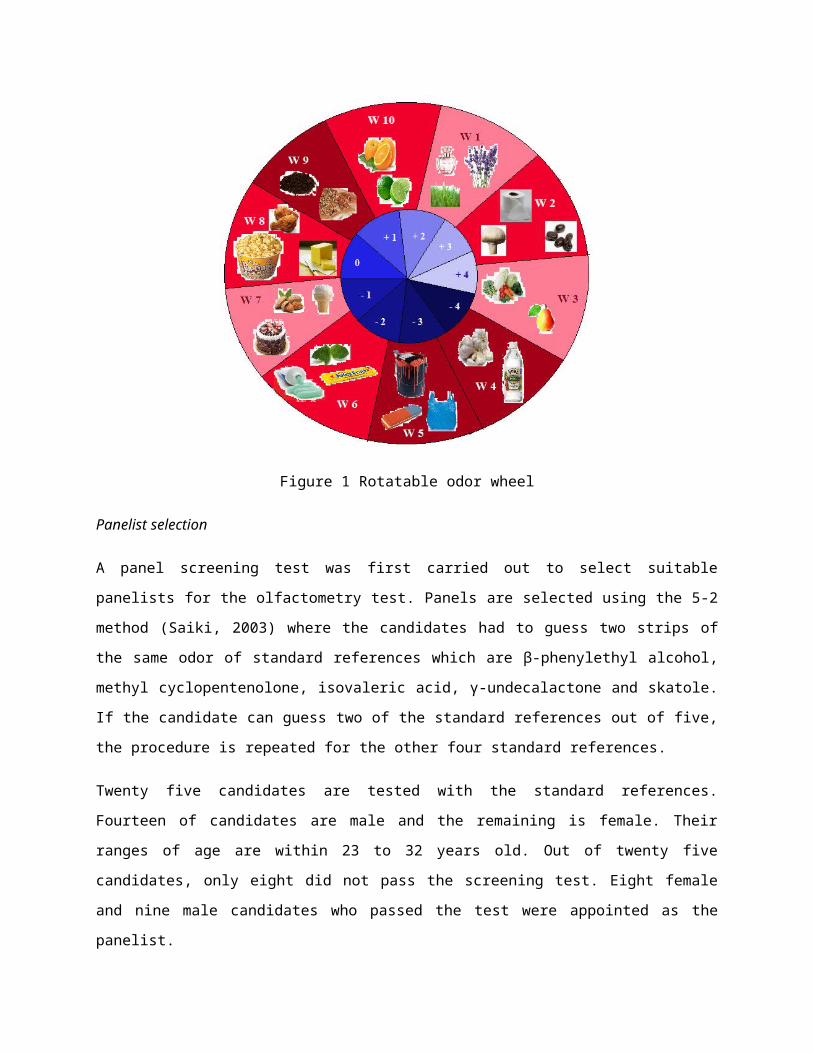
Figure 1 Rotatable odor wheel
Panelist selection
A panel screening test was first carried out to select suitable
panelists for the olfactometry test. Panels are selected using the 5-2
method (Saiki, 2003) where the candidates had to guess two strips of
the same odor of standard references which are β-phenylethyl alcohol,
methyl cyclopentenolone, isovaleric acid, γ-undecalactone and skatole.
If the candidate can guess two of the standard references out of five,
the procedure is repeated for the other four standard references.
Twenty five candidates are tested with the standard references.
Fourteen of candidates are male and the remaining is female. Their
ranges of age are within 23 to 32 years old. Out of twenty five
candidates, only eight did not pass the screening test. Eight female
and nine male candidates who passed the test were appointed as the
panelist.
Odor sampling
The odor samples were taken at five odor sources around Universiti
Sains Malaysia (Engineering Campus), involving cow and chicken farm,
poultry processing factory, palm oil factory and paper and pulp
factory. Gas samples were collected using Nalophan bag inside Eco-
drum, equipment was used to collect the odor. After that, the samples
were brought to the lab for analysis. The odor sampling and analysis
were done in the same day for each sample, to minimize error due to
sample loss or diffusion through the bags. The samples are then
continued for the assessment using odor wheel after analysis of Odor
Threshold Test. Presentation of results are compared either to choose
the Odor Threshold Test, Odor Wheel (by wording only) or Odor Wheel
(with picture). By using the same sample, the panelists are asked to
choose hedonic tone scale together with the characteristics in the
odor wheel.
RESULTS AND DISCUSSIONS
Laboratory test on develop odor wheel
After development of odor wheel, it is tested by using five standard
references that was used for panelist selection. The purpose of this
test is to check validity and suitability of that odor wheel before
proceeding to the real odor site. Table 3 shows response from ten
panelists about standard references given to them. Five females and
five males at age of 23 to 28 years old take part for this test. They
describe the odor differently because it depends on a person
experience and sense to judge the odor. Since all standard references
can be described using the developed odor wheel, the odor wheel can
proceed for the real site.
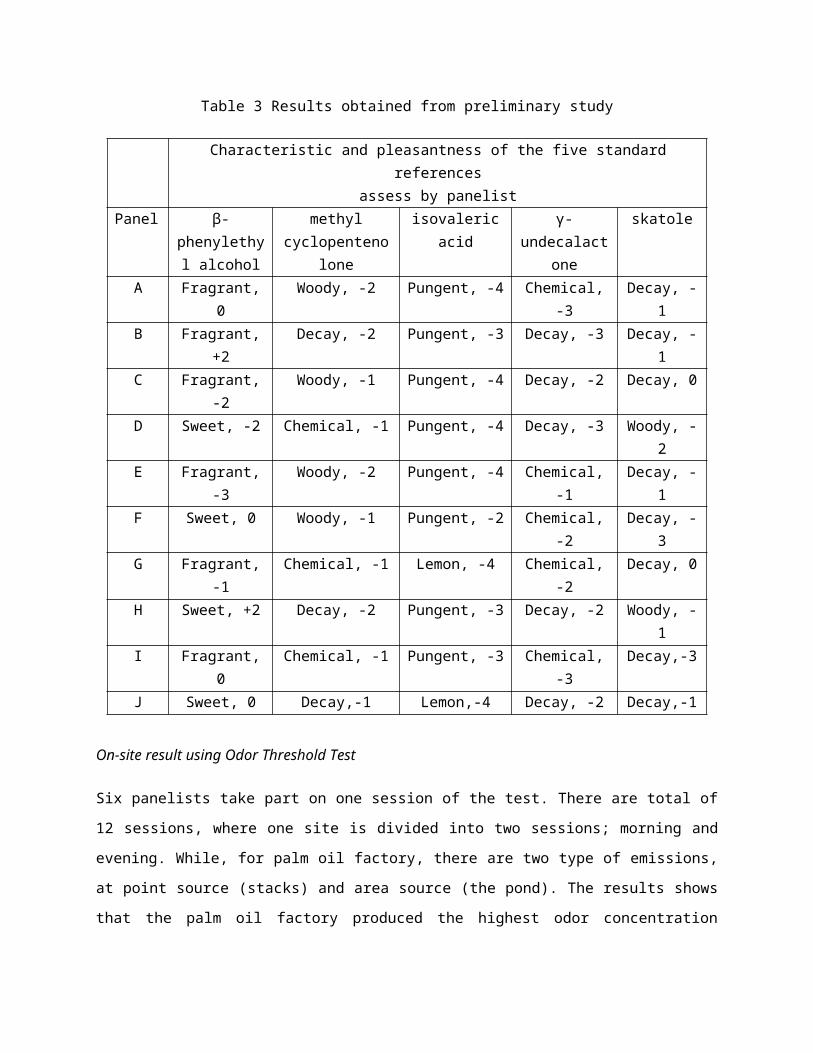
Table 3 Results obtained from preliminary study
Characteristic and pleasantness of the five standardreferences
assess by panelistPanel β-
phenylethyl alcohol
methylcyclopenteno
lone
isovalericacid
γ-undecalact
one
skatole
A Fragrant,0
Woody, -2 Pungent, -4 Chemical,-3
Decay, -1
B Fragrant,+2
Decay, -2 Pungent, -3 Decay, -3 Decay, -1
C Fragrant,-2
Woody, -1 Pungent, -4 Decay, -2 Decay, 0
D Sweet, -2 Chemical, -1 Pungent, -4 Decay, -3 Woody, -2
E Fragrant,-3
Woody, -2 Pungent, -4 Chemical,-1
Decay, -1
F Sweet, 0 Woody, -1 Pungent, -2 Chemical,-2
Decay, -3
G Fragrant,-1
Chemical, -1 Lemon, -4 Chemical,-2
Decay, 0
H Sweet, +2 Decay, -2 Pungent, -3 Decay, -2 Woody, -1
I Fragrant,0
Chemical, -1 Pungent, -3 Chemical,-3
Decay,-3
J Sweet, 0 Decay,-1 Lemon,-4 Decay, -2 Decay,-1
On-site result using Odor Threshold Test
Six panelists take part on one session of the test. There are total of
12 sessions, where one site is divided into two sessions; morning and
evening. While, for palm oil factory, there are two type of emissions,
at point source (stacks) and area source (the pond). The results shows
that the palm oil factory produced the highest odor concentration
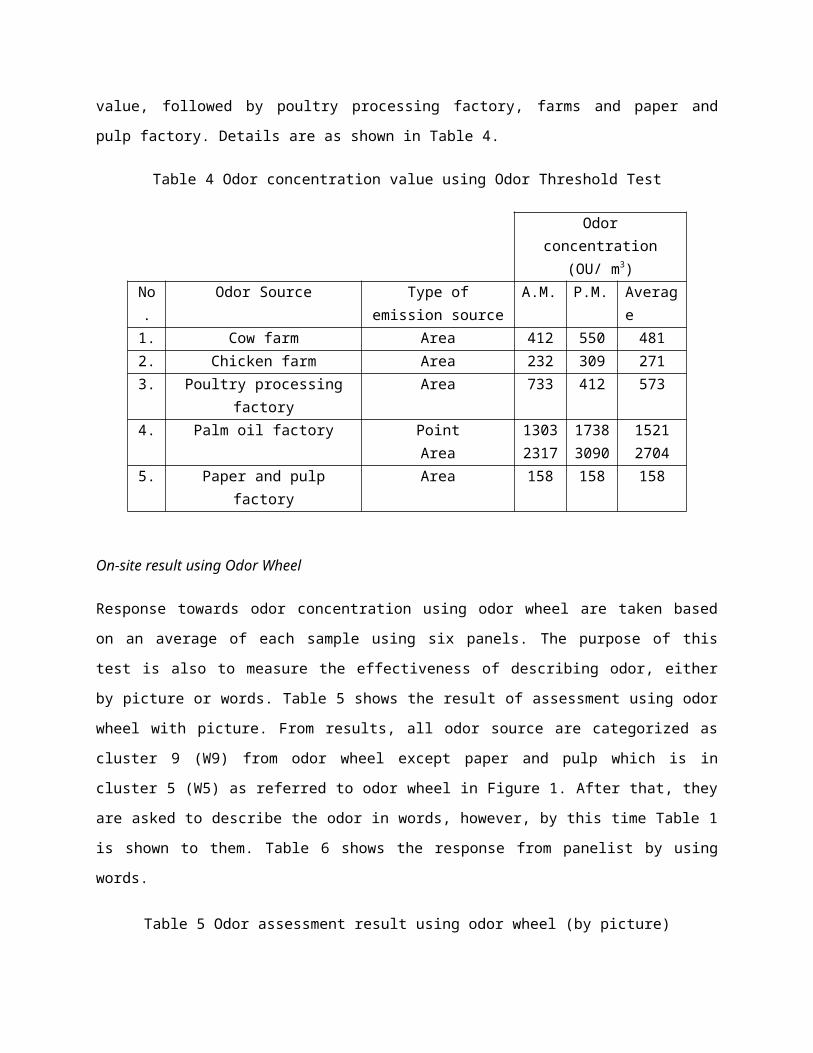
value, followed by poultry processing factory, farms and paper and
pulp factory. Details are as shown in Table 4.
Table 4 Odor concentration value using Odor Threshold Test
Odorconcentration
(OU/ m3)No.
Odor Source Type ofemission source
A.M. P.M. Average
1. Cow farm Area 412 550 4812. Chicken farm Area 232 309 2713. Poultry processing
factoryArea 733 412 573
4. Palm oil factory PointArea
13032317
17383090
15212704
5. Paper and pulpfactory
Area 158 158 158
On-site result using Odor Wheel
Response towards odor concentration using odor wheel are taken based
on an average of each sample using six panels. The purpose of this
test is also to measure the effectiveness of describing odor, either
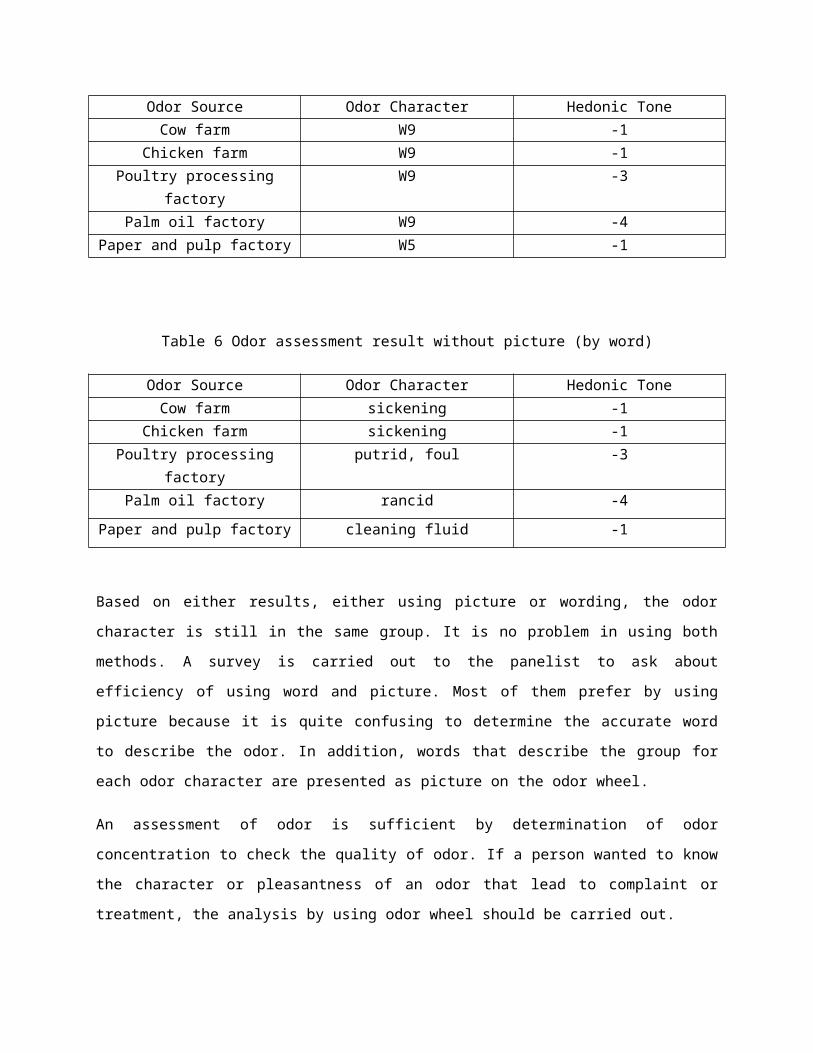
by picture or words. Table 5 shows the result of assessment using odor
wheel with picture. From results, all odor source are categorized as
cluster 9 (W9) from odor wheel except paper and pulp which is in
cluster 5 (W5) as referred to odor wheel in Figure 1. After that, they
are asked to describe the odor in words, however, by this time Table 1
is shown to them. Table 6 shows the response from panelist by using
words.
Table 5 Odor assessment result using odor wheel (by picture)
Odor Source Odor Character Hedonic Tone Cow farm W9 -1
Chicken farm W9 -1Poultry processing
factoryW9 -3
Palm oil factory W9 -4Paper and pulp factory W5 -1
Table 6 Odor assessment result without picture (by word)
Odor Source Odor Character Hedonic Tone Cow farm sickening -1
Chicken farm sickening -1Poultry processing
factoryputrid, foul -3
Palm oil factory rancid -4Paper and pulp factory cleaning fluid -1
Based on either results, either using picture or wording, the odor
character is still in the same group. It is no problem in using both
methods. A survey is carried out to the panelist to ask about
efficiency of using word and picture. Most of them prefer by using
picture because it is quite confusing to determine the accurate word
to describe the odor. In addition, words that describe the group for
each odor character are presented as picture on the odor wheel.
An assessment of odor is sufficient by determination of odor
concentration to check the quality of odor. If a person wanted to know
the character or pleasantness of an odor that lead to complaint or
treatment, the analysis by using odor wheel should be carried out.
CONCLUSION
Odor can be measured not only in terms of odor concentration. Other
parameter such as offensiveness, intensity or character can also
describe odor as well. The odor wheel is different from others with
additional picture, and hedonic tone scale is attached together with
the wheel. It helps assessors to identify types of odor more easily
compared to older odor wheel that describe using words, as agreed by
the panel. Psychologically, this increased ability to choose answer by
looking at picture either than thinking the accurate word to describe
the odor. The odor wheel was designed to be rotatable to make it
easily to combine the odor characteristic and hedonic tone parameter.
Also, by looking at the combination of color, if both darker tone
colors joined together, it means that the odor has very bad unpleasant
smell.
REFERENCES
Benzo, M., Mantovani, A., and Pittarello, A. Measurement of Odour
Concentration of Immissions using a New Field Olfactometer and
Markers’ Chemical Analysis. Chemical Engineering Transaction, Vol
30, 2012.
Castro, J. B., Ramanathan, A, Chennubhotla, C. S .2013. Categorical
Dimensions of Human Odor Descriptor Space Revealed by Non-Negative
Matrix Factorization. PLoS ONE 8(9): e73289.
doi:10.1371/journal.pone.0073289.
Guideline VDI 3882/Part 2 (1994) Olfactometry; Determination of
hedonic odour tone (Issue German/English 09/94). Düsseldorf,
Verein Deutscher Ingenieure.
Higuchi, T. 2003. Odor Measurement Japan. Odor Measurement Review,
Japan Ministry of the Environment. Available online:
http://www.env.go.jp/en/air/odor/olfactory_mm/04ref_3.pdf
[Accessed on 05 March 2014].
Iwasaki, Y. 2003. The history of odor measurement in Japan and
Triangle Odor Bag method. Odor Measurement Review, Japan Ministry
of the Environment. Pp. 37-47. Available online:
http://www.env.go.jp/en/air/odor/measure/02_1_1.pdf. [Accessed on
17 April 2013].
McGinley, M.C., McGinley, A. and Michael, P.E. (2002). Odor Testing
Biosolids for Decision Making. Water Environment Federal Specialty
Coference: Residuals and Biosolids Management Conference, Austin,
TX.
Naddeo, V., Belgiorno, V., and Zarra, T. 2013. Chapter 2 Odor
Characterization and Exposure Effects in Odour Impact Assessment
Handbook. John Wiley & Sons, Ltd., UK. Pp 7-28.
Nimmermark, S. 2011. Influence of odor concentration and individual
odour thresholds on the hedonic tone of odour from animal
production. Biosystems Engineering, 108 (3), 211-219.
Saiki, K. 2003. Standard odors for selection of panel members. Odor
Measurement Review, Japan Ministry of the Environment. Pp. 102-
105.
Saito, S., Kanamura, S.A., Takashima, Y., Gotow, N., Naito, N.,
Nozawa, T., Mise, M., Deguchi, Y., and Kobayakawa, T. 2006.
Development of a Smell Identification Test Using a Novel Stick-
Type Odor Presentation Kit. Chemical Senses 31: 379-391.
Sakai, N., Imada, S., Saito, S., Kobayakawa, T.,and Deguchi, Y. 2005.The Effect of Visual Images on Perception of Odors. Chem. Senses30 (suppl 1): i244–i245, 2005. doi:10.1093/chemse/bjh205.
Stuetz, R. and Frechen, F. B. 2001. Odours in Wastewater Treatment:
Measurement, Modelling and Control. IWA
Publishing.
Suffet, I.H. and Rosenfeld, P. 2007. The anatomy of odour wheels forodours of drinking water, wastewater, compost and the urbanenvironment. Water Science & Technology Vol 55 No 5 pp 335–344. IWAPublishing 2007