crane wheel / crane rail interface
TRANSCRIPT

Crane Wheel / Crane Rail
Interface
Testing of Material Wear Properties
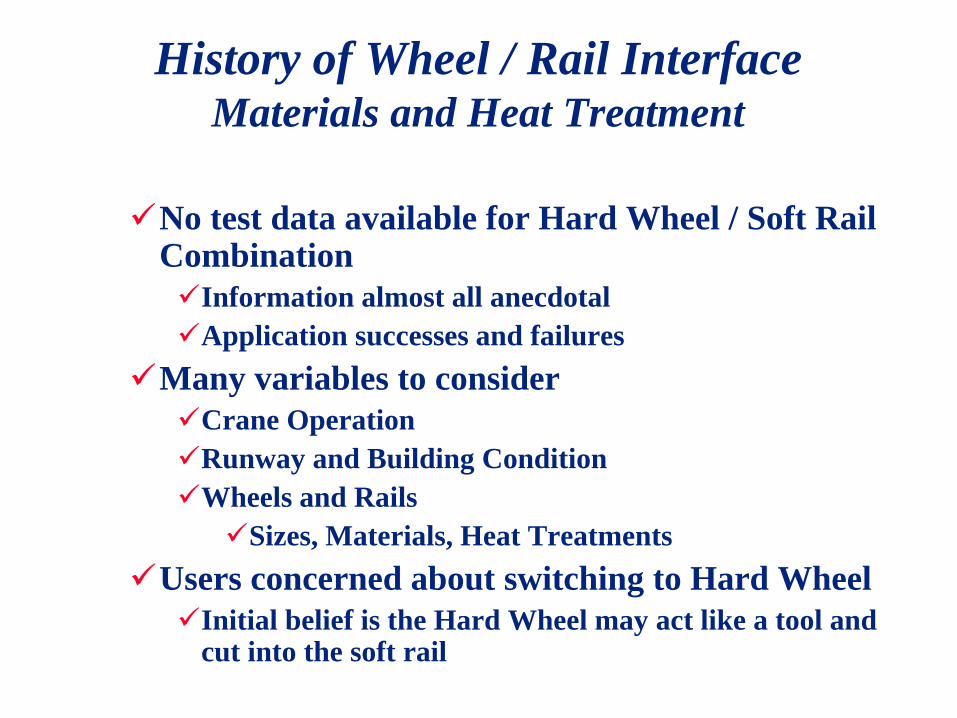
History of Wheel / Rail Interface Materials and Heat Treatment
No test data available for Hard Wheel / Soft Rail Combination
Information almost all anecdotal
Application successes and failures
Many variables to consider
Crane Operation
Runway and Building Condition
Wheels and Rails
Sizes, Materials, Heat Treatments
Users concerned about switching to Hard Wheel
Initial belief is the Hard Wheel may act like a tool and cut into the soft rail

Wheel - Rail Interface
Sub-Surface Shear
– Leads to Spalling
Sub-Surface Shear
Leads to Spalling
High Surface Stress at
Impact – Leads to
Flange Breakage
CONTACT STRESS -
LEADS TO
ADHESIVE WEAR

Adhesive Wear on Flanges Non-Lubricated Metal-to-Metal Contact

Adhesive Wear on Flanges Non-Lubricated Metal-to-Metal Contact

200
300
400
500
600
700
800
Bri
ne
ll H
ard
ne
ss
Hard Wheel
Test Sample
581 BHN
(56 HRc)
Soft Wheel
Test Sample
280 BHN
Hardened Wheel
578 - 690 BHN
(56 - 62 HRc)Hardened Wheel
420 - 481 BHN
(45 - 50 HRc)
Rim Toughened
Wheel
321 - 363 BHN
Cast Wheel
250 - 300 BHN
Wheel Test Samples
v. Wheel Hardness
Materials AISI 1055, 1070, 4140
Rim Toughened based on ASTM A504 Class C

Rail Test Samples
v. Rail Hardness
200
250
300
350
400
450
Bri
ne
ll H
ard
ne
ss
Soft Rail
Test Sample
285 BHN
Control
Cooled Rail
248 - 320 BHN
Head
Hardened Rail
321 - 388 BHN
Material based on ASTM A759
Carbon 0.67% - 0.84%

The Battelle Institute Information on Test Laboratory
Technology Development for Industry and Government
Based in Columbus, Ohio
7,500 Research Scientists and Engineers
Euro 1 Billion Annually in Revenue for Research
Serves over 2000 Companies and Government Agencies
50-100 Patents / year
Operates 4 National Laboratories

Material Test Parameters
Pressure = 13.8 MPa
Stroke Length = 28 mm
Cycle = 2 Strokes
Speed = 25 mm/sec
Delay Between Stroke = 4.9 sec
Room Temperature
Air Blown to Clear Debris

Battelle
Test Rig

Wheel Wear
0.00
0.20
0.40
0.60
0.80
1.00
1.20
1.40
0 1000 2000 3000 4000 5000 6000 7000 8000 9000 10000
Cycles
Wear
Dep
th (
mm
)
Soft Wheel
v.
Soft Rail
Hard Wheel
v.
Soft Rail

Rail Wear
0.00
0.50
1.00
1.50
2.00
2.50
0 1000 2000 3000 4000 5000 6000 7000 8000 9000 10000
Cycles
Wear
Dep
th (
mm
)
Soft Wheel
v.
Soft Rail
Hard Wheel
v.
Soft Rail

Material Test Samples after 10,000 Cycles
Hard Wheel Material
Soft Rail Material
Soft Wheel Material
Soft Rail Material

Wear Depth Test Results 10,000 Cycles
Worst combination for wear is Soft Wheel – Soft Rail
Best combination for wear is Hard Wheel – Soft Rail
2.118
0.068
1.158
0.053
0.00
0.50
1.00
1.50
2.00
2.50
Soft Rail-Soft Wheel Soft Rail-Hard Wheel
We
ar
De
pth
(m
m)
Rail Wear Wheel Wear
Crane Wheel / Crane Rail
Interface
Testing of Material Wear Properties
Thanks for your attention!