evaluation of wheel-rail load and position
TRANSCRIPT
t
FRA/0RD-82/20
EVALUATION OF WHEEL-RAIL LOAD AND POSITION MEASUREMENT CONCEPTS
RICHARD P. JOYCE MILTON R. JOHNSON
I IT RESEARCH INSTITUTE10 w, 35th street
CHICAGO, ILLINOIS 60616
PI N A L R E P O R T 1'
t)cctin®«fctis:.avdMable to the Li. 3. j?ybTtc tjipqugh theNattfcwV Technical :I f c # *<'T ■ Springfield,' Vt f ''22’] 61.!-^ " K i : « !a„ y-i«■.V ; ,
PREPARED FOR
FEDERAL RAILROAD ADMINISTRATION OFFICE OF RESEARCH AND DEVELOPMENT
WASHINGTON, D.C. 20590
02-Track-Train Dynamics
f i
NOTICE
This document is disseminated under the sponsorship of the U.S. Department of Transportation
in the interest of information exchange. The United States Government assumes no liability
for the contents or use thereof.
NOTICE
The United States Government does not endorse products or manufacturers. Trade or man
ufacturer's names appear herein solely because they are considered essential to the object of
this report.
t
Technical Report Documentation Page
1. Report No.
FRA/0RD-82/202. (iovr«nnirni Accession No. 3. Recipient's Co'olog No.
4. Ti t lo and Subfile
Evaluation of Wheel-Rail Load and Position Measurement Concepts5. Report DoteFebruary, 19826. Performing Orgoniiotion Code
T06011T0016. Performing Orgoniiotion Report No.
7. Author's)M. R. Johnson and R. P. Joyce9. Performing Organitotion Noma and AddressIIT Research Institute 1 0 W . 35th Street Chicago, Illinois 60616
10. Worl, Unit No. ( T R A IS )
11. Contract or Grant No.D0T-FR-904913. Type of Report and Period Covered
Final Task Order Report12. Sponsoring Agency Nome end Address
Federal Railroad Administration Office of Research and Development Washington, DC 20590 Id. Sponsoring Agency CodeRRD-11IS. Supplementary Notes
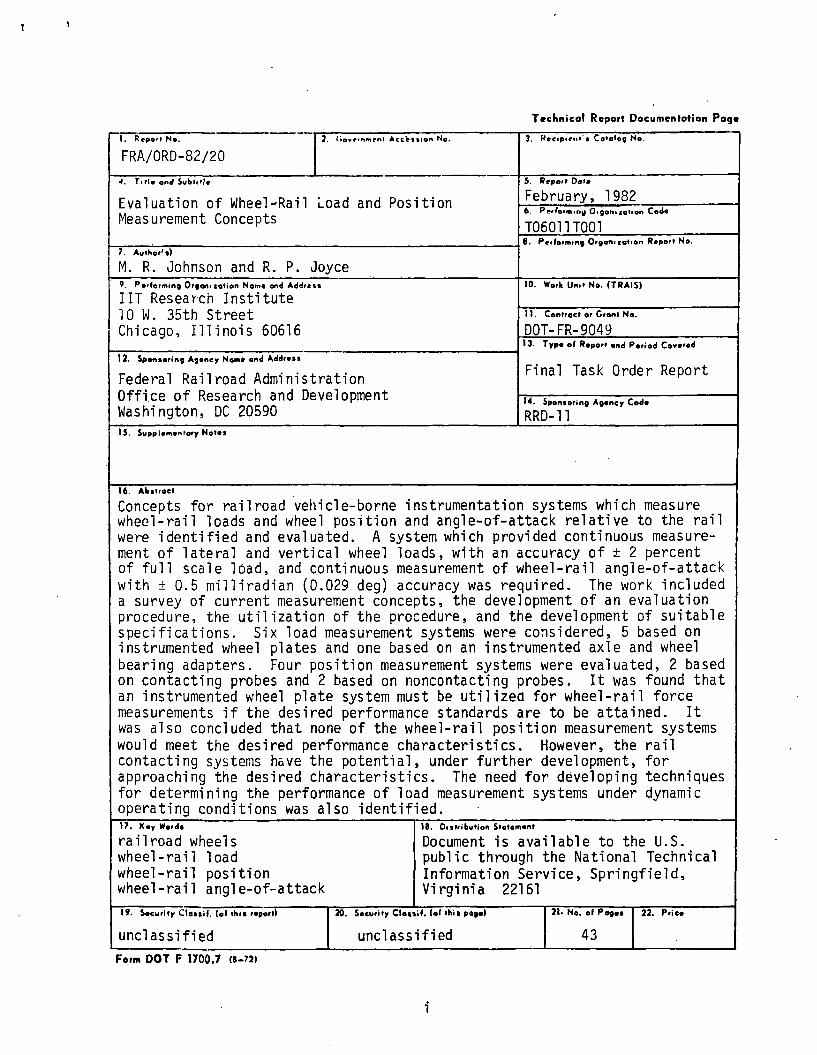
16. AbstractConcepts for railroad vehicle-borne instrumentation systems which measure wheel-rail loads and wheel position and angle-of-attack relative to the rail were identified and evaluated. A system which provided continuous measurement of lateral and vertical wheel loads, with an accuracy of ± 2 percent of full scale load, and continuous measurement of wheel-rail angle-of-attack with ± 0.5 milliradian (0.029 deg) accuracy was required. The work included a survey of current measurement concepts, the development of an evaluation procedure, the utilization of the procedure, and the development of suitable specifications. Six load measurement systems were considered, 5 based on instrumented wheel plates and one based on an instrumented axle and wheel bearing adapters. Four position measurement systems were evaluated, 2 based on contacting probes and 2 based on noncontacting probes. It was found that an instrumented wheel plate system must be utilized for wheel-rail force measurements if the desired performance standards are to be attained. It was also concluded that none of the wheel-rail position measurement systems would meet the desired performance characteristics. However, the rail contacting systems have the potential, under further development, for approaching the desired characteristics. The need for developing techniques for determining the performance of load measurement systems under dynamic operating conditions was also identified.17 , Kay Ward*railroad wheels wheel-rail load wheel-rail position wheel-rail angle-of-attack
18. Distribution StotomantDocument is available to the U.S. public through the National Technical Information Service, Springfield, Virginia 2216119. Security Clossif. (of this report)
unclassified20. Security Clossif. (of this pOQo)
unclassified21* No. of Pegas
4322. P ' i c .
Form D O T F 1700.7 ( 1 -7 2 )
i
METRIC CONVERSION FACTORS
Approximate Convartlom to Metric Measures
Symbol When You Know Multiply by To Find Symbol 8LENGTH
In inches •2.6 centimeters cmft feat 30 centimeters cmyd yardi 0 .8 meters m — ^
ml mllai 1.6 kilometers km —
AR EA— =
in* square inches 6.6 square centimeters cm*ft* square feel 0.09 square mttars m* - Eyd* square yards 0.8 square maters m* —m il square miles 2.6 square kilometers km* — 3
acres 0.4 hectares ha6 —
MASS (weight) iiil
iO X ounces 28 prams 9 “ Elb pounds 0.46 kilograms fco
short Ions 0.9 tonnes t 4 —(2000 Ibl «
VOLUME - =
•»P teaspoons 6 milliliters m l — =
Tb tp tablespoons 16 milliliters m l 3 — —II oz fluid ounces 30 milliliters m l —c cups 0.24 liters i —pt pints 0.47 liters i
qt quarts 0.96 liters i —
gel gallons 3.8 liters i —111 ■ cubic leet 0.03 cubic meters m 5 2 —yd1 cubic yards 0.76 cubic.meters m J ___ ^
TEM PERATURE (exact) _
°F Fahrenheit 6/9 (after Celsius o c— —
temperature subtracting temperature 1-------- -
32)
*1 In. ■ 2.64 cm (exactly). For other exact conversions and more detail tablet tea “NBS Mltc. Publ. 286. Unltt of Weight and Measures. Price $2.26 SO CatalogNo. C13 10 286. inches
-2 3
Approximate Conversions from Metric Measures-2 2
-21Symbol When You Know Multiply by To Find Symbol
-20LENGTH
-19 m m millimeters 0.04 inches Incm centimeters 0.4 inches In
-18 m meters 3.3 feet ftm meters 1.1 yards yd
-17km kilometers 0.6 miles mi
-1 6 A R EA
-16 cm* square centimeters 0.16 square inches in*m* square meters 1.2 square yards vd*km* square kilometers 0.4 square miles mi*-14 ha hectares (10,000 m * ) 2.6 acres
-1 3
-1 2MASS (weight)
B prams 0.036 ounces O Z- 1 1 kg kilograms 2.2 pounds lb
t tonnes 11000 kg) 1.1 short tons-1 0
- 9VOLUME
— 8 ml milliliters 0.03 fluid ounces f lo z1 liters 2.1 pints Pt1 liters 1.06 quarts q»
— 7 1 liters 0 .26 gallons galm J cubic meters 36 cubic feel ft*
- 6 m* cubic meters 1.3 cubic yards yd*
- 6 TEM PER ATUR E (exact)
- 4 °c Celsius 9/5 Ithen Fahrenheit °Ftemperature add 32) temperature
- 3
°F- 2 ° F 32 98.6 212
- 4 0 0 140 80 I 120 160 200|1 1 1 1 1 1 1 ll 1 1 1 1 1 1 1 1. 1 1 11 .1 1,1 l 1— 1 1 r i i r r i r 1 I I 1oc*10
*1 1 20 |40 60 80 100
cm °c 0 37 o c
PREFACE
The work described in this report was conducted by I IT Research Institute (IITRI) under the authorization of Department of Transportation (DOT) Federal Railroad Administration (FRA) Contract D0T-FR-9049, Task Order No. 1. Work on this task order was initiated October 16, 1980. It pertains to the evaluation of wheel-rail load and position measurement instrumentation concepts.
Dr. M. R. Johnson was the IITRI Project Manager for this work and Mr. R. P. Joyce was the Principal Investigator.
Mr. Donald E. Gray and Dr. N. T. Tsai were the cognizant FRA Technical Monitors. Their helpful suggestions and guidance throughout the course of the work are gratefully acknowledged.
Prepared by:
Richard P. Joyce Research Engineer Materials Research Division
Milton R./JohnsonSenior Engineering AdvisorTransportation Research Division
Annrm/pH hv:
Milton Pikarsky DirectorTransportation Research Division
ii
'1t ■
TABLE OF CONTENTS
Section Page
1. INTRODUCTION 1
1.1 Objectives 11.2 Background 11.3 Scope 1
2. WHEEL-RAIL LOAD AND POSITION MEASUREMENT SYSTEMS 2
2.1 Concepts Selected for Evaluation 2
2.2 Load Measurement System Descriptions 2
2.2.1 General Considerations 22.2.2 EMD Instrumented Wheel Plate System 32.2.3 BR Spoked Wheel System 42.2.4 AAR Instrumented Wheel Plate System 62.2.5 ASEA/SJ Instrumented Wheel Plate System 72.2.6 IITRI Instrumented Wheel Plate System 92.2.7 Wyle Laboratories Instrumented Axle and Wheel Bearing Adapter System 112.2.8 ENSCO Combined Instrumented Wheel Plate System 13
2.3 Lateral Position and Angle-of-Attack Measurement System Descriptions 13
2.3.1 General Considerations 132.3.2 AAR Wheel-Rail Lateral Displacement and Angle-of-Attack Measurement System 132.3.3 BR Wheel-Rail Lateral Displacement and Angle-of-Attack Measurement System 132.3.4 Wyle Wheel-Rail Lateral Displacement and Angle*-of-Attack Measurement System 132.3.5 ENSCO Wheel-Rail Lateral Displacement and Angle-of-Attack Measurement 15
System
3. EVALUATION OF WHEEL-RAIL LOAD AND POSITION MEASUREMENT SYSTEMS 16
3.1 Evaluation Procedure 163.2 Evaluation Factors 163.3 Summary of Results 163.4 Analytical Comparison of Instrumented Wheel Plate Systems 16
3.4.1 Vertical Load Bridge Response 203.4.2 Lateral Load Bridge Response 20
3.5 Analytical Evaluation of Instrumented Axle and Wheel Bearing Adapter System 233.6 Discussion of Evaluation Factors 23
4. CONCLUSIONS AND RECOMMENDATIONS 36
4.1 Conclusions 364.2 Recommendations 36
APPENDIX: SPECIFICATION FOR WHEEL-RAIL LOAD AND POSITION MEASUREMENT SYSTEM 37
REFERENCES 39
iii
1. INTRODUCTION
1.1 OBJECTIVES
There were three principal objectives for the work performed under this task order. The first objective was to identify current concepts for vehicle-borne instrumentation systems which measure the vertical, lateral and longitudinal components of wheel-rail loads and which measure the lateral wheel position and angle-of-attack relative to the rail. The second objective was to establish a procedure for ranking the various concepts and to apply this procedure to the evaluation of selected instrumentation systems. The third objective was to develop performance specifications for a system that would meet a set of "primary requirements", as defined in the following section. "
1.2 BACKGROUND
The Federal Railroad Administration (FRA)Office of Freight .Systems is engaged in research programs involving the test and evaluation of freight car components and systems. The accurate measurement of wheel- rail loads, as well as the relative wheel-rail position, is a prerequisite for much of the on-going work such as two current major FRA programs, the Facility.for Accelerated Service Testing (FAST) and the Truck Design Optimization Project (TDOP). The Office of Freight Systems is, therefore, interested in the procurement of instrumentation systems, for use with on-going and future projects, to measure the dynamic characteristics of freight cars at the wheel-rail interface.
There are several new and/or improved concepts by which these characteristics can be measured.By conducting a thorough survey and assessment of recent designs, including on-going developments in this area, information is provided on which to base the procurement of such equipment.
A set of primary requirements for a wheel-rail load and position measurement system have been identified by the FRA Office of Freight Systems as follows:
• Continuous measurement of lateral and vertical wheel loads, up to 50,000 lbs (22 kN) with an accuracy of ± 2 percent of full scale load and a frequency response upto 50 Hz. •
• Continuous measurement of wheel-rail angle-of-attack and lateral position with± 0.5 milliradian (0.029 deg) and ± 0.002 in. (0.05 mm) respectively. Lateral measurement is desired in a range up to 2 in. (50 mm) with a frequency response up to 50 Hz. An angular range of ± 5 deg is desired, which is based on the maximum angle-of-attack expected on a 16 deg curve with due allowance for truck distortion and gage clearance effects.
• Operating temperature range -30 to +120 deg F (-34 to +49 deg C )
• Ease of Installation
• Cost effectiveness
• High reliability
• Minimum data reduction and processing
Secondary requirements have been identified as follows:
t Longitudinal wheel force measurement
• Ease of installation with modular concept
1.3 SCOPE
The scope of this task order included a survey of current concepts for wheel-rail load and position measurement systems, the development of an evaluation procedure, the utilization of the procedure for the evaluation of various concepts, and the development of suitable specifications for a particular application.
The evaluation and rating technique was to consider a number of factors, including:
AccuracyCost Effectiveness Adaptability Technical Risk Ease of Installation Maintainability ReliabilityApplication over Range of Environmental Condi ti ons
Modularity/Flexibility Reuseability of Major Components Previous Application Experience Transducers, Data Collection, Signal Transmission, and Data Formats
During the project several other important evaluation factors were identified including:
• Monitoring the accuracy of output data
• Integration of both load and position measurement systems
• Signal strength and signal-to-noise ratio
• Data processing procedures
A proposed specification for a wheel-rail load and position measurement system is presented in the Appendix. It is based on the FRA requirements stated earlier on this page, but relaxes the accuracy required for the lateral position measurement and reduces the lateral load measurement range.
1
2. WHEEL-RAIL LOAD AND POSITION MEASUREMENT SYSTEMS
2.1 CONCEPTS SELECTED FOR EVALUATION
A complete system, one which would measure both load and position parameters is desired. A review of present systems indicates that load and position measurement subsystems for the most part may be treated independently. Each of the wheel-rail load measurement concepts considered in the evaluation is compatible with each of the position measurement concepts, although the field experience in the operation of a combined load and position measurement system is limited.
Six load measurement systems and four position measurement systems have been selected for evaluation. The load measurement systems are:
• the Electromotive Division (EMD) of General Motors Instrumented Wheel Plate Sys tern,
• the British Rail (BR) Spoked Wheel System,
• the Association of American Railroads (AAR) Instrumented Wheel Plate System (this evaluation included consideration of an ENSCO data processor for obtaining continuous representation of the verical load),
• the ASEA-Swedish State Railways (ASEA/SJ) Instrumented Wheel Plate System,
• the IIT Research Institute (IITRI) Instrumented Wheel Plate System, and
• the Wyle Instrumented Axle and Wheel Bearing Adapter System.
The wheel position measurement systems are:
• the AAR Wheel-Rail Lateral Displacement and Angle-of-Attack System,
• the British Rail Wheel-Rail Lateral Displacement and Angle-of-Attack System,
e the ENSCO Wheel-Rail Lateral Displacement and Angle-of-Attack System, and
• the Wyle Wheel-Rail Lateral Displacement and Angle-of-Attack System.
2.2 LOAD MEASUREMENT SYSTEM DESCRIPTIONS
2.2.1 GENERAL CONSIDERATIONS
Each of the wheel-rail load measurement systems utilizes strain gages for the generation of electrical signals which are processed to provide load data. Several different types of gages and techniques for the application of the gages are used.
None of the systems 1s limited to the use of a specific type of gage. The various systems also use different procedures for protecting these strain gage installations from environmental effects. The practices followed for several of the systems are summarized as follows:
The EMD system has used a high temperature installation of Micro-Measurements WA-06- 125Pc-120 and WA-06-250BG-120 strain gages using M-Bond 610 adhesive which 1s cured at 350 deg F. Moisture protection was provided by additional layers of adhesive, which virtually encapsulated the gage circuit, and by layers of higher temperature resistance enamel paint. Mechanical protection was provided by an RTV silicone rubber which in turn was covered by Inconel.The Inconel was spot welded over the uncured layer of silicone rubber to damp vibrations.
The BR system has utilized a strain gage bonding agent with medium temperature installation (55 deg C). Moisture protection was provided by a transparent gage coating over the gage circuits. The slip ring assembly was protected by a sealed drum, and kept dry with a small electric heater. Mechanical protection was provided by sheet aluminum wheel disks, lined inside with expanded polystyrene.
The AAR system has employed AE-10 epoxy for strain gage bonding which cures at room temperature. Sealing dielectric compound and glyptol provided moisture protection.
The ASEA/SJ system was constructed with wire strain gages with suitable temperature compensation. Foil gages have been used as a direct replacement. The strain gages were installed by using Hottinger type Z-70 cyanide-acrylate adhesive which is similar to Eastman 910 and Micro-Measurements M-Bond 200. (M-Bond 200 adhesive attachments are weakened by exposure to high humidity.For this reason, and because of aging effects, the adhesive is not generally recommended for long term permanent installations.)After installation gages were covered with Micro-Measurements M-Coat D to form a moisture barrier. A coat of 3M type EC-801 two part rubber mix was then applied. Finally, the wheel was coated with a layer of lacquer.
The IITRI system has used high temperature weldable strain gages (Micro-Measurements LWK-06-W250B-350). Moisture protection was provided by a layer of high temperature RTV. Mechanical protection was provided by sheet aluminum wheel disks.
The Wyle axle-mounted strain gages were installed in the field. The bonded strain gages were applied by using an elevated temperature curing adhesive.
2
2.2.2 EMD INSTRUMENTED WHEEL PLATE SYSTEM
The EMD system uses strain gages applied to the wheel plate for measurement of lateral and vertical loads at the wheel-rail interface (Refs 1 and 2). The gages are wired in a bridge configuration designed to generate sinusoidal waveforms as a function of wheel rotation. - The amplitudes of these waveforms are proportional to the applied load. The sinusoidal bridge outputs are not affected by axisymmetric wheel strains from rim heating and centrifugal force.
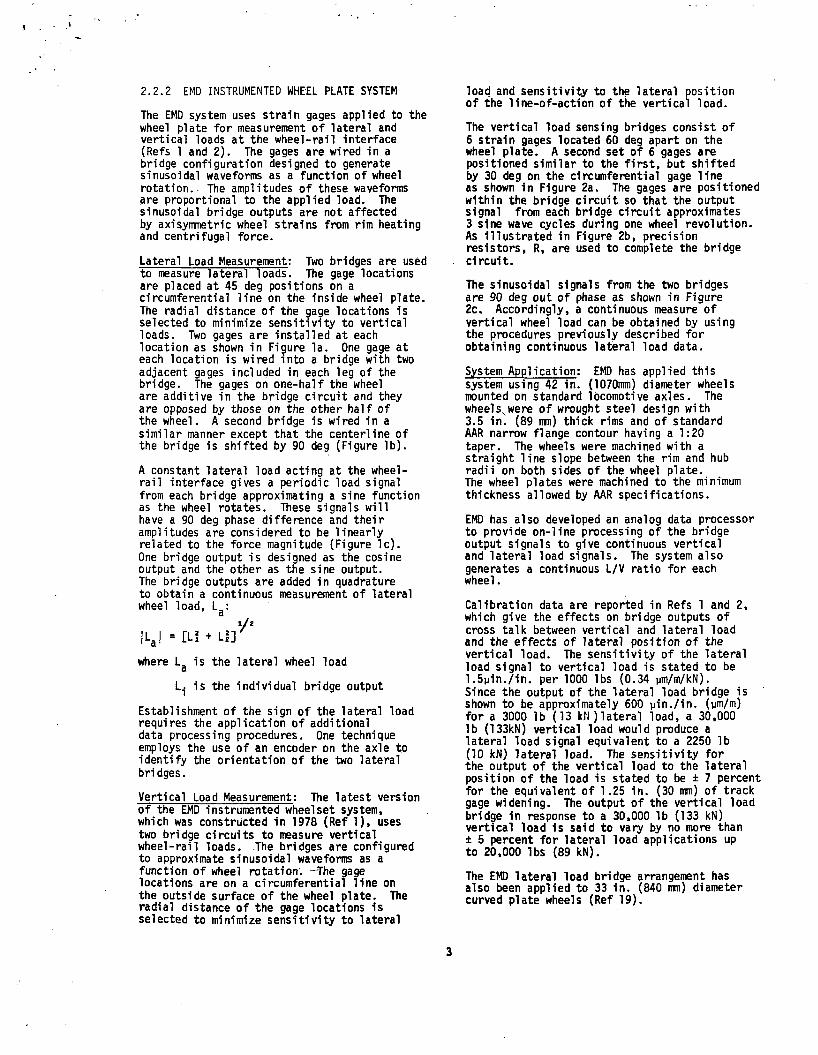
Lateral Load Measurement: Two bridges are usedto measure lateral loads. The gage locations are placed at 45 deg positions on a circumferential line on the inside wheel plate. The radial distance of the gage locations is selected to minimize sensitivity to vertical loads. Two gages are installed at each location as shown in Figure la. One gage at each location is wired into a bridge with two adjacent gages included in each leg of the bridge. The gages on one-half the wheel are additive in the bridge circuit and they are opposed by those on the other half of the wheel. A second bridge is wired in a similar manner except that the centerline of the bridge is shifted by 90 deg (Figure lb).
A constant lateral load acting at the wheel- rail interface gives a periodic load signal from each bridge approximating a sine function as the wheel rotates. These signals will have a 90 deg phase difference and their amplitudes are considered to be linearly related to the force magnitude (Figure lc).One bridge output is designed as the cosine output and the other as the sine output.The bridge outputs are added in quadrature to obtain a continuous measurement of lateral wheel load, L :a 1/2|La| = ELS + u rwhere L, is the lateral wheel loada
Li is the individual bridge output
Establishment of the sign of the lateral load requires the application of additional data processing procedures. One technique employs the use of an encoder on the axle to identify the orientation of the two lateral bri dges.
Vertical Load Measurement; The latest version of the EMD instrumented wheel set system, which was constructed in 1978 (Ref 1), uses two bridge circuits to measure vertical wheel-rail loads. The bridges are configured to approximate sinusoidal waveforms as a function of wheel rotation. -The gage locations are on a circumferential line on the outside surface of the wheel plate. The radial distance of the gage locations is selected to minimize sensitivity to lateral
load and sensitivity to the lateral position of the line-of-action of the vertical load.
The vertical load sensing bridges consist of 6 strain gages located 60 deg apart on the wheel plate. A second set of 6 gages are positioned similar to the first, but shifted by 30 deg on the circumferential gage line as shown 1n Figure 2a. The gages are positioned within the bridge circuit so that the output signal from each bridge circuit approximates 3 sine wave cycles during one wheel revolution. As Illustrated in Figure 2b, precision resistors, R, are used to complete the bridge circuit.
The sinusoidal signals from the two bridges are 90 deg out of phase as shown in Figure 2c. Accordingly, a continuous measure of vertical wheel load can be obtained by using the procedures previously described for obtaining continuous lateral load data.
System Application: EMD has applied this system using 42 in. (1070mm) diameter wheels mounted on standard locomotive axles. The wheels^ were of wrought steel design with3.5 in. (89 inn) thick rims and of standard AAR narrow flange contour having a 1:20 taper. The wheels were machined with a straight line slope between the rim and hub radii on both sides of the wheel plate.The wheel plates were machined to the minimum thickness allowed by AAR specifications.
EMD has also developed an analog data processor to provide on-line processing of the bridge output signals to give continuous vertical and lateral load signals. The system also generates a continuous L/V ratio for each wheel.
Calibration data are reported in Refs 1 and 2, which give the effects on bridge outputs of cross talk between vertical and lateral load and the effects of lateral position of the vertical load. The sensitivity of the lateral load signal to vertical load is stated to be 1.5yin./in. per 1000 lbs (0.34 ym/m/kN).Since the output of the lateral load bridge is shown to be approximately 600 yin./in. (ym/m) for a 3000 lb (13 kll) lateral load, a 30,000 lb (133kN) vertical load would produce a lateral load signal equivalent to a 2250 lb (10 kN) lateral load. The sensitivity for the output of the vertical load to the lateral position of the load is stated to be ± 7 percent for the equivalent of 1.25 in. (30 mm) of track gage widening. The output of the vertical load bridge in response to a 30,000 lb (133 kN) vertical load is said to vary by no more than ± 5 percent for lateral load applications up to 20,000 lbs (89 kN).
The EMD lateral load bridge arrangement has also been applied to 33 in. (840 ran) diameter curved plate wheels (Ref 19).
3
Inside Wheel Plate
(a) Gage Positions
Outside Wheel Plate
(b) Bridge Layouts
(Note: "R" refers to inactive resistance used to balance bridge).
V cos 6
V sin 6
FIGURE 1. EMD LATERAL LOAD MEASURING BRIDGE CONFIGURATION
FIGURE 2. EMD VERTICAL LOAD MEASURING BRIDGE CONFIGURATION
2.2.3 BR SPOKED WHEEL SYSTEM
The BR system utilizes strain gage bridges applied to a wheel with 12 spokes for the measurement of vertical, lateral, and longitudinal loads at the wheel-rail interfaces (Refs 3 and 4).
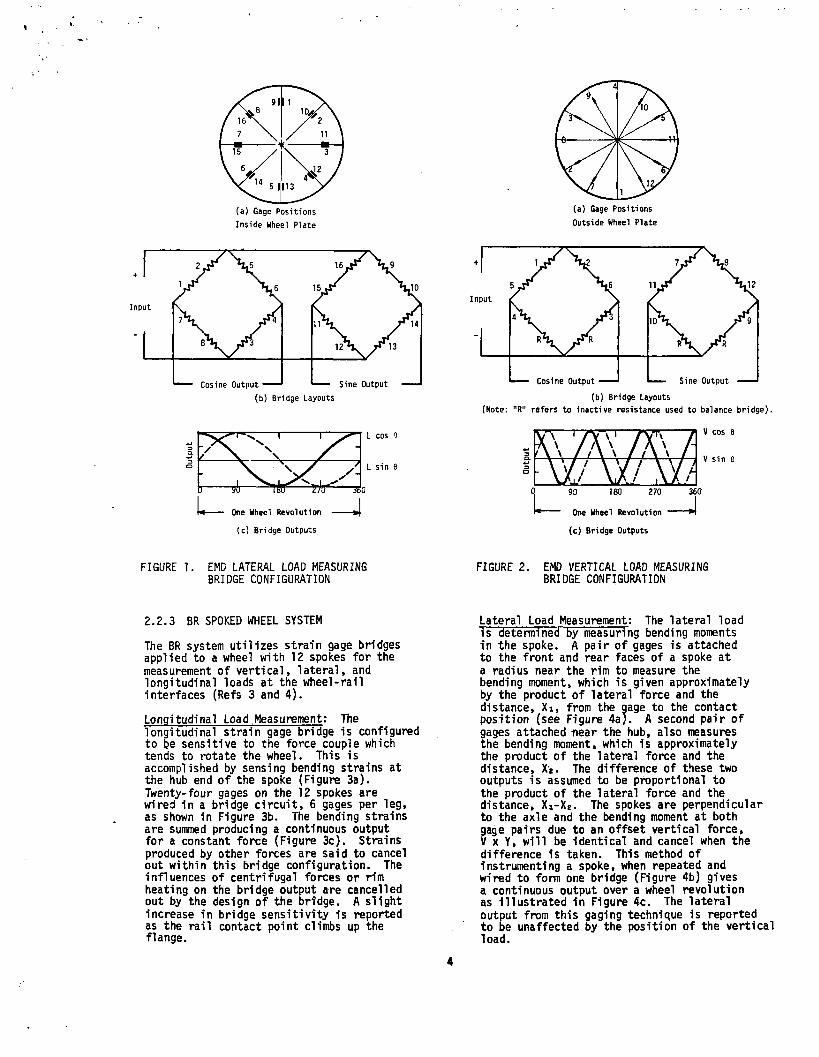
Longitudinal Load Measurement: Thelongitudinal strain gage bridge is configured to be sensitive to the force couple which tends to rotate the wheel. This is accomplished by sensing bending strains at the hub end of the spoke (Figure 3a).Twenty-four gages on the 12 spokes are wired in a bridge circuit, 6 gages per leg, as shown in Figure 3b. The bending strains are summed producing a continuous output for a constant force (Figure 3c). Strains produced by other forces are said to cancel out within this bridge configuration. The influences of centrifugal forces or rim heating on the bridge output are cancelled out by the design of the bridge. A slight increase in bridge sensitivity is reported as the rail contact point climbs up the flange.
Lateral Load Measurement: The lateral load is determined by measuring bending moments in the spoke. A pair of gages is attached to the front and rear faces of a spoke at a radius near the rim to measure the bending moment, which is given approximately by the product of lateral force and the distance, Xi, from the aage to the contact position (see Figure 4a). A second pair of gages attached near the hub, also measures the bending moment, which is approximately the product of the lateral force and the distance, X*. The difference of these two outputs is assumed to be proportional to the product of the lateral force and the distance, X1-X2. The spokes are perpendicular to the axle and the bending moment at both gage pairs due to an offset vertical force,V x Y, will be identical and cancel when the difference 1s taken. This method of instrumenting a spoke, when repeated and wired to form one bridge (Figure 4b) gives a continuous output over a wheel revolution as Illustrated in Figure 4c. The lateral output from this gaging technique is reported to be unaffected by the position of the vertical load.
4
(Note: the notation A (1-6} means summation of all A gages on spokes 1 through 6, etc.)
I J----- L
u 90 180 270
One Wheel Revolution
360
— I(c) Bridge Output
(Note: The notation A (1-12) means summation of all A gages on spokes 7 through 12, etc.)
-T '
- 1 10 90 180 270 360
u One Wheel Revolution
(c) Bridge Output
FIGURE 3. BR LONGITUDINAL LOAD MEASURING BRIDGE CONFIGURATION
Axisymmetric wheel strains caused by centrifugal force and rim heating will not affect the bridge output because the gages are applied to the region of the spoke where a constant cross section of the spoke is maintained. The spokes are oriented radially so that the effects of centrifugal forces or rim heating would be constant along the length of the spoke.
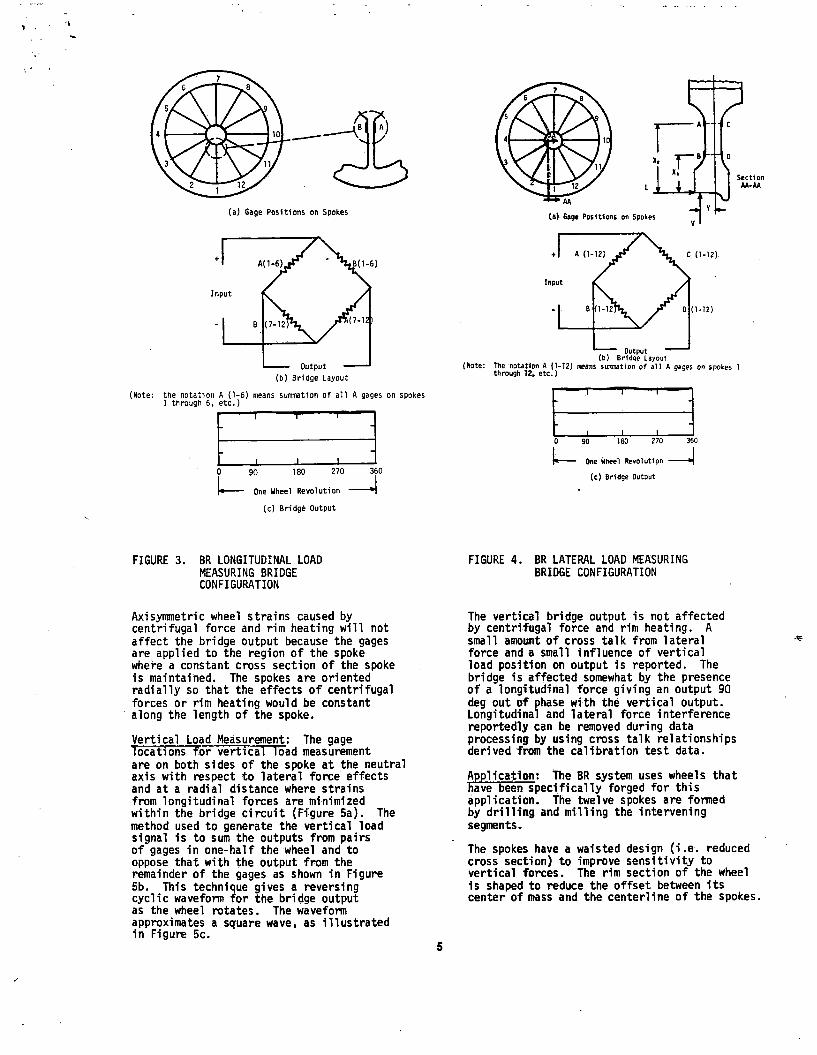
Vertical Load Measurement: The gage locations for vertical Toad measurement are on both sides of the spoke at the neutral axis with respect to lateral force effects and at a radial distance where strains from longitudinal forces are minimized within the bridge circuit (Figure 5a). The method used to generate the vertical load signal is to sum the outputs from pairs of gages in one-half the wheel and to oppose that with the output from the remainder of the gages as shown in Figure 5b. This technique gives a reversing cyclic waveform for the bridge output as the wheel rotates. The waveform approximates a square wave, as illustrated in Figure 5c.
FIGURE 4. BR LATERAL LOAD MEASURING BRIDGE CONFIGURATION
The vertical bridge output is not affected by centrifugal force and rim heating. A small amount of cross talk from lateral force and a small influence of vertical load position on output is reported. The bridge is affected somewhat by the presence of a longitudinal force giving an output 90 deg out of phase with the vertical output. Longitudinal and lateral force interference reportedly can be removed during data processing by using cross talk relationships derived from the calibration test data.
Application; The BR system uses wheels that have been specifically forged for this application. The twelve spokes are formed by drilling and milling the intervening segments.
The spokes have a waisted design (i.e. reduced cross section) to improve sensitivity to vertical forces. The rim section of the wheel is shaped to reduce the offset between its center of mass and the centerline of the spokes.
5
The output signals from the three bridges pass through the axle to the slip ring assembly. From the slip ring the signals are fed to the signal conditioning equipment. A microcomputer is used to log, process and display the triaxial forces and parameters derived from these forces in real time.
(a) Gage Positions on Spokes
{ Note: The notation A8 (10-12) means summation of all A and B gages on spokes 10 through 12, etc.)
FIGURE 5. BR VERTICAL LOAD MEASURING BRIDGE CONFIGURATION
2.2.4 AAR INSTRUMENTED WHEEL PLATE SYSTEM
The AAR system uses strain gages applied to the outside of the wheel plate for lateral and vertical wheel-rail load measurement (Ref 5).
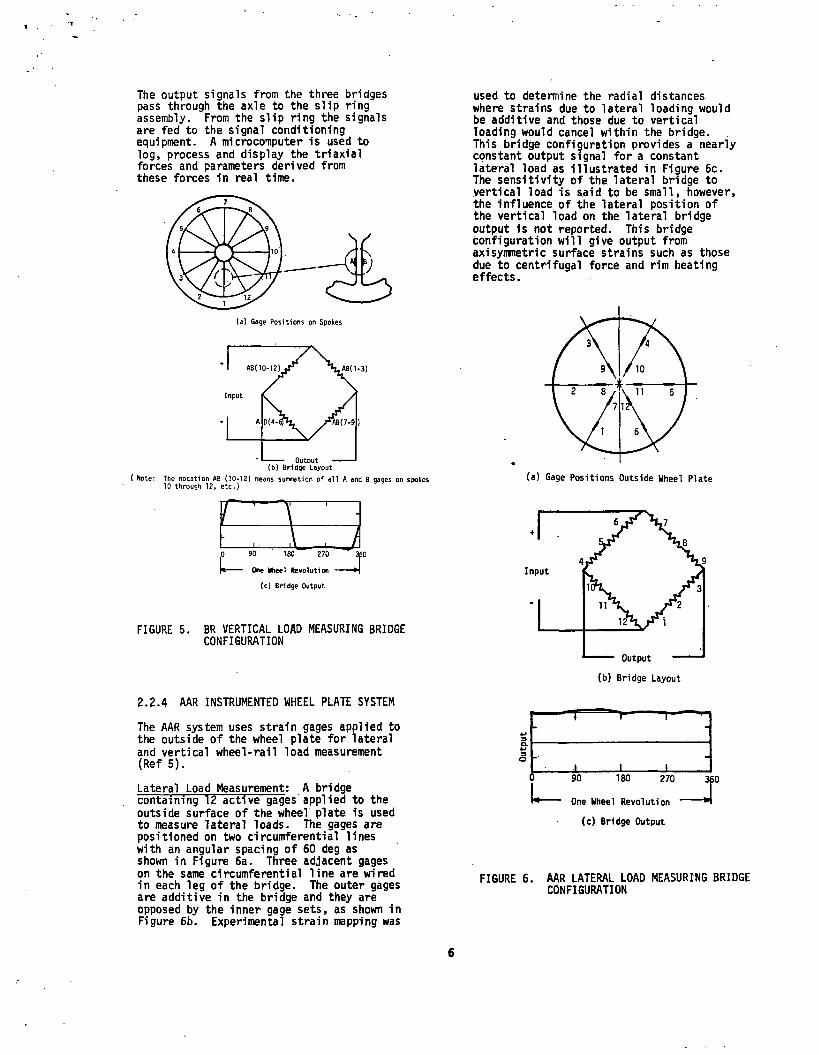
Lateral Load Measurement: - A bridge containing 12 active gages applied to the outside surface of the wheel plate is used to measure lateral loads. The gages are positioned on two circumferential lines with an angular spacing of 60 deg as shown in Figure 6a. Three adjacent gages on the same circumferential line are wired in each leg of the bridge. The outer gages are additive in the bridge and they are opposed by the inner gage sets, as shown in Figure 6b. Experimental strain mapping was
used to determine the radial distances where strains due to lateral loading would be additive and those due to vertical loading would cancel within the bridge.This bridge configuration provides a nearly constant output signal for a constant lateral load as illustrated in Figure 6c. The sensitivity of the lateral bridge to vertical load is said to be small, however, the influence of the lateral position of the vertical load on the lateral bridge output is not reported. This bridge configuration will give output from axisymmetric surface strains such as those due to centrifugal force and rim heating effects.
(a) Gage P os itio ns Outside Wheel P la te
FIGURE 6. AAR LATERAL LOAD MEASURING BRIDGE CONFIGURATION
6
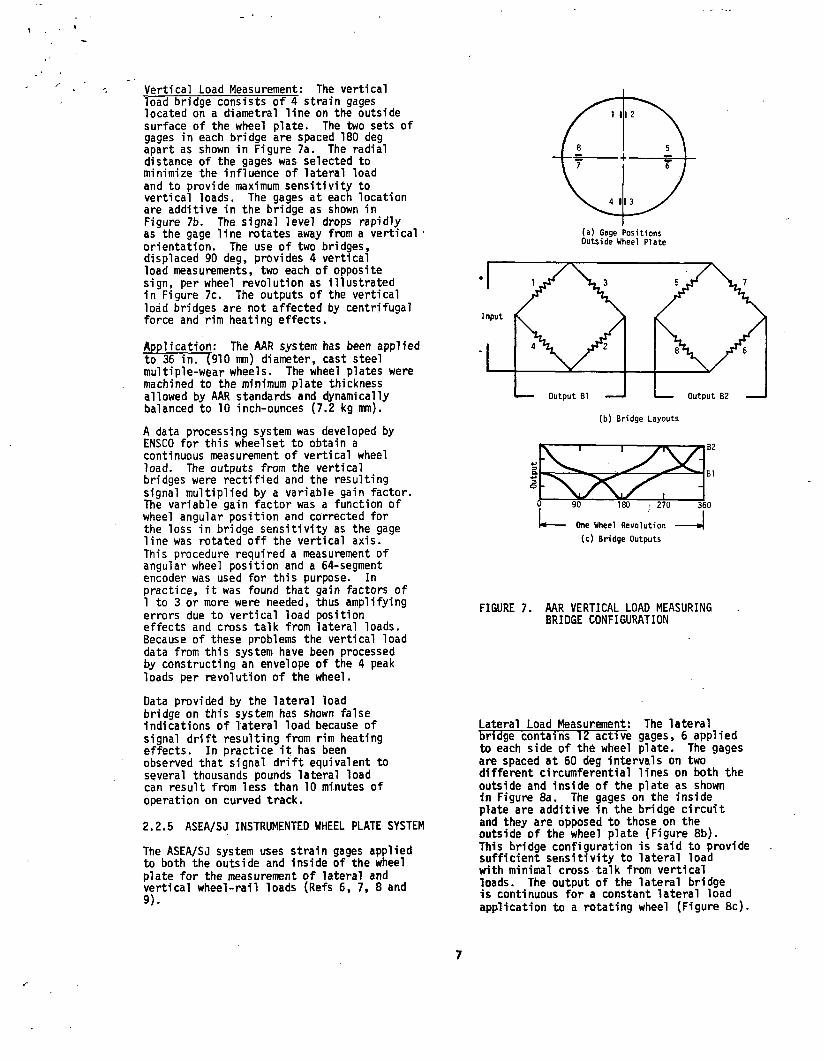
Vertical Load Measurement: The verticalload bridge consists of 4 strain gages located on a diametral line on the outside surface of the wheel plate. The two sets of gages in each bridge are spaced 180 deg apart as shown in Figure 7a. The radial distance of the gages was selected to minimize the influence of lateral load and to provide maximum sensitivity to vertical loads. The gages at each location are additive in the bridge as shown in Figure 7b. The signal level drops rapidly as the gage line rotates away from a vertical 1 orientation. The use of two bridges, displaced 90 deg, provides 4 vertical load measurements, two each of opposite sign, per wheel revolution as illustrated in Figure 7c. The outputs of the vertical load bridges are not affected by centrifugal force and rim heating effects.
Application: The AAR system has been applied to 36 in. (910 rnn) diameter, cast steel multiple-wear wheels. The wheel plates were machined to the minimum plate thickness allowed by AAR standards and dynamically balanced to 10 inch-ounces (7.2 kg mm).
A data processing system was developed by ENSCO for this wheel set to obtain a continuous measurement of vertical wheel load. The outputs from the vertical bridges were rectified and the resulting signal multiplied by a variable gain factor. The variable gain factor was a function of wheel angular position and corrected for the loss in bridge sensitivity as the gage line was rotated off the vertical axis.This procedure required a measurement of angular wheel position and a 64-segment encoder was used for this purpose. In practice, it was found that gain factors of 1 to 3 or more were needed, thus amplifying errors due to vertical load position effects and cross talk from lateral loads. Because of these problems the vertical load data from this system have been processed by constructing an envelope of the 4 peak loads per revolution of the wheel.
Data provided by the lateral load bridge on this system has shown false indications of lateral load because of signal drift resulting from rim heating effects. In practice it has been observed that signal drift equivalent to several thousands pounds lateral load can result from less than 10 minutes of operation on curved track.
2.2.5 ASEA/SJ INSTRUMENTED WHEEL PLATE SYSTEM
The ASEA/SJ system uses strain gages applied to both the outside and inside of the wheel plate for the measurement of lateral and vertical wheel-rail loads (Refs 6, 7, 8 and 9).
(a) Gage Positions Outside Wheel Plate
FIGURE 7. AAR VERTICAL LOAD MEASURING BRIDGE CONFIGURATION
Lateral Load Measurement: The lateral bridge contains 12 active gages, 6 applied to each side of the wheel plate. The gages are spaced at 60 deg intervals on two different circumferential lines on both the outside and inside of the plate as shown in Figure 8a. The gages on the inside plate are additive in the bridge circuit and they are opposed to those on the outside of the wheel plate (Figure 8b).This bridge configuration is said to provide sufficient sensitivity to lateral load with minimal cross talk from vertical loads. The output of the lateral bridge is continuous for a constant lateral load application to a rotating wheel (Figure 8c).
7
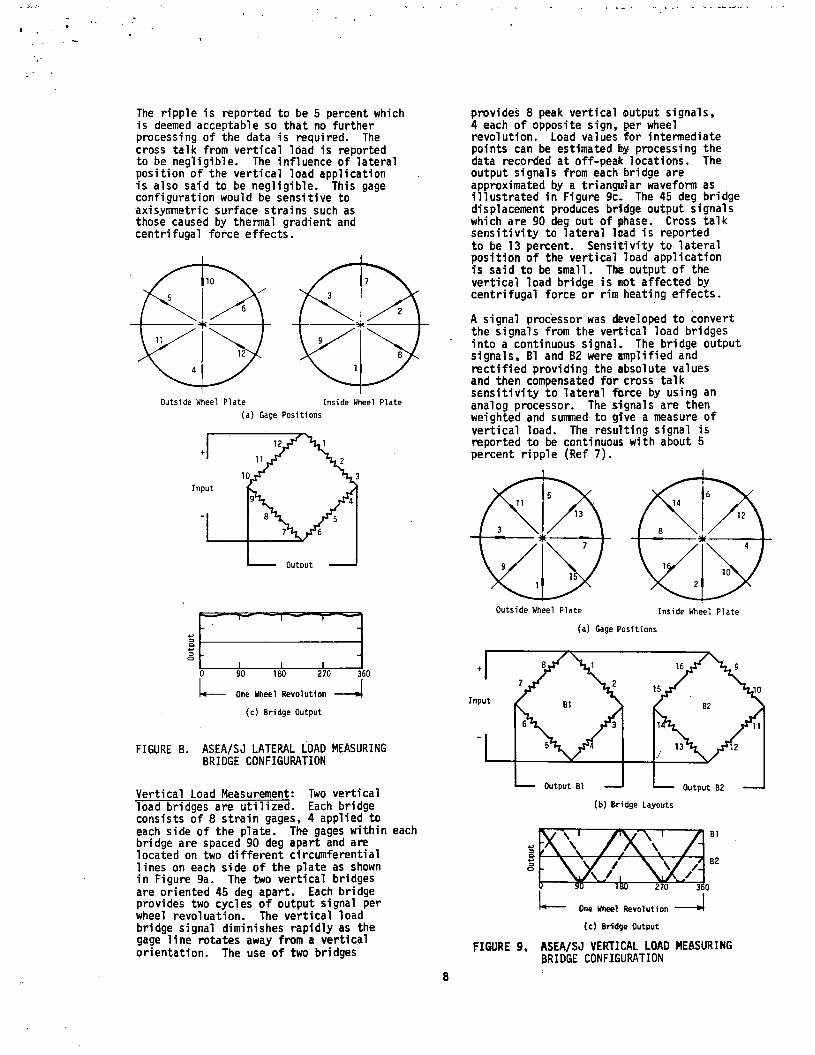
The ripple is reported to be 5 percent which is deemed acceptable so that no further processing of the data is required. The cross talk from vertical load is reported to be negligible. The influence of lateral position of the vertical load application is also said to be negligible. This gage configuration would be sensitive to axisymmetric surface strains such as those caused by thermal gradient and centrifugal force effects.
(a) Gage Positions
_L _ L _L0 90 180 270 360L ---- One Wheel Revolution
(c) Bridge Output
FIGURE 8. ASEA/SJ LATERAL LOAD MEASURING BRIDGE CONFIGURATION
Vertical Load Measurement: Two verticalload bridges are utilized. Each bridge consists of 8 strain gages, 4 applied to each side of the plate. The gages within each bridge are spaced 90 deg apart and are located on two different circumferential lines on each side of the plate as shown in Figure 9a. The two vertical bridges are oriented 45 deg apart. Each bridge provides two cycles of output signal per wheel revoluation. The vertical load bridge signal diminishes rapidly as the gage line rotates away from a vertical orientation. The use of two bridges
provides 8 peak vertical output signals,4 each of opposite sign, per wheel revolution. Load values for intermediate points can be estimated fey processing the data recorded at off-peak locations. The output signals from each bridge are approximated by a triangular waveform as illustrated in Figure 9c. The 45 deg bridge displacement produces bridge output signals which are 90 deg out of phase. Cross talk sensitivity to lateral load is reported to be 13 percent. Sensitivity to lateral position of the vertical load application is said to be small. The output of the vertical load bridge is not affected by centrifugal force or rim heating effects.
A signal processor was developed to convert the signals from the vertical load bridges into a continuous signal. The bridge output signals, B1 and B2 were amplified and rectified providing the absolute values and then compensated for cross talk sensitivity to lateral force by using an analog processor. The signals are then weighted and summed to give a measure of vertical load. The resulting signal is reported to be continuous with about 5 percent ripple (Ref 7).
(a) Gage Positions
FIGURE 9. ASEA/SJ VERTICAL LOAD MEASURING BRIDGE CONFIGURATION
8
Application: The ASEA/SJ system has beenapplied to S-shape and curved plate wheels. The wheel set fabricated by the Swedish State Railways (SJ) employs 40 in. (1000 mm) diameter wheels having an S-shaped and conical (1:40) tread. Several small holes [0.25 in. (6 mm) diameter] were drilled through the plate to facilitate wiring of the strain gage bridges. The S-shaped wheel was selected because it is reported to have no measurable variation in bridge output as a function of lateral position of the vertical load application. The ASEA/ SJ vertical load bridges have also been applied successfully to a curved plate wheel (Ref 19).
2.2.6 IITRI INSTRUMENTED WHEEL PLATE SYSTEM
The IITRI system uses six strain gage bridges on each wheel for the measurement of lateral and vertical wheel-rail loads.Two bridges are designated as lateral bridges, 3 are designated as vertical bridges and one is designated as a position bridge (Refs 10 and 11).
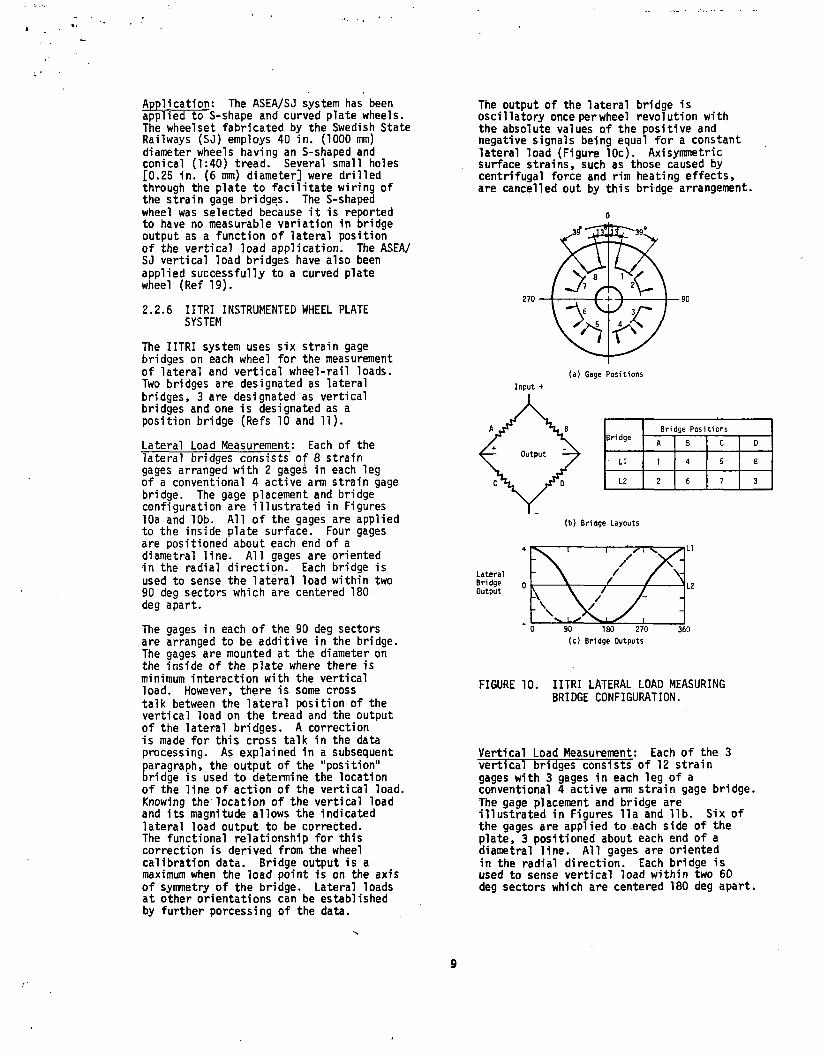
Lateral Load Measurement: Each of thelateral bridges consists of 8 strain gages arranged with 2 gages in each leg of a conventional 4 active arm strain gage bridge. The gage placement and bridge configuration are illustrated in Figures 10a and 10b. All of the gages are applied to the inside plate surface. Four gages are positioned about each end of a diametral line. All gages are oriented in the radial direction. Each bridge is used to sense the lateral load within two 90 deg sectors which are centered 180 deg apart.
The gages in each of the 90 deg sectors are arranged to be additive in the bridge. The gages are mounted at the diameter on the inside of the plate where there is minimum interaction with the vertical load. However, there is some cross talk between the lateral position of the vertical load on the tread and the output of the lateral bridges. A correction is made for this cross talk in the data processing. As explained in a subsequent paragraph, the output of the "position" bridge is used to determine the location of the line of action of the vertical load. Knowing the location of the vertical load and its magnitude allows the indicated lateral load output to be corrected.The functional relationship for this correction is derived from the wheel calibration data. Bridge output is a maximum when the load point is on the axis of symmetry of the bridge. Lateral loads at other orientations can be established by further porcessing of the data.
The output of the lateral bridge is oscillatory onceperwheel revolution with the absolute values of the positive and negative signals being equal for a constant lateral load (Figure 10c). Axisymmetric surface strains, such as those caused by centrifugal force and rim heating effects, are cancelled out by this bridge arrangement.
o
(a) Gage Positions
Input +
(b) Bridge Layouts
Lateral Bri dge Output
FIGURE 10. IITRI LATERAL LOAD MEASURING BRIDGE CONFIGURATION.
Vertical Load Measurement: Each of the 3 vertical bridges consists of 12 strain gages with 3 gages in each leg of a conventional 4 active arm strain gage bridge. The gage placement and bridge are illustrated in Figures 11a and lib. Six of the gages are applied to each side of the plate, 3 positioned about each end of a diametral line. All gages are oriented in the radial direction. Each bridge is used to sense vertical load within two 60 deg sectors which are centered 180 deg apart.
9
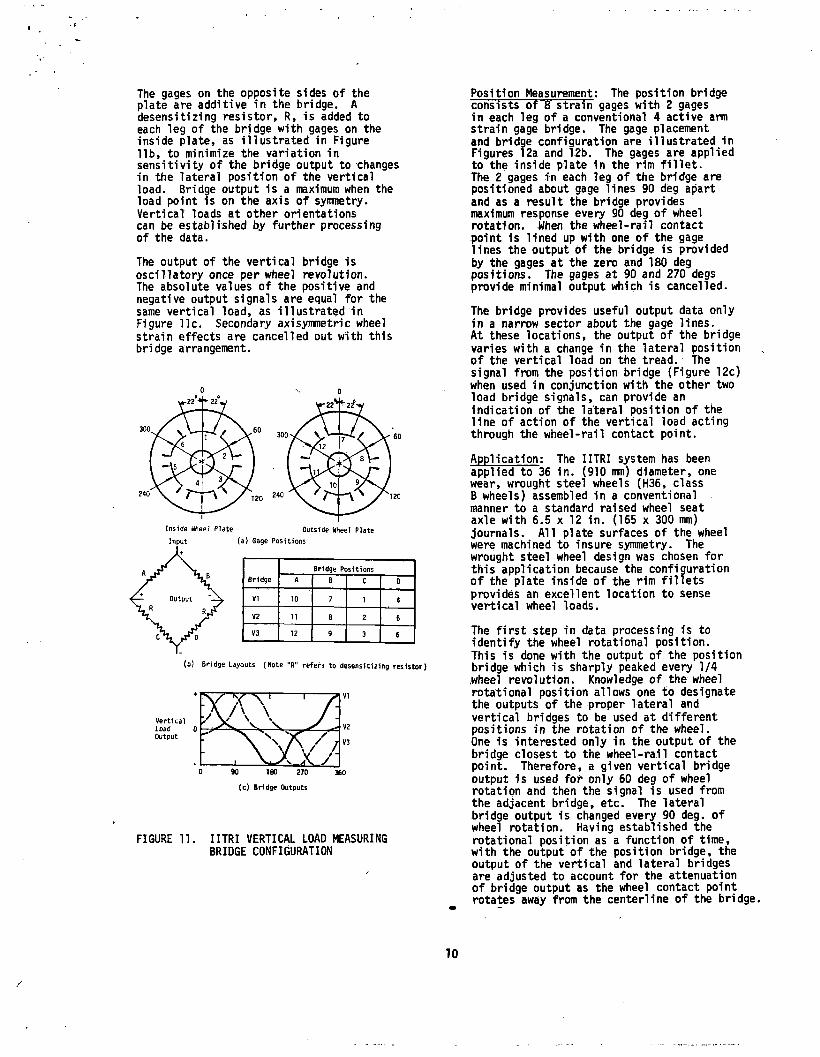
The gages on the opposite sides of the plate are additive in the bridge. A desensitizing resistor, R, is added to each leg of the bridge with gages on the inside plate, as illustrated in Figure lib, to minimize the variation in sensitivity of the bridge output to changes in the lateral position of the vertical load. Bridge output is a maximum when the load point is on the axis of symmetry. Vertical loads at other orientations can be established by further processing of the data.
The output of the vertical bridge is oscillatory once per wheel revolution.The absolute values of the positive and negative output signals are equal for the same vertical load, as illustrated in Figure lie. Secondary axisymmetric wheel strain effects are cancelled out with this bridge arrangement.
Input (a) Gage Positions
BridgeBridge Positions
A B C 0
VI 10 7 1 4
V2 11 6 2 5
V3 12 9 3 6
(b) Bridge Layouts (Note "R" refers to desensitizing resistor)
VerticalLoadOutput
(c) Bridge Outputs
FIGURE 11. IITRI VERTICAL LOAD MEASURING BRIDGE CONFIGURATION
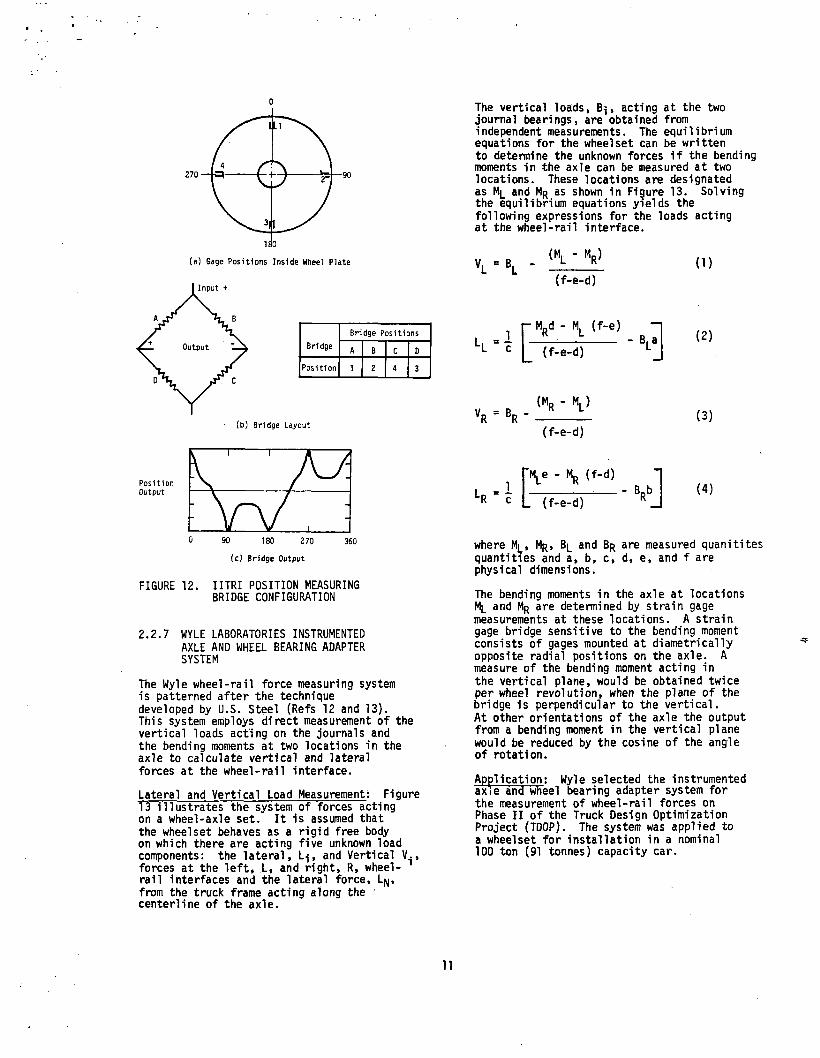
Position Measurement: The position bridge consists of 8 strain gages with 2 gages in each leg of a conventional 4 active arm strain gage bridge. The gage placement and bridge configuration are illustrated in Figures 12a and 12b. The gages are applied to the inside plate in the rim fillet.The 2 gages in each leg of the bridge are positioned about gage lines 90 deg apart and as a result the bridge provides maximum response every 90 deg of wheel rotation. When the wheel-rail contact point is lined up with one of the gage lines the output of the bridge is provided by the gages at the zero and 180 deg positions. The gages at 90 and 270 degs provide minimal output which is cancelled.
The bridge provides useful output data only in a narrow sector about the gage lines.At these locations, the output of the bridge varies with a change in the lateral position of the vertical load on the tread. The signal from the position bridge (Figure 12c) when used in conjunction with the other two load bridge signals, can provide an Indication of the lateral position of the line of action of the vertical load acting through the wheel-rail contact point.
Application: The IITRI system has been applied to 36 in. (910 mm) diameter, one wear, wrought steel wheels (H36, class B wheels) assembled in a conventional manner to a standard raised wheel seat axle with 6.5 x 12 in. (165 x 300 mm) journals. All plate surfaces of the wheel were machined to insure symmetry. The wrought steel wheel design was chosen for this application because the configuration of the plate inside of the rim fillets provides an excellent location to sense vertical wheel loads.
The first step in data processing is to identify the wheel rotational position.This is done with the output of the position bridge which is sharply peaked every 1/4 wheel revolution. Knowledge of the wheel rotational position allows one to designate the outputs of the proper lateral and vertical bridges to be used at different positions in the rotation of the wheel.One is interested only in the output of the bridge closest to the wheel-rail contact point. Therefore, a given vertical bridge output is used for only 60 deg of wheel rotation and then the signal is used from the adjacent bridge, etc. The lateral bridge output is changed every 90 deg. of wheel rotation. Having established the rotational position as a function of time, with the output of the position bridge, the output of the vertical and lateral bridges are adjusted to account for the attenuation of bridge output as the wheel contact point rotates away from the centerline of the bridge.
10
0
(a) Gage Positions Inside Wheel Plate
BridgeBridge Positions
A B c D
Position 1 2 4 3
Bridge Layout
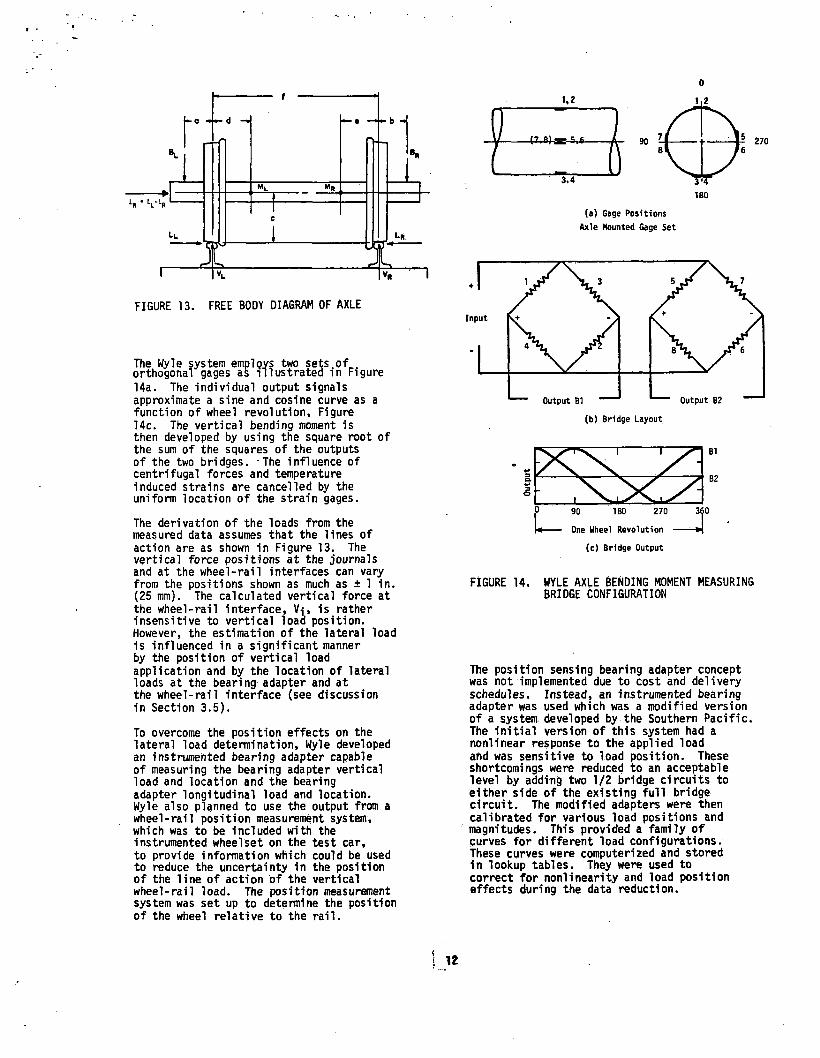
The vertical loads, B^, acting at the two journal bearings, are obtained from independent measurements. The equilibrium equations for the wheel set can be written to determine the unknown forces if the bending moments in the axle can be measured at two locations. These locations are designated as M|_ and Mr as shown in Figure 13. Solving the equilibrium equations yields the following expressions for the loads acting at the wheel-rail interface.
VL =(“l - MR>
(f-e-d)( 1)
»[-MRd - Ml (f-e)
(f-e-d)(2)
BR<m r - V(f-e-d)
(3)
0 90 1 80 2 70 360
(c) Bridge Output
FIGURE 12. IITRI POSITION MEASURING BRIDGE CONFIGURATION
2.2.7 WYLE LABORATORIES INSTRUMENTED AXLE AND WHEEL BEARING ADAPTER SYSTEM
The Wyle wheel-rail force measuring system is patterned after the technique developed by U.S. Steel (Refs 12 and 13).This system employs direct measurement of the vertical loads acting on the journals and the bending moments at two locations in the axle to calculate vertical and lateral forces at the wheel-rail interface.
Lateral and Vertical Load Measurement: Figure13 illustrates the system of forces acting on a wheel-axle set. It is assumed that the wheel set behaves as a rigid free body on which there are acting five unknown load components: the lateral, L-j, and Vertical V.,forces at the left, L, and right, R, wheel- rail interfaces and the lateral force, LN, from the truck frame acting along the centerline of the axle.
, r*Ve - Hr (f-<0^ L (f-e-d)
(4)
where M|_, Mr , Bl and Br are measured quanitites quantities and a, b, c, d, e, and f are physical dimensions.
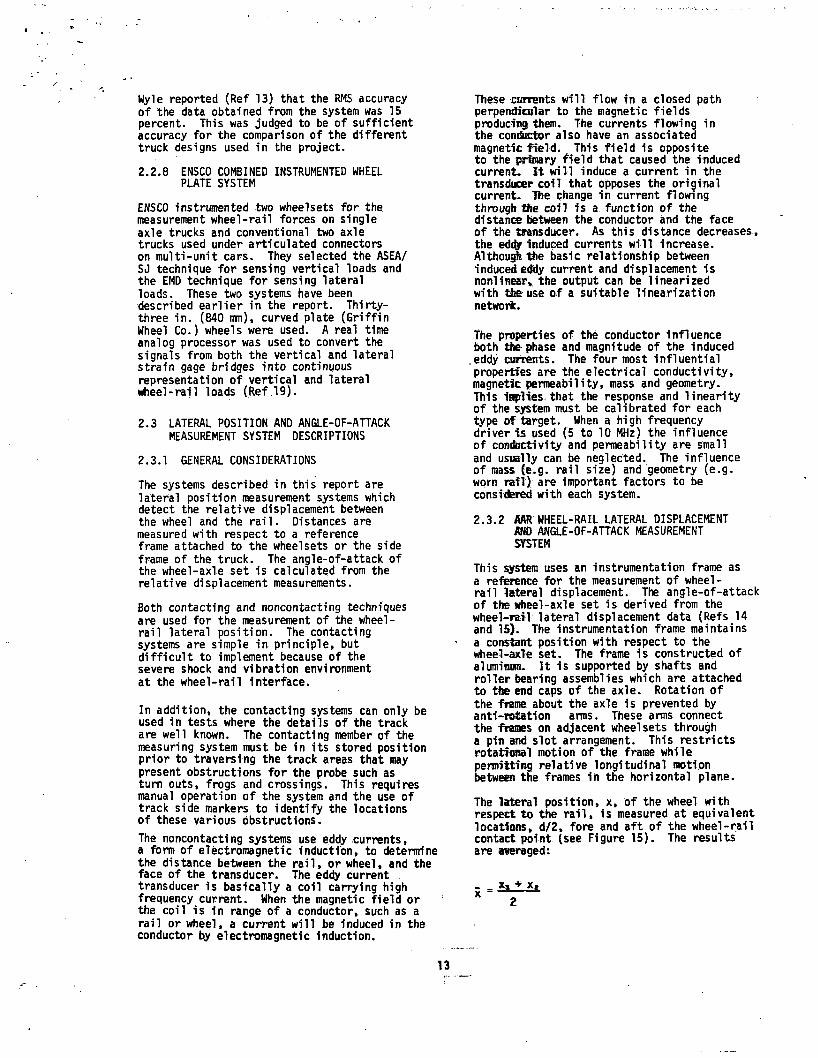
The bending moments in the axle at locations Ml and Mr are determined by strain gage measurements at these locations. A strain gage bridge sensitive to the bending moment consists of gages mounted at diametrically opposite radial positions on the axle. A measure of the bending moment acting in the vertical plane, would be obtained twice per wheel revolution, when the plane of the bridge is perpendicular to the vertical.At other orientations of the axle the output from a bending moment in the vertical plane would be reduced by the cosine of the angle of rotation.
Application: Wyle selected the instrumented axie and wheel bearing adapter system for the measurement of wheel-rail forces on Phase II of the Truck Design Optimization Project (TDOP). The system was applied to a wheelset for installation in a nominal 100 ton (91 tonnes) capacity car.
11
I •
FIGURE 13. FREE BODY DIAGRAM OF AXLE
The Wyle system emplQys two sets.of . orthogonal gages as illustrated in Figure14a. The individual output signals approximate a sine and cosine curve as a function of wheel revolution, Figure 14c. The vertical bending moment is then developed by using the square root of the sum of the squares of the outputs of the two bridges. The influence of centrifugal forces and temperature induced strains are cancelled by the uniform location of the strain gages.
The derivation of the loads from the measured data assumes that the lines of action are as shown in Figure 13. The vertical fo rc e positions at the journals and at the wheel-rail interfaces can vary from the positions shown as much as ± 1 in. (25 mm). The calculated vertical force at the wheel-rail interface, V-j, is rather insensitive to vertical load position. However, the estimation of the lateral load is influenced in a significant manner by the position of vertical load application and by the location of lateral loads at the bearing adapter and at the wheel-rail interface (see discussion in Section 3.5).
To overcome the position effects on the lateral load determination, Wyle developed an instrumented bearing adapter capable of measuring the bearing adapter vertical load and location and the bearing adapter longitudinal load and location.Wyle also planned to use the output from a wheel-rail position measurement system, which was to be included with the instrumented wheel set on the test car, to provide information which could be used to reduce the uncertainty in the position of the line of action of the vertical wheel-rail load. The position measurement system was set up to determine the position of the wheel relative to the rail.
(a) Gage Positions
Axle Mounted Gage Set
FIGURE 14. WYLE AXLE BENDING MOMENT MEASURING BRIDGE CONFIGURATION
The position sensing bearing adapter concept was not implemented due to cost and delivery schedules. Instead, an instrumented bearing adapter was used which was a modified version of a system developed by the Southern Pacific. The initial version of this system had a nonlinear response to the applied load and was sensitive to load position. These shortcomings were reduced to an acceptable level by adding two 1/2 bridge circuits to either side of the existing full bridge circuit. The modified adapters were then calibrated for various load positions and magnitudes. This provided a family of curves for different load configurations.These curves were computerized and stored in lookup tables. They were used to correct for nonlinearity and load position effects during the data reduction.
t1 12
Wyle reported (Ref 13) that the RMS accuracy of the data obtained from the system was 15 percent. This was judged to be of sufficient accuracy for the comparison of the different truck designs used in the project.
2.2.8 ENSCO COMBINED INSTRUMENTED WHEEL PLATE SYSTEM
ENSCO instrumented two wheelsets for the measurement wheel-rail forces on single axle trucks and conventional two axle trucks used under articulated connectors on multi-unit cars. They selected the ASEA/ SJ technique for sensing vertical loads and the EMD technique for sensing lateral loads. These two systems have been described earlier in the report. Thirty- three in. (840 nri), curved plate (Griffin Wheel Co.) wheels were used. A real time analog processor was used to convert the signals from both the vertical and lateral strain gage bridges into continuous representation of vertical and lateral wheel-rail loads (Ref.19).
2.3 LATERAL POSITION AND ANGLE-OF-ATTACK MEASUREMENT SYSTEM DESCRIPTIONS
2.3.1 GENERAL CONSIDERATIONS
The systems described in this report are lateral position measurement systems which detect the relative displacement between the wheel and the rail. Distances are measured with respect to a reference frame attached to the wheelsets or the side frame of the truck. The angle-of-attack of the wheel-axle set is calculated from the relative displacement measurements.
Both contacting and noncontacting techniques are used for the measurement of the wheel- rail lateral position. The contacting systems are simple in principle, but difficult to implement because of the severe shock and vibration environment at the wheel-rail interface.
In addition, the contacting systems can only be used in tests where the details of the track are well known. The contacting member of the measuring system must be in its stored position prior to traversing the track areas that may present obstructions for the probe such as turn outs, frogs and crossings. This requires manual operation of the system and the use of track side markers to identify the locations of these various obstructions.
The noncontacting systems use eddy currents, a form of electromagnetic induction, to determine the distance between the rail, or wheel, and the face of the transducer. The eddy current transducer is basically a coil carrying high frequency current. When the magnetic field or the coil is in range of a conductor, such as a rail or wheel, a current will be induced in the conductor by electromagnetic induction.
These currents will flow in a closed path perpendicular to the magnetic fields producing them. The currents flowing in the con&tctor also have an associated magnetic field. This field is opposite to the primary field that caused the induced current- It will induce a current in the transducer coil that opposes the original current- The change in current flowing through the coil is a function of the di stance between the conductor and the face of the transducer. As this distance decreases, the eddy induced currents will increase. Although the basic relationship between induced eddy current and displacement is nonlinear, the output can be linearized with the use of a suitable linearization network.
The properties of the conductor influence both the phase and magnitude of the induced ,eddy currents. The four most influential properties are the electrical conductivity, magnetic permeability, mass and geometry.This implies, that the response and linearity of the system must be calibrated for each type of target. When a high frequency driver is used (5 to 10 MHz) the influence of conductivity and permeability are small and usually can be neglected. The influence of mass (e.g. rail size) and geometry (e.g. worn rail) are important factors to be considered with each system.
2.3.2 AAR WHEEL-RAIL LATERAL DISPLACEMENT AND ANGLE-OF-ATTACK MEASUREMENT SYSTEM
This system uses an instrumentation frame as a reference for the measurement of wheel- rail lateral displacement. The angle-of-attack of the wheel-axle set is derived from the wheel-rail lateral displacement data (Refs 14 and 15). The instrumentation frame maintains a constant position with respect to the wheel-axle set. The frame is constructed of aluminum. It is supported by shafts and roller bearing assemblies which are attached to the end caps of the axle. Rotation of the frame about the axle is prevented by anti-rotation arms. These arms connect the frames on adjacent wheelsets through a pin and slot arrangement. This restricts rotational motion of the frame while permitting relative longitudinal motion between the frames in the horizontal plane.
The lateral position, x, of the wheel with respect to the rail, is measured at equivalent locations, d/2, fore and aft of the wheel-rail contact point (see Figure 15). The results are averaged:
- - *» + *«X “ 2
13

WHEEL TO RAIL ANGLE = ♦ ------ U
FIGURE 15. GEOMETRY FOR WHEEL-RAILPOSITION AND ANGLE-0F-ATTACK MEASUREMENT
The displacement measurement is accomplished by using spring-loaded displacement transducer assemblies attached to the reference frame.A transducer assembly consists of a coil spring mounted on a guide shaft which forces a hardened steel contact shoe against the gage side of the rail head. Displacement transducers are used to sense the relative lateral motion between the reference frame and the rail contact shoe. A potentiometric transducer is used (Research Inc. Model 4046) consisting of a flexible steel cable wound on a reel which is directly coupled to a potentiometer. Extension of the cable moves a potentiometer wiper arm which provides a voltage signal proportional to displacement. The cable is retracted by a self contained constant force spring motor. A double acting pneumatic cylinder is used to lift the rail contact assemblies clear of the rail when obstructions are encountered, or when the unit is not being used.
The angle-of-attack, of the wheel-axle set 1s determined from the individual displacement measurements by taking their differences and dividing by the distance between them (See Figure 15):
= Xl ~ x* (rad)D
2.3.3 BR WHEEL-RAIL LATERAL DISPLACEMENT AND ANGLE-OF-ATTACK MEASUREMENT SYS1EM
The BR system is similar to the AAR system except that small rollers are used to sense rail displacement instead of contact shoes (Ref 16). Wheel-rail relative displacements are measured fore and aft of the wheel-rail contact point. The angle-of-attack is computed by taking the difference of the independent displacement measurements and dividing by the distance between them. The BR system considered in this report is the one being implemented by the Transportation Test Center in support of the FAST Wear Index Experiment (1981).
The BR system also utilizes a measurement reference frame that remains in a constant position with respect to the wheel set. The position of the rail relative to the frame is sensed by a small roller mounted on the end of a radius arm which contacts the gage corner of the rail. The axis of the roller is kept at a 68 deg elevation.The radius arm is attached to a spindle which deflects a strain gaged beam when it rotates. The output from the strain gage bridge provides a measure of the displacement of the wheel at the end of the arm.
A small air cylinder provides the force necessary to press the roller against the rail. The magnitude of this force is sufficient to cause the rollers to remain in contact with the rail even when rapid changes in wheel-rail displacement are encountered. The radius arm may be moved laterally to move the roller clear of the rail.
2.3.4 WYLE WHEEL RAIL LATERAL DISPLACEMENT AND ANGLE-OF-ATTACK MEASUREMENT SYSTEM
The Wyle system employs a member attached to the truck side frame as a reference point for wheel-rail lateral displacement measurements (Refs 13 and 17). Noncontacting eddy current devices are used which generate a voltage output proportional to distance.Two transducers are used to measure the position of the outside surface of the wheel rim relative to the reference member. These transducers are located at equal distances fore and aft of the wheel-rail contact zone. Similarly, two transducers are used
14
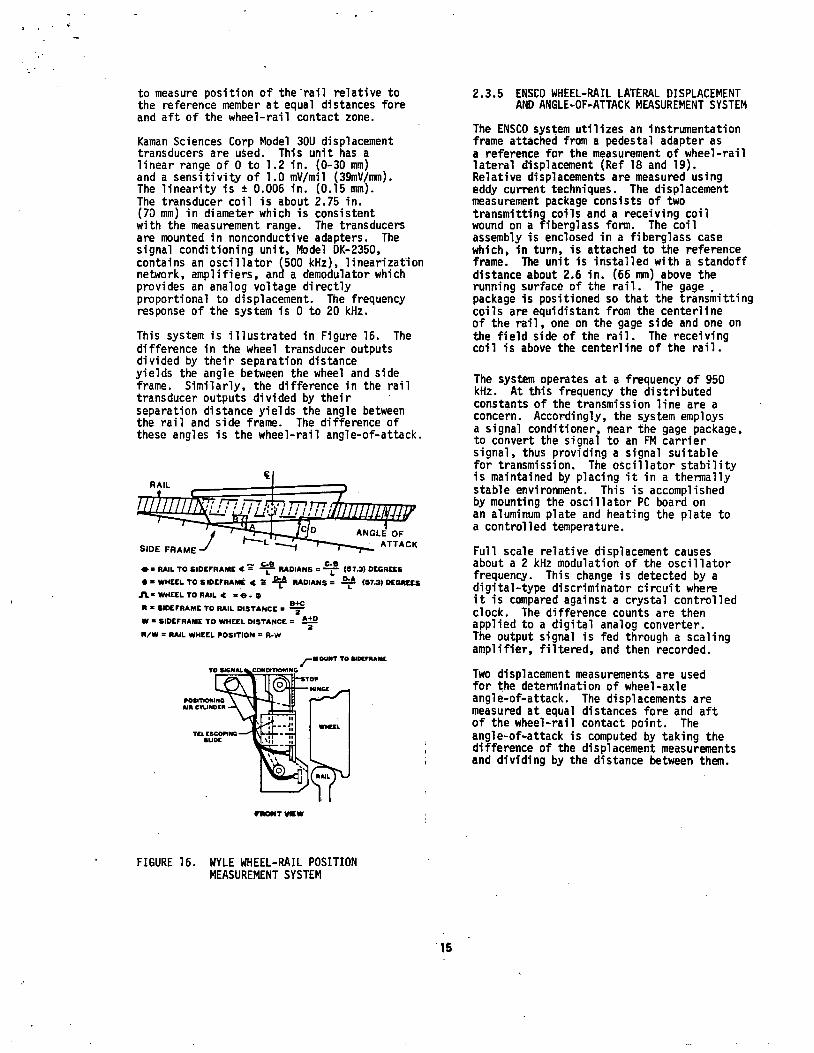
to measure position of the rail relative to the reference member at equal distances fore and aft of the wheel-rail contact zone.
Kaman Sciences Corp Model 30U displacement transducers are used. This unit has a linear range of 0 to 1.2 in. (0-30 mm) and a sensitivity of 1.0 mV/mil (39mV/mm).The linearity is ± 0.006 in. (0.15 mm).The transducer coil is about 2.75 in.(70 mm) in diameter which is consistent with the measurement range. The transducers are mounted in nonconductive adapters. The signal conditioning unit, Model DK-2350, contains an oscillator (500 kHz), linearization network, amplifiers, and a demodulator which provides an analog voltage directly proportional to displacement. The frequency response of the system is 0 to 20 kHz.
This system is illustrated in Figure 16. The difference in the wheel transducer outputs divided by their separation distance yields the angle between the wheel and side frame. Similarly, the difference in the rail transducer outputs divided by their separation distance yields the angle between the rail and side frame. The difference of these angles is the wheel-rail angle-of-attack.
WHEEL TO RAIL 4 = -© - ®R « SIDEFRAME TO RAIL DISTANCE =W • SIDEFRAME TO WHEEL DISTANCE = £12
2R/W = RAIL WHEEL POSITION = R-W
MOUNT TO AJOCFPtAML
The ENSC0 system utilizes an instrumentation frame attached from a pedestal adapter as a reference for the measurement of wheel-rail lateral displacement (Ref 18 and 19).Relative displacements are measured using eddy current techniques. The displacement measurement package consists of two transmitting coils and a receiving coil wound on a fiberglass form. The coil assembly is enclosed in a fiberglass case which, in turn, is attached to the reference frame. The unit is installed with a standoff distance about 2.6 in. (66 mm) above the running surface of the rail. The gage , package is positioned so that the transmitting coils are equidistant from the centerline of the rail, one on the gage side and one on the field side of the rail. The receiving coil is above the centerline of the rail.
2.3.5 ENSC0 WHEEL-RAIL LATERAL DISPLACEMENTAND ANGLE-OF-ATTACK MEASUREMENT SYSTEM
The system operates at a frequency of 950 kHz. At this frequency the distributed constants of the transmission line are a concern. Accordingly, the system employs a signal conditioner, near the gage package, to convert the signal to an FM carrier signal, thus providing a signal suitable for transmission. The oscillator stability is maintained by placing it in a thermally stable environment. This is accomplished by mounting the oscillator PC board on an aluminum plate and heating the plate to a controlled temperature.
Full scale relative displacement causes about a 2 kHz modulation of the oscillator frequency. This change is detected by a digital-type discriminator circuit where it is compared against a crystal controlled clock. The difference counts are then applied to a digital analog converter.The output signal is fed through a scaling amplifier, filtered, and then recorded.
Two displacement measurements are used for the determination of wheel-axle angle-of-attack. The displacements are measured at equal distances fore and aft of the wheel-rail contact point. The angle-of-attack is computed by taking the difference of the displacement measurements and dividing by the distance between them.
fWONT V C W
FIGURE 16. WYLE WHEEL-RAIL POSITION MEASUREMENT SYSTEM
15
3. EVALUATION OF WHEEL-RAIL LOAD AND POSITION MEASUREMENT SYSTEMS
3.1 EVALUATION PROCEDURE
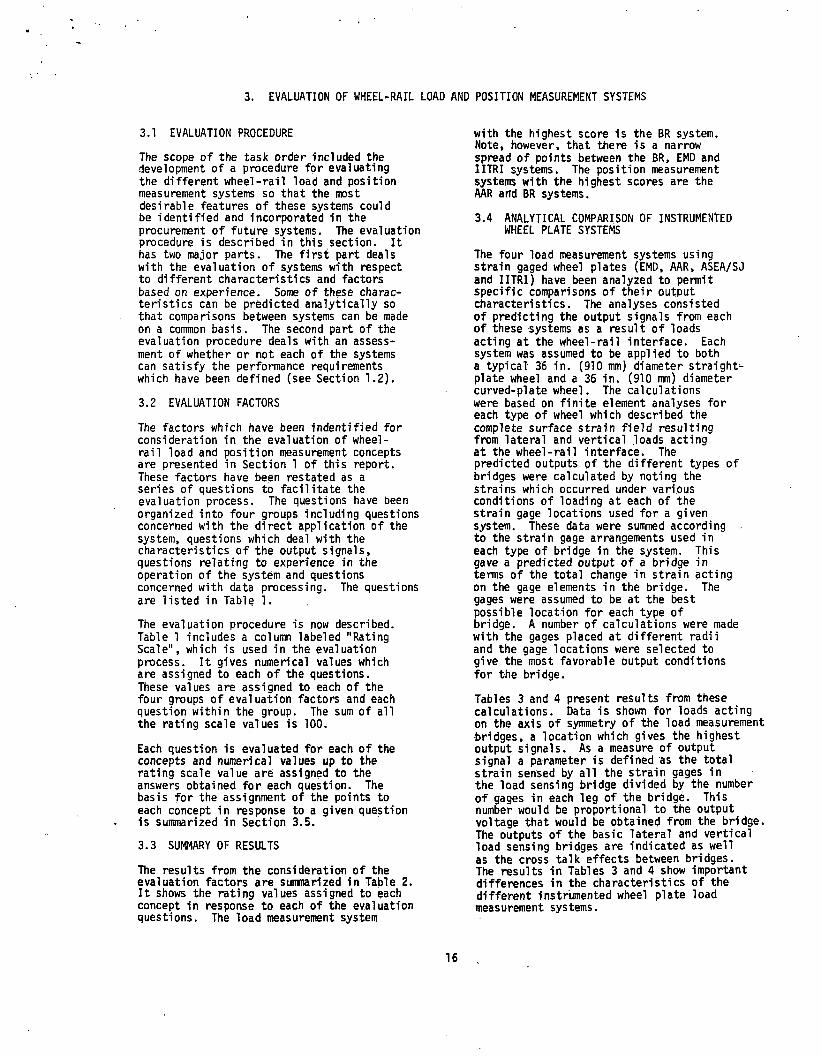
The scope of the task order included the development of a procedure for evaluating the different wheel-rail load and position measurement systems so that the most desirable features of these systems could be identified and incorporated in the procurement of future systems. The evaluation procedure is described in this section. It has two major parts. The first part deals with the evaluation of systems with respect to different characteristics and factors based on experience. Some of these characteristics can be predicted analytically so that comparisons between systems can be made on a common basis. The second part of the evaluation procedure deals with an assessment of whether or not each of the systems can satisfy the performance requirements which have been defined (see Section 1.2).
3.2 EVALUATION FACTORS
The factors which have been indentified for consideration in the evaluation of wheel- rail load and position measurement concepts are presented in Section 1 of this report. These factors have been restated as a series of questions to facilitate the evaluation process. The questions have been organized into four groups including questions concerned with the direct application of the system, questions which deal with the characteristics of the output signals, questions relating to experience in the operation of the system and questions concerned with data processing. The questions are listed in Table 1.
The evaluation procedure is now described. Table 1 includes a column labeled "Rating Scale", which is used in the evaluation process. It gives numerical values which are assigned to each of the questions.These values are assigned to each of the four groups of evaluation factors and each question within the group. The sum of all the rating scale values is 100.
Each question is evaluated for each of the concepts and numerical values up to the rating scale value are assigned to the answers obtained for each question. The basis for the assignment of the points to each concept in response to a given question is summarized in Section 3.5.
3.3 SUMMARY OF RESULTS
The results from the consideration of the evaluation factors are sunmarized in Table 2. It shows the rating values assigned to each concept in response to each of the evaluation questions. The load measurement system
with the highest score is the BR system.Note, however, that there is a narrow spread of points between the BR, EMD and IITRI systems. The position measurement systems with the highest scores are the AAR and BR systems.
3.4 ANALYTICAL COMPARISON OF INSTRUMENTED WHEEL PLATE SYSTEMS
The four load measurement systems using strain gaged wheel plates (EMD, AAR, ASEA/SJ and IITRI) have been analyzed to permit specific comparisons of their output characteristics. The analyses consisted of predicting the output signals from each of these systems as a result of loads acting at the wheel-rail interface. Each system was assumed to be applied to both a typical 36 in. (910 mm) diameter straight- plate wheel and a 36 in. (910 mm) diameter curved-plate wheel. The calculations were based on finite element analyses for each type of wheel which described the complete surface strain field resulting from lateral and vertical loads acting at the wheel-rail interface. The predicted outputs of the different types of bridges were calculated by noting the strains which occurred under various conditions of loading at each of the strain gage locations used for a given system. These data were summed according to the strain gage arrangements used in each type of bridge in the system. This gave a predicted output of a bridge in terms of the total change in strain acting on the gage elements in the bridge. The gages were assumed to be at the best possible location for each type of bridge. A number of calculations were made with the gages placed at different radii and the gage locations were selected to give the most favorable output conditions for the bridge.
Tables 3 and 4 present results from these calculations. Data is shown for loads acting on the axis of symmetry of the load measurement bridges, a location which gives the highest output signals. As a measure of output signal a parameter is defined as the total strain sensed by all the strain gages in the load sensing bridge divided by the number of gages in each leg of the bridge. This number would be proportional to the output voltage that would be obtained from the bridge. The outputs of the basic lateral and vertical load sensing bridges are indicated as well as the cross talk effects between bridges.The results in Tables 3 and 4 show important differences in the characteristics of the different instrumented wheel plate load measurement systems.
16

TABLE 1. EVALUATION FACTORS
1. Evaluation Factors Concerned With The Application Of Concept Rating Scale
a. Are there any limitations on the application of the system to different types of trucks?
3
b. Is there a restriction for the application of the system to wheels of a given type?
2
c. Describe any limitations with respect to environmental factors (e.g. temperature, humidity, blowing sand, etc.)
3
d. What maintenance actions are required during the course of a test program? 2
e. What is the accessibility to field repair of components that may fail during the testing?
2
f. Are sophisticated tools or equipment required to troubleshoot and repairsystems?
2
g- What is the expected lifetime of the device? 2
h. What components, if any, must be replaced after a test? 2
i. How is accuracy and the proper functioning of the system monitored during a test program?
2
3■ Are there any problems in the integration of load and position measurement subsystems?
3
k. Are special signal conditioning or signal transmission equipment required? 2
Group Subtotal 25
2. Evaluation Factors Which Can Be Obtained By Analysis
a. What is the anticipated signal strength? 4
b. Is cross talk between channels present and if so, how is this handled? . 4
c. Are bridge outputs sensitive to load position (or frame position in the case of wheel position measurement) and if so, how is this handled?
4
d. Is the output signal influenced by other phenomena (e.g. wheel heating in the case of instrumented wheel sets) which would cause signal drift?
4
e. For multichannel systems, can partial recovery of data be obtained for loss 4of one channel?
Group Subtotal 20
17

TABLE 1. EVALUATION FACTORS (CONTINUED)
3. Evaluation Factors Based On Experience In TheOperation Of The System Rating Scale
a. Has the concept been utilized on any major test project; if so, what was 6the experience, with respect to quality of the data, interpretation ofresults, etc?
b. What calibration procedures have been followed and what calibration data 3are available?
c. What is the experience with regard to the functioning of the system in a 6normal railroad shock and vibration environment, recognizingparticularly the harsh environment on unsprung truck components?
d. Are repeatable results obtained (note that nonlinearity ,can be tolerated 3as long as compensation can be included in the data processing)?What degree of nonlinearity or hysteresis is present in the bridge outputs?
e. What is the estimated mean time between failures (HTBF)? 3
f. How well is calibration held? 4
g. List the steps which are required for setting up and calibrating 4instrumentation in the field.
h. Give the approximate number of man hours and time required for field 4measurement-set up and calibration.
i. What frequency response limitations are present? 2
Group Subtotal 35
4. Evaluation Factors Related To Data Processing
a. What type of system is used to record data (analog or digital)? 2
b. How is the data processed (analog or digital or combination)? 2
c. Are any provisions made to identify electrical noise? 3
d. Is the data processing carried out in real time or is it handled 5subsequent to the test?
e. If the system does not have a real time display capability, what are the 2limitations for the development of this capability?
f. What spacial/time resolution capability does the concept possess? 2
g. What data formats are available? 2
h. Are assumptions made in the data processing which limit accuracy? 2
Group Subtotal 20
GRAND TOTAL 100
18
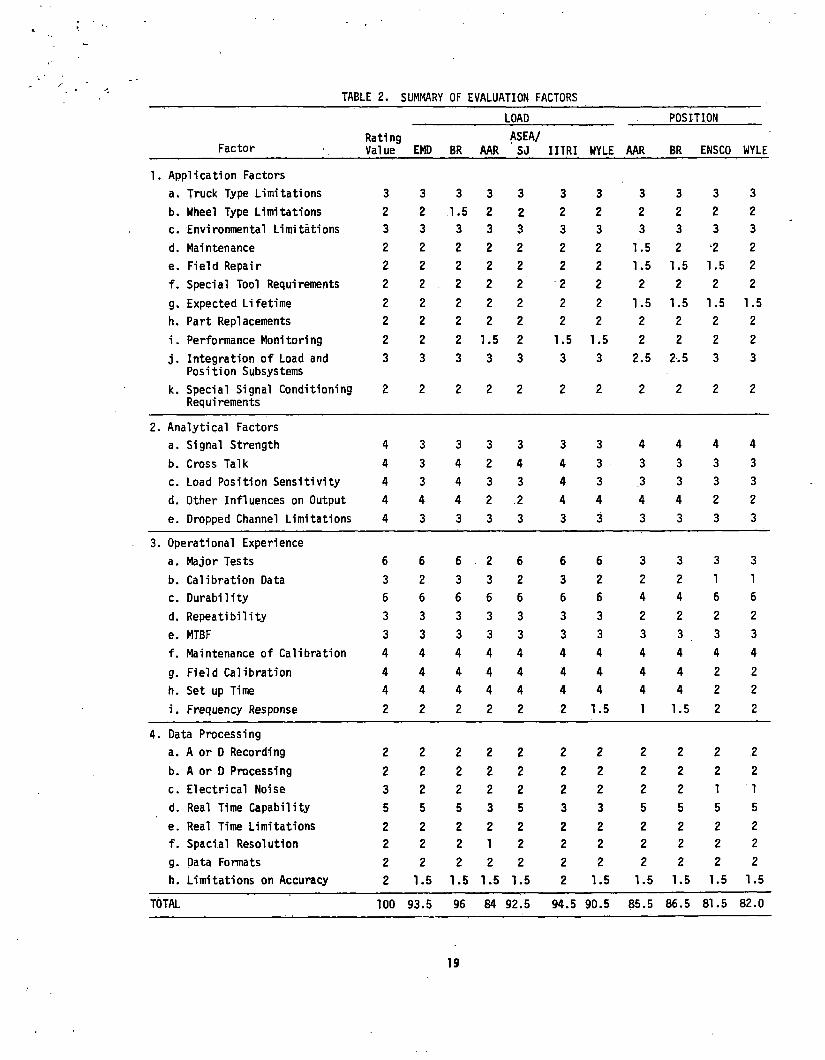
TABLE 2. SUMMARY OF EVALUATION FACTORS
LOAD ____ POSITION
FactorRatingValue EMD BR AAR
ASEA/ ' SJ II1RI WYLE AAR BR ENSCO WYLE
Application Factors
a. Truck Type Limitations 3 3 3 3 3 3 3 3 3 3 3
b. Wheel Type Limitations 2 2 1.5 2 2 2 2 2 2 2 2
c. Environmental Limitations 3 3 3 3 3 3 3 3 3 3 3
d. Maintenance 2 2 2 2 2 2 2 1.5 2 2 2
e. Field Repair 2 2 2 2 2 2 2 1.5 1.5 1.5 2
f. Special Tool Requirements 2 2 2 2 2 2 2 2 2 2 2
g. Expected Lifetime 2 2 2 2 2 2 2 1.5 1.5 1.5 1.5
h. Part Replacements 2 2 2 2 2 2 2 2 2 2 2
i. Performance Monitoring 2 2 2 1.5 2 1.5 1.5 2 2 2 2
j. Integration of Load and Position Subsystems
3 3 3 3 3 3 3 2.5 2.5 3 3
k. Special Signal Conditioning Requirements
2 2 2 2 2 2 2 2 2 2 2
Analytical Factors
a. Signal Strength 4 3 3 3 3 3 3 4 4 4 4
b. Cross Talk 4 3 4 2 4 4 3 3 3 3 3
c. Load Position Sensitivity 4 3 4 3 3 4 3 3 3 3 3
d. Other Influences on Output 4 4 4 2 .2 4 4 4 4 2 2
e. Dropped Channel Limitations 4 3 3 3 3 3 3 3 3 3 3
Operational Experience
a. Major Tests 6 6 6 2 6 6 6 3 3 3 3
b. Calibration Data 3 2 3 3 2 3 2 2 2 1 1
c. Durability 6 6 6 6 6 6 6 4 4 6 6
d. Repeatibility 3 3 3 3 3 3 3 2 2 2 2
e. MTBF 3 3 3 3 3 3 3 3 3 3 3
f. Maintenance of Calibration 4 4 4 4 4 4 4 4 4 4 4
g. Field Calibration 4 4 4 4 4 4 4 4 4 2 2
h. Set up Time 4 4 4 4 4 4 4 4 4 2 2
i. Frequency Response 2 2 2 2 2 2 1.5 1 1.5 2 2
4. Data Processing
a. A or D Recording 2 2 2 2 2 2 2 2 2 2 2
b. A or D Processing 2 2 2 2 2 2 2 2 2 2 2
c. Electrical Noise 3 2 2 2 2 2 2 2 2 1 1
d. Real Time Capability 5 5 5 3 5 3 3 5 5 5 5
e. Real Time Limitations 2 2 2 2 2 2 2 2 2 2 2
f. Spacial Resolution 2 2 2 1 2 2 2 2 2 2 2
g. Data Formats 2 2 2 2 2 2 2 2 2 2 2
h. Limitations on Accuracy 2 1.5 1.5 1.5 1.5 2 1.5 1.5 1.5 1.5 1.5
TOTAL 100 93.5 96 84 92.5 94.5 90.5 85.5 86.5 81.5 82.0
19
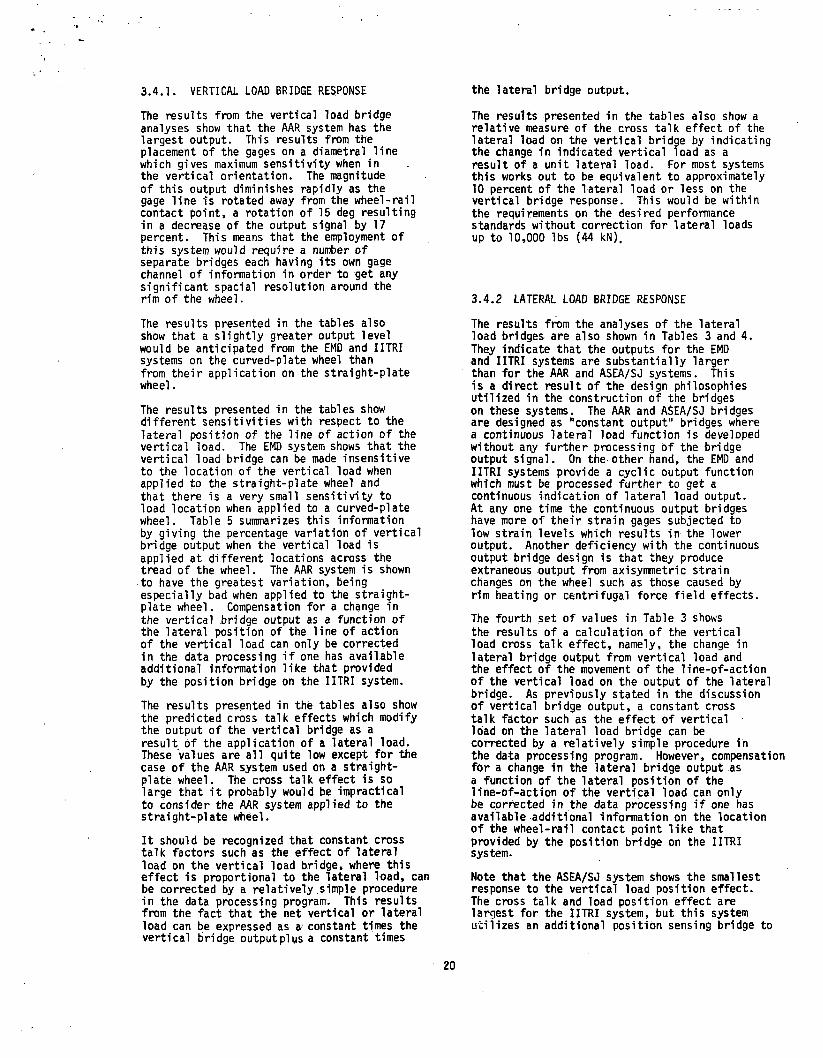
The results from the vertical load bridge analyses show that the AAR system has the largest output. This results from the placement of the gages on a diametral line which gives maximum sensitivity when in the vertical orientation. The magnitude of this output diminishes rapidly as the gage line is rotated away from the wheel-rail contact point, a rotation of 15 deg resulting in a decrease of the output signal by 17 percent. This means that the employment of this system would require a number of separate bridges each having its own gage channel of information in order to get any significant spacial resolution around the rim of the wheel.
The results presented in the tables also show that a slightly greater output level would be anticipated from the EMD and IITRI systems on the curved-plate wheel than from their application on the straight-plate wheel.
The results presented in the tables show different sensitivities with respect to the lateral position of the line of action of the vertical load. The EMD system shows that the vertical load bridge can be made insensitive to the location of the vertical load when applied to the straight-plate wheel and that there is a very small sensitivity to load location when applied to a curved-plate wheel. Table 5 summarizes this information by giving the percentage variation of vertical bridge output when the vertical load is applied at different locations across the tread of the wheel. The AAR system is shown to have the greatest variation, being especially bad when applied to the straight- plate wheel. Compensation for a change in the vertical bridge output as a function of the lateral position of the line of action of the vertical load can only be corrected in the data processing if one has available additional information like that provided by the position bridge on the IITRI system.
The results presented in the tables also show the predicted cross talk effects which modify the output of the vertical bridge as a result of the application of a lateral load. These values are all quite low except for the case of the AAR system used on a straight- plate wheel. The cross talk effect is so large that it probably would be impractical to consider the AAR system applied to the straight-plate wheel.
It should be recognized that constant cross talk factors such as the effect of lateral load on the vertical load bridge, where this effect is proportional to the lateral load, can be corrected by a relatively simple procedure in the data processing program. This results from the fact that the net vertical or lateral load can be expressed as a constant times the vertical bridge output pi us a constant times
3.4.1. VERTICAL LOAD BRIDGE RESPONSE
The results presented in the tables also show a relative measure of the cross talk effect of the lateral load on the vertical bridge by indicating the change in indicated vertical load as a result of a unit lateral load. For most systems this works out to be equivalent to approximately 10 percent of the lateral load or less on the vertical bridge response. This would be within the requirements on the desired performance standards without correction for lateral loads up to 10,000 lbs (44 kN).
the lateral bridge output.
3.4.2 LATERAL LOAD BRIDGE RESPONSE
The results from the analyses of the lateral load bridges are also shown in Tables 3 and 4.They indicate that the outputs for the EMD and IITRI systems are substantially larger than for the AAR and ASEA/SJ systems. This is a direct result of the design philosophies utilized in the construction of the bridges on these systems. The AAR and ASEA/SJ bridges are designed as "constant output" bridges where a continuous lateral load function is developed without any further processing of the bridge output signal. On the other hand, the EMD and IITRI systems provide a cyclic output function which must be processed further to get a continuous indication of lateral load output.At any one time the continuous output bridges have more of their strain gages subjected to low strain levels which results in the lower output. Another deficiency with the continuous output bridge design is that they produce extraneous output from axisymmetric strain changes on the wheel such as those caused by rim heating or centrifugal force field effects.
The fourth set of values in Table 3 shows the results of a calculation of the vertical load cross talk effect, namely, the change in lateral bridge output from vertical load and the effect of the movement of the line-of-action of the vertical load on the output of the lateral bridge. As previously stated in the discussion of vertical bridge output, a constant cross talk factor such as the effect of vertical load on the lateral load bridge can be corrected by a relatively simple procedure in the data processing program. However, compensation for a change in the lateral bridge output as a function of the lateral position of the line-of-action of the vertical load can only be corrected in the data processing if one has available additional information on the location of the wheel-rail contact point like, that provided by the position bridge on the IITRI system.
Note that the ASEA/SJ system shows the smallest response to the vertical load position effect.The cross talk and load position effect are largest for the IITRI system, but this system utilizes an additional position sensing bridge to
20
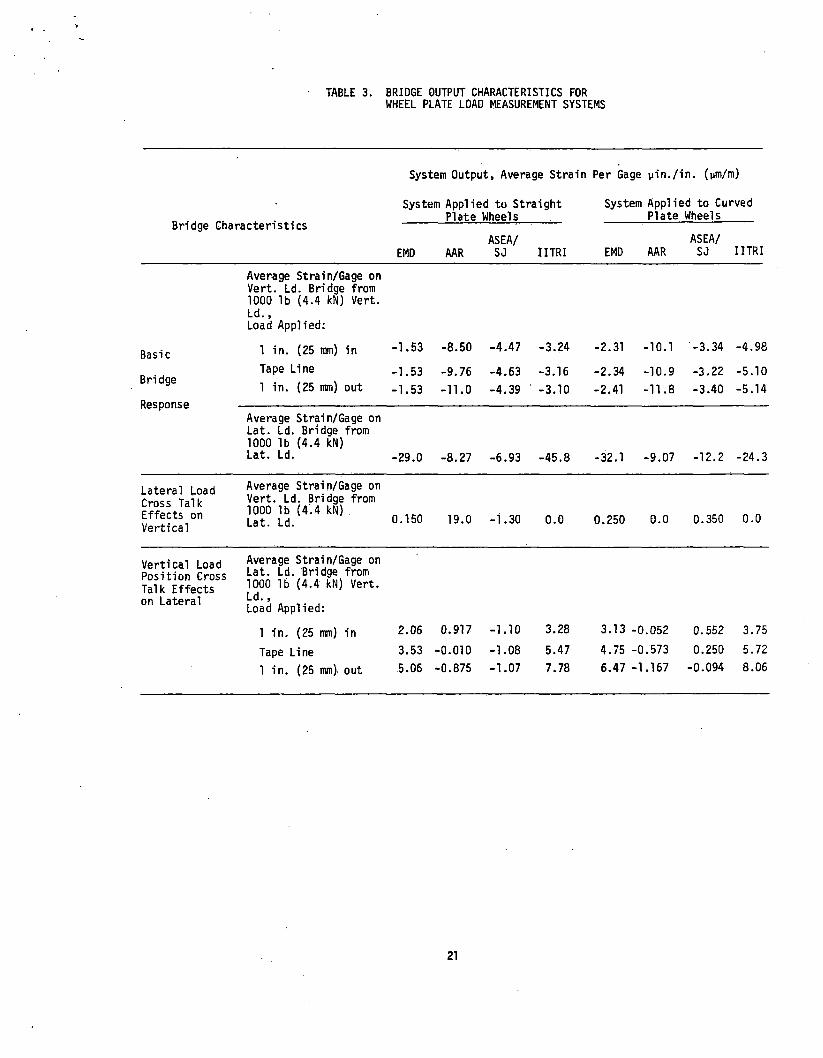
TABLE 3. BRIDGE OUTPUT CHARACTERISTICS FORWHEEL PLATE LOAD MEASUREMENT SYSTEMS
System Output;, Average Strain Per Gage yin./in. (ym/m)
System Applied to Straight Plate Wheels
System Applied to Curved Plate Wheels
bridge Characteristics
EMD AARASEA/SJ IITRI EMD AAR
ASEA/SJ IITRI
Average Strain/Gage on Vert. Ld. Bridge from 1000 lb (4.4 kN) Vert. Ld.,Load Applied:
Basic 1 in. (25 mm) in -1.53 -8.50 -4.47 -3.24 -2.31 -10.1 -3.34 -4.98
BridgeTape Line -1.53 -9.76 -4.63 -3.16 -2.34 -10.9 -3.22 -5.101 in. (25 mm) out -1.53 -11.0 -4.39 -3.10 -2.41 -11.8 -3.40 -5.14
ResponseAverage Strain/Gage on Lat. Ld. Bridge from 1000 lb (4.4 kN)Lat. Ld. -29.0 -8.27 -6.93 -45.8 -32.1 -9.07 -12.2 -24.3
Lateral Load Cross Talk Effects on Vertical
Average Strain/Gage on Vert. Ld. Bridge from 1000 lb (4.4 kN).Lat. Ld. 0.150 19.0 -1.30 0.0 0.250 0.0 0.350 0.0
Vertical Load Position Cross Talk Effects on Lateral
Average Strain/Gage on Lat. Ld. Bridge from 1000 lb (4.4 kN) Vert. Ld.,Load Applied:
1 in. (25 mm) in 2.06 0.917 -1.10 3.28 3.13 -0.052 0.552 3.75
Tape Line 3.53 -0.010 -1.08 5.47 4.75 -0.573 0.250 5.72
1 in. (25 mm) out 5.06 -0.875 -1.07 7.78 6.47 -1.167 -0.094 8.06
21
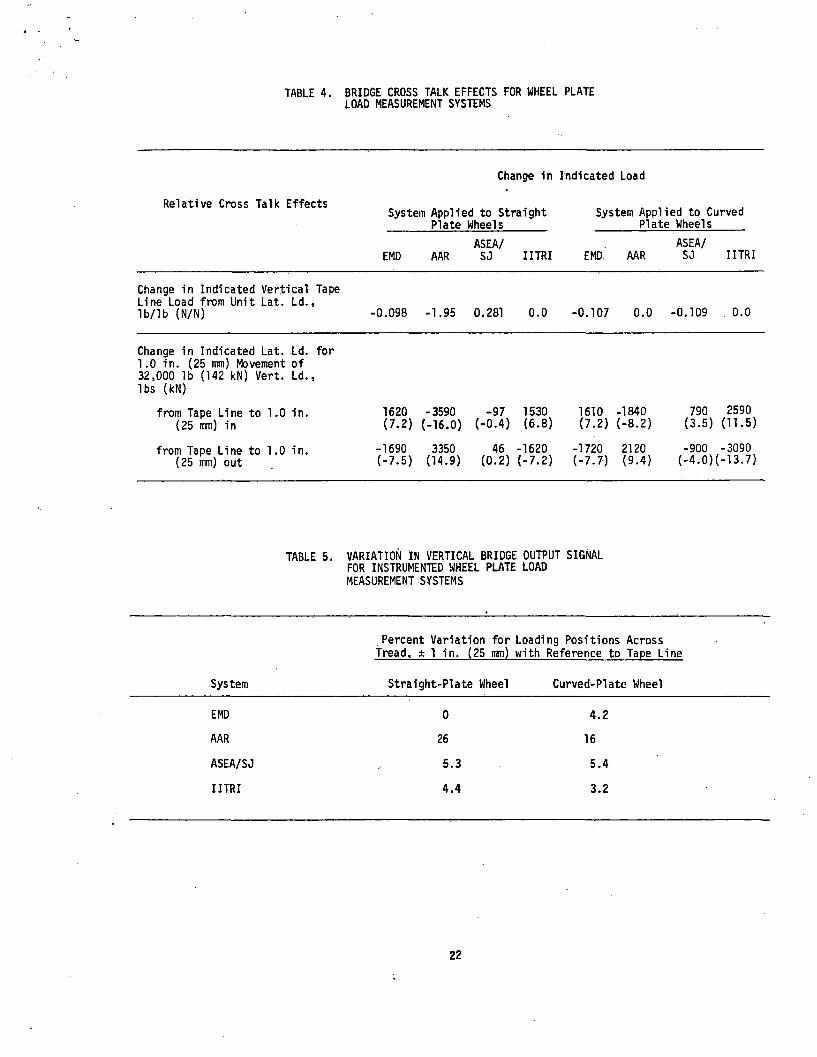
TABLE 4. BRIDGE CROSS TALK EFFECTS FOR WHEEL PLATELOAD MEASUREMENT SYSTEMS
Change in Indicated Load
Relative Cross Talk EffectsSystem Applied to Straight System Applied to Curved_______ Plate Wheels_______ _______ Plate Wheels_____
ASEA/ ASEA/EMD AAR SJ IITRI EMD AAR SJ IITRI
Change in Indicated Vertical Tape Line Load from Unit Lat. Ld.,lb/lb (N/N) -0.098 -1.95 0.281 0.0 -0.107 0.0 -0.109 0.0
Change in Indicated Lat. Ld. for1.0 in. (25 mm) Movement of32.000 lb (142 kN) Vert. Ld., lbs (kN)
from Tape Line to 1.0 in.(25 mm) in
from Tape Line to 1.0 in.(25 mm) out
1620 -3590 -97 1530 1610 -1840 790 2590(7.2) (-16.0) (-0.4) (6.8) (7.2) (-8.2) (3.5) (11.5)
-1690 3350 46 -1620 -1720 2120 -900 -3090(-7.5) 04.9) (0.2) (-7.2) (-7.7) (9.4) (-4.0)(-13.7)
TABLE 5. VARIATION IN VERTICAL BRIDGE OUTPUT SIGNAL FOR INSTRUMENTED WHEEL PLATE LOAD MEASUREMENT SYSTEMS
Percent Variation for Loading Positions Across tread, ± 1 in. (25 mm) with Reference to Tape Line
System Straight-Plate Wheel Curved-PI ate Wheel
EMD 0 4.2
AAR 26 16
ASEA/SJ 5.3 5.4
IITRI 4.4 3.2
22
allow for corrections to be made in the data processing.
The relative cross talk effect of the position of the vertical load on the output of the lateral bridge is given by the last set of values in Table 4. The results indicate that only the ASEA/SJ system applied to a straight- plate wheel would meet the design performance characteristics for a new system without making corrections.
3.5 ANALYTICAL EVALUATION OF INSTRUMENTED AXLE AND WHEEL BEARING ADAPTER SYSTEM
The instrumented axle and wheel bearing adapter system described in Section 2.2.7 is subject to measurement errors which are the result of assumptions which must be made in its use. One source of error results from assumptions which must be made in the positions of the lines of action of various forces which act on the wheel-axle set (see Figure 13). This can be illustrated by referring to specific cases. For example, a fairly representative set of locations are given as follows (Figure 13):
a = b = 10 in. (250 mm)d = e = 14 in. (360 mm)f = 58 in. (1470 mm)c = 18 in. (460 mm)
Also assume that both B. and Bp are equal to30,000 lb (133 kN). L K
Two examples are considered. First it is assumed that there is a 1 in. (25 mm) lateral translation of the wheel-axle set. It is also assumed that there are no lateral wheel- rail loads. The following dimensions in Figure 13 are modified:
a = 11 in. (280 mm) b = 9 in. (230 mm) d = 13 in. (330 mm) e = 15 in. (380 mm)
Under these conditions, Equations 1 and 3 (page 11 ) would give the correct vertical wheel-rail loads, namely:
VL = 31,034 lb (138 kN)
VR = 28,966 lb (128 kN)
However, Equations 2 and 4 would give a false indication of lateral wheel-rail load when no lateral load would exist. The indicated lateral loads would be:
LL = 1,725 lb (7.7 kN)
Lr = -1,610 lb (-7.2 kN)
For the second example, It is considered that the line-of-action of the left bearing adapter load is moved one inch Inward so that dimension "a" is reduced by 1 in.(25 urn). In this case, the indicated vertical loads given by Equations 1 and 3 would also be the correct value, but there would be an error in the calculation of the left lateral wheel-rail load (Ll ). Equation 2 would indicate that the value of this load was -1,667 lb (-7.4 kN). The zero value predicted by Equation 4 is correct.
Other examples can be considered which show the sensitivity of the instrumented axle and wheel bearing adapter system to variations in the lines of action of the applied loads. Some compensation for these effects can be provided if one has some knowledge of the movement of the lines of action of the loads. This requires further sophistication in the measurement of the bearing adapter load and the development of a technique for locating the wheel-rail contact point.
3.6 DISCUSSION OF EVALUATION FACTORS
This section presents a discussion of each of the evaluation factors listed in Table 2.
l.a. Are there any limitations on the application of the system to different types of trucks?
There are no limitations in the use of instrumented wheel systems for the measurement of wheel-rail forces. Systems of this type have been applied to locomotive, passenger car, and freight car trucks.
There is no basic restriction for the use ofposition measurement systems employing areference frame provided that one has freeaccess to the outside of the bearing cap to •==mount the frame.
All systems are scored equally with respect to this factor.
l.b. Is there a restriction for the application of the system to wheels of gi ven type?
There is no basic restriction on the use of any of the wheel plate measurement systems to wheels of specific type except for the BR system which is limited to use on spoked wheels. However, it has been shown that certain systems given better performance with certain wheel types than others. This is discussed in Section 3.4 where it is shown that the ASEA/SJ and IITRI systems give better performance on a straight-plate wheel whereas
23
the AAR and EMD concepts may be expected to give better performance on a curved-plate wheel. The wheels should be machined all over to insure their symmetry, balance and concentricity with the axis otherwise extraneous signals will be developed, particularly at high speeds.
Significant wear on the rim of the wheel would tend to change the nature of its response to the wheel-rail load, and thus require special consideration for the optimum location of gages in the strain gage bridges. The effects of small amounts of tread wear should be minimal and would be correctable by changes in the wheel calibration constants.
The position measurement systems have no limitations with respect to type of wheel.
All systems are scored equally with respect to this factor except for the BR load measurement system, which is marked down slightly because of its restriction to spoked wheels.
l.c Describe any limitations with respect to environmental factors (e.g. temperature, humidity, blowing sand, etc.)
The systems considered in this study do not have any obvious limitations for operation in the normal railroad environment. The instrumented wheel sets, however, should not be operated under tread braking conditions so as to minimize the probability of heat damage to the strain gages or associated wiring. Operational experience has shown that airborne debris in the form of blowing sand or small stones can often be experienced during test operations. This is a threat to the gage circuits and protection must be provided. The influence of moisture is aggravated by high bridge resistance and the relatively low strains associated with the loads. The oscillator circuit in the ENSCO position measurement system is reported (Ref 19) to be sensitive to temperature changes and therefore special provisions are made to keep it in a thermally stable environment.
All systems are scored equally with respect to this factor.
l.d. What maintenance actions are required during the course of a test program?
The slip rings on instrumented wheel sets should be removed when data is not being recorded.
Frequent inspections of the reference frames of position measurement systems are advisable because of the harsh vibrational environment in which they operate. The rail contact shoes on the AAR position measurement system require frequent replacement.
All systems are scored equally with respect to this factor except for the AAR position measurement system where frequent shoe replacement is required.
l.e. What is the accessibility to field repair of components that may fail during the testing?
The replacement of defective slip ring assemblies and the repair of wiring external to the bridge circuits are feasible field repairs on wheel load measurement systems.Also, determining the location of shorted (grounded) or open gages can usually be done in the field. However, replacing a defective gage is not a practical field repair. The bridge circuit is virtually encapsulated by gage coating and intrusion into this seal, in the field environment, is likely to compromise the operating stability of the system. „
It may be assumed that replacing a gage does not significantly alter the sensitivity of the bridge as given by the calibration data. Experience with the IITRI system has shown this to be a valid assumption.When necessary, gage replacement is easier on sysjtems using weldable strain gages than those using bonded strain gages.
All load measurement systems are scored equally with respect to this factor.
Wheel position measurement systems should be designed so that the reference frames do not interfere with the removal of slip ring assemblies. Otherwise the reference frame will have to be taken apart and removed every time a slip ring assembly is changed. The Wyle position measurement system is scored higher with respect to this factor because the design concept for the reference'frame is simpler than the other systems which would facilitate field repairs.
l.f. Are sophisticated tools or equipment required to troubleshoot and repair systems?
None of the systems have requirements for special service equipment. Conventional test equipment used for field work with strain gages, such as digital volt meters, regulated power supplies, and oscilloscopes, can be used to troubleshoot most problems that might be encountered.
All systems are scored equally with respect to this factor.
l.g. What is the expected lifetime of the devi ce?
The slip ring assemblies which are used on the load measurement systems are probably the component which would have the shortest lifetime.
24
They may be expected to last about 1,600 hours at normal ru n n in g speed. However, if used under conditions of severe vibration, a reduced lifetime would be anticipated. All load measurement systems are scored equally with respect to this factor.
Significant wheel wear would not be anticipated for at least 10,000 miles (16 Mm). The wear rate will depend on the operating conditions. Substantial tread wear will influence the calibration factors and cross talk sensitivity of the wheel and would require a recalibration of the device.
Estimates for component life have not been established for wheel position measurement systems because of limited operating experience. All position measurement systems are scored lower than the rating value with respect to this factor because additional operating experience is required for the development of long life components.
l.h. What components, if any, must be replaced after a test?
None of the concepts have designated expendable parts which are replaced following the test. It has usually been the practice to replace the wheel cover disks on the IITRI wheel set at the end of each test series. The replacement of the rail contact shoes and rollers on the AAR and BR wheel position measurement systems would be anticipated after each test series.
All systems are scored equally with respect to this factor because there is no evidence that one system has an advantage over another in this regard.
l.i. How is accuracy and the proper functioning of the system monitored during a test program?
Various "quick look" capabilities are used with each of the systems. EMD uses a real time analog data processor which computes and displays the lateral load, the vertical load, and the L/V ratio. BR uses a microprocessor to log, process and display vertical, lateral, and longitudinal forces and certain parameters derived from these forces in near real time, the AAR system would use a real time display, such as that given by an oscillograph, for observation of the output signals. ASEA/SJ processes both the vertical and lateral bridge outputs in real time for continuous display. IITRI displays the raw data signals from the strain gage bridges for monitoring the proper functioning of the system. Wyle makes real-time analog strip chart recordings of selected data channels for monitoring the quality of the data. A quick-look data playback provides the ability to review all recorded data channels at selected portions of the test.
The wheel position measurement systems generate an analog voltage signal which is a function of displacement. This signal is usually displayed on an oscillographic recorder. The angle-of-attack data can also be displayed real-time because the function can be developed easily by using a DG differential amplifier.
The IITRI, AAR, and Wyle load measurement systems are scored slightly lower with respect to this factor because they (AAR vertical only) do not provide real time data display. The position measurement systems are scored equally.
l.j. Are there any problems in the integration of load and position measurement subsystems?
The major problem in the integration of the load and position measureoent systems is providing support for the reference frame of the wheel position measurement system without interfering with the use of slip ring assemblies on the load measurement system. The AAR and BR systems utilize extensions on the axles for the support of the reference frame. The instrumentation cables from the wheel plate strain gage bridges must pass through these extensions and they must also be used to support the slip ring assemblies. This extension must be concentric with the axle to minimize vibrations. These vibrations can damage both the displacement system and the slip ring assemblies on the instrumented wheel set. The most desirable arrangement is to have a design which allows the slip ring assemblies to be mounted independently of the position measurement frame so that slip ring assemblies could be changed without disturbing the wheel position measurement subsystem.
The load measurement systems are scored equally with respect to this factor. The AAR and BR position measurement systems are scored slightly lower because they rely on axle extension supports. The Wyle and ENSC0 systems are scored higher because they do not utilize this feature.
l.k. Are special signal conditioning or signal transmission equipment or special techniques required?
No special requirements are associated with any of the load or position measurement systems described in this report. The load measurement systems use standard slip ring techniques for getting signals off the axle to the data recording systems. The position measurement systems utilize hard wire connections.
All systems are scored equally with respect to this factor.
25
2.a. What is the anticipated signal strength?
The relative sensitivities, of the various instrumented wheel plate load measurement systems are presented in Tables 3 and 4.Note that the lateral sensitivities are considerably greater than the vertical sensitivities for most systems. The relative strain sensitivity is generally the result of a compromise between obtaining a large output signal, the minimization of cross talk, and obtaining a signal approximating a continuous output.
The load measurement systems are scored equally at less than the full rating value because deficiencies in output signal strength are present for each system.The AAR system has the highest output for the vertical load bridge. The IITRI and EMD systems have the highest outputs for the lateral load bridge. The BR system would be expected to have a relatively low output signal because of the large number of gages in each bridge. The strain levels associated with the Wyle lateral load measurement axle bending moment system are comparable to the instrumented wheel plate systems.
Each of the position measurement systems utilize displacement transducers and signal conditioning which provide electrical output signals of approximately one volt/inch (0.04 V/mm). They are all scored equally with respect to this factor.
2.b. Is cross talk between the vertical and lateral load channels present on the load measurement system and if so, how is this handled?
"The results shown in Tables 3 and 4 for the EMD system indicate that cross talk is present on the lateral bridge due to vertical load and cross talk occurs on the. vertical bridge from lateral load. There are no provisions for correcting these cross talk effects.
BR reports that the longitudinal force bridge is virtually free of lateral and vertical load cross talk effects. Similarly, the lateral force bridge is not affected by longitudinal or vertical loads. The vertical force bridge output is reported to be significantly influenced by longitudinal load and to a lesser extent by lateral load. These effects are said to be corrected during the data processing.
The AAR vertical and lateral force bridges are said to exhibit minor cross talk effects. There are no provisions for correcting these effects.
The ASEA/SO vertical bridge response to lateral load is-corrected in the data processing. The lateral bridge response to vertical load is ' said to be negligible.
Cross talk effects are corrected with the IITRI system. Lateral load has some effect on vertical bridge output and vertical load has some effect on lateral bridge output.
The Wyle system has extensive cross talk from vertical load into the axle bending moment bridge.
Calculated values for cross talk effects are given in Tables 3 and 4 for the instrumented wheel plate systems. These numbers serve to quantify the magnitude of the cross talk effects present in each system.
The EMD, AAR and Wyle load measurement systems are scored lower than the other load measurement systems, with respect to this factor because they do not provide corrections for cross talk effects.
The position measurement systems would be influenced by vertical motion as a result of bounce, roll or pitch motions. These systems are scored equally and below maximum because of this property.
2.c. Are bridge outputs sensitive to load position (or frame position in the case of wheel position measurement) and if so, how is this handled?
The effects on the load measurement systems are discussed first. Tables 3 and 4 include calculated values for the sensitivity of bridge output to load position. Various effects and procedures have been reported for the different systems. EMD reports that sensitivity of the output of the vertical load bridge to the lateral position of the vertical load is about 7 percent. EMD reasons that most of the interest in testing is centered on the force generated when the wheel is flanging so that the wheels have been calibrated in the flanging position. The influence of vertical load position on the lateral load is not given.
BR states that longitudinal output increases0.019 percent per inch (0.48 percent per mm) as the rail contact point moves up the flange. The BR lateral force bridge is reported to be unaffected by the load position. A 0.40 in. (10 irni) offset of the vertical load from the central tread position will change the output of the BR vertical force bridge by0.3 percent. This effect is neglected.
The AAR reports that an increase in the output of the vertical load bridge is about 4 percent for a 1.75 in. (44 mm) outward movement of the vertical load position. No data are available indicating the position affect on lateral load. The influence of load position is not included in the data processing.
26
ASEA/SJ reports that there is no measurable variation in bridge output as a function of the lateral position of the vertical load. This is attributed to the use of theS-shaped wheel plate.
The IITRI system is affected by load position. The output from the lateral force bridge is equivalent to a 1,600 lb (7.1 kN) lateral load for 1.0 in. (25.mm) outward lateral movement of a vertical Toad of 32,000 lbs (142 kN) from the tape line. The vertical load bridge has about a 3 percent change in output for a vertical load position displaced 1.0 in. (25 ran) from the tape line. The influence of load position is corrected in the data processing.
On the Wyle system the vertical load determination is not substantially influenced by load position. The lateral load determination is influenced by the location of the vertical load application on the bearing adapter, the location of lateral loads on the bearing adapter, and the wheel-rail contact position.
The IITRI load measurement system is scored at the rating value with respect to this factor because it corrects for load position effects. The BR system is also scored at the rating value because of its reported accuracy. The other systems are scored lower.
The wheel lateral displacement measurement systems are operated with the assumption that the reference frame is rigid and fixed to each of the axles. There are no provisions for monitoring frame motions or distortion, although they would affect the accuracy of the measurement. All systems are scored lower than the rating value because of expected errors introduced by vertical movement of the reference frame or rail contacts.
2.d. Is the output signal influenced by other phoeomena (e.g. wheel heating in the case of instrumented wheelsets) which would cause signal drift?
The sensitivity of the wheel plate load measurement systems to axisymmetric wheel strain effects has been discussed in the sections describing these systems. The system/bridge combinations where a potential problem exists are the AAR lateral bridge and the ASEA/SJ lateral bridge. As a result these systems are scored lower with respect to this factor. The BR lateral bridge has a potential problem from these effects, but a quantitative assessment cannot be made at this time.
The influence of magnetic fields is another phenomena which must be considered. Motion of a conductor in a magnetic field causes an induced current in the conductor. This
signal has been identified as a source of interference for strain page circuits. Traction motors and signalling circuits are sources of stray magnetic fields. Residual magnetism in the rati 1s another possible source of magnetic field Influence, but it has not been investigated in depth. The TTC Railbreak Detection System is based on the observation that rail used in the construction of the FAST track becomes naturally magnetized.The rail appears to be longitudinally magnetized and its field is essentially uniform.
The minimization of magnetic field effects is considered in the design of each of the systems. EMD suppresses magnetic field influence by appropriate lead wire routing.The BR system overcomes magnetic field influence by using a carrier wave excitation. ASEA/SJ uses a carrier system for bridge excitation. Also, a shielded cable (RGU-174) is used to wire the bridge circuits. The system is grounded at a single point to break ground loops. IITRI suppresses magnetic field influence by lead wire routing.
The eddy current displacement sensors used on the Wyle and ENSC0 wheel lateral position measurement systems would exhibit drift as a function of temperature. The conductivity, permeability, mass and geometry of the rail could also have an effect on the output signal. As a result these systems are scored lower with respect to this factor.
‘ 2.e. For multichannel systems, can partial recovery of data be obtained for loss of one channel?
The load measurement systems are considered first. On the EMD system, loss of a vertical or lateral data channel would result in the loss of a continuous measurement for that load function. Special data processing techniques could be used on the other channel to obtain data at from 4 to 6 points per wheel revolution.
On the BR system one channel is used for each measurement. However, if the longitudinal force channel were lost, the vertical load bridge could not be compensated for cross talk effects from the longitudinal load.
The AAR system is multichannel for vertical load measurements. Loss of one channel would reduce spacial resolution of this load.
The loss of one of the vertical channels on the ASEA/SJ system would result in the loss of a continuous load record. An alternate method of signal processing could be used to provide an output signal 4 times per wheel revolution.
27
The loss of a vertical or lateral force bridge on the IITRI system would result in the loss of a continuous load record for the affected load functions. Special data processing techniques could be used to provide an output signal from 4 to 6 times a wheel revolution. Loss of the position bridge would result in a slight loss in accuracy for the processed vertical data and a more significant loss in accuracy for the processed lateral data.
Loss of either bending moment or bearing adapter measurement channels on the Wyle system would result in the loss of all load data. However, if bending moment bridges were utilized at more than one orientation around the axle, loss of one of these bridges would still permit the derivation of wheel loads at specific orientations of wheel rotation.
The wheel-rail lateral position measurement systems utilize two displacement measurements at each wheel for derivation of the wheel-rail angle-of-attack. Loss of either one of these channels would prevent this information from being obtained.
All systems are scored equally with respect to this factor at a value less than the full rating value.
3.a. Has the concept been utilized on any major test project; if so, what was the experience, with respect to quality of the data, interpretation of results, etc?
Wheel-rail load measurement systems are considered first. The EMD system and its predecessor systems have been used since1962. The version of the system described in this report has been applied to a locomotive wheelset. It was designed and fabricated in 1977, and first used in field testing in March, 1978. The system has been used for over 5,000 miles (8000 km) of testing.A major use has been to study the performance of 4-axle locomotives with various suspension systems. An adaptation of the EMD lateral load measurement system was used on the FRA single axle and articulated supporting truck tests conducted in January and February, 1981.
Development of the BR system began in 1972.It has been used for studies of vehicle behavior on curves. It has also been used on stability tests of various vehicles up to 125 mph (56 m/s), studies of the negotiation of switch points and crossings, and rail wear tests. An important application is its use in the Decapod test vehicle, where the wheelset is loaded vertically and laterally by hydraulic cylinders. Traction rods can also impose a yaw angle on the wheelset. This vehicle has been used for determining track strength, rail overturn, flange climbing and rail corrugation development.
The AAR system described in this report was developed for the FRA in May, 1974. The system was used at the TTC for conducting experiments on FAST. Drift in the lateral force bridge due to thermal induced strain was encountered. Also, speed dependent centrifugal force effects were present in the lateral bridge.
The early work on the ASEA/SJ system was reported by Olson and Johnson in 1960.The system has undergone several stages of development. Eriksson and Neligran added the improved vertical load sensing system described in 1978. The system has been used successfully in Europe and the USA.A recent application was its use on the Perturbed Track Tests sponsored by AAR, Amtrack and the FRA at TTC. An adaptation of the ASEA/SJ vertical load measurement system was used on the FRA single axle and articulated supporting truck tests conducted in January and February, 1981.
Exploratory work began on the IITRI load measurement system in 1976 and the system was first used on a major test program in1977. The IITRI wheelset system was also used on an extensive test program on FAST in 1979. The test program was structured to obtain wheel-rail load data under different operating conditions including speed, longitudinal train force (e.g. buff, draft and drift), car characteristics, truck types, and track structure. The system has also been used at TTC as part of the 1981 Wear Index Experiment.
The Wyle load measurement system using axle bending moments and instrumented bearing adapters has been used by other researchers in U.S. and Europe. The system considered in this report was assembled and used by Wyle under TD0P Phase II.
All load measurement systems are scored equally with respect to this factor except the AAR system which failed to give acceptable results.
The wheel-rail position measurement systems have not been utilized as extensively as the load measurement systems. The AAR system was first used in 1971. Its most recent major application was on a truck hunting program conducted on the California Division of the Union Pacific in 1977. The system was also used at TTC for the Metropolitan Atlanta Rapid Transit Authority (MARTA) vehicle tests on the Railroad Test Track. Some difficulties are reported to have been caused by undesirable levels of vibration which led to frequent repairs of the reference frame.
28
The BR system described in this report was used on the 1981 Wear Index Experiment at FAST. The Wyle system was developed and used on the TDOP Phase II Program. The ENSCO system was developed and used for the LRC program.
The position measurement systems are scored equally at less than the full rating value because of the lack of field experience with these systems.
3.b. What calibration procedures have been followed and what calibration data are available?
Load Measurement Systems: Calibration data are used to define the relationship between the forces acting across the wheel-rail contact area and the output signals from the individual force measuring bridges. The bridge output characteristics derived from these tests are primary sensitivity, linearity, hysteresis, cross talk, and the influence of load position. Static calibration tests have been used to obtain these characteristics.
END uses a test fixture where the wheel set is placed on rails spaced to represent 1.25 in. (32 mm) of track gage widening. Vertical and lateral loads are separately applied with hydraulic jacks and the data is recorded at 7.5 deg wheel rotation intervals. The vertical loads are applied to the journals of the axle in increments of10,000 lb (44 kN) to a maximum of 40,000 lb (180 kN). The wheel set is loaded at three positions: with the wheel flanging on the left rail, with wheel centered between rails and with the wheel flanging on the right rail. On lateral load tests, vertical loads are imposed at each end of the axle so that the vertical load on the flanged wheel is 30,000 lb (130 kN) and approximately zero on the nonflanging wheel. This is to reduce the influence of the vertical load on the lateral load calibration. The lateral loads are applied to the outside rim of the wheel in 1,000 lb (4.4 kN) increments to a maximum lead of 40,000 lb (180 kN).
BR uses a calibration fixture which is capable of applying force in all three directions. The vertical forces are applied through pivoted beams to small pads, representing the rails. These pads are mounted on linear bearings to allow for movement in the horizontal plane, thus preventing lateral forces. A longitudinal force can be superimposed on the vertical force by another hydraulic jack pushing on the pad. This force must be reacted by the pad at the other wheel. Lateral loads can be applied to the edge of the rim. The lateral forces may be superimposed on the vertical load or applied independently. Calibration forces are usually applied at 10 deg wheel rotation intervals.
The AAR calibration equipment applies the wheel-rail loads through two 132 lb (60 kg) rails, 10 ft (3.05 m) long, placed on four oak ties 7 in. x 9 in. x8-1/2 ft (180 mn x 230 mm x 2.6 m).Eight roller hearing tie plates are used to reduce friction during lateral loading.Two 1,5 in. x 10 ft (38 mm x 3.05 m) rods spaced 6 ft (1.83 m) apart located just below the rail head are used to apply lateral load by squeezing the rails against the wheel flanges. This load is developed by using two hydraulic rams of 50 ton (441 kN) capacity. Two 50 ton (440 kN) hydraulic jacks are used to apply the vertical loads. The calibration loads are applied to a fully assembled truck. Prior to the calibration, the truck is subjected to 20,000 cyclic loads with a load range from 20,000 to 160,000 lbs (89 to 700 kN) increments at 30 deg wheel rotation positions. The vertical loads are applied at the tape line and 1.75 in. (44 mm) out to assess the influence of load position. Loads are applied in 10,000 lb (44 kN) increments on these tests. In addition to the static calibration, each wheelset is rotated at an equivalent 76 mph (34 m/s) ground speed in a no-load condition to assess the influence of centrifugal force.
The ASEA/SJ calibration equipment includes a static and a dynamic test fixture. The static calibration fixture utilizes two short rails to place load on the wheelset. One rail is mounted to the fixture with four instrumented bolts. These bolts measure vertical and lateral forces independently.The vertical force is measured with an accuracy of one percent in the range 2,250- 22,500 lbs (10-100 kN). Lateral forces are measured with an accuracy of 1.5 percent in the range 2,250-11,250 lbs (10-50 kN). Vertical forces are applied with hydraulic jacks between the fixture and journal boxes. Lateral forces are applied with a hydraulic jack positioned between the fixture and the field side of the wheel rim. The wheelset is driven by an electric motor in the dynamic calibration fixture. The maximum equivalent ground speed is 75 mph (34 m/s) at no-load. Vertical and lateral forces are applied through a pair of rollers to each wheel.The rollers are actuated by hydraulic jacks. The applied force ranges are 0-33,700 lbs (0-150 kN), and 0-44,900 lbs (0-200 kN) for the lateral and vertical forces respectively.
The IITRI calibration test fixture consists of two journal supports and a vertical reaction frame installed on a steel base plate. The vertical loading fixture can be positioned at any location with reference to the wheel. The vertical loading fixture consists of a hydraulic cylinder and a load cell. The load cell is fitted with a loading block, which has a rounded surface at the face for simulating of the wheel-rail contact
29
zone. The load is applied between the reaction frame and the loading block on the wheel tread. The line of action of the vertical load can be directed through any lateral position on the tread. The lateral load is developed by a hydraulic cylinder through a separate fixture which is restrained by the rim of the opposite wheel.The lateral loading block has a mating surface that matches the flange and tread profile.The loading block is seated and held in place by a vertical load.
The modified bearing adapters used in the Wyle system were calibrated at TTC using the truck squeeze fixture. A number of different loading positions were used. A family of curves was developed for these load configurations. The bending moment bridges were calibrated by applying lateral forces to the inside rims of the wheel set. When applying these loads one wheel was supported by an air bearing to insure freedom in the lateral and longitudinal directions.
The BR, AAR and IITP.I load measurement systems are scored higher than the other systems because more calibration data has been published for these systems.
Position Measurement Systems: Uniike the instrumented wheel sets, the wheel-rail lateral displacement measurement systems must be calibrated after they are installed on a truck. This requires establishing, or simulating, a zero degree angle-of-attack condition.
The AAR system utilizes a calibration bar which is placed along the inside surface of the wheel to establish a zero degree angle-of-attack reference plane. The rail contact shoes are held at the edge of the bar and the output of the system is electrically zeroed, thus establishing a zero angle-of-attack reference signal. The distance from the edge of the bar to the rail contact point is measured. These measurements along with the transducer sensitivity factors, are used to calculate the actual angle-of-attack and to adjust the output signal sensitivity.
The BR system used in the Wear Index Tests at TTC has adjustable "feeler pins" for locating the wheel probes against the calibration bar. This feature assures that the front faces (contacting faces) of the wheel probes are at a zero angle with respect to the surface of the wheel flange.
In theory, the Wyle system could be calibrated by using it to measure the existing angle-of- attack and, in turn, determine the zero reference by using the transducer sensitivity factors. The relative angle of the wheel and the relative angle of the rail from a reference platform are determined independently. In practice, the transducers are adjusted by using gage blocks which is a tedious task.
Each of the force transducers must be adjusted for sensitivity, zero offset and linearity,
The ENSCO system is particularly difficult to adjust for'an absolute (as opposed to relative) measure of angle-of-attack It appears that the wheel set would have to be set physically to a zero angle-of-attack and the individual transducers then set for zero output signal. Another procedure for setting the zero signal would be to make the zero settings on a slow tangent track roll-by where a zero angle-of-attack condition would be assumed.
The Wyle and ENSCO position measurement systems are scored lower than AAR and BR systems with respect to this factor because of the difficulties in calibrating these systems which use noncontacting displacement transducers.
3.c. What is the experience with regard to the functioning of the system in a normal railroad shock and vibration environment, recognizing particularly the harsh environment on unsprung truck components?
No significant problems have been reported with the operation of any of the load measurement systems. All load measurement systems are scored equally with respect to this factor.
Some problems have been reported with wheel- rail position measurement systems which utilize axle extensions to support a reference frame. The problem is due more to the improper alignment of these extensions than to the harsh wheel-rail shock environment. The extensions must be aligned with the axle so that there is less than 0.001 in.(0.025 mm) run out along their length. Even when this condition is met, it is not unusual to damage the transducers. Worn rail may cause an acceleration at the contact shoe-rail interface which is transferred to the transducer carriage thus damaging the transducer and/or the mounting. The AAR and BR position measurement systems, which use axle supported reference frames and rail contact shoes, are scored lower than the Wyle and ENSCO systems with respect to this factor.
There are also problems associated with the operation of the noncontacting position measurement systems. The close proximity of the displacement sensors to the rail make them susceptible to damage from debris thrown up from the passage of the train and obstructions along the wayside.
3.d. Are repeatable results obtained (note that nonlinearity can be tolerated as long as compensation can be included in the data processing)? What degree of nonlinearity or hysteresis is present in the bridge outputs?
30
The load measurement strain gage bridges would be expected to provide output data with a high degree of linearity. The maximum deviation from a linear representation of the calibration data due to nonlinear effects and hysteresis would be expected to be less than 0.5 percent. Systematic deviations in output signal, such as those due to load position or centrifugal force effects, can be corrected in the data processing provided that enough independent data is obtained (e.g. the position bridge on the IITRI system). The load measurement systems are scored equally with respect to ‘ this factor.
Somewhat greater nonlinearity and hysteresis effects would be expected on the wheel position measurement systems. Random errors on the AAR and BR systems would be introduced by distortions in the reference frame or failure to maintain a fixed orientation with respect to the axle. The use of noncontact displacement sensors on the Wyle and ENSCO systems would lead to additional random errors because their outputs are influenced by the properties of the rail and its geometric configuration. The position measurement systems are scored lower than the rating value with respect to this factor.
3.e. What is estimated Mean Time Between Failures (MTBF)?
Sufficient operating experience is not available for estimating MTBF. An appreciation for the comparative reliability that may be anticipated from different wheel load measurement systems can be indicated by comparing the number of gages and slip ring contacts per wheel for the different sys terns:
LoadMeasurement
System
GagesPer
Wheel
Slip Ring Contacts Per Wheel
EMD 28 9
BR 96 8
AAR 20 9ASEA 28 9
IITRI 60 20
Wyle 12 5
All systems are scored equally with respect to this factor.
3.f. How well is calibration held?
Specific data are not available to answer this question except for the IITRI load measurement system. Static calibrations of a
wheel set conducted 18 months apart, before and after a major field test program, showed changes in calibration of approximately one percent.
All systems are scored equally with respect to this factor.
3.g. List the steps which are required for setting up and calibrating instrumentation in the field?
Load Measurement Systems: Field calibration procedures are available for only the ASEA/SJ and IITRI load measurement systems.
Prior to mounting the ASEA/SJ wheel sets on the test truck the bridge and insulation resistances are checked. The bridge resistance is measured at the input and output terminals. The insulation resistance is measured from a bridge terminal to the wheel plate surface. Readings are compared to standard values. The resistance checks are again made after the wheel sets are installed in the truck. A cable is run between the wheel set and test car and before it is connected to the instrumentation system the resistance is measured again. The bridge voltage is checked to assure that the bridge current will not exceed the maximum allowable value, 25 mA rms. The bridge circuits are connected to the instrumentation system and the bridges are balanced. The gains for the amplifiers are selected by considering the bridge sensitivities and the anticipated load levels. The bridges are shunt calibrated to verify the selected gain setting.
The ASEA/SJ vertical bridge is set by lifting the wheelset free of the rail and balancing the bridge output. The wheel is rotated so that the 0 deg position is above the rail and the wheel is placed back on the rail. The bridge output is then compared to the anticipated output. The wheelset is again lifted from the rail and rotated so that the 45 deg point on the wheel is directly above the rail. The wheel is placed on the rail and the bridge output is compared to the anticipated output signal. For the lateral bridge calibration the wheelset is lifted free of the rail and the bridge circuit is balanced to an electrical zero. A known lateral force is applied between the two wheels at the 0 deg position. The bridge output signal is compared to the anticipated signal level.
Prior to mounting the IITRI wheelsets the bridge resistance and insulation resistances are measured. The Input and output resistance of each bridge and the bridge insulation resistance are recorded. A
31
terminal board is used to gain access to the bridge circuit through the slip ring connector. After the wheels are installed on the truck and the slip ring assembly is attached the resistance values are verified for each bridge. The bridge circuits are connected to the instrumentation system and the bridges are balanced to an electrical zero. A shunt calibration is then performed on each bridge and the amplifier gain level is set according to the anticipated load level. The recording reference levels are then set at zero volts which corresponds to an unloaded wheel condition. The zero reference can be established statically or dynamically. The static method requires jacking under the journals to obtain ;an unloaded wheel condition. The dynamic method makes use of the balanced bridge condition as the wheel rotates through the transition zone. With the test wheel in motion, the balance control is used to position the bridge output signals symmetrically about zero. Temperature stability (drift) is assessed by lifting the wheel sets from the rails prior to a test run and again after the test run is completed.
Wheel-Rail Position Measurement Systems:Field calibration follows the steps outlined in answer to Question 3.b.
The Wyle and ENSCO systems are scored lower because the field calibration is tedious and time consuming.
3.h. Give the approximate number of man hours and time required for field measurement set up?
This information is available for only the IITRI load measurement system where the set up time for field measurement is approximately 8 labor hours. This is the time required to make the electrical connections and balance the instrumentation system. It assumes that the wheelset has been installed in the test truck. The requirement for other systems would be expected to be about the same.
It is estimated that from 4 to 8 labor hours would be required for the set up of the wheel-rail position measurement systems in the field.
The Wyle and ENSCO systems are scored lower because of the length of time required to perform the calibration procedures.
3.i. What frequency response limitations are present?
There are several aspects to this question.On the Toad measurement systems there is the question of frequency limitations based on the dynamics of the system and the question of
frequency limitations of continuous output systems based on the data sampling rate, speed, etc.
The response time of the strain gages themselves would be on the order of 1 - 2 v sec. The response to DC is an inherent capability for strain gage instrumentation. Both low pass and high pass electrical filtering can be used with discretion. Usually, the band pass of the electrical filter will establish the frequency response of the system.
The effect of transmission line losses must also be assessed. For example, the influence of the stray capacity in a 200 ft (61 m) transmission line on a 1000 ohm bridge would leave the band pass down 3 dB at about 26 kHz. For systems employing carrier amplifiers, the high frequency response is usually in the range of 1.6 to 3,0 kHz, depending on the carrier frequency. Typical DC systems have flat frequency responses to 10 kHz and greater.
The effective upper frequency response limit of the instrumented wheel systems is probably the fundamental resonant frequency of the wheel. Load fluctuations of the same order or shorter than the fundamental period would not be accurately indicated by wheel plate strain measurements. Short duration impulse loads between the wheel tread and rail head are caused by rail joints, crossings, switch points, etc. This type of loading has been recorded by the BR and IITRI systems, however, the actual force amplitudes are uncertain because of the lack of dynamic calibration data in the frequency range of interest.
It is generally acknowledged that dynamic response of the instrumented axle would be substantially lower than that of an instrumented wheel because the strain sensors are further removed from the wheel- rail interface. However, this has not been verified by testing. The Wyle load measurement system has been scored lower with respect to this factor than the other load measurement systems because of its limitations for defining high frequency wheel-rail loads.
The frequency response of the wheel-rail position measurement systems utilizing a wheel-rail contact roller or shoe will depend on the dynamics of this spring loaded system. These systems would respond to DC. The high frequency response of the AAR system is affected by the transducer range of 3.5 in. (89 ran) and the allowable cable acceleration of 0.9g. Assuming simple harmonic motion this works out to an upper limit of 1.56 Hz. In practice, data has been filtered at 1.0 Hz. The BR system performance would be somewhat better.
32
4.d. Is the data processing carried out in real time or is it handled subsequent to the test?
The term "data processing" is again assumed to mean the generation of a continuous load or displacement function from the raw data.
The EMD, BR, AAR/ENSCO, and ASEA/SJ load measurement systems have utilized real time data processing. The IITRI and Wyle systems have utilized off line data processing. Both procedures have been used for the wheel-rail lateral position measurement systems.
All systems are scored equally with respect to this factor except that the AAR, IITRI and Wyle load measurement systems are rated lower because they have not utilized real time data processing.
4.e. If the system does not have a real time display capability, what are the limitations for the development of the capability?
There are no limitations for the development of a real time data display capability for any of the systems which have not utilized real time processing.
All systems are scored equally with respect to this factor.
4.f. What spacial/time resolution capability does the concept possess?
Space/time resolution capabilities will depend on the sampling rate for data processing, the accuracy to which off- axis response characteristics are represented in the data processing computations, and the speed of the vehicle. There are no fundamental limitations to the degree of resolution which can be obtained as long as one stays below the resonant frequency of the fundamental mode of vibration of the system.
All systems are scored equally with respect to this factor except that the AAR load measurement system is rated lower because the vertical load bridge cannot provide a useable continuous output signal.
4.g. What data formats are available?
The load and displacement measurement systems are usually defined up to the point where they provide a continuous load or displacement function. There would be no limitations on the formats that can be used for subsequent data processing.
4.h. Are assumptions made in the data processing which limit accuracy?
The assumptions which are common to all load measurement systems which may have an influence on accuracy include:
t The transfer function is linear and independent of frequency (i.e., static calibration used),
• Coupled dynamic loads act in a linear manner,
• The load is applied at a single point,
• The zero electrical reference remains fixed (i.e., drift free), and
t Longitudinal loads are not significant (except for the BR system) and can be neglected.
Specific assumptions which are made for particular systems include the following:
• The EMD system assumes that outputs from the lateral bridges differ by a phase angle of 90 deg. The actual difference is 90 ± 0.41 deg. It also assumes that the lateral and vertical analog signals can be represented by sine and cosine functions, and that correction for load application and cross talk effects can be neglected.ThiLt Tbe-BR system assianes that the longitudinal force bridge need not be corrected for load application position.
• The AAR system assumes that no correction for cross talk and load application position effects need be considered.
t The ASEA/SJ system assumes that nocompensation for thermal strain (lateral bridge) and load application position effects are necessary.
• The IITRI system assumes that wheel position data can be estimated by linear interpolation between the 90 deg position bridge peak outputs.
t The Wyle system assumes that lines of action of the wheel-rail forces remain constant.
The assumptions which are common to all wheel-rail lateral position measurement systems include:
• that reference frames or platforms attached to the axle remain in a fixed orientation with respect to the axle, and
t that changes in track gage can beneglected over the transducer separation distance.
34
It appears to be frequency limited by the lateral positioning air cylinder used to force the roller against the rail. The response time is influenced by this force which is about half the vertical load on the roller. The vertical pressure is limited by the construction of the vertical positioning air cylinder.The lateral pressure used in a recent test was 40 psi (280 kPa). This produced a positioning time of approximately 60 miliseconds (10 to 90 percent travel) or an equivalent of about6.8 Hz.
The AAR and BR systems do not have symmetrical frequency response characteristics. They are dependent upon the direction of motion of the probe (in or out). The lowest directional frequency response characteristics were used in the above calculations.
The ENSC0 system uses frequency modulation to condition the data signals. The 960 kHz oscillator frequency is modulated by 2 kHz for a full scale displacement of1.0 in. (25 mm). Assuming a modulation index of 5, would provide an effective frequency response of 400 Hz.
The band pass of the Wyle noncontacting measurement system is 0 - 20 kHz. It is worth noting that the rail sensing transducer mount on the rail frame above the running surface is positioned at an angle of about 45 deg. Accordingly, the eddy current field is from both the running surface and sides of the rail. This is a rather complex geometry and could be expected to generate high frequency signals as a function of speed due to variation in rail characteristics other than linear displacement.
Wyle has recorded at a band pass 0 - 50 Hz and processed data at a filtered band pass 0 - 0.5 Hz because the data of interest was in the low frequency range. However, if one is considering the "useable" band width of the system, signals other than the desired signal (i.e. noise) would have to be considered in the overall assessment of frequency response.
The AAR and BR position measurement systems are scored lower with respect to this factor.
4.a. What type of system is used to record data (analog or digital)?
There are no limitations for any of the systems with regard to analog or digital data recording. Data have been recorded in both ways for most of the systems.When digital recording is used the sampling rate has to be chosen to provide the required spacial resolution along the length
of the rail.
All systems are scored equally with respect to this factor.
4.b. How is the data processed (analog or digital or combination)?
The term "data processing," as used here, refers to the generation of a continuous load function from the raw data signals. Operating on the continuous data to provide statistical summaries, etc., would normally be done by digital data processing at a later time. Various techniques have been used for the different load measurement systems. The EMD system generates continuous lateral and vertical force and L/V signals using an analog data processor. The BR system generates vertical forces and L/V ratios by using digital data processing.The vertical force signals are compensated for cross talk effects (longitudinal and lateral). No compensation is provided for wheel position. The AAR/ENSC0 system uses a combination of analog (scaling) and digital (gain) to process the vertical wheel data. L/V ratios are developed by analog dividers. The ASEA/SJ utilizes analog processing to provide corrections for lateral cross talk effects. The IITRI system processes data by using digital techniques. To date, this has been done off line. Data from the Wyle system has been processed off line by using digital processing.
Data from the wheel-rail position measurement systems have been processed by digital techniques.
There are no inherent advantages to either analog or digital processing provided the necessary accuracy is obtained. Attainment of the performance goals for future systems will probably require digital processing.
All systems are scored equally with respect to this factor.
4.c. Are any provisions made to identify electrical noise?
We are unaware of specific procedures that are followed to identify electrical noise during the data processing. IITRI practice has been to generate load and displacement curves versus time for all functions. Suspicious fluctuations in these functions are identified and the quality of the raw data reviewed. Special algorithms have also been utilized to identify suspicious fluctuations in the raw data.
All systems are scored at less than the rating value for this factor because it is believed that more attention should be given to the identification and removal of noise from the data.
33

The EMD, BR, AAR, ASEA/SJ and Wyle load measurement systems are scored lower than the rating value with respect to this factor because they do not provide a means for correcting for the load position effects. The position measurement systems are scored equally at a value slightly below the rating value.
4. CONCLUSIONS AND RECOMMENDATIONS
4.1 CONCLUSIONS
An instrumented wheel system must be utilized for wheel-rail force measurements if the desired performance standards are to be attained. The desired accuracy cannot be attained with a wheel bearing adapter load cell, axle bending moment system.
The EMD, ASEA/SJ, and IITRI instrumented wheel plate systems have the potential for satisfying vertical force measurement requi rements.
The EMD and IITRI instrumented wheel plate systems have the potential for satisfying lateral force measurement requirements provided a means is included in the EMD system to correct for the effects of variation of the lateral position of the vertical load.
The reported characteristics of the BR instrumented spoked wheel system are such that it may be able to meet the desired performance requirements. This could not be confirmed because the complex geometry of this system would require more detailed analyses for evaluation than were possible within the scope of this task order.The BR system would probably be the most expensive load measurement system because of the cost of machining and instrumenting the spoked wheel.
None of the four wheel-rail position measurement systems examined in this study will meet the desired performance characteristics. The rail contacting systems (AAR and BR) have the potential, under further development, for approaching the desired characteristics. The non-contacting systems, (Wyle and ENSCO) will require major further development if they are to fulfill the desired performance characteristics. Satisfaction of the requirement for an angle-of-attack measurement with a tolerance of ±0.029 deg requires a reference-frame to rail measurement accuracy of approximately.0,015 in. (0.38 mm)where a 60 in. (1520 mm) reference distance is used ("D" in Figure 15).An estimate is made that contact displacement transducers could probably resolve distances down to 0.005 in. (0.13 mm), whereas eddy current non-contacting displacement sensors could resolve distances to 0.020 in. (0.51 ran). When determining the errors associated with the complete system one must also consider the errors resulting from random motions of the reference frame, resolution of the electrical output signal, etc. The major problem is likely to be with motions and distortions of the reference frame. It is possible that some quantitative data on this effect will be obtained on the 1981 FAST Wear Index Tests so that this effect can be more accurately evaluated.
The requirement (see Section 1.2) for a lateral position measurenent of ± 0.002 in.(0.05 mm) seems unnecessarily restrictive.As pointed out in the preceding paragraph an accuracy of approximately 0.015 in.(0.38 ran) is sufficient to satisfy the desired accuracy for the angle-of-attack measurement. Therefore, we recommend that the requirement for accuracy of lateral measurement be modified to ± 0.015 in.(0.38 ran).A special problem regarding the accuracy of wheel position measurements is the desired accuracy (±0.029 deg) with an angular range of ±5 deg. With a 60 in. (1520 mm) reference distance this implies a aeasurement range of ±2.62 in. (67 mm) with the requirement that the signal from the transducer sensing the motion be resolved to within 0.3 percent.This is at best a marginal possibility with the contacting systems, where the displacement transducers have a resolution capability of approximately 0.5 percent and an impossibility with the noncontacting, Eddy current, displacement transducers which have a resolution capability of approximately 2 percent. To these expected errors must be added .the expected errors due to other ̂ factors. It is obvious that either the desired range of motion has to be reduced or the accuracy requirements broadened if present techniques are to be acceptable.
4.2 RECOMMENDATIONS
At the present time there is no way to demonstrate that a load or position measurement system will meet given performance standards under operating test conditions because an acceptable dynamic test procedure has not yet been developed. Therefore it is recommended that techniques be developed for verifying the accuracy of wheel-rail load and position measurement systems under operating conditions. Hie major problem is in the development of techniques for making the proof test measurements under dynamic conditions.
It has been shown that several systems can be expected to provide acceptable load data. Deficiencies have been noted for each of the position measurement systems.Therefore, it is recommended that the search for new wheel position measurement techniques be continued. Further development of these systems should include an improved method for establishing the measurement references. Ideally, electrical zero would correspond to a zero angle-of-attack measurement with the probes in their measuring position. Unless this condition is met, the data signals represent a relative, as opposed to an absolute, measure of the angle-of-attack.
.. 36
APPENDIX
SPECIFICATION FOR WHEEL-RAIL LOAD AND POSITION MEASUREMENT SYSTEM
A.l. APPLICATION
This specification pertains to a railroad vehicle-borne instrumentation system for the measurement of vertical and lateral forces between the wheel and rail at the wheel-rail interface, the measurement of the lateral position of the wheel with respect to the rail, and the measurement of the angle between the axis of the wheel- axle set and the alignment of the rail as defined by a measurement in the plane of the track.
A.2. PERFORMANCE REQUIREMENTS
A.2.1 FORCE MEASUREMENTS
The performance requirements for the measurement of forces between the wheel and rail are given as follows:
Vertical: Continuous measurement of forces from zero to 50,000 lbs (220 kN) with an accuracy of ± 2 percent [± 1,000 lbs (4.4kN)J of the full scale load, for any vertical component of wheel-rail load oriented on the tread of the wheel within one inch of the tape line.
Lateral: Continuous measurement of forcesfrom zero to 25,000 lbs (110 kN) with an accuracy of ± 2 percent [± 500 lbs (2.2 kN)] of the full scale load, for any lateral component of wheel-rail load whose line of action lies between the tread at the tape line and the gaging point on the flange of the wheel.
These performance requirements may be demonstrated by carrying out the calibration test procedures which are described in Section A.3.1 and A.3.2.
A.2.2. WHEEL POSITION MEASUREMENTS
The performance requirements for the measurement of wheel-rail lateral displacement and wheel-rail angle-of-attack are given as follows:
Lateral Position: Continuous measurementwithin ± 0.015 in. (0.38 mm) with a total range of 2 in. (50 mm).
Angle-of-Attack: Continuous measurement within ± 0.5 milliradians (0.029 deg) with a total range of ± 5 deg.
These performance requirements may be demonstrated by carrying out the calibration test procedures which are described in Section A.3.3.
A.2.3. OTHER PERFORMANCE REQUIREMENTS
Frequency Response: The frequency response characteristics of the load measurement system shall be at least 200 Hz. The data sampling rate shall be sufficient to provide a data point at least every 2 ins. along the rail. The frequency response characteristics of the position meaisurement system shall be at least 50 Hz.
Stability of Position Measurement System: the reference frame of the position measurement system will be designed so that a 5g vertical or lateral loading will not cause the support point for any of the displacement transducers to move more than 0.005 in. (0.13 mm).
Spin Test: The instrumented load measurement wheel sets shall be rotated at a speed equivalent to a ground speed of 100 mph (45 m/s) in an unloaded condition. The output of the load bridges shall not exceed 1.0 percent of full scale output.
A.3. CALIBRATION PROCEDURES
The following procedures shall be used when conducting calibration tests to demonstrate satisfaction of the performance requi rements.
A.3.1. VERTICAL LOADS - LOAD MEASUREMENT SYSTEM
A number of vertical test loads shall be applied separately to the tread of the wheel as follows:
a. At any given cross section apply vertical (radial) loads on the tread of the wheel at a position one inch (25 mm)out from the tape line, at the tape line, and from 3/4 to one inch (18-25 mm) in from the tape line.
b. Repeat the application of the above load series at intervals of 5 degrees or less around the wheel.
The output data from the vertical load application tests are to be processed utilizing the data processing system which is intended to be used with the wheel during field applications of the system. The following steps shall be followed:
c. Record output data continuously during the load application or at a minimum of five approximately equal load steps from 0 to 50,000 lbs (0 to 225 kN).
37
* d'.» V5 _
d. Determine the best straight line fit of the output data as a function of the applied load.
e. Determine the deviation of the indicated data from the straight line fit within the calibration load range.
f. If the deviation from the straight line fit at any point does not exceed 2 percent of the maximum calibration load, the result shall be considered acceptable.
A.3.2. LATERAL LOADS - LOAD MEASUREMENT SYSTEM
A number of lateral test loads shall be applied separately to the tread of the wheel as follows:
a. At any given cross section apply lateral loads (parallel to the axis of the wheel) to the tread of the wheel with the line of action of the load intersecting the tread between ’ the tape line and the gaging point on the flange. The application of the lateral load may be accompanied by the simultaneous application of a vertical load.
b. Repeat the application of the above load series at intervals of 5 degrees or less around the wheel.
The output data from the lateral load application test are to be processed utilizing the data processing system which is intended to be used with the wheel during field applications of the system. The following steps are to be followed:
c. Record output data continuously during the load application or at a minimum of five approximately equal load steps from 0 to 25,000 lbs (0 to 110 kN).
d. - Determine the best straight line fitof the output data as a function of the applied load.
e. Determine the deviation of the indicated data from the straight line fit within the calibration load range.
f. If the deviation from the straight line fit at any point does not exceed 2 percent of the maximum calibration load, the result shall be considered acceptable.
A.3.3 DISPLACEMENT MEASUREMENTS - POSITION ■MEASUREMENT SYSTEM
Calibration tests shall be performed on a suitable calibration test fixture. The fixture will permit the position measurement system to be deployed in a manner similar to an application on a test truck. The fixture will be equipped with movable lengths of rail at the locations where rail displacements are to be measured by the system. The rails will be moved in a controlled and documented manner through a 2 in. (50 m ) displacement range* at each of the transducer locations while the output from the system is monitored and recorded.The measured output will be compared with the actual displacements. If the deviation of the measured and actual displacements is less than 0.75 percent of the maximum measurement range the result shall be considered acceptable.
Provisions shall be made for the sinusoidal oscillation of the rails at each measurement location. The rails will be subject to oscillations 1n the range 1-50 Hz. The peak-to-peak displacement of this oscillation shall be limited to 2 in. (50 mm) or the maximum acceleration of the motion shall be limited to 25g, whichever is smaller. The measured output will be compared with the actual displacements. If the deviation of the measured and actual displacements is less than 0.75 percent of the maximum measurement range the result shall be considered acceptable.
A.4. ACCEPTANCE
Six consecutive hours of system operations (installed on a moving rail vehicle) with no mechanical or electrical breakdowns must be demonstrated before the system will be accepted.
*Note: This displacement range is consistent with an angular measurement range of ±1.9 deg using a 60 in. (1520 mm) reference distance. Actual displacement measurement and accuracy requirements will have to be adjusted for individual systems based on their specific requirements for angular range and accuracy.
38

REFERENCES
1. Modransky, J.; Donnelly, W.J.; Novak, S.P. and Smith, K.R., "Instrumented Locomotive Wheels for Continuous Measurements of Vertical and Lateral Loads," ASME Technical Paper 79-RT-8, April 1979.
2. Swenson, C.A. and Smith, S.R.,"Development and Use of Instrumented Locomotive Wheelsets," International Conference on Wheel/Rail Load and Displacement Measurement Techniques, Cambridge, MA, January 1981.
3. Pocklington, A.R., "The B.R. Load Measuring Wheel," International Conference on Wheel/Rail Load and Displacement Measurement Techniques, Cambridge, MA, January 1981.
4. Pocklington, A.R. and Allen, R.A.,"Improved Data from Load Measuring Wheels," Railway Engineer, Vol. 2, No. 4, July/August 1977.
5. "Instrumentation for Measuring Forces on Wheels of Rail Vehicles," Federal Railroad Administration Report No. FRA-ORD&D-75-11, May 1974.
6. Olson, P.E. and Johnsson, S.,"Lateral Forces Between Wheels and Rail, an Experimental Investigation,"ASME Technical Paper 60-RR-6, 1960.
7. Thompson, W.I., "Plate Instrumented Wheelsets for Measurement of Wheel/Rail Forces," Federal Railroad Administration Report No. FRA/0RD-80-58, October 1980.
8. Manual, Measuring Wheels for Amtrak,Swedish State Railways.
9. Anderson, T., "A Calibration Technique for Instrumented Wheelsets,"International Conference on Wheel/Rail Load and Displacement Measurement Techniques, Cambridge, MA, January 1981.
10. Johnson, M.R., "Development and Use of an Instrumented Wheelset for the Measurement of Wheel/Rail Interaction Forces," International Conference on Wheel/Rail Load and Displacement Measurement Techniques, Cambridge, MA, January 1981.
11. Joyce, R.P. and Johnson, M.R., "Instrumenting a Railroad Wheelset for Measuring a Wheel/Rail Load,"Western Regional Strain Gage Committee Spring 1980 Meeting, Pueblo, CO,April 1980.
12. Peterson, L,A,; Freeman, W.H. and Wandrisco, J.N., ’‘Measurement and Analysis of Wheel/Rail Forces,"ASME Technical Paper 71-WA/RT-4, 1971.
13. Bakken, G.B; Peacock, R.A. and Gibson, D.W., "Wheel/Rail Measurements from Concept to Utilization," International Conference on Wheel/Rail Load and Displacement Measurement Techniques, Cambridge, MA, January 1981.
14. Operational Report, Angle-of-Attack and Wheel Position Measurement System, AAR.
15. Private Communication, Thomas C. Madigan, AAR Technical Center, Chicago, toR.P. Joyce.
16. Private Communications, Roy A. Allen,AAR Technical Center, Chicago, to R.P. Joyce.
17. Private Communications, Richard A. Peacock, Wyle Laboratories, Colorado Springs, Colorado, to R.P. Joyce.
18. Private Communications, Dennis Allen, BSI/TTC Pueblo, Colorado, to R.P. Joyce.
19. "Single Axle and Articulated-Supporting Truck Test Results Report," FRA/0RD- 81-59.
39
PROPERTY OF FRA RESEAECK DEVELOPMENT LIESA fiY
:i I*
r-^0 * U /•':
* "d Pos*ionm a rd 13 Jt>y^ "ton R