testing odor response stereotypy in the drosophila mushroom body
TRANSCRIPT

Seediscussions,stats,andauthorprofilesforthispublicationat:https://www.researchgate.net/publication/23283328
TestingOdorResponseStereotypyintheDrosophilaMushroomBody
ARTICLEinNEURON·OCTOBER2008
ImpactFactor:15.05·DOI:10.1016/j.neuron.2008.07.040·Source:PubMed
CITATIONS
71
READS
20
3AUTHORS:
MalaMurthy
PrincetonUniversity
20PUBLICATIONS972CITATIONS
SEEPROFILE
IlaRFiete
UniversityofTexasatAustin
22PUBLICATIONS693CITATIONS
SEEPROFILE
GillesLaurent
MaxPlanckInstituteforBrainResearch,Fran…
138PUBLICATIONS11,440CITATIONS
SEEPROFILE
Availablefrom:GillesLaurent
Retrievedon:03February2016

Testing Odor Response Stereotypy in the Drosophila MushroomBody
Mala Murthy, Ila Fiete, and Gilles LaurentDivision of Biology, California Institute of Technology, Pasadena, California, 91125
SUMMARYThe mushroom body is required for olfactory learning in flies. Its principal neurons, the Kenyon cells(KCs), form a large cell population, usually divided into three classes(α/β, α’/β’, and γ) based onanatomical criteria. Both neuronal populations from which their olfactory input derives, theprojection neurons (PNs) and the presynaptic partners of the PNs, the olfactory sensory neurons, canbe identified individually by their glomerular projections, the expression of specific genes, and theirodor responses. We ask here whether KCs are similarly identifiable individually. We focused on asubset of ~23 genetically labeled α/β KCs, and recorded their responses to odors using whole-cellpatch-clamp in vivo. Response profiles across this sample provided no evidence for repeats acrossanimals. Further, across-animal responses were as diverse within the genetically-labeled subset asacross all KCs in a larger sample. By contrast, recorded PN odor responses clustered by glomerulartype. Using these PN responses as inputs to a simple KC model, we find that measured inter-fly PNresponse variability combined with stereotyped PN-to-KC connectivity cannot explain the absenceof KC odor response stereotypy. These results suggest differences in PN-to-KC connectivity acrossindividual flies.
KeywordsDrosophila; olfaction; mushroom body; electrophysiology; stereotypy
INTRODUCTIONRecent studies in mice and flies have revealed astonishing order in the spatial organization ofthe early olfactory system. Olfactory sensory neurons (OSNs) that express the same olfactoryreceptor genes converge to the same glomerulus in the antennal lobe (flies) or olfactory bulb(mice). The glomeruli are in turn distributed in consistent spatial patterns, in whichneighborhood relationships are conserved across individuals (Couto et al., 2005; Dobritsa etal., 2003; Fishilevich and Vosshall, 2005; Laissue et al., 1999; Mombaerts et al., 1996; Ressleret al., 1994; Vassar et al., 1994). In flies, the second-order neurons (PNs) can be classifiedanatomically by the glomerulus they innervate and consequently, by the OSN type to whichthey are postsynaptic (Jefferis et al., 2001; Jefferis et al., 2004). Not only is this anatomical/molecular mapping reproducible across individuals, but it correlates well with functionalstereotypy. Imaging and electrophysiological studies in both the antennal lobe and olfactorybulb have shown reproducible odor responses across animals (Belluscio and Katz, 2001; de
Corresponding Author: Gilles Laurent ([email protected]; 626-395-2798).Publisher's Disclaimer: This is a PDF file of an unedited manuscript that has been accepted for publication. As a service to our customerswe are providing this early version of the manuscript. The manuscript will undergo copyediting, typesetting, and review of the resultingproof before it is published in its final citable form. Please note that during the production process errors may be discovered which couldaffect the content, and all legal disclaimers that apply to the journal pertain.
NIH Public AccessAuthor ManuscriptNeuron. Author manuscript; available in PMC 2009 September 25.
Published in final edited form as:Neuron. 2008 September 25; 59(6): 1009–1023. doi:10.1016/j.neuron.2008.07.040.
NIH
-PA Author Manuscript
NIH
-PA Author Manuscript
NIH
-PA Author Manuscript

Bruyne et al., 2001; Hallem et al., 2004; Meister and Bonhoeffer, 2001; Ng et al., 2002; Rubinand Katz, 1999; Uchida et al., 2000; Wang et al., 2003; Wilson et al., 2004). Such functionalstereotypy in Drosophila PNs is surprising given that—due, in part at least, to interactionsbetween glomerular channels—these neurons are tuned more broadly than their presynapticpartners (Olsen et al., 2007; Shang et al., 2007; Wilson et al., 2004). It suggests significantstereotypy in the synaptic connections between OSNs, PNs, and local neurons within theantennal lobe.
We ask here whether precise anatomical and functional specification of antennal lobe circuitscontinues in the next relay, the mushroom body. This issue is generally important because itrelates to the specification of sensory network connectivity: at what level (if at all) does theorder that exists in early circuits break down, such that connections and cellular propertiesbecome specific to each individual animal? In insects, PNs form excitatory synapses with alarge population of neurons in the mushroom body (MB), a structure involved in learning andmemory (Davis, 2005; Gerber et al., 2004; Margulies et al., 2005). We examine whether thesetargets, called Kenyon cells (KCs), are individually stereotyped across animals. What is theevidence thus far? In Drosophila, initial morphological studies found little stereotypy in thePN projections to the MB, especially when compared with the PNs’ other axonal projectionsin the lateral horn (Marin et al., 2002; Wong et al., 2002). More recent results suggest somebroad “zonal” stereotypy, both for PN axons and for KC dendritic fields in the MB calyx(Jefferis et al., 2007; Lin et al., 2007; Tanaka et al., 2004; Zhu et al., 2003). In these studies,PNs were identified by the glomerulus from which they originate, while KCs are broadlycategorized into one of three classes, based on their axonal projections. Recent calcium imagingstudies on KCs in flies also suggest broad stereotypy (Wang et al., 2004). Thus, while availabledata indicate some regional anatomical stereotypy of projections within MBs, they remaininconclusive about the degree of variability of inputs to individual KCs across flies. Further,even if the wiring diagram between PNs and KCs was known in great anatomical detail andshown to be stereotyped across flies, we still could not conclude that KC odor responses mustbe stereotyped. To determine whether individual KCs can be identified across animals in thesame way that PNs can, functional recordings are required.
We tackled this issue of KC identifiability using functional assays and Drosophila mushroombody neurons for three main reasons. The first is that MBs, while small when compared withareas of mammalian cerebral cortex, comprise a large population of similar neurons (~2,500KCs per hemisphere). KCs can be grouped into three distinct morphological classes (α/β, α’/β’, and γ) based on adult axonal projection patterns and birth order (Crittenden et al., 1998;Lee et al., 1999), but they are too similar morphologically to one another within these classesto provide clues as to the existence of identifiable individuals. Yet, the functional stereotypyof PNs indicates that, if the detailed connectivity between PNs and KCs is identical across flies,KCs could be functionally stereotyped as well. Failing to find functional stereotypy in KCscould thus suggest variable input patterns across flies. The second reason is that MBs arerequired for learning in flies and honeybees (Davis, 1993; Heisenberg et al., 1985; Menzel,1983; Quinn et al., 1974): molecules implicated in learning are concentrated there (Han et al.,1992; Nighorn et al., 1991), experience can induce substantial structural changes to the MB(Heisenberg et al., 1995; Technau, 1984), and interfering with the function of the MB preventsmemory formation or retrieval (Dubnau et al., 2001; McGuire et al., 2003; Zars et al., 2000).Because synapses within the MB are thought to be plastic, odor representations by KCs, bytheir targets or both might differ across individuals, precluding identification based on tuning.The third reason is that Drosophila offers the unique opportunity to examine functionalstereotypy within a large network of like neurons, by exploiting the use of genetically encodedmarkers, isogenic backgrounds and homogenous rearing conditions, and in vivoelectrophysiology.
Murthy et al. Page 2
Neuron. Author manuscript; available in PMC 2009 September 25.
NIH
-PA Author Manuscript
NIH
-PA Author Manuscript
NIH
-PA Author Manuscript
Here, we have tested whether individual KCs, characterized by their response profiles, can berecognized from one fly to the next, and conclude that the precise circuit specification seen inthe antennal lobe is likely absent at the next stage of processing.
RESULTSA GAL4 line with restricted expression enables in vivo recordings from potential Kenyon cellreplicates across flies
We define “functionally replicated” or “individually identifiable” KCs as neurons fromdifferent individuals that belong to the same morphological class, have similar lineages, aremarked by the same genetic marker, and have similar physiological tuning profiles. To recordfrom potential KC functional replicates across flies, we used a GAL4 line with restrictedexpression in a small subset of KCs. The Drosophila GAL4/UAS system (Brand and Perrimon,1993) allows for spatial control over transgene expression, based on the promoter regulatingthe GAL4 insert. GAL4 line NP7175 (Tanaka et al., 2004) is an insertion in the 5’ UTR of theCG3095 gene (also known as halfway or singed wings (Schwartz et al., 2004)); when crossedto a GFP reporter construct, a small number of KCs that project to the centers of the α/β lobesare labeled (Figure 1A). Kenyon cells and glial cells of the MB are sequentially derived fromfour neuroblasts, and each neuroblast is sufficient to generate autonomously all of the axonalsubstructures (α/β, α’/β’, and γ) of the MB (Ito et al., 1997; Lee et al., 1999). KCs born earlyare pushed, through multiple rounds of cell division, to the outermost regions of the concentricsoma layer (Kurusu et al., 2002). Fortuitously, NP7175 marks KCs that are born late inmushroom body development; thus, they remain clustered close to their neuroblast of origin,enabling the reliable distinction of four clusters or clonal units. Each clonal unit occupies adistinct dendritic territory within the MB calyx, defined by the axes of the brain (Zhu et al.,2003). In particular, late-born α/β neurons neither cross these clonal boundaries within thecalyx nor project to a fourfold region of the calyx that contains dendrites of KCs from all clonalunits. Based on these characteristics of mushroom body development, the KCs labeled byNP7175 can be consistently divided into four clonal units of few neurons (Figure 1B).
We focused on the left hemisphere (when viewed from the posterior surface) and lateralposterior clonal unit (L-LP). KCs of the posterior clonal units are easier to reach with electrodesbecause they lie closer to the brain surface. We performed in vivo whole-cell patch-clamprecordings of KCs in intact one-day-old female flies, raised at constant temperature and relativehumidity (see methods). We chose one-day-old flies to limit adult olfactory experience andthus, hopefully limit inter-fly variability. Flies of this age perform robustly in olfactory learningand memory assays (Tamura et al., 2003), indicating that the mushroom body is functional.
We filled each recorded KC with biocytin (Figure 1C) to verify after the experiment that it wasan NP7175 (GFP+) KC of the L-LP subset—fills of 18 GFP− KCs (with somata adjacent toGFP+ KCs) contained projections not to the centers of the α/β lobes, but to separate regions ofmostly the α/β and occasionally the α’/β’ and γ lobes. GFP+ KCs, in contrast to these GFP−cells, were distinct in their axonal morphology—all GFP+ KCs possessed no side branch inthe alpha lobe and at most one (in 6/27 fills) side branch at the tip of the beta lobe (data notshown). Further indicating that NP7175-driven expression is consistent from fly to fly, GFPexpression co-localized (in 14 brains) with a label for F-actin (Phalloidin), enriched in a smallnumber of KC fibers in the centers of the α/β lobes (Figure 1D). Previous observations of KCslabeled by NP7175 counted approximately 60 cells per hemisphere (~15 labeled KCs per clonalunit) (Tanaka et al., 2004). We repeated these observations for our experimental conditionsand genotype (see methods), and counted either the number of cells in only the L-LP clonalunit, or in any of the 8 clonal units from both hemispheres (Figure 1E). With both methods,we found 23 ± 0.73 (mean ± SEM) labeled cells per clonal unit, with small variability around
Murthy et al. Page 3
Neuron. Author manuscript; available in PMC 2009 September 25.
NIH
-PA Author Manuscript
NIH
-PA Author Manuscript
NIH
-PA Author Manuscript
this number (SD=3.27, min=20, max=31). These data collectively argue against the possibilitythat NP7175 labels different subsets of α/β KCs in each fly.
If KCs are individually identifiable neurons, how many recordings are needed to ensurerepeated samplings of the “same” KCs across flies? With roughly 23 GFP+ KCs per clonal unitand recordings from one GFP+ L-LP neuron each in 27 flies, there must be a minimum of 13replicates (non-singletons, such as doublets, triplets, etc.), with P>0.99, and an average of 18.5replicates in the data set (Figure 1F). Even if there are as many as 31 GFP+ KCs per clonalunit, the maximum number counted in one fly, there should be at least 9 non-singletons in ourdata set (Figure 1G). Our recordings were likely biased towards KCs with posterior somataand against KCs with low GFP expression. If the distributions of these somata or GFP levelswithin each clonal unit are not random, we may have sampled from a smaller subset of the 23labeled cells, resulting in even higher probabilities of non-singletons. With this expectation,we recorded from KCs in 50 flies and looked for functional repeats among 27 GFP+ L-LPrecordings.
Odor response profiles vary across the GFP+ L-LP KC recordingsUsing whole-cell patch-clamp, we measured KC responses (below and above firing threshold)to a diverse odor set. Because we held KCs at approximately −60mV, we first assessed therelationship between holding potential and voltage changes during odor responses. This testwas to ensure that no major non-linearity occurs around this holding potential, which couldaffect our inter-cell comparisons (based on intrinsic firing frequency and membrane voltage).Figure 2A plots this relationship for two KCs and finds good linear fits over the range between−40 and −100mV. This indicates that KC synaptic responses in this range are mainly affectedby driving force, and not by voltage-dependent rectifying or amplifying non-linearities.
We challenged KCs with a set of 12 odors at 3 concentrations (10- 100- and 1000- folddilutions). Odors were presented as 1s pulses during 20s trials in blocks of 6 trials each, onaverage. We characterized the odor response profiles of 50 KCs (KC1-KC27: GFP+ L-LP,KC28-KC32: GFP+ other clonal units, and KC33-KC50: GFP−) by examining both spikingand subthreshold odor responses (Figure 2B). In all analyses, we omitted the first trial becauseit can differ significantly from subsequent ones (Stopfer and Laurent, 1999). Odor-evokedspiking responses are typically sparse; KCs respond with few spikes to only a few (if any) ofthe odors presented (Figure 2C; (Perez-Orive et al., 2002; Turner et al., 2007). “Subthreshold”responses (red, Figure 2B), in contrast, were low-passed voltage responses (see methods) andthus include both sub- and supra- threshold odor responses and trials; they are the mostcomplete description of each cell’s tuning. They also decrease the probability of wronglyclassifying two KCs as different if the only difference between them was their firing threshold,holding potential, or input resistance. A few examples are shown in Figure 2D, illustrating theonsets, amplitudes and shapes of some of the profiles observed across the 27 GFP+ L-LP KCs.With a few KCs, we presented the same odor at the beginning (red, Figure 2E) and end (black,Figure 2E) of the experiment, to control for response stability.
Spiking Responses—For analysis of spiking responses, a KC was considered responsiveto an odor if it produced at least one action potential in the period 0–2s following stimulusonset, on at least 3 trials. If a KC was tested with n odors, its response profile could be describedas a binary n-bit vector (1 for response (red), 0 for no response (gray); Figure 3A). As in thelocust (Stopfer et al., 2003), KCs in Drosophila can be odor selective and concentrationinsensitive (e.g., KC11, odor 5; Figure 3A), or odor and concentration selective (e.g., KC1,odor 8; Figure 3A). KCs could then be compared by measuring the Euclidean distances betweentheir spiking response profiles (Figure 3B). Euclidean distances were calculated with only theodors tested in common in each KC pair, and a distance of 0 (black; Figure 3B) indicates
Murthy et al. Page 4
Neuron. Author manuscript; available in PMC 2009 September 25.
NIH
-PA Author Manuscript
NIH
-PA Author Manuscript
NIH
-PA Author Manuscript
identical odor response profiles. Only 1 pair among the 27 recorded GFP+ L-LP KCs had thesame (and non-zero) profiles: KC6 and KC21 (9 common odors). The more stringent we madethe criteria for a spiking response, the fewer identical profiles we found (data not shown). Theprobability of response (percentage of odors eliciting a response) was 18.6% for the GFP+ L-LP KCs, compared to 49% for the GFP− KCs. Thus, while only one pair among the GFP+ L-LP KCs possessed identical spiking responses, the GFP+ L-LP KCs were similar to one anotheras a group, in that they responded to fewer odors overall. However, using response criteriafrom a previous study on locust KCs (Perez-Orive et al.), the probability of response for theGFP+ L-LP KCs dropped to 6.7%, matching the response probability (also using these criteria)for Drosophila α/β KCs tested with a different odor set (Turner et al., 2007). Thus, even thoughour assignment of positive KC responses was loose, only one repeat was found among all 351possible pairs from 27 GFP+ L-LP KCs.
Subthreshold Responses—Because so many (20/50) of the KCs in our data set showedno spiking response to any odors tested (Figure 3A), we could not determine the number offunctional replicates among the GFP+ L-LP KCs using spiking responses alone. We thereforeexamined subthreshold KC response profiles, a measure more directly reflective of the inputKCs receive from PNs. Subthreshold responses of a KC to an odor were measured as an averageacross trials of the filtered (to remove spikes) and baseline-subtracted membrane voltage (red,Figure 2B). We characterized each KC’s response profile as a concatenated vector of n voltagetraces (one trace for each of n odors; see supplemental data for examples). Pairwisecomparisons were made by measuring the correlation distance (one minus the mean-subtractedcross-correlation between the tuning vectors; see methods) for all odors tested in commonbetween each pair of neurons. Thus, two response profiles that differed only in their amplitudeswould be classified as identical (distance(corr)=0). The minimum and mean number of odorstested in common were 3 and 10 over all pairs, respectively (see supplemental data forjustification of minimum). The pairwise analysis was carried out over all 50 KCs in our dataset, and results are shown in the matrix in Figure 3C.
As with spiking profiles, subthreshold responses were as (or more) different across the GFP+
L-LP KCs as they were between them and GFP− KCs (Figure 3D). To ensure that suchdifferences were not due to excessive trial-trial variability, we also measured distances betweentrials for each KC/odor combination (2,356 trials and 85,328 pairwise comparisons), and foundthem to be significantly smaller than the inter-KC distances (p<10−87; Figure 3D). Thisindicates that the response of one KC to an odor is closer, on average, to individual trials withthat odor than it is to the mean response of another sampled KC to that odor.
Using these pairwise correlation distances, we then performed hierarchical clustering (seemethods) to assess similarities between KCs across the entire dataset. The closest linkagedistances between KCs were often not between KCs in the GFP+ L-LP subset (Figure 3E).Notably, KC6 and KC21 had identical spiking odor response profiles (Figure 3B), but did notcluster together based on their subthreshold odor response profiles. Finally, for each KC/odorcombination, we split its trials in half, and repeated the above analysis (supplemental data).GFP+ L-LP KCs grouped well across trials, with a goodness-of-clustering score (see methods),of 96%. This showed again that the inter-trial variability for each KC was much smaller thanthe differences in responses across different KCs.
In summary, KCs randomly sampled from the GFP+ L-LP clonal unit in 27 different fliesyielded many different physiological profiles for this odor set, and failed to reveal obviousfunctional repeats. Nevertheless, if input PN responses are variable across flies, KCs mayappear to be physiologically dissimilar even if the underlying PN-to-KC wiring is identicalacross files. To determine how much response variability we should expect across “individuallyidentified” KCs, we thus recorded from the PNs, under the same stimulus conditions.
Murthy et al. Page 5
Neuron. Author manuscript; available in PMC 2009 September 25.
NIH
-PA Author Manuscript
NIH
-PA Author Manuscript
NIH
-PA Author Manuscript

Measurement of PN odor response variability across fliesPNs are the only known excitatory drive to the KCs (Gu and O'Dowd, 2006; Yasuyama et al.,2002). We characterized PN odor responses in a first step towards testing a simple hypothesis:if connectivity between PNs and KCs is invariant across flies, then the observed functionalvariability of KCs should be explained by PN odor response variability. We know already thatPNs are both morphologically and physiologically identifiable across flies (Wang et al.,2003; Wilson et al., 2004). Here, we quantify response variability across PNs of the sameglomerular type, and assess whether this variability is large enough to preclude KC responsestereotypy.
We recorded the odor responses of nine PNs innervating the DL1 glomerulus and eight PNsinnervating six other glomeruli. These recordings were made in NP3529-GAL4 flies expressingGFP in, among other cells, 2 DL1 PNs per hemisphere (Tanaka et al., 2004). We challengedflies with the same 12 odors (1/100 dilutions only) tested on KCs and filled each recorded PNwith biocytin for post-hoc identification (Figure 4A). One of the recorded DL1 PNs was testedwith less than 3 odors shared with some other PNs, and was thus excluded from this part ofthe analysis. However, all nine DL1 PNs were used in the subsequent KC simulation model(Figure 5).
As with the KCs (Figure 3), we calculated pairwise correlation distances between all recordedPN responses based on spiking (supplemental data) or subthreshold (Figures 4C–4E) odorresponses for all odors tested in common between each pair of cells. Distances betweenresponses of PNs of one glomerular type (ie: DL1, VC3, or DM6) were significantly smallerthan across PNs of different types (Figure 4D). PNs could easily be clustered by type (Figure4E), with a goodness-of-clustering score, based on whether nearest neighbors were of the sametype, of 100%. These results were statistically similar when spiking responses were used tocalculate pairwise distances (supplemental data). Thus, despite the presence of some inter-individual variability between odor responses from PNs of a single glomerular type, it is stillpossible to observe an excellent match between functional and anatomical groupings amongthe PN population. Further, our ability to cluster PN responses served as a validation of ouranalysis methods on the KC recordings. We next used these PN data in a model to determinethe expected inter-fly variability of KCs with stereotyped connectivity to PNs (Figure 5A).
Model KCs with realistic PN input variability can be clustered by typeIf Kenyon cells are identifiable, we anticipated finding at least 13 functional replicates withP>0.99 in our recordings (Figure 1). To determine if our recordings are consistent with thepresence of such replicates, we generated model KCs, whose responses were defined byexperimental PN data (Figure 5A). If in the model, responses from different KCs of one type(generated from measured inter-fly PN variability) are far more similar to one another thanresponses from KCs of different types (in the model, a KC type is defined by its specific setof PN inputs), then KCs should be clusterable by type across flies. Further, similarity thresholdsderived from the model could be applied to the recorded KCs, to identify possible functionalreplicates.
PN recordings yielded a total of 81 different measured spiking responses (2s PSTHs), from anaverage of ~11 odors each tested on 7 different glomerular types (one PN type’s responses todifferent odors were as diverse as different PN types’ responses to one odor, based on aclustering analysis (data not shown and (Bhandawat et al., 2007)); each of these responses wastreated as equal and distinct in constructing model KC responses. To augment the data set, weadded fixed temporal shifts to each recorded PN response (see methods), generating a total of160 model PN (mPN) responses. Each mPN type response profile consisted of a concatenationof four of these responses, to mimic 4 odors tested on each mPN. To simulate inter-individual
Murthy et al. Page 6
Neuron. Author manuscript; available in PMC 2009 September 25.
NIH
-PA Author Manuscript
NIH
-PA Author Manuscript
NIH
-PA Author Manuscript
(across-fly) variability for each mPN type, we applied the measured variance across multiplePN recordings in different flies (e.g, from DL1) to an mPN type response profile to producedifferent individual responses per mPN type (see methods). PN:KC convergence inDrosophila is estimated to be approximately 10:1 (Turner et al., 2007). To produce model KC(mKC) “subthreshold” responses, we linearly summed different mPN response profiles withconvergence factors (Nconv) ranging from 5 to 20, using different binary PN:KC weight vectorsfor each mKC type (Figures 5A and 5B).
mKC types generated with larger Nconv were more similar to each other than those generatedwith smaller Nconv, as expected from the law of large numbers (averaging effects). The pairwisedistance distribution for mKC odor responses best overlapped the real KC distribution at lowerNconv (Figure 5C, black and green curves; Figure 5D, black squares). Inter-individual variancesalso grew as Nconv decreased (Figure 5C, red curves). Consequently, the separation betweenmKC types (Figure 5C, black curves) and mKC individuals of a type (Figure 5C, red curves)remained generally constant across Nconv (Figure 5D, black circles), suggesting that theclusterability of mKCs by type should be independent of Nconv. In cases where mKCs poolinputs from multiple mPNs of the same type (e.g., Nconv=5*2, or 10 inputs from 5 different PNglomerular types), the type diversity is as great as for Nconv=5, but the individual distances aresmaller, similar to Nconv=10, leading to an even larger separation between type and individualdistributions (Figure 5D, open circles and squares).
We next performed hierarchical clustering on the pairwise distances between mKC responses.The resulting goodness-of-clustering scores (see methods), was high and independent ofNconv (Figures 5D (red circles) and Figure 5E). These results implied that individual recordedKCs should be recognizable from animal to animal by their subthreshold response profiles, ifwe hypothesize that PN-to-KC wiring is stereotyped and account for KC response variabilityas due to PN response variability.
Thresholds derived from the model reveal fewer potential KC functional replicates in theexperimental dataset than predicted
By performing hierarchical clustering on the recorded KC subthreshold odor responses, weobtained linkage distances between all 27 GFP+ L-LP KCs in the data set (Figure 3E).Ultimately, we wished to determine if any of these linkages were small enough to indicatefunctional replicates. To do so, we recreated the experimental sampling procedure (27recordings from the 23-cell GFP+ L LP clonal unit) by randomly selecting 27 individual mKCsfrom 23 mKC types (see methods). We derived similarity thresholds from this samplingexperiment and directly applied them to the experimental data.
For each run of the sampling experiment, we calculated pairwise distances between mKCresponses, performed hierarchical clustering, and extracted the highest threshold value (gray,Figure 6A) below which all mKCs were correctly grouped by type. The cumulativeprobabilities of finding functional replicates (non-singletons) below the thresholds forNconv=5, 5*2, and 10 are shown in Figure 6C (blue curves). Because the thresholds wereselected to exclude any incorrect groupings, they only captured an average of ~85% (for eachNconv) of the model data’s actual non-singletons (whose distribution is equivalent to thepredicted distribution; Figure 6C, green curve).
We applied the model threshold distributions to the experimental KC tree shown in Figure 6B,and counted the number of KCs with linkage distances below each threshold. This producedprobability distributions of the recorded KCs containing n non-singletons (Figure 6C, redcurves). For direct application of model-derived thresholds to the KC data, a convergence of5*2 (pooling from 10 PNs of 5 types) was deemed most appropriate because it satisfied theintersection of two constraints: (1)the diversity of mKC types generated from 5 mPN types
Murthy et al. Page 7
Neuron. Author manuscript; available in PMC 2009 September 25.
NIH
-PA Author Manuscript
NIH
-PA Author Manuscript
NIH
-PA Author Manuscript

best matched the recorded KC diversity (Figure 5D) and (2)the net convergence of 10 matchedthe best estimate of PN:KC convergence (Turner et al., 2007). For Nconv=5*2, the probabilityof identifying ≥6 non-singletons in the model is 1, whereas in the real data, it is <0.01 (Figure6C). Across convergences, the thresholds identified an average of more than 14 non-singletonsamong the mKCs, but fewer than 3 among the real data (Figure 6C, inset). Based on our model,it is thus extremely unlikely that the recorded data represent samples from a set of functionallystereotyped KCs. These findings are consistent with the observation that the closest distancesbetween recorded odor responses in our full data set are between GFP+ L-LP and GFP− KCs,rather than between GFP+ L-LP KCs (Figure 3).
Because our analyses indicated that measured PN response variability combined withstereotyped PN:KC connectivity across individuals cannot account for the variability of KCresponses observed in the experimental data, we explored how much variation in PN:KCconnections across individuals, in addition to the measured PN response variability, would berequired to reproduce the experimental results (Figure 6D). We did this in two ways forNconv=5 (this convergence value found the largest number of potential replicates in the realdata), by (i)varying the analog synaptic weight values in a specified PN:KC connection matrix,or (ii)varying the connections themselves. We found that varying the analog weights in astereotyped connection matrix was not sufficient to reproduce the small number of replicatesflagged in the real KC data. If instead, for an mKC type, at least 2 of the 5 PN-to-KC connectionsin each individual were different, selected randomly from the pool of mPNs, the number offlagged replicates in the model would nearly match the number flagged in the KC recordings.Thus, given measured PN response variability, the degree of variability in PN-to-KCconnections in our linear model would have to be at least 40% on the level of individual KCs,to explain the low number of flagged replicates in the real KC data.
DISCUSSIONThe olfactory system of Drosophila is becoming one of the best-characterized sensory systemsin large metazoans (Bhandawat et al., 2007; Hallem and Carlson, 2004; Komiyama and Luo,2006; Turner et al., 2007; Vosshall and Stocker, 2006; Wang et al., 2003; Wilson et al.,2004). Molecular, anatomical and physiological analyses indicate that its antennal lobe circuitsare so precisely organized that OSNs and PNs can both be identified using any of the abovecharacteristics (alone or in combinations). Using electrophysiological recordings and geneticmarkers, we assessed whether circuit specification continues with similar precision in themushroom bodies. If identifiable KCs exist, we could reasonably expect to find at least 13functional replicates (P>0.99) with 27 recordings from among a subset of ~23 geneticallylabeled neurons. We observed no obvious functional similarities by analyzing both spiking andsubthrehsold odor response profiles, nor were the responses of labeled KCs more similar toone another than to responses of unlabeled KCs. To determine how similar responses fromidentifiable KCs would be, given variability present at earlier stages of the olfactory pathway(i.e., in PN responses), we measured inter-individual variability across PNs of the sameglomerular types, and used these data to simulate KC responses (with assumptions detailedand discussed below) across individuals and for many different KC types. After applyingclustering thresholds derived from this model to the experimental data, we infer that KCresponse variability across flies is not explained by PN response variability. KCs may thereforenot be individually identifiable, at least in the combined genetic, anatomical and physiologicalsenses that apply to their presynaptic inputs (PNs and OSNs).
Our study suggests that each fly possesses a complement of KCs whose tuning differs fromindividual to individual. This result is different from (though not in contradiction to) that of aprevious study (Wang et al., 2004) in which KC responses to odors were monitored usingGCaMP, a genetically-encoded calcium sensor: the somata of KCs that produced a detectable
Murthy et al. Page 8
Neuron. Author manuscript; available in PMC 2009 September 25.
NIH
-PA Author Manuscript
NIH
-PA Author Manuscript
NIH
-PA Author Manuscript
GCaMP signal to a particular odor (about 10 KCs per odor and per mushroom body) lay insimilar positions in different animals after image warping for alignment. Given the small size(<3µm) and large number of KC somata in each mushroom body, we think that KCidentification across animals based on such spatial attributes is unlikely.
Could the NP7175 driver itself be variable, labeling a different subset of α/β KCs in each fly?We observed that NP7175-labeled KCs always project to the centers of the α/β lobes and that23 ± 0.73 clustered KCs per neuroblast clonal unit are labeled in each fly (Figure 1). However,even if we assume that as many as 40 KCs per clonal unit (or 20% of the α/β KCs (Lee et al.,1999)) could be labeled by NP7175 (and a random 23 chosen for expression in each fly), wewould expect to find, with only 27 recordings, a minimum of 6 and an average of 13 replicates.This prediction is still inconsistent with our findings.
While we would have liked to repeat our study with another restricted GAL4 line labeling adistinct but comparably sized subset of KCs, we were unfortunately unable to find such a line.The responses of KCs that project to the centers of the α/β lobes (NP7175), however, do notappear unusual among KCs. Similar to other α/β KCs recorded, NP7175 KC responses weresparse and contained few spikes. Further, response probabilities among NP7175 KCs weresimilar to those in a larger set of α/β KCs (Turner et al., 2007). Finally, we note that a previousreport indicating that NP7175 KCs were the only glutamatergic KCs in the mushroom body(Strausfeld et al., 2003) is not supported by immunostaining with an antibody for theDrosophila vesicular glutamate transporter (data not shown and (Daniels et al., 2008)). In short,nothing so far indicates that NP7175 KCs are unrepresentative of the larger KC population.We now outline possible mechanisms that could give rise to a lack of functional stereotypy inthe mushroom body, and discuss both the caveats and implications of this finding.
Basic Assumptions of the KC modelThe results of our model depend on the following assumptions: 1) inter-individual PN responsevariability is well estimated in our model, 2) summation of PN inputs by KCs is linear, and 3)PN:KC connectivity is stereotyped across animals. Assumption 3 is the one we aimed to test,but the results depend on assumptions 1 and 2, which we discuss in this section.
Our experimental measurements of PN response variability came mostly from DL1 PNs. Ifother PN responses are more variable across flies, we may have overestimated how well KCresponses should cluster. However, recordings from PN duplicates that innervate VC3 andDM6 revealed comparable response variability (Figure 4). In addition, responses to a set of 18odors in PNs that innervate seven glomeruli, including DL1 (Bhandawat et al., 2007), revealsimilar variability. In fact, PN response noise could be even smaller than we report here,because our measure includes both intrinsic variability and variability introduced by recordingmethods. Also implicit in our model was that response variations are uncorrelated across PNswithin one antennal lobe; such intra-individual correlations would produce less averaging inthe construction of individual KC responses, generating greater inter-individual variability andpoorer clustering than in our mKCs. In the absence of simultaneous recordings from the samen-plets of PNs in many individuals, we cannot rule out this possibility.
Our simulation results also assume that KC subthreshold responses represent a linearsummation of their inputs. Due to the absence of obvious voltage-dependent nonlinearities(Figure 2A and (Turner et al., 2007)), linear summation in the explored range seems areasonable hypothesis for Drosophila KC integration. In addition, to affect our conclusions,nonlinear summation would have to enhance inter-individual PN variability while not affectingthe diversity of model KC types generated with the same nonlinear summing strategy. Finally,by focusing our analyses mostly on subthreshold responses, we ignored spike-generating
Murthy et al. Page 9
Neuron. Author manuscript; available in PMC 2009 September 25.
NIH
-PA Author Manuscript
NIH
-PA Author Manuscript
NIH
-PA Author Manuscript
nonlinearities. Thus, our data and analyses point instead to differences in PN:KC connectivityacross individuals as the most likely cause for the observed variability of KC response profiles.
Connectivity between PN and KC populationsOSN:PN connectivity in the antennal lobe is fully specified and independent of olfactoryexperience (Berdnik et al., 2006; Jefferis et al., 2004). Whereas beautiful anatomical data existon PN axonal and KC dendritic projections (Jefferis et al., 2007; Lin et al., 2007; Tanaka etal., 2004; Zhu et al., 2003), their resolution is not sufficient to indicate whether pairwise PN:KCconnectivity might be stereotyped across individuals. We did not know, therefore, whether theobserved inter-individual variability of KC responses resulted from (i)variability of synapticweight values in a stereotyped PN:KC connection matrix, (ii)variability of the entries in theconnection matrix, or (iii)some combination of the two.
In the first scheme, identified PNs would always contact the same set of KCs (identified bylineage, morphology, and gene expression) but with variable synaptic weights. While such ascheme is consistent with the role of the MB in learning and memory, the influence of individuallife histories during larval development is hard to gauge, given the homogeneous rearingconditions of our flies and, possibly more importantly, that both the PNs and KCs active inlarval olfaction are completely pruned during metamorphosis (Marin et al., 2005). Further, ourmodeling results suggest that KC response variability likely does not result from the variabilityof synaptic weight values alone in a stereotyped PN:KC connection matrix (Figure 6D).
The second possibility is that precise PN-to-KC connectivity forms independently in eachanimal, possibly with regional spatial specification, as indicated by the identifiability of PNaxonal arbors in the calyx (Jefferis et al., 2007) and by the existence of recognizable spatialdomains (also called glomeruli) in the developing larval mushroom body (Masuda-Nakagawaet al., 2005). Because PNs are broadly tuned to odors, such a connectivity scheme could stillresult in the lack of functional stereotypy we observe, in our inability to cluster GFP+ L-LP α/β KCs within the entire KC dataset, and yet, in the existence of like-responses within largerspatial domains across flies (Wang et al., 2004). Different patterns of connectivity betweenflies would be particularly interesting if the connections made by the same PNs in the lateralhorn were, by contrast, stereotypical—as has been proposed (Jefferis et al., 2007; Marin et al.,2002; Wong et al., 2002). Differences in PN-to-KC connectivity across flies, if the only sourceof variability, would have to be large (differences of at least ~40% across flies, Figure 6D).However, other possible contributions to KC response variability could, for example, includedifferences in release probability across time within each odor response, in short-termplasticity, or in the amount of inhibitory input onto each KC. Without information on suchdifferences, we cannot know the extent of their contribution to the observed lack of responsestereotypy in individual KCs.
Implications for Memory Formation and KC ReadoutGenetic and behavioral evidence in Drosophila indicate that KC output is required for the recallof odor memories (Dubnau et al., 2001; Krashes et al., 2007; McGuire et al., 2001; Schwaerzelet al., 2002). However, the functional stereotypy of individual KC responses is not aprerequisite for memory formation. In a system in which associative memories are stored aspatterns of synaptic strengths, the identities of the strengthened synapses could be differentacross animals (i.e., defined without a priori specification, but instead by which KCs respondin each animal to the odor producing the associated memory). By extension, a lack of stereotypymight be advantageous from a developmental perspective. The precise wiring of 25,000synapses (~2500 KCs with 10:1 connectivity between PNs and KCs) would require a complexand precisely controlled mechanism for axonal and dendritic targeting in the calyx. The KCs’own targets, presumably responsible for associating odor-specific KC patterns and reward
Murthy et al. Page 10
Neuron. Author manuscript; available in PMC 2009 September 25.
NIH
-PA Author Manuscript
NIH
-PA Author Manuscript
NIH
-PA Author Manuscript
signals, likely require that KC odor representations be stable in each individual, not that theybe identical across animals. Indeed, in a system responsible for associative learning, variabilityin the connection matrix used to generate and learn the representations of significant stimulimay be useful to the species at large.
EXPERIMENTAL PROCEDURESFly Stocks and Rearing
Flies were reared on standard cornmeal agar medium (Lewis, 1960), at constant temperature(25C) and constant relative humidity (65%). All recordings were made from 24-hour oldfemales. All KC recordings were made from flies of genotype yw, NP7175; UAS-eGFP2x/CyO; all PN recordings were made from flies of genotype UAS-eGFP2x; NP3529-GAL4. UAS-eGFP2x flies (Halfon et al., 2002) were crossed to the above GAL4 lines to generate thesestocks; both stocks were isogenized prior to the start of the project.
Drosophila Preparation for ElectrophysiologyFlies were anesthetized in a glass vial on ice, inserted into an appropriately shaped hole inaluminum foil, and mounted using melted beeswax (for more details see (Wilson et al.,2004)). For KC recordings, the proboscis was tucked into the head capsule and waxed there,and a small portion of cuticle removed to reveal the posterior side of the brain. The perineuralsheath was softened with 0.5mg/ml collagenase (Sigma) and gently picked away. Some headmuscles were removed to prevent movement during the recording; spontaneous leg movementstypically persisted. The extracellular saline composition was (in mM): NaCl 103, KCl 3, TES5, NaHCO3 26, NaH2PO4 1, CaCl2 1.5, MgCl2 4, trehalose 10, glucose 10, sucrose 9 (pH=7.25,275 mOsm). The saline was bubbled with 95% O2 and 5% CO2 and continuously perfusedover the preparation.
Patch-Clamp Recordings In VivoWhole-cell patch-clamp recordings were obtained from KC or PN somata under visual controlusing IR-DIC optics, GFP fluorescence and a 40X water-immersion objective on a Zeissupright microscope. Patch-clamp electrodes were pulled from capillary glass (OD=1.5,ID=1.1) with resistances of 10–12 MOhm for KCs, and 7–8 MOhm for PNs. They were filledwith intracellular solution (in mM): K aspartate 150, HEPES 10, MgATP 4, Na3GTP 0.5,EGTA 1.1 CaCl2 0.1, biocytin hydrazide 0.5% (Molecular Probes) (pH = 7.3, 265 mOsM).Hyperpolarizing current steps were used throughout recordings to measure intrinsic membraneproperties; only KCs with input resistances >10 GOhm and only PNs with input resistances>500 MOhm were used for analysis. Recordings from PNs with no odor-evoked spikingresponses to any tested odors (4/33 recordings) were not included in the analysis, as it wasassumed that the antennal nerve (exposed in the dissection required to reach PN somata) hadbeen damaged in these preparations. All cells were held between −55mV and −70mV, incurrent-clamp mode, using an Axoclamp-2B amplifier, and voltage signals were acquired inIGOR Pro (Wavemetrics, Inc.) at 10kHz via a National Instruments A–D board.
Physical access to PN somata for whole-cell recording sometimes required the removal of afew overlaying somata. Because PNs operate in local circuits, these occasional PN or LNinjuries might have affected the recorded PN responses. While smaller, KC somata offeredeasier access; likely few were removed during each dissection. In addition, KCs do not, as faras we know, interact with each other in the calyx, and thus inter-individual variability of KCresponses would not be, by contrast with those of PNs, subject to these technical issues.Experimental sources of variability in PNs, however, would only increase our estimate of inter-individual PN response noise.
Murthy et al. Page 11
Neuron. Author manuscript; available in PMC 2009 September 25.
NIH
-PA Author Manuscript
NIH
-PA Author Manuscript
NIH
-PA Author Manuscript
Odor DeliveryOdors were prepared and delivered as described previously (Wilson et al., 2004). Odors werepresented to the fly’s antenna in air (at 1/10, 1/100, and 1/1000 final dilutions in paraffin oiland air) using a custom-designed olfactometer. Odor pulses (typically 6 trials per odor) were1s long, and spaced 21s apart. The odors used in this study were: (1)ethyl acetate; (2)benzaldehyde; (3)proprionic acid; (4)linalool; (5)ethyl butyrate; (6)1-hexanol; (7)1-octen-3-ol; (8)2-heptanone; (9)isoamyl acetate; (10)2,3 butanedione; (11)methyl salicylate; (12)hexanal; (13)methanol; (14)ethanol. Not shown but also tested in several experiments,including all PN recordings, were 2 control stimuli: paraffin oil alone and an empty vial.
ImmunohistochemistryAdult brains were dissected in 1x PBS and stored on ice until fixing in 3.7% formaldehyde,100mM KPO4 (pH 6.8), 450mM KCl, 150mM NaCl, 20mM MgCl2 for 30–40 minutes. Anti-FasII (DSHB) was used at 1:100, Anti-nc82 (DSHB) at 1:10, AlexFluor568-conjugatedstreptavidin (Molecular Probes) at 1:150, and AlexaFluor568-conjugated Phalloidin(Molecular Probes) at 1:200. Secondary antibodies (Molecular Probes) used wereAlexaFluor568 goat anti-mouse and AlexaFluor633 goat anti-mouse.
Cell CountingKenyon cells labeled by NP7175-GAL4 were counted in brains that had been dissected andfixed on the same day. Brains were oriented such that the anterior side faced the slide. Imageswere acquired with identical and non-saturating settings for all brains on a Zeiss LSM 510upright confocal microscope, and cells were counted by hand using the same acquisitionsoftware. These images, at brightness settings > 45 (full range: 0–100), consistently revealedmore cells than could be visualized on the electrophysiology rig, using a fluorescencemicroscope.
Data AnalysisAll data analysis was carried out in either IGOR Pro (Wavemetrics, Inc.) or Matlab (TheMathworks, Inc.).
Spiking response—peri-stimulus time histograms (PSTHs) were formed by first detectingspikes by applying a threshold to the first derivative of each whole-cell voltage trace. Detectedspikes for each trial were then smoothed with a 30ms Gaussian filter to produce a PSTH foreach trial (333Hz final sampling rate). These PSTHs were then trial-averaged, and the odorresponse period + 1s was used for analysis. For PNs only, a 1s period of baseline was subtractedfrom each trial before averaging.
Subthreshold odor response—Each voltage trace was smoothed with a 30ms moving-average boxcar filter to remove spikes (spike waveforms at the soma are typically 15–20mswide, due to low-pass filtering by the unexcitable and high-resistance soma membrane). Thesesmoothed traces were then trial-averaged, and the odor response period + 1s was used foranalysis. For both KCs and PNs, a 1s period of baseline was subtracted from each trial beforeaveraging.
Pairwise distance metrics—Several pairwise distance metrics (ie, Euclidean, cosine,correlation, Minkowski) were tested on the PN data, and the one that best clustered both spikingand subthreshold responses from PNs of the same glomerular types was chosen for allsubsequent analysis (correlation distance). Using cosine distances on the KCs (formula below)produced qualitatively similar results as when correlation distances were used. The distancebetween each pair of cells was inserted into the appropriate row and column of the distance
Murthy et al. Page 12
Neuron. Author manuscript; available in PMC 2009 September 25.
NIH
-PA Author Manuscript
NIH
-PA Author Manuscript
NIH
-PA Author Manuscript
matrix (for example, see Figure 3C). Pairwise distances between either KC or PN responses(either subthreshold or PSTH) were calculated as follows: For each cell pair, we determinedthe number of tested odors in common. The 2s responses (odor stimulus + 1s; formed asdescribed above) for only those odors were concatenated into a vector for each cell (r and s),and the distance between the two vectors was determined. Cosine distance was calculated as:d(cos)=1–α, where α=rs’/(rr’)1/2(ss’)1/2 (‘ denotes the transpose). Correlation distance wascalculated as: d(corr)=1–β, where β=(r-mean(r))(s-mean(s))’/[(r-mean(r))(r-mean(r))’]1/2[(s-mean(s))(s-mean(s)’]1/2. The correlation distance metric was also chosen to ensure that auniform re-scaling of the gain of either response in a pair did not affect the distance betweenthe pair.
Hierarchical clustering—For each resulting distance matrix, the rows (each row containsthe pairwise distances between one cell and all other cells in the matrix) were compared usinghierarchical clustering. We used the average linkage algorithm, which forms clusters betweentwo groups (r and s) based on the average distance between all pairs of objects in cluster r andcluster s. If nr is the number of cells in cluster r and ns is the number of cells in cluster s, andxri is the ith object in cluster r and xsj is the jth object in cluster s, the definition of the averagelinkage method is: distance(r,s)=(1/nrns)*(∑ i=1 to nr)(∑ j=1 to ns)dist(xri,,xsj), wheredist=Euclidean distance weight function.
Statistics—All p values reported in this study are two-tailed values and derived from aStudent’s t test, assuming unequal variances.
(1) Predicted number of non-singletons if replicates exist: We numerically computed thecumulative probability of finding ≥ N non-singletons (in any combination of groupings) forn=27 recordings from m=20 to 31 KC types (n samples drawn with replacement from a bagwith m differently colored balls). The results are plotted in Figure 1E and 1F.
(2) K–L divergence: We quantified the similarity between a pair of distributions (P1(x),P2(x)) with the standard Kullback-Leibler divergence: D(P1‖ P2)=sumx[P1(x) log2(P1(x)/P2(x))]. Reported K–L divergences (Figure 5D) represent averages over 100 trials, each trialcomparing the distance distributions of 27 mKC types (gray curves, Figure 5C) or 27individuals of one mKC type (light red curves, Figure 5C) to each other or to the distancedistribution of the 27 recorded GFP+ L-LP KCs (green curve, Figure 5C).
(3) Goodness-of-clustering scores: a)Nearest neighbors method: We assessed the goodness-of-clustering for PNs (Figure 4) and KC split trials (supplemental data) by whether closestlinkages in the dendrogram were between PNs of the same glomerular types (i.e., DL1, VC3,DM6) or between split trials. We divided the number of PNs that did not group by glomerulartype or the number of KCs that did not group across their split trials by the total number ofcells in the dendrogram, and then subtracted this value from 1 to arrive at an overall goodness-of-clustering score for the particular dendrogram. b)Forced grouping method: this score wascalculated by forcing the pairwise distance data between mKCs into N groups, where N waspre-determined by the known number of mKC types in the data-set, and then subtracting from1 the fraction of data that were assigned to the wrong group; group identity was defined by themKC type most represented in that group. Over this procedure, no two groups shared the sameidentity. Goodness-of-clustering scores in Figure 5D were computed from 20 trials, each trialcontaining 23 mKC types and 10 individuals of each type.
KC simulationsGeneration of mPNs—The data and results in Figure 5 and Figure 6 were generated usingthe temporal-shift procedure (method a below). The mPN responses generated with this method
Murthy et al. Page 13
Neuron. Author manuscript; available in PMC 2009 September 25.
NIH
-PA Author Manuscript
NIH
-PA Author Manuscript
NIH
-PA Author Manuscript
produced inter-mPN and PN-mPN response profile distances that fell within the range of inter-PN distances in the recorded set (supplemental data).
a)Temporal-shift method: We selected 79/81 PN PSTH curves and delayed the response onsetby a random amount chosen uniformly from the interval of 0 to 300ms, generating 79 new PNPSTH curves. This strategy was based on the observation that the primary difference betweenrecordings from a larger set of PNs (Bhandawat et al., 2007) and those sampled here was awider range of temporal delays of response onset relative to odor onset. The distribution ofdistances between mKC and KC response profiles (Figure 5) overlapped best for mKCs formedfrom mPNs generated with the temporal-shift method (as compared to methods b and c below),serving as a post-hoc validation of this method. b)Principal component analysis (PCA)method: We used the 81 recorded PN PSTH curves, performed PCA, and used the measuredprobability distributions of the top 20 PCA coefficients, treated as independent variables, torandomly sample a new set of coefficients. With the associated principal components and newcoefficients, we constructed 79 additional curves (for a total of 160 curves) with features thatresembled the original traces. c) Only the original set of recorded PN PSTH curves were usedas the mPN responses.
Generation of inter-individual variability—We observed that individual responsevariability roughly correlates with the mean response. To port the variability curves recordedfrom PN types sampled more than once (e.g., DL1) to different PN types, we first “whitened”the content of the variability curves using a normalization procedure. The resulting inter-individual variability is a reasonable match to the data (supplemental data). Using recordingsof all odors for all PNs sampled more than once (DL1, VC3, and DM6), we constructed alibrary of 168 PN variance curves by grouping all individual spiking responses (rβi(t)) fromthe same PN/odor combination (β), and subtracting from each response the mean type response(<rβι(t)>)i for that PN/odor combination. We then multiplied each variability curve originatingfrom a type β response by a normalization factor nβ(t). nβ(t) varies inversely with the amplitudeof the instantaneous mean type response: nβ(t)=(a – (|<(rβ(t)>|/maxt(|<rβ(t)>|))/a, where 1<a<∞.This factor ranges from 1 for |<(rβ(t)>|=0 to (a-1)/a for |<(rβ(t)>|=maxt(|<rβ(t)>|. When theparameter a →∞ the factor (a-1)/a→1, so there is almost no re-normalization. When (a-1)→0,rescaling is strong, because (a-1)/a→0. In our simulations, a=1.1. To generate individuallyvarying mKC responses, we first chose a PN:KC weight vector (a binary vector of 0’s and 1’s,with a random set of Nconv entries set to 1) and generated an mKC type response (differentmKC types were generated using different random PN:KC weight vectors). For each γth mPNtype response <rγ(t)> with a non-zero entry in the weight vector, we then randomly selected avariability curve from the full library, and multiplied it with the inverse normalization factornγ(t)−1=a*(a–(|<(rγ(t)>|/maxt(|<rγ(t)>|))−1 to produce a scaled variability trace that roughly co-varied with the selected mPN type; we added this variability to <rγ(t)> to produce an individualversion of that type response, and repeated this for all mPNs selected by the weight vector.These summed curves produced one individual mKC response for that type. Reconstructingthe model using only un-normalized individual variability curves produced better separationbetween inter-individual and inter-type distances, leading to better clustering (data not shown).Thus, the normalization procedure produced more conservative statements about KCidentifiability.
Sampling experiment—For each run of the sampling experiment, we randomly selected27 individual curves from a newly generated set of mKCs consisting of 27 individuals each of23 types. The experiment was repeated 2000 times (for each Nconv).
Varying PN:KC weights and connectivity—To determine the effect of varying PN:KCweights on KC response variability, we assigned each mKC type a binary PN:KC weightvector, as before, but allowed the weights for the nonzero entries of the binary connection
Murthy et al. Page 14
Neuron. Author manuscript; available in PMC 2009 September 25.
NIH
-PA Author Manuscript
NIH
-PA Author Manuscript
NIH
-PA Author Manuscript

matrix to take analog values. For each individual of a type, the non-zero weights were selectedrandomly from the interval [1−p,1+p], where p refers to the percent variability allowed in theweights, and ranged from 0 to 0.8. To determine the effect of varying PN:KC connectivity onKC response variability, we defined each mKC type by an archetypal binary PN:KC weightvector. Individual mKCs were generated from the archetype weight vector by selecting afraction p of the non-zero entries, setting them to zero, and randomly selecting an equal numberof new non-zero entries. As above, p refers to the percent variability, and ranged from 0 to 0.8.Figure 6D was generated from these model KC data using the methods described underSampling experiment.
Supplementary MaterialRefer to Web version on PubMed Central for supplementary material.
ACKNOWLEDGEMENTSWe are grateful to Kai Zinn for the use of his laboratory to rear flies and establish crosses, to Glenn Turner for helpin establishing recording techniques from Kenyon cells, to Kei Ito for the gifts of NP7175-GAL4 and NP3529-GAL4, to Philip Coen for help with the anatomical identification of KCs, to the Caltech Biological Imaging Centerfor use of confocal microscopes, to members of the Laurent lab for advice, and to David Anderson, Benjamin Rubin,Kai Zinn, Glenn Turner, and Timothy Tayler for providing comments on this manuscript. MM is a Helen Hay WhitneyFoundation Postdoctoral Fellow and IF is a Senior Broad Fellow in Brain Circuitry. This work was funded by grantsfrom the NIDCD, the NSF BITS Program and the Lawrence Hanson Fund (GL).
REFERENCESBelluscio L, Katz LC. Symmetry, stereotypy, and topography of odorant representations in mouse
olfactory bulbs. J Neurosci 2001;21:2113–2122. [PubMed: 11245695]Berdnik D, Chihara T, Couto A, Luo L. Wiring stability of the adult Drosophila olfactory circuit after
lesion. J Neurosci 2006;26:3367–3376. [PubMed: 16571743]Bhandawat V, Olsen SR, Gouwens NW, Schlief ML, Wilson RI. Sensory processing in the Drosophila
antennal lobe increases reliability and separability of ensemble odor representations. Natureneuroscience. 2007
Brand AH, Perrimon N. Targeted gene expression as a means of altering cell fates and generatingdominant phenotypes. Development (Cambridge, England) 1993;118:401–415.
Couto A, Alenius M, Dickson BJ. Molecular, anatomical, and functional organization of the Drosophilaolfactory system. Curr Biol 2005;15:1535–1547. [PubMed: 16139208]
Crittenden JR, Skoulakis EM, Han KA, Kalderon D, Davis RL. Tripartite mushroom body architecturerevealed by antigenic markers. Learning & memory (Cold Spring Harbor, N.Y 1998;5:38–51.
Daniels RW, Gelfand MV, Collins CA, DiAntonio A. Visualizing glutamatergic cell bodies and synapsesin Drosophila larval and adult CNS. The Journal of comparative neurology 2008;508:131–152.[PubMed: 18302156]
Davis RL. Mushroom bodies and Drosophila learning. Neuron 1993;11:1–14. [PubMed: 8338661]Davis RL. Olfactory memory formation in Drosophila: from molecular to systems neuroscience. Annual
review of neuroscience 2005;28:275–302.de Bruyne M, Foster K, Carlson JR. Odor coding in the Drosophila antenna. Neuron 2001;30:537–552.
[PubMed: 11395013]Dobritsa AA, van der Goes van Naters W, Warr CG, Steinbrecht RA, Carlson JR. Integrating the
molecular and cellular basis of odor coding in the Drosophila antenna. Neuron 2003;37:827–841.[PubMed: 12628173]
Dubnau J, Grady L, Kitamoto T, Tully T. Disruption of neurotransmission in Drosophila mushroom bodyblocks retrieval but not acquisition of memory. Nature 2001;411:476–480. [PubMed: 11373680]
Fishilevich E, Vosshall LB. Genetic and functional subdivision of the Drosophila antennal lobe. CurrBiol 2005;15:1548–1553. [PubMed: 16139209]
Murthy et al. Page 15
Neuron. Author manuscript; available in PMC 2009 September 25.
NIH
-PA Author Manuscript
NIH
-PA Author Manuscript
NIH
-PA Author Manuscript
Gerber B, Tanimoto H, Heisenberg M. An engram found? Evaluating the evidence from fruit flies. Currentopinion in neurobiology 2004;14:737–744. [PubMed: 15582377]
Gu H, O'Dowd DK. Cholinergic synaptic transmission in adult Drosophila Kenyon cells in situ. J Neurosci2006;26:265–272. [PubMed: 16399696]
Halfon MS, Gisselbrecht S, Lu J, Estrada B, Keshishian H, Michelson AM. New fluorescent proteinreporters for use with the Drosophila Gal4 expression system and for vital detection of balancerchromosomes. Genesis 2002;34:135–138. [PubMed: 12324968]
Hallem EA, Carlson JR. The odor coding system of Drosophila. Trends Genet 2004;20:453–459.[PubMed: 15313555]
Hallem EA, Ho MG, Carlson JR. The molecular basis of odor coding in the Drosophila antenna. Cell2004;117:965–979. [PubMed: 15210116]
Han PL, Levin LR, Reed RR, Davis RL. Preferential expression of the Drosophila rutabaga gene inmushroom bodies, neural centers for learning in insects. Neuron 1992;9:619–627. [PubMed:1382471]
Heisenberg M, Borst A, Wagner S, Byers D. Drosophila mushroom body mutants are deficient inolfactory learning. Journal of neurogenetics 1985;2:1–30. [PubMed: 4020527]
Heisenberg M, Heusipp M, Wanke C. Structural plasticity in the Drosophila brain. J Neurosci1995;15:1951–1960. [PubMed: 7891144]
Ito K, Awano W, Suzuki K, Hiromi Y, Yamamoto D. The Drosophila mushroom body is a quadruplestructure of clonal units each of which contains a virtually identical set of neurones and glial cells.Development (Cambridge, England) 1997;124:761–771.
Jefferis GS, Marin EC, Stocker RF, Luo L. Target neuron prespecification in the olfactory map ofDrosophila. Nature 2001;414:204–208. [PubMed: 11719930]
Jefferis GS, Potter CJ, Chan AM, Marin EC, Rohlfing T, Maurer CR Jr, Luo L. Comprehensive maps ofDrosophila higher olfactory centers: spatially segregated fruit and pheromone representation. Cell2007;128:1187–1203. [PubMed: 17382886]
Jefferis GS, Vyas RM, Berdnik D, Ramaekers A, Stocker RF, Tanaka NK, Ito K, Luo L. Developmentalorigin of wiring specificity in the olfactory system of Drosophila. Development (Cambridge,England) 2004;131:117–130.
Komiyama T, Luo L. Development of wiring specificity in the olfactory system. Current opinion inneurobiology 2006;16:67–73. [PubMed: 16377177]
Krashes MJ, Keene AC, Leung B, Armstrong JD, Waddell S. Sequential use of mushroom body neuronsubsets during drosophila odor memory processing. Neuron 2007;53:103–115. [PubMed: 17196534]
Kurusu M, Awasaki T, Masuda-Nakagawa LM, Kawauchi H, Ito K, Furukubo-Tokunaga K. Embryonicand larval development of the Drosophila mushroom bodies: concentric layer subdivisions and therole of fasciclin II. Development (Cambridge, England) 2002;129:409–419.
Laissue PP, Reiter C, Hiesinger PR, Halter S, Fischbach KF, Stocker RF. Three-dimensionalreconstruction of the antennal lobe in Drosophila melanogaster. The Journal of comparativeneurology 1999;405:543–552. [PubMed: 10098944]
Lee T, Lee A, Luo L. Development of the Drosophila mushroom bodies: sequential generation of threedistinct types of neurons from a neuroblast. Development (Cambridge, England) 1999;126:4065–4076.
Lewis EB. Drosophila Information Service. 1960;34Lin HH, Lai JS, Chin AL, Chen YC, Chiang AS. A map of olfactory representation in the Drosophila
mushroom body. Cell 2007;128:1205–1217. [PubMed: 17382887]Margulies C, Tully T, Dubnau J. Deconstructing memory in Drosophila. Curr Biol 2005;15:R700–R713.
[PubMed: 16139203]Marin EC, Jefferis GS, Komiyama T, Zhu H, Luo L. Representation of the glomerular olfactory map in
the Drosophila brain. Cell 2002;109:243–255. [PubMed: 12007410]Marin EC, Watts RJ, Tanaka NK, Ito K, Luo L. Developmentally programmed remodeling of the
Drosophila olfactory circuit. Development (Cambridge, England) 2005;132:725–737.
Murthy et al. Page 16
Neuron. Author manuscript; available in PMC 2009 September 25.
NIH
-PA Author Manuscript
NIH
-PA Author Manuscript
NIH
-PA Author Manuscript
Masuda-Nakagawa LM, Tanaka NK, O'Kane CJ. Stereotypic and random patterns of connectivity in thelarval mushroom body calyx of Drosophila. Proceedings of the National Academy of Sciences of theUnited States of America 2005;102:19027–19032. [PubMed: 16357192]
McGuire SE, Le PT, Davis RL. The role of Drosophila mushroom body signaling in olfactory memory.Science (New York, N.Y 2001;293:1330–1333.
McGuire SE, Le PT, Osborn AJ, Matsumoto K, Davis RL. Spatiotemporal rescue of memory dysfunctionin Drosophila. Science (New York, N.Y 2003;302:1765–1768.
Meister M, Bonhoeffer T. Tuning and topography in an odor map on the rat olfactory bulb. J Neurosci2001;21:1351–1360. [PubMed: 11160406]
Menzel R. Neurobiology of learning and memory: the honeybee as a model system. DieNaturwissenschaften 1983;70:504–511. [PubMed: 6656885]
Mombaerts P, Wang F, Dulac C, Chao SK, Nemes A, Mendelsohn M, Edmondson J, Axel R. Visualizingan olfactory sensory map. Cell 1996;87:675–686. [PubMed: 8929536]
Ng M, Roorda RD, Lima SQ, Zemelman BV, Morcillo P, Miesenbock G. Transmission of olfactoryinformation between three populations of neurons in the antennal lobe of the fly. Neuron2002;36:463–474. [PubMed: 12408848]
Nighorn A, Healy MJ, Davis RL. The cyclic AMP phosphodiesterase encoded by the Drosophila duncegene is concentrated in the mushroom body neuropil. Neuron 1991;6:455–467. [PubMed: 1848082]
Olsen SR, Bhandawat V, Wilson RI. Excitatory interactions between olfactory processing channels inthe Drosophila antennal lobe. Neuron 2007;54:89–103. [PubMed: 17408580]
Perez-Orive J, Mazor O, Turner GC, Cassenaer S, Wilson RI, Laurent G. Oscillations and sparsening ofodor representations in the mushroom body. Science (New York, N.Y 2002;297:359–365.
Quinn WG, Harris WA, Benzer S. Conditioned behavior in Drosophila melanogaster. Proceedings of theNational Academy of Sciences of the United States of America 1974;71:708–712. [PubMed:4207071]
Ressler KJ, Sullivan SL, Buck LB. Information coding in the olfactory system: evidence for a stereotypedand highly organized epitope map in the olfactory bulb. Cell 1994;79:1245–1255. [PubMed:7528109]
Rubin BD, Katz LC. Optical imaging of odorant representations in the mammalian olfactory bulb. Neuron1999;23:499–511. [PubMed: 10433262]
Schwaerzel M, Heisenberg M, Zars T. Extinction antagonizes olfactory memory at the subcellular level.Neuron 2002;35:951–960. [PubMed: 12372288]
Schwartz YB, Boykova T, Belyaeva ES, Ashburner M, Zhimulev IF. Molecular characterization of thesinged wings locus of Drosophila melanogaster. BMC genetics 2004;5:15. [PubMed: 15189568]
Shang Y, Claridge-Chang A, Sjulson L, Pypaert M, Miesenbock G. Excitatory local circuits and theirimplications for olfactory processing in the fly antennal lobe. Cell 2007;128:601–612. [PubMed:17289577]
Stopfer M, Jayaraman V, Laurent G. Intensity versus identity coding in an olfactory system. Neuron2003;39:991–1004. [PubMed: 12971898]
Stopfer M, Laurent G. Short-term memory in olfactory network dynamics. Nature 1999;402:664–668.[PubMed: 10604472]
Strausfeld NJ, Sinakevitch I, Vilinsky I. The mushroom bodies of Drosophila melanogaster: animmunocytological and golgi study of Kenyon cell organization in the calyces and lobes. Microscopyresearch and technique 2003;62:151–169. [PubMed: 12966500]
Tamura T, Chiang AS, Ito N, Liu HP, Horiuchi J, Tully T, Saitoe M. Aging specifically impairs amnesiac-dependent memory in Drosophila. Neuron 2003;40:1003–1011. [PubMed: 14659098]
Tanaka NK, Awasaki T, Shimada T, Ito K. Integration of chemosensory pathways in the Drosophilasecond-order olfactory centers. Curr Biol 2004;14:449–457. [PubMed: 15043809]
Technau GM. Fiber number in the mushroom bodies of adult Drosophila melanogaster depends on age,sex and experience. Journal of neurogenetics 1984;1:113–126. [PubMed: 6085635]
Turner GC, Bazhenov M, Laurent G. Olfactory Representations by Drosophila Mushroom Body Neurons.Journal of neurophysiology. 2007
Murthy et al. Page 17
Neuron. Author manuscript; available in PMC 2009 September 25.
NIH
-PA Author Manuscript
NIH
-PA Author Manuscript
NIH
-PA Author Manuscript

Uchida N, Takahashi YK, Tanifuji M, Mori K. Odor maps in the mammalian olfactory bulb: domainorganization and odorant structural features. Nature neuroscience 2000;3:1035–1043.
Vassar R, Chao SK, Sitcheran R, Nunez JM, Vosshall LB, Axel R. Topographic organization of sensoryprojections to the olfactory bulb. Cell 1994;79:981–991. [PubMed: 8001145]
Vosshall LB, Stocker RF. Molecular Architecture of Smell and Taste in Drosophila. Annual review ofneuroscience. 2006
Wang JW, Wong AM, Flores J, Vosshall LB, Axel R. Two-photon calcium imaging reveals an odor-evoked map of activity in the fly brain. Cell 2003;112:271–282. [PubMed: 12553914]
Wang Y, Guo HF, Pologruto TA, Hannan F, Hakker I, Svoboda K, Zhong Y. Stereotyped odor-evokedactivity in the mushroom body of Drosophila revealed by green fluorescent protein-based Ca2+imaging. J Neurosci 2004;24:6507–6514. [PubMed: 15269261]
Wilson RI, Turner GC, Laurent G. Transformation of olfactory representations in the Drosophila antennallobe. Science (New York, N.Y 2004;303:366–370.
Wong AM, Wang JW, Axel R. Spatial representation of the glomerular map in the Drosophilaprotocerebrum. Cell 2002;109:229–241. [PubMed: 12007409]
Yasuyama K, Meinertzhagen IA, Schurmann FW. Synaptic organization of the mushroom body calyx inDrosophila melanogaster. The Journal of comparative neurology 2002;445:211–226. [PubMed:11920702]
Zars T, Fischer M, Schulz R, Heisenberg M. Localization of a short-term memory in Drosophila. Science(New York, N.Y 2000;288:672–675.
Zhu S, Chiang AS, Lee T. Development of the Drosophila mushroom bodies: elaboration, remodelingand spatial organization of dendrites in the calyx. Development (Cambridge, England)2003;130:2603–2610.
Murthy et al. Page 18
Neuron. Author manuscript; available in PMC 2009 September 25.
NIH
-PA Author Manuscript
NIH
-PA Author Manuscript
NIH
-PA Author Manuscript
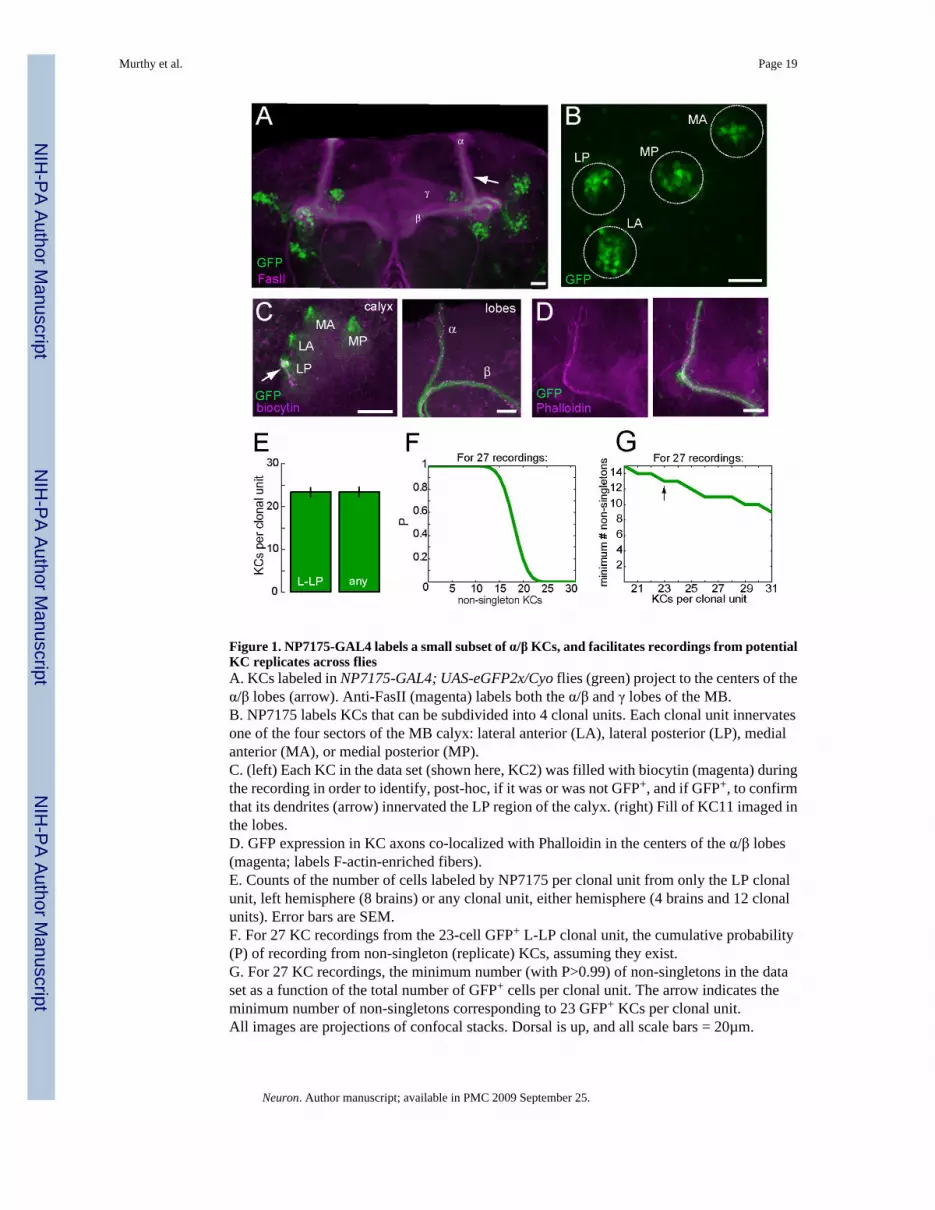
Figure 1. NP7175-GAL4 labels a small subset of α/β KCs, and facilitates recordings from potentialKC replicates across fliesA. KCs labeled in NP7175-GAL4; UAS-eGFP2x/Cyo flies (green) project to the centers of theα/β lobes (arrow). Anti-FasII (magenta) labels both the α/β and γ lobes of the MB.B. NP7175 labels KCs that can be subdivided into 4 clonal units. Each clonal unit innervatesone of the four sectors of the MB calyx: lateral anterior (LA), lateral posterior (LP), medialanterior (MA), or medial posterior (MP).C. (left) Each KC in the data set (shown here, KC2) was filled with biocytin (magenta) duringthe recording in order to identify, post-hoc, if it was or was not GFP+, and if GFP+, to confirmthat its dendrites (arrow) innervated the LP region of the calyx. (right) Fill of KC11 imaged inthe lobes.D. GFP expression in KC axons co-localized with Phalloidin in the centers of the α/β lobes(magenta; labels F-actin-enriched fibers).E. Counts of the number of cells labeled by NP7175 per clonal unit from only the LP clonalunit, left hemisphere (8 brains) or any clonal unit, either hemisphere (4 brains and 12 clonalunits). Error bars are SEM.F. For 27 KC recordings from the 23-cell GFP+ L-LP clonal unit, the cumulative probability(P) of recording from non-singleton (replicate) KCs, assuming they exist.G. For 27 KC recordings, the minimum number (with P>0.99) of non-singletons in the dataset as a function of the total number of GFP+ cells per clonal unit. The arrow indicates theminimum number of non-singletons corresponding to 23 GFP+ KCs per clonal unit.All images are projections of confocal stacks. Dorsal is up, and all scale bars = 20µm.
Murthy et al. Page 19
Neuron. Author manuscript; available in PMC 2009 September 25.
NIH
-PA Author Manuscript
NIH
-PA Author Manuscript
NIH
-PA Author Manuscript
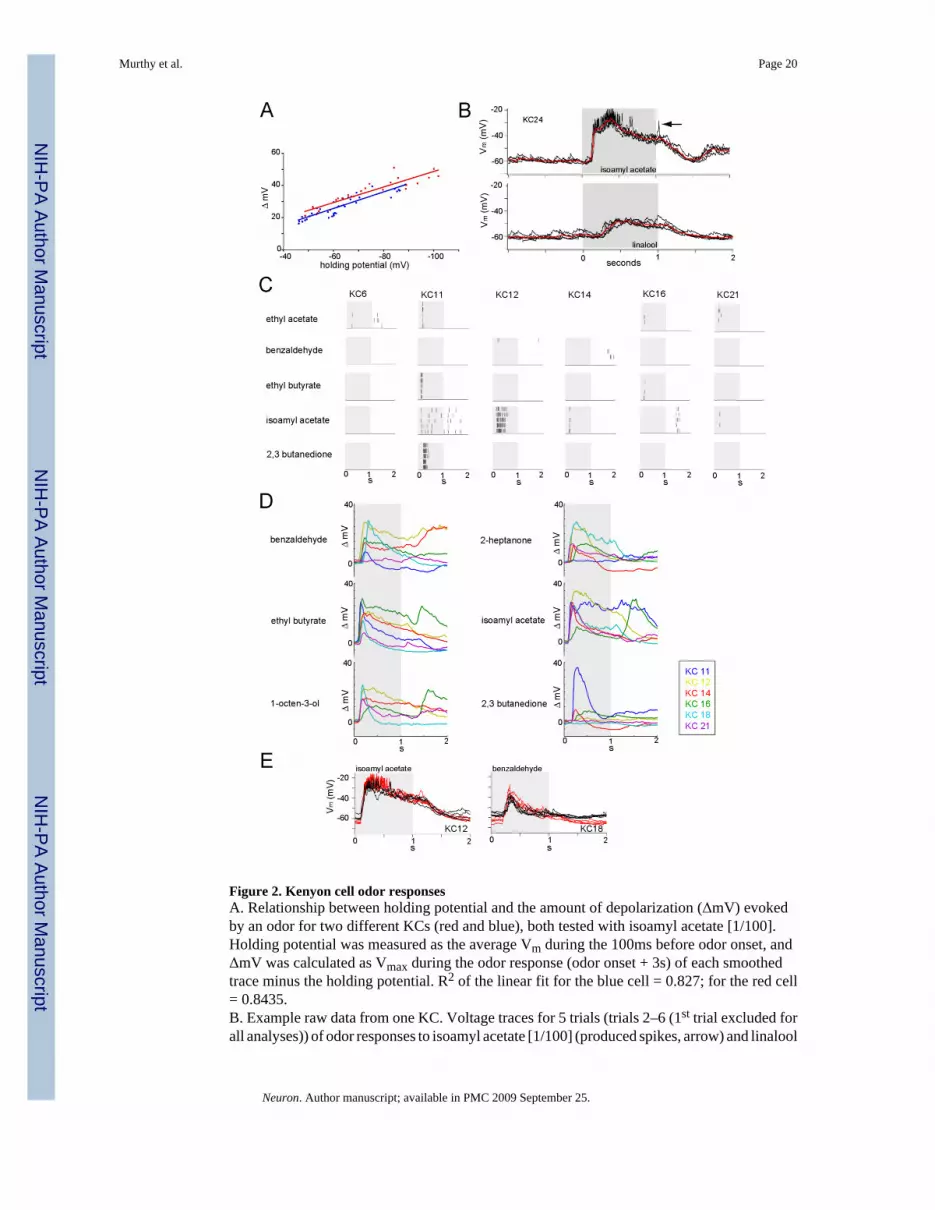
Figure 2. Kenyon cell odor responsesA. Relationship between holding potential and the amount of depolarization (ΔmV) evokedby an odor for two different KCs (red and blue), both tested with isoamyl acetate [1/100].Holding potential was measured as the average Vm during the 100ms before odor onset, andΔmV was calculated as Vmax during the odor response (odor onset + 3s) of each smoothedtrace minus the holding potential. R2 of the linear fit for the blue cell = 0.827; for the red cell= 0.8435.B. Example raw data from one KC. Voltage traces for 5 trials (trials 2–6 (1st trial excluded forall analyses)) of odor responses to isoamyl acetate [1/100] (produced spikes, arrow) and linalool
Murthy et al. Page 20
Neuron. Author manuscript; available in PMC 2009 September 25.
NIH
-PA Author Manuscript
NIH
-PA Author Manuscript
NIH
-PA Author Manuscript
[1/100] (did not produce spikes). The odor stimulus (light gray bar) occurs at time 0 and lastsfor 1s. Subthreshold odor responses (trial-averaged) are overlaid in red.C. Spike rasters for 5 odors and 6 GFP+ L-LP KCs; ethyl acetate was not tested on KCs 12 and14. All odors shown were delivered at [1/100]. Each KC in the data set was tested with 10different odors, on average.D. Subthreshold odor responses for 6 odors (all presented at [1/100]) and 6 GFP+ L-LP KCs.E. Stability of KC responses during a recording: raw membrane voltage traces from KC12(left) and KC18 (right) for the same odor presented at the beginning (red trials) and end (blacktrials) of each experiment.
Murthy et al. Page 21
Neuron. Author manuscript; available in PMC 2009 September 25.
NIH
-PA Author Manuscript
NIH
-PA Author Manuscript
NIH
-PA Author Manuscript

Figure 3. Lack of obvious functional replicates among the GFP+ L-LP KC recordingsA. Odor response chart: odors were chosen from a set of 38 (12 odors delivered at 3 differentfinal concentrations, [1/10], [1/100], and [1/1000], and 2 odors delivered only at [1/10] (seemethods for odor identities)). For each odor tested, response (red) = spikes on 3 or more trials,and no response (gray) = spikes on 2 or fewer trials. White boxes indicate odors not tested.Cells 1–27 are from the GFP+ L-LP clonal unit, 28–32 are GFP+ from other clonal units, 33–44 are GFP− α/β, 45–47 are GFP− α’/β’, and 48–50 are GFP− γ. The somata of recordedGFP− cells were located adjacent to GFP+ somata, mostly from the L-LP clonal unit.B. Pairwise Euclidean distances between odor response profiles (rows in A). A distance of 0(black) indicates that odor response profiles are identical and non-zero for the KC pair.
Murthy et al. Page 22
Neuron. Author manuscript; available in PMC 2009 September 25.
NIH
-PA Author Manuscript
NIH
-PA Author Manuscript
NIH
-PA Author Manuscript
Distances >0 and KC pairs with no responses to any common odors (spikes on 2 or fewer trials)are colored white.C. Pairwise correlation distances based on subthreshold odor responses (correlation distancescan range from 0 (perfect correlation) to 2 (anti-correlation)) for all 50 KCs, and for all odorstested in common between each pair of cells.D. Probability distributions (smoothed histograms; bin size = 0.1) of pairwise correlationdistances in C. The distribution of distances between only GFP+ L-LP cells (green) overlapsthe distribution of distances between GFP+ L-LP cells and GFP− cells (gray), as do the meansand standard deviations of the distributions (inset). The distribution of distances between trialsfor each KC/odor combination (blue) is significantly smaller than the inter-KC distances. * forStudent’s t test between GFP+ L-LP distances and trial-trial distances, p<10−87.E. Hierarchical clustering of all KCs (based on average linkage of pairwise distances shownin C). The identities (1–27) of GFP+ L-LP KCs (dark green) are indicated below thecorresponding leaves of the tree.
Murthy et al. Page 23
Neuron. Author manuscript; available in PMC 2009 September 25.
NIH
-PA Author Manuscript
NIH
-PA Author Manuscript
NIH
-PA Author Manuscript
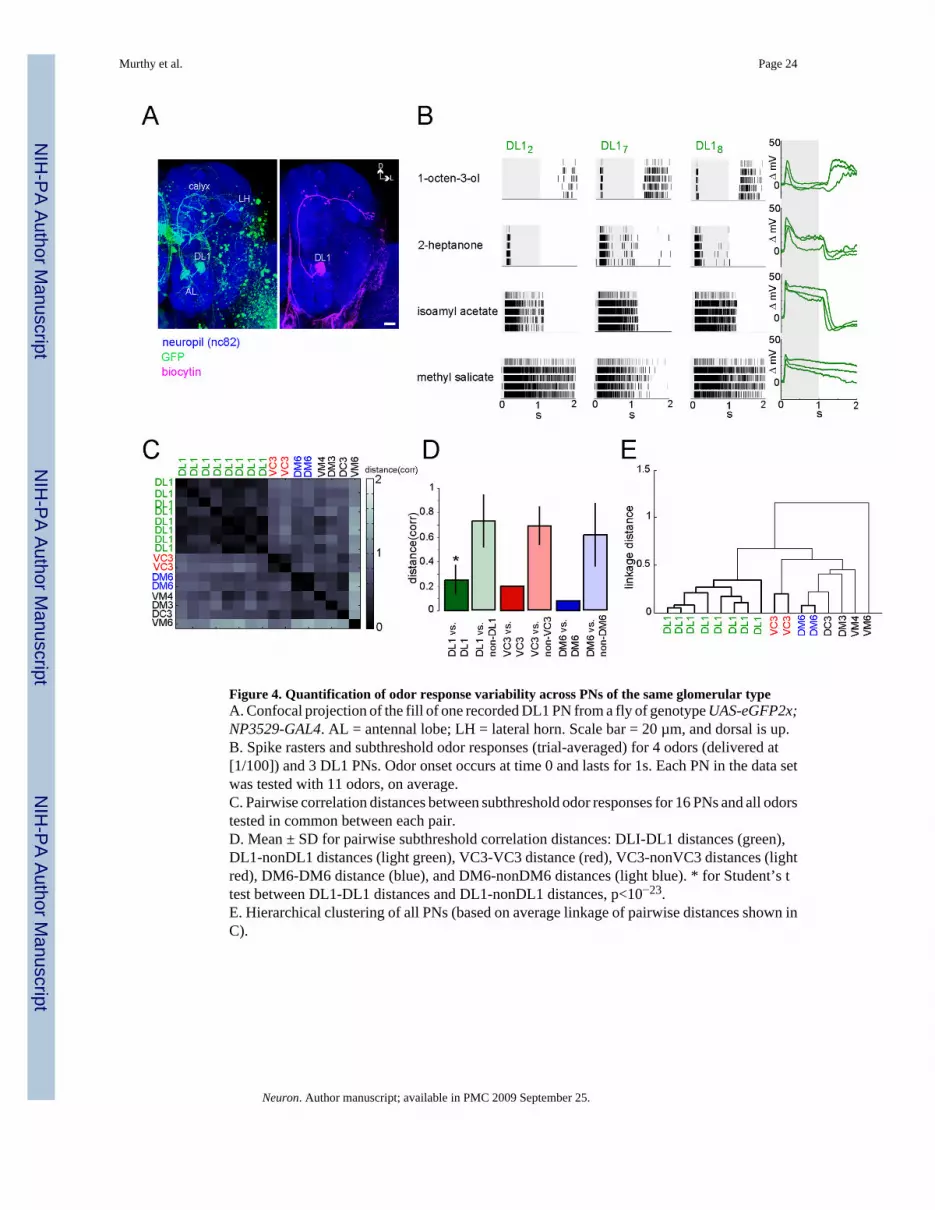
Figure 4. Quantification of odor response variability across PNs of the same glomerular typeA. Confocal projection of the fill of one recorded DL1 PN from a fly of genotype UAS-eGFP2x;NP3529-GAL4. AL = antennal lobe; LH = lateral horn. Scale bar = 20 µm, and dorsal is up.B. Spike rasters and subthreshold odor responses (trial-averaged) for 4 odors (delivered at[1/100]) and 3 DL1 PNs. Odor onset occurs at time 0 and lasts for 1s. Each PN in the data setwas tested with 11 odors, on average.C. Pairwise correlation distances between subthreshold odor responses for 16 PNs and all odorstested in common between each pair.D. Mean ± SD for pairwise subthreshold correlation distances: DLI-DL1 distances (green),DL1-nonDL1 distances (light green), VC3-VC3 distance (red), VC3-nonVC3 distances (lightred), DM6-DM6 distance (blue), and DM6-nonDM6 distances (light blue). * for Student’s ttest between DL1-DL1 distances and DL1-nonDL1 distances, p<10−23.E. Hierarchical clustering of all PNs (based on average linkage of pairwise distances shown inC).
Murthy et al. Page 24
Neuron. Author manuscript; available in PMC 2009 September 25.
NIH
-PA Author Manuscript
NIH
-PA Author Manuscript
NIH
-PA Author Manuscript
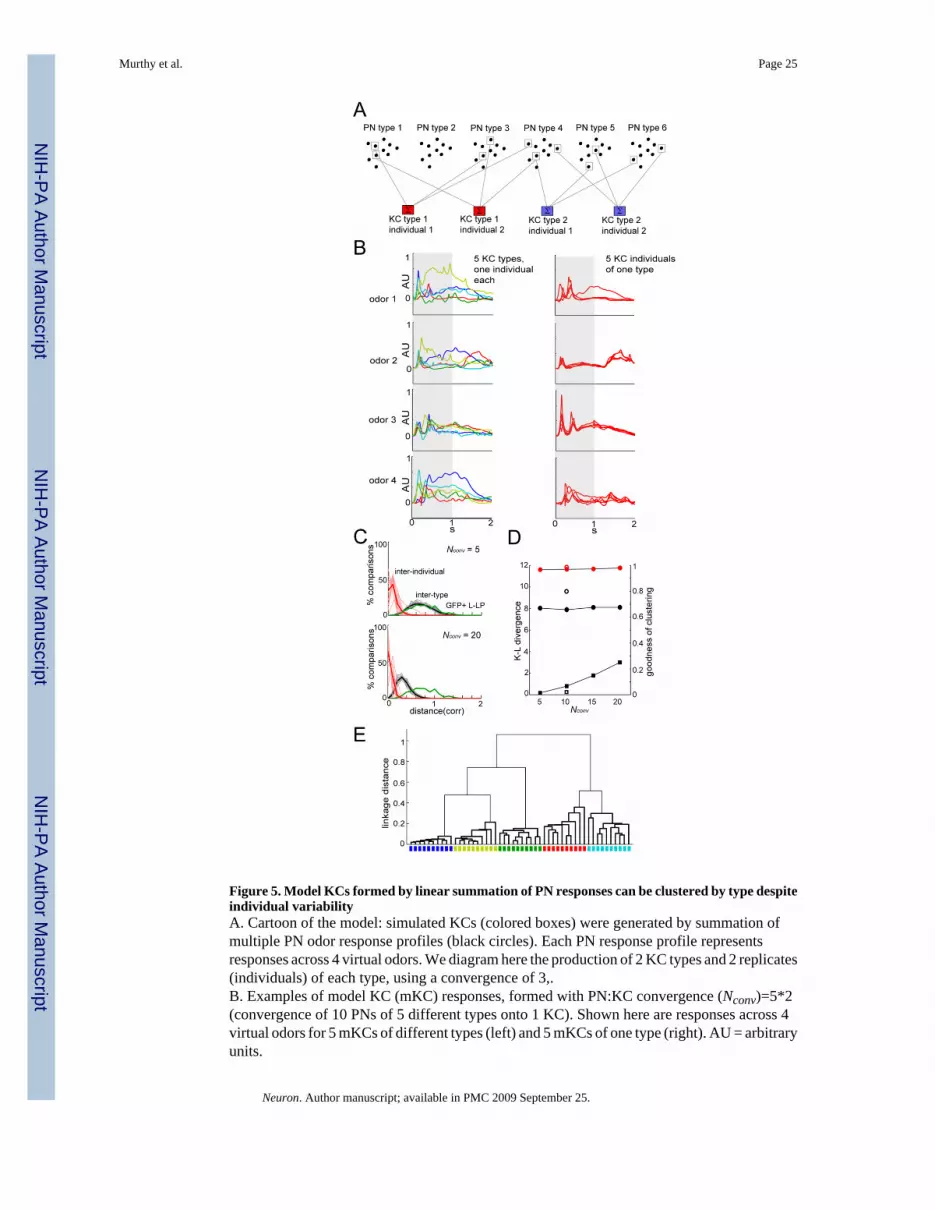
Figure 5. Model KCs formed by linear summation of PN responses can be clustered by type despiteindividual variabilityA. Cartoon of the model: simulated KCs (colored boxes) were generated by summation ofmultiple PN odor response profiles (black circles). Each PN response profile representsresponses across 4 virtual odors. We diagram here the production of 2 KC types and 2 replicates(individuals) of each type, using a convergence of 3,.B. Examples of model KC (mKC) responses, formed with PN:KC convergence (Nconv)=5*2(convergence of 10 PNs of 5 different types onto 1 KC). Shown here are responses across 4virtual odors for 5 mKCs of different types (left) and 5 mKCs of one type (right). AU = arbitraryunits.
Murthy et al. Page 25
Neuron. Author manuscript; available in PMC 2009 September 25.
NIH
-PA Author Manuscript
NIH
-PA Author Manuscript
NIH
-PA Author Manuscript

C. Probability distributions of mKC (red and black curves) and GFP+ L-LP KC (green curves;reproduced from Figure 3D) pairwise distances for Nconv=5 and 20; bin size=0.1. To comparewith the real data, we plot the distributions of correlation distances between 27 mKCs ofdifferent types (15 examples, gray) or between 27 individuals of a single mKC type (15examples, light red). The average over 100 such curves is overlaid in black (inter-typedistances) or red (inter-individual distances).D. Kulblack-Leibler (K–L) divergences between mKC inter-type distances and GFP+ L-LPdistances grew with increasing Nconv (black squares). However, K–L divergences betweenmKC inter-type and inter-individual distances were not affected by Nconv (black circles). Thegoodness-of-clustering score (red circles) is a measure of how well mKCs group by typethrough hierarchical clustering (see E). Scores for Nconv=5*2 are plotted as open circles andsquares. A K–L divergence of 0 indicates a perfect overlap between two distributions. Errorbars are SEM.E. The data in B for 5 mKC types (shown here 10 individuals of each type) was easily clusteredby type. Colored squares correspond to the different KC types shown in B.
Murthy et al. Page 26
Neuron. Author manuscript; available in PMC 2009 September 25.
NIH
-PA Author Manuscript
NIH
-PA Author Manuscript
NIH
-PA Author Manuscript

Figure 6. Clustering thresholds from the model applied to the data indicate few potential replicatesA. One run of the sampling experiment for Nconv=5*2. The numbers on the abscissa indicatedifferent mKC types. The gray line is, for this dendrogram, the highest threshold below whichall groupings are only between non-singleton mKCs (correct groupings – thick black lines).Above the threshold there is at least one grouping between mKCs of different types (e.g., mKCsof type 2 with an mKC of type 8).B. Hierarchical clustering of only GFP+ L-LP KCs. The red line is drawn at the mean valuefrom 2000 thresholds for Nconv=5*2, each threshold derived from a run of the samplingexperiment (as in A). The light red box indicates the 10–90% range of these thresholds.
Murthy et al. Page 27
Neuron. Author manuscript; available in PMC 2009 September 25.
NIH
-PA Author Manuscript
NIH
-PA Author Manuscript
NIH
-PA Author Manuscript

C. Cumulative probability distributions of identifying n non-singletons in the model (bluecurves) or in the real data (red curves). From the sampling experiment, probability distributionswere formed by thresholding the model dendrograms for each value of Nconv=5,5*2, or 10(dark to light blue, respectively). Because thresholds miss linkages between individuals of onetype with large variance, this method undercounts the true number of non-singletons in thedendrograms and the model (blue) probability distributions lie to the left of the predicteddistribution (green; reproduced from Figure 1F). For the real data, probability distributions offinding n non-singletons are formed by applying, one at a time, the complete set of thresholdsfrom the sampling experiment (for Nconv=5,5*2, or 10 (dark to light red curves, respectively))to the dendrogram in B and counting the number of KCs with linkage distances below eachthreshold. Inset: average number of non-singletons predicted (green line) or identified usingthe thresholds in the model (blue) or in the real data (red).D. For Nconv=5 only, the average number of KC non-singletons found (by the methodsdescribed above) in the model (blue) or in the real data (red) as the percent variability in eitherthe synaptic weights (left) or identities of presynaptic PNs (right) was increased systematicallyfrom 0 to 80% across individuals.
Murthy et al. Page 28
Neuron. Author manuscript; available in PMC 2009 September 25.
NIH
-PA Author Manuscript
NIH
-PA Author Manuscript
NIH
-PA Author Manuscript