how to effectively manage project risks - docushare
TRANSCRIPT
How to Effectively Manage Project Risks
Michael D. Taylor

P a g e | 2
Copyright 2003-2009 by Michael D. Taylor
All Rights Reserved. No part of this work covered by the copyright hereon may be reproduced or used in any form
or by any means -- graphic, electronic, or mechanical, including photocopying, recording, taping, or information
storage and retrieval system -- without written permission of Michael D. Taylor, Systems Management Services
(http://www.projectmgt.com).
Liability Notice
This booklet is sold as is, without warranty of any kind, either express or implied, respecting the contents of this
booklet, including but not limited to implied warranties for the booklet’s quality, performance, or fitness for any
particular purpose. Michael D. Taylor shall not be liable to the reader of this booklet or any other person or entity
with respect to liability, loss, or damage caused by, or alleged to have been caused directly or indirectly by this
booklet.
HOW TO EFFECTIVELY MANAGE PROJECT
RISKS
PMBOK defines risk as ―an uncertain event or condition that, if it occurs, has a
positive or negative effect on a project’s objectives.‖1
RISK MANAGEMENT PLANNING
Risks can be foreseeable and unforeseeable. In both cases, astute project managers
are prepared with some means of dealing with them. Many risk management plans
address only foreseeable risks and fail to address the unforeseeable ones. For that
reason, project planning must include a degree of schedule, cost, and scope
margin. Margin management techniques are addressed later in this chapter.
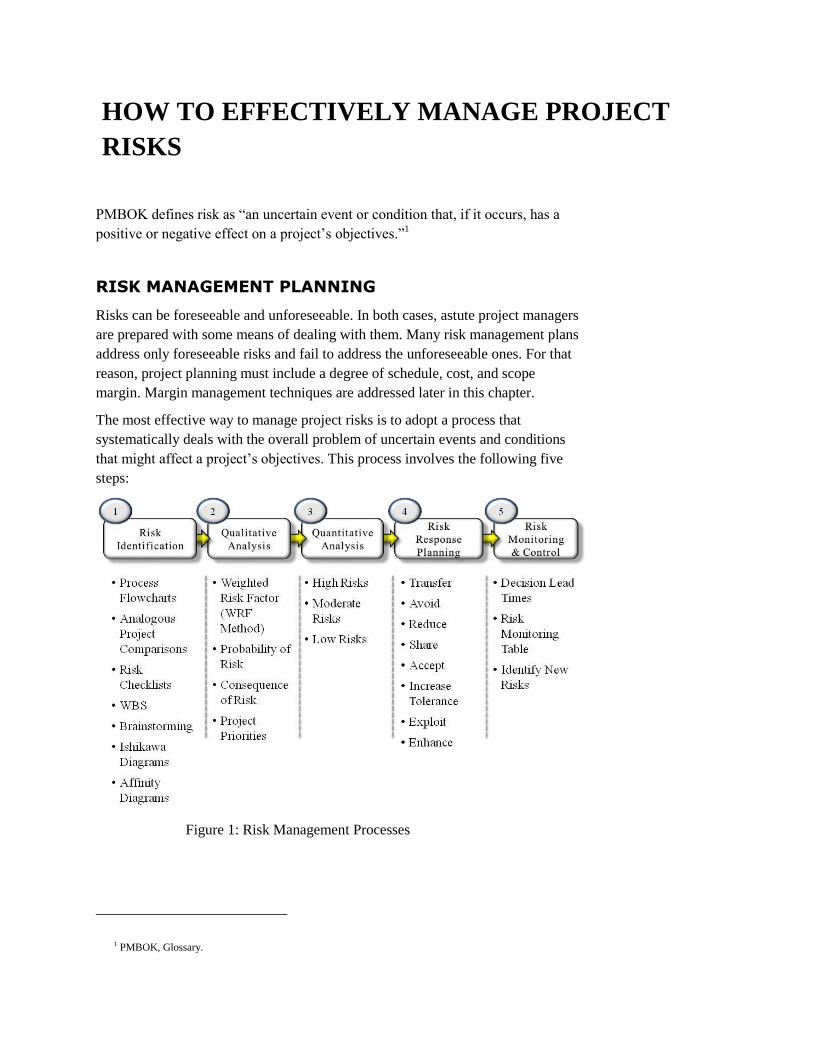
The most effective way to manage project risks is to adopt a process that
systematically deals with the overall problem of uncertain events and conditions
that might affect a project’s objectives. This process involves the following five
steps:
Figure 1: Risk Management Processes
1 PMBOK, Glossary.
P a g e | 4
RISK IDENTIFICATION
Identification of project risks is not a one-time only event. As projects progress
new risks will become evident and must be addressed accordingly. It is imperative
that project managers take full advantage of the skills and experiences of subject
matter experts, and other project managers of similar past projects. The challenge
facing risk management teams is knowing where to begin the process of risk
identification. It’s not uncommon to see blank facial expressions when one asks
the question, ―What risks do we face on this project?‖
Typical risk sources that should be examined are:
Poorly defined product requirements
Design ―drift‖
Exceeding technical
capabilities
Accepting an unproven
technology
Making too many changes to
an existing product
Limited availability of needed
skills
Project deadlines
Budget/funding limits
Extensive sharing of
resources
Learning curve
periods
Effects of major
holidays
Activity bottlenecks
Marketing risk
To avoid this phenomenon, the project manager can take advantage of any one of
the following risk identification tools. Each of these tools enables the team to
focus on parts of the project rather than the project as a whole. By doing this the
focus is more concentrated and more likely to give better visibility of potential
project risks.
Process Flowcharts. Focusing on project processes such as the schedule network
diagram2, communications, information flows, decision making, Intranet usages,
documentation, e-mail, manufacturing, coding, testing, etc., will inevitably
disclose potential project threats.
Analogous Project Comparisons. Previous similar projects, that have experienced
certain problems, can be invaluable to the new project. Project managers of these
previous projects can become a fountain of information regarding similar risks to
be faced by those on the new project.
2 Project managers should carefully examine schedule network diagrams for burst and sink nodes that might be present potential risk areas.
P a g e | 5
Risk Checklists. With project schedules becoming increasingly shorter, project
managers must find ways to identify project risks rapidly. One means of
accomplishing this is by developing a checklist of project aspects that might
present risks. This checklist should be very generic and can be carried from
project to project.
Work Breakdown Structures. Because the project WBS is a decomposition of
project elements it can also enable project risk teams to focus on specific smaller
areas within the project.
Brainstorming. The convenient practice of brainstorming can also aid in the
identification of project risks. Any possible condition or event that might prevent
reaching project goals should be presented without evaluation. It is the
combination of ideas that often generate new ideas and views, a phenomenon that
might be called ―idea hopping.‖ Eliminating any ideas or suggestions prematurely
can hamper this process.
Ishikawa Diagrams. The Ishikawa diagram (or fishbone diagram or also cause-
and-effect diagram) are diagrams, that show the causes of a certain event. A
common use of the Ishikawa diagram is in identifying potential factors that might
present unfavorable events or conditions. Most Ishikawa diagrams have a box at
the right hand side, where the effect to be examined is written. The main body of
the diagram is a horizontal line from which stem the general causes, represented
as "bones". These are drawn towards the left-hand side of the paper and are each
labeled with the causes to be investigated, often brainstormed beforehand and
based on the major causes listed above.
Affinity Diagrams. The affinity diagram is a business tool used to organize ideas
and data. The tool is commonly used within project management and allows large
numbers of ideas to be sorted into groups for review and analysis. The affinity
diagram was devised by Jiro Kawakita in the 1960s and is sometimes referred to
as the KJ Method. These diagrams work best when sound brainstorming processes
are followed.
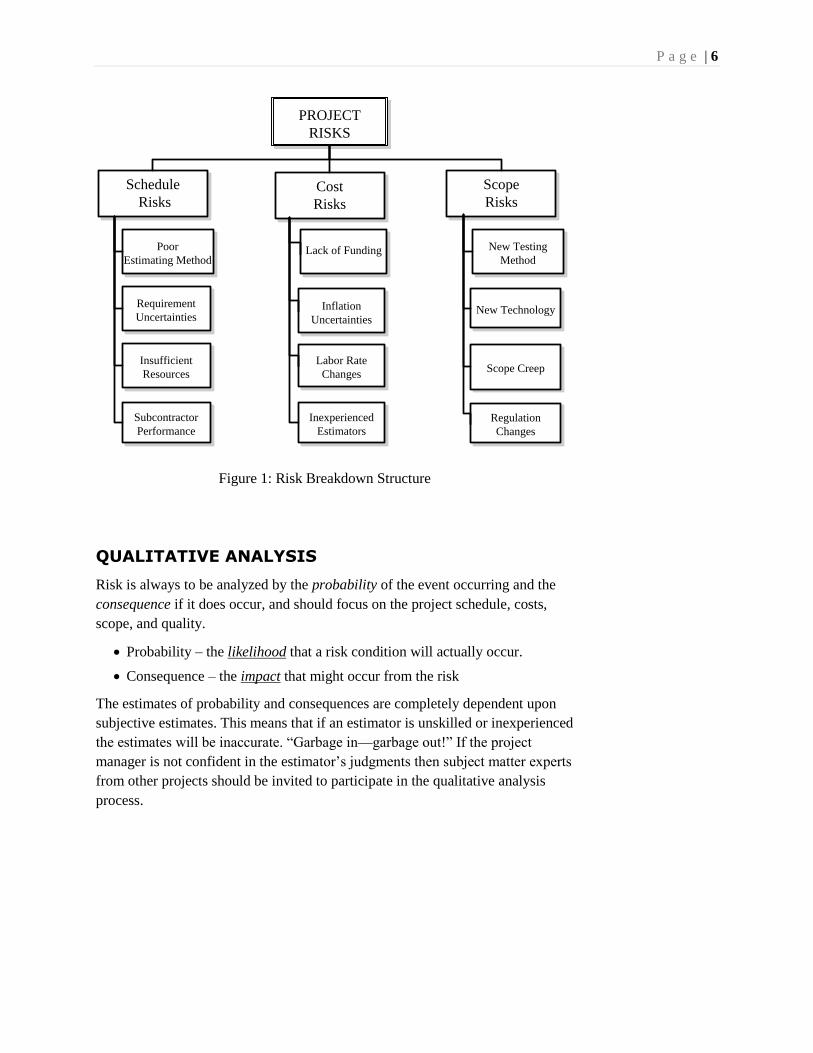
Risk Breakdown Structures. The Risk Breakdown Structures (RBS) is a
hierarchically organized depiction of identified project risks arranged by risk
category and subcategory that identifies the various areas and causes of potential
risks.3 An example is shown below:
3 PMBOK, Fourth Edition, 280.
P a g e | 6
Schedule
RisksCost
Risks
Scope
Risks
PROJECT
RISKS
Poor
Estimating Method
Requirement
Uncertainties
Insufficient
Resources
Subcontractor
Performance
Lack of Funding
Inflation
Uncertainties
Labor Rate
Changes
Inexperienced
Estimators
New Testing
Method
New Technology
Scope Creep
Regulation
Changes
Figure 1: Risk Breakdown Structure
QUALITATIVE ANALYSIS
Risk is always to be analyzed by the probability of the event occurring and the
consequence if it does occur, and should focus on the project schedule, costs,
scope, and quality.
Probability – the likelihood that a risk condition will actually occur.
Consequence – the impact that might occur from the risk
The estimates of probability and consequences are completely dependent upon
subjective estimates. This means that if an estimator is unskilled or inexperienced
the estimates will be inaccurate. ―Garbage in—garbage out!‖ If the project
manager is not confident in the estimator’s judgments then subject matter experts
from other projects should be invited to participate in the qualitative analysis
process.
P a g e | 7
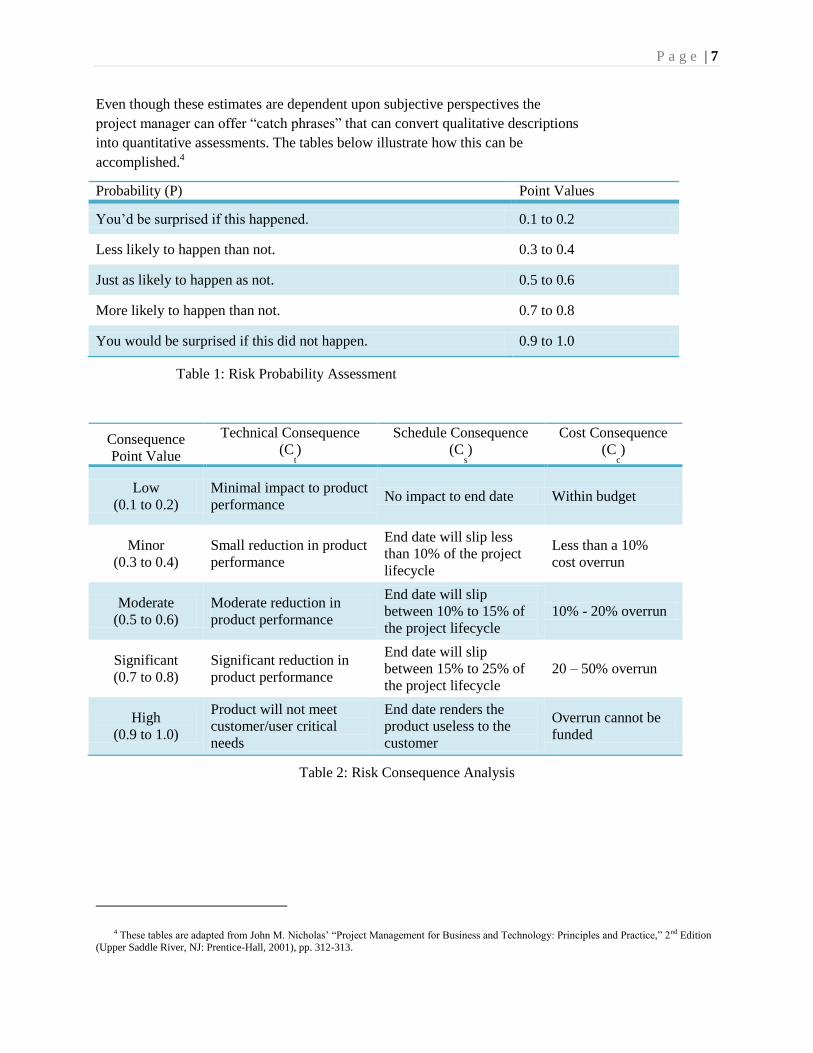
Even though these estimates are dependent upon subjective perspectives the
project manager can offer ―catch phrases‖ that can convert qualitative descriptions
into quantitative assessments. The tables below illustrate how this can be
accomplished.4
Probability (P) Point Values
You’d be surprised if this happened. 0.1 to 0.2
Less likely to happen than not. 0.3 to 0.4
Just as likely to happen as not. 0.5 to 0.6
More likely to happen than not. 0.7 to 0.8
You would be surprised if this did not happen. 0.9 to 1.0
Table 1: Risk Probability Assessment
Consequence
Point Value
Technical Consequence
(Ct)
Schedule Consequence
(Cs)
Cost Consequence
(Cc)
Low
(0.1 to 0.2)
Minimal impact to product
performance No impact to end date Within budget
Minor
(0.3 to 0.4)
Small reduction in product
performance
End date will slip less
than 10% of the project
lifecycle
Less than a 10%
cost overrun
Moderate
(0.5 to 0.6)
Moderate reduction in
product performance
End date will slip
between 10% to 15% of
the project lifecycle
10% - 20% overrun
Significant
(0.7 to 0.8)
Significant reduction in
product performance
End date will slip
between 15% to 25% of
the project lifecycle
20 – 50% overrun
High
(0.9 to 1.0)
Product will not meet
customer/user critical
needs
End date renders the
product useless to the
customer
Overrun cannot be
funded
Table 2: Risk Consequence Analysis
4 These tables are adapted from John M. Nicholas’ ―Project Management for Business and Technology: Principles and Practice,‖ 2nd Edition (Upper Saddle River, NJ: Prentice-Hall, 2001), pp. 312-313.
P a g e | 8
QUANTITATIVE ANALYSIS
Once the qualitative assessments of project risks are completed, the estimates can
be examined to determine the magnitude of the risks. A technique that not only
considers risk probability and risk consequence but also takes into account the
project priorities is the ―weighted risk factor (WRF)‖ technique.5 For each sets of
project risks a WRF is calculated as follows:
WRF=W1*RFTECH+W2*RFSCHED+W3*RFCOST
Where:
―RF‖ means Risk Factor6 = (P+C) – (P x C).
The value for weight (W) is dependent upon its project priority within the
triple constraint.
W1, W2, and W3 are valued 0 through 1.0 depending on the priorities of the
project, and together must sum to 1.0.
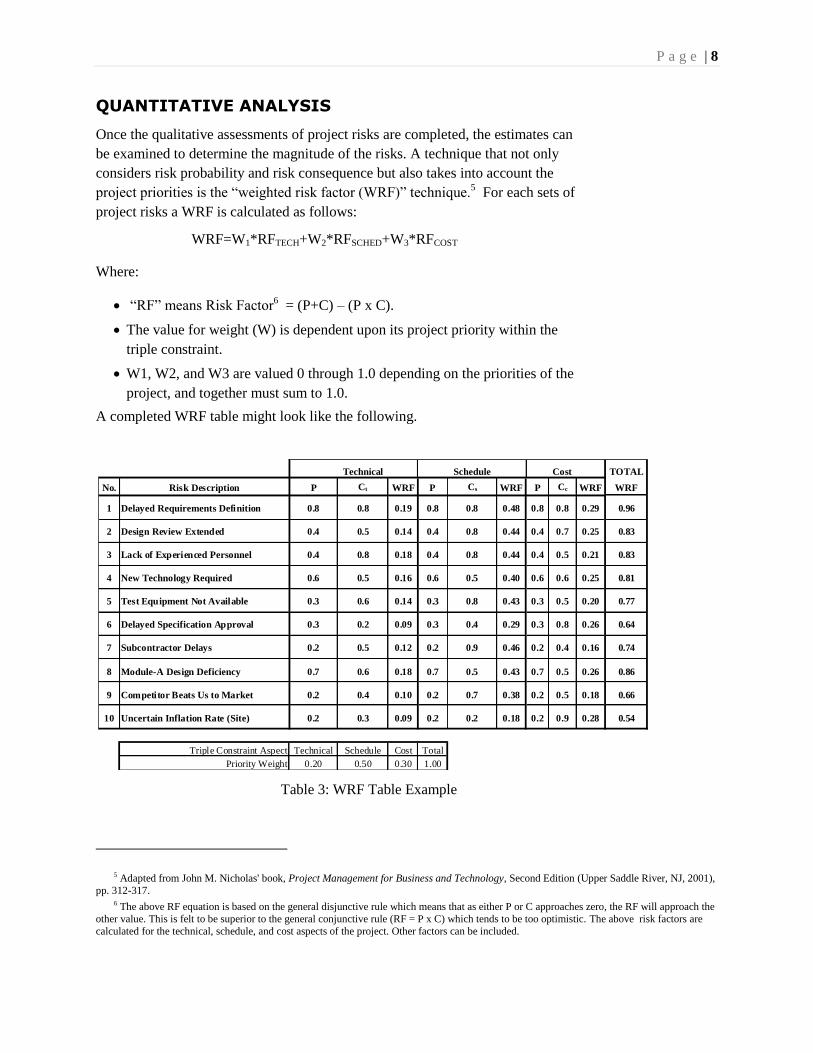
A completed WRF table might look like the following.
Table 3: WRF Table Example
5 Adapted from John M. Nicholas' book, Project Management for Business and Technology, Second Edition (Upper Saddle River, NJ, 2001),
pp. 312-317. 6 The above RF equation is based on the general disjunctive rule which means that as either P or C approaches zero, the RF will approach the
other value. This is felt to be superior to the general conjunctive rule (RF = P x C) which tends to be too optimistic. The above risk factors are
calculated for the technical, schedule, and cost aspects of the project. Other factors can be included.
Technical Schedule Cost TOTAL
No. Risk Description P Ct WRF P Cs WRF P Cc WRF WRF
1 Delayed Requirements Definition 0.8 0.8 0.19 0.8 0.8 0.48 0.8 0.8 0.29 0.96
2 Design Review Extended 0.4 0.5 0.14 0.4 0.8 0.44 0.4 0.7 0.25 0.83
3 Lack of Experienced Personnel 0.4 0.8 0.18 0.4 0.8 0.44 0.4 0.5 0.21 0.83
4 New Technology Required 0.6 0.5 0.16 0.6 0.5 0.40 0.6 0.6 0.25 0.81
5 Test Equipment Not Available 0.3 0.6 0.14 0.3 0.8 0.43 0.3 0.5 0.20 0.77
6 Delayed Specification Approval 0.3 0.2 0.09 0.3 0.4 0.29 0.3 0.8 0.26 0.64
7 Subcontractor Delays 0.2 0.5 0.12 0.2 0.9 0.46 0.2 0.4 0.16 0.74
8 Module-A Design Deficiency 0.7 0.6 0.18 0.7 0.5 0.43 0.7 0.5 0.26 0.86
9 Competitor Beats Us to Market 0.2 0.4 0.10 0.2 0.7 0.38 0.2 0.5 0.18 0.66
10 Uncertain Inflation Rate (Site) 0.2 0.3 0.09 0.2 0.2 0.18 0.2 0.9 0.28 0.54
Triple Constraint Aspect Technical Schedule Cost Total
Priority Weight 0.20 0.50 0.30 1.00
P a g e | 9
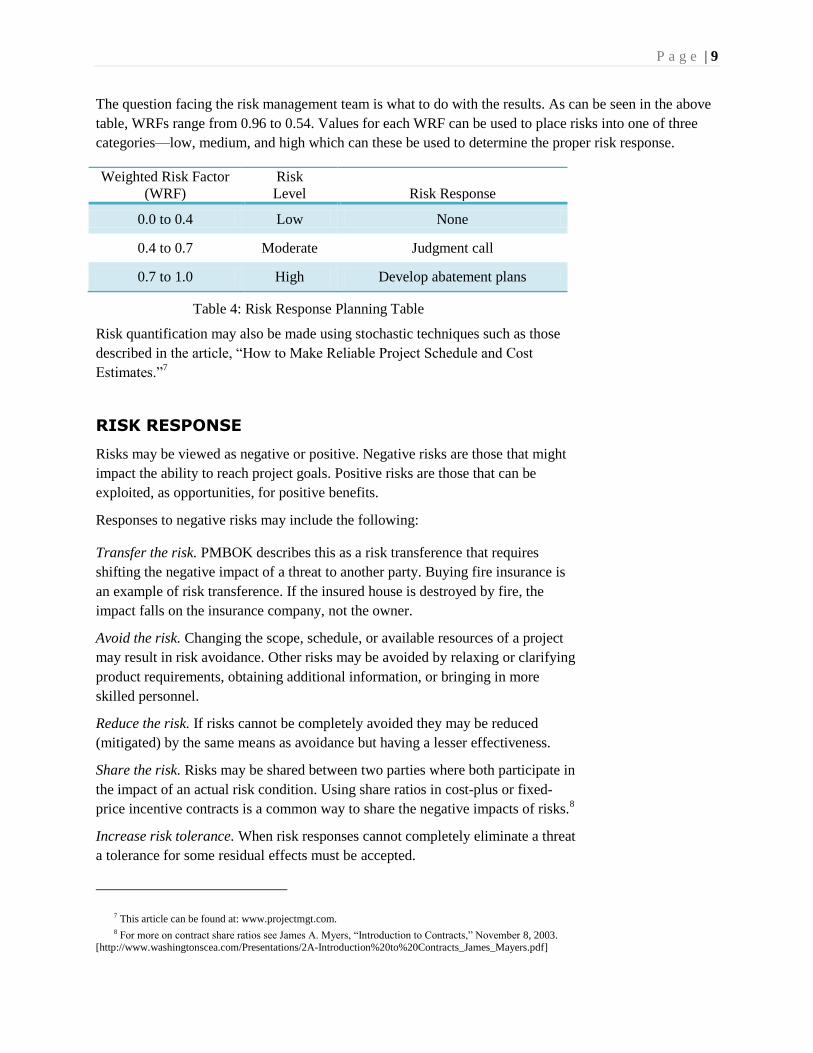
The question facing the risk management team is what to do with the results. As can be seen in the above
table, WRFs range from 0.96 to 0.54. Values for each WRF can be used to place risks into one of three
categories—low, medium, and high which can these be used to determine the proper risk response.
Weighted Risk Factor
(WRF)
Risk
Level Risk Response
0.0 to 0.4 Low None
0.4 to 0.7 Moderate Judgment call
0.7 to 1.0 High Develop abatement plans
Table 4: Risk Response Planning Table
Risk quantification may also be made using stochastic techniques such as those
described in the article, ―How to Make Reliable Project Schedule and Cost
Estimates.‖7
RISK RESPONSE
Risks may be viewed as negative or positive. Negative risks are those that might
impact the ability to reach project goals. Positive risks are those that can be
exploited, as opportunities, for positive benefits.
Responses to negative risks may include the following:
Transfer the risk. PMBOK describes this as a risk transference that requires
shifting the negative impact of a threat to another party. Buying fire insurance is
an example of risk transference. If the insured house is destroyed by fire, the
impact falls on the insurance company, not the owner.
Avoid the risk. Changing the scope, schedule, or available resources of a project
may result in risk avoidance. Other risks may be avoided by relaxing or clarifying
product requirements, obtaining additional information, or bringing in more
skilled personnel.
Reduce the risk. If risks cannot be completely avoided they may be reduced
(mitigated) by the same means as avoidance but having a lesser effectiveness.
Share the risk. Risks may be shared between two parties where both participate in
the impact of an actual risk condition. Using share ratios in cost-plus or fixed-
price incentive contracts is a common way to share the negative impacts of risks.8
Increase risk tolerance. When risk responses cannot completely eliminate a threat
a tolerance for some residual effects must be accepted.
7 This article can be found at: www.projectmgt.com. 8 For more on contract share ratios see James A. Myers, ―Introduction to Contracts,‖ November 8, 2003.
[http://www.washingtonscea.com/Presentations/2A-Introduction%20to%20Contracts_James_Mayers.pdf]
P a g e | 10
Accept the risk (do nothing). In some cases risks cannot be avoided, mitigated,
transferred, or shared. In such cases potential risk impacts must be accepted. This
is usually the most inferior response to project risks.
Product Modeling. Modeling a new product early in the project will determine if
its requirements can be met. If this is demonstrated prior to the final acceptance of
a new product’s design, significant risk impacts can be avoided.
Responses to positive risks (opportunities) may include the following:
Exploit the Risk. This strategy takes advantage of risk uncertainties that might be
turned into benefits. For example, it may be possible to not only meet a
customer’s expectations but to go beyond them. This extra effort may present
obstacles but if it is achieved it may produce a higher degree of customer
satisfaction and cause the customer to keep coming back for more business.
Share Ratios. As described previously, share ratios can be used to place the
impacts of negative risks on two parties; however, they can also result in a benefit
to both parties under contract when actual project costs fall below target costs.
Customers reap the benefit of well-managed subcontracts, and subcontractors reap
the benefit of achieving a higher fee.
Enhance the Risk. Enhancing a risk involves the pursuit of activities that might
produce a greater return-on-investment. This is accomplished by strengthening or
maximizing the chances for a positive benefit.
MANAGING UNPREDICTABLE RISKS Not all potential project risks can be identified, some risks may be unpredictable.
In such cases it is imperative that project managers ensure some degree of margin
in the project schedule, the project budget, and in the scope of the project.
RISK MONITORING AND CONTROL As stated previously, risk management is not a one-time-only effort. New risks
may present themselves as projects progress. For this reason project risk teams
must constantly be on the lookout for potential risks. New risks that surface at
various points in the project must then be subjected to the same risk management
process. Risk control takes place when project managers remain aware of possible
imminent threats and take adequate measures to implement responses in time.
Inserting decision points in the project schedule will prevent project managers
from getting caught off guard.