a project report on banana plantation - manage
TRANSCRIPT
A PROJECT REPORT ON
BANANA PLANTATION
Banana is a very popular fruit due to its low price
and high nutritive value. It is consumed in fresh
or cooked form both as ripe and raw fruit.
Banana is a rich source of carbohydrate and is rich in vitamins particularly vitamin B. It is also a
good source of potassium, phosphorus, calcium and magnesium. The fruit is easy to digest,
free from fat and cholesterol. Banana powder is used as the first baby food. It helps in
reducing risk of heart diseases when used regularly and is recommended for patients suffering
from high blood pressure, arthritis, ulcer, gastroenteritis and kidney disorder
Processed products, such as chips, banana puree, jam, jelly, juice, and wine
can be made from the fruit. The tender stem, which bears the inflorescence
is extracted by removing the leaf sheaths of the harvested pseudostem
and used as vegetable. Plantains or cooking bananas are rich in starch and
have a chemical composition similar to that of potato.
Banana fibre is used to make items like bags, pots and wall hangers. Rope and good quality paper can be
prepared from banana waste. Banana leaves are used as healthy and hygienic eating plates
Banana cultivation is a very profitable agriculture business in India. Tissue
culture banana cultivation is the new trend to lower the risk and get
higher banana production.
Banana is one of the most important major fruit crops grown in India. In
respect of area it ranks second and first in production only after mango in
this country. India leads the world in banana production with an annual
output of about 16.820 mt. In India Karnataka leads in total area and
production with 2514729 T from 71088 ha. The banana culture in India is
as old as Indian civilization. It seems that it is one of the earliest fruit
crops grown by mankind at the dawn of civilization. In India, bananas are
so predominant and popular among people that poor and rich alike like the
fruit. Considering the nutritive value and fruit value of bananas, it is the
Introduction
cheapest among all other fruits in the country.
Considering the year round availability of fruits, unlike the seasonal
availability of other tree fruits, it has become an inevitable necessity in any
household in India, for all functions. The bananas were grown in Southern
Asia even before the prehistoric periods and the world's largest diversity
in banana population is found in this area. Hence, it is generally agreed
that all the edible bananas and plantains are indigenous to the warm,
moist regions of tropical Asia comprising the regions of India, Burma,
Thailand and Indo China.
Banana is also grown, in many other countries of the world namely
Bangladesh, the Caribbean Islands, the Canary Islands, Florida, Egypt,
Israel, Ghana, Congo, South Africa, Fiji, Hawaii, Taiwan, Indonesia, the
Philippines, South China, Queensland and Sri Lanka.
Bananas and plantains are major staple food crops for millions of people
in tropical developing countries.
India is the largest producer of bananas in the world, with 29.7 million
tonne (MT) from an area of 0.88 million hectare, with a productivity of
37MT/ha.
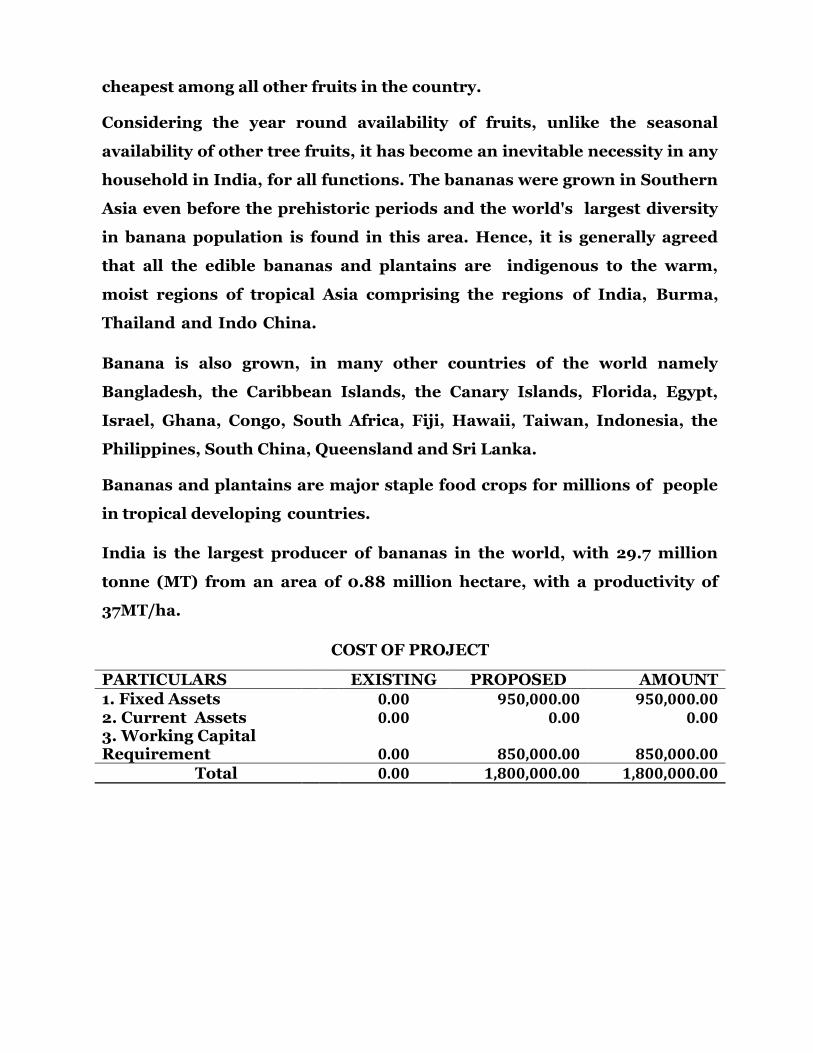
COST OF PROJECT
PARTICULARS EXISTING PROPOSED AMOUNT 1. Fixed Assets
0.00 950,000.00 950,000.00
2. Current Assets
0.00 0.00 0.00 3. Working Capital Requirement
0.00 850,000.00 850,000.00
Total 0.00 1,800,000.00 1,800,000.00
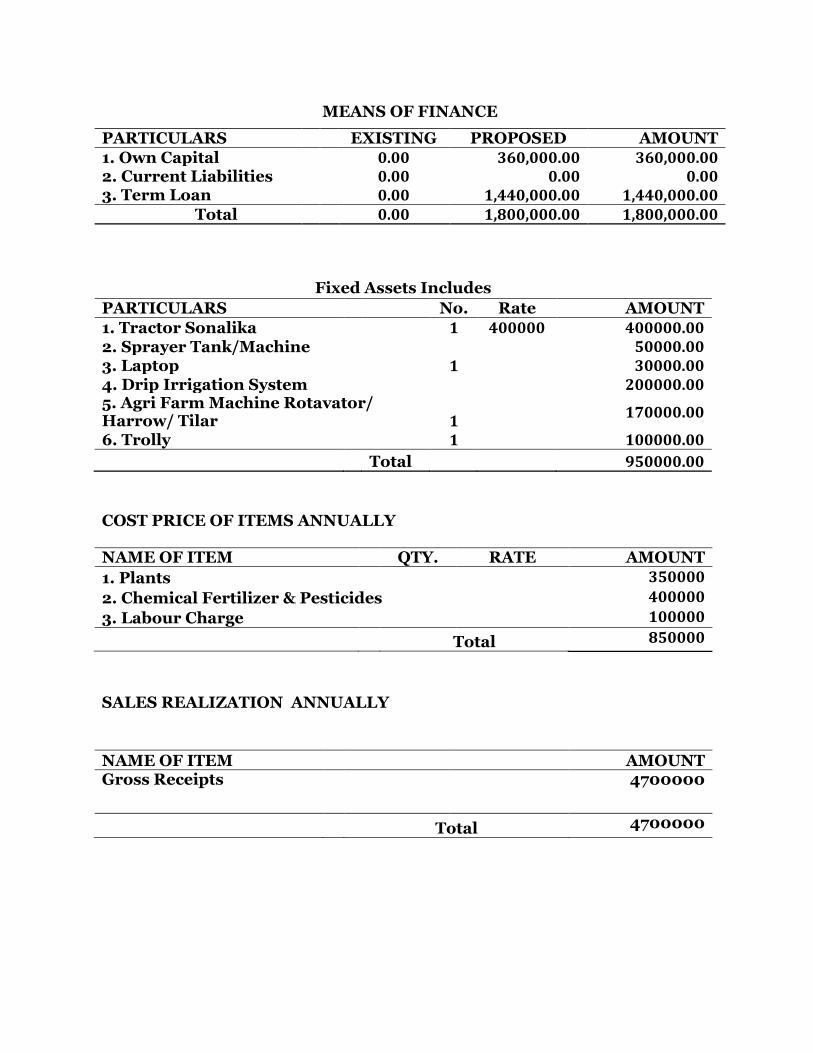
MEANS OF FINANCE
PARTICULARS EXISTING PROPOSED AMOUNT
1. Own Capital
0.00 360,000.00 360,000.00 2. Current Liabilities
0.00 0.00 0.00 3. Term Loan
0.00 1,440,000.00 1,440,000.00 Total 0.00 1,800,000.00 1,800,000.00
Fixed Assets Includes
PARTICULARS No. Rate AMOUNT
1. Tractor Sonalika
1 400000 400000.00 2. Sprayer Tank/Machine
50000.00 3. Laptop
1
30000.00 4. Drip Irrigation System
200000.00
5. Agri Farm Machine Rotavator/ Harrow/ Tilar 1
170000.00
6. Trolly
1
100000.00
Total 950000.00
COST PRICE OF ITEMS ANNUALLY
NAME OF ITEM QTY. RATE AMOUNT
1. Plants
350000
2. Chemical Fertilizer & Pesticides
400000
3. Labour Charge
100000
Total 850000
SALES REALIZATION ANNUALLY
NAME OF ITEM AMOUNT Gross Receipts
4700000
Total 4700000
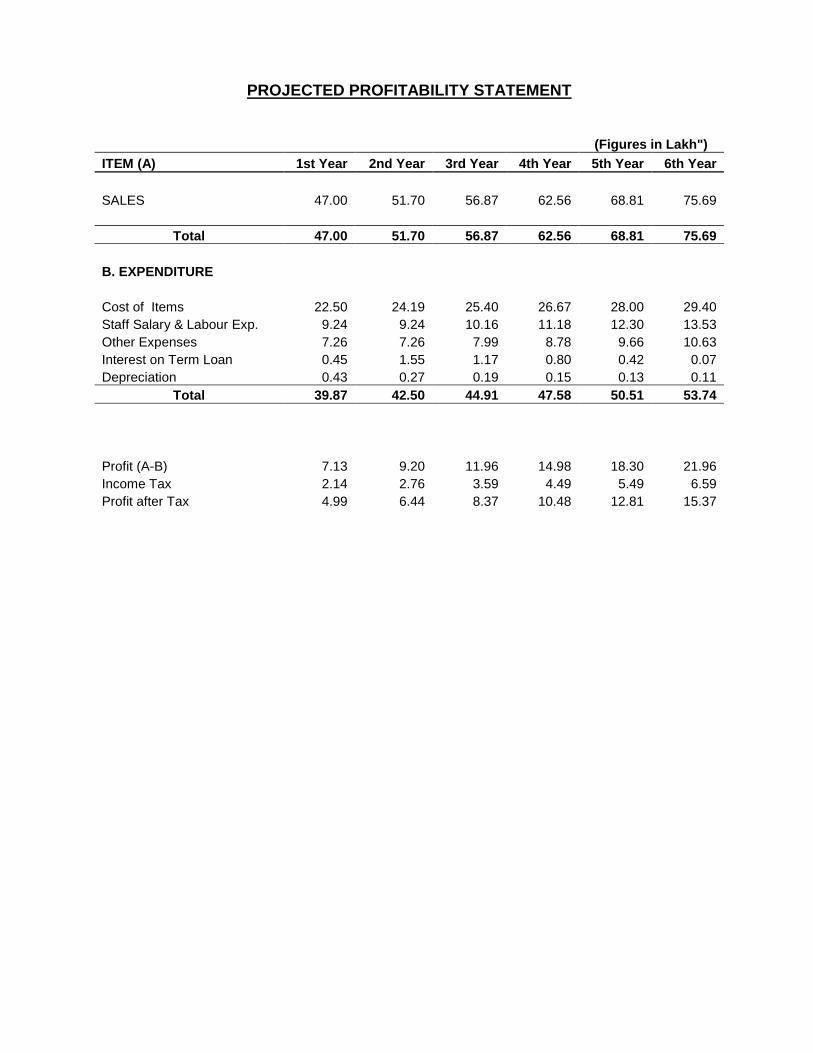
PROJECTED PROFITABILITY STATEMENT
(Figures in Lakh")
ITEM (A) 1st Year 2nd Year 3rd Year 4th Year 5th Year 6th Year
SALES 47.00 51.70 56.87 62.56 68.81 75.69
Total 47.00 51.70 56.87 62.56 68.81 75.69
B. EXPENDITURE
Cost of Items 22.50 24.19 25.40 26.67 28.00 29.40
Staff Salary & Labour Exp. 9.24 9.24 10.16 11.18 12.30 13.53
Other Expenses 7.26 7.26 7.99 8.78 9.66 10.63
Interest on Term Loan 0.45 1.55 1.17 0.80 0.42 0.07
Depreciation 0.43 0.27 0.19 0.15 0.13 0.11
Total 39.87 42.50 44.91 47.58 50.51 53.74
Profit (A-B) 7.13 9.20 11.96 14.98 18.30 21.96
Income Tax 2.14 2.76 3.59 4.49 5.49 6.59
Profit after Tax 4.99 6.44 8.37 10.48 12.81 15.37
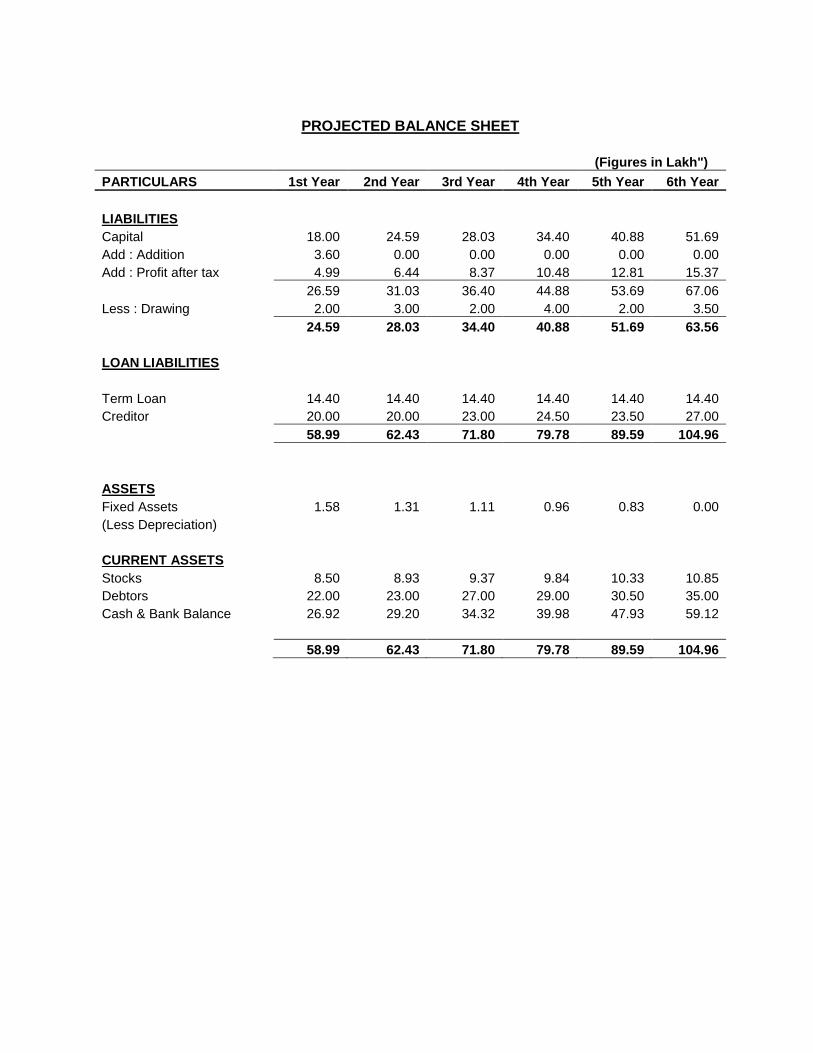
PROJECTED BALANCE SHEET
(Figures in Lakh")
PARTICULARS 1st Year 2nd Year 3rd Year 4th Year 5th Year 6th Year
LIABILITIES Capital 18.00 24.59 28.03 34.40 40.88 51.69
Add : Addition 3.60 0.00 0.00 0.00 0.00 0.00
Add : Profit after tax 4.99 6.44 8.37 10.48 12.81 15.37
26.59 31.03 36.40 44.88 53.69 67.06
Less : Drawing 2.00 3.00 2.00 4.00 2.00 3.50
24.59 28.03 34.40 40.88 51.69 63.56
LOAN LIABILITIES
Term Loan 14.40 14.40 14.40 14.40 14.40 14.40
Creditor 20.00 20.00 23.00 24.50 23.50 27.00
58.99 62.43 71.80 79.78 89.59 104.96
ASSETS Fixed Assets 1.58 1.31 1.11 0.96 0.83 0.00
(Less Depreciation)
CURRENT ASSETS Stocks 8.50 8.93 9.37 9.84 10.33 10.85
Debtors 22.00 23.00 27.00 29.00 30.50 35.00
Cash & Bank Balance 26.92 29.20 34.32 39.98 47.93 59.12
58.99 62.43 71.80 79.78 89.59 104.96
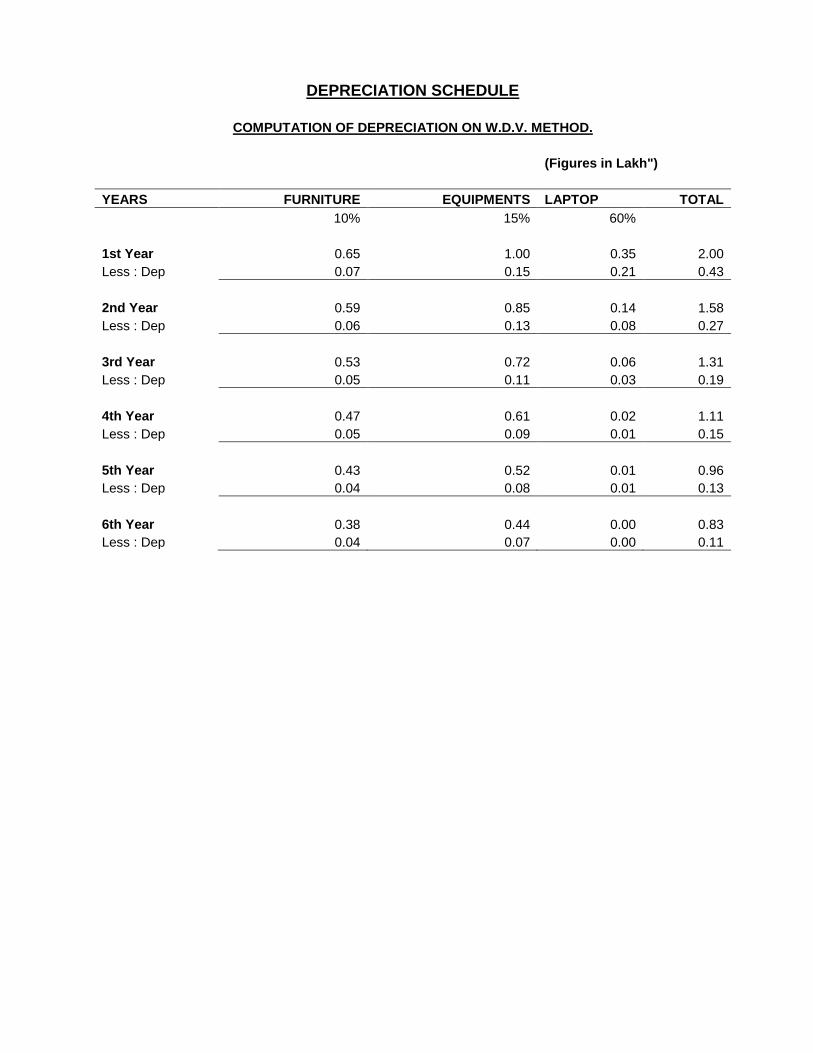
DEPRECIATION SCHEDULE
COMPUTATION OF DEPRECIATION ON W.D.V. METHOD.
(Figures in Lakh")
YEARS FURNITURE EQUIPMENTS LAPTOP TOTAL
10% 15% 60%
1st Year 0.65 1.00 0.35 2.00
Less : Dep 0.07 0.15 0.21 0.43
2nd Year 0.59 0.85 0.14 1.58
Less : Dep 0.06 0.13 0.08 0.27
3rd Year 0.53 0.72 0.06 1.31
Less : Dep 0.05 0.11 0.03 0.19
4th Year 0.47 0.61 0.02 1.11
Less : Dep 0.05 0.09 0.01 0.15
5th Year 0.43 0.52 0.01 0.96
Less : Dep 0.04 0.08 0.01 0.13
6th Year 0.38 0.44 0.00 0.83
Less : Dep 0.04 0.07 0.00 0.11
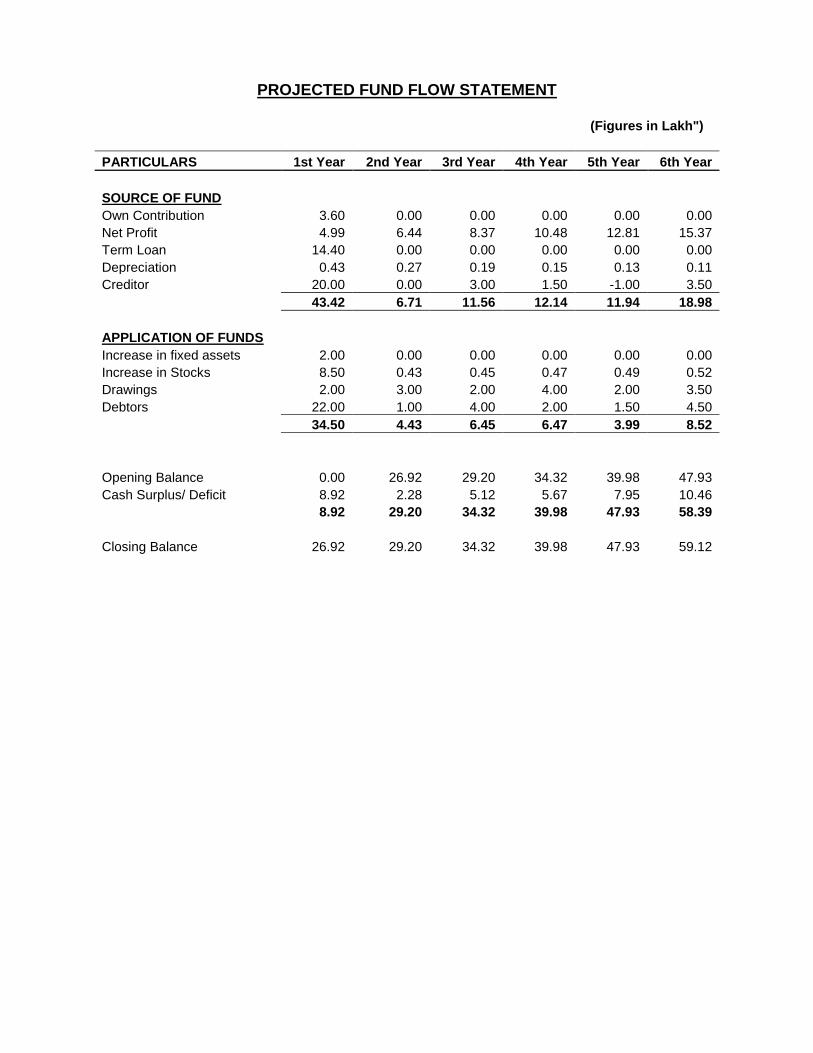
PROJECTED FUND FLOW STATEMENT
(Figures in Lakh")
PARTICULARS 1st Year 2nd Year 3rd Year 4th Year 5th Year 6th Year
SOURCE OF FUND Own Contribution 3.60 0.00 0.00 0.00 0.00 0.00
Net Profit 4.99 6.44 8.37 10.48 12.81 15.37
Term Loan 14.40 0.00 0.00 0.00 0.00 0.00
Depreciation 0.43 0.27 0.19 0.15 0.13 0.11
Creditor 20.00 0.00 3.00 1.50 -1.00 3.50
43.42 6.71 11.56 12.14 11.94 18.98
APPLICATION OF FUNDS Increase in fixed assets 2.00 0.00 0.00 0.00 0.00 0.00
Increase in Stocks 8.50 0.43 0.45 0.47 0.49 0.52
Drawings 2.00 3.00 2.00 4.00 2.00 3.50
Debtors 22.00 1.00 4.00 2.00 1.50 4.50
34.50 4.43 6.45 6.47 3.99 8.52
Opening Balance 0.00 26.92 29.20 34.32 39.98 47.93
Cash Surplus/ Deficit 8.92 2.28 5.12 5.67 7.95 10.46
8.92 29.20 34.32 39.98 47.93 58.39
Closing Balance 26.92 29.20 34.32 39.98 47.93 59.12
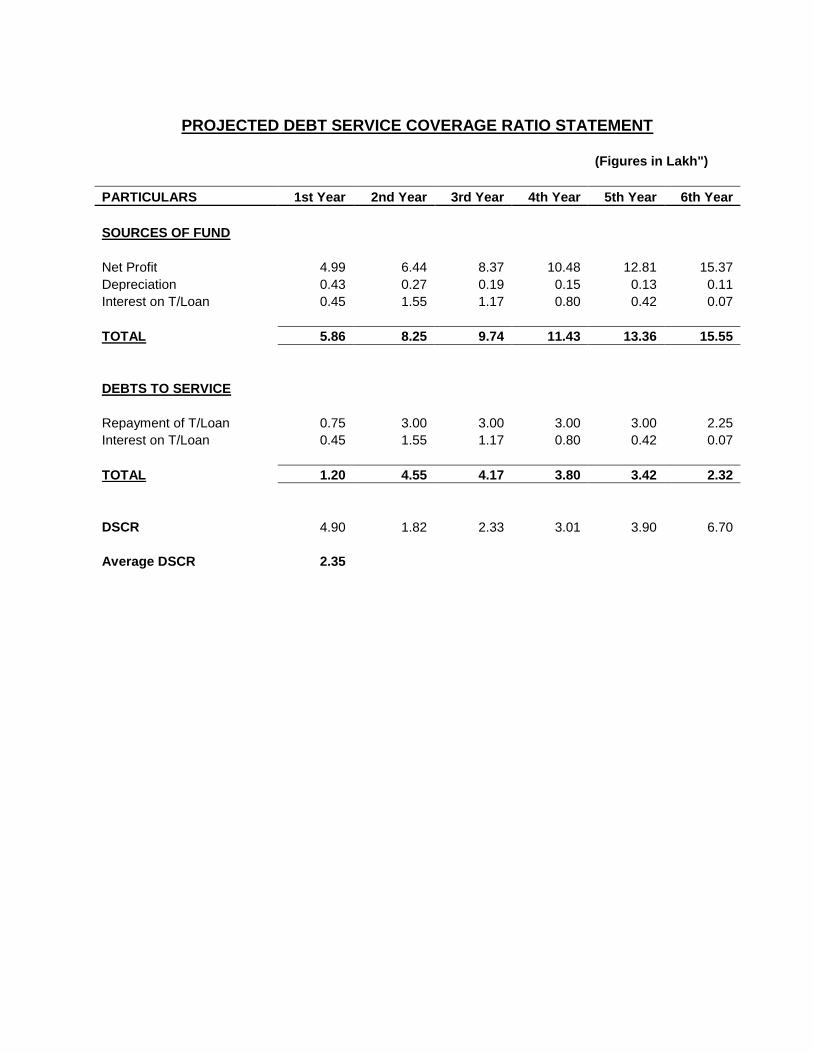
PROJECTED DEBT SERVICE COVERAGE RATIO STATEMENT
(Figures in Lakh")
PARTICULARS 1st Year 2nd Year 3rd Year 4th Year 5th Year 6th Year
SOURCES OF FUND
Net Profit 4.99 6.44 8.37 10.48 12.81 15.37
Depreciation 0.43 0.27 0.19 0.15 0.13 0.11
Interest on T/Loan 0.45 1.55 1.17 0.80 0.42 0.07
TOTAL 5.86 8.25 9.74 11.43 13.36 15.55
DEBTS TO SERVICE
Repayment of T/Loan 0.75 3.00 3.00 3.00 3.00 2.25
Interest on T/Loan 0.45 1.55 1.17 0.80 0.42 0.07
TOTAL 1.20 4.55 4.17 3.80 3.42 2.32
DSCR 4.90 1.82 2.33 3.01 3.90 6.70
Average DSCR 2.35
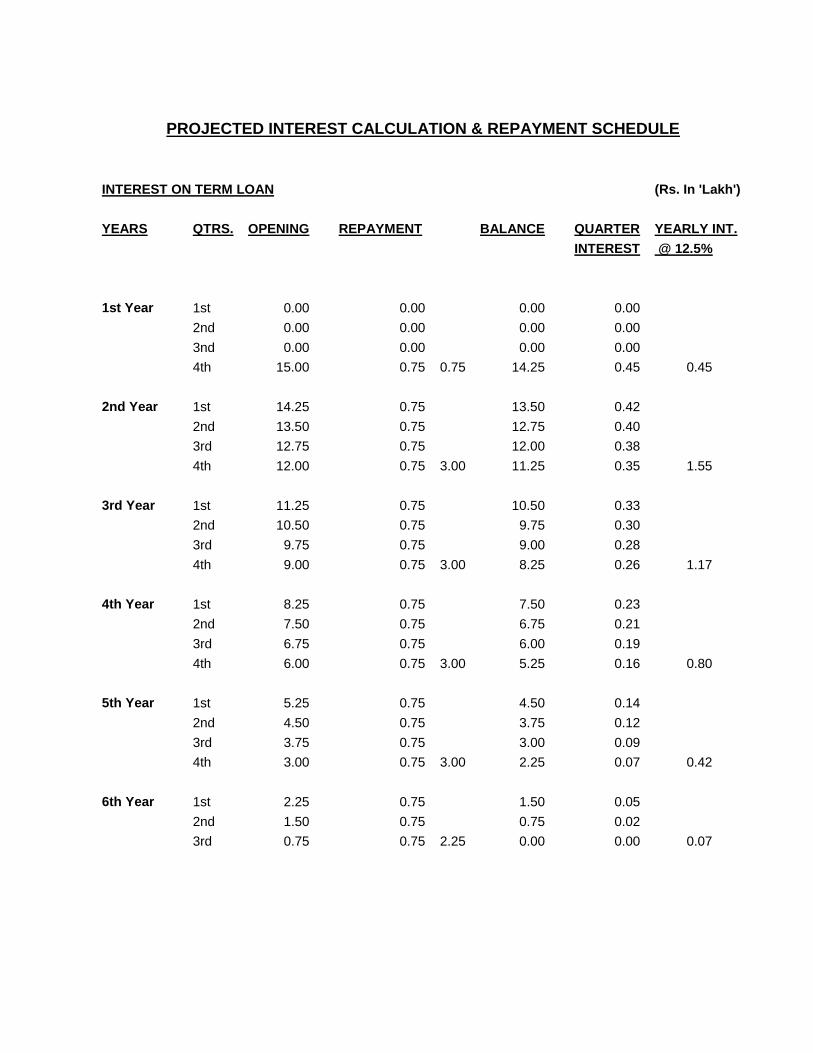
PROJECTED INTEREST CALCULATION & REPAYMENT SCHEDULE
INTEREST ON TERM LOAN
(Rs. In 'Lakh')
YEARS QTRS. OPENING
REPAYMENT
BALANCE
QUARTER YEARLY INT.
INTEREST @ 12.5%
1st Year 1st 0.00
0.00
0.00
0.00
2nd 0.00
0.00
0.00
0.00
3nd 0.00
0.00
0.00
0.00
4th 15.00
0.75 0.75 14.25
0.45 0.45
2nd Year 1st 14.25
0.75
13.50
0.42
2nd 13.50
0.75
12.75
0.40
3rd 12.75
0.75
12.00
0.38
4th 12.00
0.75 3.00 11.25
0.35 1.55
3rd Year 1st 11.25
0.75
10.50
0.33
2nd 10.50
0.75
9.75
0.30
3rd 9.75
0.75
9.00
0.28
4th 9.00
0.75 3.00 8.25
0.26 1.17
4th Year 1st 8.25
0.75
7.50
0.23
2nd 7.50
0.75
6.75
0.21
3rd 6.75
0.75
6.00
0.19
4th 6.00
0.75 3.00 5.25
0.16 0.80
5th Year 1st 5.25
0.75
4.50
0.14
2nd 4.50
0.75
3.75
0.12
3rd 3.75
0.75
3.00
0.09
4th 3.00
0.75 3.00 2.25
0.07 0.42
6th Year 1st 2.25
0.75
1.50
0.05
2nd 1.50
0.75
0.75
0.02
3rd 0.75
0.75 2.25 0.00
0.00 0.07