housing investment and consumption in urban china
TRANSCRIPT
Housing Investment and Consumption in Urban China*
Shunfeng Song
George S-F Chu
Department of Economics/030
University of Nevada at Reno
Reno, Nevada 89557-0207
Tel: (775) 784-6860
(775)784-6850
Fax: (775) 784-4728
E-Mail: [email protected]
and
Xiangming Chen
Department of Sociology
University of Illinois at Chicago
1007 West Harrison Street
Chicago, IL 60607-7140
Tel: (312) 996-5391
Fax: (312) 996-5104
E-Mail: [email protected]
*Published in Urbanization and Social Welfare in China, edited by Aimin Chen, Gordon G. Liu, and
Kevin H. Zhang. England: Ashgate, 2004.

Abstract
In the People's Republic of China, urban housing has been mainly constructed and managed
by local governments and public-owned enterprises. This paper enriches the existing literature in
two main areas. First, using a rich and unique data set on urban housing in 1991-1994, the paper
examines disparities in housing construction and consumption across Chinese cities. Second, the
paper rigorously tests factors that determine Chinese urban housing investment and consumption.
The empirical findings suggest that the public sector still plays a crucial role in urban housing in
China, though some market-oriented factors have started to influence housing investment and
consumption.
1
1. Introduction
Urban housing investment and consumption in China have been greatly affected by state
housing policy which itself has experienced dramatic changes since the PRC was born in 1949.
Before 1958, state urban housing policy allowed the coexistence of public and private properties and
the construction of new housing with both public and private finance. From the late 1950s to the late
1970s, the state limited capital investment for new housing construction under the guiding socialist
principle of production first and consumption later. Urban housing was regarded as a "non-
productive" investment. It therefore received low priority relative to "productive" investment such as
factory buildings and industrial centers. In addition, urban housing was rationed to urban residents
as a welfare good, based on occupational rank, seniority, and family size, and charged a symbolic
rent which was even lower than maintenance costs. As a result, investment was discouraged,
existing stock deteriorated prematurely, and dwelling units became more overcrowded.
China's urban housing reform began in 1978 as a major component of the overall economic
reform (Wang and Murie, 1996). This reform introduces some market elements such as raising rents
and commercializing some newly built housing; it also decentralizes urban housing investment and
construction. In this reform era, the Chinese government regards housing conditions as a major
indicator of living standards. Urban housing investment became a national priority. As a
consequence, urban housing consumption has been steadily increased.
There is an extensive literature on ChinaGs urban housing. Most previous researches have
discussed housing provision, policy changes, and the recent housing reform (e.g., Song, 1992; Wu,
1996; Wang and Murie, 1999). A few studies have evaluated determinants of housing investment
and consumption using less comprehensive and older data in the 1980s (Chen and Gao, 1993a,

2
1993b; Lim and Lee, 1993). No empirical work has examined disparities in housing investment and
consumption across Chinese cities. This research attempts to enrich the existing literature in two
main areas. First, using 1993 data on per capita living space, this paper carefully examines
disparities in housing investment and consumption across Chinese cities. Second, using 1991 and
1993-94 city-level data, this paper quantifies the factors that determine urban housing investment and
consumption. Also, the data used in this paper provide richer information on Chinese urban housing
than those used in previous studies.
The rest of this paper is organized as follows. In section 2, we examine disparities in housing
construction and consumption across Chinese regions and cities. In section 3, we discuss the
background of ChinaGs urban housing and propose hypotheses for analyzing housing investment
and consumption. In section 4, we discuss the data and the empirical findings on the determinants of
urban housing construction and consumption. The final section gives conclusions.
2. Disparities in Urban Housing Construction and Consumption
Urban housing construction and consumption vary across Chinese cities. In this section, we
present a cross-sectional analysis on these disparities using city-level data for 1993. China Urban
Statistical Yearbook 1993-1994 (CSSB, 1995) provides information on social and economic
characteristics of 565 Chinese cities at the city-level, including population, newly constructed
housing, and current per capita living space.
Table 1 shows current per capita living space and newly constructed housing across provinces
and central government municipalities. Per capita living space is the standard measure of urban
housing consumption in China, which excludes all corridors, stairways, kitchens, and toilet space.

3
Newly constructed housing measures the amount of urban housing built in 1993. As the fourth
column indicates, per capita living space in Hainan (13.32 square meters) is more than twice of that
in Guangxi (6.16 square meters).1 The same column also shows that the top four provinces with
largest per capita living spaces (Hainan, Zhejiang, Guangdong, and Fujian) are all located in the
coastal region, indicating a regional disparity in urban housing consumption. In fact, grouping cities
into three regions, we found that the eastern, central and western regions have per capita living
spaces of 8.36, 7.15, and 7.38 square meters, respectively (Table 2). Performing an ANOVA test on
the population means yields an F-value of 17.2. With a critical value of 4.64 for the 0.01
significance level, this result strongly indicates that disparities exist across the three regions. Test
results on two population mean comparisons further show that the eastern region has a larger mean
than the other two regions.
The last column in Table 1 shows a great variation in urban housing construction across
provinces and central government municipalities. In 1993, Guangdong Province achieved 1.93
square meters of newly built housing per urban resident, which is more than three times of the level
for Shaanxi Province. Grouping cities into three regions, we found that the eastern, central and
western regions have per capita newly built housing of 1.09, 0.72, and 1.00 square meters
respectively (Table 2). Performing an ANOVA test on the population means yields an F-value of
9.45. With a critical value of 4.64 for the 0.01 significance level, this result strongly indicates that
disparities exist across the three regions. Results on two population mean comparisons further show
that the eastern and western regions have larger means than the central region. Hence, urban housing
construction varies across regions, with more housing investment in richer regions. It is worth
noting that two large and relatively rich provinces (Sichuan and Xinjiang) are located in the western

4
region.
At the city-level, Tables 3 and 4 present the distributions of per capita living space and newly
constructed urban housing. Table 3 shows that per capita living space has a wide range across cities.
Among 555 cities where data are available, 186 cities have a per capita living space less than 7
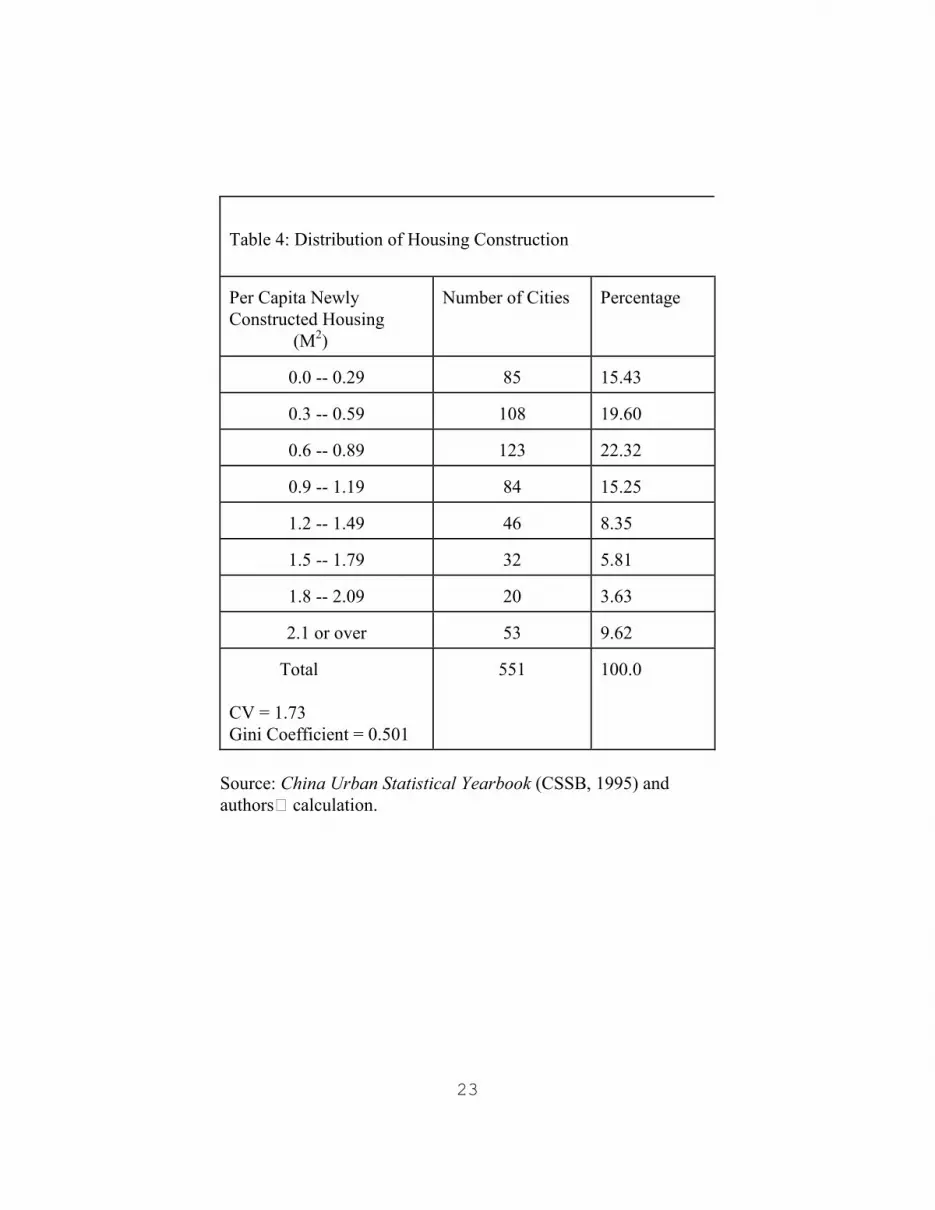
square meters, while 62 cities have values more than 11 square meters. Table 4 shows that housing
construction varies across Chinese cities. Among 551 cities where data are available, 85 cities added
per capita housing consumption less than 0.3 square meters, while 53 cities increased per capita
housing consumption more than 2.1 square meters. We calculated the coefficient of variation (CV)
and the Gini coefficient (GC) for housing construction and consumption distributions in 1993. Our
results show that CV is 1.73 and 0.31, GC is 0.501 and 0.155, respectively. These results indicate
that disparity in housing construction is much greater than in housing consumption.
3. Background and Hypotheses
Background
Under the socialist ideology, public-sector housing provision formed part of the socialist
welfare system. In the former Soviet Union, 82 percent of housing in the period of 1976-1990 was
constructed through state investment and was allocated to the population free of charge. In 1990,
state-owned housing accounted for 79 percent of all housing stock (Berezin et al., 1996). Living
space in state-owned buildings was rented to citizens for permanent residence. The monthly rent was
approximately 1 percent of the average per capita income for factory and office workersG families.
The then-existing system of distribution and rents stimulated excess demand for units and space and
simultaneously produced low-quailty housing because of the lack of incentives and funds for good
5
construction and maintenance.
Similar to the former Soviet Union, most housing in Chinese urban areas is constructed and
managed by the public sector which includes state-owned enterprises, collective enterprises, and
local governments (Chen and Gao, 1993b; Wu, 1996). For example, a survey of 200 Chinese cities
in 1981 showed that 28.7 percent of urban housing was operated by local governments, 53.6 percent
by work-units, and 17.7 percent by private individuals (Song 1992). In 1988, the above proportions
were 27.0, 54.3, and 18.7 percent, respectively (Gu and Gao, 1992). Zax (1997) shows that among
8966 urban households surveyed in 1989, 84.5 percent inhabited state-owned housing. Between
1949 and 1990, 87.4 percent of urban housing was built by the public sector (Wang and Murie,
1996).
Housing in urban China was rationed to residents based on occupational rank, seniority, and
family size, and a low rent was charged. Table 1 shows that the provincial average housing
expenditure among urban households ranges from 0.56 percent to 4.62 percent, as a percentage of the
total household living expenditure in 1993. Chen (1996) argued that such low rent was a direct
result of the low income and low expenditure policy instituted by the government. Under this
system, the government collected a heavy implicit income tax from workers through low wages, then
provided many in-kind subsidies back to them in the forms of housing, food, medical care, etc.
From the late 1950s to the late 1970s, the state limited capital investment for new housing
construction. The proportion of total capital construction funds invested in urban housing decreased
from 9.1 percent in the mid-1950s, to 6.9 percent in the mid-1960s, and 4.0% in 1966-1970 (CSSB,
1985). The persistent low housing investment meant continued low levels of new housing, together
with the rapid growth of urban population, leading to a substantial decrease in housing consumption.

6
The national average per capita living space decreased from 4.5 square meters in 1950 to 3.6 square
meters in 1978 (CSSB, 1994). The late 1970s saw a reversal of the downward trend of low housing
investment and consumption. Since 1978, housing investment has become a national priority and
greater investment has been pumped into new housing construction. The proportion of total capital
construction funds invested in urban housing became 10 percent in 1992 and 1993 (CSSB, 1995).
As a result, urban housing consumption has been steadily increased, with per capita living space
increasing from 3.6 squares meters in 1978 to 8.8 square meters in 1997 (CSSB, 1998).
The housing reform that started in 1978 allows enterprises to retain a proportion of their
profits for housing construction and maintenance, and grants local authorities more autonomy in
housing provision and investment. The reform also allows market forces and private enterprises to
play an increasing role in urban housing development. For example, the individualsG proportion of
total housing investment in Foshan increased from 3.1 percent in 1980 to 10.1 percent in 1986 (Chen
and Gao, 1993a). At the national level, the proportion of urban housing investment contributed by
urban individuals increased from 17.9 percent in 1983 to 37.1 percent in 1992 (Wu, 1996).
However, the dominant role of the public sector in urban housing provision and investment
remained. The public sector not only still constructed more than 60 percent of new urban housing
directly, but also purchased most newly developed commercial housing and sold to urban residents
directly or indirectly at subsidized prices. In a recent study, Wang and Murie (1999) show that 85
percent of commercial housing in Shanghai was sold to work units in 1990 and in 1993 this was 75
percent.
Hypotheses

7
The traditional demand and supply models constructed for a market economy do not explain
Chinese housing patterns. Nevertheless, discussion of housing demand and supply concepts help us
to understand housing consumption and construction in China. On the user side, urban residents
demand more housing than available because of the substantially lower than market-clearing rents.
Realized housing demand is constrained by housing supply. Hence, in urban China, there is a
housing shortage. Still, urban housing consumption and construction are affected by demand-side
factors, mostly indirectly. First, as housing is a normal good, desired consumption increases with
income. In cities with higher incomes, urban residents demand more housing. Local governments in
these cities might respond by constructing more housing. In a market economy, shortages induce
price increases to eliminate excess demand. In China, housing price is controlled. The greater is the
shortage, the greater the pressure on the providers to produce more urban housing. Second, China is
reforming its urban housing sector. The reform includes some market strategies such as increased
rent and privatization of some existing housing. Some old and newly built homes have been sold to
urban residents with/without subsidized prices. In this commercialized sub-market, housing demand
and construction would be affected by residentsG income.
On the provider side, local governments and work units are responsible for construction and
decide how much new housing to build. They also manage the existing urban housing. Therefore,
the amount of housing supplied is determined by two major factors. First, how much new housing is
to be constructed? Local governments and work units make their decisions based on their political
priorities, economic development strategies, perceived demand from residents and employees,
urgency of housing shortage, and resources. In section 2, we showed that the amount of newly
constructed housing varies greatly across cities and regions. Richer coastal provinces tend to invest

8
and construct more housing for their urban residents than inland provinces. Second, housing supply
is also affected by the efficiency of housing management. With a low rent policy, rent revenues do
not cover maintenance costs. Housing is a burden to local governments and work units. The more
housing constructed, the heavier the burden for housing providers to manage and maintain. This
discourages providers from building and maintaining housing. As a consequence, urban housing
deteriorates prematurely, reducing housing supply. Fortunately, the recent reform has greatly
improved the efficiency of housing management. Rent has increased, allowing providers to better
maintain and manage the existing housing. As many tenants expect to purchase the housing units
that they are currently living in, they better maintain their housing units.
In this paper, we propose two hypotheses concerning the Chinese urban housing sector. First,
we hypothesize that housing consumption in Chinese cities is determined by the cityGs political
status, population, economic structure, and urban resident income. In China, investment in work-
unit housing largely came from state CCI (Capital Construction Investment) through a bargaining
process. For government agencies and institutes, special funds were allocated through state or local
budgets. As a result, cities with higher political status have had more housing investment and more
housing consumption. Land availability is more limited in larger cities. We expect that city size
negatively affects per capita living space. Local economic structure reflects ChinaGs development
strategies in early years. It indirectly affects urban housing consumption. For a long period, China
attempted to industrialize its economy by emphasizing heavy industry and neglecting consumption.
Policy makers regarded urban housing as a non-productive investment and thus gave it a low priority.
Hence, the more a city emphasized industrialization, the less investment the city made in housing
construction, leading to less housing consumption. Urban resident income would also affect housing
9
consumption. In western countries, higher income leads to higher housing consumption. Alexeev
(1988) found a significant and positive coefficient of income on housing consumption in the former
Soviet Union. We expect that urban residents in richer Chinese cities also demand more housing. In
addition, China has promoted housing commercialization in urban areas since 1978. Some old and
newly built houses are sold to urban residents with/without subsidized prices. In this
commercialized sub-market, housing demand and construction are directly affected by residents'
income. Therefore, more commercial housing would be built to meet the stronger demand in richer
cities.
Second, we hypothesize that housing investment is affected by a cityGs political status,
openness, resources and development level, and the level of current housing consumption. In the
early 1990s, the public sector was still the main housing provider. We expect that cities with higher
political status would have more housing investment. However, housing investment started to
decentralize and became more resource-oriented. Hence, more developed and open cities have more
resources and thus make more housing investment. The level of current housing consumption could
also direct housing investment. In China, a main goal of housing providers is to alleviate housing
shortages. The greater is the shortage, the greater the pressure on housing providers, calling for more
housing investment.
Housing consumption is a stock; housing investment is a flow. Therefore, housing
consumption is more likely to be determined by previous housing policy and development strategies,
while housing investment is more likely to be affected by the current housing reform that makes
investment more decentralized and resource-oriented. If the pattern of housing investment was
consistent over the time, housing consumption should reflect housing investment. However, housing

10
investment has experienced dramatic changes since the reform. As a result, some factors may affect
housing investment significantly but have not been reflected in consumption yet. On the other hand,
some factors played an important role in urban housing in earlier years but became less relevant in
the reform era.
In our regression models, some variables appeared in both housing investment and
consumption models and some variables appeared in one model but not in the other. Variables
appearing in both models affect both the stock and the flow. Specifically, capital city represents a
cityGs political status and affects both housing investment and consumption. Special economic
zones and coastal open cities possess more resources and also enjoy greater autonomy in making
investments. These cities are expected to invest more on urban housing in the reform era. Foreign
direct investment (FDI) into China started to increase dramatically in the early 1990s. Some went
directly into the urban housing development. Jiang et al (1998) estimated that in 1993 over one-third
of total foreign capital in China flowed into the development of real estate. In 1995, $17.8 billion of
FDI went to the sector of real estate, public residential and consultancy services (CSSB, 1996). In
1996, 9.4% of the total real estate investment was contributed by FDI (Ministry of Construction,
1997, p. 18).
For two reasons, we use per capita income in the consumption equation, but use per capita
GDP (PCGDP) in the investment equation. First, we donGt have city-level data on PCGDP for
1991. Second, consumption is more related to income, while investment is more related to the
development level. We use the state sector capital investment share in the investment equation
because it is more relevant to investment. We use the state sector employment share in the
consumption equation because it better reflects past development strategies that affected housing

11
investment in early years.2
4. Empirical Results
In this section, we empirically examine factors that determine housing consumption and
construction in Chinese cities through regression analysis. Data used in this research come from
China Urban Statistics Yearbook (CSSB, 1992, 1995). One common problem with Chinese data is
inconsistency. In the data sets used in this research, we find that many variables have information
for some years but not for other years. For example, we have city-level data on per capita living
space in 1991 and 1993 but not in 1992 and 1994-95. There are no data on per capita GDP in 1992-
93. Data on per capita urban resident annual income are available only for 1991. Due to this
inconsistency and missing data on some important variables, we are unable to perform panel data
analyses on housing consumption and construction. In this research, we use cross-sectional 1991
data to examine factors that affect housing consumption, because the 1991 yearbook provides the
most comprehensive information related to housing consumption. We use 1994 data for housing
construction for two reasons. First, there is no data on per capita GDP in 1992-93 and no data on per
capita living space in 1992 and 1994-95. Second, we want to investigate how the housing
consumption level in 1993 affects housing investment in 1994.
Determinants of Housing Consumption
Table 5 presents the results on an ordinary least squares regression of per capita living space.
The effective sample size is 348 because of missing data on per capita income for many cities (the
total number of cities in 1991 is 476).3 Table 5 shows a negative coefficient for population,
suggesting that per capita living space is smaller in larger cities, ceteris paribus. We interpret this

12
finding as evidence that housing construction is more costly in larger cities due to higher land cost
and lower land availability, reducing housing supply. The coefficient for eastern cities has the
expected positive sign. It provides support that residents in eastern cities consume more housing
than those in inland regions. Historically, the eastern coastal region has been relatively more
developed. Local governments and work units in this region have more resources to construct and
provide more housing for their residents and employees. This finding is consistent with our earlier
observation that housing consumption varies across regions, with higher housing consumption in the
eastern coastal region (Table 2).
Housing consumption is also affected by political-administrative hierarchy. The coefficient
for the capital city dummy variable indicates that cities higher in the hierarchy, where central
ministry or provincial-controlled enterprises and institutes are located, have more housing
consumption than cities lower in the hierarchy. Before housing reform, work units and local
governments were responsible not only for allocating public housing but also for bargaining for
investments from their supervisory governments. Enterprises and institutes, which are directly under
the central or provincial governments and more likely located in capital cities, were more powerful in
the bargaining for resource allocation. Thus, they were more able to construct more housing for their
workers and employees, leading to a large housing consumption.
The coefficients of the two economic structure variables are negative and statistically
significant. The negative sign of the coefficients suggests that housing consumption is lower in cities
that are more industrialized and more state-sector dominant, reflecting ChinaGs development
strategies in early years. Income strongly and positively affects housing consumption in Chinese
cities. The coefficient of per capita income indicates that for every 100 yuan increase in per capita

13
income, per capita housing consumption in a city increases by 0.16 square meters. This result is
consistent with the finding of Lim and Lee (1993). The positive relationship between per capita
living space and per capita income implies that housing consumption in Chinese cities is not only
affected by supply-side factors but also affected by demand-side factors. One explanation is that
local governments respond to their residents' demand in their housing investment and construction
decisions.
Determinants of Housing Investment
Table 6 presents the results on an ordinary least squares regression of per capita housing
investment. The effective sample size is 549 because of missing data for some cities (the total
number of cities in 1993 is 565). The empirical results in Table 6 show that urban housing
investment is affected by both political and economic factors. Politically, the positive coefficient for
capital cities suggests that capital cities and central government municipalities have higher per capita
housing investment than other cities. The positive and significant coefficient for per capita GDP
indicates that economic development positively affects housing supply and increases housing
investment. Investment in urban housing is also affected by capital investment structure. Our results
confirm that per capita housing investment is higher in cities where capital investment is more state
sector dominant.
Table 6 shows that housing investment is affected by economic openness in two ways. First,
special economic zones and coastal open cities had more housing investment in 1994 than other
cities. These cities are not only more resource abundant but also more autonomous in investment
decisions. Urban housing investment in these cities is also more market-driven. Second, foreign
14
direct investment (FDI), as a direct outcome of open-door policy, played an important in housing
investment. FDI pushes up demand for urban housing by generating many job opportunities and
offering employees higher wages. It also increases housing supply by investing directly in urban
housing. For example, the real estate sector was the second largest recipient of inward FDI in 1995.
More than $17.8 billion of FDI went to the sector of real estate, public residential and consultancy
services (CSSB, 1996). The data on housing investment used in this research donGt distinguish
investment sources. But we believe that part of the total housing investment actually came from
FDI. In 1996, 9.4% of the total real estate investment was contributed by FDI (Ministry of
Construction, 1997, p. 18). It is worth noting that housing of foreigners in China is negligible. In
1998 in Shanghai, 69.1 million square meters were sold in the market. Less than 0.4% of them went
to foreigners (Shanghai Real Estate Market, 1999). This proportion would be lower in earlier years
and in most of other cities in China. The data used in this paper donGt distinguish foreignersG
housing from the total housing stock analyzed. But because of its negligible share, we expect that
foreignersG housing will not affect our empirical results qualitatively.
The estimated coefficient for 1993 per capita living space has two implications. First, it
indicates that per capita housing investment is higher in cities where per capita housing consumption
is smaller. Local governments and public-owned enterprises mitigate urban housing shortages.
Second, it suggests that inequality in housing consumption across cities is decreasing, at least in the
short run. Housing consumption is increasing faster in cities with a smaller current per capita living
space, narrowing disparity in urban housing consumption.
5. Conclusions

15
In this paper, we have examined disparities in housing construction and consumption in
urban China. Using 1993 city-level data, we observed that per capita newly built housing was 1.09,
0.72, and 1.00 square meters in the eastern, central, and western regions, respectively. Per capita
housing consumption in these three regions was 8.36, 7.15, and 7.38 square meters, respectively.
Statistical tests confirm that average per capita housing consumption and construction vary across
Chinese regions. We also calculated the coefficient of variation (CV) and the Gini coefficient (GC)
for housing construction and consumption distributions in 1993. Our results show that disparity in
housing construction is much greater than in housing consumption.
Using 1991 and 1993-94 city-level data, this paper has determined factors that affect urban
housing consumption and investment. We found that housing consumption is smaller in larger, more
industrialized, and more state-dominant cities, but larger in cities which are more economically
developed and have more political privileges. We found that housing investment is affected by
cityGs political status, openness, capital investment structure, level of economic development, and
housing consumption level in the previous year. Housing consumption is more likely determined by
previous housing policy and development strategies. Housing investment is more likely affected by
the current housing reform and has become more resource-oriented.
Our empirical results show that the public sector stills plays a crucial role in urban housing
provision in China. However, we observed that market-oriented factors already started to play an
important role in urban housing investment and consumption. For example, we found that
residentsG income pulls up housing consumption and foreign direct investment stimulates urban
housing investment. With the economic reform in general and the housing reform in particular, we
expect that housing investment will become further decentralized and a market-oriented housing

16
sector will gradually developed in urban China.
The coexistence of some housing shortage and unoccupied housing units in Chinese cities reflects
both the legacy of the old, welfare housing system and the emergence of the new, market-oriented
housing development. The persistent housing shortage can be attributed to the inherent housing
inequality among work units within and between cities under the welfare housing system, which
allocated housing based on rank, seniority, and the availability of public housing stock. While
gradually on its way out, this system has maintained housing shortage as some lower-ranked,
younger employees of financially strapped state-owned enterprises still live in crowded apartments or
are even on the waiting list. Unoccupied housing tend to exist in the more developed coastal cities
where the rapid growth of high-priced commercial properties has created an oversupply relative to
the demand level and purchasing power of even the more wealthy buyers. More recently, however,
this oversupply has dwindled due to the combined impact of a slowdown in the residential market,
discounted sales, and growing availability of housing mortgages. In Shanghai, for example, a
growing number of the higher-priced residential units for overseas sales, which were oversupplied
and under-bought, have been purchased by wealthy domestic buyers. This trend has pushed a two-
tier residential market toward convergence in price and sales (Ness, 2000). As the old housing
system disappears eventually and the commercial housing market allows the majority of consumers
to buy with loans, we expect a reduction in both housing shortage and unoccupied housing through a
more balanced supply and demand of housing development and consumption.

17
Notes

18
References
Alexeev, M. (1988) The effect of housing allocation on social inequality: a Soviet perspective,
Journal of Comparative Economics, 12, pp. 228-234.
Berezin, M., O. Kaganova, N. Kosareva, A. Pritkov, and R. Struyk. (1996) The Russian Federation,
in: D. Clapham, J. Hegedus, K. Kintrea, and I. Tosics (Eds.) Housing Privatization in Eastern
Europe, pp.79-95. Westpost, CT: Greenwood Press.
Chen, A. (1996) ChinaGs urban housing reform: price-rent ratio and market equilibrium, Urban
Studies, 33, pp. 1077-1092.
Chen, J. (1994) Lun Wuoguo Fang Di Chanyie de Fazhan Qianli (On the Development Potential of
China's Real Estate Industry), Chengshi Jingji Ouyu Jingji (City Economy-Regional Economy), 5,
pp. 47-48.
Chen, X. and Gao, X. (1993a) China's urban housing development in the shift from redistribution to
decentralization, Social Problems, 40, pp. 266-283.
Chen, X. and Gao, X. (1993b) Urban economic reform and public-housing investment in China.
Urban Affairs Quarterly, 29, pp. 117-145.
Cong, Y. (1995) Jiuwu fang di chan xiang hecku fazhan (The direction of real estate development in
1995), Chengshi Jingji-Ouvi Jingji (City Economy-Regional Economy), 2, pp. 51-52.
CSSB (China's State Statistical Bureau) (1985) Zhongguo Shehui Tongji Ziliao (Social Statistical
Information on China), Beijing: China Statistics Press.
CSSB (China's State Statistical Bureau) (1993, 1995, 1996) Zhongguo Tongji Nianjian (Statistical
yearbook of China), Beijing: China Statistics Press.
CSSB (China's State Statistical Bureau) (1992, 1995) Zhongguo Chengshi Tongji Nianjian (China
Urban Statistics Yearbook), Beijing: China Statistics Press.
Gu, Y. (2000) The current conditions and the future of ChinaGs real estate market, China1s Real
Estate, 230, pp. 28-32.
Jiang, D., Chen, J. and Isaac, D. (1998) The effect of foreign investment on the real estate industry in
China, Urban Studies, 35, pp. 2101-2110.
Li, G. (1990) Shilun wuoguo chengshi zhufang de jianshe zhuti he fenpei wenti (A preliminary
analysis of our country's housing construction and distribution), Shehuixue Yanjiu (Sociological
Studies) 4, pp. 58-72.

19
Lim, G.C. and Lee, M.H. (1993) Housing consumption in urban China. Journal of Real Estate
Finance and Economics, 6, pp. 89-102.
Ministry of Construction (1997), China Real Estate Market Yearbook, Beijing: China Planning Press
(Zhongguo Jihua Chubanshe).
Ness, A. (2000). Shanghai’s property markets begin to converge. The China Business Review, 27, pp.
36-41.
People's Daily, March 25, 1995 and December 27, 1995.
Shanghai Real Estate Market (1999), Beijing: China Statistics Press.
Song, S. (1992) Policy issues involving housing commercialization in the People's Republic of
China. Socio-Economic Planning Sciences, 26, pp. 213-222.
Song, S. (2000) Policy issues of ChinaGs urban unemployment, EAI Working Paper No. 49, East
Asian Institute, the National University of Singapore.
Tong, X. (1987) Moving toward home ownership, China Reconstructs, 36, pp. 39-40.
Wang, Y. P. and Murie, A. (1996) The process of commercialisation of urban housing in China,
Urban Studies, 33, pp. 971-989.
Wu, F. (1996) Changes in the structure of public housing provision in urban China, Urban Studies,
33, pp. 1601-1627.
Zhou, Y. (2000) Hainan makes more efforts to reduce unsold real estate, Real Estate Information of
China, 103, p. 13.

20
Table 1: Per Capita Expenditures and Living Space in 1993, by Province
Province Total Living Housing Living Newly Constructed
Expenditurea Expenditurec Spaceb Housingb
(Yuan) (%) (M2) (M2)
Beijing 2937 2.24 8.44 1.05
Tianjin 2322 1.79 6.85 0.60
Hebei 1898 2.90 7.65 0.81
Shanxi 1560 2.05 7.73 0.66
Inner Mogolia 1585 3.20 6.77 0.80
Liaoning 1977 1.59 6.58 0.90
Jilin 1596 2.78 6.21 0.82
Heilongjiang 1660 2.03 6.40 0.57
Shanghai 3530 1.81 7.28 0.74
Jiangsu 2311 3.20 7.82 1.10
Zhejiang 2856 2.93 10.94 0.72
Anhui 1846 2.38 6.68 0.64
Fujian 2341 2.32 8.84 1.28
Jiangxi 1577 4.43 7.25 1.02
Shandong 1946 2.49 8.23 1.38
Henan 1609 2.11 7.15 0.76
Hubei 2048 2.38 8.25 0.64
Hunan 2087 4.62 8.14 0.87
Guangdong 3777 3.79 10.81 1.93
Guangxi 2303 1.14 6.16 0.94
Hainan 2404 1.22 13.32 0.70
Sichuan 2034 2.84 7.54 0.97
Guizhou 1876 1.78 7.56 0.62
Yunan 2186 2.35 7.83 1.64
Shaanxi 1714 3.22 6.44 0.59
Gansu 1680 1.55 7.42 1.11
Qinghai 1870 0.56 6.68 0.67
Ningxia 1877 1.70 7.44 1.05
Xinjiang 1834 1.81 7.79 1.45
a. Source is Statistical Yearbook of China (CSSB, 1995), pp. 266-271.
b. Source is China Urban Statistical Yearbook (CSSB, 1995), pp. 304-317.
c. Housing expenditure is defined as a percentage of the total living expenditures.

21
Table 2: Disparities in Urban Housing Construction and Consumption, 1993
Region Number Urban Per Capita Per Capita Per Capita
of Cities Population Industrial Living Newly
Output Space Constructed
Housing
(Million) (Yuan) (M2) (M2)
Nation 565 175.31 17847 7.81 0.95
Eastern China 244 90.48 23053 8.36 1.09
Central China 215 59.13 12066 7.15 0.72
Western China 106 25.70 12819 7.38 1.00
Source: China Urban Statistical Yearbook (CSSB, 1995), pp. 164-177 and 304-317.

22
Table 3: Distribution of Housing Consumption
Per Capita Living Space
(M2)
Number of Cities
Percentage
3 -- 4.99
15
2.70
5 -- 6.99
171
30.81
7 -- 8.99
232
41.80
9 -- 10.99
75
13.51
11 -- 12.99
27
4.86
13 -- 14.99
20
3.60
15 -- 16.99
9
1.62
17 or over
6
1.08
Total
CV = 0.31
Gini Coefficient = 0.155
555
100.0
Source: China Urban Statistical Yearbook (CSSB, 1995) and
authorsG calculation.
23
Table 4: Distribution of Housing Construction
Per Capita Newly
Constructed Housing
(M2)
Number of Cities
Percentage
0.0 -- 0.29
85
15.43
0.3 -- 0.59
108
19.60
0.6 -- 0.89
123
22.32
0.9 -- 1.19
84
15.25
1.2 -- 1.49
46
8.35
1.5 -- 1.79
32
5.81
1.8 -- 2.09
20
3.63
2.1 or over
53
9.62
Total
CV = 1.73
Gini Coefficient = 0.501
551
100.0
Source: China Urban Statistical Yearbook (CSSB, 1995) and
authorsG calculation.

24
Table 5: Determinants of Urban Housing Consumptiona
(Dependent Variable: Per Capita Living Space)
Variable Coefficient t-Value
Constant 10.9013 7.98***
Logarithm of City Population -0.4448 -3.44***
Eastern Cities 0.3502 1.74*
Capital Cities 0.7393 6.54***
% of Employment in the Manufacturing Sector -4.2220 -7.32***
% of Employment in the State Sector -0.0169 -2.68***
Per Capita ResidentsG Income 0.0016 6.37***
Number of observations = 348.
Adjusted R2-value = 0.287.
F-value = 20.977.
a. 1991 data are used in the regression.
*. Estimated coefficient is statistically significant at 0.10 level.
***. Estimated coefficient is statistically significant at 0.01 level.

25
Table 6: Determinants of Urban Housing Investmenta
(Dependent Variable: Per Capita Urban Housing Investment)
Variable Coefficient t-Value
Constant -73.0213 -1.87*
Capital Cities 181.0384 4.28***
Special Economic Zones and Open Cities 418.9176 8.87***
Per Capita GDP 0.0226 11.51***
Per Capita Foreign Direct Investment 0.3315 4.71***
% of Capital Investment Made by the State Sector 6.8368 8.10***
Per Capita Living Space in 1993 -9.2861 -2.77***
Number of observations = 549.
Adjusted R2-value = 0.634.
F-value = 158.902.
a. 1994 data are used in the regression, except per capita living space.
*. Estimated coefficient is statistically significant at 0.1 level.
***. Estimated coefficient is statistically significant at 0.01 level.
1. There is a considerable amount of empty housing in urban China. For example, in 1998,
China had 6.1 million square meters of urban housing unsold. This is about 16% of the
total newly built housing in that year and 1% of the total housing stock (Gu, 2000). The
unsold housing problem is particularly worse in Hainan. Hainan, once a part of
Guangdong Province, became a separate province and ChinaGs fifth and largest special
economic zone (SEZ) in 1988. In the late 1980s and early 1990s, many real estate

26
developers went to Hainan from all over the country, to take advantage of favorable
policies offered by the central government in SEZs, such as lower land acquisition fees
and easier bank credit. The rapid expansion of investment in real estate resulted in a
larger housing consumption; it also produced a large supply of empty housing. In 1994,
only 39% of completed housing in Hainan was sold (Jiang et al., 1998). This
overinvestment received great attention from the government. In 1996, the city
government of Haikou, the capital of Hainan, promulgated four regulations to limit
investment and encourage consumption (Ministry of Construction, 1997, p. 218). In that
year, investment in real estate in Hainan declined 58.4% from the level in the previous
year. In 1999, the State Council specifically issued a document to urge the provincial and
local governments to further reduce empty housing in Hainan (Zhou, 2000).
2. Before the economic reform, China offered its urban workers Giron-rice bowls.G With
this permanent employment policy, a workerGs employment was virtually unchangeable
for economic reasons. Labor mobility is still limited after the reform, mainly due to the
lack of an adequate social security system (Song, 2000). Hence, employment share
reflects the past development strategies rather than the current output composition. This
can be further seen by looking at the shares of employment and output contributed by the
state-owned sector. In 1991, state-owned enterprises hired 68.3% of all industrial
workers but produced only 52.9% of total industrial output (CSSB, 1994, pp. 374-375).
In 1998, state-owned enterprises hired 57.2% of all industrial workers but produced only
28.2% of total industrial output (CSSB, 1999, pp. 422-423).
3. Due to missing data on urban resident income, 128 cities are eliminated. They are all
county-level cities, with an average city population size of 125.7 thousand and a range
from 8.7 to 362.6 thousand. The 348 cities used in our regression have an average city
size of 397.4 thousand. It is worth noting that China classifies cities into three levels:
central municipalities, prefectural-level cities, and county-level cities. In 1993, for
example, China had 3 central municipalities (Chongqing became the fourth in 1997), 196
prefectural-level cities, and 366 county-level cities. County-level cities are relatively
small; it is reasonable to expect that elimination of about one-third county-level cities
would not invalidate main arguments and empirical results.