measuring the energy consumption of china’s domestic investment from 1992 to 2007
TRANSCRIPT

Applied Energy 102 (2013) 1267–1274
Contents lists available at SciVerse ScienceDirect
Applied Energy
journal homepage: www.elsevier .com/locate /apenergy
Measuring the energy consumption of China’s domestic investment from 1992to 2007
Feng Fu a,b, Hongtao Liu a,c, Karen R. Polenske a, Zheng Li b,⇑a Department of Urban Studies and Planning, Massachusetts Institute of Technology, 77 Massachusetts Avenue, Cambridge, MA 02139, USAb State Key Laboratory of Power Systems, Department of Thermal Engineering, Tsinghua-BP Clean Energy Center, Tsinghua University, Beijing 100084, Chinac School of Management, Northwestern Polytechnical University, Xi’an 710072, China
h i g h l i g h t s
" We define the energy consumption of domestic investment as the investment-driven energy consumption (IDEC)." We build an energy input–output model to identify quantitatively the amounts of China’s IDEC from 1992 to 2007." We improve the understanding of the effects of China’s domestic investment on its energy consumption expansion." We provide some quantitative information for further determining the energy-saving potentials of China’s economy.
a r t i c l e i n f o
Article history:Received 14 March 2012Received in revised form 8 June 2012Accepted 21 June 2012Available online 31 July 2012
Keywords:ChinaDomestic investmentEnergy consumptionInput–output analysis
0306-2619/$ - see front matter � 2012 Elsevier Ltd. Ahttp://dx.doi.org/10.1016/j.apenergy.2012.06.062
⇑ Corresponding author. Tel.: +86 10 62795735; faxE-mail address: [email protected] (Z. Li).
a b s t r a c t
In this study, we first define the energy consumption of domestic investment as the investment-drivenenergy consumption (IDEC). Then, we build an energy input–output model to identify quantitativelythe amounts of China’s IDEC from 1992 to 2007. We also use the model to analyze the sector distributionsof the IDEC for the same time period. The key findings derived from this study improve the understandingof the effects of China’s domestic investment on its energy consumption expansion and reflect the factthat China’s rapid urbanization and industrialization processes are among the main reasons for the largeamount of energy consumption in China. We provide some quantitative information for further deter-mining the energy-saving potentials of China’s economy during these processes.
� 2012 Elsevier Ltd. All rights reserved.
1. Introduction
Energy conservation has been consistently regarded as one ofthe fundamental means in China to solve its energy-related chal-lenges, such as energy supply shortage and greenhouse gas(GHG) emissions. [1,2]. During the last three decades, the Chinesegovernment implemented a set of nationwide energy-intensityreduction policies, i.e., policies to reduce the energy consumptionper unit of gross domestic product (GDP), and the effects of thesepolicies have been conspicuous since then [3]. Moreover, a newround of energy-intensity reduction initiatives was ambitiouslylaunched at the beginning of the country’s Twelfth-Five-Year-Planperiod (2011–2015) [4].
As shown in Fig. 1, China’s energy consumption continuedincreasing rapidly in recent years, although its energy-intensity
ll rights reserved.
: +86 10 62795736.
declined dramatically in the same period. This decline is partiallyexplained by the fact that China’s GDP increased rapidly duringthis period.1
In recent years, China’s economic growth has been labelledinvestment-driven, because the capital formation, which is inducedby domestic investment, has contributed greatly to the country’sGDP and growth [6]. On the one hand, the domestic investmenthelped to achieve China’s goal of energy-intensity reduction, be-cause the ever-increasing volume of GDP presented a favorablecondition for calculating energy-intensity. On the other hand, thedomestic investment itself also led to the expansion of China’s en-ergy consumption, because it consumed energy goods (such as elec-tricity) and non-energy goods (such as steel and cement), both ofwhich induce direct and indirect energy consumption to producethese goods. Therefore, compared with the understanding of the
1 Energy-intensity is the ratio of energy consumption to GDP. On the basis of thefixed amount of energy consumption, the bigger the volume of GDP, the smaller thevalue of energy-intensity.

Fig. 1. The historical trends of energy intensity and primary energy consumption inChina. Source: Authors based on data from [5]. Note: tce: tonnes of coal equivalent.
Fig. 2. Defining the different economic-activity-driven energy consumption basedon the expenditure-approach.
Complete consumption coefficient matrix
Dataoutput
Other economic activity-driven
energy consumption
Calculationmodules
Investment-drivenenergy consumption
Energy statisticsDatainput
Data-calibrationmodule
Input-output tables
EnergyInput-output tables
Coefficient-calculation module
Direct consumption coefficient matrix
Energy-consumption-decomposition module
Fig. 3. The scheme of energy input–output model in this study.
Table 1Data input list for the empirical energy study of China.
Class Data input Source
Input–output tables Input–output tables byindustrial sectors of China in1992, 1997, 2002, and 2007(in monetary terms)
[32,36–38]
Energy statistics Energy balance table of Chinain 1992, 1997, 2002, and 2007(in physical terms)
[33,39–41]
Final energy consumption byindustrial sector of China 1992,1997, 2002, and 2007(in physical terms)
1268 F. Fu et al. / Applied Energy 102 (2013) 1267–1274
domestic investment’s economic effects, there is an urgent need toimprove the understanding of the effects of China’s domesticinvestment on its energy-consumption expansion.
Input–output analysis, a useful analytical and planning frame-work developed by Leontief [7], considers the various economicsectors as a series of inputs of source materials (or services) andoutputs of final or intermediate goods (or services). Input–outputanalysis is based on input–output tables, which present economicexchanges of goods and services among industrial sectors in matrixform. In order to take into account both the direct and indirect ef-fects of a growth in the output of an industry in one economy, Ras-mussen [8] developed methods for measuring inter-industrylinkages using the inverse of the input–output table. Hirschman[9] then suggested that backward-linkage effects are related to de-rived demand, while forward-linkage effects are related to outputconsumption.
Because the input–output table conveniently provides an exactquantitative relationship between the energy producers and itsusers, many analysts have used input–output analysis to studythe energy consumption caused by different economic activities[10–15]. For example, Pick and Becker [16] used input–outputanalysis to evaluate direct and indirect uses of energy and materi-als in engineering and construction. Other analysts have also con-ducted similar studies, either focusing on national or regionaleconomies [17–20].
Among the empirical studies of China, analysts have alreadystudied the effects of many economic activities on energy con-sumption. Polenske and McMichael [21], for example, designed acoke-making input–output process-flow model to understand theenergy consumption, efficiency, and environmental pollution inthe coke-making process, Chang et al. [22] estimated the embodiedenergy and environmental impacts of construction projects in Chi-na. Liu et al. [19] made a comprehensive evaluation of householdindirect energy consumption and impacts of alternative energypolicies in China. Liu et al. [23] evaluated the impacts of interna-tional trade on energy use and identified the underlying factorsthat contribute to modifying the energy embodied in exports overyears. Chen and Zhang [24] built a GHG emission inventory by eco-nomic sector in China in 2007 to reveal systematically the GHGemission embodiment in final consumption and internationaltrade of the Chinese economy, and Su et al. [25] investigatedhow sector aggregation affects estimates of energy-related car-bon-dioxide emissions in international trade based on the input–output framework.
However, few analysts have studied the investment effects, i.e.,assessing the effects of China’s domestic investment on its energyconsumption expansion. In this paper, we measure the energy con-sumption of China’s domestic investment, so as to provide criticalinsights for the country’s policy-makers to refine the current inten-
sity-reduction-oriented energy-efficiency policies. We first definethe energy consumption of domestic investment as the invest-ment-driven energy consumption. Then, we build an energyinput–output model to identify quantitatively the amounts ofChina’s investment-driven energy consumption in 1992, 1997,2002 and 2007. We also use the model to analyze the sector distri-butions of the investment-driven energy consumption for the sameperiod.

Fig. 4. Sector classification of the Chinese economy for this energy study.
F. Fu et al. / Applied Energy 102 (2013) 1267–1274 1269
2. Defining the investment-driven energy consumption
According to national economic accounting, gross domesticproduct (GDP) can be measured from the income, the production,or the expenditure (final-use) perspective [26]. Measuring GDPfrom the expenditure perspective, namely the expenditure-ap-proach, involves counting expenditures on goods and services bythe following three groups of economic activities: (1) final con-sumption (private and government), (2) domestic investment,and (3) international trade [27]. Among these three activities,domestic investment plays key roles in maintaining and expandingan economy by continuously forming new assets, such as build-ings, infrastructure, and various industrial facilities. These newlyformed assets, plus those assets formed and accumulated previ-ously, provide the current production capacities (or conditions)of goods and services of various economic sectors.
Given the expenditure-approach, we can define and differenti-ate the energy consumed by domestic investment from that con-sumed by other economic activities (i.e., final consumption andinternational trade). As shown in Fig. 2, the annual energy con-sumption can be sorted by the three groups of economic activities,i.e., final-consumption-driven energy consumption (FCDEC), ex-port-driven energy consumption (EDEC) and investment-drivenenergy consumption (IDEC). Each category of energy consumptionincludes both direct and indirect energy, i.e., embodied energy,2
2 The International Federation of Institutes for Advanced Study (IFIAS) proposedthat the concept of embodied energy should be used in empirical studies to track theenergy consumption of economic activities [28]. Embodied energy is the total(including direct and indirect) energy that is used in the production and supply ofgoods and services [29–31].
consumed by the corresponding economic activities. For example,investment consumes both energy and non-energy goods and ser-vices, so that the energy consumed by domestic investment, namelythe IDEC, should take the embodied energy of all these goods andservices into account.
3. Energy input–output model
3.1. Model scheme
The model scheme is shown in Fig. 3. The following twocomponents comprise the data input of the model: input–outputtables and energy statistics. The input–output tables reflect theexchange of goods and services among various industrial sectorsof the whole national economy [32], and the energy statistics showthe annual account balance of the energy supply and consumptionfor the whole national economy [33].
In the model, the calculation is accomplished collaboratively bythe following three modules: (1) data calibration, (2) coefficientcalculation, and (3) energy-consumption–decomposition. In thedata-calibration module, we calibrate the data inputs of input–output tables and energy statistics, so as to produce the energy in-put–output table. In the coefficient-calculation module, we firstcompute the direct-consumption coefficient matrix (i.e., the directexchange of goods and services among all industrial sectors), andthen compute the complete-consumption coefficient matrix (i.e.,both direct and indirect exchange of goods and services amongall industrial sectors). In the energy-consumption–decompositionmodule, we further decompose the annual energy consumption.Ultimately, the data output of the model is the two categories ofannual energy consumption.

(b) Percentage (a) Absolute amount
Fig. 5. The decomposition of China’s energy consumption from 1992 to 2007.
1270 F. Fu et al. / Applied Energy 102 (2013) 1267–1274
3.2. Mathematical expressions
Assume that the economy can be categorized into N + M sectors,which include N energy sectors, and M non-energy sectors. If wedenote by xi the total output of sector i (in monetary terms), bymi the total import for sector i’s products (in monetary terms),and by fi the total final demand for sector i’s products (in monetaryterms), by Zi,j the intermediate sales (in monetary terms) by sector ito sector j (including itself, when i = j), we may write a equationaccounting for the way in which sector i distributes its productsthrough sales to other sectors, as well as to final demand:
Zi;1 þ � � � þ Zi;j þ � � � Zi;NþM þ fi ¼ xi þmi ð1Þ
The total final demand for sector i’s products (i.e., fi), can be fur-ther decomposed into three parts, i.e., household and governmentexpenditures, capital formation, and exports, which are denoted byyi, ci, and wi respectively. Thus, fi can be expressed as
fi ¼ yi þ ci þwi ð2Þ
Let
�Z1;1 � � � Z1;j � � � Z1;NþM
..
. . .. ..
.
Z Z Z�
Z ¼ i;1 i;j i;NþM
..
. . .. ..
.
ZNþM;1 � � � ZNþM;j � � � ZNþM;NþM
,
� �T � �T
Fig. 6. Comparison of the investment-driven energy consumption (IDEC) as thepercentage of total energy consumption in China and Germany. The authors discussthe German data based on the results from [42].
y ¼ y1 � � � yi � � � yNþM , c ¼ c1 � � � ci � � � cNþM ,
w ¼�
w1 � � � wi � � � wNþM�T
, x ¼�
x1 � � � xi � � � xNþM�T
,
and m ¼ ½m1 � � � mi � � � mNþM �T . Here and throughout this pa-per, we use lower-case bold letters for column vectors, as in y and xand upper-case bold letters for matrices, as in Z. With this notation,Eqs. (1) and (2) on the distribution of each sector’s sales can be sum-marized in matrix notation as
Z� iþ y þ cþw ¼ xþm ð3Þ
where i represents an N + M dimensional column vector of 1s.
3.2.1. Data calibration moduleMany researchers have extended the input–output framework
incrementally to employ physical units and, in the process, theyhave laid the groundwork for new research areas, such as indus-trial ecology and ecological economics [34,35].
In the data-calibration module, we begin with the energyinput–output framework where we construct transaction tablesin the so-called hybrid unit input–output table [35]. That is, we
trace the energy sectors’ products in physical units (for example,tonnes of coal equivalent (tce)), and the non-energy sectors’ prod-ucts in monetary terms. Accordingly, we can adapt Eq. (3) to:
Z� � iþ y� þ c� þw� ¼ x� þm� ð4Þ
where EZ1;1 � � � EZ1;j � � � EZ1;NþM
..
. . .. ..
.
EZ EZ EZ
26666
37777
Z� ¼ ½EZ;ZZ�T , EZ ¼ i;1 i;j i;NþM
..
. . .. ..
.
EZN;1 � � � EZN;j � � � EZN;NþM
6666477775
,
ZNþ1;1 � � � ZNþ1;j � � � ZNþ1;NþM
..
. . .. ..
.
26666
37777
ZZ ¼ Zi;1 Zi;j Zi;NþM
..
. . .. ..
.
ZNþM;1 � � � ZNþM;j � � � ZNþM;NþM
6666477775
,
y� ¼�
ey1 � � � eyi � � � eyN yNþ1 � � � yi � � � yNþM
�T
,
c� ¼�
ec1 � � � eci � � � ecN cNþ1 � � � ci � � � cNþM�T
,
w� ¼�
ew1 � � � ewi � � � ewN wNþ1 � � � wi � � � wNþM�T
,
x� ¼�
ex1 � � � exi � � � exN xNþ1 � � � xi � � � xNþM�T
, and

Table 2The decomposition of China’s energy consumption growth from 1992 to 2007.
Period FCDEC IDEC EDEC Total
Energy consumption growth of different final uses between each period, 100 million tce (the corresponding growth rate, %)1992–1997 0.44 (7.6%) 1.15 (36.7%) 1.00 (46.6%) 2.59 (23.5%)1997–2002 0.33 (5.4%) 0.15 (3.6%) 0.88 (27.9%) 1.37 (10.0%)1992–2002 0.77 (13.4%) 1.30 (41.7%) 1.89 (87.4%) 3.96 (35.9%)2002–2007 2.60 (40.0%) 4.25 (96.1%) 3.75 (92.8%) 10.61 (70.8%)1992–2007 3.37 (58.7%) 5.55 (177.8%) 5.64 (261.5%) 14.56 (132.1%)
The energy consumption growth of final uses in the proportion of total energy consumption growth, %1992–1997 16.9% 44.3% 38.8% 100%1997–2002 24.3% 11.3% 64.5% 100%1992–2002 19.4% 32.9% 47.7% 100%2002–2007 24.5% 40.1% 35.4% 100%1992–2007 23.1% 38.1% 38.7% 100%
Note: FCDEC: final-consumption-driven energy consumption; EDEC: export-driven energy consumption; and IDEC: investment-driven energy consumption.
F. Fu et al. / Applied Energy 102 (2013) 1267–1274 1271
m� ¼�
em1 � � � emi � � � emN mNþ1 � � � mi � � � mNþM�T
.
3.2.2. Coefficient-calculation moduleIn the coefficient-calculation module, we transform Eq. (4) into
the following coefficient form:
A� � ðx� þm�Þ þ y� þ c� þw� ¼ x� þm� ð5Þ
where A� is the direct consumption-coefficient matrix, and
A�i;j ¼
EZ�i;jðex�
jþem�
jÞ i ¼ 1;2;3; . . . ;N
Z�i;jðx�
jþm�
jÞ i ¼ N þ 1;N þ 2;N þ 3; . . . ;N þM
8>><>>:
Fig. 7. The energy intensities of investment and GDP on average in Chineseeconomy. The investment energy intensity is estimated, by this study, as theinvestment-driven energy consumption per unit of GDP generated by capitalformation.
Subsequently, Eq. (5) can be further derived as
B� � y� þ B� � c� þ B� �w� ¼ x� þm� ð6Þ
where B� is the Leontief inverse matrix (I � A�)�1, or the so-calledcomplete consumption-coefficient matrix.
3.2.3. Energy-consumption–decomposition moduleLet tc� ¼ B� � c�. Among the N energy sectors, assume that there
are K primary energy sectors (for example, coal mining and oil andnatural gas extraction), N–K secondary energy sectors (for exam-ple, power and heat generation, and oil refinery). Finally, we canidentify the investment-driven energy consumption as
IDEC ¼XK
i¼1
tcið1� aiÞ þXN
i¼kþ1
tciai ð7Þ
where we denote by ai ¼ nfeifeiþnfei
the proportion of non-fossil primaryenergy used to produce the secondary energy sector i’s products, byfei the amount of fossil primary energy used to produce the second-ary energy sector i’s products, and by nfei fossil primary energy usedto produce the secondary energy sector i’s products.
3.3. Data input
Given the energy input–output model, we use 1992, 1997, 2002,and 2007 data (as shown in Table 1) in order to conduct anempirical study for China. To build the energy input–output table,we use data from the energy statistics (in physical units) and theinput–output table (in monetary units) published by the NationalBureau of Statistics of China to construct a so-called hybrid unit in-put–output table [35].
To calibrate the data for the input–output tables and energy sta-tistics, we adjust the sector classification of the input–output ta-bles, using the sector classification as shown in Fig. 4.
4. Result and discussion
The overall decomposition results of China’s energy consump-tion by its different final uses, both in absolute and percentageterms, are reported in Fig. 5.
China’s fast-growing economy, with growth rates averaging 10%from 1992 to 2007, has led to accelerated requirements of energy.The decomposition results, as shown in Fig. 5a, highlight China’sever-increasing energy consumption of different final uses duringthis period, among which the IDEC increased from 321 milliontce to 868 million tce, the FCDEC increased from 574 million tceto 911 million tce, and the EDEC increased from 216 million tceto 779 million tce. As a whole, China’s total energy consumptionincreased from 1.10 billion tce in 1992 to 2.56 billion tce in 2007.
In terms of proportion, as shown in Fig. 5b, the IDEC and theEDEC accounted for 28.3% and 19.6% of China’s total energy con-sumption in 1992, respectively, and these proportions increasedto 33.9% and 30.5% in 2007. In contrast, the FCDEC accounted for52.1% of China’s total energy consumption in 1992, which is muchhigher than the IDEC and the EDEC that year. This proportion,however, kept falling during our observation period, and droppedto 35.6% in 2007, which almost equals the IDEC and the EDEC pro-portions in the same year.
One of the key findings from the above results is that the IDECaccounted for a significant proportion of China’s total energy con-sumption during our observation period, which means that domes-tic investment played a primary role in inducing the country’s
(a) 1992
(b) 1997
(c) 2002
(d) 2007
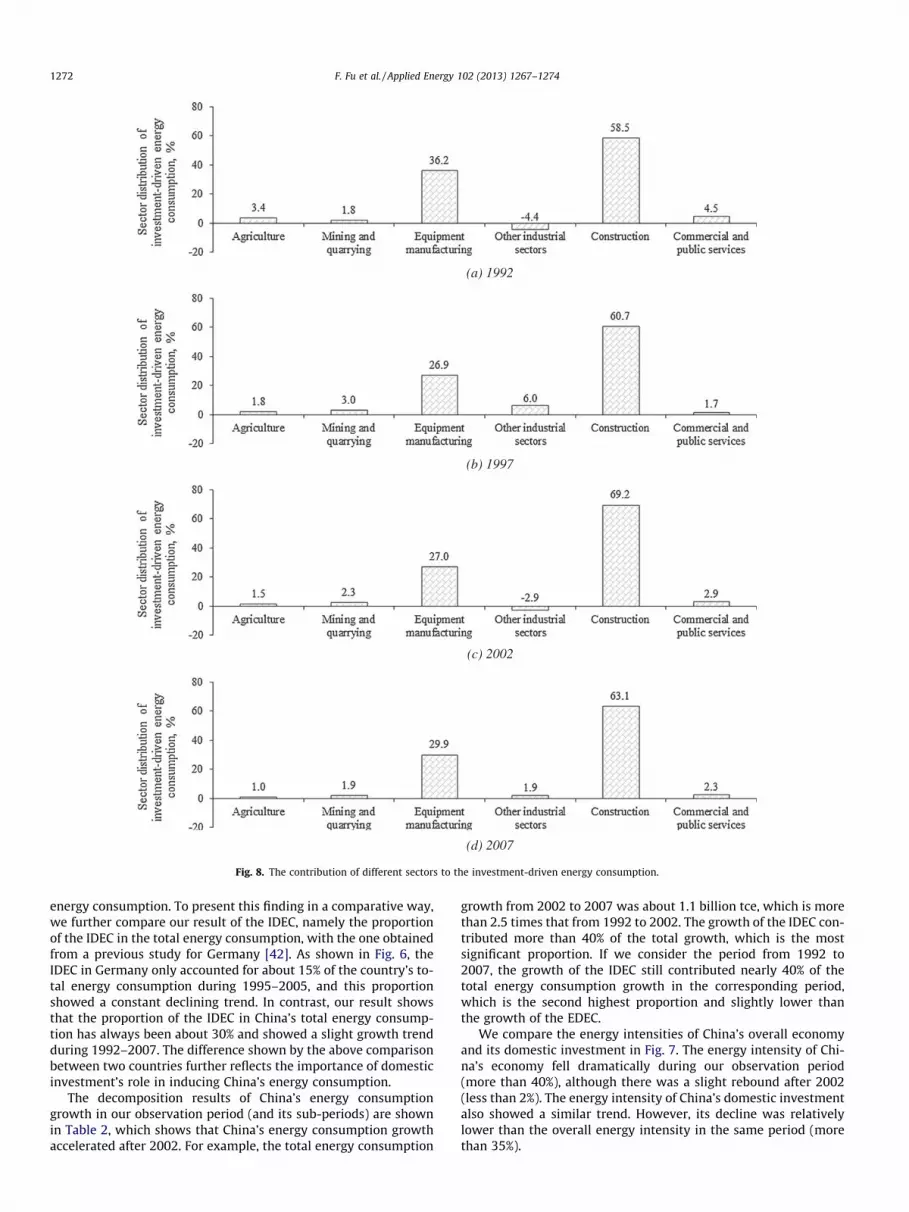
Fig. 8. The contribution of different sectors to the investment-driven energy consumption.
1272 F. Fu et al. / Applied Energy 102 (2013) 1267–1274
energy consumption. To present this finding in a comparative way,we further compare our result of the IDEC, namely the proportionof the IDEC in the total energy consumption, with the one obtainedfrom a previous study for Germany [42]. As shown in Fig. 6, theIDEC in Germany only accounted for about 15% of the country’s to-tal energy consumption during 1995–2005, and this proportionshowed a constant declining trend. In contrast, our result showsthat the proportion of the IDEC in China’s total energy consump-tion has always been about 30% and showed a slight growth trendduring 1992–2007. The difference shown by the above comparisonbetween two countries further reflects the importance of domesticinvestment’s role in inducing China’s energy consumption.
The decomposition results of China’s energy consumptiongrowth in our observation period (and its sub-periods) are shownin Table 2, which shows that China’s energy consumption growthaccelerated after 2002. For example, the total energy consumption
growth from 2002 to 2007 was about 1.1 billion tce, which is morethan 2.5 times that from 1992 to 2002. The growth of the IDEC con-tributed more than 40% of the total growth, which is the mostsignificant proportion. If we consider the period from 1992 to2007, the growth of the IDEC still contributed nearly 40% of thetotal energy consumption growth in the corresponding period,which is the second highest proportion and slightly lower thanthe growth of the EDEC.
We compare the energy intensities of China’s overall economyand its domestic investment in Fig. 7. The energy intensity of Chi-na’s economy fell dramatically during our observation period(more than 40%), although there was a slight rebound after 2002(less than 2%). The energy intensity of China’s domestic investmentalso showed a similar trend. However, its decline was relativelylower than the overall energy intensity in the same period (morethan 35%).

Fig. 9. The contribution of different sectors to the energy embodied in the equipment manufacturing.
F. Fu et al. / Applied Energy 102 (2013) 1267–1274 1273
We show the decomposition results of China’s IDEC from1992 to 2007 in Fig. 8. These results allow us to complement theaggregated analysis above with a sectoral analysis. In the wholeperiod, the construction sector possessed dominant shares (i.e.,63% on average) of the IDEC. The construction sector is mainlyengaged in civil-engineering activities to construct buildings andinfrastructure. These activities usually consume a huge amountof energy-intensive materials, such as cement and steel, whichcauses significant indirect energy consumption from a life-cycleperspective. Therefore, the construction sector transformed a largeamount of the IDEC of civil engineering activities into their embod-ied forms of buildings and infrastructure.
Due to the limited availability of statistics in China, so far, wecannot track the energy flow of the IDEC of construction sectorby further decomposing this part of energy.
The equipment manufacturing sector, including manufacturingof metal products, general and special purpose machineries,transport equipment, electrical machineries and equipment, com-munication and other electronic equipment, and machineries formeasuring, culture and office, possesses the second highest share(i.e., 30% on average) of the IDEC. The IDEC of these manufacturingsectors are transformed into their embodied forms in machineriesand equipment. Fig. 9 further shows the contribution of differentsectors to the embodied energy in machineries and equipment.Among these sectors, the contribution of manufacturing of generaland special purpose machineries, such as mining, chemical, andmetallurgical machineries, decreased over time, while the contri-bution of other sectors, such as the manufacturing of transportequipment, and communication and other electronic equipmentincreased during this period.
5. Conclusion
The purpose of this study is to improve the understanding of theimplications of China’s domestic investment on its energy-con-sumption expansion. To do this, we defined and differentiatedthe energy consumed by domestic investment from that consumedby other economic activities (i.e., final consumption and interna-tional trade) on the basis of the expenditure-approach. We alsomeasured quantitatively China’s domestic investment-driven en-ergy consumption of 1992, 1997, 2002, and 2007 by using an en-ergy input–output analysis.
The overall results obtained from the energy input–output anal-ysis show that China’s domestic investment contributed signifi-cantly to the country’s total energy consumption growth overour observation period. We also show an ever-increasing trend ofthe ratio of China’s domestic investment-driven energy consump-tion to its total energy consumption since 1990s.
The sectoral-level results we obtained from the energy input–output analysis show that China’s construction sector and equip-ment manufacturing sector together accounted for more than90% of its domestic investment-driven energy consumption inour observation period. The results reflect the fact that China’s ra-pid urbanization and industrialization has consumed a largeamount of energy. Given this fact, we can conclude that the shortlifespan of buildings and infrastructure [43–45], and overcapacitiesin many Chinese industrial sectors [46] represent inefficient use ofcapital, energy, and other resources consumed by correspondinginvestment activities. Chinese policy makers should improve theirdesign of the country’s energy efficiency policies in terms of deter-mining the energy-saving potentials of China’s economy from theperspective that we present through this study.
Acknowledgements
We are grateful to both the Chinese Academy of Engineeringand the National Energy Administration of National Developmentand Reform Commission of China for their continuous and gener-ous sponsorship. We are also grateful to the Chinese Academy ofSciences for their data and would like to thank the referees for theirhelpful comments.
References
[1] Bambawale MJ, Sovacool BK. China’s energy security: the perspective of energyusers. Appl Energy 2011;88(5):1949–56.
[2] He JK, Deng J, Su MS. CO2 emission from China’s energy sector and strategy forits control. Energy 2010;35(11):4494–8.
[3] Price L, Levine MD, Zhou N, Fridley D, Aden N, Lu HY, et al. Assessment ofChina’s energy-saving and emission-reduction accomplishments andopportunities during the 11th Five Year Plan. Energy Pol 2011;39(4):2165–78.
[4] China’s outline of the 12th Five-Year-Plan for national economic and socialdevelopment. The State Council of China. <http://big5.gov.cn/gate/big5/www.gov.cn/2011lh/content_1825838.htm>.
[5] National Bureau of Statistics of China (NBSC). China energy statistical yearbook2011. Beijing: China Statistics Press; 2011.
[6] Qin D, Cagas MA, Quising P, He XH. How much does investment driveeconomic growth in China? J Pol Model 2006;28(7):751–74.
[7] Leontief WW. Quantitative input and output relations in the economic systemsof the United States. Rev Econ Stat 1936;18(3):105–25.
[8] Rasmussen P. Studies in intersectoral relations. Amsterdam: North Holland;1956.
[9] Hirschman AO. The strategy of economic development. New Haven: YaleUniversity Press; 1958.
[10] Kizilaslan H. Input–output energy analysis of cherries production in TokatProvince of Turkey. Appl Energy 2009;86(7–8):1354–8.
[11] Chung WS, Tohno S, Shim SY. An estimation of energy and GHG emissionintensity caused by energy consumption in Korea: an energy IO approach. ApplEnergy 2009;86(10):1902–14.
[12] Hondo H, Sakai S, Tanno S. Sensitivity analysis of total CO2 emission intensitiesestimated using an input–output table. Appl Energy 2002;72(3–4):689–704.
[13] Gay PW, Proops JLR. Carbon dioxide production by the UK economy: an input–output assessment. Appl Energy 1993;44(2):113–30.

1274 F. Fu et al. / Applied Energy 102 (2013) 1267–1274
[14] Hawdon D, Pearson P. Input–output simulations of energy, environment,economy interactions in the UK. Energy Econ 1995;17(1):73–86.
[15] Bullard CW, Herendeen RA. The energy cost of goods and services. Energy Pol1975;3(4):268–78.
[16] Pick HJ, Becker PE. Direct and indirect uses of energy and materials inengineering and construction. Appl Energy 1975;1(1):31–51.
[17] Cohen CM, Lenzen M, Schaeffer R. Energy requirements of households inBrazil. Energy Pol 2005;33(4):555–62.
[18] Chang YF, Lewis C, Lin SJ. Comprehensive evaluation of industrial CO2 emission(1989–2004) in Taiwan by input–output structural decomposition. Energy Pol2008;36(7):2471–80.
[19] Liu HT, Guo JE, Qian D, Xi YM. Comprehensive evaluation of household indirectenergy consumption and impacts of alternative energy policies in China byinput–output analysis. Energy Pol 2009;37(8):3194–204.
[20] Chung WS, Tohno S, Choi KH. Socio-technological impact analysis using anenergy IO approach to GHG emissions issues in South Korea. Appl Energy2011;88(11):3747–58.
[21] Polenske KR, McMichael FC. A Chinese coke making process-flow model forenergy and environmental analyses. Energy Pol 2002;30(10):865–83.
[22] Chang Y, Ries RJ, Wang YW. The embodied energy and environmentalemissions of construction projects in China: an economic input–output LCAmodel. Energy Pol 2010;38(11):6597–603.
[23] Liu HT, Xi YM, Guo JE, Li X. Energy embodied in the international trade ofChina: an energy input–output analysis. Energy Pol 2010;38(8):3957–64.
[24] Chen GQ, Zhang B. Greenhouse gas emissions in China 2007: inventory andinput–output analysis. Energy Pol 2010;38(10):6180–93.
[25] Su B, Huang HC, Ang BW, Zhou P. Input–output analysis of CO2 emissions embodiedin trade: the effects of sector aggregation. Energy Econ 2010;32(1):166–75.
[26] Statistical Manual: GDP. The World Bank. <http://web.worldbank.org/WBSITE/EXTERNAL/DATASTATISTICS/EXTDECSTAMAN/0,contentMDK:20882526~menuPK:2648252~pagePK:64168445~piPK:64168309~theSitePK:2077967~isCURL:Y,00.html>.
[27] DEPweb: Beyond Economic Growth Student Book. The World Bank. <http://www.worldbank.org/depweb/english/beyond/global/glossary.html#34>.
[28] International Federation of Institutes for Advanced Studies (IFIAS). IFIASworkshop report, energy analysis and economics. Resource Energy1978;1(2):151–204.
[29] Brown MT, Herendeen RA. Embodied energy analysis and EMERGY analysis: acomparative view. Ecol Econ 1996;19(3):219–35.
[30] Dincer I, Rosen MA. Energy, environment and sustainable development. ApplEnergy 1999;64(1–4):427–40.
[31] Dixit MK, Fernandez-Solis JL, Lavy S, Culp CH. Identification of parameters forembodied energy measurement: a literature review. Energy Build2010;42(8):1238–47.
[32] National Bureau of Statistics of China (NBSC). Input–output tables of China2007. Beijing: China Statistics Press; 2009.
[33] National Bureau of Statistics of China (NBSC). China energy statistical yearbook2008. Beijing: China Statistics Press; 2009.
[34] Duchin F. Industrial input–output analysis: implications for industrial ecology.Proc Natl Acad Sci 1992;89:851–5.
[35] Miller RE, Blair PD. Input–output analysis: foundations and extensions. NewJersey: Prentice-Hall; 2009.
[36] National Bureau of Statistics of China (NBSC). Input–output tables of China1992. Beijing: China Statistics Press; 1995.
[37] National Bureau of Statistics of China (NBSC). Input–output tables of China1997. Beijing: China Statistics Press; 1999.
[38] National Bureau of Statistics of China (NBSC). Input–output tables of China2002. Beijing: China Statistics Press; 2006.
[39] National Bureau of Statistics of China (NBSC). China energy statistical yearbook1991–1996. Beijing: China Statistics Press; 1998.
[40] National Bureau of Statistics of China (NBSC). China energy statistical yearbook1997–1999. Beijing: China Statistics Press; 2001.
[41] National Bureau of Statistics of China (NBSC). China energy statistical yearbook2003. Beijing: China Statistics Press; 2003.
[42] Environmental-economic accounting (EEA): environmental impacts ofhousehold consumption in Germany 1995–2005. Federal Statistical OfficeGermany. <https://www.destatis.de/EN/Publications/Specialized/EnvironmentalEconomicAccounting/Environmentalimpacts.pdf?__blob=publicationFile>.
[43] Hu MM, Bergsdal H, Voet EVD, Huppes G, Muller DB. Dynamics of urban andrural housing stocks in China. Build Res Inform 2011;38(3):301–17.
[44] Short-lived buildings create huge waste. China daily. <http://www.chinadaily.com.cn/china/2010-04/06/content_9687545.htm>.
[45] Promoting energy efficiency in buildings: lessons learned from internationalexperience. United Nations Development Programme (UNDP). <http://www.beta.undp.org/undp/en/home/librarypage/environment-energy/sustainable_energy/promoting_energyefficiencyinbuildings.html>.
[46] European Union Chamber of Commerce in China (EUCCC). Overcapacity inChina: causes, impacts and recommendations. Beijing: EUCCC; 2010.