hippocampal place cell instability after lesions of the head direction cell network
TRANSCRIPT

Behavioral/Systems/Cognitive
Hippocampal Place Cell Instability after Lesions of the HeadDirection Cell Network
Jeffrey L. Calton, Robert W. Stackman, Jeremy P. Goodridge, William B. Archey, Paul A. Dudchenko, andJeffrey S. TaubeDepartment of Psychological and Brain Sciences, Center for Cognitive Neuroscience, Dartmouth College, Hanover, New Hampshire 03755
The occurrence of cells that encode spatial location (place cells) or head direction (HD cells) in the rat limbic system suggests that thesecell types are important for spatial navigation. We sought to determine whether place fields of hippocampal CA1 place cells would bealtered in animals receiving lesions of brain areas containing HD cells. Rats received bilateral lesions of anterodorsal thalamic nuclei(ADN), postsubiculum (PoS), or sham lesions, before place cell recording. Although place cells from lesioned animals did not differ fromcontrols on many place-field characteristics, such as place-field size and infield firing rate, the signal was significantly degraded withrespect to measures of outfield firing rate, spatial coherence, and information content. Surprisingly, place cells from lesioned animalswere more likely modulated by the directional heading of the animal. Rotation of the landmark cue showed that place fields fromPoS-lesioned animals were not controlled by the cue and shifted unpredictably between sessions. Although fields from ADN-lesionedanimals tended to have less landmark control than fields from control animals, this impairment was mild compared with cells recordedfrom PoS-lesioned animals. Removal of the prominent visual cue also led to instability of place-field representations in PoS-lesioned, butnot ADN-lesioned, animals. Together, these findings suggest that an intact HD system is not necessary for the maintenance of place fields,but lesions of brain areas that convey the HD signal can degrade this signal, and lesions of the PoS might lead to perceptual or mnemonicdeficits, leading to place-field instability between sessions.
Key words: navigation; ideothetic; path integration; landmark; postsubiculum; anterodorsal thalamic nucleus; spatial orientation; rat
IntroductionLimbic system structures have been implicated in the control ofnavigational behavior. Animals with lesions of the hippocampusand related structures exhibit a variety of spatial deficits (O’Keefeand Nadel, 1978; Morris et al., 1982; Jarrard, 1993). Furthermore,the limbic system contains several types of cells that encode allo-centric spatial information. Place cells, found primarily in thehippocampus, discharge when the animal is located at a particu-lar location in a familiar environment (O’Keefe and Dostrovsky,1971). Different place cells have different preferred locations(place fields), potentially allowing the activity from the overallpopulation of place cells to form a representation of externalspace, or cognitive map, that the animal might use for navigation(O’Keefe and Nadel, 1978). Head direction (HD) cells, found
primarily in the postsubiculum (PoS; dorsal presubiculum)(Taube et al., 1990a), anterior dorsal thalamus (Taube, 1995),and lateral mammillary nuclei (LMN) (Stackman and Taube,1998), signal the directional heading of the animal within anenvironment (for review, see Taube, 1998; Sharp et al., 2001a). Asin the preferred locations of place cells, individual HD cells aretuned to different preferred directions, and it is thought that thecombined activity of the HD cell population accurately reflectsthe animal’s perceived directional heading.
Place cells and HD cells share a number of characteristics. Forexample, when normally stable visual landmarks are rotated inthe absence of the animal, place fields and preferred firing direc-tions shift a similar amount when the animal is returned to theapparatus (O’Keefe and Conway, 1978; Muller and Kubie, 1987;Taube et al., 1990b). However, if visual cues are removed fromthe apparatus during a recording session, the spatial signals ofboth cell types are relatively stable for a period of time despiteongoing movement (Muller and Kubie, 1987; Quirk et al., 1990;Goodridge et al., 1998). In the absence of visual landmarks, itis thought that both place cells and HD cells maintain theirstable spatial correlates through the use of movement-related(ideothetic) cues, such as vestibular, proprioceptive, and motorefferent copy, a process known as path integration (Mittelstaedt,1983; Taube and Burton, 1995; McNaughton et al., 1996). Finally,when place cells and HD cells show unstable representations be-tween recording sessions, the spatial signals from both cell typestypically shift similar amounts (Knierim et al., 1995), supporting
Received March 21, 2003; revised Sept. 3, 2003; accepted Sept. 3, 2003.This work was supported by grants from the National Institute on Deafness and Other Communication Disorders
(DC00236), the National Institute of Mental Health (MH48924 and MH01286), and NASA through the NASA Coop-erative Agreement NCC 9-58 with the National Space Biomedical Research Institute. We thank Joshua Bassett,Russell Frohardt, Edward Golob, and Gary Muir for helpful discussions. Previous versions of these experiments werepublished in abstract form (Dudchenko et al., 1995; Archey et al., 1997).
Correspondence should be addressed to Dr. Jeffrey S. Taube, Department of Psychological and Brain Sciences,Dartmouth College, 6207 Moore Hall, Hanover, NH 03755. E-mail: [email protected].
J. L. Calton’s present address: Department of Psychology, California State University–Sacramento, 6000 J Street,Sacramento, CA 95819. E-mail: [email protected].
R. W. Stackman’s present address: Department of Behavioral Neuroscience, L470, Oregon Health and ScienceUniversity, 3181 Southwest Sam Jackson Park Road, Portland, OR 97239-3098. E-mail: [email protected].
P. A. Dudchenko’s present address: Department of Psychology, University of Stirling, FK9 4LA Stirling, UK. E-mail:[email protected] © 2003 Society for Neuroscience 0270-6474/03/239719-13$15.00/0
The Journal of Neuroscience, October 29, 2003 • 23(30):9719 –9731 • 9719
the idea that they are part of an interconnected navigationalsystem.
Several theories have suggested that place cells use the signalfrom the HD system to establish and maintain place-field activity(McNaughton et al., 1996; Touretzky and Redish, 1996; Sharp,1999). Given this possibility, one might expect alteration inplace-field characteristics after lesions that disrupt the activity ofHD cells. Goodridge and Taube (1997) found that lesions of theanterodorsal thalamic nuclei (ADN) eliminated HD cell activityin PoS, whereas lesions of PoS resulted in ADN HD cell activitythat was less influenced by the prominent visual landmark in therecording apparatus. Given these findings, and the possibilitythat the HD signal is used by place cells to maintain a stable spatialcorrelate, lesions of ADN or PoS might potentially alter place-field activity. Here, we report the finding of intact, although de-graded, place-field representations of hippocampal place cells af-ter lesions of ADN or PoS.
Materials and MethodsSubjects and apparatus. Thirty-one female Long–Evans rats, 3– 6 monthsof age, served as subjects. Free feeding weights ranged from 250 to 350 gmat the start of the study. Rats were singly housed in Plexiglas cages andmaintained on a 12 hr light/dark cycle. Although water was available adlibitum, access to food was restricted as necessary to maintain bodyweights in the range of 85–90% of free feeding weights.
Before all surgical procedures, rats were trained to forage for foodpellets randomly dropped onto the floor of a painted gray, wooden cy-lindrical enclosure (76 cm diameter; 51 cm high) that also served as thetest enclosure during recording sessions. The inside of the enclosure wasfeatureless, except for a white card occupying �100° of arc attached tothe wall. The floor of the enclosure consisted of gray paper that could bechanged as necessary between sessions. A black curtain (2.5 m diameter)completely enclosed the enclosure from floor to ceiling, effectively elim-inating external visual landmarks. Four or eight lights arranged symmet-rically and mounted on the ceiling provided illumination.
During recording sessions, the position and directional orientation ofthe rat was monitored using an automated tracking system (Ebtronics,Elmont, NY). A color video camera mounted on the ceiling enabled thedetection of a red light-emitting diode (LED) and a green LED secured�10 cm apart above the snout and back of the animal, respectively. Thevideo tracking hardware provided X and Y coordinates of each LED to aspatial resolution of 3.8 mm square in the x-y plane of the cylinder floor.The animal’s location in the cylinder was defined as the point from thered LED that was 0.25 of the distance between the two LEDs, a positionthat approximately corresponded to the center of the animal’s head. Thehead direction of the animal was determined by the relative position ofthe red and green LEDs.
Surgical procedures. All animals received implantation of the recordingelectrodes using standard surgical procedures. The recording electrodeswere constructed using methods described by Kubie (1984). Briefly, eachelectrode array consisted of a bundle of 10 25-�m-diameter wires thatwere insulated, except at the tip. The wires were threaded through astainless steel cannula that was moveable in the dorsoventral directionafter being fixed to the skull using dental acrylic. Animals were anesthe-tized with intraperitoneal Nembutal (50 mg/kg) and also given atropinesulfate (2.5 mg) to prevent respiratory distress. After exposure of theskull, a hole was drilled and the electrode was implanted just dorsal to theCA1 region of the right hippocampus based on coordinates (3.8 mmposterior to bregma, 2.7 mm lateral to bregma, and 1.5 mm below thecortical surface) provided by Paxinos and Watson (1998).
In addition to electrode implantation, some animals also received bi-lateral excitotoxic lesions of the ADN (n � 9) or PoS (n � 8). Theanterior thalamic nuclei consist of three distinct nuclei: anterodorsal(ADN), anteroventral, and anteromedial (including the interanteriormedial). The anteroventral nucleus has connectivity similar to that seenfor the ADN (van Groen and Wyss, 1995), but both the ADN and antero-ventral nuclei have different connections compared with the anterome-
dial nucleus (van Groen et al., 1999). However, because HD cells havebeen identified primarily in the ADN (Taube, 1995) and because lesionsconfined to the ADN abolish direction-specific activity in the PoS (Good-ridge and Taube, 1997), our intentions were only to lesion the ADN. Thelesions were produced by delivering the excitotoxin through either aHamilton (Reno, NV) syringe or a calibrated glass micropipettemounted on a Kopf (Tujunga, CA) stereotaxic manipulator. Stereotaxiccoordinates for these lesions are shown in Table 1. ADN lesions wereproduced by injecting two 0.15 �l injections of 100 mM NMDA (Sigma,St. Louis, MO) into each hemisphere. PoS lesions were produced byinjecting four (n � 3) or five (n � 5) 0.1– 0.15 �l injections of ibotenicacid (10 mg/ml; Bioresearch Technologies, San Rafael, CA) into eachhemisphere. The remaining animals (n � 14) received electrode implan-tation, but no excitotoxic lesions, and served as controls.
Recording procedures. To detect single-unit activity, electrical signalsrecorded from the brain were passed through a field-effect transistor in asource–follower configuration. Signals were amplified by a factor of10,000 –50,000 (Grass Instruments, West Warwick, RI), bandpass fil-tered (300 –10,000 Hz, 3 dB/octave), and sent through a dual-windowdiscriminator (BAK Electronics, Mt. Airy, MD) for spike discrimination.Screening for place cells involved examining the electrical signal on eachof the 10 implanted wires while the animal foraged in the recordingcylinder. If no location-specific activity was detected, the cannula con-taining the wires was advanced 25–50 �m, the animal was returned to itshome cage, and no additional screening for cellular activity occurred forat least 6 hr. If a cell displaying location-specific firing was isolated, theanimal was removed from the cylinder and the apparatus was preparedfor recording. Thus, cells in the present study were selected for additionalanalysis only if they contained a place field and not if they contained acomplex spike waveform (Ranck, 1973; Fox and Ranck, 1981). This pro-cedure may have biased the selection of cells but, as described in Results,we encountered a similar percentage of place cells during recordingsfrom control and lesion groups using this procedure.
Experimental manipulations. Place cell activity was monitored in therecording cylinder over one or more 16 min sessions, during which therat chased food pellets dropped randomly from above. In some cases,cells were recorded in more than one session to determine the stability ofplace fields between sessions and the amount of landmark control ex-erted by the cue card. Unless specified otherwise, before each session thefloor paper was changed and the rat was given disorientation treatmentconsisting of an experimenter placing the animal in a covered cardboardbox and spinning the box slowly (0.2– 0.5 Hz) while simultaneouslywalking around the recording cylinder at least twice. In cases in whichmultiple sessions were recorded in sequence, the animal was usually notdisconnected from the recording cable between sessions.
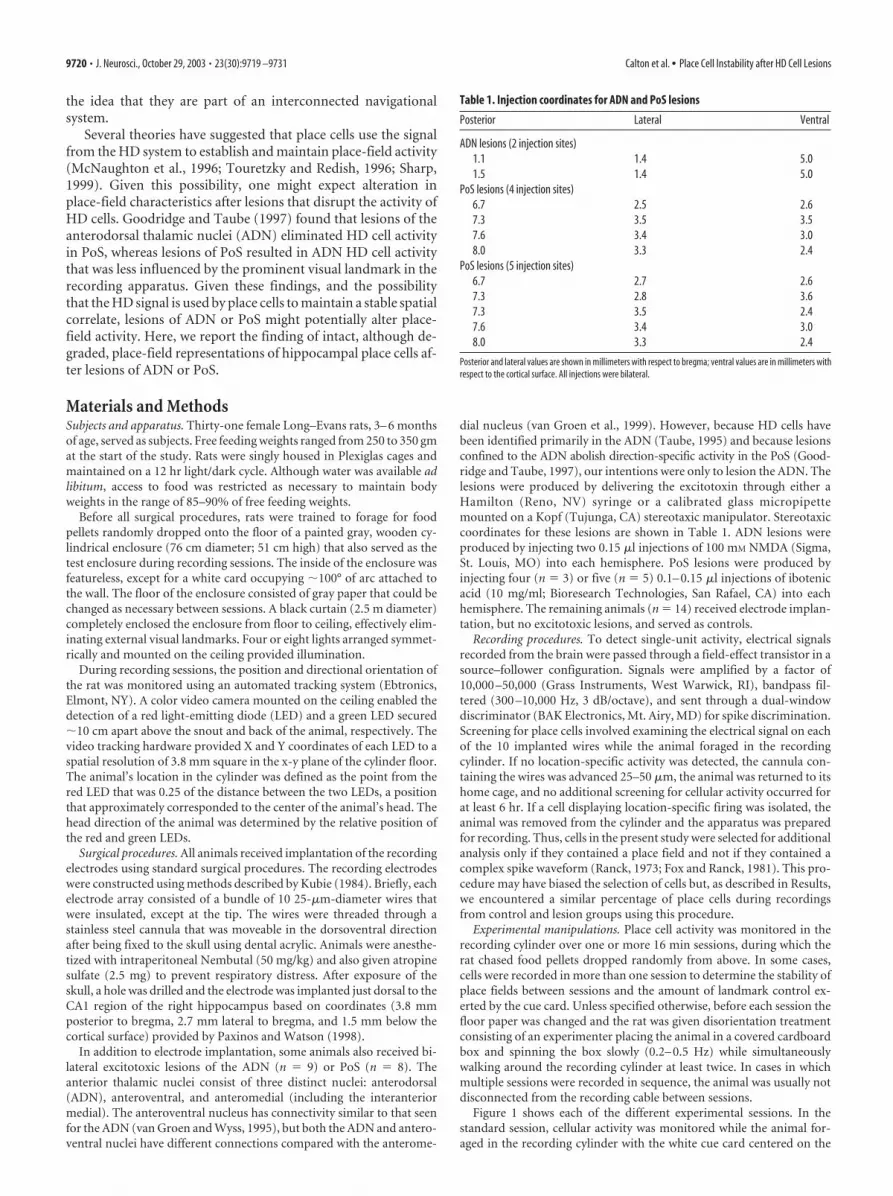
Figure 1 shows each of the different experimental sessions. In thestandard session, cellular activity was monitored while the animal for-aged in the recording cylinder with the white cue card centered on the
Table 1. Injection coordinates for ADN and PoS lesions
Posterior Lateral Ventral
ADN lesions (2 injection sites)1.1 1.4 5.01.5 1.4 5.0
PoS lesions (4 injection sites)6.7 2.5 2.67.3 3.5 3.57.6 3.4 3.08.0 3.3 2.4
PoS lesions (5 injection sites)6.7 2.7 2.67.3 2.8 3.67.3 3.5 2.47.6 3.4 3.08.0 3.3 2.4
Posterior and lateral values are shown in millimeters with respect to bregma; ventral values are in millimeters withrespect to the cortical surface. All injections were bilateral.
9720 • J. Neurosci., October 29, 2003 • 23(30):9719 –9731 Calton et al. • Place Cell Instability after HD Cell Lesions
east wall, the center of which is defined as the 0° position. Whereas allcells were recorded in this first session, some cells were also recordedduring one or two additional experiments in which the cue card wasmanipulated. The cue-rotation experiment consisted of three separatesessions (Fig. 1 B). In the first session (pre-rotation), cell activity wasmonitored with the cue centered at the standard position. This sessionwas followed by the rotation session, in which the cue was rotated 90° ineither the counterclockwise direction (50 cells) or clockwise direction (5cells). In the third session, the cue was returned to the original 0° position(counter-rotation). The rotation of the cue always occurred with theanimal in the cardboard box (i.e., out of the view of the animal).
Cue-removal experiments usually followed cue-rotation experimentsimmediately if cell isolation remained intact and a clearly defined placefield was present in the previous session. The cue-removal experimentalso consisted of three separate sessions (Fig. 1C). In the pre-removalsession, cellular activity was recorded with the cue card centered at thestandard position. In the cue-removal session, recordings were madeafter the floor paper was changed, the cue card was removed, and the ratwas returned to the cylinder without disorientation treatment. This ses-sion was followed by a cue-return session in which the cue card wasreplaced in the standard position without changing the floor paper orremoving the animal from the apparatus.
When possible, individual cells were tested sequentially on the sameday in all three experiments in the order listed above. For these cells, thefirst standard session (pre-rotation) was used for measuring place cellproperties and also served as the control session for the cue-rotationexperiment. The counter-rotation session that followed the cue-rotationsession usually served as the control session for the cue-removal experi-ment. Sequentially administered sessions were typically separated byonly 1–2 min, the time necessary to make adjustments to the room.Occasionally, after repeated sessions, the animal became unmotivated toretrieve food pellets and did not move around the apparatus sufficientlyduring recording. For these cells, different experimental series were ad-ministered on different days. In these latter instances, the experimentalsessions (e.g., cue-rotation or cue-removal) were always bracketed withtwo standard sessions.
Data analysis. The firing rate of the recorded cell and the position ofthe animal as indicated by the red and green LEDs were recorded on apersonal computer at a rate of 60 Hz using a National Instruments (Aus-tin, TX) DIO-96 data acquisition board. Data analysis was accomplishedoff-line using custom software written in LabView (National Instru-ments). For each cell, a color-coded place/firing rate map was con-
structed using the methods of Muller et al. (1987). To summarize, thefloor was divided into a grid of 32 � 32 pixels, and each pixel was dis-played as a certain color based on the average firing rate of the cell whenthe head of the animal was located at that position. Pixels displayed aswhite represent positions that were not visited by the animal. Yellowpixels represent firing rates of zero. Other pixels were displayed as or-ange, red, green, blue, or purple, based on the firing rate in ascendingorder. The cutoff values between these levels were determined such thatthe number of pixels of a given color were 0.8 as many as the number ofpixels of the next lower color (Muller et al., 1987). No additional smooth-ing was applied to the place/rate plots. After generation of the place/rateplot for a given cell, the place field was defined as the largest contiguousgroup of pixels possessing a firing rate �10% of the average firing rate ofthe three highest firing rate pixels that were sampled at least 15 times(0.25 sec). For two pixels to be considered contiguous, they had to sharea common side (i.e., adjoining corners were not considered contiguous).For some cells, there was more than one contiguous area that qualified asa place field. For these cells, the largest place field was used for the anal-yses. There was no notable difference between groups in terms of thefrequency of finding cells with multiple place fields (F(2,91) � 1.58; p �0.05); the mean number of place fields per cell was 1.29 � 0.08, 1.53 �0.19, and 1.53 � 0.13 for control, ADN-lesioned, and PoS-lesioned ani-mals, respectively.
Standard session analyses. For each place cell, the place/rate plot duringthe standard session was examined to determine: (1) place field size; (2)mean overall firing rate; (3) mean infield firing rate; (4) maximum infieldfiring rate; (5) mean outfield (background) firing rate; (6) spatial coher-ence; (7) sparsity; (8) spatial information content; and (9) directionalinformation content. The size of the place field was calculated as thepercentage of the visited apparatus occupied by the place field. The meanoverall firing rate was determined by dividing the number of spikes thatoccurred over the entire session by the duration of the session. Meaninfield and outfield firing rates were defined as the mean values for thefiring rates of all pixels within (infield) and outside (outfield) the placefield. The maximum infield firing rate was the maximum firing rate of allthe pixels within the place field of the cell. Spatial coherence is a measureof the smoothness of firing rate contours. It was calculated using themethod of Kubie et al. (1990), which involves correlating the firing rate ofindividual pixels with immediately surrounding pixels. Sparsity is a mea-sure of how compact the firing field is relative to the recording apparatusand was calculated according to the methods described by Jung et al.(1994). The more confined the firing field of the place cell, the lower thesparsity measure. Spatial information content and directional informa-tion content describe how much information is conveyed regarding thespatial position and HD of the animal, respectively, by each spike dis-charge. These two information content measures were calculated usingthe methods described by Skaggs et al. (1993). Because these measuresmay be inaccurate for very low firing rate cells, it is notable that our lowestfiring rate cell had 163 spikes in the initial session, which is more than enoughactivity to accurately determine these parameters. The values of place cellcharacteristics between different groups were compared using ANOVAs andFisher’s least significant difference (LSD) post hoc tests. Statistical signifi-cance was defined as p � 0.05.
Cue-rotation and cue-removal analyses. Location-specific firing activityduring the cue-rotation and cue-removal experiments was used to assessthe stability of place fields across multiple sessions and after cue cardmanipulations. Comparisons of location-specific firing activity betweensessions were accomplished by: (1) calculating Pearson r correlationsbetween the corresponding place/rate maps; and (2) estimating theamount of angular rotation of the place/rate maps between sessions. Thislatter value was determined by rotating the place/rate plot of the secondsession in 6° increments to determine the position at which the rotatedplot was maximally correlated with the place/rate plot of the first session.The number of degrees the place/rate plot was shifted to produce themaximal Pearson r correlation was considered to be the amount of an-gular shift of location-specific activity between the two sessions (Mullerand Kubie, 1987). Because rotation of central fields is less likely to affectplace-field location, cells with fields restricted to the central 50% of thechamber were excluded from this analysis. Rayleigh tests (Batschelet,
Figure 1. Diagram of cue card position and order of sessions during the standard session ( A),cue-rotation experiment ( B), and cue-removal experiment ( C).
Calton et al. • Place Cell Instability after HD Cell Lesions J. Neurosci., October 29, 2003 • 23(30):9719 –9731 • 9721
1981) were used to determine whether the dis-tribution of angular shifts observed betweentwo sessions for each group of cells was nonran-dom, as would be expected if shifts of location-specific activity relative to the location of thecue card were minimal. In cases in which thedistribution of shifts was significantly nonran-dom, between-group comparisons of the vari-ability of angular shifts were performed. Thisanalysis was accomplished using a modified Ftest of the concentration parameter (mean vec-tor), with the associated degrees of freedom de-termined by n � 1 for each group (Batschelet,1981).
A second analysis determined the absolutevalue of the deviation between the expected andobserved place-field locations. The expectedplace-field location was defined as the angularlocation relative to the position of the cue card,or to the position of the field in the previoussession in the case of the cue-removal experi-ment. Absolute values were used in this case toprevent equal, but opposite, deviations fromcanceling, as occurs when performing circularstatistics using the mean vector (e.g., shifts of90° and �90° would otherwise result in an av-erage deviation of 0°). The absolute deviationswere then compared between groups usingFisher’s LSD tests.
Histology. After electrodes were advanced�2–3 mm into the brain, animals were anesthe-tized and a small anodal current (�15 �A) waspassed through one recording wire for 20 sec toconduct a Prussian blue reaction. After perfus-ing the animals with 10% formalin, brains wereremoved and stored in formalin for at least 24hr. Brains were then placed in a solution of 10%formalin plus 2% potassium ferrocyanide for 24hr, followed by several 24 hr formalin rinses.Brains were then placed in a 20% sucrose solu-tion for 24 hr before sectioning (40 �m), stain-ing with cresyl violet, coverslipping, and examination under high-powermagnification to determine the location of electrode tracts and lesionextent. Lesion extent was determined by selecting four (ADN) or six(PoS) anatomical plates from Paxinos and Watson (1998) that spannedthe extent of each structure in the rostrocaudal dimension. For eachbrain, tracings of lesion extent were made from stained sections corre-sponding to each anatomical plate. The lesion percentage of each platewas multiplied by the proportion of the total brain structure representedby each individual plate, and the resulting values were summed to pro-duce a final estimation of lesion extent for each animal.
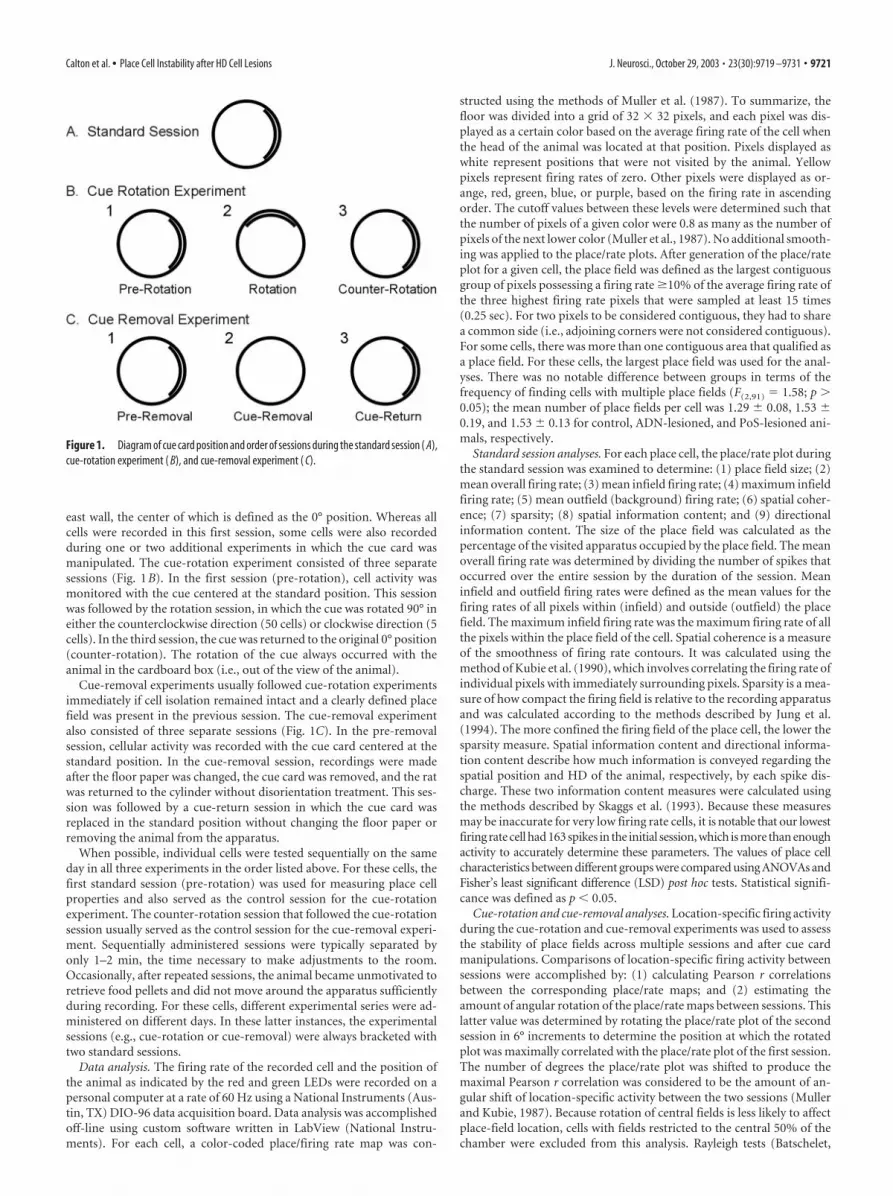
ResultsHistologyAn examination of each sectioned brain for the location and ex-tent of the electrode tract indicated that the electrode wires passedthrough the CA1 region of the hippocampus in all animals fromwhich place cells were recorded. One rat in the ADN-lesionedgroup and two rats in the PoS-lesioned group showed sparing of�50% of the target area. One of these animals had a unilateralPoS lesion on the same side of the brain as the recording sites, andthe results from this animal will be discussed separately. Datafrom the other two animals with �50% sparing of the target areahave been excluded from additional analysis. Figure 2, A and B,shows the extent of the largest and smallest lesions for the eightremaining ADN-lesioned animals and six remaining PoS-lesioned animals. For the eight ADN-lesioned animals, the lesionwas complete in all but one animal. This animal showed lesioning
of �75% of the ADN, with sparing in the dorsal aspect of therostral ADN on the right side and the ventral aspect of the caudalADN on this same side. In general, ADN lesions also tended toencroach on thalamic areas lateral and ventral to our target re-gion, with most animals showing partial damage to anteroven-tral, mediodorsal, and laterodorsal thalamic nuclei. The antero-ventral nucleus lies adjacent to the ADN and has connectivitysimilar to that seen for the ADN (van Groen and Wyss, 1995) buthas not been shown to contain HD cells. In contrast, cells withdirection-specific firing have been identified in the laterodorsalthalamic nuclei (Mizumori and Williams, 1993), but lesions ofthis area do not disrupt HD cell activity in PoS (Golob et al.,1998). Mizumori et al. (1994) found that temporary inactivationof laterodorsal thalamus diminished the spatial selectivity ofsome place cells but facilitated the spatial selectivity of an equalnumber of other cells, leading us to doubt the possibility of mea-surable effects from the incomplete (always �50%) incidentaldamage to this area in our animals. No damage to the dentategyrus or other subfields of the hippocampus was found in ADN-lesioned animals.
PoS lesions were more variable, with only one animal showinga complete lesion and remaining animals showing a range of75–98% lesioning of PoS. Damage to areas adjacent to PoS wasminimal. For three of the animals, the lesion continued anteriorlyfrom PoS for up to 1 mm. Three PoS animals showed slightdamage to the forceps major of the corpus callosum, two animals
Figure 2. Diagram showing the location and extent of the smallest (black) and largest (gray) lesion observed in animals withADN lesions ( A) or PoS lesions ( B). Values located beside each plate represent the distance in millimeters relative to bregma in therostrocaudal dimension. Plates were reproduced from Paxinos and Watson (1998).
9722 • J. Neurosci., October 29, 2003 • 23(30):9719 –9731 Calton et al. • Place Cell Instability after HD Cell Lesions

showed small areas of damage to one blade of the dentate gyrus,and there was usually slight damage to retrosplenial cortex adja-cent to PoS.
Lesion effects on behaviorAnimals receiving lesions of ADN or PoS did not show any obvi-ous differences in behavior relative to control animals. In supportof this observation, the average movement speed during eachrecording episode failed to vary significantly across the threegroups, with means of 2.1 � 0.04, 2.0 � 0.06, and 2.0 � 0.05m/min for control, ADN-lesioned, and PoS-lesioned animals,respectively (F(2,91) � 1.21; p � 0.05). Likewise, the percentage ofthe apparatus visited was similar for the three groups of animals(means of 99.2 � 0.3, 99.4 � 0.2, and 99.1 � 0.2% of enclosuresampled for control, ADN-lesioned, and PoS-lesioned animals,respectively; F � 1; p � 0.05).
Cell populationA total of 607 cells were isolated from 28 animals. Ninety-eight ofthese cells (16%) exhibited location-specific modulation of activ-ity and, hence, were classified as place cells. The percentage ofcells showing location-specific modulation did not differ acrossthe three groups of animals, with 16.1% (45 of 280) of cells incontrol animals, 17.1% (18 of 105) of cells in ADN-lesioned an-imals, and 15.8% (35 of 222) of cells in PoS-lesioned animalscategorized as place cells. These similar proportions of cells show-ing location-specific modulation are evidence that our lesions didnot greatly influence the numbers of place cells found in CA1hippocampus. Although our electrode configuration allows us tosimultaneously monitor the activity of 10 electrode channels, inonly three instances did we acquire simultaneous data on morethan one place cell over a single recording session. In each of theseinstances, a pair of place cells was simultaneously recorded. Givenour small sample size, therefore, we are precluded from reachinga firm conclusion regarding how the responses of simultaneouslyrecorded cells correlated during the cue-rotation and cue card-removal manipulations.
Lesion effects on intrasession place-field characteristicsRepresentative place/rate plots of place cells recorded from eachgroup of animals are shown in Figure 3. As shown, place fieldsfrom animals with lesions of ADN or PoS failed to differ mark-edly from those of controls. Table 2 summarizes the basic prop-erties of place cells from each group during the first standardsession. Cells from animals with lesions did not differ signifi-cantly from those of control animals on measures of place-fieldsize, mean overall firing rate, mean infield firing rate, maximuminfield firing rate, and sparsity. Spatial information content wasnoticeably lower in both lesioned groups, with the differencebetween control and PoS-lesioned animals being significantwhen tested as a planned comparison, but the omnibus F test ofthese differences failed to reach significance (F(2,91) � 2.04; p �0.05). However, cells from both groups of lesioned animals weresignificantly different from those of controls with respect to mea-sures of spatial coherence (F(2,91) � 5.58; p � 0.01), average out-field firing rate (F(2,91) � 5.52; p � 0.01), and directional infor-mation content (F(2,91) � 5.96; p � 0.01). Although significant,these differences were subtle. To show the magnitude of the av-erage differences in spatial coherence and outfield firing rate, cellspresented in the first column of Figure 3 were chosen because theywere representative of their respective groups in spatial coherence(smoothness of firing rate contours), and cells presented in the sec-
ond column were chosen because they were, likewise, representativeof their respective groups in average outfield firing rate.
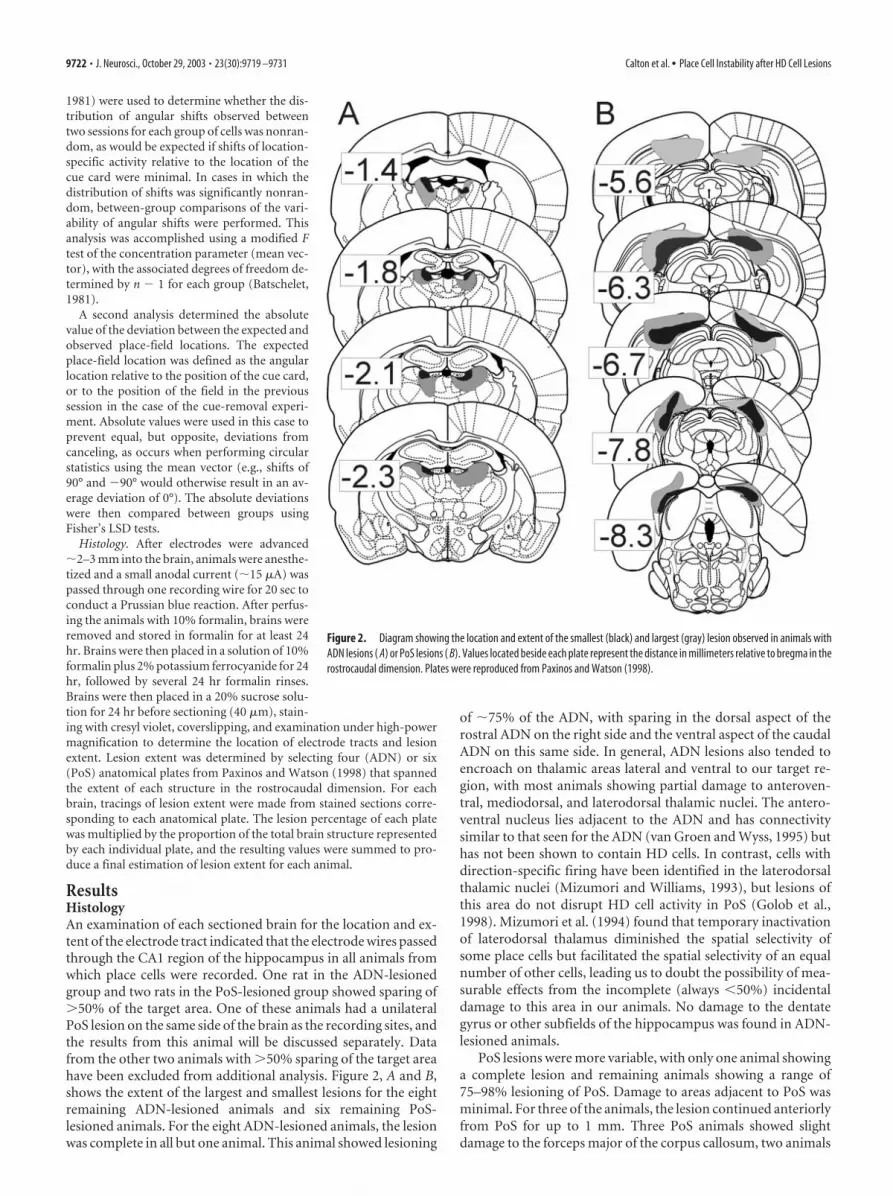
Place cells recorded from intact animals in an open-field en-vironment typically do not show a high degree of head directionsensitivity within the place field of the cell (Muller et al., 1994,their Fig. 1). Relative to cells from control animals, however,place cell activity in animals with lesions of ADN or PoS wasinfluenced more by the head direction of the animal, as evidencedby significantly higher scores for directional information content.This result was unexpected because the lesions were intended toeliminate HD cell activity, thereby potentially leaving the hip-pocampus without directional heading information. Figure 4Ashows a frequency histogram of directional information contentfor the three groups of cells. Although all groups had cells withlow directional information content scores (�0.4), animals withADN or PoS lesions had a greater proportion of cells with higherscores for directional information content. Whereas only 15.6%(7 of 45) of place cells recorded from control animals had direc-tional information content scores of �0.4, 47.1% (8 of 17) and
Figure 3. Representative place/rate plots of standard sessions obtained from three controlcells (top row), three cells from ADN-lesioned animals (middle row), and three cells from PoS-lesioned animals (bottom row). The highest firing rate pixels are shown in purple, with firingrates in descending order shown in blue, green, red, and orange. Yellow pixels represent firingrates of zero, and white pixels represent unsampled locations. Cells in the first column werechosen because they were representative of their respective groups in spatial coherence(smoothness of firing rate contours), and cells in the second column were chosen because theywere, likewise, representative of their respective groups in the average outfield firing rate.
Table 2. Comparison of intrasession hippocampal place cell firing properties incontrol, ADN-lesioned, and PoS-lesioned animals
Control(n � 45)
ADN lesion(n � 17)
PoS lesion(n � 32)
Place-field size (% of total visited area) 16.6 � 1.8 13.9 � 3.7 14.7 � 2.9Mean overall firing rate (spikes/sec) 1.67 � 0.22 1.89 � 0.34 1.70 � 0.32Mean infield firing rate (spikes/sec) 7.08 � 0.56 7.80 � 1.35 6.16 � 0.58Mean outfield firing rate (spikes/sec) 0.57 � 0.06 0.98 � 0.15* 0.80 � 0.08*Maximum infield firing rate (spikes/sec) 28.78 � 2.79 25.88 � 5.17 31.16 � 6.16Spatial coherence 0.62 � 0.03 0.50 � 0.06* 0.50 � 0.03*Sparsity 0.27 � 0.02 0.30 � 0.04 0.32 � 0.03Spatial information content (bits/spike) 1.61 � 0.13 1.37 � 0.21 1.25 � 0.10Directional information content (bits/spike) 0.25 � 0.03 0.48 � 0.10* 0.48 � 0.08*
Values are mean � SEM. Comparisons relative to controls using Fisher’s least significant difference test. *p � 0.05.
Calton et al. • Place Cell Instability after HD Cell Lesions J. Neurosci., October 29, 2003 • 23(30):9719 –9731 • 9723
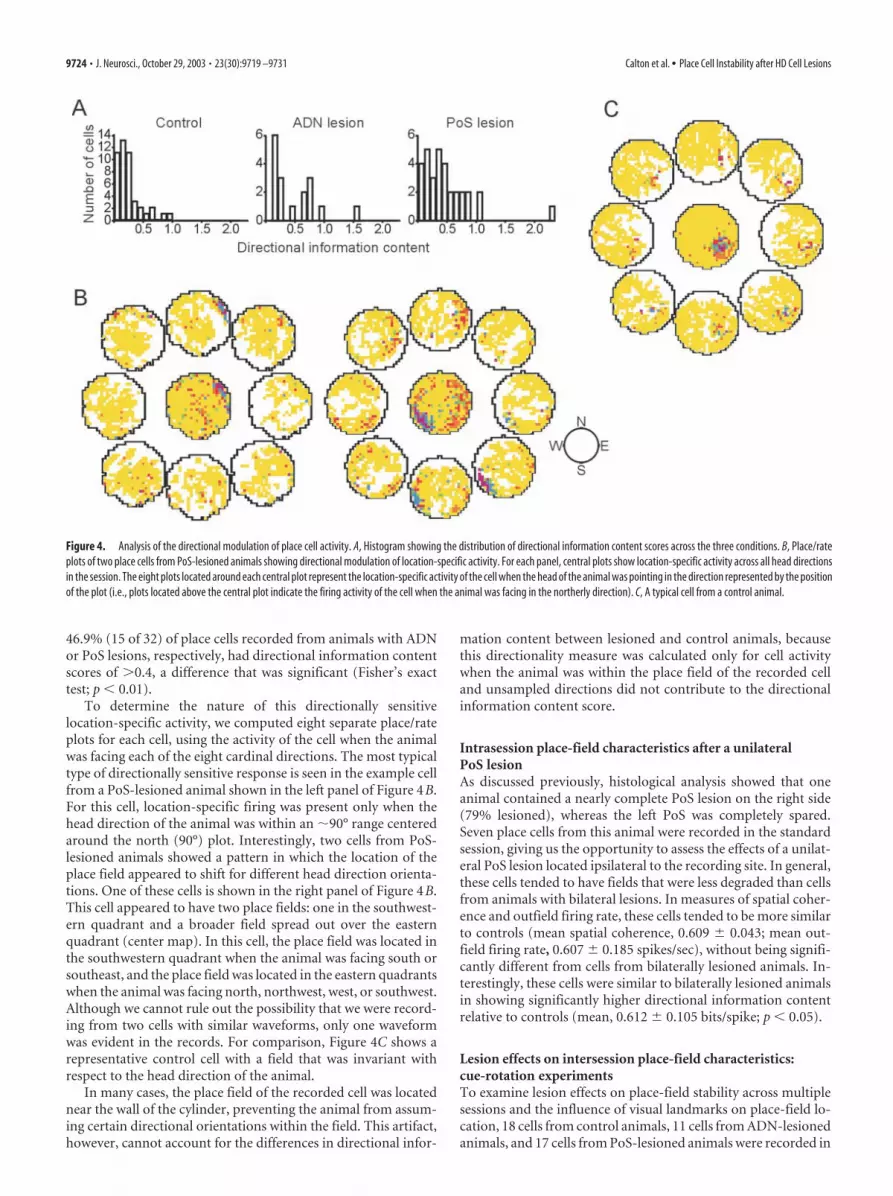
46.9% (15 of 32) of place cells recorded from animals with ADNor PoS lesions, respectively, had directional information contentscores of �0.4, a difference that was significant (Fisher’s exacttest; p � 0.01).
To determine the nature of this directionally sensitivelocation-specific activity, we computed eight separate place/rateplots for each cell, using the activity of the cell when the animalwas facing each of the eight cardinal directions. The most typicaltype of directionally sensitive response is seen in the example cellfrom a PoS-lesioned animal shown in the left panel of Figure 4B.For this cell, location-specific firing was present only when thehead direction of the animal was within an �90° range centeredaround the north (90°) plot. Interestingly, two cells from PoS-lesioned animals showed a pattern in which the location of theplace field appeared to shift for different head direction orienta-tions. One of these cells is shown in the right panel of Figure 4B.This cell appeared to have two place fields: one in the southwest-ern quadrant and a broader field spread out over the easternquadrant (center map). In this cell, the place field was located inthe southwestern quadrant when the animal was facing south orsoutheast, and the place field was located in the eastern quadrantswhen the animal was facing north, northwest, west, or southwest.Although we cannot rule out the possibility that we were record-ing from two cells with similar waveforms, only one waveformwas evident in the records. For comparison, Figure 4C shows arepresentative control cell with a field that was invariant withrespect to the head direction of the animal.
In many cases, the place field of the recorded cell was locatednear the wall of the cylinder, preventing the animal from assum-ing certain directional orientations within the field. This artifact,however, cannot account for the differences in directional infor-
mation content between lesioned and control animals, becausethis directionality measure was calculated only for cell activitywhen the animal was within the place field of the recorded celland unsampled directions did not contribute to the directionalinformation content score.
Intrasession place-field characteristics after a unilateralPoS lesionAs discussed previously, histological analysis showed that oneanimal contained a nearly complete PoS lesion on the right side(79% lesioned), whereas the left PoS was completely spared.Seven place cells from this animal were recorded in the standardsession, giving us the opportunity to assess the effects of a unilat-eral PoS lesion located ipsilateral to the recording site. In general,these cells tended to have fields that were less degraded than cellsfrom animals with bilateral lesions. In measures of spatial coher-ence and outfield firing rate, these cells tended to be more similarto controls (mean spatial coherence, 0.609 � 0.043; mean out-field firing rate, 0.607 � 0.185 spikes/sec), without being signifi-cantly different from cells from bilaterally lesioned animals. In-terestingly, these cells were similar to bilaterally lesioned animalsin showing significantly higher directional information contentrelative to controls (mean, 0.612 � 0.105 bits/spike; p � 0.05).
Lesion effects on intersession place-field characteristics:cue-rotation experimentsTo examine lesion effects on place-field stability across multiplesessions and the influence of visual landmarks on place-field lo-cation, 18 cells from control animals, 11 cells from ADN-lesionedanimals, and 17 cells from PoS-lesioned animals were recorded in
Figure 4. Analysis of the directional modulation of place cell activity. A, Histogram showing the distribution of directional information content scores across the three conditions. B, Place/rateplots of two place cells from PoS-lesioned animals showing directional modulation of location-specific activity. For each panel, central plots show location-specific activity across all head directionsin the session. The eight plots located around each central plot represent the location-specific activity of the cell when the head of the animal was pointing in the direction represented by the positionof the plot (i.e., plots located above the central plot indicate the firing activity of the cell when the animal was facing in the northerly direction). C, A typical cell from a control animal.
9724 • J. Neurosci., October 29, 2003 • 23(30):9719 –9731 Calton et al. • Place Cell Instability after HD Cell Lesions

the cue-rotation experiments. Figure 5 shows representativeplace-field plots for cells receiving these additional sessions.
Maintenance of location-specific activity acrossmultiple sessionsDespite the presence of a well established place field in the pre-rotation session, some place cells from each group failed to ex-hibit a discriminable place field after cue card manipulations inrotation or counter-rotation sessions. In each of these instances,the extracellular waveform of the cell remained unchanged, indi-cating that cell isolation was maintained. For descriptive pur-poses, cells were classified as having an intact field or absent fieldin each of the two card manipulation sessions, leading to four
categories of cells: intact rotation/intact counter-rotation, absentrotation/intact counter-rotation, intact rotation/absent counter-rotation, and absent rotation/absent counter-rotation. The num-bers and relative proportion of cells in each category across eachcondition are shown in Table 3. Although these numbers, overall,are relatively similar, there was an interesting tendency. Amongthose cells in the control and ADN-lesion conditions that failed toshow a place field in one or both of the card manipulations, themost common category of cell was absent rotation/intactcounter-rotation. That is, when cells from control and ADN-lesioned animals lost their place fields, this loss tended to occurduring the cue-rotation session, and the cell would usually ex-hibit a place field again after replacement of the cue to the stan-dard position. Such a pattern is suggestive that the context of therotation session was treated by these cells as an environment thatdiffered from the standard environment, and, thus, the cell tem-porarily showed place-field “remapping” in this new environ-ment. In contrast, although a slightly greater proportion of cellsfrom PoS-lesioned animals showed a loss of place fields, none ofthese losses proved to be temporary. Cells from PoS-lesionedanimals that lost their place fields in the rotation session did notshow a return of place-field activity in the counter-rotation ses-sion. Furthermore, unlike in the other two groups, four cells fromPoS-lesioned animals lost their place fields in the counter-rotation session despite having an intact field in the previous twosessions. We interpret this as a tendency for place cells from an-imals with PoS lesions to be less stable than cells from the otheranimals, as measured by the presence of a definable place fieldacross multiple sessions. Although only 11.1% (2 of 18) and 9.1%(1 of 11) of cells from control animals and ADN-lesioned ani-mals, respectively, failed to demonstrate location-specific firingfor the counter-rotation session, this value was 41.2% (7 of 17)for cells recorded from animals with PoS lesions, a difference thatfailed to reach significance ( p � 0.06) by a few cells. This findingis notable because Goodridge and Taube (1997) reported thatADN HD cells from PoS-lesioned animals showed a decreasedtendency to shift their preferred firing direction after similar cue-rotation sessions, suggesting that the PoS plays an important rolein processing visual landmark information. Moreover, becauseADN lesions do not significantly interfere with cue control inplace cells, landmark visual information most likely projects di-rectly to the PoS from retrosplenial cortex (Wyss and van Groen,1992) or areas 17 and 18 (Vogt and Miller, 1983), and the ADNdoes not contribute a significant role to processing landmarkinformation. Under normal (nonlesion) conditions, the ADNprobably receives information about visual landmarks from af-ferent projections from the PoS (van Groen and Wyss, 1990).
For the rotation sessions in which a place field remained, weassessed the amount of control exerted by the cue card in therotation and counter-rotation sessions. Although the initial cuecard rotation was in the counterclockwise direction for the ma-jority of cells, this card rotation was in the opposite direction forsome cells (n � 5). To equilibrate for this difference in our anal-ysis and graphical presentation, the direction of the place-fieldrotation observed in the latter group of cells was inverted (e.g., anangular shift observed in the place field of 80° clockwise wastreated as an angular shift of 80° counterclockwise). In the case ofcomplete cue card control of place-field location, we would ex-pect the location of the place field to rotate an equal amount andin an equal direction relative to the cue card (Muller and Kubie,1987). Because the amount of place-field shift observed betweena pair of sessions was calculated relative to the first session, a cellwith perfect cue card control would exhibit angular shift scores of
Figure 5. Place/rate plots showing the response of representative place cells from eachcondition during the three sessions of the cue-rotation experiment. The bottom two plots,Pre-Rotation A and Pre-Rotation B, show the first- and second-half activity of the pre-rotationsession shown from the PoS lesion group.
Table 3. Presence of location-specific firing activity across multiple sessions
Control ADN lesion PoS lesion
Cue-rotation experimentTotal cells 18 11 17Intact rotation/intact counter-rotation 13 (72.2%) 7 (63.7%) 10 (58.8%)Absent rotation/intact counter-rotation 3 (16.7%) 3 (27.3%) 0 (0%)Intact rotation/absent counter-rotation 0 (0%) 0 (0%) 4 (23.5%)Absent rotation/absent counter-rotation 2 (11.1%) 1 (9.1%) 3 (17.6%)
Cue-removal experimentTotal cells 15 10 10Intact removal/intact return 10 (66.7%) 8 (80.0%) 7 (70.0%)Absent removal/intact return 3 (20.0%) 1 (10.0%) 1 (10.0%)Intact removal/absent return 1 (6.7%) 0 (0%) 1 (10.0%)Absent removal/absent return 1 (6.7%) 1 (10.0%) 1 (10.0%)
Not included above are two control cells from the cue-removal experiment, in which isolation was lost for the returnsession. One of these cells was from the category intact removal, and the other cell was from absent removal.
Calton et al. • Place Cell Instability after HD Cell Lesions J. Neurosci., October 29, 2003 • 23(30):9719 –9731 • 9725
90° between the pre-rotation and rotation sessions (when the cuehad been rotated clockwise), �90° between the rotation andcounter-rotation sessions, and 0° between the pre-rotationand counter-rotation sessions. One cell each from the controland PoS-lesioned groups exhibited a central field and was, there-fore, excluded from this rotation analysis. Figure 5 presents ex-ample place/rate plots from each of the groups for the cue-rotation experiment. Overall, place fields from control and ADN-lesioned animals tended to shift along with the cue card. Incontrast, place fields from PoS-lesioned animals often appearedto shift randomly, regardless of cue card location. As an example,the place field of the cell shown in Figure 5 rotated �160° after theinitial card rotation and then followed the card for the returnsession.
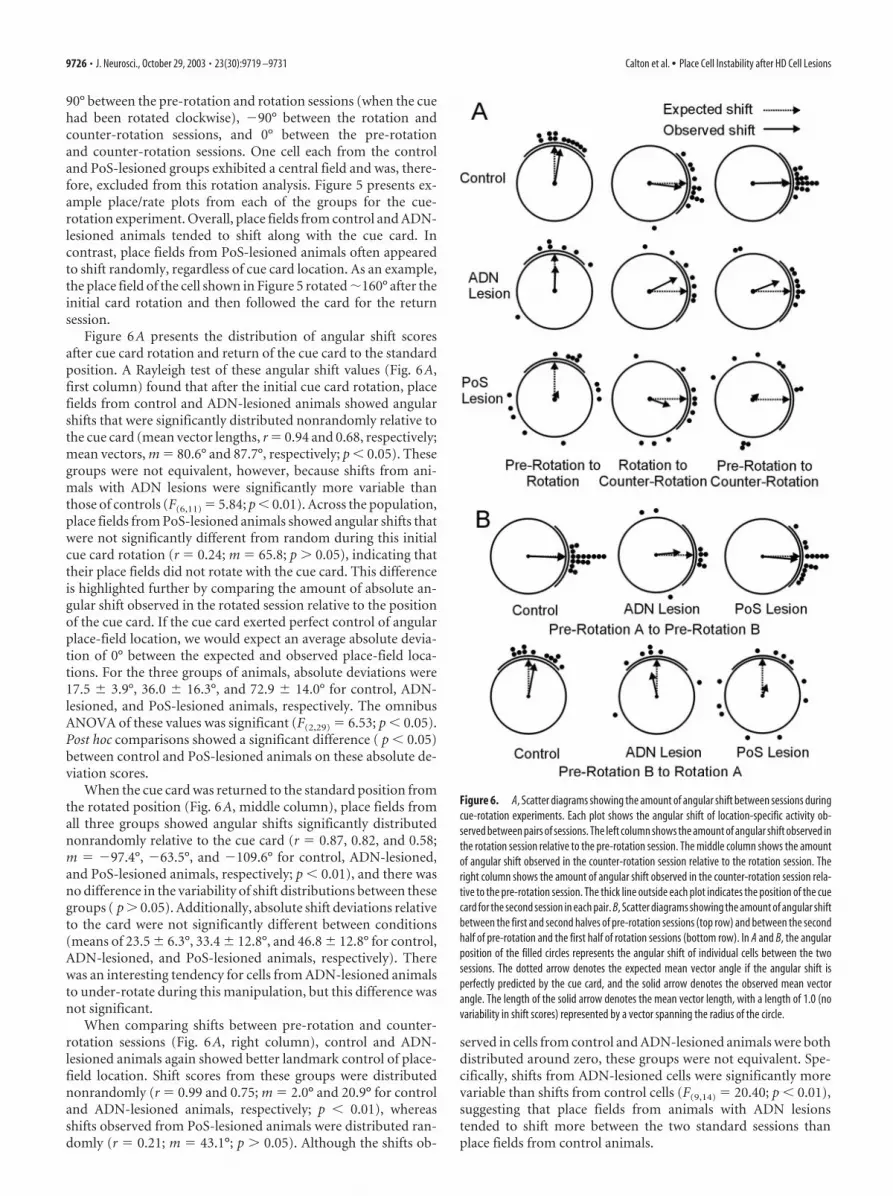
Figure 6A presents the distribution of angular shift scoresafter cue card rotation and return of the cue card to the standardposition. A Rayleigh test of these angular shift values (Fig. 6A,first column) found that after the initial cue card rotation, placefields from control and ADN-lesioned animals showed angularshifts that were significantly distributed nonrandomly relative tothe cue card (mean vector lengths, r � 0.94 and 0.68, respectively;mean vectors, m � 80.6° and 87.7°, respectively; p � 0.05). Thesegroups were not equivalent, however, because shifts from ani-mals with ADN lesions were significantly more variable thanthose of controls (F(6,11) � 5.84; p � 0.01). Across the population,place fields from PoS-lesioned animals showed angular shifts thatwere not significantly different from random during this initialcue card rotation (r � 0.24; m � 65.8; p � 0.05), indicating thattheir place fields did not rotate with the cue card. This differenceis highlighted further by comparing the amount of absolute an-gular shift observed in the rotated session relative to the positionof the cue card. If the cue card exerted perfect control of angularplace-field location, we would expect an average absolute devia-tion of 0° between the expected and observed place-field loca-tions. For the three groups of animals, absolute deviations were17.5 � 3.9°, 36.0 � 16.3°, and 72.9 � 14.0° for control, ADN-lesioned, and PoS-lesioned animals, respectively. The omnibusANOVA of these values was significant (F(2,29) � 6.53; p � 0.05).Post hoc comparisons showed a significant difference ( p � 0.05)between control and PoS-lesioned animals on these absolute de-viation scores.
When the cue card was returned to the standard position fromthe rotated position (Fig. 6A, middle column), place fields fromall three groups showed angular shifts significantly distributednonrandomly relative to the cue card (r � 0.87, 0.82, and 0.58;m � �97.4°, �63.5°, and �109.6° for control, ADN-lesioned,and PoS-lesioned animals, respectively; p � 0.01), and there wasno difference in the variability of shift distributions between thesegroups ( p � 0.05). Additionally, absolute shift deviations relativeto the card were not significantly different between conditions(means of 23.5 � 6.3°, 33.4 � 12.8°, and 46.8 � 12.8° for control,ADN-lesioned, and PoS-lesioned animals, respectively). Therewas an interesting tendency for cells from ADN-lesioned animalsto under-rotate during this manipulation, but this difference wasnot significant.
When comparing shifts between pre-rotation and counter-rotation sessions (Fig. 6A, right column), control and ADN-lesioned animals again showed better landmark control of place-field location. Shift scores from these groups were distributednonrandomly (r � 0.99 and 0.75; m � 2.0° and 20.9° for controland ADN-lesioned animals, respectively; p � 0.01), whereasshifts observed from PoS-lesioned animals were distributed ran-domly (r � 0.21; m � 43.1°; p � 0.05). Although the shifts ob-
served in cells from control and ADN-lesioned animals were bothdistributed around zero, these groups were not equivalent. Spe-cifically, shifts from ADN-lesioned cells were significantly morevariable than shifts from control cells (F(9,14) � 20.40; p � 0.01),suggesting that place fields from animals with ADN lesionstended to shift more between the two standard sessions thanplace fields from control animals.
Figure 6. A, Scatter diagrams showing the amount of angular shift between sessions duringcue-rotation experiments. Each plot shows the angular shift of location-specific activity ob-served between pairs of sessions. The left column shows the amount of angular shift observed inthe rotation session relative to the pre-rotation session. The middle column shows the amountof angular shift observed in the counter-rotation session relative to the rotation session. Theright column shows the amount of angular shift observed in the counter-rotation session rela-tive to the pre-rotation session. The thick line outside each plot indicates the position of the cuecard for the second session in each pair. B, Scatter diagrams showing the amount of angular shiftbetween the first and second halves of pre-rotation sessions (top row) and between the secondhalf of pre-rotation and the first half of rotation sessions (bottom row). In A and B, the angularposition of the filled circles represents the angular shift of individual cells between the twosessions. The dotted arrow denotes the expected mean vector angle if the angular shift isperfectly predicted by the cue card, and the solid arrow denotes the observed mean vectorangle. The length of the solid arrow denotes the mean vector length, with a length of 1.0 (novariability in shift scores) represented by a vector spanning the radius of the circle.
9726 • J. Neurosci., October 29, 2003 • 23(30):9719 –9731 Calton et al. • Place Cell Instability after HD Cell Lesions
When the amount of shift between the pre-rotation andcounter-rotation sessions was compared regardless of shift direc-tion (absolute shift deviation), cells from control and ADN-lesioned animals again showed significantly less shift between thetwo conditions than PoS-lesioned animals (means of 6.8 � 1.7°,31.8 � 13.6°, and 77.4 � 14.2° for control, ADN-lesioned, andPoS-lesioned animals, respectively; F(2,32) � 13.56; p � .001).
As a final test of landmark control of place-field location, wecorrelated location-specific activity between pre-rotation andcounter-rotation sessions. Mean Pearson r correlation values be-tween standard sessions were 0.362 � 0.051, 0.309 � 0.068, and0.129 � 0.022 for cells from control, ADN-lesioned, and PoS-lesioned animals, respectively. These correlation values were sig-nificantly different (F(2,33) � 5.30; p � 0.05), with values fromcontrol and ADN-lesioned animals being significantly higher( p � 0.05) than those from PoS-lesioned animals.
Within-session analysesThe seemingly random angular shifts in place-field location ob-served between sessions for cells from animals with PoS lesionsmight be explained by a gradual shift occurring continuouslywithin a session or alternatively by an abrupt shift occurring be-tween sessions. A gradual shift occurring within a session mightindicate deficits in both ideothetic and landmark control ofplace-field location. Conversely, the presence of a stable placefield within a session that abruptly shifts between two sessionscould be expected in the case of an intact ideothetic navigationalsystem (responsible for keeping track of location within a ses-sion), but a deficit in landmark control of place-field location(assuming ideothetic control is disrupted between sessions by thedisorientation treatment and the place field is reestablished innormal animals by orienting to landmark cues). The impairmentof within-session place-field characteristics such as spatial coher-ence and spatial information content that we observed would beexpected in the case of a gradual shift within a recording session,and so it is important to assess this possibility. To examine thisissue, we calculated the amount of angular shift in place-fieldlocation observed between the first and second halves of pre-rotation sessions. Despite the typically large angular shifts ob-served between sessions in cells from PoS-lesioned animals, thesesame cells were much more stable within the session. This findingcan be seen in the example of a cell from a PoS-lesioned animalshown in the bottom two plots of Figure 5, where the place field islocated in the same general location for both the first half (pre-rotation A) and second half (pre-rotation B) of the pre-rotationsession.
Figure 6B (top row) displays the angular shift values betweenthe first and second halves of the pre-rotation sessions for allthree groups. Supporting the view that cells from PoS-lesionedanimals were likely to maintain stable place fields within individ-ual sessions, these within-session angular shifts were significantlycentered around zero for all three groups (r � 0.99, 0.66, and0.95; m � �2.5°, 5.6°, and �5.0° for control, ADN-lesioned, andPoS-lesioned groups, respectively; p � 0.05). However, shiftsfrom cells in ADN- and PoS-lesioned animals showed signifi-cantly more variability than cells from control animals (ADN vscontrol: F(8,16) � 34.53, p � 0.01; PoS vs control: F(14,16) � 5.21,p � 0.05), providing evidence of an increase in within-sessionvariability in lesioned animals. Interestingly, cells from PoS-lesioned animals were also significantly less variable than thosefrom ADN-lesioned animals (F(8,14) � 6.63; p � 0.01). A com-parison of the absolute shift deviation between the two sessionsfurther highlighted these findings. The omnibus F test of these
values was significant (F(2,38) � 4.83; p � 0.05). Post hoc compar-isons revealed that control and PoS-lesioned animals had signif-icantly less shift than ADN-lesioned animals (means of 6.0 �1.5°, 14.4 � 3.5°, and 34.0 � 14.4° for control, PoS-lesioned, andADN-lesioned animals, respectively). Based on these analyses, weconclude that place fields from lesioned animals were somewhatmore prone to shift within an individual recording session thanfields from control animals. This result is an important finding,because it presents the possibility that the shift observed betweensessions for lesioned animals simply reflects the accumulation ofwithin-session instability over an extended time period.
To assess this possibility, we sought to compare within-sessioninstability with between-session instability over a similar timeperiod by shortening the between-session analysis to include onlydata collected during the 8 min before and 8 min after the cuecard rotation (pre-rotation B and rotation A conditions). Theshift scores from this between-session analysis are presented inthe bottom row of Figure 6B. Despite the fact that the data pro-ducing these shift scores span a similar period of time as thewithin-session shift scores (notwithstanding the 1–2 min re-quired to produce the cue manipulation), the shifts observed inPoS-lesioned animals were dramatically and significantly greaterthan the pre-rotation within-session shift scores, as evidencedfrom the fact that the directional shifts were now distributedrandomly relative to the position of the cue card (r � 0.154; m ��19.87°; p � 0.05). Interestingly, cells from control (but notADN-lesioned) animals also showed greater between-sessionshifts than within-session shifts (F test of concentration parame-ters, F(10,16) � 8.13; p � 0.01), but this difference was modestrelative to the effect seen in PoS-lesioned animals. ADN-lesionedanimals showed similar within-session and between-sessionshifts. A comparison of the absolute angular shifts also supportsthe premise that between-session shifts were greater than within-session shifts for PoS and control animals [means of 21.8 � 4.3°vs 6.0 � 1.5° for control animals ( p � 0.01), 79.1 � 15.9° vs14.4 � 3.6° for PoS-lesioned animals ( p � 0.01), and 37.7 �15.75° vs 34.0 � 14.4° for ADN-lesioned animals ( p � 0.05)].
To summarize the comparison of within-session andbetween-session instability, both lesion groups presented modestwithin-session instability relative to control animals. When ex-amined over a comparable period of time, however, the additionof a cue card manipulation did nothing to increase this instabilityfor ADN-lesioned animals, suggesting that the between-sessioninstability found after cue card manipulations can be accountedfor by the cumulative buildup of small error present within asession for this lesion group. In contrast, the much more dra-matic between-session instability seen in PoS-lesioned animalscannot be attributed to accumulation of error present withinindividual sessions and points rather to a qualitatively differentdeficit in cue control for these animals.
Cue-removal experimentsThe cue-removal experiment was used to assess whether placecells in lesioned animals could maintain a stable spatial correlatein the absence of visual landmarks. If lesions of the HD systemaffect the use of ideothetic cues to maintain a spatial correlate,this deficit might not be apparent unless visual landmarks areeliminated from the apparatus. Indeed, McNaughton et al.(1995) hypothesized that in the absence of HD cell input into thehippocampal system, place fields would become annular ifthe animals were recorded in a circular environment without thepresence of a polarizing landmark cue. Seventeen cells from con-trol animals, 10 cells from ADN-lesioned animals, and 10 cells
Calton et al. • Place Cell Instability after HD Cell Lesions J. Neurosci., October 29, 2003 • 23(30):9719 –9731 • 9727

from PoS-lesioned animals received testing in the cue-removalexperiment. Of these, five control cells, two ADN-lesioned cells,and two PoS-lesioned cells failed to show discriminable placefields in the no-cue session (Table 3). Figure 7A shows place/rateplots representative of the remaining cells in the cue-removal andcue-return sessions. The prediction of McNaughton et al. (1995)was not supported, because there was no evidence that the shapeof place fields from either ADN-lesioned or PoS-lesioned animalsbecame more annular in the no-cue sessions. As shown in therepresentative cells, the location of place fields from control and
ADN-lesioned cells tended to be stable when the card was re-moved between pre-removal and cue-removal sessions, andagain when the card was returned between cue-removal and cue-return sessions. In contrast, cells from PoS-lesioned animals ex-hibited place fields that tended to shift unpredictably betweenthese sessions. Figure 7B displays the angular shift scores of thesecells after removal and return of the cue card. Supporting theobservation that place-field location was stable between thesesessions for control and ADN-lesioned cells, these shift scoreswere distributed nonrandomly after removal of the cue card (r �0.59 and 0.98; m � -9.3° and 1.6°; p � 0.05) and after the returnof the cue card (r � 0.61 and 0.99; m � 30.1° and 1.5°; p � 0.05).These groups were not equivalent, however, because shift scoresfrom ADN-lesioned cells were significantly more concentrated(less variable) than shift scores from control animals in both ofthese manipulations (F(8,7) � 16.7 and 26.0 for cue-removal andcue-return manipulations; p � 0.01). The distribution of shiftscores from PoS-lesioned cells was not significantly differentfrom random between pre-removal and cue-removal sessions(r � 0.13; m � 60.5°; p � 0.05) and between cue-removal andcue-return sessions (r � 0.21; m � 16.2°; p � 0.05).
An examination of the absolute deviation of angular shiftscores also supports the conclusion that place fields from controland ADN-lesioned animals were more stable between these ses-sions. Between the pre-removal and cue-removal sessions, con-trol and ADN-lesioned animals showed significantly less absolutedeviation relative to PoS-lesioned animals (F(2,21) � 8.02; p �0.01), with means of 42.7 � 14.9°, 10.5 � 2.7°, and 85.7 � 16.3°,respectively for the three groups. The omnibus F test of absolutedeviation between the cue-removal and cue-return sessions wasalso significant (F(2,21) � 3.79; p � 0.05). Post hoc comparisonsrevealed that that cells from ADN-lesioned animals showed sig-nificantly less absolute deviation than PoS-lesioned animals, withno other comparisons being significant (means of 48.7 � 19.9°,7.5 � 2.4°, and 74.6 � 21.3° for control, ADN-lesioned, andPoS-lesioned animals, respectively).
DiscussionThe discovery of cells in the rat nervous system providing infor-mation about allocentric position and directional orientation hasled to much speculation about how these signals might be com-bined as part of an interconnected navigational network. HD cellshave been found in the PoS and ADN, two limbic structuressharing reciprocal connections. The PoS projects to the superfi-cial layers of the entorhinal cortex (Caballero-Bleda and Witter,1993), a major source of input to the hippocampus complex, sorelatively direct anatomical pathways exist for bringing HD in-formation into the hippocampus. After lesions of ADN or PoS,we found that: (1) place cells continued to exhibit location-specific activity, but the place fields were somewhat degraded andcells were more directionally sensitive; and (2) place fields inanimals with PoS lesions shifted unpredictably between sessionsregardless of the position of the major visual landmark, suggest-ing that the visual landmark no longer exerted significant stimu-lus control over the place fields of the cells.
Despite predictions that the HD signal is an important featurefor place cell activity, this study found that place cell activitywithin the hippocampus was normal in many respects after le-sions of either ADN or PoS. Place cells were found in equal num-bers in control and lesioned animals. An examination of place-field characteristics found that place cells from lesioned animalsexhibited place fields that were slightly noisier (less spatial coher-ence, increased outfield firing rate, decreased information con-
Figure 7. A, Representative place/rate plots of cells recorded in the cue-removal experi-ment. B, Scatter diagrams showing the amount of angular shift observed between consecutivesessions of the cue-removal experiment. In each plot, the dotted arrow denotes the expectedmean vector angle if there is no shift between conditions, and the solid arrow denotes theobserved mean vector angle. The length of the solid arrow denotes the mean vector length, witha length of 1.0 (no variability in shift scores) represented by a vector spanning the radius of thecircle. Group data reflect results similar to those seen for the representative plots shown in A.
9728 • J. Neurosci., October 29, 2003 • 23(30):9719 –9731 Calton et al. • Place Cell Instability after HD Cell Lesions

tent) and more sensitive to the HD of the animal. However, othermeasures of intrasession place-field characteristics, such as place-field size and mean infield firing rates, were unaffected in lesionedanimals. These results are in contrast to the more detrimentaleffects to place cell discharge after inactivation of the vestibularlabyrinth, in which place cells lose their location-specific firingaltogether (Stackman et al., 2002).
Given the nature of the signal carried by the HD system, thefinding that place cells were more responsive to directional head-ing after ADN or PoS lesions merits additional consideration.Previous work has shown that the degree to which place cells arenormally responsive to directional heading depends on the re-cording environment and the behavioral task performed by theanimal. Within environments that constrain the path and direc-tion of movement, such as when the animal is performing on aradial arm maze or task-specific behavior on a linear track, placecells usually show directional modulation (McNaughton et al.,1983; Muller et al., 1994; Markus et al., 1995). In contrast, inopen-field environments such as the recording cylinder used forthe present study, place cell activity normally occurs indepen-dently of directional control. One potential explanation for theincrease in directional modulation of place fields in lesioned an-imals is that input from the HD system is used to cancel thedirectionally dependent features of other signals converging onthe place cell system. For instance, assuming that the visual signalcontributes to place-field activity, one could postulate a relation-ship by which the HD system serves to catalog the different “localviews” of a given place into a cohesive nondirectional spatialrepresentation. Without an intact HD system, the convergence ofdirectionally dependent sensory information onto the place cellsystem could result in “directional fragmentation” of the placefield, giving the appearance of a place field modulated by thedirectional heading of the animal.
Intersession effects after lesions of HD systemIt was apparent that there were larger differences in place-fieldstability between sessions. Cells recorded from animals with PoSlesions showed place fields that tended to rotate unpredictablybetween sessions, regardless of the position of the major visuallandmark in the apparatus. In contrast, cells from ADN-lesionedanimals more closely resembled cells from control animals andusually showed tight coupling of place-field location with land-mark position. It is notable that we did not find evidence fordiminishing cue control after repeated experimental disorienta-tion (Knierim et al., 1995), possibly because of frequent nondis-oriented exposure to the apparatus during training and cellscreening.
The finding that animals with PoS lesions showed relativelystable place fields within recording sessions but showed fields thatmoved unpredictably between cue-rotation sessions might leadto the conclusion that PoS lesions disrupted landmark controlbut not ideothetic control of place-field location. In this frame-work, because path integration had presumably been disabled bygiving the animal disorientation treatment between sessions, theanimal would be forced to reorient in the second session solely onthe basis of landmark cues. In support of this possibility, Good-ridge and Taube (1997) found that landmark control of ADN HDcells recorded between sessions was disrupted after PoS lesions,although the HD signal was stable within single sessions. Oneaspect of the present study, however, leads us to question whetherthese animals suffered only from an inability to use landmarkcues. We found that place fields of PoS-lesioned animals also
shifted unpredictably when the animal was placed in the appara-tus in the absence of the landmark without first being disoriented.
The finding that place fields in PoS-lesioned animals wereunstable from one session to the next, regardless of the presenceor absence of the visual landmark and regardless of the availabil-ity of ideothetic cues, points to the possibility that place cells inthese animals treated each session as an exposure to a differentenvironment. Place cells have been shown to change or ceasetheir location-specific activity when the animal is placed in adifferent environment or if changes of landmark cues in a knownenvironment occur, a phenomenon referred to as remapping(Muller and Kubie, 1987; Bostock et al., 1991). Such a phenom-enon might be expected if animals with PoS lesions suffered frommnemonic or perceptual deficits, as has been shown in a radialarm maze task requiring the use of spatial working memory(Taube et al., 1992).
Interestingly, a recent study examining the effects of perirhi-nal cortex lesions on hippocampal place cell activity also reportedbetween-session place-field instability in lesioned animals (Muirand Bilkey, 2001), suggesting that this instability could be relatedto a general disruption of information flow into the hippocam-pus, rather than to a decrement in the HD system. However, theplace-field instability observed with perirhinal lesions was moretransient, occurring on some sessions but not others, even for thesame cells. Furthermore, unlike the present findings, perirhinallesions did not disrupt cue control by the landmark, because theplace fields of most cells rotated similar amounts when the rect-angular chamber and prominent visual cues were rotated to-gether 180°.
Our results can also be compared with two other lesion studiesconcerned with place cells. One study inactivated the retrosple-nial cortex while recording hippocampal place cells and foundthat the locations of place fields from inactivated animals wereinitially unstable, although this instability subsided over timewithin the same recording session (Cooper and Mizumori, 2001).This finding somewhat resembles our results, because we foundthat place-field locations were unstable across recording sessionsbut were mostly stable within sessions. Although the retrosplenialcortex sends a direct projection to the entorhinal cortex, it alsosends a projection to the PoS, which in turn projects to the ento-rhinal cortex (Wyss and van Groen, 1992). Thus, it is possible thatthe effect of retrosplenial cortex inactivation on hippocampalplace cells is mediated via the PoS. Additionally, Miller and Best(1980) reported that hippocampal place cells recorded from an-imals with entorhinal cortex lesions showed less robust location-specific firing and that place fields did not follow the extra-mazecues when the radial arm maze was rotated. These findings aresimilar to our results and suggest that the PoS3entorhinal path-way contributes to the processing of landmark information.
Implications for navigational modelsThere have been various attempts to model the relationship be-tween HD and place-field signals. One feature consistent withthese models is that the HD signal can be used by the place cellnetwork to localize allocentric position (McNaughton et al.,1996; Touretzky and Redish, 1996; Sharp, 1999). These modelsimply that the HD cell system is a necessary component for main-taining the place-field representations in the absence of visuallandmarks. However, our results from the cue-removal experi-ments demonstrate that place-field representations can remainstable in the absence of both HD cell and visual landmark infor-mation, because place fields for ADN-lesioned animals were as
Calton et al. • Place Cell Instability after HD Cell Lesions J. Neurosci., October 29, 2003 • 23(30):9719 –9731 • 9729
stable as those of controls. This result would, thus, be at odds withthese models.
One possible explanation for this contradiction is that direc-tional information still managed to converge on the place cellsystem despite our lesions. Since first being discovered in the PoSand thalamus, HD cells have been found in other brain areas thatare not part of the LMN3ADN3PoS axis, including retrosple-nial cortex (Chen et al., 1994; Cho and Sharp, 2001), lateral dorsalthalamus (Mizumori and Williams, 1993), and the dorsal stria-tum (Wiener, 1993). Recent findings of angular head velocitysignals converging on LMN (Bassett and Taube, 2001; Sharp etal., 2001b) and the finding that LMN lesions disrupt HD activityin ADN (Tullman and Taube, 1998; Blair et al., 1999) havestrengthened the view that the HD signal is generated subcorti-cally and the anterior thalamus serves as a point of convergencebetween vestibular and proprioceptive information carried bysubcortical structures and visual landmark and efferent copy sig-nals descending from cortical areas (McNaughton et al., 1996;Taube, 1998). However, the presence of cells in the retrosplenialand medial prestriate cortex that carry directional information(Chen et al., 1994), and the fact that it has not been experimen-tally verified that ADN lesions eliminate these cortical HD sig-nals, allows for the possibility that directional information wasable to enter the hippocampus despite lesions of ADN. Althoughthe lateral dorsal thalamus and dorsal striatum do not contain ahigh percentage of cells that encode directional heading, it is stillpossible that directional information may have been conveyed tothe hippocampus from these areas via indirect routes through theentorhinal cortex or subicular areas. Nonetheless, the presentstudy shows that removal of the principal areas in which HD cellshave been studied, ADN and PoS, does not abolish the hip-pocampal place cell signal but leaves it less robust within sessionsand less stable across sessions.
ReferencesArchey WB, Stackman RW, Goodridge JP, Dudchenko PA, Taube JS (1997)
Place cells show directionality in an open field following lesions of thehead direction cell system. Soc Neurosci Abstr 23:504.
Bassett JP, Taube JS (2001) Neural correlates for angular head velocity in therat dorsal tegmental nucleus. J Neurosci 21:5740 –5751.
Batschelet E (1981) Circular statistics in biology. London: Academic.Blair HT, Cho J, Sharp PE (1999) The anterior thalamic head-direction sig-
nal is abolished by bilateral but not unilateral lesions of the lateral mam-millary nucleus. J Neurosci 19:6673– 6683.
Bostock E, Muller RU, Kubie JL (1991) Experience-dependent modifica-tions of hippocampal place cell firing. Hippocampus 1:193–206.
Caballero-Bleda M, Witter MP (1993) Regional and laminar organizationof projections from the presubiculum and parasubiculum to the entorhi-nal cortex: an anterograde tracing study in the rat. J Comp Neurol328:115–129.
Chen LL, Lin LH, Green EJ, Barnes CA, McNaughton BL (1994) Head-direction cells in the rat posterior cortex. I. Anatomical distribution andbehavioral modulation. Exp Brain Res 101:8 –23.
Cho J, Sharp PE (2001) Head direction, place, and movement correlates forcells in the rat retrosplenial cortex. Behav Neurosci 115:3–25.
Cooper BG, Mizumori SJY (2001) Temporary inactivation of the retrosple-nial cortex causes a transient reorganization of spatial coding in the hip-pocampus. J Neurosci 21:3986 – 4001.
Dudchenko P, Goodridge JP, Taube JS (1995) The effects of lesions of thepostsubiculum on hippocampal place cell activity. Soc Neurosci Abstr21:945.
Fox SE, Ranck Jr JB (1981) Electrophysiological characteristics of hip-pocampal complex-spike and theta cells. Exp Brain Res 41:399 – 410.
Golob EJ, Wolk DA, Taube JS (1998) Recordings of postsubicular head di-rection cells following lesions of the lateral dorsal thalamic nucleus. BrainRes 780:9 –19.
Goodridge JP, Taube JS (1997) Interaction between postsubiculum and an-
terior thalamus in the generation of head direction cell activity. J Neurosci17:9315–9330.
Goodridge JP, Dudchenko PA, Worboys KA, Golob EJ, Taube JS (1998)Cue control and head direction cells. Behav Neurosci 112:749 –761.
Jarrard LE (1993) On the role of the hippocampus in learning and memoryin the rat. Behav Neural Biol 60:9 –26.
Jung MW, Wiener SI, McNaughton BL (1994) Comparison of spatial firingcharacteristics of units in dorsal and ventral hippocampus of the rat.J Neurosci 14:7347–7356.
Knierim JJ, Kudrimoti HS, McNaughton BL (1995) Place cells, head direc-tion cells, and the learning of landmark stability. J Neurosci15:1648 –1659.
Kubie JL (1984) A driveable bundle of microwires for collecting single-unitdata from freely-moving rats. Physiol Behav 32:115–118.
Kubie JL, Muller RU, Bostock E (1990) Spatial firing properties of hip-pocampal theta cells. J Neurosci 10:1110 –1123.
Markus EJ, Qin YL, Leonard B, Skaggs WE, McNaughton BL, Barnes CA(1995) Interactions between location and task affect the spatial and di-rectional firing of hippocampal neurons. J Neurosci 15:7079 –7094.
McNaughton BL, Barnes CA, O’Keefe J (1983) The contributions of posi-tion, direction, and velocity to single unit activity in the hippocampus offreely-moving rats. Exp Brain Res 52:41– 49.
McNaughton BL, Knierim JJ, Wilson MA (1995) Vector encoding and thevestibular foundations of spatial cognition: neurophysiological and com-putational mechanisms. In: The cognitive neurosciences (Gazzaniga M,ed), pp 585–595. Cambridge, MA: MIT.
McNaughton BL, Barnes CA, Gerrard JL, Gothard K, Jung MW, Knierim JJ,Kudrimoti H, Qin Y, Skaggs WE, Suster M, Weaver KL (1996) Deci-phering the hippocampal polyglot: the hippocampus as a path integrationsystem. J Exp Biol 199:173–185.
Miller VA, Best PJ (1980) Spatial correlates of hippocampal unit activity arealtered by lesions of the fornix and entorhinal cortex. Brain Res194:311–323.
Mittelstaedt H (1983) The role of multimodal convergence in homing pathintegration. Fortschr Zool 28:197–212.
Mizumori SJY, Williams JD (1993) Directionally selective mnemonic prop-erties of neurons in the lateral dorsal nucleus of the thalamus of rats.J Neurosci 13:4015– 4028.
Mizumori SJY, Miya DY, Ward KE (1994) Reversible inactivation of thelateral dorsal thalamus disrupts hippocampal place representation andimpairs spatial learning. Brain Res 644:168 –174.
Morris RGM, Garrud P, Rawlins JNP, O’Keefe J (1982) Place-navigationimpaired in rats with hippocampal lesions. Nature 297:681– 683.
Muir GM, Bilkey DK (2001) Instability in the place field location of hip-pocampal place cells after lesions centered on the perirhinal cortex. J Neu-rosci 21:4016 – 4025.
Muller RU, Kubie JL (1987) The effects of changes in the environment onthe spatial firing properties of hippocampal complex-spike cells. J Neu-rosci 7:1951–1968.
Muller RU, Kubie JL, Ranck JB (1987) Spatial firing patterns of hippocam-pal complex-spike cells in a fixed environment. J Neurosci 7:1935–1950.
Muller RU, Bostock E, Taube JS, Kubie JL (1994) On the directional firingproperties of hippocampal place cells. J Neurosci 14:7235–7251.
O’Keefe J, Conway DH (1978) Hippocampal place units in the freely mov-ing rat: why they fire where they fire. Exp Brain Res 31:573–590.
O’Keefe J, Dostrovsky J (1971) The hippocampus as a spatial map: prelim-inary evidence from unit activity in the freely-moving rat. Brain Res34:171–175.
O’Keefe J, Nadel L (1978) The hippocampus as a cognitive map. Oxford:Clarendon.
Paxinos G, Watson C (1998) The rat brain in stereotaxic coordinates, Ed 4.San Diego: Academic.
Quirk GJ, Muller RU, Kubie JL (1990) The firing of hippocampal place cellsin the dark depends on the rat’s recent experience. J Neurosci10:2008 –2017.
Ranck Jr JB (1973) Studies on single neurons in dorsal hippocampal forma-tion and septum in unrestrained rats. I. Behavioral correlates and firingrepertoires. Exp Neurol 41:461–531.
Sharp PE (1999) Complimentary roles for hippocampal versus subicular/entorhinal place cells in coding place, context, and events. Hippocampus9:432– 443.
9730 • J. Neurosci., October 29, 2003 • 23(30):9719 –9731 Calton et al. • Place Cell Instability after HD Cell Lesions
Sharp PE, Blair HT, Cho J (2001a) The anatomical and computational basisof the rat head direction cell signal. Trends Neurosci 24:289 –294.
Sharp PE, Tinkelman A, Cho J (2001b) Angular velocity and head directionsignals recorded from the dorsal tegmental nucleus of gudden in the rat:implications for path integration in the head direction cell circuit. BehavNeurosci 115:571–588.
Skaggs WE, McNaughton BL, Gothard KM, Markus EJ (1993) Aninformation-theoretic approach to deciphering the hippocampal code.In: Advances in neural information processing systems, Vol 5 (Hanson SJ,Cowan JD, Giles CL, eds), pp 1030 –1037. San Mateo, CA: MorganKaufmann.
Stackman RW, Taube JS (1998) Firing properties of rat lateral mammillarynuclei single units: head direction, head pitch, and angular head velocity.J Neurosci 18:9020 –9037.
Stackman RW, Clark AS, Taube JS (2002) Hippocampal spatial representa-tions require vestibular input. Hippocampus 12:291–303.
Taube JS (1995) Head direction cells recorded in the anterior thalamic nu-clei of freely moving rats. J Neurosci 15:70 – 86.
Taube JS (1998) Head direction cells and the neurophysiological basis for asense of direction. Prog Neurobiol 55:225–256.
Taube JS, Burton HL (1995) Head direction cell activity monitored in anovel environment and during a cue conflict situation. J Neurophysiol74:1953–1971.
Taube JS, Muller RU, Ranck Jr JB (1990a) Head-direction cells recordedfrom the postsubiculum in freely moving rats. I. Description and quanti-tative analysis. J Neurosci 10:420 – 435.
Taube JS, Muller RU, Ranck Jr JB (1990b) Head-direction cells recordedfrom the postsubiculum in freely moving rats. II. Effects of environmentalmanipulations. J Neurosci 10:436 – 447.
Taube JS, Kesslak P, Cotman CW (1992) Lesions of the rat postsubiculumimpair performance on spatial tasks. Behav Neural Biol 57:131–143.
Touretzky DS, Redish AD (1996) Theory of rodent navigation based oninteracting representations of space. Hippocampus 6:247–270.
Tullman ML, Taube JS (1998) Lesions of the lateral mammillary nucleiabolish head direction cell activity in the anterior dorsal thalamus. SocNeurosci Abstr 24:1912.
van Groen T, Wyss JM (1990) The postsubicular cortex in the rat: charac-terization of the fourth region of the subicular cortex and its connections.Brain Res 529:165–177.
van Groen T, Wyss JM (1995) Projections from the anterodorsal and an-teroventral nucleus of the thalamus to the limbic cortex in the rat. J CompNeurol 358:584 – 604.
van Groen T, Kadish I, Wyss JM (1999) Efferent connections of the antero-medial nucleus of the thalamus of the rat. Brain Res Rev 30:1–26.
Vogt BA, Miller MW (1983) Cortical connections between rat cingulatecortex and visual, motor, and postsubicular cortices. J Comp Neurol216:192–210.
Wiener SI (1993) Spatial and behavioral correlates of striatal neurons in ratsperforming a self-initiated navigation task. J Neurosci 13:3802–3817.
Wyss JM, van Groen T (1992) Connections between the retrosplenialcortex and the hippocampal formation in the rat: a review. Hippocam-pus 2:1–11.
Calton et al. • Place Cell Instability after HD Cell Lesions J. Neurosci., October 29, 2003 • 23(30):9719 –9731 • 9731