high-temperature compressive creep of liquid phase sintered silicon carbide
TRANSCRIPT
HIGH-TEMPERATURE COMPRESSIVE CREEP OF LIQUID
PHASE SINTERED SILICON CARBIDE
A. GALLARDO-LOÂ PEZ, A. MUNÄ OZ, J. MARTõÂNEZ-FERNAÂ NDEZ{ and
A. DOMõÂNGUEZ-RODRõÂGUEZ
Dpto. de FõÂ sica de la Materia Condensada, Universidad de Sevilla, Apdo. 1065, 41080 Sevilla, Spain
(Received 17 November 1998; accepted 17 February 1999)
AbstractÐCreep of liquid phase sintered SiC has been studied at temperatures between 1575 and 17008Cin argon under nominal stresses from 90 to 500 MPa. Creep rates ranged from 3� 10ÿ8 to 10ÿ6/s, with anactivation energy of 8402100 kJ/mol (corresponding to carbon and silicon self-di�usion), and a stressexponent of 1.620.2. The crept samples showed the presence of dislocation activity, generally formingglide bands and tangles. Degradation of the mechanical properties due to cavitation or reaction of theadditives was not detected. SEM and TEM microstructural characterization and analysis of the creep par-ameters leads to the conclusion that the creep mechanisms operating are grain boundary sliding accommo-dated by lattice di�usion and climb-controlled dislocation glide operating in parallel. Other possibleoperating mechanisms are discussed and the data are compared with published data. # 1999 Acta Metal-lurgica Inc. Published by Elsevier Science Ltd. All rights reserved.
Keywords: Structural ceramics; Silicon carbide; High temperature; Creep; Dislocations
1. INTRODUCTION
Silicon carbide is one of the structural ceramics
most frequently used for high-temperature com-ponents due to its high fracture strength, excellent
wear and creep resistance, high resistance to cor-rosion, good thermal conductivity, and relativelylow coe�cient of thermal expansion [1±4]. In many
of these applications creep processes play an im-portant role. Thus, a detailed knowledge of the con-
stitutive equations which relate the kinetics ofdeformation to the applied stress and temperature,
as well as an understanding of the active mechan-isms during creep are essential. Previous workers
have studied creep in single crystals [5±7], reactionbonded [8], chemical vapor deposited [9, 10],
sintered [11±13], and hot isostatically pressedSiC [14, 15]. Among these works, Refs [11, 13, 14]deal with the compressive creep behavior of poly-
crystalline SiC.Lane et al. [11] investigated a sintered polycrys-
talline a-SiC containing 0.5 wt% C, 0.42 wt% B,and minor amounts (under 100 p.p.m.) of Fe, V,
Se, Mg, and Cu, with an average grain size of3.7 mm and 98.4% of the theoretical density. The
study was performed within a range of temperaturesand stresses of 1547±17478C and 138±148 MPa.
The stress exponent increased from 1.44 to 1.71with temperature, but it was not a function of stress
at a given temperature. The activation energies werebetween 338±434 and 802±914 kJ/mol for tempera-
tures below and above 16508C, respectively.
Dislocation in glide bands, B4C precipitates, and
the interaction of these two entities were the domi-
nant microstructural features of the crept material.
These authors concluded: (1) the creep mechanism
at low temperatures is grain boundary sliding
(GBS) accommodated by grain boundary di�usion,
and at high temperatures the controlling mechanism
becomes GBS accommodated by lattice di�usion;
(2) the parallel mechanism of dislocation glide con-
tributes increasingly to the total strain as the num-
ber/volume of precipitates declines as a result of
progressive coalescence with increasing temperature.
Nixon et al. [13] extended the study of Lane et al.
to polycrystals with average grain sizes of 3.5, 4.9,
and 7.5 mm (the processing route and composition
were the same). The stress exponents and activation
energies had similar behavior and values to those
obtained in the previous work. The values of the
inverse grain size exponent increased with increasing
temperature from 2.5 in the low-temperature range
to 4.0 in the high-temperature range. The proposed
deformation mechanisms were the same as in
Ref. [11], but with di�erent contributions depending
on the aspect ratio and size of the grains.
Backhaus-Ricoult et al. [14] studied the behavior
of hot-pressed SiC; one type with additives (1 vol.%
B and minor amounts of Si, Fe, and C, at a total
concentration below 2000 p.p.m.), an average grain
size of 0.5 mm and 97% of the theoretical density;
and another without additives, an average grain size
of 3.5 mm and 96% of the theoretical density. The
Acta mater. Vol. 47, No. 7, pp. 2185±2195, 1999# 1999 Acta Metallurgica Inc.
Published by Elsevier Science Ltd. All rights reservedPrinted in Great Britain
1359-6454/99 $20.00+0.00PII: S1359-6454(99)00072-5
{To whom all correspondence should be addressed.
2185
study was performed within a range of temperaturesand stresses of 1500±17008C and 100±1100 MPa.
The activation energies were 364±453 kJ/mol forstresses below 500 MPa and 629 kJ/mol for stressesover 500 MPa. The stress exponent changed from
1.5 in the low stress range to 3.5±4 in the highstress range. Neither the activation energy nor thestress exponent was a function of temperature. In
the material densi®ed with impurities, micrometersize graphite grains and amorphous silica pockets,in addition to large B25C precipitates inside the SiC
grains, were identi®ed. The study demonstrated thedestructive e�ect of carbon precipitates on creep re-sistance. These authors concluded that at low stres-ses the material deformed by grain boundary sliding
accommodated by grain boundary di�usion (andlimited cavitation), and at high stresses dislocationglide becomes the dominant deformation mechan-
ism since grain boundaries are no longer an ob-stacle to dislocation motion.The aim of the present research is to study the
high-temperature creep behavior of a newly devel-oped SiC sintered using a transient liquid phase(LPS). Results from previous creep studies are com-
pared with the present data.
2. EXPERIMENTAL PROCEDURE
The material studied in this work was sinteredusing a proprietary (Hoecht AG) transient liquidphase to obtain rapid densi®cation during sintering.
The bulk density of the as-received material,measured by the Archimedes method, was3.1920.05 g/cm3. This value is 99% of the theoreti-cal density (3.211 g/cm3) of the 6H SiC polytype.
Samples were cut into parallelepipeds with dimen-sions of 2� 2� 4 mm3 with a diamond saw, andmechanically polished with diamond pastes after
cutting, ®nishing with a 3 mm grade. Slices fortransmission electron microscopy (TEM), cut fromthe as-received and deformed samples, were thinned
to electron transparency using standard techniques.Creep tests were carried out in compression
under constant load [16] at temperatures between1575 and 17008C, under nominal stresses from 90
to 500 MPa. An argon atmosphere was used inorder to protect the silicon carbide rams, heating el-ements, and samples from oxidation at high tem-
perature. The data recorded during creep were theinstantaneous length (l) vs time at constant loadand temperature, and they were plotted as strain
rate (_e) vs strain [e � ln�l=l0�, where l0 is the initiallength]. The system was kept at each load and tem-perature for long enough time to ascertain that
stationary creep state (e.g. _e independent of e) wasattained.
Microstructural observations were performed onthe as-received and deformed samples by scanning
electron microscopy (SEM) using a Philips XL-30electron microscope operating at 30 kV, and bytransmission electron microscopy (TEM) using a
Hitachi (H800-2) electron microscope operating at200 kV.{ Microanalysis was performed using aKevex 8000 energy-dispersive X-ray spectrometer
(EDS) in the SEM and STEM modes. For SEMobservations, samples were annealed for 15 min at13008C and then etched with HF for 5 min at room
temperature to reveal the grain boundaries.Fracture surfaces were also used to measure thegrain size. The grain size distribution was measuredfrom SEM and TEM micrographs using a semiau-
tomatic image analyzer (Videoplan, KontronElectronik).
3. RESULTS
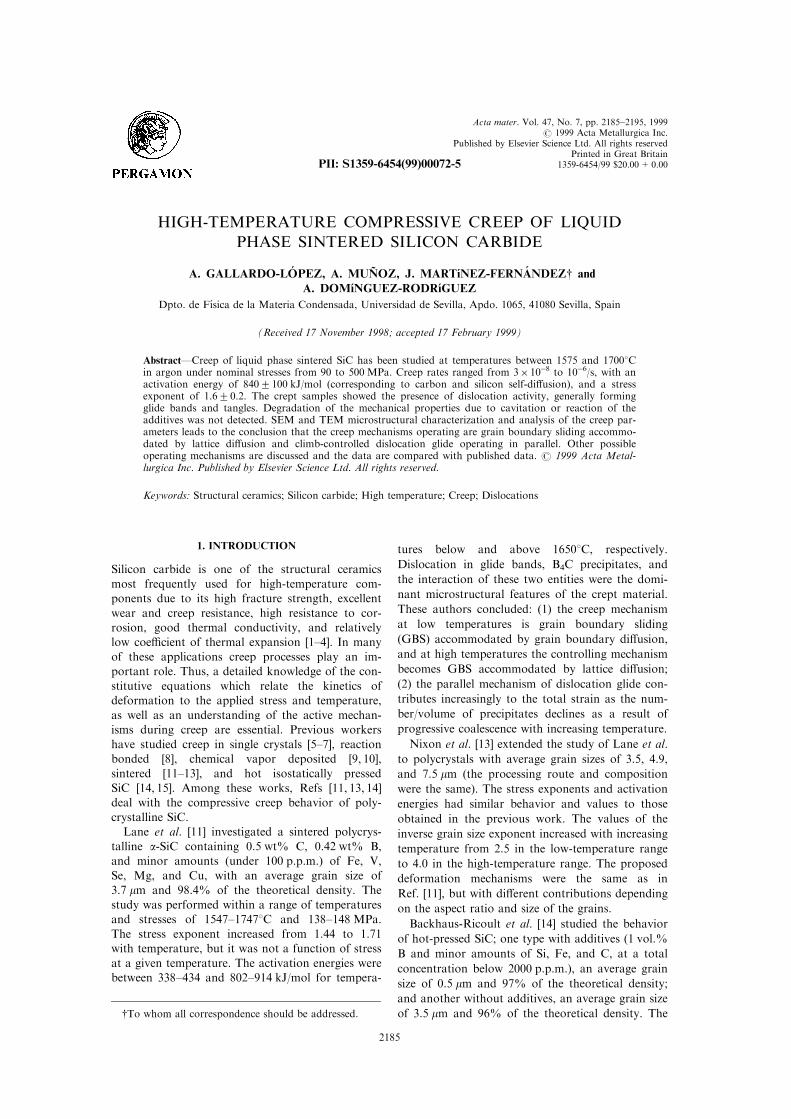
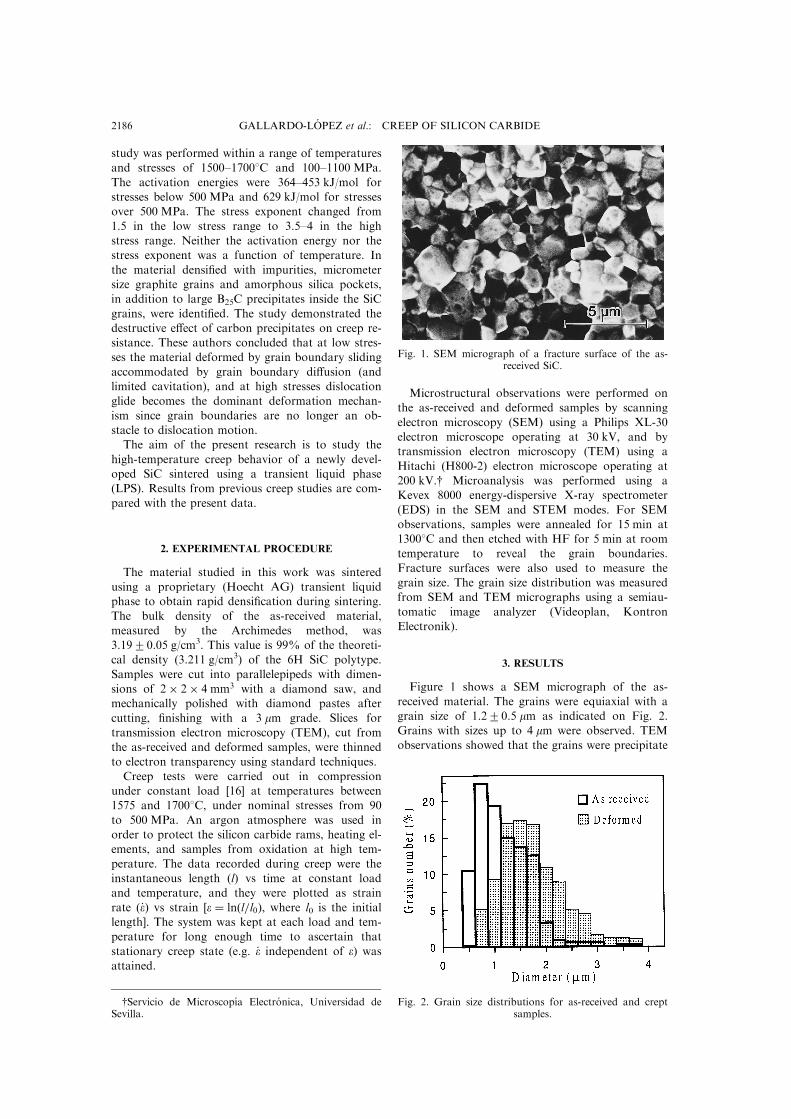
Figure 1 shows a SEM micrograph of the as-
received material. The grains were equiaxial with agrain size of 1.220.5 mm as indicated on Fig. 2.Grains with sizes up to 4 mm were observed. TEM
observations showed that the grains were precipitate
Fig. 1. SEM micrograph of a fracture surface of the as-received SiC.
Fig. 2. Grain size distributions for as-received and creptsamples.
{Servicio de Microscopõ a Electro nica, Universidad deSevilla.
GALLARDO-LOÂ PEZ et al.: CREEP OF SILICON CARBIDE2186
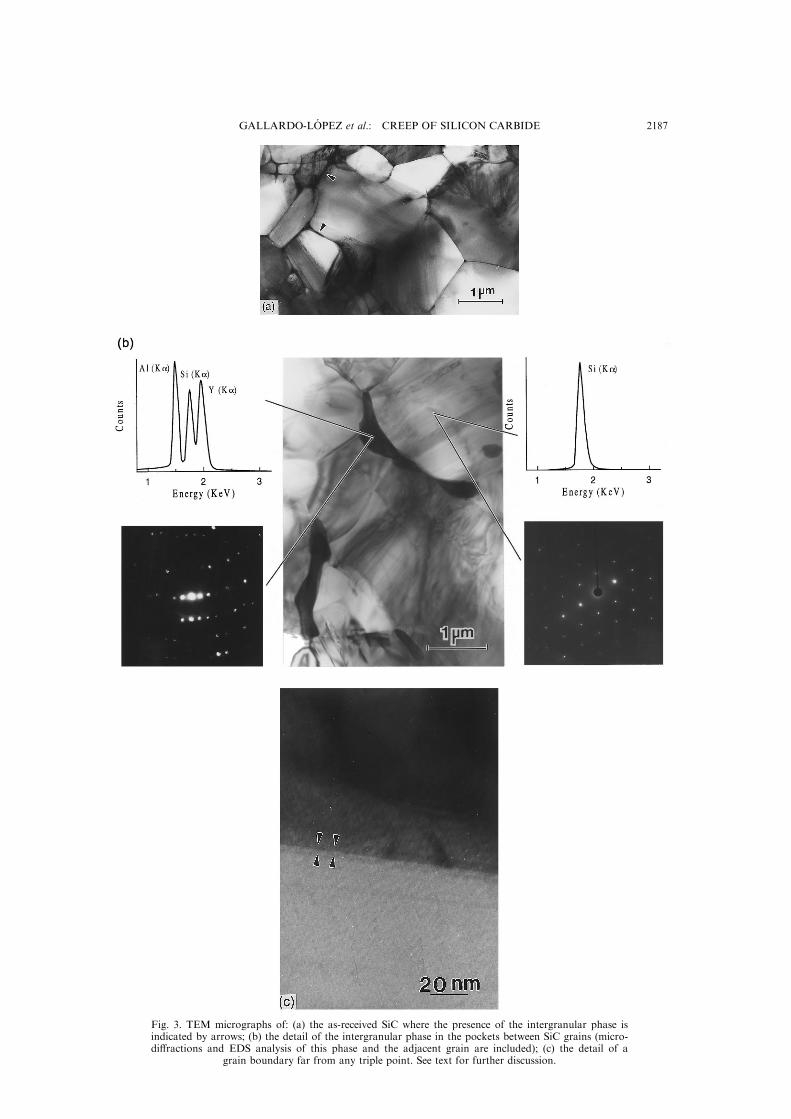
Fig. 3. TEM micrographs of: (a) the as-received SiC where the presence of the intergranular phase isindicated by arrows; (b) the detail of the intergranular phase in the pockets between SiC grains (micro-di�ractions and EDS analysis of this phase and the adjacent grain are included); (c) the detail of a
grain boundary far from any triple point. See text for further discussion.
GALLARDO-LOÂ PEZ et al.: CREEP OF SILICON CARBIDE 2187
free, and electron di�raction analysis indicated that
the major polytype present was 6H (a-SiC). In ad-
dition, the as-received samples showed the presence
of some stacking faults and dislocations originated
during processing (not shown here). An extra phase
was observed in the pockets between SiC grains
which originated from the reaction of the sintered
additives, and sometimes a grain-boundary ®lm
could be detected next to these triple points
[Figs 3(a) and (b)]. EDS analysis detected Al, Y,
and O indicating that the sintering additives were
Y2O3 and Al2O3. Microdi�raction showed that the
intergranular phase was crystalline [Fig. 3(b)]. Most
of the interfaces between grains far from the vicin-
ity of a triple point were clean, showing a contrast
width of about 1 nm [Fig. 3(c)]. The volume frac-
tion of the intergranular phase was estimated from
TEM to be under 2%. The grains of di�erent sizes
and the intergranular phase were uniformly distrib-
uted along the sample.
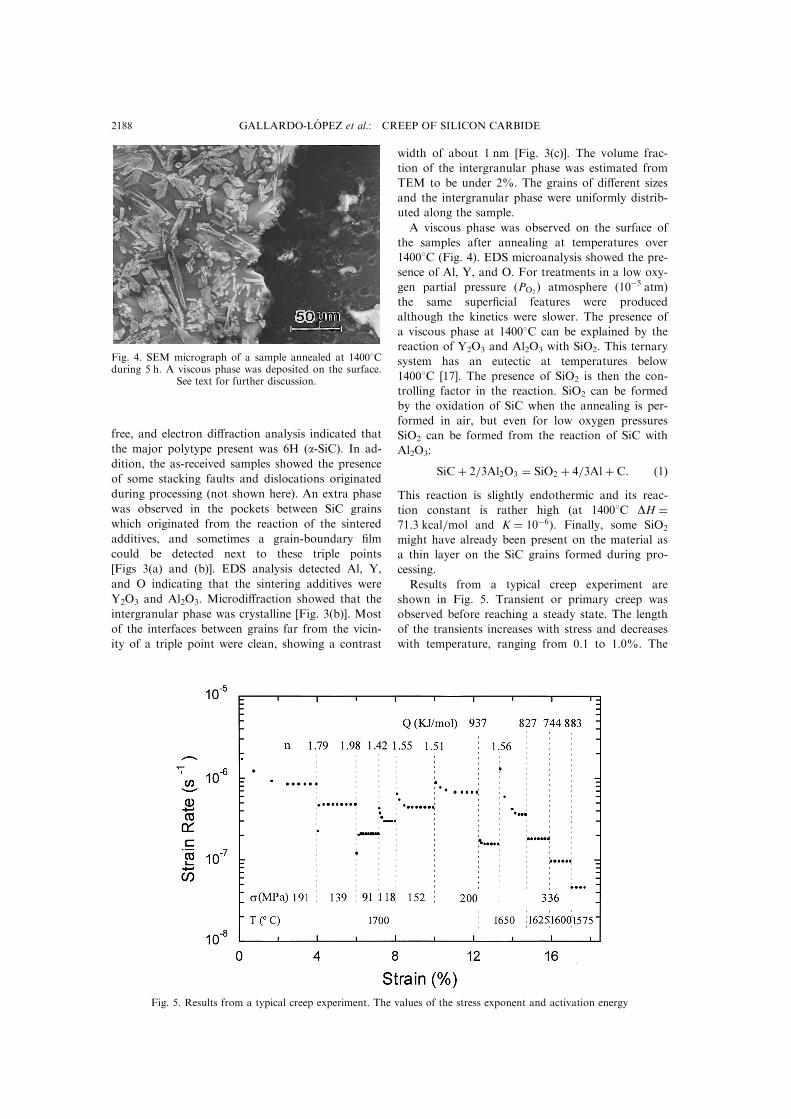
A viscous phase was observed on the surface of
the samples after annealing at temperatures over
14008C (Fig. 4). EDS microanalysis showed the pre-
sence of Al, Y, and O. For treatments in a low oxy-
gen partial pressure (PO2) atmosphere (10ÿ5 atm)
the same super®cial features were produced
although the kinetics were slower. The presence of
a viscous phase at 14008C can be explained by the
reaction of Y2O3 and Al2O3 with SiO2. This ternary
system has an eutectic at temperatures below
14008C [17]. The presence of SiO2 is then the con-
trolling factor in the reaction. SiO2 can be formed
by the oxidation of SiC when the annealing is per-
formed in air, but even for low oxygen pressures
SiO2 can be formed from the reaction of SiC with
Al2O3:
SiC� 2=3Al2O3 � SiO2 � 4=3Al� C: �1�This reaction is slightly endothermic and its reac-
tion constant is rather high (at 14008C DH �71:3 kcal=mol and K � 10ÿ6). Finally, some SiO2
might have already been present on the material as
a thin layer on the SiC grains formed during pro-
cessing.
Results from a typical creep experiment are
shown in Fig. 5. Transient or primary creep was
observed before reaching a steady state. The length
of the transients increases with stress and decreases
with temperature, ranging from 0.1 to 1.0%. The
Fig. 4. SEM micrograph of a sample annealed at 14008Cduring 5 h. A viscous phase was deposited on the surface.
See text for further discussion.
Fig. 5. Results from a typical creep experiment. The values of the stress exponent and activation energy
GALLARDO-LOÂ PEZ et al.: CREEP OF SILICON CARBIDE2188
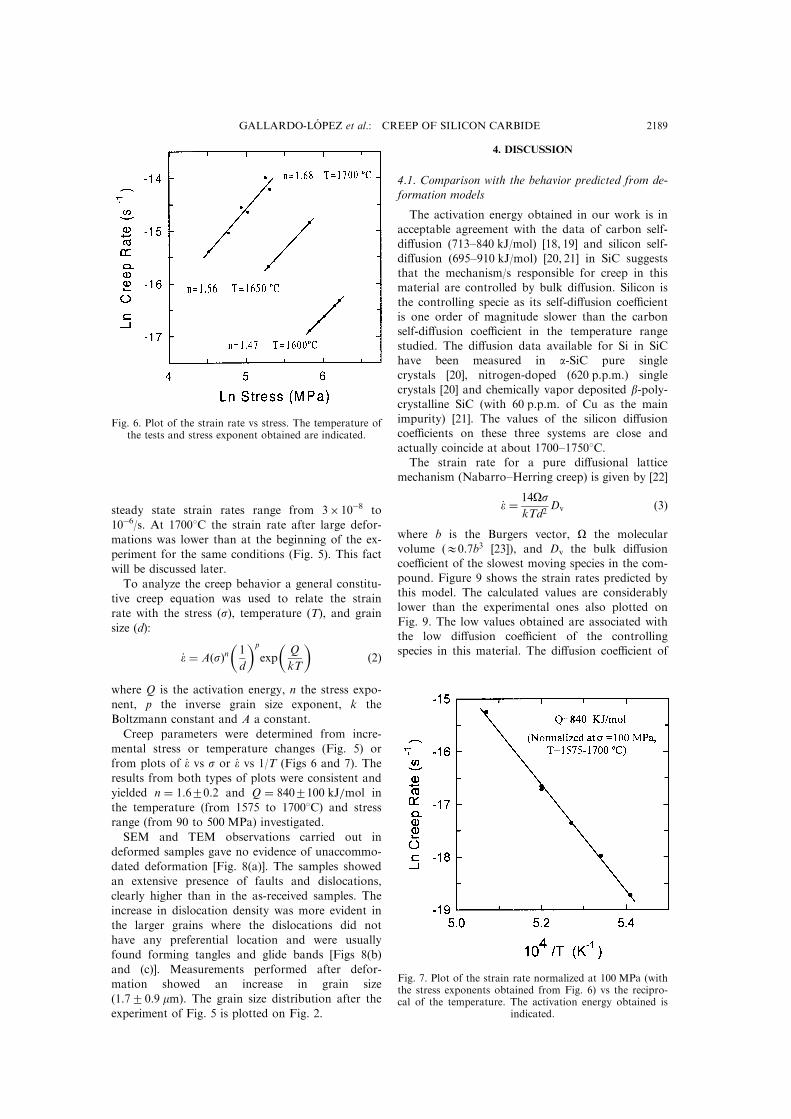
steady state strain rates range from 3�10ÿ8 to
10ÿ6/s. At 17008C the strain rate after large defor-
mations was lower than at the beginning of the ex-
periment for the same conditions (Fig. 5). This fact
will be discussed later.
To analyze the creep behavior a general constitu-
tive creep equation was used to relate the strain
rate with the stress (s), temperature (T), and grain
size (d):
_e � A�s�n�1
d
�p
exp
�Q
kT
��2�
where Q is the activation energy, n the stress expo-
nent, p the inverse grain size exponent, k the
Boltzmann constant and A a constant.
Creep parameters were determined from incre-
mental stress or temperature changes (Fig. 5) or
from plots of _e vs s or _e vs 1/T (Figs 6 and 7). The
results from both types of plots were consistent and
yielded n � 1:620:2 and Q � 8402100 kJ=mol in
the temperature (from 1575 to 17008C) and stress
range (from 90 to 500 MPa) investigated.
SEM and TEM observations carried out in
deformed samples gave no evidence of unaccommo-
dated deformation [Fig. 8(a)]. The samples showed
an extensive presence of faults and dislocations,
clearly higher than in the as-received samples. The
increase in dislocation density was more evident in
the larger grains where the dislocations did not
have any preferential location and were usually
found forming tangles and glide bands [Figs 8(b)
and (c)]. Measurements performed after defor-
mation showed an increase in grain size
(1.720.9 mm). The grain size distribution after the
experiment of Fig. 5 is plotted on Fig. 2.
4. DISCUSSION
4.1. Comparison with the behavior predicted from de-formation models
The activation energy obtained in our work is inacceptable agreement with the data of carbon self-
di�usion (713±840 kJ/mol) [18, 19] and silicon self-di�usion (695±910 kJ/mol) [20, 21] in SiC suggeststhat the mechanism/s responsible for creep in thismaterial are controlled by bulk di�usion. Silicon is
the controlling specie as its self-di�usion coe�cientis one order of magnitude slower than the carbonself-di�usion coe�cient in the temperature range
studied. The di�usion data available for Si in SiChave been measured in a-SiC pure singlecrystals [20], nitrogen-doped (620 p.p.m.) single
crystals [20] and chemically vapor deposited b-poly-crystalline SiC (with 60 p.p.m. of Cu as the mainimpurity) [21]. The values of the silicon di�usioncoe�cients on these three systems are close and
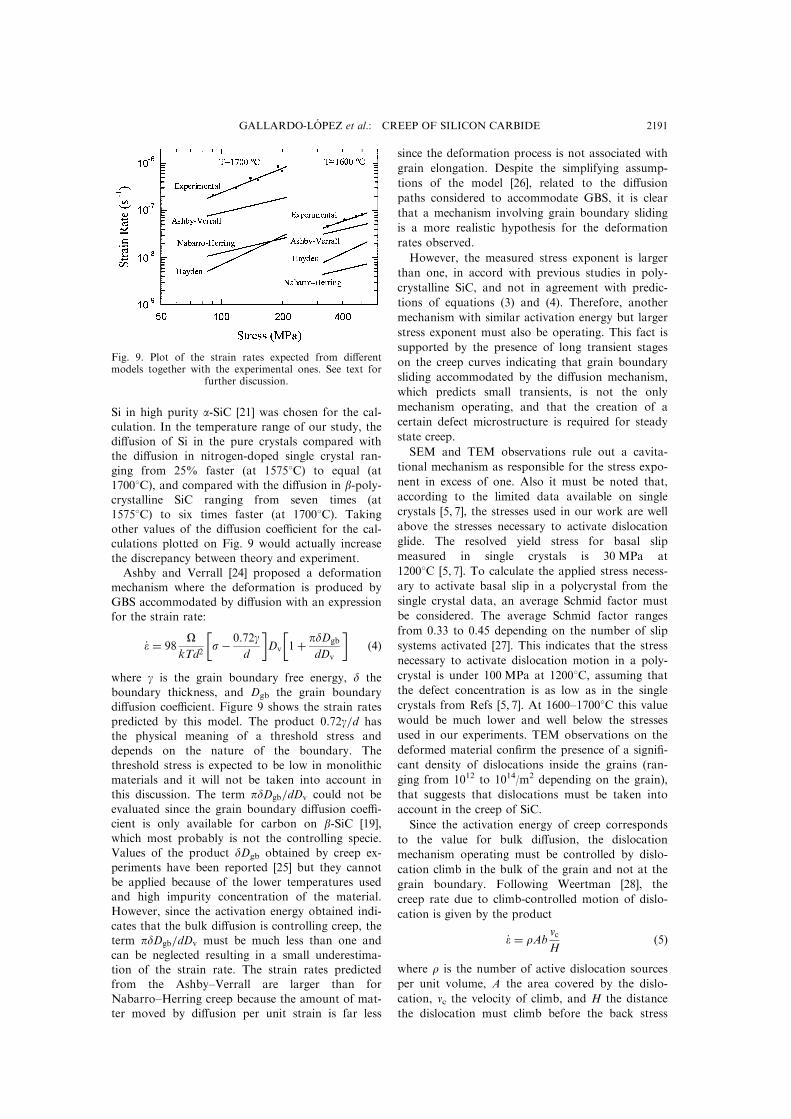
actually coincide at about 1700±17508C.The strain rate for a pure di�usional lattice
mechanism (Nabarro±Herring creep) is given by [22]
_e � 14OskTd2
Dv �3�
where b is the Burgers vector, O the molecularvolume (10:7b3 [23]), and Dv the bulk di�usioncoe�cient of the slowest moving species in the com-
pound. Figure 9 shows the strain rates predicted bythis model. The calculated values are considerablylower than the experimental ones also plotted on
Fig. 9. The low values obtained are associated withthe low di�usion coe�cient of the controllingspecies in this material. The di�usion coe�cient of
Fig. 6. Plot of the strain rate vs stress. The temperature ofthe tests and stress exponent obtained are indicated.
Fig. 7. Plot of the strain rate normalized at 100 MPa (withthe stress exponents obtained from Fig. 6) vs the recipro-cal of the temperature. The activation energy obtained is
indicated.
GALLARDO-LOÂ PEZ et al.: CREEP OF SILICON CARBIDE 2189
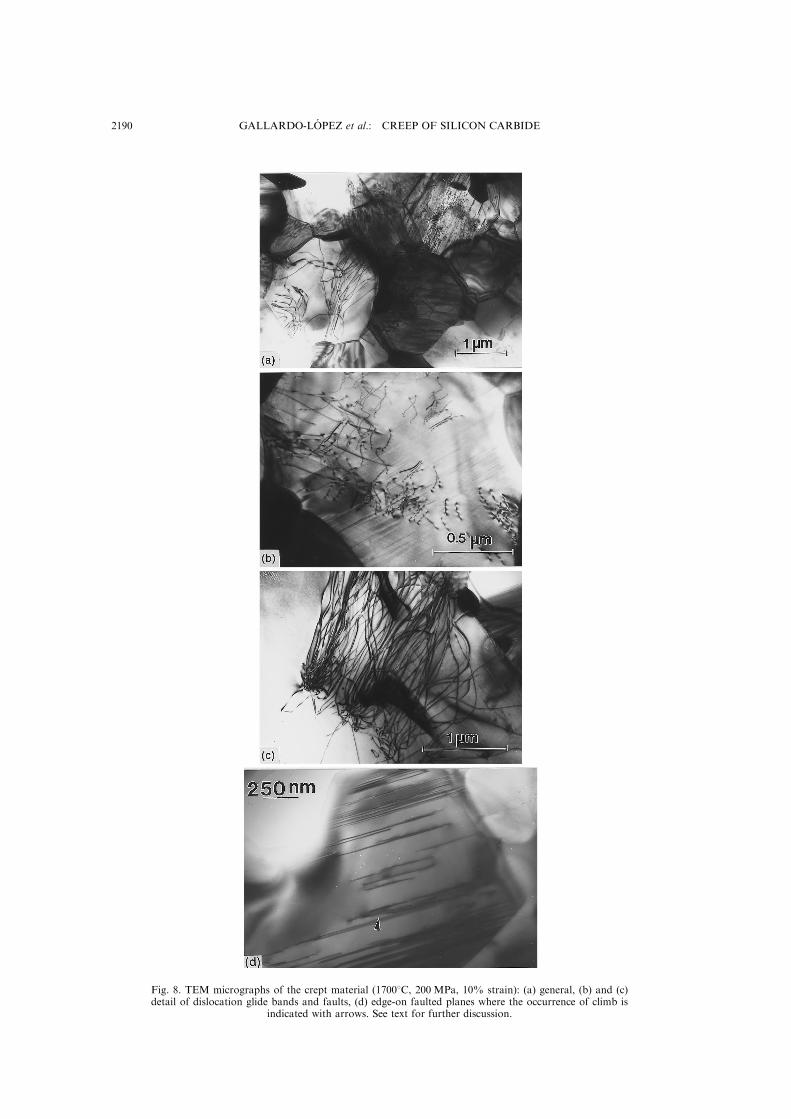
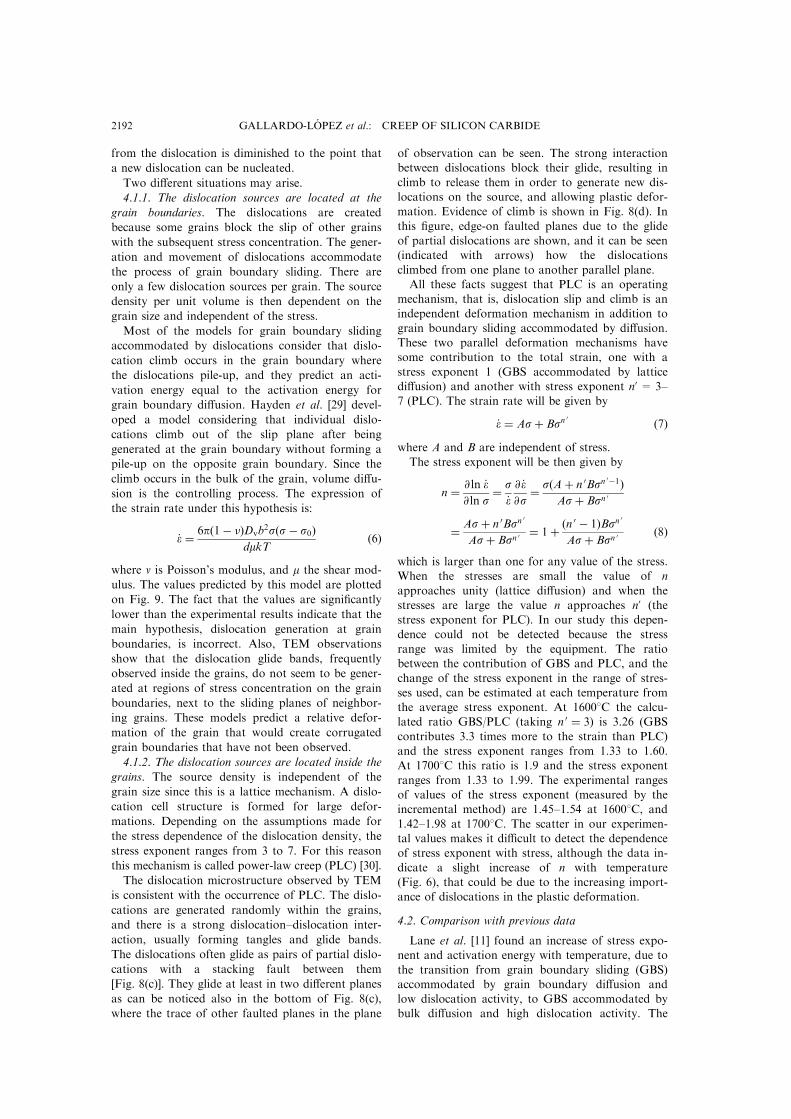
Fig. 8. TEM micrographs of the crept material (17008C, 200 MPa, 10% strain): (a) general, (b) and (c)detail of dislocation glide bands and faults, (d) edge-on faulted planes where the occurrence of climb is
indicated with arrows. See text for further discussion.
GALLARDO-LOÂ PEZ et al.: CREEP OF SILICON CARBIDE2190
Si in high purity a-SiC [21] was chosen for the cal-culation. In the temperature range of our study, the
di�usion of Si in the pure crystals compared withthe di�usion in nitrogen-doped single crystal ran-
ging from 25% faster (at 15758C) to equal (at
17008C), and compared with the di�usion in b-poly-crystalline SiC ranging from seven times (at
15758C) to six times faster (at 17008C). Taking
other values of the di�usion coe�cient for the cal-culations plotted on Fig. 9 would actually increase
the discrepancy between theory and experiment.
Ashby and Verrall [24] proposed a deformationmechanism where the deformation is produced by
GBS accommodated by di�usion with an expression
for the strain rate:
_e � 98O
kTd2
�sÿ 0:72g
d
�Dv
�1� pdDgb
dDv
��4�
where g is the grain boundary free energy, d the
boundary thickness, and Dgb the grain boundarydi�usion coe�cient. Figure 9 shows the strain rates
predicted by this model. The product 0:72g=d hasthe physical meaning of a threshold stress and
depends on the nature of the boundary. The
threshold stress is expected to be low in monolithicmaterials and it will not be taken into account in
this discussion. The term pdDgb=dDv could not be
evaluated since the grain boundary di�usion coe�-cient is only available for carbon on b-SiC [19],
which most probably is not the controlling specie.Values of the product dDgb obtained by creep ex-
periments have been reported [25] but they cannot
be applied because of the lower temperatures usedand high impurity concentration of the material.
However, since the activation energy obtained indi-
cates that the bulk di�usion is controlling creep, theterm pdDgb=dDv must be much less than one and
can be neglected resulting in a small underestima-tion of the strain rate. The strain rates predicted
from the Ashby±Verrall are larger than for
Nabarro±Herring creep because the amount of mat-ter moved by di�usion per unit strain is far less
since the deformation process is not associated with
grain elongation. Despite the simplifying assump-
tions of the model [26], related to the di�usion
paths considered to accommodate GBS, it is clear
that a mechanism involving grain boundary sliding
is a more realistic hypothesis for the deformation
rates observed.
However, the measured stress exponent is larger
than one, in accord with previous studies in poly-
crystalline SiC, and not in agreement with predic-
tions of equations (3) and (4). Therefore, another
mechanism with similar activation energy but larger
stress exponent must also be operating. This fact is
supported by the presence of long transient stages
on the creep curves indicating that grain boundary
sliding accommodated by the di�usion mechanism,
which predicts small transients, is not the only
mechanism operating, and that the creation of a
certain defect microstructure is required for steady
state creep.
SEM and TEM observations rule out a cavita-
tional mechanism as responsible for the stress expo-
nent in excess of one. Also it must be noted that,
according to the limited data available on single
crystals [5, 7], the stresses used in our work are well
above the stresses necessary to activate dislocation
glide. The resolved yield stress for basal slip
measured in single crystals is 30 MPa at
12008C [5, 7]. To calculate the applied stress necess-
ary to activate basal slip in a polycrystal from the
single crystal data, an average Schmid factor must
be considered. The average Schmid factor ranges
from 0.33 to 0.45 depending on the number of slip
systems activated [27]. This indicates that the stress
necessary to activate dislocation motion in a poly-
crystal is under 100 MPa at 12008C, assuming that
the defect concentration is as low as in the single
crystals from Refs [5, 7]. At 1600±17008C this value
would be much lower and well below the stresses
used in our experiments. TEM observations on the
deformed material con®rm the presence of a signi®-
cant density of dislocations inside the grains (ran-
ging from 1012 to 1014/m2 depending on the grain),
that suggests that dislocations must be taken into
account in the creep of SiC.
Since the activation energy of creep corresponds
to the value for bulk di�usion, the dislocation
mechanism operating must be controlled by dislo-
cation climb in the bulk of the grain and not at the
grain boundary. Following Weertman [28], the
creep rate due to climb-controlled motion of dislo-
cation is given by the product
_e � rAbvcH
�5�
where r is the number of active dislocation sources
per unit volume, A the area covered by the dislo-
cation, vc the velocity of climb, and H the distance
the dislocation must climb before the back stress
Fig. 9. Plot of the strain rates expected from di�erentmodels together with the experimental ones. See text for
further discussion.
GALLARDO-LOÂ PEZ et al.: CREEP OF SILICON CARBIDE 2191
from the dislocation is diminished to the point that
a new dislocation can be nucleated.
Two di�erent situations may arise.
4.1.1. The dislocation sources are located at the
grain boundaries. The dislocations are created
because some grains block the slip of other grains
with the subsequent stress concentration. The gener-
ation and movement of dislocations accommodate
the process of grain boundary sliding. There are
only a few dislocation sources per grain. The source
density per unit volume is then dependent on the
grain size and independent of the stress.
Most of the models for grain boundary sliding
accommodated by dislocations consider that dislo-
cation climb occurs in the grain boundary where
the dislocations pile-up, and they predict an acti-
vation energy equal to the activation energy for
grain boundary di�usion. Hayden et al. [29] devel-
oped a model considering that individual dislo-
cations climb out of the slip plane after being
generated at the grain boundary without forming a
pile-up on the opposite grain boundary. Since the
climb occurs in the bulk of the grain, volume di�u-
sion is the controlling process. The expression of
the strain rate under this hypothesis is:
_e � 6p�1ÿ ��Dvb2s�sÿ s0�
dmkT�6�
where n is Poisson's modulus, and m the shear mod-
ulus. The values predicted by this model are plotted
on Fig. 9. The fact that the values are signi®cantly
lower than the experimental results indicate that the
main hypothesis, dislocation generation at grain
boundaries, is incorrect. Also, TEM observations
show that the dislocation glide bands, frequently
observed inside the grains, do not seem to be gener-
ated at regions of stress concentration on the grain
boundaries, next to the sliding planes of neighbor-
ing grains. These models predict a relative defor-
mation of the grain that would create corrugated
grain boundaries that have not been observed.
4.1.2. The dislocation sources are located inside the
grains. The source density is independent of the
grain size since this is a lattice mechanism. A dislo-
cation cell structure is formed for large defor-
mations. Depending on the assumptions made for
the stress dependence of the dislocation density, the
stress exponent ranges from 3 to 7. For this reason
this mechanism is called power-law creep (PLC) [30].
The dislocation microstructure observed by TEM
is consistent with the occurrence of PLC. The dislo-
cations are generated randomly within the grains,
and there is a strong dislocation±dislocation inter-
action, usually forming tangles and glide bands.
The dislocations often glide as pairs of partial dislo-
cations with a stacking fault between them
[Fig. 8(c)]. They glide at least in two di�erent planes
as can be noticed also in the bottom of Fig. 8(c),
where the trace of other faulted planes in the plane
of observation can be seen. The strong interactionbetween dislocations block their glide, resulting in
climb to release them in order to generate new dis-locations on the source, and allowing plastic defor-mation. Evidence of climb is shown in Fig. 8(d). In
this ®gure, edge-on faulted planes due to the glideof partial dislocations are shown, and it can be seen(indicated with arrows) how the dislocations
climbed from one plane to another parallel plane.All these facts suggest that PLC is an operating
mechanism, that is, dislocation slip and climb is an
independent deformation mechanism in addition tograin boundary sliding accommodated by di�usion.These two parallel deformation mechanisms havesome contribution to the total strain, one with a
stress exponent 1 (GBS accommodated by latticedi�usion) and another with stress exponent n'= 3±7 (PLC). The strain rate will be given by
_e � As� Bsn0 �7�
where A and B are independent of stress.
The stress exponent will be then given by
n � @ ln _e@ ln s
� s_e@ _e@s� s�A� n 0Bsn
0ÿ1�As� Bsn 0
� As� n 0Bsn0
As� Bsn 0� 1� �n
0 ÿ 1�Bsn 0As� Bsn 0
�8�
which is larger than one for any value of the stress.When the stresses are small the value of n
approaches unity (lattice di�usion) and when thestresses are large the value n approaches n' (thestress exponent for PLC). In our study this depen-
dence could not be detected because the stressrange was limited by the equipment. The ratiobetween the contribution of GBS and PLC, and the
change of the stress exponent in the range of stres-ses used, can be estimated at each temperature fromthe average stress exponent. At 16008C the calcu-lated ratio GBS/PLC (taking n 0 � 3) is 3.26 (GBS
contributes 3.3 times more to the strain than PLC)and the stress exponent ranges from 1.33 to 1.60.At 17008C this ratio is 1.9 and the stress exponent
ranges from 1.33 to 1.99. The experimental rangesof values of the stress exponent (measured by theincremental method) are 1.45±1.54 at 16008C, and1.42±1.98 at 17008C. The scatter in our experimen-tal values makes it di�cult to detect the dependenceof stress exponent with stress, although the data in-
dicate a slight increase of n with temperature(Fig. 6), that could be due to the increasing import-ance of dislocations in the plastic deformation.
4.2. Comparison with previous data
Lane et al. [11] found an increase of stress expo-nent and activation energy with temperature, due to
the transition from grain boundary sliding (GBS)accommodated by grain boundary di�usion andlow dislocation activity, to GBS accommodated bybulk di�usion and high dislocation activity. The
GALLARDO-LOÂ PEZ et al.: CREEP OF SILICON CARBIDE2192
data from our work are in good agreement with
their high-temperature regime. However, the tran-
sition is not observed. This fact does not correlate
with grain size diferences. It must be related to the
easier glide of the dislocations within the grains in
our case. Easier glide makes the contribution of dis-
locations to the total strain more important (in our
TEM observations we have not detected a single
precipitate inside the SiC grains). This explanation
is consistent with the presence of B4C precipitates
in the SiC studied by Lane et al. These authors
speci®cally indicated that the dislocation activity
increased with the coalescence of the precipitate
phase, because the interaction of dislocations with
the precipitates makes it di�cult to glide. Figure 11
exhibits the strain rates obtained experimentally by
Lane et al. and by this work, normalized to a stress
of 100 MPa using the stress exponent obtained in
each work, and at a grain size of 1 mm using a
grain size exponent of 2. The results from Lane et
al. match our results at high temperature indicating
that the same mechanisms are controlling defor-
mation.
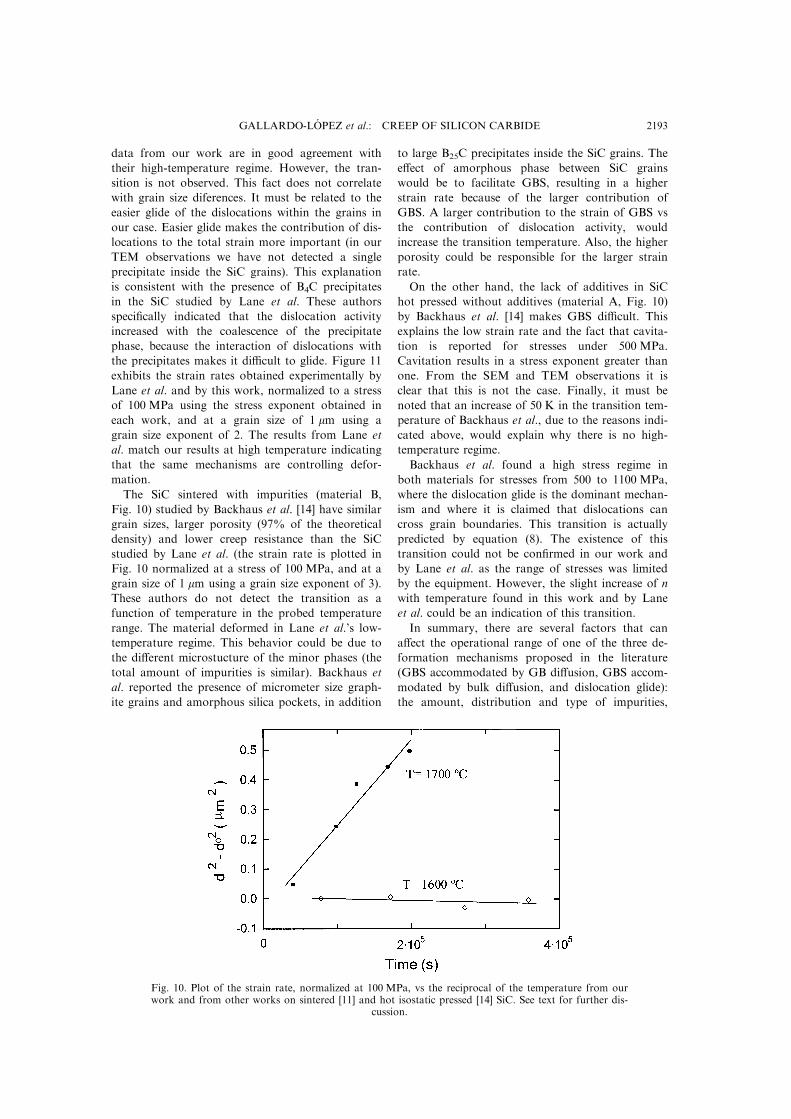
The SiC sintered with impurities (material B,
Fig. 10) studied by Backhaus et al. [14] have similar
grain sizes, larger porosity (97% of the theoretical
density) and lower creep resistance than the SiC
studied by Lane et al. (the strain rate is plotted in
Fig. 10 normalized at a stress of 100 MPa, and at a
grain size of 1 mm using a grain size exponent of 3).
These authors do not detect the transition as a
function of temperature in the probed temperature
range. The material deformed in Lane et al.'s low-
temperature regime. This behavior could be due to
the di�erent microstucture of the minor phases (the
total amount of impurities is similar). Backhaus et
al. reported the presence of micrometer size graph-
ite grains and amorphous silica pockets, in addition
to large B25C precipitates inside the SiC grains. The
e�ect of amorphous phase between SiC grains
would be to facilitate GBS, resulting in a higher
strain rate because of the larger contribution of
GBS. A larger contribution to the strain of GBS vs
the contribution of dislocation activity, would
increase the transition temperature. Also, the higher
porosity could be responsible for the larger strain
rate.
On the other hand, the lack of additives in SiC
hot pressed without additives (material A, Fig. 10)
by Backhaus et al. [14] makes GBS di�cult. This
explains the low strain rate and the fact that cavita-
tion is reported for stresses under 500 MPa.
Cavitation results in a stress exponent greater than
one. From the SEM and TEM observations it is
clear that this is not the case. Finally, it must be
noted that an increase of 50 K in the transition tem-
perature of Backhaus et al., due to the reasons indi-
cated above, would explain why there is no high-
temperature regime.
Backhaus et al. found a high stress regime in
both materials for stresses from 500 to 1100 MPa,
where the dislocation glide is the dominant mechan-
ism and where it is claimed that dislocations can
cross grain boundaries. This transition is actually
predicted by equation (8). The existence of this
transition could not be con®rmed in our work and
by Lane et al. as the range of stresses was limited
by the equipment. However, the slight increase of n
with temperature found in this work and by Lane
et al. could be an indication of this transition.
In summary, there are several factors that can
a�ect the operational range of one of the three de-
formation mechanisms proposed in the literature
(GBS accommodated by GB di�usion, GBS accom-
modated by bulk di�usion, and dislocation glide):
the amount, distribution and type of impurities,
Fig. 10. Plot of the strain rate, normalized at 100 MPa, vs the reciprocal of the temperature from ourwork and from other works on sintered [11] and hot isostatic pressed [14] SiC. See text for further dis-
cussion.
GALLARDO-LOÂ PEZ et al.: CREEP OF SILICON CARBIDE 2193
level of porosity, crystallinity of the intergranularphases, grain size, and processing route. These fac-
tors also determine the creep rate. In the SiC stu-died in this paper the intergranular phases werelocated primarily at the triple points and the SiC
grains contained no precipitates. These two factorspromote the occurrence of dislocation glide andclimb as an independent mechanism of defor-
mation.
4.3. E�ect of grain growth
Despite the low values of the di�usion coe�-
cients, grain growth must be taken into account athigh temperatures since the grain size had increasedduring testing (Fig. 2). Theoretically grain growthfollows a parabolic dependence with time if the co-
alescence of precipitates or inclusions, solute segre-gation, or a dependence of the mobility with thegrain size, can be neglected [31]. Grain growth is
described as:
d 2 ÿ d 20 � 2Mbgt �9�
where d0 is the initial grain size, Mb the grainboundary mobility, and g the grain boundary freeenergy. The continuous increase in grain size causes
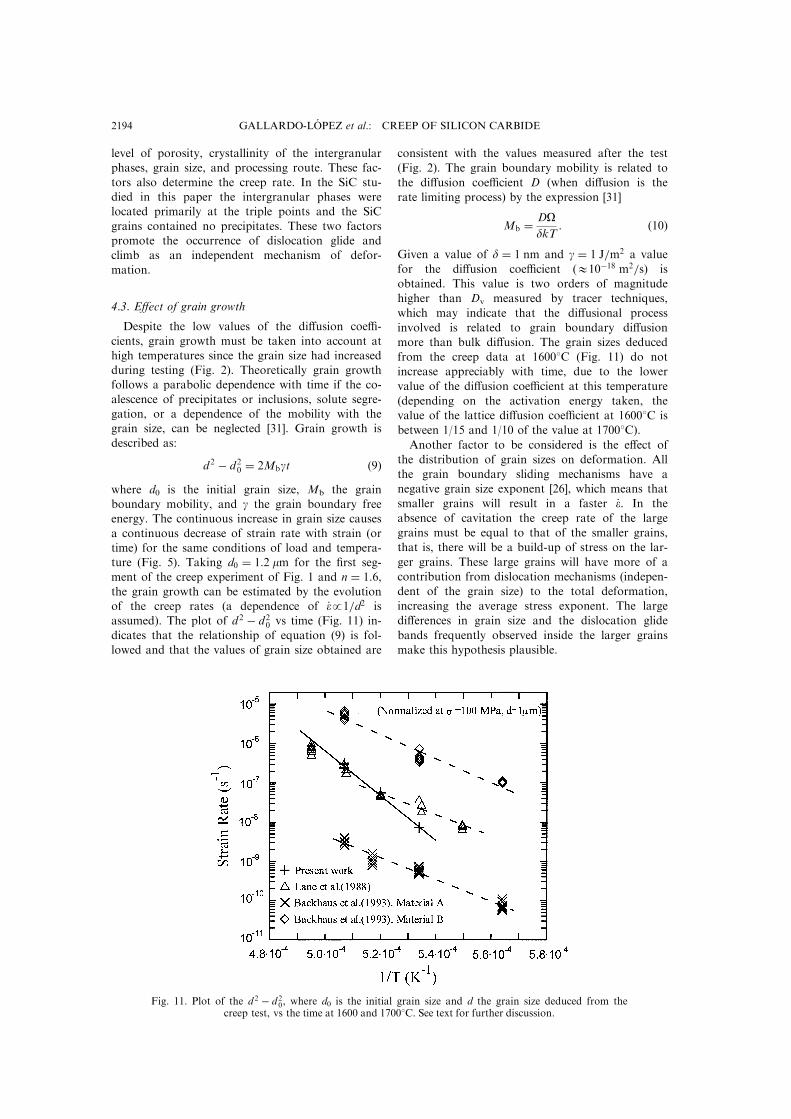
a continuous decrease of strain rate with strain (ortime) for the same conditions of load and tempera-ture (Fig. 5). Taking d0 � 1:2 mm for the ®rst seg-ment of the creep experiment of Fig. 1 and n � 1:6,the grain growth can be estimated by the evolutionof the creep rates (a dependence of _eA1=d2 isassumed). The plot of d 2 ÿ d 2
0 vs time (Fig. 11) in-
dicates that the relationship of equation (9) is fol-lowed and that the values of grain size obtained are
consistent with the values measured after the test
(Fig. 2). The grain boundary mobility is related to
the di�usion coe�cient D (when di�usion is the
rate limiting process) by the expression [31]
Mb � DOdkT
: �10�
Given a value of d � 1 nm and g � 1 J=m2 a value
for the di�usion coe�cient (110ÿ18 m2=s) is
obtained. This value is two orders of magnitude
higher than Dv measured by tracer techniques,
which may indicate that the di�usional process
involved is related to grain boundary di�usion
more than bulk di�usion. The grain sizes deduced
from the creep data at 16008C (Fig. 11) do not
increase appreciably with time, due to the lower
value of the di�usion coe�cient at this temperature
(depending on the activation energy taken, the
value of the lattice di�usion coe�cient at 16008C is
between 1/15 and 1/10 of the value at 17008C).Another factor to be considered is the e�ect of
the distribution of grain sizes on deformation. All
the grain boundary sliding mechanisms have a
negative grain size exponent [26], which means that
smaller grains will result in a faster _e. In the
absence of cavitation the creep rate of the large
grains must be equal to that of the smaller grains,
that is, there will be a build-up of stress on the lar-
ger grains. These large grains will have more of a
contribution from dislocation mechanisms (indepen-
dent of the grain size) to the total deformation,
increasing the average stress exponent. The large
di�erences in grain size and the dislocation glide
bands frequently observed inside the larger grains
make this hypothesis plausible.
Fig. 11. Plot of the d 2 ÿ d 20, where d0 is the initial grain size and d the grain size deduced from the
creep test, vs the time at 1600 and 17008C. See text for further discussion.
GALLARDO-LOÂ PEZ et al.: CREEP OF SILICON CARBIDE2194
5. CONCLUSIONS
. Creep testing in argon at temperatures between1575 and 17008C under nominal stresses from 90
to 500 MPa resulted in creep rates ranging from3�10ÿ8 to 10ÿ6/s.
. The activation energy obtained was 8402100 kJ/
mol comparable to the carbon and silicon self-di�usion, and the stress exponent was 1.620.1.
. Climb-controlled dislocation glide and grainboundary sliding accommodated by lattice di�u-
sion are the operating creep mechanisms. Thesemechanisms contribute independently to creep,the contribution of each being dependent on the
grain size.
AcknowledgementsÐWe would like to acknowledge D.Go mez-Garcõ a (University of Seville) for his help duringthe creep tests, M. Singh (NYMA Inc.) for the useful dis-cussions on thermodynamics, and J. Routbort for thereview of this paper. We also thank Hoecht AG for pro-viding the samples. The research was funded by projectCICYT MAT94-0481.
REFERENCES
1. Somiya, S. and Inomata, Y., Silicon Carbide Ceramics.Elsevier Applied Science, Oxford, 1991, p. 13.
2. Cawley, J. D. and Semler, C. E., Silicon Carbide `87,Ceramic Transactions Vol. 2. American CeramicsSociety, 1987.
3. Dapkunas, S. J., Am. Ceram. Soc. Bull., 1988, 67(2),388.
4. Strock, H. B., Spectrum Mater. Manufaturing, 1992,35, 1.
5. Corman, G. S., J. Am. Ceram. Soc., 1992, 75(12),3421.
6. Frantsevich, I. N., Kravets, V. A. and Nazarenco, K.V., Soviet Powder Metall. Met. Ceram., 1975, 14(8),679.
7. Maeda, K., Yogyo Kyokaishi, 1986, 94(8), 784.8. Carter, C. H. Jr, Davis, R. F. and Bentley, J., J. Am.
Ceram. Soc., 1984, 67(6), 409.
9. Carter, C. H. Jr, Davis, R. F. and Bentley, J., J. Am.Ceram. Soc., 1984, 67(10), 732.
10. Morscher, G. N., Lewinsohn, C. A., Bakis, C. E.,Tressler, R. E. and Wagner, T., J. Am. Ceram. Soc.,1995, 78(12), 3244.
11. Lane, J. E., Carter, C. H. Jr and Davis, R. F., J. Am.Ceram. Soc., 1988, 71(4), 281.
12. Jou, Z. C., Virkar, A. V. and Cutler, R. A., J. Mater.Res., 1991, 6(9), 1945.
13. Nixon, R. D. and Davis, R. F., J. Am. Ceram. Soc.,1992, 75(7), 1786.
14. Backhaus-Ricoult, M., Mozdzierz, N. and Eveno, P.,J. Physique III Fr., 1993, 3, 2189.
15. Francis, T. L. and Coble, R. L., J. Am. Ceram. Soc.,1968, 51(2), 115.
16. Gervais, H., Pellisier, B. and Castaing, J., Rev. Int.Hautes Temp. Refract., 1978, 15, 43.
17. Phase Diagrams for Ceramists. American CeramicSociety, 1969, p. 165.
18. Hong, J. D. and Davis, R. F., J. Am. Ceram. Soc.,1980, 63(9), 546.
19. Hong, M. H. and Davis, R. F., J. Mater. Sci., 1979,14, 2411.
20. Hong, J. D., Davis, R. F. and Newbury, D. E., J.Mater. Sci., 1981, 16(12), 2485.
21. Hong, J. D., Davis, R. F. and Newbury, D. E., J.Mater. Sci., 1980, 15(12), 2073.
22. Herring, C., J. appl. Phys., 1950, 21, 437.
23. Cannon, W. R. and Langdon, T. G., J. Mater. Sci.,1988, 23, 1.
24. Ashby, M. F. and Verrall, R. A., Acta metall., 1973,21(2), 149.
25. Krishnamachari, V. and Notis, M. R., Mater. Sci.Engng, 1977, 27, 83.
26. Langdon, T. G., Mater. Sci. Engng, 1991, A137, 1.
27. Adda, Y., Dupouy, J. M., Philibert, J. and Quere, Y.,Elements de Metallurgie Physique: deÂformation plas-tique. La Documentation Franc° aise, 1979, p. 1334.
28. Weertman, J., J. appl. Phys., 1955, 26(10), 1213.
29. Hayden, H. W., Floreen, S. and Goodele, P. D.,Metall. Trans., 1972, 3(4), 833.
30. Poirier, J., Creep of Crystals. Cambridge UniversityPress, Cambridge, 1985.
31. Chiang, Y., Birnie, D. and Kingery, W. D., PhysicalCeramics. Wiley, New York, 1997, p. 372.
GALLARDO-LOÂ PEZ et al.: CREEP OF SILICON CARBIDE 2195