hhs public access - cdc stacks
TRANSCRIPT
Cancer Incidence Rates and Trends Among Children and Adolescents in the United States, 2001–2009
David A. Siegel, MD, MPHa, Jessica King, MPHb, Eric Tai, MD, MSc, Natasha Buchanan, PhD, MAd, Umed A. Ajani, MBBS, MPHe, and Jun Li, MD, PhDd
aAflac Cancer and Blood Disorders Center of Children’s Healthcare of Atlanta, Emory University School of Medicine, Atlanta, Georgia
bCancer Surveillance Branch
cComprehensive Cancer Control Branch
dEpidemiology and Applied Research Branch, Division of Cancer Prevention and Control, National Center for Chronic Disease Prevention and Health Promotion
eOffices of Surveillance, Epidemiology, and Laboratory Services (OSELS), Centers for Disease Control and Prevention, Atlanta, Georgia
Abstract
OBJECTIVES—Cancer continues to be the leading disease-related cause of death among
children and adolescents in the United States. More current information is needed to describe
recent cancer trends and identify demographic and geographic variations.
METHODS—We analyzed data from the National Program of Cancer Registries and
Surveillance, Epidemiology, and End Results statewide registries representing 94.2% of the US
population to identify cancers diagnosed among persons aged 0 to 19 years during 2001–2009.
Age-adjusted rates and annual percentage change for trends were calculated. Data were stratified
by age, gender, race, ethnicity, and geography.
RESULTS—We identified 120 137 childhood and adolescent cancer cases during 2001–2009
with an age-adjusted incidence rate of 171.01 per million. The overall rate of all cancers combined
remained stable over time (annual percent change [APC], 0.3%; 95% confidence interval [CI],
−0.1 to 0.7). There was an increase in the overall cancer trend among African American children
and adolescents (APC, 1.3%; 95% CI, 0.2 to 2.5). An increasing trend for thyroid cancer was
Address correspondence to Jun Li, MD, PhD, Epidemiologist, Division of Cancer Prevention and Control, Centers for Disease Control and Prevention, 4770 Buford Hwy, MS K55, Atlanta, GA 30341. [email protected].
Dr Siegel contributed to study design, carried out the initial analyses, drafted the initial manuscript, and edited the final manuscript as submitted; Ms King conceptualized changes made in revision, contributed to study design, carried out data analysis, and critically reviewed the manuscript; Dr Li brought in the research idea, conceptualized and designed the study, oversaw this study, carried out initial data analysis, and critically reviewed the manuscript; Drs Tai, Buchanan, and Ajani conceptualized and designed the study and critically reviewed the manuscript; and all authors approved the final manuscript as submitted.
The findings and conclusions in this report are those of the authors and do not necessarily represent the official position of the Centers for Disease Control and Prevention.
FINANCIAL DISCLOSURE: The authors have indicated they have no financial relationships relevant to this article to disclose.
POTENTIAL CONFLICT OF INTEREST: The authors have indicated they have no potential conflicts of interest to disclose.
HHS Public AccessAuthor manuscriptPediatrics. Author manuscript; available in PMC 2015 October 01.
Published in final edited form as:Pediatrics. 2014 October ; 134(4): e945–e955. doi:10.1542/peds.2013-3926.
Author M
anuscriptA
uthor Manuscript
Author M
anuscriptA
uthor Manuscript
observed among both genders (APC, 4.9%; 95% CI, 3.2 to 6.6) and specifically among
adolescents and those in the Northeast, South, and West regions of the United States. Renal
carcinoma incidence was increasing significantly overall (APC, 5.4%; 95% CI, 2.8 to 8.1).
Extracranial and extragonadal germ cell tumors and melanoma were both significantly decreasing.
CONCLUSIONS—This study reports the novel finding that renal carcinoma rates are increasing
among children and adolescents. This study confirms that thyroid cancer rates are increasing and
further describes rising cancer rates among African Americans.
Keywords
adolescent; cancer; children; incidence; pediatric
Although cancer continues to be the leading disease-related cause of death among children
and adolescents in the United States, it is difficult to describe its incidence accurately
without national cancer data.1,2 Using 2001–2003 National Program of Cancer Registries
(NPCR) and Surveillance, Epidemiology, and End Results (SEER) data, Li et al3
demonstrated regional differences in the incidence of childhood cancer and that the
incidence varied by age, gender, and race. Additional studies have looked at recent
childhood cancer trends by using smaller data sets, or have included the overall childhood
cancer rates without detailing the specific types of cancer.4–8 Although several of these
studies have examined trends in overall cancer incidence rates among children and
adolescents, study findings vary partially because of differing time range and population
coverage.4–6,9,10 By focusing analysis on specific cancers and subgroups among individuals
aged 0 to 19 years, Linabery and Ross4 reported increases in incidence rates of leukemia
(acute lymphoblastic leukemia, in particular), hepatoblastoma, and melanoma from 1992 to
2004 and concluded that ongoing population-based evaluation is needed to further
understand these dynamic and subgroup-based trends.
Although the diagnosis, age, gender, and race characteristics of pediatric cancer are well
reported, the change of these characteristics over time is less defined. Determining recent
cancer-specific trends is important in identifying high-risk populations and in developing
research hypotheses. However, information about pediatric cancers and cancer subtypes by
demographic and temporal factors across the nation is lacking.3 This study aimed to describe
cancer rates and trends among children and adolescents by demographic characteristics by
using data for more than 90% of the US population.
METHODS
Data Source
We analyzed data from 47 population-based state cancer registries affiliated with the
Centers for Disease Control and Prevention’s NPCR and the National Cancer Institute’s
SEER Program. These data met US Cancer Statistics publication criteria for 2001–2009.
Case ascertainment is 90% or more complete, with a margin of error of +/−5% per the
quality standards for these registries (www.cdc.gov/cancer/npcr/uscs/technical_notes/
criteria.htm). Data from Mississippi, Tennessee, Virginia, and Washington, DC, were
excluded from our study. The 47 registries included in the study covered 94.2% of the US
Siegel et al. Page 2
Pediatrics. Author manuscript; available in PMC 2015 October 01.
Author M
anuscriptA
uthor Manuscript
Author M
anuscriptA
uthor Manuscript
population. All cases in this study were collected by NPCR and SEER programs by using
medical records as the source of information for tumor and demographic characteristics.11,12
Case Definition
Cases were restricted to children (aged 0–14 years) and adolescents (aged 15–19 years) who
were diagnosed with a primary neoplasm in the United States during 2001–2009. Diagnoses
were grouped by histology and primary site according to the International Classification of
Childhood Cancer (ICCC), third edition. The ICCC-3 applied the rules, nomenclature, and
topographic, morphologic, and behavioral codes of the International Classification of
Diseases for Oncology, Third Edition.13 Race was categorized as white, African American,
American Indian/Alaskan Native, or Asian/Pacific Islander. We first analyzed ethnicity
grouped by Hispanic or non-Hispanic, which was not mutually exclusive from race. We then
analyzed the data by race and ethnicity by using the following groupings: non-Hispanic
white, non-Hispanic black, and Hispanic. Results were not displayed for American Indian/
Alaska Natives or Asian/Pacific Islanders because of small sample sizes.
Analyses
New cases in the ICCC-3 groups were presented by age, gender, race, ethnicity, and
geography. We calculated rates with SEER*Stat Software, version 8.1.2 by using annual
population estimates as our denominator (www.seer.cancer.gov/seerstat).14 All rates were
expressed per million persons and were age-adjusted to the 2000 US standard population.
Incidence trends were quantified by using annual percent change (APC). The APC and
corresponding 95% confidence intervals (CIs) were calculated with SEER*Stat. The APC
was calculated by fitting a straight line to the data, in which the dependent variable was the
natural logarithm of the data, and calendar year was the independent variable. Statistical
significance was determined if the 95% CI of APC did not include zero (P < .05). We
compared childhood and adolescent cancer incidence rates and trends according to ICCC-3
group, subgroup, gender, age, race, ethnicity, and US Census region. Rates were not
displayed if there were <16 cases total from 2001 to 2009. APC for the study interval was
not calculated if there were <16 cases per year in any 1 calendar year, which is consistent
with previous studies using SEER*Stat.5,6
RESULTS
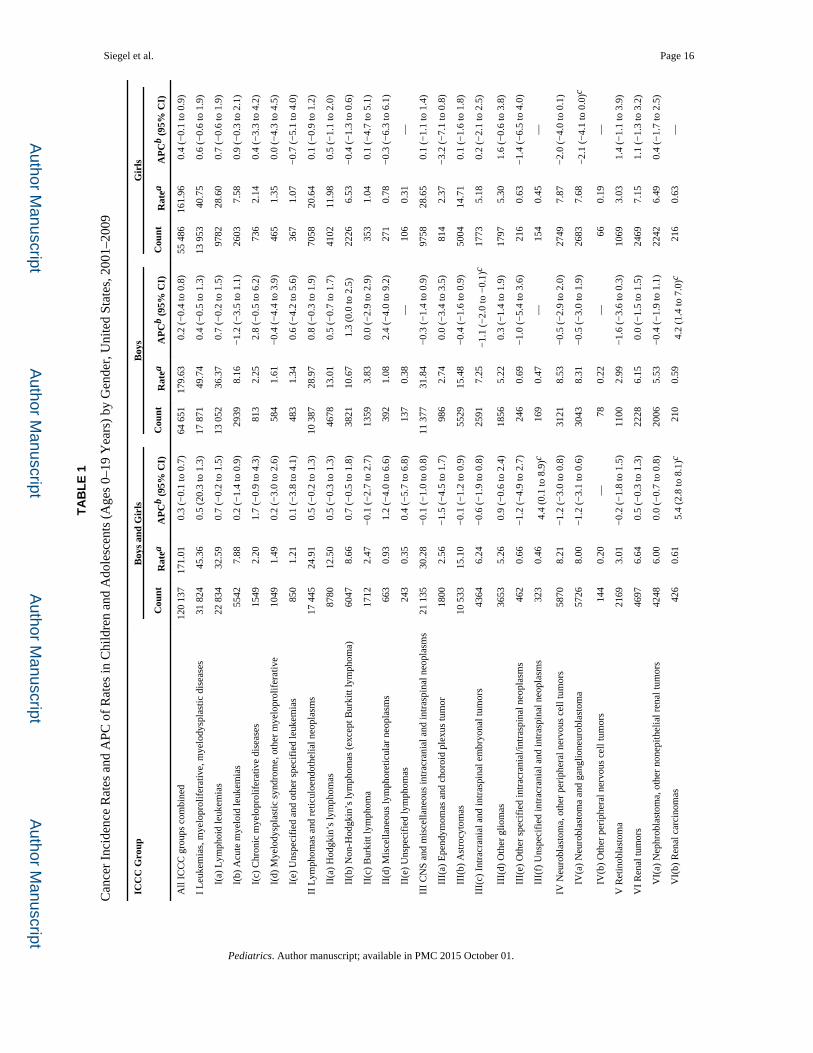
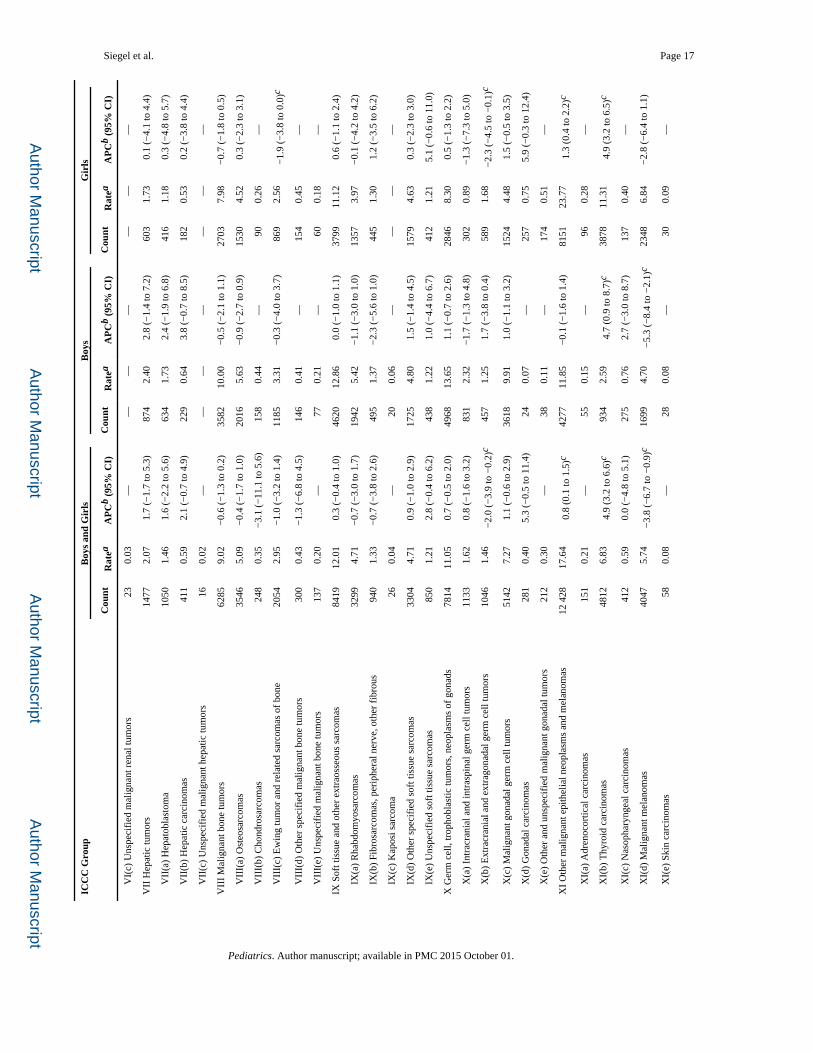
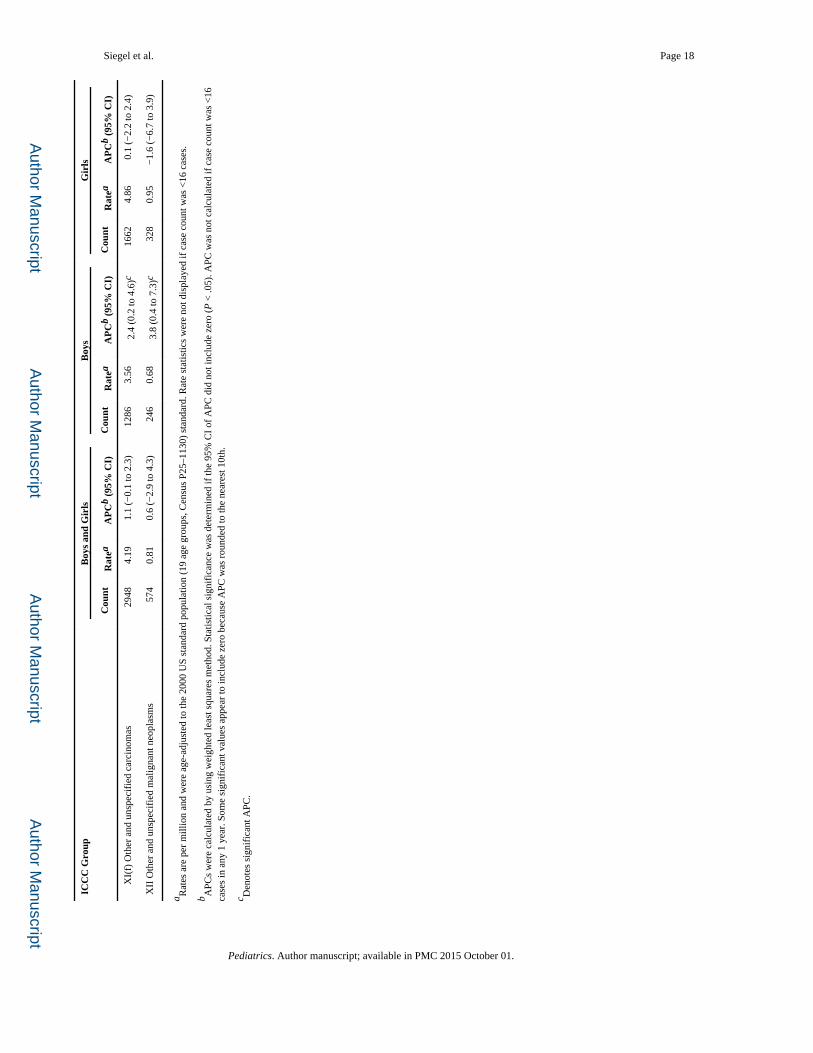
During 2001–2009, there were 120 137 childhood and adolescent cancer cases diagnosed in
the United States. Overall incidence rates and APC according to ICCC-3 group, subgroup,
and gender are presented in Table 1. The overall age-adjusted cancer incidence rate was
171.01 per million persons, and boys had a higher childhood cancer rate than girls.
Adolescents aged 15 to 19 years had a higher rate than children aged 0 to 14 years, white
children had a higher rate than African American children, and the Northeast had the highest
incidence rate among US regions (data not shown). Rates for leukemias were the highest,
followed by rates for central nervous system (CNS) neoplasms, and then rates for
lymphomas (45.36, 30.28, and 24.91 per 1 000 000 persons aged 0–19 years, respectively).
Overall and age-specific cancer rates are presented in Fig 1. The overall cancer incidence
rates were stable (APC, 0.3%; 95% CI, −0.1 to 0.7) from 2001 to 2009. Of all cancers and
Siegel et al. Page 3
Pediatrics. Author manuscript; available in PMC 2015 October 01.
Author M
anuscriptA
uthor Manuscript
Author M
anuscriptA
uthor Manuscript
among all children and adolescents, thyroid carcinoma rates (APC, 4.9%; 95% CI, 3.2 to
6.6) and renal carcinoma rates (APC, 5.4%; 95% CI, 2.8 to 8.1) increased significantly, as
did the group of unspecified intracranial and intraspinal neoplasms among the CNS tumors
(APC, 4.4%; 95% CI, 0.1 to 8.9). Extracranial and extragonadal germ cell tumors (APC,
−2.0%; 95% CI, −3.9 to −0.2) and malignant melanomas (APC, −3.8%; 95% CI, −6.7 to
−0.9) were decreasing overall. Selected overall significant trends are presented in Fig 2.
Rates of renal carcinomas, thyroid carcinomas, other unspecified epithelial carcinomas, and
other unspecified malignant neoplasms increased significantly for boys, and the trend for
thyroid carcinomas increased significantly for girls (Table 1). Rates of intracranial and
intraspinal embryonal tumors and malignant melanomas decreased significantly among
boys. Among girls, the rates of neuroblastoma, Ewing tumor and related sarcomas, and
extracranial and extragonadal germ cell tumors were all significantly decreasing.
Age-specific trend analyses (data not shown) revealed that rates for cancers in the malignant
gonadal germ cell tumors group increased among children aged 0 to 14 years (APC, 1.9%;
95% CI, 0.2 to 3.6). Among adolescents aged 15 to 19 years, the rates for renal tumors
(APC, 6.2%; 95% CI, 1.3 to 11.4), thyroid carcinomas (APC, 5.7%; 95% CI, 3.7 to 7.7), and
unspecified epithelial carcinomas (APC, 1.2%; 95% CI, 0.3 to 2.1) increased, whereas the
rates for intracranial and intraspinal embryonal tumors (APC, −5.9%; 95% CI, −9.5 to −2.2)
and malignant melanoma (APC, −5.1%; 95% CI, −8.1 to −2.0) decreased.
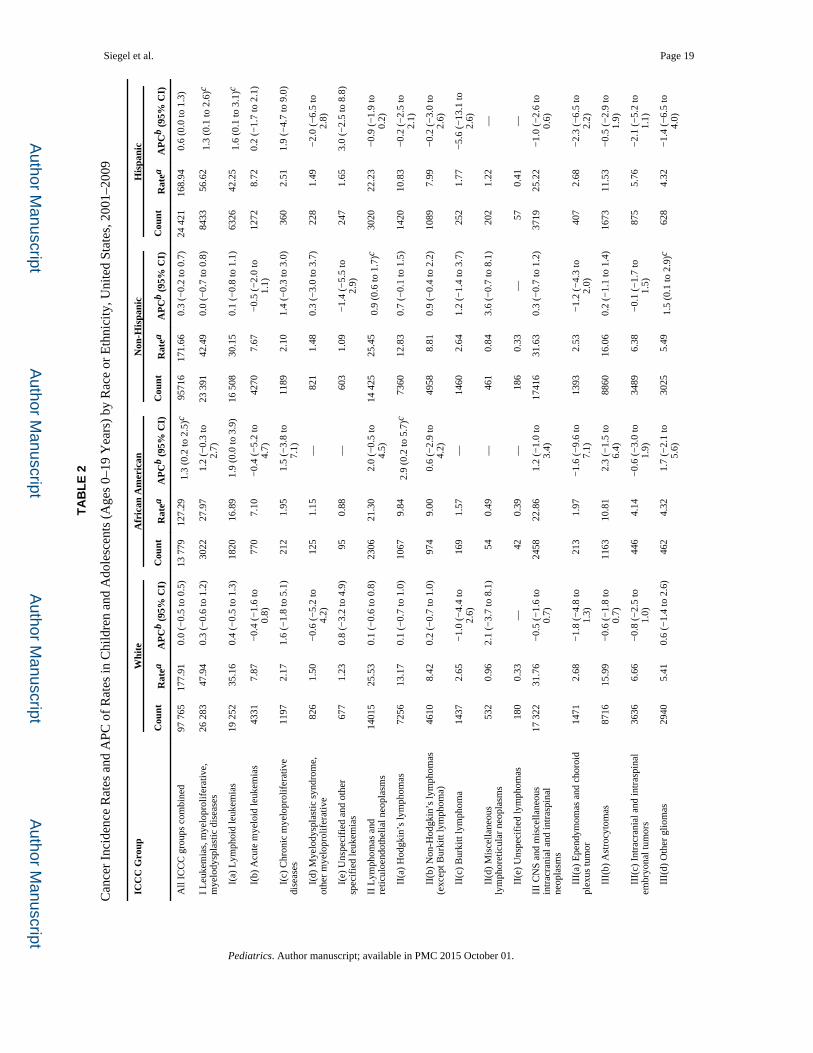
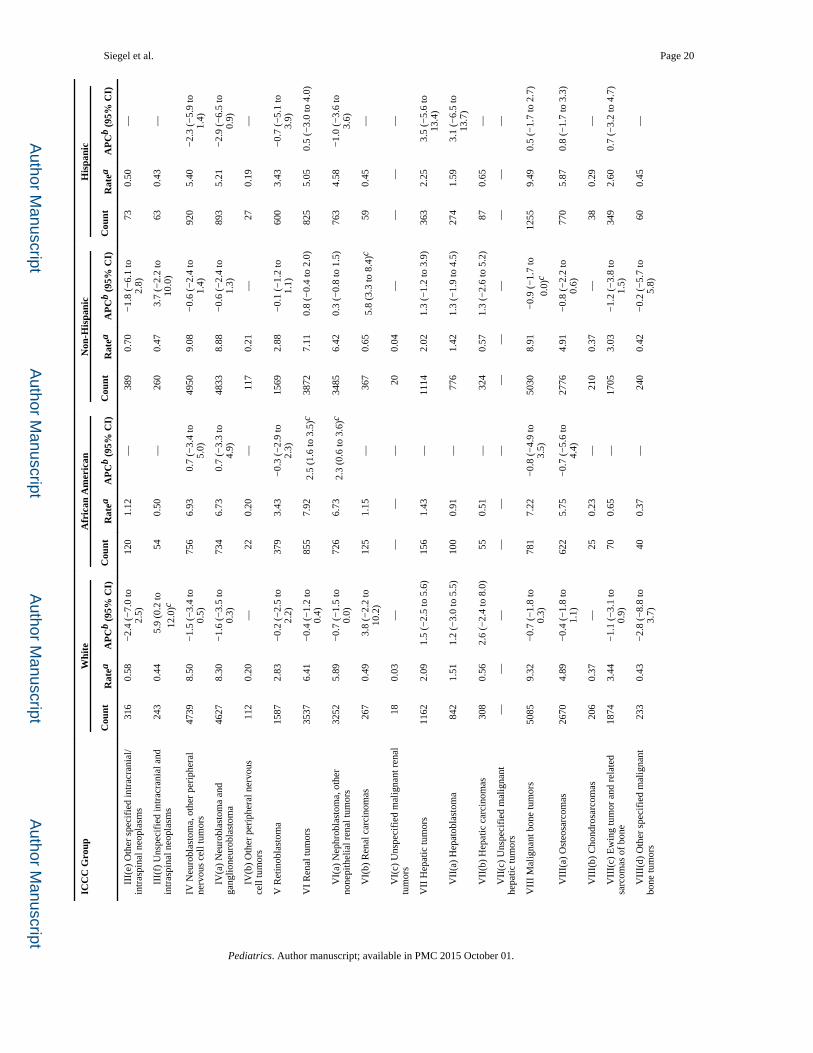
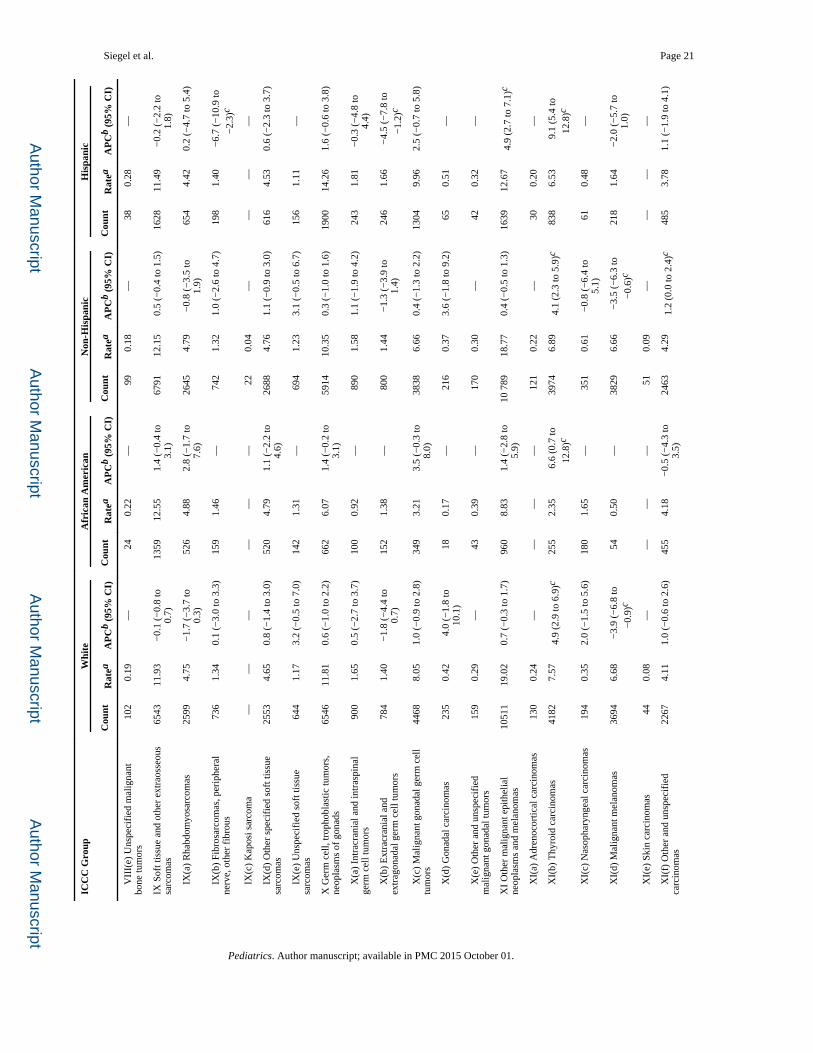
Trends by race and ethnicity are displayed in Table 2 and reveal a significant increase in the
overall cancer rates for African American children and adolescents (APC, 1.3%; 95% CI,
0.2 to 2.5). The significant increases in African Americans held for children of the 0- to 14-
year age group (APC, 1.3%; 95% CI, 0.1 to 2.5) but not the 15- to 19-year age group (APC,
1.4%; 95% CI, −0.1 to 2.9). Among African American children and adolescents, we found a
significant increase in the rates for Hodgkin’s lymphoma, renal tumors (specifically the
nephroblastoma and other nonepithelial renal tumors group), and thyroid carcinomas.
Among white children and adolescents, there was a significant increase in unspecified
intracranial and intraspinal neoplasms and in thyroid carcinoma and a significant decrease in
malignant melanoma. Among non-Hispanic children and adolescents, we found significantly
increasing trends of lymphomas and reticuloendothelial neoplasms, other gliomas, renal
carcinomas, and unspecified epithelial carcinomas and decreasing trends of bone tumors and
malignant melanomas. In the Hispanic group, there were significantly increasing trends of
leukemias and decreasing trends in the fibrosarcomas and the extracranial and extragonadal
germ cell tumors groups. Regardless of ethnicity, rates of thyroid carcinoma significantly
increased. For rates by race and ethnicity (non-Hispanic white children and non-Hispanic
black children compared with the above analysis), findings were similar overall
(Supplemental Table 3).
Figure 3 reveals all significant cancer trends stratified by US Census region. Thyroid
carcinomas were increasing in all regions except the Midwest region, with APCs ranging
from 4.3% to 6.6%. There were decreased rates of acute myeloid leukemia, Ewing tumor,
and malignant melanoma in the Northeast. In the Midwest, there was an increase in rates for
lymphomas and reticuloendothelial neoplasms, other gliomas, and intracranial and
Siegel et al. Page 4
Pediatrics. Author manuscript; available in PMC 2015 October 01.
Author M
anuscriptA
uthor Manuscript
Author M
anuscriptA
uthor Manuscript
intraspinal germ cell tumors. In the South, there was an increase in the rates for chronic
myeloproliferative diseases, unspecified soft tissue sarcomas, and other malignant epithelial
neoplasms and melanomas. In the West, there was a rate decrease in intracranial and
intraspinal germ cell tumors and also in malignant melanomas. Regional trends subdivided
by race are displayed in Supplemental Table 4, and is significant for increasing rates for
overall cancers in African Americans in the South and increasing rates overall in Hispanics
in the West.
DISCUSSION
Specific Findings
Our study revealed that overall incidence rates of pediatric cancer have increased among
African American children and adolescents, which has been previously documented.4,15
Previous reports have commented on decreased pediatric cancer survival among minorities,
including African American children and adolescents, and suggested this could be caused by
differences in drug metabolism, delayed detection, tumor characteristics, or barriers
associated with socioeconomic status.16–18 Given that no increases in race-combined cancer
incidence rates were observed for the entire pediatric population, further investigation is
needed to better understand the underlying causes for this increase and better guide the
development of preventive measures among African Americans.
Increased rates of thyroid cancers were found among the overall pediatric population in most
geographic regions, in both genders, in adolescents aged 15 to 19 years, and among white,
African American, Hispanic, and non-Hispanic populations. Holmes et al7 previously
reported increased pediatric thyroid cancer incidence rates during 1973–2007 among girls
and adolescents aged 15 to 19 years, but that report only included 11% population coverage.
Previous studies also have revealed increased rates of thyroid cancers among adults of both
genders.19–21 It is unclear if this increase in pediatric thyroid cancer is caused by the same
forces that are driving the increase in adult thyroid cancer. There is evidence that exposure
to radiation by computed tomography scans or dental radiographs may be associated with
thyroid cancer, although many studies looking at radiographs and cancer were unable to find
a significant association.22–26 Previous studies have suggested obesity as a possible cause
for the increase in adult thyroid cancers.27,28 As both thyroid cancer rates and obesity
prevalence increase among the pediatric population, further research is needed to investigate
an association between these 2 variables.29 Other potential causes of an increase in thyroid
cancer rates include environmental exposures, such as exposures to perchlorate or
polybrominated diphenyl ethers.30,31 Reproductive or hormonal factors have been
inconsistently associated with thyroid cancer in the literature, but this potential cause may
explain why girls are more affected than boys.7,19,32 Alternatively, some studies suggest that
increasing incidence could reflect enhanced detection through improved diagnostic tests,
although other studies disagree.21,33
Our study is consistent with previous reports that girls, people in their 20s, and African
Americans have higher incidence rates of renal carcinoma.34,35 There are few studies about
the epidemiology of pediatric renal carcinomas because of their rarity, making our finding of
increased renal carcinoma rates among boys and those aged 15 to 19 years a novel
Siegel et al. Page 5
Pediatrics. Author manuscript; available in PMC 2015 October 01.
Author M
anuscriptA
uthor Manuscript
Author M
anuscriptA
uthor Manuscript
finding.6,34,36 Renal cancers are known to be increasing among both male and female
adults.6,37 Recent research has suggested that the increase of renal cancers among adults
may be related to obesity and a lack of sufficient physical activity.6,38 Increased rates of
obesity among adolescents might explain increases in renal carcinomas observed overall and
among those aged 15 to 19 years. Our study revealed that the incidence of nephroblastoma
(Wilms tumor) remained stable in the 0- to 14-year age range (APC, −0.1%; 95% CI, −1.1 to
0.8) from 2001 to 2009. However, this finding does not necessarily contradict the
observation that Wilms tumor may have decreased after the fortification of grains with folic
acid in the United States from 1996 to 1998.39
A significant decrease in melanoma was seen overall, in boys, white patients, non-Hispanic
patients, persons aged 15 to 19, and in both the Northeast and the West. Although previous
studies using SEER have documented an increasing incidence of melanoma, these studies
examined a much longer period (19–36 years) and did not include NPCR data.40–42 It is
possible that pediatric melanoma is decreasing after an increase seen at the end of the last
century. However, melanoma is often an outpatient disease that adds registry data late into
SEER and NPCR. It is important to monitor this trend to distinguish significant decrease
from an artifact of late reporting.
The extracranial and extragonadal germ cell tumor group was decreasing overall and in girls
and Hispanics. This group contains sacrococcygeal teratomas and germ cell tumors located
in the mediastinum, retroperitoneal area, and uterus. Sacrococcygeal teratomas are the most
common of this group, are often diagnosed prenatally, and are more common in girls.43
Unspecified intracranial and intraspinal neoplasms were increasing overall, which is a small
group of unspecified CNS neoplasms that is difficult to attribute to any 1 type of CNS
tumor. Rates of pediatric acute lymphoblastic leukemia, acute myeloid leukemia, non-
Hodgkin’s lymphoma, and testicular germ cell tumors have been previously reported as
increasing from 1975 to 2010, but our study did not reveal an overall increase in these
cancers looking at the last decade of this time period.10
Overall Findings
This study summarizes childhood and adolescent cancer incidence and trends by using
nationwide NPCR and SEER data. Overall and subgroup cancer incidence rates were similar
to previous studies of pediatric cancer incidence using SEER and NPCR (leukemia was the
highest, followed by CNS neoplasms).3,4,10,44 Incidence variance by age, gender, and race
were similar to previous reports.3,4,10
Our findings indicate that overall cancer rates among children and adolescents are stable.
Several studies have revealed significant increases in cancer rates among children and
adolescents during the past 2 decades,5,15,44 but other studies have revealed an increase4,45
or decrease, neither of which were significant.46 These different findings may be due to
different study years and population coverage. Consistent with the 2013 Annual Report to
the Nation on the Status of Cancer (years 2000–2009), our study revealed that overcall
cancer incidence rates for children and adolescents were stable from 2001 to 2009.8
Siegel et al. Page 6
Pediatrics. Author manuscript; available in PMC 2015 October 01.
Author M
anuscriptA
uthor Manuscript
Author M
anuscriptA
uthor Manuscript
Strengths and Limitations
The NPCR and SEER databases have quality standards that help to minimize
misclassification of gender, age, and race.3,11 Because the International Classification of
Diseases for Oncology, Third Edition, coding standard was introduced in 2001, limiting our
analysis to 2001–2009 further minimized misclassification artifacts that were potentially
caused by the coding standard change.3 Additionally, restricting our analysis to use no data
beyond 2009 allowed us to avoid a change in demographic denominators that would be
included with 2010 data using the 2010 census.15 Using the SEER and NPCR databases
allowed us to analyze cancer incidence and trends by US Census region.3
Despite using high-quality data, the NPCR and SEER database may have some variation in
the coding of individual races and ethnicities, especially when considering the Hispanic and
American Indians/Alaska Natives designations.3,47,48 Changes in diagnostic accuracy or
coding changes during this period, such as a change in the coding of astrocytomas, may have
had a small effect on the trend result.4,9,49 Late-diagnosed cancers, such as melanomas,
might be underrepresented in the later years contained in this study and may explain
differences in findings from other studies that evaluated trends over a longer period of time
or that used a delay-adjustment model to estimate late-reported cases.5,8,40 Because our
study did not use delay-adjusted data, the finding of significantly decreasing rates of
melanoma must be interpreted critically.
Given the rarity of pediatric cancer, there is a greater possibility of a type I error when
analyzing subgroup analyses with small numbers. Some significant findings in the present
study demonstrate significance that is very close to the cutoff margin, such as the finding of
increasing leukemia among the Hispanic group or increasing Hodgkin’s lymphoma among
the African American population. Although these trends may be true, these findings must be
further validated to distinguish rate changes secondary to coding or diagnostic artifact versus
a change that could be caused from behavioral, environmental, genetic, or population-based
factors. The cause of changing incidence rates is often unknown. Findings such as the
increase of thyroid carcinoma that hold true across several age, geographic, and racial
subgroups may need to be the subject of future investigations that would help us better
understand the forces driving this change.
CONCLUSIONS
This study illustrates recent childhood and adolescent cancer incidence rates and trends in
the United States and demonstrates, previously unreported, that renal carcinoma rates are
increasing. In addition, this study supplements previous research of increasing overall cancer
incidence rates in African Americans and provides data with more comprehensive
population coverage demonstrating increasing rates of thyroid carcinoma among children
and adolescents. These findings highlight an opportunity to improve our knowledge of the
driving factors of these cancer incidence rate trends, and this understanding may help
develop new preventive measures.
Siegel et al. Page 7
Pediatrics. Author manuscript; available in PMC 2015 October 01.
Author M
anuscriptA
uthor Manuscript
Author M
anuscriptA
uthor Manuscript
Supplementary Material
Refer to Web version on PubMed Central for supplementary material.
Acknowledgments
FUNDING: No external funding.
ABBREVIATIONS
APC annual percent change
CI confidence interval
CNS central nervous system
ICCC International Classification of Childhood Cancer
NPCR National Program of Cancer Registries
SEER Surveillance, Epidemiology, and End Results
References
1. Heron M, Sutton PD, Xu J, Ventura SJ, Strobino DM, Guyer B. Annual summary of vital statistics: 2007. Pediatrics. 2010; 125(1):4–15. [PubMed: 20026491]
2. National Vital Statistics System, Centers of Disease Control and Prevention. 10 leading causes of death by age group, United States – 2008. Available at: www.cdc.gov/injury/wisqars/leadingcauses.html. Accessed February 9, 2012
3. Li J, Thompson TD, Miller JW, Pollack LA, Stewart SL. Cancer incidence among children and adolescents in the United States, 2001–2003. Pediatrics. 2008; 121(6) Available at: www.pediatrics.org/cgi/content/full/121/6/e1470.
4. Linabery AM, Ross JA. Trends in childhood cancer incidence in the U.S. (1992–2004). Cancer. 2008; 112(2):416–432. [PubMed: 18074355]
5. Kohler BA, Ward E, McCarthy BJ, et al. Annual report to the nation on the status of cancer, 1975–2007, featuring tumors of the brain and other nervous system. J Natl Cancer Inst. 2011; 103(9):714–736. [PubMed: 21454908]
6. Eheman C, Henley SJ, Ballard-Barbash R, et al. Annual Report to the Nation on the status of cancer, 1975–2008, featuring cancers associated with excess weight and lack of sufficient physical activity. Cancer. 2012; 118(9):2338–2366. [PubMed: 22460733]
7. Holmes L Jr, Hossain J, Opara F. Pediatric thyroid carcinoma incidence and temporal trends in the USA (1973–2007): race or shifting diagnostic paradigm? ISRN Oncol. 2012; 2012:906197. [PubMed: 22530151]
8. Jemal A, Simard EP, Dorell C, et al. Annual Report to the Nation on the Status of Cancer, 1975–2009, featuring the burden and trends in human papillomavirus (HPV)-associated cancers and HPV vaccination coverage levels. J Natl Cancer Inst. 2013; 105(3):175–201. [PubMed: 23297039]
9. Spector LG, Linabery AM. Childhood cancer incidence: is it really going up? Pediatr Blood Cancer. 2009; 53(1):1–2. [PubMed: 19326404]
10. Ward E, DeSantis C, Robbins A, Kohler B, Jemal A. Childhood and adolescent cancer statistics, 2014. CA Cancer J Clin. 2014; 64(2):83–103. [PubMed: 24488779]
11. Merrill RM, Dearden KA. How representative are the surveillance, epidemiology, and end results (SEER) program cancer data of the United States? Cancer Causes Control. 2004; 15(10):1027–1034. [PubMed: 15801487]
12. Wingo PA, Jamison PM, Hiatt RA, et al. Building the infrastructure for nationwide cancer surveillance and control—a comparison between the National Program of Cancer Registries
Siegel et al. Page 8
Pediatrics. Author manuscript; available in PMC 2015 October 01.
Author M
anuscriptA
uthor Manuscript
Author M
anuscriptA
uthor Manuscript
(NPCR) and the Surveillance, Epidemiology, and End Results (SEER) Program (United States). Cancer Causes Control. 2003; 14(2):175–193. [PubMed: 12749723]
13. Steliarova-Foucher E, Stiller C, Lacour B, Kaatsch P. International Classification of Childhood Cancer, Third Edition. Cancer. 2005; 103(7):1457–1467. [PubMed: 15712273]
14. Surveillance, Epidemiology, and End Results (SEER) Program. National Cancer Institute SEER*Stat Software, version 8.1.2. Bethesda, MD: National Cancer Institute; 2013. Available at: www.seer.cancer.gov/seerstat. Accessed February 3, 2014
15. Edwards BK, Noone AM, Mariotto AB, et al. Annual Report to the Nation on the status of cancer, 1975–2010, featuring prevalence of comorbidity and impact on survival among persons with lung, colorectal, breast, or prostate cancer. Cancer. 2014; 120(9):1290–1314. [PubMed: 24343171]
16. Pui CH, Pei D, Pappo AS, et al. Treatment outcomes in black and white children with cancer: results from the SEER database and St Jude Children’s Research Hospital, 1992 through 2007. J Clin Oncol. 2012; 30(16):2005–2012. [PubMed: 22547602]
17. Kadan-Lottick NS, Ness KK, Bhatia S, Gurney JG. Survival variability by race and ethnicity in childhood acute lymphoblastic leukemia. JAMA. 2003; 290(15):2008–2014. [PubMed: 14559954]
18. Linabery AM, Ross JA. Childhood and adolescent cancer survival in the US by race and ethnicity for the diagnostic period 1975–1999. Cancer. 2008; 113(9):2575–2596. [PubMed: 18837040]
19. Holman DM, Soman A, Watson M, Weir H, Trivers KF, White MC. Examination of the increase in thyroid cancer incidence among younger women in the United States by age, race, geography, and tumor size, 1999–2007. J Adolesc Young Adult Oncol. 2011; 1(2):95–102.
20. Siegel R, Ma J, Zou Z, Jemal A. Cancer statistics, 2014. CA Cancer J Clin. 2014; 64(1):9–29. [PubMed: 24399786]
21. Vergamini LB, Frazier AL, Abrantes FL, Ribeiro KB, Rodriguez-Galindo C. Increase in the incidence of differentiated thyroid carcinoma in children, adolescents, and young adults: a population-based study. J Pediatr. 2014; 164(6):1481–1485. [PubMed: 24630354]
22. Hammer GP, Seidenbusch MC, Regulla DF, et al. Childhood cancer risk from conventional radiographic examinations for selected referral criteria: results from a large cohort study. AJR Am J Roentgenol. 2011; 197(1):217–223. [PubMed: 21701033]
23. Hammer GP, Seidenbusch MC, Schneider K, et al. A cohort study of childhood cancer incidence after postnatal diagnostic x-ray exposure. Radiat Res. 2009; 171(4):504–512. [PubMed: 19397451]
24. Brenner D, Elliston C, Hall E, Berdon W. Estimated risks of radiation-induced fatal cancer from pediatric CT. AJR Am J Roentgenol. 2001; 176(2):289–296. [PubMed: 11159059]
25. Schonfeld SJ, Lee C, Berrington de González A. Medical exposure to radiation and thyroid cancer. Clin Oncol (R Coll Radiol). 2011; 23(4):244–250. [PubMed: 21296564]
26. Memon A, Godward S, Williams D, Siddique I, Al-Saleh K. Dental x-rays and the risk of thyroid cancer: a case-control study. Acta Oncol. 2010; 49(4):447–453. [PubMed: 20397774]
27. Meinhold CL, Ron E, Schonfeld SJ, et al. Nonradiation risk factors for thyroid cancer in the US Radiologic Technologists Study. Am J Epidemiol. 2010; 171(2):242–252. [PubMed: 19951937]
28. Almquist M, Johansen D, Björge T, et al. Metabolic factors and risk of thyroid cancer in the Metabolic syndrome and Cancer project (Me-Can). Cancer Causes Control. 2011; 22(5):743–751. [PubMed: 21380729]
29. Sokol RJ. The chronic disease of childhood obesity: the sleeping giant has awakened. J Pediatr. 2000; 136(6):711–713.
30. De Groef B, Decallonne BR, Van der Geyten S, Darras VM, Bouillon R. Perchlorate versus other environmental sodium/iodide symporter inhibitors: potential thyroid-related health effects. Eur J Endocrinol. 2006; 155(1):17–25. [PubMed: 16793945]
31. Zhang Y, Guo GL, Han X, et al. Do polybrominated diphenyl ethers (PBDEs) increase the risk of thyroid cancer? Biosci Hypotheses. 2008; 1(4):195–199. [PubMed: 19122824]
32. La Vecchia C, Ron E, Franceschi S, et al. A pooled analysis of case-control studies of thyroid cancer. III. Oral contraceptives, menopausal replacement therapy and other female hormones. Cancer Causes Control. 1999; 10(2):157–166. [PubMed: 10231164]
33. Li N, Du XL, Reitzel LR, Xu L, Sturgis EM. Impact of enhanced detection on the increase in thyroid cancer incidence in the United States: review of incidence trends by socioeconomic status
Siegel et al. Page 9
Pediatrics. Author manuscript; available in PMC 2015 October 01.
Author M
anuscriptA
uthor Manuscript
Author M
anuscriptA
uthor Manuscript
within the surveillance, epidemiology, and end results registry, 1980–2008. Thyroid. 2013; 23(1):103–110. [PubMed: 23043274]
34. Silberstein J, Grabowski J, Saltzstein SL, Kane CJ. Renal cell carcinoma in the pediatric population: results from the California Cancer Registry. Pediatr Blood Cancer. 2009; 52(2):237–241. [PubMed: 18937317]
35. Grabowski J, Silberstein J, Saltzstein SL, Saenz N. Renal tumors in the second decade of life: results from the California Cancer Registry. J Pediatr Surg. 2009; 44(6):1148–1151. [PubMed: 19524731]
36. Selle B, Furtwängler R, Graf N, Kaatsch P, Bruder E, Leuschner I. Population-based study of renal cell carcinoma in children in Germany, 1980–2005: more frequently localized tumors and underlying disorders compared with adult counterparts. Cancer. 2006; 107(12):2906–2914. [PubMed: 17109448]
37. Chow WH, Dong LM, Devesa SS. Epidemiology and risk factors for kidney cancer. Nat Rev Urol. 2010; 7(5):245–257. [PubMed: 20448658]
38. World Cancer Research Fund/American Institute for Cancer Research. Food, Nutrition, Physical Activity, and the Prevention of Cancer: A Global Perspective. Washington, DC: American Institute for Cancer Research; 2007.
39. Linabery AM, Johnson KJ, Ross JA. Childhood cancer incidence trends in association with US folic acid fortification (1986–2008). Pediatrics. 2012; 129(6):1125–1133. [PubMed: 22614769]
40. Wong JR, Harris JK, Rodriguez-Galindo C, Johnson KJ. Incidence of childhood and adolescent melanoma in the United States: 1973–2009. Pediatrics. 2013; 131(5):846–854. [PubMed: 23589817]
41. Strouse JJ, Fears TR, Tucker MA, Wayne AS. Pediatric melanoma: risk factor and survival analysis of the surveillance, epidemiology and end results database. J Clin Oncol. 2005; 23(21):4735–4741. [PubMed: 16034049]
42. Austin MT, Xing Y, Hayes-Jordan AA, Lally KP, Cormier JN. Melanoma incidence rises for children and adolescents: an epidemiologic review of pediatric melanoma in the United States. J Pediatr Surg. 2013; 48(11):2207–2213. [PubMed: 24210187]
43. Olson, TA.; Schneider, DT.; Perlman, EJ. Germ cell tumors. In: Pizzo, PA.; Poplack, DG., editors. Principles and Practice of Pediatric Oncology. 6th. Philadelphia, PA: Wolters Kluwer Health/Lippincott Williams & Wilkins; 2010. p. 1045-1067.
44. Howlader, N.; Krapcho, M.; Neyman, N., et al., editors. SEER Cancer Statistics Review, 1975–2008. Bethesda, MD: National Cancer Institute; Available at: http://seer.cancer.gov/csr/1975_2008/. Accessed March 20, 2012
45. Kaatsch P, Steliarova-Foucher E, Crocetti E, Magnani C, Spix C, Zambon P. Time trends of cancer incidence in European children (1978–1997): report from the Automated Childhood Cancer Information System project. Eur J Cancer. 2006; 42(13):1961–1971. [PubMed: 16919764]
46. Bao PP, Zheng Y, Gu K, et al. Trends in childhood cancer incidence and mortality in urban Shanghai, 1973–2005. Pediatr Blood Cancer. 2010; 54(7):1009–1013. [PubMed: 20052777]
47. Clegg LX, Reichman ME, Hankey BF, et al. Quality of race, Hispanic ethnicity, and immigrant status in population-based cancer registry data: implications for health disparity studies. Cancer Causes Control. 2007; 18(2):177–187. [PubMed: 17219013]
48. Gomez SL, Glaser SL. Misclassification of race/ethnicity in a population-based cancer registry (United States). Cancer Causes Control. 2006; 17(6):771–781. [PubMed: 16783605]
49. McKean-Cowdin R, Razavi P, Barrington-Trimis J, et al. Trends in childhood brain tumor incidence, 1973–2009. J Neurooncol. 2013; 115(2):153–160. [PubMed: 23925828]
Siegel et al. Page 10
Pediatrics. Author manuscript; available in PMC 2015 October 01.
Author M
anuscriptA
uthor Manuscript
Author M
anuscriptA
uthor Manuscript
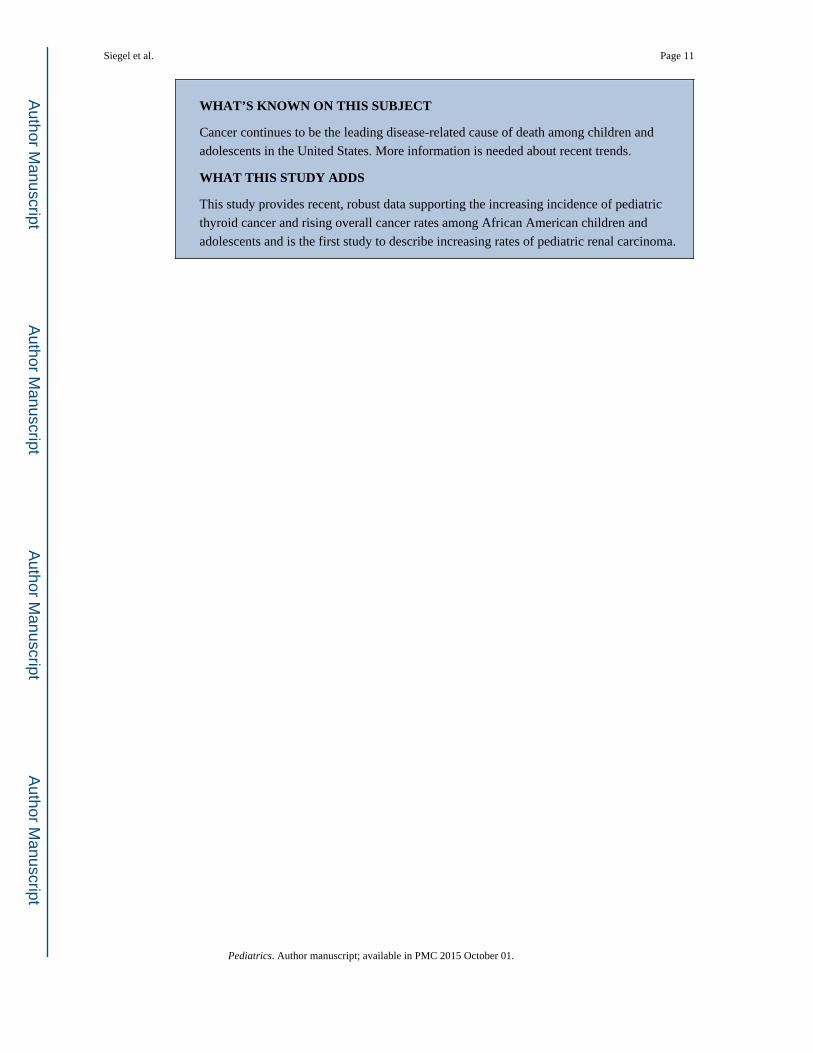
WHAT’S KNOWN ON THIS SUBJECT
Cancer continues to be the leading disease-related cause of death among children and
adolescents in the United States. More information is needed about recent trends.
WHAT THIS STUDY ADDS
This study provides recent, robust data supporting the increasing incidence of pediatric
thyroid cancer and rising overall cancer rates among African American children and
adolescents and is the first study to describe increasing rates of pediatric renal carcinoma.
Siegel et al. Page 11
Pediatrics. Author manuscript; available in PMC 2015 October 01.
Author M
anuscriptA
uthor Manuscript
Author M
anuscriptA
uthor Manuscript
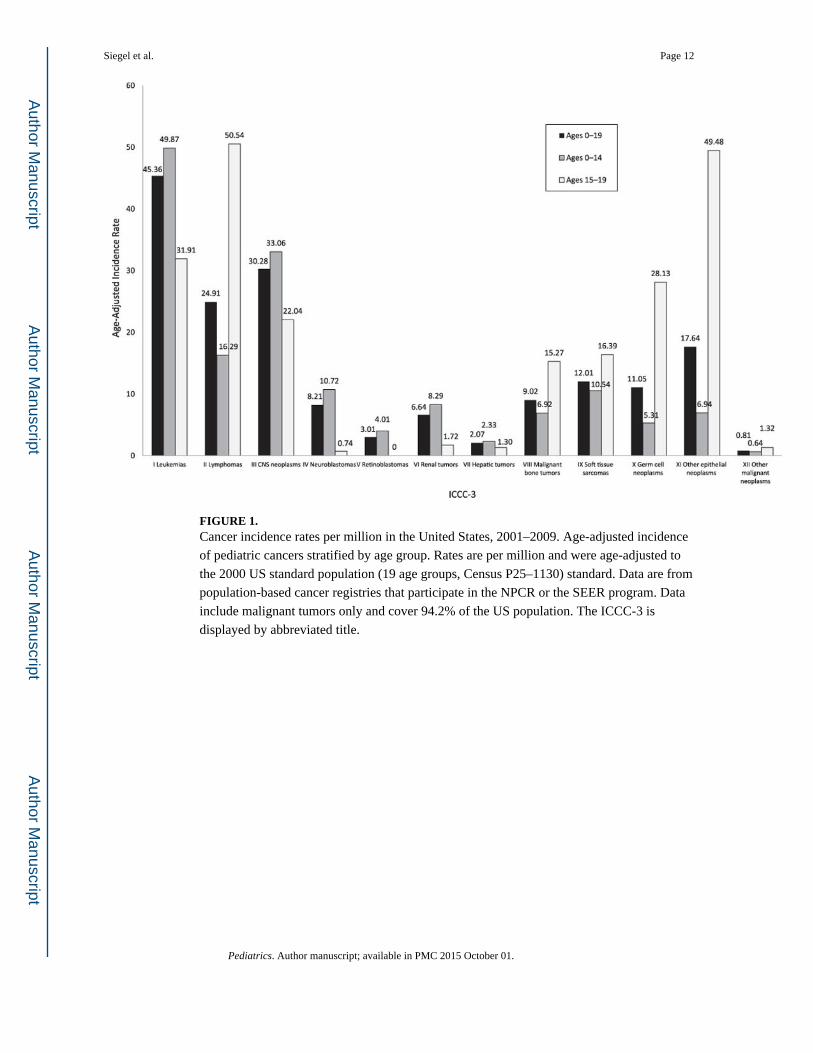
FIGURE 1. Cancer incidence rates per million in the United States, 2001–2009. Age-adjusted incidence
of pediatric cancers stratified by age group. Rates are per million and were age-adjusted to
the 2000 US standard population (19 age groups, Census P25–1130) standard. Data are from
population-based cancer registries that participate in the NPCR or the SEER program. Data
include malignant tumors only and cover 94.2% of the US population. The ICCC-3 is
displayed by abbreviated title.
Siegel et al. Page 12
Pediatrics. Author manuscript; available in PMC 2015 October 01.
Author M
anuscriptA
uthor Manuscript
Author M
anuscriptA
uthor Manuscript
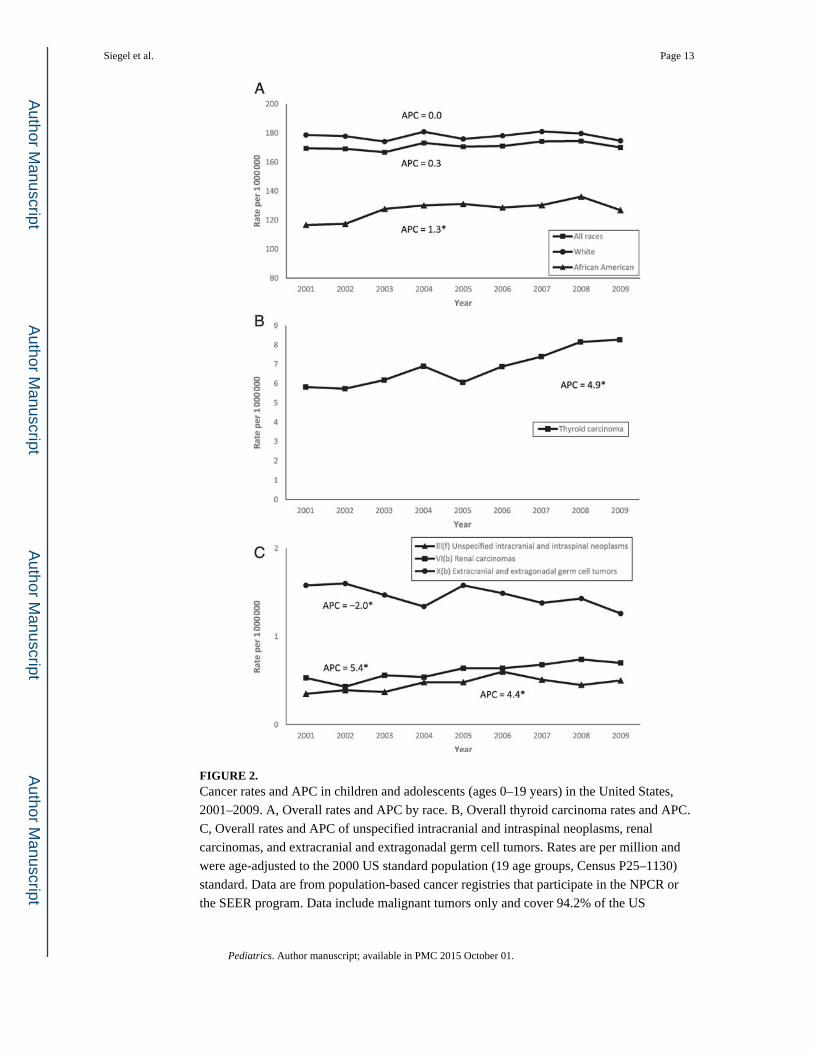
FIGURE 2. Cancer rates and APC in children and adolescents (ages 0–19 years) in the United States,
2001–2009. A, Overall rates and APC by race. B, Overall thyroid carcinoma rates and APC.
C, Overall rates and APC of unspecified intracranial and intraspinal neoplasms, renal
carcinomas, and extracranial and extragonadal germ cell tumors. Rates are per million and
were age-adjusted to the 2000 US standard population (19 age groups, Census P25–1130)
standard. Data are from population-based cancer registries that participate in the NPCR or
the SEER program. Data include malignant tumors only and cover 94.2% of the US
Siegel et al. Page 13
Pediatrics. Author manuscript; available in PMC 2015 October 01.
Author M
anuscriptA
uthor Manuscript
Author M
anuscriptA
uthor Manuscript
population. *Denotes significant APC. APCs were calculated by using weighted least
squares method. Statistical significance was determined if the 95% CI of APC did not
include zero (P < .05).
Siegel et al. Page 14
Pediatrics. Author manuscript; available in PMC 2015 October 01.
Author M
anuscriptA
uthor Manuscript
Author M
anuscriptA
uthor Manuscript
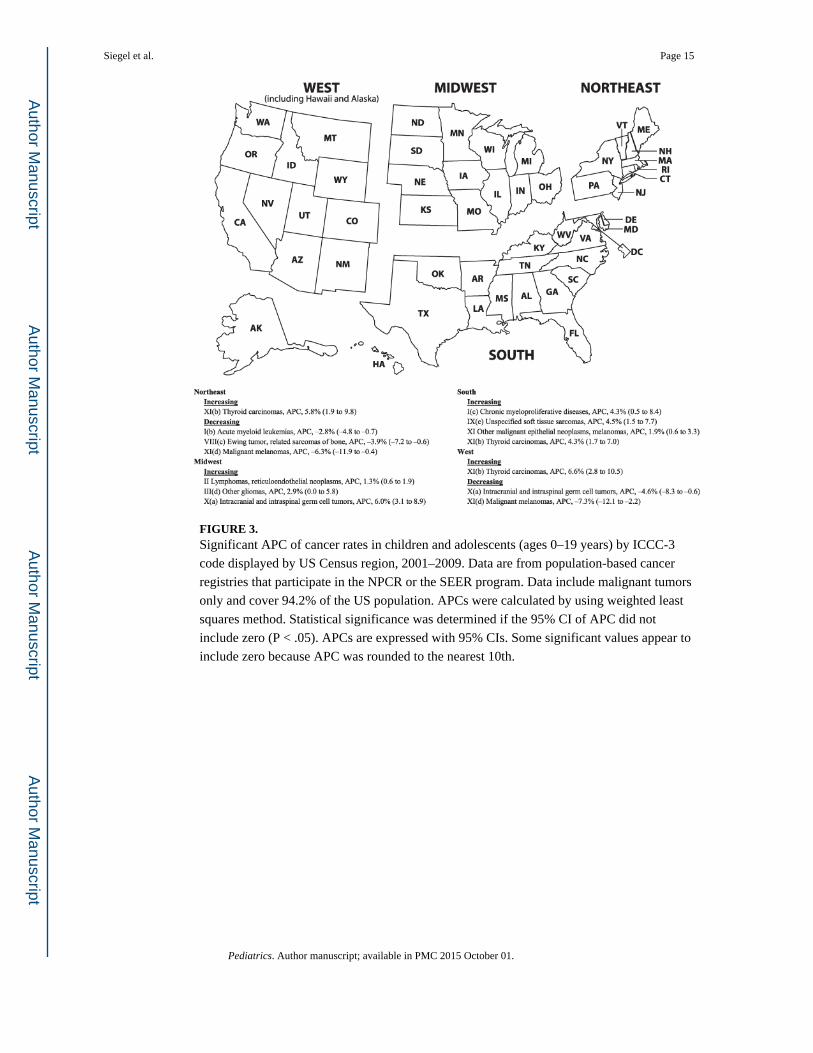
FIGURE 3. Significant APC of cancer rates in children and adolescents (ages 0–19 years) by ICCC-3
code displayed by US Census region, 2001–2009. Data are from population-based cancer
registries that participate in the NPCR or the SEER program. Data include malignant tumors
only and cover 94.2% of the US population. APCs were calculated by using weighted least
squares method. Statistical significance was determined if the 95% CI of APC did not
include zero (P < .05). APCs are expressed with 95% CIs. Some significant values appear to
include zero because APC was rounded to the nearest 10th.
Siegel et al. Page 15
Pediatrics. Author manuscript; available in PMC 2015 October 01.
Author M
anuscriptA
uthor Manuscript
Author M
anuscriptA
uthor Manuscript
Author M
anuscriptA
uthor Manuscript
Author M
anuscriptA
uthor Manuscript
Siegel et al. Page 16
TA
BL
E 1
Can
cer
Inci
denc
e R
ates
and
APC
of
Rat
es in
Chi
ldre
n an
d A
dole
scen
ts (
Age
s 0–
19 Y
ears
) by
Gen
der,
Uni
ted
Stat
es, 2
001–
2009
ICC
C G
roup
Boy
s an
d G
irls
Boy
sG
irls
Cou
ntR
atea
AP
Cb
(95%
CI)
Cou
ntR
atea
AP
Cb
(95%
CI)
Cou
ntR
atea
AP
Cb
(95%
CI)
All
ICC
C g
roup
s co
mbi
ned
120
137
171.
01 0
.3 (
−0.
1 to
0.7
)64
651
179.
63 0
.2 (
−0.
4 to
0.8
)55
486
161.
96 0
.4 (
−0.
1 to
0.9
)
I L
euke
mia
s, m
yelo
prol
ifer
ativ
e, m
yelo
dysp
last
ic d
isea
ses
31 8
2445
.36
0.5
(20
.3 to
1.3
)17
871
49.7
4 0
.4 (
−0.
5 to
1.3
)13
953
40.7
5 0
.6 (
−0.
6 to
1.9
)
I(
a) L
ymph
oid
leuk
emia
s22
834
32.5
9 0
.7 (
−0.
2 to
1.5
)13
052
36.3
7 0
.7 (
−0.
2 to
1.5
)97
8228
.60
0.7
(−
0.6
to 1
.9)
I(
b) A
cute
mye
loid
leuk
emia
s55
427.
88 0
.2 (
−1.
4 to
0.9
)29
398.
16−
1.2
(−3.
5 to
1.1
)26
037.
58 0
.9 (
−0.
3 to
2.1
)
I(
c) C
hron
ic m
yelo
prol
ifer
ativ
e di
seas
es15
492.
20 1
.7 (
−0.
9 to
4.3
)81
32.
25 2
.8 (
−0.
5 to
6.2
)73
62.
14 0
.4 (
−3.
3 to
4.2
)
I(
d) M
yelo
dysp
last
ic s
yndr
ome,
oth
er m
yelo
prol
ifer
ativ
e10
491.
49 0
.2 (
−3.
0 to
2.6
)58
41.
61−
0.4
(−4.
4 to
3.9
)46
51.
35 0
.0 (
−4.
3 to
4.5
)
I(
e) U
nspe
cifi
ed a
nd o
ther
spe
cifi
ed le
ukem
ias
850
1.21
0.1
(−
3.8
to 4
.1)
483
1.34
0.6
(−
4.2
to 5
.6)
367
1.07
−0.
7 (−
5.1
to 4
.0)
II L
ymph
omas
and
ret
icul
oend
othe
lial n
eopl
asm
s17
445
24.9
1 0
.5 (
−0.
2 to
1.3
)10
387
28.9
7 0
.8 (
−0.
3 to
1.9
)70
5820
.64
0.1
(−
0.9
to 1
.2)
II
(a)
Hod
gkin
’s ly
mph
omas
8780
12.5
0 0
.5 (
−0.
3 to
1.3
)46
7813
.01
0.5
(−
0.7
to 1
.7)
4102
11.9
8 0
.5 (
−1.
1 to
2.0
)
II
(b)
Non
-Hod
gkin
’s ly
mph
omas
(ex
cept
Bur
kitt
lym
phom
a)60
478.
66 0
.7 (
−0.
5 to
1.8
)38
2110
.67
1.3
(0.
0 to
2.5
)22
266.
53−
0.4
(−1.
3 to
0.6
)
II
(c)
Bur
kitt
lym
phom
a17
122.
47−
0.1
(−2.
7 to
2.7
)13
593.
83 0
.0 (
−2.
9 to
2.9
)35
31.
04 0
.1 (
−4.
7 to
5.1
)
II
(d)
Mis
cella
neou
s ly
mph
oret
icul
ar n
eopl
asm
s66
30.
93 1
.2 (
−4.
0 to
6.6
)39
21.
08 2
.4 (
−4.
0 to
9.2
)27
10.
78−
0.3
(−6.
3 to
6.1
)
II
(e)
Uns
peci
fied
lym
phom
as24
30.
35 0
.4 (
−5.
7 to
6.8
)13
70.
38—
106
0.31
—
III
CN
S an
d m
isce
llane
ous
intr
acra
nial
and
intr
aspi
nal n
eopl
asm
s21
135
30.2
8−
0.1
(−1.
0 to
0.8
)11
377
31.8
4−
0.3
(−1.
4 to
0.9
)97
5828
.65
0.1
(−
1.1
to 1
.4)
II
I(a)
Epe
ndym
omas
and
cho
roid
ple
xus
tum
or18
002.
56−
1.5
(−4.
5 to
1.7
)98
62.
74 0
.0 (
−3.
4 to
3.5
)81
42.
37−
3.2
(−7.
1 to
0.8
)
II
I(b)
Ast
rocy
tom
as10
533
15.1
0−
0.1
(−1.
2 to
0.9
)55
2915
.48
−0.
4 (−
1.6
to 0
.9)
5004
14.7
1 0
.1 (
−1.
6 to
1.8
)
III(
c) I
ntra
cran
ial a
nd in
tras
pina
l em
bryo
nal t
umor
s43
646.
24−
0.6
(−1.
9 to
0.8
)25
917.
25 −
1.1
(−2.
0 to
−0.
1)c
1773
5.18
0.2
(−
2.1
to 2
.5)
II
I(d)
Oth
er g
liom
as36
535.
26 0
.9 (
−0.
6 to
2.4
)18
565.
22 0
.3 (
−1.
4 to
1.9
)17
975.
30 1
.6 (
−0.
6 to
3.8
)
II
I(e)
Oth
er s
peci
fied
intr
acra
nial
/intr
aspi
nal n
eopl
asm
s46
20.
66−
1.2
(−4.
9 to
2.7
)24
60.
69−
1.0
(−5.
4 to
3.6
)21
60.
63−
1.4
(−6.
5 to
4.0
)
II
I(f)
Uns
peci
fied
intr
acra
nial
and
intr
aspi
nal n
eopl
asm
s32
30.
46 4
.4 (
0.1
to 8
.9)c
169
0.47
—15
40.
45—
IV N
euro
blas
tom
a, o
ther
per
iphe
ral n
ervo
us c
ell t
umor
s58
708.
21−
1.2
(−3.
0 to
0.8
)31
218.
53−
0.5
(−2.
9 to
2.0
)27
497.
87−
2.0
(−4.
0 to
0.1
)
IV
(a)
Neu
robl
asto
ma
and
gang
lione
urob
last
oma
5726
8.00
−1.
2 (−
3.1
to 0
.6)
3043
8.31
−0.
5 (−
3.0
to 1
.9)
2683
7.68
−2.
1 (−
4.1
to 0
.0)c
IV
(b)
Oth
er p
erip
hera
l ner
vous
cel
l tum
ors
144
0.20
—78
0.22
—66
0.19
—
V R
etin
obla
stom
a21
693.
01−
0.2
(−1.
8 to
1.5
)11
002.
99−
1.6
(−3.
6 to
0.3
)10
693.
03 1
.4 (
−1.
1 to
3.9
)
VI
Ren
al tu
mor
s46
976.
64 0
.5 (
−0.
3 to
1.3
)22
286.
15 0
.0 (
−1.
5 to
1.5
)24
697.
15 1
.1 (
−1.
3 to
3.2
)
V
I(a)
Nep
hrob
last
oma,
oth
er n
onep
ithel
ial r
enal
tum
ors
4248
6.00
0.0
(−
0.7
to 0
.8)
2006
5.53
−0.
4 (−
1.9
to 1
.1)
2242
6.49
0.4
(−
1.7
to 2
.5)
V
I(b)
Ren
al c
arci
nom
as42
60.
61 5
.4 (
2.8
to 8
.1)c
210
0.59
4.2
(1.
4 to
7.0
)c21
60.
63—
Pediatrics. Author manuscript; available in PMC 2015 October 01.
Author M
anuscriptA
uthor Manuscript
Author M
anuscriptA
uthor Manuscript
Siegel et al. Page 17
ICC
C G
roup
Boy
s an
d G
irls
Boy
sG
irls
Cou
ntR
atea
AP
Cb
(95%
CI)
Cou
ntR
atea
AP
Cb
(95%
CI)
Cou
ntR
atea
AP
Cb
(95%
CI)
V
I(c)
Uns
peci
fied
mal
igna
nt r
enal
tum
ors
230.
03—
——
——
——
VII
Hep
atic
tum
ors
1477
2.07
1.7
(−
1.7
to 5
.3)
874
2.40
2.8
(−
1.4
to 7
.2)
603
1.73
0.1
(−
4.1
to 4
.4)
V
II(a
) H
epat
obla
stom
a10
501.
46 1
.6 (
−2.
2 to
5.6
)63
41.
73 2
.4 (
−1.
9 to
6.8
)41
61.
18 0
.3 (
−4.
8 to
5.7
)
V
II(b
) H
epat
ic c
arci
nom
as41
10.
59 2
.1 (
−0.
7 to
4.9
)22
90.
64 3
.8 (
−0.
7 to
8.5
)18
20.
53 0
.2 (
−3.
8 to
4.4
)
V
II(c
) U
nspe
cifi
ed m
alig
nant
hep
atic
tum
ors
160.
02—
——
——
——
VII
I M
alig
nant
bon
e tu
mor
s62
859.
02−
0.6
(−1.
3 to
0.2
)35
8210
.00
−0.
5 (−
2.1
to 1
.1)
2703
7.98
−0.
7 (−
1.8
to 0
.5)
V
III(
a) O
steo
sarc
omas
3546
5.09
−0.
4 (−
1.7
to 1
.0)
2016
5.63
−0.
9 (−
2.7
to 0
.9)
1530
4.52
0.3
(−
2.3
to 3
.1)
V
III(
b) C
hond
rosa
rcom
as24
80.
35−
3.1
(−11
.1 to
5.6
)15
80.
44—
900.
26—
V
III(
c) E
win
g tu
mor
and
rel
ated
sar
com
as o
f bo
ne20
542.
95−
1.0
(−3.
2 to
1.4
)11
853.
31−
0.3
(−4.
0 to
3.7
)86
92.
56 −
1.9
(−3.
8 to
0.0
)c
V
III(
d) O
ther
spe
cifi
ed m
alig
nant
bon
e tu
mor
s30
00.
43−
1.3
(−6.
8 to
4.5
)14
60.
41—
154
0.45
—
V
III(
e) U
nspe
cifi
ed m
alig
nant
bon
e tu
mor
s13
70.
20—
770.
21—
600.
18—
IX S
oft t
issu
e an
d ot
her
extr
aoss
eous
sar
com
as84
1912
.01
0.3
(−
0.4
to 1
.0)
4620
12.8
6 0
.0 (
−1.
0 to
1.1
)37
9911
.12
0.6
(−
1.1
to 2
.4)
IX
(a)
Rha
bdom
yosa
rcom
as32
994.
71−
0.7
(−3.
0 to
1.7
)19
425.
42−
1.1
(−3.
0 to
1.0
)13
573.
97−
0.1
(−4.
2 to
4.2
)
IX
(b)
Fibr
osar
com
as, p
erip
hera
l ner
ve, o
ther
fib
rous
940
1.33
−0.
7 (−
3.8
to 2
.6)
495
1.37
−2.
3 (−
5.6
to 1
.0)
445
1.30
1.2
(−
3.5
to 6
.2)
IX
(c)
Kap
osi s
arco
ma
260.
04—
200.
06—
——
—
IX
(d)
Oth
er s
peci
fied
sof
t tis
sue
sarc
omas
3304
4.71
0.9
(−
1.0
to 2
.9)
1725
4.80
1.5
(−
1.4
to 4
.5)
1579
4.63
0.3
(−
2.3
to 3
.0)
IX
(e)
Uns
peci
fied
sof
t tis
sue
sarc
omas
850
1.21
2.8
(−
0.4
to 6
.2)
438
1.22
1.0
(−
4.4
to 6
.7)
412
1.21
5.1
(−
0.6
to 1
1.0)
X G
erm
cel
l, tr
opho
blas
tic tu
mor
s, n
eopl
asm
s of
gon
ads
7814
11.0
5 0
.7 (
−0.
5 to
2.0
)49
6813
.65
1.1
(−
0.7
to 2
.6)
2846
8.30
0.5
(−
1.3
to 2
.2)
X
(a)
Intr
acra
nial
and
intr
aspi
nal g
erm
cel
l tum
ors
1133
1.62
0.8
(−
1.6
to 3
.2)
831
2.32
−1.
7 (−
1.3
to 4
.8)
302
0.89
−1.
3 (−
7.3
to 5
.0)
X
(b)
Ext
racr
ania
l and
ext
rago
nada
l ger
m c
ell t
umor
s10
461.
46 −
2.0
(−3.
9 to
−0.
2)c
457
1.25
1.7
(−
3.8
to 0
.4)
589
1.68
−2.
3 (−
4.5
to −
0.1)
c
X
(c)
Mal
igna
nt g
onad
al g
erm
cel
l tum
ors
5142
7.27
1.1
(−
0.6
to 2
.9)
3618
9.91
1.0
(−
1.1
to 3
.2)
1524
4.48
1.5
(−
0.5
to 3
.5)
X
(d)
Gon
adal
car
cino
mas
281
0.40
5.3
(−
0.5
to 1
1.4)
240.
07—
257
0.75
5.9
(−
0.3
to 1
2.4)
X
(e)
Oth
er a
nd u
nspe
cifi
ed m
alig
nant
gon
adal
tum
ors
212
0.30
—38
0.11
—17
40.
51—
XI
Oth
er m
alig
nant
epi
thel
ial n
eopl
asm
s an
d m
elan
omas
12 4
2817
.64
0.8
(0.
1 to
1.5
)c42
7711
.85
−0.
1 (−
1.6
to 1
.4)
8151
23.7
7 1
.3 (
0.4
to 2
.2)c
X
I(a)
Adr
enoc
ortic
al c
arci
nom
as15
10.
21—
550.
15—
960.
28—
X
I(b)
Thy
roid
car
cino
mas
4812
6.83
4.9
(3.
2 to
6.6
)c93
42.
59 4
.7 (
0.9
to 8
.7)c
3878
11.3
1 4
.9 (
3.2
to 6
.5)c
X
I(c)
Nas
opha
ryng
eal c
arci
nom
as41
20.
59 0
.0 (
−4.
8 to
5.1
)27
50.
76 2
.7 (
−3.
0 to
8.7
)13
70.
40—
X
I(d)
Mal
igna
nt m
elan
omas
4047
5.74
−3.
8 (−
6.7
to −
0.9)
c16
994.
70 −
5.3
(−8.
4 to
−2.
1)c
2348
6.84
−2.
8 (−
6.4
to 1
.1)
X
I(e)
Ski
n ca
rcin
omas
580.
08—
280.
08—
300.
09—
Pediatrics. Author manuscript; available in PMC 2015 October 01.
Author M
anuscriptA
uthor Manuscript
Author M
anuscriptA
uthor Manuscript
Siegel et al. Page 18
ICC
C G
roup
Boy
s an
d G
irls
Boy
sG
irls
Cou
ntR
atea
AP
Cb
(95%
CI)
Cou
ntR
atea
AP
Cb
(95%
CI)
Cou
ntR
atea
AP
Cb
(95%
CI)
X
I(f)
Oth
er a
nd u
nspe
cifi
ed c
arci
nom
as29
484.
19 1
.1 (
−0.
1 to
2.3
)12
863.
56 2
.4 (
0.2
to 4
.6)c
1662
4.86
0.1
(−
2.2
to 2
.4)
XII
Oth
er a
nd u
nspe
cifi
ed m
alig
nant
neo
plas
ms
574
0.81
0.6
(−
2.9
to 4
.3)
246
0.68
3.8
(0.
4 to
7.3
)c32
80.
95−
1.6
(−6.
7 to
3.9
)
a Rat
es a
re p
er m
illio
n an
d w
ere
age-
adju
sted
to th
e 20
00 U
S st
anda
rd p
opul
atio
n (1
9 ag
e gr
oups
, Cen
sus
P25–
1130
) st
anda
rd. R
ate
stat
istic
s w
ere
not d
ispl
ayed
if c
ase
coun
t was
<16
cas
es.
b APC
s w
ere
calc
ulat
ed b
y us
ing
wei
ghte
d le
ast s
quar
es m
etho
d. S
tatis
tical
sig
nifi
canc
e w
as d
eter
min
ed if
the
95%
CI
of A
PC d
id n
ot in
clud
e ze
ro (
P <
.05)
. APC
was
not
cal
cula
ted
if c
ase
coun
t was
<16
ca
ses
in a
ny 1
yea
r. S
ome
sign
ific
ant v
alue
s ap
pear
to in
clud
e ze
ro b
ecau
se A
PC w
as r
ound
ed to
the
near
est 1
0th.
c Den
otes
sig
nifi
cant
APC
.
Pediatrics. Author manuscript; available in PMC 2015 October 01.
Author M
anuscriptA
uthor Manuscript
Author M
anuscriptA
uthor Manuscript
Siegel et al. Page 19
TA
BL
E 2
Can
cer
Inci
denc
e R
ates
and
APC
of
Rat
es in
Chi
ldre
n an
d A
dole
scen
ts (
Age
s 0–
19 Y
ears
) by
Rac
e or
Eth
nici
ty, U
nite
d St
ates
, 200
1–20
09
ICC
C G
roup
Whi
teA
fric
an A
mer
ican
Non
-His
pani
cH
ispa
nic
Cou
ntR
atea
AP
Cb
(95%
CI)
Cou
ntR
atea
AP
Cb
(95%
CI)
Cou
ntR
atea
AP
Cb
(95%
CI)
Cou
ntR
atea
AP
Cb
(95%
CI)
All
ICC
C g
roup
s co
mbi
ned
97 7
6517
7.91
0.0
(−
0.5
to 0
.5)
13 7
7912
7.29
1.3
(0.
2 to
2.5
)c95
716
171.
66 0
.3 (
−0.
2 to
0.7
)24
421
168.
940.
6 (0
.0 to
1.3
)
I L
euke
mia
s, m
yelo
prol
ifer
ativ
e,
mye
lody
spla
stic
dis
ease
s26
283
47.9
4 0
.3 (
−0.
6 to
1.2
)30
2227
.97
1.2
(−
0.3
to
2.7)
23 3
9142
.49
0.0
(−
0.7
to 0
.8)
8433
56.6
2 1
.3 (
0.1
to 2
.6)c
I(
a) L
ymph
oid
leuk
emia
s19
252
35.1
6 0
.4 (
−0.
5 to
1.3
)18
2016
.89
1.9
(0.
0 to
3.9
)16
508
30.1
5 0
.1 (
−0.
8 to
1.1
)63
2642
.25
1.6
(0.
1 to
3.1
)c
I(
b) A
cute
mye
loid
leuk
emia
s43
317.
87−
0.4
(−1.
6 to
0.
8)77
07.
10−
0.4
(−5.
2 to
4.
7)42
707.
67−
0.5
(−2.
0 to
1.
1)12
728.
72 0
.2 (
−1.
7 to
2.1
)
I(
c) C
hron
ic m
yelo
prol
ifer
ativ
e di
seas
es11
972.
17 1
.6 (
−1.
8 to
5.1
)21
21.
95 1
.5 (
−3.
8 to
7.
1)11
892.
10 1
.4 (
−0.
3 to
3.0
)36
02.
51 1
.9 (
−4.
7 to
9.0
)
I(
d) M
yelo
dysp
last
ic s
yndr
ome,
ot
her
mye
lopr
olif
erat
ive
826
1.50
−0.
6 (−
5.2
to
4.2)
125
1.15
—82
11.
48 0
.3 (
−3.
0 to
3.7
)22
81.
49−
2.0
(−6.
5 to
2.
8)
I(
e) U
nspe
cifi
ed a
nd o
ther
sp
ecif
ied
leuk
emia
s67
71.
23 0
.8 (
−3.
2 to
4.9
)95
0.88
—60
31.
09−
1.4
(−5.
5 to
2.
9)24
71.
65 3
.0 (
−2.
5 to
8.8
)
II L
ymph
omas
and
re
ticul
oend
othe
lial n
eopl
asm
s14
015
25.5
3 0
.1 (
−0.
6 to
0.8
)23
0621
.30
2.0
(−
0.5
to
4.5)
14 4
2525
.45
0.9
(0.
6 to
1.7
)c30
2022
.23
−0.
9 (−
1.9
to
0.2)
II
(a)
Hod
gkin
’s ly
mph
omas
7256
13.1
7 0
.1 (
−0.
7 to
1.0
)10
679.
84 2
.9 (
0.2
to 5
.7)c
7360
12.8
3 0
.7 (
−0.
1 to
1.5
)14
2010
.83
−0.
2 (−
2.5
to
2.1)
II
(b)
Non
-Hod
gkin
’s ly
mph
omas
(e
xcep
t Bur
kitt
lym
phom
a)46
108.
42 0
.2 (
−0.
7 to
1.0
)97
49.
00 0
.6 (
−2.
9 to
4.
2)49
588.
81 0
.9 (
−0.
4 to
2.2
)10
897.
99−
0.2
(−3.
0 to
2.
6)
II
(c)
Bur
kitt
lym
phom
a14
372.
65−
1.0
(−4.
4 to
2.
6)16
91.
57—
1460
2.64
1.2
(−
1.4
to 3
.7)
252
1.77
−5.
6 (−
13.1
to
2.6)
II
(d)
Mis
cella
neou
s ly
mph
oret
icul
ar n
eopl
asm
s53
20.
96 2
.1 (
−3.
7 to
8.1
)54
0.49
—46
10.
84 3
.6 (
−0.
7 to
8.1
)20
21.
22—
II
(e)
Uns
peci
fied
lym
phom
as18
00.
33—
420.
39—
186
0.33
—57
0.41
—
III
CN
S an
d m
isce
llane
ous
intr
acra
nial
and
intr
aspi
nal
neop
lasm
s
17 3
2231
.76
−0.
5 (−
1.6
to
0.7)
2458
22.8
6 1
.2 (
−1.
0 to
3.
4)17
416
31.6
3 0
.3 (
−0.
7 to
1.2
)37
1925
.22
−1.
0 (−
2.6
to
0.6)
II
I(a)
Epe
ndym
omas
and
cho
roid
pl
exus
tum
or14
712.
68−
1.8
(−4.
8 to
1.
3)21
31.
97−
1.6
(−9.
6 to
7.
1)13
932.
53−
1.2
(−4.
3 to
2.
0)40
72.
68−
2.3
(−6.
5 to
2.
2)
II
I(b)
Ast
rocy
tom
as87
1615
.99
−0.
6 (−
1.8
to
0.7)
1163
10.8
1 2
.3 (
−1.
5 to
6.
4)88
6016
.06
0.2
(−
1.1
to 1
.4)
1673
11.5
3−
0.5
(−2.
9 to
1.
9)
II
I(c)
Int
racr
ania
l and
intr
aspi
nal
embr
yona
l tum
ors
3636
6.66
−0.
8 (−
2.5
to
1.0)
446
4.14
−0.
6 (−
3.0
to
1.9)
3489
6.38
−0.
1 (−
1.7
to
1.5)
875
5.76
−2.
1 (−
5.2
to
1.1)
II
I(d)
Oth
er g
liom
as29
405.
41 0
.6 (
−1.
4 to
2.6
)46
24.
32 1
.7 (
−2.
1 to
5.
6)30
255.
49 1
.5 (
0.1
to 2
.9)c
628
4.32
−1.
4 (−
6.5
to
4.0)
Pediatrics. Author manuscript; available in PMC 2015 October 01.
Author M
anuscriptA
uthor Manuscript
Author M
anuscriptA
uthor Manuscript
Siegel et al. Page 20
ICC
C G
roup
Whi
teA
fric
an A
mer
ican
Non
-His
pani
cH
ispa
nic
Cou
ntR
atea
AP
Cb
(95%
CI)
Cou
ntR
atea
AP
Cb
(95%
CI)
Cou
ntR
atea
AP
Cb
(95%
CI)
Cou
ntR
atea
AP
Cb
(95%
CI)
II
I(e)
Oth
er s
peci
fied
intr
acra
nial
/in
tras
pina
l neo
plas
ms
316
0.58
−2.
4 (−
7.0
to
2.5)
120
1.12
—38
90.
70−
1.8
(−6.
1 to
2.
8)73
0.50
—
II
I(f)
Uns
peci
fied
intr
acra
nial
and
in
tras
pina
l neo
plas
ms
243
0.44
5.9
(0.
2 to
12
.0)c
540.
50—
260
0.47
3.7
(−
2.2
to
10.0
)63
0.43
—
IV N
euro
blas
tom
a, o
ther
per
iphe
ral
nerv
ous
cell
tum
ors
4739
8.50
−1.
5 (−
3.4
to
0.5)
756
6.93
0.7
(−
3.4
to
5.0)
4950
9.08
−0.
6 (−
2.4
to
1.4)
920
5.40
−2.
3 (−
5.9
to
1.4)
IV
(a)
Neu
robl
asto
ma
and
gang
lione
urob
last
oma
4627
8.30
−1.
6 (−
3.5
to
0.3)
734
6.73
0.7
(−
3.3
to
4.9)
4833
8.88
−0.
6 (−
2.4
to
1.3)
893
5.21
−2.
9 (−
6.5
to
0.9)
IV
(b)
Oth
er p
erip
hera
l ner
vous
ce
ll tu
mor
s11
20.
20—
220.
20—
117
0.21
—27
0.19
—
V R
etin
obla
stom
a15
872.
83−
0.2
(−2.
5 to
2.
2)37
93.
43−
0.3
(−2.
9 to
2.
3)15
692.
88−
0.1
(−1.
2 to
1.
1)60
03.
43−
0.7
(−5.
1 to
3.
9)
VI
Ren
al tu
mor
s35
376.
41−
0.4
(−1.
2 to
0.
4)85
57.
92 2
.5 (
1.6
to 3
.5)c
3872
7.11
0.8
(−
0.4
to 2
.0)
825
5.05
0.5
(−
3.0
to 4
.0)
V
I(a)
Nep
hrob
last
oma,
oth
er
none
pith
elia
l ren
al tu
mor
s32
525.
89−
0.7
(−1.
5 to
0.
0)72
66.
73 2
.3 (
0.6
to 3
.6)c
3485
6.42
0.3
(−
0.8
to 1
.5)
763
4.58
−1.
0 (−
3.6
to
3.6)
V
I(b)
Ren
al c
arci
nom
as26
70.
49 3
.8 (
−2.
2 to
10
.2)
125
1.15
—36
70.
65 5
.8 (
3.3
to 8
.4)c
590.
45—
V
I(c)
Uns
peci
fied
mal
igna
nt r
enal
tu
mor
s18
0.03
——
——
200.
04—
——
—
VII
Hep
atic
tum
ors
1162
2.09
1.5
(−
2.5
to 5
.6)
156
1.43
—11
142.
02 1
.3 (
−1.
2 to
3.9
)36
32.
25 3
.5 (
−5.
6 to
13
.4)
V
II(a
) H
epat
obla
stom
a84
21.
51 1
.2 (
−3.
0 to
5.5
)10
00.
91—
776
1.42
1.3
(−
1.9
to 4
.5)
274
1.59
3.1
(−
6.5
to
13.7
)
V
II(b
) H
epat
ic c
arci
nom
as30
80.
56 2
.6 (
−2.
4 to
8.0
)55
0.51
—32
40.
57 1
.3 (
−2.
6 to
5.2
)87
0.65
—
V
II(c
) U
nspe
cifi
ed m
alig
nant
he
patic
tum
ors
——
——
——
——
——
——
VII
I M
alig
nant
bon
e tu
mor
s50
859.
32−
0.7
(−1.
8 to
0.
3)78
17.
22−
0.8
(−4.
9 to
3.
5)50
308.
91 −
0.9
(−1.
7 to
0.
0)c
1255
9.49
0.5
(−
1.7
to 2
.7)
V
III(
a) O
steo
sarc
omas
2670
4.89
−0.
4 (−
1.8
to
1.1)
622
5.75
−0.
7 (−
5.6
to
4.4)
2776
4.91
−0.
8 (−
2.2
to
0.6)
770
5.87
0.8
(−
1.7
to 3
.3)
V
III(
b) C
hond
rosa
rcom
as20
60.
37—
250.
23—
210
0.37
—38
0.29
—
V
III(
c) E
win
g tu
mor
and
rel
ated
sa
rcom
as o
f bo
ne18
743.
44−
1.1
(−3.
1 to
0.
9)70
0.65
—17
053.
03−
1.2
(−3.
8 to
1.
5)34
92.
60 0
.7 (
−3.
2 to
4.7
)
V
III(
d) O
ther
spe
cifi
ed m
alig
nant
bo
ne tu
mor
s23
30.
43−
2.8
(−8.
8 to
3.
7)40
0.37
—24
00.
42−
0.2
(−5.
7 to
5.
8)60
0.45
—
Pediatrics. Author manuscript; available in PMC 2015 October 01.
Author M
anuscriptA
uthor Manuscript
Author M
anuscriptA
uthor Manuscript
Siegel et al. Page 21
ICC
C G
roup
Whi
teA
fric
an A
mer
ican
Non
-His
pani
cH
ispa
nic
Cou
ntR
atea
AP
Cb
(95%
CI)
Cou
ntR
atea
AP
Cb
(95%
CI)
Cou
ntR
atea
AP
Cb
(95%
CI)
Cou
ntR
atea
AP
Cb
(95%
CI)
V
III(
e) U
nspe
cifi
ed m
alig
nant
bo
ne tu
mor
s10
20.
19—
240.
22—
990.
18—
380.
28—
IX S
oft t
issu
e an
d ot
her
extr
aoss
eous
sa
rcom
as65
4311
.93
−0.
1 (−
0.8
to
0.7)
1359
12.5
5 1
.4 (
−0.
4 to
3.
1)67
9112
.15
0.5
(−
0.4
to 1
.5)
1628
11.4
9−
0.2
(−2.
2 to
1.
8)
IX
(a)
Rha
bdom
yosa
rcom
as25
994.
75−
1.7
(−3.
7 to
0.
3)52
64.
88 2
.8 (
−1.
7 to
7.
6)26
454.
79−
0.8
(−3.
5 to
1.
9)65
44.
42 0
.2 (
−4.
7 to
5.4
)
IX
(b)
Fibr
osar
com
as, p
erip
hera
l ne
rve,
oth
er f
ibro
us73
61.
34 0
.1 (
−3.
0 to
3.3
)15
91.
46—
742
1.32
1.0
(−
2.6
to 4
.7)
198
1.40
−6.
7 (−
10.9
to
−2.
3)c
IX
(c)
Kap
osi s
arco
ma
——
——
——
220.
04—
——
—
IX
(d)
Oth
er s
peci
fied
sof
t tis
sue
sarc
omas
2553
4.65
0.8
(−
1.4
to 3
.0)
520
4.79
1.1
(−
2.2
to
4.6)
2688
4.76
1.1
(−
0.9
to 3
.0)
616
4.53
0.6
(−
2.3
to 3
.7)
IX
(e)
Uns
peci
fied
sof
t tis
sue
sarc
omas
644
1.17
3.2
(−
0.5
to 7
.0)
142
1.31
—69
41.
23 3
.1 (
−0.
5 to
6.7
)15
61.
11—
X G
erm
cel
l, tr
opho
blas
tic tu
mor
s,
neop
lasm
s of
gon
ads
6546
11.8
1 0
.6 (
−1.
0 to
2.2
)66
26.
07 1
.4 (
−0.
2 to
3.
1)59
1410
.35
0.3
(−
1.0
to 1
.6)
1900
14.2
6 1
.6 (
−0.
6 to
3.8
)
X
(a)
Intr
acra
nial
and
intr
aspi
nal
germ
cel
l tum
ors
900
1.65
0.5
(−
2.7
to 3
.7)
100
0.92
—89
01.
58 1
.1 (
−1.
9 to
4.2
)24
31.
81−
0.3
(−4.
8 to
4.
4)
X
(b)
Ext
racr
ania
l and
ex
trag
onad
al g
erm
cel
l tum
ors
784
1.40
−1.
8 (−
4.4
to
0.7)
152
1.38
—80
01.
44−
1.3
(−3.
9 to
1.
4)24
61.
66 −
4.5
(−7.
8 to
−
1.2)
c
X
(c)
Mal
igna
nt g
onad
al g
erm
cel
l tu
mor
s44
688.
05 1
.0 (
−0.
9 to
2.8
)34
93.
21 3
.5 (
−0.
3 to
8.
0)38
386.
66 0
.4 (
−1.
3 to
2.2
)13
049.
96 2
.5 (
−0.
7 to
5.8
)
X
(d)
Gon
adal
car
cino
mas
235
0.42
4.0
(−
1.8
to
10.1
)18
0.17
—21
60.
37 3
.6 (
−1.
8 to
9.2
)65
0.51
—
X
(e)
Oth
er a
nd u
nspe
cifi
ed
mal
igna
nt g
onad
al tu
mor
s15
90.
29—
430.
39—
170
0.30
—42
0.32
—
XI
Oth
er m
alig
nant
epi
thel
ial
neop
lasm
s an
d m
elan
omas
1051
119
.02
0.7
(−
0.3
to 1
.7)
960
8.83
1.4
(−
2.8
to
5.9)
10 7
8918
.77
0.4
(−
0.5
to 1
.3)
1639
12.6
7 4
.9 (
2.7
to 7
.1)c
X
I(a)
Adr
enoc
ortic
al c
arci
nom
as13
00.
24—
——
—12
10.
22—
300.
20—
X
I(b)
Thy
roid
car
cino
mas
4182
7.57
4.9
(2.
9 to
6.9
)c25
52.
35 6
.6 (
0.7
to
12.8
)c39
746.
89 4
.1 (
2.3
to 5
.9)c
838
6.53
9.1
(5.
4 to
12
.8)c
X
I(c)
Nas
opha
ryng
eal c
arci
nom
as19
40.
35 2
.0 (
−1.
5 to
5.6
)18
01.
65—
351
0.61
−0.
8 (−
6.4
to
5.1)
610.
48—
X
I(d)
Mal
igna
nt m
elan
omas
3694
6.68
−3.
9 (−
6.8
to
−0.
9)c
540.
50—
3829
6.66
−3.
5 (−
6.3
to
−0.
6)c
218
1.64
−2.
0 (−
5.7
to
1.0)
X
I(e)
Ski
n ca
rcin
omas
440.
08—
——
—51
0.09
——
——
X
I(f)
Oth
er a
nd u
nspe
cifi
ed
carc
inom
as22
674.
11 1
.0 (
−0.
6 to
2.6
)45
54.
18−
0.5
(−4.
3 to
3.
5)24
634.
29 1
.2 (
0.0
to 2
.4)c
485
3.78
1.1
(−
1.9
to 4
.1)
Pediatrics. Author manuscript; available in PMC 2015 October 01.
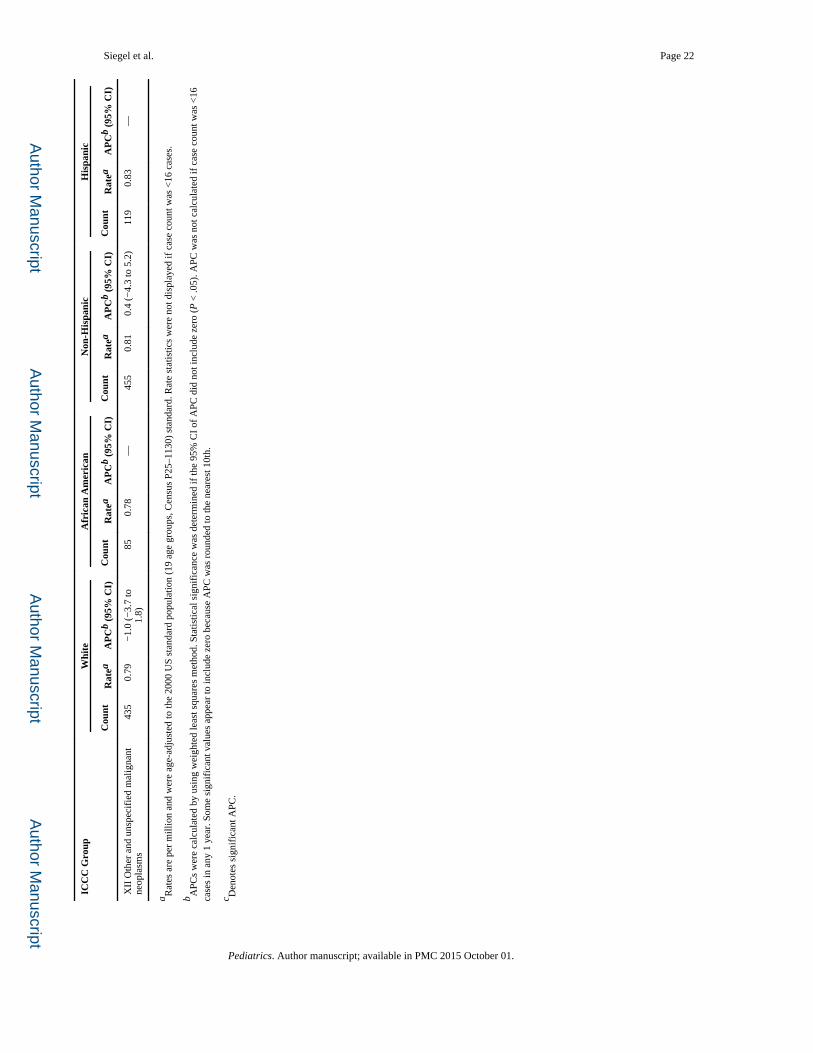
Author M
anuscriptA
uthor Manuscript
Author M
anuscriptA
uthor Manuscript
Siegel et al. Page 22
ICC
C G
roup
Whi
teA
fric
an A
mer
ican
Non
-His
pani
cH
ispa
nic
Cou
ntR
atea
AP
Cb
(95%
CI)
Cou
ntR
atea
AP
Cb
(95%
CI)
Cou
ntR
atea
AP
Cb
(95%
CI)
Cou
ntR
atea
AP
Cb
(95%
CI)
XII
Oth
er a
nd u
nspe
cifi
ed m
alig
nant
ne
opla
sms
435
0.79
−1.
0 (−
3.7
to
1.8)
850.
78—
455
0.81
0.4
(−
4.3
to 5
.2)
119
0.83
—
a Rat
es a
re p
er m
illio
n an
d w
ere
age-
adju
sted
to th
e 20
00 U
S st
anda
rd p
opul
atio
n (1
9 ag
e gr
oups
, Cen
sus
P25–
1130
) st
anda
rd. R
ate
stat
istic
s w
ere
not d
ispl
ayed
if c
ase
coun
t was
<16
cas
es.
b APC
s w
ere
calc
ulat
ed b
y us
ing
wei
ghte
d le
ast s
quar
es m
etho
d. S
tatis
tical
sig
nifi
canc
e w
as d
eter
min
ed if
the
95%
CI
of A
PC d
id n
ot in
clud
e ze
ro (
P <
.05)
. APC
was
not
cal
cula
ted
if c
ase
coun
t was
<16
ca
ses
in a
ny 1
yea
r. S
ome
sign
ific
ant v
alue
s ap
pear
to in
clud
e ze
ro b
ecau
se A
PC w
as r
ound
ed to
the
near
est 1
0th.
c Den
otes
sig
nifi
cant
APC
.
Pediatrics. Author manuscript; available in PMC 2015 October 01.