heavy metal pollution and pb isotopes in urban soils of napoli, italy
TRANSCRIPT
Heavy metal pollution and Pb isotopes in urban soils of Napoli, Italy
D. Cicchella1, B. De Vivo2, A. Lima2, S. Albanese2, R.A.R. McGill3 & R.R. Parrish3
1Dipartimento di Studi Geologici ed Ambientali, Università degli Studi del Sannio, Via dei Mulini 59/A, 82100Benevento, Italy (e-mail: [email protected])
2Dipartimento di Scienze della Terra, Università di Napoli ’Federico II’, Via Mezzocannone 8, 80138 Napoli, Italy3NERC Isotope Geosciences Laboratory, British Geological Survey, Nottingham, UK
ABSTRACT: Lead isotope analysis is an increasingly widespread tool in the study ofenvironmental pollution as Pb isotope compositions do not change during industrialand environmental processes, and always reflect their source origin. In this study wepresent the results of R-mode factor analysis for associations between chemicalelements in Neapolitan soils, combined with the distribution of Pb concentrationsand Pb isotope compositions in order to differentiate natural from anthropogenicmetal sources. Results show Neapolitan urban soils to be significantly enriched in Pb,Hg, Zn, Sb, and to a lesser extent in Cu, Cd, Cr and Ni. Lead isotope measurementsform a trend suggesting mixing between two end-member compositions, one of clearnatural origin (geogenic) and another related to human activities (anthropogenic).Lead isotope investigations demonstrate that road traffic is one of the main sourcesof metal pollution.
KEYWORDS: heavy metal, urban soil, environmental pollution, Pb isotopes, R-mode factor analysis
INTRODUCTION
In recent years, many scientists have focused their interest onheavy metals in the soils of urban areas where pollution mighthave a direct influence on public health (Markus & McBratney2001; Fordyce et al. 2005; Wong et al. 2006). This is due to theoften close juxtaposition of humans with soils, either assuspended dust or by direct contact. The compilation ofdatabases of trace metal concentrations has enabled informeddecision-making for setting soil protection guidelines anddetermining the suitability of a particular land use, by assessingpotential risk to humans or the environment. Mapping contami-nant distribution allows immediate appraisal of the variability ofharmful elements in an area and enables rapid identification ofareas that may contain excessive concentrations of toxic metals(Facchinelli et al. 2001; Salminen et al. 2005; Lee et al. 2006). Thisis essential for site and subsequent risk assessment (Manta et al.2002; Cicchella et al. 2005; De Vivo et al. 2006).
In the Napoli metropolitan area it has already been shown(Cicchella et al. 2005) that heavy metal compositions of soil areaffected by a combination of two components: one natural,related to volcanic lithologies, and one anthropogenic, related totraffic and industrial activities. In this study we present thefactor score distribution of elemental associations resultingfrom R-mode factor analysis, along with the distribution of Pbconcentrations and Pb isotope compositions in order to differ-entiate natural from anthropogenic sources.
In the last 50 to 100 years, the natural geochemical Pb cyclehas been completely overwhelmed by anthropogenic emissionsin the atmosphere from industrial and vehicle contamination(Nriagu 1989; Pacyna & Pacyna 2001; USGS 2002). Leadisotope analyses are widely used to study environmental pollu-tion as the Pb isotope composition does not change duringindustrial and environmental processes, but always reflects thesource origin. In addition, Pb is relatively immobile in the
surface environment and it is ubiquitous in many industrialprocesses.
The introduction of Pb into soils occurs by atmosphericdeposition and by incorporation of Pb from underlying bed-rock. Stable Pb isotope ratios, in combination with concen-tration data of Pb and other heavy metals, are a useful methodof differentiating natural from anthropogenic sources (Erelet al. 1997; Hansmann & Köppel 2000; De Vivo et al. 2001a;Charalampides & Manoliadis 2002; Flament et al. 2002; Tarziaet al. 2002; Haack et al. 2004; Ayuso et al. 2004, 2005).
Lead isotopes used for this study are 204Pb, 206Pb, 207Pb and208Pb. Lead-204 is non-radiogenic and 206Pb, 207Pb and 208Pbare formed by the radioactive decay of 238U, 235U and 232Th,respectively.
STUDY AREA
Geographical setting
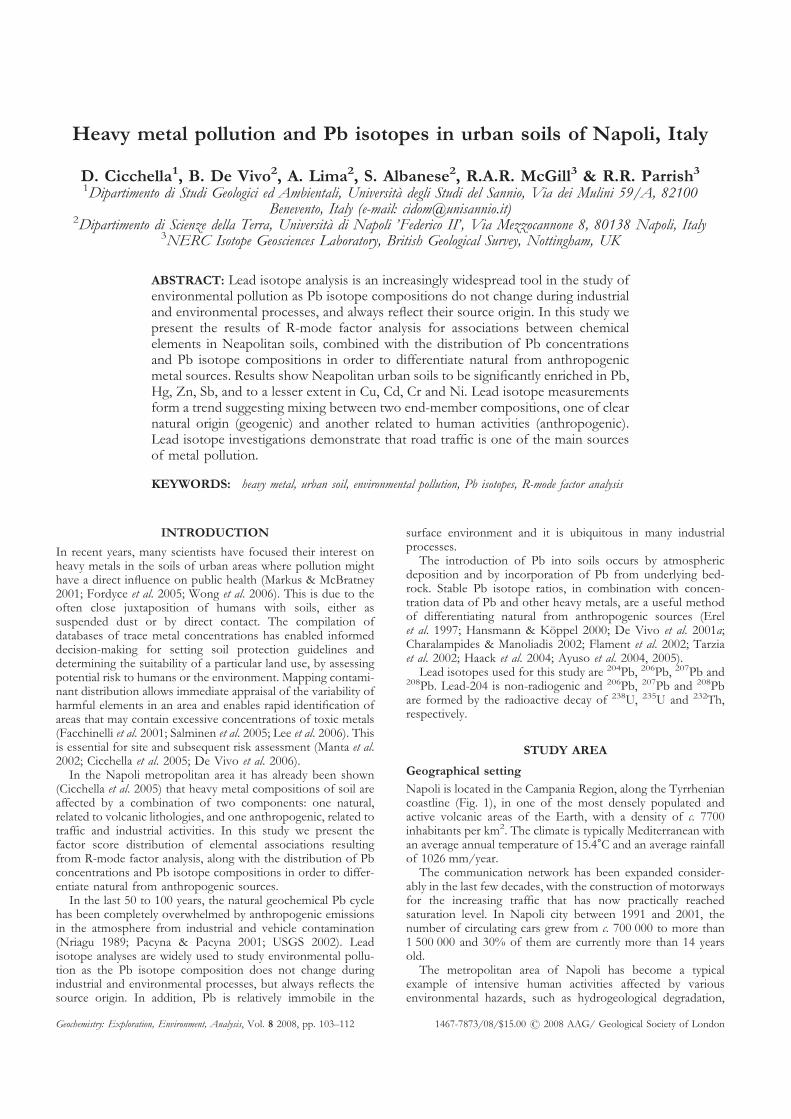
Napoli is located in the Campania Region, along the Tyrrheniancoastline (Fig. 1), in one of the most densely populated andactive volcanic areas of the Earth, with a density of c. 7700inhabitants per km2. The climate is typically Mediterranean withan average annual temperature of 15.4�C and an average rainfallof 1026 mm/year.
The communication network has been expanded consider-ably in the last few decades, with the construction of motorwaysfor the increasing traffic that has now practically reachedsaturation level. In Napoli city between 1991 and 2001, thenumber of circulating cars grew from c. 700 000 to more than1 500 000 and 30% of them are currently more than 14 yearsold.
The metropolitan area of Napoli has become a typicalexample of intensive human activities affected by variousenvironmental hazards, such as hydrogeological degradation,
Geochemistry: Exploration, Environment, Analysis, Vol. 8 2008, pp. 103–112 1467-7873/08/$15.00 � 2008 AAG/ Geological Society of London
soil and water pollution, as well as volcanic, seismic andbradyseismic activities.
Geological setting
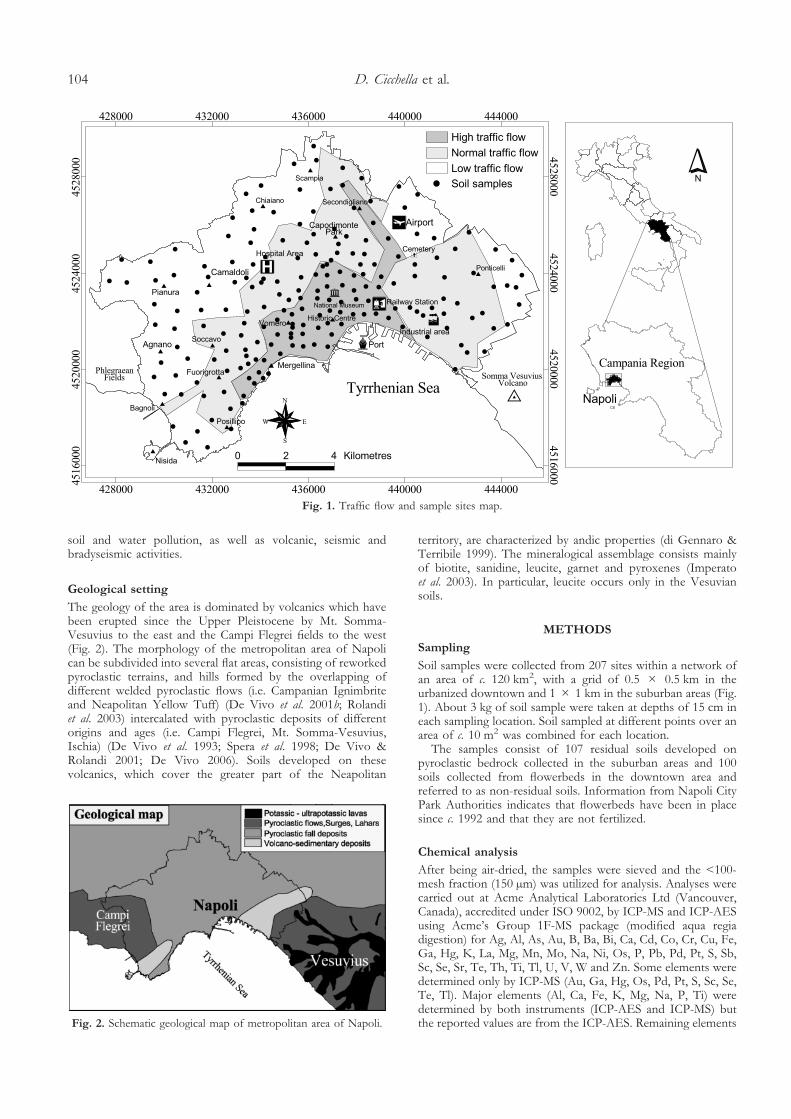
The geology of the area is dominated by volcanics which havebeen erupted since the Upper Pleistocene by Mt. Somma-Vesuvius to the east and the Campi Flegrei fields to the west(Fig. 2). The morphology of the metropolitan area of Napolican be subdivided into several flat areas, consisting of reworkedpyroclastic terrains, and hills formed by the overlapping ofdifferent welded pyroclastic flows (i.e. Campanian Ignimbriteand Neapolitan Yellow Tuff) (De Vivo et al. 2001b; Rolandiet al. 2003) intercalated with pyroclastic deposits of differentorigins and ages (i.e. Campi Flegrei, Mt. Somma-Vesuvius,Ischia) (De Vivo et al. 1993; Spera et al. 1998; De Vivo &Rolandi 2001; De Vivo 2006). Soils developed on thesevolcanics, which cover the greater part of the Neapolitan
territory, are characterized by andic properties (di Gennaro &Terribile 1999). The mineralogical assemblage consists mainlyof biotite, sanidine, leucite, garnet and pyroxenes (Imperatoet al. 2003). In particular, leucite occurs only in the Vesuviansoils.
METHODS
Sampling
Soil samples were collected from 207 sites within a network ofan area of c. 120 km2, with a grid of 0.5 � 0.5 km in theurbanized downtown and 1 � 1 km in the suburban areas (Fig.1). About 3 kg of soil sample were taken at depths of 15 cm ineach sampling location. Soil sampled at different points over anarea of c. 10 m2 was combined for each location.
The samples consist of 107 residual soils developed onpyroclastic bedrock collected in the suburban areas and 100soils collected from flowerbeds in the downtown area andreferred to as non-residual soils. Information from Napoli CityPark Authorities indicates that flowerbeds have been in placesince c. 1992 and that they are not fertilized.
Chemical analysis
After being air-dried, the samples were sieved and the <100-mesh fraction (150 µm) was utilized for analysis. Analyses werecarried out at Acme Analytical Laboratories Ltd (Vancouver,Canada), accredited under ISO 9002, by ICP-MS and ICP-AESusing Acme’s Group 1F-MS package (modified aqua regiadigestion) for Ag, Al, As, Au, B, Ba, Bi, Ca, Cd, Co, Cr, Cu, Fe,Ga, Hg, K, La, Mg, Mn, Mo, Na, Ni, Os, P, Pb, Pd, Pt, S, Sb,Sc, Se, Sr, Te, Th, Ti, Tl, U, V, W and Zn. Some elements weredetermined only by ICP-MS (Au, Ga, Hg, Os, Pd, Pt, S, Sc, Se,Te, Tl). Major elements (Al, Ca, Fe, K, Mg, Na, P, Ti) weredetermined by both instruments (ICP-AES and ICP-MS) butthe reported values are from the ICP-AES. Remaining elements
Fig. 1. Traffic flow and sample sites map.
Fig. 2. Schematic geological map of metropolitan area of Napoli.
D. Cicchella et al.104
(Ag, As, B, Ba, Bi, Cd, Co, Cr, Cu, La, Mn, Mo, Ni, Pb, Sb, Sr,Th, U, V, W, Zn) were determined by both instruments. Traceand ultra-trace levels (i.e, <100 mg/kg) of these elements arereported from the ICP-MS whereas elevated concentrations (i.e.>100 mg/kg) are reported from the ICP-AES.
Specifically, a 15-g split of powdered soil was digested in45 ml of aqua regia (2:2:2 of HCl:HNO3:H2O) at 95�C for 1hour. The solution was taken to a final volume of 300 ml with5% HCl. Aliquots of sample solution were aspirated into a JarrelAsh Atomcomp 975 ICP-emission spectrometer and a PerkinElmer Elan 6000 ICP-mass spectrometer.
Analysis of the same sample solution by both ICP-MS andICP-AES allows greater accuracy through cross-checking andbetter interference correction in addition to extending the upperrange of major elements such as Ca, Fe and P. Calibrationsolutions were included at the beginning and end of ananalytical run of 40 solutions. Spiking of the sample solutionwith a tracer element allowed internal standardization. Precisionwas �10% at concentrations of 50 times the detection limit orhigher. Precision was calculated on three in-house replicates and
two blind duplicates submitted by the authors. Accuracy iscalculated on Acme’s in-house reference material, DS3. Refer-ence material DS3 was calibrated to a modified aqua regiadigestion / ICP-MS determination against published values fora concentrated HCl and HNO3 digestion of Canadian CertifiedReference materials (CCRMP) TILL-4 and LKSD-2. The re-sults obtained for these reference materials were consistent withthe values obtained from the certification programme (e.g. Cu,Pb, Zn, Mo, Ag). The digestion by modified aqua regia isconsidered to be pseudo-total for the dissolution of metalbound as water-soluble salts, at cation-exchange sites, staticallybound to clay particles, in organic chelates, in amorphousoxides and hydroxides of Mn and Fe, in carbonates, in sulphidesand some sulphates. It also partially solubilizes metal in silicates(generally the darker-coloured ferromagnesian-rich silicates)and some crystalline oxides of Fe, Ti and Cr.
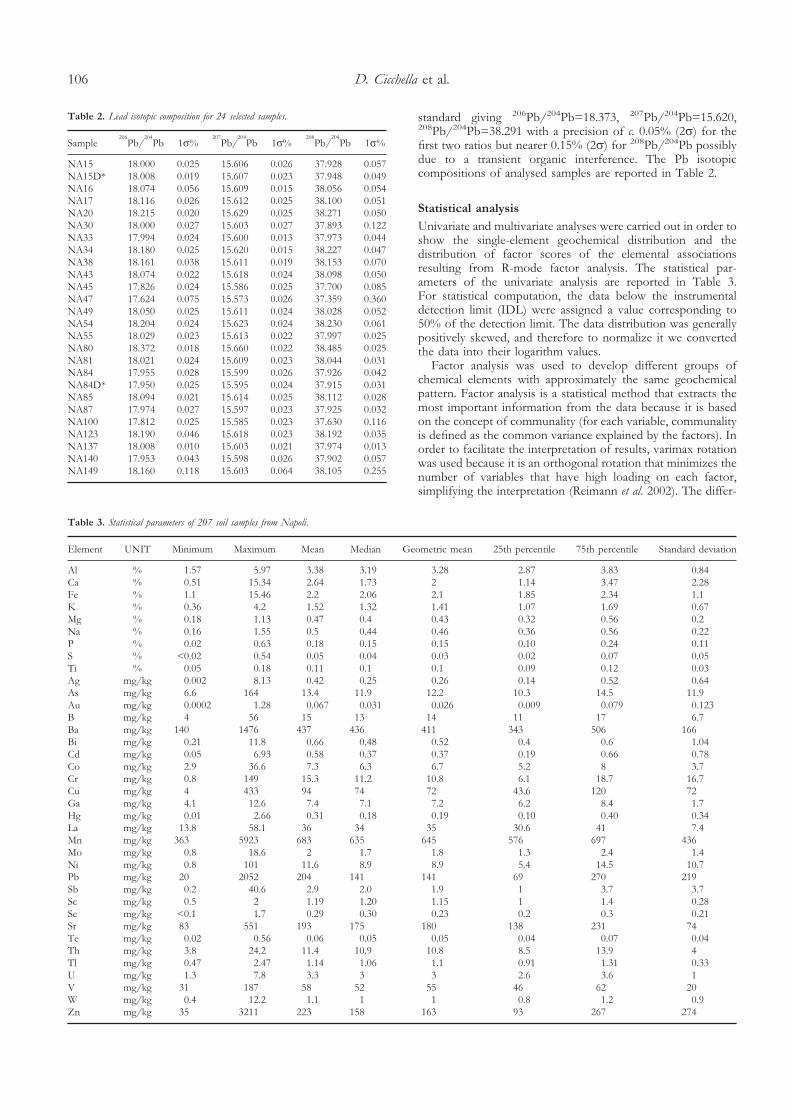
Table 1 lists the elements determined, the instrumentaldetection limits, and the accuracy and the precision of thegeochemical data.
Isotope analysis
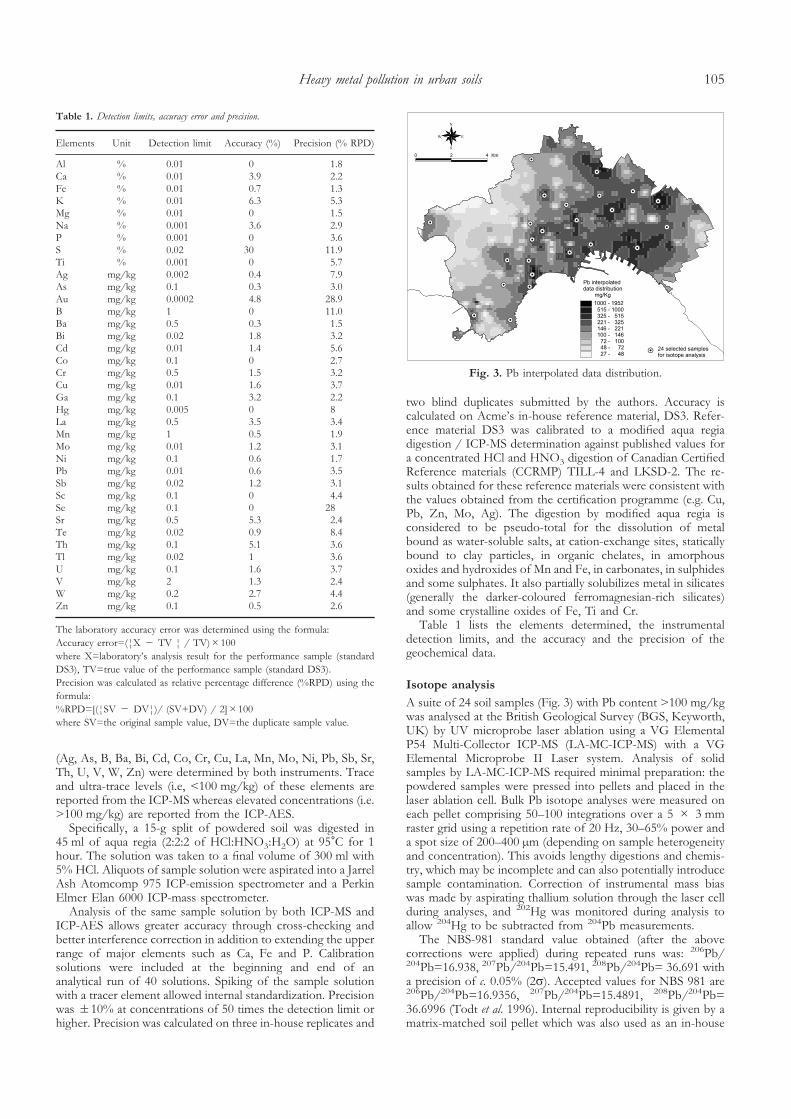
A suite of 24 soil samples (Fig. 3) with Pb content >100 mg/kgwas analysed at the British Geological Survey (BGS, Keyworth,UK) by UV microprobe laser ablation using a VG ElementalP54 Multi-Collector ICP-MS (LA-MC-ICP-MS) with a VGElemental Microprobe II Laser system. Analysis of solidsamples by LA-MC-ICP-MS required minimal preparation: thepowdered samples were pressed into pellets and placed in thelaser ablation cell. Bulk Pb isotope analyses were measured oneach pellet comprising 50–100 integrations over a 5 � 3 mmraster grid using a repetition rate of 20 Hz, 30–65% power anda spot size of 200–400 µm (depending on sample heterogeneityand concentration). This avoids lengthy digestions and chemis-try, which may be incomplete and can also potentially introducesample contamination. Correction of instrumental mass biaswas made by aspirating thallium solution through the laser cellduring analyses, and 202Hg was monitored during analysis toallow 204Hg to be subtracted from 204Pb measurements.
The NBS-981 standard value obtained (after the abovecorrections were applied) during repeated runs was: 206Pb/204Pb=16.938, 207Pb/204Pb=15.491, 208Pb/204Pb= 36.691 witha precision of c. 0.05% (2�). Accepted values for NBS 981 are206Pb/204Pb=16.9356, 207Pb/204Pb=15.4891, 208Pb/204Pb=36.6996 (Todt et al. 1996). Internal reproducibility is given by amatrix-matched soil pellet which was also used as an in-house
Table 1. Detection limits, accuracy error and precision.
Elements Unit Detection limit Accuracy (%) Precision (% RPD)
Al % 0.01 0 1.8Ca % 0.01 3.9 2.2Fe % 0.01 0.7 1.3K % 0.01 6.3 5.3Mg % 0.01 0 1.5Na % 0.001 3.6 2.9P % 0.001 0 3.6S % 0.02 30 11.9Ti % 0.001 0 5.7Ag mg/kg 0.002 0.4 7.9As mg/kg 0.1 0.3 3.0Au mg/kg 0.0002 4.8 28.9B mg/kg 1 0 11.0Ba mg/kg 0.5 0.3 1.5Bi mg/kg 0.02 1.8 3.2Cd mg/kg 0.01 1.4 5.6Co mg/kg 0.1 0 2.7Cr mg/kg 0.5 1.5 3.2Cu mg/kg 0.01 1.6 3.7Ga mg/kg 0.1 3.2 2.2Hg mg/kg 0.005 0 8La mg/kg 0.5 3.5 3.4Mn mg/kg 1 0.5 1.9Mo mg/kg 0.01 1.2 3.1Ni mg/kg 0.1 0.6 1.7Pb mg/kg 0.01 0.6 3.5Sb mg/kg 0.02 1.2 3.1Sc mg/kg 0.1 0 4.4Se mg/kg 0.1 0 28Sr mg/kg 0.5 5.3 2.4Te mg/kg 0.02 0.9 8.4Th mg/kg 0.1 5.1 3.6Tl mg/kg 0.02 1 3.6U mg/kg 0.1 1.6 3.7V mg/kg 2 1.3 2.4W mg/kg 0.2 2.7 4.4Zn mg/kg 0.1 0.5 2.6
The laboratory accuracy error was determined using the formula:Accuracy error=(¦X � TV ¦ / TV)�100where X=laboratory’s analysis result for the performance sample (standardDS3), TV=true value of the performance sample (standard DS3).Precision was calculated as relative percentage difference (%RPD) using theformula:%RPD=[(¦SV � DV¦)/ (SV+DV) / 2]�100where SV=the original sample value, DV=the duplicate sample value.
Fig. 3. Pb interpolated data distribution.
Heavy metal pollution in urban soils 105
standard giving 206Pb/204Pb=18.373, 207Pb/204Pb=15.620,208Pb/204Pb=38.291 with a precision of c. 0.05% (2�) for thefirst two ratios but nearer 0.15% (2�) for 208Pb/204Pb possiblydue to a transient organic interference. The Pb isotopiccompositions of analysed samples are reported in Table 2.
Statistical analysis
Univariate and multivariate analyses were carried out in order toshow the single-element geochemical distribution and thedistribution of factor scores of the elemental associationsresulting from R-mode factor analysis. The statistical par-ameters of the univariate analysis are reported in Table 3.For statistical computation, the data below the instrumentaldetection limit (IDL) were assigned a value corresponding to50% of the detection limit. The data distribution was generallypositively skewed, and therefore to normalize it we convertedthe data into their logarithm values.
Factor analysis was used to develop different groups ofchemical elements with approximately the same geochemicalpattern. Factor analysis is a statistical method that extracts themost important information from the data because it is basedon the concept of communality (for each variable, communalityis defined as the common variance explained by the factors). Inorder to facilitate the interpretation of results, varimax rotationwas used because it is an orthogonal rotation that minimizes thenumber of variables that have high loading on each factor,simplifying the interpretation (Reimann et al. 2002). The differ-
Table 2. Lead isotopic composition for 24 selected samples.
Sample206
Pb/204
Pb 1�%207
Pb/204
Pb 1�%208
Pb/204
Pb 1�%
NA15 18.000 0.025 15.606 0.026 37.928 0.057NA15D* 18.008 0.019 15.607 0.023 37.948 0.049NA16 18.074 0.056 15.609 0.015 38.056 0.054NA17 18.116 0.026 15.612 0.025 38.100 0.051NA20 18.215 0.020 15.629 0.025 38.271 0.050NA30 18.000 0.027 15.603 0.027 37.893 0.122NA33 17.994 0.024 15.600 0.013 37.973 0.044NA34 18.180 0.025 15.620 0.015 38.227 0.047NA38 18.161 0.038 15.611 0.019 38.153 0.070NA43 18.074 0.022 15.618 0.024 38.098 0.050NA45 17.826 0.024 15.586 0.025 37.700 0.085NA47 17.624 0.075 15.573 0.026 37.359 0.360NA49 18.050 0.025 15.611 0.024 38.028 0.052NA54 18.204 0.024 15.623 0.024 38.230 0.061NA55 18.029 0.023 15.613 0.022 37.997 0.025NA80 18.372 0.018 15.660 0.022 38.485 0.025NA81 18.021 0.024 15.609 0.023 38.044 0.031NA84 17.955 0.028 15.599 0.026 37.926 0.042NA84D* 17.950 0.025 15.595 0.024 37.915 0.031NA85 18.094 0.021 15.614 0.025 38.112 0.028NA87 17.974 0.027 15.597 0.023 37.925 0.032NA100 17.812 0.025 15.585 0.023 37.630 0.116NA123 18.190 0.046 15.618 0.023 38.192 0.035NA137 18.008 0.010 15.603 0.021 37.974 0.013NA140 17.953 0.043 15.598 0.026 37.902 0.057NA149 18.160 0.118 15.603 0.064 38.105 0.255
Table 3. Statistical parameters of 207 soil samples from Napoli.
Element UNIT Minimum Maximum Mean Median Geometric mean 25th percentile 75th percentile Standard deviation
Al % 1.57 5.97 3.38 3.19 3.28 2.87 3.83 0.84Ca % 0.51 15.34 2.64 1.73 2 1.14 3.47 2.28Fe % 1.1 15.46 2.2 2.06 2.1 1.85 2.34 1.1K % 0.36 4.2 1.52 1.32 1.41 1.07 1.69 0.67Mg % 0.18 1.13 0.47 0.4 0.43 0.32 0.56 0.2Na % 0.16 1.55 0.5 0.44 0.46 0.36 0.56 0.22P % 0.02 0.63 0.18 0.15 0.15 0.10 0.24 0.11S % <0.02 0.54 0.05 0.04 0.03 0.02 0.07 0.05Ti % 0.05 0.18 0.11 0.1 0.1 0.09 0.12 0.03Ag mg/kg 0.002 8.13 0.42 0.25 0.26 0.14 0.52 0.64As mg/kg 6.6 164 13.4 11.9 12.2 10.3 14.5 11.9Au mg/kg 0.0002 1.28 0.067 0.031 0.026 0.009 0.079 0.123B mg/kg 4 56 15 13 14 11 17 6.7Ba mg/kg 140 1476 437 436 411 343 506 166Bi mg/kg 0.21 11.8 0.66 0.48 0.52 0.4 0.6 1.04Cd mg/kg 0.05 6.93 0.58 0.37 0.37 0.19 0.66 0.78Co mg/kg 2.9 36.6 7.3 6.3 6.7 5.2 8 3.7Cr mg/kg 0.8 149 15.3 11.2 10.8 6.1 18.7 16.7Cu mg/kg 4 433 94 74 72 43.6 120 72Ga mg/kg 4.1 12.6 7.4 7.1 7.2 6.2 8.4 1.7Hg mg/kg 0.01 2.66 0.31 0.18 0.19 0.10 0.40 0.34La mg/kg 13.8 58.1 36 34 35 30.6 41 7.4Mn mg/kg 363 5923 683 635 645 576 697 436Mo mg/kg 0.8 18.6 2 1.7 1.8 1.3 2.4 1.4Ni mg/kg 0.8 101 11.6 8.9 8.9 5.4 14.5 10.7Pb mg/kg 20 2052 204 141 141 69 270 219Sb mg/kg 0.2 40.6 2.9 2.0 1.9 1 3.7 3.7Sc mg/kg 0.5 2 1.19 1.20 1.15 1 1.4 0.28Se mg/kg <0.1 1.7 0.29 0.30 0.23 0.2 0.3 0.21Sr mg/kg 83 551 193 175 180 138 231 74Te mg/kg 0.02 0.56 0.06 0.05 0.05 0.04 0.07 0.04Th mg/kg 3.8 24.2 11.4 10.9 10.8 8.5 13.9 4Tl mg/kg 0.47 2.47 1.14 1.06 1.1 0.91 1.31 0.33U mg/kg 1.3 7.8 3.3 3 3 2.6 3.6 1V mg/kg 31 187 58 52 55 46 62 20W mg/kg 0.4 12.2 1.1 1 1 0.8 1.2 0.9Zn mg/kg 35 3211 223 158 163 93 267 274
D. Cicchella et al.106
ent factors obtained were studied and interpreted in accordancewith their hypothetical origin (natural, anthropogenic or mixed).
R-mode factor analysis has been performed using GRFACsoftware (Miesch Programs 1990) on a matrix containing 35elements. The chemical elements with an elevated percentage(>5%) of analytical determinations below the instrumentaldetection limit were not considered for factor analysis. Thefour-factor model, accounting for 78.5% of the data variability,deemed appropriate for Neapolitan volcanic soil data is shownin Table 4. Elements with loadings over (0.5) are considered asrepresentative members of each association that results fromthe chosen factor model. The element association F1 (Pb-Sb-Ag-Au-Cd-Cr-Zn-P-Hg-Ni-Cu-Ca-Mo-Ba) accounts for 51.6%of total data variability while the F2 association (Ga-La-Al-Ti-Tl-Th-U-Sc-Co) accounts for 28.6% of total data variability; F3(Na-Sr-K-B-Mg-Ca-Mo-V-Ba) and F4 (As-Mn-Fe-W-Bi-Te-V)account for 12.4% and 7.4% of total data variability, respect-ively. In each association, elements are listed with decreasingloadings (Table 4).
Geochemical mapping
Maps showing Pb and the four association factor score distri-butions have been obtained using GeoDAS and ArcView GIS
software. Multifractal inverse distance weighted (IDW) is theinterpolation method used with a search distance of 1 km andmap resolution of 150 m (for more details on this methodology,see Cheng 2000; Lima et al. 2003a; Cicchella et al. 2005).
RESULTS AND DISCUSSION
Heavy metal distribution
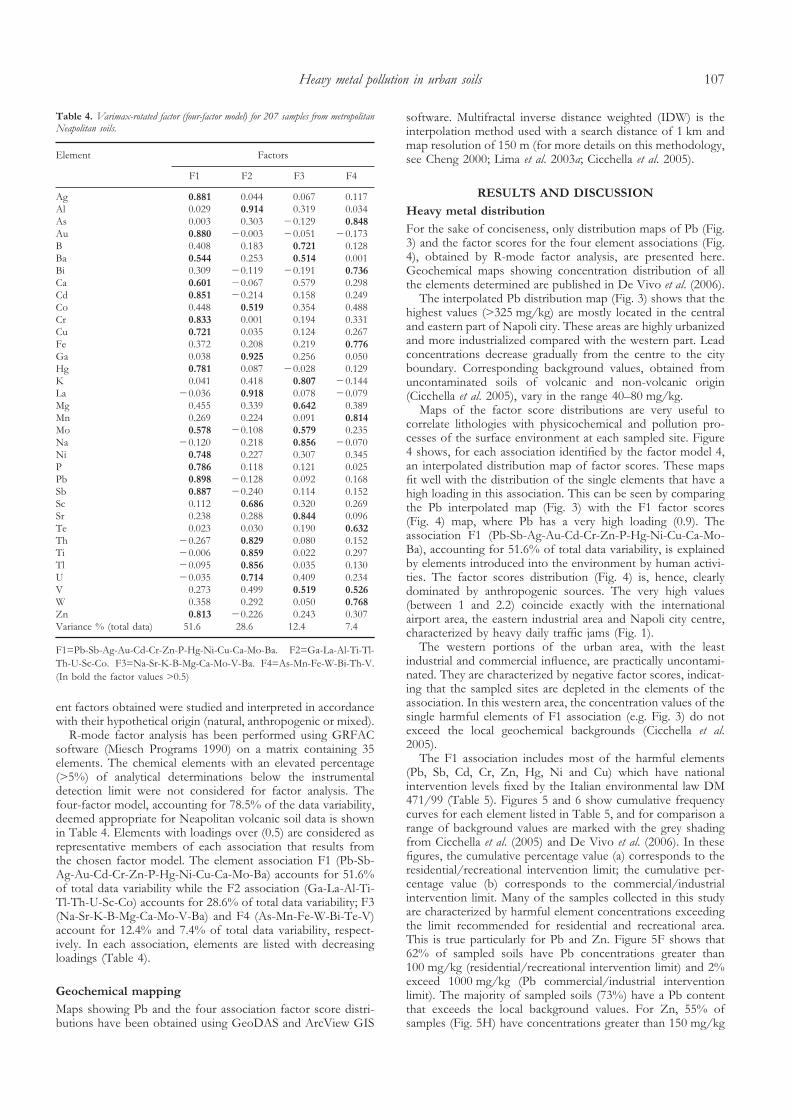
For the sake of conciseness, only distribution maps of Pb (Fig.3) and the factor scores for the four element associations (Fig.4), obtained by R-mode factor analysis, are presented here.Geochemical maps showing concentration distribution of allthe elements determined are published in De Vivo et al. (2006).
The interpolated Pb distribution map (Fig. 3) shows that thehighest values (>325 mg/kg) are mostly located in the centraland eastern part of Napoli city. These areas are highly urbanizedand more industrialized compared with the western part. Leadconcentrations decrease gradually from the centre to the cityboundary. Corresponding background values, obtained fromuncontaminated soils of volcanic and non-volcanic origin(Cicchella et al. 2005), vary in the range 40–80 mg/kg.
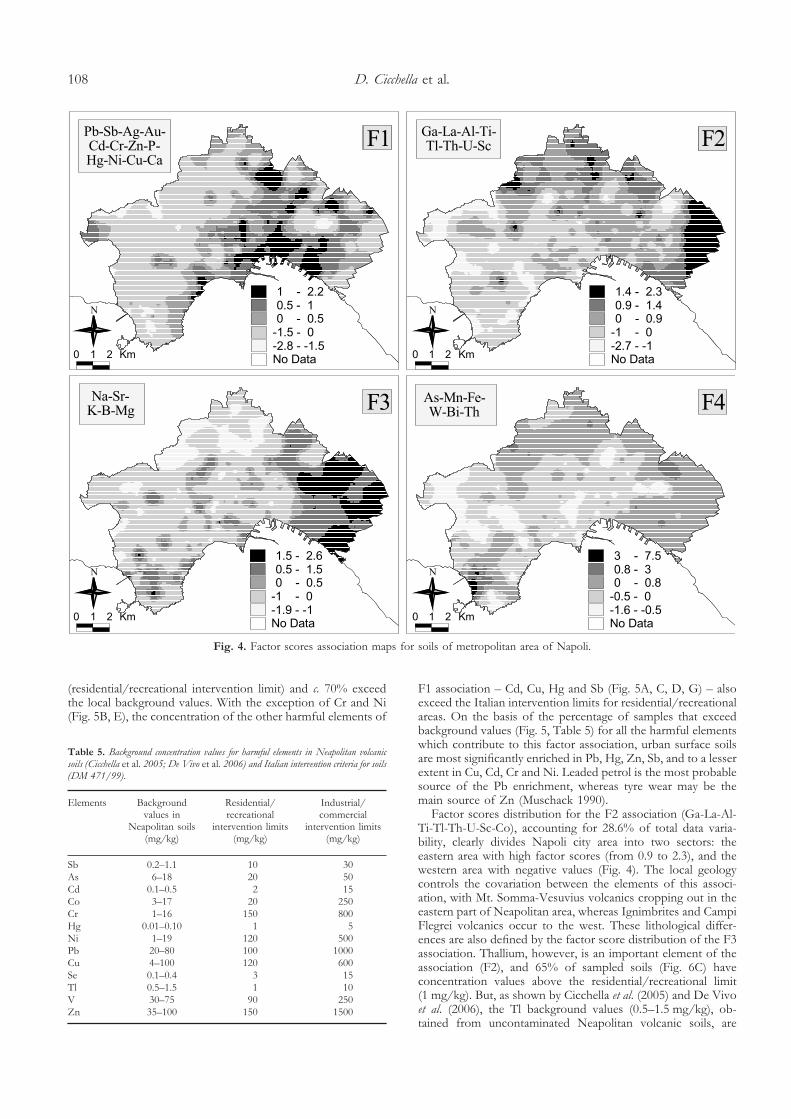
Maps of the factor score distributions are very useful tocorrelate lithologies with physicochemical and pollution pro-cesses of the surface environment at each sampled site. Figure4 shows, for each association identified by the factor model 4,an interpolated distribution map of factor scores. These mapsfit well with the distribution of the single elements that have ahigh loading in this association. This can be seen by comparingthe Pb interpolated map (Fig. 3) with the F1 factor scores(Fig. 4) map, where Pb has a very high loading (0.9). Theassociation F1 (Pb-Sb-Ag-Au-Cd-Cr-Zn-P-Hg-Ni-Cu-Ca-Mo-Ba), accounting for 51.6% of total data variability, is explainedby elements introduced into the environment by human activi-ties. The factor scores distribution (Fig. 4) is, hence, clearlydominated by anthropogenic sources. The very high values(between 1 and 2.2) coincide exactly with the internationalairport area, the eastern industrial area and Napoli city centre,characterized by heavy daily traffic jams (Fig. 1).
The western portions of the urban area, with the leastindustrial and commercial influence, are practically uncontami-nated. They are characterized by negative factor scores, indicat-ing that the sampled sites are depleted in the elements of theassociation. In this western area, the concentration values of thesingle harmful elements of F1 association (e.g. Fig. 3) do notexceed the local geochemical backgrounds (Cicchella et al.2005).
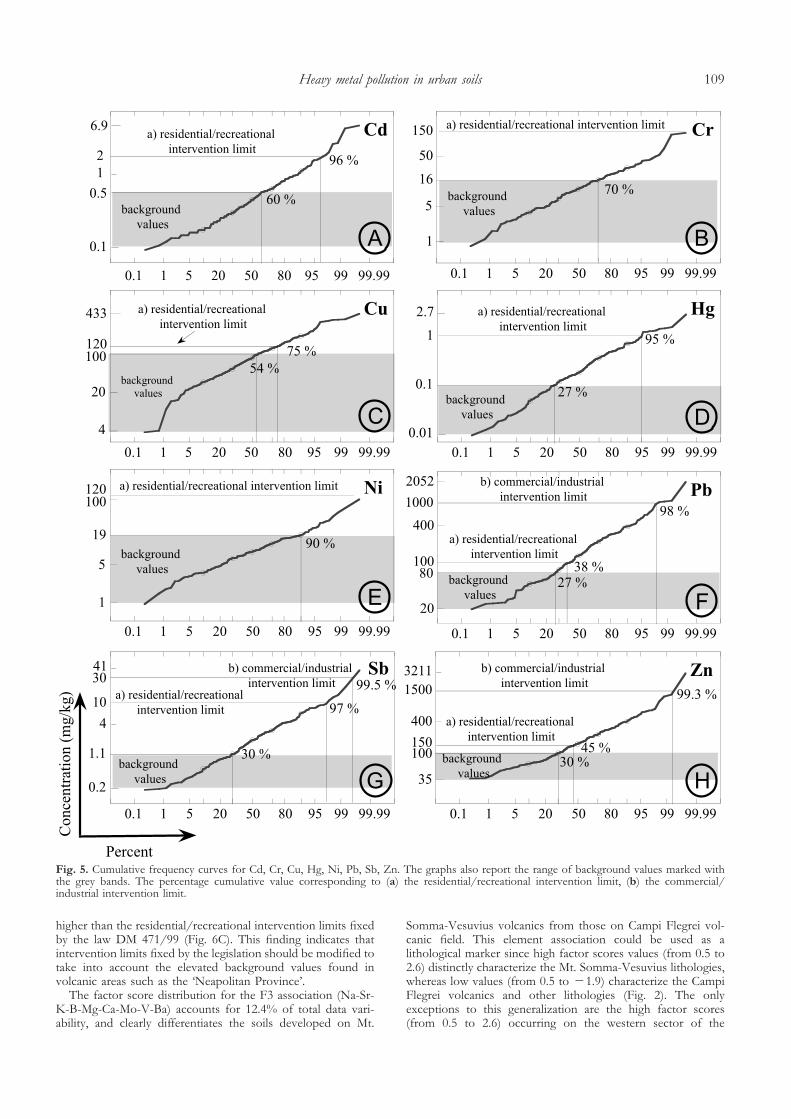
The F1 association includes most of the harmful elements(Pb, Sb, Cd, Cr, Zn, Hg, Ni and Cu) which have nationalintervention levels fixed by the Italian environmental law DM471/99 (Table 5). Figures 5 and 6 show cumulative frequencycurves for each element listed in Table 5, and for comparison arange of background values are marked with the grey shadingfrom Cicchella et al. (2005) and De Vivo et al. (2006). In thesefigures, the cumulative percentage value (a) corresponds to theresidential/recreational intervention limit; the cumulative per-centage value (b) corresponds to the commercial/industrialintervention limit. Many of the samples collected in this studyare characterized by harmful element concentrations exceedingthe limit recommended for residential and recreational area.This is true particularly for Pb and Zn. Figure 5F shows that62% of sampled soils have Pb concentrations greater than100 mg/kg (residential/recreational intervention limit) and 2%exceed 1000 mg/kg (Pb commercial/industrial interventionlimit). The majority of sampled soils (73%) have a Pb contentthat exceeds the local background values. For Zn, 55% ofsamples (Fig. 5H) have concentrations greater than 150 mg/kg
Table 4. Varimax-rotated factor (four-factor model) for 207 samples from metropolitanNeapolitan soils.
Element Factors
F1 F2 F3 F4
Ag 0.881 0.044 0.067 0.117Al 0.029 0.914 0.319 0.034As 0.003 0.303 �0.129 0.848
Au 0.880 �0.003 �0.051 �0.173B 0.408 0.183 0.721 0.128Ba 0.544 0.253 0.514 0.001Bi 0.309 �0.119 �0.191 0.736
Ca 0.601 �0.067 0.579 0.298Cd 0.851 �0.214 0.158 0.249Co 0.448 0.519 0.354 0.488Cr 0.833 0.001 0.194 0.331Cu 0.721 0.035 0.124 0.267Fe 0.372 0.208 0.219 0.776
Ga 0.038 0.925 0.256 0.050Hg 0.781 0.087 �0.028 0.129K 0.041 0.418 0.807 �0.144La �0.036 0.918 0.078 �0.079Mg 0.455 0.339 0.642 0.389Mn 0.269 0.224 0.091 0.814
Mo 0.578 �0.108 0.579 0.235Na �0.120 0.218 0.856 �0.070Ni 0.748 0.227 0.307 0.345P 0.786 0.118 0.121 0.025Pb 0.898 �0.128 0.092 0.168Sb 0.887 �0.240 0.114 0.152Sc 0.112 0.686 0.320 0.269Sr 0.238 0.288 0.844 0.096Te 0.023 0.030 0.190 0.632
Th �0.267 0.829 0.080 0.152Ti �0.006 0.859 0.022 0.297Tl �0.095 0.856 0.035 0.130U �0.035 0.714 0.409 0.234V 0.273 0.499 0.519 0.526
W 0.358 0.292 0.050 0.768
Zn 0.813 �0.226 0.243 0.307Variance % (total data) 51.6 28.6 12.4 7.4
F1=Pb-Sb-Ag-Au-Cd-Cr-Zn-P-Hg-Ni-Cu-Ca-Mo-Ba. F2=Ga-La-Al-Ti-Tl-Th-U-Sc-Co. F3=Na-Sr-K-B-Mg-Ca-Mo-V-Ba. F4=As-Mn-Fe-W-Bi-Th-V.(In bold the factor values >0.5)
Heavy metal pollution in urban soils 107
(residential/recreational intervention limit) and c. 70% exceedthe local background values. With the exception of Cr and Ni(Fig. 5B, E), the concentration of the other harmful elements of
F1 association – Cd, Cu, Hg and Sb (Fig. 5A, C, D, G) – alsoexceed the Italian intervention limits for residential/recreationalareas. On the basis of the percentage of samples that exceedbackground values (Fig. 5, Table 5) for all the harmful elementswhich contribute to this factor association, urban surface soilsare most significantly enriched in Pb, Hg, Zn, Sb, and to a lesserextent in Cu, Cd, Cr and Ni. Leaded petrol is the most probablesource of the Pb enrichment, whereas tyre wear may be themain source of Zn (Muschack 1990).
Factor scores distribution for the F2 association (Ga-La-Al-Ti-Tl-Th-U-Sc-Co), accounting for 28.6% of total data varia-bility, clearly divides Napoli city area into two sectors: theeastern area with high factor scores (from 0.9 to 2.3), and thewestern area with negative values (Fig. 4). The local geologycontrols the covariation between the elements of this associ-ation, with Mt. Somma-Vesuvius volcanics cropping out in theeastern part of Neapolitan area, whereas Ignimbrites and CampiFlegrei volcanics occur to the west. These lithological differ-ences are also defined by the factor score distribution of the F3association. Thallium, however, is an important element of theassociation (F2), and 65% of sampled soils (Fig. 6C) haveconcentration values above the residential/recreational limit(1 mg/kg). But, as shown by Cicchella et al. (2005) and De Vivoet al. (2006), the Tl background values (0.5–1.5 mg/kg), ob-tained from uncontaminated Neapolitan volcanic soils, are
Fig. 4. Factor scores association maps for soils of metropolitan area of Napoli.
Table 5. Background concentration values for harmful elements in Neapolitan volcanicsoils (Cicchella et al. 2005; De Vivo et al. 2006) and Italian intervention criteria for soils(DM 471/99).
Elements Backgroundvalues in
Neapolitan soils(mg/kg)
Residential/recreational
intervention limits(mg/kg)
Industrial/commercial
intervention limits(mg/kg)
Sb 0.2–1.1 10 30As 6–18 20 50Cd 0.1–0.5 2 15Co 3–17 20 250Cr 1–16 150 800Hg 0.01–0.10 1 5Ni 1–19 120 500Pb 20–80 100 1000Cu 4–100 120 600Se 0.1–0.4 3 15Tl 0.5–1.5 1 10V 30–75 90 250Zn 35–100 150 1500
D. Cicchella et al.108
higher than the residential/recreational intervention limits fixedby the law DM 471/99 (Fig. 6C). This finding indicates thatintervention limits fixed by the legislation should be modified totake into account the elevated background values found involcanic areas such as the ‘Neapolitan Province’.
The factor score distribution for the F3 association (Na-Sr-K-B-Mg-Ca-Mo-V-Ba) accounts for 12.4% of total data vari-ability, and clearly differentiates the soils developed on Mt.
Somma-Vesuvius volcanics from those on Campi Flegrei vol-canic field. This element association could be used as alithological marker since high factor scores values (from 0.5 to2.6) distinctly characterize the Mt. Somma-Vesuvius lithologies,whereas low values (from 0.5 to �1.9) characterize the CampiFlegrei volcanics and other lithologies (Fig. 2). The onlyexceptions to this generalization are the high factor scores(from 0.5 to 2.6) occurring on the western sector of the
Fig. 5. Cumulative frequency curves for Cd, Cr, Cu, Hg, Ni, Pb, Sb, Zn. The graphs also report the range of background values marked withthe grey bands. The percentage cumulative value corresponding to (a) the residential/recreational intervention limit, (b) the commercial/industrial intervention limit.
Heavy metal pollution in urban soils 109
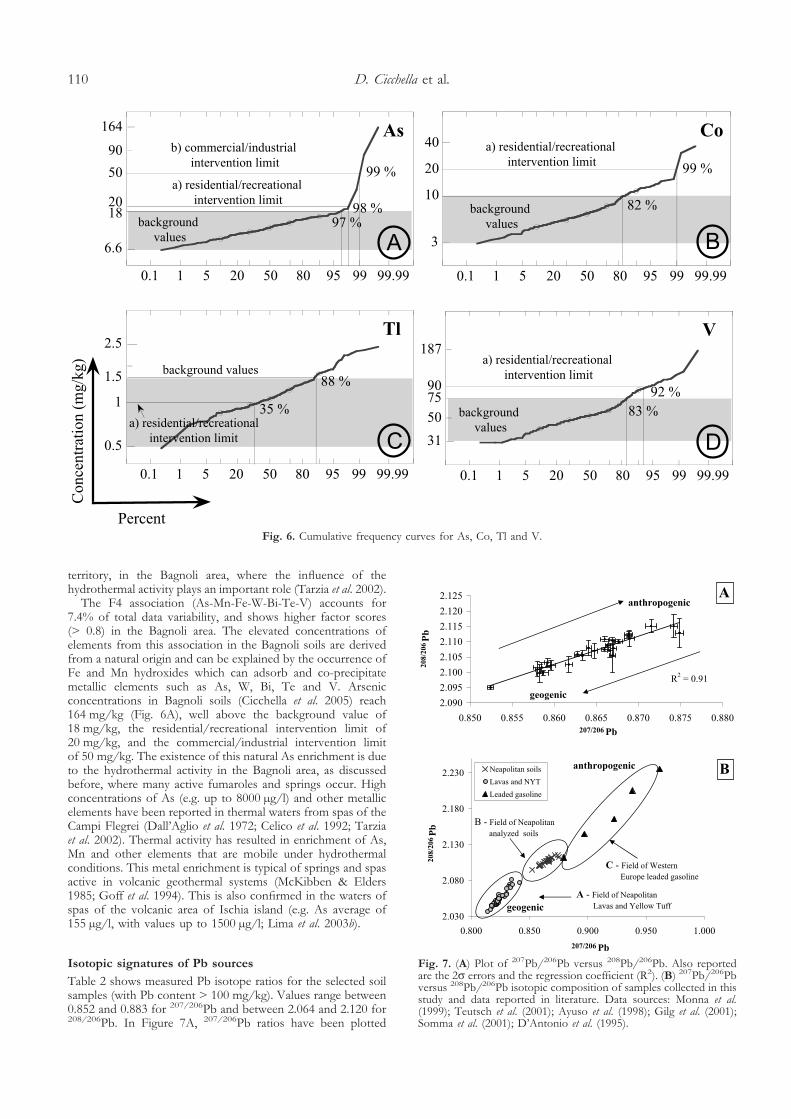
territory, in the Bagnoli area, where the influence of thehydrothermal activity plays an important role (Tarzia et al. 2002).
The F4 association (As-Mn-Fe-W-Bi-Te-V) accounts for7.4% of total data variability, and shows higher factor scores(> 0.8) in the Bagnoli area. The elevated concentrations ofelements from this association in the Bagnoli soils are derivedfrom a natural origin and can be explained by the occurrence ofFe and Mn hydroxides which can adsorb and co-precipitatemetallic elements such as As, W, Bi, Te and V. Arsenicconcentrations in Bagnoli soils (Cicchella et al. 2005) reach164 mg/kg (Fig. 6A), well above the background value of18 mg/kg, the residential/recreational intervention limit of20 mg/kg, and the commercial/industrial intervention limitof 50 mg/kg. The existence of this natural As enrichment is dueto the hydrothermal activity in the Bagnoli area, as discussedbefore, where many active fumaroles and springs occur. Highconcentrations of As (e.g. up to 8000 µg/l) and other metallicelements have been reported in thermal waters from spas of theCampi Flegrei (Dall’Aglio et al. 1972; Celico et al. 1992; Tarziaet al. 2002). Thermal activity has resulted in enrichment of As,Mn and other elements that are mobile under hydrothermalconditions. This metal enrichment is typical of springs and spasactive in volcanic geothermal systems (McKibben & Elders1985; Goff et al. 1994). This is also confirmed in the waters ofspas of the volcanic area of Ischia island (e.g. As average of155 µg/l, with values up to 1500 µg/l; Lima et al. 2003b).
Isotopic signatures of Pb sources
Table 2 shows measured Pb isotope ratios for the selected soilsamples (with Pb content > 100 mg/kg). Values range between0.852 and 0.883 for 207/206Pb and between 2.064 and 2.120 for208/206Pb. In Figure 7A, 207/206Pb ratios have been plotted
Fig. 6. Cumulative frequency curves for As, Co, Tl and V.
Fig. 7. (A) Plot of 207Pb/206Pb versus 208Pb/206Pb. Also reportedare the 2� errors and the regression coefficient (R2). (B) 207Pb/206Pbversus 208Pb/206Pb isotopic composition of samples collected in thisstudy and data reported in literature. Data sources: Monna et al.(1999); Teutsch et al. (2001); Ayuso et al. (1998); Gilg et al. (2001);Somma et al. (2001); D’Antonio et al. (1995).
D. Cicchella et al.110
against 208/206Pb ratios, and show a linear trend with asignificant regression coefficient (R2=0.91).
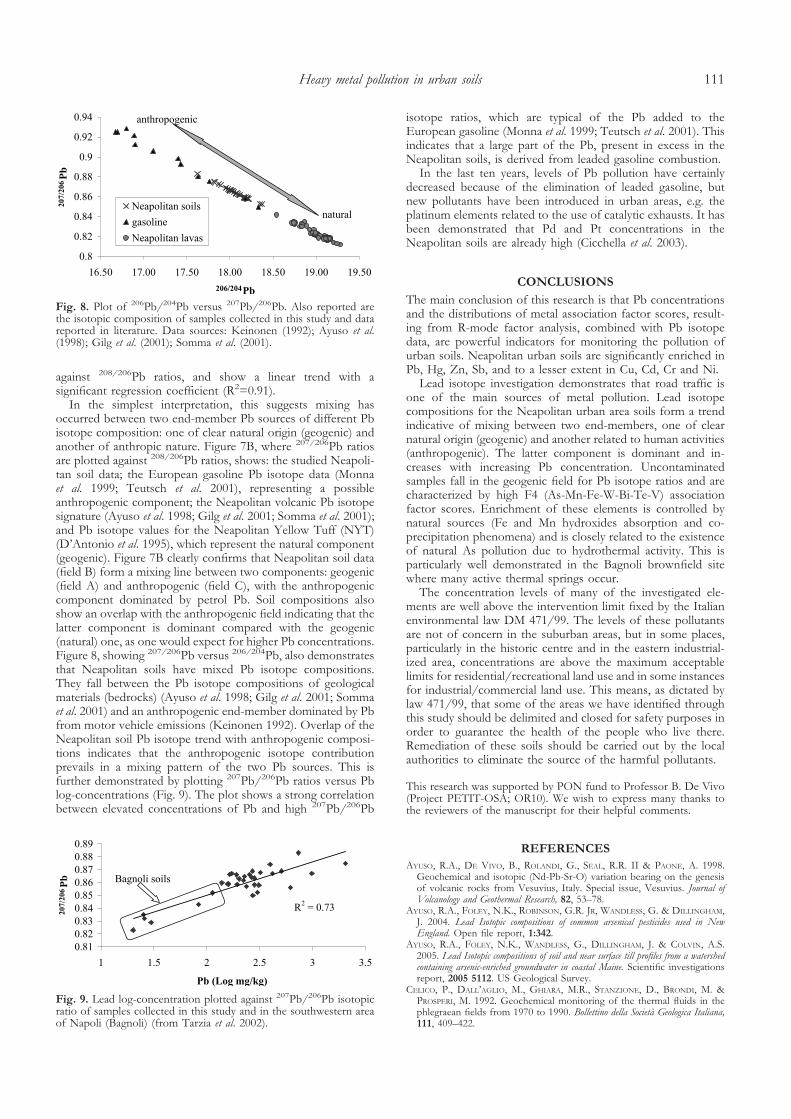
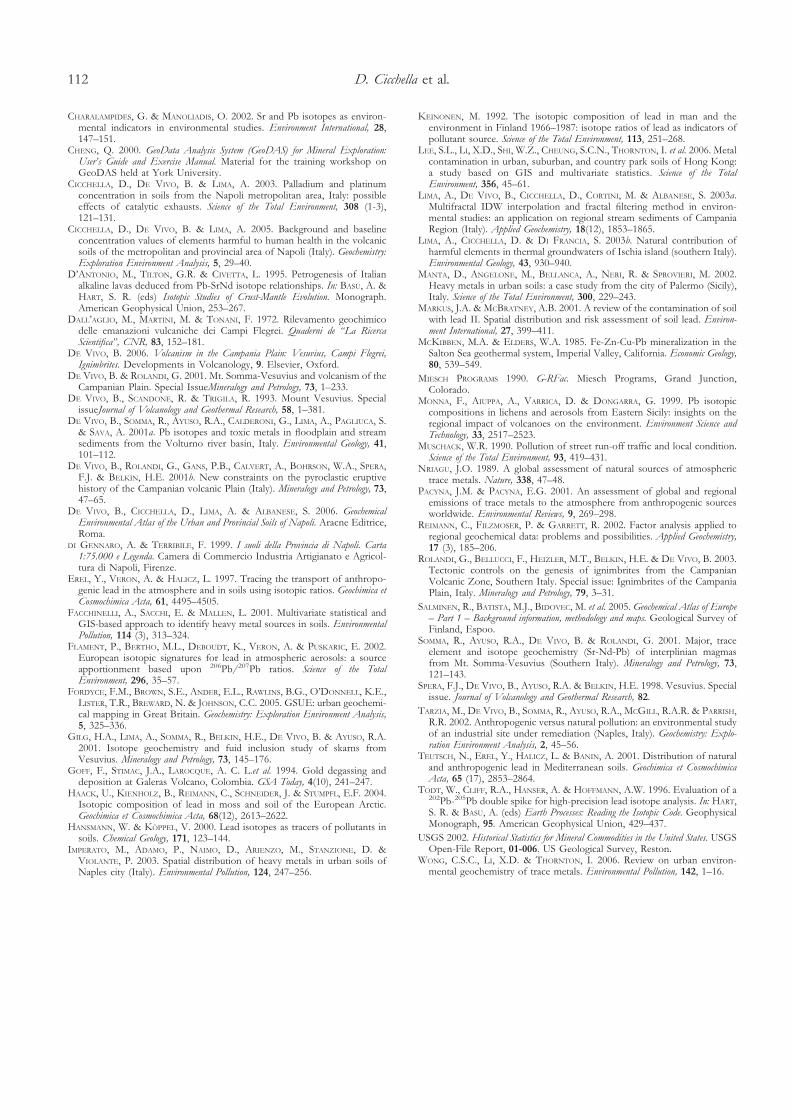
In the simplest interpretation, this suggests mixing hasoccurred between two end-member Pb sources of different Pbisotope composition: one of clear natural origin (geogenic) andanother of anthropic nature. Figure 7B, where 207/206Pb ratiosare plotted against 208/206Pb ratios, shows: the studied Neapoli-tan soil data; the European gasoline Pb isotope data (Monnaet al. 1999; Teutsch et al. 2001), representing a possibleanthropogenic component; the Neapolitan volcanic Pb isotopesignature (Ayuso et al. 1998; Gilg et al. 2001; Somma et al. 2001);and Pb isotope values for the Neapolitan Yellow Tuff (NYT)(D’Antonio et al. 1995), which represent the natural component(geogenic). Figure 7B clearly confirms that Neapolitan soil data(field B) form a mixing line between two components: geogenic(field A) and anthropogenic (field C), with the anthropogeniccomponent dominated by petrol Pb. Soil compositions alsoshow an overlap with the anthropogenic field indicating that thelatter component is dominant compared with the geogenic(natural) one, as one would expect for higher Pb concentrations.Figure 8, showing 207/206Pb versus 206/204Pb, also demonstratesthat Neapolitan soils have mixed Pb isotope compositions.They fall between the Pb isotope compositions of geologicalmaterials (bedrocks) (Ayuso et al. 1998; Gilg et al. 2001; Sommaet al. 2001) and an anthropogenic end-member dominated by Pbfrom motor vehicle emissions (Keinonen 1992). Overlap of theNeapolitan soil Pb isotope trend with anthropogenic composi-tions indicates that the anthropogenic isotope contributionprevails in a mixing pattern of the two Pb sources. This isfurther demonstrated by plotting 207Pb/206Pb ratios versus Pblog-concentrations (Fig. 9). The plot shows a strong correlationbetween elevated concentrations of Pb and high 207Pb/206Pb
isotope ratios, which are typical of the Pb added to theEuropean gasoline (Monna et al. 1999; Teutsch et al. 2001). Thisindicates that a large part of the Pb, present in excess in theNeapolitan soils, is derived from leaded gasoline combustion.
In the last ten years, levels of Pb pollution have certainlydecreased because of the elimination of leaded gasoline, butnew pollutants have been introduced in urban areas, e.g. theplatinum elements related to the use of catalytic exhausts. It hasbeen demonstrated that Pd and Pt concentrations in theNeapolitan soils are already high (Cicchella et al. 2003).
CONCLUSIONS
The main conclusion of this research is that Pb concentrationsand the distributions of metal association factor scores, result-ing from R-mode factor analysis, combined with Pb isotopedata, are powerful indicators for monitoring the pollution ofurban soils. Neapolitan urban soils are significantly enriched inPb, Hg, Zn, Sb, and to a lesser extent in Cu, Cd, Cr and Ni.
Lead isotope investigation demonstrates that road traffic isone of the main sources of metal pollution. Lead isotopecompositions for the Neapolitan urban area soils form a trendindicative of mixing between two end-members, one of clearnatural origin (geogenic) and another related to human activities(anthropogenic). The latter component is dominant and in-creases with increasing Pb concentration. Uncontaminatedsamples fall in the geogenic field for Pb isotope ratios and arecharacterized by high F4 (As-Mn-Fe-W-Bi-Te-V) associationfactor scores. Enrichment of these elements is controlled bynatural sources (Fe and Mn hydroxides absorption and co-precipitation phenomena) and is closely related to the existenceof natural As pollution due to hydrothermal activity. This isparticularly well demonstrated in the Bagnoli brownfield sitewhere many active thermal springs occur.
The concentration levels of many of the investigated ele-ments are well above the intervention limit fixed by the Italianenvironmental law DM 471/99. The levels of these pollutantsare not of concern in the suburban areas, but in some places,particularly in the historic centre and in the eastern industrial-ized area, concentrations are above the maximum acceptablelimits for residential/recreational land use and in some instancesfor industrial/commercial land use. This means, as dictated bylaw 471/99, that some of the areas we have identified throughthis study should be delimited and closed for safety purposes inorder to guarantee the health of the people who live there.Remediation of these soils should be carried out by the localauthorities to eliminate the source of the harmful pollutants.
This research was supported by PON fund to Professor B. De Vivo(Project PETIT-OSA; OR10). We wish to express many thanks tothe reviewers of the manuscript for their helpful comments.
REFERENCES
AYUSO, R.A., DE VIVO, B., ROLANDI, G., SEAL, R.R. II & PAONE, A. 1998.Geochemical and isotopic (Nd-Pb-Sr-O) variation bearing on the genesisof volcanic rocks from Vesuvius, Italy. Special issue, Vesuvius. Journal ofVolcanology and Geothermal Research, 82, 53–78.
AYUSO, R.A., FOLEY, N.K., ROBINSON, G.R. JR, WANDLESS, G. & DILLINGHAM,J. 2004. Lead Isotopic compositions of common arsenical pesticides used in NewEngland. Open file report, 1:342.
AYUSO, R.A., FOLEY, N.K., WANDLESS, G., DILLINGHAM, J. & COLVIN, A.S.2005. Lead Isotopic compositions of soil and near surface till profiles from a watershedcontaining arsenic-enriched groundwater in coastal Maine. Scientific investigationsreport, 2005 5112. US Geological Survey.
CELICO, P., DALL’AGLIO, M., GHIARA, M.R., STANZIONE, D., BRONDI, M. &PROSPERI, M. 1992. Geochemical monitoring of the thermal fluids in thephlegraean fields from 1970 to 1990. Bollettino della Società Geologica Italiana,111, 409–422.
Fig. 8. Plot of 206Pb/204Pb versus 207Pb/206Pb. Also reported arethe isotopic composition of samples collected in this study and datareported in literature. Data sources: Keinonen (1992); Ayuso et al.(1998); Gilg et al. (2001); Somma et al. (2001).
Fig. 9. Lead log-concentration plotted against 207Pb/206Pb isotopicratio of samples collected in this study and in the southwestern areaof Napoli (Bagnoli) (from Tarzia et al. 2002).
Heavy metal pollution in urban soils 111
CHARALAMPIDES, G. & MANOLIADIS, O. 2002. Sr and Pb isotopes as environ-mental indicators in environmental studies. Environment International, 28,147–151.
CHENG, Q. 2000. GeoData Analysis System (GeoDAS) for Mineral Exploration:User’s Guide and Exercise Manual. Material for the training workshop onGeoDAS held at York University.
CICCHELLA, D., DE VIVO, B. & LIMA, A. 2003. Palladium and platinumconcentration in soils from the Napoli metropolitan area, Italy: possibleeffects of catalytic exhausts. Science of the Total Environment, 308 (1-3),121–131.
CICCHELLA, D., DE VIVO, B. & LIMA, A. 2005. Background and baselineconcentration values of elements harmful to human health in the volcanicsoils of the metropolitan and provincial area of Napoli (Italy). Geochemistry:Exploration Environment Analysis, 5, 29–40.
D’ANTONIO, M., TILTON, G.R. & CIVETTA, L. 1995. Petrogenesis of Italianalkaline lavas deduced from Pb-SrNd isotope relationships. In: BASU, A. &HART, S. R. (eds) Isotopic Studies of Crust-Mantle Evolution. Monograph.American Geophysical Union, 253–267.
DALL’AGLIO, M., MARTINI, M. & TONANI, F. 1972. Rilevamento geochimicodelle emanazioni vulcaniche dei Campi Flegrei. Quaderni de “La RicercaScientifica”, CNR, 83, 152–181.
DE VIVO, B. 2006. Volcanism in the Campania Plain: Vesuvius, Campi Flegrei,Ignimbrites. Developments in Volcanology, 9. Elsevier, Oxford.
DE VIVO, B. & ROLANDI, G. 2001. Mt. Somma-Vesuvius and volcanism of theCampanian Plain. Special IssueMineralogy and Petrology, 73, 1–233.
DE VIVO, B., SCANDONE, R. & TRIGILA, R. 1993. Mount Vesuvius. SpecialissueJournal of Volcanology and Geothermal Research, 58, 1–381.
DE VIVO, B., SOMMA, R., AYUSO, R.A., CALDERONI, G., LIMA, A., PAGLIUCA, S.& SAVA, A. 2001a. Pb isotopes and toxic metals in floodplain and streamsediments from the Volturno river basin, Italy. Environmental Geology, 41,101–112.
DE VIVO, B., ROLANDI, G., GANS, P.B., CALVERT, A., BOHRSON, W.A., SPERA,F.J. & BELKIN, H.E. 2001b. New constraints on the pyroclastic eruptivehistory of the Campanian volcanic Plain (Italy). Mineralogy and Petrology, 73,47–65.
DE VIVO, B., CICCHELLA, D., LIMA, A. & ALBANESE, S. 2006. GeochemicalEnvironmental Atlas of the Urban and Provincial Soils of Napoli. Aracne Editrice,Roma.
DI GENNARO, A. & TERRIBILE, F. 1999. I suoli della Provincia di Napoli. Carta1:75.000 e Legenda. Camera di Commercio Industria Artigianato e Agricol-tura di Napoli, Firenze.
EREL, Y., VERON, A. & HALICZ, L. 1997. Tracing the transport of anthropo-genic lead in the atmosphere and in soils using isotopic ratios. Geochimica etCosmochimica Acta, 61, 4495–4505.
FACCHINELLI, A., SACCHI, E. & MALLEN, L. 2001. Multivariate statistical andGIS-based approach to identify heavy metal sources in soils. EnvironmentalPollution, 114 (3), 313–324.
FLAMENT, P., BERTHO, M.L., DEBOUDT, K., VERON, A. & PUSKARIC, E. 2002.European isotopic signatures for lead in atmospheric aerosols: a sourceapportionment based upon 206Pb/207Pb ratios. Science of the TotalEnvironment, 296, 35–57.
FORDYCE, F.M., BROWN, S.E., ANDER, E.L., RAWLINS, B.G., O’DONNELL, K.E.,LISTER, T.R., BREWARD, N. & JOHNSON, C.C. 2005. GSUE: urban geochemi-cal mapping in Great Britain. Geochemistry: Exploration Environment Analysis,5, 325–336.
GILG, H.A., LIMA, A., SOMMA, R., BELKIN, H.E., DE VIVO, B. & AYUSO, R.A.2001. Isotope geochemistry and fuid inclusion study of skarns fromVesuvius. Mineralogy and Petrology, 73, 145–176.
GOFF, F., STIMAC, J.A., LAROCQUE, A. C. L.et al. 1994. Gold degassing anddeposition at Galeras Volcano, Colombia. GSA Today, 4(10), 241–247.
HAACK, U., KIENHOLZ, B., REIMANN, C., SCHNEIDER, J. & STUMPFL, E.F. 2004.Isotopic composition of lead in moss and soil of the European Arctic.Geochimica et Cosmochimica Acta, 68(12), 2613–2622.
HANSMANN, W. & KÖPPEL, V. 2000. Lead isotopes as tracers of pollutants insoils. Chemical Geology, 171, 123–144.
IMPERATO, M., ADAMO, P., NAIMO, D., ARIENZO, M., STANZIONE, D. &VIOLANTE, P. 2003. Spatial distribution of heavy metals in urban soils ofNaples city (Italy). Environmental Pollution, 124, 247–256.
KEINONEN, M. 1992. The isotopic composition of lead in man and theenvironment in Finland 1966–1987: isotope ratios of lead as indicators ofpollutant source. Science of the Total Environment, 113, 251–268.
LEE, S.L., LI, X.D., SHI, W.Z., CHEUNG, S.C.N., THORNTON, I. et al. 2006. Metalcontamination in urban, suburban, and country park soils of Hong Kong:a study based on GIS and multivariate statistics. Science of the TotalEnvironment, 356, 45–61.
LIMA, A., DE VIVO, B., CICCHELLA, D., CORTINI, M. & ALBANESE, S. 2003a.Multifractal IDW interpolation and fractal filtering method in environ-mental studies: an application on regional stream sediments of CampaniaRegion (Italy). Applied Geochemistry, 18(12), 1853–1865.
LIMA, A., CICCHELLA, D. & DI FRANCIA, S. 2003b. Natural contribution ofharmful elements in thermal groundwaters of Ischia island (southern Italy).Environmental Geology, 43, 930–940.
MANTA, D., ANGELONE, M., BELLANCA, A., NERI, R. & SPROVIERI, M. 2002.Heavy metals in urban soils: a case study from the city of Palermo (Sicily),Italy. Science of the Total Environment, 300, 229–243.
MARKUS, J.A. & MCBRATNEY, A.B. 2001. A review of the contamination of soilwith lead II. Spatial distribution and risk assessment of soil lead. Environ-ment International, 27, 399–411.
MCKIBBEN, M.A. & ELDERS, W.A. 1985. Fe-Zn-Cu-Pb mineralization in theSalton Sea geothermal system, Imperial Valley, California. Economic Geology,80, 539–549.
MIESCH PROGRAMS 1990. G-RFac. Miesch Programs, Grand Junction,Colorado.
MONNA, F., AIUPPA, A., VARRICA, D. & DONGARRA, G. 1999. Pb isotopiccompositions in lichens and aerosols from Eastern Sicily: insights on theregional impact of volcanoes on the environment. Environment Science andTechnology, 33, 2517–2523.
MUSCHACK, W.R. 1990. Pollution of street run-off traffic and local condition.Science of the Total Environment, 93, 419–431.
NRIAGU, J.O. 1989. A global assessment of natural sources of atmospherictrace metals. Nature, 338, 47–48.
PACYNA, J.M. & PACYNA, E.G. 2001. An assessment of global and regionalemissions of trace metals to the atmosphere from anthropogenic sourcesworldwide. Environmental Reviews, 9, 269–298.
REIMANN, C., FILZMOSER, P. & GARRETT, R. 2002. Factor analysis applied toregional geochemical data: problems and possibilities. Applied Geochemistry,17 (3), 185–206.
ROLANDI, G., BELLUCCI, F., HEIZLER, M.T., BELKIN, H.E. & DE VIVO, B. 2003.Tectonic controls on the genesis of ignimbrites from the CampanianVolcanic Zone, Southern Italy. Special issue: Ignimbrites of the CampaniaPlain, Italy. Mineralogy and Petrology, 79, 3–31.
SALMINEN, R., BATISTA, M.J., BIDOVEC, M. et al. 2005. Geochemical Atlas of Europe– Part 1 – Background information, methodology and maps. Geological Survey ofFinland, Espoo.
SOMMA, R., AYUSO, R.A., DE VIVO, B. & ROLANDI, G. 2001. Major, traceelement and isotope geochemistry (Sr-Nd-Pb) of interplinian magmasfrom Mt. Somma-Vesuvius (Southern Italy). Mineralogy and Petrology, 73,121–143.
SPERA, F.J., DE VIVO, B., AYUSO, R.A. & BELKIN, H.E. 1998. Vesuvius. Specialissue. Journal of Volcanology and Geothermal Research, 82.
TARZIA, M., DE VIVO, B., SOMMA, R., AYUSO, R.A., MCGILL, R.A.R. & PARRISH,R.R. 2002. Anthropogenic versus natural pollution: an environmental studyof an industrial site under remediation (Naples, Italy). Geochemistry: Explo-ration Environment Analysis, 2, 45–56.
TEUTSCH, N., EREL, Y., HALICZ, L. & BANIN, A. 2001. Distribution of naturaland anthropogenic lead in Mediterranean soils. Geochimica et CosmochimicaActa, 65 (17), 2853–2864.
TODT, W., CLIFF, R.A., HANSER, A. & HOFFMANN, A.W. 1996. Evaluation of a202Pb-205Pb double spike for high-precision lead isotope analysis. In: HART,S. R. & BASU, A. (eds) Earth Processes: Reading the Isotopic Code. GeophysicalMonograph, 95. American Geophysical Union, 429–437.
USGS 2002. Historical Statistics for Mineral Commodities in the United States. USGSOpen-File Report, 01-006. US Geological Survey, Reston.
WONG, C.S.C., LI, X.D. & THORNTON, I. 2006. Review on urban environ-mental geochemistry of trace metals. Environmental Pollution, 142, 1–16.
D. Cicchella et al.112