pb–pb dating and pb isotope geochemistry of neoproterozoic carbonate rocks from the são francisco...
TRANSCRIPT

Ž .Chemical Geology 160 1999 175–199
Pb–Pb dating and Pb isotope geochemistry of Neoproterozoiccarbonate rocks from the Sao Francisco basin, Brazil:˜
implications for the mobility of Pb isotopes during tectonism andmetamorphism
Marly Babinski a,), W.R. Van Schmus b, Farid Chemale Jr. c
a Instituto de Geociencias, UniÕersidade de Sao Paulo, Caixa Postal 11.348, Sao Paulo, SP, 05422-970, Brazilˆ ˜ ˜b Department of Geology, UniÕersity of Kansas, Lawrence, KS, 66045, USA
c Instituto de Geociencias, UniÕersidade Federal do Rio Grande do Sul, Caixa Postal 15001, Porto Alegre, RS, 91501-970, Brazilˆ
Received 11 September 1998; accepted 9 April 1999
Abstract
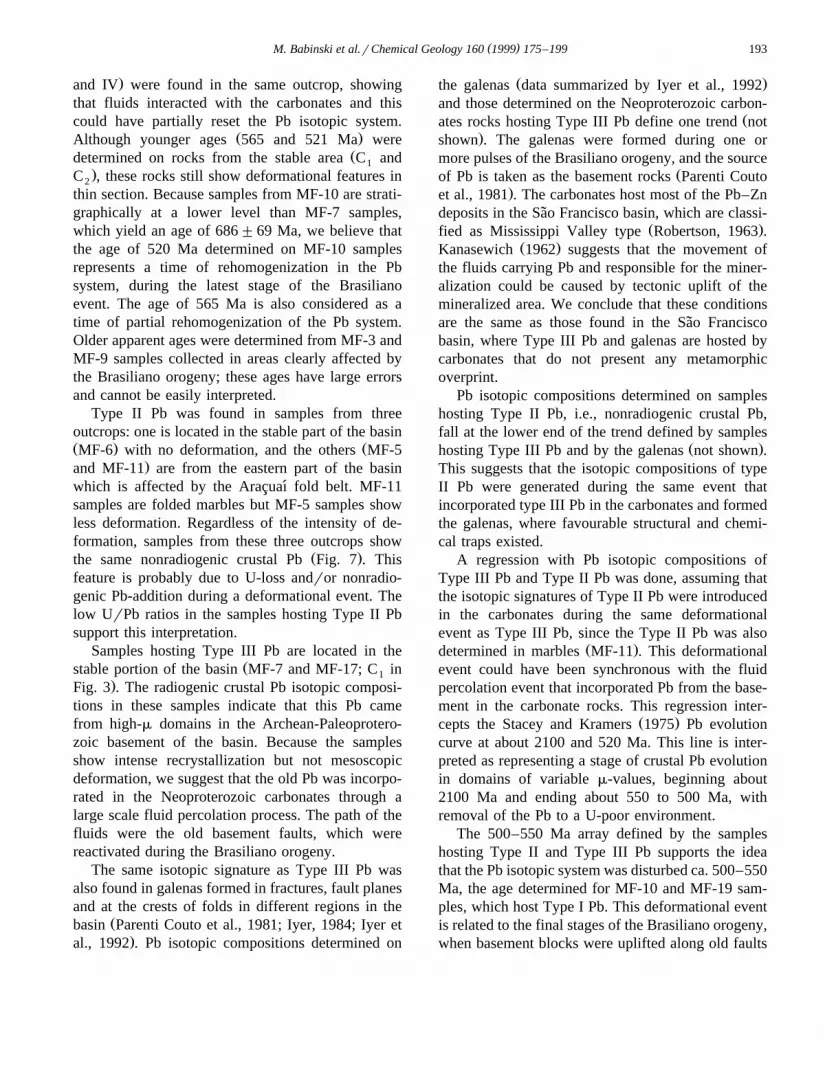
A U–Pb study was carried out on carbonate rocks from the Neoproterozoic Bambuı Group in the southern part of the Sao´ ˜Francisco basin, Brazil. Pb isotopic compositions and U and Pb concentrations were determined on more than 90 samplesfrom different parts of the basin. These samples were found to contain four distinct types of Pb, here called Types I, II, IIIand IV. Type I Pb was found in samples with low Pb concentrations and relatively high U concentrations; it represents insitu growth of radiogenic Pb and has a large enough variation to define PbrPb isochron ages. Type II Pb is present insamples with relatively high Pb concentrations and low U concentrations; it is nonradiogenic crustal Pb that could eitherrepresent average crustal Pb at the time of deposition or, as interpreted here, at the time of deformation of these rocks. TypeIII Pb is also found in samples with high Pb concentrations and low U concentrations, but it apparently is radiogenic crustalPb from the Archean or Paleoproterozoic basement that was incorporated into the carbonates during the 600 Ma Brasilianoorogeny. Type IV Pb is intermediate in composition between Type III and Type I Pb; it represents a mixture of these twotypes.
PbrPb isochron ages obtained from mesoscopically undeformed carbonates containing Type I Pb range from 686"69 to520"53 Ma; the older age is the minimum depositional age for carbonate rocks from the Sete Lagoas Formation. Duringthe interval from 690 to 500 Ma, the Pb isotope system of carbonates from the Sao Francisco basin was disturbed, and in˜some areas it was totally reset. Type III Pb compositions define a straight line; Type II Pb falls on the lower end of this line,
Ž .which intercepts the Stacey and Kramers S&K Pb growth curve at about 520 and 2100 Ma. This line is interpreted asrepresenting a stage of crustal Pb evolution beginning about 2100 Ma and ending about 550 to 500 Ma, when variablyradiogenic Pb from the basement was incorporated into these carbonates. The ages determined in this study are in agreement
) Corresponding author. Tel.: q55-11-818-3908; fax: q55-11-818-3993; e-mail: [email protected]
0009-2541r99r$ - see front matter q 1999 Elsevier Science B.V. All rights reserved.Ž .PII: S0009-2541 99 00067-4

( )M. Babinski et al.rChemical Geology 160 1999 175–199176
with most published ages for Brasiliano fold belts marginal to underlying Sao Francisco craton, showing that isotopic˜systems of Sao Francisco basin rocks were largely affected by Brasiliano tectonism. q 1999 Elsevier Science B.V. All rights˜reserved.
Keywords: Neoproterozoic carbonate rocks; Pb–Pb dating; Pb isotope geochemistry
1. Introduction
The Pb–Pb isochron method on carbonate rockshas proven useful for determining sedimentation ormetamorphic ages of Archaean to Paleoproterozoic
Žunits Moorbath et al., 1987; Jahn et al., 1990;.Babinski et al., 1995; Jahn and Simonsen, 1995 .
However, the Pb isotopic system is not well under-stood with respect to its mobility during deformationand metamorphism of carbonates formed during the
ŽMesoproterozoic to Phanerozoic Jahn and Cuvellier,. Ž .1994 , although Jahn 1988 presented it as an im-
portant tool for determining the metamorphic age ofMesozoic carbonates. For Paleozoic carbonates, theU–Pb method has been successfully applied on corals
Žand calcites Smith and Farquhar, 1989; Smith et al.,. Ž .1991 , whole rocks DeWolf and Halliday, 1991 ,
Ž .and carbonate concretions Israelson et al., 1996 .However, this method requires a closed system for Uand Pb, which is difficult to find in older rocks.
For this study, we collected carbonate samplesfrom the Neoproterozoic Sao Francisco sedimentary˜basin, which contains an extensive carbonate se-quence that was partially affected by the ca. 600 Ma
Ž .Brasiliano orogeny Almeida, 1967 . In order tostudy Pb isotopes of carbonate rocks from regionswith different degrees of deformation, most sampleswere collected from the southern portion of basin,where Bambuı Group carbonates are not covered by´younger units. We made an E–W profile in order toget samples ranging from undeformed ones in thecenter of the basin to metamorphosed ones near the
Ž .borders. The purposes of this work were: 1 to testthe reliability of Pb–Pb isochron method for dating
Ž .these Neoproterozoic carbonates; 2 to determinethe susceptibility of the Pb isotope system to alter-
Ž .ation during deformation; and 3 to use the Pb datato get a better understanding of the evolution of thisbasin.
2. Geologic setting
2.1. Stratigraphy
The Sao Francisco basin, which is 200–350 km˜wide and 800 km long, comprises much of the
Ž .western part of the Sao Francisco craton Fig. 1 .˜This basin contains an extensive sedimentary coverof Neoproterozoic clastic and carbonate sedimentaryrocks that comprise the Sao Francisco Supergroup.˜This supergroup is divided into two groups, theMacaubas Group and the overlying Bambuı Group´ ´Ž .Fig. 2 . The Macaubas Group represents a´
Žwidespread glaciation event Dardenne, 1978; Kar-.funkel and Hoppe, 1988 and is comprised mainly of
diamictites, shales, and quartzites. The youngerBambuı Group consists of two main sequences: basal´shallow-water marine strata, and upper shallow-waterto alluvial strata. The lower sequence is furtherdivided into four formations: Sete Lagoas, Serra deSanta Helena, Lagoa do Jacare, and Serra da Saudade,´which correspond to cycles of carbonate andpelitic–psamitic sedimentation. The lowest unit ofthis sequence, the Sete Lagoas Formation, containsthe most extensive shallow water carbonates of thisbasin, with well-preserved stromatolite structures. Inthe Lagoa do Jacare Formation, beds of oolitic and´pisolitic carbonates occur. Pelitic to psamitic sedi-ments of the Santa Helena and Serra da SaudadeFormations represent clastic cycles of this sequence.Overlying the lower sequence is a clastic shallow-marine to alluvial unit, the Tres Marias Formation,ˆwhich is interpreted as deposited in a foreland basinformed in advance of ca. 600 Ma Brasiliano fold
Žbelts Costa and Angeiras, 1971; Marshak and Alk-.mim, 1989; Brito Neves and Cordani, 1991 .
Brasiliano orogenic belts border most of the Sao˜Ž .Francisco basin Fig. 1 . The Brasılia belt is on the´
west, the Aracuaı belt and the Espinhaco´ŽMeridional-Paramirim Block belt ESPB, after
( )M. Babinski et al.rChemical Geology 160 1999 175–199 177
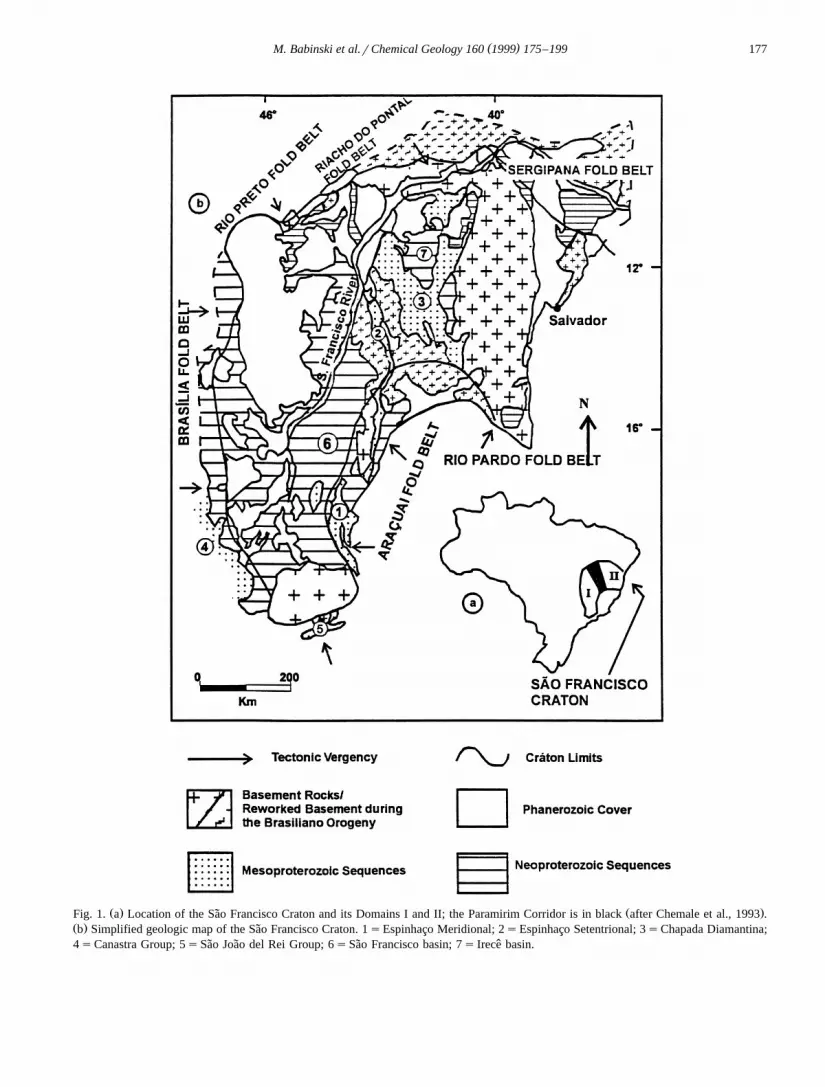
Ž . Ž .Fig. 1. a Location of the Sao Francisco Craton and its Domains I and II; the Paramirim Corridor is in black after Chemale et al., 1993 .˜Ž .b Simplified geologic map of the Sao Francisco Craton. 1sEspinhaco Meridional; 2sEspinhaco Setentrional; 3sChapada Diamantina;˜4sCanastra Group; 5sSao Joao del Rei Group; 6sSao Francisco basin; 7s Irece basin.˜ ˜ ˜ ˆ

( )M. Babinski et al.rChemical Geology 160 1999 175–199178
Ž .Fig. 2. Stratigraphic Column of the Sao Francisco Supergroup, Sao Francisco basin after Dardenne, 1978 .˜ ˜
.Chemale et al., 1993 are on the east, and the RioPreto belt is on the north. Archean to Paleoprotero-
Ž .zoic basement Teixeira and Figueiredo, 1991 isexposed to the south. In the southern portion of Sao˜
Ž .Francisco basin Fig. 3 , where the Neoproterozoicsupracrustal rocks are not covered by younger sedi-
Ž .ments, Alkmim et al. 1989 and Chemale et al.Ž .1993 distinguished regions affected by the east-
Ž .verging Brasılia fold belt BIZ and by the west-´Ž .verging Aracuaı fold belt AIZ from undeformed´
regions in the center where rocks of the BambuıGroup are not deformed. Deformation in the Sao˜Francisco Supergroup increases progressively to-wards the Brasılia and Aracuaı fold belts; it devel-´ ´oped in ductile conditions near the margins of thebasin and grades to brittle-ductile conditions towardsthe center. Metamorphism reaches greenschist faciesat the eastern border of the basin but decreases toanchimetamorphic conditions in the center. Two un-
Ždeformed regions, called C and C subzones Fig.1 2
. Ž .3 , were recognized by Alkmim et al. 1989 in thecenter of the basin. These regions are probably re-lated to pre-Brasiliano topographic highs whichplayed an important role during the deposition and
Žinversion of the Sao Francisco basin Chemale et al.,˜.1993 .
2.2. PreÕious age constraints
The age of the Sao Francisco Supergroup has not˜been well constrained. The Macaubas Group, the´glacial sequence of the base of the supergroup, hasnot been dated directly in the southern part of thebasin. A U–Pb age of 906"2 Ma from one zirconand two baddeleyite fractions was determined on adike that intrudes underlying Espinhaco Supergrouprocks but does not cut the overlying Macaubas Group´
Ž .sequence Machado et al., 1989 ; this currently rep-resents a maximum age for deposition of the glacialunit. In the northern part of the basin, 40Arr39Ar ages

( )M. Babinski et al.rChemical Geology 160 1999 175–199 179
Ž .Fig. 3. Geologic and structural map of the southern part of the Sao Francisco basin after Chemale et al., 1993 , showing sample locations.˜Ž . Ž .WsFaixa Brasılia Influence Zone BIZ ; EsFaixa Aracuaı Influence Zone AIZ ; C and C sundeformed zones. Cities: JAsJanuaria;´ ´ ´1 2
MCsMontes Claros; JQsJequitaı; PCsParacatu; TMsTres Marias; SLsSete Lagoas; BAsBambuı; PIsPiumhi; BHsBelo´ ˆ ´Horizonte.
Ž .determined on mafic dikes by Renne et al. 1990 ,Žpaleomagnetic data on the dikes D’Agrella Filho et
.al., 1990a,b , and intracontinental correlationsŽ .D’Agrella Filho et al., 1990a suggest that the glacialevent took place somewhat earlier, around 1050"50Ma, when this region was closest to the paleopole.K–Ar and Rb–Sr ages ranging from 932 to 816 Ma
ŽBonhomme et al., 1982; Macedo and Bonhomme,.1984 were obtained on clays and whole-rock sam-
ples from correlative glaciogenic sediments of theBebedouro Formation in Bahia State. These ageswere interpreted by those authors as diagenetic agesand the deposition age was suggested as 960 Ma.Rb–Sr and K–Ar ages decrease westward and range

( )M. Babinski et al.rChemical Geology 160 1999 175–199180
from 667 to 534 Ma close to the Espinhaco Range,which was affected by the Brasiliano orogeny.
Data for Bambuı Group sedimentary rocks from´the southern part of the basin were obtained by theRb–Sr method on clays and whole-rock samples and
Žby the K–Ar method on clays Bonhomme, 1976;Thomaz Filho and Bonhomme, 1979; Parenti Coutoet al., 1981; Thomaz Filho and Lima, 1981; Bon-
.homme et al., 1982 . Rb–Sr ages range from 695"Ž . Ž .12 Ma R s0.7077 to 560"40 Ma R s0.71100 0
and K–Ar ages on fine fraction clays range from662"18 to f478 Ma. The older ages were consid-ered as minimum depositional ages, and the youngerones as a result of later thermal events related to theBrasiliano orogeny.
87Srr86Sr ratios and d13C values have been deter-
mined for some carbonates from the Sete LagoasFormation, Bambuı Group. An average 87Srr86Sr´
Ž .ratio of 0.7075 Kawashita et al., 1993 and a rangeŽ .of 0.70734 to 0.70759 Chang et al., 1993 were
13 Žobtained for these samples. The d C values Chang. 13et al., 1993 show a depletion of C from the top
towards the base of the formation, with negatived
13C values at the base of the sequence, close to thecontact with the glaciogenic deposits. Based on thesedata, these authors suggest that the deposition ofthese carbonates took place around 600 Ma, accord-ing to the seawater evolution curve available in the
Žliterature Derry et al., 1989 and Asmeron et al.,. Ž . 131991 . Iyer et al. 1995 also reported d C analyses
for carbonates from the Sete Lagoas and Lagoa doJacare formations and also noticed the depletion of´13C toward the base of the sequence.
Ž .Fairchild et al. 1996 recently evaluated the bios-tratigraphic and chronostratigraphic data for the Sao˜Francisco Supergroup and concluded that it wasprobably deposited between 900 and 700 Ma, withan age closer to 900 Ma more likely.
Despite these previous studies, the age of the Sao˜Francisco Supergroup is still only approximatelyconstrained between 600 and 1000 Ma. Thus, thepresent study was undertaken in an attempt to placebetter constrains on the age of the Bambuı Group.´
3. Sample localities and descriptions
Most of the outcrops are located along highwaysor in quarries, where fresh carbonate samples are
available. More than 90 carbonate samples wereŽ .collected from 10 outcrops Fig. 3 ; five outcrops
Ž .MF-6, MF-7, MF-10, MF-17, MF-19 are in theŽundeformed region C and C subzones; Alkmim et1 2
. Ž .al., 1989 , three outcrops MF-3, MF-5, MF-11 areŽin the eastern zone AIZ; affected by the Aracuaı
. Ž .fold belt , and one outcrop MF-9 is in the westernŽ .zone BIZ; affected by the Brasılia fold belt .´
The carbonate samples from the eastern zoneŽ . Ž .AIZ and western zone BIZ are mesoscopicallydeformed, mostly under ductile-brittle conditions.Microscopically they show an oriented to nonori-ented fabric and are made up of calcite or dolomitewith grain sizes )0.002 mm. The grains display astrong undulate extinction and deformed lamellae;recrystallized filled fractures and stylolites were alsoobserved. Samples collected in the C and C central1 2
zones do not display mesoscopic deformation. Mi-croscopically the carbonates are fine grained. Thegrain contacts are straight, irregular, andror diffuse,showing dissolution. Microscopic deformation canbe recognized by undulate extinction and some mi-crofractures, as well as stylolites and thin calciteveins. Calcite veins are common in MF-10 samples.
Ž .Oolites diameterf 0.008 mm occur well dis-tributed in MF-6, MF-7, and MF-17 samples. Al-
Ž .though the rocks from these domains C and C1 2
are considered undeformed, microscopic features at-test to internal deformation and several recrystalliza-tion or solution processes.
4. Analytical procedures
Analyses were carried out at the Isotope Geo-chemistry Laboratory of the University of Kansas.During this study many experiments were done inorder to find the best chemical procedure for dissolu-
Žtion of the carbonate rocks being investigated see.Appendix A . Based on these results, we discarded
data from the first leaching step and only used datafrom intermediate leaching steps that did not con-sume the entire sample; in many cases this involved
Ž .only a single intermediate step L2 . Isotopic analy-ses for Pb composition and Pb and U concentrationswere carried out with a multicollector VG Sectormass spectrometer. Samples were loaded on singleRe filaments with silica gel and H PO and mea-3 4
( )M. Babinski et al.rChemical Geology 160 1999 175–199 181
sured as Pbq and UOq; in the latter part of the study2
U was loaded with graphite and H PO and mea-3 4
sured as Uq. The Pb isotopic ratios were corrected toa fractionation factor of 0.13%ramu, based on suc-cessive determinations of NBS 981 Common Pbstandard. External variations in isotopic ratios arenormally 0.1% or less, based on repeated analyses ofstandards; some samples that did not run well hadsomewhat larger internal variations, as noted in Ta-bles 2 and 3. Isochron regressions were done using
Ž .the ISOPLOT program of Ludwig 1990 . Decayconstants used are those recommended by Steiger
Ž .and Jager 1977 .¨
5. Results
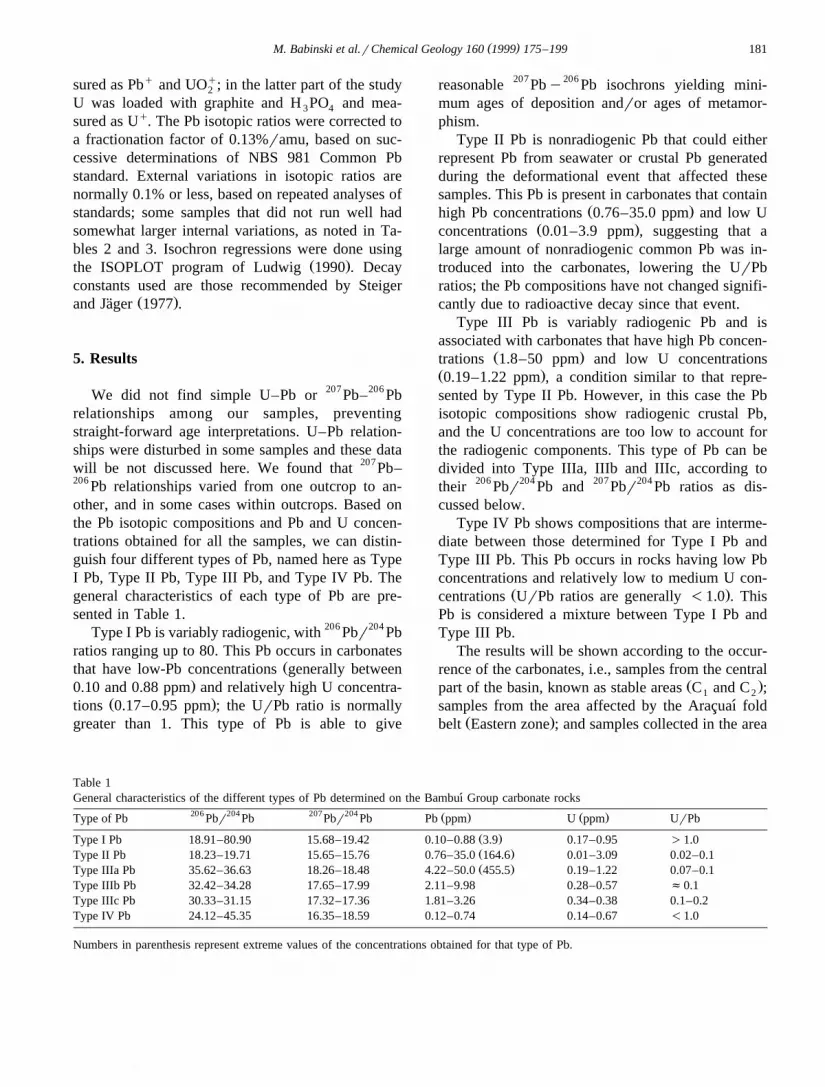
We did not find simple U–Pb or 207Pb–206 Pbrelationships among our samples, preventingstraight-forward age interpretations. U–Pb relation-ships were disturbed in some samples and these datawill be not discussed here. We found that 207Pb–206 Pb relationships varied from one outcrop to an-other, and in some cases within outcrops. Based onthe Pb isotopic compositions and Pb and U concen-trations obtained for all the samples, we can distin-guish four different types of Pb, named here as TypeI Pb, Type II Pb, Type III Pb, and Type IV Pb. Thegeneral characteristics of each type of Pb are pre-sented in Table 1.
Type I Pb is variably radiogenic, with 206 Pbr204 Pbratios ranging up to 80. This Pb occurs in carbonates
Žthat have low-Pb concentrations generally between.0.10 and 0.88 ppm and relatively high U concentra-
Ž .tions 0.17–0.95 ppm ; the UrPb ratio is normallygreater than 1. This type of Pb is able to give
reasonable 207Pby206 Pb isochrons yielding mini-mum ages of deposition andror ages of metamor-phism.
Type II Pb is nonradiogenic Pb that could eitherrepresent Pb from seawater or crustal Pb generatedduring the deformational event that affected thesesamples. This Pb is present in carbonates that contain
Ž .high Pb concentrations 0.76–35.0 ppm and low UŽ .concentrations 0.01–3.9 ppm , suggesting that a
large amount of nonradiogenic common Pb was in-troduced into the carbonates, lowering the UrPbratios; the Pb compositions have not changed signifi-cantly due to radioactive decay since that event.
Type III Pb is variably radiogenic Pb and isassociated with carbonates that have high Pb concen-
Ž .trations 1.8–50 ppm and low U concentrationsŽ .0.19–1.22 ppm , a condition similar to that repre-sented by Type II Pb. However, in this case the Pbisotopic compositions show radiogenic crustal Pb,and the U concentrations are too low to account forthe radiogenic components. This type of Pb can bedivided into Type IIIa, IIIb and IIIc, according totheir 206 Pbr204 Pb and 207Pbr204 Pb ratios as dis-cussed below.
Type IV Pb shows compositions that are interme-diate between those determined for Type I Pb andType III Pb. This Pb occurs in rocks having low Pbconcentrations and relatively low to medium U con-
Ž .centrations UrPb ratios are generally -1.0 . ThisPb is considered a mixture between Type I Pb andType III Pb.
The results will be shown according to the occur-rence of the carbonates, i.e., samples from the central
Ž .part of the basin, known as stable areas C and C ;1 2
samples from the area affected by the Aracuaı fold´Ž .belt Eastern zone ; and samples collected in the area
Table 1General characteristics of the different types of Pb determined on the Bambuı Group carbonate rocks´
206 204 207 204 Ž . Ž .Type of Pb Pbr Pb Pbr Pb Pb ppm U ppm UrPb
Ž .Type I Pb 18.91–80.90 15.68–19.42 0.10–0.88 3.9 0.17–0.95 )1.0Ž .Type II Pb 18.23–19.71 15.65–15.76 0.76–35.0 164.6 0.01–3.09 0.02–0.1Ž .Type IIIa Pb 35.62–36.63 18.26–18.48 4.22–50.0 455.5 0.19–1.22 0.07–0.1
Type IIIb Pb 32.42–34.28 17.65–17.99 2.11–9.98 0.28–0.57 f0.1Type IIIc Pb 30.33–31.15 17.32–17.36 1.81–3.26 0.34–0.38 0.1–0.2Type IV Pb 24.12–45.35 16.35–18.59 0.12–0.74 0.14–0.67 -1.0
Numbers in parenthesis represent extreme values of the concentrations obtained for that type of Pb.

( )M. Babinski et al.rChemical Geology 160 1999 175–199182
Žaffected by tectonism of the Brasılia fold belt West-´.ern zone .
( )5.1. Central zone C and C1 2
Five outcrops, MF-6, MF-7, MF-10, MF-17, andŽ .MF-19, were sampled in the central zone Fig. 3
where no mesoscopic deformation is observed in therocks. The results from MF-7 are the most complexand helped to define three of the four Pb types, so itwill be presented first.
( X Y X Y )5.1.1. Outcrop MF-7 45828 44 W, 19846 28 STwenty six samples from the Sete Lagoas Forma-
tion were collected from four different profiles in aŽ .quarry at this location Fig. 4 . The vertical distance
between samples is about 50 cm and the horizontaldistance from one profile to another varies between10 and 20 m. The samples were collected fromhorizontal layers with no mesoscopic deformationexcept fractures. In Profile 1, eight dark-gray toblack carbonate samples were collected; MF-7A isfrom the base of the profile and MF-7H is from thetop. Samples MF-7A to MF-7E are coarser than the
Fig. 4. Profiles for samples collected at the MF-7 outcrop. Thevertical distance between each sample is about 50 cm. Distancebetween the profiles varies from 10 to 20 m. SquaressType I Pb;open circlessType III Pb; filled circlessType IV Pb.
other ones and clearly show recrystallization. OnlyŽtwo samples were collected from Profile 2 MF-7I
.and MF-7J , and they are stratigraphically belowMF-7A from Profile 1. Fourteen samples were col-
Ž .lected MF-7K to MF-7X from Profile 3, whileŽProfile 4 consisted of two samples MF-7Y and
.MF-7Z from the top of the section exposed at thislocality. The Pb relationships at this locality arecomplex, and three of the four different types of Pb
Ž .described above Table 1 were defined from thisquarry: Type I Pb, Type III Pb, and Type IV Pb.They are discussed in that order.
Type I Pb, normal radiogenic Pb, was found fromŽsamples in Profile 1 MF-7G and MF-7H, from the
. Ž .top of Profile 1 and Profile 3 MF-7K to MF-7U .Pb concentrations range from 0.1 to 0.8 ppm and Uconcentrations range from 0.2 to 0.8 ppm, while the206 Pbr204 Pb ratios range from 22.8 to 53.6 and207Pbr204 Pb ratios range from 16.0 to 17.9. Accord-ing to our classification, these samples show Type IPb because they have relatively high UrPb ratioswhich generate radiogenic Pb growth by post-deposi-tional in situ decay of U in carbonates with loworiginal Pb concentrations, yielding a large range inisotopic compositions that potentially define a Pb–Pbisochron. In this case the data define a linear array
Ž .with some scatter Fig. 5 , and regression of thesedata yields a 207Pbr206 Pb age of 686"69 Ma. Weinterpret this age as a minimum age for deposition ofthe carbonates at this locality. A 206 Pbr204 Pb vs.238 Ur204 Pb plot does not yield a meaningful array,probably due to recent U mobility.
Type III Pb was found in Profiles 1 and 2. Pbcompositions for MF-7A to MF-7D plus MF-7I and
Ž .MF-7J which are stratigraphically below MF-7Aare radiogenic, but cluster with 206 Pbr204 Pb ratiosranging from 36.0 to 36.6 and 207Pbr204 Pb ratios
Ž .ranging from 18.3 to 18.5 Fig. 5 . The Pb concentra-tions are very high, ranging from 4.2 to )100 ppm,but the U concentrations are relatively low, rangingfrom 0.2 to 1.0 ppm; bulk UrPb ratios are thus also
Ž .low typically F0.10 , and the radiogenic compo-nent could not have come from in situ decay ofuranium. We have defined this cluster as Type IIIaPb. Analytical data from sample MF-7E show Pbconcentrations from 2.1 to 4.2 ppm, and U concen-trations of 0.28 ppm. The Pb is less radiogenic thanthat in MF-7A to MF-7D and MF-7I and MF-7J,

( )M. Babinski et al.rChemical Geology 160 1999 175–199 183
Fig. 5. Pb diagram showing the three different types of Pb determined for the MF-7 samples. The age of 686"69 Ma was determined fromsamples containing Type I Pb.
with 206 Pbr204 Pb ratios ranging from 33.8 to 34.2and 207Pbr204 Pb ratios ranging from 17.92 to 17.97;UrPb ratios are f0.1. As with the Type IIIa Pb, theradiogenic component could not have come from insitu decay of uranium, but because of the lower
Žisotopic ratios, we define this as Type IIIb Pb Fig.. Ž .5 . As argued below MF-17 discussion , we believe
that this Pb came from the Archean to Paleoprotero-zoic basement of the basin and was incorporated intothe carbonates after their deposition.
Type IV Pb was found in Profiles 1, 3, and 4.Sample MF-7F is a medium-grained, dark-gray car-bonate that overlies MF-7E. Pb concentrations fromits leach fractions range from 0.12 to 0.64 ppm andU concentrations range from 0.17 to 0.25 ppm. ThePb is not as radiogenic as found in MF-7A to MF-7Esamples: 206 Pbr204 Pb ratios range from 24.1 to 26.5and 207Pbr204 Pb ratios range from 16.4 to 16.6. Five
Žsamples near the top of the sequence MF-7V to.MF-7Z show similar properties, but the Pb is some-
Ž .what more radiogenic Table 2 . The Pb isotopiccompositions for all these samples fall on a trendwith a slope lower than that defined by the sampleswith Type III Pb, but greater than that defined by the
Ž .samples with Type I Pb Fig. 5 . We believe thatsamples with Type IV Pb represent mixing of TypeIII Pb into samples that otherwise would have pro-duced Type I Pb, as discussed further below.
Ž .One sample from Profile 3 MF-7-Q shows aunusual behavior; this sample was analyzed in tripli-
Ž .cate. Two analyses yQ1, yQ3 show Type I Pb,Ž . Ž .while the third yQ2 shows Type IV Pb Table 2 .
In addition, all analyses show lower UrPb ratiosthan determined for samples with Type I Pb. Theseresults suggest that the Pb system did not behavehomogenously, even in hand-sized sample scale.
( X Y X Y )5.1.2. Outcrop MF-17 45828 37 W, 19846 44 SThis outcrop is located about 500 m north of
MF-7. It is a natural outcrop along the Sao Francisco˜river and composed of gray carbonate rocksŽ .calcarenites that show laminar stromatolites thatare intensively recrystallized, although no macro-scopic deformation was observed. In thin section,oolites as well as carbonate grains show incipient
Žflattening and undulate extinction. Six samples MF-.17A to MF-17F were collected from this outcrop
Ž .Table 3 . Pb concentrations range from 1.8 to 10.0ppm and the U concentrations range from 0.3 to 0.6ppm. The 206 Pbr204 Pb ratios range from 31.2 to 33.4and 207Pbr204 Pb ratios range from 17.3 to 17.9.
Ž .When plotted Fig. 6 , they fall in the same trenddefined by MF-7A to MF-7E samples; consequently,they contain type III Pb. Samples MF-17-A andMF-17-F are less radiogenic and are classified as
( )M. Babinski et al.rChemical Geology 160 1999 175–199184
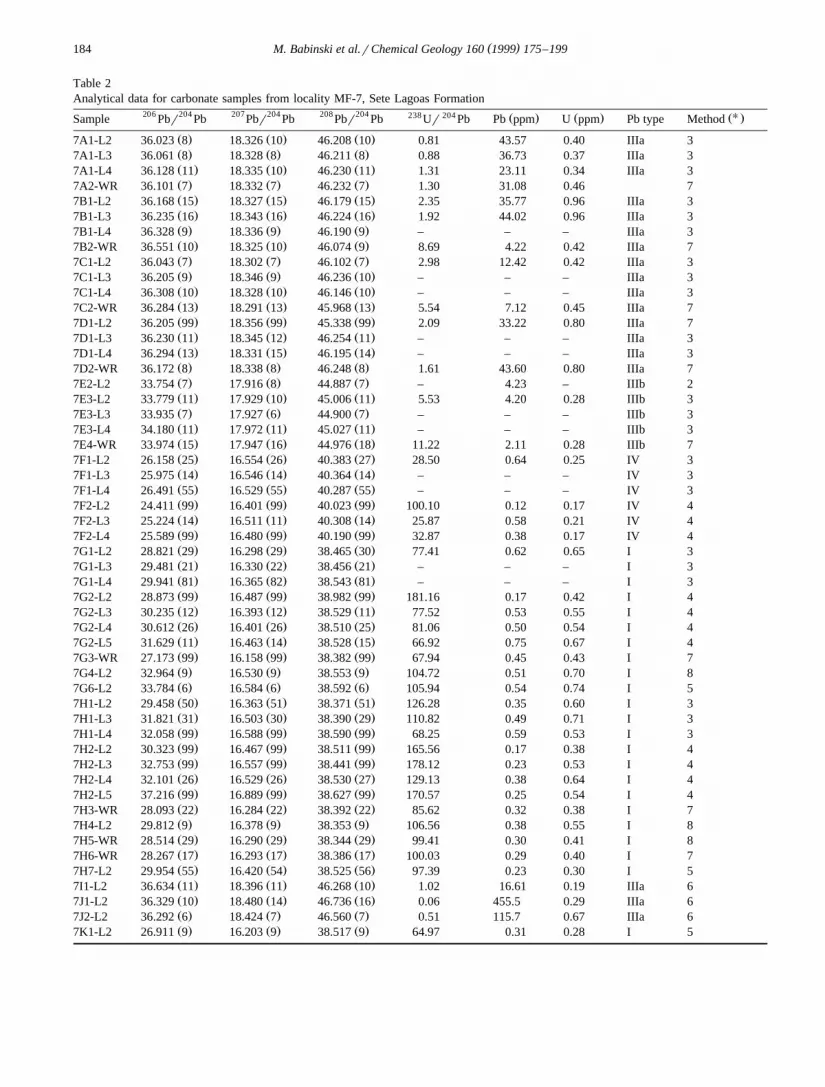
Table 2Analytical data for carbonate samples from locality MF-7, Sete Lagoas Formation
206 204 207 204 208 204 U238 204 Ž . Ž . Ž .Sample Pbr Pb Pbr Pb Pbr Pb Ur Pb Pb ppm U ppm Pb type Method
Ž . Ž . Ž .7A1-L2 36.023 8 18.326 10 46.208 10 0.81 43.57 0.40 IIIa 3Ž . Ž . Ž .7A1-L3 36.061 8 18.328 8 46.211 8 0.88 36.73 0.37 IIIa 3Ž . Ž . Ž .7A1-L4 36.128 11 18.335 10 46.230 11 1.31 23.11 0.34 IIIa 3Ž . Ž . Ž .7A2-WR 36.101 7 18.332 7 46.232 7 1.30 31.08 0.46 7Ž . Ž . Ž .7B1-L2 36.168 15 18.327 15 46.179 15 2.35 35.77 0.96 IIIa 3Ž . Ž . Ž .7B1-L3 36.235 16 18.343 16 46.224 16 1.92 44.02 0.96 IIIa 3Ž . Ž . Ž .7B1-L4 36.328 9 18.336 9 46.190 9 – – – IIIa 3Ž . Ž . Ž .7B2-WR 36.551 10 18.325 10 46.074 9 8.69 4.22 0.42 IIIa 7Ž . Ž . Ž .7C1-L2 36.043 7 18.302 7 46.102 7 2.98 12.42 0.42 IIIa 3Ž . Ž . Ž .7C1-L3 36.205 9 18.346 9 46.236 10 – – – IIIa 3Ž . Ž . Ž .7C1-L4 36.308 10 18.328 10 46.146 10 – – – IIIa 3Ž . Ž . Ž .7C2-WR 36.284 13 18.291 13 45.968 13 5.54 7.12 0.45 IIIa 7Ž . Ž . Ž .7D1-L2 36.205 99 18.356 99 45.338 99 2.09 33.22 0.80 IIIa 7Ž . Ž . Ž .7D1-L3 36.230 11 18.345 12 46.254 11 – – – IIIa 3Ž . Ž . Ž .7D1-L4 36.294 13 18.331 15 46.195 14 – – – IIIa 3Ž . Ž . Ž .7D2-WR 36.172 8 18.338 8 46.248 8 1.61 43.60 0.80 IIIa 7Ž . Ž . Ž .7E2-L2 33.754 7 17.916 8 44.887 7 – 4.23 – IIIb 2Ž . Ž . Ž .7E3-L2 33.779 11 17.929 10 45.006 11 5.53 4.20 0.28 IIIb 3Ž . Ž . Ž .7E3-L3 33.935 7 17.927 6 44.900 7 – – – IIIb 3Ž . Ž . Ž .7E3-L4 34.180 11 17.972 11 45.027 11 – – – IIIb 3Ž . Ž . Ž .7E4-WR 33.974 15 17.947 16 44.976 18 11.22 2.11 0.28 IIIb 7Ž . Ž . Ž .7F1-L2 26.158 25 16.554 26 40.383 27 28.50 0.64 0.25 IV 3Ž . Ž . Ž .7F1-L3 25.975 14 16.546 14 40.364 14 – – – IV 3Ž . Ž . Ž .7F1-L4 26.491 55 16.529 55 40.287 55 – – – IV 3Ž . Ž . Ž .7F2-L2 24.411 99 16.401 99 40.023 99 100.10 0.12 0.17 IV 4Ž . Ž . Ž .7F2-L3 25.224 14 16.511 11 40.308 14 25.87 0.58 0.21 IV 4Ž . Ž . Ž .7F2-L4 25.589 99 16.480 99 40.190 99 32.87 0.38 0.17 IV 4Ž . Ž . Ž .7G1-L2 28.821 29 16.298 29 38.465 30 77.41 0.62 0.65 I 3Ž . Ž . Ž .7G1-L3 29.481 21 16.330 22 38.456 21 – – – I 3Ž . Ž . Ž .7G1-L4 29.941 81 16.365 82 38.543 81 – – – I 3Ž . Ž . Ž .7G2-L2 28.873 99 16.487 99 38.982 99 181.16 0.17 0.42 I 4Ž . Ž . Ž .7G2-L3 30.235 12 16.393 12 38.529 11 77.52 0.53 0.55 I 4Ž . Ž . Ž .7G2-L4 30.612 26 16.401 26 38.510 25 81.06 0.50 0.54 I 4Ž . Ž . Ž .7G2-L5 31.629 11 16.463 14 38.528 15 66.92 0.75 0.67 I 4Ž . Ž . Ž .7G3-WR 27.173 99 16.158 99 38.382 99 67.94 0.45 0.43 I 7Ž . Ž . Ž .7G4-L2 32.964 9 16.530 9 38.553 9 104.72 0.51 0.70 I 8Ž . Ž . Ž .7G6-L2 33.784 6 16.584 6 38.592 6 105.94 0.54 0.74 I 5Ž . Ž . Ž .7H1-L2 29.458 50 16.363 51 38.371 51 126.28 0.35 0.60 I 3Ž . Ž . Ž .7H1-L3 31.821 31 16.503 30 38.390 29 110.82 0.49 0.71 I 3Ž . Ž . Ž .7H1-L4 32.058 99 16.588 99 38.590 99 68.25 0.59 0.53 I 3Ž . Ž . Ž .7H2-L2 30.323 99 16.467 99 38.511 99 165.56 0.17 0.38 I 4Ž . Ž . Ž .7H2-L3 32.753 99 16.557 99 38.441 99 178.12 0.23 0.53 I 4Ž . Ž . Ž .7H2-L4 32.101 26 16.529 26 38.530 27 129.13 0.38 0.64 I 4Ž . Ž . Ž .7H2-L5 37.216 99 16.889 99 38.627 99 170.57 0.25 0.54 I 4Ž . Ž . Ž .7H3-WR 28.093 22 16.284 22 38.392 22 85.62 0.32 0.38 I 7Ž . Ž . Ž .7H4-L2 29.812 9 16.378 9 38.353 9 106.56 0.38 0.55 I 8Ž . Ž . Ž .7H5-WR 28.514 29 16.290 29 38.344 29 99.41 0.30 0.41 I 8Ž . Ž . Ž .7H6-WR 28.267 17 16.293 17 38.386 17 100.03 0.29 0.40 I 7Ž . Ž . Ž .7H7-L2 29.954 55 16.420 54 38.525 56 97.39 0.23 0.30 I 5Ž . Ž . Ž .7I1-L2 36.634 11 18.396 11 46.268 10 1.02 16.61 0.19 IIIa 6Ž . Ž . Ž .7J1-L2 36.329 10 18.480 14 46.736 16 0.06 455.5 0.29 IIIa 6Ž . Ž . Ž .7J2-L2 36.292 6 18.424 7 46.560 7 0.51 115.7 0.67 IIIa 6Ž . Ž . Ž .7K1-L2 26.911 9 16.203 9 38.517 9 64.97 0.31 0.28 I 5

( )M. Babinski et al.rChemical Geology 160 1999 175–199 185
Ž .Table 2 continued206 204 207 204 208 204 U238 204 Ž . Ž . Ž .Sample Pbr Pb Pbr Pb Pbr Pb Ur Pb Pb ppm U ppm Pb type Method
Ž . Ž . Ž .7L2-L2 33.382 24 16.591 24 39.018 26 110.76 0.31 0.44 I 5Ž . Ž . Ž .7M1c-L2 53.559 36 17.884 37 38.663 36 237.50 0.34 0.83 I 5Ž . Ž . Ž .7M1f-L2 37.754 24 16.893 23 38.904 22 79.30 0.23 0.22 I 5Ž . Ž . Ž .7N1-L2 34.293 11 16.709 12 38.674 12 151.32 0.26 0.50 I 6Ž . Ž . Ž .7N2-L2 33.493 52 16.649 52 38.648 52 138.91 0.24 0.44 I 5Ž . Ž . Ž .7O1-L2 41.871 10 17.081 9 38.777 11 – 0.22 – I 6Ž . Ž . Ž .7O2-L2 41.442 60 17.028 60 38.725 60 70.35 0.26 0.22 I 5Ž . Ž . Ž .7P1-L2 41.524 11 17.103 12 38.766 13 – 0.24 – I 6Ž . Ž . Ž .7P2-L2 38.258 9 16.910 9 38.800 9 85.13 0.27 0.28 I 5Ž . Ž . Ž .7Q1-L2 28.030 8 16.272 9 38.308 10 25.33 0.74 0.26 I 6Ž . Ž . Ž .7Q2-L2 29.918 19 16.840 19 39.543 19 37.27 0.66 0.33 IV 5Ž . Ž . Ž .7Q3-L2 28.738 20 16.295 20 38.279 20 48.81 0.63 0.42 I 5Ž . Ž . Ž .7R1-L2 51.531 20 17.754 20 39.731 20 – 0.23 – I 6Ž . Ž . Ž .7R2-L2 50.437 25 17.693 25 39.733 29 152.15 0.25 0.40 I 5Ž . Ž . Ž .7S1-L2 22.971 23 16.016 22 38.556 24 26.42 0.45 0.17 I 5Ž . Ž . Ž .7S2-L2 22.762 12 15.983 12 38.452 13 28.50 0.54 0.23 I 5Ž . Ž . Ž .7T1-L2 45.374 43 17.454 42 39.145 43 106.54 0.16 0.19 I 5Ž . Ž . Ž .7U1-L2 44.263 99 17.182 99 39.640 99 155.82 0.12 0.21 I 5Ž . Ž . Ž .7U2-L2 38.684 50 16.796 49 39.242 50 185.05 0.12 0.26 I 5Ž . Ž . Ž .7V1-L2 38.554 9 17.705 9 42.721 9 66.09 0.60 0.46 IV 5Ž . Ž . Ž .7V2-L2 37.630 12 17.672 12 42.733 12 – – – IV 5Ž . Ž . Ž .7W1-L2 44.451 13 18.593 14 45.178 15 100.16 0.37 0.39 IV 5Ž . Ž . Ž .7W2-L2 45.346 18 18.540 18 44.831 18 103.57 0.61 0.67 IV 5Ž . Ž . Ž .7X1-L2 43.920 10 18.124 11 43.325 11 – 0.33 – IV 6Ž . Ž . Ž .7X2-L2 43.601 6 18.076 7 43.201 7 84.67 0.33 0.30 IV 5Ž . Ž . Ž .7Y1-L2 43.114 20 18.067 21 43.206 22 66.59 0.20 0.14 IV 5Ž . Ž . Ž .7Z1-L2 38.477 19 17.774 19 43.123 21 89.73 0.45 0.47 IV 5
Isotopic compositions corrected for fractionation of 0.13%ramu, determined through more than 100 measurements of the NBS 981Common Pb Standard. Concentrations determined using a mixed spike with 5.37 ppm 235U and 0.637 ppm 208 Pb. Analytical blanks wereless than 0.1 ng for L1 and less than 0.2 ng for L2. By the end of the study, the analytical blank for L2 was less than 30 pg. 238 Ur204 Pb
Ž .ratios are presented where available to indicate general UrPb levels, but the data show too much discordance for meaningfulinterpretation.ŽU . Ž . Ž . Ž .Dissolution Methods see Appendix A : 1 dual-leaching, L1: 2 ml 1 N HCl; L2: 2 ml 3 N HCl; 2 multiple leaching, L1 to L3: 2 ml
Ž . Ž . Ž .0.5 N HCl; L4: 2 ml 1 N HCl; 3 multiple leaching with 2 ml 0.5 N HCl; 4 multiple leaching with 2 ml 0.6 N HBr, powdered sample; 5w x Ž .dual-leaching, L1: 2 ml HBr 0.6 N; L2: 10 ml HBr 0.6 N rock chips; final preferred procedure ; 6 dual-leaching, L1: 1 ml 1.2 N HBr; L2:
Ž . Ž .5 ml 1.2 N HBr, rock chips; 7 one leach with 10 ml 0.6 N HBr, rock chips; 8 dual-leaching, L1: 1 ml 0.6 N HBr; L2: 10 ml 0.6 N HBr,rock chips.
Type IIIc Pb; the other four samples are classified asŽ .Type IIIb Pb Table 3; Fig. 6 .
The trend defined by all MF-7 and MF-17 sam-Ž .ples with Type III Pb Fig. 6 yields an apparent
207Pb–206 Pb isochron age of 2500 Ma. However, thiscannot represent the age of the carbonates, whichmust be younger than 1000 Ma. As mentioned abovefor MF-7, samples with Type III Pb do not yield anage; instead, they indicate that the carbonates werecontaminated with old radiogenic crustal Pb from
Ž .basement see Section 6 .
( X Y X Y )5.1.3. Outcrop MF-6 44832 25 W, 19846 28 SThese samples come from a roadcut along high-
way BR-040 and belong to the Lagoa do JacareFormation. The rocks are light-gray calcarenites with
Žoolites and the original depositional structures paral-.lel bedding, hummocky structure are still preserved,
although recrystallizaton and dissolution structuresare observed in thin sections. X-ray diffraction anal-yses show that these samples are composed of calcitewith trace-amounts of K-feldspar and quartz;dolomite was not detected.

( )M. Babinski et al.rChemical Geology 160 1999 175–199186
Table 3Analytical data from other Bambuı Group carbonates´
206 204 207 204 208 204 238 204 Ž . Ž .Sample Pbr Pb Pbr Pb Pbr Pb Ur Pb Pb ppm U ppm Pb type Method
Ž . Ž . Ž .MF3A-1-L2 19.034 10 15.682 10 39.423 10 7.24 3.90 0.44 I 6Ž . Ž . Ž .MF3B-1-L2 22.518 9 15.932 9 39.856 9 37.19 2.03 1.10 I 6Ž . Ž . Ž .MF3C-1-L2 37.390 10 16.841 10 40.828 10 178.24 0.19 0.42 I 6Ž . Ž . Ž .MF3D-1-L2 36.773 8 16.911 9 42.583 8 137.27 0.61 0.99 I 5Ž . Ž . Ž .MF3E-1-L2 36.425 11 16.904 12 43.317 12 148.69 0.38 0.67 I 5Ž . Ž . Ž .MF3G-1-L2 30.304 10 16.448 10 40.338 10 78.41 0.45 0.47 I 5Ž . Ž . Ž .MF4A1-L2 22.906 22 16.077 21 39.784 21 22.93 0.55 0.18 I 5Ž . Ž . Ž .MF4B1-L2 23.174 12 16.084 12 39.610 12 24.30 0.96 0.34 I 5Ž . Ž . Ž .MF4C1-L2 27.093 47 16.332 76 39.988 87 – 0.60 – I 5Ž . Ž . Ž .MF4E1-L2 30.616 21 16.656 22 41.377 21 61.10 0.41 0.33 I 5Ž . Ž . Ž .MF4F1-L2 28.172 44 16.495 42 40.816 43 – 0.38 – I 5Ž . Ž . Ž .MF4G1-L2 27.174 29 16.397 30 40.585 31 – 0.51 – I 5Ž . Ž . Ž .MF4J1-L2 24.641 12 16.143 12 39.489 12 45.08 0.55 0.35 I 5Ž . Ž . Ž .MF4K1-L2 28.481 23 16.397 23 39.875 23 76.93 0.28 0.29 I 5Ž . Ž . Ž .MF4L1-L2 27.065 7 16.364 7 41.122 6 55.32 0.48 0.36 I 5Ž . Ž . Ž .MF4M1f-L2 27.173 15 16.425 14 40.876 13 51.58 0.48 0.33 I 5Ž . Ž . Ž .MF4M1c-L2 30.042 9 16.564 10 40.583 13 83.48 0.29 0.32 I 5Ž . Ž . Ž .MF5A1-L2 19.706 8 15.746 9 39.713 9 6.40 7.48 0.73 II 5Ž . Ž . Ž .MF5D1-L2 19.073 6 15.715 7 38.846 7 6.00 5.35 0.50 II 5Ž . Ž . Ž .MF5E1-L2 19.123 6 15.741 6 38.484 6 7.94 2.70 0.33 II 5Ž . Ž . Ž .MF5E2-L2 18.951 8 15.702 8 38.315 9 – 3.21 – II 5Ž . Ž . Ž .MF6A1-L2 18.717 19 15.724 19 38.842 17 8.10 2.15 0.27 II 4Ž . Ž . Ž .MF6A1-L3 18.759 11 15.705 11 38.843 11 4.15 6.93 0.45 II 4Ž . Ž . Ž .MF6A1-L4 18.794 6 15.697 6 38.939 6 3.03 35.24 1.66 II 4Ž . Ž . Ž .MF6A1-L5 18.596 9 15.693 9 38.671 9 0.35 164.63 0.90 II 4Ž . Ž . Ž .MF6B1-L2 18.537 9 15.707 9 38.686 9 10.40 0.76 0.12 II 4Ž . Ž . Ž .MF6B1-L3 18.544 10 15.699 11 38.681 11 3.88 4.73 0.29 II 4Ž . Ž . Ž .MF6B1-L4 18.600 9 15.713 9 38.788 9 3.05 8.18 0.39 II 4Ž . Ž . Ž .MF6B1-L5 18.664 7 15.682 8 38.810 7 2.52 78.48 3.09 II 4Ž . Ž . Ž .MF6C1-L2 18.702 11 15.714 11 38.961 12 5.16 2.99 0.24 II 4Ž . Ž . Ž .MF6C1-L3 18.704 11 15.693 10 38.956 11 – – – II 4Ž . Ž . Ž .MF6C1-L4 18.907 16 15.789 16 39.394 16 3.20 30.07 1.48 II 4Ž . Ž . Ž .MF6C1-L5 19.082 14 15.761 20 39.445 27 1.15 4.87 0.09 II 4Ž . Ž . Ž .MF9A1-L2 23.476 13 16.008 12 39.027 11 60.50 0.75 0.66 I 5Ž . Ž . Ž .MF9B1-L2 20.643 9 15.818 9 38.827 8 19.06 2.37 0.69 I 5Ž . Ž . Ž .MF9C1-L2 21.624 10 15.888 10 38.820 10 19.68 1.75 0.52 I 5Ž . Ž . Ž .MF9D1-L2 20.782 8 15.817 8 38.765 9 13.15 3.73 0.74 I 6Ž . Ž . Ž .MF9E1-L2 21.165 13 15.849 14 38.909 16 11.50 1.83 0.32 I 6Ž . Ž . Ž .MF9F1-L2 21.994 7 15.898 7 38.886 7 19.74 1.36 0.40 I 6Ž . Ž . Ž .MF9G1-L2 32.619 99 16.446 99 38.904 99 123.08 0.34 0.54 I 5Ž . Ž . Ž .MF10A1-L2 32.276 53 16.473 52 38.614 52 118.61 0.23 0.35 I 3Ž . Ž . Ž .MF10A1-L3 34.103 99 16.511 99 38.288 99 – 0.49 – I 3Ž . Ž . Ž .MF10A2-L2 41.412 99 17.037 99 38.877 99 – – – I 4Ž . Ž . Ž .MF10A2-L3 43.826 99 17.144 99 38.743 99 – – – I 4Ž . Ž . Ž .MF10A3-WR 41.186 84 16.990 83 38.544 84 252.27 0.12 0.37 I 7Ž . Ž . Ž .MF10B1-L2 27.706 29 16.216 29 38.689 29 62.92 0.59 0.51 I 3Ž . Ž . Ž .MF10B1-L3 28.370 77 16.196 78 38.486 77 – 0.69 – I 3Ž . Ž . Ž .MF10B2-L2 36.327 28 16.698 27 39.143 28 – – – I 4Ž . Ž . Ž .MF10B3-WR 35.393 28 16.648 27 39.132 28 125.71 0.38 0.37 I 7Ž . Ž . Ž .MF10B4-L2 36.843 10 16.777 11 39.361 15 125.38 0.34 0.52 I 5Ž . Ž . Ž .MF10C1-L2 27.978 75 16.200 76 38.584 79 134.53 0.26 0.48 I 3Ž . Ž . Ž .MF10C1-L3 29.496 87 16.369 87 38.819 86 – 0.30 – I 3Ž . Ž . Ž .MF10C3-WR 34.764 20 16.638 20 38.669 20 150.37 0.25 0.48 I 7

( )M. Babinski et al.rChemical Geology 160 1999 175–199 187
Ž .Table 3 continued206 204 207 204 208 204 238 204 Ž . Ž .Sample Pbr Pb Pbr Pb Pbr Pb Ur Pb Pb ppm U ppm Pb type Method
Ž . Ž . Ž .MF10C4-L2 35.335 7 16.664 6 38.799 6 157.78 0.25 0.50 I 5Ž . Ž . Ž .MF10D1-L2 28.870 46 16.300 46 38.502 45 119.79 0.25 0.42 I 3Ž . Ž . Ž .MF10D1-L3 32.715 99 16.541 99 38.573 99 – 0.42 – I 3Ž . Ž . Ž .MF10D3-WR 34.999 99 16.714 99 38.701 99 181.59 0.19 0.43 I 7Ž . Ž . Ž .MF10D4-L2 44.885 16 17.247 16 38.886 16 290.84 0.14 0.46 I 5Ž . Ž . Ž .MF10E3-WR 36.139 24 16.666 24 38.969 24 162.89 0.24 0.49 I 7Ž . Ž . Ž .MF10E4-L2 43.345 18 17.054 19 39.100 20 239.28 0.16 0.45 I 5Ž . Ž . Ž .MF10F3-WR 54.068 99 17.738 99 38.991 99 301.98 0.14 0.43 I 7Ž . Ž . Ž .MF10F4-L2 105.459 55 20.615 56 39.734 56 910.67 0.07 0.42 I 5Ž . Ž . Ž .MF10G1-L3 27.718 99 16.204 99 38.539 99 – 0.28 – I 3Ž . Ž . Ž .MF10G3-WR 29.090 54 16.300 50 38.641 56 89.20 0.34 0.41 I 7Ž . Ž . Ž .MF10G4-L2 49.478 33 17.424 33 39.660 33 312.08 0.14 0.47 I 5Ž . Ž . Ž .MF10H1-L2 55.813 7 17.872 7 39.699 7 341.68 0.14 0.48 I 5Ž . Ž . Ž .MF10H2-L2 54.620 7 17.803 7 39.712 7 – – – I 5Ž . Ž . Ž .MF10I1-L2 45.796 7 17.252 7 39.436 8 232.59 0.19 0.48 I 5Ž . Ž . Ž .MF10J1-L2 32.782 8 16.502 7 39.345 7 111.27 0.37 0.54 I 5Ž . Ž . Ž .MF10K1-L2 61.680 17 18.129 17 39.472 17 393.94 0.17 0.63 I 5Ž . Ž . Ž .MF10L1-L2 45.777 25 17.234 25 38.869 26 255.87 0.16 0.47 I 5Ž . Ž . Ž .MF10M1-L2 39.182 23 16.863 30 39.411 33 149.28 0.30 0.54 I 5Ž . Ž . Ž .MF10N1-L2 47.530 25 17.375 25 39.251 26 259.27 0.19 0.55 I 5Ž . Ž . Ž .MF10O1-L2 35.214 7 16.651 7 38.951 8 133.62 0.37 0.63 I 5Ž . Ž . Ž .MF11A1-L2 18.356 13 15.672 15 38.551 16 0.36 1.54 0.01 II 8Ž . Ž . Ž .MF11B1-L2 18.359 10 15.676 9 38.623 8 0.86 1.38 0.02 II 8Ž . Ž . Ž .MF11C1-L2 18.407 10 15.666 11 38.578 11 – 2.27 – II 8Ž . Ž . Ž .MF11D1-L2 18.428 9 15.662 9 38.592 9 – 1.63 – II 8Ž . Ž . Ž .MF11E1-L2 18.244 12 15.661 12 38.354 12 0.29 3.00 0.01 II 8Ž . Ž . Ž .MF11F1-L2 18.234 12 15.645 12 38.345 13 – 2.65 – II 8Ž . Ž . Ž .MF17A1-L2 31.152 11 17.317 11 42.549 10 16.48 1.81 0.38 IIIc 5Ž . Ž . Ž .MF17B1-L2 32.424 18 17.652 19 43.813 19 12.91 3.26 0.51 IIIb 5Ž . Ž . Ž .MF17C1-L2 32.633 5 17.694 5 43.922 5 9.62 4.84 0.57 IIIb 5Ž . Ž . Ž .MF17D1-L2 33.093 12 17.766 13 44.193 15 8.05 4.53 0.44 IIIb 5Ž . Ž . Ž .MF17E1-L2 33.370 7 17.869 8 44.561 7 2.79 9.98 0.33 IIIb 5Ž . Ž . Ž .MF19A1-L2 41.951 8 17.148 8 39.610 8 134.67 0.39 0.61 I 5Ž . Ž . Ž .MF19A2-L2 42.620 13 17.176 13 39.594 13 – – – I 5Ž . Ž . Ž .MF19B1-L2 57.130 54 17.929 55 39.741 55 251.82 0.12 0.29 I 5Ž . Ž . Ž .MF19B2-L2 58.090 63 18.024 64 39.817 63 – – – I 5Ž . Ž . Ž .MF19C1-L2 51.253 20 17.706 21 39.340 22 181.37 0.20 0.38 I 5Ž . Ž . Ž .MF19D1-L2 74.362 21 19.072 20 39.230 21 419.82 0.17 0.61 I 5Ž . Ž . Ž .MF19D2-L2 80.895 99 19.416 99 39.176 99 – – – I 5Ž . Ž . Ž .MF19E1-L2 45.801 41 17.207 40 38.993 39 251.35 0.16 0.44 I 5Ž . Ž . Ž .MF19E2-L2 45.831 55 17.231 56 39.067 55 – – – I 5Ž . Ž . Ž .MF19F1-L2 61.605 19 18.323 19 40.155 19 257.64 0.14 0.34 I 5Ž . Ž . Ž .MF19F2-L2 57.458 28 18.002 29 39.803 28 – – – I 5Ž . Ž . Ž .MF19G1-L2 49.570 25 17.622 24 40.636 25 312.07 0.12 0.41 I 5Ž . Ž . Ž .MF19G2-L2 49.520 20 17.578 21 40.563 21 301.57 0.12 0.38 I 5Ž . Ž . Ž .MF19H1-L2 65.409 43 18.469 43 40.739 43 282.90 0.17 0.45 I 5Ž . Ž . Ž .MF19H2-L2 62.944 21 18.421 21 40.788 21 – – – I 5Ž . Ž . Ž .MF19I1-L2 51.852 23 17.672 22 39.980 23 201.73 0.19 0.40 I 5Ž . Ž . Ž .MF19I2-L2 54.245 27 17.827 26 40.084 27 – – – I 5
All the parameters are the same as those presented in Table 2.
Three samples were analyzed from this outcropŽ . ŽTable 3 . They have high Pb concentrations 0.8 to
. Ž165 ppm and relatively low U concentrations 0.1 to.3.1 ppm . Pb compositions are similar, with average

( )M. Babinski et al.rChemical Geology 160 1999 175–199188
Fig. 6. Pb diagram showing the isotopic compositions determined on MF-17 samples containing Type III Pb. Pb isotopic compositions fromMF-7 samples containing Type III Pb were plotted for comparison. Type III Pb is divided into IIIa, IIIb, and IIIc according to their isotopiccompositions.
206 Pbr204 Pb and 207Pbr204 Pb values of 18.8 andŽ .15.7, respectively. If these data are plotted Fig. 7 ,
they are represented by a tight cluster which fallsŽ .slightly above the Stacey and Kramers 1975 Pb
Ž .Fig. 7. Pb diagram showing MF-5, MF-6 and MF-11 samples containing Type II Pb. The Stacey and Kramers 1975 evolution curve isshown for reference.

( )M. Babinski et al.rChemical Geology 160 1999 175–199 189
evolution curve. The extremely low UrPb ratiosŽ .0.02 to 0.10 do not allow measurable radiogenic Pbgrowth in these rocks; the Pb compositions represent
Ž .either a the composition of Pb in seawater at theŽ .time of deposition, or b the composition of nonra-
diogenic average crustal Pb introduced into the sam-ples at or after deposition. These compositions areclassified as Type II Pb, completing the four typesdescribed in this paper.
( X Y X Y )5.1.4. Outcrop MF-10 45836 31 W, 20819 22 SFifteen samples were collected from this outcrop.
The rocks belong to the Sete Lagoas Formation andare horizontal beds exposed in the wall of a largequarry; they do not show any mesoscopic deforma-tion. Although these rocks belong to the undeformed
Ž .zone C of Alkmim et al., 1989 , they are only 32
km west of the BIZ. The rocks are medium- toŽ .dark-gray calcilutites, and some very thin -1 mm
veins can be observed in them. In thin section,recrystallization of calcite is observed, as well as
Ž .microfractures and many thin 0.005 mm calciteveins that cut each other in various directions. Thesamples analyzed were selected to be as free of veinsas possible.
Ž .These samples Table 3 have Pb concentrationsranging from 0.07 to 0.69 ppm and U concentrationranging from 0.35 to 0.63 ppm. The Pb isotopic
ratios show 206 Pbr204 Pb values between 27.7 and61.7 and 207Pbr204 Pb values between 16.2 and 18.1.These Pb compositions represent Type I Pb. All dataexcept F4 yield a linear array with an apparent207 206 Ž .Pbr Pb age of 520"53 Ma Fig. 8 . SampleF4 contained very radiogenic Pb; its inclusion in theregression would cause essentially a two-point
Ž .isochron 461"59 Ma , which is not definitive dueto probable open system behavior of this most radio-genic point. This age is clearly younger than thatdetermined for MF-7 samples with Type I Pb, eventhough outcrop MF-10 is stratigraphically below out-crop MF-7. Therefore, we suggest that this age rep-resents the age of a deformational event that affectedthe Sao Francisco basin, especially because these˜samples came from an area close to the regionaffected by the Brasılia fold belt.´
( X Y X Y )5.1.5. Outcrop MF-19 44815 10 W, 15812 29 SŽThis outcrop is in the C undeformed zone Al-2
.kmim et al., 1989 and is located along the highwayabout 20 km north of Januaria. The rocks belong to´the Januaria Formation, which corresponds to the´Sete Lagoas Formation in the C zone. The samples1
are gray to dark-gray recrystallized carbonates. Atthis outcrop no macroscopic deformation was ob-served, but in thin section undulate extinction andmicrofractures were observed. The Pb concentrations
Fig. 8. Pb diagram for MF-10 and MF-19 samples containing Type I Pb.

( )M. Babinski et al.rChemical Geology 160 1999 175–199190
Ž .Table 3 are between 0.12 and 0.39 ppm and the Uconcentrations range from 0.29 to 0.61 ppm; UrPbratios are higher than 1. The 206 Pbr204 Pb valuesrange from 41.95 to 80.9 and 207Pbr204 Pb isotopicratios range from 17.2 to 19.4. These samples haveType I Pb and define an array that yields an age of
Ž .631"120 Ma not shown . However, sample MF-19-E falls slightly below the alignment defined bythe other eight samples. If this sample is not includedin the regression, an age of 565"89 Ma resultsŽ .Fig. 8 . This age is interpreted as the minimum ageof deposition for these carbonates, although it proba-bly corresponds to the time of rehomogenization ofthe Pb isotope system during the Brasiliano orogeny.
( )5.2. Eastern zone Aracuaı fold belt influence zone´
ŽRocks from four outcrops MF-3, MF-4, MF-5,. Žand MF-11 were collected within this domain Fig.
.3 ; they were affected by the Brasiliano deformationthat resulted in the overthrust of Espinhaco Super-group rocks upon the Sao Francisco basin.˜
( X Y X Y )5.2.1. Outcrop MF-3 44817 01 W, 19830 03 SŽSamples from outcrop MF-3 Sete Lagoas Forma-
.tion are black, recrystallized, medium- to coarse-grained carbonates; they were collected from theMinerasete quarry, 3 km south of Sete Lagoas. In the
outcrop centimeter-size, light-gray calcite veins areŽ .slightly folded. The Pb concentrations Table 3
range from 0.19 to 0.61 ppm and U concentrationsrange from 0.42 to 0.99 ppm. Samples MF-3-A and
ŽMF-3-B show higher Pb concentrations 0.88 to 3.9. Žppm and relatively low U concentrations 0.44 to
. 206 2041.1 ppm . The Pbr Pb values range from 19.0to 37.4 and the 207Pbr204 Pb values range from 15.7to 16.9. Samples with high Pb concentrations havelower Pb isotopic ratios, but they follow the sametrend defined by samples with low Pb concentra-tions; this Pb is classified as Type I Pb. The207Pbr206 Pb age determined from regression of these
Ž .data is 842"240 Ma Fig. 9 . Because of the nar-row range in the isotopic ratios, the error in the ageis relatively large and this result cannot be used toplace better constraints on the age of these rocksthan already exist.
( X Y X Y )5.2.2. Outcrop MF-4 44817 29 W, 19828 25 SŽ .MF-4 samples Sete Lagoas Formation are dark-
gray carbonates with columnar stromatolites and werecollected from an outcrop near Km 471 on BR-040.
Ž .These stromatolites were studied by Marchese 1974 ,who considered them to belong to the Gym-
Žnosolenida supergroup of Upper Riphean age 950 to.650 Ma . The carbonates are overlain by metasiltites
from Serra de Santa Helena Formation; these
Fig. 9. Pb diagram for MF-3 samples containing Type I Pb.
( )M. Babinski et al.rChemical Geology 160 1999 175–199 191
metasiltites display open folds and axial planarcleavage. The carbonates show the main deformationalong the S bedding. The Pb isotopic compositions0Ž . Ž .Table 3 have a large scatter not shown which can
Ž .be due to a some of the samples have differentŽ .initial Pb ratios, or b the Pb isotopic system was
partially disturbed during the deformational eventthat affected the area. No regression was attempted.
( X Y X Y )5.2.3. Outcrop MF-5 44820 55 W, 19816 57 SMF-5 samples were collected from the Lagoa do
Jacare Formation in the Servenge quarry, 4 km east´of BR-040; they are light-gray carbonates showingvery little deformation. The Pb isotopic compositionsŽ .Table 3 are not radiogenic. The Pb concentrations
Ž .are relatively high 2.7 to 7.5 ppm and the UŽ .concentrations are relatively low 0.33 to 0.73 ppm
Ž .with correspondingly low UrPb ratios -0.1 . TheŽ .spread in the Pb isotopic ratios is small Fig. 7 and
this is classified as Type II Pb, as already observedfor MF-6 samples.
( X Y X Y )5.2.4. Outcrop MF-11 43835 43 W, 19818 22 SMF-11 samples were collected from a large aban-
doned quarry at Serra do Cipo Park in the eastern´part of the Sao Francisco basin, close to the contact˜between Sao Francisco basin and Espinhaco Range.˜
The Espinhaco Range rocks were thrust upon Sao˜Francisco basin rocks during the Brasiliano orogeny.The samples are light-gray marbles, metamorphosedunder greenschist facies conditions and intensivelydeformed; sheath folds approximately 3 m in lengthcan be observed. Pb concentrations range from 0.6 to3.0 ppm, and the U concentrations determined for
Ž .some samples are very low about 0.02 ppm . TheŽ .range in Pb compositions is small Table 3 and this
is classified as Type II Pb, as already observed forŽ .MF-5 and MF-6 samples Fig. 7 . These samples
approximate average crustal Pb, plotting slightlyŽ .above the Stacey and Kramers 1975 Pb evolution
curve.
( )5.3. Western zone Brasılia fold belt influence zone´
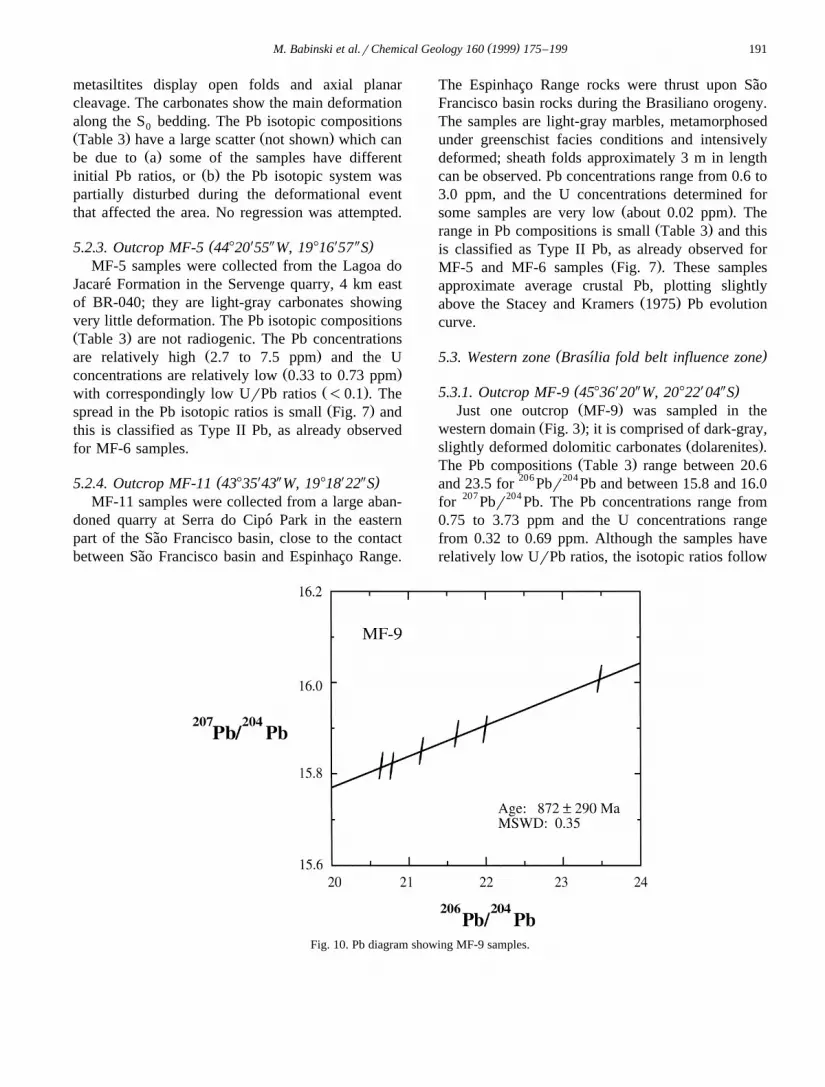
( X Y X Y )5.3.1. Outcrop MF-9 45836 20 W, 20822 04 SŽ .Just one outcrop MF-9 was sampled in the
Ž .western domain Fig. 3 ; it is comprised of dark-gray,Ž .slightly deformed dolomitic carbonates dolarenites .
Ž .The Pb compositions Table 3 range between 20.6and 23.5 for 206 Pbr204 Pb and between 15.8 and 16.0for 207Pbr204 Pb. The Pb concentrations range from0.75 to 3.73 ppm and the U concentrations rangefrom 0.32 to 0.69 ppm. Although the samples haverelatively low UrPb ratios, the isotopic ratios follow
Fig. 10. Pb diagram showing MF-9 samples.

( )M. Babinski et al.rChemical Geology 160 1999 175–199192
the same trend defined by other samples containingType I Pb. The age defined by all samples except
Ž .MF-9-G is 872"290 Ma Fig. 10 . Sample MF-9-Gshows more radiogenic Pb ratios, lower Pb concen-tration, relatively higher U concentration, and plotsdistinctly below the regression defined by the othersamples, yielding an age of 304"190 Ma. Becauseof the narrow range in the isotopic ratios, the error inthe age is relatively large, and the result of 872"290Ma cannot be used to place better constraints on theage of these rocks than already exist.
6. Discussion
6.1. Pb isotope geochemistry
Based on the four different types of Pb found andon the Pb–Pb isochron ages for Neoproterozic car-
bonates in the Sao Francisco basin, we suggest a Pb˜Ž .evolution model for these units Fig. 11 .
Samples hosting Type I Pb, the only ones that canprovide geologically meaningful isochron ages be-cause most of the Pb originates from in situ decay of
Ž .U, yielded ages of 686"69 Ma MF-7 , 565"89Ž . Ž .Ma MF-19 , and 521"53 Ma MF-10 . All sam-
ples were collected in the central area of the basin,where no mesoscopic deformation is observed. Theage of 686"69 Ma is interpreted as a minimumdepositional age for the carbonates, while the youngerones can represent post-depositional disturbance ofthe Pb isotopic system due to the thermal eventsrelated to the Brasiliano orogeny. We do not acceptthat the 686 Ma age represents the true depositional
Ž .age because: 1 in thin section, we observed featuresthat show the rocks undewent deformation and
Ž . Žrecrystallization, and 2 two other types of Pb III
Fig. 11. Pb isotopic evolution model proposed for carbonate rocks from the Bambuı Group, in the southern part of the Sao Francisco basin.´ ˜Ž .S&KsStacey and Kramers 1975 Pb evolution curve. The dashed line represents the age of 686"69 Ma determined for MF 7 samples
containing Type I Pb and is plotted for reference. The line through Type III Pb represents third-stage evolution of Pb in different m
environments from ca. 2100 Ma continental crustal to 500 Ma.
( )M. Babinski et al.rChemical Geology 160 1999 175–199 193
.and IV were found in the same outcrop, showingthat fluids interacted with the carbonates and thiscould have partially reset the Pb isotopic system.
Ž .Although younger ages 565 and 521 Ma wereŽdetermined on rocks from the stable area C and1
.C , these rocks still show deformational features in2
thin section. Because samples from MF-10 are strati-graphically at a lower level than MF-7 samples,which yield an age of 686"69 Ma, we believe thatthe age of 520 Ma determined on MF-10 samplesrepresents a time of rehomogenization in the Pbsystem, during the latest stage of the Brasilianoevent. The age of 565 Ma is also considered as atime of partial rehomogenization of the Pb system.Older apparent ages were determined from MF-3 andMF-9 samples collected in areas clearly affected bythe Brasiliano orogeny; these ages have large errorsand cannot be easily interpreted.
Type II Pb was found in samples from threeoutcrops: one is located in the stable part of the basinŽ . ŽMF-6 with no deformation, and the others MF-5
.and MF-11 are from the eastern part of the basinwhich is affected by the Aracuaı fold belt. MF-11´samples are folded marbles but MF-5 samples showless deformation. Regardless of the intensity of de-formation, samples from these three outcrops show
Ž .the same nonradiogenic crustal Pb Fig. 7 . Thisfeature is probably due to U-loss andror nonradio-genic Pb-addition during a deformational event. Thelow UrPb ratios in the samples hosting Type II Pbsupport this interpretation.
Samples hosting Type III Pb are located in theŽstable portion of the basin MF-7 and MF-17; C in1
.Fig. 3 . The radiogenic crustal Pb isotopic composi-tions in these samples indicate that this Pb camefrom high-m domains in the Archean-Paleoprotero-zoic basement of the basin. Because the samplesshow intense recrystallization but not mesoscopicdeformation, we suggest that the old Pb was incorpo-rated in the Neoproterozoic carbonates through alarge scale fluid percolation process. The path of thefluids were the old basement faults, which werereactivated during the Brasiliano orogeny.
The same isotopic signature as Type III Pb wasalso found in galenas formed in fractures, fault planesand at the crests of folds in different regions in the
Žbasin Parenti Couto et al., 1981; Iyer, 1984; Iyer et.al., 1992 . Pb isotopic compositions determined on
Ž .the galenas data summarized by Iyer et al., 1992and those determined on the Neoproterozoic carbon-
Žates rocks hosting Type III Pb define one trend not.shown . The galenas were formed during one or
more pulses of the Brasiliano orogeny, and the sourceŽof Pb is taken as the basement rocks Parenti Couto
.et al., 1981 . The carbonates host most of the Pb–Zndeposits in the Sao Francisco basin, which are classi-˜
Ž .fied as Mississippi Valley type Robertson, 1963 .Ž .Kanasewich 1962 suggests that the movement of
the fluids carrying Pb and responsible for the miner-alization could be caused by tectonic uplift of themineralized area. We conclude that these conditionsare the same as those found in the Sao Francisco˜basin, where Type III Pb and galenas are hosted bycarbonates that do not present any metamorphicoverprint.
Pb isotopic compositions determined on sampleshosting Type II Pb, i.e., nonradiogenic crustal Pb,fall at the lower end of the trend defined by samples
Ž .hosting Type III Pb and by the galenas not shown .This suggests that the isotopic compositions of typeII Pb were generated during the same event thatincorporated type III Pb in the carbonates and formedthe galenas, where favourable structural and chemi-cal traps existed.
A regression with Pb isotopic compositions ofType III Pb and Type II Pb was done, assuming thatthe isotopic signatures of Type II Pb were introducedin the carbonates during the same deformationalevent as Type III Pb, since the Type II Pb was also
Ž .determined in marbles MF-11 . This deformationalevent could have been synchronous with the fluidpercolation event that incorporated Pb from the base-ment in the carbonate rocks. This regression inter-
Ž .cepts the Stacey and Kramers 1975 Pb evolutioncurve at about 2100 and 520 Ma. This line is inter-preted as representing a stage of crustal Pb evolutionin domains of variable m-values, beginning about2100 Ma and ending about 550 to 500 Ma, withremoval of the Pb to a U-poor environment.
The 500–550 Ma array defined by the sampleshosting Type II and Type III Pb supports the ideathat the Pb isotopic system was disturbed ca. 500–550Ma, the age determined for MF-10 and MF-19 sam-ples, which host Type I Pb. This deformational eventis related to the final stages of the Brasiliano orogeny,when basement blocks were uplifted along old faults
( )M. Babinski et al.rChemical Geology 160 1999 175–199194
that were reactivated. The fault planes seem to havebeen used as paths for the fluid percolation. At thistime, in some parts of the basin the Pb isotopicsystem was reset and in others old Pb from thebasement was incorporated into the carbonates. K–Arages of 500–550 Ma were determined in biotites
Žfrom basement rocks Hertz, 1970; Cordani et al.,.1980; Teixeira, 1985; Cordani et al., 1989 and in
fine fractions from sediments of the Sao Francisco˜Žbasin Bonhomme, 1976; Thomaz Filho and Bon-
.homme, 1979; Bonhomme et al., 1982 . Rb–Sr agesŽ .determined on fine fractions clays from some rocks
Žof the basin fall in the same interval Bonhomme,.1976; Bonhomme et al., 1982 . Probably, the galenas
were also formed at this time. However, it is possiblethat the migration of the old Pb to the interior of thebasin, could have started earlier, ca. 700 Ma, and ithas evolved from 700 to 500 Ma. This hypothesis is
Ž .based on 1 some of the galenas from the westernportion of the basin, close to the Brasılia fold belt,´
Žpresent Pb model ages of 600–700 Ma Iyer, 1984;. Ž .Iyer et al., 1992 ; 2 samples hosting Type I Pb
from the MF-7 outcrop, where Type III Pb was alsodetermined, yield an isochron age of 686"69 Ma.In this case, the 500–550 Ma third stage array willindicate either the end of the fluid percolation pro-cess or the most significant pulse of fluid migration.At this time, we cannot choose between either of thetwo possibilities.
Considering the above, the fluid percolation pro-cess that we suggest as responsible for the migrationof old Pb from the basement rocks through theNeoproterozoic carbonate rocks from the Sao Fran-˜cisco basin appears to be the simplest way to explainthe Pb isotopic behaviour observed in the southernportion of the basin. Two facts support this hypothe-
Ž .sis: 1 the presence of orogenic belts in both sidesŽ .of the basin, and 2 the rocks of the Tres Mariasˆ
Formation, which represent sediments generated as aresult of the erosion of the marginal fold belts. The
Ž .sequence could have been thick enough ca. 2 km tocause the pressure necessary to provoke fluid migra-tion. The lateral pressure caused by the fold beltsassociated with the vertical pressure caused by theoverlying sedimentary sequence could have beenresponsible for the large scale fluid percolation eventthat took place in the southern part of the Sao˜Francisco basin.
6.2. Age of deposition of the Bambuı Group´
The Pb–Pb ages obtained in this work are in thesame range of those previously reported in the litera-
Žture, and some authors Kawashita et al., 1987,.Chang et al., 1993 and Kawashita et al., 1993
defend the idea that Bambuı Group rocks were de-´posited around 600 Ma. The conclusions of theseauthors are based on stable isotope data, Rb–Sr datadetermined on whole-rocks and fine fractions, and Sr
Žisotopic ratios determined on carbonates see Section.2.2 . We do not agree that the Bambuı Group rocks´
were deposited at 600 Ma for the following reasons.Ž .1 The UrPb ages obtained on the carbonate
rocks from the basin agree with the deformationalages determined on rocks from the adjacent foldbelts as well as from the deformed phases, whichsuggests that deformation of the rocks in the foldbelts and rocks of the basin are synchronous. Be-cause of this, the deposition of the sedimentary rocksshould have been taken place before this main defor-mational phase, which is registered at 650–600 Ma
Žin both fold belts Brito Neves et al., 1979; Siga,.1986; Pimentel et al., 1991; Valeriano, 1993 .
Ž .2 The Sr values obtained for carbonates ofBambuı Group are around 0.70750 and could repre-´sent any interval of age ranging from 1000 to 600Ma according to the Sr evolution curve proposed by
Ž .Veizer et al. 1983 . Other Sr evolution curves pro-Ž . Ž .posed by Derry et al. 1989 , Asmeron et al. 1991 ,
Ž . Ž .Derry et al. 1992 and Kaufman and Knoll 1995do not present the whole age interval mentionedabove and it is difficult to evaluate the possible age.
ŽHowever, based on these curves, older ages 760.Ma, )850 Ma can also be attributed to the Bambuı
Group carbonates.Ž .3 The carbon isotope data determined on car-
bonates show a depletion in 13C toward the base ofthe sequence, characterizing a negative excursion.
ŽAccording to many authors Knoll et al., 1986; Kauf-man et al., 1991; Derry et al., 1992; Knoll and
.Walter, 1992; Smith et al., 1994 the negative excur-sion indicates that the deposition took place duringor soon after a glacial event. The Varanger glacialevent at ca. 600 Ma is excluded for the reasons
Ž .presented in 1 . Although the glacial event is notclearly defined in the southern portion of the basin,in the northern part a glacial event is dated at about

( )M. Babinski et al.rChemical Geology 160 1999 175–199 195
0.9 to 1.0 Ga. Thus, the depletion in 13C in the lowerpart of the Bambuı Group could be related either to´the ca. 780 Ma Sturtian glacial event or to an older,ca. 900 to 1000 Ma glacial event. Considering theseoptions, the deposition of the base of the BambuıGroup rocks could have started as early as 900 Maor at ca. 780 Ma. The younger formation of theBambuı Group, the Tres Marias Formation, which is´ ˆconsidered as a molassic sequence resulting fromerosion of the ca. 600 Ma Brasiliano fold belts, isprobably much younger than the underlying se-quences, from which it is separated by an uncon-formity.
7. Conclusions
Ž .1 Carbonates of the Bambuı Group from the´southern part of the Sao Francisco basin show four˜different types of Pb. Type I Pb is found in rockscontaining relatively low-Pb and high-U concentra-
Ž .tions UrPb)1 ; it represents in situ growth ofradiogenic Pb and it is the only type of Pb thatprovides Pb–Pb isochron ages. Type II Pb is foundin samples with relatively high-Pb and low-U con-centrations; it is nonradiogenic and probably repre-sents the average crustal Pb at the time of depositionor deformation of the rocks. Type III Pb is alsofound in samples with high-Pb and low-U concentra-tions, but it is radiogenic crustal Pb, likely derivedfrom the basement of the basin and was incorporatedinto the carbonate rocks during the Brasilianoorogeny. Type IV Pb occurs in samples with UrPbratios lower than about 1.0 and is intermediate incomposition between Type III and Type I Pb; itprobably represents a mixture of those two types.Although most of the outcrops studied contain onlyone type of Pb, three out of four types were found in
Ž .one outcrop MF-7 . This fact implies that cautionhas to be taken during sample collection, since olderages can be obtained from samples containing oldradiogenic Pb inherited or introduced from the base-ment.
Ž .2 The Pb–Pb isochron ages obtained frommesoscopically undeformed carbonate rocks contain-ing Type I Pb range from 686"69 to 520"53 Ma.The older age is considered as the minimum deposi-tional age for the Sete Lagoas Formation. The
younger ages may represent post-depositional reho-mogenization of the U–Pb system. The agreement of207Pbr206 Pb isochron ages determined in this studywith those determined on rocks from the adjacentfold belts, and representing the metamorphic peak
Ž .and post- to late-tectonic activity 650 to 500 Ma ,indicates that the Pb system in the carbonates wasreset during the tectonism and that the deposition ofthe carbonates took place before 650 Ma.
Ž .3 Samples with Type I Pb collected in the areasaffected by the Brasiliano orogeny yielded regres-sions of 872"290 and 842"240 Ma. Althoughthese ages could represent the approximate time ofdeposition of the carbonates, the errors are too largeto allow precise interpretation. The large errors prob-ably reflect disturbance of the UrPb system in thesesamples caused by later tectonism.
Ž . Ž .4 Samples from the stable area MF-6 of thebasin as well from the area affected by the Aracuaı
Ž .fold belt MF-5 and MF-11 showed nonradiogenicType II Pb. We suggest that the Pb isotopic composi-tions result from U-loss from or Pb-addition to thecarbonates during deformation.
Ž .5 Isotopic compositions from Type III Pb definea linear array. The Pb isotopic compositions of TypeII Pb fall on the lower end of this line, which
Ž .intercepts the Stacey and Kramers S&K Pb evolu-tion curve at about 520 and 2100 Ma. This line isinterpreted as an array of Pb compositions generatedduring a stage of Pb evolution with variable m,indicating that old Pb from the basement was incor-porated into the carbonate rocks at about 500 to 550Ma through a large scale fluid percolation event thatcould have begun before 500–550 Ma. However, itis not possible to define, with the available data, aprecise time at which the process started. The pathsof these fluids may have been along old basementfaults reactivated during the Brasiliano orogeny.
Ž .6 Our study has shown that Pb compositions incarbonate sequences can have multiple origins, andmisleading interpretation of Pb ‘isochron’ ages mayresult if Pb compositions of different sources arecombined.
Acknowledgements
Isotopic work was done while the senior authorwas an exchange student at the Isotope Geochem-

( )M. Babinski et al.rChemical Geology 160 1999 175–199196
istry Laboratory, Department of Geology, Universityof Kansas. Discussions on analytical procedures withDrew Coleman, Kay Chung, Mark Martin, and DougWalker were very valuable. Support during the ana-lytical work was provided by a CNPq fellowshipŽ .Proc. No. 20.3157r89.3 to the senior author. TheUniversidade de Ouro Preto and CPRM providedlogistical support during the field work. Commentsand suggestions from Bor-ming Jahn, NunoMachado, Mike Bickle, and Theo Toulkeridis onearlier versions of the manuscript helped to improve
[ ]it. MB
Appendix A. Analytical procedures
All procedures were carried out at the IsotopeGeochemistry Laboratory of the University ofKansas. Several experiments were done in order tofind the best chemical procedure for dissolution ofthe carbonates. Our main purpose was to determinethe procedure that could give a low Pb analyticalblank, since most of the rocks have low-Pb concen-trations and the procedural blank could affect theirPb isotopic compositions.
In our first experiment, we used a powderedsample which was washed three times with distilled
Ž .H O to remove any dust and dried. About 250 mg2
was dissolved in two leaches using HCl. The firstleach was performed with 2 ml 1.0 N HCl and asecond one with 2 ml 3.0 N HCl. The Pb isotopiccompositions obtained from both leaches were very
Ž .similar, as were the Pb concentrations f3.5 ppm .The Pb analytical blank was about 280 pg for eachleach. A second experiment was done under thesame conditions, but a four-leach procedure wasapplied. The first three leaches were obtained with 2ml 0.5 N HCl and the last one was performed with 2ml 1.0 N HCl. The Pb isotopic compositions deter-mined on these leachates were almost identical, butthey showed a slight increase in radiogenic Pb fromthe first to the last leach.
For the next experiment two different sets ofsamples weighing about 250 mg were analyzed using0.5 N HCl. Eight samples were dissolved with afive-leach procedure and five samples were dis-solved using a three-leach procedure. Results show
Ž .that: a In samples with high-Pb, the concentration
determined in each leach is different and there is alarge variation among the different leaches; in thefirst leach, Pb concentration is generally lower thanin the others, possibly because Pb is concentrated inmineral grains which are not susceptible to dissolu-
Ž .tion during the first leach. b Low-Pb samples showPb compositions and Pb concentrations that increasefrom the first to the last leach, and the Pb composi-tions are more radiogenic than those determined inhigh-Pb samples. U concentrations are relatively highand roughly follow the same pattern determined forPb concentrations. The Pb analytical blank deter-mined in this procedure was about 250 pgrleach.
In an attempt to decrease Pb blanks, 0.6 N HBrwas tried for dissolution. Three low-Pb samples wereanalyzed because they would be more sensitive toblank effects. We observed that 2 ml of 0.6 N HBrdissolves about 60 mg of sample; the Pb composi-
Ž .tions are much more radiogenic f25% higher thanthose obtained through dissolution with HCl. The Pbanalytical blank in this procedure was 60 pgrleach.Up to this point Pb compositions determined in thefirst leach from low-Pb samples were always lowerthan those obtained from subsequent leaches. Thismay suggest that some contamination had been addedto the powdered samples during sample preparationŽ .crushing, sieving, etc . In order to decrease this
Ž .effect, small chips 2 to 5 mm of sample weredissolved, rather than powdered sample. The smallchips were washed three times with distilled waterand dried before dissolution. The analytical datashowed that no significant difference was caused bythis change, and the handling of small chips is moreconvenient than powdered samples.
Pb compositions obtained through HCl and HBrdissolution fall roughly on the same trend, but somescatter is observed, resulting in imprecise ages. Inorder to reduce scatter caused by leachates, sampleswere subsequently dissolved using only two leaches.
Ž .A first leach L1 was performed with 2 ml 0.6 NŽ .HBr dissolving f60 mg of sample , and a secondŽ . Žleach L2 was done using 10 ml 0.6 N HBr dissolv-
.ing f300 mg of sample . About 450 mg of samplewas used for dissolution so that significant residuewas left after reaction and thus did not contribute tothe solution. For some samples the Pb isotopic ratios
Ž .determined in the first leach L1 are not consistentwith L2 Pb ratios, perhaps due to variable effects of
( )M. Babinski et al.rChemical Geology 160 1999 175–199 197
blank, and the Pb isotopic compositions obtained inL1 do not fit the regression line defined by L2 data.For high-Pb samples, which show less radiogenicratios, in most cases the L1 data are concordant withL2 data.
A dual-leaching procedure using 0.6 N HBr wasalso tested using 1.0 ml of acid for the first leachŽ . Ž .L1 and 10.0 ml for the second leach L2 . Pbcompositions from L1 and L2 from all samples aresimilar, although the L1 ratios are slightly moreradiogenic than L2 ratios. The samples used for thisexperiment contain Pb less radiogenic than modernŽ .blank Pb, and the slightly higher L1 ratios couldreflect a blank effect which increases the pure sam-ple ratios towards modern common Pb.
Some samples were also dissolved through adual-leach procedure using 1.2 N HBr. For high-Pbsamples the Pb isotopic compositions determined forL1 are similar to those determined for L2; however,the Pb concentrations are lower in L1. For low-Pbsamples the Pb isotopic compositions are higher inL2 relative to L1 and the Pb concentrations are veryclose for both. Finally, samples dissolved in just one
Ž .step whole-rock , using 10 ml 0.6 N HBr, yieldedPb isotopic compositions with values that could rep-resent the average of those determined in the firstand second leaches.
A.1. Preferred Procedure
After the experiments outlined above we con-cluded that the best procedure to dissolve our car-bonate rocks is that in which a dual-leach is appliedusing weak acid, i.e., 0.6 N HBr. Samples are first
Ž .crushed into small 0.2 to 0.5 cm pieces, washedthree times with distilled H O, and dried. About 4502
mg of clean sample chips is weighed into a teflonŽ .Savillex beaker. The first leach L1 is performed
Ž .with 2 ml of 0.6 N HBr. This leachate L1 isdiscarded. Residual chips were transferred to a Sav-illex beaker, washed three times with H O, dried,2
Ž .and weighed. For the second leach L2 , 10 ml of 0.6N HBr is added to the residue of L1 and allowed toreact overnight to achieve complete reaction. Thesolution and residue are transferred to a test tube andcentrifuged. The clear solution is split into a 75%aliquot for Pb isotopic composition and a 25% aliquot
for Pb and U concentration analysis using a mixed208 Pb–235U spike.
After the aliquots of solution are prepared, theyare dried and 2–3 ml of 0.6 N HBr was added to theresidue. The Pb and U are extracted using ion ex-change techniques, with AG-1=8, 200–400 mesh,anion resin. Polyethylene columns with 0.03 ml ofresin are prewashed with 3.0 ml of 6 N HCl and 0.3ml of H O and then conditioned with 0.3 ml of 0.62
N HBr. The sample solution is added and the resinrinsed three times with 0.3 ml of 0.6 N HBr to
Žisolate Pb from the other elements for spiked sam-.ples the rinses are saved for further U purification ;
Pb is collected with 1.0 ml of 6 N HCl. This solutionis dried and subjected to a second purification of Pbfollowing the same procedure. The final solutions aredried with one drop each of 7 N HNO and 0.25 N3
H PO . Pb blanks were 0.2 ng for L2 and by the end3 4
of the study Pb blanks were less than 30 pg for L2;in either case, they have negligible effect on the Pbisotopic compositions measured.
The solution containing U from a spiked aliquot isdried and 2.0 ml of 7 N HNO added. This solution3
is passed through an ion exchange column filled with2.0 ml of AG-1=8, 200–400 mesh, anion resinpreviously rinsed twice alternatively with 2.0 ml of 6N HCl and 2.0 ml of H O and preconditioned with2
2.0 ml of 7 N HNO . The sample and resin are3
eluted three times with 2.0 ml of 7 N HNO , and the3
U is collected by eluting with 2.0 ml of H O fol-2
lowed by 2.0 ml of 6 N HCl. The U-bearing solutionis dried with one drop of 0.25 N H PO . U blanks3 4
Ž .were generally below detection limits -0.01 ng .After choosing this procedure, all the samples
analyzed toward the end of the study did not havetheir L1 ratios determined, only the L2 ratios weredetermined. In all the tables with analytical data, thedissolution procedure applied to each sample is indi-cated.
References
Alkmim, F.F., Chemale, F., Bacellar, L.A.P., Oliveira, J., Maga-lhaes, P.M., 1989. Arcabouco estrutural da porcao sul da˜ ˜Bacia do Sao Francisco. In: Simp. Geol. Nucleo Minas Gerais,˜ ´5; Simp. Geol. Nucleo Brasılia, 1, Belo Horizonte. Anais,´ ´SBG, pp. 289–293.

( )M. Babinski et al.rChemical Geology 160 1999 175–199198
Almeida, F.F.M., 1967. Origem e evolucao da plataforma˜brasileira. DNPM, Bol., Div. Geol. e Miner. 241, 1–36.
Asmeron, Y., Jacobsen, S.B., Knoll, A.H., Butterfield, N.J., Swett,K., 1991. Strontium isotopic variation of Neoproterozoic sea-water: implications for crustal evolution. Geochim. Cos-mochim. Acta 55, 1883–2894.
Babinski, M., Chemale, F., Van Schmus, W.R., 1995. The PbrPbage of Minas Supergroup carbonate rocks, Quadrilatero´Ferrıfero, Brazil. Precambrian Res. 72, 235–245.´
Bonhomme, M.G., 1976. Mineralogie des fractions fines et data-tions Rubidium–Strontium dans le Groupe Bambuı, MG,´Bresil. Rev. Bras. Geocienc. 6, 211–220.´
Bonhomme, M.G., Cordani, U.G., Kawashita, K., Macedo,M.H.F., Thomaz Filho, A., 1982. Radiochronological age andcorrelation of Proterozoic sediments in Brazil. PrecambriamRes. 18, 103–118.
Brito Neves, B.B., Cordani, U.G., 1991. Tectonic evolution ofSouth America during the Late Proterozoic. Precambrian Res.53, 23–40.
Brito Neves, B.B., Kawashita, K., Cordani, U.G., Delhal, J., 1979.A evolucao geocronologica da Cordilheira do Espinhaco—˜ ´Dados novos e integracao. Rev. Bras. Geocienc. 9, 71–85.˜
Chang, H.K., Kawashita, K., Alkmim, F.F., Moreira, M.Z., 1993.Consideracoes sobre a estratigrafia isotopica do Grupo Bambuı.˜ ´ ´In: Simp. sobre o Craton do Sao Francisco, 2, Salvador. Anais,´ ˜SBG, pp. 195–196.
Chemale, F., Alkmim, F.F., Endo, I., 1993. Late Proterozoictectonism in the interior of the Sao Francisco craton. In: R.H.˜
Ž .Findlay et al. Eds. , Gondwana Eight-Assembly, Evolutionand Dispersal, Balkema, pp. 29–42.
Cordani, U.G., Kawashita, K., Muller, G., Quade, H., Reimer, V.,¨Roeser, H., 1980. Interpretacao tectonica e petrologica de˜ ˆ ´dados geocronologicos do embasamento na borda sudeste do´Quadrilatero Ferrıfero. An. Acad. Bras. Cienc. 52, 785–799.´ ´
Cordani, U.G., Teixeira, W., Siga, O., 1989. Geocronologia doQuadrilatero Ferrıfero. Bol. XXI Sem. Estudos, Soc. Interc.´ ´Cult. Est. Geol., Ouro Preto, v. 21, pp. 27–44.
Costa, L.A.M., Angeiras, A.G., 1971. Geosynclinal Evolution ofthe epi-Baykalian Platform of Central Brazil. Geol. Rundsch.60, 1024–1050.
D’Agrella Filho, M.S., Pacca, I.G., Teixeira, W., Onstott, T.C.,Renne, P.R., 1990a. Paleomagnetic evidence for the evolutionof Meso- to Neo-Proterozoic glaciogenic rocks in central-east-ern Brazil. Palaeogeog., Palaeoclimatol., Palaeoecol. 80, 255–265.
D’Agrella Filho, M.S., Pacca, I.G., Renne, P.R., Onstott, T.C.,Teixeira, W., 1990b. Paleomagnetism of Middle ProterozoicŽ .1.01 to 1.08 Ga mafic dykes in southeastern Bahia State—Sao Francisco Craton, Brazil. Earth Planet. Sci. Lett. 101,˜332–348.
Dardenne, M.A., 1978. Sıntese sobre a estratigrafia do Grupo´Bambuı no Brasil Central. In: Congr. Bras. Geol., 30, Recife.´Anais, SBG, v. 2, pp. 597–610.
Derry, L.A., Keto, L.S., Jacobsen, S.B., Knoll, A.H., Swett, K.,1989. Sr isotopic variations in Upper Proterozoic carbonatesfrom Svalbard and East Greenland. Geochim. Cosmochim.Acta 53, 2331–2339.
Derry, L.A., Kaufman, A.J., Jacobsen, S.B., 1992. Sedimentarycycling and environmental change in the Late Proterozoic:evidence from stable and radiogenic isotopes. Geochim. Cos-mochim. Acta 56, 1317–1329.
DeWolf, C.P., Halliday, A.N., 1991. U–Pb dating of a remagne-tized limestone. Geophys. Res. Lett. 18, 1445–1448.
Fairchild, T.R., Schorpf, J.W., Shen-Miller, J., Guimaraes, E.M.,˜Edwards, M.D., Lagstein, A., Xiau, Li, Pabst, M., Melo-Filho,L.S., 1996. Recent discoveries of Proterozoic micorfossils insouth-central Brazil. Precambrian Res. 80, 125–152.
Hertz, N., 1970. Gneissic and Igneous Rocks of the Quadrilatero´Ferrıfero, Minas Gerais, Brazil. U.S. Geol. Surv. Prof. Pap.´641B, 1–58.
Israelson, C., Halliday, A.N., Buchardt, B., 1996. U–Pb dating ofcalcite concretions from Cambrian black shales and thePhanerozoic time scale. Earth Planet. Sci. Lett. 141, 153–159.
Iyer, S.S., 1984. A discussion on the lead isotope geochemistry ofgalenas from the Bambuı Group, Minas Gerais, Brazil. Miner.´Deposita 19, 132–137.
Iyer, S.S., Hoefs, J., Krouse, H.R., 1992. Sulfur and lead geo-chemistry of galenas from the Bambuı Group, Minas Gerais,´Brazil—implications for the ore genesis. Econ. Geol. 87,437–443.
Iyer, S.S., Babinski, M., Krouse, H.R., Chemale, F., 1995. Highly13C-enriched carbonate and organic matter in the Neoprotero-zoic sediments of the Bambuı Group, Brazil. Precambrian Res.´73, 271–282.
Jahn, B.M., 1988. Pb–Pb dating of young marbles from Taiwan.Nature 332, 429–432.
Jahn, B.M., Cuvellier, H., 1994. Pb–Pb and U–Pb geochronologyŽof carbonate rocks: an assessment. Chem. Geol. Isot. Geosci.
.Sect. 115, 125–151.Jahn, B.M., Simonsen, B.M., 1995. Carbonate Pb–Pb ages of the
Wittenoom Formation and Carawine Dolomite, HamersleyŽbasin, Western Australia with implications for their correla-
.tion with the Transvaal Dolomite of South Africa . Precam-brian Res. 72, 247–261.
Jahn, B.M., Bertrand-Sarfati, J., Morin, N., Mace, N., 1990.´Direct dating of stromatolitic carbonates from the Schmidtsdrif
Ž .Formation Transvaal Dolomite , South Africa, with implica-tions on the age of the Ventersdorp Supergroup. Geology 18,1211–1214.
Kanasewich, E.R., 1962. Approximate age of tectonic activityusing anomalous lead isotopes. R. Astron. Soc., Geophys. J. 7,158–168.
Karfunkel, J., Hoppe, A., 1988. Late Proterozoic glaciation incentral-eastern Brazil: synthesis and model. Palaeogeog.,Palaeoclimatol., Palaeoecol. 65, 1–21.
Kaufman, A.J., Knoll, A.H., 1995. Neoproterozoic varations in theC-isotopic compositions of seawater: stratigraphic and biogeo-chemical implications. Precambrian Res. 73, 27–49.
Kaufman, A.J., Hayes, J.M., Knoll, A.H., Germs, G.J.B., 1991.Isotopic compositions of carbonates and organic carbon fromUpper Proterozoic successions in Namibia: stratigraphic varia-tion and the effects of diagenesis and metamorphism. Precam-brian Res. 49, 301–327.
Kawashita, K., Mizusaki, A.M.P., Chang, H.K., 1987. Razoes˜

( )M. Babinski et al.rChemical Geology 160 1999 175–199 199
87Srr86Sr em sedimentos carbonaticos do Grupo Bambuı´ ´Ž .MG . In: Congr. Bras. Geoq., 1, Porto Alegre. Anais, SBGq,v. 1, pp. 133–137.
Kawashita, K., Thomaz Filho, A., Sato, K., Kawashita, M.Y.,Ž .Babinski, M., 1993. Idade do Grupo Bambuı MG com base´
em isotopos de Carbono, Oxigenio, Estroncio e Enxofre. In:´ ˆ ˆCongresso de Geoquımica dos Paıses de Lıngua Portuguesa, 2,´ ´ ´Porto, Portugal. Memorias, pp. 391–395.
Knoll, A.H., Walter, M.R., 1992. Latest Proterozoic stratigraphyand Earth history. Nature 356, 673–678.
Knoll, A.H., Hayes, J.M., Kaufman, A.J., Swett, K., Lambert,I.B., 1986. Secular variation in carbon isotope ratios fromUpper Proterozoic successions of Svalbard and East Green-land. Nature 321, 832–838.
Ludwig, K.R., 1990. Isoplot: a plotting and regression programfor radiogenic-isotope data, for IBM-PC compatible comput-ers, Version 2.02. USGS Open-File Rep. 88-557.
Macedo, M.H.F., Bonhomme, M.G., 1984. Contribuicao a cro-˜ `noestratigrafia das Formacoes Caboclo, Bebedouro e Salitre na˜
Ž .Chapada Diamantina BA pelos metodos Rb–Sr e K–Ar.´Rev. Bras. Geocienc. 14, 153–163.
Machado, N., Noce, C.M., Belo de Oliveira, O.A., Ladeira, E.A.,1989. Evolucao geologica do Quadrilatero Ferrıfero no˜ ´ ´ ´Archeano e Proterozoico Inferior, com base em geocronologia´U–Pb. In: Simp. Geol. Nucleo Minas Gerais, 5; Simp. Geol.´Nucleo Brasılia, 1, Belo Horizonte. Anais, SBG, pp. 1–5.´ ´
Marchese, H.G., 1974. Estromatolitos Gymnosolenidos en el ladooriental de Mians Gerais, Brasil. Rev. Bras. Geol. 4, 257–271.
Marshak, S., Alkmim, F.F., 1989. Proterozoic contractionrexten-sion tectonics of the southern Sao Francisco region, Minas˜Gerais, Brazil. Tectonics 8, 555–571.
Moorbath, S., Taylor, P.N., Orpen, J.L., Treloar, P., Wilson, J.F.,1987. First direct radiometric dating of Archean stromatolitelimestone. Nature 326, 865–867.
Parenti Couto, J.G., Cordani, U.G., Kawashita, K., Iyer, S.S.,Moraes, N.M.P., 1981. Consideracoes sobre a idade do Grupo˜Bambuı com base em analises isotopicas de Sr e Pb. Rev.´ ´ ´Bras. Geocienc. 11, 5–16.
Pimentel, M.M., Heamann, L., Fuck, R.A., 1991. U–Pb zircongeochronology of Precambrian tin-bearing continental-typeacid magmatism in central Brazil. Precambrian Res. 52, 321–335.
Renne, P.R., Onstott, T.C., D’Agrella, M.S., Pacca, I.G., Teixeira,W., 1990. 40Arr39Ar dating of 1.0–1.1 Ga magnetizationsfrom the Sao Francisco and Kalahari cratons: tectonic implica-˜tions for Pan-African and Brasiliano mobile belts. Earth Planet.Sci. Lett. 101, 349–366.
Robertson, J.F., 1963. Geology of the lead–zinc deposits in themunicıpio de Januaria, State of Minas Gerais, Brazil. U.S.´ ´Geol. Surv. Prof. Pap. 1110B, 110.
Siga, O., 1986. A evolucao geotectonica da porcao nordeste de˜ ˆ ˜Minas Gerais, com base em interpretacoes geocronologicas.˜ ´Unpublished Master thesis, Universidade de Sao Paulo, Brazil,˜140 pp.
Smith, P.E., Farquhar, R.M., 1989. Direct dating of Phanerozoicsediments by 238 U–206 Pb method. Nature 341, 518–521.
Smith, P.E., Farquhar, R.M., Hancock, R.G., 1991. Direct radio-metric age determination of carbonate diagenesis using U–Pbin secondary calcite. Earth Planet. Sci. Lett. 105, 474–491.
Smith, L.H., Kaufman, A.J., Knoll, A.H., Link, P.K., 1994.Chemostratigraphy of predominantly siliciclastic Neoprotero-zoic successions: a case study of the Pocatello Formation andlower Brigham Group, Idaho. Geol. Mag. 131, 301–314.
Stacey, J.C., Kramers, J.D., 1975. Approximation of terrestriallead isotope evolution by a two-stage model. Earth Planet. Sci.Lett. 26, 207–221.
Steiger, R.H., Jager, E., 1977. Subcommission on Geochronology:¨convention on the use of decay constants in geo- and cos-mochronology. Earth Planet. Sci. Lett. 36, 359–362.
Teixeira, W., 1985. A evolucao geotectonica da porcao meridional˜ ˆ ˜do craton do Sao Francisco, com base em interpretacoes´ ˜ ˜geocronologicas. Unpublished PhD dissertation, Universidade´de Sao Paulo, Brazil, 207 pp.˜
Teixeira, W., Figueiredo, M.C.H., 1991. An outline of EarlyProterozoic crustal evolution in the Sao Francisco Craton,˜Brazil: a review. Precambrian Res. 53, 1–22.
Thomaz Filho, A., Bonhomme, M.G., 1979. Datations isotopiquesRb–Sr et K–Ar dans le Groupe Bambuı, a Sao Francisco´ ` ˜Ž .MG , au Bresil. Phase metamorphique bresilienne synchrone´ ´ ´de la premiere phase panafricaine. C. R. Acad. Sci., Ser. D.`289, 1221–1224.
Thomaz Filho, A., Lima, V.Q., 1981. Datacao radiometrica de˜ ´rochas sedimentares pelıticas pelo metodo RbrSr. Bol. Tec.´ ´PETROBRAS 24, 109–119.
Valeriano, C.M., 1993. Evolucao tectonica da extremidade merid-˜ ˆional da Faixa Brasılia, regiao da Represa de Furnas, sudoeste´ ˜de Minas Gerais. Unpublished PhD dissertation, Universidadede Sao Paulo, Brazil, 192 pp.˜
Veizer, J., Compston, W., Clauer, N., Schidlowski, M., 1983.87Srr86Sr in late Proterozoic carbonates: evidence for a ‘man-tle’ event at f900 Ma ago. Geochim. Cosmochim. Acta 47,295–302.