handbook on disaster management - regional centre for
TRANSCRIPT
Handbook
on
Disaster Management
Disaster Management Cell
Regional Centre for Urban and Environmental Studies
Lucknow University Campus, Lucknow Telefax: 0522-2740165, Website: www.rcueslko.org
Contents
Page No. FOREWORD
PREFACE
CHAPTER-I INTRODUCTION 1-10
CHAPTER-II HAZARDS AND DISASTERS 11-30
CHAPTER-III EARTHQUAKE 31-43
CHAPTER-IV TSUNAMI 44-50
CHAPTER-V CYCLONE 51-60
CHAPTER-VI FLOOD 61-69
CHAPTER-VII DROUGHT
70-77
CHAPTER-VIII LANDSLIDE
78-87
CHAPTER-IX HUMAN INDUCED DISASTERS
88-106
CHAPTER-X DISASTER MITIGATION
107-127
CHAPTER-XI DISASTER MANAGEMENT
128-161
CHAPTER-XII DISASTER MANAGEMENT IN STATES
162-170
CHAPTER-XIII BUILDING A NEW TECHNO-LEGAL REGIME
171-182
CHAPTER-XIV AGENCIES INVOLVED IN DISASTER RESPONSE
183-199
ANNEXURES
i-xxix
FURTHER READINGS i-viii
Foreword
India is one of the major countries which witness natural and human
induced disasters very frequently. Floods, droughts, cyclones, and
earthquakes cause severe loss to human lives and physical resources.
Communal riots, conflicts, fires, epidemics, accidents and other disasters
compound the country's chronic troubles. The social and economic
progress achieved over decades by the people, and advances in physical
development, can be significantly devastated and degraded by disasters.
The Government of India and State Governments through various agencies
have been making efforts to meet the exigencies as arisen by natural and
man made disasters. It is, however, experienced that all these efforts and
contingency plans concentrate on the post disaster situation. Thus it is
imperative to prevent and mitigate the disasters, and also prepare the
community and other stakeholders for disaster response, rehabilitation and
reconstruction of disasters affected victims and areas.
The Handbook on Disaster Management highlights various
dimensions, approaches and issues pertaining to disasters management. It
is hoped that the Handbook will be use of immense in understanding the
dynamics of disaster management in the country.
We received suggestions from various individuals and organizations
on this volume. We are thankful to all of them. Our special thanks are due
to the Principal Secretary to the Government of U.P. in the Deptt. of Urban
Development and Director of Urban Local Bodies for their support in the
endeavor.
RCUES Prof. Nishith Rai
Lucknow Director
Preface
India is one of the most disasters prone countries of the world. About 60
percent of the landmass is reported to be susceptible to seismic activity and
about 18 percent country’s total area is drought prone. About 40 million hectares
of land in the country has been identified as flood prone. The Indian Ocean is
one of the six major cyclone prone reasons of the globe. Among the 32 states
and union territories in the country, 22 are multi disasters prone.
Increasing urbanization, expansion of habitats into unsuitable vulnerable
areas, higher population density, higher housing density, vulnerable housing and
buildings constructions and non-engineered unsafe construction and aging
buildings and other infrastructures are some of the factors that have increased
vulnerability of hazards and disasters in urban areas. The poor planning of
drainage and defunct drainage system in some of the major cities have also
caused pro-longed water logging and urban floods. The natural disasters such as
floods, droughts, cyclone, earthquakes etc. that adversely affect the agricultural
income also result in migration of people from rural areas to urban centers. This
may put immense pressure on civic services and infrastructure. The man made
disasters such as accidents, epidemics, communal violence etc are more prone to
urban centers.
Disasters can not be predicted, however the loss of disasters may be
reduced significantly through proper planning, mitigation measures,
preparedness and effective management system. Thus, it is imperative to develop
perspective planning for the prevention, disaster response and rehabilitation and
reconstruction of disaster’s affected victims and areas. Present Handbook on
Disaster Management highlights emerging perspective of different types of
disasters and their effective management. I hope that the volume will be highly
useful to those who are interested in this field.
(Dr. A.K. Singh)
Assistant Director
1
CHAPTER-I
INTRODUCTION
India is one of the world's major theaters of disasters-both natural and
human made. Floods, droughts, cyclones, and earthquakes pound it end to
end every year. Communal riots, conflicts, fires, epidemics, and other
disasters compound the country's chronic troubles. The social and economic
progress and advances physical development in any country achieved over
decades can be significantly devastated and degraded by disasters.
Urbanization, industrialization, globalization and liberalization of economy
all have influenced human life. People are tend to live in disaster prone
areas due to severe stress on land, high prices of land and construction of
buildings, poverty, migration and non-regulation of urban housing
constructions. Even, the natural protection measures are neglected to pave
the way for economic development. The government of India through
various stake-holding agencies has been making efforts to meet the
exigencies as arisen by natural disasters. It is, however, experienced that all
these efforts and contingency plans concentrate on the post disaster situation.
A half backed approach is adopted for preventing the occurrence of
disasters. There is need for fundamental change in national disaster policy
itself. The community has to be associated at all levels of planning and
implementation of the disaster management programmes.
Urbanization
Urbanization is a global phenomenon experienced by developed as
well as developing countries. There is migration from villages to towns and
2
cities with results in growth of metropolitan cities since they provide
multiple avenues, services and amenities viz. education, health care,
employment, business and entertainment options etc. People also migrate for
economic opportunities and urban life styles. (Though urbanization brings
about development in social, economic and cultural spheres of life, it
sometimes disturbs the ecological systems. Rapid and unplanned growth of
urban agglomerations generates a series of negative environmental effects.
Today urban India presents a very pathetic scene. Cities have become a site
of rotting garbage, degrading drainage system and shocking night soil
removal system. India's life line is in danger. Many Indian rivers are heading
towards an environmental disaster due to discharging of untreated sewage
into water bodies. Besides, poor have practically no access to sanitary toilets
and in many towns and cities, the majority defecate in the open. The
untreated sewage being dumped into the river and water bodies leads to
health hazards.)
India is one of the least urbanized countries in the world. However, it
has second largest urban population in the world. As per 2001 Census, 285
million populations i.e. 27.8 per cent of 1027 million total population of
India is residing in 4368 cities and towns in the country, whereas in 1971, 20
per cent population lived in urban areas. In 2021, about two fifth populations
are expected to live in urban areas with absolute size of 550 million
populations. The characteristic of urbanization in India is concentration of
urban population in larger urban centres. About two-thirds of its urban
content are found concentrated in class-I towns i.e. towns with more than
one lakh population. Four mega cities viz., Mumbai, Kolkata, Delhi, and
3
Chennai with a population of more than 6 millions each in 2001, account for
almost one fourth populations living in cities.
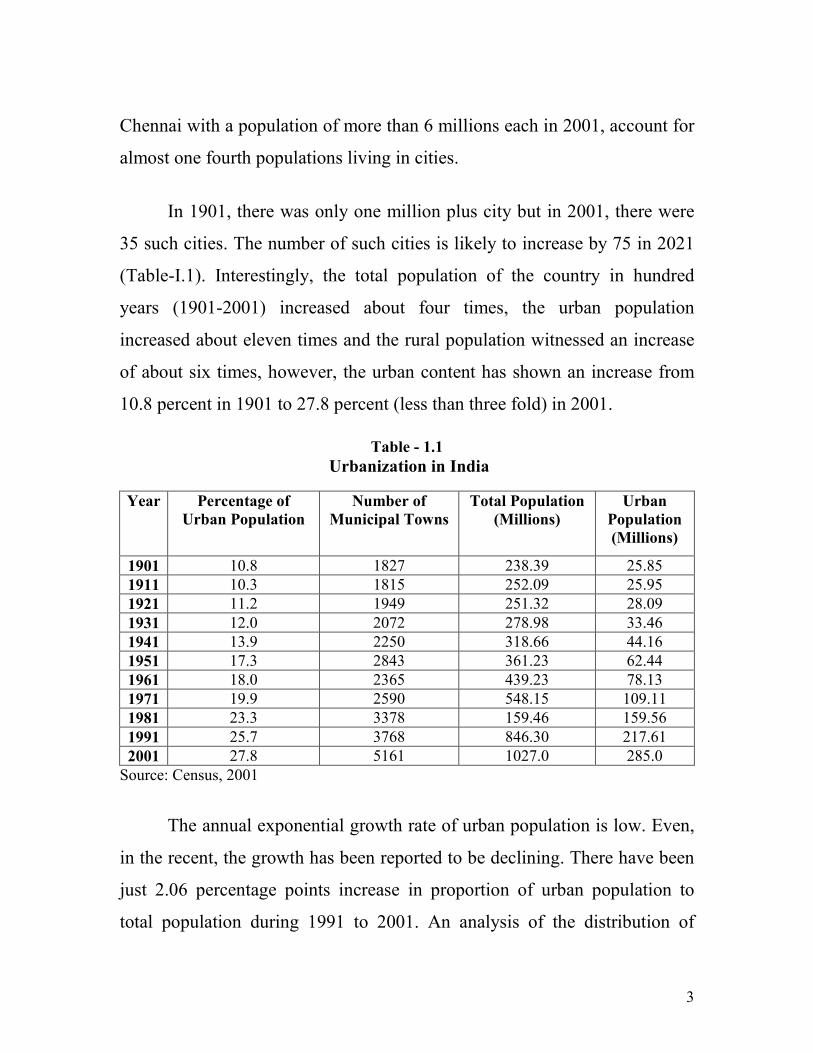
In 1901, there was only one million plus city but in 2001, there were
35 such cities. The number of such cities is likely to increase by 75 in 2021
(Table-I.1). Interestingly, the total population of the country in hundred
years (1901-2001) increased about four times, the urban population
increased about eleven times and the rural population witnessed an increase
of about six times, however, the urban content has shown an increase from
10.8 percent in 1901 to 27.8 percent (less than three fold) in 2001.
Table - 1.1
Urbanization in India
Year Percentage of
Urban Population
Number of
Municipal Towns
Total Population
(Millions)
Urban
Population
(Millions)
1901 10.8 1827 238.39 25.85
1911 10.3 1815 252.09 25.95
1921 11.2 1949 251.32 28.09
1931 12.0 2072 278.98 33.46
1941 13.9 2250 318.66 44.16
1951 17.3 2843 361.23 62.44
1961 18.0 2365 439.23 78.13
1971 19.9 2590 548.15 109.11
1981 23.3 3378 159.46 159.56
1991 25.7 3768 846.30 217.61
2001 27.8 5161 1027.0 285.0
Source: Census, 2001
The annual exponential growth rate of urban population is low. Even,
in the recent, the growth has been reported to be declining. There have been
just 2.06 percentage points increase in proportion of urban population to
total population during 1991 to 2001. An analysis of the distribution of
4
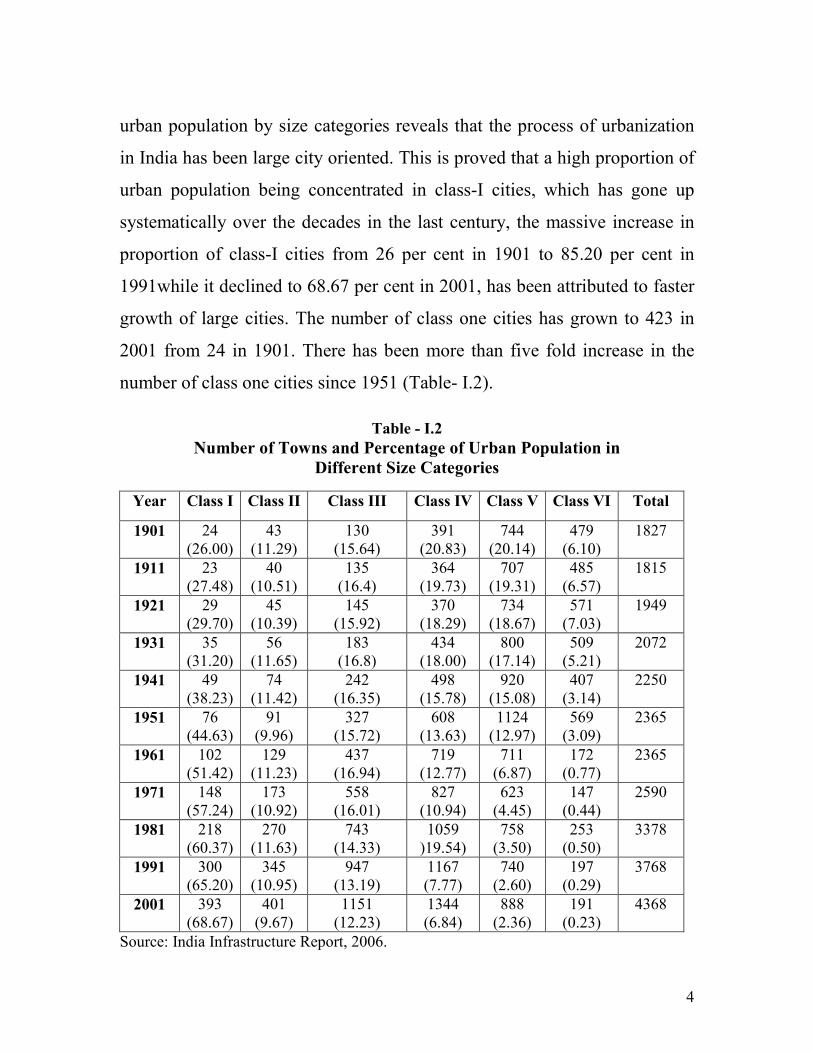
urban population by size categories reveals that the process of urbanization
in India has been large city oriented. This is proved that a high proportion of
urban population being concentrated in class-I cities, which has gone up
systematically over the decades in the last century, the massive increase in
proportion of class-I cities from 26 per cent in 1901 to 85.20 per cent in
1991while it declined to 68.67 per cent in 2001, has been attributed to faster
growth of large cities. The number of class one cities has grown to 423 in
2001 from 24 in 1901. There has been more than five fold increase in the
number of class one cities since 1951 (Table- I.2).
Table - I.2
Number of Towns and Percentage of Urban Population in
Different Size Categories
Year Class I Class II Class III Class IV Class V Class VI Total
1901 24 (26.00)
43 (11.29)
130 (15.64)
391 (20.83)
744 (20.14)
479 (6.10)
1827
1911 23 (27.48)
40 (10.51)
135 (16.4)
364 (19.73)
707 (19.31)
485 (6.57)
1815
1921 29 (29.70)
45 (10.39)
145 (15.92)
370 (18.29)
734 (18.67)
571 (7.03)
1949
1931 35 (31.20)
56 (11.65)
183 (16.8)
434 (18.00)
800 (17.14)
509 (5.21)
2072
1941 49 (38.23)
74 (11.42)
242 (16.35)
498 (15.78)
920 (15.08)
407 (3.14)
2250
1951 76 (44.63)
91 (9.96)
327 (15.72)
608 (13.63)
1124 (12.97)
569 (3.09)
2365
1961 102 (51.42)
129 (11.23)
437 (16.94)
719 (12.77)
711 (6.87)
172 (0.77)
2365
1971 148 (57.24)
173 (10.92)
558 (16.01)
827 (10.94)
623 (4.45)
147 (0.44)
2590
1981 218 (60.37)
270 (11.63)
743 (14.33)
1059 )19.54)
758 (3.50)
253 (0.50)
3378
1991 300 (65.20)
345 (10.95)
947 (13.19)
1167 (7.77)
740 (2.60)
197 (0.29)
3768
2001 393 (68.67)
401 (9.67)
1151 (12.23)
1344 (6.84)
888 (2.36)
191 (0.23)
4368
Source: India Infrastructure Report, 2006.
5
The startling fact is that the proportion of population living in smaller
towns has shown declining trend over the period while there is massive
growth in population of larger towns. Importantly, growth of population in
smaller towns has been reported negative while growth of population in
larger cities and towns has been found massive. During 2001, the high
proportion of urban population to total population has been reported to be in
Delhi, Pondicherry, Goa, Chandigarh, Maharastra, Mizoram, Lakshadeep,
Tamil Nadu, Karnataka, Gujarat etc. The high rate of growth of urban
population during 1991-2001 has been reported high in Dadra and Nagar
Haveli (14.59 per cent) followed by Arunachal Pradesh (7.00 per cent),
Andman Nicobar (4.14 per cent), Sikkim (4.83 per cent), and Delhi, (4.14
per cent). During 2002, there were 384 urban local bodies in India. Out of
total urban local bodies in India, 107 ULB's were Municipal Corporations,
1443 Municipal Councils and 2091 Nagar Panchayats. The highest number
of local bodies were reported in Tamil Nadu (719) followed by Uttar
Pradesh (628), Madhya Pradesh and Maharastra.
Increasing urbanization, expansion of habitat into unsuitable
vulnerable areas; higher population density, higher housing density,
vulnerable housing and buildings construction; non engineered unsafe
construction; and aging buildings and other infrastructure are some of the
factors that have increased vulnerability of hazards and disasters in urban
areas.
Thus, disaster risk management includes measures which reduce
disaster related losses of life, property or assets by either reducing the hazard
or vulnerability of the elements at risk. Disaster management is
6
conceptualized as the body of policy and administrative decisions and
operational activities which pertain to the various stages of a disaster at all
levels. Broadly disaster management can be divided into pre-disaster and
post-disaster contexts. There are three key stages of activity that are taken up
within disaster management. They are (i) pre-disaster-mitigation, prevention,
preparedness, risk assessment; (ii) during a disaster-emergency response,
relief distribution, search and rescue, shelter, medical and trauma care etc.,
(iii) post disaster-rehabilitation and reconstruction of disaster affected
persons and areas.
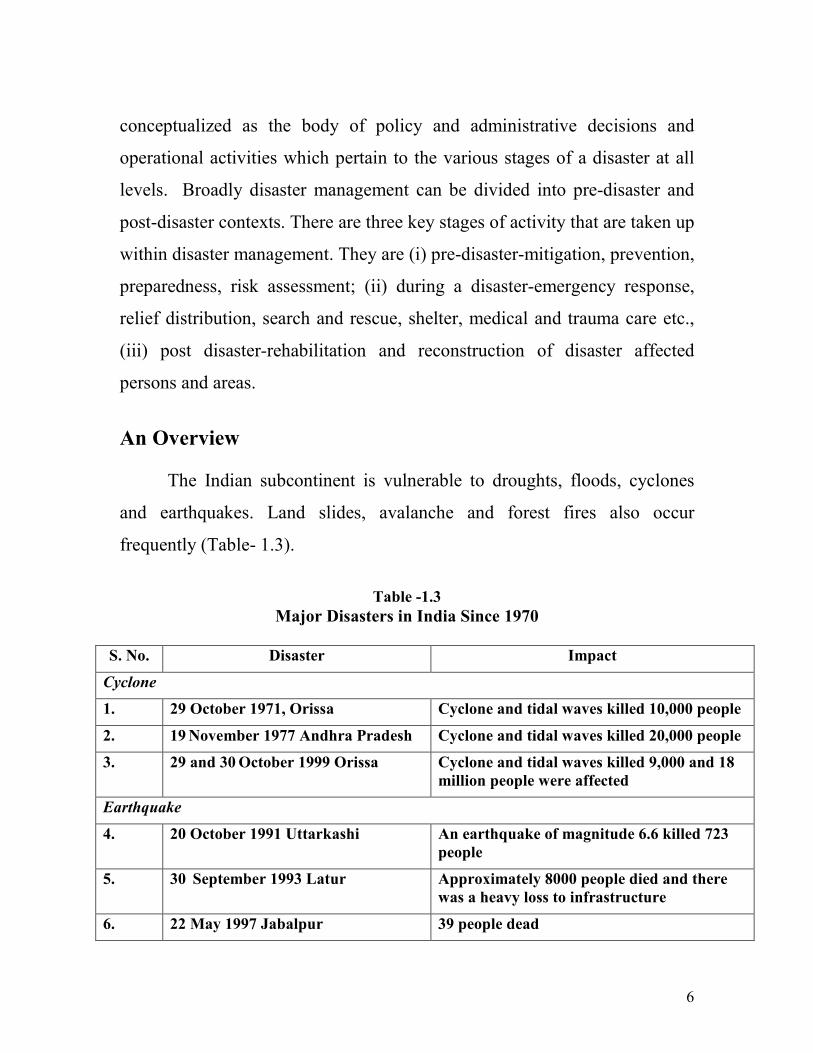
An Overview
The Indian subcontinent is vulnerable to droughts, floods, cyclones
and earthquakes. Land slides, avalanche and forest fires also occur
frequently (Table- 1.3).
Table -1.3
Major Disasters in India Since 1970
S. No. Disaster Impact
Cyclone
1. 29 October 1971, Orissa Cyclone and tidal waves killed 10,000 people
2. 19 November 1977 Andhra Pradesh
Cyclone and tidal waves killed 20,000 people
3. 29 and 30 October 1999 Orissa Cyclone and tidal waves killed 9,000 and 18
million people were affected
Earthquake
4. 20 October 1991 Uttarkashi An earthquake of magnitude 6.6 killed 723
people
5. 30 September 1993 Latur Approximately 8000 people died and there
was a heavy loss to infrastructure
6. 22 May 1997 Jabalpur 39 people dead
7
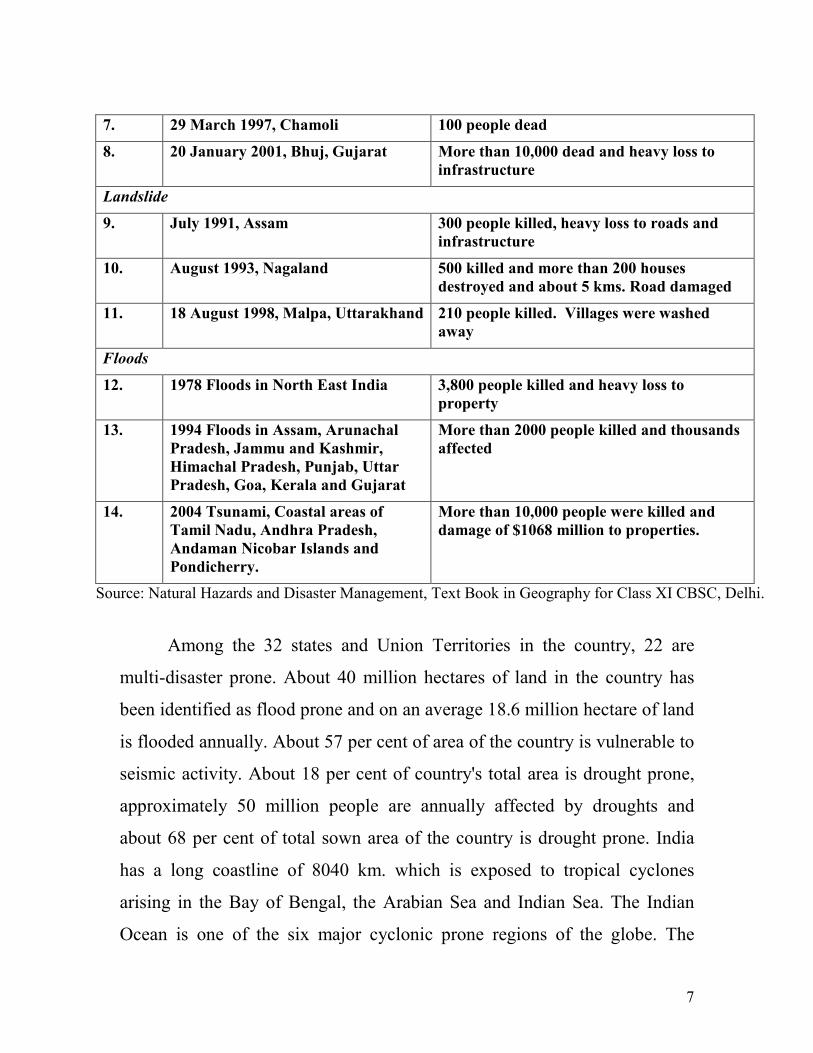
7. 29 March 1997, Chamoli 100 people dead
8. 20 January 2001, Bhuj, Gujarat More than 10,000 dead and heavy loss to
infrastructure
Landslide
9. July 1991, Assam 300 people killed, heavy loss to roads and
infrastructure
10. August 1993, Nagaland 500 killed and more than 200 houses
destroyed and about 5 kms. Road damaged
11. 18 August 1998, Malpa, Uttarakhand 210 people killed. Villages were washed
away
Floods
12. 1978 Floods in North East India 3,800 people killed and heavy loss to
property
13. 1994 Floods in Assam, Arunachal
Pradesh, Jammu and Kashmir,
Himachal Pradesh, Punjab, Uttar
Pradesh, Goa, Kerala and Gujarat
More than 2000 people killed and thousands
affected
14. 2004 Tsunami, Coastal areas of
Tamil Nadu, Andhra Pradesh,
Andaman Nicobar Islands and
Pondicherry.
More than 10,000 people were killed and
damage of $1068 million to properties.
Source: Natural Hazards and Disaster Management, Text Book in Geography for Class XI CBSC, Delhi.
Among the 32 states and Union Territories in the country, 22 are
multi-disaster prone. About 40 million hectares of land in the country has
been identified as flood prone and on an average 18.6 million hectare of land
is flooded annually. About 57 per cent of area of the country is vulnerable to
seismic activity. About 18 per cent of country's total area is drought prone,
approximately 50 million people are annually affected by droughts and
about 68 per cent of total sown area of the country is drought prone. India
has a long coastline of 8040 km. which is exposed to tropical cyclones
arising in the Bay of Bengal, the Arabian Sea and Indian Sea. The Indian
Ocean is one of the six major cyclonic prone regions of the globe. The
8
Coromandal coastline is more cyclones prone, with 80 per cent of the total
cyclones generated in this region. Risk to the existing housing stock in
various states and union-territories had been estimated by Expert Group Set
up by the Ministry of Urban Development, Government of India. About 3.9
million houses are susceptible to earthquakes of very high intensity, about
20 million houses are susceptible to damage due to winds and about 9.3
million houses are susceptible to damage due to floods. Besides the risk of
earth quakes, cyclones and floods are liable to very high damage and
destruction of vulnerable houses under heavy rains. Some 49 per cent of the
total housing stock is liable to very high damage from natural hazards, while
about 1 per cent of the total housing stock gets destroyed every year. It is to
be noted that in earth quake, 80 per cent of the casualties are due to
collapsing buildings. Brick and stone buildings without proper support are
liable to collapse. Non-engineered buildings continue to be built in the areas
prone to natural disasters. Unemployment, poverty backwardness, migration
from rural areas and increasing price of land and construction, million of
people are occupying disaster prone areas. Thus about 6 per cent increase in
disaster affected population has been reported.
According to the World Bank assessment, the natural disasters alone
accounted India whopping amount of $13 million during 1986-2001,
depleting 2 per cent of the GDP and 12 per cent of national revenue.
Compared to the loss of $13.4 billion during 1981-95 and $2.9 million
during 1965-80, the present swelling in the volume of losses is certainly
frightening and demands urgent attention of development planners. The
dilapidated and poorly built houses in urban areas increase the risks of
9
disasters. Lack of tenurial rights over the urban space and shortage of
housing facilities have forced to urban poor to live in the most unsafe
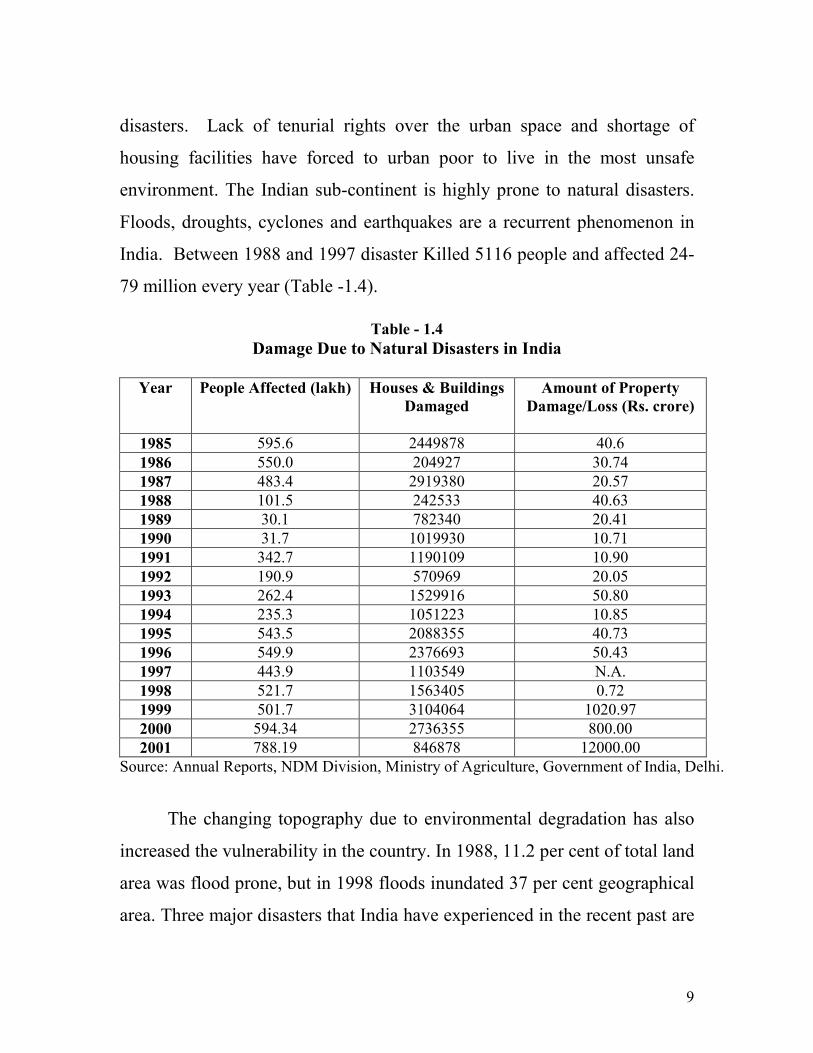
environment. The Indian sub-continent is highly prone to natural disasters.
Floods, droughts, cyclones and earthquakes are a recurrent phenomenon in
India. Between 1988 and 1997 disaster Killed 5116 people and affected 24-
79 million every year (Table -1.4).
Table - 1.4
Damage Due to Natural Disasters in India
Year People Affected (lakh) Houses & Buildings
Damaged
Amount of Property
Damage/Loss (Rs. crore)
1985 595.6 2449878 40.6
1986 550.0 204927 30.74
1987 483.4 2919380 20.57
1988 101.5 242533 40.63
1989 30.1 782340 20.41
1990 31.7 1019930 10.71
1991 342.7 1190109 10.90
1992 190.9 570969 20.05
1993 262.4 1529916 50.80
1994 235.3 1051223 10.85
1995 543.5 2088355 40.73
1996 549.9 2376693 50.43
1997 443.9 1103549 N.A.
1998 521.7 1563405 0.72
1999 501.7 3104064 1020.97
2000 594.34 2736355 800.00
2001 788.19 846878 12000.00
Source: Annual Reports, NDM Division, Ministry of Agriculture, Government of India, Delhi.
The changing topography due to environmental degradation has also
increased the vulnerability in the country. In 1988, 11.2 per cent of total land
area was flood prone, but in 1998 floods inundated 37 per cent geographical
area. Three major disasters that India have experienced in the recent past are
10
the super cyclone in Orissa (1999), earthquake in Gujarat (2001) and
Tsunami (2004) in Tamil Nadu, Pondicherry, Andaman Nicobar Islands and
parts of other southern states. Frequent disasters lead to erosion of
development gains and restricted options threatened by hazards.
The continent of Asia is particularly vulnerable to disasters strikes.
Between the years 1991 to 2000 Asia has accounted for 83 per cent of the
population affected by disasters globally. Within Asia, 24 per cent of deaths
due to disasters occurred in India, on account of its size population and
vulnerability. Floods and high winds account for 60 per cent of all disasters
in India. Many parts of the Indian sub-continent are susceptible to different
types of disasters owing to the unique topography and climatic
characteristics. About 54 per cent of the sub continent's landmass is
vulnerable to earthquakes while about 4 crore hectares is vulnerable to
periodic floods. The country has suffered four major earthquakes in the span
of last 50 years along-with a series of moderate intensity earthquakes that
have occurred at regular intervals. Since 1988, six earth quakes have struck
different parts of the country. Tsunami in India killed 10749 persons while
$1068 million loss or damage to properties was reported.
11
CHAPTER-II
HAZARDS AND DISASTERS
Hazard may be conceptualized as a dangerous condition or events that
threaten or have the potential for causing injury to life or damage to property
or the environment. They can be categorized in various ways but, they are
basically grouped in two broad headings:
1. Natural Hazards (hazards with meteorological, geological or even
biological origin)
2. Unnatural Hazards (hazards with human-caused or technological
origin)
It is also important to know that natural phenomena are extreme
climatologically, hydrological, or geological, processes that do not pose any
threat to persons or property. A massive earthquake in an unpopulated area
is a natural phenomenon, not a hazard. It is when these natural phenomena
interact with the man made environment or fragile areas which causes wide
spread damage.
Hazards may be grouped into two broad categories, namely natural
and manmade. Natural hazards are those hazards which are caused because
of natural phenomenon. Cyclones, tsunamis, earthquake, and volcanic
eruption are exclusively of natural origin. Manmade hazards are hazards
which occur due to human negligence. Manmade hazards are associated with
industries or energy generation facilities and include explosions, leakage of
toxic waste, pollution, dam failure, wars or civil strife etc. There may be
12
another category which includes landslides, floods, drought, fires are
socio-natural hazards since their causes are both natural and manmade.
Hazard refers to the potential occurrence, in a specific time period,
and geographic area, of a natural phenomenon that may adversely affect
human life, properly or activity to the extent of causing a disaster. A hazard
occurrence becomes a disaster when it results in loss of life, displacements
and homelessness, destruction and damage to infrastructure and property.
Methods of predicting various hazards and the likelihood and frequency of
occurrence vary widely by type of hazard.
Risk refers to the expected or anticipated losses (lives lost, people
injured, properly damaged, and economic activities or livelihoods disrupted)
from the impact of a given hazard on a given element at risk over a specific
period of time.
Vulnerability
Vulnerability may be conceptualized as the extent to which a
community structure, service, or geographic area is likely to be damaged or
disrupted by the impact of particular hazard on account of their nature,
construction and proximity to hazardous terrain or a disaster prone area. The
vulnerable buildings and infrastructure are more prone to earthquake
hazards. Hence structures should be built strong enough to resist maximum
force exerted by any event or for combination of event. Social and economic
conditions also determine the vulnerability of a society to an extent.
Interestingly, risk is a measure of the expected losses (deaths, injuries,
property, economic activity etc.) due to a hazard of a particular magnitude
occurring in a given area over a specific time period. The level of risk
13
depends upon (i) nature of the hazard; (ii) vulnerability of the elements
which are affected; and (iii) economic value of those elements.
Vulnerability is defined as “The extent to which a community,
structure, service, or geographic area is likely to be damaged or disrupted
by the impact of particular hazard, on account of their nature, construction
and proximity to hazardous terrain or a disaster prone area."
Human vulnerability is the relative lack of capacity of a person or
community to anticipate, cope with, resist and recover forms the impact of a
hazard. Vulnerability has two components. One is the exposure to hazards
and the other is the difficulty in coping with and recovering from them (due
to lack of resources). Human vulnerability increases with:
(a) Rapid urbanization
(b) Population growth
(c) Lack of knowledge about how to effectively resist the effects of
disasters.
(d) Poverty
Physical Vulnerability: It is the extent to which a structure is likely to be
damaged or disrupted by a hazard event. It assumes importance in case of
earthquakes.
Economic Vulnerability: It is the extent to which the economic activities
such as employment generation in services, trade, industrial and agricultural
production is disrupted or likely to be damaged. Economic vulnerability
affects the reconstruction work directly.
14
Disasters
The term ‘disaster’ owes its origin to the French World 'Desastre"
which refers to bad or evil star. A disaster can be defined as 'a serious
disruption in the functioning of the community or a society causing wide
spread material, economic, social or environmental losses which exceed the
ability of the affected society to cope using its own resources.' A disaster is a
result from the combination of hazard, vulnerability and insufficient capacity
or measures to reduce the potential changes of risk. A disaster is the product
of a hazard such as earthquake, flood or wind storm coinciding with a
vulnerable situation which might include communities, cities or villages. A
disaster happens when hazard impose on the vulnerable population and
causes damage, casualties and disruption. Without vulnerability or hazard
there is no disaster. A disaster occurs when hazards and vulnerability meet.
Hazard, thus may be termed as a dangerous condition or event that threat or
has the potential for causing injury to life or damage to property or the
environment.
There has been increase in the number of natural disasters over the
past years, on account of urbanization and population growth; as a result
impact of natural disasters is now felt to a larger extent. According to the
United Nations, in 2001 alone, natural disasters of medium to high range
caused at least 250,000 deaths around the world, more than double the
previous year, and economic losses of around 836 billion. The natural
disasters are not bound by political boundaries and have no social or
economic considerations. They are borderless as they affect both developing
and developed countries. Since 1991, two third of the victims of natural
disasters were from developing countries, while just 2 per cent were from
highly developed nations. Those living in developing countries and
15
especially those with limited resources tend to be more adversely affected.
The continent of Asia is particularly vulnerable to disaster strikes.
A disaster is the product of a hazard such as earthquake, flood or
windstorm coinciding with a vulnerable situation which might include
communities, cities or villages. There are two main components in this
definition: hazard and vulnerability. Without vulnerability or hazard there is
no disaster. A disaster occurs when hazards and vulnerability meet.
There are several important characteristics that make disasters
different from accidents. The loss of a sole income earner in a car crash may
be a disaster to a family, but only an accident to the community. Variables
such as causes, frequency, and duration of the impact, speed of onset, and
scope of the impact, destructive potential, and human vulnerability etc
determine the difference.
Disasters are events that disrupt the functioning of a society. They
cause widespread human, material, or environmental losses that exceed the
ability of the affected society using its own resources. Earthquakes, floods,
and cyclones, landslides are not disasters in themselves. They become
disasters when human life, livelihoods and properly are adversely and
severely affected.
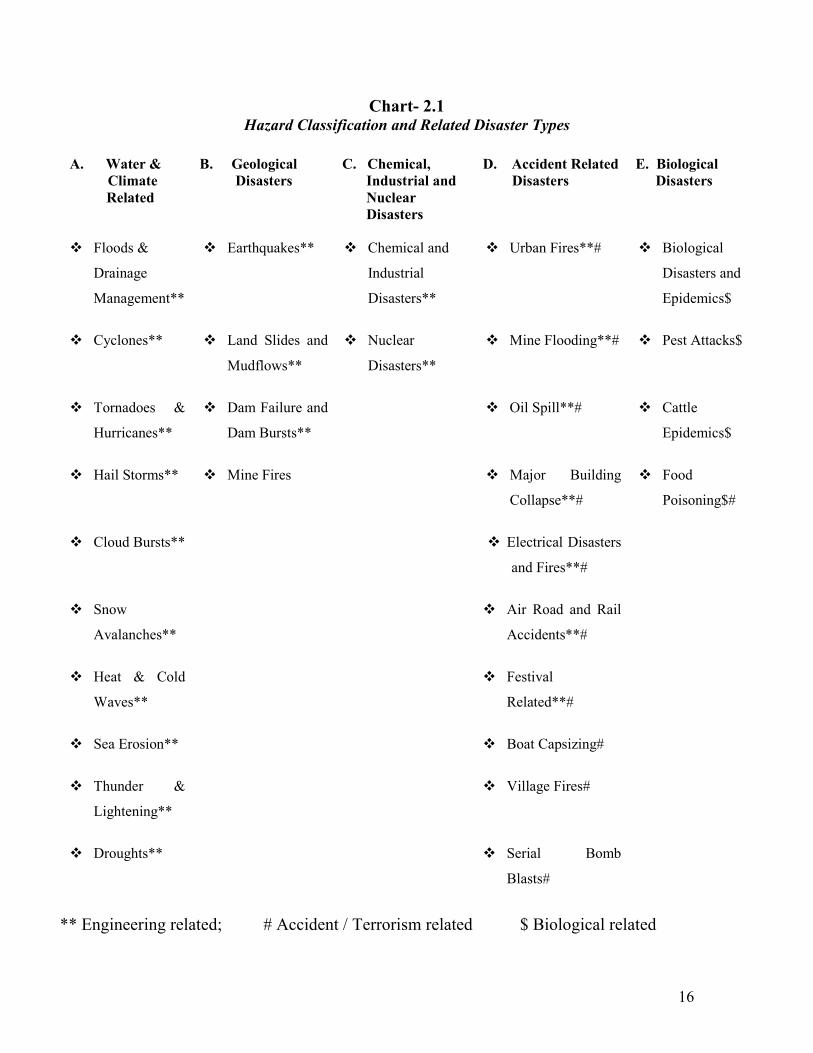
There are different ways to classify disasters. Disasters are often
classified according to their cause, their speed of onset (sudden or slow).
Disasters classified according to cause are named after the hazard, which
results in the disastrous social and economic consequences. Thus, this
classification includes earthquakes, floods, cyclones, tornadoes, landslides,
mudflows, droughts, pest and insect infestation, etc. (Chart- 2.1)
16
Chart- 2.1 Hazard Classification and Related Disaster Types
A. Water &
Climate
Related
B. Geological
Disasters
C. Chemical,
Industrial and
Nuclear
Disasters
D. Accident Related
Disasters
E. Biological
Disasters
� Floods &
Drainage
Management**
� Earthquakes** � Chemical and
Industrial
Disasters**
� Urban Fires**# � Biological
Disasters and
Epidemics$
� Cyclones** � Land Slides and
Mudflows**
� Nuclear
Disasters**
� Mine Flooding**# � Pest Attacks$
� Tornadoes &
Hurricanes**
� Dam Failure and
Dam Bursts**
� Oil Spill**# � Cattle
Epidemics$
� Hail Storms** � Mine Fires � Major Building
Collapse**#
� Food
Poisoning$#
� Cloud Bursts** � Electrical Disasters
and Fires**#
� Snow
Avalanches**
� Air Road and Rail
Accidents**#
� Heat & Cold
Waves**
� Festival
Related**#
� Sea Erosion** � Boat Capsizing#
� Thunder &
Lightening**
� Village Fires#
� Droughts** � Serial Bomb
Blasts#
** Engineering related; # Accident / Terrorism related $ Biological related
17
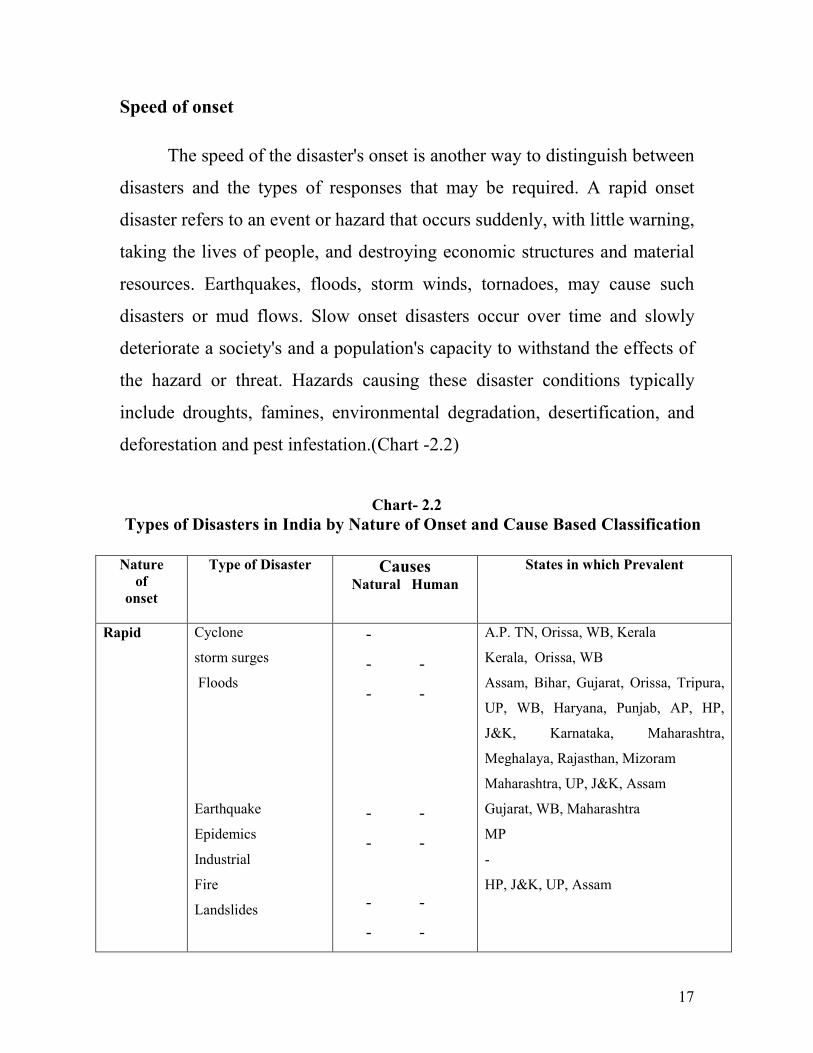
Speed of onset
The speed of the disaster's onset is another way to distinguish between
disasters and the types of responses that may be required. A rapid onset
disaster refers to an event or hazard that occurs suddenly, with little warning,
taking the lives of people, and destroying economic structures and material
resources. Earthquakes, floods, storm winds, tornadoes, may cause such
disasters or mud flows. Slow onset disasters occur over time and slowly
deteriorate a society's and a population's capacity to withstand the effects of
the hazard or threat. Hazards causing these disaster conditions typically
include droughts, famines, environmental degradation, desertification, and
deforestation and pest infestation.(Chart -2.2)
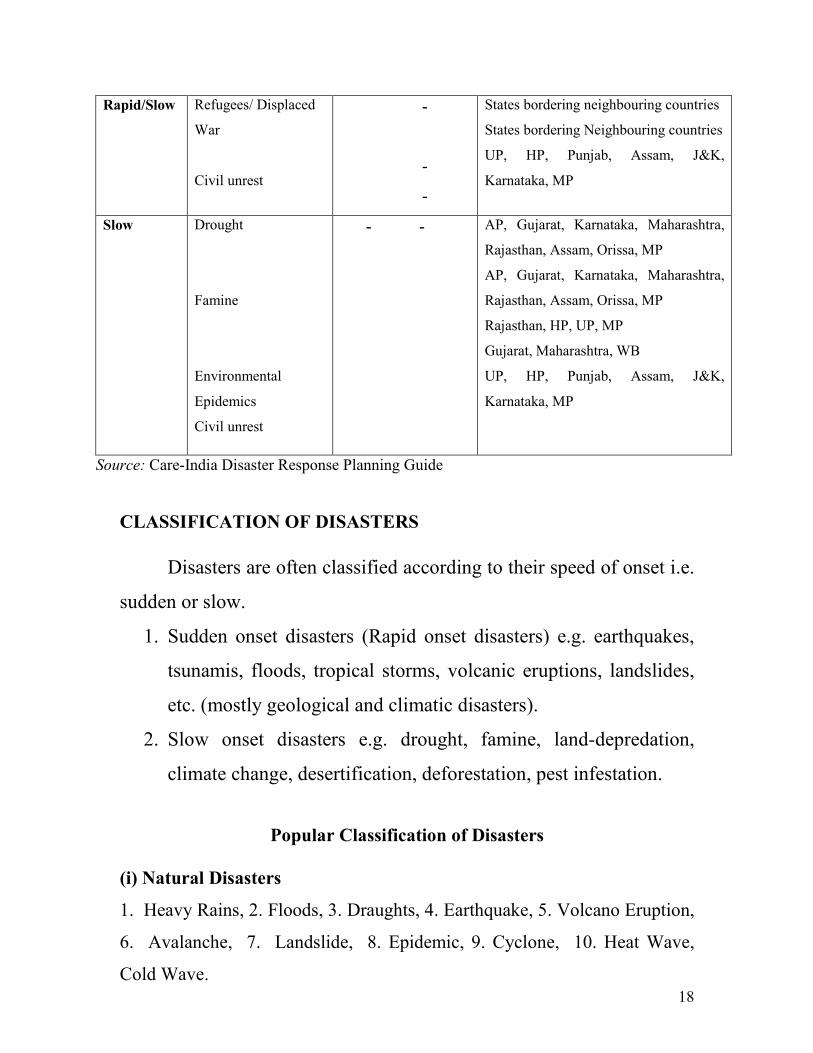
Chart- 2.2
Types of Disasters in India by Nature of Onset and Cause Based Classification
Nature
of
onset
Type of Disaster Causes Natural Human
States in which Prevalent
Rapid Cyclone
storm surges
Floods
Earthquake
Epidemics
Industrial
Fire
Landslides
-
- -
- -
- -
- -
- -
- -
A.P. TN, Orissa, WB, Kerala
Kerala, Orissa, WB
Assam, Bihar, Gujarat, Orissa, Tripura,
UP, WB, Haryana, Punjab, AP, HP,
J&K, Karnataka, Maharashtra,
Meghalaya, Rajasthan, Mizoram
Maharashtra, UP, J&K, Assam
Gujarat, WB, Maharashtra
MP
-
HP, J&K, UP, Assam
18
Rapid/Slow Refugees/ Displaced
War
Civil unrest
-
-
-
States bordering neighbouring countries
States bordering Neighbouring countries
UP, HP, Punjab, Assam, J&K,
Karnataka, MP
Slow Drought
Famine
Environmental
Epidemics
Civil unrest
- - AP, Gujarat, Karnataka, Maharashtra,
Rajasthan, Assam, Orissa, MP
AP, Gujarat, Karnataka, Maharashtra,
Rajasthan, Assam, Orissa, MP
Rajasthan, HP, UP, MP
Gujarat, Maharashtra, WB
UP, HP, Punjab, Assam, J&K,
Karnataka, MP
Source: Care-India Disaster Response Planning Guide
CLASSIFICATION OF DISASTERS
Disasters are often classified according to their speed of onset i.e.
sudden or slow.
1. Sudden onset disasters (Rapid onset disasters) e.g. earthquakes,
tsunamis, floods, tropical storms, volcanic eruptions, landslides,
etc. (mostly geological and climatic disasters).
2. Slow onset disasters e.g. drought, famine, land-depredation,
climate change, desertification, deforestation, pest infestation.
Popular Classification of Disasters
(i) Natural Disasters
1. Heavy Rains, 2. Floods, 3. Draughts, 4. Earthquake, 5. Volcano Eruption,
6. Avalanche, 7. Landslide, 8. Epidemic, 9. Cyclone, 10. Heat Wave,
Cold Wave.
19
(ii) Manmade Disasters
(a) Un-Intentional or Inadvertent:
(1) Poor Maintenance, (2) Low Quality Work, (3) Human Error
(b) Wilfully and Intentional:
1. Sabotage, 2. Mischief, 3. Revenge. 4. Riots, 5. Mob Furry,
6. Enemy Attack
(c) Industrial and Technological - (Mostly system/Process Malfunction)
1. Nuclear Radiation. 2. Gas Leak. 3. Explosion. 4. Fire
Nature Based classification of Disasters
1. Elemental Disasters
(a) Earthquake
(b) Tidal waves
(c) Floods
(d) Volcanic eruptions
(e) Landslides
2. Foreseeable Disasters
(a) Famines
(b) Epidemics
3. Deliberate Disasters
(a) Wars
(b) Civil wars
(c) Guerrilla warfare
(d) Insurgency activities
(e) Terrorism
20
4. Accidental Disasters
(a) Industrial catastrophes
(b) Nuclear Catastrophes
Elemental disasters are distinguished from other disasters because
they are instantaneous and prompted, by climatic or geological forces. Their
destructive capability depends more on the number of vulnerable people in a
given area than on their inherent severity. In many parts of the world, man-
made errors exacerbate the damage such elemental disasters cause.
Foreseeable disasters have complex root causes in which climatic and
human activity interact over extended periods, leaving large numbers of
people vulnerable. Such as interaction creates a vicious circle whose
recurrence is often predictable.
Deliberate disasters have roots in social economic and politics
inequity. This can result in both high intensity hostile enemy actions in
forms of declared battles or wars or low intensity conflicts such as guerrilla
warfare, terrorism, sabotage, riots, communal discord or riots, civil strife,
internal disturbance, arson or crowd violence.
Accidental disasters are a byproduct of negligence of risk-assessment
while making scientific and technological advances. Recent incidents of
Bhopal, Chernobyl, Three Mile Island etc. attest to the grave threat posed by
such disasters.
As per another classification based on predominant agent, disasters
could be categorized as of three types, i.e. first the natural, secondly the
man-made, and lastly as hybrid disasters.
21
Natural disasters are the result of natural phenomena, for instance,
earthquake, volcanic eruption, hurricane, tornado, avalanche or flood.
Man-made disasters are of an anthropogenic origin, and exemplifies
some of the terrible accidents that have resulted from human beings
interaction with artificial environment, which they themselves have created.
Hybrid Disasters arise from a linkage of anthropogenic events and
natural events. For example, spread of disease from a community in which
the disease is endemic to a community which has no natural immunity,
destruction of forests and resulting increased floods; large scale deaths due
to smog, etc.
Natural disasters
1. Climate and Wind Related
� Wind storm (tropical storms)/ storm surges/ hailstorm/ snowstorm
� Cyclone/Tropical cyclones
� Tornadoes
� Hurricane
� Tidal waves
� Typhoons
� Blizzard
� Fog
2. Climate and Water Related
� Floods/ drainage/ river bank erosion/ dam-bursting/ levee failure
� Cloud bursts
� Flash flood
22
� Heavy (excessive) rains/ glaze (freezing rain) storms
� Drought
� Snowfall/ cold spell waves/ bitter winters/ hail/ frost
3. Earth Related (Geological)
� Earthquakes/severe tremors
� Tsunamis
� Avalanches/snow avalanches
� Landslides
� Volcanic eruptions
� Rock falls
� Mudslides
� Subsidence
� Shifting sands
4. Ocean Related
� Ocean currents EI Nino / La Nina
5. Space Related
� Asteroid collisions
� Lightning's
6. Temperature Related
� Heat wave
� White-out
� Forest fires/Bush fire
Man-Made Disasters
� War/battle/hostile enemy actions.
23
� Arson/sabotage/internal disturbance/riots crowd violence.
� Accidents of vehicles/trains/aircrafts/ships/traffic accidents/transport
accidents.
� Industrial accidents disaster/explosion of boilers/ gas cylinders/gas
chambers/gas leak technological disasters/ industrial explosions/ fires.
� Fire/forest fires/scrub fires/ wildfires/bushfire/grassland fires.
� Nuclear explosion disaster/accidents/radioactive fallout/leakages/
commercial nuclear power/radiation: Non-radon plant
failure/accidents.
� Ecological disasters like deforestation/desertification environmental
pollution/ social erosion/air pollution water pollution.
� Famine/food crises /food contamination/food security/food additives.
� Epidemics/ pest infestations epidemics/insect infestations infections
diseases proliferation/destitution refugee cities.
� Population Explosion.
� Land degradation/salinization / alkalinization.
� Toxic chemicals and hazardous wastes/release/dumping/carriage/
chemical time bombs/ chemical accidents.
� Chemicals in workplace.
� Indoor air/radon/non-radon.
� Toxic air pollutants.
� Stratospheric ozone depletion/ground-level ozone formation.
� Acid rain/acidification.
� Thermal radiation.
� Ocean water intrusion/sea-level rise/ coastal flooding/marine
pollution.
� Groundwater contamination/depletion.
� Wildlife extinction.
24
� Fish deaths.
� Freshwater contamination/biological/metal and toxic/eutrophication
/sedimentation.
� Pollution climate change/global warming/greenhouse effect.
� Renewable resource depletion.
� HIV / AIDS.
� Demographic disaster/population bombs.
� Biotechnological hazards threats/GMOs (Genetically modifying
organisms).
� Refugee crises/settler migration.
� Slums/shanty habitats/shelter problems war victims/war deaths/ civil
war/riot.
� Sanctions.
� Plastic panics.
� Apartheid forced removals.
� Poverty & deprivation.
� Smoking.
� Mountaineering.
� Germ (Biological) and chemical warfare.
� Nuclear warfare.
� Failures of public buildings or other structures.
� Animal and plant invasions (locusts).
� Oil spills.
� Mining disasters.
� Radio-active dumping at sea.
� Terrorism.
25
Epidemics
� Vector-borne diseases.( Pleague)
� Water-borne diseases.
� Food-borne diseases.
� Person-to-person diseases (contact and respiratory spread).
� Complications from wounds.
� Veterinary epidemics (within and across species)
Significant Disasters
Blizzards and Snowstorms: A snowstorm is a winter storm in which the
primary form of precipitation is snow. When such a storm is accompanied
by winds above 32 mph that severely reduce visibility, it becomes a blizzard.
Hazards from snowstorms and blizzards include traffic-related accidents,
hypothermia for those unable to find shelter, as well as major disruptions to
transportation and fuel and power distribution system.
Drought: A drought is a long-lasting weather pattern consisting of dry
conditions with very little or no precipitation. During his period, food and
water supplies can run low, and other conditions, such as famine, can result.
Droughts can last for several years and are particularly damaging in areas in
which the residents depend on agriculture for survival.
Earthquakes: An earthquake is a sudden shift or movement in the tectonic
plate in the Earth's crust. On the surface, this is manifested by a moving and
shaking of the ground, and can be massively damaging to poorly built
structures. The most powerful earthquakes can destroy even the best built of
structures. In addition, they can trigger secondary disasters, such as tsunamis
and volcanic eruptions. Earthquakes occur along fault line, and are
26
unpredictable. They are capable of killing hundreds of thousands of people,
such as in the 1976 Tangshan and 2004 Indian Ocean earthquakes.
Epidemic: An epidemic is a massive outbreak and spread of an infectious
disease, and is historically the most dangerous of all natural disasters.
Different epidemics are caused by different diseases, and different epidemics
have included the Black Death, smallpox, and AIDS. The Spanish flu of
1918 was the deadliest ever epidemic, it killed 25-40 million people. The
Black Death, which occurred in the 14th Century, killed over 20 million
people, one third of Europe's population.
Famine: Famine is a natural disaster characterized by a widespread lack of
food in a region, and can be characterized as a lack of agriculture foodstuffs,
a lack of livestock, or a general lack of all foodstuffs required for basic
nutrition and survival. Famine is almost always caused by pre-existing
conditions, such as drought, but its effects may be exacerbated by social
factors, such as war. Particularly devastating examples include the Ethiopian
famine and the Irish Potato Famine.
Flood: A flood is a natural disaster caused by too much rain or water in a
location, and could be caused by many different sets of conditions. Floods
can be caused by prolonged rainfall from a storm, including thunderstorms,
rapid melting of large amounts of snow, or rivers which swell from excess
precipitation upstream and cause widespread damage to areas downstream,
or less frequently the bursting of man-made dams. A river which floods
particularly often is the Huang He in China, and a particularly damaging
flood was the Great Flood of 1993.
27
Forest Fire: A forest fire is a natural disaster consisting of a fire which
destroys a forested area, and can be a great danger to people who live in
forests as well as wildlife. Forest fires are generally started by lightning but
also by human negligence or arson, and can burn thousands of square
kilometers.
Hailstorm: A hailstorm is a natural disaster where a thunderstorm produces
a numerous amount of hailstones which damage the location in which they
fall. Hailstorms can be especially devastating to farm fields, ruining crops
and damaging equipment. A particularly damaging hailstorm hit Munich,
Germany on August 31, 1986, felling thousands of trees and causing
millions of dollars in insurance claims.
Heat Wave: A heat wave is a disaster characterized by heat which is
considered extreme and unusual in the area in which it occurs. Heat waves
are rare and require specific combinations of weather events to take place,
and may include temperature inversions, katabatic winds, or other
phenomena. The worst heat wave in recent history was the European Heat
Wave of 2003.
Hurricanes: A hurricane is a cyclonic storm system which forms over the
oceans. It is caused by evaporated water which comes off of the ocean and
becomes a storm. The Coriolis Effect causes the storms to spin, and a
hurricane is declared when this spinning mass of storms attains a wind speed
greater than 74mph. In different parts of the world hurricanes are known as
cyclones or typhoons. The former occur in the Indian Ocean, which the latter
occur in the Eastern Pacific Ocean. The most damaging hurricane ever was
Hurricane Andrew, which hit southern Florida in 1992.
28
Ice Storm: An ice storm is a particular weather event in which precipitation
falls as rain, due to atmosphere conditions, but the in an area in which the
temperature is below the freezing point of water. The rain falls to the
ground, and immediately turns to ice, accumulating in that fashion. A heavy
ice storm can cause large accumulations of ice cause trees to fall over or lose
branches, and power lines to snap. The worst recent ice storm was the 1998
Ice Storm that struck eastern Canada and areas of the US northeast.
Lahar: A lahar is a type of natural disaster closely related to a volcanic
eruption, and involves a large amount of material; including mud, rock, and
ash sliding down the side of the volcano at a rapid pace. These flows can
destroy entire towns in seconds and kill thousands of people. The Tangiwai
disaster in an excellent example, as is the one which killed an estimated
23,000 people in Armero, Colombia, during the 1985 eruption of Nevado del
Ruiz.
Landslides and Mudslides: A landslide is a disaster closely related to an
avalanche, but instead of occurring with snow, it occurs involving actual
elements of the ground, including rocks, trees, and parts of houses, and
anything else which may happen to be swept up. Landslides can be caused
by earthquakes, volcanic eruptions, or general instability in the surrounding
land. Mudslides, or mud flows, are a special case of landslides, in which
heavy rainfall causes loose soil on steep terrain to collapse and slide
downwards; these occur with some regularity in parts of California after
periods of heavy rain.
Sinkholes: A localized depression in the surface topography, usually caused
by the collapse of a subterranean structure, such as a cave. Although rare,
29
large sinkholes that develop suddenly in populated areas can lead to the
collapse of buildings and other structures.
Tornado: A tornado is a natural disaster resulting from a thunderstorm.
Tornadoes are violent currents of wind which can blow at up to 318mph.
Tornadoes can occur one at a time, or can occur in large tornado outbreaks
along a squall line. The worst tornado ever recorded in terms of wind speed
was the tornado which swept through Moore, Oklahoma on May 3, 1999.
This tornado has wind speeds of 318mph and was the strongest ever
recorded.
Tsunami: A tsunami is a giant wave of water which rolls into the shore of
an area with a height of over 15 m (50 ft.). It comes from Japanese words
meaning harbor and wave. Tsunami can be caused by under sea earthquakes
as in the 2004 Indian Ocean Earthquake, or by landslides such as the one
which occurred at Lituya Bay, Alaska. The tsunami generated by the 2004
Indian Ocean Earthquake currently ranks as the deadliest tsunami in
recorded history. The highest Tsunami ever recorded was estimated to be
85m (278 ft.) high. It appeared off Ishigaki Island, Japan.
Volcanic Eruption: This natural disaster is caused by the eruption of a
volcano, and eruptions come in many forms. They range from daily small
eruptions which occur in places; like Kilauea, in Hawali, or extremely
infrequent supervolvano eruptions in places like Lake Toba. Greatest
Volcanic explosion occurred when Krakatoa in Indonesia blew up in 1883,
hurling rocks 55km (34 miles) in the air! The explosion was heard in
Australia and generated a 40m. (131 ft.) High Tsunami; 36,000 people died.
The greatest volcanic eruption was of Mt.Tambora on Sumbawa, Indonesia
30
in 1815 which threw up more than 100 cubic km. (24cu. miles) of ash. The
island was lowered by 1250m (4100 ft.); 92,000 people died.
Ice Age: An ice age is a geologic period, but could also be viewed in the
light of a catastrophic natural disaster, since in an ice age, the climate all
over the world would change and places which were once considered
habitable would then be too cold in permanently inhabit. A side effect of an
ice age could possibly be a famine, caused by a worldwide drought.
Volcano: A super volcano is a eruption which is thousands of times more
massive than a normal eruption, the lower threshold for an eruption being
declared that of a super volcano is that such an eruption must expel at least
1000 cubic kilometers of material. The last eruption of this magnitude
occurred over 75,000 year ago at Lake Toba. If such an eruption were to
occur today, a wholesale general die-off of both animals and humans would
occur, as well as a significant short-term climate change.
Risk reduction can take place in two ways:
31
Chapter-3
EARTHQUAKE
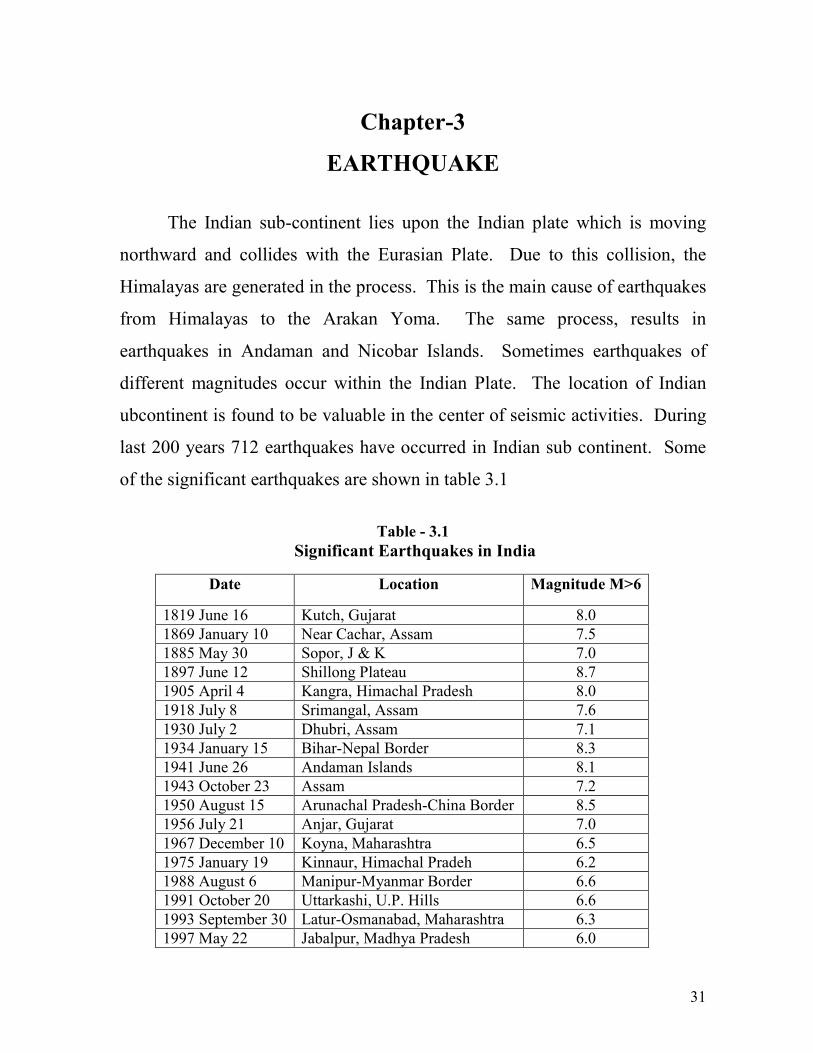
The Indian sub-continent lies upon the Indian plate which is moving
northward and collides with the Eurasian Plate. Due to this collision, the
Himalayas are generated in the process. This is the main cause of earthquakes
from Himalayas to the Arakan Yoma. The same process, results in
earthquakes in Andaman and Nicobar Islands. Sometimes earthquakes of
different magnitudes occur within the Indian Plate. The location of Indian
ubcontinent is found to be valuable in the center of seismic activities. During
last 200 years 712 earthquakes have occurred in Indian sub continent. Some
of the significant earthquakes are shown in table 3.1
Table - 3.1
Significant Earthquakes in India
Date Location Magnitude M>6
1819 June 16 Kutch, Gujarat 8.0
1869 January 10 Near Cachar, Assam 7.5
1885 May 30 Sopor, J & K 7.0
1897 June 12 Shillong Plateau 8.7
1905 April 4 Kangra, Himachal Pradesh 8.0
1918 July 8 Srimangal, Assam 7.6
1930 July 2 Dhubri, Assam 7.1
1934 January 15 Bihar-Nepal Border 8.3
1941 June 26 Andaman Islands 8.1
1943 October 23 Assam 7.2
1950 August 15 Arunachal Pradesh-China Border 8.5
1956 July 21 Anjar, Gujarat 7.0
1967 December 10 Koyna, Maharashtra 6.5
1975 January 19 Kinnaur, Himachal Pradeh 6.2
1988 August 6 Manipur-Myanmar Border 6.6
1991 October 20 Uttarkashi, U.P. Hills 6.6
1993 September 30 Latur-Osmanabad, Maharashtra 6.3
1997 May 22 Jabalpur, Madhya Pradesh 6.0
32
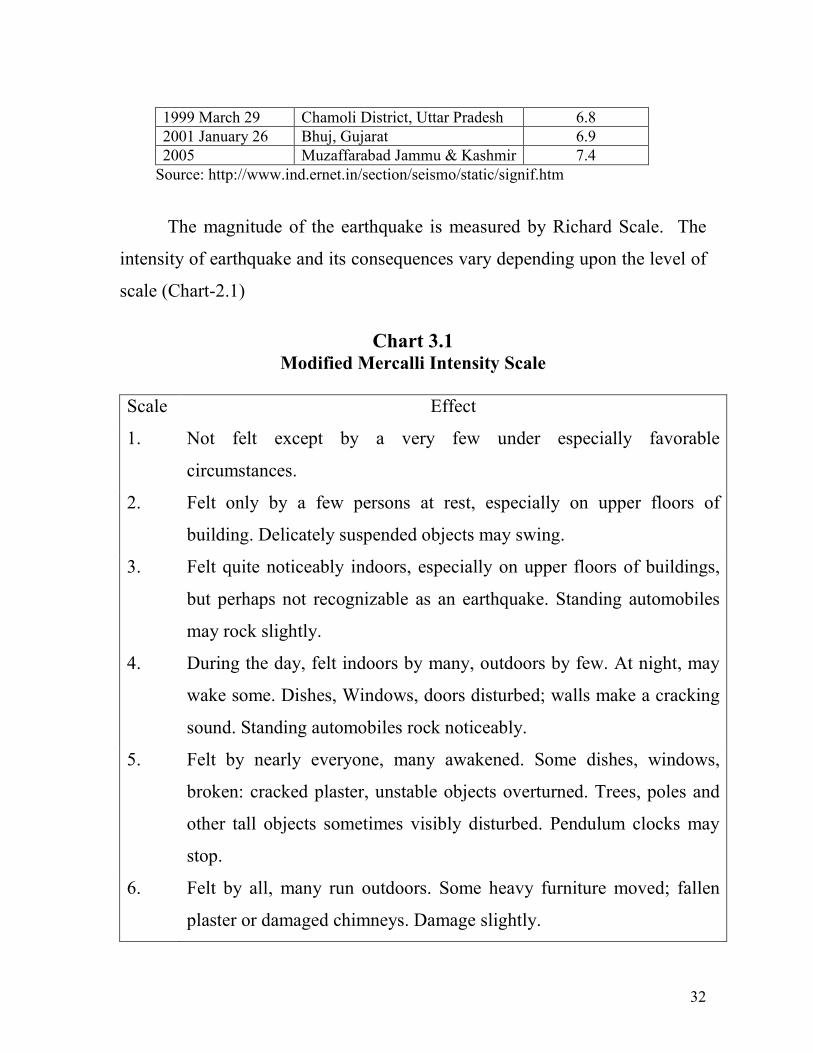
1999 March 29 Chamoli District, Uttar Pradesh 6.8
2001 January 26 Bhuj, Gujarat 6.9
2005 Muzaffarabad Jammu & Kashmir 7.4
Source: http://www.ind.ernet.in/section/seismo/static/signif.htm
The magnitude of the earthquake is measured by Richard Scale. The
intensity of earthquake and its consequences vary depending upon the level of
scale (Chart-2.1)
Chart 3.1 Modified Mercalli Intensity Scale
Scale Effect
1. Not felt except by a very few under especially favorable
circumstances.
2. Felt only by a few persons at rest, especially on upper floors of
building. Delicately suspended objects may swing.
3. Felt quite noticeably indoors, especially on upper floors of buildings,
but perhaps not recognizable as an earthquake. Standing automobiles
may rock slightly.
4. During the day, felt indoors by many, outdoors by few. At night, may
wake some. Dishes, Windows, doors disturbed; walls make a cracking
sound. Standing automobiles rock noticeably.
5. Felt by nearly everyone, many awakened. Some dishes, windows,
broken: cracked plaster, unstable objects overturned. Trees, poles and
other tall objects sometimes visibly disturbed. Pendulum clocks may
stop.
6. Felt by all, many run outdoors. Some heavy furniture moved; fallen
plaster or damaged chimneys. Damage slightly.
33
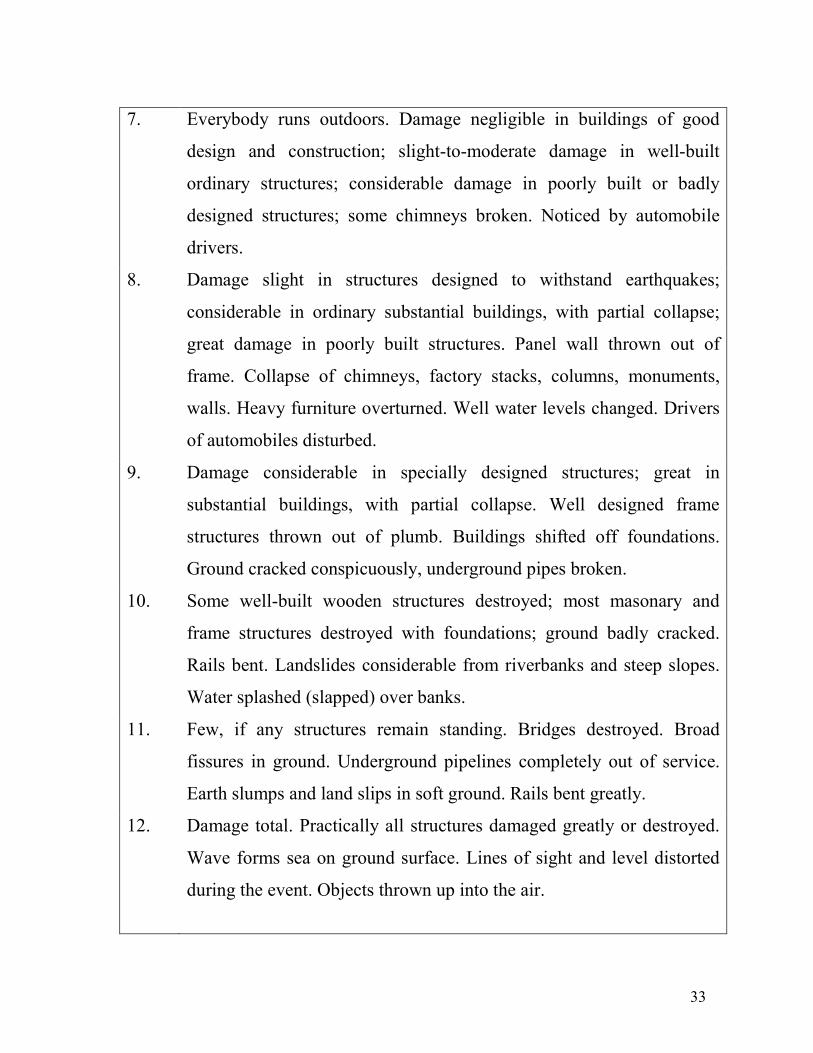
7. Everybody runs outdoors. Damage negligible in buildings of good
design and construction; slight-to-moderate damage in well-built
ordinary structures; considerable damage in poorly built or badly
designed structures; some chimneys broken. Noticed by automobile
drivers.
8. Damage slight in structures designed to withstand earthquakes;
considerable in ordinary substantial buildings, with partial collapse;
great damage in poorly built structures. Panel wall thrown out of
frame. Collapse of chimneys, factory stacks, columns, monuments,
walls. Heavy furniture overturned. Well water levels changed. Drivers
of automobiles disturbed.
9. Damage considerable in specially designed structures; great in
substantial buildings, with partial collapse. Well designed frame
structures thrown out of plumb. Buildings shifted off foundations.
Ground cracked conspicuously, underground pipes broken.
10. Some well-built wooden structures destroyed; most masonary and
frame structures destroyed with foundations; ground badly cracked.
Rails bent. Landslides considerable from riverbanks and steep slopes.
Water splashed (slapped) over banks.
11. Few, if any structures remain standing. Bridges destroyed. Broad
fissures in ground. Underground pipelines completely out of service.
Earth slumps and land slips in soft ground. Rails bent greatly.
12. Damage total. Practically all structures damaged greatly or destroyed.
Wave forms sea on ground surface. Lines of sight and level distorted
during the event. Objects thrown up into the air.
34
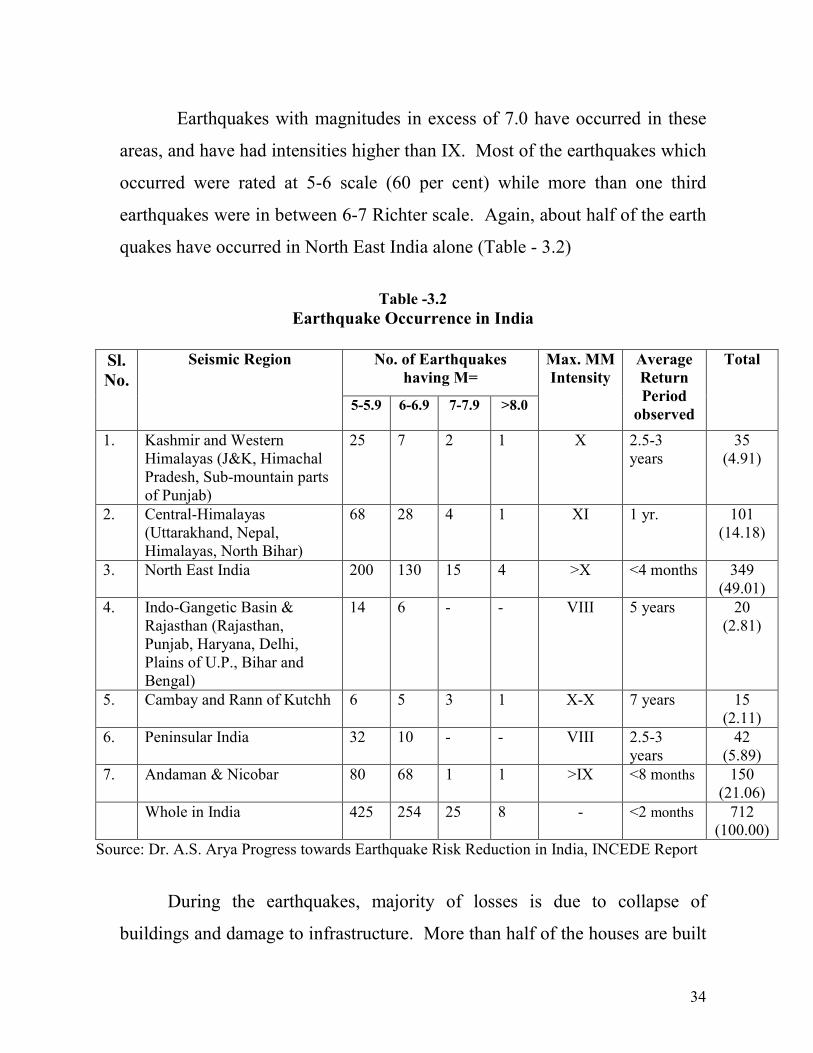
Earthquakes with magnitudes in excess of 7.0 have occurred in these
areas, and have had intensities higher than IX. Most of the earthquakes which
occurred were rated at 5-6 scale (60 per cent) while more than one third
earthquakes were in between 6-7 Richter scale. Again, about half of the earth
quakes have occurred in North East India alone (Table - 3.2)
Table -3.2
Earthquake Occurrence in India
Sl.
No.
Seismic Region No. of Earthquakes
having M=
Max. MM
Intensity
Average
Return
Period
observed
Total
5-5.9 6-6.9 7-7.9 >8.0
1. Kashmir and Western
Himalayas (J&K, Himachal
Pradesh, Sub-mountain parts
of Punjab)
25 7 2 1 X 2.5-3
years
35
(4.91)
2. Central-Himalayas
(Uttarakhand, Nepal,
Himalayas, North Bihar)
68 28 4 1 XI 1 yr. 101
(14.18)
3. North East India 200 130 15 4 >X <4 months 349
(49.01)
4. Indo-Gangetic Basin &
Rajasthan (Rajasthan,
Punjab, Haryana, Delhi,
Plains of U.P., Bihar and
Bengal)
14 6 - - VIII 5 years 20
(2.81)
5. Cambay and Rann of Kutchh 6 5 3 1 X-X 7 years 15
(2.11)
6. Peninsular India 32 10 - - VIII 2.5-3
years
42
(5.89)
7. Andaman & Nicobar 80 68 1 1 >IX <8 months 150
(21.06)
Whole in India 425 254 25 8 - <2 months 712
(100.00)
Source: Dr. A.S. Arya Progress towards Earthquake Risk Reduction in India, INCEDE Report
During the earthquakes, majority of losses is due to collapse of
buildings and damage to infrastructure. More than half of the houses are built
35
with stone walls and 35 per cent have burnt brick units which are highly
vulnerable to sustain damage of seismic intensities namely VII, VIII and IX.
Several key factors that contribute to vulnerability of human
populations to earthquakes:
• Location of settlements in an earthquake prone area, especially on soft
ground, on area prone to landslides or along fault lines.
• Dense collection of weak buildings with high occupancy.
• Non-engineered buildings constructed by earth, rubble, buildings with
heavy roofs (more vulnerable than light weight structures), poor quality
and maintenance of buildings
• Weak or flexible storey intending for parking purposes.
HAZARD ZONES
As per the latest seismic zoning map of India the country is divided into
four Seismic Zones. Zone V marked in red shows the area of Very High Risk
Zone, Zone IV marked in orange shows the area of High Risk Zone. Zone III
marked in yellow shows the region of Moderate Risk Zone and Zone II
marked in blue shows the region of Low Risk Zone. Zone V is the most
vulnerable to earthquakes, where historically some of the country's most
powerful shock has occurred.
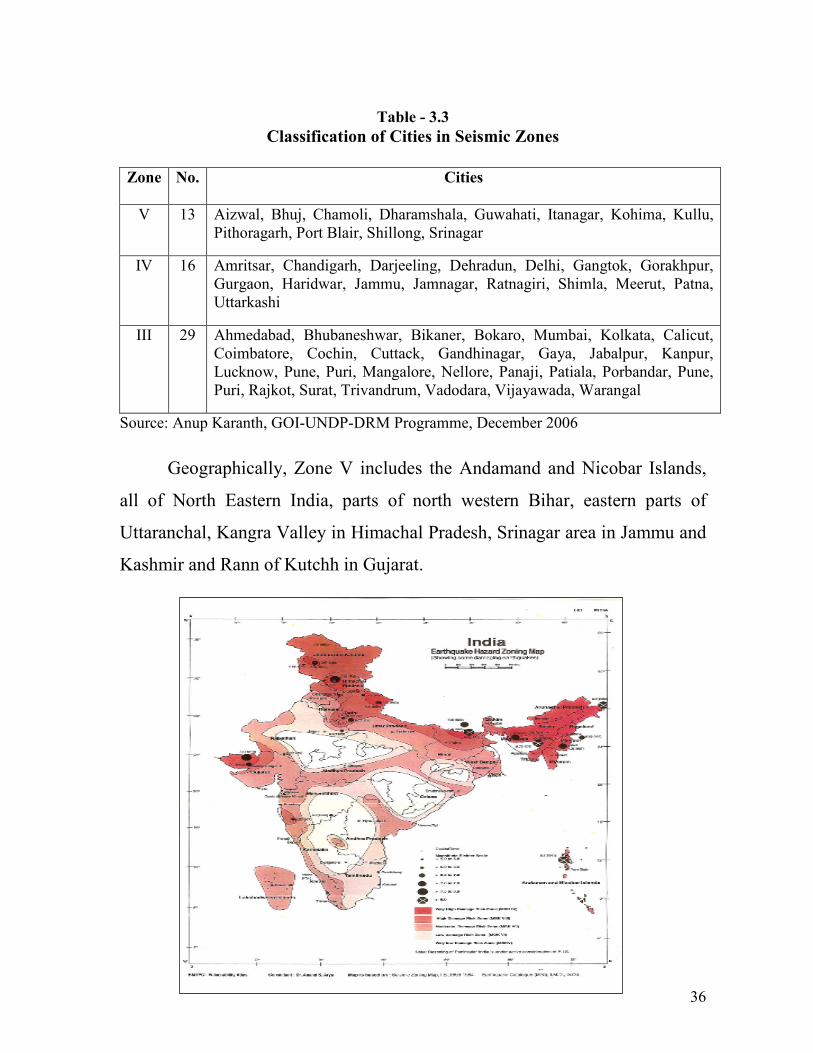
As per India's Seismic Vulnerability Atlas, 58 cities of India fall within
seismic vulnerability Zones. Out of which 13 cities are located in Zone V, 16
Cities in Zone IV and 29 cities are situated in Zone III (Table - 3.3)
36
Table - 3.3
Classification of Cities in Seismic Zones
Zone No. Cities
V 13 Aizwal, Bhuj, Chamoli, Dharamshala, Guwahati, Itanagar, Kohima, Kullu,
Pithoragarh, Port Blair, Shillong, Srinagar
IV 16 Amritsar, Chandigarh, Darjeeling, Dehradun, Delhi, Gangtok, Gorakhpur,
Gurgaon, Haridwar, Jammu, Jamnagar, Ratnagiri, Shimla, Meerut, Patna,
Uttarkashi
III 29 Ahmedabad, Bhubaneshwar, Bikaner, Bokaro, Mumbai, Kolkata, Calicut,
Coimbatore, Cochin, Cuttack, Gandhinagar, Gaya, Jabalpur, Kanpur,
Lucknow, Pune, Puri, Mangalore, Nellore, Panaji, Patiala, Porbandar, Pune,
Puri, Rajkot, Surat, Trivandrum, Vadodara, Vijayawada, Warangal
Source: Anup Karanth, GOI-UNDP-DRM Programme, December 2006
Geographically, Zone V includes the Andamand and Nicobar Islands,
all of North Eastern India, parts of north western Bihar, eastern parts of
Uttaranchal, Kangra Valley in Himachal Pradesh, Srinagar area in Jammu and
Kashmir and Rann of Kutchh in Gujarat.
37
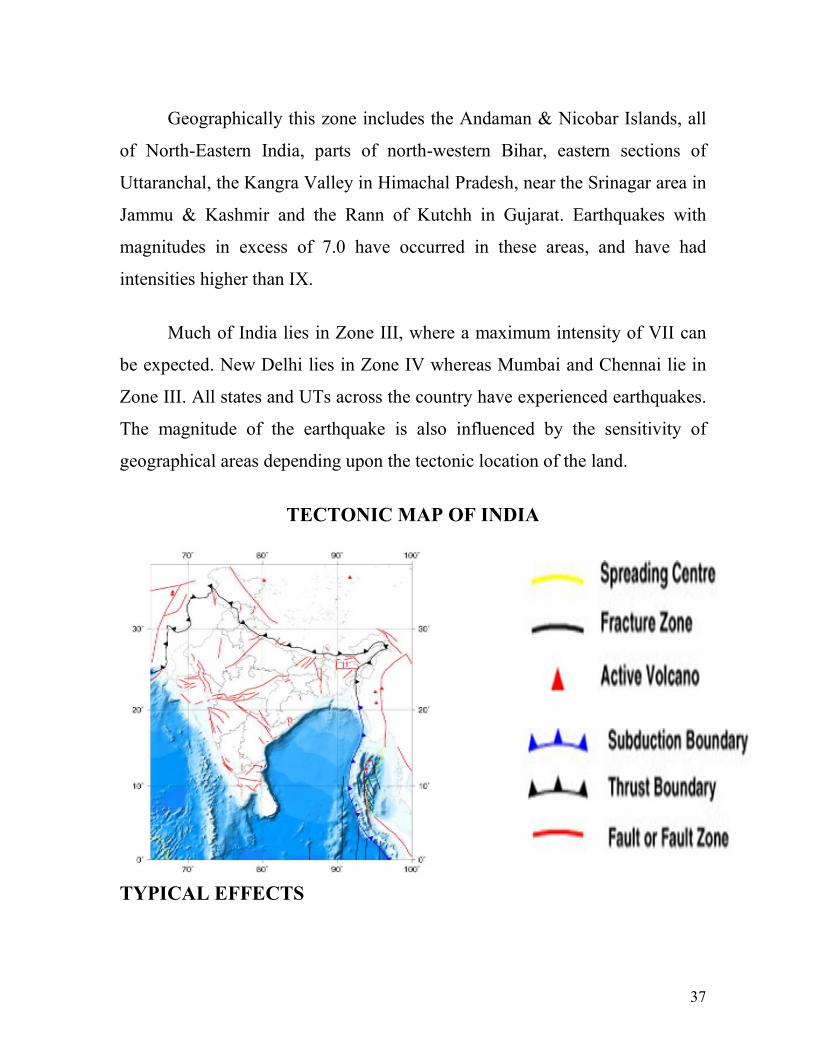
Geographically this zone includes the Andaman & Nicobar Islands, all
of North-Eastern India, parts of north-western Bihar, eastern sections of
Uttaranchal, the Kangra Valley in Himachal Pradesh, near the Srinagar area in
Jammu & Kashmir and the Rann of Kutchh in Gujarat. Earthquakes with
magnitudes in excess of 7.0 have occurred in these areas, and have had
intensities higher than IX.
Much of India lies in Zone III, where a maximum intensity of VII can
be expected. New Delhi lies in Zone IV whereas Mumbai and Chennai lie in
Zone III. All states and UTs across the country have experienced earthquakes.
The magnitude of the earthquake is also influenced by the sensitivity of
geographical areas depending upon the tectonic location of the land.
TECTONIC MAP OF INDIA
TYPICAL EFFECTS
38
The effects of earthquake may in change physical damage to property,
humanism and also disrupt the social and infrastructural services due to
occurasion of earthquakes. Damage or loss of buildings and service
structures, fires, floods due to dam failures, landslides could occur.
The casualties often high, near to the epi-center and in places where the
population density is high (say, multistoried buildings) and structures are not
resistant to earthquake forces. Multiple fracture injuries, moderately and
severely injured is the most widespread problem, breakdown in sanitary
conditions and large number of casualties could lead to epidemics. Severe
problems due to failure of the water supply distribution network and storage
reservoirs are noticed. Fire hydrants supply lines if vulnerable could hamper
fire service operations. Transport network is generally severely affected due
to failure of roads and bridges, railway tracks, failure of airport runways and
related infrastructure. Electricity and Communication also affect due to
collapse of transmission towers, transponders, transformers etc.
MITIGATION STRATEGIES
Engineered structures (designed and built) to withstand ground shaking.
Architectural and engineering inputs put together to improve building design
and construction practice. Analyze soil type before construction and do not
build structures on soft soil. To accommodate on weak soils adopt safety
measures in design.
• Follow Indian Standard Codes for construction of buildings.
• Enforcement of the Byelaws including Land use control and restriction
on density and heights of buildings
39
• Strengthening of important lifeline buildings which need to be
functional after a disaster. Upgrade level of safety of hospital, fire
service buildings etc.
• Public awareness, sensitization and training programmes for Architects,
Builders, Contractors, Designers, Engineers, Financiers, Government
functionaries, House owners, Masons etc. Reduce possible damages
from secondary effects such as like fire, floods, landslides etc. e.g.
identify potential landslide sites and restrict construction in those areas.
The principles and construction features for earthquake resistance
structure are shown in chart-2.2
Chart 3.2
Principles and Construction Features for Quake-Resistance
Principle Effect in an earthquake Construction Features
Structural Avoid • Subsoil bears loads
stability overturning and collapse • Adequate tying elements
• proper aspect ratios
• Geometrical regularity
• Uniform rigidity distribution
• Mansonary courses planned
Minimize Lessen over- • Light building materials
building inertia turning moments • Thin walls
Strong and Transfer of • Tie-bands
well-tied inertial forces • Triangulation of frame
framework to ground • Corner reinforcement
In-plane stiffness Resistance to • Few openings, suitably placed
In both directions inertial forces • Cross walls and Buttresses
Low CG Lessen over- • Low storey heights
turning probability • Light building materials
Shear centre Reduce local • Symmetrical and regular
close to CG stress and initiation • Building forms
of collapse • Avoid long lengths
• Simple designs with minimum
projections/openings/cut outs.
40
Increase absorption
of ductility of
steel/bamboo
• Use ductile materials at point of
inertial forces tensile stresses,
• Structure reinforcement at corner
joints
• Provide several support for key
structural elements and
• Multiple columns support for long
portions of a building.
COMMUNITY BASED MITIGATION
Community preparedness along with public education is vital for
mitigating the earthquake impact earthquake drills and public awareness
programme. Community based Earthquake Risk Management Project
should be developed and sustainable programmes launched. Retrofitting of
schools and important buildings, purchase of emergency response equipment
and facilities, establishing proper insurance can be the programmes under
Earthquake Risk Management Project. A large number of local masons and
engineers may be trained in disaster resistant construction techniques. A large
number of masons, engineers and architects can get trained in this process.
A Guide to Earthquake Reduction
(i) Prepare a Home Earthquake Plan
� Choose a safe place in every room-under a sturdy table or desk or
against an inside wall where nothing can fall on you.
� Practice drop, cover, and hold on. Drop under a sturdy desk or table,
hold on, and protect your eyes by pressing your face against your arm.
If there's no table or desk nearby, sit on the floor against an interior wall
41
away from windows or tall furniture that could fall on you. Teach
children to drop, cover, and hold on.
� Choose an out-of-town family contact.
� Consult a professional to find out additional ways to protect your home,
by implementing structural mitigation techniques.
� Take a first aid class.
� Get training in how to use a fire extinguisher.
� Bolt bookcases, kichten cabinets, and other tall furniture to wall studs.
(ii) Prepare a Disaster Supplies Kit for Home-
� First aid kit and essential medications.
� Potable water.
� Protective clothing, rainwear, and bedding.
� Battery-powered radio, flashlight, and extra batteries.
� Special items for infant, elderly, or disabled family members.
� Identify where you could go if told to evacuate. Choose safe places-a
relative's/friend's home in another town, a motel, or a shelter.
(iii) What to Do when the Shaking Begins
� Drop, cover, and hold on. Move only a few steps to a nearby safe
place. Stay indoors until the shaking stops and you're sure it's safe to
exit. Stay away from windows. In a high-rise building, expect the fire
alarms and sprinklers to Government off during a quake.
� If you are in bed, hold on and stay there, protecting your head with a
pillow.
42
� If you are outdoors, find a clear spot away from buildings, trees, and
power lines. Drop to the ground.
� If you are in a car, slow down and drive to a clear place (as described
above). Stay in the car until the shaking stops.
(iv) What to Do After the Shaking Stops
� Check yourself for injuries. Protect yourself from further danger by
putting on long pants, a long-sleeved shirt, sturdy shoes, and work
gloves.
� Check others for injuries. Give first aid for serious injuries.
� Look for and extinguish small fires. Eliminate fire hazards.
� Listen to the radio/TV for instructions.
� Expect aftershocks. Each time you feel one, drop, cover, and hold on.
� Inspect your home for damage. Get everyone out if your home is
unsafe.
(v) Make Your Home Fire Safe
� Smoke alarms save lives. Install a smoke alarm outside sleeping area
and on additional levels of your home.
� If people sleep with doors closed, install smoke alarms inside sleeping
areas, too.
� Use the test button to check each smoke alarm once a month. When
necessary, replace batteries immediately. Replace all batteries at least
once a year.
� Clean cobwebs and dust from your smoke alarms monthly.
43
� Consider having one or more working fire extinguishers in your home.
Get training from the fire department in how to use them.
(vi) Plan Your Escape Routes
� Determine at least two ways to escape from every room of your home.
� Consider escape ladders for sleeping areas on the second or third floor.
Learn how to use them and store them near the window.
� Select a location outside your home where everyone would meet after
escaping.
� Practice your escape plan at least twice a year.
(vii) Escape Safely
� Once you are out, stay out! Call the fire department.
� If you see smoke or fire in your first escape route, use your second way
out. If you must exit through smoke, crawl low under the smoke to your
exit.
� If you are escaping through a closed door, feel the door before opening
it. If it is warm, use your second way out.
� Smoke, heat, or flames block your exit routes, stay in the room with the
door closed. Signal for help using a bright-colored cloth at the window.
If there is a telephone in the room, call the fire brigade and tell them
where you are.
44
Chapter- 4
TSUNAMI
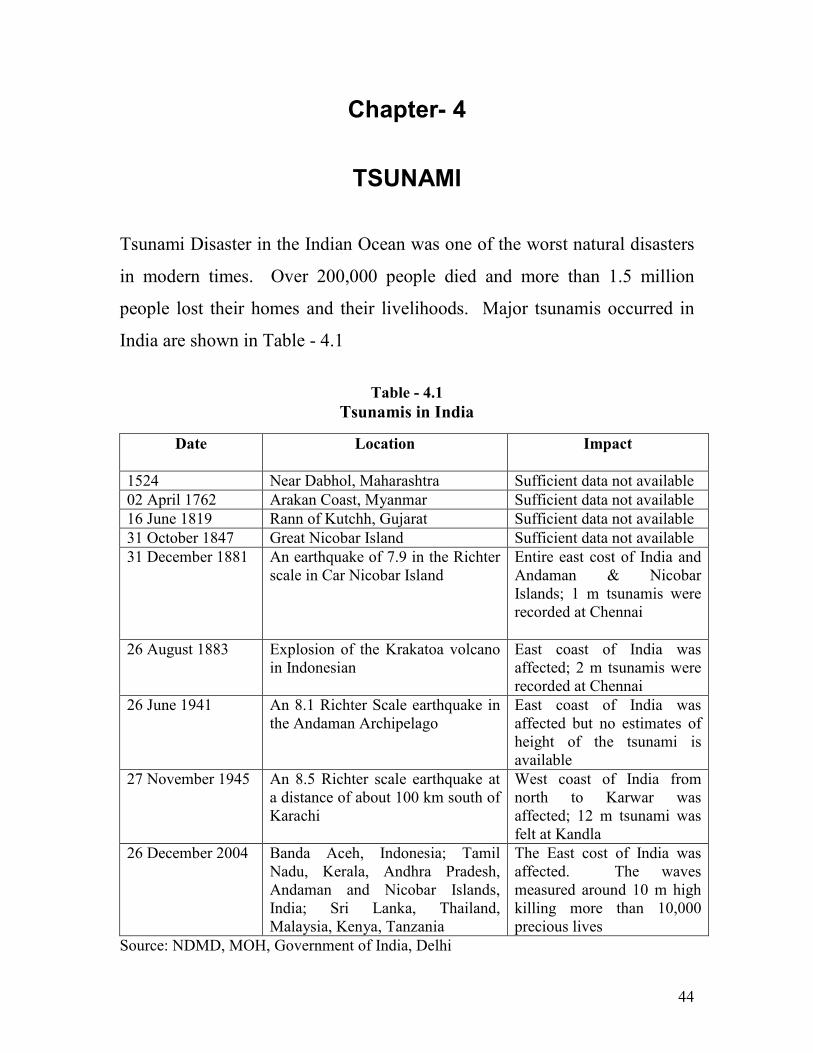
Tsunami Disaster in the Indian Ocean was one of the worst natural disasters
in modern times. Over 200,000 people died and more than 1.5 million
people lost their homes and their livelihoods. Major tsunamis occurred in
India are shown in Table - 4.1
Table - 4.1
Tsunamis in India
Date Location Impact
1524 Near Dabhol, Maharashtra Sufficient data not available
02 April 1762 Arakan Coast, Myanmar Sufficient data not available
16 June 1819 Rann of Kutchh, Gujarat Sufficient data not available
31 October 1847 Great Nicobar Island Sufficient data not available
31 December 1881 An earthquake of 7.9 in the Richter scale in Car Nicobar Island
Entire east cost of India and Andaman & Nicobar Islands; 1 m tsunamis were recorded at Chennai
26 August 1883 Explosion of the Krakatoa volcano in Indonesian
East coast of India was affected; 2 m tsunamis were recorded at Chennai
26 June 1941 An 8.1 Richter Scale earthquake in the Andaman Archipelago
East coast of India was affected but no estimates of height of the tsunami is available
27 November 1945 An 8.5 Richter scale earthquake at a distance of about 100 km south of Karachi
West coast of India from north to Karwar was affected; 12 m tsunami was felt at Kandla
26 December 2004 Banda Aceh, Indonesia; Tamil Nadu, Kerala, Andhra Pradesh, Andaman and Nicobar Islands, India; Sri Lanka, Thailand, Malaysia, Kenya, Tanzania
The East cost of India was affected. The waves measured around 10 m high killing more than 10,000 precious lives
Source: NDMD, MOH, Government of India, Delhi
45
The recent tsunami strike in December 2004 severely hit the coastal states of
Tamil Nadu, Kerala, Andhra Pradesh and union territory of Andaman
Nicobar Islands. According to Government reports, 10739 people in India
lost their lives and 6913 were injured. It was reported that 5640 persons are
still missing. The highest human losses were in the Andaman Nicobar
Islands and the state of Tamil Nadu. Overall damages were estimated at
about $660 million and losses to $410 million (UN, 2005).
CONCEPT AND CAUSES
If the earthquake or under water land movement is near the coast then
tsunami may strike suddenly and if the earth movement is far in the sea then
it may take few minutes to hours before striking the coast. The onset is
extensive and often very destructive. The general causes of Tsunamis are
geological movements. It is produced in three major ways. The most
common of these is fault movement on the sea floor, accompanied by an
earthquake. To say that an earthquake causes a tsunami is not completely
correct. Rather, both earthquakes and tsunamis result from fault movements.
Probably the second most common cause of tsunamis is a landslide either
occurring underwater or originating above the sea and then plunging into the
water. The third major cause of tsunamis is volcanic activity. The flank of a
volcano, located near the shore or underwater, may be uplifted or depressed
similar to the action of a fault. Or, the volcano may actually explode. In
1883, the violent explosion of the famous volcano, Krakatoa in Indonesia,
produced tsunamis measuring 40 meters which crashed upon Java and
Sumatra. Over 36,000 people lost their lives as a result of tsunami waves
from Krakatoa. The giant tsunamis that are capable of crossing oceans are
46
nearly always created by movement of the sea floor associated with
earthquakes which occur beneath the sea floor or near the ocean.
Tsunami is not a single giant wave. It consists of ten or more waves which
are termed as a “tsunami wave train”. Since scientists cannot predict when
earthquakes will occur, they cannot predict exactly when a tsunami will be
generated. Studies of past historical tsunamis indicate where tsunamis are
most likely to be generated, their potential heights, and flooding limits at
specific coastal locations. With use of satellite technology it is possible to
provide nearly immediate warnings of potentially tsunamigenic earthquakes.
Warning time depends upon the distance of the epi-center from the coast
line. The warning includes predicted times at selected coastal communities
where the tsunami could travel in a few hours. In case of tsunami genie
earthquakes or any other geological activity people near to the coastal areas
may get very little time to evacuate on receiving of warning.
All structures located within 200 mts. of the low lying coastal area are most
vulnerable to the direct impact of the tsunami waves as well as the impact of
debris & boulders brought by it. Settlements in adjacent areas will be
vulnerable to floods & scour. Structures constructed of wood, mud, thatch,
sheets and structures without proper anchorage to foundations are liable to
be damaged by tsunami waves & flooding. Other elements at risk are
infrastructure facilities like ports & harbours, telephone and electricity poles,
cables. Ships & fishing boats/nets near the coast also add to the destruction
caused by tsunami waves.
47
EFFECTS OF TSUNAMI:
Local tsunami events or those less than 30 minutes from the source
cause the majority of damage. The force of wave can raze everything in
its path. It is the flooding effect of a tsunami, however, that most
greatly affects human settlements by water damage to homes and
businesses, roads, bridges and other infrastructure. Ships, port facilities,
boats/trawlers, fishing nets also get damaged.
There is evidence of ever increasing impact upon the environment on
account of the effects of tsunamis. The range varies from generation of
tonnes of debris on account of structural collapse of weaker buildings,
release of toxic chemicals into the environment on account of chemical
leak/spillage/process failure/utility breakages/ collateral hazards and
negative impact on the already fragile ecosystems.
Deaths occur principally from drowning as water inundates homes or
neighborhoods. Many people may be washed out to sea or crushed by
the giant waves. There may be some injuries from battering by debris
and wounds may become contaminated.
Sewer pipes may be damaged causing major sewage disposal problems.
Drinking water shortage arises due to breakage of water mains and
contamination. Open wells and ground water may become unfit for
drinking due to contamination of salt water and debris.
48
Flooding by tsunami causes damage to the standing crops and also to
the food supplies in the storage facilities. The land may be rendered
infertile due to salt water incursion from the sea.
PREPAREDNESS MEASURES
A hazard map should be prepared with designated areas expected to be
damaged by flooding by tsunami waves. Historical data could be of
help in showing areas inundated in the past. Keeping in mind the
vulnerable areas, evacuation routes should be constructed and mapped.
The plan should be followed by evacuation drill.
A well networked system in place can warn the communities of the
coastal areas when the threat is perceived. Tsunami warning should be
disseminated to local, state, national as well as the international
community so as to be prepared as they are capable of crossing across
continents. The information can be broadcasted to the local emergency
officers and the general public. On receiving of the warning the action
should be to evacuate the place as decided in the evacuation plan.
Communities in the coastal areas are faced by the wrath of cyclones,
storm surge and tsunami waves. It is important that the community is
better prepared to take suitable actions on receiving the threat and
follow emergency evacuation plans and procedures. A community
which choose to ignore warning may get severely affected if they are
not prepared to take immediate measures.
49
MITIGATION STRATEGIES
Site Planning and Land Management
Within the broader framework of a comprehensive plan, site planning
determines the location, configuration, and density of development on
particular sites and is, therefore, an important tool in reducing tsunami
risk.
• The designation and zoning of tsunami hazard areas for such
open-space uses as agriculture, parks and recreation, or natural
hazard areas is recommended as the first land use planning
strategy. This strategy is designed to keep development at a
minimum in hazard areas.
• In areas where it is not feasible to restrict land to open-space
uses, other land use planning measures can be used. These
include strategically controlling the type of development and uses
allowed in hazard areas, and avoiding high-value and high-
occupancy uses to the greatest degree possible.
• The capital improvement planning and budgeting process can be
used to reinforce land use planning policies.
Engineering Structures
As most of the structures along the coast area comprises of fisherman
community, which are constructed of light weight materials without
any engineering inputs. Therefore there is an urgent need to educate the
community about the good construction practices that they should
adopt such as:
50
• Avoid building or living in buildings within several hundred feet
of the coastline as these areas are more likely to experience
damage from tsunamis.
• Construct the structure on a higher ground level with respect to
mean sea level.
• Elevate coastal homes: Most tsunami waves are less than 3
meters in height. Elevating house will help reduce damage to
property from most tsunamis. Structural columns resist the
impact while other walls are expendable. It is important also to
take note that adequate measures are brought into the design to
cater for earthquake forces.
• Construction of water breakers to reduce the velocity of waves.
• Use of water & corrosion resistant materials for construction.
• Construction of community halls at higher locations, which can
act as shelters at the time of a disaster.
Flooding will result from a tsunami. Tsunami waves will flood the
coastal areas. Flood mitigation measures could be incorporated.
Building barriers or buffers such as special breakwaters or seawalls can
be an effective risk reduction measure against gushing waters in case of
Tsunami/Storm surge during cyclones.
51
CHAPTER- 5
CYCLONE HAZARDS AND DISASTERS
INDIAN CYCLONES
The coastal areas are subjected to severe wind storms and cyclonic
storms. A full-grown cyclone is a violent whirl in the atmosphere 150
to 1000 km across, 10 to 15 km high. Gale winds of 150 to 250 kmph
or more spiral around the center of very low pressure area. Torrential
rains, occasional thunder and lightning flashes - join these under an
overcast black canopy. Through these churned chaotic sea and
atmosphere, the cyclone moves 300 to 500 km, in a day to hit or skirt
along a coast, bringing with it storm surges as high as 3 to 12 metres, as
if splashing a part of the sea sometimes up to 30 km inland leaving
behind death and destructions. A storm surge is the sudden abnormal
rise in the sea level caused by cyclone. The sea water flows across the
coast as well as inland and then recedes back to the sea. Great loss of
life and property takes place in the process.
Cyclones affect both the Bay of Bengal and the Arabian Sea. They are
rare in Bay of Bengal from January to March. Isolated ones forming in
the South Bay of Bengal move west-north-westwards and hit Tamil
Nadu and Sri Lanka coasts. In April and May, these form in the South
and adjoining Central.
52
Bay and move initially northwest, north and then recurve to the
northeast striking the Arakan coasts in April and Andhra-Orissa-West
Bengal-Bangla desh coasts in May. Most of the monsoon (June-
September) storms develop in the central and in the North Bay and
move west-north-westwards affecting Andhra-Orissa-West Bengal
coasts. Post monsoon (October-December) storms form mostly in the
south and the central Bay, recurve between 150O and 18
0O N affecting
Tamil Nadu-Andhra Orissa-West Bengal-Bangladesh coasts.
Cyclones do not form in Arabian Sea during the months of January,
February and March and are rare in April, July, August and September.
They generally form in southeast Arabian Sea and adjoining central
Arabian Sea in the months of May, October, November and December
and in east central Arabian Sea in the month of June. Some of the
cyclones that originate in the Bay of Bengal travel across the peninsula
weaken and emerge into Arabian Sea as low pressure areas. These may
again intensify into cyclonic storms. Most of the storms in Arabian Sea
move in west-north-westerly direction towards Arabian Coast in the
month of May and in a northerly direction towards Gujarat Coast in the
month of June. In other months, they generally move northwest north
and then recurve northeast affecting Gujarat-Maharashtra coasts; a few,
however, also move west north westwards towards Arabian
coast.(Table-5.1)
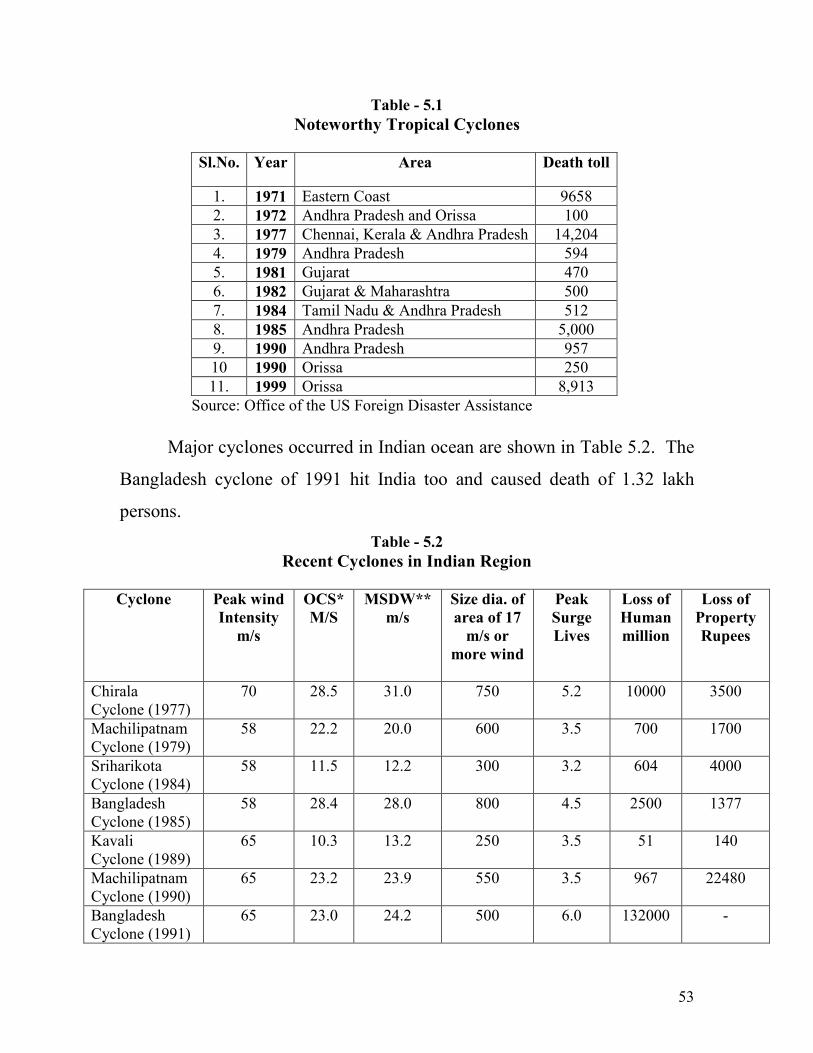
53
Table - 5.1
Noteworthy Tropical Cyclones
Sl.No. Year Area Death toll
1. 1971 Eastern Coast 9658
2. 1972 Andhra Pradesh and Orissa 100
3. 1977 Chennai, Kerala & Andhra Pradesh 14,204
4. 1979 Andhra Pradesh 594
5. 1981 Gujarat 470
6. 1982 Gujarat & Maharashtra 500
7. 1984 Tamil Nadu & Andhra Pradesh 512
8. 1985 Andhra Pradesh 5,000
9. 1990 Andhra Pradesh 957
10 1990 Orissa 250
11. 1999 Orissa 8,913
Source: Office of the US Foreign Disaster Assistance
Major cyclones occurred in Indian ocean are shown in Table 5.2. The
Bangladesh cyclone of 1991 hit India too and caused death of 1.32 lakh
persons.
Table - 5.2
Recent Cyclones in Indian Region
Cyclone Peak wind
Intensity
m/s
OCS*
M/S
MSDW**
m/s
Size dia. of
area of 17
m/s or
more wind
Peak
Surge
Lives
Loss of
Human
million
Loss of
Property
Rupees
Chirala
Cyclone (1977)
70 28.5 31.0 750 5.2 10000 3500
Machilipatnam
Cyclone (1979)
58 22.2 20.0 600 3.5 700 1700
Sriharikota
Cyclone (1984)
58 11.5 12.2 300 3.2 604 4000
Bangladesh
Cyclone (1985)
58 28.4 28.0 800 4.5 2500 1377
Kavali
Cyclone (1989)
65 10.3 13.2 250 3.5 51 140
Machilipatnam
Cyclone (1990)
65 23.2 23.9 550 3.5 967 22480
Bangladesh
Cyclone (1991)
65 23.0 24.2 500 6.0 132000 -
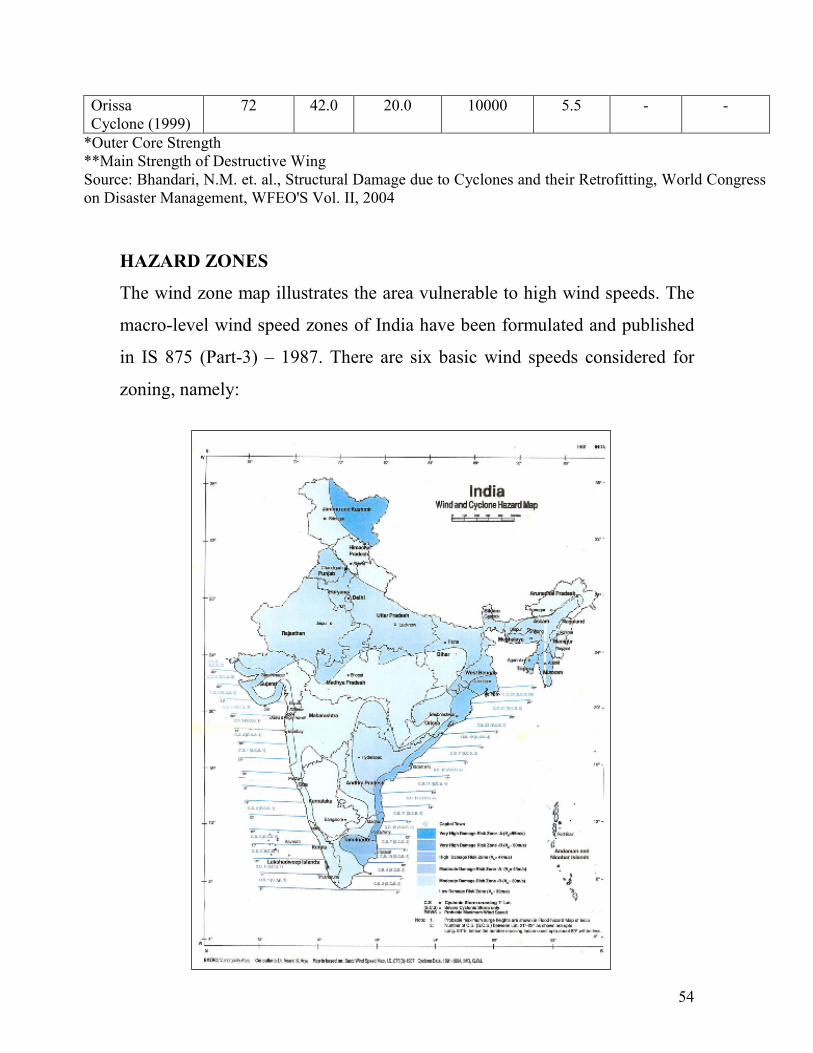
54
Orissa
Cyclone (1999)
72 42.0 20.0 10000 5.5 - -
*Outer Core Strength
**Main Strength of Destructive Wing
Source: Bhandari, N.M. et. al., Structural Damage due to Cyclones and their Retrofitting, World Congress
on Disaster Management, WFEO'S Vol. II, 2004
HAZARD ZONES
The wind zone map illustrates the area vulnerable to high wind speeds. The
macro-level wind speed zones of India have been formulated and published
in IS 875 (Part-3) – 1987. There are six basic wind speeds considered for
zoning, namely:
55
The criteria followed by the Meteorological Department of India to classify
the low pressure systems in the Bay of Bengal and in the Arabian Sea as
adopted by the World Meteorological Organisation (WMO) is shown in
Box:
Wind Circulation and Disturbances
Types of Disturbances Associated wind speed in the Circulation
Knot Km/hr
1. Low Pressure Area Less than 17 knots < 31 kmph
2. Depression 17 to 27 knots 31 to 49 kmph
3. Deep Depression 28 to 33 knots 50 to 61 kmph
4. Cyclonic Storm 34 to 47 knots 62 to 88 kmph
5. Severe Cyclonic Storm 48 to 63 knots 89 to 118 kmph
6. Very Severe Cyclonic Storm 64 to 119 knots 119 to 221 kmph
7. Super Cyclonic Storm 120 knots and above 222 kmph and above
Level of Risks Wind Speed
(km/hr)
Very High Damage Risk Zone-A 198
Very High Damage Risk Zone-B 180 km/hr
High Damage Risk Zone 169.2 km/hr
Moderate Damage Risk Zone-A 158.4 km/hr
Moderate Damage Risk Zone-B 140.4 km/hr
Low Damage Risk Zone 118.8 km/hr
The cyclone affected areas of the country are classified in 50 and 55m/s
zones. It is known that in certain events, the wind gusts could appreciably
56
exceed the given basic wind speeds. For design of structures and
classification of vulnerability and risk to buildings, the above macro-level
zoning is considered as sufficient.
Surge Prone Coasts of India
Storm surge heights depend on the intensity of the cyclone, i.e., very high-
pressure gradient and consequent very strong winds and the topography of
seabed near the point where a cyclone crosses the coast. Sea level also rises
due to astronomical high tide. Elevation of the total sea level increases when
peak surge occurs at the time of high tide. Vulnerability to storm surges is
not uniform along Indian coasts.
The following segments of the East Coast of India are most vulnerable to
high surges:
• North Orissa and West Bengal coasts.
• Andhra Pradesh coast between Ongole and Machilipatnam.
• Tamil Nadu coast, south of Nagapatnam.
The West Coast of India is less vulnerable to storm surges than the east
coast of India in terms of both the height of storm surge as well as frequency
of occurrence. However, the following segments are vulnerable to
significant surges:
• Maharashtra coast, north of Harnai and adjoining south Gujarat coast
and the coastal belt around the Gulf of Bombay.
• The coastal belt around the Gulf of Kutch.
57
The coastal belt plantation (green belt plantation along the coastal line in a
scientific interweaving pattern) can reduce the adverse impact of hazards of
cyclone, tsunami, and flood. However, the frequent cutting of plants, trees
and clearance of forest and mangroves, the cyclone and tsunami waves trend
freely in land. The lakh of productive forest cover allows water to
immediate large areas and cause destruction. Thus, community based
mitigation strategies are to be introduced.
VULNERABILITY
All lightweight structures and those built of mud, wood, older buildings
with weak walls and structures without proper anchorage to the
foundations will be at great risk. Settlements located in low lying
coastal areas will be vulnerable to the direct effects of the cyclones
such as wind, rain and storm surge. Settlements in adjacent areas will
be vulnerable to floods, mudslides or landslides due to heavy rains.
Other elements at risk are fences, telephone & electricity poles, cables,
light elements of structures–roofs, signboards, hoardings, coconut
crowns, fishing boats & large trees.
EFFECTS OF CYCLONE HAZARD
First, in a sudden, brief onslaught, high winds cause major damage to
infrastructure and housing, in particular fragile constructions. They are
generally followed by heavy rains and floods and, in flat coastal areas
by storm surge riding on tidal waves and inundating the land over long
58
distances of even up to 15km inland. Structures will be damaged or
destroyed by the wind force, flooding and storm surge. Light pitched
roofs of most structures especially the ones fitted on to industrial
buildings will suffer severe damage. Caused by flooding and flying
elements, contamination of water supplies may lead to viral outbreaks,
diarrhea, and malaria. Ground and piped water supply may get
contaminated by flood waters. High winds and rains will ruin the
standing crop and food stock lying in low lying areas. Plantation type
crops such as banana and coconut are extremely vulnerable. Salt from
the sea water may be deposited on the agricultural land and increase the
salinity. The loss of the crop may lead to acute food shortage.
Severe disruption in the communication links as the wind may bring
down the electricity and communication towers, electricity and
telephone poles, telephone lines, antennas and satellite disk and
broadcasting services. Transport lines (road and rail) may be curtailed.
Relief materials may not reach the affected site.
MITIGATION STRATEGIES
Meteorological records of the wind speed and the directions give the
probability of the winds in the region. Cyclones can be predicted several
days in advance. The onset is extensive and often very destructive. Past
records and paths can give the pattern of occurrence for particular wind
speeds. A hazard map will illustrate the areas vulnerable to the cyclone in
any given year. It will be useful to estimate the severity of the cyclone and
various damage intensities in the region. The map is prepared with data
59
inputs of past climatological records, history of wind speed, frequency of
flooding etc.
Land use control should be designed so that least critical activities are placed
in vulnerable areas. Location of settlements in the flood plains is at utmost
risk. Setting of key facilities must be marked in the land use. Policies should
be in place to regulate land use and enforcement of building codes.
Vulnerable areas should be kept for parks, grazing or play grounds.
Engineered structures need to be built to withstand wind forces. Good site
selection is also important. Majority of the buildings in coastal areas are
built with locally available materials and have no engineering inputs. Good
construction practice should be adopted such as:
- Cyclonic wind storms inundate the coastal areas. It is advised to
construct on stilts or on earth mound.
- Houses can be strengthened to resist wind and flood damage. All
elements holding the structures need to be properly anchored to resist
the uplift or flying off of the objects.
- A row of planted trees will act as a shield. It reduces the energy.
- Buildings should be wind and water resistant.
- Buildings storing food supplies must be protected against the winds
and water.
- Protect river embankments. Communication lines should be installed
underground.
- Provide strong halls for community shelter in vulnerable locations.
60
Flooding will result from a cyclonic storm. Storm surge will flood the
coastal areas. Heavy rains will bring in flash floods. There are possibilities
of landslides too. Flood mitigation measures could be incorporated.
Improving vegetation cover – improvement of the vegetation will increase
water infiltration capacity of the soil. The roots of the plants and trees will
keep the soil intact and prevent erosion and slow runoff to prevent or lessen
flooding. The use of tree planted in rows will act as a windbreak.
Coastal shelterbelt plantation can be developed to break severe wind
speeds. It minimizes devastating effects. The Orissa calamity has also
highlighted the need for urgent measures like shelterbelt plantation along
cyclone-prone coastal areas. Species chosen for this purpose should not only
be able to withstand the impact of strong cyclonic winds, but also check soil
erosion.
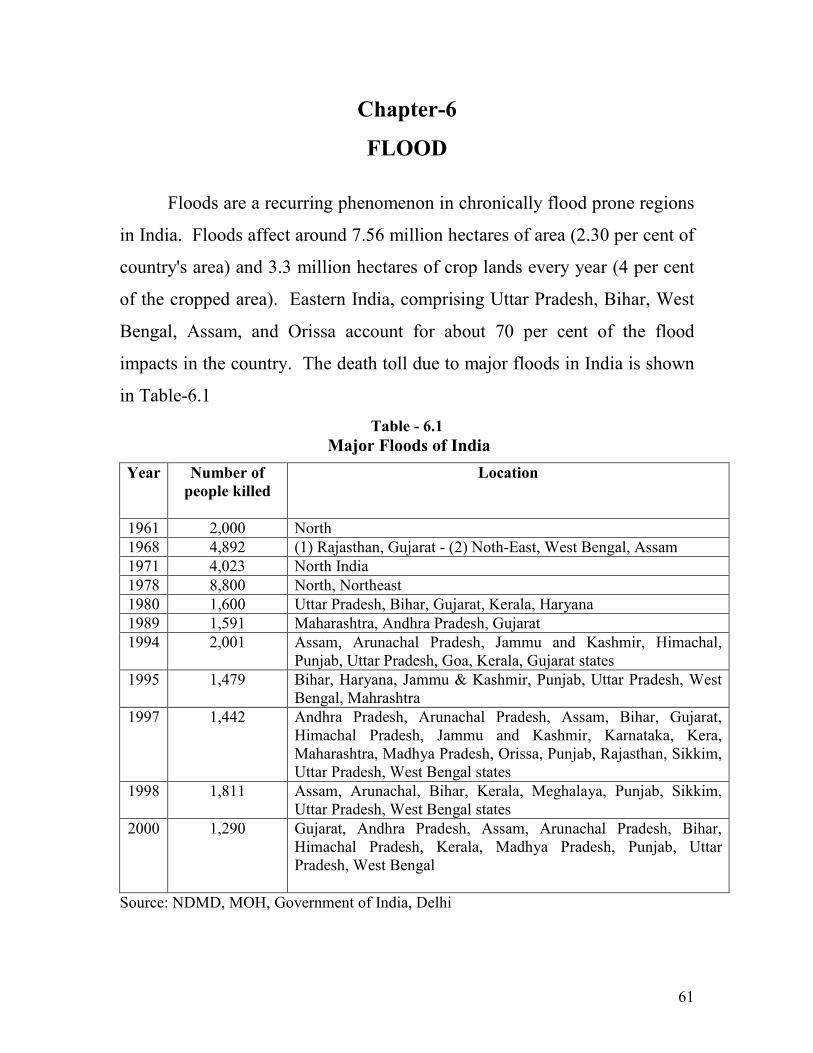
61
Chapter-6
FLOOD
Floods are a recurring phenomenon in chronically flood prone regions
in India. Floods affect around 7.56 million hectares of area (2.30 per cent of
country's area) and 3.3 million hectares of crop lands every year (4 per cent
of the cropped area). Eastern India, comprising Uttar Pradesh, Bihar, West
Bengal, Assam, and Orissa account for about 70 per cent of the flood
impacts in the country. The death toll due to major floods in India is shown
in Table-6.1
Table - 6.1
Major Floods of India
Year Number of
people killed
Location
1961 2,000 North
1968 4,892 (1) Rajasthan, Gujarat - (2) Noth-East, West Bengal, Assam
1971 4,023 North India
1978 8,800 North, Northeast
1980 1,600 Uttar Pradesh, Bihar, Gujarat, Kerala, Haryana
1989 1,591 Maharashtra, Andhra Pradesh, Gujarat
1994 2,001 Assam, Arunachal Pradesh, Jammu and Kashmir, Himachal,
Punjab, Uttar Pradesh, Goa, Kerala, Gujarat states
1995 1,479 Bihar, Haryana, Jammu & Kashmir, Punjab, Uttar Pradesh, West
Bengal, Mahrashtra
1997 1,442 Andhra Pradesh, Arunachal Pradesh, Assam, Bihar, Gujarat,
Himachal Pradesh, Jammu and Kashmir, Karnataka, Kera,
Maharashtra, Madhya Pradesh, Orissa, Punjab, Rajasthan, Sikkim,
Uttar Pradesh, West Bengal states
1998 1,811 Assam, Arunachal, Bihar, Kerala, Meghalaya, Punjab, Sikkim,
Uttar Pradesh, West Bengal states
2000 1,290 Gujarat, Andhra Pradesh, Assam, Arunachal Pradesh, Bihar,
Himachal Pradesh, Kerala, Madhya Pradesh, Punjab, Uttar
Pradesh, West Bengal
Source: NDMD, MOH, Government of India, Delhi
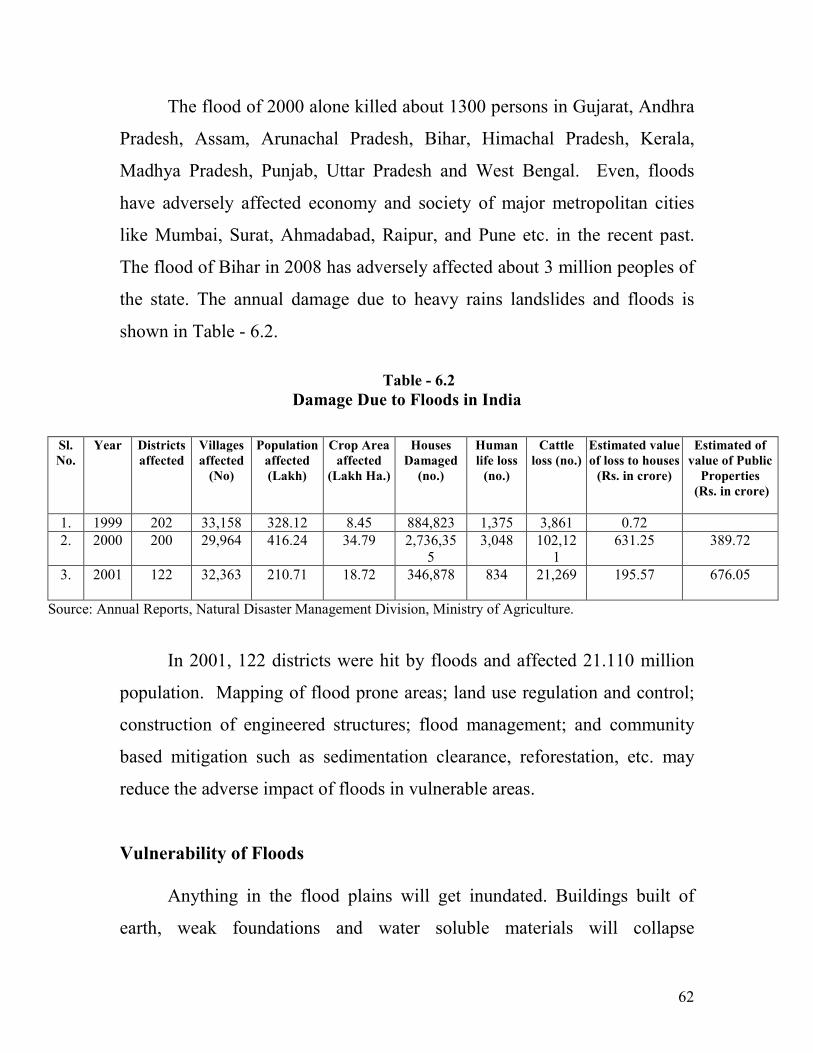
62
The flood of 2000 alone killed about 1300 persons in Gujarat, Andhra
Pradesh, Assam, Arunachal Pradesh, Bihar, Himachal Pradesh, Kerala,
Madhya Pradesh, Punjab, Uttar Pradesh and West Bengal. Even, floods
have adversely affected economy and society of major metropolitan cities
like Mumbai, Surat, Ahmadabad, Raipur, and Pune etc. in the recent past.
The flood of Bihar in 2008 has adversely affected about 3 million peoples of
the state. The annual damage due to heavy rains landslides and floods is
shown in Table - 6.2.
Table - 6.2
Damage Due to Floods in India
Sl.
No.
Year Districts
affected
Villages
affected
(No)
Population
affected
(Lakh)
Crop Area
affected
(Lakh Ha.)
Houses
Damaged
(no.)
Human
life loss
(no.)
Cattle
loss (no.)
Estimated value
of loss to houses
(Rs. in crore)
Estimated of
value of Public
Properties
(Rs. in crore)
1. 1999 202 33,158 328.12 8.45 884,823 1,375 3,861 0.72
2. 2000 200 29,964 416.24 34.79 2,736,35
5
3,048 102,12
1
631.25 389.72
3. 2001 122 32,363 210.71 18.72 346,878 834 21,269 195.57 676.05
Source: Annual Reports, Natural Disaster Management Division, Ministry of Agriculture.
In 2001, 122 districts were hit by floods and affected 21.110 million
population. Mapping of flood prone areas; land use regulation and control;
construction of engineered structures; flood management; and community
based mitigation such as sedimentation clearance, reforestation, etc. may
reduce the adverse impact of floods in vulnerable areas.
Vulnerability of Floods
Anything in the flood plains will get inundated. Buildings built of
earth, weak foundations and water soluble materials will collapse
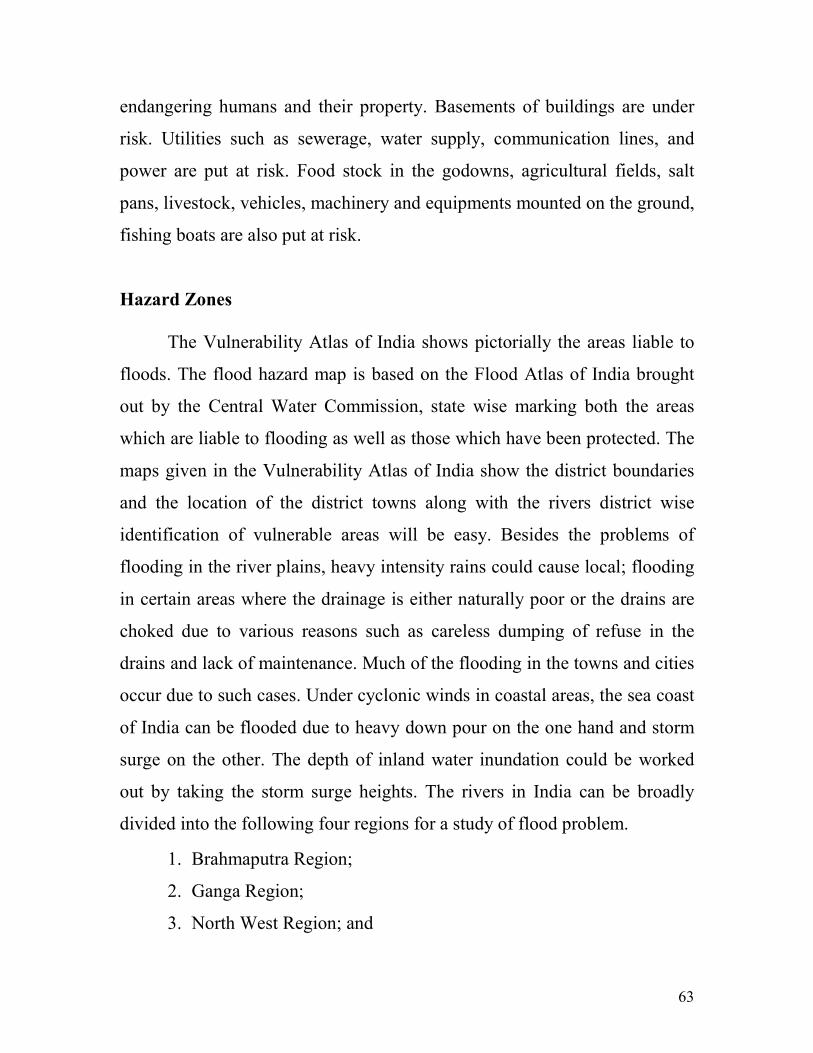
63
endangering humans and their property. Basements of buildings are under
risk. Utilities such as sewerage, water supply, communication lines, and
power are put at risk. Food stock in the godowns, agricultural fields, salt
pans, livestock, vehicles, machinery and equipments mounted on the ground,
fishing boats are also put at risk.
Hazard Zones
The Vulnerability Atlas of India shows pictorially the areas liable to
floods. The flood hazard map is based on the Flood Atlas of India brought
out by the Central Water Commission, state wise marking both the areas
which are liable to flooding as well as those which have been protected. The
maps given in the Vulnerability Atlas of India show the district boundaries
and the location of the district towns along with the rivers district wise
identification of vulnerable areas will be easy. Besides the problems of
flooding in the river plains, heavy intensity rains could cause local; flooding
in certain areas where the drainage is either naturally poor or the drains are
choked due to various reasons such as careless dumping of refuse in the
drains and lack of maintenance. Much of the flooding in the towns and cities
occur due to such cases. Under cyclonic winds in coastal areas, the sea coast
of India can be flooded due to heavy down pour on the one hand and storm
surge on the other. The depth of inland water inundation could be worked
out by taking the storm surge heights. The rivers in India can be broadly
divided into the following four regions for a study of flood problem.
1. Brahmaputra Region;
2. Ganga Region;
3. North West Region; and
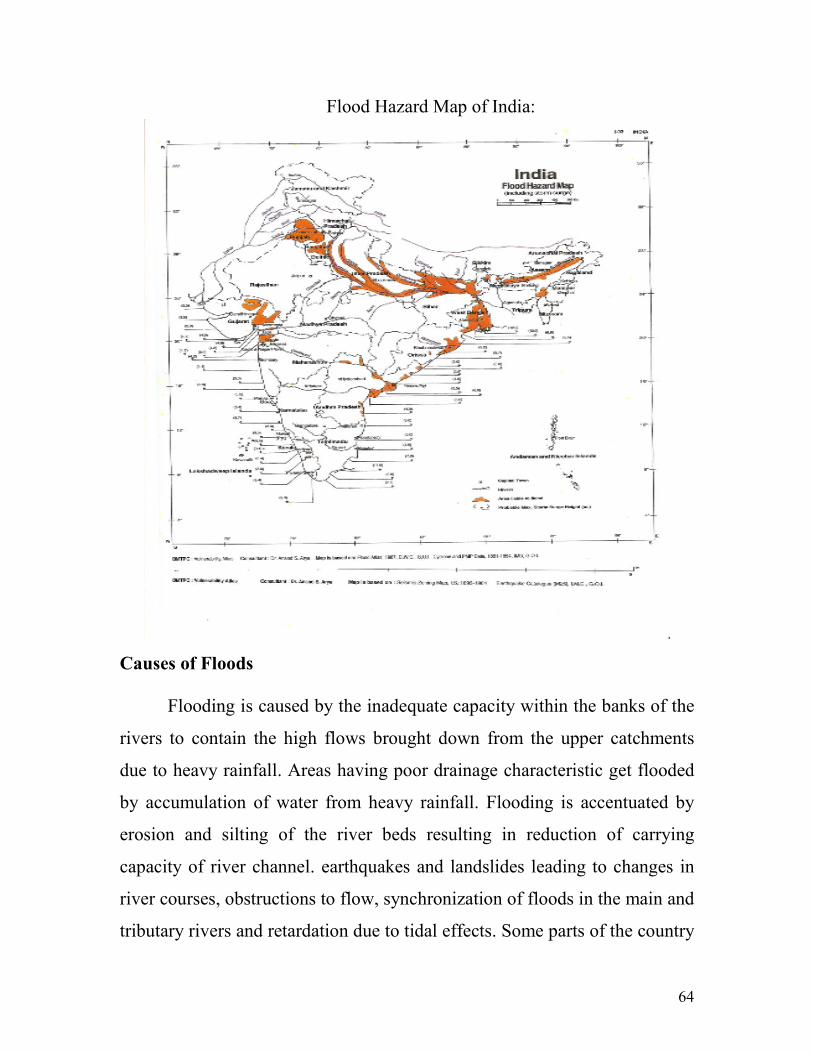
64
Flood Hazard Map of India:
Causes of Floods
Flooding is caused by the inadequate capacity within the banks of the
rivers to contain the high flows brought down from the upper catchments
due to heavy rainfall. Areas having poor drainage characteristic get flooded
by accumulation of water from heavy rainfall. Flooding is accentuated by
erosion and silting of the river beds resulting in reduction of carrying
capacity of river channel. earthquakes and landslides leading to changes in
river courses, obstructions to flow, synchronization of floods in the main and
tributary rivers and retardation due to tidal effects. Some parts of the country
65
mainly coastal areas of Andhra Pradesh, Assam, Orissa, Tamilnadu and
West Bengal experience cyclones which often are accompanied by heavy
rainfall leading to flooding.
Another cause for flooding has been the water logging in the irrigated
area. This is due to excess irrigation water applied to command area and
increase in ground water level due to seepage from canals and irrigated field.
It has been assessed that an area of 2.46 m. ha. is suffering from problem of
water logging under irrigation commands in India.
Effects of Flood
Physical Damag- The structures may damage or collapse by washing
waters, landslide triggering on account of water getting saturated. Boats and
fishing equipments may be lost or damaged in coastal areas. People and
livestock deaths may be caused by drowning, very few serious injuries.
Outbreak of epidemics, diarrhea, viral infections, malaria may also be
happened. Contamination of water (wells, ground water, piped water
supply) is very common during floods. Clean water may be unavailable.
Sudden food shortage can be caused due to loss of entire harvest, spoiling of
grains when saturated in water along with loss of animal fodder. The crop
storage facilities and go-downs may get submerged resulting in immediate
food shortage. Floods may also affect the soil characteristics. The land may
be rendered infertile due to erosion of top layer or may turn saline if sea
water floods the area.
Embankments along the rivers, sea walls along the coasts may keep
water away from the flood plains. Water flow can be regularized through
66
construction of the reservoirs, check dams, alternate drainage
channels/routes, increasing vegetation cover and by providing storm drains.
Mitigation Strategies
Mapping of the flood prone areas is a primary step involved in
reducing the risk of the region. Historical records give the indication of the
flood inundation areas and the period of occurrence and the extent of the
coverage. The basic map is combined with other maps and data to form a
complete image of the floodplain. Warning can be issued looking into the
earlier marked heights of the water levels in case of potential threat. In the
coastal areas the tide levels and the land characteristics will determine the
submergence areas. Flood hazard mapping will give the proper indication of
water flow during floods.
Land use control will reduce danger of life and property when waters
inundate the floodplains and the coastal areas. The number of casualties is
related to the population in the area at risk. It’s better to reduce the densities
in areas where neighborhoods are to be developed. In areas where people
already have built their settlements, measures should be taken to relocate to
better sites so as to reduce vulnerability. No major development should be
permitted in the areas which are subjected to high flooding. Important
facilities should be built in safe areas. In urban areas, water holding areas
can be created in ponds, lakes or low-lying areas. Construction of engineered
structures in the flood plains and strengthening of structures to withstand
flood forces and seepage is imperative. The buildings should be constructed
on a elevated area. If necessary build on stilts or platform.
67
Flood Control aims to reduce flood damage. This can be done by
Flood Reduction by decreasing the amount of runoff by treatment like
reforestation protection of vegetation, clearing of debris from streams and
other water holding areas, conservation of ponds and lakes etc. Flood
Diversion include levees, embankments, dams and channel improvement.
Dams can store water and can release water at a manageable rate. But failure
of dams in earthquakes and operation of releasing the water can cause floods
in the lower areas. Flood Proofing reduces the risk of damage. Measures
include use of sand bags to keep flood water away, blocking or sealing of
doors and windows of houses etc. Houses may be elevated by building on
raised land. Buildings should be constructed away from water bodies.
Flood Management in India, was initiated by systematic planning for
flood management commenced with the Five Year Plans, particularly with
the launching of National Programme of Flood Management in 1954. During
the last 48 years, different methods of flood protection structural as well as
non-structural have been adopted in different states depending upon the
nature of the problem and local conditions. Structural measures include
storage reservoirs, flood embankments, drainage channels, anti-erosion
works, channel improvement works, detention basins etc. and non-structural
measures include flood forecasting, flood plain zoning, flood proofing,
disaster preparedness etc. The flood management measures undertaken so
far have provided reasonable degree of protection to an area of 15.81 million
hectares through out the country. The various flood management measures
undertaken through the successive five year plans (up to 3/2000) are
summarized below:
68
Approaches, Policies and Measures
The approaches to deal with Floods may be any one or more
combination of the following available options:
(i) Attempts to modify the food.
(ii) Attempts to modify the susceptibility to flood.
(iii) Attempts to modify the loss burden.
(iv) Bearing the loss.
Evolution of Policies on Flood Management in India
After the unprecedented floods of 1954, the Government of India took
several initiatives and constituted a number of Committees to study the
problem of floods in the country. The important steps are,
• Policies Statement- 1954
• High Level Committee on Floods-1957
• Policy Statement of 1958.
• Ministerial Committee on Flood Control-1964.
• Minister's Committee on Flood Control for Five Year Plans.
• Rashtriya Barh Ayog (RBA) - 1980
• National Water Policy (1987).
• National Commission for Integrated Water Resource Development
Plan-1996.
• Regional Task Forces-1996.
• National Water Policy (2002).
All the measures for flood management can be classified as under:
69
Structural measures
(i) Embankments, flood walls, sea wall.
(ii) Dams and Reservoirs.
(iii) Natural detention basin.
(iv) Channel improvement.
(v) Drainage improvement.
(vi) Diversion of flood waters.
Non-structural measures
(i) Flood Plain Zoning
(ii) Flood Proofing including Disaster Preparedness and Response
Planning.
(iii) Flood Forecasting and Warning.
(iv) Disaster Relief.
(v) Flood Fighting including Public Health Measures.
(vi) Flood Insurance
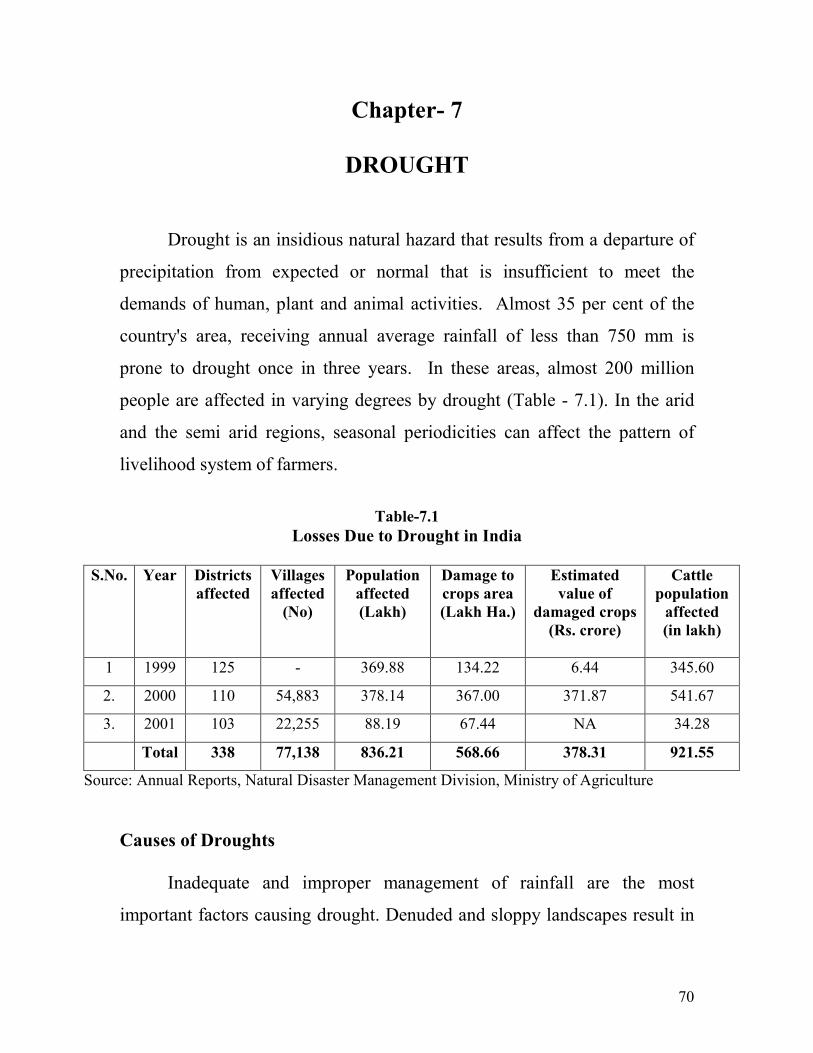
70
Chapter- 7
DROUGHT
Drought is an insidious natural hazard that results from a departure of
precipitation from expected or normal that is insufficient to meet the
demands of human, plant and animal activities. Almost 35 per cent of the
country's area, receiving annual average rainfall of less than 750 mm is
prone to drought once in three years. In these areas, almost 200 million
people are affected in varying degrees by drought (Table - 7.1). In the arid
and the semi arid regions, seasonal periodicities can affect the pattern of
livelihood system of farmers.
Table-7.1
Losses Due to Drought in India
S.No. Year Districts
affected
Villages
affected
(No)
Population
affected
(Lakh)
Damage to
crops area
(Lakh Ha.)
Estimated
value of
damaged crops
(Rs. crore)
Cattle
population
affected
(in lakh)
1 1999 125 - 369.88 134.22 6.44 345.60
2. 2000 110 54,883 378.14 367.00 371.87 541.67
3. 2001 103 22,255 88.19 67.44 NA 34.28
Total 338 77,138 836.21 568.66 378.31 921.55
Source: Annual Reports, Natural Disaster Management Division, Ministry of Agriculture
Causes of Droughts
Inadequate and improper management of rainfall are the most
important factors causing drought. Denuded and sloppy landscapes result in
71
colossal loss of soil and washes away soil nutrients, which are scarce in
drought prone areas creating nutrient stressed conditions. Studies at Solapur
in run off plots put the loss of 60-90 tones of soil from one hectare each year
due to erosion resulting from different management practices. Proper land
treatment for retention of rain water is a part of drought proofing. Division
of land amongst family members and extending cultivation to the marginal
and sub marginal areas destroys the natural grass cover resulting in erosion
and thereby poor production. Fragmentation of land, unchecked cattle
population, destruction of grass lands and trees accelerate the land
degradation and also encourage soil erosion.
Consequences of Droughts
Indian economy being agriculture oriented any adversely effect on
agriculture affects the economy badly. The major kharif crops are rain water
dependent and depending upon the rain water crops face stress in different
parts of country. In addition to poor crop production and reduced water
availability, drought affects rural life in several ways. Drought results in
large scale unemployment of the rural population, who migrate to urban and
industrially advanced areas, in search of livelihood. This creates large scale
problems of environmental pollution and social crimes in cities. A long term
objective to manage drought is, therefore, to provide alternate employment
in rural areas. We should include agro-based industries in thrust areas for
employment of the rural population. Poultry farms, dairy industries, silk
worm rearing and handicrafts should be encouraged by various incentives.
72
Peculiarities of Droughts
Drought has always been listed as a principle-limiting factor for the
productivity of the land. The World's climate patterns are so made that the
smaller the level of precipitation the larger is the variability. It is not only a
question of water shortage but also a problem of uncertainty in the
availability of water. Stability of production is finally dependent on stability
in water. In Bihar (a high rainfall area) the coefficient of variation is 13-14
percent, whereas in drought prone areas it could be as high as 32 percent.
Drought prone areas will have to make special efforts to overcome their
natural handicap on account of shortage of water and also on account of
uncertainties in the availability of their share of scarce water.
Elements at Risk
Drought impacts mostly rain fed crops to start with and subsequently
the irrigated crops. Areas with minimum of alternative water sources to
rainfall (ground and canal water supplies), areas subjected to drastic
environmental degradation such as denuded forest lands and altered
ecosystems, and areas where livelihoods alternative to agriculture are least
developed are most vulnerable to drought. The herdsman, landless laborers,
subsistence farmers, the women, children, and farm animals are the most
vulnerable groups affected by the drought conditions.
Effects of Droughts
Drought, different from other natural disasters, do not cause any
structural damages. The typical effects include loss of crop, dairy, timber
(forest fires), and fishery production; increase in energy demand for
73
pumping water; reduced energy production; increased unemployment, loss
of biodiversity, reduced water, air, and landscape quality; groundwater
depletion, food shortage, health reduction and loss of life, increased poverty,
reduced quality of life, and social unrest leading to migration.
Mitigation Strategies
Drought monitoring is continuous observation of rainfall
situation, water availability in reservoirs, lakes, rivers and comparing
with the existing water needs of various sectors of the society.
Water supply augmentation and conservation through rainwater
harvesting in houses and farmers’ fields increases the content of water
available. Expansion of irrigation facilities reduces the drought
vulnerability. Land use based on its capability helps in optimum use of
land and water and can avoid the undue demand created due to their
misuse.
Livelihood planning identifies those livelihoods which are least
affected by the drought. Some of such livelihoods include increased
off-farm employment opportunities, collection of non-timber forest
produce from the community forests, raising goats, and carpentry etc.
Drought Planning
The basic goal of drought planning is to improve the
effectiveness of preparedness and response efforts by enhancing
monitoring, mitigation and response measures. Planning would help in
74
effective coordination among state and national agencies in dealing
with the drought. Components of drought plan include establishing
drought taskforce which is a team of specialists who can advise the
government in taking decision to deal with drought situation,
establishing coordination mechanism among various agencies which
deal with the droughts, providing crop insurance schemes to the
farmers to cope with the drought related crop losses, and public
awareness generation.
Public Awareness and Education
Educating the masses on various strategies would help in
effective drought mitigation. This includes organizing drought
information meetings for the public and media, implementing water
conservation awareness programs in the mass media like television,
publishing and distributing pamphlets on water conservation techniques
and agricultural drought management strategies like crop contingency
plans and rainwater harvesting and establishing drought information
centers for easy access to the farmers.
Watersheds
Watersheds are the geographic areas where the water flows to a
common point. To mitigate the drought impact, all kinds of soil and water
conservation measures are taken up with the involvement of the local
communities. This approach helped these areas to manage efficiently the
soil, vegetation, water and other resources. By conserving scarce water
75
sources and improving the management of soil and vegetation, watersheds
have the potential to create conditions conducive to higher agricultural
productivity while conserving natural resources.
Check dams
These are check dams or diversion weirs built across rivers. A
traditional system found in Maharashtra, their presence raises the water level
of the rivers so that it begins to flow into channels. They are also used to
impound water and form a large reservoir. Where a bandhara was built
across a small stream, the water supply would usually last for a few months
after the rains.
Following measures are suggested to mitigate drought consequences:
(a) Supply-Oriented Measures are intended to increase the available water
supply during drought through:-
• Maximizing surface water storage capacity.
• Maximizing ground water storage capacity.
• Water transfer between river basins or within the same river
basin.
• Evaporation and evapotranspiration suppression.
• Reduction of infiltration losses
• Soil conservation practices.
• Utilization of inferior quality water.
• Relaxation of water quality standards
• Increasing ground water use
• weather modification
76
• Interception of dew and fog
• Long distance transfer of water
• Regional interconnection of water supply networks.
• Water transportation by vehicles or boats
• Desalination of salt or blackish waters
(b) Demand-Oriented Measures are intended to decrease the water
demand during drought through:-
• Appeals to consumers to reduce water use
• Water reuse
• Restrictions on water use
• Adjustment of patterns of water consumption by users
• Economic incentives for reducing water consumption
• Regional and local support for water demand reducing strategies.
(c) Impact-Minimization Measures are intended to minimize drought
impacts occurring in spite of increased water supply and decrease
demands through:-
• Drought forecast
• Drought warnings
• Drought insurance
• Disaster aid programmes
Comprehensive Monitoring
Based on the use feedback and their requirements, a comprehensive
national drought monitoring system is under implementation. The enhanced
system may include:-
77
(i) Near real-time drought monitoring with biweekly bulletins
disseminated within a week.
(ii) Coverage of both kharif and rabi seasons.
(iii) Coverage of 12 drought vulnerable and agriculturally important States
(Andhra Pradesh, Gujarat, Karnataka, Maharashtra, Orissa, Tamil
Nadu, Haryana, Madhya Pradesh, Rajasthan, Uttar Pradesh, West
Bengal and Bihar).
(iv) Cover meteorological, hydrologic, agricultural and socio economic
drought indicators and impacts.
(v) Technology intensification for near real-time sub-district level
monitoring with use of new sensor data and analysis techniques.
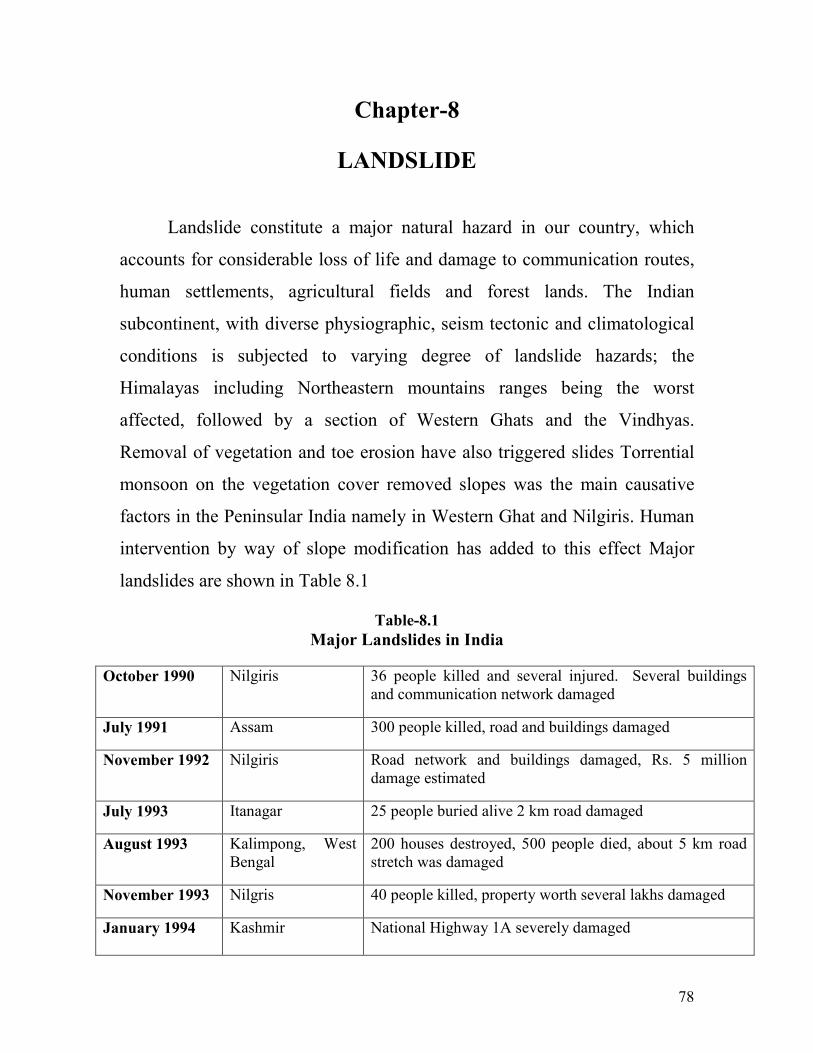
78
Chapter-8
LANDSLIDE
Landslide constitute a major natural hazard in our country, which
accounts for considerable loss of life and damage to communication routes,
human settlements, agricultural fields and forest lands. The Indian
subcontinent, with diverse physiographic, seism tectonic and climatological
conditions is subjected to varying degree of landslide hazards; the
Himalayas including Northeastern mountains ranges being the worst
affected, followed by a section of Western Ghats and the Vindhyas.
Removal of vegetation and toe erosion have also triggered slides Torrential
monsoon on the vegetation cover removed slopes was the main causative
factors in the Peninsular India namely in Western Ghat and Nilgiris. Human
intervention by way of slope modification has added to this effect Major
landslides are shown in Table 8.1
Table-8.1
Major Landslides in India
October 1990 Nilgiris 36 people killed and several injured. Several buildings
and communication network damaged
July 1991 Assam 300 people killed, road and buildings damaged
November 1992 Nilgiris Road network and buildings damaged, Rs. 5 million
damage estimated
July 1993 Itanagar 25 people buried alive 2 km road damaged
August 1993 Kalimpong, West
Bengal
200 houses destroyed, 500 people died, about 5 km road
stretch was damaged
November 1993 Nilgris 40 people killed, property worth several lakhs damaged
January 1994 Kashmir National Highway 1A severely damaged
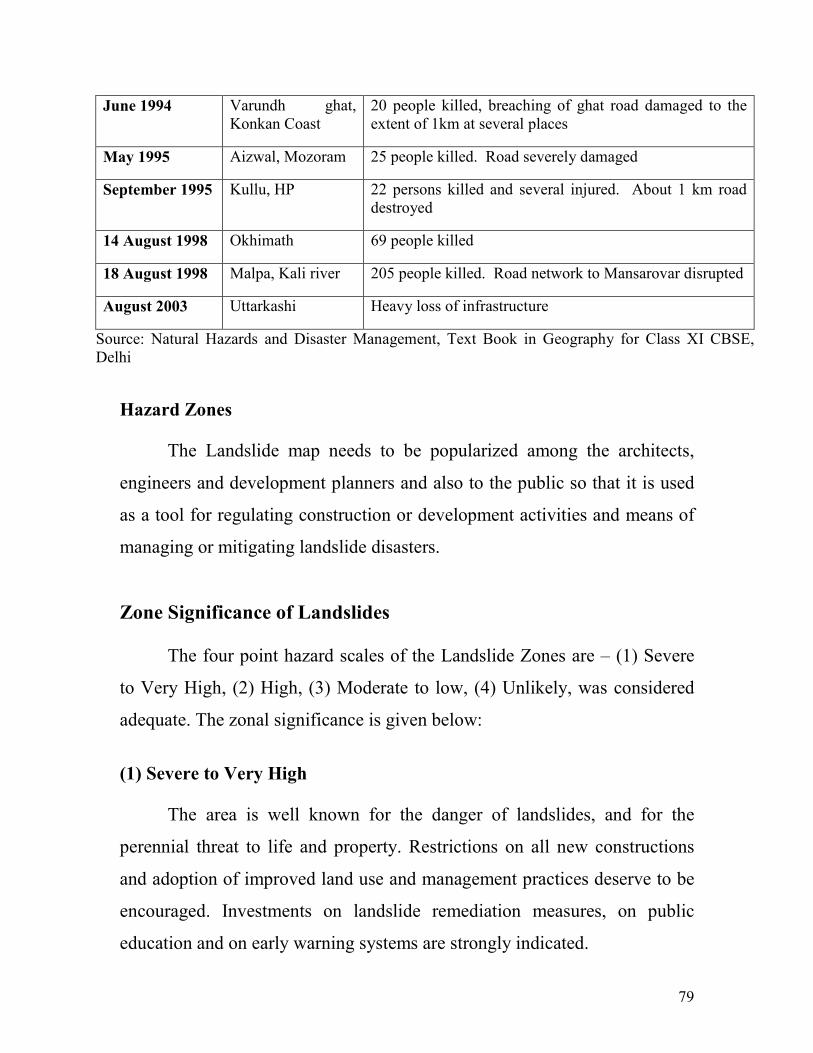
79
June 1994 Varundh ghat,
Konkan Coast
20 people killed, breaching of ghat road damaged to the
extent of 1km at several places
May 1995 Aizwal, Mozoram 25 people killed. Road severely damaged
September 1995 Kullu, HP 22 persons killed and several injured. About 1 km road
destroyed
14 August 1998 Okhimath 69 people killed
18 August 1998 Malpa, Kali river 205 people killed. Road network to Mansarovar disrupted
August 2003 Uttarkashi Heavy loss of infrastructure
Source: Natural Hazards and Disaster Management, Text Book in Geography for Class XI CBSE,
Delhi
Hazard Zones
The Landslide map needs to be popularized among the architects,
engineers and development planners and also to the public so that it is used
as a tool for regulating construction or development activities and means of
managing or mitigating landslide disasters.
Zone Significance of Landslides
The four point hazard scales of the Landslide Zones are – (1) Severe
to Very High, (2) High, (3) Moderate to low, (4) Unlikely, was considered
adequate. The zonal significance is given below:
(1) Severe to Very High
The area is well known for the danger of landslides, and for the
perennial threat to life and property. Restrictions on all new constructions
and adoption of improved land use and management practices deserve to be
encouraged. Investments on landslide remediation measures, on public
education and on early warning systems are strongly indicated.
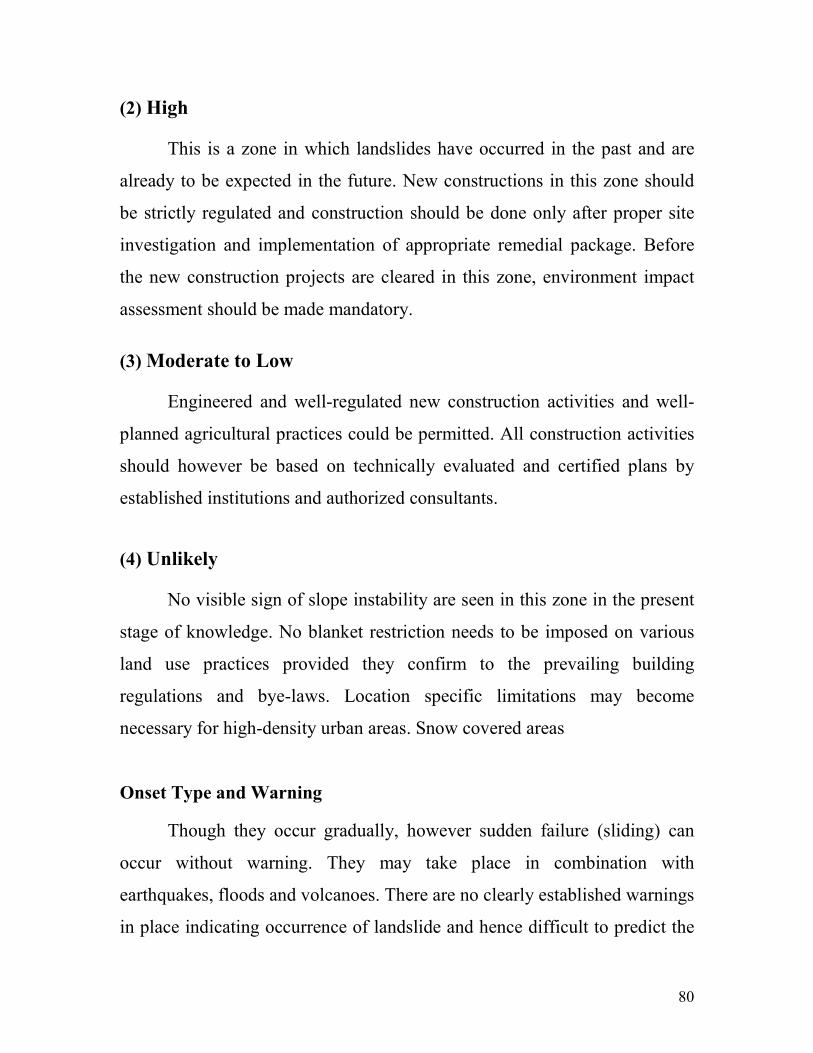
80
(2) High
This is a zone in which landslides have occurred in the past and are
already to be expected in the future. New constructions in this zone should
be strictly regulated and construction should be done only after proper site
investigation and implementation of appropriate remedial package. Before
the new construction projects are cleared in this zone, environment impact
assessment should be made mandatory.
(3) Moderate to Low
Engineered and well-regulated new construction activities and well-
planned agricultural practices could be permitted. All construction activities
should however be based on technically evaluated and certified plans by
established institutions and authorized consultants.
(4) Unlikely
No visible sign of slope instability are seen in this zone in the present
stage of knowledge. No blanket restriction needs to be imposed on various
land use practices provided they confirm to the prevailing building
regulations and bye-laws. Location specific limitations may become
necessary for high-density urban areas. Snow covered areas
Onset Type and Warning
Though they occur gradually, however sudden failure (sliding) can
occur without warning. They may take place in combination with
earthquakes, floods and volcanoes. There are no clearly established warnings
in place indicating occurrence of landslide and hence difficult to predict the
81
actual occurrence. Areas of high risk can be determined by use of
information on geology, hydrology, vegetation cover, past occurrence and
consequences in the region.
Causes of Landslides
Geological weak material weathered materials, jointed or fissured
materials, contrast in permeability and contrast in stiffness (stiff, dense
material over plastic materials) may cause landslides.
Wave erosion of slope toe, glacial erosion of slope toe, subterranean
erosion Deposition loading slope or its crest, vegetation removal etc also
cause landslides.
Storms that produce intense rainfall for periods as short as several
hours or have a more moderate intensity lasting several days have triggered
abundant landslides. Human excavation of slope and its toe, loading of
slope/toe, draw down in reservoir, mining, deforestation, irrigation,
vibration/blast, water leakage from services may result in landsliding.
Earthquake shaking has triggered landslides in many different topographic
and geologic settings. Rock falls, soil slides and rockslides from steep slopes
involving relatively thin or shallow dis-aggregated soils or rock, or both
have been the most abundant types of landslides triggered by historical
earthquakes. Deposition of loose volcanic ash on hillsides commonly is
followed by accelerated erosion and frequent mud or debris flows triggered
by intense rainfall.
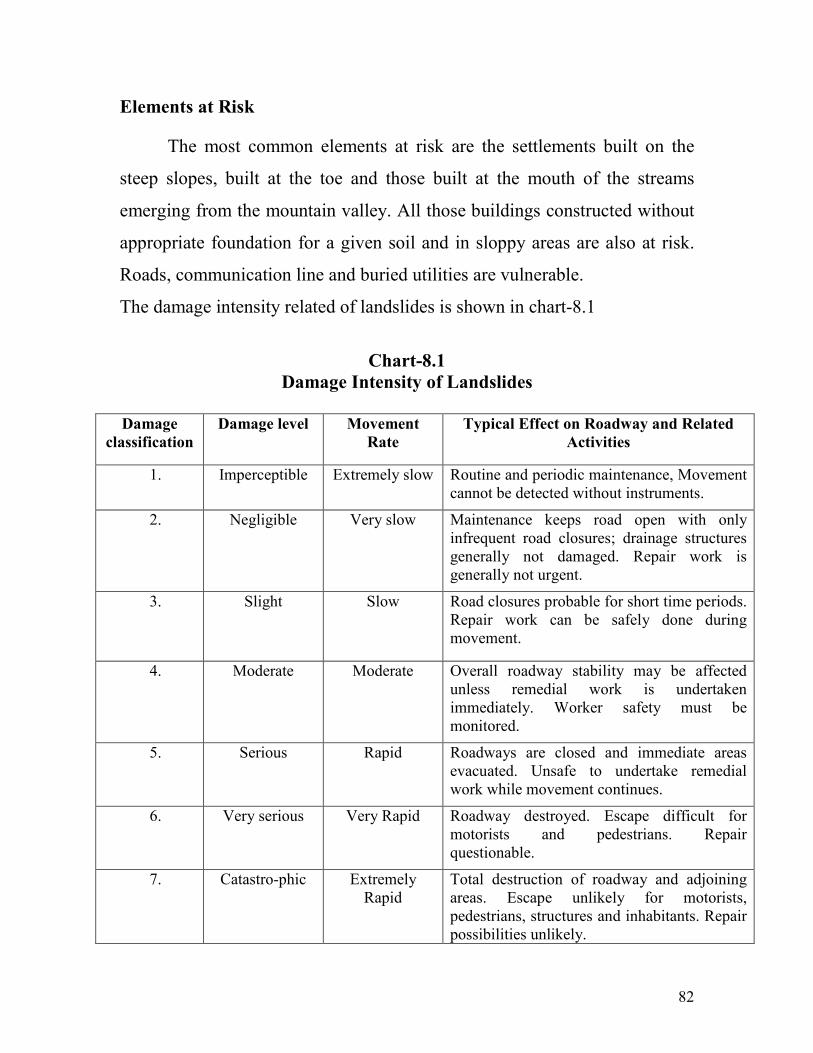
82
Elements at Risk
The most common elements at risk are the settlements built on the
steep slopes, built at the toe and those built at the mouth of the streams
emerging from the mountain valley. All those buildings constructed without
appropriate foundation for a given soil and in sloppy areas are also at risk.
Roads, communication line and buried utilities are vulnerable.
The damage intensity related of landslides is shown in chart-8.1
Chart-8.1
Damage Intensity of Landslides
Damage
classification
Damage level Movement
Rate
Typical Effect on Roadway and Related
Activities
1. Imperceptible Extremely slow Routine and periodic maintenance, Movement
cannot be detected without instruments.
2. Negligible Very slow Maintenance keeps road open with only
infrequent road closures; drainage structures
generally not damaged. Repair work is
generally not urgent.
3. Slight Slow Road closures probable for short time periods.
Repair work can be safely done during
movement.
4. Moderate Moderate Overall roadway stability may be affected
unless remedial work is undertaken
immediately. Worker safety must be
monitored.
5. Serious Rapid Roadways are closed and immediate areas
evacuated. Unsafe to undertake remedial
work while movement continues.
6. Very serious Very Rapid Roadway destroyed. Escape difficult for
motorists and pedestrians. Repair
questionable.
7. Catastro-phic Extremely
Rapid
Total destruction of roadway and adjoining
areas. Escape unlikely for motorists,
pedestrians, structures and inhabitants. Repair
possibilities unlikely.
83
Effects of Landslides
Landslides destroy anything that comes in their path. They block or
bury roads, lines of communication, settlements, river flow, agricultural
land, etc. It also includes loss to agricultural production and land area. In
addition physical effects such as flooding may also occur. They cause
maximum fatalities depending on the place and time of occurrence.
Catastrophic landsides have killed many thousands of persons, such as the
debris slide on the slopes of Huascaran in Peru triggered by an earthquake in
1970, which killed over 18,000 people.
Mitigation Strategies
Hazard mapping will locate areas prone to slope failures. This will
permit to identify avoidance of areas for building settlements. These maps
will serve as a tool for mitigation planning.
Proper land use practices may mitigated the landsliding. The land use
practices are discussed below:
• Areas covered by degraded natural vegetation in upper slopes are to
be afforested with suitable species. Existing patches of natural
vegetation (forest and natural grass land) in good condition should be
preserved.
• Any developmental activity initiated in the area should be taken up
only after a detailed study of the region and slope protection should be
carried out if necessary.
• In construction of roads, irrigation canals etc. proper care is to be
taken to avoid blockage of natural drainage
84
• Total avoidance of settlement in the risk zone should be made
mandatory.
• Relocate settlements and infrastructure that fall in the possible path of
the landslide
• No construction of buildings in areas beyond a certain degree of slope.
Retaining Walls can be built to stop land from slipping. It’s
constructed to prevent smaller sized and secondary landslides that often
occur along the toe portion of the larger landslides. The surface drainage
control works are implemented to control the movement of landslides
accompanied by infiltration of rain water and spring flows. Engineered
structures with strong foundations can withstand or take the ground
movement forces. Underground installations (pipes, cables, etc.) should be
made flexible to move in order to withstand forces caused by the landslide.
Increasing vegetation cover is the cheapest and most effective way of
arresting landslides. This helps to bind the top layer of the soil with layers
below, while preventing excessive run-off and soil erosion. Insurance will
assist individuals whose homes are likely to be damaged by landslides or by
any other natural hazards. For new constructions it should include standards
for selection of the site as well as construction technique.
Landslide and Debris Flow
Landslides are a serious geologic hazard very common in northern
part of India. Globally, landslides cause billions of dollars in damage and
thousands of deaths and injuries each year.
85
(i) How to Protect Property
(a) If your property is in a landslide-prone area, contract with a
consulting company specializing in earth movement for opinions
and advice on landslides problems and on corrective measures
you can take. Such companies would likely be those specializing
in geotechnical or structural engineering. Taking steps without
consulting a professional could make your situation worse.
(b) Install flexible pipe fittings to avoid gas or water leaks. Flexible
fittings will be less likely to break.
(ii) What to Do Before Intense Storms
(a) Become familiar with the land around. Learn whether landslides
and debris flows have occurred in the area by contacting local
officials. Knowing the land can help to assess the risk for danger.
(b) Watch the patterns of storm-water drainage on slopes near to
home, and especially the places where runoff water converges,
increasing flow over soil-covered slopes. Watch the hillsides
around the home for any signs of land movement, such as small
landslides or debris flows, or progressively tilting trees.
Watching small changes could alert to the potential of a greater
landslide threat.
(iii) What to Do During Intense Storms
(a) Stay alert and awake. Many debris-flow fatalities occur when
people are sleeping. Listen to a Radio or television for warnings
of intense rainfall. Be aware that intense, short bursts of rain may
86
be particularly dangerous, especially after longer periods of
heavy rainfall and damp weather.
(b) If one is in areas susceptible to landslides and debris flows,
consider leaving if it is safe to do so. Remember that driving
during an intense storm can be hazardous. If one remains at
home, move to a second story. If possible. Staying out of the path
of a landslide or debris flow saves lives.
(c) Listen for any unusual sounds that might indicate moving debris,
such as trees cracking or boulders knocking together. A trickle of
flowing or falling mud or debris may precede larger landslides.
Moving debris can flow quickly and sometimes without warning.
(d) If someone is near a stream or channel, be alert for any sudden
increase or decrease in water flow and for a change from clear to
muddy water. Such changes may indicate landslide activity
upstream, so be prepared to move quickly. Don't delay! Save
oneself, not the belongings.
(e) Be especially alert when driving. Embankments along roadsides
are particularly susceptible to landslides. Watch the road for
collapsed pavement, mud, fallen rocks, and other indications of
possible debris flows.
(iv) What to Do If Suspect Imminent Landslide Danger
(a) Contact local fire, police, or public works department. Local
officials are the best persons able to assess potential danger.
(b) Inform affected neighbors. The neighbors may not be aware of
potential hazards. Advising them of a potential threat may help
save lives. Help neighbors who may need assistance to evacuate.
87
(c) Evacuate. Getting out of the path of a landslide or debris flow is
the best protection.
(v) What to Do During a Landslide
(a) Quickly move out of the path of the landslide or debris flow.
Moving away from the path of the flow to a stable area will
reduce the risk.
(b) If escape is not possible, curl into a tight ball and protect the
head. A tight ball will provide the best protection for the body.
(vi) What to Do After a Landslide
(a) Stay away from the slide area. There may be danger of additional
slides.
(b) Check for injured and trapped persons near the slide, without
entering the direct slide area. Direct rescuers to their locations.
88
Chapter-9
HUMAN INDUCED DISASTERS
In a society where gender, caste, religion, region, and class
differentials are extremely predominated human made disasters tend
to occur more frequently and often with great intensity. Communal riots,
terrorism, militancy, ethnic conflicts, plight of refugees, internally displaced
persons, road and train accidents, forest and buildings fire, epidemics and
industrial accidents etc. cause heavy toll of human lives and property. The
natural disasters cannot be properly predicted and controlled while manmade
disasters may be controlled through proper planning and preparedness.
Forest fires are a major cause of degradation of India's forests. About
90 per cent of the forest fires in India are created by humans. India witnessed
the most severe forest fire in during the summer of 1945 in the hills of
Uttarakhand and Himachal Pradesh. The fires were very severe and attracted
the attention of whole nation. These affected 6.78 million hectares of forest
land. About 3.75 million hectares of forests are affected by fire annually, as
per Forest Protection Division, Ministry of Forests and Environment,
Government of India.
Fires in Urban Structure - houses, buildings, and other structure also
cause destruction to property and human lives. Heating sources, cooking
accidents, electric short, combustible and hazardous materials etc. cause the
fire in urban structures. In the event of fires, chemical leakages, or
explosions occurring in industrial facilities, people are exposed to risks and
hazards. Bhopal chemical gas leak disaster (1984) was the worst industrial
89
disasters of India. The tragedy was a technological accident in which highly
poisonous methyl iso-cyanide gas along with hydrogen cyanide and other
reaction products leaked out of the pesticide factory of Union Carbide into
the night air of Bhopal. The official death toll reached to 3,598 in 1989 and
thousands still face a fate worse than death.
The nature and impact of disasters are changing. They need to be
placed in the larger context of present day realities. Most experts refuse to
include epidemics in their short list of disasters, costing the world dearly in
terms of morbidity, mortality, and hence, the human capital. Today, aid and
relief go largely to non-biological disasters while increasingly treatment
immune and mutagenic bio-systems wreck havoc in the developing
countries. The Surat plague outbreak in 1994 killed 56 people nationwide.
This outbreak served as a chilling reminder of how rapid urbanization and
deterioration of the urban environment can bring people into contact with
forgotten disease factors. The scientific studies show that an increase in the
temperature viz. 1-2 degrees would enable mosquitoes to extent their range
to low geographical areas, leading to an increase in cases of malaria and
several other infectious diseases especially in populations living at the
periphery of the areas currently prone to these diseases. Tuberculosis,
Malaria, Kalajar Dengue, plague, Japanese encephalitis, diarrhea diseases,
including cholera, poliomyelitis, HIV/AIDS, etc. are some of the chronic
diseases which have caused concern today.
India has one of the largest populations of people living with
HIV/AIDS, second only to South Africa. An estimated 5.1 million
individuals currently live with the HIV infection, across all states. The HIV
prevalence rate among the adult population is 0.8 per cent, but the absolute
90
number of people living with HIV/AIDS is very high and growing gradually.
The endemic is challenging the development achievements of recent years
and raising fundamental issues of human rights. In India, HIV/AIDS
epidemic is characterized by heterogeneity; it seems to be following the type
4 pattern, where the epidemic shifts from the most vulnerable populations
(including sex workers, injecting drug users, men who have sex with man) to
bridge populations (client of sex workers, STD patients, partners of drug
users) and then to the general population. The epidemic continues to shift
towards woman and young people. Migrates both within and between states
is a major source of transmission of infection. Srivastava and Sasikumar
(2003) estimated that migrants account for 26.6 per cent of the country's
population. This shows a declining trend, however, the absolute number of
migrants grew from 67.7 million in 1971 to 231.9 million in 1991. Migration
of semi skilled and unskilled labours to West Asia and OECD countries
started in mid 1970; the growth in demand for foreign labour was triggered
by the oil price boom. South Arabia and UAE were the principal destinations
for Indian migrants during the past two decades State-wise distribution of
emigration clearances granted during the period 1993-2001 shows that 16
states contributed to the process of emigration to the OECD countries. Three
states - Kerala, Tamil Nadu, and Andhra Pradesh-together accounted for 60
per cent of those who obtained emigration clearance. The returning migrant
is often unaware of whichever has been infected with HIV and the potential
risk of infection that his spouse and urban children face.
Trans-border migrants in India- especially Nepali, and Bangladesh
migrants also face the high risk of HIV infection. Nepalese women migrants
are highly vulnerable to commercial and sexual exploitation. Those who are
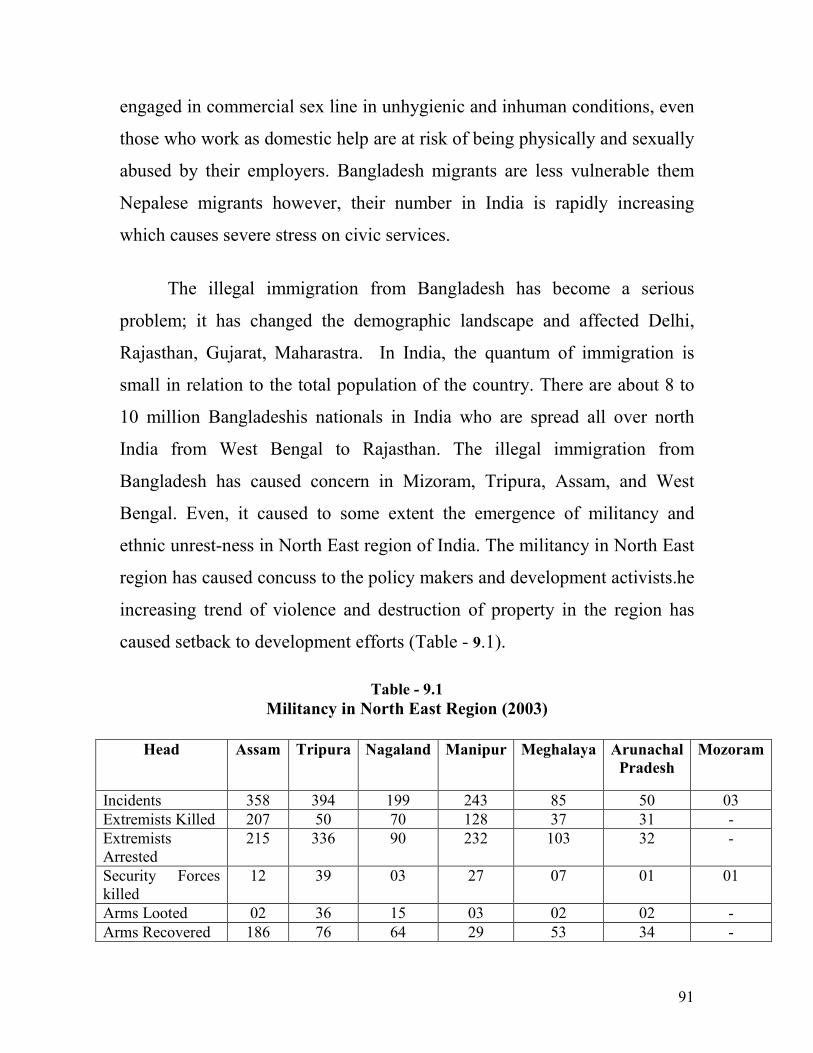
91
engaged in commercial sex line in unhygienic and inhuman conditions, even
those who work as domestic help are at risk of being physically and sexually
abused by their employers. Bangladesh migrants are less vulnerable them
Nepalese migrants however, their number in India is rapidly increasing
which causes severe stress on civic services.
The illegal immigration from Bangladesh has become a serious
problem; it has changed the demographic landscape and affected Delhi,
Rajasthan, Gujarat, Maharastra. In India, the quantum of immigration is
small in relation to the total population of the country. There are about 8 to
10 million Bangladeshis nationals in India who are spread all over north
India from West Bengal to Rajasthan. The illegal immigration from
Bangladesh has caused concern in Mizoram, Tripura, Assam, and West
Bengal. Even, it caused to some extent the emergence of militancy and
ethnic unrest-ness in North East region of India. The militancy in North East
region has caused concuss to the policy makers and development activists.he
increasing trend of violence and destruction of property in the region has
caused setback to development efforts (Table - 9.1).
Table - 9.1
Militancy in North East Region (2003)
Head Assam Tripura Nagaland Manipur Meghalaya Arunachal
Pradesh
Mozoram
Incidents 358 394 199 243 85 50 03
Extremists Killed 207 50 70 128 37 31 -
Extremists
Arrested
215 336 90 232 103 32 -
Security Forces
killed
12 39 03 27 07 01 01
Arms Looted 02 36 15 03 02 02 -
Arms Recovered 186 76 64 29 53 34 -
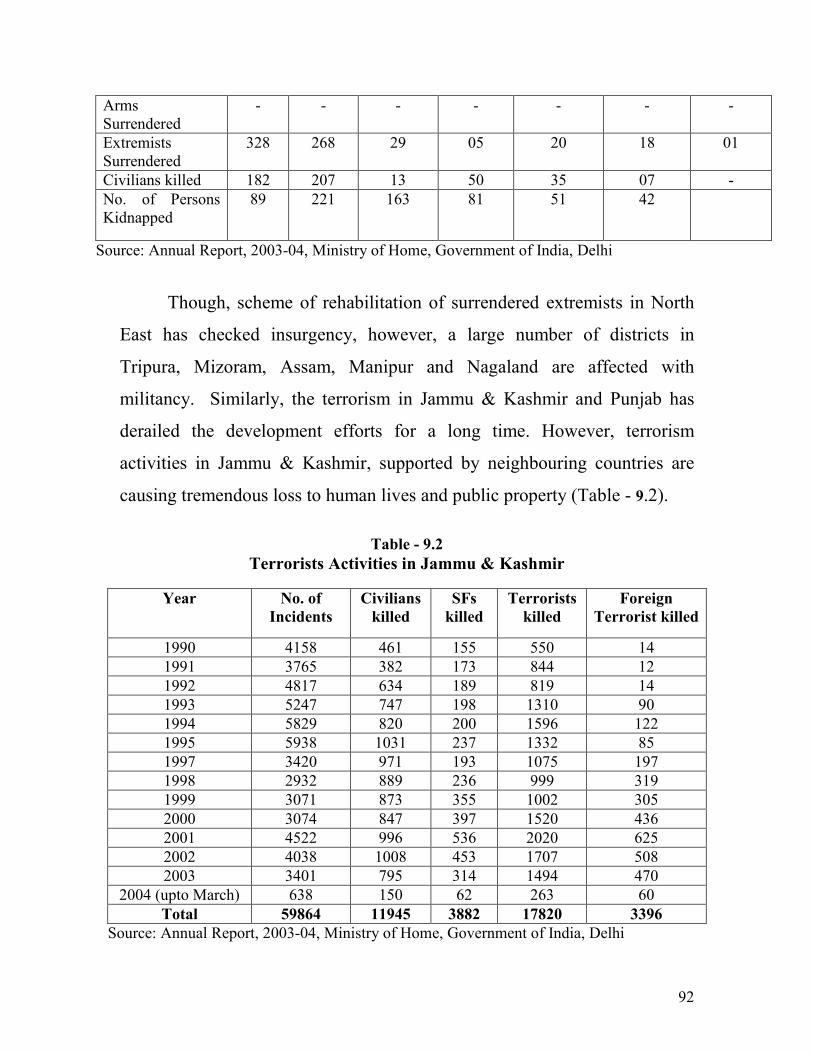
92
Arms
Surrendered
- - - - - - -
Extremists
Surrendered
328 268 29 05 20 18 01
Civilians killed 182 207 13 50 35 07 -
No. of Persons
Kidnapped
89 221 163 81 51 42
Source: Annual Report, 2003-04, Ministry of Home, Government of India, Delhi
Though, scheme of rehabilitation of surrendered extremists in North
East has checked insurgency, however, a large number of districts in
Tripura, Mizoram, Assam, Manipur and Nagaland are affected with
militancy. Similarly, the terrorism in Jammu & Kashmir and Punjab has
derailed the development efforts for a long time. However, terrorism
activities in Jammu & Kashmir, supported by neighbouring countries are
causing tremendous loss to human lives and public property (Table - 9.2).
Table - 9.2
Terrorists Activities in Jammu & Kashmir
Year No. of
Incidents
Civilians
killed
SFs
killed
Terrorists
killed
Foreign
Terrorist killed
1990 4158 461 155 550 14
1991 3765 382 173 844 12
1992 4817 634 189 819 14
1993 5247 747 198 1310 90
1994 5829 820 200 1596 122
1995 5938 1031 237 1332 85
1997 3420 971 193 1075 197
1998 2932 889 236 999 319
1999 3071 873 355 1002 305
2000 3074 847 397 1520 436
2001 4522 996 536 2020 625
2002 4038 1008 453 1707 508
2003 3401 795 314 1494 470
2004 (upto March) 638 150 62 263 60
Total 59864 11945 3882 17820 3396
Source: Annual Report, 2003-04, Ministry of Home, Government of India, Delhi
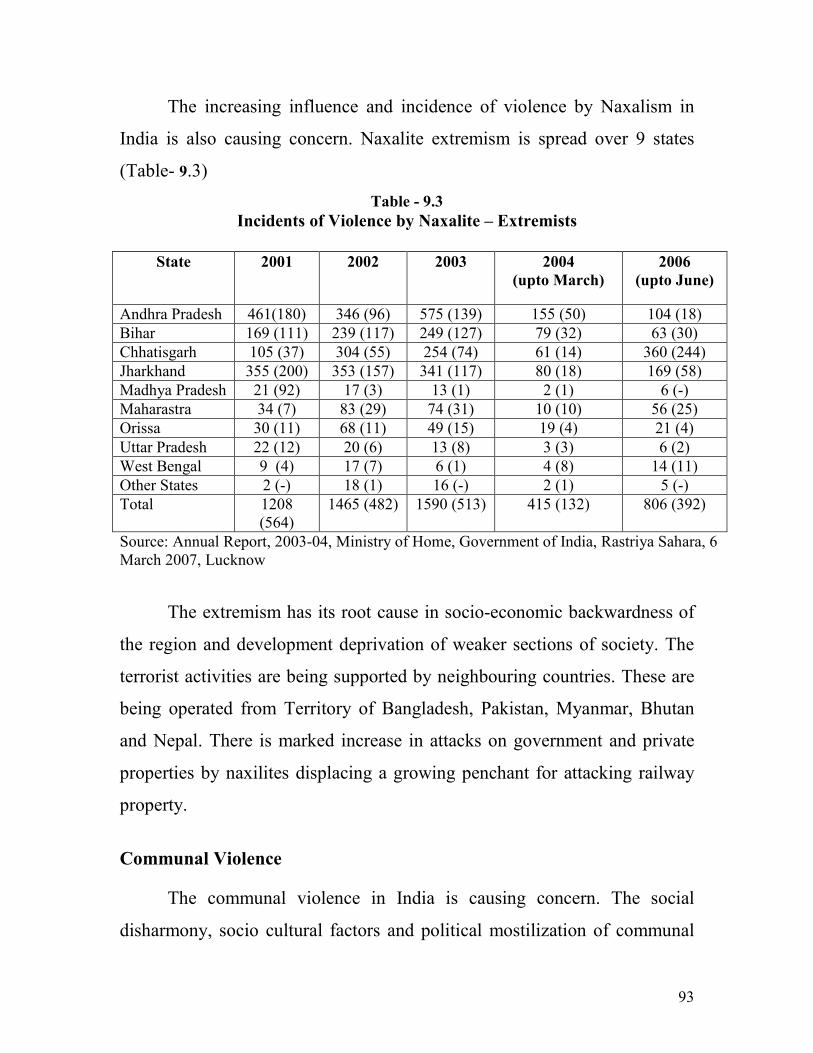
93
The increasing influence and incidence of violence by Naxalism in
India is also causing concern. Naxalite extremism is spread over 9 states
(Table- 9.3)
Table - 9.3
Incidents of Violence by Naxalite – Extremists
State 2001 2002 2003 2004
(upto March)
2006
(upto June)
Andhra Pradesh 461(180) 346 (96) 575 (139) 155 (50) 104 (18)
Bihar 169 (111) 239 (117) 249 (127) 79 (32) 63 (30)
Chhatisgarh 105 (37) 304 (55) 254 (74) 61 (14) 360 (244)
Jharkhand 355 (200) 353 (157) 341 (117) 80 (18) 169 (58)
Madhya Pradesh 21 (92) 17 (3) 13 (1) 2 (1) 6 (-)
Maharastra 34 (7) 83 (29) 74 (31) 10 (10) 56 (25)
Orissa 30 (11) 68 (11) 49 (15) 19 (4) 21 (4)
Uttar Pradesh 22 (12) 20 (6) 13 (8) 3 (3) 6 (2)
West Bengal 9 (4) 17 (7) 6 (1) 4 (8) 14 (11)
Other States 2 (-) 18 (1) 16 (-) 2 (1) 5 (-)
Total 1208
(564)
1465 (482) 1590 (513) 415 (132) 806 (392)
Source: Annual Report, 2003-04, Ministry of Home, Government of India, Rastriya Sahara, 6
March 2007, Lucknow
The extremism has its root cause in socio-economic backwardness of
the region and development deprivation of weaker sections of society. The
terrorist activities are being supported by neighbouring countries. These are
being operated from Territory of Bangladesh, Pakistan, Myanmar, Bhutan
and Nepal. There is marked increase in attacks on government and private
properties by naxilites displacing a growing penchant for attacking railway
property.
Communal Violence
The communal violence in India is causing concern. The social
disharmony, socio cultural factors and political mostilization of communal
94
groups may cause out standing communal violence. Some of the major
incidents are discussed below:
The following points may be helpful in managing communal riots and
terrorism related incidents:
(i) If Disaster Strikes
� Remain calm and be patient.
� Follow the advice of local emergency officials.
� Listen to your radio or television for news and instructions.
� If the disaster occurs near you, check for injuries. Give first aid and
get help for serious injured people.
� Shut off any other damaged utilities.
� Confine or secure your pets.
� Check on your neighbors, especially those who are elderly or
disabled.
(ii) A Word on What Could Happen
� There can be significant numbers of causalities and / or damage to
buildings and the infrastructure. So, employers need up-to-date
information on how to contact your designated beneficiaries.
� Heavy law enforcement involvement follows a terrorist attack due
to the event's criminal nature.
� Health and mental health resources in the affected communities
can be strained to their limits.
95
� Extensive media coverage, strong public fear and international
implications and consequences can continue for a prolonged
period.
� Workplaces and schools may be closed, and there may be
restrictions on domestic and international travel.
� You and your family or household may have to evacuate an area,
avoiding roads blocked for your safety.
� Clean-up may take many months.
(iii) Evacuation
If local authorities ask you to leave home, they have a good reason to
make this request, and you should need to advice immediately. Keep these
simple tips in mind-
� Wear long-sleeved shirts, long pants and sturdy shoes so you can
be protected as much as possible.
� Take your disaster supplies kit.
� Lock your home.
� Use travel routes specified by local authorities don't use shortcuts
because certain areas may be impassable or dangerous.
� Shut off water & electricity before leaving.
(iv) Shelter-in-place
If you are advised by local officials to remain inside your home or
office and protect yourself there, close and lock all windows and exterior
doors. Get your disaster supplies kit, and make sure the radio is working.
96
(v) First Aid Primer
If you encounter someone who is injured, apply the emergency action
steps. Check the scene to make sure it is safe for you to approach. Then
check the victim for unconsciousness and life-threatening condition, such as
not breathing or severe bleeding, requires immediate care by trained
responders and may require treatment by medical professionals. Call out for
help. There are some steps that you can take, however, to care for someone
who is hurt, but whose injuries are not life threatening.
(a) Control Bleeding
Cover the wound with a dressing, and press firmly against the wound
(direct pressure). Elevate the injured area above the level of the heart if you
do not suspect that the victim has a broken bone. Cover the dressing with a
roller bandage. If the bleeding does not stop,
(i) Apply additional dressing and bandage.
(ii) Use a pressure point to squeeze the artery against the bone.
Provide care for shock.
(b) Care for Shock
Keep the victim from getting chilled or overheated. Elevate the legs
about 12 inches (if broken bones are not suspected). Do not give food to the
victim.
(c) Tend Burns
Stop the burning by cooling the burn with large amounts of water.
Cover the burn with dry, clean dressings or cloth.
97
(d) Care for Injuries to Muscles, Bones
Rest the injured part. Apply ice or a cold pack to control swelling and
reduce pain. Avoid any movement or activity that causes pain. If you must
move the victim because the scene is becoming unsafe, try to immobilize the
injured part to keep it from moving.
(e) Reduce Any Care Risk
The risk of getting a disease while giving first aid is extremely rare.
However, to reduce the risk even further;
(i) Avoid direct contact with blood and other body fluids.
(ii) Use protective equipment, such as disposable gloves and
breathing barriers.
(iii) Wash your hands with soap and water immediately giving care.
Road Accidents
India like many other developing countries, is witnessing a spiraling
increase in the number of vehicles clogging its roads. Between 1970 and
2003, number of registered vehicles increased by about 48 times. During
2003, registered vehicles were reported to be 67.03 million. By 2050, there
will be over 267 million vehicles on Indian roads. Of the world wide annual
average of 0.7 million road accidents, 10 per cent occur in India. In 2003,
number of road accidents was reported to be 406.73 million in which 85.99
million persons were killed. Number of accidents per ten thousand vehicles
was reported to be 60.68 while number of persons killed per ten thousand
vehicles was 12.88. Most of the road fatalities were reported in Andhra
Pradesh, Mahrashtra, Rajasthan, Uttar Pradesh, Tamil Nadu, and Karnataka.
98
The economic cost of road accidents is equivalent to about one per cent of
Gross National Product.
A large number of deaths in developing world are due to road
accidents. Apart from humanitarian aspect of the problem, road accidents
cost countries of developing world at least one percentage of their GNP each
year. The proportion of commercial and public service vehicles involved in
road accidents are often much greater. Pedestrians and cyclist are often the
most vulnerable. During the year 2002, nearly 85,000 people died due to
road accidents in India. Fatality risk (defined as, road accidental deaths per
million population) in India is increasing over the years, from 64 in 1990 to
80 in 2002. During the same period, road accidental deaths have increased at
a rate of 3.8 percent per annum while the population of the country has
increased by only 1.8 percent per annum. Although fatality rate (defined as,
number of fatalities per 10,000 vehicles) in India is declining over the years,
it is still quite high in comparison to developed world.
It is alarming to note that more than 38 people die per week due to
road accidents in Delhi alone. Between the year 1990 and 2000, number of
road accidental casualties has increased in almost all the metropolitan cities
in India. Analysis shows that except Kolkata, Mumbai, and Nagpur all cities
are showing very high growth rate in fatalities over the period. Accident
severity index (defined as, number of fatalities per 100 accidents) is also
very high for all the cities other than Ahmedabad, Bangalore, Kolkata, and
Mumbai.
Road traffic clashes and injuries are increasing in India due to
increase in vehicle population and traffic density. Road accidents in India
are shown in Table 9.4. There has been phenomena increase in the number
of road accidents during 1997-2007. Similarly, there has been significant
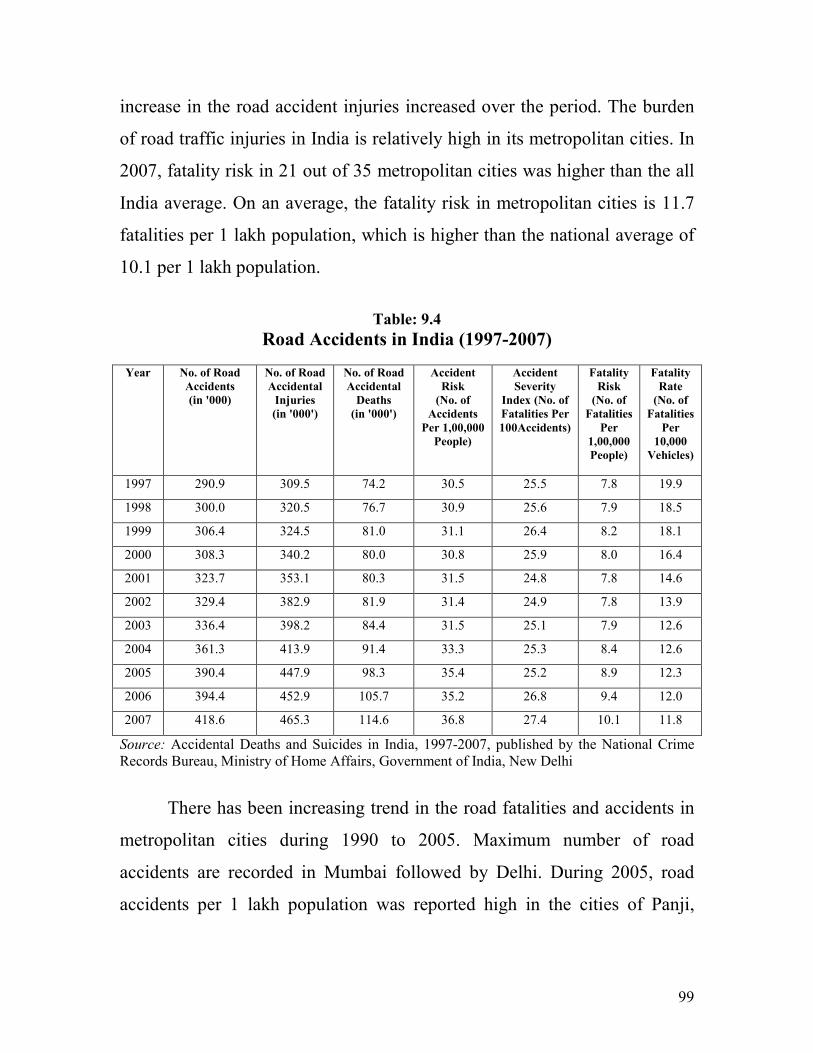
99
increase in the road accident injuries increased over the period. The burden
of road traffic injuries in India is relatively high in its metropolitan cities. In
2007, fatality risk in 21 out of 35 metropolitan cities was higher than the all
India average. On an average, the fatality risk in metropolitan cities is 11.7
fatalities per 1 lakh population, which is higher than the national average of
10.1 per 1 lakh population.
Table: 9.4
Road Accidents in India (1997-2007)
Year No. of Road
Accidents
(in '000)
No. of Road
Accidental
Injuries
(in '000')
No. of Road
Accidental
Deaths
(in '000')
Accident
Risk
(No. of
Accidents
Per 1,00,000
People)
Accident
Severity
Index (No. of
Fatalities Per
100Accidents)
Fatality
Risk
(No. of
Fatalities
Per
1,00,000
People)
Fatality
Rate
(No. of
Fatalities
Per
10,000
Vehicles)
1997 290.9 309.5 74.2 30.5 25.5 7.8 19.9
1998 300.0 320.5 76.7 30.9 25.6 7.9 18.5
1999 306.4 324.5 81.0 31.1 26.4 8.2 18.1
2000 308.3 340.2 80.0 30.8 25.9 8.0 16.4
2001 323.7 353.1 80.3 31.5 24.8 7.8 14.6
2002 329.4 382.9 81.9 31.4 24.9 7.8 13.9
2003 336.4 398.2 84.4 31.5 25.1 7.9 12.6
2004 361.3 413.9 91.4 33.3 25.3 8.4 12.6
2005 390.4 447.9 98.3 35.4 25.2 8.9 12.3
2006 394.4 452.9 105.7 35.2 26.8 9.4 12.0
2007 418.6 465.3 114.6 36.8 27.4 10.1 11.8
Source: Accidental Deaths and Suicides in India, 1997-2007, published by the National Crime
Records Bureau, Ministry of Home Affairs, Government of India, New Delhi
There has been increasing trend in the road fatalities and accidents in
metropolitan cities during 1990 to 2005. Maximum number of road
accidents are recorded in Mumbai followed by Delhi. During 2005, road
accidents per 1 lakh population was reported high in the cities of Panji,
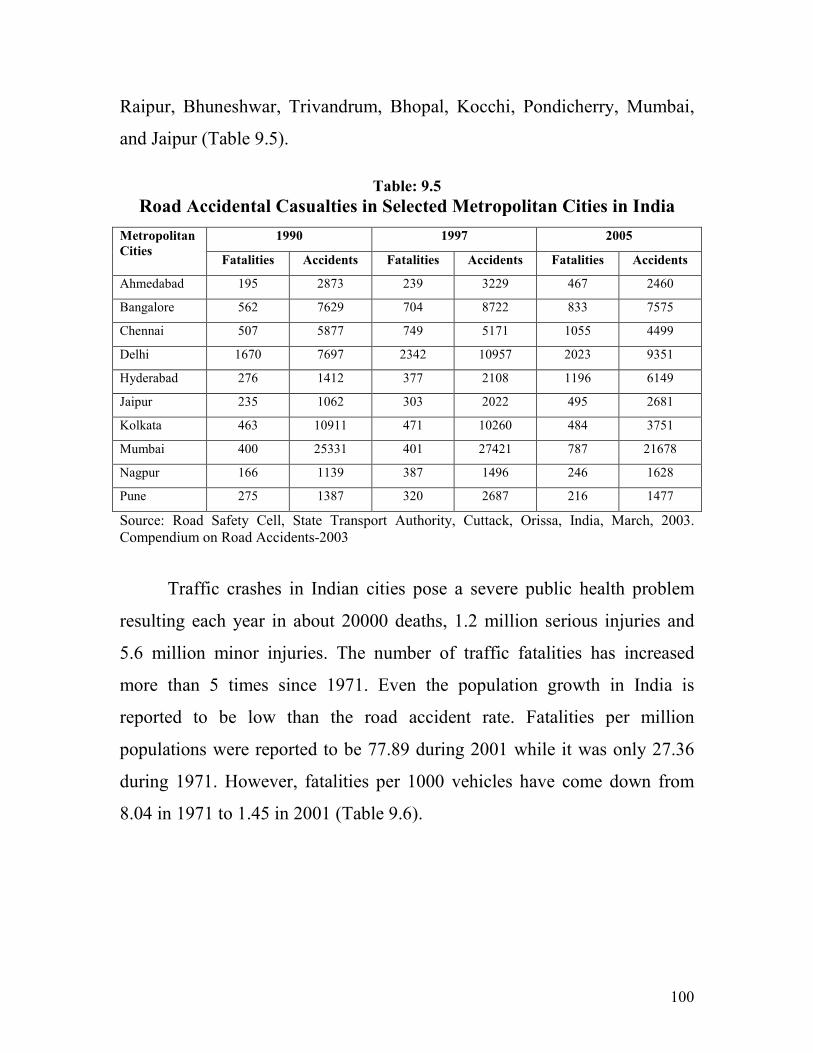
100
Raipur, Bhuneshwar, Trivandrum, Bhopal, Kocchi, Pondicherry, Mumbai,
and Jaipur (Table 9.5).
Table: 9.5
Road Accidental Casualties in Selected Metropolitan Cities in India
Metropolitan
Cities
1990 1997 2005
Fatalities Accidents Fatalities Accidents Fatalities Accidents
Ahmedabad 195 2873 239 3229 467 2460
Bangalore 562 7629 704 8722 833 7575
Chennai 507 5877 749 5171 1055 4499
Delhi 1670 7697 2342 10957 2023 9351
Hyderabad 276 1412 377 2108 1196 6149
Jaipur 235 1062 303 2022 495 2681
Kolkata 463 10911 471 10260 484 3751
Mumbai 400 25331 401 27421 787 21678
Nagpur 166 1139 387 1496 246 1628
Pune 275 1387 320 2687 216 1477
Source: Road Safety Cell, State Transport Authority, Cuttack, Orissa, India, March, 2003.
Compendium on Road Accidents-2003
Traffic crashes in Indian cities pose a severe public health problem
resulting each year in about 20000 deaths, 1.2 million serious injuries and
5.6 million minor injuries. The number of traffic fatalities has increased
more than 5 times since 1971. Even the population growth in India is
reported to be low than the road accident rate. Fatalities per million
populations were reported to be 77.89 during 2001 while it was only 27.36
during 1971. However, fatalities per 1000 vehicles have come down from
8.04 in 1971 to 1.45 in 2001 (Table 9.6).
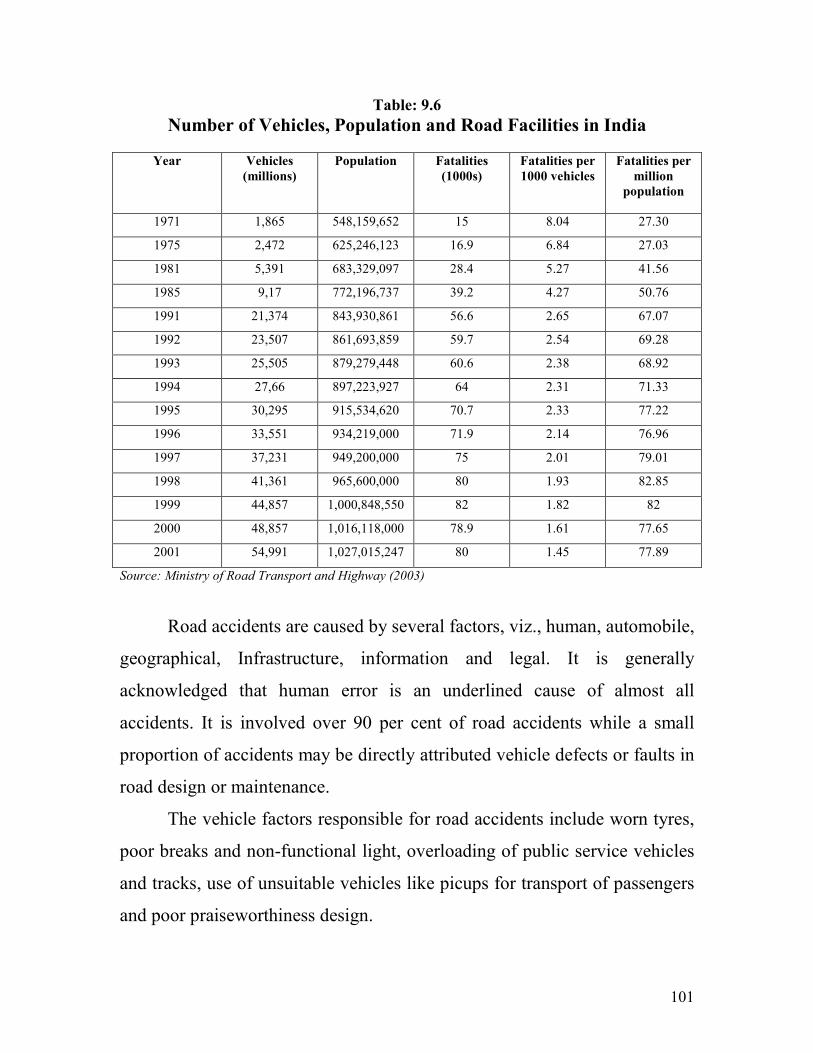
101
Table: 9.6
Number of Vehicles, Population and Road Facilities in India
Year Vehicles
(millions)
Population Fatalities
(1000s)
Fatalities per
1000 vehicles
Fatalities per
million
population
1971 1,865 548,159,652 15 8.04 27.30
1975 2,472 625,246,123 16.9 6.84 27.03
1981 5,391 683,329,097 28.4 5.27 41.56
1985 9,17 772,196,737 39.2 4.27 50.76
1991 21,374 843,930,861 56.6 2.65 67.07
1992 23,507 861,693,859 59.7 2.54 69.28
1993 25,505 879,279,448 60.6 2.38 68.92
1994 27,66 897,223,927 64 2.31 71.33
1995 30,295 915,534,620 70.7 2.33 77.22
1996 33,551 934,219,000 71.9 2.14 76.96
1997 37,231 949,200,000 75 2.01 79.01
1998 41,361 965,600,000 80 1.93 82.85
1999 44,857 1,000,848,550 82 1.82 82
2000 48,857 1,016,118,000 78.9 1.61 77.65
2001 54,991 1,027,015,247 80 1.45 77.89
Source: Ministry of Road Transport and Highway (2003)
Road accidents are caused by several factors, viz., human, automobile,
geographical, Infrastructure, information and legal. It is generally
acknowledged that human error is an underlined cause of almost all
accidents. It is involved over 90 per cent of road accidents while a small
proportion of accidents may be directly attributed vehicle defects or faults in
road design or maintenance.
The vehicle factors responsible for road accidents include worn tyres,
poor breaks and non-functional light, overloading of public service vehicles
and tracks, use of unsuitable vehicles like picups for transport of passengers
and poor praiseworthiness design.
102
Road factors responsible for road accidents are related with high or no
speed limits and poor visual guidance, poorly controlled intersections and
uncontrolled access, narrow roads, poor alignment standards and poor
maintenance of pavements and shoulders and steep ditches and hard objects
near the road.
Traffic and environmental factors include mix of motorized and non-
motorized vehicles, pedestrians, poor traffic management and enforcement
of traffic codes, darkness and inclement weather conditions and inadequate
emergency medical services.
Economic pressure factors have also become more important
following the liberalization of road transport services, as intense competition
for passengers have resulted more speeding and reckless driving of the
public service vehicles. Moreover, with the globalization and economic
liberalization, there is increasing trend of automobiles having speedy
pickups with high speed suitability of vehicles, though conditions of roads
do not support it. Thus, there will be increasing demand for financial
resources for catering to the imperatives of road safety measures.
Road safety measures in India vary from state to state and within the
state from district to district and within a district from one department to
another department. The states like Karnataka, Kerala, Tamil Nadu have
performed well in road safety measures while states like Delhi, Tamil Nadu,
Rajasthan and Haryana mobilized substantial amount of resources for road
safety measures.
Road safety being a multi-sectoral activity, its functional
responsibility lies with many key sectors associated with the road safety,
structural conditions of roads and their maintenance, emergency medical
care and rehabilitation, justice, finance, information, education and training,
103
law enforcement and traffic regulations. In the State of Uttar Pradesh, there
are six departments/agencies which have identified as the agencies
delivering road safety related sub tasks. These are PWD, Home (Traffic),
Transport, Urban Development, Medical and Public Health & Education.
PWD is responsible for formulation of road network projects,
construction, maintenance, physical marking of extent of encroachment of
road space, etc. Home (Traffic) Department is entrusted with the task of
enforcement of intra city, intercity, inter-district, inter-state traffic on roads
and highways; checking of vehicles and drivers for compliance of Motor
Vehicle Acts, & Rules; road safety regulations; rescue, first aid and transport
of accident victims to emergency and trauma care facility; filing of FIR,
accident investigation and pursuing prostitution in road accident cases.
Transport Department is responsible for registration of different types
of vehicles, licensing of different categories of drivers, collection of road tax
and fee, passengers of goods transport, issuing of permits for special purpose
and specific destinations commercial vehicles; checking of compliance of
rules and regulations on Motor Vehicle Act and road worthiness of vehicles;
planning and operation of road transport system; road safety education.
Urban Development is supposed to prevent and remove
encroachment; planning of construction of new roads and maintenance of
roads within their respective areas of jurisdictions; provisions and
maintenance of parking, pavement and pedestrians space; planning,
installation and maintenance of traffic signaling, infrastructure and traffic
regulation, etc. Medical & Health Department is entrusted with post-accident
emergency and trauma care of the accident victims. Education Department is
supposed to provide road safety education to school and college going
students.
104
Measures related to road safety in the state are mainly concern with
education, awareness creation of road users and installing road safety signs
on sensitive places. There is lack of coordination among the different
organizations, departments and officials. There is also lack of mechanism for
creating data base related to road accidents, deaths and persons injured. The
task of road safety measures among the different stakeholders is highly
fragmented with responsibilities defused amongst constituting sub-sectors
viz., ambulances, pre-hospital care, transport authority, driver and vehicle
licensing, enforcement of traffic laws and regulations, compliance of Motor
Vehicle Acts, etc. Post-accident critical cares of accident victims are highly
inadequate in the state. The budgetary provision for road safety financing is
grossly inadequate and therefore, resource mobilization for financing of road
safety measures is imperative.
India's Ariel skies and airports seem relatively safe an average of two
accidents and 10 deaths a year, however, India's skies are a battleground of
bad policies, civil military and technological obsolescence. The increased
aircraft movement and number of private air lines have increased density
with more vulnerability of air accidents.
Rail Accidents
India has the largest rail system which played by ad-hoc
modernization, a bureaucratic outlook on some of the worst global accidents
and an inadequately trained work force. The increasing incidence of bomb
blasts and explosions in trains has caused concern. There has been
fluctuating trend in rail accidents and fatalities. During 1997-98, 420 rail
accidents caused 316 fatalities (Table - IX.5). During 2001-02, 413 rail
accidents occurred in India. Number of train accidents per million km. has
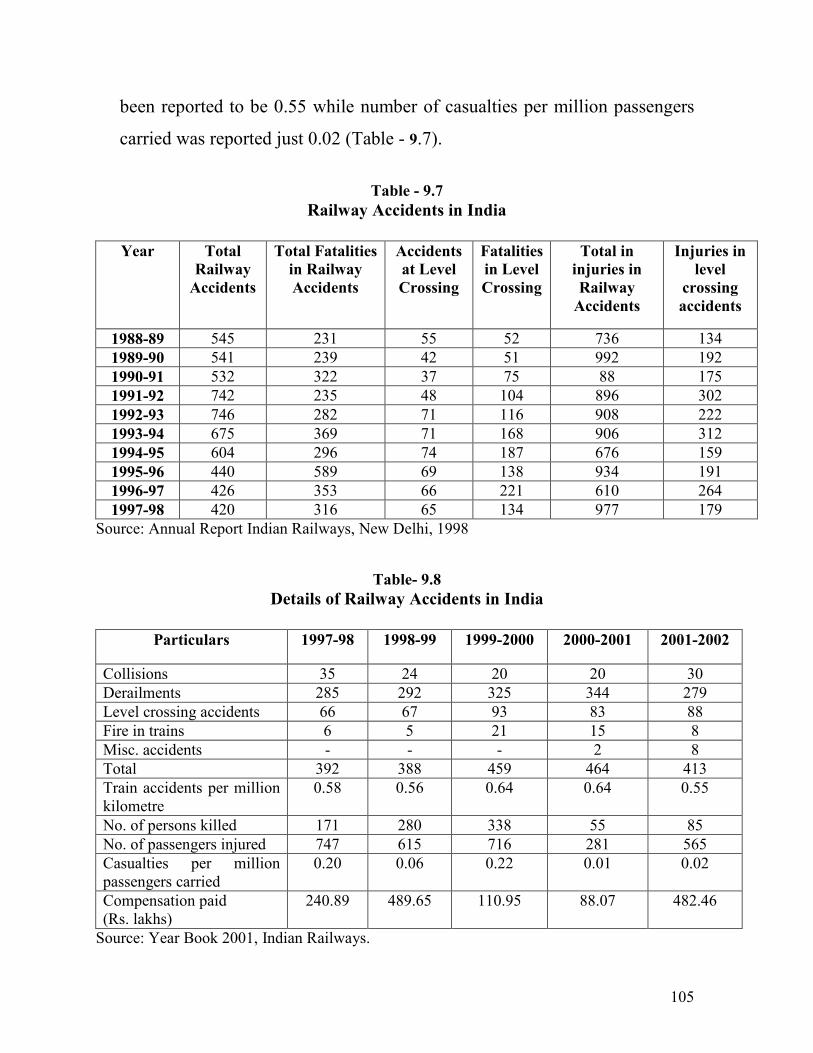
105
been reported to be 0.55 while number of casualties per million passengers
carried was reported just 0.02 (Table - 9.7).
Table - 9.7
Railway Accidents in India
Year Total
Railway
Accidents
Total Fatalities
in Railway
Accidents
Accidents
at Level
Crossing
Fatalities
in Level
Crossing
Total in
injuries in
Railway
Accidents
Injuries in
level
crossing
accidents
1988-89 545 231 55 52 736 134
1989-90 541 239 42 51 992 192
1990-91 532 322 37 75 88 175
1991-92 742 235 48 104 896 302
1992-93 746 282 71 116 908 222
1993-94 675 369 71 168 906 312
1994-95 604 296 74 187 676 159
1995-96 440 589 69 138 934 191
1996-97 426 353 66 221 610 264
1997-98 420 316 65 134 977 179
Source: Annual Report Indian Railways, New Delhi, 1998
Table- 9.8
Details of Railway Accidents in India
Particulars 1997-98 1998-99 1999-2000 2000-2001 2001-2002
Collisions 35 24 20 20 30
Derailments 285 292 325 344 279
Level crossing accidents 66 67 93 83 88
Fire in trains 6 5 21 15 8
Misc. accidents - - - 2 8
Total 392 388 459 464 413
Train accidents per million
kilometre
0.58 0.56 0.64 0.64 0.55
No. of persons killed 171 280 338 55 85
No. of passengers injured 747 615 716 281 565
Casualties per million
passengers carried
0.20 0.06 0.22 0.01 0.02
Compensation paid
(Rs. lakhs)
240.89 489.65 110.95 88.07 482.46
Source: Year Book 2001, Indian Railways.
106
Thus it is clear that a number of human induced disasters cause
concern and call for strategic planning to mitigate and manage them.
Moreover, manmade disasters may be checked and the adverse effects may
be drastically reduced through proper planning and management.
107
Chapter-10
DISASTER MITIGATION
Disaster Preparedness Measures
It is a broad concept that describes a set of measures that minimizes
the adverse effects of a hazard including loss of life and poverty and
disruption of livelihoods. Disaster preparedness is achieved through
readiness measures that expedite emergency response, rehabilitation and
recovery and result in rapid, timely and targeted assistance. Most important
factor is to increase capacities of people and communities to cope with and
minimize the effects of a disaster on their lives. It must be done with their
active participation.
Risk Assessment: All planning and implementation of disaster preparedness
measures is passed on an assessment of the hazards and risks, as well as the
ability or inability of the people to withstand the effects of those hazards. It
is based on identification of-
(a) Characteristics, frequency and potential severity of the hazards a
community faces.
(b) Geographical areas and communities that is most susceptible and
vulnerable to those hazards.
(c) Main sectors of a community (population infrastructure, housing,
services, etc.) that would be affected by a specific type of hazard and
anticipate how they might be affected.
108
(d) The ability of those sectors to withstand and cope with effects of
hazardous phenomena.
Response Strategies: To increase the effectiveness of the emergency
response, strategies and mechanisms are to be strengthened. They include,
� Evacuation procedure,
� Search and rescue teams,
� Assessment teams,
� An assessment process and information priorities for an emergency
response.
� Procedures for activating distribution systems,
� Preparations for emergency reception centers and shelters,
� Procedures for activating emergency programs for airports, harbors
and land transport,
� Preparations for storing or making arrangements for rapid acquisition
of emergency relief supplies and equipment,
� Measures to activate special installations, such as emergency or
mobile hospital facilities.
Preparedness Plan: Emergency requires an immediate response. It depends
upon the existence and implementation of the plan. The plan is not site
specific, nor does it contain the details of the disaster. However it contains
the methodology of emergency response. The response team is trained on
the basis of this plan. It involves identification of resources, roles and
responsibilities of the team, policy development, procedures and whatever is
required for the effective and timely emergency response. All of these
measures will go a long way to improving the quality, timing and
109
effectiveness of the response to a disaster. The aim of the preparedness
planning is to build, equip, train and organize disaster response team that
will function effectively in the emergency.
Coordination: The emergency response demands a variety of skills, which
are provided by different specialist teams and agencies. Coordination of
these various teams and the agencies, to prevent duplication of work is the
single most critical task of the project director. It is very common in our
country to see the Service Organizations and Government machinery
replicating the food distribution to the disaster affected people. The most
important issue involved in the coordination is the mutual trust and the
confidence amongst the various components of the disaster response teams.
Information Management: Disaster preparedness and response depend on
gathering, analyzing and acting on timely and accurate information before
(hazard and early warning information), during (disaster needs assessment)
and after disasters (process of post-disaster recovery). Once a disaster strike,
relief agency must conduct initial assessments that are timely and that
inform emergency responders about critical and immediate life-saving
needs. Disaster needs assessments should develop a picture of location,
condition, activity, needs and the resources of the affected people.
Early Warning Systems: The purpose of early warning system is to detect,
forecast, and when necessary, issue alerts related to impending hazard
events. Early warning systems have to be supported by information about
the actual and potential risks that a hazard poses, as well as the safety
measures people can take. To achieve the best results early warning
information has to be communicated to the potential victims of the disaster.
110
The people too often ignore early warnings. Credibility of the source is one
of the main reasons.
Resource Mobilization: A preparedness plan should spell out the policies
for acquisition and disbursement of funds use of outside equipment and
services, and emergency funding strategies well before a disaster occurs.
The disaster management agency must have certain emergency funds at their
disposal. If procedural sanctions and clearances are required before their
availability, the response will be delayed. Large numbers of organizations
are giving funds for specific functions in disaster-affected region. Some
agencies are providing funds for reconstruction only, while others are
making the funds available for rescue and relief work only. Some agencies
are funding through the government, or government agencies while others
are funding through the NGOs only. Thus with such a wide spectrum of fund
distribution methods and functions, the disaster planners must be fully
conversant with the different lending agencies as well as their methodology
of funding. The planners must have full list of donors and their conditions.
Similarly a definite arrangement must be available for the accessing the
funds from the International Agencies.
Public Awareness, Education and Training: Disaster preparedness must
have sizable contribution from the affected people. As the major
stakeholders they have right to know about the proposed preparedness plan,
and the rescue, relief rehabilitation and construction measures. The
awareness measures will be supported by public education campaigns,
training of response teams and rehearsals of emergency response scenarios.
111
Community Based Disaster Preparedness: Disaster preparedness and
response are not solely the work of experts and emergency responders from
national Societies and government disaster organizations. Local volunteers,
citizens, organizations, and businesses have an active and important role to
play before, during and after major emergencies and disasters. Local
populations in disaster-stricken areas are the first to respond to a disaster.
They are usually involved in search and rescue activities as well as in
providing emergency treatment and relief to their families, friends and
neighbor.
State Level Plan: In our country, the actual execution of the various
schemes, relief etc is done by the state machinery. Therefore the
organizational plans which cover the role and responsibilities of various
authorities and organization required for its execution. State level plans are
confirmed mitigation and after disaster recovery. They will provide backing
to the local level plans for immediate relief.
Local Bodies: They are the third level of Governance in our country. They
are the ones who are in actual contact with the disaster location. Naturally
the planning at their level will be confined to the preparedness, local
operations, and immediate relief, whereas other aspects such as mitigation
and recovery measures are normally directed from state level.
Community Based Plan: At the community or village level the capabilities
and limitations will obviously vary considerably between different
circumstances, and this point must be taken into account in disaster
preparedness measures generally. On first reflection, it may be felt that little
disaster preparedness capability exists at community of village level; and
112
that, when disaster strikes it is largely a question of government sending in
assistance mostly in the form of equipment, supplies, and specialist
manpower. This is not necessarily true. All communities and villages have
some vitally important assets when it comes to dealing with disaster. These
include local knowledge and experience. Clearly, these assets need to be
organized and utilized to optimum effect. This local knowledge contains.
� Traditional capability for reading disaster-warning signs,
� Knowledge of local safe and vulnerable areas,
� Experience and lore concerning disaster impact,
� Survival experience in face of disaster loss,
� Understanding of the hierarchical local system which may be essential
in disaster circumstances,
� They have inherent capability to utilize the extended family system,
which is often vitally important in withstanding crisis.
Basic Skills Required
The modern day disaster mitigation and management requires a high
level of professional skill, while volunteers will always be important in
disaster response operations, staff involved in planning, situation evaluation,
needs assessment or service delivery have to be equipped with the technical
and management skill required to participate in increasingly complex
programs. It is an establishment fact that the disasters of different types will
require different types of trained rescue workers, and the equipments. The
skills required for rescue work cannot be dealt in isolation. They have to
dovetail into the holistic picture of the disaster management plan as stated
earlier. The post disaster management can be divided into four distinct
113
phases. First phase is the rescue work, which involves saving the victims of
the disaster. Second phase is the relief, which involves comforting the
victims and establishment of order at the disaster location. The third is the
rehabilitation of the victims. The fourth and the last phase is Reconstruction.
It also takes the longest time. The first phase is the most critical from the
point of view of saving human lives. It also has a very short duration when
the victims can be saved. This makes rescue work the most critical so far as
the disaster management is concerned. Thus the rescue workers must be
trained and equipped to deal with the ground realities. Then and only then
they can be effective in saving the human lives. The skills required in the
disaster management include those required for (1) Rescue Work, (2) Relief,
(3) Rehabilitation, and (4) Reconstruction. The skills can be disaster specific
for Rescue and the relief works. Rehabilitation and Reconstruction are more
or less similar in the different types of disasters. The most common natural
disasters affecting our country are, (1) Earthquakes, (2) Floods, (3)
Landslides, (4) Hurricanes, (5) Drought and Desertification. The different
types of skills required for the management of these disasters is
comprehensive and a can be listed under different categories.
Basic Search and Rescue: Emergency response is one of the most
demanding forms of activity worldwide because it operates in conditions of
uncertainty, often in remote locations and within severe time constraints. It
therefore tests the management and logistic capabilities of the agencies
involved to the limit. These teams are the first to reach the disaster locations.
Their basic function is to provide First Aid to the disaster affected and
organize Rescue operation. These tasks require certain basic skills. These
include-
114
� Civil Defense to organize rescue operations,
� Fire protection in case of fire hazard,
� Ground and a serial first-aid service,
� Medical help in disasters,
� Environmental protection,
� Emergency supplies and provision of food,
� Labor safety and occupational hygiene,
� Water and food protection and treatment,
� Rescue operations in traffic crashes,
� Rescue and first-aid service in mining and mountaineering,
� Protection of material values and property rescue operations in natural
disasters.
The disasters victims in these categories are affected more severely than the
other victims. They required specialist treatment. The medical team should
have trained persons to deal with these categories of patients. In case of
severe disasters like Earthquakes or Major floods the mass fatalities are
common phenomena. To deal with the ground situation, it requires skill of
the highest order. Disposal or cremation of the dead bodies becomes a
serious problem and places a heavy strain on the resources of the
organization. This situation is further complicated by the problem of
identification of the dead.
Technical skills are the specialized engineering skills in various fields. The
specialists in these fields are professionals and required very little training
before inducting them into rescue work.
115
Communication is one of the most important part of the disaster
management work. The biggest problem faced by the planners is the level of
dependence of the existing communication network, either in the form of
landlines, or cell phones. Both the forms of communication are susceptible
to damage in the event of disaster. The only reliable link can be wireless
network. Unfortunately it requires specialist knowledge for operation and
maintenance. Satellite linked phones can be a better option but it is
exorbitantly expensive.
The disaster affected areas might contain a number of utility services like
electricity, water supply, telephones, and gas lines for domestic or industrial
supply petrol oil and lubricant storage at the petrol pumps. The live electric
lines, gas lines and water lines can pose a serious threat to life. They have to
be effectively disabled to prevent accidents. It requires technical as well as
the local knowledge.
Like any large scale project the disaster mitigation and management project
is a multidisciplinary and multi specialty project. To conduct such an
operation a variety of organizational skills and the best of the project
management skills are required.
Every project throws up a variety of problems during the execution stage.
Despite of the care taken at the planning stage to avoid such situation, these
emergencies are increasing. The emergency planners are required to take
care of this situation and find away to by pass the emergencies and permit
the project to run smoothly.
116
The manpower requirement in the disaster management is very large. To
mobilize and organize such a large force of volunteers is a Herculean task.
The volunteers are invariably untrained or at best semi-trained persons. To
motivate such a force requires very high level of commitment and
organization skill. The decision-making capability is a gift and very few
people have this capability. It is more so in case of a crisis situation. The
decision has to be made at that point of time. Correctness of the decision can
only be judged by subsequent results. The project Managers is the specialists
who oversee the project execution. Their main functions are to ensure that-
� Resources are deployed at right time,
� Adequate resources are available,
� Coordination between different agencies or Groups,
� Monitoring the progress of the project.
Finance or the Money forms an important part of resources. The main
sources of funds are the Government departments, Voluntary Organizations,
Public and Private sectors. All of them have their own rules, regulations and
other conditions for the release of funds. These conditions have to be
fulfilled. The funds have to be deployed for productive work. All this
process requires specialist knowledge and skills.
(a) Strategic Planning,
(b) Leadership,
(c) Decision Making
In any emergency, people will generally suffer from varying degrees
of anxiety. Any emotional support will help to reduce excessive stress
reactions. Possible source for emotional support skills may include
117
following categories of persons who have experience in counseling and
providing emotional support.
� Teachers,
� Counselors,
� Nurses,
� First responder,
� Social Workers,
� Religious Workers,
� Persons with crisis management skills,
� Volunteers
Integration of the skills in Disaster management plan-All the skills
listed above are integral part of disaster management, Most of the skills are
part of some Medical, Technical Management sciences. There are qualified
specialists working in these fields. To integrate these skills into the disaster
management plan will mean bringing in all these specialists into the action
plan. Then only these skills can be utilized in the execution of the action
plan. The plan has to be prepared by professional planners.
Manpower Mobilisation and Training
The requirement of manpower for disaster management is very high.
The mobilizing such a huge force is itself is a formidable job. It a common
practice all over the world to look for the manpower from various organized
and disciplined groups like armed forces, civil defense fire brigade etc.
There is another big source of manpower that has not been paid adequate
118
attention. These are the local population who are the biggest stakeholders.
The various sources of manpower are:
� Government Departments,
� Use of Armed Forces,
� Non-Governmental organizations, (NGOs)
� Peoples Participation as main Stakeholders,
� Community Based Volunteer force for Relief and Rescue work.
The basic requirement of the rescue volunteers is that they must be
properly organized, should have discipline, adequate resources to operate on
their own if necessary and last but not the least they must have some basic
rescue and or disaster management training.
Armed Forces: Referring to the above list, we find armed forces are the
only group coming closet to the requirements. Unfortunately their main
training and responsibility is National defense. The deployment of armed
forces for disaster management or counter insurgency is not a good practice.
It affects their training as well as their moral. This point has been stressed by
the Armed forces high command as well as various high-powered
committees. Unfortunately we lack an organized, disciplined and trained
force to counter the disasters as well as the insurgency.
Government Departments: The Government departments have very little
training and organization to combat any disaster. Their best use will be for
organizing the back end of the project execution like inventory management,
supply and logistics, emergency centers management.
119
Non-Government Organizations (NGOs): Some of the organizations like
Red Cross, St. John Ambulance Brigade are reasonably organized and
adequately trained for disaster management. Their limitations are their
limited authority to undertake the disaster management on their own. They
have to tie up with government officials.
Community based Volunteer Force: This is one area where India as a
nation has not done any effort to form such a force. Our thrust has always
been on Government doing everything themselves. It resulted in chaos.
Number of Government appointed committees have recommended
formation of a disaster management agency on the lines on the lines of
FEMA of USA. They have recommended formation of an independent
ministry for this work. Formation of community based response teams
(CRT) in disaster prone area is a necessity. These teams can then become the
first respondents in case of emergency. At the moment no such facility is
available anywhere in the country. We are totally dependant on the
Government machinery. The volunteer force can be raised on the lines of
Territorial Army where the participants are part time service personnel. They
are paid partial wages during peace postings and full pay when on active
duty. The deployment of ex-servicemen in this force would be a good
option. The National Social service group, which forms the chunk of
university students, would be another source of volunteers. They can be
easily trained in disaster management. As it is they are in contact with the
local population an account of their social work, their contact can be further
utilized for disaster management through public awareness programmes.
120
People's Participation: It is extremely important that the main stakeholders
be involved in this process of disaster management. The biggest stumbling
block in this process is the mistrust the people have against the officialdom.
An average person does not want to have anything to do with the
departments like Police, Revenue, RTO or the Health departments. Under
the give situation Government machinery must win the trust of the
stakeholder population and bring about the disaster awareness and the
participation.
The second problem in dealing with the Government machinery is
their obsession with secrecy and the lack of transparency. All plans,
programmes, schemes are kept within the four walls of the offices. Even
with the right to information bill, having passed, the information is not easily
available. One of the best examples is the disaster map of India. This
document is available on CD costing Rs. 3000. In fact it should be freely
available on line. Unless this system is drastically altered, peoples'
participation will remain only on paper like so many other things.
Different Levels of Responsibility: The manpower mobilized for the
disaster management has to clearly deployed, depending on their training,
skill levels, and equipment available with them. FEMA has classified the
levels depending on the above factors. In an earthquake the classification is a
follows.
� The most skilled and trained teams are the Urban Search and Rescue.
It is their responsibility to look for the victims who are entombed and
whose rescue requires specialized equipment and trained rescue teams
to rescue them.
121
� Second level of rescue is for the victims trapped under collapsed
structures but is visible and accessible to the rescue teams they are to
be attended by the emergency service providers.
� Third level of rescue work is by the community response teams who
will attend to the victims entrapped under minor obstruction that do
not need specialists equipment and expertise as in the first two cases.
� Fourth level of rescue is by the rescuers from the disaster location and
has preliminary knowledge of first aid and can attend the injured
victims.
Disaster Relief Equipments and Tools
Heavy Moving Machinery / Equipment
� JCB / Excavators.
� Cranes
� Skit Steer Loader (Escorts)
� Crawler Tractor Size II
� Portable Power Pack (Escorts)
� Power Cutters
� Hand held pneumatic cutters
� RCC Cutters
� Air Bags High Pressure Kevlar
� Jacks Hydraulic 20 T and 5 T
� Hydraulic wedge lifter 24 T
� Hydraulic Breaker
� Hydraulic Bolt Cutter
� Air Chisel
122
� Air Hammer
� Collapsible Ladders
� Ropes 2"
� Face Masks
� Synthetic Gloves
� Life Detection Endoscope Cameras
� Radar Based Life Detection Equipment
� Acoustic Life Detection Equipment
� Heat Sensing Life Detection Equipment
Rescue and Relief Equipment
� Synthetic tents (10'x10'x8') (living)
� Synthetic tents (4'x4'x6') (Toilet)
� Blankets, bed sheets and pillows
� Ground sheets
� Water Tanks Fabric (230 lit)
� Water Tanks Fabric (6140 lt.)
� Cooking Gas Stove/Cylinder (100 strength)
� Cooking/Serving utensils (100 strength)
� Buckets and Mug aluminium
� Emergency lights
� Generating Sets (3.5 KVA), electrical accessories and fuel
� Cover Waterproof (5.5mx4.5m)
� Cover Waterproof (9.1mx9.1m)
� Water purification kit
� Portable Hand held DC Light beam
123
� Collapsible Ladders
� Splinter proof Helmets with mounted torch
� Orange Colored uniform complete
� Inmarsat Mini M Terminals
� Cellular Mobile Phone with national roaming facility
� Hand held Radio Sets
� Rations (Two days)
� Meals ready to eat (One day)
� HQ/Office requisites & computers
� Personal ruck sack
� Sleeping Bags
� Lifting harness/blocks & tackles
� Sniffer Dogs
� Vibraphone/Acoustic life detection equipment
� Heat Sensing equipment to pick up human life from background
� Hand held pneumatic concrete cutters
� Portable Compressors.
Shelter Pack
� Extendable Tents (20 men)
� Canvas Tarpaulins (30'x3')
� PVC Tarpaulins (12'x12';)
� Blankets, Bed sheets, Pillows.
� Ground sheets.
� Modified Geodesic dome (Dia 5.25m, centre height 3.4m)
124
Water Supply Pack
� Water Bowsers / Tankers
� Rubberized Tanks (50,000 Lit.)
� Water Purification Plant.
� Well boring Equipments.
� Pumping sets (various capacities)
� HDPE pipe/Victaulic pipes
Power Supply Pack
� Generator Set. 63 KVA & Accessories
� Generator Sets 30 KVA & Accessories
� Enervator Sets 7.5 KVA & Accessories
� Electrical Repair kits
� Emergency Lighting System
Communication Pack
� Inmarsat Mini M terminal
� VSAT Terminals in KU Band
� Radio set HX
� VHF System
� Hand held Radio Set
� VHF Bases Stn
� VHF Repeater Stn
� Containerized 100 line EPABX and Integrated WLL System with 20
remote telephones
� Telephones
125
� Cable
� Portable Generators 2 KVA
� Portable Generators 4 KVA
Food Pack
� Dry rations to include ATTA, Rice, Dal, Sugar, Tea, Powder milk,
Salt, Masalas, Fuel etc. and hard variety of vegetable.
� Pre cooked food/survival rations.
Medical Equipment
� Stretchers Light Weight folding (serving as a cot)
� Cardiopulmonary monitor
� Oxygen Cylinder 623 liters with mask
� Inflatable pneumatic (set of 4) splints
� Ventilator Portable
� Portable electrical
� Portable mechanical foot
� OT Packs
� OT general stores like gowns, masks scrub brushes, slippers etc.
� X-ray Machine Portable
� X-ray films all sizes
� Sprayer Hand
� Sprayer Shoulder 16 Liters
� Operation Theatre on wheels. (Mobile Theatre)
� Medical Equipment Scale Complete of TSP of Field Ambulance
(operational theatre grounded)
126
� Medical Equipment Scale Complete of Medical Platoon of field
Ambulance. (Store for hospital Grounded).
Medicine/Fluids Pack
� Hygiene Chemicals
� Bayon Liquid
� Bayon Granules
� Malathion (conc.)
� Vaccines
� Cholera Amp.
� Tetnus Amp.
� TAB Amp.
� Others as applicable
� Resuscitation Fluids
� 5% Isotonic
� Ringers
� Normal Saline
� Haemaccel
Functional Equipment and Patient Comfort Pack
� Water Bowser 3000 Liter
� Lighting set mobile operating theatre.
� Generating set 5.5 KVA
� Charging set ED 500 W 30V 4A
� Batteries lead acid portable 12A 75 AH.
� Generating Set 30 KVA
127
� Electrical wire with 20 points set @ 500.
� Ice box 20 liters. (For preservation of vaccines).
� Patients Blankets (all types)
� Pillows & Bed sheets.
� Emergency Lights and Torches.
� Gypsy Ambulance Vans
� Emergency First Aid Pack.
128
Chapter-11
DISASTER MANAGEMENT
India has been traditionally vulnerable to natural disasters on account
of its unique geo-climate conditions. Floods, droughts, cyclones,
earthquakes and landslides are regular phenomena in India. The multi-
hazard scenario depicted in the Vulnerability Atlas of India (produced by
Building Materials and Technology Promotion Council (BMTPC), New
Delhi, India), shows that out of the total geographical area of 32, 87, 263 sq.
km, about 60% of the landmass is prone to earthquakes of various
intensities; over 40 million hectares is prone to floods; about 8% of the total
area is prone to cyclone and 68% of the area is susceptible to drought.
During 1990-2000, on an average of about 4344 people lost their lives, about
30 million people were affected by various disasters every year and average
annual damage has been estimated to be approximately 2700 million rupees.
As per the World Bank estimates, during 1996-2001 the total losses due to
disasters, including the super cyclone of Orissa in October 1999 and the
Bhuj earthquake in Gujarat in January, 2001, amounts to US$ 13.8 billion.
Over the past two decades, there has been an increase in disaster
occurrences costing human and economic losses. This is due to the ever
increasing vulnerabilities of people to natural disasters. The need is felt to
reduce disaster risks by improving capabilities of people and ensuring
preparedness, mitigation and response planning processes at various levels.
The objective is to look at the entire cycle of disaster management in
reducing risk and linking it to developmental planning process. In the past,
disasters were viewed as isolated events, responded to by the Governments
129
and various agencies without taking into account the social and economic
causes and long term implication of these events. In short, disasters were
considered as emergencies.
The recent disasters and its socio-economic impact on the country at
large, and in particular the communities has underscored the need to adopt a
multi dimensional approach involving diverse scientific, engineering,
financial and social processes to reduce vulnerability in multi-hazard prone
areas. in view of this, the Government of India has brought about a paradigm
shift in its approach to disaster management. The change is from "relief and
emergency response" to a balanced approach covering all phases of the
Disaster Management Cycle. The approach acknowledges disaster
management as a part of the development process, and investments in
mitigation are perceived to be much more cost effective than relief and
rehabilitation expenditure. In this regard, Government of India has taken
various initiatives in area of disaster preparedness, mitigation and response
through networking of various institutions, institutional capacity building,
and policy interventions at all levels.
Community participation and community ownership risk reduction is
one of the key factors in reducing vulnerabilities of people and minimizing
the loss. The Government of India's focus Community Based Disaster
Preparedness (CBDP) approach promotes community involvement and
strengthening of their capacities for vulnerability reduction through
decentralized planning process. This document deals with the concept,
component and some of the best practices in India.
Institutional Arrangements
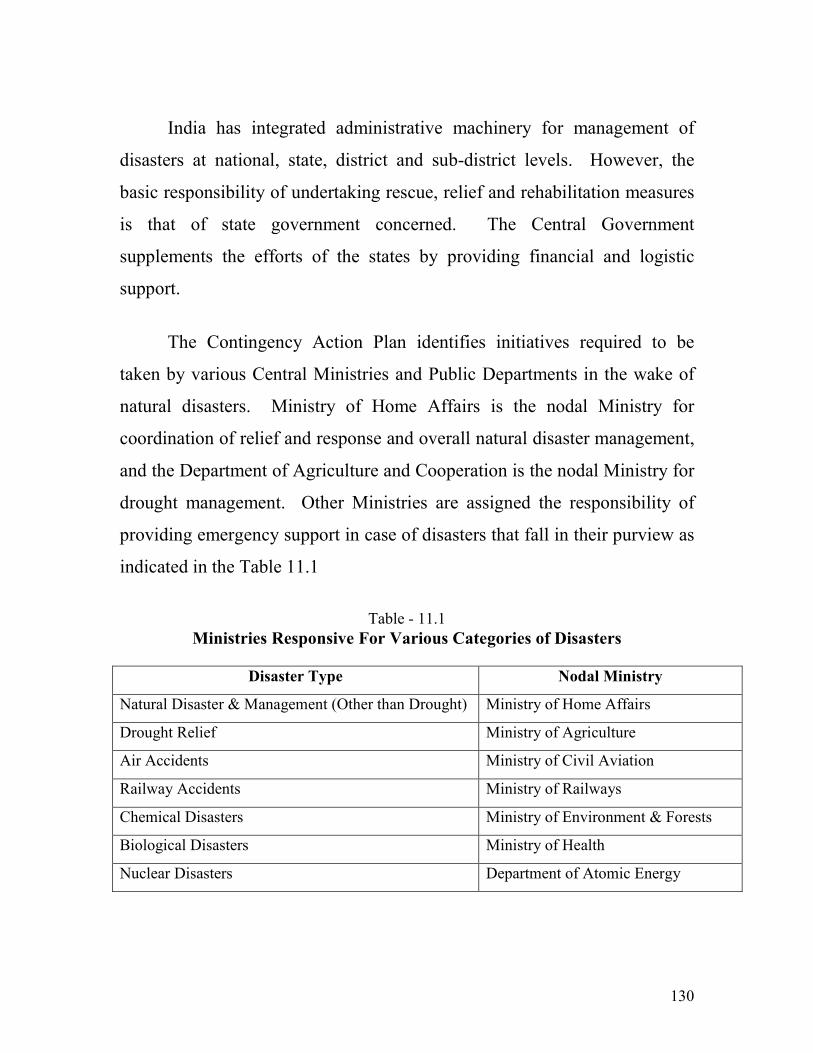
130
India has integrated administrative machinery for management of
disasters at national, state, district and sub-district levels. However, the
basic responsibility of undertaking rescue, relief and rehabilitation measures
is that of state government concerned. The Central Government
supplements the efforts of the states by providing financial and logistic
support.
The Contingency Action Plan identifies initiatives required to be
taken by various Central Ministries and Public Departments in the wake of
natural disasters. Ministry of Home Affairs is the nodal Ministry for
coordination of relief and response and overall natural disaster management,
and the Department of Agriculture and Cooperation is the nodal Ministry for
drought management. Other Ministries are assigned the responsibility of
providing emergency support in case of disasters that fall in their purview as
indicated in the Table 11.1
Table - 11.1
Ministries Responsive For Various Categories of Disasters
Disaster Type Nodal Ministry
Natural Disaster & Management (Other than Drought) Ministry of Home Affairs
Drought Relief Ministry of Agriculture
Air Accidents Ministry of Civil Aviation
Railway Accidents Ministry of Railways
Chemical Disasters Ministry of Environment & Forests
Biological Disasters Ministry of Health
Nuclear Disasters Department of Atomic Energy
131
The responsibility to cope with natural disasters is essentially that of
the state Government. The Chief Secretary of the state heads a state level
Committee which is in overall charge of the relief operations in the state and
the Relief Commissioners who are in charge of the relief and rehabilitation
measures in the wake of natural disasters in their states function under the
overall direction and control of the state level Committee. In many states,
Secretary, Department of Revenue is also in charge of relief.
The district administration is the focal point for implementation of all
governmental plans and activities. The administration of relief is the
responsibility of the Collector/District Magistrate who exercises
coordinating and supervising powers over all departments at the district
level.
The 73rd and 74th constitutional amendments gave the status of
'Institutions of self government' to Panchayati Raj Institutions. The
constitutional amendments also laid down necessary guidelines for the
structure of their composition, powers, functions, devolution of finances,
regular holding of elections and reservation of seats for weaker sections and
women. These local bodies may be effective instruments in tackling
disasters through early warming system, relief distribution, providing shelter
to the victims, medical assistant etc. The Eleventh Finance Commission too
paid detailed attention to the issue of disaster management and came out
with a number of recommendations, including expenditure on restoration of
infrastructure and other capital assets as well as capacity building. Training
and education are crucial for mitigating disasters and also for disaster
response. Training is an integral part of the capacity building as trained
132
personnel respond much better to different disasters. The multi sectoral and
multi hazard prevention based approach to disaster management requires
specific professional inputs. Similarly, preventive disaster management and
development of a national ethos of prevention calls for awareness generation
at all levels. Again, capacity building should not be limited to professionals
and personnel involved in disaster management but should also focus on
building the knowledge, attitude and skills of a community to cope with the
effects of disasters.
The Yokohama Convention in May 1994 underlined the need for an
emphatic shift in the strategy for disaster management. It was inter alia
stressed that disaster prevention mitigation, preparedness and relief are four
elements which contribute to and gain from the implementation of
sustainable development policies. The Government of India has adopted
mitigation and prevention as essential components of development strategy.
In order to respond affectively to flood, Ministry of Home Affairs has
initiated National Disaster Risk Management Programme in all the flood
prone states. Elected representatives and officials of local bodies are being
trained in flood disaster management under the programme. Bihar, Orissa,
West Bengal, Assam and Uttar Pradesh are among 17 multi hazards prone
states where this programme is being implemented with assistance from
UNDP, USAID and European Commission.
A comprehensive programme has been taken up for earth quake risk
mitigation. The building construction in urban and sub-urban areas is
regulated by Town Country Planning Acts and Building Regulations. A
National Core Group for Earthquake Risk Mitigation has been constituted
133
consisting of experts in earthquake engineering and administration. Review
of Building Bye-Laws and Adoption is being insured by the various state
Governments. A National Programme for Capacity Building of Engineers
and Architects in Earthquake Risk Mitigation has been implemented by the
Central Government. Training for rural masons for construction of
earthquake resistance buildings and houses is being provided under UNDP -
Government of India, Disaster Management Programme in various States.
Retrofitting of lifeline buildings is also been insured by the State
Governments. An Earthquake Mitigation Project has been drawn with an
estimated cost of Rs. 1132 crores. The programme includes training of
masons in earthquake resistance constructions and adopting techno-legal
regimes by state governments. Accelerated Urban Earthquake Vulnerability
Reduction Programme has been taken in 38 cities in Seismic Zone III, IV
and V in a population of half a million and above. Training Programmes
have been organized for engineers and architects to impart knowledge about
seismically safe construction and implementation of Bureau of Indian
Standards Norms. A National Cyclone Mitigation Project with cost of Rs.
1050 crores has been drawn up in cyclone prone states. The project
envisages construction of cyclone shelters, coastal shelter belt plantation,
strengthening of warning systems, training and education etc. A Disaster
Risk Management Programme has been taken in 169 districts in 17 multi
hazards state prone with assistance from UNDP, USAID and European
Union. Importantly, Disaster Management Faculties have already been
created in Administrative Training Institutes located in 28 districts. Disaster
Management as a subject in social sciences has been introduced in school
curriculum for classes VIII and IX. Besides, 8 battalions of Disaster Risk
Response have been created for providing prompt response during disasters.
134
In order to provide training and knowledge for prevention, mitigation,
response of disaster as well as rehabilitation and reconstruction of affected
persons and areas, academic institutions have been established with financial
assistance from government. However, disaster management required multi
disciplinary and pro active approach.
Disaster Management
1. Preparedness
This protective process embraces measures which enable
governments, communities and individuals to respond rapidly to disaster
situations to cope with them effectively. Preparedness includes the
formulation of viable emergency plans, the development of warning
systems, the maintenance of inventories and the training of personnel. It may
also embrace search and rescue measures as well as evacuation plans for
areas that may be at risk from a recurring disaster.
Preparedness therefore encompasses those measures taken before a
disaster event which are aimed at minimizing loss of life, disruption of
critical services, and damage when the disaster occurs. All preparedness
planning need to be supported by appropriate legislation with clear
allocation of responsibilities and budgetary provisions.
2. Mitigation
Mitigation embraces all measures taken to reduce both the effect of
the hazard itself and the vulnerable conditions to it in order to reduce the
scale of a future disaster. Therefore mitigation activities can be focused on
the hazard itself or the elements exposed to the threat. Examples of
135
mitigation measures which are hazard specific include modifying the
occurrence of the hazard, e.g. water management in drought prone areas,
avoiding the hazard by sitting people away from the hazard and by
strengthening structures to reduce damage when a hazard occurs.
In addition to these physical measures, mitigation should also be
aimed at reducing the physical, economic and social vulnerability to threats
and the underlying causes for this vulnerability.
Human Capacity: Human capacities are the qualities are resources of an
individual or community to anticipate, cope with, resist and recover from the
impact of a hazard. Human Capacities and Human vulnerability are
inversely related. Higher the Human capacity lower will be the vulnerability
and vice versa.
Approaches of Disaster Management
Disaster risk management can be addressed in three ways: structural
measures, non-structural measures and establishing communication
networks. Structural measures would reduce the impact of disasters and
non-structural measures would enhance the management skills and improve
capacities of the community, local self governments, urban local bodies and
the state authorities to prepare, prevent and respond effectively to disasters.
Non-structural measures are more important and include vulnerability
mapping, risk assessment analysis, hazard zoning, inventory of resources to
meet the emergency etc. The approaches of disaster management are shown
in chart 11.1
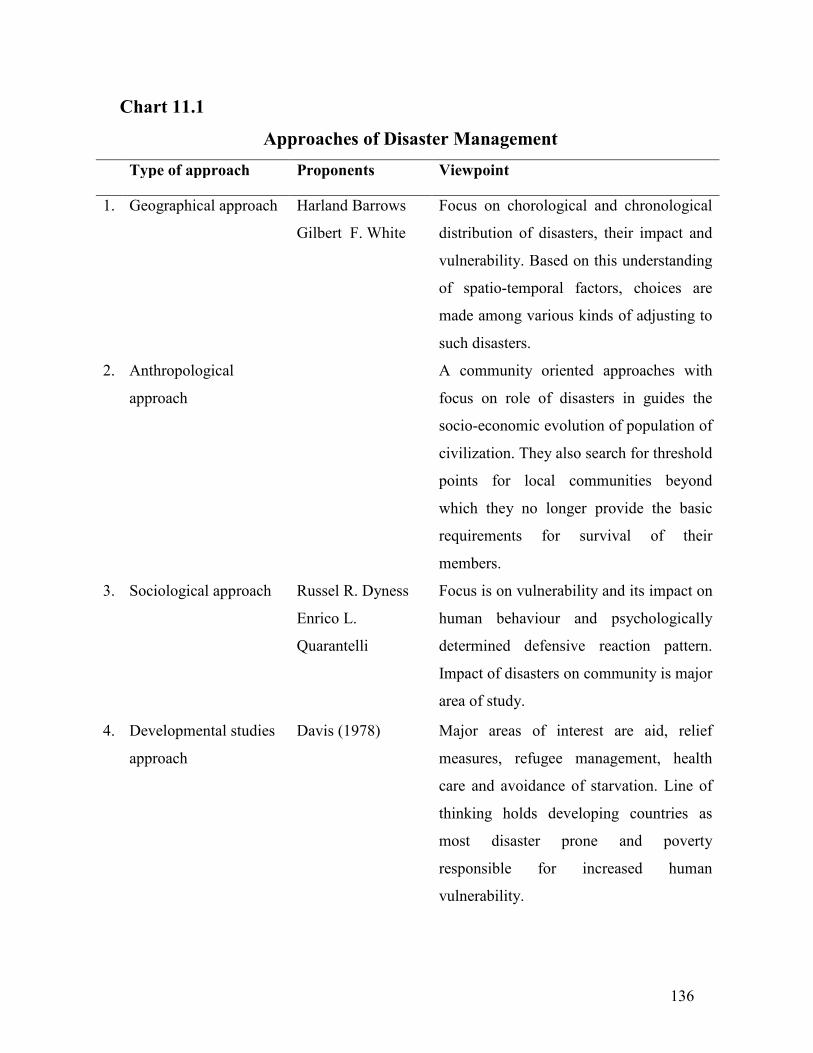
136
Chart 11.1
Approaches of Disaster Management
Type of approach Proponents Viewpoint
1. Geographical approach Harland Barrows
Gilbert F. White
Focus on chorological and chronological
distribution of disasters, their impact and
vulnerability. Based on this understanding
of spatio-temporal factors, choices are
made among various kinds of adjusting to
such disasters.
2. Anthropological
approach
A community oriented approaches with
focus on role of disasters in guides the
socio-economic evolution of population of
civilization. They also search for threshold
points for local communities beyond
which they no longer provide the basic
requirements for survival of their
members.
3. Sociological approach Russel R. Dyness
Enrico L.
Quarantelli
Focus is on vulnerability and its impact on
human behaviour and psychologically
determined defensive reaction pattern.
Impact of disasters on community is major
area of study.
4. Developmental studies
approach
Davis (1978) Major areas of interest are aid, relief
measures, refugee management, health
care and avoidance of starvation. Line of
thinking holds developing countries as
most disaster prone and poverty
responsible for increased human
vulnerability.
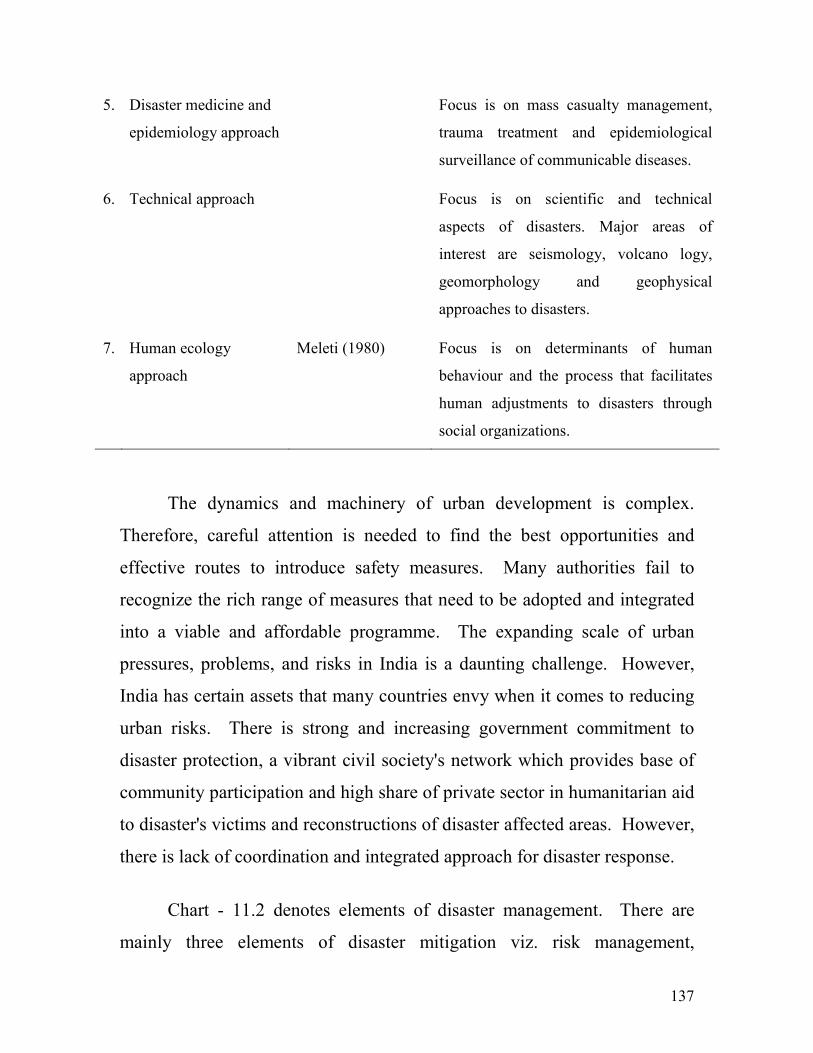
137
5. Disaster medicine and
epidemiology approach
Focus is on mass casualty management,
trauma treatment and epidemiological
surveillance of communicable diseases.
6. Technical approach Focus is on scientific and technical
aspects of disasters. Major areas of
interest are seismology, volcano logy,
geomorphology and geophysical
approaches to disasters.
7. Human ecology
approach
Meleti (1980) Focus is on determinants of human
behaviour and the process that facilitates
human adjustments to disasters through
social organizations.
The dynamics and machinery of urban development is complex.
Therefore, careful attention is needed to find the best opportunities and
effective routes to introduce safety measures. Many authorities fail to
recognize the rich range of measures that need to be adopted and integrated
into a viable and affordable programme. The expanding scale of urban
pressures, problems, and risks in India is a daunting challenge. However,
India has certain assets that many countries envy when it comes to reducing
urban risks. There is strong and increasing government commitment to
disaster protection, a vibrant civil society's network which provides base of
community participation and high share of private sector in humanitarian aid
to disaster's victims and reconstructions of disaster affected areas. However,
there is lack of coordination and integrated approach for disaster response.
Chart - 11.2 denotes elements of disaster management. There are
mainly three elements of disaster mitigation viz. risk management,
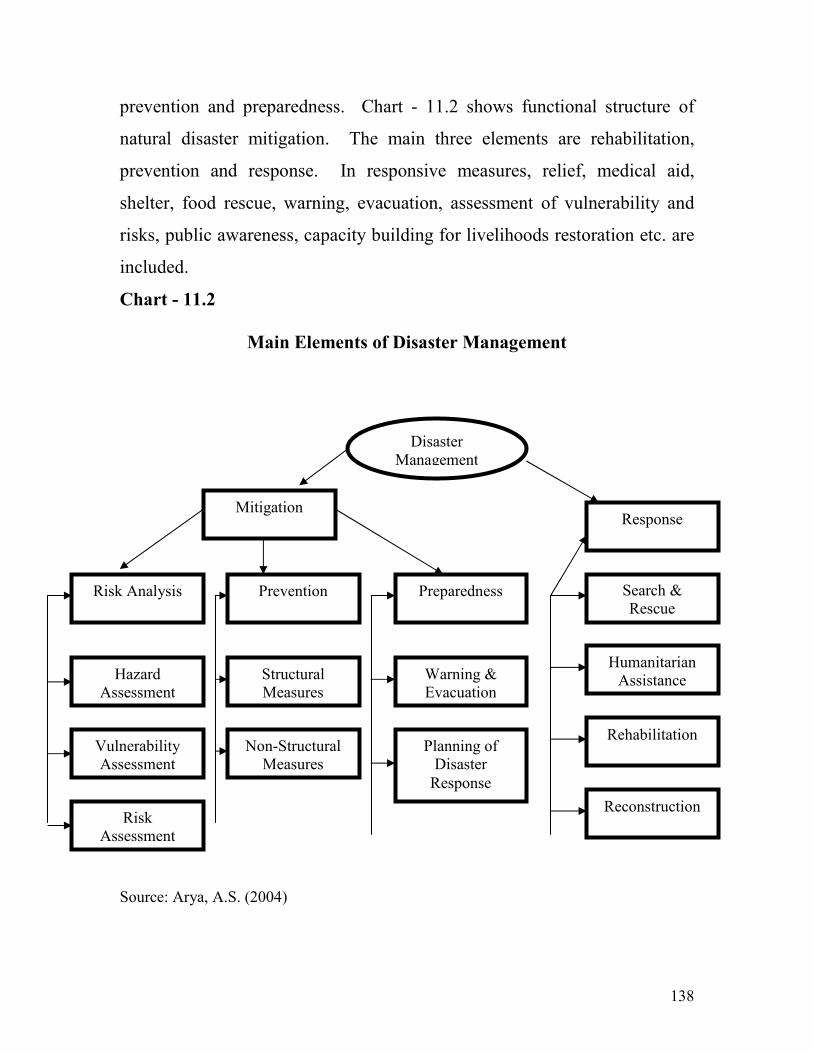
138
prevention and preparedness. Chart - 11.2 shows functional structure of
natural disaster mitigation. The main three elements are rehabilitation,
prevention and response. In responsive measures, relief, medical aid,
shelter, food rescue, warning, evacuation, assessment of vulnerability and
risks, public awareness, capacity building for livelihoods restoration etc. are
included.
Chart - 11.2
Main Elements of Disaster Management
Source: Arya, A.S. (2004)
Disaster Management
Mitigation Response
Risk Analysis Prevention Preparedness Search & Rescue
Humanitarian Assistance
Rehabilitation
Reconstruction
Hazard Assessment
Structural Measures
Warning & Evacuation
Vulnerability Assessment
Non-Structural Measures
Planning of Disaster
Response
Risk Assessment
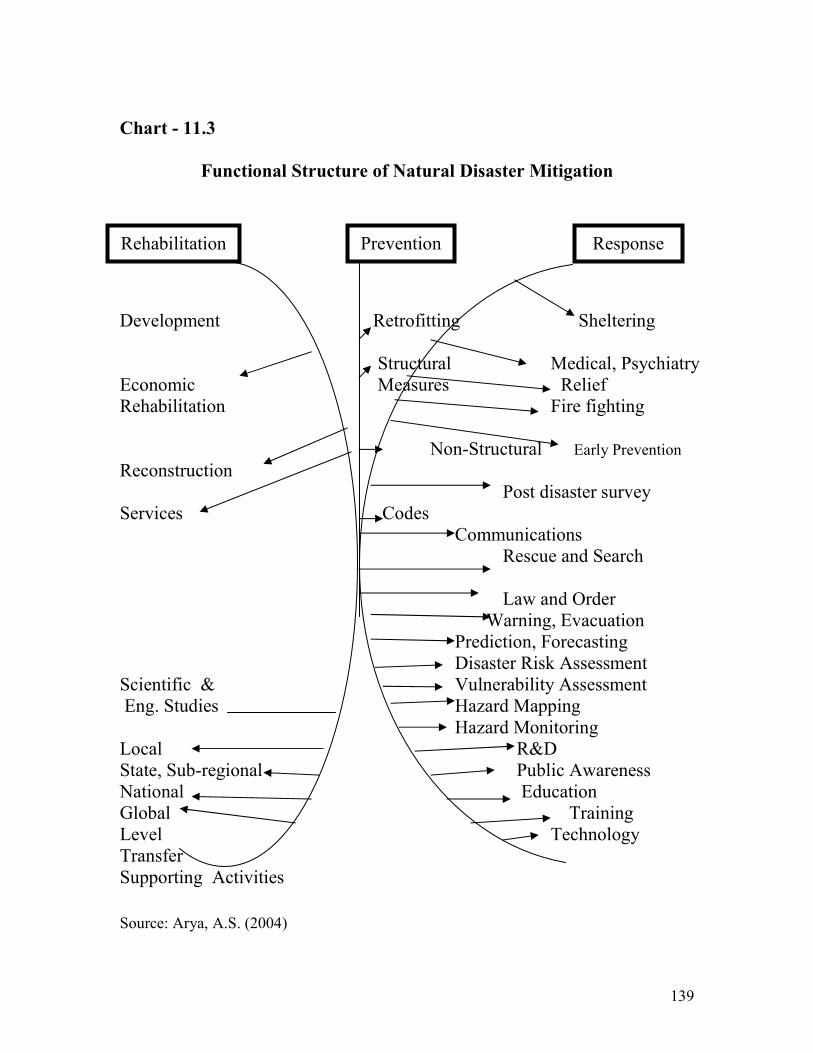
139
Chart - 11.3
Functional Structure of Natural Disaster Mitigation
Development Retrofitting Sheltering Structural Medical, Psychiatry Economic Measures Relief Rehabilitation Fire fighting Non-Structural Early Prevention Reconstruction Post disaster survey Services Codes Communications Rescue and Search Law and Order Warning, Evacuation Prediction, Forecasting Disaster Risk Assessment Scientific & Vulnerability Assessment Eng. Studies Hazard Mapping Hazard Monitoring Local R&D State, Sub-regional Public Awareness National Education Global Training Level Technology Transfer Supporting Activities
Source: Arya, A.S. (2004)
Rehabilitation Prevention Response
140
Disasters are the ultimate test of emergency response capability. The
ability to effectively deal with disasters is becoming relevant because of the
increasing risk factors. Increase in population density population shifts and
increasing technology are some of the important factors for increasing risks,
leading to disasters. As areas become more densely populated, there are
more potential victims when a disaster strikes. National disasters such as
earthquakes, hurricanes, cyclones, Tsunami, and floods tend to result in
greater losses due to densely populated areas in India. Another reason for
increasing disaster losses are that population density in disaster prone areas
is increasing. The increasing settlements development in high risk areas is
the cause of concern. The pattern of settlement in high risk areas is reflected
in the increasing mortality ratio in India. In the process of setting high risk
areas, natural protection against environmental threats is removed. In India,
the vegetative coverage and forests were destroyed in coastal areas for
promoting shrimp farming, business, and tourism and housing colonies.
This lead to damage of natural protection against hurricanes, and Tsunami
and ultimately Tsunami affected to the large population in coastal areas in
southern states recently. The vulnerability of people living in high risk areas
is increasing because the habitations are often unaware of potential risks and
how to deal with them. Even, the prices of land for house construction in
high risk areas are lower which attract people for housing construction, even
without proper approval of housing structures. People are living in
structures that are not designed to resist the forces of local hazards. In India,
earthquakes have affected severely due to lack of good design technology
and inadequate earthquake resistance housing and building structures. The
new technology is also adding to the list of disaster agents at an ever
increasing rate. A large quantity of hazardous chemicals, wastes, bio-
141
medical wastes, and dumping adds proliferation of high risk office buildings
and hotels that subject their inhabitants to fire threats not experienced
before. The society is also becoming more dependent on technology and
specialization, making more vulnerable to disaster. Our dependence on
computers is introducing a new form of disaster vulnerability.
In the context of ever increasing risks of disaster losses, it is
imperative to deal with these catastrophes with full preparedness and
planning. In disasters there are often conditions that may make the
traditional division of labour and resources, characteristics of routine
emergency management, unsuitable for disaster response. These are as
follows:
� Disaster may put demands on organizations, requiring them to
make internal changes in structure and delegation of
responsibilities;
� Disasters may create demands that exceed the capacities of single
organizations, requiring them to share tasks and resources with
other organizations that use unfamiliar procedures;
� Disaster may attract the participation of organization and individual
volunteers who usually do not respond to emergencies;
� Disasters may cross jurisdictional boundaries, resulting in multiple
organizations being faced with overlapping responsibilities;
� Disasters may create new tasks for which no organization has
traditional responsibility;
� Disasters may render unusable the normal tools and facilities used
in emergency response;
142
� Disasters may result in the spontaneous formation of new
organizations that did not exist before.
The typical response to a disaster includes multiple independent
organizations from the private sector as well as from agencies of city,
country, state, region and district governments. Disasters do not need to
cover large geographical areas in order to cross multiple levels of
government responsibility. However, disaster management is the only
responsibility of government. Community based organizations and NGOs
have to play a critical role in disaster management. Disasters are
characterized by great uncertainty. Often the character and extent of damage
and the secondary threats are not immediately apparent and therefore the
necessary counter measures not undertaken. Disasters often create the need
for different organizations to share resources. Therefore, coordination of
multi organizational task accomplishment is required. The needs such as
fuel and maintenance for vehicles, sanitary facilities, food, shelter and rest
facilities, relief and replacement, personnel and emergency message, contact
arrangement also are to be included in the logistic support of an organization
responding to a disaster. In contrast to daily emergencies, disasters often
call for large scale search and rescue operations. An important security task
in disasters is keeping unauthorized persons out of the disaster area in order
to prevent looting and decrease congestion hampering rescue efforts, and to
prevent persons from being injured in the wreckage. Moreover, mass
handling of the dead creates problems that may not have been faced in
routine emergencies. Handling the dead poses different problems in
disasters. The other tasks that are important in disaster response are:
143
� Warning and communicating with the public
� Shelter and feeding of displaced persons
� Evacuating neighborhoods
� Evacuating hospitals, prisons, nursing homes and psychiatric facilities
� Coordinating volunteers
� Acquiring and allocating unusual resources
� Dealing with mass arrival carcasses
� Dealing with livestock or family pets that had to be left behind or
sheltered
� Procedures for condemning damaged buildings
� Disposing of unclaimed valuable and merchandise found in the rubble
at the scene
� Control of air traffic
� Disposing of large amounts of donations
� Controlling emergency vehicle traffic in order to avoid blockage of
routes by emergency vehicles
� Checking the hospitals, nursing homes and day care centers that may
need assistance
� Prioritizing of utility sources delivery
Adequate communication is a recurring challenge in disaster response.
The importance of communication is its ability to get people to work
together on a common task or toward a common goal to coordinate. It is the
process by which each person understands that how his individual efforts
intermesh with those of others. The information is required for need
assessment and rescue operations. The most crucial types of information that
need to be shared are related to:
144
� An ongoing assessment of what the disaster situation is and what
disaster counter measures need to be undertaken;
� An ongoing determination of what resources are needed to undertake
the counters measure. What resources are presently available and
how they can be obtained;
� A determination of the priority of needed disaster counter measures;
� A determination of what persons and organizations will be responsible
for the various tasks necessary to accomplish the counter measures
Computers are not only useful for sharing and analyzing disaster
information, but also for sharing it. The internet facility may provide strong
base for efficient communications in the following measures:
� Sharing and collecting information about what agencies have
responded and what resources they have dispatched.
� Locating and specifying procedures for obtaining special disaster
resources;
� Sharing information about the location, scope, and character of the
disaster and damage that has resulted;
� Sharing information about the status of transportation routes facilities,
docking and landing sites;
� Generating and sharing predictions about weather and other expected
conditions;
� Obtaining information on how to deal with a specific hazardous
chemical;
� General electronic mail.
145
Thus, it is clear that the communication and equipments and procedures used
by most emergency agencies are established primarily to deal with
information flow within the organization. Disasters care for inter agency
communication also. To some extent, it can be facilitated by the availability
of inter-agency radio networks. However, the critical information
requirements of the various organizations involved in disaster response need
to be mutually understood and the responsibility for gathering and
disseminating it needs to be made clear.
Significantly, disasters pose problems for resource management. A
prerequisite to effective and efficient resource management is an accurate
system for overall analysis of the disaster situation and the available
resources. Overall, need, assessment, involves two major processes: (1)
situation analysis; and (2) resource analysis. Situation analysis is the
collection of information about the extent and character of the disaster itself
and problems that have to be tackled. While resource analysis involves the
collection of information about the resources needed to be handled. The
source allocation of disaster resources depends on the task priorities already
decided for the response of disaster.
In contrast to most routine emergencies, efficient response in disaster
requires procedures for triage and casualty distribution. Triage has been
called the key stone to mass causality management. The technique for
assigning priorities for treatment of the injured when resources are limited is
called triage. Generally, attention is given first to those with the most urgent
conditions and to those who are the most salvageable. The triage is
beneficial in disaster response due to the facts: (i) triage separates out those
146
who need rapid medical care to some life or lives, (ii) by separating out the
minor injuries; triage reduces the urgent burden on medical facilities and
organizations, (iii) by providing for the equitable and rationale distribution
of causalities among the available hospitals. Triage reduces the burden on
each to a manageable level, often even to non-disaster level. In order to
distribute casualties rationally among the hospitals, capacity assessment of
the existing hospitals, dispensaries and clinics need to be examined.
It is to be noted that convincing the public to evacuate areas
threatened by impending disaster is often challenging one. In disasters,
communication with the public assumes new dimensions not present in
routine emergencies. Warning can be one of the most important types of
disaster communication allowing the recipients to avoid the threat altogether
or to significantly lesson its effects. However, people are often reluctant to
evacuate the premises stricken by disaster. There are a number of reasons
why persons hesitate to evacuate in the face of threatening disaster. They
may not be convinced that they are actually at risk, they may wish to stay
and protect their property, or they may want to assure the safety of other
family members and property before leaving. Those living in disaster
threatened areas are more likely to evacuate if they are encouraged by
invitations from relatives and friends outside.
In the impact area people prefer to seek shelter with friends or
relatives rather than at public shelters. Importantly, the process of warning is
complicated since it requires the accomplishment of a number of tasks.
Jammed telephone lines and circuits as well as traffic congestion, make the
process more difficult.
147
Disaster response and preparedness is most effective when it is built
in to development programmes. In long run, disaster mitigation could be
implemented at nominal cost by incorporating them into development
programmes. The expenditure on disaster mitigation would reduce the
potential losses that disaster cause. Significantly, urban planning urgently
begs fundamental conceptual change, with a need for locating urban disaster
management strategies in a holistic framework embracing issues like
poverty, provision of institutional support for informal sector activities, over
urbanization, environmental degradation and unchecked consumerism etc.
A sound, effective and people centric urban disaster management strategy
can emerge only in the context of a truly sustainable, and people centric
development paradigm. Disaster management and mitigation be organized
around local recovery efforts. In an integrated disaster risk management
approach, activities from structural interventions to community based
disaster management, which reduces hazard and vulnerability, should be
coordinated. It is imperative to orient and train development agencies to
integrate disaster risk management into the national and local planning
process, thus mainstreaming disaster reduction into development
collaboration among the stakeholders is a critical strategy in disaster
reduction. It enhances complements the respective capabilities of concerned
sectors and organizations in the pursuit of development objectives.
2. Community Based Disaster Preparedness
Analyses of response to past disasters have highlighted reaching out to
the victims within the critical period during an emergency as a major
requirement to protect people and assets. This has resulted in developing
mechanisms to mitigate disasters at the grassroots level through participation
148
of communities. Communities being the first responder and having more
contextual familiarity with hazards and available resources are in better
position in planning and executing immediate rescue and relief actions. In
areas that have experienced repeated disasters, the communities are realizing
that they need to work out a plan to prevent losses and at the same time
enable faster recovery in the event of an emergency situation. To convert
this realization into an effective plan, they need guidelines which will help
them to prepare their own Community Based Disaster Management plans to
safeguard lives, livelihood and property.
The Community Based Disaster Preparedness (CBDP) planning
referred to in the following sections pertains to preparedness, mitigation and
response plans. The primary goal of CBDP is to reduce vulnerability of the
concerned community and strengthen its existing capacity to cope with
disasters. The approach of preparing the CBDP plans considers people's
participation a necessary pre-requisite for disaster management. By
involving the community in the preparedness phase, it not only increases the
likelihood of coordinated-action by the communities to help in mitigation
disasters but also brings the community together to address the issue
collectively. There are evidence of collective and coordinated action
yielding good results and to a great extent it has been effective in lessening
the impact of disaster.
In view of the above, the Government of India and United Nations
Development Programme reviewed various models of CBDP being
conducted in the country. Several entities have been supporting communities
in developing CBDP. The concept varies; for some, CBDP is getting the
149
communities organized to maintain a cyclone structure and having a well
developed evacuation plan. Similarly, the process followed also differs-
some organizations have been developing the plan and explaining
the components to the communities; other preferred to develop the plan with
the involvement of the communities. Most of these process remained outside
the Government system and it has the inherent danger of communities
forgetting the roles and responsibilities, especially if they did not have to use
the plan over a period of time.
Preparation of CBDP plans are being promoted under the GOI-UNDP
Disaster Risk Management programme in 169 districts in 17 states by
institutionalizing the process within the Government system, with the local
authorities playing a dominant role in partnership with other key
stakeholders. It is a scientific approach, tested in some pilot states and
covers all aspects of disaster management through a process involving
communities at risk. Recently the Government of India has decided to
launch a project in the remaining multi-hazard regions of the country.
3. Components of CBDP
(a) Disaster Management Committee: Village Disaster Management
Committee (VDMC) is formed in each village and it is responsible for
initiating disaster preparedness activities. It consists of local elected
representatives, grass root level Government functionaries, local Non-
Government Organizations (NGOs)/Community Based Organizations
(CBOs), members of youth groups such as the National Service Scheme
(NSS) and Nehru Yuva Kendra Sangatan (NYKS), women groups, youth
150
club members, grass root level Government functionaries, etc. The size of
VDMC is based on the population and need of the villagers. The head of the
VDMC takes a lead in mobilizing the community for the preparation of the
CBDP plans.
(b) Review & Analysis of Past Disasters: It refers to prioritizing disasters
based on its frequency and analysis of the estimated losses. This is an
important activity as it forms the basis for preparedness and mitigation
plans.
(c) Seasonality Calendar of Disasters: While analyzing the past experience
pertaining to various natural disasters, communities develop the seasonality
calendar based on the occurrence of disaster events. In the calendar below
prepared by the community show the month of occurrence of the disaster
and month for preparedness and mock drill.
(d) Mapping Exercise: One of the most important activities of the CBDP is
the mapping of risk, vulnerabilities and capacities of the village by the
community itself because it is considered to be a very simple and cost
effective tool to collect ground level data. This is done through Participatory
Rural Appraisal (PRA) exercise. Before the mapping exercise starts, the
community members first discuss among themselves, about the experience
of previous disasters they have faced or the disasters they may face in future.
It aims to provide a pictorial base to the planning process especially for the
semi- literate populace and ensures maximum community involvement
across gender, caste and other divides. It has also been found to be very
effective in raising awareness among the community and thereby enhancing
151
participation of the community in problem identification. The maps generate
awareness among the community about the avenues for smooth evacuation
during any imminent disaster. The strategy adopted is to use locally
available resources rather than depending on the external agencies for helps
and support. The villagers/community members are encouraged to draw the
maps on the ground using locally available materials such as stone, stand
and various colour powders for different items and indicators. The maps
drawn need not be to scale. The types of maps are as follows:
• Resource Map: Resource mapping focuses on identifying locally
available assets and resources that can be utilized for building the
capacities of the community during and after disasters. Apart from
infrastructure and funds, this could be individuals with specific skills,
local institutions and people's knowledge as all these have the capacity
to create awareness and bring about changes in the community. A
resource map is therefore not limited to a map depicting the available
resources but also plotting of the distribution, access and its use by
taking into consideration prevailing sensitiveness within the village.
• Risk and Vulnerability Map: In the vulnerability map the
community members have to identity the hazards that the village is
prone to and the possible areas that would be affected. They also
demarcate the low lying areas, areas near the water bodies such as the
sea and river, direction of wind, etc. Through this mapping exercise
the community members identify the location of groups at risk and the
assets that require protection from various hazards.
• Safe and Alternate Route Map: In a similar exercise, the villagers
identify safe areas such as strong houses/buildings, raised platforms
152
etc. These act as a shelter place for the people in the event of an
evacuation. It would be useful to identify the alternate approach routes
which could be used during the time of an emergency.
(e) Disaster Management Team
Village level Disaster Management Team (DMT)/Task Forces are
formed to outline coordinated response during crisis situations. DMTs have
sectoral focus such as early warning, shelter management, evacuation &
rescue, medical and first aid, water and sanitation, carcass disposal,
counseling, damage assessment and relief and coordination. Based on a
needs assessment of the teams, specialized training could be provided to the
members. DMT members would be linked to the existing service providers
for continuous training and discharging of their responsibilities effectively.
The roles and responsibilities of the DMTs are the following:
1. Early Warning Team: The members of this team are responsible for
providing latest warning information to the villager so that the
villagers get ample time to get prepared for the advent of the hazard.
At the time of the disaster the members of this team keep a track of
the developments. Emergency contact telephone numbers are
collected well in advance of the hazard season, tools such as radio,
television etc. are to be kept in working condition prior to the hazard
period. During the occurrence of the event, the team would be
responsible to inform every household of the latest position. They
would also keep a track of the situation and listen to the de-warning
messages to decide on the timing for calling off the emergency state.
153
2. Evacuation, Search and Rescue Team: Members of this task force
are mainly responsible to evacuate and carry out search and rescue
operation during the time of emergency. The members of this team are
mainly young men and women of the village, ex-service men;
swimmers, etc. Rescue kits necessary to carry out the activities of this
team would be ideally made locally with indigenous materials
available. These members are trained with the help of Civil Defense,
Police, Fire services etc.
3. Shelter Management Team: Members of this team takes care of the
identified shelter buildings in pre, during and post disaster scenario.
Care needs to be taken to stock necessary material such as food,
drinking water, medicines, bleaching powder, firewood, lantern, etc.
Special care needs to be taken for the animal stock during any
disaster. The team needs to ensure hygiene in and around the shelter
place. Women are generally active members of the shelter team as
they are well acquainted with house management, and are able to
manage shelter during emergency. The team leader or any other team
member should have the keys of the safe shelters so that prior to the
disaster they will clean up the place and make available the necessary
materials like food, water, medicines, bleaching powder, firewood,
lantern, etc. required for the evacuees during disaster period.
4. Water & Sanitation Team: Members of this team ensures
availability of safe drinking water and the cleanliness of the village so
that there is no danger of epidemics even after the event. They will
154
make arrangements for storing drinking water and water for cooking
and other chores.
5. Medical & First Aid Team: This specialized team is responsible for
preparing and updating the list of vulnerable population like old and
ailing people, pregnant ladies, children etc. They also have to procure
the necessary medicines before the hazard season and conduct a
routine check-up of the ailing people in the village. They have to
collect health related information and make the community aware of
the health measures to be taken up. Women and existing health
practitioners of the village are the members of this team. This team
would receive periodic training from the local medical (local health
centre) personnel.
6. Relief and Coordination Team: This team maintains the list of all
household members so that they can arrange or procure sufficient
quantity of food materials for each category of people. They are also
responsible for the distribution of relief materials. And in the post
disaster period they will make arrangements for getting relief
materials from the Block office. They should have the list of shops/
wholesale dealerships where food grains are available for use during
the time of emergency.
7. Carcasses Disposal Team: The team is responsible for the clearing of
carcasses (if any) after the disaster. They are exposed to different
types of carcasses disposal methods. The team should put in all their
effort to check spread of diseases by disposing of the carcasses at the
earliest and in the right manner.
155
8. Trauma Counseling Team: The existing relief system does not have
any provision for treatment of mental health, which enhances suicidal
cases after any major disaster. It has been seen that most of the
community members are traumatized due to loss of family members
and assets. After the large scale damages, it becomes difficult for
some of the victims to get back to normalcy. In such a situation, the
counseling team is responsible for counseling the victims to ease them
of their trauma.
9. Damage Assessment Team: With things getting better after the
disaster, the damage assessment team carries out an assessment of the
damaged houses, livelihood assets and crops etc. Usually a Govt.
functionary from the state Revenue Department carries out such
assessment after a particular period. During this exercise, the damage
assessment team helps him/her in making a timely and useful
assessment.
(f) Mock Drill: Mock drill is an integral part of the village CBDP plan, as it
is a preparedness drill to keep the community alert. Keeping this in view,
mock drills are organized in all villages to activate the DMTs and
modification of the DM plan based on the gaps identified during such
exercises. Basically this is a simulation exercise, which if practiced several
times, would help in improving the cohesiveness of the community during
an emergency.
(g) Identification of Hazard Specific Mitigation Activities: While
developing the CBDP, the villagers would develop a mitigation plan for
156
each hazard for long term planning. These could be coastal belt plantation,
cyclone shelter in cyclone prone areas, improved drainage system in low
lying areas, raising the platform of the community hall or school building
etc. All mitigation plans would be forwarded to higher authorities for
financial provision. It helps the community to minimize the loss, and
prevents the impact of various natural disasters. All community mitigation
plans are consolidated at Gram Panchayat (GP) level and become the part of
the respective GP developmental plan. The mitigation plans would
eventually be funded under the on-going development programmes in the
district, for which the District Magistrate/Collector is the nodal officer.
Disaster management committee at the district levels and the State Steering
Committee (a mechanism established at the state headquarters level) play a
major role in ensuring this.
h. Community Contingency Fund (CCF): Availability of resources for
various activities to be carried at different phases of the cycle is very crucial.
To meet this contingency, each household in the village would be motivated
to contribute resources which could be in the form of funds and/or food
grains, which becomes the grain bank for the village. A very nominal
amount based on the affording capacity of the inhabitants (households) is
collected and kept as the Community Contingency Fund or village
emergency fund. In the annual meeting they decide how to use this fund as
per the need and developmental plan of the village.
4. Preparation of CBDP Plan-Process
In order to ensure ownership by the community and to ensure reflection of
local conditions and sensitiveness, preparation of CBDP will have to be
157
through a participatory approach. Community based organizations and the
NGOs who have been working with communities are to be identified to
facilitate a PRA exercise. The process followed is listed below:
(a) Awareness Campaign: A massive awareness campaign is necessary to
support the community in preparation of the disaster management plans.
These campaign are carried out through various means like rallies, street
plays, competitions in schools, distribution of IEC materials, wall paintings
on do's and don'ts for various hazards. Meetings with key persons of a
village such as the village head, health worker, school teachers, elected
representatives and members of the youth clubs and women also motivate
the villagers to carry forward these plans for a safer living.
(b) Training of Gram Panchayat/Block Members: In several states of
India Gram Panchayat is the intermediary administrative unit between block
and village level, which has a vital link for disaster management activities. It
is the responsibility of the Gram Panchayat Disaster Management
Committee to supervise and guide the community in this process. Similarly
block is the administrative unit that executes all developmental programmes
in the rural areas, and has a very good linkage with upper level of
administration. Therefore, both levels of functionaries are very important to
ensure risk reduction as a part of the development programme. The district
level master trainers are responsible to train the functionaries of GP and
blocks before initiation of the activities at the village level.
(c) Identification of Village Volunteers and Training: One of the major
objective of CBDP process is to develop a cadre of trained human resources
at community level to carry out all disaster management and mitigation
158
initiatives. An innovative method is used in this programme to train at least
two persons as disaster management volunteers who, after being trained are
supporting the community in development of the village disaster
management plan. These volunteers are selected by the representatives of
local self-Government, block functionaries and CBOs. Most of the
volunteers are from local youth clubs, women self help groups or from
CBOs and belong to the same community.
(d) Training of PRI Members: The three tier Panchayat Raj System
(peoples' representatives) existing in India has laid down responsibilities of
elected local Government officials at various levels. To mainstream CBDP.
It is suggested to involve PRIs in the process to address the vulnerability
reduction initiatives through the developmental programme because they are
responsible for the local area's development. All PRIs are oriented by the
master trainers on disaster risk management initiatives and encouraged to be
involved to reduce the disaster impact. These oriented PRIs would help the
trained volunteers and community on disaster preparedness and
management. They are vital players in the disaster reduction programme and
help to sustain the same.
(e) Sensitization Meeting at Village/ Community Level: Village
sensitization meetings are organized with help of the representative of local
self-Government, trained volunteers, local NGOs etc. for the implementation
of disaster preparedness and mitigation initiatives. In some villages the
communities are ready for disaster management planning and other activities
in one meeting or in some places they require more efforts.
159
(f) Women Participation in Community Based Disaster Preparedness:
Women, children and old age people are the most vulnerable groups in any
emergency situation and need special attention and support. While preparing
the preparedness and response plan of a village, importance is laid on the
vulnerability of women and children. It gives equal opportunity to women
groups to participate in the preparedness and mitigation initiatives of the
village. Women are encouraged to be the members of shelter management,
search & rescue and first aid and water and sanitation DMTs. Special
trainings such as swimming, first aid etc. are organized to enhance the skills
of women DMTs to perform their duties better during the time of an
emergency. In formation of DMCs/DMTs, efforts are being given to ensure
30 percent membership for women to improve the local level planning and
response process. This would also provide equal opportunities to show their
capability, sincerity and dedication.
5. Linkages with Development Programmes:
The GOI-UNDP Disaster Risk Management programme primarily
focuses institutionalization of the CBDP process. While external support is
being provided to facilitate the plan preparation, the plans become an
integral part of the Government's development agenda. At the village level,
the disaster seasonality calendar prepared by the communities indicates the
appropriate timing for conducting mock drills, which helps the community
and authorities to remind various groups their roles and responsibilities.
Some of the measures that are being promoted to ensure sustainability and
institutionalization are as follow:
160
• Approval of DM plan by the Development Committee at district level to
mainstream the vulnerability reduction activities. All DM plans are the
integral part of the developmental plan of villages as per the Government
instruction.
• DM plan, DMC and DMTs are recognized by the Government
institutions as an integral part of the disaster preparedness and mitigation
process.
• Priority is given to the need of the area while developing the
development plan of the Gram Panchayat by the community. Utilisation
of GP fund for mitigation activities and capacity building of DMTs is
encouraged. Special provision for disaster preparedness activities is being
made in fund allocation by the Government at various levels.
• It is the Gram Panchayats' responsibility to guide the villagers on
development of disaster preparedness plan and after its completion on the
compilation of all village plans at the GP level. In a similar way GP
Mitigation Plans are consolidated at block level, which ultimately
become the block mitigation plan. Now Gram Panchayats are responsible
for development programme as well as disaster management progrmme.
Thus the govt. has decentralized the process of disaster preparedness and
mitigation.
• The existing government service providers are used for up grading the
knowledge and skills of GP DMTs and village DMTs. Training
institutions are strengthened for a comprehensive training programme of
DMCs and DMTs before the hazard season.
• Trained volunteers, CBOs and NGOs are based at grass root level and
make the process sustainable.
161
The process of preparation of CBDP plans through a participatory
process, institutionalization of risk management as well as linking it to the
overall developmental planning process could be ensured only with capacity
enhancement of the stakeholders. Simultaneously, there is a need to create
large scale awareness about various options of development process which
reduces risks. These cannot be a one-time activity. The chart below outlines
some of the essential tools at various stages that would ensure sustainability
of community based disaster management.
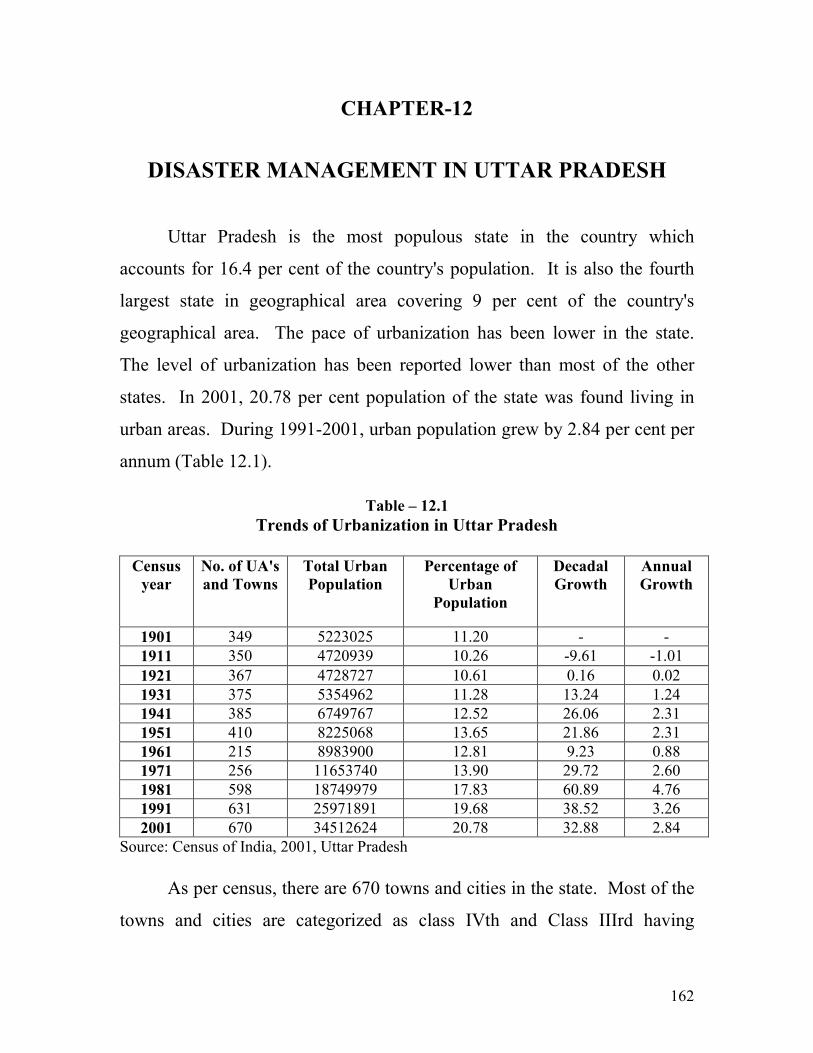
162
CHAPTER-12
DISASTER MANAGEMENT IN UTTAR PRADESH
Uttar Pradesh is the most populous state in the country which
accounts for 16.4 per cent of the country's population. It is also the fourth
largest state in geographical area covering 9 per cent of the country's
geographical area. The pace of urbanization has been lower in the state.
The level of urbanization has been reported lower than most of the other
states. In 2001, 20.78 per cent population of the state was found living in
urban areas. During 1991-2001, urban population grew by 2.84 per cent per
annum (Table 12.1).
Table – 12.1
Trends of Urbanization in Uttar Pradesh
Census
year
No. of UA's
and Towns
Total Urban
Population
Percentage of
Urban
Population
Decadal
Growth
Annual
Growth
1901 349 5223025 11.20 - -
1911 350 4720939 10.26 -9.61 -1.01
1921 367 4728727 10.61 0.16 0.02
1931 375 5354962 11.28 13.24 1.24
1941 385 6749767 12.52 26.06 2.31
1951 410 8225068 13.65 21.86 2.31
1961 215 8983900 12.81 9.23 0.88
1971 256 11653740 13.90 29.72 2.60
1981 598 18749979 17.83 60.89 4.76
1991 631 25971891 19.68 38.52 3.26
2001 670 34512624 20.78 32.88 2.84
Source: Census of India, 2001, Uttar Pradesh
As per census, there are 670 towns and cities in the state. Most of the
towns and cities are categorized as class IVth and Class IIIrd having
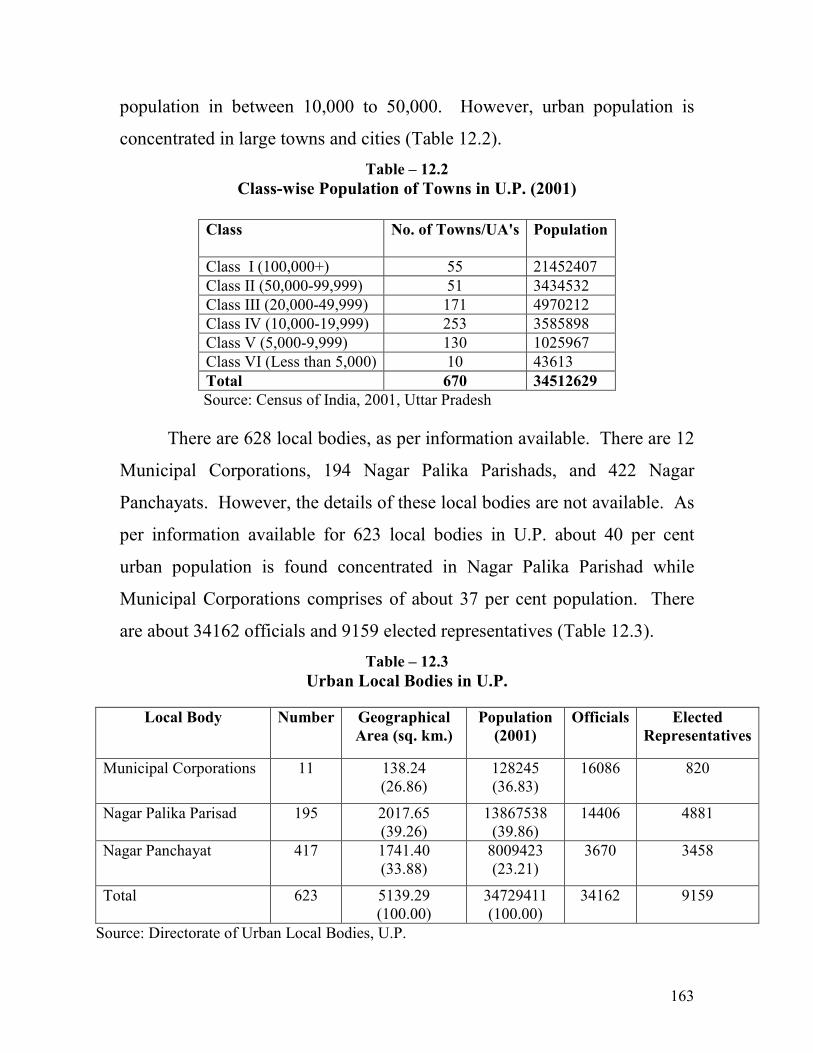
163
population in between 10,000 to 50,000. However, urban population is
concentrated in large towns and cities (Table 12.2).
Table – 12.2
Class-wise Population of Towns in U.P. (2001)
Class No. of Towns/UA's Population
Class I (100,000+) 55 21452407
Class II (50,000-99,999) 51 3434532
Class III (20,000-49,999) 171 4970212
Class IV (10,000-19,999) 253 3585898
Class V (5,000-9,999) 130 1025967
Class VI (Less than 5,000) 10 43613
Total 670 34512629
Source: Census of India, 2001, Uttar Pradesh
There are 628 local bodies, as per information available. There are 12
Municipal Corporations, 194 Nagar Palika Parishads, and 422 Nagar
Panchayats. However, the details of these local bodies are not available. As
per information available for 623 local bodies in U.P. about 40 per cent
urban population is found concentrated in Nagar Palika Parishad while
Municipal Corporations comprises of about 37 per cent population. There
are about 34162 officials and 9159 elected representatives (Table 12.3).
Table – 12.3
Urban Local Bodies in U.P.
Local Body Number Geographical
Area (sq. km.)
Population
(2001)
Officials Elected
Representatives
Municipal Corporations 11 138.24
(26.86)
128245
(36.83)
16086 820
Nagar Palika Parisad 195 2017.65
(39.26)
13867538
(39.86)
14406 4881
Nagar Panchayat 417 1741.40
(33.88)
8009423
(23.21)
3670 3458
Total 623 5139.29
(100.00)
34729411
(100.00)
34162 9159
Source: Directorate of Urban Local Bodies, U.P.
164
The 74th Amendment Act of the Constitution opened a new chapter in
the process of decentralized governance. The Uttar Pradesh Local Self
Government Laws (Amendment) Act, 1994 was passed in May, 1994. The
changes in relation to the Conformity Act were mainly in composition of
municipalities, reservation, election process, functional domain, and
devolution of powers and finances. Besides the civic services functions,
municipalities being local governments also perform several statutory and
regulatory roles which strictly do not fall within their own functional domain
but fall within the functional domain of state government. In the state all the
functions as envisaged by the Twelfth Schedule are being performed by
urban local bodies except the functions as enurmated at item No.1, 2, 3 and 7
of twelfth Schedule. Significantly, the state has formulated a strategy of
introducing innovative Policy and legislative changes and implementing
multifaceted institutional and financial capability building reforms for urban
local bodies.
In the state of Uttar Pradesh flood damages have been heavy and
increasing, both dimensionally and impact wise. The eastern Uttar Pradesh
is flood prone area and witnesses' regular floods, causing severe losses to
crops, cattle, human lives and properties (Table 12.4 & 12.5).
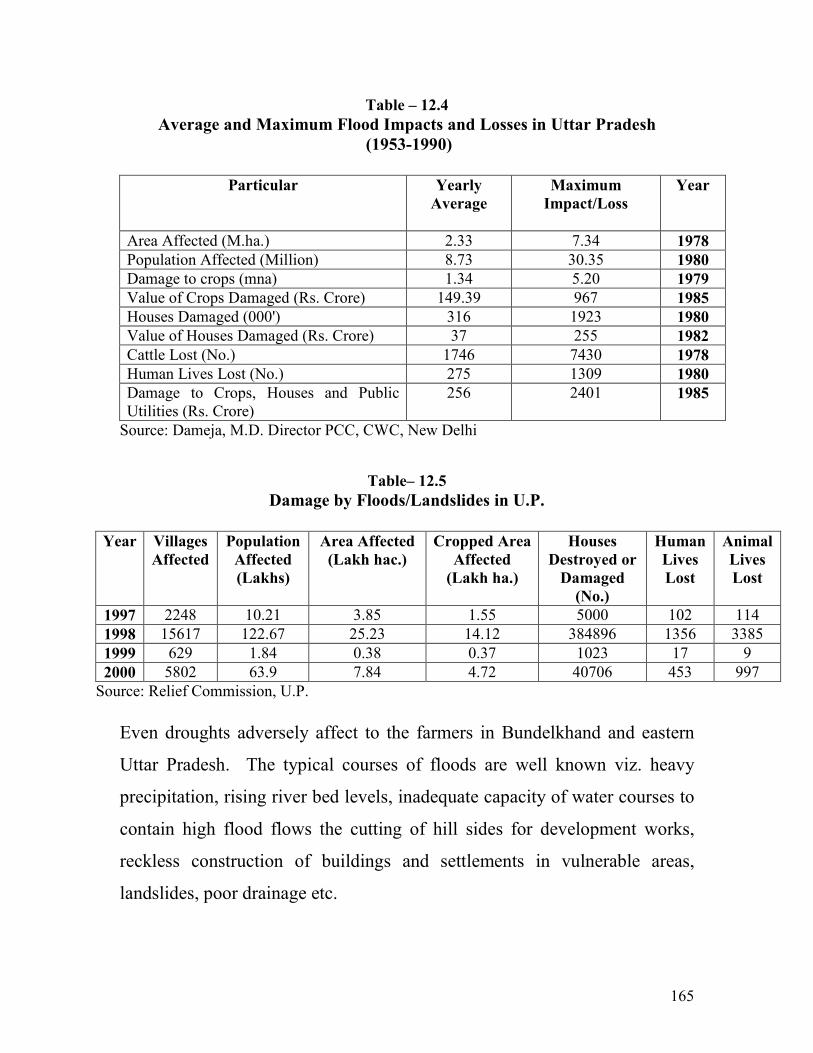
165
Table – 12.4
Average and Maximum Flood Impacts and Losses in Uttar Pradesh
(1953-1990)
Particular Yearly
Average
Maximum
Impact/Loss
Year
Area Affected (M.ha.) 2.33 7.34 1978
Population Affected (Million) 8.73 30.35 1980
Damage to crops (mna) 1.34 5.20 1979
Value of Crops Damaged (Rs. Crore) 149.39 967 1985
Houses Damaged (000') 316 1923 1980
Value of Houses Damaged (Rs. Crore) 37 255 1982
Cattle Lost (No.) 1746 7430 1978
Human Lives Lost (No.) 275 1309 1980
Damage to Crops, Houses and Public
Utilities (Rs. Crore)
256 2401 1985
Source: Dameja, M.D. Director PCC, CWC, New Delhi
Table– 12.5
Damage by Floods/Landslides in U.P.
Year Villages
Affected
Population
Affected
(Lakhs)
Area Affected
(Lakh hac.)
Cropped Area
Affected
(Lakh ha.)
Houses
Destroyed or
Damaged
(No.)
Human
Lives
Lost
Animal
Lives
Lost
1997 2248 10.21 3.85 1.55 5000 102 114
1998 15617 122.67 25.23 14.12 384896 1356 3385
1999 629 1.84 0.38 0.37 1023 17 9
2000 5802 63.9 7.84 4.72 40706 453 997
Source: Relief Commission, U.P.
Even droughts adversely affect to the farmers in Bundelkhand and eastern
Uttar Pradesh. The typical courses of floods are well known viz. heavy
precipitation, rising river bed levels, inadequate capacity of water courses to
contain high flood flows the cutting of hill sides for development works,
reckless construction of buildings and settlements in vulnerable areas,
landslides, poor drainage etc.
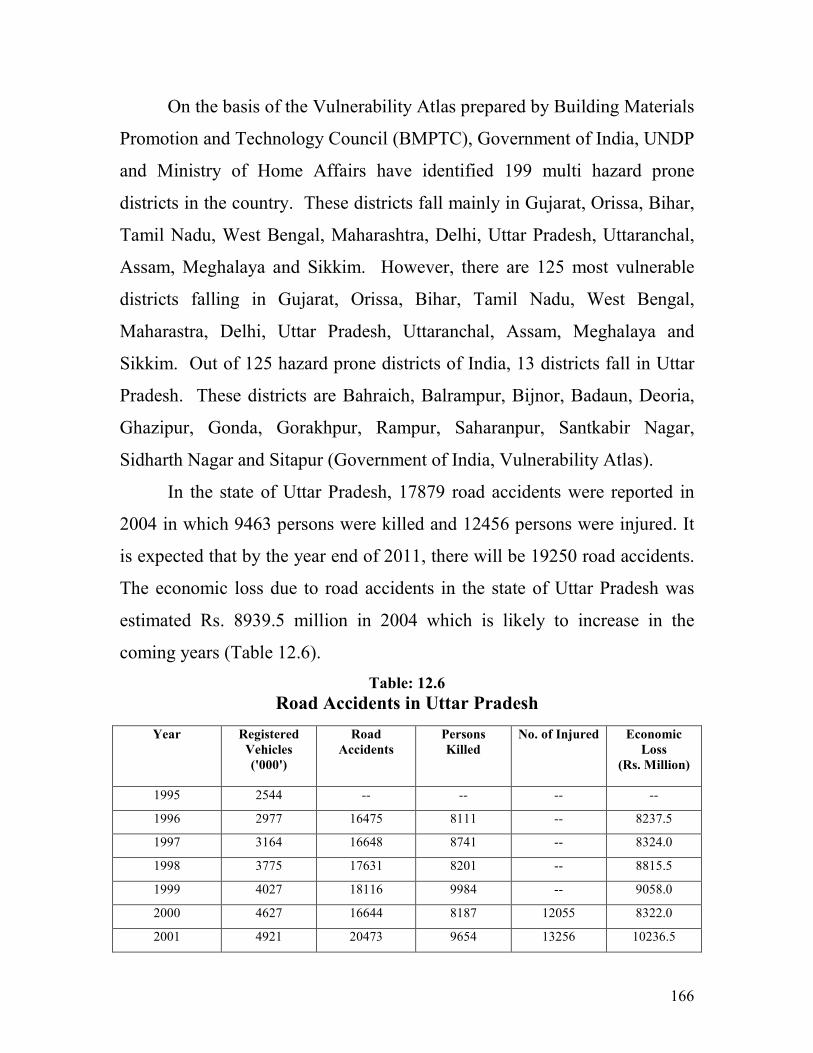
166
On the basis of the Vulnerability Atlas prepared by Building Materials
Promotion and Technology Council (BMPTC), Government of India, UNDP
and Ministry of Home Affairs have identified 199 multi hazard prone
districts in the country. These districts fall mainly in Gujarat, Orissa, Bihar,
Tamil Nadu, West Bengal, Maharashtra, Delhi, Uttar Pradesh, Uttaranchal,
Assam, Meghalaya and Sikkim. However, there are 125 most vulnerable
districts falling in Gujarat, Orissa, Bihar, Tamil Nadu, West Bengal,
Maharastra, Delhi, Uttar Pradesh, Uttaranchal, Assam, Meghalaya and
Sikkim. Out of 125 hazard prone districts of India, 13 districts fall in Uttar
Pradesh. These districts are Bahraich, Balrampur, Bijnor, Badaun, Deoria,
Ghazipur, Gonda, Gorakhpur, Rampur, Saharanpur, Santkabir Nagar,
Sidharth Nagar and Sitapur (Government of India, Vulnerability Atlas).
In the state of Uttar Pradesh, 17879 road accidents were reported in
2004 in which 9463 persons were killed and 12456 persons were injured. It
is expected that by the year end of 2011, there will be 19250 road accidents.
The economic loss due to road accidents in the state of Uttar Pradesh was
estimated Rs. 8939.5 million in 2004 which is likely to increase in the
coming years (Table 12.6).
Table: 12.6
Road Accidents in Uttar Pradesh
Year Registered
Vehicles
('000')
Road
Accidents
Persons
Killed
No. of Injured Economic
Loss
(Rs. Million)
1995 2544 -- -- -- --
1996 2977 16475 8111 -- 8237.5
1997 3164 16648 8741 -- 8324.0
1998 3775 17631 8201 -- 8815.5
1999 4027 18116 9984 -- 9058.0
2000 4627 16644 8187 12055 8322.0
2001 4921 20473 9654 13256 10236.5
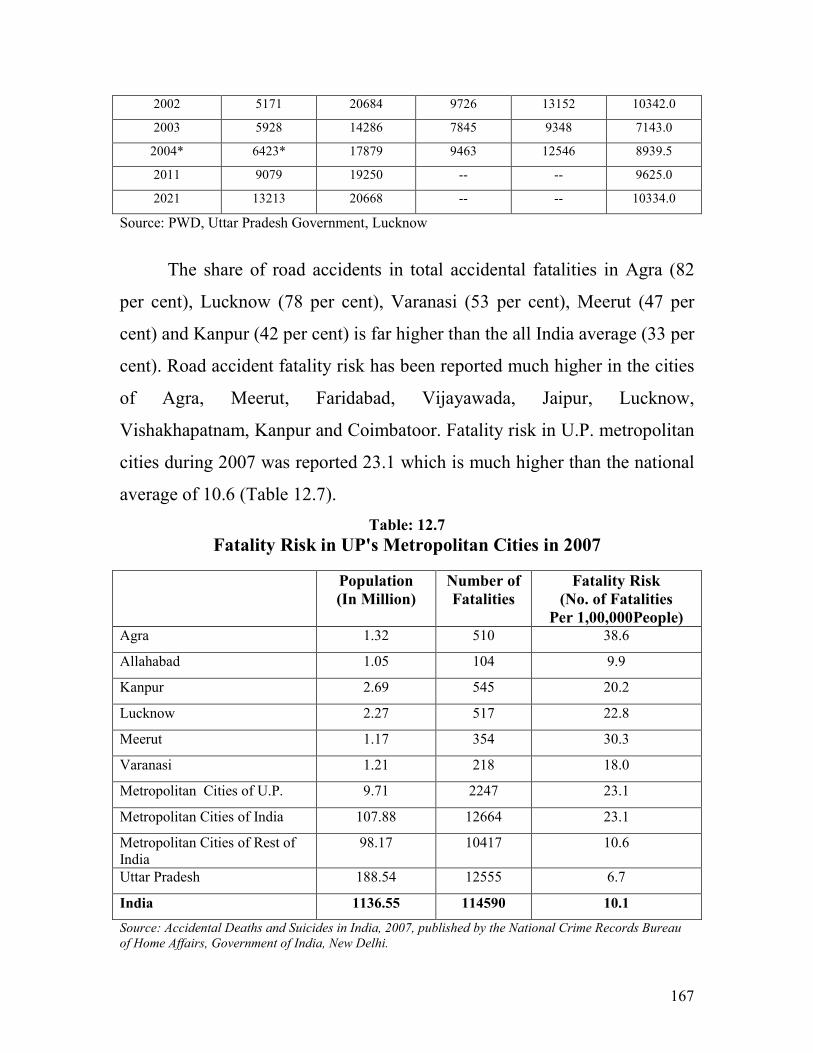
167
2002 5171 20684 9726 13152 10342.0
2003 5928 14286 7845 9348 7143.0
2004* 6423* 17879 9463 12546 8939.5
2011 9079 19250 -- -- 9625.0
2021 13213 20668 -- -- 10334.0
Source: PWD, Uttar Pradesh Government, Lucknow
The share of road accidents in total accidental fatalities in Agra (82
per cent), Lucknow (78 per cent), Varanasi (53 per cent), Meerut (47 per
cent) and Kanpur (42 per cent) is far higher than the all India average (33 per
cent). Road accident fatality risk has been reported much higher in the cities
of Agra, Meerut, Faridabad, Vijayawada, Jaipur, Lucknow,
Vishakhapatnam, Kanpur and Coimbatoor. Fatality risk in U.P. metropolitan
cities during 2007 was reported 23.1 which is much higher than the national
average of 10.6 (Table 12.7).
Table: 12.7
Fatality Risk in UP's Metropolitan Cities in 2007
Population
(In Million)
Number of
Fatalities
Fatality Risk
(No. of Fatalities
Per 1,00,000People) Agra 1.32 510 38.6
Allahabad 1.05 104 9.9
Kanpur 2.69 545 20.2
Lucknow 2.27 517 22.8
Meerut 1.17 354 30.3
Varanasi 1.21 218 18.0
Metropolitan Cities of U.P. 9.71 2247 23.1
Metropolitan Cities of India 107.88 12664 23.1
Metropolitan Cities of Rest of
India
98.17 10417 10.6
Uttar Pradesh 188.54 12555 6.7
India 1136.55 114590 10.1
Source: Accidental Deaths and Suicides in India, 2007, published by the National Crime Records Bureau
of Home Affairs, Government of India, New Delhi.
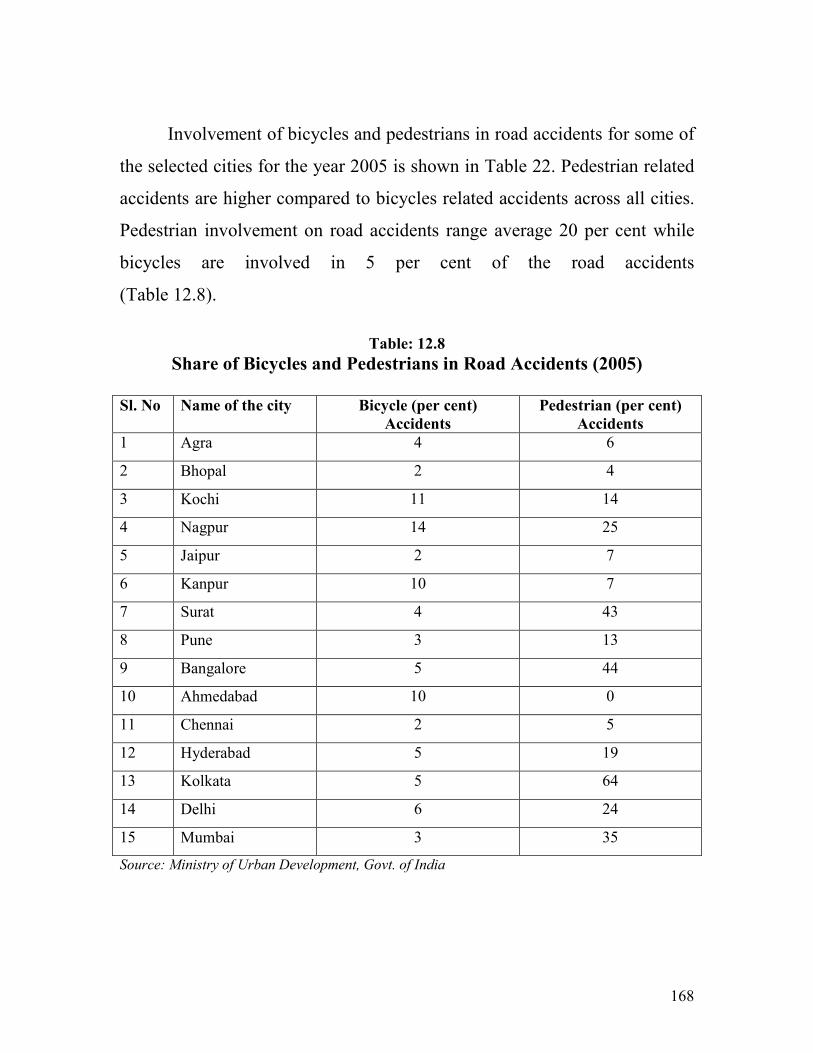
168
Involvement of bicycles and pedestrians in road accidents for some of
the selected cities for the year 2005 is shown in Table 22. Pedestrian related
accidents are higher compared to bicycles related accidents across all cities.
Pedestrian involvement on road accidents range average 20 per cent while
bicycles are involved in 5 per cent of the road accidents
(Table 12.8).
Table: 12.8
Share of Bicycles and Pedestrians in Road Accidents (2005)
Sl. No Name of the city Bicycle (per cent)
Accidents
Pedestrian (per cent)
Accidents
1 Agra 4 6
2 Bhopal 2 4
3 Kochi 11 14
4 Nagpur 14 25
5 Jaipur 2 7
6 Kanpur 10 7
7 Surat 4 43
8 Pune 3 13
9 Bangalore 5 44
10 Ahmedabad 10 0
11 Chennai 2 5
12 Hyderabad 5 19
13 Kolkata 5 64
14 Delhi 6 24
15 Mumbai 3 35
Source: Ministry of Urban Development, Govt. of India
169
One of the most crucial needs is the provision of improved rights of
way for pedestrians and cyclists. Throughout the world, these non-motorized
travelers are among the most vulnerable roadway users. Thus, Western
European cities generally provide them with a wide range of separate
facilities such as wide sidewalks (pavements), crosswalks, cycle paths,
ped/bike traffic signals, intersection modifications (bulb-outs, raised surface,
special lighting), car-free zones, and traffic-calmed neighborhoods. By
comparison, Indian government officials and planners have largely ignored
non-motorists— although they account for about half of all trips made—and
thus expose them to intolerably high levels of traffic danger. It is very rare
indeed to find any special provisions for pedestrians and Cyclists. While
narrow roads, densely built central cities, and lack of funding obviously
hinder the allocation of scarce roadway space to cyclists and pedestrians, the
real problem is government priorities that favor motorized traffic. Since the
powerful elite are more likely to drive private cars, they have strongly
favored highway projects over improvements for pedestrians and cyclists.
Policy makers rarely consider the needs of the non-motorized urban poor.
Thus, it is clear that the communication and equipments and
procedures used by most emergency agencies are established primarily to
deal with information flow within the organization. Disasters care for inter
agency communication also. To some extent, it can be facilitated by the
availability of inter-agency radio networks. However, the critical
information requirements of the various organizations involved in disaster
response need to be mutually understood and the responsibility for gathering
and disseminating it needs to be made clear.
170
In the impact area people prefer to seek shelter with friends or
relatives rather than at public shelters. Importantly, the process of warning
is complicated since it requires the accomplishment of a number of tasks.
Jammed telephone lines and circuits as well as traffic congestion, make the
process more difficult.
171
HAPTER-13
BUILDING A NEW TECHNO-LEGAL REGIME
Building Regulations/Bye-laws provide the mandatory techno-legal
framework for regulating building activity from planning, design to
completion of construction. Mainly such laws are State Legislations as the
State is competent to legislate and make laws on such subjects. However,
where the Central Government is to legislate on such subjects and where
Parliament is to make law in this behalf such legislations are applicable in
the Union Territories. Central laws are advisory and recommendatory in
nature. Taking this legislation as Model, other State Governments formulate
the rules and regulations with the help of local bodies, under the various
legislations. After the approval, the concerned local bodies enforce these
rules and regulations pertaining to development and building standards as
building regulations/building bye-laws in their respective areas.
Authorities for Controlling Development
To regulate the growth of urban areas, the State Governments notify
areas for planned growth under certain laws. These are notified under
relevant Planning and Development Act. State Government formulates the
rules and regulations with the help of the local bodies under the various
legislations. After the approval, the concerned local bodies enforce these
rules and regulations pertaining to development and building standards as
building regulations/building bye-laws in their respective areas.
172
Central Legislation/Guidelines
Model Town and Country Planning Act, 1960
The Town and Country Planning Organization (TCPO), which is an
organization of Central Government to deal with the subject of planning
(regional, urban and rural) and developmental policies, formulated a Model
Town and Country Planning Act in the year 1960. The Model Act provides
as follows:
a. Provision for preparation of comprehensive Master Plan for urban
areas of various states. The states may adopt the Model legislation
with suitable modifications for this purpose.
b. To constitute a Board to advise and to coordinate in the matter of
planning and plan formulation by the Local Planning Authorities in
the State.
c. Provisions for implementation and enforcement of the Master Plans
the miscellaneous provisions to achieve planned urban growth of
various urban areas in the state.
National Building Code
National Building Code prepared by the Bureau of Indian Standards in
1970 and subsequent revisions are advisory in nature and not mandatory.
The various provisions in the Codes are framed by a panel of experts
keeping other standards in view. It lays down a set of minimum provisions
designed to protect the safety of the public with regard to structural
sufficiency, fire hazards and health aspects in buildings. So long these basic
requirements are made, the choice of materials, methods of design and
construction is left to the ingenuity of the architect and the engineers and
173
other experts engaged in such projects. The code also covers aspects of
administrative requirements and bye-laws including building services.
State Level Legislation
The planning and development are mainly the State subjects and
therefore, the development in the State is based on the legislative support as
applicable in that State. The legislative support in the state is applicable to
formulate Master Plans, Zonal Plan, Development Plans and Development
Schemes and for their implementation and enforcement.
Legislative Support at the Local Level
At the local level, the Municipal Authorities and Panchayat regulate
the development/construction of building through the building
regulation/building bye-laws as followed in their respective areas. The State
Government from time to time issues directions/guidelines for safety against
natural hazards, which are followed by local bodies while granting
permission for construction of buildings/structures.
Initiative Taken to Strengthen Legislative Framework
The State Government have based their legislation, regulation and
bye-laws on the guidelines issued by the Central Government. Post disaster
studies of some of the devastating earthquakes like Uttarkashi Earthquake
(M-6.6) in October 1991, Killari earthquake (M-6.3) 1993, Chamoli
Earthquake (M-6.8) in March 1999 and Kutchch Earthquake (M-6.9) in
January 2001 showed the need for planning and engineering intervention in
174
development plan, design and construction of buildings to make them strong
enough to withstand the impact of natural hazards and to impose restrictions
on land use so that the exposure of the society to the hazard situation is
avoided or minimized. Due to lack of adequate or no land sue restrictions in
the hazard prone areas in the town and country planning laws, Master Plan
rules or bye-laws, cities tend to expand in all directions, occupying even
most vulnerable areas resulting in vulnerability of more and more areas
getting threatened by natural hazards. Realizing this urgent need was felt for
establishing a proper techno-legal regime through appropriate provisions for
safety against natural hazards.
The Expert Committee constituted by the Ministry of Home Affairs
studied the existing guidelines Acts, Regulations, Development Control
Rules and Bye-laws and prepared a Model Building Regulations to enable
the States in Seismic Zones III, IV and V (based on M. M. Intensities VII,
VIII and IX or more respectively) to adopt them for safety against natural
hazards. Recommendations for amendment in Model Town & Country
Planning Act, 1960 and Model Regional & Town Planning and
Development law, 1985 cover the following aspects:
� Addition of definition of Natural Hazard, Natural Hazard Prone
Areas, Natural Disaster and Mitigation
� To keep in view natural hazard proneness in preparation of
Development Plans by Local Planning Authorities
� Due consideration to follow the Regulations pertaining to Land use
Zoning and necessary protection measures in perspective and
Development Plan of State, district and local planning areas
� Existing map(s) to indicate hazard provisions of the areas
175
Regulations for Land Use Zoning for Natural Hazard Prone Areas
The regulations for land use zoning for natural hazard prone areas are
notified under Town and Country Planning Act as applicable in the
respective States as and when Master Plan/Development Plan of different
cities/towns/areas are formulated. These zoning regulations are implemented
through the provisions of Development Control Regulation/Building Bye-
laws, wherever the Master Plan are not in existence or not formulated.
Classification of urban land use is based on the sequences of various plans as
shown below:
Perspective Plan - Policy document
Development Plan - Comprehensive plan indicating use of each
Parcel of land
Layout of Projects - For detailed layout of projects/schemes
The main purpose of the land use zoning is to provide regulations for
development of a particular area to serve the desired purpose efficiently and
to preserve its character. It also provides for the kind of buildings to be
constructed. Zoning regulations are legal tools for guiding the use of land
and protection of public health, welfare and safety. Such regulations also
include provisions for the use of premises/property and limitations upon
shape, size and type of buildings that are constructed. or occupy the land.
These provide both horizontal as well as vertical use of land and also
improve the quality of life in urban areas.
This includes:
• Definition of natural hazard, natural hazard prone areas, natural
disaster, mitigation.
176
• Identification of natural hazard prone areas with respect to
earthquakes, cyclones, floods and landslides
• Specific recommendations for land use zoning for earthquake,
landslide, cyclones and flood areas
• Protection measures of building of essential services and installations
from natural hazards in hazard prone areas
• Prioritization of types of building for land use zoning:
(i) Defense installation, industries, public utilities, life line
structures like hospitals, electricity installations, water supply,
telephone exchange, aerodromes and railway stations;
commercial centers, libraries, other buildings or installations
with contents of high economic value.
(ii) Public and Semi Public institutions, Government offices, and
residential areas.
(iii) Parks play grounds, wood lands, gardens, green belts, and
recreational areas.
• Regulation for land use zoning shall be an over riding effect on any
other regulation.
• For any relaxation, adoption of safe guard and protective measures to
the satisfaction of the Competent Authority will be incumbent on the
part of user.
• Additional provisions with regard to land use zoning for natural
hazard areas are suggested in Model Planning Legislation.
State Governments have been advised to suitably incorporate the
modification in their respective Planning Legislation (s), so that regulation
177
for land use zoning for natural hazard prone areas may be notified by the
competent authority under the above legal provision.
Additional Provisions in Development Control Regulations
Development Control Regulations and Bye-laws
To regulate development within the framework of a development plan
regulation, known as development promotion regulation prescribed as a part
of the development plan. The basic purpose of such regulations is to promote
quality of life of people by organizing the most appropriate development of
land in accordance with the developmental policies and the land use
proposals contained therein.
• Registration preferred - Registration, qualification and duties of
professional defined.
• In order to bring professionalism in all development and construction
work, especially with respect to safety against natural hazards,
registration of the following professionals have been recommended
mandatory requirement.
(i) Structural engineer - qualification and experience defined on
the basis of types and importance of structures
(ii) Engineers
(iii) Construction Engineer (RCE)
(iv) Construction Management Agency-owner shall be a RCE
(v) Quality Auditor
(vi) Architect
(vii) Geotechnical Agency
(viii) Town Planner
178
(ix) Developer
• The owner/developer shall appoint the professionals from the
registered professionals from the registered professionals and will
submit a list of professionals on Record with the application for
development permission to the Competent Authority.
• Indication of designation and registration number of each professional
on every plan, document prepared by him/her made compulsory.
• Structural engineer on Record and Architect on Record shall be
responsible for adhering to the provision of the relevant and prevailing
Indian Standards.
• Procedure for securing Development Permission requires certificate of
undertaking in the prescribed form by the Owner, Developer,
Structural Engineer on Record and Architect on Record and
Construction Engineer on Record regarding the mandatory application
of all structural safety regulations including safety from natural
hazards in both design and construction of the buildings.
• Adequate protection clause for land liable to liquefaction, storm surge
and landslide.
• For adequate record and checking compulsory submission of detailed
working drawing/structural drawing along with soil investigation
report before the commencement of the work.
• For Structural Design details of various National Standards/Codes
relating to structural safety from natural hazards as listed below have
been included for guidance of the professionals to design the
structures/buildings, keeping in view the provision of such codes
against different hazards.
179
Structural Design Basis Report
To ensure the compliance of various codes, Structural Engineer on
Record is required to submit Structural Design Basis Report in prescribed
proforma for applicable type of structure. Design Basis Report format for
Load Bearing Buildings. Reinforced concrete framed building and structural
steel, interalia, include essential elements of design required for safety
against hazard. In compliance of the design with the above Indian Standard,
the Structural Engineer on Record will submit a Structural Design Basis
Report in the prescribed Proforma covering the essential safety requirements
specified in the Standard.
Seismic Strengthening of Existing Building
Prior to seismic strengthening/ retrofitting of any existing structure,
evaluation of the existing structure as regards structural vulnerability in the
specified wind/ seismic hazard zone shall be carried out by a Registered
Structural Engineer (RSE) / Registered Structural Design Agency (RSDA).
If as per the evaluation of the RSE / RSDA the seismic resistance is assessed
to be less than the specified minimum seismic resistance in the note below,
action will be initiated to carry out the upgrading of the seismic resistance of
the building as per applicable standard guidelines.
Review of Structural Design
Provision for proof checking of design by a Senior Structural
Engineer selected from the Structural Design Review Panel registered with
the Authority has also been introduced.
180
Supervision
All construction except load bearing building up to 3 storeys shall be
carried out under supervision of Construction Engineer or Construction
Management Agency on Record.
Quality Control and Inspection
To ensure proper quality, it is recommended that all the construction
for high rise buildings higher than seven storeys, public buildings and
special structures shall be carried out under quality inspection programme
prepared and implemented under Quality Auditor on Record or Quality
Auditor Agency on Record in seismic zone IV and V.
Inspection
The Indian standers/codes relating to structural safety from natural
hazards are shown in chart 12.1
Generally all development work for which permission is required shall be
subject to inspection by competent Authority as deemed fit.
The applicant shall keep a board at site of development mentioning the
survey No, city survey No, Block No, Final Plot No., Sub Plot No., etc. with
names of owner, the Architect, the Structural Engineer, the construction
Engineer as Recorded with the competent Authority for the project.
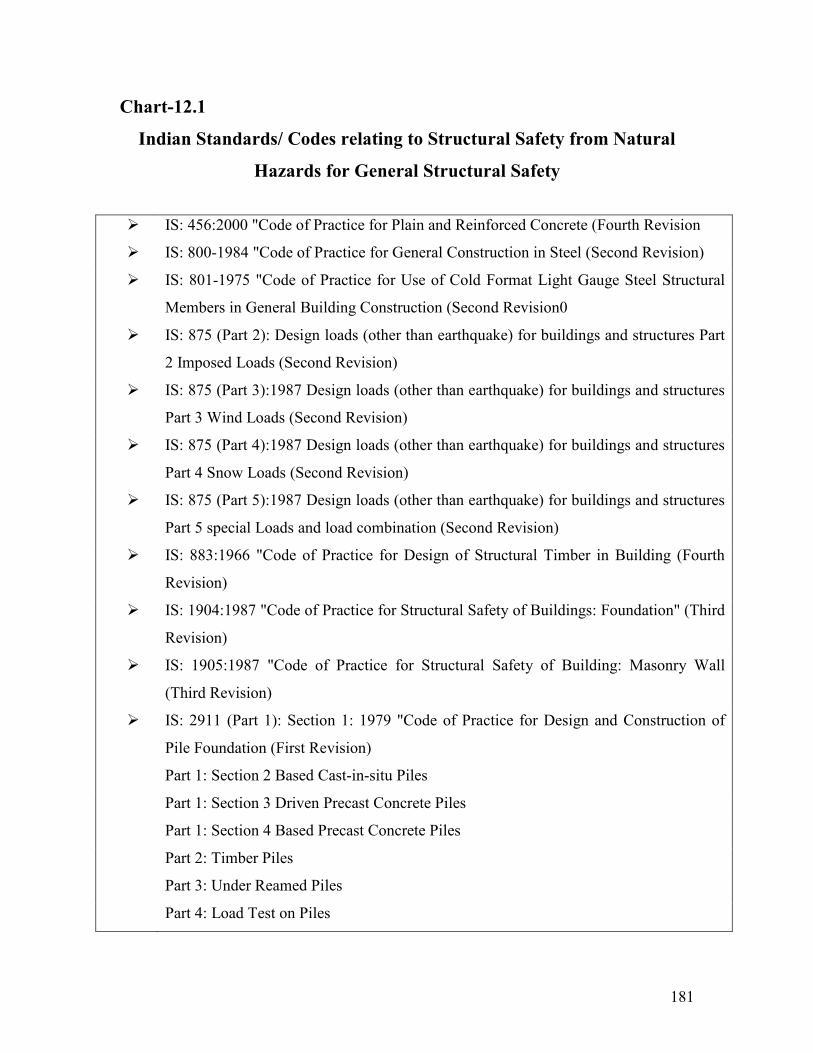
181
Chart-12.1
Indian Standards/ Codes relating to Structural Safety from Natural
Hazards for General Structural Safety
� IS: 456:2000 "Code of Practice for Plain and Reinforced Concrete (Fourth Revision
� IS: 800-1984 "Code of Practice for General Construction in Steel (Second Revision)
� IS: 801-1975 "Code of Practice for Use of Cold Format Light Gauge Steel Structural
Members in General Building Construction (Second Revision0
� IS: 875 (Part 2): Design loads (other than earthquake) for buildings and structures Part
2 Imposed Loads (Second Revision)
� IS: 875 (Part 3):1987 Design loads (other than earthquake) for buildings and structures
Part 3 Wind Loads (Second Revision)
� IS: 875 (Part 4):1987 Design loads (other than earthquake) for buildings and structures
Part 4 Snow Loads (Second Revision)
� IS: 875 (Part 5):1987 Design loads (other than earthquake) for buildings and structures
Part 5 special Loads and load combination (Second Revision)
� IS: 883:1966 "Code of Practice for Design of Structural Timber in Building (Fourth
Revision)
� IS: 1904:1987 "Code of Practice for Structural Safety of Buildings: Foundation" (Third
Revision)
� IS: 1905:1987 "Code of Practice for Structural Safety of Building: Masonry Wall
(Third Revision)
� IS: 2911 (Part 1): Section 1: 1979 "Code of Practice for Design and Construction of
Pile Foundation (First Revision)
Part 1: Section 2 Based Cast-in-situ Piles
Part 1: Section 3 Driven Precast Concrete Piles
Part 1: Section 4 Based Precast Concrete Piles
Part 2: Timber Piles
Part 3: Under Reamed Piles
Part 4: Load Test on Piles
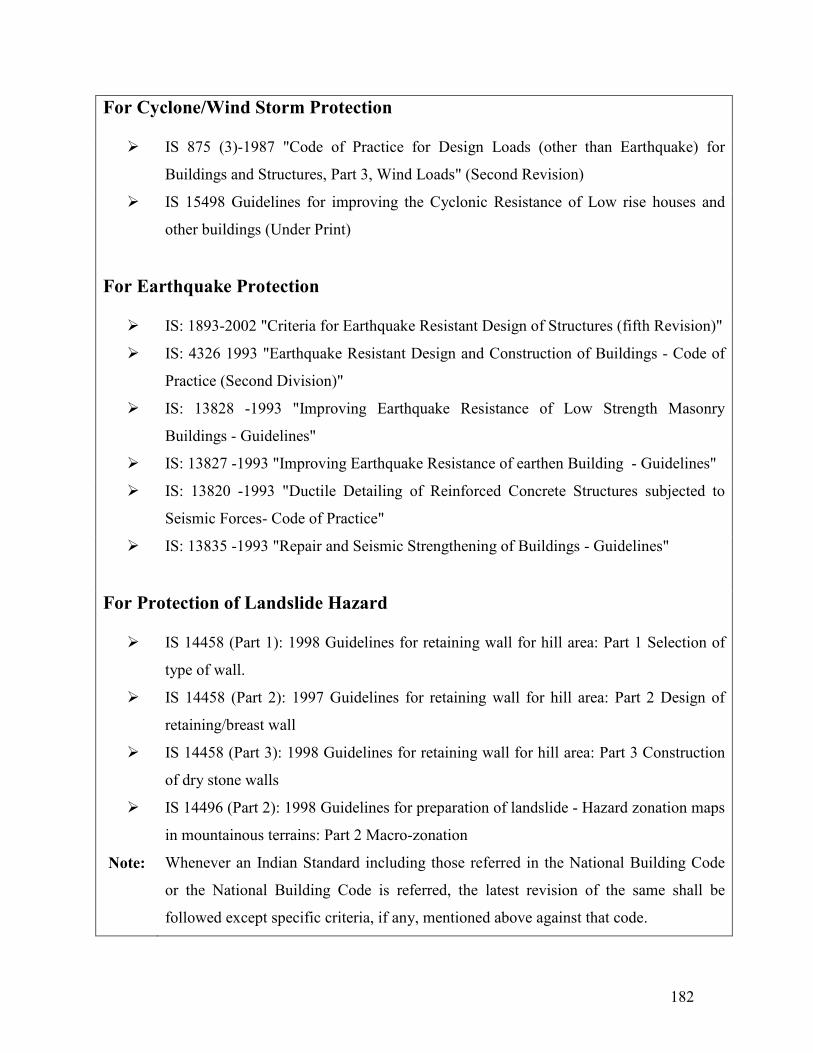
182
For Cyclone/Wind Storm Protection
� IS 875 (3)-1987 "Code of Practice for Design Loads (other than Earthquake) for
Buildings and Structures, Part 3, Wind Loads" (Second Revision)
� IS 15498 Guidelines for improving the Cyclonic Resistance of Low rise houses and
other buildings (Under Print)
For Earthquake Protection
� IS: 1893-2002 "Criteria for Earthquake Resistant Design of Structures (fifth Revision)"
� IS: 4326 1993 "Earthquake Resistant Design and Construction of Buildings - Code of
Practice (Second Division)"
� IS: 13828 -1993 "Improving Earthquake Resistance of Low Strength Masonry
Buildings - Guidelines"
� IS: 13827 -1993 "Improving Earthquake Resistance of earthen Building - Guidelines"
� IS: 13820 -1993 "Ductile Detailing of Reinforced Concrete Structures subjected to
Seismic Forces- Code of Practice"
� IS: 13835 -1993 "Repair and Seismic Strengthening of Buildings - Guidelines"
For Protection of Landslide Hazard
� IS 14458 (Part 1): 1998 Guidelines for retaining wall for hill area: Part 1 Selection of
type of wall.
� IS 14458 (Part 2): 1997 Guidelines for retaining wall for hill area: Part 2 Design of
retaining/breast wall
� IS 14458 (Part 3): 1998 Guidelines for retaining wall for hill area: Part 3 Construction
of dry stone walls
� IS 14496 (Part 2): 1998 Guidelines for preparation of landslide - Hazard zonation maps
in mountainous terrains: Part 2 Macro-zonation
Note: Whenever an Indian Standard including those referred in the National Building Code
or the National Building Code is referred, the latest revision of the same shall be
followed except specific criteria, if any, mentioned above against that code.
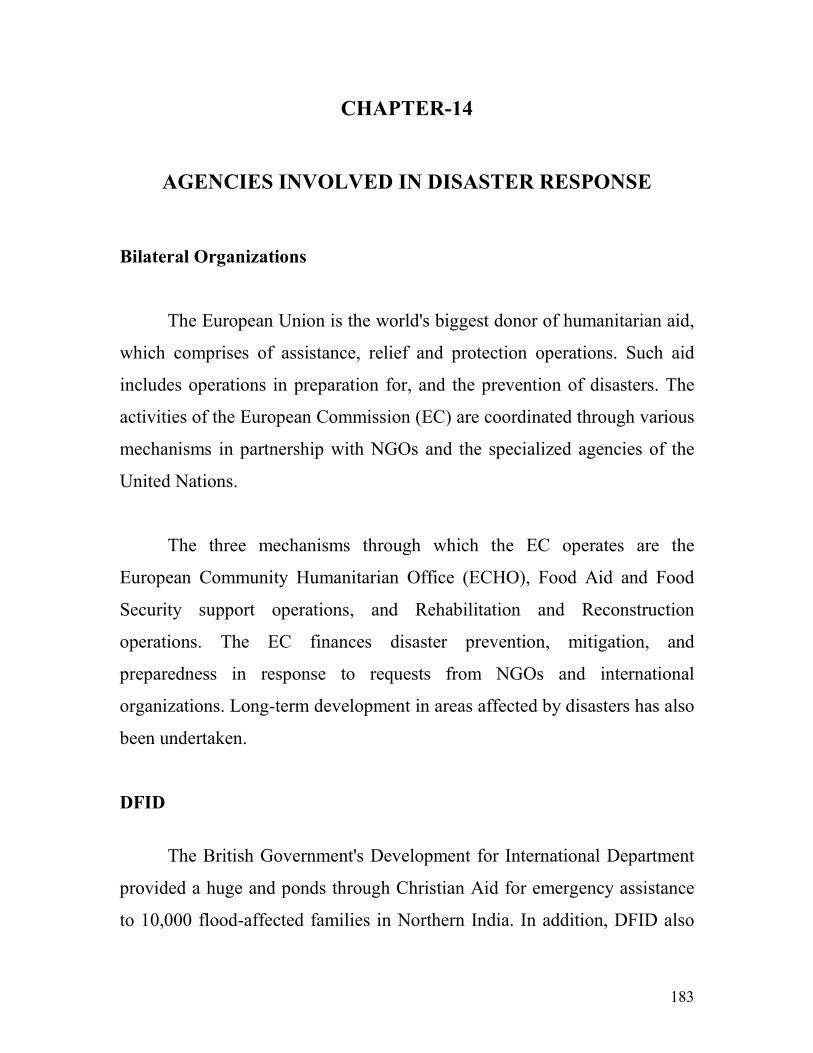
183
CHAPTER-14
AGENCIES INVOLVED IN DISASTER RESPONSE
Bilateral Organizations
The European Union is the world's biggest donor of humanitarian aid,
which comprises of assistance, relief and protection operations. Such aid
includes operations in preparation for, and the prevention of disasters. The
activities of the European Commission (EC) are coordinated through various
mechanisms in partnership with NGOs and the specialized agencies of the
United Nations.
The three mechanisms through which the EC operates are the
European Community Humanitarian Office (ECHO), Food Aid and Food
Security support operations, and Rehabilitation and Reconstruction
operations. The EC finances disaster prevention, mitigation, and
preparedness in response to requests from NGOs and international
organizations. Long-term development in areas affected by disasters has also
been undertaken.
DFID
The British Government's Development for International Department
provided a huge and ponds through Christian Aid for emergency assistance
to 10,000 flood-affected families in Northern India. In addition, DFID also
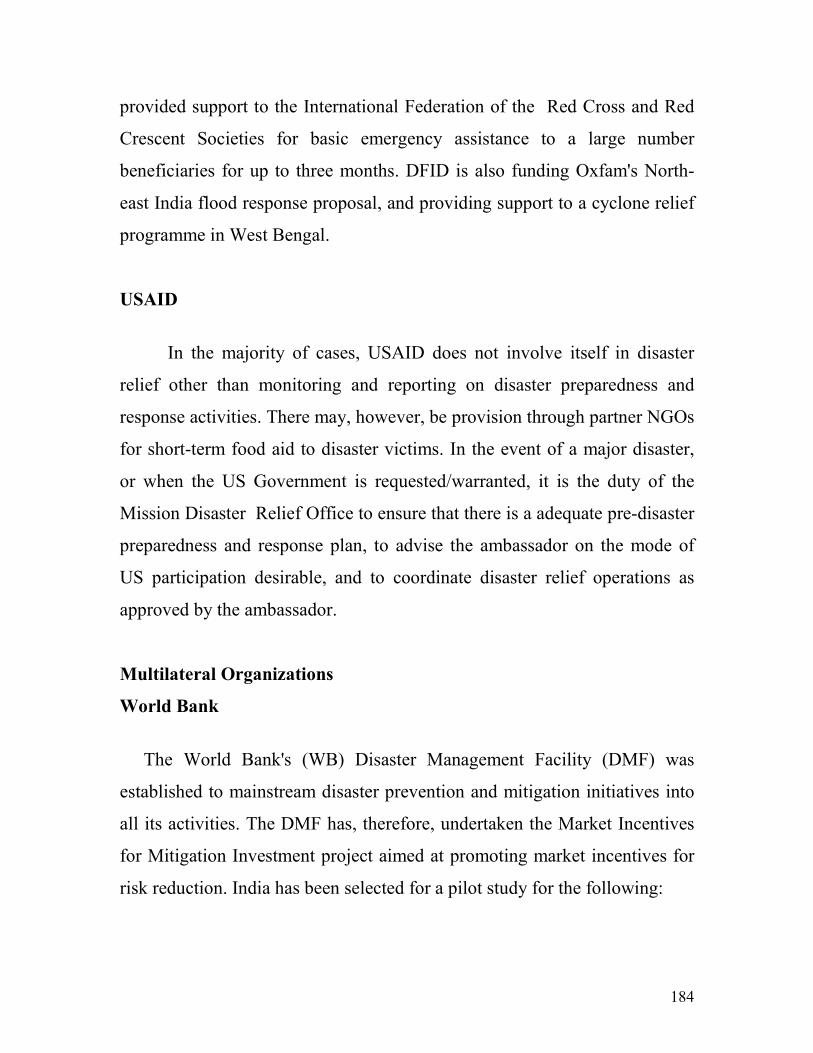
184
provided support to the International Federation of the Red Cross and Red
Crescent Societies for basic emergency assistance to a large number
beneficiaries for up to three months. DFID is also funding Oxfam's North-
east India flood response proposal, and providing support to a cyclone relief
programme in West Bengal.
USAID
In the majority of cases, USAID does not involve itself in disaster
relief other than monitoring and reporting on disaster preparedness and
response activities. There may, however, be provision through partner NGOs
for short-term food aid to disaster victims. In the event of a major disaster,
or when the US Government is requested/warranted, it is the duty of the
Mission Disaster Relief Office to ensure that there is a adequate pre-disaster
preparedness and response plan, to advise the ambassador on the mode of
US participation desirable, and to coordinate disaster relief operations as
approved by the ambassador.
Multilateral Organizations
World Bank
The World Bank's (WB) Disaster Management Facility (DMF) was
established to mainstream disaster prevention and mitigation initiatives into
all its activities. The DMF has, therefore, undertaken the Market Incentives
for Mitigation Investment project aimed at promoting market incentives for
risk reduction. India has been selected for a pilot study for the following:
185
• Disaster loss experience and vulnerability to sudden and slow onset
disasters.
• Institutional and regulatory structure: regulations related to natural for the
insurance industry.
• Structure of the insurance sector for casualty insurance: primary and
reinsurance.
• Role of the insurance sector in motivating mitigation investment, risk-
based premium, and public education.
• Role of public policy to support the insurance industry in mitigation.
• The role of the global reinsurance industry in risk reduction.
• The role of International Financial Institutions (IFIs) in risk reduction.
Between June and December 1996, heavy rains, floods and cyclones killed
1,689 people in the subcontinent and caused an estimate US$ 2 billion in
damage. In late November 1996, the State Government of Andhra Pradesh
requested the WB's assistance in the recovery efforts. To ensure the
sustainability of the State's future development, the focus of the WB's
assistance has been to provide long-term disaster mitigation capability across
the state. The project has an estimated cost of US$ 220 million. Its
objectives are to assist the State Government of Andhra Pradesh in preparing
and implementing a hazard management programme in high risk areas; and
restoring public infrastructure according to hazard resistance criteria and to
enhance the early warning capacity of the Government of India.
Following the 1993 Latur earthquake, the WB undertook a
rehabilitation project to assist with reconstruction, increase the earthquake
resistance of buildings and infrastructure through the development of
186
improved standards for design and construction and to develop the ability of
the state of Maharastra to plan for and manage disasters. The project's
estimated cost is US$ 328 million and its most important focus is the
development of long-term disaster management capacity in the state.
WHO
In 1995, an Emergency and Humanitarian Action unit was established at
WHO's South East Asia Regional Office in New Delhi. Its goal is to provide
assistance to the member states in developing and strengthening their
emergency prevention, preparedness, mitigation and response programmes
and to promote national self-reliance, The ERA also acts to strengthen the
Regional Officer's emergency prevention, preparedness, mitigation and
response programmes and to provide emergency assistance upon request
from the member states. With each of the member states, the until will focus
on:
• National health policy and legislation
• Planning, emergency preparedness and management
• Community-based emergency preparedness and management
• Emergency information system
• Human resource development and institutionalization, based on a
multi-sectorial approach.
UNDP
UNDP has been operating in India for 50 years. Its agreement with the
Government of India does not allow it to participate in relief operations
187
unless specially requested. However, development programmes are often
initiated following a disaster. The concept of disaster preparedness and
management has been incorporated into its development programmes,
particularly after the 1993 Latur earthquake.
Although not involved in immediate disaster relief, UNDP receives
information on the extent of disaster damage and loss of life. Following the
recent floods in West Bengal, UNDP was part of a joint agency mission to
the Malda district to assess the damage and the response of UN agencies.
The focus on incorporating disaster management training and preparedness
into development reflects the newfound awareness that disaster planning has
on large-scale development.
To strengthen the national capacity to mitigate, prevent and manage
crises, UNDPs Emergency Response Division sponsors activities in two
areas. The first is preventive development, which includes:
• Assessing vulnerability to crises and natural disasters
• Establishing early warning systems
• Developing and maintaining a framework of development responses
and other contingency disaster plan to be used if a crisis erupts
• Forming and strengthening UN Disaster Management Teams
• Integrating disaster preparedness, mitigation, prevention and response
programmes into national development programmes
• Identifying and engaging the services of consultants to be placed at the
disposal of the Resident Coordinator/Humanitarian Coordinator in crisis
situations
188
• Preparing National Human Development Reports.
The Second activity is training in order to contribute to human
resources development by improving capabilities in:
• Risk and vulnerability analyses
• Planning for contingencies
• Designing responsive structures
• Implementing prevention and mitigation strategies for disaster and
crises.
The training is provided through the Disaster Management Training
Programme to personnel from the Government, NGOs, community leaders,
and partners in the United Nations. UNDP expects to deliver US$ 200
million in development oriented assistance between 1997 and 2001.
UNICEF
UNDP has a long-term presence in India with a strong field-based
structure. Through its state offices, UNICEF is able to respond quickly and
flexibly to disaster situations. Its response is subject to being requested by
the Government of India (which has not asked for outside help since 1974).
Thus, UNICEF can only help by donating funds to the Prime Minister's
Relief Fund, an avenue that it feels inappropriate.
However, requests from the state or district levels enable UNICEF to
provide disaster assistance. When a disaster occurs, US$ 10,000is
immediately made available. In many cases, disaster relief is an extension of
an ongoing programme (for instance, drinking water programmes may be
altered to incorporate the bleaching of wells contaminated during a flood).
189
UNICEF produced four flood situation reports and also examined how
children were severely traumatized during the floods. The fragmented
response of the Government, the United Nations, and NGOs is a major
concern of UNICEF. It is, therefore, meeting with the Government in order
to facilitate a more coordinated disaster response mechanism.
UNHCR
The two main functions of UNHCR are to provide international
protection to refugees, and to seek permanent solutions to refugee problems.
UNHCR first established its office in New Delhi in February 1969 to assist
the 100,000 Tibetan refugees in India. It has since provided assistance to
over 10 million refugees from Bangladesh, 50,000 refugees from
Afghanistan, as well as assisted the Government of India to repatriate Sri
Lankan refugees from Tamil Nadu. UNHCR provides limited financial
assistance, since it would prefer to help refugees become self-reliant. It
encourages able-bodied refugees to participate in income generating
activities and is further investigating the possibility of micro-credits,
cooperatives, and community development activities.
CARE India
CARE India is committed to respond to mitigate human suffering and
loss of support systems in disaster situations. CARE works closely with
national and state Governments, generally responding to disasters at their
request, and its relief and development interventions aim at improving the
socioeconomic conditions of the poor. CARE activates its Emergency
190
Response Unit at its headquarters in Delhi, a State Emergency Response
Team at the state level, and an On-Site Emergency Response Coordinator.
Its organizational structural allows it to implement both regular
development and emergency work down to the community level. CARE
India is also the convener of the Government of India NGO Committee on
Emergency Preparedness.
IFRC
The IFRC is the world's largest humanitarian organization. Its
mission, broadly speaking, is to improve the situation of the world's most
vulnerable people. The IFRC is represented in India through its South Asian
Regional Delegation.
Over the past two years, the Federation has actively supported and
jointly carried out a series of Regional Disaster Preparedness Workshops
with the Indian Red Cross Society (IRCS). Its Regional Progamme Manager
has been involved in this training since august 1997 and will continue till the
end of 1999, by which time the IRCS is slated to have developed sufficient
expertise and ownership to carry on this training with little or no expatriate
involvement.
The implementation is being shared by IRCS, the Federation and the
International Committee for the Red Cross (ICRC). The Federation will
support a three year training initiative to the IRCS staff and to volunteers in
disaster preparedness, risk management, hazard identification, vulnerability,
and community capacity analysis. These workshops will enable staff to
191
conduct their own sub-branch and village-based training events and apply
the skills to disaster situations. District plans will gradually be developed
from the vulnerability and community capacity analyses. This database will
provide the foundation for a state level and, eventually, national level,
disaster preparedness plan.
ICRC
Although the ICRC has been operating in India for the past 50 years,
its South Asian regional office was established in New Delhi in 1982. The
ICRC has responded to several conflict in the region, including the Indo-
Pakistan conflict (1948), assisting Tibetan refugees (1959), the Indo-
Portuguese conflict (1960-1), the Sino-Indian conflict (1962-3), the second
Indo-Pakistan conflict (1965-6) and the Indo-Pakistan/Bangladesh conflict
(1971).
Recently, the ICRC has become increasingly involved in working
with the victims of internecine conflict, such as, in the case of prisoners in
Jammu and Kashmir, and violence against Dalits. Here, the ICRC's mandate
is to ensure the fair and proper treatment of prisoners, which therefore
interdicts its involvement in long-term development projects: natural disaster
response is more the responsibility of the Indian Red Cross Society,
although the ICRC provides support where necessary. During emergencies
priority is given to the treatment and evacuation of the injured, especially
those in the more marginalized groups-women and children. In South Asia,
the ICRC's 'tracing services' forwarded more than 16 million family
messages and opened 20,000 inquiries to trace missing family members. In
192
this region, the Committee operates on an annual budget of Swiss Franc 8
million.
IRCS
The Indian Red Cross Society was founded in 1920. It follows its own
established disaster plan, the most basic being disaster relief. Through some
650 branches, the IRCS provides a well-knit and well-organized network
countrywide. In the event of a disaster, the services of the Red Cross become
auxiliary and/or complementary to that of the Government. The district
committee of the affected area immediately goes into action by initiating
disaster relief operations. The state branch reinforces these efforts and
informs the national headquarters of the situation, of the services, the quality
and type of materials required. There is close cooperation with the
Government and other NGOs.
CHAI
The Catholic Health Association of India is the world's largest
voluntary healthcare organization. Its disaster response is characterized by
'holistic health through people's empowerment'. Following the Latur
earthquake in 1993, CHAI not only provided relief but supported an ongoing
development process to lead to people's self reliance and liberation'. CHAI's
first priority was to provide relief: it established one of the first health camps
in the area. It also insured that its activities were not in competition with
those of other relief organizations, but rather filled in the gaps.
193
CHAI's main priorities are to provide medical aid and healthcare;
concentrate on physical, social, emotional, and spiritual rehabilitation; attend
to hygiene and sanitation; mobilize relief material for villages; and create
economic development programmes that assist in returning to normalcy.
VHAI
VHAI links 4,000 health and developmental organizations across
India through State Voluntary Health Associations. Its goal is to make health
a reality for the people of India'. VHAI's long-term major objectives are the
promoting social justice and human rights in health service, building up a
people's health movement, and advocating a cost-effective, preventive,
promotive and sustainable healthcare system. At the macro level, VHAI acts
jointly with health-planners, policymakers, parliamentarians, activists, and
other leading health organizations. At the micro level, it maintains grassroots
contact through programmes designed to respond to local needs, receiving
feedback from the field about its concepts on community health and
suggestions about the organization's future direction.
CASA
CASA has been involved in relief and development since 1947, when
the Government of India requested the Church to help provide relief to the
Partition's refugees. CASA established the Committee on Relief and Gift
Supplies (CORAGS), and later extended its relief operations to victims of
natural disasters.
194
In 1972, CASA became independent of the National Council of Churches
and re-orientated itself towards development and disaster mitigation.
Throughout the 1980s, emergency relief gradually dovetailed with
development activity, and disaster preparedness became an integral part of
the development progress. This involved community interaction and
empowerment, ensuring in times of calamity the community's capacity to
help itself, rather than promoting a relief psychology.
Disaster Management Training programmes, a close association with
the Government, and a strong network within the Church and among
grassroots NGOs has allowed CASA to pool resources and expertise from
various sectors to provide a holistic approach to development and disaster
mitigation, preparedness and relief.
EFICOR
EFICOR is a Church-based organization that provides relief to all
communities during times of calamity and supports long term development
programmes. EFICOR's first response was to the 1971 Bihar famine, with its
primary role that of a 'welfare organization responding to need'. In the
1980's, a review of the effectiveness of EFLICOR's response reoriented it
towards long term development programmes and disaster preparedness.
EFICOR still involves itself in disaster relief, responding to 30-35 disaster
situations a year, but in a supplemental capacity to the efforts of the
Government and other NGOs.
When a disaster occurs, a member from EFICOR's Disaster
Management Unit goes to the affected area to assess where it can 'fill the
195
gaps' of the relief effort. The organization outlays Rs 1.5-2 lakhs for
immediate disaster assistance. In workshops held twice a year, participants
from partner NGOs are brought to a previously disaster affected area to
teach them to assess how relief was administered and to evaluate the
redevelopment programme.
Action Aid
Action Aid has been involved in India since 1972 and 'exists to
facilitate the empowerment of the poor in the process of social development.'
Recognising that long- term development is where its core competence lies,
Action Aid, through local NGOs, supports long term (8-12 years)
development programmes, with the aim of making the community self-
sufficient and improving the life of the marginalized.
Action Aid has also perceived any involvement in disaster-related
work as another process perpetuating poverty. However, venturing into the
heartland of poverty in India-which is also prone to disasters- it has had to
develop strategies to systematically deal with disasters. In this context,
Action Aid has recently produced an Emergency Strategy Paper.
NOVIB
NOVIB was founded in the Netherlands in 1956. The devastating
floods in Holland in the early 1950s which killed over 2,000 people and the
ensuring humanitarian aid from the rest of the world prompted secular
philanthropists to found NOVIB.
196
Country operation is South Asia, particularly in India, began during
late 1970s in the form of supporting relief-rehabilitation, basic needs
satisfaction, and food security programmes like 'food for work'. NOVIB
started the disaster relief-related work in India following the 1977 cyclone
along the AP coast.
NOVIB's disaster/emergencies-related work is primarily, but not
exclusively, with the direct target group with whom its partner NGOs works.
For example, it participated in the Latur earthquake relief work through its
partner NGO Manavlok, the flood relief programme in the Tirunelveli and
Nagercoil districts through partner NGOs like the Centre for Appropriate
Technology (CAT) and the Centre for Rural Technology (CRT), and the AP
cyclone relief programme through Oxfam Hyderabad (1997-8). In the past,
NOVIB's work has been emergency response rather than preparedness. It
seeks to provide immediate relief such as food, cloth, temporary shelter,
health resources, compliment the work of Government and other local
institutions in long-term rehabilitation, and strengthens the capacities of the
communities to have access to local resources, and adopt appropriate
technologies and influence policies.
Currently, the disaster /relief programmes are handled by one person
in NOVIB's International Bureau in close cooperation with the respective
country programme officers. NOVIB and Oxfam are also working to
develop a policy framework and protocol regarding emergency relief.
There have been no separate allocations for Indian on the issue of
emergencies. NOVIB's annual budget for India for the past three years has
been about 8 million Dutch Guilders (roughly Rs 160 million, at the current
197
exchange rate), with most of it earmarked for direct structural poverty
alleviation programmes. Its total for emergency relief/rehabilitation
expenditure in India during the past three years is about Rs 25 million.
CARITAS India
CARITAS India, operating in India since 1962, is a development
organization of the Catholic Bishops Conference of India. Initially,
CARITAS focused on providing relief to the poor and suffering, especially
during times of calamity. However, this approach was deemed unsatisfactory
and the thrust of its involvement shifted toward developing skills to enable
higher income generation. Although effective, this approach was also found
wanting as it benefited only those without it were further marginalized.
CARITAS, therefore, redeployed itself to target the population as active
participants in the development process rather than as passive recipients of
aid.
The people's empowerment is the priority, in keeping with its motto of
'building people through building homes and building homes through
building houses'. During the past five years, CARITAS has released over Rs
439 lakh for relief, rehabilitation and long-term environmental programmes.
Save the Children
Save the Children began working ink pre-Independence India proving
relief during emergencies. The India office was established in 1975 to
coordinate the existing relief operations to explore new areas and long-term
development programmes incorporating disaster mitigation and
198
preparedness. Relief operations also under-went a review, leading to better
assessment of disasters and the needs of the people affected. Save the
Children Fund works through partner NGOs by providing financial and
technical resources and training assistance. It is currently involved with six
programmes in 12 states, including child sponsorship and Tibetan refugees.
Both these programmes are, however, to be phased out.
CRS
CRS has been operating in India for nearly 50 years. It is closely
affiliated to USAID and has a working partnership with the Indian
Government. When a disaster occurs, CRS is informed of the relief required
by one of its local counterparts and has the capacity to immediately release
up to 50 metric tones of food relief supplies, as well as other auxiliary relief
resources such as blankets, tarpaulins and cash. If the amount required
exceeds 50 metric tones, it requests the US Government for additional
resources. CRS, which provides about US$ 350,000 a year in food
assistance, has an agreement with Indian Government that it be responsible
for the transportation of the relief supplies to the affected area.
LWS
LWS has operated in India since 1974, when it responded to the needs
of refugees following the Bangladesh war. LWS has since been
implementing relief, rehabilitation and integrated development programmes
in several Indian states, particularly in West Bengal and Orissa. All
199
programmes are taken up at the Government's request or on its own
initiatives in consultation with Government authorities.
LWS works with disaster response at different levels. Relief
operations are short term initiatives in which disaster victims are given
temporary shelter, materials and food. Rehabilitation programmes assist
affected communities to rebuild damaged houses, construct school-flood
shelter, develop safe water sources, as well as repair and strengthen other
community assets. Disaster preparedness programmes are long-term
initiatives to improve the coping capacity of disaster -prone communities.
i
ANNEXURE-I
An Outlines of
District Disaster Management Plan
Chapter I: Introduction
o Location
• Area
• Boundaries with other districts/State
o Administrative Divisions
• Subdivision
• Taluqa / Tehsils
• Blocks
• Villages
• Zila Panchayat
• Intermediate level Panchayats
• Gram Panchayats
• District/Metropolitan Planning Committees
• Municipal Corporations
• Municipalities
• Nagar Panchayats
o Physical Features
• Geology
• Climate
• Rainfall
• Drainage System
• Economic and Social Conditions
ii
• Population
• Decennial changes
• Composition
• Age-structure
• Sex-ratio
• Rural-urban distribution
• Scheduled Caste/Scheduled/Backward Composition and their
locational distribution
• Education and Literacy
• Occupational Distribution
• Poverty Ratio
• Status of agriculture-direct and indirect dependence on it
• Status of Industry; Its nature and direct and indirect dependence on it.
Townships developed or developing along with the industry may be
specifically stated.
• Status of tertiary sector indicating the extent of dependence on it.
• Health Infrastructure
• Educational Infrastructure
• Non-Government and other voluntary organizations engaged in social
work.
Chapter II: Hazard Analysis
o Status of Disasters in and around the District
• Water and Climate related disasters
• Floods
• Cyclones
• Tornadoes and Hurricanes
iii
• Hailstorm
• Droughts
• Any other indicated in the HPC list or peculiar to the district and
falling in this category.
o Geologically related disasters
• Landslides and mudflows
• Earthquakes
• Dam Failures/ Dam Bursts
• Mine Fires
o Biologically related disasters
• Biological disasters and epidemics
• Pest Attacks
• Cattle Epidemics
• Food Poisoning
o Chemical, Industrial and Nuclear disasters
• Chemical and Industrial disasters
• Nuclear disasters
o Accident related disasters
• Forest Fires
• Urban Fires
• Serial Bomb Blasts.
• Air, Rail, and Road Accidents
• Any other disasters mentioned in the HPC list for this category or a
type of disaster peculiar to the district falling in this category but
including in the list.
iv
o Details of the disasters which occurred in the district along with
information about the loss- physical, material and human- and the
measures taken to meet it.
Chapter III: Risk Analysis
o Identification of Areas likely to be affected by each type of disaster
Population and Area to be indicated in the map of the district.
o Vulnerable Groups should be identified.
o Capability assessment be Done. In particular, following aspects is
covered:
• Level of awareness.
• Existing prevention and mitigation measures
• Present level of preparedness
• Response Capability
• Community and NGO preparedness, capability, response and
participating abilities.
• Existing Laws and regulations; their analysis and effectiveness for
meeting disasters.
Chapter IV: Organizational Structure
o National Level
• The nodal Ministry/Department for each disaster to which the district
is prone may be indicated. For example, The Ministry of Agriculture
is the Ministry for every natural disaster. Similarly, Ministry of
Environment and Forests is the nodal Ministry for the management of
chemical accidents. The nodal Ministry/Department be ascertained
and indicated so that unnecessary time is not wasted in ascertaining it
at the time of disaster and furnishing information and getting Support.
v
Ordinarily, Secretary of the concerned Ministry/Department acts as
head of the Crisis Management Group with representatives from other
concerned Central Government organizations and Ministries. For each
disaster, it should be separately given.
• In the case of serious disasters, The Cabinet Secretary heads the Crisis
Management Group with Secretaries of concerned Ministries/
Departments and heads of Central organizations.
o State Level
• The State level organizational structure for disaster management is
indicated. Where responsibility for management of different types of
disasters is assigned to different departments, the nodal department for
each type of disaster should be clearly indicated. While ordinary
disasters (difficult to define and therefore intensity and severity to be
determined in each case) may be dealt by the secretariat
administrative departments, serious may require coordination and
action at the Chief Secretary and Chief Minister's level. Provisions of
an official Committee at the Chief Secretary's level consisting of
Secretaries of relevant departments and a ministerial level Committee
at the Chief Ministers level consisting of Ministers of relevant
departments for coordination, direction, monitoring action and
organizing support be provided in the plan.
o District Level
• At the district level, the Collector is the focal point for disaster
response and recovery. A district level Committee consisting of the
district level representatives of all the concerned departments. This
could be designated as District crisis management Group.
vi
• Sub-division level committees consisting of subdivision level officers
for coordination and action.
• Each concerned departmental head to organize his team for carrying
out the plan of action for management.
• Involvement of Panchayat raj and municipal institutions with
responsibility for disaster management.
• Involvement of District Planning committee and other representatives
in disaster management role as may be determined.
• Involvement of NGO's and community in awareness generated
management.
• Involving media for collection and dissemination of information.
Chapter V: Prevention and Mitigation Measures
o Emphasis on prevention and mitigation
o Prevention and Mitigation measures be identified for each type of to which
the district is prone.
o Preparation of a plan of action with time schedule for implements keeping
in view the availability of resources.
o Generating private and institutional support- institutional and other for
identified prevention and mitigation measures.
o Exploring financial support for prevention and mitigation plan
Government, private, and institutions including financial institutions.
o Review existing legal framework for proper implementation of prevention
and mitigation measures and suggest modifications for making the
effective where necessary.
Chapter VI: Preparedness Plan
o Inventory of human resources. This may consist of :
vii
• Names and address of principal functionaries all concerned
department at the district level to be kept in the District Emergency
Committee (DECR).
• Names and addresses of all key functionaries of all concerned
department at the district to be kept with the principal functionary of
the department
• List of equipment and stores for rescue and relief operations in each
by type of disaster and their availability at various places private
Government - be prepared and kept in the DECR and with the
department at the district level.
• Preparation of list of members of the community, NGOs and the
members and elected representatives who could be helpful in
management of the disaster.
• Setting of DECR in the Collector's office and due publicity to it.
• Identification of Shelters and other facilities near the hazard prone are
for accommodating affected population.
• Identification of sites near the hazard prone areas for setting
temporary control rooms for rescue and relief operation.
• Establishing a coordination mechanism for incoming relief material
teams from outside at their possible places of disembarkation at
deploying them in affected areas in a planned manner.
• Preparation of alternate communication arrangements in case
conventional communication channels.
• Inventory of transport-public and private-available for deployment
times of emergence including names and address of owners, driver
mechanics and repair workshops and fuel depots.
viii
• Preparation of the community especially in the disaster prone areas.
• Identification of manpower for manning the DECR and other control
rooms and allocation of duties.
• Arrangement for training of all identified functionaries and period
upgrading of their knowledge.
• Periodic simulation exercise as test preparedness for all the
functionaries and the community.
Chapter VII: Response Plan
• Alerting and strengthening the various control rooms
• Alerting the community
• Restoring the communication channels
• Organizing Rescue of the affected population
• Organizing medical relief
• Organizing Shelters for population rendered homeless
• Coordinating the relief operations of NGOs and community worker
• Coordinating relief from outside agencies including distribution
material
• Assessment of damage
• Organizing post-mortem, death certificates, disposal of dead bodies
carcasses
• Maintaining law and order and protecting the property of the
population
• Assisting the population towards rehabilitation
Chapter VIII: Recovery
• Physical and Economic rehabilitation of the affected population
ix
• Restoration of community services-street lighting, water supply,
schools and medical services
• Restoration of private enterprises including farming activities
• Restoration of private residential buildings
• Helping organizing institutional finance in restoration work
• Medical rehabilitation of people seriously affected by the disasters
• Psychological rehabilitation of persons and families traumatized by
the disaster
Chapter IX: Appraisal, Documentation, and Reporting
• Reappraisal of the plan in operation
• Comprehensive documentation on disaster management
• Preparation of report and submitting it to the State Government
Source: HPC at a Glance, 2001, Ministry of Agriculture, Govt. of
India.
x
ANNEXURE-II
Emergency Preparedness Checklists
This checklist can be used for developing or evaluation emergency
preparedness programmes.
Policy
� Have all emergency management parts of relevant legislation been located,
and have the implications of this legislation been considered in community
emergency preparedness?
� Is there power for the following actions during emergencies
• Commandeering of resource?
• Evacuation of people at risk?
• Centralized coordination of emergency work at the national; district
and community level?
Vulnerability Assessment
� Is a Vulnerability Assessment available for emergency preparedness, as well
as for emergency response and recovery work?
� Are there procedures for reviewing Vulnerability Assessment in the light of :
• Community change?
• Vulnerability change?
• Hazards change?
• Capacity / capability change?
xi
Planning
� Have people - stakeholders, private organizations and NGOs been involved
ink the planning process?
� Has assistance or guidance in developing emergency plan been provided to
government, private organizations and NGOs?
� Are there emergency plans that are related to the community emergency
plan?
� If such plans exist, what are the implications for your plans?
� Has contact been made with people in other organizations jurisdictional
areas that may be able to assist community?
� Has the District Plan been approved by the Disaster Management
Community?
� Has the plan been endorsed by all relevant organization and copies given?
� Has a person or an organization been assigned responsibility for developing
the community emergency plan? (Do's, Don'ts during disaster )
� Who is responsible for keeping the emergency plan up date and how often is
it to be formally reviewed in the month of April & May? Last week of April
& May every year nationwide (except for cyclone prone District)
� Do people who held existing plans receive amendments?
� Is a distributions list of the plan maintained?
� Have the community emergency management structure as organizational
responsibilities been described?
� Who is responsible for the overall management?
� Who is responsible for the operations of particular organizations?
� Who is responsible for coordinating particular tasks?
� Are all the necessary tasks assigned to organizations as personnel?
xii
� Are the responsibilities of all organizations described?
� Does the plan contain a summary of the vulnerability assessment?
� Has the relationship between different levels of planning been described?
� Have mutual aid and twining agreements with adjacent communities been
made?
� Is the plan consistent with the related district plans?
Training and Education
� Who is responsible for the various training and education requirements of
emergency workers and the public?
� Has a training needs analysis of emergency workers been performed?
� Have a number of different public education strategies been implemented in
emergency?
� Has quickly the new personnel in organizations are man capable of working
in emergency management?
� Is institutional memory being preserved? For example, people have to
"reinvent the wheel" or are past, practicable lessons learned, documented,
and passed on?
� Do the capabilities and capacities of organizations improve over time during
the implementation of preparedness strategies?
Monitoring and Evaluation
� Is there a procedure for reviewing emergency preparedness on a regular or
as- required basis? How is it done and who is responsible?
� How often is the community plan to be exercised? Who is responsible?
� How are the lessons learned from exercises to be incorporate into plans?
� Are multi-organizational (Department) exercise run, as well as single-
organizational exercises?
xiii
Communication
� What forms of communication are available?
� Are there backups?
� Who is responsible for communications maintenance and planning?
� Do people know the relevant radio frequencies and contact numbers?
� Are there contact lists updated (containing names, telephone numbers, etc.)
for all emergency management organizations?
� Do the communications systems allow communication between all relevant
organizations?
Search and Rescue
� What rescue tasks may need to be performed?
� Who is responsible, who coordinates?
� Are there procedure for detecting and marking danger areas?
� How are search and rescue activities integrated with other emergency
functions, particularly in health?
Health and Medical
� Have the ambulance and hospital services planned and be trained for the
handling of mass casualties?
� Are they aware of each other's arrangements?
� Are there emergency field medical teams?
� Who manages these on-site?
� Are there arrangements for counseling the public emergency workers? Who
is responsible for providing the service and who pays for it?
Social Welfare
� Are the arrangements for feeding and accommodating people linked to the
registration and enquiry system and the evacuation procedure ?
xiv
� Is there any arrangement for expediting the assessment damage to private
and public property and payment losses ?
� Do the insurance companies have any cooperative arrangements among
themselves?
� Where, when, and how do people have access to insurance companies?
� What is insurance company policy on makeshift repairs minimize damage?
Transport and Lifelines
� Who is responsible for each lifeline?
� What are the priorities for repairing damaged lifelines?
� How long should it take to repair each lifeline from the predicted levels of
damage?
� How are alternative lifelines to be arranged if required?
Police and Investigation
� Are there procedures to ensure that resources are reserve from the
emergency response work to enforce law and order?
Alerting
� Who is responsible for receiving warning from outside the community?
� Is there a clear system that ensures that all relevant organizations and
personnel are alerted?
� Does this system :
• Assign responsibility for initiating an alert?
• Provide for a "cascade" method of alerting, whereby those alerted are
responsible for further alerting where appropriate?
• Describe the first actions required by those alerted?
• Provide for the cancellation of an alert and the stand down of
organizations and personnel?
xv
Command, Control and Coordination
� Have all officers and elected officials, civil defense wardens been allocated
a task?
� To whom do one turn for information?
� Are there procedures for ensuring the safety of the Government and
administrative records (paper and computerized)?
� Have lines of succession been determined to ensure continuity of leadership?
� Have alternative sites for Government organizations been identified?
� Have locations for emergency coordination centers been designated and
promulgated?
� Are there alternative centers?
� Are they remote from areas likely to be damaged?
� Do they have adequate communication, feeding, sleeping, and sanitation
facilities?
� Do they have backup power?
� Is the availability of backup communications equipment known?
� Is there adequate water supply?
� Is there a designated site manager and alternative and relieving managers?
� Do the centers have trained staff?
� Are there procedures for development staff rosters?
� Are there procedures for activating and operating the centers?
� Is there adequate administrative support for the centers?
� Are functions of the centers succinctly described?
� Is there a procedure method for collecting, verifying analyzing, and
disseminating information?
� Is there a procedure for recording events, requests for assistance, decisions,
and allocating resources?
xvi
� Are there internal security arrangements for the centers?
� Has responsibility for day-to-day maintenance of the centers been assigned?
� Are there procedures within and between organizations for the briefing of
personnel on an impending or actual emergency?
� Are there procedures for conducting single and multi-organizational
debriefings followings an emergency or alert?
Information Management
� Are maps prepared and available to the community (topographic,
demographic, hazard, and vulnerability)?
� It a public information centre/ control room designated as the official point
of contact by public and the media during an emergency?
� Are there provisions for releasing information to the public including
appropriate protective actions and devised responses?
� Have agreements been reached with the media for disseminating public
information and emergency warnings?
� Are contact details for all media outlets (radio, television and newspapers)
available?
� Who is responsible for providing information to the media?
� Who is responsible for authorizing information?
� Who is responsible for emergency assessment and to whom do they report?
How is the information recorded and who relays the information to those
concerned?
� Who is responsible for issuing public statements about emergencies?
� Do they have public credibility and adequate Liaison with other
organizations who may also issue warnings?
� Who is responsible for providing warnings for each type of emergency?
xvii
� To whom is the warning supplied?
� At which warning level is response action initiated?
� What is the purpose of the warnings and what action is required of the
public?
� Who will inform the public when the danger has passed?
� Is there a point of contact for members of the public wanting specific
information, and is this point of contact public known? (Control room).
� Is there a referral service for directing people to the appropriate sources of
information?
� Is there a registration and enquiry system for recording the where about of
displaced, injured, or dead persons?
� Is there a system for providing this information to bonafide inquiries?
� Does the community know how to contact the registration and inquiry
system?
� Are there plans for establishing public information centers?
� Is the community aware of the existence of these centers?
Resource Management
� Who coordinates resources within each organization?
� Who is responsible for supplying resources beyond the normal capabilities
of each organization? Who records the sue and cost of resources?
� Have arrangements been made with State or Military Organizations for
assistance in times of emergency?
� Is there agreed access to emergency funds?
� Who records the expenditure for future acquittal/repayment?
� What are the limits of expenditure for personnel?
� What tasks can be safely performed by unskilled volunteers?
xviii
� Who coordinates this work?
� Is it likely that some organizations will begin public appeals for donations to
emergency-affected persons?
� How can these appeals be coordinated?
� How is equitable disbursement of appeal money to be ensured
� Who coordinate the requests for assistance for the community
� Who sort of assistance is likely to be required?
� Where is the assistance likely to come from?
� Is there an expected form that the request should take
� Is the following information available to help outside assistance:
• Lists of organizations working in the country, with information on their
competence and capability to be involved in emergency response and
recovery activities
� Is the following information available :
� Lists of essential response and recovery items, with specifications and
average costs? Availability.
� Lists of local manufacturers and regional manufacturers or suppliers of
response and recovery items, with information on quality, capacity and
capability, delivery times, and reliability?
� information on essential response and recovery resources that will allow a
rapid response, e.g. water supply systems, sanitation systems, heath
networks, alternative shelter sites and materials, Tarpaulins. Tents, ports and
transport networks, warehouses. Communication systems, etc.?
Evacuation
� Does any person or organization have the authority to evacuate people who
are threatened?
� Are there designated locations to which evacuees should travel?
xix
� How many people may need to be evacuated?
� In what circumstances should they be evacuated?
� Who will tell people that it is safe to return? Who will trigger this?
� Are staging areas and pick-up points identified for evacuation?
� Are evacuees to be provided with information on where they are going and
how they will be cared for?
� Is there security for evacuated?
� How are prisoners to be evacuated?
� How are the cultural and religious requirements of evacuees?
� Who is responsible for traffic control during evacuation?
� How are evacuees to be registered?
Response and Recovery Operations
� Has a community emergency committee been set up?
� Have response teams been organized?
� Is anything being done for isolated families?
� Have arrangements been made to pick up the injured and take them to the
health centre or hospital?
� Have people been evacuated from dangerous buildings?
� Have steps been taken to resolve the most urgent problems for the survival
of the victims, including water, food, and shelter?
� Has a place been assigned for the dead to be kept while awaiting burial?
� Are steps taken to identify the dead?
� Has an information centre been established?
� Have communications been established with the state headquarters
government?
xx
� Has there been a needs assessment to consider the number of people needing
assistance, the type of assistance required, and the resources locally
available?
� Are steps being taken to reunite families?
� Have safety instructions been issued?
� Are steps being taken to circulate information on :
• The consequences of the emergency?
• The dangers that exist?
• Facts that may reassure people?
� Are communications being maintained with the state/central government?
� Is information on requirements being coordinated?
� Are local volunteer workers being coordinated?
� Are volunteer workers from outside being coordinated?
� Is inappropriate aid being successfully prevented and avoided?
� Are response and recovery supplies being fairly distributed?
� Is contact being maintained with all family grouping?
� Have families who are living in buildings that are damaged but not
dangerous been reassured?
� Has an appropriate site been chosen for temporary shelters?
� In setting up shelters for emergency victims, have family and neighbourhood
relationships and socioeconomic and cultural needs been taken into account?
� Have the victims been organized in family groupings?
� Have the essential problems been dealt with:
• Water supply
• The provision of clothing, footwear, and blankets?
• Food supply?
xxi
• Facilities for preparing food (Community kitchen)?
• The installation of latrines/sanitation facilities?
• Facilities for washing clothes, pots and pans?
• Collection and disposal of waste?
� Have meetings been arranged in the community to discuss the various
problems and find solutions to them?
� Have steps been taken to encourage solidarity, mutual assistance, and
constructive efforts among the people?
� Have school activities started up again?
� Have measures, been adopted to ensure that there is favoritism in the
distribution of response and recovery supplies? (Transparent - relief policy
to be announced).
� Is care being taken to make certain that volunteer worker from outside to not
taken the place of local people but help them to take the situation in hand?
� Have the victims been encouraged and helped to resume to work?
Source: Source Book on District Disaster Management, Ministry of
Agriculture Govt. of India, & Lal Bahadur Shastri, National Academy
of Administration Mussoorie.
xxii
ANNEXURE-III
Trigger Mechanism
The man has conquered the nature and feels so. The nature on its part shows its
fury and takes its tall now and then reminding the mankind to be careful. There are
a number of factor, which contribute to the natural disasters in different parts of the
world. These can be traced to the process of evolution of the planet earth, impacts
of developmental activities without regeneration to meet endless demands of the
man, explosion and concentration of population and changing social pattern of life.
The effects of the modern culture are reflected in the global warming, excessive
generation of heat energy and depletion of the protective environmental layer.
Whereas the natural disasters are the manifestation of the nature of trying to
maintain equilibrium, the man made disasters are the fall out of modern
developmental activities, levels of human inefficiency and the man's intense desire
of being the supreme and unchecked.
As and when a disaster takes place, be it natural or man made, the managers
struggle to mitigate its effects on human lives and material losses. The immediate
response in all disasters has more or less the same parameters. These are to provide
rescue and relief and save the precious human life. Thus, the emergency response
of the disaster managers is a factor independent of the types of intensity of the
disasters.
We already have Contingency Action Plans. The national contingency plan
has already been notified. These management plans lay down in detail the activities
which are required to be undertaken with reference to the particular disaster. These
are very exhaustive management plans. However, these plans can not put into
operation immediately, as such as, the functional spontaneous mechanism has not
been provided, for example who will do what ?
xxiii
As and when the disasters strike or take place, the managers are required to
swing in action without losing time. Generally, In such situations, the managers
start organizing planning and activating the mitigation process. On the other hand,
the event had already taken place and the need of that hour is to start the mitigation
process and virtually no time can be spared at that stage for the activities like
organizing and planning. Time is the essence of the immediate relief and rescue
operations to save human lives and mitigate human miseries for the next 48 to 72
hours. Therefore, actually what is required to be done is a part of long term
rehabilitation and reconstruction programmes.
The trigger mechanism, therefore, envisages that on receiving signals of a
disaster happening or likely happen, all activities required for the mitigation
process are energized and activated simultaneously without loss of any time and
the management of the event is visible on the ground. The primary objective of the
trigger mechanism is to undertake immediate rescue and relief operations and
stabilize the mitigation process as quickly as possible.
The trigger mechanism in fact is a preparedness plan which all the
participating managers, and actors, know advance the task assigned to them and
the manner in which they have to be prepared themselves to respond. As such the
organization and planning has already been taken care of. The resources are
identified including manpower material and equipment. The performers should
have adequate delegation and financial and administrative powers and have the
mandate for accomplishing the task.
The success of the trigger mechanism depends on the vision and perception
of the planners. They are required to anticipate the likely activities with reference
to the nature of the disaster and its impact. In fact the trigger mechanism can also
be called the operating standard procedure where the implementations of the
efforts on ground are well laid down. Generally, the activities will include
xxiv
evacuation, search and rescue, temporary shelter, food, drinking water, clothing,
health and sanitation, communications, accessibility, and public information. All
these major activities which are common in all types of disasters will require sub-
division and preparation of sub-action plans by each specified authority. They will
be required to list all requirements and their availability within the prescribed
response time.
To sum up the trigger mechanism is an emergency quick response
mechanism like ignition switch which when energized spontaneously sets the
vehicle of management into motion on the road of disaster mitigation process.
The Concept in Nut Shell
• Key to ignition
• Spontaneous response
• Suo motto activation
• Simultaneous energisation
• Command and control
The Parameters
• Signal/warning mechanism
• Activities and their levels
• Sub activities defined
• Authorities specified
• Response time determined
• Sub action plans formulated
• Quick response team
• Alternative plans
• Appropriate delegation
xxv
The Preparedness
• Know the tasks in advance
• Have clear mandate and authority
• Identify and earmark resources
• Lay down mechanism to respond
• Network the team
• Undergo preparedness drills
• Coordinate and communicate
• Appraisal and updating
Structural Details
Activities / Authorities
• Listing probable disasters
• Signals / warning mechanism
• Coordination command, control
• Media management
• Rescue and evacuation
• Food and clothing
• Drinking water
• Health and medicine
• Trauma Centers
• Disposal of bodies and carcass
• Shelter camps and sanitation
• Fuel and power
• Transportation
• Communication
xxvi
Levels of Activities
• Area of operation
• Numbers to be looked after
• Activity quantification
• Three level decision
Sub Activities
• List sub activities
• Entrust to sub authority
• Constitute quick response team
• Delegation - financial and administrative
Quick Response Team
• Procurement
• Distribution
• Mobilization
• Finance
Source: Source Book on District Disaster Management, Ministry of
Agriculture, Govt. of India, & Lal Bahadur Shastri National Academy
of Administration Mussoorie.
xxvii
ANNEXURE-VI
District Control Room
• The District control room is the nerve centre for the disasters management.
• To monitor, coordinate and implement the actions for disaster management.
• Periodic check to ensure that all warning, communication systems and
instruments, are in working condition.
• An information system on a routine basis from the district departments on
the vulnerability of the various places and villages. (parts of the districts)
• Receive reports on the preparedness of the district level departments and the
resources at their disposal to arrange and meet their requirements.
• Upgrade the Disaster Management Action Plan according to the changing
scenario.
• Maintain an inventory of all resources.
• Provide information to the Relief Commissioner.
• Furnish information to all those who are seeking and needy.
• Monitor preparedness measures and conduct training programmes.
• Providing information at district level, local level and disaster prone areas
through appropriate media.
• Brief the media of the situations and day to day reports during the disasters.
• To report the ground situation and the action taken by the District
Administration.
• The District control room would be placed under Senior Officers, who have
already been trained adequately to handle disasters.
• Duty chart along with all basic facilities to be provided.
xxviii
• Control room can have many service divisions with assigned duties,
example, infrastructure / health / drinking water / logistics / agriculture /
communication / resources etc. According to the need it could be expanded.
• The District Control Room should have all the facilities for effective
communication and also to anticipate in case of system failure has
alternative, ordinary and mobile phones, e-mail facility etc.
• List of all personnel and trained persons who could be contacted at any time.
• Organize post disaster evaluation.
• Liaise with site operation centre. Site operation centre is the centre in the
Disaster site to be set up and an officer earmarked to be in charge. The
Officer In charge will conduct the relief, transit camps, feeding centers,
cattle camp; salvage operations, disposal of the dead bodies and carcasses of
animals, construction of temporary sheds with adequate facilities, medical
relief, clearance of debris and repair of damaged infrastructure etc.
• Collect information and activate the District/State Level Department for
handling/getting assistance on need basis.
Source: Source Book on District Disaster Management, Ministry of
Agriculture, Govt. of India, & Lal Bahadur Shastri National Academy
of Administration Mussoorie.
xxix
ANNEXURE-V
Role of District Collectors in Disaster Management
• Preparation of the Disaster Management action plan for the District with the
assistance of the Disaster Management Committee and other experts.
• To implement the disaster management action plan.
• Setting up the district control room and making it function effectively.
• Earmarking and entrusting responsibility to the various departments.
• Coordination with line departments of the state, Central and other agencies.
• To liaise with the Government periodically about the disaster and the action
taken.
• Integrating the MARG (Mutual Aid and Response Group) of the industrial
belt with the disaster management committee.
• Before the disaster make the district machinery to equip and to be prepared.
• Setting up relief camps and transit camps.
• Conducting relief and rescue operations.
• Corresponding with the Defense Ministry Personnel.
• To interact with the donor agencies for relief and rehabilitation.
• Collector is the central authority exercising emergency powers to issue
directives to all the departments and to provide emergency response service.
• Organizing Training and conducting mock drills
• Maintaining the supply of essential commodities.
• Preparing Memoranda for getting resources for Relief.
• Giving adequate and right information to the people.
Source: Source Book on District Disaster Management, Ministry of
Agriculture, Govt. of India, & Lal Bahadur Shastri National Academy
of Administration Mussoorie.
i
Further Readings
Arya, A.S., Engineering Role in Earthquake Disaster Reduction in India,
paper presented in World Congress on Natural Disaster Mitigation, by
World Federation of Engineering Organization, at Delhi, 19-22,
February, 2004.
Bahme CW: Fire officer’s guide to disaster control, National Fire Protection
Association, Quincy, MA, 1978
Baker CW: and Chapman DW, editors: Man and society in disaster, New
York, 1962, Basic Books Inc.
Baker FJ: The management of mass casualty disasters, Topics in Emergency
Med I (I): 149, May 1979.
Barton A: Communities in disaster: a sociological analysis of collective
stress situations, Garden City, NY, 1969, Doubleday & Co.
Barton AH: Social organization under stress: a sociological review of
disaster studies, disaster study on 17, publication no 1032, Disaster
Research Group, National Academy of Sciences National Research
Council, Washington, 1963.
BMTPC, Building A New Techno-Legal Regime for Safer India; Building
Materials & Technology Promotion Council, New Delhi.
Bolduc J: Natural disasters in developing countries: myths and the role of
the media, Emerg Prepared Digest (Canada) 14(3):12, July-Sept.
1987
Bose (ed), Modern Encyclopedia of Disaster and Hazard Management Vol I-
V, Rajat Pub., Delhi, 2006
Bose, B.C., Introductions to Disaster Management, Rajat Publications,
Delhi, 2007
Bourque LB, Reeder LG, and Cherlin A: the unpredictable disaster in a
metropolis: public response to the Los Angeles earthquake of
Februrary 1971, report#SRC-TR1-73 (AD-7655130), (microfilm),
University of California at Los Angeles, Survey Research Center,
1973.
Bowers, W.E. et.al., Surgical Philosophy in Mass Casualty Management,
Springfield, IL, CC, Tharnao, 1960.
Brunacini, A.V., Fire Command, National Fire Protection Association,
Quinty, MA, 1985.
Brunacini, A.V., Phoenix Fire Department Operation and Manual Vol. 2,
Standard Operating Procedures, Unpublished, Phoenix, A2, 1998.
ii
Carroll, J.M., Emergency Planning: Proceedings of the Conference or
Emergency Planning, January 27-29, 1983, San Diego, CA,
Simulation Series, Vol.11(2), Society for Computer Formulation,
Lactolla, CA, 1983.
CASA Disaster Management & Mitigation: Perspective in Community
Participation, CASA, New Delhi
CBRI, Earthquake Design Manual for Practicing Engineers, Central
Building Research Institution, Roorkee, Uttarakhand, 2004
Cigler B: Emergency management and public administration, report 86-12,
University of North Carolina at Chapel Hill, 1986
Clary BB: The evolution and structure of natural hazard policies. In petak
WJ: Emergency management: a challenge for public administration,
special issue, Public Admin Rev 45:20, Jan 1985
Cohen E: Disasters: an emergency care work-book, Instructional
Development and Educational Aids, Inc, San Diego, CA, 1982
Committee on Disasters and the Mass Media, Commission on
Sociotechnical Systems: Disasters and the mass media, National
Research Council-National Academy of Sciences, Washington, DC,
1980
Cowley RA: The use of communications satellite systems in major disaster
situations. In Manni C and Magalini SL: Emergency and disaster
medicine, New York, 1985, Springer-Verlag.
Dheri S.K and Mishra, G.C., Fire: Blazing Questions, in India Disaster
Report, OUP, Delhi, 2000
Drabek TE, et al: Managing the emergency response. In Petak WJ:
Emergency management: a challenge for public administration
(special issue), Public Admin Rev 45:85, Jan 1985
Drabek TE: Emergency management: the human factor, Federal Emergency
Management Agency, National Emergency Training Center,
Emmitsburg, MD, 1985
Drabek TE: Human system responses to disaster: an inventory of
sociological findings, New York, 1986, Springer-Verlag
Drabek TE: The professional emergency manager: structures and strategy
for success, monograph no 44, Institute of Behavioral Science
Drabek, T.E. et.al., Managing Multi Organizational Emergency Responses:
Emergent Search and Rescue Networks in Natural Disaster and
Remote and Settings, Natural Hazards Information Centre, University
of Colorado, Boulder, 1981.
iii
Dynes RR, Quarantelli EL, and Kreps GA: A perspective on disaster
planning, ed 3, report series 11, Disaster Research Center, University
of Delaware, Newark, 1981
Dynes RR: Organized behavior in disaster, Disaster Research Center,
University of Delaware, Newark, 1974
Dynes, R.R. et.al., Organizational Communications and Decision Making in
Crises, Disaster Research Centre, University of Delware, New York,
1977.
Elegant, S., Resurrection, Time, April 4, 2005.
Faupel CE: The ecology of disaster, New York, 1985, Irvington Publishers,
Inc.
FICCI Chemical (Industrial) Disaster Management, NDMA, New Delhi,
2009
Form W, and Nosow S: Community in disaster, New York, 1958, Harper
Foster HD: Disaster planning: the preservation of life and property, New
York, 1980, Springer-Verlag
Fox GG: Disaster planning: a tale of two cities, Public Management 63:7,
Jan/Feb 1981
Francis, C.M. et. al., Epidemics: Diseases as Disaster, in India Disaster
Report, OUP, Delhi, 2000
Gandhi, P.J., Disaster Mitigates and Management, Deep & Deep Pub.,
Delhi, 2007
Ghosh, G.K., Disaster Management Vol I-II, APH Pub., Delhi, 2006
Gibson G: Disaster and emergency medical care: methods, theories and a
research agenda, Mass Emerg 2:195, 1977
Goel, S.L., Disaster Administration and Management: Text and Case
Studies, Deep & Deep Pub., Delhi, 2007
Goel, S.L., Encyclopedia of Disaster Management Vol I-III, Deep & Deep
Pub., Delhi, 2006
Government of India - Disaster Management: Development Perspectives,
National Disaster Management Division, Ministry of Home Affairs,
Government of India, Delhi, 2002
Government of India - Hazards, Disasters and Your Community: Primer for
Parliamentarians, NDM Division, Ministry of Home Affairs,
Government of India, Delhi
Government of India Tenth Five Year Plan (2002-07), Government of India,
Delhi.
Gupta, M.P., Crises Management, Maxford Books, Delhi, 2006
iv
Hamilton, R.V., et. al., Social Psychological Interpretation on the
Udaukansas, Tornado, Unpublished Report, University of Wichita,
October 1985.
Hazarika S., Ethnic Conflicts in North East, in India Disaster Report, OUP,
Delhi, 2000
Heide, Erik Aderfder, Disaster Response: Principles of Preparation and
Coordination, Disaster Research Centre, University Delaware, New
York.
Husain, A. Natural Disaster, Sumit Enterprises, New Delhi, 2006
Irwin RL: Personal communication, Emergency Management Consultant,
Basic Governmental Services, Sonora, CA, 1987
Jain, A.K., Emergency Planning for Natural Disasters, paper presented in
World Congress on Nature Disaster Mitigation, organized by World
Federation of Engineering Organization, at Delhi, dated 19-22 Feb.
244.
Kallsen, G., Collapse of Coalinga, Journal of Emergency Medical Services
8(7), 1983
Kapur, A. etal., Disasters in India, Studies of Grim Realities, Rawat
Publications, Delhi, 2005
Kilijanek TS, et al: The emergency of a post-disaster communications
network, a paper presented at the Annual meeting of the American
Sociological Association, Boston, MA, Aug, 1979
Kreimer A: The role of the mass media in disaster reporting: a search for
relevant issues, in: Disasters and the mass media, Committee on
Disasters and the Mass Media, Commission on Sociotechnical
Systems, National Research Council-National Academy of Sciences,
Washingtion, DC, 1980
Kumar, A. (ed), Disaster Management: Recent Approaches, Anmol Pub.,
New Delhi, 2006
Larson JF: A review of the state of the art in mass media disaster reporting.
In: Disasters and the mass media, Committee on Disasters and the
Mass Media, Commission on Sociotechnical Systems, National
Research Council-National Academy of Sciences, Washington, DC,
1980
Marshall, Andrao, Healing Hands, Time April 4, 2005.
Mathur, Ranjeet, Railway Accidents, in India Disaster Report, OUP, Delhi,
2000
Mcluckie B: The warning system in disaster situations: a selective analysis,
report series no 9, Disaster Research Center, University of Delaware,
Newark, 1970
v
Medury and Dhameja, Rehabilitation of Cyclone in Orissa in Administrative
Reforms (ed) Amita Singh in India, Sage Publications Delhi, 2006.
Moore, H.E., Tornadoes Over Texas: A Study of Waco and San Angelo in
Disaster University of Texas Press, Austin, 1958.
Murthy D. B. N., Disaster Management: Text and Case Studies, Deep &
Deep Pub. Delhi, 2007
Nath Meenakshi, Sarangi S., Industrial Disasters: Working Towards
Oblivion Bhopal Gas Tragedy, in India Disaster Report, OUP, Delhi,
2000.
National Interagency Incident Management System: Information and guides,
Publication Management System, National Wildfire Coordination
Group, Boise Interagency Fire Center, Boise, ID, 1983
Parausraman, S. and Unnikrishnan, P.V. (ed), India Disaster Report, Oxford
University Press, Delhi 2000.
Perry, R.W., Comprehensive Emergency Management: Evacuating
Threatened Populations, Greenwich, CT, JAI Press, Inc., 1985.
Petak WJ: Emergency management: a challenge for public administration. In
Petak WJ: Emergency management: a challenge for public
administration special issues, Public Admin. Revisions, International
Fire Chief 47:12, Jan 1981. 45:3, Jan 1985
Prasad K. and B.D.Singh, Drought Disaster and Development, Mittal
Publications, New Delhi, 1994
Quarantelli EL, and Dynes RR: When disaster strikes (it isn’t much like
what you’ve heard or read about), Psychology Today, p 67, Feb 1972,
Quarantelli EL, and Tierney KJ: Disaster preparation planning. In: Office of
Public Sector Programs, Fire safety and disaster planning, 263-313,
reprint no 118, American Association for the Advancement of
Science, Washington DC, Disaster Research Center, University of
Delaware, Newark, 1981
Quarantelli EL: Human resources and organizational behaviours in
community disasters and their relationship to planning, preliminary
paper no 76, Disaster Research Center, University of Delaware,
Newark, 1982.
Quarantelli EL: Some basic themes in sociological studies of disasters. In
Quarantelli EL: Disasters: theory and research, Beverly Hills, CA,
1978, Sage Publications.
Quarantelli, E.L., Disaster Planning: Small and Large - Past, Present and
Future, presented at American Red Cross, EFO Division Disaster
Conference, Blacksburg, V.A., February 19-22, 1981, Disaster
Research Centre, University of Delaware, New York, 1981.
vi
Quarantelli, E.L., Organizational Behaviour in Disasters and Implications
for Disaster Planning Report Series 18, Disaster Research Centre
University of Delaware, New York, 1985.
Quarantelli, E.L., Socio-Behavioural Response to Chemical Hazards:
Preparations for and Responses to Acute Chemical Emergencies at the
Local Community Level, Disaster Research Centre, University of
Delaware, New York, 1981.
Quarantelli, EL: Studies in disaster response and planning, final project rep
no 24, Disasters Research Center, University of Delaware, Newark,
1979
Rai N. & Singh A.K. (ed), Disaster Management in India, New Royal Book
Comp., Lucknow, 2008
Rai, N. and Singh, A.K., Disaster Response in India: With Special Reference
to Tsunami Disaster, Urban Panorama, Vol. V (1), January-June, 2006
Roth R: Cross-cultural perspectives on disaster response, Am Behave Sci
13(3): 440, Jan-Feb 1970.
Roy, S., Natural Disaster Management Abhjeet Publications, New Delhi,
2004
S.L. and Kumar, R. (ed), Disaster Management, Deep & Deep Pub. Delhi,
2000
Sahu, B.P. and Mahapatra S., Post Disaster Management of Super Cyclone,
Mittal Publications, New Delhi, 2004
Seismic Safety Commission: Public official attitudes toward disaster
preparedness in California, publication no SSC 79-05, Sacramento,
1979.
Shaftan GW: Disaster and medical care, J Trauma 2:11, 1962.
Sharma R.K. (ed) Natural Disaster: Institutional Building for Mitigating the
Impact of Vulnerable Sections, APH Publishing Corp., New Delhi,
2005
Shashi Kumar S.K., Trends in International Migration from India- 1950-
2000, Paper presented at Labour Mobility and Globalizing World,
September 18-19, VVGNLI, ISLE, IHD, Noida 2002
Silver Mcein M.E., Triage Decision Trees and Triage Protocols: Changing
Strategies for Medical Rescue in Civilian Mass Casualty Situations,
U.S. Department of Commerce, Springfield, U.A. 1984.
Singh P.P. and S.Sharma (ed) Modern Dictionary of Natural Disasters, Deep
& Deep Publications & Pvt. Ltd., New Delhi, 2005
Singh, K.K., Indian Policy, Legislation and Institutional Arrangements for
Urban Risk Mitigation: An Argument for Right Based Approach,
paper presented in World Congress on Natural Disaster Mitigation, by
vii
World Federation of Engineering Organization, at Delhi, dated 19-22,
February, 2004.
Singh, R.B. (ed), Natural Hazards & Disaster Management, Rawat
Publications, Delhi, 2006
Singh, U.B., and Singh A.K., Socio-Economic Dimensions of National
Disasters in India: Suggested Strategies for Mitigation, paper
presented in World Congress on Natural Disaster Mitigation by World
Federation of Engineering Organizations at Delhi, February 19-22,
2004.
Sinha P. (ed) Disaster vulnerabilities and Risks, SBS Publications and
Distributions, New Delhi, 2006
Sinha P.C.(ed) Disaster Mitigations, SBS Publications & Distributors Pvt.
Ltd. New Delhi, 2006
Sinha P.C.(ed) Disaster Relief, SBS Publication & Distributors Pvt. Ltd.
New Delhi, 2006
Sorensen, J.H., et.al., Inter and Intra Organizational Cohesion in
Emergencies, Mass Emergencies and Disasters 3(3), November 1989.
Spirgi EH: Disaster management: comprehensive guidelines for disaster
relief, Bern, 1979, Hans Huber Publishers.
Srivastava R.S. and Sashikumar S.K., An Overview of Migration in India:
Its Implications and Key Issues, JNU, VVGNLI, New Delhi, 2003.
Srivastava, H. N. And Gupta, G.D., (ed), Management of Natural Disasters
in Developing countries, Daya Publishing House, Delhi, 2006
Stallings R: Communications in natural disasters, rep no 10, Disaster
Research Center, University of Delaware, Newark, 1971.
Subbiah, A.R., Natural Disaster Management, Vol. 21, State of Indian
Farmers, Academic Foundation, Delhi, 2004
Super G: START: A triage training module, Hoag Memorial Hospital
Presbyterian, Newport Beach, CA, 1984.
Swain, M. etal, Disaster and Gender, Serials Publications, New Delhi, 2006
Taori, K., Disaster Management Through Panchayati Raj, Concept
Publication, Delhi, 2005
Thomas, V.J., Road Accidents in India, in India Disaster Report, OUP,
Delhi, 2000
Tiwari, B.K. and Singh, A.K., Bangladeshi Issue in Perspective: The
Problem of Immigrants in India, Dynamics of Public Administration,
Vol. III-IV (1-2), January, December 1998.
UN Recovery Frame Work in Support of government of India for a Post
Tsunami Rehabilitation and Reconstruction Programme, United
States, March, 2005.
viii
UNAIDS - Innovative Approaches to HIV Prevention, UNAIDS, Geneva,
2001
UNAIDS - Migrants: Right to Health, UNAIDS, Geneva, 2001
UNDP - HIV Vulnerability and Migration: South Asia Perspectives, UNDP,
Delhi, 2002
UNDP - Recovery Framework in Support of Government of India for a Post
Tsunami Rehabilitation and Reconstruction Programme, UNDP,
Delhi, 2005
UNDP Disaster Risk Management Programme, (2002-07) MoHRD,
Government of India, Delhi, 2003.
UNDP No Safety Signs Here, UNDP, Delhi 2004
Wallace, W.A., et.al., Decision Support Systems for Disaster Management,
IW Petak W.J. Emergency Management: A Challenge for Public
Administration, special issue, Public Administration Review, Jan.
1985.
Waugh, W.L., Handbook of Disaster Management, Crest Publishing House,
New Delhi, 2005
Wenger D: Mass media and disasters, preliminary paper no 98, Disaster
Research Center, University of Delaware, Newark, 1985.
Wenger DE: Community response to disaster: functional and structural
alterations. In Quarantelli EL: Disasters: theory and research, Beverly
Hills, CA, 1978, Sage Publications.
Wohlworth, N., Putting Computer Technology to Work in Emergency
Planning, Emergency Preparedness Digest, 14(2) April-June 1987.
World Bank, World Bank in India, Newsletter, Vol. 4(3), November 2005.