guidebook to carbon neutrality in china - springer
TRANSCRIPT

Guidebook to Carbon Neutrality in China
CICC Research, CICC Global Institute
Macro and Industry Trends under New Constraints

Guidebook to Carbon Neutrality in China

CICC Research, CICC Global Institute
Guidebook to CarbonNeutrality in ChinaMacro and Industry Trends under NewConstraints

CICC Research, CICC Global InstituteBeijing, China
CICC
ISBN 978-981-16-9023-5 ISBN 978-981-16-9024-2 (eBook)https://doi.org/10.1007/978-981-16-9024-2
Translation from the Chinese language edition: 碳中和经济学 by 中金公司研究部,中金研究院, ©中信出版集团 2021. Published by中信出版集团. All Rights Reserved.
© The Editor(s) (if applicable) and The Author(s) 2022. This book is an open access publication.Open Access This book is licensed under the terms of the Creative Commons Attribution-NonCommercial-NoDerivatives 4.0 International License (http://creativecommons.org/licenses/by-nc-nd/4.0/), which permits any noncommercial use, sharing, distribution and reproduction in any medium orformat, as long as you give appropriate credit to the original author(s) and the source, provide a link to theCreative Commons license and indicate if you modified the licensed material. You do not have permissionunder this license to share adapted material derived from this book or parts of it.The images or other third party material in this book are included in the book’s Creative Commons license,unless indicated otherwise in a credit line to the material. If material is not included in the book’s CreativeCommons license and your intended use is not permitted by statutory regulation or exceeds the permitteduse, you will need to obtain permission directly from the copyright holder.This work is subject to copyright. All commercial rights are reserved by the author(s), whether the wholeor part of the material is concerned, specifically the rights of translation, reprinting, reuse of illustrations,recitation, broadcasting, reproduction on microfilms or in any other physical way, and transmission orinformation storage and retrieval, electronic adaptation, computer software, or by similar or dissimilarmethodology now known or hereafter developed. Regarding these commercial rights a non-exclusivelicense has been granted to the publisher.The use of general descriptive names, registered names, trademarks, service marks, etc. in this publicationdoes not imply, even in the absence of a specific statement, that such names are exempt from the relevantprotective laws and regulations and therefore free for general use.The publisher, the authors and the editors are safe to assume that the advice and information in this bookare believed to be true and accurate at the date of publication. Neither the publisher nor the authors orthe editors give a warranty, expressed or implied, with respect to the material contained herein or for anyerrors or omissions that may have been made. The publisher remains neutral with regard to jurisdictionalclaims in published maps and institutional affiliations.
This Springer imprint is published by the registered company Springer Nature Singapore Pte Ltd.The registered company address is: 152 Beach Road, #21-01/04 Gateway East, Singapore 189721,Singapore

Foreword
At the UN General Assembly session held in September 2020, Chinese President XiJinping announced China’s solemn pledge on carbon neutrality and carbon emissionpeak. In December 2020, President Xi went on to highlight a number of aggregateindicators to show China’s further commitment to the fight against climate change attheClimateAmbition Summit. At the recentNinthMeeting of theCentral Committeefor Financial and Economic Affairs, policymakers discussed fundamental ideas andkey measures to accomplish the country’s targets on carbon neutrality and carbonemission peak. To implement and achieve such a profound goal requires exten-sive efforts from both the regulators and the market. Recently, China InternationalCapital Corporation Limited (CICC) has publishedGuidebook to Carbon Neutralityin China: Macro and Industry Trends under New Constraints, a comprehensive andinformative work that serves as a good lead in the research on carbon neutrality andcarbon emission peak. I am confident it will become a highly influential piece ofwork. That said, I think the research on carbon neutrality and carbon emission peakis still in its early stage. Many issues in this field remain controversial and requirefurther in-depth analysis.
Peak Volume of Carbon Emissions: Careful Estimation isEssential
CICC’s work endeavors to derive an exact number for China’s peak carbon emissionsand draw a clearer picture of the pathway to achieve this goal in the next 10 yearsthrough analysis of aggregate targets. While this is quite important, it is also worthnoting that part of the basic data for China in this area remains unavailable. Forinstance, China’s carbon emission intensity in 2030 should be 65% lower than thelevel in 2005 so that the country could achieve the target for emission peak. Naturally,we will need to know China’s carbon emissions in 2005. Another example wouldbe that China aims to increase its forest stock volume in 2030 by 6 billion cubic
v

vi Foreword
meters from the 2005 level. Then, we also need to know how much China’s foreststock volume was in 2005 and how much carbon dioxide can be absorbed by eachcubic meter of forest stock per year. However, due to the lack of accurate officialstatistics from government agencies or other authoritative sources, the answers tothese questions could be inconclusive and misleading. A possible explanation is theinadequacies of China’s data compilation in the past, causing incomplete and incon-sistent data with little verification. Another possibility is that these vague numbersprovided additional room for policy maneuvering before China changed its policystance toward climate change.
CICCResearch spent a considerable amount of resources obtaining its preliminaryestimate on China’s peak net carbon emissions in 2030. Why didn’t governmentagencies or relevant authorities announce this number directly?The reason is possiblythe lack of accurate data of year 2005. CICC’s estimate is based on official data in2017 and government announcement that the emission intensity in 2017 was 46%lower than the 2005 level. What is the rationale for our endeavors to estimate thepeak emission volume? This estimation is critical as it is vital to future plans foremission cuts, the choice of proper roadmaps, as well as the design of incentivemechanisms, notably pricing schemes. Therefore, it is quite necessary to analyzethis number further.
The first issue is the measurements of data. CICC’s work proposes to use emissiondata in 2005 as the baseline for calculation. However, the measurements of thebenchmark data need clarification: Is it gross or net emissions volume? Does itinclude other greenhouse gases besides carbon dioxide? The data measurementsalso affect the total carbon emission data in 2020 that has not yet been announced,as well as the strategic roadmap of emission cuts for the next 10 years. Ensuring aunified data measurement is still a challenging job in our calculation and estimation.
The second issue is GDP comparability. China aims to reduce its carbon emissionintensity in 2030 by 65% from the 2005 level. To achieve this goal, we need to knowhow much China’s comparable GDP increased over the period of 2005–2020. Inprinciple, calculating comparable GDP with the GDP deflator or GDP growth rateis unlikely to cause much controversy. However, we should still be cautious aboutthe use of data. For instance, there are sometimes substantial differences within thepreliminary GDP growth rate, the initial and final verified GDP growth rate, and therevised number released after the national economic census. Such differences werequite visible in GDP data for 2005, 2006, and 2007. But generally speaking, the useand comparability of historical GDP data are unlikely to face significant disputes.However, forecasts on China’s average GDP growth over the next 10 years are basedon assumptions, and different assumptions may result in a range of estimates. Allthese issues call for attention in our calculation of aggregate targets.
Apart from technical details, there are also debatable questions about the logicof the calculation. As discussed above, we may use the published data from thegovernment to derive China’s carbon emission volume in 2005 and the peak emissionvolume in 2030. In fact, there is a logical relationship between the emission intensitydata for 2005 and 2017 and the 46% decline in emission intensity from 2005 to 2017based on verified comparable historical GDP. In other words, knowing two of the

Foreword vii
three numbers would surely enable us to know the third. This inevitably leads to aquestion: Why has no one officially confirmed the 2005 data? There may be someother reasons, but it is also possible that there is no disclosure plan in the first place.
Forming a Carbon Market and Determining Carbon Price
An important view in CICC’s report is that peak emissions and carbon neutralityrequire significant investment, and we need the carbon market to guide investmentinto cutting carbon emissions and eventually achieving carbon neutrality. A carbonmarket would provide incentives for investment from two dimensions: (1) A carbonmarket encourages emitters to increase current productivity or reduce unit emissionwithin their existing capacity, which helps improve carbon balance. (2) The potentialof current productivity growth or emission cut is limited as capabilities of currentemission control technologies are unlikely to improve much in the near term. There-fore,we need to guide intertemporal investment to substitute high-emission activities.A carbon market can provide clear signals for market investment, especially throughcarbonmarket derivatives such as carbon futures trading and forward contracts. Thus,it can help with risk control and calculations for future investment and production.Overall, the second point of investment incentives is critically important as efforts toachieve carbon emission peak and carbon neutrality largely depend on the effectiveguiding of investments.
CICC estimates in its report that China’s demand for green investment wouldtotal Rmb139trn by 2060, and I believe this figure is based on the 2020 value of theRMB. However, different institutions offer different estimates. In a report publishedin March 2021, the International Renewable Energy Agency (IRENA) estimatedrenewable energy investments planned globally should rise 30% to US$131trn by2050. Given that China accounts for about one-third of the world’s total carbon emis-sions, China alone would require approximately Rmb283trn worth of investment.Such an enormous amount of investment does not emerge out of mere persuasion.Carbonmarkets should play a crucial role in stimulating and guiding such investment.
There also exists some doubts concerning a few aspects of the carbon market,notably fluctuations and instability of carbon prices. One important notion of CICC’sresearch is to compare the concept of green premium with carbon price and applythese two concepts in different scenarios in light of their respective strengths. In themeantime, we should be aware that high uncertainties in future carbon prices couldbe attributed to three possible reasons: (1) Investment is subject to uncertainties intechnological progress and the cost-performance ratios of future technologies. Asmost investment projects are medium- to long-term ones, the returns and investmentaccountings are also subject to uncertainties. (2) To strike a balance between currenteconomic growth and future carbon neutrality, the government may introduce transi-tional arrangements before the country reaches the carbon emission peak and carbonneutrality. Such transitional arragementsmay takemany forms to reduce the addtionalcosts brought by the carbon trading system. In addition, the schedule of emission

viii Foreword
cuts could be front-loaded or back-loaded. As such, fluctuations in the volume ofemission cuts would lead to uncertainties in the quantity of emission allowancestraded in the carbon market, which affects carbon prices. (3) There are uncertaintiesin the government’s fiscal strength and subsidy policies, which affect the formation ofpost-subsidy carbon prices. In our exploration of emission-cut roadmaps, we shouldbe fully aware of these uncertainties and their impacts on carbon prices.
CICC believes that unified carbon pricing may cause problems, and differentiatedcarbon pricing might be the solution. The world has become a human communitywith a shared future. It is virtually impossible to trace all the greenhouse gasesin the atmosphere back to industries responsible for the emissions. Each tonne ofcarbon dioxide has the same negative impact on society and the economy. There-fore, the overall cost (not marginal cost) of reducing each tonne of carbon dioxideshould also be the same. Nevertheless, due to the differences in green premiums andindustry characteristics, a unified policy mechanism may have varying effects acrossdifferent sectors. To address such differences, the government’s industrial policiesand fiscal policies should treat various sectors in distinct ways, providing them withdifferentiated incentive mechanisms.
Priority and Structural Optimization
As China endeavors to reach carbon emission peak and carbon neutrality, the countryshould pay adequate attention to differences between various industries, and avoid“penny-wise, pound-foolish” actionswhen prioritizing its efforts. The power industryshould be the top priority for emission cuts as it accounts for 52% of total emissionsin China and 41% on average around the world. CICC’s work calls for an increasein electrification, e.g., a shift from direct consumption of fossil fuels to electricity.Meanwhile, power plants should also switch to green power production or zero-carbon power production. Therefore, electricity’s share in primary energy is set toexpand substantially, and CICC expects this figure to reach 70% in 2060. Althoughall industries should take action to reduce emissions, their demand for emissionallowances may differ from each other due to variations in their emission volumes.
President Xi Jinping stated at the Climate Ambition Summit that China wouldincrease the share of non-fossil fuels in primary energy consumption to approxi-mately 25% in 2030, meanwhile bringing its total installed capacity of wind and solarpower to over 1.2 billion kilowatts.We also need to convert the installed capacity intoannual power supply by analyzing annual average utilization hours and grid absorp-tion capacity. A critical factor in the conversion is the annual average utilization hoursfor different types of power generation facilities. For those who are not familiar withthe power industry, here are some approximate numbers: Annual average utiliza-tion hours are 1,500 for photovoltaic (PV) power, 2,500 for wind power, 3,500 forhydropower, 4,500–6,500 for mainly coal-fired or thermal power plants, and 7,500for nuclear power plants. It is important to note that annual average utilization hoursvary significantly across different types of power plants, and the actual numbers in
Foreword ix
China are slightly lower. In China, the current annual average utilization hours arearound 2,100 in the wind power sector and below 1,300 in the country’s PV powerindustry (in regions with less sunlight, the number even drops below 1,000). Whilethe international annual average utilization hours of thermal power plants could beas high as 6,000–7,000, the actual number in China is just 4,200, still less than 4,500.We should be aware of these deductions in calculation when we convert installedcapacity into annual power generation volume and calculate electricity’s share inprimary energy. At present, some analysts are too optimistic about the prospect ofemission cuts in the power industry as they have neglected technological difficul-ties in non-fossil electricity production, power transmission, and distribution. In fact,analysis of the power industry should cover not only power production but also powergrids, transmission, and distribution. Extra attention should be paid to the relation-ship between installed capacity and utilization hours, and the relationship betweenintermittent power production, peak shaving, and energy storage.
In addition to the issues discussed above, we shall also consider the investmentneeded in new installed capacity. While installed cost accounts for a large proportionof total investment, it is important to note how installed cost is to be amortized intothe operating cost of power supply, which is closely related to annual utilization hoursand grid absorption capacity. Therefore, we should not ignore additional investmentfor power grid performance (line loss included), energy storage, peak shaving, powertransmission, and distribution. If we only look at the installed cost, it appears to berather encouraging as the installed cost of wind and solar power has already becomelower than that of thermal and nuclear power. The installed cost of nuclear powerremains the highest, but the annual utilization hours of nuclear power plants mayexceed 7,000. While investment returns from coal-fired power plants have remainedquite competitive, the need for substantial emission cutsmay compel coal-fired powerproducers to invest in carbon capture and storage (CCS) equipment, substantiallydriving up total investment costs.Moreover, CCSequipmentwill incur high operatingcosts and raise power plants’ auxiliary power consumption by roughly 20%. SinceCCS technology is still immature, the country should pay extra attention to supportits development. When we calculate the amount of future investment needed in thepower industry, we should take all these factors into account rather than focusingonly on the installed cost of alternative power generation facilities. Another importantissue is the source of future returns for new investment in the power industry. As therevenue from selling electricity is not sufficient to cover the investment cost, we needsupplementary returns from the carbon market (or carbon tax) to provide adequateincentives for investment in the power sector. To avoid confusion and misguidance,analysis and judgment of all these issues should be aligned with the green premiumfor the power industry.
A similar issue is the capacity of forest stock for carbon absorption. We lackbenchmark data in this field, such as China’s exact forest stock volume in 2005 andthe amount of carbon dioxide each cubic meter of forest stock can absorb. As Chinacommits to increase its forest stock volume by 6 billion cubicmeters by 2030, we alsoneed data on the species, ages, and the geographic distribution of trees to estimate theapproximate number of trees to be planted each year, assess the forestation roadmap,

x Foreword
and calculate the approximate amount of carbon dioxide can be absorbed at carbonemission peak.
Additionally, we should pay attention to the difference between domesticand international sector classification frameworks when conducting internationalcomparison. China traditionally classified its industries into primary, secondary andtertiary sectors. China’s secondary sector is a particularly large emitter of carbondioxide and accounts for almost 70% of the country’s total electricity consumption,which is quite rare around the world. In fact, China’s sector classification frameworkfor emission analysis differs from the international system, posing an obstacle tointernational comparison. In Europe and the US, the power generation sector is thelargest carbon emitter, followed by the transportation sector, the construction mate-rial (including construction steel) sector, and heating and cooling sector. Under theEuropean and US framework, more than 80% of issues relating to emissions reduc-tion could be solved if we direct most of our efforts to the power, transportation, andresidential sectors. Such a classification framework stresses the energy consumptionand carbon emissions for residential purposes. Extensive attention should be paid toresidential-related activities, such as construction, urbanization, heating, cooling, anddevelopment of certain infrastructures as they account for a fairly large proportion oftotal greenhousegas emissions.On the contrary, itwouldbe confusing andmisleadingif we include a major part of residential-related emissions into production-relatedemissions in the secondary sector.
The Use of the CGE Model
A key contribution from CICC is its emphasis on the use of the computable generalequilibrium (CGE) model for policy analysis and discussion. In fact, we may adoptthe CGE model to address two more important issues. First, a slightly revised CGEmodel can help us analyze general equilibrium with quotas. In the days beforeChina adopted a market economy, the central government relied on administrativemeasures to directly assign tasks to various departments, provinces, and municipali-ties. However, this mechanism neither provided sufficient incentives nor allowed themarket to play an adequate role. This may also lead to exaggeration of accomplish-ments or failure to complete assigned tasks. The model of general equilibrium withquotas can help us analyze how the overall mechanism works in a market economywith quota restrictions. It is especially useful in finding ways to avoid excessivereliance on administrative measures.
Second, as we highlighted above, the government may introduce various transi-tional arrangements to strike a balance between carbon emission targets and otherfactors such as GDP, inflation, and people’s living standards. For example, thegovernment may design various transitional arrangements to determine how fastemission allowances will be released and whether they will be sold at full prices.How to analyze and compare these arrangements? Intertemporal CGE model cansolve this problem through systemic simulations. As the CGE model can take into

Foreword xi
account quotas with different designs, it enables us to analyze different transitionalarrangements from multiple policy perspectives and find the optimal solution.
Emphasis on Green Governance
The international community has attached tremendous importance to green gover-nance amid its endeavor to address climate change and pursue green development.International consensus and collaborations also need to be reflected in green gover-nance. At present, there are still disputes on climate issues between developed anddeveloping countries, and some specific problems remain unsolved. First,most devel-oping countries believe that financial and technological support for emission reduc-tion from developed countries is far from sufficient. Second, cross-border carbonemissions also raise concerns. This involves not only border adjustment tax for inter-national trade but also carbon emissions from international flights and shipping lines.While it is relatively easy to reach a consensus on the need to control cross-bordercarbon emissions, it remains controversial which country should receive the tax orfee on such emissions since all countries want to pocket the money. This reflects theinadequate international consensus, which hinders international collaboration andundermines the credibility of joint global efforts to address climate change. To solvethese problems, we should uphold principles ofmultilateralism and a human commu-nity with a shared future. The construction of the Bretton Woods system after WorldWar II could serve as a useful reference. Bold plans and vigorous commitments toaction are essential.
Sound green governance needs a solid digital foundation.We should build a greengovernance system that effectively enables and supports measurement, accounting,pricing, evaluation, and incentivemechanisms. This system is the key to ensuring thatall organizations involvedwork proactively to accomplish targets on carbon emissionpeak and carbon neutrality. China’s progress in this field is limited, and many issuesare still under preliminary discussion. In this regard, we may adopt practices of themeasurement, reporting, and verification (MRV) system, one of the core factors inthe construction of carbon trading market.
Xiaochuan ZhouPresident of China Society for Finance and Banking
Vice Chairman of the Boao Forum for AsiaFormer Governor of the People’s Bank of China
Beijing, China

Preface: Economics of Carbon Neutrality: SomeThoughts on the Coming Transformations
The once-in-a-century COVID-19 pandemic has compelled us to think moreprofoundly about the human relationship with nature, notably on the urgent needto address climate change. The Chinese government has pledged to achieve peakcarbon emissions by 2030, and achieve carbon neutrality, i.e., net-zero carbon emis-sions, by 2060. Across the Pacific, the Biden administration has brought the USback to the Paris Agreement in January 2021. Meanwhile, the 27-member EuropeanUnion has committed to increasing emission cuts before 2030 and achieving carbonneutrality by 2050. Achieving carbon neutrality requires not only coordinated effortsby government bodies and non-governmental institutions but alsomultilateral collab-orations among countries. What kind of obstacles and challenges will we encounteron the road to carbon neutrality? What new opportunities may emerge? How willcarbon neutrality impact the global economy and human society?
CICC Research and CICC Global Institute sought to answer these questions inGuidebook to Carbon Neutrality in China: Macro and Industry Trends under NewConstraints. The work systematically analyzes the pathways for China to achievepeak carbon emissions and carbon neutrality, as well as their broader implications. Itdiffers from our usual market research in two critical aspects: 1) The study of carbonneutrality involvesmany disciplines, covering economics, science, and social studies;and 2) Carbon neutrality is an unprecedented challenge without past experience asa reference for public policy, which will undoubtedly play a pivotal role. Our workrepresents the collaborative efforts of four macro research teams and more thantwenty sector teams, with invaluable contributions from external sources.
Since its initial release, Guidebook to Carbon Neutrality in China has triggeredextensive discussions and drawn close attention from industries, academia, andpolicy-making institutions both in China and around the globe. This has not onlydeeply inspired us, but also made us realize that the impact of carbon neutrality hasexpanded far beyond the financial sector and even the whole economy. In fact, carbonneutrality has become a new systemic constraint on a broad range of industries andsectors. Based on extensive discussions with various parties, we have decided toadapt the original work and publish it as a book to make it both publicly accessibleand academically rigorous. We hope the book will further facilitate more extensive
xiii

xiv Preface: Economics of Carbon Neutrality: Some Thoughts …
discussions on carbon neutrality. Since the issuance of our work on carbon neutrality,a few changes have taken place both in China and abroad. This preface will focus onseven issues in conjunction with these new developments.
Cost-Effectiveness Analysis with a Clear Objective
Since the Industrial Revolution, human activities have disrupted the delicate balancebetween carbon emission (“carbon source”) and absorption (“carbon sink”). Theconsumption of fossil fuels has led to a dramatic increase in the CO2 levels, resultingin the greenhouse effect and global warming. Most scientists agree that the warmingclimate over the past century is attributable to human activities. Over the past 5decades, in particular, we have witnessed profound changes in the natural environ-ment, including melting glaciers, rising sea levels, and collapsing ocean ecosystems.This has had domino effects on the environment, resulting in a range of consequences,from growing water shortages, spreading diseases, to extreme weather conditionssuch as floods, droughts, and hurricanes.
The Intergovernmental Panel onClimateChange (IPCC)predicted that theworld’saverage temperature in 2100 will be 1.5–4.8°C higher than the level recorded priorto the Industrial Revolution. If no action is taken and the current trend continues, theimpact of climate change on the economy and the society will escalate. Therefore,emissions reduction and carbon neutrality will benefit human civilization in the longrun.
However, emissions reduction incurs costs and may hurt the economy in thenear term. Carbon emissions stem from economic activities, and fossil fuels haveplayed a vital role in substantially improving living standards since the IndustrialRevolution. Carbon emissions can be reduced in two ways: 1) Electrification ofeconomic activities, such as industrial production, transportation and home heating;and 2) Switching from fossil fuels for electricity generation to alternative sources(e.g. renewable energy and nuclear energy) or adopting carbon capture and storagetechnologies to mitigate the adverse effects of fossil fuel consumption. However,these solutions face a critical problem: Clean energy is more expensive than fossilfuels and requires new infrastructure, while the higher cost is detrimental to economicgrowth.
The cost-benefit analysis was an early approach to studying the economic implica-tions of climate change and policy responses. This approach compares the long-termbenefits and short-term costs of emission cuts, and offers policy proposals based onthe findings. However, the monetary evaluation of long-term impacts from climatechange is highly imprecise and often underestimates the benefits of controlling emis-sions. Therefore, government policies based on cost-benefit analysis often prove tobe inadequate.
Inmost cases, the economic analysis only captures economic activities that involvemarket transactions and economic effects that can be measured by monetization.However, impacts from climate change such as rising sea levels, ocean acidification

Preface: Economics of Carbon Neutrality: Some Thoughts … xv
and ecological imbalances often transcend the scope of traditional economic analysis,or simply cannot bemonetized.Moreover, emissions reduction incurs costs at presentbut delivers benefits in the future. The majority of the public including policymakerstends to pay more attention to near-term costs and impacts to the economy, butneglects the interests of future generations.
As there is growing attention around the world on climate change, a globalconsensus on the need to address this problemhas formed. Instead of arguingwhetheractions need to be taken, discussions now focus more on how to effectively achievepolicy targets at the lowest cost. Therefore, researchers have switched from cost-benefit analysis to cost-effectiveness analysis in order to find the most effectivesolution with specific action plans.
Whenwe analyzeChina’s emissions reduction targets, a critical issue is to estimatethe peak emission volume in 2030. A high peak means the country would facerelatively less pressure to curb carbon emissions over 2021–2030, but may have towork hard over 2031–2060 to bring net emissions to zero as promised. The oppositewould be true if the emission peak was low. Most studies on this issue derive thepeak emission target from China’s actual carbon emission in 2005 and the Chinesegovernment’s pledge to reduce the country’s carbon intensity (i.e. carbon emissionper unit of GDP) by at least 65% over 2005–2030. In our opinion, however, it isnot appropriate to set the peak emission target to a specific value. Instead, a range ismore suitable for realizing China’s pledge.
Although a rigid, specific target on emission peak will help enhancing emis-sions reduction, it poses a risk of inducing stagflation. The increase of PPI in 2021clearly shows the emergence of such risks. Even though carbon neutrality inevitablymeans higher costs for the economy, we do not think it is necessary to bear thebrunt of the transformation pressure in the near term. As the economic recoveryfrom the COVID-19 pandemic is not stable enough, extra caution is needed formeasures with strong supply shocks, such as production limits or business shut-downs. Instead, policymakers should pay greater attention to less costly and moreefficient measures. Therefore, we believe that setting a range for the peak emissiontarget will help improve supply elasticity and facilitate both economic growth andemissions reduction.
Following the above rationale, we estimate that China’s net peak emission volumein 2030 will be between 9.9bn tonnes and 10.8bn tonnes. How to interpret thisestimate? Even considering the lower limit, China’s aggregate peak emission volumewill still be much higher than the EU’s (4.1bn tonnes) and the US’s (6.1bn tonnes).Moreover, the proposed duration from China’s emission peak to carbon neutralityis shorter than the EU and the US. Both point to the need to significantly reduceChina’s carbon emissions after the peak. Regarding the upper limit, the relativelyhigh peak emissions seem to suggest that China does not have to substantially cutcarbon emissions over 2021–2030. But an examination of the per capita emissionvolume reveals a different picture. We estimate China’s per capita peak emission at7.4 tonnes in 2030, well below peak volumes in the US (19.6 tonnes) and the EU (9.9tonnes). As the low per capita peak emission leaves little room for carbon emissionsover 2021–2030, we believe China will have to strictly curb emissions in this period.

xvi Preface: Economics of Carbon Neutrality: Some Thoughts …
Since both aggregate and per capita perspectives are essential to a complete pictureof emission control, we believe China will need to work hard to significantly reducecarbon emissions both before and after the peak in 2030.
Correcting Externality: What Carbon Prices Canand Cannot Do?
The effects of global endeavors to address climate change have been rather limitedand far from ideal. This poses a puzzling question: Why has climate change failedto stimulate innovations in emissions reduction while population ageing has led tothe development of machines to replace humans? In our view, a key factor is the so-called “negative externality”: Economic activities that emit carbon dioxide benefitindividuals, but their consequences such as air pollution and climate change, areborne by the entire public. With such negative externalities, prices of goods andservices in the free market are inconsistent with the public interest. For example,market prices of fossil fuels are too low and the amount consumed is rather high.
Economic activities involve several types of externalities. Most externalities, suchas financial risks and soil contamination, are limited to certain areas. However,climate change is a worldwide negative externality—it affects every nation andevery individual. The ongoing battle against COVID-19 is comparable to emis-sion control. Vaccination against COVID-19 has a positive global externality, asit not only protects individuals but also helps stop virus transmission. Global herdimmunity could be achieved when each country vaccinates 70%–80% of its popu-lation. However, if cross-national collaboration on vaccination failed, even 100%vaccination in a single country would be unlikely to end the pandemic, because thecontinuation of the pandemic in other countries may cause the virus to mutate andrender existing vaccines ineffective.
However, there is a key difference between addressing climate change and thebattle against COVID-19. While pandemic containment measures usually have animmediate impact, it may take decades or centuries for the results of climate effortsto be seen, and such results are extremely hard to predict. Given the length of timerequired to address this negative externality, there is little motivation for the privatesector to participate in tackling climate change, while adjustment mechanisms in freemarkets are very limited. As such, correcting this negative externality is the key toachieving carbon neutrality.
To correct the negative externality, intervention from public policies is essential. Akey concept here is carbon pricing that measures the social cost of carbon emissions.By requiring carbon emitters to pay for their emissions, carbon pricing transformsthe social cost of emissions into emitters’ costs, hence prompts them to reduce energyconsumption and switch from fossil fuels to clean and renewable energy. Discussionsand implementation of carbon pricing policies involve two connected yet differentissues: The form and the level of carbon pricing.

Preface: Economics of Carbon Neutrality: Some Thoughts … xvii
In theory, carbon prices should be based on the social cost of carbon emissions.To determine a proper carbon price, we need to discount the future loss caused bycarbon emissions to derive its current cost. However, it is quite difficult to forecastthe impacts of climate change over decades. The choice of a proper discount ratemay also cause disputes as it involves a trade-off between interests of the currentgeneration and those of their descendants. For example, the Obama administrationpreferred a 3% discount rate, which implies the US is willing to pay US$0.22 atpresent to avoid each dollar of loss due to climate change five decades from now, orless than US$0.05 at present to avoid each dollar of loss 100 years in the future.
Nicholas Stern, a renowned professor at London School of Economics andthe former Chief Economist of the World Bank, estimated carbon prices in TheEconomics of Climate Change: The Stern Review, a masterpiece released in 2006 thathas received widespread attention from the international community. The discountrate adopted by Professor Stern is lower than the rate adopted by the 2018Nobel Prizelaureate William Nordhaus, which implies that Professor Stern attached a heavierweight to the interests of future generations. The carbon price derived with ProfessorStern’s discount rate is about US$266/tonne, well above estimates predicted byProfessor Nordhaus (US$37/tonne), the Obama administration (US$42/tonne), andthe Trump administration (less than US$10/tonne). Significant differences betweenthese estimates illustrate the uncertainty and subjectivity in carbon pricing.
Carbon pricing can be implemented in two ways: Carbon tax and carbon tradingprice. The carbon tax is directly set by the government in areas where market-basedprices for carbon emissions are missing. The carbon trading price is the price ofemissions permits traded in a market established under a total emissions cap setby the government (i.e. the “cap-and-trade” system). Both carbon tax and carbontrading price have pros and cons. Advantages of imposing carbon tax include hightransparency and predictability of the carbon price, which helps economic entitiesdraw long-term plans. However, the carbon tax is not directly or stably related to theemission control target, which means the volume of emissions reduction is barelypredictable under the carbon tax framework. The cost of levying carbon tax is low, asit may leverage on the existing taxation system, although the introduction of a newtax could induce issues of social resistance.
In terms of the carbon trading framework, policymakers need to develop newtrading mechanisms and set a cap on the total volume of emissions permitted. Assuch, the volume of emissions reduction is more predictable under the framework ofcarbon trading than carbon tax. However, carbon trading price is less predictable asit is driven by multiple factors, such as economic cycles and technological advances.For example, the carbon trading price would decline due to the falling demand foremissions in an economic recession, but may rise due to the growing demand in aneconomic boom. The main problem for carbon trading lies in the inelastic supply,which means all demand-side shocks would result in price fluctuations. This maylead to excessive price volatility and significantly disrupt business plans of companiesand other economic entities.
Both carbon tax and carbon trading price are valuable tools for the correctionof externalities. They are not entirely incompatible with each other, and both can

xviii Preface: Economics of Carbon Neutrality: Some Thoughts …
be effective in a well-designed framework. The main difficulty for policymakersis deciding the appropriate tax rate and the proper cap on emission permits. Anexcessively low tax rate and an extremely high emission cap would be ineffective inimposing adequate constraints on carbon emissions or providing sufficient incentivesfor emission cuts. On the other hand, the economy would face significant adverseimpacts if the tax ratewere too high or the emission capwere too low.Aswe discussedearlier, the fundamental problem still lies in the excessive uncertainties in setting aproper price for each tonne of carbon emissions.
As we have set our target for carbon neutrality, the key question at present is howto effectively achieve this target at a low cost rather than assessing the long-termconsequences. How should we set a proper carbon price under the cost-effectivenessframework? When economic entities choose between fossil fuels and clean energy,they usually base their decisions on cost comparison. The carbon price that makesthe cost of clean energy equal to that of fossil energy is termed the “switchingprice” or “parity price”. When describing the roadmap for carbon neutrality, theInternational Energy Agency (IEA) adopted the concept of switching prices in lieuof traditional carbon prices. Another example of a switching price is the so-called“green premium”, a new concept proposed by Bill Gates in his recent book How toAvoid a Climate Disaster.
Green Premium: A More Practical Tool for Analysis
The green premium is defined as the difference between the cost of clean (zero-emission) energy and the cost of fossil energy for a certain economic activity. Anegative green premium indicates that the cost of fossil energy is higher than thatof clean energy—in this scenario, economic entities have the incentive to switch toclean energy and reduce carbon emissions. The green premium and carbon pricingare compatible and connectedwith each other. However, the green premium has threedistinct advantages over carbon pricing as an analytical tool:
(1) The concept of green premium is broader than carbon pricing. The scope ofcarbon pricing, such as carbon tax and carbon trading price, is rather narrowand cannot fully correct the negative externality of carbon emissions. Thiscompels regulators to intervene by issuing public policies with a broadercoverage. In contrast, the green premium provides a more comprehensiveframework that encompasses not only carbon pricing but also many alternativeapproaches. Apart from carbon tax and carbon trading, we may also lowerthe green premium by increasing public expenditures on technologies andinnovations. Moreover, building new infrastructure to reduce the cost of cleanenergy consumption and formulating green standards for various industriesand products could also contribute to lowering the green premium.
(2) The green premium measures the present, while carbon pricing involvesassessing future uncertainties. To determine a proper carbon price, we have

Preface: Economics of Carbon Neutrality: Some Thoughts … xix
to discount the future loss caused by carbon emissions and climate change toderive its current cost. In contrast, the green premium calculates the differencebetween current costs of clean energy and fossil fuels, and employs the resultto project possible future trends. As we have already set long-term targets forpeak carbon emissions and carbon neutrality, the green premium is considereda more practical tool for analysis.
(3) The concept of carbon price is uniform, whereas green premiums have distinctstructural features and vary significantly across industries due to differences intechnologies, businessmodels and public policies. Calculating green premiumsacross industries helps policymakers assess policy feasibility in different areas.Based on assumptions about new technologies, new business models and thethreshold of economies of scale, the green premium could help us identifycritical periods and indicators along the implementation path.
A key innovation of this work is to apply the concept of green premium in China.Our in-depth industry knowledge has enabled us to estimate green premiums invarious sectors, and incorporate them into our analysis of carbon emissions reduction.The green premium also serves as a fundamental link to combine top-down macroanalysis with bottom-up micro analysis to form a complete, systematic frameworkfor study of carbon neutrality.
Our sector teams assessed green premiums in eight industries with high carbonemissions. Under current conditions, our estimation shows the green premium is141% in the transportation industry (excluding transportation by passenger vehicles1)and 138% in the construction material industry (e.g. cement and glass). In otherwords, the cost of using clean and renewable energy is 1–2 times higher than thecost of fossil energy. The green premium remains positive at 3%–17% in industrieswith relatively mature technologies, such as papermaking, nonferrous metals, steel,passenger vehicles and electricity. These figures suggest thatmarket prices are unableto provide sufficient incentives for a switch to clean energy in those industries thatcollectively account for as much as 88% of total carbon emissions in China.
We calculated each of the eight industries’ share of total carbon emissions andused them as weights to derive the weighted average green premium. The result(about 35%) implies a Rmb377/tonne parity carbon price, i.e. the price that canreduce the green premium to zero. Despite conceptual differences discussed earlier,the parity price is within the estimated range of international research literature(US$37–266/tonne). Based on available data, we also calculated the eight indus-tries’ historical weighted average green premium since 2015 to compile a CICCGreen Premium Index. The Index shows that the switching price for clean energyhas declined remarkably in recent years, although there were significant differencesbetween industries.
We can lower the green premium by reducing the cost of clean energy and/orraising the cost of fossil fuels. However, relying solely on the second option couldcause severe adverse impacts on the economy, as it may require a dramatic increase
1 Passenger vehicles include most cars, station wagons, and vans but exclude taxies, buses, coaches,ambulances, and all waterway/air vehicles.

xx Preface: Economics of Carbon Neutrality: Some Thoughts …
in the cost of fossil fuels. In our view, the optimal solution is to reduce the cost ofclean energy or energy consumption per unit of GDP, which calls for technologicaladvances and innovations in social governance. We believe this would be a positivesupply shock to the economy and may generate new opportunities.
It is worth noting that the green premium is not static: It declines along withprices of clean energy, but rises when prices of fossil fuels fall due to shrinkingdemand. If the current clean energy prices drop below fossil fuel prices, the resultis not necessarily conducive to carbon neutrality. We should dynamically examinechanges in the green premium to analyze their implications. Ultimately, we still needdirect or indirect intervention from public policies to set a lower bound for fossilfuel prices and carbon prices. In general, carbon prices measure the social cost ofcarbon emissions, while the green premium gauges incentives for the private sectorto switch to clean energy. We believe both are effective tools for analysis and policyimplementation and should be compatible with and complementary to each other.
Technological Advances and Social Governance
The 2018 Nobel Prize in Economics was shared by William D. Nordhaus “for inte-grating climate change into long-run macroeconomic analysis” and Paul M. Romer“for integrating technological innovations into long-run macroeconomic analysis.”2
Although the sharing of the prize seems to be fortuitous, we believe the two Nobellaureates’ research fields are indeed linked to each other, as technological advancesare crucial for addressing climate change.Moreover, technological advancement alsoshows externalities—individuals bear R&D costs and risks, while the whole societybenefits fromR&D accomplishments. That’s why the private sector’s R&D spendingis falling below the level required to generate social benefits.
Given the negative externality of carbon emissions and positive externality oftechnological advances, intervention from public policies is essential to both emis-sion control and technological development. Over the past few years, the electricityindustry has been the primary contributor to the sharp decline inChina’s overall greenpremium. However, green premiums remain high in a few industries, and existingtechnologies are unlikely to considerably reduce the cost of clean energy usage inthe foreseeable future. Only striking innovations and technological breakthroughscan effectively lower green premiums in these sectors. For example, only expensivecarbon capture technologies can sufficiently reduce emissions in several manufac-turing industries, such as cement and chemicals, as electricity consumption is notthe main source of carbon emissions in these industries.
In the electricity industry, the green premium has already fallen below zero forpower generation. The applications of clean energy, including wind power, solarpower and electric vehicles, seem to have similar attributes in the manufacturing
2 https://www.nobelprize.org/prizes/economic-sciences/2018/summary/.

Preface: Economics of Carbon Neutrality: Some Thoughts … xxi
industry. Growing production volumes reduce unit costs and improve project feasi-bility for clean energy, demonstrating the trait of economies of scale. The Chinesegovernment’s support and subsidies for the photovoltaic (PV) industry effectivelyboosted the development of the industry at an early stage. As the PV industry grows,it begins to benefit fromeconomies of scale and technological advances. Furthermore,it no longer needs favorable policies or subsidies to support its business viability. Thisis a typical successful example of technological advancement supported by publicinvestment.
Innovations are important for not only natural science and technology but alsosocial governance. The relationship between green premium and emissions reductionis not always linear due to people’s habits, customs and path dependence. Carbonpricing may adversely affect the economy in the near term as the emission controltarget may require rather high carbon prices. Meanwhile, technological R&D facesmany uncertainties. To solve these problems, social governance reforms and admin-istrative intervention are needed to promote emissions reduction and energy conser-vation, including the guidance towards healthier lifestyles. For example, campaignsagainst wasting food may help free up some farmland for soil remediation, carbonsink, or bio-energy production.
In some sectors, the introduction of new technology products may entail a steeplearning curve and economies of scale could take time to achieve. Therefore, rules andregulations are more effective tools than price-based guidance to encourage emissioncuts and carbon neutrality in such sectors. Examples of such rules and regulationsinclude detailed industrial and product standards, refined urban planning, sustainablelandmanagement, and building new infrastructure such as charging stations andmoreconvenient public transportation systems. In addition, the development of the digitaleconomy could also play a vital role. The application of big data, for instance, canhelp magnify the benefits of clean energy and reduce costs. In particular, big datais able to make the generation of wind energy and solar energy more predictable byimproving management efficiency on the demand side to better match power supplywith demand.
Green Finance: Correct Versus Incorrect Perceptions
To understand the financial industry’s role in emissions reduction and carbonneutrality, we should analyze its relationship with the real economy in two ways: 1)Financial business results from activities in the real economy. With sufficient infor-mation, the financial system can effectively convert savings into investments. In thiscase, the development of the financial industry follows the steps of the real economy.2)When the real economycannot accomplish the effective allocation of resources, thefinancial industry can help remedymarket failures in certain areas. A good example isthe development of inclusive finance. In otherwords, the development of the financialindustry leads the way for the real economy.

xxii Preface: Economics of Carbon Neutrality: Some Thoughts …
We believe green finance can contribute to emission control and carbon neutralityin both cases discussed above. In the first case, the green premium has fallen belowzero, which means entities in the real economy have financial incentives to switchto green energy. Therefore, the financial industry’s role is to provide financing forgreen projects. In the second case, the financial industry directly helps lower thegreen premium. Both cases have been witnessed in the financing of green projects.However, we believe the second case, in which the financial industry leads the wayfor the real economy, is considerably more important from the perspective of publicpolicies.
Specifically, we believe the financial industry can play an essential role in emis-sion control and carbon neutrality in the following three ways: Reducing the cost offinancing, improving the availability of financing, and creating new trading markets.The government may intervene directly by providing favorable financing condi-tions, such as subsidies on loan interest rates, or specifying the range of industrieseligible for loans. Development financial institutions may play key roles in the initialfinancing for green projects. Other approaches include balancing investors’ percep-tion of risks in green and brown projects through financial instruments. The financialindustry may also create new types of trading products to improve the availability offinancing for green projects.
To effectively reduce carbon emissions, it is imperative to determine key sectorsto be supported by green finance and main financial instruments to be employed.We estimate that the green premium is only 17% in the electricity industry, whichaccounts for more than 40% of total carbon emissions. Please note that this estimatealso takes the amortization of fixed costs over asset life cycles into account. If we onlyconsider variable costs, the green premium in the electricity industry should havealready become negative, whichmeans the variable cost of clean energy is lower thanthat of fossil fuels. Given the electricity industry’s enormous share of total emissionsand the high financial feasibility of going green in this sector, we believe greenfinance should prioritize its support to the electricity industry and electrification inother industries.
Given the highly predictable risk-return profile of the projects we discussed above,we believe credit loans, bonds and other fixed-income instruments should be theprimary means of financing. While this type of green finance can be categorized asthe financial support discussed in the first case above to some extent, we believe thesecond case also applies here. In other words, financial institutions may help directlylower the green premium and encourage participation from the private sector byimproving the availability of financing or reducing the cost of capital for the initialinvestment. This is especially important for low-carbon projects that require highinitial investment. Considering the green energy sector is essentially amanufacturingindustry and China is a large manufacturing powerhouse, we anticipate the greenenergy sector will have strong scale effects and spillover effects in China. As a result,green finance may help boost the overall development of the Chinese economy.
Green premiums remain relatively high in some industries, such as aviation,construction materials and chemicals, largely due to technological limitations.Carbon capture technology, for instance, is still the major solution to emissions

Preface: Economics of Carbon Neutrality: Some Thoughts … xxiii
reduction, making technological innovations and breakthroughs extremely criticalto those industries. But innovations and breakthroughs take time and need financialsupport. A key part of the financial support is public investment in fundamentalresearch, including fiscal and development finance from development financial insti-tutions. On the other hand, an efficient capital market, notably the equity market, canalso facilitate high-risk, high-return innovations and accelerate resource reallocation.
While the amount of green credit and green bonds has been growing rapidly inrecent years, the environmental, social and governance (ESG) criteria for invest-ments have become another popular topic. The total amount of ESG investments hasexceeded US$40trn around the globe. A number of studies reveal that the averagereturn from ESG investments is actually not lower than conventional, unrestrictedinvestments, and the yields of green loans and bonds are also not lower than ordinaryproducts. These findings suggest that taking social and environmental responsibilitydoes not conflict with investors’ personal interests, which appears rather counterin-tuitive. We propose three possible explanations for this anomaly below, and each ofthem has different policy implications.
(1) Financial business reflects activities in the real economy. ESG investment andtraditional investment deliver the same returns because externalities of carbonemissions have already been corrected in the real economy. Although thisexplanation is partially justifiable, it is at least incomplete for thewhole picture.
(2) Not all industries supported by green finance are really green, as the defini-tion of green companies/industries is not clear enough. Evaluating a company’snon-financial performance is not just a technical issue, but a social-ethical chal-lenge that requires a complete system with proper standards and indicators togauge the company’s social and environmental performance. At present, westill lack widely-accepted standards on critical issues such as composition ofESG criteria and how much we can trust the ESG data provided by compa-nies. We believe this is a key problem for the development of green finance.Therefore, a pressing issue for policymakers is to set up a better system forthe formulation and evaluation of green standards, which are the fundamentalinfrastructure for green finance.
(3) Financial institutions and investors hold positive views on the outlook of greenprojects, which lower their demand for risk premiums. Optimism about new,green assets enhances the appeal of financial instruments, as they usually serveas tools for investment in new assets. On the other hand, existing assets arealso an important part of our analysis because the financial industry suffersfrom “path dependence” as well. We believe value of existing assets related totraditional energy may be impaired during the economic transformation. Thisaffects the financial industry as corporate borrowings related to such existingassets are listed as financial assets in the balance sheets of financial institutions.
The balance between existing and incremental assets is critical to the financialindustry as it affects not only the industry’s support to the green economy but alsothe stability of the financial system. Fundamentally, we believe this is a public policyissue that calls for actions from financial institutions. The central bank and other

xxiv Preface: Economics of Carbon Neutrality: Some Thoughts …
regulators should require financial institutions to fully disclose risks of brown projectassets in a timelymanner, andmore stringent standards should be imposed on capital-and liquidity-coverage ratios of these assets. Regulators should also discourage finan-cial institutions from supporting investment in high-emission assets, hence facilitateinvestment in green projects. In addition, the establishment of mechanisms that dealwith risk exposures in brown assets will help maintain financial stability amid thegreen transition.
New Landscape in International Cooperationand Competition
International collaboration is essential in our battle against climate change dueto the global externality of this crisis. A critical issue is how to strike a balancebetween equity and efficiency. In theory, the most efficient way to reduce emissionsis to impose a uniform carbon price around the world and prioritize emission cutsin low-cost sectors regardless of their locations. If we adopt these measures, thevolume of emission cuts would be higher in developing countries, as carbon pricesare less affordable to low-income consumers in these countries. The subsequentlosses in developing countries could, in theory, be covered by transfer paymentsfrom developed economies.
However, equity and efficiency are hard to balance in reality. For low-incomecountries, carbon emissions reduction has a large marginal impact on consumption,and fiscal transfer payments between nations are difficult to accomplish. In the nearterm, poverty reduction is more urgent than climate problems. In fact, developedeconomies are responsible for most of the carbon emissions since the IndustrialRevolution, while developing countries actually suffer from the lack of energy—akey manifestation of economic poverty and development inequality. On the otherhand, low-income countries should not follow the same development path adoptedby advanced economies in the past due to its huge demand for resources, especiallyenergy, that is clearly unsustainable from a global perspective.
To better understand the international cooperation and competition on climatechange, we need to examine price differentials in two key areas and their significantimplications:
(1) Given the income gap between developed and developing economies, thevolume of emissions reduction in developing countries ismore elastic to carbonprices. In other words, the same carbon price would lead to higher emissioncuts in developing countries. This implies carbon prices should be lower indeveloping countries than in developed economies. However, the differential incarbon pricesmay lead to “carbon leakage”, i.e. the relocation of high-emissionindustries to developing countries. In response to this problem, a number ofdeveloped economies are discussing a “carbon border tax”. However, setting a

Preface: Economics of Carbon Neutrality: Some Thoughts … xxv
proper tax rate is a complex issue involving numerous uncertainties. If handledimproperly, the tax could easily be turned into a tool for trade protectionism.
(2) Interest rates are higher in developing economies than in developed countries.A high discount rate means a lower present value of the future that benefitsfrom climate improvements. For emerging markets, a high interest rate alsomeans high returns from investment in sectors unrelated with climate change,which makes it necessary to strike a balance between investments in emissioncontrol and in other areas. Moreover, a high interest rate means there is moreroom for the financial sector to function,which leads to capital flows fromhigh-income countries into low-income ones. To solve these international problemsin green finance, we need bilateral and multilateral cooperation to remedymarket failures. Development financial institutions may help reduce projectrisks and attract investment from the private sector.
In our view, international cooperation and competition to address climate changewill no doubt significantly impact the existing global governance system. A majorchallenge for the international community is how to build a more binding mech-anism than the Paris Agreement for emission control. Substantial changes in theinternational arena call for revamping of the governance structure of internationaltrade and financial systems established after the Second World War, including theWorld Trade Organization, the International Monetary Fund and theWorld Bank. Asa large economy, China’s commitment to carbon neutrality is an important part of theglobal effort to address climate problems. Moreover, China should play an importantrole in shaping a new international governance system, including cooperation withcountries along the Silk Road Economic Belt and the 21st-Century Maritime SilkRoad (the Belt and Road).
Although China is at a disadvantage regarding fossil fuels due to differencesin natural resource endowments, the country’s strengths in manufacturing and thedigital economy give it a potentially competitive edge in clean energy. We believethat international peer pressure will compel all countries to adopt similar strategiesto address climate change, and emissions reduction will become a prevailing trend.Although this could be a challenge for China, we believe the country actually has afirst-mover advantage in emission control and carbon neutrality.
Stagflation or New Opportunity: Thoughts About MarketEconomy in Reality
Addressing climate change and achieve carbon neutrality, in essence, requires thetransformationof developmentmodels and economic structures through relative pricechanges. All measures to reduce carbon emissions, including the carbon tax, carbontrading price, administrative regulation and green finance, take effect by raisingfossil fuel prices and lowering clean energy prices. Under the new growth model,clean energy will serve as the foundation for healthier lifestyles and sustainable

xxvi Preface: Economics of Carbon Neutrality: Some Thoughts …
development of human society. However, relative price change is a supply shockthat causes frictions in the economy’s transition from the old equilibrium to the newequilibrium.
Effects of carbon pricing are similar to the impact from shrinking oil supply:Production cost rises on the supply side and real income declines on the demandside. From a macroeconomic perspective, these are characteristics of stagflation.How strong is the pressure of stagflation?Our computable general equilibrium (CGE)model shows that whether China can achieve carbon neutrality by 2060 hinges ontechnological advancement, which comes at a cost. A rising carbon price could serveas an incentive for technological development, but it may undermine GDP growthand drive up other prices. Our sector studies reveal that reducing the green premiumto zero at this stage would raise costs significantly in manufacturing sectors such aschemicals and construction materials.
Our structural analysis suggests that certain economic activities, technologies andeven industries may be replaced by new models amid the transformation to achievecarbon neutrality. Traditional energy industries, notably the coal industry, may facesevere adverse impacts. Therefore, we expect employment to decline in infras-tructure, manufacturing and service sectors related to traditional energy, whereasemployment will rise in clean/renewable energy industries and related sectors. Asthe regional distributions of fossil fuels are largely natural endowments, the transfor-mationwill inevitably vary across different regions, especially in a large economy likeChina. Severe negative impacts are expected in provinces and regions that producehigh volumes of fossil fuels, of which the economies are usually underdeveloped.Meanwhile, prices of traditional energy may rise for some time amid the transi-tion. We believe this will hurt low-income groups more severely than middle- tohigh-income groups. To address these problems in structural adjustment and incomedistribution, we will need effective public policies, notably fiscal policies.
From a more fundamental perspective, carbon neutrality imposes on economicactivities a single quantitative constraint that affects all aspects of the economy butcannot be priced in the free market. This is an unprecedented challenge to publicpolicies and the market economy. Policymakers are confronted with a multitude ofproblems that they have never encountered before: Under such rigid constraints, howdo we remedy the absence of market mechanisms and avoid excessive governmentintervention at the same time? How to balance short-term and local interests withlong-term and overall interests of the whole society? It remains highly uncertain howcarbon neutrality will affect the economy and society, but themost fundamental issueis probably the impact on mainstream social thoughts and ideas. How to interpretthis issue?
Looking ahead, we envisage three possible scenarios: 1) Efforts to achieve carbonneutrality are unsuccessful or fail to reach the target in time. Consequently, globalclimate change causes severe damage to human civilization; 2) Carbon neutralityis achieved mainly by raising the cost of energy consumption. As such, the worldeconomy suffers from long-term stagflation; 3) Carbon neutrality is achieved thanksto technological advances and innovations in social governance under effective public

Preface: Economics of Carbon Neutrality: Some Thoughts … xxvii
policies and international cooperation. As a result, the world will shift to a newdevelopment pattern and people will enjoy a better and healthier life.
All three scenarios represent challenges to neoclassical economics, which hasprevailed over the past 4 decades. As climate change’s spillover effects are cross-regional and intertemporal, we doubt whether externality is an adequate supplementto basic assumptions of neoclassical economics, i.e. complete information, certaintyand perfect competition. How can a single, quantitative indicator such as carbonemissions become a uniform constraint on global economic and social development?How will interactions among public policies, social governance mechanisms andmarket mechanisms evolve alongwith our process toward carbon neutrality? Perhapsonly time will tell. However, the endeavor to achieve carbon neutrality will definitelylead to a deeper understanding of the difference between the neoclassical idealmarketand the market in reality.
Neoclassical economics’ deviation from reality calls for a close reexamination ofeconomic thoughts and points to the necessity of returning to classical economics.Classical economists, such as Adam Smith and David Ricardo, recognized thathuman activities are subject to natural constraints, and emphasized political economyperspectives such as social ethics and humanities. In response to climate change,economists are compelled to reevaluate the role of nature in their analytical frame-work. In addition to labor and productive capital, we should also take into accountnatural capital such as clean water, clean air, forests, oceans, and biodiversity. Asnatural capital cannot be fully priced in free markets, proper public policies andsocial governance are essential. Meanwhile, we believe people will attach greaterimportance to equity in the equity-efficiency tradeoff.
The road to carbon neutrality is a long learning curve for all of us. While wehave tried our best to analyze carbon neutrality in this book, we are well aware thatmistakes and omissions may be inevitable. We will pay close attention to China’sprogress toward carbon neutrality and update our analysis and conclusions whennecessary.
Wensheng PengExecutive Dean, CICC Global Institute
Chief Economist and Head of Research Department, CICCBeijing, China

Acknowledgments
The motivation behind this book is rooted in the endeavor to discuss the pathwaysof China towards carbon neutrality and the economic and industry trends under newconstraints, which are of great significance to China and the world. The publicationof this book would not have been possible without support from many people towhom we would like to express our sincere thanks and gratitude. We would like toextend special thanks to four macro and over twenty sector research teams of CICCResearch and CICC Global Institute for their great work and effort. We are highlyindebted to our translating and editing team for their dedications to translation andrefining the English manuscript. We also would like to thank all of those who havemade remarkable contributions to the book.
ForewordAuthor: Xiaochuan ZhouTranslator: Bin KongEditors: Kenneth Ho, Min Zhu, Xinran Liu, Zhiyuan Li
Preface: Economics of Carbon Neutrality: Some Thoughts on EntailedTransformationsAuthor: Wensheng PengTranslator: Bin KongEditors: Andrew Cheng, Xinran Liu, Yuwei Zhang
Chapter 1: Exploring the Road to Carbon NeutralityAuthors: Wensheng Peng, Chao Xie, Jundong Zhang, Liu Liu, Jin Li.Translator: Jincheng HuangEditors: Kenneth Ho, Jundong Zhang, Nanding Chen
Chapter 2: Balancing Efficiency and Fairness: Kaldor-Hicks Improvement?Authors: Wenlang Zhang, Zhengning Liu, Qiaofeng DengTranslator: Wendong WangEditors: Andrew Cheng, Enduo Xu, Nanding Chen
xxix

xxx Acknowledgments
Chapter 3: The Capacity of Carbon Pricing MechanismAuthors: Wensheng Peng, Chao Xie, Jin Li, Enduo XuTranslator: Wendong WangEditors: Kenneth Ho, Enduo Xu, Weihan Zhang
Chapter 4: Green Finance: Clarifying Functions and CapacityAuthors: Zipeng Zhou, Shuaishuai Zhang, Zeyu Yao, Xiaoxiao Zhou, Peng Zhou,Yu ChengTranslator: Jian LiuEditors: Andrew Cheng, Xinran Liu, Weihan Zhang
Chapter 5: Green Technology: From Quantity to QualityAuthors: Xiaofeng Qiu, Yan Chen, Jun Liu, Zhongyang WangTranslator: Yi ZhangEditors: Carol Keaty, Xinran Liu, Donghua Jiao
Chapter 6: Green Energy: A New Chapter in ChinaAuthors: Xiaofeng Qiu, Yan Chen, Jun Liu, Zhongyang Wang, Tao ZengOther contributors: Jiani Liu, Song WangTranslator: Tong SunEditors: Michael Hoare, Zhiyuan Li, Donghua Jiao
Chapter 7: Green Manufacturing: Carbon Emissions Reduction Roadmap of CarbonIntensive SectorsAuthors: Yan Chen, Xiaofeng Qiu, Lingxin Kong, Keyue LiOther contributors: Qing Gong, Qichao ZhaoTranslators: Bo Liu, Yu YanEditors: Kenneth Ho, Zhiyuan Li, Xinran Liu
Chapter 8: Green Transportation: A Challenging Road to Carbon NeutralityAuthors: Xin Yang, Wenjie Zhang, Tao Zeng, Jing Chang, Zhenhao Chen, Xue DengTranslator: Wei LuEditors: Andrew Cheng, Donghua Jiao, Xinran Liu
Chapter 9: Living Green: New Chapter of Consumption and Social GovernanceAuthors: Haiyan Guo, Junhao Fan, Wei He, Sijie Lin, Wenbo ChenTranslator: Bo LiuEditors: Jonathan Barlow, Donghua Jiao, Zhiyuan Li
Chapter 10: Green City: Towards Low-Carbon Urban Planning and GovernanceAuthors: Yu Zhang, Xin Yang, Aobo Zhan, Xinhao Jiang, Pu WangOther contributors: Wenjie Zhang, Yuqi ZhangTranslator: Xinyue ZhangEditors: Robert Park, Nanding Chen, Zhiyuan Li
Chapter 11: Digital Economy Goes Green: Taking Over Energy-EfficiencyManagementAuthors: Kai Qian, Hu Peng, Liping Zhao, Hao Chen

Acknowledgments xxxi
Translator: Yi ZhangEditors: Wanbo Zhou, Weihan Zhang, Enduo Xu
Chapter 12: Green Investment: New Trend, New DirectionAuthors: Hanfeng Wang, Hao Wang, Yue KouTranslator: Wei LuEditors: Kenneth Ho, Weihan Zhang, Enduo Xu
Chapter 13: TacklingClimateChange:Global Cooperation andChina’sCommitmentAuthors: Ting Wu, Huimin WuTranslator: Qian WangEditors: Andrew Cheng, Nanding Chen, Yuwei Zhang

Contents
1 Exploring the Road to Carbon Neutrality . . . . . . . . . . . . . . . . . . . . . . . . 11.1 Seeking a Peak: 9.9–10.8bn Tonnes of Net Carbon
Emissions . . . . . . . . . . . . . . . . . . . . . . . . . . . . . . . . . . . . . . . . . . . . . . . 21.2 Structural Path: Analysis Based on Green Premium . . . . . . . . . . . 71.3 Four Scenarios: General Equilibrium Analysis Under CGE
Model . . . . . . . . . . . . . . . . . . . . . . . . . . . . . . . . . . . . . . . . . . . . . . . . . . 131.3.1 Model Data . . . . . . . . . . . . . . . . . . . . . . . . . . . . . . . . . . . . . . 141.3.2 Scenario Assumptions . . . . . . . . . . . . . . . . . . . . . . . . . . . . . 141.3.3 BAU Scenario . . . . . . . . . . . . . . . . . . . . . . . . . . . . . . . . . . . . 151.3.4 Carbon Tax Scenario (M1) . . . . . . . . . . . . . . . . . . . . . . . . . 151.3.5 Carbon Trading Scenario (M2) . . . . . . . . . . . . . . . . . . . . . 161.3.6 Carbon Tax + Carbon Trading + Technological
Progress Scenario (M3) . . . . . . . . . . . . . . . . . . . . . . . . . . . . 191.3.7 Sensitivity Analysis of Technology Curve . . . . . . . . . . . . 231.3.8 Sensitivity Analysis of Carbon Tax . . . . . . . . . . . . . . . . . . 25
1.4 Road to Carbon Neutrality = Technology + CarbonPricing + Social Governance . . . . . . . . . . . . . . . . . . . . . . . . . . . . . . 26
2 Balancing Efficiency and Fairness: Kaldor-HicksImprovement? . . . . . . . . . . . . . . . . . . . . . . . . . . . . . . . . . . . . . . . . . . . . . . . . 312.1 Three Approaches to Achieving Carbon Neutrality:
Innovation is the Key . . . . . . . . . . . . . . . . . . . . . . . . . . . . . . . . . . . . . 332.1.1 Carbon Neutrality Cannot Be Achieved Through
“zero-sum game” . . . . . . . . . . . . . . . . . . . . . . . . . . . . . . . . . 332.1.2 Approach 1: Raising Carbon Price to Internalize
External Costs . . . . . . . . . . . . . . . . . . . . . . . . . . . . . . . . . . . . 342.1.3 Approach 2: Accelerating Innovation
to Fundamentally Alter Mode of Production . . . . . . . . . . 352.1.4 Multiple Barriers to Eco-Innovation . . . . . . . . . . . . . . . . . 372.1.5 Innovation-Related Policy Suggestions . . . . . . . . . . . . . . . 37
xxxiii

xxxiv Contents
2.1.6 Approach 3: Improving the Social GovernanceSystem and Encouraging Emission ReductionAmong the General Public . . . . . . . . . . . . . . . . . . . . . . . . . 38
2.2 Issues Related to Fairness . . . . . . . . . . . . . . . . . . . . . . . . . . . . . . . . . 392.2.1 Distribution of Income . . . . . . . . . . . . . . . . . . . . . . . . . . . . 392.2.2 How to Share the Cost of Emission Reduction
Among Industries and Regions? . . . . . . . . . . . . . . . . . . . . 41
3 The Capacity of Carbon Pricing Mechanism . . . . . . . . . . . . . . . . . . . . . 453.1 Unified Carbon Price: Social Cost or Net Social Cost? . . . . . . . . . 463.2 Green Premium and the Choice of Carbon Pricing
Mechanisms . . . . . . . . . . . . . . . . . . . . . . . . . . . . . . . . . . . . . . . . . . . . . 513.2.1 Pigou Versus Coase: Similarities and Differences
Between Carbon Tax and Carbon Market . . . . . . . . . . . . . 533.2.2 Carbon Pricing from the Perspective of Green
Premium: Carbon Market to Be the Mainstay,with Carbon Tax as a Complement . . . . . . . . . . . . . . . . . . 61
3.2.3 Establishing a CarbonMarket TradingMechanismwith Auctions and Futures at the Core . . . . . . . . . . . . . . . 64
3.3 What Carbon Market Can and Cannot Do: RegionalTransfer of Pollutants Under Carbon Trading . . . . . . . . . . . . . . . . . 663.3.1 Social Governance: A Policy Instrument to Lower
Green Premium in Addition to Carbon Pricing . . . . . . . . 693.3.2 Mandatory Policies Can Be Used to Regulate
Waste of Financial Resources as Seen in BitcoinMining . . . . . . . . . . . . . . . . . . . . . . . . . . . . . . . . . . . . . . . . . . 72
3.3.3 Advocacy Policies as Necessary Move to ControlWaste of Resources in the Real Economy . . . . . . . . . . . . . 73
4 Green Finance: Clarifying Functions and Capacity . . . . . . . . . . . . . . . 774.1 Green Finance: Serving or Guiding the Real Economy? . . . . . . . . 774.2 Green Finance in China . . . . . . . . . . . . . . . . . . . . . . . . . . . . . . . . . . . 794.3 How Much Investment is Needed to Achieve Carbon
Neutrality? . . . . . . . . . . . . . . . . . . . . . . . . . . . . . . . . . . . . . . . . . . . . . . 824.3.1 Bottom-up Analysis of China’s Demand for Green
Investment . . . . . . . . . . . . . . . . . . . . . . . . . . . . . . . . . . . . . . . 824.3.2 Aggregate Investment Demand and Structural
Features . . . . . . . . . . . . . . . . . . . . . . . . . . . . . . . . . . . . . . . . . 834.4 New Targets Bring in New Challenges. What Are
the Weaknesses in China’s Green Finance? . . . . . . . . . . . . . . . . . . . 854.4.1 Mismatch Between Supply and Demand in Green
Investment . . . . . . . . . . . . . . . . . . . . . . . . . . . . . . . . . . . . . . . 854.4.2 Lack of Widely Accepted Green Standards . . . . . . . . . . . 904.4.3 Defects in Green-Information Disclosure System . . . . . . 934.4.4 Weak Guidance from Financial Institutions . . . . . . . . . . . 95

Contents xxxv
4.5 Turning Challenges into Opportunities: How to Addressthe Weaknesses in China’s Green Finance? . . . . . . . . . . . . . . . . . . . 964.5.1 Setting a Unified Green Standard in China . . . . . . . . . . . . 964.5.2 Establishing a Binding Green-Information
Disclosure Mechanism . . . . . . . . . . . . . . . . . . . . . . . . . . . . 974.5.3 Improving Incentive Policy to Boost the Overall
Development of Green Financial Market . . . . . . . . . . . . . 984.5.4 Strengthening Education of Green Concept;
Financial Institutions Offering Both Servicesand Guidance . . . . . . . . . . . . . . . . . . . . . . . . . . . . . . . . . . . . 98
4.5.5 Incorporating Environmental Risks into PrudentialRegulations . . . . . . . . . . . . . . . . . . . . . . . . . . . . . . . . . . . . . . 103
5 Green Technology: From Quantity to Quality . . . . . . . . . . . . . . . . . . . . 1055.1 Technological Breakthrough and Carbon Neutrality . . . . . . . . . . . 106
5.1.1 Why Do We Need a Technological Breakthrough? . . . . . 1065.1.2 What Can Become Carbon Neutral
by Technological Advances and What Cannot? . . . . . . . . 1075.1.3 What Are the Technological Routes for the Carbon
Neutrality Initiative? What Are the Constraints? . . . . . . . 1075.2 Cost is a Touchstone for the Development of Technology . . . . . . 109
5.2.1 What Kind of Technologies Are Capableof Reaching Emission Peak and Carbon-Neutralas Planned? What Are the Differencesin the Choices of Various Technological Routes? . . . . . . 109
5.2.2 Three Measures to Reduce the Cost of DevelopingEnergy Technologies . . . . . . . . . . . . . . . . . . . . . . . . . . . . . . 110
5.3 Existing and Potential Technologies for Net Zero CarbonEmissions and Carbon Neutrality Initiatives . . . . . . . . . . . . . . . . . . 1115.3.1 Technologies to Help Cut CO2 Emissions Focus
on Reducing Energy Consumption and Shiftingto Energy Technologies that Produce Lower CO2
Emissions . . . . . . . . . . . . . . . . . . . . . . . . . . . . . . . . . . . . . . . 1115.3.2 Carbon-Neutral Technologies: Technologies
that Help Achieve Zero-Carbonand Negative-Carbon Emissions . . . . . . . . . . . . . . . . . . . . 112
5.4 “Photovoltaic + Energy Storage”, Hydrogen Energy,and Carbon Capture Becoming the Main TechnologicalRoutes . . . . . . . . . . . . . . . . . . . . . . . . . . . . . . . . . . . . . . . . . . . . . . . . . . 1165.4.1 The Main and Auxiliary Technological Routes
for the Carbon Neutrality Initiative . . . . . . . . . . . . . . . . . . 1165.4.2 The Main Technological Route for the Carbon
Neutrality Initiative in the Power Industry . . . . . . . . . . . . 118

xxxvi Contents
5.5 Policy Suggestions: Enhancing Technology R&DProtection; Supporting the Industrialization of NewTechnologies . . . . . . . . . . . . . . . . . . . . . . . . . . . . . . . . . . . . . . . . . . . . 1235.5.1 Technologies that May Develop More Rapidly
Than Expected . . . . . . . . . . . . . . . . . . . . . . . . . . . . . . . . . . . 1255.5.2 Technologies that May Develop More Slowly
Than Expected . . . . . . . . . . . . . . . . . . . . . . . . . . . . . . . . . . . 126
6 Green Energy: A New Chapter in China . . . . . . . . . . . . . . . . . . . . . . . . 1276.1 Overview of China’s Current Energy Structure . . . . . . . . . . . . . . . 127
6.1.1 Energy Sector Produces Nearly 90% of CarbonEmissions in China; Building Green EnergySupply System is Top Priority . . . . . . . . . . . . . . . . . . . . . . 127
6.1.2 Total Energy Demand May Increase Under SteadyEconomic Growth Despite Decline in EnergyConsumption Per Unit of GDP . . . . . . . . . . . . . . . . . . . . . . 128
6.1.3 Carbon Emissions Reduction is Difficultto Achieve Under Current Energy Structure; TheCountry Needs Stronger Top-Down Planningand Policy Support . . . . . . . . . . . . . . . . . . . . . . . . . . . . . . . . 129
6.2 Start from More Feasible Methods to Achieve EnergyTransition Through More Economical Ways . . . . . . . . . . . . . . . . . . 131
6.3 Lowering Costs to Raise Non-fossil Fuels’ Proportionin Power Generation . . . . . . . . . . . . . . . . . . . . . . . . . . . . . . . . . . . . . . 1326.3.1 Calculation of Green Premiums in Power Sector . . . . . . . 1326.3.2 Power Generation: Non-fossil Energy’s Lower
Costs Per kWh Fuels Transition to Cleaner EnergyMix . . . . . . . . . . . . . . . . . . . . . . . . . . . . . . . . . . . . . . . . . . . . . 134
6.3.3 Absorption: Complementary Multi-energy SystemMinimizes Absorption Costs . . . . . . . . . . . . . . . . . . . . . . . 135
6.4 Non-power Sector: Electrification, Hydrogen Powerand Carbon Capture Fuel Energy Transition . . . . . . . . . . . . . . . . . . 1366.4.1 China’s Electrification Rate Will Likely Reach
70%; The Remaining 30% Demand RequiresNon-electric Power and Other Energy ResourcesSupported by New Technologies to AchieveCarbon Neutrality . . . . . . . . . . . . . . . . . . . . . . . . . . . . . . . . . 136
6.4.2 Non-power Sector: Hydrogen Power and CarbonCapture is Feasible Technology Solutionto Carbon Neutrality . . . . . . . . . . . . . . . . . . . . . . . . . . . . . . 136
6.4.3 Other Energy Resources Adopted Carbon Captureand Hydrogen Power to Meet 22% and 8% EnergyDemand in 2060 . . . . . . . . . . . . . . . . . . . . . . . . . . . . . . . . . . 138
6.4.4 Costs and Green Premiums of Non-power CarbonNeutrality Solutions . . . . . . . . . . . . . . . . . . . . . . . . . . . . . . . 139

Contents xxxvii
6.5 Policy Recommendation: Power System ReformAccelerates Non-fossil Energy Absorption and Helpsthe Development of Hydrogen Power . . . . . . . . . . . . . . . . . . . . . . . 1416.5.1 Policy Recommendation for the Power Sector:
Stabilize New Energy Absorption . . . . . . . . . . . . . . . . . . . 1416.5.2 Policy Recommendation for Non-power Sector:
Building Supporting System for CarbonReduction; Establishing Reward and PenaltySystem to Fuel Clean Energy Development . . . . . . . . . . . 142
7 Green Manufacturing: Carbon Emissions ReductionRoadmap of Carbon Intensive Sectors . . . . . . . . . . . . . . . . . . . . . . . . . . . 1437.1 Cost of Zero Emissions: Analyzing the Carbon Neutrality
Roadmaps of Manufacturing Industries from Perspectiveof Green Premiums . . . . . . . . . . . . . . . . . . . . . . . . . . . . . . . . . . . . . . . 144
7.2 Steel Industry: Mature Emission Reduction Pathwith Electric Arc Furnace Gradually DemonstratingAdvantages . . . . . . . . . . . . . . . . . . . . . . . . . . . . . . . . . . . . . . . . . . . . . . 1477.2.1 Industry Green Premium: Cost for the Steel
Industry to Achieve Carbon Neutralityat the Current Stage . . . . . . . . . . . . . . . . . . . . . . . . . . . . . . . 147
7.2.2 Technology Roadmaps for Carbon EmissionsReduction in the Steel Industry . . . . . . . . . . . . . . . . . . . . . 148
7.2.3 Lowering the Green Premium: Will the SteelIndustry Achieve Carbon Peak and CarbonNeutrality as Planned? . . . . . . . . . . . . . . . . . . . . . . . . . . . . . 148
7.3 Cement Industry: Achieving Carbon Neutrality is Difficult.Demand and Cost of Carbon Capture are the Key . . . . . . . . . . . . . 1497.3.1 Industry Green Premium: Cost of Achieving
Carbon Neutrality at Current Stage for CementIndustry . . . . . . . . . . . . . . . . . . . . . . . . . . . . . . . . . . . . . . . . . 149
7.3.2 Technology Roadmaps for Carbon EmissionsReduction in the Cement Industry . . . . . . . . . . . . . . . . . . . 151
7.3.3 Lowering the Green Premium: FeasiblePaths to Carbon Peak and Carbon Neutralityin the Cement Industry . . . . . . . . . . . . . . . . . . . . . . . . . . . . 153
7.4 Aluminum Industry: The Decarbonization of Electricity isthe Key to Carbon Neutrality . . . . . . . . . . . . . . . . . . . . . . . . . . . . . . . 1557.4.1 Industry Green Premium: Cost for the Aluminum
Industry to Achieve Carbon Neutralityat the Current Stage . . . . . . . . . . . . . . . . . . . . . . . . . . . . . . . 155
7.4.2 Technology Roadmap for Carbon EmissionsReduction in the Aluminum Industry . . . . . . . . . . . . . . . . 155

xxxviii Contents
7.4.3 Lowering the Green Premium: A FeasiblePath for Carbon Peak and Carbon Neutralityin the Aluminum Industry . . . . . . . . . . . . . . . . . . . . . . . . . . 157
7.5 Chemical Industry: When Carbon Negative BecomesPossible . . . . . . . . . . . . . . . . . . . . . . . . . . . . . . . . . . . . . . . . . . . . . . . . . 1587.5.1 Industry Carbon Emission: Cost for the Chemical
Industry to Achieve Carbon Neutralityat the Current Stage . . . . . . . . . . . . . . . . . . . . . . . . . . . . . . . 158
7.5.2 Technology Roadmaps for Carbon EmissionsReduction in the Chemical Industry . . . . . . . . . . . . . . . . . 160
7.5.3 Policy Guidance and System Buildingfor Emissions Reduction are Crucialfor the Chemical Industry . . . . . . . . . . . . . . . . . . . . . . . . . . 161
7.5.4 Lowering the Green Premium: A FeasiblePath for Carbon Peak and Carbon Neutralityin the Chemical Industry . . . . . . . . . . . . . . . . . . . . . . . . . . . 161
7.6 General Manufacturing Industry: Achieving Carbon Peak;Using Clean Energy to Achieve Carbon Neutrality . . . . . . . . . . . . 1647.6.1 Industry Green Premium: Cost for the General
Manufacturing to Achieve Carbon Neutralityat the Current Stage . . . . . . . . . . . . . . . . . . . . . . . . . . . . . . . 164
7.6.2 Technology Roadmap for Carbon EmissionsReduction in General Manufacturing Industries . . . . . . . 165
7.6.3 Lowering the Green Premium: The FeasiblePathway to Achieving Carbon Neutralityin the General Manufacturing Industry . . . . . . . . . . . . . . . 165
8 Green Transportation: A Challenging Road to CarbonNeutrality . . . . . . . . . . . . . . . . . . . . . . . . . . . . . . . . . . . . . . . . . . . . . . . . . . . . 1678.1 How Far Away is Green Transportation? . . . . . . . . . . . . . . . . . . . . . 168
8.1.1 Sources of Carbon Emissions in the TransportationIndustry . . . . . . . . . . . . . . . . . . . . . . . . . . . . . . . . . . . . . . . . . 168
8.1.2 Current Amount of Global Carbon Emissionsfrom Transportation . . . . . . . . . . . . . . . . . . . . . . . . . . . . . . . 169
8.1.3 Have Carbon Emissions from TransportationPeaked in EU and US? What Experiences CanChina Draw upon? . . . . . . . . . . . . . . . . . . . . . . . . . . . . . . . . 170
8.2 The Difficulties for Chinese Transportation Industryto Achieve Carbon Neutrality Measured by the “GreenPremium” . . . . . . . . . . . . . . . . . . . . . . . . . . . . . . . . . . . . . . . . . . . . . . . 1718.2.1 Carbon Emissions from Transportation Rise
Notably in China . . . . . . . . . . . . . . . . . . . . . . . . . . . . . . . . . 172

Contents xxxix
8.2.2 The High “Green Premium” IndicatesDecarbonization in the Transportation IndustryIs Costly and Challenging, and Requiresa Combination of Technological Innovationand Favorable Policies . . . . . . . . . . . . . . . . . . . . . . . . . . . . . 174
8.3 Viable Options for China to Achieve Green Transportation . . . . . 1758.3.1 Carbon Emissions from the Transportation
Industry: Emission Peak in 2030; CarbonNeutrality in 2060 Seems Unlikely Undera Neutral Assumption that Emissions in 2060Equal 23% of the Level in 2019 . . . . . . . . . . . . . . . . . . . . . 175
8.3.2 The PV-Based Transport Sector: PV Ownershipto Rise at First and then Decline; Zero CarbonEmissions to Be Achieved in 2060 . . . . . . . . . . . . . . . . . . 180
8.3.3 Carbon Emissions from CV-Based TransportSector: Rising Applications of New Energy,Digitalization Technology and ChangingTransport Structure to help this sector achievecarbon neutrality in 2060 . . . . . . . . . . . . . . . . . . . . . . . . . . 183
8.3.4 The Aviation Sector: Emissions in 2060 to Doublefrom 2019; Achieving Carbon Neutrality isthe Most Challenging for All Modes of Transport . . . . . . 186
8.3.5 Marine Transportation: Carbon Emissions in 2060to Be 38% of the Emissions in 2019 . . . . . . . . . . . . . . . . . 189
8.3.6 Railway Transport: Zero Carbon Emissionsin 2060 Via Electrification-Based Decarbonization . . . . . 191
8.4 Forecasts for the Use of LIB and Hydrogen Fuel CellTechnologies . . . . . . . . . . . . . . . . . . . . . . . . . . . . . . . . . . . . . . . . . . . . 1918.4.1 LIB to Promote Electrification in PV-Based
Transport and Certain Public TransportationSectors . . . . . . . . . . . . . . . . . . . . . . . . . . . . . . . . . . . . . . . . . . 192
8.4.2 Hydrogen Fuel Cells to Enable Zero-CarbonEmissions from HDT-Based Transportation . . . . . . . . . . . 193
8.5 Supportive Policies to Help the Transportation SectorAchieve Carbon Neutrality . . . . . . . . . . . . . . . . . . . . . . . . . . . . . . . . 1958.5.1 Policy Suggestions on Industrial
Development—PV and CV: Shiftingthe Focus of Policies Towards Market Orientationand Innovation . . . . . . . . . . . . . . . . . . . . . . . . . . . . . . . . . . . 195
8.5.2 Policy Suggestions on IndustryDevelopment—Airlines: Focusingon Development of Biomass and Hydrogen Energy . . . . 197

xl Contents
8.5.3 Policy Suggestions on TechnologicalAdvances—LIB: Zero Emissions Throughoutthe Lifecycle Requires Coordination BetweenCompanies and Governments . . . . . . . . . . . . . . . . . . . . . . . 197
8.5.4 Policy Recommendations—Fuel Cells: It isNecessary to Promote Industrialized Applicationsof Fuel Cells Via Policies . . . . . . . . . . . . . . . . . . . . . . . . . . 198
8.6 Reassessing the Effectiveness of Our Green TransportationSolutions Based on the “Green Premium” . . . . . . . . . . . . . . . . . . . . 1998.6.1 The “Green Premium” to Decline Considerably,
but Unlikely to Plunge to Zero in 2060 . . . . . . . . . . . . . . . 1998.7 Outlook for Green Transportation: A Combination
of Autonomous Vehicles, Super High-Speed Trainsand Supersonic Aircraft . . . . . . . . . . . . . . . . . . . . . . . . . . . . . . . . . . . 2018.7.1 Autonomous Driving: It Changes More Than
Travel . . . . . . . . . . . . . . . . . . . . . . . . . . . . . . . . . . . . . . . . . . . 2018.7.2 Can Hyperloop Trains be Realized? . . . . . . . . . . . . . . . . . 2028.7.3 Commercialization of Supersonic Aircraft Likely
to Be in Sight . . . . . . . . . . . . . . . . . . . . . . . . . . . . . . . . . . . . 203
9 Living Green: New Chapter of Consumption and SocialGovernance . . . . . . . . . . . . . . . . . . . . . . . . . . . . . . . . . . . . . . . . . . . . . . . . . . . 2059.1 Living Green Needs Efforts of All Stakeholders . . . . . . . . . . . . . . 205
9.1.1 Low-Carbon Lifestyle is of Great Significanceas Households Are Responsible for 40% of TotalCarbon Emissions . . . . . . . . . . . . . . . . . . . . . . . . . . . . . . . . 205
9.1.2 Social Governance Requires Effortsfrom Households, Companies, and Government . . . . . . . 206
9.2 Green Lifestyle: What Can Households Do to HelpAchieve Carbon Peak? . . . . . . . . . . . . . . . . . . . . . . . . . . . . . . . . . . . . 2089.2.1 Eating Green . . . . . . . . . . . . . . . . . . . . . . . . . . . . . . . . . . . . . 2089.2.2 Reduction in Food Waste . . . . . . . . . . . . . . . . . . . . . . . . . . 2119.2.3 Green Home . . . . . . . . . . . . . . . . . . . . . . . . . . . . . . . . . . . . . 2129.2.4 Support for Environmental Protection . . . . . . . . . . . . . . . . 212
9.3 Green Business Model: What Can Consumer GoodsCompanies Do to Help Achieve Carbon Peak? . . . . . . . . . . . . . . . . 2139.3.1 Product Innovation . . . . . . . . . . . . . . . . . . . . . . . . . . . . . . . . 2139.3.2 Efficiency Improvement and Energy Consumption
Reduction . . . . . . . . . . . . . . . . . . . . . . . . . . . . . . . . . . . . . . . 2149.3.3 Environmental Protection and Emission Reduction . . . . 2169.3.4 Recycling . . . . . . . . . . . . . . . . . . . . . . . . . . . . . . . . . . . . . . . . 2189.3.5 Sharing Economy . . . . . . . . . . . . . . . . . . . . . . . . . . . . . . . . . 2219.3.6 Environmental, Social, and Governance (ESG)
Development . . . . . . . . . . . . . . . . . . . . . . . . . . . . . . . . . . . . . 222

Contents xli
9.4 Policy Formulation and Social Governance: ComparingChina with Other Countries to Identify Future Directions . . . . . . 2249.4.1 Home Appliances: Energy Efficiency Standards,
Energy-Saving Subsidies and Recycling SystemsNeed to Be Improved . . . . . . . . . . . . . . . . . . . . . . . . . . . . . . 224
9.4.2 Furniture: Promote Sustainable Use of ForestResources . . . . . . . . . . . . . . . . . . . . . . . . . . . . . . . . . . . . . . . 226
9.4.3 Packaging: Overseas Experienceand the Overcoming of Difficulties . . . . . . . . . . . . . . . . . . 226
9.4.4 Catering: Promote “Clear Your Plate” Campaignand Organic Food Waste Reusing . . . . . . . . . . . . . . . . . . . 230
9.5 Quantitative Calculations: A Green Lifestyle Is of GreatSignificance . . . . . . . . . . . . . . . . . . . . . . . . . . . . . . . . . . . . . . . . . . . . . 2319.5.1 Electricity Saving and Use of Clean Energy . . . . . . . . . . . 2319.5.2 Reduction in Food Waste . . . . . . . . . . . . . . . . . . . . . . . . . . 2319.5.3 Changes in Dietary Structure . . . . . . . . . . . . . . . . . . . . . . . 2329.5.4 Recycling of Express Delivery Packaging . . . . . . . . . . . . 2329.5.5 Shared Power Bank Help Reduce Purchase
Demand . . . . . . . . . . . . . . . . . . . . . . . . . . . . . . . . . . . . . . . . . 233
10 Green City: Towards Low-Carbon Urban Planningand Governance . . . . . . . . . . . . . . . . . . . . . . . . . . . . . . . . . . . . . . . . . . . . . . . 23510.1 Problems and Challenges Facing China in Its Green City
Vision . . . . . . . . . . . . . . . . . . . . . . . . . . . . . . . . . . . . . . . . . . . . . . . . . . 23510.2 Urban Spatial Planning: Building Cities with Sufficient
Housing Supply and Evenly Distributing Residencesand Workplaces . . . . . . . . . . . . . . . . . . . . . . . . . . . . . . . . . . . . . . . . . . 23710.2.1 Evenly Distributing City Resources to Reduce
Commuting Distances . . . . . . . . . . . . . . . . . . . . . . . . . . . . . 23810.2.2 Designing a Reasonable Housing System,
and Matching Housing Supply with Demandto Reduce Carbon Emissions . . . . . . . . . . . . . . . . . . . . . . . 240
10.2.3 Using Land Efficiently to promote High-QualityGrowth . . . . . . . . . . . . . . . . . . . . . . . . . . . . . . . . . . . . . . . . . . 244
10.3 Urban Transportation: Wider Use of AFVs to ReduceCarbon Emissions from Urban Transportation . . . . . . . . . . . . . . . . 24610.3.1 Electrification of Urban Buses, Taxis,
and Ride-Hailing Vehicles to Complete in 2030 . . . . . . . 24710.3.2 Switching to Low-Carbon Modes
of Transportation Before 2030 . . . . . . . . . . . . . . . . . . . . . . 24710.4 Urban Construction: New Ideas, New Materials, and New
Technologies Drive Reduction in Carbon Emissions . . . . . . . . . . . 25010.4.1 Overview: Building Sector as a Whole Accounted
for 36% of National Carbon Emissions . . . . . . . . . . . . . . . 250

xlii Contents
10.4.2 Carbon Emissions from Construction: ReducingOverall Construction Volume and EnhancingConstruction Efficiency . . . . . . . . . . . . . . . . . . . . . . . . . . . . 253
10.4.3 Carbon Emission from Building Management:Passive House Technology and ComprehensiveEnergy Conservation Solutions to Reduce CarbonEmissions from Building Management . . . . . . . . . . . . . . . 255
10.5 Urban Maintenance: Reduce Energy Consumptionby Public Service Facilities, and Improve ResourceRecycling Efficiency . . . . . . . . . . . . . . . . . . . . . . . . . . . . . . . . . . . . . . 25810.5.1 Conserving Energy and Reducing Emissions
by Using Technology to Reduce CarbonEmissions from Public Utilities . . . . . . . . . . . . . . . . . . . . . 259
10.5.2 Resource Recycling to Help Build Low-CarbonCities . . . . . . . . . . . . . . . . . . . . . . . . . . . . . . . . . . . . . . . . . . . 261
11 Digital Economy Goes Green: Taking Over Energy-EfficiencyManagement . . . . . . . . . . . . . . . . . . . . . . . . . . . . . . . . . . . . . . . . . . . . . . . . . . 26511.1 Digitalization to Help Cities Improve Energy Efficiency
and Reduce Carbon Emissions . . . . . . . . . . . . . . . . . . . . . . . . . . . . . 26611.1.1 CVIS Projects: Enhancing Vehicle Allocation
Efficiency and Reducing Fuel Consumption . . . . . . . . . . 26711.1.2 Smart Airport: Optimizing Aircraft Taxiing
Distance with AI-Enabled Precision Calculation . . . . . . . 26911.1.3 Smart Logistics: Internet Platform-Based
Logistics Companies to Help Reduce the EmptyRunning Ratio . . . . . . . . . . . . . . . . . . . . . . . . . . . . . . . . . . . . 269
11.2 Industrial Internet Empowers Enterprise Productionto Achieve Cost Reduction and Efficiency Increase . . . . . . . . . . . . 26911.2.1 Industrial Internet: Enhancing Energy Efficiency
Through Monitoring and Managing EnergyConsumption Data . . . . . . . . . . . . . . . . . . . . . . . . . . . . . . . . 273
11.2.2 Application of Big Data TechnologiesBrings Accurate Energy-Savingand Efficiency-Improving Solutionsin Power and Water Sectors . . . . . . . . . . . . . . . . . . . . . . . . 274
11.3 AI and Other New Technologies Help the TechnologyIndustry Reduce Energy Consumption and EnhanceEnergy Efficiency . . . . . . . . . . . . . . . . . . . . . . . . . . . . . . . . . . . . . . . . 27411.3.1 How AI Technologies Help Companies Reduce
CO2 Emissions . . . . . . . . . . . . . . . . . . . . . . . . . . . . . . . . . . . 27511.3.2 Improving Equipment, Station Locations,
and Networks to Help 5G Jointly Built and SharedBase Stations to Reduce Energy Consumption . . . . . . . . 276

Contents xliii
11.3.3 Software and Hardware Technologies: TheTrend of Upgrading Base Structures of TelecomInfrastructure . . . . . . . . . . . . . . . . . . . . . . . . . . . . . . . . . . . . 277
11.3.4 Data Centers: Cloud Computing and AdvancedRefrigeration Technologies Help Improve PowerUsage Effectiveness (PUE) . . . . . . . . . . . . . . . . . . . . . . . . . 281
11.4 What Are the Challenges Ahead? . . . . . . . . . . . . . . . . . . . . . . . . . . . 284
12 Green Investment: New Trend, New Direction . . . . . . . . . . . . . . . . . . . 28712.1 How Will Following the Principles of Carbon Neutrality
and Sustainable Development Affect Potential InvestmentReturns? . . . . . . . . . . . . . . . . . . . . . . . . . . . . . . . . . . . . . . . . . . . . . . . . 28912.1.1 Existing Framework for Building Sustainable
Investment Portfolios and Its Potential Challenges . . . . . 28912.1.2 How Will the Real Investment Returns Be
Affected by Following the Principles of CarbonNeutrality and Sustainable Development? . . . . . . . . . . . . 293
12.2 How Will Addressing Climate Change and Followingthe Principles of Carbon Neutrality Affect IndustrialStructures? . . . . . . . . . . . . . . . . . . . . . . . . . . . . . . . . . . . . . . . . . . . . . . 29612.2.1 Increasing Use of Clean and Renewable Energy . . . . . . . 29712.2.2 Mounting Financial Risks to Industries with Large
Carbon Footprints . . . . . . . . . . . . . . . . . . . . . . . . . . . . . . . . 29712.2.3 Resource Recycling Amid Transformation
Towards a Circular Economy . . . . . . . . . . . . . . . . . . . . . . . 29912.2.4 The Positive Role of Advanced Technologies
in “Green Energy” Use and Conservation . . . . . . . . . . . . 30012.2.5 Low-Carbon Consumption . . . . . . . . . . . . . . . . . . . . . . . . . 30112.2.6 Reshaping of Regional Economies . . . . . . . . . . . . . . . . . . 30212.2.7 Impact of Carbon Neutrality on Each Industry,
Based on Views of CICC Sector Analysts . . . . . . . . . . . . 30312.3 How to Capture Investment Opportunities from Carbon
Neutrality and Guard Against Risks? . . . . . . . . . . . . . . . . . . . . . . . . 30312.3.1 Investment Opportunities and Risks
from the Carbon Neutrality Investment Theme . . . . . . . . 30312.3.2 Summary of Existing Carbon Neutrality Indices . . . . . . . 305
13 Tackling Climate Change: Global Cooperation and China’sCommitment . . . . . . . . . . . . . . . . . . . . . . . . . . . . . . . . . . . . . . . . . . . . . . . . . 31713.1 Building Fair and Effective Global Climate Governance
System . . . . . . . . . . . . . . . . . . . . . . . . . . . . . . . . . . . . . . . . . . . . . . . . . 31813.1.1 History of International Cooperation inAddressing
Climate Issues . . . . . . . . . . . . . . . . . . . . . . . . . . . . . . . . . . . . 31813.1.2 Discussion on Fair and Effective Governance
Model . . . . . . . . . . . . . . . . . . . . . . . . . . . . . . . . . . . . . . . . . . . 319

xliv Contents
13.2 Spillover Effects of Global ClimateGovernance—International Trade and ClimateFinance . . . . . . . . . . . . . . . . . . . . . . . . . . . . . . . . . . . . . . . . . . . . . . . . . 32213.2.1 International Trade: Embodied Carbon and BTA . . . . . . 32213.2.2 Global Climate Finance: Realities and Challenges . . . . . 325
13.3 China’s Commitment to Global Climate Cooperation . . . . . . . . . . 33113.3.1 From Participant to Leader: China’s Active
Involvement in Global Climate Cooperation . . . . . . . . . . 33113.3.2 China is Promoting Global Response to Climate
Change Along with Europe and the US . . . . . . . . . . . . . . 33213.3.3 Climate Cooperation and Building a Green Belt
and Road . . . . . . . . . . . . . . . . . . . . . . . . . . . . . . . . . . . . . . . . 333

Chapter 1Exploring the Road to Carbon Neutrality
Abstract How to deal with carbon emissions—a rare externality that spans a largetime frame and geographical scope—is a difficult task for the world. This taskis particularly challenging for China, mainly in that the country must coordinatedual objectives, including existing economic growth targets and the newly addedcarbon neutrality goal. Over the past 40 years of reform and opening up, China hasbeen setting economic growth targets and striving to achieve them. In recent years,although growth targets have softened along with the secular decline in potentialgrowth rate, economic growth remains a top priority for China, the world’s largestdeveloping country. We expect China to reach the current standard for a high-incomecountry by the end of the 14th Five-Year Plan period, and to double its GDP or percapita income by 2035. Currently, China is adding a new constraint over the next40 years. As the world’s largest carbon emitter, China has set out a clear timetablefor carbon neutrality—to reduce its carbon emission intensity in 2030 by more than65% from the 2005 level, and reach the peak of carbon dioxide emissions by 2030and become carbon neutral by 2060.We note that it will take 71 and 45 years, respec-tively, for the EU and the US to achieve the carbon neutrality goal from peak carbonemissions (reached by the EU in 1979 and by the US in 2005) to net zero emissions.China’s aggressive timetable to achieve carbon neutrality within 40 years means thatthe country will face a much steeper slope of carbon emissions than the EU and theUS. How will China strike a balance between the objectives of economic growth inthe past 40 years and carbon neutrality in the next 40 years? We discuss this issuefrom an aggregate and a structural point of view. In our aggregate analysis, the mostimportant task is to identify the peak of China’s carbon emissions in 2030.We believethat in order to take economic growth and emission reduction into consideration, itis more appropriate to set the carbon peak target in a range to avoid rigid constraints.From a structural perspective, we discuss how China can achieve its carbon peakand neutrality goals. Under the framework of a “green premium”, we come up witha preliminary idea of “technology + carbon pricing” based on the analysis of eighthigh-emission industries. We prove that this idea can strike a balance between theconstraints of economic growth and carbon neutrality goals through general equi-librium analysis using the computable general equilibrium (CGE) model. Finally,we incorporate social governance into our analysis by discussing the meaning of a
© The Author(s) 2022CICC Research, CICC Global Institute, Guidebook to Carbon Neutrality in China,https://doi.org/10.1007/978-981-16-9024-2_1
1

2 Chapter 1 Exploring the Road to Carbon Neutrality
Table 1.1 Annual and cumulative carbon emissions
Year Indicator (bn tonnes) EU US India China
1950 Annual carbon emissions 1.3 2.5 0.06 0.08
Cumulative carbon emissions 65.6 92 2 1.9
2019 Annual carbon emissions 2.9 5.3 2.6 10.2
Cumulative carbon emissions 287 410.2 51.9 220
Source Our World in Data, World Bank, CICC Research
Table 1.2 Intensity of carbon emissions and emissions per capita
Year Indicator EU US India China
1970 Carbon emission intensity (kg/USD) 0.6 0.9 0.8 4.1
Carbon emissions per capita (tonne) 8.6 20.6 0.3 0.9
2019 Carbon emission intensity (kg/USD) 0.2 0.3 0.9 0.9
Carbon emissions per capita (tonne) 6.6 16.1 1.9 7.1
Source Our World in Data, World Bank, CICC Research
negative green premium, and arrive at this formula: the road to carbon neutrality =technology + carbon pricing + social governance.
1.1 Seeking a Peak: 9.9–10.8bn Tonnes of Net CarbonEmissions
WeexamineChina’s carbon emission issue fromahistorical and a future perspective.1
As shown in Table 1.1, while China’s annual carbon emissions in 2019 were muchlarger than other economies, the US and the EU, which started industrializationearlier, had greater cumulative emissions.2 Moreover, China’s carbon emissions percapita were 7.1 tonnes, still less than half the US’s 16.1 tonnes (see Table 1.2). Suchhistorical perspective is very important for countries to distinguish their “commonbut differentiated” responsibilities whenmaking coordinated carbon neutrality goals.
1 For details, please refer to President Xi Jinping’s explanation about the CPC Central CommitteeProposals on Formulating the 14th Five-Year Plan of National Economic and Social Developmentand the Long-Range Objectives through 2035: During the process of soliciting opinions, some localgovernments and government departments proposed to clearly set a target of economic growth rateduring the 14th Five-Year Plan period, and clearly set a goal of doubling GDP or per capita incomeby 2035. After careful research and calculations, the document drafting team believes that judgingfrom economic development capabilities and conditions, China has the promise and potential tomaintain long-term stable development, and it is entirely possible for China to reach the currenthigh-income country standard by the end of the 14th Five-Year Plan period, and to double itseconomic aggregate or per capita income by 2035.2 Cumulative carbon emissions are calculated based on data since 1751.

1.1 Seeking a Peak: 9.9–10.8bn Tonnes of Net Carbon Emissions 3
However, from a future perspective, these facts are of little significance to China’sachievement of its goals of carbon peak by 2030 and carbon neutrality by 2060.
Although China’s carbon emission intensity has declined the fastest among majoreconomies in the past few decades, its current carbon emission intensity is still about5 times that of the EU and 3 times that of the US due to large differences in industrialstructure. If the road to carbon peak in the next 10 years is understood as seizing the“buffer period” to catch up with the US in terms of cumulative emissions and percapita emissions, the road to carbon neutrality in the subsequent 30 years would betremendously challenging.
More importantly, carbon peak in the US and the EU is not a target of previouslydecided emission constraints but a natural result of development, which means it isof little significance for referencing in China’s peak setting. From our point of view,the targeting of a carbon peak by 2030 does not mean that China can emit freelyin the next 10 years. Instead, as carbon neutrality has become a new constraint, thetarget of carbon peaking by 2030 requires that China changes its thinking from nowon and take actions immediately to reach the peak as soon as possible and try itsbest to lower the peak. Additionally, we believe that it is more appropriate to set thetarget within a range instead of a specific number so as to avoid a rigid constraint insupply side. Such consideration is mainly based on the following three aspects:
First, the statistics of carbon emission are inherently uncertain and are difficult toquantify accurately. Constrained by current technological measures, the amount ofgreenhouse gas emissions in each country is obtained through aggregating the levelsof emission in various activities multiplied by the corresponding emission factors.Such calculation results are uncertain because of inherent methods. To unify thecalculation measure for all countries, Intergovernmental Panel on Climate Change(IPCC) has formulated the Guidelines for National Greenhouse Gas Inventories,which provides basic technical regulations and emission factor data applicable to allcountries.
Nevertheless, the IPCC also emphasizes and encourages each country to takemeasurements and parameters that are applicable to the country-specific situation.Since it is difficult to accurately calculate the level of emission activities and emissionfactors, different institutions have various standards to determine localized parame-ters. Even different literature in major scientific journals such as Nature would havea difference of 10%–20% in the calculation of carbon emissions in the same country.Due to the inherent uncertainty in carbon emission calculation, it may not conformto the scientific laws to pursue an accurate target of carbon peak.
Secondly, our estimates suggest that China’s net carbon emissions will range from9.9 to 10.8bn tonnes in 2030. Looking into the future, the peak of China’s carbonemissions depends on two factors. One is the GDP growth trajectory from now to2030. According to the Outline of the 14th Five-Year Plan (FYP), we assume thatGDP will double over the period of 2020–2035 and the GDP growth rate will dropat a constant rate from 6% in 2019.3 Thus we derive the GDP CAGR over 2020–2030 at 5%. The other is the reduction in carbon emission intensity in 2030 from
3 Here we exclude the temporary impact of the COVID-19 pandemic in 2020.

4 Chapter 1 Exploring the Road to Carbon Neutrality
the current level. The authorities have stated that carbon emission intensity in 2030will drop by more than 65% from the level in 2005. In recent years, the governmenthas announced the reduction in carbon emission intensity each year from the levelin 2005 (for example, the intensity in 2019 was 48.1% lower than that in 2005).The 13th and 14th FYPs clearly set a target of reducing carbon emission intensityby 18%. We assume that the 15th FYP will also target an 18% reduction. As such,we estimate that carbon emission intensity will be reduced by an average of 3.9%annually in the next 10 years, and the intensity in 2030 will decline for more than65% from the level in 2005.
Thirdly, the risk of stagflation is looming. As a result, setting the peak targetwithin a range would help improve supply elasticity and balance between economicgrowth and emission reduction. As the world’s largest developing country, sustain-able economic growth remains China’s top priority. Meanwhile, the launch of“carbon peak in 2030, carbon neutral in 2060” suggests that the country is imple-menting a new constraint to the next 40 years. Before carbon neutral technologiesbecome fully mature, the conflict between the two constraints will persist. In such ascenario, a rigid emission target would be able to help promote emission reduction,but would also easily induce stagflation.
In fact, such risk may have emerged already. The rapid increase in PPI duringMarch and April 2021 may be partially attributed to the post-pandemic demandrecovery, but what is more noteworthy is the decrease in supply elasticity understrengthened environmental constraints. This is relevant to the heavy reliance on therigid administrative policies such as shutdowns or restricted production in certainareas. Although carbon neutrality means cost increases are inevitable, it is notnecessary to cope with the transition pressures in short term.
At the current stage, in which the foundation of economic recovery is stillunstable, measures with strong supply shocks such as production restriction andshutdown should be implemented with caution. Measures that come with lowersocial cost and higher efficiency, such as promoting inventory adjustment throughincremental reforms, enlarging low-carbon and zero-carbon capacity investment toenhance high-carbon capacity replacement, and strictly controlling new-added high-carbon capacity investments, deservemore consideration. From amedium- and long-term perspective, a more important aspect of overall management is to set the peakemission target within a range to avoid overly rigid supply constraints.
Based on the above-mentioned trajectories of GDP growth and carbon emissionintensity reduction in the future, we can discuss in further details the peak of carbonemissions in 2030. First, we need to solve the issue of carbon emission data. Theexisting carbon emission databases mainly include the China Emission Accountsand Datasets (CEADs), BP database, and official data from the Ministry of Ecologyand Environment (MoEE). Since data from the MoEE is not continuous, the time-continuous CEADs and BP databases are more suitable for research (see Fig. 1.1).Carbon emissions according to the three databases (not considering carbon sinks)were 5.4, 6.1, and 5.98bn tonnes in 2005, and 9.44, 9.24, and 10.28bn tonnes in

1.1 Seeking a Peak: 9.9–10.8bn Tonnes of Net Carbon Emissions 5
0
2
4
6
8
10
12
Carbon Emissions
BP CEADs Official(bn tonnes)
Fig. 1.1 Carbon emissions according to different databases. Source CEADs, BP, MoEE, CICCResearch
2014.4 Emissions in 2017 according to the CEADs and BP database were 9.34 and9.3bn tonnes. It can be seen that the numerical difference between the CEADs andBP database has narrowed significantly in recent years. Considering that the CEADsinclude emission data for 29 industries and is convenient for structural analysis andCGE model simulation, we decided to use the CEADs for analysis.
In order to avoid the uncertainty caused by the large differences between earlycarbon emission data of different databases, we select carbon emissions in 2017according to the CEADs (9.34bn tonnes) as the calculation benchmark. We calculatepeak carbon emissions in 2030 under two scenarios of carbon emission intensityreduction: (1) carbon emission intensity reduced by 46% in 2017 (official data) andby 65% in 2030 (official target) from the level in 2005; and (2) carbon emissionintensity falling by an average of 3.9% annually before emissions peak, or carbonemission intensity reduced by 66.5% in 2030 from the level in 2005. Carbon emis-sions in 2030 will peak at 11.7bn tonnes and 10.8bn tonnes respectively in these twoscenarios. Considering that there will be 910mn tonnes of agricultural and forestrycarbon sinks in 2030,5 net emissions in 2030 will peak at 10.8bn tonnes and 9.9bntonnes respectively in these two scenarios. Since scenario 2 is based on an additionalassumption that the 15th FYP will still target an 18% reduction in carbon emissionintensity, which increases the uncertainty of the calculation result, we tend to adoptthe calculation result of scenario 1, i.e. a peak of 10.8bn tonnes. In addition, although
4 Official carbon emission data is often relatively large due to more comprehensive statistics oncarbon emissions during industrial production processes.5 According to calculations by the Institute of Climate Change and Sustainable Development ofTsinghua University; please refer to China’s Long-term Low-Carbon Development Strategy andPathway.

6 Chapter 1 Exploring the Road to Carbon Neutrality
Table 1.3 Calculations of peak carbon emissions (net emissions) in 2030
Peak value calculation in 2030 (net emissions, bn tonnes)
Carbon intensity in 2030 is65% lower than that in 2005
Reduce carbon intensity by18% in each 5-year period
CEADs (9.3bn tonnes in 2017) 10.8 9.9
BP (9.8bn tonnes in 2019) 10.4 10
Official (10.3bn tonnes in 2014) 11.9 12
Source CEADs, BP, MoEE, Institute of Climate Change and Sustainable Development of TsinghuaUniversity, CICC Research
we use the CEADs as the benchmark database, we alsomake same calculations basedon the BP data in 2019 and the official data in 2014 (see Table 1.3), in order to assessthe extent of the calculation uncertainty.
Discussion on the Uncertainty of Calculations Our calculations of peak emissionsin 2030 based on emission intensity may face uncertainty in three aspects: Theassumption on future GDP growth rate, the quality of historical emission data, andthe understanding of the emission intensity reduction target itself.
1. The assumption on GDP growth rate is mainly based on the proposal to “doubleChina’s economic aggregate or per capita income by 2035”. The uncertaintylies in the assumption that the GDP growth rate will drop at a constant rate from2019 in the next 15 years.
2. As many studies have noticed, the quality of historical data on carbon emissionsin early years is not high enough. For example, there is a controversy about theamount of China’s emissions in 2005. We noticed two phenomena in the calcu-lation process. One is that BP data and CEADs data have gradually convergedover time. The other is that the officially announced emission intensity in 2017declined 46% from the level in 2005, and the newer emission data in 2017 is lesscontroversial. Hence, we use 2017, for which data is of higher quality, ratherthan 2005, for which data is more controversial, as the benchmark for calcu-lations, to avoid the risk of errors stemming from the relatively low quality ofearly emission data.
3. Academically, scholars’ calculations of peak carbon emissions usually refer tonet emissions after deduction of carbon sinks. The CEADs and BP databasescalculate gross emissions without deduction of carbon sinks. Whether the targetof reducing carbon emission intensity in 2030 by 65% from the level in 2005 isbased on gross emissions or net emissions does not seem to be specified. In ouraforementioned calculationmethod, we interpret this target from the perspectiveof gross emissions. We first calculate peak gross emissions in 2030 at 11.7bntonnes, then deduct carbon sinks in 2030, and derive peak net emissions in 2030at 10.8bn tonnes, roughly between the peaks calculated by Tsinghua Universityand theWorld Resources Institute. If we interpret the target from the perspectiveof net emissions, we need to first convert the data on gross emissions in the

1.1 Seeking a Peak: 9.9–10.8bn Tonnes of Net Carbon Emissions 7
CEADs into data on net emissions based on historical carbon sinks calculatedby Tsinghua University and other institutions, and then we arrive at peak netemissions of about 10.9bn tonnes in 2030, close to the calculation result basedon gross emissions. Upon consultation with our utilities analysts, we tend tounderstand the target of emission intensity reduction from the perspective ofgross emissions, which means that we estimate peak net emissions in 2030 atabout 10.8bn tonnes.
In summary, even with the upper limit of 10.8bn tonnes for peak carbon emissionin 2030, our estimate still suggests that China’s emissions can only increase lessthan 10% in the next 10 years compared with the level in 2020.6 At the same time,China’s annualized real GDP growth rate needs to reach 5%. This highlights thedifficulty of China’s carbon peaking in the next 10 years. From the perspective ofinternational comparison, China’s peak emissions are much higher than those of theEU and theUS,meaning that it ismore difficult for China to achieve carbon neutralityafter reaching the carbon peak. The EU reached its carbon peak in 1979, with peakemissions at about 4.1bn tonnes and peak emissions per capita at 9.9 tonnes. The USreached its carbon peak in 2005, with peak emissions at about 6.1bn tonnes and peakemissions per capita at 19.6 tonnes. According to our above calculations, China’speak emissions in 2030 will be 10.8bn tonnes and peak emissions per capita will be7.4 tonnes. Both the EU7 and the US8 aim to become carbon neutral by 2050. If thestage from peak to neutrality is defined as the second half of carbon neutrality, thesecond half will be 71 years for the EU and 45 years for the US, but only 30 yearsfor China. From an aggregate perspective, China will face a much steeper slope ofemission reduction than the EU (see Figs. 1.2 and 1.3). How can China achieve thisdifficult goal?Wewill discuss the industry-level neutralization path from a structuralperspective in the next section.
1.2 Structural Path: Analysis Based on Green Premium
After the aggregate target is determined, the next step is to explore how to achievepeak carbon emissions and become carbon neutral. There are two ways to do this:(1) reducing emissions on the demand side, or even directly curbing demand (such aspower rationing); and (2) promoting clean energy, improving production technology,and developing carbon capture on the supply side. Restricting demand runs counterto the pursuit of economic growth in the past 40 years, and demand-side manage-ment such as power rationing and emission reduction promotion can only realize a(temporary) reduction in emissions but is unable to achieve carbon neutrality. The
6 China’s Long-term Low-Carbon Development Strategy and Pathway, Institute of Climate Changeand Sustainable Development of Tsinghua University, Chinese Journal of Population Resourcesand Environment.7 https://ec.europa.eu/clima/policies/strategies/2050_en.8 https://joebiden.com/climate-plan/.

8 Chapter 1 Exploring the Road to Carbon Neutrality
0
2
4
6
8
10
12
0 10 20 30 40 50 60 70
EU-27 US China
Total carbon emissions(bn tonnes)
Peak carbonemissions
Time interval (year)Carbon neutrality
Fig. 1.2 Countries’ estimated slope of emission reduction after the peak.9 Source Our World inData,World Bank, CICCResearch.Note tonne= 0 represents the time when carbon peak is reached
0
5
10
15
20
25
0 10 20 30 40 50 60 70
EU-27 US China
Carbon emissions per capita (tonnes)
Peak carbonemissions
Time interval (year)Carbon neutrality
Fig. 1.3 Countries’ estimated slope of per capita emission reduction after the peak.10 Source OurWorld in Data, World Bank, CICC Research
9 Since the Our World in Data database does not specify whether a country’s carbon emissions arenet emissions or gross emissions, there is a certain degree of uncertainty in the comparison here.10 Since the Our World in Data database does not specify whether a country’s carbon emissions arenet emissions or gross emissions, there is a certain degree of uncertainty in the comparison here.

1.2 Structural Path: Analysis Based on Green Premium 9
83.21
84.05 84.56
85.02 85.48
85.86
86.69 87.09 87.18
87.51 87.11
87.43 87.81
80
81
82
83
84
85
86
87
88
89
2005 2006 2007 2008 2009 2010 2011 2012 2013 2014 2015 2016 2017
(%) Share of carbon emissions of 8 highest-emission industries
Fig. 1.4 Carbon emission proportion of 8 high-emission industries combined. Source CEADs,CICC Research
fundamental solution is to use zero-emission energy and zero-emission productiontechnologies on the supply side. The supply side holds the key to China’s goals toachieve peak emissions at 10.8bn tonnes and become carbon neutral in 30 years.
The key to exploring how to achieve carbon neutrality on the supply side lies inproper handling of emissions of 8 high-emission industries. In the Notice on KeyPoints for the Launch of the National Carbon Emissions Trading Market issued in2016, the National Development and Reform Commission listed the petrochemi-cals, chemicals, building materials, steel, nonferrous metals, paper, power (thermalpower), and airlines as high-emission industries. According to the CEADs, nationalcarbon dioxide emissions increased from 3.003bn tonnes in 2000 to 9.339bn tonnesin 2017, and the proportion of these 8 industries11 in total emissions increased from80% to 88% (see Fig. 1.4), mainly driven by the power and steel industries. Amongthe 8 industries (see Fig. 1.5), the power industry accounted for the largest proportionof total emissions in 2017 (mainly thermal power, 44%), followed by steel (18%),building materials (13%), transportation (including airlines, 8%), chemicals (3%),petrochemicals (2%), nonferrous metals (1%), and paper (0.3%).
It should be noted that the CEADs’ statistics on the industrial structure of carbonemissions are mainly based on the net emissions of the production process, andthe indirect emissions generated by energy-intensive industries from their elec-tricity consumption are not included in the emissions of the industries. The powerindustry accounts for nearly half of total emissions because the emissions frompowerconsumption of all sectors are included in the power industry, while the emissions ofother high-emission industries such as steel, building materials, nonferrous metals,
11 For airlines, we use the carbon emission data of transportation (including airlines) due to thestatistical scope of the CEADs.
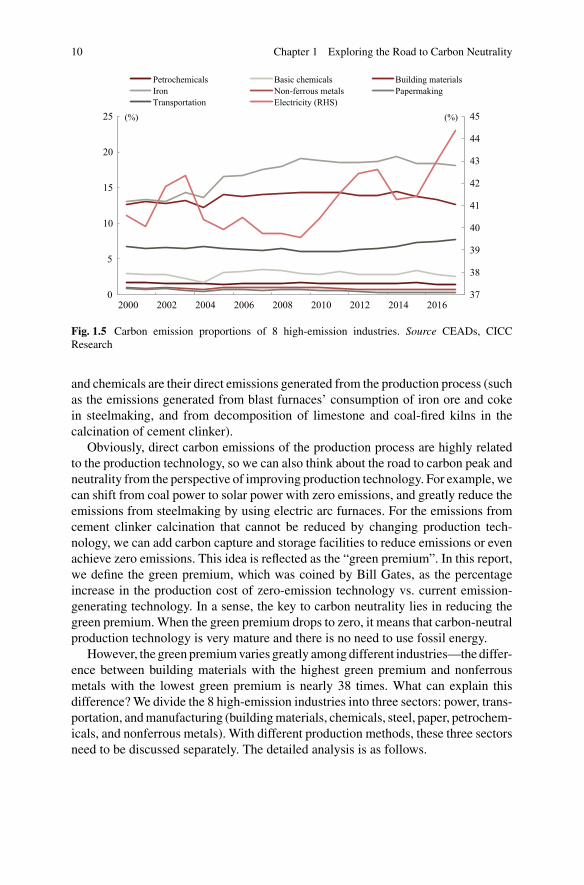
10 Chapter 1 Exploring the Road to Carbon Neutrality
37
38
39
40
41
42
43
44
45
0
5
10
15
20
25
2000 2002 2004 2006 2008 2010 2012 2014 2016
Petrochemicals Basic chemicals Building materialsIron Non-ferrous metals PapermakingTransportation Electricity (RHS)
(%) (%)
Fig. 1.5 Carbon emission proportions of 8 high-emission industries. Source CEADs, CICCResearch
and chemicals are their direct emissions generated from the production process (suchas the emissions generated from blast furnaces’ consumption of iron ore and cokein steelmaking, and from decomposition of limestone and coal-fired kilns in thecalcination of cement clinker).
Obviously, direct carbon emissions of the production process are highly relatedto the production technology, so we can also think about the road to carbon peak andneutrality from the perspective of improving production technology. For example, wecan shift from coal power to solar power with zero emissions, and greatly reduce theemissions from steelmaking by using electric arc furnaces. For the emissions fromcement clinker calcination that cannot be reduced by changing production tech-nology, we can add carbon capture and storage facilities to reduce emissions or evenachieve zero emissions. This idea is reflected as the “green premium”. In this report,we define the green premium, which was coined by Bill Gates, as the percentageincrease in the production cost of zero-emission technology vs. current emission-generating technology. In a sense, the key to carbon neutrality lies in reducing thegreen premium.When the green premium drops to zero, it means that carbon-neutralproduction technology is very mature and there is no need to use fossil energy.
However, the green premiumvaries greatly amongdifferent industries—the differ-ence between building materials with the highest green premium and nonferrousmetals with the lowest green premium is nearly 38 times. What can explain thisdifference?We divide the 8 high-emission industries into three sectors: power, trans-portation, andmanufacturing (buildingmaterials, chemicals, steel, paper, petrochem-icals, and nonferrous metals). With different production methods, these three sectorsneed to be discussed separately. The detailed analysis is as follows.

1.2 Structural Path: Analysis Based on Green Premium 11
1. Power sector. The green premium in power generation is already negative.Currently hydropower and wind power generation costs are lower than thermalpower, and nuclear power and solar power generation costs are slightly higherthan thermal power. Based on the current power structure (thermal power 66%,hydropower 19%, wind power 6%, nuclear power 5%, and solar power 4%), theoverall clean energy power generation cost is already lower than thermal power.However, the cost for the power grid to realize carbon neutrality is relativelyhigh. Overall, our sector analysts estimate the green premium in the powersector in 2021 at 17%. For the power grid to absorb alternative energy, it isnecessary to increase the flexibility of grid resource dispatch in the auxiliaryservice market, including power adjustment of thermal power units, pumping ofpumped storage units, and charging of energy storage power stations. The costfor the power grid increases along with the proportions of wind power and solarpower. Currently, thermal power peak shaving is still the lowest-cost method ofgrid dispatch. Before new technology emerges to greatly reduce the cost for thepower grid to absorb alternative energy, thermal power is unlikely to be removedfrom the power system.
2. Transportation sector. The transportation sector includes roads, railways,airlines, and marine transport, which have quite different green premiums. Oursector analysts estimate the green premium in the transportation sector in 2021at 68%. Under existing technologies, various transportation sub-sectors needto adopt different methods in order to achieve zero emissions. Assuming thatpassenger vehicles, medium/light-duty trucks and railways use clean power andheavy-duty trucks, airlines andmarine transport use hydrogen energy, our sectoranalysts estimate the green premium at 18% in road passenger transport, 127%in road freight transport, 343% for airlines, 319% in marine transport, and –29% for railways. Since the cost of hydrogen energy is much higher than that ofclean power, heavy-duty trucks, airlines, andmarine transport havemuch highergreen premiums than road passenger transport and light-duty trucks.As railwaysbecome increasingly electrified, their green premium has been negative.
3. Manufacturing sector. Under existing technologies, the green premium in themanufacturing sector is related to production technology. High-emission indus-tries such as cement and chemicals need to adopt high-cost carbon capture andother technologies in order to achieve zero emissions. Our sector analysts esti-mate the green premium in 2021 at 138% in the buildingmaterials industry, 53%in the chemical industry, 15% in the steel industry, 11% in the paper industry,7% in the petrochemical industry, and 4% in the nonferrous metals industry.
The analysis of these three sectors shows that the degree of technology maturityis an important determinant of the green premium. Taking the power sector withthe highest emission proportion as an example, zero-carbon electricity has becomefeasible, as non-fossil energy technologies have made progress and wind and solarpower costs have declined significantly in the past 10 years thanks to economies ofscale, material replacement and efficiency improvement. Even taking into accountgrid costs, we expect electricity to achieve a negative green premiumwithin 10 years.

12 Chapter 1 Exploring the Road to Carbon Neutrality
In fact, the technological progress achieved by the power sector has made the largestcontribution to the continuous decline of the CICC Green Premium Index over thepast few years.
Manufacturing industries such as building materials, steel, nonferrous metals,and chemicals have relatively high green premiums. In addition to the cost increaseresulting from electrification of the production process, the main reason is that theinevitable use of rawmaterials and burning of fossil energy in the production of someproducts makes it necessary to use hydrogen energy and carbon capture technologiesin order to achieve carbon neutrality, but these technologies are not yet mature andhave high costs. The transportation sector has a high green premium because heavy-duty trucks, airlines andmarine transport need to replace existing fuelswith hydrogenenergy in order to achieve zero emissions, and a future decline in the green premiumrequires maturity of hydrogen energy technology.
In summary, technological progress plays an important role in lowering the greenpremium, but it is not the complete answer. We can see from the calculation methodthat the reduction in green premium can be achieved by relying on technologicaladvancement to reduce the production cost of zero-emission technologies, or byincreasing the production cost of emission-generating technologies. In fact, the latteris the most recommended way to achieve carbon neutrality under the frameworkof mainstream economics. According to mainstream economics, carbon emissionshave become a problem because of their negative externalities. From a temporalperspective, it may take decades or even centuries for carbon emissions to haveserious consequences by causing climate change, so this externality may have arelatively limited impact on current economic activities and daily life. From a spatialperspective, as carbon emissions enter global atmospheric circulation, emissions inany region will have an impact on the global climate. Since the global ecosystem isthe basis for human survival and development, the problem of carbon emissions mayhave consequences that we cannot afford if it is not properly resolved. The currentmainstream belief is that it is necessary to internalize the great externality of carbonemissions in order to solve it. From the perspective of green premium, this is toincrease the production cost of existing emission-generating technologies.
The green premium is a more compatible analytical framework for thinking aboutthe road to carbon neutrality that offers two basic paths: (1) the mainstream carbonpricing approach, which internalizes the negative externality of emissions throughcarbon tax or carbon market pricing mechanisms to increase the production cost ofemission-generating technologies; and (2) technological advancement that makeszero-emission technologies more economically mature to reduce their productioncosts. Which of these two ways is more effective? What do they mean for the outputand structure of the economy? How can we achieve the goals of carbon peak by 2030and carbon neutrality by 2060? We will try to answer these questions in the CGEmodel analysis in the next section.

1.3 Four Scenarios: General Equilibrium Analysis Under CGE Model 13
1.3 Four Scenarios: General Equilibrium Analysis UnderCGE Model
The computable general equilibrium (CGE)model is a quantitative simulation systembased on general equilibrium theory, macroeconomic structure relations and nationalaccounting data that describes the operation of the economic system in a panoramicmanner. The model is usually used to study the long-term, deterministic behavior ofthe overall economy and its response to external shocks, and has become a standardtool for global economic and policy analysis. In the model, changes in any part of thestructure will have an impact on the entire system, leading to changes in the pricesand quantities of goods and factors. When an exogenous shock occurs, the systemwill transition from one equilibrium state to another, thus fully demonstrating theimpact of the shock.
Under constrained conditions, producers minimize costs while consumers maxi-mize utility. The markets for factors of production and goods reach supply anddemand balance through production, distribution, exchange, and consumption,thereby forming the equilibrium price. On the basis of the traditional CGE methodfor studying the environmental economy, we have incorporated endogenous climate-friendly technologies into the framework. Thus, the CGE model in this reportcomprises a production module, energy module, income and expenditure module,trade module, carbon tax/carbon trading module, dynamic module, climate-friendlytechnology module, and macro closure module.
In the context of carbon neutrality, the energy module is the key part of the model.The energy module consists of two parts: fossil energy (coal, oil, natural gas) andelectricity. Thermal power and renewable energy make up the electricity system. Onthis basis, the energy structure is generated endogenously by the model and changesover time. Energy and non-energy factors are intermediate inputs, which togetherwith the added value of capital and labor constitute total input. Essentially, we takefossil energy as a factor of production in the model and assign a price to it throughcarbon tax/carbon trading to correct the externality of carbon emissions. In this sense,the model has a similar core as the classical growth model of Nobel Prize laureateWilliam Nordhaus, which includes carbon cycle. In the absence of climate-friendlytechnological advancements, companies will make a trade-off between the bene-fits of using one more unit of fossil energy and the additional costs paid given thecarbon costs. The economy will eventually converge to a new equilibrium growthpath, which often corresponds to lower economic output. The gap between the oldand new equilibrium output can be understood as the social cost of emission reduc-tion. Introduction of climate-friendly technologies can help reduce the social costof emission reduction, thereby lifting the equilibrium growth path. Climate-friendlytechnologies are driven by investment, which is composed of corporate investmentand carbon fee (from carbon tax or carbon trading) reutilization. More investment inclimate-friendly technologies can help companies reduce the additional carbon costto a greater extent, minimizing the negative impact of carbon tax/carbon trading onoutput.

14 Chapter 1 Exploring the Road to Carbon Neutrality
1.3.1 Model Data
We choose 2017 as the base year. The main data sources of the model include thefollowing: (1) China’s social accounting matrix (SAM). According to China’s 2017input-output tables of 149 sectors, we obtain the energy input-output tables of 29sectors, including coal, oil, natural gas, thermal power, and renewable energy throughmerge and split. The fiscal and tax data in the SAM are derived from the 2018 ChinaTaxation Yearbook and 2018 Finance Yearbook of China. (2) Exogenous elasticityof substitution, such as the elasticity of substitution between inputs in the productionfunction, the elasticity of substitution between imported and domestic products inthe CES function of the foreign trade module, etc. The data makes reference tothe Global Trade Analysis Project (GTAP) database. (3) Carbon dioxide emissioncoefficients derived from calculating sectors’ carbon dioxide emissions and energyproduct consumption. The carbon dioxide data come from the CEADs.
1.3.2 Scenario Assumptions
In order to quantify the different effects of the aforementioned two paths in termsof carbon neutrality and economic development, we examine the following fourscenarios:
1. Business-as-usual scenario (BAU): No constraint is imposed on carbon emis-sions. The economic growth rate refers to the forecast made by the CICCmacroteam based on the proposal to double China’s economic aggregate or per capitaincome by 2035.
2. Carbon tax scenario (M1): A unified carbon tax is imposed on carbon-emissionindustries so that China can strive to achieve the goals of carbon peaking by2030 and neutrality by 2060, and keep peak emissions as close to 10.8bn tonnesas possible.
3. Carbon trading scenario (M2): Carbon trading is introduced for 8 high-emissionindustries. Free carbon allowances are set based on the green premium ofindustries—free allowances should be lower for industries with higher greenpremiums to strengthen their incentives to cut emissions. Thus, China can striveto achieve the goals of carbon peaking by 2030 and neutrality by 2060, and keeppeak emissions as close to 10.8bn tonnes as possible.
4. Carbon tax + carbon trading+ technological progress scenario (M3): A three-pronged approach is adopted to achieve the goals of carbon peaking (at 10.8bntonnes) by 2030 and neutrality by 2060, while maintaining economic growth.

1.3 Four Scenarios: General Equilibrium Analysis Under CGE Model 15
1.3.3 BAU Scenario
In this scenario, there is no constraint on carbon emissions and the only goal isto double China’s economic aggregate or per capita income by 2035. The figuresbelow depict the corresponding economic growth and carbon emission trajectorysimulations: GDP will grow at an average annual rate of 5.2% from 2021 to 203012;carbon emissions will be 15.8bn tonnes in 2030, and after deducting 900mn tonnesof carbon sequestration, net emissions will be 14.9bn tonnes.
1.3.4 Carbon Tax Scenario (M1)
In theory, as long as China keeps raising carbon tax, the country can achieve the goalsof carbon peaking by 2030 and neutrality by 2060, and keep peak emissions closeto 10.8bn tonnes. However, a relentless increase in carbon tax could paralyze theeconomic system—in that case, the CGE model is unable to converge to an equilib-rium path. This means that the setting of carbon tax needs to take into account botheconomic development and carbon neutrality goals. Based on the green premiumcalculated by our sector analysts, we derive the parity carbon cost13 of the wholesociety at about Rmb377/tonne. Countries that have levied a carbon tax (mostlydeveloped countries) set the tax at Rmb80-800/tonne. Our basic materials analystsestimate that for industries to remain profitable, the maximum affordable carbon taxis Rmb100/tonne for steel and cement industries and Rmb60/tonne for the aluminumindustry. Meanwhile, our calculations show that the CGE model cannot converge toan equilibrium path when carbon tax is higher than Rmb150/tonne.14 After consid-ering all these factors, we set carbon tax at Rmb100/tonne. Later we will conduct asensitivity analysis of carbon tax in a bid to identify what would be an extreme levelof carbon tax and the time path of carbon tax rate change.
In this scenario, carbon emissions continue to increase and cannot be peaked,let alone achievement of carbon neutrality. Specifically, net emissions will reach12.3bn tonnes in 203015 and 33.4bn tonnes in 2060 (see Fig. 1.6), but still 2.6 and16.6bn tonnes lower than the BAU scenario. GDP will decline by 0.6% in 2030 and0.9% in2060 compared to theBAUscenario. Prices are under greater upwardpressurethan in the BAU scenario, especially in the first few years. Wholesale & retail,restaurant & hotel, transportation, and information & financial service industries
12 Excluding 2021 with high growth, the average annual growth rate will be 4.8%.13 This refers to the extra cost that emitters need to pay for carbon emissions, calculated based onthe green premium, to ensure that the production cost of emitters is on par with the production costunder carbon–neutral technology.14 Here we assume that carbon tax is constant. If carbon tax increases year by year, it can exceedthe Rmb150/tonne limit.15 Regarding carbon sequestration, we refer to the calculations made by the Institute of ClimateChange and Sustainable Development of Tsinghua University and CICC sector analysts.

16 Chapter 1 Exploring the Road to Carbon Neutrality
0
5
10
15
20
25
30
35
40
-1.00
-0.90
-0.80
-0.70
-0.60
-0.50
-0.40
-0.30
-0.20
-0.10
0.00
2021 2024 2027 2030 2033 2036 2039 2042 2045 2048 2051 2054 2057 2060
(bn tonnes)
GDP changes in the carbon tax scenario compared to the BAU scenario
Total emssions (RHS)(%)
Fig. 1.6 GDP loss in the carbon tax scenario compared to the BAU scenario. Source CEADs,Centre for Economic Systems Simulation Research, CICC Research
will face higher price pressures in the next few years (see Fig. 1.7). The impositionof a carbon tax will also bring about changes in the economic structure. The output ofthe power sector excluding thermal power in 2030 will be more than 2% higher thanin the BAU scenario, while the output of coal, thermal power, natural gas extraction,and buildingmaterials industrieswill be under pressure (the output of coal processingand mining industries will be over 7% lower than in the BAU scenario).
1.3.5 Carbon Trading Scenario (M2)
We assume that only the petrochemical, chemical, building materials, steel, nonfer-rous metals, paper, power, and airline industries will be engaged in carbon tradingin the unified carbon market, and we determine the free emission allowance foreach industry based on the green premium calculated by our sector analysts andGuangdong province’s 2020 Carbon Emission Allowance Allocation Implementa-tion Plan. Free allowances should be lower for industries with higher green premiumsto increase their incentives to switch to zero-emission technologies. The nonfer-rous metals, petrochemical, and paper industries with lower green premiums havea free allowance of 90%; the steel, power, chemical, and airline industries have a

1.3 Four Scenarios: General Equilibrium Analysis Under CGE Model 17
0.0 0.2 0.4 0.6 0.8 1.0 1.2
Natural gas industry
Oil exploitation industry
Gas production and supply
IT and financial servics
Other transportation, storage, and postalservice
Wholesale and retail, accomodation, andcatering
PPI YoY
Industries with large differences in PPI comparing to the BAU scenario in 2030
BAU scenario Carbon tax scenario
(%)
Fig. 1.7 Industries with higher cost pressures in the carbon tax scenario. Source CEADs, Centrefor Economic Systems Simulation Research, CICC Research
free allowance of 80%; and the building materials industry with the highest greenpremium has a free allowance of 70%.16
In this scenario, carbon emissions would peak in 2042 at 17.1bn tonnes, beforedeclining to 13bn tonnes in 2060 (see Fig. 1.8). Although this scenario still doesnot result in carbon neutrality, it represents a considerable improvement comparedto the carbon tax scenario. GDP performance in this scenario is also better than thecarbon tax scenario. Compared to the BAU scenario, GDP would only decrease byan average of 0.15% per year in the next few decades. Similar to carbon tax, carbontrading would also bring inflationary pressure, especially in the first few years. Thethermal power, building materials, chemical, steel, and airline industries would facegreater price pressures (Fig. 1.9). In terms of industry structure, the proportion ofthe power sector excluding thermal power in 2030 would be much higher than in theBAU scenario, while of coal processing and mining industries would be 10% and5.5% lower than in the BAU scenario.
In the computable general equilibriummodel, factor prices are jointly determinedby the forces of supply and demand in the market, and carbon trading prices areno exception. The parity carbon cost implied by the green premium measures therelative cost of emission-generating technology to zero-emission technology. Whenthe carbon trading price is close to this cost, theoretically effective emission reduction
16 Here we only analyze the allowance issue from the perspective of economic model simulation.In practice, CICC sector analysts’ calculation shows that a 70% free allowance may be too low forthe cement industry.

18 Chapter 1 Exploring the Road to Carbon Neutrality
0
2
4
6
8
10
12
14
16
18
-0.30
-0.25
-0.20
-0.15
-0.10
-0.05
0.00
2021 2024 2027 2030 2033 2036 2039 2042 2045 2048 2051 2054 2057 2060
(bn tonnes)
GDP changes in the carbon trading scenario compared to the BAU scenarioTotal emissions (RHS)
(%)
Fig. 1.8 GDP loss in the carbon trading scenario compared to the BAU scenario. Source CEADs,Centre for Economic Systems Simulation Research, CICC Research
0.0 0.2 0.4 0.6 0.8 1.0 1.2 1.4
Thermal power
Building materials
Biomass electricity
Chemical industry
Steel industry
Aviation industry
PPI YoY
Industries with large differences in PPI comparing to the BAU scenario in 2030
BAU scenario Carbon trading scenario
(%)
Fig. 1.9 Industrieswith higher cost pressures in the carbon trading scenario. SourceCEADs,Centrefor Economic Systems Simulation Research, CICC Research

1.3 Four Scenarios: General Equilibrium Analysis Under CGE Model 19
can be achieved. According to the analysis in the M2 scenario, assuming that acarbon trading mechanism is introduced in 2021, the carbon price would rise fromRmb31/tonne at first to Rmb650/tonne in 2060. As mentioned above, the overallparity carbon cost implied by the green premium isRmb377/tonne. Simulation resultsshow that the carbon trading price in the next 20 years will be much lower than theparity carbon cost, which may be an important reason why emissions cannot bepeaked in time. When the carbon price approaches or even exceeds the parity carboncost, emissions are significantly reduced. This means that raising the carbon price,especially when it is raised to near the parity carbon cost, can effectively reduceemissions.
1.3.6 Carbon Tax + Carbon Trading + TechnologicalProgress Scenario (M3)
As mentioned above, while carbon pricing (in the form of a carbon tax or a carbonmarket) is the mainstream way to solve the externality of emissions, carbon pricingalone cannot achieve a balance between GDP growth and carbon neutrality. In otherwords, if the GDP growth target is not abandoned, it will be difficult to achievecarbon neutrality through carbon pricing alone. Therefore, we need to shift from themainstream path of carbon pricing to the green premium analysis framework. It isnecessary to not only increase the production cost of emission-generating technolo-gies through carbon pricing, but also reduce the production cost of zero-emissiontechnologies through technological progress.
For the analysis of technological progress, we adopt the “S-curve” theory oftechnological innovation. Freeman and Louçã (2001) proposed a long wave (orKondratieff Wave) theory of technological revolution from a historical perspective.The life cycle of any widely used technology consists of six phases: (1) the labora-tory/invention phase, (2) decisive demonstration, (3) explosive growth, (4) continuedhigh growth, (5) slowdown, and (6) maturity. The whole process forms an “S-shapedcurve”,whichmay be driven by the investment path, according toKöhler (2005). ThisS-shaped curve is widely accepted as a way to describe technological change. In ourmodel, this S-shaped curve in a reduced form encompasses all climate-friendly tech-nologies: energy efficiency technologies, emission reduction technologies, carbonsequestration, carbon capture and storage, etc.
Take the power industry that accounts for the bulk of carbon emissions as anexample. Using clean energy (such as solar energy) for power generation on thesupply side and increasing the electrification rate on the demand side is the besttechnological path to achieve carbon neutrality. Solar power generation technologyis mature and has been successfully commercialized. On the other hand, grid absorp-tion still faces challenges given that energy storage has not yet reached parity. Forpower transmission, it is necessary to establish distributed smart grids and changethe power structure. Breakthroughs must be made in infrastructure technologies that

20 Chapter 1 Exploring the Road to Carbon Neutrality
Permeability tehchnology
Time
S S1 S2
Photovoltaic generatingelectricity
Technologymaturity stage, demand side needs to improve electrification rate
Laboratory or demonstration stage
New generation nuclear power technology,hydrogen energy and carbon capture
S1: Relatively mature technologyS2: Still in the testing and demonstration phase
Fig. 1.10 Climate-friendly technology advancement curve. Source Centre for Economic SystemsSimulation Research, CICC Research
enable the transition from a centralized grid to a smart grid and the realization offull electrification. On the application side, the fundamental solution is to compre-hensively increase the electrification rate (electric vehicles, electric arc furnaces forsteelmaking, etc.). In Fig. 1.10, the vertical axis represents the extent of applicationor penetration rate of technology over time, and the S1 curve depicts the technologypath of the power industry towards carbon neutrality. We are now at a stage wherethe technology curve gradually begins to steepen.
Compared to the technology path represented by the S1 curve, the S2 curve repre-sents a new generation of nuclear power technology, hydrogen energy technology,and carbon capture technology. These technologies are still in the laboratory ordemonstration phase and are far from successful commercialization, meaning greatuncertainty.We combine the S1 and S2 curves to derive the S curve, which representsall climate-friendly technologies. We define it as a share of non-carbon technology(SNCT) curve. The faster the curve begins to steepen, the faster the technology iscommercialized; the steeper the curve is, the faster the large-scale application of thetechnology will be.
The SNCT curve measures the extent of decline in the carbon emission coeffi-cient of the economic systemwith the advancement of climate-friendly technologies.Here, we use a curve to simulate the entire life cycle of climate-friendly technologies.This curve is determined by five exogenous parameters (to construct the curve shapeand simulate technology life cycle, growth rate, etc.) plus an endogenous variable(climate-friendly technology investment). We assume that taking actions to addressclimate change will lead to a transfer of investment from traditional energy technolo-gies to climate-friendly technologies, and this can effectively increase the share ofclimate-friendly technologies. In this sense, this curve in a reduced form summarizes

1.3 Four Scenarios: General Equilibrium Analysis Under CGE Model 21
a series of investment-driven technological advancements from improving energyefficiency to decarbonizing and reducing carbon (such as carbon capture and carbonfixation). Therefore, this curve explains how to lower the carbon emission coefficientand thus reduce emissions.
In this scenario, we adopt the same carbon tax of Rmb100/tonne as in the M1scenario and the same carbon allowances for the 8 high-emission industries as inthe M2 scenario. Through simulation, we found that the combination of carbon tax,carbon trading, and technological progress can achieve the dual goals of economicgrowth and carbon neutrality. The GDP loss compared to the BAU scenario is almostnegligible. After 2040, GDP even exceeds that in the BAU scenario, indicating thattechnological progress offsets or evenmore than offsets the negative impact of carbonpricingon economicgrowth. In this scenario, carbon emissions peak in 2030 at 10.9bntonnes, before decreasing year by year towards the goal of net zero emissions (seeFig. 1.11).
The simulation results also show that carbon tax and carbon trading still putupward pressure on costs in the economy in the early stages, possibly because theeffect of technological progress has not fully kicked in. However, the cost pressureis milder than in the scenarios without technological progress (see Fig. 1.12 forindustries with higher cost pressures in the M3 scenario). We analyze changes inthe industrial structure from two perspectives: (1) the change in industry outputcompared to the BAU scenario, and (2) the change in the proportion of industryoutput over time. First, the output of the solar power, hydropower, wind power,and nuclear power industries in 2030 all increase more than 3% compared to the
0
2
4
6
8
10
12
-0.12
-0.1
-0.08
-0.06
-0.04
-0.02
0
0.02
2021 2024 2027 2030 2033 2036 2039 2042 2045 2048 2051 2054 2057 2060
(bn tonnes)
GDP changes in "carbon tax + carbon trading + technologyinnovation" scenario compared to the BAU scenarioTotal emissions (RHS)
(%)
Fig. 1.11 GDP in the M3 scenario compared to the BAU scenario. Source CEADs, Centre forEconomic Systems Simulation Research, CICC Research

22 Chapter 1 Exploring the Road to Carbon Neutrality
0.0 0.2 0.4 0.6 0.8 1.0 1.2 1.4 1.6
Agriculture, farming, and services
Construction
Thermal energy
Biomass electricity
Building material
Chemical industry
Steel industry
Aviation industry
Industries with large differences in PPI comparing to the BAU scenario in 2030
BAU scenario M3 Scenario
PPI YoY
(%)
Fig. 1.12 Industries with higher cost pressures in the M3 scenario. Source CEADs, Centre forEconomic Systems Simulation Research, CICC Research
BAU scenario, while the output of coal processing and mining industries shrinkconsiderably. Second, the proportions of output of agriculture, public services, andlight industries show more obvious declines over time, while the proportions ofoutput of equipmentmanufacturing, real estate& leasing, and information&financialservices industries increase year by year.
The carbon trading price will rise gradually from Rmb10/tonne in 2021 toRmb140/tonne before 2030. At a time when climate-friendly technologies have notbeen adopted on a large scale, rising carbon prices will help peak emissions in atimely manner and at around 10.9bn tonnes. When green technologies are widelyused, carbon prices will drop. As an endogenous variable of the S-shaped technologycurve, investment is the key to driving technological progress. The model estimatesthat R&D investment in green technologies will account for about 2% of GDP, andit will increase gradually in the first few years to help bring technologies from thelaboratory phase into commercial use. In the M3 scenario, the climate-friendly tech-nology curve SNCT simulates the shape of the S curve. The SNCT will reach 0.32 in2030 and 0.99 in 2060, meaning that the carbon emission coefficient17 in 2030 and2060 will be 68% and 1% respectively of that in 2020 (see Fig. 1.13). As such, Chinawill be able to strike a balance between the existing economic growth objective andthe new carbon neutrality goal. The energy structure will also be optimized gradually,with clean energy accounting for 44% in 2030 and 96% in 2060.
17 Carbon emissions per unit of output.

1.3 Four Scenarios: General Equilibrium Analysis Under CGE Model 23
0.0
0.2
0.4
0.6
0.8
1.0
1.2
0
20
40
60
80
100
120
140
160
2020 2023 2026 2029 2032 2035 2038 2041 2044 2047 2050 2053 2056 2059
Carbon price SNCT (RHS)(Rmb/tonne)
Fig. 1.13 Carbon trading price and Climate-friendly technology advancement curve in the M3scenario. Source CEADs, Centre for Economic Systems Simulation Research, CICC Research
1.3.7 Sensitivity Analysis of Technology Curve
A comparative analysis of the above-mentioned four scenarios shows that techno-logical progress is essential to balance economic growth and carbon neutrality goals.However, since technological innovation is highly uncertain, we need to examinethe impact of an optimistic/pessimistic scenarios for technology on GDP and carbonemissions. We assume that the climate-friendly technology curve in the M3 scenariois the baseline scenario of technological progress, and the pessimistic scenario isa situation in which technological development is disappointing or commercializa-tion is difficult. Intuitively, the technology curve in the pessimistic scenario shouldbe flatter than in the baseline scenario: the laboratory phase may be longer, large-scale application of technology may face greater resistance, or the penetration rateof technology may be lower. In reality, the pessimistic scenario may correspond totechnologies that are not yet mature and quite uncertain, such as hydrogen energyand carbon capture. The opposite is true for the optimistic scenario.
Consistent with intuition, GDP is considerably affected in the pessimistic techno-logical scenario (Fig. 1.14), and the carbon emission curve is significantly elevated—emissions do not peak until 2034 and the peak is as high as 13.4bn tonnes (Fig. 1.15).The simulated technology curve is also in line with our thinking about the technologypath in the pessimistic scenario. Due to disappointing technological progress, theshare of clean energy is relatively low and the carbon trading price is much higherafter carbon emission peaks. In addition, compared with baseline and optimistic

24 Chapter 1 Exploring the Road to Carbon Neutrality
-0.14
-0.12
-0.10
-0.08
-0.06
-0.04
-0.02
0.00
0.022021 2024 2027 2030 2033 2036 2039 2042 2045 2048 2051 2054 2057 2060
Cha
nge
com
pare
d w
ith B
AU
scen
ario
(%)
Pessimistic Benchmark Optimistic
Fig. 1.14 GDP changes in different technological scenarios compared to the BAU scenario. SourceCEADs, Centre for Economic Systems Simulation Research, CICC Research
13.4 in 2034
10.9 in 2030
10.4 in 2025
0
2
4
6
8
10
12
14
16
2020 2025 2030 2035 2040 2045 2050 2055 2060
(bn tonnes)
Total carbon emissions under different technology scenarios
Pessimistic Benchmark Optimistic
Fig. 1.15 Carbon emission simulation. Source CEADs, Centre for Economic Systems SimulationResearch, CICC Research

1.3 Four Scenarios: General Equilibrium Analysis Under CGE Model 25
0
2
4
6
8
10
12
14
16
18
20
0
5
10
15
20
25
30
35
2021 2024 2027 2030 2033 2036 2039 2042 2045 2048 2051 2054 2057 2060
(bn tonnes)
Carbon tax rate
Total carbon emissions under high carbon tax rate (RHS)
(100Rmb/tonne)
Fig. 1.16 Extreme carbon tax rate and carbon emission simulation. Source CEADs, Centre forEconomic Systems Simulation Research, CICC Research
scenarios, the carbon trading market lasts longer in the pessimistic scenario—theprice mechanism needs to play a greater role in both price and time dimensions.
1.3.8 Sensitivity Analysis of Carbon Tax
According to the simulation of the M1 scenario, it is difficult to peak carbon emis-sions at a carbon tax that can achieve model convergence. As mentioned earlier, aslong as the carbon tax rate is high enough (regardless of economic growth), it cancorrect the negative externality of carbon emissions and turn the emission curve downat a certain point. In the M1 scenario, emissions fail to peak before 2060, illustratingtwo points: (1) the calculation time span is not long enough; or (2) the carbon taxrate used in the model is too low. Here, we set a goal of peaking carbon emissionsby 206018 and calculate how much carbon tax is required. After simulation calcula-tions, we derive a carbon price index (see Fig. 1.16). This curve roughly follows anexponential increase, fromRmb46/tonne in 2021 to Rmb140/tonne in 2030, and thento Rmb3,300/tonne in 2060. With such a high carbon tax, emissions would enter aplateau phase in 2040 and begin to slowly decline in 2052. Economic growth is alsounder great pressure, with a GDP loss of 3%–5% in the final 10 years compared tothe BAU scenario (Fig. 1.17). This simulation further confirms that carbon tax alone
18 With only a carbon tax, neutrality is impossible, so we only see if the peak can be reached.

26 Chapter 1 Exploring the Road to Carbon Neutrality
-6
-5
-4
-3
-2
-1
02021 2024 2027 2030 2033 2036 2039 2042 2045 2048 2051 2054 2057 2060
Cha
nges
com
pare
d w
ith B
AU
scen
ario
(%)
S1 scenario High tax rate scenario
Fig. 1.17 GDP change compared to the BAU scenario. Source CEADs, Centre for EconomicSystems Simulation Research, CICC Research
cannot enable China to achieve the goals of carbon peak by 2030 and neutrality by2060.
1.4 Road to Carbon Neutrality = Technology + CarbonPricing + Social Governance
The aforementioned general equilibrium analysis based on the CGE model showsthat internalization of the negative externality of carbon emissions alone could notsolve the conflict between economic growth and carbon neutrality goals, and only acombination of technology and carbon pricing under the green premium frameworkcould help strike a balance between the two goals. Reaching such a conclusion doesnot mean the end of the research in achieving carbon neutrality. Instead, it marksthe starting point of exploring China’s road to carbon neutrality. For example, giventhat technology is so important to achieve carbon neutrality, what carbon neutraltechnologies are worth nurturing? What is the current development status of thesetechnologies? We will discuss carbon neutral technologies in more detail in thefollowing chapters.
In terms of carbon pricing, the establishment of a unified national carbon marketis accelerating, and the 8 high-emission industries may gradually be included inthe unified carbon market during the 14th FYP period. As China promotes carbonneutrality, the implementation of a unified carbon price for different industriesthrough the establishment of a unified market seems to have become a consensus inthe country. However, our analysis shows that the situation may not be that simple.

1.4 Road to Carbon Neutrality = Technology + Carbon Pricing … 27
For example, when internalizing the negative externality of emissions, it may notbe appropriate to calculate the discounting of social costs according to mainstreampractices, and a differentiated pricing perspective based on net social costs should beadopted instead; the analysis of green premium shows that it may not be appropriateto choose a carbon pricing method based solely on the proportion of emissions; also,a unified carbon market may exacerbate pollution problems in the Beijing-Tianjin-Hebei region. For detailed analysis on these issues, please refer to a later chapter thatdirectly addresses carbon market, carbon tax and other carbon pricing methods.
More importantly, technology and carbon pricing are just two basic means toreducing the green premium, and they could not represent a comprehensive solu-tion to carbon neutrality under this framework. According to the calculation of oursector analysts, the green premium of the power industry will be −3.9% in 2030.A negative green premium means that in terms of economic performance, zero-emission technologieswould be decisively superior to emission-generating technolo-gies. However, due to the path dependence of economic development, or a lack ofsufficient awareness of the importance of carbon neutrality among decision makersor the general public, industries may not shift to more economical zero-emissionproduction technologies, and may instead stick with high-cost emission-generatingtechnologies. Such problems cannot be resolved by relying solely on “technology+ carbon pricing”. It also requires the intervention of social governance or publicpolicy.
From the perspective of social governance, there aremainly three types of policies,i.e., price-based, command-based and publicity-based policies. In fact, technology,carbon pricing, and social governance, which together constitute the road to carbonneutrality, are closely correlatedwith each other. For example, technological progressand improvement in production processes cannot be achieved without support frompublic policies such as fiscal subsidies. Carbon tax and auctions in the carbon marketare important sources of such funds. Carbon pricing itself is part of public policies,and publicity-based policies could help raise people’s awareness of carbon neutrality,and thus reduce friction costs in the implementation of carbon pricing policies. Inview of the green premium analysis framework, the “technology + carbon pricing+ social governance” approach is important to the road to carbon neutrality in threeways.
First, the approach addresses issues related to innovation and fairness on the road tocarbon neutrality. The green premiumonlymeasures the difference in production costbetween zero-emission technologies and emission-generating technologies, whileit does not measure the total cost borne by the society for carbon neutrality. Thesimulation calculations basedon theCGEmodel show that the output of coal, buildingmaterials, and chemical industries may shrink considerably, while the proportions ofoutput of information & financial services and real estate & leasing industries mayexpand. Such structural changes may cause a series of social problems. For example,the large-scale launchof zero-emissionpower generation capacitywill inevitably leadto large-scale idling of thermal power assets, as well as subsequent layoffs at coalmines and thermal power plants, and an increase in non-performing loans at banks.Transformation will be required for coal-producing provinces. In a more general

28 Chapter 1 Exploring the Road to Carbon Neutrality
sense, the reliance on innovation to achieve carbon neutrality may lead to unfairdevelopment between high-carbon industries, workers and regions, and low-carbonindustries,workers, and regions. Such problemsmaynot be resolved by relying solelyon the “technology + carbon pricing” approach, and coordinated arrangements andearly planning from the perspective of social governance are needed. Whether theinnovation- and fairness-related issues can be well addressed determines whether theentire society can continue to move towards carbon neutrality.
Second, the “technology+ carbon pricing+ social governance” approach is vitalto coping with risks of rebound in the green premium. The large-scale adoption ofzero-emission technologies may result in shrinking demand for emission-generatingtechnologies. For example, the large-scale launch of clean energy power genera-tion capacity will affect the demand for thermal power generation, thereby reducingfossil energy prices and production costs of emission-generating technologies. Sucha phenomenon may lead to a rebound in green premiums. If the demand for fossilenergy continues to shrink, the decline in prices will likely also lead to spontaneoussupply-side contraction. Therefore, with large-scale promotion of zero-emissiontechnologies, fossil energy prices may face both upward and downward pressures. Itis difficult to predictwhich factorwill dominate, but one thing is certain: the change inthe green premiumwill be a dynamic process, and the green premiummay rebound inthe downward trend, whichmay evenweaken themomentum around reaching carbonneutrality in society as a whole. Therefore, it is necessary to restrict the re-expansionof fossil energy-based power generation capacity through command-based policieswhen it is economically feasible to adopt zero-emission technologies on a large scale.
Third, “technology + carbon pricing + social governance” approach putsemphasis on the role of green finance. As we mentioned earlier, the estimated greenpremium of the power industry is negative in 2030. This means that even withcarbon pricing and technological progress, the economically advantageous cleanpower generation technologies will not fully replace thermal power generation tech-nologies in the next 10 years. This may be because technologies still need to beimproved or carbon prices are not high enough. However, it also reveals a socialgovernance problem, i.e., how to formulate reasonable public policies to promote theformation of economically beneficial zero-emission production capacity as soon aspossible so as to accelerate the replacement of existing emission-generating assets.We believe green finance will play an important role in this regard. In fact, thesignificance of green finance to carbon neutrality lies not only in accelerating thepromotion of mature technologies, but also in the highly uncertain R&D phase. Forexample, carbon neutral technologies that are still in the laboratory phase such ashydrogen energy and carbon capture still require a large amount of R&D funding.Do carbon neutral technologies require different forms of financial support in thetwo different stages of development? What are the implications of green finance forcarbon neutrality? We will examine these topics in greater detail in Chapter 4.
The above thoughts are based on the assumption of a closed economy. As Chinaemphasizes the new dual-circulation pattern with domestic and foreign markets rein-forcing each other, it is also necessary to take an international perspective when

1.4 Road to Carbon Neutrality = Technology + Carbon Pricing … 29
dealing with carbon emissions, an externality that requires long-term and compre-hensive efforts. On March 10, 2021, the European Parliament passed a resolution onthe EU’s Carbon Border Adjustment Mechanism (CBAM). According to the mecha-nism, if economies that have trade relations with the EU do not comply with the EU’scarbon emission regulations, the EU can impose carbon tariffs on goods importedfrom them. This can be regarded as the first step towards the implementation ofNordhaus’ international “Climate Club” proposal. It is also a direct application ofthe carbon tax-based pricing mechanism at the governance level of the internationalcommunity. What are the implications of the “technology+ carbon pricing+ socialgovernance” approach from an international perspective and howwill it play its role?We will analyze these in the chapter that focuses on international cooperation.
Open Access This chapter is licensed under the terms of the Creative Commons Attribution-NonCommercial-NoDerivatives 4.0 InternationalLicense (http://creativecommons.org/licenses/by-nc-nd/4.0/), which permits any noncommercial use, sharing, distribution and reproduction in anymedium or format, as long as you give appropriate credit to the original author(s) and the source,provide a link to the Creative Commons license and indicate if you modified the licensed material.You do not have permission under this license to share adapted material derived from this chapteror parts of it.
The images or other third party material in this chapter are included in the chapter’s CreativeCommons license, unless indicated otherwise in a credit line to the material. If material is notincluded in the chapter’s Creative Commons license and your intended use is not permitted bystatutory regulation or exceeds the permitted use, you will need to obtain permission directly fromthe copyright holder.

Chapter 2Balancing Efficiency and Fairness:Kaldor-Hicks Improvement?
Abstract This chapter mainly discusses two issues related to achieving carbonneutrality: innovation and fairness. We believe that innovation (efficiency enhance-ment) is critical to carbon neutrality, and the attendant fairness-related issues needto be addressed. To efficiently achieve carbon neutrality, we believe the followingmeasures should be simultaneously taken: (1) internalizing external costs by raisingcarbon prices; (2) fundamentally altering the mode of production by expeditingeco-innovation; and (3) improving the social governance system by encouraginglow-carbon lifestyles, and reaching a consensus on environmental protection amongthe general public. Among these measures, we believe innovation is the key, as itcan help reduce carbon emissions per unit of energy consumption as well as energyconsumption per unit of GDP. In the long term, we believe innovation is also themajor driving force for economic growth. In retrospect, we find that each techno-logical revolution has led to a reshaping of the global economic landscape, andcountries with an early start to innovation usually achieved economic advances inthe end. Eco-innovation is a general-purpose technology innovation that has a greatereffect in terms of improving productivity. Nevertheless, innovation does not happenovernight or without hindrances. Eco-innovation features double externality, and asa result sees slower progress and faces more barriers than general innovation. Publicsector policies and capital investment (green finance) need to be coordinated, in ourview, to inspire innovation among enterprises and to remove the systemic obstacles toinnovation. Carbon neutrality may cause fairness issues both domestically and inter-nationally. Globally, principles of fairness and each country’s stage of developmentshould be taken into consideration to avoid unfair distribution of rights, responsibil-ities and interests among different countries. Domestically, emission reduction maylead to fairness problems between different social classes, generations, sectors, andregions. Hence, fiscal policies should play a more important role in income distri-bution and cross-cycle adjustments to prevent worsening imbalances in residents’income distribution and regional development.
The COVID-19 pandemic that swept the world in 2020 shows that an unexpectedcrisis related to public health and climate issues is no longer a challenge that is faraway from us. Such challenges will cause substantial economic losses and endanger
© The Author(s) 2022CICC Research, CICC Global Institute, Guidebook to Carbon Neutrality in China,https://doi.org/10.1007/978-981-16-9024-2_2
31

32 Chapter 2 Balancing Efficiency and Fairness: Kaldor-Hicks Improvement?
60
70
80
90
100
110
120
130
140
150
1995 1999 2003 2007 2011 2015 2019
USCO2 emissions per capita GDP per capita
(1995=100)
Fig. 2.1 GDPper capita and carbon emissions in theUS. SourceOurWorld inData, CICCResearch
60
70
80
90
100
110
120
130
140
150
1995 2000 2005 2010 2015
EUCO2 emissions per capita GDP per capita
(1995=100)
Fig. 2.2 GDPper capita and carbon emissions in theEU. SourceOurWorld inData, CICCResearch
human life, health, and safety. In the past decade or so, carbon emissions in Europeand the US have shown a downward trend, while China’s carbon emissions were stillgrowing, which means that it is increasingly important for China to reduce carbonemissions (Figs. 2.1, 2.2 and 2.3).
How to achieve carbon neutrality? What effects will this process have on theeconomy? What challenges will we face? What are the policy implications? We willanswer these questions in the following sections.

2.1 Three Approaches to Achieving Carbon Neutrality … 33
0
100
200
300
400
500
600
700
1995 1999 2003 2007 2011 2015 2019
ChinaCO2 emissions per capita GDP per capita
(1995=100)
Fig. 2.3 GDP per capita and carbon emissions in China. SourceOurWorld in Data, CICCResearch
2.1 Three Approaches to Achieving Carbon Neutrality:Innovation is the Key
2.1.1 Carbon Neutrality Cannot Be Achieved Through“zero-sum game”
The first approach people most likely have in mind to achieve carbon neutrality isadjusting the structure of industries. For example, policy guidance can reduce theproportion of high-emission industries (usually high-energy-consuming manufac-turing industries) in the economy and vigorously develop low-emission industries(usually service industries). This is also the experience of European countries and theUS. However, historical experience suggests that high-emission industries usually donot disappear but will only move to other countries without such policy interventionsand with lower production costs. In the end, products produced by high-emissionindustries will return to their home country in the form of imports, and the country’s“carbon emissions trade deficit”1 would widen.
In the US, the amount of carbon emissions contained in the country’s importedgoods grew over 1990–2008. Therefore, the country’s “carbon emissions tradedeficit” also widened (Fig. 2.4).
From a global perspective, moving high-emission industries to other countries isa “zero-sum game”, and this is a process of transferring carbon emissions rather thanachieving carbon neutrality. This cannot fundamentally solve the issue of greenhouse
1 A “carbon emissions trade deficit” means that a country’s imported goods contain more carbonemissions than its exported goods, and a “carbon emissions trade surplus” means that a country’sexported goods contain more carbon emissions than its imported goods.

34 Chapter 2 Balancing Efficiency and Fairness: Kaldor-Hicks Improvement?
-2,000
-1,500
-1,000
-500
0
500
1,000
1,5001990 1993 1996 1999 2002 2005 2008 2011 2014 2017
UK Italy France Germany US China(mn tonnes)
Fig. 2.4 Carbon emissions trade deficit/surplus. SourceOurWorld inData (based onGlobalCarbonProject), CICC Research
gas emissions because the damage to the environment is determined by the totalamount of emissions rather than where the emissions came from. Therefore, it is notenough to just adjust the structure of industries and we must find a way to get to theroot of the problem.
2.1.2 Approach 1: Raising Carbon Price to InternalizeExternal Costs
The externality of environmental pollution is at the root of the carbon emissionproblem. To cope with the negative externalities of carbon emissions, the key isto introduce a carbon pricing mechanism and raise carbon prices. Carbon pricingmeans setting a price for carbon emissions (carbon price) to link the external costs ofcarbon emissions with emitters’ private costs. Carbon pricing does not specify whoshould reduce emissions, where to reduce emissions, or how to reduce emissions.Instead, it provides an economic signal to emitters and allows them to decide whetherto take measures to reduce emissions or continue to emit carbon dioxide and payfor their emissions. Carbon pricing works via two mechanisms: First, under theconstraint of the carbon price, companies begin to regard emission permits as a factorof production, which could help to manifest the hidden costs of carbon emissions andinternalize external costs. Second, carbon price could promote innovation in energyconservation and emission reduction technologies. Studies have found that higher

2.1 Three Approaches to Achieving Carbon Neutrality … 35
carbon prices drive innovation in low-carbon technologies and increase companies’incentive to develop and adopt low-carbon technologies. The European Union (EU)is more experienced in carbon pricing at present.
2.1.3 Approach 2: Accelerating Innovation to FundamentallyAlter Mode of Production
Another way to achieve carbon neutrality is to fundamentally change theway compa-nies operate, and specifically, (1) by reducing the carbon emission intensity perunit of energy consumption, or (2) by reducing the energy consumption intensityper unit of GDP. In this case, we have the following formula:
CO2
GDP= CO2
E× E
GDP
CO2 represents carbon dioxide emissions, E represents the consumption of theenergy, the first term on the right-hand side of the equation is carbon emissions perunit of energy consumption, and the second term is energy consumption per unit ofGDP.
Innovation is crucial to reducing the two parts of intensity. Environmentalprotection-related technological innovation is usually called “eco-innovation” in theacademic world. For example, the development of new emission reduction tech-nologies and carbon capture technologies can reduce carbon emissions per unit ofenergy, while the use of clean energy can reduce energy consumption per unit ofGDP. When promoting development of the low-carbon economy, many developedcountries would focus on how to promote environmental technological advancement,and encourage and facilitate innovation.
In the longer term, innovation can not only solve the problem of carbon emissionsbut is also themajor driving force for economicgrowth.Each technological revolutionhas reshaped the global economic landscape, and countries with an early start toinnovation eventually achieved economic advances.
Unlike innovation in regular technologies, eco-innovation is a general-purposetechnology innovation that has great effects on improving the productivity of thehuman society. The core feature of general-purpose technologies is the wide rangeof applications, and they could often be used as inputs by downstream industries,promoting innovation in the field where they are used. In addition, this type oftechnology also has large potential for improvement. Therefore, when innovation ingeneral-purpose technologies emerges, it tends to be more conducive to the improve-ment of total factor productivity of the whole economy than regular technologies(Fig. 2.5). It is believed that eco-innovation, just like the invention of the steamengine and electric motor, could also trigger an important technological revolutionin the history of human development (Fig. 2.6).

36 Chapter 2 Balancing Efficiency and Fairness: Kaldor-Hicks Improvement?
Fig. 2.5 General-purposetechnologies drive otherinnovations. Source Gartner,CICC Research
General-purposetechnologyinnovation
Regulartechnology
innovation B
Regulartechnology
innovation A
Regulartechnology
innovation C
Steamengine(1698)
Electricity(1879)
Computer(1946)
Semi-conductor
(1947)
Internet(1983)
Eco-innovation
(Now)
Fig. 2.6 Eco-innovation has potential for leading a new round of technological revolution. SourceNASSCOM Insights, CICC Research

2.1 Three Approaches to Achieving Carbon Neutrality … 37
2.1.4 Multiple Barriers to Eco-Innovation
Although innovation could help to achieve carbon neutrality, technological progresscould be relatively slow and face considerable uncertainty. If history is any guide, thedevelopment of a new technology usually traces an S-shaped curve from the stageof invention to the stage of application. That is to say, the development process ofa new technology would accelerate from a low level first before it gradually slowsdown. It seems that the process of eco-innovation is slower than the development ofregular technologies. In the early 1990s, some scholars believed that eco-innovationand internet technology represent the most promising directions of technologicaldevelopment in the future. In the past three decades, internet technologies haveexperienced exponential growth, but the overall progress of eco-innovation has beenslow.
The slow development of eco-innovation could be due to the issue of double exter-nality. The externality of environmental issues lies in the fact that the benefits fromreleasing pollutant emissions are enjoyed by companies, while the costs are borne bythe whole society. The externality of innovations lies in that new technologies andproducts developed by companies can be easily imitated by their competitors so thatthe latter can gain the benefits of R&D, but the developers bear the R&D costs. Aseco-innovation is both environmentally friendly and innovative, it features doubleexternalities. Under the market mechanism, this would ultimately lead to insufficientinvestment in eco-innovation, which slows down the development of eco-innovation.Polzin (2017)2 did in-depth research on barriers to eco-innovation. Specifically,eco-innovation faces multiple barriers such as technological, institutional, financial,economic, political and transformation barriers (Table 2.1).
2.1.5 Innovation-Related Policy Suggestions
How to remove the barriers above? One could address this issue from the followingperspectives.
First, comparedwith developed economies, financial support channels at the inno-vation stage are not well-developed in China, so it is imperative to promote greenfinance. Second, promoting eco-innovation requires policy intervention, and policydepartments should collaborate to form a joint force. Third, from a global perspec-tive, removing political barriers requires the international community to reach aconsensus, identify a more consistent development direction and vision, and thensystematically promote eco-innovation policies under the framework of intergovern-mental cooperation. In general, in order to accelerate eco-innovation, the governmentneeds to introduce a series of tools and policy mechanisms, including government-enterprise R&D partnership, goal-driven public investment, demand stimulation,
2 Polzin (2017), Mobilizing private finance for low-carbon innovation–A systematic review ofbarriers and solutions, Renewable and Sustainable Energy Reviews.

38 Chapter 2 Balancing Efficiency and Fairness: Kaldor-Hicks Improvement?
Table 2.1 Barriers to capital support for eco-innovation along the innovation process
Basic R&D Applied R&D Demonstration Pre-commercial
Niche market &supported
commercialFully
commercial
Technological barriers Institutional barriers
Economic barriers
Financial barriers
Political barriers
Transformation barriers
Private researchgrants by firms
(corporates)
Privatedevelopment
grantsby firms
(corporates)
Own profits,Business angels,family offices,crowdfunding,venture capital
Business angels,family offices,crowdfunding
Own profits, VC,private equity
(PE),spin-off,
mezzanine fund,corporate debt
Own profits, PE,public equity,
project finance,mezzanine fund,corporate debt
Private finance instruments and structures
Source Friedemann Polzin (2017), Mobilizing private finance for low-carbon innovation—Asystematic review of barriers and solutions, Renewable and Sustainable Energy Reviews, CICCResearch
and tax system reforms to break the “lock-ins” and path dependence that hinder eco-innovation. Policies should be introduced to eliminate the advantages of traditionalenergy sources under the free price system, achieve the internalization of externali-ties, and encourage the transfer of social resources from conventional technologiesto a green economy.
2.1.6 Approach 3: Improving the Social Governance Systemand Encouraging Emission Reduction Amongthe General Public
Innovation is very important for achieving carbon neutrality, but eco-innovationfaces multiple barriers and does not happen overnight. Therefore, to achieve carbonneutrality, efforts must also be made to improve social governance. Such effortsinclude formulating corporate governance standards compatible with a low-carbonworld, building an environmentally friendly financial system, improving carbon taxand carbon market systems, encouraging low-carbon lifestyles, and advocating newconsumption concepts. These efforts could help reach a consensus on environmentalprotection and promote carbon neutrality among the general public. For example,garbage classification, shared mobility services, and reducing electricity use at homecan help to cut carbon emissions. Such efforts do not necessarily require new tech-nologies and may simply require emitters (mainly consumers) to adopt low-carbon

2.1 Three Approaches to Achieving Carbon Neutrality … 39
Energy-savingtechnology
Emissionreductionequipment
New energyvehicles
Shared mobility
Green finance
ESG investment
ISO standards
Environmentalprotectionculture
Consumer attitudes
EnvironmentalTechnological and Product
Innovation
Social Governance System andEnvironmental Protection
Concept
Energy-efficientappliances
Green buildingLegal system
Greenmanufacturing
Fig. 2.7 In addition to innovation, efforts must be made to improve social governance. SourceCICC Research
lifestyles. Therefore, improving the social governance system and raising publicawareness of environmental protectionwill play an essential part in promoting carbonneutrality (Fig. 2.7). We will elaborate on it in the following sections.
2.2 Issues Related to Fairness
2.2.1 Distribution of Income
Carbon neutrality also has global negative externalities. If only a single countrystrives to achieve carbon neutrality, energy consumption intensity may be negativelyimpacted in the short term.A single country’s efforts to reduce emissions often cannotoffset the unrestricted emissions of other countries. Instead, this could push up costsand damage the competitiveness of related industries in the country, while othercountries may benefit. Domestically, fairness regarding carbon neutrality is relatedto the issue of income distribution, including the distribution of income betweendifferent income groups and between different generations.
Distribution of carbon neutrality cost between different income groups:Carbon tax is “regressive” and may add burden to the low-income group. Giventhe low elasticity of demand for fossil fuels and the high proportion of direct andindirect spending on fossil fuels by the low-income group, the low-income groupmay bear a higher proportion of cost when prices of fossil fuels rise driven bycarbon prices. Carbon tax “regressivity” is related to consumption baskets of different

40 Chapter 2 Balancing Efficiency and Fairness: Kaldor-Hicks Improvement?
income groups, but a deeper reason is that carbon taxes are indirect taxes and couldbe easily passed on. As for solutions, one method is to reduce the use of carbon taxand rely more on carbon trading to raise carbon prices. However, carbon trading alsocan be regressive as it essentially adds constraints on production. The other methodis to increase tax rebates and compensate low-income groups with the carbon taxescollected. For example, 15% of the Regional Greenhouse Gas Initiative’s (RGGI)proceeds from the auction of carbon dioxide allowances are used to subsidize low-income groups’ energy expenditures to mitigate their economic pressure from risingenergy costs.
Distribution of carbon neutrality cost between different generations: Thepresent generation may bear the majority of the cost of carbon neutrality, while theprevious generation and the next generation could benefit more. If carbon neutralityis achieved, the next generation will benefit more from the improving environmentand economic growth. However, the investment to achieve carbon neutrality willbe mainly made by the present generation. The present generation may bear themajority of the cost of carbon neutrality. Therefore, the next generation is likely tobenefitmore than the present generation on the road to carbon neutrality (Fig. 2.8). Tobalance the costs and benefits between the two generations, the government shouldtransfer payment across different periods. For example, the government could issuegreen bonds to finance carbon neutrality-related public investment, and the presentgeneration and the next generation could jointly repay the interest and principal ofthe bonds.
The fairness issue also exists between the present generation and the previousgeneration. For example, the majority of the environmental pollution today is relatedto the production and life activities of the previous generation. We have calculatedthe ultimate distribution coefficient (the consumption of a product to produce aunit of another final product) for the electric power, heat generation and supplyindustries that contributes most to carbon emissions. We find that the residentialproperty construction sector has the highest distribution coefficient (Fig. 2.9). In
Economic growth
Time
Comfort zone Comfort zonePain zone
Ideal green development path
Traditional development path
Not so ideal green development path
Fig. 2.8 Next generation to benefit more than present generation on the road to carbon neutrality.Source CICC Research

2.2 Issues Related to Fairness 41
0.0
0.1
0.2
Con
stru
ctio
n of
resi
dent
ial b
uild
ings
Stee
l rol
ling
prod
ucts
Fabr
icat
ed m
etal
pro
duct
s
Bas
ic c
hem
ical
s
Non
-fer
rous
met
als a
nd re
late
d al
loys
Rai
lway
, roa
d, tu
nnel
and
brid
ge e
ngin
eerin
g
Elec
troni
c co
mpo
nent
s and
par
ts
Non
-fer
rous
met
als r
ollin
g pr
oduc
ts
Bus
ines
s ser
vice
s
Parts
and
acc
esso
ries f
or m
otor
veh
icle
s
Plas
tic p
rodu
cts
Farm
ing
prod
ucts
Ref
ined
pet
role
um p
rodu
cts,
nucl
ear f
uel p
roce
ssin
gpr
oduc
tsM
otor
veh
icle
s, ex
cept
par
ts a
nd a
cces
sorie
s for
mot
or v
ehic
les
Prod
ucts
of p
last
er a
nd c
emen
t and
sim
ilar p
rodu
cts
Cem
ent,
lime
and
plas
ter
Synt
hetic
mat
eria
ls
Com
mun
icat
ion
equi
pmen
t
Con
stru
ctio
ns in
stal
latio
n ac
tiviti
es
Publ
ic m
anag
emen
t and
soci
al o
rgan
izat
ion
Electricity and heat generation and supply
Fig. 2.9 Ultimate distribution coefficient of the electric power, heat generation and supply indus-tries. Note Coefficient value on the y-axis. Source Input–output tables of China (2018), CICCResearch
other words, the real estate industry consumes the most electric power and heat.Therefore, property owners should bear more “historical responsibility” to reducecarbon emissions. In this regard, perhaps a proper amount of taxes should be leviedon property owners with “high-carbon assets.”
2.2.2 How to Share the Cost of Emission Reduction AmongIndustries and Regions?
Carbon neutrality also involves the issue of cost sharing among different industriesand regions within a country, and the issue of direct and indirect carbon emissions. In2017, eight major industries accounted for nearly 90% of carbon emissions in China.The power industry (mainly thermal power) accounted for the largest share (44.4%),

42 Chapter 2 Balancing Efficiency and Fairness: Kaldor-Hicks Improvement?
followed by the steel industry (18.1%), the construction materials industry (12.6%),the transportation3 industry (7.8%), the chemicals industry (2.6%), the petrochem-icals industry (1.5%), the nonferrous metals industry (0.7%), and the papermakingindustry (0.3%). Power and steel industries are major contributors to the overallgrowth in the proportion of carbon emissions by the eight major industries, while theproportions of carbon emissions by other industries among the eight industries havebeen relatively stable. So, should these eight industries bear the majority of the costof emission reduction? Obviously, these eight industries are only industries with highlevels of direct carbon emissions, and the output of these eight industries is mainlyused as intermediate input by other industries. Without the output of these industriesas intermediate input, other industries may not be able to operate normally. Thus,the eight major industries should not be responsible for the entire cost.
From the perspective of geographical regions, China’s fossil energy supply ismoreconcentrated in the north of the country. Fossil energy production in China is mainlyconcentrated in provinces such as Shanxi, InnerMongolia, and Shaanxi. Specifically,coal production is mainly concentrated in provinces such as Inner Mongolia, Shanxi,and Shaanxi; crude oil production ismainly concentrated in provinces andmunicipal-ities such as Shaanxi, Heilongjiang, and Tianjin; and natural gas production is mainlyconcentrated in provinces and municipalities such as Hebei, Shanxi, and Shandong.Historical experience suggests that restrictions on fossil energy sources often leadto employment problems. For example, the number of employees in China’s miningindustry has rapidly decreased from the peak level of 6.36mn in 2013 to 3.68mn in2019 due to environmental protection-related production restrictions. Although therapid growth of emerging service industries in the past several years can create newemployment opportunities, it is often difficult to achieve stable employment transferdue to different technical thresholds between new and traditional industries, and themismatch in regional distribution of industries.
The impacts of emission reduction on local government finances also should notbe ignored. Fiscal revenues are highly dependent on mining and power industriesin provinces such as Shanxi, Inner Mongolia, and Shaanxi, indicating that carbonneutrality may have a larger impact on these provinces (Fig. 2.10). On the one hand,fiscal policies should play a role in transferring part of fiscal revenues generatedby carbon pricing to these provinces to prevent their fiscal revenues from fallingsharply (whichmayaffect people’s livelihood anddebt repayment in these provinces),supporting the green transformation of industries in these provinces, and developinglow-carbon and decarbonization technologies for industries in these provinces topromote carbon emission reduction. On the other hand, industrial policies shouldplay a role in transforming and upgrading industries in coastal areas, and supportingand encouraging some industries to move to provinces with abundant fossil energyto prevent the hollowing out of industries and population outflows in such provinces.In addition, the ability to absorb and store carbon in China’s terrestrial ecosystems
3 Including airlines.

2.2 Issues Related to Fairness 43
0
5
10
15
20
25
30
35
40
45Sh
anxi
Inne
r Mon
golia
Shaa
nxi
Qin
ghai
Nin
gxia
Hei
long
jiang
Xin
jiang
Gan
su
Gui
zhou
Liao
ning
Shan
dong
Tian
jin
Yun
nan
Hen
an
Sich
uan
Heb
ei
Anh
ui
Gua
ngxi
Fujia
n
(%)Reliance on Taxes from Mining and Power Industries
Fig. 2.10 Provinces with high reliance on taxes from mining and power industries. Source ChinaTaxation Yearbook 2018, CICC Research
may be underestimated. Economies in the southwest and northeast of China are lessdeveloped. In our view, carbon sinks could play an important role in alleviatingpoverty, promoting carbon emission reduction, and facilitating the rebalancing ofincome distribution among different regions.
Open Access This chapter is licensed under the terms of the Creative Commons Attribution-NonCommercial-NoDerivatives 4.0 InternationalLicense (http://creativecommons.org/licenses/by-nc-nd/4.0/), which permits any noncommercial use, sharing, distribution and reproduction in anymedium or format, as long as you give appropriate credit to the original author(s) and the source,provide a link to the Creative Commons license and indicate if you modified the licensed material.You do not have permission under this license to share adapted material derived from this chapteror parts of it.
The images or other third party material in this chapter are included in the chapter’s CreativeCommons license, unless indicated otherwise in a credit line to the material. If material is notincluded in the chapter’s Creative Commons license and your intended use is not permitted bystatutory regulation or exceeds the permitted use, you will need to obtain permission directly fromthe copyright holder.

Chapter 3The Capacity of Carbon PricingMechanism
Abstract From the perspective of policy tools to promote carbon neutrality,constructing a unified national carbon market may be one of the most importantmeasures in 2021. The carbon market has drawn a growing amount of attention sinceChina announced its aim to reach carbon emission peak before 2030 and achievecarbon neutrality before 2060. The Ministry of Ecology and Environment statedin September 2020 that the power generation industry is ready to be included inthe national carbon market. Under these circumstances, China should accelerate theestablishment of the carbon market over the 14th Five-year Plan period to includeother key industries (e.g., the steel, cement, and electrolytic aluminum industries)in the market. As the official launch of the national carbon market is approaching,the topic of carbon market is ever-present in the discussions of policy instrumentsin promoting carbon neutrality. The carbon market appears to have become key toformulating policies for carbon neutrality. Such an inevitable move may imply thatseveral important issues have been ignored, e.g., is it appropriate to include severaldifferent industries in one single carbon market? After carbon emission permits aregranted to different production activities, should a unified carbon price be leviedagainst different production activities? Would a unified carbon market produce anyunexpected spillover effects? In addition to the carbon market, are there any similaror different carbon neutrality policy instruments that could be considered as moresuitable choices? In this chapter, we analyze these issues based on the green premiumconcept and we draw several conclusions: (1) The power and steel industries are twomajor industries that are suitable for inclusion in the carbon market, while the carbontax-based carbon pricing mechanism may be more suitable for the transportation,chemicals and construction materials industries; (2) Unified carbon pricing may notbe appropriate, and differentiated carbon pricing should be adopted; (3) Comparedwith theoretical discounting of the social cost of carbon, “parity carbon cost” maybe more suitable to be used as a reference for setting carbon prices in reality. Inorder to explain the logic behind these conclusions, we also discuss the followingissues in this chapter: (1) We distinguish between carbon price concepts related tocarbon neutrality, offering the basis for further discussion; (2) We analyze problemsin the logic behind the idea of a unified carbon price, and we propose the idea ofdifferentiated carbon prices based on the concept of net social cost; (3) From theperspective of green premium, we explore more realistic calculation methods for
© The Author(s) 2022CICC Research, CICC Global Institute, Guidebook to Carbon Neutrality in China,https://doi.org/10.1007/978-981-16-9024-2_3
45

46 Chapter 3 The Capacity of Carbon Pricing Mechanism
differentiated carbon prices; (4) Based on the green premium concept, we discusscarbon pricing mechanisms that are suitable for different industries, and the estab-lishment of trading mechanisms in the carbon market; (5) We discuss the possibilityof lowering the green premium from the perspective of social governance.
3.1 Unified Carbon Price: Social Cost or Net Social Cost?
There are many similar carbon price concepts in different contexts, such as in theo-ries, in policy discussions and on daily basis. The connotations of these conceptsare clear in their respective contexts, but some ambiguities may arise in cross-contextual discussions, especially in the discussions of carbon pricing.1 Therefore,the World Bank has distinguished and defined different concepts related to carbonprice.2 Among these concepts, carbon price refers to the price determined by trans-actions in the carbon market, as well as the carbon tax rate. Unless otherwise spec-ified, the carbon cost in this chapter refers to the “social cost of carbon”, which isthe discounted value of the social cost of carbon in each period as Nordhaus et al.measured. US President Biden also used this definition of the carbon price when heannounced the social cost of carbon calculation immediately after he took office.
In fact, this is not the first time the US government calculated carbon cost. TheObama administration calculated carbon cost in 2010, and carbon cost in 2020 wasabout US$26 per tonne of carbon based on the calculation back then3 and US$42per tonne of carbon based on the updated calculation in 2016 (Fig. 3.1). In 2017, theTrump administration updated the calculation of carbon cost again, and estimated thecarbon cost in the US at only around US$7 per tonne of carbon.4 US policymakerswho oppose or advocate emission reductions both support their views by calculatingcarbon cost, reflecting the importance of carbon cost for carbon pricing. Since carbonpricing is regarded as the most important policy instrument to achieving carbonneutrality, the calculation of carbon cost can also be considered as an importantfoundation for carbon neutrality policies to some extent.
1 http://www.nbd.com.cn/articles/2020-09-29/1514734.htm.2 World Bank stated in 2019 that “Carbon pricing puts an explicit price on greenhouse gas emissionsexpressed as a monetary unit per tonne of carbon dioxide equivalent (CO2e). The effective carbonrate is the sum ofmarket-based instruments (specific energy taxes, carbon taxes and carbon emissionpermit prices) applied to carbon emissions. Explicit carbon pricing meanwhile puts a price directlyon greenhouse gas emissions. Two instruments that fall into this category are the carbon tax, whichis a price-based instrument and the emissions trading system, which is a quantity-based instrument.Implicit carbon pricing is used in a variety of ways and refers to policies that impose compliancecosts (i.e. an implicit price) on activities that emit greenhouse gases. Internal carbon pricing iswhen organizations assign a monetary value to greenhouse gas emissions in their policy analysisand decision making.”3 Technical Support Document: Social Cost of Carbon for Regulatory Impact Analysis UnderExecutive Order 12866, February 2010.4 Brad Plumer, Trump put a low cost on carbon emissions. Here’s why it matters. The New YorkTimes. August 2018.

3.1 Unified Carbon Price: Social Cost or Net Social Cost? 47
266
5842.89 42 37.3 29.65
70
50
100
150
200
250
300
SCC Stern Parity Carbon CostCICC
Carbon PriceAverage Carbon Tax
SCC ObamaAdministration
SCC Nordhaus Carbon Price EU-ETS
SCC TrumpAdministration
(USD/tonne)
Fig. 3.1 Carbon cost and carbon price (US dollar per tonne of carbon).5 Note The “parity carboncost” is the parity carbon cost in China calculated based on the green premium in 2021. The carbonprice (EU ETS) is the arithmetic average of the spot transaction prices in the European Union’scarbon trading market in 2020. The “average carbon tax” is the average value of carbon taxes ineach country calculated based on World Bank data in 2020. Source Nordhaus (2016), World Bank,EEX, CICC Global Institute
However, policymakers have not reached a consensus on the important funda-mental data usage (i.e. carbon cost), and scholars also have different views on thecalculation of carbon cost. For example, climate economist William Nordhaus esti-mated carbon cost at about US$37 per tonne of carbon in 2020.6 Nicholas Stern,an economist in the field of carbon cost calculation who hold different views fromNordhaus, estimated the carbon cost at about US$266 per tonne of carbon.7 Theparity carbon cost in China calculated by us based on the green premium is aroundRmb377 (about US$58) per tonne of carbon. Why do different calculation methodsderive such different carbon costs for the same carbon emissions? Fromwhat perspec-tive should we comprehend carbon cost? Why should we calculate carbon cost fromthe perspective of green premium? What are the implications for carbon neutralitypolicies?
To explore these questions, it would be necessary to discuss externalities. In1920, the British economist Arthur Pigou conducted a groundbreaking study on theissue of externalities. Almost all of the current mainstream carbon cost calculationmethods can be traced back to Pigou’s idea of the internalization of social costs.The theory is simple and clear, but the calculation methods at the technical levelare very complicated and different. An important difference between Nordhaus andStern comes from their highly different views on discount rate (see Fig. 3.2). The
5 For the sake of brevity, “tonne of carbon” is used in this chapter to represent “tonne of carbondioxide.” Unless otherwise stated, carbon prices below are in renminbi terms.6 William D. Nordhaus, Revisiting the social cost of carbon, November 2016.7 William D. Nordhaus, Revisiting the social cost of carbon, November 2016.

48 Chapter 3 The Capacity of Carbon Pricing Mechanism
(USD)
Soci
alco
stof
carb
on,2
015
(%)Growth corrected discount rate (per year)
Fixed disc rate DICE base disc rate Stern disc rate
Fig. 3.2 Carbon cost and discount rate. Note “DICE base” represents the discount rate adopted byNordhaus in 2016 and the corresponding carbon cost; “Stern” represents the social cost of carbonderived with the discount rate in “The Stern Review”. Source Revisiting the social cost of carbonby William D. Nordhaus, CICC Global Institute
Obama administration and the Trump administration not only had different viewson discount rates but also had different views on the scope of coverage: the formercalculated global carbon cost, while the latter only calculated the social cost of carbonin the US.
The Obama administration used three different methods to calculate carbon cost,namely the Dynamic Integrated Climate and Economy (DICE) model, the PolicyAnalysis of the Greenhouse Effect (PAGE) model and the Climate Framework forUncertainty, Negotiation, and Distribution (FUND) model. Among them, the DICEmodel is themost fundamental one. In this endogenous growthmodel, carbon dioxideaffects temperature and thus overall economic output, but it does not factor in thecarbon emissions’ impacts on various other economy components. The PAGEmodeland FUND model make up for this deficiency to a certain extent, and they respec-tively factor in the structural differences of carbon emissions’ impacts on differentgeographic regions and different industries.8
However, behind these seemingly serious differences, it seems that a question hasbeen intentionally or unintentionally ignored: Should carbon costs be differentiatedin different industries? Based on current mainstream calculation methods, there isonly one carbon cost among all sectors in an economy. Since carbon cost is animportant basis for carbon pricing, such a unified carbon cost calculation that doesnot factor in differences of industries seems to have produced an important impact onthe logic of carbon pricing in reality that a unified carbon cost implies a unified carbon
8 Pigou A C, The Economics of Welfare. Macmillan, New York, 1920: 193–194.

3.1 Unified Carbon Price: Social Cost or Net Social Cost? 49
price. For example, as of 2020, the world’s largest carbon trading market, the EUEmissions Trading System (EU ETS), covered 14 industries such as the power andtransportation industries, and these industries have a unified carbon price in the samemarket. There is a similar situation inChina. The country’s upcoming national carbonmarket mainly covers the power industry at present and will also cover industrieswith high carbon emissions such as the steel, cement, and electrolytic aluminumindustries in the future. This seems to mean that these different industries may havea unified carbon price after they are included in the national carbon market.9
However, is the idea of a unified carbon price implied by mainstream carbon costcalculation methods appropriate? Pigou’s argument is still useful for thinking aboutthis question. He believes that “All such effects must be included—some of themwillbe positive, others negative elements— in reckoning up the full physical net productof the marginal increment of any volume of resources turned into any occupation.10”In other words, what Pigou is actually discussing is not the social cost, but the netsocial cost as the difference between social cost and social benefit.
RonaldCoase, another economist who has done in-depth research on externalities,questioned the feasibility of Pigouvian tax in his masterpiece article The Problemof Social Cost (published in 1960), but he clearly wrote: “the problem is to devisepractical arrangements which will correct defects in one part of the system withoutcausing more serious harm in other parts.11” In other words, Coase’s perspective onexternalities is still a concept of net social cost.
Due to the difference between social cost and net social cost, it seems that thereshould be a certain degree of skepticism about the idea of a unified carbon price.Such a carbon cost analysis based on net social cost rather than social cost could beextended in a more general way. This means that different carbon price levels shouldalso be applied to industries with different social benefits. So, can we infer that itmay not be appropriate to calculate the same carbon cost for industries with differentnet social costs? Then a more practical question may emerge: For carbon pricingin reality, is it appropriate to include industries with different net social costs in aunified carbon market to bear the same carbon price determined by transactions, oris it appropriate to set the same carbon tax rate for different industries with differentnet social costs?
So far there is a big controversy over the differentiated carbon prices system. Thereare two major issues. First is the argument about efficiency: why do products such asgas and automobiles use a unified carbon price decided by the market, but productssuch as the carbon mission rights use differentiated carbon prices? Second is the
9 The Ministry of Ecology and Environment stated in September 2020 that the power generationindustry is ready to be included in the national carbon emissions trading market, and that Chinashould accelerate the establishment of the carbon emissions trading market over the 14th Five-year Plan period to include other key industries (e.g., the steel, cement, and electrolytic aluminumindustries) in the market.Source: http://www.mee.gov.cn/ywdt/hjywnews/202009/t20200927_800752.shtml.10 Pigou A C, The Economics of Welfare. Macmillan, New York, 1920: 115–116.11 Coase RH, The Problem of Social Cost,Classic Papers in Natural Resource Economics. PalgraveMacmillan UK, 1960.

50 Chapter 3 The Capacity of Carbon Pricing Mechanism
argument about fairness, which indicates that the differentiated carbon prices violatethe principle of fairness, and lead to arbitrage problems such as carbon leakage.
For the first issue, we recommend thinking from the externality perspective.Whenwe talk about ordinary goods such as gas and automobiles, we don’t have to considerthe externality issue because the market is efficient for these products, so it is logicalto let the market determine the price. However, when carbon emission rights becomea special good in an inefficient market, the pricing of such a good needs to considerits externalities. Externalities exist when the free market fails or when the marketcannot determine the price, so it is not suitable to compare carbon emission rightswithgeneral goods in the market. More importantly, when we consider these externalities,why should we only account for the negative externality and neglect the positiveexternality? Of course, if we don’t take the externality effect into account, then thesocial return problem doesn’t exist either, and we can simply use the free market todetermine the price for general goods. Thus, an economic activity with externalitiesthat has different net social costs in different industries may require differentiatedpricing.
From the perspective of new institutional economics, another problem worthmentioning is that market pricing is not necessarily efficient. Whether we use admin-istrative or market allocation to allocate resources, the transaction cost will greatlyaffect the efficiency of pricing. For an ordinary good, themarket is efficient due to thelack of externalities. Nonetheless, carbon emissions are different. EU ETS was notformed because of the economic incentives. Instead, the establishment of the marketitself can be considered as the correction of excessive spontaneous profit-seekingbehaviors. Furthermore, the operations of the market mainly rely on the compulsoryforces from the government. As a result, the transaction cost is higher under the EUETS than that of the carbon tax. In this context, it is hard to say the carbon markethas higher pricing efficiency than that of the carbon tax.
Therefore, to simply regard carbon emission as an ordinary good, or to overem-phasize a unified carbon price may be questionable. If we disregard the fact thatthe carbon price derives from the externality of carbon emissions, and consider thecarbon emission as an ordinary good that lacks externality, it may cause a theoreticaldilemma: now that a unified carbon price is justifiable in one economy, why can’twe have a unified carbon price among different economies? On a practical level, ifwe match the carbon price among developing countries and developed countries, itwould impose extensive cost to developing countries. From a solely theoretical pointof view, although the social costs imposed to all countries are the same from carbonemissions as a global externality, developing countries have larger populations andmore urgent needs to improve their living environments through economic growth.Therefore, the social benefits of carbon emissions for these countries are higher thanthose of developed countries. This means that although the social cost of the samecarbon emissions in different countries is the same, the net social cost of developingcountries should be lower. Thus, it is logical to say that simply requiring developingand developed countries to use a single unified carbon price is unreasonable.
For the second question we mentioned above, it involves a value judgement ques-tion:what is fairness? Fairness has twoperspectives: the private economic perspective

3.1 Unified Carbon Price: Social Cost or Net Social Cost? 51
and the public economic perspective. We can take one question into consideration:if we see carbon emission price as a punishment, does it mean that carbon emissionsfrom different economic activities should bear various degrees of punishment? Forexample, let’s compare a person mining bitcoin and a large number of people whoburn coal for heating on cold winter days. In this case, both actions create emis-sions. Should both of them be covered in the carbon market to get the same carbonprice and level of punishment? From the social cost perspective, one unit of carbonleads to the same level of harm to society, and thus calls for the same punishmentregardless of energy use for heating or bitcoin mining. If they are punished differ-ently, from the private economic perspective, it indeed seems unfair. However, it isobvious that emitting large amount of carbon to “dig” a currency that could havebeen easily printed produces very different social benefits from saving lives underextreme temperatures. Hence, punishing the two activities in the same way is unfairfrom the public perspective.
In addition, the so-called carbon leakage seems like an inequality issue caused bythe differential price. However, it is one of the most common industrial policies topromote balanced regional development through differential pricing of productionfactors, such as regional tax incentives, export tax rebates for different industries,and distorting polices as differentiated pricing for inclusive finance. These policiesseem to distort the fairness in market competition, but they actually contribute tosocial fairness in a broader sense. The question is, in reality, how can we achieveoptimal carbon pricing arrangements? In the next section, we apply this question togreen premium.
3.2 Green Premium and the Choice of Carbon PricingMechanisms
As mentioned earlier, it is reasonable to think about carbon pricing in terms of socialnet cost rather than social cost. However, whether it is based on social cost or netsocial cost, carbon price is a concept that is theoretically feasible. In reality, it isdifficult to calculate and possibly subject to large errors. In addition to the above-mentioned discount rate, the greater dispute lies in how to define the social cost. AsStern has put forward: (1) Causes and consequences of climate change are global, andthe economic harm caused by the emission of the same equivalent of carbon dioxidehas nothing to do with regions. (2) Greenhouse gases may remain in the atmospherefor hundreds of years and there will be a lag in the impact of accumulated emissions.(3) Greenhouse gases’ potential impacts on human society are uncertain and difficultto estimate.12
Even after making various assumptions about the discount rate and social cost,calculation is still very difficult. Taking the calculations by the Obama administration
12 Nicholas Stern, The Economics of Climate Change the Stern Review, Cambridge University Press2007.

52 Chapter 3 The Capacity of Carbon Pricing Mechanism
as examples, threemodels not only simulate the scenarios of three discount rates (5%,3%, and 2.5%), but the initial settings of each specific calculation model also containsome randomly generated parameters. To alleviate the unreliability of results causedby this, each model has repeated calculations 10,000 times. President Biden intendsto spend a year and a half updating the carbon cost calculation.13 This not only reflectsthe importance of carbon cost calculation under mainstream frameworks, but couldalso be because that the calculation process is highly complicated and uncertain, andrequires a high input cost.
It is already so difficult to calculate one unified carbon cost based on social cost. Ifdifferentiated carbon costs of various industries are calculated from the perspectiveof net social cost, the related disputes in definition of carbon costs, and the time andresources required in the calculation process may be much greater than those forthe unified carbon cost. However, despite of the difficulty in calculation, the aboveanalysis on net social cost shows that it is indeed necessary to calculate differentcarbon costs for different industries. Therefore, it is necessary to think about how tocalculate differentiated carbon costs in a more feasible way outside the mainstreamframework and how to promote it in reality.
There are two ways to set the carbon prices. One method still uses the carbonmarket as the only pricing mechanism and complemented by operational design toarrive at a differential carbon price, e.g., issuing more quotas for industries withlower net social cost, or transfer the auction revenue to the industries with lower netsocial costs. Obviously, these approaches contribute to the de facto differential carbonprice, but also distort the so-called fair competition. In other words if the distortedmechanism is used to realize the differential carbon price, then the questioning ofthe differentiated carbon prices system may be untenable in the first place.14
The other way is to rethink the single pricing approach relying on carbon market.In this aspect, the green premium could give us some hints. The green premium isessentially a kind of carbon cost parity which requires emitters to pay additional costsfor carbon emissions to ensure that the emitters’ production costs are equal to theproduction costs with the clean energy and put emphasis on using carbon neutralitytechnologies to solve the problem of carbon emissions in the future.
Therefore, green premium based on reality seems to have greater practical signif-icance than mainstream carbon costs in theory. More importantly, green premiumcan reflect the policy implications of differentiated carbon costs and differentiatedcarbon pricing from the perspective of net social cost. Next, we will discuss howto achieve carbon pricing based on the framework of green premium, which mainlyincludes three aspects: (1) Should different industries adopt different carbon pricingmechanisms? (2) Should different industries have different carbon price levels? (3)If there is a need to set differentiated carbon prices, is there a differentiated carbonprice benchmark for each industry?
13 White House, Executive order on protecting public health and the environment and restoringscience to tackle the climate crisis, January 20, 2021.14 As there are opinions oppose to set the differential carbon price mechanism at first.

3.2 Green Premium and the Choice of Carbon Pricing … 53
0
20
40
60
80
100
120
140
Swed
en
Switz
erla
nd
Liec
hten
stei
n
Finl
and
(tran
spor
tatio
nfu
els)
Finl
and
(oth
erfu
els)
Nor
way
Fran
ce
Icel
and
Irel
and
(tran
spor
tatio
nfu
els) Can
ada
Den
mar
k
Portu
gal
Den
mar
k(f
luor
inat
ed g
as)
Irel
and
(oth
erfu
els)
UK
(low
er li
mit
pric
e fo
r car
bon
tradi
ng)
Alb
erta
, Can
ada
Slov
enia
Spai
n
Latv
ia
(USD/tonne)
Fig. 3.3 Carbon tax rates in various countries (US$/tonne of carbon). Note Data as of November2020. Source World Bank State and Trends of Carbon Pricing 2020, CICC Global Institute
3.2.1 Pigou Versus Coase: Similarities and DifferencesBetween Carbon Tax and Carbon Market
The theoretical foundations of carbon tax and carbonmarket, twobasic carbonpricingmechanisms, come from Pigou and Coase separately. Although both analyze exter-nalities from the perspective of net social cost, their views on how to realize theinternalization of net social cost are not the same. Pigou’s solution is Pigouvian tax.Coase believes that the Pigouvian tax is an idea that is difficult to realize, because itis difficult to know what the right tax rate is. He proposes the pricing of externalitiesthrough free-market transactions after clarifying property rights.
In practice, as of 2019, therewere 31 carbon tradingmechanisms and 30 carbon taxmechanisms implemented or scheduled around the world. Specifically, the represen-tative countries that levy carbon taxes were mainly the Nordic countries like Finlandand Norway.15 Currently, the largest carbon market in the world is EU ETS, andthe Regional Greenhouse Gas Initiative (RGGI) in the US is also a carbon tradingmechanism. We analyze the similarities and differences between the two pricingmechanisms from three perspectives, i.e., emission reduction effects, transactioncosts, and the use of public revenue. In the end, we explore the applicability of thetwo pricing mechanisms to China in light of green premiums.
Carbon tax rates in different countries or regions are shown in Fig. 3.3, and pricesof carbon emission allowance futures in the EU ETS are displayed in Fig. 3.4.
15 World Bank, State and Trends of Carbon Pricing 2020, 2020, May 27.

54 Chapter 3 The Capacity of Carbon Pricing Mechanism
0
5
10
15
20
25
30
35
40
45
2008 2009 2010 2011 2012 2013 2014 2015 2016 2017 2018 2019 2020 2021
EUA future price
Phase 2 Phase 3 Phase 4(EUR/tonne)
Fig. 3.4 EU ETS carbon emission allowance futures prices (EUR/tonne of carbon). Note Data asof March 2021, EU ETS has four phases: phase 1 is 2005–2007, phase 2 is 2008–2012, phase 3 is2013–2020, phase 4 is 2021–2030. Source ECX EUA futures from ICE, CICC Global Institute
3.2.1.1 Compared to Carbon Tax, Carbon Trading Has More CertainEffects on Emissions Reduction
Both carbon tax and carbon trading could help reduce carbon emissions by increasingthe cost of carbon emissions. However, there are still some differences between thetwo from the perspective of internal logic of operating mechanisms. Carbon tax isessentially a fixed carbon price determined in advance. Therefore, market partici-pants can form relatively stable expectations for returns on R&D and investment inemissions reduction technologies. The mechanism is conducive to promoting inno-vation, but it remains uncertain whether such a mechanism can effectively reduceemissions.
Because as long as the benefit of increasing one unit of carbon emissions can coverthe cost of carbon tax, enterprises will continue to increase carbon emissions. Thissituation has also been evidenced by empirical analysis of the emission reductionsin Nordic countries such as Sweden and Norway from 1981 to 2007. Compared withthe baseline scenario in which no carbon tax is levied, the imposition of carbon taxreduced emissions by approximately 2.8%–5%. In addition, the absolute amount ofemissions in the four Nordic countries, i.e., Finland, Denmark, Sweden, and Norway,did not show a significant decline after the imposition of the carbon tax, or the dropwas significantly smaller than that after joining the carbon market (Fig. 3.5).

3.2 Green Premium and the Choice of Carbon Pricing … 55
60
80
100
120
140
160
180
200
75
80
85
90
95
100
105
110
115
120
125
1990 1992 1994 1996 1998 2000 2002 2004 2006 2008 2010 2012 2014 2016 2018
Finland's changes in greenhouse gas emission (base on 1990)
Finland's changes in GDP per capita (RHS)
(%)After EU ETS in 2005
(%)
80
130
180
230
280
330
380
90
95
100
105
110
115
1990 1992 1994 1996 1998 2000 2002 2004 2006 2008 2010 2012 2014 2016 2018
Norway's changes in greenhouse gas emission (base on 1990)
Norway's changes in GDP per capita (RHS)
(%) After EU ETS in 2005 (%)
Fig. 3.5 Carbon emissions and GDP per capita in the Finland and Norway. Source EuropeanEnvironment Agency (EEA), CICC Global Institute
Compared with carbon tax, which lacks constraints on total emissions, the controlover total emissions under the carbon trading mechanism provides a better solutionin this regard. Since the upper limit of carbon emissions is set in advance, even inthe case of an overheating economy, the ultimate amount of carbon emissions is stillunlikely to exceed the predetermined cap significantly. Therefore, a big differencebetween carbonmarket and carbon tax is that the former provides a relatively definitepath to reducing carbon emissions. TheEUETS (Fig. 3.6) and theUSRGGI (Fig. 3.7)basically confirm this argument.
However, this does not mean that the carbon trading mechanism is perfect. Infact, compared to carbon tax, as a quantitative carbon pricing mechanism, the carbonmarket increases the certainty over carbon emission reductions, but creates uncer-tainties over carbon prices. In a pure carbon market, the supply of carbon emissionpermits is inelastic. Once economic fluctuations trigger changes in the demand forcarbon emission permits, the demand-side shocks will be fully absorbed by carbonprices, which leads to highly volatile carbon prices in the carbon market. Highly
0
500
1,000
1,500
2,000
2,500
2005 2006 2007 2008 2009 2010 2011 2012 2013 2014 2015 2016 2017 2018 2019 2020 2021 2022 2023 2024 2025 2026 2027 2028 2029 2030
EU ETS cap phase 1 and phase 2EU ETS cap phase 3 and phase 4 based on an annual linear reductionVerified emissions
(mt CO2)
1st phase 2nd phase 3rd phase 4th phase
Fig. 3.6 EU ETS’s emissions caps and the actual emissions. Source EEA, CICC Global Institute

56 Chapter 3 The Capacity of Carbon Pricing Mechanism
0
20
40
60
80
100
120
140
160
180
200
2009 2010 2011 2012 2013 2014 2015 2016 2017 2018 2019 2020
Actual emissions Cap(mt CO2)
Fig. 3.7 USRGGI’s emissions cap and actual emissions.Note In 2020, RGGI’s coverage expandedfrom 9 states to 10, so the cap was raised. Source RGGI COATS, CICC Global Institute
-1.5
-1
-0.5
0
0.5
1
1.5
0
2
4
6
8
10
12
14
Electricityportfolio
Market Oil price Gas price EUA price Electricity price
Std. dev. Mean (RHS)
Fig. 3.8 EUETS stage 1 (November 21, 2005–December 31, 2007): yields and standard deviationsof several types of assets.16 Note Right-axis represents average values. Source Yuan Tian et al.(2015), CICC Global Institute
volatile carbon prices mean that the expected returns on investment in low-carbontechnologies are uncertain; this is not conducive to the development of technologiesrelated to carbon neutrality. The asset yields and standard deviation of the first stageof the EU ETS are shown Fig. 3.8.

3.2 Green Premium and the Choice of Carbon Pricing … 57
30.7
15
38.8
26.5
0
5
10
15
20
25
30
35
40
45
Internal cost measured by working days (day) All cost measured by currency (1,000 Euro)
Enterprise under carbon tax Enterprise under EU ETS
Fig. 3.9 MRV cost enterprises need to pay under two carbon pricing mechanisms. Note There arefive types of companies participating in the survey: all companies subject to the requirements of theEU carbon taxMRV system, all companies subject to the requirements of the EUETSMRV system,companies subject to both the EU carbon tax and ETS MRV system requirements, companies thatare only subject to the requirements of the EU carbon tax MRV system, and companies that areonly subject to the requirements of the EU ETS MRV system. Three types of cost are consideredin the survey: the internal costs of management and actual work need to be undertake under MRV,measured by the time and money spent; the external costs, i.e., the costs of consulting servicesconcluded in accordance with MRV regulations, measured by the money spent; capital costs, i.e.,the costs of measuring, monitoring, recording, and data storage related to carbon emissions. SourceJessica Coria (2019), TransactionCosts ofUpstreamVersusDownstreamPricing of CO2 Emissions,CICC Global Institute
3.2.1.2 Compared to Carbon Market, Carbon Tax Mechanism LowersTransaction Costs
As new institutional economics emphasizes, the operation of the resource allocationmechanism also creates costs. Due to the inconsistent operation logic of the twocarbon pricing mechanisms, there is a significant gap between their transaction costsas measured by monitoring, reporting and verification (MRV). As shown in Fig. 3.9,transaction costs in the carbon market are usually higher than those under the carbontaxmechanism. Themain reason for such a difference is that the imposition of carbontax relies on the existing taxation system, so there is no need to build a brand newdedicated MRV system.
In contrast, the carbon trading market is not an existing market formed sponta-neously by profit-seeking economic entities, but a new dedicated market establishedwith mandatory policies, such as legislation, as the institutional basis. Compared
16 Yuan Tian, Akimov A, Roca E, et al., 2016, Does the Carbon Market Help or Hurt the StockPrice of Electricity Companies? Further Evidence from the European Context, Journal of CleanerProduction.

58 Chapter 3 The Capacity of Carbon Pricing Mechanism
to the carbon tax-based pricing mechanism, the effective operation of the carbontrading market as a new deliberately created market requires more market entitiesbesides carbon tax participants to work together, which will generate more coor-dination and supervision costs. On the one hand, in an artificially created market,the effective operation of the basic system does not depend on the market’s genuineprofit-seeking motivation, but on the enforcement of mandatory policies. This mayrequire a large investment of resources. For example, the carbon emission allocationsystem, regardless of free allocation or fee-based, requires sufficient resources tomonitor the process. Otherwise, the allocation process could easily become ineffi-cient. On the other hand, in the carbon market, market participants not only comprisegovernments, carbon-emitting firms, and exchanges which serve as the infrastruc-ture, but also intermediary institutions, a large number of institutional investors, andeven individual investors introduced to improve pricing efficiency. In addition to spotproducts, there are also products such as futures and options. This means that thecarbon market needs a new tailored MRV system to strengthen the supervision overparticipating entities. Increased interactions between participants also suggest highertransaction costs.
3.2.1.3 Distribution of Carbon Pricing Revenue: Carbon Tax CouldPromote Fairness, While Carbon Trading Focuses Moreon Enhancing Efficiency
Regardless of whether the carbon tax or the carbon trading mechanism is adopted,there will be a carbon emission price. This, coupled with the transaction costsinvolved in the operations of the pricing mechanism, will cause two problems, i.e.,weakening competitiveness of enterprises at the micro level, and carbon leakage atthe macro level. A possible solution to these problems is to use the public revenuefrom carbon pricing reasonably. Public revenue is reflected as the government’stax revenue under the carbon tax mechanism, and the government’s public revenuefrom the auction of carbon emission permits under the auction system. Theoretically,although these two types of revenuesflow into the government throughdifferent chan-nels, both can be used to solve the issues of weakening corporate competitivenessand carbon leakage caused by carbon pricing.
However, in practice, the use of public revenues from carbon taxes and the carbonmarket can still be somewhat different in terms of method of use. Concerning the useof revenues, as auction revenues from the carbon market are not directly includedin fiscal revenues like carbon tax, the use of 78% of the auction revenues from thecarbonmarket is subject to constraints in the form of legislation to avoid improper useof public revenues due to lack of fiscal discipline. However, the use of carbon taxesdoes not face such stringent constraints. Only about 43% of carbon taxes are used inlegally stipulated ways. Because carbon taxes enter the government’s fiscal systemand are subject to existing fiscal disciplines, compared with the carbon market, thereis no such strong need to impose additional constraints.

3.2 Green Premium and the Choice of Carbon Pricing … 59
There are also some differences between the two in the final direction of revenueuse. As the carbon tax directly enters the taxation system, they also reflect theattributes of public finance in terms of the final direction of use. More than halfof the EU’s carbon tax revenues in 2016 were used to support tax policies such astax cuts and rebates (Table 3.1), with a portion used to reflect the pursuit of fair-ness in public finance. For example, Norway reduces taxes from other sectors whenlevying carbon taxes, and a portion of carbon tax revenues flow to government-fundedprojects17 such as pension funds. The Canadian province of British Columbia stipu-lates that carbon tax revenues can be used to support low-income groups in a one-offtax rebate, which works as transfer payment.18 The Climate Action Rebate Act of2019 introduced by the US Congress proposed to return 70% of the carbon fee tolow- and middle-income residents through tax rebates.19
Unlike carbon taxeswith public finance features, revenues from the carbonmarketare earmarked for specific uses. The auction revenues generated to reduce carbonemissions are mainly used to promote emissions reduction. According to OECDresearch, 86% of the carbon market’s auction revenues face clear constraints onthe direction of revenue use (78% through legal earmarking, 8% through politicalcommitment). The No. 1 expenditure is the promotion of green travel (22%). Forexample, Canada promotes electrifiedmobility, Italy subsidizes low-carbonmobility,and California has started to build high-speed rail connecting major cities in thestate. The second largest expenditure is to improve energy efficiency. For example,France and Italy have adopted energy-saving renovations for buildings for publicinstitutions such as schools. In addition, a considerable proportion of revenues areused to support the development of renewable energy resources and subsidize greenR&D. For example, half of the funds for the UK’s Renewable Heat Incentive in 2016came from auction revenues.20
The use of carbon taxes is not limited to the field of carbon neutrality. Carbontax revenue has certain characteristics of public finance, and part of it can be used tosupport tax cuts in other areas, or transfer payments, etc., helping to promote fairness.Revenues generated by auctions in the carbon market are from carbon reduction, andused on carbon reduction. Expenditure mainly focuses on improving the efficiencyof carbon neutrality, and to a certain extent, it helps reduce sharp price fluctuations’negative impacts on green investment and reduce the lack of motivation to innovate.
17 OECD, The Use of Revenues from Carbon Pricing, 2019.18 Michael Maiello & Natasha Gural Illustrations by KELSEY DAKE. (n.d.). The Tax thatCould Save the World. Retrieved January 31, 2021.19 https://taxfoundation.org/carbon-tax-bills-introduced-congress/. The bill was not passed.20 OECD, The Use of Revenues from Carbon Pricing, 2019.

60 Chapter 3 The Capacity of Carbon Pricing Mechanism
Table3.1
Constraintson
useof
theEU’scarbon
pricingrevenues
andexpenditu
restructures
in2016
Con
straints
Legal
earm
arking
(%)
Political
commitm
ent
(%)
Type
ofconstrainedspending
(%)
Carbon
trading
788
Focuson
energy
effic
iency
Supportto
renuew
able
energy
use
Prom
oting
sustainable
mob
ility
Subsidizing
greenR&D
Forestry,
water,w
aste,
land
and
biod
iversity
managem
ent,
protectio
nand
conversatio
n
Com
pensation
toenergy
users
Other
green
spending
Others
Electric
Public
17.78
7.33
2.11
172.55
1.49
16.86
15.5
0.83
Carbontax
4322
Taxpolicychanges(e.g.
taxcuts,rebates)
Green
and
environm
ental
spending
Energyandenergy
security
spending
Com
pensationto
energy
users
Others
52.47
0.11
2.66
2.17
3.87
Source
OECD:T
heuseof
revenues
from
carbon
pricing,
CICCGlobalInstitute

3.2 Green Premium and the Choice of Carbon Pricing … 61
3.2.2 Carbon Pricing from the Perspective of GreenPremium: Carbon Market to Be the Mainstay,with Carbon Tax as a Complement
Current choices of carbon pricing mechanisms seem to only focus on the shareof emissions and emphasize the restriction of high-emission industries through thecarbon market, which does not meet the requirement of differentiated carbon pricesfrom the perspective of net social cost. Moreover, carbon tax and carbon pricingmechanisms have their respective advantages and disadvantages from the perspectiveof comprehensive emission reduction effects, transaction costs, and the use of publicrevenues, and there is no definite conclusion that one is better than the other (Table3.2). As shown in the table below, it seems that carbon trading is indeed an idealchoice from the perspective of increasing the certainty of emission reductions alone.However, this also means that higher transaction costs may need to be paid, and in asociety where the gap between the rich and the poor is widening, the opportunity topromote fairness through carbon tax would thus be lost.
More importantly, restricting carbon emissions through carbon market meansthat related industries will face greater uncertainty in carbon prices, which is lessconducive to green investment and technological progress than under carbon tax.From the perspective of achieving carbon neutrality, carbon pricing is certainly oneof the most important policy measures, but technological progress may be moredecisive for ultimate success. In this sense, it is necessary for us to re-examine thelogic of achieving carbon pricing through carbon market alone.
In this regard, the calculation of green premium can still give us some mean-ingful inspirations. The significance of green premium for carbon pricing is notonly to support the concept of differentiated carbon prices under the net social costtheory, but also to measure the maturity of carbon neutrality technologies in variousindustries. Generally speaking, if an industry’s green premium is high, it means thatthe industry’s carbon neutrality technologies are not mature enough and that the
Table 3.2 Comparison of the advantages and disadvantages of carbon tax and carbon market
Carbon tax Carbon market
Effect on emission Total emissions Uncertain Relatively certain
Carbon pricing Relatively certain Uncertain
Technologicaladvancement
Relatively strong Relatively weak
Transaction cost MRV Relatively low Relatively high
Use of public revenue Constrained revenueproportion
Relatively low Relatively high
Direction of use Helps improve fairness Focuses on emissionreduction efficiency
Source CICC Global Institute

62 Chapter 3 The Capacity of Carbon Pricing Mechanism
industry is in urgent need of promoting technological innovation. In this way, wecan think about how to choose a carbon pricing mechanism from the dimension ofgreen premium and share of emissions, to make better use of the advantages of thetwo pricing mechanisms to create a policy combination that is more conducive topromoting carbon neutrality in related industries.
Specifically, from the perspective of choosing carbon pricing mechanism, theabove-mentioned 8 industries can be classified into 4 categories: the power andsteel industries with high emissions and low green premiums, the construction mate-rial industry with high emissions and high green premiums, the transportation andchemical industries with low emissions and high green premiums, and the nonferrousmetals, petrochemicals, and the papermaking industries with low emissions and lowgreen premiums.
For the power and steel industries with high emissions and low green premiums,the two industries respectively have a green premiumof 17%and 15.4%. This impliesthat carbon neutrality technologies in the two industries are relatively mature from aneconomic perspective, and the needs for technological innovation in these industriesare not as urgent as those in industries with high green premiums. At the sametime, emissions of these two industries account for 44% and 18% of total emissions,respectively, and their combined emissions account for 62% of the total (Fig. 3.10).Therefore, the power and steel industries are more suitable for adopting the carbonmarket-based carbon pricing mechanism. Such a carbon pricing mechanism caneffectively promote the reduction of overall emissions, and there is no need to worry
Power
Iron & SteelConstruction
materials
Transportation
ChemicalsPetrochemicalNonferrous metals
Paper0
5
10
15
20
25
30
35
40
45
50
0 20 40 60 80 100 120 140 160
Prop
ortio
n of
car
bon
emis
ison
s
Green premium
(%)
(%)
ETS
Carbon tax
Fig. 3.10 Different choices for carbon pricing.Note Proportion of emissions is based on 2017 data,and the percentage of green premium is an estimate for 2021. Source CEADS, Wind Info, CICCResearch

3.2 Green Premium and the Choice of Carbon Pricing … 63
-0.2
0
0.2
0.4
0.6
0.8
1
1.2
1.4
1.6
Bulidingmaterials
Transportation Chemicals Electricity Iron & Steel Papermaking Petrochemical Non-ferrousmetal
(%)2021 2030 2060
Fig. 3.11 Green premiums in various industries. Source CEADS, Wind Info, CICC Research
too much about the fact that innovation incentives are weakened under uncertaincarbon prices.
As shown in Fig. 3.11, the green premium ratios of the low-emission, high-premium transportation and chemical industries in 2021 are 68% and 53% respec-tively, indicating that carbon neutrality technologies in these two industries have along way to go before reaching maturity, and there is an urgent need to promoterelated research and development and technological progress. In the meantime, thecombined emissions of these two industries account for only 10% of total emissions.This means that even if restrictions on total emissions are imposed on these twoindustries, their contribution to overall emissions reduction may not be as obviousas that of the power and steel industries. Meanwhile, highly volatile carbon prices inthe carbon market may not be conducive to the technological progress in the trans-portation and chemical industries. Therefore, weighing the pros and cons, it may bemore suitable to adopt the carbon tax-based carbon pricing mechanism for the trans-portation and chemical industries with low emissions and high green premiums. Theconstruction material industry’s emissions account for 12.6% of the total, rankingNo. 3 among the 8 industries and roughly near the average level of 11%. In the mean-time, the industry’s green premium is as high as 138%, much higher than the 68% ofthe transportation industry, which ranks No. 2. Relatively speaking, the constructionmaterial industry needs more incentives for innovation and technological progress.Therefore, the carbon tax-based carbon pricing mechanism may also be suitable forthe construction material industry.
As for the nonferrous metals, petrochemicals, and papermaking industries, theiremissions account for 0.68%, 1.46%, and 0.26% of the total, respectively, and thegreen premiums in these three industries are 3.7%, 7.4%, and 10.9%. As their greenpremiums and share of emissions are relatively low, it seems that either pricingmechanism can work in the three industries. However, considering the transactioncost of the emission market is much higher than the carbon tax, from the perspective

64 Chapter 3 The Capacity of Carbon Pricing Mechanism
of reducing the unnecessary burden of emission reduction on companies, the carbontax is an ideal choice.
3.2.3 Establishing a Carbon Market Trading Mechanismwith Auctions and Futures at the Core
The analysis based on green premium shows that the power and steel industriesare more suitable for adopting the carbon market-based carbon pricing mechanism,which together account for 62% of total emissions. Therefore, although the carbonmarket is not suitable to be the sole pricingmechanism, it is indeed themost importantcarbon pricing mechanism. To deal with issues like price uncertainty and insufficientinnovation incentives, we recommend building an carbon market trading mechanismwith “auction + carbon futures”, implementing an auction-based mechanism in theallowances allocation and introduce options, futures and other derivatives in tradingprocedure.
3.2.3.1 Allocation of Emission Allowances: We Should GraduallyIncrease the Proportion of Paid Allocation via Auctions
According to the Coase Theorem, in a market mechanism with transaction costs, theinitial allocation of property rights is directly related to the efficiency ofmarket trans-action. Therefore,whether the allocation of carbon emission allowances is reasonableprovides the basis for the effective operation of the entire carbon market. In theory,there are mainly two ways of allocating carbon emission allowances, namely, freeallocation based on the grandfathering method and the benchmarking method, andpaid allocation, mainly by auctions.
China released Measures for the Management of Carbon Emission PermitsTrading (trial) on October 28, 2020 and proposed to “introduce paid allocationof emission allowances in due course and gradually increase the proportion of paidallocation”. In the document officially released on December 31, 2020, the wordingwas changed to “free allocation would be the mainstay, and paid allocation can beintroduced in a timely manner per relevant government requirements”. Looking atthe wording alone, it seems that in the officially released document, greater emphasisis placed on the free allocation-based approach.
At the same time, the US RGGI uses auctions to allocate allowances and EUETS has mainly adopted the auction approach in its third stage, as paid allocation ofemission allowances could help to promote fairness. As mentioned above, the carbonmarket is a pricing mechanism with relatively high transaction costs. If there is nopublic revenue from auctions, the government, as a representative of public interest,will pay more using public funds to support the operation of the carbon market. Ifthere is no revenue from auctions to cover the costs, it would be unfair for the public.

3.2 Green Premium and the Choice of Carbon Pricing … 65
More importantly, auctions can help improve pricing efficiency and promoteinnovation. Regardless of whether the grandfathering method or the benchmarkingmethod is adopted to allocate emission allowances, free emission allowances meanthe absence of a price discovery mechanism in the allocation of emission allowances.Participants in the trading of emission allowances would bear all risks in pricediscovery and volatility. For example, during 2009–2013 when the EU ETS mainlyfocused on free allocation, the problem of excessive free allocations often occurreddue to the lack of price signals in free allocation, which at one time led to a sharpdrop in carbon prices and affected market activity.
In terms ofmitigating the carbonmarket’s adverse impact on innovation, it is moreimportant to establish a price stabilization mechanism based on auctions and supportrenewable energy investment and green R&D through revenues from auctions. Forexample, in the EU ETS, if the auction clearing price is lower than the reserveprice, the auction is cancelled, and a new auction is held.21 In the RGGI in the US,the upper and lower limits of auction clearing prices are set through two differentmechanisms: cost containment reserve (CCR) and emissions containment reserve(ECR). When the auction clearing price exceeds the trigger price, regulators releasethe CCR allowances to make the auction clearing price the CCR trigger price. Whenall the CCR allowances specified by policies are released, CCR allowances are nolonger be released even if the auction clearing price is higher than the CCR triggerprice; when the auction clearing price is lower than the ECR trigger price, regulatorswithdraw part of the auction allowances to make the auction clearing price the ECRtrigger price.22
3.2.3.2 Emission Allowances Trading: Introduction of Futuresand Other Financial Derivatives Should Be Takeninto Consideration
As mentioned above, due to the low supply elasticity of carbon emission permits,the relatively large volatility of carbon prices has become a significant problem inthe carbon market. How to control excessive volatility in carbon prices has alsobecome one of the core issues in the design of the trading mechanism. TheMeasuresfor the Management of Carbon Emission Permits Trading released on December31, 2020 proposed that trading of carbon emission permits should be conductedthrough a national carbon emission permits trading system, and agreed transfer,one-way bidding or other methods that meet requirements could be adopted in thesystem; excessive speculative trading behavior should be prevented. Judging fromthe previous pilot projects in 8 provinces and municipalities in China, control on spotprices of transactions such as upper and lower limits on price fluctuations is the mainway to prevent excessive fluctuations in carbon trading prices. Only the ShanghaiEnvironment and Energy Exchange has launched forward contracts for carbon, but
21 EUROPEAN COMMISSION, EU ETS Handbook, 2015.22 RGGI Inc, RGGI Model Rule, 2017.

66 Chapter 3 The Capacity of Carbon Pricing Mechanism
trading of financial derivative products for carbon is not due to constraints fromChina’s carbon market not yet reaching maturity.
In fact, setting price limits for the spot market is just a way of delaying the releaseof real price signals and it is not a truly effective price stabilization mechanism, noris it an effective way to help relevant companies avoid the risk of price fluctuations.Looking at EU ETS as an example, the EU launched a carbon futures product linkedto the European Union Allowance (EUA) in April 2005, and a EUA options productin October 2006. InMarch andMay 2008, carbon futures and options products linkedto Certified Emission Reduction (CER) were launched. In 2019, the trading volumeof carbon financial derivatives on the European Energy Exchange reached 426mntonnes, of which the trading volume of EUA futures was 167mn tonnes, while thetrading volume of carbon emission allowances in the spot market was only 50mntonnes.23
In fact,financialderivativessuchascarbonfuturesmaybemore importantprice riskhedging methods for emitting companies, as carbon emission allowances are a kindof artificially created emission rights product, and there are relatively concentrateddelivery deadlines for such products. For companies engaged in production activi-ties, carbon emission allowances as an asset cannot be directly put into production. Ifheld until expiry, theywill incur economic costs or opportunity costs, which could puta burden on the liquidity of companies. If carbon futures are introduced, companieswill be given a choice: They can choose to sell the carbon emission allowances heldby them in the spot market and buy futures for carbon emission allowances. This notonly helps them hedge against the risk of price fluctuations, but also helps to unleashthe liquidity occupied by carbon emission allowances to support the development ofcompanies. For investors, carbon futures and other financial derivatives with carbonemissionallowancesasthetargethavemoreattributesoffinancialproducts thancarbonemission allowances in the spot market, which could help attract more financial insti-tutions to trade in the carbon market, and is conducive to improving the liquidity andpricing efficiency of the entire carbon market.
3.3 What Carbon Market Can and Cannot Do: RegionalTransfer of Pollutants Under Carbon Trading24
A unified carbon market can help reduce the distortions caused by externalities ofcarbon emissions and improve the overallwelfare of the country.However, itmay alsocause some unexpected problems in absence of other complementary policies. The
23 EEX Group, Annual Report 2019, 2020.24 This section is co-written by CICC Global Institute and Guojun He, Assistant Professorof the Hong Kong University of Science and Technology. Mr. He is appointed jointly at Divisionof Social Science, Division of Environment and Sustainability, and Department of Economicsat the Hong Kong University of Science and Technology. In addition, he holds a concurrentappointment at EnergyPolicy Institute at theUniversity ofChicago (EPIC) and serves as the researchdirector of its China center (EPIC-China).

3.3 What Carbon Market Can and Cannot Do: Regional Transfer … 67
strong correlation between emissions of carbon dioxide and air pollutants will leadto changes in the environmental quality in different regions after the establishment ofthe national carbon market, and may affect the benefits brought by the establishmentof the carbon market in two specific aspects.
First, from a national point of view, for the same pollutant, even if the correlationbetween carbon dioxide and air pollutant emissions is positive, the overall carbonemission reduction may actually lead to an increase in the ultimate volume of pollu-tant emissions due to the differences in the elasticity coefficients between carbon andpollutant emissions in different provinces.
Second, from a regional (inter-provincial) perspective, when the carbon emissionsof a region increase or decrease, emissions of air pollutants in the region are likely tochange simultaneously due to the positive correlation between pollutants and emis-sions. However, as a kind of greenhouse gas, carbon dioxide is completely differentfrom traditional air pollutants. Specifically, the externality of greenhouse gases isglobal, and greenhouse gases affect the changes in temperature of the entire planetand thus the welfare of all of humanity. However, the externality of air pollutants isregional, and emissions of air pollutants in a region mainly affect the region alone(transboundary air pollution does exist but its externality will be greatly reducedwith the increase of distance). Therefore, if a province substantially increases itscarbon emissions through emission permits trading, air pollutants that move alongwith carbon emissions have a great impact on the province’s environment.
For example, we estimated changes in sulfur dioxide emissions in each provincebased on the changes in carbon emissions and the correlation coefficient betweencarbon and sulfur dioxide emissions under a unified carbon trading market. If carbonintensity drops by 4.5%, not all regions see increasing sulfur dioxide emissionswhen carbon emissions in these regions increase. On the contrary, carbon emis-sion permits trading could lead to a decrease in sulfur dioxide emissions in someregions. Regions such as Henan in central China and Sichuan and Yunnan in westernChina have lower marginal costs for emission reduction. By selling carbon emissionpermits, sulfur dioxide emissions could decline by more than 10,000 tonnes in allthese regions. However, in the Beijing-Tianjin-Hebei region and coastal regions, wecan generally observe an increase in sulfur dioxide emissions. Combined with theabove figure, we can see that if carbon emissions increase by about 2% under thisscenario, sulfur dioxide emissions are likely to increase by more than 10% nation-wide. Under strict policy constraints (the 7.5% scenario), sulfur dioxide emissionsin coastal regions of eastern China and regions of central China would be reducedsubstantially. However, in the Beijing-Tianjin-Hebei region and a few provinces inwestern China, sulfur dioxide emissions would still increase. In particular, it can beseen that regions with increasing sulfur dioxide emissions would be concentratedin some regions of northern China such as the Beijing-Tianjin-Hebei region, whereenvironmental pollution is more serious at present. For regions in southern Chinawith better environmental conditions, carbon market could further improve the localenvironment. The above results may have two implications.
First, the movement of carbon emissions may cause unexpected movement ofpollution, which could lead to distortions in pollutant emissions. The carbon market

68 Chapter 3 The Capacity of Carbon Pricing Mechanism
optimizes the allocation of cross-industry and cross-regional carbon resources in amarket-based way so as to allow industries with higher emission reduction coststo reduce emissions less and encourage those with lower emission reduction coststo reduce emissions more, hence reducing distortions in carbon emissions. Corre-sponding to the carbon market is the potential pollutants market. In the absence of apollutants market, if carbon emissions and pollutant emissions are highly correlated,but as the cost of pollutant emission reduction is inconsistent with the cost of carbondioxide emission reduction, it may cause industries with higher pollutant emissionreduction costs to reduce emissions more, and those with lower pollutant emissionreduction costs to reduce emissions less. A certain degree of pollutants emissiondistortion cannot be avoided. To solve such problems, it is necessary to correctlyevaluate pollutants emission reduction cost, understand the substitutive and comple-mentary relationships between pollutants and carbon emission reduction costs andbetween emission reduction costs of different pollutants, and use the appropriatemethods to coordinate the relationship between the carbon market and the potentialpollutants market.
Second, there may be lack of compatibility in incentives between the nationalunified carbon market and environmental policies. At the national level, due to theheterogeneity of the relationship between carbon emissions and pollutants in differentregions, increasing (or decreasing) total carbon emissions in a national unified carbonmarket does not mean that the total volume of pollutants in the country will increase(or decrease). At the regional level, greenhouse gas emissions are a global problem,while pollutant emissions are a local problem. The central government and localgovernments may have different preferences and requirements for regulatory poli-cies on these two types of problems, resulting in different regulatory motives. Aspollutants and carbon emissions are highly correlated, existing regional environ-mental policiesmay affect the carbonmarket in the form of “cross subsidies”,makingcarbon emissions subject to both the regulation of the carbonmarket and the impact ofpollutant regulation. Based on the above results, a national carbon market may not beable to promote emissions reduction for all pollutants. More importantly, a nationalcarbon market may exacerbate the air pollution problem in some regions of northernChina such as the Beijing-Tianjin-Hebei region, which may be incompatible withmany existing environmental protection goals. Therefore, it is necessary to clarify therelationship between various environmental protection policies and climate gover-nance policies to avoid the emergence of many repetitive and contradictory policies,whichwould not only increase the various transaction costs of companies and admin-istrative costs of the government, but also negatively affect efficiency and welfarelevels.
In addition to the contradiction between environmental policies and a unifiedcarbon market, such problems may be widespread in industries and policies relatedto carbon emissions. For example, in view of power industry emission reduction’skey role in carbon emission reduction, achieving coordinated advancement of thecarbon market and the electricity price reform may require prudent design of pricemechanisms and the consideration of additional targeted regulatory policies. There-fore, while promoting carbon emission reduction through the carbonmarket, it is also

3.3 What Carbon Market Can and Cannot Do: Regional Transfer … 69
Remnant glacial ice keptglobal temperatures cooler
Today~2.5℃ warmer
CO2~160 ppm higherthan 12,000 years ago
Global average annualtemperature
Warmer
Colder
Industrial Revolution
Seasonal temperature change
CO2 inatmosphere
Rise of modern agriculture
Thousands of years before present
Fig. 3.12 The process of temperature evolution during the Holocene epoch.25 Source SamanthaBova, Seasonal origin of the thermal maxima at the Holocene and the last interglacial, Nature, 2021,CICC Global Institute
necessary to jointly analyze the effects of interaction between relatedmarkets as soonas possible, assess the true cost of various regulations, and avoid the externalitiesthat are counterproductive to the regulation of a specific market.
3.3.1 Social Governance: A Policy Instrument to LowerGreen Premium in Addition to Carbon Pricing
Three Types of Carbon Neutrality Policies and Two Types of CarbonEmissionsBased on the discussion of carbon pricing from the perspective of green premium, wehave observed that technological progress is important or even decisive for carbonneutrality. However, according to the Holocene time series data (see Fig. 3.12), therate of increase in carbon dioxide concentration in the air has accelerated because ofthe Industrial Revolution, but such an upward trend began when human civilizationbecame increasingly sophisticated starting 6,000–7,000 years ago. In other words,technology has been an important accelerator for the upward trend of greenhouse gasconcentration for thousands of years, but the root cause lies in the economic activities
25 Samantha Bova, Seasonal origin of the thermal maxima at the Holocene and the last interglacial,Nature (2021).

70 Chapter 3 The Capacity of Carbon Pricing Mechanism
of humankind. Looking at the road to carbon neutrality from this perspective, itis important to promote progress in clean technology, but it is also necessary tostrengthen social governance that regulates human economic activities.
In order to regulate human economic activities, we can take reference fromthe classification method for environmental protection policies and classify carbonneutrality policy instruments into three types: mandatory policies, price-based poli-cies and advocacy policies. Price-based polices are considered the most importanttype of carbon neutrality policy. Mandatory policies mainly refer to policies thatrely on the government’s compulsory orders or laws and regulations. Such policiesinclude institutionalized formulation and implementation of emission standards androutine administrative intervention for emission behavior. Production shutdown orcurtailment and the license plate policy that restricts the use of cars also belongto the category of mandatory policies. Advocacy policies influence human emis-sion behavior via methods such as information disclosures and advocacy targetingpublic opinions. Such policies are usually not mandatory and offer nomaterial incen-tives, and they promote carbon neutrality by raising people’s awareness of emissionreduction.
Viewing from lowering the green premium, the differences between these threetypes of carbon neutrality policies are not clear-cut. For example, carbon pricingmechanisms, whether carbon tax or carbon market, must be built on theMRV systembased on mandatory policies. If there is no compulsory force to promote the actualimplementation of relevant systems and effectively deter violations, the design ofcarbon pricing mechanisms would be in vain. The same applies to the field of greenfinance. How to identify and confirm the authenticity of green projects also needsto be established based on a series of rules and regulations. In an economy wherethe habit of paying for carbon emissions has not been developed, if we want thegeneral public to accept the carbon pricingmechanism as soon as possible and reducefrictions in the operation of the carbon pricing mechanism as much as possible, itwould be necessary to step up efforts to advocate and raise the awareness of carbonneutrality among the general public. According to OECD research (2020), 16% ofrevenues from auctions in the carbon market were invested in carbon neutrality-related education, training and other fields.26 Therefore, social governance policiessuch as mandatory and advocacy policies are also important tools to help to lowerthe green premium.
Moreover, mandatory and advocacy policies have their own policy implicationsfrom the perspective of social governance. Here, we need to distinguish between twotypes of carbon emission behavior, namely reasonable carbon emissions and unrea-sonable carbon emissions. So-called reasonable carbon emissions refer to carbonemissions that are necessary for meeting the needs of the survival and developmentof human society. Without such emissions, human society would suffer relativelyserious welfare losses. For example, Japan launched large-scale energy conserva-tion campaigns after the nuclear accident at the Fukushima nuclear power plant, butresearch indicates that this led to an increase in mortality rate during summer, largely
26 OECD, The use of revenues from carbon pricing, 2019.

3.3 What Carbon Market Can and Cannot Do: Regional Transfer … 71
0
1,000
2,000
3,000
4,000
5,000
6,000
7,000
8,000
Chi
naU
nite
d St
ates
Indi
aJa
pan
Rus
sia
Can
ada
Kor
eaG
erm
any
Bra
zil
Fran
ceSa
udi A
rabi
aU
nite
d K
ingd
om Italy
Mex
ico
Turk
eyIr
anIn
done
sia
Spai
nA
ustra
liaV
ietn
amSo
uth
Afr
ica
Thai
land
Pola
ndEg
ypt
Mal
aysi
aSw
eden
Bitc
oin
Ukr
aine
Nor
way
Power consumption (annualized, TWH)
Fig. 3.13 Annualized power consumption by bitcoin mining ranks 27th among economies in theworld.28 Source US Energy Information Administration, University of Cambridge, CICC GlobalInstitute
because energy conservation reduced the use of air-conditioning in high-temperatureweather.27 In this example, if sufficient energy supply was to be provided despiteincreasing carbon emissions and thereby lower the mortality rate of humans, suchcarbon emissions can be considered as reasonable carbon emissions. It ismore appro-priate to use price-based policies to reduce green premiums and promote carbonneutrality for reasonable emission behavior.
So-called unreasonable carbon emissions refer to emissions caused by economicactivities that are not necessary for human survival and development. Waste isthe most typical type of unreasonable carbon emissions. The waste discussed hereincludes waste in the physical world such as foodwaste, which has raised widespreadconcerns, and waste of financial resources as seen in bitcoin mining (Fig. 3.13). Thewasteful behavior in the financial sector could generate large returns, and price-basedpolicies may not be effective enough to curb such behavior; the wasteful behaviorin the residential sector involves a wide range of various aspects and pushing price-based policies too hard may cause greater social friction if awareness of carbonneutrality is weak. Therefore, for such unreasonable carbon emissions, it may bemore suitable to adopt mandatory or advocacy social governance policies.
27 Guojun He, Takano Tanaka (2021), Energy Saving May Kill: Evidence from the FukushimaNuclear Accident, working paper.28 If the annualized electric power consumption by bitcoin mining is regarded as the electric powerconsumption of an economy, annualized power consumption by bitcoin mining would rank 27th inthe world. Power consumption of economies is based on data in 2018, and power consumption bybitcoin is the annualized power consumption data as of February 2021.

72 Chapter 3 The Capacity of Carbon Pricing Mechanism
3.3.2 Mandatory Policies Can Be Used to Regulate Wasteof Financial Resources as Seen in Bitcoin Mining
Due to the low administrative costs of implementation, mandatory policies are theearliest type of environmental protection policies from a global perspective, and alsothemost commonpolicy instrument for environmental protection inChina. Examplesof such policies include restrictions on purchasing and driving cars and restrictionson the use of electricity to meet requirements on emissions. However, mandatorypolicies have also exposed some problems in the long-term process of implementa-tion. Due to information asymmetry, mandatory policies may produce unexpectedeffects. For example, the use of chlorofluorocarbons (CFCs) has been banned in orderto protect the ozone layer, which has promoted the use of hydrochlorofluorocarbons(HCFCs), and this ultimately “unexpectedly” exacerbated the problem of globalwarming.29 Meanwhile, mandatory policies also usually present problems such aslack of openness in the decision-making process, complicated approval process, andoverly rigid enforcement process. If policies with such characteristics are applied toreasonable carbon emissions, it may cause additional transaction costs or opportunitycosts.
It should be noted that some of the above-mentioned problems are mainly due tothe decision-making mechanism of mandatory policies, and this does not mean thatmandatory policies are undesirable. In fact, if more opinions from all relevant partiesin the decision-making process can be solicited andmandatory policies can be imple-mented through a rule-based system rather than through discretionary administrativemethods, the effect of such policies may be greatly improved. More importantly,although such policies have been criticized for their rigidity and lack of flexibility,they may be an ideal method to deal with unreasonable carbon emission activitiessuch as bitcoin mining.
We assume that bitcoinwill become a real currency, and thatmore andmore peoplewill rely on bitcoin mining instead of producing general goods and services to makemoney. Will this be a waste of social resources?30 In fact, bitcoin mining consumesabout 130 gigawatt-hours of electricity annually. Given about 0.529kg of carbondioxide is produced per kilowatt-hour of electricity consumption in China, annualelectricity consumption by bitcoin could generate 68.77mn tonnes of carbon dioxideemissions. From the perspective of currency creation, the 68.77mn tonnes of carbonemissions donot need to begenerated. In themeantime, bitcoinmining could generateattractive profits, and ordinary price-based policy instruments may not be effec-tive in preventing such wasteful behavior. Therefore, we could consider prohibitingsuch activities through mandatory policies for unreasonable carbon emissions withfinancial characteristics such as bitcoin mining.
From the perspective of lowering green premium, mandatory policies also havegreat significance for the sustainable reduction in green premium in the future. The
29 Miranda Schreurs: Perspectives on Environmental Governance, Research of EnvironmentalSciences, Vol.19, Supplement, 2006.30 PENG Wensheng: Monetary implications of the financial technology, September 2017.

3.3 What Carbon Market Can and Cannot Do: Regional Transfer … 73
large-scale use of zero-emission technologies may cause a decline in the demand foremission-generating technologies. For example, large-scale launches of clean-energypower generation projects may affect the demand for thermal power generation andlower the price of fossil energy and the production cost of emission-generating tech-nologies.31 This may lead to a rebound in green premium, which could reducethe entire society’s motivation to move towards carbon neutrality. Therefore, it isnecessary to define the production supported by emission-generating technologiesas unreasonable carbon emissions through administrative orders when it is economi-cally feasible to use zero-emission technologies on a large scale, and to prohibit the re-expansion of the production capacity supported by emission-generating technologiesthrough administrative orders.
3.3.3 Advocacy Policies as Necessary Move to Control Wasteof Resources in the Real Economy
In the field of environmental protection, the importance of advocacy policies hasbeen increasingly emphasized globally in recent years. The main reason for this isthat policymakers are increasingly aware that whether it is environmental protectionin a broad sense or carbon emissions in a narrow sense, it is a problem that involvesthe entire human race, and it is not only related to the contemporary era but alsoinvolves the welfare of humans in the future. It is necessary to raise awareness onenvironmental protection and emission reduction among the general public. In termsof the nature of means, advocacy policies are less compulsory and binding thanmandatory policies, and their effectiveness is generally considered to be lower thanmaterial incentive effects of price-basedpolicies.Nonetheless, this does notmean thatadvocacy policies are ineffective. For example, studies have shown that the automaticdisclosure of PM10 concentration data has substantially increased online searchesfor face masks and air purifiers.32 To a certain extent, this reflects environmentalprotection information disclosure’s effects on people’s behavior by improving thelevel of welfare as measured by people’s health. More importantly, advocacy policiescould help raise the awareness on environmental protection among the general public.This means that subtle influence for a long period of time could promote gradual low-carbon evolution of the utility function among the general public, which improves
31 If demand for fossil energy continues to shrink, the decline in prices will also cause the industryto spontaneously enter supply-side contraction, which is specifically reflected in the reductionof investment and the degradation of mining technologies. Therefore, in the case of large-scalepromotion of zero-emission technologies, upward and downward pressure on prices of fossil energywill both appear. It may be difficult to judge which will become dominant, but in the face of the riskof reversal of downward trend in green premium, it is still necessary to take mandatory prohibitivemeasures at some stages.32 Michael Greenstone, Guojun He, Ruixue Jia, Tong Liu, 2020. Can Technology Solve thePrincipal-Agent Problem? Evidence from China’s War on Air Pollution, Working Papers 2020–87,Becker Friedman Institute for Research in Economics.

74 Chapter 3 The Capacity of Carbon Pricing Mechanism
GDP per capita (2011 PPP International)(USD/year)
(kg/year)
Was
te p
er c
apita
900
800700600500400
300200100
00 20 000 40 000 60 000 80 000 100 000 120 000 140 000
Actual Predicted
Fig. 3.14 GDP per capita and per capita solid waste generation volume.34 Source World Bank,CICC Global Institute
the acceptance of price-based policies and mandatory policies by the general public,and lays the foundation for promoting price-based policies and mandatory policies.
For China, raising awareness on anti-waste practices among the general publicmay be an important direction for the use of advocacy policies at present. In fact,waste of resources does not only exist in bitcoin mining in the financial sector, but iseven more common in the real economy. If solid waste is used as a measure of wasteof resources,33 the global volume of solid waste generated in 2016 was as high as2.01bn tonnes, and the solid waste spread almost all over the world. Such a broadgroup of waste is very different from a small group of people’s wasteful behaviorsuch as bitcoin mining. China has a large population and the country’s overall wastegeneration volume is large. However, as GDP per capita in China is not high, thecurrent per capita solid waste generation volume is not at a high level in the country.On the one hand, these characteristics and factsmean that China should adopt policiesto control waste at the current stage. This is because the country’s GDP per capitais likely to double in the next 15 years as China gradually grows from an uppermiddle-income country to a high-income country, implying that China’s per capitasolid waste generation volume and total solid waste generation volume are still likelyto grow rapidly (Fig. 3.14).
On the other hand, this also means that it may not be suitable to deal with theproblem of waste among residents mainly through compulsory policies or incentiveprice-based policies at the current stage. Looking at waste sorting as an example,compared to developed countries, China’s per capita solid waste generation volumeis still at a relatively low level. In the early stage of controllingwasteful and unreason-able carbon emissions by residents, if mandatory or price-based policies are directly
33 Strictly speaking, solid waste is not equal to waste of resources, but generally speaking, theirchanges are mostly in the same direction. Therefore, the waste of resources can be roughly observedby observing the amount of solid waste generated.34 World Bank:What aWaste 2.0 AGlobal Snapshot of SolidWasteManagement to 2050, publishedin 2018.

3.3 What Carbon Market Can and Cannot Do: Regional Transfer … 75
0% 10% 20% 30% 40% 50% 60% 70% 80% 90% 100%
Low-income
Lower-middle income
Upper-middle income
High-income
Food waste Metal Paper and cardboardRubber and leather Glass PlasticWood Other
Fig. 3.15 Composition of solid waste in economies with different income levels.35 Source WorldBank, CICC Global Institute
used to intervene, either relevant mandatory or price-based policies may becomemere formalities, or such policies may easily increase the friction cost of socialgovernance and cannot be sustained for various reasons (e.g., it may be difficultto implement a new policy among the general public, and residents’ awareness ofenvironmental protection needs to be improved further).
Therefore, currently, we can consider using advocacy policies with the main goalof raising residents’ awareness of low carbon emissions as the main methods oflow-carbon governance for residents, such as waste sorting. After the awareness ofemission reduction gradually increases among the general public, we could thenconsider converting relevant advocacy policies into institutionalized, mandatory, orprice-based policies. In the meantime, according to World Bank statistics, when aneconomy grows from an upper high-income economy into a high-income economy,there will be two important structural changes in its waste generation. First, theproportion of food waste will drop sharply, but it will remain the largest source ofwaste. Second, the proportion of paper and cardboard waste will likely double andbecome the second largest source of waste (Fig. 3.15). This means that China muststep up efforts to advocate the collection of sorted foodwaste and paper and cardboardwaste in the process of controlling waste as soon as possible, and gradually promoteinstitutionalized or price-based waste sorting, collection and treatment.
35 World Bank:What aWaste 2.0 AGlobal Snapshot of SolidWasteManagement to 2050, publishedin 2018.

76 Chapter 3 The Capacity of Carbon Pricing Mechanism
Open Access This chapter is licensed under the terms of the Creative Commons Attribution-NonCommercial-NoDerivatives 4.0 InternationalLicense (http://creativecommons.org/licenses/by-nc-nd/4.0/), which permits any noncommercial use, sharing, distribution and reproduction in anymedium or format, as long as you give appropriate credit to the original author(s) and the source,provide a link to the Creative Commons license and indicate if you modified the licensed material.You do not have permission under this license to share adapted material derived from this chapteror parts of it.
The images or other third party material in this chapter are included in the chapter’s CreativeCommons license, unless indicated otherwise in a credit line to the material. If material is notincluded in the chapter’s Creative Commons license and your intended use is not permitted bystatutory regulation or exceeds the permitted use, you will need to obtain permission directly fromthe copyright holder.

Chapter 4Green Finance: Clarifying Functionsand Capacity
Abstract Unlike traditional finance, green finance (e.g. green loans or green bonds)aims to address the current inadequate levels of investment and financing availablefor green development as a result of “market failure”. Finance usually follows andserves the real economy in an effective market. However, when the market is ineffec-tive in allocating resources to green development, green finance should enhance itsguiding role in the real economy in order to reduce the cost of green investment andfinancing, improve the accessibility of green funds and even meet the demand forgreen investment and financing by establishing new tradingmarkets. China has madeconsiderable progress in green finance with a decent market for financial productssuch as green credits and bonds. However, several obstacles need to be overcometo realize carbon neutrality, such as inadequate green investment and financing, lackof unified standards for green finance and the absence of mandatory requirementson information disclosure. To realize carbon neutrality, we estimate China needsto invest Rmb139trn before 2060 and Rmb22trn before 2030. It will be a signif-icant challenge for China’s green finance system to meet such enormous demandfor green investment and financing. To better promote green development, Chinashould establish a unified standard for green finance, improve mechanisms for greeninformation disclosure, strengthen policy incentives for internalizing externalities,develop a more diversified green financial market, enhance education and aware-ness about green investment and include environmental risks into regulatory policyconsiderations. These actions should help turn the challenges of the next 4 decadesinto unprecedented opportunities for green development.
4.1 Green Finance: Serving or Guiding the Real Economy?
Internationally, green finance is generally defined as financial activities related tosustainable development.Most countries and international organizations define greenfinance based on the ultimate goals of financial activities, that is, a financial activitycan be regarded as green if its ultimate goal is related to real-economy activitieson sustainable development. However, these definitions might not be adequate to
© The Author(s) 2022CICC Research, CICC Global Institute, Guidebook to Carbon Neutrality in China,https://doi.org/10.1007/978-981-16-9024-2_4
77

78 Chapter 4 Green Finance: Clarifying Functions and Capacity
fully understand the significance of green finance. We believe two issues need to bediscussed before we dive into deeper analysis.
First, what is the ultimate goal of green finance?For the real economy, the core goal of green finance is realizing carbon neutrality,
and the essence of achieving this target is to address carbon emissions that impact theworld beyond the scope of time and space. We previously introduced the concept ofgreen premium, an essentialmeasure to realize carbon neutrality. Both accomplishingcarbon neutrality and reducing the green premium are the goals of the real economy;however, coordination and support from financial activities are also indispensable toachieve these goals.
Second, how tounderstand the relationship betweenfinance and the real economy?In addition to the serving function, finance also guides the resource allocation
of real economy. When finance mainly plays the role of serving the real economy,the latter takes the dominant position and financial activities should act in accor-dance with its development. However, finance is also an important means of resourceallocation, and can guide the development of the real economy.
Combining the previous two questions, green finance can therefore be dividedinto service-oriented and guidance-oriented green finance. Both aim to reduce thegreen premium, albeit through different channels.
• Service-oriented green finance: In this type of finance, real economy reform isthe fundamental source of green premium reduction, and finance plays a supple-mentary role, providing financial services based on the demand of low-carbontransformation of the real economy. In this case, policy fine-tuning, technolog-ical advances and changes in social governance mechanisms all center on real-economy sectors. Actions to reduce carbon emissions in real-economy sectorswould lower the green premium, and raise the relative cost of industries thatproduce high emissions or the relative returns of more environmentally friendlyindustries. Reflected in the financialmarkets, such changes in relative priceswouldlead to changes in the financing demand and prices of the low-carbon economy.Based on the principle of profit maximization, the financial sector will meetthe financing demand of the real economy and provide corresponding financialservices. The financial sector in this case mainly facilitates the green transforma-tion of the real economy, indirectly helping reduce the green premium rather thandirectly.
• Guidance-oriented green finance: Financial activities directly lower the greenpremium, and guide the low-carbon transformation of the real economy. In thiscase, the financial sector can also be the direct driver of green premium reduction.As important productive inputs, different ways of funding allocation can directlyaffect resource distribution of the real economy. Even without reforms in thereal economy, the financial sector can fine-tune the relative production cost ofhigh-carbon and low-carbon industries and hence reduce the green premium, ifthe financial sector could effectively distinguish emission-increasing financingactivities from emission-decreasing financing activities and reduce the financingcost of the latter or increase the expenses of the former accordingly. During the

4.1 Green Finance: Serving or Guiding the Real Economy? 79
process, reformof thefinancial sectorwill be the direct driver of lowering the greenpremium, and resource allocation of the real economy will follow the changes ofthe financial sector.
The development of green finance requires close collaboration between service-oriented and guidance-oriented green finance, suggesting an indispensable positionfor both. As we previously discussed, carbon emission is a complex externalityissue influencing the whole world across different time and space, and it is muchmore difficult to address than any other externality issues. All means to address theproblem of carbon emissions such as establishing a carbon trading market, imposinga carbon tax, promoting technological advances and implementing non-market-oriented measures, are very complicated undertakings with various uncertainties.Therefore, China still needs to promote guidance-oriented green finance and regardit as an essential strategy to reduce the green premium.
4.2 Green Finance in China
China has made preliminary progress in establishing infrastructure for green finance.In 2014, the People’s Bank of China and UNEP Inquiry jointly established theGreen Finance Task Force, and proposed 14 recommendations for developing agreen finance system. Following that, a number of documents have been released tohelp establish China’s green finance system, including the “Green Bond EndorsedProjects Catalogue”, “Guiding Opinions on Building a Green Financial System”and “Notice on the Establishment of a Special Statistical System for Green Loans”(Fig. 4.1).
• Firstly, preliminary classification standards for green industries, green loansand green bonds are in place. The National Development and Reform Commis-sion issued the “Green Industry Directory Guidance” in March 2019, whichprovides a comprehensive classification of green industries. Based on the Guid-ance, various financing tools have established different classification standards,among which the standards of green loans and green bonds are relatively mature.China in 2013 released the “Green Credit Statistics System” that clearly defineswhat projects are eligible for green credit loans. It marked one of the first efforts toestablish a green loan system in emergingmarkets. For green bonds, the definitionof green industries or projects is mainly based on guidance or catalogues releasedby corresponding regulators. The guidance on green bond issuance released by theNational Development and Reform Commission in 2015 stipulated that proceedsraised from green corporate bonds should be invested in projects related to green,recycling and low-carbon development. Other types of green bond projectsmainlyrefer to those included in the green bond endorsed projects catalogue released in2015.
• Secondly, evaluation systems for investment and financing tools have gradu-ally been established. Comparatively speaking, the evaluation system for green

80 Chapter 4 Green Finance: Clarifying Functions and Capacity
2015 2016 2017 2018 2019 2020
Issued the Integrated Reform Plan for Promoting Ecological Progress;Issued the Green Bond Endorsed Projects Catalogue.
Issued the 13th Five-Year Plan (2016-2020);Green Finance Task Force proposed 14 suggestions for building China’s green finance system;Issued the Guiding Opinions on Building a Green Financial System.
Established pilot zones for green finance reform and innovations;Issued the Development Plan of the National Standardization System in the Finance Sector (2016-2020);Issued the Implementation Plan for Green Bank Evaluation in the Banking Sector of China (for Trial Implementation).
Enshrined the goal of ecological civilization into the Chinese Constitution;Issued the Guidelines for the Conduct of Assessment and Certification of Green Bonds (Interim);Issued the Notice on the Establishment of a Special Statistical System for Green Loans.
The National Development and Reform Commission of the PRC issued the Green Industry Directory Guidance.
Issued the Guiding Opinions on Building a Modern Environmental Governance System.
Fig. 4.1 Major policies in China’s green finance reforms. Source Climate Policy Initiative, CICCResearch
credit loans is the most comprehensive one in China. In 2014, the self-evaluationsystem for green credit was set up for banks, evaluating the extent of green creditdevelopment from a qualitative perspective, as well as setting the balance of loansfor energy-saving and environmentally-friendly projects, “Two Highs and OneOvercapacity” industry, and CO2 emission reduction as key indicators to assessperformance from a quantitative perspective. In 2018, the People’s Bank of Chinaincreased the frequency of performance evaluations for green credit loans, intro-ducing the central bank as an external evaluator and including the results of theevaluations in its macro prudential assessment. In addition, a rating system forESG investment has basically been formulated. China Securities Index CompanyLimited in December 2020 released the CSI ESG rating method that thoroughlyconsiders the industry characteristics and information quality of listed companies,comprising 3 components (i.e. environmental, social and corporate governance),14 themes, 22 units and over 100 underlying indicators.
• Thirdly, development of legal systemsandregulatory rules hasbegun. Ecolog-ical civilization was included into China’s constitution in 2018 with legal status ofgreen finance being recognized indirectly. From the regulatory side, the People’sBank of China has launched the Green Finance Committee to regulate the devel-opment of green finance. Meanwhile, various regulatory measures have beenadopted for different financing tools. For example, financial institutions that issuegreen loans need to report relevant data to financial regulators. On information

4.2 Green Finance in China 81
disclosure, China has started to mandate listed companies to disclose informa-tion about major pollutants from production, major processing facilities for thesepollutants and their capacity in recent years. Moreover, companies listed on theChiNext are required to disclose information about social responsibility.
Amid the improving infrastructure, China’s green financemarket has seen consid-erable development, mainly in indirect financing. Data from the People’s Bank ofChina shows that the amount of domestic green-financing totaled about Rmb13trnby the end of 2020, including Rmb12trn of green credit loans and Rmb870bn ofgreen bonds. Meanwhile, the green equity market in China remains relatively smalland PE/VC equity investment, green IPOs and follow-on equity offerings by greenenterprises have just started. Green equity investment in China averagedRmb42.4bn1
over 2018–2019, well below the Rmb550bn for annual incremental green loans andgreen bonds.2 However, growth of green financing has decelerated in recent years.The balance of green loans at banks rose at a CAGR of 12.3% between end-June2013 and end-June 2020 from Rmb4.90trn to Rmb11.01trn. That said, growth ofgreen loan balance (3.9% at end-1H20) was slower than overall loan balance growthin recent years (13% at end-1H20).
Green bonds currently do not have advantages in pricing and their financing termsare generally short. Based on the green bonds issued since 2020, we note that about80% of green bond issuers had a positive interest rate spread compared with overallbond yields, especially for bonds with medium/low ratings. For example, over 90%of the AA+ rated green bonds had a positive interest rate spread.
From a term perspective, 1–3Y green bonds account for 43% of outstanding greenbonds, while the 3–5Y and 5–10Y green bonds account for 37% and 11%, respec-tively. Generally speaking, the terms of green bonds remain relatively short, andthus cannot provide financing for the long-term investment required for developinggreen technologies and clean energies, or promoting carbon offset projects such asafforestation. Due to the lack of long-term funding, domestic PE/VC funds usuallylast for about 5–7 years,3 but it may take about 7–10 years for green-tech companiesto qualify for an IPO. As a result, domestic equity investment institutions are lessinterested in green-tech companies.
From an industry perspective, transportation and energy sectors account for a largeportion of green financing. As of end-2019, green transportation made up 44% oftotal green loans, while renewable energy and clean energy represented 24%. By theend of 3Q20, transportation, warehousing and delivery accounted for 30% of greenloans, while the power, heat, gas and water production and supply industries took upanother 29%. The proportion of other sectors climbed from 24% in end-2018 to 41%in 3Q20, implying a diversified trend in sector distribution of green loans. In greenbond financing, the financial sector has long accounted for the largest proportion,
1 Based on data from International Institute of Green Finance at Central University of Finance andEconomics and Asset Management Association of China.2 Estimated based on the balance of green loans at banks and Wind Info data.3 Based on data from An, Guojun. For Lucid Waters and Green Mountains- A Journey on FinancialInnovation. 2020.

82 Chapter 4 Green Finance: Clarifying Functions and Capacity
and that of green bonds issued by the industrial and utility sectors have increasedsignificantly in recent years, accounting for 45%, 30% and 18%of green bond issuersin 2020 respectively. Other sectors represented less than 5%, mainly concentrated inheavy-asset industries that have abundant resources of financing.
4.3 How Much Investment is Needed to Achieve CarbonNeutrality?
Achieving peak carbon emissions and carbon neutrality are the two important targetsfor green development in China, and have been included in the 14th Five-Year Planand the Long-Range Objectives through the Year 2035, which implies a substan-tial demand for funding. Proper assessment of the funding demand and its structureshould allow the financial system to better serve and guide China’s low-carbon trans-formation. Our bottom-up analysis shows that China’s total green investment demandshould reach about Rmb139trn4 to achieve carbon neutrality, including Rmb22trnover 2021–2030 and Rmb117trn over 2031–2060.
4.3.1 Bottom-up Analysis of China’s Demand for GreenInvestment
It is a complicated task to estimate the amount of investment needed for carbonemission reduction for financial institutions, but from the perspective of the greenpremium, the investment needed is simply the amount of funds required to replacetraditional technologies and equipment causing high carbon emissionswith those thatreduce carbon emissions. As shown in Fig. 4.2, we divide technologies and equip-ment into four categories, namely existing high-carbon technologies and equipment,existing low-carbon technologies and equipment, older technologies and equipmentthat need to be upgraded, and innovative low-carbon technologies and equipment. Toreach peak carbon emissions and move toward carbon neutrality, we have to reducethe production capacity that relies only on high-carbon technologies and equipment(meaning no further investment), and increase capacity of the other three technolo-gies and equipment. We can roughly estimate the amount of investment for eachcategory of technologies and equipment at different times based on the changes incapacity and the investment/capacity ratio under anticipated progress of emissionsreduction, and then add up to calculate the aggregate green investment demand.
To fully estimate the amount of investment, we select seven sectors with thehighest carbon emissions in China and calculate the green investment demand from
4 Based on prices in 2020.

4.3 How Much Investment is Needed to Achieve Carbon Neutrality? 83
Classification of industry capacity basedon level of carbon emissions
Current high-carbon technology:
Capacity A
Current low-carbon
technologyCapacity B
Upgrade of oldequipment for
carbon reductionCapacity C
Innovativelow-carbon
technologyCapacity D
0Green investmentneeds correspond toeach productioncapacity
B *(Investmentcapacity ratio)
C *(Upgradeinvestment capacity
ratio)
D *(Investmentcapacity ratio)
Capacity changesunder decarbonization
Green investmentneeded by the industry
Fig. 4.2 Methods for estimating green investment. Source CICC Global Institute
them. Based on data from China Emission Accounts and Datasets, the seven sectors5
accounted for over 85% of China’s total carbon emissions in 2017. They are also themajor sectors with fixed asset expansion.
4.3.2 Aggregate Investment Demand and Structural Features
4.3.2.1 Annualized Green Investment Accounts for about 2% of GDP
Considering the investment demand of major sectors, we estimate that China’s greeninvestment demand needs to total about Rmb139trn6 to achieve carbon neutralitywith annual green investment demand accounting for about 2%7 of GDP on average.
Specifically, we estimate China’s annual green investment demand will hitRmb2.2trn over 2021–2030 to reach peak carbon emissions, and reach Rmb3.9trnover 2031–2060 to achieve carbon neutrality. Over 2021–2060, China’s annual greeninvestment demand needs to be Rmb3.5trn to achieve carbon neutrality (Fig. 4.3).According to GFMA’s (2020) assessment, global green investment demandwill needto total US$121.7trn8 to reach carbon neutrality, and China’s green investment basedon our calculation will comprise 17%9 of the global demand.
5 Compared with the eight sectors mentioned in previous chapters, we included airlines into thetransportation sector and replaced papermaking with agriculture.6 Based on 2020 prices.7 Actual ratio fluctuates with macroeconomic variables such as GDP.8 GFMA: Climate Finance Markets and the Real Economy, 2020.12.9 Based on USD/RMB exchange rate at 1:6.7.

84 Chapter 4 Green Finance: Clarifying Functions and Capacity
0.0
0.5
1.0
1.5
2.0
2.5
3.0
3.5
4.0
4.5
2021E 2024E 2027E 2030E 2033E 2036E 2039E 2042E 2045E 2048E 2051E 2054E 2057E 2060E
(Rmb trn)
Peak carbonemissions
Carbonneutrality
Year
Annual green investment from 2021 to 2060 is forecastto be around Rmb3.5trn
Annual green investmentfrom 2021 to 2030 isforecast to be around
Rmb2.2trn
Annual green investment from2031 to 2060 is forecast to be around Rmb3.9trn
Fig. 4.3 Estimated green investment for China (based on 2020 prices). Source CICC GlobalInstitute, CICC Research
4.3.2.2 Investment is Most Needed for Power Sector
To accomplish carbon neutrality, green investment is most needed for the powersector, which requires investment of Rmb67.4trn, followed by Rmb37.4trn for thetransportation sector and Rmb22.3trn for the construction sector (Fig. 4.4). Theneed for investment in the power sector mainly comes from the spending on cleanpower-generation equipment, including Rmb16.2trn for solar power equipment and
9.86.3
3.91.1 0.7 0.3 0.2
57.6
31.1
18.4
2.0 2.90.6
3.9
0
10
20
30
40
50
60
70
Power Transport andshipping
Building Iron & Steel Agriculture Cement Chemical
(Rmb trn)2021-2030 2031-2060
Fig. 4.4 Estimated green investment needed for different sectors to accomplish carbon-neutralitytargets (based on 2020 prices). Source CICC Global Institute, CICC Research

4.3 How Much Investment is Needed to Achieve Carbon Neutrality? 85
Rmb14.3trn for wind power equipment. The need for investment is also high in thetransportation sector. First, we expect China’s electric vehicle output to grow signifi-cantly driven by the replacement of traditional fuel vehicles, and this would increaseinvestment in new energy vehicles and related energy production. Second, we alsoforesee high investment in the low-carbon transformation in aircraft and vessels,as well as the development of new energy infrastructure. In terms of the buildingsector, the investment needs mainly result from the utilization of environmentallyfriendly and energy-saving technologies as well as low-carbon equipment. Mean-while, the need for green investment is relatively low for the steel and cement sectors,and we expect their share of green investment to decline amid China’s industrialrestructuring.
4.3.2.3 Investment Demand is Likely to be Postponed for SectorsFacing Technological Hurdles in Emissions Reduction
Technological difficulty for emission reduction varies for different sectors.While thetechnologies are relatively mature for electric vehicles and EV chargers, it remainscostly or not feasible for hydrogen-powered aircraft or carbon-capture technologiesin cement production.
Variations in technological difficulty of emission reduction may lessen the incen-tive for emission-reduction investment in the early stages, thus increasing the riskof lagged investment accumulation. Table 4.1 shows the relative proportion of greeninvestment for different sectors in 2021–2030 and 2031–2060. For sectors withgreater technological difficulty in reducing carbon emissions, the relative proportionof green investment is lower for 2021–2030 and their investment demand is pushedto a later stage. This shows that select sectors anticipate technological advances thattake place after reaching peak carbon emissions will lower technological difficultyfor emissions reduction. However, a significant delay in investments may exacerbatethe shortage of green investment and financing.
4.4 New Targets Bring in New Challenges. What Arethe Weaknesses in China’s Green Finance?
4.4.1 Mismatch Between Supply and Demand in GreenInvestment
4.4.1.1 Shortfall in Green Investment and Financing with Even WiderGap After 2030
China is facing a sharp shortfall in green investment and financing, and the gapmay widen after 2030. While the gap between green investment supply and demand

86 Chapter 4 Green Finance: Clarifying Functions and Capacity
Table 4.1 Breakdown of green investment for different sectors
Industry Source of greeninvestment need
Investment needin 2021–2030(Rmb bn)
Investment needin 2031–2060(Rmb bn)
Power Energy storage 100 13,700
Grid investment 2,300 8,500
Clean powergeneration
6,900 28,300
Special facilitiesrequired for cleanhydrogenproduction
0 3,100
Iron & Steel H2 DRI-EAF 179 235
DRI-EAF withCCUS
219 251
Scrap-based EFwith CCUS
377 1,216
Transport &Shipping
Light transport Electric light dutyvehiclesmanufacture(battery)
282 630
Electric light dutyvehiclesmanufacture(other parts)
38 50
Electric charginginfrastructure
1,849 22,288
Heavy transport Electriccommercialvehiclesmanufacture(battery)
99 124
Electriccommercialvehiclesmanufacture(other parts)
7 8
Clean fueldevelopment
13 153
Hydrogenrefueling andotherinfrastructure
Aviation Low carbonaircraft
70 1,442
527 1,126
(continued)

4.4 New Targets Bring in New Challenges. What Are the Weaknesses … 87
Table 4.1 (continued)
Industry Source of greeninvestment need
Investment needin 2021–2030(Rmb bn)
Investment needin 2031–2060(Rmb bn)
Hydrogen aircraft 0 503
New energy 8 988
Shipping Low carbontransformation ofships
78 78
New energyinfrastructure
69 813
Cement CCUS equipment 0 201
Environmentalprotectiontechnologytransformation
14 54
Chemical Fixed assets ofnew technologyand clean energy
203 7,162
Fixed assets ofCCS installations
20 464
Agriculture New equipmentand technologyR&D for no-tillfarming
25 293
Equipment formanuremanagement
216 660
Artificial meatproduction
284 997
Building Constructionsafety and built-inelectricalappliances
3,922 18,439
Source CICC Global Institute, CICC Research
narrowed in 2017–2019, the shortfall was still high at about Rmb600bn in 2019(Fig. 4.5). Considering the current supply of green investment, we estimate that theshortfall in green investment and financing may expand to Rmb5.4trn in 2021–2030with an annual average amount of Rmb0.54trn. In addition, the shortage may worsenafter 2030 due to the possibility of investment being postponed as mentioned earlier.Without policy intervention, we estimate that the shortfall in green investment andfinancing may rapidly increase to over Rmb1.3trn/year after 2031.

88 Chapter 4 Green Finance: Clarifying Functions and Capacity
0.0
0.5
1.0
1.5
2.0
2.5
2017 2018 2019
(Rmb trn)Supply Demand
1.1 0.8 0.6
Fig. 4.5 Supply and demand of green investment in China (2017–2019). Source China GreenFinance Progress Report, CICC Global Institute
4.4.1.2 Concentration of Green Financial Support in Certain Sectors
From the perspective of financing structure, certain sectors account for an excessivelyhigh proportion of China’s green investment and may affect the amount of greeninvestment in other sectors. For example, green credit loans accounted for over 90%of overall green financing tools in 2018–2019, and more than 40% of the green creditloans went to the transportation sector in the 2 years (Fig. 4.6).
The high concentration of green investment in the transportation sector led toa mismatch in the supply and demand of green funding. The power sector hasthe highest need for green investment and financing, while the building sector hasthe third highest need after the transportation sector. This implies that the current
46.5 43.7
25.2 24.4
28.3 31.9
0102030405060708090
100
2018 2019
(%)
TransportationRenewable energy and clean energyOthers
Fig. 4.6 Breakdown of green credit loans in China (2018–2019). Source PBoC, CICC GlobalInstitute, CICC Research

4.4 New Targets Bring in New Challenges. What Are the Weaknesses … 89
Estimated Future Green Investment Demand Structure
Equities, 30%
Bonds, 8%
Loans, 62%
2021-2030
Equities, 30%
Bonds, 10%
Loans, 60%
2031-2060
Equities, 3%Bonds, 7%
Loans, 90%
2018-2020 Average
Current Green Investment Structure
Fig. 4.7 Green credit loans account for about 90% of green financing, and sharp change in thedemand structure of green financing is needed. Source Wind Info, CICC Global Institute, CICCResearch
green financing tools have not yet covered the industries with large green invest-ment demand, and that the allocation of green funding does not match the greendevelopment needs of the entire society.
4.4.1.3 Unable to Meet Diversified Financing Needs with Limited Tools
In addition to the high concentration of green investment in select sectors, the devel-opment of green financial tools in China is also lopsided. From 2018 to 2020, greencredit loans accounted for about 90% of total green financing in China, whereasgreen bonds and green equities only accounted for 7% and 3% respectively (seeFig. 4.7 left side)10,11. However, we estimate12 that green equities and green bondswill account for about 40% of the green investment demand after 2030, which differssharply from the current financing structure (see Fig. 4.7 right side). The dominanceof credit loans and the limited availability of other green financial tools will partlydepress green investment demand.
10 China Chengxin International Credit Rating.11 https://m.21jingji.com/article/20201229/herald/e43125877848294726df12e3caab7ecb_zaker.html.12 We assume the financing structure remains unchanged for Chinese companies, with new tech-nologies adopting the financing structure of listed companies and older technologies relying oncredit loans and bonds for financing.

90 Chapter 4 Green Finance: Clarifying Functions and Capacity
4.4.2 Lack of Widely Accepted Green Standards
4.4.2.1 Absence of Unified Domestic Standards
Domestic green standards differ for various financial products, and several standardsare not aligned with the carbon neutrality target. For example, the People’s Bankof China has removed “clean coal utilization” and other projects related with fossilenergy from the catalogue of projects supported by green bonds released in July2020. Nevertheless, this remains included in other green financial standards, suchas the guided catalogue for green credit loans released in 2019. This leads to aninconsistency in the standards of China’s green financial system, and some of thegreen projects listed in the catalogue do not meet the zero-emission requirement ofthe carbon-neutrality target.
Discrepancies in standards and definitions also occur within the same financialtools because of multiple regulations. While the standards for green credit loansare relatively mature, they still differ in some areas. For example, nuclear powerprojects qualify for green finance according to theNationalDevelopment andReformCommission and the People’s Bank of China, but are not included in the greenfinance catalogue from the China Banking and Insurance Regulatory Commission.In addition, the People’s Bank of China, the National Development and ReformCommission and the China Securities Regulatory Commission in July 2020 issuedan exposure draft for the catalogue of green-bond supported projects, which definedgreen bonds for the first time and set out the criteria. However, the finalized documenthas not been issued yet. In terms of green equity, it is still in its infancy with no cleardefinition or standards established in China.
4.4.2.2 Domestic Standards for Green Finance Still BelowInternational Level
The domestic criterion gives a narrower definition to green credit loans than theinternational definition. To prevent greenwashing, China narrowly defines greencredit loans as those for developing green industries and reducing carbon emis-sions, whereas the international standards of green finance tend to include loansfor the green transformation of high-emission industries, and loans that considerenvironmental risks in the credit lending process (Table 4.2).
For green bonds, despite the similarity in definition, classification and voluntaryprinciples, domestic standards for green bonds differ from international criteria inproject eligibility, use of proceeds and third-party assessment, etc. For example,green-bond supported projects in China almost do not cover climate adaptation orgreen service (such as climate monitoring and warning systems or trading servicesfor environmental rights), suggesting a relatively narrow market coverage. In addi-tion, the National Development and Reform Commission allows proceeds raised

4.4 New Targets Bring in New Challenges. What Are the Weaknesses … 91
Table 4.2 Comparison between China’s green loan standards, the green loan principles and theequator principles
Green loan standards
Green loan principles Equator principles China green loanstandards
Aim Promote and supportenvironmentallysustainable economicdevelopment
Ensure that thefinancing projects aredeveloped in a sociallyand environmentallyresponsible manner
Promote greeneconomicdevelopment, preventclimate andenvironmental risks
Definition Loans designed tofinance or refinancenew or existing “greenprojects”
Loans issued byfinancial institutions tocorporates(institutions) or otherorganizations that canact as borrowersaccording to nationalregulations forsupportingenvironmentalimprovement, effortsto combat climatechange, resourceconservation, andinvesting in projects inenvironmentalprotection, energyconservation, cleanenergy, greentransportation, greenbuildings, etc.
Restrictions for thepurpose of the loan
Full loan for “greenproject”; the “GreenLoan Principles” setout a non-exhaustivelist of 10 types of greenprojects; the projectshould be credited to adedicated account ortracked in other ways
It is suitable for newproject financing with atotal cost of more thanUS$10mn in variousindustries around theworld, as well as theproject financingrelated to expansion ofold projects and theproject financingrelated to upgradingexisting equipment thatmay have a significantimpact on theenvironment andsociety. Refuse to offerloans to projects thatviolate EquatorPrinciples
Require accurate proofthat the use of greenloans meets therequirements of thestandards, andclassification of theindustry and loanquality of the greenloan undertaker.Explanations on theloans of enterpriseswith major risks suchas environment andsafety risk are needed
(continued)

92 Chapter 4 Green Finance: Clarifying Functions and Capacity
Table 4.2 (continued)
Green loan standards
Green loan principles Equator principles China green loanstandards
The impact ofborrowers’ behavioron loan pricing
The impact ofborrowers’ behavior ongreen loan pricing isnot considered
The impact ofborrowers’ behavior ongreen loan pricing isnot considered
The impact ofborrowers’ behavioron green loan pricingis not considered
Censorship/report Borrowers should keeprecords of the greenloan projects,including projectdescriptions, allocatedamounts, expectedimpacts, etc. Anexternal review isrecommended but notrequired
According to IFC’senvironmental andsocial screeningcriteria, EPFI isdivided into categoriesA, B, C based on thepotential impacts andrisks of the projects tobe financed. EPFIconductsenvironmental andsocial assessment(ESIA) on categories Aand B, which isreviewed byenvironmental or socialexperts who have noconnection with theborrower, and reportsits implementationprocess and experienceto the public at leastannually
On the basis ofself-evaluation of dataquality managementmechanism or dataaccuracy, financialinstitutions shallsubmit an applicationfor number reporting,and report the specialstatistical data of greenloans to the financialstatistical monitoringand managementinformation systemaccording to thestandards after beingconfirmed by thePeople’s Bank ofChina
Source LMA, IFC, PBoC, CICC Research
from green bonds to repay bank loans and replenish working capital, while inter-national standards stipulate that all the proceeds from green bonds should be usedin green projects. Moreover, projects need to be assessed by professional environ-mental evaluation institutions and third-party institutions to determine whether theymeet the green standards before international green bonds can be issued. After thebonds are issued, institutions should monitor and evaluate the use of funds as well astheir contribution to energy saving and emission reduction, which should enable themarket to evaluate green bond issuers and the environmental performance of projectsfunded by green bond issuances. However, China has not provided clear guidanceon these areas.
To better support the development of green finance, the government is currentlyworking on the green standards that are aligned with international criteria andunifying the standards for different green financial products.We anticipate the unifiedstandards will be released shortly.

4.4 New Targets Bring in New Challenges. What Are the Weaknesses … 93
4.4.3 Defects in Green-Information Disclosure System
A well-established green-information disclosure system is the basis of decision-making strategies about green products and preventing information asymmetrysuch as greenwashing. Green-information disclosure system includes two aspects,namely green-information disclosure for companies and for assets held by financialinstitutions, equity investment institutions, etc.
China’s green-information disclosure system suffers from a number of issues,including lack of mandatory requirement, absence of unified standards and unclearrelationship between companies, financial institutions and regulators.
4.4.3.1 Lack of Mandatory Requirement on Green-InformationDisclosure and Unified Standards
Listed companies are facing problems of unclear standards and limited coverage ofgreen indicators for green-informationdisclosure. In 2016, seven regulators includingthe People’s Bank of China issued Guidelines for Establishing the Green FinancialSystem, proposing to establish and improve a mandatory green-information disclo-sure system for listed companies with a three-stage implementation plan. However,there was still no clear or unified standard of green-information disclosure for listedcompanies in China as of 1Q21. For example, listed companies included in theCSI300 Index rely on numerous guidelines to compile their social responsibilityreports, such as guidelines from the Shanghai Stock Exchange, the Global ReportingInitiative, the Chinese Academy of Social Sciences, and the Hong Kong StockExchange. The lack of unified, comparable and quantitative guidelines leaves roomfor data manipulation and selective disclosure, thus failing to provide comprehensiveand reliable green information for investors. Moreover, even though the proportionof listed companies voluntarily disclosing ESG information has climbed in recentyears in China, the range of green information disclosed is still far smaller thanoverseas peers, and mandatory information disclosure is only confined to selectedenvironmental indicators such as air, water and solid waste.13
For green bond issuers, the biggest issue is the absence of unified standardsfor green-information disclosure. The People’s Bank of China, the Shanghai StockExchange, the Shenzhen Stock Exchange and the National Association of FinancialMarket Institutional Investors have all released standards on information disclosurefor green bonds, providing many but ununified disclosure mechanisms in effect fordifferent types of green bonds. Notably, China has set clear criteria for informationdisclosure for green financial bonds, requiring quarterly disclosure on the use ofproceeds raised, the incremental green projects invested (amount and number) andfund management, as well as annual disclosure about the environmental benefitsfrom the projects invested. Other types of green bonds are also mandated to disclose
13 ESG data in China: Recommendations for Primary ESG Indicators.

94 Chapter 4 Green Finance: Clarifying Functions and Capacity
related information, but requirements are not clear in terms of exactlywhat categoriesof green information should be disclosed, leaving room for improvement.
In addition, there is a lack of unified standards and effective supervision fornon-listed companies (except for heavy-polluting companies). Third-party institu-tions responsible for certifying green enterprises and quantifying the environmentalbenefits brought by green projects are also not in place.
In terms of financial institutions, there is no mandatory green-information disclo-sure mechanism in effect. Various regulators have provided guidelines on green-information disclosure for key entities in the financial markets, such as banks, insur-ance companies and funds.Requirements have also beenmade for banks to strengthenESG information disclosure and fund managers to provide self-evaluation reports ongreen investments. However, a mandatory green-information disclosure mechanismis absent for banks, asset management companies or equity investment institutionssuch as PE and VC firms in most regions of China. There is also no quantitativeindicator for performance evaluation, i.e. exposure to green assets, the proportionof green funds in total funds, operating models or development targets. Moreover,actual use of funds and their environmental benefits are not effectively supervised orevaluated.
4.4.3.2 Unclear Relationship Between Companies, FinancialInstitutions and Regulators in Green-Information DisclosureSystem
Close cooperation among companies, financial institutions and regulators is essentialto establish an effective green-information disclosure system thatmonitors and sharesgreen information. However, the relationship of the three parties and their respectiveresponsibilities in the green information disclosure system are not well defined.
The development of green-information disclosure system in China should addressthe absence of an incentive mechanism, and the unclear division of rights and respon-sibilities, in our view. Companies, financial institutions and regulators all play crit-ical roles that could potentially affect each other in the green-information disclosuresystem, and if any of the three fails to function properly, it may render the entiresystem ineffective. For example, it may become challenging for regulators to designawell-functioning green information disclosure system if companies are not aware ofthe necessity of disclosing green information voluntarily. Lack of unified standardsfrom regulators makes it more difficult for financial institutions to carry out greenassessment, which may further impede the green transformation of companies iffinancial institutions are not interested in investing in green financial products due toinadequate information. In addition, the relationship and responsibilities of the threeare not well defined in the green information network: A number of financial insti-tutions have taken the corporate responsibility of reviewing information disclosure,thus increasing their cost of investing in green projects. We believe the green infor-mation network and investment process will become more streamlined if companiesand third-parties can share this cost in the future.

4.4 New Targets Bring in New Challenges. What Are the Weaknesses … 95
There also lacks an environmental data sharing mechanism among companies,financial institutions and regulators. In China, governments, third-party institutionsand companies cannot effectively share environmental data among themselves atpresent, and environmental regulators have not yet started data sharing with financialinstitutions, which hinders development of the green investment market and fullinformation disclosure. Some of the institutions have cited confidentiality as thereason for not disclosing information in the past, but we believe that disclosure ofgreen information is inevitable amid the clear target for green development. Fromour point of view, earlier information disclosure will facilitate troubleshooting andsystem improvement, which can help reduce losses caused by environmental andother risks.
4.4.4 Weak Guidance from Financial Institutions
4.4.4.1 Upside Potential in Guidance from Domestic FinancialInstitutions
Funding support fromfinancial institutions such as banks, insurancefirms, investmentbanks and asset management firms is indispensable for the green transformationof industrial companies. However, the penetration rate of green investment ideasremains low in the investing activities of domestic financial institutions. Accordingto the 2021 Global Institutional Investor Survey released by MSCI, 75%, 59% and56% of the investment managers from Canada, Japan and Europe respectively haveadopted ESG frameworks in their asset management, while the penetration of ESGinvestingwas as low as 16%14 amongChinese fundmanagement institutions in 2019.
Insurance firms, pension funds and social security funds are inclined to investin the long term, which is a natural fit for the long development cycles of certaingreen projects and green companies. However, the participation of long-term funds ingreen investment is limited in China. In mature markets overseas, long-term funds, inparticular large institutional investors such as pension funds and insurance firms, arefrontrunners inESG investing due to their large investment, long investment cycle anddemand for entrusted management. Their investment concept and requirement forasset management institutions usually set an example for the entire market. However,long-term funds in China are relatively cautious about ESG investing. Data fromUN-PRI (Principles for Responsible Investment) shows that only two Chinese pensionfunds are signatories of the UN-PRI as of March 2020, showing that ESG investingconcepts are still relatively new to Chinese insurance and pension institutions.
14 ESG investment survey by the Asset Management Association of China in 2019.

96 Chapter 4 Green Finance: Clarifying Functions and Capacity
4.4.4.2 Coordination Mechanism is Absent for Financial InstitutionsLooking to Play a Guiding Role in Green Finance
The lack of a coordinated guidance mechanism for Chinese financial institutionsmay weaken financial institutions’ ability to guide corporate green development. Forexample, commercial banks can guide green transformation of companies throughtwo measures, namely providing credit loan support for green companies or greenprojects, and restricting credit loans for non-green projects such as those fromhigh-emission industries, forcing them to conduct green transformation. However, itremains voluntary whether banks guide the green development of companies (suchas adopting the Equator Principles). As a result, some banks may seek short-termeconomic returns by providing loans for high-emission projects rejected by others,thus impeding other banks from guiding the green development of companies. Aunified coordination mechanism may provide constraints on the behavior of allcommercial banks, and thus contribute to concerted efforts to channel funds forsupporting green projects.
4.5 Turning Challenges into Opportunities: Howto Address the Weaknesses in China’s Green Finance?
Achieving carbon neutrality is a challenge aswell as a newopportunity for China, andgreenfinance needs to play a vital role in serving andguiding the green transformationof the real economy. Given the weaknesses in China’s green finance and its need tocut carbon emissions, we review international experiences and offer correspondingsuggestions on the policy-making for the development of green finance.
4.5.1 Setting a Unified Green Standard in China
A well-established standard is essential to the sustainable development of China’sgreen financial system. Currently, the system has issues with multiple supervisions,inconclusive regulations, and incompatibilitywith international standards.Therefore,we suggest improvements for setting a unified green standard in China from thesethree perspectives.
First, clearer and more systematic standards for green financial productsshould be established. In the short term, the government may need to first establisha unified standard for financial products, laying the foundation for green financialproducts’ healthy and sustainable growth. In the medium and long term, we believea systematic green financial system framework should be built to reduce differencesin the classification standards of green products and boost balanced developmentbetween different types of financial products, thus bridging the gap between supply

4.5 Turning Challenges into Opportunities; How to Address … 97
and demand in green investment. Second, domestic standards should align withinternational standards. For green credit loans, the internationally accepted idea ofsustainability-linked loans could be gradually introduced to eliminate the differencebetween Chinese and global standards. With respect to green bonds, we suggest thatthe government could set a green bond standard that is aligned with internationalstandards, expanding green bonds’ coverage and establishing a green bond systemwith external assessment, information disclosure as well as duration management.Third, introducing third-party attestation institutions should also be an impor-tant measure, especially in bringing in international institutions. Third-partyattestation institutions play a vital role in promoting the healthy and sustainable devel-opment of China’s green financial system, enhancing a green company’s reputationand the attention from corporate and investment institutions through the independentattestation reports. In addition, independent third-party attestation institutions willhelp reduce information asymmetry in financing and investment, and lower the creditrisk and information searching costs of China’s green financial system. Moreover, ifthird-party attestation institutions adopt international standards, Chinese green finan-cial products could be more recognized by the global market and be more attractiveto investors overseas. This may further reduce financing cost of green industries andimprove availability of funding.
4.5.2 Establishing a Binding Green-Information DisclosureMechanism
Given the green-information disclosure mechanism and industry attributes, weoffer the following suggestions. For listed companies, mandatory green-informationdisclosure mechanism should be improved, and a clear and quantitative green-information disclosure standard system that is in line with international standardsneeds to be established. For green bond issuers, barriers between regulators shouldbe removed to establish a unified information disclosure system for green bondissuers. For non-listed companies, improving the information disclosure mechanismand building an information sharing platform are the key ways to reduce informationasymmetry in the launch of green products. For financial institutions, establishinga green-information disclosure mechanism will help to quantify and assess greenproducts’ environmental benefits with regards to the participants of the green financemarket.

98 Chapter 4 Green Finance: Clarifying Functions and Capacity
4.5.3 Improving Incentive Policy to Boost the OverallDevelopment of Green Financial Market
We attribute the gap between supply and demand of green investment to the low ROI,long investment cycles and high risks associated with green investment projects. Tofurther encourage the development of green finance, the People’s Bank of China,China Banking and Insurance Regulatory Commission and China Securities Regula-tory Commission can introduce incentive policies from the following aspects (Table4.3). From the liability side, expanding funding sources and reducing liability costshould be considered to address issues related to term matching and asset pricing.With regard to the credit cost side, the government should expand the green insur-ance product portfolio, initiate and invest in guarantee funds, reduce the cost of bankcredits and credit debt defaults, and support credit financing products through insur-ance or guarantee funds. Regarding taxation, preferential taxes for green investorscould be introduced to enhance their interest in green investment. From the capitalcost side, it is important to reduce capital consumption of green products. From thetrading cost perspective, potential suggestions could be lowering administrativeapproval requirements and increasing exit potential of green projects.
4.5.4 Strengthening Education of Green Concept; FinancialInstitutions Offering Both Services and Guidance
The support of long-term funds and asset management institutions as well as thegeneral public is indispensable for the long-term sustainable development of thegreen industry. To better facilitate green development, financial institutions need toguide funds towards green projects, which relies heavily on education about greeninvestment. One of the typical fields that requires guidance from financial institutionsis ESG investing. Therefore, we propose the following policy suggestions followingthe experience overseas.
Firstly, based on the nature of funds and institutions, mandatory administrativerequirements and market-oriented incentives could be used to guide fund flows intothe ESG field, thereby enhancing the awareness of the public and asset managementinstitutions about responsible investment as well as long-term investment. It alsoguides the green finance system to shift from the top-down government-dominatedESG investing into the market-oriented stage. Secondly, we also encourage assetmanagement institutions to voluntarily join the Principles forResponsible Investment(UN-PRI). The government could encourage asset management institutions to joinresponsible investment organizations or establish their own ESG investment systemsin the near term and offer favorable policies. For example, the government can opengreen channels for product application for asset management institutions incorpo-rating ESG principles, and/or provide them with additional credit in performancereviews.

4.5 Turning Challenges into Opportunities; How to Address … 99
Table4.3
Measuresfortransformingpo
sitiv
eexternalities
into
business
incentives
Liabilityside
(expanding
sources
andreducing
costs)
Creditcost
Taxcost
Capita
lcost
Transactio
nfrictio
ncost
Financing
Loans
Discountinterest,
reloans,greenbond
issuance,A
BS
Reduceassetrisk
weightand
reduce
capitalconsumption;
revitaliz
egreenloan
assetsby
issuinggreen
loan
ABS
Furthersimplifythe
approvalprocess,reduce
thecostof
pre-loan
environm
ental
certificatio
n,environm
entalp
rotection
technology
testingand
post-loansupervision
throughthe
popu
larizatio
nof
ratin
gagencies
Bonds
Reloans
priority
Con
siderhalving
interestincometax
Banks
orbank
wealth
managem
entw
hich
investin
greenbonds
will
receivecertain
preferentia
ltreatment
interm
sof
capital
consum
ption,
andthe
balancesheetw
illno
longer
occupy
100%
ofthecapital
Certain
preferentia
lpo
liciesarealso
givento
market-oriented
institu
tions
forsetting
upgreeninvestment
funds/assetm
anagem
ent
products.F
orexam
ple,
setting
upspecial
approvalchannelsto
improveapproval
effic
iency
(contin
ued)

100 Chapter 4 Green Finance: Clarifying Functions and Capacity
Table4.3
(contin
ued)
Liabilityside
(expanding
sources
andreducing
costs)
Creditcost
Taxcost
Capita
lcost
Transactio
nfrictio
ncost
Equ
ityLow
erthethresholdof
qualified
investorsfor
qualified
greenprivate
equity
andventure
capitalfunds;exempt
thesing
le-layer
nesting
regulatio
nsforgreen
privateequity
investmentfunds;for
qualified
greenPE
/VC,
thegovernment
directly
investsas
anLP,andcan
mod
eratelyextend
the
fund
evaluatio
nperiod;
guidelong-term
funds
such
aspensionfunds,
socialsecurity
fund
s,endowmentfunds,and
insurancefundsto
investin
qualified
greenPE
/VC
institu
tions;introduce
overseas
capital
focusedon
investingin
greenindu
stries
Providetaxrelie
fand
othersupportin
gpo
liciesforgreen
PE/V
Cinstitu
tions
with
high
participationin
greeninvestmentand
outstanding
environm
entalb
enefi
ts
Furtherprom
otethe
developm
ento
fregional
stockexchange
markets
andthepilotP
Esecondarymarket,
prioritizeandencourage
qualified
greencompanies
tolisto
ntheNEEQor
exchange
listin
gs,and
prioritiz
ethepilot
qualificatio
nsof
PE/VC
institu
tions
with
high
erparticipationin
green
equity;establishgreen
boardandgreenchannels
forgreenenterprise
main
boardlistin
g,stream
line
theconditionsof
green
enterprise
refin
ancing
onmainbo
ardandSci-Tech
boardissuance,explore
andoptim
izethe
stratifi
catio
nandtransfer
mechanism
oftheNEEQ
greenenterprise;include
brokeragegreenproject
participationin
the
assessment
(contin
ued)

4.5 Turning Challenges into Opportunities; How to Address … 101
Table4.3
(contin
ued)
Liabilityside
(expanding
sources
andreducing
costs)
Creditcost
Taxcost
Capita
lcost
Transactio
nfrictio
ncost
Investment
ESG
andgreen
funds
Speedup
theentryof
long-term
fundssuch
associalsecurity,
pensionfunds,and
insurancefundsinto
themarket,andguide
long-term
fundsto
incorporateESG
principles
into
investmentd
ecisions
assoon
aspossible
Exemptionof
relevant
capitalg
ains
taxfor
investmentcom
panies
thatmeetthe
requirem
entsforgreen
exposure
ratio
and
holdingtim
e
Assetmanagem
ent
institu
tions
thatpractic
eESG
investmentare
given
certainpo
licypreferences
inproductissuance,such
assimplifying
theproduct
approvalprocessand
setting
upgreenchannels
Insuranceor
guaranteefund
Subsidiesaregivento
insurancecompanies
tosupportthem
inprovidingdiscountsto
low-carbonem
ission
companies
Green
insuranceor
guaranteefunds
play
aleverage
role
byreducing
thecost
ofcreditforasset
holders
Prem
iumspaid
bycompanies
canbe
deducted
before
tax
Reducethesolvency
requ
irem
entsof
green
insurancebusiness
and
reduce
thecapital
consum
ptionof
such
business
type
Whatm
easuresarecurrently
beingim
plem
ented
Currently
relie
son
policysupportm
ethods
includ
inginterest
discountsandreloans
Guarantee
Reducingtherisk
weighto
fgreenloan
assetshasbeen
piloted
insomebanks(H
uzhou
Bank)
The
catalogof
green
loansandbondshelpsto
identifywhether
the
projectisgreenandspeed
uptheapprovalprocess
(contin
ued)

102 Chapter 4 Green Finance: Clarifying Functions and Capacity
Table4.3
(contin
ued)
Liabilityside
(expanding
sources
andreducing
costs)
Creditcost
Taxcost
Capita
lcost
Transactio
nfrictio
ncost
Overseascases
The
British
government
establishedGreen
InvestmentB
ankatthe
endof
2012
toprovide
financialsupportfor
greencompanies
and
greenprojects.In
2011,the
British
governmentinvested
GBP3
.87bnto
establishthe
InternationalC
limate
Fund,w
hich
aimsto
prom
oteprivate
investmentin
sustainable
developm
entand
build
alow-carbon
investmentm
arket.As
ofApril2016,the
fund’sAUM
had
reachedGBP5
.8bn
In1993,the
US
governmentinitia
ted
Qualifi
edSm
all
Businessrequ
irem
ent.If
aqu
alified
investor
investsin
asm
all
enterprise
underthis
standard
andholdsitfor
morethan
5years,the
investor
cangetu
pto
100%
capitalg
ains
tax
relie
fto
increase
investors’enthusiasm
forsm
allenterprises
and
start-up
s,which
also
meetsthefin
ancing
needsof
small
enterprisesforlong-term
fund
sto
acertainextent
In1980,the
USCongress
establishedtheBDC
(BusinessDevelopment
Com
pany)system
.The
shares
ofPE
/VC
institu
tions
identifi
edas
BDCareallowed
tobe
listedandtraded,and
investorscanbenefit
from
taxincentives,w
hich
broadens
thefin
ancing
channelsforPE
/VC
institu
tions
andindirectly
prom
otes
thedevelopm
ent
ofgreenequity
investment.Atp
resent,
someBDCinstitu
tions
have
gradually
extended
theirinvestmentfi
elds
togreenindustries
Source
China
Banking
andInsuranceRegulatoryCom
mission,M
a,Jun.
CaseStudiesof
Green
Financein
China
(2017),C
ICCResearch

4.5 Turning Challenges into Opportunities; How to Address … 103
4.5.5 Incorporating Environmental Risks into PrudentialRegulations
Amid the green transformation of the economy, financial regulators should pay atten-tion to two kinds of environmental risks: extreme climate change’s impact to thereal economy, and the erosion of valuations of traditional-energy companies, thusweighing on the stability of financial institutions.
When managing environmental risks, financial regulators can release pruden-tial regulatory policies and incorporate systemic environmental risks into the macroregulatory framework. For example, the central bank of Brazil sets different reserverequirement ratios according to the amount of green loans issued by private banks. Italso requires commercial banks to incorporate environmental risks into their gover-nance framework, and assess environmental risks when calculating capital demand,thus internalizing the transition risks of carbon-intensive assets by incorporatingenvironmental risks of carbon-intensive assets into macro prudential indicators.
Financial regulators can add environmental factors into the asset evaluationcriteria. The central banks of Switzerland and Norway have included ESG indi-cators in the evaluation criteria for asset investment and collateral. The central bankof Norway manages the government pension based on the ESG principle, purchasesgreen bonds as proprietary investment, and has stopped investing in assets that arerelated to coal production or companies that seriously damage the environment. Thecentral bank of Switzerland adopts ethical standards for foreign equity purchases.Similar principles can also be applied to the collateral business of the central bank.For example, the central bank can stop taking collateral with serious environmentaldamage, or offer differentiated haircuts based on the collaterals’ environmental risks.
Regulators also need to establish a risk exposure and disposal mechanism forbrown assets15 to maintain financial stability amid the green transformation. Weshould prevent impacts from transition risks on the real economy and the financialsystem. To assess the financial system’s exposure to environmental risks and theimpact of the green transition, the central bank should regularly assess the financialinstitutions’ tolerance to impacts. During the green development, the value of tradi-tional assets with high carbon emissions may drop, affecting the real economy andthe financial system (this is a transition risk). By assessing the financial institutions’tolerance to such impacts, the central bank can effectively improve the informationtransparency of green finance, internalize environmental risks into financial risks, andallow investors to understand the investment risks they are facing. This measure canalso help fine-tune the prudential regulatory framework, identify possible weaknessin the system and incorporate it into the regulatory mechanism.
15 Brown assets refer to assets related to high-emission industries, which are traditionally heavyindustry and manufacturing industries.

104 Chapter 4 Green Finance: Clarifying Functions and Capacity
Open Access This chapter is licensed under the terms of the Creative Commons Attribution-NonCommercial-NoDerivatives 4.0 InternationalLicense (http://creativecommons.org/licenses/by-nc-nd/4.0/), which permits any noncommercial use, sharing, distribution and reproduction in anymedium or format, as long as you give appropriate credit to the original author(s) and the source,provide a link to the Creative Commons license and indicate if you modified the licensed material.You do not have permission under this license to share adapted material derived from this chapteror parts of it.
The images or other third party material in this chapter are included in the chapter’s CreativeCommons license, unless indicated otherwise in a credit line to the material. If material is notincluded in the chapter’s Creative Commons license and your intended use is not permitted bystatutory regulation or exceeds the permitted use, you will need to obtain permission directly fromthe copyright holder.

Chapter 5Green Technology: From Quantityto Quality
Abstract Energy is the foundation of the green technology industry, and fossil fuelhas built the current global energy and industrial system. Under the goals of emis-sion peak and carbon neutrality, all countries need to change their energy structuresto achieve net-zero carbon emissions, which in essence represents a revolution forenergy. The core of carbon-neutral technologies is the transformation in the energysupply side. Without the feasibility and affordability of zero-carbon technologies, itwould be impossible for the consumption side to put those technologies into practice.Considering the green premium of the current electricity supply vs. non-electricityenergy supply, it is still difficult and costly to achieve carbon neutrality based onexisting technologies. Hence, reducing costs will be the main development direc-tion of energy technologies in the future. In the long term, energy technologieswill demonstrate significant variations over time, which gives a perspective to thisreport.Wewill analyze the possible development of different technologies in terms ofpotential cost savings, and investigate the development of technological routes underconstraints of scheduling and resources for China’s carbon neutrality initiative. Webelieve the falling cost of carbon neutrality technologies will eventually be the maindriving force for large-scale application. In the power industry, photovoltaics (PV)and energy storage are expected to reach tariff parity with thermal power (or a zerogreen premium) by 2028. For non-electricity energy supply, a higher electrificationrate will promote CO2 emissions reduction in consumer, construction, and toll roadtransport sectors, and then the net-zero carbon emissions of transportation andmanu-facturing industries will be achieved by using hydrogen energy and carbon capturetechnologies ultimately. Although China’s mission to achieve carbon neutrality in 40years is a challenging undertaking, it is ample time in which technological develop-ments and breakthroughs are possible. For example, the technological developmentroutewould change if nuclear safety can be improved on the back of advanced nuclearenergy technologies, as well as the CO2 obtained via carbon capture technologies canbe utilized and become a revenue source. In addition, if the photoelectric conversionefficiency exceeds 30%, the hydrogen energy cost will continue to drop.
© The Author(s) 2022CICC Research, CICC Global Institute, Guidebook to Carbon Neutrality in China,https://doi.org/10.1007/978-981-16-9024-2_5
105

106 Chapter 5 Green Technology: From Quantity to Quality
5.1 Technological Breakthrough and Carbon Neutrality
5.1.1 Why Do We Need a Technological Breakthrough?
Reducing CO2 emissions from energy projects is crucial to China’s carbon neutrality.According to the CICC macro team, the energy sector accounts for 90% of CO2
emissions in China (before factoring in carbon sinking).With existing technologies, it is costly to achieve carbon neutrality in the
energy and manufacturing industries, which makes costs reduction via technologicaladvancement the key to reducing the green premiums. According to our estima-tion, green premiums will stand at 17% in the power industry and at 175% in otherindustries in 2021. We attribute the high green premiums to the elevated cost ofclean energy, and if there are no technological advancements, the cost of the trans-formation towards carbon neutrality will be high. Concerning the current situation,there is still room for improvements in the efficiency of clean power projects. Greenhydrogen energy and carbon capture technologies need to further increase the techno-logical maturity and expand industrial application, hence reducing the cost of greenenergy via three fundamental technological routes: economies of scale, materialreplacement, and efficiency enhancement.
The technological transformation will bring changes in cost. According to thesales data of wind and photovoltaic power companies, we estimate that the costs ofsolar and wind power dropped 89% and 34% over 2010–2020 due to developmentsin non-fossil energy technologies (Fig. 5.1). This means that the costs of solar andwind power fell 13% and 7% each for every 100% increase in the installation ofpower generation facilities. In contrast, the costs of coal, petroleum, and natural gascontinued to fluctuate during this period, as shown by an increase of about 45%in China’s coal price compared with the lowest price recorded in 2015 followingthe short supply. China has long focused on the cost advantage in energy supply (its
0
500
1,000
1,500
2,000
2,500
1965
1967
1969
1971
1973
1975
1977
1979
1981
1983
1985
1987
1989
1991
1993
1995
1997
1999
2001
2003
2005
2007
2009
2011
2013
2015
2017
2019
Historical average energy cost in China Global historical average energy costPhotovoltaic Wind power
(Rmb/tonne of standard coal energy)Fossil energy consumption continues to rise,
pushing up marginal extraction costs, bringing up comprehensive energy costs
Global fossil energy- 500% increase in consolidated cost- 230% increase in total consumption
Wind power- 34% reduction in cost
- 8-fold increase in installed capacity
Photovoltaic- 89% reduction in cost
- 17-fold increase in installed capacity
2010-2020
Fig. 5.1 Costs of fossil energy, wind power, and photovoltaic power. Source BP, Solarzoom,Corporate filings of wind and solar power companies, CICC Research

5.1 Technological Breakthrough and Carbon Neutrality 107
electricity price was 14%–64% lower than those in developed countries in 2018), andas alternative-energy costs drop following the use of advanced technologies, the costsof wind and photovoltaic power projects have fallen short of the costs of coal-firedpower projects in China. These are all sensible changes brought by technologicaladvancements.
Therefore, to reach an emission peak in 2030 and achieve carbon neutrality in2060, transformations from technological maturity to industrial maturity are neededfor various carbon-reduction and carbon-neutral technologies in the next 4 decadesto pave the way for China’s carbon neutrality. Currently, China is still confrontinghigh green premiums in various industries. If green premiums are forced to bereduced without technological advancements, the significant social costs will hinderthe transition to carbon neutrality.
5.1.2 What Can Become Carbon Neutral by TechnologicalAdvances and What Cannot?
Carbon neutrality will be difficult to achieve if the energy supply cannot realize netzero carbon emissions, which suggests the development of energy technologies isthe foundation for carbon neutrality. In addition, since the growth of new economiesalso relies on electricity supply, if China can realize net zero carbon emissions ofelectricity generation through solar, wind, hydro, and nuclear, the growth of neweconomies will not be bound by emission reduction targets. We should also recog-nize that although energy supply depends heavily on technological development,public policy also plays an important role in end-market consumers’ choosing low-energy consumption models. Cost is only one of the factors that consumers considerwhen they choose low-energy consumption models. This means that companiesmay not spontaneously shift to zero-carbon-emissions technologies even when thegreen premium reaches zero. As a result, reducing carbon emissions in consumer-related industries, such as transportation and heating, requires not only technologicaladvances but also additional policy tailwinds.
5.1.3 What Are the Technological Routes for the CarbonNeutrality Initiative? What Are the Constraints?
In the choice of the technological routes for 2020–2060, economic optimization ofenergy transition can be achieved through technology selection (i.e., easy to diffi-cult). In addition to cost, resource constraints and the application scenario will alsoinfluence consumer choices in technology.
Net zero emissions in the power industry should first consider multiple energysources to help reduce the electricity generation cost. Photovoltaic and energy storage

108 Chapter 5 Green Technology: From Quantity to Quality
should be the major emphasis in electric supply, but the complementary smart powergrid technologies that utilize multiple energy sources are also crucial. Additionalpolicy tailwinds for power grid and energy storage technologies and a higher propor-tion of non-fossil energy are pivotal in helping the power system operate in a saferand steadier way and reducing the overall electricity cost.
Carbon neutrality technologies for activities other than power generation hingeon areas where the technologies are utilized. Outside the power sector, energy forother industries is used in various areas and the technologies utilized are not 100%transferable with each other. As a result, companies need to use different energytechnologies in different applications. Based on the trajectory of cost reductions,we believe the cost of hydrogen energy-enabled transportation will drop to a levelacceptable to consumers by 2035, while industries are more likely to achieve carbonneutrality via the use of carbon capture technologies.
To summarize the technology routes for carbon neutrality, photovoltaic and energystorage technologies will be the major technological foundation in the power sector,with hydrogen accompanying carbon capture in the non-power sector. We believeChina can achieve its CO2 emission target by 2030 through multiple technologiesthat reduce energy consumption and CO2 emissions. Then we expect the power-generation industry to reach net zero emissions based on the photovoltaic-skewedpower system with multiple energy sources. In addition, the supply of cleaner andcheaper electricity should lead to greater electrification in industries such as tollroads, railways, construction, and some manufacturing industries. For hard elec-trification fields such as heavy transportation, aviation, and the chemical industry,net zero carbon emission could be achieved through hydrogen and biofuels. Othermanufacturing industries may ultimately achieve carbon neutrality by using carboncapture technologies.
Summing up the policy implications of technological routes for the carbonneutrality initiative, we believe a technological breakthrough is possible given theevolution of existing technologies, but several industries (such as hydrogen power-enabled industrial heating) probably will not be able to reach a zero green premiumon the back of existing technological routes. These industries will continue tohave positive green premiums and rely greatly on policy tailwinds for their carbonneutrality efforts. From our point of view, China should first propel the develop-ment of non-fossil energy to at least mitigate the CO2 emission problem in non-electric energy sectors through increasing the electrification rate, and then promotethe industrialization as well as scale-up of the use of hydrogen energy over 2020–2040 and encourage the use of carbon capture technologies over 2040–2060 to makezero-carbon-emissions technologies feasible and affordable in all industries. Thetechnological route to realizing carbon neutrality in energy is shown in Fig. 5.2.

5.2 Cost is a Touchstone for the Development of Technology 109
CO2 emission to drop rapidly
CO2 emission to reach neutral
CO2 emission to peak
Energy saving technologies
Reducing industrial energy consumption
Reducing consumer electricity consumption
Emission reduction technologies
Reducing coal consumption in large thermal power plants
Coal to gas switching
Artificial meat
Carbon neutral technologies for electricity
Zero emission technologies
Solar and energy storage
Wind and energystorage
Nuclear power generation
Hydro electricity
Gas to electricity
Grey hydrogen
Zero emission technologies
Green hydrogen
Fossil energy and carbon capture
Biomass fuels
Carbon negative technologies
Biomass and carbon capture
2021-20302030-2050
2050-2060
Fig. 5.2 Technological routes for the carbon neutrality initiative. Source CICC Research
5.2 Cost is a Touchstone for the Development of Technology
5.2.1 What Kind of Technologies Are Capable of ReachingEmission Peak and Carbon-Neutral as Planned? WhatAre the Differences in the Choices of VariousTechnological Routes?
At the stage of emissions peak, the mainly adopted technologies should be able tohelp to reduce CO2 emissions as much as possible. To pursue carbon neutrality, moreadvanced technologies are required. China’s forests naturally form carbon sinks, buttheir energy density and overall capacity remain relatively low. Therefore, net zerocarbon emissions technologies and even negative carbon emissions technologiesmust be applied in energy and manufacturing industries to achieve carbon neutrality.In the long term, we should take the current costs of technologies as well as thepotential of reducing the costs of these technologies into consideration.

110 Chapter 5 Green Technology: From Quantity to Quality
5.2.2 Three Measures to Reduce the Cost of DevelopingEnergy Technologies
In retrospect of the history of technological development in energy, three mainmeasures have helped to reduce technological cost: economies of scale, materialreplacement, and efficiency enhancement. Although photovoltaic, electrochemicalEV batteries, and hydrogen energy technologies remain controversial, these tech-nologies continue to develop rapidly. The fundamental reasons behind the rapiddevelopment in these technologies lie in their manufacturing attributes. The costsof these technologies are likely to drop on the back of economies of scale, mate-rial replacement, and efficiency enhancement, while traditional fossil energy (suchas coal, petroleum, and natural gas) due to their energy attributes may see costs
0123456
Technology maturity
Current cost of use
Cost reduction rate
Cost reduction byscale advantage
Const reduction bymaterial innovation
Cost reduction byefficiency
improvement
Comparison of carbon neutral technologies for electricity
Wind
Nuclear
Hydro electricity
Electrochemical energy storage
Pumped hydro storage
Solar
0
1
2
3
4Technology maturity
Current cost of use
Cost reduction rate
Cost reduction byscale advantage
Const reduction bymaterial innovation
Cost reduction byefficiency
improvement
Comparison of carbon neutral technologies for non-electricity energy
Fossil and carboncapture
Biomass fuel
Hydrogen
Fig. 5.3 Carbon neutrality technologies for use in power generation and other industries. Note Alarger number indicates better performance. Source CICC Research

5.2 Cost is a Touchstone for the Development of Technology 111
increase amid higher demand. As such, photovoltaic, electrochemical EV batteries,and hydrogen energy technologies will likely become pivotal energy technologiesgoing forward. The multidimensional comparison of power sector and non-powersector’s technologies for carbon neutrality is shown in Fig. 5.3.
In conclusion, energy-efficient and carbon reduction technologies are likely tocontributemore to reaching the peak of CO2 emissions in the coming decade. Amongnet zero emissions technologies, hydropower has the lowest cost, followed by wind,photovoltaic, and nuclear power, while pumped hydro storage projects have lowercosts than electrochemical energy storage projects. The costs of photovoltaic andelectrochemical energy storage technologies will fall faster than other technolo-gies, thanks to efficiency enhancement, material replacement, and economies ofscale. Concerning net zero emissions technologies for industries other than powergeneration, hydrogen energy and carbon capture technologies differ in maturityand cost, and neither has yet reached the commercial stage. Nevertheless, costsof hydrogen energy could be reduced through scaling, material substitution, andefficiency. Carbon capture technologies can also realize cost reduction via the firsttwo methods. At the critical point for carbon neutrality, the cost of manufacturinghydrogen will likely drop rapidly as the electricity generation cost at photovoltaicprojects may decline notably thanks to the electrolysis of water. As a result, hydrogenenergy may realize price parity with traditional energy in the toll road industry andbe put into use.
5.3 Existing and Potential Technologies for Net ZeroCarbon Emissions and Carbon Neutrality Initiatives
5.3.1 Technologies to Help Cut CO2 Emissions Focuson Reducing Energy Consumption and Shiftingto Energy Technologies that Produce Lower CO2Emissions
Technologies that help thermal power stations reduce coal consumption:Thermal power stations can raise thermal efficiency to 45%, thereby reducing CO2
emissions. Over the past decade, coal consumption for electricity generation atdomestic power stations has dropped 27g per kWh to 306g per kWh. This impliesthat power stations cut 320mnt of CO2 emissions in 2019 (equal to around 3% offull-year CO2 emissions in China), as the annual amount of electricity generatedwas 4.6trn kWh. We estimate that domestic thermal power stations can reduce CO2
emissions by 470mnt if coal consumption for electricity generation drops by 41gper kWh to the level recorded by the most advanced existing supercritical reheatingthermal power stations in China (265g per kWh).
Replacing coal with gas: The coal-fired heating facilities in rural areas dischargemultiple pollutants, including sulfur and nitrogen. They intensify the problem of

112 Chapter 5 Green Technology: From Quantity to Quality
scattered CO2 emissions. Replacing 2t of coal with natural gas in the rural heatingsystem can help reduce CO2 emissions by 230mnt annually, according to the CICCcommodities team.
Industrial energy-efficient technologies: During the 13th FYP period (2016–2020), energy consumption per industrial value-added at companies above the desig-nated scale dropped 15.6%, meaning that these companies cut CO2 emissions by240mnt in the given time span. We estimate that industrial energy consumption willdrop 14%by 2025, referring to the energy reduction target formulated in theNationalNew and High-Tech Green Development Action Implementation Plan released by theMinistry of Science and Technology. As such, we estimate that industrial companieswill reduce 220mnt of CO2 emissions by 2025.
Technologies making home appliances more energy-efficient: The amount ofelectricity usage may continue to increase due to consumption upgrades. Neverthe-less, the CICC home appliance team estimates that the growth rate of electricity usedby consumers will decrease 2.4ppt annually due to the initiative to raise energy effi-ciency standards for home appliances. This suggests that electricity used by homeappliances will fall 36.8bn kWh (down 3.2%) in 2021, meaning a drop of 36.7mntin CO2 emissions.
Cultured meat technologies help reduce CO2 emissions of the animalhusbandry industry: The CICC agriculture team estimates that replacing animalprotein with cultured meat can reduce CO2 emissions by 13mnt. Coupledwith photosynthesis-enabled carbon sequestration during the process of plantingsoybeans, it could further enhance the effect of carbon sequestration.
Operating thermal power stationsmore flexibly: The flexible transformation ofthermal power stationsmay slightly increase theCO2 emissions per kWhof electricitygenerated, but it also will help power grids use additional net-zero-emission non-fossil energy, thereby reducing the overall utilization hours of coal-fired power plantsand reducing CO2 emissions of the entire power system.
5.3.2 Carbon-Neutral Technologies: Technologies that HelpAchieve Zero-Carbon and Negative-Carbon Emissions
Predictions of cost drops of carbon-neutral technologies in the power industry are asfollows: Concerning the zero-carbon-emissions technologies available to the powerindustry, electrochemical energy storage technologies may record the largest dropin cost, as the use of this type of storage is currently in its infancy; we estimatethat the cost of photovoltaic technologies will drop 50% in the coming decade due toeconomies of scale,material replacement, and efficiency enhancement; the utilizationrate of wind power projects is close to the theoretical limit, but because of increasedturbine capacity and the domestic production of raw materials, we expect the costof wind power technologies to drop 20%–30%; the mass production and domesticproduction of nuclear power projects is expected to generate more than 10% decrease

5.3 Existing and Potential Technologies for Net Zero Carbon … 113
in the cost of investment, and the drop in the cost of hydropower projects will belimited, as locations suitable for hydropower stations are scarce. The expected costdrop and core driving force of carbon-neutral technologies in the power industry arelisted in Table 5.1.
Photovoltaic power cost forecast: With the use of perovskite technologies, themodule efficiency is expected to reach 35% by 2030, in which the module costwill come in at Rmb0.9/W and the BOS cost will drop to Rmb0.8/W. Overall, weestimate that the CAPEX of photovoltaic power projects will drop to Rmb1.6/W by2030. Assuming utilization hours remain unchanged, the photovoltaic cost has thepotential of dropping to Rmb0.15/W in eastern China and Rmb0.2/W in westernChina.
Table 5.1 Falling costs of carbon-neutral technologies in the power industry
2020cost perkWh
Cost reduction pathway 2030cost perkWh
2020–30costreductionrate
Economies ofscale
Materialsubstitution
Efficiencyimprovement
Power technologies (Rmb/kWh)
Solar (westernChina)
0.31√ √ √
0.15 + + +
Solar (easternChina)
0.41√ √ √
0.20 + + +
Onshore wind 0.28√ √
0.21 + +Offshore wind 0.61
√ √0.40 + +
Hydrogenelectricity inYunnan
0.25 0.25 –
Coastal nuclear 0.35√
0.31 +Biomass power 0.73 0.73 –
vs. Nationalthermal
0.37 0.37 –
2020cost perkWh
Cost reduction pathway 2030cost perkWh
2020–30costreductionrate
Economies ofscale
Materialsubstitution
Efficiencyimprovement
Grid technologies (Rmb/kWh)
Pumped hydrostorage
0.18 0.18
Electrochemicalenergy storage
0.71√ √ √
0.29 + + +
vs. Thermalpower flexibility
0.14 0.14
Source Current electricity cost calculated based on data from China Electricity Council, corporatefilings of wind, solar, hydro, and nuclear power companies, GGII, LEK Consulting, and cross-checked via electricity prices released by NEA and regional power grid companies; electricity costfor 2030 is a CICC estimate

114 Chapter 5 Green Technology: From Quantity to Quality
Wind power cost forecast: We estimate that the cost of electricity generatedby onshore and offshore wind power projects may have the potential to drop toRmb0.21/kWh (basedon the assumption that utilization hourswill increase to 3,500h,construction costwill drop toRmb5.8/W) andRmb0.4/kWh (basedon the assumptionthat utilization hours could reach as high as 4,000h, and investment cost could dropas low as Rmb12.5/W) to achieve price parity by 2030.
Hydropower cost forecast: Hydropower is currently one of the lowest-cost powersources in China. According to NEA, the average on-grid tariff of hydropowerprojects is low at less than Rmb0.25/kWh in Yunnan, Qinghai, Gansu, and Xinjiang.The current cost of hydropower equipment has stabilized in China, and given theCAPEX released by hydropower companies, we estimate that the construction costof hydropower units that start operation after the 14th FYP period will increase toRmb10–15/W. As upstream reservoirs will likely increase the utilization hours ofhydropower units through region-wide scheduling, the overall cost of hydropowershould remain stable in the future.
Nuclear power cost forecast: The cost of third-generation nuclear power unitsunder development has exceeded Rmb0.35/kWh due to stricter safety regulations.(According to the corporate filings of power companies, the investment cost of China-made nuclear power unit HualongOne,which utilizes third-generation nuclear powertechnologies, stands at about Rmb16.4/W based on an operation period of 60 yearsand annual utilization hours of 7,500h.) The cost of nuclear power will likely decline,thanks to the domestic production of the third-generation nuclear power units, themass-production of these products, better design, and shorter construction periods.Power companies hope to reduce the investment cost of third-generation nuclearpower units to the level of second-generation nuclear power units (Rmb12.3/W).
Biomasspower cost forecast: The cost of biomass power is high atRmb0.73/kWhgiven the straw cost of Rmb300/tonne, the investment cost of Rmb10/W, and 7,900utilization hours. According to International Renewable Energy Agency (IRENA),the equipment cost of biomass power units is unlikely to drop. Since the total volumeof biomass resources in China is subject to the output of the agriculture, forestry, andhusbandry industry, the grain safety program, and transportation (transportation’scontribution to costs is high due to straw’s low energy density), we believe the costof biomass power will remain stable.
Pumped hydro storage cost forecast: We estimate that the cost of pumped hydrostorage projects could reach about Rmb0.2/kWh (given the cycle efficiency of 75%,investment cost of Rmb6/W, and 2,500 discharging hours) with efficient power gridscheduling. Pumpedhydro storage is also economically viable (current annual utiliza-tion hours are generally less than 1,000h, indicating substantial room for improve-ments). Construction of pumped hydro storage projects, similar with constructionof hydro power projects, requires certain geographic resources and conditions. Thecost of pumped hydro storage is not very likely to drop, due to limited locations forsuch projects and higher resident resettlement costs.
Electrochemical energy storage cost forecast: With the development ofadvanced battery technology, the cost of electrochemical energy storage technologyhas dropped notably. However, the cost is still at a relatively high level, Rmb0.6–0.8/kWh (the battery system cost is Rmb0.7/Wh; the total system cost is Rmb1.7/Wh;

5.3 Existing and Potential Technologies for Net Zero Carbon … 115
cycle life is about 5,000 cycles). By 2030, the system cost may reach Rmb1/Wh. Inaddition, improved electrode materials and advanced maintenance technologies areexpected to increase the cycle life of batteries to more than 10,000 cycles. As such,we anticipate the energy storage cost will drop to Rmb0.3–0.4/kWh.
Falling costs of carbon-neutral technologies besides power generation are listedas follows. Electricity substitution is the least expensive method to achieve net zeroemissions in the non-power industries and may continue to benefit from the fallingcost of clean electricity in the future. The cost of hydrogen energy may drop 70%as the result of economies of scale in the industrial value chain and the use of cleanelectricity in producing hydrogen via electrolysis. The cost of fossil energy equippedwith carbon capture will likely drop by less than 10%, as the cost of fossil energyis unlikely to decrease. The cost of biomass fuel may drop 35% if technologicaladvances can help reduce the cost of rawmaterials in the long term. The expected costdrop and core driving force of carbon-neutral technologies besides power industryare listed in Table 5.2.
Electricity substitution cost: Under the existing electricity supply structure inChina of 2020, we estimate that the end-market cost of green electricity stands atRmb0.58/kWh (factoring in the cost of electricity generation, peak-season powerunit rescheduling, and power distribution), implying the cost of electric energy ataround Rmb1,900 per tonne of standard coal equivalent. As the non-fossil energycost keeps decreasing, the end-market cost of green electricity will likely drop toRmb0.41/kWh in 2060, with the corresponding cost of electric energy decreasing toaround Rmb1,600 per tonne of standard coal equivalent.
Hydrogen energy substitution cost: Based on the estimation of the CICC elec-trical equipment team, green hydrogen energy seems to have a clearer cost-reductionroute than other non-power energy. The transportation and refilling cost will likely
Table 5.2 Falling costs of carbon-neutral technologies in industries other than power generation
2020cost perkWh
Cost reduction pathway 2030cost perkWh
2020-30costreductionrate
Economies ofscale
Materialsubstitution
Efficiencyimprovement
Non-electricity technologies (Rmb/kg of standard coal equivalent)
Electrification 1.9√ √ √
1.6 ++
Hydrogen 15.0√ √ √
3.9 +++
Biomassethanol
7.0 4.5 ++
Natural gasand carboncapture
5.9√ √
5.5 +
Diesel andcarbon capture
7.2√ √
6.8 +
Note Existing cost based on market prices; we use the CICC chemicals team’s carbon capturecost estimate, the CICC electrical equipment’s hydrogen cost estimate, and the cost of electricitysubstitution program is the cost of carbon-neutral technologies in the power industry. Source CICCResearch

116 Chapter 5 Green Technology: From Quantity to Quality
drop by around 80% to Rmb8/kg from Rmb44/kg thanks to increased hydrogentransportation and refilling facilities and improved technologies. The cost of manu-facturing hydrogenwill likely drop by about 60% toRmb9/kg fromRmb22/kg thanksto lower cost of non-fossil energy. We estimate that the cost of hydrogen energy willfall short of Rmb20/kg in 2060, meaning an energy cost at Rmb3,900 per tonne ofstandard coal equivalent.
Biomass-based fuel ethanol cost: According to the estimates of the CICC chem-icals team, the reduction in the cost of fuel ethanol is limited, for the grain and cropdemand is rather significant in China, restricting the amount of available resources.We estimate that the raw material cost will drop to Rmb2,000/tonne in the long termif technological routes utilizing less expensive raw materials (such as straw) canimprove the quality of their products. In addition, we expect the cost of manufac-turing fuel ethanol to drop to Rmb1,500/tonne. Overall, the cost of fuel ethanol willlikely fall 35% to Rmb4,000/tonne, implying the energy cost at Rmb4,500 per tonneof standard coal equivalent.
Carbon capture cost: The CICC chemicals team estimates that the cost ofcarbon capturewill drop to Rmb306/tonne (capture cost: Rmb195/tonne) in 2030 andRmb262/tonne (capture cost: Rmb163/tonne) in 2060. Carbon capture technologieshave advantages in integrating with the existing fossil energy system, but the down-side is that such technologies always increase the energy use cost no matter whatcost-reducing measures are conducted, making end-market energy use cost subjectto the cost of fossil energy.
Biomass and carbon capture: Using straw and other plants as fuel, combinedwith carbon capture technologies, net CO2 emission is likely to be reduced (carbonnegative in other words). Positive returns can also be obtained if the cost of capturingcarbon is lower than the carbon price.
5.4 “Photovoltaic + Energy Storage”, Hydrogen Energy,and Carbon Capture Becoming the Main TechnologicalRoutes
5.4.1 The Main and Auxiliary Technological Routesfor the Carbon Neutrality Initiative
How to choose themain technological routes for carbon neutrality in power andnon-power industries? The development targets for carbon-neutral technologies inpower and non-power industries as well as the feasibility of achieving these targetsshould be clarified on the supply side of energy, so as to lay a foundation for industriesto meet the demand for energy.
The prototypes of many carbon-neutral technologies for power and non-powerindustries now can be utilized, and the costs of these technologies are likely to dropin the long term. The main technology selection and the turning point of technology

5.4 “Photovoltaic + Energy Storage”, Hydrogen Energy, and Carbon … 117
- 2,000 4,000 6,000 8,000 10,000 12,000 14,000 16,000 18,000 20,000
-
100
200
300
400
500
600
700
800
Retail tariff Electricity generation tariffSolar and storage Diesel and carbon capture (RHS)Coal and carbon capture (RHS) Hydrogen (RHS)Aviation fuel and carbon capture (RHS) Electrification (RHS)
Distributed solar and storage reach parity vs. retail power tariff
Utility solar and storage reach parity vs. wholesale power tariff
Hydrogen reach parity vs. road traffic
Rmb/MWh Rmb/tonne of standard coal
Hydrogen industry and aviation hard to reach parityElectrification has almost reached parity
vs. fossil fuel and carbon capture
Fig. 5.4 Timingof price parity for themain carbon-neutral technological routes in power generationand other industries. Source Same as Fig. 5.5 & 5.7, CICC Research
penetration can be deduced through the following constraints: first, the benchmark forprice parity, which traditional energy sources are selected to compare the price parityof carbon-neutral technologies and themethodof comparison; second, the applicationscenario of carbon-neutral technologies, which refers to the compatibility of carbonneutralization technology with existing technologies and equipment; third, resourceconstraints, referring to the accessibility of raw materials required by carbon-neutraltechnologies.
Overall, carbon-neutral technologies for the power industry will achieve priceparity earlier than those for non-power sectors. As shown in Fig. 5.4, the timeline wespeculated for price parity is that hydropower and nuclear power have achieved priceparity with coal-fired power, becoming the base energy in today’s power generationhierarchy. In non-power sectors, we assess that electrification has achieved priceparity with “fossil fuel + carbon capture” if we only consider the cost of energysupply. The distributed photovoltaic and energy storagemay realize retail price paritywith coal-fired power, and electricity consumers may spontaneously shift to cleanenergy in the early 14th FYP period. By themiddle of the 15th FYP period, collectivephotovoltaic and energy storage will likely achieve on-grid tariff parity with coal-fired power projects, increasing the use of clean energy in power generation. By theend of the 16th FYP period (2030–2035), hydrogen energy will likely achieve priceparity with diesel supplemented by carbon capture, and non-power toll road industrymay steadily shift to clean energy. Nevertheless, it is unlikely to achieve price parityfor hydrogen with “coal + carbon capture” in the industrial sector.
For the timing of implementing policies, we note that alternative-energy-basedpower projects that received 5–10-year government subsidies have achieved priceparity with coal-fired power projects and this industry’s reliance on policy tailwindshas come to an end, while energy storage and hydrogen energy projects have notachieved price parity. Policies favorable for the large-scale development of these

118 Chapter 5 Green Technology: From Quantity to Quality
industries are still required in the efforts to reduce technology costs and help theseprojects achieve price parity.
5.4.2 The Main Technological Route for the CarbonNeutrality Initiative in the Power Industry
In terms of the price parity of electricity generation, we notice that wind, solar, hydro,and nuclear power projects have achieved on-grid tariff parity with coal-fired power,and the cost advantages compared to fossil energy are likely to increase in the future.
The price parity timing of carbon-neutral technologies depends on when the costof generating electricity per kWh will fall short of the benchmark price of coal-firedpower. The on-grid tariffs for coal-fired power projects now average Rmb0.37/kWhin China (we assume that the cost of generating 1 kWh of electricity will remainstable as coal-fired power projects going forward), and if the cost of carbon-neutraltechnologies falls below the level of 0.37, the economic competitiveness of suchtechnologies will be demonstrated.
In 2020, the cost of most carbon-neutral power is already less than that of coal-fired power.We estimate that the cost of generating 1 kWh of electricity from nuclear,photovoltaic, wind, and hydropower is 5%, 17%, 25%, and 34% lower than the costof electricity generated through coal-fired power. Only the costs of generating 1 kWhof electricity at gas and biomass power projects remain 143% and 98% higher. By2060, the manufacturing attributes will keepmaximizing the cost advantages of windand photovoltaic power, where the cost of the latter will be 68% lower than that ofthermal power (see Fig. 5.5), becoming the cheapest clean energy source. The costof wind, hydro, and nuclear power will be 47%, 34%, and 18% lower than the costof thermal power respectively. The cost of gas and biomass power is constrained bylimited raw materials and will stay higher than the cost of thermal power.
143%
94%
-5%
-17%
-25%
-34%
Gas
Biomass
Nuclear
Solar
Wind
Hydro
2020
143%
94%
-18%
-34%
-44%
-59%
Gas
Biomass
Nuclear
Hydro
Wind
Solar
2030
143%
94%
-18%
-34%
-47%
-68%
Gas
Biomass
Nuclear
Hydro
Wind
Solar
2060
Fig. 5.5 The costs of gas, biomass, nuclear, hydro, wind, and hydropower compared to thermalpower.Notes The current cost of generating 1 kWh of electricity is calculated using data fromChinaElectricity Council, corporate filings of wind, solar, hydro, and nuclear power companies, and cross-checked via electricity prices released by NEA and regional power grid companies; electricity costfor 2030 is CICC estimate; gas-based power projects utilize low-carbon technologies, with carbonemissions 50% lower than the carbon emissions of traditional thermal power projects. SourceChinaElectricity Council, Corporate filings, CICC Research

5.4 “Photovoltaic + Energy Storage”, Hydrogen Energy, and Carbon … 119
Conditions of price parity for grid energy storage: The cost of storing 1 kWhof electricity at electrochemical energy storage projects is unlikely to fall under thecost of pumped hydro storage projects and thermal power peak-season reschedulingprojects. But the technological availability may force electrochemical energy storageto become the main technological route for the carbon neutrality initiative in thepower industry.
Power grid-related energy storage costs are indispensable in electricity genera-tion and distribution. Electricity generation from renewable energy (especially fromwind power and photovoltaic projects) is less dispatchable and predictable than elec-tricity generation from other energy sources. Improving the quality of electricitygeneration from these renewable-energy-based power projects requires electricityflexibility technologies. As the penetration rate of renewable energy in the powersystem increases, we think that inadequate flexibility in electricity will not onlyweigh on the balance and safety of the power system but also makes the traditionalpower grid model less adaptable to future power sources (and even makes existingcontrollable load uncontrollable). As such, the maturity of electricity flexibility tech-nologies and lower costs of such technologies are crucial to the carbon neutrality ofthe power system.
The timing of price parity for carbon-neutral technologies utilized in power grid-related energy storage: Electrochemical energy storage and pumped hydro storageare not very likely to reach price parity with thermal power peak-season reschedulingprojects (measured by the electricity cost per kWh). Given the existing technolog-ical routes, we think the electricity charging cost of electrochemical energy storageprojects and pumped hydro storage projects per kWh is unlikely to fall short ofthe electricity charging cost of thermal power peak-season rescheduling projects(Rmb0.14/kWh).
Electrochemical energy storage will likely become the main carbon-neutral tech-nology for power grid-related energy storage, due to restraints from applicationscenarios and the potential of project development. Given the life cycle of thermalpower units, we think that from 2030 the phase-out of coal-fired power units thatare less than 0.6mn kW will be intensive (such units have been transformed so as tobecome more flexible, and they can improve power grids’ capabilities of receivingrenewable energy), and that most thermal power units in the power system will bemore than 1mn kW (such units have high parameters and low emissions, and are lessflexible) aswell as combined heat and power (CHP) units (electricity generation fromsuch units is subject to heat supply conditions, and they are less flexible). As a result,the energy storage competence of thermal power peak-season rescheduling projectswill likely weaken from 2030. In addition, the pumped hydro storage capacity thatcan be developed in China is around 120GW, according to China Renewable EnergyEngineering Institute. We think that as the penetration rate of wind and photovoltaicpower exceeds 30%, the existing energy storage capacity of the power system willbecome insufficient to store electricity generated by renewable-energy-based powerprojects and electrochemical energy storage may become the main technologicalroute for the carbon neutrality initiative in the power industry.

120 Chapter 5 Green Technology: From Quantity to Quality
Fig. 5.6 Comparing the electricity generation and energy storage cost of gas, biomass, nuclear,hydro, wind, and solar power to thermal power projects (assuming an energy storage ratio of 50%).Note The current cost of generating and storing 1 kWh of electricity is calculated from data of ChinaElectricity Council, corporate filings of wind, solar, hydro, and nuclear power companies, and cross-checked via electricity prices released by NEA and regional power grid companies; electricity costfor 2030 is CICC estimate; gas-based power projects utilize low-carbon technologies, with carbonemissions 50% lower than the carbon emissions of traditional thermal power projects. SourceCICCResearch
Factoring in electricity generation and energy storage, we think that photovoltaicand electrochemical energy storage projects will achieve on-grid tariff parity withcoal-fired power projects in 2028, and the cost of photovoltaic and electrochemicalenergy storage projects will be slightly higher than the cost of hydro and nuclearpower projects in 2060. We believe photochemical energy storage technologies willplay an important role in the carbon neutrality initiative of the power industry, giventhe flexibility of these technologies and the availability of related resources.
The timing of the price parity of carbon-neutral technologies in the power sectordepends on when the cost of electricity generation and storage will drop below theon-grid tariff for coal-fired power. As shown in Fig. 5.6, the costs of electricitygeneration and energy storage of photovoltaic and wind power are 77% and 69%higher than the cost of thermal power, assuming the energy storage ratio to be 50%.Their costs are also higher than the costs of nuclear and hydropower that are capableof self-adjusting and relieving energy storage problem of the power grids. We expectthe cost of photovoltaic and energy storage to be on par with the average on-gridtariff for coal-fired power (Rmb0.37/kWh) by 2028. As thermal power is phased-out subsequently, photovoltaic will gradually replace thermal power to avoid costrebounds and the cost of photovoltaic will be 41% lower than that of thermal powerby 2060. In addition, nuclear and hydro power projects do not incur energy storageproblems in power grids. We estimate that the costs of nuclear and hydro power willbe 18% and 34% lower than the cost of thermal power by 2060, largely on par withthe cost of photovoltaic power.
The places where energy technologies are utilized and the potential of developingpower projects: Photovoltaic projects can be developed in a rather flexible way andphotovoltaic resources are ample (see Fig. 5.7). As such, we believe photovoltaictechnology will become the main technological route for carbon neutrality in thepower industry, even if it does not have an absolute cost advantage compared withnuclear and hydropower. We think hydro, nuclear and wind power technologies willbecome the auxiliary technological routes for amulti-energy complementary system.

5.4 “Photovoltaic + Energy Storage”, Hydrogen Energy, and Carbon … 121
Natural gas 6.9 billion
GJ
Hydroelectricity7.2 billion GJ
Nuclear4.1 billion GJ
Biomass7.8 billion GJ
Petroleum 8.6 billion GJ
Wind 291.9 billion GJ
Solar 79,680 billion GJ
Domestic energy demand in 2060 is about 100 billion GJ
Fig. 5.7 Carbon-neutral resources for electricity projects in China.Note The sizes of these bubblesrepresent the volume of carbon-neutral resources that are available in China; we show only 25% ofthe bubble for photovoltaic resources, as the volume of this energy source is markedly higher thanthe volume of other resources. Source China Meteorological Administration, National Bureau ofStatistics of China, CICC Research
Application scenarios: Distributed photovoltaic and energy storage projects canhelp reduce the cost of power distribution. We expect such projects to achieve priceparity more easily than centralized photovoltaic and energy storage projects.
The exploitation boundaries: The volume of photovoltaic resources is higherthan that of other clean energy, which makes it possible to meet the increased energydemand.
5.4.2.1 Assessment of Practical Potential for Carbon-NeutralTechnologies in Non-Power Industries
The concept of price parity is not applicable to carbon capture alone. Given estimateson technology-enabled drops in energy costs per tonne of standard coal equivalent,we think that electrification has largely achieved price parity with the fossil energyand carbon capture technological route, and hydrogen energy may reach price parityin the land transportation industry by 2035. However, biomass fuel and hydrogenenergy are not very likely to achieve price parity in the manufacturing and aviationindustries.
Electrification: According to the estimates of CICC industry teams, the cost ofelectrification technologies stands at Rmb1,900 per tonne of standard coal equiv-alent, lower than the cost of natural gas and carbon capture technologies (aroundRmb3,600 per tonne of standard coal equivalent), diesel and carbon capture tech-nologies (around Rmb6,000 per tonne of standard coal equivalent), and on par withthe cost of coal and carbon capture technologies (aroundRmb1,700 per tonne of stan-dard coal equivalent). Thanks to lower clean energy costs, the cost of electrificationtechnologies may continue to drop and maintain its economic advantage.
Hydrogen energy: Hydrogen energy is expected to achieve price parity withdiesel and carbon capture technologies in the ground transportation industry by theend of the 16th FYP period, with the cost of hydrogen energy coming in at around

122 Chapter 5 Green Technology: From Quantity to Quality
Rmb5,500 per tonne of standard coal equivalent according to CICC’s estimates.However, price parity with coal and carbon capture technologies (Rmb1,200 pertonne of standard coal equivalent) in the manufacturing industries and with jet fueland carbon capture technologies (Rmb2,500 per tonne of standard coal equivalent)for hydrogen is relatively hard to achieve by 2060.
Biomass-based fuel ethanol: The CICC agriculture team estimates that the priceof biomass-based fuel ethanol will drop to Rmb4,500 per tonne of standard coalequivalent by 2060 from nearly Rmb7,000 per tonne of standard coal equivalent in2021e, higher than the cost of jet fuel and carbon capture technologies (Rmb2,500per tonne of standard coal equivalent) and thus cannot realize price parity.
If higher photovoltaic efficiency and lower electricity cost can reduce the end-market hydrogen price to Rmb12.5/kg (and Rmb5.8/kg for manufacturing industries,lower than our base-case hydrogen price forecast of Rmb18.8/kg for 2060), hydrogenwill achieve price parity in the aviation industry (and the manufacturing industries).The cost of photovoltaic power should drop to Rmb0.02/kWh or even Rmb0.00/kWhto enable price parity of hydrogen in the aviation industry, lower than our base-casephotovoltaic power price forecast of Rmb0.12/kWh for 2060. This shows that thelarge-scale use of hydrogen in the aviation and manufacturing industries remainsdifficult. In addition to hydrogen manufacturing costs, hydrogen storage and trans-portation costs should also decline. Otherwise, end-market users are more likely toutilize carbon capture technologies to achieve carbon neutrality.
Comparisons among costs of traditional energy, electrification, hydrogen energy,and biomass fuel are shown in Fig. 5.8.
In addition to the cost reduction of energy technologies, the penetration rate oftechnologies is also important. Exploitations in application scenarios and boundariesshould expand from the application side.
Application scenarios: Hydrogen energy substitution is incompatible withcurrent mainstream technologies. Carbon capture technologies can only be utilizedin fixed manufacturing facilities.
- 5,000 10,000 15,000 20,000 25,000 30,000
Coa
l and
carb
onca
ptur
eEl
ectri
ficat
ion
Avi
atio
n fu
elan
d ca
rbon
capt
ure
Die
sel a
ndca
rbon
capt
ure
Fuel
eth
anol
Hyd
roge
n
2020
Energy + Carbon capture
Rmb/tonne of standard coal equivalent
- 5,000 10,000 15,000 20,000 25,000 30,000
Coa
l and
carb
onca
ptur
eEl
ectri
ficat
ion
Avi
atio
n fu
elan
d ca
rbon
capt
ure
Die
sel a
ndca
rbon
capt
ure
Hyd
roge
nFu
el e
than
ol
2030
Energy + Carbon capture
Rmb/tonne of standard coal equivalent
- 5,000 10,000 15,000 20,000 25,000 30,000
Coa
l and
carb
onca
ptur
eEl
ectri
ficat
ion
Avi
atio
n fu
elan
d ca
rbon
capt
ure
Hyd
roge
nFu
el e
than
ol
Die
sel a
ndca
rbon
capt
ure
2060
Energy + Carbon capture
Rmb/tonne of standard coal equivalent
Fig. 5.8 Comparing the cost of traditional energy and the costs of electrification, hydrogen energy,and biomass fuel. Note Existing cost based on market prices; we use the CICC chemicals team’scarbon capture cost estimate, the CICC electrical equipment’s hydrogen cost estimate, and the costof electricity substitution program is the cost of carbon-neutral technologies in the power industry.Source CICC Research

5.4 “Photovoltaic + Energy Storage”, Hydrogen Energy, and Carbon … 123
Application boundaries: Obtaining the rawmaterials for manufacturing biomassfuels faces constraints.
5.5 Policy Suggestions: Enhancing Technology R&DProtection; Supporting the Industrialization of NewTechnologies
Policies should give support to energy forms that are cleaner and more efficient, andcreate an open environment for various technologies to compete, leaving room for themarket to decide themain direction for technology development. In formulating poli-cies, the common development direction of energy technologies should be clarified.For the development of low-carbon clean energy, policies should put forward specificrequirements (such as support for zero emissions and advanced technologies that havehigher efficiency and the potential of “surpassing” the existing more advanced tech-nologies) so as to improve China’s advantage in top-level design. Judging from pastexperience, we think that China should allow multiple technological routes to co-exist and compete. Market should have the final say, with end-market users makingchoices based on the advances in and the costs of energy technologies. Patent protec-tion is crucial to the shift from importing technologies to developing proprietarytechnologies. Since the protection of intellectual property has not been emphasizedin China, someChinese companies were forced to locate their R&D centers overseas,which bodes will for the development of alternative energy technologies in China.Policies that support patent protection should be intensified and should encouragepatent applications for research outputs, as well as support for enterprises that keepinvesting in technological development, so as to improve energy technologies.
Power sector should focus on propelling the use of non-fossil energy technologies.Emphasis should be put on the large-scale use of energy storage and power grid-related technologies. As the proportion of non-fossil energy rises, whether energystorage technologies can keep abreast of such energy holds the key. On the onehand, energy storage technologies are slightly different from electric vehicle (EV)batteries. Such technologies require lower energy density, more cycles, and attachgreater importance on safety. It will be difficult to promote energy storage technologydevelopment without sufficient market demand. On the other hand, the structure ofelectrical grids will turn from the previous “uncontrollable load and controllableelectricity source” structure to “uncontrollable load and uncontrollable electricitysource” structure, suggesting that not only policies that clarify costs are required,technological applications that reduce standby redundancy in power grids are alsoindispensable to increase efficiency and optimize the parity between supply anddemand. Policies should put emphasis on propelling pilot projects for smart powergrid technologies, showing development directions of such technologies. Non-powersectors should also support the industrialization of new technologies and introduceincentive policies at the appropriate time. Only technological advancements could

124 Chapter 5 Green Technology: From Quantity to Quality
stimulate the end-market usage in non-power sectors as the costs remain relativelyhigh. Based on historical experience, we estimate that it takes 20 years for a tech-nology to attain the level of industrialization, and takes the same amount of timeto achieve maturity in the application. Multiple technologies, including hydrogenenergy, carbon capture, and biomass technologies, among others, are now utilizedin non-power industries. However, hydrogen energy technologies are not compat-ible with the fossil energy technologies utilized in non-power industries. As such,policies that support the development of hydrogen energy-related technologies arenecessary.
The Frontrunner Photovoltaic program is a replicable success and can help indus-trialize new technologies. Government executes pilot projects and implement pref-erential policies that provide subsidies and reduce taxation to facilitate new tech-nologies to overcome barriers. The Frontrunner Photovoltaic program has providedan arena for high-efficient products and advanced technologies in the photovoltaicindustry. In the meantime, projects under this program enjoy a series of favorablepolicies that pertain to land parcels and network connections. These favorable poli-cies can reduce non-technological costs to the fullest, allowing projects to focus oncutting photovoltaic power cost and enhancing electricity generation efficiency.
When should policy support be provided? Judging from experience in other coun-tries and subsidy policies launched at the preliminary development stage for renew-able energy in China, we think that governments can roll out favorable policies fornon-power technologies (such as hydrogen and carbon capture technologies) whenthe costs of such technologies are 200% higher than the cost of traditional energy.
Reviewing Germany and Japan’s experiences in rolling out photovoltaic powersubsidies in 2000 and 2012, the prices of photovoltaic power were 163% and 250%higher than the on-grid electricity prices. In addition, China began to provide subsi-dies for onshore wind power, photovoltaic power, and offshore wind power in 2009,2013, and 2014 respectively, as the prices of onshorewind power, photovoltaic power,and offshore wind power were 45%–68%, 120%–254%, and 89% higher than theon-grid tariff for coal-fired power projects. According to these cases, it seems to bea general pattern that countries typically provide photovoltaic power subsidies whenthe price of photovoltaic power is around 200% higher than the on-grid tariff. Thecost of photovoltaic power continues to drop following the implementation of subsidypolicies, and photovoltaic power can ultimately achieve price parity with traditionalpower sources. As a result, favorable policies can be rolled out for hydrogen energyand carbon capture technologieswhen the costs of these technologies are nearly 200%higher than the cost of traditional energy. In our opinion, these policy tailwinds willfacilitate the development of hydrogen energy and carbon capture technologies, andhelp reduce the costs of these technologies.

5.5 Policy Suggestions: Enhancing Technology R&D Protection … 125
5.5.1 Technologies that May Develop More Rapidly ThanExpected
If the cost of carbon capture reduces and brings the economic advantage of thistechnology, the demand for developing hydrogen technologies may shrink. Carbon-neutral technologies used in non-power industries are mainly carbon capture,hydrogen, and biomass technologies, each having different pros and cons. Carboncapture technologies have gained the advantage of being compatible with existingenergy technologies, for carbon capture devices can be attached to the tail ends ofexisting facilities to reduce CO2 emissions, which is more convenient than hydrogentechnologies. But reducing the cost of storing the carbon captured from energyprojects remains difficult, and the overall zero-carbon cost (fossil energy + carboncapture) is subject to fossil energy prices. If carbon capture technologies can make anew breakthrough in application, the cost of carbon capture technologies may dropmarkedly, which means carbon neutrality will likely come earlier than expected asthese technologies are compatible with existing energy and manufacturing systems.
The use of nuclear powermay increasemarkedly if fourth-generation technologiescan notably improve the safety of nuclear power projects, which may further affectthe power structure. Nuclear power is of great importance as one of the cleanest andhighly efficient base-load powers. However, the development of the nuclear powerindustry has faced headwinds, e.g., nuclear power stations must be built far fromresidential areas. Workplace safety is the top priority in the nuclear power industryand the focus of nuclear technological development. Hence, if the design of nuclearpower stations can secure the safety of these projects, the scale of application willincrease rapidly. In the long term, nuclear energy is still an energy source with thehighest energy density available, and solar energy also comes from the reaction ofnuclear fusion, suggesting the sustainability of nuclear power. We believe the use ofnuclear fusion technologies will start a new technological revolution in the energyindustry once controllable nuclear fusion is achieved.
Photovoltaic efficiency is also likely to exceed our estimate. In the previoussection, we only considered the perovskite technology (the photoelectric conversionefficiency of this technology can reach 30% thanks to the current technological route),and we did not consider the use of condensation and multi-junction technologies. Itis likely for the photoelectric conversion efficiency of photovoltaic technologies toexceed 40% in the long term, given continuous technological advancements. If thecosts of photovoltaic technologies continue to drop, more applications and energyusages can be expected.

126 Chapter 5 Green Technology: From Quantity to Quality
5.5.2 Technologies that May Develop More Slowly ThanExpected
The development of energy storage technologies may proceed more slowly thanwe expect. Connecting voluminous renewable-energy-based power projects to theexisting electricity system in China may make regional power grids less balanced,due to the fluctuation in instantaneous electricity generation, daily curves, andseasonal resources of renewable-energy-based power projects. The penetration ratesof renewable-energy-based power projects (such as wind and solar power projects)are high in Australia, the UK, and California. Their power systems in recent yearsexperienced balance and safety issues under extreme conditions, requiring strongerinstantaneous balancing capabilities. In the short term, enhancing the flexibility ofthe electricity system is crucial to increasing the use of non-fossil energy. Electricitysystems could encourage thermal power peak-season rescheduling and pumpedenergy storage to improve scheduling at regional and national levels. However, prob-lems related to electricity demand forecasts and electricity price signals need to beresolved.
The development of hydrogen energy technologies may proceed more slowlythan expected. Hydrogen energy technologies are not compatible with the existingtechnologies. Technologies should improve notably so as to enable industries toshift from traditional energies to hydrogen energy. In the air transportation industry,countries have accelerated theR&Dof hydrogen-powered airplanes to resolve relatedproblems. Themixed combustion of hydrogen in aero-engines requires technologicalbreakthroughs, and hydrogen storage has imposed higher requirements on the designof fuel tanks. In September 2020, Airbus released three concepts for zero-emissionhydrogen-powered commercial aircraft slated to enter service in 2035.China’s carbonneutrality initiative may be affected, if the use of hydrogen technologies proceedsmore slowly than expected (or such technologies cannot be utilized).
Open Access This chapter is licensed under the terms of the Creative Commons Attribution-NonCommercial-NoDerivatives 4.0 InternationalLicense (http://creativecommons.org/licenses/by-nc-nd/4.0/), which permits any noncommercial use, sharing, distribution and reproduction in anymedium or format, as long as you give appropriate credit to the original author(s) and the source,provide a link to the Creative Commons license and indicate if you modified the licensed material.You do not have permission under this license to share adapted material derived from this chapteror parts of it.
The images or other third party material in this chapter are included in the chapter’s CreativeCommons license, unless indicated otherwise in a credit line to the material. If material is notincluded in the chapter’s Creative Commons license and your intended use is not permitted bystatutory regulation or exceeds the permitted use, you will need to obtain permission directly fromthe copyright holder.

Chapter 6Green Energy: A New Chapter in China
Abstract This chapter discusses howChina can cut energy-related emissions whichaccount for nearly 90% total. The sticking point is that apart from having a largebase, China’s sustained economic growth will boost its overall energy consumptiondemand as its GDP per capita catches up with developed countries, making curbingenergy-related emissions a tougher task. After calculating the green premium, webelieve green electricity and electrification have become economically feasible andtechnologically available. However, non-electric applications, including hydrogenpower require further technological upgrades and cost reductions to become econom-ically viable. Given the changes in energy consumption habits and the structuralchanges necessary to achieve carbon neutrality in China, we believe there needs tobe policy guidance and society-wide support with regard to cutting emissions. Weexpect the government to accelerate the development of immature technologies suchas hydrogen power, after their green premiums fall to certain levels. According to theestimation by CICC research teams, 70% of the energy usage will be provided bygreen electricity and 8% by green hydrogen. The rest of the 22% will be neutralizedusing carbon capture to achieve carbon neutrality in terms of energy. Realizing thisgoal requires effort from both the supply and demand sides.
6.1 Overview of China’s Current Energy Structure
6.1.1 Energy Sector Produces Nearly 90% of CarbonEmissions in China; Building Green Energy SupplySystem is Top Priority
At the current stage, China’s energy supply is still dominated by coal, with petroleum,natural gas, and non-fossil fuels providing the rest. Reducing carbon emission andtackling climate change have become the common task of the international commu-nity, and according to UN Environment Programme’s Emissions Gap Report 2019of the total emission, China is the largest carbon dioxide emitter and contributed
© The Author(s) 2022CICC Research, CICC Global Institute, Guidebook to Carbon Neutrality in China,https://doi.org/10.1007/978-981-16-9024-2_6
127

128 Chapter 6 Green Energy: A New Chapter in China
over 25% of global emissions in 2018. China’s promise to achieve carbon neutralityin 2060 will facilitate its integration into the international community and help thecountry achieve its dual circulation model, creating synergies between domestic andoverseas markets.
We believe greater efforts toward reaching “low-carbon” and “zero-emissions”are key to achieving carbon neutrality in the energy sector.
6.1.2 Total Energy Demand May Increase Under SteadyEconomic Growth Despite Decline in EnergyConsumption Per Unit of GDP
Official data shows that China’s GDP per capita is only one-sixth to one-third ofthat of developed countries, pointing to substantial growth potential. CICC macroteam expects that in 2020Q1 China’s GDP to grow 4.2%, 3.0%, 2.5% and 2.0% in2030, 2040, 2050 and 2060 respectively. China’s GDP per capita rose to US$10,276in 2019 (more than doubling from US$4,628 in 2010, see Fig. 6.1), which meansit not only met twice as much the US$10,000 GDP per capita national target buthas also successfully built a moderately prosperous society in 2020 in all respects(initiated by the 18th CPC National Congress). Looking ahead, given China’s planto basically achieve modernization by 2035 and national rejuvenation by 2050, weexpect its GDP per capita to rise to US$41,105 in 2060, reaching current levels inJapan and Germany.
0
10,000
20,000
30,000
40,000
50,000
60,000
70,000
2020
2025
E
2030
E
2040
E
2060
E
US
2019
Japa
n 20
19
Ger
man
y 20
19
Kor
ea 2
019
Taiw
an, C
hina
201
9
(USD)
Fig. 6.1 Comparison of per capita GDP (China vs. other countries and regions). Source NBS,government websites, CICC Research

6.1 Overview of China’s Current Energy Structure 129
0.0
0.1
0.2
0.3
0.4
2020
2025
E
2030
E
2040
E
2060
E
US
2019
Japa
n 20
19
Ger
man
y 20
19
Kor
ea 2
019
Taiw
an, C
hina
201
9
Standard coal in kg/USD
Fig. 6.2 Comparison of energy consumption per GDP (China vs. foreign countries and regions).Source National Energy Administration, NBS, government websites, CICC Research
China’s current energy consumption per unit ofGDP is still at a high level and to belowered by energy restructuring and conservation. According to official data, China’senergy consumption per unit of GDP stood at 0.328kg of standard coal/USD, whichis higher than developed countries’ 0.116–0.264kg of standard coal/USD (Fig. 6.2).With improvements in the country’s economic structure and its greater efforts to curbenergy consumption, we expect its energy consumption per GDP to drop 63% fromthe current level to 0.123kg of standard coal/USD in 2060, lower than current levelsin the US and Japan.
However, even considering the possible decline in energy consumption per capita,we expect China’s economic growth to boost total energy consumption to 6.73bnt ofstandard coal in 2060 (+38% compared to the current level, see Fig. 6.3).We estimatethat China’s total energy consumption will likely rise to 5.76, 6.36 and 6.73bnt ofstandard coal in 2025, 2035 and 2060 respectively, with continuous YoY growth. Asthe proportion of tertiary industries with lower energy consumption per unit of GDPrising, we expect China’s energy consumption growth to be slower and its CAGR tofall from 3.3% in 2021–2025 to 1.0% in 2025–2035 and 0.2% in 2035–2060.
6.1.3 Carbon Emissions Reduction is Difficult to AchieveUnder Current Energy Structure; The Country NeedsStronger Top-Down Planning and Policy Support
As the world’s largest emitter, China confronts multiple difficulties in loweringcarbon emissions. To achieve carbon neutrality, China’s energy structure should be

130 Chapter 6 Green Energy: A New Chapter in China
0
50
100
150
200
250
300
350
0
1
2
3
4
5
6
7
2005 2010 2015 2019 2020E 2025E 2030E 2035E 2040E 2045E 2050E 2055E 2060E
Primary sector Secondary sectorTertiary sector Household sectorGDP per capita vs. 2020 (RHS) Unit GDP energy consumption vs. 2020 (RHS)
(bn tonnes of standard coal) (%)
Fig. 6.3 Total energy consumption forecast. Source NBS, CICC Research
cleaner, safer and more economically feasible. With increasing energy demand andrestrictions on carbon emissions, the goal to achieve carbon neutrality will be morechallenging for China, which requires stronger policy support. It will also accelerateChina’s energy transformation, benefiting economic growth eventually. Setting thegoal of carbon neutralitymarks China’s step toward energy reform, andwill make thecountry’s energy structure cleaner, safer and more economically favorable in 2060.The energy structure in China is displayed in Fig. 6.4.
To reach carbon neutrality in the energy industry, China should make electricpower generated by non-fossil fuels the major energy source in its future zero-emission system and accelerate the rate of electrification. The government may also
84 80 72
52
31 22
9 8
8
7
7
7
2 3
4
7
10
11
3 5
8
13
17 17
2 4 9 21
33 35
2 8
0
10
20
30
40
50
60
70
80
90
100
2019 2025E 2030E 2040E 2050E 2060E
Fossil energy Hydropower Nuclear power Wind power Photovoltaic Hydrogen energy
16 20
48
6770
28
(%)
Emission offset by carbon capture
Fig. 6.4 China’s energy structure (2019–2060). Source BP Energy, CICC Research

6.1 Overview of China’s Current Energy Structure 131
promote the development of new non-electric technologies such as hydrogen energyand carbon capture technology. Based on estimates by various CICC sector researchteams, we expect the energy sector to achieve carbon neutrality by 2060 throughraising clean electricity’s share of total energy supply to 70%, green hydrogen’sshare to 8%, and the share of other energy sources supported by carbon capturetechnologies to 22%. Attaining this goal requires efforts from both the supply anddemand sides. On the supply side, power generation should be cleaner, while onthe demand side, government should encourage the deployment of other renewabletechnologies.
6.2 Start from More Feasible Methods to Achieve EnergyTransition Through More Economical Ways
How can the energy sector contribute to carbon neutrality? Given that Chinashould achieve green electricity first, then clean non-electric energy, raising theelectrification rate should help accelerate emission cuts.
Energy transition lays the foundation for carbon neutrality. We think it will bedifficult for the cement, steel and electrolytic aluminum industries to completelyinternalize the cost of achieving carbon neutrality given their current energy structure,technology level and costs. In contrast, the chemical industry can internalize the costsbut would have to sacrifice profitability. The costs of carbon neutrality are moreaffordable for manufacturing industries only.
Among all the paths to achieve carbon neutrality, why dowe think green electricityshould come first, and then non-electric applications?
Green Electricity: We believe replacing thermal power with clean energies caneffectively lower carbon emissions from power generation. We estimate the powerindustry’s green premium will likely turn negative by 2030, ahead of other sectors.A zero-emission electric power generation system is almost economically feasibletoday, and its green premiums may turn negative in 10 years with lower grid costs.
Clean Non-electric Energy: Acceleration of electrification rate, energy conser-vation, carbon emissions reduction, and new technology applications includinghydrogen power and carbon capture, rely on technology breakthroughs and policysupport. Green premiums for hydrogen power and carbon capture are likely toremain high in the near future and China should focus on electrification since itis more economically feasible. We estimate China’s electrification rate may rise to70% by 2060, and the remaining 30% of energy demand could be met by hydrogenpower and carbon capture technology. These two technologies have different applica-tions. According to estimates by various sector teams in CICC Research, we believethe penetration rate of carbon capture will likely be higher in 2060, especially inthe commodities sector. In contrast, hydrogen power will likely be applied more inthe transportation and chemical sectors. Our estimation of the green premium in thenon-power sector is 175% in 2021. If costs of fossil fuels stay unchanged but those

132 Chapter 6 Green Energy: A New Chapter in China
of carbon capture and hydrogen power decline, green premiums in the non-powersector may fall to 57% in 2030 and 14% in 2060.While theymay fall, we believe theywill stay above 0%. This means that the total cost of non-electric power consumptionwill likely rise to achieve carbon neutrality.
As shown in Table 6.1, green electricity and clean non-electric applicationscombined present the best solution for carbon neutrality.
6.3 Lowering Costs to Raise Non-fossil Fuels’ Proportionin Power Generation
6.3.1 Calculation of Green Premiums in Power Sector
Costs in the power sector mainly come from three key variables: power generation,absorption, and electricity transmission and distribution. For power generation, welook at the structure of power sources and their costs per kilowatt-hour (kWh) ofelectricity generation. For absorption, the proportion of flexible power resourcesincluding peak-load regulation supported by thermal power units, pumped-storagehydropower, electrochemistry energy storage, and their costs per kWh generation.Moreover,we expect the penetration rate growthofwind andphotovoltaic (PV)powerto boost demand for absorption, pushing up the proportion of absorption volumein power generation. Thus, compared with the base scenario, achieving carbonneutrality will change power generation costs and boost demand for absorption. Weassume the costs of electricity transmission and distribution remain unchanged. Weexpect green premiums in China’s power industry to turn negative by 2030 (Fig. 6.5).
2021: Compared to the basic scenario, in the carbon neutrality scenario, the greenpremium is 6% for power generation, and 3,600% for absorption. If the cost ofelectricity transmission and distribution remain unchanged, the green premium inthe power sector would be 17%.
2030 forecast: Compared with the base scenario, power generation sees a greenpremium of −17% in the carbon neutrality scenario and around 5 times the size ofgreen premiums in absorption. The green premium in the power sector may thus turnto −4% in 2030.
The CICC alternative energy and electrical equipment team expects all thermalpower units to retire in 2051. By then, China’s energy source mix should includehydro, nuclear, wind and solar energies, achieving zero-emissions.

6.3 Lowering Costs to Raise Non-Fossil Fuels’ Proportion … 133
Tabl
e6.
1Green
electricity
andcleanno
n-electricapplications
combinedpresentthe
bestsolutio
nforcarbon
neutrality
Green
electricity
+Clean
non-electric
energy
Energysaving
andem
ission
reduction
only
Carbonsink
only
Impacton
econom
icdevelopm
ent
Emerging
manufacturing
drives
industrialupgradingandeconom
icdevelopm
ent
Suppress
thegrow
thof
energy
demandandeconom
icdevelopm
ent
Massive
forestland
required
toachieve
carbon
neutrality,thus
affectingland
resources
Conclusion
Positive
Negative
Negative
Impacton
energy
security
Renew
ablemanufacture
industry
will
help
China
getrid
ofenergy
importand
becomean
energy
exporter
Still
rely
onenergy
impo
rtStill
rely
onenergy
import
Conclusion
Positive
Neutral
Neutral
Impacton
carbon
emissions
Reach
carbon
neutrality
Carbonpeak
canbe
reached,
while
carbon
neutralitycannot
bereached
Reach
carbon
neutrality
Conclusion
Positive
Positive
Positive
Cost
The
decrease
ofthecostof
Photovoltaicpower
generatio
nand
storageisexpected
todrivedownthe
costof
energy
usein
thewholesociety,
whilehydrogen
energy
andcarbon
captureslightly
raisethecostof
energy
use
The
carbon
taxcolle
ctionprocessas
adrivingfactor
will
bringadditio
nal
econ
omiclosses
Highcostof
greening
Conclusion
Positive
Negative
Negative
Com
preh
ensi
veco
nclu
sion
Bes
tso
luti
on
Source
CIC
Cresearch

134 Chapter 6 Green Energy: A New Chapter in China
0
100
200
300
400
500
600
Benchmark scenario Carbon neutrality
2021Transmission and distributionGrid balancingElectricity generation
+17%Green
premium
Rmb/MWh
0
100
200
300
400
500
600
Benchmark scenario Carbon neutrality
2030Transmission and distributionGrid balancingElectricity generation
-4%Green
discount
Rmb/MWh
Fig. 6.5 The green premium in the power industry in 2021 and 2023 (the CICC alternative energyand electrical equipment team expects China’s power system to achieve carbon neutrality in 2051).Note Our estimation of costs per kWh power generation is based on data from China ElectricityCouncil, energy companies, GGII and LEK Consulting; we cross check it with electricity pricesreleased by National Energy Administration and regional power grids. Source China ElectricityCouncil, corporate filings, GGII, LEK, CICC Research
6.3.2 Power Generation: Non-fossil Energy’s Lower CostsPer kWh Fuels Transition to Cleaner Energy Mix
The costs per kWh electricity generation of hydropower and wind power are alreadylower than that of thermal power in 2021 (see Fig. 6.6 left side). But the nationwideaverage costs per kWh of nuclear power and PV power are still slightly higher thanfor thermal power. Thermal, hydro, wind, nuclear and PV power account for 68%,16%, 7%, 5% and 4% of total generation, respectively. We estimate average powergeneration cost in China is Rmb293/kWh. In the carbon neutrality scenario, if the
49% 24% 16% 10%
2060Power structure
-
50
100
150
200
250
300
350Power cost
Photovoltaic Wind power Nuclear power Hydropower
54% 14% 13% 12% 7%
2030Power structure
-
50
100
150
200
250
300
350Power cost
Thermal power Photovoltaic Wind powerHydropower Nuclear power
68% 16% 7% 5% 4%
2021Power structure
-
50
100
150
200
250
300
350
400Power cost
Thermal power Hydropower Wind power
Nuclear power Photovoltaic
(Rmb/MWh)(Rmb/MWh) (Rmb/MWh)
Fig. 6.6 Breakdown of costs per kWh power generation (generation costs determine proportion).NoteOur calculation of costs per kWh power generation is based on data from the China ElectricityCouncil, energy companies, GGII and LEK Consulting; we cross check it with electricity pricesreleased by the National Energy Administration and regional power grids. Source China ElectricityCouncil, corporate filings, GGII, LEK, CICC Research

6.3 Lowering Costs to Raise Non-Fossil Fuels’ Proportion … 135
power system achieves zero-emissions by 2060, average green electricity costs willrise to Rmb311/kWh, with a green premium of 6%.
In 2030, we estimate the costs of PV and wind power may be lower than that ofhydro and nuclear power, and the cost of clean energy lower than thermal power.According to the CICC alternative energy and electrical equipment team’s powerresource mix forecast (thermal, PV, wind, hydro and nuclear power contribute 54%,14%, 13%, 12% and 7% of total power generated in 2030), we estimate China’spower generation cost would then be Rmb257/kWh in 2030. In the carbon neutralityscenario, the cost of green electricity is Rmb213/kWh under a zero-emission struc-ture. And as the costs of wind, hydro, nuclear and solar power are lower than thermalpower, the green premium of power generation would turn to −17% by 2030 (seeFig. 6.6 middle).
As the costs of clean power are lower than thermal power after 2030 and thermalpower units would gradually retire, the CICC alternative energy and electrical equip-ment team expects emissions of the power generation system would fall withoutexternal help and would see zero emissions by 2060 (see Fig. 6.6 right side).
6.3.3 Absorption: Complementary Multi-energy SystemMinimizes Absorption Costs
We believe that increasing the new energy penetration rate will drive up absorp-tion costs. Given global experiences, we notice that absorption costs (calculatedby amortized ancillary power system service costs of per kWh power generation)will likely rise notably with wind power and PV power’s penetration rate growthin the power system. By then, absorption can represent 10%–20% of total costs indifferent power markets, hence extending the time for green premiums to fall to zero.We expect a multi-energy complementary power system would minimize absorptioncosts. Breakdown of per kWh absorption costs is displayed in Fig. 6.7.
As peak-load regulation supported by thermal power can minimize absorptioncosts, we don’t think thermal power will be abandoned in the near future.
Amulti-energy complementary system effectively lowers absorption demand andcosts as well as green premiums of power generation and power grid (see Fig. 6.8).
If electrochemistry energy storage achieves technology breakthroughs and muchlower prices with policy support, it may notably lower absorption costs and helpChina achieve green electricity earlier.

136 Chapter 6 Green Energy: A New Chapter in China
100%
2021Grid balancing energy structure
-
200
400
600
800Grid balancing cost
Thermal power flexibility transformationPumped storageElectric energy storage
(Rmb/MWh) (Rmb/MWh) (Rmb/MWh)
70% 30%
2030Grid balancing energy structure
-
100
200
300
400
Thermal power flexibility transformationPumped storageElectric energy storage
17% 83%
2060Grid balancing energy structure
165 170 175 180 185 190 195 200 205 210 Grid balancing cost
Pumped storage Electric energy storage
Grid balancing cost
Fig. 6.7 Breakdownof per kWhabsorption costs (costs determine structure).SourceOur estimationof costs per kWh power generation is based on filings, and data from GGII and LEKConsulting, wecross check it with the electricity prices released by National Energy Administration and regionalpower grids
6.4 Non-power Sector: Electrification, Hydrogen Powerand Carbon Capture Fuel Energy Transition
6.4.1 China’s Electrification Rate Will Likely Reach 70%;The Remaining 30% Demand Requires Non-electricPower and Other Energy Resources Supported by NewTechnologies to Achieve Carbon Neutrality
Looking into sub-sectors, black metal (iron and steel), transportation and ware-housing (AFV, railway) and civil sectors (collective heating) have more room forgrowth in electrification (Fig. 6.9). Based on our estimation, non-electric powerconsumption accounted for 54% of China’s energy consumption in 2019. However,some energy cannot be replaced by electric power given higher requirements forenergy density and long-term storage, and the fact that it cannot transform to electricpower. Based on the estimation from the CICC research team of the future form ofenergy, together we see the electrification rate in 2060 may reach 70%, with otherenergy sources meeting the remaining 30% demand.
6.4.2 Non-power Sector: Hydrogen Power and CarbonCapture is Feasible Technology Solution to CarbonNeutrality
Achieving carbon neutrality in the non-power sector is the last step towards overallcarbon neutrality. We think carbon capture and hydrogen power are two feasibletechnologies at the current stage. Carbon capture’s penetration rate will likely behigher, especially in commodities sectors. In contrast, hydrogen power would be

6.4 Non-power Sector: Electrification, Hydrogen Power … 137
01
23
45
67
89
1011
1213
1415
1617
1819
2021
2223
Hou
r
Phot
ovol
taic
out
put
Ener
gy st
orag
e ch
argi
ng (-
)
Ener
gy st
orag
e di
scha
rge
(+)
Elec
tric
load
Peak
shav
ing
44%
01
23
45
67
89
1011
1213
1415
1617
1819
2021
2223
Hou
r
Win
d po
wer
out
put
Ener
gy st
orag
e ch
argi
ng (-
)
Ener
gy st
orag
e di
scha
rge
(+)
Elec
tric
load
Peak
shav
ing
28%
01
23
45
67
89
1011
1213
1415
1617
1819
2021
2223
Hou
r
Phot
ovol
taic
out
put
Win
d po
wer
out
put
Ener
gy st
orag
e ch
argi
ng (-
)En
ergy
stor
age
disc
harg
e (+
)
Elec
tric
load Pe
aksh
avin
g 13
%
Fig
.6.8
Windandsolarpower
cancompensateeach
other;multi-energy
complem
entary
system
lowersdemandforenergy
storage.Source
CIC
CResearch

138 Chapter 6 Green Energy: A New Chapter in China
26
60
11
56 50
100
55 57 46
70
0
20
40
60
80
100
120
01,0002,0003,0004,0005,0006,0007,000
2017 2060E 2017 2060E 2017 2060E 2017 2060E 2017 2060E
Ferrous metalindustry
Transportation andlogistics
Householdconsumption
Others Total
Amount electrified Amount not electrified Electrification rate(mn tonnes of standard) (%)
Fig. 6.9 Electrification rate forecast for major energy consumption sectors (2017 vs. 2060). SourceNational Energy Administration, CICC Research
applied in the transportation and chemical industries. The two technologies havedifferent application scenarios but should develop at the same pace.
Carbon capture is more suitable for industrial sectors. Electrification is limited insome industrial sectors, including chemistry, metal and non-metal smelting, paper-making as they require fuel burning which cannot be substituted by the electricity.Adopting hydrogen power would require a new production process. In contrast,we believe carbon capture technology is more convenient in these instances. It canintegrate with existing technologies and requires some extra equipment.
Hydrogen power is more suitable for transportation and chemical industries. Insome sectors, it is the energy consumption model rather than costs that limit elec-trification. For example, electric power cannot support long-term transport such asaviation and shipping. But hydrogen power’s high energy density makes it the mostfeasible to replace the fossil energy.
6.4.3 Other Energy Resources Adopted Carbon Captureand Hydrogen Power to Meet 22% and 8% EnergyDemand in 2060
6.4.3.1 Hydrogen Power
Given the carbon emission forecasts for major emissions contributors, we expecthydrogen power consumption volume will rise to 110mnt (540mnt of standard coal)and 130mnt (650mnt of standard coal) in 2060 in neutral and optimistic scenariosunder carbon neutrality, fulfilling 8%–10% of energy demand in 2060.
Transportation: With hydrogen power’s high mass-energy density and low volu-metric energy density, hydrogen fuel cells can be used in long-distance transportscenarioswithout strict space requirements, such as highways, heavy-duty trucks, and

6.4 Non-power Sector: Electrification, Hydrogen Power … 139
aviation. Its fast charging feature also facilitates commercialization. In the optimisticscenario, the CICC transportation team expects 100% hydrogen-fueled heavy-dutytrucks and the use of hydrogen power in aviation and shipping sectors.
Chemical industry: We expect to see hydrogen power in synthetic ammonia andmethanol production. We think synthetic ammonia production can transform fromalkaline electrolysis cells (AEC) to proton exchange membrane electrolysis (PEM)and finally to solid oxide electrolysis cells (SOEC), achieving 100% replacementof fossil fuels by hydrogen power. Methanol production will likely see similartransitions.
Manufacturing: We expect manufacturing subsectors to raise their concentrationratios via merger and acquisition, as well as market competition. As the total numberof players reduces, advanced processes can be more widely applied.
6.4.3.2 Carbon Capture
Given our technology path forecast, some raw materials or fuels cannot be replacedby electric or hydrogen power. Based on estimation by CICC sector research teams,around 22% of fossil-fuel energy (equivalent to 1.34bnt of standard coal) cannot bereplaced, which accounts for around 3.4bnt in carbon dioxide emissions.
Cement: According to the estimation from Gao Changming and other academics,they expect that the theoretical substitution ratio (TSR) in China’s cement industryto reach 25% in 2030 and 70% in 2050. Carbon dioxide emissions from calciumcarbonate consumption and fuel consumption are 0.36 tonnes and 0.18 tonnes pertonne of cement. Even considering the reduction in the total output of cement throughrecycling and overall infrastructure development, the remaining carbon dioxide willstill need to be offset by carbon capture.
Steel: If directly reducing iron ore in a blast furnace, it is possible to use 100%non-fossil fuels but not feasible for production processes. So the CICC commodityteam’s estimate is made on the assumption that steel production requires fossil fuelsand that coke remains a vital reducing agent.
Aluminum: Aluminum oxide production needs carbon capture technology as itcannot avoid the use of fossil fuels.
6.4.4 Costs and Green Premiums of Non-power CarbonNeutrality Solutions
As mentioned earlier, we estimate that electric power will not meet the remaining30% energy consumption demand in our carbon neutrality case. To achieve zero-emissions in non-power energy consumption, we estimate 33% of energy can be

140 Chapter 6 Green Energy: A New Chapter in China
replaced by hydrogen power, and the rest, i.e. coal, petroleum, and natural gas willneed to adopt carbon capture technology. Based on these assumptions, we comparethe carbon neutrality and base cases, and estimate the green premium of the non-power energy supply at 175% in 2021. If the costs of fossil-fuel energy remainunchanged and that of carbon capture and hydrogen power decline, we expect thesector green premiums of non-power sector to fall to 57% in 2030 and 14% in 2060,still above zero. In sum, to achieve carbon neutrality, the overall cost of non-powerenergy consumption will likely rise.
For hydrogen power, we estimate the per unit hydrogen-based power costs will fallfrom around Rmb13,000/tonne of standard coal in 2021 to around Rmb4,000/tonneof standard coal in 2060, still higher than the estimated weighted average power costsof around Rmb2,400/tonne of standard coal in 2021. Thus, hydrogen power will stillhave a green premium by 2060.
For carbon capture, we expect that per tonne carbon dioxide capture costs to fallfrom Rmb465/tonne (our estimate) in 2021 to Rmb262/tonne in 2060. As carboncapture is applied in the end-process, it creates extra costs compared with the basescenario and its green premium will stay above zero.
Based on our estimates, we note the cost of hydrogen power is lower than thediesel oil plus carbon capture solution (Fig. 6.10). As it is difficult for coal power ornatural gas to adopt carbon capture technology, it would be easier to use hydrogenpower in diesel-based consumption scenarios. Given practices in foreign countriesand subsidy policy for renewable energy inChina,we suggest that supporting policieskick inwhen the green premiumof non-electricity energy technologies, i.e., hydrogenpower and carbon capture, is near 200%.
0
3,000
6,000
9,000
12,000
15,000
2021E 2030E 2040E 2050E 2060E
Coal+Carbon capture Natural gas+Carbon capture Petroleum+Carbon capture Hydrogen energyRmb/tonne standard coal
Fig. 6.10 Comparison of non-power zero-carbon solutions. Source CICC Research

6.5 Policy Recommendation: Power System Reform Accelerates Non-fossil … 141
6.5 Policy Recommendation: Power System ReformAccelerates Non-fossil Energy Absorption and Helpsthe Development of Hydrogen Power
6.5.1 Policy Recommendation for the Power Sector: StabilizeNew Energy Absorption
First, continue to improve the ancillary power system service market. Improvingancillary power system services is a good choice for China, as power storage isstill not economically feasible. The government can enhance pricing mechanisms,incentivizing flexible power sources (thermal power with adjustable output, pumped-storage hydropower, power storage and demand response) to participate in powerdispatching. Thus, when renewable resources account for the majority of output,it can lower the proportion of flexible resources to reduce the waste of renewableelectric power.
Second, begin to adopt emission trading system. We think the government shouldbuild support mechanisms for emission trading system. Electricity’s spot pricesreflect real-time demand and supply conditions. This facilitates peak shaving andvalley filling. Moreover, it enables peak-valley spread arbitrage, accelerating thegrowth of energy storage demand. However, a mature trading system take time andeffort to build. The spot market may face uncontrollable risks, such as fluctuationsin prices. When electricity spot market can guide flexible resource investment, aswell as operation and demand response, we expect the government to build effectivesupporting mechanisms to avoid potential risk in extreme scenarios.
Third, promote pilot energy storage projects. Energy storage helps enhance thestability andflexibility of newenergypower output.Webelieve this is an effectivewayto raise renewable energy absorption capability in the parity era of “new energy plusenergy storage solutions”. We believe energy storage reform at new-energy powerplants is the most effective and least challenging way to promote energy storage. Itdoesn’t need a newmarket mechanism and will not challenge the power grid’s safetyrequirements. However, such a reform may lower ROI. Apart from policy support,we think the government can launch pilot energy storage projects, offering subsidies,tax reductions, and preferential policies to facilitate project developers’ land use andgrid connections.

142 Chapter 6 Green Energy: A New Chapter in China
6.5.2 Policy Recommendation for Non-power Sector:Building Supporting System for Carbon Reduction;Establishing Reward and Penalty System to Fuel CleanEnergy Development
First, the government may build supporting systems for carbon reduction. Takingcoal-to-gas and coal-to-electricity programs as an example, they may encounterproblems including unstable natural gas supply, subsidy delays, and insufficientinfrastructure construction such as transmission pipelines. Apart from technologyavailability, we think the supporting system is crucial in planning low-carbon andzero-emission technology promotion.
Second, the government should launch a carbon trading rewards and punishmentsystem to make the industrialization of new technology more economical. We expectcarbon trading to accelerate upgrades of low-carbon technology in the non-powersector by limiting total emissions. Companies with large emissions will suffer envi-ronmental costs that weigh on production and operation and weaken their compet-itiveness. We expect carbon trading to push companies to reduce carbon emissionsso as to lower costs. We believe subsidies for zero-emission or carbon-negative tech-nologies (e.g., hydrogen power and carbon capture) will likely motivate companiesto make the required changes to their operations.
Open Access This chapter is licensed under the terms of the Creative Commons Attribution-NonCommercial-NoDerivatives 4.0 InternationalLicense (http://creativecommons.org/licenses/by-nc-nd/4.0/), which permits any noncommercial use, sharing, distribution and reproduction in anymedium or format, as long as you give appropriate credit to the original author(s) and the source,provide a link to the Creative Commons license and indicate if you modified the licensed material.You do not have permission under this license to share adapted material derived from this chapteror parts of it.
The images or other third party material in this chapter are included in the chapter’s CreativeCommons license, unless indicated otherwise in a credit line to the material. If material is notincluded in the chapter’s Creative Commons license and your intended use is not permitted bystatutory regulation or exceeds the permitted use, you will need to obtain permission directly fromthe copyright holder.

Chapter 7Green Manufacturing: CarbonEmissions Reduction Roadmapof Carbon Intensive Sectors
Abstract The implementation of green manufacturing is a key step for China toachieve carbon neutrality. According to China Emission Accounts and Datasets(CEADs), energy-intensive industries such as steel, cement, oil and gas, chemi-cals and non-ferrous metals, were responsible for about 36% of China’s total carbonemissions in 2017. This chapter analyzes changes in the green premiums of thesteel, cement, non-ferrous metals, general manufacturing industries, as well as oil,gas and chemicals at different stages of development to explore how manufacturingsectors may become carbon neutral. Having analyzed total carbon emissions andgreen premiums of various sectors, we conclude that the higher the proportion ofcarbon emissions from internal production processes is, the higher green premiumsare and the more difficult it is to reduce carbon emissions. As thermal power may begradually replaced by renewable energy sources, we believe emissions from powerconsumption may decline sharply. If emissions of an industry mainly come frominternal production processes rather than electricity consumption, such an industrywould need to upgrade technological routes or adopt carbon capture technologiesto reduce emissions, which means a higher green premium. We believe 2021–2030may be the toughest period for emission cuts in manufacturing industries. Whileit is relatively easier to cut emissions from power generation, electricity consump-tion is not the main culprit for carbon emissions in most energy-intensive industries.Therefore, these industries may face both financial and technological problems incutting emissions, especially in the early stages before 2030. Based on the directemissions from internal production processes (without taking into account emis-sions from power consumption), we estimate a green premium ratio (i.e., magnitudeof cost increase to achieve net-zero emissions) of 21% for steel, 151% for cement, 4%for aluminum, 61% for chemicals, and 8% for oil and gas sectors in 2019. Earningsof general manufacturing industries may decline about 3% if the green premium istaken into account. We believe these industries will need supportive public policiesin this period to help them solve their problems, complete technology upgrading, andfind a feasible path for emission cuts. During the period from carbon peak to carbonneutrality, we believe energy-intensive industries may face much milder pressure onemission reduction as these industries can finally develop a feasible and affordableroadmap for emission cuts. With low-carbon transition and falling aggregate supplyand demand of some energy-intensive industries, we believe the green premium ratio
© The Author(s) 2022CICC Research, CICC Global Institute, Guidebook to Carbon Neutrality in China,https://doi.org/10.1007/978-981-16-9024-2_7
143

144 Chapter 7 Green Manufacturing: Carbon Emissions Reduction Roadmap …
(based on emissions from internal production processes) may decline to 6.7% forsteel, 67.5% for cement, 2.0% for aluminum, −0.8% for chemicals, and −3.3% foroil and gas sectors in 2060, much lower than the current levels.
7.1 Cost of Zero Emissions: Analyzing the CarbonNeutrality Roadmaps of Manufacturing Industriesfrom Perspective of Green Premiums
This chapter analyzes changes in the green premiums of the steel, cement, non-ferrous metals, oil and gas, chemicals, and general manufacturing industries atdifferent developing stages to explore how manufacturing sectors might becomecarbon neutral.
First of all, under the current technological conditions, the additional cost ofachieving zero emissions inmajormanufacturing industries is very high. Therefore, itis difficult to achieve carbon neutrality in manufacturing sectors overnight. Reducingcarbon emissions must be conducted progressively at a cost that the industry itselfand downstream sectors can afford. The current carbon emissions of energy-intensivemanufacturing industries can mainly be classified into two categories: electricityand non-electric emissions. The electricity category can achieve zero emissions byconverting thermal power into low-carbon electricity such as wind power and photo-voltaic power generation, resulting in lower additional costs. However, it is difficultfor the non-electric category to achieve zero emissions without the help of carboncapture technology, and achieving zero emissions is costly. Overall, apart from thegeneral manufacturing industry, the current green premium level of key manufac-turing industries is generally high.We estimate that in order to achieve zero emissionswith direct and indirect emissions reduction method, the green premium ratios of thesteel, cement, electrolytic aluminum, basic chemical, and petrochemical industriesare 22%, 156%, 34%, 66%, and 8%, respectively. The profit of the general manufac-turing industry will drop by about 3% from the level of 2019. If considering the non-electric emissions only, the green premiums of steel, cement, electrolytic aluminum,basic chemicals, and petrochemicals in 2019 were 21%, 151%, 4%, 61%, and 8%,respectively.Most industrieswill not be able to afford the internalized carbon neutral-ization costs without passing on rising costs to downstream. The cement industry,which has the highest green premium, would even need to pay about 3 years ofnet profit to achieve zero emissions at this point. Therefore, it is difficult to achievecarbon neutrality inmanufacturing industry now. It needs to be done step by step, andpublic policy tools should be used to guide enterprises to and promote technologicalinnovation. Various industries need to develop practical emission reduction pathsbased on actual conditions of their industries and downstream sectors (see Fig. 7.1).
Second, we discuss whether various industries can use existing technologicalinnovations and available public policy tools to explore an optimal emission reduc-tion path. The manufacturing industry still needs to use policy tools such as supplyrestriction in the early stages of carbon peak, while after carbon peak is reached,

7.1 Cost of Zero Emissions: Analyzing the Carbon Neutrality Roadmaps … 145
Current carbon dioxide emission scale measurement
Green premium in various industries
Green premium for the carbon emission structure of energy-
intensive manufacturing industries
Effective carbon emission reduction paths
Possible combination of technical paths
Power decarbonization
Mature non-electric emission reduction path
The immature technical path
Carbon capture
Public policy tools available
Carbon trading/carbon tax
Other innovative incentives
Close down high-emission production
capacity
Carbon emission reduction path under reasonable scenario
(2020~2060)
Can achieve carbon neutrality
Can't achieve carbon neutrality
Carbon emissions are expected to peak in 2030 and green premium
will go down
Green premium during carbon peak and carbon neutrality period
By 2060, the green premium for electrolysis aluminum, general manufacturing and steel will be
reduced to a lower level
Green premium means the extra cost to manufacture products per tonne using zero
emission technologies at current stage
Fig. 7.1 A mind map for green manufacturing. Source CICC Research
the mature carbon reduction technology and the natural decline of industry produc-tion and sales will become important drivers of emission reduction. First, since themain sources of carbon emissions of aluminum and general manufacturing industriescome from electricity, it is the least difficult to reduce emissions. Carbon peak andreduction of carbon emissions can be achieved through imposing proper productionlimits as well as restricting the upper limit of production capacity at the initial stage.As the proportion of thermal power gradually reduces to zero, we expect electricity-related carbon emissions to be close to zero by 2060. Second, the steel industry canconvert high-emission blast furnace production capacity into low-emission electricarc furnaces (this technology is mature but faces constraints from the availabilityof raw materials. We expect the proportion of steel production using electric arcfurnaces to reach 60% by 2060). The adoption of low-carbon transformation byblast furnaces could be another solution, but it is not yet at a mature stage. In theearly stages of carbon peak, certain restrictions on production capacity and outputstill need to be imposed. In the middle and later stages, public policy tools, such ascarbon tax, carbon trading mechanism, and pilot subsidy mechanism can be used toencourage enterprises to reduce emissions and achieve industrial upgrading. Third,under the current conditions, as cement and chemical industries lack mature tech-nologies to significantly reduce carbon emissions, they are highly dependent oncarbon capture technologies. The early carbon peak mainly relies on restrictions onproduction capacity and output. It is also necessary to adopt policies to encourage

146 Chapter 7 Green Manufacturing: Carbon Emissions Reduction Roadmap …
enterprises to carry out technological transformation to reduce emissions.In order to quantify the effectiveness of emission reductions, we also forecast
the carbon emissions of various industries from 2020 to 2060 under reasonabledeductions on future circumstances. This shows that most industries are expected toreach peak carbon emissions ahead of schedule and achieve carbon neutrality withthe aid of carbon capture in 2060. Other than prompting technologies upgrading andlimiting production, forcing retirement of outdated productionmethods could also bean important tool. The impact on these industries is similar to supply-side reforms.Based on our estimates,most industries are likely to achieve carbon peak around 2030given the policies above. From 2030 to 2060, the growth of production and sales insome industries might slowdown or even decline. After the new technology reachesa mature stage, the technological transformation of enterprises will be promoted on alarger scale, which will lead to reduction in carbon emissions per tonne of products.By 2060, the steel, cement, aluminum, and the chemical industries are expected toreduce carbon emissions by 79%, 78%, 90%, and 63% compared to 2019 levels,respectively, without the use of carbon capture technology. As the cost of carboncapture drops sharply, the technology will be used to achieve carbon neutrality, andbecome affordable for these industries. As a result, these industries are expectedto become carbon neutral. We expect the general manufacturing industry to fullyachieve carbon neutrality without the use of carbon capture technology by 2060.
Finally, we calculate the green premiums of various industries during the carbonpeak (2030) and carbon neutrality (2060) periods under reasonable circumstancesto observe whether the burden of achieving carbon neutrality on enterprises willdecrease significantly over time and lead to a positive conclusion. For industries inwhich carbon emissions are mainly derived from electricity, namely aluminum andgeneral manufacturing, and industries that have mature paths to significantly reducecarbon emissions, namely steel, their green premiums should decline sharply andwill reach an affordable level, or even close to zero. For industries that have notyet established a mature emission reduction path, such as cement and chemical, thegreen premium will also fall sharply. Companies can carry cost pressures throughappropriate price increases.
In summary, manufacturing industries will likely face the greatest challenge inreducing emissions in the following 10 years, and the pressure may be reducedsignificantly after that. In these 10 years, the industries face both technical diffi-culties and cost dilemmas. To achieve carbon neutrality under current conditions,all high-energy-consuming manufacturing industries except for general manufac-turing will face substantial increases in costs and potentially heavy losses. There-fore, in the early stages of reducing carbon emissions, it is necessary to takestep-by-step approach, and the government should provide strong support to enter-prises using public policy such as carbon trading mechanisms, pilot subsidies, andproduction restrictions to help overcome difficulties. After 2030, the green premiumsof various industries are likely to decline sharply. In 2060, the green premium ratios ofsteel, cement, aluminum, chemicals, and petrochemicals will be 6.7%, 67.5%, 2.0%,−0.8%, and −3.3%, respectively, all of which will drop significantly compared to

7.1 Cost of Zero Emissions: Analyzing the Carbon Neutrality Roadmaps … 147
2019. Therefore, with technological innovation and policy support, manufacturingindustries will eventually find a reasonable and affordable way to reduce emissions.
7.2 Steel Industry: Mature Emission Reduction Pathwith Electric Arc Furnace Gradually DemonstratingAdvantages
7.2.1 Industry Green Premium: Cost for the Steel Industryto Achieve Carbon Neutrality at the Current Stage
The steel industry is the industrywith the largest carbon emissions in China industrialsectors and a pillar industry for economic and social development. Therefore, carbonneutrality in the steel industry is crucial to China carbon neutrality. We estimatecarbon emissions from China’s steel industry might reach 1.54bn tonnes in 2019,accounting for 47% of carbon emissions from industrial sectors and 18% of China’stotal carbon emissions. The steel industry is the largest carbon emitter among allindustrial sectors.
High carbon emissions have led to a relatively high level of green premium inthe steel industry. We estimate that production of one tonne of steel using the blastfurnace process emits 1.68tonnes of carbon dioxide, of which 1.42tonnes comesfrom internal production processes and 0.26tonnes from electricity consumption.About 0.4tonnes of carbon dioxide is emitted for every tonne of steel produced usingthe electric furnace process. The main raw materials are iron ore and coke for blastfurnace process and are steel scraps for electric furnace process. Having consideredelectricity consumption, we estimate the green premium for each tonne of crudesteel produced is Rmb695, corresponding to a 22% increase of pre-carbon neutralitycosts. It also implies an industry-wide green premium of Rmb690bn. Given that theaverage annual total profit of the steel industry was Rmb223bn in the past 10 years,the green premium of the steel industry in 2019 was approximately equivalent to 3years of total profit for the steel industry.
The steel industry cannot fully internalize the costs of achieving carbon neutrality.We estimate that if the steel industry were to reach carbon neutral, and that all ofthe related costs were internalized in 2019, the cost to the steel industry would beRmb690bn with a corresponding increase of Rmb695/tonne for crude steel. Togetherwith oversupply and product homogeneity issues, we believe the steel industry willnot be able to fully internalize the entire cost to achieve carbon neutrality. Withoutgovernment guidance and support, it is difficult for the steel industry to achievecarbon neutrality on its own.

148 Chapter 7 Green Manufacturing: Carbon Emissions Reduction Roadmap …
7.2.2 Technology Roadmaps for Carbon EmissionsReduction in the Steel Industry
Replacing traditional blast furnace with electric arc furnace is the most effective andeconomical technology roadmap. Electric arc furnace can significantly reduce carbonemissions with lower per unit costs and shorter production cycles. Moreover, China’scurrent dependence on imported iron ore is as high as 90%, making the switch fromblast furnaces to electric arc furnaces an essential measure to help China graduallyreduce its dependence on imported coking coal and iron ore. It would also help Chinasecure the supply of raw materials in important industrial sectors. With the target ofcarbon neutrality, we expect China’s demand for coking coal and iron ore to declineby 60% by 2030 and by 70% by 2060 thanks to the rising supply of steel scraps, closeto the current level in the US and Europe. We expect China’s demand for coking coaland iron ore to drop by 60% and 70% as of 2030 and 2060, which will help Chinaachieve independence in raw materials.
China is currently exploring new technologies to develop a more environmentalfriendly metallurgy industry. One path is hydrogen metallurgy and the other isnon-hydrogen direct reduced iron. Hydrogen metallurgy can greatly reduce carbonemissions of blast furnaces, but it remains too early for large-scale applications.Non-hydrogen direct reduced iron technology is a mature technology which cansignificantly reduce carbon emissions from blast furnaces. However, its applicationsin China are constrained by gas sources and equipment. We believe China’s steelindustry needs to continuously explore new technologies to reduce carbon emissions.We see three main potential approaches (1) green energy; (2) separation and recy-cling of carbon dioxide from blast furnaces; and (3) recycling of carbon monoxidein blast furnace gas.
We suggest that the steel industry adopt emissions trading mechanisms to helpreduce carbon emissions with the current emissions reduction strategies. Reductionof carbon emissions in the steel industry requires decades of continuous effort, andall measures targeting the goal should be implemented progressively. In the earlystages, it is necessary to impose certain restrictions on production capacity and outputto reach carbon peak. In the later stages, we suggest using public policy tools toencourage enterprises to reduce emissions independently. On the one hand, leadingsteelmakers may be more willing to switch to electric arc furnaces as the cost ofelectricity can be reduced to strengthen their cost advantages. On the other hand, theemissions trading mechanisms can generate additional revenue.
7.2.3 Lowering the Green Premium: Will the Steel IndustryAchieve Carbon Peak and Carbon Neutralityas Planned?
Due to the continuous development of electric arc furnace technology and the policyconstraints, the steel industry is expected to achieve carbon peak before 2030.

7.2 Steel Industry: Mature Emission Reduction Path … 149
However, due to limited scrap steel resources, electric arc furnaces cannot completelyreplace blast furnaces. Carbon neutrality can only be achieved with the support ofcarbon capture. We believe carbon emission reduction will be driven by two factors:(1) a sharp decline in demand for construction steel after China’s urbanization rategradually approaches 75%, which will drive the production of steel down to 0.88bntonnes in 2030 and 0.65bn tonnes in 2060 (Fig. 7.2); and (2) the proportion of elec-tric arc furnaces rising to 30% and 60% in 2030 and 2060. We estimate carbondioxide emissions may reach 960mn tonnes in 2030, reaching carbon peak ahead ofschedule, and we expect carbon dioxide emissions to fall further to 320mn tonnesin 2060, about 79% below the 2019 level. The steel industry is expected to achievecarbon neutrality when the cost of carbon capture technology becomes affordable.
By 2060, the steel industry is expected to fully internalize the cost of carbonneutrality, and to achieve zero carbon emissions. Taking electricity consumptioninto account, we estimate green premium for the steel industry (mainly the costof carbon capture) are Rmb695, Rmb270, and Rmb115 per tonne of steel in 2019,2030, and 2060, respectively (Fig. 7.3). With carbon emissions falling to 320mntonnes industry-wide, the overall green premium for the steel industry may drop toRmb74.4bn. As the proportion of green premium in the cost of steel manufacturingcontinues to drop, we expect that the cost of carbon neutralization can be internalizedand the industry can achieve zero carbon emissions by 2060.
7.3 Cement Industry: Achieving Carbon Neutrality isDifficult. Demand and Cost of Carbon Capture arethe Key
7.3.1 Industry Green Premium: Cost of Achieving CarbonNeutrality at Current Stage for Cement Industry
The cement industry is among the industries with the highest level of carbon emis-sions. We estimate that China’s cement industry emitted 1.37bn tonnes of carbondioxide emissions in 2019, accounting for 14% of China’s total carbon emissions.Productionof one tonneof cement emits 0.6tonnes of carbondioxide,with 0.36tonnesfrom limestone production, 0.18tonnes from coal combustion and 0.05tonnes fromelectricity consumption.
The cement industry currently has no mature emission reduction method otherthan carbon capture. However, it is costly to achieve zero emissions through carboncapture. Currently, 99% of the production lines in the cement industry are dry-process clinker production lines and the technology system is mature. In the cementmanufacturing process, carbon dioxide generated by electricity can be eliminatedby outsourcing non-thermal power, and carbon dioxide generated from non-electricprocesses needs to be absorbed by carbon capture. We estimate that the carboncapture cost was about Rmb500 per tonne of cement in 2019. Assuming the cement

150 Chapter 7 Green Manufacturing: Carbon Emissions Reduction Roadmap …
0.0
0.2
0.4
0.6
0.8
1.0
1.2
1.4
1.6
1.8
2019
2025
E20
30E
2035
E20
40E
2045
E20
50E
2055
E20
60E
Car
bon
diox
ide
emis
sion
fro
m b
last
furn
ace
Car
bon
diox
ide
emis
sion
fro
m e
lect
ric fu
rnac
e(to
nne)
0.88
0.65
0.0
0.2
0.4
0.6
0.8
1.0
1.2
2019
2025
E20
30E2
035E
2040
E20
45E
2050
E20
55E
2060
E20
1920
25E
2030
E203
5E20
40E
2045
E20
50E
2055
E20
60E
Tota
l ste
el o
utpu
t(b
nto
nnes
)
0.0
0.2
0.4
0.6
0.8
1.0
1.2
1.4
1.6
1.8
Car
bon
diox
ide
emis
sion
s of t
he st
eel i
ndus
try
(bn
tonn
es)
Fig.7.2
Carbonem
issionsin
thesteelindustry,China’ssteelp
roduction,andcarbon
emissionsby
blastand
electricfurnaces.SourceMysteel,C
hina
Iron
and
SteelAssociatio
n,mid-term
evaluatio
nandlong-term
outlo
okof
coal
consum
ptionin
thesteelindustry
during
the13th
Five-YearPlan
period,2
019Energy
Data,CIC
CResearch

7.3 Cement Industry: Achieving Carbon Neutrality is Difficult. Demand … 151
Carbon capture costs, 279
0
500
1,000
1,500
2,000
2,500
3,000
2030E The cost of achieving carbonneutrality (2030E)
Iron ore costs Coke costs Steel scrap costsElectricity costs Graphite electrode cost Blank processing costsFuel costs and others Carbon capture costs
(Rmb/tonne)
Green premium:+270Rmb/tonne(11%)
Carbon capture costs, 115
0
400
800
1,200
1,600
2,000
2060E The cost of achieving carbonneutrality (2060E)
Iron ore costs Coke costs Steel scrap costsElectricity costs Graphite electrode cost Blank processing costsFuel costs and others Carbon capture costs
(Rmb/tonne)
Green premium:+115Rmb/tonne (7%)
Fig. 7.3 Green premiums for leading steelmakers to achieve carbon neutrality through carboncapture in 2030 and 2060. SourceGlobal status of CCS 2019, European Zero Emission, Technologyand Innovation Platform, the National Petroleum Council, GCCS, Wind Info, CICC Research
industry was operating at net zero emissions in 2019, we estimate the green premiumat Rmb278/tonne, implying an industry-wide green premium of Rmb647.8bn, threetimes the profit in 2019.
The cement industry cannot afford to internalize the full cost of achieving carbonneutrality.We estimate that if the cement industry were carbon neutral, and all relatedcosts were internalized in 2019, the increase in total cost to the industry would havebeen Rmb650bn. The profit of the cement industry in 2019 reached a historical highof about Rmb186.7bn, implying net profit of about Rmb80 per tonne of cement. Thetotal profit in 2015 to 2016 was only Rmb30 to 50bn, implying net profit of Rmb15-25 per tonne. Therefore, the cement industry will not be able to withstand this costpressure even during high earning periods unless it can pass costs on to downstreamparticipants. If cement manufacturers manage to increase their prices, the real estate,infrastructure, and rural construction sectors would likely see much higher costs.
7.3.2 Technology Roadmaps for Carbon EmissionsReduction in the Cement Industry
The cement industry has very limited ways to reduce carbon emissions per unit.Based on our discussions with industry associations and cement companies, it isdifficult for the cement industry to significantly reduce per unit carbon emissions.There are only a few ways to reduce carbon emissions at a marginal level, mainlyincluding:

152 Chapter 7 Green Manufacturing: Carbon Emissions Reduction Roadmap …
First, reducing coal and electricity consumption through technological upgradingand renewable energy. The cement industry can reduce cement power consumptionby one-third and coal consumption by more than 10% through waste heat powergeneration and use of alternative fuels.
Second, pushing forward decarbonization of the power sector. The cementindustry mainly uses thermal power currently. However, as thermal power is gradu-ally replaced by non-carbon energy sources or coal-fired power plants using carboncapture technology, we expect the electricity used in the cement industry to graduallybecome decarbonized.
Third, using low-carbon raw materials. The use of low-carbon alternative rawmaterials such as desulfurized gypsum and electric arc furnace slag can slightlyreduce the carbon emissions caused by the decomposition of limestone.
The cement industrymainly relies on carbon capture and storage to achieve carbonneutrality. We expect these three technological pathways to help the industry gradu-ally reduce the unit energy consumption. If technological upgrading can be achievedto reach a theoretically maximum level, the consumption of electricity, coal and rawmaterials could decline by 22%, 15%and 30%, respectively, for each tonne of cementby 2060. That said, carbon emissions per tonne of cement may remain as high as0.4 tonnes in 2060. Therefore, the two main ways to achieve carbon neutrality inthe cement industry in the future will still be technological transformation to reduceper unit carbon emissions and carbon capture. The current cost of carbon capture ishigh and it is likely to be relatively expensive in the future even with technologicalupgrading.
In terms of policy guidance, carbon allowance can be restricted in the short termand carbon tax or carbon trading can be adopted in the long term. Due to the tech-nical difficulty in reducing emissions and high cost of carbon capture in the cementindustry, it is difficult to afford the carbon at present. Thus, the cement industrymainly relies on the capacity and output restrictions of cement companies. In thelong run, the industry also needs to encourage enterprises to pursue emission reduc-tion through technological transformation by adopting policies such as carbon tradingand carbon tax. Both carbon tax and carbon trading are suitable policies for guidingthe cement industry to actively reduce emissions. However, compared with carbontax, carbon trading adopts a flexible market-based mechanism that takes the largedifferences between profitability in different regions and time periods into account.It also enables companies that make bigger cuts in emissions to obtain some revenueas a reward.
In addition, China may unveil a pilot program that subsidizes and encouragescement manufacturers to use solid waste and waste heat to generate power and useother raw materials to replace limestone. Driven by the carbon trading mechanismand green subsidy policies, companies that actively explore emission reduction plansand focus on energy conservation and emission reduction may receive additionalrevenue from the sale of carbon indicators, pilot subsidies, and ultimately increasetheir market share. Meanwhile, companies that find reducing emissions difficult willgradually withdraw from the market and the industry will be further optimized.

7.3 Cement Industry: Achieving Carbon Neutrality is Difficult. Demand … 153
7.3.3 Lowering the Green Premium: Feasible Pathsto Carbon Peak and Carbon Neutrality in the CementIndustry
The cement industry has not yet found a mature way to achieve carbon neutralitywithout carbon capture. However, the green premium will gradually decline due tothe progress in carbon capture technology. We estimate green premiums, which aremainly the cost of carbon capture in the cement industry,will beRmb156andRmb106per tonne of cement in 2030 and 2060, respectively, driving up manufacturing costby 91% and 64% (see Fig. 7.4). As the technology advances, the green premium willdecline amid the falling carbon capture expenses.
The decline in cement demand is key to the emissions reduction for the cementindustry. We expect the cement industry to achieve carbon peak before 2030, andcarbon neutrality by 2060 with the support of affordable carbon capture. We alsoexpect that cement demand will decline significantly as the urbanization rate grad-ually increases. It is estimated that in 2030, domestic cement production will bebetween 1.9 and 2.0bn tonnes (see Fig. 7.5). By 2060, with reference to globalper capita cement consumption, domestic cement demand will be between 760 and770mn tonnes. In 2030, the entire industry’s carbon emissions will be reduced to1.07bn tonnes, which is lower than the current level of carbon emissions, and thecement industry is expected to achieve carbon peak ahead of schedule. In 2060,carbon emissions will be further reduced to 310mn tonnes, a 77% decrease from2019. But without carbon capture, the industry still cannot achieve carbon neutrality.We estimate that due to the decline in total cement production in 2060, if carbonneutrality in the cement industry is achieved through carbon capture, the overallgreen premium of the industry will be Rmb80.6bn.
Carbon capture cost:
157.3Rmb/tonne
0
50
100
150
200
250
300
350
2030E The cost of achieving carbonneutrality (2030E)
Raw material costs Coal costs Electricity costs
Depreciation cost Others Carbon capture cost
(Rmb/tonne)
Green premium+156Rmb/tonne (91%)
Carbon capture cost:
106Rmb/tonne
0
50
100
150
200
250
300
2060E The cost of achieving carbonneutrality (2060E)
Raw material costs Coal costs Electricity costs
Depreciation cost Others Carbon capture cost
(Rmb/tonne)
Green premium+106Rmb/tonne(67%)
Fig. 7.4 Forecasted green premiums in the cement industry in 2030 and 2060. Source CSR reportof ACC, cenews.com.cn, CICC Research

154 Chapter 7 Green Manufacturing: Carbon Emissions Reduction Roadmap …
0.0
0.2
0.4
0.6
0.8
2019
2025
E20
30E
2035
E20
40E
2045
E20
50E
2055
E20
60E
Car
bon
diox
ide
emis
sion
s per
tonn
e of
cem
ent
(tonn
e)
0.0
0.5
1.0
1.5
2.0
2.5
2019
2025
E20
30E
2035
E20
40E
2045
E20
50E
2055
E20
60E
Chi
na's
cem
ent o
utpu
t(b
n to
nnes
)
0.0
0.4
0.8
1.2
1.6
2019
2025
E20
30E
2035
E20
40E
2045
E20
50E
2055
E20
60E
Car
bon
diox
ide
emis
sion
s of t
he c
emen
t ind
ustry
(bn
tonn
es)
Fig.7.5
Carbonem
issionso
fthe
cementindustry,China’scementoutput,andcarbon
emissionsp
ertonneofcement.Source
QianzhanIntelligence,dcem
ent.com
,The
Norm
ofEnergyConsumptionPerUnitP
roductsof
Cem
ent,CICCResearch

7.4 Aluminum Industry: The Decarbonization of Electricity … 155
7.4 Aluminum Industry: The Decarbonizationof Electricity is the Key to Carbon Neutrality
7.4.1 Industry Green Premium: Cost for the AluminumIndustry to Achieve Carbon Neutrality at the CurrentStage
Aluminum is the main source of carbon emissions in the non-ferrous industry.According to our calculations, carbon emissions from China’s non-ferrous metalssector reached 421mn tonnes in 2019, with aluminum production accounting for363mn tonnes, copper about 11mn tonnes, lead 16mn tonnes, and zinc 31mn tonnes.Since aluminum production makes up 86% of emissions, making it the largest sourceof carbon emissions in the non-ferrous metals industry, we will mainly discuss thecarbon reduction strategy for the aluminum industry. Based on our estimates, elec-tricity consumption in the process of producing aluminumgenerates 279mn tonnes ofcarbon emissions. In the aluminum industry, electricity consumption contributes 80%of carbon emissions, and the remaining 20% are from internal production processes.
Since decarbonized power generation is still costly at this point, the green premiumfor the aluminum industry is high and cannot be internalized. Zero emissions can beachieved by replacing thermal power with clean energy and using carbon capture todeal with the remaining non-electric carbon emissions. However, the cost of usingclean energy and carbon capture technology at the current stage is relatively high.The cost of electricity per tonne of electrolytic aluminum may increase by 50–60%compared to current levels with a switch to clean energy. We estimate that the greenpremium is at Rmb3,436 per tonne of aluminum to reach zero emissions in 2019,which may raise costs by 26.9%. The total green premium is Rmb122bn, which isequivalent to 2–3 years’ worth of high-level net profit for the industry, or average netprofit for 6–7 years.
7.4.2 Technology Roadmap for Carbon Emissions Reductionin the Aluminum Industry
The decarbonization of electricity is the key to reducing emissions in the aluminumindustry. Decarbonization of electricity can reduce the industry’s carbon emissionsby 80%, and the remaining non-electricity carbon emissions need to wait for thecost of carbon capture to be lower. The production process of aluminum is “bauxite→ alumina → electrolytic aluminum”. The “bauxite → alumina” process mainlyresults in non-electric carbon emissions, accounting for 20%of the carbon emissions.Given that 90% of the current production has adopted a low-carbon process (Bayer

156 Chapter 7 Green Manufacturing: Carbon Emissions Reduction Roadmap …
method1), process optimization can only marginally reduce the per unit carbon emis-sion. Therefore, it requires carbon capture to achieve zero emissions. We estimatethat the cost of carbon capture per tonne of alumina in 2019 would be Rmb501,but will drop to Rmb262 by 2060. The “alumina → electrolytic aluminum” processcreates carbon emissions by using electricity, accounting for 80% of the emissions.Zero emissions can be achieved by replacing thermal power with green electricity.We expect green electricity to have lower cost than thermal power electricity in thelong run, and this process to achieve carbon neutrality by 2060.
In the early stages of carbon emission reduction, it is difficult for companies toafford the cost due to the high green premium. In order tomeet the carbon peak target,policies need to impose certain restrictions on the supply side. The current policy hasimplemented a limit on the total carbon emissions of the industry, of which the impactmay be similar to the supply-side reforms in 2016–2017. It helps balance supply anddemand in the industry, reduce cyclical fluctuations of the industry’s profits, and alsopromotes the development of leading companies.
In the long run, it will become possible to achieve carbon neutrality through tech-nological advancements as the cost of green energy and carbon capture decreases. It isimportant to use policies to encourage enterprises to reduce electricity consumption,upgrade to green energy, and adopt carbon capture technology.More importantly, thegovernment may use carbon trading or carbon tax mechanisms to strengthen the costadvantages of companies that use less thermal power. Companies with hydro-poweror other clean power generation facilities will have notable cost advantages, whereassmall companies that do not performwell in emission reduction may be forced out ofthe market. Considering the sharp profit fluctuations in the aluminum industry (elec-trolytic aluminum industry has brought profit of less than Rmb200 per tonne in thepast 5 years, but could also exceed Rmb2,000 at the highest level) and regional vari-ations, we believe that carbon trading may be more suitable for companies to adjusttheir production compared to carbon tax, which involves a unified carbon price. Inaddition to carbon trading, we also recommend using subsidies to encourage enter-prises with suitable conditions to develop secondary aluminum, establish their owngreen power plants, or increase the use of green energy.
1 The main processes for preparing alumina from bauxite are Bayer method, sintering methodand hybrid method. Compared with the latter two methods, the Bayer method can reduce carbonemission per tonne of alumina by about 67% and 49%.

7.4 Aluminum Industry: The Decarbonization of Electricity … 157
7.4.3 Lowering the Green Premium: A Feasible Pathfor Carbon Peak and Carbon Neutralityin the Aluminum Industry
Based on previous technology roadmaps and public policies, we expect the aluminumindustry to achieve carbon neutrality before 2030. Aluminum Corporation of Chinaand ShandongWeiqiao Pioneering Group jointly issued the Joint Proposal for Accel-erating the Green and Low-Carbon Development of the Aluminum Industry in early2021, striving to reach their peakproduction capacity andoutput for domestic aluminaand electrolytic aluminum during the 14th Five-Year Plan period. It also estimatesthat the capacity ceiling of the aluminum industry is around 45mn tonnes. Given thatthe growth in supply and demand is expected to slow significantly, we expect thealuminum industry to achieve carbon peak before 2030 with the help of new energy.By 2030, we estimate that the total carbon emissions of the aluminum industry willbe about 258mn tonnes, a decrease of 28.9% from 2019.
We expect the aluminum industry to achieve carbon neutrality by 2060 withthe support of affordable carbon capture technology. Using green electricity in theproduction process, carbon emissions per tonne of aluminum might be reduced by80% compared to the current level. At the same time, the development of carboncapture technology is expected to bring down green premium per tonne of aluminumfrom Rmb554 to Rmb262. We estimate that the carbon emissions of the electrolyticaluminum industry in 2060 will be about 38mn tonnes with green premium of onlyRmb4.89bn. The green premium can be internalized by the industry and thereforecarbon neutrality might be achieved by then.
Green premium for aluminum industry is expected to decline significantly asthe cost of green energy and carbon capture declines. Even considering the cost ofswitching to green energy, the green premium per tonne of the electrolytic aluminumin 2030 and 2060 will be Rmb1,079 and Rmb262, respectively (see Fig. 7.6), whichmainly comes from the cost of carbon capture and green energy usage. The cost ofelectrolytic aluminum per tonne will increase by 8.3% and 2.0%, respectively. Thedecline in the green premium is also mainly due to the decline in the cost of carboncapture and green power energy. By 2060, with development of green electricity,overall carbon emissions will also decline, and the remaining non-electric carbonemissionswill decline to aminimal level (seeFig. 7.7). If carbonneutrality is achievedthrough carbon capture, we estimate that the industry’s green premium per tonne willbe as low as Rmb262, which is more affordable for aluminum companies.

158 Chapter 7 Green Manufacturing: Carbon Emissions Reduction Roadmap …
5,531 5,851
5,2395,999
8118111,385
1,385
0
4,000
8,000
12,000
16,000
2030E The cost of achieving carbon neutrality (2030E)
(Rmb/tonne)
Green premium=
new alumina cost 320+
new electricity cost 759
=1079
5,538 5,800
5,593 5,593
811 8111,385 1,385
0
4,000
8,000
12,000
16,000
2060E The cost of achievingcarbon neutrality (2060E)
Cost of raw material Cost of electricityPeriod expenses Manufacturing cost
Cost of raw material Cost of electricityPeriod expenses Manufacturing cost
(Rmb/tonne)Green prmium
=new alumina
cost 262=
262
Fig. 7.6 Green premiums for aluminum industry to go carbon neutral through carbon capture in2030 and 2060. Source Woodmac, Corporate filings, Analysis on the Guidelines for AccountingMethods and Reporting of Greenhouse Gas Emissions of Chinese AluminumManufacturers, CICCResearch
257 249 240
182
110
62
25 2 0 0
81 88 82 76
67 59
52 47 42 38
0
50
100
150
200
250
300
2020
E
2021
E
2025
E
2030
E
2035
E
2040
E
2045
E
2050
E
2055
E
2060
E
Total carbon emission trend of 2020-2060e aluminum industry
Carbon emissions of aluminum sector
Carbon emissions of alumina sector(mn tonnes)
9.1 8.78.6
7.3
5.5
4.2
3.0
2.1 2.0
2.0
0
2
4
6
8
10
2020
E
2021
E
2025
E
2030
E
2035
E
2040
E
2045
E
2050
E
2055
E
2060
E
Total carbon emission trend of 2020-2060e aluminum per tonne
(tonne)
Fig. 7.7 Carbon emissions trend for alumina and aluminum industries in 2020–2060. SourceWoodmac, CNKI, tanpaifang.com, CICC Research
7.5 Chemical Industry: When Carbon Negative BecomesPossible
7.5.1 Industry Carbon Emission: Cost for the ChemicalIndustry to Achieve Carbon Neutrality at the CurrentStage
The chemical industry can be divided into two main fields: Petrochemicals and basicchemicals. In chemical industry, the replacement of naphtha and coal faces substantialpressure from heavy energy consumption in the chemical synthesis process. Lookingat the consumption structure of chemical engineering, naphtha and coal consumptionin chemical synthesis makes up themost of total consumption. Coal is not only one of

7.5 Chemical Industry: When Carbon Negative Becomes Possible 159
the main synthetic raw materials, but is also one of the main energy sources. Carbonemissions of general chemical manufacturing mainly come from two processes: (1)energy consumption, including electricity required to operate equipment and steamfor production environment; and (2) chemical reaction during the production ofchemical products. To take the production of synthetic ammonia as an example ofchemical reaction: in the first step of turning coal to gas, one unit of carbon andone unit of H2O should theoretically generate one unit of CO and one unit of H2.But in reality, the transformation cannot be 100% efficient. If natural gas, coal andoil are used directly as fuels or energy during the process of producing chemicals,that energy may be replaced by green energy. However, if this energy is used as rawmaterials in chemical reactions, it would be difficult to be replaced. The demand ofchemicals will continue to grow along with economic and social development.
Theproductionof synthetic ammonia andmethanol accounts for a large proportionof emissions in the chemical industry. Based on China’s standards, we estimatethat the total carbon emissions of important products such as methanol, syntheticammonia, ethylene and propylene account for 61% of total carbon emissions.
Despite sharp divergence among different segments, the overall green premiumfor the chemical industry is high. We believe that under current conditions, the pathfor carbon emissions of combining green energy with carbon capture and storageis the most suitable for the industry. Due to the differences in energy consumptionand carbon emissions in various reactions, as well as the variations in the cost ofcarbon capture (Rmb100–420 per tonne) as a result of different CO2 concentrationlevels, there is large variation in the green premiums for different sub-sectors in thechemical industry. The distance between carbon source and storage location as wellas the resources available at the location will also lead to discrepancies in cost oftransportation and storage.
At the same time, it is difficult to accuratelymeasure the green premium of all sub-sectors in the chemical industry. Since methanol, synthetic ammonia, and ethyleneaccount for a large proportion of the production capacity and carbon emissions,and they are also indispensable basic chemical products, we use them as examplesto understand the amount of emissions in this industry. We have found that in thethree sub-sectors, the path of combining current technology and carbon capture andstorage technology ismore economically preferable.Our analysis indicates that greenpremium ratios of chemicals and petrochemicals are 56.9% and 7.9%, respectively,in 2021. If carbon emissions from electricity consumption are not taken into account,these figures are 53.2% and 7.4%.
The chemical industry can absorb green premiums internally, but profitabilitymaydecline significantly with the current cost to achieve zero carbon. Given the sharpdivergence among different segments in this analysis, we use a holistic method toestimate an industry-wide green premium. If the chemical industry reached carbonneutrality in 2019, total costs would have increased by Rmb250.74bn leading to a36.7% industry-wide decline in profit (calculated by “cost of carbon capture multi-plied by amount of emission” factoring in electric emissions). According to theNational Bureau of Statistics, the total profit of the chemical industry in 2019 wasabout Rmb683.756bn, and the industry profit would have dropped by 36.7% after

160 Chapter 7 Green Manufacturing: Carbon Emissions Reduction Roadmap …
carbon neutrality. Even with the high level of profit in 2017, the industry profit aftercarbon neutrality would still have dropped by 24.4%. If new technologies were to beadopted, the cost of carbon neutrality could not be internalized since new technolo-gies would be immature and expensive. Therefore, we believe the chemical industrycould bear the cost of carbon neutrality by fully utilizing carbon capture and storage,but would have resulted in serious decline in profit. Besides, the downward transmis-sion would have caused the cost of terminal infrastructure, consumption and otherindustries to rise sharply. In the meantime, we need to pay attention to the risk factorsbrought about by large-scale storage, and it is necessary to improve the feasibility ofnew technologies by reducing costs.
7.5.2 Technology Roadmaps for Carbon EmissionsReduction in the Chemical Industry
Multiple technologies are being used to help the chemical industry achieve net zeroor negative carbon emissions. Given the large number of sub-sectors, the chemicalindustry needs different roadmaps to achieve carbon neutrality. (1) Carbon emis-sions attributable to electricity and energy consumption needs can be eliminated byoutsourcing zero-carbon electricity; (2) Calcium carbide is widely used in currentPVC production. As the ethylene method becomes mainstream, demand for calciumcarbide products should drop sharply or even fall to zero, leading to carbon neutrality;(3) Carbon capture and storage technology plays an important role in helping theindustry reduce emissions. Carbon emissions from coal chemical industries can onlybe handled through carbon capture given the current technology; (4) Biomass is ahigh-quality raw material that can help achieve carbon neutrality; (5) Products suchas methanol and olefins can be produced through direct synthetic transformation ofcarbon dioxide and hydrogen. This process has net negative emissions, and the entireprocess has net zero emissions; and (6) Improving thermal efficiency or reaction effi-ciency can help achieve energy savings and emissions reduction. In this section, wewill discuss the last four technology roadmaps.
Carbon capture and storage technology plays a key role in building a resilientenergy system in China with its flexibility and sustainability, and it is especiallyimportant in China’s coal-dominated energy system.
Use of biomass as raw material has strong potential. Biomass raw materials aremostly renewable and have varied sources. China’s total biomass reserves are equiv-alent to 460mn tonnes of standard coal (this figure varies sharply based on differentstudies).
Chemical engineering synthesis with carbon dioxide and hydrogen can replace thecurrent technology and achieve zero carbon emissions. This method uses hydrogenand carbon dioxide to synthesizemethanol and gas. For instance, hydrogen fromelec-trolysis of water and carbon dioxide can be directly used to synthesize olefins. This

7.5 Chemical Industry: When Carbon Negative Becomes Possible 161
process consumes a large amount of carbon dioxide, resulting in negative emissionsfor the whole process.
Energy conservation and emissions reduction are also important in many sub-sectors. Through technological upgrading, the amount of raw materials for reac-tion will be reduced. Technological advancements can also help reduce energyconsumption and carbon emissions. Popular methods are: (1) Improving reactioncatalyst activity and easing requirements for reaction environment; (2) Introducingenergy saving production equipment and other new equipment; and (3) Improvingthe efficiency of energy regeneration of waste heat.
7.5.3 Policy Guidance and System Building for EmissionsReduction are Crucial for the Chemical Industry
Given the numerous sub-sectors, different product markets and complex tech-nological roadmaps, we believe policy guidance is appropriate for the chemicalindustry.
Carbon tax and carbon trading mechanisms can naturally guide companies toupgrade production methods and reduce energy consumption. With the help of somegovernment restrictions, leading companies with low per unit carbon emissions andcompanies with advanced production methods will enjoy comparative advantages.
Policy guidance can also encourage innovation by subsidizing new technologiessuch as zero-carbon biomass and carbon dioxide conversion and utilization technolo-gies. Additional investments in advanced technologies such as advanced electrolytichydrogen technology and new material innovation projects such as lithium batterymaterials can reduce the R&D cost.
Introducing supportive policies to subsidize recycling of chemical products suchas PETwould also lower production of related products and eventually reduce carbonemissions.
7.5.4 Lowering the Green Premium: A Feasible Pathfor Carbon Peak and Carbon Neutralityin the Chemical Industry
There are various technological approaches to achieving carbon neutrality in thechemical industry.We calculate green premiums of the synthetic ammonia,methanol,and ethylene industries under two roadmaps: (1) Traditional approach plus carboncapture and storage; and (2) C1 chemical engineering with green hydrogen energyand carbon dioxide as raw materials (including AEC, PEM, SOEC). Both roadmapscan help the industry achieve carbon neutrality.
As shown in Table 7.1, the second approach lowers the green premium more

162 Chapter 7 Green Manufacturing: Carbon Emissions Reduction Roadmap …
Table7.1
Prod
uctio
ncostof
synthetic
ammon
ia(viacleanelectricity
vs.traditio
nalapp
roach)
andgreenprem
iums
Scale:2,000tonnes
NH3/day
2021
2030
2060
AEC
PEM
SOEC
Traditio
nal
approach
AEC
PEM
SOEC
Traditio
nal
approach
AEC
PEM
SOEC
Traditio
nal
approach
Green
prem
ium
3,292
3,450
3,780
979
762
773
1,557
582
308
194
−13
427
Actualg
reen
prem
ium
979
582
−13
Scale:6bntonnes
MTO/year
2021
2030
2060
Green
prem
ium
12,137
12,692
13,851
416
2,287
2,323
4,878
247
857
487
−188
181
Actualg
reen
prem
ium
416
247
−188
NoteAssum
ingsolarpower
pricemay
drop
toRmb0.14/KWhin
2060,the
hydrogen
productio
ncostfrom
SOEelectrolysiswould
beRmb6.81/kg.W
ithout
taking
into
accountem
issionsfrom
power
consum
ption,
thegreenprem
iumswould
beRmb979,R
mb583,a
ndRmb427
pertonnein
2021,2030,a
nd2060,
respectiv
ely
Source
CIC
CResearch

7.5 Chemical Industry: When Carbon Negative Becomes Possible 163
significantly. Although both approaches would result in negative green premium, thecost of the second approach would be higher than the first one by 2050, suggestingthat new technology may replace the traditional approach by that time. We alsoreckon that carbon neutral technology without carbon capture is the better approachand deserves the corresponding cost, so the second approach could be implementedgradually before 2050.
Using previous calculations, we estimate the carbon emissions of the chemicalindustry. First, we estimate the output growth of the chemical industry. The growthrate will be around 1% before 2030 and plateau after 2030. Also, the progress ininnovation of traditional technology will reduce the carbon emission coefficient by0.5% every year. The use of “green hydrogen + carbon dioxide” technology willhave an increasing penetration rate of 5% in 2030 and 70% in 2060. The penetrationrate of substitutional rawmaterials such as biomass will have a penetration rate of 1%in 2051 and 10% in 2056. With carbon capture and storage technology, the chemicalindustry can reach carbon peak in 2030 and reach emissions of -14.2bn tonnes in2060 (see Fig. 7.8).
-100
0
100
200
300
400
500
600
700
800
Chemical carbon emissions
(mn tonnes)
Fig. 7.8 Estimations of carbon emissions of the oil & gas and chemicals industries in the next40 years (taking carbon emissions from electricity consumption into account). Note Assumingcarbon consumption coefficient is 1.375 for methanol. Carbon consumption coefficient refersto amount of carbon dioxide that can be absorbed by one tonne of product. Source sci99.com,baiinfo.cn, CICC Research

164 Chapter 7 Green Manufacturing: Carbon Emissions Reduction Roadmap …
7.6 General Manufacturing Industry: Achieving CarbonPeak; Using Clean Energy to Achieve CarbonNeutrality
7.6.1 Industry Green Premium: Cost for the GeneralManufacturing to Achieve Carbon Neutralityat the Current Stage
The general manufacturing industry accounts for only about 2% of overall carbonemissions in China. However, the general manufacturing industry involves a widerange of downstream industries, and some production processes and productionequipment are highly versatile. Therefore, The R&D in the general manufacturingsector can play an important role in helping many sectors achieve carbon neutrality.
Carbon emissions from general manufacturing amount to 205mn tonnes per year,with emissions from electricity accounting for 2.2% of China’s total carbon emis-sions and 5.7% of the manufacturing sector’s emissions. Electricity consumptioncontributes 70% and internal production processes 30% of total carbon emissionsfrom the sector. In terms of annual contribution, industries with heavier emissionsare: Raw coal (128mn tonnes), coke (23mn tonnes), natural gas (22mn tonnes), diesel(8mn tonnes), gasoline (6mn tonnes), other washed coal (4mn tonnes), other gases(4mn tonnes) and coke oven gas (1mn tonne). The top five industries together accountfor more than 95% of carbon emissions. Of these, emissions from coal mainly corre-spond to electricity and emissions from cokemainly correspond tometallurgy. There-fore, reducing power consumption and reducing carbon emissions frommetallurgicalcasting are key to reduce the overall carbon emissions of the general manufacturingindustry.
The general manufacturing industry can achieve carbon neutrality through cleanenergy substitution. Power consumption bygeneralmanufacturing accounts for about70% of carbon emissions, so it is easy and economical to achieve carbon neutralityby clean energy substitution. Producing green electricity is 11%more expensive thancurrent hybrid electricity productions. The use of electricity and hydrogen energyare the two main paths for energy consumption and metallurgy. We assume thatthe cost of achieving carbon neutrality. Overall, the green premium in the generalmanufacturing industry is Rmb110.60bn.
General manufacturing industries can afford the costs of achieving carbonneutrality. Energy accounts for a relatively low proportion of total cost in generalmanufacturing industries. According to the previous calculations, if green energy isused to replace fossil energy, the cost of achieving carbon neutrality in the generalmanufacturing industry is Rmb110.6bn, equivalent to only about 3%of the industry’sprofit in 2019.
7.6 General Manufacturing Industry: Achieving Carbon Peak … 165
7.6.2 Technology Roadmap for Carbon Emissions Reductionin General Manufacturing Industries
Carbon emissions in general manufacturing industries mainly come from electricityconsumption and metallurgy. In term of electricity consumption, the most suitableway to reduce carbon emissions is to reduce energy use by improving production effi-ciency. In term of metallurgy, the main way to reduce carbon emissions is to increasethe proportion of electrification and improve the original production methods.
Digital transformation can improve production efficiency. Increasing digitizationof production equipment and penetration rate of industrial software can help improveproduction efficiency and energy utilization of manufacturers.
Electric motor systems consume about 75% of industrial electricity, and high-efficiency motors and variable frequency equipment can significantly reduce energyuse. High-efficiency motors can reduce energy use by about 20% on average andvariable frequency technology can help cut electricity uses by 30%.
The main source of carbon emissions in metal casting is the smelting copula, forwhichproduction is responsible for 53%of carbon emissions.Through improvementsin the casting production process, we think energy consumption per unit of finishedproduct can be reduced by 63.6%.2
Through lightweight and modular design of products, raw materials and energyconsumption may be reduced. Equipment refurbishment can also help reduce wasteof raw materials, energy use, and carbon emissions.
In term of policy, subsidies can promote the use of new technologies, butrequire standards and supervision. Complicated subsidy application procedures,loose market regulation, and poorly-designed evaluation standards might have theopposite effect.
Most Chinese general manufacturing companies are small businesses with lowprofitability. In addition, there are significant differences across different industries.Subsidies and regulation need to be different for different industries and differentprofit levels.
7.6.3 Lowering the Green Premium: The Feasible Pathwayto Achieving Carbon Neutrality in the GeneralManufacturing Industry
The general manufacturing industry already reached peak carbon emissions in 2010and should achieve carbon neutrality before 2060. According to CAEDs, carbonemissions from general manufacturing industries peaked at 392mn tonnes in 2010.Since then, this figure has been falling year-over-year, with 2017 carbon emissions
2 Analysis on Status Quo of Energy Saving and Emission Reduction in the Foundry Industry by LiYuanyuan et al., 2010.

166 Chapter 7 Green Manufacturing: Carbon Emissions Reduction Roadmap …
Table 7.2 Current Green Premium for General Manufacturing Industries3
Energy cost ofgeneralmanufacturingindustries (Rmbbn)
2019 Cost after carbonneutrality (2019)
2030 Cost after carbonneutrality (2030)
2060 Cost after carbonneutrality (2060)
Electricity 118 132 161 161 234 234
Coke 22 74 34 53 104 104
Natural gas 31 31 53 53 147 147
Diesel 18 45 27 32 64 64
Gasoline 17 35 25 25 49 49
Total 206 317 301 325 598 598
Green premium 111 24 0
Source CEADs, CICC Research
being 40% lower than the 2010 level. Taking into account the proportion of greenelectricity, electrification rate of vehicles, the proportion of metallurgical electricfurnaces, utilization rate of hydrogen energy, China’s economic growth, and energy-saving technological advancements, we expect general manufacturing industries toachieve carbon neutrality before 2060.
Our calculation shows that the green premiums for general manufacturing indus-tries would be Rmb110.6bn, Rmb24.1bn. and Rmb0 in 2019, 2030, and 2060 respec-tively (see Table 7.2). The main reasons for this decline are electrification of vehiclesand falling cost of renewable energy sources and hydrogen.
Open Access This chapter is licensed under the terms of the Creative Commons Attribution-NonCommercial-NoDerivatives 4.0 InternationalLicense (http://creativecommons.org/licenses/by-nc-nd/4.0/), which permits any noncommercial use, sharing, distribution and reproduction in anymedium or format, as long as you give appropriate credit to the original author(s) and the source,provide a link to the Creative Commons license and indicate if you modified the licensed material.You do not have permission under this license to share adapted material derived from this chapteror parts of it.
The images or other third party material in this chapter are included in the chapter’s CreativeCommons license, unless indicated otherwise in a credit line to the material. If material is notincluded in the chapter’s Creative Commons license and your intended use is not permitted bystatutory regulation or exceeds the permitted use, you will need to obtain permission directly fromthe copyright holder.
3 The current green premium for general manufacturing industries is Rmb110.60bn.

Chapter 8Green Transportation: A ChallengingRoad to Carbon Neutrality
Abstract Chinese transportation industry: Carbon emissions under upward pressureand “green premium” may stay high.
Transportation industry is of vital importance to social development. InternationalEnergy Agency (IEA) data indicates that the transportation sector contributed 9.7%of China’s carbon emissions in 2018,1 5ppt higher than that in 1990. As GDP percapita rises, we expect the turnover rate of the transportation volume in 2060 todouble, leading to a significant rise in carbon emissions in the near future.
In addition, we expect the “green premium” (i.e. the additional cost of choosinga clean energy over one that emits a greater amount of greenhouse gases like fossilfuels) of the transportation sector to be 68% in 2021, implying the cost of zerocarbon emissions (i.e. the difference between the cost of using new energy andthe cost of using fossil fuels) at about Rmb2.7trn, which indicates the process ofdecarbonization would be costly and challenging. In this chapter, we focus on thesolution to China’s green transportation, and aim to deduce a feasible pathway for thetransportation industry to achieve carbon neutrality, potential challenges we mightface, and supportive policies that are throughout the process.
Green transportation requires a combination of clean energy adoption and effi-cient energy consumption. While adopting clean energy is the key solution, energyconservation and emissions reduction would also help the transportation industryachieve carbon neutrality. Under neutral assumptions, we believe carbon emissionsof the transportation sector will peak at 1.33bn tonnes in 2030 and decline 77% from1.16bn tonnes in 2019 to 261mn tonnes in 2060.
From a sub-sector perspective, the pathway to carbon neutrality is very clear forthe segment of transportation by passenger vehicles2, we believe this segment islikely to make substantial progress in emissions reduction with China’s competitiveadvantage in lithium-ion batteries. The segment of transportation by commercial
1 There are differences in the statistics of carbon emissions from transportation industry in variousdatabases. In previous chapters we cite data from CEADs which is lower than the carbon emissionsdata of the International Energy Agency and the “Second Two-Year Update on Climate Changeof the People’s Republic of China”. We refer to data from IEA in this chapter for the purpose ofinternational comparison.2 Passenger vehicles in this chapter refer to private cars.
© The Author(s) 2022CICC Research, CICC Global Institute, Guidebook to Carbon Neutrality in China,https://doi.org/10.1007/978-981-16-9024-2_8
167

168 Chapter 8 Green Transportation: A Challenging Road to Carbon Neutrality
vehicles3 sector is likely to achieve carbon neutrality by 2060 by relying on mid- andmini-electric trucks as well as heavy-duty fuel cell trucks. The railway transportationsector provides a clear vision for decarbonization by means of electrification. Yet itis more challenging to achieve carbon neutrality for the air and marine transportationsegments, which heavily depends on technology advancement.
We will also discuss the potential technological evolution in automotive batteriesand hydrogen fuel cells. In terms of technological advancements, the former has apromising pathway, whereas hydrogen fuel cell may develop beyond or under ourexpectations. In addition to technology advancement, achieving carbon neutralityfor the transportation sector also requires policy intervention. We will give policyrecommendations from both the industry level (such as separation of vehicle andbattery) and technology level (such as establishing standards for hydrogen fuel cells).
The “green premium”of the transportation sector is likely to reach 2% inboth 2030and 2060,with “zero emission costs” of Rmb89.7bn andRmb70.1bn, 97% lower thanthat in 2021, indicating the viability of such emissions-reduction pathways.
Finally, we will briefly discuss the changes that autonomous driving, super-high-speed rail and supersonic aircraft might bring to our lives. In an era of rapidtechnological change, we look forward to the arrival of “green transportation”.
8.1 How Far Away is Green Transportation?
To reach the Paris Agreement’s goal of capping the rise of global temperature under1.5°C degrees requires extensive global cooperation to reduce carbon emissions. Asthe world’s second largest carbon emitter among all industries needs to be more envi-ronmentally friendly. Before moving on to discuss how to achieve the ultimate goalof green transportation, the industry’s current performance and historical develop-ment will be discussed in this section descibed first. We further discuss the followingissues in this section: (1) sources of carbon emissions in the transportation industry;(2) current volume of carbon emissions from global transportation, and emissionsstructure by country and transportation segments; and (3) prediction of carbon emis-sions trend in the Chinese transportation industry based on past experience from theUS and Europe.
8.1.1 Sources of Carbon Emissions in the TransportationIndustry
Steam engines were invented during the first Industrial Revolution and were usedfor marine and rail transportation in the early nineteenth century, signaling the startof carbon emissions in the transportation industry. The internal combustion engines
3 In this chapter, commercial vehicles (CV) refer to trucks unless stated otherwise.

8.1 How Far Away is Green Transportation? 169
invented during the second Industrial Revolution led to the emergence of cars in 1887and airplanes in 1903, accelerating carbon emissions in the transportation industry.Subsequently, improved transport infrastructure made transportation and travel moreconvenient. For example, the total length of railways around the world has increasedby about 600,000km over the past century, which is nearly double the length in theprevious century, and the global ownership of aircrafts for aviation expanded fromzero to about 450,000 at present. The market for transportation via roads, aviation,rail and marine has entered the era of all-round development, which has led to a largeamount of carbon emissions.
8.1.2 Current Amount of Global Carbon Emissionsfrom Transportation
IEA data shows that the world emitted 33.5bn tonnes of carbon in 2018 (+63%from 1990), with 24.6% or 8.26bn tonnes from the transportation industry (Fig. 8.1),second only to the power generation industry (41.7%). Moreover, the 24.6% propor-tion expanded2.2 ppt from1990, as carbon emissions from the transportation industryrose at a 2.1% CAGR over 1990–2018, exceeding the 1.8% CAGR of overall globalemissions.
This section will analyze changes in global carbon emissions within the trans-portation industry, by segment and country (starting from 2008 due to dataavailability).
20.0
21.0
22.0
23.0
24.0
25.0
26.0
0
10,000
20,000
30,000
40,000
1990
1991
1992
1993
1994
1995
1996
1997
1998
1999
2000
2001
2002
2003
2004
2005
2006
2007
2008
2009
2010
2011
2012
2013
2014
2015
2016
2017
2018
Global total carbon emissions
Global transportation carbon emissions
Percentage of total carbon emissions generated through transportation (RHS)
(mn tonnes) (%)
Fig. 8.1 Global carbon emissions from transportation. Source IEA, CICC Research

170 Chapter 8 Green Transportation: A Challenging Road to Carbon Neutrality
8.1.2.1 Type of Transportation: Road Transport is the Largest Sourceof Emissions, While Aviation’s Emission Volume Growth isthe Highest
Total emissions volume: In 2018, road transport emitted 6.1bn tonnes of carbon,accounting for 74.5% of global emissions from the transportation industry. The shareof aviation andmarine transportation stood at 11.7% and 10.5%,while the proportionof railway transportation was only 1.1% due to the wide adoption of electrification.
Incremental emissions volume: The world’s incremental carbon emissions fromtransportation totaled 1.4bn tonnes in 2008–2018, with 78% or 1.1bn tonnes fromroad transportation. Carbon emissions from aviation recorded the highest growthamong all modes of transport—expanding at a 3.4% CAGR in 2008–2018 andincreasing about 200mn tonnes in 2008–2018—and accounted for 14% of the globalincremental emissions from transportation. The world’s aviation passenger turnoverrate increased at a 5.9% CAGR, which is a major driver for the growth in carbonemissions from aviation.
8.1.2.2 Countries: US Contributed Most to Global Carbon Emissionsfrom Transportation, while Emissions from ChineseTransportation Industry Had the Highest Growth
Total carbon emissions volume: The transportation industry in the US, EU andChina emitted 1.81bn, 1.24bn and 1.12bn tonnes of carbon respectively in 2018,accounting for 21.9%, 15.0% and 13.6% of global emissions from transportation.
Incremental emissions volume: Carbon emissions from transportation in Chinahad the highest growth rate, while emissions from transportation in the EU and theUS trended downward. Carbon emissions from transportation in China increased580mn tonnes in 2008–2018, accounting for 41% of global incremental emissions.Of the 580mn tonnes, 88% or 510mn tonnes were from road transport, as Chinesepersonal vehicle (PV) ownership surged 557% YoY and road cargo turnover soared177% YoY during 2008–2018. In contrast, carbon emissions of transportation inthe EU and the US in 2018 contracted about 68mn and 200mn tonnes from 2008,implying a CAGR of –0.2% and –1.1%.
8.1.3 Have Carbon Emissions from Transportation Peakedin EU and US? What Experiences Can China Drawupon?
Carbon emissions from transportation have not yet peakedEUandUS. The emissionsfrom transportation declined after hitting highs of 1.3bn tonnes in the EU and 2bntonnes in the US in 2007. However, the emissions in both EU and US rebounded

8.1 How Far Away is Green Transportation? 171
later. According to the latest available data, carbon emissions from transportation inEU and US both recovered to more than 90% of their respective highs seen in 2007.Whether the emissions have peaked still depends on the adoption rate of new energy.
8.1.3.1 Experiences that China May Draw upon from the EU and US
First, we do not think the transportation industry can reach peak carbon emissionsunless emissions from road transportation have peaked. In 2018, road transportationcontributed 86% and 72% of the total transportation sector’s carbon emissions inthe US and EU. Emissions in these two regions both temporarily peaked after roadtransportation’s emissions peaked.
Second, the transport turnover trend largely moves in tandem with carbon emis-sions. Asmentioned earlier, after peaking temporarily, the emissions from transporta-tion in EU and US declined at first and then picked up again. Partially it is driven bythe fact that both cargo and passenger transport turnover contracted after the finan-cial crisis in 2007 and did not grow again until 2013 when the economies started torecover. In other words, transport turnover plays an important role in affecting thetotal carbon emission from transportation.
Third, the decline in carbon emissions from transportation relies on the enhance-ment in energy consumption efficiency, and the application of new energy and newtechnologies can also accelerate the enhancement. We noticed that per-unit energyconsumption of each mode of transportation declined at an accelerated pace in boththe US and EU after 2007. For example, per-unit energy consumption in the USPV-based transport sector dropped 1.1% in a decade after 2007, faster than the 0.6%decline seen in the decade before 2007. This trend, to a large extent, is driven byapplications of new energy and new technologies.
8.2 The Difficulties for Chinese Transportation Industryto Achieve Carbon Neutrality Measured by the “GreenPremium”
This section focuses on carbon emissions from the Chinese transportation industry,and uses the “green premium” to calculate the cost of zero carbon emissions for it.We notice that carbon emissions from transportation might rise notably in China, andthe high “green premium” indicates the industry faces great difficulties in achievingcarbon neutrality.
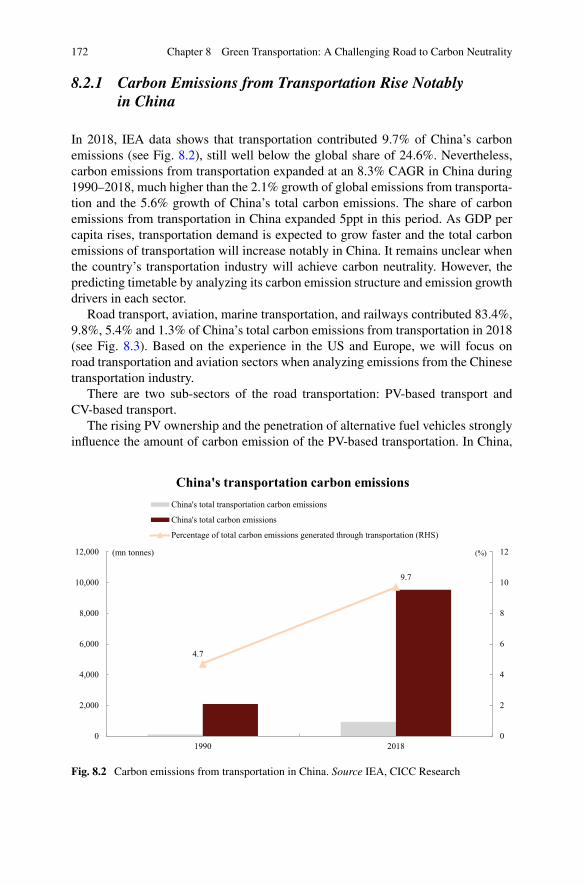
172 Chapter 8 Green Transportation: A Challenging Road to Carbon Neutrality
8.2.1 Carbon Emissions from Transportation Rise Notablyin China
In 2018, IEA data shows that transportation contributed 9.7% of China’s carbonemissions (see Fig. 8.2), still well below the global share of 24.6%. Nevertheless,carbon emissions from transportation expanded at an 8.3% CAGR in China during1990–2018, much higher than the 2.1% growth of global emissions from transporta-tion and the 5.6% growth of China’s total carbon emissions. The share of carbonemissions from transportation in China expanded 5ppt in this period. As GDP percapita rises, transportation demand is expected to grow faster and the total carbonemissions of transportation will increase notably in China. It remains unclear whenthe country’s transportation industry will achieve carbon neutrality. However, thepredicting timetable by analyzing its carbon emission structure and emission growthdrivers in each sector.
Road transport, aviation, marine transportation, and railways contributed 83.4%,9.8%, 5.4% and 1.3% of China’s total carbon emissions from transportation in 2018(see Fig. 8.3). Based on the experience in the US and Europe, we will focus onroad transportation and aviation sectors when analyzing emissions from the Chinesetransportation industry.
There are two sub-sectors of the road transportation: PV-based transport andCV-based transport.
The rising PV ownership and the penetration of alternative fuel vehicles stronglyinfluence the amount of carbon emission of the PV-based transportation. In China,
4.7
9.7
0
2
4
6
8
10
12
0
2,000
4,000
6,000
8,000
10,000
12,000
1990 2018
China's transportation carbon emissionsChina's total transportation carbon emissions
China's total carbon emissions
Percentage of total carbon emissions generated through transportation (RHS)
(mn tonnes) (%)
Fig. 8.2 Carbon emissions from transportation in China. Source IEA, CICC Research

8.2 The Difficulties for Chinese Transportation Industry … 173
39.4%
44.0%
1.3%
9.8%
5.4%
Road transport (freight)Road transport (passenger)RailwayAviationShipping
Fig. 8.3 Chinese transportation industry’s emissions structure in 2018.Source IEA,CICCResearch
the PV ownership still has large upside potential. Wind Info data shows that theownership per 1,000 persons in China was only about 1/6 and 1/5 of the levels in theUS and Europe in 2019. Meanwhile, China leads the world in NEVs. We believe therising NEV penetration and increasing PV ownership will both affect the country’sPV-based transport carbon emission.
The changes to freight transport structure and the timing of mass adoption ofalternative fuel CVs hold the key to the carbon emissions from CV-based transport.In our view, alternative fuel CVs will first enter the market with light-duty trucks,then mid-duty trucks, and eventually heavy-duty trucks, to gradually reduce carbonemissions of CV-based transport. We believe China’s freight transport structure willchange as freight owners shift away from road transport to railway and waterway.In addition, efforts in energy saving and emissions reduction such as improvingfuel efficiency and digitalization applications are equally important before massivepenetration of alternative fuel CVs.
The aviation sector also merits attention. It is the second largest carbon emitter inthe transportation industry, and its emission growth remains high. Decarbonizationof the aviation sector is challenging, and the key lies in jet fuel replacement bynew energy. We predict aviation transport volume will continue to grow. Wind Infodata shows that the number of per-capita air trips in China was only 1/7 and 1/5 ofthe levels in the US and EU in 2018. Due to its long transporting distance, heavyenergy consumption and immature zero-carbon technologies, decarbonization in theaviation sector is challenging.
The marine transportation sector faces challenges down its road to decarboniza-tion. It contributed only 5.4% of carbon emissions from the transportation industryin 2018, and its emissions CAGR remained low at 1.4% in the past decade. However,decarbonization is challenging due to long transport distance and high vessel tonnage.
The railway sector faces a visible pathway of decarbonization via electrification.Electrification rate in this sector expanded 36ppt in the past decade to reach 72%.

174 Chapter 8 Green Transportation: A Challenging Road to Carbon Neutrality
We believe the railway sector will achieve zero carbon emissions if electrificationsystem is fully adopted.
8.2.2 The High “Green Premium” Indicates Decarbonizationin the Transportation Industry Is Costlyand Challenging, and Requires a Combinationof Technological Innovation and Favorable Policies
As mentioned earlier, the “green premium” refers to the additional cost arising fromusing new energy as a percentage of the cost of using fossil fuels, and the cost of zerocarbon emissions is the additional cost that needs to be paid to achieve zero carbonemissions.
Take PV-based transport an example. The “green premium” in the PV-based trans-port sector is defined as follows: (clean electricity cost–gasoline cost)/gasoline cost.We estimate that PV’s clean electricity cost per 100 km is 60% lower than that ofgasoline cost in 2021. However, as pure electric PVs are more expensive than tradi-tional fuel PVs, we think calculating based on lifecycle cost is more reasonable.Assuming similar specifications and torque, we estimate that the lifecycle cost ofa traditional fuel PV is about Rmb0.57/km, versus Rmb0.68/km of a pure electricPV. The PV industry’s energy consumption cost will increase from Rmb2.3trillion atpresent to Rmb2.7trillion after traditional fuel PVs are completely replaced. In otherwords, the “green premium” is about 18%. For more details, please refer to Table8.1.
The “green premium” of the aviation sector is defined as (hydrogen cost–jet fuelcost)/jet fuel cost. Although calculation based on lifecycle cost is more reasonable,
Table 8.1 We estimate that the transportation industry’s “green premium” in 2021 is around 68%
2021E Current energycost (Rmb bn)
Alternative energycost (Rmb bn)
Zero carbonemission cost(Rmb bn)
Green premium(%)
Road transport(freight)
1,519 3,454 1,935 127
Road transport(passenger)
2,267 2,685 418 18
Railway 41 29 –12 –29
Aviation 72 317 245 343
Shipping 28 116 88 319
Total 3,926 6,601 2,675 68
Note We calculate zero carbon emission cost of PV- and CV-based transport sectors based onlifecycle cost. Source CICC Research

8.2 The Difficulties for Chinese Transportation Industry … 175
the “green premium” is calculated with only energy consumption cost, given unavail-able data on the cost of newly or renovated hydrogen-powered planes. We calculatethe “green premium” is 343%, with total jet fuel cost at Rmb71.5bn and hydrogenconsumption cost at Rmb316.7bn.
Generally speaking, the transportation industry’s zero carbon emission cost in2021 is estimated to be around Rmb2.7trn, implying a “green premium” of 68%,which suggests a high cost from carbon neutrality. The energy consumption costfrom transportation is about Rmb3.9trn in 2021. The total cost of new energy wouldbe aboutRmb6.6trn, assuming allHDTs are powered by hydrogen, andMDTs, LDTs,PVs and trains all by clean electricity. As such, the zero carbon emission cost for thetransportation industry is around Rmb2.7trn in 2021, implying a “green premium”of 68%.
Overall, the road to carbon neutrality is costly and challenging for the transporta-tion industry. For transportation, achieving carbon neutrality requires a combinationof technological innovation and policy support. The next three sections will discussthe carbon emissions trend in the transportation industry, potential technologicalinnovations, and public policy support.
8.3 Viable Options for China to Achieve GreenTransportation
In previous sectionswe discussed carbon emissions from transportation inChina, andanalyzed difficulties for the industry to achieve carbon neutrality by calculating greenpremium. This section will mainly discuss the pathway of carbon emissions reduc-tion. Carbon emissions of the transportation industry will be calculated, followed bythe prediction of emissions from each transportation subsector. Specifically, trans-port turnover rate and ownership in the next 4 decades will be predicted, carbonemissions based on the forecasts will be calculated and assumptions on penetrationof new energy and per-unit energy consumption will be made. Last but not least,specific options on decarbonization shall be provided.
8.3.1 Carbon Emissions from the Transportation Industry:Emission Peak in 2030; Carbon Neutrality in 2060Seems Unlikely Under a Neutral Assumptionthat Emissions in 2060 Equal 23% of the Level in 2019
8.3.1.1 Transport Turnover in 2060 to Double the Level of 2019
Turnover rate (i.e. tonnes-km) can measure carbon emissions more effectively thanfreight or passenger traffic volume. The transportation industry’s turnover reached

176 Chapter 8 Green Transportation: A Challenging Road to Carbon Neutrality
19.7trn tonnes-km in 2019, and may rise to 38.7trn tonnes-km in 2060, implying a1.7% CAGR in 4 decades.4
We expect turnover growth in the next 4 decades to be 0.6%, 3.5%, 1.8% and 2.4%for road transport, aviation, marine transport and railway respectively (see Table 8.2).For road transport, expected turnover growth is the lowest as high-speed trains andairlines will divert passenger traffic and certain cargo owners may shift away fromroad transport to railway or waterway. In comparison, aviation sector is expected to
Table 8.2 Our forecasts for transport turnover in 2060
Transportationturnover
2019 2060E 2060Eversus 2019(%)
CAGR (%) Assumption
Total (bntonne-km)
197,164 387,418 196 1.7
By transport
Road transport 60,425 78,408 130 0.6 We believe a portionof highwaytransportation willcontinuously be takenaway by high-speedrails and aviation;compared to thoseprior to 2019, growthrate of freighttransportation onhighways will slowdown driven by traffictaken away byrailways
Aviation 1,293 5,393 417 3.5 Based on the case ofthe US, CAGR ofaviation turnover isaround 5% if GDP percapita isUS$10,000–20,000;CAGR of aviationturnover is around 4%if GDP per capita isUS$20,000–30,000;CAGR of aviationturnover is around 2%if GDP per capita isUS$30,000–40,000
(continued)
4 The Ministry of Transport’s statistics on road passenger turnover do not include transportation byPVs. However, we take it into consideration when calculating carbon emissions.

8.3 Viable Options for China to Achieve Green Transportation 177
Table 8.2 (continued)
Transportationturnover
2019 2060E 2060Eversus 2019(%)
CAGR (%) Assumption
Total (bntonne-km)
197,164 387,418 196 1.7
By transport
Shipping 103,970 219,094 211 1.8 Driven by internalcirculation of theeconomy, we believeCAGR oftransportationturnover of inlandrivers is 3.4%, whichis higher than that ofshort seas (2.0%) andthat of deep seas(1.0%)
Railway 31,476 84,523 269 2.4 We believe totalrailway transportationmileage will reach250,000 km by 2060,95,000 km of which ison high-speed rails.Also by 2060, thedensity of China’srailway system will beclose to that of the USrailway system in2019; passengertransportation willbenefit from theincrease of totalrailway mileage; aportion of freighttransportation throughhighways will bereplaced by railways
Source Wind Info, CICC Research
record the highest turnover growth driven by rising per capita air trips and low-carbonrailway and marine transport will also generate high turnover growth.

178 Chapter 8 Green Transportation: A Challenging Road to Carbon Neutrality
8.3.1.2 Under Our Neutral Assumption, We Expect Carbon Emissionsfrom Transportation in 2060 to Plunge 77% from 2019
The transportation industry emitted 1.16bn tonnes of carbon in 2019. Under ourneutral assumption,we expect carbon emissions from transportation to peak at 1.33bntonnes in 2030. The emission will plunge 77% from 2019 to 261mn tonnes in 2060.Unless there are significant technology breakthroughs, we do not think the aviationand marine transportation sectors will achieve decarbonization by 2060. As such, thetransportation industry is unlikely to achieve carbon neutrality under neutral assump-tions. However, technology advances may give positive shocks, and technologicalbreakthroughs may help the transportation industry achieve carbon neutrality in thenext 4 decades.
Overall, carbon emissions in the transportation industry will be affected by theincreasing turnover rate, the improvement in fuel efficiency of each type of transport,and the replacement of traditional fossil fuels by low- or zero-carbon energy sources(e.g. applications of electric vehicles, LNG-powered vessels, and biomass jet fuel).
What are the assumptions timing (see Fig. 8.4 and Table 8.3).The road transport (passenger) sector: Carbon emissions will peak in 2028 when
ownership-based penetration rate of NEVs may reach around 10%. The penetrationrate of NEVs will rise continuously and reach 100% by 2045, and all PVs will beNEVs thereafter, achieving carbon neutrality in 2060.
The road transport (freight) sector: Carbon emissions will peak in 2030 whenownership-based penetration rate of alternative-fuel trucks may reach around 10%.In our view, the ownership-based penetration rate of electric MDT, LDT, and minitrucks will rise to 100% in 2050, and the rate of fuel cell-powered HDTs will reach
0
200
400
600
800
1,000
1,200
1,400
2019
2020
E20
21E
2022
E20
23E
2024
E20
25E
2026
E20
27E
2028
E20
29E
2030
E20
31E
2032
E20
33E
2034
E20
35E
2036
E20
37E
2038
E20
39E
2040
E20
41E
2042
E20
43E
2044
E20
45E
2046
E20
47E
2048
E20
49E
2050
E20
51E
2052
E20
53E
2054
E20
55E
2056
E20
57E
2058
E20
59E
2060
ERoad transport (freight) Road transport (passenger) Aviation Shipping Railway
(mn tonnes)
Road transport (freight)
Road transport (passenger)
Aviation
ShippingRailway
Fig. 8.4 Our forecasts for carbon emissions from transportation in 2020–2060. Note The red lineindicates the timing that the transportation industry will reach peak carbon emissions. Source IEA,CICC Research

8.3 Viable Options for China to Achieve Green Transportation 179
Table 8.3 Major timing of carbon emissions from transportation sectors and our assumptions
T i m e li n e 2025E 2028E 2030E 2040E 2045E 2050E 2060E
Ke y e ve n t s r e la t e d t oc a r b o n e m i s s i o n s
Ca r b o n p e a k fo r p a s s e n g e rc a r s
Ca r b o n p e a k fo rh i g h w a y s
Ca r b o n p e a k fo rs h i p p i n g
Ca r b o n p e a k fo ra v i a t i o n
Ca r b o n n e u t r a li t y fo rh i g h w a y s a n d r a i lw a y s
R o a d t r a n s p oo r t(p a s s e n g e r )
BEV achieves purchaseparity compared with
traditional fuel vehicles,and the penetration rate of
new green-cars reaches20%
1) The penetration rate ofgreen-cars reaches 10% by
20282) The car parc per 1,000
people reachesapproximately 250
1) The car parc per 1,000 people willreach 500, and autonomous drivingwill spread, after which the car parc
will begin to decline.2) The penetration rate of new green
vehicles reaches 100%.
100% green for passenger cars
R o a d t r a n s p o r t (f r e i g h t )1) The penetration rate ofgreen medium and light
trucks will reach 3%2) The penetration rate ofFCEV heavy trucks will
reach 1%
1) The penetration rate ofgreen medium and lighttrucks will reach 20%
2) The penetration rate ofFCEV heavy trucks will
reach 3%
1) The penetration rate ofgreen medium and lighttrucks will reach 70%
2) The penetration rate ofFCEV heavy trucks will
reach 30%
The penetration rate ofgreen medium and
light trucks will reach100%
The penetration rate of greanheavy trucks will reach 100%
Avi a t i o n Biomass fuel will start tosupply energy, accounting
for 1%
Hydrogen aircraft willenter the market
Biomass fuel andhydrogen will supply
25% of energy
Biomass fuel and hydrogen willsupply 45% of energy
Sh i p p i n g1) Penetration rate ofinland water electricvessels reaches 1%
2) LNG replaces 3% ofshipping fuel
1) Penetration rate ofinland water electricvessels reaches 10%
2) LNG replaces 10% ofshipping fuel
1) Fully electrified inlandwatercraft
2) LNG supplies 50% of energydemand, hydrogen energy andammonia energy each supply
20% of energy demand
R a i lw a yRailway electrification rate
reaches 82%Railway electrification rate
reaches 85%Railway electrification
rate reaches 91%Railway electrification rate reaches
94%Railway electrification
rate reaches 96%Railway electrification rate
reaches 100%
Source CICC Research
100% in 2060. In other words, we think the CV-based transport sector will reachcarbon neutrality in 2060.
The aviation sector: Emission peak will be reached in 2050. In our view, thepenetration of biomass fuel and hydrogen energy in airplanes will rise to 25% in2050, and then rise gradually, but cannot completely replace traditional jet fuel. Weexpect the penetration of biomass fuel and hydrogen energy to rise to 30% and 15%in 2060, implying carbon emissions of 232mn tonnes, almost doubling the emissionsin 2019 and accounting for 89% of total carbon emissions from transportation.
Marine transportation sector: Carbon emissions will peak in 2040. In our view,the penetration of new energy in this sector will reach 25% in 2040. Although LNG,hydrogen and ammonia will have an increasingly high penetration rate, traditionalfuel cannot be completely replaced. Carbon emissions from marine transportation isexpected to drop 62% from 2019 to about 29mn tonnes in 2060, accounting for 11%of total carbon emissions from the transportation industry.
Railway sector: Electrification adoption rate will rise to 100% in 2060, helpingthe railway sector achieve carbon neutrality.
What may go beyond expectation or under expectation? Technology advancesand applications of new energy are highly promising for the next 10–15 years. Yetthe longer-term technological evolution is unpredictable.
Beyond expectation: (1) The era of intelligent driving is likely to arrive earlierthan expected: When the era arrives, vehicle ownership may largely shrink and thePV-based transport sector may achieve carbon neutrality earlier than 2060; (2) fuelefficiency improvement might beat expectations: If carbon trading market matures,this may encourage companies to accelerate energy conservation and emissionsreduction, leading to a positive fuel efficiency enhancement; and (3) technologies

180 Chapter 8 Green Transportation: A Challenging Road to Carbon Neutrality
on hydrogen energy are likely to beat expectations, given recent breakthroughs inhydrogen storage technology.5
Under expectation: (1) penetration rate of new energy inCV-based transport sectoris slower than expected: As trucks are mostly owned by individuals that focus moreon returns, we believe the penetration rate could be slower than expected beforeprice parity is achieved; and (2) applications of biomass fuel in airplanes missingexpectations: The applications require a sound biomass value chain, but collectionand conversion of biomass raw materials are both challenging. As such, we believethe applications may miss expectations.
Optimistic and pessimistic scenarios on the transportation industry’s carbon emis-sions roadmap are examined as follows (see Fig. 8.5): For the optimistic scenario,carbon emissions from transportation will peak in 2028 at 1.27bn tonnes (earlier thanexpected), and transportation will achieve zero carbon emissions in 2060. For thepessimistic scenario, we expect the emissions from transportation to peak at 1.44bntonnes in 2035 and drop only 48% from 2019 to 610mn tonnes in 2060.
In the next part, we focus on individual transportation sectors. We first discusseach sector’s current emissions, predict future ownership, turnover and emissions in2060, and then propose specific emissions-reduction options.
8.3.2 The PV-Based Transport Sector: PV Ownership to Riseat First and then Decline; Zero Carbon Emissions to BeAchieved in 2060
8.3.2.1 PV Ownership to Rise First, then Decline, and Reach 531mnUnits in 2060, Rising 158% from 2019
China’s PV ownership is expected to experience three periods:Period I: From now to 2030. The Chinese economy will undergo mid- or high-
growth momentum and rising GDP per capita will lead to strong growth in PVownership per 1,000 persons. China’s PV ownership will expand from 210mn unitsin 2019 to 432mn units in 2030, in our view implying a 6.9% CAGR.
Period II: From 2030 to 2045. During the second period, the Chinese economywill reach amature stagewhichGDP per capita will maintain at amid- or low-growthmomentum level, and growth of PV ownership per 1,000 persons will decelerate.China’s PV ownership per 1,000 people in the longer term will be similar to levels inJapan and South Korea, and reach 500 units in 2045, still lower than the 800 units inthe US. Chinese PV ownership will peak at 710mn in 2045, implying a 3.3% CAGR.
Period III: From 2045 to 2060. In the third period, intelligent driving and trafficwill effectively enhance transport efficiency, and hence reduce PV demand and drive
5 Balancing volumetric and gravimetric uptake in highly porous materials for clean energy, writtenby CHEN Zhijie Chen and LI Penghao, published in Science in April 17, 2020.

8.3 Viable Options for China to Achieve Green Transportation 181
0
200
400
600
800
1,00
0
1,20
0
1,40
0
1,60
0
2019
2020E
2021E
2022E
2023E
2024E
2025E
2026E
2027E
2028E
2029E
2030E
2031E
2032E
2033E
2034E
2035E
2036E
2037E
2038E
2039E
2040E
2041E
2042E
2043E
2044E
2045E
2046E
2047E
2048E
2049E
2050E
2051E
2052E
2053E
2054E
2055E
2056E
2057E
2058E
2059E
2060E
Fore
cast
of t
rans
port
atio
n ca
rbon
em
issi
ons
Bes
t-cas
e sc
enar
ioB
ase-
case
scen
ario
Wor
st-c
ase
scen
ario
(mn
tonn
es)
Fig
.8.5
Our
forecastsforcarbon
emissionsfrom
transportatio
nin
2020–2060underthreescenarios.NoteThe
marks
inthischartind
icatethetim
ingof
peak
carbon
emissions.Source
IEA,C
ICCResearch

182 Chapter 8 Green Transportation: A Challenging Road to Carbon Neutrality
down PV ownership. Thus, China’s PV ownership may drop to 531mn units in 2060,in our view implying a –1.9% CAGR in 2045–2060.
8.3.2.2 NEV Sales Volume Forecast: We Expect Alternative-Fuel PVsto Achieve a Purchase Price Parity in 2025 and TheirPenetration Rate (Based on Sales) to Reach 100% in 2045
Given the expected PV ownership, alternative fuel vehicle’s penetration rate can beused as the most important factor when calculating carbon emissions. Installationcost of ternary battery packs in 2025 is likely to decline 35% from 2020 due to cleareconomies of scale and lower cost of LIB materials. This drop in cost should helppure electric vehicles achieve purchase price parity with traditional fuel vehicles,thus further driving up the penetration rate of pure electric vehicles. Alternative-fuelPVs had a penetration rate of 6.2% in 2020 (based on sales volume). Penetration rateis likely to reach 20% in 2025, 50% in 2035, and 100% in 2045, given China’s NEVindustry blueprint for 2021–2035 and a technological roadmap for NEV and energyconservation.
We expect the PV-based transport sector to reach peak carbon emissions in 2028,given our forecasts for new energy vehicle penetration and energy conservationof traditional fuel vehicles. Based on our estimation, traditional fuel PVs will beall scrapped in 2060, and the PV-based transport sector will achieve zero carbonemissions.
8.3.2.3 Energy Conservation and Emissions Reduction in the PV-BasedTransport Sector Requires a Combination of Multiple Factors
The technical pathways for the PV-based transport sector to acheive carbon neutralitymainly rely on energy conservation of traditional fuel vehicles and the use of cleanenergy. The next section will closely examine three different pathways: light mate-rials, hybrid power, and LIB. The light material pathway is the least effective inemissions reduction, while the LIB option is the most effective.
The light material pathway can reduce the weight of a vehicle by 35% in2030 compared with 2015. The light material pathway refers to the application ofaluminumalloy,magnesiumalloy and carbonfiber reinforcedmaterials.According toa study made by European Automobile Manufacturers Association, a 100kg declinein a vehicle’s weight can reduce oil consumption per 100km and carbon emissionsby 0.4L and 1kg. We noticed that aluminum consumption per vehicle in the US andEurope increased steadily and both exceeded 180kg in 2020. In contrast, the amountin China was only 105kg in 2017, pointing to large upside. We expect the averagevehicle weight in China in 2030 to decline 35% from 2015.
The hybrid power pathway is the best emissions-reduction option beforeNEVs completely replace traditional fuel vehicles. China Society of AutomotiveEngineers released a document on technological roadmap 2.0 for energy conservation

8.3 Viable Options for China to Achieve Green Transportation 183
and NEVs. According to this document, penetration rate of new hybrid vehicles mayreach 50% in 2035 and hybrid vehicles could begin to completely replace traditionalfuel vehicles. Hybrid vehicles are driven by both engines and electric motors, whichcan help engines work efficiently under different road conditions.
China’s domestic automakers have developed hybrid power technologies. Forexample, SAICMotor, GuangzhouAutomobile Group, GreatWallMotor, Geely, andBYD have all released their hybrid power development platforms to better cope withincreasingly tight oil consumption standard.
Mass LIB production is of great importance to carbon neutrality in the PV-based transport sector. NEVs still have significant disadvantages in comprehen-sive performance and driving experience. For example, their driving range declinesconsiderably when the temperature is low, and hot weather tends to trigger thermalrunaway in battery packs, raising strong consumer concerns on driving range andsafety. LIB producers and automakers both play an important role in resolving suchchallenges.
LIB producers will settle technological constraints by optimizing battery materialsystem and developing new cell technologies. We believe these efforts will quellconsumer concerns on driving range to some extent and pave the way for NEVs tocompletely replace traditional fuel vehicles in 2045.6
Emerging automakers began to work on vehicle intelligence, innovate busi-ness models, and improve driving experience. For example, Tesla has promotedfast charging technology, enlarging the maximum charging power to 250kW, whichcan meet consumer needs for charging time. In addition, we think rising penetra-tion of smart electric vehicles will push consumers to shift away from traditionalfuel vehicles to NEVs. Compared with its 1.0 platform, NIO’s pilot 2.0 platformhas significantly improved performance of smart electric vehicles in aspects such asalgorithm, computing power, and hardware products.
8.3.3 Carbon Emissions from CV-Based Transport Sector:Rising Applications of New Energy, DigitalizationTechnology and Changing Transport Structure to helpthis sector achieve carbon neutrality in 2060
8.3.3.1 Changing Freight Transport Structure to Reduce Demandfor Road Freight Transportation
After analyzing freight transport structure in the US and EU, we found that thestructure is dominated by waterway in the EU and by railway in the US. These tworegions have been less reliant on road transportation, whereas the exposure to roadtransportation is increasing in China.
6 For detailed analysis, please refer to the technological section on green transportation.

184 Chapter 8 Green Transportation: A Challenging Road to Carbon Neutrality
A number of government agencies began to promote switching freight transporta-tion from roads to railways in 2017. The efforts paid off, as railway freight transportvolume in 2019 increased about 1.06bn tonnes from 2016. The cost of road trans-port is twice that of railway transport and is four times that of marine transport. Theper-unit energy consumption of road transport is 4 and 10 times that of railway andwaterway transport. Furthermore, the shift in the demand for transportation servicefrom roads to railways and marine will continue to divert freight sources and reducethe demand for road freight transport.
8.3.3.2 CV Ownership: HDT Ownership to Peak in 2030; MDTand LDT to Reach Peak Ownership in 20457
HDTs: HDT ownership is expected to rise at first and then trend downward, andit will peak around 2030. Real estate, infrastructure construction, and road-basedlogistics will continue to boost HDT demand in the coming years. However, HDTdemand is likely to decline in the longer term, as cargo owners shift away from roadtransport to railway and transport efficiency increases. HDT ownership is expectedto peak at 10.40mn units in 2030 and drop to 8.17mn units in 2060.
MDT, LDT and mini trucks: Ownership will peak in 2045. The ownership isaffected by transport efficiency and road transport demand. According to our esti-mation, ownership of MDTs, LDTs and mini trucks will rise in the medium and longterm driven by increasing urbanization rate, and then peak in 2045. Subsequently, theownership of these subsectors will start to shrink as autonomous driving dominatesthe CV market. In addition, we think coach ownership has peaked and will remainstable in the long term.
8.3.3.3 New Energy Vehicles Are Expected to Fully Replace TraditionalFuel Vehicles in 2060, Helping the CV-Based Transport SectorAchieve Carbon Neutrality
The penetration rate will reach 100% in 2030 for alternative-fuel coaches, in 2050for new-energy MDTs, LDTs and mini trucks, and in 2060 for alternative-energyHDTs. In other words, we think the CV-based transport sector will achieve carbonneutrality in 2060.
Alternative-fuel coaches will completely replace traditional coaches in 2030 aslocal governments buy a growing number of pure electric coaches.
The penetration rate of electric LDTs, MDTs and mini trucks will rise to 100%around 2050.
The rising penetration rate of fuel cell-powered HDTs depends on policy supportand the magnitude of reduction in fuel cell cost. According to the technological
7 HDT, MDT, and LDT refer to heavy duty truck, medium duty truck, and light duty truck,respectively.

8.3 Viable Options for China to Achieve Green Transportation 185
roadmap 2.0 on NEVs and energy conservation, the ownership of fuel cell-poweredCVs may rise to around 1mn units in 2035, implying a penetration rate of about 8%.As fuel cells generate electricity more efficiently and hydrogen storage technologiesimprove, hydrogen fuel cells will be widely used in HDTs, and fuel cell HDTs willfully replace traditional fuel HDTs in 2060.
The options on energy conservation and emissions reduction in the CV-basedtransport sector are listed as follows:
Option I: Hydrogen fuel cells replacing traditional fuel.Using hydrogen fuel cells becomes an important option for theCV-based transport
sector to save energy and reduce emissions because of their extensive raw materialsources and they are also more environmentally friendly. Hydrogen fuel cells have adefinite technological direction, but the development of such technologies is still inits infancy. More details are provided in the next section.
Option II: A combination of power unit technology and exhaust gas after treatmenttechnology.
In the past decade, China has repeatedly upgraded its emissions standard oninternal combustion engines, and each upgrade is associated with the release ofstricter emissions requirements. For example, under the China VI emissions standardfor HDTs (effective in July 2021), the emissions cap on hydrocarbon and carbonmonoxide is only half the level under theChinaVstandard, and the limit onparticulatematters is 1/10 of the specified number in the previous standard. China will continueto upgrade the emissions standard and launch China VII standard in the next decadewhich may have stricter requirements for pollutant emissions.
Option III: Digitalization enhances road freight transport efficiency.Digitalization technology can effectively eliminate agents and settle the problem
of freight-truck matching. Specifically, freight-truck matching platforms can reducethe time that truck drivers spend in finding loads and raise matching efficiency byleveraging big data and algorithms based on drivers’ locations, habits and routes.According to a report from Sohu,8 monthly average driving mileage facilitated byFuyou (a truck-freight matching platform) is 22%–57% higher than the level undertraditional dispatching model. Based on transportation data in 2019, we estimatethat a 1% decline in the proportion of deadhead trucks can reduce carbon dioxideemissions by about 7.30mn tonnes, accounting for 1.6% of emissions from the CV-based transport sector in 2019.
8 https://www.sohu.com/a/354965965_168370 (source in Chinese).

186 Chapter 8 Green Transportation: A Challenging Road to Carbon Neutrality
8.3.4 The Aviation Sector: Emissions in 2060 to Doublefrom 2019; Achieving Carbon Neutrality is the MostChallenging for All Modes of Transport
This section will first discuss current emissions from the aviation sector, then esti-mate its turnover rate and emissions in 2060, followed by predicting the emissions-reduction options such as the use of alternative fuel, operation optimization andcarbon offsetting and reduction scheme.
8.3.4.1 In the Past Decade, Aviation Turnover Drove High Growthin Carbon Emissions
The aviation sector emitted 117mn tonnes of carbon in 2019 (including internationalflights), accounting for about 10% of emissions from the transportation industry andimplying an 11.5% CAGR in the past decade driven mainly by aviation turnoverexpansion (an 11.7% CAGR in the past decade).
8.3.4.2 The Aviation Sector is Unlikely to Completely AchieveDecarbonization; Its Carbon Emissions to Double in 2060Under Neutral Assumptions
There is rising demand for air passenger and freight transportation. In 2019, China’sper capita air trips was only 0.4, much lower than levels of 2.2 in the EU and 2.8 inthe US. Air passenger and freight traffic in 2060 are expected to be 3.7 and 3.2 timesthe respective levels in 2019.
In our view, the aviation sector is unlikely to achieve decarbonization completely,and jet fuel replacement by new energy and operation optimization are two optionsfor emissions reduction in this sector. The aviation sector is characterized by heavyenergy consumption and long transport distances, posing strong challenges to decar-bonization. As such, energy conservation and emissions reduction are of vitalimportance.
The aviation sector is estimated to emit about 232mn tonnes of carbon in 2060,doubling the emissions in 2019.Assumptions for the above conclusion are as follows:(1) penetration of biomass fuel to rise to 30% in 2060; (2) hydrogen-powered planesto be commercialized in 2040 and have a penetration rate of 15% in 2060; and (3)per-unit fuel consumption efficiency rising 0.5% per annum.
What are the areas that may exceed and fall short of expectations? The part thatexceeds expectations: Technological advances tend to exceed expectations, so thereis a possibility that hydrogen aircraft will have unprecedented breakthrough. Lowerthan expected:We believe that the development of biomass fuel oil may be lower thanexpected, mainly because the collection, transportation and conversion of biomassfuel is difficult to scale.

8.3 Viable Options for China to Achieve Green Transportation 187
0
100
200
300
400
2020
E20
21E
2022
E20
23E
2024
E20
25E
2026
E20
27E
2028
E20
29E
2030
E20
31E
2032
E20
33E
2034
E20
35E
2036
E20
37E
2038
E20
39E
2040
E20
41E
2042
E20
43E
2044
E20
45E
2046
E20
47E
2048
E20
49E
2050
E20
51E
2052
E20
53E
2054
E20
55E
2056
E20
57E
2058
E20
59E
2060
E
Forecast of carbon emissions of the aviation transportation segementBest-case scenario Base-case scenario Worst-case scenario
(mn tonnes)
Fig. 8.6 Our scenario analysis and assumptions on carbon emissions from the aviation sector in2020–2060. Source CICC Research
Overall, we expect the aviation sector to achieve carbon neutrality in 2060 underour optimistic scenario. This sector will emit about 351mn tonnes of carbon in 2060under our pessimistic scenario, tripling the emissions in 2019 (Fig. 8.6).
8.3.4.3 Option 1: Alternative Energy Replacing Traditional Jet Fuel
The alternative energy that is most suitable for airplanes includes biomass fuel,hydrogen energy, and electrical energy. We are relatively upbeat on the applicationsof biomass fuel after comparing these three energy sources.
The biomass fuel technology is more mature than technologies on hydrogen andelectrical energy. China and other countries have produced biomass fuel and appliedit to airplanes. For example, the bio-jet fuel made by Sinopec was successfully usedin China Eastern Airlines’ planes as early as 2013. Moreover, biomass fuel beingmixed with existing jet fuel and then used in existing plane engines has been provenfeasible.
The application of hydrogen fuel in planes could reshape aircraft architecture.With flying distance being unchanged, the space needed for storing hydrogen fuel is4–8 times the storage space for traditional fuel. As such, we believe the structure ofhydrogen-powered aircraft is very likely to be revamped.Completing the processes ofdesigning, testing and verifying new aircraft normally takes 10–20 years. Therefore,we do not think hydrogen-powered aircraft will be commercialized in the near term.

188 Chapter 8 Green Transportation: A Challenging Road to Carbon Neutrality
The weight of batteries may equal or remain lower than maximum take-offweight only when their energy density rises 6–8 times, which is technologically chal-lenging. Thus, pure electric aircraft can only meet requirements for short distanceflying.
How much can new energy meet energy demand from aircraft in 2060?Under neutral assumptions, biomass fuel can meet 30% of energy demand from
aircraft. Energy Transitions Commission and RockyMountain Institute estimate in areport that China’s biomass energy supply potential could be 400–850mn tonnes ofstandard coal. Given the difficulties in building the biomass value chain, we conser-vatively assume the potential is 400mn tonnes. Excluding the biomass energy forpower generation, chemical material production, and heating for buildings, 40mntonnes of standard coal (i.e. 10% of the assumed potential) will be used to poweraircraft in 2060 under neutral assumptions, accounting for about 30% of jet fueldemand in the same year.
Hydrogen fuel can meet 15% of energy demand from aircraft under the neutralassumption.Hydrogen-powered aircraft are unlikely to be commercialized until 2040after technological breakthroughs are made. As such, hydrogen fuel can meet 15%of energy demand from aircraft under the neutral assumptions.
We cannot rule out the possibility that other new energy sources (e.g. nuclearenergy and solar kerosene) can be used as jet fuel. However, delevopment of rele-vant technology is still in the early stages. In our view, before new energy replacestraditional jet fuel, improving operations to save fuel consumption9 is also of greatimportance to emissions reduction in the aviation sector.
8.3.4.4 Option 2: Improving Operations Can Moderately ReduceCarbon Emissions
Improving operations mainly includes optimization in the flying process, routes andaircraft fleets.
Optimization of flying process: A study made by EUROCONTROL shows thatpersistent ascending and descending can help aircraft reduce carbon emissions byabout 0.6%.
Shortening flying distance: In our view, relying on radar to guide non-stop flightsand opening temporary routes can shorten flying distances. For example, ChinaEasternAirlines’ Shanghai-Londonflight reducedflyingdistanceby270kmby takingsimilar measures.10
In addition to these optimization measures, improving aircraft design and enginethermal efficiency can also reduce carbon emissions. However, China benefits fromthe potential improvement mainly because it is a buyer of aircraft (the researchand development of commercial aircraft might help improve the energy efficiency
9 We assume 0.5% of jet fuel is saved per year.10 http://www.caacnews.com.cn/1/6/201803/t20180312_1242843.html (source in Chinese).

8.3 Viable Options for China to Achieve Green Transportation 189
of domestically-made aircraft). Overall, operation optimization can reduce carbonemissions moderately per annum.
Are there any other options if the abovementioned options cannot help the aviationsector completely achieve decarbonization?
8.3.4.5 CORSIA Can Help International Air Transportation MarketAchieve Net Zero Carbon Emissions
What is CORSIA?CORSIA (Carbon Offsetting and Reduction Scheme for International Aviation)
is a carbon-reduction system that is launched by International Civil Aviation Orga-nization (ICAO) to cover international flights. Under CORSIA, which starts in2021, airlines buy carbon offset credits to cover any emissions from internationalflights above the current baseline of average emissions in 2019 so as to achieve zeroemissions compared to 2019 level.
China has not participated in CORSIA so far. Its aviation industry may facemounting cost pressure if the country becomes a member. However, this may alsohelp the industry strive to enhance efficiency and reduce cost. We estimate, basedon our previous assumptions on turnover and penetration of new energy, that carbonoffsetting cost of international flights should be around Rmb8.4–16.8bn in 2060(assuming carbon price of EUR20–40/tonne). If the cost is passed on to consumers,we estimate this would boost the round-trip ticket of the 4,000km flight betweenShanghai and Singapore by 2%–4%. From our point of view, CORSIA may spur theChinese aviation industry to speed up energy conservation and emissions reduction,amid the high offsetting cost.
8.3.5 Marine Transportation: Carbon Emissions in 2060to Be 38% of the Emissions in 2019
8.3.5.1 Marine Transportation Accounts for Only a Small Proportionof Total Emissions from the Transportation Industry; ItsEmission Growth Remains Slow, and Per-Unit EnergyConsumption Has Dropped Rapidly
We estimate marine transportation (including international routes) emitted 74.70mntonnes of carbon in 2019, accounting for 5.4% of total carbon emissions from thetransportation industry and implying a 1.4% CAGR in the past decade. We attributethe slow CAGR to rapid decline in per-unit energy consumption (–31% in 2019 from2009).

190 Chapter 8 Green Transportation: A Challenging Road to Carbon Neutrality
8.3.5.2 Carbon Emissions from Marine Transportation in 2060 to Drop62% from 2019 Under Neutral Assumptions
We expect marine transportation turnover growth to stay low all the way to 2060(1.8% CAGR). Replacing traditional fuel with new energy and helping vessels raiseenergy efficiency are two emissions-reduction options.
The carbon emissions of the marine transportation sector are estimated to contract62% from 2019 to about 29mn tonnes in 2060. Our assumptions include: (1) allvessels sailing on domestic waterways to be powered by electricity in 2060; (2)ships along coastlines and ocean-going vessels to be powered by diversified energysources (50% by LNG, 20% by ammonia and 20% by hydrogen energy); and (3) per-unit fuel consumption to fall by an average of 1% per year. The marine transportationsector can achieve carbon neutrality in 2060 under the optimistic scenario, and itscarbon emissions in 2060 will drop 20% from 2019 under the pessimistic scenario.
8.3.5.3 Option 1: Clean Energy Replacing Traditional Fuel
Clean energy sources for marine transportation mainly include electricity, ammonia,hydrogen and LNG.We are upbeat on the use of electric ships in domestic waterwaytransportation. On domestic waterways, transport distance is shorter (about 400 km),and ships have lower deadweight tonnage (around 1,500tonnes), laying a techno-logical foundation for using electricity- or fuel cell-powered ships. For coastal andocean sailing, the technology on LNG-powered vessels is relatively mature, but thatof ammonia- or hydrogen-powered ships has not matured.
The technology on LNG-powered vessels is relatively mature. LNG is sulfur free,and emits 20% less carbon than traditional fuel. IMO’s 0.5% global sulfur cap onmarine fuel may push the marine transportation industry to use LNG.
The use of ammonia and hydrogen as clean energy still needs further advance-ments in technology. Ammonia has been widely used to produce fertilizer, but its useas clean energy has not matured. For example, the use of ammonia relies on enginerenovation and a specific energy supply system. The applications of hydrogen energy,to a large extent, require solutions to a number of issues on hydrogen size, densityand engines.
In addition, other new energy sources such asmethanolmay also be used to replacetraditional marine fuel.
8.3.5.4 Option 2: Improving Energy Efficiency for Vessels
For energy efficiency, new vessels need to meet requirements from EEDI (EnergyEfficiency Design Index), while existing carriers need to comply with SEEMP (ShipEnergy Efficiency Management Plan). CE Delf and UMAS estimate that improve-ment in energy efficiency can help vessels reduce carbon dioxide emissions by up to8%.

8.3 Viable Options for China to Achieve Green Transportation 191
8.3.6 Railway Transport: Zero Carbon Emissions in 2060 ViaElectrification-Based Decarbonization
8.3.6.1 Carbon Emissions from Railway Transportation Contractedin the Past Decade Thanks to Higher Electrification Rate
Railway transportation is estimated to have emitted 13.84mn tonnes of carbon in2019, plunging 50% from 2009 and implying a CAGR of –7.2% in the past decade.Electrification rate in the railway sector expanded 36ppt in the last 10 years, whichis a major driver for the plunge in emissions.
8.3.6.2 The Railway Transport Sector Relies on Electrificationto Achieve Decarbonization
China’s railway operating length totaled 140,000km as of 2019, with 40,000km ofrailways have not been electrified. The country built about 5,500km of rail lines perannum in the past decade, and these lines are mostly electrified. In addition, an extra1,050km of old lines went under electrification transformation per year in the lastdecade. Under a neutral assumption that an extra 1,000km of existing lines becomeelectrified each year in the future, the electrification rate will rise to 100% in 2060.In other words, the railway transport sector may achieve zero carbon emissions in2060. The cost of railway electrification renovation is Rmb4–6mn/km, indicatingrenovating 1,000km of railway per year would cost around Rmb4–6bn, accountingfor only 4–6% of China State Railway Group’s funds available for use. China’srailway sector is very likely to achieve full electrification.
Overall, a full range of options that China has on the road to green transportationhas been provided. The most important option is the use of new energy. The use ofelectrical energy (automotive batteries) and hydrogen energy (fuel cells) is essentialto emissions reduction in the road and air transportation sectors. The technologicalroadmaps based on these two options will be discussed in the next section.
8.4 Forecasts for the Use of LIB and Hydrogen Fuel CellTechnologies
Asmentioned above, electricity, hydrogen and other newenergy sources are crucial toChina’s initiative of hitting peak carbon emissions by 2030. In the section discussing“green premium”, we mentioned that policies and technologies are two majorfactors that can propel carbon emissions reduction. This section will focus on tech-nologies, especially lithium-ion battery (LIB) technologies and hydrogen fuel celltechnologies.

192 Chapter 8 Green Transportation: A Challenging Road to Carbon Neutrality
2000 2010 2020 2030 2040
Lead-acid batteries
Lithium-ion battery
Solid state lithium ion battery
Fuel cell
Passenger cars
NCM111 ->523 ->811LFP NCA
High voltage single crystal NCM811+CTP
Solid state battery
Full application of solid-state batteries
Two -wheelers
Lithium battery speed up
Full lithium batteryEnergy storage
Heavy trucks
Widely used energy storage
Bus
H2 production
H2transportation
Hydrogeneration
Charging:Wireless charging
Fast charging
Batteryreplacement
Recycle
Two-wheeler battery
replacement
Lead acid recovery
Consumer electronics
2050
Consumption application
period
Early stage of transportation electrification
2060
Speeding up transportation electrification
Fully electrified passenger cars
Commercial vehicles to
accelerate zero emissions
Zero emission for commercial
vehicles
Zero emissions in the transportation
sector
Heavy trucks
Fuel cell from the pilot to the promotion
Widely used fuel cellszero -emission
commercial vehicles
Zero emission of small and
medium/inland watercraft
Zero emissions for medium and large ships and aviation
Fig. 8.7 Technologies used in the transportation industry. Source GGII, CICC Research
LIB: As an energy carrier for electric vehicles, LIBs are being used widelyacross the world. Electric PVswith a driving range of 600–800kmwill achieve priceparity over 2021–2025, thanks to lower costs and better quality enabled by advancedbattery technologies. New-generation technologies (such as solid-state batteries) areexpected to emerge over 2025–2030. The industrialization of these technologies willpromote electrification in a growing number of areas such as ships and small aircraftover 2030–2040. Coupled with carbon footprint monitoring in manufacturing andrecycling industries, this trend indicates that the industries that utilize LIB are likelyto achieve zero-carbon emissions.
Hydrogen fuel cells: Medium- and long-term clean energy solutions to emis-sions from HDT-based transportation. Due to the characteristics of its cost, thefuel cell system is more likely than LIBs to be used for medium- and long-haultransportation by HDTs. The cost and performance of the hydrogen fuel cell systemwill meet the commercialization requirements over 2030–2040, and that alterna-tive fuel-enabled electricity generation projects will propel the use and price parityof hydrogen energy. HDT-based transportation will achieve zero-carbon emissionsover 2040–2060, given potential commercialization of hydrogen fuel cell systemsand hydrogen fuel cell-powered HDTs amid price parity.
The application trend of technologies used in the transportation industry is shownin Fig. 8.7.
8.4.1 LIB to Promote Electrification in PV-Based Transportand Certain Public Transportation Sectors
As mentioned earlier, zero carbon emissions in the PV-based transport sector relieson the eventual adoption of pure electric vehicles. Penetration rate of NEVs (basedon sales volume) is likely to reach 100% in 2045, which to a large extent dependson the performance and technological roadmap of LIB technologies.

8.4 Forecasts for the Use of LIB and Hydrogen Fuel Cell Technologies 193
On the demand side, the incremental installation of electric vehicle (EV) batteriesin PVs will peak in China in 2045. Installations will increase at a CAGR of 21% over2020–2045 and reach 4,140GWh in 2045 (vs. 36GWh in 2020).
There is high visibility regarding the evolution of EV battery technologies and theresulting price parity. In our view, lithium iron phosphate (LFP) batteries will firsthelpNEVswith low- ormid-driving range to achieve price paritywith traditional fuelvehicles, and then nickel-rich ternary batteries will follow suit, boosting the marketdemand. We foresee the commercialization of solid electrolyte batteries, lithium-sulfur batteries, lithium-air batteries, and other next-generation batteries over 2030–2060. We think these trends will further improve the performance of LIB, and enableelectrification in additional industries.
Price parity to be partially achieved in the short term (2021–2023): NEVswith selling prices at Rmb100,000–150,000/unit and a driving range of less than450km will achieve price parity over 2021–2022, thanks to the use of LFP batteries.
Price parity to accelerate electrification in the medium term (2023–2030):As LIB technologies advance and industrialization capability improves, the use ofnickel-rich cathode LIBs will accelerate, further reducing their cost and raising theirquality. We expect EVs with a driving range of around 600km and more than 800kmto reach price parity with fossil-fuel vehicles over 2024–2025 and 2026–2030.
Next-generation technologies to be used in the long term (after 2030): Webelieve commercialization of next-generation batteries (such as solid-state batteries,lithium-sulphury batteries, and lithium-air batteries) will propel the evolution ofadvanced battery technologies. These technologies will improve battery safety andenhance battery energy density, thereby increasing the use of NEVs that are moreadvanced and have a range of more than 1,000km. They will also likely be used inother areas such as small aircraft.
8.4.2 Hydrogen Fuel Cells to Enable Zero-Carbon Emissionsfrom HDT-Based Transportation
Fuel cells are a chemical device that converts the chemical energy contained in fuelinto electric energy. According to fuel types, they can be categorized into hydrogenfuel cells as well as methane, methyl alcohol, and ethanol fuel cells. Hydrogen fuelcells are more likely to be commercialized, thanks to multiple advantages (such assafety and clean by-products). Hydrogen energy’s volumetric energy density is onpar with that of LIB, but it outperforms LIB in terms of mass energy density. Assuch, hydrogen energy is more likely to be used in long-haul HDTs.
The system cost of hydrogen fuel cells and the cost of using hydrogen energyare both high at the moment. In 2019, the system cost of fuel cells averagedRmb20,000/kW in China. We estimate that fuel cell systems will reach price paritywith HDT engines after the system cost drops to Rmb300–500/kW.

194 Chapter 8 Green Transportation: A Challenging Road to Carbon Neutrality
China is also likely to build a domestic value chain in 2020–2025. The country’shydrogen fuel cell industry now relies heavily on overseas materials. Given govern-ment subsidies and domestic demand, we believe China can produce its core mate-rials by 2025. The system cost of hydrogen fuel cells is estimated to drop 90% fromRmb20,000/kW in 2019 to Rmb2,000/kW in 2025, thanks to domestic productionand the use of advanced technologies from other countries.
Fuel cell system will achieve price parity over 2025–2040 amid further expan-sion of domestic value chain, major materials advancement and economies of scale.Domestic value chain will expand further and comprehensive system technologiesare likely to improve by 2035, thereby helping reduce the system cost to Rmb300–500/kW (down around 70%–80% from 2025). The fuel cell system will reach priceparity with traditional HDT engines by 2035.
The costs of manufacturing, transporting, and refilling hydrogen accounts for25%, 19% and 56% of the total cost of hydrogen consumption in the end market. Weexpect hydrogen energy to reach price parity driven by diesel with cost reduction inthe aforementioned areas.
The two main methods for generating hydrogen include the natural gas and coalgas reforming method and the alternative fuel-based electricity generation method.However, a growing number of companies are trying to generate hydrogen viathe alternative fuel-based water electrolysis method in the medium and long term.The cost of hydrogen generation via the reforming method and carbon capturetechnologies has fallen short of Rmb20/kg in energy-rich regions.
In contrast, amid the current electricity prices, the cost of hydrogen generation viathe water electrolysis method is high at more than Rmb40/kg. However, the cost ofsuch hydrogen will drop to less than 10/kg after 2025, as: (1) alternative fuel-basedelectricity generation accounts for a rising proportion of total electricity generation;and (2) alternative fuel-based electricity priceswill likely be low at Rmb0.1–0.3/kWhin energy-rich regions. The cost of such hydrogenwill likely drop to aroundRmb5/kgafter 2040. In addition, economies of scale will produce notable impacts on costs.As such, centralized and large-scale hydrogen generation will play a major role incost reduction in the medium and long term.
The decline in transport cost depends on technological advances and expansion ofapplication scale. High-pressure hydrogen ismostly transported in Type-III cylindersinChina,while it ismostly transported in Type-IV cylinders overseas.11 The transportcost in 2030will drop 30%–50% fromcurrent levels, thanks to advanced technologiesand expansion of application scale in China.
Hydrogen refilling costs are expected to drop markedly with domestic productionof key equipment and accelerating construction of hydrogen stations. The cost ofbuilding a 35Mpa hydrogen station is high at US$2–2.5mn in China, as: (1) keyequipment is being mostly imported from other countries; and (2) depreciation andmaintenance account for a high proportion of total hydrogen station cost. The cost ofrefilling hydrogen will drop rapidly driven by accelerating construction of hydrogen
11 Type-IV cylinders can contain more hydrogen than Type-III cylinders, and the manufacturingtechniques for Type-IV cylinders are more complex.

8.4 Forecasts for the Use of LIB and Hydrogen Fuel Cell Technologies 195
stations and domestic production of key equipment hydrogen refilling cost will fallshort of Rmb10/kg after 2030 (vs. nearly Rmb40/kg at present).
8.5 Supportive Policies to Help the Transportation SectorAchieve Carbon Neutrality
In the previous two sections, we elaborate on the feasibility and ways to achievecarbon neutrality in the transportation industry. In this section, we discuss how toleverage supportive policies to reduce carbon emissions from transportation, andgive our policy suggestions from the perspective of industrial development andtechnological advances.
8.5.1 Policy Suggestions on Industrial Development—PVand CV: Shifting the Focus of Policies Towards MarketOrientation and Innovation
8.5.1.1 Domestic Policies on NEVs: Marginal Effect from SubsidiesWeakening; “Dual Credit” Policy to Guide Long-Term IndustryDevelopment
China’s government and governments around the world mainly promote the devel-opment of the NEV industry through short-term subsidies and long-term guidance.As subsidies are gradually scrapped in China, the marginal effect from subsidies willweaken, and the “dual credit” policy, as a substitute for subsidy policy, will guide thelong-term industry development, in our view. In the EU, automakers that fail to meetthe carbon emissions target may face substantial fines, pushing them to shift awayfrom fossil-fuel vehicles to NEVs. In the long term, carbon emission assessment willguarantee the healthy development of the industry following the subsidy cut.
8.5.1.2 Guiding Technological Roadmap to Enhance Overall Qualityof NEVs
With subsidies gradually being scrapped, high-quality NEV models will becomemore important in boosting NEV penetration rate. Therefore, the policy focus shouldbe encouraging automakers to produce more high-quality NEV models.
Guiding technological roadmap: The “dual credit” policy promotes the use ofhybrid power technology in fossil fuel vehicles, and requires automakers to furtherraise the proportion of all-electric vehicles. To accumulate credits, certain vehiclemanufacturers produce low-quality NEVs, and sell them to taxi companies at a low

196 Chapter 8 Green Transportation: A Challenging Road to Carbon Neutrality
price which weighs on NEV demand from individuals. We believe the criteria forgranting credits can be further specified. For example, indicators such as drivingrange, battery safety, and energy conversion efficiency could be considered toencourage the production of higher-quality NEVs.
Vehicle-related taxation:Allowing local governments to collect part of the vehicle-related tax revenue can stimulate cooperation between local governments and localautomakers. Taxation policies should encourage both purchases and the use ofNEVs.
8.5.1.3 Encouraging Innovation to Remove Hindrances to NEV SectorDevelopment
LIB technology is not yet mature. Policies should be directed at removing customerpain points inNEVpurchases and promoting the development of NEV infrastructure.
The focus of subsidies should gradually shift from NEV purchases to the devel-opment of NEV infrastructure. In particular, subsidies are necessary to fund theconstruction of infrastructure facilities such as EV charging spots and EV batteryswapping stations, so as to enhance the convenience of driving NEVs.
Policymakers should support business model innovation. For example, sellingNEVs and batteries separately can reduce the initial vehicle purchasing cost, andquell consumer concerns on battery life. However, China needs to launch new poli-cies to clearly define the ownership of NEVs and batteries. In addition, EV batteryswapping stations are mainly operated under an asset-heavy model, and requireheavy investment in the early stages. These stations are unlikely to achieve large-scale commercialization unless they receive government subsidies and capital marketsupport.
8.5.1.4 Reduction of Carbon Emissions from Vehicles on the Road
Forming more environmentally friendly driving habits: Improper driving behaviorsuch as street racing and poor driving habits such as random lane changes cause extragasoline consumption as well as additional carbon emissions. Therefore, applyingdriver-monitoring technologywill better discipline drivers, and further reduce carbonemissions from vehicles.
Internet-connected vehicles to reduce traffic jams: Vehicles that are connected tothe internet can choose the best route based on cloud data, enhancing transportationefficiency. Thus, the installation of roadside sensors and signal reception devices willeffectively promote internet-connected vehicles, thereby reducing carbon emissions.

8.5 Supportive Policies to Help the Transportation Sector … 197
8.5.2 Policy Suggestions on Industry Development—Airlines:Focusing on Development of Biomass and HydrogenEnergy
8.5.2.1 Alternative Energy Sources: Offering Subsidies for MatureBiomass Fuels; Paying Attention to the Developmentof Hydrogen Energy
We believe the government can offer subsides to create the aviation biomass fuelmarket. Biomass fuels for aircraft are expensive, which is a major restraint onmarket demand and economies of scale. We thus believe regulators should offersubsidies to fill the price gap between biomass fuels and traditional fuels to promotethe development of the biomass-fuel value chain.
We believe the government should promote the combination of other new energysources such as hydrogen with aeroengines. China still lags other countries in aircraftmanufacturing technology, and we suggest paying attention to hydrogen-enabledtechnological advances.
8.5.3 Policy Suggestions on Technological Advances—LIB:Zero Emissions Throughout the Lifecycle RequiresCoordination Between Companies and Governments
Carbon emissions fromLIBs should be evaluated throughout the full lifecycle.Whiledriving cars powered by LIBs is carbon emission-free, the manufacture of LIBs andtreatment of used LIBs both produce carbon emissions.
China needs to further improve policies to push the automotive battery value chainto achieve zero carbon emissions. A number of authorities have released a seriesof policy moves to strengthen recycling of unused NEV batteries. However, theyhave not clarified the details. In addition, China also needs to issue clear policiesto push NEV producers to save energy and reduce carbon emissions. We suggestpolicymakers take the following actions:
Establishing a system of traceability management during the battery lifecycleto track carbon footprints in each step: The Ministry of Industry and InformationTechnology (MIIT) has built a comprehensive management platform for nationalNEVmonitoring and automotive battery recycling. Authorities also need to promotecarbon footprint traceability in each step of the value chain, and ensure effectiveimplementation of a system that incorporates rewards and punishments, in order topush the value chain to control and reduce carbon emissions.
Clarifying the parties liable for automotive battery recycling, and building a recy-cling network that consists of 4S stores, NEV producers and third-party institutions:The Ministry of Industry and Information Technology (MIIT) has clearly stated thatNEV producers are held liable for recycling automotive batteries. Thus, China needs

198 Chapter 8 Green Transportation: A Challenging Road to Carbon Neutrality
to further improve the recycling network, clarify the details on storage, logistics andreprocessing, and explore viable business models and interest-distribution options.
Relying on mandatory policies and a system that incorporates both carrots andsticks to guide alternative fuel vehicle makers and users to actively participate inautomotive battery recycling: China has built a system of LIB traceability and recy-cling, but compliant channels have not played an important role in the recycling. Thegovernment should set up a clear system that incorporates rewards and punishments,clarify regulatory options, and make NEV makers more interested in recycling. Inaddition, China also needs to strengthen the automotive battery traceability system,and rely on rewards or subsidies to guide users to participate in recycling.
8.5.4 Policy Recommendations—Fuel Cells: It is Necessaryto Promote Industrialized Applications of Fuel CellsVia Policies
The adoption of hydrogen fuel cells is still at a very early stage. Chinese suppliers ofhydrogen fuel cells lag their foreign counterparts in terms of both expertise and scale.In addition, the adoption of hydrogen fuel cells requires substantial infrastructureinvestment, and the hydrogen fuel cell industry cannot offer decent returns in a longtime if there are no supportive policies. In other words, R&D, production, adoption,and infrastructure construction all need policy support.
Current policies: China launched a 4-year campaign of pilot promotions ofhydrogen fuel cell-powered vehicles in September 2020. In the period of the pilotpromotions, the country aims to build a full value chain, focus on technological inno-vations, target applications in actual scenarios and explore effective business modelsto support healthy development.
Our longer-term policy recommendations: Given FCH-JU’s report HydrogenRoadmap Europe: A sustainable pathway for the European Energy Transition, theadoption of hydrogen fuel cells needs the following supportive policies in the longterm:
First, policymakers should promote construction of hydrogen energy infrastruc-ture and formulation of fuel cell standards, and clarify liabilities of each party in thevalue chain. The hydrogen fuel cell industry now lacks regulatory standards, espe-cially on the infrastructure side. Formulating standards can facilitate construction andinvestment of hydrogen fueling stations, and accelerate infrastructure construction.In addition, the hydrogen fuel cell systemalso needs to further improve technological,production and qualification standards to promote mass adoption.
Second, China needs to formulate a long-term infrastructure construction plan toensure large-scale adoption and visible development in the medium and long term.
The country also needs to further clarify and guide adoption roadmaps forhydrogen energy in specific transport scenarios, and make clear promotion targets.

8.5 Supportive Policies to Help the Transportation Sector … 199
China should promote cross-border cooperation on the adoption of hydrogen fuelcell systems, expand its coverage of the global value chain, and accelerate industrialexpansion.
8.6 Reassessing the Effectiveness of Our GreenTransportation Solutions Based on the “GreenPremium”
In previous sections, we predicted the trend of carbon emissions from transporta-tion by 2060, and discussed green transportation solutions including technologicalroadmaps and necessary policies. In this section, we measure the effects of thesesolutions again from the perspective of “green premium”.
8.6.1 The “Green Premium” to Decline Considerably,but Unlikely to Plunge to Zero in 2060
As estimated in the previous section, the “green premium” for the transportationindustry is 68% in 2021, implying a zero carbon-emissions cost of Rmb2.7trn. Thisindicates decarbonization in this industry would be costly and challenging. Givenour forecast carbon-emissions trends, we intend to calculate the “green premium” in2030 (when emissions may peak) and in 2060. Then we try to answer two questions:(1) What will be the cost of zero carbon emissions in 2030 and 2060? (2) How willthe “green premium” change from the current level? Answers to these questionscan measure the effectiveness and feasibility of our recommended technologicalroadmaps and policies.
8.6.1.1 Zero Carbon Emissions Cost to be Rmb89.7bn in 2030,Implying a “Green Premium” of 2%
The estimation that the “green premium” in the transportation industry should be 2%in 2030 implies zero carbon emissions cost of Rmb89.7bn (Table 8.4), down aboutRmb2.6trn from 2021 with around Rmb1.7trn (or 65%) from the CV-based transportsector and about Rmb750bn (or about 29%) from the PV-based transport sector.
The CV-based transport sector’s zero carbon emissions cost is expected to declineRmb1.7trn to Rmb242.3bn in 2030. Specifically, we estimate that the zero emissionscost of the HDT transport submarket will drop by Rmb1.5trn due to a combinationof falling hydrogen cost (–52%) and lower purchase price of hydrogen-poweredHDTs (–80%). We expect the zero emissions cost of the MDT and LDT transportsubmarkets to slide about Rmb180bn. In our view, the purchase price of electric

200 Chapter 8 Green Transportation: A Challenging Road to Carbon Neutrality
Table 8.4 We expect the transportation industry’s zero carbon emissions cost to be Rmb89.7bn in2030
2030E Current energycost (Rmb bn)
Cost after newenergy (Rmb bn)
Cost of zerocarbon emission(Rmb bn)
Green premium(%)
Road transport(freight)
1,847 2,089 242 13
Road transport(passenger)
3,493 3,159 –333 –10
Railway 45 35 –10 –22
Aviation 136 287 151 111
Shipping 37 77 40 107
Total 5,557 5,647 90 2
Source CICC Research
MDTs and LDTs will decline 38%, pushing down their lifecycle cost. We estimatethat per-unit cost of electric MDTs and LDTs in 2030 would be 17% lower than thecost of those using traditional fuels (vs. a 7% premium in 2021).
The PV-based transport sector’s zero carbon emissions cost will shrink aboutRmb750bn to –Rmb333.5bn in 2030 with purchase price parity of pure electric PVs.As mentioned previously, we expect pure electric PVs to achieve purchase priceparity with traditional fuel PVs in 2025 and per-unit electricity cost to be 60% lowerthan gasoline cost. The full lifecycle cost of pure electric PVs in 2030 (Rmb0.47/km)will be 10% lower than that of traditional fuel PVs (Rmb0.53/km). And this sector’szero emissions cost will be around –Rmb333.5bn.
8.6.1.2 The “Green Premium” to Be 2% in 2060, but Zero CarbonEmissions Cost to Drop to Rmb70.1bn
The “green premium” in the transportation industrywill be 2% in 2060, implying zerocarbon emissions cost of Rmb70.1bn (Table 8.5). The “green premium” in the PV-,CV- and railway-based transport sectors are expected to be all zero in 2060 due to fullpenetration of new energy. In contrast, the aviation andmarine transportation sectors’zero carbon emissions cost will be Rmb53.7bn and Rmb16.4bn in 2060, implyinga “green premium” of 18% and 31%, as their energy demand cannot be fully metby new energy and per-unit hydrogen consumption cost should remain higher thanfuel cost in 2060. Overall, the transportation industry’s zero carbon emissions costshould be Rmb70.1bn in 2060, implying a “green premium” of 2%.
Generally speaking, we think the “green premium” in the transportation industrywill plunge from 68% in 2021 to 2% in 2060, with the implied zero carbon emissionscost slipping fromRmb2.7trn in 2021 toRmb89.7bn in 2030 andRmb70.1bn in 2060.This indicates our recommended solutions are reasonable. Nevertheless, the “greenpremium” is unlikely to drop to zero in 2060, suggesting the transportation industry

8.6 Reassessing the Effectiveness of Our Green Transportation Solutions … 201
Table 8.5 We expect the transportation industry’s zero carbon emissions cost to be Rmb70.1bn in2060
2060E Current energycost (Rmb bn)
Cost after newenergy (Rmb bn)
Cost of zerocarbon emission(Rmb bn)
Green premium(%)
Road transport(freight)
1,530 1,530 – 0
Road transport(passenger)
2,494 2,494 – 0
Railway 55 55 – 0
Aviation 298 352 53.7 18
Shipping 52 69 16.4 31
Total 4,429 4,499 70.1 2
Source CICC Research
still requires more advanced technologies. The decline in the “green premium”, to alarge extent, relies on advances in LIB and hydrogen technologies. LIB technologicalroadmap remains visible, while development of hydrogen technology is uncertainand requires policy support for R&D, adoption and criteria formulation.
8.7 Outlook for Green Transportation: A Combinationof Autonomous Vehicles, Super High-Speed Trainsand Supersonic Aircraft
We discussed the future based on visibility on technological development in previoussections. This sectionwill picture the future of the transportation industry in 2060 thatis 4 decades away from now. In the future predicted by us, modes of transportationin 2060 are very likely to include autonomous vehicles, hyperloop trains (superhigh-speed trains) and supersonic aircraft.
8.7.1 Autonomous Driving: It Changes More Than Travel
Autonomous driving requires highly effective coordination among vehicles, personsand the environment, and can complement normal driving under complicatedconditions.

202 Chapter 8 Green Transportation: A Challenging Road to Carbon Neutrality
8.7.1.1 Autonomous Driving to Change Travel Habits and SignificantlyImprove Road Transport Efficiency
The impact of complete autonomous driving on road transportation includes thefollowing:
In the era of autonomous driving, vehicles will become the “third space” betweenhome and office. Internal space in vehicles will be designed based on user needs tomeet the comfort requirements from passengers. What’s more, vehicles will becomethe “third space” instead of a means for travel, and passengers can work, relax andplay inside vehicles.
Part of the travel demandwill be diverted away from air and railway transportationto autonomous vehicles. For example, users in Beijing may sleep in an autonomousvehicle and arrive in Shanghai the next day.
Autonomous driving can effectively raise a vehicle’s utilization rate and enhancetransport efficiency. In our view, autonomous driving will promote PV sharing andraise utilization rate, and can help resolve safety problems such as driver fatigue andfurther enhance transport efficiency.
8.7.1.2 Rising Penetration of Autonomous Driving to Producea Profound Impact on Infrastructure Construction
Autonomous driving will reshape the concept of road and promote the constructionof multi-tiered underground tunnels. The era of autonomous driving will triggerlarge-scale construction of these tunnels. Autonomous vehicles can drive in tunnelswith different depths, significantly enhancing road transport efficiency.
The demand for new parking lots will decline, saving urban land resources. Sinceautonomous driving will trigger the sharing economy in the area of travel, idlevehicles will no longer occupy parking space, and urban demand for parking lotconstruction will shrink considerably, thereby saving urban land resources.
8.7.2 Can Hyperloop Trains be Realized?
Hyperloop train is a mode of transport that Elon Musk proposed and is based on thetheory of evacuated tube transportation. They have a number of advantages, suchas high speed, low energy consumption, quietness and low pollution. The US andChina have bothmade a big step in the R&D of hyperloop trains. For example, VirginHyperloop in the US completed its first test ride with passengers in November 2020.China’s Southwest Jiaotong University experimented with a hyperloop train with anhourly speed of more than 600km in January 2021.12
12 https://www.163.com/dy/article/G0831MQ20511NEUN.html (source in Chinese).

8.7 Outlook for Green Transportation: A Combination … 203
If hyperloop trains are commercialized, they will reshape existing transportationsystems and lifestyles.
Hyperloop trains have a faster theoretical speed than aircraft, and are very likely toaffect the role of airplanes in long-distance travel. As a carbon-freemode of transport,hyperloop trains can help the transportation industry achieve carbon neutrality afterreplacing aircraft.
Moreover, we believe the development of hyperloop trains is very likely to re-define the concept of cities. For example, passengers in Shanghai might arrive inBeijing or Shenzhen in only 1 hour if they travel by hyperloop train. In other words,Beijing, Shanghai and Shenzhen would be as close to three places in a city.
The speed of hyperloop trains is amazing, and we believe supersonic aircraft withfaster speeds are likely to be commercialized in the years ahead.
8.7.3 Commercialization of Supersonic Aircraft Likely to Bein Sight
Supersonic aircraft can travel at about 1,200kmper hour,which is faster than the speedof sound. Passenger and cargo aircraft have been subsonic for around 100 years sincetheir inception. Yet fundamental changes are likely to take place in the coming years.Boom Supersonic released XB-1,13 the first supersonic demonstrator, in October2020. According to its announcement, the test flight is set to take place in 2021, withthe highest speed at 2,335km per h. The XB-1 can carry only two people, and is stillonly a demonstrator. The real bright spot is Boom Supersonic’s Overture that cantransport 55–75 people. Boom Supersonic expects Overture to be commercializedin 2025.
Energy consumption by supersonic aircraft is more than double that of existingairplanes.Will they increase carbon emissions from the air transportation sector? Ouranalysis shows that they will not necessarily increase the emissions. XB-1’s design,development and tests have all taken environmental impact into consideration. Forexample, when XB-1 is tested on the ground, 80% of the fuel consumed is clean fuel.If clean fuel applications in supersonic aircraft prove viable, this will significantlyreduce carbon emissions. Supersonic aircraft can shorten the travel time and mayalso help the air transportation sector achieve carbon neutrality.
13 https://boomsupersonic.com/xb-1

204 Chapter 8 Green Transportation: A Challenging Road to Carbon Neutrality
Open Access This chapter is licensed under the terms of the Creative Commons Attribution-NonCommercial-NoDerivatives 4.0 InternationalLicense (http://creativecommons.org/licenses/by-nc-nd/4.0/), which permits any noncommercial use, sharing, distribution and reproduction in anymedium or format, as long as you give appropriate credit to the original author(s) and the source,provide a link to the Creative Commons license and indicate if you modified the licensed material.You do not have permission under this license to share adapted material derived from this chapteror parts of it.
The images or other third party material in this chapter are included in the chapter’s CreativeCommons license, unless indicated otherwise in a credit line to the material. If material is notincluded in the chapter’s Creative Commons license and your intended use is not permitted bystatutory regulation or exceeds the permitted use, you will need to obtain permission directly fromthe copyright holder.

Chapter 9Living Green: New Chapterof Consumption and Social Governance
Abstract We all hope that everyone can protect the earth and live a better life. Asconsumers are the last link in the carbon emission chain, hundreds of millions ofconsumers need to play their part in achieving the carbon peak by 2030 and carbonneutrality by 2060. Everyone can contribute by changing the way they live andconsume.
In the meantime, consumers may face increased costs and inconvenience broughtby green consumption. However, we believe this is a worthwhile since changes andsacrifices of several generations will bring a better life for future generations.
In this chapter, we emphasize the need to change our lifestyle and social gover-nance as well as the reinforcing interaction between the two. Enterprises shouldtake measures to effectively lower cost and improve economies of scale, quality andexperience of green consumption. Governments should improve green standards,introduce subsidies and formulate policies and regulations to facilitate consumers’shift to green consumption and lifestyle changes.
Let us work together to build healthies lifestyles with clear water and greenmountains, and to build and share a beautiful era of carbon neutrality.
9.1 Living Green Needs Efforts of All Stakeholders
9.1.1 Low-Carbon Lifestyle is of Great Significanceas Households Are Responsible for 40% of TotalCarbon Emissions
Households generate carbon emissions both directly and indirectly. Energy consump-tion contributes directly to the carbon footprint of households, while indirect carbonemissions are generated by consumption and services purchased in daily life.According to the definition of ‘carbon footprint’, indirect carbon emissions alsoinclude emissions generated in producing consumer goods. We estimate that carbon
© The Author(s) 2022CICC Research, CICC Global Institute, Guidebook to Carbon Neutrality in China,https://doi.org/10.1007/978-981-16-9024-2_9
205

206 Chapter 9 Living Green: New Chapter of Consumption and Social Governance
40
6167
72 73 74 75 77 78 80
0
10
20
30
40
50
60
70
80
90
China Japan France Spain Italy UnitedKingdom
India Germany Australia UnitedStates
(%)
Fig. 9.1 Proportions of household carbon footprints by country. Note Research data is compiledbased on 2017 data. Source Mapping the Carbon Footprint of EU regions, Diana Ivanova et al.Environ. Res. Lett. 12 (2017) 054013, How to Reduce Household Carbon Emissions: A Reviewof Experience and Policy Design Consideration, Xiaoling Zhang et al. Energy Policy 102 (2017)116–124, CICC Research
emissions from households account for approximately 40% of China’s total emis-sions,1 compared to 60%–80% in developed economies2 (Fig. 9.1). Households mayaccount for a higher proportion of total carbon emissions as their living standardsimprove. Therefore, living a green lifestyle is crucial for carbon neutrality.
9.1.2 Social Governance Requires Efforts from Households,Companies, and Government
How to lower the proportion of household carbon footprint in total carbon emissions?A low-carbon lifestyle may play an important role in achieving carbon neutrality.As the economy continues to grow, the proportion of household carbon footprintis increasing. Living a low-carbon lifestyle has become increasingly important, andneeds the engagement of all stakeholders: Households should turn to low-carbonconsumption, businesses should step up innovations and efforts to reduce supply-sidecarbon emissions, and governments should introduce favorable policies. Therefore,breakthroughs relating to household lifestyles, business models, and governmentpolicies are necessary to achieve green consumption (Fig. 9.2).
What can households do to help achieve carbon peak? Households can takemeasures to reduce demand-side carbon emissions, such as adoption of green
1 How to Reduce Household Carbon Emissions: A Review of Experience and Policy DesignConsideration, Xiaoling Zhang et al. Energy Policy 102 (2017) 116–124.2 Mapping theCarbonFootprint of EURegions, Ivanova et al. Environ. Res. Lett. 12 (2017) 054,013.

9.1 Living Green Needs Efforts of All Stakeholders 207
Old ProblemsFood waste
Energy efficiency
White pollution
Resource consumption
......
Increasing cost
Less convenience
......
Households
Eating green
Reduction in food waste
Green home
Recycling
Support for environmentalprotection
......
Enterprises
Product innovation
Efficiency improvement
Environmental protectionand emission reduction
Recycling
Sharing economy
ESG development
......
GovernmentsHome appliances: Energystandards, subsidies and
recycling systems
Furniture: Promotesustainable use of forest
resources
Packaging: Overseasexperiences and
overcoming of difficulties
Catering: "Clear Your Plate"campaign and organic
matter reusing
......
New Problems
Lower cost
Increase qualityIntroduce subsidies
Provide guidance
Fig. 9.2 Roadmap of green lifestyle. Source CICC Research
lifestyles, cultivation of green consumption habits, improvement of consumer behav-iors, as well as practicing a low-carbon diet, waste reduction, energy conservationand environmental protection.
However, households may face new problems in this process, i.e., rising costs andinconvenience. The engagement of enterprises and governments can help addressthese issues and enable households to play their roles in the achievement of carbonneutrality.
What can consumer goods companies do to help achieve carbon peak? Enterprisescan take multiple measures to reduce supply-side carbon emissions, such as productinnovation, efficiency improvement, energy consumption reduction, environmentalprotection, recycling, reusing, sharing economy, and ESG development. In addition,enterprises can achieve economies of scale in green consumer products to lowerhousehold expenses on their products.
What cangovernments do to help achieve carbonpeak?Governments should intro-duce favorable policies to encourage enterprises to take more ambitious measures.These policies include energy efficiency system and recycling of home appliances,subsidies for energy-saving products, sustainable use of forest resources, comprehen-sive management of packaging, “Clear Your Plate” campaign and reusing of organicproducts. Implementation and improvement of these policies may also help lowerthe incremental cost of households.

208 Chapter 9 Living Green: New Chapter of Consumption and Social Governance
30%
22%17%
10%
4%
14%
3%
Transportation
Housing
Food
Furniture and othermanufactured productsClothing
Services
Others
Fig. 9.3 Carbon emission breakdownofEuropean households in 2017. SourceMapping theCarbonFootprint of EURegions,Diana Ivanova et al. Environ. Res. Lett. 12 (2017) 054,013,CICCResearch
9.2 Green Lifestyle: What Can Households Do to HelpAchieve Carbon Peak?
Studies have shown that transportation, food, housing, furniture and other manu-factured products account for 30%, 17%, 22%, 10% and 4% of the average carbonfootprint of European households in 2017 (Fig. 9.3) (see Footnote 2). This sectionmainly discusses green diet and green home that jointly account for approximately39% of the average household carbon footprint.
9.2.1 Eating Green
Vegetarian diets produce much lower carbon emissions than meat, mainly due tolow utilization of feed and methane gas emissions from animals. Carbon emissionsgenerated by producing beef and mutton are four times as high as those from chickenand pork3 (Fig. 9.4). On the averageUS diet, meat products account for 56.6%of totalcarbon emissions in 2018, being the largest component of dietary carbon emissions4
(Fig. 9.5). As for dietary consumption is mainly rice, meat products account forapproximately 36.6% of all carbon emissions from food in China in 2016 (Fig. 9.6).
3 A Comparative Study on Carbon Footprints Between Plant and Animal-based Foods in China, Xuet al. Journal of Cleaner Production 112 (2016) 2581–2592.4 Center for Sustainable Systems, University of Michigan, 2020.

9.2 Green Lifestyle: What Can Households … 209
8.3 8.3
2.2 2.21.6
1.2 1.1 1.0 0.9 0.9 0.8 0.6 0.5 0.5 0.5 0.5 0.3 0.3 0.2 0.2 0.1 0.1 0.00
2
4
6
8
10M
utto
n
Bee
f
Chi
cken
Pork
Can
ola
oil
Egg
Can
ola
Milk
Soyb
ean
oil
Ric
e
Pean
ut o
il
Whe
at fl
our
Bee
t sug
ar
Pean
ut
Soyb
ean
Whe
at
Can
e su
gar
Mai
ze
Ora
nge
App
le
Tang
erin
e
Suga
rcan
e
Veg
etab
le
Carbon emissions per kg
(Carbon emission equivalence per kg)
Fig. 9.4 Estimated per kg carbon emission from food production and consumption inChina. SourceA Comparative Study on Carbon Footprints Between Plant and Animal-based Foods in China, Xuet al. Journal of Cleaner Production 112 (2016) 2581–2592, CICC Research
Rice25%
Pork16%
Corn12%
Beef9%
Wheat8%
Chicken6%
Mutton5%
Egg5%
Milk5%
Vegetation4%
Soybean oil2%
RicePorkCornBeefWheatChickenMuttonEggMilkVegetationSoybean oilCanola oilAppleCane sugarTangerine
Fig. 9.5 Carbon footprint breakdown by type of food in 2016 in China. Note Data on carbon foot-print of aquatic products is not available. Source Food andAgriculture Organization, AComparativeStudy on Carbon Footprints Between Plant and Animal-based Foods in China, Xu et al. Journal ofCleaner Production 112 (2016) 2581–2592, CICC Research

210 Chapter 9 Living Green: New Chapter of Consumption and Social Governance
Meat products56.6%
Dairy products18.3%
Drink5.9%
Seafood5.8%
Egg2.8%
Vegetable2.6%
Cereal2.1%
Others5.9%
Meat products
Dairy products
Drink
Seafood
Egg
Vegetable
Cereal
Others
Fig. 9.6 Carbon footprint breakdown by type of food in 2018 in the U.S. Source Center forSustainable Systems, University of Michigan, CICC Research
For adults, carbon footprints of vegan diets and ovo-lacto vegetarian diets are59% and 65% of that of omnivorous diets,5 and could provide all the nutrients thata human being needs.6 According to our calculations, improving eating habits alonecan reduce carbon emissions by 66.21mn tonnes by 2030. Therefore, green diet canplay an important role in achieving carbon peak by 2030 and carbon neutrality by2060.
The improvement of the dietary structure depends on government advocacy andguidance, as well as on innovations in food processing. Using vegetarian foodto emulate meat can minimize changes in tastes from the adjusted dietary struc-ture, which will help the transformation of dietary structure. Among these innova-tions, plant-based meat production technology has advanced. Founded in 2009 (US),Beyond Meat has become the world’s largest producer of plant-based meats. Thecompany’s plant-based products are designed to have the same taste as animal-basedmeat. BeyondMeat offers Beyond Burger, Beyond Beef, Beyond Fried Chicken, andBeyond Sausage, covering various products. According to 3Q20 earnings announce-ment, Beyond Meat’s market share of the US retail channel increased 6.14 ppt YoYin 3Q20.
Eating more vegetables, moderate amount of poultry and less red meat, as wellas switching to an ovo-lacto vegetarian diet may reduce carbon emissions and couldbe good for health. Compared to veganism, ovo-lacto vegetarianism may be moreeasily accepted since it provides nutrition within a more flexible dietary framework.
5 Environmental Impact of Omnivorous, Ovo-lacto-vegetarian, and Vegan diet, Alice Rosi et al.Scientific Reports, 7,6015(2017).6 Nutrient Intake of Endurance Runners with Ovo-lacto-vegetarian Diet and Regular Western Diet,M. Eisinger et al., 1994.

9.2 Green Lifestyle: What Can Households … 211
Extensive research shows an ovo-lacto vegetarian diet has potential health benefits.According to The Long-term Health of Vegetarians and Vegans, the prevalence ofoverweight and obesity is lower among ovo-lacto vegetarians and vegans. In addi-tion, ovo-lacto vegetarians and vegans have a lower risk of ischemic heart disease(IHD), and longer life expectancy compared with non-vegetarians from a similarbackground. Studies also show that compared with eaters of other meats, red meateaters have a much higher risk of a range of diseases.7 The World Health Organiza-tion (WHO) announced that the consumption of red meat is probably carcinogenicto human beings (Group 2A). Therefore, we suggest eating less red meat, moderatepoultry meat, andmore vegetables, and considering adopting an ovo-lacto vegetariandiet.
9.2.2 Reduction in Food Waste
Food waste at the consumer level is a massive problem, especially at banquets andget-togethers. As consumer spending rises, foodwaste in China is concentrated at theconsumer level. According to the 2018 China Urban Catering Food Waste Reportreleased by theWorld Wide Fund for Nature (WWF) and the Institute of GeographicSciences and Natural Resources Research of the Chinese Academy of Sciences,food waste in China’s restaurant industry is 93g/person/meal, implying a waste rateof 11.7%. Food waste in urban restaurants was about 17–18mn tonnes in China in2015. The ChineseAcademy of Social Sciences also points out that Chinawastes 40–50mn tonnes of grain every year, equivalent to 6.0%–7.5% of the country’s annualgrain production.
Food waste is more severe for special events such as friends’ get-togethers,weddings, birthdays, and business banquets. According to the 2018 China UrbanCatering Food Waste Report, the average food waste is 107g/person/meal and102g/person/meal at friends’ get-togethers and business banquets, compared to95g/person/meal for family gatherings and67g/person/meal for a typical dinner. Foodwaste is positively correlated to restaurant size. Large restaurants have the largest foodwaste of 132g/person/meal, compared to an industry average of 93g/person/meal, and69g/person/meal for small restaurants and 38g/person/meal for fast-food restaurants.
Reducing foodwaste in restaurants can lower carbon emissions from food produc-tion and reduce greenhouse gas emissions generated by waste going to landfills. Inaddition, households should purchase consumer goods, such as household supplies,grocery, and clothing, according to actual needs. Thesemoves can help protect naturalresources and achieve carbon peak.
7 The Long-termHealth of Vegetarians and Vegans. Paul et al. Proc Nutr Soc. 2016 Aug;75(3):287–93.

212 Chapter 9 Living Green: New Chapter of Consumption and Social Governance
4.03
2.351.95
1.62 1.47 1.391.07 0.96
0.48 0.46
0
1
2
3
4
5
Wea
ther
izat
ion
App
lianc
es
HV
AC
equ
ipm
ent
Ther
mos
tat s
etba
cks
Stan
dby
elec
trici
ty
Cha
nge
HV
AC
air
filte
rs
Effic
ient
wat
er h
eate
r
Line
dry
ing
Tune
up
AC
Wat
er h
eate
r tem
pera
ture
(%)
Fig. 9.7 Green home—estimated carbon emission reduction resulting from adoption of certainhabits. Source Household Actions Can Provide a Behavioral Wedge to Rapidly Reduce US CarbonEmissions. Thomas Dietz et al. PNAS.0908738106, CICC Research
9.2.3 Green Home
Adopting certain habits can help reduce carbon emissions. Although householdsaccount for more than 20% of household carbon footprint, there is no simple solutionfor reducing carbon emissions of home life. Reducing such carbon emissions dependson technological advancements and energymix improvements, andmore importantly,some daily habits. According to the research from Michigan State University, theadoption of a green lifestyle can reduce carbon emissions of home life by morethan 15%8 (Fig. 9.7). Good lifestyles include energy-saving renovation of houses,renovation andmaintenance of home appliances, drying clothes under the sun insteadof using laundry dryer, and lower temperature of hot water. In addition, waste sortingis also an important part of green home habits.
9.2.4 Support for Environmental Protection
As environmental awareness increases, people’s consumption patterns will play abigger role in helping China achieve carbon neutrality.
8 Household Actions Can Provide a Behavioral Wedge to Rapidly Reduce US Carbon Emissions.Thomas Dietz et al. PNAS.0908738106.

9.2 Green Lifestyle: What Can Households … 213
Reducing food delivery packaging is an important measure to protect the envi-ronment. As the food delivery packaging market is rapidly expanding, left over foodpackaging has become an important issue and needs to be solved urgently. Consumerscan play their roles in reducing unnecessary packaging. Specific measures includereuse of packaging, reduced use of disposable products, and wide use of durableproducts. The food delivery market is booming due to the popularization of mobileinternet. According to iResearch, China’s food deliverymarket increased 39.3%YoYto Rmb653.6bn in 2019, implying a CAGR of 90% over 2015–2019. We estimatethat, in China, the number of disposable food boxes used in food delivery of restau-rants might exceed 30bn in 2019, and the number of packaging bags may exceed15bn.
Plastics are the main materials for food delivery packaging at current stage.According to Meituan Waimai, the proportion of plastic materials in food deliverypackaging boxes and bags exceeds 80% in 2020. Polypropylene and polyethyleneare the most widely used plastic materials. The treatment and recycling marketsof food delivery packaging waste remain underdeveloped, and plastics generate alarge volume of carbon emissions during landfills or incineration. Constraints intechnology, performance and cost prevent degradable packaging from being reusedwidely.
In addition, there are many things we can do to reduce carbon emissions, such asbuying e-books and using paper cups less frequently. As environmental awarenessincreases, we can protect our future by supporting environmental protection.
9.3 Green Business Model: What Can Consumer GoodsCompanies Do to Help Achieve Carbon Peak?
In the process of reaching carbon peak, enterprises can play an active role in productinnovation, efficiency improvement, energy consumption reduction, environmentalprotection, emission reduction, recycling, economic sharing, and ESG development.These measurements can effectively increase economies of scale, lower cost, andimprove the quality and experience of green consumption.
9.3.1 Product Innovation
Product innovation can lead to slower growth in household energy consumption.Chinese households consume large volumes of electricity and natural gas, along witha small amount of bulk coal to meet the needs of home appliance operation, cooking,and heating. In 2019, Chinese households consumed 1025bn kWh of electricity,implying 705mn tonnes of carbon dioxide emissions (China’s clean energy accounted

214 Chapter 9 Living Green: New Chapter of Consumption and Social Governance
for 31% of total electricity generation in 2019); 114bn m3 of natural gas, implying246mn tonnes of carbon dioxide emissions; and 60mn tonnes of bulk coal (mainlyfor heating), implying 114mn tonnes of carbon dioxide emissions.
Electricity demand by residential users is relatively inelastic. To fundamentallysolve the carbon emission problem of household electricity consumption, use ofrenewable energies such as wind, solar, and hydropower needs to increase substan-tially, while the use of coal-fired thermal power generation should be reduced.Improving energy efficiency standards of home appliancesmay help reduce the usageof household electricity. Newly produced home appliances, especially air condi-tioners and central air conditioners, are more energy efficient. Moreover, the olderthe home appliance is, the lower its average energy efficiency. Trade-in programsshould be introduced to substitute home appliances with poor energy efficiency.
Many new technologies can facilitate the improvement of home appliances’energy efficiency. Inverter technology can improve energy efficiency of air condi-tioners, refrigerators, and washingmachines. Solar water heaters and condensing gaswater heaters can alleviate the burden on power grid. LED lights could replace thetraditional light bulbs.
9.3.2 Efficiency Improvement and Energy ConsumptionReduction
Material loss in the process of production is another important factor affecting carbonemissions. The furniture industry is using flexible production and other intelligentmanufacturing technologies to continuously improve the utilization rate of timber.In this section, we use the furniture industry as an example to illustrate the potentialof the industry’s efficiency improvement and energy consumption reduction.
China is theworld’s second largest consumer of timber, and its timber consumptionhas continued to increase in recent years (Fig. 9.8). Reducing timber consumptionand improving its utilization can play an important role in helping achieve carbonneutrality. The amount of plantation, especially in the form of tree, is crucial forcarbon neutrality. One tree can absorb more than 21.8 kg of carbon dioxide per year(Fig. 9.9). According to data from the China National Forest Products Industry Asso-ciation and Qianzhan Intelligence, China’s timber consumption has increased 173%in the past decade and it has become the world’s second largest consumer and largestimporter of timber. The proportion of home furnishings in total timber consump-tion continues to increase. Wood-based panels account for the highest proportion, at32.99%, and solid wood furniture products account for about 3%.
As themajor consumer of timber, furniture and home decoration industries contin-uously improve the utilization rate of wooden products through intelligent manufac-turing and flexible production. Currently, the timber utilization rate at some leadingmanufacturers of custom-made furniture exceeds 85%. This utilization rate caneffectively lower timber consumption and help achieve carbon neutrality.

9.3 Green Business Model: What Can Consumer … 215
0.38
0.6
0.8
0
0.2
0.4
0.6
0.8
1
2007 2016 2020
Total timber consumption in China(bn cubic meters)
Fig. 9.8 China’s timber consumption continues to rise. Source China National Forest ProductsIndustry Association, chinatimber.org, CICC Research
A mature tree can absorb more than 21.8kg of carbon dioxide from the atmosphere every
year
Fig. 9.9 One tree can absorb more than 21.8kg of carbon dioxide per year. Source Arbor DayFoundation, CICC Research
Intelligent manufacturing technologies such as advanced flexible production canfully meet the needs of furniture customization. Through the organic combination ofmicroelectronics, computer and system engineering technologies, flexible produc-tion technology can effectively cope with the contradiction between high automationand high flexibility in mechanical manufacturing. The technology uses big data andsoftware to automatically combine, calculate, and arrange cabinets of different sizes

216 Chapter 9 Living Green: New Chapter of Consumption and Social Governance
to design the most efficient sawing process. This can help reduce material losses,improve timber utilization rate, and lower timber consumption. China’s leadingmanufacturers of custom-made furniture such as Oppein and Suofeiya continue toincrease their timber utilization rate using flexible production technologies.
9.3.3 Environmental Protection and Emission Reduction
Environmental pollution resulting from the production process is one of the majorobstacles to achieving carbon neutrality. We will use the personal care and textile &apparel industries as examples to analyze the relation between pollution emissionand carbon neutrality and corresponding solutions.
9.3.3.1 Manufacturers of Laundry Detergent Have Stepped up Effortsto Reduce Carbon Emissions
Reduction of carbon emissions in the process of producing laundry detergent playsan important role in achieving carbon neutrality. China’s laundry detergent consump-tion is huge. In 2019, China’s laundry detergent market size reached Rmb27.2bn.Assuming an average price of Rmb7.8/500g, China consumed 1.744mn tonnes oflaundry detergents in 2019. The penetration rate of laundry detergent in 2019 wasabout 44% in China, which wasmuch lower than Japan’s 79.5% and US’s 91.4%.Weexpect China’s laundry detergent market to grow at a rapid CAGR of 13.6% in thenext 5 years, reaching a total of Rmb51.5bn in 2024, which implies a sales volumeof 3.30mn tonnes.
According to Carbonstop, producing one tonne of laundry detergent can generateabout 0.67tonnes of carbon dioxide. We estimate that China’s laundry detergentproduction generated 1.17mn tonnes of carbon emissions in 2019, then this figuremight reach 2.21mn tonnes in 2024. As consumption of laundry detergent continuesto grow, adopting greener formulas and reducing carbon emissions in the productionprocess can play an important role in achieving carbon neutrality in China.
In the context of rising environmental awareness among global enterprises andconsumers, the global giants of personal care products have continuously intro-duced eco-friendly laundry detergents in recent years. Compared with traditionalpetroleum-derived laundry detergents, eco-friendly laundry detergents are mainlymade from all-natural ingredients, which can reduce the carbon footprint duringboth production and use.
Tide Purclean: As a world-renowned laundry detergent brand, Tide launchedPurclean, a 75% plant-based detergent. Purclean greatly reduces uses of petroleum-derived ingredients without compromising on its cleaning performance.
SeventhGeneration’s Free&Clear: SeventhGeneration is one of themost populareco-friendly brands in the world. It is a certified partner of Rainforest Alliance and

9.3 Green Business Model: What Can Consumer … 217
Forest Stewardship Council, and 97% of its Free & Clear laundry detergent is madefrom biology-based and plant-based ingredients.
Looking ahead, we firmly believe concentrated laundry detergent will help reduceenergy consumption, and lower carbon emissions. According to the Report on LifeCycle Assessment of China’s Concentrated Laundry Detergent released by ChinaCleaning Industry Association, if all Chinese consumers switch to concentratedlaundry detergents, it can reduce carbon emission by 1.75mn tonnes in the produc-tion process and transportation of detergents, and lower electricity consumption by8.57bn kWh. In addition, this can reduce the discharge of wastewater by 2.42mntonnes from the consumer-side.
9.3.3.2 Leading Textile and Apparel Companies Take the Leadin Energy Conservation and Emission Reduction
Greenhouse gas emissions during textiles production process are mainly the result ofenergy consumption, including direct emissions (natural gas, biomass fuel and coal)and indirect emissions (electricity and steam). Fabric production is responsible formost energy consumption. Major waste products include wastewater, exhaust gasand solid waste. Wastewater and exhaust gas are mainly generated in the processesof printing and dyeing.
Shenzhou International, a leading knitwear manufacturer, continues to step upefforts to improve the utilization rate of water and energies in order to lower theadverse impact of production on environment. The introduction of green productionprocess enables products to be eco-friendly.
Pollution discharge: Shenzhou International (Shenzhou) attaches great impor-tance to pollutant control. When selecting suppliers, Shenzhou emphasizes eco-friendliness of raw materials. They continue to improve their production processesto ensure that technologies used are eco-friendly in different production stages. Thecompany adjusts energymix by usingmore renewable energy sources. Shenzhou alsointroduces new eco-friendly equipment to reduce the consumption of resources anddischarges of pollutants. All laws and regulations on pollutants discharge are strictlyimplemented. The company plans to continue make efforts to reduce unit wastew-ater discharge and waste gas emissions. The company expects its unit wastewaterdischarge to decline by about 35% in 2020, compared to 2015.
Energy consumption: Shenzhou’sNingbo plant has fully switched over to naturalgas as its basic fuel, effectively reducing the adverse impact on the environment. Thetotal consumption of natural gas in 2019 was 59mn m3, an increase of 61.44% YoY.Total consumption of biomass fuel and coal fell to 174,770tonnes in 2019, which isa decrease of 16.15% YoY.

218 Chapter 9 Living Green: New Chapter of Consumption and Social Governance
9.3.4 Recycling
Recycling needs engagements of residents, governments, and enterprises. In thissection, we will mainly discuss the optimization of product packaging and the recy-cling of express delivery packaging. Optimizing packaging is the first step to promoterecycling which requires the engagement of the packagingmanufacturers. Regardingthe recycling of retired products, we will focus on consumer goods manufacturerssuch as the home appliances industry where recycling and trade-in programs mayreduce carbon emissions. The reusage of delivery packaging also needs to engageall stakeholders.
9.3.4.1 Optimizing Packaging is the First Step to Promote Recycling
Reducing plastic use is the most important measure for carbon emission reduction.According to UCSB, if the plastic output growth slows from 4% to 2%, carbonemissions from plastic products in 2050 may decline by 56%.9 The biodegradableplastic industry has been growing rapidly in recent years. The use of biodegradableplastics in consumer goods packaging can help lower carbon emissions.
Excessive packaging is another issue that needs to be addressed. Excessive pack-aging is a long-term problem for the baijiu industry. Due to the rising environmentalawareness among enterprises and consumers, convenient packaged baijiu are gradu-ally replacing boxed baijiu, and glass bottles are replacing traditional ceramic bottles.In the past 5 years, sales of convenient packaged baijiu increased at a CAGR of 20%,and we expect this figure to grow at a CAGR of 15% over the coming 5 years.Compared with ceramic bottles, recycling of glass bottles generates lower carbonemissions, as well. We believe these new trends can help lower carbon emissionsfrom the packaging process.
9.3.4.2 Recycling Needs Active Engagement of Manufacturers
Waste recycling is one of the most direct ways to reduce carbon emissions (Table9.1). The carbon emissions from the recycling process are usually much lower thanthose from remanufacturing and landfilling. Studies have shown that depending ontypes of materials, one tonne of recycled waste can reduce carbon emissions by upto 8.1tonnes. Meanwhile, sorting of plastics can significantly improve efficiency ofgarbage recycling, which can help reduce unit carbon emissions by 50%–100%.10
The replacement of home appliances can help improve energy efficiency ofexisting ones. Used home appliances contain nonferrous metals, rubber, and toxic
9 Strategies to Reduce the Global Carbon Footprint of Plastics, Zheng et al. Nature Climate Change9, 374–378(2019).10 Greenhouse Gas Emission Factors for Recycling of Source-segregated Waste Materials. D.A.Turner et al. / Resources, Conservation and Recycling 105 (2015) 186–197.

9.3 Green Business Model: What Can Consumer … 219
Table 9.1 Contribution ofwaste recycling to carbonemission reduction
Waste material type Net CO2 Eq. per tonne (kg)
Glass 314
Paper 459
Card 120
Books 117
Steel cans 862
Aluminium cans 8,143
Scrap metal 3,577
Mixed plastics 1,024
Mixed plastic bottles 1,084
PET 2,192
PVC 1,549
Wood 444
Light bulbs 779
Fridge and freezers 853
Automotive batteries 435
Vegetable oil 2,759
Composite food 452
Textiles and footwear 3,376
SourceGreenhouseGasEmission Factors forRecycling of Source-segregatedWaste Materials. D.A. Turner et al. Resources, Conser-vation and Recycling 105 (2015) 186–197, CICC Research
substances such as lead and mercury and they may generate a large number of pollu-tants without proper handling. We estimate that refrigerators, washing machines, airconditioners, and color TVs with a service life of more than 9 years accounted for11%, 21%, 9%, and 20% of their respective total ownerships in China, implying atotal of around 330mn units. So the replacement of home appliances needs activeengagement from enterprises and appropriate policies from governments.
Soft drink companies are actively involved in recycling, which may improvethe recycling efficiency of PET bottles and reduce carbon emissions. China has ahuge demand for soft drink bottles. Given its high economic benefits, recycling ofsoft drink bottles is already well-established. China’s soft drink industry mainlyuses disposable PET packaging. According to China Chemical Fiber Website, totaldemand for PET bottles from China’s soft drink industry maintained steady growthin 2017–2019, reaching 4.29mn tonnes in 2019 (Fig. 9.10). Thanks to the wideadoption of recycled bottles, high economic benefits, and sound recycling system,China’s recycling rate of PET bottles exceeded 94% in 2019 (a high figure comparedby international standards, according to the China Beverage Industry Association,Table 9.2). However, China’s recycling market still has significant potential in itsrecycling technology and efficiency.

220 Chapter 9 Living Green: New Chapter of Consumption and Social Governance
Fig. 9.10 Demand for PETbottles from China’s softdrink industry and YoYgrowth in 2017–2019.Source ccf.com.cn, IPOprospectus of CR ChemicalMaterials, CICC Research
3.84
4.02
4.29
4.7
6.7
0
2
4
6
8
3.6
3.9
4.2
4.5
2017 2018 2019
PET bottle consumption of soft drinks YoY (RHS)
(mn tonnes) (%)
Table 9.2 Recycling rates ofPET drink packages bycountry and region in 2019
Country Package types Recycling rate (%)
China PET bottle >94
Germany Can, PET bottle,glass bottle
97
The CzechRepublic
Beer and softdrinks bottle
99
Finland Can, PET bottle,glass bottle
93
US (varies amongstates)
Beer and softdrinks bottle
50–85
Norway PET bottle 95
Denmark Can, PET bottle,glass bottle
89
Sweden Can, PET bottle 84, 81
Glass bottle 93
Belgium PET bottle >85
Japan PET bottle 92
Switzerland PET bottle 82
Source China Beverage Industry Association, Chinese ResearchAcademy of Environmental Sciences, The Council for PET BottleRecycling of Japan, CICC Research
Nongfu Spring plans to collect and recycle 1mn 19L packaging bottles each year.These bottles will be remanufactured into plastic products. In addition, internationalsoft drink giants have begun to focus on carbon reduction actions in recent years byusing more recycled PET to manufacture beverage packaging.

9.3 Green Business Model: What Can Consumer … 221
The packaging of rice, flour and oil mainly made with PET plastic bottles andplastic woven bags in China. The current recycling rate for those packaging is low.According to Recycling Plastics Branch of China National Recycling ResourcesAssociation, China Packaging Federation, and Euromonitor, the recycling rate ofPET plastic bottles for cooking oil in 2019 was about 83% in China, compared to85% inEurope and 93% in Japan. The recycling rate of plasticwoven bags for rice andflour in 2019was about 24% in China, compared to 42% in Europe and 47% in Japan.There are many reasons behind the low recycling rate of plastic woven bags for riceand flour, including difficulty in sorting, high recycling cost and inefficient recyclingsystem. The active engagement of enterprises may help increase the recycling rate.
9.3.4.3 Reusing of Express Delivery Packaging
Although package delivery service is graduallymore convenient than before, deliverypackaging has brought several challenges to urban cleaning and environmentalprotection, including the low recycling rate of delivery packaging (less than 20%),redundant packaging and the low utilization rate of degradable garbage. Targetedmeasures such as “3R1D” were adopted to reduce the utilization of express pack-aging. The three Rs are the abbreviations of “Reduce”, “Reuse” and “Recycle”, whilethe “D” is the abbreviation of “degradable”.
Reduce: The volume and weight of packaging materials should be minimized inorder to lower resource consumption. For example, reducing the redundant packagingof e-commerce parcels (zero secondary packaging by 2025) and increasing the fillingrate of packages through smart packaging algorithm.
Reuse: Packaging materials should be reused to the maximum level in order toreduce the consumption of disposable materials. According to China’s State PostBureau (SPB), 2mn recyclable shipping boxes were put into use and utilization rateof recyclable transit bags reached 75% in 2019. The SPB estimated that the scale ofrecyclable express delivery parcels will reach 10mn by 2025.
Recycle: The wasted express delivery packaging materials can be recycled intonew packaging materials through reproduction. For example recycled corrugatedpaper can be recycled into produce pulp.
Degradable: Degradable plastics can be used to replace disposable plastics. Themost popular degradable materials are plant-based plastics and Polylactic acid.
9.3.5 Sharing Economy
With the emergence of the sharing economy as a hot topic for startups over the pasttwo or three years, many new business models have emerged. While the umbrellasharing and toy sharing systems have disappeared and the popular bicycle sharingsystem is waning, the once-obscure power bank-sharing is beginning to dominate theChinese market. The sharing economy epitomizes a lifestyle philosophy that values

222 Chapter 9 Living Green: New Chapter of Consumption and Social Governance
renting and sharing. As the sharing economymatches productivity with consumptiondemand more efficiently, it can save resources and support a low-carbon economy.
The power bank sharing system has reduced Chinese consumers’ purchase ofpower banks, thus reducing the carbon emissions caused by power bank produc-tions. According to China Internet Network Information Center (CNNIC), Chinahas 932mn mobile internet users. Without the power bank sharing system, assumingeverymobile internet user owns one power bank and the average replacement cycle isthree years, we estimate that the annual demand for power banks may reach 300mn.According to iResearch’s statistics, in 2019, the number of the shared power bankusers was nearly 250mn and the transaction amount reached about Rmb8bn. Thismeans that users spend Rmb32 on shared power banks on average. As each userspends Rmb1–1.5 each time they use shared power bank, it is estimated that they useshared power banks 20–30 times. On average, shared power banks are rented out 0.8times per day, indicating that there are 20–30mn power banks in the market.
In addition to power bank sharing, many other business models of the sharingeconomy help reduce carbon emissions bymore efficiently meeting people’s produc-tion and living needs. These businessmodels include ride sharing,workspace sharing,and study room sharing.
Different sharing economy businessmodels centralize the originally scattered andindividualized needs. This can minimize unnecessary production, improve produc-tion efficiency created by the economies of scale, and create a lower-carbon produc-tion model that requires larger upfront investment, thus further reducing carbonemission.
For example, WeWork offices are usually located close to metro stations withthe purpose of encouraging low-carbon travel. Additionally, WeWork adopted anintelligent booking system for allmeeting rooms and remotemeetings are encouragedto reduce emissions. And all office supplies should switch to digitalized products oruse recyclable materials. In the future, thanks to further exploration of demands forsharing economy, model innovations and technological progressions, we believe thatsocial production methods will become low carbon and energy-saving.
9.3.6 Environmental, Social, and Governance (ESG)Development
ESG refers to an investment philosophy and evaluating standards that pay attentionto the environmental, social and governance performance of enterprises. It helpsevaluate the contribution of an enterprise to sustainable economic growth and socialresponsibility (Fig. 9.11).
ESG pushes enterprises to pursue not only the maximum self-interest but alsomaximum social interest. Companies with good ESG performance can better antic-ipate and manage opportunities and risks from economic condition, environmentalproblems and social changes for now and in the future. They pay more attention to

9.3 Green Business Model: What Can Consumer … 223
Fig. 9.11 ESG of consumergoods companies. SourceCICC Research
SOCIAL (S)Employee
responsibility, productresponsibility, and
social responsibility, etc.
ENVIRONMENTAL(E)
Carbon emission, waste pollution, energy usage,
and resources usage, etc.
GOVERNANCE (G)Corporate governance,compliance, and anti-unfair competitions,
etc.
quality, production innovations, environmental protections, energy saving and carbonemission reductions. These can lower operating costs, create competitive advantagesand generate long-term values. China’s leading home appliance companies havemade substantial progress in the fields of energy-saving, emission reduction andwaste recycling.
Midea and Haier have won recognition from overseas investors because of theiremphasis on ESG performance, which were fully disclosed in their social respon-sibility reports. Haier’s energy consumption per unit of output value in 2017,2018, and 2019 dropped by 13.22%, 16.67%, and 6.77% year-on-year(YoY), andcarbon dioxide emissions were reduced by 44,221tonnes and 10,503tonnes in 2018and 2019. Haier Smart Energy Center uses automation and information technolo-gies with central management model to dynamically monitor and digitally controlwater, electricity and natural gas consumption in all factories. The center automat-ically controls energy conversion, transportation, distribution and consumption andaccurately collects energy data to predict, analyze and optimize energy consumption.

224 Chapter 9 Living Green: New Chapter of Consumption and Social Governance
9.4 Policy Formulation and Social Governance: ComparingChina with Other Countries to Identify FutureDirections
9.4.1 Home Appliances: Energy Efficiency Standards,Energy-Saving Subsidies and Recycling Systems Needto Be Improved
China’s current entry-level energy efficiency standards for home appliances areabout 20% lower than those of the US, Europe, and Japan (statistical methods anddimensions not completely comparable).11
For air conditioners, refrigerators and washing machines, the US has introducedthe mandatory Energy Guide label (under the supervision of Department of Energy)and the voluntary ENERGY STAR label (under the supervision of EnvironmentalProtection Agency).
The European Union Directive (EU) No. 626/2011 requires that air conditionerswith a rated cooling capacity equal or greater than 12kW must be affixed with anenergy efficiency label. This energy efficiency label is required to indicate the annualpower consumption. The EU has also enacted similar regulations on refrigerators andwashing machines.12
Japan’s energy efficiency standards for household appliances mainly include thequasi-mandatory TopRunner Program,mandatory energy-saving labels for electricalappliance retailers, and voluntary energy-saving labels.
Having analyzed energy efficiency standards for air conditioners and refrigeratorsin Japan and the US, we find that the minimum energy efficiency standards for homeappliances in developed countries are about 10%–30% higher than that of China(statistical methods and dimensions not completely comparable).
Subsidies can help promote energy-efficient home appliances. Between 2009 and2013, China’s household air conditioner industry experienced two rounds of subsi-dies for energy-efficient products and two rounds of energy efficiency standardsupgrades. Historical experiences indicate that these subsidies can helpmanufacturersand consumers switch to energy-efficient products smoothly. On 10 February 2021,the Ministry of Commerce called for expanding the sales of energy-efficient homeappliances and green products. We believe that moderate energy-saving subsidiescan enhance the competitiveness of energy-efficient products, thereby improving the
11 China, US and Japan have different classifying standards. Some of the measurements used inthese classifying standards are not comparable. For example, air conditioner classifying standardsin China use APF measurement while the US uses EER measurement. These two measurementsare not comparable.12 The Commission Directive 94/2/EC of 21 January 1994 implementing Council Directive92/75/EEC with regard to energy labelling of household electric refrigerators, freezers and theircombinations; Delegated regulation 2010/1061 - Supplement to Directive 2010/30/EU with regardto energy labelling of household washing machines Text with EEA relevance.

9.4 Policy Formulation and Social Governance … 225
energy efficiency structure of home appliances, and helping China achieve carbonneutrality as soon as possible.
In addition, numerous countries have developed carbon footprint assessmentstandards to encourage the production and consumption of low-carbon products,and quantify the greenhouse gas emissions of products by “carbon labels”. Forexample, the international standard ISO/TS14067 and the British Standards Insti-tution’s PAS2050 are two widely-used carbon footprint accounting and certifica-tion standards. “Carbon label” is a voluntary certification index, which can helpcompanies establish a positive corporate image of low carbon and environmentalprotection, attract more consumers who are concerned about climate change, andenhance competitiveness of products in the international markets that have stricterenvironmental laws and regulations.
Environmental protection requirements include:The US federal government has passed the Toxic Substances Control Act (TSCA)
and state governments have passed other relevant laws and regulations.Products in the EU market need to meet the electronic waste recycling require-
ments listed in the EU’sWaste Electrical and Electronic Equipment (WEEE) Direc-tive. For example, the recovery rate of temperature exchange devices, including airconditioners, refrigerators, freezers and others, must reach 85%. And the reuse andrecycling rate must reach 80%. The products also need to comply with the hazardoussubstance control requirements in the Restriction of Hazardous Substances (RoHS)Directive and the ecological design requirements in the Energy-related Products(ErP) Directive. In addition, there are voluntary eco-labels, such as the EU Ecolabelthat applies to refrigerators, washing machines, dishwashers, and vacuum cleaners,and the Nordic Swan Ecolabel that applies to refrigerators, washing machines, andkitchen appliances.
In Japan, air-conditioners, refrigerators, and washingmachines need tomeet recy-cling requirements for waste home appliances in theHomeAppliance Recycling Law.Air-conditioners, refrigerators, washing machines, dryers and microwave ovens alsoneed to meet the hazardous substance control requirements stipulated by J-MOSS.
While establishing environmental protection standards, China also continues toimprove its used home appliance recycling system:
In 2012, China introduced the Administrative Measures for the Collection andUse ofWaste Electrical and Electronic Product Disposal Fund, establishing a fund tosubsidize companies that dismantle and dispose of used home appliances. However,the fund has a large funding gap due to insufficient budgets and cannot meet actualneeds.
In May 2020, China introduced the Implementation Plan on Improving theWaste Home Appliance Recycling and Disposal System to Promote Home ApplianceReplacement Consumption, encouraging home appliance manufacturers to developself-owned recycling networks, commissioned recycling, joint recycling, and newinternet-based recycling models, as well as to launch trade-in programs.
In December 2020, China issued the Action Plan on Actively Building a WasteHomeApplianceRecycling andDisposal IndustryChain toPromoteHomeApplianceReplacement Consumption.

226 Chapter 9 Living Green: New Chapter of Consumption and Social Governance
9.4.2 Furniture: Promote Sustainable Use of ForestResources
The EU and the US imposed strict supervisions over logging and the productionof wooden products, and promulgate relevant laws and regulations to promote thesustainable use of forests and avoid excessive logging and timber consumption.
On the global level, the FSC forest certification (FSC stands for Forest StewardCouncil, a non-profit international organization initiated by the World Wide Fundfor Nature) aims to ensure a sustainable operation of the forestry production industrychain and encourage the public to purchase standardized forest products to improveforest management, promote sustainable use of forests and avoid excessive loggingand consumption.
The EU and the US have also issued corresponding laws and regulations. Forexample, both Lacey Act Amendment and the European Union Timber Regulationrequire relevant documents to prove the legality of the source of timber, and imposesevere punishments on illegal trading of wooden products.
9.4.3 Packaging: Overseas Experience and the Overcomingof Difficulties
9.4.3.1 Product Packaging: Comprehensive Regulation is Imperative
China has issued multiple documents to regulate product packaging. In 2014, theGeneral Administration of Quality Supervision, Inspection and Quarantine and theStandardization Administration issued the General Rules for Restricting ExcessivePackaging of Goods, promulgating requirements on packaging costs, materials, anddesign. Many local governments have followed suit.
In recent years, the central and local governments, food delivery platforms andcatering companies have adopted plastic reduction measures to support sustainabledevelopment.
In terms of the use of plastic packaging, the National Development and ReformCommission (NDRC) and the Ministry of Ecology and Environment (MEE) issuedthe Opinions on Further Strengthening the Control of Plastic Pollution in 2020.According to the document, the use of non-degradable plastic bags shall be prohibitedby the end of 2020 in shopping malls, supermarkets, pharmacies, bookstores, as wellas food delivery services and exhibition activities in urban areas of municipalities,provincial capital cities, and cities under separate state planning. Additionally, theconsumption intensity of non-degradable disposable plastic tableware in the fooddelivery industry should be reduced by 30% by 2025 in cities above the prefecturelevel. In terms of plastic packaging recycling, Xiamen introduced new rules forgarbage classification in July 2020, reclassifying disposable plastic lunch boxes,

9.4 Policy Formulation and Social Governance … 227
plastic bags from “other garbage” into “low-value recyclables” and including themin the recycling system.
Globally, plastic restriction policies are becoming stricter. With the rise of globalawareness of environmental protection and emission reduction, developed economiessuch as the EU and the US are continuously tightening their regulations over plasticpackaging products and restricting the use of plastic packaging. The Chinese author-ities can improve existing systems and regulations based on international experience.For example, the EU has banned the production and sale of disposable tableware andother disposable plastic products from 2021, and replaced them with paper, straw,or reusable hard plastics. The UK announced in 2019 that it would introduce a taxon various plastic products. Japan has a higher recycling rate of PET bottles andrice/flour plastic woven bags than China, which helps the country reduce carbonemissions (Fig. 9.12). We attribute this to Japan’s strict regulations, comprehensiveand meticulous recycling system, and mature technologies.
Strict regulations lay the foundation for packaging recycling. Japan has formu-lated a number of regulations on packaging recycling. The country promulgated theWaste Management and Public Cleansing Law in 1970 and the Container and Pack-aging Recycling Law in 1995, and established a “Reduce, Reuse, Recycle” policyframework, stipulating that PET bottle manufacturers and food manufacturers usingPET bottles need to bear the cost of recycling.
Japan’s comprehensive and meticulous recycling system becomes a formidableforce. A recycling system for plastic products in Japan has been in place for decades.
Fig. 9.12 Japan’s recycling experience. Source Japan’s Council for PET Bottle Recycling, Japan’sMinistry of the Environment, Yihai Kerry Arawana’s corporate filings, CICC Research

228 Chapter 9 Living Green: New Chapter of Consumption and Social Governance
Waste plastic packaging is cleaned in advance by residents. It is sorted and recycledby government-designated personnel or recycled through various collection points.Then recycling companies carry out heat recovery, landfill treatment, processing andreuse.
Mature reusable technologies can help. Japan’s waste plastic reuse technologiesmainly include mechanical treatment and chemical degradation. 24% of the recycledplasticwaste is used to produce high value-added bottles. Japan uses F2P andBioTcattechnologies to keep chemically degradedmolecules tough and safe for food, therebyrealizing the reuse of plastic waste.
The deposit refund system in Germany is a model of efficient recycling ofPET bottles. At present, the mainstream international method for recycling of PETbottles is the deposit refund system, which has been adopted by Western Europeancountries, Canada, and some states in the US. Germany’s deposit refund systemwas approved by legislature in 1991 and implemented in 2003, mainly for variousbeverage packaging, such as PETbottles, aluminumpackaging, and glass.We believeGermany’s recycling system possesses the following advantages:
Clear rights and responsibilities: The system lays out the responsibilities ofmanufacturers, retailers, and consumers to contribute to the circular economy.
Digital supervision and management: The operator established by the retailand manufacturing industry associations supervises and maintains the system andmonitors the overall process digitally.
High level of automation: In the recycling system, 80%adopts automatic recyclingand 20% adopts manual recycling.
Large-scale reuse: Their reprocessing process achieves economies of scale.As one of the first countries to establish a deposit refund system, Germany has
achieved a high PET recycling rate by virtue of this system, and has increased theproportion of PET bottles made from recycled materials leveraging an efficient reusesystem (Fig. 9.13). According to GVM, the recycling rate of PET bottles in Germanywas97% in2015, the utilization ratewas 93.5%, and about 34%of the recycledbottleswere reprocessed into PET bottles, much higher than the world average (less than10%).
9.4.3.2 Delivery Packaging: Difficulties and Breakthroughs
China has been steadily promoting green delivery packaging, and has issued theInterim Regulations on Express Delivery and theOpinions on Accelerating theGreenTransformation of Express Delivery Packaging. However, we still see obstacles inthe industry’s green transformation.
Thereare standards forpackaging reductionbut it is difficult to implement. In2018, the General Administration of Quality Supervision, Inspection and Quarantineand the Standardization Administration issued national standards for delivery pack-aging supplies, putting forward requirements for reduction of delivery packaging.However, the porosity and volume ratio in the standards are difficult to determine

9.4 Policy Formulation and Social Governance … 229
Fig. 9.13 Germany’s deposit refund system for recycling of PET bottles and its efficient reusesystem. Note All are 2015 data. *93.5% refers to the PET utilization rate after removing the capsand labels. Source CM Consulting, GVM, Forum PET, CICC Research
with the naked eye, while random inspection of delivery companies would be tooinefficient.
Recycling requires the cooperation of the government, manufacturers, logis-tics companies, and the public. In China, there is currently no systematic recyclingpath. Elderlies, cleaning staff and scavengers remain the main force of recycling.Package delivery companies have gradually initiated recycling actions in recentyears, but the overall recycling efficiency is not high. The establishment of a large-scale recycling system needs to adopt a multi-pronged approach and refer to theexperiences of Germany and Japan.
Both Germany and Japan have enacted relevant laws. Germany introducedthe packaging waste management measures and the packaging recycling law, settingrecycling targets and time limits for different packaging waste. Japan enacted theenergy protection and recycling promotion law and the packaging recycling law tobuild a recycling system. People’s awareness of waste classification is the foundationof the recycling systemof these two countries.Both countries have implemented stricthousehold waste classification mechanisms.
Both countries make clear the recyclers and responsible parties. Germanyrequires packaging material manufacturers to register with the Green Dot, thecountry’s dual system of waste collection, and pay Green Dot fees. Japan has builta large number of recycling sites to make recycling convenient, and encouragesresidents to participate in collective recycling.
We suggest that China establishes an express delivery packaging recycling systemby taking the following actions:
Strengthening laws and regulations on packaging waste management. There areonly a few general rules for waste disposal, which only result in relatively minorpenalties.
230 Chapter 9 Living Green: New Chapter of Consumption and Social Governance
Raising the public’s awareness of recycling: China should promote the ideaof packaging recycling through media communication, corporate activities andother methods. It should also implement waste classification in major cities in anappropriate time.
Improving the recycling system: China should make clear the main recyclingchannels such as campus, community and office. It should also enrich recyclingchannels such as convenience stores, express delivery outlets and community prop-erty management firms, as well as deploy recycling infrastructures such as recyclingbins and express delivery cabinets.
9.4.4 Catering: Promote “Clear Your Plate” Campaignand Organic Food Waste Reusing
In recent years, China has strengthened anti-food waste education and propaganda,and catering companies have taken measures to help reduce food waste. At present,Chinamainly relies on education andpublicity to reduce foodwaste. TheCPCCentralCommittee and the State Council issued the Regulations for Party and GovernmentAgencies to Practice Economy and Oppose Waste in November 2013, promoted the“Clear Your Plate” campaign through posters and TV screens or advertising screens?and encouraged ordering and cooking food on demand. The central government’s callagainst food waste received positive responses from consumers and catering compa-nies. In 2013, the official reception and catering expenditures of central governmentagencies fell 60% and kitchen waste declined more than 30%.
Looking forward, we believe legal control and technological innovation will helpreduce the environmental impact caused by food waste. Foreign countries controlfood waste mainly through policies, laws and recycling, in an combination witheducation and publicity. In terms of policies and laws, France introduced the anti-food waste law in 2016, stipulating that supermarket donating food that is aboutto expire will receive a tax credit equal to 60% of the value of the donated food,and restaurants destroying edible unsold food will face fines of up to 0.1% of therevenue in the previous fiscal year. In terms of recycling, kitchen waste is used forcomposting and fermentation in countries such as the UK, the US, and Japan. Forexample, US company Re-Nuble converts organic waste such as kitchen waste intoorganic fertilizers, and develops soilless cultivation techniques to grow new crops.Another US company Ecovative Design uses plant fibers from wasted mushroomsandother discarded organic crops tomanufacture strong, easily degradable packagingmaterials.

9.5 Quantitative Calculations: A Green Lifestyle … 231
9.5 Quantitative Calculations: A Green Lifestyle Isof Great Significance
In order to better understand the positive impacts of residents’ green lifestyles andconsumption habits, companies’ active participation, and the government’s guidanceand promotion on carbon neutrality, we made feasibility assumptions and quantita-tive calculations on carbon emission reduction that can be achieved by five typicalmeasures: Electricity saving, “Clear Your Plate” campaign, low-carbon diet, deliverypackaging recycling, and shared power bank. The results from this model show thatthe promotion of green lifestyles is of great significance to carbon neutrality.
9.5.1 Electricity Saving and Use of Clean Energy
The growth of carbon emissions from household power consumption can be effec-tively controlled by promoting the improvement in energy efficiency of home appli-ances and the increase in the proportion of clean energy compared with the baselinesituation (where energy efficiency of home appliances and the proportion of cleanenergy stay the same). With the improvement in energy efficiency of home appli-ances and the increase in the proportion of clean energy, carbon emissions fromhousehold power consumption in 2030 will be 810mn tonnes, a decrease of 494mntonnes compared to the baseline situation, with the former accounting for 57% of theemission reduction and the latter for 43%. And with the improvement in energy effi-ciency of home appliances, household power consumption in 2030 will be reducedby 21% compared to the baseline situation.
To reverse the upward trend of carbon emissions from household power consump-tion, the rate of increase in the proportion of clean energy needs to be further accel-erated. We currently assume that the proportion of clean energy will increase from34% in 2020 to 46% in 2030.
With the improvement in energy efficiency of home appliances, we estimate thathousehold power consumption will grow at a 3.3% CAGR over 2020–2030, 2.5 pptslower than the baseline situation; household power consumption in 2030 will be1,513.8bn kWh, 21% lower than the baseline situation.
9.5.2 Reduction in Food Waste
According to the 2018 China Urban Catering FoodWaste Report issued by theWorldWide Fund for Nature (WWF) and the Institute of Geographic Sciences and NaturalResources Research, CAS, the amount of food waste in China’s urban cateringindustry reached 17–18mn tonnes in 2015.

232 Chapter 9 Living Green: New Chapter of Consumption and Social Governance
We assume that: (1) If no measures are taken to reduce food waste, the amountof food waste in urban catering will grow at a 10% CAGR over 2016–2030, largelythe same as the growth rate of urban catering consumption. (2) The structure of foodwaste in urban catering in the future is consistent with the data in the 2018 ChinaUrban Catering Food Waste Report. (3) For carbon emissions of major foods, werefer toAComparative StudyonCarbonFootprints betweenPlant- andAnimal-basedFoods in China.
With the promotion of reduction in urban food waste, we assume that the wastewill be reduced by half by 2030, andwe estimate that corresponding carbon emissionswill be reduced by 26.91mn tonnes.
9.5.3 Changes in Dietary Structure
We assume that: (1) 10% of the population will switch from omnivorous diets toovo-lacto-vegetarian diets, with reference to Environmental Impact of Omnivorous,Ovo-lacto-vegetarian, and Vegan Diet. (2) The remainder of the population will usepork and chicken to replace half of their beef and mutton intake. (3) The remainingfood intake structure will remain unchanged. (4) According to the forecast usingdata from the Food and Agriculture Organization of the United Nations in 2018,Chinese population will reach 1.464bn in 2030. (5) For carbon emissions of majorfoods, we refer to A Comparative Study on Carbon Footprints between Plant- andAnimal-based Foods in China.
If the Chinese dietary structure in 2030 changes align with our assumptions, weestimate that corresponding carbon emissions in 2030 will be reduced by 66.21mntonnes.
9.5.4 Recycling of Express Delivery Packaging
Package delivery business volumewill continue to grow rapidly in the next few years,and the consumption of packaging material will grow accordingly with packagedelivery business volume. Parcel volume will reach about 164.4bn in 2025, implyinga CAGR of 18.3% over 2018–2025. And the consumption of packaging material willreach 27.46mn tonnes in 2025, accounting for 8% of urban domestic waste collectionand transportation volume.
The disposal of delivery packaging through incineration and landfill generatesa significant amount of green house gases, especially carbon dioxide, since pack-aging material is mainly made out of paper or plastic. If the current recycling rate(below 20%) remains unchanged and reusable delivery boxes are not applied, carbondioxide generated from the disposal of express delivery packaging (largely landfilland incineration) is expected to increase from 5.27mn tonnes in 2018 to 15.36mntonnes in 2025, a CAGR of 16.5%.

9.5 Quantitative Calculations: A Green Lifestyle … 233
However, if delivery packaging can be reduced, reused and recycled, we believecorresponding carbon emissions will be reduced significantly.
We assume that by 2025: (1) China’s delivery packaging recycling system willimprove and the recycling rate will rise to 40%; (2) reduction of redundant pack-aging and intelligent algorithms will reduce packaging per parcel by 15%; and (3)the number of reusable express delivery boxes will reach more than 10mn. Underthese assumptions, carbon dioxide emissions from the disposal of express deliverypackaging in 2030 will be reduced from 15.36mn tonnes by 32.2% (or about 4.94mntonnes) to 10.42mn tonnes, with the increase in recycling rate contributing 61% ofthe emission reduction.
9.5.5 Shared Power Bank Help Reduce Purchase Demand
The stock of shared power banks will further expand, as their penetration of majorbusiness venues, the number of users, and the times of usage per capita increase.Shared power banks meet the charging needs of users and restrain individuals’purchase demand for power banks. Assuming that there is no breakthrough incharging technology, we estimated the reduction in demand for power banks in thenext five years due to the growing use of shared power bank. Considering the reduc-tion in outdoor activities in 2020 due to the pandemic, we make assumptions basedon the situation in 2019. Shared power banks are used frequently and their efficiencygenerally drops significantly after 500 charges assuming that the replacement cycleis 1.5 years.
Shared power bank will reduce the average annual consumption of power banksin the next 10 years by about 100mn units. Because the specific energy consumptionof producing a power bank is not available, we use China’s data on carbon dioxideemissions per unit of GDP, i.e. 0.14tonnes per Rmb1,000 of GDP. Assuming thatthe average price of power banks is Rmb50/unit, shared power banks will reduce theaverage annual carbondioxide emissions in the next 10years by about 700,000tonnes.
Open Access This chapter is licensed under the terms of the Creative Commons Attribution-NonCommercial-NoDerivatives 4.0 InternationalLicense (http://creativecommons.org/licenses/by-nc-nd/4.0/), which permits any noncommercial use, sharing, distribution and reproduction in anymedium or format, as long as you give appropriate credit to the original author(s) and the source,provide a link to the Creative Commons license and indicate if you modified the licensed material.You do not have permission under this license to share adapted material derived from this chapteror parts of it.
The images or other third party material in this chapter are included in the chapter’s CreativeCommons license, unless indicated otherwise in a credit line to the material. If material is notincluded in the chapter’s Creative Commons license and your intended use is not permitted bystatutory regulation or exceeds the permitted use, you will need to obtain permission directly fromthe copyright holder.

Chapter 10Green City: Towards Low-CarbonUrban Planning and Governance
Abstract Green city is a development concept that has been widely embraced bythe international community, especially by metropolises. In a broad sense, “green”indicates a city’s overall habitability, in terms of environmental health (pollutionprevention and control, carbon emissions, and air quality), public space design (envi-ronmental aesthetics and a city’s vitality), equality of the social resource distribution(housing supply andwealth inequality), transportation efficiency (green commuting),and sustainability of energy consumption (efficient use of renewable energy sources).China is facing a series of issues as it heads towards its green city vision. From theperspective of spatial planning, we believe high carbon emissions are fundamentallyresulted from outdated construction methods due to inefficient land use and housingsupply–demand mismatch, and long commutes for workers caused by the separa-tion of residence from workplace. From the perspective of technologies used in theconstruction andmaintenance of transportation facilities, we believe that the penetra-tion of alternative-fuel vehicles (AFV) in public transport remains low, and the lackof profitability of urban rail transit is a problem that should be urgently addressed.New technologies and techniques are needed to reduce energy consumption andcarbon emissions from the production of building materials and the construction andoperation of buildings. The use of aging water and heat supply facilities leads to highloss rates. Meanwhile, China’s resource recovery sector is still in its infancy, and thereliance on human labor to offer services such as waste sorting points to room foroperating efficiency enhancement. This chapter discusses the goal of building greencities in the context of carbon neutrality, outlines possible policies and measures toaddress the above-mentioned issues, and quantifies the carbon emission reductionachieved by optimizing systems for urban planning and housing supply, and adoptingnew technologies.
10.1 Problems and Challenges Facing China in Its GreenCity Vision
Globally, cities such asVancouver,Melbourne, Toronto, Copenhagen, andRotterdamhave made remarkable progress in their green city development, especially in terms
© The Author(s) 2022CICC Research, CICC Global Institute, Guidebook to Carbon Neutrality in China,https://doi.org/10.1007/978-981-16-9024-2_10
235

236 Chapter 10 Green City: Towards Low-Carbon Urban Planning and Governance
of energy conservation, emission reduction, and the overall consideration of environ-mental issues during the urban planning process. Several factors have contributed totheir success, including the early adoption of sustainable development visions, theeffectiveness of their environmental policies, and their improving industrial struc-tures. Cities with stronger industrial vitality such as London, Paris, NewYork, Tokyoand Singapore are also taking the lead in green city development, which representsan important component of a city’s “soft power”. We have noticed many similaritiesbetween these cities: (1) preliminary urban planning (comprehensive urban planningfocusing on sustainability in the long term, corresponding with long-term devel-opment goals, and adopting to extensive public feedback); (2) widespread supportamong the public; (3) continuity and integration of macro policy and city planningregulations; and (4) establishment of effective supervision mechanisms.
Green technologies utilized in urban planning aremainly related to transportation,municipal facilities, ecological land use, and construction engineering. We believethe experience from other countries is instructive for China, and will help Chinaaddress problems of its emerging “urban diseases”. Furthermore, the developmentof livable cities with more environmental-friendly facilities and a more sustainableatmosphere fundamentally echoes the pursuit of la dolce vita for Chinese people.
Two major challenges confronting China in its process towards green cities areimproving the overall spacial structure of cities and promoting the technologicaldeveloping in related fields. Nowadays, most urban planning for major Chinesecities still fits into the “monocentric city” framework, which has caused the followingissues:
1. Inefficient urban land use—e.g. inefficient use of industrial land, the separationof residence from workplace, and the mismatch between housing supply anddemand.
2. Inefficient transportation system. The overall transportation planning efficiencyas well as the coverage and accessibility of public transport facilities still needimprovement.
3. Insufficient construction technology improvement and lack of managementmethods for existing building. At present, building management and main-tenance in China consumes high quantities of energy and generates heavypollution, especially a large volume of carbon emissions in the process ofbuilding materials production and the building construction. The standard forthe management of buildings throughout their life cycles is not yet in place.
4. Inefficient city operation and maintenance. The idea of environmental protec-tion and sustainable development has been more widely promoted in China inrecent years, but problems remain in fields such as water/heat supply, resourcerecycling, and waste sorting.
We believe that several factors including spatial arrangements, formulation ofpolicies and regulations, technology application, standard setting, and public partic-ipation in city planning should be better coordinated in order to address the aboveproblems. Given the increasingly strict control over new land quotas for building

10.1 Problems and Challenges Facing China in … 237
Problems leading to high carbon emissions in cities
Planning system
Urban spatial planning and system design
Job-housing balance
Improve the matching degree of housing
supply and demand
Efficient land use
Urban traffic planning and management Urban construction management Urban maintenance management
Low-carbon travel mode
Improve the greening degree of
transportation
Social governance
Reduce energyconsumption
Improve management
Develop new materials
Improve resource recovery
Improve the utilization rate of water and heating
Improvementmeasures
Policy recommendations
Carbon emission reduction calculation
Provide inputs
Fig. 10.1 Structure of this chapter. Source CICC Research
construction, we believe China needs to find a balance between expectations andrealities to achieve its sustainable urban development goals.
In order to achieve the green city vision, we believe future urban planning shouldbe based on: (1) the current development stage of the industrial economy, and theenvironmental governance goal; (2) coordination between the industrial developmentand infrastructure construction; and (3) optimization of spatial arrangements andmanagement skills of urban development. This chapter discusses possible solutionsto the abovementioned problems from four perfectives: (1) urban spatial planning(addressing issues such as inefficient land use, separation of the residence fromwork-place, and housing supply–demand mismatch); (2) urban transportation planning(promoting low-carbon commuting); (3) urban constructionmanagement (addressingthe issue of using energy-consuming construction technologies and environmentallyharmful building materials as well as improving the management of existing build-ings): and (4) urban maintenance and management (promoting efficient water usageand waste recycling). See Fig. 10.1 for the structure of this chapter.
10.2 Urban Spatial Planning: Building Citieswith Sufficient Housing Supply and EvenlyDistributing Residences and Workplaces
Cities are major sources of carbon emissions, which are mainly generated byfollowing 3 factors: (1) residents’ reliance on private cars for long-distancecommuting due to the spatial separation between residence and workplace as well

238 Chapter 10 Green City: Towards Low-Carbon Urban Planning and Governance
as the uneven distribution of urban resources (e.g., restaurants, entertainment facil-ities, supermarkets and hospitals); (2) the mismatch between housing supply anddemand; and (3) low-density construction in built-up areas. This chapter discussespossible countermeasures from the perspectives of urban spatial planning and insti-tutional design, and suggests methods for calculating carbon emissions reduction infollowing sections.
10.2.1 Evenly Distributing City Resources to ReduceCommuting Distances
Developing multiple business centers and creating 15-min community lifecircles. The majority of mature and emerging cities in China are suffering from“urban disease” as a result of the monocentric city model. Due to the concentrationof urban resources in a single core area, residents living in the suburbs have to sufferlong commutes to work. The cost of long-distance commuting increases the valueof residences and living space in the core area which increase market prices of theseresidences and forcing some people to move to the suburbs. This further exacerbatesthe uneven distribution of urban resources leading to high carbon emissions and lowtraffic efficiency. In order to reduce urban carbon emissions by shortening the averagecommuting distance, we believe it is important to create multiple business centersand 15-min community life circles.
Switching from the single-core to the multi-core city model. The even andfair redistribution of urban resources in a city is the key to addressing the issue ofspatial separations between living and working areas, and it can eventually leadsto shorter commutes. We believe that the following should be considered in futureurban planning:
• Promoting multi-core city model development and improving the rapidtransit system. We believe developing subcenters based on traffic locations,industrial bases, and economic connections between city cores is more likelyto bring capital to high-quality industries which can boost economic growth inthe short- and medium-term. On the other hand, a rail transit network is importantfor a city’s sustainable development. Rail transit network needs to be extendedto suburbs to strengthen economic linkages between urban centers and subcen-ters. Inter-city rapid transit systems should also be encouraged between majorcities such as Beijing and Shanghai to strengthen economic interconnectivitywith surrounding satellite cities.
• Encouraging mixed-use urban planning ideas. We believe large- and medium-sized cities should focusmoreonurbanplanning in order to unleashpotential of thelimited land resources.While ensuring land resources for different uses are reason-ably allocated, we believe governments should consider adding more functionsto the previous single-purposed lands during the planning process. On the otherhand, government should pay more attention to “fill-in” the structures of existing

10.2 Urban Spatial Planning: Building Cities with Sufficient … 239
construction land and to revitalize these areas by renovating and upgrading oldresidential communities, factories, commercial buildings, and other supportingfacilities.
Building 15-min community-life circles by better allocating basic servicefacilities. Reasonable allocation of urban resources surrounding the residential area isimportant to build 15-min community-life circles that can fulfill the residents’ needsfor consumption, entertainment and social life. Two issues should be consideredwhen building 15-min community-life circles:
• Efficient combination of facilities for walking, cycling and public transport.Cities should provide transportation facilities based on walking distance so thatresidents have various options to reach their destinations (walking, cycling andpublic transport) within a 15-min community-life circle. The availability of trans-port options will help reduce the use of private cars to reduce traffic jams duringrush hours. Moreover, during urban planning and designing, it is necessary toconstruct supplementary facilities in residential areas to satisfy basic service needsof residents. The locations of these service facilities should be selected based onthe principle of covering wider range of residents and areas.
• Compact and diversified arrangement of business structures. Under thetransit-oriented development (TOD) model, properties within the 15-min lifecircle needs to be compactly arranged to include all the necessary resources forvarious daily life scenarios (e.g. residence, shopping, medical care, entertain-ment, and socializing). This compactness is not only reflected in the compressionof distance and efficient use of space, but also in the diversification of servicesprovided. Urban planners also need to consider the varying demand for dailyservices across different income groups.
Taking the above-mentioned urban planning strategy as the future adjustment path,we calculate the possible reduction of urban commuting distance in somemajor citiesin China, and use the result as a basis to calculate the carbon emission reduction inurban traffic management segment. Assuming residence and workplace are evenlydistributed in 36 selected major cities, we estimate that the average commutingdistance will decrease to 115.3bn km (adjusted to 83.7bn km after considering someuncontrollable factors in urban planning).
From the perspective of urban planning, there are two types of commutes: (1)Commutes caused by the separation between residential areas and the workplace.Excluding individual preferences for employment and the location of residences, weassume that if everyone worked as close to home as possible, it would minimizethe average commuting distance. According to data from China Academy of UrbanPlanning andDesign (CAUPD),we estimate that 30–60%of the commuting distancesare caused by the separation of residence from workplace (Fig. 10.2). (2) Extradistance caused by the discrepancy between individual preferences for the locationof workplaces and residences.
International urban planning scholars have noted that a reasonable commutingdistance for walking and biking is 1–2 miles (1.6–3.2 km). Although cities havebeen profoundly changed by economic development and technological advances,

240 Chapter 10 Green City: Towards Low-Carbon Urban Planning and Governance
4.5 4.5 5.3 5.4 3.4 5.0 2.8 4.7 4.8 5.2 2.9 3.9 4.2 4.7 3.7 5.6 4.3 4.6 3.7 3.9 5.0 4.2 4.2 4.8 4.4 4.4 5.0 3.6 3.9 3.9 4.4 4.4 4.1 4.1 3.1 3.1
6.6
4.6 3.8 3.7 5.6 3.7 5.7 3.8 3.7 3.3 5.4 4.4 4.1 3.5 4.4 2.5 3.7 3.1 3.8 3.6 2.5 3.2 3.2 2.5 2.8 2.8 2.1 3.4 3.1 3.1 2.6 2.5 2.7 2.5 3.2 2.9
0
2
4
6
8
10
12B
eijin
g
Che
ngdu
Cho
ngqi
ng
Shan
ghai
Xin
ing
Gua
ngzh
ou
Yin
chua
n
Cha
ngsh
a
Nan
jing
Tian
jin
Shiji
azhu
ang
Zhen
gzho
u
Xi'a
n
Wuh
an
Qin
gdao
Shen
zhen
Jina
n
Gui
yang
Lanz
hou
Cha
ngch
un
Kun
min
g
Han
gzho
u
Shen
yang
Dal
ian
Har
bin
Hef
ei
Xia
men
Nan
chan
g
Taiy
uan
Hai
kou
Uru
mqi
Fuzh
ou
Nan
ning
Nin
gbo
Huh
ehot
Lasa
Composition of commuting distance in 36 major citiesOther factors Job-housing balance
(km)
Fig. 10.2 We estimate that 30–60% of the commuting distances in 36major cities are caused by theseparation of residence from workplace. Source 2020 Monitoring Report on Commuting in MajorCities by CAUPD, CICC Research
we believe the commuting distance proposed by the scholars remains valid today.We believe measures, such as building multi-centric cities and 15-min life circles,can help reduce the commuting distance to the suggested range, and we can calcu-late the decline of commuting distance for each employee when the residence andworkplace are evenly distributed from the perspective of urban planning. Nearly70% of the Chinese population worked in cities at end-2019, of which our calcu-lation of commuting population in 36 select cities is based. We estimate that theeven distribution of residence and workplace can reduce total commuting distance inthese cities by around 115.3bn km per year. Considering the difficulty of urban plan-ning adjustments varies for cities at different development stages, we classify citiesinto super-large, extra-large, large and medium-sized based on population size andaverage commuting distance, and set breakage coefficients based on the difficulty ofurban planning changes. Factoring in the difficulty of urban planning adjustments,we estimate the total commuting distance in major cities would be reduced to 83.7bnkm per year.
10.2.2 Designing a Reasonable Housing System,and Matching Housing Supply with Demandto Reduce Carbon Emissions
China’s housing supply is sufficient though the distribution of housing supply stillhas structural problems. China had around 30bn sqm in housing inventory in urbanareas at end-2019, and the ratio between number of inventory housing and households(1.1/household) was already on par with that in overseas mature housing markets.However, structural problems remain to be solved: (1) Uneven geographical distri-bution. Judging by the permanent resident population, we believe the residential land

10.2 Urban Spatial Planning: Building Cities with Sufficient … 241
supply is insufficient in ultra-high-tier and high-tier cities (classified by CICC realestate team). (2) Uneven distribution among different income groups. According to asurvey by the National Bureau of Statistics (NBS), nearly 15% of urban householdsfaced housing difficulties in 2015, and the proportion was over 25% in developedcities such as Beijing and Shanghai. Meanwhile, the lowest-income urban residents(20%) only occupied 6% of housing resources.
Housing construction is a major source of urban carbon emissions. We explorepossible improvement of system design (from the perspective of housing supply, landmarket and taxation system) to address the housing supply–demand mismatch.
10.2.2.1 Housing Supply System: Focusing on Commercialand Government-Subsidized Housing
Government-subsidized housing programs satisfy the basic housing needs ofmid/low-income households, helps build a multi-layer housing supply system, andreduce invalid housing supply. We believe the existing housing supply system canbe improved in the following aspects:
• Catering to the housing needs of neglected groups. China’s subsidized housingprogram has long neglected college graduates and professional employees. Webelieve maintaining a reasonable ratio between the supply of subsidized housingfor professional employees and general subsidized housing (e.g. 7:3 in Shenzhen)canmeet the basic housing needs of college graduates and professional employees.
• Designing a suitable investment and financing system to encourage governmentsand the private sector to participate in subsidizedhousingprojects. The long invest-ment recovery period and ineffective exit mechanism are major reasons hinderingthe acceleration of subsidized housing construction. We believe designing a suit-able investment and financing system is the key to encouraging local govern-ments and the private sector to participate in subsidized housing projects, suchas increasingly land supply and using REITs (real estate investment trusts). Atthe same time, financial and fiscal measures could further encourage non-state-owned companies to participate in the construction of affordable housing, whileexpanding the coverage of policy-based housing should increase the return onREITs and enhance the feasibility of their exit mechanism.
• Balancing subsidized housing construction among different cities and districts.Land sales data over 2009–2019 suggests that more subsidized housing projectswere built in medium/low-tier cities, and we believe supply of public rentalhousing in ultra-high and high-tier cities should be increased. Moreover, buildingsubsidized housing and supporting infrastructure facilities where public transportis accessible should fulfill the demand from middle-to-low income households,and reduce the vacancy rate of subsidized housing. Meanwhile, extensive housingconstruction in one single region should be avoided to prevent social tensioncaused by residential isolation.

242 Chapter 10 Green City: Towards Low-Carbon Urban Planning and Governance
10.2.2.2 Deepening Land Market Reform
Land market reform is the prerequisite and foundation for building a multi-layeredhousing supply system. We believe that most supply-side issues in domestic realestate market can be traced back to the low efficiency of land supply. Under theexisting institutional framework, we believe the land market reform should bedeepened in the following aspects:
• Improving national system for the trading of construction land quotas. Academicstudies generally accept that the inefficiency of national construction land quotasystem is the key reason for the uneven distribution of land supply. Provincialland quota trading systems are relatively mature, and cross-province trading ofunused land quotas has been successfully trialed. We believe the national landquota trading system should be improved in the following aspects: (1) delegatingof trading rights from provinces to counties and cities; (2) supplementing inner-provincial trading rights with inter-provincial trading; and (3)making informationmore transparent and distributing benefits fairly.
• Building unified construction land markets for urban and rural areas. In order todevelop a unified land supply market for urban and rural areas, we believe: (1)construction land in all area should be equally considered in urban planning; (2)a unified benchmark land price system should be built and land transaction pricesshould be disclosed (market competition will drive land prices in rural and urbanareas towards a similar outcome); and (3) a reasonable profit distribution systemshould be built to avoid assigning too much social responsibilities on collectiveland owners.
10.2.2.3 Fiscal and Taxation Systems: Introducing Fair and ReasonableProperty Taxes
We believe the introduction of a fair and reasonable housing property tax will: (1)better motivate local governments to advance land market reform; and (2) curb spec-ulative housing investment and facilitate income redistribution. We believe that thehousing property tax should take these two issues into consideration:
• Clarifying the purpose of levying housing property tax. We believe property taxshould remain stable over the long term, which differs from the flexibility andtimeliness of regulatory measures. Judging by the experience in overseas housingmarkets, we do not believe that property taxes alone can sufficiently curb housingprice hikes and speculation. On the contrary, the property tax is a stable fiscalrevenue source (over 20% in developed countries) due to its stability, transparency,and counter-cyclicality. Overall, we believe a combination of property tax andvacancy tax (as charged in France and Canada) will propel home owners to sellor rent, and curb housing speculation.
• Implementing property tax in two steps; promoting supporting systems. Both theland transfer fee and property tax are related to home ownership, and this may

10.2 Urban Spatial Planning: Building Cities with Sufficient … 243
result in duplicate charges. However, we think the legal basis of property tax canbe established by replacing lease renewalwith sustainable land use after the periodof residential land use expires, and adopting a low-rate and narrow-base propertytax before the use period expires. We believe these measures would ensure thatfairness is maintained, common housing demand is protected, and wealth effectin property market is regulated.
• By comparing the demand matching model and the current extensive recon-struction model, we estimate that the demand matching model will reduce theconstruction area by 21.2bn sqm in the next 40 years.
• Estimated new construction area in next 40 years under current “extensive demo-lition and reconstruction”model: Urban population is calculated based on popula-tion forecasts from the United Nations and the assumption that the China achievesits urbanization goal of 80% in 2050. New construction area per urban residentis calculated based on the correlation between urbanization rate and per capitanew construction area. By multiplying the urban population and new constructionarea per urban resident, we estimate total new construction area in urban area at65.1bn sqm over 2021–2060 (Fig. 10.3).
• Estimated new construction area in the next 40 years under the “supply–demandmatching” model: We calculate reasonable demand for residential area in thenext 40 years based on our estimate on the reasonable demand for houses overthe medium-to-long term, and the assumption that per capita residential areawill increase. We assume housing projects account for nearly 72% of total newconstruction area, which estimates total new construction area in urban area at43.9bn sqm over 2021–2060.
0
10
20
30
40
50
60
70
2021
E
2024
E
2027
E
2030
E
2033
E
2036
E
2039
E
2042
E
2045
E
2048
E
2051
E
2054
E
2057
E
2060
EEstimated new construction area under current model
Current model "Supply-demand matching" model(bn sqm)
Fig. 10.3 Estimated newconstruction area under current “extensive demolition and reconstruction”model, and under “supply-demand matching” model. Source United Nations, National Bureau ofStatistics, CICC Research

244 Chapter 10 Green City: Towards Low-Carbon Urban Planning and Governance
30%
35%
40%
45%
0.0
5.0
10.0
15.0
20.0
25.0
2021
E
2024
E
2027
E
2030
E
2033
E
2036
E
2039
E
2042
E
2045
E
2048
E
2051
E
2054
E
2057
E
2060
E
Possible saving of new housing construction current "extensive demolition and reconstruction" model, if the housing supply system is resonably designed and under
"Supply-demand matching" model
Accumulated new starts saved Proportion of accumulated new starts saved (RHS)(bn sqm)
Fig. 10.4 Possible saving of new housing construction if the housing supply system is reasonablydesigned. Source United Nations, National Bureau of Statistics, CICC Research
• The difference of new construction area under two housing supply models is aredeeming feature of new housing construction. If China switches from current“extensive demolition and reconstruction” model to “supply-demand matching”model, we estimate new construction area in urban areas will drop 21.2bn sqm by2060, equivalent to 33% of total new starts under the current model (Fig. 10.4).
10.2.3 Using Land Efficiently to promote High-QualityGrowth
Low-efficiency and low-quality land use has led to high carbon emissions in cities.Under the conventional resource-driven developmentmodel, citiesmainly rely on theinput of production factors to enhance economicoutput.Mostmunicipal governmentshave extensively developed land to attract ruralmigrants during the progress of urban-ization, and the construction of large volumes of low-utilization supporting facilitiespushed up overall carbon emissions. Average economic density in built-up areasof prefecture-level cities was around Rmb1,200/sqm by the end-2019, and there isplenty of room for improvement in all regions except formajor city clusters in easternChina. We believe that improving city-industry integration and urban resilience isimportant for improving land use efficiency and reducing carbon emissions.

10.2 Urban Spatial Planning: Building Cities with Sufficient … 245
10.2.3.1 Improving City-Industry Integration; Exploring DevelopmentAxes
Regional centers and satellite cities within major city clusters in mid-west Chinaare the main destination for the migration of people and industries from the moreeconomically-developed eastern coastal regions. Such cities are focused on turninga large population into a driver of economic growth by using land more efficiently.The following two issues should be addressed:
• City-industry integration. We believe high-quality urban expansion can beachieved by setting up economic and technological development zones and high-tech industrial parks on the fringes of main urban areas and attracting high-quality industrial projects with tax reductions and exemptions as well as lowland costs. For example, the Zhengzhou municipal government built a modernservice industry system in the Zhengdong New Area by introducing industryleading, competitive and large-size companies, creating a new growth driver forZhengzhou’s economy.We believe building infrastructure and developing serviceindustries are important for new districts to reduce the reliance on urban centers.
• Development axis: Central urban areas—urban fringes—newurban areas—cross-border functional areas. Major cities such as Zhengzhou and Chengdu all havedeveloped central urban areas and new urban areas, but the economic density stillneeds to improve in regions located between the main and new urban areas and inregions within the one-hour urban living circle. Economic links between differentareas should also be strengthened. The function of urban fringes depends on thedegree of separation between residential and workplaces in central urban areas.Fringe areas will mainly be used as residential areas when there is a lack in centralurban housing. Otherwise, urban fringes will be used to develop employmentsubcenters to enhance economic density in between the central and new urbanareas.
10.2.3.2 Voluntarily Downsizing to Strengthen Urban Resilience
Population density declined in nearly 80 cities inmid-western and northeasternChinaover 2010–2019, and population migration and relocation of companies to otherregions were major reasons. As inefficient land use in these shrinking cities maycause more serious consequences, we believe the following measures should betaken:
• Promoting industrial transformation. In response to the stagnation of local tradi-tional industries, we believe governments should develop new industries to meetlocal conditions. For example, the Yumen municipal government switched devel-opment focus from oil resources to tourism and organic agriculture after localoilfields were exhausted.
• Strengthening urban resilience. Urban functions in sparsely populated citiesshould be restored by building ecological networks on idle land, and public

246 Chapter 10 Green City: Towards Low-Carbon Urban Planning and Governance
service facilities in city centers or commercial districts. This will strengthen urbanresilience of these cities and prevent further population declines.
• Adopting proactive downsizing strategy. The bulk of domestic cities have yetto see serious downsizing, but we believe that cities should be forward-lookingwhen urban planning. In cities that rely on traditional industries and lack naturalresources, supply of land for traditional industries should be reduced, andinefficiently-used land in built-up areas should be readjusted.
10.3 Urban Transportation: Wider Use of AFVs to ReduceCarbon Emissions from Urban Transportation
This section discusses the potential reduction of carbon emissions in the urban trans-portation sector via measures such as increasing the use of alternative-fuel vehicles(AFV) in public transport, optimizing the urban railways, improving bike-sharingsystems, and shortening average commutes. We believe that all buses, taxis andride-hailing vehicles will be electric by 2030, and that more passengers may chooselow-carbon modes of transportation such as urban rail transit and bike sharing.
Transportation methods in cities mainly include rail transit, buses, taxis, ride-hailing services, and bike sharing. Total urban passenger volume in China reached165.6bn in 2019, of which buses, taxis, urban rail transit, ride-hailing platforms,and bike sharing accounted for 21%, 42%, 14%, 12%, and 10%, respectively. Theproportion of taxis and buses declined compared to 2010, while the proportion ofurban rail transit, ride-hailing platforms, and bike sharing increased 9%, 12% and10%, respectively, contributing to the progress of building low-carbon transportationsystem.
Taxis, buses, and ride-hailing services are the main sources of carbon emissionsfrom urban transportation (excl. ride-hailing as it is classed among passenger vehi-cles in Chap. 8). We estimate carbon emissions in China from taxis and buses in2019 totaled 31.32mnt, with 24% from buses and 76% from taxis. We expect urbanpassenger volume to maintain annualized growth rate of 3–4% (daily passengervolume in the US grew at a CAGR of 3.0% as per capita GDP increased fromUS$13,000 to US$36,000). We do not believe that carbon neutrality for urban trans-portation has only one solution as we think it can be achieved via the followingmeasures: (1) gradually increasing the use of electric buses, electric taxis, and elec-tric vehicles for ride-hailing services; (2) promoting low-carbon transportation suchas urban rail transit and bike sharing before the electrification of public transportis complete. The urban rail transit and bike-sharing segments are facing differentissues, which will be discussed in the following sections.

10.3 Urban Transportation: Wider Use of AFVs to Reduce … 247
10.3.1 Electrification of Urban Buses, Taxis,and Ride-Hailing Vehicles to Complete in 2030
The Innovation Center for Energy and Transportation (ICET) proposes in its reportof Research on the Timetable for the Exit of Gasoline-fueled Vehicles in China (the“timetable research report”) that taxis, ride-hailing cars, and buses should be amongthe first to complete electrification (gradual expansion from ultra-large cities suchas Beijing, Shanghai and Shenzhen to other cities such as Tianjin, Hangzhou andGuangzhou).
• 59% of buses were electric in 2019, and the proportion may reach 100% in 2025.Data from the Ministry of Communications shows that China had nearly 0.41mnelectric buses in 2019, accounting for 59% of total buses in the country, and 90%of buses sold in 2018 were electric. We expect the electrification of buses to reach100% in 2025.
• Electrification of taxis and ride-hailing cars will be completed before 2030.According to the Study on China’s Timetable for Phasing-out Traditional ICE-vehicles, gasoline-fueled taxis and gasoline-fueled cars for ride-hailing serviceswill be gradually replaced by electric vehicles over 2020–2030.
Led by the government, taxis and ride-hailing cars may be first to achieve electrifi-cation. For example, the Shenzhen municipal government issued a blue-sky sustain-able action plan in April 2018, and the electrification rate had reached 99% for taxisand 100% for buses as of 2019. The electrification of government cars, public vehi-cles, and buses can be achieved by governments restricting purchases of gasoline-powered vehicles.We expect the electrification of urban buses, taxis, and ride-hailingvehicles to complete in 2030, realizing zero carbon emission.
10.3.2 Switching to Low-Carbon Modes of TransportationBefore 2030
We expect increased use of low-carbon transportation modes such as urban railtransit, bike sharing, and walking before 2030, mainly considering: (1) urban railtransit will transport more passengers as the model of financing and profitabilitymatures; (2) governments will collaborate with enterprises to enhance the efficiencyof bike-sharing services; and (3) residents will likely be able to walk and bike to theirworkplaces thanks to the shortened commuting distance.

248 Chapter 10 Green City: Towards Low-Carbon Urban Planning and Governance
10.3.2.1 Increased Use of Urban Rail Transit to Reduce CarbonEmissions from Urban Transportation
Density of urban rail transit in China remains lower than in developed countries.Among the world’s ten largest cities measured by the operating mileage of urbanrail transit, three are from China (Beijing, Shanghai and Guangzhou). However, thedensity of urban rail transit (as measured by the urban rail transit length per unitarea) remains significantly lower in Beijing, Shanghai and Guangzhou (0.13, 0.07and 0.05 km per sq.km.) than in overseas large cities such as Paris, New York andLondon (2.03, 0.54 and 0.29 km per sq.km.).
Urban rail transit volumes as share of total public transport still has a large room togrow. Even in large cities where urban rail transit was introduced years ago, such asBeijing, Shanghai and Guangzhou, the proportion of urban rail transit in total publictransport volume is a mere 40%–50%, significantly lower than 70%–80% in Parisand Tokyo. Nationwide, the ratio is only 14%, indicating large upside. We expecturban rail transit transport volumes to maintain a 15% growth over the next 10 years,and its proportion of total public transport volume to reach 30%.
Urban rail transit companies are generally loss-making inChina, and their earningsmodel needs further improvement.Data fromChinaAssociation ofMetros shows thataverage operating cost and operating revenue of urban rail transit per unit passenger-kilometers (PKM) stood at Rmb0.7 and Rmb0.5 in 2019, with average operatingrevenue to cost ratio falling from 78.0% in 2018 to 72.7%. Overall, operation ofurban rail transit is loss-making, and metro as a major type of urban rail transit isalso reporting losses due to inefficiency of business diversification and operatingmechanism.
China may look to the experience of Mass Transit Railway’s (MTR) in HongKong for ways to optimize its subway operation mechanism. The overall intensityof MTR passenger transport (as measured by daily transport volume divided byoperating length) is close to 23,000 passengers per km per day, 30% higher than thepassenger transport intensity of metro in Guangzhou and more than three times thenational average (7,000 passenger per km per day). MTR Corporation adopts thetransit-oriented development (TOD) model, under which property developers obtainthe land development rights at a relatively low cost, and the property projects createa new revenue source. In 2019, MTR Corporation recorded EBITDA of HK$21bn(Fig. 10.5), with EBITDA margin reaching 38% (well above the 19% at domesticpeer ShentongMetro) where the station commercial services, property development,rental andmanagement businesses each contributed 29%, 27% and 20% of EBITDA.We think the Transit OrientedDevelopment model (combination ofmetro and relatedproperty) will significantly enhance the operating efficiency of urban rail transitsystems and reduce urban rail transit companies’ reliance on government subsidies,creating awin–win for governments, the public, property developers as well as transitoperators.
Issuance of real estate investment trusts (REITs) backed by urban rail transit assetsoffers a new solution for direct financing. We believe that REITs will serve as aneffective supplement to the PPP model, and will help build a sustainable financing

10.3 Urban Transportation: Wider Use of AFVs to Reduce … 249
0
5
10
15
20
25
Passenger Transport5.91
Station Business6.12
Property leasing and management
5.61
Others-2.29
Non-operating business (property development)
5.68
(HKD bn)
Fig. 10.5 Breakdown of MTR Corporation’s EBITDA in 2019 (unit: HK$100mn). Source MTR’sannouncement, CICC Research
system for urban rail transit. In addition, strict regulatory approval and informationtransparency are required to issue REITs in the urban rail transit industry. We believecloser supervision by regulators, themarket and the public will force urban rail transitcompanies to improve operating efficiency, and diversify their business portfolio, thusimproving sector profitability.
10.3.2.2 Bike Sharing: A Solution for Last-Mile Travel
As an environmentally friendly way of traveling, bike sharing could be a solutionfor the last mile from home and it would help reduce the traffic congestion and airpollution. The number of bike-sharing app users increased from 2.45mn in 2015 to240mn in 2018, a CAGR as high as 358%, while fundraising volume in the bike-sharing industry climbed from Rmb5.2bn in 2015 to Rmb83.3bn in 2017. Withthe bike-sharing industry being reshaped in 2018, investors became more prudent,and aggressive marketing campaigns were replaced by efficiency enhancement andquality improvement as the new focus for bike-sharing companies. The competitivelandscape largely stabilized in 2019,with the three internet giant-backed bike-sharingfirms (Hellobike, Meituan and Qingju) holding a combined market share of 95%.We believe governments and bike-sharing companies should cooperate in addressingproblems arising from the disorderly competition in past few years, such as excessivesupply and unequal distribution of shared bikes, inefficient parkingmanagement, andhiding shared bikes for personal use.
We believe that governments should work more closely with bike-sharing compa-nies to encourage shared bike supply, bike parking management, and business opera-tion, in order to enhance the efficiencyof bike-sharing services. Efficientmanagementof shared bikes relies on the use of big data and the internet, and we thus believe

250 Chapter 10 Green City: Towards Low-Carbon Urban Planning and Governance
governments and bike-sharing companies should collaborate in following aspects:(1) introducing a tender system for the increased supply of shared bikes; (2) jointlybuilding the IT platform for data sharing; and (3) developing a credit system for thebike parking management. We believe closer cooperation between governments andbike-sharing companies will efficiently increase the active use of shared bikes, andreduce the vacancy rate.
10.3.2.3 Jobs-Housing Balance Should Shorten Average CommutingDistance and Reduce Carbon Emissions
Jobs-housing balance should markedly shorten commuting distance. As statedabove, we estimate the total urban commuting distance will drop 83.7bn km per yearif residence and workplace are evenly distributed in 36 major cities. On the basis ofthis calculation,we estimate carbon emissions fromcommutingwill decrease accord-ingly by 2.92mnt after considering the energy consumption and carbon emissions ofdifferent modes of transport (Table 10.1).
10.4 Urban Construction: New Ideas, New Materials,and New Technologies Drive Reduction in CarbonEmissions
This section discusses: (1) volume of carbon emissions from urban construction; (2)previous policies aimed at promoting energy conservation and emission reduction inthe building sector; (3) possible reduction of carbon emissions from building sectorby 2060.
10.4.1 Overview: Building Sector as a Whole Accountedfor 36% of National Carbon Emissions
10.4.1.1 Domestic Carbon Emissions from Building Sector Around4.5bnt in 2019; to Drop 77% to 1.1bnt in 2060
Domestic carbon emissions from the building sector stood at around 4.5 bnt in 2019,andpaceof emissiongrowth significantly slowedduring the13thfive-year plan (FYP)period (2016–2020). Based on data from China Association of Building EnergyEfficiency (CABEE),we estimate domestic carbon emissions from the entire buildingprocess reached 4.3bnt in 2018 and 4.52bnt in 2019, much higher than the globallevel. The carbon emission fromurban construction also outpaced the population over

10.4 Urban Construction: New Ideas, New Materials … 251
Table 10.1 Estimated carbon emission reduction after residence and workplace are evenlydistributed in 36 major cities
Estimates of carbon emission saved by commuting distance
Saved commuting distance (bn km) 83.7
Proportion ofpassengertransportationvolume
Saved commuting distance (bn km)
Buses 47% 39.0
Urban rail transit 16% 13.5
Passenger cars (including taxis andride-hailing cars)
37% 31.2
Buses Total CO2 reduction: 2.92mnt
Bus electrification rate 59%
Fuel consumption per 100 km ofdiesel buses (L)
30
Assumption of the number of peoplecarried by the bus
20
Save carbon dioxide emissions bybuses (thousand tonnes)
520
Passenger cars
Passenger car electrification rate 3%
Passenger car fuel consumption per100 km (L)
6.8
Assumption of the number ofpassengers carried by passenger car
2
Save carbon emissions by passengercars (thousand tonnes)
2,404
Source CICC Research
2008–2018 (76% vs. 5%) due to the large-scale urban construction. Domestic carbonemissions from building sector during the 11th, 12th and 13th FYP grew at a CAGRof 7.5%, 7.0% and 1.9%, respectively. The marked slowdown of carbon emissiongrowth during the 13th FYP indicates the effectiveness of energy conservation andemission reduction policies introduced during the period.
We expect carbon emissions from building sector to drop 32% and 77% in 2030and2060 comparedwith 2019.Energy consumption and carbon emissions of buildingsector mainly come from material production, building construction and buildingmanagement (Table 10.2). Given that the building sector is a major source of carbonemissions, we believe energy conservation and emission reduction in the buildingsector is important for China and the rest of the world to achieve peak carbon emis-sions and carbon neutrality. The IEAestimates global carbon emissions frombuildingsector should annually drop 6% over 2020–2030 in order for the sector to achieve

252 Chapter 10 Green City: Towards Low-Carbon Urban Planning and Governance
Table 10.2 Carbon emissions from building material production, construction, and buildingmanagement
Carbon emissionsfrom materialproduction
Carbon emissionsfrom buildingconstruction
Carbon emissionsfrom buildingmanagement
Proportion ofenergyconsumption(2018)
51% 2% 47%
Proportion ofcarbon emissions(2018)
55% 2% 43%
Measures to saveenergy and reduceemissions
Reduce emissions frombuilding materialproduction by:upgrading productiontechnology, etc.
Reduce buildingconstruction by:optimize urbanplanning; prolongingbuilding service life,etc.
Promoting advancedenergy-conservationbuildings: such aspassive housing
Increase use ofeco-friendly materials:such as light partitionwall material, etc.
Enhance constructionefficiency by: applyingdigital technology tobuilding construction;enhancing theelectrification ofconstructionmachinery, etc.
Design: to enhance thebuilding energyefficiency
Building materials:promote use of greenmaterials
Building management:Deploying smartenergy conservationsystem
Energy equipment andenergy supply system:Optimize forms ofenergy supply toenhance energyefficiency
Renewable energy:increase use ofrenewable energysources such as solarpower and geothermalpower
Source China Association of Building Energy Efficiency, CICC Research
carbon neutrality in 2050. We expect carbon emissions from building sector to drop32% and 77% compared with 2019 in 2030 and 2060 to 3.11bnt and 1.05bnt.
• Carbon emissions from buildingmaterial production can be reduced by upgradingproduction technology, and the increased use of eco-friendly materials such aslight partition wall materials.

10.4 Urban Construction: New Ideas, New Materials … 253
• Carbon emissions from construction can be reduced by prolonging buildingservice life, applying digital technology (improving construction efficiency andreduce the production of construction waste), and enhancing the electrification ofconstruction machinery.
• Carbon emissions from building management can be reduced by promotingadvanced energy-conservation buildings such as passive houses, and developingfull-process energy conservation solutions.
10.4.2 Carbon Emissions from Construction: ReducingOverall Construction Volume and EnhancingConstruction Efficiency
10.4.2.1 Production of Building Materials and Construction BothGenerate Carbon Emissions, With the Majority Generatedby Building Material Production
Nearly 51% of carbon emissions from the building sector were generated by buildingmaterial production and construction. Based on data from the China Associa-tion of Building Energy Efficiency, we estimate domestic carbon emissions frombuilding material production and construction reached 2.09bnt and 100mnt in 2018,accounting for 49% and 2% of total emissions from the building sector.
• Carbon emissions frombuildingmaterial production:Cement, steel and aluminumare major materials used in construction, and production of these materials eachaccounted for 35%, 61%, and 3% of total carbon emissions from buildingmaterialproduction in China.
• Carbon emissions from construction: Emissions are largely due to energyconsumption by construction machinery (such as excavator and power crane),as well as resource waste caused by the ineffective architectural design and theconstruction of temporary offices on construction sites.
Ways to reduce carbon emissions: Direct emissions reduction, and enhancementof construction efficiency. We think the new construction can be reduced by morereasonable urban planning and extension of building service life. Building demoli-tions and reconstructions are extensive in China.We believe reasonable and scientificurban planning can avoid unnecessary new construction, and the building service lifecan be prolonged by building quality improvements. In addition, the increased use ofeco-friendly building materials and construction technologies will decrease carbonemissions per unit GFA.

254 Chapter 10 Green City: Towards Low-Carbon Urban Planning and Governance
10.4.2.2 Direct Emission Reduction: Improved Urban Planningand Extension of Building Service Life
Optimizing urban planning to avoid unnecessary demolition and reconstruction.Demand-based urban planning can avoid unnecessary new construction and reducecarbon emissions from building demolition.
Improving building quality to prolong building service life. Short building servicelife will lead to more new construction per year. The average service life of buildingsconstructed in the early stage of urbanization is less than 50 years inChina, suggestingsignificant upside compared to an average of 132 years in the UK and 74 years inthe US.
Using recyclable buildingmaterials. Unlike existing buildingsmade by reinforcedconcrete, the steel structure buildings are more recyclable, flexible, earthquake-resistant, and produce less construction waste. In addition, the steel used in thesteel structure buildings can be recycled after buildings are dismantled. We expectthe penetration rate of steel structure buildings to rise from current around 10% to60% in 2060.
10.4.2.3 Improving Construction Efficiency #1: Reducing CarbonEmissions from Building Material Production
Cement: Technological upgrades can reduce unit consumption of coal and electricpower during cement production. Our estimate of CO2 emissions from producingone tonne of cement was 0.59tonnes in 2019. Due to technological upgrades andincreased the use of clean energy sources, it will likely drop to 0.57tonnes in 2025,0.55tonnes in 2030, and 0.40tonnes in 2060.
Steel: Switch from blast furnace to electric arc furnace (EAF). Our estimate ofCO2 emissions from producing one tonne steel was 1.52tonnes in 2019 and it willlikely drop to 1.33tonnes in 2025, 1.10tonnes in 2030, and 0.50tonnes in 2060.
Aluminum: Increased use of power generated from clean energy sources. Ourestimate of CO2 emissions from producing one tonne of aluminumwas 7.37tonnes in2019 and it will likely drop to 6.91tonnes in 2025, 5.80tonnes in 2030, and 1.76tonnesin 2060.
New materials: Replacement of bricks and tiles with light partition walls. Weestimate the application of light partition walls will reduce carbon emissions per unitGFA by 53 kg.
10.4.2.4 Improving Construction Efficiency #2: Reducing CarbonEmissions from the Construction Process
Industrialized construction. Penetration rate of prefabricated buildings remained aslow as 13.4% in 2019 and we expect it to increase gradually. This, coupled with

10.4 Urban Construction: New Ideas, New Materials … 255
economies of scale, should reduce energy consumption and carbon emissions ofbuildings.
Digital technologies such as building informationmodeling (BIM) to reduce extracarbon emissions and building waste caused by reconstruction. Reconstruction oftenoccurs due to inefficient communication between building designers and constructioncompanies. We believe digital technologies such as BIM can detect flaws in theengineering design before construction starts, and this will help reduce waste andcarbon emissions caused by reconstruction.
Electrification of constructionmachinery such as excavators. Only a small portionof existing construction machinery in China is electric, and most are small or microexcavators used in small construction projects. The large-scale adoption of electricexcavators is hindered by the insufficient energy storage (insufficient for excavators’high power draw) and the difficulty of setting up connection cables on constructionsites.We believe advances in battery energy storage technology and the promotion ofindustrialized construction, which helps tidy up construction sites, may help increasethe use of electric construction machinery.
10.4.3 Carbon Emission from Building Management:Passive House Technology and ComprehensiveEnergy Conservation Solutions to Reduce CarbonEmissions from Building Management
10.4.3.1 Passive Houses (Ultra-Low Energy Buildings): ImprovingThermal Insulation of Buildings to Save Energy
Passive houses (ultra-low energy buildings): High-standard insulation to reduceenergy consumption, especially in cold regions. Passive house is a standard forenergy efficiency in a building and its requirement for high-level heat insulationand air impermeability can minimize heat loss and active fossil fuel consumption.1
We believe it is a reasonable solution to saving energy consumption by buildings incold regions.
Promoting ultra-low energy buildings started in China during the 13th FYP andwe expect a pick-up in the adoption of such buildings in northern China. Chinaintroduced the advanced passive house technology from abroad a few decades agoand gradually adapted it to domestic conditions. The demonstrative passive houseprojects were launched during the 13th FYP.
1 The definitionincluded in European standards, technologies and practices for ultra-low energybuildings and passive buildings announced by MoHURD in 2011.

256 Chapter 10 Green City: Towards Low-Carbon Urban Planning and Governance
10.4.3.2 Comprehensive Energy Conservation Solutions for the EntireConstruction Process
We believe coordinated efforts are needed for China’s building sector to achieveits carbon emissions reduction target in 2060, and possible solutions include: (1)reducing building energy consumption by optimizing architectural design, increasingthe use of eco-friendly building materials, and installing smart building managementsystems; and (2) reducing per unit energy consumption by optimizing energy systemssuch as heating, cooling, household hot water supply, and heat for cooking as wellas promoting the use of renewable energy sources such as solar power, geothermalpower, and PV.
Architectural design: Introducing Passive House-alike standards to enhanceenergy savings. The Ministry of Housing and Urban–Rural Development(MoHURD) issued several standards for conserving energy in buildings in the pastfew years to promote the concept of Passive House. Only some requirements aremandatory and we think full adoption of energy conservation standards will enhancethe building energy efficiency.
Building materials: Promoting use of green building materials such as energy-efficient glass, and thermal insulation materials. The CICC Building Materials teamexpects the introduction of higher standards for building energy efficiency willboost demand for energy-efficiency glass, heat insulation materials, and lightweightmaterials.
Building management: Deploying smart energy conservation system for moreefficient operation of energy systems and equipment.
Energy equipment and energy supply system: Optimizing forms of energy supplyto reduce waste and enhance energy efficiency. The heating and ventilation facilitiesinside a building consume energy and produce carbon emissions. Assuming demandfor energy consumption in buildings remains unchanged, we believe carbon emis-sions per unit energy consumption can be reduced by replacing central heating withflexible heating and using heating appliances that are more efficient.
Renewable energy: Increasing the use of renewable energy sources such as solarpower and geothermal power. Data from the MoHURD shows that the penetrationrate of renewable energy among civic buildings exceeded 4% at end-2015, and willlikely reach 6% in 2020.2
10.4.3.3 Carbon Emissions from Building Management to Drop 79%to 450mnt Over 2019–2060
We expect domestic carbon emissions from building management to reach 1.49bntin 2030 and 450mnt in 2060, down 31% and 79% compared with 2019. We believefactors affecting carbon emissions from building management include population,
2 A target set by the MoHURD in the 13th FYP for conserving energy in buildings issued in March2017.

10.4 Urban Construction: New Ideas, New Materials … 257
12
13
14
15
0.0
0.2
0.4
0.6
0.8
1.0
1.220
1620
1820
2020
22E
2024
E20
26E
2028
E20
30E
2030
E20
32E
2034
E20
36E
2038
E20
40E
2042
E20
44E
2046
E20
48E
2050
E20
52E
2054
E20
56E
2058
E20
60E
Estimate of energy consumption from building operationEnergy consumption/sq.m (RHS)
(bn tce) (kgce/sqm)
0
5
10
15
20
25
30
35
0
1
1
2
2
3
2016
2018
2020
2022
E20
24E
2026
E20
28E
2030
E20
30E
2032
E20
34E
2036
E20
38E
2040
E20
42E
2044
E20
46E
2048
E20
50E
2052
E20
54E
2056
E20
58E
2060
E
Estimate of emissions from building operationEmissions/sq.m (RHS)
(bn tonnes CO2) (kgce/sqm)
40
42
44
46
48
50
0
10
20
30
40
50
60
70
80
2016
2018
2020
2022
E20
24E
2026
E20
28E
2030
E20
30E
2032
E20
34E
2036
E20
38E
2040
E20
42E
2044
E20
46E
2048
E20
50E
2052
E20
54E
2056
E20
58E
2060
EGFA of existing buildings GFA per capita (RHS)
(bn tce) (sqm per capita)
0
1
1
2
2
3
2016
2018
2020
2022
E20
24E
2026
E20
28E
2030
E20
30E
2032
E20
34E
2036
E20
38E
2040
E20
42E
2044
E20
46E
2048
E20
50E
2052
E20
54E
2056
E20
58E
2060
E
Average building energy efficiency
(kgCO2/kgce)
Fig. 10.6 Energy consumption and carbon emissions in domestic building sector will likelydrop markedly in 2030 and 2060. Source National Bureau of Statistics, China Building EnergyConsumptionResearchReport byChinaAssociation of Building Energy Efficiency, CICCResearch
building GFA per capita, energy consumption per unit GFA (energy consumptionintensity) and carbon emissions per unit energy consumption (energy efficiency).Specifically, we believe energy efficiency enhancement is a major driver of carbonemission reduction in building management (Fig. 10.6).
• Population: Slower growth from 2020 onwards. Data from National Bureau ofStatistics shows that national population stood at 1.4bn in 2019. Based on datafrom United Nations, we expect population growth to gradually slow over 2020–2030, and total population start to decline from 2034 onwards. Based on ourforecast, the national population will reach 1.46bn in 2030 and 1.33bn in 2060.
• Building GFA per capita: Expect continued declines from 2020 onwards. Weestimate that domestic building GFA per capita is 49.0 sqm in 2019, including15.7 sqm of public buildings, 36.8 sqm of urban residential housing, and 43.7 sqmof rural residential housing. We expect GFA per capita of public buildings, urbanresidential housing, and rural residential housing to drop to 13.3 sqm, 31.3 sqmand 36.8 sqm in 2060, respectively.

258 Chapter 10 Green City: Towards Low-Carbon Urban Planning and Governance
• Energy consumption intensity: We expect average energy consumption intensityto drop for building renovations, accompanied by a higher proportion of low-energy buildings. We estimate that national average building energy consumptionreached 14.9 kgce/sqm in 2019 and it will likely decline to 12.0 kgce/sqm in 2060.We assume: (1) the proportion of near-zero ultra-low-energy buildings in existingbuilding GFA will reach 3% in 2060; and (2) the energy conservation solutionsalong the value chain will help reduce energy consumption intensities of normalbuildings. Based on these assumptions, we estimate average energy consumptionintensity of buildings will drop to 12.9 kgce/sqm in 2060.
• Energy efficiency: We expect energy efficiency to markedly decline driven bylower proportion of non-fossil energy in primary energy consumption. Our esti-mate shows that national average building energy efficiency is 2.1 kg CO2/kgcein 2019 and coal accounted for 76% of primary energy consumption (of which50% was used for power generation, 30% for heat generation, and 20% as fossilfuels). In 2060, we expect national average building energy efficiency to drop to0.6 kg CO2/kgce, assuming: (1) the proportion of coal used for heat generationand as fossil fuels will fall to 5%; and (2) the proportion of fossil energy in primaryenergy consumption for power generation will drop to 10%.
10.5 Urban Maintenance: Reduce Energy Consumptionby Public Service Facilities, and Improve ResourceRecycling Efficiency
This section discusses potential reduction of carbon emissions from urban main-tenance and the importance of improving the efficiency of urban maintenance andresource recycling. We believe energy conservation and adopting digital technolo-gies are the key to reducing carbon emissions from public utilities such as water andheating supply. We also believe that introducing supportive policies will help reducecarbon emissions from facilities for water and heat supply and provide plenty growthpotential for resource recycling.
With the economic development, the desire for a higher standard of living hasdriven up energy consumption for urban maintenance and operations. For example,the Building Energy Research Centre of Tsinghua University estimates that energyconsumption for urban heating in northern China reached 212mnt of standard coal in2018, producing around 550mnt of carbon emissions (around 25% of total emissionsfrom the building sector). We believe improving urban maintenance efficiency andlowering unit energy consumption hold the key to reducing carbon emissions fromurban maintenance. Carbon neutrality can be achieved through these two aspects.
• Improving urban maintenance efficiency. Public utilities such as heat and watersupply are generally a necessity for urban residents, and the continued urbanconstruction will gradually boost demand for such facilities. The lack of new

10.5 Urban Maintenance: Reduce Energy Consumption by Public … 259
infrastructure facilities and the agingof existing facilities have led to lowefficiencyof urban maintenance. We believe energy use by urban infrastructure can beoptimized by renovating existing infrastructure and improving supply efficiency.
• Improving resource recycling efficiency. The rapid urban development hassubstantially increased resource demand. We believe that the recycling of renew-able resources is less energy-consuming than direct resource production which isaligns with the green city strategy. We see large upside in the domestic recyclingrate.
10.5.1 Conserving Energy and Reducing Emissions by UsingTechnology to Reduce Carbon Emissions from PublicUtilities
10.5.1.1 Water Supply: Using Digital Water Supply Managementto Enhance Water Use Efficiency
Energy consumption for urban water supply: Water supply volume per resident hasgradually increased in China, while stable urban water supply is of vital importance.Water supply companies need energy sources, mostly electrical power, to adjusthydraulic pressure and flow speed. Based on the current output of water supply firmsin cities, our estimate shows that power consumption for urban water supply hadreached 19.12bn kWh in 2019.
Possible measures to reduce carbon emissions fromwater supply: The low qualityand inefficient management of water supply pipes built in the early stage of urbandevelopment have led to a water loss as high as 14% in 2019 according toMoHURD.We believe energy consumption for water supply can be reduced by using watermore efficiently, raising awareness about water conservation among residents, andapplying digital technology in water supply management.
• Reducing water loss: The National Water Pollution Control Action Plan stressesthat renovating 50-year-old or older water supply pipes will improve the overallstability of water supply and reduce water loss. In addition, the digitalization ofwater management system can locate the water loss by monitoring water supplypipes, and eventually avoid water loss.
• Adopting smart water supply system: We believe technologies such as artifi-cial intelligence, big data, and internet of things (IoT) will help water supplycompanies reduce unit power consumption.

260 Chapter 10 Green City: Towards Low-Carbon Urban Planning and Governance
10.5.1.2 Heat Supply: Promoting Central Heating to Improve HeatingEfficiency in the Near Term; Transforming the Energy Mixover the Long Term
Central heating has been available in Northern China since the 1950s. The Qinling–Huaihe Line is a reference line used by geographers to distinguish between northernand southern China, corresponding roughly to the 33rd parallel. Central heating helpsmaintain the basic living condition for general public and the functioning of cities’utilities.
Promoting central heating has been faster in urban than in rural regions. Areascovered by central heating in cities and counties grew from 1.1bn sqm and 70mnsqm in the early 21st century to 9.25bn and 1.75bn sqm in 2019, a CAGR of 9% and12%. According to the China Clean Energy Development Report (2020) by ChinaInstitute of Energy economics research, the central heating system covered 14.1bnsqm of northern cities and counties (78%) and 7bn sqm of northern rural regions(nearly 6%) as of 2019.
Central heating offers higher thermal efficiency than individual heating whilecoal remains a major heat source. According to China Heat Supply Industry Devel-opment Report (2020),3 45% of central heating in northern cities and counties camefrom coal-fired cogeneration, 27% from coal-fired boilers, 3% from gas-fired cogen-eration, 10% from gas-fired boilers, and 7% from gas-fired wall-mounted heaters.Overall, coal and gaswere the heat sources for nearly 72%and20%of central heating.According toDiscussions on How to Improve Thermal Efficiency of Central Heating,thermal efficiency is around 85% for cogeneration, 80%–90% for large heatingboilers, 30%–50% for individual coal-fired boilers, 55%–65% for coal-fired boilersthat complete energy conservation renovation, and 75%–80% for gas-fired boilers.We believe the central heating system can help reduce the energy consumption perunit heating area.
Carbon emissions in the heating supply sector are to be reduced by enhancingthermal efficiency in the near term and by transforming energy consumption mix inthe long term. Household heating demand may continue to grow, thus, coordinatedefforts along the value chain are needed in order to reduce carbon emission fromurban heating. Cities can reduce emissions by: (1) reducing overall energy demandwhile satisfying residents’ heating demand, via measures such as enhancing heatingefficiency and adopting energy-saving building materials or smart building systems,and (2) improving the energy consumption mix by increasing the use of renewableenergy.
3 The report issued by China Urban Heating Association in August 2020.

10.5 Urban Maintenance: Reduce Energy Consumption by Public … 261
10.5.1.3 Ample Downside in Carbon Emissions from Water and HeatSupply
Carbon neutrality and environmental protection will be long-term policy directions.2021 marks the first year of the 14th FYP period, and we expect the governmentto continue promulgating policies that enhance water efficiency and promote cleanheating.
• Water supply: The National Water Pollution Control Action Plan requires thatwater loss rate of national water supply pipes should fall below 10% in 2020.Given the renovation of old water pipes and the application of digital technology,we expect water loss will decline to 5% in 2030. In addition, we believe unitwater consumption for both household and industrial uses will decrease on theconstruction of water-efficient cities. We expect unit water consumption to fall5% in 2030 compared with 2020 and further decline in future.We think the digitaltechnology will enhance the water supply efficiency and further reduce the unitenergy consumption for water supply. We expect unit energy consumption forwater supply will decline 5% over the 14th and 15th FYP periods.
• Heat supply: We expect the penetration rate of central heating to rise from 54%in 2020 to 75% in 2030 (including in rural regions) and the proportion of heatgenerated from coal burning to drop to 50%.
10.5.2 Resource Recycling to Help Build Low-Carbon Cities
10.5.2.1 Resource Recycling to Reduce Carbon Emissions
Domestic demand for resources keeps rising. The Chinese economy has maintainedrapid growth since its opening-up which, coupled with industrialization and higherstandards of living, has led to growing demand for resources. Chinese industrialadded value increased at a CAGR of 10.8% since the start of the twenty-first centurywith the growth rate slowing from over 15% over 2000–2010 to 5.4% over 2011–2020. In addition, consumption per urban resident and per rural resident increasedat a CAGR of 8.7% and 11.1% since the start-twenty-first century and maintainedhigh growth on the whole despite mild declines in 2020 due to the pandemic.
Demand for all types of resources rising rapidly; resource recycling may helpreduce urban carbon emissions.Rising gross industrial output and consumption levelsboost China’s resource demand. In 2019, China represented around 51%, 15%, and40%of global consumption demand for steel, plastic and rubber. Since the productionof industrial and consumer goods requires energy, we think the recycling of wasteresources (i.e., steel, rubber and plastic) will ease the rising demand pressure andlower energy consumption in production, contributing to the goal of carbon neutrality.
• Scrap steel recycling:Overseas experience shows that the proportion of electric arcfurnace (EAF) process in total output will rise when crude steel output reaches a

262 Chapter 10 Green City: Towards Low-Carbon Urban Planning and Governance
0
1
2
3
4
5
6
2014 2015 2016 2017 2018
Reclaimed rubber(mn tonnes)
0
5
10
15
20
25
30
35
40
45
0
1
2
3
4
5
6
2011 2012 2013 2014 2015 2016 2017 2018
Waste tire recycling volume
Waste tire recycling ratio (RHS)(mn tonnes) (%)
Fig. 10.7 Recyclingvolumeof rubber andwaste tires.SourceMinistry ofCommerce,ChinaRubberIndustry Association, CICC Research
certain level. In 2018, EAF process only contributed 10% output, much lower thanglobal market’s 35%. According to the Transformation and Upgrade Plan for theIron and Steel Industry released by theMinistry of Industry and Information Tech-nology, China aims to raise the proportion of scrap steel in steelmaking to 30%,pointing to large growth potential. Compared with iron ore-based steelmaking,EAF process lowers energy consumption by 76%.
• Waste rubber recycling: Based on R&D data of relevant companies, we estimatethat waste rubber recycling lowers renewable energy consumption by 30%. Recy-cling reduces waste rubber’s harm to the environment. Data from China RubberIndustry Association shows that China produced 14.8mnt waste tires in 2019with a CAGR of 5% over 2011–2019, pointing to ample waste tire resources.However, only 5.12mnt (35.3%) waste tires were recycled in 2018, far less thanthe 8.5mnt/year target for 2020 (set in the Guideline for Green Manufacturing2016–2020) (Fig. 10.7).
• Plastic waste recycling: As a large plastic producer and consumer, China keepsimproving its plastic recycling system. According to INTCO’s prospectus, 38%of plastic waste was recycled in 2018. Data from Shanghai Resource RecyclingTrade Association shows that China recycled around 30% plastic waste in 2019.According to a study published on the Science of The Total Environment by theUniversity ofManchester, the recycling of one tonne of plastic lowers 2.3tonnes ofcarbon emission. The world is also stepping up efforts in plastic waste recycling.The EU plans to raise its plastic-waste recycling rate to 50% in 2025 and 55% by2030. Japan aims at a 100% effective utilization of used plastic (including thermalrecovery) in 2035. The US also announced its plan to achieve 100% recycling &reuse of plastic packaging in 2040.
Lithium-ion battery (LiB) recycling: Given efforts toward carbon neutrality, webelieve alternative fuel vehicle will replace traditional vehicles and LiB demand willcontinue to surge, boosting demand for relevant raw materials (i.e., metals). Someelements will be reused in the new LiB production, lowering demand for the miningof raw materials and carbon emissions.

10.5 Urban Maintenance: Reduce Energy Consumption by Public … 263
Perishable garbage47.7%
Toxic and harmful garbage
0.8%
Other garbage30.6%
Paper9.1%
Plastic rubber6.0%
Fabric3.0%
Glass1.6%
Metal1.2%
Recyclables21.00%
Fig. 10.8 Recyclable waste accounts for a high proportion in household waste. Note Data as of2018. Source Data from Sound Group, CICC Research
10.5.2.2 Expecting Policy Support to Accelerate Recyclingof Renewable Resources
Various recyclable materials are present in waste material. Households and indus-trial production produce considerable waste. China’s waste volume is rising amidrapid economic growth. However, waste is not useless and contains a range of recy-clable materials. Data from Sound Group shows that recyclable waste (i.e., paper,plastic, glass and scrap metal) accounted for around 20% of household waste in 2018(Fig. 10.8).
Waste sorting lays a foundation for resource recycling. Waste sorting is the firststep in resource recycling. We attribute the slow growth of renewable resource recy-cling in China to underdeveloped recycling systems, the extensive market expansion,and the country’s reliance on low-efficiency waste pickers who collect renewablewaste from the streets. We believe the construction of waste sorting system sets anindustry-wide standard and will boost the recycling rate of renewable resources. Thegovernment has issued supporting policies such as “zero waste city” and “wastesorting” since 2019, promoting recycling and reuse of renewable resources.
Implementation of waste sorting policies. The Ministry of Housing and Urban–Rural Development and other eight ministries jointly announced the application ofhousehold waste sorting in prefecture- or higher-level cities on June 11, 2019. Itstated that 46 major cities should complete the waste sorting and disposal system bythe end of 2020 and other cities should complete the system in 2025. In November2020, the Ministry of Housing and Urban–Rural Development and other 11 depart-ments announced measures to promote household waste sorting, aiming to furtherreduce household waste volume, achieve harmless treatment, and turn waste intopower. They plan to enact relevant laws and regulations and continue to raise China’shousehold waste recycling rate to over 35% within five years.

264 Chapter 10 Green City: Towards Low-Carbon Urban Planning and Governance
Open Access This chapter is licensed under the terms of the Creative Commons Attribution-NonCommercial-NoDerivatives 4.0 InternationalLicense (http://creativecommons.org/licenses/by-nc-nd/4.0/), which permits any noncommercial use, sharing, distribution and reproduction in anymedium or format, as long as you give appropriate credit to the original author(s) and the source,provide a link to the Creative Commons license and indicate if you modified the licensed material.You do not have permission under this license to share adapted material derived from this chapteror parts of it.
The images or other third party material in this chapter are included in the chapter’s CreativeCommons license, unless indicated otherwise in a credit line to the material. If material is notincluded in the chapter’s Creative Commons license and your intended use is not permitted bystatutory regulation or exceeds the permitted use, you will need to obtain permission directly fromthe copyright holder.

Chapter 11Digital Economy Goes Green: TakingOver Energy-Efficiency Management
Abstract Digital economy is one of the main themes of the 14th Five-YearPlan (2021–2025). The rapid development of new technologies—such as cloudcomputing, artificial intelligence (AI), and Internet of Things (IoT)—can supportincreased demand for cloud services and digital transformation at company andgovernment department levels. These technologies can also boost the developmentof 5G base stations, data centers and the construction of other new technology infras-tructures. The Fourth Plenary Session of the 19th CPCCentral Committee in October2019 has, for the first time,made it clear that data has become a new production factorin the era of the digital economy. We believe as the quantity and quality of the databoth improve in the future, data can boost output growth in certain industries thatare closely related to the digital economy and it can also provide computing powerto support R&D of new technologies, serving as a source of technological innova-tion. New technologies represent a strong driving force for China’s digital trans-formation, and electricity is also a key in supporting the development of the digitaleconomy.Webelieve advanced technologies can fuel the growth of computing power,and stronger computing power, in turn, can help improve technologies and supportsustained growth of digital economy. In our opinion, the process of digitization canalso make the conversion of electricity into computing power be more energy effi-cient in the future, thereby reducing CO2 emissions and boosting the growth of thedigital economy. This chapter consists of four parts. In part one and two, we analyzehow technologies help cities and industries improve energy efficiency and reduceCO2 emissions. Then in the third section, we analyze how AI and other new tech-nologies help the technology sector becomemore energy efficient and achieve carbonneutrality. In the final part, we summarize the challenges that are likely to be facedthroughout the process of digitization.
© The Author(s) 2022CICC Research, CICC Global Institute, Guidebook to Carbon Neutrality in China,https://doi.org/10.1007/978-981-16-9024-2_11
265

266 Chapter 11 Digital Economy Goes Green: Taking Over …
11.1 Digitalization to Help Cities Improve EnergyEfficiency and Reduce Carbon Emissions
In digital economy, we believe AI, 5G and other new technologies will empowermultiple industries and enrich our lives. This prompts us to think about the followingquestions: How far are we from living in the digital lifestyles? And how can weachieve carbon neutrality in the digital lifestyles? We think smart cities that inte-grate digital technologies and utilize data into city governance and management willimprove the way cities operate, thereby enhancing the experience of citizens in theirdaily lives.
The concept of “smart city” has drawn worldwide attention since it was proposedby IBM in 2008. In our opinion, smart city is more than just a concept but also repre-sents the idea of incorporating digital technologies into city governance. We foreseethat the utilization of new technologies such as AI, IoT, 5G networks, and cloudcomputing will transform the current society into a mature technology ecosystemthat can make cities smarter and solve issues throughout the process of urbanization.A research organization Markets and Markets estimates that the total market sizeof the global smart cities’ development will increase from US$308bn in 2018 toUS$717bn in 2023, implying a CAGR of 18.4%.
What are the application scenarios of smart city? As the idea of “smart city”is becoming increasingly popular and new smart city projects are under construc-tion globally, we expect a new city governance model will be created and promotesustainable development of the entire society. Smart city projects have been carriedout in many areas, including environmental protection projects such as pollutionmonitoring and waste sorting projects; transportation projects such as cooperativevehicle infrastructure systems (CVIS), smart parking lots, and smart transport plan-ning; and projects in other sectors like smart factories for manufacturers, and bigdata-enabled city governance projects.
While smart city projects are able to make citizens’ lives easier and more enjoy-able, digital technologies can also contribute to enhancing energy efficiency andreducing CO2 emissions in cities. How will smart city projects in various applicationscenarios utilize technologies to cut energy consumption and reduce CO2 emissions?And how much carbon emission reduction can this process ultimately achieve?
In order to answer these questions, we calculate the net reduction of CO2 emis-sions enabled by CVIS, smart airports, and smart cargo transport, comparing theCO2 discharged by facilities after utilizing digital technologies and the amount ofemission reduction by these projects. In addition, we calculate the drop in CO2 emis-sions per 1kWh of electricity to analyze the “value for money” provided by digitaltechnologies.

11.1 Digitalization to Help Cities Improve Energy … 267
11.1.1 CVIS Projects: Enhancing Vehicle AllocationEfficiency and Reducing Fuel Consumption
CVIS, enabled by sensor detection, edge computing, and autonomous driving tech-nologies, can obtain and share information about road and vehicle conditions viaroadside units and vehicle-mounted terminals. Such systems, based on traffic flow,accident and road condition forecasts, can enable the coordination between vehi-cles (and also between vehicles and infrastructure), thereby accelerating crossroadvehicle throughput, reducing vehicle fuel consumption, and increasing transportationsafety and redundancy.
Efficiency enhancement: Smart traffic lights, tidal lanes, and autopilot cars canhelp reduce traffic congestion and make the traffic system safer and improve effi-ciency. Smart traffic lights can adjust light cycling time based on the amount oftraffic to reduce the waiting time for both drivers and pedestrians. Tidal lanes allowcars to travel in a direction that can help improve traffic flow during rush hours byincreasing the number of lanes for the sidewith heavier traffic. Autonomous vehicles,with vehicle-mounted cameras, radars, and other devices, can analyze conditions ofvehicles and their surrounding environment before braking, taking turns, changinglanes, or adjusting their speed.
Emission reduction: Smart vehicles can utilize the simultaneous localization andmapping (SLAM) technology to locate their positions and formulate a map oftheir surroundings. This is achieved based on the information collected by vehicle-mounted cameras and the time-of-flight (ToF) distance measurement function oftheir laser radars. The SLAM technology helps vehicles improve route planning andreduce carbon footprint. In addition, trucks that use vehicle to everything (V2X)communication devices can travel in a fleet to mitigate wind resistance, share trafficlight information to arrange braking time, and reduce fuel consumption thereby.
Towhat extent can autopilot enhance efficiency? According to a research from theUniversity of Michigan, autopilot can reduce energy consumption by 19% comparedwith a traditional vehicle because they can improve route planning and optimizebraking efficiency through the inter-vehicle-communication (IVC) system. In addi-tion, we assume that the total number of private cars will drop by 1% followingthe wide adoption of autopilot technologies. Based on these assumptions, we esti-mate that by 2024, the annual carbon emission reduction of vehicles will be around118mnt empowered by the autopilot technologies. Suppose that the amount of datagenerated by an autopilot test vehicle can reach around 10TB (terabytes) with anInspur high-end full flash storage of HF18000G5 server. Then there would be about25.66mn servers needed to support the computing processwith 82mntCO2 emissionsthroughout the year. In total, we estimate that self-driving technologies can reduceCO2 emissions by 42mnt per year, which means that the CO2 emissions reduced byservers for self-driving cars is 1.51 kg/kWh (Table 11.1).

268 Chapter 11 Digital Economy Goes Green: Taking Over …
Table11.1
Netreductionin
CO2em
issionsfrom
self-driving
technologies
peryear
byend2024
Estimated
energy
conservation
ofautonomousdrivingvehicles:
Beforetheintroductio
nof
autopilot
Efficiency
ofenergy
conservatio
nAfter
theintroductio
nof
autopilot
Num
berof
carsperthousand
people(unit)
500
Populatio
n(bn)
1.42
Car
volumn(bn)
0.71
1%0.7
Annualk
ilometersdriven
(km)
5,000
19%
4,050
Fuelconsum
ptionperhu
ndredkilometers(litre)
7.5
7.5
Annualo
ilconsum
ption(bnlitre)
266.25
-20%
213.51
Correspon
ding
redu
ctionof
carbon
dioxideem
ission
s(bntonn
es)
0.12
Estim
ated
energy
conservation
ofservers:
Amount
ofdatagenerated(TB/car/day)
10
Amount
ofannualdatagenerated(bnTB)
2,566
Amount
ofdatastored
onasingleserver
(TB)
100,000
Num
berof
serversrequired
(bn)
0.0257
Power
ofasingleserver
(kW)
0.88
Amount
ofannualpower
consum
ed(bnkW
h)82
Correspon
ding
carbon
dioxideem
ission
s(bntonn
es)
0.08
Conclusion
Ann
ualn
etredu
ctionof
carbon
dioxideem
ission
s(bntonn
es)
0.04
Reduction
ofcarbon
dioxideem
ission
sperkilowatt-ho
ur(kg)
1.51
Source
Inspur
website,C
ICCResearch

11.1 Digitalization to Help Cities Improve Energy … 269
11.1.2 Smart Airport: Optimizing Aircraft Taxiing Distancewith AI-Enabled Precision Calculation
Through accurate prediction andmanagement, ShenzhenAirport has reduced the taxitime of each aircraft by 1–2min, cutting oil consumption by 10–20L per aircraft onaverage. According to the Civil Aviation Administration of China (CAAC), there arearound 10.25mn aircraft takeoffs and landings in China every year, and we estimatethat smart airport projects will reduce carbon emissions by about 363,100tonnes peryear (Table 11.2). Additionally, we estimate that data centers for smart airports willdischarge 0.24mnt of CO2 per year, based on the number of data centers and cabinetsfor the 241 airports in China as of February 18, 2021, and an additional 3% datastorage required by AI- and digitization-enabled smart airports. Overall, we expectthat smart airport projects can net reduce CO2 emissions by 0.12mnt per year. Thismeans the CO2 emissions reduced by smart airport projects would be 1.52 kg/kWh.
11.1.3 Smart Logistics: Internet Platform-Based LogisticsCompanies to Help Reduce the Empty Running Ratio
We estimate that the current empty running ratio for cargo trucks in the logisticsindustry is around 40% in China. An internet platform-based logistics companyoperating under the model of technology companies such as Uber would notablyreduce this ratio. According to the Ministry of Public Security, China had 29.44mncargo trucks as of June 2020. We estimate that CO2 discharged by trucks will fallby 69.5bn kg, if the empty running ratio drops to 20% (from 40%) and the emptymileage falls 147.2bn km per year. Assuming this logistics company requires 0.1mndata center cabinets, it would discharge about 8.5bn kg of extra CO2 per year. There-fore, we estimate that internet platform-based logistics companies can reduce CO2
emissions by 60.99bn kg per year in total or 8.14kg/kWh (Table 11.3).
11.2 Industrial Internet Empowers Enterprise Productionto Achieve Cost Reduction and Efficiency Increase
Industrial internet projects are developing rapidly in China thanks to thewide deploy-ment of 5G networks. As of March 2021, over 1,100 industrial internet projectswere under construction in China. We note that the industrial internet has beenapplied in various scenarios by companies in multiple industries, such as ShanghaiCommercial Aircraft Corporation of China, Shanxi Huayang Group, Sany HeavyIndustry, and Xiamen Port. 5G technologies have facilitated industrial upgrades andtransformation. The architecture of the industrial internet platform is displayed inFig. 11.1.

270 Chapter 11 Digital Economy Goes Green: Taking Over …
Table 11.2 Net CO2 emissions net reduced by smart airports
Estimated energy conservation of data centers:
Shenzhen Airport Beijing Daxing Airport
Data center coverage areas (squaremeter)
4,232 16,000
Total building areas (square meter) 15,502 48,000
Cabinet areas as a percentage oftotal building areas
65% 65%
Cabinet areas (square meter) 10,076 31,200
Single cabinet areas (square meter) 2.5 2.5
Number of cabinets (unit) 4,030 12,480
Single cabinet power consumption(kW)
8 8
PUE 1.3 1.3
Launch rate 90% 90%
Load rate 70% 70%
Annual power consumption(kWh)
231,331,342 716,296,090
Annual power consumption of asingle data center (kWh)
Number of data centers Total energy consumption (kWh)
71,62,96,090 3 2,148,888,269
23,13,31,342 10 2,313,313,420
1,54,22,089 228 3,516,236,398
Total 241 7,978,438,086
Coefficient: Incrementalproportional of introducing AI
3%
Total increase of powerconsumption (kWh)
239,353,143
Corresponding reduction ofcarbon dioxide emissions (tonne)
238,635
Estimated energy conservation of flight aircraft takeoffs and landings:
Unit: thoudsand flights 2019(No COVID-19 impact)
Average of 2019&2020(With COVID-19 impact)
Eastern region 5,283 4,595
Central region 1,738 1,517
Western region 3,888 3,500
Northeastern region 746 640
Total 11,655 10,252
Reduction of fuel consumption(litre/flight)
15
(continued)

11.2 Industrial Internet Empowers Enterprise Production … 271
Table 11.2 (continued)
Number of annual aircraft take-offand landing
102,516,818
Amount of annual fuelconsumption saved (litre)
1,537,753,273
Corresponding reduction ofcarbon dioxide emissions (tonne)
363,063
Conclusion:
Annual net reduction of carbondioxide emissions (tonne)
124,428
Reduction of carbon dioxideemissions per kilowatt-hour (kg)
1.52
Source CAAC, CICC Research
Table 11.3 CO2 emissions net reduced by smart cargo transport projects
Estimated energy conservation of cargos:
Empty running ratio 40% 20%
Number of trucks (mn) 29.44 29.44
Mileage driven (km/year) 25,000 25,000
Annual valid mileages driven (bn km) 441.60 588.80
Annual invalid mileages driven (bn km) 294.40 147.20
Reduction of valid mileages driven (bn km) 147.20
Unit fuel consumption (litre/km) 20
Reduction of fuel emissions (bn liters) 29.44
Corresponding reduction of carbon dioxide emissions (bn kg) 69.51
Estimated carbon emissions of required data centers:
Number of cabinets 100,000
Power consumption (kW) 7.50
PUE 1.30
Annual power consumption (bn kWh) 8.54
Corresponding carbon dioxide emissions (bn kg) 8.52
Conclusion:
Annual net reduction of carbon dioxide emissions (bn kg) 60.99
Reduction of carbon dioxide emissions per kilowatt-hour (kg) 8.14
Note Valid mileage refers to situations where vehicles are fully loaded with cargo; invalid mileagerefers to situations where vehicles are not fully loaded with cargoSource Ministry of Public Security website, CICC Research

272 Chapter 11 Digital Economy Goes Green: Taking Over …
Device access Protocol analysis Edge data processingEdge layer
Iaas Cloud infrastructure (server, storage, network, virtualization)
Platform(PaaS)
Device Management Operation Fault repair
PaaS resource management
Industrial data modeling and analysis
Application development Industrial microservice component library
Application(SaaS)
Business operationApplication innovation
APP design APP management
App servicesDevice status Supply chain Power consumption
optimizationApp production
Fig. 11.1 Architecture of the industrial internet platform. Source Industrial internet platformwhitepaper released by Alliance of Industrial Internet in 2017, CICC Research. Note SaaS refers tosoftware as a service, PaaS refers to platform as a service, IaaS refers to infrastructure as a service
How will the industrial internet contribute to energy conservation and emissionreduction? The industrial internet utilizes software platform and big data analysistechnologies to process data collected by sensors in order to help industrial companiesrealize automatic control and smart corporate governance. Therefore, companiescan use the industrial internet to improve manufacturing efficiency, reduce energyconsumption and cut CO2 emissions.
What are the implications of the industrial internet? According to the Ministry ofIndustry and Information Technology (MIIT), digital transformation of the economyis an inevitable trend. China should grasp the right development opportunitiesthroughout the process of digitalization and informatization, given existing foun-dation and advantages to coordinate digital industrialization and industrial digital-ization. In addition, China should also integrate a new generation of informationtechnologies in manufacturing sectors, as well as mix manufacturing with otherservice industries and speed up the development of the digital economy. The ulti-mate goal of these fundamental pursuits is to promote the development of the realeconomy in China.

11.2 Industrial Internet Empowers Enterprise Production … 273
11.2.1 Industrial Internet: Enhancing Energy EfficiencyThrough Monitoring and Managing EnergyConsumption Data
Weare optimistic that the idea of carbonneutralitywill promote the demand for down-stream software applications, such as systems for energy monitoring, early warning,and other subdivisions. The increase in demand would bring business opportunitiesto downstream companies that provide digital solutions. For example, SaaS compa-nies in energy management and control can help clients reduce energy consumptionthrough analyzing energy consumption data collected via IoT and providing earlywarnings and solutions to clients. Companies that operate industrial cloud platformscan also help clients reduce cost and enhance efficiency, on the back of their cloudplatforms and industrial apps.
State Grid released its carbon neutrality action plan in March 2021. Accordingto the action plan, the firm will transform the power grid into an “energy internet”by strengthening the innovation and integration of technologies such as AI, IoT,big data, cloud computing and mobile internet technologies in the energy and powerindustry. This planwill also improve the interconnectivity of different energy sourcesand support alternative energy-based electricity and energy storage projects. StateGrid also plans to accelerate the establishment of information collection, perception,processing, and application projects in order to promote data sharing on differentenergy sources and tap the value of these energy sources. According to the actionplan, the firm aims to establish a world-leading “energy internet” by 2025.
• Smart energy management: Enesource Inc. provides industrial internet SaaSservices to help clients reduce energy consumption and enhance efficiency.It has rolled out a series of solutions to improve energy efficiency in build-ings, data centers, industrial companies, and commercial firms. Enesource canmonitor energy efficiency online to help clients receive refined energy manage-ment services and reduce their CO2 emissions. Specifically, it helps a nationalleading thermoelectricity company in Shanghai to develop smart energy services,reducing. Its energy costs by about Rmb15mn and cutting CO2 emissions byaround 44,200tonnes per year.
• Smart manufacturing: Cloudiip, a subsidiary of Boncloud (300166.SZ), is aleading industrial internet platform inChina. Cloudiip supportsmultiple industrialapplication sub-platforms such as the big data platform for steel and iron compa-nies, and the cloud service platform for boiler companies. At the same time, it hasalso launched a series of mobile apps to help industrial companies reduce energyconsumption and improve manufacturing efficiency. For example, the big dataplatform for steel and iron companies can increase the value created by a blastfurnace by Rmb24mn per year; the cloud platform for wind power companies canhelp reduce maintenance expenses by 30% per year; and the cloud platform forboilers can cut energy consumption by 15% per year.
274 Chapter 11 Digital Economy Goes Green: Taking Over …
11.2.2 Application of Big Data Technologies Brings AccurateEnergy-Saving and Efficiency-Improving Solutionsin Power and Water Sectors
The wide application of big data technologies makes it possible to process massiveamounts of data. Big data platforms based on data analysis algorithms can visuallymonitor the data collected by sensors, make precision estimates, and improve thedecision-making process. These platforms can help power and waterworks compa-nies monitor data pertaining to electricity and water usage, thereby improvingelectricity and water management.
China Southern Power Grid has utilized big data technologies to provide elec-tricity data services in Guangdong province. The company, via the electricity bigdata platform, can monitor electricity data at factories and identify high energy-consuming devices. For example, China Southern Power Grid has helped a manu-facturing company identify the energy-intensive, fixed-frequency equipment in itsfactories and reduce energy consumption by 0.5mn kWh per year after installingfrequency converters in these devices. China Southern Power Grid has also helped agroup of companies reduce electricity consumption since 2019. According to ChinaSouthern Power Grid, electricity cost at its clients can drop 10–20% thanks to itselectricity big data platform.
Xi’an Waterworks Company utilizes the smart waterworks platform to monitorinformation about water treatment and coordinate production and management andenhance the process of fault handling. This process enhances the timeliness of equip-ment maintenance, and improves planning, scheduling and decision making of thecompany. With this platform, the company can coordinate production data, videos,management, equipment, and employees. The smart platform has helped the firmreduce its labor cost by 3.6%, equipment breakdown ratio by 15%, suspension ratioby 20% and energy consumption by 20%.
11.3 AI and Other New Technologies Help the TechnologyIndustry Reduce Energy Consumption and EnhanceEnergy Efficiency
In previous sections, we analyzed how technologies help reduce energy consumptionand cut CO2 emissions in different industries, and calculated the net reductions inCO2 emissions facilitated by technologies. However, the technology industry itselfis also energy intensive. In the following section, we analyze how AI and othernew technologies have been utilized in the telecommunications industry to improveenergy efficiency, and how 5G base stations and data centers have adopted multiplemeasures to reduce energy consumption.

11.3 AI and Other New Technologies Help the Technology … 275
11.3.1 How AI Technologies Help Companies Reduce CO2Emissions
The AI algorithm can be used in the operation, maintenance and managementof internet data centers (IDC) to optimize their power usage. AI technologieshave been utilized in equipment breakdown forecast and analysis, system fine-tuning, and internal services. Companies, via these technologies, can monitorthe environment around data centers and then they can use a real-time coolingsystem to allocate resources and reduce energy consumption. Many companies—such as Google, Global Data Services (GDS), and Zhongxing Telecommunica-tion Equipment (ZTE)—have already utilized AI technologies in their businessoperations.
• Google: In 2016, Google began to use the DeepMind AI system in its data centers.This system has reduced energy consumption bymore effectively controlling theirservers, cooling systems and other modules. Cooling expenses at Google datacenters have dropped 40% since then.
• GDS:GDS is one of the first domestic companies to utilizeAI technologies in theirdata centers. The development and design of its weak current system and softwareshould ensure that AI technologies can be applied, so as to make AI algorithm-based temperature control possible. It has also utilized robots to patrol data centersand detect equipment breakdowns, thereby reducing equipmentmaintenance costsand improving early warning systems.
• ZTE: The firm has developed an AI algorithm system based on its own AIExplorer platform. This system can collect data about the cooling and electricitysystems before conducting data governance on the AI-enabled platform. It alsoutilizes AI algorithms to improve the operation strategy, which can reduce energyconsumption by 15%.
In the 5G era, AI technologies can improve the adaptability of base stations toreduce their energy consumption. AI-enabled smart energy efficiency solutions canhelp networks under different standards reduce energy consumption. The AI systemcan use historical data to build learning models, and continues modifying the modelsbased on the real-time data. ZTE began providing AI-enabled energy efficiencysolutions for domestic telecom carriers in 2019. This product has been utilized inmore than 100,000 residential communities, helping base stations reduce energyconsumption by 10%–15%. We estimate that electricity consumed by every 1,000base stations can be reduced by 1.5–2mn kWh per year.
• Recognizing energy-saving scenarios: The AI system can automatically monitorthe energy efficiency of base stations in different residential communities. It canbe connected to the interfaces of base stations and the Oracle Management Cloud(OMC) platform. Base stations can be operated under the energy efficient modelin accordance with changes to traffic volume and other business indicators.

276 Chapter 11 Digital Economy Goes Green: Taking Over …
Community
Environment
Energy-saving scenarios
Traffic forecast
Smart opening and closing
Scenario strategy
Energy-saving strategy
Signal off
Channel off
Load off
Deep sleeping
Customer data Energy saving Base station load
Fig. 11.2 AI-enabled energy efficiency strategies. Source Research on AI-enabled energy effi-ciency technologies for 5G stations published on Application of Electronic Technique in 2019,CICC Research
• Business forecast: The AI system can estimate the load of networks, based on AIalgorithms, base station data, and the load model of the training business. Withthe load forecast, the system can take measures to regulate traffic volume andimprove user experience.
• Choosing energy efficiency strategies: The system can improve learning algo-rithms to choose, fine-tune, upgrade, and execute proper energy efficiency strate-gies. Such efforts can also help companies achieve energy efficiency goals andKPI targets. The selection model of AI-enabled energy efficiency strategies isshown in Fig. 11.2.
11.3.2 Improving Equipment, Station Locations,and Networks to Help 5G Jointly Built and SharedBase Stations to Reduce Energy Consumption
Energy consumption of the telecommunication industry has been increasing inthe 5G era. However, we think the total energy consumption in the constructionof 5G networks will drop due to improved equipment and advanced technolo-gies. According to China Communications Standards Association, no-load powerconsumption of main equipment in existing 5G base stations is around 2.2–2.3kW,and the full-load power consumption stands at around 3.7–3.9kW. We estimate thatthe average power consumption of 5G base stations will drop to around 3.3kW by2025 (vs. 3.85kW in 2019), as equipment is likely to become more energy efficientand base stations will no longer operate under the full-loadmodel thanks to the use of

11.3 AI and Other New Technologies Help the Technology … 277
hibernation technology and other new technologies for the base station. In addition,we estimate that the overall power consumption of 5G base stations will be around79.3bn kWh in 2025, as 2G and 3G networks will be gradually dismantled and thegrowth of new 5G base stations will be mild (Table 11.4).
11.3.3 Software and Hardware Technologies: The Trendof Upgrading Base Structures of TelecomInfrastructure
Base-station equipment: Enhancing energy efficiency of active antenna units (AAU)will notably reduce energy consumption. RF amplifiers are more energy intensivethan other devices in base stations. As a result, we think improving technologies forkey devices—such as power amplifiermodules, digital intermediate frequency (DIF),baseband modules, and transmitter receivers—will noticeably improve the energyefficiency of AAU. For instance, we think the power consumption of base-stationequipment will drop and the performance of 5G systems will improve, if companiescan improve semiconductor technologies and upgrade semiconductors to make chipssmarter and enhance their integration and processing capability.
Base-station locations: Using software and AI technologies to reduce energyconsumption of base stations in residential communities.AI technologies can analyzetraffic volume in different hours and in different locations, and then they can improveenergy efficiency solutions for different base stations during different hours. Suchsolutions can help reduce energy consumption without weighing on user experience.
Networks: Multi-network coordination technologies can help existing networksachieve energy reduction targets. Given the use of 5G technologies, we think 4Gnetworks using TDD/FDD technologies will coexist with 5G networks that utilizeNR technologies. According to China Mobile Research Institute, multi-networkcoordination technologies can apply clustering and neutral network algorithms toimprove the energy efficiency of 5G equipment. Such technologies can both be usedin 4G and 5G networks. According to China Mobile Research Institute, companieshave also developed the 4G multi-carrier energy system (MCES). Tests on existingnetworks show that the MCES can reduce the power consumption of 4G networksby more than 0.4mn kWh per 10,000 residential communities. We think the powerconsumption reduction will be even more notable, after base stations are connectedto 5G networks. The plan for energy-saving technological advancements for 5G basestations is displayed in Fig. 11.3.

278 Chapter 11 Digital Economy Goes Green: Taking Over …
Table11.4
Power
consum
ptionby
base
stations
ofthreemajor
telecom
carriersin
China
China
Mob
ile2018A
2019A
2020E
2021E
2022E
2023E
2024E
2025E
Num
berof
2Gbase
stations
(thousand)
802
802
802
321
240
80–
–
Average
Power
(kw)
0.8
0.8
0.8
0.8
0.8
0.8
0.8
0.8
Num
berof
3Gbase
stations
(thousand)
55.5
55.5
55.5
55.5
55.5
55.5
27.7
27.7
Average
Power
(kw)
0.8
0.8
0.8
0.8
0.8
0.8
0.8
0.8
Num
berof
4Gbase
stations
(thousand)
2,410
3,090
3,150
3,180
3,200
3,210
3,210
3,210
Average
Power
(kw)
1.04
1.04
1.04
1.04
1.04
1.04
1.04
1.04
Num
berof
5Gbase
stations
(thousand)
–60
410
750
1,050
1,350
1,650
1,950
Average
Power
(kw)
–3.85
3.85
3.85
3.66
3.48
3.30
3.30
TotalP
ower
(kWh)
2,806,236
3,631,042
4,867,129
5,134,441
5,526,970
5,715,614
5,798,516
6,019,575
Average
electricity
price(RMB/kWh)
0.65
0.65
0.65
0.65
0.65
0.65
0.65
0.65
Totalelectricity
costof
base
stations
(RMBbn
)18.24
23.60
31.64
33.37
35.93
37.15
37.69
39.13
Asapercentage
ofrevenue(%
)2.48
3.16
4.21
4.30
4.47
4.58
4.61
4.72
China
Telecom
2018A
2019A
2020E
2021E
2022E
2023E
2024E
2025E
Num
berof
2Gbase
stations
(thousand)
459
459
459
184
138
46–
–
Average
Power
(kw)
0.8
0.8
0.8
0.8
0.8
0.8
0.8
0.8
Num
berof
3Gbase
stations
(thousand)
31.8
31.8
32.0
31.8
31.8
31.8
15.9
15.9
Average
Power
(kw)
0.8
0.8
0.8
0.8
0.8
0.8
0.8
0.8
Num
berof
4Gbase
stations
(thousand)
1,380
1,590
1,650
1,680
1,700
1,720
1,720
1,720
Average
Power
(kw)
1.0
1.0
1.0
1.0
1.0
1.0
1.0
1.0
Num
berof
5Gbase
stations
(thousand)
–40
215
405
585
765
945
1,125
Average
Power
(kw)
–3.85
3.85
3.85
3.66
3.48
3.30
3.30
(contin
ued)

11.3 AI and Other New Technologies Help the Technology … 279
Table11.4
(contin
ued)
China
Mob
ile2018A
2019A
2020E
2021E
2022E
2023E
2024E
2025E
Totalp
ower
(kWh)
1,606,890
1,934,069
2,579,567
2,749,695
3,017,585
3,166,818
3,239,661
3,388,260
Average
electricity
price(RMB/kWh)
0.65
0.65
0.65
0.65
0.65
0.65
0.65
0.65
Totalelectricity
costof
base
stations
(RMBbn
)10.44
12.57
16.77
17.87
19.61
20.58
21.06
22.02
Asapercentage
ofrevenue(%
)2.77
3.35
4.37
4.49
4.72
4.75
4.69
4.74
China
Unicom
2018A
2019A
2020E
2021E
2022E
2023E
2024E
2025E
Num
berof
2Gbase
stations
(thousand)
329
329
329
329
165
33–
–
Average
Power
(kw)
0.8
0.8
0.8
0.8
0.8
0.8
0.8
0.8
Num
berof
3Gbase
stations
(thousand)
22.8
22.8
23.0
22.8
22.8
22.8
Average
Power
(kw)
0.8
0.8
0.8
0.8
0.8
0.8
0.8
0.8
Num
berof
4Gbase
stations
(thousand)
990
1410
1500
1,550
1,580
1,600
1,600
1,600
Average
Power
(kw)
1.0
1.0
1.0
1.0
1.0
1.0
1.0
1.0
Num
berof
5Gbase
stations
(thousand)
–40
171.0
359.0
479
599
719
839
Average
Power
(kw)
–3.85
3.85
3.85
3.66
3.48
3.30
3.30
TotalP
ower
(kWh)
1,152,769
1,672,134
2,196,597
2,589,135
2,646,076
2,662,181
2,658,508
2,724,325
Average
electricity
price(RMB/kWh)
0.65
0.65
0.65
0.65
0.65
0.65
0.65
0.65
Totalelectricity
costof
base
stations
(RMBbn
)7.49
10.87
14.28
16.83
17.20
17.30
17.28
17.71
Asapercentage
ofrevenue(%
)2.58
3.74
4.76
5.40
5.27
5.10
4.96
4.95
Sum
ofthreetelecom
operators
2018A
2019A
2020E
2021E
2022E
2023E
2024E
2025E
Num
berof
2/3G
base
stations
(thousand)
1,700
1,700
1,700
944
653
269
4444
Num
berof
4Gbase
stations
(thousand)
4,780
6,090
6,300
6,410
6,480
6,530
6,530
6,530
Num
berof
5Gbase
stations
(thousand)
–140.0
796.0
1,514.0
2,114.0
2,714.0
3,314.0
3,914.0
(contin
ued)

280 Chapter 11 Digital Economy Goes Green: Taking Over …
Table11.4
(contin
ued)
China
Mob
ile2018A
2019A
2020E
2021E
2022E
2023E
2024E
2025E
Power
consum
ptionof
2/3G
base
stations
(bnkW
/h)
11.9
11.9
11.9
6.6
4.6
1.9
0.3
0.3
Power
consum
ptionof
4Gbase
stations
(bnkW
/h)
43.7
55.7
57.7
58.7
59.3
59.8
59.8
59.8
Power
consum
ptionof
5Gbase
stations
(bnkW
/h)
–4.7
26.9
51.1
67.8
82.7
95.9
113.3
Totalp
ower
consum
ption(bnkW
/h)
55.7
72.4
96.4
116.4
131.7
144.3
156.0
173.3
2/3G
base
stationelectricity
cost(bnkW
/h)
7.7
7.7
7.7
4.3
3.0
1.2
0.2
0.2
4Gbase
stationelectricity
cost(bnkW
/h)
28.4
36.2
37.5
38.1
38.5
38.8
38.8
38.8
5Gbase
stationelectricity
cost(bnkW
/h)
0.0
3.1
17.5
33.2
44.1
53.7
62.3
73.6
Totalelectricity
cost(R
MBbn
)36.18
0.47
0.63
0.76
0.86
0.94
1.01
1.13
Propo
rtionof
2/3G
base
stationelectricitycost(%
)21
1612
63
10
0
Propo
rtionof
4Gba
sestationelectricitycost(%
)79
7760
5045
4138
34
Propo
rtionof
5Gba
sestationelectricitycost(%
)0
728
4451
5761
65
Source
Corpo
ratefilings,C
ICCResearch

11.3 AI and Other New Technologies Help the Technology … 281
2020E 2021E 2022E
Baseband chip: 3 loads (64 channels)Up to 16 downstream and 8 upstream each loadBaseband chip technology: 7nm
Baseband chip: 3 loads (64 channels)Up to 16 downstream and 8 upstream each loadBaseband chip technology: 5nm
GaN power amplifier ratio80%
GaN power amplifier ratio 98%
GaN power amplifier ratio 100%
Power consumption of complete machine: 18% lower than the previous year
Sub-frame off, channel off, deep sleeping field test
Sub-frame off, channel off, large -scale commercialization of deep sleeping
Enhanced function technology research(Microstation off, load off, common module basestation off, equipment off, intelligence energy saving, etc.)
Enhanced functions test Large-scale commercialization of enhanced functions
Lab test Field test
i-GREEN platform R&D(5G PM NRM data collection, process of
community shutdown)
i-GREEN platform function enhanced
(AI algorithm)
Large-scale pilots Large-scale deploymentof i-GREEN
Launch Demo Launch prototype machine
Equipment
Base -station
Network
Power consumption of complete machine: 10% lower than the previous year
Power consumption of complete machine: 8% lower than the previous year
Fig. 11.3 Timeline of energy-saving technologies for 5G base stations. Source CMRI, CICCResearch
11.3.4 Data Centers: Cloud Computing and AdvancedRefrigeration Technologies Help Improve PowerUsage Effectiveness (PUE)
Data center architectures have evolved from centralized computing in 2000 todistributed computing in the PC era and then back to centralized computing in thenew era. In the 1960s, computing and storage resources were stored in mainframes,which served as the computing power supply centers for companies. Only businesscustomers could afford these expensive devices. As a result, computing resourceswere concentrated in companies in the era of mainframes. In 1979, IBM launchedprivate computers (PC) and started the PC era. Computing resources began to beoperated separately, shifting from mainframes to PC. Since 2000, the computingmodel has become centralized again thanks to data centers that could operate morethan 1,000 servers.
Data centers are the underlying infrastructure in the era of the digital economy;they play a crucial role in converting electricity into computing power. Large datacenters implement centralized management of computing and storage resources(Fig. 11.4), and users can share resources through the internet. This model is

282 Chapter 11 Digital Economy Goes Green: Taking Over …
Fig. 11.4 Large data centers manage computing and storage resources. Source Juimg.com, CICCResearch
becoming increasingly popular, and the concept of “cloud computing” is graduallydeveloping (Fig. 11.5). Data centers represent the upstream of the IDC industry valuechain. They provide server trusteeship and other infrastructure services for cloudcompanies, internet companies, and government customers. Data centers convert
Computing device
(RAM, CPU, hard disk, etc.)
Computer network
I/O devices
Fig. 11.5 Cloud computing concept diagram. Source Sangfor.com, CICC Research

11.3 AI and Other New Technologies Help the Technology … 283
electricity into computing power, as their machinery equipment and temperature &humidity control devices consume electricity.
Collective computing power can notably reduce energy consumption at datacenters, contributing to the process of achieving carbon neutrality. According to PikeResearch, the use of cloud computing technologies reduced the energy consumptionof global data centers by 38% in 2020. AWS believes that collective computingresources can notably enhance computing efficiency. Microsoft estimates that Azurecollective data centers are 72%–98% more energy efficient than traditional datacenters, as they can enhance the IT maintenance efficiency, IT equipment efficiency,data-center infrastructure efficiency, and regeneration capacity.
Standard and modular electromechanical devices can help data centers reducecost and enhance efficiency. We think the structure of the machine room system isthe key to the competence of operating IDC. Arranging the structure of this systemrequires the capability to predict the IT load capacity, the electromechanical layout,and the heat-sinking conditions to support higher power density in the future.
Electricity and refrigeration resources represent the core electromechanical deviceservices provided by IDC. IT and refrigeration devices account for around 85%energy consumption of IDC. The use of IDC cooling measures should follow localconditions. In northern China, devices can be cooled via indirect evaporation asthe environment is drier and colder, thereby reducing the use of cooling water. Insouthern China, IDC utilize the immersive liquid cooling technology, using liquid toreduce the heat generated by central processing units (CPU), memories, and otherIT devices. IDC also utilizes distributed energy supply, high-voltage direct currentpower supply, and modular UPS technologies to reduce power losses and improvePUE.
Sharing electromechanical resources and using modular base stations can alsohelp reduce energy consumption and enhance efficiency. Prefabricated modular datacenters represent a pre-engineered product. The infrastructure units in such datacenters are pre-assembled in factories before being re-assembled at constructionsites. Data centers that utilize the modular design can be constructed rapidly. Theyshare cabinets and other infrastructure in order to save the space inmachine rooms andreduce electricity cost. Modular data centers also enjoy policy tailwinds in China.The Three-Year Action Plan for Cloud Computing (2017–2019) released by theMIIT encouraged companies to improve technologies and products for environmen-tally friendly and modular data centers. For example, Chindata provides modularcooling devices and power distribution devices for data centers, thereby shorteningthe construction period of data centers by 30%–40%. US companies also use themodular design to make the allocation of machine room resources more flexible.As a result, a machine room can operate in conformity with standards for tier-2,tier-3, and tier-4 data centers, cabinets with different unit power dissipation canexpand their capability, and companies can provide data centers for wholesale andretail customers.We thinkmodular technologies can showcompanies’ competence inutilizing IT equipment technologies. However, the iteration cycles for IT and networkequipment technologies last shorter than that for infrastructure. We think modulardata centers are key to improving the planning for the structure of machine rooms

284 Chapter 11 Digital Economy Goes Green: Taking Over …
Table 11.5 Advantages of modular data centers
No need todifferentiatefunctions
No need to differentiate functions in advance as with traditional data centers.Modular data centers can effectively integrate the functions of the host room,the power engine room, and the AC engine room into the modules saving spacefor the computer room.
Prefabricationby the factory
The infrastructure needed for the prefabricated modular data center such ascabinets, ACs, UPS, networking, wiring, monitoring, etc. are all prefabricatedby the factory. The factory assembly line ensures the quality of each processand improves the reliability of data centers.
Quickassemblingthroughstandardizedinstallation
The prefabricated modules can be quickly assembled and aligned at the projectsite. The internal structure of the module follows the standardized installation,which helps simplify the construction work, lower the difficulty of the project,shorten the construction period, and reduce labor cost. Data centers that used totake one or two years to build can now be completed within one or two months.
Easy errorchecks
Prefabricated modular data centers can be built on demand, and capacity can beexpanded as needed. Such flexibility allows phased investment in data centersand improves overall operational efficiency. Meanwhile, only the faulty moduleneeds to be removed and repaired when an error occurs. It will not affect theentire system as with traditional data centers, where it will take a lot of time toidentify the fault.
High density,low cost
Prefabricated modular data centers usually use horizontal AC between rows tocool nearby areas with stable air supply and temperature. Coordinated with theshutdown of cold/hot channels and strict air management, they can greatlyimprove the uitilization rate of AC in the computer to deliver cooling for 20kWor higher power density per cabinet. It also saves space in the room andelectricity costs, reducing PUE.
One-stopprofessionalservices
The characteristics of the prefabricated modular data center enable one-stopservices from manufacturers, and prevent buck-passing or a lack of clarifiedresponsibilities. With advanced and user-friendly management software, staffswho manage the computer rooms can control the operating status of the entiredata center at any time.
Source Delta Electronics, CICC Research
so as to make electromechanical modules more applicable and more affordable andenable such modules to work in conformity with standards for the rapidly-changinginformation and communication technologies. In our opinion, enhancing the effi-ciency of modular and standard equipment means that companies need to keep theentire structure in their mind. The detailed advantages of modular data centers arelisted in Table 11.5.
11.4 What Are the Challenges Ahead?
There is a long way to go before reaching carbon neutrality. In our opinion, investorsshould be neither too optimistic nor too pessimistic. In order to realize the goal of net

11.4 What Are the Challenges Ahead? 285
zero carbon emissions, it is necessary to be aware of potential risks and challengesahead, and in particular we need keep an eye on the following challenges.
The penetration rate of the industrial internet remains relatively low. According tothe Industrial Internet Industry and Economic Development Report (2020) releasedby China Academy of Information and Communications Technology (CAICT),the economic value-added scale of China’s industrial internet industry reachedRmb3.1trn in 2020, accounting for 2.9% of the total GDP. The industrial internethas been gradually used in petrochemical, steel & iron, electronics, and informationindustries but the penetration rate is still only 2.76% and there is still much roomfor improvement. We think this industry should consider the following questions.How to utilize data to shorten the commercial investment period and extend theinvestment return period? How to improve the inclusiveness of their platforms andthe connectivity of data in order to utilize data as a production factor to the utmostdegree.
The application of energy-saving systems inmany cases remains at the data collec-tion level. The energy conservation platform enabled by the industrial internet tech-nologies consists of three layers—the edge layer is for data collection, the platformlayer is for the industrial PaaS (platform as a service), and the application layer isfor industrial apps. We note that in real applications, some companies only use thissystem to collect data, and the data they collect has not been utilized to help reduceenergy consumption. We believe that the industry in the future should think abouthow to quickly realize data empowerment to shorten the commercial investmentcycle and generate returns over an extended period of time. How to achieve platformcompatibility and data connection, and maximize data production factors?
The costs of developing and maintaining AI systems are generally high. For awide range of small and medium-sized companies, it is necessary to balance thetrade-off between the benefits of higher energy efficiency and the cost of AI systems.The use of AI systems to reduce energy consumption is facing headwinds fromthe increased cost of system development, data storage and algorithm updates, asthe computing power of such systems continues to increase. Meanwhile, the hugeenergy consumption brought by the increase in computing power should also not beunderestimated. Small andmedium-sized companies should be aware of the trade-offbetween the use of AI systems to improve energy efficiency and the energy consumedby such systems. How to reduce the cost of developing and maintaining AI systems,how to help companies in different industries to develop and adopt AI systems, andhow to use AI technologies to reduce energy consumption and cut CO2 emissionsare the questions we need to consider.
The feasibility of using 5G technologies to reduce energy consumption remainsto be seen. China Mobile Research Institute (CMRI) expects that by 2022, the use of5nmprocess baseband chipswill be realized, the penetration ofGaNpower amplifierswill also reach 90% with the development of process, semiconductor material, and

286 Chapter 11 Digital Economy Goes Green: Taking Over …
RF system technologies. In the meanwhile, CMRI estimates that the overall powerconsumption will drop 8% YoY in 2022. In addition, through the sharing of base-band units (BBU) following the use of 5G networks will likely remove the need forhardware board configuration thereby reducing the power consumption. However,it remains to be seen whether using 5G technologies to reduce energy consumptionwill be effective since most of these developments are still developments. In additionto considering making technological breakthroughs, we suggest thinking about thefollowing questions. How to improve the allocation of low-frequency resources inorder to reduce construction of base stations? How to help telecom carriers, to theutmost extent, co-build and share base stations?
We see risks and challenges ahead in the journey towards carbon neutrality. Wethink companies and industries should be aware of these risks and challenges andstick to the ultimate goal of achieving carbon neutrality.
Open Access This chapter is licensed under the terms of the Creative Commons Attribution-NonCommercial-NoDerivatives 4.0 InternationalLicense (http://creativecommons.org/licenses/by-nc-nd/4.0/), which permits any noncommercial use, sharing, distribution and reproduction in anymedium or format, as long as you give appropriate credit to the original author(s) and the source,provide a link to the Creative Commons license and indicate if you modified the licensed material.You do not have permission under this license to share adapted material derived from this chapteror parts of it.
The images or other third party material in this chapter are included in the chapter’s CreativeCommons license, unless indicated otherwise in a credit line to the material. If material is notincluded in the chapter’s Creative Commons license and your intended use is not permitted bystatutory regulation or exceeds the permitted use, you will need to obtain permission directly fromthe copyright holder.

Chapter 12Green Investment: New Trend, NewDirection
Abstract This chapter focuses on asset and investment management within theframework of carbon neutrality and sustainable development. Our conclusions areas follows: At first glance, it appears investment based on the principle of carbonneutrality and sustainable development (sustainable investing) may reduce expectedreturns. In our view, however, this is not necessarily the case. Though achievingcarbon neutrality is a process of internalizing the externalities from traditional energyuse, increasing costs in the near term and requiring technological breakthroughs andthe further development of rules in themedium term,we believe sustainable investingwould not necessarily lead to a decline in returns. In addition, as the world strives toachieve carbon neutrality, opportunities and risks vary among markets with differentresource endowments and relative positions on the value chain. We think makingactive decisions and doing rigorous research are the key to realizing investmentreturns and guarding against risks.
Second, we believe combating climate change and abiding by sustainability prin-ciples will have profound medium- and long-term effects on industries, industrialstructure and regional economies. In our view, implementing the principles of carbonneutrality will generate far-reaching implications for production, energy, financials,technologies, consumption, and relative geographical advantages and landscape. Wesuggest paying attention to a number of issues and trends: (1) the growing utilizationof clean and renewable energy; (2) themountingfinancial risks to industrieswith largecarbon footprints; (3) recycling of resource amid transformation towards a circulareconomy; (4) the positive role of advanced technologies in “green energy” use andenergy conservation; (5) the reshaping of regional economies; and (6) low-carbonconsumption.
Third, we identify potential winners and losers in a wide range of industries amidthe goal toward carbon neutrality and sustainable development based on the views ofCICCsector analysts.Wealso compile theCICCChinaCarbonNeutrality InvestmentIndex (CCCNII). Themarket cap-weightedCCCNII and the equal-weightedCCCNIIhave registered annualized returns of 17.2% and 25.1% since 2009, outperformingmajor benchmark indices. They have delivered notable excess returns in the past3 years, partly driven by gains from the solar-power and electric-vehicle value chains.
© The Author(s) 2022CICC Research, CICC Global Institute, Guidebook to Carbon Neutrality in China,https://doi.org/10.1007/978-981-16-9024-2_12
287

288 Chapter 12 Green Investment: New Trend, New Direction
From an economic perspective, achieving carbon neutrality is essentially a processof changing the way people internalize negative externalities from traditional humanactivity and production. We think this process will also generate a fundamental shiftin how people invest.
This chapter focuses on a number of topics relating to sustainable investment andasset management. In particular, we aim to answer the following three questions:
(1) How will sustainable investment affect potential investment returns? Will itnecessarily reduce expected investment gains?
(2) How will following carbon neutrality principles affect the structure of theindustries? What trends will it bring to industries?
(3) Which sectors will benefit from carbon neutrality and sustainable develop-ment?Which sectorswill be negatively impacted?How can investors capitalizeon opportunities from carbon neutrality and hedge against risks?
Overall, we draw the following conclusions:Sustainable investing will not necessarily reduce investment returns. Under the
investment framework based on carbon neutrality and sustainable development,environmental externalities from human activities that were not fully reflected inprevious investment decisions are now taken into consideration. While sustain-able investing seemingly imposes extra restrictions on investments and may reduceexpected returns, it may also help balance short-term costs with medium/long-termreturns. Additionally, sustainable investment based on carbon neutrality and sustain-able development provides investors with additional information on corporate funda-mentals. We also think carbon neutrality may trigger a technological revolution. Assuch, we do not believe sustainable investing will necessarily reduce investmentreturns, though whether it would provide a substantial boost to returns remains to beseen. Making active decisions and doing rigorous research are of great importance.
Combating climate change and following the principles of carbon neutrality andsustainable development represent a new industrial revolution, which will impactindustries, the industrial structure and regional economies significantly in themediumand long term.We believe they will bring about far-reaching implications for produc-tion, living environments, energy, financials, technologies, consumption, and relativegeographical advantages and landscape.
We suggest paying attention to a number of issues and trends: (1) rising utilizationof clean and renewable energy, (2) the complexity of financial analysis, andmountingfinancial risks to industries with large carbon footprints, (3) resource recycling amidtransformation towards a circular economy, (4) the positive role of advanced tech-nologies in “green energy” use and energy conservation, (5) reshaping of regionaleconomies, and (6) low-carbon consumption.

12 Green Investment: New Trend, New Direction 289
Potential winners and losers: We identify potential winners and losers undercarbon neutrality within a wide range of industries based on the views of CICCsector analysts. We also compile the CICC China Carbon Neutrality InvestmentIndex (CCCNII). The market cap-weighted CCCNII and equal-weighted CCCNIIhave registered annualized returns of 17.2% and 25.1% since 2009, outperformingmajor benchmark indices. They have delivered notable excess returns in the past3 years, partly as a result of gains from the solar-power and electric-vehicle valuechains.
12.1 How Will Following the Principles of CarbonNeutrality and Sustainable Development AffectPotential Investment Returns?
This is a general question, but investment institutions and researchers have yet toreach a consensus. We try to answer this question by exploring the following twoparts.
12.1.1 Existing Framework for Building SustainableInvestment Portfolios and Its Potential Challenges
12.1.1.1 Why Should Investors Focus on Carbon Neutrality?
In previous chapters, we elaborated on why humans should place emphasis oncarbon neutrality and sustainable development. In this chapter, we will focus onwhy investors should attach importance to these two issues.
Overall, the reason why investors should pay attention to carbon neutrality andsustainable development can be divided into financial (affecting investment returns)and non-financial (complying with laws and industry requirements) factors.
First, sustainable investment has attracted wide attention from the global financialand investment industries. In order to fulfill the Paris Agreement, an internationaltreaty on climate change, more than 275 large asset-management institutions in 16countries created the Institutional Investors Group on Climate Change (IIGCC),and launched the Net Zero Investment Framework that is consistent with the ParisAgreement and can be constantly revised (Fig. 12.1). Institutions that participate inthe IIGCC have a combined assets under management (AUM) of US$35trn.1 Webelieve the positive response from financial and investment institutions around theworld to the call for addressing climate change may push their Chinese counterparts
1 https://www.iigcc.org/about-us/our-members/.

290 Chapter 12 Green Investment: New Trend, New Direction
Policy advocacy
Net zero aligned policy and regulation
Disclosure, shareholder rights
Stakeholder and market engagement
Asset managers or clients
Index, data, and service providers
Assess assets and set targets
Assess assets based on current and forward-looking alignment criteria, and investment in climate solutions
Set goals for increasing share of AUM invested in aligned assets in climate solutions, plus coverage of engagement activity
Implement
Portfolio construction: Screening, positive and negative weighting, tilted benchmarks to allocate capital to support alignment and invest in climate solutions
Engagement: Criteria based escalating engagement and voting strategy for nonaligned assets, tenant and issuer engagement
Investment/management actions for directly owned assets (e.g., real estate)
Governance and strategy
Commit to aligning investment strategy with achievement of global net zero emissions by 2050
Undertake climate financial risk assessment in line with TCFD recommendations
Define beliefs, set investment strategy andperformance objectives for asset managers
Publish information on strategy and targets, monitor and report on implementation
Portfolio reference targets
Set medium term emissions reduction and climate solutions reference targets to inform SAA and monitor impact of strategy
Strategic Asset Allocation
Update risk and return expectations based on scenario analysis
Set asset classes considering climate variants
Optimize based on emissions and climate solutions metrics
Review constraints to increasing alignment
Portfolio/fund level Asset class level External
The Net Zero Investment Framework
.
.
.
.
.
.
.
.
.
.
.
.
.
.
.
.
.
.
Fig. 12.1 IIGCC’s net zero investment framework for consultation. Source IIGCC (Net ZeroInvestment Framework), CICC Research2
to follow suit. We think China’s financial and investment institutions that take thelead in combating climate change will gain first-mover advantage.
Second, China’s commitment to carbon neutrality will also push a wide rangeof domestic industries (including financials and investment) to formulate codes ofconduct on carbon neutrality and sustainable development. China’s goal of achievingcarbon neutrality by 2060 has drawn wide attention across the country. All domesticindustries, includingfinancials and investment, are discussing how the country shouldachieve this goal. We think the 14th Five-Year Plan and longer-term policy frame-work will update China’s targets and measures on green development based on thecommitment to carbon neutrality. In our view, all industries including financials mayformulate codes of conduct to help China achieve carbon neutrality and sustainabledevelopment. We think this will affect future investment behavior.
Chinese investors just begin to give consideration to compliance with climatetreaties. However, as China officially announced the target of reaching peak carbonemissions by 2030 and achieving carbon neutrality by 2060, we think Chinese regu-lators and domestic financial and investment institutions may introduce disciplinedframeworks. In addition, as global asset managers play a greater role in the Chinesemarket amid further opening-up of the market, their behavior will also affect theperformance of the Chinese market and domestic investors will need to focus moreon the principle of low carbon and zero emissions in their investment management.
Lastly, as the world steps up efforts to embrace the principles of carbon neutralityand sustainable development, we believe this will also change risks and return
2 IIGCC, https://www.iigcc.org/resource/net-zero-investment-framework-for-consultation/.

12.1 How Will Following the Principles of Carbon Neutrality … 291
conditions that investors will face. The commitment to carbon neutrality by majoreconomies and strict implementation of the widespread “carbon neutrality andsustainable development” principles in China could be similar to a new roundof longer-lasting and farther-reaching worldwide supply-side reform. Moreover,requirements from carbon neutrality and sustainable development are somethinglike a new “energy revolution”. We believe this will produce notable and sustainedimpacts on almost all industries and companies at various positions of differentindustries, thereby affecting the investment value of many sectors and companies.
Overall, investors need to attach importance to carbon neutrality and sustainabledevelopment in all of the three scenarios: (1) fulfilling obligations, (2) capturingopportunities from green development, and (3) guarding against the risk that certainareas face due to carbon neutrality. When exploring international markets andattracting foreign money, Chinese asset managers also need to place emphasis on theprinciple of carbon neutrality and sustainable development as following this prin-ciple has become one of the prevalent options in foreign financial and investmentindustries.
12.1.1.2 How to Follow the Principle of Carbon Neutralityand Sustainable Development in Formulating InvestmentPortfolios?
How can investors help achieve the goal of carbon neutrality? Superficially,achieving carbon neutrality and promoting sustainable development seem like a jobfor industrial companies, and financial institutions are not directly responsible foremissions reduction as they are not large carbon emitters. However, in practice,global financial and investment industries are both following the rules that the ParisAgreement stipulated in their investment process. As investors face new financialand investment principles, the cost of obtaining financial resources will change fordifferent types of companies, thereby affecting corporate and individual behavior.
How do investors follow the principles of carbon neutrality and sustainabledevelopment? Currently, in the Chinese market, carbon emission-related regula-tory rules are still under development, and the disclosure of emissions data remainsincomplete. Therefore, there are only a few quantitative investment portfolios thatare built based on the carbon neutrality framework in China. In foreign markets,however, a number of investment portfolios are built based on corporate emissionsdata in an attempt to curb investment behavior and affect industrial companies. IIGCCreleased the Paris Aligned Investment Initiative (PAII) in May 2019, and issued theNet Zero Investment Framework for Consultation in 2020, providing asset ownerswith a preliminary framework on how to build investment portfolios that complywith the Paris Agreement. IIGCC stressed that this framework also applies to assetmanagers, although it is designed for asset owners.
EU and other relevant institutions have taken the lead in developing investmentframeworks that are systematically built based on the goal of carbon neutrality.The investment framework developed by IIGCC whose members are mostly from

292 Chapter 12 Green Investment: New Trend, New Direction
Europe is relatively more mature than the others. As such, our analysis is mainlybased on IIGCC’s investment framework, although this framework is not perfect andit continues to be updated frequently.
Investment portfolio-based emissions reduction via two aspects: Accordingto the Net Zero Investment Framework for Consultation, delivering a “net zeroinvestment strategy” should focus on achieving two alignment objectives: (1) decar-bonizing investment portfolios in a way that is consistent with achieving global netzero greenhouse gas (GHG) emissions by 2050, and (2) increasing investment in“climate solutions” that are needed to meet climate goals such as renewable energy,low carbon buildings, and energy efficient technologies.3
IIGCC’s investment framework covers four major asset classes: sovereignbonds, listed equities, corporate fixed income, and real estate. Further work will beundertaken in Phase II of the PAII to broaden the investment framework to includeadditional asset classes (infrastructure and private equity), consider the adaptationgoals of the Paris Agreement, and address technical issues identified in Phase I.4 Inaddition, a large number of asset management institutions are also exploring how topromote low or zero carbon emissions via their investment portfolios.
Potential creation of investment portfolios based on informative corporateemissions data: If data on any individual company’s carbon emissions is available,the strategy of building investment portfolios that are aligned with carbon neutralityand emissions reduction will be relatively intuitive. Investment institutions can esti-mate an investment portfolio’s carbon emissions volume or emissions density perunit of investment value based on emissions volume, investment size and proportionof each asset in the portfolio, so as to formulate emissions reduction targets consistentwith climate treaties.
12.1.1.3 Potential Problems
We believe the IIGCC’s investment framework still needs to be improved further.Under the current conditions, it may face the following issues when it is used to buildand manage investment portfolios based on the principle of tackling climate change,reaching carbon neutrality and promoting sustainable development.
Collection of complete, sustained and public carbon emissions data is of greatimportance to building sustainable investment portfolios. However, such data collec-tion still faces hurdles even in Europe, which has made significant progress in carbonemissions control. In our view, continuous and complete disclosure of carbon emis-sions data aswell asworldwide standard unificationmight need coordination betweenpolicymakers around the world.
3 Source: https://www.iigcc.org/download/net-zero-investment-framework-consultation/?wpdmdl=3602&refresh=60530ef5ea9bd1616056053.4 Source: https://www.iigcc.org/download/net-zero-investment-framework-consultation/?wpdmdl=3602&refresh=60530ef5ea9bd1616056053.

12.1 How Will Following the Principles of Carbon Neutrality … 293
Potential double counting issues in calculating a portfolio’s carbon emissionsvolume:Asmentioned earlier, when calculating a portfolio’s emissions volume, threetypes of carbon emissions merit close attention: (1) a company’s carbon emissionsgenerated in the course of its operations (scope 1), (2) carbon emissions from gener-ation of electricity and heating that the company purchases from third parties (scope2), and (3) carbon emissions from the value chain (scope 3), such as the emissionsfrom upstream firms that produce components or the emissions from downstreamconsumers when using this company’s products. In the process of asset allocation,incorrect separationof these three scopesmay lead to double counting. For example, ifan asset manager invests in both a power plant and the plant’s downstream customers,it would be difficult to accurately calculate a portfolio’s carbon emission density.
The impact of investor behavior on corporate actions tends to be indirect. Whilelong-only investors who avoid investing in companies with a large carbon footprint,this practice also reduces their impact on these companies. Constraining corporatecarbon emissions via investor behavior only has an indirect impact. If long-onlyinvestors in the stock market tentatively avoid investing in large carbon emitters, itwill in turn weaken their impact on corporate behavior.
The role of short selling in emissions reduction via investment portfolios: Investorscannot affect a company’s behavior if they do not hold this company’s assets.However, we believe things will change if short selling is allowed. Investors canrely on short selling to hedge against the risk of climate change. They can alsoleverage short selling to affect the behavior of companies with high emissions. Inaddition, shorting companies with large carbon footprints can be used to offset theimpact of longing firms with limited emissions volume. We believe the short sellingsystem will play different roles in regional carbon emission reduction, as its maturityvaries between countries.
Target setting of investment portfolios under IIGCC’s investment frameworkfor carbon neutrality and climate change is displayed in Fig. 12.2. The strategicasset allocation (SAA) under IIGCC’s carbon neutrality-based investment frameworkis presented in Fig. 12.3.
12.1.2 How Will the Real Investment Returns Be Affectedby Following the Principles of Carbon Neutralityand Sustainable Development?
As the notion of carbon neutrality and sustainable development is becoming increas-ingly popular in recent years, investment research institutions and other organizationshave paid more attention to the impact of these principles on potential investmentreturns. In particular, sectors related to solar power and electric vehicles (EVs) havesignificantly outperformed the overall market. Driven by policy support around theworld and the plunging cost of EVs, the era of grid parity for solar power plants

294 Chapter 12 Green Investment: New Trend, New Direction
At portfolio level
Set an initial emissions intensityreduction goal and < 10-year referencetarget, in line with a net zero by 2050pathway.
Set an initial goal for allocation toclimate solutions representing a % ofrevenues or capex from AUM, in linewith investment trajectories based on anet zero pathway.
At asset class level
Investors should set a 5-year goal forincreasing the %AUM invested in netzero or aligned assets.
Recommend investors to set aminimum threshold for emissions inmaterial sectors so that they are alignedwith a net zero pathway.
Assess the current emissionsintensity of the portfolio and theallocation to climate solutions.
Assess global, sector and regionalpathways that define the requiredemissions reductions and investmenttrajectories over time to reach globalnet zero emissions by 2050.
Determine the maximum extent towhich they are able to adjustportfolio construction which theyexpect assets to respond to theirengagement strategies or be divesteddue to inconsistency of activitieswith net zero pathways.
How they consider their targetsto be aligned to the pathway toachieve global net zero emissionsby 2050.
The strategy and actions theyhave implemented across allasset classes and performanceagainst the objectives and targetsover time.
Be associated with limitingwarming to 1.5C above pre- industriallevels with at least 50% probability.
Reach global net zero emission by2050, or soon after.
Provide differentiated pathwaysinformation for regions and sectorswhich may require net zero emissionsearlier or later, consistent with theglobal goal.
Ideally be a multi-sector model,taking account of all emissionssources.
Rely on limited volume of NegativeEmissions Technologies (NETs) to2050.
Types of targets and objectives
Transparency and reporting (investors should publish
information annually)Pathways
Setting targets1
2 34
Fig. 12.2 Setting targets for investment portfolios under IIGCC’s Net Zero Investment Framework.Source IIGCC (Net Zero Investment Framework), CICC Research8
Steps for alignment through SAAUsing scenario analysis to ensure SAA asset class return expectations are informed by
a realistic assessment of climate risks and opportunities. Setting targets for these metrics in line with a trajectory consistent with net zero
emissions by 2050. Specifying variants of asset classes that use more systematic approaches to reduce
carbon intensity and increase exposure to climate solutions. Monitoring achievement of alignment objectives including portfolio carbon intensity
and allocation to climate solutions. Supplementing standard financial SAA objectives with objectives related to climate
change. Considering less familiar asset classes when constructing portfolios.
Standardization of different asset classesTilted indices: replace standard equity benchmarks with climate-tilted versions that
closely track market cap weighted benchmarks. Review constraints to increasing alignment and optimize based on emissions and
climate
direction.
solution metrics. Custom benchmarks: shift active portfolios in a more Paris Agreement-compliant
Challenges for implementing alignment through SAAMany pension funds and life assurance portfolios are now very mature and are
increasing the weighting of fixed income securities as well as using liability hedgingstrategies. The pursuit of climate objectives cannot reduce expected risk-adjusted investment
returns relative to other alternatives. Liquidity constraints or solvency capital charges may limit exposure to renewable
energy infrastructure investments. Some portfolios tent to only allow mainstream liquid assets to have very tight cost
constraints, and have rather more rigid investment structure with multiple, risk-tiered‘lifecycle’ options. It can be difficult to make dynamic changes to these portfolios.
1
2
3
Metrics for alignmentCarbon emissions intensity (scope 1 and 2) –
CO2e/US$m revenues or CO2e/US$m invested. Climate solutions allocations as % of portfolio.
Supplemental forward-looking metricsExposure to fossil fuel reserves. % of portfolio with net zero targets. Aggregate management indicators score. Levels of capex relating to EU taxonomy
activities.
Optimization process“Mean variance optimization”: 1) expected
returns; 2) volatility of returns; 3) covariance ofreturn. Additional factors: 1) carbon intensity; 2)
percentage allocated to climate solutions.
4
5
6
Fig. 12.3 Steps for alignment through Strategic Asset Allocation (SAA) under IIGCC’s Net ZeroInvestment Framework. Source IIGCC (Net Zero Investment Framework), CICC Research9

12.1 How Will Following the Principles of Carbon Neutrality … 295
is coming and the replacement of traditional fuel vehicles by EVs is also acceler-ating globally. This trend has also sparked discussions about the relationship betweenfollowing principles of sustainability and reaping investment returns.
For example, in a research paper released in April 2020, MSCI stated that5 fromDecember 2009 to December 2019, the environmental, social and governance factorcumulatively contributed 1.88 percentage point to the top 20 ESG funds’ returns,with more than 80% of those returns occurring in the last 4 years of the study period.Other studies such as research by G Badía (2018) and JC Mollet (2014)6 show thatthere are no statistically significant differences between the performance of high-and low-rated portfolios built based on social responsibilities and carbon neutrality.
Our views and analysis are as follows:If investing based on the principles of carbon neutrality and sustainable devel-
opment can have a clear and positive impact on investment returns, we believethis would contribute to achieving carbon neutrality without government supportor legal restrictions and mandates. As the Nash Equilibrium shows, if a strategy canbenefit all players in a game, this strategy is very likely to be naturally chosen in anentire countrywithout additional government support or legal constraints.However, itremains unclear whether a country can achieve carbon neutrality without governmentsupport or legal restrictions due to the following reasons:
Abandoning fossil fuel technologies and pursuing carbon neutrality represent arevolutionary initiative to be undertaken by humanity voluntarily. It is a processof internalizing externalities from the use of traditional energy. It will increasea country’s short-term cost, which is clearly a near-term challenge, especially forcompanies and individuals that rely heavily on traditional energy.
The goal of achieving carbon neutrality is a process of self-disciplined technolog-ical innovation and revolution. We believe this process needs the support of capexin the short and medium term, which can create both winners and losers. In thelong term, direct or indirect benefits of this revolution will remain uncertain andunpredictable, although potential gains might outweigh the cost, especially for anentire country or the whole world. For example, in order to cut carbon emissions,automakers need to invest heavily in advance. However, the rising penetration ofEVs amid emissions reduction is also a revolution in the auto industry, given thatthe interconnection of intelligent vehicles may effectively improve travel experienceand efficiency.
Whether costs and benefits from carbon neutrality can be reasonably allocatedbetween different groups or production to some extent depends on the design ofsystems which also affects the potential investment returns. The specific mid- andlong-term impact of carbon neutrality on a country’s capital market indices also
5 https://www.msci.com/www/blog-posts/quantifying-esg-fund/01760099215#:~:text=Over%20the%20entire%20analysis%20period,seen%20in%20the%20exhibit%20above.6 https://www.efmaefm.org/0EFMAMEETINGS/EFMA%20ANNUAL%20MEETINGS/2019-Azores/papers/EFMA2019_0220_fullpaper.pdf,
https://www.zora.uzh.ch/id/eprint/100678/1/WP_JM&AZi.pdf.

296 Chapter 12 Green Investment: New Trend, New Direction
depends on the country’s stage of development and position in the global valuechain.
If a country is determined to reach carbon neutrality, we believe taking systematicactions earlier may help the country face lower costs. Our view is echoed by anumber of theoretical studies on climate change such as the research paper “TheEnvironment and Directed Technical Change”7 published in American EconomicReview in 2012. If a country will eventually return to the correct path, assumingother conditions remain constant, early “stop loss” can ensure lower costs.
Lastly, it remains uncertain whether following the principle of sustainability canboost investment returns. However, carbon neutrality and sustainable developmentare external shocks that humans have brought on themselves. Active research andpreparations can help enhance returns and lessen riskswhen facing uncertainties fromboth carbon neutrality and all other issues. For example, investors who invested inalternative energy and EV reaped solid returns in recent years. They would not haveregistered such returns if they had not done forward-looking studies on the solarpower and EV industries.
Overall, our conclusion is consistent with the view in the article “ResponsibleInvesting: the ES-efficient Frontier” published in Journal of Financial Economics.Carbon neutrality is an entirely new topic that investors around the globe are facing.In our view, it will not only affect investment procedures and portfolio building,but will also have an impact on potential investment returns. We think investors canseize opportunities earlier and effectively against risks by making active decisionsand doing rigorous research.
12.2 How Will Addressing Climate Change and Followingthe Principles of Carbon Neutrality Affect IndustrialStructures?
Combating climate change and following the principles of sustainability have thepotential of fueling a new technological revolution that can revamp the ways energyis used. Like the Industrial Revolution in the past, we believe this technologicalrevolution will affect all aspects of production and how people live, which willgenerate far-reaching implications for existing industries and the overall industriallandscape.
We think the following impacts on industries and industrial structure merit atten-tion based on the views of CICC sector analysts and existing studies, as well as ourresearch.
7 https://economics.mit.edu/files/8076.

12.2 How Will Addressing Climate Change and Following … 297
12.2.1 Increasing Use of Clean and Renewable Energy
Mass adoption of fossil fuels such as coal and petroleum started several centuriesago. Efforts to address climate change and follow the principles of carbon neutralityand sustainable development help cut emissions, save energy and reduce the use oftraditional energy that causes heavy pollutions. In addition, we believe these effortswill also stimulate consumption of clean and renewable energy such as solar, windand hydro power. We think this will push human society to rely more on clean andrenewable energy for production and daily life.
Renewable energy industries such as wind power and solar power are coming intoa new era around the globe over the past decade, which is one of the signs of thefourth industrial revolution. The world’s energy structure is increasingly diversifiedand will be dominated by clean and low-carbon energy sources. According to BP’sStatistical Review of World Energy 2020, the share of non-fossil fuel energy sourcesin energy consumption rose from 9% in 1980 to 16% in 2019. Annual average growthin the consumption of renewable energy reached 13.7% in the past decade, makingrenewable energy the only energy source with double-digit consumption growth inthe same period. In addition the International Renewable Energy Agency (IRENA)expects renewable energy to contribute almost 36% of global energy supply in 2030.
China played a major role in the transformation of the global energy structure.According to the National Bureau of Statistics (NBS), coal accounted for 57.7% ofChina’s energy consumption in 2019, 1.5 ppt lower than the share in 2018, and theproportion of clean energy expanded 1.3 ppt to 23.4%.
Over a longer period, the proportion of raw coal production within the China’stotal energy production trended downward from 74.2% in 1990 to 68.6% at end-2019(Fig. 12.4), whereas the share of renewable energy expanded from 4.8% to 18.8%in the same period. In addition, raw coal and crude oil combined made up 92.8%of China’s energy consumption in 1990, and the aggregate share of hydro, nuclear,and wind power rose from only 5.1% in 1990 to 15.3% at end-2019. China’s world-leading adoption of non-fossil fuel energy facilitated the country’s transformationtowards clean energy sources. As of 2019, China’s cumulative installation volumesof hydro, wind and solar power were among the highest around the world.
12.2.2 Mounting Financial Risks to Industries with LargeCarbon Footprints
In Chap. 4, we discussed the status quo, existing problems and policy recommenda-tions for “green finance”.We believe efforts to address climate change and follow theprinciples of sustainability will lead to at least two changes in the financial industry:
Under a financial analytical framework, a new factor—sustainable development—is added, making financial investment, pricing, risk measurement and regulationcomplicated. Putting aside carbon neutrality, a financial analytical framework needsto include factors that are mostly limited to economic and financial returns. However,

298 Chapter 12 Green Investment: New Trend, New Direction
when considering carbon neutrality and efforts to address climate change, externali-ties arising from resource and energy utilization could be internalized. The process offinancial decision making, regulation and system design will become more compli-cated. In the previous section, we stated that following the principles of carbonneutrality and sustainable development will make the process of building investmentportfolios more complex. We believe this is probably only one of the impacts on thefinancial industry from carbon neutrality.
Under the principles of carbon neutrality and sustainable development, a numberof industries that are closely related to traditional energy sources or emit high levelsof carbon (e.g. petroleum, coal and raw material processing) may lose their luster.We believe this will create large uncertainties in the value of financial assets relatedto traditional industries (e.g. loans and equities), thus heightening the risk of baddebts and defaults.
We believe this problem is particularly striking in China. The outstanding mid-and long-term loans that Chinese financial institutions issued to heavy industries withlarge carbon footprints totaled Rmb9.54trn (as of December 3, 2020, see Fig. 12.5),accounting for 86% of the total balance of mid- and long-term loans to the entire
0
20
40
60
80
100
1952
1962
1970
1978
1980
1982
1984
1986
1988
1990
1992
1994
1996
1998
2000
2002
2004
2006
2008
2010
2012
2014
2016
2018
China's energy producttion structureShare of raw coal Share of crude oil Share of gas Share of hydro, nuclear, and wind power(%)
68.6%
6.9%
5.7%
18.8%
Fig. 12.4 Coal output as a percentage of China’s energy production has contracted, while the shareof renewable energy has increased considerably. Source Wind Info, CICC Research
8 IIGCC, https://www.iigcc.org/resource/net-zero-investment-framework-for-consultation/.9 IIGCC, https://www.iigcc.org/resource/net-zero-investment-framework-for-consultation/.

12.2 How Will Addressing Climate Change and Following … 299
0
5
10
15
20
25
30
0
10
20
30
40
50
60
3Q11
4Q11
1Q12
2Q12
3Q12
4Q12
1Q13
2Q13
3Q13
4Q13
1Q14
2Q14
3Q14
4Q14
1Q15
2Q15
3Q15
4Q15
1Q16
2Q16
3Q16
4Q16
1Q17
2Q17
3Q17
4Q17
1Q18
2Q18
3Q18
4Q18
1Q19
2Q19
3Q19
4Q19
1Q20
2Q20
3Q20
4Q20
Balance and growth of mid- and long-term loans
Balance of mid- and long-term loans in light industry Balance of mid- and long-term loans in heavy industryBalance of mid- and long-term loans in service industry YoY growth rate of mid- and long-term loans in heavy industry (RHS)YoY growth rate of mid- and long-term loans in service industry (RHS)
(Rmb trn) (%)
Fig. 12.5 Growth rate of mid- and long-term loans in heavy industry keeps increasing. SourceWind Info, CICC Research
secondary sector. The heavy chemical industry now faces strong pressure to trans-form, which we believe is technologically challenging and will last for some time. Inour view, additional requirements from carbon neutrality may reducemarket demandfor products from heavy industries, heightening the risk to banks with exposure tothese industries.
12.2.3 Resource Recycling Amid Transformation Towardsa Circular Economy
Production of basic materials such as steel, nonferrous metals and cement accountsfor a very large share of China’s total carbon emissions. Implementing the idea of“circular economy” in these industries could be one of themost important options forChina to reduce carbon emissions and reach carbon neutrality. In “The CircularityGap Report 2021”, the Circle Economy organization stated10 that only 8.6% of theworld’s economic resources are currently participating in the practices promoted bythe “circular economy”. Simple practices such as reducing usage of raw materialscan reduce the global emissions and total material footprint by 39% and 28%.
10 https://www.circularity-gap.world/2021.

300 Chapter 12 Green Investment: New Trend, New Direction
It is particularly important for the steel, cement, fertilizer and plastics industries totransform and accept the concepts promoted by the notion of circular economy andconsiderably raise the recycling rate of keymaterials.We believe China’s demand forcrude steel and cement is likely to shrink as its population begins to contract and theurbanization rate decelerates. Energy Transitions Commission estimates steel outputbased on recycling of steel scrap as a percentage of total steel production will risefrom less than 10% at present to 60% in 2050.11 In the cement industry, recyclingpotential is limited, but modification of building design and material quality mayalmost halve cement demand compared to current practices. According to the EnergyTransitions Commission, 52% of China’s plastics demand could be met by recycledplastics thanks to advancement of physical and chemical recycling technologies.Thus, reducing the use of and recycling of raw materials are of vital importance tocarbon emissions reduction.
Looking at the steel industry as example, as steel production relies heavily on fossilfuel energy such as coal, the steel industry accounted for 18% of total carbon emis-sions among all energy-consuming sectors in China in 2017, according to CEADs. Inother words, emissions reduction in the steel industry is crucial for China to achievecarbon neutrality. Chinese Academy of Engineering estimates recycling 1tonne ofsteel scrap can save 4.3tonnes of iron ore, 1tonne of raw coal, and 1.7tonnes of water,i.e. reducing 1.6tonnes of carbon dioxide emissions. Energy Transitions Commis-sion expects steel scrap supply to grow 10% every year and its price to plunge asa growing number of vehicles, buildings and other equipment reach their designedlifespans. The World Steel Association estimates China’s annual steel scrap supplywill be around 300–400mn tonnes in total in 2050, which can be used to replacenatural resources to save raw materials and reduce carbon dioxide emissions.
12.2.4 The Positive Role of Advanced Technologiesin “Green Energy” Use and Conservation
The process of reaching carbon neutrality itself is a technological revolution. Thepositive role of technologies in carbon emissions reduction cannot be overestimated.Their positive role includes at least two aspects:
Technological advances hold the key to full-scale utilization of renewable andclean energy. For example, incremental photovoltaic (PV) installed capacity rosefrom 16GW in 2010 to 105GW in 2019.12 We believe technological advances servedas a fundamental driver for the strong growth. Innovations in silicon wafers, cellsand other modules not only enhanced the power of PV panels, but also reduced themanufacturing cost.
The price of polysiliconmodules has dropped fromUS$2/W to aroundUS$0.2/W.The lower manufacturing cost of PVmodules has also pushed down the average cost
11 https://www.rmi-china.com/static/upfile/news/nfiles/ETC.pdf (source in Chinese).12 http://guangfu.bjx.com.cn/news/20200115/1036603.shtml.

12.2 How Will Addressing Climate Change and Following … 301
of solar power generation. According to IRENA, the average cost of global PV powerstations dropped from US$0.378/kWh in 2010 to US$0.068/kWh in 2019,13 closeto or even below the cost of traditional energy-based power stations, making solarpower generation more attractive around the world.
However, electricity generated by solar and wind power plants cannot be fullyconnected to power grids at times, and curtailment occurs due to a number ofproblems such as intermittent production and ineffective peak shaving.
The combination of energy storage technologies and renewable power genera-tion helps store the electricity that cannot be transmitted to power grids immediatelyand reduce the volatility of electricity transmission. The mass adoption of electro-chemical energy storage systems is less costly than before thanks to technologicaladvancements in lithium-ion batteries and further cost contraction.
Apart from supply-side electricity storage, ultra high-voltage (UHV) power trans-mission has effectively resolved the problem of long-distance power transmissionthat renewable power plants face. It paves the way for mass development of qualityrenewable energy in northwestern China.
Technological advances create important ways to conserve energy. Accordingto a report on China’s energy consumption in the construction industry, buildingsaccounted for 21.7% of China’s total energy consumption and made up 21.9% ofthe country’s carbon emissions in 2018.14 Reducing carbon emissions related tobuildings is of vital importance for China to achieve carbon neutrality. In particular,technological advances hold the key to reaching this goal.
For example, technological improvements to buildings’ outer protective structurecan reduce the use of heating and cooling systems. Energy use technologies such assolar power systems and heating based on ground-source heat can effectively convertsolar and geothermal energy into heat and electricity to meet the needs of productionand daily life. In addition, installing reclaimedwater and rainwater recycling systemsin buildings can considerably enhance resource recycling efficiency and reduce thenegative impact of buildings on the environment.
12.2.5 Low-Carbon Consumption
Low-carbon consumption is key to carbon emissions reduction in the endmarket. Consumption is the sole end and purpose of all production activities, andpersonal consumption is the final source of carbon emissions. Chinese consump-tion is maintaining strong growth momentum. Consumer spending has contributedmore to economic growth than investment, and now serves as a driver of economicgrowth. The transition period for consumption upgrading also presents opportunitiesfor consumers to develop the habits of green consumption and green lifestyle. Ifthese opportunities are missed, the economy would face higher transitional costs due
13 https://www.irena.org/publications/2020/Jun/Renewable-Power-Costs-in-2019.14 https://www.cabee.org/site/content/24020.html.

302 Chapter 12 Green Investment: New Trend, New Direction
to the vicious circle of mass production, ever-higher levels of consumption and agrowing number of disused materials. We believe it is of vital importance that Chinaplaces increasing strategic emphasis on a low-carbon lifestyle.
Green consumption has penetrated almost all aspects of human life such asclothing, food, shelter and travel. Environmentally friendly and resource-savingconsumption has become mainstream as disposable income per capita rises further,consumers adopt “green” lifestyles, and consumption upgrading is increasinglyapparent.
The UN Environment Programme (UNEP) released a report15 in 2017 showingthat half of Chinese consumers are willing to pay a premium of up to 10% for sustain-able products.16 Meanwhile, China released a report in 2019 on a survey of domesticgreen consumption. According to this report, the concept of green consumption isincreasingly popular among Chinese consumers, with 83% of the respondents sayingthey were in favor of green consumption behavior (47% showing strong support forsuch behavior). In addition, according to another report on household low-carbonliving and consumption, 54% of the respondents said they would consider energyconservation, low utilization cost, and environmental friendliness when buying homeappliances. Overall, the concept of energy conservation and low-carbon consump-tion is increasingly popular among Chinese consumers, and a growing number ofChinese people live a green lifestyle.
12.2.6 Reshaping of Regional Economies
A country is unlikely to gain first-mover advantage in the process of the carbonneutrality revolution unless it formulates strategies based on local economic condi-tions, strengths and weakness. How effective a country or a region is in respondingto the revolution could be affected by a number of factors such as the extent ofits reliance on traditional energy sources, expertise of domestic manufacturers, itsposition in the global value chain, and its technological innovation capabilities.
The cost of carbon neutrality transformation would be lower if a country starts thetransformation earlier. Developed economies have natural advantages in this aspect.Theoretical studies17 show that the sooner the transformation starts, the lower thecost would be. In developed economies, their technologies are more advanced, andsectors with lower carbon emissions account for a large proportion. As such, theyare more likely than other economies to achieve carbon neutrality. In other words,they have gained first-mover advantage.
We think economies that rely heavily on traditional energy sourceswill face strongchallenges in the medium and long term. These economies can be divided into two
15 This report is titled Consumer Awareness and Behavior Change in Sustainable Consumption.16 https://www.oneplanetnetwork.org/sites/default/files/en_report_on_consumer_awareness_and_behavior_change_in_sustainable_consumption_in_china-final.pdf.17 https://economics.mit.edu/files/8076.

12.2 How Will Addressing Climate Change and Following … 303
groups: resource-rich economies (such as the Middle East countries, Russia andAustralia), and resource-depleted economies like China and Japan.
We think economies with stronger manufacturing industries and advanced tech-nologies are more likely to gain advantages in the transformation towards carbonneutrality. China’s alternative energy value chains, especially the solar power valuechain, have obtained a global competitive edge following years of efforts. If Chinacan retain the competitive edge, we believe this advantage will also contribute to itstransformation towards carbon neutrality.
12.2.7 Impact of Carbon Neutrality on Each Industry, Basedon Views of CICC Sector Analysts
We identify the sectors that may benefit from carbon neutrality and sustainable devel-opment and the sectors that could be impaired, based on CICC sector analysts’ fore-casts of opportunities and challenges (Table 12.1). Our analysis focuses on fourfactors: (1) current carbon emission, (2) the magnitude of policy support and regu-latory pressure, (3) “green premium” (additional cost from widespread adoption ofthe most advanced clean technologies), and (4) social awareness of social and envi-ronmental governance (measured by whether companies issue social responsibilityreports and disclose full data).
12.3 How to Capture Investment Opportunitiesfrom Carbon Neutrality and Guard Against Risks?
In this section, our analysis focuses on two parts:We discuss how to capture opportunities and avoid risks, based on CICC macro
and sector teams’ views on carbon neutrality.We analyze existing indices on carbon neutrality and sustainable development,
and compile the CICC China Carbon Neutrality Investment Index (CCCNII).
12.3.1 Investment Opportunities and Risks from the CarbonNeutrality Investment Theme
We suggest paying attention to the following issues when analyzing investmentopportunities from carbon neutrality:
Achieving carbon neutrality is a long process, and relies heavily on technologicaladvances. Our views on both investment opportunities and risks are based on current

304 Chapter 12 Green Investment: New Trend, New Direction
Table 12.1 Potential winners and losers amid carbon neutrality
Sector Current Emission Policy Green
premium
Social manage-
mentDescription
CoalGoal: Demand for coal reaches its peak to realize the replacement by renewable energyPathway: Decrease the demand for coal, CCS, increase the efficiency of miningTrend: Clean coal, transformation of coal enterprise
Non-ferrousPathway: Eliminating outdated production capacity, restricting the investment of high energy-consuming production capacity, and promoting metal recyclingTrend: Production capacity optimization, recycling, and transfer to resource-rich areas
Oil & gasGoal: Demand peaking as soon as possible to realize the replacement of renewable energyPathway: CO2 flooding enhanced oil recovery technologyTrend: Gradually achieve full exit and corporate transformation
Construction materials
Pathway: Technological transformation of the technical route, reduction in the construction process, promotionof energy-saving products and application of energy-saving systems during operationTrend: Carbon reduction in the entire industry chain and life cycle of building materials
Lightmanufacturing
Pathway: Take furniture as an example, using smart manufacturing technologies such as flexible production tocontinuously increase the utilization rate of custom home woodTrend: Internationalization of industry standards, recycling of resources and products, low -carbon and efficientcustomized consumption
Chemicals
Goal: Seek a full life cycle carbon-neutral cyclePathway: Energy saving and emission reduction, the development of C1 chemistry with carbondioxide and hydrogen as the core, biomass chemical industry, CCSTrend: Digitization, intelligence, renewable energy, green path
Power
Goal: Use clean electricity to meet growing energy demandPathway: Improve the economic benefits of clean energy, improve the grid's absorption and energy storagecapacity, and improve the flexibility of grid dispatchingTrend: Renewable energy integrated into the grid, electricity is parity
MachineryPathway: Increase the electrification rate (increase the penetration rate of electrified engineering machinery),and use digital and intelligent production methodsTrend: Industrial automation, new energy equipment demand remains high
Electrical equipment
Pathway: Develop scale efficiency of photovoltaic and wind power equipment, improve equipment energyefficiency standards, and popularize distributed power generation system equipmentTrend: Gradually entering the era of parity, smart grid
SteelPathway: Demand-side control volume, production-side low-carbon emission technology (hydrogen energymetallurgy), market-side combination of carbon tax and carbon tradingTrend: Production decline, electric furnace technology replaces traditional blast furnace technology
Toll road
Goal: Achieve carbon neutrality through full mileage electrification (high certainty)Pathway: Expand the scale of EVs and develop energy-saving and emission-reduction technologiesTrend: 1) Passenger transportation: increasing passenger car ownership and penetration of new energyvehicles; 2) Freight: "Round to Rail" and "Round to Water"
Railway Goal: Achieve carbon neutral in 2060Pathway: Full electrification
Shipping Goal: Solve decarbonization problems caused by large tonnage and long transportation distancePathway: LNG, ammonia, hydrogen and electric energy to replace shipping fuel
Airlines &airports
Prediction: Aviation carbon emissions in 2060 may be 230 million tons, about twice that of 2019, making it themost difficult to achieve carbon neutralityPathway: Provide energy subsidy policies to create a clean aviation fuel market, replace aviation fuel with newenergy sources such as hydrogen, and optimize operations to improve fuel efficiency
Auto & partsPathway: 1) New energy vehicles: improve safety, improve operating efficiency, shorten charging time, andincrease product life; 2) Traditional cars: accelerating the transition to electrification or hybridTrend: Intelligent electric vehicles enhance the pace of new energy consumption transformation
AgriculturePathway: Large-scale farming, the implementation of fine management in manure management, feedefficiency, logistics planning to achieve emission reductionTrend: Modern intensive agriculture, circular agriculture, intelligent agriculture
Home appliances
Pathway: Improve the energy efficiency standards of household appliances, LED replacing ordinary energy -Saving lamps; extensive use of solar water heatersTrend: Energy-saving appliances, recycling
Textiles & apparel
Pathway: Use environmentally friendly and renewable raw materials; use clean energy in the productionprocess; Improve the environmental protection standards
Food & beverage
Pathway: Use biodegradable materials to optimize packaging; increase recycling rateTrend: Lightweight packaging, green transportation
Banks Pathway: Green credit, green bonds, green asset securitization and green product innovationTrend: Strengthen deposit financial institutions to carry out green credit performance evaluation
InsurancePathway: Develop environmental pollution liability insurance, catastrophe insurance, agricultural -related green
insurance, green building insurance, clean energy Insurance, etc.
Diversifiedfinancials
Pathway: 1) Improve ESG disclosure; 2) Diversification of trust services; 3) Develop carbon marketTrend: Economical improvement of financial products
Securities Pathway: Green securities market innovation, including green bonds, green corporate IPOs; green funds andgreen PPP, including guiding social capital, and responsible investment concepts
Note In the policy column, red suggests the sector faces regulatory pressure, while green indicatesthe magnitude of policy support. In the “green premium” column, green indicates negative “greenpremium”, i.e. the cost of decarbonization or clean technologies is lower than that of traditionaltechnologies, while red indicates the other way round; Source CICC Research

12.3 How to Capture Investment Opportunities from Carbon … 305
forecasts for economic growth and technological advances. However, economicgrowth and technological advances may face major uncertainties in the long term.
Carbon neutrality requires changes in energy use, which affects all aspectsof production and everyday living. As such, it is difficult to identify investmentopportunities and risks from the perspective of all areas.
Nevertheless, given the extent of the impact of moving toward carbon neutrality,we find the following investment themes, based on CICC macro and sector teams’views and our forecasts for technology development and economic growth in bothChina and around the world in the next 3–5 years.
Clean energy:Companies that produce clean energy or provide relevant services ina bid to increase clean energy supply, including energy-storage service providers andthe firms that focus on wind, nuclear, solar, and hydro power, lithium-ion batteries,and hydrogen energy.
Energy conservation and emissions reduction: In addition to the firms that increaseclean energy supply, we think beneficiaries of carbon neutrality may also includeareas related to energy conservation and emissions reduction such as smart powergrids, smart cities, intelligent transport, energy-saving buildings, circular economy,green agriculture, low-carbon consumption, environmentally friendly packaging,carbon capture and storage, as well as green finance.
Indirect changes arising from carbon neutrality: Rising penetration of smart vehi-cles driven by 5Gapplications inEVs; demand for relevant services fromcarbon taxesand trading; and demand for data and services from ESG investment. In addition,as mentioned earlier, regions with different industrial landscapes may have differentfeatures due to carbon neutrality, which could present investment opportunities, inour view.
The areas that investors should avoid amid the transition toward carbon neutralityinclude:
Traditional energy producers and relevant service providers that are slow in trans-forming, such as companies in the petroleum and coal value chains that are reluctantto take actions in response to carbon neutrality.
Companies that are in the areas with high carbon emissions; lack a strong desireto transform and face high additional cost from carbon neutrality such as producersof steel, nonferrous metals and cement in the manufacturing industry, as well assuppliers of traditional fuel vehicles and companies in the related value chain in thetransport industry.
12.3.2 Summary of Existing Carbon Neutrality Indices
12.3.2.1 Existing Carbon-Neutrality Indices
The world’s major index companies such as MSCI, FTSE, S&P Global, STOXX,and China Securities Index Co., Ltd. have all released a series of indices on low-carbon economy and green development. These indices have different design plans

306 Chapter 12 Green Investment: New Trend, New Direction
(see Table 12.2), and can be divided into three categories based on compilationmethodology.
Broad-based indices retain all constituents of benchmark indices. They reducecarbon footprint by overweighting stocks with limited carbon emissions andunderweighting stocks with significant emissions volumes. Such indices showsperformance similar to that of benchmark indices.
Indices focusing on leading stocks in the low-carbon economy exclude sectorsor stocks with large carbon footprints and prefer representative companies with lowcarbon emissions. Such indices have fewer constituents, but are more representative.They also perform better than other indices during market rallies.
Thematic indices: select environmental stocks that benefit from the low-carboneconomy. The China Mainland Low Carbon Economy Index and China Low CarbonIndex are both thematic indices. Unlike the indices in the first two categories thatfocus on carbon emissions of listed firms, the thematic indices mainly includeenvironmental stocks that stand to benefit from the low-carbon economy.
12.3.2.2 Carbon Neutrality-Related Funds
In a broad sense, carbon neutrality funds refer to funds whose investment portfoliosfollow the low carbon principle. Morningstar classifies worldwide low-carbon prod-ucts based on two factors: carbon risk score and fossil-fuel involvement. Accordingto Morningstar, for a fund to receive the Low Carbon designation, it must have aMorningstar Portfolio Carbon Risk Score below 10 for the trailing 12 months andexposure to companies with fossil-fuel involvement below 7% over the same trailing12 months.18 The size and share of Low Carbon Designation™ funds have trendedupward since 2012.
In a narrow sense, carbon neutrality funds refer to fundswhose purpose is to reducethe global carbon footprint. For example, index funds that passively track low-carbonbenchmark indices are typical narrow-sense carbon neutrality funds. The world nowhas 34 index ETFs and open-ended funds that are related to carbon neutrality, andtheir aggregate size stands at about US$19bn. Among them, the larger ones wereissued mainly in Europe. As the concept of carbon neutrality did not emerge untilrecently, they were mostly launched in the past 3 years, and they mainly track MSCIand FTSE’s low-carbon indices.
12.3.2.3 CICC China Carbon Neutrality Investment Index
The CICC China Carbon Neutrality Investment Index’s (CCCNII) constituentsinclude typical Chinese companies that strive to achieve carbon neutrality and are
18 https://www.morningstar.com/articles/862383/a-closer-look-at-our-new-tools-to-assess-carbon-risk-in-a-portfolio.

12.3 How to Capture Investment Opportunities from Carbon … 307
Table12.2
Detailson
compilatio
nof
MSC
I,ST
OXX,S
&P,FT
SE’slow-carbo
nindices
MSC
IST
OXX
Basicinform
ationand
preparationmethod
MSC
Igloballowcarbon
targetindex
MSC
Igloballowcarbon
leadingindex
Low
carbon
indices
Low
carbon
footprint
indices
Basicinform
ationand
preparationmethod
Indexdesign
method
Re-em
powerment
Stockselectionand
re-empowerment
Samecomponentsas
the
benchm
ark
Com
paredwith
the
benchm
ark,
thecarbon
footprintissignificantly
reduced(>90%),andthe
risk
andreturn
status
isgood
Com
pilatio
nmetho
dandcharacteristics
The
goal
Minim
izecarbon
emissions(carbon
emission
intensity
and
carbon
reserves
perunit
ofmarketv
alue)while
limiting
thetracking
errorfrom
the
benchm
arkwith
inthe
target(default:
30bps),
whileretainingrevenue
opportunities,u
seop
timizationto
redu
cepo
rtfolio
pairs,risk
exposure
ofcompanies
mostv
ulnerableto
carbon
emissions
Exclude
individual
stocks
basedon
carbon
emission
intensity
and
carbon
emissionsper
unitof
marketv
alue,
then
minim
izetracking
errorswhilelim
iting
carbon
storageperunit
ofmarketv
alue
with
inthreshold(defaultvalue:
50%)by
selectingthe
currentlow
carbon
emissionsand
companies
with
low
fossilfuelreserves
toreduce
exposure
torisks
relatedto
carbon
emission
s
Adopt
acarbon
tilt,
increase
theweightin
gof
low-emission
companies,reducethe
weigh
tingof
high-emission
companies,and
reduce
carbon
footprintw
ithout
exception
Excluding
the7
indu
stries
with
the
highestcarbon
emissionsandthe10%
ofcompanies
with
the
highestcarbon
emission
sin
the
remaining
indu
stries
(contin
ued)

308 Chapter 12 Green Investment: New Trend, New Direction
Table12.2
(contin
ued)
MSC
IST
OXX
Optionalb
enchmark
index
Any
MSC
Imarket
capitaliz
ationweigh
ted
index
Any
MSC
Imarket
capitaliz
ationweigh
ted
index
Weigh
toptim
ization
with
outaffectin
grevenue
Boththeannounced
carbon
intensity
data
andtheestim
ated
carbon
intensity
dataareused
Elim
inationcrite
ria
Not
culled
The
20%
ofcompanies
with
thelargest
emission
sin
the
benchm
arkindexand
the30%
ofcompanies
with
thelargestcarbo
nstoragein
various
indu
stries
Com
paredwith
the
benchm
ark,
tracking
errorsareminim
aland
therisk-rew
ard
characteristicsare
simila
r
Optim
ization/weigh
ting
method
Under
givenconstraints,
minim
izecarbon
emission
intensity
and
minim
izecarbon
storage
perunitof
marketv
alue
Exclusionsbasedon
carbon
emission
intensity
andcarbon
storageperunitmarket
value
Boththeannounced
carbon
intensity
data
andtheestim
ated
carbon
intensity
dataareused
Trackingerrorwith
reference:Sp
ecified
target(defaultvalue:30
bps)
Minim
izetracking
errors
Selectallstocksthat
have
announcedand
estim
ated
carbon
intensity
data
Supersectorsnot
includ
ed:chemicals,
utilitie
s,oiland
gas,
constructio
nmaterials,
tourism
andleisure,real
estateandbasic
resources
Stockcandidatepool
Handoverconstraints:
The
industry
deviation
does
notexceed2%
,and
thereisno
constraint
ontheenergy
industry
Reducecarbon
emission
intensity
andcarbon
reserves
perunitmarket
valueby
atleast5
0%(defaultvalue)
(contin
ued)

12.3 How to Capture Investment Opportunities from Carbon … 309
Table12.2
(contin
ued)
MSC
IST
OXX
Industry
constraints:The
industry
deviationdoes
notexceed2%
,and
there
isno
constraint
onthe
energy
industry
Handoverratelim
it:less
than
10%
ofhandovers
everysixmonths
Sortby
ICBSu
persector
Supersectorsnot
includ
ed:chemicals,
utilitie
s,oiland
gas,
constructio
nmaterials,
tourism
andleisure,real
estateandbasic
resources
CalculatetheZ-score
ofeach
supersector
CalculatetheZ-score
ofeach
supersector
Cou
ntry/regionlim
it:deviationdoes
not
exceed
2%
Industry
constraints:
industry
deviationdoes
notexceed2%
Free
floatmarketv
alue
ismultip
liedby
the
correspondingZ-score
carbon
intensity
factor
oftheindividualstocks.
High-allocatio
nstocks
with
lower
carbon
intensity,low
-allo
catio
nstocks
with
high
erem
ission
s
Free
floatmarketv
alue
ismultip
liedby
the
correspondingZ-score
carbon
intensity
factor
oftheindividualstocks.
High-allocatio
nstocks
with
lower
carbon
intensity,low
-allo
catio
nstocks
with
high
erem
issions
Weightin
gmethod
Riskmod
el:B
arra
GEM3
Riskmod
el:B
arra
GEM3
5%5%
Weightcap
Short-term
risk
control
Use
optim
izationto
reduce
thetracking
error
ofthebenchm
arkindex
Use
optim
izationto
reduce
thetracking
errorsof
thebenchm
ark
index
(contin
ued)

310 Chapter 12 Green Investment: New Trend, New Direction
Table12.2
(contin
ued)
MSC
IST
OXX
S&P
FTSE
Basicinform
ationand
preparationmethod
S&Pglobalcarbon
effic
ient
indexseries
S&Pcarbon
efficient
selectindexseries
FTSE
ESG
lowcarbon
emissionstargetexposure
indexes
Basicinform
ationand
preparationmethod
The
goal
Measure
the
performance
ofbenchm
arkindex
constituent
stocks
after
excludingcompanies
with
nocarbon
emissions
data,com
panies
with
high
carbon
emissions
Measure
the
performance
ofcompanies
with
lower
carbon
emissionsam
ong
theconstituent
stocks
ofthebenchm
arkindex
FTSE
ESG
indexseries
reflectsthelowcarbon
emission
characteristicsof
ESG
indexseries
Indexlevel
Benchmarkindex
S&Pseries
index
S&Pseries
index
Reducecarbon
emissionsattheindexleveland
significantly
improvetheoverallE
SGscore
The
goal
Elim
inationcrite
ria
Exclude
companies
with
nocarbon
emissionsdata
Elim
inatehigh
-carbo
ncompanies
FTSE
series
index
Benchmarkindex
(contin
ued)

12.3 How to Capture Investment Opportunities from Carbon … 311
Table12.2
(contin
ued)
MSC
IST
OXX
Selectionof
constituent
stocks
andweights
Firstcalculatetheweigh
tof
asinglecomponent
stockin
themarketv
alue
oftheindustry
inwhich
itislocatedin
the
benchm
arkindex…
Constitu
entstocksare
sorted
accordingto
the
ratio
ofcarbon
emissionsto
revenue
from
high
tolow.Ifthe
totalw
eighto
fthetop
20%
oftheconstituent
stocks
inan
indu
stry
does
notexceed50%
oftheindustry,allof
them
areelim
inated.Ifa
company
exceedsthe
50%
criticalp
oint
but
does
notexceed55%
afterbeingremoved,itis
still
removed;ifa
company
hasexceeded
the50%
criticalp
oint
whenitisremoved
orexceeds55%
after
removal,the
component
stockisretained
StandardizetheESG
scoreandcarbon
emission
levelo
feach
stockto
obtain
theZ-score,w
hich
isthen
convertedinto
S-scorethroughthe
exponentialfunction
Weightconfirmation
method
…then
usethecarbon
emission
weight
adjustmentfactorto
adjusttheresultof
the
previous
step
The
remaining
constituent
stocks
are
weightedbasedon
the
standard
ofminim
izing
thetracking
errorof
the
benchm
arkindex,
and
constituent
stocks
with
toosm
allw
eigh
tsare
removed
Bring
S-scoreinto
theweigh
tcalculatio
nform
ula,
andtheweigh
tisinclined
tocompanies
with
high
ESG
scores
andlowcarbon
emissions
(contin
ued)

312 Chapter 12 Green Investment: New Trend, New Direction
Table12.2
(contin
ued)
MSC
IST
OXX
Finally,adjustthe
weight
oftheprevious
step
againso
thatthetotal
weighto
feach
industry
compo
nent’sequity
is100%
toensure
thatthe
indexindustry
weightis
consistent
with
the
benchm
arkindex
The
numberof
constituent
stocks
≤the
numberof
constituent
stocks
ofthebenchm
ark
index*75%
Whenallconstrainsaremet,the
weighto
fthefin
alconstituent
stocks
isob
tained
Weigh
trestrictio
nIn
thisseries
ofindexes,
only
S&PSo
uthAfrica
Dom
estic
Carbon
EfficientC
appedIndex
hasan
equity
weight
limitof
notm
orethan
10%
0.015%
≤weight≤
5%0.5%
≤weight≤
10%
Restrictio
ns
Reducecarbon
emissionsby
50%
20%
increase
inESG
score
Sour
ceMSC
I,ST
OXX,S
&P,FT
SE,C
ICCResearch

12.3 How to Capture Investment Opportunities from Carbon … 313
Onshore and offshore Chinese companies (A-shares, H-shares, ADRs, etc.)
Exclude the names with low market cap and turnover
Select carbon neutrality-related
sectors
CCCNII
Confirm sample scope
Exclude stocks with
low liquidity
Select relatedsectors
Optimal stocks based on CICC
research
Fig. 12.6 Details on compilation of the CCCNII. Source CICC Research
listed on the Chinese mainland or overseas. They can reflect the performance ofChinese industries related to carbon neutrality (see Fig. 12.6).
Our compilation process is as follows:Sample scope:Our sample scope is limited to stocks that are publicly traded in China or overseas
and have launched IPOs in a specified period. It covers A-shares, H-shares, B-shares,red chips, P chips, and ADRs.
Stock selection:
• Among stocks in the sample scope, the names with market cap and turnover areexcluded.
• We select carbon neutrality-related sectors from the perspective of fundamentals.Our constituent candidates include listed firms in areas such as circular economy,environmentally friendly energy, transportation, manufacturing, consumption,agriculture, and city development. Our selection is based on three factors: energysupply, energy demand, and comprehensive changes.
• We choose leading firms in respective areas as final constituents based on theviews of CICC sector analysts.
Methodology for constructing the CCCNII:
We review constituents biannually and add newly listed stocks. We adopt marketcap-weighted and equal-weighted methods to calculate weight of individual stocks.The weighting of each constituent is up to 10%.

314 Chapter 12 Green Investment: New Trend, New Direction
0
100
200
300
400
500
600
700
800
900D
ec-0
8M
ay-0
9Se
p-09
Jan-
10M
ay-1
0Se
p-10
Jan-
11Ju
n-11
Oct
-11
Feb-
12Ju
n-12
Oct
-12
Feb-
13Ju
n-13
Oct
-13
Mar
-14
Jul-1
4N
ov-1
4M
ar-1
5Ju
l-15
Nov
-15
Mar
-16
Aug
-16
Dec
-16
Apr
-17
Aug
-17
Dec
-17
Apr
-18
Aug
-18
Jan-
19M
ay-1
9Se
p-19
Jan-
20M
ay-2
0Se
p-20
Jan-
21
CCCNII vs. Market Indexes (Market Cap-weighted)CSI300 MSCI China CCCNII
(Dec 31, 2008 = 100)
Fig. 12.7 A glance at CCCNII’s market cap-weighted performance. Source Factset, Wind Info,CICC Research
The market cap-weighted CCCNII and equal-weighted CCCNII have registeredannualized returns of 17.2% and 25.1% since 2009, outperforming major benchmarkindices. They have delivered notable excess returns in the past 3 years, partly drivenby the gains of companies in the solar-power and electric-vehicle value chains.
Comparisons of CCCNII and other main indices are displayed in Fig. 12.7.Detailed constituents of CCCNII are shown in Fig. 12.8.

12.3 How to Capture Investment Opportunities from Carbon … 315
Fig. 12.8 CCCNII’s constituents. Source CICC Research

316 Chapter 12 Green Investment: New Trend, New Direction
Open Access This chapter is licensed under the terms of the Creative Commons Attribution-NonCommercial-NoDerivatives 4.0 InternationalLicense (http://creativecommons.org/licenses/by-nc-nd/4.0/), which permits any noncommercial use, sharing, distribution and reproduction in anymedium or format, as long as you give appropriate credit to the original author(s) and the source,provide a link to the Creative Commons license and indicate if you modified the licensed material.You do not have permission under this license to share adapted material derived from this chapteror parts of it.
The images or other third party material in this chapter are included in the chapter’s CreativeCommons license, unless indicated otherwise in a credit line to the material. If material is notincluded in the chapter’s Creative Commons license and your intended use is not permitted bystatutory regulation or exceeds the permitted use, you will need to obtain permission directly fromthe copyright holder.

Chapter 13Tackling Climate Change: GlobalCooperation and China’s Commitment
Abstract Climate issues require a coordinated global response. Greenhouse gases,such as carbon dioxide, remain in the atmosphere for a long period of time andexert a strong influence. Carbon emissions are transnational and intergenerationalin nature; they also present a “free-rider” problem due to their role as global publicgoods. This makes it necessary for nations to go beyond their own decision-makingprocesses and seek global cooperation to solve the problem of climate change. In fact,in the absence of supranational governance bodies, it requires transnational nego-tiations and consultations to build a global climate governance system. However,under existing technological systems and energy resource endowments, respondingto climate change by reducing greenhouse gas emissions may impose constraintson economic development. Looking back at global cooperation in tackling climatechange, we find that disputes between countries in politics, economy, science, andtechnology have posed challenges to the creation of a “fair and effective” globalclimate governance model. Of course, from a broader perspective, global climategovernance has spillover effects, due to its interplay with other fields of internationalcooperation, such as security, trade, investment, and technology. For example, thecarbon border tax proposed by the EU may have a profound impact on current inter-national trade patterns, and high-emission industries could bear the brunt of suchactions. In addition, addressing climate change and achieving sustainable develop-ment also impose new requirements for the development of global climate finance.Lastly, as a large economy, China will play an important role in promoting the estab-lishment of a global governance system that is fair and reasonable, and focuses onwin–win cooperation. For example, we believe China will be an important leaderalong with the US and Europe in the global response to climate change, and that itwill also cooperate with “Belt and Road” countries on climate issues in its processof “going global.”
© The Author(s) 2022CICC Research, CICC Global Institute, Guidebook to Carbon Neutrality in China,https://doi.org/10.1007/978-981-16-9024-2_13
317

318 Chapter 13 Tackling Climate Change: Global Cooperation and China’s Commitment
13.1 Building Fair and Effective Global ClimateGovernance System
13.1.1 History of International Cooperation in AddressingClimate Issues
According to the timeline of international climate negotiations, we divide the processinto four stages: The UNFCCC stage, the Kyoto Protocol stage, the Bali Roadmapstage, and the Durban Platform and the Paris Agreement stage.
• UNFCCC in 1990–1994: UNFCCCwas the formal starting point of internationalcooperation in addressing climate change. The UNFCCC established the goal ofaddressing climate change and it clarified the principles for international coop-eration (e.g. principle of fairness and the principle of common but differentiatedresponsibilities). It also stated that developed countries should take the responsi-bility before other countries. At this stage, the international community had highexpectations on cooperative efforts in coping with climate change.
• Kyoto Protocol in 1995–2004: Kyoto Protocol formulated and establishedspecific targets and mechanisms. It set the overall target of 5.2% emissions reduc-tion for developed countries during the first commitment period (2008–2012)and established three flexible mechanisms, namely the International EmissionsTrading Mechanism (IET), the Joint Implementation Mechanism (JI), and theCleanDevelopmentMechanism (CDM). However, because theUS refused to signthe legal document that included emissions reduction commitments for developedcountries, the process came to a halt. At this stage, the international communityreassessed the difficulties in tackling climate change issues and various partiesadopted more pragmatic approaches. Developed countries also put more pressureon developing countries over emissions reduction.
• Bali Roadmap in 2005–2010: The issue of climate change received unprece-dented attention from the international community, and all major powers activelyparticipated in addressing climate change. Much progress was made at this stage,including the establishment of the “two-track” approach. Developing countrieswould need to take actions within their national capacities and began to estab-lish a bottom-up approach with “commitment + regular review” to achieve therelatively flexible target of limiting the temperature increase to within 2°C (i.e.the 2°C target). However, due to the disagreement between countries, the Copen-hagen Accord was set aside at the end in 2009. The binding force of the CancunAgreements in 2010 also turned out to be unsatisfactory.
• Durban Platform and Paris Agreement in 2011–2015: This stage began withthe Durban Platform negotiations in 2011 and further developed in 2012 withthe Doha Amendment to the Kyoto Protocol. Eventually, the landmark 2015 ParisAgreement further established themodels andmechanisms for international coop-eration to tackle climate change. This agreement stated that all countries should

13.1 Building Fair and Effective Global Climate Governance System 319
contribute to reach peak global emissions as soon as possible, and the goal ofcapping the global temperature rise below 1.5°Cwas added through the first roundof periodic review. Additionally, the Green Climate Fund (GCF) was establishedand the internationally transferred mitigation outcomes (ITMO) and sustainabledevelopment mechanism (SDM) were proposed.
• However, there were also some problems with the “bottom-up” model of nation-ally determined contributions (NDCs). In the “2020 Emission Gap Report”, theUnited Nations Environment Programme (UNEP) pointed out that current NDCsremain seriously inadequate for achieving the Paris Agreement climate goals andwould lead to a temperature increase of at least 3°C by the end of the century.1
In addition, it suggests that the Paris Agreement lacked rigorous target manage-ment and reward/punishment mechanisms, resulting in challenges to internationalcooperation.
13.1.2 Discussion on Fair and Effective Governance Model
Given the externalities of climate issues that span a long time frame, how to measure“climate fairness” and establish “fair” and “effective” climate governance modelsaccordingly are the two core issues that draw the most attention in global efforts totackle climate change.
13.1.2.1 What is Climate Fairness?
Climate fairness is a basic prerequisite for global climate cooperation and an impor-tant guide for action. Climate fairness refers not only to the equal rights of all coun-tries, regions and individuals to enjoy the world’s resources, but also to the equitablesharing of obligations to stabilize the climate. Furthermore, in the context of inter-national cooperation in tackling climate change, all countries have the same right toenjoy sustainable development.
From an intergenerational perspective, the discussion on “outcome fairness”focuses on the principle of “common but differentiated responsibilities” and respec-tive capabilities. It not only clarified the “common” responsibilities of all countries todeal with climate change, but also emphasized the “differences” and respective capa-bilities. That is to say, different countries bear different responsibilities according totheir impact on climate change, economic condition, and capabilities. The conceptof this principle is clear, but there have been considerable disputes and controversieswith regards to the specific details involved. For example, it is difficult to determinethe responsibility of previous generations, and to hold them accountable for climate
1 https://wedocs.unep.org/bitstream/handle/20.500.11822/34438/EGR20ESC.pdf?sequence=27&isAllowed=y.

320 Chapter 13 Tackling Climate Change: Global Cooperation and China’s Commitment
issues. To compensate for their historically larger emissions, developed countrieswere responsible for not only reducing emissions, but also providing financial, tech-nical and capacity-building support to developing countries. However, in the absenceof a well-defined monitoring mechanism, the actual effects were relatively limited.
Moreover, different understandings of “common but differentiated responsibili-ties” also affect the international community’s discussion on distribution of carbonemission credits on an intra-generational basis. The Paris Agreement did not estab-lish rules for sharing the emissions reduction contributions of various countries.Therefore, many countries have carried out research to find solutions that are recog-nized by the international community. For example, the “contraction& convergence”framework proposed by Global Commons Institute (GCI) in the UK reflected the“grandfather clause”; proposal from Chinese and Brazilian scholars is based on theprinciple of “equal cumulative emission per capita”, proposing to take into accounthistorical emissions when evaluating current emission responsibilities.
13.1.2.2 What is an Effective Governance Model?
Another focus of international climate negotiations is the dispute over whether top-down or bottom-up governance models are more suitable for climate issues. Thegovernance approaches adopted in the stages ofUNFCCCand theKyoto Protocol canbe regarded as the preliminary versions of the top-down global climate governancemodel. However, in the absence of supranational governance bodies, the effects of thetop-down institutional design were not ideal. To address these problems, theWarsawClimate Change Conference 2013 and the 2014 Lima Climate Change Conferenceintroduced the innovative idea of NDCs. The Paris Agreement in 2015 allowed eachcountry to carry out climate reduction actions based on its own national conditionsand capabilities. It adopted a bottom-up approach to achieve the goal of reducingemissions and tackling climate change in order to enhance execution and raise theenthusiasm of all countries. However, the bottom-up model also has drawbacks, forexample, there is still a certain gap between various countries’ NDC targets and theoverall global target.
Climate Club may provide a new alternative for effective global climategovernance.
According to the club theory (the study of club goods in economics), the successfuloperation of clubs often depends on a unified set of rules. Members pay “contribu-tions” to join the club and obtain exclusive benefits relative to non-members. Thebenefits may be provided directly by the club or created collectively by members.Based on this theory, William Nordhaus, the 2018 Nobel Prize laureate in economicsciences, introduced the concept of the “climate clubs” mechanism. In the fieldof climate cooperation, the “contributions” made by member states to partici-pate in the Climate Club consist of carbon emissions reduction actions and thecosts incurred. Climate resources are their common benefits. However, considering

13.1 Building Fair and Effective Global Climate Governance System 321
the non-exclusiveness of climate change, non-participants are penalized for beingfree-riders.
Nordhaus’2 Climate Club relies on the implementation of two rules: (1) an agree-ment between participating countries to undertake harmonized emissions reductions;and (2) countries that fail to fulfill their obligations are penalized. The agreementenvisioned here centers on a “target carbon price that is agreed by the internationalcommunity”, which is the focal provision of an international agreement. The simplestand most effective measure to punish non-participating countries is to impose tariffson products imported from non-participating countries to club member states. Basedon this, Nordhaus used the Dynamic Integrated Climate Change (C-DICE) coali-tion model to show that with a unified tariff penalty mechanism, participating in theClimate Club would be the best choice for the US. When considering the sum ofemissions reduction costs, environmental gains, and trade benefits, participating inthe Climate Club would give the US the optimal net gain.
The Climate Club adopts a unified carbon tariffs-based penalty mechanism andthe ultimate goal is to have countries take initiatives to reduce carbon emissions.However, in practice, we believe successful operation of the Climate Club requiresaddressing a number of obstacles.
First, it is challenging to form a unified carbon emissions target price; standardsand methods of implementing a unified carbon tariff also require further discussion.
Second, the punishment mechanism can effectively overcome the free riderproblem, but international climate cooperation also involves the issue of justice.Designing effective assistance and compensation mechanisms may be of greatsignificance to motivate developing countries to participate in carbon emissionsreduction.
Lastly, trade-related carbon emissions are only part of total carbon emissions.The scope of the carbon tariff only covers part of the carbon reduction initiatives bycountries around the world, and it remains to be seen whether the tariff can promoteglobal carbon reduction.
2 Nordhaus W. Climate Clubs: Overcoming Free-Riding in International Climate Policy[J].American Economic Review, 2015, 105(4):1339–1370.

322 Chapter 13 Tackling Climate Change: Global Cooperation and China’s Commitment
13.2 Spillover Effects of Global ClimateGovernance—International Trade and ClimateFinance
13.2.1 International Trade: Embodied Carbon and BTA
Embodied carbon refers to carbon emissions associated with the production processof imported and exported goods. With the development of economic globaliza-tion, a country’s carbon emissions are not only determined by domestic productionand consumption, but also by international trade. According to Organization forEconomic Co-operation and Development (OECD) data, the scale of carbon emis-sions embodied in global exports was close to 9bn tonnes in 2015, accounting forabout a quarter of global carbon emissions (Fig. 13.1).
From the perspective of the scale andflowof global trade, embodied carbonmainlyflows fromdeveloping countries to developed countries. Such phenomenonmay havethree implications. First, developed countries may simply reduce domestic emissionsfrom production by importing goods and passing the carbon emissions (by transfer-ring production) to developing countries. Second, high-carbon-producing industriesmay move from developed countries to developing ones, which increases the volumeof domestic carbon emissions in developing countries. Third, due to technologicalrestrictions, carbon emissions associated with the same production process in devel-oping countries are likely to be higher than those in developed countries, which mayeventually lead to a net increase in global carbon emissions (Fig. 13.2).
13.2.1.1 Carbon Emissions Embodied in Trade and the Principleof Fairness
The Intergovernmental Panel on Climate Change (IPCC) proposed adoptingExtended Producer Responsibility (EPR) which means that carbon emissions caused
Fig. 13.1 Carbon emissionsembodied in global exportsaccounted for nearlyone-fourth of the world’stotal carbon emissions.Source OECD, Our World inData, CICC Global Institute 25%
20
22
24
26
28
30
0
2,000
4,000
6,000
8,000
10,000
2005 2007 2009 2011 2013 2015
Carbon emissions emodied in global exports
% of total global carbon emissions
(mn tonnes) (%)

13.2 Spillover Effects of Global Climate Governance… 323
1,200
1,500
1,800
2,100
2005 2007 2009
China-ASEAN-India (carbon US-EU-Japan (carbon emissi
(mn tonnes)
2011 2013 2015
emissions embodied in net export) ons embodied in net import)
Fig. 13.2 Carbon emissions embodied in trade of world’s major economies in 2005–2015. SourceOECD, CICC Global Institute
by production and exports would be counted toward carbon emissions of produc-tion areas while the impact of importing high-carbon emission products wouldbe excluded. However, the development of international trade has highlighted theunfairness of the EPR approach to production areas.
Another accountingmethod isExtendedConsumerResponsibility (ECR). In otherwords, all carbon emissions in the production process of commodities are borne byconsumers. This method is relatively fair to producers, though it also has limitations.It lacks binding force and discourages producers from reducing emissions. To solvethis problem, many scholars have proposed the principle of shared responsibilityfor carbon emissions, which aims to effectively achieve global emissions reductiontargets by restricting and controlling carbon emissions on both the production andconsumption sides as well as distinguishing between responsibilities of producersand consumers. However, under the principle of shared responsibility for carbonemissions, how to allocate the responsibilities of producers and consumers whileestablishing a reasonable, clear, and feasible scheme of shared responsibility forinternational carbon emissions would also pose a challenge.
13.2.1.2 Carbon Emissions Embodied in Trade and BTAs
Border tax adjustments (BTAs) refer to a special carbon emission tariff levied onexported goods that are not taxed in the producing country. BTAs are introducedmainly because developed countries hope to impose tariffs on carbon emission-intensive products imported from developing countries.
The EU started to discuss and study carbon BTAs in the 1990s, and it advocateslevying taxes on industrial products imported from countries with loose environ-mental regulations. Themain targets include: (1) reducing global “carbon leakage”, inother words, reducing the transfer of production and manufacturing to countries thatdo not implement strict emissions reduction policies, and (2) creating a “level playing

324 Chapter 13 Tackling Climate Change: Global Cooperation and China’s Commitment
field” and levying carbon tariffs to prevent countries lagging behind in carbon emis-sions reduction fromgaining trade advantages. This could help protect EU companiesfacing extra emissions reduction costs in the EU carbon emissions trading market,and ultimately enhance the global competitiveness and international influence of theEU. On July 14, 2021, the European Commission adopted the proposal for estab-lishing a carbon border adjustment mechanism.3At the same time, the US also helddiscussions onBTAs, for example, both theAmerican Clean Energy and Security Actof 2009 and the American Opportunity Carbon Fee Act passed in 2014 mentionedcarbon tariffs.
However, there are also many controversies surrounding BTAs:
• Legitimacy. Does the imposition of BTAs violate the basic rules of the WTO?Carbon tariffs conflict with theWTO’s most-favored-nation treatment (MFN) andnational treatment (NT)principles.However,WTOrules allow for the introductionof trade restriction clauses under exceptional circumstances, which may providea legitimate basis for carbon tariffs. When the domestic tax base of a certain typeof product is linked to the carbon footprint in the production process, tariffs leviedwith reference to domestic standards are allowed.
• Fairness. Taking into account the distribution of carbon emissions embodiedin global trade and trade flows, is the BTAs mechanism promoting trade protec-tionism in the name of environmental protection and hurting the interests of devel-oping countries?Will the carbon tariffs collected be used for climate cooperation?These questions still need to be answered.
• Effectiveness. It remains to be seen if BTAs can effectively reduce global “carbonleakage” and help achieve the ultimate goal of carbon emissions reduction.
• Feasibility. How to calculate BTAs? For example, how to calculate the carboncontent of imported products, especially products manufactured in multiplecountries? How to set an effective and reasonable carbon price?
If the EU promotes the adoption of BTAs, what would be the impact on globaltrade and the industrial landscape?
• BTAs may change current landscape of international trade. The carbon factoras a new cost factor may have a greater impact on the production side. Devel-oped countries will benefit more, while the competitiveness of related developingcountries could be weakened. That said, the inclusion of embodied carbon inthe international trading system may also force developing countries to adjusttheir industrial structures and production methods and move towards clean andlow-carbon development.
• Trade pattern of high-carbon industries will bear the brunt of the impact. A reportfrom Boston Consulting Group discusses this impact with regard to the carbonintensity and trade intensity of different industries, and further analyzes the impactof the EU’s BTAs on international trade in different industries.4 For example,
3 https://ec.europa.eu/info/sites/default/files/carbon_border_adjustment_mechanism_0.pdf.4 https://www.bcg.com/publications/2020/how-an-eu-carbon-border-tax-could-jolt-world-trade.

13.2 Spillover Effects of Global Climate Governance… 325
emissions from steel production in Turkey and the US average only half of theemissions from China and Ukraine. If the EU imposes BTAs, the competitivenessof Turkish and US steel in EU imports will be strengthened.
• Lastly, we think BTAs may drive up the prices of corresponding products inthe international market, and lead to deteriorating terms of trade and weakeninginternational competitiveness; it could also have a negative impact on developingeconomies. A research report5 written by experts from the World Bank and thePeterson Institute for International Economics pointed out that once industrialcountries impose carbon tariffs, China’s manufacturing exports would decline byone-fifth and those of all low- and middle-income countries by 8%.
13.2.2 Global Climate Finance: Realities and Challenges
13.2.2.1 Global Climate Finance: Realities
The concept of climate finance was born amidst negotiations over funding issues inthe United Nations Climate Change Conference. The United Nations defines climatefinance as financing and investment activities related to the UNFCCC that couldreduce emissions and seek to support mitigation and adaptation actions in order toaddress climate change.6 In a broad sense, climate finance covers all investment andfinancing activities in response to and supporting mitigation of climate change.7
In recent years, the scale of global climate finance has grown rapidly. Accordingto a report released by the Climate Policy Initiative,8 the scale of global climatefinancing may have reached US$608–622bn (Fig. 13.3), corresponding to a CAGRof around 10.1%–10.5% from 2013 to 2019. Specifically:
• Geographic flows: (1) The Asia–Pacific region, Western Europe and NorthAmericawere the three primarydestinations, accounting for 41%, 19%and17%ofglobal climate finance in 2018; (2)Climate finance that flowed to developing coun-tries grew to US$356bn per year in 2017–2018, indicating a 32% increase fromUS$270bn per year in 2015–20169; (3) A strong domestic preference continues,as 76% of finance was raised and spent domestically in 2017–2018.10
• Financial sources: (1) The public sector accounted for 52% of global climatefunding sources in 2017–2018 which was higher than the 48% for the private
5 Aaditya Mattoo, Arvind Subramanian, Dominique van der Mensbrugghe, and Jianwu He,290919536009. Reconciling Climate Change and Trade Policy. Peterson Institute for InternationalEconomics Working Paper Series.6 https://unfccc.int/topics/climate-finance/the-big-picture/introduction-to-climate-finance.7 https://www.worldbank.org/content/dam/Worldbank/document/Climate/FinanceClimateAction_Web.pdf.8 Climate Policy Initiative, Global Landscape of Climate Finance 2019.9 Climate Policy Initiative, Global Landscape of Climate Finance 2019.10 Climate Policy Initiative, Global Landscape of Climate Finance 2019.

326 Chapter 13 Tackling Climate Change: Global Cooperation and China’s Commitment
342388
472 455
608541
608-622
0
100
200
300
400
500
600
700
2013 2014 2015 2016 2017 2018 2019 E
(USD bn)
2013-2019 CAGR: 10.1%-10.5%
Fig. 13.3 Scale of global climate finance grew rapidly. Source Updated View on the Global Land-scape of Climate Finance 2019, CICC Global Institute. Note CPI statistics seek to capture a non-double-counted estimate of financial flows. Finance provided through some financial instrumentssuch as guarantees, insurance, government revenue support schemes, and fiscal incentives are notcounted to avoid double counting and overestimating project investment costs
sector; (2) Global climate finance from the public sector is concentrated at thenational level, with governments and state-owned enterprises (including domesticdevelopment financial institutions) making up 37% of global climate financialsources; (3) Climate finance from the private sector is concentrated on non-financial corporations, which made up about 27% of global climate financialsources (Fig. 13.4).
• Financing structure: The majority of climate finance was raised as debt, whichaccounted for 66% of total climate finance in 2017–2018, including on-balancesheet credit and bonds. Equity investments made up about 29% of total climatefinance while grants and others were 5% (Fig. 13.5).
• Financialmechanismsmainly compriseUNFCCCsystemand traditional financialmarkets. The Paris Agreement proposed making finance flows consistent with apathway towards low carbon emissions and climate-resilient development in thelong run. Moreover, financial mechanisms under the UNFCCC framework, suchas GCF, the Special Climate Change Fund (SCCF) and the Adaptation Fund(AF), were established. Beyond the UNFCCC framework, there are also someother financial mechanisms such as bilateral and multilateral capital channels,and regional private sector climate finance.
13.2.2.2 Issues and Challenges Facing Global Climate Finance Today
The development of global climate cooperation poses some thorny issues andchallenges to climate finance:
(1) Huge global climate funding gap. International agencies have different fore-casts on funding needs for tackling climate change. According to UNEP fore-casts, in order to address climate change, the transformation of the globalenergy sector will require raising supply-side investment to betweenUS$1.6trn

13.2 Spillover Effects of Global Climate Governance… 327
Source
Developed countries public
funds
Domestic fiscal funds
International and domestic carbon
market
NGOs
Traditional financial market
Business investment/FDI
Channel
Multilateral financial
institutions
Bilateral financial institutions
CDM funds
Other policy fund
Policy bank
Social security funds
Carbon financial services
Insurance
Commercial bank
Investment bank
Public funds
Other
Tool
Grants
Policy incentives
Risk management
Carbon credit and derivatives
Debt
Market-rate loans
Equity
Other
Usage
Mitigation
Adjust industry structureOptimize energy structureImprove energy efficiencyCCUS etc.
Adaptation
Improve adaptability in key areasStrengthen capacity building
Foreign aid and international cooperation
Prime-rate loans
Fig. 13.4 Sources, channels, tools and usage of global climate finance. SourceNCSC,CICCGlobalInstitute
29%
66%
5%
By fund type (2017/18 average)
Equity
Debt
Grant and others
GlobalUS$574bn
27%
8%
9%3%
37%
14%2%
By fund source (2017/18 average)
Corporation
Commercial bank
Household & Individuals
Funds, institutional investor,and others
Government & SOE
Multilateral/bilateralinstitution
Climate funds and other
GlobalUS$574bn
Private Sector 48%
Public 52%
41%
19%
17%
7%
4%3%
9%
By region (2018)
Asia Pacific
West Europe
North America
Latin America
Africa
Middle East
Other
GlobalUS$541bn
Fig. 13.5 Different perspectives of global climate finance analysis. Source CPI Updated view onthe Global Landscape of Climate Finance 2019, CICC Global Institute
and US$3.8trn per year in 2020–2050 (Fig. 13.6).11 Considering the currentglobal annual climate finance of approximately US$500–600bn, we projectthe annual global climate finance gap to be US$3–4trn in the future. With
11 https://wedocs.unep.org/bitstream/handle/20.500.11822/30798/EGR19ESCH.pdf.

328 Chapter 13 Tackling Climate Change: Global Cooperation and China’s Commitment
current climate financing instruments and methods, the financial pressure fromthe global response to climate change and carbon emissions reduction targetswould be high.
(2) Limitations in scale and efficiency of public funds provided by devel-oped countries to developing countries. According to provisions in the ParisAgreement, developed countries should commit to mobilizing a minimumof US$100bn each year to assist developing countries by 2025. However,according to OECD data,12 the scale of climate finance provided by developedcountries to developing countries still lagged behind this target in 2016–2018(Fig. 13.7). Meanwhile, the proportions of climate funds provided by devel-oped countries that are used for mitigation (short-term emission reduction) andadaptation (long-term construction of capabilities) are 70% and 21% respec-tively, suggesting amismatch in the structure. Efficiency of the funds still needsto be improved.
(3) Insufficient private sector investment along with limited effects of market-based and innovative financial tools. According to statistics by the ClimatePolicy Initiative, the total scale of climatefinance fromchannels such asmarket-oriented funds and institutional investment was only US$17bn from 2017 to2018, accounting for about 3%of global climate finance. Private sector,market-based institutions, and innovative financial instruments played a limited rolein global climate finance.
(4) “Green Swan” events may pose risks to global economic and financialsystem. According to the Bank for International Settlements’ (BIS) definition,“Green Swan” refers to potentially extremely disruptive climate-related eventsthat could be behind the next systemic financial crisis, such as credit, liquidity,and market risks. At present, the international community’s understanding andassessment of this new type of risk is inadequate.
13.2.2.3 Outlook for Global Climate Finance
Bridging the global climate funding gap is a top priority for governments.We believeit is necessary not only to explore breakthroughs and expand the scale of climatefinance under the international multilateral mechanism, but also to further innovateclimate financing tools and unleash market vitality.
• Tapping the potential of international multilateral institutions and leveragingsocial capital investment with public sector funds are also important forclimate finance.International multilateral financial institutions were established by a number ofmember states and they have played an active role in global climate finance.World Bank data shows that every US$1 invested by multilateral developmentbanks in public climate funds mobilizes some US$2–5 in private investment.13 In
12 OECD, Climate Finance Provided and Mobilized by Developed Countries in 2013–18.13 https://www.huanbao-world.com/a/zixun/2018/1125/62198.html.

13.2 Spillover Effects of Global Climate Governance… 329
342 388 472 455 608 541 608-622
0
1,000
2,000
3,000
4,000
5,000
2013 2014 2015 2016 2017 2018 2019 E
(USD bn)
USD3.8trn
USD1.6trn
Range of investment needed each year in a 1.5ºC scenario (IPCC)
Fig. 13.6 Global climate finance gap. Source CPI Updated View on the Global Landscape ofClimate Finance 2019, CICC Global Institute
42.252.3 55
10.1
13.316.8
6.2
5.57.1
58.5
71.178.9
0
20
40
60
80
2016 2017 2018
Mitigation Adaptation Other
(USD bn)
Fig. 13.7 Structure of climate finance provided by developed countries to developing countries.Source OECD, CICC Global Institute
recent years, international multilateral development banks have provided large-scale financing to tackle climate change and reduce carbon emissions, and the scaleof financing continues to expand. In 2019, the world’s seven major multilateraldevelopment banks14 provided a total of US$46.4bn in climate finance, and theCAGR of their climate financing hit 7.0% in 2011–2019 (Fig. 13.8).
14 Including World Bank, Islamic Development Bank, European Investment Bank, European Bankfor Reconstruction and Development, Inter-American Development Bank, Asian Investment Bank,African Development Bank.

330 Chapter 13 Tackling Climate Change: Global Cooperation and China’s Commitment
27 26.823.8
28.325.1 27.4
35.2
43.146.4
0
10
20
30
40
50
2011 2012 2013 2014 2015 2016 2017 2018 2019
(USD bn)2011-2019 CAGR: 7.0%
Fig. 13.8 Climatefinance commitments of theworld’s sevenmajormultilateral development banks.Source 2019 Joint Report on Multilateral Development Banks’ Climate Finance, CICC GlobalInstitute
• Exploring and innovating climate investment and financing tools. Countriesand regions that lag in developing climate finance could explore mechanisms andmodels for climate investment and financing tools (such as credit, bonds, andinsurance) by launching pilot climate investment and financing projects. Theycould then innovate products and leverage the investment and financing functionsof financial tools in view of local conditions.
• Improving global climate finance rules, incorporating climate risk assess-ment, and strengthening climate information disclosure can enhance thefinancial system’s ability to respond to climate change.
• Establishing and improving climate risk assessment system. In the report TheGreen Swan: Central Banking and Financial Stability in the Age of ClimateChange published in January 2020, the BIS urged central banks to be vigilantof green swan events and incorporate climate change considerations into theirmoves to prevent financial risks.
• Strengthening disclosure of climate information. Although international orga-nizations and countries have imposed requirements for information disclosure ofclimate change-related projects, the problem still exists. The main concerns areinconsistent certification standards for climate or green projects and inconsistentlevels of information disclosure required in different countries. The InternationalFinancial Reporting Standards (IFRS) Foundation, an international authoritativeorganization responsible for developing accounting standards, is soliciting opin-ions from all parties on whether to take the lead in formulating an internationallyaccepted climate information disclosure standard. If a consensus can be reachedon including mandatory disclosure of climate information in international infor-mation disclosure rules, it will effectively guide and promote the development ofglobal climate finance.

13.3 China’s Commitment to Global Climate Cooperation 331
13.3 China’s Commitment to Global Climate Cooperation
As a large economy, China plays an important role in promoting the establishmentof a global governance system that is fair and reasonable and focuses on win–wincooperation. We believe China will be an important leader along with the US andEurope in the global response to climate change, and that it will also cooperate with“Belt and Road” countries on climate issues in its process of “going global.”
13.3.1 From Participant to Leader: China’s ActiveInvolvement in Global Climate Cooperation
China was among the first 10 parties to sign the UNFCCC in 1992 and an activeparticipant in global climate cooperation. From the Copenhagen Climate ChangeConference to the Paris Climate Change Conference, China has evolved from animportant participant to a key leader. China’s important contribution to the ParisAgreement is evidenced by its efforts in promoting negotiations, reaching agree-ments, and efficiently implementing the agreements. After the Paris Climate ChangeConference, China utilized its advantages in host diplomacy to promote the signingof a declaration between China and the US at the G20 summit held in September2016 and significantly accelerated the enforcement of the agreement which tookeffect in November of that year.15
However, with the rapid increase in China’s carbon emissions, China’s partici-pation in global climate governance also faces challenges. For example, developedcountries could take the lead in achieving carbon neutrality, and their accumulatedgreenhouse gas emissions in a century could be lower than that of China. China needsnot only to assume the responsibility of emissions reduction as required by the inter-national community, but also to assume more ethical responsibilities. In addition,China has a limited say in scientific research in international climate cooperation.For example, in the IPCC’s Fifth Assessment Report (AR5), the number of Chinesepapers cited accounted for merely 2.8%, 1.7% and 1.6% of the total number of papersin climate change science, impact adaptation, and climatemitigation. To some extent,this restricts China’s voice in global climate governance.
15 China’s Strategies for Global Climate Governance and International Cooperation, NCSC,September 2020, https://www.efchina.org/Reports-zh/report-lceg-20210207-2-zh.

332 Chapter 13 Tackling Climate Change: Global Cooperation and China’s Commitment
13.3.2 China is Promoting Global Response to ClimateChange Along with Europe and the US
As mentioned earlier, in the process of promoting the adoption and enforcement ofthe Paris Agreement, China has strengthened cooperation with major powers andvigorously promoted various parties to reach a consensus. The four joint statementsissued by China and the US along with the bilateral consensus between China andmajor developed countries and regions played an important role in ensuring thesuccess of the Paris Climate Change Conference, especially the conclusion, signing,enforcement and implementation of the Paris Agreement.
13.3.2.1 China-EU Climate Cooperation Continues to Advance Steadily
In 2005, China and the EU decided to establish a partnership in the field of climatechange. Since then, their relationship has continued to evolve. The release of theJoint Statement on Climate Change and Clean Energy in 2018 confirmed that the twopartieswill continue to strengthen bilateral cooperation in areas such as long-term lowgreenhouse gas emission development strategies, carbon trading, energy efficiency,and climate-related technologies.16 In the China-EU Comprehensive Agreement onInvestment, which was signed in 2020, the two sides reaffirmed their commitment toimplementing the Paris Agreement and tackling climate change jointly.
In terms of climate cooperation between China and the US, the two partiesexplored multiple fields through multiple channels during the Obama administra-tion. Since 2009, the two countries have signed a total of seven bilateral agreementsinvolving climate change cooperation. Leveraging platforms such as the China-US Climate Change Working Group and the China-US Clean Energy ResearchCenter, China and the US established multiple forms of cooperation, such as jointR&D, policy cooperation, and technical assistance.AsChina-USclimate cooperationachieved substantial progress, the fields of cooperation include auto emissions reduc-tion, power systems, carbon capture, utilization, and storage, building and industrialenergy efficiency, aswell as climate-smart and low-carbon cities.17 However,with thecooling of China-US relations during the Trump administration, China-US climatecooperation also stalled.
13.3.2.2 Outlook for China-US Climate Cooperation Under BidenAdministration
So far, the US remains the country with the largest cumulative emissions since theIndustrial Revolution, and one of the countries with the highest per capita emissions,
16 http://www.ncsc.org.cn/SY/gjlhsm/202003/t20200319_769645.shtml.17 http://www.ccchina.org.cn/archiver/ccchinacn/UpFile/Files/Default/20160617103440817412.pdf.

13.3 China’s Commitment to Global Climate Cooperation 333
while China is currently the world’s largest carbon emitter.18 The full and effec-tive implementation of the Paris Agreement requires cooperation between the twocountries.
In terms of domestic development, both China and the US have proposed carbonneutrality goals. In order to consolidate the advantages of the US in low-carbon tech-nologies and industries, President Biden campaigned to have “a carbon-pollution-free power sector” by 2035 and “net zero greenhouse gas emissions” by 2050. Healso proposed investing US$2trn in promoting the development of low-carbon indus-tries.19 Meanwhile, at the end of 2020, the Chinese government put forward the goalof achieving peak carbon emissions by 2030 and carbon neutrality by 2060.
In terms of global cooperation, President Biden announced on the first day of hispresidency that the US will return to the Paris Agreement and the US may rely moreon the power of its allies, including the EU, the UK, Japan, Australia, and Canada, inthe implementation of the Paris Agreement as well as multilateral or bilateral climatediplomacy to reshape relations between large powers. OnApril 22, 2021, the US helda Leaders’ Climate Summit,20 and over 40 world leaders convened for the meeting,where Canada, the UK, and Japan announced new emissions targets.21 Through thesummit, the US aimed to regain the initiative and leadership in the global climatedialogue.
13.3.3 Climate Cooperation and Building a Green Beltand Road
13.3.3.1 China Actively Promoting a Green Belt and Road
Since the Belt and Road Initiative was put forward in 2013, it has received positiveresponses from the international community. More than 140 countries around theworld have formally signed agreements with China. In 2019, Belt and Road countriesaccounted for 22% of the world’s GDP and about 30.8% of the world’s total carbonemissions (Fig. 13.9), mainly because most of these countries are in the stage ofrapid industrialization and urbanization.
Since 2013, the Chinese government has issued policy documents to guide firmsto adhere to green development and eventually to build a Green Belt and Road.
• Green infrastructure: According to data from the American Enterprise Insti-tute for Public Policy Research (AEI), in 1H20, the proportion of renewableenergy investment in China’s investment in the energy sector of the Belt and
18 http://www.tanpaifang.com/tanzhonghe/2020/1204/75653_2.html; http://www.tanpaifang.com/tanguwen/2020/0307/68701.html.19 http://www.xinhuanet.com/energy/2021-02/02/c_1127052697.htm.20 http://forex.cngold.org/fxb/c5476149.htm.21 https://news.un.org/zh/story/2021/04/1082682.

334 Chapter 13 Tackling Climate Change: Global Cooperation and China’s Commitment
2019 GDP Population Trade volumn FDI stock Total carbon emissions
US 24.4% 4.3% 11.4% 26.0% 14.5%
EU 17.8% 5.8% 30.1% 30.4% 8.0%
China 16.3% 18.2% 10.4% 4.9% 27.9%
India 3.3% 17.8% 2.3% 1.2% 7.2%
BRI Countries 22.0% 43.8% 30.6% 24.8% 30.8%
Fig. 13.9 Carbon emissions of the Belt and Road countries accounted for nearly one-third of theworld’s total. Source World Bank, UNCTAD, CICC Global Institute
Road countries surpassed that of fossil fuel energy for the first time, reaching58.1%.22
• Green finance cooperation: In 2017, the People’s Bank of China (PBoC) partic-ipated in the launch of the Network for Greening the Finance System (NGFS).By the end of April 2019, the number of NGFS members reached 36, includingthe central banks and regulatory authorities of Thailand, Malaysia, Morocco, andso on.23 In addition, the Belt and Road Green Investment Principles (GIP) draftedby Chinese and British institutions was signed by 26 large financial institutionsfrom 13 countries and regions.24
• Green technology cooperation: During the second Belt and Road Forum forInternational Cooperation in 2019, the Chinese government established the Beltand Road Initiative International Green Development Coalition (BRIGC) jointlywith 42 countries to promote the development of Belt and Road green technologycooperation.25
By exploring constructionof greenprojects,Chinese companies have accumulatedvaluable experience and are actively sharing their experience. For example, at the endof 2019, the Mozura wind power project in Montenegro, held by Shanghai ElectricPower, was officially put into commercial operation. The project’s annual averagepower generation accounted for 5% of Montenegro’s annual electricity consumptionvolume. It could reduce Montenegro’s carbon emissions by 3,000tonnes each year
22 http://www.21jingji.com/2020/12-26/4MMDEzNzlfMTYxNjA4MQ.html.23 http://kz.mofcom.gov.cn/article/scdy/202008/20200802994698.shtml.24 http://intl.ce.cn/sjjj/qy/202008/14/t20200814_35527622.shtml.25 http://news.china.com.cn/txt/2019-04/29/content_74735382.htm.

13.3 China’s Commitment to Global Climate Cooperation 335
and should effectively help Montenegro achieve its energy development goals. Itshould also help the country accelerate the progress toward its sustainable modernenergy goals.26
13.3.3.2 How to Promote Green Belt and Road?
Looking ahead, in order to develop the Green Belt and Road, we think China needs toexplore, innovate, and adapt to different local conditions of Belt and Road countries.
First, we believe China should encourage Belt and Road countries to embracethe idea of green development, adopt a green and low-carbon development model,engage Belt and Road countries in global climate cooperation, and urge them toexpand their NDCs.
Second, green finance and green investment could aid the development of theGreen Belt and Road. Green infrastructure projects require large investments as theyhave long duration and limited short-term economic benefits. We think multilateralfinancial institutions should be at the forefront of green infrastructure investment andgreen financial support is needed to encourage commercial financial institutions andsocial capital to engage in green investment.
Third, a Belt and Road national green development information exchange plat-form needs to be established, to provide assistance and support within China’scapacity in areas such as green energy, green technology, green finance, and greenmanufacturing.
Lastly, we think the continued decline in the costs of renewable energy will grad-ually create conditions for domestic industries to “go global”. Given China’s expe-rience in renewable energy equipment, technology, and management, we believe itcan guide and encourage renewable energy companies to actively participate in theconstruction of the Belt and Road.
Open Access This chapter is licensed under the terms of the Creative Commons Attribution-NonCommercial-NoDerivatives 4.0 InternationalLicense (http://creativecommons.org/licenses/by-nc-nd/4.0/), which permits any noncommercial use, sharing, distribution and reproduction in anymedium or format, as long as you give appropriate credit to the original author(s) and the source,provide a link to the Creative Commons license and indicate if you modified the licensed material.You do not have permission under this license to share adapted material derived from this chapteror parts of it.
The images or other third party material in this chapter are included in the chapter’s CreativeCommons license, unless indicated otherwise in a credit line to the material. If material is notincluded in the chapter’s Creative Commons license and your intended use is not permitted bystatutory regulation or exceeds the permitted use, you will need to obtain permission directly fromthe copyright holder.
26 Belt and Road Green Development Report: Case Studies 2020, BRIGC, http://www.sasac.gov.cn/n2588025/n2588139/c11632202/content.html.